


10F Printing House Yard Hackney Road, London E2 7PR +44 (0) 20 7580 5383 eftec@eftec.co.uk eftec.co.uk Water for Growth Independent Economic Assessment Final Report Westcountry Rivers Trust March 2023
This document has been prepared for Westcountry Rivers Trust by:
Economics for the Environment Consultancy Ltd (eftec)
10F Printing House Yard
Hackney Road, London
E2 7PR
www.eftec.co.uk

Study team:
Natalya Kharadi
Claudio Contento
Allan Provins
Reviewer(s)
Allan Provins (eftec) and Ian Dickie (eftec)
Disclaimer
This report has been prepared in accordance with our proposal submitted on 26 August 2022 and agreed revisions to it. We are reliant on the information provided by Westcountry Rivers Trust, and that is available in the public domain collected by eftec. While we have endeavoured to provide accurate and reliable information, we are not responsible for the completeness or accuracy of any such information. This report is intended solely for the information and use of Westcountry Rivers Trust and is not intended to be, and should not be, used by anyone other than the specified parties. eftec, therefore, assumes no responsibility to any user of this document other than Westcountry Rivers Trust.
Document evolution
This report is based on eftec’s Version 3 – November 2021 report template.
eftec offsets its carbon emissions through a biodiversity-friendly voluntary offset purchased from the World Land Trust (http://www. carbonbalanced.org) and only prints on 100% recycled paper.
Final Report | March 2023
Water for Growth Independent Economic Assessment
Draft Final Report 25/01/2023 Reviewed by Allan Provins Final Report 15/03/2023 Reviewed by Ian Dickie Final Report 17/03/2023 Reviewed by Allan Provins
Executive summary
This the final report of the independent economic assessment (IEA) of the Water for Growth (W4G) project. It summarises the work undertaken to measure and value the impact of the W4G project, accounting for the ecological, economic, and social uplifts arising from: (a) improved fish passage in the River Camel and Fowey; and (b) benefits to anglers from modernisation of the payment mechanism for accessing fishing beats. The evaluation questions answered are:
1. What has been achieved?
2. How has this been achieved?
3. What is the value for money of the W4G project?
The results and findings from this assessment support WRT’s reporting to the ERDF.
The IEA examines the costs for and benefits from the outcomes achieved by the W4G project during the implementation period from 2016 to 20221 and future impacts for an additional eight years. Benefits and costs have been assessed at the local level (impacts within Cornwall), based on the impact of the W4G project compared to a counterfactual scenario (i.e., without intervention), in which some of the improvements from W4G are delivered but they are not as well-coordinated, occur at a slower rate, and across a smaller scale.
The assessment found that the benefits provided by the W4G project outweigh the costs of implementation and ongoing maintenance. The benefit-cost ratio is estimated to be approximately 7.7. In other words, for every £1 spent by the project, around £8 in benefits has been generated. To a large extent the benefit is driven by increased natural capital value in the River Fowey and Camel catchments from improved fish passage and enhanced river habitats. The economic impacts of the project have been found to be marginal, through expenditure by anglers.
Key recommendations and learnings for future evaluations of similar projects focus on improved data gathering and monitoring during the project period, as well as collecting information that supports the development of a counterfactual scenario for the analysis. Provision of a monitoring and evaluation plan earlier in the project cycle will allow for better link-up to the IEA (which is usually ex-post analysis). In doing so, data needs for the assessment are clearly defined and will ensure that appropriate baseline (i.e., pre-intervention) information is collected along with data on the achievement of project outcomes throughout the project implementation period.
Water for Growth Independent Economic Assessment Final Report | March 2023 Page i
1 W4G project funding was awarded in 2016, with WRT incurring costs in 2016 (see Table 2 3), however interventions and activities associated with C29/C1 and C22/C23 delivery did not launch until 2017.
Water for Growth Independent Economic Assessment Final Report | March 2023 Page ii Contents Abbreviations & Acronyms vi 1. Introduction 7 1.1 Background 7 1.2 Objectives of this study 8 1.3 Report structure 9 2. Approach and methodology 10 2.1 W4G project 10 2.2 Economic assessment requirement 14 2.3 Economic assessment 16 2.4 Data collection 19 3. Economic assessment 21 3.1 Scope and counterfactual 21 3.2 Identify costs and benefits 25 3.3 Quantify and value of costs and benefits 27 3.4 Compare costs and benefits 30 3.5 Sensitivity analysis 32 3.6 Results and interpretation 32 4. Findings 42 4.1 What has been achieved? 42 4.2 How has this been achieved? 43 4.3 What is the value for money of the W4G project? 46 4.4 Broader evaluation questions 49 5. Conclusions 52 5.1 Summary 52 5.2 Limitations 53
Water for Growth Independent Economic Assessment Final Report | March 2023 Page iii 5.3 Recommendations 54 References 55 Appendix 1 – The Fish Pass application 57 Appendix 2 – Maps of W4G activities 59 Appendix 3 – Fish beat owner summary 62 Appendix 4 – W4G logic model 64 Appendix 5 – Quantification of benefits and costs 65 A5.1 Benefits 65 A5.2 Costs 70 Appendix 6 – Net present value calculation 72
Water for Growth Independent Economic Assessment Final Report | March 2023 Page iv Tables Table 2.1: Breakdown of W4G project funding 10 Table 2.2: Profile of W4G project expenditure by WRT, £000 11 Table 2.3: Profile of capital and revenue expenditure by W4G deliverable, £000 11 Table 2.4: W4G project deliverable targets and achievements 12 Table 2.5: Profile of W4G achieved outcomes 13 Table 2.6: Quantified W4G project outcomes 13 Table 3.1: W4G project outcomes pre-intervention 23 Table 3.2: Descriptions of W4G project and counterfactual 24 Table 3.3: W4G project outcomes - counterfactual (“without” intervention) - estimated 25 Table 3.4: Cost typology 26 Table 3.5: Uplifts and benefit typology 27 Table 3.6: List of cost items included in the IEA 28 Table 3.7: List of benefit indicators included in the IEA 29 Table 3.8: Summary of future cost and benefit assumptions 30 Table 3.9: Description of confidence rating 33 Table 3.10: Quantified uplifts of the W4G project in Year 6 34 Table 3.11: Monetised uplifts of the W4G project in Year 6, £000 in 2022 prices 35 Table 3.12: Monetised costs of the W4G project in Year 6, £000 in 2022 prices 37 Table 3.13: W4G Project - independent Economic Assessment results, PV15 £000 39 Table 3.14: Water quality unit values – sensitivity results 40 Table 3.16: Fish Pass App not developed - sensitivity results 41 Table 4.1: W4G funding and spend, £000s 42 Table 4.2: W4G project deliverable targets and achievements 43 Table 4.3: Gross and net additional impact for employment and GVA 47 Table 4.4: Environmental and social uplifts attributed to W4G project (£000, PV15) 48 Table 4.5: Cost per output analysis 49 Table 4.6: Summary of W4G uplift 49 Appendix Table 1 : Summary of businesses engaged with and beats owned. 62 Appendix Table 2 : Average trip-related expenditure (£/trip), 2022 prices 66 Appendix Table 3 : Scoring of fishery environment attributes relevant to the W4G project for Fish Pass App users 67
Boxes
Water for Growth Independent Economic Assessment Final Report | March 2023 Page v Appendix Table 4 : Scoring of fishery environment attributes relevant to the W4G project for Other anglers 68 Appendix Table 5 Average impact on consumer surplus due to changes in site environment, 2022 prices 68 Appendix Table 6 : Profile of capital and revenue expenditure by W4G deliverable, £000 71 Figures Figure 2.1: Summative assessment logic model Source: Adapted from (MHCLG et al., 2020a). 14 Figure 2.2: Natural capital impact pathway Source: Adapted from HM Treasury (2022) 17 Figure 2.3: Illustration of natural capital approach and W4G logic model 17 Appendix Figure 1 : Flow chart of the Fish Pass app 57 Appendix Figure 2 : Interface of the Fish Pass app 58 Appendix Figure 3 : Map of C22 (habitat improvement) areas in River Camel 59 Appendix Figure 4 : Map of C23 (weir removal) areas in River Camel 59 Appendix Figure 5 : Map of C22 (habitat improvement) in River Fowey 60 Appendix Figure 6 : Map of C23 (weir removal) areas in River Fowey 61
Box 1.1: Overview of the Camel and Fowey Catchments 7 Box 2.1: Factors of a high-quality counterfactual impact evaluation 18 Box 3.1: Examples of similar assessments 38
Water for Growth Independent Economic Assessment
Abbreviations & Acronyms
BCR Benefit-cost ratio
BEIS Department for Business, Energy & Industrial Strategy
Defra Department for Environment, Food and Rural Affairs
DLUHC Department for Levelling Up, Housing and Communities
DRN Detailed River Network
ERDF European Regional Development Fund
IEA Independent Economic Assessment
FRIC PLACE HOLDER
INNS Invasive Non-Native Species
MHCLG Ministry of Housing, Communities & Local Government
NPV Net Present value
NWEBS National Water Environment Benefits Survey
PES Payment for Ecosystem Services
PVB Present value of benefits
PVC Present value of costs
SMART Specific, measurable, achievable, realistic, and time-limited
WAP Westcountry Angling Passport
W4G Water for Growth
WFD Water Framework Directive
WRT Westcountry Rivers Trust
Final Report | March 2023 Page vi
1. Introduction
This is the final report of the independent economic assessment (IEA) of the Water for Growth (W4G) project. It reports the work undertaken to measure and value the impact of the project, accounting for the ecological, economic, and social uplifts arising from improved fish passage in the River Camel and River Fowey and benefits to anglers from modernisation of the payment mechanism for accessing fishing beats These findings are used to assess whether W4G has delivered its objectives as planned and assess the benefits to society realised in return for the project costs
1.1 Background
The Westcountry Rivers Trust (WRT) is an environmental charity that aims to protect and restore inland waterways and waterbodies in the Westcountry, for the benefit of the surrounding natural environment and people. The Trust educates local communities on water use and value and implement programmes and/or projects to enhance rivers, lakes, and estuary ecosystems.
The Water for Growth (W4G)2 project aims to improve fish passage for migratory fish species and improve river habitats in the River Camel and River Fowey. Cornwall’s river natural capital has been degrading over time, due to well-known drivers such as weirs and habitat loss. The result has impacted the stocks and flows of migratory fish species - salmon and sea trout – and without intervention could result in a decrease in angling and ultimately impacting local Cornish businesses over the longer term. The link between the river’s natural capital and local business activity establishes the importance of restoring and maintaining fish stocks in the local area.
Box 1.1: Overview of the Camel and Fowey Catchments
River Camel3: River Camel drains a 413km2 area between Bodmin Moor and Padstow and encompasses a diverse range of farming landscapes. The Camel Valley and its major tributaries are designated as Special Site of Scientific Interest (SSSI) and Special Area of Conservation (SAC) status under the EU Habitats Directive, due to the presence of otters and bullheads. Further designations include Area of Outstanding Natural Beauty (AONB) status for the Camel estuary and Area of Great Landscape Value (AGLV) status for the Camel and Allen valleys.
River Fowey4: One of the largest river catchments in south Cornwall, draining an area of approximately 177.5km² from central and southern Bodmin Moor. The river rises on Bodmin Moor at a height of 290m, flowing in a southerly direction for approximately 35km before reaching the tidal limit at Lostwithiel. The estuary continues for a further 9km before reaching the coast at Fowey town. The catchment includes two strategic reservoirs, supplying water to the majority of Cornwall’s population.
Source: Cornwall Rivers Project
2 For further information see: https://wrt.org.uk/project/water-for-growth/
3 For further information see: http://www.cornwallriversproject.org.uk/geography/camel.htm
4 For further information see: http://www.cornwallriversproject.org.uk/geography/fowey.htm
Water for Growth Independent Economic Assessment Final Report | March 2023 Page 7
Implemented over a 5-year period from 2017 – 2022, the project has received £2.5 million of funding from the England European Regional Development Fund (ERDF) as part of the European Structural and Investment Funds Growth Programme (2014 – 2020) alongside match funding inputs from Natural England, the Environment Agency, South West Water and WRT of £700,000. The W4G project overall goals are to: (i) restore aquatic natural assets; (ii) support sustainable economic growth of local businesses (including angling and tourism); and (iii) modernise and develop angling payment for ecosystem services (PES) market mechanisms to ensure maximum sustainable economic benefit.
The review and evaluation of the W4G project is timely. There is increasing public awareness and media attention on the quality of the water environment and the long-term health of rivers due to pressures and stresses from pollution, abstraction, habitat degradation as well changing weather patterns and climateas exemplified by the Summer 2022 drought. Reliable ex-post evidence from projects like W4G – showing both successes and lessons learnt – is scarce but vital to bring such approaches to the attention of a wider set of decision-makers. There is considerable opportunity to learn from past experiences about what works and why, in order to improve the effectiveness and efficiency of future projects and programmes
Moreover, the financial and human resources that are available to restore rivers are limited, and value for money (VfM) is a key consideration not only for public funding, but also for private investment that is expected to fill gaps in the overall funding requirement.
1.2 Objectives of this study
The purpose of this study is to provide an independent economic assessment (IEA) of the W4G project. It is an ex-post analysis to estimate the economic, ecological, and social impacts of the W4G project outcomes. The evaluation questions to answer are:
1. What has been achieved? Determine if the W4G project deliverables have been met (e.g., targets for restoration)
2. How has this been achieved? Evaluate whether the W4G logic-model framework has been realised (i.e., have intended impacts been realised and also have impacts arisen through the logic chain envisaged).
3. What is the value for money of the W4G project? Estimate the value of the economic, ecological, and social uplifts of the project to compare its benefits to the costs and calculate the benefit-cost ratio (BCR) at the local scale (Cornwall).
• The assessment considers both the short-term (project timescale) and longer-term outcomes of the W4G project. The principal question to answer with respect to the longer-term perspective is the extent to which the improved fish habitat and fish stock sustainability achieved by the project impacts the socio-economic sustainability of migratory salmonid angling on the Camel and Fowey.
The results and findings from this assessment supports WRT’s reporting to ERDF. It will provide evidence and interpretation on the VfM and estimated benefit-cost ratio (BCR) of the project, along with observations on the delivery of the project’s four deliverables, drivers of the results and lessons learned that can inform future projects aiming to improve design and delivery of similar projects both for WRT and a wider audience
Water for Growth Independent Economic Assessment Final Report | March 2023 Page 8
1.3 Report structure
The remainder of this report is structured as follows:
• Section 2 – Describes the approach to the economic assessment.
• Section 3 – Presents the economic assessment results, including the quantified costs and benefits.
• Section 4 – Provides discussion of findings and addresses the key evaluation questions project
• Section 5 – Provides conclusions, discusses limitations of the assessment and recommendations.
• Appendix 1 – Provides a brief description of the Fish Pass App.
• Appendix 2 – Mapping of W4G activities.
• Appendix 3 – Summary of businesses engaged with and beat ownership across angling schemes.
• Appendix 4 – Presents the W4G logic model inputs from Context to Rationale.
• Appendix 5 – Will describe the methods used to quantify costs and benefits.
• Appendix 6 – Outlines how the net present value (NPV) is calculated.
Water for Growth Independent Economic Assessment Final Report | March 2023 Page 9
2. Approach and methodology
This section sets out the approach to the independent economic assessment. It summarises the W4G project outcomes that have been assessed, the principles for the analysis and methodological steps, along with the data collection process.
2.1 W4G project
2.1.1 Funding (inputs)
The W4G project received a total of £2.6 million of funding from the England ERDF and £713,000 in match funding from WRT and other stakeholders in the Westcountry. A breakdown of the funding is shown in Table 2 1
Source: Original from W4G logic model – ESIF form 1011, Revised breakdown provided by WRT Finance Team (pers. comm).
Table Notes:
1 Capital expenditure includes the following cost categories: land acquisition, building acquisition, site investigation, site preparation, building and construction, plant & machinery, fees, other capital (costs inappropriate for other capital cost categories).
2 Revenue is defined as the following cost categories: salaries (including salary/wage costs, staff travel and expenses and staff training), overheads (including direct overheads and indirect overheads), premises (including rent, rates, heat & light), fees (including consultants fees, evaluation, accounting and audit), other revenue (including depreciation, marketing & publicity, irrecoverable VAT and other costs).
The profile of actual expenditure (including both ERDF and match funding) over the project timescale is summarised in Table 2.2, based on regular reporting to ERDF by WRT. A summary of expenditure by deliverable over time is shown in Table 2.3. With respect to the match funding received, it is understood that the Environment Agency in particular were interested in supporting activities related to weir removals (C23), whilst South West Water and Natural England have supported habitat improvement works (C22) and
Water for Growth Independent Economic Assessment Final Report | March 2023 Page 10
Funding source Amount (£k) % Of W4G funding Original Revised Change Original Revised ERDF capital1 886 1,071 185 40% 33% ERDF revenue2 702 1,479 777 32% 45% WRT 85 202 117 4% 6% Natural England 15 15 - 1% 0.5% Environment Agency 400 456 56 18% 14% Southwest Water 100 40 -60 5% 1% ERDF total 1,588 2,550 962 73% 78% Match funding total 600 713 113 27% 22% Total W4G funding 2,188 3,263 1,075 100% 100%
Table 2.1: Breakdown of W4G project funding
maintenance activities.
Table notes: From WRT Finance Team (November 2022).
Table
Table notes: From WRT Finance Team (November 2022).
2.1.2 Project outcomes
The W4G project comprises of a set of activities that have specific target outputs and outcomes, which are defined according to four main deliverables5:
• Multiple small-scale habitat restoration works (C22): River habitat improvements such as woody debris dams’ manipulation, invasive flora removal and gravel cleaning, along with daylighting and removing abandoned coppice to improve habitat for juvenile salmonoids. This deliverable is measured as the hectares (ha) of river habitat improved.
• Infrastructure capital works and delivery of weir improvements (C23): Improved fish habitat connectivity in the River Camel and River Fowey by the removal of man-made barriers to migratory fish. Where the complete removal of useful infrastructure has not been possible, partial removal or construction of a fish bypass has been implemented. This deliverable is measured as the hectares (ha) of river area with better conservation status, determined by the change in width of upstream and downstream measurement between two barriers.
• Creation of new angling mobile application (C29): Development of the Fish Pass App – formerly Westcountry Angling Passport (WAP)6 – a bespoke mobile app that allows anglers to buy and exchange tokens7 for fishing. The aim for the app is to improve the WAP scheme by removing
5 Note that C29 was originally one deliverable but has been divided into two.
6 Description of the Fish Pass app is in Appendix 1.
7 'Tokens’ is the Fish Pass app term and refers to a fishing permit that anglers pre-pay for to have access to private rivers for angling.
Water for Growth Independent Economic Assessment Final Report | March 2023 Page 11
Deliverable 2016 2017 2018 2019 2020 2021 2022 Total Capital expenditure 0.9 50 81 76 92 39 78 417 Revenue expenditure 5 242 340 451 395 405 128 1,965 Total expenditure 6 291 421 526 487 444 205 2,382
Table 2.2: Profile of W4G project expenditure by WRT, £000
Deliverable 2016 2017 2018 2019 2020 2021 2022 Total C1/C29 - 81 187 281 217 216 52 1,035 C22/C23 6 210 234 245 270 228 153 1,346 Total 6 291 421 526 487 444 205 2,382
2.3: Profile of capital and revenue expenditure by W4G deliverable, £000
inefficiencies of its paper-based token system and benefit local businesses and communities. This deliverable is measured as the number of enterprises that have been added to the Fish Pass app (i.e., successful engagement).
• Business support to angling businesses (C1): The businesses engaged with as part of C29 (i.e., businesses added to the app) were offered 12-hours of business support relevant to the W4G project, including how to manage the restored habitats on their fishing beats, support to develop marketing and promotional materials and other customer-based activities/assistance. This deliverable is measured as the number of businesses added to the app that have accepted the 12-hours of businesses support offered.
Locations of habitat restoration (C22) and infrastructure capital works (C23) that have been undertaken are shown in Appendix 2. The capital works targeted weirs that were an obstruction for fish passage. Identification and selection of these weirs across the Camel and Fowey was informed by discussions with the W4G project partners (Environment Agency, Natural England) and other stakeholders to ensure that all fish passage blockers were identified within these project river areas. Note that the mapped areas for C23 capital works in Appendix 2 shows weirs that were deemed relevant for the W4G project, with other weirs (i.e., those that are not a barrier to fish passage) beyond the W4G project scope and therefore not included.
Over the course of the project two proposal revisions were submitted by WRT to increase the W4G project outputs (Table 2 4) The difference between achieved outcomes and contracted targets is informed by data and information provided by WRT. Note that verification of the achievement of the outcomes as measured (e.g., through site visit by external third party) is beyond the scope of this assessment.
Table 2.4: W4G project deliverable targets and achievements
Table notes:
1. Revision submitted in 2019 and correspond to “Contracted ER/C/O/ 22 or 23 or 29 or 01” reported under physical progress in the latest Quarterly Report (1st October 2022 to 31st December 2022).
2. W4G outputs and target log provided December 2022 (pers. comm, WRT)
2.1.3 Timing of outcomes
The timing of deliverable outcomes – i.e., when they were achieved - is shown in Table 2.5 as reported by WRT to the ERDF. Note that by 2019, the initial contracted targets for C22 and C23 had been achieved indicating that areas of river habitat rehabilitated, and further weir removals undertaken go above and
Water for Growth Independent Economic Assessment Final Report | March 2023 Page 12
Total C22 (Area rehabilitated) C23 (Area with better conservation status) C29 (Enterprises engaged with) C1 (Enterprises supported) Unit Hectares Hectares Number Number Original contracted targets 2.1 63 8 8 Revised contracted targets1 4.4 96 21 21 Achieved outcomes2 4.5 100.21 21 21 Difference: Achieved- Contracted 0.1 4.21 - -
beyond the initial W4G project proposal. The revised contracted targets were achieved by the end of 2022.
Table 2.5: Profile of W4G achieved outcomes
Sources:
1 W4G outputs and target log provided December 2022 (pers. comm, WRT).
2 Summary of W4G C1 Support provided November 2022 (pers. comm, WRT).
Table 2.6 shows quantified measures of the W4G project outcomes that provide the basis for the economic assessment. Note that Fish Pass App figures are assessed based on transactions that have been recorded in the App, as this is the minimum input required by all app users. As part of App use, users are prompted to record catches (length and weight), as well as report no catch visits.
Table 2.6: Quantified W4G project outcomes
1 Counts of beats, visits (i.e., trips) and unique users are limited to beats in Cornwall (i.e., not the whole Fish Pass App).
of App and Paper-token transactions provided November 2022 and January 2023 (pers. comm, WRT). List of beats owners and beat names in Appendix 3
2 Active beats refer to those where a transaction using the Fish Pass App has been recorded.
3 W4G outputs and target log provided December 2022 (pers. comm, WRT)
4 Summary of W4G C1 Support provided November 2022 (pers. comm, WRT).
5 Maps provided by WRT GIS Team (see Appendix 2)
Water for Growth Independent Economic Assessment Final Report | March 2023 Page 13
Deliverable 2016 2017 2018 2019 2020 2021 2022 Total C22 (hectares)1 - - 1.2 1.3 0.3 1.0 0.7 4.5 C23 (hectares)1 - - 37.8 23.6 25.0 3.7 10.1 100.21 C29 (number)1 - - - 9 6 - 6 21 C1 (number)1 - - - 9 6 - 6 21 C1 (hours)2 - - 91 56 409 468 453 1,477
W4G Project Measure Quantity Fish Pass App1 Number of active beats in 20222 24 Number of visits reporting catch in 2022 424 Business engagement (C1 and C29)3 Total number of new businesses in Fish Pass App (2016-2022) 21 Total number of businesses receiving training and support (2016-2022)4 21 Habitat improvement (C22) Total hectares of rehabilitated river and bankside habitats (2016-2022)3 4.5 Total kilometres of river improved (2016-2022)5 11.7 Weir removal (C23) Total number of weirs in Camel and Fowey (2016)5 27 Total number of weirs removed (complete, partial and easements) (2016-2022)5 19 Total hectares with better conservation status (2016-2022)3 100.2 Total kilometres of river improved (2016-2022)5 260.3 Sources:
Summary
2.2 Economic assessment requirement
2.2.1 Summative assessment
The ERDF grant funding agreement for the W4G project requires that a summative assessment is undertaken. In broad terms the summative assessment is required to provide insights on the experience of implementing the project, the difference it has made, and lessons learnt (MHCLG et al., 2020a, 2020b) The specific objective for this study to determine the VfM of the W4G project is a supplementary requirement of summative assessment guidance.
The IEA provides: (i) evidence that will support and input to WRT’s final reporting for the summative assessment; and (ii) broader economic analysis and insight that will support WRT’s continuing work to improve the water environment in the Westcountry. With respect to (i), the reporting requirement for the IEA includes details on the approach to the impact evaluation, along with the analysis and results and interpretations that will help answer the question whether the project has achieved its objectives. The IEA does not, however, provide supporting evidence to answer summative assessment questions concerning project delivery and management.
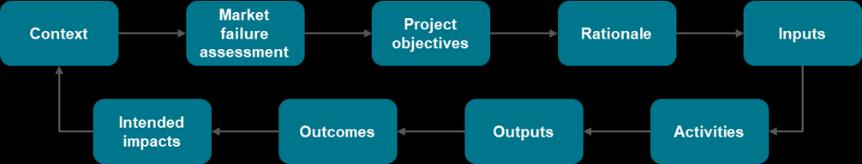
As part of the funding application, WRT completed the summative assessment logic model for the W4G project (Figure 2 1). Further detail is provided in Appendix 48. The logic model is the foundation of the project and a key mechanism for: (1) describing what has been achieved in terms of outputs and impacts;
(2) assessing how this has been achieved by tracing the logic pathway from inputs through activities and outputs to outcomes; and (3) determining the VfM of the project in terms of the value of economic, ecological, and social uplifts (impacts) arising from the project outcomes. Potential impacts include full-time equivalent (FTE) jobs secured (economic), rehabilitated riparian habitats (ecological) and improved wellbeing of local residents (social).
Water for Growth Independent Economic Assessment Final Report | March 2023 Page 14
Figure 2.1: Summative assessment logic model Source: Adapted from (MHCLG et al., 2020a).
8 Appendix 2 provides the text inputs describing the Context, Market failure assessment, Project objectives and Rationale of the W4G project. The remaining logic model descriptions (i.e., Inputs to Intended Impacts) are described in Section 1.1
2.2.2 Evaluation framing
The basis for the economic analysis is a “with” and “without” assessment of the W4G project, providing a comparative view between two scenarios for the project. The “with” scenario is defined according to the W4G project outcomes achieved, which is informed by the project monitoring and reporting and data collated through the implementation period. The “without” scenario is constructed as a counterfactual forecasting the expected outcomes for the project areas – the rivers Camel and Fowey in the absence of the W4G project implementation. The counterfactual is constructed according to pre-intervention baseline data and supporting assumptions and wider data. The impact of the project is assessed as the (net) difference in outcomes between the two scenarios.
2.2.3 Practical steps
The method for the assessment is intended to ensure a systematic and transparent approach to defining the boundaries of the evaluation and assumptions used. This includes defining the assessment scope, geographic boundary and stating any key non-monetary costs and benefits. The IEA is based around the analytical steps for evidencing the summative assessment logic model for the W4G project and, ultimately, the valuation of the project impacts in terms of the economic, ecological, and social uplifts:
1. Define the scope and counterfactual: the boundary of the assessment is explicitly defined, and various considerations are taken into account to ensure that the counterfactual for the assessment is a credible representation of what would have occurred in the absence of the implementation of the W4G project.
2. Identify costs and benefits: the assessment identifies a long list of potential costs and benefits related to the delivery of the W4G project activities. This determines the scope of costs and benefit uplifts to be included in the economic analysis based on materiality of the impact.
3. Quantification and valuation of costs and benefits: where possible, material costs and benefits are quantified and valued in monetary terms. This allows for their direct comparison in the same unit of measure. Material non-monetised impacts are also identified and either assessed in qualitative or quantitative terms to ensure that all material impacts of the W4G project are captured within this assessment.
4. Compare costs and benefits: the quantified and valued costs and benefits are aggregated to give an overall assessment of the (net) impact of the W4G project and its deliverables. The distribution of costs and benefits over specific groups, time and space is assessed as far as practically possible (e.g., distinction between Camel and Fowey, uplift by beneficiary groups).
5. Sensitivity analysis: key assumptions and parameters for the calculation of the most significant costs and benefits are subject to sensitivity testing to address areas of uncertainty and understand their influence on the study’s results.
6. Results and interpretation: the primary study results will establish whether the W4G project has resulted in a net benefit to society, meaning the beneficial outcomes outweigh the costs, and the value for money of the project.
Water for Growth Independent Economic Assessment Final Report | March 2023 Page 15
2.2.4 Assessment scope and limitations
The assessment scope is limited to the local scale (Cornwall). Impacts on marine and estuary environments, adult fish populations (and food supply – e.g., commercial fishing), and climate change impacts are outside the W4G project scope (see Appendix 4 - market failure description) and hence beyond the scope of the IEA.
The W4G project delivery is limited to river sections that are on average, no narrower than 4 metres in the detailed river network (DRN). Therefore, reported outputs reflect where works were undertaken, but does not necessarily reflect the full upstream impacts (i.e., potential improvements in connectivity within the catchments). As such, the W4G project outcomes do not double-count with agri-environmental schemes
It should also be noted that the areas measured as part of C22 (habitat improvements) and C23 (weir removal) do not overlap (i.e., no double-counting of outcome hectare area)9. The achievement of both these deliverables, however, is critical to the overall goal to restore aquatic natural assets – i.e., they are complementary, and isolation of the individual outputs would be less effective in achieving the project outcomes. Therefore, the assessment attributes outcomes and impact to the combination of these deliverables; the analysis does not attempt to differentiate the impact from habitat restoration versus weir removals.
From a practical perspective, the robustness of the assessment - as with any analysis - is only as good as the data and assumptions that feed into it. The results must therefore be interpreted with an understanding of the confidence and limitations of the outputs produced. According to a series of sensitivity analyses, various data and assumption inputs are tested to ensure greater understanding and confidence in the reported results.
2.3 Economic assessment
The assessment is underpinned by economic analysis principles outlined in the HM Treasury Green Book (HM Treasury, 2022a) and HM Treasury Magenta Book (HM Treasury, 2020), and the natural capital approach (Defra, 2021), which has become the conventional perspective for assessing the impact of natural environment interventions.
2.3.1 Conceptual overview
Natural capital is “the stock of renewable and non-renewable natural resources (e.g., plants, animals, air, water, soils, minerals) that combine to yield a flow of benefits to people” (Natural Capital Coalition, 2016). A natural capital approach can be defined as distinguishing between the natural capital stocks and the flows of benefits they provide; projecting benefits into the future and linking the provision of benefits to the extent and condition of assets. The intention is to ensure that interventions and business decisions prioritise maintaining the assets to sustain benefits, and not to maximise one of the benefits at the expense of others or the extent and condition of the natural capital asset itself. The Green Book (HM Treasury, 2022a) provides a higher-level view of the impact pathway(s) linking changes in the natural environment to
9 The primary area of C22 improved is deducted from C23 area.
Water for Growth Independent Economic Assessment Final Report | March 2023 Page 16
changes in value to society. The impact pathway described in the Green Book (ibid.) is shown in Figure 2 2 and adapted to align with the W4G project context.
The W4G project deliverables will be assessed in terms of economic, ecological, and social uplifts. By utilising a natural capital perspective, the assessment takes a more holistic basis for determining and measuring impacts, resulting from changes in stocks and/or flows of natural assets. The resulting approach to the assessment is illustrated in Figure 2 3, where the natural capital impact pathway (Figure 2 2) is mapped to the W4G logic model (Figure 2.1). The W4G logic model functions as an input to the IEA whilst the natural capital impact pathway sets the assessment approach, linking the project outcomes to impacts that are measured in economic terms as benefits, and the associated beneficiaries (i.e., effects on local economy and/or social welfare).

This approach allows for synergies between economic, ecological, and social uplifts to be clearly established. Therefore, the BCR and accompanying reporting outputs will capture a wider view of benefits and values.
2.3.2 Measuring costs and benefits
The IEA measures and values benefits in terms of uplifts in economic, ecological, or social indicators. Where relevant this requires estimating the value of an uplift (e.g., increased number of fishing beats) and aggregating it over the spatial scale for the assessment (e.g., fish pass anglers). For the purposes of the assessment, an ‘uplift’ due to the W4G project is defined as the provision of an additional outcome and associated benefit (i.e., something that would not have occurred otherwise) and/or bringing forward an outcome/benefit in time (i.e., something that would have occurred eventually, but has been delivered earlier).
The additionality of an outcome is assessed as the difference between the “with” and “without” scenarios as described in Section 2.2.2 – i.e., what has occurred over and above the counterfactual projection (see below). To practically measure the project uplifts, therefore, both the timing and magnitude of changes in outcomes associated with the W4G deliverables needs to be determined. For all benefits and costs identified as material the following questions are considered:
Water for Growth Independent Economic Assessment Final Report | March 2023 Page 17
Figure 2.2: Natural capital impact pathway Source: Adapted from HM Treasury (2022)
Figure 2.3: Illustration of natural capital approach and W4G logic model
• How have deliverables been achieved (i.e., specific actions and/or activities)?
• What is the change in outcome?
• What is the timing of these changes (both activities and outcomes)?
• Who are the beneficiaries (i.e., direct, indirect)?
Information on unsuccessful actions (e.g., number of businesses that WRT reached out to versus number of businesses participating in the W4G project) has also been collected to establish what has been achieved relative to what could have been achieved.
Costs and benefits will be assessed in qualitative, quantitative, and/or monetary terms. In some cases, it may not be possible to fully quantify outcomes and value them in monetary terms. Those that are considered material to the IEA (i.e., they can change the net cost and benefit positions) are listed as ‘key non-monetised impacts’. They are assessed as appropriate in qualitative and quantitative terms.
2.3.3 Defining the counterfactual
High-level guiding principles for specifying the counterfactual for the assessment are provided in the summative assessment guidance (MHCLG et al., 2020c)10 Box 2 1 lists the key considerations for appropriate specification of the counterfactual.
Box 2.1: Factors of a high-quality counterfactual impact evaluation
Under the ERDF guidance a high-quality counterfactual for an impact evaluation should:
• Accurately measure the change that occurs across relevant indicators of outcome or impact after a project has been implemented
• Indicate the measure that will be used and the baseline against which they will be judged.
• Include the rough estimates of the number or proportion of beneficiaries that will be contacted.
• Construct a counterfactual which can disentangle the influence of other factors on the impact indicators and allow the impacts of the project to be isolated.
Source: MHCLG et al. (2020c), p. 21
The summative assessment guidance highlights that the approach to defining and specifying the counterfactual cannot be generalised. Rather it should be determined on a case-by-case basis, reflecting the type of project, range of impacts and their beneficiary groups. Wider guidance (European Commission, 2013; HM Treasury, 2022a, 2020) echoes this and provides minimal practical steer on what to explicitly consider in developing a counterfactual. There are, though, some over-arching and consistent principles that are identified to help ensure that the counterfactual that is defined supports the evaluation of a given policy or project intervention. These include:
• From the Magenta Book (HM Treasury, 2020): Key considerations in defining the counterfactual are
10 As defined in Summative Assessment Guidance “Uses comparison group or areas to isolate the difference which an intervention makes to the beneficiaries or treatment areas” (MHCLG et al., 2020b, p. 20).
Water for Growth Independent Economic Assessment Final Report | March 2023 Page 18
the quality and quantity of data, the comparability of the counterfactual to the intervention and that the intervention effect can be clearly identified (i.e., sufficiently large). The latter has implications for interpretation of the results.
• From the Green Book (HM Treasury, 2022a): Intervention objectives are specific, measurable, achievable, realistic and time-limited (SMART), and that they are objectively observable and measurable.
• From EVALSED (European Commission, 2013):The counterfactual is hypothetical (i.e., unobserved) so effects and impacts are possible to identify if the data inputs are robust. And where data quality or inference is a problem, these biases should be caveated and made clear.
A common point across all these sources of guidance is that plausibility of the counterfactual needs to be demonstrated within the assessment, based on appropriate evidence sources (e.g., pre-intervention data, an appropriate reference case). In the context of the W4G project and its implementation timescale, particular aspects to consider for the specification of the counterfactual are: (a) natural processes (e.g., factors affecting fish stocks); (b) other actors’ behaviour (e.g., levels of public investment in habitat restoration, and weir removal); and (c) treatment of other exogenous shocks and changes in ‘state of the world’ (particularly COVID-19).
2.4 Data collection
A total of 75 documents have been reviewed for the economic assessment, of which 28 have been provided by WRT. The other evidence reviewed are sources listed in the study specification (the IEA Proposal) and documents identified by desk-based searches. All data and evidence collected from wider research is limited by accessibility (i.e., open-access and public). As part of the initial research for the assessment, a number of documents were reviewed as part of the scoping exercise to identify potential costs and benefits, as well as the data and evidence to quantify them.
The evidence collected relates to three key categories:
1. W4G project: Includes a description of activities undertaken for each deliverable, expenditure, contracted targets and achieved outcomes, as well as contextual documents such as strategy documents. This will support the quantification and valuation of W4G uplifts from the project outcomes, and the general understanding of what the W4G project has achieved to date and at what cost. This information is provided by WRT and includes reporting to ERDF.
2. State of rivers and fisheries: This includes fish stock assessments (electrofishing reports from WRT (Environment Agency, 2016) and latest catchment assessments (Environment Agency, 2022a, 2022b). It also includes historical evidence to support the characterisation of the pre-intervention condition of the River Camel and River Fowey (i.e., pre-2017) and the specification of the counterfactual scenario for the assessment.
3. Economic valuation evidence: A selection of appropriate sources of economic valuation evidence to support the quantification and monetisation of the ecological, economic, and social uplifts. It includes published research and metrics used in government guidance (Defra, 2021; Environment Agency, 2022c) and approaches used by other published studies (eftec, 2014; Le Quesne, 2005;
Water for Growth Independent Economic Assessment Final Report | March 2023 Page 19
Mawle and Peirson, 2009; Vardakoulias and Arnold, 2015)
Water
Growth Independent
Final Report | March 2023 Page 20
for
Economic Assessment
3. Economic assessment
This section describes the economic assessment, following the practical steps outlined in Section 2 to identify, measure and compare the W4G project costs and benefits.
3.1 Scope and counterfactual
3.1.1 Economic assessment parameters
The scope of the assessment is defined according to the following key parameters:
• Geographic boundary: Rivers Camel and Fowey, economic and ecological uplifts to Cornwall. Some uplifts can have broader geography (e.g., tourists).
• Price base for valuing impacts/uplifts: 2022
• Pre-intervention period: 2016 or average over 3-years (2014-2016)
• Time period for W4G project implementation: 2016–202211
• Timing of interventions: Launch year 2017, with three delivery windows (2017, 2018, 2019), plus a 12month extension.
• Timing of impacts: Informed by data collected by WRT and wider evidence sources to reflect aspects such as potential lags in impacts (i.e., where impacts are not assumed to be realised immediately).
• Assessment time horizon: 15-year assessment period, which is the minimum recommended by the Green Book (HM Treasury, 2022a). The W4G project implementation is profiled in the first seven years (Year 0 to 6) and impacts forecasted and profiled for an additional eight years (Year 7 to 14).
• Discount rate: Follows HMT Green Book guidance (2022) using the standard discount rate (3.5%). Discounting is applied to future flows (i.e., from Year 7 onwards), with benefits and costs incurred during the project period treated as realised (and therefore left undiscounted).
Note that benefits from weir removals and easements (i.e., C23) are permanent, whilst habitat rehabilitation and improvement activities will require maintenance to ensure that benefits are sustained. This is factored into the projection of costs, the considered future resource needs to maintain the impacts of W4G.
A 15-year assessment period is judged to be appropriate for the assessment based on the activities undertaken within the W4G project. The lifecycle of salmonoid species has also been considered, given project outcomes concerning improved fish stocks (i.e., support juvenile salmon to adulthood). Generally, juvenile salmon will remain in freshwater river systems for about four years, before swimming out to sea to mature (The Tweed Foundation, n.d.). Salmon return to the river to spawn after one to two years (maximum four years) at sea (AST and IFM, n.d.). Hence 15 years is deemed sufficient as it covers multiple fisheries lifecycles within which to expect impacts on salmonid populations.
Water for Growth Independent Economic Assessment Final Report | March 2023 Page 21
11 W4G project funding was awarded in 2016, with WRT incurring costs in 2016 (see Table 2 3), however interventions and activities associated with C29/C1 and C22/C23 delivery did not launch until 2017.
The assessment also needs to, as far possible, account for changes to the project context during delivery, and the implications of these changes in the analysis and reporting of results. This includes exogenous shocks (e.g., collapse in fish stocks, COVID-19) as well as changes in environmental policy in the UK (e.g., The UK’s EU exit, Defra’s 25 Year Environment Plan, the Environment Bill). For the W4G project, a key consideration is how the project’s impacts are likely to be maintained after the project ends (e.g., habitat restoration and modifications, business support). Establishing this means assessing whether these impacts are likely to remain and understanding plans to maintain them and who is responsible for this into the future. Based on answers to these questions, the associated costs and benefits can be projected forward where possible (See approach in Appendix 4 for details).
3.1.2 Pre-intervention
The W4G logic model reflects the policy and wider context under which the project was proposed to operate (as described in Appendix 4). This includes the policy context at the time (e.g., 2011 Environmental White Paper), but also actions by other actors in the catchments (e.g., Natural England and the Environment Agency’s priorities) and the condition of the Camel and Fowey as described in the W4G logic model’s ‘market failure’ explanation. In combination, this sets the scene in which the W4G project was intended to be implemented and provides the basis for specifying the counterfactual for the assessment
Prior to the W4G project, the defining characteristics of the River Camel and River Fowey include:
• State of nature: Declining condition of habitats, limiting the spawning areas for juvenile salmon and sea trout. Fish stocks in the Camel experienced a significant collapse in 2016, with levels in the Fowey remaining stable.
• Physical infrastructure: Total of 27 weirs impeding fish passage across the two catchments (17 in the Camel and 10 in the Fowey)12
• Accessibility of fishing beats: Information concerning accessible beats was not centrally organised.
• Resources to manage angling passport scheme: Westcountry angling passport (WAP) scheme as a paper-token system was costly for WRT to maintain (i.e., collection and processing of tokens). The number of beats included in the scheme was reduced to remove those that were un-economical to service through consultation with beat owners.
• Business engagement: Local businesses not consistently contributing to management of riparian habitat, nor coordination across catchment to benefit of fish stocks.
Note that data on the resources needed to manage the scheme pre-intervention, in terms of operational costs (e.g., staff time) and capital costs (e.g., replacing token boxes), is not available for this assessment. Historic data on tokens, payments, and visits to Cornish fishing beats included in the scheme preintervention is available to quantify angler use for pre-intervention period.
Table 3.1 summarises the pre-intervention context for the W4G project outcomes. Where measures related to the previous angling scheme are primarily based on data provided by WRT (pers. comm) and understanding that business engagement related to the scheme was low following reduction in the number
Water for Growth Independent Economic Assessment Final Report | March 2023 Page 22
12 Based on count of weirs identified in maps provided by WRT GIS Team (see Appendix 2).
of active beats included. In addition, the scale and extent of habitat improvements that would have occurred in the absence of the W4G project are unknown, although it is understood that WRT and other stakeholders in the River Camel and River Fowey were delivering some level of improvements as part of their regular delivery procedures. These outcomes are therefore estimated for the counterfactual to enable comparison to the W4G project.
Table 3.1: W4G project outcomes pre-intervention
1 Summary of WAP Scheme Beats data from 2013-2017 provided by WRT January 2023 Counts of beats, visits (i.e., trips) are limited to beats in Cornwall (i.e., not all beats in the scheme). List of beats owners and beat names in Appendix 3
2 Maps provided by WRT GIS Team (see Appendix 2)
3.1.3 Counterfactual
The definition of the counterfactual has been informed by discussions with WRT, as well as historical and baseline data collected on the River Camel and Fowey prior to the intervention.
The specification of the counterfactual for the assessment and comparison to the intervention case (the W4G project) is outlined in Table 3 2. A relatively simple set of assumptions are applied, where most preintervention factors are assumed to remain the same over the project period (i.e., first six years). The forward-looking projection of outcomes in the absence of the W4G project follows a general understanding that natural recovery of natural capital assets (e.g., habitats and fish stocks) and interventions to remove fish barriers will occur at some point. However, without the W4G project weir removals or modifications would occur in fewer locations, and there is significant uncertainty around the timing and coordination of habitat restoration alongside weir removals, leading to a lower level of outcome.
Development of the Fish Pass App would probably have also happened eventually. Schemes in other catchments and regions in England and Wales are understood to have faced similar pressures from administrative burden of paper/physical token-based systems and it is therefore not unreasonable to assume that modernisation via digitisation would occur at some stage, either due to WRT investment, or
Water for Growth Independent Economic Assessment Final Report | March 2023 Page 23
Pre-intervention Measure Quantity Angling scheme Number of active beats (2015)1 10 Number of visits (2015)1 240 Business engagement (C1 and C29) Number of new businesses in Angling scheme (2015) 0 Number of businesses receiving training and support (2015) 0 Habitat improvement (C22) Hectares of habitat improved (2015) Unknown Kilometres of river improved Unknown Weir removal (C23) Number of weirs in Camel and Fowey (2015)2 27 Number of weirs removed (2015) Unknown Hectares with better conservation status Unknown Sources:
another parties (pers. comm, WRT). The counterfactual therefore represents a slower pace and timing to modernisation of the previous paper token mechanism. This is quantified based on historical data from WRT on the WAP scheme, where in 2014 the WAP scheme had 19 beats in Cornwall, of which 10 beats were retained for 2015 and decreased to 9 in 2017 (pers. comm, WRT)13 Business engagement and overall behaviour is assumed to probably remain unchanged without the W4G project (pers. comm, WRT).
Table 3.2: Descriptions of W4G project and counterfactual
Counterfactual (without intervention)
W4G project does not occur:
• Investment in fisheries assets (both public and private) remains the same as per pre-intervention.
• C22: In-river habitat restoration work undertaken at same rate as per pre-intervention.
• C23: Some removal or modification would have occurred.
• Combined effect of C22 and C23: Recovery of fish stocks would have occurred naturally (i.e., slower)
• C29: PES market continues, but number of beats included in the Fish Pass app is reduced as per preintervention, modernisation is slower.
• C1: Businesses behaviour likely to have remained the same as pre-intervention.
Other interventions in the Camel and Fowey (as planned) still occurred, however these remain unobserved.
In conclusion, it is assumed that given the policy context and other exogenous changes (e.g., collapse in fish stocks, COVID-19), some of the improvements delivered as part of the W4G would have been less well targeted and occurred at a slower rate and therefore across a smaller scale during the project duration.
W4G project (with intervention)
W4G project occurs:
• Funding received to invest in resilience and accessibility of fisheries.
• C22: Range of in-river habitat restoration work undertaken at a faster rate than under counterfactual, to address multiple issues.
• C23: Removal of manmade passage barriers at a faster rate and better targeted, with flexibility to modify where necessary.
• Combined effect of C22 and C23: Supported faster recovery of fish stocks in Camel following collapse.
• C29: Modernisation of the Fish Pass app and PES market (i.e., digitisation), increasing beats included
• C1: Businesses engage more with the Fish Pass app and customers.
Other interventions in the Camel and Fowey (as planned) still occurred, however these remain unobserved.
In conclusion, the W4G project delivers economic, ecological, and social uplifts.
Treatment of the effect of the COVID-19 pandemic in the counterfactual has been considered in the scoping of the assessment. It is reasonable to assume that the impacts of the COVID-19 are likely to feature in the data collected to inform the assessment (for example, angling visit numbers during 2020 and 2021). However, recent studies on the physical, economic, and social repercussions of COVID-19 (Chudik et al., 2021; Eriksson et al., 2022) do not provide useful insight on how to treat effects in an economic analysis for an impact evaluation. Given this, a reasonable approach is to apply observed trends for the project intervention scenario to the counterfactual scenario.
Water for Growth Independent Economic Assessment Final Report | March 2023 Page 24
13 WAP Scheme Beats data shared by WRT with eftec, covering 2006-2014 and paper-token transaction summary for 2013-2017.
Table 3 3 summarises the counterfactual for the W4G project outcomes, aligned to the description provided in Table 3.2. The quantified outcomes related to the Fish Pass App, reflect the number of beats retained in post-2014 and thus the associated visits to these Cornish beats (pers. comm WRT). Outcomes related to the C1 and C29 W4G deliverables are assumed to not occur under the counterfactual, in part because the paper-token scheme is expected to still be used (therefore no new businesses added to the App), and business behaviour is not expected to change from the pre-intervention period.
With respect to habitat improvements (C22) and weir removals (C23), the pre-intervention context is unknown. It is expected, however, that some level of improvement or removals would be delivered under the counterfactual (Table 3.2). Therefore, to quantify this it is assumed that the counterfactual would result in 10-20% of achieved W4G outcomes for these deliverables (i.e., 10% of quantified outcome delivered as stated in Table 2.6).
Table 3.3: W4G project outcomes - counterfactual (“without” intervention) - estimated
1 Summary of WAP Scheme Beats retained after 2014 provided by WRT November 2022 and January 2023 Counts of beats, visits (i.e., trips) are limited to beats in Cornwall (i.e., not all beats in the scheme). List of beats owners and beat names in Appendix 3.
2 Estimates based on assumed reduction (i.e., 10 – 20%) from achieved W4G project outcomes stated in Table 2 6
3 Maps provided by WRT GIS Team (see Appendix 2).
3.2 Identify costs and benefits
The relevant costs and benefits for each W4G project deliverable are identified in this section. Not all costs and benefits can be quantified and valued in monetary terms. Those that are considered material to the economic assessment results (i.e., they could change the net cost and benefit positions) are listed as ‘key non-monetised effects’.
3.2.1 Costs
Costs of The W4G project accrue primarily to WRT through: (1) capital expenditure on restoration or
Water for Growth Independent Economic Assessment Final Report | March 2023 Page 25
Counterfactual Measure Quantity Angling Scheme Number of active beats in 20161 10 Number of visits in 20161 280 Business engagement (C1 and C29) Total number of new businesses in Fish Pass App (2016 – 2022) 0 Total number of businesses receiving training and support (2016 – 2022) 0 Habitat improvement (C22) Total hectares of rehabilitated river and bankside habitats (2016 – 2022)2 0.4 – 0.9 Total kilometres of river improved (2016-2022)2 1.2 – 2.3 Weir removal (C23) Total number of weirs in Camel and Fowey (2016)3 27 Total number of weirs removed (2016 – 2022)3 2 – 4 Total hectares with better conservation status (2016-2022)3 10 – 20 Total kilometres of river improved (2016-2022)2 26 – 52 Sources:
removal activities; (2) operating costs (e.g., maintenance and employee time); and (3) overhead costs such as administration time. Other costs accrue to the other beneficiaries and/or actors such as the anglers using the Fish Pass app and businesses that have been engaged with the W4G project.
Table 3 4 provides a list of the cost typology and with material costs by deliverable shaded green Costs that accrue to actors outside of WRT will be difficult to quantify without further engagement (e.g., discussion with businesses), which is beyond the scope of this IEA. Volunteer effort can be treated as a cost to reflect the contribution of volunteers as part of the resources required to carry out project activities, and hence deliver the outputs that outcomes are dependent on. It is also recognised that there is a private benefit received by volunteers from the activity as a whole (i.e., the enjoyment from what they are doing).
3.2.2 Benefits
Table 3 5 lists benefit categories grouped by type of uplift, with attribution to the W4G project deliverable shaded green. The long-list of potential benefits has been compiled from review of wider literature and other strategic environment policy programs in the UK, such as the Water Industry National Environment Programme (Environment Agency, 2022c) and the Enabling a Natural Capital Approach (Defra, 2021), freshwater natural capital indicators (Lusardi et al., 2018) and other government guidance (e.g., Business Support Evaluation Framework (BEIS, 2019)
Note that ecological uplifts can directly or indirectly impact the economic and social uplifts, which determines the possibility of synergies between deliverables and their impacts. For example, the potential ecological benefits of reducing river flood damages directly influence the social uplift, providing benefits in well-being and improved health for nearby residents and visitors. Hence some proportion of the outcome is captured through the social uplift, and some proportion is captured through the ecological uplift. The risk of double counting benefits is addressed in the valuation of impacts.
Water for Growth Independent Economic Assessment Final Report | March 2023 Page 26
Cost category W4G deliverables W4G project overall C22 C23 C29/C1 W4G capital costs ✓ ✓ ✓ ✓ W4G operating costs ✓ ✓ ✓ ✓ Grant admin costs - - - ✓ Cost to beat and landowners ✓ ✓ ✓ ✓ Costs of angling - - - -
Table 3 4: Cost typology
Table 3.5: Uplifts and benefit typology
As highlighted in Box 1.1, the River Fowey is a key water resource for Cornwall, however water supply impacts are not included in this assessment. The scope of the W4G project does not include activities aimed at improving water supply within the catchment (i.e., there is no change from the baseline).
3.3 Quantify and value of costs and benefits
This section summarises the basis for quantifying and valuing the project impacts. A proportionate approach has been applied to focus on the material outcomes and target analytical effort to assessing the most significant impacts. The focus is on measuring impacts relative to the counterfactual defined in Section 3.1.
Water for Growth Independent Economic Assessment Final Report | March 2023 Page 27
Uplift Benefit category W4G deliverables W4G project overall C22 C23 C29/C1 Ecological Fish stock ✓ ✓ - ✓ Extent of habitat ✓ ✓ - ✓ Hydrology & geomorphology ✓ ✓ - ✓ Invasive species ✓ - - ✓ Soil/sediment process - - -Vegetation ✓ - - ✓ Spatial configuration ✓ - - ✓ Water quality ✓ ✓ - ✓ Economic Agricultural output - - -Business activity - - ✓ ✓ Water supply - - -Efficiency gains - - ✓ ✓ Social Carbon sequestration - - -Air quality regulation - - -Hazard regulation - - -Recreation - - ✓ ✓ Health and wellbeing ✓ ✓ ✓ ✓ Training and education - - ✓ ✓ Other cultural services ✓ ✓ - ✓
3.3.1 Costs
Table 3.6, summarises the breakdown of cost elements captured in the assessment. Capital costs include building and construction and other capital expenditures to support the delivery of the W4G project, whilst operating costs (or revenue) capture consultancy, staff salaries, FRIC and other revenue costs incurred throughout the project implementation period. These cost elements are all captured in Table 2.3 for the combination of C1/C29 deliverables and C22/C23 deliverables. Volunteer time has been used to deliver the W4G project, however a record of time and number of volunteers has not been made, and therefore it is not included in this analysis of costs Further detail on the calculation (or estimation) is provided in Appendix 5.
Table 3.6: List of cost items included in the IEA
3.3.2 Benefits
Table 3 7 summarises the breakdown of the benefits captured in the assessment, indicating whether or not they are calculated in monetary terms. Further detail on the approach to quantification and valuation is provided in Appendix 5
Water for Growth Independent Economic Assessment Final Report | March 2023 Page 28
Cost category Cost element Accrues to? Monetised for W4G? Capital costs Restoration activities WRT Y Removal of physical infrastructure WRT Y Development of Fish Pass App WRT Y Engagement with businesses WRT Y Revenue costs Maintenance of habitats WRT Y Maintenance of modifications WRT Y Employee time by deliverable WRT Y Volunteer time by deliverable WRT N Maintenance of Fish Pass App WRT Y Grant management costs Monitoring costs WRT N Administration and reporting costs WRT N
Table 3.7: List of benefit indicators included in the IEA
Fish stock Number of juvenile fish
Total area of rehabilitated river and bankside habitats
Extent of habitat
Total length of river improved by C22 and C23 activities
Total area with better conservation status
Hydrology & geomorphology
Invasive species
Total completed weir removals (full, easements and partial)
area with reduced risk of invasive species
Total number of businesses adopting new technology
Total number of active businesses receiving training and support
Employment impact from angling activity (Fish Pass users and Other Anglers)
Number of active beats Cornish in Fish Pass App
Number of Fish Pass App angling visits to Cornish beats
Number of other anglers visits to Cornish beats
Number of active angling visits by anglers
Gross-value added from angling activity (Fish Pass users and other Anglers)
Trip-related angling expenditure (Fish Pass users and other anglers)
(tourists and local) Y
(tourists and local)
(tourists and local)
Health & wellbeing
saving from use of the Fish Pass app WRT
Anglers’ consumer surplus (Fish Pass users and other anglers)
Improvements to recreational experience for non-anglers (e.g., other water-based activities)
Avoided medical treatment costs from angling
Physical health benefits from water-based activities (e.g., canoeing)
Water for Growth Independent Economic Assessment Final Report | March 2023 Page 29
Outcome
Beneficiary Measured? Quantity Ecological
Wider
N
Uplift Benefit category
indicator
society
Wider
society Y
Wider
society Y
Wider
Y
Wider
Y
society
society
Total
Wider
N Economic Business
society
activity
Businesses Y
Businesses Y
Businesses Y Social Recreation
Anglers
Anglers
Y
Anglers
Y
Health & wellbeing
Fish
(tourists
Y
Economic Business
Pass Anglers
and local)
Monetary
activity
Businesses Y
Businesses Y
Cost
N Social
Anglers
Y
Efficiency gains
Recreation
(tourists and local)
Tourists and
N
local
Fish
Pass Anglers (tourists and locals) Y
Tourists
and locals N
3.4 Compare costs and benefits
The estimated costs and benefits are aggregated and summed to give an overall assessment of the impacts of the W4G project in present value terms. Net impacts are calculated as the difference between the W4G project outcomes and assessed outcomes in the absence of the W4G project (the counterfactual).
The calculations use the parameters summarised in Section 3.1 (e.g., discount rate, time scales). Costs and benefits have been profiled to capture: (a) timing of impacts – e.g., immediacy of benefits/costs as well as any potential lags; and (b) forecast of impacts after the project period – e.g., constant, increasing, declining. For both the W4G project and counterfactual the timing of impacts is aligned with the profile of actual spend and achieved outcomes of the project as shown in Table 2 2 and Table 2 5
The assumptions used to project the monetised costs and benefits into the future (i.e., beyond the W4G project lifetime) are summarised in Table 3.8 for the W4G project and the counterfactual.
Table 3.8: Summary of future cost and benefit assumptions
Cost/Benefit
Costs
Capital costs - Business engagement and support
Quantity Monetary
W4G project: 2022 number of fishing beats is assumed constant.
Counterfactual: 2015 number of fishing beats retained is assumed constant.
W4G project: 2022 number of fishing beats is assumed constant.
W4G project: W4G average (2017-2022) costs are assumed constant.
Counterfactual: W4G average capital (2017-2022) and revenue costs per fishing beat are assumed constant.
W4G project: W4G average revenue costs (2017-2022) are assumed constant.
Revenue costs - Business engagement and support
Counterfactual: 2015 number of fishing beats retained is assumed constant.
Counterfactual: W4G average revenue costs per fishing beat (2017-2022) are assumed constant.
Water for Growth Independent Economic Assessment Final Report | March 2023 Page 30 Uplift Benefit category Outcome indicator Beneficiary Measured? Physical health benefits for volunteers Volunteers N Opportunity cost of volunteer time Volunteers N Improvements to the social well-being of the local population Cornish residents N Water quality Willingness to pay for avoided deterioration in rivers by C22 and C23 activities Wider society Y Cultural services Existence and/or bequest value Wider society N Sense of place and landscape value Wider society N
Cost/Benefit
Capital costs – Habitat improvements and weir removal
Quantity
W4G project: No further habitat improvement or weir removals.
Counterfactual: Estimated area improved is assumed to remain constant.
Monetary
W4G project: W4G average (2016-2022) costs are assumed constant.
Counterfactual: W4G average capital costs per hectare improved (2016-2022) are assumed constant.
Revenue costs – Habitat improvements and weir removal
Benefits
Trip-related angling expenditure (Fish Pass Anglers and Other Anglers)
Change in angler’s consumer surplus (Fish Pass Anglers and Other Anglers)
W4G project: Habitat improvements and weir removals in 2022 are maintained.
Counterfactual: Estimated area improved is assumed to remain constant.
W4G project: W4G average (2016-2022) costs are assumed constant.
Counterfactual: W4G average revenue costs per hectare improved (2016-2022) are assumed constant.
W4G Project: Five-year (2018-2022) average number of angling trips.
Counterfactual: 2014 number of angling trips to retained beats is assumed constant.
W4G Project: Five-year (2018-2022) average number of angling trips.
Counterfactual: 2014 number of angling trips to retained beats is assumed constant.
W4G Project: Proportion* of five-year (20182022) average number of angling trips.
For both W4G Project and counterfactual, the average spend per angling trip in the South West River Basin District remains constant (Environment Agency, 2018a)
For both W4G Project and counterfactual, the determinants of angler welfare –measured by change in consumer surplus (£ per counterfactual visit) in the South West River Basin District - remains constant (Environment Agency, 2018a)
Avoided NHS medical treatment costs (Fish Pass Anglers)
Willingness to pay for avoided deterioration in rivers
Counterfactual: Proportion* of 2014 number of angling trips to retained beats is assumed constant.
For both W4G Project and Counterfactual, Length of river improved is assumed to remain constant.
For both W4G project and counterfactual, the unit avoided medical treatment costs remains constant (Claxton et al., 2015).
For both W4G project and counterfactual, the unit willingness to pay remains constant (Environment Agency, 2013)
Table note: * White et al. (2016) estimate that 92% of angling visits are active this proportion is assumed to remain constant and applied to the average number of Fish Pass angling visits in future years.
To compare the costs and benefits, the annual values are converted to the same price year (2022 prices) using the latest HM Treasury GDP deflators (HM Treasury, 2022b) and discounted in line with Green Book guidance (HM Treasury, 2022a), using the standard discount rate (3.5%). Individual costs and benefits are aggregated over time in present value (PV) terms and directly compared to generate a net present value (NPV)14, 15 and the benefit-cost ratio (BCR)16. Results are reported in Section 3.6.
14 The present value of benefits minus the present value of costs: NPV = PVB - PVC
15 Further details on how the NPV is calculated is shown in Appendix 6.
16 The present value of benefits divided by the present value of costs: BCR = PVB / PVC
Water for Growth Independent Economic Assessment Final Report | March 2023 Page 31
3.5 Sensitivity analysis
Sensitivity analysis has been performed on key assumptions identified during the analysis based on the most significant costs and benefits or those with greater uncertainty. The two principal scenarios considered were:
• Sensitivity 1 – Water quality unit values: The NWEBS values provide low, central, and high estimates of average willingness to pay (WTP) for improvements in river quality (£/km). The assessment applies the central value to estimate the main results of the IEA, and it is assumed representative for improvements achieved under both the W4G project and the counterfactual. The sensitivity analysis examines an alternative set of assumptions based on the potential for a nonlinear relationship with the improvement profile – i.e. diminishing marginal benefit where the initial areas improved would have a higher value placed on them than the final improvements achieved. To test the variance in results and given the difference in scale of improvements between the W4G project and the counterfactual, the lower NWEBS unit values were applied to the W4G project (large improvement) and the higher NWEBS unit values were applied to the counterfactual (small improvement).
• Sensitivity 2 – Fish Pass App not developed without funding: The main results reflect a counterfactual scenario where fishing activity from the pre-intervention scheme continues. However, an alternative scenario was tested where it is assumed that all fishing activity on beats within the Fish App Pass would stop (i.e., app development and subsequent fishing activity is attributable to W4G).
The results of the sensitivity analysis are reported in Section 3.6.4
3.6 Results and interpretation
The results show the assessment of value for money for the W4G project, where benefits and costs associated with habitat restoration (C22) and weir removal (C23) have been aggregated together, and similarly business engagement deliverables and expenditure have also been aggregated (C29 and C1). This enables better understanding of how funding has been allocated to each W4G deliverable package. Key metrics (including BCR, NPV) have been produced for the W4G project17. Note that gross valued added (GVA) and employment impacts (full-time equivalent) are reported in line with ERDF Summative Assessment forms18 in Section 4.3
Where the quantified counterfactual estimates were presented as a range in Table 3.3, the values from the lower end of the range have been used to calculate the results below. Each monetised benefit and cost indicator is given a confidence rating, using the ratings described in Table 3 9
As previously stated, an ‘uplift’ due to the W4G project is defined as the provision of an additional outcome and associated benefit and/or bringing forward an outcome/benefit in time. In practical terms, the uplift percentage change that is reported throughout this section is calculated as the change between the gross W4G project and the Counterfactual estimates, relative to the gross counterfactual estimates (i.e., (W4G –
17 Note that these results will also be produced for each deliverable package if possible as part of final report.
18 ESI Form 1-014.
Water for Growth Independent Economic Assessment Final Report | March 2023 Page 32
Counterfactual) / Counterfactual).
Table 3.9: Description of confidence rating
Level of confidence Description
Poor Evidence is partial and significant assumptions are made to attribute value to the W4G project. The data provides only order of magnitude estimates of value to inform the cost-benefit analysis.
Moderate Science-based assumptions and published data are used but there is some uncertainty in combining them and attributing values to the W4G project. There is reasonable confidence in using the data to inform the cost-benefit analysis.
Good Evidence is peer reviewed or based on published guidance, and values are clearly attributable to the W4G project. There is good confidence in using the data to inform the cost-benefit analysis.
3.6.1 Benefits
Table 3 10 presents the estimated uplifts of the W4G project in Year 6 (i.e., final year of the project). There is good to moderate confidence in the estimated uplifts. Note that the main driver for moderate confidence in the uplift is typically due to assumptions made in the counterfactual scenario. In particular, counterfactual estimates that are based on historical evidence result in a higher confidence in the estimated uplift.
Compared to the counterfactual, there are significant uplifts estimated for ecological and social impacts attributed to the W4G project. Most notable are the extent of changes in habitat condition as a result of activities undertaken as part of C22 and C23 delivery, including rehabilitated habitats, improved river lengths and completed weir removals.
At the end of the project (i.e., Year 6 in this IEA), angling visits are estimated to be marginally lower relative to the counterfactual (-2%), however this is not assumed to persist into the post-project period19 . Furthermore, the analysis shows that visits from other anglers remains unchanged. This results in the overall number of angling visits (trips) in Cornwall remaining the same in both the W4G project and counterfactual. The longer-term impact of W4G is that angling visits from other Cornish beats (i.e., non-Fish Pass App), will occur on fishing beats included in the Fish Pass App as the App user base grows
All of the uplift for outcome indicators for deliverables related to the Fish Pass App and business engagement (i.e., C29 and C1) is attributed to the W4G project (i.e., 100%). It is assumed under the counterfactual that without the W4G project, businesses engagement would not have changed. Furthermore, because of the W4G project, previously closed beats (as shown in Appendix 3) have been reintroduced into the Fish Pass App, resulting in an increased number of active fishing beats (uplift of 111% or increase of 1.1 times).
19 Based on assumptions in Table 3 8
Water for Growth Independent Economic Assessment Final Report | March 2023 Page 33
Table 3.10: Quantified uplifts of the W4G project in Year 6
Table notes: 1 Uplift % calculated as the change between W4G and counterfactual relative to the counterfactual.
Water for Growth Independent Economic Assessment Final Report | March 2023 Page 34
Uplift Benefit category Outcome indicator (unit) Counterfactual W4G W4G compared to Counterfactual Uplift %1 Confidence Ecological Extent of habitat Total area of rehabilitated river and bankside habitats (ha) 0.4 4.4 +900% Good Total length of river improved by C22 activities (km) 1.2 11.7 +900% Good Total length of river improved by C23 activities (km) 26.0 260.3 +900% Good Hydrology & geomorphology Total area with better conservation status (ha) 10 100 +900% Good Total completed weir removals (no.) 2 19 +900% Good Economic Business activity Total number of businesses adopting new technology (no.) - 21 - Good Total number of businesses receiving training and support (no.) - 21 - Good Social Recreation Total number of active beats in Fish Pass App (no.) 10 24 +140% Good Recreation Annual number of Fish Pass App angling visits to Cornish beats (no.) 435 424 -2% Good Recreation Annual number of other anglers visits to Cornish beats (no.) 3,922 3,933 +0% Moderate Health & wellbeing Annual number of active Fish Pass angling visits (no.) 400 390 -2% Moderate
Table 3 11 presents the estimated annual values (i.e., value in Year 6) for the outcome indicators that can be monetised. Overall, there is good to moderate confidence in the estimates, as the estimates are based on published peer-reviewed evidence and specific attribution to the W4G project as shown through the estimated uplift proportion. The values here primarily relate to social uplifts arising to anglers who have used Cornish fishing beats (via the Fish Pass App), but also the benefits arising to Cornish residents more generally through improvements in river quality.
Table notes:
1 Uplift % calculated as the change between W4G and counterfactual relative to the counterfactual.
Non-monetised benefits
The monetised benefits estimated reflect social uplifts, but as identified in Section 3.3.2 there are economic uplifts that are attributable to the W4G project that are captured in Section 4.3. This relates primarily to business activity, measured through gross value added and full-time equivalent employment impacts to Cornwall.
As discussed previously, ecological uplifts can directly or indirectly impact the economic and social uplifts. Some of the ecological uplifts identified in Table 3 10 have been inputs to monetary estimates (e.g.,
Water for Growth Independent Economic Assessment Final Report | March 2023 Page 35
Uplift Benefit category Outcome indicator Counterfactual W4G W4G compared to Counterfactual Uplift %1 Confidence Social Recreation Annual trip-related expenditure from Fish Pass App anglers to Cornish beats 25 24 -2% Good Recreation Annual trip-related expenditure from other anglers to Cornish beats 221 222 +0% Moderate Recreation Fish Pass anglers’ consumer surplus2 3 22 +558% Moderate Recreation Other anglers’ consumer surplus2 31 97 +216% Moderate Health & well-being Annual avoided NHS medical treatment costs from Fish Pass Angling visits 1.6 1.4 -2% Moderate Water quality Annual willingness to pay for avoiding deterioration in rivers by C22 activities 7 73 +900% Moderate Water quality Annual willingness to pay for avoiding deterioration in rivers by C23 activities 163 1,633 +900% Moderate Total 452 2,072 +359%
Table 3 11: Monetised uplifts of the W4G project in Year 6, £000 in 2022 prices
improved river length). However, most of the ecological uplifts are non-monetised material benefits in this IEA. The non-monetised benefits not captured in Table 3.11 include:
• Efficiency gains (i.e., time-savings) for WRT attributable to the development of the Fish Pass App (i.e., move away from paper-token scheme).
• Benefits arising from invasive species management (i.e., avoided costs of eradicating invasive species) is not separately assessed within the IEA. Removal of INNS or vegetation management in general, is captured within the total area of rehabilitated river and bankside habitats (i.e., C22 delivery).
• Recreational and health & well-being benefits arising to non-anglers (e.g., other water-based activities) who, like anglers, benefit from improvements in river quality and surrounding bankside areas.
• Angling tourism cannot be isolated from local angling (i.e., as recreation), as the distinction cannot be made using the Fish Pass App user data. Therefore, it is expected that some of the tourism-value is captured within the recreational angling measures.
• Health & well-being benefits arising to volunteers that have supported delivery of the W4G project. This would capture physical health benefits associated with active volunteer time (i.e., only a proportion of volunteer effort would fall into this category) as well as the opportunity cost of volunteer’s leisure time.
• There is evidence to suggest that the wider public (i.e., households) have a non-use value20 associated with the protection of salmon stocks. An economic analysis of inland fisheries in England (Mawle and Peirson, 2009) estimated that on average, households were willing to pay around £21 per year (2022 prices) to protect against a severe decline (i.e., 95% reduction) in salmon stocks. This is a “national" value reflecting the status of salmon stocks 15-years ago, however, and not easily attributable to actions impacting individual rivers. Hence, while it indicates that households’ value for conserving salmon stocks is significant, it is not appropriate to use this evidence to value wider public benefits of the W4G project.
3.6.2 Costs
Table 3.12 presents the estimated annual values (i.e., spend in Year 6) of the costs associated with the delivery of the W4G project, based on the indicators identified in Section 3.3. Note that W4G project spend reflects expenditure up to Q3 of 2022. Overall, there is moderate to poor confidence in the estimated uplift in costs. This is because costs under the counterfactual are generally unknown. There is moderate confidence in estimates associated with C22 and C23 delivery, as it is assumed that average W4G capital and revenue costs (i.e., Average-£/hectare improved) are representative of pre-intervention expenditure associated with similar activities. There is poor confidence in expenditure levels for business engagement, support and the angling scheme/Fish Pass App as:
• Capital costs: W4G expenditure on these activities has been pro-rated to the counterfactual based on number of active fishing beats.
20 Non-use value is the value given to goods or services that will not or have never been used.
Water for Growth Independent Economic Assessment Final Report | March 2023 Page 36
• Revenue costs: it is assumed that costs in the counterfactual are at least as high as W4G revenue costs.
These assumptions are likely to represent an under-estimate in counterfactual costs. Note that under the counterfactual, it is assumed that no businesses adopt new technologies or engage with the PES-market without the W4G project. Therefore, the estimated capital and revenue costs in the counterfactual relate to maintaining the pre-intervention angling scheme (i.e., WAP).
Table 3.12: Monetised costs of the W4G project in Year 6, £000 in 2022 prices
Table notes: 1 Uplift % calculated as the change between W4G and counterfactual relative to the counterfactual.
Non-monetised costs
The key non-monetised costs not captured in the above results include:
• With respect to the counterfactual, a key non-monetised cost is the capital and operational costs of the previous paper-token based PES system that accrue to WRT and beat owners (e.g., staff time, replacement of token boxes).
• Volunteer effort as an operational cost that is required to deliver the W4G project outcomes.
• Cost to beat owners that have engaged with the W4G project (i.e., related to C29/C1) with respect to staff time receiving support to use the Fish Pass App, getting set up and management costs associated with the fishing beats they manage.
3.6.3 Comparing benefits and costs
The assessment results are presented in Table 3.13. The present value of benefit (PVB) of the W4G project is estimated to be approximately £21 million. The benefit estimate for the counterfactual is around £6.4 million in present value terms, representing a total benefit of £14 million, and uplift of 220% for the W4G project. This is primarily due to the value attributed to improvements in river quality where combined total for C22 and C23 activities equates to 90% of the estimated total benefit uplift (£13 million).
Water for Growth Independent Economic Assessment Final Report | March 2023 Page 37
Cost category Cost indicator Counterfactual W4G W4G compared to Counterfactual Uplift %1 Confidence Capital costs Business engagement, business support and Fish Pass App development 10 46 +340% Poor Habitat improvements and weir removal 3 6 +145% Moderate Revenue costs Business engagement, business support and maintenance of Fish Pass App 32 32 - Poor Habitat improvements and weir removal 15 121 +684% Moderate Total 60 205 +241%
The present value costs (PVC) estimate for the W4G project is approximately £2.6 million. For the counterfactual the estimated PVC is around £0.7 million. The W4G project costs are assessed to almost two times higher than the counterfactual in aggregate, mainly due to the capital expenditure associated with C22 and C23 delivery (i.e., infrastructure removal). The (additional) net present value (NPV) for the W4G project is assessed to be £12.5 million over 15 years. The corresponding benefit-cost ratio (BCR) is 7.7:1 (i.e., every £1 spent by the W4G project resulted in just under £8 of benefits).
Whilst the IEA results indicate that the net positive benefit of the W4G project, there are notable benefits and costs that have not been accounted for in this economic assessment, these include:
• Costs: Costs to beat owners that engaged with W4G project (e.g., staff time for C1/C29 engagement, future maintenance of habitats).
• Benefits: Cost savings (i.e., efficiency gains) from the use of the Fish Pass App arising to WRT, health & well-being benefits arising to volunteers that supported delivery of W4G project and improvements to the social well-being of the local population.
• On balance and taking account of the sensitivity testing around the main results (see Section 3.6.4), it is judged that the inclusion of these factors – if possible – would not materially change the conclusion with respect to the value-for-money of the W4G project.
Box 3.1: Examples of similar assessments
To put these figures into context, evaluations and appraisals of similar assessments have been reviewed:
• Le Quesne (2005) evaluated the Cornwall Rivers Project showing a net present value of £9.2 million, over 10 years.
• Inman, (2013) assessed the socio-economic impacts of investing in the Westcountry Passport Scheme providing a social benefit-cost ratio of between 1.10 – 2.14 over a 10-year appraisal period
• Vardakoulias and Arnold (2015) assessed returns on investments of six river improvement projects in Cornwall and Devon and concluded benefits of each scheme outweigh the costs by a ratio between 1.9:1 and 4.5:1. Overall, the six projects are estimated to have BCR of 3.5:1, assuming a 10-year benefit period.
It should be noted that the evaluation scope for these projects is different to the W4G IEA. Where the W4G project differs in not only it’s geographic scope (limited to impacts to Cornwall) but also has a broader breadth of potential impacts. In addition, this IEA has also forecasted future impacts, for both costs and benefits, to reflect future maintenance of impacts beyond the project implementation period.
Water for Growth Independent Economic Assessment Final Report | March 2023 Page 38
Table 3.13: W4G Project - independent Economic Assessment results, PV15 £000
Table notes:
Water for Growth Independent Economic Assessment Final Report | March 2023 Page 39
Category Cost/benefit Counterfactual W4G W4G compared to Counterfactual Change Uplift %1 Costs (monetised) Capital costs Business engagement and business support (C1/C29) 147 154 7 +5% Habitat improvements and weir removal (C22/C23) 13 906 893 +7,096% Revenue costs Business engagement and business support (C1/C29) 430 430 -Habitat improvements and weir removal (C22/C23) 157 1,114 958 +611% Total present value costs (PVC) 747 2,605 1,858 +249% Benefits (monetised) Recreation Trip-related angling expenditure from Fish Pass anglers to Cornish beats 224 265 42 19% Recreation Trip-related angling expenditure from other anglers to Cornish beats 4,130 4,131 0.5 +0.01% Recreation Fish Pass anglers’ consumer surplus 31 249 218 700% Recreation Other anglers’ consumer surplus 574 1,809 1,235 215% Health & wellbeing Avoided NHS medical treatment costs from angling 13 15 2 19% Water quality Welfare of avoiding deterioration in rivers by C22 activities 68 706 637 +931% Water quality Welfare of avoiding deterioration in rivers by C23 activities 1,432 13,533 12,180 +900% Total present value benefits (PVB) 6,393 20,707 14,314 +224% Results Net present value (NPV) 5,646 18,103 12,456 +221% Benefit-cost ratio (BCR) 8.6 8.0 7.7
the counterfactual.
1 Uplift % calculated as the change between W4G and counterfactual relative to
3.6.4 Sensitivity analysis
This section presents the results of the sensitivity analysis outlined in Section 3.5.
Sensitivity Scenario 1 – Water quality unit values
The results reported in Table 3 13 apply the central unit value for river quality improvement (approx. £2,960/km). The sensitivity testing proxies a non-linear effect by applying the high unit value (£3,500/km) to (estimated) improved area under the counterfactual and the low unit value (£2,400/km) to the W4G project. Aggregate benefit values for the C22 and C23 activities are:
• For the counterfactual, C22 and C23 activities result in £0.1 million and £1.6 million, PV15 respectively.
• For the W4G project, C22 and C23 activities result in £0.5 million and £11.1 million, PV15 respectively
The resulting PVB, PVC, BCR and NPV are shown in Table 3 14
Table 3 14: Water quality unit values – sensitivity results
Table notes:
1 Uplift % calculated as the change between W4G and counterfactual relative to the counterfactual.
Overall, the scenario represents the most conservation set assumptions that can be specified on the basis the sensitivity range for the value of water quality improvements. The reduction in the overall BCR is notable (decrease to 6.2 from 7.7), but in general this does not change the overall value for money conclusion for the W4G project.
Sensitivity Scenario 2 – Fish Pass App not developed
A key assumption within the defined counterfactual (see Table 3.2) is the continuation of the PES market, with a reduced number of beats. This assumption reflects reduction in beat offering within the preintervention passport scheme, where both the administrative burden for WRT (i.e., staff costs) and beat owners resulted in certain beats being removed from the passport scheme. Equally, the counterfactual assumes that business behaviour (i.e., beat owners) would remain the same as in the pre-intervention period, resulting in no new beats being added to the passport scheme. These assumptions have implications for both the estimated costs (i.e., to WRT) and benefits (i.e., from angling activity) under the counterfactual.
A more conservative approach to defining the counterfactual for the delivery of C1 and C29 would be to assume that without W4G the PES market and associated business engagement with beat owners would
Water for Growth Independent Economic Assessment Final Report | March 2023 Page 40
Counterfactual (PV15 £000) W4G (PV15 £000) W4G compared to Counterfactual Change Uplift %1 Total present value costs (PVC) 747 2,605 1,858 249% Total present value benefits (PVB) 6,640 18,069 11,429 172% Net present value (PVB – PVC) 5,893 15,465 9.572 162% Benefit-cost ratio (PVB / PVC) 8.9 6.9 6.2
cease This would mimic the counterfactual assumptions in the sense that Fish Pass anglers have less choice of where to fish and will fish on more crowded beats. However, the worst-case scenario would reflect that these angling visits are not replaced (i.e., not displaced to other locations within Cornwall) resulting in the following changes to the counterfactual:
• No capital and revenue costs for business engagement and business support;
• Loss of fishing activity and associated benefits (i.e., local economy expenditure, consumer surplus and physical health benefits of fish pass anglers).
The resulting PVB, PVC, BCR and NPV estimates are shown in Table 3 15 The results indicate that for every £1 spent, the W4G project results in £6 of benefits (a reduction from 7.7 in Table 3.13). The lower BCR –compared to the main results – indicates that under the counterfactual the costs of supporting fishing activity (i.e., those of the scheme) outweigh the benefits. This is in line with discussions with WRT on administrative burden associated with the previous angling scheme. The sensitivity scenario, therefore, shows that by assuming no fishing activity occurs without W4G intervention, costs are reduced by a greater proportion than the benefits in the counterfactual.
Through the implementation of the W4G project, the development of the Fish Pass App has lowered administrative burden, whilst sustaining the same level of angling visits and improving the experience for the anglers. However, given current understanding of costs and benefits it is not clear whether benefits will ultimately outweigh costs. The long-term impact of the Fish Pass app is discussed in Section 4.4.
Table notes:
1 Uplift % calculated as the change between W4G and counterfactual relative to the counterfactual.
Water for Growth Independent Economic Assessment Final Report | March 2023 Page 41
Counterfactual (PV15 £000) W4G (PV15 £000) W4G compared to Counterfactual Change Uplift %1 Total present value costs (PVC) 169 2,605 2,435 1,439% Total present value benefits (PVB) 6,126 20,707 14,582 238% Net present value (PVB – PVC) 5,956 18,103 12,146 204% Benefit-cost ratio (PVB / PVC) 36.2 8.0 6.0
Table 3.15: Fish Pass App not developed - sensitivity results
4. Findings
This Section presents the findings from the IEA of the W4G project, addressing the three evaluation questions: (1) what has been achieved; (2) how has this been achieved; (3) what is the value for money of the W4G project; along with the broader questions concerning longer term sustainability.
4.1 What has been achieved?
Summative Assessment Guidance questions
Project progress:
• Has the project delivered what it expected to in terms of spend and outputs?
• What are the factors which explain this performance?
• When the project draws to a close, is it expected to have achieved what it set out?
Based on evidence collected through periodic reporting by WRT and supporting data, the W4G project is expected to achieve its targeted spend and outputs when it draws to a close. Table 4.1 presents the original and revised project budget submitted to ERDF, along with the latest information on project expenditure. The difference between the revised budget totals and spend so far indicates that approximately 27% of the total proposed budget was unspent at the time of this IEA. However, it is expected that all the remaining budgeted revenue expenditure will be incurred, with only a small portion of the capital budget (about £5£10k) remaining unspent when the project draws to a close (pers. comm, WRT). This includes funding received from W4G project partners as match funding, which is reported as a combined total in W4G’s quarterly reports.
Table notes: From WRT Finance Team (November 2022).
Water for Growth Independent Economic Assessment Final Report | March 2023 Page 42
Amount Capital expenditure Revenue expenditure Match funding Total Original 886 702 600 2,188 Revised 1,071 1,479 713 3,263 Spend by Q3 2022 1,035 1,346 Not reported separately 2,382 Difference: Spend – Revised -36 -133 - -881
Table 4.1: W4G funding and spend, £000s
Table 4 2 shows that the W4G project has delivered its target outputs across all outcomes and is expected to deliver above the contracted targets by project close.
Table 4.2: W4G project deliverable targets and achievements
Table notes:
1. Revision submitted in 2019 and correspond to “Contracted ER/C/O/ 22 or 23 or 29 or 01” reported under physical progress in the latest Quarterly Report (1st October to 31st December 2022).
2. W4G outputs and target log provided December 2022 (pers comm, WRT)
Critical success factors for project delivery include the coordination with the project steering group (i.e., Environment Agency and Natural England for C22 and C23) in terms of setting objectives that reflect the catchment context, including understanding waterbody pressures and their impacts on water quality and fisheries ecology (i.e., expert knowledge). Furthermore, the project has actively engaged the local stakeholders that were critical to the overall delivery of the targets (e.g., beat owners for C29/C1 and landowners for C23), and continued to engage with them throughout the project cycle (i.e., beat owners for C1). Additionally, WRT have shown through quarterly reports on W4G that they have effectively managed the project based on achievement of contracted final targets, but also achieving interim quarterly targets ahead of schedule.
4.2 How has this been achieved?
Summative Assessment Guidance questions
Project delivery and management:
• Has the project delivered its intended activities to a high standard?
• For projects with direct beneficiaries: Did the project engage with and select the right beneficiaries? Were the right procedures and criteria in place to ensure the project focused on the right beneficiaries?
Project outcomes and impacts:
• What progress has the project made towards achieving the outcome and impacts set out in its logic model?
• To what extent are the changes in relevant impact and outcome indicators attributable to project activities?
Water for Growth Independent Economic Assessment Final Report | March 2023 Page 43
Total C22 (Area rehabilitated) C23 (Area with better conservation status) C29 (Enterprises engaged with) C1 (Enterprises supported) Unit Hectares Hectares Number Number Revised contracted targets1 4.4 96 21 21 Achieved outcomes2 4.5 100.21 21 21 Difference: Achieved – Contracted 0.1 4.21 - -
Conclusions and lessons learnt:
• Conclusions should identify strengths and weaknesses
• Highlight specific lessons for different audiences (e.g., grant recipient/project delivery body, those designing and implementing similar interventions, policy makers)
The W4G project has achieved its targeted outcomes following the inputs, activities and outputs defined in the logic model (Figure 2 1). Measurable aspects of the project indicate that activities have delivered their intended outcomes - as shown in Section 4.1 - and suggests the required standard has been achieved. The logic model defines two resulting impacts: greater resilience of fisheries in the Camel and Fowey, and an increase in the natural capital value of these fisheries. The latter of the two, is examined in this IEA where a natural capital approach has been integrated within the assessment methodology21. The results of this IEA and implications for natural capital values are described in further detail in Sections 3.6 and 4.3
Overall, the success of the W4G project and the logic model are largely results from the high degree of control and direct intervention led by WRT. Whilst achievement of project outcomes was dependent on the actions and behaviours of other actors (e.g., anglers, businesses, landowners), WRT has been the coordinating and driving party in delivering the project. Therefore, the risk of failure to achieve the targeted outcomes should - generally – be deemed low, particularly given WRT’s existing relationships with stakeholders and established role in coordinating waterbody and catchment level improvements in the region.
Potential risks to the success of the Fish Pass App could have been the development phase (i.e., complexity and delays) and the uptake by the angling community (i.e., low and slow to switch from paper-token system). The app, however, effectively digitised the established market mechanism based around token payments, implying limited deviation from a tried-and-tested system for both beat owners and anglers. Use of the app became mandatory for fishing access as a result of the COVID-19 pandemic. In this regard the development of the app was timely and allowed angling activity to be safely carried out in accordance with the varying levels of restrictions imposed on outside activities throughout the pandemic. Overall, however, the ‘what-if’ scenario without COVID-19 is difficult to explore in terms of whether uptake could have been slower, and therefore the IEA results show no-net difference due to COVID-19.
The attribution of changes in outcomes and impacts of the W4G are largely determined by the definition of the counterfactual (see Section 3.1.3) and informed through consultation with WRT. The estimated impacts from habitat restoration and in-river infrastructure changes (C22 and C23), are nearly 100% attributable to the implementation of the W4G project. Without it, it is assumed that some actions would have occurred given wider political context (e.g., drive for weir removal overall in national policies and strategies and the direction of travel indicated in Defra’s 25 Year Environment Plan); however, these efforts would have been less well-coordinated. Indeed, the strategic approach taken by the W4G project – e.g., remove all / as many as possible barriers to fish passage along the water course – can be contrasted to a likely piecemeal approach of removing weirs and small-scale habitat improvements over a longer timescale. The W4G project therefore represents a systematic change in the hydro-morphology of the Rivers Fowey and Camel
Water for Growth Independent Economic Assessment Final Report | March 2023 Page 44
21 As described in Section 2.3
resulting in significant environmental improvements.
It is reasonable to expect that the development of the Fish Pass App and related business engagement (C1 and C29) would have eventually occurred (i.e., over longer timescale). But again, these outputs are entirely dependent on WRT’s involvement as coordinating actor. Without additional funding, the timeline for these improvements is uncertain and would likely have come at a higher risk to WRT, particularly if developed from internal budgets. The W4G funding received from ERDF essentially minimised the risk borne by WRT and brought forward delivery of an app-based PES scheme.
Furthermore, the W4G project has a wide array of beneficiaries including anglers (local and tourists), local businesses and landowners, Cornish residents and wider society more generally. Where engagement with beneficiaries has been critical to the overall success of W4G activities, it is deemed that appropriate selection criteria has been applied:
• For C1/C29: The Westcountry Angling Passport (WAP) formed the basis for prioritising the project’s engagement activities, whereby 22 businesses were targeted based on their economic viability (or lack thereof) under the previous paper-token scheme. Engagement activities under C1/C29 activities have resulted in 21 out of 22 businesses being added to the Fish Pass App and receiving business support from WRT – a success rate of 95%.
• For C23: WRT, with support from the W4G Steering Group, targeted weirs that were actively blocking fish passage in the Camel and Fowey (not all weirs in the catchments are relevant to the W4G project) and engaged directly with those landowners. At the time of this report, 19 out of 27 weirs have been eased, partially removed or completely removed – a success rate of 70%22. A total of four weirs were not proceedable, due to reasons beyond WRT’s control.
It should be noted that anglers using the Fish Pass App have not been directly engaged with as part of the W4G project (e.g., via feedback survey), but this is not considered critical to the overall success of the intervention. Direct engagement with landowners and beat owners has resulted in anglers gaining access to previously (or recently) inaccessible fishing beats in the Westcountry region and improved the quality of their angling experience in Cornwall.
The Summative Assessment is based on analysis of data from, and discussions with, WRT. The IEA process has highlighted the need to better link project monitoring and evaluation plans to (post-implementation) economic evaluation, to ensure that all necessary data is collected in a format that is compatible with the assessment methodology. This includes, both data collection during project implementation but also collection of baseline data to inform counterfactual development (e.g., state of the world pre-intervention). A key lesson learnt is that this should be factored in at the project design stage.
As a desk-based IEA, it was beyond its scope to verify the achievement of outcomes measured and reported to ERDF (e.g., through site visits). Furthermore, not all impacts of the W4G project have been measured (e.g., change in fish stocks, number of unique app users) and there has not been any post-project consultation stakeholder engagement (e.g., with anglers, local residents) to establish how the W4G project has been perceived overall. Notwithstanding, the data and information collated and analysed in the IEA
22 Note that complete removal of a weir is not the overall objective of this activity, in some instances easement and/or partial removal is sufficient to allow fish passage
Water for Growth Independent Economic Assessment Final Report | March 2023 Page 45
suggest a positive overall impact of the project.
4.3 What is the value for money of the W4G project?
Summative Assessment Guidance questions
Project outcomes and impacts:
• What are the gross and net additional economic, social and environmental benefits of the project (where relevant and applicable to project activities)?
• Includes standard table format for reporting Gross and Net Additional Impacts for Employment and GVA
Project value for money:
• As a bare minimum should provide cost per output analysis
• Can be supplemented by cost-benefit analysis (benefit-cost ratio)
The scope of the assessment is defined according to a set of key parameters, which include focusing the analysis of economic, social and ecological impacts to Cornwall. Impacts of the project are calculated both as gross and net additional – where net additional is estimated as an uplift from the counterfactual. The benefits and costs included within the IEA are informed by data collected by WRT (e.g., timings of habitat improvements and associated expenditure), with wider evidence informing the appropriate assessment time horizon (e.g., to account for salmon and sea trout lifecycle) to ensure that long-term impacts of the W4G project are adequately captured
4.3.1 Impact on economic activity
The economic impact attributable to the W4G project is measured through business activity indicators, linked to both C29/C1 outcomes as well as regional angling expenditure. Key outcome indicators include the 21 businesses that have adopted new technology (i.e., been added to the Fish Pass App) and received training and support from WRT through C1 activities.
The local economy impact of angling through the App includes both the income effect (i.e., gross value added) and employment impact (i.e., FTEs) resulting from visit expenditures. The gross and net additional impact estimates are reported in Table 4 3 The results show that expenditure from Fish Pass angling visits support less than 1 additional full-time equivalent job (direct and indirect) and additional regional GVA of approximately £43,000 (direct and indirect)23
Note that GVA and FTEs assess only one dimension of the W4G project impacts to Cornwall and are assessed across a relatively small user base. Latest evidence on the economic value of freshwater angling
23 Estimated based on average GVA or FE per £-spent by anglers from Environment Agency (2018b), for the South West River Basin District. Where every £1 spent by anglers results in £1 FVA impact or 0.01 FTE. These average GVA and FTE impacts are multiplied by the estimated Fish Pass angler expenditure under both the W4G project and Counterfactual, as reported in Table 3 13
Water for Growth Independent Economic Assessment Final Report | March 2023 Page 46
in the South West River Basin District show direct and indirect GVA and FTEs attributable to angling expenditure of £62.5 million and 1,200 jobs, respectively (Environment Agency, 2018a).
Table 4.3: Gross and net additional impact for employment and GVA
Impact Area 1: Fish Pass anglers in Cornwall
/ reference case2 3.0
no adjustments for deadweight
Displacement3 / substitution4 - No displacement or substitution effects Leakage5 - IEA scope is limited to Cornwall.
Unit = £ms
Counterfactual, no adjustments for deadweight
Displacement / substitution - No displacement or substitution effects
Leakage - IEA scope is limited to Cornwall.
Source: MHCLG, 2020a
Table notes:
1 Gross impact defined as “an estimate of total effect of an intervention option or the reference case in terms of a specific output” (Dancer, 2014, p. 4)
2 Reference case is defined as the counterfactual within this IEA. No deadweight adjustments have been made.
3 Displacement is defined as “the number or proportion of intervention outputs accounted for by reduced outputs elsewhere in the target area” (ibid, p.4).
4 Substitution effects arise where a one activity is substituted for a similar one.
5 Leakage is defined as the proportion of outputs that benefit those outside the intervention’s target area or group.
4.3.2
Natural capital value
The primary intent of the W4G project was to increase the natural capital value of the fisheries. Impact on economic activity is only one-dimension of this (and not the primary focus) as change in natural capital value also is reflected through ecological and social uplifts, which typically lie outside the scope of economic impact assessments. Based on findings reported in Table 3.10, the W4G project has resulted in an overall increase in Cornwall’s natural capital value through the area of rehabilitated river and bankside habitats; improved river lengths across the catchments; and increased total area with better conservation status. The breakdown of estimated uplift is shown in Table 4.4, where net present value of the W4G project is approximately £12.5 million in present value terms over 15 years, and is predominantly attributed to
Water for Growth Independent Economic Assessment Final Report | March 2023 Page 47
Measure Adjustment
Employment Unit
Gross
3.6
Impact Indicator:
= FTEs
Impact1
Deadweight
Counterfactual,
Net
0.6
Additional
GVA
Gross
Impact Indicator:
Impact £0.3 Deadweight / reference case £0.2
Net
Additional £0.04
environmental uplift (i.e., benefits from C22 and C23 activities).
Table 4.4: Environmental and social uplifts attributed to W4G project (£000, PV15)
Table notes:
1 Uplift % calculated as the change between W4G and counterfactual relative to the counterfactual.
2 Costs and monetised benefits for W4G deliverables C22 and C23.
3 Costs and monetised benefits for W4G deliverables C29 and C1.
Estimated impacts take into account downstream effects (i.e., benefits not only to fishing beats, but across river areas), where river fish stocks have been enhanced. The ecological uplifts are key inputs to estimating the subsequent change in measurable value of social uplifts – which include the quality of angling visits (i.e., change in consumer surplus) and health and well-being of anglers (i.e., avoided medical treatment costs). However, the natural capital value improved by the W4G project does not reflect all uses of natural capital within the project area – for example the Fowey catchment is the main source of drinking water in Cornwall, and part of the Camel catchment is a Special Protected Area. Although, the W4G project is likely to support these wider benefits (i.e., water supply and landscape value), the IEA scope is limited to the W4G project remit.
4.3.3 Cost per output
Table 4.5 reports the cost per output estimates for the combined outcomes achieved under the two aggregated deliverable groups. The results show that with current expenditure and outcomes achieved by Q4 of 2022, the majority of capital and revenue spend habitat improvement works has been made (83% of total spend), resulting in an average cost per hectare improved of approximately £19,000. With respect to outcomes related to the Fish Pass App, average cost per business is £20,000 – this captures WRT staff time in developing the App itself, to add the beat to the App, supporting beat owners in maintaining the beat, and any additional training and support provided by WRT staff.
It is important to note that the cost per output estimates require careful interpretation. They do not represent the marginal cost of achieving an outcome, but rather reflect the (averaged) cost of achieving outcomes within the W4G project timeframe. For example, the additional cost per business will be substantially lower moving forward, since costs due to the development of the App (i.e., software) - the main driver of the capital and revenue spend for this outcome – have been incurred already. As such, it is estimated that the cost of adding new beats to the App (i.e., onboarding) is £300 per business (pers. comm, WRT).
Water for Growth Independent Economic Assessment Final Report | March 2023 Page 48
W4G vs Counterfactual1 Environmental uplift2 Social uplift3 Total uplift Total present value costs (PVC) 1,851 7 1,858 Total present value benefits (PVB) 14,269 45 14,314 Net present value (PVB – PVC) 12,419 38 12,456 Benefit-cost ratio (PVB / PVC) 7.7 6.4 7.7
Table 4.5: Cost per output analysis
4.3.4 Benefit-cost ratio
Table 4.6 summarises the headline results from Section 4.3. These show the W4G project attributable benefits outweigh the costs (i.e., a positive NPV), where benefits are social uplifts arising to anglers (both local and tourists) and wider society through improved river quality. Assessed costs are primarily borne by WRT and do not capture any cost impact on other actors (e.g., beat and landowners in the future). The calculated BCR indicates that for every £1 spent by the project around £8 in benefits has been generated. On this basis it can be concluded that the W4G project has provided value for money.
Table 4.6: Summary of W4G uplift
4.4 Broader evaluation questions
In addition to evaluating the W4G project impacts, the IEA also set out to answer two broader and longterm impact questions. The IEA and consultation with WRT have informed the findings here, with the aim of evaluating whether W4G impacts can be sustained and what are the critical needs for sustaining them.
Given the improved fish habitat and fish stock sustainability achieved by the project, will this have an impact on the socio-economic sustainability of migratory salmonid angling on the Camel and Fowey?
The long-term sustainability of the W4G project impacts will depend on a series of factors – including ensuring future maintenance of the impacts achieved and the degree of change (i.e., permanent or temporary). For example, the outcome of C23 is the removal of weirs and obstructions which are both permanent changes to the Fowey and Camel, and therefore a long-lasting benefit that will extend well beyond the 15-year assessment timescale.
Water for Growth Independent Economic Assessment Final Report | March 2023 Page 49
Deliverable Outcome indicator Achieved outcome Capital and revenue spend (£k) Cost per output (£k/unit) C1/C29 Number of businesses engaged with and supported (no.) 21 £417 £20k /business C22/C23 Total area rehabilitated or improved conservation status (ha) 104.6 £1,965 £19k /hectare
Measure Change: W4G compared to Counterfactual Uplift1 Present value costs (£m) +1.9 +249% Present value benefits (£m) +14.3 +224% Net present value (£m) +12.5 +221% Benefit-cost ratio 7.7
Uplift % calculated as the change between W4G and counterfactual relative to the counterfactual.
Table notes: 1
Benefits from habitat improvements require regular maintenance to ensure their long-term sustainability. This is part of forward planning outside of the W4G project timeframe. The delivery of the W4G project has considered this within C1 activities, which include management and commercialisation support, customerbased assistance, marketing and promotional materials as well as training on responsible fisheries and habitat improvements. The latter was aimed at beat owners to show them how to maintain the habitat improvements undertaken so far. In addition, WRT have also received funding and donations to continue habitat improvement works after the completion of the W4G project (note: this funding is reflected in the future profile of costs within the IEA).
Overall, the changes to river hydro-morphology and habitat maintenance are fundamental to improving conditions for fish and the long health of migratory salmonid populations. However, whilst they contribute to the continuing viability of angling on the Camel and Fowey, external factors are also at play. For example, future survival rates of adult fish will also depend on pressures in the marine environment and the effects of a changing climate. Hence, whilst the W4G measures improve the chances of sustaining angling activity over the longer term, other effects (climate) and trends (proportion of the population engaging in angling) may ultimately be the determining factors.
A particular observation that can be made for the W4G project – in terms of the engagement with land and beat owners – is that it has helped change perceptions of riparian land. Rather than being seen as a redundant part of a landholding (and in some cases a liability), they are actually an asset. This is only possible, however, if the cost and administrative burden of maintaining access to fishing beats is minimised, as is done through the Fish Pass App. In this regard, the App has ensured that the economically marginal beats have not been closed down. More widely, there is the opportunity for WRT to continue their coordination role within the region and expand the coverage of the Fish Pass App. Therefore, the W4G project is expected to result in more sustainable use of the natural capital assets in the Camel and Fowey beyond the W4G project timescale.
It should be acknowledged that future maintenance of habitat improvements is therefore largely dependent on the actions of beat and landowners that have been engaged with throughout the project. Therefore, C1 activities related to training and C29 engagement actions are a starting point – but there is a need for continued contribution and effort from land and beat owners, and ultimately continued engagement from WRT with these local stakeholders.
What is the impact on business support and app development by the project?
The Fish Pass App has allowed fishing beats that were previously deemed too costly to maintain within the WAP (because the administrative burden of the WAP was high), to be included within the digital PES market. Furthermore, the development of the Fish Pass App allowed WRT to adapt to COVID-19 restrictions put in place in 2020 and 2021. Beats were able to close and re-open in line with changing government guidelines, resulting in a more dynamic response without any additional administrative burden on either WRT or the beat owners.
Business support was a key feature of the W4G project through deliverable C1, where WRT staff have supported businesses added to the Fish Pass App. The impact on businesses and app development would generally be viewed as short-term, unless effort is made to ensure long-term viability and support is
Water for Growth Independent Economic Assessment Final Report | March 2023 Page 50
available (as noted above, C1 activities aim to ensure that W4G outcomes are maintained beyond this ERDF funding cycle). Overall, though, there is evidence that suggests it is feasible that the App and business support can continue beyond the W4G project delivery period. Currently, the App provides access to more beats in Devon than Cornwall, with WRT also expanding the beat offerings beyond the South West, into the Midlands (pers. comm, WRT). In general, it is difficult to judge the lasting effect of business support as it does largely depend on the actions of the business owners and continued interest in maintaining angling access (i.e., future priorities and other potential revenue streams).
Reduced operating costs are one of the incentive mechanisms to encourage beat owners to be added to the App. In addition, future updates will provide greater autonomy to beat owners to decide when anglers are able to access fishing beats (pers comm, WRT). Although the App is targeting these reduced operating costs for both WRT and beat owners, in isolation it is unlikely to be sustained without continued engagement and resource input from WRT (i.e., some minimal level of contact between WRT and beat owners is required). It is not possible to evaluate the impact on an individual business level, however maintaining the established relationships between WRT and the beat owners is crucial to long-term continuation of the project outcomes related to the App and habitat improvements.
Water for Growth Independent Economic Assessment Final Report | March 2023 Page 51
5. Conclusions
This Section provides conclusions from the IEA, highlighting limitations and makes recommendations for future evaluations of similar projects.
5.1 Summary
Summative assessment guidance questions
Project context:
• Was the project appropriately designed to achieve its objective? Was the delivery model appropriate?
• Were the targets set for the project realistic and achievable?
• Bearing in mind any changes in context or weaknesses in the project design/logic model, can the project reasonably be expected to perform well against its targets?
Project progress:
• When the project draws to a close, is it expected to have achieved what it set out?
Project outcomes and impacts:
• What are the main sources of Strategic Added Value that the project has created?
Based on evidence collected, the W4G project is expected to achieve its targeted outputs and will have minimal underspend when it draws to a close. The W4G project has delivered against each contracted outcome target set, with the project design and delivery deemed appropriate. Critical success factors for the W4G project include the coordination between WRT and the project steering group, active engagement with local stakeholders throughout the project cycle, and effective project management by WRT.
The IEA has produced a cost-benefit analysis of the W4G project – where achieved project outcomes have been evaluated against a counterfactual (i.e., without intervention). As a desk-based exercise, the assessment was reliant on information and data provided by WRT on the W4G project outcomes achieved (through regular reporting to ERDF) and complemented by a review of wider evidence to establish the state of rivers and fisheries in the UK, as well as economic valuation evidence to support quantification and monetisation of impacts. It was beyond the scope of the IEA to verify achieved outcomes (e.g., site-visits, survey of stakeholders and/or app users).
The results of the IEA are influenced by the framing of the analysis, in particular:
• Definition of the counterfactual: which assumes that some of the improvements delivered as part of the W4G project would be less well-targeted and occur at a slower rate and across a smaller scale. Therefore, without the W4G project:
Only some of the habitat improvements and removal/modification of fish passage barriers would occur (10-20% of W4G achieved outcomes);
Water for Growth Independent Economic Assessment Final Report | March 2023 Page 52
The previous Angling Passport (i.e., paper-token system) would continue as is (i.e., no modernisation or digitisation within the project timeframe); and
Catchment stakeholders (i.e., businesses) behaviour will remain the same.
• The boundaries of costs and benefits assessed: the economic, ecological, and social uplifts attributable to the W4G project have been quantified and monetised (where possible). The scope of impacts has been limited to Cornwall and use of river natural capital in the Camel and Fowey catchments. Some indicators reflect users (e.g., tourists) from outside Cornwall, but ultimately final impact (e.g., expenditure) is limited to Cornwall. Costs borne by WRT have been assessed, however those borne by other actors (e.g., beat and landowners) are unaccounted for.
• Impacts on natural capital value: these reflect a narrow scope of benefits in Cornwall (i.e., limited to angling and benefits of improved river quality). This is due to the scope of the W4G project outcomes (i.e., improving habitats), and as a result they do not reflect features of the Camel and Fowey that are important for water supply, biodiversity, and habitat connectivity (i.e., landscape value).
With respect to the results of the IEA, there is good to moderate confidence in estimated benefit uplifts –with significant uplifts estimated for ecological (e.g., change in habitat extent) and social impacts (e.g., willingness to pay for avoided river quality deterioration). Overall confidence in the estimated costs is lower (moderate to poor), as there is greater uncertainty in the counterfactual capital and revenue costs associated with the paper-token based angling scheme. The results herein represent conservative assumptions and approaches to estimating uplifts. Non-monetised costs and benefits have been considered and identified in Section 3.6. There are some omitted material costs and benefits, however their omission is unlikely to change the overall reported result and findings.
The conclusion of the IEA is that benefits from the W4G project outweigh the associated costs, with a best estimate benefit-cost ratio of 7.7:1. The results highlight that the project has significantly improved river natural capital value within Cornwall, with lower measurable impacts on the Cornish economy through angling expenditure.
5.2 Limitations
The results presented here are contingent on the structure of the economic assessment, in particular the framing of the counterfactual and the boundaries of the costs and benefits assessed. There are methodological limitations as values have been estimated by applying significant assumptions to fill in gaps in understanding (e.g., costs of pre-intervention Angling Scheme under the counterfactual). This is reflected in the confidence ratings applied to the quantified and/or monetised costs and benefits in Sections 3.6.1 and 3.6.2
A key challenge was primarily related to data quantity and quality, particularly with respect to establishing a reasonable statement of what would have happened without the W4G project for the counterfactual. This, however, is not unique to the assessment of the W4G project, but rather a common issue that most evaluations will face in this context. There is also uncertainty in the timing of impacts (e.g., rate of change). Reasonable assumptions can (and have) been made within the IEA.
Addressing these limitations are unlikely to change the overall conclusion of the IEA (i.e., the value-for-
Water for Growth Independent Economic Assessment Final Report | March 2023 Page 53
money of the W4G project), but rather would improve the counterfactual estimated and increase confidence in the results.
5.3 Recommendations
The recommendations for future assessments primarily focus on counterfactual development and data gathering and monitoring during the project period. This is more generally associated with the development of the monitoring and evaluation plan in the early stages of the project cycle. This is particularly relevant for projects targeting wider outcomes such as natural capital value since the data requirements and needs are greater than simply assessing economic impacts.
Overall, data needs should be considered before the project starts. Ensuring that the appropriate data is collected during the project timeframe to meet needs to assess the VfM, cost per output and overall success of the project. Furthermore, by setting a clear monitoring and evaluation plan, baseline data can be collected before project implementation and will ultimately support the definition of the IEA’s counterfactual – supporting the evaluators to make a reasonable definition of what would have occurred without the project.
For projects with a similar scope and overarching objectives as W4G (i.e., focus on natural capital improvements), a traditional IEA focusing on economic impacts (i.e., measuring GVA and FTEs) would overlook key benefits provided by these projects. Therefore, the integration of a natural capital approach provides a more holistic way to recognise impacts on stocks and flows of natural capital assets. This allows for ecological and social uplifts to be captured within a cost-benefit analysis structure. For W4G this is particularly relevant, as all monetised benefits included in the results are social uplifts that reflect improved quality of natural capital assets, with angling expenditure (i.e., market values) showing a marginal change.
Water for Growth Independent Economic Assessment Final Report | March 2023 Page 54
References
AST, IFM, n.d. The AST/IFM Samlon Population Modeller.
Beale, S., Bending, M., Trueman, P., 2007. An Economic Analysis of Environmental Interventions That Promote Physical Activity.
BEIS, 2019. Business support evaluation framework.
Brown, A., 2013. Westcountry Rivers Trust Socio-Demographic Survey of Angling Passport Scheme Users Final Report 44.
Chudik, A., Mohaddes, K., Pesaran, M.H., Raissi, M., Rebucci, A., 2021. A counterfactual economic analysis of Covid-19 using a threshold augmented multi-country model. J Int Money Finance 119, 102477. https://doi.org/10.1016/j.jimonfin.2021.102477
Claxton, K., Martin, S., Soares, M., Rice, N., Spackman, E., Hinde, S., Devlin, N., Smith, P.C., Sculpher, M., 2015. Health Opportunity Costs (Estimating health opportunity costs in the NHS and other health care systems) Methods for estimation of the NICE cost-effectiveness threshold.
Dancer, S., 2014. Additionality Guide.
Defra, 2021. Enabling a Natural Capital Approach (ENCA).
eftec, 2014. An estimation of the benefits of enhanced regulations for fish barrier management Final Report to Defra 44.
Environment Agency, 2022a. Catchment Data Explorer - Camel Operational Catchment, Classifications. Environment Agency, 2022b. Catchment Data Explorer - Fowey Operational Catchment, Classifications. Environment Agency, 2022c. Water Industry National Environment Programme.
Environment Agency, 2018a. A survey of freshwater angling in England - phase 1 report 129.
Environment Agency, 2018b. A survey of freshwater angling in England - phase 2 report 179.
Environment Agency, 2016. Assessment of Salmon Stocks and Fisheries in England and Wales.
Environment Agency, 2013. Updating the National Water Environment Benefit Survey values: summary of the peer review.
Eriksson, E.A., Hallding, K., Skånberg, K., 2022. Ensuring representativity of scenario sets: The importance of exploring unknown unknowns. Futures 139, 102939. https://doi.org/10.1016/j.futures.2022.102939
European Commission, 2013. EVALSED Sourcebook: Method and Techniques 1–165.
HM Treasury, 2022a. The Green Book: appraisal and evaluation in central government 1–148.
HM Treasury, 2022b. GDP deflators at market prices, and money GDP November 2022 (Autumn Statement).
HM Treasury, 2020. The Magenta Book: central government guidance on evaluation 1–97.
Inman, A., 2013. Assessment of the socio-economic impact of RDPE investment in the Angling Passport Scheme Final Report.
Le Quesne, T., 2005. Cornwall Rivers Project Independent Economic Evaluation 1–34.
Lusardi, J., Rice, P., Waters, R.D., Craven, J., 2018. Natural Capital Indicators: for Defining and measuring change in natural capital (NERR076).
Mawle, G.W., Peirson, G., 2009. Economic evaluation of inland fisheries 58.
MHCLG, BEIS, DLUHC, 2020a. European Regional Development Fund 2014 to 2020 Summative Assessment Guidance (ESIF-GN-1-033).
Water for Growth Independent Economic Assessment Final Report | March 2023 Page 55
MHCLG, BEIS, DLUHC, 2020b. European Regional Development Fund 2014 to 2020 Summative Assessment Guidance Appendices (ESIF-GN-1-034).
MHCLG, BEIS, DLUHC, 2020c. European Regional Development Fund 2014 to 2020 Summative Assessment Guidance Appendices (ESIF-GN-1-034) 1–79.
Natural Capital Coalition, 2016. Natural Capital Protocol.
The Tweed Foundation, n.d. Life Cycle of the Atlantic Salmon.
Vardakoulias, O., Arnold, S., 2015. The returns on investment of river improvement projects : A CostBenefit analysis of WRT’s interventions in Cornwall and Devon.
White, M.P., Elliott, L.R., Taylor, T., Wheeler, B.W., Spencer, A., Bone, A., Depledge, M.H., Fleming, L.E., 2016. Recreational physical activity in natural environments and implications for health: A population based cross-sectional study in England. Prev Med (Baltim) 91, 383–388.
https://doi.org/10.1016/j.ypmed.2016.08.023
Water for Growth Independent Economic Assessment Final Report | March 2023 Page 56
Appendix 1 – The Fish Pass application
The Westcountry Angling Passport scheme was introduced in 2000 by the Westcountry River Trust (WRT) to issue angling permits and allow for sustainable fishing for residents and visitors. The scheme works as a payment for ecosystem services (PES) market, a marked-based mechanism to exchange natural resources and land access with monetary payments. As such, the WRT works as an “ethical broker” between landowners and users, and the WRT takes no profit from the scheme.
Between 2010 and 2013 the scheme received additional funding from the European Rural Development Programme, to develop and expand further angling opportunities across the Devon region.
In 2018 the WRT updated the passport scheme by introducing the “Fish pass” mobile app, which allows users to buy digital non-exchangeable tokens that can be converted to fishing permits to fish for a defined amount of time. Tokens can be bought in batches of 5 or 10, using PayPal or debit/credit cards and cost 3GBP each. Contrary to previous paper versions of the angling permits, these tokens have no expiry dates and can be exchanged at any point, without direct access to the internet. Alternatively, users can scan “paper tokens” which will be converted to the digital version on the app.
To exchange tokens, users must scan the QR codes available on fishing beats which will provide a “boarding pass” (effectively a permission to fish). Once a fishing session is completed, users are asked to submit their catch return before being able to fish somewhere else. The app provides a map of all beats and allows the users to see their 30 closest beats they can access.
The app also keeps track of the users’ details and fishing records, as well as their rod fishing number.
Beats
•Users can buy digital tokens through the app, or
•Users buy paper tokens that can be later scanned on the app
Tokens
•Users can look up the location and distance of fishing beats, and
•Users scan a QR code to access the beat and use their tokens
•Users can start fishing and,
•Users can log their catches/releases through the app
Appendix Figure 1 : Flow chart of the Fish Pass app
Water for Growth Independent Economic Assessment Final Report | March 2023 Page 57
Fishing
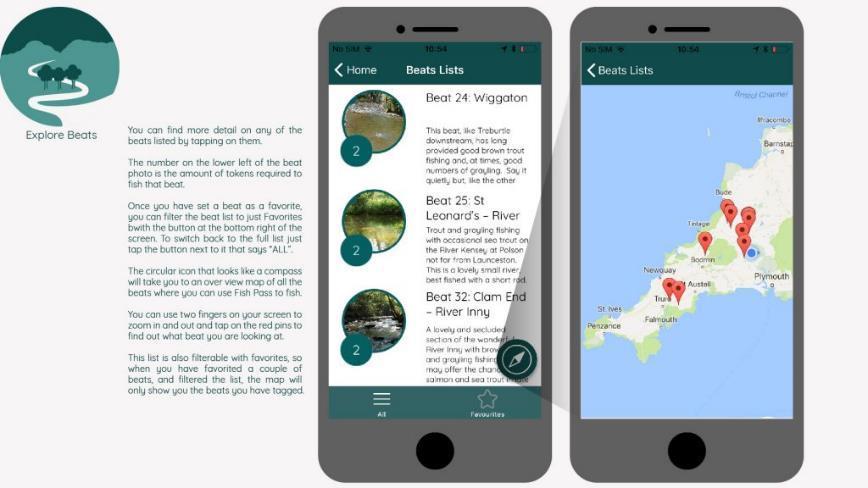
Water for Growth Independent Economic Assessment Final Report | March 2023 Page 58
Appendix Figure 2 : Interface of the Fish Pass app
Source: WooCommerce, Built with Storefront. Westcountry Angling Passport – Wild Rivers, Wild Fishing. westcountryangling.com.
Appendix 2 – Maps of W4G activities
This appendix shows maps of the W4G activities for deliverables C22 and C23 provided by the WRT
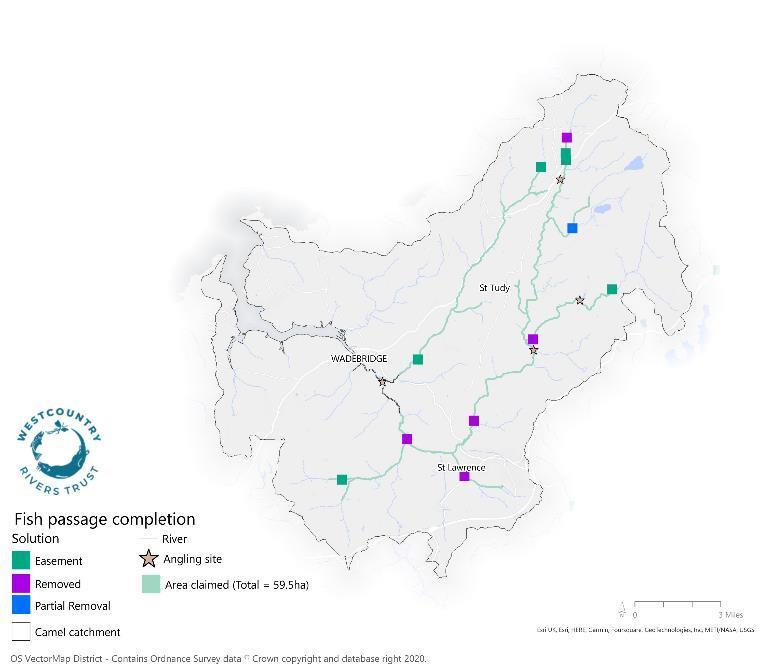
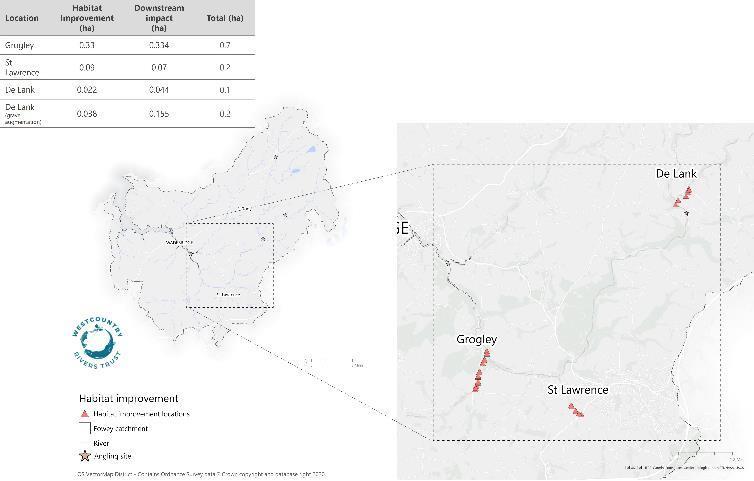
Water for Growth Independent Economic Assessment Final Report | March 2023 Page 59
GIS Team.
Appendix Figure 3 : Map of C22 (habitat improvement) areas in River Camel
Appendix Figure 4 : Map of C23 (weir removal) areas in River Camel
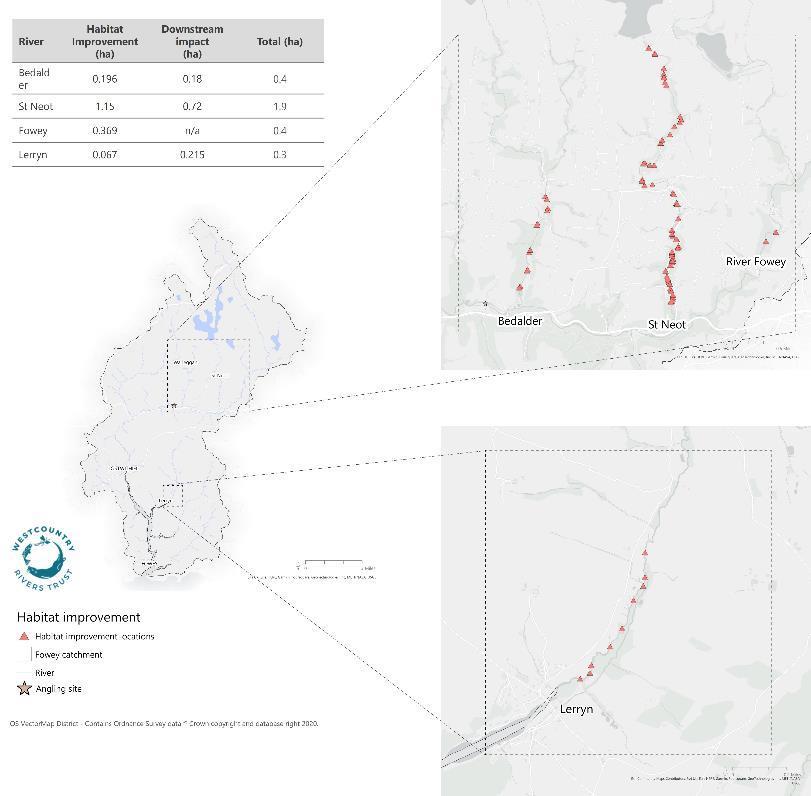
Water for Growth Independent Economic Assessment Final Report | March 2023 Page 60
Appendix Figure 5 : Map of C22 (habitat improvement) in River Fowey
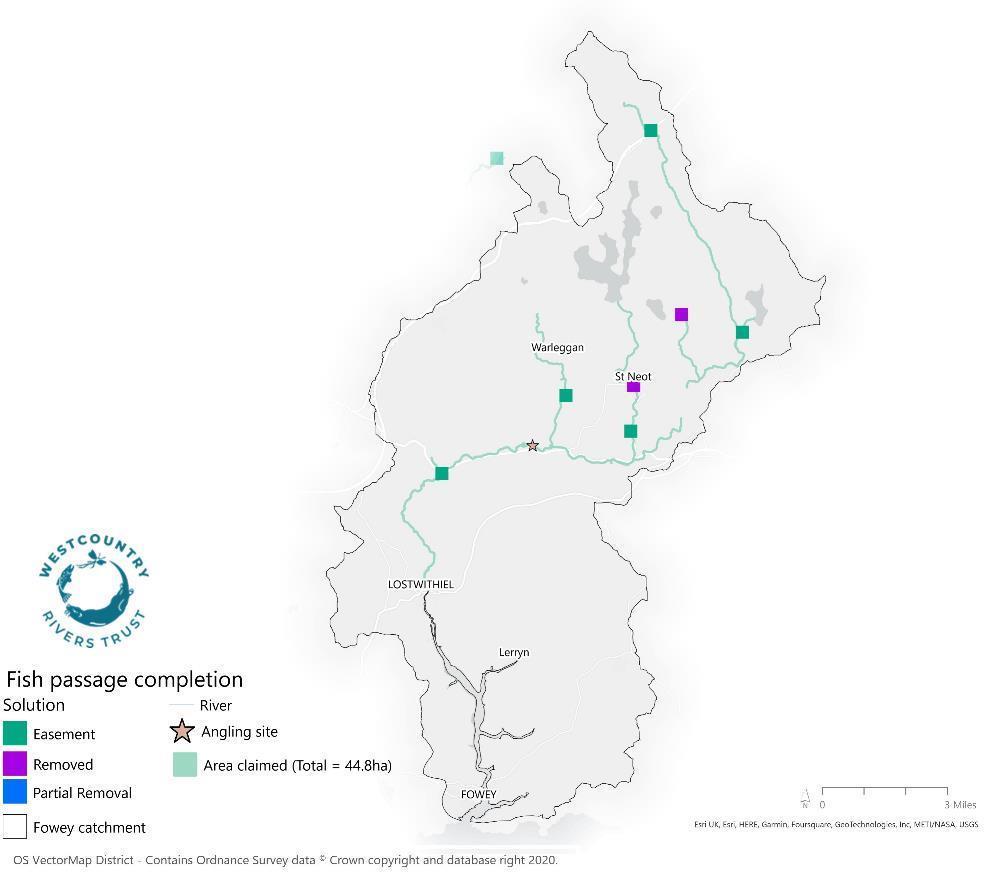
Water for Growth Independent Economic Assessment Final Report | March 2023 Page 61
Appendix Figure 6 : Map of C23 (weir removal) areas in River Fowey
Water for Growth Independent Economic Assessment
Appendix 3 – Fish beat owner summary
Appendix Table 1 : Summary of businesses engaged with and beats owned.
Company
Final Report | March 2023 Page 62
name1 Unique beat name Added to the App?1 In WAP (2013-2017)2 Paper tokens (2018-2019)3 App transactions (2018 onwards)4 Comments (Ham mill) Werrington Park Estate Ham Mill Y 2013 2018 2018 Berrio Mill Cottages Berrio Mill Y 2013 2018 2018 Collon Barton Collon Barton Y 2014 2019 2019 Fenteroon Cottages (Fenteroon) Fenteroon Y No transactions recorded No transactions recorded 2022 Friends of the Fal/ Trewithen Estate (Grampound) Grampound Y No transactions recorded No transactions recorded 2022 GAIA Trust Treraven Farm (Treraven) Treraven Y No transactions recorded No transactions recorded 2021 Grogarth Farm Grogarth Y 2013 2018 2018 Higher Tredundle (Coombe) Coombe Y No transactions recorded No transactions recorded 2022 Kingscombe Holiday Cottages and Farm (Kingscoombe) Kingscombe Y No transactions recorded No transactions recorded 2022 Netherbridge Netherbridge Y 2014 No transactions recorded 2018 Netherbridge Court Y 2014 No transactions recorded 2018 Netherbridge & Netherbridge Court N/A 2013 2018 No transactions recorded Transactions and tokens were reported together
Water for Growth Independent Economic Assessment
Final Report | March 2023 Page 63 Company name1 Unique beat name Added to the App?1 In WAP (2013-2017)2 Paper tokens (2018-2019)3 App transactions (2018 onwards)4 Comments Penpont Water- Penpont Water Y No transactions recorded No transactions recorded 2020 Rivermead Holiday Cottages (Rivermead) Rivermead Y No transactions recorded No transactions recorded No transactions recorded No transactions recorded for this beat Rose Park Fishery Rose Park Fishery Y No transactions recorded No transactions recorded 2020 South Penquite South Penquite Y 2014 2019 2018 St Leonards St Leonards Y 2013 2018 2018 South West Lakes Trust (SWLT) Stithians Y No transactions recorded No transactions recorded 2020 Crowdy Y No transactions recorded No transactions recorded 2020 Siblyback Y No transactions recorded No transactions recorded 2020 Colliford Lake Y No transactions recorded No transactions recorded 2019 Treburtle Treburtle Y 2013 2018 2018 Tregeagle Tregeagle Y 2013 2018 2018 Tresarrett Manor Tresarrett Y No transactions recorded 2018 2018 Wiggaton Wiggaton Y 2013 2018 2018
Appendix 4 – W4G logic model
Logic model Text input
The Rivers Camel and Fowey are natural blue infrastructure. In the case of the Camel, Natural England and the Environment Agency have a strategy in place to improve the SAC. Additionally, the EA continue to prioritise WFD improvements in both catchments. Whilst the project takes these into context and will support these objectives it is focus in on the Natural Capital values of the Salmon and Sea Trout populations on these rivers and Water for Growth seeks to increase the resilience of these fish stocks and create novel market mechanisms to support their sustainable exploitation and benefit to the local economy. The project is synergistic with the 2010 Making Space for Nature report, the 2011 Environmental white paper 'The Natural Choice', the 2013 Ecosystem Task Force report, England’s Biodiversity strategy 2020 and Cornwall’s Environmental Growth Strategy.
The ecosystem function of the Camel and Fowey has been compromised by a) a decline in habitats to enable the growth of juvenile salmon and trout, b) A post-industrial legacy of weirs impeding access of migratory fish to their spawning grounds, c) high 'Friction-cost' models for public access to exploit these fisheries for local economic development. Fisheries are a classic example of a Natural Capital resource and bring significant benefits to the local economy. However, investment in their resilience and accessibility is beyond the means of current stakeholders, despite the long-term benefits that can be achieved by investing in this Natural Capital resource (the fishery). There are additional market failures including marine and estuarine mixed stock netting, impacts on adult fish food supply and river flow conditions from climate change. These external market failures are outside the scope of the project but have relevance to the final project outcomes and impact. These are being delt with by national and international consortia where possible.
The project will a) deliver multiple small scale habitat restoration works (C22) covering an area of 2 hectares, b) deliver multiple small-scale infrastructure works to improve access of adult upstream access to spawning grounds and downstream juvenile access to feeding grounds (C23) to a total of 63 hectares, c) the creation of a new angling mobile application (C29) improve access to the public to utilise these angling resources in Cornwall
The project will target sustainable, inclusive growth a) to create a market mechanism designed to run beyond the life of the project, b) find cost effective solutions to habitat improvements, c) deliver the performance targets set within the operational programme, d) encourage ownership of environmental protection by businesses and communities, e) unlocks land that is currently degraded, underused or neglected, but vital for growth, f) targets ERDF investment to both improve business resilience but also environmental protection, g) Integrate restoration of blue infrastructure for multiple benefits, h) deliver on current UK and EU initiatives, e.g. WFD and Natural Environment white paper.
Water for Growth Independent Economic Assessment Final Report | March 2023 Page 64
1. Context
2. Market failure assessment
3. Project objectives
4. Rationale
Appendix 5 – Quantification of benefits and costs
This appendix summarises the methods used to quantify the costs and benefits covered in the IEA, as outlined in Section 3.3. All evidence and sources cited in this Appendix are included in the main report reference list.
A5.1 Benefits
Recreation – Trip-related expenditure from Fish Pass anglers and other anglers
The latest report on angling activity and economic impact (Environment Agency, 2018a) reflects findings from a 2015 survey. In 2015 the total number of angling days in England was estimated to be 22.3 million, with an associated trip-related expenditure of approximately £1.06 billion. The number of days spent fishing and associated trip-related expenditure vary by type of fishing (e.g., coarse vs game) as well as where the activity was undertaken (i.e., rivers/streams, canals or lakes, reservoirs and ponds) and the angler type (i.e., local or tourist). The report (Environment Agency, 2018a) provides estimates for each river basin district along with national figures.
For the purposes of the IEA, outputs from Environment Agency (2018a) were used to estimate the triprelated expenditure from Fish Pass anglers (i.e., those who use the Fish Pass App) and other anglers (i.e., non-Fish Pass App users) across Cornwall. The number of Fish Pass App visits under the W4G project was estimated based on App transactions (i.e., minimum requirement for app use) between 2018 and 2022 (pers. comm, WRT). Visits post-2022 (i.e., future projection) was set equal to the average number of trips between 2018 and 2022 and remain constant For the counterfactual, the number of visits for 2016 and 2017 reflected paper-tokens collected as part of the pre-intervention period, with a three-year average (2015-2017) assumed to be representative for the rest of the assessment period. Note that it has not been possible to distinguish between district-based (i.e., local) and visitor (i.e., tourist) anglers within the angling visit data provided by WRT24. Therefore, no tourism benefit from the W4G project is assessed beyond the component captured in the recreation benefit estimate.
In 2015, angling expenditure in the South West RBD was approximately £72 million (in 2015 prices) over 1.04 million days. Most angling expenditure in the South West is attributed to coarse fishing (£57 million and 831,000 days) whilst the least is attributed to salmon and sea trout fishing (£1.3 million and 30,000 days). These figures are also broken down by type of angler (i.e., district-based vs visitor). This assessment applies an estimated average South West RBD expenditure per trip to the recorded number of fish pass and other angler visits. The estimated South West RBD average spend per trip, by type of angling and angler are shown in Appendix Table 2
Within the IEA, the RBD average for game angling has been applied, and is assumed to remain constant over time. Note that between the W4G project and counterfactual, it is assumed that total angling expenditure remains the same (i.e., W4G project has not created new anglers, but improved access to
Water for Growth Independent Economic Assessment Final Report | March 2023 Page 65
24 Within Environment Agency, (2018a) angling trips and angling days are used interchangeably. It is assumed that trips, days and visits within the W4G context are also interchangeable.
fishing beats). The benefit of more fishing beats (i.e., improved access) is captured as part of angling welfare.
Appendix Table 2 : Average trip-related expenditure (£/trip), 2022 prices
Recreation – Consumer surplus for Fish Pass anglers and other anglers
Within the IEA, the welfare benefit for anglers is valued for both Fish Pass anglers and other anglers in Cornwall. Through the implementation of the W4G project, it is expected that Fish Pass anglers (i.e., those that use the app) will derive benefits from:
• Access to another 21 fishing beats (i.e., larger choice set relative to non-App users)
• Fishing on less crowded beats (since beats are only accessible to App users).
Both angler groups fishing experience will also improve due to increased fish abundance as a result of W4G project delivery (i.e., removal of weirs and habitat restoration).
Under the counterfactual, it is assumed that App users will continue to fish, but on other Cornish fishing beats. This is supported by evidence from Brown (2013) socio-demographic survey of WRT angling passport users, where respondents indicated that without the WRT passport scheme they would have gone angling elsewhere in the region. Therefore, the counterfactual for both Fish Pass anglers and other anglers within Cornwall assumes:
• App users will still have access to some unique beats (9 beats included in the App under the counterfactual).
• Other Cornish beats (i.e., those not included in the App) are more crowded; and
• Change in fish quantity is less than under W4G project, as it is still assumed that a much lower level of habitat improvement (10-20%) is completed.
The estimated number of visits in both the W4G project and Counterfactual are based on data provided by WRT (pers. comm), with profiling assumptions the same as that described in the approach for ‘Recreation – Trip-related expenditure from Fish Pass anglers and other anglers’
As part of surveying freshwater angling in England, the Environment Agency (2018b) undertook an assessment of non-market values associated with angling. They produced an appraisal tool that allows users to assess changes in quality of angling at an individual fishery site to generate predicted impacts on
Water for Growth Independent Economic Assessment Final Report | March 2023 Page 66
Angler type Angling type £ per trip (2022 prices) District-based All fishing 60 Game angling 45 Visitor All fishing 182 Game angling 78 Combined average (RBD average) All fishing 117 Game angling 56
visitor numbers, consumer surplus and revenue. In addition, the tool provides aggregated willingness to pay (i.e., change in consumer surplus / welfare value) and by river basin district for changes in type of fishery (coarse to game, coarse to mixed), fish size (small to medium, medium to large) and fish quantity (low to medium, medium to high), in addition to 16 attributes25 related to the fishery site environment.
To make use of the Freshwater Angling Appraisal tool unit consumer surplus, number of visits to the site in both a ‘baseline’ and ‘scenario’ must be provided (i.e., W4G project and counterfactual within this IEA), and users must score the attributes on a scale from 0 to 1, to represent the level of change. In this instance, a score of 0 represents the ‘worst possible conditions’ (i.e., site is unusable) and 1 represents ‘best’ possible conditions. In addition, a weight is applied to reflect awareness of visitors to each type of change, where 0 reflects not aware and 1 means visitors are fully aware. The relevant attributes and scoring for the IEA are shown in Appendix Table 3 and Appendix Table 4 for Fish Pass App users and other anglers respectively.
Appendix Table 3 : Scoring of fishery environment attributes relevant to the W4G project for Fish Pass App users
Table notes:
1 W4G project deliverables C22 and C23 result in improved fish quantity in Camel and Fowey. Have assumed change in quantity reflects an increase from low to medium, rather than medium to high.
2 Deliverable C29 adds more businesses to the Fish Pass App (i.e., more beats) that were previously not included resulting in more available fishing spots.
3 Fish Pass App beats are less crowded (i.e., better experience for Fish Pass anglers).
4 Although changes in these attributes are within the W4G project scope, consumer surplus value is not captured within this calculation to avoid double-counting with estimated water quality benefits (see ‘Water quality – Value of improved river quality (C22 and C23 activities)).
5 It is assumed that all Fish Pass anglers are aware of the improvements resulting from the W4G project.
25 Site environment attributes include: litter; no visible pollution; availability of fishing spots and/or pegs at sites; number of other angler; disturbance from other site users; public toilet; footpaths for easy access to fishing spot; free car park with no time limits; free car park with maximum stay of 3 hours; all legal fishing methods permitted; good hatches of fly life; limited catch taken away rather than catch and release; environment is safe for children; crime rate; diversity of plants, birds and other animals; and a beautiful or attractive environment.
Water for Growth Independent Economic Assessment Final Report | March 2023 Page 67
Type of change W4G project Counterfactual Awareness5 Low High Fish quantity: low to medium1 0.8 0.2 0.2 1 Availability of fishing spots and/or pegs at sites2 1.0 - - 1 Number of other anglers3 1 0.4 0.4 1 Diversity of plants, birds and other animals4 - - -A beautiful or attractive environment4
Appendix Table 4 : Scoring of fishery environment attributes relevant to the W4G project for Other anglers
Table notes:
1 W4G project deliverables C22 and C23 result in improved fish quantity in Camel and Fowey. Have assumed change in quantity reflects an increase from low to medium, rather than medium to high.
2 Other anglers do not have access to more fishing beats.
3 Other fishing beats in Cornwall are marginally less crowded (i.e., better experience for Other anglers).
4 Although changes in these attributes are within the W4G project scope, consumer surplus value is not captured within this calculation to avoid double-counting with estimated water quality benefits (see ‘Water quality – Value of improved river quality (C22 and C23 activities)).
5 It is assumed that Other anglers are aware of the improvements resulting from the W4G project.
For both angler types and under both the W4G project and counterfactual, an angling visits consumer surplus value for a given attribute is estimated by multiplying the score by the awareness weight, the product is then applied to the relevant monetary unit value in Appendix Table 5 Note the attributes are additive, therefore the combined weighted unit value (i.e., fish quantity + availability of fishing spots + number of other anglers) is applied to the estimated number of angling visits in each year. Under both the W4G project and counterfactual, it is assumed that the change value per visit remains constant over the assessment period.
Appendix Table 5 Average impact on consumer surplus due to changes in site environment, 2022 prices
Table notes:
1 All monetary values have been inflated from 2015 to 2022 prices using HM Treasury (2022b) GDP deflators.
2 Table 4.3 and Table 4.4 in Environment Agency, (2018b).
3 Table 4.5 and 4.6 in Environment Agency, (2018b)
Water for Growth Independent Economic Assessment Final Report | March 2023 Page 68
Type of change W4G project Counterfactual Awareness5 Low High Fish quantity: low to medium1 0.8 0.2 0.2 1 Availability of fishing spots and/or pegs at sites2 - - -Number of other anglers3 0.5 0.4 0.4 1 Diversity of plants, birds and other animals4 - - -A beautiful or attractive environment4 - - - -
Type of change1 England (£ per baseline visit)2 South West RBD (£ per baseline visit)3 Fish quantity: medium to high 2.9 3.0 Availability of fishing spots and/or pegs at sites 24.0 25.1 Number of other anglers 5.7 6.0
Health & well-being – Avoided NHS medical treatment costs from angling
In addition to improving the general welfare of Fish Pass angling visits, if anglers are active during their visits, there can also be a measurable physical health benefit. White et al. (2016) estimate that 92% of fishing recreation visits are ‘active’, where an ‘active visit’ is defined as those who met recommended daily physical activity guidelines (visits equal to or greater than 30 minutes) either fully, or partially, during visits.
For both the W4G project and counterfactual estimates, the White et al. (2016) proportion of active visits is applied to the annual angling visits between 2016 and 2022. With respect to future visits (i.e., post-2022), for the W4G project it is assumed that average number of visits between 2018-2022 is representative of future years, whilst for the counterfactual the average number of visits between 2015-2017 under the previous scheme are representative.
The benefit is measured as the health benefits of active recreation (in terms of improvements in Quality
Adjusted Life years – QALYs26) and the valued based on the economic value of health improvement (in terms of the avoided health cost due to improvement in QALY). Beale et al. (2007) analysed Health Survey for England data, estimating that 30 minutes a week of moderate-intense physical exercise, if undertaken 52 weeks a year, would be associated with 0.0106768 QALYs per individual per year. Beale et al. (2007) assume this relationship between physical activity and QALYs is both cumulative and linear. Claxton et al. (2015b) estimate a cost-effectiveness threshold of a QALY to be roughly £12,900/QALY in 2008 prices. This figure is used as a proxy for health costs, reflecting the avoided health costs for a one QALY improvement Based on this information, the avoided health cost is estimated as £3.54 per active visit in 2022 prices. The monetary unit value is assumed to remain constant over time.
Water quality – Value of improved river quality (C22 and C23 activities)
Improving the quality of the Camel and Fowey is the primary benefit of activities associated with C22 and C23 W4G deliverables and can be valued as the contribution to WFD status improvement based on willingness to pay for improved river quality.
The length of river improved (km) in the Camel and Fowey under C22 and C23 deliverables has been measured by WRT as part of W4G project reporting. The total deliverable river length improvement is 272 km across both catchments, with C23 accounting for 95% of this area. For the counterfactual, it is assumed that 10-20% of achieved W4G improvement area (i.e., hectares) would be achieved without the W4G project (areas are reflected in Table 3 3). These total improvement areas are converted to river length by estimating an average length of river improved per hectare, using W4G outcomes. This shows that for each hectare of habitat improvement from C22 and C23, there is 2.6 km of river length improved. This average river length improved is applied to the estimated rehabilitated or better managed habitat area in the counterfactual. The length of river improved in each year under both the W4G project and counterfactual estimates, is assumed to be reflected in the profile of achieved C22 and C23 outcomes between 2016 and 2022 (as shown in in Table 2.4). Post-2022, it is assumed that total river length improved is maintained across the assessment period (i.e., no future improvement actions).
The economic value is based on the National Water Environment Benefits Survey (NWEBS) values (NERA
Water for Growth Independent Economic Assessment Final Report | March 2023 Page 69
26
QALY is a health measurement used widely in health and health economics research. QALY of zero denotes death, and 1 denotes full health.
Economic Consulting 2007; Metcalfe, 2012). For each operational catchment, the NWEBS values provide low, central, and high estimates of average willingness to pay (WTP) for improvements in river quality (£/km) in 2012 prices. NWEBs values have been inflated to 2022 prices using the HM Treasury, (2022b) GDP deflator. The NWEBS values are composed of six equal weighted ecosystem components (Defra, 2015, p.69): fish; other animals such as vertebrates; plant communities; clarity of water; condition of river channel and flow of water; and safety of water for recreational contact. To avoid double-counting with other estimates within the IEA, it two out of six components are applied within this analysis – fish and condition of river channel and flow of water – which reflect actions undertaken as part of C22 and C23 delivery.
The physical change is estimated as a change in WFD status. For the purpose of this IEA it is assumed that river improvement activities result in a change in WFD ecological status from poor to moderate, under both the W4G and counterfactual estimates. This assessment uses the central value estimates for the North Cornwall, Seaton, Looe and Fowey operational catchment (£2,963/component/km in 2022 prices) and is applied to the length of river improved in each year. As part of sensitivity analysis (results in Section 3.5), a high value (£3,495/component/km in 2022 prices) is applied. Note that monetary unit values are assumed to remain constant over the assessment period, and post-project period assumes that willingness to pay for improvement in status is the same as willingness to pay for avoided deterioration (i.e., maintenance of status change).
A5.2 Costs
W4G project – capital and revenue costs
The capital and revenue costs for the delivery of the W4G project outcomes reflects the actual spend (including both ERDF and match funding) over the W4G project period (i.e., 2016 to 2022). The profile of expenditure by type and W4G deliverable is shown in Appendix Table 6 With respect to the match funding received, it is understood that the Environment Agency in particular were interested in supporting activities related to weir removals (C23), whilst South West Water and Natural England have supported habitat improvement works (C22) and maintenance activities.
WRT provided information on the future spend to feed into the IEA. For the maintenance of C22 outcomes, South West Water will provide £6,000/year for the Fowey and a local rivers association has provided a oneoff donation of £7,000 to support maintaining habitat improvements in the Camel. Note that maintenance of C23 outcomes (i.e., removal of weirs) are permanent changes, with costs borne by landowners. These costs are not included within the scope of this IEA. It is assumed that funding from South West Water is available for the remaining four years within the IEA assessment period, and that the donation is split evenly across remaining assessment years). Additionally, total funding in a given year (£7,750/yr) is split between capital and revenue costs following the expenditure profile of the W4G project (i.e., 45%/55% capital to revenue).
Furthermore, an estimate of future revenue costs for the Fish Pass App and continued business engagement (i.e., C29 and C1 deliverables) has been estimated based on the average revenue spend per business. Therefore, post-2022 it is assumed that WRT spend approximately £23,600 per year to continue to support businesses already included in the App. Note that within the IEA, it is not assumed that more businesses (i.e., beats) are added to the App. No additional capital costs associated with C29/C1 are
Water for Growth Independent Economic Assessment Final Report | March 2023 Page 70
assumed to be incurred for the post-2022.
Appendix Table 6 : Profile of capital and revenue expenditure by W4G deliverable, £000
Table notes: From WRT Finance Team (November 2022).
Counterfactual – capital and revenue costs
Data on the resources needed to manage the scheme pre-intervention, in terms of operational costs (e.g., staff time) and capital costs (e.g., replacing token boxes), was not available for this assessment. Method and approaches to estimating costs associated with each W4G deliverable are as follows:
• C1/C29: It is assumed that no new businesses are added to the passport scheme and no additional engagement activities are undertaken – therefore capital and revenue costs are associated with the 9 beats/businesses that are included within the fish angling scheme. However, it is known that the administrative burden of operating the paper-based angling passport was higher than the app, therefore a simple assumption is to assume that C1/C29 capital and revenue costs are at least as high as those incurred through the implementation of the W4G project (i.e., counterfactual and W4G project are equal).
• C22/C23: 10-20% of river area rehabilitated (C22) and area with better conservation (C23) is achieved under the counterfactual27. Therefore, capital and revenue costs reflect the assumed costs borne by WRT to undertake these activities. On average, capital spend per ha improved (i.e., combined C22 and C23 area) is approximately £1,202/year, with revenue costs equal to £1,479/year. These unit costs are applied to the assumed improvement area between 2016-2022, with capital spending ceasing after 2022 and revenue costs remaining constant across the assessment period.
Water for Growth Independent Economic Assessment Final Report | March 2023 Page 71
Type Deliverable 2016 2017 2018 2019 2020 2021 2022 Total Capital expenditure C1/C29 - 8 30 26 44 - 46 154 C22/C23 - 73 157 256 173 216 6 881 Total - 81 187 281 217 216 52 1,035 Revenue expenditure C1/C29 1 41 51 50 48 39 32 262 C22/C23 5 169 183 195 222 189 121 1,084 Total 6 210 234 245 270 228 153 1,346 Total expenditure C1/C29 1 50 81 76 92 39 78 417 C22/C23 5 242 340 451 395 405 128 1,965 Total 6 291 421 526 487 444 205 2,382
27 The lower end (10%) has been included in the main results. As part of sensitivity analysis of these results, and where relevant, the results have been produced to include the upper end of the range (20%)
Appendix 6 – Net present value calculation
In developing the IEA, the annual benefits and costs over the assessment period are aggregated in present value (discounted) terms. The formal calculations are presented below.
Where PVB is present value benefit, i is an index for the year and r is the discount rate.
Where PVC is present value cost, i is an index for the year and r is the discount rate.
Costs and benefits are compared in present value terms. The net present value (NPV) of an intervention is calculated as the difference between Present Value of the Benefits (PVB) and the Present Value of the Costs (PVC):
Water for Growth Independent Economic Assessment Final Report | March 2023 Page 72
������= ∑( �� ��+��)�� ∗���������������� �� �� ��=��
������= ∑( �� ��+��)�� ∗���������� �� �� ��=��
������=������ ������=[∑( �� ��+��)�� ∗���������������� �� �� ��=�� ] [∑( �� ��+��)�� ∗������������ �� ��=�� ]

10F Printing House Yard, Hackney Road London, E2 7PR +44 (0) 20 7580 5383 eftec@eftec.co.uk eftec.co.uk

