


TAMERTON FOLIOT
SONDE & TRAIL CAMERA DATA
July 2021 – November 2022


This report has been put together by Westcountry Rivers Trust as part of the Plymouth Rivers Keepers project. Published January 2023.


Sonde, Trail Cameras and Rainfall Data
• A trail camera (TC1) was installed at the bottom of the Tamerton stream in February 2020. The camera is programmed to take a photograph every 15 minutes. Due to the camera’s limitations to take photographs during hours of darkness, only photographs taken during daylight hours can be used to monitor the stream.
• An Aqua TROLL 200 sonde (data logger/probe) was installed upstream from the trail camera in July 2020. The sonde captures data on water depth, temperature and electrical conductivity. Electrical conductivity can be an indicator of anthropogenic (human-related) pollution. The sonde is connected to a MACE telemetry unit, which sends the data to Hydrovu website every 15 minutes. The Hydrovu website can be viewed by WRT staff and the local community.
• A second trail camera (TC2) was installed U/S of TC1 in July 2022 on the Tamerton Stream in a bid to determine the direction of multiple visible flushed plumes visible on TC1, e.g. if the direction of flow of the visible flushed plumes is from the Tamerton Stream or the Whitleigh/Cann Stream.
• The trail camera and sonde data are matched up to 15 minute rain data from a local rain gauge at Crownhill, approximately 2.5km away, to determine how rainfall affects the stream due to pollutants such as road run-off from the local area, and soil from higher up the catchment entering the watercourse.
• Due to it’s small size, the Tamerton Stream reacts quickly to periods of heavy rain or dry conditions, and to pollution.
• At the height of summer in August 2021 the lowest depth recorded on the sonde was 0.1m / 10cm, and the highest water temperature was 18.1oC, with 57.8mm of rain falling during the whole month.
• By comparison, August 2022 saw the water depth fall to its lowest recorded depth during the time the sonde was deployed to 0.07m/7cm, and the highest water temperature of 19.8oC, with 45.59mm of rain falling throughout the whole month. During the previous month of July, there was only 9.99mm of rainfall. In mid-August 2022, a drought was declared in most of England, including the South West due to the prolonged hot, dry conditions in which we witnessed unprecedented global temperatures.
• The maximum water depth recorded during the time the sonde was deployed was 0.95m / 95cm in November 2022 in which there was 268.75m of rain over the month.
• The minimum water temperature recorded was 5.2oC in January 2022.
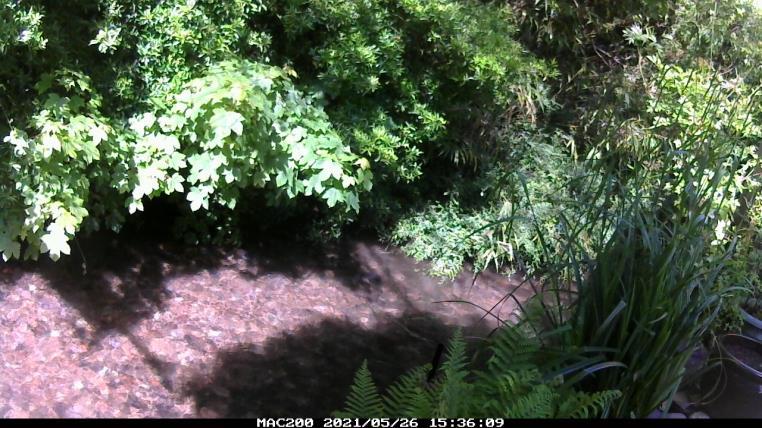
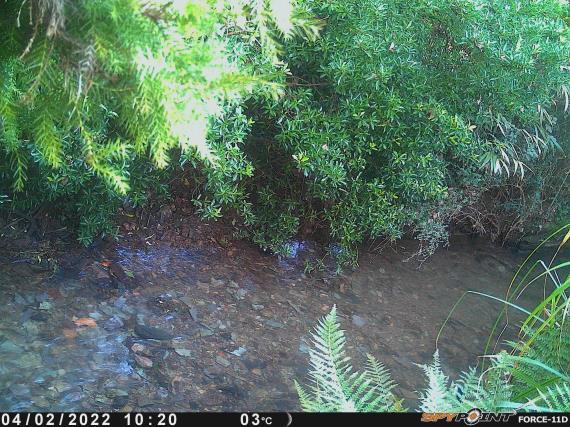
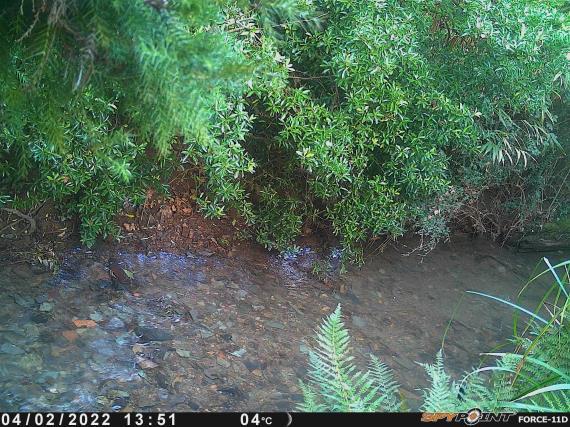
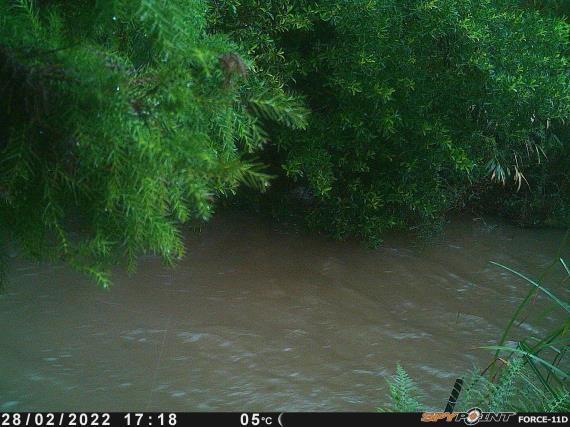
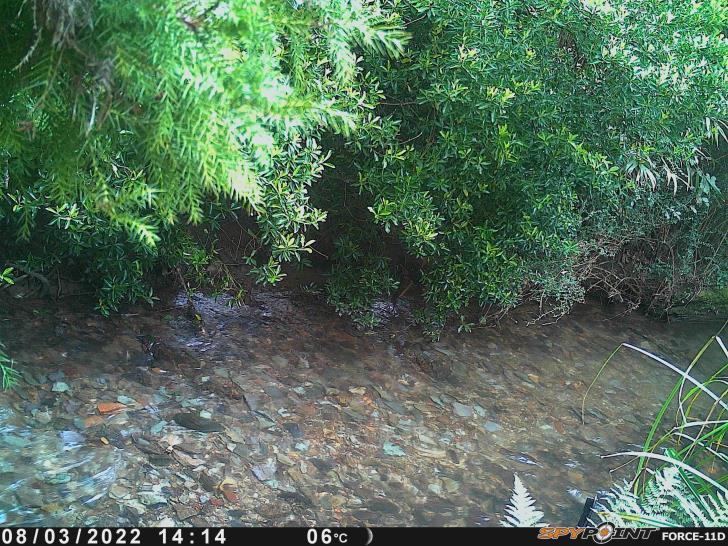
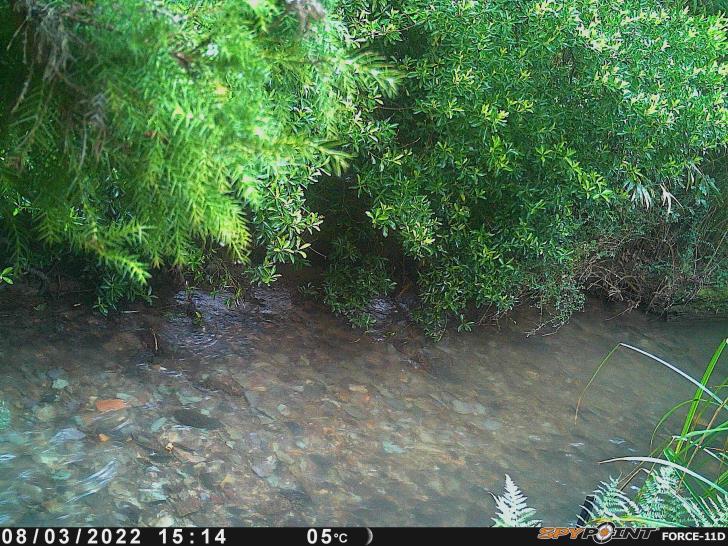
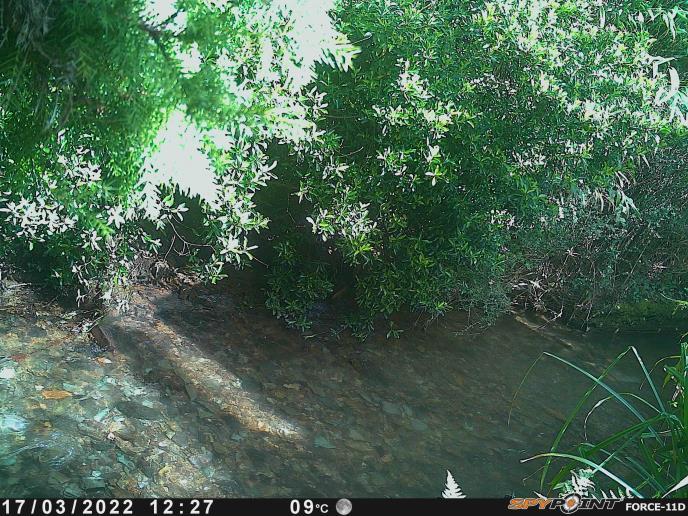
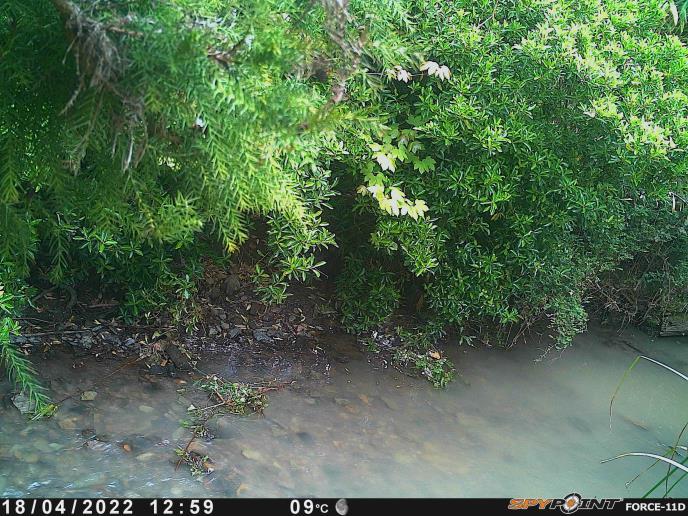
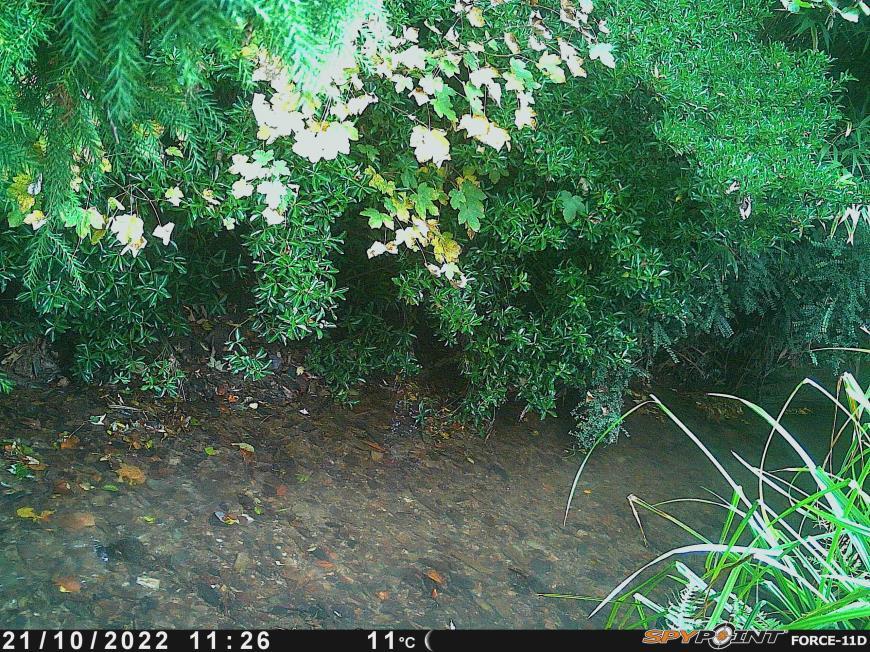
• The photographs below show some examples of how the stream changes depending on rainfall, drought, or flushed plumes.


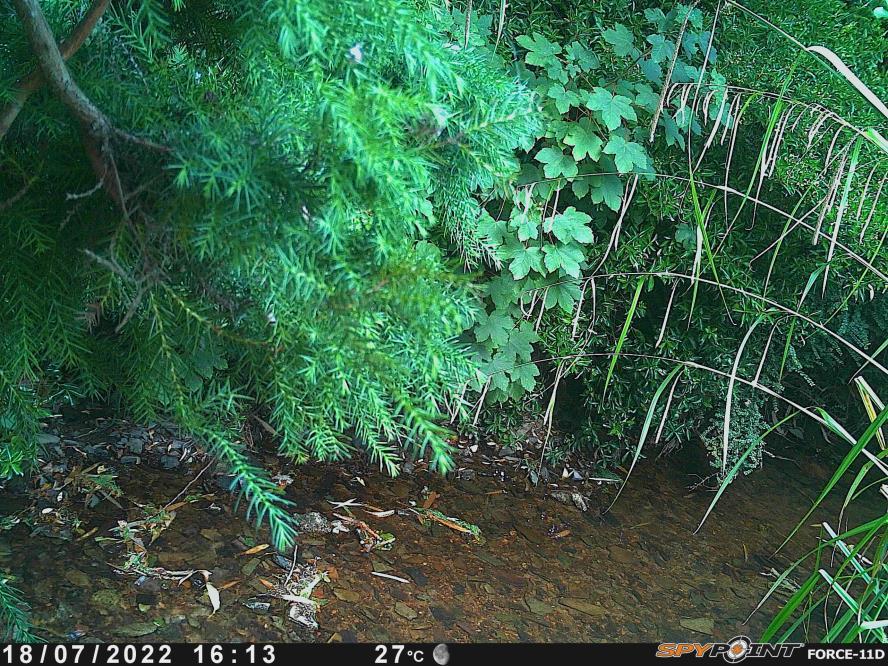
• The photographs below show some examples of how the stream changes depending on typical conditions, rainfall or flushed plumes.


Electrical Conductivity
The highest peaks in specific conductivity each month were the following:
• 27th July 2021 – 313.83 µS/cm
• 4th August 2021 – 317.50 µS/cm
• 20th September 2021 - 314.28 µS/cm
• 25th October 2021 - 336.53 µS/cm
• 30th November 2021 - 500.73 µS/cm (links to 1st December peak)
• 1st December 2021 - 612.25 µS/cm (links to 30th November peak)
• 6th January 2022 - 529.33 µS/cm / 15th January 2022 - 446.61 µS/cm
• 4th February 2022 - 516.81 µS/cm / 19th February 2022 - 480.90 µS/cm /
28th February - 452.64 µS/cm
• 8th March 2022 – 371.4 µS/cm
• 6th April 2022 – 292.05 µS/cm
• 7th May 2022 – 265.99 µS/cm
• 17th June 2022 – 279.62 µS/cm
• 29th July 2022 – 294.41 µS/cm
• August 2022 – 1037.64 µS/cm
• September 2022 – 313.02 µS/cm
• October 2022 – 360.59 µS/cm
• November 2022 – 353.86 µS/cm
Electrical conductivity can be a good indicator of general water quality.
Increased conductivity levels can be an indicator of anthropogenic pollution, including pollution from waste water and sewage, and urban and agricultural run-off.
Heavy rainfall can increase the depth and volume of the stream relatively quickly, which can lead to a dilution effect. This is observed as a sudden decrease in the conductivity level following rainfall.
In contrast, rainfall can also cause an increase in conductivity, particularly after a long dry period, as pollutants from the surrounding urban environment (e.g. roads) are washed into the stream.
It is therefore important to consider rainfall when analysing the sonde data.
Rainfall is included on the graphs and monthly rainfall can be found on page 74.
• Between 27th July 2021 and 31st March 2022, the sonde was triggered with a specific conductivity reading of ≥310 µS/cm a total of 331 times (15 minute readings) and on 28 separate days. The sonde did not record specific conductivity ≥310 µS/cm between 8th
March 2022 and July 31st 2022. Between 1st August and 30th November 2022, there were 1576 incidents on 59 separate days.
During the whole time the sonde was deployed there was a total of 3109 incidents over 87 days.
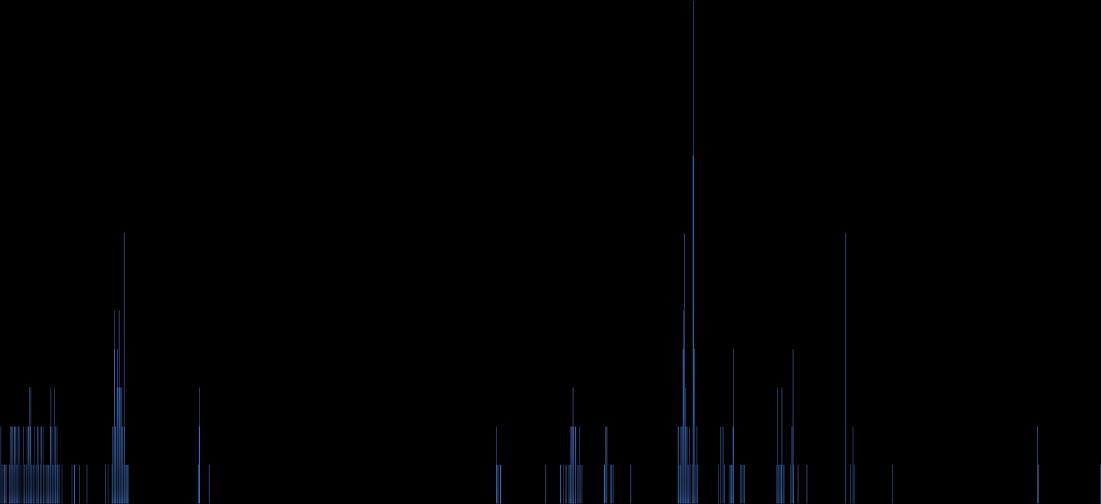
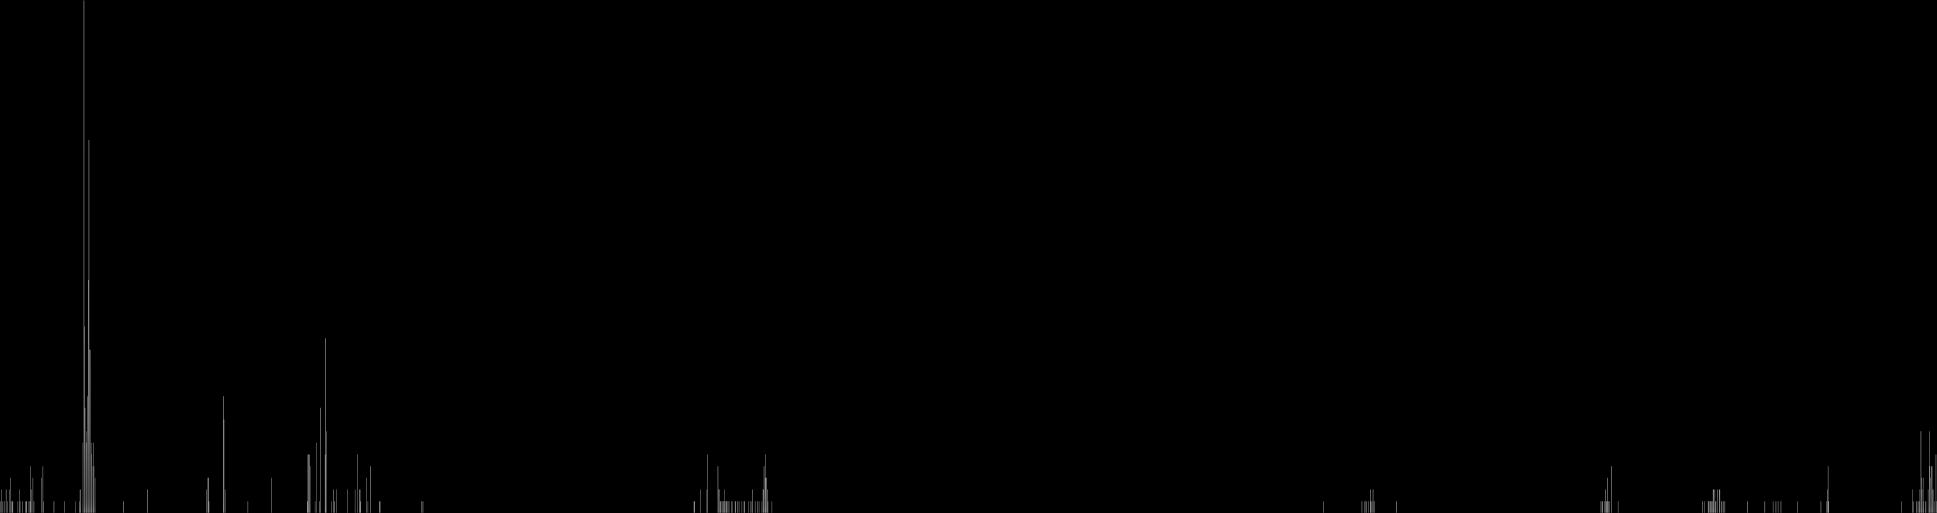
• Of the 3109 incidents recorded, the highest amount occurred on Fridays, with 558 incidents (17.95%).
• The most common day for the sonde to trigger was Saturday (16 days out of 87 / 18.39%).
• Time duration of specific conductivity incidents over ≥310 µS/cm ranged from one incident (1 x 15-minute reading) to 87 hours and 45 minutes (5264 x consecutive 15-minute readings, 10th to 14th November 2022).
• Rainfall incidents (15 minute readings with a value >0) occurred 7978 times during the same period (Crownhill rain gauge datalocated approximately 2.6km south-east of the sonde). If rainfall were to fall evenly, each day would have 14.29% of rain incidents.

Kruskall-Wallis Test
• The graph on the left shows how many times the sonde triggered ≥310 µS/cm on each day of the week between August 2021 and November 2022. The graph on the right shows how many days out of the total of 87 days the sonde triggered on any particular day of the week.
• A Kruskall-Wallis Test was performed to determine if there was a statistically significant difference in the number of times the sonde triggered ≥310 µS/cm on each day of the week.
• The test was performed for each month individually for August 2021 – November 2022 and another test performed for the months combined for August 2021 – November 2022. April 2022 – July 2022 were not included in the test as the sonde was not triggered over 310 µS/cm during these months.
• The p-value for each test was >0.05, which shows that the results are not significantly different on any day of the week.
Tidal limits in relation to the sonde and trail camera 1. Location of trail cameras 1 & 2.

The map shows the mean high and low water marks in relation to the location of the sonde and trail camera.
Monthly tides are defined as ‘Spring tides’ when the tidal range is at its highest, and ‘Neap tides’ when the tidal range is lowest. The height of Mean High Water Springs is the average throughout the year, of two successive high waters, during a 24-hour period in each month when the range of the tide is at its greatest (Spring tides)*.
The map indicates that the sonde is outside of the mean high water mark, however, the sonde may at times be directly affected by tidal waters during exceptionally high Spring tides.
Conductivity increases as salinity increases so high Spring tides have been taken into account during analysis of data, supported by trail camera photographs.
Spring tide dates, times and heights can be found on page 75.
* Source - https://www.gov.uk/guidance/marine-licensingdefinitions#mean-high-water-springs

High Specific Conductivity & Visible Pollution Events – D/S Sonde and Camera
The following pages give examples of events in which specific conductivity exceeds 310 µS/cm, along with visible pollution events during which the level did not exceed 310 µS/cm. Graphs against rainfall data, and trail camera photographs are shown where available.
26th May 2021 Event
No sonde data is available for this day therefore it is not included within the stats. It has been included here, although prior to July 2021 when the sonde was installed, as trail camera photographs are available which appear to show visible pollution from flushed plumes.
Rainfall data was available from the Crownhill rainfall gauge.
On Wednesday 26th May (Bank Holiday Monday was on 31st May), the trail camera photos show flushed plumes at 12:36 & 15:21, with photographs either side of these times showing clear water.
There had been no previous rainfall since 01:45 on 26th May (0.2mm). There had been rainfall between 12:15 and 17:30 on 25th May with a total of 11mm falling during this time. It can be seen from the trail camera photos that there was no rain at the time of the visible pollution and conditions appeared to be dry and sunny.
Trail camera photos are on the following page.
Spring tide was on Friday 28th May. High tides on 26th May were at 06:25 (5.60m) & 18:52 (5.65m).


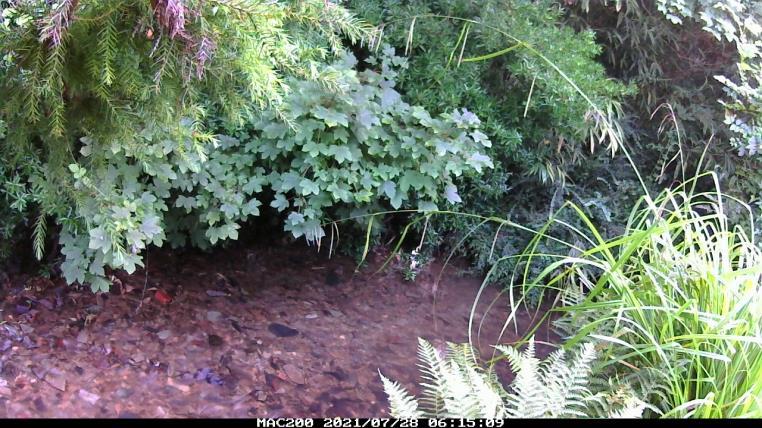
2021-07-28
2021-07-28
2021-07-28
On Wednesday 28th July, the trail camera photos show flushed plumes at 06:15, 11:30 and 16:15 (dotted lines on the graph), with the water showing as clear at other times.
No significant change in specific conductivity was observed during this time. Temperature changes appeared to be in line with fluctuating temperature during the day.
There had been no previous rainfall since 21:30 on 27th July, and it can be seen from the trail camera photos that there was no rain during the day (to take into account the distance to the Crownhill rainfall gauge).
The specific conductivity fluctuated slightly during the day although it did not exceed 310 µS/cm.
Trail camera photos are on the following page.
Spring tide was on Monday 26th July. High tides on 28th July were at 09:49 (5.16m) & 21.54 (5.38m).


29th July 2021 Event
On Thursday 29th July, the trail camera photos show flushed plumes between 12:15 & 13:15 (dotted lines on the graph).

No change in specific conductivity was observed during this time.
Temperature increased slightly from 14.90c to 15.10c but this appears to be in line with increasing temperature during the day.
There had been no previous rainfall since 20:30 on 27th July, and it can be seen from the trail camera photos that there was no rain at this time (to take into account the distance to the Crownhill rainfall gauge).
The specific conductivity remained relatively stable between 12:15 & 13:15, at around 285 µS/cm.
Trail camera photos are on the following page.
Spring tide was on Monday 26th July. High tides on 29th July were at 10:21 (5.01m) & 22:24 (5.18m).


30th July 2021 Event

On Friday 30th July, the trail camera photographs show two separate incidents of flushed plumes at 07:45 & 15:45, with water showing as clear at either side of these times (see the two dotted lines on the graph).
During these times, the specific conductivity level was rising following a dilution event related to rainfall the following evening, therefore the sonde was not triggered at over 310 µS/cm.
Trail camera photos are on the following page.
Spring tide was on Monday 26th July. High tides on 30th July were at 10:51 (4.83m) & 22:55 (4.95m).


On Friday 31st July, the trail camera photographs show three separate incidents of flushed plumes at 06:1506:30, 08:45 & 14:15, with water showing as clear at either side of these times (see the three dotted lines on the graph).
During these times the specific conductivity fluctuated slightly, with between a minimum of 277.25 µS/cm and a maximum of 289.09 µS/cm, therefore the sonde was not triggered at over 310 µS/cm.
There had been no rainfall since 30th July at 01:15 (0.2mm), prior to which there had been 17.8mm of rain on 29th July between 18:45 and 22:45.
Trail camera photos are on the following page.
Spring tide was on Monday 26th July and Tuesday 10th August. High tides on 31st July were at 11:25 (4.66m) & 23:31 (4.71m).


On Tuesday 31st August (the day after the Bank Holiday Monday), the trail camera photographs show intermittent flushed plumes between 13:30 & 17:00 (between the two dotted lines on the graph).
During these times, the specific conductivity level remained relatively stable and below 310 µS/cm, so the sonde was not triggered. The specific conductivity peaked at 17:00 at 299.76 µS/cm.
There had not been any rain since 16:15 on 21st August.
Trail camera photos are on the following page.
Spring tide was on Sunday 24th August.
High tide on 31st August was at 12:02 (4.41m).


The highest recorded specific conductivity during the period July 2021 – Feb 2022 was 612.25 µS/cm which occurred on Wednesday 1st December 2021 at 00:45.
Rainfall started on Tuesday 30th November at 20:30.
The first rise in specific conductivity was seen on 30th November at 22:00 to 379.92 µS/cm. The previous reading at 21:45 was 271.28 µS/cm.
The specific conductivity remained elevated until 1st December at 06:45 when it fell to 304.68 µS/cm.
There are no trail camera photographs from these dates.
There was no spring tide on these dates.
On 1st December high tide occurred at 02:44 (4.96m).
Friday 17th – Monday 20th December 2021 Event

2021-12-20 16:00
2021-12-20 21:00
2021-12-21 02:00
2021-12-21 07:00
2021-12-21 12:00
2021-12-21 17:00
2021-12-21 22:00
2021-12-22 03:00
2021-12-22 08:00
2021-12-22 13:00
2021-12-22 18:00
2021-12-22 23:00
2021-12-23 04:00
2021-12-23 09:00
2021-12-23 14:00
2021-12-23
Between approximately 15:15 on Friday 17th December and 13:00 on Monday 20th December (the weekend before Christmas week), specific conductivity fluctuated, with four peaks:
• 300.60 µS/cm at 16:00 17th December
• 318.61 µS/cm at 12:30 18th December
• 320.00 µS/cm at 12:30 on 19th December
• 302.89 µS/cm at 11:15 on 20th December
Prior to these fluctuations the specific conductivity had been relatively stable around 260.00 µS/cm.
There had been little rainfall in the days preceeding the fluctuations, with 0.2mm falling on Tuesday 14th December at 12:45 and no further rainfall until 19:00 on Wednesday 22nd December (0.2mm).
There are no trail camera photographs from these dates.
Spring tide was on Tuesday 21st December (high tide 06:55 & 19:16). High tides on 17th were at 04:27 (5.18m) & 16:45 (5.14m), on 18th were 05:07 (5.32m) & 17:26 (5.21m), on 19th 05:44 (5.41m) & 18:04 (5.24m) and on 20th 06:21 (5.45m) & 18:41 (5.22m).
5th and 6th January 2022 Event
The event on 6th January was the highest peak in specific conductivity in January 2022.

Rainfall started on Thursday 6th January at 10:30 and continued almost consistently until 15:45 (8.0mm). The peak in specific conductivity occurred at 13:00 at 529.33 µS/cm.
In addition, on Wednesday 5th January the graph shows a small but sustained increase in specific conductivity between 16:45 on 5th January and 04:30 on 6th January, although it is below the trigger level of 310 µS/cm. The specific conductivity reaches a peak of 245.51 µS/cm, where it had previously been relatively consistent around 210 µS/cm. There was little previous rainfall, with 0.2mm of rainfall at 03:00. Following this event specific conductivity then returns to approx. 214 µS/cm until it rains.
Spring tide was on Tuesday 4th January. On 5th January high tide was at 07:38 (5.80m) & 20:07 (5.42m). On 6th January high tide was at 08:24 (5.71m) and 20:53 (5.28m).
There are no trail camera photographs from these dates.

Rainfall started on Saturday 15th January at 18:00 and continued intermittently until 16th January 02:00 (17.2mm).
The peak in specific conductivity occurred 15th January at 20:15 at 466.66
µS/cm. Spring tides occurred on Tuesday 4th January and Friday 21st January.
On 15th January high tide was at 03:54 (4.89m) and 16:20 4.83m) and 16th January at 04:42 (5.09m) and 17:07 (4.98m).
There are no trail camera photographs from these dates.

This event was the highest peak in specific conductivity in February 2022.
Rainfall started on Friday 4th February at 06:00 and continued until 06:45 (1.8mm), with a further 0.2mm falling at 10:00.
The first rise in specific conductivity was seen at 06:15 to 271.42 µS/cm, the previous readings had been fairly consistent at around 245 µS/cm.
The first increase to over 310 µS/cm was seen at 06:30 to 376.40 µS/cm. The specific conductivity peaked at 08:00 at 516.81 µS/cm. Levels remain elevated above 310 µS/cm until 20:30 (13 hours).
Spring tide was on Thursday 3rd February with high tide 07:25 & 19:54 on that date.
On 4th February high tides were at 08:07 (5.78m) & 20:32 (5.40m).
Trail camera photographs are on the following page.


19th February 2022 Event

Rainfall started on Wednesday 19th February at 10:30 and continued until 12:15 (4.6mm during that time, with a total of 5.4mm in 24 hours of that day).
The specific conductivity peaked at 12:30 at 480.90 µS/cm.
Spring tide was on Sunday 20th February with high tide at 08:12 and 20:31.
On 19th February high tide was at 07:39 (5.49m) and 20:00 (5.26m).
Trail camera photographs are on the following page.


28th February 2022 Event
Rainfall started on Friday 28th February at 11:00 and continued almost consistently until 18:30 (26mm).

The first rise in specific conductivity was seen at 11:30 to 360.07 µS/cm. The previous reading at 11:15 was 263.22µS/cm.
The specific conductivity peaked at 12:30 at 452.64 µS/cm.
Spring tides were on Sunday 20th February and Saturday 5th March. On 28th February high tide was at 03:46 (4.96m) and 16.27 (4.93m).
Trail camera photographs are on the following page.


8th March 2022 Event
Rainfall started on Tuesday 8th March at 14:45 and continued until 15:15, then again between 16:00 and 16:15 (1.198mm in total).

The first rise in specific conductivity was seen at 15:00 to 323.43 µS/cm . The previous reading at 14:45 was 254.58 µS/cm.
The specific conductivity peaked at 15:45 at 371.4 µS/cm.
Spring tide was on Saturday 5th March with high tide at 07:43 and 20:02.
High tide on 8th March was at 09:05 (5.12m) and 21:17 (4.96m).
Trail camera photographs are on the following page.


13th March 2022 Event

On Sunday 13th March, the trail camera photos show flushed plumes at 09:34 (dotted line on the graph), with the water clearing by 10:49, and flushed plumes showing again at 14:20 (dotted line on the graph).
No significant change in specific conductivity was observed at either of these times.
There had been no previous rainfall recorded on the Crownhill rain gauge since 02:00 on 13th March (0.2mm).
Spring tides were on Saturday 5th March with high tide at 07:43 and 20:02 and Sunday 20th March with high tide at 07:19 (5.58m) & 19:39 (5.43m).
High tide on 13th March was at 01:11 (4.21m) and 14.24 (4.14m).
Trail camera photographs are on the following page.


On Thursday 17th March, the trail camera photos show flushed plumes at 09:42 until 12:27 (dotted lines on the graph).
There was an increase in depth at 9:45 from 0.17m to 0.20m, until 12:15 when it fell to 0.18m, returning to 0.17m at 12:30.
Specific conductivity increased very slightly from 241.84 µS/cm at 9:30 to 249.95 µS/cm at 10:00, before decreasing to 212.55 µS/cm at 11:30. After 11:30 the specific conductivity again began to rise.
There had been no previous rainfall recorded on the Crownhill rain gauge since 07:30 on 17th March (0.2mm).
Spring tides was on Sunday 20th March with high tide at 07:19 (5.58m) & 19:39 (5.43m).
High tide on 17th March was at 05.21 (5.28mm) and 17:49 (5.18m).
Trail camera photographs are on the following page.


22nd March 2022 Event
On Tuesday 22nd March, the trail camera photos show flushed plumes at 10:14 (dotted line on the graph), with the water showing as clear at other times.
No significant change in specific conductivity was observed during this time.
There had been no previous rainfall since 07:30 on 17th March (0.2mm), and it can be seen from the trail camera photos that there was no rain during the day (to take into account the distance to the Crownhill rainfall gauge).
Spring tide was on Sunday 20th March with high tide at 07:19 (5.58m) & 19:39 (5.43m).
High tide on 22nd March was at 08:29 (5.45m) and 20:43 (5.30m).
Trail camera photographs are on the following page.


On Monday 18th April, the trail camera photos show flushed plumes between 12:44 and 14:59 (between the dotted lines on the graph), with the water showing as clear at other times either side.
No significant increase in specific conductivity was observed during this time. A slight decrease occurred at 14:30.
There had been no previous rainfall since 17:00 – 17:30 on 17th April (0.4mm), and it can be seen from the trail camera photos that there was no rain during the day on 18th April (to take into account the distance to the Crownhill rainfall gauge).
Spring tide was on Monday 18th April with high tide at 07:55 (5.62m) & 20:15 (5.56m).
Trail camera photographs are on the following page.


On Tuesday 12th July, the trail camera photos show flushed plumes at 08:05 (the dotted line on the graph), with very slight flushed plumes visible at 08:20 with the water showing as clear in the photographs either side of these times.
No increase in specific conductivity was observed during this time.
There had been no previous rainfall since 3rd July (0.19mm), with July experiencing very hot and dry conditions.
Spring tide was on Friday 15th July, with high tide at 07:59 (5.42m) & 20:15 (5.74m).
Trail camera photographs are on the following page.


2022/08/14
2022/08/14 13:30
2022/08/14 14:45
2022/08/14 16:00
2022/08/14 17:15
2022/08/14 18:30
2022/08/14 19:45
2022/08/14 21:00
2022/08/14 22:15
On Saturday 13th August (A) the depth of the stream increased from 88mm at 19:15 to 226mm at 20:00, before decreasing to 83mm at 20:45. At 20:00, the specific conductivity increased from 295.72µS/cm at 19:45 to 1037.62µS/cm, before decreasing to 319.15µS/cm at 20:15.
High tide on the evening of Saturday 13th August was at 20:01 (5.85m) which coincided with the depth increase and conductivity spike.
Spring tide fell on Sunday 14th August, with high tide in the evening at 20:46 (5.85m). On this day, the depth increased from 85mm at 20:00 to 217mm at 20:45, reducing to 83mm at 21:30 (B). The specific conductivity increased from 288.80µS/cm at 20:45 to 381.03µS/cm at 21:15 before decreasing to 287.58µS/cm at 21:30.
There had been no previous rainfall since 3rd August.
Conductivity increases as salinity increase, therefore it was concluded that the conductivity spikes were a result of extremely high tides.
Trail camera photographs are on the following page.
13th August 2022 Event


The trail camera photos show the increase in depth due to an exceptionally high tide. A similar increase in depth in seen on 14th August on the high Spring tide.

Visible Pollution Events – U/S Camera
The following pages give examples of events in which visible pollution events occurred. There is no sonde data to pair with the photographs in this location.
27th July Event
The trail camera captured multiple visible flushed plume events over several days (27th – 29th July), the photos below show an example of two consecutive events.


13th August Event
The trail camera captured multiple visible flushed plume events on this day, the photos below show an example of one event.


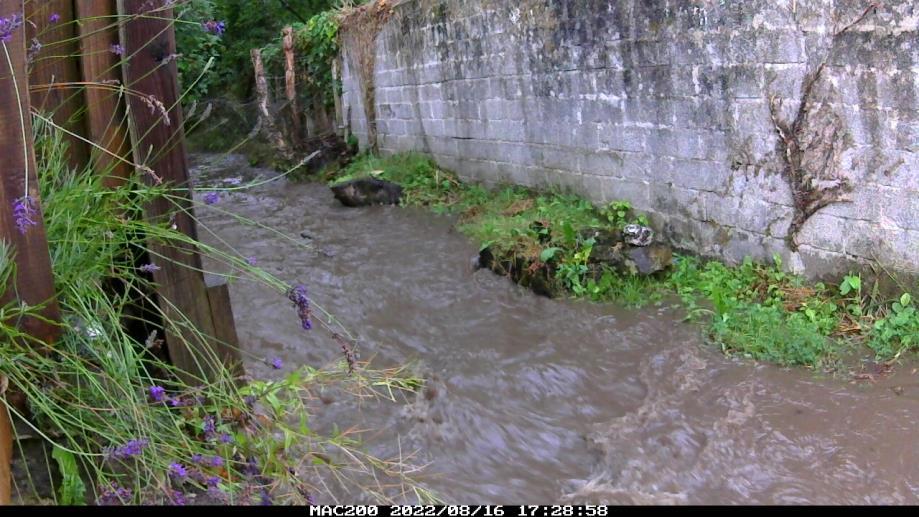
16th August Rainfall Event
The trail camera captured how quickly the small stream responds to heavy rainfall.
The local rain gauge recorded 17.8mm of rainfall between 14:45 and 18:30.


15th September Event


At 14:43 a visible flushed plume was captured on the trail camera, with the water next appearing clear at 15:43.
There was no rainfall visible on the trail camera on that day. The local rain gauge had not recorded any rain on that day, with the most recent rainfall ending at 07:45 on the previous day, 14th September. It is therefore considered very unlikely that the flushed plume was related to rainfall.
The flushed plume appears to be a different colour to the usual flushed plumes captured on the trail camera, which tend to be more white or grey hues rather than the brown hue seen in the photos above.
21st October – Example of flushed plumes visible on both trail cameras. The photographs from the two trail cameras showing flushed plumes were matched up with dates and times to determine if there was any correlation between incidents in the two locations. The cameras are located approximately 400m apart.
10:59 – U/S trail

11:26
On the 21st October at 10:59, a visible flushed plume was captured on the U/S trail camera. Approximately 30 mins later, at 11:26, a flushed plume was captured on the D/S trail camera.
24th October – Example of flushed plumes visible on both trail cameras.

10:59
11:21

On the 24th October at 10:59, a visible flushed plume was captured on the U/S trail camera. Less than 30 mins later at 11:21, a flushed plume was captured on the D/S trail camera. The timing of the flushed plume being visible on both of the trail cameras is very similar to the previous event on 21st October, with the flushed plume appearing to take under 30 mins to flow from the U/S camera to the D/S camera.
The trail cameras take a photograph every 15 minutes. The flushed plume events are observed to be relatively fast-moving, so it is possible that there were more instances of the flushed plume being visible in both the U/S and D/S areas, but they may not have been captured on camera in both locations due to the 15 minute intervals.

Monthly AT200 & Rainfall Data
The following pages show graphs of specific conductivity, depth and rainfall data for each month between July 2021 and July 2022.
July 2021 (sonde readings began on 26th July)

August 2021

2021-08-03 07:00
2021-08-03 18:00 2021-08-04 05:00 2021-08-04 16:00
2021-08-05 03:00
2021-08-05 14:00 2021-08-06 01:00
2021-08-06 12:00
2021-08-06 23:00
2021-08-07 10:00
2021-08-07 21:00
2021-08-08 08:00
2021-08-08 19:00
2021-08-09 06:00
2021-08-09 17:00
2021-08-10 04:00
2021-08-10 15:00
2021-08-11 02:00
2021-08-11 13:00
2021-08-12 00:00
2021-08-12 11:00
2021-08-12 22:00
2021-08-13 09:00
2021-08-13 20:00
2021-08-14 07:00
2021-08-14 18:00
2021-08-15 05:00
2021-08-15 16:00
2021-08-16 03:00
2021-08-16 14:00
2021-08-17 01:00
2021-08-17 12:00
2021-08-17 23:00
2021-08-18 10:00
2021-08-18 21:00
2021-08-19 08:00
2021-08-19 19:00
2021-08-20 06:00
2021-08-20 17:00
2021-08-21 04:00
2021-08-21 15:00
2021-08-22 02:00
2021-08-22 13:00
2021-08-23 00:00
2021-08-23 11:00
2021-08-23 22:00
2021-08-24 09:00
2021-08-24 20:00
2021-08-25 07:00
2021-08-25 18:00
2021-08-26 05:00
2021-08-26 16:00
2021-08-27 03:00
2021-08-27 14:00
2021-08-28 01:00
2021-08-28 12:00
2021-08-28 23:00
2021-08-29 10:00
2021-08-29 21:00
2021-08-30 08:00
2021-08-30 19:00
2021-08-31 06:00
2021-08-31 17:00
Rainfall (mm) Depth (mm) Spec.Cond (S/cm)
September 2021

2021-09-08 00:00
2021-09-08 10:30
2021-09-08 21:00
2021-09-09 07:30
2021-09-09 18:00
2021-09-10 04:30
2021-09-10 15:00
2021-09-11 01:30
2021-09-11 12:00
2021-09-11 22:30
2021-09-12 09:00
2021-09-12 19:30
2021-09-13 06:00
2021-09-13 16:30
2021-09-14 03:00
2021-09-14 13:30
2021-09-15 00:00
2021-09-15 10:30
2021-09-15 21:00
2021-09-16 07:30
2021-09-16 18:00
2021-09-17 04:30
2021-09-17 15:00
2021-09-18 01:30
2021-09-18 12:00
2021-09-18 22:30
2021-09-19 09:00
2021-09-19 19:30
2021-09-20 06:00
2021-09-20 16:30
2021-09-21 03:00
2021-09-21 13:30
2021-09-22 00:00
2021-09-22 10:30
2021-09-22 21:00
2021-09-23 07:30
2021-09-23 18:00
2021-09-24 04:30
2021-09-24 15:00
2021-09-25 01:30
2021-09-25 12:00
2021-09-25 22:30
2021-09-26 09:00
2021-09-26 19:30
2021-09-27 06:00
2021-09-27 16:30
2021-09-28 03:00
2021-09-28 13:30
2021-09-29 00:00
2021-09-29 10:30
2021-09-29 21:00
2021-09-30 07:30
2021-09-30 18:00 Depth

2021-10-08 04:00
2021-10-08 14:45
2021-10-09 01:30
2021-10-09 12:15
2021-10-09 23:00
2021-10-10 09:45
2021-10-10 20:30
2021-10-11 07:15
2021-10-11 18:00
2021-10-12 04:45
2021-10-12 15:30
2021-10-13 02:15
2021-10-13 13:00
2021-10-13 23:45
2021-10-14 10:30
2021-10-14 21:15
2021-10-15 08:00
2021-10-15 18:45
2021-10-16 05:30
2021-10-16 16:15
2021-10-17 03:00
2021-10-17 13:45
2021-10-18 00:30
2021-10-18
November 2021

2021-11-08 10:30
2021-11-08 21:00
2021-11-09 07:30
2021-11-09 18:00
2021-11-10 04:30
2021-11-10 15:00
2021-11-11 01:30
2021-11-11 12:00
2021-11-11 22:30
2021-11-12 09:00
2021-11-12 19:30
2021-11-13 06:00
2021-11-13 16:30
2021-11-14 03:00
2021-11-14 13:30
2021-11-15 00:00
2021-11-15 10:30
2021-11-15 21:00
2021-11-16 07:30
2021-11-16 18:00
2021-11-17 04:30
2021-11-17 15:00
03:00
2021-11-21 13:30
2021-11-22 00:00
2021-11-22 10:30
2021-11-22 21:00
2021-11-23 07:30
2021-11-23 18:00
2021-11-24 04:30
2021-11-24 15:00
2021-11-25 01:30
2021-11-25 12:00
2021-11-25 22:30
2021-11-26 09:00
2021-11-26 19:30
2021-11-27 06:00
2021-11-27 16:30
2021-11-28 03:00
2021-11-28 13:30
2021-11-29 00:00
2021-11-29 10:30
2021-11-29 21:00
2021-11-30 07:30
2021-11-30 18:00
December 2021

2021-12-08 04:00
2021-12-08 14:45
2021-12-09 01:30
2021-12-09 12:15
2021-12-09 23:00
2021-12-10 09:45
2021-12-10 20:30
2021-12-11 07:15
2021-12-11 18:00
2021-12-12 04:45
2021-12-12 15:30
2021-12-13 02:15
2021-12-13 13:00
2021-12-13 23:45
2021-12-14 10:30
2021-12-14 21:15
2021-12-15 08:00
2021-12-15 18:45
2021-12-16 05:30
2021-12-16 16:15
2021-12-17 03:00
2021-12-17 13:45
2021-12-18 00:30
2021-12-18 11:15
01:15
2021-12-22 12:00
2021-12-22 22:45
2021-12-23 09:30
2021-12-23 20:15
2021-12-24 07:00
2021-12-24 17:45
2021-12-25 04:30
2021-12-25 15:15
2021-12-26 02:00
2021-12-26 12:45
2021-12-26 23:30
2021-12-27 10:15
2021-12-27 21:00
2021-12-28 07:45
2021-12-28 18:30
2021-12-29 05:15
2021-12-29 16:00
2021-12-30 02:45
2021-12-30 13:30
2021-12-31 00:15
2021-12-31 11:00
2021-12-31
January 2022

2022-01-10 09:45 2022-01-10 20:30 2022-01-11 07:15
2022-01-11 18:00
2022-01-12 04:45 2022-01-12 15:30
2022-01-13 02:15
2022-01-13 13:00
2022-01-13 23:45
2022-01-14 10:30
2022-01-14 21:15
2022-01-15 08:00
2022-01-15 18:45
2022-01-16 05:30
2022-01-16 16:15
2022-01-17 03:00
2022-01-17 13:45
2022-01-18 00:30
2022-01-18 11:15

2022-02-14 00:00
2022-02-14 09:45
2022-02-14 19:30
2022-02-15 05:15
2022-02-15 15:00
2022-02-16 00:45
2022-02-16 10:30
2022-02-16
March 2022
2022-03-14 10:30 2022-03-14 21:15 2022-03-15 08:00
2022-03-15 18:45
2022-03-16 05:30
2022-03-16 16:15
2022-03-17 03:00
2022-03-17 13:45
2022-03-18 00:30
2022-03-18 11:15
2022-03-24
2022-03-24
2022-03-26
2022-03-27
April 2022
2022-04-09 08:00
2022-04-09 18:30
2022-04-10 05:00
2022-04-10 15:30
2022-04-11 02:00
2022-04-11 12:30
2022-04-11 23:00
2022-04-12 09:30
2022-04-12 20:00
2022-04-13 06:30
2022-04-13 17:00
2022-04-14 03:30
2022-04-14 14:00
2022-04-15 00:30
2022-04-15 11:00
2022-04-15 21:30
2022-04-16 08:00
2022-04-16 18:30
2022-04-17 05:00
2022-04-17 15:30
2022-04-18 02:00
14:00
2022-04-22 00:30
2022-04-22 11:00
2022-04-22 21:30
2022-04-23 08:00
2022-04-23 18:30
2022-04-24 05:00
2022-04-24 15:30
2022-04-25 02:00
2022-04-25 12:30
2022-04-25 23:00
2022-04-26 09:30
2022-04-26 20:00
2022-04-27 06:30
2022-04-27 17:00
2022-04-28 03:30
2022-04-28 14:00
2022-04-29 00:30
2022-04-29 11:00
2022-04-29 21:45
2022-04-30 08:15
May 2022
11:15
2022-05-15 22:00
2022-05-16 08:45
2022-05-16 19:30
2022-05-17 06:15
2022-05-17 17:00
2022-05-18 03:45
2022-05-18 14:30
June 2022

2022-06-10 15:30 2022-06-11 02:00
2022-06-11 12:30
2022-06-11 23:00
2022-06-12 09:30
2022-06-12 20:00
2022-06-13 06:30
2022-06-13 17:00
2022-06-14 03:30
2022-06-14 14:00
2022-06-15 00:30 2022-06-15 11:00
2022-06-15 21:30
2022-06-16 08:00
2022-06-16 18:30
2022-06-17 05:00
2022-06-17 15:30
2022-06-18 02:00
2022-06-18 12:30
2022-06-18
2022-06-19
2022-06-29
July 2022

2022-07-10 04:00 2022-07-10 15:00
2022-07-11 02:00
2022-07-11 13:00
2022-07-12 00:00
2022-07-12 11:00
2022-07-12 22:00
2022-07-13 09:00
2022-07-13 20:00
2022-07-14 07:00
2022-07-14 18:00
2022-07-15 05:00
2022-07-15 16:00
2022-07-16 03:00
2022-07-16 14:00
2022-07-17 01:00
2022-07-17 12:00
2022-07-17 23:00
2022-07-18 10:00
2022-07-18
August 2022

14/08/2022 22:00
15/08/2022 09:15
15/08/2022 20:30
16/08/2022 07:45
16/08/2022 19:00
17/08/2022 06:15
For August and September’s data analysis, a direct download of the sonde data was used, due to technical issues with HydroVu. For all other months, HydroVu data was used for analysis. Both datasets are valid, with two different measurements being taken and recorded for the same time stamp. These two settings are separated by a small amount of time which may cause a disparity between the two data sets.
16:30 14/09/2022 03:00 14/09/2022 13:30 15/09/2022 00:00 15/09/2022 10:30 15/09/2022 21:00 16/09/2022 12:30 16/09/2022 23:00 17/09/2022 09:30 17/09/2022 20:00 18/09/2022 06:30 18/09/2022 17:15 19/09/2022 03:45 19/09/2022 14:15 20/09/2022
For August and September’s data analysis, a direct download of the sonde data was used, due to technical issues with HydroVu. For all other months, HydroVu data was used for analysis. Both datasets are valid, with two different measurements being taken and recorded for the same time stamp. These two settings are separated by a small amount of time which may cause a disparity between the two data sets.
October 2022

15/10/2022 09:30 15/10/2022 20:15 16/10/2022 07:00 16/10/2022 17:45 17/10/2022 04:30 17/10/2022 15:15 18/10/2022
Due to the sonde losing connection with the online telemetry briefly on 1st and 2nd of October, there is a gap in the sonde data which is visible on the graph.
November 2022

22:00 14/11/2022 08:15 14/11/2022 18:30 15/11/2022 04:45 15/11/2022 15:00 16/11/2022 01:15 16/11/2022 11:30 16/11/2022 21:45 17/11/2022 09:45 17/11/2022 20:00 18/11/2022 06:15 18/11/2022 16:30 19/11/2022 02:45 19/11/2022 13:00 19/11/2022
Due to the sonde losing connection with the online telemetry briefly on 7th and 8th of November, there are some gaps in the sonde data which are visible on the graph.

Wildlife Sightings
Wildlife sightings from the trail cameras:
• Little egret
• Heron
• Mallard & feral/domestic mallard
• Wood pigeon
• Magpie
• Robin
• Blackbird
• Pied wagtail
• Chaffinch
• Grey squirrel
• Suspected tawny owl
• Blackcap
• Great tit
A number of unidentified smaller species of birds were also seen, including a suspected warbler.
A domestic cat was also seen on several occasions.


Total rainfall for each month:
• July 2021 – 142mm (whole month) / 32.2mm (26th July onwards)
• August 2021 – 57.8mm
• September 2021 – 92.2mm
• October 2021 – 248.4mm
• November 2021 – 36.4mm
• December 2021 - 156.6mm
• January 2022 - 64.2mm
• February 2022 – 122mm
• March 2022 – 71.2mm
• April 2022 – 26.38mm
• May 2022 – 60.58mm
• June 2022 – 79.38mm
• July 2022 – 9.99mm
• August 2022 – 45.59mm
• September 2022 – 120.17mm
• October 2022 – 109.56mm
• November 2022 – 268.75mm
2021 Spring tides (27th July onwards):
• Monday 26th July / High tide 08:29 (5.34m) & 20:40 (5.63m)
• Tuesday 10th August / High tide 08:07 (5.23m) & 20:16 (5.51m)
• Sunday 24th August / High tide 08:09 (5.42m) & 20:18 (5.69m)
• Thursday 9th September / High tide 08:23 (5.49m) & 20:35 (5.72m)
• Saturday 23rd September / High tide 08:11 (5.49m) & 20:19 (5.61m)
• Friday 8th October / High tide 07:59 (5.71m) & 20:15 (5.83m)
• Saturday 23rd October / High tide 08:05 (5.51m) & 20:18 (5.42m)
• Saturday 6th November / High tide 06:35 (5.82m) & 18:54 5.82m)
• Sunday 21st November / High tide 06:40 (5.52m) & 18:55 (5.33m)
• Monday 6th December / High tide 07:01 (5.83m) & 19:27 (5.59m)
• Tuesday 21st December / High tide 06:55 (5.43m) & 19:16 (5.15m)
2022 Spring tides:
• Tuesday 4th January / High tide 06:50 (5.80m) & 19:19 (5.51m)
• Friday 21st January / High tide 07:53 (5.38m) & 20:16 (5.08m)
• Thursday 3rd February / High tide 07:25 (5.82m) & 19:54 (5.48m)
• Sunday 20th February / High tide 08:12 (5.47m) & 20:31 (5.22m)
• Saturday 5th March / High tide 07:43 (5.75m) & 20:02 (5.46m)
• Sunday 20th March / High tide 07:19 (5.58m) & 19:39 (5.43m)
• Saturday 2nd April / High tide 07:40 (5.69m) & 19:59 (5.52m)
• Monday 18th April / High tide 07:55 (5.62m) & 20:15 (5.56m)
• Sunday 1st May / High tide 07:10 (5.48m) & 19:26 (5.45m)
• Wednesday 18th May / High tide 08:19 (5.52m) & 20:35 (5.61m)
• Wednesday 1st June / High tide 07:46 (5.15m) & 19:57 (5.32m)
• Wednesday 15th June / High tide 07:16 (5.45m) & 19:36 (5.64m)
• Friday 1st July / High tide 08:06 (5.01m) & 20:16 (5.26m)
• Friday 15th July / High tide 07:59 (5.42m) & 20:15 (5.74m)
Spring tide dates from BSAC https://www.bsac.com
High tide times and depths from https://www.tidetimes.org.uk/saltash-tide-times
2022 Spring tides (continued):
• Monday 1st August / High tide 09:04 (5.03m) & 21:09 (5.27m)
• Sunday 14th August / High tide 08:34 (5.55m) & 20:46 (5.85m)
• Tuesday 30th August / High tide 08:44 (5.23m) & 20:51 (5.43m)
• Monday 12th September / High tide 08:09 (5.66m) & 20:19 (5.88m)
• Thursday 29th September / High tide 08:49 (5.41m) & 21:01 (5.46m)
• Tuesday 11th October / High tide 07:39 (5.70m) & 19:50 (5.79m)
• Thursday 27th October / High tide 07:52 (5.61m) & 20:08 (5.61m)
• Wednesday 9th November / High tide 06:07 (5.64m) & 18:22 (5.59m)
• Friday 25th November / High tide 06:30 (5.69m) & 18:52 (5.58m)
Spring tide dates from BSAC https://www.bsac.com
High tide times and depths from https://www.tidetimes.org.uk/saltash-tide-times