

Gareth Cox
PLYMOUTH RIVER KEEPERS EVIDENCE REVIEW ©
report has been put together by Westcountry Rivers Trust as part of the Plymouth Rivers Keepers project.
Contents Plymouth River Keepers Creation ………………………………….. 1 The Tamar Management Catchment …………………………… 2 Plymouth Overview ……………………………………………………………….. 3 Net-Benefits Wheels ………………………………………………………......... 11 Net-Benefits Indicators …………………………………………………………. 12 Waterbody Characteristics …………………………………………......... 26 Waterbody Pressures ………………………………………………................ 32 Plymouth River Keepers Actions ……………………………........... 37
This
Published August 2021.
Introduction and Background
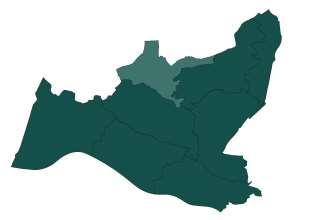
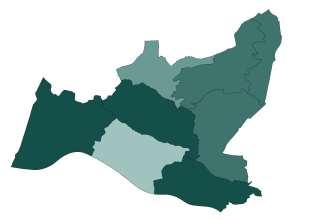
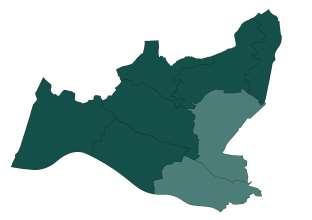
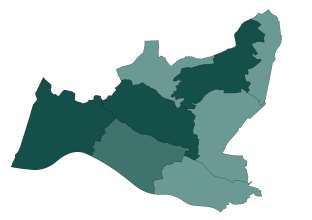
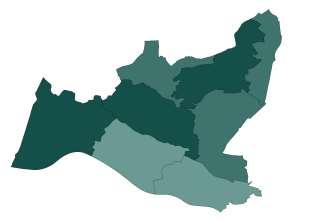
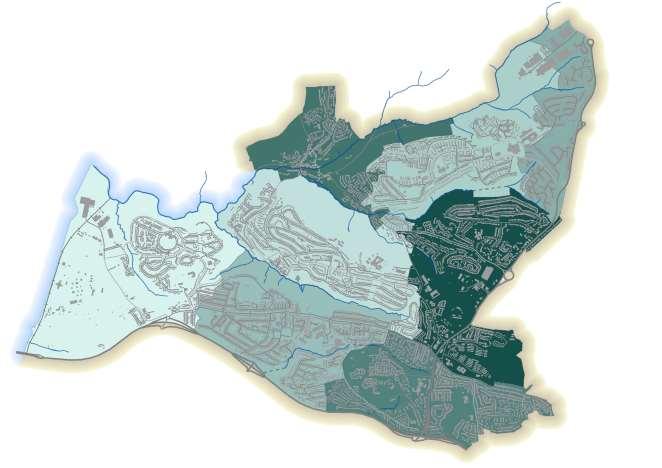
The following section of this report provides an introduction to the Plymouth River Keepers project. In addition to background information about Plymouth, the Tamar management catchment and the project area, it also explores socio-economic priorities and drivers such as population, the Index of Multiple Deprivation (IMD) and crime rates. On these pages, the main map highlights the project area, whilst the smaller map shows the whole of Plymouth.
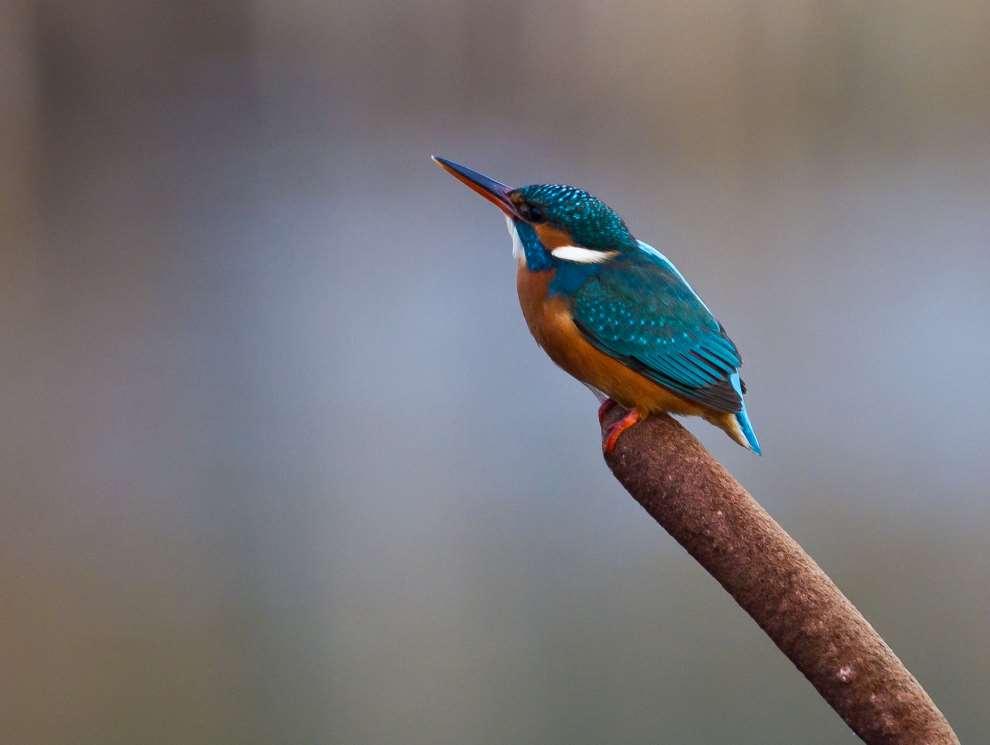
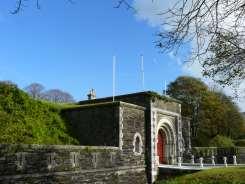
© Natural England/Neil Pike
PLYMOUTH RIVER KEEPERS
Connecting water, people and place
The Tamerton Stream near Plymouth has suffered several pollution incidents over the years. In August 2016, a pollution incident caused by the buildup of commercial-use wet wipes created a blockage in the sewerage pipe, which led to a Category 1 (major) pollution incident. The pollution had a substantial impact on the stream, unfortunately killing more than 80 Brown Trout.
As a result of this incident, an Enforcement Undertaking (EU) was agreed by the Environment Agency with South West Water (SWW) to the value of £350,000. To help improve the area, SWW used this EU to enable Westcountry Rivers Trust to conduct work to improve the urban watercourses in the Plymouth area, particularly the Tamerton stream, which has led to the creation of the Plymouth River Keepers (PRK) project (2020 – 2023).

Plymouth River Keepers aims are:
• To prevent pollution incidents and improve water quality.
• To protect the streams for wildlife and current and future generations.
• To ensure the places streams flow are ones people can enjoy, now and in the future.
• To embed water environment caretakers in communities.
• To build a local love for water.

Page/Map ID: 1
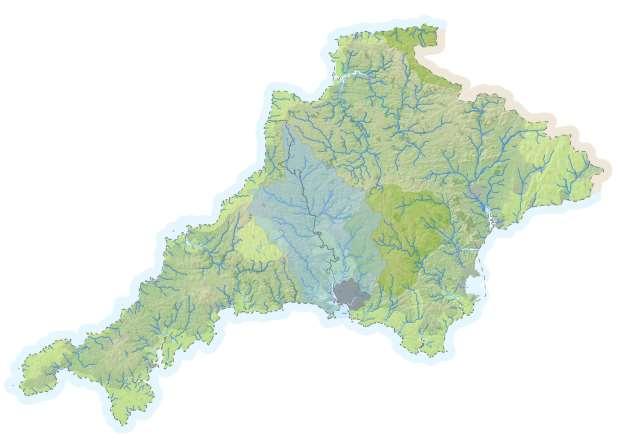
THE TAMAR CATCHMENT
The Plymouth River Keepers project area falls in the Tamar management catchment, which straddles the boundaries of Devon and Cornwall and covers a total land area of approximately 1800km2 .
The River Tamar itself, into which the Plymouth River Keepers project area streams flow, is approximately 98km in length and flows into Plymouth Sound. Other rivers in the Tamar catchment are the Rivers Tavy, Plym, Yealm, Lynher and Tiddy.
The catchment includes agricultural land, coastal land and both rural and urban areas, with Plymouth being the largest and most densely populated urban area
Plymouth Tamar Catchment
The Tamar Catchment Partnership, led by a steering group and hosted by Westcountry Rivers Trust, brings together a wide range of stakeholders and is part of the national Catchment Based Approach (CaBA) initiative.
The aim of the Catchment Partnership is to work collaboratively to identify and facilitate better environmental outcomes across the catchment.


Page/Map ID: 2
Reference source: http://my-tamar.org/ / https://www.naturaldevon.org.uk/catchment-management-in-devon/tamar-catchment-partnership/ Cornwall Devon
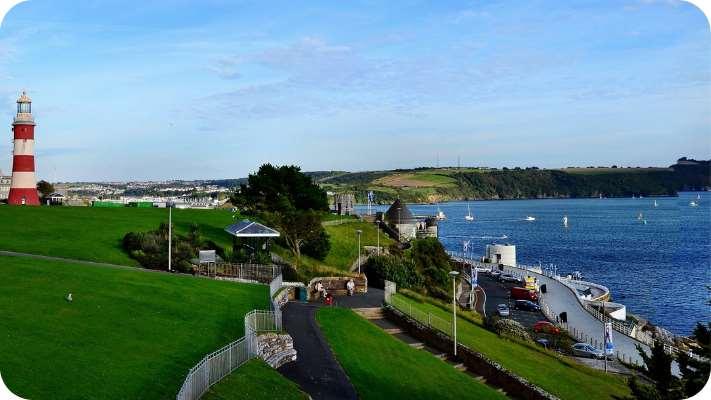
PLYMOUTH
Britain’s Ocean City
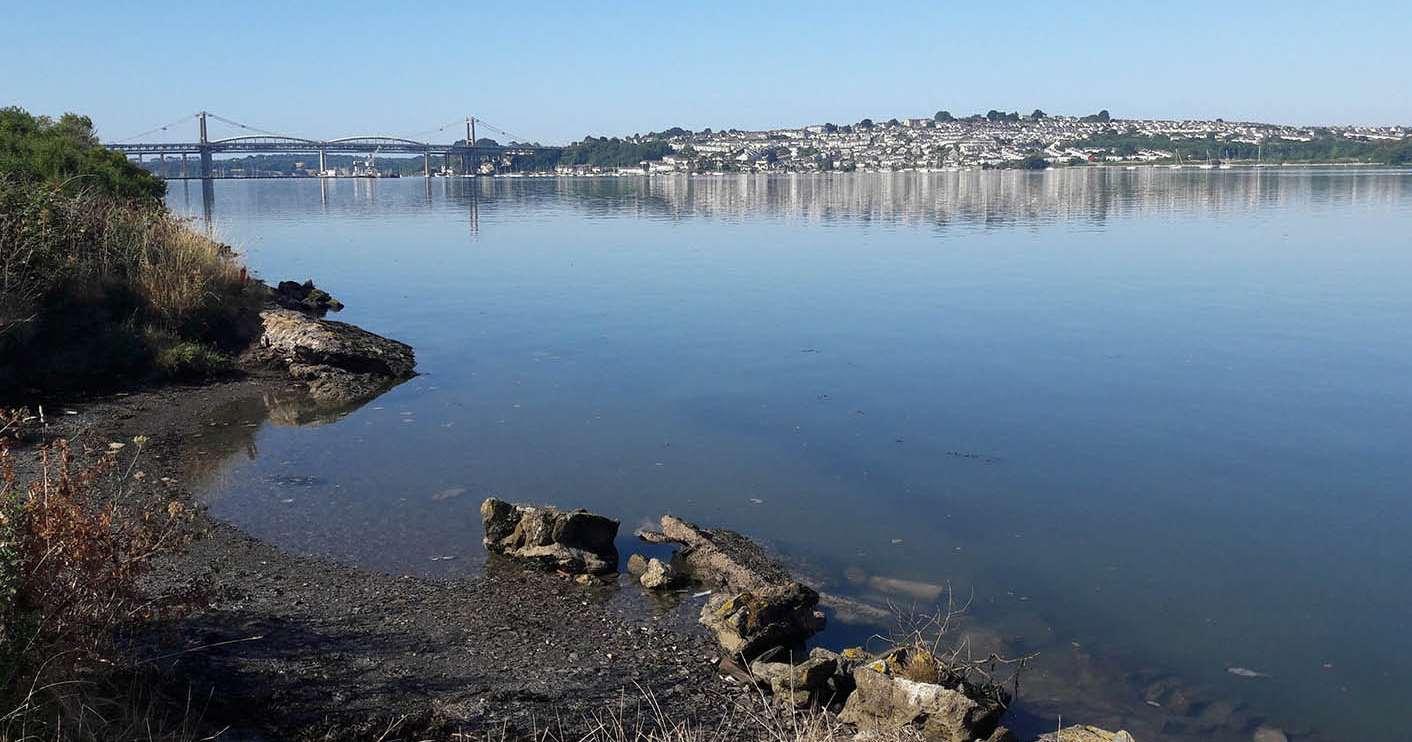
Plymouth is one of the largest cities on the south coast and the 15th largest city in England. Plymouth is branded as ‘Britain’s Ocean City’ and is enclosed by the mouths of the River Tamar and the River Plym, which feed into Plymouth Sound.
Plymouth is a port city with a long maritime history and is still closely associated with the sea today with sailing, fishing, research and military activities, in addition to a variety of recreational activities. There are many urban streams flowing through Plymouth and the condition of these waterways has an impact on the people living near them as well the habitats downstream.
Plymouth Report (2019):
• 93% of the Plymouth population are white British.
• 10% of Plymouth residents report having a disability or long term health problem that limits their day-to-day activities lasting for at least 12 months (2011 Census)
• Plymouth has an employment rate of 76 8% (higher than the national average).
• Plymouth is the UK’s first ‘social enterprise city’. There are approximately 150 social enterprises in the city employing around 7,000 people.
Plymouth City Survey Results (2020):
• 43% agreed they are aware of community activities/groups in their local area
• 43% said they regularly volunteer, with 20% helping out a neighbour, 13% volunteer with a charity and 10% with a sports event/club.
• 34% agreed they know how to get involved in decisions that affect their local area, with 37% disagreeing.
Reference source: Plymouth Report 2019 and Plymouth City Survey 2020 www.Plymouth.gov.uk
Flickr CC © Robert Pittman
Page/Map ID: 3
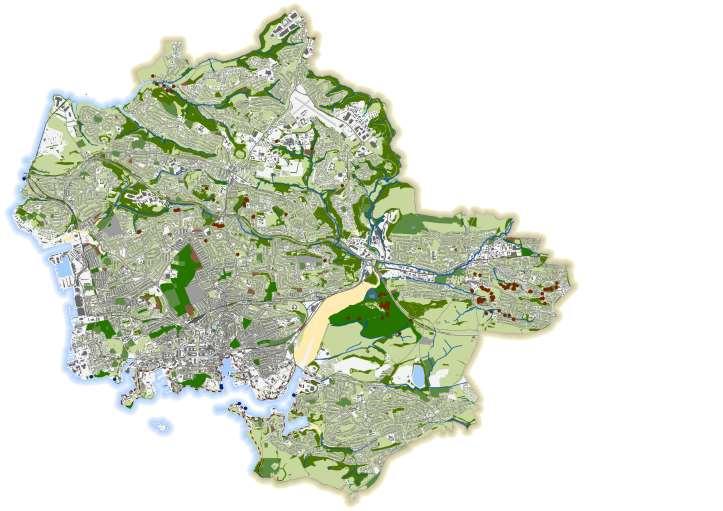
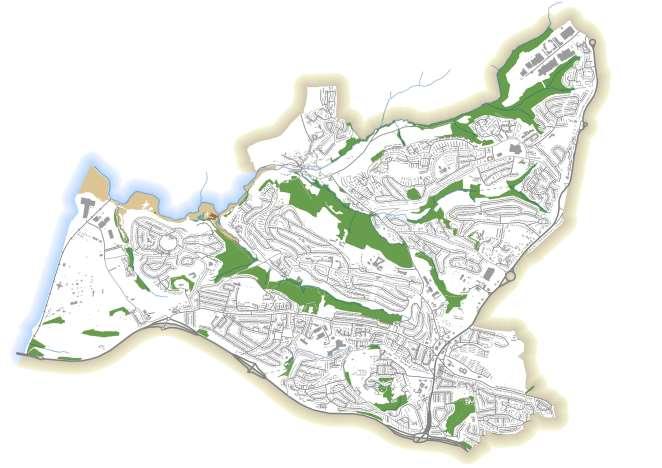
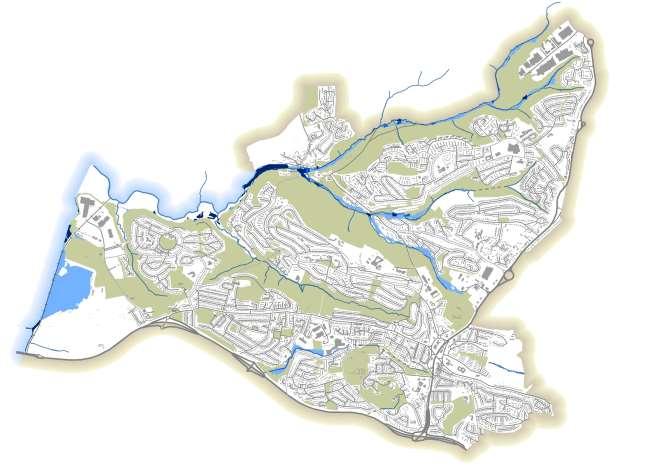
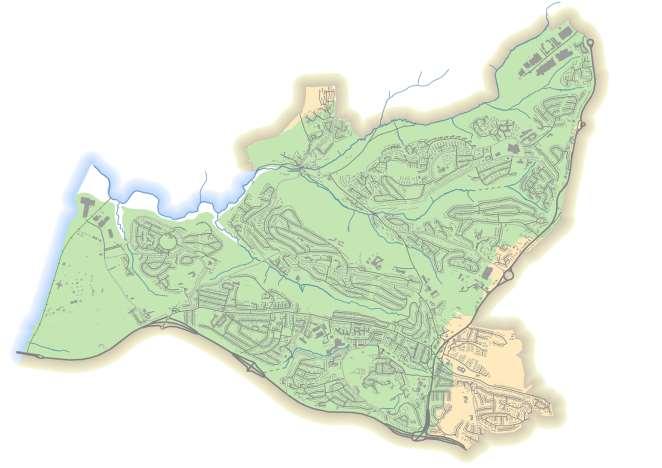
PLYMOUTH’S NATURAL INFRASTRUCTURE
Natural infrastructure (or green and blue infrastructure) refers to naturally occurring landscape features, such as parks, woodlands, rivers and oceans. It provides benefits to both people and place, providing areas for relaxation, play and exercise, areas for wildlife to thrive, as well as helping to combat climate change by alleviating flooding, reducing the urban heat island effect, and absorbing and storing atmospheric carbon dioxide (CO2)
Over 40% of Plymouth is designated as green space, including over 1440ha of accessible green space. Plymouth has a network of 120 wildlife sites, including over 40 wildflower meadows covering approximately 100ha1 .
Greenspace
Allotments Or Community Growing Spaces
Playing Field / Bowling Green / Golf Course
Public Park Or Garden Cemetery
Woodland
GreenSpace
Lakes/ Open water
! ! Priority Habitat
Coastal saltmarsh
Mudflats
Public Slipways
AncientTrees
South West Coast Path
Reference source: 1 www.dataplymouth.co.uk/ / 2 https://environment.data.gov.uk / Plymouth City Survey 2020 www.Plymouth.gov.uk
Plymouth City Survey Results (2020):
• 91% agreed Plymouth Sound is special to the city.
• 90% agreed that parks and woodlands are important to Plymouth.
• 85% agreed there is good access to parks and woodlands in/from their local areas.
• The percentage of respondents who agreed they feel they have pride in their local area varied from 44% to 83%.
Plymouth Hoe East and Plymouth Hoe West are designated bathing water areas, and were classified as ‘good’ and ‘excellent’ respectively in 2019, with both bathing areas being classified as ‘excellent’ in 20182 .
Page/Map ID: 4
DESIGNATED SITES
Plymouth lies in an enviable location between the moors and the sea. Three Areas of Outstanding Natural Beauty surround Plymouth - Tamar Valley AONB, Cornwall AONB and South Devon AONB. Dartmoor National Park lies several kilometres to the north-east of Plymouth.
Marine designations include the Tamar Estuary Sites Marine Conservation Zone (MCZ) Plymouth Sound and Estuaries Special Area of Conservation (SAC), Tamar Estuaries Complex Special Protection Area (SPA), in addition to the Tamar/Tavy Estuary Site of Special Scientific Interest (SSSI).
Plymouth has 13 Local Nature Reserves (LNR) encompassing an area of more than 297ha, and 26 County Wildlife Sites (CWS). There are 9 Sites of Special Scientific Interest (SSSI) within Plymouth itself.
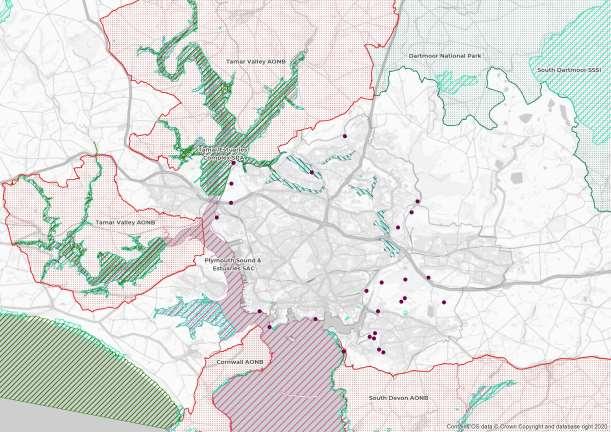
Within the Plymouth River Keepers project area there are 5 CWSs and 5 LNRs:
• Southway Woods CWS
• Whitleigh Woods CWS
• Warren Point CWS
• Ernesettle Complex CWS
• St Budeaux CWS
• Southway Valley LNR
• Whitleigh Wood LNR
• Cann Woods LNR
• Budshead Wood LNR
• Woodland Wood Valley LNR
Plymouth City Boundary
! County Wildlife Site
Local Nature Reserve
Marine Conservation Zone
Special Area of Conservation
Special Protection Area
Sites of Special Scientific Interest
Area of Outstanding Natural Beauty
National Park
Data source: County Wildlife Site locations are approximate – data source www.plymouth.gov.uk/parksnatureandgreenspaces/countywildlifesites
Page/Map ID: 5
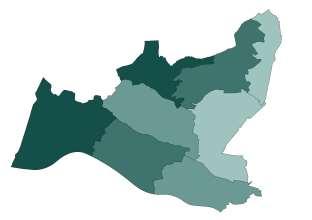
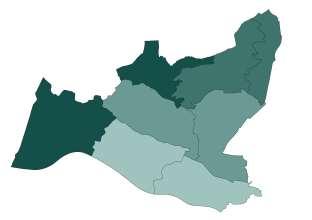
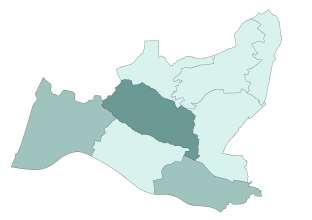
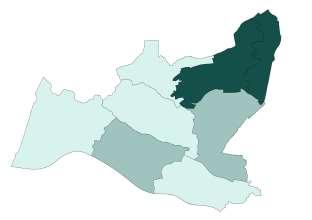
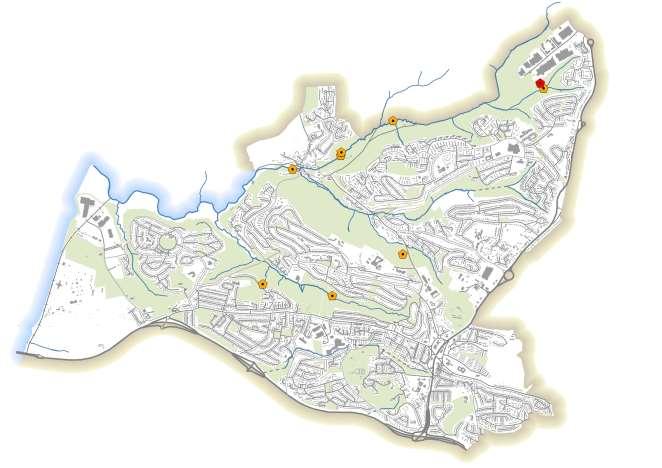
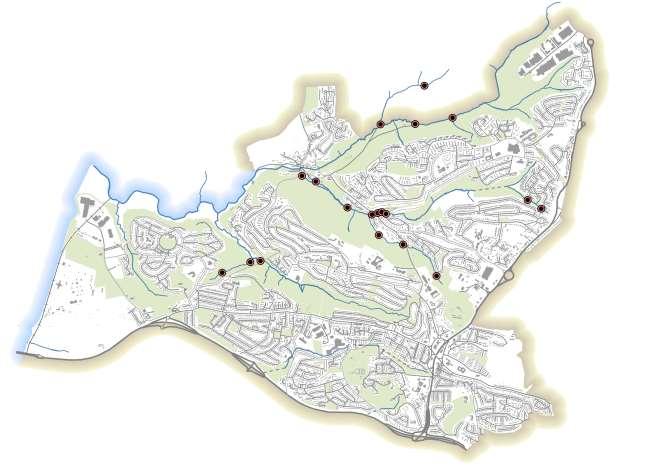
PLYMOUTH RIVER KEEPERS PROJECT AREA
Neighbourhoods
The Plymouth River Keepers project area is located in the North West of Plymouth, bounded to the east by the A386 Tavistock Road and to the south by the A38 Devon Expressway.
For the purposes of this Evidence Review the entirety of any neighbourhoods which fall within the project boundary have been included.
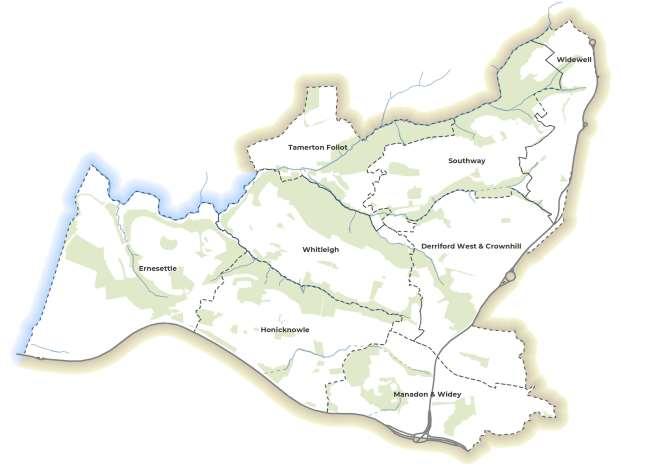
The map shows the Plymouth River Keepers neighbourhood boundaries:
• Ernesettle
• Honicknowle
• Whitleigh
• Tamerton Foliot
• Southway
• Widewell
• Derriford West and Crownhill
• Manadon and Widey
Plymouth is made up of 39 neighbourhoods, eight of these neighbourhoods are included in the Plymouth River Keepers project area.
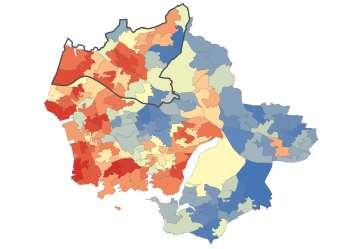
Four of the eight neighbourhoods are classed as being ‘more deprived’ than the rest of Plymouth (Index of Multiple Deprivation).
http://www.dataplymouth.co.uk/ / Plymouth Report 2019 www.Plymouth.gov.uk Page/Map ID: 6
Reference source:
PRIORITY HABITATS
UK Biodiversity Action Plan (BAP)
UK Biodiversity Action Plan priority habitats cover a wide range of semi-natural habitat types. The habitats included are those that were identified as being the most threatened and requiring conservation action under the UK Biodiversity Action Plan (BAP)1 .
As a result of devolution, and new country-level and international drivers and requirements, much of the work previously carried out by the UK BAP is now focussed at a country-level rather than a UK-level, and the UK BAP was succeeded by the ‘UK Post-2010 Biodiversity Framework’ in July 2012. The UK list of priority habitats, however, remains an important reference source and has been used to help draw up statutory lists of priority habitats in England, Scotland, Wales and Northern Ireland, as required under Section 41 of the Natural Environment and Rural Communities (NERC)1 .
Priority Habitats
Coastal saltmarsh
Deciduous woodland
Intertidal Mudflats
Reedbeds
Coastal saltmarsh consists of a low number of salt-tolerant plant species, adapted to regular immersion by the tide. Saltmarshes are important for wading birds, invertebrates & juvenile fish1 .
Intertidal mudflats consist mostly of silts & clays of high organic content. They are highly productive areas which support juvenile flatfish and internationally important populations of migrant & wintering waterfowl1 .
Reedbeds are wetlands dominated by stands of common reed Phragmites australis, where the water table is at or above ground level for most of the year. Reedbeds are amongst the most important habitats for birds in the UK & provide valuable habitat for invertebrates1 .
Deciduous woodland comprises trees with broadleaves; they may have been managed e.g. coppicing and may comprise areas of ancient woodland. Deciduous woodland provides valuable habitats for a variety of species such as birds, mammals, invertebrates & fungi1 .
Reference source: 1 https://jncc.gov.uk
Page/Map ID: 7
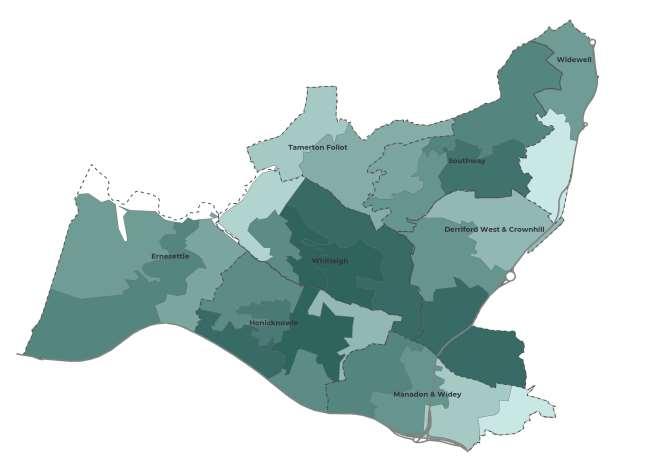
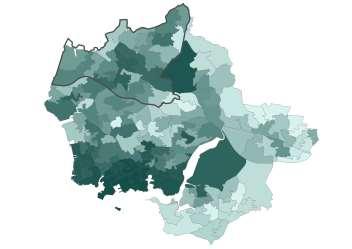
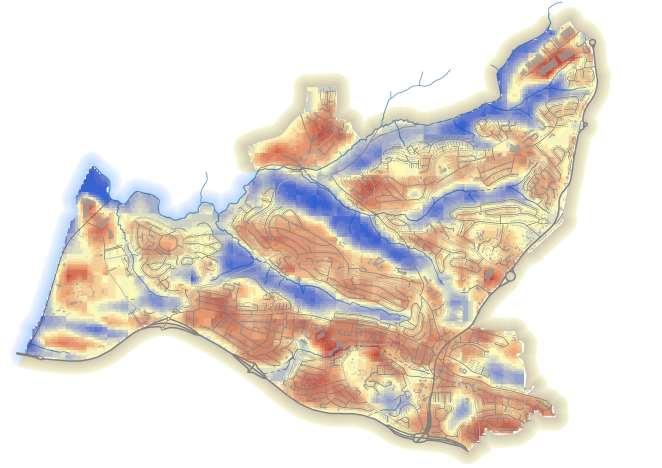
POPULATION
Plymouth had an estimated population of 262,100 in 2019 (Office for National Statistics ONS MYE 2019).
The ONS project that if current trends continue, the population will grow to 274,300 by 2034, an increase of 4.3%.
Population Density: Data from the Census allows central and local government, health authorities and many other organisations to target their resources more effectively and to plan housing, education, health and transport services.
Reference source: Office for National Statistics www.ons.gov.uk / http://www.dataplymouth.co.uk
The population within the Plymouth River
Keepers project area is estimated to be 52,240 (based on 2017 ONS estimates).
Population (2011 Census)
Higher Lower
Page/Map ID: 8
STRATEGIC TARGETING
Socio-economic priorities and drivers
Before assessing the baseline benefits received by local communities, it is important to consider any existing priority areas and drivers for improving natural infrastructure, including legislative drivers and restrictions, socio-economic patterns, funding incentives or local plans
Areas of social deprivation are often linked to poor health, reduced air quality, increased crime rates and lower access to natural spaces, but it has also been found that investment in natural infrastructure in economically deprived areas can have a greater positive impact on health and wellbeing than in more affluent areas. This can provide both an enabler and motivator for action to deliver ‘nature-based solutions’ into these areas, and also a potentially significant blocker to environmental action (as these social issues often take priority)1 .
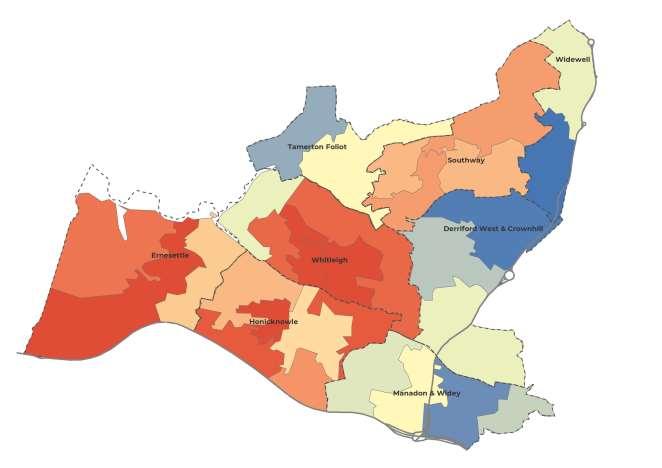
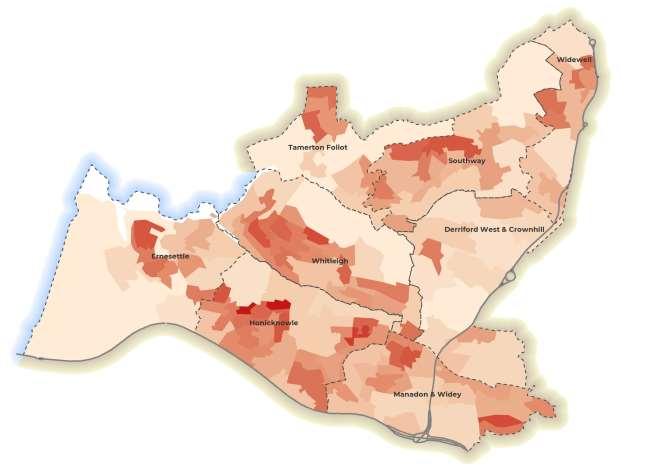
Index of Multiple Deprivation
More Deprived
Less Deprived
The Index of Multiple Deprivation (2019) shows relative deprivation for neighbourhoods in England. It uses 7 indicators of deprivation; income, employment, health deprivation and disability, education and skills training, crime, barriers to housing and services, and the living environment.
Reference source: 1 The Nature of Manchester Local Action Project © Manchester City Council and Westcountry Rivers Trust Ltd. 2018.
Page/Map ID: 9
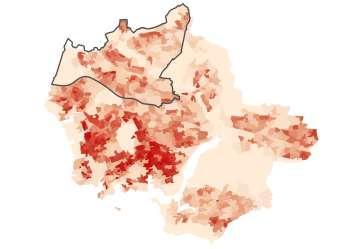
CRIME
Crime can cause significant social and economic problems to individuals and communities. Communities which experience higher crime rates can be adversely affected; home insurance premiums may rise, property prices may be affected, businesses may suffer due to theft or the cost of repairing vandalism, and individuals may be affected by being frightened inside or outside of their home1 .
According to the Office of National Statistics, for the 12 month period ending September 2020 the level of crime in England and Wales throughout 2020 fluctuated, particularly in relation to the Covid-19 lockdown restrictions and the later easing of restrictions Total police recorded crime decreased by 6%; this was driven by substantial falls during the April to June 2020 period, particularly in theft offences2 .
Crime Rates (2018/2019) Higher Lower
Crime rate levels show street-level crime, including anti-social behaviour, bicycle theft, burglary/robbery, shoplifting, vehicle crime, criminal damage and arson, drug-related crime and violent crime (www.data.police.uk).
90% of respondents to the Plymouth City Survey (2020) said they felt safe in their local area during the day and 58% said they felt safe after dark.
Reference source: 1 https://www.bbc.co.uk/bitesize/guides/zbhpgwx/revision/2 / 2 https://www.ons.gov.uk / Plymouth City Survey 2020 www.Plymouth.gov.uk
Page/Map ID: 10
.

Local Action Project (LAP) Mapping
The Local Action Project (LAP) aims to work with local communities to enhance the value of nature (‘natural capital’) in their local landscapes to improve people’s lives, the environment and economic prosperity.
The following section of this report establishes a baseline of ecosystem service benefits for each neighbourhood within the project area, using a breakdown of 12 indicators, including access to natural space, cultural activities and water quality.
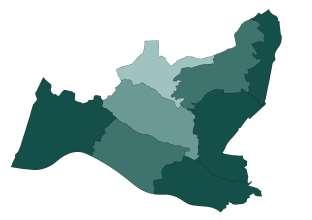
On the indicator pages, the main map presents the data across the project area, whilst the smaller map shows the ‘benefit metrics’ by neighbourhood, with benefits of each indicator received ranked from higher benefit to lower benefit.
© Natural England/Allan Drewitt
NET-BENEFITS WHEELS
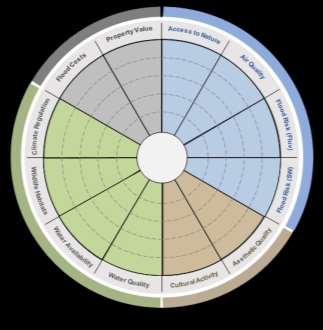
The analysis method uses a series of 12 ecosystem service benefit-indicators, visualised in a wheel graphic, which can be used to:
1) Characterise the benefits derived from existing natural capital; 2) Establish a baseline of benefits experienced by people living in specific communities (facilitating a strategic assessment of need for enhancement or deficiency of provision); and 3) To predict the magnitude and diversity of benefits generated through the delivery of a targeted urban environmental management intervention programme.
The net-benefits wheels enable the viewer to quickly and easily gain an insight into where there are communities that are suffering from a lack of benefits from natural infrastructure and to allow areas of ‘need’ or opportunity for improvement to be prioritised.
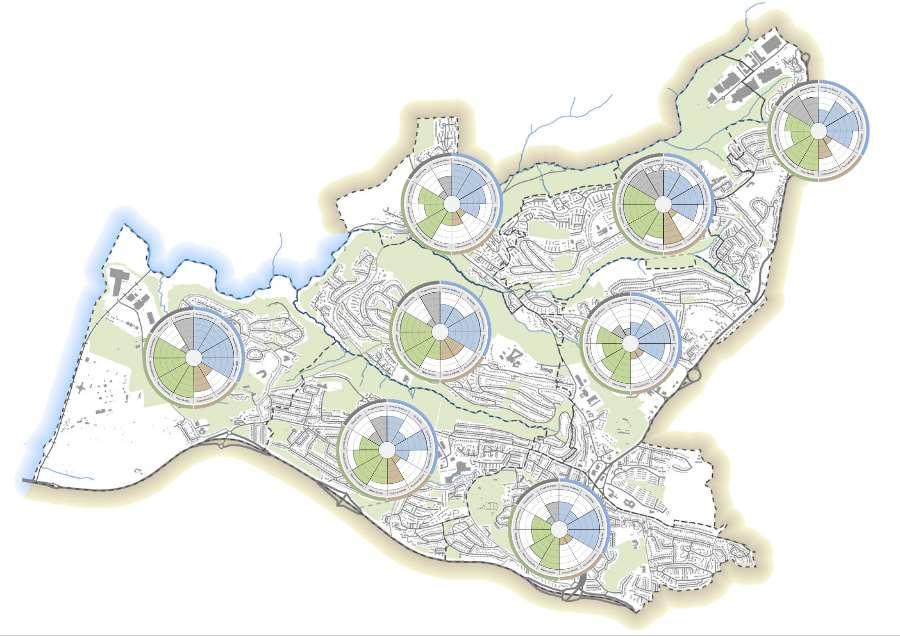
This map shows the net-benefits wheels for the eight neighbourhoods in the Plymouth River Keepers project area.
Each indicator was assessed for the study area and the value for each neighbourhood calculated.
Reference source: For more comprehensive details about how the indicators were calculated, see the ‘Local Action Toolkit (LAT) Mapping Methodology’ and the ‘Local Action Toolkit (LAT) Report’, available at the project website (http://urbanwater-eco.services/).
Page/Map ID: 11 Example wheel
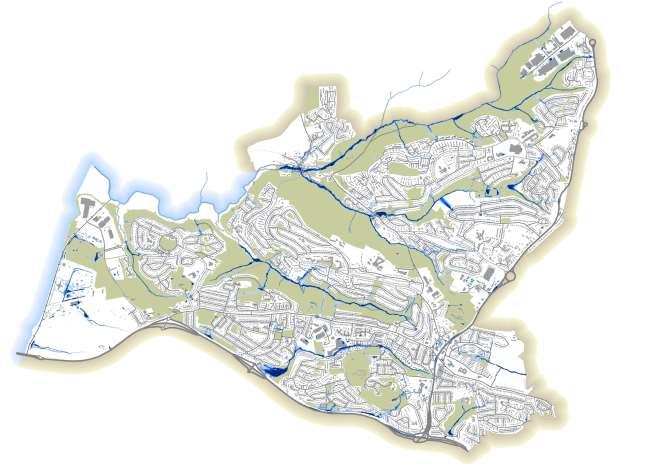
INDICATOR 1
Access to blue and green spaces
Many studies have shown that spending time in natural green and blue spaces can significantly improve mental and physical health. Not only do these spaces provide the opportunity for fitness and recreation but they also provide non-physical benefits, such as emotional and spiritual benefits.
The importance of accessible open spaces to people living in urban environments is reflected in UK Government’s 2012 National Planning Policy Framework in which the Government set out their high level policy objectives for the provision of open space. This map shows the natural spaces included in the analysis; accessible greens spaces greater than 1ha, accessible water environments, and footpaths and minor roads. The indicator used for this assessment shows the percentage of people who live within a short 600m (10 minutes) walk of an accessible green space.
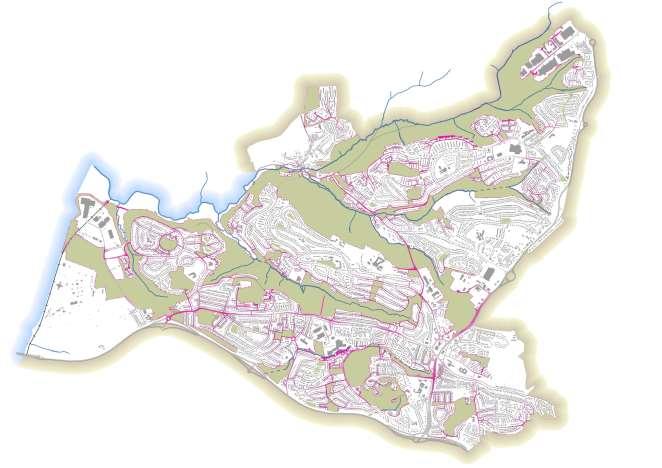
In the map below, darker shades indicate neighbourhoods with better access to natural spaces, while lighter shades indicate poorer access and a greater need/opportunity for improvement.
Data source: Data on accessible green spaces obtained under Open Government Licence from Plymouth City Council via www.data.gov.uk
Benefits Higher Lower Higher Lower Access to Natural Space (Restricted to 600m distance)
Page/Map ID: 12
INDICATOR 2
Impacts of air pollution
The regulation of air quality is an important ecosystem service that delivers significant social benefits. Air pollution, comprised of contaminants such as particulate matter of <10µM (PM10) or <2.5µM (PM2.5) in size, nitrous oxides (NOx) and sulphur dioxides (SOX), can reduce life expectancy (COMEAP, 2009; DEFRA, 2008) It could cause associated health costs in the UK of up to £15 billion a year (DEFRA, 2008) In addition, it is also thought to have a negative impact on the natural environment and reduce biodiversity (CEH RoTAP Report, 2009)1 .
The estimated background air pollution maps available from the DEFRA UK-AIR website enable the concentrations of air pollutants such as PM10 and PM2 5 to be mapped across the city.
The indicator for air quality was assessed by calculating the average concentration of PM2 5 (using modelled mean background concentration levels for 2019) in each spatial unit. Darker shades in the map below indicate better air quality, while lighter shades indicate poorer air quality and a greater need/opportunity for improvement.
Data source: 1 The Nature of Manchester Local Action Project © Manchester City Council and Westcountry Rivers Trust Ltd. 2018. / Air pollution background concentration maps are published by DEFRA and the Devolved Administrations to assist local authorities in carrying out review and assessment of local air quality as part of their duties under the Environment Act 1995. See https://uk-air.defra.gov.uk/data/laqm-background-home and https://laqm.defra.gov.uk/documents/2015-based-background-maps-user-guide-v1.0.pdf
Air Pollution (PM2.5 Concentration) Higher : 8.7 Lower : 5.8 Benefits Higher Lower
Air Quality Management Area Page/Map ID: 13
INDICATOR 3
Flood risk from rivers and sea (fluvial flooding)
Understanding where residential and commercial properties are at risk of flooding from rivers, and flood risk management, is extremely important as flooding can not only cause a huge amount of physical damage and disruption to an area, but both living at risk of flooding and being flooded can also have a profound effect on the psychological health and emotional wellbeing of the people who live there
Risk of Fluvial Flooding
Higher (>1 in 30 yrs)
Medium (1 in 30 - 1 in 100 yrs)
Lower (1 in 100 - 1 in 1000 yrs)
The Environment Agency Risk of Flooding from Rivers and Sea dataset uses local water level and flood defence data to model flood risk, for different flood likelihoods.
The indicator used to indicate flood risk from rivers and sea is the number of properties located in >1 in 100 year flood risk areas (from rivers and sea).
Very Low (<1 in 1000 yrs) Benefits Higher Lower
In the map below, darker shades indicate neighbourhoods with fewer properties at risk of flooding.
Page/Map ID: 14
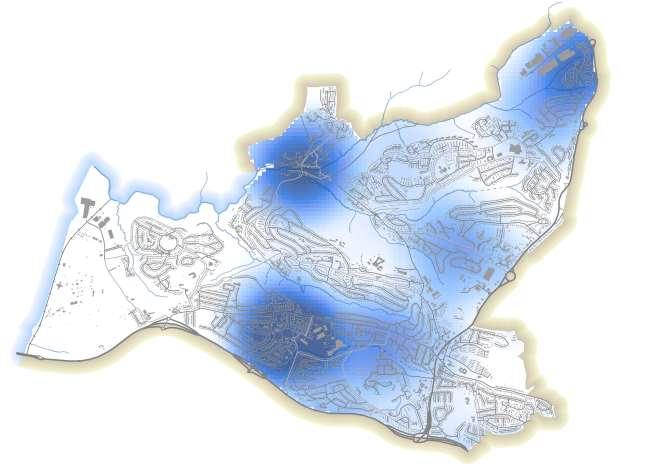
INDICATOR 4
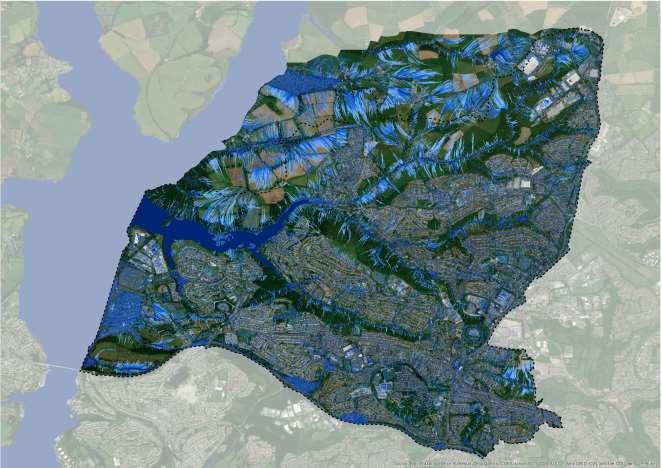
Flood risk from surface water (pluvial flooding)
Surface water flooding happens when rainwater does not drain via the normal drainage systems or soak into the ground, but lies on or flows over the ground instead. Surface water flooding can cause serious problems, particularly as it can often be contaminated with untreated waste water. In addition, as stated previously, living at risk of flooding and being flooded can also have a profound effect on the psychological health and emotional wellbeing of the people who live there.
Risk of Surface Water Flooding
Higher (>1 in 30 yrs)
Medium (1 in 30 - 1 in 100 yrs)
Lower (<1 in 1000 yrs)
The Environment Agency’s Updated Flood Map for Surface Water uses national scale modelling combined with locally produced data where available
The indicator for the social impacts of flood risk from pluvial sources (surface water flooding) was assessed by calculating the number of residential properties located in areas with a greater than 1 in 100 year risk of surface water flooding
In the map below, darker shades indicate neighbourhoods with fewer properties at risk of flooding.
Benefits Higher Lower
Page/Map ID: 15
INDICATOR 5
Aesthetic quality
Cultural services are the non-material benefits people obtain from ecosystems through spiritual enrichment, cognitive development, reflection, recreation, and aesthetic experience (Millennium Ecosystem Assessment 2005).
A number of studies1 have used the distribution of photos taken and uploaded to the internet as an indicator of high quality and culturally important natural resources – i e the aesthetic value of a landscape The indicator for the aesthetic value of the landscape was assessed by calculating the number of Flickr-posted photos per spatial unit, which had been tagged with keywords relating to ecosystems and nature, and ranking them to indicate the highest to lowest need/opportunity for improvement relating to ecosystems and nature.
The main map shows the distribution of nature photos across the study area, highlighting a number of parks and other natural spaces.
In the map below, darker shades indicate a higher aesthetic quality, whereas lighter shades indicate lower aesthetic quality and a greater need/opportunity for improvement.
Data source: Flickr images downloaded from the Flickr API (https://www.flickr.com/services/api/) in accordance with the Flickr Community Guidelines, and the Flickr Terms & Conditions of Use – https://www.flickr.com/help/terms/api / 1 Richard Wagner Figueroa-Alfaro &Zhenghong Tang (2017) Evaluating the aesthetic value of cultural ecosystem services by mapping geo-tagged photographs from social media data on Panoramio and Flickr, Journal of Environmental Planning and Management, 60:2, 266-281, DOI: 10.1080/09640568.2016.1151772 Page/Map ID: 16
Aesthetic Quality - Nature Photos Flickr Photo Site Higher Density Lower Density Benefits Higher Lower
INDICATOR 6 (a)
Cultural activity
Natural infrastructure and open spaces can be used for a variety of cultural activities, presenting opportunities for increased learning, a sense of place, increased environmental awareness and commitment, as well as social cohesion, neighbourhood participation and tolerance.
By adding facilities that support cultural services to existing natural spaces or urban landscapes, significant increases in the benefits provided to local communities can be realised.
! ( Allotments
! ( Play areas
! ( Public slipway
The indicator for natural resources for cultural activities was assessed by determining the number of cultural activity groups or facilities related to nature per 1000 people.
In the map below, darker shades indicate neighbourhoods with a better provision for cultural resources, whereas lighter shades indicate a greater need/opportunity for improvement.
Cultural Activities Higher Lower Benefits Higher Lower
Page/Map ID: 17
INDICATOR 6 (b)
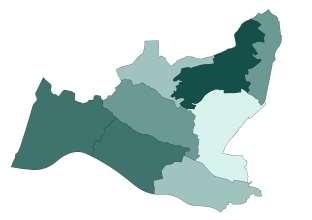
Cultural sites – Scheduled Monuments
Monuments of national archaeological importance are designated as Scheduled Monuments by Historic England. Although archaeology is all around us, Scheduled sites form a carefully chosen sample of them, which are closely managed. Scheduled Monuments are not always ancient, or visible above ground Only deliberately created structures, features and remains can be scheduled There are over 200 categories of monuments on the schedule, and they range from prehistoric standing stones and burial mounds, through to the many types of medieval site - castles, monasteries, abandoned farmsteads and villages - to the more recent results of human activity, such as industrial sites. These Royal Commission fortifications are a group of related sites established in response to the 1859 Royal Commission report on the defence of the United Kingdom.
$ Scheduled Monuments
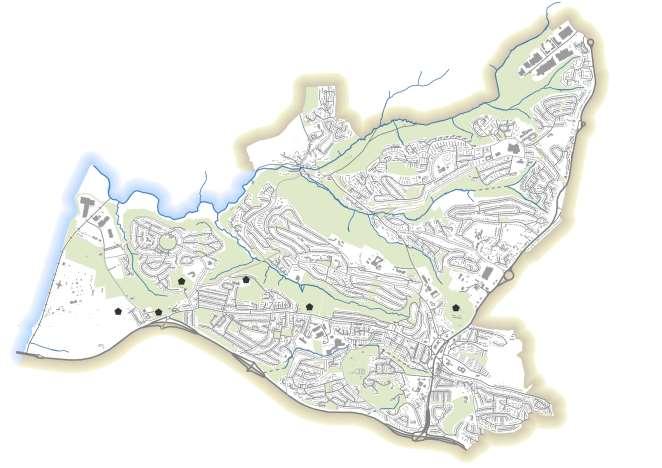
Agaton Fort
Ernesettle Battery
Reference source: https://historicengland.org.uk
Woodland Fort
Knowle Battery
Crownhill Fort
Knowle Battery is now part of Knowle Primary School
Crownhill Fort is accessible to the public via paid open days and bookable events which provides revenue for the upkeep of the Fort.
Ernesettle Battery, Agaton Fort and Woodland Fort are not accessible to the public
Flickr CC MsNice Page/Map ID: 18
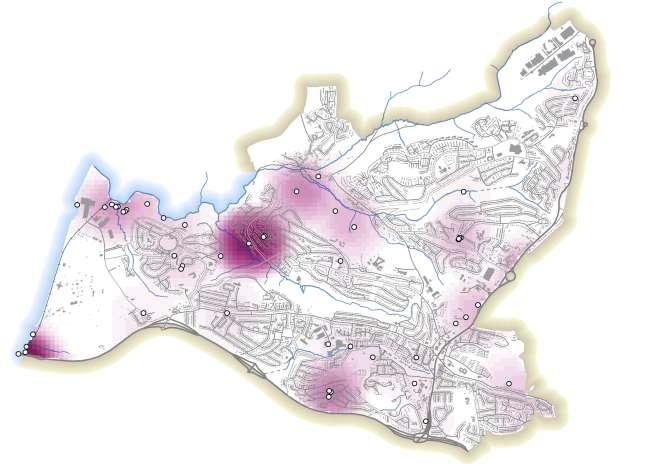
INDICATOR 7
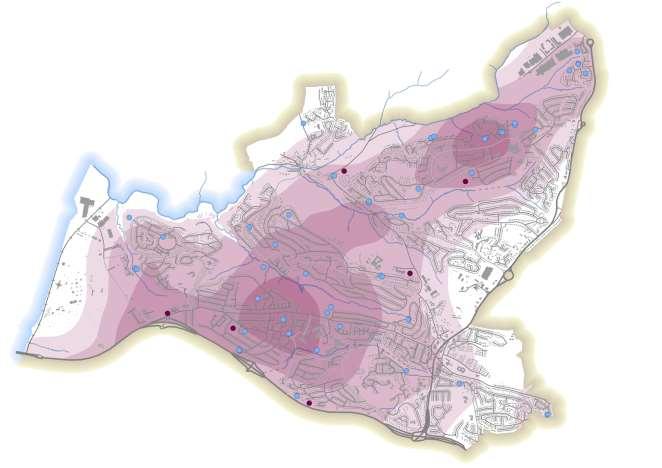
Water quality
The water cycle is one of the fundamental processes that sustains life on Earth. All of us depend on the fresh clean water in our rivers and streams that we drink, use for recreation and leisure, and which sustains the natural world around us. If the waterbodies of urban areas are polluted, then the amenity value of accessible natural spaces can be reduced, it can negatively impact people’s health and wellbeing and it can degrade the ecological health and biodiversity of the water environment.
Pollution Incidents (Water)
$ Category 1 (Major)
$ Category 2 (Significant)
$ Category 3 (Minor)
$ Category 4 (No Impact)
Pollution Incidents (Count per km2)
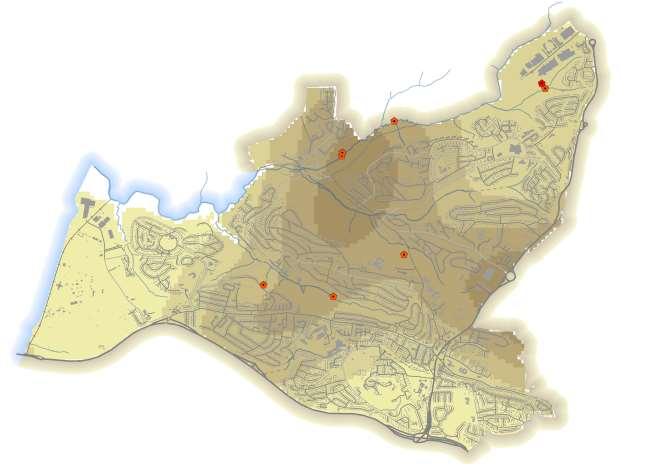
The map shows the density of Category 1 (major) and Category 2 (significant) water pollution incidents recorded by the Environment Agency up to 2016.
The indicator for water quality was assessed by determining the number of pollution events registered by the Environment Agency in each spatial unit. In the map below, darker shades indicate fewer pollution incidents, whereas lighter shades indicate a need/opportunity for improvement
Benefits Higher Lower
Higher Lower
Page/Map ID: 19
INDICATOR 8
Water resource availability
Rivers require sufficient flow to remain in good ecological condition. Water quantity in a river also has a direct bearing on the volumes and concentrations that can be discharged from point sources of pollution as sufficient flows are required to ensure that effluent is diluted appropriately downstream, which is an important consideration for drinking water supplies
The Environment Agency (EA) is responsible for managing water resources in England and they use the catchment abstraction management strategy (CAMS) process and abstraction licensing strategies to do this. No water abstraction points are present within the project area.
Water resource availability
Time water is available for abstraction: less than 30%
least 30%
least 50%
least 70%
least 95%
White areas have not been assessed
The indicator for low flows was assessed by determining the water reliability predicted for each waterbody in the EA’s CAMS process, averaging this out across each spatial unit. Darker shades in the map below indicate better reliability of water supply, whereas lighter shades show a greater need/opportunity for improvement
N.B. This indicator is not a relative score within the urban area, but a reporting of the environmental performance against the national benchmark
at
at
at
at
Benefits Higher Lower Page/Map ID: 20
INDICATOR 9
Wildlife habitats
The species and biodiversity that occur in an urban area are supported by the network of natural habitats and greenspaces that currently exist in the landscape. Ecological theory suggests that the habitat patches must be of a particular diversity and extent, and have sufficient connectivity (corridors) between them in order for the landscape to have a functional ecological network and for the assemblage of wildlife species to be supported at the correct or desired level
The priority habitat inventory dataset provided by Natural England (NE) shows the distribution of habitats of principal importance, identified in the Natural Environment and Rural Communities (NERC) Act (2006). It replaces NE’s previous separate Biodiversity Action Plan (BAP) habitat inventories.
Priority Habitats
Coastal saltmarsh
Deciduous woodland
Intertidal Mudflats
Reedbeds
The indicator for habitat provision was assessed by determining the area of priority habitats in each spatial unit
In the map below, darker shades indicate higher biodiversity, whereas lighter shades show a greater need/opportunity for improvement.
Benefits Higher Lower
Page/Map ID: 21
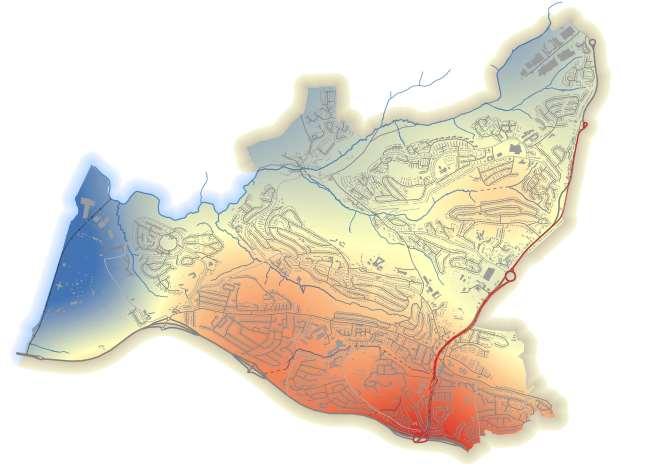
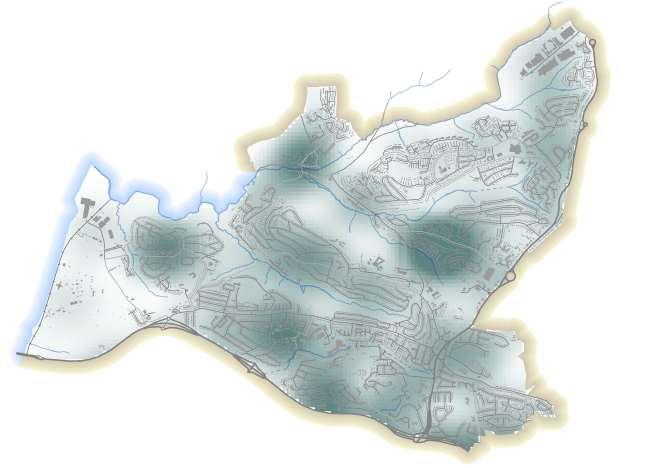
INDICATOR 10
Local climate regulation (‘urban heat island’)
Health and wellbeing can be severely impacted by the urban heat island effect, which is a result of the large areas of heat-absorbing surfaces in combination with higher energy usage in city areas1 . Vegetation and urban trees reduce urban temperatures through shading and the consumption of heat energy through evapotranspiration Additionally, in winter trees reduce heating costs by disrupting wind speeds2
Thermal imagery data acquired from Landsat 8 shows temperature variation across the study area, during the summer months.
The indicator used for this analysis is the average temperature in each ward as determined using this Landsat 8 thermal imaging
In the map below, darker shades indicate cooler summer temperatures, whereas lighter shades indicate typically warmer temperatures and therefore a greater need/opportunity for improvement
Reference source: 1. Ecosystem services in urban areas, Bolund & Hunhammar, 1999 / 2. Quantifying urban forest structure, function and value: The Chicago Urban Forest Climate Project, McPherson et al. 1997.
Temperature Warmer Cooler
Benefits Higher Lower Page/Map ID: 22
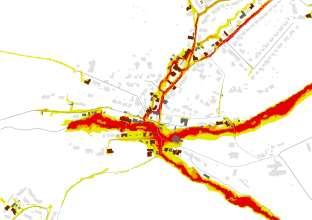
INDICATOR 11 (a)
Flood costs – Residential properties
In addition to the social impacts (especially psychological health and wellbeing) resulting from people living at risk of flooding and being flooded, there are also economic impacts of flooding – the actual cost of the damage done and the impacts on the local economy of infrastructure damage and disruption to services This calculation must take into consideration the type of property that may be flooded (residential or commercial), the likelihood of flooding and the severity of the flooding predicted to occur.
Residential Properties at Risk of Surface Water Flooding
Higher
Lower
Surface water flood damage - A simplified application of the NaFRA Damage Calculation Methodology (EA, 2013) was used to estimate annual flood damage costs. The number of residential properties and the area of commercial properties in different flood risk zones were identified for each ward and estimated annual damage costs were calculated using the values given in the NaFRA report. Area and grade of agricultural land was also taken into account.
Tamerton Foliot area
RiskofSurfaceWaterFlooding
Higher(1in30years)
Medium(1in100years)
Lower(1in1000years)
PropertyType
ResidentialBuildings
CommercialBuildings
Reference source: For more information on the process taken, see the ‘Local Action Toolkit (LAT) Mapping Methodology’ and the ‘Local Action Toolkit’ (LAT) Report’, available at the project website (http://urbanwater-eco.services/).
Page/Map ID: 23
INDICATOR 11 (b)
Flood costs – Commercial properties
Flood costs relating to commercial properties can be direct (e.g. physical damage to property and/or stock) and/or indirect ( e.g. disruption to, or loss of, business) Studies have suggested that the indirect impacts of flooding often have a greater impact than direct impacts (Heite et al , 2009; Kleindorfer and Germaine, 2005)1
The indicator was generated using the Environment Agency’s (EA) National Flood Risk assessment (NaFRA). The indicator for the cost of surface water flood damages was assessed by calculating the total estimated cost of flood damages in a year in each neighbourhood.
The darker shades in the map below indicate lower risk of incurring flood costs, whereas the lighter shades indicate the greatest need/opportunity for improvement.
Reference source: 1 https://www.rics.org - Flood risk mitigation and commercial property advice: An international comparison (March 2017)
Commercial Properties at Risk of Surface Water Flooding Higher Lower
Benefits Higher Lower Page/Map ID: 24
INDICATOR 12
Property value
It has been shown that a high-quality public environment that is pleasant and well-maintained increases footfall in retail areas and offers very clear benefits to the local economy in terms of stimulating increased house prices, since house-buyers are willing to pay to be near green or blue space. In fact, there are a number of factors, both environmental and socioeconomic, that have a positive and/or negative impact on the quality of life (or ‘liveability’) of the urban landscape and several studies have now used the value of property as an indicator of this landscape quality or value.
Average Property Price (2018)
Higher
Lower
Average property prices - This data set was Land Registry Price Paid, for properties sold in 2018.
The indicator for property value was assessed by calculating the average price paid for a property in 2018 in each neighbourhood
Darker shades in the map indicate neighbourhoods which have a lower need/opportunity for improvement in ‘liveability’, whereas lighter shades show a greater need/opportunity for improvement.
Page/Map ID: 25
Waterbody Characteristics and Pressures
The following section of this report provides details on the characteristics of the streams in the project area, including habitats for fish, riparian (or bankside) habitats, barriers to fish migration and potential sources of pollution.
The information contained in this section will be built upon over the course of the project and used to prioritise and drive decisions on Westcountry Rivers Trust’s actions within the project area.
© Natural England/Chris Gomersall
WATERBODY CHARACTERISTICS
Tamerton Stream Catchment
Tamerton stream drains a relatively small (13km2), undulating, steep-sided catchment area north of the A38 on the outskirts of Plymouth and flows into the main stem of the River Tamar upstream of the Tamar Bridge.
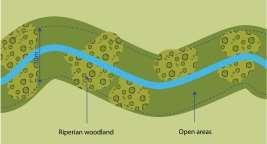
The catchment drains a predominantly urban area comprising of residential housing with some industry. The steep sides of the catchment lead to rapid runoff which is further exacerbated by surface water drainage from the extensive impermeable areas. The riparian corridor itself largely comprises community greenspace and degraded woodlands, some of which form Local Nature Reserves. The streams are typical of many in urban settings and suffer from issues such as neglect and antisocial behaviour, barriers to fish migration and a large number of surface water outfalls.
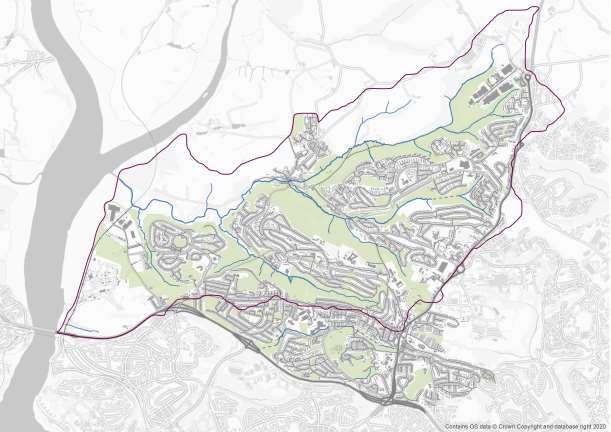
The catchment area of a river or stream is the area of land over which water, such as rainfall, is collected by the natural landscape, eventually feeding into the river or stream.
Factors which determine how water moves through the catchment include how hilly or flat the landscape is, the soil type, and whether the land is covered by natural surfaces (e.g. grassland or woodland) or artificial surfaces (e.g. buildings, roads and pavements)
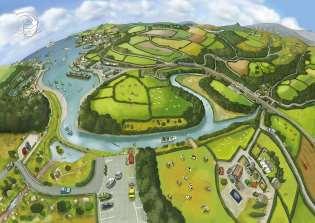 Catchment Vision © Brian Hopkins
Page/Map ID: 26
Tamerton Stream Surface Water Catchment
WATERBODY CHARACTERISTICS
Reaches
For the purposes of the 2017 Westcountry Rivers Trust walkover survey, the Tamerton Stream surface water catchment was divided into three broadly consistent reaches / sub-catchments, based on the geography and the nature of the reach, and the pressures exerted upon it.
The objective of the walkover survey was to gather information about the location and extent of the various physical habitat features present along and immediately surrounding the river, so that an assessment could be made about the habitat quality and quantity (instream and bankside) primarily with regards to Salmonids, although other fish species were considered.
Reach 1 (Budshead Creek)
Reach 2
Reach 3 (Tamerton Stream)
Mudflats
Ernesettle Creek
Reference source: Tamerton Stream and Budshead Creek Walkover Survey, Westcountry Rivers Trust (March 2017)
The 2017 walkover survey was conducted along Reaches 1-3 with an additional walkover of the estuarine habitat (mudflats) below the Normal Tidal Limit (NTL). Ernesettle Creek was not surveyed during the 2017 walkover but is included within the Plymouth River Keepers project area.
Reach Locations:
Reach 1 – Berwick Avenue, Crownhill to Budshead Creek.
Reach 2 – Crownhill Fort / Southway (Goodwin Park) to Tamerton Foliot.
Reach 3 – Belliver / Haxter Wood / Porsham to Tamerton Foliot.
Mudflats - Tamerton Foliot to Budshead Creek.
Ernesettle Creek – Tamerton Lake to land adjacent to Redhill Close.
Page/Map ID: 27
WATERBODY CHARACTERISTICS
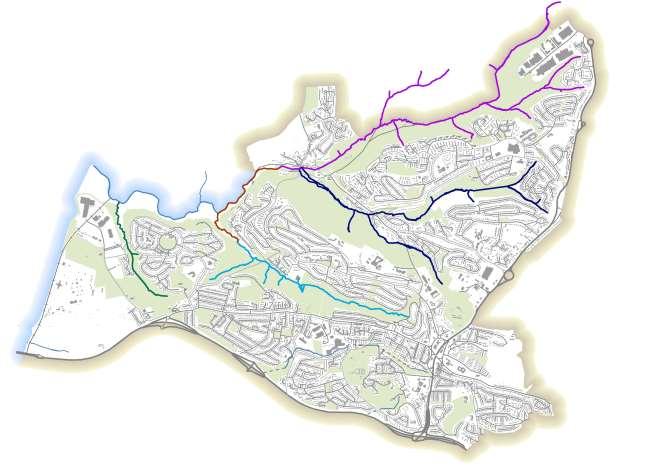
Fisheries Habitat (2017)
Fisheries habitats need to be healthy and functioning to provide refuge and food for all life stages of fish, to support spawning, nursery areas, feeding and growth to maturity.
Therefore, a productive river, in terms of its fisheries, needs to contain a diversity of habitats, as listed in map key below.
Culvert
Bedrock
Chute
Fry
Glide
Modified Channel
Parr
Pool
Silted Spawning
Spawning
Reference source: Tamerton Stream and Budshead Creek Walkover Survey, Westcountry Rivers Trust (March 2017)
Reach 1 – Fry habitat was the most common habitat in Reach 1, broken in places by chutes and glides with a small amount of parr habitat near the normal tidal limit (NTL), providing sanctuary for territorial salmonids.
Reach 2 – The fisheries habitat in Reach 2 was more diverse than in Reach 1, alternating parr and fry habitat in many places. However, the habitat was heavily shaded which may negatively impact on the productivity of the Reach.
Reach 3 – The fisheries habitat in the upper section of Reach 3 was fairly uniform fry habitat. In contrast, the lower section offers a combination of fry, parr, glides and pools. The habitat in this Reach was also heavily shaded.
Mudflats - The habitat below the NTL was typical of a muddy estuary, with mudflats, glides from the NTL downwards and no overshading due to the extensive channel width.
Page/Map ID: 28
WATERBODY CHARACTERISTICS
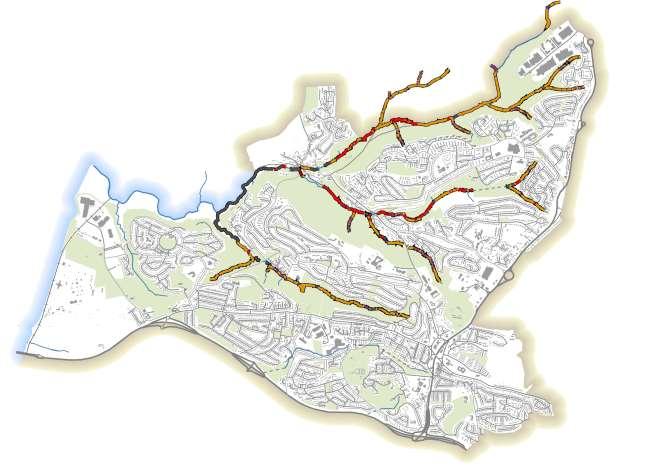
Bankside Habitat (2017)
Rivers and streams need an adequate supply of sunlight to support primary production and their complex food web. Heavy shading and tunnelling (a completely closed canopy) can therefore impact the in-stream biodiversity. All of the reaches are over shaded and would benefit from targeted coppicing. Good practice follows the 80:20 rule when clearing bankside vegetation; 80% of shade is kept on pool habitats to provide larger fish with a refuge from direct sunlight and help to reduce the risk of high water temperatures that may be lethal for salmonids; 20% of shade is kept for fry gravel areas / shallow riffle habitats to increase productivity which will benefit the whole river in terms of food supply. Elsewhere, it is of benefit to create a ‘dappled shade,’ where water temperatures don’t get too high yet there is enough sunlight for primary production of algae and aquatic plants.
Bank Erosion
Bankside Fencing
Revetment
Shaded
Tunnelled Vegetation (abandoned coppice)
Tunnelled Vegetation (standards)
 Reference source: Tamerton Stream and Budshead Creek Walkover Survey, Westcountry Rivers Trust (March 2017)
Typical shaded section, Reach 2.
Reference source: Tamerton Stream and Budshead Creek Walkover Survey, Westcountry Rivers Trust (March 2017)
Typical shaded section, Reach 2.
Page/Map ID: 29
Culvert
WATERBODY CHARACTERISTICS
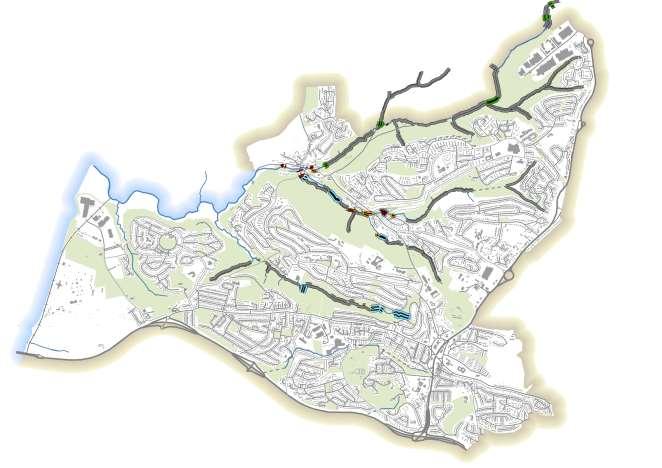
Debris (2017)
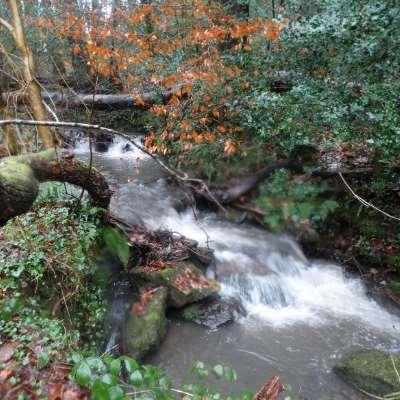
Woody debris plays a vital role in river/stream ecosystems. It can create habitat diversity which can be beneficial in areas where the positive impacts of this diversity outweigh the risk of barriers to fish migration. Woody material offers a range of microhabitats for aquatic organisms at various stages of their growth; traps sediment and creates a variety of velocities within the river (suiting invertebrate species that do not thrive in strong currents and gravel beds) and provides in-stream cover that is essential for Brown Trout spawning.
Anthropogenic debris, litter and fly-tipping however, not only detracts from the aesthetic value of the streams but also creates issues associated with fish passage/migration. This debris also poses other risks to wildlife (e.g. by trapping/entanglement and ingestion) and may be transported into the River Tamar, eventually flowing out to sea where it could continue to negatively impact upon animals and their habitats.
k Large Woody Debris (2017)
k Coarse Woody Debris (2017)
! Debris (2017)
Culvert
Reference source: Tamerton Stream and Budshead Creek Walkover Survey, Westcountry Rivers Trust (March 2017)
In addition to woody debris, in-stream debris identified included shopping trolleys, bicycles, scooters, tyres, building materials, and garden waste, in addition to general litter. There was also a large amount of debris on the banks of the streams which added to the neglected nature of the area as a whole and posed a risk to wildlife.
 Woody in-stream debris
Page/Map ID: 30
WATERBODY CHARACTERISTICS
SCIMAP
SCIMAP (Sensitive Catchment Integrated Modelling Analysis Platform - www.scimap.org.uk) is a piece of modelling software used to help understand diffuse pollution. Diffuse pollution is pollution which does not come from a single source, but from widespread activities across the catchment. Together these multiple diffuse sources can cause pollution problems in rivers and streams. Pollution can be picked up as water moves across the land, such as runoff from agricultural fields or from roads and urban areas. Hydrological connectivity mapping in SCIMAP models the areas where water is more likely to flow across the surface.
Hydrological Connectivity
High
Boundary
Hydrological connectivity
In some locations water has a greater propensity to run over the surface and collect due to the shape of the land and the size of the upstream catchment area. These areas are of critical importance to the regulation of water quality as moving water has the greatest chance of becoming contaminated and/or they are where contaminated water may be moving along a pathway.
Tamerton Foliot area
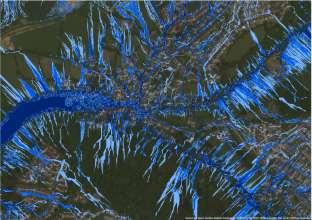
Reference source: https://www.scimap.org.uk/
Low Project
Higher Lower
Page/Map ID: 31
WATERBODY PRESSURES
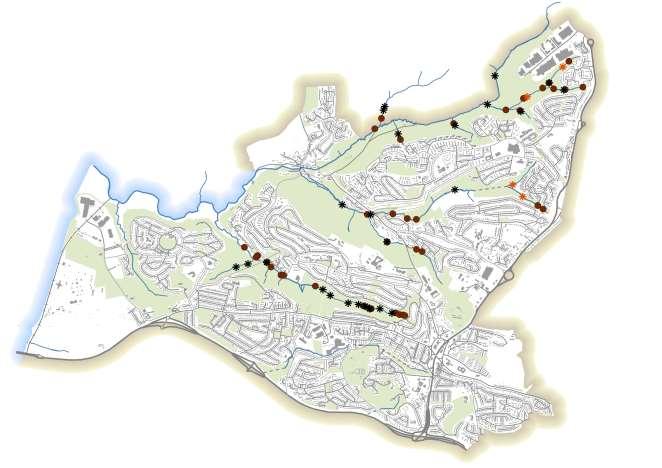
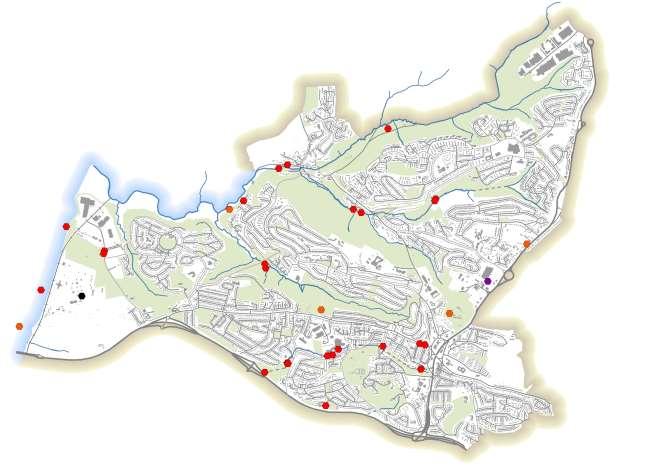
Environmental pollution incidents - Water (Category 1 and 2)
Environmental pollution incidents to water, land and air are categorised by their impact on the environment and people – Category 1 (major), Category 2 (significant), Category 3 (Minor) and Category 4 (No impact).
The map below shows Category 1 and 2 pollution incidents (water) occurring in the project area between 2004 - 2020. The Category 1 incident relates to the 2016 pollution incident which led to the Enforcement Undertaking and subsequently the creation of the Plymouth River Keepers project.
A FOI request revealed that during 2019/2020 there had also been eight Category 3 and three Category 4 pollution incidents in the project area.
$ Category 1 (Major)
$ Category 2 (Significant)
Please report environmental incidents, such as pollution to water or land, dead or dying fish or damage to the natural environment immediately to the Environment Agency 24/7 service:
Hotline: 0800 80 70 60
Email: ics@environment-agency gov uk
Environmental Impact Level (Water)
Sewage related litter and pollution from an outfall © South East Rivers Trust
Page/Map ID: 32
WATERBODY PRESSURES
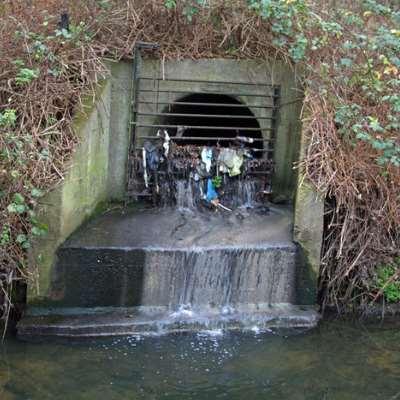
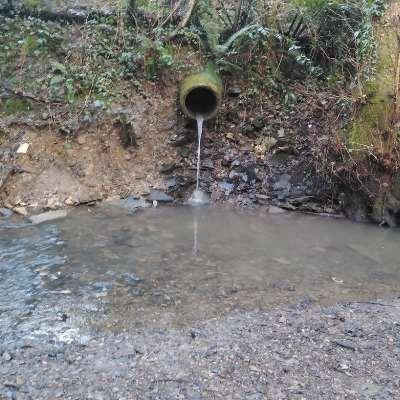
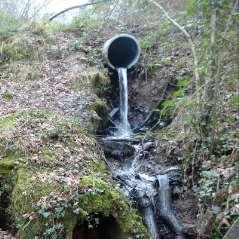
Surface Water Outfalls (2017)
Surface water outfalls carry rainfall run-off into rivers via a network of pipes. They can a be a source of serious pollution in urban rivers. For example, misconnections such as incorrectly plumbed (‘misconnected’) household appliances can cause wastewater to make its way into the surface water system via drains, resulting in grey water. Rainfall run-off can also carry a range of other potential contaminants with it, from chemicals used in gardens such as slug pellets, weed killer and fertiliser, to oil and particles from tyres and brake discs, and any chemicals disposed of directly down the drain such as paint or oil, or the detergent and water from washing a car on the street or driveway.
# Surface Water Outfalls (2017)
In 2017 over 50 surface water outfalls were identified, including eighteen in Reach 1, nineteen in Reach 2 and sixteen in Reach 3.
Following rainfall, the surface water outfalls make up a significant proportion of the flow in the streams and thus have a significant impact on the water quality, resulting in cloudy / turbid / grey / brown water.
Page/Map ID: 33
Reference source: Tamerton Stream and Budshead Creek Walkover Survey, Westcountry Rivers Trust (March 2017)
Culvert
Surface water outfall – actively discharging
WATERBODY PRESSURES
Consented discharges to controlled waters
A permit is required for releasing potentially polluting liquids (such as sewage or waste water from factories and industries) into or onto the ground (i.e. to groundwater) or into surface waters (such as rivers or streams). This includes combined sewer overflows (CSOs). During intense or prolonged rainfall, the UK's combined sewer system, which also takes surface water from roads, can sometimes become overloaded. CSOs provide a vital release valve to allow excess waste water to be released to local waters to avoid sewers being overwhelmed and waste water 'backing up' along sewers and flooding streets and properties, or overwhelming waste water treatment plants. The backflow of waste water to properties and streets would present human health hazards, and flooded and overflowing treatment plants would disrupt treatment processes.
% , Agriculture
% Miscellaneous
% Sewage - not water company
% Sewage - water company
% Sewage and Trade combined
% Trade
% Waste site
With our sewer systems already under pressure, we all have the power to help prevent problems arising by only flushing the 3Ps – Pee, Poo and toilet Paper down the toilet.
Wet wipes, sanitary items and cottons buds should be disposed of safely in a bin and not flushed down the toilet as this can lead to blockages and cause sewer related pollution in our streams, and sometimes even in our homes.

Reference source: www.southwestwater.co.uk
Page/Map ID: 34
WATERBODY PRESSURES
Historic Landfill Sites and Permitted Waste Sites
Historic landfill sites are places where records of waste being received to be buried are now closed, meaning there is no Pollution Prevention and Control (PPC) permit or waste management licence currently in force. This includes sites that existed before the waste licensing regime, if a site has been licensed in the past, and this licence has been revoked, ceased to exist or surrendered and a certificate of completion has been issued. Some historic landfills were not well built or regulated so are more likely to be point sources of pollution than current waste sites. The map below shows historic landfill sites within or adjacent to the Plymouth River Keepers project area.
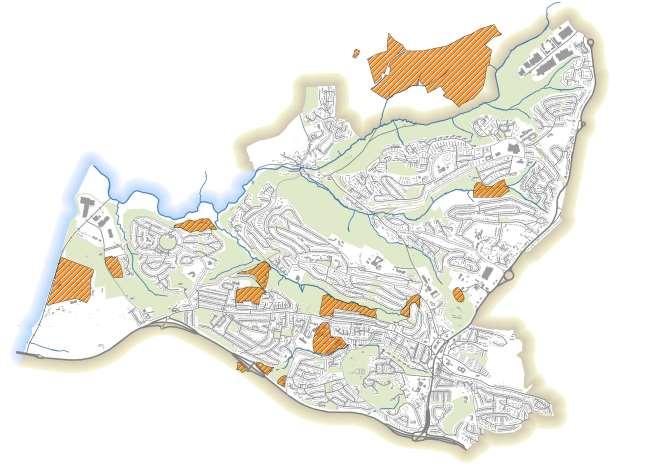
There are no Permitted Waste Sites (Authorised Landfill Sites) within or directly adjacent to the Plymouth River Keepers project area. These are sites that are currently authorised by the Environment Agency under Environmental Permitting Regulations. These sites are less likely to be point sources of pollution than Historic Landfill Sites due to current environmental regulations. Reference
source: www.environment-agency.gov.uk / www.catchmentbasedapproach.org Page/Map ID: 35
Historic Landfill Sites
WATERBODY PRESSURES
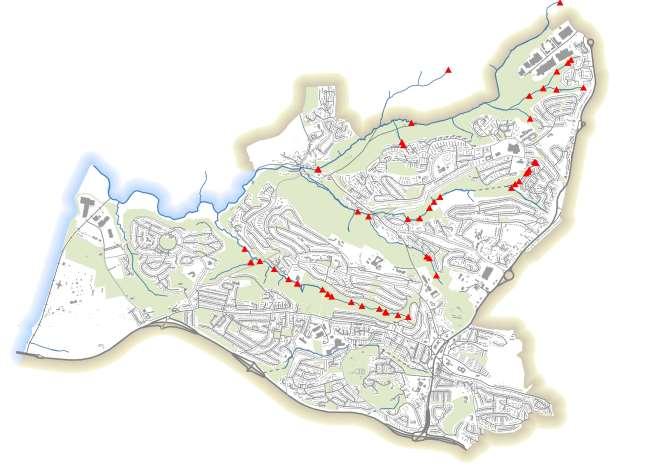
Barriers to Fish Migration (2017 and 2020)
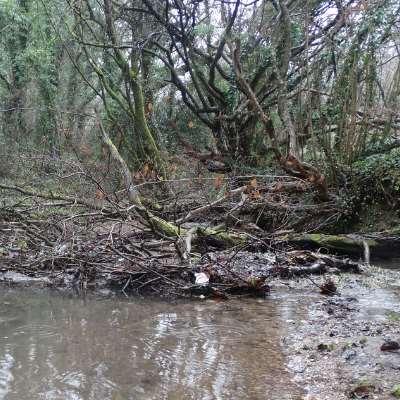
For fish to flourish, connectivity between their habitats is crucial to allow free passage for all fish, no matter what life history stage, to allow access to vital adult, juvenile and breeding habitat. Good access also allows fish to avoid areas that will negatively impact upon them, such as low flows or pollution incidents. Barriers can prevent the free movement of fish and could isolate a resident population in the streams, as a result the population could struggle to escape from and/or recover from pollution incidents. Barriers to migration also result in a reduced effective breeding population, fragmenting the population into reproductively isolated units and thus impacting on the genetic structure. All of these factors will affect the abundance of the population and its long-term viability.

In 2017, 8 barriers were identified in Reach 1, 14 in Reach 2 and 7 in Reach 3. In 2020, 2 additional barriers were identified in Reach 2.
Urbanisation of the catchment and particularly culverting has created multiple barriers to fish passage Barriers included man-made structures such as weirs, pipes, culverts and a crossing point with a dam, as well as accumulated woody debris, litter and a shopping trolley trapping waste.
 Reference source: Tamerton Stream and Budshead Creek Walkover Survey, Westcountry Rivers Trust (March 2017)
! P Barrier to Fish Migration (2017) Culvert
Culverted tributary – barrier to fish migration
Reference source: Tamerton Stream and Budshead Creek Walkover Survey, Westcountry Rivers Trust (March 2017)
! P Barrier to Fish Migration (2017) Culvert
Culverted tributary – barrier to fish migration
Page/Map ID: 36
Plymouth River Keepers’ Actions
The final section of this report summarises the main actions being undertaken by Westcountry Rivers Trust so far, including water quality monitoring, fish surveys and farm advice
PLYMOUTH RIVER KEEPERS ACTIONS
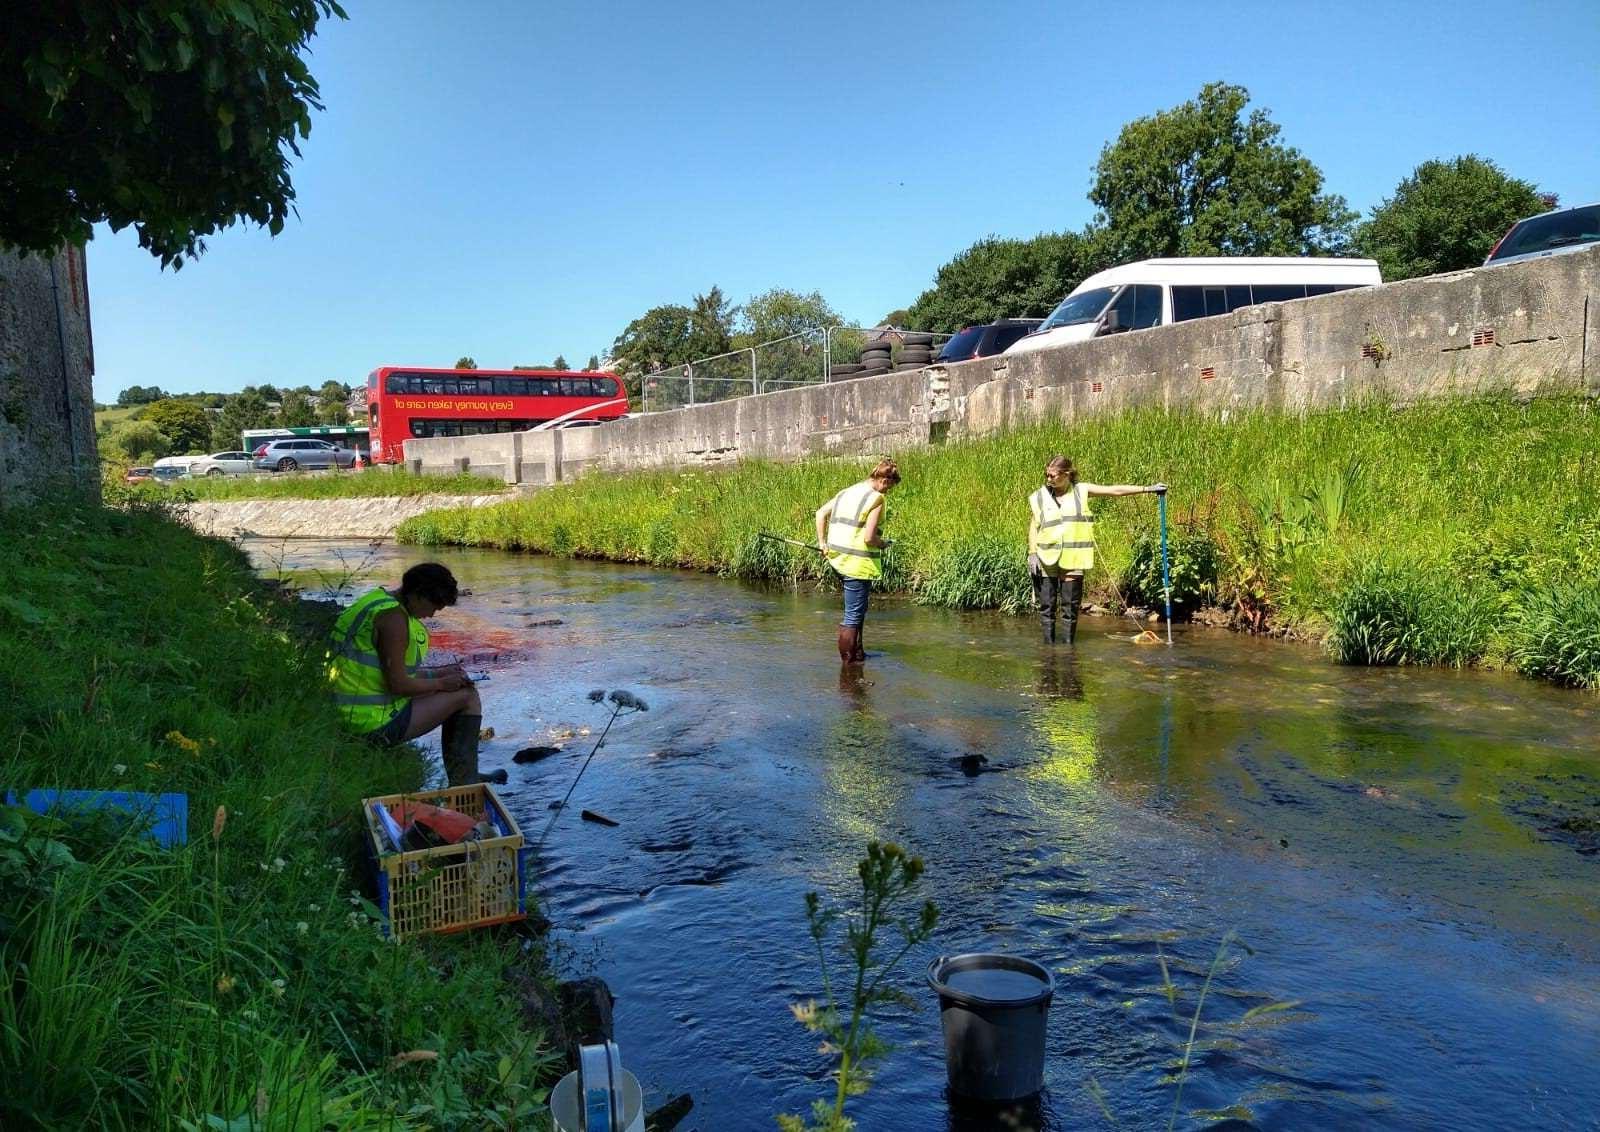
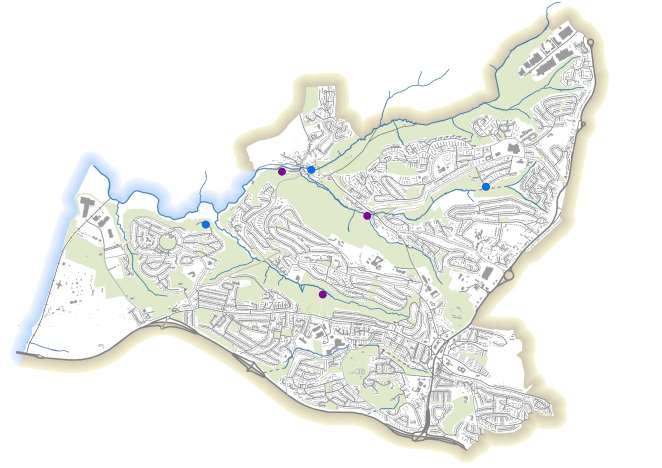
Water Quality Monitoring
Water quality monitoring aims to establish baseline levels of a range of indicators of river health within the streams; identify, locate and characterise pollution sources; monitor water quality changes throughout the project and engage local communities.
Monthly spot sampling by Westcountry Rivers Trust staff commenced in November 2020 and will continue for the length of the project. It can take time to build up an accurate picture of water quality due to fluctuations in rainfall, temperature and other variables throughout the seasons. The first set of water quality data will be shared with the community in autumn/winter 2021 once a full year’s worth of data has been collected.

Spot sampling points measure:
• Temperature
• Electrical Conductivity
• Turbidity
• Suspended Sediment
• Colour
• Phosphates
• Dissolved Oxygen Saturation
• Dissolved Oxygen Concentration
• Colour Dissolved Organic Matter (CDOM)
• Optical Brightening Agents (OBA)
A static probe (an Aqua Troll 200) has been installed in the catchment. The probe will automatically collect data every 15 minutes:
• Electrical conductivity
• Depth
• Temperature
This data will be transmitted via telemetry to an online platform that will be available to the community to view.
Spot
!
Sampling Point
Page/Map ID: 37
PLYMOUTH RIVER KEEPERS ACTIONS
Westcountry Citizen Science Investigations (CSI)


Westcountry CSI is a volunteer program which aims to educate and engage people with the water environment, to produce data that can be used to target work and identify degrading water bodies, to spot pollution events so that they can be dealt with as quickly as possible and to create a network of catchment communities that are invested in their local environment.
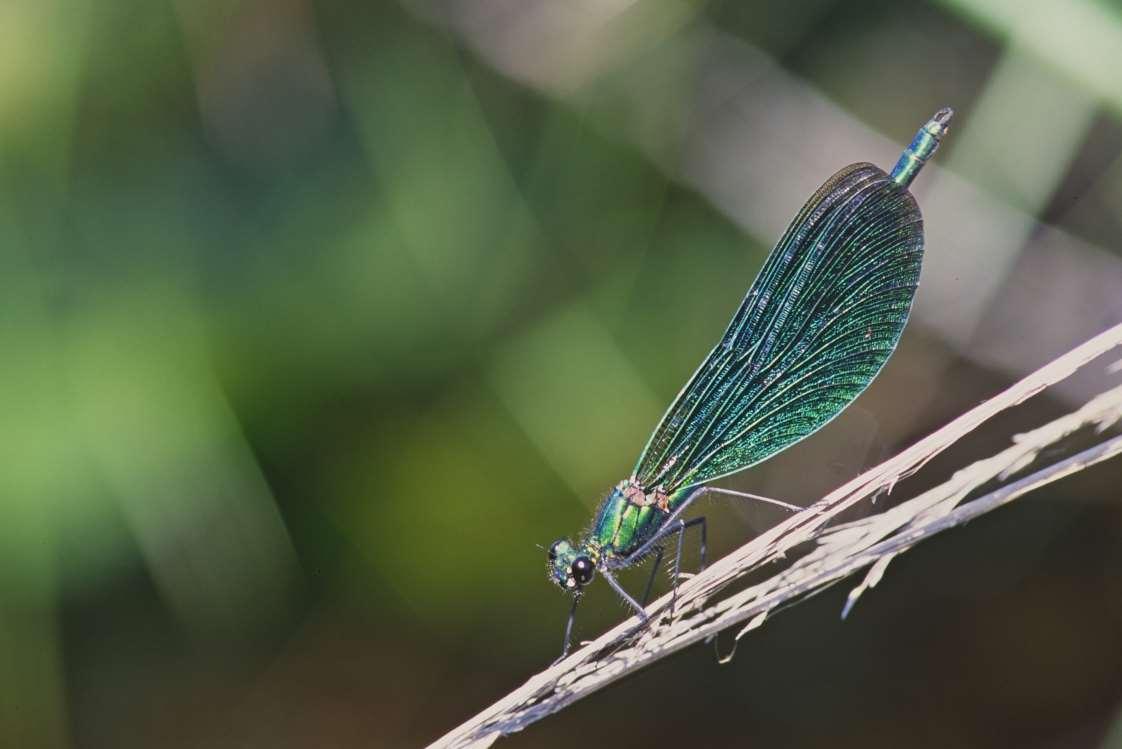
Riverfly will be incorporated into the CSI program, with quarterly kick-sampling to assess the health of aquatic invertebrate communities which reflect water quality due to their sensitivity to pollution. The Riverfly Partnership aims to protect the water quality of our rivers, further the understanding of riverfly populations and actively conserve riverfly habitats. Riverflies are mayflies, caddisflies and stoneflies, and more than 270 species have been recorded in the UK.

Proposed Sample Points
! CSI Sample Point
! CSI & Riverfly Sample Point
The project aims for Westcountry CSI to be carried out by community volunteers supported by Westcountry Rivers Trust staff.
Westcountry CSI points are sampled monthly to measure:
• Temperature
• Total Dissolved Solids
• Turbidity
• Phosphate
Visual survey includes invasive plant species, wildlife, visible sources/evidence of pollution
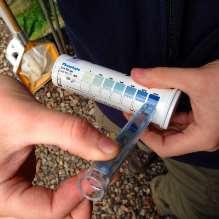
Phosphate testing kit. Photo © Bioregional Learning Centre
Page/Map ID: 38
PLYMOUTH RIVER KEEPERS ACTIONS
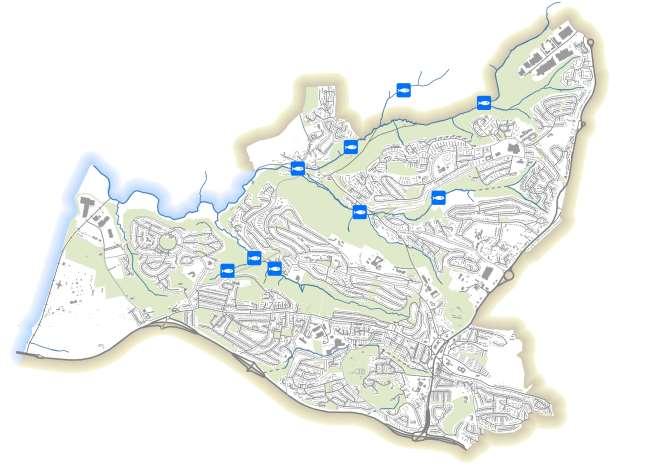
SNIFFER Surveys
An assessment of barriers to migratory fish species, ‘SNIFFER’ protocol, looks in-depth at barriers (such as weirs) to give expert judgement of its “passability” in terms of different migratory fish species. During the process many measurements are taken such as head height, flows, depth and transect across the barrier itself. All this data is inputted into the protocol using a dedicated guidance manual to give a final assessment. This detailed approach allows us to not only judge individual barriers but make an assessment of catchment scale priorities for fish passage solutions.
SNIFFER surveys of the fish migration barriers in our project area will determine their impact on the catchment. A prioritization exercise will ascertain which barrier works would provide the most benefit.
! SNIFFER Survey Locations
Reference source: Fisheries Plan for the Plymouth River Keepers Project, Westcountry Rivers Trust (December 2020)
The SNIFFER protocol is a technique developed by the Scottish and Northern Irish Forum For Environmental Research (SNIFFER).
SNIFFER surveys of 19 fish migration barriers began in Spring 2021
Barrier removal works are proposed to be undertaken from Summer 2021.
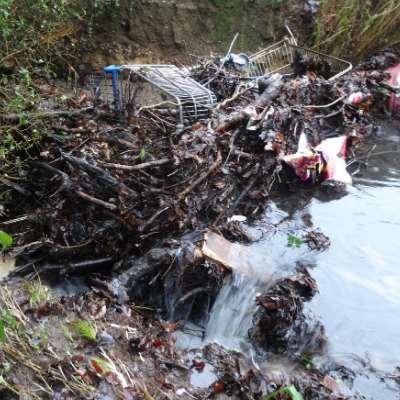 Trolleys trapping waste and creating a barrier to fish migration.
Page/Map ID: 39
PLYMOUTH RIVER KEEPERS ACTIONS
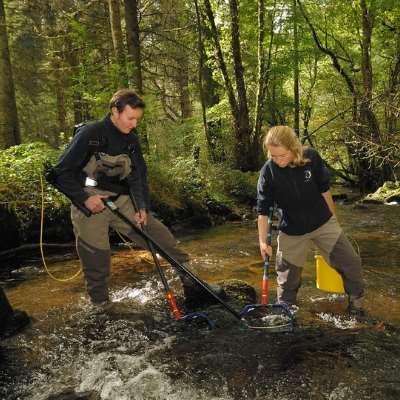
Electrofishing Surveys
Electrofishing uses a controlled electric current to temporarily immobilise fish or influence them to swim in a particular direction to be caught with a hand net, and thereby be counted and assessed. When carried out correctly by experienced and qualified surveyors, it is not harmful to fish and the fish are released back to the same location they were caught.
Electrofishing is one of the most accurate methods of assessing fish populations. It can be qualitative (to determine presence/absence), semiquantitative (determine presence/absence, abundance of juveniles and fish sizes) or quantitative (allow an accurate count of the number of fish present, including species, size and age). Westcountry Rivers Trust will be undertaking fully quantitative electrofishing in the Plymouth River Keepers project area.
! Electrofishing Sites
Electrofishing surveys of nine sites throughout the catchment are proposed to take place in summer 2021 prior to barrier works and habitat works, and again in summer 2022 and 2023 after the works. This will allow us to assess the impact of barriers to fish passage on populations and to inform the effectiveness of the works undertaken. (proposed locations)
Reference source: www.wrt.org.uk / https://catchmentbasedapproach.org / Fisheries Plan for the Plymouth River
Project, Westcountry Rivers Trust (December 2020) Electrofishing
Keepers
Page/Map ID: 40
PLYMOUTH RIVER KEEPERS ACTIONS
Fixed-Point Photography (FPP) Posts and Time-lapse Camera
Fixed-point photography posts aim to encourage community engagement and provide a set of photographs which can be used for analysis and engagement, including creating a time-lapse video.
A time-lapse camera has also been installed in the catchment. The camera is set to capture every 15 minutes and in addition has a motion sensor to capture when movement occurs. The photographs will be used to create a time-lapse video to allow visual assessment of changes to water level and colour/turbidity, as well as changes to in-river and riparian habitats throughout the seasons and in relation to habitat management works.
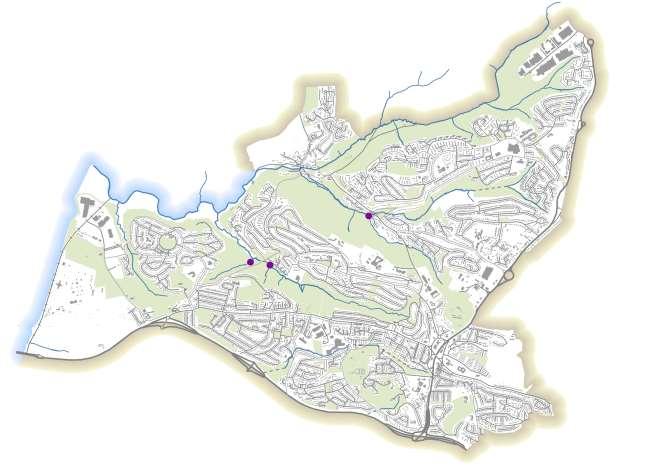
! Fixed Point Photography Posts
Installation of three fixed-point photography posts is proposed for summer 2021.
Photographs can be taken with a camera or a smartphone and emailed to Westcountry Rivers Trust or uploaded to social media #PRKNature
We aim to have at least 50 photographs provided from the FPP posts during the course of the project.
Page/Map ID: 41
PLYMOUTH RIVER KEEPERS ACTIONS
River Clean-ups, Litter Picking and Plastics Surveys
Clean-ups of the river habitats and surrounding areas will begin in summer 2021. This will include the removal of the debris and rubbish dams to remove these barriers to fish migration in addition to the removal of large items of fly-tipping which are negatively impacting the streams.
Plymouth River Keepers will also be working in partnership with Preventing Plastic Pollution (PPP) in the project area. We will be holding community litter picks and litter surveys. The PPP litter surveys help to inform the project of the types and quantities of litter entering our waterways. This information will then be fed back into a hotspot map which can be used to inform intervention work. The information collected in these surveys will also be used in a model that will be produced to predict areas of litter accumulation in other catchments across the world.
Proposed Event Locations
Litter Pick and Survey
Pop-up Event with Litter Pick and Survey
Preventing Plastic Pollution:
Working in partnership with 17 other organisations from across France and England, Westcountry Rivers Trust is proud to be a part of the Preventing Plastic Pollution (PPP) project.
This seeks to understand and reduce the impacts of plastic pollution in the marine environment.
By looking at catchments from source to sea, the project will identify and target hotspots for plastic, embed behaviour change in local communities and businesses, and implement effective solutions and alternatives.

Page/Map ID: 42
! ! (
PLYMOUTH RIVER KEEPERS ACTIONS
Farm Advice
WRT Farm Advisors began working with farmers and landowners to the north of the Plymouth River Keepers project area in 2020.
For eligible farms in the area, Farm Advisors will undertake a full farm survey and provide a farm plan with an aim to deliver land management advice and on-farm measures to minimise pollutant loss from farms while maximising efficiency & enhancing ecological health.
Farm visits and plans / interventions to benefit the environment and water quality:
• Reducing pollution e.g. from run-off
• Management of water courses
• Natural flood management (NFM) options
• Farm waste management, including plastics with Preventing Plastic Pollution (PPP) project
• Soil health
Page/Map ID: 43
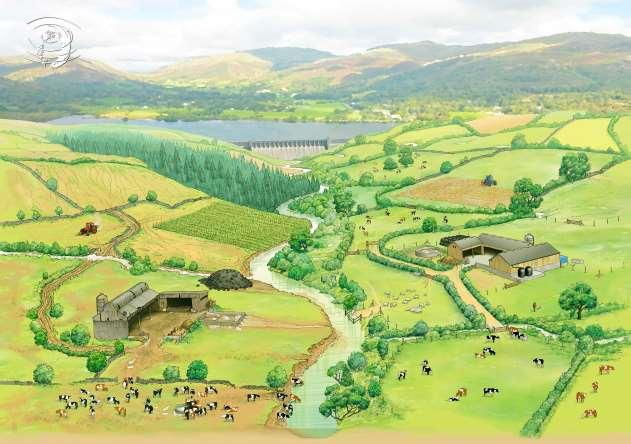
Good Farm, Bad Farm © Brian Hoskins
DATASET SOURCES:
Page/map ID numbers in teal show which maps/indicators the dataset was used to create.
• CaBA Partnership Boundaries 2018 - © Environment Agency copyright and/or database right 2014. Included in the CaBA data package. (2)
• Devon and Cornwall Boundaries – OS Boundary Line 2019. Contains public sector information licensed under the Open Government Licence v3.0. (2)
• Plymouth Neighbourhoods – Plymouth City Council. Contains public sector information licensed under the Open Government Licence v3.0. (2, 4, 5, 6, 7, 8, 9, 10, 11, 12, 13, 14, 15, 16, 17, 18, 19, 20, 21, 22, 23, 24, 25, 26, 27, 28, 29, 30, 31, 32, 33, 34, 35, 36, 37, 38, 39, 40, 41, 42)
• Surface Water – © Environment Agency copyright and/or database right 2014. Included in the CaBA data package. (2, 4, 6, 7, 11, 12, 13, 14, 15, 16, 17, 18, 19, 20, 21, 22, 23, 24, 25, 26, 27, 28, 29, 30, 31, 32, 33, 34, 35, 36, 37, 38, 39, 40, 41, 42)
• OS Open Grey – Contains OS data © Crown Copyright and database right 2020 (5, 25)
• National Parks – Natural England . Contains public sector information licensed under the Open Government Licence v3.0. (2, 5)
• AONB - Natural England. Contains public sector information licensed under the Open Government Licence v3.0. (2, 5)
• Lakes – Strategi. Contains OS data © Crown copyright and database right 2020. (2)
• Woodland - OS Open Map Local. Contains OS data © Crown copyright and database right 2020. (2, 4)
• Urban Region – Strategi. Contains OS data © Crown copyright and database right 2020. (2)
• Hillshade - Contains OS data © Crown copyright and database right 2016. (2)
• OS Terrain 50 – Contains OS data © Crown copyright and database right 2016. Included in the CaBA data package. (2)
• Priority Habitat Inventory – Natural England. Contains public sector information licensed under the Open Government Licence v3.0. (4, 7, 21)
• Ancient Trees – Plymouth City Council. Contains public sector information licensed under the Open Government Licence v3.0. (4)
• South West Coast Path – Plymouth City Council. Contains public sector information licensed under the Open Government Licence v3.0. (4)
• Railway – OS Open Map Local. Contains OS data © Crown copyright and database right 2020. (4, 7, 11, 12, 13, 14, 15, 16, 17, 18, 19, 20, 21, 22, 23, 24, 25, 26, 27, 28, 29, 30, 32, 33, 34, 35, 36)
• Public Slipways – Plymouth City Council. Contains public sector information licensed under the Open Government Licence v3.0. (4, 17)
• Road – OS Open Map Local. Contains OS data © Crown copyright and database right 2020. (4, 6, 7, 8, 9, 10, 11, 12, 13, 14, 15, 16, 17, 18, 19, 20, 21, 22, 23, 24, 25, 26, 27, 28, 29, 30, 32, 33, 34, 35, 36, 37, 38, 39, 40, 41, 42)
• OS Greenspace - Contains public sector information licensed under the Open Government Licence v3.0. (4)
• Buildings – OS Open Map Local. Contains OS data © Crown copyright and database right 2020. (4, 7, 11, 12, 13, 14, 15, 16, 17, 18, 19, 20, 21, 22, 23, 24, 25, 26, 27, 28, 29, 30,, 32, 33, 34, 35, 36, 37, 38, 39, 40, 41, 42)
• Domestic Gardens – Plymouth City Council. Contains public sector information licensed under the Open Government Licence v3.0. (4)
• Lakes/Open Water – OS Vector Map District. Contains public sector information licensed under the Open Government Licence v3.0. (4)
• Greenspace – Plymouth City Council. Contains public sector information licensed under the Open Government Licence v3.0. (4, 6, 11, 12, 14, 15, 18, 26, 27, 28, 29, 30, 32, 33, 34, 35, 36, 37, 38, 39, 40, 41, 42)
• Local Nature Reserves – Natural England. Contains public sector information licensed under the Open Government Licence v3.0. (5)
• Marine Conservation Zones – Natural England - Contains public sector information licensed under the Open Government Licence v3.0. (5)
DATASET SOURCES:
Page/map ID numbers in teal show which maps/indicators the dataset was used to create.
• Special Area of Conservation – Natural England - Contains public sector information licensed under the Open Government Licence v3.0. (5)
• Special Protection Area – Natural England. Contains public sector information licensed under the Open Government Licence v3.0. (5)
• Site of Special Scientific Interest – Natural England. Contains public sector information licensed under the Open Government Licence v3.0. (5)
• LSOA - Contains public sector information licensed under the Open Government Licence v3.0. (8, 9, 10)
• Population – Census 2011. Contains public sector information licensed under the Open Government Licence v3.0. (8)
• Index of Multiple Deprivation - Contains public sector information licensed under the Open Government Licence v3.0. (9)
• Crime – Contains public sector information licensed under the Open Government Licence v3.0. (10)
• Air Quality Management Area © Crown copyright and database rights licensed under Defra's Public Sector Mapping Agreement with Ordnance Survey (licence No. 100022861) and the Land and Property Services Department (Northern Ireland) MOU206. (13)
• Air pollution - 2019 NO2 projections data (2017 reference year) © Crown 2021 copyright Defra via uk-air.defra.gov.uk, licenced under the Open Government Licence (OGL). (13)
• The Environment Agency Risk of Flooding from Rivers and Sea - Contains public sector information licensed under the Open Government Licence v3.0. © Environment Agency copyright and/or database right 2018. All rights reserved. Some features of this map are based on digital spatial data from the Centre for Ecology & Hydrology, © NERC (CEH) © Crown copyright and database rights 2018 Ordnance Survey 100024198 (14)
• Updated Flood Map for Surface Water (uFMfSW) (March 2020) Contains public sector information licensed under the Open Government Licence v3.0. © Environment Agency copyright and/or database right 2015. All rights reserved. (15, 23, 24)
• Play spaces - Plymouth City Council . Contains public sector information licensed under the Open Government Licence v3.0. (17)
• Allotments and outdoor spaces - OS Open Greenspace. Contains public sector information licensed under the Open Government Licence v3.0. (17)
• Scheduled Monuments – © Historic England [2019]. Contains Ordnance Survey data © Crown copyright and database right [2019]. (18)
• Pollution incidents – Contains OS data © Crown copyright and database right 2016. Included in the CaBA data package. (19)
• Water Resource Availability – CAMS Water Availability Status © Environment Agency copyright and/or database right 2015. Included in the CaBA data package. (20)
• Temperature Data Source – Landsat 8 Operational Land Imager (OLI) / Thermal Infrared Sensor (TIRS) Collection 1 Level-1 data products held in the USGS archives can be searched by using the EarthExplorer Tool. https://www.usgs.gov/core-science-systems/nli/landsat/landsat-8 (22)
• Surface Water Flooding - © Environment Agency copyright and/or database right 2015. All rights reserved. (23)
• Average Property Price - Contains HM Land Registry data © Crown copyright and database right [2018]. This data is licensed under the Open Government Licence v3.0. (25)
• Tamerton Stream Catchment – Contains Digital Elevation Model (DEM) from Tellus SW © NERC 2017 (26)
• World Imagery - Source: Esri, Maxar, GeoEye, Earthstar Geographics, CNES/Airbus DS, USDA, USGS, AeroGRID, IGN, and the GIS User Community (31)
• SCIMAP - Contains LiDAR Digital Terrain Model (DTM) from TellusSW. © NERC [2017]. This data is licensed under the Open Government Licence v3.0. (31)
• Environmental pollution incidents (Category 1 and 2) © Environment Agency copyright and/or database right 2017. All rights reserved. (32)
• Consented discharges to controlled waters © Environment Agency copyright and/or database right 2018. All rights reserved. (34)
• Historic Landfill Sites © Environment Agency copyright and/or database right 2018. All rights reserved. Contains information © Local Authorities (35)
