

Quality Monitoring Scorecard
–
Plymouth River Keepers Water
November 2020
October 2021
Lydia Deacon and Dr Holly Pearson

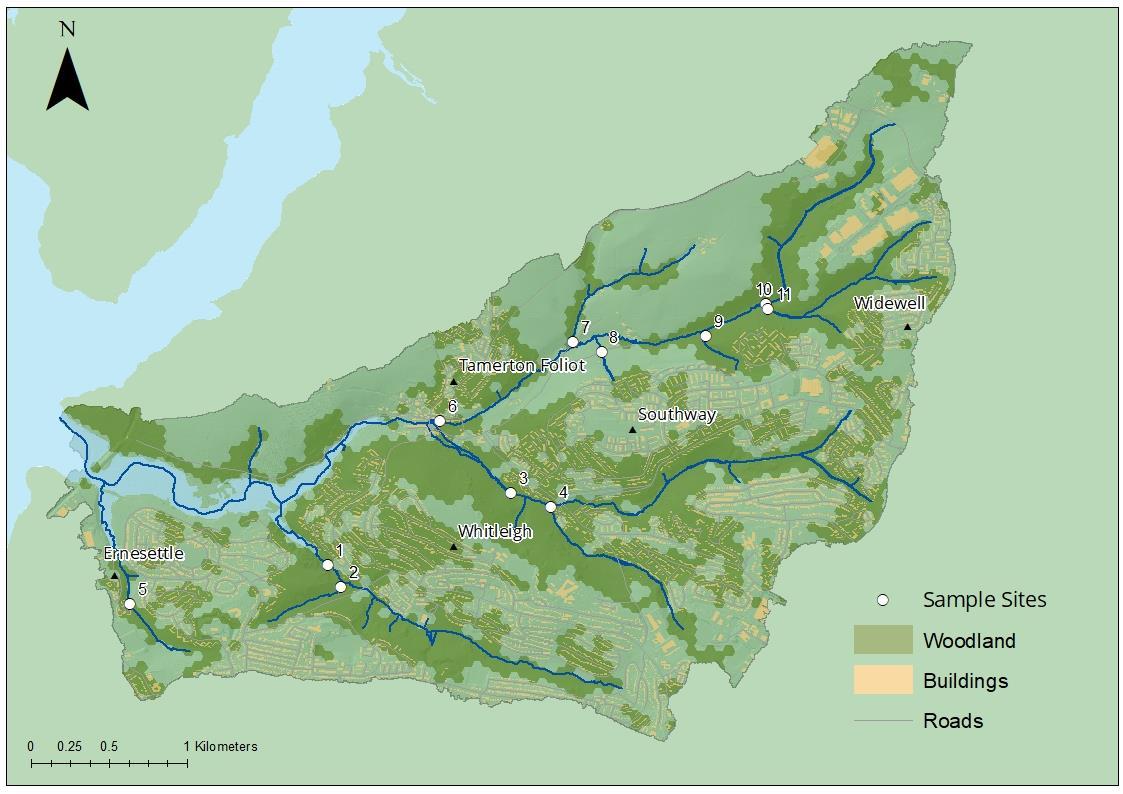
• Sites chosen carefully to monitor the main rivers and their tributaries
• Results from the spot sampling will give a baseline health score for the catchment.
• Agricultural, waste water and residential influences captured.
• The following data presents results from 12 monthly surveys
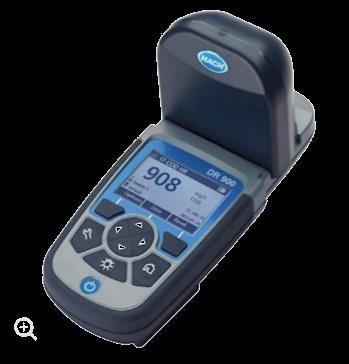
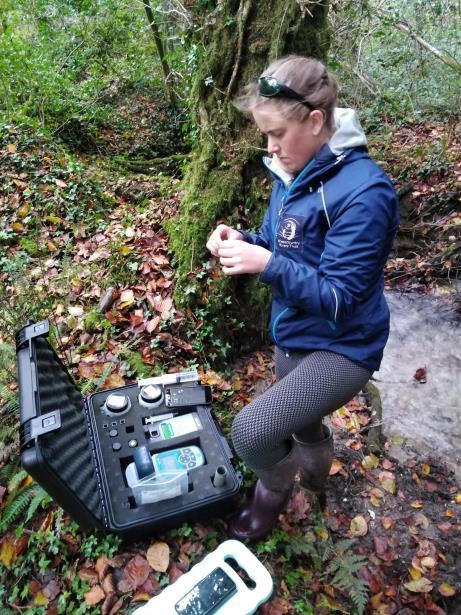
DR900 colourimeter used for PO4, turbidity and colour
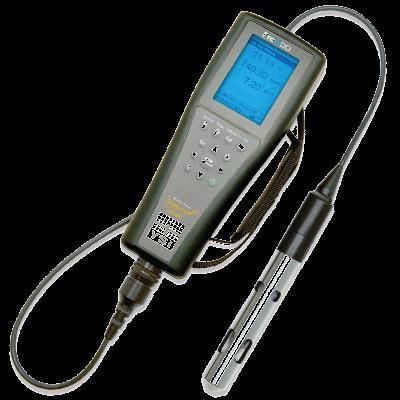
Dissolved oxygen meter

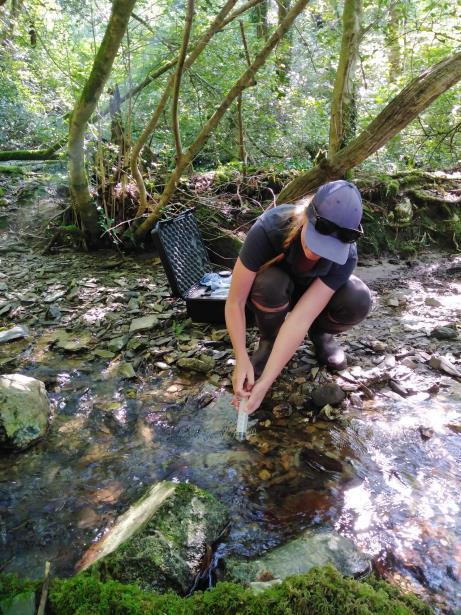
Samples were collected from the streams using a bucket and or a syringe.
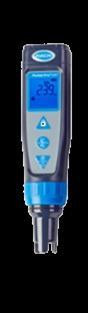
Unfiltered samples were analysed on-site for electrical conductivity using a calibrated handheld probe. Colour, turbidity and suspended sediment were measured using colourimetry using a predefined programme on the instrument. Phosphate was analysied using the pre-programmed colourimetric HACH PhosVer 3® (Ascorbic Acid) method on the DR900. Coloured dissolved organic matter (CDOM) and optical brightening agents (OBA) was analysed using a handheld Turner AquaFluor fluorimeter.
Temperature and electrical conductivity meter
Measurements were also taken for temperature and dissolved oxygen. Approximate flow rates were estimated by eye.
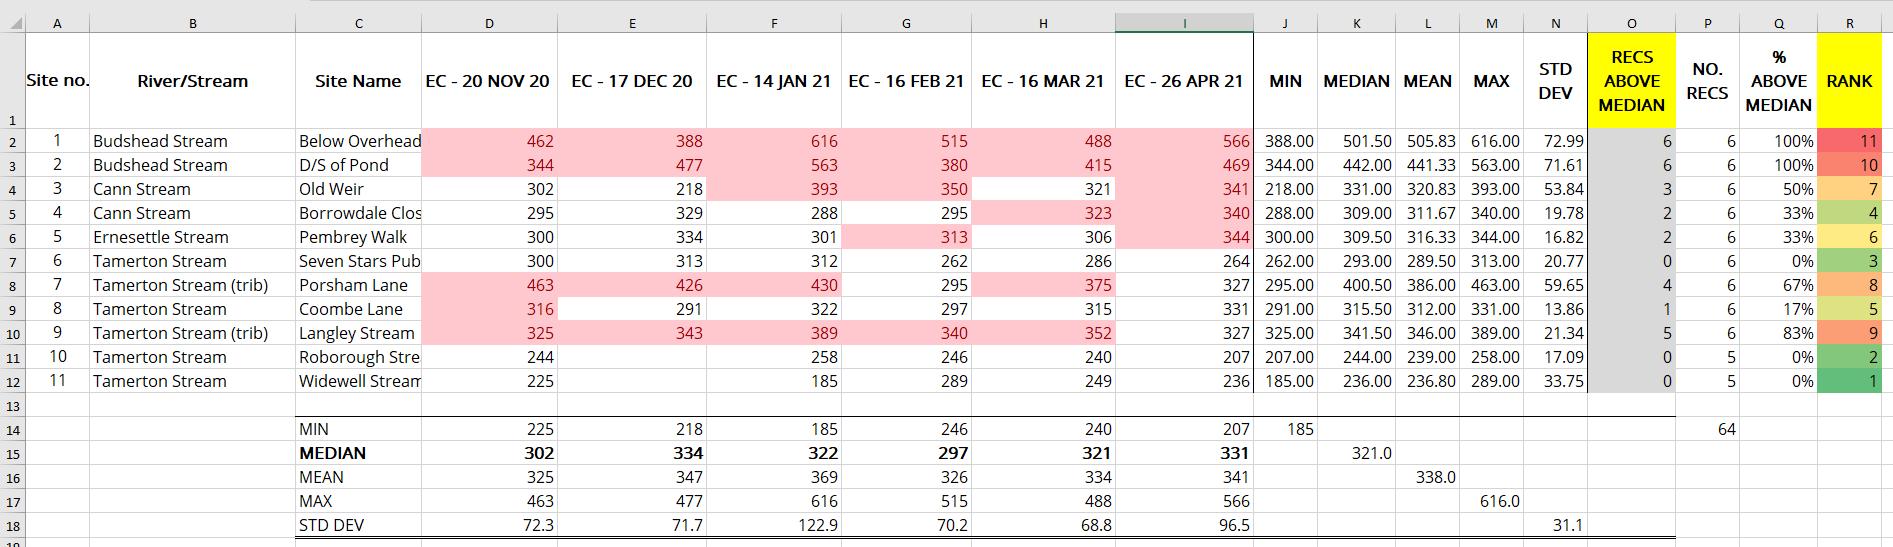
The median of all sites for each survey (outlined in orange box) was calculated and exceedances of this value were identified (marked as pink cell).
These were summed (outlined in blue box) and used to calculate the percentage of times the site exceeded the median (outlined in purple box). Sites were first ranked according to % above median, but if the % exceedances were the same, sites were ranked according to the mean (outlined in green box). Rankings were from “best” (1) to “worst” (11).
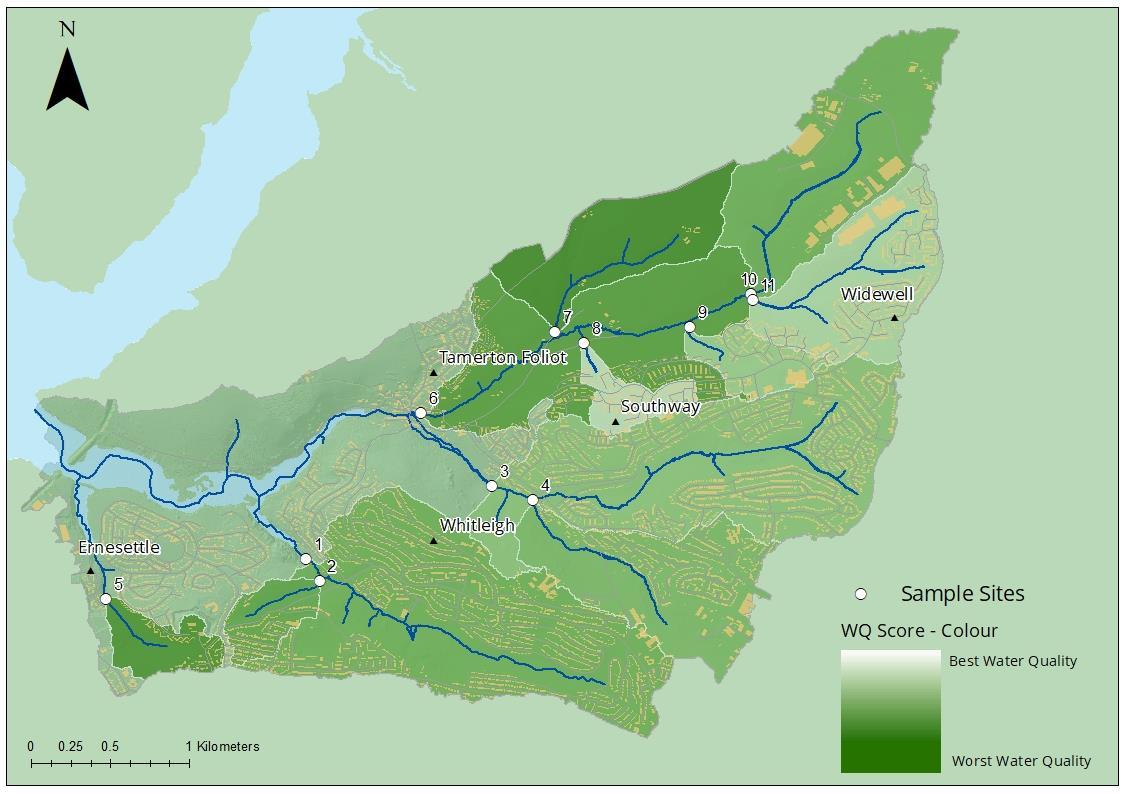
The Watershed tool in Arc GIS was used to delineate the subcatchments that represented each sampling point (A). A colour scale was used to represent the rankings (as determined by the methodology given in the previous slide) of each subcatchment from “best” to “worst”.
Box and whisker plots give the distribution of values at each site for each parameter (B). The number of samples, n, for each parameter at each site was 12 unless the box and whisker plot displays a ‘*’, in which case n = <12

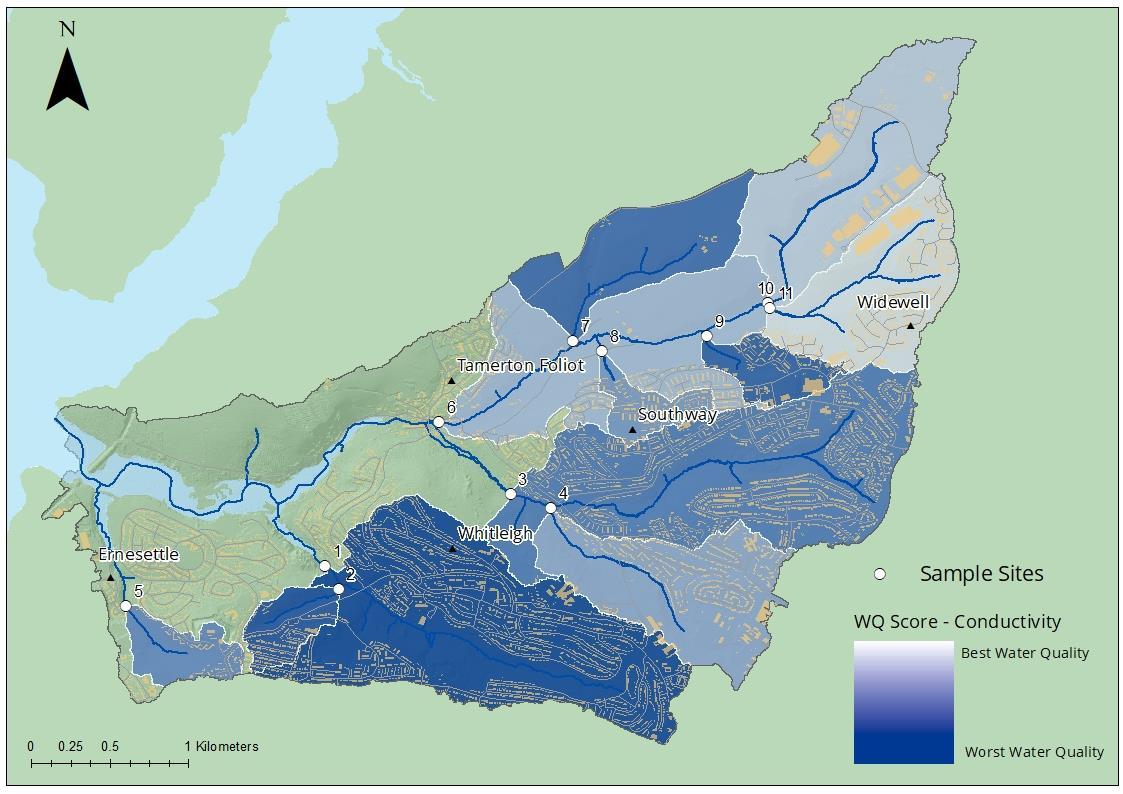
Electrical conductivity (EC) is a good proxy for changes in general water quality. Pollution from wastewater and urban and agricultural runoff will cause an increase in EC.
Conductivity for the catchments ranges from 150 – 616 µS/cm with a median of 322
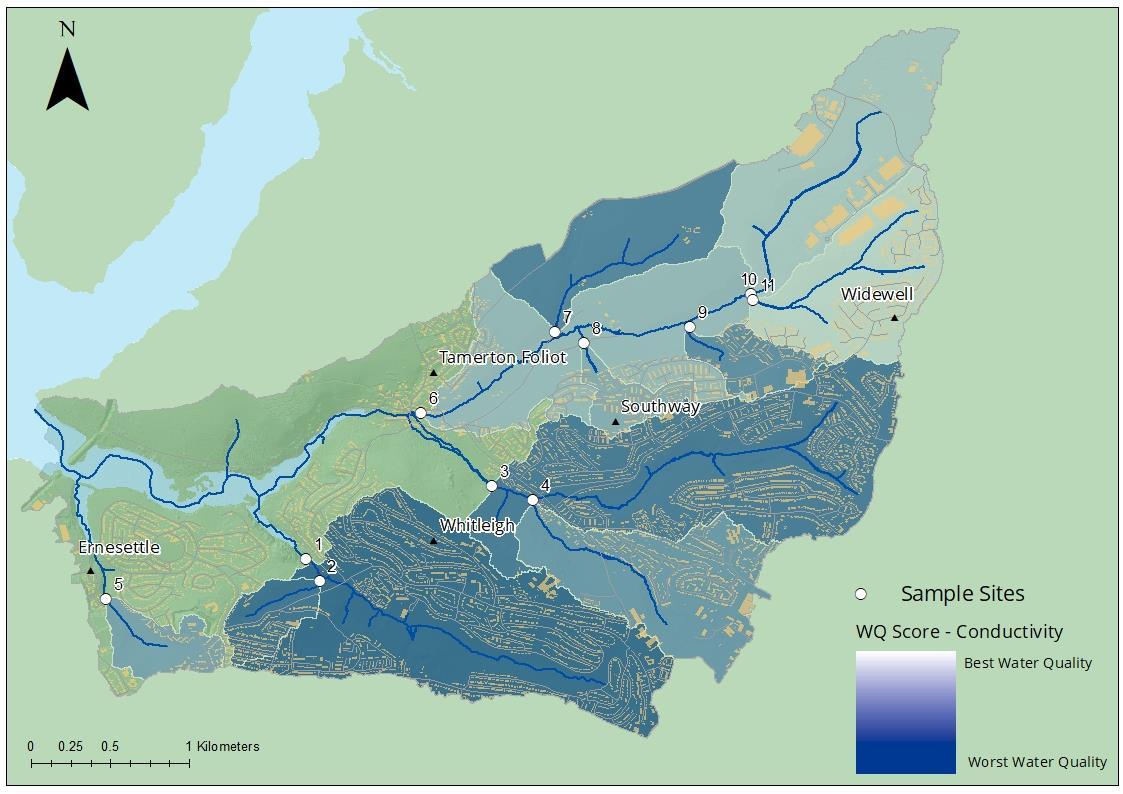
µS/cm. The greatest range in conductivity is observed on the Budshead Stream D/S of pond (site 2).
The Budshead Stream site 1 and 2 score worst for this parameter. The conductivity at both sites on the Budshead stream are consistently above the median for the whole catchment. The stream suffers from the influence of multiple pipes carrying suspected misconnected grey water and road runoff contributing to the high conductivity score.
The brown colour often found in samples occurs primarily as a result of tanninstained waters released from decaying detritus or peat. Although our samples were unfiltered and therefore represent apparent and not true colour, suspended sediment was generally very low in all streams and therefore interference from particulate material was minimal.
Colour for the catchments ranges from 0 – 270 Hazen, with a median of 37.5 Hazen. The greatest range in colour is observed on the Budshead Stream downstream of the pond (site 2), likely due to decaying organic material in the pond. The Tamerton Stream at Porsham Lane (site 7) returns the highest score for colour, possible due to woodland and agricultural influences.
The brown colour seen in a river causing a brown to orange, cloudy appearance is suspended sediment. For these monitoring surveys, turbidity is used as a proxy for suspended sediment as filtration, drying and weighing of the sample is not possible.
Turbidity for the catchments ranges from below detection limits - 33 NTU, with a
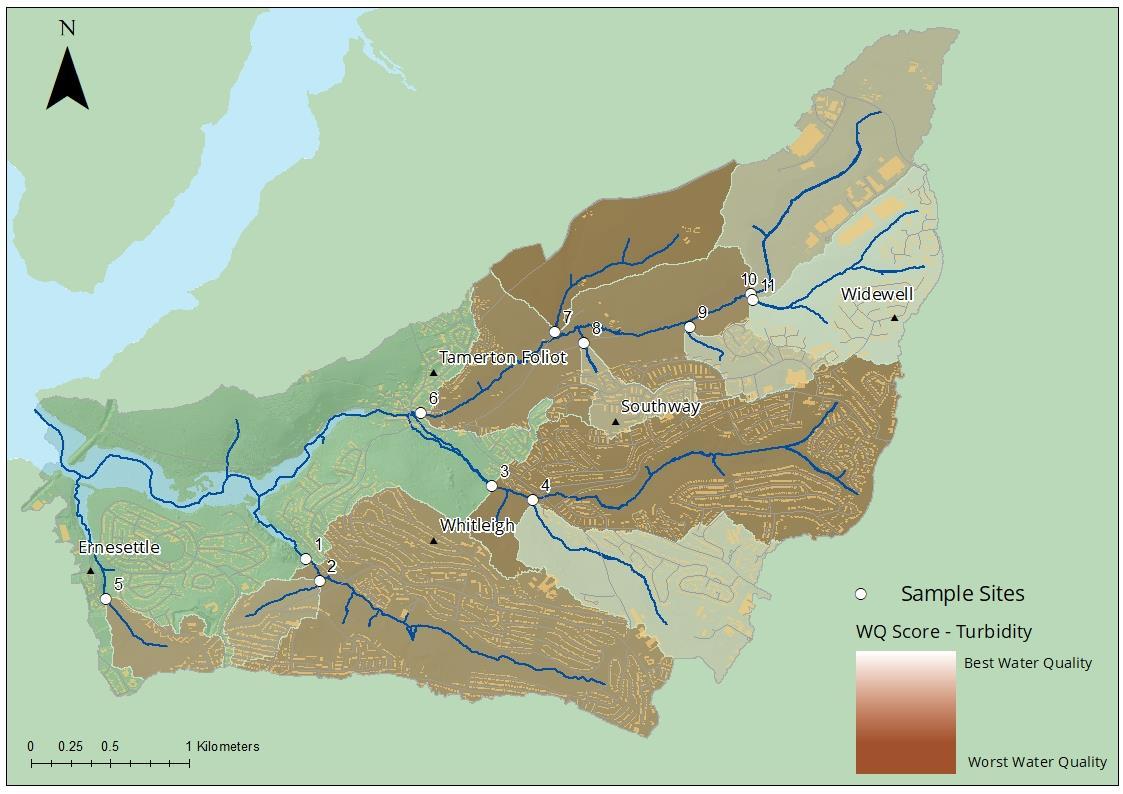
median of 3 NTU. The greatest range in turbidity is observed on the Tamerton Stream at Seven Stars Pub (site 6) where the highest measurement was made during the September survey.
Turbidity values are generally low in this area which may be a consequence of undertaking spot sampling during dry weather and therefore the impact of rainfall was not fully observed. The Tamerton Stream at Porsham Lane (site 7) is the worst affected catchment, likely due to its rural position, followed by Budshead Stream below overhead pipe (site 1) which suffers from turbid discharges.
Site Number
Phosphate, PO4, is a nutrient which in excess can lead to algal growth, oxygen depletion and eutrophication.
Phosphate for the catchments ranges from <LOD to 2.7 mg/L, with a median of 0.2 mg/L. The greatest range in PO4 is observed on the Combe Lane Stream.
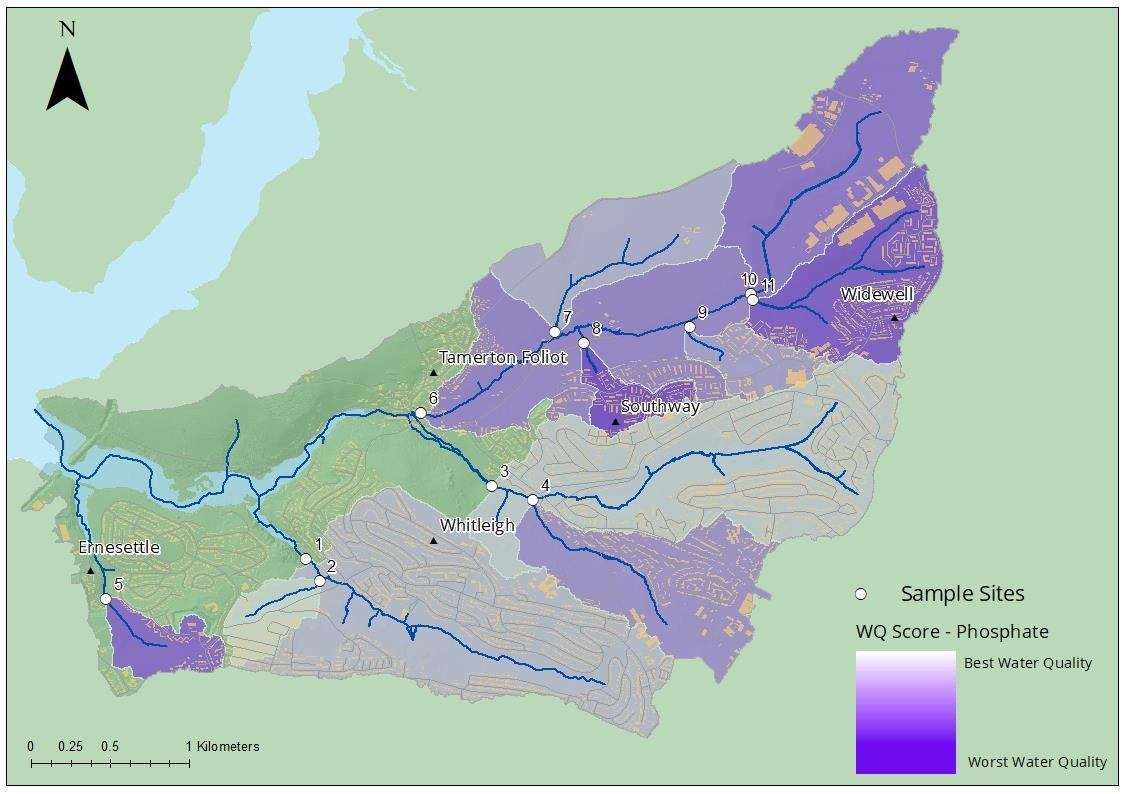
The Tamerton Stream at Coombe Lane (site 8) , the Ernesettle Stream at Pembery Walk (site 5) and Tamerton Stream at Widewell Stream Footbridge (site 11) are worst the affected. There are very elevated PO4 concentrations at site 8 the highest of which came during the April sample run where flows were very low, which reiterates our suspicions of a point source input. Phosphate levels are generally high for all sample sites, particularly during low flows indicating that there are issues from point source inputs throughout the catchment. The effects of elevated phosphate are not immediately evident in the streams. However, there have been a number of reports of algal blooms in the Tamerton Lake (which receives all streams in this catchment) during the summer months for which high phosphate could be a contributing factor.
CDOM, or coloured dissolved organic matter, is dissolved organic matter that absorbs strongly in the UV spectrum. It is evaluated by measuring the fluorescing fraction of CDOM, known as fDOM. CDOM may vary in abundance with activities such as forestry, agriculture, effluent discharge and wetland drainage
CDOM for the catchments ranges from 5–69 counts, with a median of 24.5 counts.
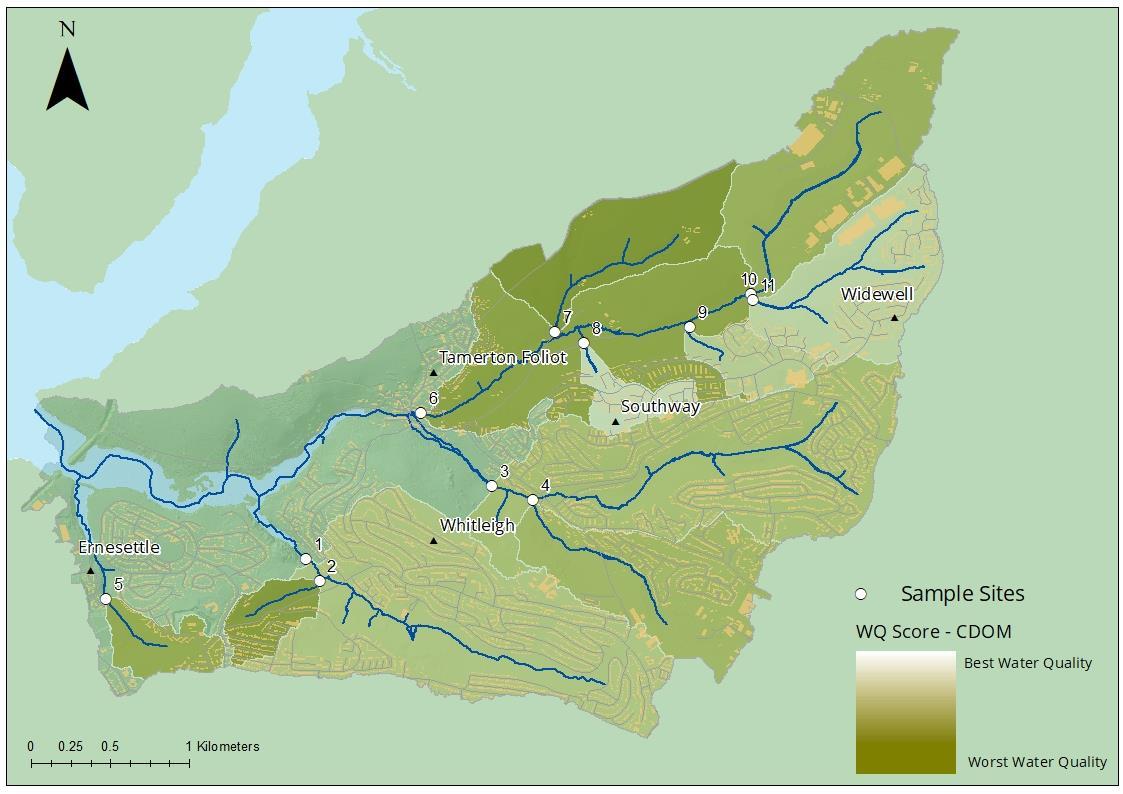
The greatest range in CDOM is observed on the Porsham Stream (site 7).
The highest CDOM signals all come from the Porsham Stream. This could be due to its wooded and rural setting with the added pressure of agricultural input. The other streams and tributaries in the catchment are predominantly urban and give a weaker CDOM signal.
OBA, or optical brightening agents, are chemical compounds that absorb UV light and emit it by fluorescence, making it measurable (like CDOM) using a fluorimeter. They are used in washing detergents and some cosmetics and are a useful indicator for potential misconnections in homes.
CDOM and OBA both fluoresce in a similar part of the spectrum. While the 'peak' fluorescence occurs at wavelengths of c. 420 nm and 440 nm respectively, there is a fluorescence response from nearby wavelengths too. As the fluorescence responses from CDOM and OBA 'overlap', CDOM will give a 'false' OBA reading and vice versa (Fig 1). If the sample contains only CDOM then we can expect that the ratio of the measured CDOM to OBA 'peaks' should be consistent. If there is OBA present in the sample then we would expect it to change the shape of the fluorescence response curve and this would be reflected in the ratio between the two.
We notice the ‘normal’ relationship between the two parameters is consistently: CDOM OBA = ~6. A
Sample containing CDOM and OBA
Fig 1. The theoretical output from the fluorescence analysis whereby peaks from OBA and CDOM overlap one another due to their wavelength proximities
The ratio of CDOM to OBA has been worked out for all sites and plotted as a box plot and mapped to show the high to low ratios across the catchment.
Tamerton Stream at Porsham Lane (site 7) is the only one to show a higher ratio of CDOM to OBA with a max of 9.3 likely due to organic matter from the surrounding riparian woodland and from agricultural inputs. The Cann Stream at the Old Weir
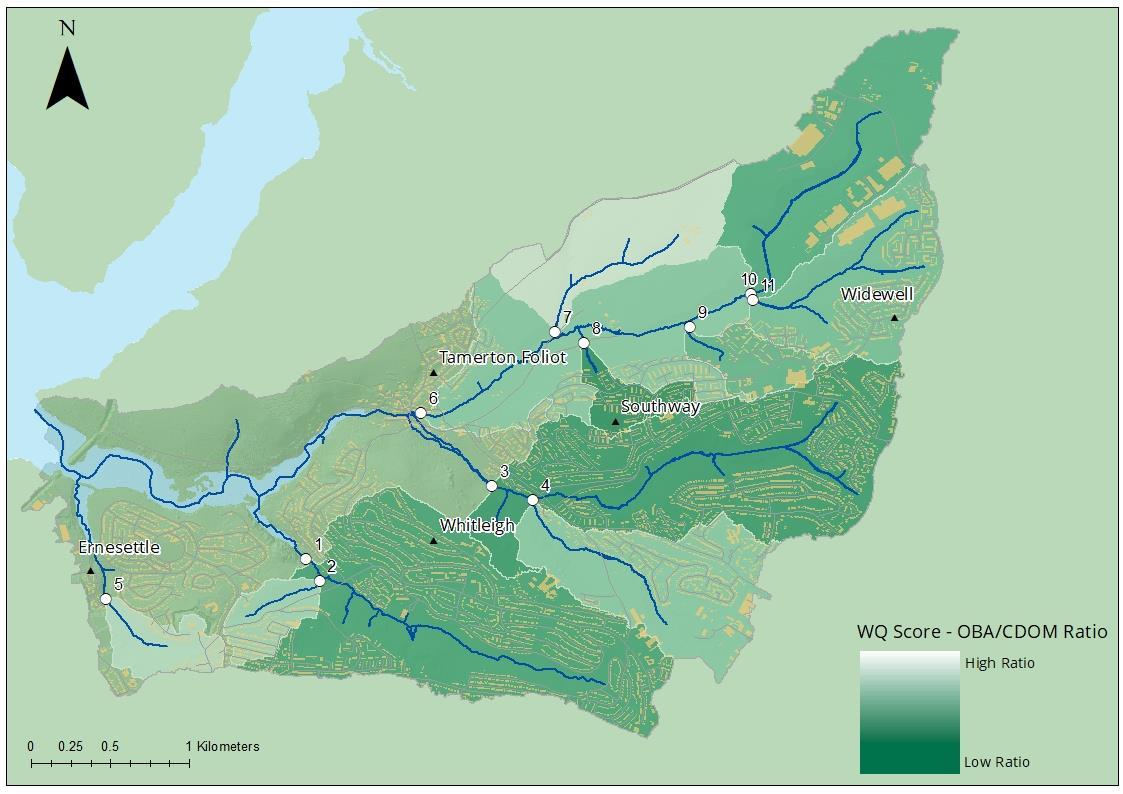
(site 3) and The Roborough Stream (site 10) show the lowest ratios (0.2), meaning the highest levels of OBA were seen in these stream.
Although this method gives a good indication that OBA is present in these streams, our instrumentation limits us to only semi-quantitative data, All other sites show the presence of OBA with a mean ratio of 4.2, indicating that all streams may well be receiving grey water in varying amounts. Although further investigation would be needed to prove and quantify this, these numerical observations are in line with the observations of the suspected misconnected outfalls entering the streams.
Site Number
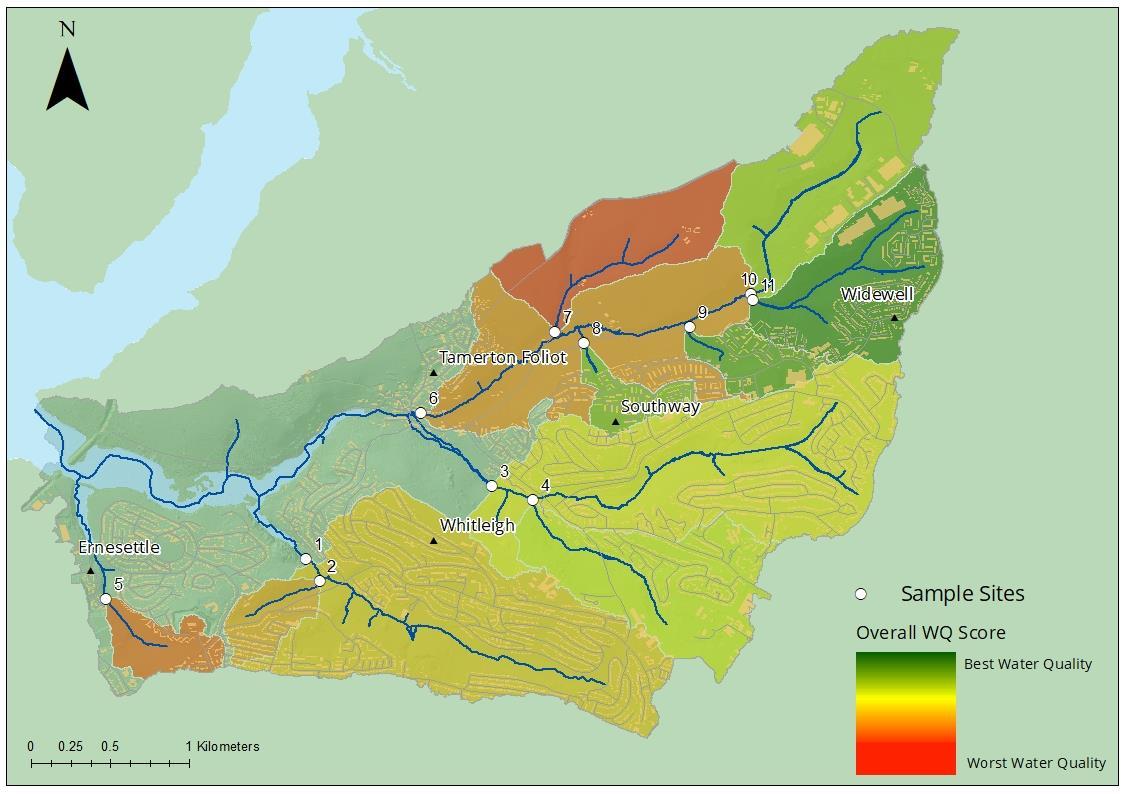
Overall water quality is the average of the scores given for each basic water quality indicator; conductivity, phosphate, colour, sediment and C-DOM. Because CDOM and OBA tend to score the same, OBA was not included so as not to bias the overall score too much towards the fluorescence.
The Tamerton Stream at Porsham Lane (site 7) is the worst affected overall. Ernesettle Stream at Pembery Walk (site 5), Tamerton Stream at Seven Stars Pub (site 6) and Budshead Stream downstream of pond (site 2) also score poorly for overall quality.
It is recommended that improvement works during the PRK project are focused on these worst performing streams, identified during this baseline monitoring. Farm advisory work has already begun in the Porsham Stream catchment and further monitoring could focus on interventions and improvements being made to give quantifiable evidence of the impact of works.
Invertebrate sampling was carried out using the ARMI Riverfly partnership method of 3-minute kick sample followed by a 1-minute hand search. This method was chosen so that it can be applied by volunteers in the future.
Riverflies include three groups of pollution sensitive insects; mayflies (Ephemeroptera), caddisflies (Trichoptera) and stoneflies (Plecoptera) (fig. 3). They are a vital link in the aquatic food chain as a food source for fish, birds and mammals. Populations are affected by many factors, predominantly water quality, habitat diversity, water level and flow rate. In a healthy river most of the pollution sensitive invertebrates should be present. Declines in water quality are reflected in declines in invertebrate diversity.
The trigger level is the baseline score given to a waterbody. After collecting a sample, if the score (determined from numbers of species collected during sampling (fig.1)) is above the trigger level then the stream health is good, and no action is needed. If the score is below the trigger level the site must be resampled and, if still below the trigger level, the local Riverfly coordinator and the Environment Agency should be informed.
After consultation with the Environment Agency ecology lead, it was decided that Tamerton Stream at Severn Stars Pub (site 6) and Cann Stream at Old Weir (site 3) should have a trigger level of 7 and Budshead Stream below overhead pipe (site 1) should have a trigger level of 4.
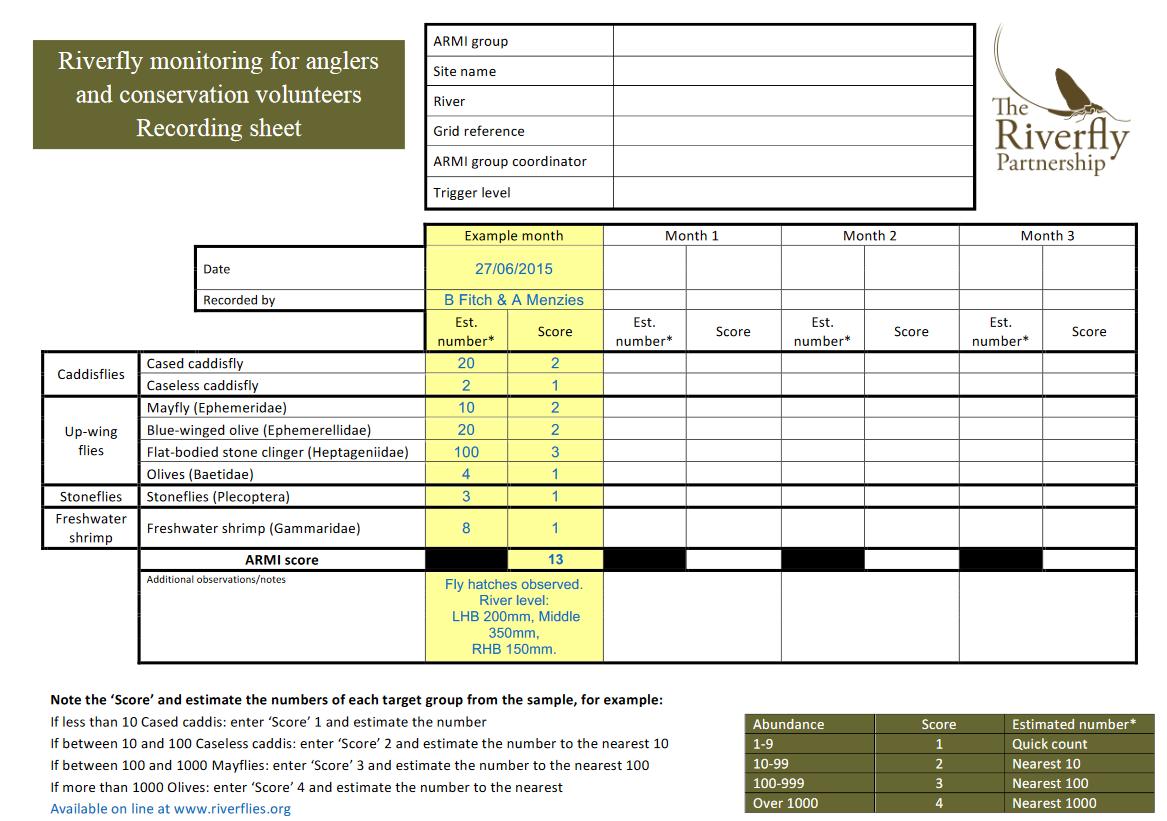 Fig.1 Example Riverfly recording sheet. © Riverfly Partnership
Two samples were taken at each kick sampling site during the year. This was to establish a baseline to aid in assigning a trigger level and to establish these sites for volunteer monitoring in the future.
On the Budshead Wood Stream below the overhead pipe, an initial kick sample on 24th April 2021 was taken downstream of a constantly discharging pipe. However, the score was extremely low (Table 1A), suspected to be due to the pipe discharge. It was thus decided that all future samples should be taken upstream of the discharging pipe to discount it’s effects on the invertebrate population. The score of 4 for the above site is still very low, indicating that the stream is receiving pollutants which decrease the diversity of the invertebrate populations. It was also noted that there were leeches and bloodworms present in the sample which are all pollution tolerant species.
All other sites have good diversity and abundance of the eight Riverfly species (Table 1 B and C). The Tamerton Stream in March showed the highest abundance and diversity of species of all kick samples taken.
Ideally, monthly samples would be taken for all sites to give a good picture of overall health of the streams. However, this was not possible this year due to time constraints.
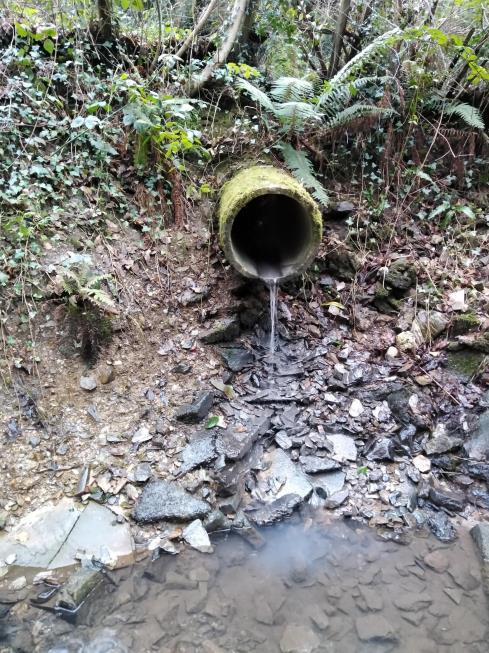
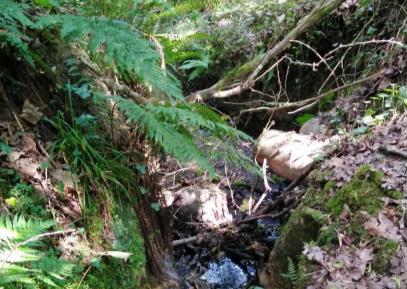
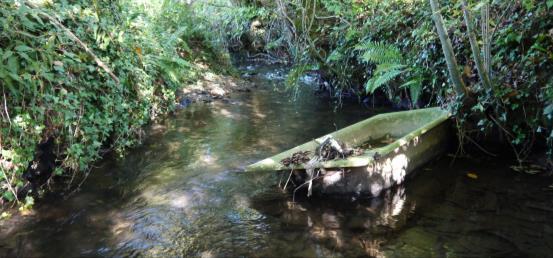
Throughout the whole catchment there are issues with misconnected pipes and outfalls (fig. 2 A) as evidenced from the smell, visual observations and the water quality results detailed in this scorecard.
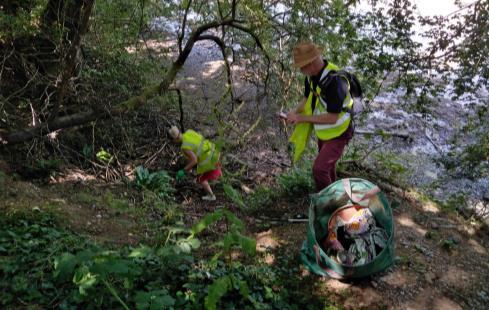
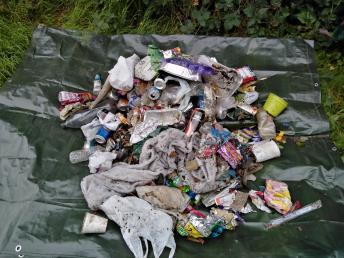
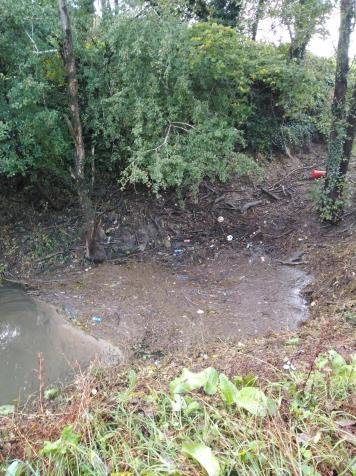
The other big issue is the prevalence of litter, which has been observed at 8 out of the 11 sampling sites and seen 92 times in the past year of sampling. Through the PRK and PPP (Preventing Pastic Pollution) projects there have been four community litter picks carried out to help reduce the litter in the catchment (fig.2 B).
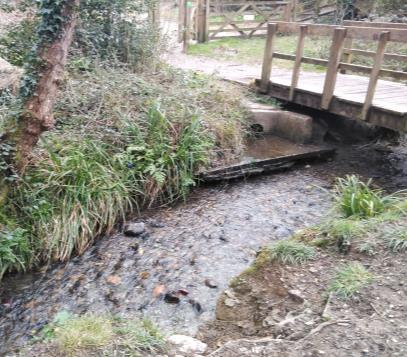
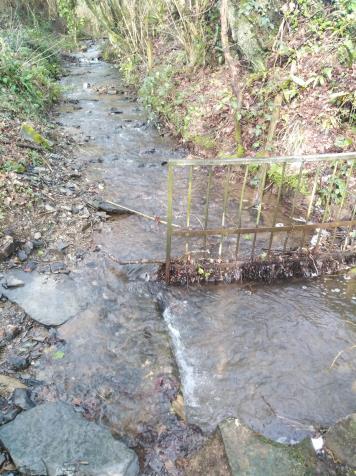
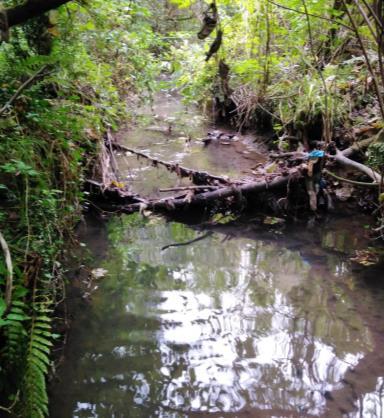
A number of barriers in the stream, both natural and manmade, have been observed at half of the sampling sites (fig.2 C). These are often accumulators of plastic and can be an issue for wildlife, particularly migrating fish.
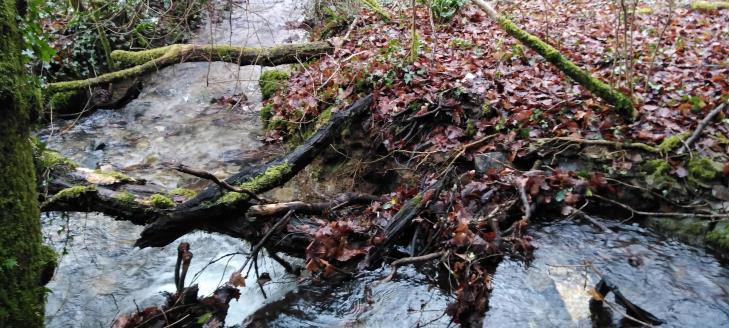
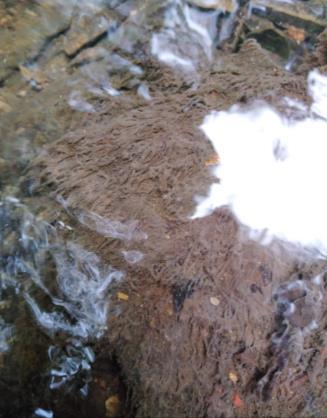
Pollution incidents have been spotted and reported by community individuals and by the PRK monitoring team. On 24th September 2021 high ammonia and low oxygen was recorded on the Budshead Stream. Sewage fungus and sewage debris (fig.2 D) was also observed and the pollution incident was reported to the Environment Agency.

An AquaTROLL 200 (AT200) sonde measuring temperature, depth and conductivity was installed at the bottom of the Tamerton Foliot Stream on Riverside Walk in July 2021 (fig.3). It was connected to a Mace telemetry unit (fig.4) which sends data to the Hydrovu website every 15 minutes (fig.5). A Brinno time-lapse camera is also installed at this site, capturing data every 15 minutes to give a visual picture alongside the data.
An alarm is set to go off if the conductivity exceeds 310 µS/cm, as over this value may indicate that pollution has run through the stream. This figure is based on analysis of the conductivity data which shows a median of 292 µS/cm. As we receive more data from the sonde it may be that we adjust this alarm.
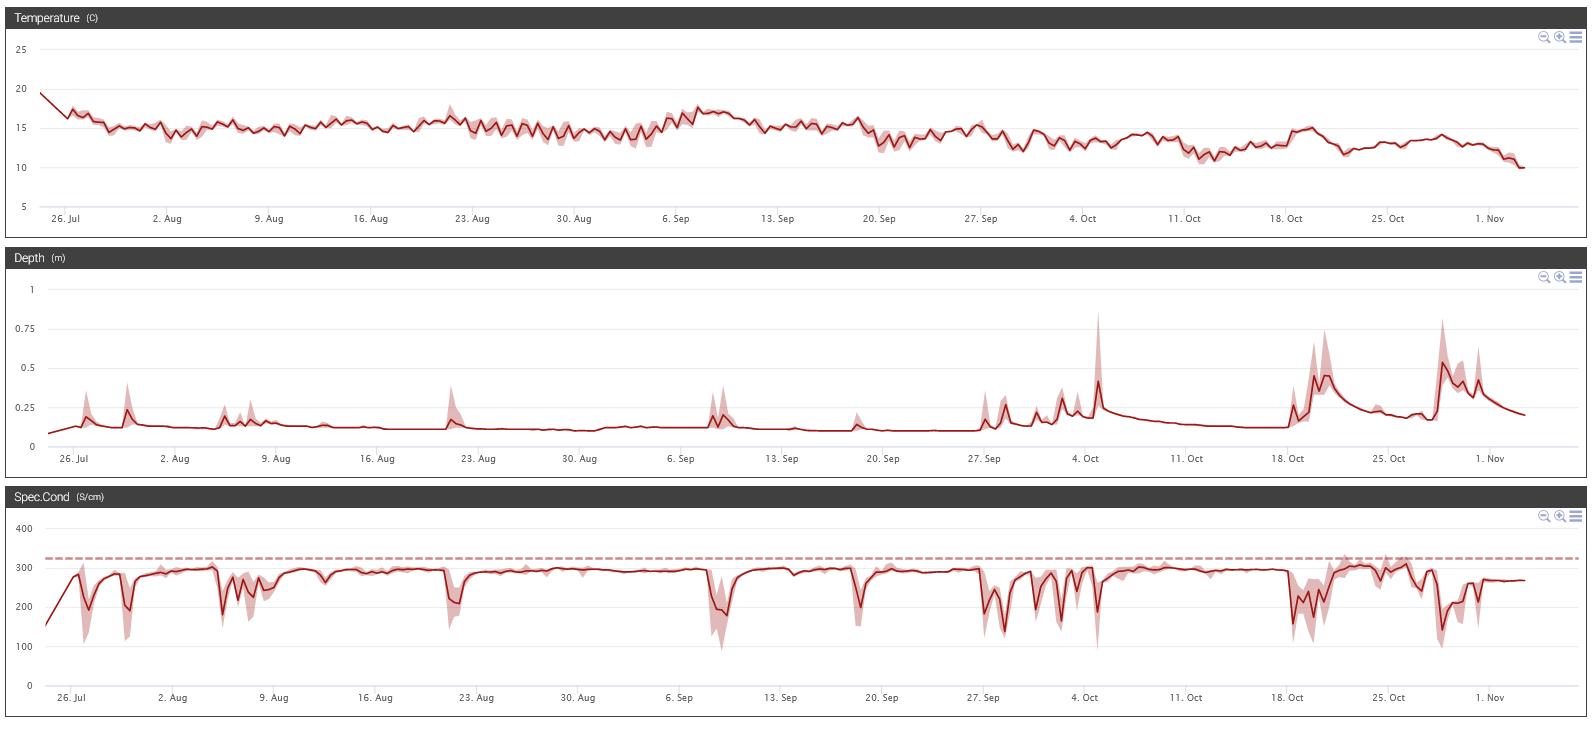
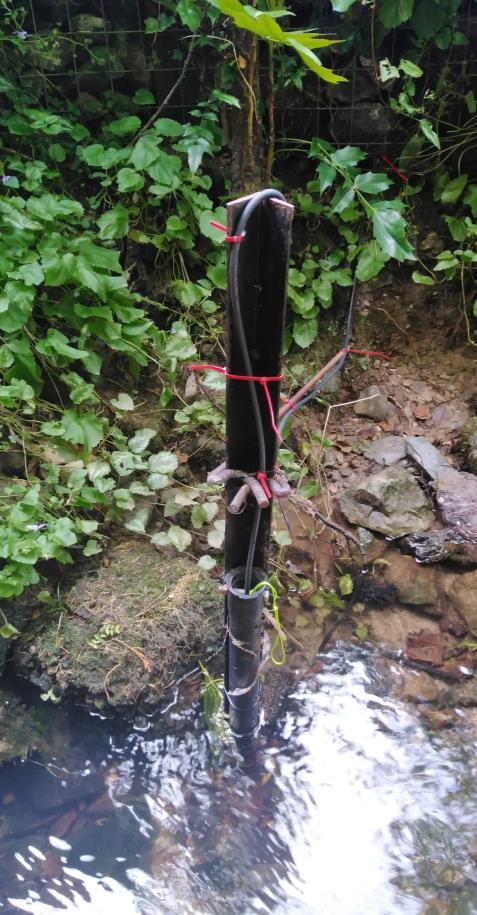
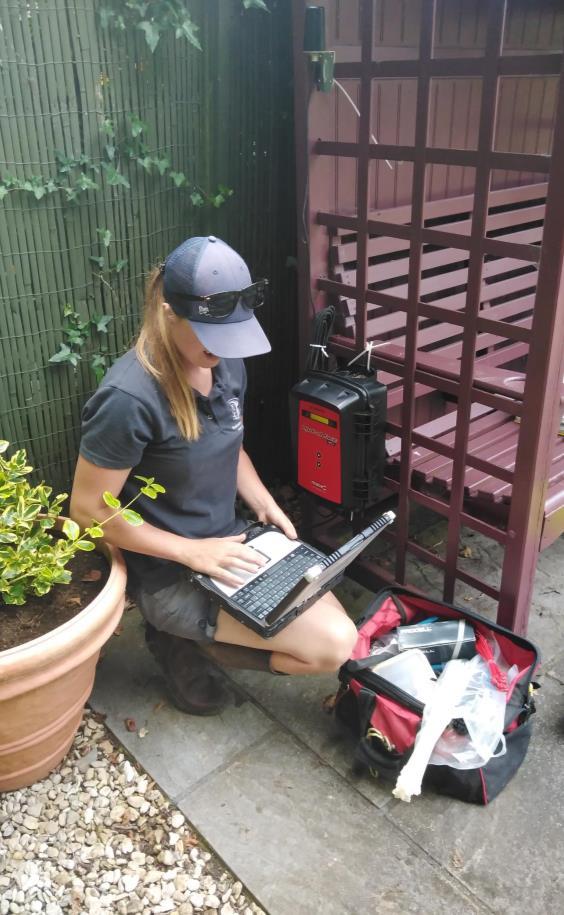 Fig. 3 Screen grab from the Hydrovu website showing the live data from the sonde.
Fig. 4 The AT200 sonde in it’s casing. It is installed so it sits upright inside the pipe to avoid it getting damaged or clogged with debris and sediment.
Fig. 5 Holly Pearson setting up the Mace telemetry unit.
Fig. 3 Screen grab from the Hydrovu website showing the live data from the sonde.
Fig. 4 The AT200 sonde in it’s casing. It is installed so it sits upright inside the pipe to avoid it getting damaged or clogged with debris and sediment.
Fig. 5 Holly Pearson setting up the Mace telemetry unit.
Conductivity and depth data from the AT200 has been plotted against 15 minute rainfall data (downloaded from the EA rain gauge at Crownhill) (fig.6 A/B). As would be expected, rainfall causes the depth to rise and the conductivity to reduce as the higher water level dilutes the ions in the water column.
The minimum value for conductivity is 88 µ S/cm seen on 9th September 2021 (C) and the maximum is 334 S/cm (F) seen on the 26th October 2021. From our spot sampling results, the Tamerton Stream at Seven Stars (upstream of the sonde) is ranked 3 out of the 11 sites for conductivity, indicating that it is not consistently elevated. This is confirmed from the sonde data which shows there are only small rises above the baseline level of conductivity and from the photographs these seem not to coincide with pollution that is visible (D).
Depth reached a maximum of 0.87 m (E) on the 4th October 2021 (coinciding with the highest rainfall of 7 mm) and a minimum of 0.1 m on the 31st August 2021.
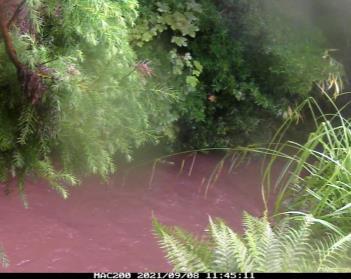
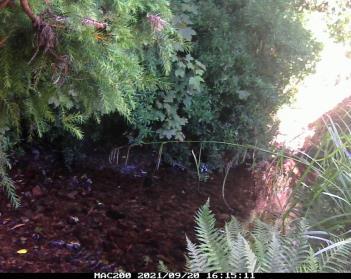
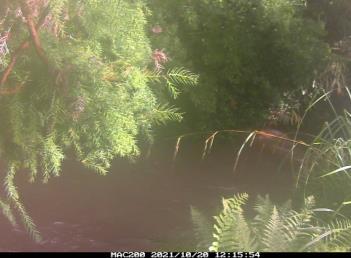
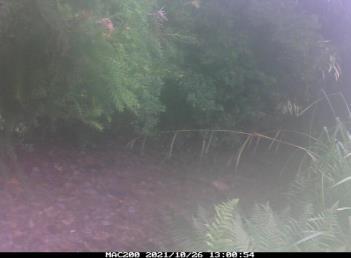
Fig. 6 A) graph of conductivity plotted with rainfall between 26th July and 28th October 2021. B) Depth plotted against rainfall for the same period. C) 09SEPT21 rise in stream level. D) 20SEPT21 rise in conductivity. E) 04OCT21 rise in river level. F) Rise in conductivity.
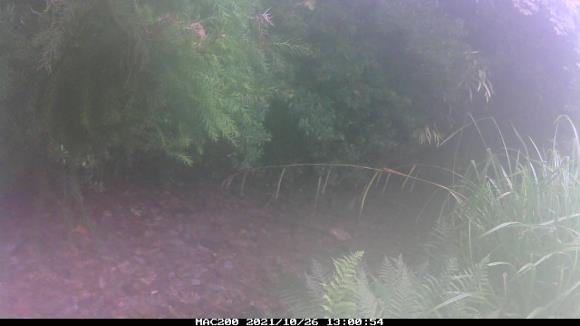
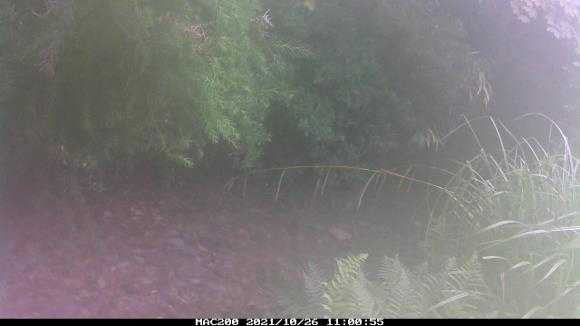
To better understand how the stream is reacting during high conductivity, a more detailed look at the highest conductivity spike is show in the graph in fig. 7. The peak of conductivity (334 µS/cm) occurred at 07:15 on the 26th October 2021. Unfortunately, due to the time-lapse camera not being able to take photos in the dark, we do not have pictures for that exact time. However, the spike at 11:00 (A) and 13:00 (B) can be matched to photographs.
From the images there appears to be no visible pollution in the stream (i.e. change of stream colour, debris or foam). It may be that these spikes in conductivity are just natural fluctuations, or it may be that the rise conductivity was caused by pollution that is not visible. More data will be needed to observe the trends of conductivity in the stream. We are also involving the community in observing visual evidence during spikes in conductivity which will help us to determine whether the spikes coincide with visual pollution incidents.