Local and remote observation techniques to monitor
(optical) water quality in lakes, rivers, estuaries and coastal zones

 Stefan Simis, Elizabeth C. Atwood
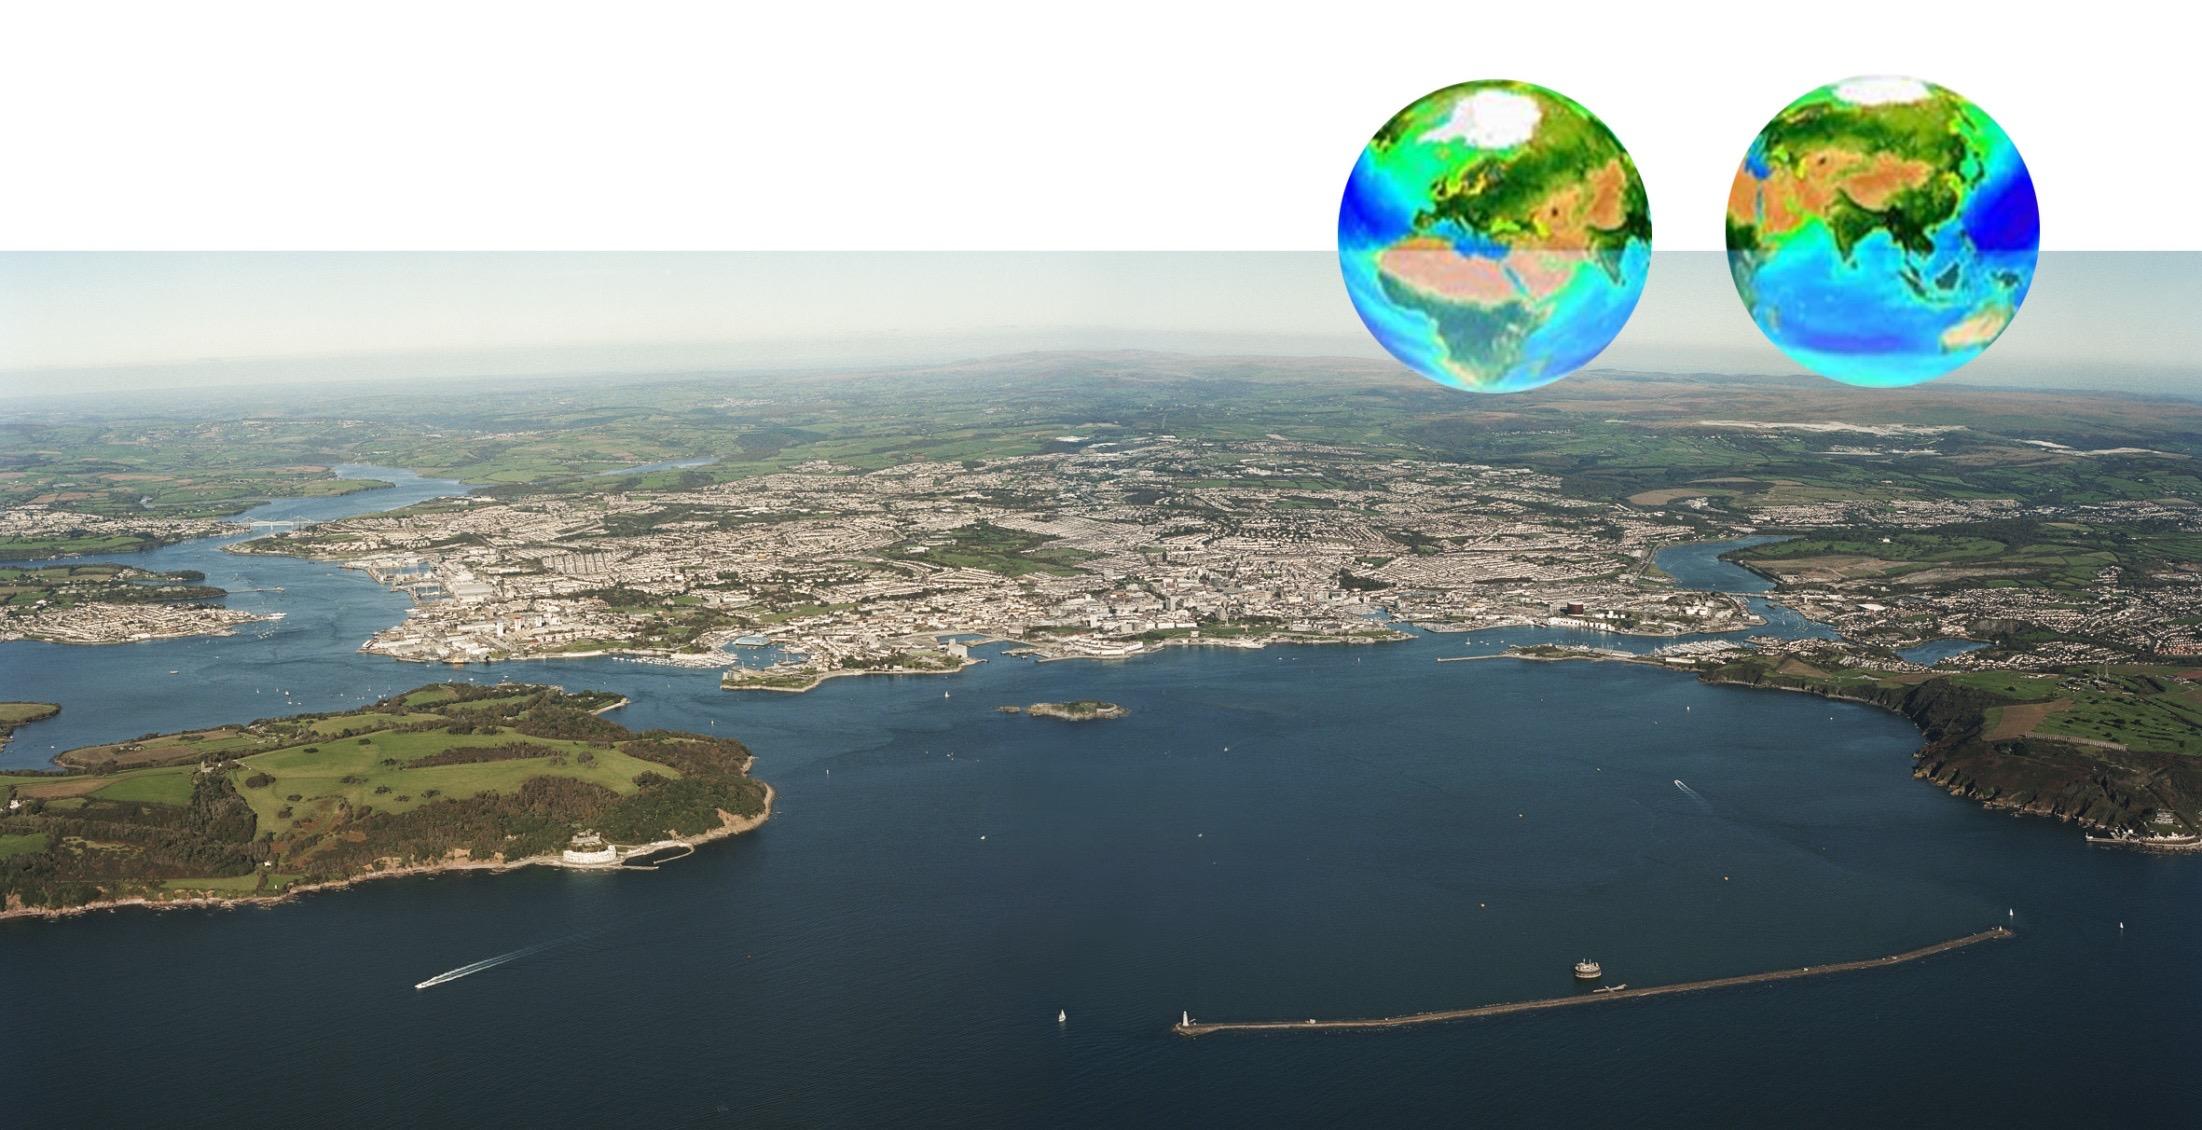
Tamar Catchment Partnership meeting
22nd June 2023

Stefan Simis, Elizabeth C. Atwood
Tamar Catchment Partnership meeting
22nd June 2023
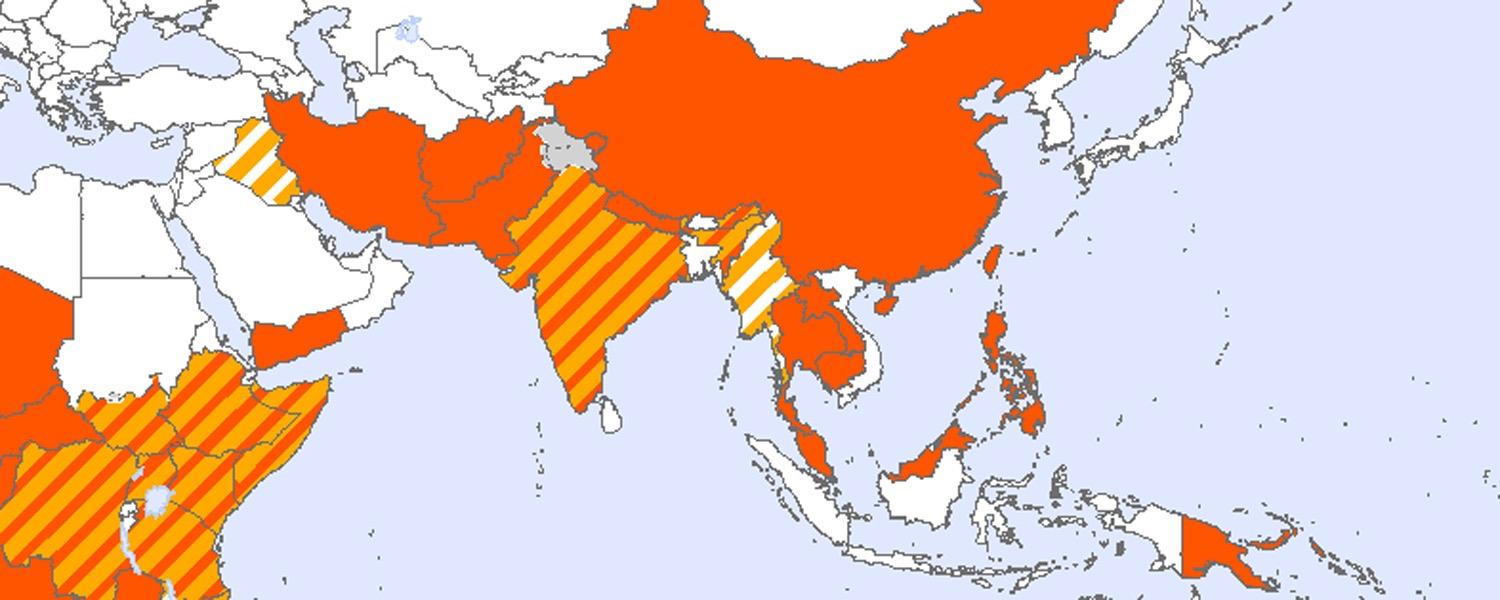

Nearshore and inland water quality indicator projects support EU directives and global conventions


EU Water Framework Directive
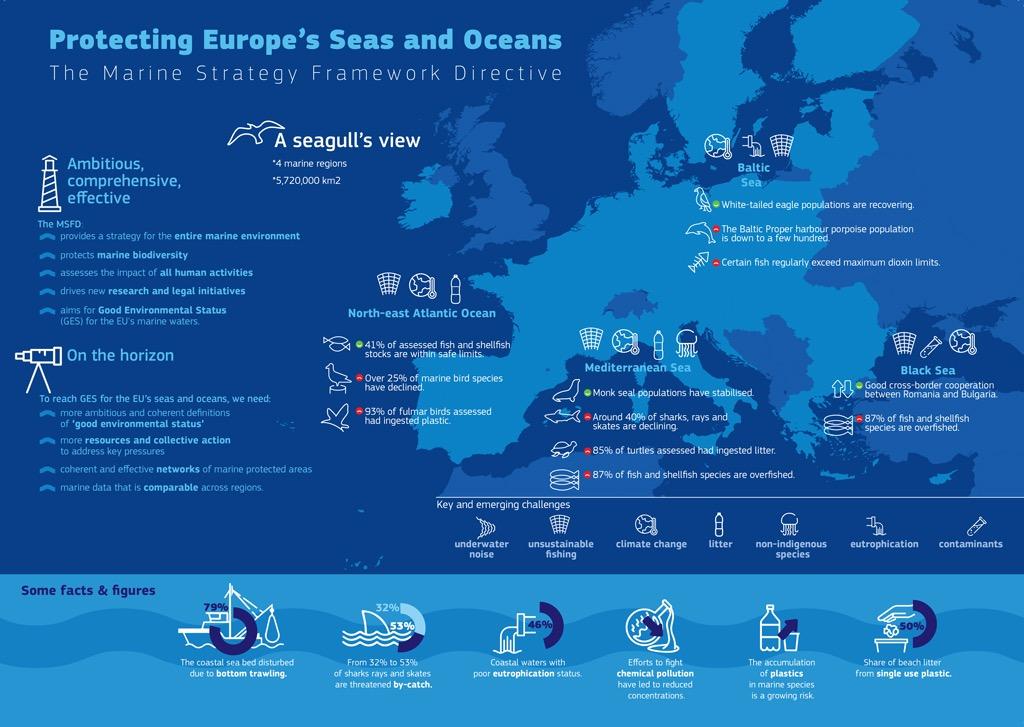
EU Marine Strategy Framework Directive

UN Sustainable Development Goals

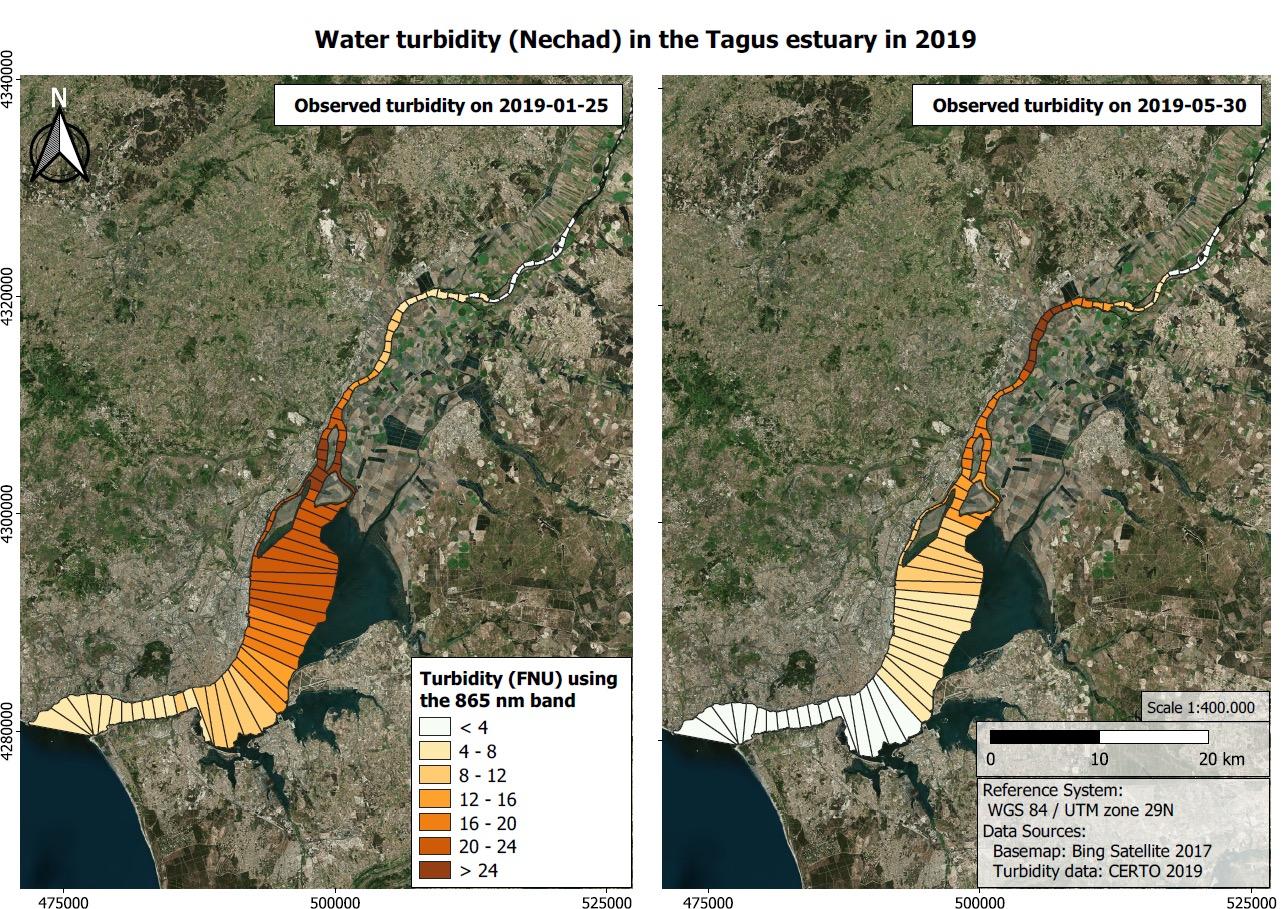
• Medium and high-resolution optical imagery
• Algorithm blending over Optical Water Types
• Chlorophyll-a indicator of algal activity
• Suspended Particulate Matter (SPM) indicator of sediment transport
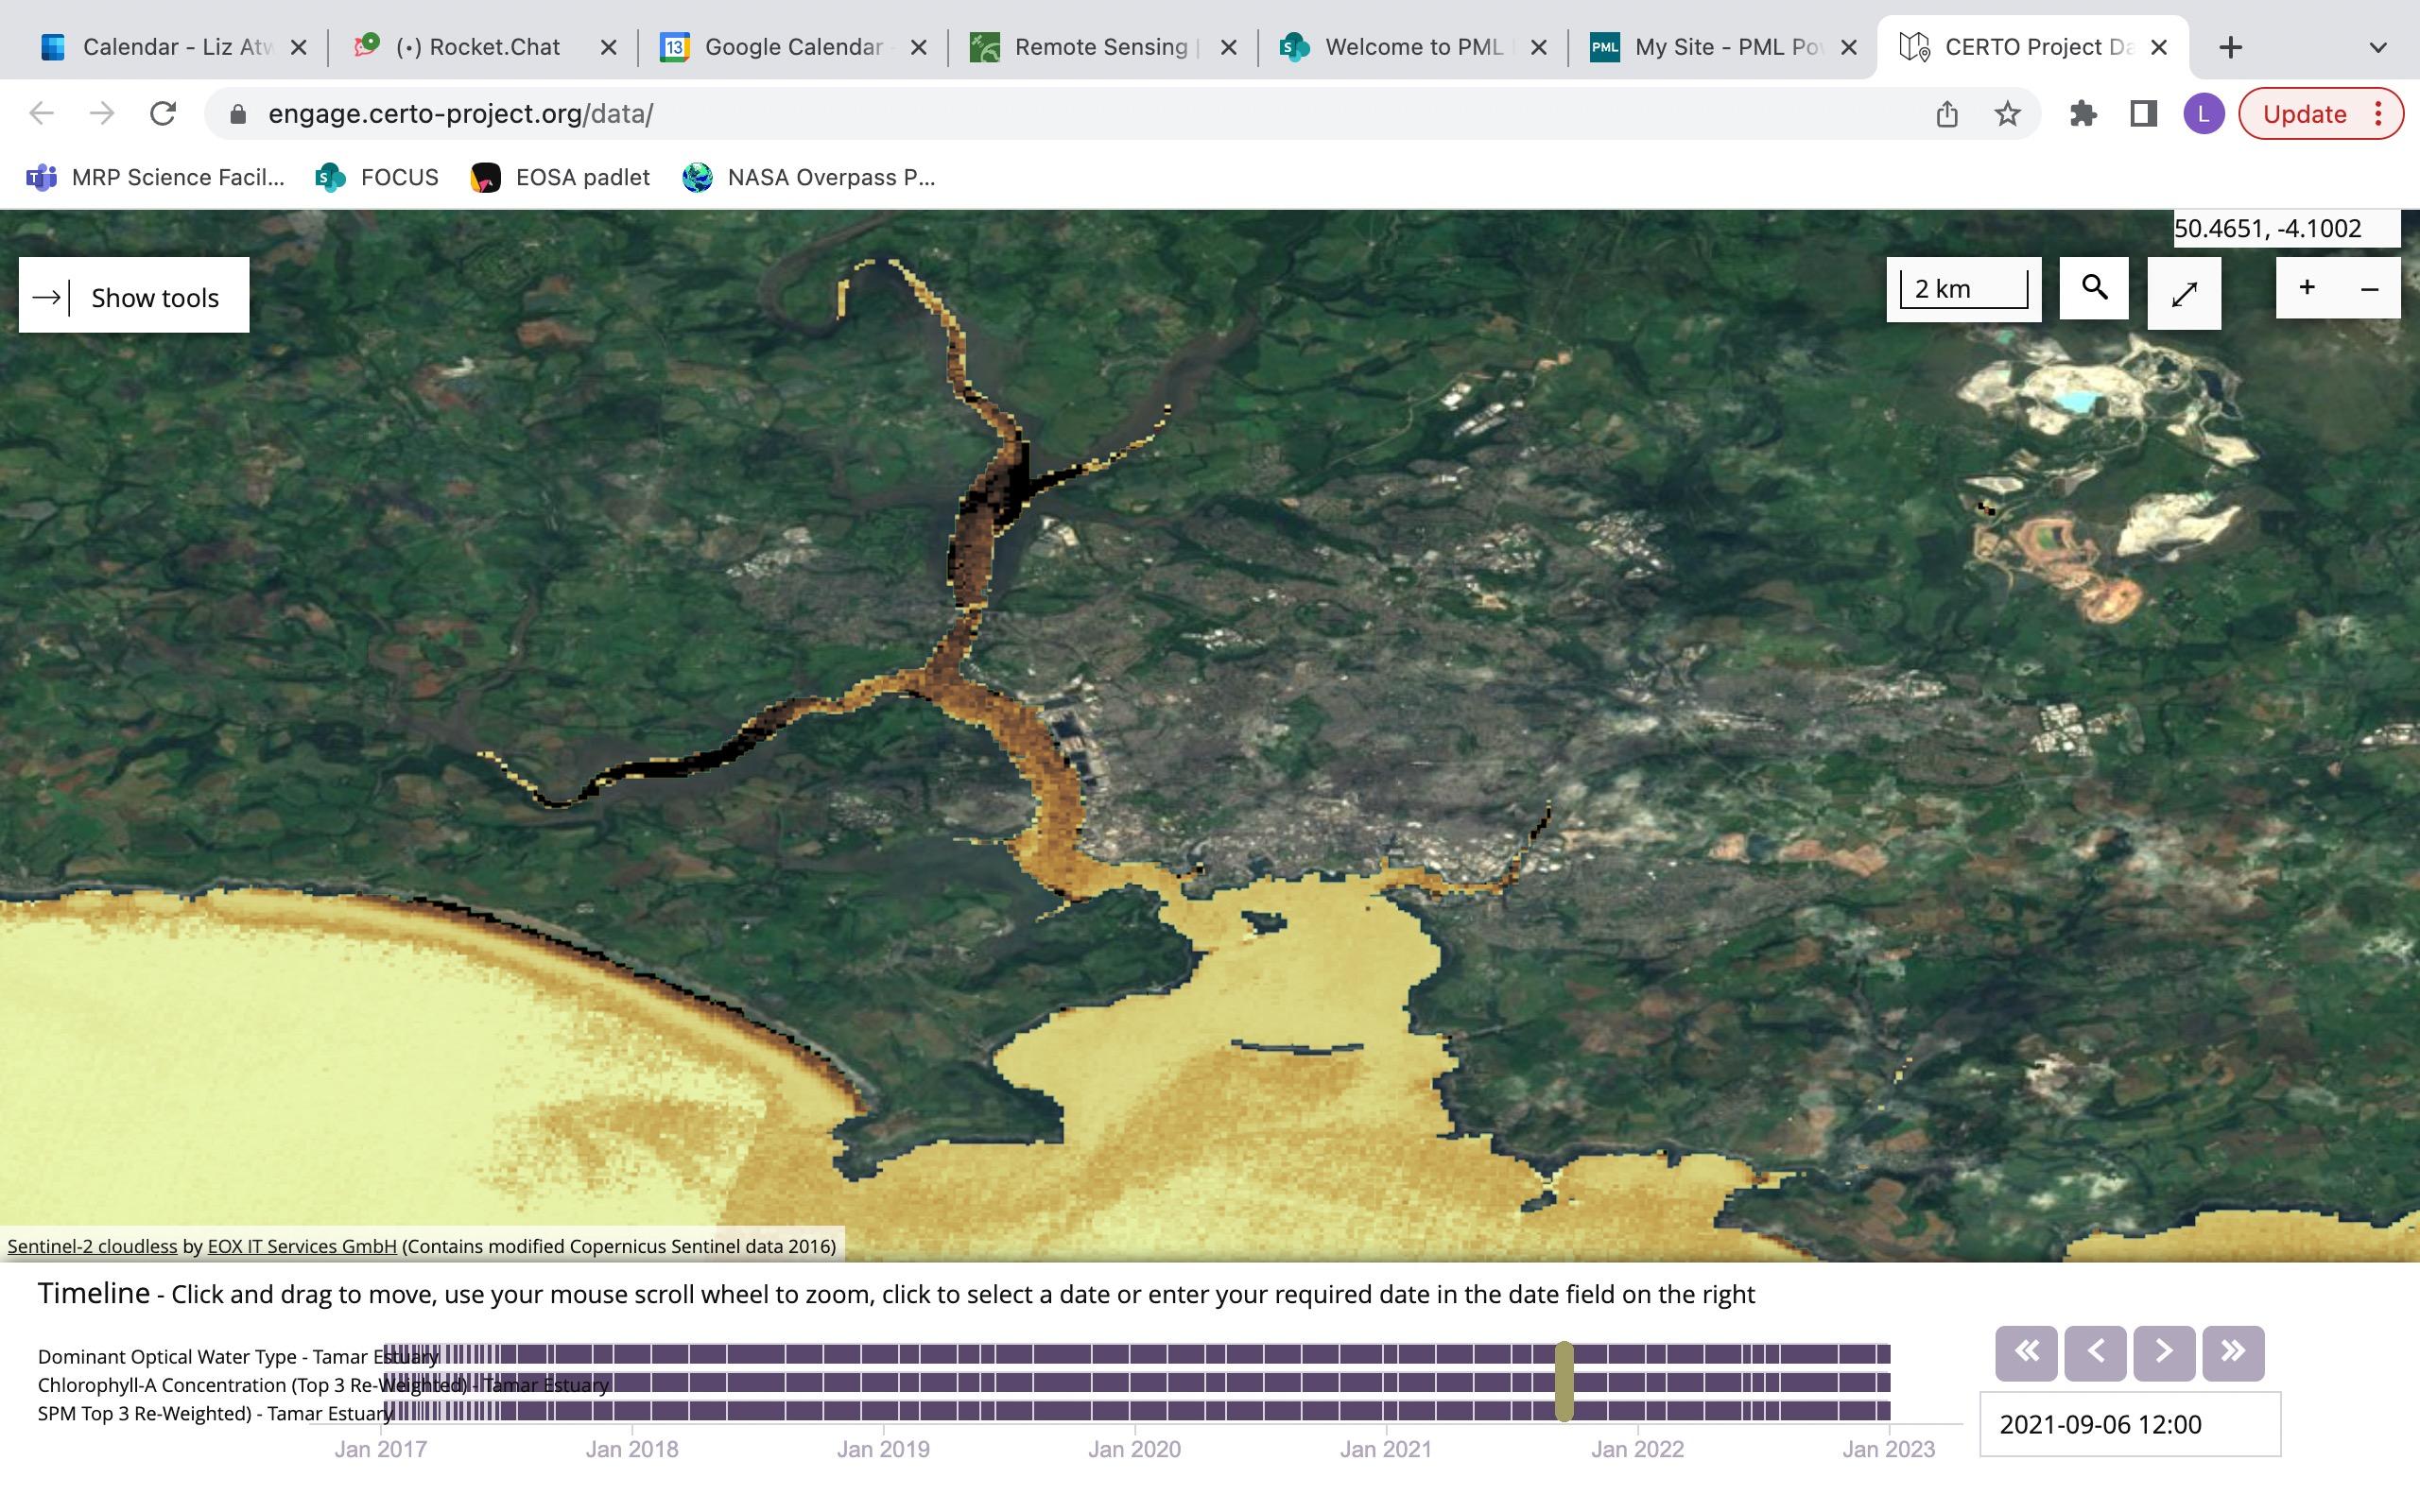
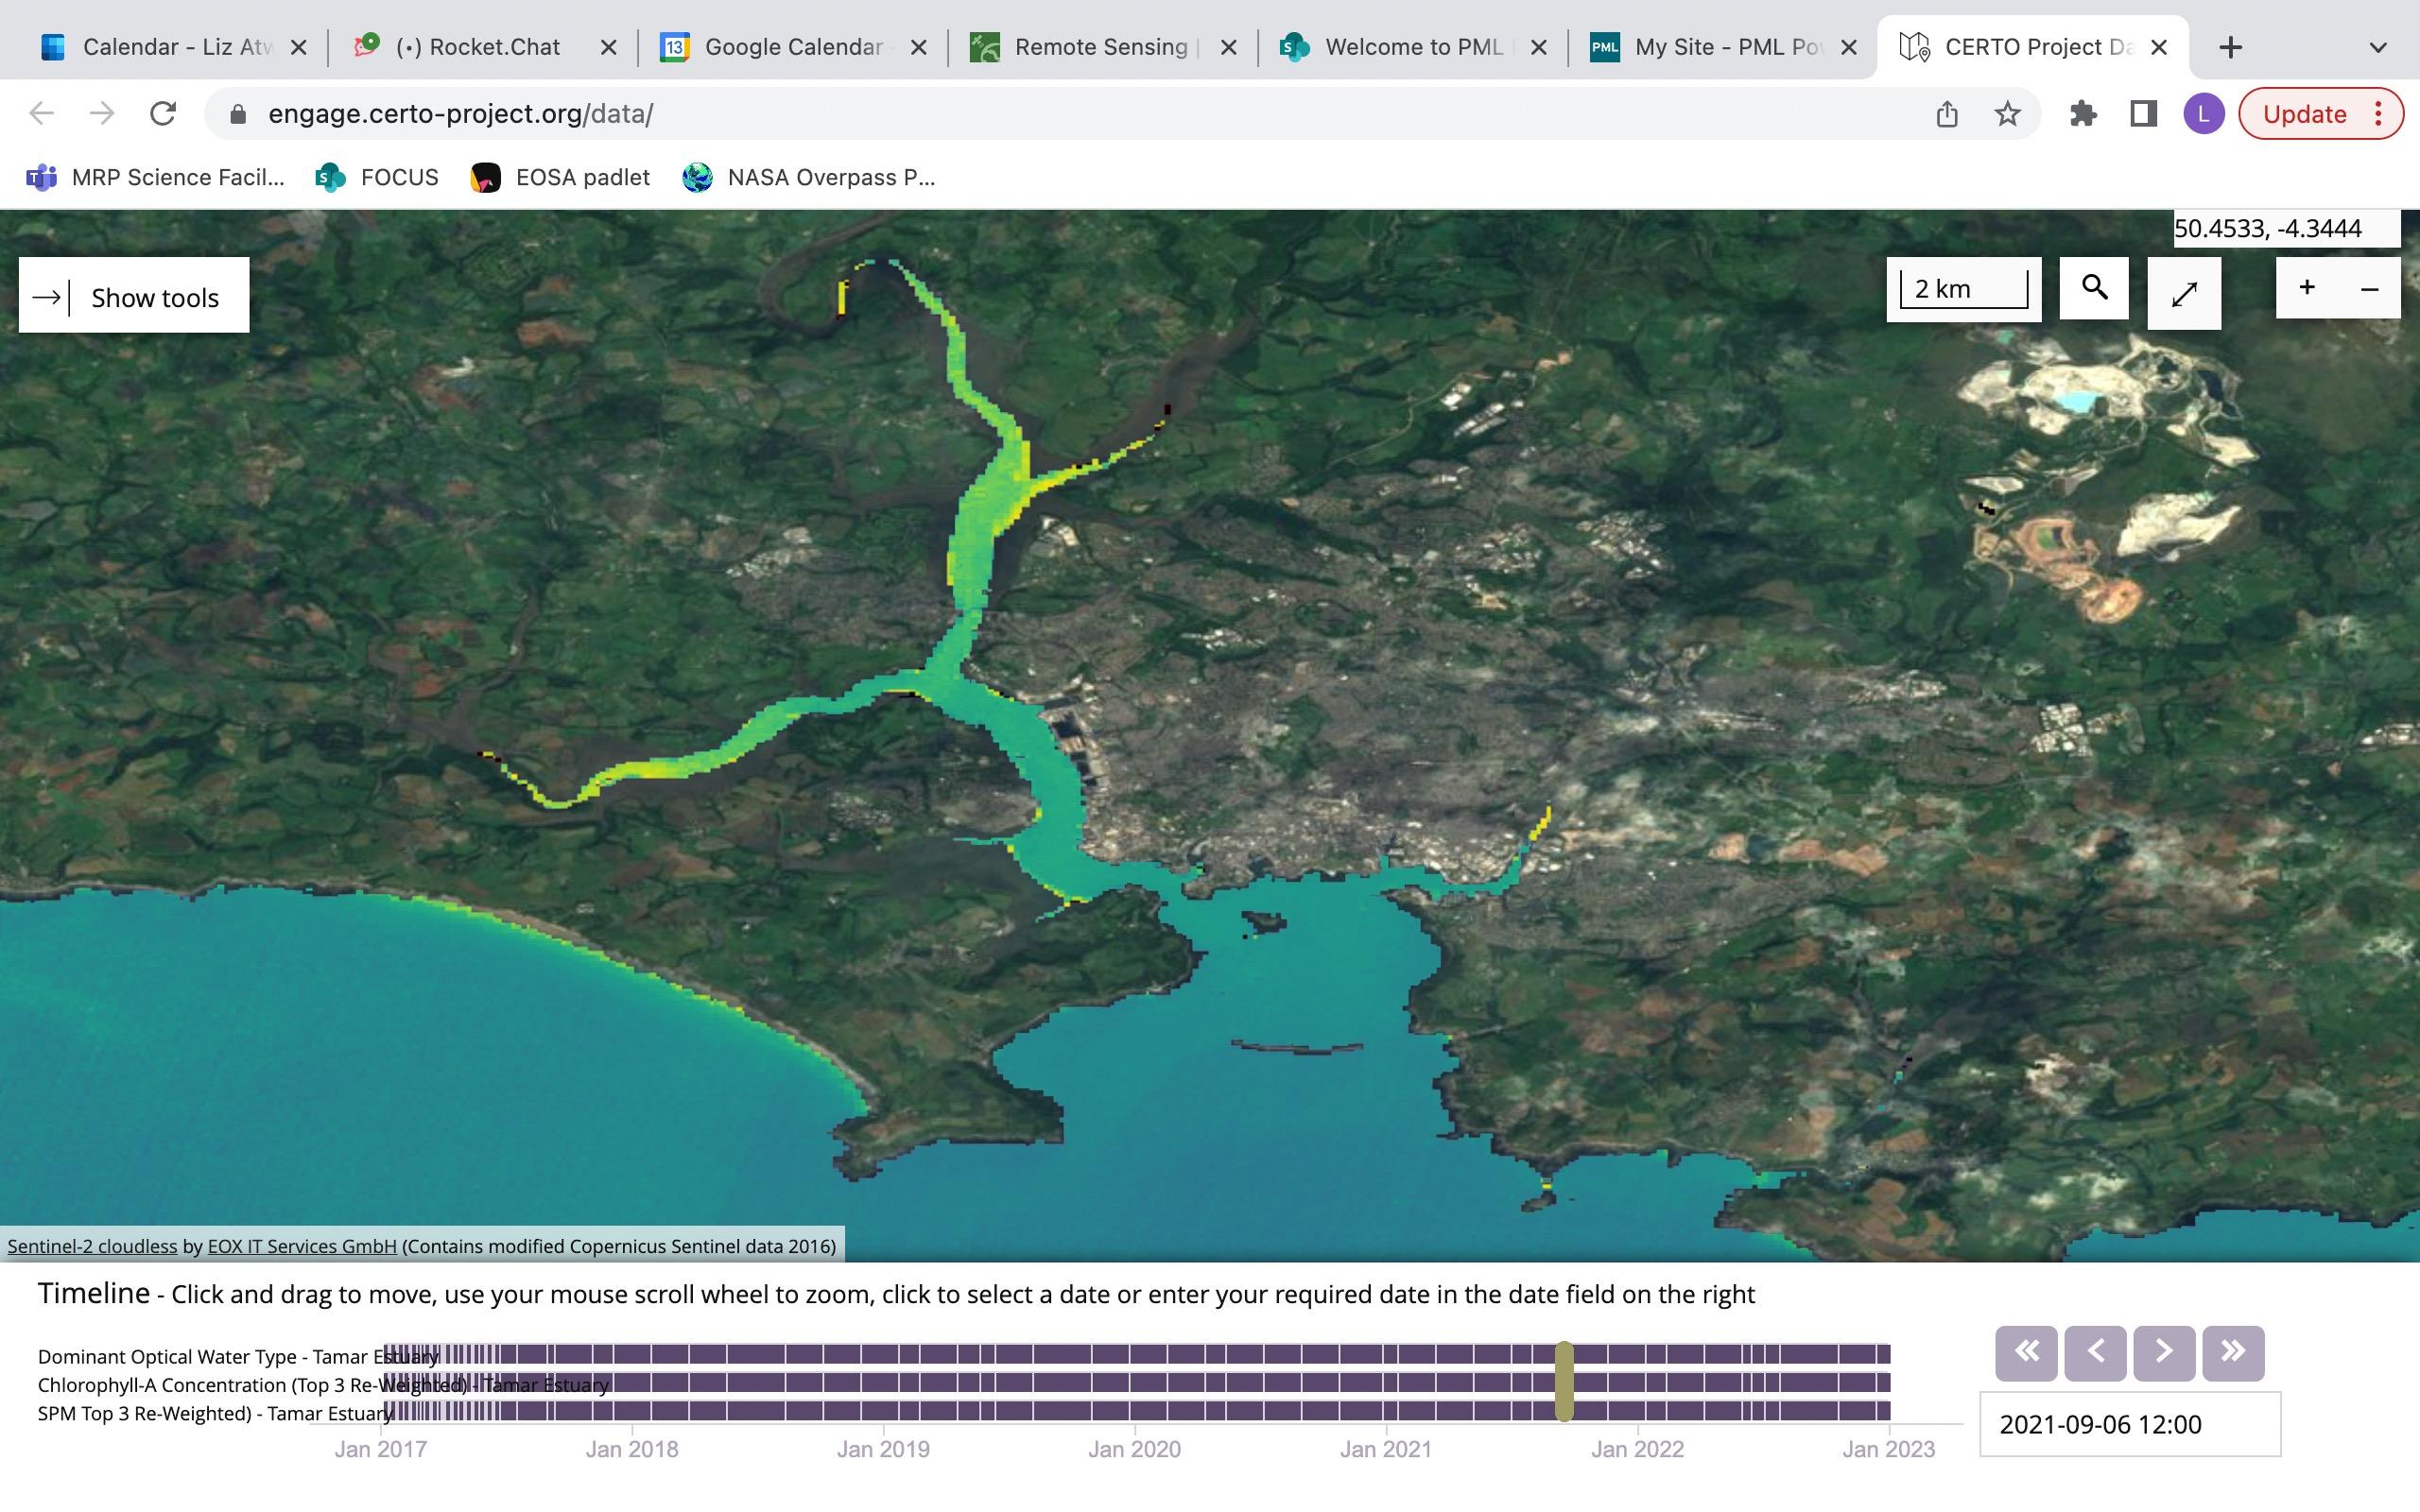
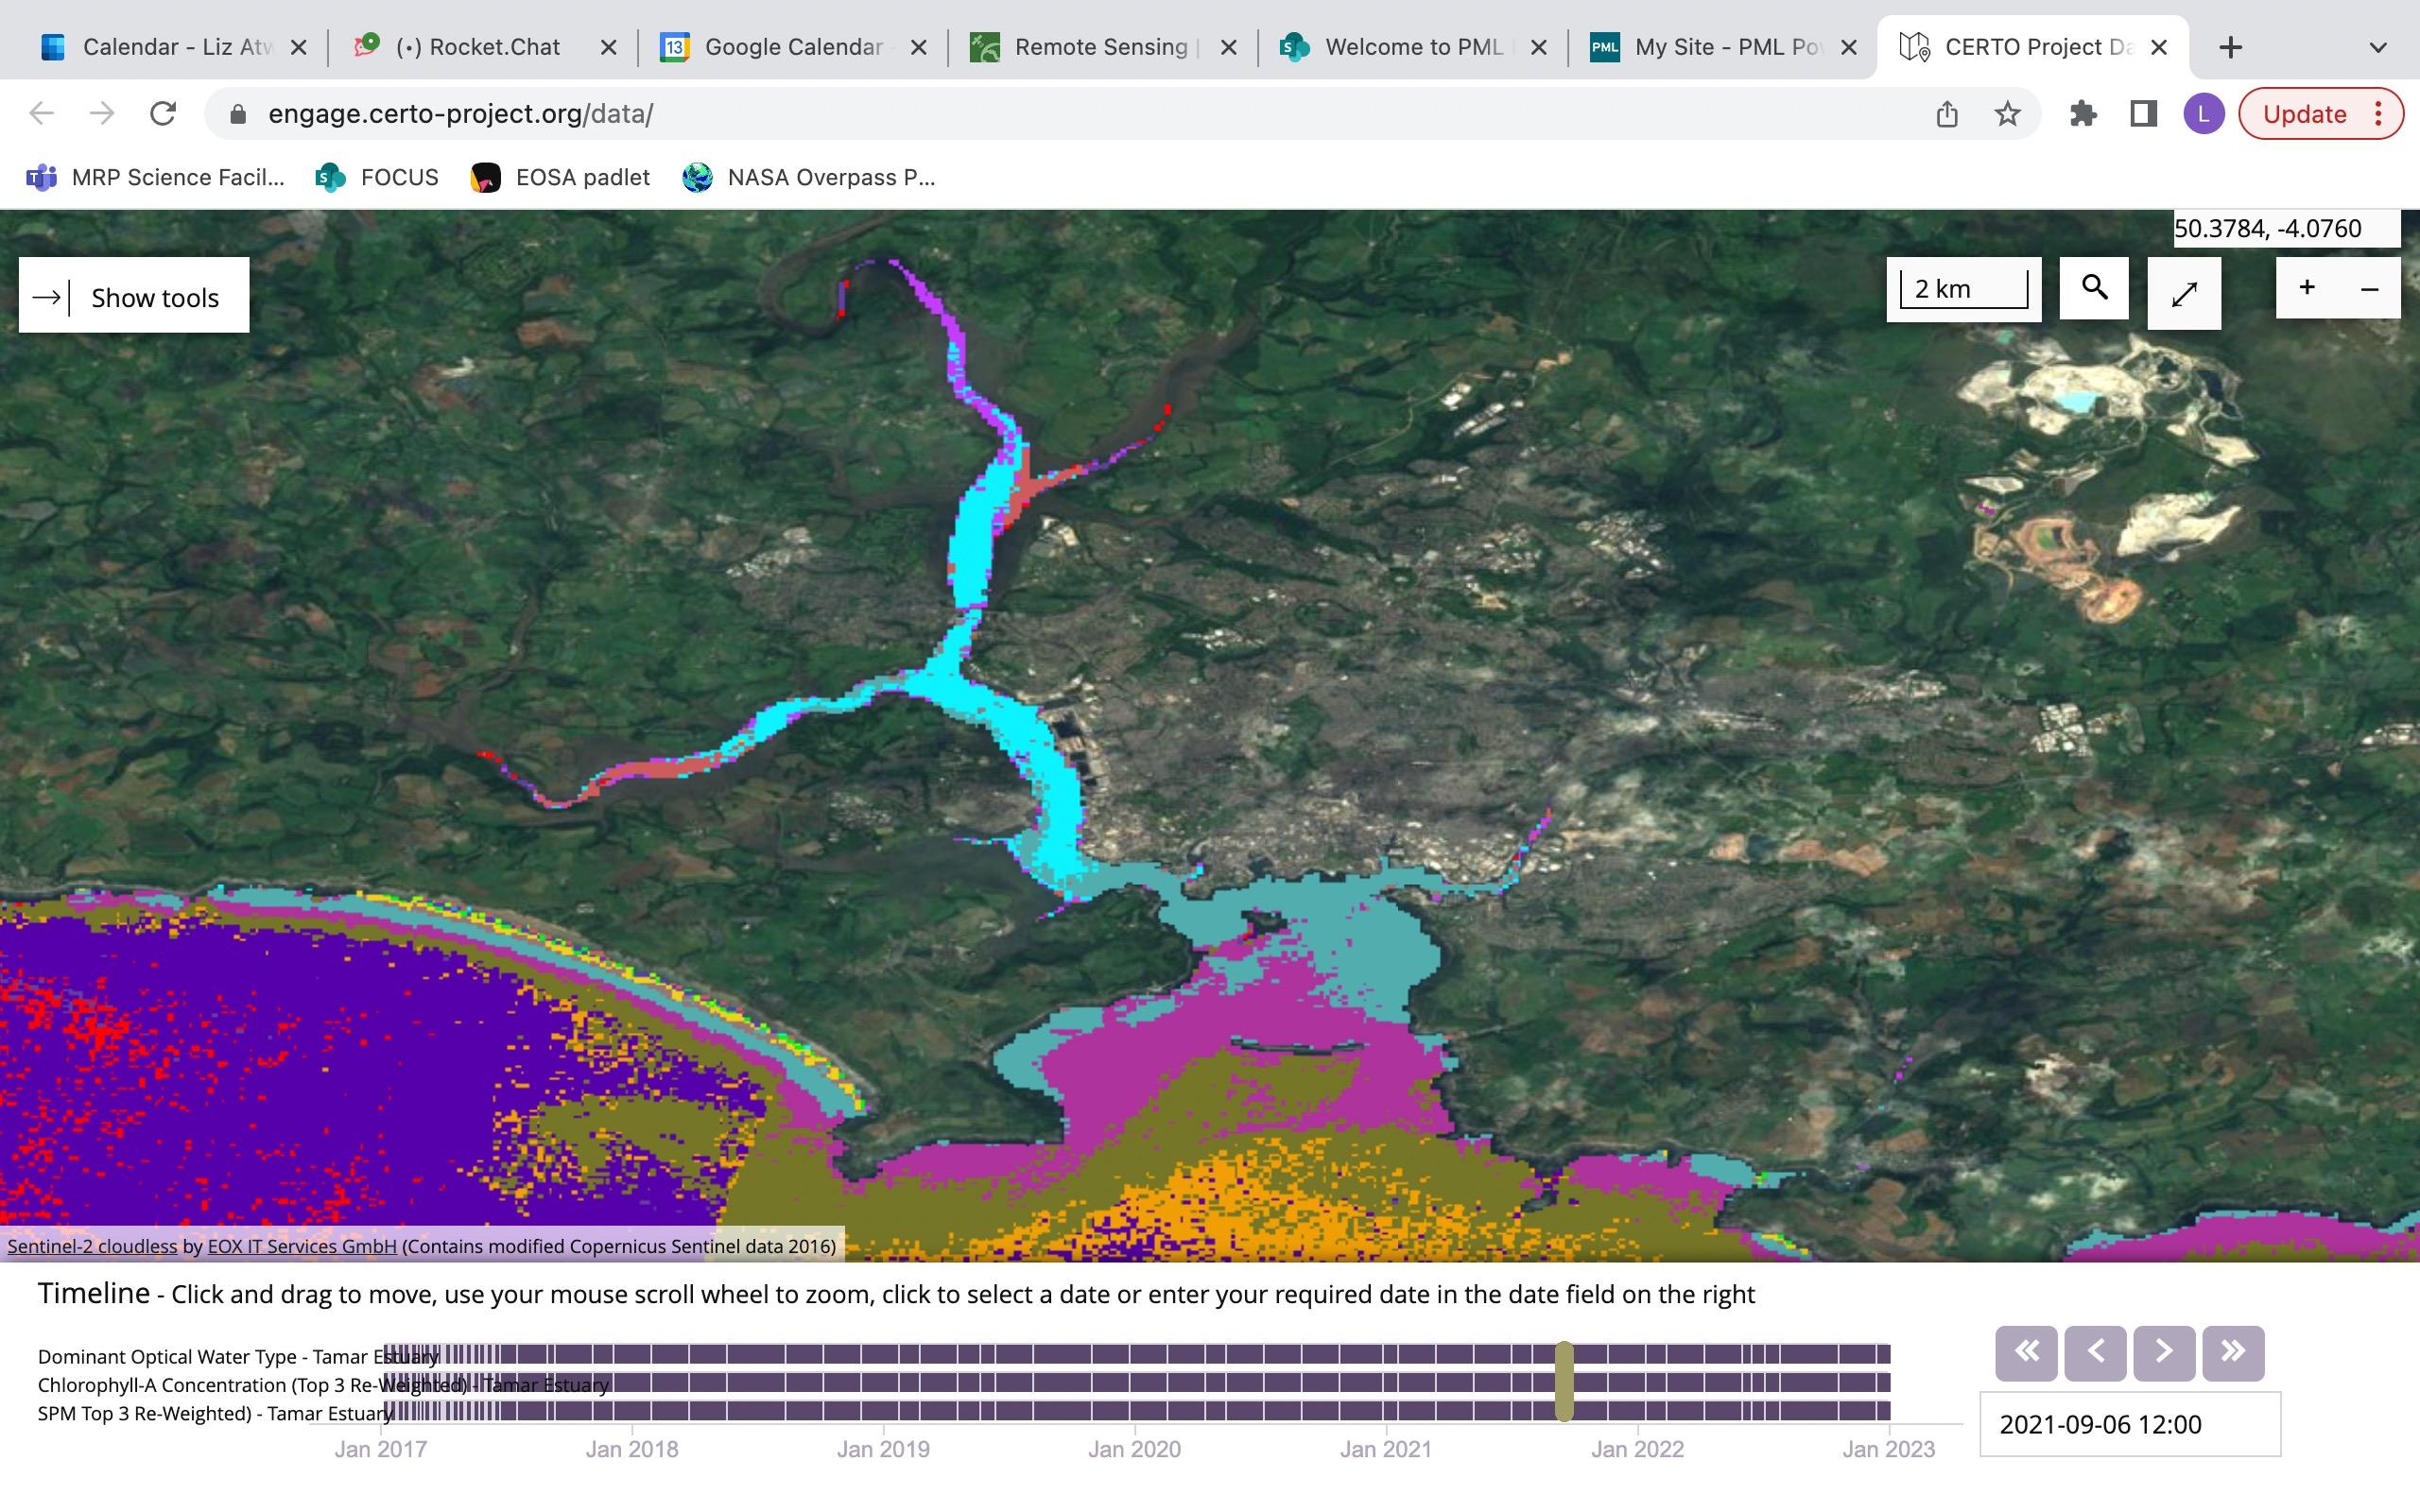
https://engage.certo-project.org/data/
Maximum turbidity zone / high loads zone indicator
–
Analyse trends, daily/weekly/monthly maps to see shifts and seasonal trends
– Take tides into account (inflow/outflow)
à interesting also when looking at less tidal influenced zones
– Expansion/decrease of zones
Dredging impacts – Deepening of ports/channels
–
Before and after analysis
– Does dredging lead to higher TSM concentrations or are they swept by the currents?
à Mostly visual analysis
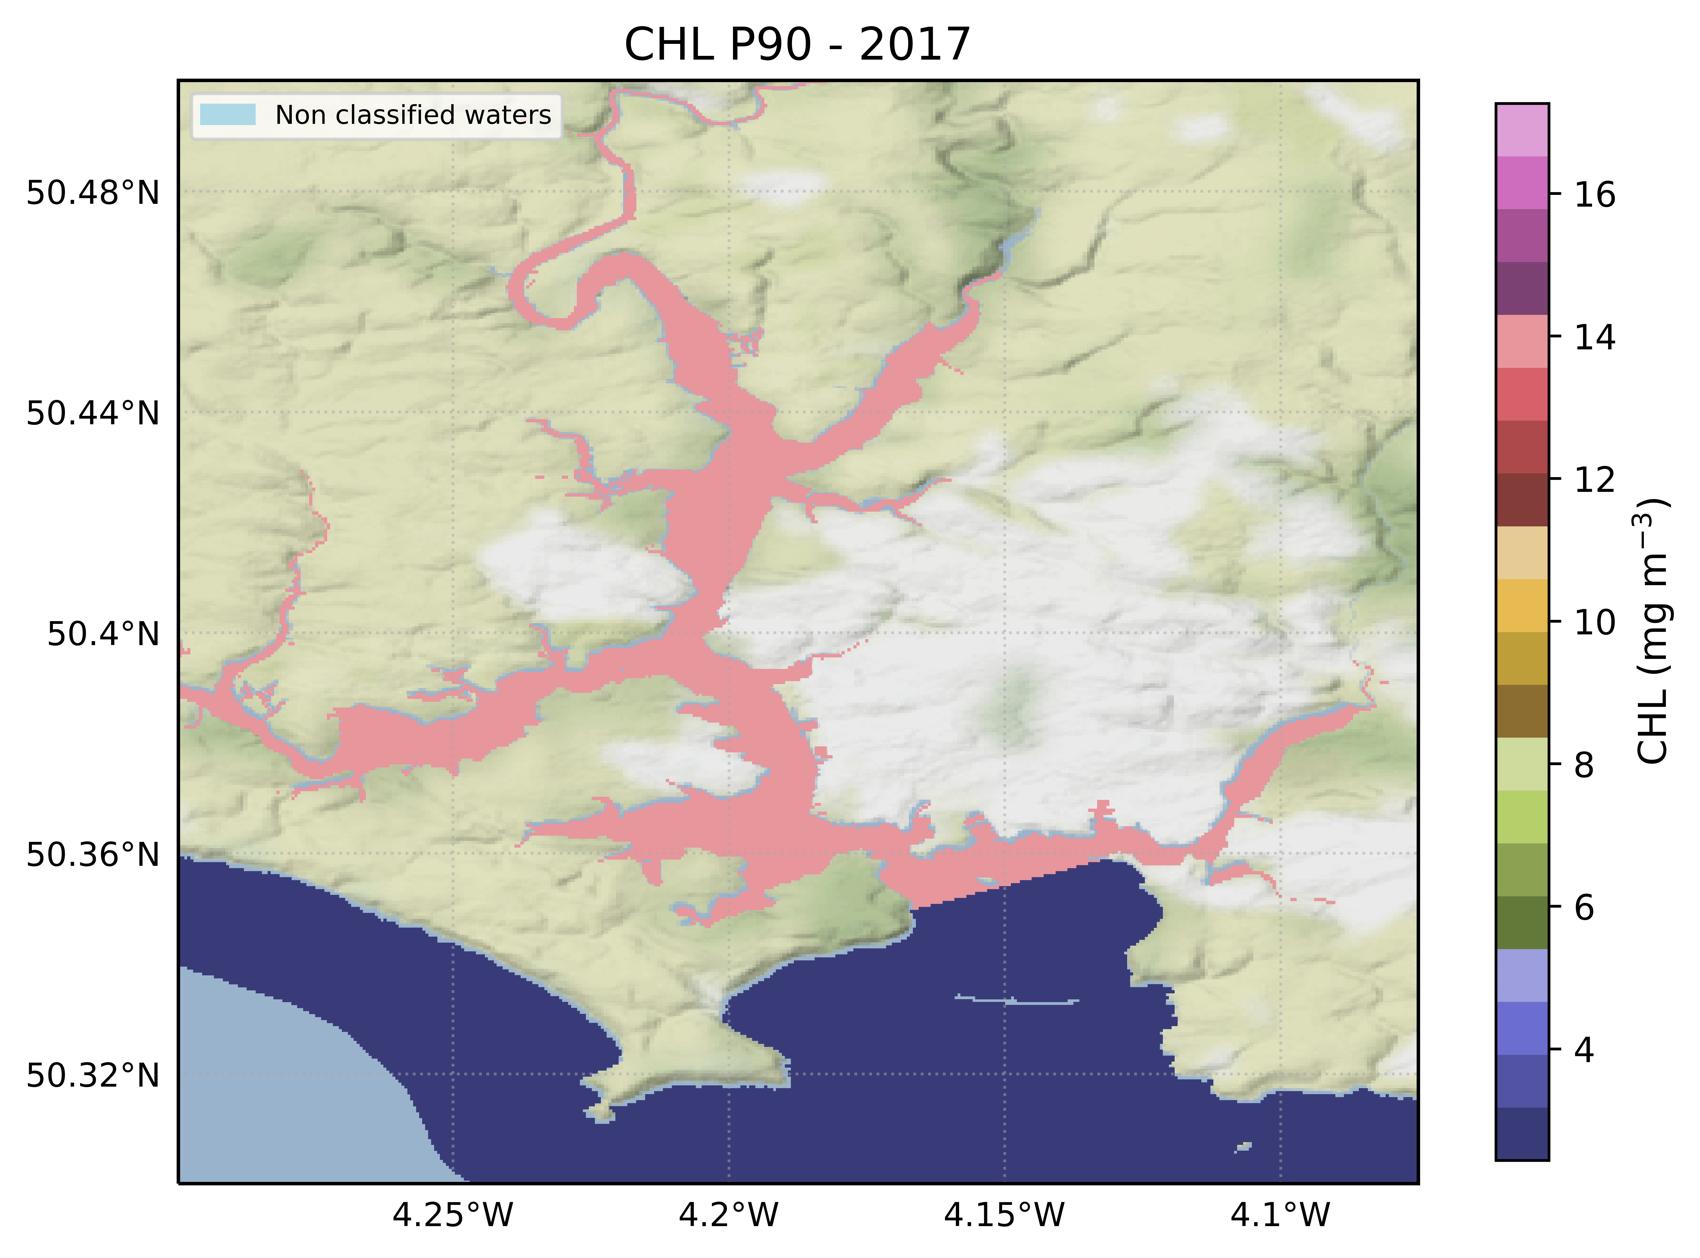
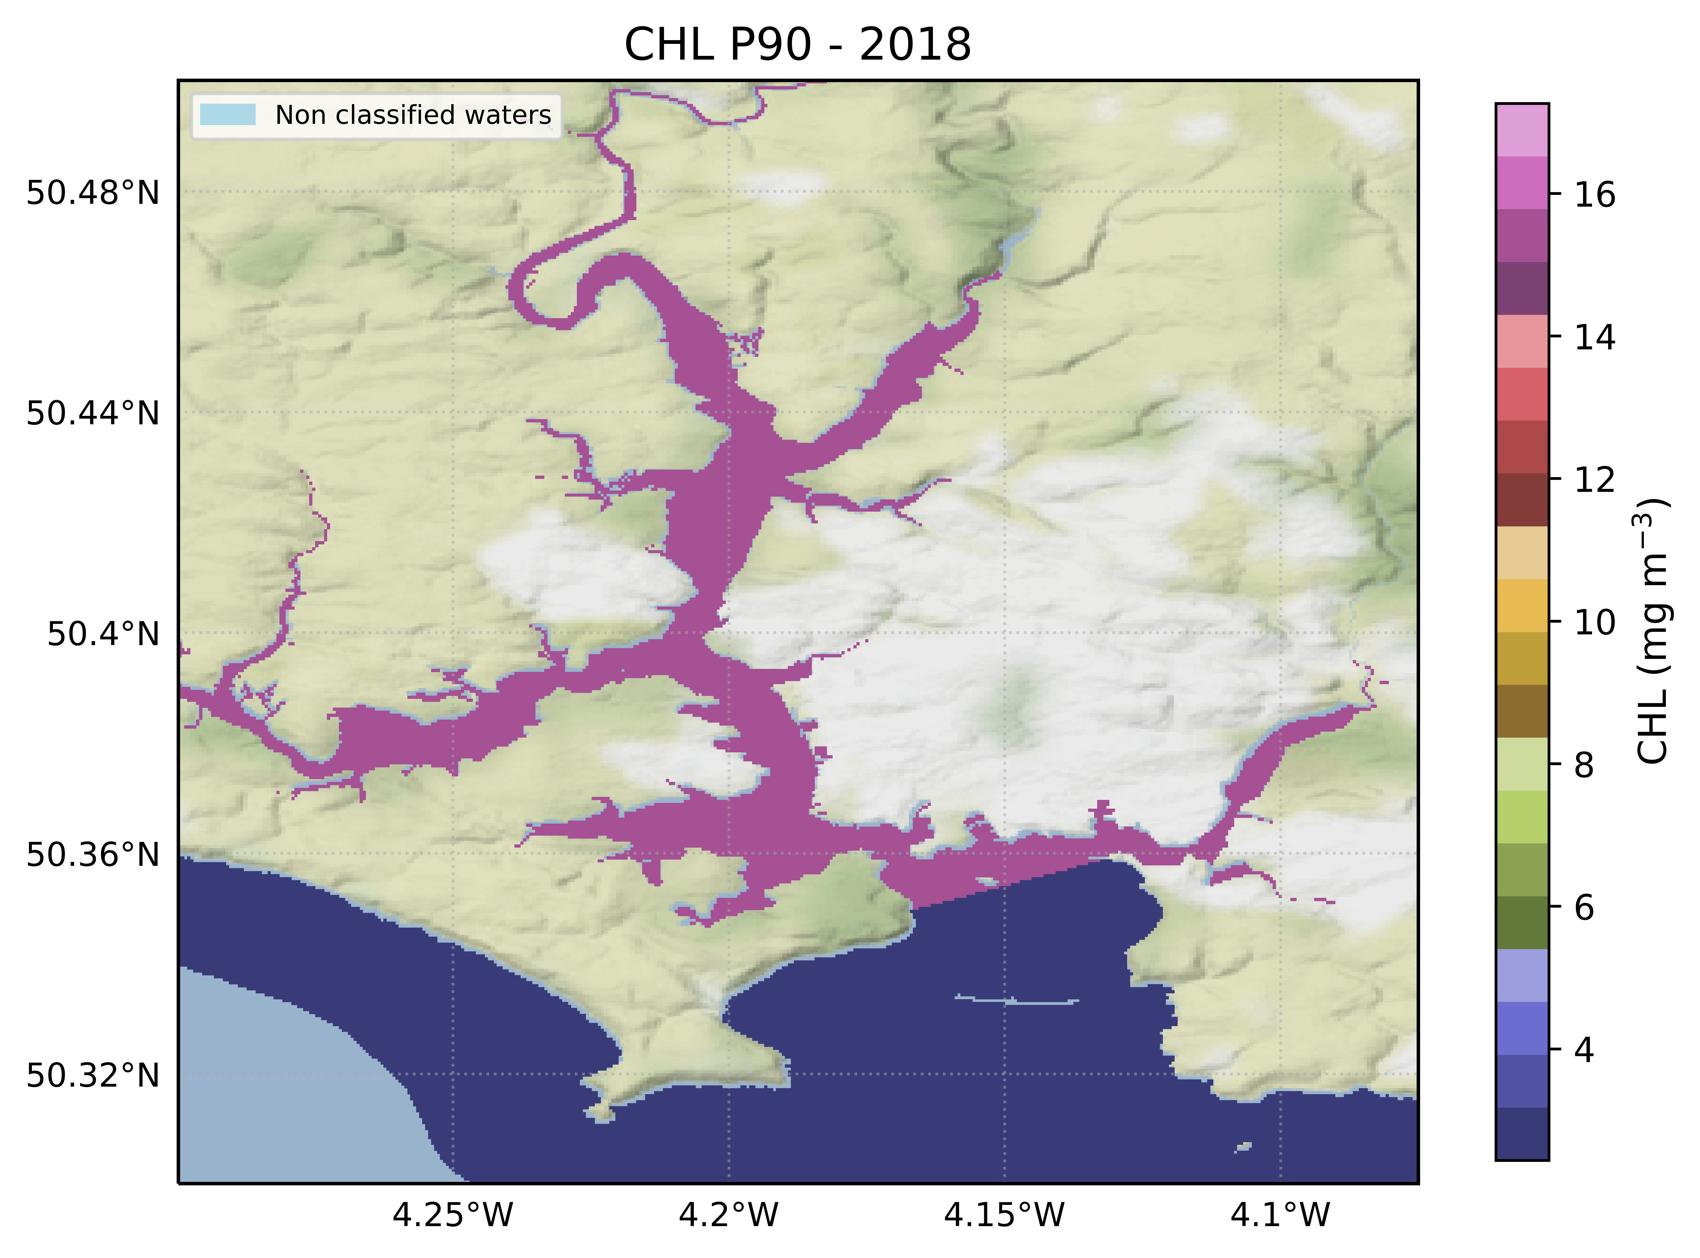
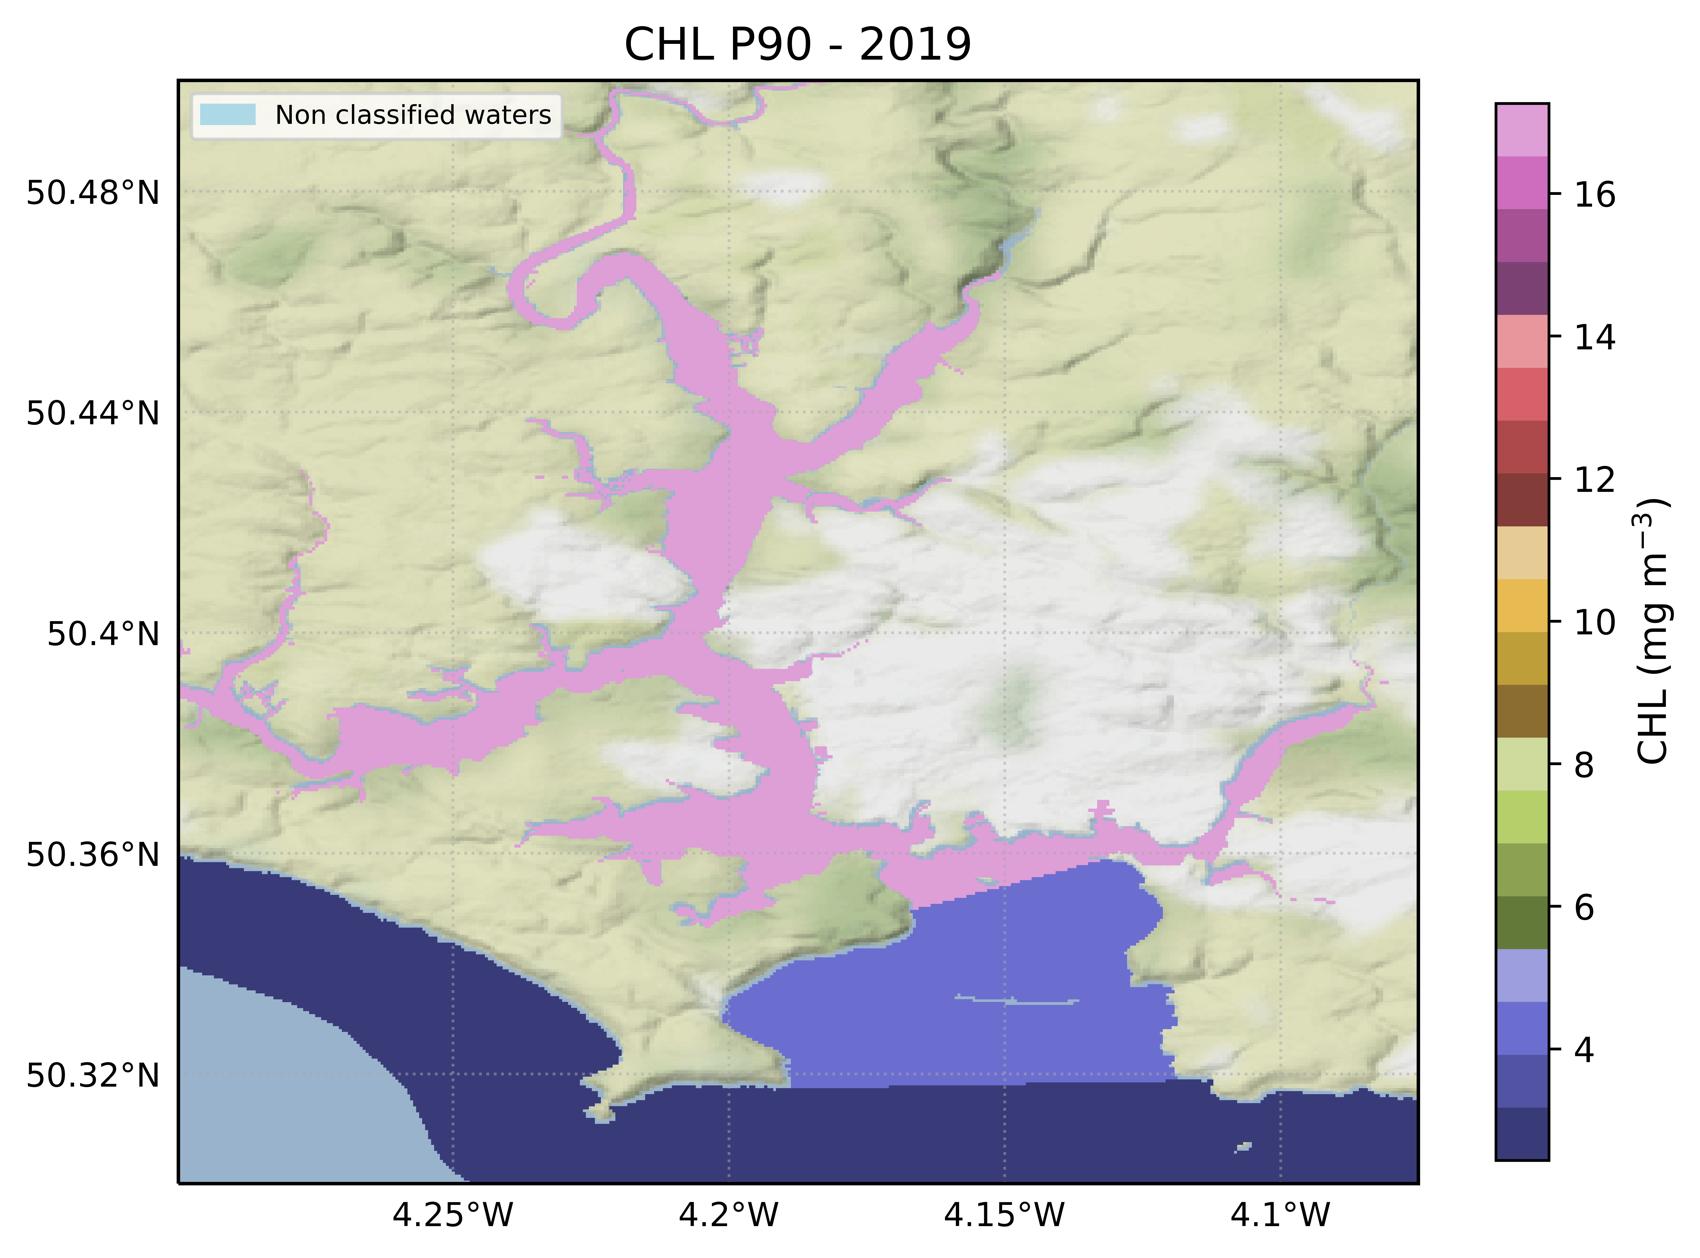
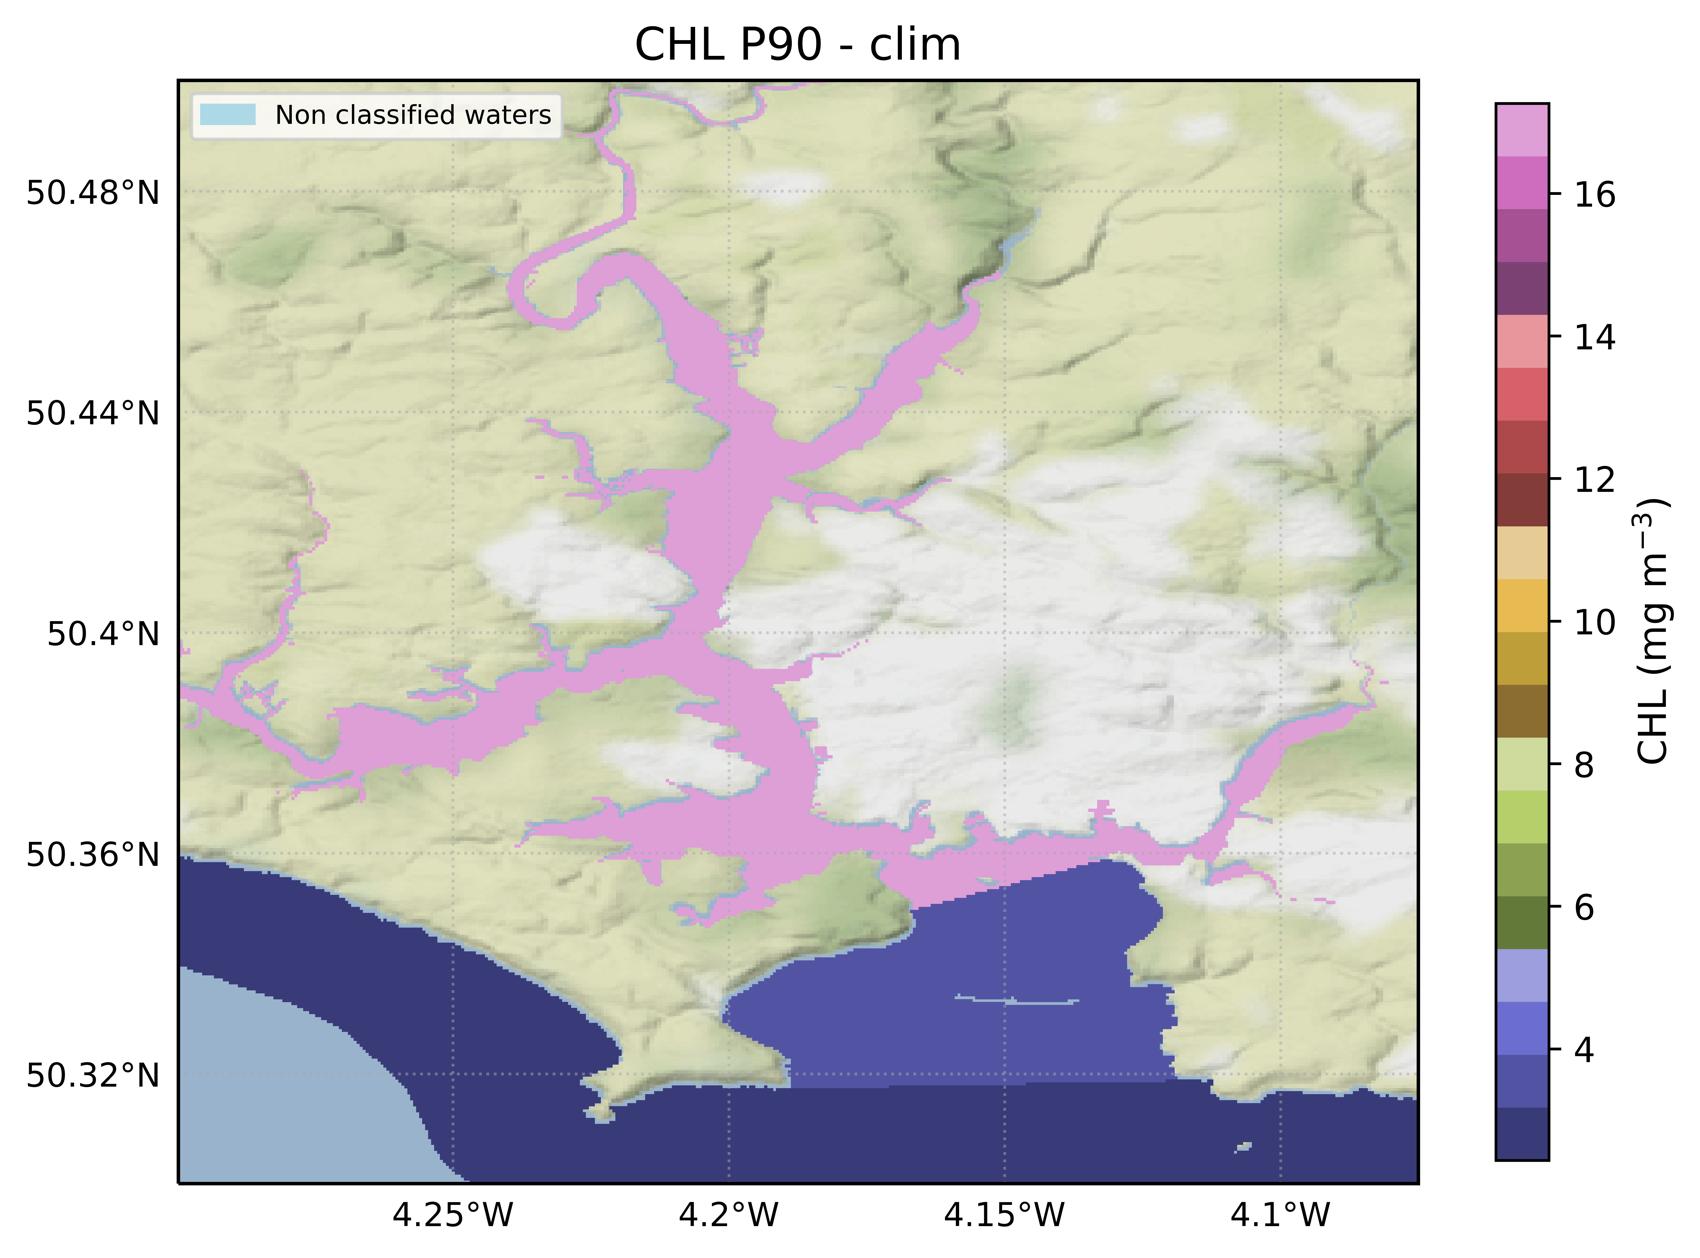
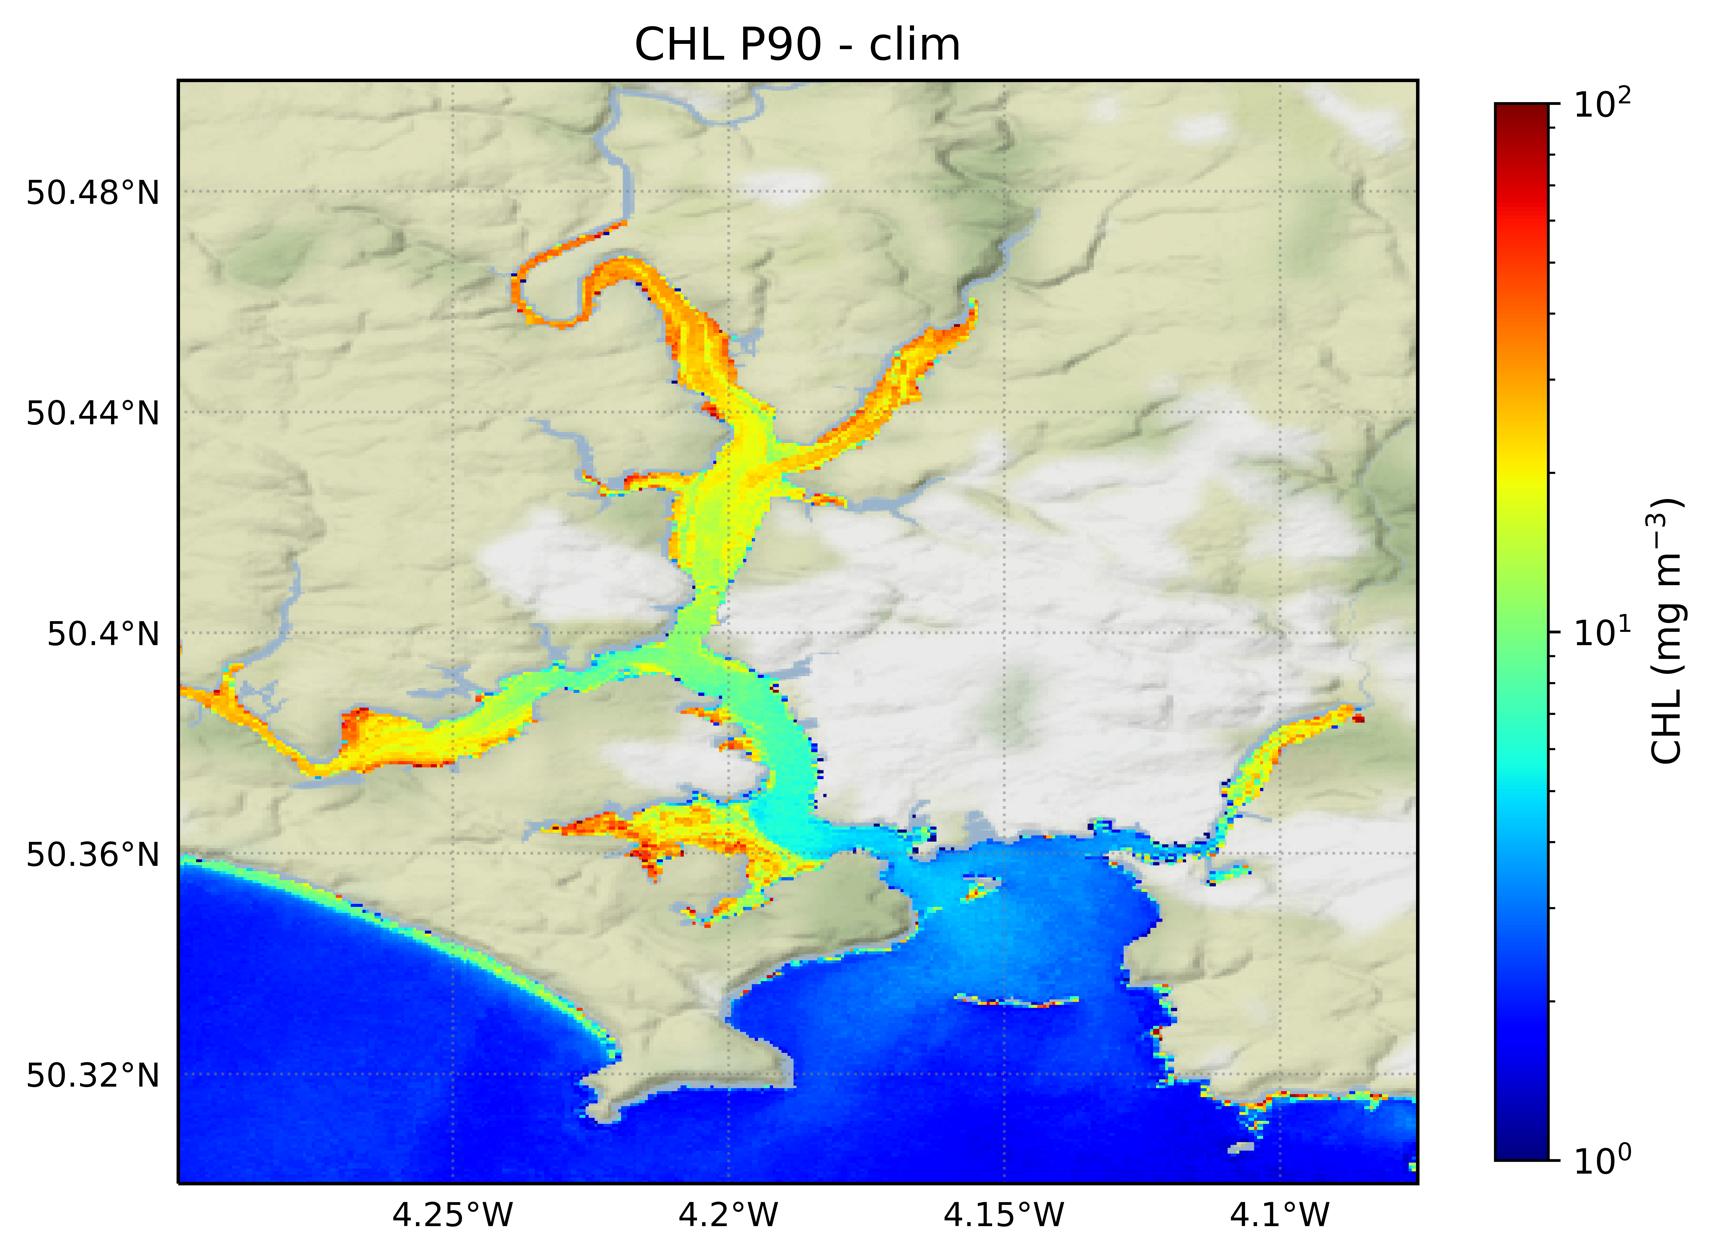
Two sets of indicators computed using satellite data:
1. Chlorophyll-a 90th percentile (CHL P90)
2. Phytoplankton bloom phenology indices
These can be:
• Based on WFD contours used for spatial integration
• Temporal aggregation as required (daily, monthly, seasonally)
• Metric as required (average, P90, timing of blooms)
• Surface estimates (satellite) versus depth profiles (gliders, profilers)
• Non-optical water quality components (nutrients, metals, etc)
• Near-shore observations – where satellite product uncertainty is high
• Microscale observations – identify sources of pollution

Data integration is the next unresolved challenge:
-
Varying observation uncertainties
-
Varying revisit frequency
-
Different proxies for the same property
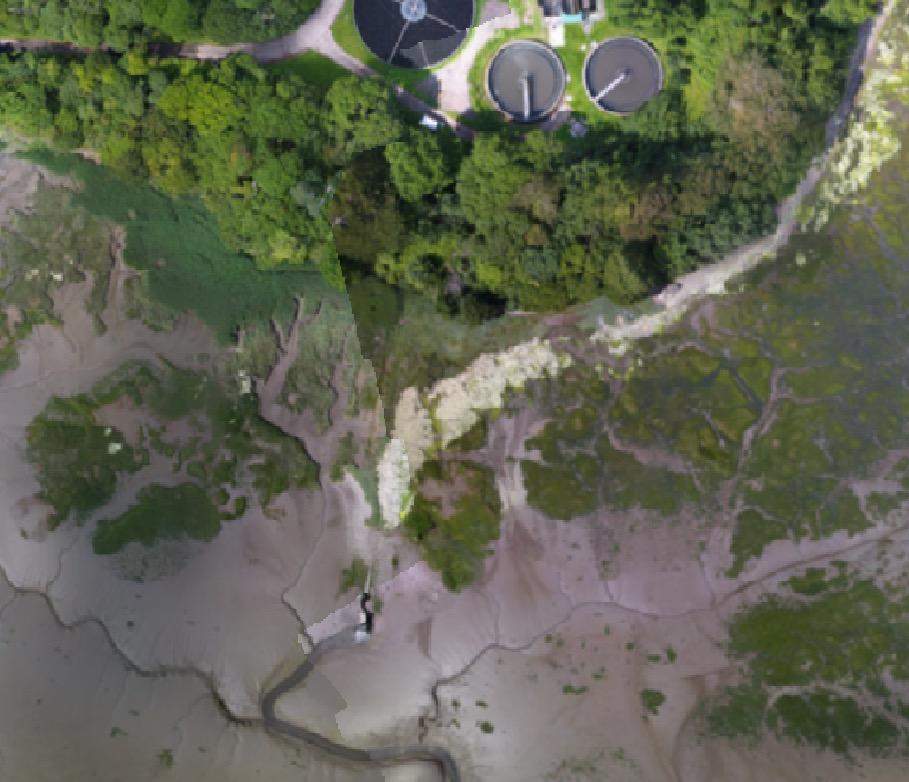
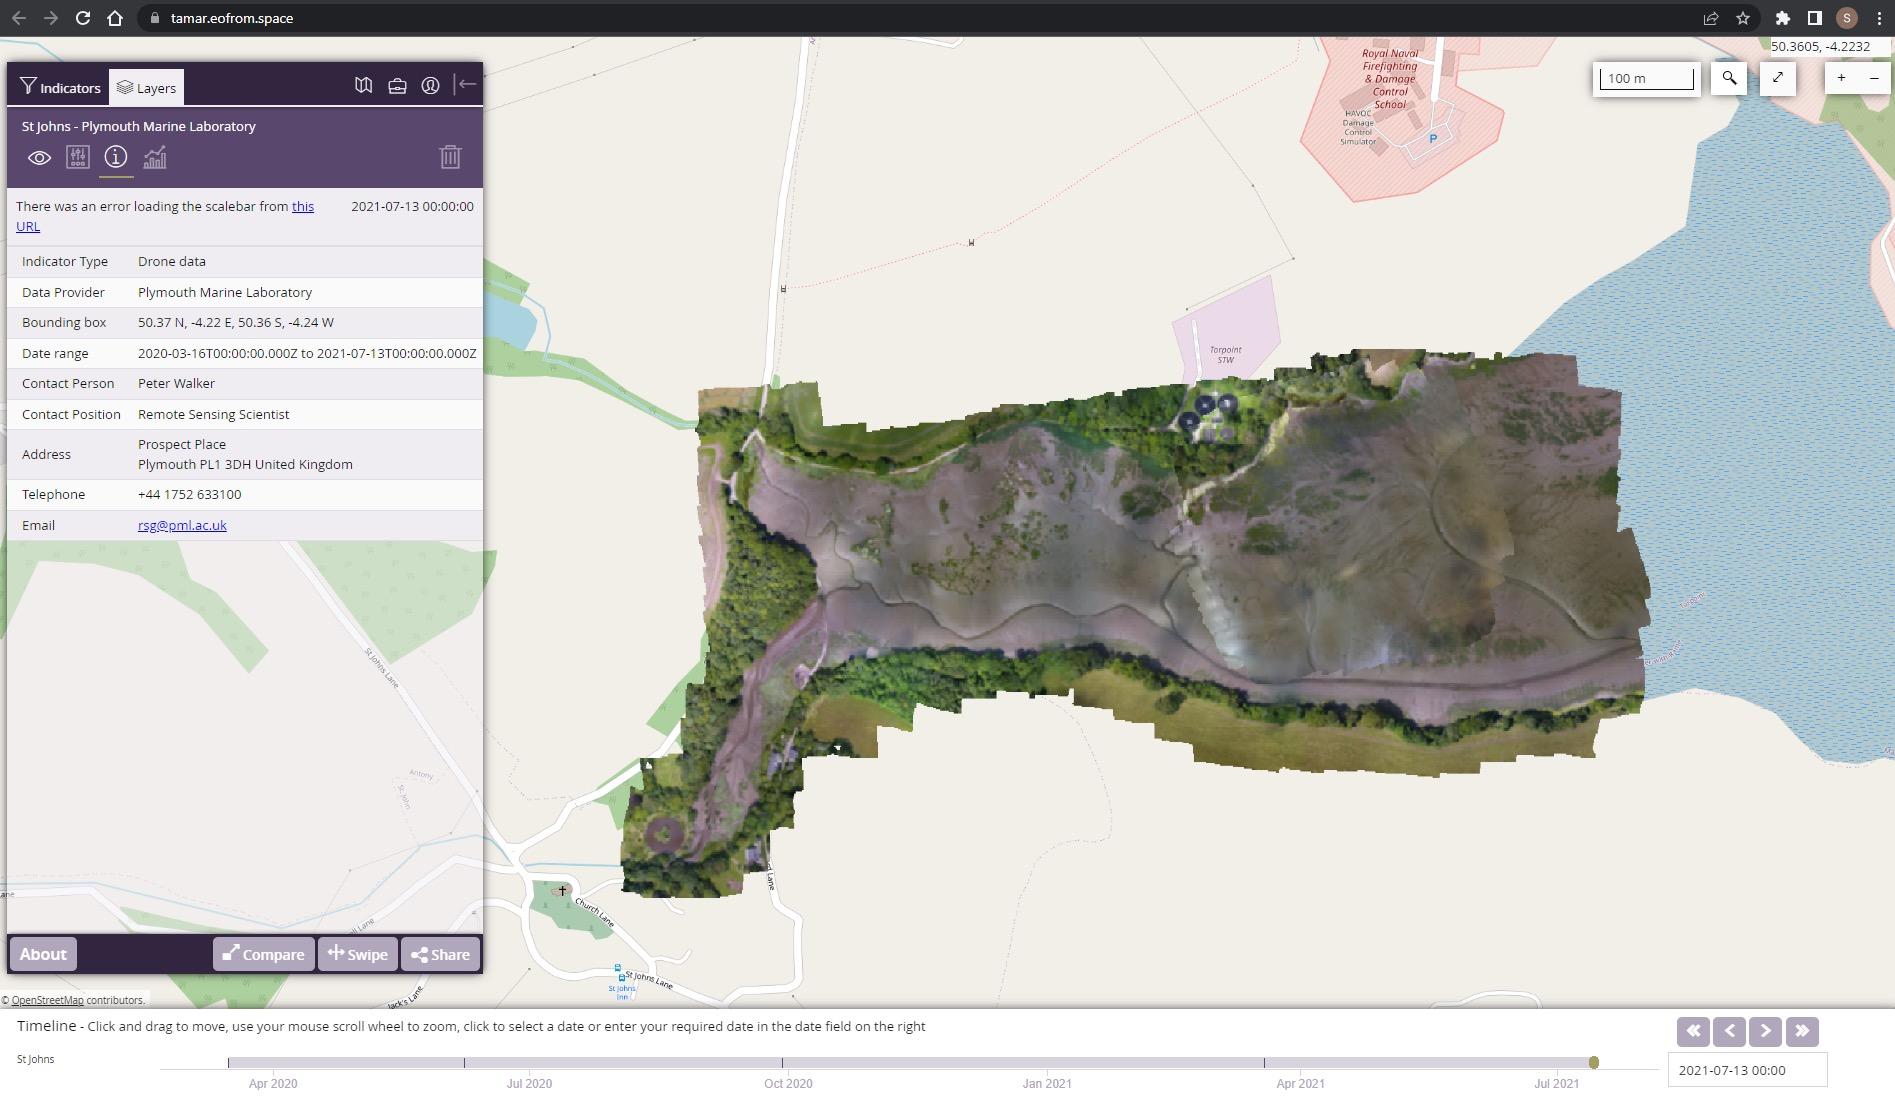
Macrophyte survey in St John’s lake, RGB camera on DJI Phantom 4. https://tamar.eofrom.space
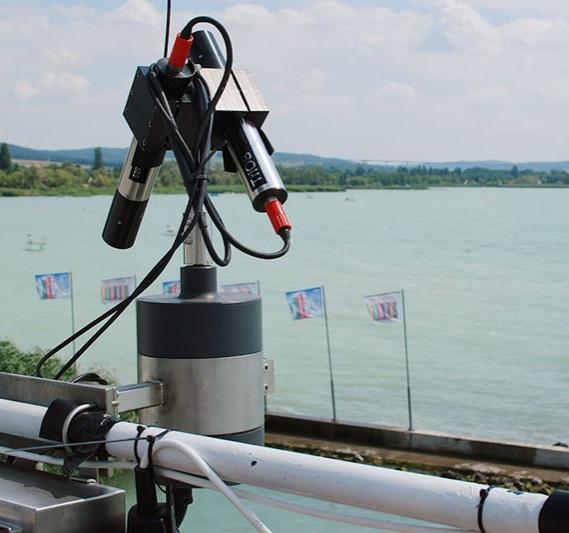
Needed to improve confidence in satellite products:
- High frequency observations provide reference data under diverse set of atmospheric conditions
- Hyperspectral radiometry allows simulating any satellite sensor
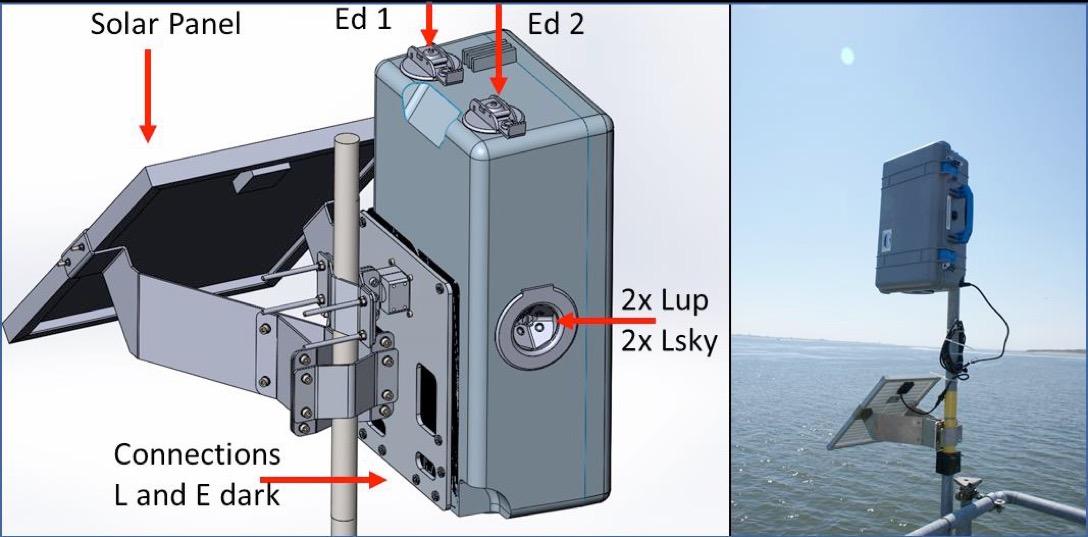
Typical deployments:
-
At a strategic or high-value location where continuous observation (incl. under cloud) provides additional benefit
- At location with high ‘optical complexity’ and dynamics, to test the limitations of satellite algorithms
- A combination of both, traversing optical gradients using ships
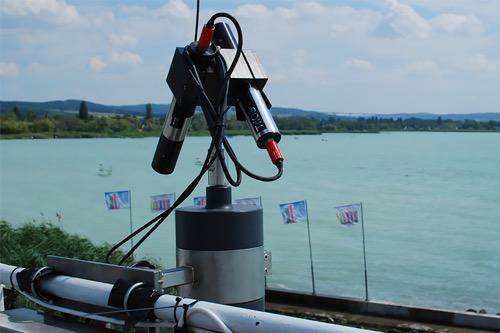
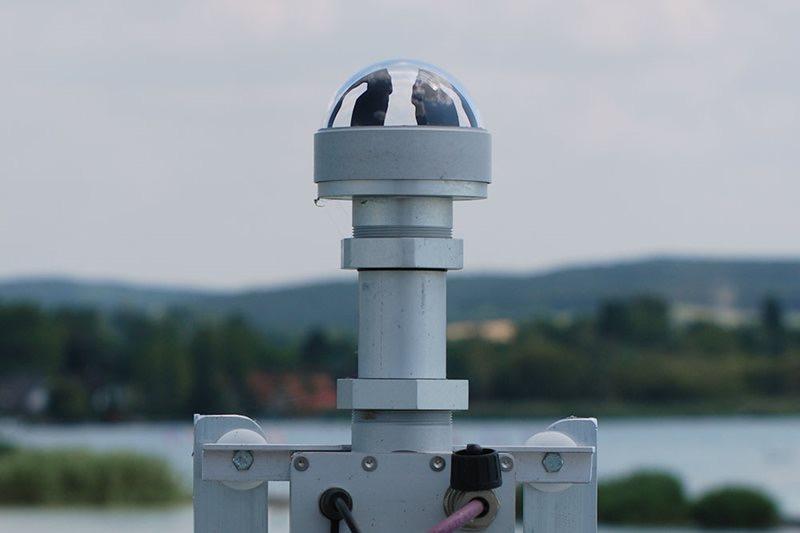
WISPstation by Water Insight for waterleaving reflectance from stationary platforms. €25k (with tech support, data handling).
So-Rad (Solar-tracking radiometry platform) by PML for water-leaving Reflectance automation (£9k) with commercial sensors (£25k).
Peak Design HSP-1

(Hyperspectral Pyranometer) for global and diffuse downwelling irradiance, for aerosol, air pollution measurements and to improve water colour observations. £15-20k


Strong synergy with satellite products:
• Temperature
• Transparency
• Colour
• Microalgal and macrophyte composition
Strong complementarity:
• Inorganic nutrients
• Dissolved Oxygen
Satellites measure back-scattered light
- closely related to Turbidity
- indirectly related to Transparency, Suspended Matter concentration
Mini-Secchi disk with Forel-Ule colour index (Brewtek)
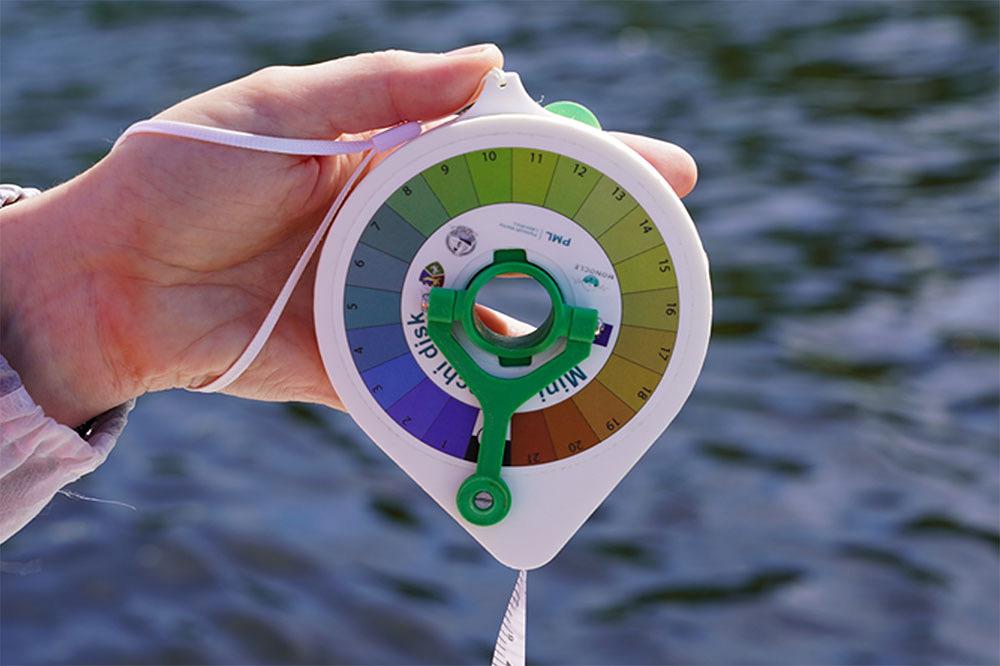
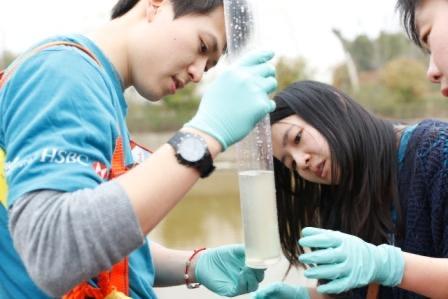
Citizen Science solutions:

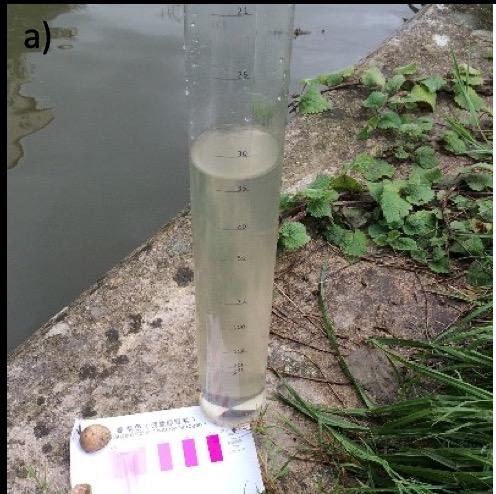
• Secchi disk (clear and turbid water) or Turbidity tube (hazy-turbid)
• Forel-Ule colour scale, pH paper, nutrient kits can be added
Turbidity tube
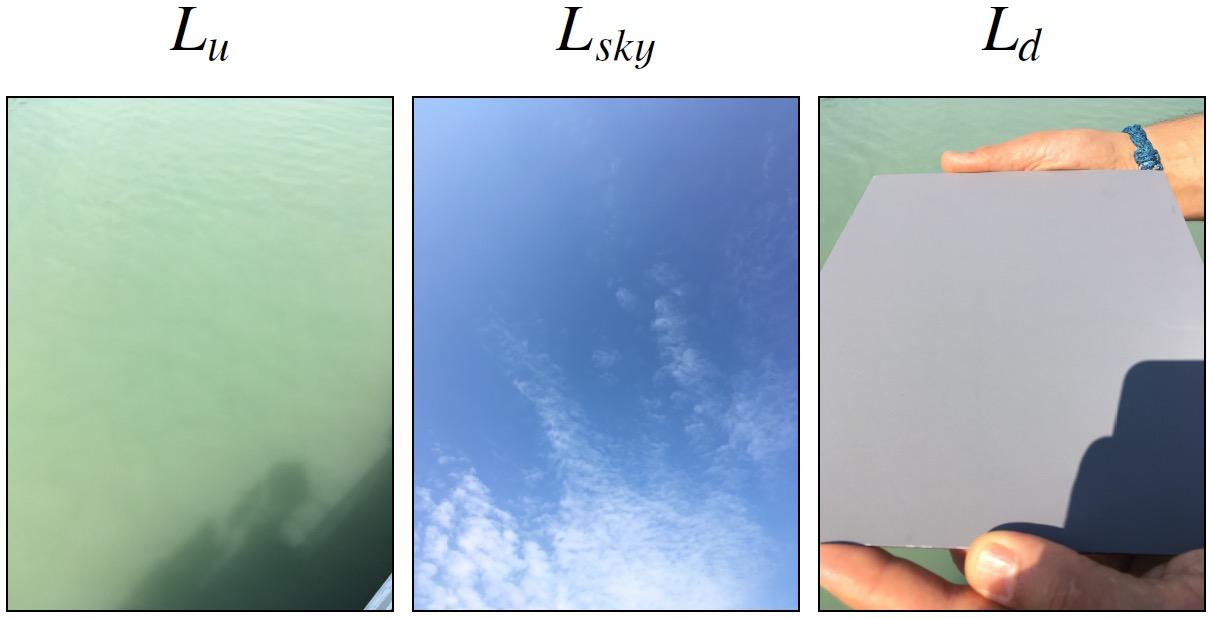
- Corrected for atmospheric effects (90% of signal)
- Water quality (Chl-a, Turbidity) are derived from features in the spectrum of reflected light.
Citizen Science solutions:
• Dominant water colour (e.g. Forel-Ule scale)
• Smartpone-based technology
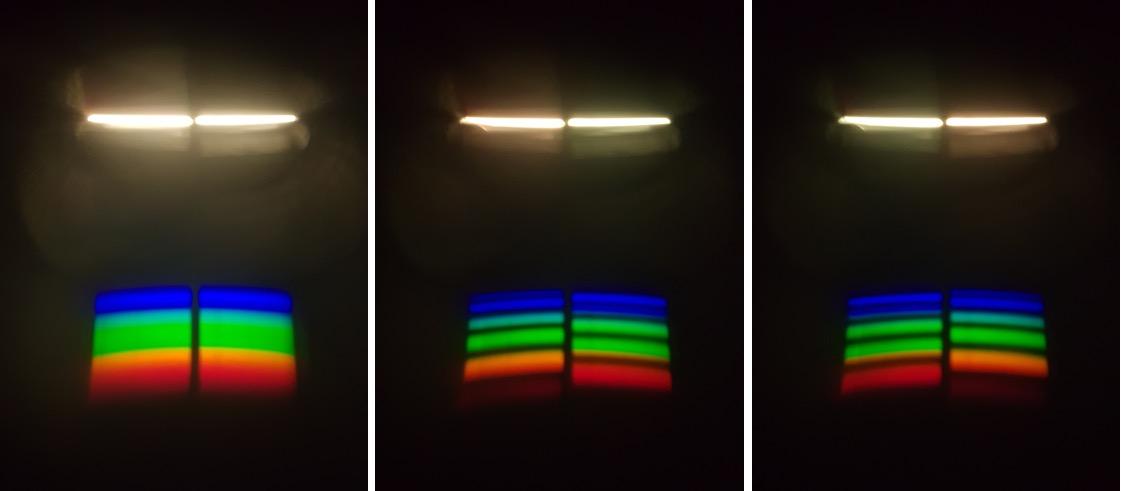
• iSPEX 2 (right) now in field validation phase
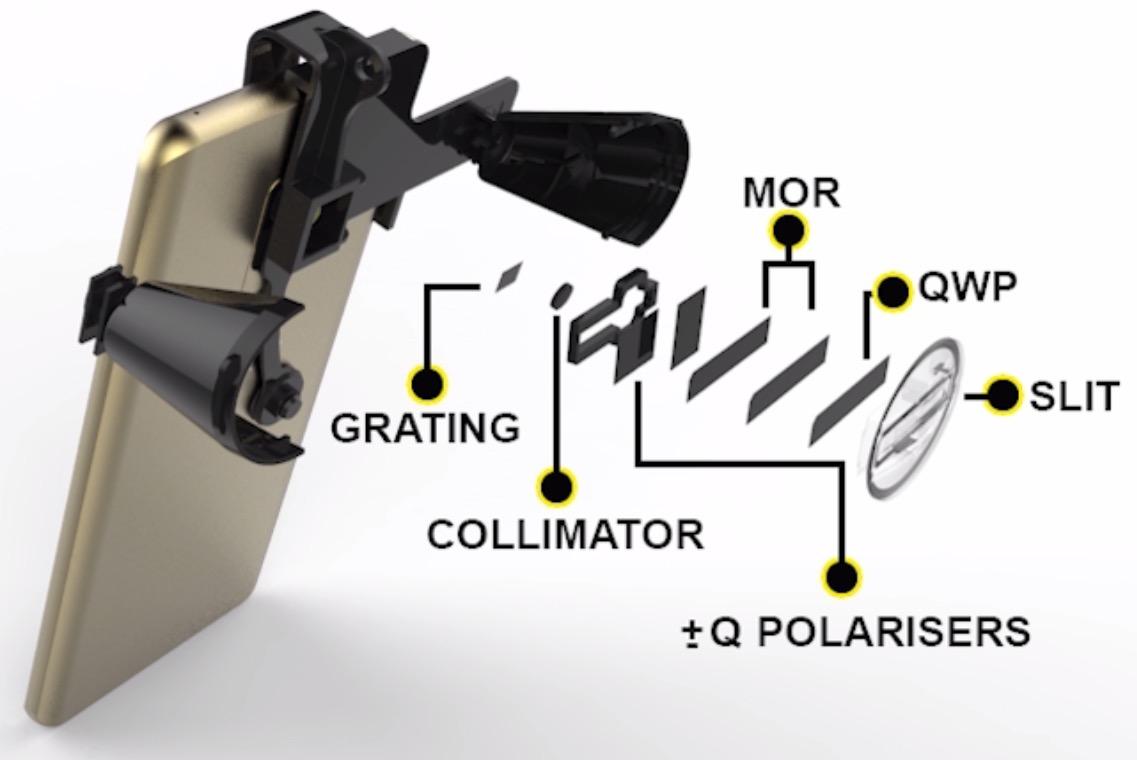
• Hyperspectral 400-690 nm
• For optically deep water (bottom not visible)
• Expected to deliver
• Satellite reference
• Dominant optical substance(s)
• Cyanobacteria risk
• Chlorophyll-a
Talking points
• Satellite observation now delivers water quality indicators at relevant scales
• Several in situ observation solutions to link micro to macroscale
• The next major challenges are data integration and forecasting (role of AI?)
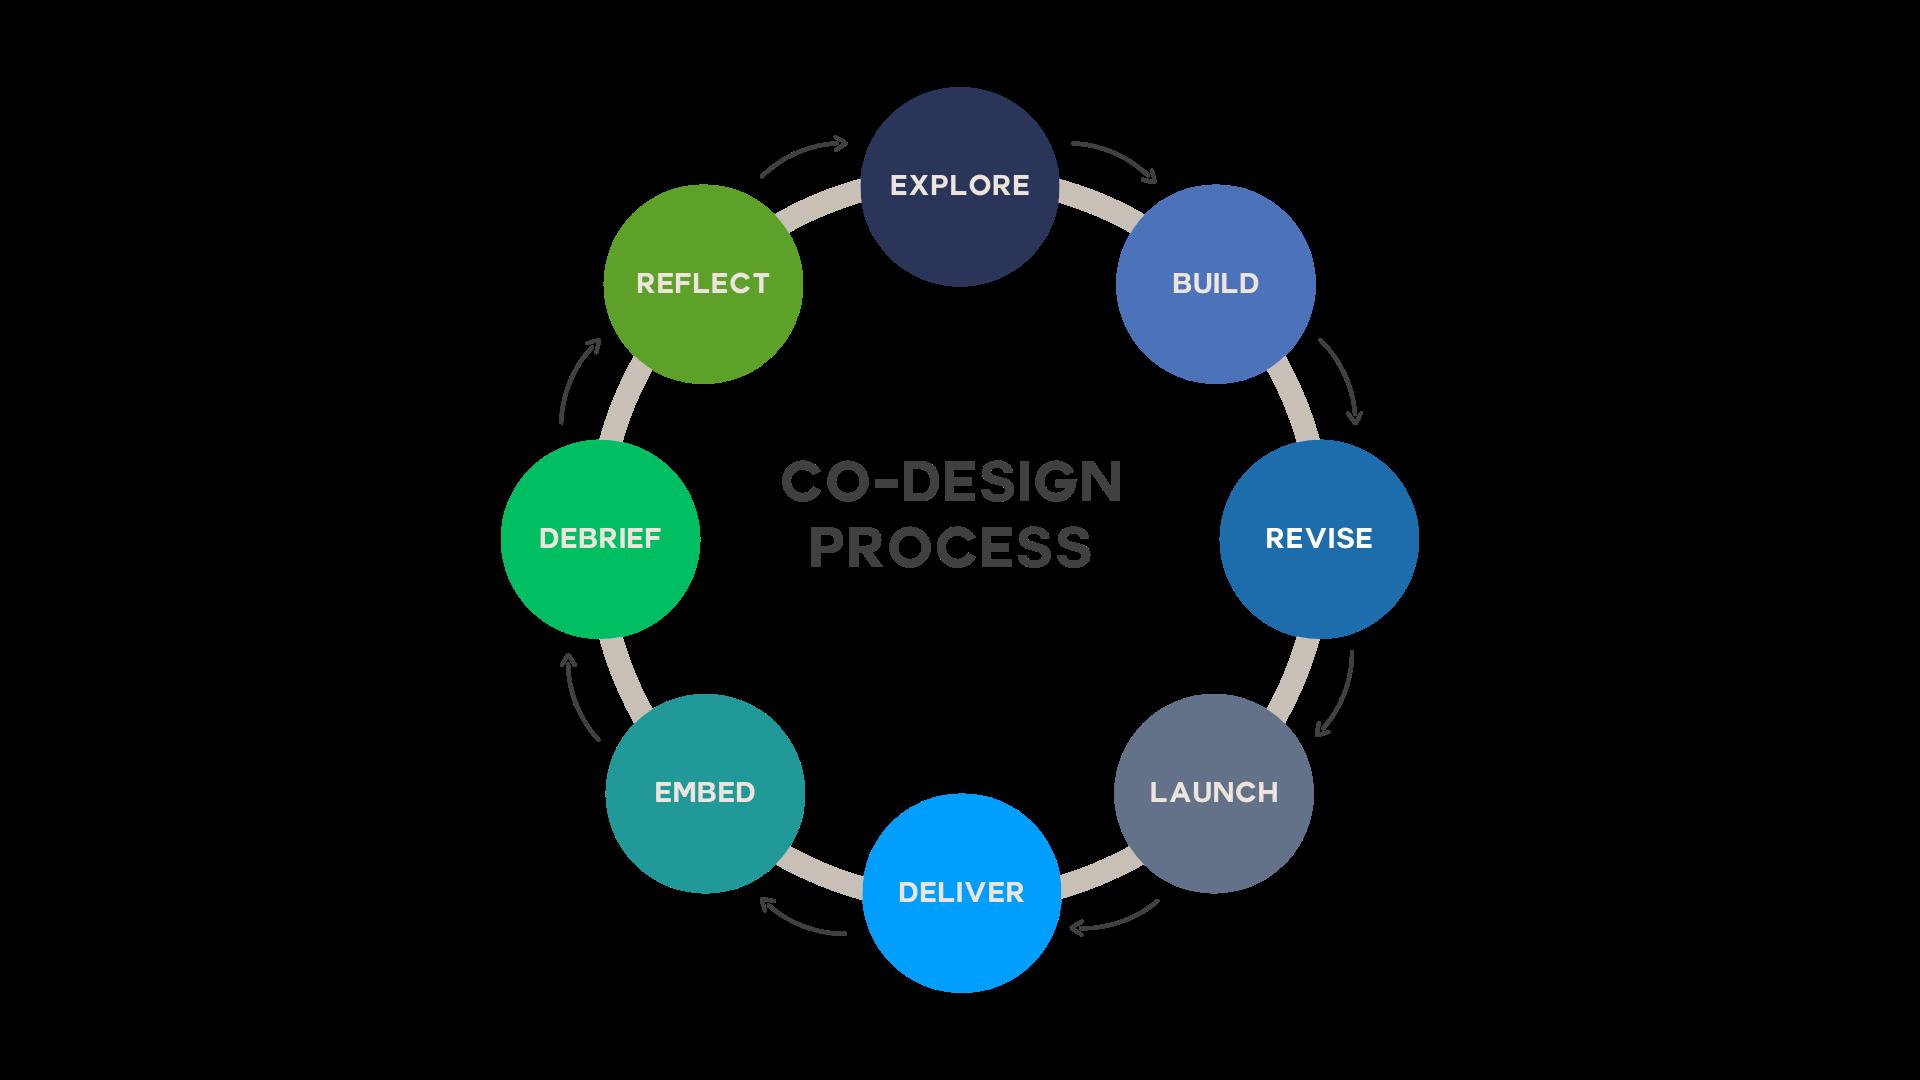
• Co-designing catchment management solutions around state-of-the-art observation
• Citizen science – pilots to establish appropriate level of engagement around observation of physics (optics) of water bodies
– Local challenges
– Education (Ocean Conservation Curriculum, European Blue Schools)