COMMUNICATION PLACE
November 2020 +

Introduction
Current Members of the Academic Task Force
A Message from Christina Lyons
Chair, SEGD Academic Task Force
A Message from Cybelle Jones
SEGD CEO
Democratizing Place-Making:
Utilizing, Evaluating, and Improving Participatory Design Processes in the Built Environment
Caitlin Giambroni
TYPE+C0DE IV & V: (Typographic Selfie)
Yeohyun Ahn
[Dis]embodied Senses: Interaction Beyond the Screen
Tristen Click
The Green Book: Conduit of Experience
Sabrill Holcomb
Teaching 3D to 2D Students:
Part 2: Additional Strategies for Introducing Three-Dimensional Design to Conventionally-Trained
Graphic Designers
Wayne Hunt
How Do We Begin?
Mapping a Territory in Research for the Creative Practice
James Silva
København, Sustainable by Design:
Expanding the Study Abroad Experience Through EGD
Karen Watkins
The Society for Experiential Graphic Design (SEGD) is a multi-disciplinary network of designers, industry and technology specialists, educators, and students dedicated to experiential graphic design. We work in wayfinding, placemaking and identity, digital experience design, exhibitions, public installations, branded environments, and other aspects of EGD/XGD.
SEGD exists to “educate, connect and inspire” the global, multidisciplinary community of professionals creating experiences that connect people to place. We are committed to knowledge sharing and continually raising the standards of practice in a design discipline that has the potential to enrich the lives of people wherever they work, play, shop, learn, travel, or gather.
SEGD’s Education conferences, workshops, webinars, and courses span a wide swath of design practice areas including branded environments, exhibition and experience design, technology and interactive experiences, user experience, healthcare, practice and technical topics, wayfinding, accessibility, and the business of design.
SEGD actively collaborates with and provides outreach to design programs at internationally recognized colleges and universities. Our signature academic education event is the annual SEGD Academic Summit, immediately preceding the SEGD Conference each June. Design educators from around the world are invited to submit papers for presentation at the Summit and publication in SEGD’s blind peer-reviewed Communication + Place, which is published electronically on an annual basis. The Summit and e-publication are platforms for academic researchers to disseminate their creative work, models for innovation in curriculum, and best practices for research related to experiential graphic design.
Chair: Christina Lyons | Fashion Institute of Technology/SUNY
Yeohyun Ahn | University of Wisconsin, Madison
Joell Angel-Chumbley | University of Cincinnati, College of Design, Architecture, Art, and Planning
Michael Chad Eby | University of Kentucky
Angela Iarocci | York University, Sheridan College
Tim McNeil | University of California, Davis
Michael Lee Poy | Ontario College of Art + Design
Amy Rees | Drexel University, Westphal School of Art + Design
Debra Satterfield | California State University, Long Beach
Inessah Selditz | New York University
Neeta Verma | University of Notre Dame
Willhemina Wahlin | School of Communication and Creative industries, Charles Sturt University
Michele Washington | Columbia University
For more information, please contact Cybelle Jones or Christina Lyons
Cover photo and journal design: Willhemina Wahlin
Chair SEGD Academic Task Force
"The SEGD Academic Task Force is a team of dedicated design educators, researchers and practitioners that work together to support and create resources that advance the global academic design community.
Our mission is to promote knowledge of experiential design academic trends, professional practices, curricular innovations and research. Each year we commit to multiple projects in an effort to serve educators advancing interdisciplinary experiential graphic design curriculum and research and initiatives that introduce students and programs to the experiential graphic design field.
The SEGD Academic Task Force produces an annual Call for Papers and conducts a peer review of abstracts submitted from across the globe. The Task Force then invites authors to present at the annual SEGD Academic Summit and to publish full papers in Communication + Place to highlight research and insights for professional development and education in the field experiential graphic design.
If you are interested in learning more about the work of the SEGD Academic Task Force, please feel free to contact me at christina_lyons@fitnyc.edu.
"Our community of educators, designers and makers strive to create environments that improve the human experience...
"The Society for Experiential Graphic Design (SEGD) exists to “educate, connect and inspire” the global, multidisciplinary community of professionals creating experiences that connect people to place.
We are an association of people who create content-rich, emotionally compelling, experiential spaces for a wide range of environments, from hospitals and transit hubs to museums and educational campuses.
Our work creates a sense of place, helps people find their way, communicates important information and fuels a dialogue between users and the spaces they inhabit. We research, plan, design and build a diverse range of visual communications and information systems for the built environment.
Our community of educators, designers and makers strive to create environments that improve the human experience and share knowledge that raises the standards of design in practice.
We hope that you will explore more about our educational and professional resources at www.segd.org
Cybelle Jones CEO, SEGDPlace-based design projects are often initiated by those with power and therefore can contribute to place-making that excludes and ignores marginalized voices. It is, therefore, advantageous for designers to understand how the places they are contributing to either represent or overlook the many people who live within or utilize them on a regular basis.
One way designers can balance the power scales in place-making is through the utilization of participatory design practices.The heart of participatory design is equal distribution of power, and accordingly, it has the potential to aid designers in creating and contributing to place more responsibly. It is through truly participatory activities and experiences that designers are best able to uncover the most latent needs and desires of the user (Sanders, 2002) which can, in turn, be used to inform more representational design outcomes. For this reason, participatory activities and experiences must be evaluated often to avoid devolving into tokenism. This study reimagines the role of the designer in place-making and investigates the potential for participatory design methods, as they were used within a community setting, to assist in making places of greater representation.
Places are a collection of stories and human behavior. Through building, planning, creating, and the like, place is where humans make their meaning (Tuan, 1977), the implications of which are tremendous. For example, much of place-making centers around creating spaces that mimic the idyllic view of home—secure, nurturing, comfortable, spacious, free (Cresswell, 2004; Bachelard, 1964) as perceived by the maker. However, the attempt to replicate home can promote erasure when the visual narrative of place fails to represent the population as a whole. This can occur intentionally in an attempt by particular groups to maintain power, or subconsciously as a result of cultural ignorance. In either case, it is those with decision-making power who will be most accurately and abundantly represented in place unless practices of accountability are established to prevent it from happening. In the words of geographer Tim Cresswell (2004), “Place, at a basic level, is space invested with meaning in the context of power.”
When considering the relationship between power and place, two large problems arise, the first of which is exclusion. The materiality of place informs visitors and inhabitants of the type of behavior that will be deemed appropriate or perceived as conforming with the status quo and therefore safe. Those who do not conform will be perceived as transgressors of place and as a result may be excluded or even expelled (Seamon, 1980). There is typically a correlation between those who are excluded and those who hold the least power, although this is not always the case.
Another main problem of place is homogeneity, a descendant of globalization. Cities tend to produce similar businesses and structures with analogous aesthetics as they attempt to establish themselves globally as a good place to live, work, or visit (Massey, 1977; Cresswell, 2004; Harvey, 1996).
Unfortunately this often means that place design is geared towards attraction, rather than representing the longtime community, trading a genuine sense of place for one that is sanitized, artificial, and in some cases oppressive.
Designers have all too often acted in ignorance of these issues, contributing to these and other problems of place. It is a responsibility of the designer to understand the relationship between places and people, especially as it relates to matters of exclusion and homogeneity. What does this look like practically? How does the designer or design student apply a working knowledge of place-based issues to place-making?
One such way is by employing participatory design, a methodology rooted in democratic processes and committed to equal distribution of power. Participatory design invites all stakeholders to play a part in creating solutions to a problem. Though similar to user-centered/human centered design, participatory design utilizes making as a key method. A 2002 infographic from design researcher Elizabeth B.-N. Sanders illustrates how through traditional user-centered design methods, like interviews, surveys, and observations, practitioners can learn what people think and how they operate. It is through making with users that design practitioners gain access to the most latent needs of the user: what they know, feel, and dream. This invaluable information to the designer on how to best represent the user in a genuine way.
How are designers to be sure their methods are truly participatory, garnering responsible and equitable results? Simply implementing participatory design is not a guarantee. This study explored how designer researchers might collaborate with practitioners to evaluate and iterate the participatory process as it is used in place-making projects. There will be implications for both design practitioners and educators as the study was completed alongside student designers working in a professional setting.

This study analyzed the participatory process as it was employed by students at Kent State University as part of a course that introduced future landscape architects to community engagement practices in design. Community engagement is an important part of landscape architecture as it often involves the design of public spaces. My goal as researcher was to determine the extent to which the planned activities were participatory and identify areas of improvement for future projects.
The project was led by a landscape architecture professor and two Masters of Landscape Architecture (MLA) students. It consisted of three workshops over four months with residents of East Cleveland, Ohio who were involved with a nonprofit the professor had worked alongside before. For context, East Cleveland is a formerly wealthy city that experienced a major population loss and economic decline beginning in the 1950s that continued through the 1970s. The city has been in a state of fiscal emergency for two decades and the population continues to decline. As a result, there are quite a few vacant and neglected spaces in the city.The MLA students were tasked with designing a plan for a community park that could fill one of these vacant spaces The plans could then be used by the nonprofit to request funding from foundations and other organizations for future community development projects. The purpose of the workshops was to engage consistent resident input on what would constitute a successful community park, both in location and design.
Each workshop, planned by the professor and MLA students, was comprised of group mapping activities, occasional educational presentations, and designated time for residents provide feedback on the students’ work. The third meeting also included a design activity that allowed residents to join in the making process. Many activities required maps, worksheets, or other tools that were provided by the professor and MLA students. I acted solely as researcher and was not responsible for workshop facilitation or content creation.
The data for this study was gathered by means of observational research and post meeting surveys. The surveys combine quantitative and qualitative questions to amass a variety of responses. The third and final survey included inquiries that applied to all three meetings, including questions about the usefulness of the tools that were provided.
Observational research was completed during all three meetings. Written observations, drawn from post meeting surveys, were used to analyze the extent of participation and resident survey responses. Research observations and participant survey responses are both subject to personal bias, so comparing these two sets of data served to counterbalance bias and present further insights. Photo ethnography was implemented during the third meeting to
aid visualization of the environment, presentation style, and group activity arrangements. Photo documentation was not used throughout all meetings in order to create a natural environment for residents. Perceptions of being under surveillance can make a workshop participant uncomfortable and could potentially impact the ways in which they are willing to participate. The photo documentation from the final workshop is representative of the environment, presentations, and activities that were used throughout the course of the project.
During analysis, the majority of the data was color coded according to which meeting it generated from and then organized by category. Categories (which are outlined in the analysis) were chosen according to data patterns. Coding the data in this manner assisted in pinpointing successes and opportunities for improvement based on both category and overall meeting plan.
Lastly, to evaluate the degree of participation, I needed a working definition of what constitutes participation. According to researchers Greenbaum and Loi (2012) it is imperative that participatory design hold to a few main values:
1. Participatory design activities should occur within the setting being designed. Abstract contexts and activities should be avoided.
2. The tools used in participatory design activities should create a common language between the designer and the participants to supplant power structures.
3. Participatory Design celebrates the collective learning that comes from the differing opinions shared through experiences and activities
These values served as a filter through which I could evaluate the workshop activities.
Furthermore, to evaluate the degree of participation of each activity I borrowed from Sherry Arnstein’s 1969 Ladder of Citizen Participation which measures participation on a scale. This model recognizes that during community based projects, people are typically not divided into two groups with one holding all the power and the other holding none It is more accurate and helpful to describe a level of participation that was able to be reached through a planned activity. The ladder consists of 6 levels ranging from non-participation to citizen feedback (tokenism) to full participation. Full participation is rare and requires that the citizens hold the main decision making power (Arnstein, 1969).
The degree to which the planned activities, presentation, and tools were participatory was determined by a matrix graph that explored the relationship between perceived positivity/negativity of residents’ responses (y-axis) to each planned event and level of participation as informed by Arnstein’s ladder (x-axis). Once graphed, the data could be labeled as successes, iterations, and opportunities based on where each point landed on the matrix. For example the majority of the points in the positive response/high participation quadrant were considered successes while those in the negative response/low participation quadrant were considered opportunities. The points in the middle were somewhat successful, but were in need of iteration for higher levels of participation in the future.
This analysis found that activities that were more hands on and involved less professional jargon and tools were also more participatory. This was particularly true of the third meeting. In this meeting, the planned activity was incredibly hands on for the residents, where in other meetings the activities relied more on conversation and feedback. Allowing the residents to design a lot of their choice using whichever tools they preferred was a participatory activity that allowed residents full control of design outcomes.
Participation could be improved through refinements to the mapping activities. Residents seemed to enjoy discussing and locating places on the map, but struggled or were disinterested with landscape architecture terms. Using professional jargon limited the extent to which the residents were able to participate. It was also clear in the analysis that the greatest opportunity to improve participation was in the maps provided for these exercises. The maps were table sized prints that were, in theory, an acceptable low-tech tool, but proved to be difficult in use. The small type and grayscale tones were hard to comprehend, especially for an aging group of residents. It was important to residents to find the locations they were speaking about on the map, but doing so was a tedious process that impeded discussion. Of course, the MLA students were able to find the locations for the residents, but to maintain agency, the residents should be able to find and mark locations themselves as they are bringing them up.
These results were supported by a second analysis comparing observational research notes, rather than perceived resident responses, to degree of participation.
To benefit the future planning of workshops, the elements were also organized into four main categories of planning: activities, tools, presentations, and environment. The color coding for this graph is based on levels of success as analyzed on the first matrix. This graph uncovered the presentations as another major opportunity for improvement. These presentations were typically educational in nature.
"
" This analysis found that activities that were more hands on and involved less professional jargon and tools were also more participatory.

Presentations in a participatory setting require clear communication and supporting visuals that are immediately relevant to the purpose of the planned activities. Many of the presentations that were used lacked clarity of communication and the supporting visuals were either too small or required extensive explanation, losing the interest of residents and putting the students in a position of power.
Survey responses from each meeting were also color-coded according to meeting and graphed on a matrix investigating their correlation to observational notes.This analysis supported the earlier findings that greater amounts of participation resulted in higher resident engagement. It also showed that residents enjoyed the opportunity to dream and plan for a more beautiful city, especially alongside their neighbors.
One point of interest in the surveys was the maps which received both positive and negative response. Observational research showed that the residents responded well to mapping activities, but struggled to use the map without help from a facilitator. In survey responses, residents either didn’t respond to questions about the maps or responded generally positively. Residents may not have wanted to admit that the tools were difficult to use or perhaps were not bothered by the frustrations with the map in a lasting way. Discerning this point would require further investigation. Paradoxically, the survey analysis also supported the prior findings regarding maps as an opportunity for improvement. One resident asked for larger maps while another wondered if the maps could be shown on a computer instead. This could be a desire to use maps that feel more visually familiar, such as Google Maps, or perhaps this resident sees the benefits in utilizing technology. For example, a computer map can typically zoom which would solve the readability issue. Again, discerning this would require further investigation.
Finally, the written survey responses were categorized based on response patterns: desires, emotions, activities, tools, and facilitation. They were then further broken down into positive and negative responses within each category. The majority of responses fell into the desires and emotions category. Many of the residents have had a relationship with each other for awhile, whether from involvement with the non-profit or living in the same neighborhood. The residents have a mutual interest and hope in the renewal of East Cleveland which is reflected in survey responses. The category with the greatest percentage of negative responses, indicating room for improvement, was tools. Forty percent of written comments about the tools by residents were negative. This supported the earlier findings of the observational research.
After the last meeting the MLA students applied the residents’ feedback to their design plans. Ideally their final designs would be evaluated for creativity and increased quality of life, but while the final design plans are available, responses from the residents are not. At the time of initial sharing the residents were


overall impressed with the MLA students’ plans. Although it would have been preferable to allow residents to design alongside the MLA students, the final designs appeared to be informed heavily by feedback and information received from residents. One major change brought about by resident participation was site location. Initially the students had located a vacant space on a main strip to be the location of a new park. Residents shared that they were hoping to promote new business in that location and suggested a different site tucked among a residential area. The MLA students followed the expertise of the residents and moved the site location. This decision, made early on in the project, helped to build trust with the residents. Further evaluation would require surveys or interviews with residents about the final designs, as well as documentation on which pieces, if any, are implemented in the future.
Overall the majority of the planned activities were participatory in some way, with a direct correlation between hands on activities and resident engagement in participation. The greatest room for improvement was in the variety of tools provided, most significantly, the maps. A redesign of the maps and other tools could increase the party-cation of residents in future workshops.

The following are implications from this study for design practitioners working within the context of place, followed by questions and considerations for educators working with young designers who will one day contribute to place-making.
1. Participatory experiences require flexibility and iteration. The purpose of participatory design is to learn from the people who will be directly impacted by the designer object or place. Throughout the participatory process, the designer will learn more about the participants and may find they need to adjust the activities and tools to better meet participant needs.
Educators: Consider planning projects and exercises that require mid project structural iteration.
2. Communication of process is an equalizer in participatory design experiences.
To maintain democracy, all participants should have a clear understanding of project goals and expectations, the purpose of each activity, and reasonable anticipated outcomes. Engagement decreases when participants lose control through uncertainty about the process or lack of understanding of how their involvement will be used to garner end results.
Educators: Teach students skills for building relational capital. For example, how could you incorporate active listening activities into your course?
3. Participatory tools should be designed to support a common visual language between all participants and designers.
Participants are able to contribute the most when the tools provided help them feel like experts. This requires tools that are designed to level the playing field of design literacy. This also applies to any materials used for presentations or shared for feedback. Participants cannot fully engage when they are also required to discern professional materials they are not familiar with. The designer should remove communication barriers, caused by a difference in visual language or professional experience, in both the tools they provide to participants and the visualizations of their designs.
Educators: Too often participatory tools are designed based on the language of the designer, rather than on shared communication between designer and participant. Consider an exercise that utilizes user-centered design techniques to create tools that are for the participant. Rather than merely simplifying design tools (i.e. maps), ask students to put themselves in the participants shoes and create new tools from scratch.
4. Designers can contribute to place through collaborating with other professionals who are already utilizing participatory methods. Participatory design provides an excellent opportunity for collaboration among disciplines. For example, visual communication designers are skilled in communicating information in a way that is optimal for the intended audience and could provide built environment professionals working in a participatory manner with tools and resources to help build trust and engage more deeply with participants. Design researchers are also in the unique position to help evaluate participatory design experiences.This concept reimagines and expands the role of the designer in place-based projects.
Educators: Is it possible to plan collaborative projects across programs and disciplines? Teach young designers from various parts of the field ways of working together before they set foot in the workplace.
5. Making places of greater representation requires that designers learn the devalued histories of place.
Much of place branding and identity is geared toward communicating narratives that will attract economic growth. While this is not always harmful, in many cases, this narrative overlooks and devalues less represented voices in the community. If designers wish to be responsible contributors to place, it is imperative that they educate themselves on how the places they are working in came to be made, what stories and voices have been neglected and erased, and the potential costs of a new designed identity or place.
Educators: Consider including a place-based history course into your programs as well as teaching students to be aware of how design decisions impact the inequities of place. Include these ideas in design research courses.
Educating future designers and rethinking and restructuring our role as designer in place is one sustainable way to come alongside important justice work rather than continuing to contribute to the problem of oppressive places.
Place is where we find and make meaning, but the problems of place have left many to suffer from invisibility, oppression, and exclusion.The design of place is continually in process, ever evolving to meet the growing demands of consumerism and globalization. Our cities are plagued with pockets of homogeneity and demands for conformity. The hope for better places—ones of diversity, inclusion, and representation—is not lost, but it does demand a reevaluation of placemaking processes. In his seminal book Space and Place, Yi-Fu Tuan asks, “How do we promote visibility of rooted communities that lack striking visual symbols?” (1977) Furthermore, how can the designer aid in helping the everyday citizen be a place-maker. Through not only utilizing, but also evaluating and refining participatory design methods, designers can take effective steps in this direction.
References
Arnstein, S. (1969). A Ladder of Citizen Participation. Journal of the American Planning Association, 35, 216–224. Doi: 10.1080/0194436690897725
Bachelard, G. (1964). The poetics of space (M. Jolas, Trans.). Boston, MA: Beacon Press.
B.-N.Sanders, E. (2002). From user-centered to participatory design approaches. Design and the Social Sciences, 1–8.
https://doi.org/10.1201/9780203301302.ch1
Greenbaum, J. & Loi, D. (2012). Participation, the camel and the elephant of design: an introduction. CoDesign, 8(2–3), 81–85.
https://doi.org/10.1080/15710882.2012.690232
Harvey, D. (1996). Justice, nature and the geography of difference. Cambridge, MA: Blackwell Publishing.
Massey, D. (1997). A global sense of place. In T. Cresswell, Place: a short introduction, (p. 63–70)
Seamon, D. (1980). Body-subject, time-space routines. In A. Buttimer & D. Seamon (Eds.), The Human Experience of Space and Place. (p. 148–165). London: Croom Helm Ltd.
Tuan, Y.-F. (1977). Space and place : the perspective of experience. Minneapolis, MN: University Of Minnesota Press.
Yeohyun Ahn is a designer, educator and researcher, integrating creative coding, digital fabrication, and physical interaction into spatial typography and graphic design. Ahn has worked as a freelance graphic artist for the New York Times Magazine.
Ahn’s current project, Social Homelessness on US Campuses, is a multidisciplinary art and design project to bring awareness of Asian female faculty in America. Having immigrated as a designer in America brings her to be aware of social inequity, discrimination, and marginality. She is currently exploring generative self-portrait photographs for social homelessness, being isolated and marginalized in professional areas of American society. Ahn has taught at the School of the Art Institute of Chicago, Chicago State University, and Valparaiso University. She is currently an Assistant Professor of Graphic Design at the University of Wisconsin Madison.
This paper is the continuation of a presentation from the 2020 SEGD Academic Summit.
Floral Typography is a design trend that combines typography, calligraphy and lettering with floral elements. TYPE+C0DE IV reinterprets expressive typography with floral elements by using computation in graphic design education.
TYPE+C0DE IV is from the course ART568: Motion Typography, which was delivered in the fall of 2019 in the Art department at the University of Wisconsin Madison. The class is a 4 credit, intermediate level graphic design course for 5 hours per week during the 15th week term. As a pioneer of computational graphic design research, I introduce basic and intermediate programming skills and experience to graphic design and minor students in via structured graphic design education.
The instruction was simple: create floral typography by using Processing. Over six weeks, the class project included computational drawing and figurative drawings by computation to generative typography.
For assignment 1, students explore how to create illustrative images reminding us of flowers in computation.


For assignment 2, students embed floral elements into letterforms in computation.


For assignment 3, each student’s work is extended to his or her own gallery plan with physical interaction such as sound and motion tracking.These class projects were displayed at the exhibition, “Beyond Print”, at Gallery 7, Humanities Building at the University of Wisconsin, Madison, in December 2019. It included typographic installation, mural typography, physical interaction design and computational literature.

A selfie is a photograph typically one taken with a smartphone or webcam and shared by social media. Over 1 million selfies are now taken every day. Selfies are not always as spontaneous as they seem. A selfie is a form of art. It can be a communication tool purposely. Typography is a form of art to make written language expressive by using letter forms and text. Based on the type choices, different emotions and moods can be visually expressed through the generative selfies. The typographic selfie + CODE is visual research with diverse typefaces to embed visual expression into generative selfies.
Helvetica is a modern, intelligent and stylish typeface designed by Max Miedinger in 1957. It is among the most widely used sans-serif typefaces.

2. Times New Roman
Times is an intellectual, confident, academic and professional typeface designed by Stanley Morison Victor Lardent in 193. It was commissioned by the British newspaper, The Times. It is one of the most popular and influential typefaces in history.

3. Futura
Futura is a modern, practical, comfortable, and capable sans serif typeface designed by Paul Renner in 1927.

4. Didot
Didot is a sophisticated, polished and professional typeface developed in the period 1784-1811 by Didot family.

5. Asmelina Harley
Asmelina Harley is an elegant calligraphy script typeface designed by Arif Dwi at Kotak Kuning Studio in 2019.

TYPOGRAPHIC SELFIE+C0DE is visual research project to showcase how to use typeface in generative selfies to convey feeling and thoughts, as an extended typographic practice and application. The research demonstrates how traditional typographic principles and practices, including typeface choice, arrangement and visual expression, may be applicable for generative selfies. It shows the possibilities to use the personality of each typeface in expressive and visually appealing generative art. The future development of this research will involve more diverse typefaces, aligning with thier history and style.
"The research demonstrates how traditional typographic principles and practices, including typeface choice, arrangement and visual expression, may be applicable for generative selfies.
"
This paper explores the value of multisensory design by drawing upon graduate thesis research, personal experience, and design pedagogy.
Can designers shift their thinking to incorporate practices found in immersive installations into the design process? Can designers create multisensory experiences to communicate specific messages? Can immersive experiences build connections?
Connection—here defined as experience, learning, socializing—is one of the primary drivers of human social behavior. Over the past decade, most of humanity has experienced a major paradigm shift in how they connect. One of the main drivers behind this change is advancing technology—primarily the reliance on smartphones and the internet. Physical connection has been replaced with virtual connection, and while this has provided some societal advances and benefits, research shows this has also led to negative impacts on mental and physical well-being.
Designers communicate and build connections through their work. Immersive experiences can build connections by having no (or low) barriers to entry, creating layers of meaning, and engaging all of the senses.
Perhaps inevitably, technology will continue to advance at a rapid pace. Can designers embrace this change while simultaneously being mindful of methods for reconnecting the physical and the virtual beyond the screen, through the use of the full multisensory experience? Would this enhanced experience improve people’s sense of connection? Designers often limit themselves to the visual—form, texture, color—but are surrounded by options for using mixed reality. Alexa, Siri, and other sources of conversational design, as well as advanced haptics (vibrating phones, for example), are cases in point. Expanding further beyond visual and voice into touch, taste, and smell, can designers improve people’s feeling of connection and well-being? In a visually overstimulated world, what would happen if designers more deeply considered all five senses? What would that feel like? Would the impact be deeper, longer lasting?
Furthermore, how exactly can designers prototype and create these experiences?
Category: Design Research
Keywords: Multisensory design, Immersive experiences, Connection, Technology
Additional Images: https://www.tristenclick.com/thesis
Memorable experiences tend to encompass all five senses. Experiences happen in the present and then evolve into memories. They involve objects, space, and psychology. They can juxtapose the good and bad. The five senses determine how people experience the world around them, while cognitive perception decides what that sensory information means and what people are aware of. Interactive experiences within art and design can create a level of enjoyment that is different than simply looking at the aesthetics of a well-designed poster; they can create a different emotional impact.
Research and experimentation with touch and interaction unearthed this excerpt from The Senses: Design Beyond Vision: “Touch is our first language, the first sense that we acquire. Touch is our silent interface with the material world. Touch is the third dimension of surface that speaks to our emotions. Unconsciously, touch tells us whether to trust, whether to pull away or lean in and embrace.”1
Multisensory design, especially incorporating touch, can connect the audience to the work emotionally.
Because of humans’ overreliance on vision, it is easy to forget how strong and important the sense of smell is. A study in 2014 showed that humans can distinguish more than one trillion odors.2 People might not be aware of these instinctive smelling abilities because they don’t have the language to describe that many smells, and they often don’t even realize they are picking up a smell. Some organizations have started to utilize smell (e.g., certain Canadian paper currency smells like maple syrup), but, aside from government branding, how else can the subtle power of smell be used for creating an engaging, meaningful experience?
What about taste? In a restaurant, when the plates arrive, one first eats with the eyes; a beautifully plated meal could be described the same way as a piece of graphic design. The plate has balance, texture, and color. Next the aroma fills the nostrils. The silverware is picked up, and the food touches the tongue, which is met with texture, and finally (hopefully) an amazing taste. Sound comes into play through audible chewing and maybe even vocalization, “Mmmmm.”
1 Ellen Lupton and Andrea Lipps, The Senses: Design Beyond Vision (New York: Cooper Hewitt, Smithsonian Design Museum, 2018), 22.
2 Zaraska, Marta. “September/October 2019,” Discover Magazine, accessed August 10, 2019, http://discovermagazine.com/2017/nov/scents-and-sensibility.
Investigation into these questions was accomplished through a variety of methods and tools, including Makey Makeys, conductive ink, PlayDoh, scratch-and-sniff wallpaper, and video explorations.
Experimentation and research led to the discovery of the work of Kenya Hara, a Japanese graphic designer, curator, and writer. In his book Designing Design, he points out, “Sense-driven describes a situation in which progress pivots on our sensory perceptions. Let’s pit this concept against that of the technology-driven world. Reviewing the world based on our senses would be sound and meaningful for technology as well.”3
Exploration of the idea of sensory and interactive design that incorporates technology began through experimenting with Makey Makey: An Invention Kit for Everyone. For those who know next to nothing about programming, this tool allows users to learn and play. Makey Makey began as a project from two MIT Media Lab students who were inspired by other creative tools and invention kits using the Scratch software, which is a drag-and-drop platform for coding. The creators believe “that everyone is creative, inventive, and imaginative [and] that everyone can create the future and change the world.”4
The initial projects included a carrot piano and banana bongos. (Other makers have created interactive maps, made game controllers out of Play-Doh, and invented brand new games.) Later projects paired the Makey Makey with conductive paint to create an interactive poster that recited parts of a poem as different areas on the canvas were touched. The emotional weight of the poem was increased when multiple places were touched and the lines of the poem audibly overlapped. Pairing spoken words with art created a new and engaging experience.
Specifically in the thesis exhibition space, some of the experiential design incorporated technology, while others were more traditional. All senses were targeted.
As a person entered the exhibition space, they were guided into a completely dark area that was illuminated by blacklights and other colored lighting. In this space there were reflective balloons and motion-triggered lights. Within the dark space there was also scratch-and-sniff wallpaper in bright neon colors. Visitors were asked to by hyperaware of their senses and self-examine if, when their sight was impaired, any other senses were heightened.

"As a person entered the exhibition space, they were guided into a completely dark area that was illuminated by blacklights and other colored lighting.
"
Exiting the dark area, full vision was brought back in a well-lit room. A potentiometer was used to trigger sounds when a person exited the dark area. A smell station was set up consisting of clear liquids, and observers were invited to test their sense of smell through six different bottles with funnels. A video of nearly synesthetic sensory images and experimental sound effects played on a projector in the thesis exhibition space.
While this graduate thesis work was primarily a study, incorporating sensory activities into a teaching practice has expanded opportunities for employing simple methods and tools that can be used for prototyping sensory experiences both in the classroom and in one’s design practice. Classroom methods have included interactive poster Makey Makey workshops at the Eyeo Festival, Otis College of Art and Design, and Arkansas State University
One workshop focused on using tactile tools and supplies such as foil, conductive ink, and Play-Doh to create an interactive experience and add another layer of depth or understanding by focusing on more than just the visual aspect of a poster. This can be serious, experimental, or playful, with one lighthearted result being a 24’ x 36’’ poster minesweeper game.
While reading The Senses: Design Beyond Vision, one notion resonated with this research: “Design for the feeling of an idea.”5
Sensory design can build connection between many different audiences: people to people, interfaces to people, people to objects, and brands to people.
A digital art collective called teamLab created the world’s first digital art museum in Tokyo. Entering the space, one can interact with the art, influence it, and be fully immersed in another world alongside other people. There are physical structures, digital projections, LED lights, and sounds. The scenery is always changing in each room, so one never sees the exact same thing twice. The museum is called “Borderless” because the art moves freely from “world” to “world” with no boundaries.
Why do spaces like this make people feel like they are in another reality? There is more than one reason people are drawn to experiences that make them feel blissfully in another world. Google’s English dictionary defines escapism as “the tendency to seek distraction and relief from unpleasant realities, especially by seeking entertainment or engaging in fantasy.” Living in a high-stress sociopolitical climate can make people want to shut off their brains and flee from the harsh realities of the world. Escaping to different mental and physical places can be therapeutic.
Culture Track is a cultural-innovation engine dedicated to addressing the most pressing challenges facing the worlds of culture and creativity through research, education, dialogue, and action. They believe that studying and tracking the shifting patterns of audience behavior is critical to shaping the future of culture.6 They conduct research studies mainly focused on the changing behaviors of cultural audiences.
According to a few of their reports from 2017 the top motivators for cultural participation were fun, interest in the content, and experiencing new things. This lined up with the explanation of why unique places like the Museum of Ice Cream are becoming so popular. It is inviting for objects to be human scale, allow use, be touchable, and tell stories through all the senses.
Learning from these reports and studies gives insight into how designers can best connect to the changing interests of audiences.
Discussion
It’s unfortunate that most designers spend the majority of their time on the computer and rarely have other multisensory experiences. Striking a balance between work on the computer and away from it can be rejuvenating. After a long day of design work, one might cleanse the palate by working with one’s hands—cooking a meal, painting, throwing pots on a wheel, and many other practices—and emerge feeling more fulfilled.
Experiential graphic design methodology helps open the door to multisensory activation. In order to successfully relay a message to any audience through graphic design, there should be no prerequisites. One doesn’t have to know anything special in order to appreciate the Museum of Ice Cream, as opposed to many other traditional museums. This is not to say that such a museum is “better” than something like MoMA or the Met, but investigating the popularity of these experiences can help influence design work and motivate designers to consider all the senses in their work, rather than simply vision.
Multisensory spaces can make it easier to break down barriers and force people to be present. Designers should make an effort not to separate mind and body in the design process, in order to create experiences that spark new, memorable connections or convey a message.


 NEEDS IMAGE CAPTIONS
There is a gap between physical and digital spaces. Designers can use these advancing technologies to create physical multisensory experiences and help bridge this gap. For example, many companies are creating digital bodyenhancements that change users’ perceptions, like Fitbit or Amazon Alexa.
Emotional intelligence is an important layer in human experience, one that can determine whether or not something engages or resonates. Business and technology leaders are starting to use this sort of thinking in implementing things like eye tracking and voice recognition in their human experience platforms.
The implication for designers and educators is to understand how new, sense-oriented approaches to traditional design can deliver a powerful message that might resonate more deeply with viewers.
While the thesis that initiated this work was focused on personal design research, a new goal is to bring these tools and thoughts into the design classroom. The practices used in experiential graphic design can help introduce students to a future-proof practice. Incorporating multidisciplinary design disciplines can improve the human experience through richer and more meaningful interactions.
Three questions were posed at the beginning of this paper:
1. Can designers shift their thinking to incorporate practices found in immersive art installations into the design process?
2. Can designers create multisensory experiences to communicate specific messages?
3. Can immersive experiences build connections?
Simply put, yes, designers can do all of these things. Sense-driven design pushes people to feel, rather than think. The connections built through sensory experiences can be more powerful than traditional and old ways of connecting and can expand designer roles.
By realizing that much of society is seeking connection, designers can think more empathetically in their design practice. They can use their five senses and their observant minds to create lasting impressions and make people look and think differently about things.
As noted, immersive experiences can build connections by having no (or low) barriers to entry and engaging all the senses. Artists and designers communicate and build connections through their work, and their messages can have layers of meaning that can be interpreted through various senses. Design should be about awakening those senses and shifting people’s views of the world and how it could be.
Author’s note on COVID-19 pandemic implications
A thesis is ever growing and evolving, and the pandemic pushes us all to explore new forms of connection through design.
I live in Seattle, one of the earliest US cities to be hit with COVID-19 in February 2020.
Pre-pandemic, I found that our screens could often make us feel less connected to those around us, but since COVID has swept our country, technology has become just the opposite: it’s now the way we keep in touch with our community.
Through the lens of my thesis topics, I found myself pondering how our senses are being impacted by social-isolation measures. I started taking note of personal sensory observations, as I had done while researching my thesis.
As wearing a mask in public started to be the norm, I realized I was no longer looking at what I recognized as human faces. It’s a hard thing to explain or notice that for 30 years my brain has been distinguishing human faces as just that, and now my brain is recording face masks. The panic buying of the pandemic’s early days also affected my vision: the first time the grocery store shelves were completely empty, I realized I had never seen anything like this.
While this was less drastic at first, I remember having a moment while driving on a usually packed highway. My windows were down, and I suddenly noticed the absence of all the road sounds I had grown so accustomed to. As schools closed and unemployment rates went up, I heard sounds during the day in my house and neighborhood that were never there before.
3. Smell
I have a very sensitive nose, so when I first started wearing a mask I realized I was picking up fewer of the aromas I usually notice. On the opposite end, I started smelling cleaning agents and hand sanitizer everywhere I went. At this point, I think I could do a blind smell test and let you know when a person who had just used hand sanitizer was walking toward me.
While taste might not seem as significantly impacted as the other senses, eating hot and fresh food at a restaurant is a much different experience from ordering takeout. The food actually tastes different after sitting in takeout containers and traveling from the restaurant to one’s house. Taking restaurants one step further, sitting down for a meal with someone can be an intimate experience, and with restaurants closed to in-person dining this is the sort of intimacy the pandemic has stolen from us. Ironically, temporary loss of the ability to taste and smell is one symptom of COVID-19.
This is probably the most obviously impacted sense, one that did not take heavy observation to immediately notice. Meeting new people was suddenly entailed an awkward wave versus a standard handshake. Greeting friends and family six feet apart felt less intimate.
I’ve found myself asking these questions:
• Can we share a sensory experience virtually?
• How can we fill that sensory void?
• More directly related to education, how do we keep connection in this online/Zoom environment?
I wish I had answers to these questions. I am doing my best to observe and to reimagine how I have done things before. I try to bring tactile exercises into the online classroom environment. One icebreaker my class did was to draw (with pen and paper) the animal they were feeling like that day and explain why. I am hoping to have a virtual dinner party at the beginning of one class and have everyone bring food, talk, and collaborate.
While I don’t have all the answers, I do know that paying attention to the sensory input we experience can help us stay in the moment and focus on the things we can control. This new pandemic reality has increased our anxiety and isolation, and finding ways to cope by focusing on all our senses has never been more important.
Abram, David. The Spell of the Sensuous: Perception and Language in a More-than-human World. New York: Vintage Books, 2017.
“Culture Track.” Culture Track. Accessed June 13, 2019. http://www.culturetrack.com/
Dunne, Anthony, and Fiona Raby. Design Noir: The Secret Life of Electronic Objects. London: Birkhauser, 2001.
Hara, Kenya, Lidewij Edelkoort, John Maeda, Jasper Morrison, and Naoto Fukasawa. Designing Design: Kenya Hara. Baden: Lars Müller, 2011.
Heywood, Ian, ed. Sensory Arts and Design. London: Bloomsbury Academic, 2018.
Kreifeldt, John. “Some Thoughts on Haptic Aesthetics for Design Transmodal Aesthetics.” Lecture Notes in Computer Science Cross-Cultural Design. Methods, Practice, and Case Studies, 2013, 76–85. https://doi.org/10.1007/978-3-642-39143-9_9.
Lupton, Ellen and Andrea Lipps. The Senses: Design Beyond Vision. New York: Cooper Hewitt, Smithsonian Design Museum, 2018.
Lutz, Ashley. “Abercrombie Employees Have To Spritz Clothes With Cologne Every Hour.” Business Insider. May 17, 2013. https://www.businessinsider. com/abercrombie-employees-spritz-cologne-2013-5
“Makey Makey: About Us.” Makey Shop. Accessed July 23, 2019. https://makeymakey.com/pages/about-us
Postrel, Virginia I. The Substance of Style: How the Rise of Aesthetic Value Is Remaking Commerce, Culture, and Consciousness. London: Harper Perennial, 2008.
Rawsthorn, Alice. Hello World: Where Design Meets Life. New York: Overlook Press, 2015.
Smith, David Woodruff. “Phenomenology.” Stanford Encyclopedia of Philosophy. Stanford University, December 16, 2013. https://plato.stanford.edu/entries/phenomenology/ Zaraska, Marta. “September/October 2019.” Discover Magazine. Accessed August 10, 2019. http://discovermagazine.com/2017/nov/scents-and-sensibility.
Abstract
Black Americans have, for centuries, employed design thinking to enhance their experiences within American society. This paper uses Marc Hassenzahl’s guidelines for experience design to explore how The Negro Motorist Green Book was not only an innovative wayfinding tool but a constellation of design choices deliberately chosen to enhance the experience of Black travelers during the Jim Crow era.
Keywords: experience design, the Green Book, Jim Crow, transportation, wayfinding.
The comedy-drama movie Green Book, which takes its name from The Negro Motorist Green Book (most often called the Green Book), was a huge commercial success. It won three Golden Globe Awards for Best Comedy, Screenplay, and Supporting Actor; however, it polarized critics. Its most salient criticism was not going nearly enough into confronting its subject (Wilkinson, 2019), which was the sheer terror that Black Americans experienced during Jim Crow that would cause them even to need such a thing. Perhaps the benign-violation theory explains one’s ability to extract humor from such a painful source for many.
The theory proposes that we find humor in things when we: (1) perceive there to be a violation, (2) perceive it to be benign, (3) perceive both to be happening simultaneously, and (4) perceive it to be psychologically distant temporally, spatially, hypothetically, or socially (McGraw et al., 2012). Alternatively, perhaps this genre was chosen deliberately to enhance the brand experience. Studies show that brands rely on comedy to increase likability and drive profits (Garza, 2003). Would the film have been as successful if rewritten as a drama?
For some, the feel-good film provided an escape from the humdrum of daily life; for others, it was a mnemonic reminder of a horrific past. This paper posits that the Green Book, relegated to just a prop in the movie, was not just a wayfinding tool, but a constellation of design choices deliberately chosen to facilitate a specific experience, happiness, by synthesizing physical and cultural contexts to create a new experience for those who needed it the most.
A people once denied “Life, Liberty, and the pursuit of Happiness” have somehow managed to find happiness in the darkest of times. Hassenzahl et al. (2013) summarize the pursuit of happiness as “the acquisition of positive experiences on a day-to-day basis and a more general assessment of life as positive and meaningful” (p. 21). As to what constitutes an experience as positive, Hassenzahl et al. (2013) claim that it is the fulfillment of psychological needs. There are things in life that are arbitrary; however, Lyubomirsky, Sheldon, and Schkade (2005) assert that much of one’s happiness is under their control, which implies that, through activity, humans can influence their experiences (and thus, their happiness) directly.
Needs, foundational for experience design, are interconnected with “specific practices” (Hassenzahl et al., 2013, p. 23). While actions can be modified to influence an experience, experience design focuses on the design of objects to influence an experience (Hassenzahl et al., 2013). Gilovich et al. (2015) claim that tangible objects can act as conduits of an experience. If pleasure and satisfaction are to derive from the use of an object, a designer must focus more on the experiences it is to create, rather than the way it is rendered (Hassenzahl et al., 2013).
Psychologist Abraham Maslow proposed in “A Theory of Human Motivation” (1943) that humans were all motivated by five fundamental needs: physiological, safety, social, esteem, and self-actualization. Based on Maslow’s theory, Sheldon et al. (2001) proposed ten fundamental psychological needs as motives: selfesteem, relatedness, autonomy, competence, pleasure-stimulation, and physical thriving, self-actualization-meaning, security, popularity-influence, and money-luxury. In the context of experience design, Hassenzahl et al. (2013) narrowed Sheldon et al. ‘s list down to what they consider six relevant needs: autonomy, competence, relatedness, popularity, stimulation, and security (Table 1), understood as contributors to the meaning and positivity of experience and as a source of happiness when fulfilled (Hassenzahl et al., 2013).
"While actions can be modified to influence an experience, experience design focuses on the design of objects to influence an experience.
Autonomy
Feeling that you are the cause of your own actions rather than feeling that external forces or pressure are the cause of your action.
Competence Feeling that you are very capable and effective in your actions rather than feeling incompetent or ineffective.
Relatedness Feeling that you have regular intimate contact with people who care about you rather than feeling lonely and uncared for.
Popularity
Stimulation
Security
Feeling that you are liked, respected, and have influence over others rather than feeling like a person whose advice or opinion nobody is interested in.
Feeling that you get plenty of enjoyment and pleasure rather than feeling bored and under-stimulated by life.
Feeling safe and in control of your life rather than feeling uncertain and threatened by your circumstances.
According to Taylor (2019, p. 64), the Great Depression of the 1930s ravaged the nation, threatening the needs of all Americans. Many suffered bouts of homelessness, starvation, and illness. While the industrial expansion provided Americans with more economic stability, the historical practices of spatial discrimination that shaped American cities left Black Americans vulnerable as they navigated racial landmines for basic and complex needs.
The expansion of the economy and the interstate highway system after World War 2 meant increased access to the automobile and the roads. Black Americans embraced automobile travel because, according to Franz and Smulyan (2011, p. 242), it “offered African Americans escape from the Jim Crow segregation they encountered on trains and street cars.” However, the landscape of racism extended well onto the roads, and choosing the wrong place for accommodations could have violent, even fatal implications.
A common misconception is that segregation was confined only to the South; it permeated the entire nation (Figure 1). While many establishments employed overt Jim Crow signage, the cognitive load was more substantial for Blacks in places that imposed segregation in more savvy, covert ways. Those who experience disorientation and lack of recognition of the environment have experienced the uncertainty of being lost and feelings of frustration, anxiety, stress, fear, or anger (Wang, 2005). Coupled with the stress of disorientation is the onus of cognitive workload associated with the uncertainty of navigating segregation. According to O’Shea (2016), excessive cognitive load can lead to psychological stress. Uncertainty is the only source of stress that can be reduced. Therefore, information is the best way to reduce stress, as there is a reduction in uncertainty through necessary wayfinding information (Arthur & Passini, 1992).
As a Black American postal worker who traveled frequently, Victor Green (Figure 2) was in a unique position to be able to understand intimately and deeply empathize with Black travelers' struggles at that time, having also experienced many tribulations with traveling. He also was in a unique position to do something about it. Using his access to a network of mailmen, he set out to lighten the cognitive load on travelers by creating a guidebook that led Black travelers directly to safe havens. Designers typically start on the surface level with the material when designing tangible objects. However, experience designers begin with the intangible experience they intend to provide via “shaping practices through the material representation of the artifact” (Hassenzahl et al., 2013, p. 23).
Conceptual consumption, a term coined by Ariely and Norton (2009), is the act of translating the physical characteristics of products into mental concepts. Because technology has made it easier to satisfy our physical needs, we now look to fulfill this natural urge on a psychological level through the consumption of ideas. The positioning of a product determines which goals are attended to and consequently consumed. The Green Book falls under the consumption of fluency category, defined as "the ease with which stimuli are processed and experienced" (Ariely & Norton, 2009, p. 482).
Before the Green Book, traveling was cognitively demanding. There was no way for Black travelers to know whether an establishment would serve them until they arrived. Often denied the basic requirements of traveling on the road, many Black families would take weeks to prepare (Figure 3). Some brought receptacles in case of restriction from the use of public restrooms. There was a surplus of food and gas in case they were turned away from gas stations and restaurants. Extra pillows and blankets were packed in case finding a safe place to sleep was ambiguous, particularly in states populated with “sundown towns,” where the Black population was (intentionally) low.
Though the Black community was prospering economically and socially, they could not escape the classification of second-class citizens in America (Luria & Maher, 2019). Jim Crow law affected every aspect of their lives, but the Green Book made life more comfortable. The guide enabled them to feel like fully realized citizens by providing them with opportunities to engage in more positive experiences while on the road. Therefore, the Green Book’s consumption was arguably more psychological as a concept of safety and autonomy.
Hassenzahl et al. (2013) proposed an approach to designing experiences. First, discover the pattern within individual experiences. Then, if the pattern can give insight into what made an experience emotional, an experience
designer can use it when designing the new ideal experience. Lastly, only “after having outlined the desired emotional and cognitive content of an experience, the action involved, its context and temporal structure, [she] may start designing the ‘product’ (Hassenzahl, 2010, p. 68).
For Black travelers, there was a pattern of inconsistency while traveling. During Jim Crow, a stop for basic needs could be met with humiliation or worse. If one had the good fortune of only stopping at non-discriminatory businesses the entire duration of their trip, they were on edge the entire time. The purpose of the Green Book was deliberate: to equip Black travelers with information that kept them "from running into difficulties, embarrassments," and to make their trips overall "more enjoyable" (Green, 1949, p. 1).
The Green Book provided a compelling foreshadowing of what is now called the end-to-end customer experience. The end-to-end experience, comprised of three factors: (1) points of contact, (2) customer journey, and (3) the environments in which the aforementioned takes place, is the aggregation of all of a user’s interaction with a brand (Veyrat, 2017).
The customer contact points are the moments when customers come into contact with a brand most strikingly (Veyrat, 2017). As the only major retail distributor of the guide, Esso gas stations were the point of contact for most Green Book users. Esso was highly effective as a touchpoint because it was established as progressive, as the only major gas station to serve, hire, and franchise to Black Americans at the time (Figure 4).
Green resolved what could have been a crucial frustration for users during a vital part of their overall journey through his early use of the iterative process. A successful wayfinding system relies on more than just graphic design; it also relies on the contributions of those who help scope out spaces (Arthur & Passini, 1992). Green not only relied on mail carriers to create the guide but also tips from readers (Andrews, 2019), which we now refer to as user-generated content (Townsend, 2016). With each edition came a reduction in usability issues and a refined user experience, maintaining a consistently high-quality and repeatable experience.
Tangible artifacts symbolize the intangible. The design of a product requires understanding how form actualizes a concept, affects people emotionally, and amplifies the experience. According to Arthur and Passini (1992), people need three functional types of information in new settings: (1) orientation and general information about the setting, (2) directional information to destinations, and (3) identification of destinations.


This page:
Figure 1 (above): Kennedy, R. (2013) [Cities with establishments listed in the Green Book, 1949]. Retrieved from shorturl.at/BENP5
Left: Figure 2 [Victor Green, Green Book creator]. Retrieved from shorturl.at/aCEKP
Over page:
Figure 3 [Black Family Preparing to travel] (2011). Retrieved from https://docplayer.net/ docs-images/59/44051995/images/5-1.png
Figure 4 [Lyndon Wright, owner of Lenny’s Esso Service Center] (2016). Retrieved from https://cdm16694.contentdm.oclc.org/ digital/collection/p15281coll12/id/16599


The environmental knowledge we acquire and mentally represent are not adequate for wayfinding purposes within complex environments. Therefore, effective information design, such as graphic information with signs, maps, and information booths should be implemented (Wang, 2005). The Green Book, as a directory comprised of names, street addresses, and sometimes pictures, effectively helped travelers identify their destination. While directories certainly have their shortcomings, they contain large amounts of information while being able to manage not overwhelming the user through “displaying only as much as a viewer can absorb at any given time” (Arthur & Passini, 1992, p. 204).
While color is often thought of as an aesthetic choice by designers, it is a crucial component of the psychological impact design has on users and is thus experiential. Perhaps as an homage to its creator, the Green Book uses green as the cover color on all editions of the publication (Figure 5). The color green in the automotive industry means “go,” which can evoke autonomy and freedom. In color psychology, the color green is associated with tranquility and wellness, which can evoke a sense of security.
The Green Book, as a physical representation, was an intangible experience mediated through the tangible. It reformed the context to better align with the intended experiences (e.g., safety, autonomy) and prompted users to engage in certain actions (e.g., go to a specific establishment) (Hassenzahl et al., 2013). “Only when deliberately designing the experiential portion of an artifact by addressing a psychological need and a meaningful related action does design become Experience Design, that is, design becomes design for happiness” (Hassenzahl et al., 2013, p. 28).
The quality of the experiences we live define the quality of our lives. Artifacts are not static creations, but dynamic facilitators. The Green Book was not just a guidebook; it was a vessel full of possible experiences, activated with each use. The guide improved the quality of life of those that used it by improving the experiences they lived as citizens. Its success was predicated on the fact that it put experience at the fore, rather than the product, by starting with actual needs (for security and autonomy), and fitting that story into the product. Designers, more than any other profession, have the power to shape the spaces where experience originates in more gratifying ways. As we continue to design with an all-inclusive future in mind, we should be cognizant of the relics of our past (especially those left by the marginalized) that may act as blueprints or simply risk falling behind.
"
" While color is often thought of as an aesthetic choice by designers, it is a crucial component of the psychological impact design has on users and is thus experiential.
 Above: Figure 5 [Various Green Book Covers] (2019). Retrieved from https://newsinteractive.post-gazette.com/greenbook/img/page-of-books.jpg

Andrews, Evan. “The Green Book: The Black travelers’ guide to Jim Crow America.” HISTORY, 13 Mar. 2019, www.history.com/news/the-green-book-the-black-travelers-guide-to-jim-crow-america
Arthur, Paul, and Romedi Passini. Wayfinding: People, signs, and architecture. 1992.
Franz, Kathleen, and Susan Smulyan. Major problems in American popular culture. Cengage Learning, 2011.
Garza, Steven David. The influence of movie genre on audience reaction to product placement. Diss. Texas Tech University, 2003.
Gilovich, Thomas, Amit Kumar, and Lily Jampol. “A wonderful life: Experiential consumption and the pursuit of happiness.” Journal of Consumer Psychology 25:1 (2015): 152-165.
Green, Victor H., ed. The Negro motorist green-book. Snowball Publishing, 1949.
Hassenzahl, Marc. “Experience design: Technology for all the right reasons.” Synthesis lectures on human-centered informatics 3:1 (2010): 1-95.
Hassenzahl, Marc, et al. “Designing moments of meaning and pleasure. Experience design and happiness.” International Journal of Design 7:3 (2013).
Lyubomirsky, Sonja, Kennon M. Sheldon, and David Schkade. “Pursuing happiness: The architecture of sustainable change.” Review of General Psychology 9:2 (2005): 111-131.
Maslow, Abraham Harold. “A Dynamic Theory of Human Motivation.” (1958).
McGraw, A. Peter, et al. “Too close for comfort, or too far to care? Finding humor in distant tragedies and close mishaps.” Psychological Science 23:10 (2012): 1215-1223.
O’Shea, James. “Cognitive Load and the Emergency Physician.” EmDOCs.NetEmergency Medicine Education, 2 June 2017, www.emdocs.net/cognitiveload
Sheldon, Kennon M., et al. “What is satisfying about satisfying events? Testing 10 candidate psychological needs.” Journal of Personality and Social Psychology 80.2 (2001): 325.
Smithsonian Channel. “The Green Book: Guide to Freedom (Full Episode).” YouTube, uploaded by Smithsonian Channel, 8 June 2020, www.youtube.com/watch?v=xjAppLwDm6U
Taylor, Steven JL. Exiles, Entrepreneurs, and Educators: African Americans in Ghana. SUNY Press, 2019.
Townsend, J. (2016, March 23). How the Green Book Helped African-American Tourists Navigate a Segregated Nation. Retrieved from https://www.smithsonianmag.com/ smithsonian-institution/history-green-book-african-american-travelers-180958506/
Wang, Y. (2005). Creating positive wayfinding experience
Wilkinson, A. (2019, January 7). Green Book builds a feel-good comedy atop an artifact of shameful segregation. Yikes. Retrieved from https://www.vox.com/2018/11/16/18069756/ green-book-review-racism-schomburg-segregation-golden-globes
Figures
Table 1 Hassenzahl et al. (2010); Sheldon et al. (2001). [Overview of a set of needs suitable for Experience Design]. Retrieved from http://www.ijdesign.org/index.php/IJDesign/article/view/1480/589
Figure 1 Kennedy, R. (2013) [Cities with establishments listed in the Green Book, 1949]. Retrieved from shorturl.at/BENP5
Figure 2 [Victor Green, Green Book creator]. Retrieved from shorturl.at/aCEKP
Figure 3 [Black Family Preparing to travel] (2011). Retrieved from https://docplayer.net/docs-images/59/44051995/images/5-1.png
Figure 4 [Lyndon Wright, owner of Lenny’s Esso Service Center] (2016). Retrieved from https://cdm16694.contentdm.oclc.org/digital/collection/p15281coll12/id/16599
Figure 5 [Various Green Book Covers] (2019). Retrieved from https://newsinteractive.post-gazette.com/greenbook/img/page-of-books.jpg
This session is the continuation of a presentation from the 2019 SEGD Academic Summit. In summary, the basic principles of three-dimensional design can be taught to competent graphic designers through a series of exercises, each adding to the previous one. Combined with student’s existing graphicdesign skills, the student can then move on to more complex environmental graphics challenges.
Wayne Hunt is a long-term adjunct professor at Art Center College of Design. For many years previous to this, he was a practicing environmental graphic designer. Art Center is a top art and design school with an exemplary graphic design program, featuring specialties or tracks such as motion graphics, package design and interface design, but does not have an environmental graphic design track. For the last few years, Hunt’s unique course, Typography in Three Dimensions, has served as Art Center’s environmental graphics option and introduction to the EGD field.
The class is offered as an elective and is typically taken mid-way through the program. The class meets for four hours one day each week for the fourteenweek term. As a stand-alone EGD experience I approach the subject matter as an additive or enhancement to a solid graphic design education. That is, I am not trying to mint environmental graphics designers, but rather I try to add some three-dimensional skills and general EGD awareness and vocabulary.
Additive is the key word here – I believe that most learning is adding on to and relating to things already known. Identifying a student-accepted design principle and adding to it or adapting it to new circumstance is an effective teaching strategy. So, going in I assume that the students are well-versed in basic graphic design composition, principles of rhythm, contrast, figure/ground, proportion, etc., and of course, typography. On day one I commit to the class that I can help add a layer of knowledge to their design skillset – I can show them how to adapt their graphic design skills to the three-dimensional world. Note, this is not a class in symbol-making, metaphor or narrative – it is a form-based course.
Repeated here to make the connection from 2019 to 2020
Teaching true architectural-quality three-dimensional design is highly complex and requires much more than can be taught to graphic designers in a single class. Therefore, I have identified four principles or differences from 2D that serve as an introduction and that have immediate value and application to environmental graphics or 3D design. A competent graphic designer who understands and applies these principles can credibly participate in environmental graphic design. My four principles:
Dimensionality – physicality; multiple points of view.
While graphic design often simulates or implies three dimensions, it remains on a single 2D plane; 3D design, however, is tangible and has physical presence; it has a side view, can cast a shadow, and, importantly, can be viewed from an infinite number of vantage points.

Relative Scale – relationship between physical objects.
Unlike a ‘graphic design,’ say a logo or web page, a 3D design or object inherently is bigger or smaller than other objects. As such, the designer makes size choices along with all of the other design decisions.

Architectural Scale – relationship to human size and the built environment. In addition to object-to-object size relationships, 3D objects have inherent size relationships to people and architecture.

Physical Context – relationship to surroundings.
3D objects also have contextual relationships with the environment. Such factors as sun and shade, field color, position above or below the horizon play roles in 3D design decisions.

These are the primary differences between ‘regular,’ graphic design and 3D or environmental graphic design.
The class is organized to sequentially address each of the principles by means of a series of quick weekly projects. An assignment is due each week with no interim review or critique. The projects are pitched to the class as exercises, each conceived to show or teach one or more of the principles. While craft is important, slickness is not.
Three-dimensional Numeral. Learning objective: Dimensionality; evolving a 2D item into an interesting 3D object.
The student creates an interesting three-dimensional interpretation of a numeral, working with strict outside dimensions.


Note that these models have no symbolic scale; they simply exist as table top 3D objects.
Assignment 2
Relative Scale and Physical Context Learning objective: relationship between physical objects and environments.
By means of photography or illustration, the student incorporates the model from the Assignment 1 into an actual environment, thereby introducing context and relative scale. Adapting the sculpture into a functional object or structure is encouraged.


Assignment 3
Architectural Scale Learning objective: implied relationship to human size and built environment. (Not illustrated herein.)
After a brief lecture in scale measuring and drawing, the student makes a simple orthographic drawing of the sculptural numeral but using the implied scale and dimensions from Assignment 2.
Assignment 4
Urban Scale and Context Learning objective: Measurable relationship with urban and architectural scale. For Summit 2020 I focused on this area.
The student selects a poem or song lyric to be applied to an actual place in the city, usually an urban alley. First the student measures the actual space and buildings as appropriate and with the help of satellite mapping creates a credible site plan and elevation drawings. The wording is then designed ‘into’ the space via the elevations and plan view, in scale. Over three to four weeks the design evolves into a finished design presented in a photo rendering and scaled elevations.


Note presentation requirement: design and all elements are compsed into an architecture-style ‘poster.’


A variation on the assignment is to design a mile marker for a marathon using an actual intersection in the city. Again the student surveys, measures and documents the location and then develops a large typebased gateway element. The design is a reaction to the several environmental contexts: street width, building sizes, sight lines, landscape elements, direction of (runner) travel and others.
In addition, for some students the project introduces symbolism, metaphor and even narrative as the designs come to reflect or integrate into the neighborhood culture or history.


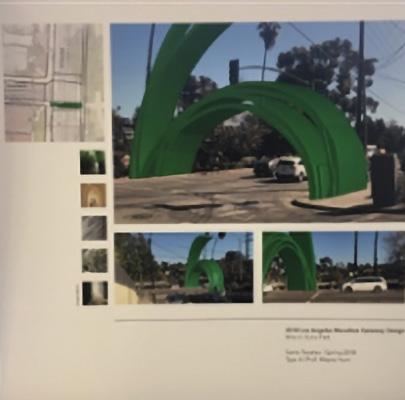
"
" ...for some students the project introduces symbolism, metaphor and even narrative as the designs come to reflect or integrate into the neighborhood culture or history.
Assignment 5
Urban Gateway
A more advanced version of the previous assignment is to create a civic gateway monument. Again, documenting an actual city intersection or location, the student designs an in-scale gateway, interacting with the physical context. A detailed ‘architectural’ single-board presentation is required.


After executing the assignments the student is surprisingly empowered to bring his/her typographic and 2D skills to the 3D world and ready for more complex EGD assignments. Note, the courses work is supplemented by examples of professional projects, drawings and renderings.
Abstract
The most natural of questions to ask at the beginning of any project: how do we begin?
Whether you are a seasoned professional or first-year design student this question has plagued us all at some point. The experienced designer may respond with “research.” However, the next logical question (often posed to me by students) is where do we begin with our research? What do we research? How do we know if our research is too broad? Too narrow? Or when to stop and start production, and, likewise, when to circle back around and reengage with it?
The most natural of questions to ask at the beginning of any project: how do we begin? Whether you are a seasoned professional or first-year design student this question has plagued us all at some point. The experienced designer may respond with “research.” However, the next logical question (often posed to me by students) is where do we begin with our research? What do we research? How do we know if our research is too broad? Too narrow? Or when to stop and start production, and, likewise, when to circle back around and reengage with it?
While attending graduate school, I was introduced to a model, a tool, that has proved to be incredibly helpful in answering the questions: a creative research map. It proved to be not only be helpful with my academic work, as a graduate student, but has aided me in my professional practice as an experiential graphic designer and an adjunct professor in communication design.
The construct of this “research map” was first introduced to me by my one of my thesis advisors, Dr. Neil Maycroft, Associate Professor at the University of Lincoln’s School of Design in Lincoln, England. From the book Soul Food, and Music: Research and Innovation for Creative Business that he co-authored with Kim Errington and Jim Shorthose, this model is an augmented form of Paul Ricœur’s model of interpreting text. Soul Food, and Music… added to and adjusted Ricœur’s system, so the creative professional might use it for the purpose to elicit innovation within their own practice.
What do we mean when we say, “creative research”? It is a phrase that has been used in areas outside of creative practices. Defining the phrase – within this context for creative professionals – should be a starting point and/or perhaps choosing a different nomenclature.
What is the Soul Food, and Music model? How does it work? In addition to outlining Maycroft, Errington, and Shorthose’s model, I will present my own adjustments and augmentations. These fit the purpose of using it more for an individual design project, as opposed to an entire creative practice. Bringing research into the design classroom empowers students to look beyond their own immediate knowledge (and their professor’s) to solve a design problem or implement a project.
I also conducted an interview/discussion with Dr. Maycroft on the impetus of the work in Soul Food, and Music – why they decided that a work in research for the creative practice was needed. It should be noted that the book is written for creative practitioners and professionals as opposed to academics – which seems to be a very definite and intriguing choice.
I. What do we mean when we say creative research? And is it the correct term?
New York University’s Tisch School of the Arts states “… there is no singular definition of ‘creative research’ …,” however proposes there should be and then lays out the following:
Creative research is creative production that produces new knowledge through an interrogation/disruption of form vs. creative production that refines existing knowledge through an adaptation of convention. It is often characterized by innovation, sustained collaboration and inter/trans-disciplinary or hybrid praxis, challenging conventional rubrics of evaluation and assessment within traditional academic environments.1
In other words, a system of creative practice that is meant to break down dogma or convention by infusing creative thinking, methods, and production into a research practice.
This is not exactly what we are talking about, despite some overlaps in the practices and the outcomes. Perhaps, a more accurate phrasing for the practice we are referring to is ‘research in support of the creative practice’: that is, research that provides a basis, a backbone, a direction, a conceptual framework, and/or a starting point for creative work. It helps to define a project by setting out the goals and parameters of a project or practice. And when a designer’s creative output is questioned (be it by a client, a professor, or one’s peers) it can provide a foundation to back up and support the design decisions that were made, such as, “I used this color/typeface/material, because, through my research, it resonates/communicates/evokes our message in this way.”
II. A book.
Having established that we are engaging in research to support creative practice, where does one begin?
Often designers may brainstorm or just begin intuitively searching. For experienced designers that might be effective, but for design students, more times than not, they just want to jump into the making. It is a good practice to slow them down, encourage them to formulate a direction – a conceptual structure – before they start the making process.
When I spoke to Dr Maycroft, he took a different tack. He now prefers to introduce the research component a bit later – have the students establish what they want to do, allow them to develop their ideas to some level, and then bring in the research component to test, refine, or expand on their initial thoughts.
“I used to start off with it, but now I tend to have three or four weeks of other stuff. Then I go into it, and then finish up with a few more weeks of other [material].”2
1 New York University/Tisch, https://tisch.nyu.edu/tisch-research-news-events/research-at-tisch/what-is-creative-research2 Maycroft, Neil. Interview with James Silva. May 29, 2020.
It should be noted that he is working with graduate students, who usually have a better idea of what they want to accomplish, whereas I have been instructing first year undergraduate students, who are just getting immersed into this whole world of design for the very first time and need a bit more direction initially. Likewise, the durations for projects are a good deal different for both our programs.
I met Dr. Maycroft as a graduate student at the University of Lincoln in Lincoln, England. It was about a decade and a half after completing my BFA in Design. I was pretty wellversed in my own professional practice of design. On the other hand, it had been a long while since I had engaged with design in the academic arena. I certainly had ideas and a project I wanted to explore, but I needed to give them form and structure.
It was during this time at Lincoln that Dr. Neil Maycroft introduced our MA group to a book he co-wrote with Kim Errington and Jim Shorthose: Soul Food, and Music: Research and Innovation for Creative Business. The book, by extension, introduced us to a model for formulating/organizing starting points in our research for our creative practice and projects.
III. A map.
I will be mainly outlining what is contained within Soul Food, and Music’s second chapter, “Behind, In/Through, For and In Front Of: Research Starting Points”. I will interject and make apparent my own augmentations, modifications, and experiences with its application. However, in general, all credit should be given to Errington, Maycroft, and Shorthose for the content that follows. With that said, the tree of ideas goes back even further, and Dr. Maycroft in conversation with me (and within the book itself) acknowledges that the map, the structure, is in fact built off of the hermeneutical philosopher Paul Ricœur’s methodology of reading/interpreting text:
“I actually got it from my reading of literature – Paul Ricœur – and then I adapted it to just thinking about creative practice. … It was always offered in a kind of spirit of a heuristic, rather than a didactic, device and people can take it and adapt it how they like.”3
This is how Dr. Maycroft approached Ricœur’s original structure of three research starting points, adding a fourth of his own.
Behind the Text: “… what were the various economic, political, social, and cultural contexts framing the writing of this text?”4 Within Soul Food, they use the example of George Orwell’s dystopian novel,1984 and enumerate all the Cold War era elements reflected in that text. To give another example, if we were dissecting Moby Dick, we might choose the following: “the whaling industry of 19th Century New England”, biographical details of Melville that influenced the novel, the true story of the sinking of the whaling ship, The Essex, etc. All topics would fit under the Behind starting point. 3 ibid.
4 Errington, Kim, Neil Maycroft, and Jim Shorthose. Soul Food, and Music; Research and Innovation for Creative Business. 2008.
When I teach the Behind starting point I boil it down further to “background information.” What is the background information; what are the issues, the subject matter, that concerns your project, client, creative practice?
In/Through the Text: “… the writing process itself; … What particular routines or processes did [the writer] follow in the editing and, how did all of these manifest themselves in the text as a whole? The way the book itself came together …”5
So in either the Orwell or Melville examples you’d look at the literal mechanics of writing – longhand vs. typewriter, the editing/revision process, how long it took, etc.
Once again, I simplify this down for my students: production. How are you going to produce this project? What skills will you need? How will you acquire them? Will you need to team up with others? How long will this all take? All of these are topics to research under the In/Through starting point.
In Front Of the Text: “… what were the reactions of the various audiences who read the text – editors, reviewers, critics, the general public and so on?”
For designers and design students this is a pretty straightforward one: audience. Who is the audience/consumer of your project? Yes, we mean the end consumer, but also take into consideration the intermediate audience – your client – as well. Research topics for the In Front Of starting point could include such things as demographic studies, interviews, community outreach, etc.
The final category was the one added by Errington, Maycroft, and Shorthose to Ricœur’s original three:
For the Text: “… this involves valuing the kind of research that ‘runs alongside’ the actual doing of the creative work itself. The value in knowing what is going on in other related disciplines and viewpoints as the work itself develops. Research ‘for’ creative practice takes account of these other perspectives and what they can add to ‘your thing’ itself.”6
I have experimented, adjusted, and reinterpreted this category the most depending on the class or project I am teaching. Most recently, I was teaching a multidisciplinary design project that involved developing a branding package. For this project, I had the students think about this category as “assessment.” As I stated in the assignment text: “This is about testing and assessing what you are doing. That can come through your work with designers both inside and outside of your team in order to get different viewpoints. It can come through discussions with me as well. However, you can also reach out to other professionals (designers or otherwise) within the fields you are dealing with, or members of the proposed audience (‘laypeople’). This can take the form of various survey or interview methods, etc. How will you know if things are working?”
5 Errington, Kim, Neil Maycroft, and Jim Shorthose. Soul Food, and Music; Research and Innovation for Creative Business. 2008. 6 ibid.
As part of this starting point, I have also had students use the For category as a space for self-assessment – to take time/breaks throughout the process of doing and assess in a written format how things are going. What is working? What could be improved? Do you think you need to change course?
The research categories for the For category may take on the form of questions to ask oneself or others. It may also take on the form of a list of possible candidates you might seek out to contact for this assessment. Or use this space to formulate an assessment schedule to run throughout the project.
At this point, I should mention that Soul Food, and Music, overall, and the research map model therein, is not directed at designers or design projects specifically. It is directed at the broader audience of creative practitioners and their own approaches to their practices and at how an academic or conceptual approach or method of thought might spawn innovation – new approaches, ways of thinking, etc.
Circling back for a moment – it is interesting on whether you are engaging in “Creative Research” or “Research in Support of the Creative Practice,” both carry the same goal – to disrupt the way we normally go about things to elicit discoveries, connections, approaches, and new inspirations to what we do.
So what does this all look like …

Source: Soul-Food-andMusic11-diagram.
As with any diagram, it is an attempt to give form and structure to the abstract. As I tell my students, use it as a spot to begin from, but feel free to depart from it. Theirs’s may look differently. Their research starting points end up may exist more in the in between spaces – the arrow areas as opposed to the bubble areas. Do what makes sense to them, their thinking, and their project. For some students, they often end up with something that looks more like an outline, others end up with Venn diagramlike structures, and still others molecular or planetary structures – whatever works.
When I spoke with Dr. Maycroft, he also said he uses it very much in the same way – it’s just a point of departure and for problem solving if things are not working out or communicating properly:
“I think it does help students decide where the question is that they want to answer … it offers starting points: Is the problem with me, because its lack of basic understanding or learning? Is it a problem with my understanding of context? … Is it about my professional practice in terms of my relationship to my tools and materials…? Or is it about who am I doing this for? … it does narrow down a little bit those sorts of areas where you need to start asking questions.”7
Not all the starting points need to be treated equally for each and every project. But he’s found the same thing I have, when you bring up research within the creative context most design students only think of the Behind – the background information – when approaching a project. (Quite honestly, a lot of experienced designers do this as well.)
Dr. Maycroft: “For most of these students they have done context somewhere, but that’s just what we call the Behind bit – they’ve done some design history or … a little bit of the cultural studies type stuff. So they think that might be the place to look for the answer. Well that might not be the place to look for the answer. The place to look for the answer might be in the audience or end user or it might be in your own practice. Or it just may be [in how you work] as a student.”8
So if putting together a research map does nothing else, it broadens the scope of the research. However, I found it also results in something else with younger design students …
IV. Empowerment.
What their map looks like isn’t nearly as important as that, in the end, the student has a nice constellation of research topics to embark on. That, after completing their body of research, they will have a fairly full and cohesive understanding of their project. And as mentioned in the last section – they will be able to test or assess their work and discover new avenues of inspiration that they did not have prior to
7 Maycroft, Neil. Interview with James Silva. May 29, 2020.
8 ibid.
their research component. Perhaps what is most valuable is that by going through this process the student will develop greater confidence in their design decisions, as well as, be empowered to be their own problem-solver.
Through the accumulation of background material through the Behind starting point, the student will have built a broad basis of what their project is about. They can use this information to find points of inspiration and creative departure for their work. And they can also come back to it to justify their design decisions.
A group in one of my classes was tasked with designing a branding package for a fictitious WNBA team in Austin, TX. None of the students had ever been to Austin, so they really had to rely on the research phase. Regardless, of the branding element – whether it was the team name, color palette, or logo –they could point out any detail and there was a research component to back it up – much of it entailing information from the Behind starting point.9

Through the In/Through starting point a student can plan ahead in how they are going to execute the project. What skills will they need? What skills do they have? Will they need to learn additional skills to fill in the gaps? Will they add these skills through teaming up with others? How long will all this take?
As an end of the semester project, I had a student propose that they wanted to design and build a toy – a stuffed animal. I promptly let them know that I didn’t know the first thing about making a stuffed animal, so wouldn’t I be a whole lot of help on production guidance. I asked them if they had ever done anything like that. No, they hadn’t. I informed them that, to begin with, they needed to really pay attention to the In/Through starting point: to think about things they would need to know and start researching them. They did so, and it started off well:
“I researched old teddy bears and their origins. And I looked up how to piece together a basic teddy bear pattern and then made my own pattern off of it. But the student hit some snags as production really got going:
When I first started working on this project I thought it couldn’t be that hard to make a stuffed animal by hand without a sewing machine. The weekend after the assignment was given I started diligently trying to make the stuffed dragon myself. This didn’t turn out too well. The fabric kept bunching and clumping in weird places and the fabric was somehow shrinking.
The student made a quick assessment and put in some additional research time and discovered
… a sewing place nearby me. At the sewing place they taught me how to sew on a sewing machine. This was much faster than sewing by hand. With the guidance of the people from the sewing shop I got my stuffed dragon made and I learned that sewing a stuffed animal together is harder than it looks.10
"Through the In/Through starting point a student can plan ahead in how they are going to execute the project. What skills will they need? What skills do they have? Will they need to learn additional skills to fill in the gaps? Will they add these skills through teaming up with others? How long will all this take?

Through the In Front Of starting point of audience data, the student is given another body research to justify their design decisions and discover unexpected points of creative inspiration. However, instead of reflecting and reinterpreting the background information of the Behind starting point, they acquire information on their potential audience and seek out ways to reach out, communicate, and resonate with them.
Another group that was completing their capstone branding project was given a fictitious traveler hotel company. Through their In Front Of research they came up with the following:
The wanderers, or the guests that we cater towards the most, would mostly be lone travelers. We target people ages 18 to 29 years old, and preferably those who are tech savvy.
Some adjectives of our audience include: young, technologically savvy, extroverted, those who prefer the night, backpackers, light-travelers, college students, loners, and those who are socially aware.
And further developed this archetype: “The Wanderer”: The wanderer archetype is lulled into a quiet comfort that comes via endless travel, be it outward or inward. The wanderer is more comfortable with uncertainty than certainty. The wanderer practices the spiritual grace of detachment, allowing the person to embrace the present moment.
For this group the In Front Of starting point was key to unlocking who their brand was and what design decisions were in brand and what were out of brand.11 6

The final starting point, the For starting point, which I’ve interpreted as a place for assessment, though the Soul Food, and Music… uses a more broad interpretation of process. When we begin this process, I tell the students that though these Research Maps are all about coming up with starting points for their research that does not mean that research only happens at the beginning. Things will come up and you will have to return to any of these research starting points – for example, returning to the In/Through point to find an alternative to hand sewing when you realize things aren’t going according to plan. With that said, the For starting point is very specifically about accumulating information throughout the design process. This is an opportunity for them to get feedback on their materials, to test them, before arriving at the finish line. It’s also an opportunity for them to test drive design options before an audience.
This starting point is for them to figure out how they want to go about getting outside assessment – meeting with their professor, internal team critiques, as well as feedback from outside the university. So this starting point can be used to search out designers or other sources of feedback concerning their ideas and work.
Additionally, at the end of the process, and the project, I often require my students to produce “process booklets”; they are not only an accumulation of all their materials from their project, but they must also annotate the process. Where did they make changes, adjustments, revisions? Why? What worked? What didn’t? And no project is perfect, so what would they improve on if they had more time, resources, or what did they simply miss?
The process books are often grumbled about, however a student that I had in my class for two semesters emailed me to let me know:
Your class and focus on the process of projects really allowed me to hone into my own design style. I know I joke a lot about the process books, but I think I secretly appreciated them; they allowed me to look back at my work and ask why? Why did I choose certain things to incorporate into the final product? 12
The Research Map and all the starting points – Behind, In/Through, In Front Of, For – are all about the student designer building this type of confidence and empowerment with their design decisions. Strengthening conviction in supporting, defending, and explaining why they did what they did. Within all this body of research there is still a lot of room for inspiration, experimentation, and all the messiness of the creative process – but there is huge value in the justification that comes through a health body research. And that value can come when one is presenting the final product – when one has to justify what they are showing – but it can also help throughout the entire design process.
Boston University. https://www.bu.edu/cfa/creative-research/
Errington, Kim, Neil Maycroft, and Jim Shorthose. Soul Food, and Music; Research and Innovation for Creative Business. 2008.
Fazzino, A., M. Khan, M. Mordini, A. Sigalas, and K. Vedia. Halò: Capstone. Spring 2018.
Imperial College of London. Doing Creative Research: A Good Practice Guide for Postdocs in STEM Disciplines, 2009.
https://www.imperial.ac.uk/media/imperial-college/administrationand-support-services/staff-development/public/postdocs/Doing-creative-research.pdf
Maycroft, Neil. Interview with James Silva. May 29, 2020.
New York University/Tisch,
https://tisch.nyu.edu/tisch-research-news-events/research-at-tisch/what-is-creative-research-
Nirelli, S., L. Carr, C. Sapius, and B. Murillo. Austin Surge: Capstone. Spring 2020.
Ricœur, Paul. Hermeneutics and the Human Sciences. Cambridge University Press, 2016.
Santos, J. Email to James Silva. May 25, 2020.
Segarra, L. The Making of a Dragon. Fall 2018.
Books free to download from Dr. Neil Maycroft and onscreen SEGD conference presentation by James Silva: https://www.dropbox.com/sh/g14y5sml02674ld/AABZP9QSCh2JvDrXTdNSPJega?dl=0
Also included in this paper: Fashion Institute of Technology, Communication Design Department students’ work.
In this case study, experiential graphic design (EGD) was used as a pedagogical approach to expand and bridge interdisciplinary learning by connecting key programs and concepts through dynamic and powerful storytelling. This paper examines the reformulation of an existing study abroad curriculum. In the revised course, principles of narrative design were woven into a culminating exhibit that served as catalyst for social good and helped form connections across curricula that highlighted two key programs at West Chester University: the Center for International Programs, and the Office of Sustainability.
As an adjunct professor with an EGD background, the author created the original course and curriculum that ran in May of 2017. The adapted version, implemented for a second study abroad by the author and a co-director in May of 2019, is the primary focus of this paper, which showcases the resulting student work.
As a multidisciplinary designer with years of experience, the interdisciplinary nature of experiential graphic design (EGD) resonates in my classroom where the art of the narrative extends naturally into my pedagogy. As there is no formal instruction in exhibition design in our current program, I seek opportunities to enable students to become storytellers in the three-dimensional world of the built environment to ignite an interest in EGD and to add other tools and vocabulary to their design skillset.
The objective of the curriculum for the first study abroad course in Copenhagen was a general cultural immersion created exclusively for graphic design students in the Art + Design Department in the College of Arts and Humanities at West Chester University in West Chester, Pennsylvania. The focus of that trip was to explore the historical and transformative contribution of Danish culture to Scandinavian design tradition. Throughout our time abroad, travelling in and around the country, an underlying story that consistently emerged was Denmark’s leadership role in sustainability. We lived it, we felt it, we saw it. Sustainability underscored every touch point in the lives of the Danes and all of them were beautifully designed and thoughtfully executed. The noticeable difference, as identified by the students, was the deliberate and strategic planning and execution of Danish infrastructure. They witnessed first-hand how it was designed to contribute to their quality of life. Consequently, they returned to the U.S. with an alternative understanding of the concept of “social welfare.”
In the following months, faculty at WCU and the local community were invited to participate in The Brandywine Project, a workshop sponsored by the Office of Sustainability.1 For two days, all topics revolved around the 17 Sustainable Development goals determined by the 2015 Paris Climate Agreement, where 197 nations came together to agree on a shared world plan “to end extreme poverty, reduce inequality, and protect the planet by 2030.”2
During the workshop, participants learned that the benchmarks for carbon neutrality at our university aligned with those of Denmark. Denmark was on target to reach those benchmarks, but it was surprising to learn that we were not far behind.
1 Faculty from West Chester University and neighboring communities are invited to participate in the Brandywine Project Workshop, an opportunity to develop or modify courses to focus on issues of sustainability, surrounded by supportive and creative colleagues from our region. This workshop is the perfect place to begin learning or to deepen your understanding by further exploring your discipline, creating interdisciplinary connections, and becoming more informed about campus and regional sustainability actions & opportunities for teaching.
2 The Paris Agreement is a landmark environmental accord that was adopted by nearly every nation in 2015 to address climate change and its negative impacts. The agreement includes commitments from all major emitting countries to cut their climate-altering pollution and to strengthen those commitments over time. https://www.nrdc.org/stories/paris-climate-agreement-everything-you-need-know
One of the main objectives of the Brandywine Project was to explore ways to integrate sustainability and the strategic plan of the university into our present curricula to raise consciousness and help ignite change.
Our recent study abroad experience came to mind and an idea crystallized. The sustainability goals and initiatives of our university and Denmark’s could merge into one storytelling that would benefit multiple initiatives on campus. These ideas coalesced to become the context for an innovative curriculum shift for the next study abroad trip, which was scheduled for 2019.
Using EGD as a powerful pedagogical tool, an interactive exhibit – København, Sustainable by Design – was created by the students and effectively transported the exhibit visitor to Copenhagen through the lens of their study abroad experiences to learn about sustainability efforts modeled by Denmark. The experiences and data would then be collated with parallel initiatives on our own campus. Researched, developed, designed, and fabricated in a total of five weeks, a small campus art gallery was transformed into an immersive exhibit space by 11 students, myself, and my colleague, Associate Professor David P.L. Jones. The exhibit remained on display for the West Chester University community throughout the month of October in 2019.
The challenges faced in employing this innovative pedagogical approach were many. Among them were the need for diverse participation and inclusion through recruitment, limited EGD foundations in our existing department curriculum, an extremely condensed timeframe in which to run the entire course and install the subsequent culminating exhibition, zero assets, and a granular multiinterdisciplinary fusion of methods for successful learning outcomes. Additionally, with limited fiscal commitment to underwrite our endeavor, funding for the final fabrication and installation would challenge us to explore innovative ways of creating a unique experience that was lean but powerful in its messaging.
As is sometimes common for study abroad programs, many enthusiastic students wanted to participate in 2019, despite financial barriers. In line with Sustainable Development Goal #10 –reduced inequalities–we sought to actively help students gain the resources to participate and to increase diversity among our participants. We were successfully designated by the Center for International Programs to be eligible for Global Rams, an initiative that encourages and supports underrepresented minority students to participate in study abroad programs.3
3 West Chester University’s Center for International Programs (CIP), in collaboration with President Christopher Fiorentino, offers underrepresented minority students the opportunity to apply for the Global Rams Initiative Scholarship. Scholarships are given to selected students participating in approved study abroad programs that have been granted the Global Rams. West Chester University’s Strategic Plan, Building on Excellence, has made the objective to increase the international educational opportunities for students a top priority.
The program was instrumental in helping to partially fund one minority student. Additionally, with support from the WCU Foundation, donor partners and leaders at the university worked with us to secure partial scholarships for a number of participants and fully funding one first generation American who is also a first-generation student.
Another development goal we hoped to address was SDG #4, quality education. The curriculum shift that led to the incorporation of principles of EGD for the creation of a culminating exhibit allowed us to open up our course to a broader, multidisciplinary group of students outside of the Graphic and Interactive Design department in the College of Arts and Humanities. Critical to the success of our storytelling, we hoped to attract researchers and writers. Ultimately, two enthusiastic anthropology students joined and contributed to our group.
Research/Inquiry
The conceptual framework for the culminating project emerged from a series of lectures and inquiries built into the curriculum before travelling abroad. On the first of three scheduled classes held on our campus, we gathered facts and data from a brief review of Danish history, culture, and design. From a variety of sources, we looked for patterns of information in the discoveries and asked ourselves, what do we know about Denmark? What do we want to know about Denmark? And finally, why should we care about Denmark? While analyzing the implications of the information, we worked to determine what it meant. These questions led us to evaluate how the Danish cultural footprint led to sustainability initiatives that, over time, have evolved to position Denmark at the top of the 10 best performing countries of the Paris agreement. Currently, WCU is meeting their own stated goals of achieving carbon neutrality by 2025 and working with the West Chester Borough to attain 100% renewable electricity by 2035. The university’s plans to meet the global SDGs of the 2015 climate agreement were further questioned and explored with the Office of Sustainability.4 Among the topics examined were “green” as a trend and sustainability as a mindset. This distillation revealed the very definition of sustainability, which includes three aspects simultaneously: environment, economy, and society, where the idea of people, planet, and profit are the new triple bottom line. Further analysis required a personal investment in responsibility. It was eye-opening to discover how many planets were necessary for each of us to sustain our current lifestyles when we calculated our individual carbon footprints.5 With this revelation, we each pledged a paradigm shift for the duration of our trip. Ideas included renting bikes and using mass transportation, bringing reusable bags for food purchases, carrying cloth napkins, and having reusable straws and drink containers. Some participants would take cold showers or change their diet to eat less (or no) meat.
5 https://www.footprintnetwork.org/resources/footprint-calculator/
As part of our initial orientation, we performed an affinity diagram exercise to make sense of all the information, mixed data, facts, and ideas we were collecting. We focused on translating what we had organized and looked for stories that could potentially come together to form the narrative arc or “the big idea” for our exhibit. Moving from analysis to synthesis, we bundled and grouped the information we had culled to draw connections between ideas and to develop new and deeper insights. This and a reflection on the nature of our journey, which would compare and contrast a country with a university, ultimately emerged as København: Sustainable by Design, the title for our exhibit.
Basic principles of EGD such as scale, hierarchy, “big story” messaging, visitor flow, and immersive storytelling were introduced through model case studies, including Stefan Sagmeister’s thematic exhibition, The Happy Show. Drawing on previous training that I had with the National Association for Interpretation,6 we explored the range of interpretive and participatory methods of audience engagement.
In this modified course, the students from the anthropology department participated as part of an integrative approach across curricula that enabled students to work collaboratively. These asymmetrical but complementary roles increased engagement and expanded skillsets in meaningful ways. The anthropology students taught the graphic design students about ethnography and sustainability, required study in their curriculum. They brought fresh observational and critical thinking to their writing, which found voice later in the script. The graphic design students, with a sympathetic eye for the Danish aesthetic, determined that the look and feel of the components of the exhibit should be minimal and clean. Keeping in mind the objectives of the messaging, we committed to use only materials that were (or could be) recycled, reused, repurposed, or reclaimed. A clean, minimal aesthetic aligned conveniently with our limited budget. A simple palette of red, white, and cardboard became selfimposed constraints that worked well in our condensed timeframe. The students also determined that integrating the Danish language into the “voice” of the cultural immersion was a necessary experience that we would create for our visitors.
Drawing further on foundations of interpretive design, we identified our audience and created goals and objectives. In other preparatory work, we inspected the physicality of the gallery space, a long narrow room with a door on one side that was flanked by windows. Our envisioned aesthetic would pair well with the white walls and light wooden floor and maximize the site’s potential. In our program, graphic design students become well versed in EGD concepts such as “storytelling” and “designing with empathy”. They have rigorous training in motion graphics and animation. While methodologies are explored through extensive packaging projects, applying those principles to a three-dimensional space was a new challenge.
6 https://www.interpnet.com/
One EGD methodology that we introduced is described by Ellen Lupton in her book Graphic Design as Storytelling as “emotional engagement mapping,” the ebb and flow of the visitor’s journey. A deep discussion about how we would keep that balanced in the long, narrow gallery was instructive. From the list of “stories” that emerged from our affinity diagramming exercise, two theories of communication – Miller’s Magic Number or “chunk” theory7and Cowan’s Magic Number Four8 – facilitated our strategy for determining 4-5 sub-themes that would be positioned and experienced as “zones” throughout the room.
As we turned our sights abroad to Denmark, we focused on how the experiences we had included in our travel agenda might manifest in the final built exhibit environment. In Denmark, our activities included a three-hour green bike tour, architectural, cultural, and historical experiences, and an analysis of Danish design. We enjoyed visits to topical museums and learned about wayfinding at a type foundry whose bespoke typeface is used throughout the city of Copenhagen. In a special presentation by the branding team at their corporate headquarters, we learned how Carlsberg Brewery – like every corporation in Denmark – has its own required initiatives that contribute to the overall goals of the country as pledged at the Paris Accord. In the classroom, we began to flesh out and test the smaller theme stories that would support our big idea.
At the outset, finding a cohesive flow seemed daunting. Having a prepared floor plan, simple elevations, and schematics helped the students to visualize the space as we mapped the visitor experience in a non-linear arrangement. The students divided into teams to tackle the components and each gravitated toward the tasks that resonated with their interests and skills. The identity team determined how the experience would be branded and communicated consistently to the audience. Together with guidance by from co-director David Jones, they developed a flexible system that maintained a simple, clear hierarchy and was organized within a classic grid architecture. With access to a large plotter, we planned to print 10’ panels suspended from ceiling to floor to divide and define theme zones. A video spanning the width of the end wall was later realized with GoPro footage obtained on the trip. A refurbished stationary bike was added so visitors could experience bike riding in Copenhagen, a highpoint of our trip, as well as the exhibit. On brand, the bike was painted red and was strategically placed to draw the visitor forward and around the back where the sustainability zone featured lo- and hi-fi interactives that utilized existing department iPads, monitors, and a projector.
7 “Miller (1956) presented the idea that short-term memory could only hold 5-9 chunks of information (seven plus or minus two) where a chunk is any meaningful unit. A chunk could refer to digits, words, chess positions, or people’s faces. The concept of chunking and the limited capacity of short term memory became a basic element of all subsequent theories of memory.” https://www.instructionaldesign.org/theories/information-processing/
8 “Miller (1956) summarized evidence that people can remember about seven chunks in shortterm memory (STM) tasks. However, that number was meant more as a rough estimate and a rhetorical device than has a real capacity limit. Others have since suggested that there is a more precise capacity limit, but that it is only three to five chunks.” https://www.semanticscholar.org/paper/The-magical-number4-in-short-term-memory%3A-a-of-Cowan/c8f359b3967ddef8e6d7f6ad58213a543d33ea22
When we returned stateside, the final and challenging work of bringing the exhibit together ensued. For everyone to know in advance what the experience would look like, the elevation and schematic were updated to specify what needed to be fabricated, the timeframes for each, and the costs. Once the schematics were displayed and everyone signed on to specific tasks, we had a clear vision of what the experience would look like. The script continued to be refined until it was ready to be shared with the Office of Sustainability for the addition of the WCU content. Ideas grew organically and additional components came to life to support our narrative. Upon entry, an iPad slideshow of student photos arranged in a grid that randomly exposed elements of the logo gave a personal visual overview of each participant’s experience. iPads and monitors led the visitor through stories brought alive by interactives and animations about Danish design and sustainability, “hygge” (the happiness model), and product design thinking. Cardboard replicas of a classic Danish chair and Poul Henningsen’s famous artichoke lamp were constructed by an enthusiastic, driven student who loved to build. A toilet flip-door revealed an infographic explaining biogasification, a practice we witnessed on one of our tours. A cutaway view of a green roof was revealed in a glass pan to represent the surprising number of instances we viewed them from a rooftop playground. Window clings with a vector drawing of iconic architecture and key features that correlated with our content served as advertising on the long, exterior window and contributed to a sense of place within.
Upon exiting, visitors could pledge a paradigm shift in the form a statement pin with messaging: “this is my last straw,” “I like to ride my bicycle,” and “live like a Dane.”
Drawing from existing technology and materials, and as simple as our solutions were, the cost of the entire exhibit, once fabricated, was $1,100.00, which was generously funded by the College of Arts and Humanities and the Art + Design department. Some modest advertising and social media drew a large crowd of over 200 people to our opening. Incorporating all senses, we served them hot cinnamon rolls from an authentic Danish recipe brought back from the trip. The gallery was visited every day that the display was open, and we watched the pledge pins steadily disappear, a measure of our success.
For the duration of the course and subsequently afterwards, there were also noticeable paradigm shifts made by the students themselves, including: less single use plastic containers in the computer labs, reusable materials such as cloth napkins, and a growing interest in patronizing B Certified businesses. One senior capstone project branded reusable felted pouches for everyday necessities, such as glasses and lunch utensils, with proceeds to benefit animal rescue from the Australian bushfires. Another student determined that motion graphics would be her area of concentration due to the skills she greatly improved through her contributions. And another thesis saw the creation of three built environments in a system developed for 3D board games
that emerge from story book forms. Another enthusiastic entrepreneur has started a line of custom hand-painted clothing from select thrift shops.
In line with the 2015 UN Sustainable Development Goals #10 reduced inequalities and #3 good health and well-being for all, we sold reusable straws and donated the proceeds to the resource pantry on campus, which supports students in the PA Promise program, among others. Some remnants of the exhibit are being repurposed for a performance by the Theatre department for a dance performance and installation called “Carnival of Ruin.“ The bicycle has been requested for display in a future Anthropology department exhibit that will celebrate the 50th anniversary of Earth Day. The panels were divided among participants to become gift wrap. The exhibit created a buzz that remains in the halls of the art center where the cardboard chair and lamp reside as a symbol of a transformative experience, and that less is more by design. For the participants of the course, these objects are a reminder of the tools they added to their skillset, including the power of design as a catalyst for change.
This paper outlines how integrating EGD methodologies into a culminating project provides a powerful and successful pedagogical tool that can be a catalyst for dynamic critical thinking in the design curriculum. Originally a study abroad course created for design students, it was the first international program to travel to Scandinavia. Making the culminating project an exhibit on sustainability and design opened up collaborative inter-curricular opportunities and connections at the university. The pedagogy outlined in this revised course coalesces the approaches of inquiry, collaboration, integration, constructivism, and reflection to expand learning objectives and create deeper, more meaningful experiences that resonated beyond the classroom and served a wider community audience. To be successful, students must be committed to a clear statement of expectations for the time necessary in the planning of an extensive project such as an exhibit before, during, and after the study abroad experience. Support from campus constituencies, including access to exhibit space and funding, was critical.
"For the duration of the course and subsequently afterwards, there were also noticeable paradigm shifts made by the students themselves, including: less single use plastic containers in the computer labs, reusable materials such as cloth napkins, and a growing interest in patronizing B Certified businesses.
Bertin, Jacques. Semiology of graphics: diagrams, networks, maps. Redlands, CA: ESRI Press, 2011.
Brochu, Lisa. The 5-M Model for Successful Planning Projects, 2003. Interpress.
Byrne, David and Gareth Cook. The best American infographics, 2013. Boston: Mariner Books, 2013.
“Danish Design Is Smart Design.” The Official Website of Denmark. N.p., n.d. Web. 06 Nov. 2016.
Elam, Kimberly. Grid systems principles of organizing type. New York: Princeton Architectural Press, 2005.
Fallan, Kjetil. Scandinavian Design: Alternative Histories. London: Berg, 2012. Print.
Fiell, Charlotte, and Peter Fiell. Scandinavian Graphic Design. Köln: Taschen, 2007. Print.
Rand, J. (1996). The 227-mile museum, or, why we need a visitor’s bill of rights. Visitor Studies, 9(1), 7–26. doi: 10.1080/10645579609512685.
Simon, N. (2010). The participatory museum. Museum 2.0.
Lankow, Jason, Josh Ritchie, and Ross Crooks. Infographics: The Power of Visual Storytelling. Hoboken, NJ: John Wiley & Sons, 2012. Print.
Roberts, Lucienne, and Julia Thrift. The designer and the grid. Hove: RotoVision, 2005.
Serrell, B. (2015). Exhibit labels: an interpretive approach. Rowman & Littlefield.