INTERNATIONAL DEBT REPORT


© 2022 International Bank for Reconstruction and Development / The World Bank 1818 H Street NW, Washington, DC 20433
Telephone: 202-473-1000; Internet: www.worldbank.org
Some rights reserved
1 2 3 4 25 24 23 22
This work is a product of the staff of The World Bank with external contributions. The findings, interpretations, and conclusions expressed in this work do not necessarily reflect the views of The World Bank, its Board of Executive Directors, or the governments they represent. The World Bank does not guarantee the accuracy, completeness, or currency of the data included in this work and does not assume responsibility for any errors, omissions, or discrepancies in the information, or liability with respect to the use of or failure to use the information, methods, processes, or conclusions set forth. The boundaries, colors, denominations, and other information shown on any map in this work do not imply any judgment on the part of The World Bank concerning the legal status of any territory or the endorsement or acceptance of such boundaries.
Nothing herein shall constitute or be construed or considered to be a limitation upon or waiver of the privileges and immunities of The World Bank, all of which are specifically reserved.
This work is available under the Creative Commons Attribution 3.0 IGO license (CC BY 3.0 IGO) http:// creativecommons.org/licenses/by/3.0/igo. Under the Creative Commons Attribution license, you are free to copy, distribute, transmit, and adapt this work, including for commercial purposes, under the following conditions:
Attribution—Please cite the work as follows: World Bank. 2022. International Debt Report 2022: Updated International Debt Statistics. Washington, DC: World Bank. doi:10.1596/978-1-4648-1902-5. License: Creative Commons Attribution CC BY 3.0 IGO
Translations—If you create a translation of this work, please add the following disclaimer along with the attribution: This translation was not created by The World Bank and should not be considered an official World Bank translation. The World Bank shall not be liable for any content or error in this translation.
Adaptations—If you create an adaptation of this work, please add the following disclaimer along with the attribution: This is an adaptation of an original work by The World Bank. Views and opinions expressed in the adaptation are the sole responsibility of the author or authors of the adaptation and are not endorsed by The World Bank.
Third-party content—The World Bank does not necessarily own each component of the content contained within the work. The World Bank therefore does not warrant that the use of any third-party-owned individual component or part contained in the work will not infringe on the rights of those third parties. The risk of claims resulting from such infringement rests solely with you. If you wish to re-use a component of the work, it is your responsibility to determine whether permission is needed for that re-use and to obtain permission from the copyright owner. Examples of components can include, but are not limited to, tables, figures, or images.
All queries on rights and licenses should be addressed to World Bank Publications, The World Bank Group, 1818 H Street NW, Washington, DC 20433, USA; e-mail: pubrights@worldbank.org
ISBN (paper): 978-1-4648-1902-5
ISBN (electronic): 978-1-4648-1918-6
DOI: 10.1596/978-1-4648-1902-5
Cover photo: © Dominic Chavez / World Bank. Further permission required for reuse.
Cover design: Parul Agarwal / World Bank and Bill Pragluski / Critical Stages, LLC.
Library of Congress Control Number: 2022918025
Foreword ix
Acknowledgments xi
Introduction xiii
PART I: Overview 1
Overview 3
Trends in External Debt, 2010–21 3
The Evolving Maturity Composition of External Debt, 2010–21 8
Changes in the Creditor Composition of External Debt, 2010–21 11
Extraordinary Support from Multilateral Creditors during the COVID-19 Pandemic 15
The Debt Service Suspension Initiative: Update and Perspectives 17
Spotlight on Debt Data Transparency: The Role of the World Bank’s Debtor Reporting System 18 Notes 24 References 24
PART II: Aggregate and Country Tables 27
All Low- and Middle-Income Countries 29
East Asia and Pacific 30 Europe and Central Asia 31 Latin America and the Caribbean 32 Middle East and North Africa 33 South Asia 34
Sub-Saharan Africa 35 Afghanistan 36 Albania 37 Algeria 38 Angola 39 Argentina 40 Armenia 41 Azerbaijan 42
Bangladesh 43 Belarus 44 Belize 45 Benin 46 Bhutan 47 Bolivia, Plurinational State of 48 Bosnia and Herzegovina 49 Botswana 50 Brazil 51 Bulgaria 52 Burkina Faso 53 Burundi 54 Cabo Verde 55 Cambodia 56 Cameroon 57 Central African Republic 58 Chad 59 China 60 Colombia 61 Comoros 62 Congo, Democratic Republic of 63 Congo, Republic of 64 Costa Rica 65 Côte d’Ivoire 66 Djibouti 67 Dominica 68 Dominican Republic 69 Ecuador 70 Egypt, Arab Republic of 71 El Salvador 72 Eritrea 73 Eswatini 74 Ethiopia 75 Fiji 76 Gabon 77 Gambia, The 78 Georgia 79 Ghana 80 Grenada 81 Guatemala 82 Guinea 83
Guinea-Bissau 84 Guyana 85 Haiti 86 Honduras 87 India 88 Indonesia 89 Iran, Islamic Republic of 90 Iraq 91 Jamaica 92 Jordan 93 Kazakhstan 94 Kenya 95 Kosovo 96 Kyrgyz Republic 97
Lao People’s Democratic Republic 98 Lebanon 99 Lesotho 100 Liberia 101 Madagascar 102 Malawi 103 Maldives 104 Mali 105 Mauritania 106 Mauritius 107 Mexico 108 Moldova 109 Mongolia 110 Montenegro 111 Morocco 112 Mozambique 113 Myanmar 114 Nepal 115 Nicaragua 116 Niger 117 Nigeria 118 North Macedonia 119 Pakistan 120 Papua New Guinea 121 Paraguay 122 Peru 123 Philippines 124 Russian Federation 125 Rwanda 126
Samoa 127 São Tomé and Príncipe 128 Senegal 129 Serbia 130
Sierra Leone 131
Solomon Islands 132
Somalia 133 South Africa 134 Sri Lanka 135 St. Lucia 136 St. Vincent and the Grenadines 137 Sudan 138 Syrian Arab Republic 139 Tajikistan 140 Tanzania 141 Thailand 142 Timor-Leste 143 Togo 144 Tonga 145 Tunisia 146 Türkiye 147 Turkmenistan 148 Uganda 149 Ukraine 150 Uzbekistan 151 Vanuatu 152 Vietnam 153 Yemen, Republic of 154 Zambia 155 Zimbabwe 156
APPENDIX: About the Data 157
User Guide to Tables 159 Tables 159 Statistics 159 Aggregate Measures for Income Groups and Regions 159 Classification of Countries 160 Symbols 160
User Guide to Online Tables and Database 161 How to Access the Online Country Tables 161 Indicators 163 How to Access the Database 165 Actions 165
Data Sources and Methodology 167 Data Sources 167 Methodology 168 External Debt and Its Components 170 Data Documentation 173 Sources of the Macroeconomic Indicators 178 Country Groups 181 Regional Groups 181 Income Groups 182 Glossary 183
O.1 External Debt Data: Concepts, Sources, and Coverage 3
O.2 World Bank Income and Lending Classifications Used in the International Debt Report 2022 5
O.3 Allocation of the International Monetary Fund’s Special Drawing Rights in 2021 9
O.4 Sovereign Debt Market Fragmentation in Highly Indebted Poor Countries 14
O.5 Improvements in Debtor Reporting System Coverage Enhance Debt Transparency 22
BO.1.1 Net Equity Inflows and External Debt Flows to Low- and Middle-Income Countries, 2010–21 4
BO.2.1 Number of Low- and MiddleIncome Countries Covered in the International Debt Report 2022, by FY2023 Income and Lending Groups 5
O.1 External Debt-to-GNI Ratios for Low- and Middle-Income Countries, 2010–21 6
O.2 External Debt-to-GNI Ratios, by Country and Region, 2010 and 2021 6
O.3 External Debt Stocks of Low- and Middle-Income Countries, 2010–21 7
O.4 Percent Change in External Debt Stocks of Low- and Middle-Income Countries, 2010–21 7
O.5 Share of External Debt Stocks of Low- and Middle-Income Countries, 2010–21 8
BO.3.1 SDR Allocations as a Share of General Government External Debt and International Reserves, by Region, 2021 9
O.6 Long-Term and Short-Term Debt Stocks of Low- and Middle-Income Countries, 2010–21 10
O.7 Share of Short-Term Debt Stocks of Low- and Middle-Income Countries, 2010–21 10
O.8 Change in Low- and Middle-Income Countries’ Short-Term Debt Stocks and Trade-Related Debt, 2010–21 10
O.9 Net Debt Inflows by Maturity in Low- and Middle-Income Countries, 2010–21 10 O.10 IDA-Eligible Countries’ Long-Term External Debt Owed to Private Creditors, 2010–21 11 O.11 IDA-Eligible Countries’ Creditor Composition of Long-Term Public and Publicly Guaranteed External Debt, 2010–21 12 O.12 Share of Public and Publicly Guaranteed External Debt Stocks of IDA-Eligible Countries Owed to Bilateral Paris Club and Non–Paris Club Creditors, 2010–21 12 O.13 IDA-Eligible Countries’ Disbursements, Debt Service Payments, and Net Transfer as a Share of GNI, 2010–21 13 O.14 Average Terms of Commitments of External Public and Publicly Guaranteed Debt to IDAEligible Countries, by Creditor Type, 2010–21 13 BO.4.1 Creditor Base Fragmentation in Highly Indebted Poor Countries 14 BO.4.2 Debtor Base Fragmentation in Highly Indebted Poor Countries 15 O.15 Commitments to Low- and MiddleIncome Countries from Multilateral Institutions, 2010–21 16 O.16 Disbursements to Low- and MiddleIncome Countries by Multilateral Institutions, 2019–21 16 O.17 Loan Commitments from Official Creditors to IDA-Eligible Countries, 2010–21 17 O.18 DSSI-Participating Countries’ Debt Service Paid and Deferred, by Creditor Groups, 2019–21 17 O.19 Percent of Countries That Report Public and Publicly Guaranteed and Private Nonguaranteed Year-End Transaction Data to the DRS, 2010–21 20 O.20 Number of Indicators Published in the International Debt Statistics Database, Year-End Data, 2017–21 21
BO.5.1 Ex Post Upward Revisions of External Public and Publicly Guaranteed Loan Commitments 22
BO.5.2 Countries with the Largest Cumulative Upward Revisions since International Debt Statistics 2018 23
A.1 External Debt and Its Components 171
TABLE
O.1 External Debt-to-GNI Ratios for Income and Lending Categories, 2010 and 2019–21 5
The external debt service payments on public and publicly guaranteed debt by the world’s poorest countries are expected to surge by 35 percent from 2021 to over US$62 billion in 2022. Debt service payments take away scarce fiscal resources from health, education, social assistance, and infrastructure investment. Payments scheduled for 2023 and 2024 are likely to remain elevated because of high interest rates, maturing principal, and the compounding of interest on Debt Service Suspension Initiative deferrals. The increased liquidity pressures in poor countries go hand in hand with solvency challenges, causing a debt overhang that is unsustainable for dozens of countries. Nearly 60 percent of countries subject to the Joint World Bank–International Monetary Fund Debt Sustainability Framework for LowIncome Countries are at high risk of debt distress or already experiencing it.
In 2021, the debt stock of low- and middleincome countries rose by 5.6 percent to US$9 trillion, of which International Development Association (IDA) countries owe nearly US$1 trillion. Although on average countries’ public and publicly guaranteed external debt as a share of gross national income returned to prepandemic levels, such was not the case for IDA countries; in those countries, ratios of debt to gross national income remained well above their levels before the pandemic. With the 2022 growth outlook cut in half, interest rates much higher, and many currencies depreciating, the burden of debt is likely to increase further.
As debt has grown in recent years, its composition has also changed rapidly. Low- and middle-income economies have become increasingly indebted to private creditors, especially bondholders. At the end of 2021, 61 percent of the US$3.6 trillion in long-term public and publicly guaranteed external debt stock was owed to private creditors—up from 46 percent in 2010.
In IDA-eligible countries, the share owed to private creditors rose from 5 percent in 2010 to 21 percent in 2021.
The composition of debt owed by IDA countries to official bilateral creditors has also changed significantly. The proportion owed to Paris Club creditors fell to 32 percent at the end of 2021 (US$64.2 billion), down from 58 percent (US$48.9 billion) at the end of 2010. Meanwhile, the amount owed to non–Paris Club creditors (China, India, Saudi Arabia, the United Arab Emirates, and others) increased to 68 percent (US$138.3 billion) in 2021 from 42 percent (US$35.3 billion) in 2010. Among the non–Paris Club creditors, China’s share of official bilateral debt stock grew from 18 percent in 2010 to 49 percent in 2021. This growth is also reflected in the increase of debt service flows to China, estimated at US$17 billion in 2022 and accounting for 66 percent of official bilateral debt service.
Increases in the size of debt and debt payments underscore the need to create a more effective debt reduction process for low- and middle-income countries in debt distress. Given the changes in debt composition, creating such a process has become challenging and requires cooperation from all major creditors. The growth of debt also underscores the need for greater debt transparency. The World Bank is actively engaged in discussions at various international forums to design solutions for addressing unsustainable debt in developing countries.
For more than four decades, the World Bank has been a leader in disseminating information on the external debt of low- and middle-income countries. Our database constitutes the most comprehensive publicly available source of cross-country comparable data on external debt for those countries. Much remains to be done on transparency, but we are making significant
progress. Over the past five years, we have added US$631 billion in previously unreported loan commitments to the database. In the past three years, we have released 569 new debt indicators, constituting a significant increase in instrument and creditor coverage as well as in specificity.
This year, we are rebranding our annual International Debt Statistics publication with a new name— International Debt Report . This change reflects the report’s new and substantive analyses on debt issues and improvements in its coverage to close data gaps. The report offers a crucial base of information for shaping debtrelated policies and programs.
Raising the bar on debt transparency means supporting borrowers’ efforts to implement reforms to build such systems. Greater transparency will improve incentives for the implementation of policies that strengthen debt and fiscal sustainability and promote debt transparency. We are also working with national debt offices to enhance debt reporting and advocating for further disclosure by debtors and creditors alike.
David Malpass President, World Bank GroupThis volume was prepared by the Debt Statistics Team of the Development Data Group (DECDG) at the World Bank, led by Evis Rucaj and comprising Parul Agarwal, Arturo Albarran-Cortes, Ogma Dessirama Bale, Arzu Aytekin Balibek, Kifaye Didem Bayar, Daniella Kathyuska Bolanos-Misas, Wendy Ven-dee Huang, Chineze Olive Okafor, Malvina Pollock, Rubena Sukaj, Tin Yu To, Rasiel Vellos, and Bedri Zymeri. The overview was prepared by the Debt Statistics Team with contributions from Sebastian Andreas Horn, Clemens Graf von Luckner, and David Mihalyi. The work was carried out under the management of Nada Hamadeh and the direction of Haishan Fu. The team was assisted by Nancy Kebe.
Valuable guidance was provided by Indermit S. Gill, Senior Vice President and Chief Economist of the World Bank Group, and Aart C. Kraay, Deputy Chief Economist and Director of Development Policy. Sebastian Andreas Horn, Rita Ramalho, and Sergio Schmukler from the Development Economics Vice Presidency; Ivailo V. Izvorski and Diego Rivetti
from the Macroeconomics, Trade and Investment Global Practice; and Abha Prasad, Xubei Luo, and Toru Nishiuchi from the Development Finance Vice Presidency at the World Bank provided valuable feedback on the overview section. The final statistics were reviewed by country economists.
The cover was designed by Parul Agarwal and Bill Pragluski. Jewel McFadden, Mark McClure, and Orlando Mota coordinated the publication and dissemination of this volume. Elizabeth Price, Joseph Rebello, and Shane Kimo Romig managed the communications surrounding the release.
The accompanying International Debt Statistics electronic products were prepared with support from a team led by Sebastian Ariel Dolber and Anna Maria Kojzar and comprising Surya Anandan, Rajesh Kumar Danda, Vijayakumar Juttu Mohan, Ramgopal Erabelly Kunal Patel, Meher Vikramadhitya Varma Penmetsa, Gangadhar Simhani, Ivan Spiriev, and Ajith Kumar Rajagopal Vijaya.
Public debt reached record levels during the pandemic, in both advanced economies and low- and middle-income countries. For the poorest and most fragile countries, high fiscal and debt vulnerabilities undermined macroeconomic stability. Today, 60 percent of the countries eligible for the Debt Service Suspension Initiative are assessed at high risk of debt distress or are already in debt distress. Escalation of geopolitical tensions from the Russia-Ukraine war could lead to even tighter global financial conditions, higher inflation, lower growth, and higher stress on public finances and, consequently, have adverse implications for lowand middle-income countries’ debt dynamics.1
Rising debt vulnerabilities underscore the urgency of enhanced debt transparency and more complete debt information to strengthen countries’ ability to manage debt risks and use resources efficiently for sustainable development. Complete and transparent debt data are the cornerstone of good debt management and accurate debt sustainability analyses. They are also critical to facilitating an appropriate and more efficient response to debt restructuring needs through initiatives such as the Group of Twenty Common Framework to help the most vulnerable countries return quickly to stability and economic growth.
The World Bank has been collecting external debt data from its client countries through the World Bank Debtor Reporting System since the 1950s. The World Bank International Debt Statistics (IDS) database2 is the most comprehensive source of cross-country comparable information on the external debt liabilities of low- and middle-income countries. The World Bank is supporting governments and working with development partners to strengthen debt recording and reporting, raising the bar on debt transparency.
Central to this agenda is its commitment to continuously improve the coverage, accuracy, timeliness, and transparency of the external debt statistics it compiles and disseminates in the IDS database.
Along with the release of the newly updated online IDS database based on the latest round of Debtor Reporting System reporting of the 2021 external debt for low- and middle-income countries, Part I of International Debt Report 2022 discusses the following key messages from the newly available 2021 data, and Part II presents aggregate and country tables.
• In 2021, total external debt increased 5.6 percent in nominal terms to US$9 trillion at year end. External debt as a share of gross national income (GNI) declined 3 percentage points in 2021 to 26 percent for low- and middleincome countries. This largely reversed the sharp pandemic-induced increase during 2020, with the debt-to-GNI ratio returning to 2019 levels. This decline was driven by a resumption of GNI growth in 2021 rather than a reduction in debt. Debt-to-GNI ratios remain high for many low- and middleincome countries following a decade of rapid debt accumulation since 2010. This is particularly so for countries eligible for International Development Association (IDA) assistance; in these countries, the ratio of external debt to GNI rose from an average of 20 percent in 2010 to 36.2 percent in 2021.
• Short-term debt accounted for half of the increase in the total net external debt inflows for low- and middle-income countries in 2021, even though it accounts for only 27 percent of the overall external debt stock. Short-term debt inflows are volatile and to a
large extent reflect fluctuations in the demand for trade credit as import volumes change. Trade credits and advances and short-term commercial bank deposits used to facilitate imports are estimated at about 60 percent (US$1.4 trillion) of short-term debt, and the rebound in international trade in 2021 drove much of the increase in short-term debt during the year.
• Private creditors account for an increasing share of low- and middle-income countries’ external debt. At year-end 2021, 61 percent of the public and publicly guaranteed debt of low- and middle-income countries was owed to private creditors, up from 46 percent in 2010. For IDA-eligible countries, the private creditor share increased fourfold from 5 percent in 2010 to 21 percent in 2021. While creditor diversification has brought benefits to borrowing countries with maturing sovereign debt markets, greater reliance on private creditors has also been associated with higher debt servicing costs. Because of an increase in both the level and cost of borrowing, debt service as a share of GNI for IDA-eligible countries has increased from 1 percent in 2010 to 3 percent in 2021, a level not seen since 1997 and before the implementation of the Heavily Indebted Poor Countries Initiative and the Multilateral Debt Relief Initiative. Greater reliance on a larger number of creditors also risks complicating creditor coordination in debt relief efforts.
• Multilateral creditors provided extraordinary levels of assistance to help mitigate the
economic and social costs of the COVID-19 pandemic and support the recovery. In 2021, loan disbursements to low- and middleincome countries from multilateral creditors remained slightly above prepandemic levels in 2021, at US$108 billion, including US$12 billion from the International Monetary Fund and US$40 billion from the World Bank. During 2020 and 2021, the World Bank also provided US$11 billion in grants to IDAeligible countries. Related to COVID-19, disbursements rose from US$104 billion in 2019 to US$157 billion in 2020, including US$50 billion from the International Monetary Fund and US$41 billion from the World Bank.
• Bilateral official creditors deferred US$8.9 billion in debt service payments owed in 2020 and 2021 by a group of 48 countries who participated in the DSSI. During this period, these countries also paid US$99 billion in total debt service, representing 4 percent of their combined average GNI in 2020 and 2021. This included US$71 billion to service public and publicly guaranteed debt, of which US$16.1 billion represented debt service payments to bilateral official creditors.
1. Development Committee. 2022. “Making Debt Work for Development and Macroeconomic Stability.” Press Release DC2022-0003, April 1, 2022.
2. The IDS database is available at https://databank .worldbank.org/source/international-debt-statistics.
In 2021, total external debt increased 5.6 percent in nominal terms to US$9 trillion at year end. External debt as a share of gross national income (GNI) declined 3 percentage points in 2021 to 26 percent for low- and middle-income countries. This largely reversed the sharp pandemic-induced increase during 2020, with the debt-to-GNI ratio returning to 2019 levels. This decline was driven
by a resumption of GNI growth in 2021 rather than a reduction in debt. Debt-to-GNI ratios remain high for many low- and middle-income countries following a decade of rapid debt accumulation since 2010. This is particularly true for countries eligible for International Development Association assistance, where the ratio of external debt to GNI rose from an average of 20 percent in 2010 to 36.2 percent in 2021.
This report presents data and analysis on external debt for 121 low- and middle-income countries. The primary source for these data is reports to the World Bank’s Debtor Reporting System (DRS) from member countries that have received either International Bank for Reconstruction and Development loans or International Development Association credits and have outstanding obligations to the World Bank. The DRS, instituted in 1951, has its origins in the World Bank’s need to monitor and assess the financial position of its borrowers.
Comprehensive information on data sources and the methodology used to compile the statistics presented in this report are given in the appendix under Data Sources and Methodology. The following describes the key concepts and data sources.
The total external debt of a country is the sum of public and publicly guaranteed debt, private nonguaranteed debt, and short-term debt.
• Public and publicly guaranteed external debt comprises long-term external obligations (maturities of over one year) of all public debtors, including the central government and state-owned enterprises. Data are collected on a loan-by-loan basis through the DRS. Reporting countries submit quarterly reports on new loan commitments and
annual reports on loan status and transactions (new commitments, gross disbursements, principal, and interest payments).
• Private nonguaranteed debt comprises longterm external obligations of private debtors that are not guaranteed by a public entity. The DRS covers private nonguaranteed debt since 1973; however, for this category of debt data, the annual status and transactions (gross disbursements, principal, and interest payments) are reported in aggregate.
• Short-term debt is defined as debt with an original maturity of one year or less and is not covered under DRS reporting requirements. However, most DRS reporters provide an annual report on outstanding short-term debt stocks on a voluntary basis. For countries that do not provide these data, information on their short-term debt is drawn from the Quarterly External Debt Statistics database, a joint World Bank–International Monetary Fund initiative where data are compiled and reported by the countries’ central banks, along with data compiled by the Bank for International Settlements.
All debt data reported to the DRS are validated against—and, when appropriate, supplemented by—data from other sources. These include the Balance of Payments and
International Investment position statistics, Quarterly External Debt Statistics, information published on official government websites, reports from the International Monetary Fund, regional development banks, the Organisation for Economic Co-operation and Development, the Bank for International Settlements, and websites and annual publications of lending agencies.
Other forms of capital flows: External debt stocks and flows as presented in International Debt Report 2022 constitute only about half of overall capital inflows to low- and middle-income countries, which also include significant equity inflows such as foreign direct investment (FDI) and portfolio equity. Between 2010 and 2021, equity inflows to the 121 low- and middle-income countries included in this report totaled US$6.9 trillion, equivalent to 54 percent of aggregate net inflows (debt and equity combined). FDI equity investmentsa accounted for 90 percent of equity inflows over this period. Only a small number of low- and middle-income countries benefit from portfolio equity inflows to any significant degree. Net equity inflows rose 31 percent in 2021 to US$687 billion from the previous year, the highest level since 2010 and equivalent to 55 percent of the aggregate financial inflows (figure BO.1.1).
The debt and equity inflows presented in this report are “net” flows in that they take account of principal payments on external loans and
Figure BO.1.1 Net Equity Inflows and External Debt Flows to Low- and Middle-Income Countries, 2010–21 US$ (billion)
In 2021, the easing of the COVID-19 pandemic and rebound in global economy activity led to a widespread decline in ratios of external debt to GNI in low- and middle-income countries (see box O.1). For low- and middle-income countries combined, the debt-to-GNI ratio fell by 3 percentage points to 26 percent in 2021. This ratio was on a par with the 2019 prepandemic ratio and down from 29 percent in 2020 when external debt as a share of GNI peaked at its highest level since 2010. The decline in 2021 was the outcome of an increase in the US dollar value of low- and middle-income countries’ combined GNI, which rose 17.4 percent in 2021, to US$35.1 trillion from US$29.9 trillion in 2020, compared with a 5.6 percent increase in external debt. This figure includes China, which accounts for about half of low- and middle-income
1,000
500
0
–500
1,500 2010 2011 2012 2013 2014 2015 2016 2017
Foreign direct investment equity flows
Private nonguaranteed debt flows Short-term debt flows
Portfolio investment equity flows
Public and publicly guaranteed debt flows
Sources: International Monetary Fund and United Nations Conference on Trade and Development.
repatriation of earnings on FDI and disinvestment. However, they do not take account of the outflows from low- and middle-income countries in the form of lending and investment abroad, which for some low- and middle-income countries like China, India, the Russian Federation, and Türkiye are substantial.
a. FDI equity investments exclude the loan component, which is captured in private nonguaranteed debt data as intercompany lending.
countries’ combined GNI and 29 percent of external debt. However, even for low- and middleincome countries excluding China, the pattern was the same: the ratio of external debt to GNI rose, on average, 5 percentage points of GNI in 2020, to 41 percent, and fell by a corresponding amount in 2021, returning to its prepandemic level of 36 percent. In countries eligible for International Development Association (IDA) assistance, the pattern was different. Although external debt relative to GNI declined marginally in 2021, to 36.2 percent, it remained 3.4 percentage points of GNI higher than the prepandemic level of 32.8 percent in 2019 (see table O.1 and box O.2).
The changes in debt in 2020 and 2021 follow a decade of steady debt accumulation over 2010–19 in many low- and middle-income countries.
Year
Country groups
2010 2019 2020 2021
Low- and middle-income 21.4 26.3 28.5 25.7 Excluding China 25.6 36.1 40.5 36.3
Income classification:
Low-income 17.1 48.5 52.5 48.5 Middle-income 21.6 26.0 28.2 25.4
Lending classification: IDA-eligible (IDA only and blend) 20.0 32.8 36.8 36.2 IBRD 21.6 25.8 27.8 24.9
Sources: World Bank International Debt Statistics and World Development Indicators databases.
Note: See box O.2 for more information on World Bank income and lending classifications. GNI = gross national income; IBRD = International Bank for Reconstruction and Development; IDA = International Development Association.
The most significant rise took place in IDA-eligible countries and particularly in low-income countries. On average, external debt as a share of GNI for IDA-eligible countries rose from 20 percent in 2010 to 36.2 percent in 2021. For low-income countries, 24 of which benefited from the Heavily Indebted Poor Country (HIPC) Initiative and Multilateral Debt Relief Initiative (MDRI), the increase was even more pronounced. For these countries, external debt as a share of GNI rose from an average of 17.1 percent in 2010 to 48.5 percent in 2021. In contrast, for middle-income countries the increase in external debt relative to GNI was moderate over the past decade, rising from 21.6 percent in 2010 to 25.4 percent in 2021 (table O.1 and figure O.1). The evolution of external debt-to-GNI ratios over the past decade varied widely at the individual
The World Bank classifies economies by income level for analytical purposes (to broadly group countries by level of development) and operational purposes (to determine their Financial Terms and Conditions of Bank Financing).
This report presents data for 121 lowand middle-income countries reporting to the World Bank Debtor Reporting System. Of these, 26 countries are classified as low-income countries with a per capita income of US$1,085 or below and 95 countries are classified as middle-income countries with a per capita income greater than US$1,085 and less than US$13,205.a The income classifications are updated annually at the start of the World Bank fiscal year (July 1) on the basis of gross national income per capita for the previous year. Gross national income is expressed in US dollars determined by conversion factors derived according to the Atlas methodology.b
Fifty-two of the 121 countries covered by this report and classified as middle-income are eligible only for nonconcessional loans from the International Bank for Reconstruction and Development (IBRD). They are referred to as IBRD countries. The remaining 26 low- and 43 middle-income countries reporting to the Debtor Reporting System are either (a) eligible only for concessional lending from the International Development Association (IDA) and referred to as IDA-only countries; or (b) eligible for a mix of IBRD and IDA lending and referred to as “blend” countries. Together, IDA-only and blend countries are referred to as IDA-eligible countries.
Figure BO.2.1 Number of Low- and Middle-Income Countries Covered in the International Debt Report 2022, by FY2023 Income and Lending Groups Number
60
50
40
30
20
10
0
IDA-only countries Blend countriesIBRD countries Low-income Middle-income
Sources: World Bank Country and Lending Groups at https://datahelpdesk.worldbank.org/knowledgebase/ articles/906519-world-bank-country-and-lending-groups and World Bank International Development Association (IDA) at https://ida.worldbank.org/en/home. FY = fiscal year; IBRD = International Bank for Reconstruction and Development.
Figure BO.2.1 shows the distribution of the 121 low- and middle-income countries included in the International Debt Report 2022 by income and lending groups. A comprehensive list of each country’s income and lending classifications is given in the appendix of this report under Country Groups.
a. The country grouping is held fixed when data are compared over time in the International Debt Report. For example, the aggregate for low-income countries from 2010 to 2021 consists of the same group of countries that are classified as low-income countries according to the latest World Bank income classification. b. More information on the Atlas methodology can be found at https://datahelpdesk.worldbank.org/knowledgebase /articles/378832-what-is-the-world-bank-atlas-method
Figure O.1 External Debt-to-GNI Ratios for Low- and Middle-Income Countries, 2010–21 Percent
60
50
40
30
20
10
0
Low-income countries
Middle-income countries IDA-eligible countries
Source: World Bank International Debt Statistics database.
Note: External debt stocks excludes the International Monetary Fund’s special drawing rights (SDRs) allocation. GNI = gross national income; IDA = International Development Association.
country level. By 2021, 13 low- and middle-income countries had a debt-to-GNI ratio above 100 percent in 2021, including some that benefited from the HIPC and MDRI. Reasons for these elevated external debt-to-GNI ratios varied. Zambia’s debt vulnerabilities are well documented and stem from expansionary and procyclical fiscal policies, a rapid increase in nonconcessional external borrowing, and a large-scale public investment program that did not yield a growth dividend. In Georgia and Montenegro, the elevated ratio is the result of increased borrowing by public and private entities for large-scale infrastructure projects. Jamaica’s debt-to-GNI ratios have been elevated over the past decade as a result of low growth and vulnerability to natural disasters. Recent fiscal consolidation measures were derailed by the pandemic, which led to a sharp contraction in tourism, and the external debt-to-GNI ratio rose to 127 percent in 2021 from a prepandemic level of 111 percent. Côte d’Ivoire’s external debt-to-GNI ratio has climbed moderately from 35 percent in 2012 following agreement on the HIPC completion point and MDRI to 42 percent in 2021, reflecting an increase in investment in infrastructure and social spending supported by external financing from official creditors. Belize has confronted the challenges of the vulnerabilities of a small island economy, including the elevated risk of natural disasters and managing a currency pegged to the US dollar, but a concerted fiscal consolidation reduced the external debt-to-GNI ratio from 102 percent in 2010 to 76 percent in 2019. Belize
2021 debt-to-GNI ratio
Zambia
Montenegro Belize
Jamaica Guinea-Bissau
Bulgaria
Lebanon Mozambique Mongolia 0 20 40 60 80 100 120 140 160 180 250 270 370 390 410 020406080100120140160180 200
2010 debt-to-GNI ratio East Asia and Pacific Latin America and the Caribbean South Asia
Europe and Central Asia Middle East and North Africa Sub-Saharan Africa
Sources: World Bank International Debt Statistics and World Development Indicators databases.
Note: Countries above the dashed 45-degree line correspond to increases in external debt-to-GNI ratios from 2010 to 2021 whereas countries below the 45-degree line correspond to decreases in external debt-to-GNI ratios from 2010 to 2021. Note the break in the vertical axis to retain data on outliers. GNI = gross national income.
was hard hit by the pandemic, and the debt-to-GNI ratio rose to 98 percent in 2020. The resumption of growth in 2021, which led to an increase in GNI, coupled with external debt restructuring, including a debt swap for marine protection, reduced the debt-to-GNI ratio to 81 percent in 2021. Countries with the highest debt-to-GNI ratio in 2021 included Mozambique (396 percent), where the ratio is driven up be a large share of private nonguaranteed debt in total external debt stocks to finance mega infrastructure projects; Lebanon (375 percent), which is going through a severe macroeconomic and financial crisis; and Mongolia (259 percent), resulting largely from massive mining investment financed with debt rather than equity, loose fiscal and monetary policies, and sharp exchange rate depreciation (figure O.2).
Rising debt vulnerabilities in low- and middleincome countries are also underscored by the number of countries that have recorded a significant increase in the ratio of external debt-to-GNI over the past decade. In 2010, 54 of 121 (or 45 percent) low- and middle-income countries had an external debt-to-GNI ratio below 30 percent, and in 71 percent of low- and middle-income countries it was at or below 60 percent. By 2021, the number
of low- and middle-income countries with a debtto-GNI ratio below 30 percent had fallen to 22 (or 18 percent), and the ratio was at or below 60 percent in 61 percent of the low- and middle-income countries. Over the same period, the number of low- and middle-income countries with a debt-to-GNI ratio that exceeded 100 percent rose from 7 to 13, including 4 countries that benefited from HIPC and MDRI: Mozambique, Nicaragua, Senegal, and Zambia.
Following a slowdown in 2020, the pace of external debt accumulation in low- and middleincome countries accelerated in 2021. The external debt stocks of low- and middle-income countries rose on average 5.6 percent in nominal terms in 2021 to a year-end total of US$9 trillion, up from US$8.5 trillion in 2020 (figure O.3). The US$482 billion increase in gross external debt stocks in 2021 resulted from (a) net debt inflows (new disbursements minus principal payments) of US$559 billion, of which half were short-term debt inflows, predominantly trade credits; (b) downward adjustment of US$60 billion in the US dollar value of external debt denominated and payable in currencies other than the US dollar, reflecting the appreciation of the US dollar against most major currencies in 2021; and (c) outflow of US$17 billion related to other factors including the sale of nonresident holdings of domestically issued debt to residents and debt forgiveness.1
The increase in gross nominal external debt in 2021 outpaced the 4.6 percent rise in comparable
external debt stocks in 2020. Measures to mitigate the economic and social impact of the COVID-19 pandemic raised financing needs in low- and middleincome countries in 2020, met in part by emergency support from external creditors. At the same time, the pandemic-induced global lockdown and trade restrictions led to a slowdown in economic activity, reflected in a fall in new external loan commitments and inflows (disbursements) for infrastructure projects. As a result, the pace at which gross external debt stocks grew slowed to 4.6 percent in 2020 compared to 4.9 percent in 2019 before COVID-19. The rebound in global economic activity in 2021 pushed the increase in gross external debt stocks up to 5.6 percent, but that growth was still much slower than the average annual increase of 7.9 percent recorded from 2010 to 2019.
The pace of external debt stock accumulation by individual countries and country groups has been uneven. Countries recording the fastest increase in gross external debt, in nominal terms over the past decade, were China, where it increased by 262 percent between 2010 and 2021, and IDA-eligible countries, where the increase was 182 percent over this period. In 2020, China’s gross external debt stocks rose 10.1 percent and accelerated to 14.5 percent in 2021. IDA-eligible countries’ gross external debt stocks rose 12.1 percent in 2020, faster than all other low- and middle-income countries, and it rose a further 7.4 percent in 2021 (figure O.4).
Figure O.3 External Debt Stocks of
and Middle-Income Countries, 2010–21 US$ (billion)
Figure O.4 Percent Change in External Debt Stocks of Low- and Middle-Income Countries, 2010–21 Percent Source: World Bank International Debt Statistics database. Note: IDA = International Development Association.
The external debt stocks of low- and middleincome countries are highly concentrated. Eleven countries accounted for 72 percent of the combined year-end 2021 gross external debt stocks. The most significant change in the concentration of low- and middle-income countries’ external debt stocks over the past decade has been the steady increase in China’s share of the total, which rose from 17 percent in 2010 to 29 percent in 2021. There was a corresponding fall in the share of the next 10 largest borrowers,2 from 53 percent at the start of the decade to 43 percent in 2021. The remaining 110 low- and middle-income countries’ share accounted for 28 percent in 2021, largely unchanged from the start of the decade (figure O.5).
In August 2021, the International Monetary Fund (IMF) made by far the largest allocation of special drawing rights (SDRs) to date, US$650 billion to help countries address the economic crisis created by the COVID-19 pandemic. From this amount, US$199 billion was allocated to the 121 low- and middle-income countries included in International Debt Report 2022. SDR allocations are recorded as an increase in reserves. However, because SDRs do not represent a change in the net wealth of the receiving country, following
the statistical guidelines of the IMF (2009), they are also recorded as a long-term debt liability (box O.3). SDR allocations are separately identified and included in the tables for total external debt stocks for individual countries and country groups presented in International Debt Report 2022 and the International Debt Statistics database. The analysis in this overview, however, excludes SDR allocations from external debt stocks because they do not contribute to the net indebtedness of countries.
Short-term debt accounted for half of the increase in total net external debt inflows for low- and middle-income countries in 2021, but only 27 percent of the overall external debt stock. Short-term debt inflows are volatile and to a large extent reflect fluctuations in the demand for trade credit as import volumes change. Trade credits and advances and short-term commercial bank deposits used to facilitate imports are estimated at about 60 percent (US$1.4 trillion) of short-term debt, and the rebound in international trade in 2021 drove much of the increase in short-term debt during the year.
The share of short-term debt in the total external debt stocks of low- and middle-income countries was US$2.4 trillion or 27 percent at year-end 2021, comparable to its share in 2010 (figure O.6). Over the period, short-term debt as a share of total external debt has remained stable, oscillating within a narrow band from a peak of 31 percent in 2014 to a low of 24 percent in 2016. As a share of low- and middleincome countries’ combined GNI, short-term debt rose from 5.8 percent in 2010 to 6.9 percent in 2021.
Source: World Bank International Debt Statistics database.
Note: The 10 largest borrowers are based on total external debt stock at year-end 2021. The 10 largest borrowers excluding China are Argentina, Brazil, Colombia, India, Indonesia, Mexico, the Russian Federation, South Africa, Thailand, and Türkiye.
Short-term debt stocks are highly concentrated and dominated by the low- and middleincome countries’ largest economies. Moreover, compared to the maturity composition of other low- and middle-income countries, China is an outlier. It accounted for 59 percent of low- and middle-income countries’ total short-term debt stocks at year-end 2021, compared to 28 percent for the next 10 largest borrowers combined and
In August 2021, the International Monetary Fund made a general allocation of special drawing rights (SDRs) equivalent to US$650 billion. The newly created SDRs were credited to International Monetary Fund members in proportion to their existing quotas in the Fund. The main purpose of the allocation was to help with the economic crisis created by the COVID-19 pandemic and to meet the long-term global need to supplement members’ existing reserve assets in a manner that avoided economic stagnation and deflation as well as excess demand and inflation (IMF 2021a).
Allocations of SDRs do not change a country’s net wealth, but they create an increase in long-term debt liabilities and a corresponding increase in gross international reserves (holdings of SDRs). Both transactions are reflected in balance of payments statistics and international investment positions (IMF 2009). In government finance statistics, SDR allocations are recorded as a long-term debt liability within public sector gross debt, with a corresponding entry for SDR holdings as a part of the public sector’s financial
assets (IMF 2014). Following these guidelines, SDR allocations are recorded in the International Debt Statistics database as part of long-term gross external public debt and are separately identified.
SDR liabilities are not subject to debt limits in International Monetary Fund programs because they do not fall within the definition of “debt” for program purposes under the Fund’s Guidelines on Public Debt Conditionality in Fund Arrangements. SDR allocations are generally considered to have limited impact on debt sustainability, but new guidance issued in August 2021 on incorporating SDR allocations into debt sustainability analyses aims to better reflect the impact of how SDRs are used (IMF 2021b).
Total outstanding SDR allocations of the 121 low- and middle-income countries included in International Debt Report 2022 were US$273 billion at year-end 2021, equivalent on average to 11 percent of general government external debt stocks and 4 percent of international reserves, but with sharp divergence at the regional level (figure BO.3.1).
13 percent for all other low- and middle-income countries (figure O.7).
Trade-related debt in the form of trade credits and advances and other short-term commercial bank deposits used to facilitate imports are estimated at about 60 percent (US$1.4 trillion) of short-term debt. Over the past decade,
low- and middle-income countries’ short-term debt stocks have averaged 25 percent of their annual imports. Reporting of short-term debt is not a Debtor Reporting System (DRS) requirement and, although most reporting countries provide information on short-term debt stocks on a voluntary basis, the data are aggregates with
Figure O.6 Long-Term and Short-Term Debt Stocks of Low- and Middle-Income Countries, 2010–21 US$ (trillion)
Figure O.8 Change in Low- and Middle-Income Countries’ Short-Term Debt Stocks and TradeRelated Debt, 2010–21 US$ (billion)
Long-term Short-term
Source: World Bank International Debt Statistics database.
Figure O.7 Share of Short-Term Debt Stocks of Low- and Middle-Income Countries, 2010–21
Percent
Source: World Bank International Debt Statistics database.
Note: The 10 largest borrowers are based on total external debt stock at year-end 2021. The 10 largest borrowers, excluding China, are Argentina, Brazil, Colombia, India, Indonesia, Mexico, the Russian Federation, South Africa, Thailand, and Türkiye.
no granularity. However, drawing on the data reported to the Quarterly External Debt Statistics database,3 about 60 percent of the change in short-term debt stocks to low- and middleincome countries is driven by trade-related debt. These short-term debt stocks fluctuate with the change in the countries’ short-term trade-related debt (figure O.8).
In contrast to the relative stability of net inflows of long-term debt stocks, net inflows of short-term debt are highly volatile. On an annual basis, short-term debt inflows as a share of total debt inflows of low- and middle-income countries fluctuated widely from as high as 60 percent in
Short-term debt Short-term, trade-related debt
Sources: World Bank International Debt Statistics and World Bank/ International Monetary Fund Quarterly External Debt Statistics databases.
Figure O.9 Net Debt Inflows by Maturity in Low- and Middle-Income Countries, 2010–21 US$ (billion)
Long-term Short-term
Source: World Bank International Debt Statistics database.
2010 to 3 percent in 2020. In some years, such as 2015, they turned sharply negative in response to downturns in the global economy and sharp contraction in low- and middle-income countries’ imports. In 2020, COVID-19-related restrictions on global trade reduced low- and middle-income countries’ imports by 11 percent, and short-term debt inflows fell by two-thirds to US$11.3 billion. In 2021, in response to the easing of the pandemic and resumption of growth and trade, low- and middle-income countries’ imports rose 29 percent, and short-term debt inflows surged to US$278 billion, equivalent to half of net external debt inflows in 2021 (figure O.9).
Private creditors account for an increasing share of lending to low- and middle-income countries. At year-end 2021, 61 percent of the public and publicly guaranteed debt of low- and middleincome countries was owed to private creditors, up from 46 percent in 2010. The same is true among IDA-eligible countries, where the private creditor share increased from 5 percent in 2010 to 21 percent in 2021. Although creditor diversification has brought benefits to borrowing countries with maturing sovereign debt markets, greater reliance on private creditors has also been associated with higher debt servicing costs and risks complicating creditor coordination in debt relief efforts.
The rising share of external debt owed to private creditors has been a key feature of the evolution of low- and middle-income countries’ long-term public and publicly guaranteed external debt stocks over the past decade. By year-end 2021, 61 percent of the US$3.6 trillion gross longterm public and publicly guaranteed external debt stocks was owed to private creditors rather than official creditors, compared to 46 percent in 2010. The share of debt owed to bondholders has risen from 29 percent to 47 percent. Over the same period, private sector entities’ nonguaranteed obligations to private creditors increased from US$1.4 trillion in 2010 to US$3.0 trillion in 2021, although their share of total long-term external debt has fallen back from a peak of 51 percent in 2016 to 45 percent in 2021. In IDA-eligible countries, obligations to private creditors account for a smaller share of long-term public and publicly guaranteed debt, but they too have risen sharply over the past decade, from US$13 billion in 2010, equivalent to 5 percent, to US$133 billion, or 21 percent at year-end 2021 (figure O.10). In addition, nonguaranteed external borrowing by private sector entities from private creditors has risen fourfold over this period, from US$50 billion in 2010 to US$201 billion in 2021. Although not guaranteed by the state, private entities’ debt contracted in foreign currency ultimately represents a claim on a country’s international reserves, especially when private entities cannot hedge their foreign currency liabilities against foreign currency assets. Even when such debt is denominated in
Figure O.10
Countries’ Long-Term External Debt Owed to Private Creditors, 2010–21 US$ (billion)
local currency but held by external creditors, it presents the risk of a sudden reversal in external credit flows that have the potential to undermine debt sustainability.
An important factor in the increased share of public and publicly guaranteed external debt owed to private creditors in IDA-eligible countries is the increase in financing raised from bondholders. Since Ghana issued its first sovereign Eurobond in 2007, about 30 IDA-eligible countries have issued bonds in international capital markets. Obligations to bondholders have risen from US$2.7 billion, equivalent to just 1 percent of gross long-term public and publicly guaranteed debt in 2010, to US$76.2 billion or 12 percent in 2021 (figure O.11). Over this period, obligations to other private creditors, primarily commercial banks, also rose from US$10.2 billion or 4 percent in 2010, to US$56.5 billion or 9 percent in 2021. The increase in the share of debt owed to private creditors was accompanied by a decline in the share of debt owed to multilateral creditors from 59 percent of gross external debt stocks at yearend 2010 to 47 percent at year-end 2021. Bond issuance has opened an important alternate financing source, and the rigorous information requirements of market participation and maintenance of credit ratings has also led to improvements in institutional arrangements for debt management and greater debt transparency. Some debut bond issues have already been repaid, and others refinanced with lower cost issues; these issues build track records for debt servicing and active debt management.
Changes in the Creditor Composition of External Debt, 2010–21
Figure O.11 IDA-Eligible Countries’ Creditor Composition of Long-Term Public and Publicly Guaranteed External Debt, 2010–21 US$ (billion)
Figure O.12 Share of Public and Publicly Guaranteed External Debt Stocks of IDA-Eligible Countries Owed to Bilateral Paris Club and Non–Paris Club Creditors, 2010–21 Percent
Source: World Bank International Debt Statistics database.
Note: IDA = International Development Association; IMF = International Monetary Fund; SDR = special drawing right.
The increase in borrowing from private creditors has been accompanied by a shift in the composition of bilateral official creditors. Over the past decade, bilateral official creditors’ share of gross external public and publicly guaranteed debt stocks was broadly stable, falling only moderately from 36 percent in 2010 to 32 percent in 2021. However, over this period the composition of bilateral creditors changed. There has been a marked shift away from Paris Club bilateral creditors toward bilateral lending from China and other nontraditional sources, including other middle-income countries like India, the Russian Federation, and Türkiye. Thus, there is now a greater reliance on financial cooperation between low- and middle-income countries, in addition to financing from private creditors. This carries its own risks, for example in the form of a rise in the use of loan collaterals for commodity-linked infrastructure loans, particularly in the extractive industries, and potentially higher interest costs and other charges. IDA-eligible countries’ obligations to non–Paris Club creditors as a share of total obligations to bilateral creditors rose from 42 percent in 2010 to 68 percent in 2021 (figure O.12).
Inflows of long-term debt from external creditors to IDA-eligible countries have risen sharply throughout the past decade and particularly in 2020 and 2021. Gross inflows (disbursements) of external financing to IDA-eligible countries maintained an upward trajectory throughout the past
Source: World Bank International Debt Statistics database.
Note: IDA = International Development Association.
decade, except in 2015 and 2016. New inflows (disbursements) of long-term debt from external creditors were particularly pronounced over the past five years, notably in 2020 and 2021, when gross inflows rose 15 percent from the 2019 prepandemic level of US$101 billion to an average of US$119 billion annually in 2020 and 2021. Disbursements of long-term public and publicly guaranteed debt rose 20 percent from the prepandemic level to an average of US$84 billion over the same period. These record high inflows reflected in large part the exceptional support from the World Bank and IMF to assist IDA-eligible countries in mitigating the economic and social costs of the pandemic.
Increasing long-term debt inflows have led to a rise in debt servicing costs. Gross inflows of long-term external debt reached US$122 billion in 2021, equivalent to 5 percent of GNI, compared with 2 percent of GNI in 2010. Debt service payments on long-term external debt rose to US$78 billion in 2021, equivalent to 18 percent of exports of goods and services and 3 percent of GNI, compared to 5 percent and 1 percent respectively in 2010. This was the highest level recorded since 1997, and before the implementation of the HIPC Initiative and MDRI. Between 2010 and 2021, interest payments as a share of GNI rose from 0.23 percent to 0.72 percent, reflecting the increased share of borrowing from private creditors at higher interest costs. Debt service payments in 2021 accounted for 64 percent of gross inflows, which reduced the net transfer (disbursements minus total debt service payments) to 1.7 percent of GNI (figure O.13). Regarding long-term external public
Percent
Source: World Bank International Debt Statistics database.
Note: GNI = gross national income; IDA = International Development Association.
and publicly guaranteed debt, debt service payments accounted for 55 percent of gross inflows, resulting in a net transfer of US$38 billion, after taking into account the temporary debt relief provided by bilateral creditors in the context of the Debt Service Suspension Initiative (DSSI).
Increased borrowing from private creditors has led to a hardening of the average terms of new loan commitments to IDA-eligible countries. The average terms on loans contracted from private creditors between 2010 and 2021 were much harder than the average terms on loans from official (bilateral and multilateral) creditors. The average maturity on loans from private creditors during this period was 12 years, compared to 26 years for loans from official creditors, and the average interest rate was 5 percent, or 3 percentage points higher than the average interest rate of 2 percent on loans from official creditors. The average grace period on loans from private creditors, 6.7 years, was slightly longer than the average grace period of 6.3 years on loans from official creditors (figure O.14). In this context, an important factor was the rise in bonds issued in international markets, of which the majority have a bullet repayment. Unlike the terms on loans from official creditors, which remain broadly the same from year to year, the average terms on loans from private creditors may oscillate sharply because they
Type, 2010–21
Source: World Bank International Debt Statistics database.
Note: IDA = International Development Association.
are heavily weighted by which IDA-eligible borrowers are active in the market at that time and the terms on which they are able to issue. Bond maturities range from 3 years to 40 years, but interest rates on bonds issued in international capital markets have averaged about 5 percentage points above those paid on loans from official creditors. The average terms on loans from private creditors are also downwardly biased in recent years because loans and deposits from bilateral creditors at subsidized interest rates that are channeled through commercial banks are thus captured in the International Debt Statistics (IDS) database as loans from private creditors.
The increase in IDA-eligible countries’ borrowing from private sources and new bilateral creditors has led to a fragmentation of public debt portfolios (box O.4). Almost all IDA-eligible countries report loans from commercial banks and other private entities, some of which have complex structures with a portion covered by an export credit guarantee from a bilateral agency. Other commercial bank loans are guaranteed by multilateral institutions, including the World Bank, and borrowing by public sector entities from commercial banks and through bond issuance with a government guarantee has also increased. Some of the bonds issued in international capital markets have collective action clauses but others do not, adding to the challenges of coordination in the event of a restructuring. Conventional distinctions between external and domestic debt are increasingly blurred: nonresident holders of domestic bonds are common in domestic debt, which can be denominated in either local or foreign currency.
Over the course of the past two decades, sovereign debt markets in low- and middle-income countries have become increasingly complex (Gelpern et al. 2021; IMF 2020; World Bank 2022). Against that backdrop, this box quantifies the heterogeneity of the creditor and debtor base, particularly in countries that benefited from large-scale relief in the context of the Highly Indebted Poor Countries (HIPC) Initiative and the Multilateral Debt Relief Initiative. The empirical evidence presented in this box shows that HIPC sovereign borrowing has become increasingly fragmented since countries reached the HIPC completion point. In other words, external public and publicly guaranteed debt is now contracted between an increasing number of creditor and debtor entities. The findings of the analysis are based on the uniquely granular loan-level data that underlie the World Bank’s International Debt Statistics Database. They also build on an ongoing research project that examines the evolving microstructure of sovereign debt markets since the 1970s (Graf von Luckner and Horn 2022).
The focus on the countries under the HIPC Initiative reflects the fact that this group of countries has seen a particularly pronounced change in the structure of their sovereign debt portfolio over the past 20 years. At the same time, most HIPC countries face increasing and considerable risk of debt distress with potentially severe implications for poverty reduction and long-run development prospects (Farah Yacoub et al. 2022). The strong rebound since about 2010 in public external debt levels in HIPC countries is well documented (World Bank 2022). However, these increases in public external debt can occur at both the extensive and the intensive margins. Debtor countries may borrow additional financing from their existing, traditional creditors, or they can seek to increase their financing options and contract loans with new creditor entities. The research shows a significant part of the debt accumulation in HIPC countries occurred at the extensive margin and resulted in a substantial increase in the number of creditor entities. Importantly, the fragmentation is not limited to the creditor dimension: a wider group of debtor entities in HIPC countries has been able to contract external public debt, albeit often only with the support of a guarantee from the government.
Figure BO.4.1 shows that HIPC countries have contracted loans with on average 10 new
Average number of different creditor entities
40
30
HIPC completion point
Black line: From how many different creditor entities, on average, has an HIPC country borrowed?
20
50 –5 05 10 15
Years before and after HIPC completion point
Source: World Bank Debtor Reporting System. Note: The figure shows the average number of different creditor entities across all countries under the Heavily Indebted Poor Countries (HIPC) Initiative for years before and after HIPC completion points. The average HIPC completion year is 2006.
creditor entities in the 15 years since reaching the HIPC completion point. As a result, an HIPC country now has an outstanding external public debt portfolio with obligations to, on average, more than 40 different creditor entities, an increase of more than 30 percent from its completion point portfolio. As others have observed, many of the new creditors that have extended loans to HIPC countries are middleincome countries, particularly China (Broner et al. 2020; Horn, Reinhart, and Trebesch 2021) but also others like Brazil, India, and Türkiye. A significant share of HIPC countries have accessed international bond markets, some on repeated occasions since Ghana’s entry into the Eurobond market led the way in 2007 (Presbitero et al. 2016).
The increasing fragmentation on the creditor side is mirrored by a similar expansion on the debtor side. Information provided to the World Bank Debtor Reporting System shows an increasing number of debtor entities in lowincome countries have contracted external public debt (figure BO.4.2). The number of public sector entities in HIPC countries with outstanding external obligations rose from an average of 11 entities to an average of 16 entities per country following achievement of the HIPC completion point, an increase of almost 50 percent. This increase is driven primarily by a growing number of state-owned and mixed enterprises able to tap international credit markets and by private sector entities reliant on government guarantees to borrow abroad.
Average number of different debtor entities
continued)
HIPC completion point
16
14
12
Black line:
On average, how many different debtor entities contract public external debt in an HIPC country?
10
18 –5 05 10 15
Years before and after HIPC completion point
Source: World Bank Debtor Reporting System.
Note: This figure shows the average number of different debtor entities with outstanding external public and publicly guaranteed debt across all countries under the Heavily Indebted Poor Countries (HIPC) Initiative for years before and after HIPC completion points. The average HIPC completion year is 2006.
These findings have important policy implications and call for further empirical research on the microstructure of sovereign debt markets,
Multilateral creditors provided extraordinary levels of assistance to help mitigate the economic and social costs of the COVID-19 pandemic. Loan disbursements to low- and middle-income countries from multilateral creditors rose from US$104 billion in 2019 to US$157 billion in 2020, including US$50 billion from the IMF and US$41 billion from the World Bank. Disbursements from multilateral creditors remained slightly above prepandemic levels in 2021, at US$108 billion, including US$12 billion from the IMF and US$40 billion from the World Bank. During 2020 and 2021, the World Bank also provided US$11 billion in grants to IDAeligible countries
The unprecedented level of support to mitigate the economic and social impact of the global pandemic led to a surge in commitments to lowand middle-income countries in 2020 and 2021 from multilateral creditors, who stepped up to
particularly in the world’s poorest countries. A more dispersed creditor base can help to diversify financing risks and lead to better international risk-sharing outcomes (Arslanalp and Tsuda 2014; Callen, Imbs, and Mauro 2015). In times of crisis, however, sovereign debt theory predicts that a larger number of creditors will likely aggravate collective action problems and burden sharing by creditors and lead to longer and more costly restructuring processes (Bai and Zhang 2012; Cobas 2022; Krueger 2002). Greater diversification of borrower entities in the debtor country presents its own challenges: for borrowing by entities outside the central government, including those that benefit from a government guarantee, reporting standards are often inconsistent and frequently inadequate (World Bank 2021). Diversification also imposes additional challenges for sovereign debt restructuring processes (Gulati and Buchheit 2013), not least because government guarantees that have not been called are typically outside the scope of the restructuring process.
fill the gap left by a downturn in new commitments from private creditors and other official, bilateral creditors. New loan commitments from multilateral creditors, excluding the IMF, rose to US$132 billion in 2020, an increase of 49 percent from the 2019 prepandemic level of US$89 billion. They fell to US$109 billion in 2021 but were still 23 percent above the prepandemic level (figure O.15). Loan commitments from the World Bank in 2020 and 2021 totaled US$101 billion, equivalent to 42 percent of loan commitments by all multilateral institutions combined in those two years.
COVID-19-related support from multilateral institutions extended beyond IDA-eligible countries to cover middle-income International Bank for Reconstruction and Development (IBRD) countries. Fifty-six percent of loan commitments from the World Bank in 2020 and 2021 were extended to IBRD borrowers. For IBRD borrowers, commitments from multilateral institutions as a share of total long-term commitments of public and publicly guaranteed debt rose from 15 percent in 2019 to 20 percent and 18 percent in 2020
Figure O.15 Commitments to Low- and Middle-Income Countries from Multilateral Institutions, 2010–21 US$ (billion)
Figure O.16 Disbursements to Low- and Middle-Income Countries by Multilateral Institutions, 2019–21 US$ (billion)
40 60 80 100 120 140 2010 2011 2012
20
2014
Source: World Bank International Debt Statistics database.
and 2021, respectively. Bilateral creditors had a smaller share, which fell from 6 percent in both 2019 and 2020 to 4 percent in 2021. In contrast, for IDA-eligible countries, multilateral creditors’ share of comparable long-term commitments rose from 41 percent in 2019 to 52 percent in 2020, then dropped back to 44 percent in 2021. Bilateral creditors’ share fell from 33 percent in 2019 to 18 percent in 2021.
Looking beyond loan commitments to loan disbursements, in 2020 multilateral institutions disbursed a total of US$106 billion to low- and middle-income countries, 37 percent higher than the 2019 disbursements of US$78 billion (figure O.16). Financing from the IMF provided an additional US$50 billion, raising overall disbursements from multilateral institutions to US$157 billion in 2020. In 2021, disbursements declined by 31 percent largely on account of the steep US$38 billion contraction in financing from the IMF to US$12 billion. For other multilateral institutions, including the World Bank, disbursements were also lower in 2021. They fell 10 percent to US$96 billion but remained 23 percent higher than their prepandemic level. IDA-eligible countries received 30 percent of the 2020 and 2021 disbursements from multilateral creditors. In addition, in 2020 and 2021 these countries received a total of US$11 billion in IDA grants and the poorest countries among them also benefited from grants from the IMF’s Catastrophe Containment and Relief Trust of US$488 million
100
80
60
40
20
0
120 201920202021201920202021
IDA-eligible countries IBRD countries
World Bank IMF Other multilateral Institutions
Source: World Bank International Debt Statistics database.
Note: IBRD = International Bank for Reconstruction and Development; IDA = International Development Association; IMF = International Monetary Fund.
in 2020 and US$509 million in 2021 that offset debt service payments made to the IMF.4
The World Bank is IDA-eligible countries’ single largest creditor, but financing from other official creditors is also highly concentrated. Between 2010 and 2021, the World Bank (IBRD and IDA) extended US$453 billion in loan commitments, of which US$166 billion, or 37 percent, went to IDA-eligible countries. Commitments from the World Bank were equivalent to 27 percent of the US$618 billion in loan commitments from all official creditors, excluding the IMF, and half of those from multilateral creditors. Over this period, IDA-eligible countries also received an additional US$35 billion in IDA grants. Three regional development banks (African Development Bank, Asian Development Bank, and Inter-American Development Bank) were the second most important group of multilateral creditors, with combined loan commitments of US$93 billion from 2010 to 2021, equivalent to 15 percent of official creditors and 28 percent of commitments from multilateral creditors. China was IDA-eligible countries’ second most important creditor and the largest bilateral creditor. It extended US$138 billion in new loans over this period, equivalent to 22 percent of commitments from all official creditors and 48 percent of those from bilateral creditors. Japan, the second largest bilateral creditor and largest Paris Club creditor, accounted for 7 percent of official creditors and 16 percent of overall loan commitments from bilateral creditors. Taken together, the World Bank, the three
O.17
US$ (billion)
Source: World Bank International Debt Statistics database.
Note: IDA = International Development Association.
regional development banks, China, and Japan extended 72 percent of loan commitments from official creditors. The remaining 28 percent was spread across around 40 bilateral (Paris Club and non–Paris Club) and multilateral creditors (figure O.17).
Bilateral official creditors deferred US$8.9 billion in debt service payments owed in 2020 and 2021 by a group of 48 countries that participated in the DSSI. During that period, these countries also paid US$99 billion in total debt service, representing 4 percent of their combined average GNI in 2020 and 2021. This debt service included US$71 billion to service public and publicly guaranteed debt, including US$16.1 billion in debt service payments to bilateral official creditors.
In 2020 and 2021, 68 DSSI-eligible countries reporting to the DRS spent a total of US$160 billion to service external debt, of which US$99 billion was debt service payments on public and publicly guaranteed debt.5 The US$99 billion was equivalent to 2 percent of the countries’ combined average GNI in 2020 and 2021, and comprised US$68.7 billion in principal payments and US$30.5 billion in interest and other charges.
Private creditors accounted for only 25 percent of DSSI-eligible countries’ year-end 2021 public and publicly guaranteed external debt stocks but received 49 percent of the total debt service paid in 2020 and 2021, because their lending on average is more costly and of shorter maturity. Multilateral creditors received 29 percent of 2020–21 debt service payments, and 22 percent went to bilateral creditors. Debt service payments to the World Bank and the IMF were US$8.3 billion and US$5.9 billion, respectively, and together accounted for just under half of the debt service paid in 2020 and 2021 to multilateral creditors.
Bilateral creditors deferred US$8.9 billion in debt service payments due in 2020 and 2021 for the 48 DSSI-eligible countries that chose to participate in the initiative, but also received US$16.1 billion in debt service payments from them. These participating countries paid US$71 billion in 2020–21 to service external public and publicly guaranteed debt, of which US$16.1 billion was paid to bilateral creditors. The US$8.9 billion deferred included US$3.4 billion falling due in 2020 and US$5.5 billion due in 2021 and reflected deferrals agreed with Group of Twenty creditors and some bilateral creditors outside the Group of Twenty, notably Kuwait and the United Arab Emirates, which participate in the initiative on comparable terms (figure O.18). Of the deferred debt service, US$1.9 billion, or 22 percent, were interest payments that were capitalized and added to external debt stock. Principal payments
Figure O.18 DSSI-Participating Countries’ Debt Service Paid and Deferred, by Creditor Groups, 2019–21 US$ (billion)
Source: World Bank International Debt Statistics database. Note: DSSI = Debt Service Suspension Initiative; IMF = International Monetary Fund.
subject to the deferral were already included in external debt stocks because they were not paid on the original due date.
Instead of providing a debt reduction, the DSSI established that the standstill in debt service payments would be net present value neutral. Bilateral creditors were expected to charge interest on the amount of debt service deferred at an interest rate comparable to the one that applied to the original terms of a loan subject to deferral. The DSSI restructured repayments on the debt service deferred over a six-year period, including a one-year grace period and five-year repayment term. Based on information provided by participating countries, the cost of the deferral is estimated at about US$575 million in additional interest charges on the principal and interest payments due in 2020 and 2021 and deferred. Total principal and interest payments due on the deferred payments are estimated to average US$1.8 billion in 2022–25, equivalent to 8.7 percent of projected debt service payments to bilateral creditors over that period.
The deferral process requires a detailed reconciliation between debtor and creditor records and has been administratively costly. Loans to which the deferral applies and the precise amount of debt service to be deferred must be identified, and a legal document to revise the contractual payment terms of the original loan(s) is created. This is a timeconsuming process, as shown by a statement from the Pakistan Ministry of Economic Affairs in June 2022, when it announced the signing of two more deferral agreements (BR Web Desk 2022). One agreement, with Japan, covered deferrals related to the first half of 2021; the other agreement, with Switzerland, covered deferrals related to the second half of 2021. These new agreements brought the total number of deferral agreements signed by Pakistan to 93 with 21 different creditors. During the protracted DSSI implementation process, participating countries reporting to the World Bank DRS have taken various approaches in managing their public debt portfolio. For example, some countries reported debt service potentially subject to deferral as paid to avoid any unintended consequences of payment arrears, in the expectation of reimbursement upon signature of the deferral agreement. Other countries recorded “technical arrears” or reported estimated amounts of debt service deferred pending an agreement with the creditor on the actual amount.
Data presented in International Debt Report 2022 for deferred debt service have been standardized, to the extent possible. The data reflect all amounts reported as actually deferred by DSSIparticipating countries, estimates agreed with national authorities for those still being finalized, and, where available, amounts reconciled with creditor data for all agreements that have been concluded. For example, the Japanese authorities shared information that enabled its accounts of debt service deferred to be reconciled on a loanby-loan basis with debtor records. This exercise confirmed that, in most instances, the two data sets had only a small percentage point difference, not only assuring concordance regarding the deferrals but also providing confidence regarding the accuracy of borrowers’ reports to the DRS.
Figures for debt deferrals do not include debt forgiveness or debt restructuring outside the parameters of the DSSI. Other debt restructuring arrangements are captured by the World Bank DRS in the appropriate debt restructuring transactions. These arrangements include forgiveness of some concessional loans by China, reprofiling of terms including for some in oil-backed facilities, Kuwait’s US$900 million write-off of for Mauritania of interest arrears and restructuring of the principal on longstanding “passive” debt, and the refinancing agreement between Australia and Papua New Guinea that substituted for the debt deferral. For countries in conflict like the Republic of Yemen, which currently do not report to the DRS, the debt service deferred under the DSSI is only partially recorded.
The World Bank has collected external debt data from its client countries through the DRS since the 1950s. The World Bank IDS database is the most comprehensive source of cross-country comparable information on the external debt liabilities of lowand middle-income countries. The World Bank supports governments and works with development partners to strengthen debt recording and reporting and to raise the bar on debt transparency. Central to this agenda is its commitment to continuously
improve the coverage, accuracy, timeliness, and transparency of the external debt statistics it compiles and disseminates in the IDS database.
The World Bank has collected external debt data since the 1950s and has disseminated them for almost 50 years. Comprehensive, accurate, and transparent data on external debt liabilities are central to effective debt management by debtors and key to supporting countries to restructure unsustainable debt and generate a durable economic recovery. The World Bank’s IDS database is the most comprehensive source of cross-country comparable information on the external debt liabilities of low- and middle-income countries. These data are drawn from DRS. The World Bank requires all member countries that borrow from IBRD and IDA to provide regular detailed reports on a debt instrument basis on long-term external debt with an original maturity of over one year owed by a public agency or by a private agency with a public guarantee.6 It also requires borrowers to report aggregate data on long-term external debt owed by the private sector with no public guarantee. Currently, 121 low- and middleincome countries report to the DRS, including all countries eligible for loans from IDA.
Information recorded in the DRS is drawn from debt instrument agreements and the transaction records of the borrowers’ loan recording system. Most countries submit DRS reports electronically using a customized debt management software package or the standardized software packages developed by the Commonwealth Secretariat and the United Nations Conference on Trade and Development. Data compiled include the basic elements of each instrument such as commitment date, amount and currency of the instrument, name and type of debtor, name and type of creditor, and repayment terms as well as the annual transactions on each instrument (disbursements and principal and interest payments) and related outstanding debt stocks.
Accurately and transparently reporting public debt liabilities requires a debt data management framework that ensures the capture of all relevant liabilities (data coverage) and the accuracy of the information recorded (data quality). Greater debt transparency is not simply a matter of information disclosure. It requires (a) a sound and enforceable legal and institutional framework governing all public sector borrowing, (b) an effective debt
management office staffed by qualified and experienced officials, and (c) robust debt recording and reporting systems. Ensuring adequate coverage of public and external debt data is also compounded by the need for debt recording to keep pace with an expanding universe of domestic and external creditors and increasingly complex mechanisms for mobilizing financing.
The DRS has evolved with the changing landscape of external debt. Since its establishment in the 1950s, the DRS has routinely expanded and adapted is reporting requirements to take into account changes in the external borrowing landscape of low- and middle-income countries and to support the data needs of policy makers, debt practitioners, and researchers during the periodic debt crises and concomitant debt restructuring and debt relief initiatives. The emergence of external borrowing by private sector entities without a government guarantee led to the introduction of the reporting requirement for this category of external debt in the 1970s. The requirement to report loan-by-loan transaction records to measure the extent and impact of debt restructuring arrangements and buybacks was introduced in the late 1970s and modified on several occasions thereafter to include the effects of these innovations on countries’ debt obligations. Similarly, the introduction of new lending instruments such as bond buybacks, zero coupon bonds, interest rates set as a fixed spread and adjustable base rate, debt swaps, and central banks deposits with openended repayment terms has necessitated changes in the data elements captured in the DRS.
The DRS continues to expand its support of greater debt transparency. This expansion includes implementation of revisions to the reporting requirement to ensure that DRS reports capture all debt instruments, to gather information on borrower and creditor loan guarantees and other creditor risk mitigation mechanisms, and to extend the scope of the DRS to all public debt liabilities, domestic and external.
The past decade has seen a marked improvement in the coverage, completeness, and accuracy of DRS reporting. This improvement arises from concerted efforts to strengthen and enhance countries’ debt recording and reporting to better understand rising debt vulnerabilities. It also reflects implementation of reforms to strengthen debt management capacity in low- and middle-income countries, often supported
by development policy financing from the World Bank and the Debt Management Facility launched in 2008 by the World Bank with donor support and now run jointly by the World Bank and the IMF with technical support from other international partners.7
The IDA Sustainable Development Finance Policy (SDFP) incentivizes countries to move toward transparent and sustainable financing. The SDFP has been instrumental in increasing and institutionalizing the disclosure and publication of public debt data. Since the policy became effective in July 2020, implementation of policy performance actions to improve debt transparency has resulted in the publication of annual debt reports and/or quarterly debt bulletins by 33 IDA-eligible countries and has seen the process institutionalized through government orders or decrees. These initiatives have further improved the coverage, completeness, and accuracy of DRS reports.
Recent years marked an important improvement in the number of countries reporting to the DRS. The DRS received additional data from previously nonreporting countries, such as Iraq and Turkmenistan, which started to report again in 2021 after a 12-year hiatus. Tanzania resumed its reporting in 2020 after a 5-year gap, and South Africa increased the transparency of its data and started reporting debt instrument–level data instead of aggregate data.
The completeness of the DRS reports, particularly the reporting of private nonguaranteed debt, also improved in recent years. Historically, private nonguaranteed debt did not represent a large proportion of many low- and middle-income countries’ external debt. As countries’ external debt portfolios evolved and private sector entities were able to access external financing without a government guarantee, however, the importance of providing comprehensive data to the DRS on all types of external debt increased.
For the year-end 2018 data, about 51 percent of DRS countries reported private nonguaranteed debt, the highest share of countries since the DRS introduced the reporting requirement in the 1970s (figure O.19). About 43 percent of DRS countries reported year-end 2021 private nonguaranteed data, demonstrating countries’ quick recovery and ability to send data to the DRS after facing difficulties reporting during the COVID-19 pandemic. Of the remaining DRS countries, 36 countries have private nonguaranteed data supplemented by other sources
Figure O.19 Percent of Countries That Report Public and Publicly Guaranteed and Private Nonguaranteed Year-End Transaction Data to the DRS, 2010–21 Percent
0 10 20 30 40 50 60
Public and publicly guaranteed debt Private nonguaranteed debt
Source: World Bank Debtor Reporting System (DRS). Note: The dip in year 2019 reflects the countries’ challenges to report during the COVID-19 pandemic lockdowns. The list of reporting countries is based on year-end 2021 data.
as noted in the methodology (box O.1) and 33 countries do not have data. Out of the 33 countries with no data, two-thirds are classified as countries affected by fragility, conflict, and violence (most of which are low-income countries facing capacity constraints). Other countries have no outstanding obligations for the private nonguaranteed sector, confirming the challenges that arise when borrowing without the guarantee of the public sector in economies that are more susceptible to shocks.
The most significant current gap in data reported to the DRS relates to borrowing by state-owned enterprises (SOEs), particularly SOE borrowing without a government guarantee. Most data omissions reflect discrepancies between the country’s definition of public debt and DRS reporting standards, the absence of systems to collect these data at the national level, and the limited authority of the national debt office. Many countries, including high-income developed economies, define public debt as the direct borrowing of the general government and borrowing of a public or private sector entity with a state guarantee. As such, recording and reporting on debt outside these parameters will be beyond the legal authority and remit of the national debt office. The DRS definition of public debt extends to external borrowing by nonfinancial SOEs in which the government holds more
than a 50 percent share of the debt, but historically this information was rarely reported.
The heightened emphasis by the World Bank and the IMF since 2018 on the liabilities of SOEs and policy actions incentivized by the SDFP to strengthen fiscal risk management and greater transparency are leading to the compilation and reporting of more data on the external liabilities of SOEs. This information is being used to expand coverage of the DRS database. Most data on SOE debt liabilities, however, are as yet available only in aggregate. Incorporating these data at the loan level into national recording and reporting systems, as needed to meet the DRS reporting requirement, will likely take time.
Major efforts have been made to improve the accuracy of the data reported to the DRS. They include a comprehensive review of the entire database (currently about 50,000 active loans) to ensure consistency of borrower type, creditor type, and entity name and classification. Debt data submitted by DRS reporting countries are validated against other sources such as creditor records, market data compiled by private entities like Dealogic, academic data sets, and information from central banks and other national agencies that compile the balance of payments and international investment position statistics. When data gaps are identified through reconciliation with other sources, they are brought to the attention of national debt compilers and the information is used to improve the comprehensiveness of the DRS.
There has also been a major expansion in the scope and granularity of the debt data drawn from the DRS and presented in the annual publication and the online IDS database. For decades, the number of indicators available hovered around 214. In 2019 (year-end 2018 data), the number of indicators available more than doubled with the addition of 283 indicators to the database. The new indicators consisted mostly of the breakdown of external debt stock and flow data by debtor types including general government, public sector, and private sector guaranteed by the public sector. In 2021 (year-end 2020 data), another 72 indicators were added to reflect the breakdown of external debt by the central bank, bringing the total number of indicators to 569 (figure O.20).
The most important increase in granularity in the history of the publication of debt data was the addition of a fourth dimension of data
Figure O.20 Number of Indicators Published in the International Debt Statistics Database, Year-End Data, 2017–21 Number
500
400
300
200
100
0
600 2017 2018 2019 2020 2021
Source: World Bank International Debt Statistics database.
disaggregated by creditor in 2020. The IDS database added the ability to disaggregate data by more than 300 creditors, including bilateral lenders at the country level and about 100 multilateral institutions. This addition allows users to view and download data at the debtor-creditor level and provides additional transparency not only on the debt stocks and flows, but also on lending terms (average maturity, grace period, grant element, and interest rate on new commitments). In addition, in 2020 the IDS database was also expanded to support the DSSI. Projected debt service payments were expanded from an annual periodicity to a monthly periodicity and presented for each official bilateral creditor and multilateral entity to facilitate implementation of the DSSI. Going forward, proposed enhancements to the DRS are designed to ensure that the information the World Bank collects and disseminates will support and advance the debt transparency agenda. A four-point agenda to be implemented over the next two to three years centers on redesigning the DRS to further align with changes in borrowing patterns and instruments, and expanding the reporting requirement where appropriate to support current data needs. An important element of this work will be extending the coverage of the DRS to domestic public debt to reflect its increasing importance in low- and middle-income countries’ overall debt portfolios. Additional effort will be made to close data gaps to enhance data quality and coverage, including the debt instrument information for the nonguaranteed debt of SOEs. This work will build on policy actions undertaken in the context of the IDA
SDFP to institutionalize transparency and regular recording and reporting of this category of debt. In addition, the platform that serves for recording and disseminating the data captured through the DRS will be replaced with a state-of-the-art cloud-based system to accommodate all the new
data requirements, allow for faster and easier electronic transfer of DRS reports from national debt systems, and provide users of the IDS database expanded access and the capability to extract customized reports to support policy making, research, and analysis (box O.5).
Since 2018, there have been substantial improvements in the coverage of the external debt data published by the World Bank for both official and private creditors.a Successive editions of the International Debt Statistics (IDS), 2018–22, and International Debt Report, 2022, have identified and added US$631 billion in previously unreported loan commitments, equivalent to more than 17 percent of the total outstanding public and publicly guaranteed debt stock in 2021.b When previously unreported loans are identified and recorded, past debt stocks, transactions (disbursements and debt service payments), and loan commitment figures are revised ex post in the new releases of debt statistics (figure BO.5.1). Tracking these revisions across IDS reports enables the quantification of debt not previously captured in public debt statistics and increases the coverage and completeness of debt statistics.
Newly identified loans were extended in almost equal parts by official creditors and private creditors. International Debt Statistics 2022 added US$199 billion in loans to past data, the single largest increase in debt coverage since the World Bank first published external debt statistics in 1973.
These coverage increases have occurred in many middle-income borrowers and those eligible for assistance from the International Development Association. Over the past five IDS vintages, upward revisions in external debt stocks, and related flows, were made for more than 60 countries reporting to the Debtor Reporting System. In most cases, the size of the upward revisions was limited: on average, the public and publicly guaranteed external debt stock was revised upward by 5.6 percent over the past six editions of the International Debt Statistics/Report.
Example: According to IDS 2018, Tanzania’s debt stock to official creditors in 2016 was US$9.8 billion. According to IDR 2022, the debt stock to official creditors in 2016 was US$11.8 billion, an upward revision of US$2 billion or more than 16 percent of the initial reporting.
0102030405060708090 100
Ex post upward revision of the 2016 external public and publicly guaranteed debt stock (%) Revision of debt to official creditors Revision of debt to private creditors
Source: World Bank International Debt Statistics database. Note: The figure shows the cumulative ex post upward revision of external public and publicly guaranteed debt for the countries with the largest revisions over the past six IDS/IDR vintages. The debt stock in 2016 serves as the comparison year because it is the latest year available in all six vintages. Turkmenistan is an outlier, and its upward revision of 3,200 percent is curtailed for readability. Turkmenistan repaid all obligations to the World Bank in 2018 and was not obligated to report in 2019 and 2020. When the country resumed borrowing from the World Bank in 2021, the old series was restored and significantly revised. IDR = International Debt Report; IDS = International Debt Statistics
In 19 countries, however, the upward revision was more than 10 percent of the initially reported debt stock. Low-income countries and countries with weak public debt recording and reporting capacity dominate this group (figure BO.5.2).
Debt recording and reporting need to keep up with an increasingly complex borrowing landscape if data are to remain relevant. The revisions described in this box are in part driven by the addition of new debt instruments and expanding coverage of borrower entities, specifically borrowing by state-owned enterprises and central bank liabilities deposits that have become an important financing source in some
low- and middle-income countries. Despite the significant progress made in the coverage of debt stocks and flows, important knowledge gaps remain (Pazabarsioglu and Reinhart 2022). They include undisclosed lending terms such as collateralization (Mihalyi et al. 2022) and the issue of “hidden defaults,” that is, the lack of systematic data on credit events with non–Paris Club bilateral creditors and nonbond private external creditors (Horn, Reinhart, and Trebesch 2022).
a. This box is based on a Horn, Mihalyi, and Nickol 2022.
b. Another way to look at it is that ex post added commitments accounted for 19 percent of all newly added commitments in vintages 2018 to 2023.
1. About half of the external debt stock of low- and middle-income countries is denominated in currencies other than the US dollar.
2. The 10 largest borrowers are based on total external debt stock at year-end 2021. The 10 largest borrowers excluding China are Argentina, Brazil, Colombia, India, Indonesia, Mexico, the Russian Federation, South Africa, Thailand, and Türkiye.
3. Country reporting of statistics to the Quarterly External Debt Statistics database, jointly developed by the World Bank and IMF, is voluntary.
4. Eligibility for assistance from the IMF’s Catastrophe Containment and Relief Trust is reserved for countries eligible for concessional borrowing from the IMF Poverty Reduction and Growth Trust and whose per capita income is below the IDA’s operational cutoff (US$1,255 for fiscal year 2023).
5. Of the 73 countries eligible for the DSSI, 4 countries are not required to report to the DRS because they do not have any outstanding obligations to the World Bank (Kiribati, Marshall Islands, Micronesia, and Tuvalu). South Sudan has not reported any data to the World Bank DRS. Countries eligible for DSSI are defined as those that were IDA-eligible countries at the time the initiative was announced and countries on the United Nations list of least developed countries.
6. Reporting requirements to the DRS are spelled out in the “Bank Policy on External Debt Reporting and Financial Statements” document available at https:// ppfdocuments.azureedge.net/8fcc4c7a-0e1c-47e0 -84b3-0950b0fc4d9b.pdf Countries that receive only IDA grants and have no outstanding debt obligations to the World Bank are not required to report to the DRS. They are typically small island economies for example, Kiribati, the Marshall Islands, and Tuvalu.
7. Since 2014, the World Bank and IMF have jointly administered the Debt Management Facility.
Arslanalp, S., and T. Tsuda. 2014. “Tracking Global Demand for EM Sovereign Debt.” Working Paper 2014/039, International Monetary Fund, Washington, DC.
Bai, Y., and J. Zhang. 2012. “Duration of Sovereign Debt Renegotiation.” Journal of International Economics 86 (2): 252–68.
BR Web Desk. 2022. “G-20 DSSI: Pakistan Signs Debt Suspension Agreements Worth $197mn.” Business Recorder, June 15, 2022. https://www.brecorder.com /news/40180253
Broner, F., T. Didier, S. Schmuckler, and P. von Goetz. 2020. “Bilateral International Investments: The Big Sur?” Policy Research Working Paper 9501, World Bank, Washington, DC.
Callen, M., J. Imbs, and P. Mauro. 2015. “Pooling Risk among Countries.” Journal of International Economics 96 (1): 88–99.
Cobas, A. 2022. “Coordinating in the Haircut: A Model of Sovereign Debt Restructuring in Secondary Markets.” Unpublished manuscript.
Farah Yacoub, J. P., C. Graf von Luckner, R. Ramalho, and C. Reinhart. 2022. “The Social Costs of Sovereign Default.” Policy Research Working Paper 10157, World Bank, Washington, DC.
Gelpern, A., S. Horn, S. Morris, B. Parks, and C. Trebesch. 2021. “How China Lends: A Rare Look into 100 Debt Contracts with Foreign Governments.” Discussion Paper 16331, Center for Economic and Policy Research, Washington, DC.
Graf von Luckner, C., and S. Horn. 2022. “Sovereign Debt Market Fragmentation.” Unpublished manuscript.
Gulati, M., and L. C. Buchheit. 2013. “Restructuring a Sovereign Debtor’s Contingent Liabilities.” In Sovereign Financing and International Law: The UNCTAD Principles on Responsible Lending and Borrowing, edited by Carlos Esposito, Yuefen Li, and Juan Pablo Bohoslavsky, 287–94. Oxford: Oxford University Press.
Horn, S., D. Mihalyi, and P. Nickol. 2022. “Systematic Underreporting of Public Debt Statistics: 50 Years of Evidence and Recent Progress.” World Bank Blogs, March 3, 2022. https://blogs.worldbank.org /developmenttalk/systematic-underreporting-public -debt-statistics-50-years-evidence-and-recent.
Horn, S., C. M. Reinhart, and C. Trebesch. 2021. “China’s Overseas Lending.” Journal of International Economics 133: 103539.
Horn, S., C. M. Reinhart, and C. Trebesch. 2022. “Hidden Defaults.” American Economic Association Papers & Proceedings 112: 531–35.
IMF (International Monetary Fund). 2009. Balance of Payments and International Investment Position Manual, 6th edition. Washington, DC: IMF.
IMF (International Monetary Fund). 2014. Government Finance Statistics Manual 2014. Washington, DC: IMF.
IMF (International Monetary Fund). 2020. “The Evolution of Public Debt Vulnerabilities in Lower Income Countries.” Policy Paper 2020/003, IMF, Washington, DC.
IMF (International Monetary Fund). 2021a. “IMF Governors Approve a Historic US$650 Billion SDR Allocation of Special Drawing Rights.” Press release, August 2021.
IMF (International Monetary Fund). 2021b. “Guidance Note for Fund Staff on the Treatment and Use of
SDR Allocations.” Policy Paper 2021/059, IMF, Washington, DC.
Krueger, A. O. 2002. A New Approach to Sovereign Debt Restructuring. Washington, DC: International Monetary Fund.
Mihalyi, D., J. Hwang, D. Rivetti, and J. Cust. 2022. “Resource-Backed Loans in Sub-Saharan Africa.” Policy Research Working Paper 9923, World Bank, Washington, DC.
Pazarbasioglu, C., and C. Reinhart. 2022. “Shining a Light on Debt.” Finance & Development March: 10–13. https://www.imf.org/en/Publications/fandd
/issues/2022/03/Shining-a-light-on-debt-Pazarbasioglu -Reinhart.
Presbitero, A., D. Ghura, O. S. Adedeji, and L. Njie. 2016. “Sovereign Bonds in Developing Countries: Drivers of Issuance and Spreads.” Review of Development Finance 6 (1): 1–15.
World Bank. 2021. Debt Transparency in Developing Economies. Washington, DC: World Bank.
World Bank. 2022. World Development Report 2022: Finance for an Equitable Recovery. Washington, DC: World Bank.
(US$ billion, unless otherwise indicated)
Summary external debt data, by debtor type
2010 2017 2018 2019 2020 2021
Total external debt stocks 4,2927,3987,8598,2438,6209,296
Use of IMF credit and SDR allocations 134 124 151 171 224 415 of which: SDR allocations 85 79 77 77 80 273
Long-term external debt 3,0105,3985,5975,9286,2386,447
Public and publicly guaranteed sector 1,5662,7612,9373,1253,3533,485 Public sector 1,5602,7582,9353,1233,3513,472 of which: General government 1,1641,9922,1072,2782,4652,537
Private sector guaranteed by public sector 6 3 2 2 2 13 Private sector not guaranteed 1,4442,6372,6602,8032,8852,962 Short-term external debt 1,1481,8762,1112,1432,1582,434
Disbursements (long-term)
6421,1361,1121,2021,2101,201
Public and publicly guaranteed sector 284 481 475 451 495 473 Public sector 283 481 475 451 495 461 of which: General government 182 313 296 310 334 294 Private sector guaranteed by public sector 1 0 0 0 0 12 Private sector not guaranteed 358 655 637 751 714 728
Principal repayments (long-term) 362 711 786 883 886 921
Public and publicly guaranteed sector 135 208 260 262 289 285 Public sector 134 208 259 262 289 285 of which: General government 74 110 136 128 173 172 Private sector guaranteed by public sector 1 1 1 0 0 1 Private sector not guaranteed 227 502 525 621 597 636
Interest payments (long-term) 99 188 210 230 203 222
Public and publicly guaranteed sector 47 99 107 122 108 115 Public sector 46 99 107 122 108 115 of which: General government 38 75 79 85 74 82 Private sector guaranteed by public sector 0 0 0 0 0 0 Private sector not guaranteed 52 89 103 108 95 107
Long-term external debt stocks 3,0105,3985,5975,9286,2386,447
Public and publicly guaranteed debt from: 1,5662,7612,9373,1253,3533,485 Official creditors 8231,0601,0991,1391,2511,276 Multilateral 467 636 658 693 776 808 of which: World Bank 239 314 323 342 377 390 Bilateral 356 424 440 446 474 468
Private creditors 7421,7021,8381,9872,1022,210 Bondholders 4621,2271,3561,5071,6281,709 Commercial banks and others 281 475 482 479 475 501
Private nonguaranteed debt from: 1,4442,6372,6602,8032,8852,962 Bondholders 210 479 488 574 677 708 Commercial banks and others 1,2352,1572,1722,2292,2082,254
Use of IMF credit and SDR allocations 134 124 151 171 224 415
Net debt inflows
Use of IMF credit 9 4 31 21 45 1
Long-term 280 426 326 319 323 280
Official creditors 55 54 53 43 77 55 Multilateral 45 32 33 37 66 49 of which: World Bank 23 12 15 19 27 20 Bilateral 10 22 20 6 11 7 Private creditors 225 372 273 276 247 225 Bondholders 101 281 198 234 228 142 Banks and others 124 90 75 42 19 83
Short-term 428 322 231 32 11 278
Foreign direct investment 526 457 483 490 464 640 Portfolio equity 126 67 38 48 61 47
External debt stocks to exports (%) 80 105 102 107 123 103
External debt stocks to GNI (%) 22 26 26 27 29 26 Debt service to exports (%) 9 14 14 16 17 14 Short-term to external debt stocks (%) 27 25 27 26 25 26 Multilateral to external debt stocks (%) 11 9 8 8 9 9 Reserves to external debt stocks (%) 122 79 73 72 73 69
Gross national income (GNI) 19,62928,67130,26331,03329,94535,141
(US$ billion, unless otherwise indicated)
2010 2017 2018 2019 2020 2021
Total external debt stocks 1,1922,4822,7902,9933,2693,679
Use of IMF credit and SDR allocations 18 17 17 17 18 75 of which: SDR allocations 18 17 16 16 17 74
Long-term external debt 5581,2771,4001,6181,8481,979
Public and publicly guaranteed sector 318 546 641 727 835 914 Public sector 318 546 641 727 835 903 of which: General government 240 404 449 510 581 600 Private sector guaranteed by public sector 0 0 0 0 0 11 Private sector not guaranteed 240 731 759 8901,0141,065 Short-term external debt 6161,1881,3721,3591,4031,624
Disbursements (long-term) 116 362 407 510 500 491
Public and publicly guaranteed sector 47 98 132 130 150 172 Public sector 47 98 132 130 150 161 of which: General government 29 49 65 81 93 74 Private sector guaranteed by public sector 0 0 0 0 0 11 Private sector not guaranteed 69 264 276 381 350 320
Principal repayments (long-term) 65 231 252 309 278 341
Public and publicly guaranteed sector 29 34 34 43 57 76 Public sector 29 34 34 43 57 76 of which: General government 17 15 18 19 32 45 Private sector guaranteed by public sector 0 0 0 0 0 0 Private sector not guaranteed 36 197 218 266 221 265
Interest payments (long-term) 16 35 47 57 53 65
Public and publicly guaranteed sector 9 14 18 22 23 30 Public sector 9 14 18 22 23 30 of which: General government 7 10 13 14 13 21 Private sector guaranteed by public sector 0 0 0 0 0 0 Private sector not guaranteed 7 21 29 35 30 35
Long-term external debt stocks 5581,2771,4001,6181,8481,979
Public and publicly guaranteed debt from: 318 546 641 727 835 914 Official creditors 217 205 209 212 235 233
Multilateral 87 107 111 116 130 135 of which: World Bank 47 59 60 62 66 68 Bilateral 130 98 98 96 105 98 Private creditors 101 341 432 516 600 681 Bondholders 72 284 371 449 534 597 Commercial banks and others 29 57 61 67 66 84 Private nonguaranteed debt from: 240 731 759 8901,0141,065 Bondholders 20 183 216 276 371 391 Commercial banks and others 220 548 544 615 643 674
Use of IMF credit and SDR allocations 18 17 17 17 18 75
Net debt inflows
Use of IMF credit 0 0 0 0 1 0
Long-term 51 130 155 201 222 150 Official creditors 2 0 4 2 15 6 Multilateral 4 4 5 5 12 7 of which: World Bank 3 2 2 2 3 3 Bilateral -2 -3 -1 -2 3 -1 Private creditors 49 130 151 198 207 144 Bondholders 9 111 124 138 177 94 Banks and others 40 19 26 60 30 50
Short-term 307 259 184 -13 44 221
Foreign direct investment 265 190 245 217 258 334 Portfolio equity 40 35 49 46 65 83
External debt stocks to exports (%) 50 69 71 77 84 75
External debt stocks to GNI (%) 16 17 17 18 19 18 Debt service to exports (%) 5 9 9 11 10 10 Short-term to external debt stocks (%) 52 48 49 45 43 44 Multilateral to external debt stocks (%) 7 4 4 4 4 4 Reserves to external debt stocks (%) 269 146 128 122 118 107
Gross national income (GNI) 7,58014,48216,15616,73516,98520,130
(US$ billion, unless otherwise indicated)
Total external debt stocks
2010 2017 2018 2019 2020 2021
1,1501,5001,4481,4681,4811,509
Use of IMF credit and SDR allocations 46 30 29 27 31 64 of which: SDR allocations 17 16 16 15 16 50
Long-term external debt 8911,2311,1831,1821,1751,163
Public and publicly guaranteed sector 341 507 495 511 533 527 Public sector 340 506 494 511 533 527 of which: General government 183 284 289 316 340 345 Private sector guaranteed by public sector 0 1 0 0 0 0 Private sector not guaranteed 551 724 689 670 643 636
Short-term external debt 213 239 236 260 275 281
Disbursements (long-term) 219 247 200 212 226 201
Public and publicly guaranteed sector 84 91 73 80 94 62 Public sector 83 91 73 80 94 62 of which: General government 41 46 44 50 60 47 Private sector guaranteed by public sector 0 0 0 0 0 0 Private sector not guaranteed 135 156 127 132 132 139
Principal repayments (long-term) 159 191 224 212 226 201
Public and publicly guaranteed sector 40 47 81 62 83 57 Public sector 40 47 80 62 83 57 of which: General government 15 19 35 22 45 33 Private sector guaranteed by public sector 0 0 0 0 0 0 Private sector not guaranteed 119 144 144 150 144 144
Interest payments (long-term) 32 44 43 43 43 42
Public and publicly guaranteed sector 8 17 20 19 20 20 Public sector 8 17 20 19 20 20 of which: General government 6 10 12 12 13 15 Private sector guaranteed by public sector 0 0 0 0 0 0 Private sector not guaranteed 24 27 24 24 23 22
Long-term external debt stocks 8911,2311,1831,1821,1751,163 Public and publicly guaranteed debt from: 341 507 495 511 533 527 Official creditors 96 139 140 140 149 147 Multilateral 62 90 90 89 97 97 of which: World Bank 33 40 40 40 42 42 Bilateral 34 49 50 52 52 50
Private creditors 245 367 355 371 384 380 Bondholders 85 196 206 234 248 252 Commercial banks and others 160 172 149 136 135 128 Private nonguaranteed debt from: 551 724 689 670 643 636 Bondholders 34 75 75 83 85 80 Commercial banks and others 517 649 614 587 558 556
Use of IMF credit and SDR allocations 46 30 29 27 31 64
Net debt inflows
Use of IMF credit 3 0 -1 -2 3 -1
Long-term 60 57 -24 0 0 1 Official creditors 14 7 4 1 3 3 Multilateral 11 4 2 0 4 4 of which: World Bank 3 1 1 0 1 1 Bilateral 4 3 2 2 -1 -1 Private creditors 45 50 -28 -1 -4 -3 Bondholders 13 33 13 35 10 3
Banks and others 33 17 -41 -36 -14 -6
Short-term 43 26 -3 23 14 7
Foreign direct investment 64 60 45 67 38 81 Portfolio equity -1 -5 -7 -4 -18 -12
External debt stocks to exports (%) 123 150 123 126 154 112
External debt stocks to GNI (%) 40 49 47 47 51 44 Debt service to exports (%) 21 24 24 23 29 19
Short-term to external debt stocks (%) 18 16 16 18 19 19 Multilateral to external debt stocks (%) 5 6 6 6 7 6 Reserves to external debt stocks (%) 56 38 40 44 44 48
Gross national income (GNI) 2,8693,0413,1013,1532,9163,404
(US$ billion, unless otherwise indicated)
Total external debt stocks
2010 2017 2018 2019 2020 2021
1,0081,7491,8631,8991,8941,991
Use of IMF credit and SDR allocations 19 17 45 62 78 113 of which: SDR allocations 17 16 15 15 16 57
Long-term external debt 8341,5411,5821,5901,6121,656
Public and publicly guaranteed sector 427 814 848 857 889 901 Public sector 422 812 846 855 888 899 of which: General government 327 563 588 601 631 642 Private sector guaranteed by public sector 4 2 2 1 1 2 Private sector not guaranteed 407 727 734 733 723 755
Short-term external debt 155 191 237 247 205 221
Disbursements (long-term) 190 283 278 250 282 298
Public and publicly guaranteed sector 83 136 128 100 132 95 Public sector 82 136 128 100 132 94 of which: General government 55 86 83 63 84 65 Private sector guaranteed by public sector 1 0 0 0 0 1 Private sector not guaranteed 108 147 151 150 150 203
Principal repayments (long-term) 83 185 177 235 224 234
Public and publicly guaranteed sector 39 76 75 91 72 71 Public sector 38 75 74 91 72 71 of which: General government 24 43 30 41 40 40 Private sector guaranteed by public sector 1 1 1 0 0 0 Private sector not guaranteed 44 109 102 144 152 163
Interest payments (long-term) 35 73 73 78 63 71
Public and publicly guaranteed sector 19 48 44 49 37 37 Public sector 19 48 43 49 37 37 of which: General government 16 38 34 35 25 24 Private sector guaranteed by public sector 0 0 0 0 0 0 Private sector not guaranteed 15 25 29 29 26 34
Long-term external debt stocks 8341,5411,5821,5901,6121,656
Public and publicly guaranteed debt from: 427 814 848 857 889 901 Official creditors 158 203 209 209 225 234 Multilateral 122 154 162 168 184 194 of which: World Bank 48 57 58 61 67 71 Bilateral 37 49 47 41 41 39 Private creditors 268 610 639 648 664 668 Bondholders 227 478 498 504 529 525 Commercial banks and others 41 133 141 144 135 142 Private nonguaranteed debt from: 407 727 734 733 723 755 Bondholders 133 195 171 184 185 196 Commercial banks and others 274 532 562 550 538 558
Use of IMF credit and SDR allocations 19 17 45 62 78 113
Net debt inflows
Use of IMF credit 1 0 29 17 13 -3
Long-term 108 98 102 14 58 63 Official creditors 20 8 6 0 14 11 Multilateral 15 3 9 6 15 12 of which: World Bank 8 -1 2 2 7 4 Bilateral 5 6 -2 -6 -1 -1 Private creditors 87 90 95 14 44 53 Bondholders 59 69 46 20 41 20 Banks and others 28 21 50 -6 3 33
Short-term 53 11 45 10 -43 17
Foreign direct investment 120 130 120 127 74 108 Portfolio equity 40 20 -2 -3 -6 1
External debt stocks to exports (%) 120 168 166 167 193 160
External debt stocks to GNI (%) 23 37 41 42 50 46 Debt service to exports (%) 14 25 23 28 30 26 Short-term to external debt stocks (%) 15 11 13 13 11 11 Multilateral to external debt stocks (%) 12 9 9 9 10 10 Reserves to external debt stocks (%) 56 44 42 40 41 36
Gross national income (GNI) 4,3224,7624,5884,5253,7784,344
(US$ billion, unless otherwise indicated)
Total external debt stocks
2010 2017 2018 2019 2020 2021
210 328 350 368 395 418
Use of IMF credit and SDR allocations 11 22 23 26 36 52 of which: SDR allocations 10 9 9 9 9 26
Long-term external debt 161 252 278 288 298 296 Public and publicly guaranteed sector 130 204 221 237 256 259 Public sector 129 204 221 236 255 259 of which: General government 105 155 168 182 200 199 Private sector guaranteed by public sector 1 0 0 0 0 0 Private sector not guaranteed 31 48 56 52 42 37 Short-term external debt 38 54 49 55 61 70
Disbursements (long-term) 23 49 52 39 34 35
Public and publicly guaranteed sector 14 35 34 31 31 33 Public sector 14 35 34 31 31 33 of which: General government 12 27 24 25 25 20 Private sector guaranteed by public sector 0 0 0 0 0 0 Private sector not guaranteed 9 13 18 8 2 2
Principal repayments (long-term) 18 24 24 27 31 32
Public and publicly guaranteed sector 11 14 14 14 19 25 Public sector 10 14 14 14 19 24 of which: General government 7 10 9 10 12 16 Private sector guaranteed by public sector 0 0 0 0 0 0 Private sector not guaranteed 8 10 11 12 12 7
Interest payments (long-term) 6 8 10 11 9 8
Public and publicly guaranteed sector 5 6 7 9 6 6 Public sector 5 6 7 9 6 6 of which: General government 4 5 6 7 5 5 Private sector guaranteed by public sector 0 0 0 0 0 0 Private sector not guaranteed 2 2 2 3 2 2
Long-term external debt stocks 161 252 278 288 298 296
Public and publicly guaranteed debt from: 130 204 221 237 256 259 Official creditors 91 132 134 138 149 144 Multilateral 37 61 62 65 75 76 of which: World Bank 13 25 27 30 33 34 Bilateral 54 71 72 72 74 68 Private creditors 39 72 87 99 107 114 Bondholders 27 61 71 79 86 91 Commercial banks and others 12 11 16 19 20 23 Private nonguaranteed debt from: 31 48 56 52 42 37 Bondholders 1 0 1 1 1 1 Commercial banks and others 30 48 56 51 42 36
Use of IMF credit and SDR allocations 11 22 23 26 36 52
Use of IMF credit 1 4 2 3 9 0
Long-term 5 25 28 12 3 3
Official creditors 2 8 5 5 6 1 Multilateral 3 5 3 4 7 4 of which: World Bank 1 3 3 3 3 1 Bilateral -1 3 3 0 -1 -3 Private creditors 3 17 22 7 -3 3 Bondholders 3 13 10 9 6 6 Banks and others 0 3 12 -1 -9 -3 Short-term 5 1 -5 5 4 8
Foreign direct investment 24 16 14 14 11 8 Portfolio equity 2 -1 0 1 -2 -2
External debt stocks to exports (%) 57 91 86 100 154 118 External debt stocks to GNI (%) 14 24 28 29 34 30
Debt service to exports (%) 7 10 9 11 17 13 Short-term to external debt stocks (%) 18 17 14 15 15 17 Multilateral to external debt stocks (%) 18 19 18 18 19 18 Reserves to external debt stocks (%) 166 77 72 65 51 48
Gross national income (GNI) 1,4701,3591,2711,2821,1731,373
(US$ billion, unless otherwise indicated)
2010 2017 2018 2019 2020 2021
Total external debt stocks 410 717 743 802 828 911
Use of IMF credit and SDR allocations 20 17 16 17 20 42 of which: SDR allocations 9 9 8 8 9 32
Long-term external debt 323 574 597 649 677 717
Public and publicly guaranteed sector 189 328 340 366 385 415 Public sector 189 328 340 366 385 414 of which: General government 167 273 279 297 313 332 Private sector guaranteed by public sector 0 0 0 0 0 0 Private sector not guaranteed 134 246 256 283 292 303 Short-term external debt 67 126 130 136 131 152
Disbursements (long-term) 52 104 84 103 98 96
Public and publicly guaranteed sector 31 61 44 50 47 61 Public sector 31 61 44 50 46 61 of which: General government 25 54 30 36 36 42 Private sector guaranteed by public sector 0 0 0 0 0 0 Private sector not guaranteed 22 43 41 53 52 34
Principal repayments (long-term) 24 48 58 52 77 52
Public and publicly guaranteed sector 9 20 29 26 34 27 Public sector 9 20 29 25 34 27 of which: General government 6 11 21 17 27 16 Private sector guaranteed by public sector 0 0 0 0 0 0 Private sector not guaranteed 15 28 29 26 43 25
Interest payments (long-term) 6 14 19 18 16 17
Public and publicly guaranteed sector 3 5 6 8 6 7 Public sector 3 5 6 8 6 7 of which: General government 2 4 5 5 5 4 Private sector guaranteed by public sector 0 0 0 0 0 0 Private sector not guaranteed 4 9 12 10 10 11
Long-term external debt stocks 323 574 597 649 677 717
Public and publicly guaranteed debt from: 189 328 340 366 385 415 Official creditors 156 188 204 219 248 264
Multilateral 101 118 122 130 147 155 of which: World Bank 64 72 72 75 82 84 Bilateral 56 70 82 90 101 109 Private creditors 33 139 137 147 138 151 Bondholders 18 102 95 104 93 99 Commercial banks and others 15 37 41 43 45 52
Private nonguaranteed debt from: 134 246 256 283 292 303 Bondholders 13 15 14 19 26 29 Commercial banks and others 120 231 242 263 265 273
Use of IMF credit and SDR allocations 20 17 16 17 20 42
Use of IMF credit 2 0 0 1 2 -1
Long-term 29 56 27 51 21 44
Official creditors 7 11 18 16 21 20
Multilateral 6 4 5 8 14 11 of which: World Bank 3 1 2 3 5 4 Bilateral 2 6 12 8 7 10
Private creditors 21 45 9 35 -1 24 Bondholders 10 36 -7 13 -4 10 Banks and others 11 9 16 22 3 14 Short-term 13 19 4 5 -4 20
Foreign direct investment 31 42 43 48 63 45 Portfolio equity 30 6 -5 14 24 4
External debt stocks to exports (%) 96 118 112 119 139 117 External debt stocks to GNI (%) 20 21 21 22 24 22
Debt service to exports (%) 7 11 12 11 16 9 Short-term to external debt stocks (%) 16 18 18 17 16 17 Multilateral to external debt stocks (%) 25 17 16 16 18 17 Reserves to external debt stocks (%) 77 65 59 63 76 74
Gross national income (GNI) 2,0483,4013,5033,6283,4544,054
(US$ billion, unless otherwise indicated)
2010 2017 2018 2019 2020 2021
Total external debt stocks 322 622 665 712 752 790
Use of IMF credit and SDR allocations 19 21 22 23 41 69 of which: SDR allocations 14 13 12 12 13 35
Long-term external debt 243 524 557 602 627 636
Public and publicly guaranteed sector 161 364 392 427 456 471 Public sector 161 364 392 427 456 471 of which: General government 142 313 334 371 400 420 Private sector guaranteed by public sector 0 0 0 0 0 0 Private sector not guaranteed 82 160 165 175 172 166 Short-term external debt 59 77 86 87 83 85
Disbursements (long-term) 42 91 90 88 70 79
Public and publicly guaranteed sector 26 60 64 60 41 50 Public sector 26 60 64 60 41 50 of which: General government 20 52 51 55 36 46 Private sector guaranteed by public sector 0 0 0 Private sector not guaranteed 15 31 25 28 28 30
Principal repayments (long-term) 13 32 51 48 49 61
Public and publicly guaranteed sector 7 17 29 26 24 29 Public sector 7 17 29 26 24 29 of which: General government 4 12 24 19 18 22 Private sector guaranteed by public sector 0 0 0 0 0 0 Private sector not guaranteed 6 14 21 22 26 32
Interest payments (long-term) 4 14 19 21 19 18
Public and publicly guaranteed sector 3 9 12 15 15 14 Public sector 3 9 12 15 15 14 of which: General government 3 8 10 12 13 12 Private sector guaranteed by public sector 0 0 0 0 Private sector not guaranteed 1 5 6 7 4 4
Long-term external debt stocks 243 524 557 602 627 636
Public and publicly guaranteed debt from: 161 364 392 427 456 471 Official creditors 105 192 203 220 246 254 Multilateral 59 105 111 125 144 150 of which: World Bank 34 61 65 74 86 91 Bilateral 46 86 92 95 102 104 Private creditors 57 172 189 207 210 216 Bondholders 32 106 116 137 138 145 Commercial banks and others 24 66 73 70 72 71
Private nonguaranteed debt from: 82 160 165 175 172 166 Bondholders 9 11 11 12 9 11 Commercial banks and others 73 149 154 163 163 155
Use of IMF credit and SDR allocations 19 21 22 23 41 69
Use of IMF credit 1 1 2 1 17 6
Long-term 28 59 39 41 20 18
Official creditors 10 19 16 18 17 14 Multilateral 6 12 10 14 14 11 of which: World Bank 4 6 6 9 9 7 Bilateral 3 7 6 4 4 3 Private creditors 19 40 24 23 3 4 Bondholders 6 19 12 19 -3 10 Banks and others 12 21 12 3 6 -5 Short-term 7 6 6 1 -3 5
Foreign direct investment 23 19 16 18 20 64 Portfolio equity 16 12 3 -5 -3 -27
External debt stocks to exports (%) 79 160 153 165 212 179
External debt stocks to GNI (%) 24 38 40 42 46 43
Debt service to exports (%) 5 13 17 17 20 19
Short-term to external debt stocks (%) 18 12 13 12 11 11 Multilateral to external debt stocks (%) 18 17 17 18 19 19 Reserves to external debt stocks (%) 48 26 25 22 19 15
Gross national income (GNI) 1,3421,6241,6441,7101,6351,832
(US$ million, unless otherwise indicated)
Total external debt stocks
2010 2017 2018 2019 2020 2021
2,4362,7522,6792,6623,0403,531
Use of IMF credit and SDR allocations 355 285 275 277 6291,185 of which: SDR allocations 239 221 216 215 224 652
Long-term external debt 1,9761,9981,9701,9651,9761,926
Public and publicly guaranteed sector 1,9761,9821,9491,9441,9581,908 Public sector 1,9761,9821,9491,9441,9581,908 of which: General government 1,9761,9821,9491,9441,9581,908
Private sector guaranteed by public sector Private sector not guaranteed 16 22 21 18 18
Short-term external debt 105 470 434 420 435 420
Disbursements (long-term) 76 3 16 29 0
Public and publicly guaranteed sector 76 3 16 29 0 Public sector 76 3 16 29 0 of which: General government 76 3 16 29 0 Private sector guaranteed by public sector Private sector not guaranteed
Principal repayments (long-term)
1 27 31 31 26 14
Public and publicly guaranteed sector 1 23 25 25 22 14 Public sector 1 23 25 25 22 14 of which: General government 1 23 25 25 22 14 Private sector guaranteed by public sector Private sector not guaranteed 4 6 6 5
Interest payments (long-term) 8 9 9 9 8 5
Public and publicly guaranteed sector 8 8 8 7 7 5 Public sector 8 8 8 7 7 5 of which: General government 8 8 8 7 7 5 Private sector guaranteed by public sector Private sector not guaranteed 1 1 1 1
Long-term external debt stocks 1,9761,9981,9701,9651,9761,926 Public and publicly guaranteed debt from: 1,9761,9821,9491,9441,9581,908 Official creditors 1,9761,9821,9491,9441,9581,908
Multilateral 1,0161,023 983 955 968 919 of which: World Bank 406 364 348 338 344 329 Bilateral 959 959 965 989 991 989
Private creditors 0
Bondholders
Commercial banks and others 0 Private nonguaranteed debt from: 16 22 21 18 18 Bondholders Commercial banks and others 16 22 21 18 18 Use of IMF credit and SDR allocations 355 285 275 277 6291,185
Use of IMF credit 9 -8 -4 4 329 142
Long-term 75 -24 -14 -2 -26 -14 Official creditors 75 -19 -8 3 -21 -14 Multilateral 75 -19 -15 -20 -21 -14 of which: World Bank 8 -8 -8 -8 -8 -6 Bilateral 0 0 7 23 -1
Private creditors -4 -6 -6 -5
Bondholders
Banks and others -4 -6 -6 -5
Short-term 37 80 -68 -44 -10 -17
Foreign direct investment 191 52 119 23 13 21 Portfolio equity 0 0 0 0 0
External debt stocks to exports (%) 89 189 141 142 177
External debt stocks to GNI (%) 15 14 15 14 15 Debt service to exports (%) 0 4 3 3 3 Short-term to external debt stocks (%) 4 17 16 16 14 12 Multilateral to external debt stocks (%) 42 37 37 36 32 26 Reserves to external debt stocks (%) 171 261 273 279 277
Gross national income (GNI) 15,88519,00018,24119,09820,305
(US$ million, unless otherwise indicated)
Total external debt stocks
2010 2017 2018 2019 2020 2021
5,4379,8019,6519,27510,47711,086
Use of IMF credit and SDR allocations 129 489 470 448 627 734 of which: SDR allocations 72 66 65 64 67 252
Long-term external debt 4,5647,4217,2778,2209,1809,395
Public and publicly guaranteed sector 3,2104,3354,3344,1604,8965,292 Public sector 3,2104,3354,3344,1604,8965,292 of which: General government 2,8544,0514,0223,8774,5025,037
Private sector guaranteed by public sector Private sector not guaranteed 1,3543,0852,9424,0604,2844,103 Short-term external debt 7431,8921,904 607 670 957
Disbursements (long-term) 866 7761,037 4571,1621,520
Public and publicly guaranteed sector 631 421 699 207 8801,223 Public sector 631 421 699 207 8801,223 of which: General government 613 420 560 202 7741,211 Private sector guaranteed by public sector Private sector not guaranteed 235 355 338 250 283 298
Principal repayments (long-term) 250 407 922 498 948 693
Public and publicly guaranteed sector 174 222 554 263 537 369 Public sector 174 222 554 263 537 369 of which: General government 146 198 456 234 511 245 Private sector guaranteed by public sector Private sector not guaranteed 76 185 368 234 410 323
Interest payments (long-term) 110 96 147 112 146 115
Public and publicly guaranteed sector 66 83 119 95 96 102 Public sector 66 83 119 95 96 102 of which: General government 59 80 114 92 92 92 Private sector guaranteed by public sector Private sector not guaranteed 44 12 28 17 50 13
Long-term external debt stocks 4,5647,4217,2778,2209,1809,395
Public and publicly guaranteed debt from: 3,2104,3354,3344,1604,8965,292 Official creditors 2,1752,9843,0373,0043,2543,411
Multilateral 1,5212,2792,3622,3382,5472,639 of which: World Bank 8751,3001,3011,3301,4181,409 Bilateral 654 705 675 666 708 773
Private creditors 1,0351,3511,2981,1561,6421,880 Bondholders 477 696 718 6421,1161,430 Commercial banks and others 558 656 580 514 526 451
Private nonguaranteed debt from: 1,3543,0852,9424,0604,2844,103 Bondholders 69 192 329 306 284 266 Commercial banks and others 1,2852,8942,6143,7544,0003,837
Use of IMF credit and SDR allocations 129 489 470 448 627 734
Net debt inflows
Use of IMF credit -12 77 -7 -20 155 -63 Long-term 616 369 116 -40 215 827
Official creditors 111 243 137 -1 69 336 Multilateral 103 240 148 1 71 222 of which: World Bank 18 226 40 44 4 64 Bilateral 8 3 -11 -2 -1 114
Private creditors 506 126 -22 -39 146 492 Bondholders 444 43 108 -20 263 537 Banks and others 61 83 -130 -19 -118 -46
Short-term 63 245 12-1,297 63 287
Net equity inflows
Foreign direct investment 1,0521,0731,2711,2521,1171,248 Portfolio equity 7 -12 -3 7 -8 -1
External debt stocks to exports (%) 147 213 184 175 272 182 External debt stocks to GNI (%) 46 75 64 61 70 62 Debt service to exports (%) 10 11 21 12 30 15 Short-term to external debt stocks (%) 14 19 20 7 6 9 Multilateral to external debt stocks (%) 28 23 24 25 24 24 Reserves to external debt stocks (%) 45 36 40 39 44 49
Gross national income (GNI) 11,80813,05115,13815,20014,88218,010
(US$ million, unless otherwise indicated)
Total external debt stocks
2010 2017 2018 2019 2020 2021
7,2535,7075,7105,4925,1787,379
Use of IMF credit and SDR allocations 1,8451,7061,6661,6571,7264,306 of which: SDR allocations 1,8451,7061,6661,6571,7264,306
Long-term external debt 3,6301,9041,7251,5711,6691,476
Public and publicly guaranteed sector 2,6621,7161,5231,3981,4361,240 Public sector 2,5211,7131,5211,3971,4361,240 of which: General government 9271,3661,2681,2051,2781,131 Private sector guaranteed by public sector 141 3 2 1 0 0 Private sector not guaranteed 968 188 202 173 232 236 Short-term external debt 1,7782,0962,3192,2641,7841,597
Disbursements (long-term) 42 11 44 33 98 70
Public and publicly guaranteed sector 40 1 0 0 0 0 Public sector 40 1 0 0 0 0 of which: General government 31 0 0 0 0 0 Private sector guaranteed by public sector 0 0 0 0 0 0 Private sector not guaranteed 2 11 44 33 98 70
Principal repayments (long-term) 557 176 151 118 119 147
Public and publicly guaranteed sector 324 140 122 93 77 101 Public sector 291 139 121 92 77 100 of which: General government 31 41 40 36 28 62 Private sector guaranteed by public sector 33 1 1 1 1 0 Private sector not guaranteed 234 36 29 25 41 46
Interest payments (long-term) 95 31 29 25 23 22
Public and publicly guaranteed sector 64 27 26 23 22 22 Public sector 64 27 26 23 22 22 of which: General government 13 20 21 20 20 20 Private sector guaranteed by public sector 0 0 0 0 0 0 Private sector not guaranteed 31 4 3 2 1 1
Long-term external debt stocks 3,6301,9041,7251,5711,6691,476 Public and publicly guaranteed debt from: 2,6621,7161,5231,3981,4361,240 Official creditors 1,9861,6821,5121,3931,4331,239
Multilateral 101,0791,0311,0071,095 984 of which: World Bank 9 0 Bilateral 1,976 603 481 386 338 256 Private creditors 676 34 11 6 3 1 Bondholders Commercial banks and others 676 34 11 6 3 1 Private nonguaranteed debt from: 968 188 202 173 232 236 Bondholders Commercial banks and others 968 188 202 173 232 236
Use of IMF credit and SDR allocations 1,8451,7061,6661,6571,7264,306
Use of IMF credit
Long-term -516 -165 -107 -85 -21 -76
Official creditors -129 -97 -99 -88 -75 -98 Multilateral -2 -1 0 0 0 -35 of which: World Bank -1 -1 Bilateral -126 -96 -99 -88 -75 -63
Private creditors -387 -68 -8 3 54 22 Bondholders
Banks and others -387 -68 -8 3 54 22 Short-term 286 110 223 -55 -481 -187
Foreign direct investment 2,3151,2311,4401,3641,068 835
Portfolio equity 0
External debt stocks to exports (%) 11 14 13 14 20 17
External debt stocks to GNI (%) 5 3 3 3 4 5 Debt service to exports (%) 1 1 0 0 1 0
Short-term to external debt stocks (%) 25 37 41 41 34 22 Multilateral to external debt stocks (%) 0 19 18 18 21 13 Reserves to external debt stocks (%) 2,2421,7101,4051,152 944 624 Gross national income (GNI) 160,762167,559170,507167,568142,065163,926
(US$ million, unless otherwise indicated)
Summary external debt data, by debtor type
Total external debt stocks 26,79659,75863,80264,77667,52967,277
Use of IMF credit and SDR allocations 1,302 3891,3741,8612,9925,872 of which: SDR allocations 420 389 380 378 3931,375
Long-term external debt 20,92655,66259,59659,65258,16055,281
Public and publicly guaranteed sector 15,66242,92148,09547,61647,38646,740
Public sector 15,66242,92148,09547,61647,38646,740 of which: General government 7,06928,25133,88135,00735,28934,844 Private sector guaranteed by public sector Private sector not guaranteed 5,26412,74111,50212,03610,7748,541
Short-term external debt 4,5683,7082,8323,2636,3776,124
Disbursements (long-term)
6,7147,41212,1828,9053,9506,194
Public and publicly guaranteed sector 4,0827,41212,1828,1053,9506,194 Public sector 4,0827,41212,1828,1053,9506,194 of which: General government 5856,1529,8827,1052,4504,894 Private sector guaranteed by public sector Private sector not guaranteed 2,632 801
Principal repayments (long-term) 2,6397,3918,1448,8115,8168,985
Public and publicly guaranteed sector 2,1136,8236,9058,5444,5556,752 Public sector 2,1136,8236,9058,5444,5556,752 of which: General government 5342,7534,1545,9402,5405,251 Private sector guaranteed by public sector Private sector not guaranteed 526 5681,239 2671,2612,233
Interest payments (long-term) 2571,6762,8092,9492,5902,232
Public and publicly guaranteed sector 1771,3612,4082,5502,4082,129
Public sector 1771,3612,4082,5502,4082,129 of which: General government 77 9341,6271,8431,8191,672 Private sector guaranteed by public sector Private sector not guaranteed 80 315 401 399 182 103
Long-term external debt stocks 20,92655,66259,59659,65258,16055,281 Public and publicly guaranteed debt from: 15,66242,92148,09547,61647,38646,740 Official creditors 4,7469,28010,4619,6449,92610,636
Multilateral 4452,2392,2682,8473,0693,858 of which: World Bank 3781,0251,0421,6361,7462,481 Bilateral 4,3017,0418,1936,7966,8576,777 Private creditors 10,91633,64137,63337,97337,46036,104 Bondholders ..2,5006,0008,0008,0008,000 Commercial banks and others 10,91631,14131,63329,97329,46028,104
Private nonguaranteed debt from: 5,26412,74111,50212,03610,7748,541 Bondholders Commercial banks and others 5,26412,74111,50212,03610,7748,541
Use of IMF credit and SDR allocations 1,302 3891,3741,8612,9925,872
Net debt inflows
Use of IMF credit 524 -30 1,012 4951,0192,007 Long-term 4,074 214,038 95-1,866-2,790
Official creditors 70 111,193 -816 110 597
Multilateral 3 184 44 585 201 808 of which: World Bank -1 55 31 600 89 751 Bilateral 67 -1731,148-1,402 -91 -210
Private creditors 4,004 102,846 911-1,977-3,388 Bondholders ..3,5002,000 0 0 Banks and others 4,004 10 -654-1,089-1,977-3,388 Short-term 1,992 -685 -863 4403,112 -251
Net equity inflows
Foreign direct investment 3,326-7,293-7,104-4,739-1,980-4,604
Portfolio equity 0 0 0 0 0
Debt ratios
External debt stocks to exports (%) 52 167 153 181 314 198 External debt stocks to GNI (%) 36 92 89 103 138 101
Debt service to exports (%) 6 26 26 33 40 33 Short-term to external debt stocks (%) 17 6 4 5 9 9 Multilateral to external debt stocks (%) 2 4 4 4 5 6 Reserves to external debt stocks (%) 73 29 24 25 20 22
Gross national income (GNI) 73,81564,73471,78363,04349,10666,834
(US$ million, unless otherwise indicated)
Summary external debt data, by debtor type
2010 2017 2018 2019 2020 2021
Total external debt stocks 126,642225,925277,827280,685255,558246,307
Use of IMF credit and SDR allocations 3,1112,87730,92346,92448,87448,055 of which: SDR allocations 3,1112,8772,8092,7932,9097,103
Long-term external debt 107,119167,542179,134166,744164,078154,278
Public and publicly guaranteed sector 69,184128,247135,603121,319118,035114,750 Public sector 69,075128,247135,603121,297118,013114,750 of which: General government 66,419127,653135,171120,792117,764114,670 Private sector guaranteed by public sector 109 0 0 22 22 0 Private sector not guaranteed 37,93439,29543,53145,42546,04239,527
Short-term external debt 16,41355,50767,77067,01642,60743,974
Disbursements (long-term)
6,92361,80266,55525,17123,15514,562
Public and publicly guaranteed sector 2,62341,04748,36911,55912,3264,906 Public sector 2,62341,04748,36911,53712,3264,906 of which: General government 2,62341,04748,36911,35112,3264,906 Private sector guaranteed by public sector 0 22 0 0
Private sector not guaranteed 4,30020,75518,18613,61210,8309,656
Principal repayments (long-term)
11,69025,51928,20229,84221,68616,661
Public and publicly guaranteed sector 6,03517,82115,78719,2968,2004,473 Public sector 6,01717,82115,78719,2968,2004,450 of which: General government 5,76417,72315,69819,2107,9564,313 Private sector guaranteed by public sector 18 0 22 Private sector not guaranteed 5,6557,69812,41510,54613,48512,189
Interest payments (long-term)
3,78913,90013,38511,4985,6083,308
Public and publicly guaranteed sector 2,70012,43310,9968,8832,4841,290 Public sector 2,70012,43310,9968,8832,4841,290 of which: General government 2,59712,40110,9668,8552,4651,288 Private sector guaranteed by public sector 0 0 0
Private sector not guaranteed 1,0891,4672,3892,6153,1242,019
Long-term external debt stocks 107,119167,542179,134166,744164,078154,278
Public and publicly guaranteed debt from: 69,184128,247135,603121,319118,035114,750 Official creditors 22,87428,26629,05829,11330,26031,412 Multilateral 17,01621,34223,00523,87925,30127,107 of which: World Bank 5,3496,3276,8797,1287,7218,517 Bilateral 5,8596,9246,0535,2354,9594,305
Private creditors 46,31099,980106,54592,20687,77583,339 Bondholders 44,34498,095105,28791,24086,53782,219 Commercial banks and others 1,9661,8861,258 9661,2381,119
Private nonguaranteed debt from: 37,93439,29543,53145,42546,04239,527 Bondholders 7,85515,79915,93315,37815,74215,354 Commercial banks and others 30,08023,49627,59830,04730,30024,173
Use of IMF credit and SDR allocations 3,1112,87730,92346,92448,87448,055
Net debt inflows
Use of IMF credit ..28,62316,166 0 -3,780 Long-term -4,76736,28438,353-4,6711,470-2,099
Official creditors 5571,346 879 82 9761,263
Multilateral 7841,0661,669 8801,4261,806 of which: World Bank 46 239 557 249 594 796 Bilateral -227 280 -790 -797 -450 -543
Private creditors -5,32434,93837,473-4,754 494-3,363 Bondholders -2,66628,08833,580-6,7692,437-1,653
Banks and others -2,6586,8503,8932,016-1,943-1,710
Short-term 2,46517,47112,149 -721-24,7551,436
Net equity inflows
Foreign direct investment 7,8269,09510,2936,4823,9515,753 Portfolio equity -71 3,013 -508 86 -520 1
Debt ratios
External debt stocks to exports (%) 151 289 333 325 373 274
External debt stocks to GNI (%) 31 36 55 65 67 51
Debt service to exports (%) 19 52 52 51 43 29
Short-term to external debt stocks (%) 13 25 24 24 17 18
Multilateral to external debt stocks (%) 13 9 8 9 10 11 Reserves to external debt stocks (%) 39 23 23 15 14 15
Gross national income (GNI) 409,192627,201506,094435,009379,419481,548
(US$ million, unless otherwise indicated)
Total external debt stocks
2010 2017 2018 2019 2020 2021
6,30710,22810,72611,88412,60013,818
Use of IMF credit and SDR allocations 876 530 451 375 646 735 of which: SDR allocations 136 125 122 122 127 296
Long-term external debt 4,7758,8109,1419,91510,35211,560
Public and publicly guaranteed sector 2,5605,2285,3715,6525,6166,263
Public sector 2,5605,2285,3715,6525,6166,263 of which: General government 2,5445,0155,1515,4385,3855,975
Private sector guaranteed by public sector Private sector not guaranteed 2,2163,5833,7704,2624,7355,296 Short-term external debt 656 8891,1341,5951,6031,524
Disbursements (long-term) 1,7341,5011,6782,3771,8272,950
Public and publicly guaranteed sector 198 677 347 867 1291,009 Public sector 198 677 347 867 1291,009 of which: General government 198 588 321 854 101 912 Private sector guaranteed by public sector Private sector not guaranteed 1,536 8241,3311,5101,6981,941
Principal repayments (long-term) 8571,1171,2821,5861,5381,626
Public and publicly guaranteed sector 24 91 138 568 313 246 Public sector 24 91 138 568 313 246 of which: General government 24 85 125 550 291 217 Private sector guaranteed by public sector Private sector not guaranteed 8331,0261,1441,0181,2251,380
Interest payments (long-term) 60 238 269 362 320 333
Public and publicly guaranteed sector 35 140 162 189 167 145 Public sector 35 140 162 189 167 145 of which: General government 35 136 156 183 161 140 Private sector guaranteed by public sector Private sector not guaranteed 25 98 107 174 152 188
Long-term external debt stocks 4,7758,8109,1419,91510,35211,560
Public and publicly guaranteed debt from: 2,5605,2285,3715,6525,6166,263 Official creditors 2,5564,1634,3104,4964,5554,460 Multilateral 1,5133,2373,2783,3523,4013,334 of which: World Bank 1,2671,8101,7981,8241,8301,763 Bilateral 1,042 9271,0321,1441,1541,125
Private creditors 4 1,0641,0611,1561,0611,803 Bondholders ..1,0001,0001,0981,0001,750 Commercial banks and others 4 64 61 59 61 53 Private nonguaranteed debt from: 2,2163,5833,7704,2624,7355,296 Bondholders 300 300 Commercial banks and others 2,2163,5833,7704,2624,4354,996
Use of IMF credit and SDR allocations 876 530 451 375 646 735
Net debt inflows
Use of IMF credit 163 -29 -68 -73 247 -66 Long-term 877 384 396 792 2891,324
Official creditors 174 578 208 204 -84 34 Multilateral 110 301 87 86 -36 0 of which: World Bank 73 5 14 31 -37 -36 Bilateral 65 277 122 118 -48 34 Private creditors 703 -193 188 588 3731,291 Bondholders 0 0 98 202 733 Banks and others 703 -193 188 490 171 558 Short-term 127 -183 245 461 8 -79
Foreign direct investment 361 70 303 -24 54 393 Portfolio equity 7 -3 0 -5 1 2
External debt stocks to exports (%) 193 188 184 176 295 255
External debt stocks to GNI (%) 65 86 85 86 101 103 Debt service to exports (%) 30 26 29 31 46 38 Short-term to external debt stocks (%) 10 9 11 13 13 11 Multilateral to external debt stocks (%) 24 32 31 28 27 24 Reserves to external debt stocks (%) 30 23 21 24 21 23
Gross national income (GNI) 9,71911,93312,65813,79812,44513,469
(US$ million, unless otherwise indicated)
Summary external debt data, by debtor type
Total external debt stocks
2010 2017 2018 2019 2020 2021
7,25115,30116,21115,84315,81214,645
Use of IMF credit and SDR allocations 282 219 214 212 221 740 of which: SDR allocations 237 219 214 212 221 740
Long-term external debt 5,97014,40715,42815,01415,13813,904
Public and publicly guaranteed sector 3,81212,47013,95613,97914,00013,020
Public sector 3,81212,47013,95613,97914,00013,020 of which: General government 2,4908,0527,5407,7767,5687,100
Private sector guaranteed by public sector Private sector not guaranteed 2,1581,9371,4711,0351,138 884 Short-term external debt 999 675 570 617 452 0
Disbursements (long-term) 2,6432,8863,2691,2701,111 616
Public and publicly guaranteed sector 7292,8223,2501,266 584 575
Public sector 7292,8223,2501,266 584 575 of which: General government 5691,104 902 767 308 523 Private sector guaranteed by public sector Private sector not guaranteed 1,914 64 19 4 527 42
Principal repayments (long-term) 3051,7712,1221,6441,2931,568
Public and publicly guaranteed sector 2331,2621,6391,198 8611,272 Public sector 2331,2621,6391,198 8611,272 of which: General government 72 5101,384 523 571 941 Private sector guaranteed by public sector Private sector not guaranteed 72 509 483 447 432 296
Interest payments (long-term) 78 443 538 496 540 411
Public and publicly guaranteed sector 65 326 446 429 482 370 Public sector 65 326 446 429 482 370 of which: General government 39 201 252 257 243 191 Private sector guaranteed by public sector Private sector not guaranteed 13 117 91 66 58 41
Summary external debt stock, by creditor type
Long-term external debt stocks 5,97014,40715,42815,01415,13813,904
Public and publicly guaranteed debt from: 3,81212,47013,95613,97914,00013,020 Official creditors 2,6466,6626,8857,3187,2336,691
Multilateral 1,7585,5695,7896,0845,8975,496 of which: World Bank 1,0632,6652,5382,3952,0981,681 Bilateral 8881,0931,0961,2341,3371,195
Private creditors 1,1665,8097,0716,6616,7676,330 Bondholders ..3,7503,7503,7503,7503,750 Commercial banks and others 1,1662,0593,3212,9113,0172,580
Private nonguaranteed debt from: 2,1581,9371,4711,0351,138 884 Bondholders 500 500 Commercial banks and others 2,1581,9371,4711,035 638 384
Use of IMF credit and SDR allocations 282 219 214 212 221 740
Net debt inflows
Use of IMF credit -15
Long-term 2,3371,1151,147 -374 -182 -952
Official creditors 325 901 246 433 -183 -425 Multilateral 315 914 245 302 -220 -376 of which: World Bank 137 435 -116 -140 -310 -410 Bilateral 11 -13 0 130 37 -48
Private creditors 2,012 214 901 -807 1 -527 Bondholders 500 500 Banks and others 2,012 -286 901 -807 -499 -527 Short-term 404 -721 -105 47 -165 -452
Net equity inflows
Foreign direct investment 3,3532,8671,4031,504 507-1,708
Portfolio equity 1 0 0 19 75 117
External debt stocks to exports (%) 25 72 60 63 93 54
External debt stocks to GNI (%) 15 39 36 34 37 27
Debt service to exports (%) 1 11 10 9 11 7 Short-term to external debt stocks (%) 14 4 4 4 3 0 Multilateral to external debt stocks (%) 24 36 36 38 37 38 Reserves to external debt stocks (%) 88 44 41 44 48 57
Gross national income (GNI) 49,74139,32144,85446,31942,42353,304
(US$ million, unless otherwise indicated)
2010 2017 2018 2019 2020 2021
Total external debt stocks 26,57251,04157,08962,42773,50791,429
Use of IMF credit and SDR allocations 1,4031,6251,5361,4142,1093,301 of which: SDR allocations 786 727 710 706 7352,145
Long-term external debt 22,22238,65146,52351,27660,41270,040
Public and publicly guaranteed sector 21,14635,25641,28546,37654,78762,425
Public sector 21,14635,25641,28546,37654,78762,425 of which: General government 21,14530,44135,77840,47648,42353,742
Private sector guaranteed by public sector Private sector not guaranteed 1,0763,3955,2384,9015,6257,615
Short-term external debt 2,94710,7659,0299,73710,98618,088
Disbursements (long-term)
1,3555,6359,8519,31710,21713,775
Public and publicly guaranteed sector 9684,8577,1566,2047,9289,365 Public sector 9684,8577,1566,2047,9289,365 of which: General government 9684,7146,9786,0097,6958,444 Private sector guaranteed by public sector Private sector not guaranteed 388 7782,6963,1132,2894,410
Principal repayments (long-term) 8211,4682,0334,6812,8714,207
Public and publicly guaranteed sector 724 9931,1801,2501,3071,787 Public sector 724 9931,1801,2501,3071,787 of which: General government 724 9741,1421,2131,2701,488 Private sector guaranteed by public sector Private sector not guaranteed 97 475 8533,4311,5652,420
Interest payments (long-term)
203 553 641 808 8631,088
Public and publicly guaranteed sector 195 495 528 657 707 985 Public sector 195 495 528 657 707 985 of which: General government 195 348 361 477 515 540 Private sector guaranteed by public sector Private sector not guaranteed 8 59 113 152 155 102
Long-term external debt stocks 22,22238,65146,52351,27660,41270,040 Public and publicly guaranteed debt from: 21,14635,25641,28546,37654,78762,425 Official creditors 21,12931,39936,76141,55849,47457,040
Multilateral 18,46323,88525,39327,69131,13733,338 of which: World Bank 10,65313,62114,50115,78817,57217,832 Bilateral 2,6667,51411,36813,86618,33723,701
Private creditors 163,8574,5254,8185,3135,386 Bondholders ..1,2711,4331,5691,7361,675 Commercial banks and others 162,5863,0923,2493,5773,710
Private nonguaranteed debt from: 1,0763,3955,2384,9015,6257,615 Bondholders Commercial banks and others 1,0763,3955,2384,9015,6257,615
Use of IMF credit and SDR allocations 1,4031,6251,5361,4142,1093,301
Net debt inflows
Use of IMF credit -45 -13 -52 -114 616 -182 Long-term 5344,1677,8184,6367,3469,569
Official creditors 2533,7535,8184,8216,4587,528
Multilateral 3521,5801,9542,3572,5492,953 of which: World Bank 831,0201,2191,3871,101 783 Bilateral -99 2,1743,8642,4643,9084,575
Private creditors 282 4132,000 -185 8882,041 Bondholders 114 162 136 167 -84 Banks and others 282 2991,839 -321 7212,125 Short-term 1,0142,930-1,736 7081,2497,102
Net equity inflows
Foreign direct investment 8851,4771,2421,3051,3701,309
Portfolio equity -54 258 -33 -70 -355 -270
External debt stocks to exports (%) 122 130 128 138 190 184
External debt stocks to GNI (%) 21 17 17 17 19 21
Debt service to exports (%) 5 6 7 13 10 11 Short-term to external debt stocks (%) 11 21 16 16 15 20 Multilateral to external debt stocks (%) 69 47 44 44 42 36 Reserves to external debt stocks (%) 40 64 55 51 58 50
Gross national income (GNI) 124,617303,897334,231365,626389,379438,175
(US$ million, unless otherwise indicated)
Summary external debt data, by debtor type
2010 2017 2018 2019 2020 2021
Total external debt stocks 28,41239,58438,76840,73441,79241,654
Use of IMF credit and SDR allocations 4,063 525 513 510 5311,430 of which: SDR allocations 568 525 513 510 5311,430
Long-term external debt 12,48629,33528,72930,02631,18029,859
Public and publicly guaranteed sector 8,01420,98819,98819,51120,27019,979
Public sector 8,01420,98819,98819,51120,27019,979 of which: General government 6,55416,72716,89417,13218,57318,143 Private sector guaranteed by public sector Private sector not guaranteed 4,4718,3468,74110,51410,9109,880 Short-term external debt 11,8649,7259,52610,19910,08210,365
Disbursements (long-term)
3,8105,8113,7434,1064,0991,691
Public and publicly guaranteed sector 2,6794,3492,6731,9963,5331,691 Public sector 2,6794,3492,6731,9963,5331,691 of which: General government 2,5624,0392,3671,6563,1571,187 Private sector guaranteed by public sector Private sector not guaranteed 1,1321,4621,0702,111 566
Principal repayments (long-term)
1,2653,0304,1302,9002,8812,968
Public and publicly guaranteed sector 4631,6803,4552,5632,7121,938 Public sector 4631,6803,4552,5632,7121,938 of which: General government 1161,0291,9981,5121,6301,610 Private sector guaranteed by public sector Private sector not guaranteed 8021,350 675 338 1691,030
Interest payments (long-term) 2081,1101,2881,3071,2821,240
Public and publicly guaranteed sector 128 8681,0221,015 892 853 Public sector 128 8681,0221,015 892 853 of which: General government 107 688 789 817 765 785 Private sector guaranteed by public sector Private sector not guaranteed 80 241 265 292 391 387
Long-term external debt stocks 12,48629,33528,72930,02631,18029,859
Public and publicly guaranteed debt from: 8,01420,98819,98819,51120,27019,979 Official creditors 5,72915,97416,49516,59516,71016,437
Multilateral 2953,9423,8103,4803,5953,678 of which: World Bank 291 822 905 948 9551,002 Bilateral 5,43412,03212,68513,11513,11512,759
Private creditors 2,2865,0143,4932,9163,5603,543 Bondholders 1,0192,2002,0002,1623,5213,519 Commercial banks and others 1,2662,8141,493 755 39 23
Private nonguaranteed debt from: 4,4718,3468,74110,51410,9109,880 Bondholders 368 367 Commercial banks and others 4,4718,3468,74110,51410,5429,512
Use of IMF credit and SDR allocations 4,063 525 513 510 5311,430
Net debt inflows
Use of IMF credit 668 Long-term 2,5452,780 -3881,2061,218-1,277
Official creditors 1,4701,812 727 15 151 -234 Multilateral 34 563 -124 -329 82 134 of which: World Bank 36 98 83 39 -10 68 Bilateral 1,4371,249 851 344 69 -368 Private creditors 1,075 968-1,1151,1911,067-1,043 Bondholders 1,0001,400 -200 1541,759 0 Banks and others 75 -432 -9151,036 -692-1,043 Short-term 2,786 -897 -199 672 -112 283
Net equity inflows
Foreign direct investment 1,3481,0681,3901,0931,3081,053 Portfolio equity 1 6 4 7 1 -4
External debt stocks to exports (%) 95 106 89 94 110 83
External debt stocks to GNI (%) 51 75 67 65 72 63
Debt service to exports (%) 6 12 13 10 11 9 Short-term to external debt stocks (%) 42 25 25 25 24 25 Multilateral to external debt stocks (%) 1 10 10 9 9 9 Reserves to external debt stocks (%) 12 14 13 17 11 13 Gross national income (GNI) 56,06052,67157,86162,49957,86265,619
(US$ million, unless otherwise indicated)
Total external debt stocks
2010 2017 2018 2019 2020 2021
1,3041,3391,3491,3781,5261,450
Use of IMF credit and SDR allocations 35 25 25 25 26 61 of which: SDR allocations 28 25 25 25 26 61
Long-term external debt 1,2621,3091,3201,3491,4921,380
Public and publicly guaranteed sector 1,0191,2311,2601,2861,4081,276 Public sector 1,0191,2311,2601,2861,4081,276 of which: General government 1,0011,2151,2261,2441,3631,219
Private sector guaranteed by public sector 0 Private sector not guaranteed 243 78 61 63 84 103 Short-term external debt 7 5 4 4 8 10
Disbursements (long-term) 39 107 77 79 153 482
Public and publicly guaranteed sector 32 98 71 70 146 458 Public sector 32 98 71 70 146 458 of which: General government 32 91 53 60 141 442 Private sector guaranteed by public sector 0 Private sector not guaranteed 7 9 6 9 7 24
Principal repayments (long-term) 69 57 65 50 45 599
Public and publicly guaranteed sector 49 44 42 44 43 597 Public sector 49 44 42 44 43 597 of which: General government 42 44 41 41 42 593 Private sector guaranteed by public sector 0 Private sector not guaranteed 20 12 22 6 2 2
Interest payments (long-term) 58 48 49 54 34 19
Public and publicly guaranteed sector 47 42 43 50 32 17 Public sector 47 42 43 50 32 17 of which: General government 46 41 43 48 30 14 Private sector guaranteed by public sector 0 Private sector not guaranteed 11 6 6 4 2 3
Long-term external debt stocks 1,2621,3091,3201,3491,4921,380
Public and publicly guaranteed debt from: 1,0191,2311,2601,2861,4081,276
Official creditors 425 679 706 734 821 872 Multilateral 254 336 348 368 429 485 of which: World Bank 13 16 19 19 28 38 Bilateral 171 344 358 366 392 387 Private creditors 594 552 554 552 587 404 Bondholders 21 527 527 527 563 17 Commercial banks and others 573 25 27 25 24 387 Private nonguaranteed debt from: 243 78 61 63 84 103 Bondholders Commercial banks and others 243 78 61 63 84 103
Use of IMF credit and SDR allocations 35 25 25 25 26 61
Net debt inflows
Use of IMF credit 0
Long-term -30 50 13 28 108 -117 Official creditors -7 28 27 28 87 51 Multilateral 4 18 13 19 61 57 of which: World Bank -5 0 2 0 9 10 Bilateral -11 10 14 8 26 -6 Private creditors -23 22 -14 0 21 -168 Bondholders 17 -553 Banks and others -23 22 -14 0 3 385
Short-term 0 0 0 0 0 0
Foreign direct investment 94 32 122 94 76 130 Portfolio equity 0 0 0 0 0 0
External debt stocks to exports (%) 156 129 125 124 211 138
External debt stocks to GNI (%) 104 78 78 77 100 85 Debt service to exports (%) 15 10 11 9 11 59 Short-term to external debt stocks (%) 1 0 0 0 1 1 Multilateral to external debt stocks (%) 19 25 26 27 28 33 Reserves to external debt stocks (%) 17 23 22 20 23 29
Gross national income (GNI)
1,2491,7201,7311,7821,5271,706
(US$ million, unless otherwise indicated)
Total external debt stocks
2010 2017 2018 2019 2020 2021
1,5962,7993,5903,9205,3046,864
Use of IMF credit and SDR allocations 146 226 245 267 563 699 of which: SDR allocations 91 84 82 82 85 249
Long-term external debt 1,1122,5113,2993,6034,4595,828
Public and publicly guaranteed sector 1,1122,5113,2993,6034,4595,828 Public sector 1,1122,5113,2993,6034,4595,828 of which: General government 1,1122,5113,2993,6034,4595,828
Private sector guaranteed by public sector Private sector not guaranteed
Short-term external debt 339 62 46 50 283 336
Disbursements (long-term) 175 3901,061 761 6722,289 Public and publicly guaranteed sector 175 3901,061 761 6722,289 Public sector 175 3901,061 761 6722,289 of which: General government 175 3901,061 761 6722,289 Private sector guaranteed by public sector Private sector not guaranteed
Principal repayments (long-term) 26 54 170 416 99 621 Public and publicly guaranteed sector 26 54 170 416 99 621 Public sector 26 54 170 416 99 621 of which: General government 26 54 170 416 99 621 Private sector guaranteed by public sector Private sector not guaranteed
Interest payments (long-term) 13 33 40 77 111 105
Public and publicly guaranteed sector 13 33 40 77 111 105 Public sector 13 33 40 77 111 105 of which: General government 13 33 40 77 111 105 Private sector guaranteed by public sector Private sector not guaranteed
Long-term external debt stocks 1,1122,5113,2993,6034,4595,828
Public and publicly guaranteed debt from: 1,1122,5113,2993,6034,4595,828 Official creditors 1,1122,4702,4842,5393,1993,327
Multilateral 9372,0502,0322,1002,6722,718 of which: World Bank 383 914 9841,0821,3091,369 Bilateral 175 420 452 439 528 609
Private creditors 41 8151,0641,2592,501 Bondholders 557 6141,898 Commercial banks and others 41 815 508 646 603
Private nonguaranteed debt from: Bondholders Commercial banks and others Use of IMF credit and SDR allocations 146 226 245 267 563 699
Net debt inflows
Use of IMF credit 16 28 24 24 275 -14
Long-term 149 336 892 345 5731,668
Official creditors 149 297 91 82 483 269 Multilateral 137 249 42 88 422 188 of which: World Bank 78 102 93 104 162 121 Bilateral 12 48 49 -6 61 81
Private creditors 39 801 263 901,399 Bondholders 555 5 1,392 Banks and others 39 801 -291 85 7
Short-term 134 9 -15 38 233 54
Foreign direct investment -26 44 -14 102 101 242 Portfolio equity 5 18 0 -8 0
External debt stocks to exports (%) 93 82 91 106 143 172
External debt stocks to GNI (%) 17 22 25 28 34 39 Debt service to exports (%) 3 3 6 14 6 19 Short-term to external debt stocks (%) 21 2 1 1 5 5 Multilateral to external debt stocks (%) 59 73 57 54 50 40 Reserves to external debt stocks (%) 75
Gross national income (GNI) 9,48212,56114,10614,24815,48917,600
(US$ million, unless otherwise indicated)
2010 2017 2018 2019 2020 2021
Total external debt stocks 9352,6082,5522,7043,0373,069
Use of IMF credit and SDR allocations 9 9 8 8 9 36 of which: SDR allocations 9 9 8 8 9 36
Long-term external debt 9192,5962,5392,6683,0273,031
Public and publicly guaranteed sector 9192,5412,4842,6162,9852,987 Public sector 9192,5412,4842,6162,9852,987 of which: General government 8522,4312,3842,5052,8772,881 Private sector guaranteed by public sector
Private sector not guaranteed 56 55 51 41 44
Short-term external debt 6 3 4 28 1 3
Disbursements (long-term) 178 220 168 198 408 139
Public and publicly guaranteed sector 178 220 168 198 408 136 Public sector 178 220 168 198 408 136 of which: General government 178 220 168 185 408 136 Private sector guaranteed by public sector Private sector not guaranteed 1 3
Principal repayments (long-term)
47 46 51 28 37 73
Public and publicly guaranteed sector 47 42 51 24 27 73 Public sector 47 42 51 24 27 73 of which: General government 47 42 51 24 27 72 Private sector guaranteed by public sector Private sector not guaranteed 5 1 5 10
Interest payments (long-term) 41 36 36 32 21 45
Public and publicly guaranteed sector 41 34 34 31 20 43 Public sector 41 34 34 31 20 43 of which: General government 37 29 29 23 14 38 Private sector guaranteed by public sector Private sector not guaranteed 2 2 1 1 2
Long-term external debt stocks 9192,5962,5392,6683,0273,031 Public and publicly guaranteed debt from: 9192,5412,4842,6162,9852,987 Official creditors 8992,5052,4552,5922,9642,971
Multilateral 330 532 563 646 789 830 of which: World Bank 112 219 244 271 337 353 Bilateral 5681,9731,8921,9462,1742,141 Private creditors 21 35 29 24 22 16
Bondholders
Commercial banks and others 21 35 29 24 22 16 Private nonguaranteed debt from: 56 55 51 41 44 Bondholders Commercial banks and others 56 55 51 41 44
Use of IMF credit and SDR allocations 9 9 8 8 9 36
Net debt inflows
Use of IMF credit
Long-term 131 174 117 170 371 66
Official creditors 115 183 122 179 385 68 Multilateral 44 48 41 85 118 60 of which: World Bank 0 30 30 29 52 26 Bilateral 72 134 81 93 267 8 Private creditors 16 -9 -5 -9 -15 -2
Bondholders
Banks and others 16 -9 -5 -9 -15 -2 Short-term 1 3 1 23 -26 1
Foreign direct investment 20 -1 3 13 -1 7 Portfolio equity 0 0 0 0 0
External debt stocks to exports (%) 154 349 311 332 372 402
External debt stocks to GNI (%) 64 117 115 117 140
Debt service to exports (%) 14 11 11 8 7 16
Short-term to external debt stocks (%) 1 0 0 1 0 0 Multilateral to external debt stocks (%) 35 20 22 24 26 27 Reserves to external debt stocks (%) 107 46 39 45 48 33 Gross national income (GNI) 1,4602,2382,2272,3062,173
(US$ million, unless otherwise indicated)
Summary external debt data, by debtor type
Total external debt stocks
2010 2017 2018 2019 2020 2021
5,77712,99013,24814,30115,42015,964
Use of IMF credit and SDR allocations 253 234 228 227 582 552 of which: SDR allocations 253 234 228 227 236 552
Long-term external debt 5,18712,48612,31713,43714,26014,653
Public and publicly guaranteed sector 2,8309,1519,90511,00011,87712,281
Public sector 2,8299,1519,90511,00011,87712,281 of which: General government 2,5639,1269,88410,98211,86112,268
Private sector guaranteed by public sector 1 Private sector not guaranteed 2,3583,3362,4122,4372,3832,372 Short-term external debt 336 270 703 637 577 759
Disbursements (long-term) 5482,6611,3731,7411,4451,226
Public and publicly guaranteed sector 5182,3901,1981,5141,2441,226 Public sector 5172,3901,1981,5141,2441,226 of which: General government 4532,3901,1981,5141,2441,226 Private sector guaranteed by public sector 1 Private sector not guaranteed 30 271 176 227 201
Principal repayments (long-term) 569 688 640 658 764 772
Public and publicly guaranteed sector 247 331 360 412 458 761 Public sector 247 331 360 412 458 761 of which: General government 241 328 356 409 456 758 Private sector guaranteed by public sector 0 Private sector not guaranteed 322 357 280 246 306 11
Interest payments (long-term) 76 283 346 400 391 332
Public and publicly guaranteed sector 54 250 316 371 363 307 Public sector 54 250 316 371 363 307 of which: General government 51 250 316 371 363 306 Private sector guaranteed by public sector 0 Private sector not guaranteed 22 33 30 28 29 26
Long-term external debt stocks 5,18712,48612,31713,43714,26014,653
Public and publicly guaranteed debt from: 2,8309,1519,90511,00011,87712,281 Official creditors 2,8067,1417,8978,9599,81810,181 Multilateral 2,2856,1566,7107,4678,2488,631 of which: World Bank 355 830 847 9271,3001,416 Bilateral 521 9851,1871,4921,5691,550
Private creditors 242,0102,0082,0412,0602,100 Bondholders ..2,0002,0002,0002,0002,000 Commercial banks and others 24 10 8 41 60 100 Private nonguaranteed debt from: 2,3583,3362,4122,4372,3832,372 Bondholders Commercial banks and others 2,3583,3362,4122,4372,3832,372
Use of IMF credit and SDR allocations 253 234 228 227 582 552
Net debt inflows
Use of IMF credit 334 -342 Long-term -21 1,973 7331,083 681 454
Official creditors 3381,060 8401,070 771 418 Multilateral 305 826 613 756 748 412 of which: World Bank 44 19 37 84 344 137 Bilateral 33 235 227 314 23 6 Private creditors -359 913 -106 13 -90 35 Bondholders ..1,000 0 0 0 0 Banks and others -359 -87 -106 13 -90 35 Short-term 32 -205 433 -66 -60 182
Net equity inflows
Foreign direct investment 774 706 220 -190-1,121 593 Portfolio equity 0 30 24 13 -2 4
External debt stocks to exports (%) 83 133 125 137 206 139 External debt stocks to GNI (%) 31 36 34 36 43 41 Debt service to exports (%) 9 10 10 10 16 13 Short-term to external debt stocks (%) 6 2 5 4 4 5 Multilateral to external debt stocks (%) 40 47 51 52 53 54 Reserves to external debt stocks (%) 141 65 54 31 17 14
Gross national income (GNI) 18,76136,39939,31240,04836,21339,358
(US$ million, unless otherwise indicated)
2010 2017 2018 2019 2020 2021
Total external debt stocks 14,28913,02912,93612,70313,86612,986
Use of IMF credit and SDR allocations 769 592 466 398 7961,115 of which: SDR allocations 248 229 224 222 232 581
Long-term external debt 12,37212,1519,5029,50010,0819,164
Public and publicly guaranteed sector 3,7334,8374,9194,8765,2075,058 Public sector 3,7334,8374,9194,8765,2075,058 of which: General government 3,7274,4254,5234,5314,8454,989 Private sector guaranteed by public sector 0 Private sector not guaranteed 8,6387,3144,5844,6244,8754,106 Short-term external debt 1,149 2862,9672,8052,9882,707
Disbursements (long-term)
5662,3924,065 9421,1261,229
Public and publicly guaranteed sector 441 310 600 409 403 862 Public sector 441 310 600 409 403 862 of which: General government 441 295 559 391 403 860 Private sector guaranteed by public sector 0 Private sector not guaranteed 1252,0823,465 533 723 367
Principal repayments (long-term) 373 8891,034 895 7071,337
Public and publicly guaranteed sector 145 304 340 384 381 410 Public sector 145 304 340 384 381 410 of which: General government 145 286 301 322 368 396 Private sector guaranteed by public sector Private sector not guaranteed 227 585 694 512 327 926
Interest payments (long-term) 177 231 122 117 106 87
Public and publicly guaranteed sector 55 63 77 80 82 68 Public sector 55 63 77 80 82 68 of which: General government 55 61 75 77 80 67 Private sector guaranteed by public sector Private sector not guaranteed 121 167 46 38 25 19
Long-term external debt stocks 12,37212,1519,5029,50010,0819,164
Public and publicly guaranteed debt from: 3,7334,8374,9194,8765,2075,058 Official creditors 3,2554,6684,5964,5904,9284,494
Multilateral 2,4163,7653,7243,7374,0243,697 of which: World Bank 1,6261,5721,6101,5841,6701,586 Bilateral 840 903 872 853 904 797
Private creditors 478 169 322 286 278 564 Bondholders 273 89 256 231 229 526 Commercial banks and others 204 80 66 55 50 37 Private nonguaranteed debt from: 8,6387,3144,5844,6244,8754,106 Bondholders Commercial banks and others 8,6387,3144,5844,6244,8754,106
Use of IMF credit and SDR allocations 769 592 466 398 7961,115
Net debt inflows
Use of IMF credit 237 -218 -114 -66 369 -15
Long-term 1941,5033,031 47 419 -107
Official creditors 319 59 94 55 53 132 Multilateral 278 27 96 63 58 182 of which: World Bank 123 -36 81 -12 1 -10 Bilateral 41 33 -3 -8 -5 -50
Private creditors -1251,4432,937 -8 365 -239 Bondholders -25 -21 176 -21 -21 329 Banks and others -1011,4642,761 12 386 -568 Short-term -308 -3622,682 -162 184 -281
Foreign direct investment 149 463 618 362 4251,315 Portfolio equity 0 5 -2 1 4 -6
External debt stocks to exports (%) 251 163 140 143 186 123 External debt stocks to GNI (%) 82 73 64 63 70 58 Debt service to exports (%) 10 17 15 12 11 14 Short-term to external debt stocks (%) 8 2 23 22 22 21 Multilateral to external debt stocks (%) 17 29 29 29 29 28 Reserves to external debt stocks (%) 31 49 52 56 61 72
Gross national income (GNI) 17,45617,92720,06020,13519,78322,360
(US$ million, unless otherwise indicated)
Total external debt stocks
2010 2017 2018 2019 2020 2021
1,8071,7411,7821,5651,5971,982
Use of IMF credit and SDR allocations 88 82 80 79 83 345 of which: SDR allocations 88 82 80 79 83 345
Long-term external debt 1,3581,5521,4511,3461,2971,481
Public and publicly guaranteed sector 1,3581,5521,4511,3341,2781,466
Public sector 1,3581,5521,4511,3341,2781,466 of which: General government 1,3501,5381,4471,3341,2381,386
Private sector guaranteed by public sector Private sector not guaranteed 0 12 19 14
Short-term external debt 360 108 251 139 218 156
Disbursements (long-term) 17 12 47 48 90 336
Public and publicly guaranteed sector 17 12 47 26 74 329 Public sector 17 12 47 26 74 329 of which: General government 17 12 47 26 33 290 Private sector guaranteed by public sector Private sector not guaranteed 22 16 7
Principal repayments (long-term) 58 144 144 152 147 145
Public and publicly guaranteed sector 58 144 144 141 138 135 Public sector 58 144 144 141 138 135 of which: General government 54 135 135 137 138 135 Private sector guaranteed by public sector Private sector not guaranteed 10 10 10
Interest payments (long-term) 18 29 31 40 32 14
Public and publicly guaranteed sector 18 29 31 40 31 14 Public sector 18 29 31 40 31 14 of which: General government 17 29 31 40 31 13 Private sector guaranteed by public sector Private sector not guaranteed 1 1 0
Long-term external debt stocks 1,3581,5521,4511,3461,2971,481 Public and publicly guaranteed debt from: 1,3581,5521,4511,3341,2781,466 Official creditors 1,3571,5381,4471,3341,2781,466 Multilateral 1,2191,4761,3891,2871,2421,443 of which: World Bank 11 151 174 172 194 470 Bilateral 138 63 58 47 37 24
Private creditors 1 13 4 0
Bondholders
Commercial banks and others 1 13 4 0 Private nonguaranteed debt from: 0 12 19 14 Bondholders
Commercial banks and others 0 12 19 14 Use of IMF credit and SDR allocations 88 82 80 79 83 345
Net debt inflows
Use of IMF credit
Long-term -41 -132 -97 -104 -57 192
Official creditors -40 -123 -88 -111 -63 195 Multilateral -27 -118 -84 -100 -51 206 of which: World Bank 6 -7 22 -2 22 276 Bilateral -13 -5 -4 -11 -12 -11 Private creditors -1 -9 -9 8 6 -3 Bondholders
Banks and others -1 -9 -9 8 6 -3
Short-term 202 -271 143 -112 79 -62
Foreign direct investment 222 243 164 -172 -178 -183 Portfolio equity -64 -47 -47 35 -19 72
External debt stocks to exports (%) 32 24 23 24 32 25
External debt stocks to GNI (%) 15 12 12 10 11 12
Debt service to exports (%) 1 2 2 3 4 2 Short-term to external debt stocks (%) 20 6 14 9 14 8 Multilateral to external debt stocks (%) 67 85 78 82 78 73 Reserves to external debt stocks (%) 436 430 374 394 309 242
Gross national income (GNI) 12,14714,72215,33015,82014,68116,658
Summary external debt data, by debtor type
Total external debt stocks
352,364543,000557,743568,690549,263606,485
Use of IMF credit and SDR allocations 4,4464,1124,0153,9924,15818,853 of which: SDR allocations 4,4464,1124,0153,9924,15818,853
Long-term external debt 282,426486,480486,883485,518476,122508,879
Public and publicly guaranteed sector 97,486181,161190,193193,782194,266200,522 Public sector 94,425179,675189,132192,792193,379198,786 of which: General government 67,30070,02670,44974,61279,45078,888 Private sector guaranteed by public sector 3,0611,4851,061 989 8871,736 Private sector not guaranteed 184,940305,320296,690291,737281,856308,357
Short-term external debt 65,49252,40866,84479,17968,98378,753
Disbursements (long-term)
85,37996,730105,059114,564126,746156,031
Public and publicly guaranteed sector 19,95730,31528,81023,88439,47616,624 Public sector 19,06330,18828,67623,69839,37015,573 of which: General government 9,1557,0944,6558,9228,2977,089 Private sector guaranteed by public sector 894 128 134 186 1061,051 Private sector not guaranteed 65,42266,41576,24990,68087,270139,408
Principal repayments (long-term) 32,02675,66874,509123,460109,827125,913
Public and publicly guaranteed sector 9,62823,21828,43330,50123,16413,988 Public sector 9,20922,71827,87630,24922,95413,787 of which: General government 7,9648,4503,6454,6723,4617,034
Private sector guaranteed by public sector 419 500 557 252 210 201
Private sector not guaranteed 22,39852,45046,07792,95886,663111,924
Interest payments (long-term) 13,15718,46718,68125,70119,05528,689
Public and publicly guaranteed sector 5,1726,6965,67911,3847,7638,519 Public sector 5,0816,6395,63011,3447,7308,476 of which: General government 4,2553,3483,1863,5482,9922,793 Private sector guaranteed by public sector 91 57 49 40 33 43 Private sector not guaranteed 7,98511,77113,00214,31711,29220,169
Long-term external debt stocks 282,426486,480486,883485,518476,122508,879
Public and publicly guaranteed debt from: 97,486181,161190,193193,782194,266200,522 Official creditors 41,55348,32747,86043,21644,00043,863
Multilateral 29,98032,67833,38633,26633,71534,502 of which: World Bank 13,52316,39016,21316,25315,68215,419 Bilateral 11,57315,65014,4749,95010,2859,361
Private creditors 55,933132,833142,333150,565150,266156,659 Bondholders 46,80644,87441,97943,50447,88545,020 Commercial banks and others 9,12787,959100,355107,062102,381111,639
Private nonguaranteed debt from: 184,940305,320296,690291,737281,856308,357 Bondholders 83,03248,02632,68637,55335,90348,157 Commercial banks and others 101,908257,294264,004254,184245,953260,200
Use of IMF credit and SDR allocations 4,4464,1124,0153,9924,15818,853
Use of IMF credit
Long-term 53,35321,06230,550-8,89516,91930,119
Official creditors 8,6417,140 -358-4,682 508 283 Multilateral 5,049 633 787 -105 516 867 of which: World Bank 3,512 159 -114 43 -569 -262 Bilateral 3,5926,506-1,144-4,577 -8 -584
Private creditors 44,71213,92230,907-4,21316,41229,836 Bondholders 29,391 -6431,287 -5243,7429,567 Banks and others 15,32114,56529,620-3,68912,67020,269
Short-term 25,706-4,79814,44012,335-10,1969,770
Net equity inflows
Foreign direct investment 68,92063,99957,32263,63133,57746,470 Portfolio equity 37,6715,674-3,062-1,810-5,2065,069
External debt stocks to exports (%) 141 197 194 199 212 175
External debt stocks to GNI (%) 16 27 30 31 39 39
Debt service to exports (%) 18 35 33 53 50 45
Short-term to external debt stocks (%) 19 10 12 14 13 13
Multilateral to external debt stocks (%) 9 6 6 6 6 6 Reserves to external debt stocks (%) 81 68 67 62 64 58
Gross national income (GNI) 2,138,5932,020,3451,858,1101,816,0171,410,3021,558,511
(US$ million, unless otherwise indicated)
Summary external debt data, by debtor type
Total external debt stocks
2010 2017 2018 2019 2020 2021
50,69740,98940,10340,50146,90644,943
Use of IMF credit and SDR allocations 941 870 850 845 8802,057 of which: SDR allocations 941 870 850 845 8802,057
Long-term external debt 34,61330,58329,70829,76234,15134,417
Public and publicly guaranteed sector 4,84511,63011,50611,18615,48615,519
Public sector 4,84511,63011,50611,18615,48615,519 of which: General government 4,09210,42410,41910,19514,49213,896
Private sector guaranteed by public sector Private sector not guaranteed 29,76818,95318,20218,57618,66518,898
Short-term external debt 15,1439,5369,5469,89511,8768,468
Disbursements (long-term)
1,6205,4455,0524,5547,9086,158
Public and publicly guaranteed sector 250 312 917 1503,2751,486 Public sector 250 312 917 1503,2751,486 of which: General government 232 46 892 1503,275 669 Private sector guaranteed by public sector Private sector not guaranteed 1,3705,1324,1354,4054,6334,672
Principal repayments (long-term)
3,5506,8445,0554,2863,9194,680
Public and publicly guaranteed sector 2681,355 300 256 266 261 Public sector 2681,355 300 256 266 261 of which: General government 1861,294 203 179 186 184 Private sector guaranteed by public sector Private sector not guaranteed 3,2825,4894,7544,0293,6534,418
Interest payments (long-term) 6091,7131,3881,1801,0211,166
Public and publicly guaranteed sector 180 304 269 276 280 313 Public sector 180 304 269 276 280 313 of which: General government 160 290 253 261 265 299 Private sector guaranteed by public sector Private sector not guaranteed 4301,4081,118 904 741 854
Long-term external debt stocks 34,61330,58329,70829,76234,15134,417
Public and publicly guaranteed debt from: 4,84511,63011,50611,18615,48615,519 Official creditors 3,2103,6643,2093,0423,4003,685
Multilateral 2,3883,3392,9622,8303,2123,549 of which: World Bank 1,3381,148 831 727 701 575 Bilateral 822 325 247 211 187 136
Private creditors 1,6357,9678,2978,14412,08711,834 Bondholders 1,6187,9608,2868,13011,94811,708 Commercial banks and others 17 7 11 14 138 127
Private nonguaranteed debt from: 29,76818,95318,20218,57618,66518,898 Bondholders 1341,6861,4051,4891,4651,546 Commercial banks and others 29,63517,26716,79717,08617,20017,351
Use of IMF credit and SDR allocations 941 870 850 845 8802,057
Net debt inflows
Use of IMF credit
Long-term -1,930-1,399 -2 2683,9881,478
Official creditors -12 31 -96 -111 78 516 Multilateral 42 -14 -20 -74 114 552 of which: World Bank -70 -80 -60 -87 -85 -75 Bilateral -53 45 -76 -36 -36 -36
Private creditors -1,919-1,430 94 3793,911 962 Bondholders -941 560 862,735 741 Banks and others -1,919 -488 -466 2941,176 221 Short-term -2,654 897 -113 2601,789-3,432
Net equity inflows
Foreign direct investment 1,642 9641,8591,1121,9732,052 Portfolio equity -1 -110 49 -91 -166 -106
Debt ratios
External debt stocks to exports (%) 194 99 89 89 113 83
External debt stocks to GNI (%) 102 71 62 60 68 58
Debt service to exports (%) 16 21 15 13 12 11 Short-term to external debt stocks (%) 30 23 24 24 25 19
Multilateral to external debt stocks (%) 5 8 7 7 7 8 Reserves to external debt stocks (%) 30 65 67 64 75 82
Gross national income (GNI) 49,62857,86764,21466,96968,56078,140
(US$ million, unless otherwise indicated)
Total external debt stocks
2010 2017 2018 2019 2020 2021
4,80012,76810,6219,1579,75710,297
Use of IMF credit and SDR allocations 217 284 269 310 466 586 of which: SDR allocations 89 82 80 80 83 242
Long-term external debt 4,58212,48410,3528,8479,2919,711
Public and publicly guaranteed sector 1,9602,8733,0413,3724,0204,329 Public sector 1,9602,8733,0413,3724,0204,329 of which: General government 1,9352,8413,0163,3524,0014,313
Private sector guaranteed by public sector Private sector not guaranteed 2,6229,6117,3115,4755,2715,382 Short-term external debt 0 0 0 0 0 0
Disbursements (long-term) 1,3921,448 344 4632,0851,046
Public and publicly guaranteed sector 286 183 344 463 524 625 Public sector 286 183 344 463 524 625 of which: General government 278 183 344 463 524 625 Private sector guaranteed by public sector Private sector not guaranteed 1,1061,265 ..1,560 421
Principal repayments (long-term) 2931,0442,3841,9331,864 412 Public and publicly guaranteed sector 31 83 84 98 100 102 Public sector 31 83 84 98 100 102 of which: General government 30 78 78 93 98 102 Private sector guaranteed by public sector Private sector not guaranteed 262 9612,3001,8361,764 310
Interest payments (long-term) 149 514 582 348 274 55
Public and publicly guaranteed sector 18 33 32 32 36 41 Public sector 18 33 32 32 36 41 of which: General government 18 32 31 31 36 41 Private sector guaranteed by public sector Private sector not guaranteed 131 481 550 316 238 14
Long-term external debt stocks 4,58212,48410,3528,8479,2919,711 Public and publicly guaranteed debt from: 1,9602,8733,0413,3724,0204,329 Official creditors 1,9192,8573,0283,3604,0094,318 Multilateral 1,6112,5072,6703,0083,5493,835 of which: World Bank 7761,3341,4581,6732,0142,146 Bilateral 308 351 358 351 460 482 Private creditors 41 16 14 12 10 11 Bondholders Commercial banks and others 41 16 14 12 10 11 Private nonguaranteed debt from: 2,6229,6117,3115,4755,2715,382 Bondholders Commercial banks and others 2,6229,6117,3115,4755,2715,382
Use of IMF credit and SDR allocations 217 284 269 310 466 586
Net debt inflows
Use of IMF credit 20 -18 -9 42 139 -29 Long-term 1,100 404-2,040-1,471 221 634
Official creditors 241 103 262 367 427 523 Multilateral 230 129 246 370 341 487 of which: World Bank 67 78 166 228 230 239 Bilateral 10 -26 16 -3 86 36
Private creditors 859 301-2,302-1,837 -206 111 Bondholders Banks and others 859 301-2,302-1,837 -206 111 Short-term 0 0 0 0 0 0
Foreign direct investment -32 93 242 234 343 137 Portfolio equity 3 28 31 29 31
External debt stocks to exports (%) 242 325 224 196 174 168 External debt stocks to GNI (%) 49 94 69 60 59 55
Debt service to exports (%) 22 40 63 49 39 8
Short-term to external debt stocks (%) 0 0 0 0 0 0 Multilateral to external debt stocks (%) 34 20 25 33 36 37 Reserves to external debt stocks (%) 22 Gross national income (GNI) 9,80813,57715,38815,32616,66518,718
(US$ million, unless otherwise indicated)
Summary external debt data, by debtor type
2010 2017 2018 2019 2020 2021
Total external debt stocks 620.9606.8585.0622.2657.1966.4
Use of IMF credit and SDR allocations 223.4188.1166.4149.1132.4399.9 of which: SDR allocations 113.7105.2102.7102.1106.4309.9
Long-term external debt 381.8418.5418.4472.8524.5566.2
Public and publicly guaranteed sector 381.8418.5418.4472.8524.5566.2 Public sector 381.8418.5418.4472.8524.5566.2 of which: General government 380.5407.3407.1439.3489.5508.1 Private sector guaranteed by public sector Private sector not guaranteed
Short-term external debt 15.7 0.3 0.3 0.3 0.3 0.3
Disbursements (long-term)
31.6 5.2 14.2 73.8 48.6 60.4
Public and publicly guaranteed sector 31.6 5.2 14.2 73.8 48.6 60.4 Public sector 31.6 5.2 14.2 73.8 48.6 60.4 of which: General government 31.6 5.2 14.2 51.4 48.6 33.8 Private sector guaranteed by public sector Private sector not guaranteed
Principal repayments (long-term)
2.4 8.0 9.1 18.3 10.3 13.0
Public and publicly guaranteed sector 2.4 8.0 9.1 18.3 10.3 13.0 Public sector 2.4 8.0 9.1 18.3 10.3 13.0 of which: General government 2.4 8.0 9.1 18.1 9.8 12.5
Private sector guaranteed by public sector Private sector not guaranteed
Interest payments (long-term)
1.4 2.4 3.1 4.4 3.9 5.7
Public and publicly guaranteed sector 1.4 2.4 3.1 4.4 3.9 5.7 Public sector 1.4 2.4 3.1 4.4 3.9 5.7 of which: General government 1.4 2.4 3.0 4.3 3.7 5.5
Private sector guaranteed by public sector Private sector not guaranteed
Long-term external debt stocks 381.8418.5418.4472.8524.5566.2 Public and publicly guaranteed debt from: 381.8418.5418.4472.8524.5566.2 Official creditors 381.8418.5418.4472.8524.5566.2
Multilateral 325.1319.2313.7342.2353.2380.0 of which: World Bank 162.7148.2141.5137.5139.9132.1 Bilateral 56.7 99.3104.6130.5171.3186.2
Private creditors
Bondholders Commercial banks and others Private nonguaranteed debt from: Bondholders Commercial banks and others Use of IMF credit and SDR allocations 223.4188.1166.4149.1132.4399.9
Net debt inflows
Use of IMF credit 20.1 -16.6 -17.6 -16.2 -22.2 65.9
Long-term 29.1 -2.8 5.1 55.5 38.3 47.4 Official creditors 29.1 -2.8 5.1 55.5 38.3 47.4 Multilateral 29.1 -2.6 -1.1 29.3 0.0 33.8 of which: World Bank 17.8 -3.2 -3.3 -3.2 -3.2 -3.9 Bilateral -0.2 6.2 26.2 38.4 13.6
Private creditors
Bondholders
Banks and others
Short-term 8.0 0.0 0.0 0.0 0.0 0.0
Net equity inflows
Foreign direct investment 0.8 0.3 1.0 1.0 8.5 7.9
Portfolio equity
Debt ratios
External debt stocks to exports (%) 341.4213.6193.8202.5226.0
External debt stocks to GNI (%) 30.7 22.4 21.9 24.0 23.5 33.2
Debt service to exports (%) 2.4 9.6 9.9 13.0 12.6
Short-term to external debt stocks (%) 2.5 0.0 0.0 0.0 0.0 0.0
Multilateral to external debt stocks (%) 52.4 52.6 53.6 55.0 53.8 39.3
Reserves to external debt stocks (%) 53.3 15.8 11.4 17.7 13.5 27.4
Gross national income (GNI) 2,021.32,713.82,665.82,588.72,795.12,910.1
(US$ million, unless otherwise indicated)
2010 2017 2018 2019 2020 2021
Total external debt stocks 8851,7901,7671,8212,0712,060
Use of IMF credit and SDR allocations 23 13 13 13 47 78 of which: SDR allocations 14 13 13 13 13 45
Long-term external debt 8621,7771,7551,8082,0241,982
Public and publicly guaranteed sector 8621,7771,7551,8082,0241,982
Public sector 8621,7741,7521,8072,0231,982 of which: General government 8621,7741,7521,8072,0231,982
Private sector guaranteed by public sector 3 3 2 1 0 Private sector not guaranteed
Short-term external debt 0 0 0 0 0 0
Disbursements (long-term) 203 112 75 118 124 115
Public and publicly guaranteed sector 203 112 75 118 124 115 Public sector 203 112 75 118 124 115 of which: General government 203 112 75 118 124 115 Private sector guaranteed by public sector Private sector not guaranteed
Principal repayments (long-term) 25 33 37 42 43 43
Public and publicly guaranteed sector 25 33 37 42 43 43 Public sector 25 32 37 41 42 43 of which: General government 25 32 37 41 42 43 Private sector guaranteed by public sector 0 0 1 1 1 Private sector not guaranteed
Interest payments (long-term) 8 18 19 19 17 10
Public and publicly guaranteed sector 8 18 19 19 17 10 Public sector 8 18 19 19 16 10 of which: General government 8 18 19 19 16 10 Private sector guaranteed by public sector 0 0 0 Private sector not guaranteed
Long-term external debt stocks 8621,7771,7551,8082,0241,982
Public and publicly guaranteed debt from: 8621,7771,7551,8082,0241,982 Official creditors 7781,2381,2401,3021,4661,467
Multilateral 598 812 817 8821,0141,041 of which: World Bank 303 362 351 406 482 523 Bilateral 180 427 424 419 452 425 Private creditors 84 539 514 507 558 515
Bondholders
Commercial banks and others 84 539 514 507 558 515
Private nonguaranteed debt from: Bondholders Commercial banks and others Use of IMF credit and SDR allocations 23 13 13 13 47 78
Net debt inflows
Use of IMF credit -2 33 0
Long-term 178 79 38 76 82 72
Official creditors 100 67 38 74 78 71 Multilateral 70 17 28 74 79 73 of which: World Bank 22 -6 -1 57 55 57 Bilateral 30 50 10 0 -2 -2 Private creditors 78 13 2 4 0
Bondholders
Banks and others 78 13 2 4 0 Short-term 0 0 0 0 0 0
Foreign direct investment 95 120 103 85 43 94 Portfolio equity 0 0 0 0 0 0
External debt stocks to exports (%) 137 217 177 175 470 427 External debt stocks to GNI (%) 56 105 92 94 125 108
Debt service to exports (%) 5 6 6 6 13 11 Short-term to external debt stocks (%) 0 0 0 0 0 0 Multilateral to external debt stocks (%) 68 45 46 48 49 51 Reserves to external debt stocks (%) 43 34 34 41 33 35 Gross national income (GNI) 1,5911,7091,9201,9401,6631,898
(US$ million, unless otherwise indicated)
Summary external debt data, by debtor type
Total external debt stocks
2010 2017 2018 2019 2020 2021
4,01011,42513,53315,34217,56920,020
Use of IMF credit and SDR allocations 129 120 117 116 121 352 of which: SDR allocations 129 120 117 116 121 352
Long-term external debt 3,5029,52711,05011,81413,66615,231
Public and publicly guaranteed sector 3,0606,5776,9947,5628,7649,452
Public sector 3,0606,5776,9947,5628,7649,452
of which: General government 3,0606,5776,9947,5628,7649,452
Private sector guaranteed by public sector
Private sector not guaranteed 4422,9514,0564,2524,9025,779 Short-term external debt 3791,7782,3663,4133,7824,437
Disbursements (long-term) 5961,9672,7502,0652,9403,683
Public and publicly guaranteed sector 348 657 716 8241,2111,151
Public sector 348 657 716 8241,2111,151 of which: General government 348 657 716 8241,2111,151 Private sector guaranteed by public sector Private sector not guaranteed 2481,3102,0331,2421,7292,532
Principal repayments (long-term) 33 8881,1091,2631,3441,947
Public and publicly guaranteed sector 33 140 180 218 264 292 Public sector 33 140 180 218 264 292 of which: General government 33 140 180 218 264 292 Private sector guaranteed by public sector Private sector not guaranteed 747 9281,0451,0791,654
Interest payments (long-term) 27 87 103 139 150 171
Public and publicly guaranteed sector 26 72 85 93 95 103
Public sector 26 72 85 93 95 103 of which: General government 26 72 85 93 95 103 Private sector guaranteed by public sector Private sector not guaranteed 1 15 17 47 55 67
Long-term external debt stocks 3,5029,52711,05011,81413,66615,231 Public and publicly guaranteed debt from: 3,0606,5776,9947,5628,7649,452 Official creditors 3,0606,5776,9947,5628,7649,452 Multilateral 1,5291,9381,9572,1022,6912,845 of which: World Bank 565 550 544 585 685 727 Bilateral 1,5314,6395,0375,4596,0736,607
Private creditors Bondholders Commercial banks and others Private nonguaranteed debt from: 4422,9514,0564,2524,9025,779 Bondholders 300 300 650 550 Commercial banks and others 4422,9513,7563,9524,2525,229
Use of IMF credit and SDR allocations 129 120 117 116 121 352
Net debt inflows
Use of IMF credit
Long-term 5621,0791,641 8021,5961,736
Official creditors 315 517 536 606 946 859 Multilateral 51 98 65 156 502 217 of which: World Bank 9 1 7 44 73 63 Bilateral 264 419 471 449 444 642 Private creditors 248 5621,105 196 650 878 Bondholders 300 350 -100 Banks and others 248 562 805 196 300 978 Short-term 149 51 5881,046 369 655
Net equity inflows
Foreign direct investment 1,4042,7883,2133,6633,6253,483 Portfolio equity 0 0 0 0 0 0
External debt stocks to exports (%) 66 70 71 70 84 97 External debt stocks to GNI (%) 37 55 59 60 71 78 Debt service to exports (%) 1 6 7 7 7 11 Short-term to external debt stocks (%) 9 16 17 22 22 22 Multilateral to external debt stocks (%) 38 17 14 14 15 14 Reserves to external debt stocks (%) 81 99 99 111 106 86 Gross national income (GNI) 10,72820,80022,91525,52624,86225,533
(US$ million, unless otherwise indicated)
external debt data, by debtor type
Total external debt stocks
2010 2017 2018 2019 2020 2021
3,19010,07310,94612,87214,78416,003
Use of IMF credit and SDR allocations 445 602 714 7601,2691,777 of which: SDR allocations 273 252 247 245 255 618
Long-term external debt 2,7378,9439,79811,73513,14713,568
Public and publicly guaranteed sector 2,1608,0189,09610,33211,45112,427
Public sector 2,1608,0189,09610,33211,45112,427 of which: General government 2,1578,0179,09510,33111,45112,426
Private sector guaranteed by public sector
Private sector not guaranteed 577 925 7031,4031,6951,141 Short-term external debt 9 528 433 377 368 658
Disbursements (long-term)
2781,6481,7122,5931,7291,784
Public and publicly guaranteed sector 2781,5881,6591,7571,0961,784
Public sector 2781,5881,6591,7571,0961,784 of which: General government 2781,5881,6591,7561,0951,784 Private sector guaranteed by public sector Private sector not guaranteed 61 53 837 633 0
Principal repayments (long-term) 160 413 623 762 8541,017
Public and publicly guaranteed sector 122 175 372 436 514 463 Public sector 122 175 372 436 514 463 of which: General government 118 175 372 436 512 463 Private sector guaranteed by public sector Private sector not guaranteed 38 238 250 325 341 554
Interest payments (long-term) 42 272 400 342 343 292
Public and publicly guaranteed sector 27 240 232 230 330 277 Public sector 27 240 232 230 330 277 of which: General government 27 240 232 230 330 277 Private sector guaranteed by public sector Private sector not guaranteed 15 32 168 112 13 15
Summary external debt stock,
Long-term external debt stocks 2,7378,9439,79811,73513,14713,568 Public and publicly guaranteed debt from: 2,1608,0189,09610,33211,45112,427 Official creditors 2,1406,8807,8198,95510,08310,377
Multilateral 7872,4483,2083,7504,4234,783 of which: World Bank 3741,3061,4321,7331,9152,068 Bilateral 1,3534,4314,6115,2065,6605,595 Private creditors 201,1381,2771,3761,3682,049 Bondholders 750 750 750 7501,526 Commercial banks and others 20 388 527 626 618 523 Private nonguaranteed debt from: 577 925 7031,4031,6951,141 Bondholders Commercial banks and others 577 925 7031,4031,6951,141 Use of IMF credit and SDR allocations 445 602 714 7601,2691,777
Net debt inflows
Use of IMF credit 258 128 50 461 177 Long-term 1181,2351,0901,832 875 767
Official creditors 1501,3181,1311,214 627 574 Multilateral 118 480 857 581 391 610 of which: World Bank 75 353 165 312 93 247 Bilateral 32 837 274 632 236 -36 Private creditors -32 -82 -41 618 248 193 Bondholders 811 Banks and others -32 -82 -41 618 248 -618 Short-term 0 262 -95 -62 -27 279
Foreign direct investment 526 219 476 758 661 821 Portfolio equity 0 0 0 0 0 0
External debt stocks to exports (%) 56 149 146 162 235 211 External debt stocks to GNI (%) 12 28 28 33 37 36 Debt service to exports (%) 4 11 14 14 19 17 Short-term to external debt stocks (%) 0 5 4 3 2 4 Multilateral to external debt stocks (%) 25 24 29 29 30 30 Reserves to external debt stocks (%) 114 32 32
Gross national income (GNI) 27,24335,43739,23438,82839,92044,375
(US$ million, unless otherwise indicated)
2010 2017 2018 2019 2020 2021
Total external debt stocks 634 723 786 849 8991,115
Use of IMF credit and SDR allocations 173 235 279 296 355 518 of which: SDR allocations 82 76 74 74 77 224
Long-term external debt 376 399 418 421 411 435
Public and publicly guaranteed sector 376 399 418 421 411 435 Public sector 376 399 418 421 411 435 of which: General government 357 396 416 419 409 434 Private sector guaranteed by public sector Private sector not guaranteed
Short-term external debt 86 89 88 132 133 162
Disbursements (long-term) 35 15 67 22 26 38
Public and publicly guaranteed sector 35 15 67 22 26 38 Public sector 35 15 67 22 26 38 of which: General government 35 15 67 22 26 38 Private sector guaranteed by public sector Private sector not guaranteed
Principal repayments (long-term) 2 15 10 15 4 5
Public and publicly guaranteed sector 2 15 10 15 4 5 Public sector 2 15 10 15 4 5 of which: General government 1 3 10 14 3 5 Private sector guaranteed by public sector Private sector not guaranteed
Interest payments (long-term)
1 7 2 2 1 1
Public and publicly guaranteed sector 1 7 2 2 1 1 Public sector 1 7 2 2 1 1 of which: General government 1 6 2 2 1 1 Private sector guaranteed by public sector Private sector not guaranteed
Long-term external debt stocks 376 399 418 421 411 435
Public and publicly guaranteed debt from: 376 399 418 421 411 435 Official creditors 337 353 372 375 386 408 Multilateral 43 96 151 154 177 177 of which: World Bank 14 64 99 107 130 133 Bilateral 294 257 221 221 209 231
Private creditors 39 46 46 46 25 27
Bondholders
Commercial banks and others 39 46 46 46 25 27
Private nonguaranteed debt from: Bondholders Commercial banks and others Use of IMF credit and SDR allocations 173 235 279 296 355 518
Net debt inflows
Use of IMF credit 13 39 50 19 45 24
Long-term 33 -1 56 8 22 32 Official creditors 33 -1 56 8 22 30
Multilateral 5 13 58 3 16 5 of which: World Bank 5 1 37 9 18 7 Bilateral 28 -14 -2 4 6 25 Private creditors 1 2
Bondholders
Banks and others 1 2
Short-term 0 1 0 10 19 26
Foreign direct investment 62 7 18 26 35 30
Portfolio equity
External debt stocks to exports (%)
External debt stocks to GNI (%) 29 33 33 36 37 41
Debt service to exports (%)
Short-term to external debt stocks (%) 14 12 11 16 15 15 Multilateral to external debt stocks (%) 7 13 19 18 20 16 Reserves to external debt stocks (%) 29 50 46 41
Gross national income (GNI) 2,1522,1782,3872,3862,4572,688
(US$ million, unless otherwise indicated)
Total external debt stocks
2010 2017 2018 2019 2020 2021
2,1583,1233,2433,3253,6703,934
Use of IMF credit and SDR allocations 99 254 395 470 678 914 of which: SDR allocations 83 76 75 74 77 263
Long-term external debt 2,0492,8412,8182,8292,9602,999
Public and publicly guaranteed sector 2,0492,8412,8182,8292,9602,999 Public sector 2,0492,8412,8182,8292,9602,999 of which: General government 2,0162,8412,8182,8292,9602,999
Private sector guaranteed by public sector Private sector not guaranteed
Short-term external debt 9 28 31 27 31 21
Disbursements (long-term) 366 250 53 51 123 183
Public and publicly guaranteed sector 366 250 53 51 123 183 Public sector 366 250 53 51 123 183 of which: General government 366 250 53 51 123 183 Private sector guaranteed by public sector Private sector not guaranteed
Principal repayments (long-term) 45 128 43 30 61 100 Public and publicly guaranteed sector 45 128 43 30 61 100 Public sector 45 128 43 30 61 100 of which: General government 45 128 43 30 61 100 Private sector guaranteed by public sector Private sector not guaranteed
Interest payments (long-term) 17 55 61 59 50 50
Public and publicly guaranteed sector 17 55 61 59 50 50 Public sector 17 55 61 59 50 50 of which: General government 16 55 61 59 50 50 Private sector guaranteed by public sector Private sector not guaranteed
Summary external debt stock, by creditor type
Long-term external debt stocks 2,0492,8412,8182,8292,9602,999
Public and publicly guaranteed debt from: 2,0492,8412,8182,8292,9602,999 Official creditors 2,0321,5831,5601,5711,7031,741
Multilateral 1,529 699 673 669 714 798 of which: World Bank 865 189 181 176 180 169 Bilateral 504 884 887 902 989 943
Private creditors 171,2581,2581,2581,2581,258 Bondholders Commercial banks and others 171,2581,2581,2581,2581,258
Private nonguaranteed debt from: Bondholders Commercial banks and others Use of IMF credit and SDR allocations 99 254 395 470 678 914
Net debt inflows
Use of IMF credit -11 49 149 77 183 68
Long-term 321 122 11 21 63 82 Official creditors 323 236 11 21 63 82 Multilateral 27 91 -8 2 9 120 of which: World Bank -16 -1 -4 -4 -3 -6 Bilateral 296 144 18 19 54 -38 Private creditors -2 -114 -1 Bondholders
Banks and others -2 -114 -1 Short-term -6 0 0 0 0 0
Foreign direct investment 313 363 461 567 558 562 Portfolio equity
External debt stocks to exports (%)
External debt stocks to GNI (%) 21 32 29 30 37 35
Debt service to exports (%)
Short-term to external debt stocks (%) 0 1 1 1 1 1 Multilateral to external debt stocks (%) 71 22 21 20 19 20 Reserves to external debt stocks (%) 29 0 5 9 Gross national income (GNI) 10,3129,87011,07511,1419,94811,381
(US$ million, unless otherwise indicated)
Summary external debt data, by debtor type
Total external debt stocks
742,7371,704,5941,961,5622,114,1622,326,7512,702,505
Use of IMF credit and SDR allocations 10,7649,9549,7219,66510,06750,674 of which: SDR allocations 10,7649,9549,7219,66510,06750,674
Long-term external debt 219,650664,006732,940899,1841,080,4521,205,606
Public and publicly guaranteed sector 102,275196,290259,687318,064392,201475,424 Public sector 102,146196,256259,666318,057392,201464,582 of which: General government 59,405101,853126,558161,780208,420231,232 Private sector guaranteed by public sector 129 34 20 7 0 10,842 Private sector not guaranteed 117,375467,717473,254581,120688,252730,182
Short-term external debt 512,3231,030,6331,218,9011,205,3121,236,2321,446,225
Disbursements (long-term)
39,167226,992247,559338,220360,755360,267
Public and publicly guaranteed sector 12,42151,01979,73179,49394,643122,211 Public sector 12,42151,01979,73179,49394,643111,369 of which: General government 3,1446,48229,61138,59848,66929,974 Private sector guaranteed by public sector 0 0 0 0 10,842
Private sector not guaranteed 26,746175,974167,828258,727266,112238,056
Principal repayments (long-term)
18,782144,686160,494180,617180,783225,855
Public and publicly guaranteed sector 11,97815,44515,29120,63224,17832,777
Public sector 11,96515,43115,27820,61824,17132,777 of which: General government 3,1543,7754,7793,3763,1735,755
Private sector guaranteed by public sector 14 14 14 14 7
Private sector not guaranteed 6,803129,241145,203159,985156,605193,078
Interest payments (long-term)
5,48416,56627,18435,73031,59346,498
Public and publicly guaranteed sector 1,8193,3506,1358,6708,50617,050
Public sector 1,8173,3496,1348,6708,50617,007 of which: General government 1,0521,4792,8253,3871,95711,020 Private sector guaranteed by public sector 1 1 1 1 0 43
Private sector not guaranteed 3,66513,21521,04927,05923,08729,448
Long-term external debt stocks 219,650664,006732,940899,1841,080,4521,205,606
Public and publicly guaranteed debt from: 102,275196,290259,687318,064392,201475,424 Official creditors 75,47656,21154,49953,84053,51351,979
Multilateral 35,52734,19134,43935,42736,00736,424 of which: World Bank 22,13516,35616,09516,27116,23616,585 Bilateral 39,94922,02020,06018,41217,50615,554 Private creditors 26,799140,079205,188264,225338,688423,445 Bondholders 12,398101,554163,960214,523288,234352,295 Commercial banks and others 14,40138,52441,22849,70150,45471,150
Private nonguaranteed debt from: 117,375467,717473,254581,120688,252730,182 Bondholders 5,561152,191179,902234,623323,512340,414 Commercial banks and others 111,814315,525293,351346,497364,739389,768
Use of IMF credit and SDR allocations 10,7649,9549,7219,66510,06750,674
Net debt inflows
Use of IMF credit
Long-term 20,38582,30687,065157,604179,972134,412
Official creditors -2,276-3,651-1,700 -696-1,008 -544 Multilateral 959 399 3821,063 317 684 of which: World Bank -160 -15 -205 205 -83 411 Bilateral -3,235-4,050-2,082-1,759-1,324-1,229
Private creditors 22,66185,95788,765158,300180,980134,956 Bondholders -1,45982,18994,185105,319161,72488,951
Banks and others 24,1203,768-5,42052,98119,25646,004
Short-term 271,814229,237188,268-13,58930,920209,993
Net equity inflows
Foreign direct investment 225,593140,569185,911162,253220,806277,191 Portfolio equity 31,35736,20960,66844,90680,33583,121
External debt stocks to exports (%) 41 63 67 73 78 71
External debt stocks to GNI (%) 12 14 14 15 16 15
Debt service to exports (%) 3 8 8 9 9 9 Short-term to external debt stocks (%) 69 60 62 57 53 54
Multilateral to external debt stocks (%) 5 2 2 2 2 1 Reserves to external debt stocks (%) 386 185 158 148 139 123
Gross national income (GNI) 6,061,09212,294,27913,833,78914,239,92814,583,28517,576,648
(US$ million, unless otherwise indicated)
Summary external debt data, by debtor type
Total external debt stocks
64,432126,055133,251138,907155,696171,993
Use of IMF credit and SDR allocations 1,1371,0511,0271,0216,4649,024 of which: SDR allocations 1,1371,0511,0271,0211,0633,776
Long-term external debt 55,383111,975117,307122,251135,332147,195
Public and publicly guaranteed sector 37,05874,47774,89375,09285,52293,901 Public sector 36,55574,24074,67074,88285,32493,841 of which: General government 31,63151,21454,45854,88161,41767,327 Private sector guaranteed by public sector 503 237 224 210 197 60 Private sector not guaranteed 18,32537,49842,41447,15949,81053,294
Short-term external debt 7,91213,02914,91815,63513,90015,774
Disbursements (long-term)
12,97017,42622,91217,18927,64531,053
Public and publicly guaranteed sector 3,6297,2096,8875,03613,52518,768 Public sector 3,5597,2096,8875,03613,52518,768 of which: General government 3,4265,5895,7123,7798,31912,123 Private sector guaranteed by public sector 71 0 0 0 Private sector not guaranteed 9,34010,21716,02512,15314,12012,286
Principal repayments (long-term)
6,56616,28017,86312,08115,06518,340
Public and publicly guaranteed sector 2,3186,6516,7544,6743,5969,538 Public sector 2,2236,6426,7414,6603,5839,401 of which: General government 1,9262,8872,1433,2602,3435,567 Private sector guaranteed by public sector 95 10 13 13 13 137 Private sector not guaranteed 4,2489,62811,1097,40811,4698,802
Interest payments (long-term)
2,8395,4805,8756,4015,9916,226
Public and publicly guaranteed sector 2,1213,5283,5813,8023,4783,808 Public sector 2,1123,5223,5743,7943,4743,806 of which: General government 1,8122,2782,2572,4982,3452,559 Private sector guaranteed by public sector 10 5 7 7 4 2 Private sector not guaranteed 7171,9522,2932,6002,5132,418
Long-term external debt stocks 55,383111,975117,307122,251135,332147,195
Public and publicly guaranteed debt from: 37,05874,47774,89375,09285,52293,901
Official creditors 16,48325,57427,74427,77531,14733,587
Multilateral 15,89820,54822,01722,69225,54328,051 of which: World Bank 7,5049,52010,23310,58211,98913,515 Bilateral 5855,0265,7275,0835,6045,536
Private creditors 20,57448,90347,14947,31754,37460,314 Bondholders 17,96542,86241,13841,86848,53652,916 Commercial banks and others 2,6096,0416,0115,4505,8387,398
Private nonguaranteed debt from: 18,32537,49842,41447,15949,81053,294 Bondholders 3,32910,2069,52110,4818,9549,604 Commercial banks and others 14,99627,29232,89236,67740,85643,689
Use of IMF credit and SDR allocations 1,1371,0511,0271,0216,4649,024
Net debt inflows
Use of IMF credit ..5,224 0 Long-term 6,4041,1465,0495,10812,58112,713
Official creditors 1,137 1522,501 1692,9873,068 Multilateral 1,082 3441,683 7832,6142,923 of which: World Bank 936 -279 908 4101,1591,849 Bilateral 55 -192 818 -615 372 145
Private creditors 5,267 9942,5474,9399,5949,645 Bondholders 9873,955-2,2841,7155,0275,234
Banks and others 4,280-2,9614,8313,2244,5674,411
Short-term 3,9001,7491,889 718-1,7361,874
Net equity inflows
Foreign direct investment 7,06511,9079,69511,5784,9327,242
Portfolio equity 1,488 472 -823-1,232 -454-1,189
Debt ratios
External debt stocks to exports (%) 132 230 222 238 365 304
External debt stocks to GNI (%) 23 41 41 44 58 56
Debt service to exports (%) 20 41 41 33 51 45
Short-term to external debt stocks (%) 12 10 11 11 9 9
Multilateral to external debt stocks (%) 25 16 17 16 16 16
Reserves to external debt stocks (%) 43 37 36 37 37 34
Gross national income (GNI) 276,601306,544325,925316,058267,842306,268
(US$ million, unless otherwise indicated)
2010 2017 2018 2019 2020 2021
Total external debt stocks 278.4186.6245.0264.2301.1336.7
Use of IMF credit and SDR allocations 25.4 26.1 22.3 30.7 41.9 62.9 of which: SDR allocations 13.1 12.1 11.8 11.8 12.2 35.8
Long-term external debt 248.5159.5221.4231.6258.0272.7
Public and publicly guaranteed sector 248.5159.5221.4231.6258.0272.7
Public sector 248.5159.5221.4231.6258.0272.7 of which: General government 248.5159.5221.4231.6258.0272.7
Private sector guaranteed by public sector Private sector not guaranteed
Short-term external debt 4.4 1.1 1.2 1.9 1.2 1.1
Disbursements (long-term) 0.0 5.5 68.2 14.5 18.7 16.7
Public and publicly guaranteed sector 0.0 5.5 68.2 14.5 18.7 16.7 Public sector 0.0 5.5 68.2 14.5 18.7 16.7 of which: General government 0.0 5.5 68.2 14.5 18.7 16.7 Private sector guaranteed by public sector Private sector not guaranteed
Principal repayments (long-term)
3.1 1.9 2.0 1.8 1.8 1.9
Public and publicly guaranteed sector 3.1 1.9 2.0 1.8 1.8 1.9 Public sector 3.1 1.9 2.0 1.8 1.8 1.9 of which: General government 3.1 1.9 2.0 1.8 1.8 1.9 Private sector guaranteed by public sector Private sector not guaranteed
Interest payments (long-term)
1.1 0.1 1.0 0.4 1.6 1.3
Public and publicly guaranteed sector 1.1 0.1 1.0 0.4 1.6 1.3 Public sector 1.1 0.1 1.0 0.4 1.6 1.3 of which: General government 1.1 0.1 1.0 0.4 1.6 1.3
Private sector guaranteed by public sector Private sector not guaranteed
Long-term external debt stocks 248.5159.5221.4231.6258.0272.7 Public and publicly guaranteed debt from: 248.5159.5221.4231.6258.0272.7 Official creditors 248.5159.5221.4231.6258.0272.7
Multilateral 201.6 54.2 54.0 68.0 76.7 90.2 of which: World Bank 115.5 13.3 12.7 12.3 16.7 21.8 Bilateral 46.9105.2167.4163.5181.3182.4
Private creditors 0.0 0.0 Bondholders
Commercial banks and others 0.0 0.0
Private nonguaranteed debt from: Bondholders Commercial banks and others Use of IMF credit and SDR allocations 25.4 26.1 22.3 30.7 41.9 62.9
Net debt inflows
Use of IMF credit 2.4 -2.0 -3.2 8.5 9.6 -1.8
Long-term -3.1 3.6 66.2 12.7 16.9 14.7 Official creditors -3.1 3.6 66.2 12.7 16.9 14.7
Multilateral -3.1 -0.3 0.3 14.1 6.0 16.3 of which: World Bank -1.7 -0.3 -0.3 -0.3 3.5 5.9
Bilateral 3.9 65.9 -1.4 10.9 -1.6
Private creditors
Bondholders Banks and others
Short-term 0.0 0.0 0.0 0.0 0.0 0.0
Foreign direct investment 8.4 3.9 5.7 4.3 3.9 4.0
Portfolio equity 0.0
External debt stocks to exports (%) 306.7137.2154.9174.9385.2222.2
External debt stocks to GNI (%) 30.7 17.2 20.7 22.6 24.5 25.5
Debt service to exports (%) 4.7 3.0 3.9 4.1 8.2 3.4
Short-term to external debt stocks (%) 1.6 0.6 0.5 0.7 0.4 0.3
Multilateral to external debt stocks (%) 72.4 29.1 22.0 25.8 25.5 26.8
Reserves to external debt stocks (%) 52.2111.0 81.0 76.1 97.4 97.6
Gross national income (GNI) 907.11,083.41,185.41,171.01,227.31,319.0
(US$ million, unless otherwise indicated)
Total external debt stocks
2010 2017 2018 2019 2020 2021
7,2376,9206,8497,5698,16110,288
Use of IMF credit and SDR allocations 1,110 954 8391,1301,5113,317 of which: SDR allocations 787 728 710 706 7362,145
Long-term external debt 5,6925,7825,8016,0576,2896,517
Public and publicly guaranteed sector 5,6925,7825,8016,0576,2896,517 Public sector 5,6925,7825,8016,0576,2896,517 of which: General government 4,3614,0044,0234,2794,5114,739
Private sector guaranteed by public sector Private sector not guaranteed
Short-term external debt 435 184 209 382 362 454
Disbursements (long-term) 178 348 233 480 277 529
Public and publicly guaranteed sector 178 348 233 480 277 529 Public sector 178 348 233 480 277 529 of which: General government 78 348 233 480 277 529 Private sector guaranteed by public sector Private sector not guaranteed
Principal repayments (long-term) 89 182 180 184 146 242
Public and publicly guaranteed sector 89 182 180 184 146 242 Public sector 89 182 180 184 146 242 of which: General government 77 182 180 184 146 242 Private sector guaranteed by public sector Private sector not guaranteed
Interest payments (long-term) 124 119 98 824 110 106
Public and publicly guaranteed sector 124 119 98 824 110 106 Public sector 124 119 98 824 110 106 of which: General government 120 119 98 824 110 106 Private sector guaranteed by public sector Private sector not guaranteed
Long-term external debt stocks 5,6925,7825,8016,0576,2896,517 Public and publicly guaranteed debt from: 5,6925,7825,8016,0576,2896,517 Official creditors 5,6145,7815,7715,9556,1526,386
Multilateral 2,5851,9952,0372,1222,2902,448 of which: World Bank 849 9421,0981,2881,5211,772 Bilateral 3,0293,7863,7343,8333,8623,938
Private creditors 77 1 30 102 137 130 Bondholders Commercial banks and others 77 1 30 102 137 130
Private nonguaranteed debt from: Bondholders Commercial banks and others Use of IMF credit and SDR allocations 1,110 954 8391,1301,5113,317
Use of IMF credit 19 -92 -94 295 323 427
Long-term 89 166 53 296 131 287 Official creditors 73 166 37 224 95 294 Multilateral 1 182 73 93 92 220 of which: World Bank 17 65 180 195 178 294 Bilateral 73 -16 -36 130 4 74 Private creditors 16 -1 16 72 35 -7 Bondholders Banks and others 16 -1 16 72 35 -7
Short-term 38 9 -33 116 -78 35
Foreign direct investment 2,7361,3401,6171,4781,6471,870 Portfolio equity -10 -7 -30 -6
External debt stocks to exports (%) 81 59 42 50 58 External debt stocks to GNI (%) 35 19 15 15 17 20 Debt service to exports (%) 3 3 2 7 2 Short-term to external debt stocks (%) 6 3 3 5 4 4 Multilateral to external debt stocks (%) 36 29 30 28 28 24 Reserves to external debt stocks (%) 18 10 10 16 9 34
Gross national income (GNI) 20,65536,94645,86448,96247,44451,987
(US$ million, unless otherwise indicated)
Total external debt stocks
2010 2017 2018 2019 2020 2021
2,7935,4645,1835,3535,3066,966
Use of IMF credit and SDR allocations 150 120 115 157 162 374 of which: SDR allocations 123 113 111 110 115 329
Long-term external debt 2,4475,0674,7934,9634,8606,302
Public and publicly guaranteed sector 2,4475,0674,7934,9634,8546,291 Public sector 2,4475,0674,7934,9634,8546,291 of which: General government 2,4475,0674,7934,9634,8546,291
Private sector guaranteed by public sector Private sector not guaranteed 6 11
Short-term external debt 197 277 276 234 284 290
Disbursements (long-term) 882 878 269 639 189 201
Public and publicly guaranteed sector 882 878 269 639 183 195 Public sector 882 878 269 639 183 195 of which: General government 843 878 269 639 183 195 Private sector guaranteed by public sector Private sector not guaranteed 6 5
Principal repayments (long-term) 95 370 390 456 618 389
Public and publicly guaranteed sector 95 370 390 456 618 389 Public sector 95 370 390 456 618 389 of which: General government 95 370 390 456 618 389 Private sector guaranteed by public sector Private sector not guaranteed
Interest payments (long-term) 24 36 77 83 98 72
Public and publicly guaranteed sector 24 36 77 83 98 71 Public sector 24 36 77 83 98 71 of which: General government 24 36 77 83 98 71 Private sector guaranteed by public sector Private sector not guaranteed 0 1
Long-term external debt stocks 2,4475,0674,7934,9634,8606,302
Public and publicly guaranteed debt from: 2,4475,0674,7934,9634,8546,291 Official creditors 1,0204,1083,7924,0603,9743,917
Multilateral 182 644 640 869 9851,021 of which: World Bank 84 153 192 243 342 413 Bilateral 8393,4643,1523,1912,9892,896
Private creditors 1,426 9581,001 903 8802,374 Bondholders 454 350 322 295 268 241 Commercial banks and others 973 609 679 608 6122,133
Private nonguaranteed debt from: 6 11 Bondholders Commercial banks and others 6 11
Use of IMF credit and SDR allocations 150 120 115 157 162 374
Net debt inflows
Use of IMF credit 2 -2 -2 43 -1 -1
Long-term 787 508 -121 183 -429 -188 Official creditors 480 623 -150 281 -249 -28 Multilateral -15 415 6 233 67 84 of which: World Bank 2 23 43 53 87 84 Bilateral 495 208 -156 48 -316 -112
Private creditors 307 -115 29 -98 -180 -160 Bondholders 0 -27 -27 -27 -27 -27 Banks and others 307 -88 56 -71 -153 -132
Short-term -40 135 -63 -47 54 -33
Foreign direct investment 6714,4174,315 986 -2063,691 Portfolio equity 0 75 32
Debt ratios
External debt stocks to exports (%) 31 68 113
External debt stocks to GNI (%) 23 57 44 53 60 70 Debt service to exports (%) 1 7 15
Short-term to external debt stocks (%) 7 5 5 4 5 4 Multilateral to external debt stocks (%) 7 12 12 16 19 15 Reserves to external debt stocks (%) 159 7 8 18 13 50
Gross national income (GNI) 12,2229,53611,65010,0178,8959,884
(US$ million, unless otherwise indicated)
2010 2017 2018 2019 2020 2021
Total external debt stocks 8,15425,61628,36929,80131,26933,788
Use of IMF credit and SDR allocations 241 223 218 216 7571,520 of which: SDR allocations 241 223 218 216 225 715
Long-term external debt 5,48222,85524,78226,82926,57027,584
Public and publicly guaranteed sector 3,82211,03711,94113,39212,57712,386 Public sector 3,82211,03711,94113,39212,57712,386 of which: General government 2,7726,2646,5818,4578,4799,054
Private sector guaranteed by public sector Private sector not guaranteed 1,66011,81712,84113,43713,99415,198 Short-term external debt 2,4312,5383,3702,7553,9424,683
Disbursements (long-term)
1,4551,9854,4183,5691,8732,890
Public and publicly guaranteed sector 928 5991,7012,486 497 746 Public sector 928 5991,7012,486 497 746 of which: General government 596 248 4492,006 383 697 Private sector guaranteed by public sector Private sector not guaranteed 5281,3862,7161,0831,3752,144
Principal repayments (long-term) 6171,7972,0241,9592,1501,852
Public and publicly guaranteed sector 342 485 8971,0731,311 913 Public sector 342 485 8971,0731,311 913 of which: General government 146 135 127 131 367 130 Private sector guaranteed by public sector Private sector not guaranteed 2751,3121,127 886 839 939
Interest payments (long-term) 3131,1091,2611,123 7691,144
Public and publicly guaranteed sector 213 638 687 674 311 578 Public sector 213 638 687 674 311 578 of which: General government 161 364 368 375 177 395 Private sector guaranteed by public sector Private sector not guaranteed 100 471 574 448 458 566
Long-term external debt stocks 5,48222,85524,78226,82926,57027,584 Public and publicly guaranteed debt from: 3,82211,03711,94113,39212,57712,386 Official creditors 2,1963,2304,6624,9104,9245,363
Multilateral 1,7672,7774,1994,4434,4484,911 of which: World Bank 570 788 903 9551,0211,292 Bilateral 430 453 464 466 476 452
Private creditors 1,6267,8077,2788,4827,6527,023 Bondholders 1,3106,2506,2507,6006,9836,500 Commercial banks and others 3161,5571,028 882 669 523
Private nonguaranteed debt from: 1,66011,81712,84113,43713,99415,198 Bondholders ..2,1502,1002,1002,1001,250 Commercial banks and others 1,6609,66710,74111,33711,89413,948
Use of IMF credit and SDR allocations 241 223 218 216 7571,520
Net debt inflows
Use of IMF credit 515 294 Long-term 839 1882,3941,610 -2771,038
Official creditors 590 1841,333 209 16 462 Multilateral 579 1711,321 208 28 476 of which: World Bank 512 52 115 52 71 272 Bilateral 11 13 12 1 -12 -13
Private creditors 249 3 1,0611,401 -293 575 Bondholders 0 299 -50 1,350 -617-1,332 Banks and others 249 -2961,111 50 3241,908 Short-term 188 -16 831 -6141,186 742
Net equity inflows
Foreign direct investment 1,5082,3522,2212,1451,5922,793 Portfolio equity 8 53 54 55 57 88
External debt stocks to exports (%) 64 129 129 128 154 141
External debt stocks to GNI (%) 22 45 48 49 53 56 Debt service to exports (%) 8 15 16 13 15 13 Short-term to external debt stocks (%) 30 10 12 9 13 14 Multilateral to external debt stocks (%) 22 11 15 15 14 15 Reserves to external debt stocks (%) 57 28 26 30 23 20 Gross national income (GNI) 36,45057,35359,04360,55858,59559,926
(US$ million, unless otherwise indicated)
Total external debt stocks
2010 2017 2018 2019 2020 2021
11,70313,44916,19819,83125,10729,752
Use of IMF credit and SDR allocations 8611,7381,8141,9153,0473,647 of which: SDR allocations 479 443 432 430 4481,308
Long-term external debt 10,43111,68314,24617,02721,00423,918
Public and publicly guaranteed sector 9,41310,44513,23415,74820,01323,169
Public sector 9,41310,44513,23415,74820,01323,169 of which: General government 9,41210,44512,68615,19719,05122,248
Private sector guaranteed by public sector Private sector not guaranteed 1,0181,2381,0111,279 991 749 Short-term external debt 411 28 138 8901,0562,188
Disbursements (long-term)
5993,2323,8675,0834,3084,974
Public and publicly guaranteed sector 2443,0913,7474,5114,3084,974 Public sector 2443,0913,7474,5114,3084,974 of which: General government 2443,0913,1824,4983,9394,938 Private sector guaranteed by public sector Private sector not guaranteed 355 141 120 572
Principal repayments (long-term) 6231,7301,0362,2471,565 803
Public and publicly guaranteed sector 4381,418 7021,9461,226 602 Public sector 4381,418 7021,9461,226 602 of which: General government 4381,418 7021,9461,191 602 Private sector guaranteed by public sector Private sector not guaranteed 185 312 334 302 340 200
Interest payments (long-term) 114 399 453 556 701 701
Public and publicly guaranteed sector 58 329 407 518 671 685 Public sector 58 329 407 518 671 685 of which: General government 58 329 406 517 642 683 Private sector guaranteed by public sector Private sector not guaranteed 56 70 47 38 29 17
Long-term external debt stocks 10,43111,68314,24617,02721,00423,918
Public and publicly guaranteed debt from: 9,41310,44513,23415,74820,01323,169 Official creditors 9,3015,0075,2005,9727,96210,075
Multilateral 2,3731,5822,0242,6094,0104,752 of which: World Bank 1,763 781 8831,2041,8822,488 Bilateral 6,9283,4253,1763,3633,9525,322
Private creditors 1125,4388,0349,77612,05113,094 Bondholders 0 5,3987,2307,5898,5329,010 Commercial banks and others 112 40 8042,1873,5194,085
Private nonguaranteed debt from: 1,0181,2381,0111,279 991 749 Bondholders Commercial banks and others 1,0181,2381,0111,279 991 749
Use of IMF credit and SDR allocations 8611,7381,8141,9153,0473,647
Net debt inflows
Use of IMF credit 44 150 119 1111,019 -190 Long-term -25 1,5022,8312,8362,7434,171
Official creditors -220 540 328 7691,5522,539 Multilateral 17 450 497 5171,0951,055 of which: World Bank -26 205 132 236 536 765 Bilateral -237 90 -169 252 4571,484
Private creditors 196 9622,5032,0671,1911,633 Bondholders ..1,1361,928 404 478 959
Banks and others 196 -173 5751,663 713 673
Short-term 20 -241 110 752 1661,131
Net equity inflows
Foreign direct investment 371 644 590 618 636 Portfolio equity 2 24 15 12 21
External debt stocks to exports (%) 91 102 121 140 184 188
External debt stocks to GNI (%) 49 27 29 35 42 44
Debt service to exports (%) 6 17 12 21 18 11 Short-term to external debt stocks (%) 4 0 1 4 4 7 Multilateral to external debt stocks (%) 20 12 12 13 16 16 Reserves to external debt stocks (%) 31 Gross national income (GNI) 23,99650,05255,80956,97659,47167,653
(US$ million, unless otherwise indicated)
Summary external debt data, by debtor type
2010 2017 2018 2019 2020 2021
Total external debt stocks 7692,2672,3212,5532,6793,191
Use of IMF credit and SDR allocations 35 44 37 32 72 109 of which: SDR allocations 23 22 21 21 22 64
Long-term external debt 6121,9452,0452,1462,3542,412 Public and publicly guaranteed sector 6121,9452,0452,1462,3542,412 Public sector 6121,9452,0452,1462,3542,412 of which: General government 463 514 537 468 515 553 Private sector guaranteed by public sector Private sector not guaranteed
Short-term external debt 122 278 240 375 253 670
Disbursements (long-term) 35 336 141 136 214 86
Public and publicly guaranteed sector 35 336 141 136 214 86 Public sector 35 336 141 136 214 86 of which: General government 19 28 45 43 45 52 Private sector guaranteed by public sector Private sector not guaranteed
Principal repayments (long-term) 22 25 27 35 28 23 Public and publicly guaranteed sector 22 25 27 35 28 23 Public sector 22 25 27 35 28 23 of which: General government 12 14 13 16 15 12 Private sector guaranteed by public sector Private sector not guaranteed
Interest payments (long-term) 8 36 32 29 25 19 Public and publicly guaranteed sector 8 36 32 29 25 19 Public sector 8 36 32 29 25 19 of which: General government 5 7 5 6 5 4 Private sector guaranteed by public sector Private sector not guaranteed
Long-term external debt stocks 6121,9452,0452,1462,3542,412
Public and publicly guaranteed debt from: 6121,9452,0452,1462,3542,412
Official creditors 5951,9452,0452,1462,3542,412
Multilateral 406 519 551 611 660 692 of which: World Bank 155 144 152 161 191 215 Bilateral 1891,4261,4941,5341,6941,719
Private creditors 16 0 Bondholders Commercial banks and others 16 0 Private nonguaranteed debt from: Bondholders Commercial banks and others Use of IMF credit and SDR allocations 35 44 37 32 72 109
Use of IMF credit -3 -4 -6 -5 38 -4
Long-term 13 311 114 102 186 63
Official creditors 15 311 114 102 186 63
Multilateral 8 15 39 62 35 44 of which: World Bank -1 8 12 10 22 30 Bilateral 7 296 75 40 150 19 Private creditors -2 0
Bondholders
Banks and others -2 0 Short-term 3 220 -56 109 -159 398
Foreign direct investment 37 165 170 175 158 167 Portfolio equity 0 0 0 219 -199
External debt stocks to exports (%) 169 54 50 49 71 61
External debt stocks to GNI (%) 67 86 84 85 87 98
Debt service to exports (%) 8 2 2 2 2 1
Short-term to external debt stocks (%) 16 12 10 15 9 21 Multilateral to external debt stocks (%) 53 23 24 24 25 22 Reserves to external debt stocks (%) 32 25 20 20 26 18
Gross national income (GNI) 1,1462,6362,7712,9953,0833,266
(US$ million, unless otherwise indicated)
2010 2017 2018 2019 2020 2021
Total external debt stocks 271 300 278 278 330 378
Use of IMF credit and SDR allocations 30 24 22 21 36 48
of which: SDR allocations 12 11 11 11 11 26
Long-term external debt 236 264 243 246 277 312 Public and publicly guaranteed sector 236 264 243 246 277 312 Public sector 236 264 243 246 277 312 of which: General government 214 243 224 226 253 290 Private sector guaranteed by public sector Private sector not guaranteed
Short-term external debt 6 11 13 12 18 18
Disbursements (long-term) 30 11 5 22 39 48
Public and publicly guaranteed sector 30 11 5 22 39 48 Public sector 30 11 5 22 39 48 of which: General government 30 10 4 19 38 47 Private sector guaranteed by public sector Private sector not guaranteed
Principal repayments (long-term) 10 20 23 19 19 11
Public and publicly guaranteed sector 10 20 23 19 19 11 Public sector 10 20 23 19 19 11 of which: General government 7 15 20 16 17 9 Private sector guaranteed by public sector Private sector not guaranteed
Interest payments (long-term) 5 8 9 7 7 6
Public and publicly guaranteed sector 5 8 9 7 7 6 Public sector 5 8 9 7 7 6 of which: General government 4 7 8 6 6 6 Private sector guaranteed by public sector Private sector not guaranteed
Long-term external debt stocks 236 264 243 246 277 312 Public and publicly guaranteed debt from: 236 264 243 246 277 312 Official creditors 162 207 188 178 209 247
Multilateral 117 129 124 122 153 191 of which: World Bank 28 33 34 36 51 88 Bilateral 45 78 64 56 56 55 Private creditors 74 57 55 68 68 65 Bondholders 57 30 30 45 42 42 Commercial banks and others 16 28 26 23 26 24 Private nonguaranteed debt from: Bondholders Commercial banks and others Use of IMF credit and SDR allocations 30 24 22 21 36 48
Net debt inflows
Use of IMF credit -1 -1 -2 -1 14 -2
Long-term 20 -9 -18 4 20 37 Official creditors 20 -8 -16 -9 25 38
Multilateral 1 0 -4 -2 30 38 of which: World Bank 0 7 2 2 14 38 Bilateral 19 -8 -12 -7 -5 -1 Private creditors 0 -1 -2 13 -5 -1 Bondholders 0 1 15 -3
Banks and others 0 -2 -2 -3 -1 -1 Short-term 0 2 2 -2 6 0
Foreign direct investment 10 7 78 65 22 42 Portfolio equity 0 0 0 0 0
External debt stocks to exports (%) 151 130 166 123 310 322
External debt stocks to GNI (%) 56 57 50 46 65 69
Debt service to exports (%) 9 13 20 12 25 17
Short-term to external debt stocks (%) 2 4 5 4 5 5 Multilateral to external debt stocks (%) 43 43 45 44 47 51 Reserves to external debt stocks (%) 28 71 69 56 50 50
Gross national income (GNI) 484 523 556 602 511 547
(US$ million, unless otherwise indicated)
2010 2017 2018 2019 2020 2021
Total external debt stocks 13,49929,45631,86434,16540,26343,712
Use of IMF credit and SDR allocations 1,461 297 290 289 9881,601 of which: SDR allocations 322 297 290 289 301 933
Long-term external debt 10,28327,15729,38631,36137,10339,800
Public and publicly guaranteed sector 9,44118,51421,37523,00629,85632,507 Public sector 9,43718,51321,37423,00629,85632,506 of which: General government 8,70018,42421,32622,98329,83832,491
Private sector guaranteed by public sector 3 1 1 0 0 0 Private sector not guaranteed 8438,6438,0118,3557,2467,294 Short-term external debt 1,7542,0012,1872,5152,1722,311
Disbursements (long-term)
2,1113,3554,6202,4599,7693,510
Public and publicly guaranteed sector 2,1112,0803,6512,3959,7693,210 Public sector 2,1112,0803,6512,3959,7693,210 of which: General government 2,1072,0803,6512,3959,7693,210 Private sector guaranteed by public sector 0 0 0 0 Private sector not guaranteed ..1,275 969 64 300
Principal repayments (long-term) 7991,9611,4221,8494,586 715
Public and publicly guaranteed sector 798 808 752 6792,789 549 Public sector 798 807 752 6792,789 549 of which: General government 688 748 714 6552,784 547 Private sector guaranteed by public sector 1 0 0 0 0 0 Private sector not guaranteed 0 1,154 6701,1691,797 166
Interest payments (long-term) 4441,0121,4401,8221,7571,857
Public and publicly guaranteed sector 336 716 9681,2951,4151,668 Public sector 336 716 9681,2951,4151,668 of which: General government 309 713 9661,2941,4151,667 Private sector guaranteed by public sector 0 0 0 0 0 0 Private sector not guaranteed 108 296 472 528 342 190
Long-term external debt stocks 10,28327,15729,38631,36137,10339,800 Public and publicly guaranteed debt from: 9,44118,51421,37523,00629,85632,507 Official creditors 6,3435,7055,7906,0687,0897,134
Multilateral 3,0794,4544,7045,0865,9005,779 of which: World Bank 872 923 923 9391,1831,185 Bilateral 3,2641,2511,086 9821,1891,356
Private creditors 3,09812,80915,58516,93822,76725,372 Bondholders 1,13411,50014,59616,22922,15824,893 Commercial banks and others 1,9641,309 989 709 609 479
Private nonguaranteed debt from: 8438,6438,0118,3557,2467,294 Bondholders 8431,9451,9451,395 7071,007 Commercial banks and others 0 6,6986,0666,9596,5396,287
Use of IMF credit and SDR allocations 1,461 297 290 289 9881,601
Net debt inflows
Use of IMF credit 383 665 0
Long-term 1,3121,3943,197 6105,1832,795
Official creditors 870 -123 91 2801,008 62 Multilateral 469 10 253 383 812 -120 of which: World Bank 116 -10 0 16 243 2 Bilateral 401 -133 -162 -102 195 182 Private creditors 4421,5173,106 3304,1752,733 Bondholders 6451,7003,1081,1555,4083,010 Banks and others -203 -183 -2 -825-1,233 -277
Short-term -1 -1,051 186 328 -345 139
Net equity inflows
Foreign direct investment 1,4703,7332,6772,7962,8893,161 Portfolio equity 0 0 0 0 0 0
External debt stocks to exports (%) 106 151 154 161 262 207
External debt stocks to GNI (%) 26 39 39 40 54 49
Debt service to exports (%) 11 16 14 18 41 16
Short-term to external debt stocks (%) 13 7 7 7 5 5 Multilateral to external debt stocks (%) 23 15 15 15 15 13 Reserves to external debt stocks (%) 29 23 24 26 27 30
Gross national income (GNI) 51,93376,20481,86484,87275,02089,537
(US$ million, unless otherwise indicated)
Summary external debt data, by debtor type
Total external debt stocks
2010 2017 2018 2019 2020 2021
15,37741,15744,96051,89656,33258,259
Use of IMF credit and SDR allocations 444 783 7652,1146,7818,183 of which: SDR allocations 444 411 401 399 4151,340
Long-term external debt 13,86939,27943,11748,84848,51448,634
Public and publicly guaranteed sector 8,78731,61335,48138,39137,81138,707
Public sector 8,75931,59135,46138,37337,79638,694 of which: General government 8,26029,43133,85937,43437,07438,097 Private sector guaranteed by public sector 28 23 20 18 15 13 Private sector not guaranteed 5,0827,6667,63610,45810,7039,928 Short-term external debt 1,0641,0941,078 9331,0371,442
Disbursements (long-term)
2,9779,99810,36412,2867,6694,578
Public and publicly guaranteed sector 2,3078,8957,1536,8773,6892,662 Public sector 2,3048,8957,1536,8773,6892,662 of which: General government 2,2537,8596,9636,7963,4972,492 Private sector guaranteed by public sector 2 0 0 0 Private sector not guaranteed 6701,1033,2115,4093,9811,916
Principal repayments (long-term)
1,2594,5586,4436,5057,5484,441
Public and publicly guaranteed sector 6362,9053,2023,9173,8131,750 Public sector 6362,9023,2003,9153,8101,747 of which: General government 5872,4952,4523,1713,3991,455 Private sector guaranteed by public sector 0 2 2 2 2 2 Private sector not guaranteed 6231,6533,2412,5883,7352,691
Interest payments (long-term) 4702,0312,6632,7921,5171,857
Public and publicly guaranteed sector 3311,7532,2382,3851,1721,360 Public sector 3301,7512,2372,3841,1711,359 of which: General government 3151,6402,1082,3031,1281,335 Private sector guaranteed by public sector 1 1 1 1 1 1 Private sector not guaranteed 139 279 425 407 344 497
Long-term external debt stocks 13,86939,27943,11748,84848,51448,634
Public and publicly guaranteed debt from: 8,78731,61335,48138,39137,81138,707 Official creditors 7,54716,78517,26918,11919,67220,951
Multilateral 5,2078,7079,86411,08113,29414,776 of which: World Bank 456 399 6171,2512,5962,897 Bilateral 2,3408,0787,4057,0386,3786,175 Private creditors 1,24014,82818,21120,27218,13917,756 Bondholders 1,08212,56515,25018,30717,69417,494 Commercial banks and others 1592,2632,9611,965 445 262 Private nonguaranteed debt from: 5,0827,6667,63610,45810,7039,928 Bondholders Commercial banks and others 5,0827,6667,63610,45810,7039,928
Use of IMF credit and SDR allocations 444 783 7652,1146,7818,183
Net debt inflows
Use of IMF credit 0 0 1,3534,428 669 Long-term 1,7185,4403,9215,781 121 137
Official creditors 1,727 -11 549 8741,4971,290 Multilateral 822 5191,1811,2242,2141,488 of which: World Bank -87 153 218 6341,345 304 Bilateral 904 -530 -632 -350 -717 -198
Private creditors -9 5,4503,3724,907-1,376-1,153 Bondholders -16 6,4512,6853,057 -77 -200
Banks and others 7 -1,001 6871,850-1,298 -953 Short-term -304 205 -33 -157 89 390
Net equity inflows
Foreign direct investment 478 682 702 600 994 720 Portfolio equity 0 4 6 2 1 3
External debt stocks to exports (%) 78 181 175 197 251 198
External debt stocks to GNI (%) 22 40 43 49 58 56
Debt service to exports (%) 9 29 36 36 41 22 Short-term to external debt stocks (%) 7 3 2 2 2 2 Multilateral to external debt stocks (%) 34 21 22 21 24 25 Reserves to external debt stocks (%) 9 4 4 4 9 10
Gross national income (GNI) 68,569101,858104,605104,93596,468104,530
(US$ million, unless otherwise indicated) 2010 2017 2018 2019 2020 2021
Total external debt stocks
36,77584,54099,356114,484129,792143,246
Use of IMF credit and SDR allocations 1,3847,4019,22013,13020,36223,681 of which: SDR allocations 1,3841,2801,2501,2421,2943,990
Long-term external debt 32,24266,01179,79590,07097,471106,723
Public and publicly guaranteed sector 32,18965,60579,34989,71097,069105,939 Public sector 31,82565,54679,32389,71097,069105,939 of which: General government 28,26742,10150,40960,36867,33570,676 Private sector guaranteed by public sector 364 58 26 0 Private sector not guaranteed 54 406 446 360 402 784
Short-term external debt 3,14911,12810,34111,28411,95912,842
Disbursements (long-term)
3,61615,66720,28715,32215,57223,448
Public and publicly guaranteed sector 3,61115,37020,16115,25115,37922,838 Public sector 3,60915,37020,16115,25115,37922,838 of which: General government 3,30211,74411,30212,32910,95912,802 Private sector guaranteed by public sector 2 Private sector not guaranteed 5 298 126 71 193 610
Principal repayments (long-term)
2,1644,6225,7664,8429,60613,623
Public and publicly guaranteed sector 2,1394,5755,6804,6869,45613,395 Public sector 2,0584,5475,6504,6609,45613,395 of which: General government 1,6782,7042,6422,3244,7188,355 Private sector guaranteed by public sector 81 27 30 26 Private sector not guaranteed 25 48 87 156 151 229
Interest payments (long-term) 7701,5792,2203,4033,3383,616
Public and publicly guaranteed sector 7691,5652,2043,3843,3263,536 Public sector 7551,5642,2033,3843,3263,536 of which: General government 6551,1051,6162,2232,2632,677 Private sector guaranteed by public sector 14 1 1 1 Private sector not guaranteed 1 14 16 19 12 79
Long-term external debt stocks 32,24266,01179,79590,07097,471106,723
Public and publicly guaranteed debt from: 32,18965,60579,34989,71097,069105,939 Official creditors 28,00452,76755,97057,63661,22660,105
Multilateral 9,29318,87620,11921,50825,57527,627 of which: World Bank 3,8818,4359,93011,25011,99312,037 Bilateral 18,71233,89135,85136,12835,65132,479 Private creditors 4,18412,83823,37932,07435,84345,834 Bondholders 3,3339,81814,97022,67725,89431,446 Commercial banks and others 8513,0208,4099,3969,94914,388
Private nonguaranteed debt from: 54 406 446 360 402 784 Bondholders 100 Commercial banks and others 54 406 446 360 402 684
Use of IMF credit and SDR allocations 1,3847,4019,22013,13020,36223,681
Net debt inflows
Use of IMF credit ..3,2292,0293,9596,4681,182
Long-term 1,45211,04514,52010,4805,9669,824
Official creditors -1893,7723,7901,8662,323 87 Multilateral 7552,5621,4261,4543,7222,411 of which: World Bank 6491,2891,5071,321 733 60 Bilateral -9441,2102,364 411-1,399-2,324
Private creditors 1,6417,27310,7318,6143,6439,737 Bondholders 1,5006,2185,2207,6773,2186,008
Banks and others 1411,0555,511 937 4253,729 Short-term 588 -817 -787 943 675 884
Net equity inflows
Foreign direct investment 6,3867,4098,1419,0105,8525,122 Portfolio equity 1,724 224 220 -12 -1,997-1,486
External debt stocks to exports (%) 74 194 189 210 319 242
External debt stocks to GNI (%) 17 37 41 39 37 37 Debt service to exports (%) 6 15 16 17 34 32
Short-term to external debt stocks (%) 9 13 10 10 9 9
Multilateral to external debt stocks (%) 25 22 20 19 20 19 Reserves to external debt stocks (%) 91 39 39 36 26 24
Gross national income (GNI) 214,619231,165243,433292,071353,899391,744
(US$ million, unless otherwise indicated)
Total external debt stocks
2010 2017 2018 2019 2020 2021
11,49617,17916,72517,37918,33420,171
Use of IMF credit and SDR allocations 252 233 228 227 6501,016 of which: SDR allocations 252 233 228 227 236 615
Long-term external debt 10,40814,90314,42614,93915,81316,897
Public and publicly guaranteed sector 6,8399,4899,5059,85610,64511,463 Public sector 6,8369,4899,5059,85610,64511,463 of which: General government 6,2578,6558,7279,0639,78010,580 Private sector guaranteed by public sector 2 0 0 Private sector not guaranteed 3,5695,4144,9215,0835,1675,434 Short-term external debt 8362,0432,0702,2141,8712,258
Disbursements (long-term)
1,4553,5133,2115,2835,2975,708
Public and publicly guaranteed sector 1,107 978 5881,4191,3781,257 Public sector 1,107 978 5881,4191,3781,257 of which: General government 943 748 4961,2661,1911,104 Private sector guaranteed by public sector Private sector not guaranteed 3482,5352,6233,8653,9184,451
Principal repayments (long-term) 6052,9952,8794,8734,2054,596
Public and publicly guaranteed sector 456 434 4361,179 421 412 Public sector 456 434 4361,179 421 412 of which: General government 242 292 2901,039 304 278 Private sector guaranteed by public sector 0 0 0 Private sector not guaranteed 1492,5612,4433,6943,7854,184
Interest payments (long-term) 495 768 589 684 9271,241
Public and publicly guaranteed sector 380 547 589 684 625 696 Public sector 380 547 589 684 625 696 of which: General government 355 511 539 632 577 654 Private sector guaranteed by public sector 0 0 0 Private sector not guaranteed 115 221 302 545
Long-term external debt stocks 10,40814,90314,42614,93915,81316,897 Public and publicly guaranteed debt from: 6,8399,4899,5059,85610,64511,463
Official creditors 4,2114,2254,3684,3974,5395,335 Multilateral 3,5493,8043,9964,0494,1584,987 of which: World Bank 922 906 876 831 786 768 Bilateral 661 421 372 348 382 348
Private creditors 2,6285,2645,1375,4596,1066,127 Bondholders 2,5965,2375,1085,4226,0716,071 Commercial banks and others 32 27 29 37 35 56
Private nonguaranteed debt from: 3,5695,4144,9215,0835,1675,434 Bondholders 38 38 12 0 0 Commercial banks and others 3,5695,3764,8835,0715,1675,434
Use of IMF credit and SDR allocations 252 233 228 227 6501,016
Net debt inflows
Use of IMF credit 400 0
Long-term 850 518 331 4101,0921,113
Official creditors 319 -27 148 30 124 821 Multilateral 364 -2 194 54 106 832 of which: World Bank 345 0 -31 -45 -45 -18 Bilateral -45 -25 -46 -24 18 -11 Private creditors 531 545 183 381 967 292 Bondholders 400 589 0 196 839 0 Banks and others 131 -44 183 185 129 292 Short-term -27 -490 27 143 -342 387
Foreign direct investment 282 844 129 576 88 700 Portfolio equity 0 0 0 0 0 0
External debt stocks to exports (%) 229 233 215 209 284 234 External debt stocks to GNI (%) 64 73 68 68 79 74
Debt service to exports (%) 22 52 45 68 80 68
Short-term to external debt stocks (%) 7 12 12 13 10 11 Multilateral to external debt stocks (%) 31 22 24 23 23 25 Reserves to external debt stocks (%) 22 20 21 25 16 17 Gross national income (GNI) 17,91023,59224,55125,55923,32527,113
(US$ million, unless otherwise indicated)
Summary external debt data, by debtor type
Total external debt stocks
2010 2017 2018 2019 2020 2021
1,037.3820.8791.2771.7788.5744.7
Use of IMF credit and SDR allocations 23.3 21.6 21.1 21.0 21.8 42.5 of which: SDR allocations 23.3 21.6 21.1 21.0 21.8 42.5
Long-term external debt 998.4772.0736.1718.1729.4663.3
Public and publicly guaranteed sector 998.4772.0736.1718.1729.4663.3
Public sector 998.4772.0736.1718.1729.4663.3 of which: General government 998.4772.0736.1718.1729.4663.3
Private sector guaranteed by public sector Private sector not guaranteed
Short-term external debt 15.5 27.1 34.0 32.7 37.3 38.9
Disbursements (long-term)
8.6 6.9 4.2 4.2 2.8 0.9
Public and publicly guaranteed sector 8.6 6.9 4.2 4.2 2.8 0.9 Public sector 8.6 6.9 4.2 4.2 2.8 0.9 of which: General government 8.6 6.9 4.2 4.2 2.8 0.9 Private sector guaranteed by public sector Private sector not guaranteed
Principal repayments (long-term)
16.9 23.7 24.9 18.4 19.0 19.5
Public and publicly guaranteed sector 16.9 23.7 24.9 18.4 19.0 19.5 Public sector 16.9 23.7 24.9 18.4 19.0 19.5 of which: General government 16.9 23.7 24.9 18.4 19.0 19.5 Private sector guaranteed by public sector Private sector not guaranteed
Interest payments (long-term)
10.0 3.2 3.1 2.6 2.6 2.4
Public and publicly guaranteed sector 10.0 3.2 3.1 2.6 2.6 2.4
Public sector 10.0 3.2 3.1 2.6 2.6 2.4 of which: General government 10.0 3.2 3.1 2.6 2.6 2.4
Private sector guaranteed by public sector Private sector not guaranteed
Long-term external debt stocks 998.4772.0736.1718.1729.4663.3
Public and publicly guaranteed debt from: 998.4772.0736.1718.1729.4663.3 Official creditors 960.5738.0703.6686.2694.5631.2
Multilateral 651.4587.3571.6567.1587.8565.4 of which: World Bank 467.9444.9434.5432.0449.9437.2 Bilateral 309.1150.7132.0119.0106.8 65.7
Private creditors 38.0 34.1 32.5 31.9 34.9 32.2 Bondholders Commercial banks and others 38.0 34.1 32.5 31.9 34.9 32.2
Private nonguaranteed debt from: Bondholders Commercial banks and others
Use of IMF credit and SDR allocations 23.3 21.6 21.1 21.0 21.8 42.5
Net debt inflows
Use of IMF credit
Long-term -8.3 -16.8 -20.6 -14.2 -16.2 -18.6
Official creditors -8.3 -16.8 -20.6 -14.2 -16.2 -18.6 Multilateral 0.1 -1.6 -3.8 -1.7 -2.4 -4.1 of which: World Bank -0.5 0.0 0.0 0.0 0.0 Bilateral -8.4 -15.2 -16.8 -12.5 -13.8 -14.5
Private creditors
Bondholders Banks and others
Short-term 2.0 -4.0 4.4 -4.4 0.0 0.0
Foreign direct investment 91.0 55.5 61.0 67.1 73.8 70.5
Portfolio equity
External debt stocks to exports (%)
External debt stocks to GNI (%) 66.1
Debt service to exports (%)
Short-term to external debt stocks (%) 1.5 3.3 4.3 4.2 4.7 5.2 Multilateral to external debt stocks (%) 62.8 71.6 72.2 73.5 74.5 75.9 Reserves to external debt stocks (%) 11.0 17.5 20.6 24.8
Gross national income (GNI) 1,569.9
(US$ million, unless otherwise indicated)
Total external debt stocks
2010 2017 2018 2019 2020 2021
1,016 873 766 834 9571,130
Use of IMF credit and SDR allocations 74 69 67 67 183 283 of which: SDR allocations 74 69 67 67 70 173
Long-term external debt 733 622 685 747 748 808
Public and publicly guaranteed sector 431 427 498 540 584 620 Public sector 431 427 498 540 584 620 of which: General government 424 417 488 530 577 620 Private sector guaranteed by public sector
Private sector not guaranteed 302 195 186 207 164 188
Short-term external debt 208 182 14 20 26 40
Disbursements (long-term) 320 80 113 92 78 121
Public and publicly guaranteed sector 18 80 113 71 78 97 Public sector 18 80 113 71 78 97 of which: General government 18 80 113 71 78 97 Private sector guaranteed by public sector Private sector not guaranteed 302 21 24
Principal repayments (long-term) 34 113 41 31 82 49
Public and publicly guaranteed sector 34 32 32 31 39 49 Public sector 34 32 32 31 39 49 of which: General government 31 32 32 31 36 42 Private sector guaranteed by public sector Private sector not guaranteed 81 8 43 0
Interest payments (long-term) 17 13 15 22 20 15
Public and publicly guaranteed sector 17 13 15 22 20 15 Public sector 17 13 15 22 20 15 of which: General government 17 13 15 22 20 15 Private sector guaranteed by public sector Private sector not guaranteed 0
Long-term external debt stocks 733 622 685 747 748 808
Public and publicly guaranteed debt from: 431 427 498 540 584 620 Official creditors 390 412 486 529 574 611
Multilateral 239 205 223 245 274 341 of which: World Bank 5 39 40 36 43 87 Bilateral 152 207 263 285 300 270
Private creditors 41 16 12 11 10 9
Bondholders
Commercial banks and others 41 16 12 11 10 9
Private nonguaranteed debt from: 302 195 186 207 164 188 Bondholders
Commercial banks and others 302 195 186 207 164 188
Use of IMF credit and SDR allocations 74 69 67 67 183 283
Net debt inflows
Use of IMF credit 109 0
Long-term 286 -33 72 61 -4 72
Official creditors -15 48 82 42 39 48
Multilateral -20 30 24 21 27 73 of which: World Bank -5 11 1 -3 6 44 Bilateral 5 18 57 21 12 -25
Private creditors 301 -81 -10 19 -43 24 Bondholders
Banks and others 301 -81 -10 19 -43 24 Short-term 181 128 -168 7 8 13
Foreign direct investment 49 45 -14 112 75 74
Portfolio equity 5
External debt stocks to exports (%) 45 42 37 38 50 50
External debt stocks to GNI (%) 24 21 18 21 27 25
Debt service to exports (%) 2 6 3 3 5 3 Short-term to external debt stocks (%) 21 21 2 2 3 3 Multilateral to external debt stocks (%) 23 23 29 29 29 30 Reserves to external debt stocks (%) 74 65 58 53 57 51
Gross national income (GNI) 4,2134,1084,3454,0423,5744,464
(US$ million, unless otherwise indicated)
Total external debt stocks
2010 2017 2018 2019 2020 2021
7,28626,17027,84228,37730,36330,017
Use of IMF credit and SDR allocations 485 301 242 318 9401,317 of which: SDR allocations 197 182 178 177 184 582
Long-term external debt 6,49925,23526,85027,57629,01528,171
Public and publicly guaranteed sector 6,49925,23526,85027,57629,01528,171
Public sector 6,49925,23526,85027,57629,01528,171
of which: General government 4,07014,34915,37016,65818,72918,930
Private sector guaranteed by public sector Private sector not guaranteed
Short-term external debt 302 634 749 482 408 530
Disbursements (long-term)
1,7633,5223,5672,3632,1941,094
Public and publicly guaranteed sector 1,7633,5223,5672,3632,1941,094 Public sector 1,7633,5223,5672,3632,1941,094 of which: General government 7471,7561,9691,5771,675 766 Private sector guaranteed by public sector Private sector not guaranteed
Principal repayments (long-term) 129 9851,1381,4311,3711,531 Public and publicly guaranteed sector 129 9851,1381,4311,3711,531 Public sector 129 9851,1381,4311,3711,531 of which: General government 32 142 167 210 168 208 Private sector guaranteed by public sector Private sector not guaranteed
Interest payments (long-term) 46 430 436 670 599 458 Public and publicly guaranteed sector 46 430 436 670 599 458 Public sector 46 430 436 670 599 458 of which: General government 30 165 201 207 196 202 Private sector guaranteed by public sector Private sector not guaranteed
Summary external debt stock, by creditor type
Long-term external debt stocks 6,49925,23526,85027,57629,01528,171 Public and publicly guaranteed debt from: 6,49925,23526,85027,57629,01528,171 Official creditors 4,61218,49719,57520,61822,50522,244 Multilateral 2,81210,08611,04312,20014,02414,194 of which: World Bank 1,8047,0408,3389,35410,99111,170 Bilateral 1,7998,4118,5328,4198,4818,050 Private creditors 1,8876,7387,2766,9586,5115,927 Bondholders ..1,0001,0001,0001,0001,000 Commercial banks and others 1,8875,7386,2765,9585,5114,927
Private nonguaranteed debt from: Bondholders Commercial banks and others Use of IMF credit and SDR allocations 485 301 242 318 9401,317
Net debt inflows
Use of IMF credit 122 -52 -53 78 588 0 Long-term 1,6342,5372,428 932 824 -436 Official creditors 1,0092,1611,8691,1981,307 102 Multilateral 4721,4941,7031,2201,347 527 of which: World Bank 385 9331,4941,0751,209 494 Bilateral 537 667 166 -21 -40 -425 Private creditors 625 376 559 -267 -483 -538 Bondholders 0 0 0 0 Banks and others 625 376 559 -267 -483 -538 Short-term 75 -293 115 -267 -74 121
Net equity inflows
Foreign direct investment 2884,0173,3602,5492,3964,259
Portfolio equity
Debt ratios
External debt stocks to exports (%) 157 393 362 371 393 316 External debt stocks to GNI (%) 24 32 33 30 28 27 Debt service to exports (%) 4 22 21 28 26 21 Short-term to external debt stocks (%) 4 2 3 2 1 2 Multilateral to external debt stocks (%) 39 39 40 43 46 47 Reserves to external debt stocks (%) 31 12 14 11 10 Gross national income (GNI) 29,82681,28583,89295,323107,045110,714
(US$ million, unless otherwise indicated)
Total external debt stocks
2010 2017 2018 2019 2020 2021
1,1071,2681,2461,3441,5192,028
Use of IMF credit and SDR allocations 103 96 93 93 97 226 of which: SDR allocations 103 96 93 93 97 226
Long-term external debt 9261,1091,1081,1991,4001,758
Public and publicly guaranteed sector 426 753 738 714 9041,213 Public sector 353 717 714 702 9041,213 of which: General government 315 683 681 669 8711,180
Private sector guaranteed by public sector 73 36 24 12 0 Private sector not guaranteed 500 355 370 485 497 545
Short-term external debt 78 64 45 53 22 44
Disbursements (long-term) 50 119 86 153 433 399
Public and publicly guaranteed sector 38 59 37 17 403 326 Public sector 38 59 37 17 403 326 of which: General government 33 58 36 17 403 326 Private sector guaranteed by public sector Private sector not guaranteed 13 59 49 136 30 73
Principal repayments (long-term) 36 137 75 59 250 39
Public and publicly guaranteed sector 9 33 40 38 231 15 Public sector 9 21 28 26 219 15 of which: General government 9 21 26 26 219 15 Private sector guaranteed by public sector 12 12 12 12 Private sector not guaranteed 27 104 35 21 19 24
Interest payments (long-term) 23 30 31 150 24 9
Public and publicly guaranteed sector 15 24 26 146 24 9 Public sector 14 23 25 146 24 9 of which: General government 12 23 25 145 24 9 Private sector guaranteed by public sector 1 1 1 1 0 Private sector not guaranteed 7 6 5 4 0 0
Long-term external debt stocks 9261,1091,1081,1991,4001,758
Public and publicly guaranteed debt from: 426 753 738 714 9041,213 Official creditors 276 553 538 514 9041,213 Multilateral 113 224 253 263 638 828 of which: World Bank 0 54 73 76 142 326 Bilateral 162 329 285 251 265 385 Private creditors 150 200 200 200 0 Bondholders 150 200 200 200 0 Commercial banks and others Private nonguaranteed debt from: 500 355 370 485 497 545 Bondholders Commercial banks and others 500 355 370 485 497 545
Use of IMF credit and SDR allocations 103 96 93 93 97 226
Net debt inflows
Use of IMF credit
Long-term 15 -18 11 95 183 360
Official creditors 29 27 -3 -21 372 311 Multilateral 9 51 29 10 374 194 of which: World Bank 0 3 20 3 64 189 Bilateral 19 -25 -32 -30 -2 117 Private creditors -14 -45 15 116 -189 49 Bondholders 0 0 0 -200 Banks and others -14 -45 15 116 11 49 Short-term 22 -34 -19 8 -31 23
Foreign direct investment 177 418 435 397 207 416
Portfolio equity
External debt stocks to exports (%) 59 50 46 50 118 165
External debt stocks to GNI (%) 36 26 24 27 35 47
Debt service to exports (%) 3 7 4 8 21 4 Short-term to external debt stocks (%) 7 5 4 4 1 2 Multilateral to external debt stocks (%) 10 18 20 20 42 41 Reserves to external debt stocks (%) 65 88 76 77 71 75 Gross national income (GNI) 3,0434,9305,2225,0464,2964,360
(US$ million, unless otherwise indicated)
Total external debt stocks
2010 2017 2018 2019 2020 2021
2,9296,4996,8117,1997,6167,722
Use of IMF credit and SDR allocations 226 412 601 7221,0631,427 of which: SDR allocations 226 209 204 203 211 495
Long-term external debt 2,5325,8806,0226,1186,4786,278
Public and publicly guaranteed sector 2,5325,8806,0226,1186,4786,278 Public sector 2,5325,8806,0226,1186,4786,278 of which: General government 2,5315,8305,9676,0606,3996,209
Private sector guaranteed by public sector Private sector not guaranteed
Short-term external debt 170 207 187 360 76 17
Disbursements (long-term) 5091,173 854 5941,252 897 Public and publicly guaranteed sector 5091,173 854 5941,252 897 Public sector 5091,173 854 5941,252 897 of which: General government 5091,152 826 5891,235 896 Private sector guaranteed by public sector Private sector not guaranteed
Principal repayments (long-term) 313 450 496 4241,128 906 Public and publicly guaranteed sector 313 450 496 4241,128 906 Public sector 313 450 496 4241,128 906 of which: General government 313 449 494 4231,126 902 Private sector guaranteed by public sector Private sector not guaranteed
Interest payments (long-term) 137 168 216 252 273 219
Public and publicly guaranteed sector 137 168 216 252 273 219 Public sector 137 168 216 252 273 219 of which: General government 137 167 215 250 272 218 Private sector guaranteed by public sector Private sector not guaranteed
Long-term external debt stocks 2,5325,8806,0226,1186,4786,278
Public and publicly guaranteed debt from: 2,5325,8806,0226,1186,4786,278 Official creditors 1,1362,6723,0433,3973,5903,344
Multilateral 4661,4501,6971,9202,0811,932 of which: World Bank 22 336 369 581 680 654 Bilateral 6701,2221,3461,4771,5081,412
Private creditors 1,3973,2072,9802,7202,8882,934 Bondholders 8792,2002,1862,1862,4362,573 Commercial banks and others 5181,007 794 534 452 360
Private nonguaranteed debt from: Bondholders Commercial banks and others Use of IMF credit and SDR allocations 226 412 601 7221,0631,427
Use of IMF credit 198 202 123 301 107
Long-term 196 722 358 169 124 -9
Official creditors 36 850 486 400 -26 -77 Multilateral 16 786 331 257 -1 -5 of which: World Bank 6 249 64 220 46 25 Bilateral 19 64 155 143 -25 -72
Private creditors 160 -128 -128 -231 150 68 Bondholders -23 -18 -14 250 137 Banks and others 183 -110 -114 -231 -100 -70 Short-term 67 -37 -11 178 -299 -60
Foreign direct investment 6511,3141,3791,5531,7171,635
Portfolio equity 0
External debt stocks to exports (%) 31
External debt stocks to GNI (%) 23 46 43 46 53 45 Debt service to exports (%) 5
Short-term to external debt stocks (%) 6 3 3 5 1 0 Multilateral to external debt stocks (%) 16 22 25 27 27 25 Reserves to external debt stocks (%) 59 15 19 19
Gross national income (GNI) 12,48413,98615,75515,51114,50317,052
(US$ million, unless otherwise indicated)
Summary external debt data, by debtor type
2010 2017 2018 2019 2020 2021
Total external debt stocks 543 695 723 802 9191,074
Use of IMF credit and SDR allocations 77 94 84 77 103 228 of which: SDR allocations 46 42 41 41 43 125
Long-term external debt 422 587 621 698 787 808 Public and publicly guaranteed sector 422 587 621 698 787 808 Public sector 422 587 621 698 787 808 of which: General government 404 580 617 697 786 808 Private sector guaranteed by public sector Private sector not guaranteed
Short-term external debt 45 14 19 26 29 38
Disbursements (long-term) 43 134 71 107 92 58
Public and publicly guaranteed sector 43 134 71 107 92 58 Public sector 43 134 71 107 92 58 of which: General government 36 134 71 107 92 58 Private sector guaranteed by public sector Private sector not guaranteed
Principal repayments (long-term) 18 26 29 28 20 21
Public and publicly guaranteed sector 18 26 29 28 20 21 Public sector 18 26 29 28 20 21 of which: General government 13 23 26 26 19 21 Private sector guaranteed by public sector Private sector not guaranteed
Interest payments (long-term) 7 6 7 9 7 10
Public and publicly guaranteed sector 7 6 7 9 7 10 Public sector 7 6 7 9 7 10 of which: General government 6 6 6 8 7 10 Private sector guaranteed by public sector Private sector not guaranteed
Long-term external debt stocks 422 587 621 698 787 808
Public and publicly guaranteed debt from: 422 587 621 698 787 808 Official creditors 415 584 620 698 787 808 Multilateral 295 421 450 469 521 526 of which: World Bank 65 105 116 118 128 131 Bilateral 120 163 169 230 265 283
Private creditors 6 3 1 0 0 0 Bondholders
Commercial banks and others 6 3 1 0 0 0
Private nonguaranteed debt from: Bondholders
Commercial banks and others Use of IMF credit and SDR allocations 77 94 84 77 103 228
Net debt inflows
Use of IMF credit 3 9 -8 -6 22 45
Long-term 25 108 41 80 72 37 Official creditors 22 110 43 81 72 37 Multilateral 14 88 36 20 39 21 of which: World Bank 2 44 13 3 5 7 Bilateral 8 22 7 60 33 16 Private creditors 3 -2 -2 -1 0
Bondholders
Banks and others 3 -2 -2 -1 0
Short-term 1 -4 3 8 2 10
Foreign direct investment 37 64 82 71 190 252 Portfolio equity
External debt stocks to exports (%) 194 247 193 215 501 764
External debt stocks to GNI (%) 36 47 44 45 51 53
Debt service to exports (%) 9 14 12 12 19 26
Short-term to external debt stocks (%) 8 2 3 3 3 4 Multilateral to external debt stocks (%) 54 61 62 58 57 49 Reserves to external debt stocks (%) 37 24 27 32 42 61
Gross national income (GNI) 1,5131,4771,6411,7841,7992,027
(US$ million, unless otherwise indicated)
2010 2017 2018 2019 2020 2021
Total external debt stocks 8,79016,42417,32618,75720,08922,053
Use of IMF credit and SDR allocations 1,272 397 416 448 7921,158 of which: SDR allocations 222 205 200 199 207 484
Long-term external debt 6,41813,58414,59316,03316,97418,524
Public and publicly guaranteed sector 3,2746,6156,7496,9937,9679,081 Public sector 3,2746,6156,7496,9937,9679,081 of which: General government 3,0245,8655,9996,2437,7178,581
Private sector guaranteed by public sector Private sector not guaranteed 3,1436,9697,8449,0409,0079,442
Short-term external debt 1,1012,4432,3182,2762,3222,372
Disbursements (long-term)
1,0262,0032,4682,9832,5083,792
Public and publicly guaranteed sector 651 536 567 6161,4522,543 Public sector 651 536 567 6161,4522,543 of which: General government 401 536 567 6161,4522,043 Private sector guaranteed by public sector Private sector not guaranteed 3751,4671,9002,3671,0561,249
Principal repayments (long-term) 5101,9741,6811,6691,8202,002
Public and publicly guaranteed sector 169 434 300 324 7991,079 Public sector 169 434 300 324 7991,079 of which: General government 169 184 300 324 299 829 Private sector guaranteed by public sector Private sector not guaranteed 3421,5401,3811,3451,022 923
Interest payments (long-term) 247 526 609 676 587 655
Public and publicly guaranteed sector 87 175 167 185 135 100 Public sector 87 175 167 185 135 100 of which: General government 87 111 112 129 118 92 Private sector guaranteed by public sector Private sector not guaranteed 160 351 442 491 452 554
Long-term external debt stocks 6,41813,58414,59316,03316,97418,524
Public and publicly guaranteed debt from: 3,2746,6156,7496,9937,9679,081 Official creditors 2,4484,4164,5804,8806,3296,941
Multilateral 1,8023,6643,7943,9344,7985,375 of which: World Bank 1,3592,0261,9601,8792,0542,043 Bilateral 645 752 786 9461,5311,567
Private creditors 8272,1992,1692,1131,6382,140 Bondholders 7501,2501,2501,250 7501,000 Commercial banks and others 77 949 919 863 8881,140
Private nonguaranteed debt from: 3,1436,9697,8449,0409,0079,442 Bondholders ..1,1521,6603,3203,3723,535 Commercial banks and others 3,1435,8176,1845,7205,6355,907
Use of IMF credit and SDR allocations 1,272 397 416 448 7921,158
Net debt inflows
Use of IMF credit 275 70 28 35 315 108
Long-term 516 29 7871,314 6881,790
Official creditors 330 315 259 3441,142 962 Multilateral 294 337 212 181 659 808 of which: World Bank 126 125 -31 -58 115 39 Bilateral 36 -22 48 163 482 154 Private creditors 186 -287 528 970 -454 828 Bondholders 250 -454 2361,323 -290 383 Banks and others -64 167 291 -353 -164 445 Short-term 176 181 -262 -19 37 43
Net equity inflows
Foreign direct investment 7401,7271,2821,339 529 935 Portfolio equity -22 -2 4 -6 1 2
External debt stocks to exports (%) 191 189 170 172 292 241
External debt stocks to GNI (%) 73 106 102 112 133 125
Debt service to exports (%) 18 30 24 23 35 29
Short-term to external debt stocks (%) 13 15 13 12 12 11
Multilateral to external debt stocks (%) 21 22 22 21 24 24 Reserves to external debt stocks (%) 26 19 19 19 19 19
Gross national income (GNI) 12,02615,44716,91216,69315,10417,666
(US$ million, unless otherwise indicated)
2010 2017 2018 2019 2020 2021
Total external debt stocks 8,36522,51923,57527,08231,87136,182
Use of IMF credit and SDR allocations 9371,4651,5081,5762,6123,411 of which: SDR allocations 545 504 492 489 5101,485
Long-term external debt 5,33717,72218,41520,86524,08427,623
Public and publicly guaranteed sector 5,33717,46918,16220,61223,83127,370
Public sector 5,33717,46918,16220,61223,83127,370 of which: General government 4,78216,37017,06719,55222,74126,297 Private sector guaranteed by public sector Private sector not guaranteed 0 253 253 253 253 253 Short-term external debt 2,0923,3333,6534,6415,1755,147
Disbursements (long-term) 1,3141,2532,7673,9904,4175,757
Public and publicly guaranteed sector 1,3141,2532,7673,9904,4175,757 Public sector 1,3141,2532,7673,9904,4175,757 of which: General government 1,0781,2272,7303,9854,4005,694 Private sector guaranteed by public sector Private sector not guaranteed 0
Principal repayments (long-term)
1711,2051,8571,4751,6221,824
Public and publicly guaranteed sector 1711,2051,8571,4751,6221,824 Public sector 1711,2051,8571,4751,6221,824 of which: General government 1501,1941,8431,4431,5871,780 Private sector guaranteed by public sector Private sector not guaranteed 0
Interest payments (long-term) 96 745 675 885 9411,220
Public and publicly guaranteed sector 96 739 669 878 9341,214 Public sector 96 739 669 878 9341,214 of which: General government 89 730 661 869 9251,204 Private sector guaranteed by public sector Private sector not guaranteed 0 6 6 6 6 6
Long-term external debt stocks 5,33717,72218,41520,86524,08427,623 Public and publicly guaranteed debt from: 5,33717,46918,16220,61223,83127,370 Official creditors 4,2159,0878,7728,7349,2589,526 Multilateral 2,7435,3835,3785,4986,0656,292 of which: World Bank 1,8683,9453,9263,9894,4774,663 Bilateral 1,4723,7053,3943,2363,1943,233
Private creditors 1,1228,3819,39011,87814,57317,844 Bondholders ..3,7504,9787,69510,21513,120 Commercial banks and others 1,1224,6314,4124,1834,3584,724
Private nonguaranteed debt from: 0 253 253 253 253 253 Bondholders 0 253 253 253 253 253 Commercial banks and others Use of IMF credit and SDR allocations 9371,4651,5081,5762,6123,411
Net debt inflows
Use of IMF credit 124 18 78 76 939 -119 Long-term 1,143 47 9102,5152,7963,932
Official creditors 923 123 -155 6 243 491 Multilateral 435 399 111 147 358 389 of which: World Bank 308 323 75 88 309 316 Bilateral 488 -276 -266 -141 -115 102
Private creditors 220 -76 1,0652,5092,5533,441 Bondholders 0 ..1,2282,7172,5212,904
Banks and others 220 -76 -163 -208 32 537
Short-term 571 409 2901,005 390 398
Net equity inflows
Foreign direct investment 2,5273,2552,9893,8801,8762,614 Portfolio equity 18
Debt ratios
External debt stocks to exports (%) 88 109 102 104 140 246
External debt stocks to GNI (%) 26 39 37 41 45 48
Debt service to exports (%) 3 10 12 10 12 22 Short-term to external debt stocks (%) 25 15 15 17 16 14 Multilateral to external debt stocks (%) 33 24 23 20 19 17 Reserves to external debt stocks (%) 57 30 25 26 23 26
Gross national income (GNI) 31,66357,43264,27065,52770,77775,637
(US$ million, unless otherwise indicated)
Summary external debt data, by debtor type
2010 2017 2018 2019 2020 2021
Total external debt stocks 560.6561.5554.5525.5658.5725.6
Use of IMF credit and SDR allocations 46.3 44.5 38.6 35.6 58.8 76.6 of which: SDR allocations 17.2 15.9 15.5 15.4 16.1 37.6
Long-term external debt 476.7495.0499.1476.0497.6528.6
Public and publicly guaranteed sector 476.7495.0499.1476.0497.6528.6
Public sector 476.7495.0499.1476.0497.6528.6 of which: General government 472.4494.6499.1476.0497.6528.6
Private sector guaranteed by public sector Private sector not guaranteed
Short-term external debt 37.6 22.0 16.7 13.8102.2120.4
Disbursements (long-term)
21.1 14.8 38.3 12.0 44.9 65.8
Public and publicly guaranteed sector 21.1 14.8 38.3 12.0 44.9 65.8 Public sector 21.1 14.8 38.3 12.0 44.9 65.8 of which: General government 21.1 14.8 38.3 12.0 44.9 65.8 Private sector guaranteed by public sector Private sector not guaranteed
Principal repayments (long-term)
15.1 32.1 33.3 34.2 28.7 30.7
Public and publicly guaranteed sector 15.1 32.1 33.3 34.2 28.7 30.7
Public sector 15.1 32.1 33.3 34.2 28.7 30.7 of which: General government 14.8 31.7 32.9 34.2 28.7 30.7 Private sector guaranteed by public sector Private sector not guaranteed
Interest payments (long-term)
10.5 22.7 17.4 17.0 15.6 15.0
Public and publicly guaranteed sector 10.5 22.7 17.4 17.0 15.6 15.0 Public sector 10.5 22.7 17.4 17.0 15.6 15.0 of which: General government 10.4 22.7 17.4 17.0 15.6 15.0
Private sector guaranteed by public sector Private sector not guaranteed
Long-term external debt stocks 476.7495.0499.1476.0497.6528.6 Public and publicly guaranteed debt from: 476.7495.0499.1476.0497.6528.6 Official creditors 278.2356.0370.3358.4390.6432.4
Multilateral 187.8256.0278.7273.6305.0329.0 of which: World Bank 58.2102.0131.1131.4161.4187.0 Bilateral 90.4100.0 91.7 84.7 85.6103.3
Private creditors 198.5139.0128.8117.6107.0 96.3 Bondholders 193.2135.6126.7115.9105.4 94.8 Commercial banks and others 5.3 3.3 2.1 1.7 1.6 1.5
Private nonguaranteed debt from: Bondholders Commercial banks and others Use of IMF credit and SDR allocations 46.3 44.5 38.6 35.6 58.8 76.6
Use of IMF credit 6.4 -2.0 -4.9 -2.8 21.0 -2.6 Long-term 6.0 -17.3 5.0 -22.2 16.2 35.1
Official creditors 10.4 -5.9 16.8 -11.0 26.9 45.8
Multilateral 13.4 -0.4 24.8 -4.1 27.4 28.3
of which: World Bank 8.6 7.3 31.3 1.2 26.1 29.9
Bilateral -3.1 -5.6 -8.1 -7.0 -0.5 17.5
Private creditors -4.4 -11.4 -11.7 -11.1 -10.7 -10.7
Bondholders -10.6 -10.6 -10.7 -10.6 -10.6
Banks and others -4.4 -0.8 -1.2 -0.4 -0.1 -0.1
Short-term -2.0 -5.3 -5.8 -3.3 87.9 17.5
Foreign direct investment 42.3162.0162.4197.6150.6143.4
Portfolio equity 0.0 0.0 0.0 -0.3 -0.4
External debt stocks to exports (%) 293.6 94.6 87.2 77.2150.3175.9
External debt stocks to GNI (%) 76.7 55.9 52.4 48.0 65.9 67.9
Debt service to exports (%) 13.6 10.1 8.8 8.0 11.2 12.6
Short-term to external debt stocks (%) 6.7 3.9 3.0 2.6 15.5 16.6
Multilateral to external debt stocks (%) 33.5 45.6 50.3 52.1 46.3 45.4
Reserves to external debt stocks (%) 21.3 35.5 42.2 45.0 44.5 48.0
Gross national income (GNI) 731.11,004.11,057.61,093.9999.21,069.2
(US$ million, unless otherwise indicated)
Total external debt stocks
2010 2017 2018 2019 2020 2021
15,04323,26524,27525,03524,81326,965
Use of IMF credit and SDR allocations 309 286 279 278 289 856 of which: SDR allocations 309 286 279 278 289 856
Long-term external debt 13,14921,93622,39723,41923,13624,732
Public and publicly guaranteed sector 5,5598,3668,4289,84311,06111,710
Public sector 5,5598,3668,4289,84311,06111,710 of which: General government 5,0618,1348,2349,68610,94211,621
Private sector guaranteed by public sector Private sector not guaranteed 7,58913,57013,96913,57612,07513,022 Short-term external debt 1,5851,0421,5991,3381,3881,376
Disbursements (long-term)
1,4725,197 8822,0201,9572,092
Public and publicly guaranteed sector 881 662 4061,8121,7451,061 Public sector 881 662 4061,8121,7451,061 of which: General government 878 662 4061,8121,7451,061 Private sector guaranteed by public sector Private sector not guaranteed 5924,536 476 208 2121,030
Principal repayments (long-term) 9493,226 416 9942,252 476
Public and publicly guaranteed sector 264 457 342 394 539 393 Public sector 264 457 342 394 539 393 of which: General government 242 419 305 357 502 363 Private sector guaranteed by public sector Private sector not guaranteed 6852,768 74 5991,713 84
Interest payments (long-term) 636 922 714 9991,2261,044
Public and publicly guaranteed sector 284 376 267 408 521 496 Public sector 284 376 267 408 521 496 of which: General government 253 362 255 397 513 491 Private sector guaranteed by public sector Private sector not guaranteed 352 546 447 591 705 547
Long-term external debt stocks 13,14921,93622,39723,41923,13624,732
Public and publicly guaranteed debt from: 5,5598,3668,4289,84311,06111,710 Official creditors 4,6005,4065,4705,1885,2094,861 Multilateral 4,2414,9114,9774,6864,8204,509 of which: World Bank 1,3721,5551,7181,6411,7581,689 Bilateral 359 496 493 502 389 352
Private creditors 9592,9602,9584,6555,8536,849 Bondholders 9552,9302,9304,6305,8306,830 Commercial banks and others 4 30 28 25 23 19
Private nonguaranteed debt from: 7,58913,57013,96913,57612,07513,022 Bondholders 5 1,6501,6501,500 7001,700 Commercial banks and others 7,58411,92012,31912,07611,37511,322
Use of IMF credit and SDR allocations 309 286 279 278 289 856
Net debt inflows
Use of IMF credit
Long-term 5241,972 4661,026 -2951,615
Official creditors 615 -291 65 -280 9 -328 Multilateral 630 -289 68 -288 133 -310 of which: World Bank 260 -124 163 -78 118 -69 Bilateral -15 -2 -2 8 -125 -18 Private creditors -91 2,263 4001,306 -3041,944 Bondholders ..1,000 ..1,550 4002,000 Banks and others -91 1,263 400 -244 -704 -56 Short-term 359 122 556 -261 49 -11
Foreign direct investment 794 8801,037 930 8913,403 Portfolio equity 0 0 0 0 0 0
External debt stocks to exports (%) 151 166 170 171 181 167
External debt stocks to GNI (%) 38 33 34 33 33 32
Debt service to exports (%) 16 30 8 14 26 10
Short-term to external debt stocks (%) 11 4 7 5 6 5 Multilateral to external debt stocks (%) 28 21 21 19 19 17 Reserves to external debt stocks (%) 37 49 51 58 73 76
Gross national income (GNI) 39,64370,15371,70675,61676,14284,327
(US$ million, unless otherwise indicated)
Total external debt stocks
2010 2017 2018 2019 2020 2021
3,2452,3942,5953,0054,1614,702
Use of IMF credit and SDR allocations 205 426 464 481 668 886 of which: SDR allocations 158 146 143 142 148 431
Long-term external debt 2,9251,8601,9892,3313,3433,591
Public and publicly guaranteed sector 2,9251,8601,9892,3313,3433,591 Public sector 2,9251,8601,9892,3313,3433,586 of which: General government 2,7171,8151,9422,2743,2693,496
Private sector guaranteed by public sector Private sector not guaranteed
Short-term external debt 115 108 142 193 150 226
Disbursements (long-term) 36 90 239 422 945 363
Public and publicly guaranteed sector 36 90 239 422 945 363 Public sector 36 90 239 422 945 358 of which: General government 24 85 235 411 934 334 Private sector guaranteed by public sector Private sector not guaranteed
Principal repayments (long-term) 48 57 82 72 34 59 Public and publicly guaranteed sector 48 57 82 72 34 59 Public sector 48 57 82 72 34 59 of which: General government 47 57 82 72 34 58 Private sector guaranteed by public sector Private sector not guaranteed
Interest payments (long-term) 21 22 29 30 40 50
Public and publicly guaranteed sector 21 22 29 30 40 50 Public sector 21 22 29 30 40 50 of which: General government 14 22 28 29 39 49 Private sector guaranteed by public sector Private sector not guaranteed
Long-term external debt stocks 2,9251,8601,9892,3313,3433,591
Public and publicly guaranteed debt from: 2,9251,8601,9892,3313,3433,591 Official creditors 2,9001,8361,9662,2633,1153,308
Multilateral 1,875 690 8231,0281,2511,458 of which: World Bank 1,248 252 344 471 572 621 Bilateral 1,0251,1461,1421,2351,8641,850
Private creditors 25 24 24 68 228 283
Bondholders
Commercial banks and others 25 24 24 68 228 283
Private nonguaranteed debt from: Bondholders Commercial banks and others Use of IMF credit and SDR allocations 205 426 464 481 668 886
Net debt inflows
Use of IMF credit -10 24 49 20 162 -52
Long-term -13 33 157 350 911 304 Official creditors -13 33 157 306 766 229 Multilateral -7 35 148 208 159 243 of which: World Bank 0 17 98 129 79 66 Bilateral -6 -2 9 98 608 -14 Private creditors 44 145 74
Bondholders
Banks and others 44 145 74
Short-term 75 28 34 52 -44 76
Foreign direct investment 40 -28 13 12 34
Portfolio equity 1 0 0 0 0
External debt stocks to exports (%) 210 51 63 73 46 46
External debt stocks to GNI (%) 48 23 23 24 32 34
Debt service to exports (%) 5 2 3 3 2 2 Short-term to external debt stocks (%) 4 5 5 6 4 5 Multilateral to external debt stocks (%) 58 29 32 34 30 31 Reserves to external debt stocks (%) 9 41 45 40 30 Gross national income (GNI) 6,77610,27411,44912,78212,85313,991
(US$ million, unless otherwise indicated)
Total external debt stocks
2010 2017 2018 2019 2020 2021
1,097 500 594 692 9171,112
Use of IMF credit and SDR allocations 25 52 53 50 49 103 of which: SDR allocations 21 19 19 19 20 57
Long-term external debt 980 427 511 594 820 950 Public and publicly guaranteed sector 980 427 511 594 820 950 Public sector 980 427 511 594 820 950 of which: General government 970 427 511 594 820 950 Private sector guaranteed by public sector Private sector not guaranteed
Short-term external debt 92 21 30 47 48 60
Disbursements (long-term) 10 94 125 95 206 183
Public and publicly guaranteed sector 10 94 125 95 206 183 Public sector 10 94 125 95 206 183 of which: General government 10 94 125 95 206 183 Private sector guaranteed by public sector Private sector not guaranteed
Principal repayments (long-term) 6 9 9 8 11 24
Public and publicly guaranteed sector 6 9 9 8 11 24 Public sector 6 9 9 8 11 24 of which: General government 6 9 9 8 11 24 Private sector guaranteed by public sector Private sector not guaranteed
Interest payments (long-term) 4 4 6 8 12 20
Public and publicly guaranteed sector 4 4 6 8 12 20 Public sector 4 4 6 8 12 20 of which: General government 4 4 6 8 12 20 Private sector guaranteed by public sector Private sector not guaranteed
Long-term external debt stocks 980 427 511 594 820 950
Public and publicly guaranteed debt from: 980 427 511 594 820 950 Official creditors 980 358 415 468 607 628 Multilateral 496 238 294 348 488 510 of which: World Bank 289 67 111 126 164 182 Bilateral 484 121 120 120 119 118
Private creditors 69 97 126 213 322 Bondholders 69 97 126 213 322 Commercial banks and others Private nonguaranteed debt from: Bondholders Commercial banks and others
Use of IMF credit and SDR allocations 25 52 53 50 49 103
Use of IMF credit 8 6 2 -2 -3 17
Long-term 4 85 116 87 195 159
Official creditors 4 44 88 57 109 50 Multilateral -2 38 89 58 109 52 of which: World Bank -1 9 46 16 31 24 Bilateral 6 6 -1 -1 -1 -1
Private creditors 41 28 29 86 109 Bondholders 41 28 29 86 109 Banks and others
Short-term -6 1 9 17 1 12
Foreign direct investment 26 16 17 71 45 24 Portfolio equity 3 0
External debt stocks to exports (%) 597 119 136 187 306 918
External debt stocks to GNI (%) 130 37 41 47 63 68
Debt service to exports (%) 10 4 4 5 9 39 Short-term to external debt stocks (%) 8 4 5 7 5 5 Multilateral to external debt stocks (%) 45 48 50 50 53 46 Reserves to external debt stocks (%) 14 Gross national income (GNI) 8461,3531,4541,4701,4561,641
(US$ million, unless otherwise indicated)
Total external debt stocks
2010 2017 2018 2019 2020 2021
1,4081,5821,6071,5301,5071,890
Use of IMF credit and SDR allocations 190 124 121 120 125 366 of which: SDR allocations 134 124 121 120 125 366
Long-term external debt 8851,3431,3621,3611,3271,467
Public and publicly guaranteed sector 8851,1351,2051,2551,2711,342
Public sector 8851,1351,2051,2551,2711,342 of which: General government 8161,0991,1701,2201,2371,308
Private sector guaranteed by public sector
Private sector not guaranteed 0 208 157 106 56 125
Short-term external debt 333 116 124 49 54 57
Disbursements (long-term) 123 109 138 92 48 218
Public and publicly guaranteed sector 123 109 138 92 48 121 Public sector 123 109 138 92 48 121 of which: General government 123 109 138 92 48 121 Private sector guaranteed by public sector Private sector not guaranteed 0 97
Principal repayments (long-term)
16 66 106 105 103 85
Public and publicly guaranteed sector 16 39 55 54 52 57 Public sector 16 39 55 54 52 57 of which: General government 15 38 55 54 52 57 Private sector guaranteed by public sector
Private sector not guaranteed 27 51 51 51 28
Interest payments (long-term)
11 32 33 33 30 25
Public and publicly guaranteed sector 11 19 22 23 24 23 Public sector 11 19 22 23 24 23 of which: General government 11 19 22 23 24 22 Private sector guaranteed by public sector Private sector not guaranteed 13 11 9 6 3
Long-term external debt stocks 8851,3431,3621,3611,3271,467
Public and publicly guaranteed debt from: 8851,1351,2051,2551,2711,342 Official creditors 8691,1011,1721,2231,2401,312
Multilateral 533 726 788 815 825 910 of which: World Bank 9 36 75 83 90 92 Bilateral 336 376 384 408 415 402 Private creditors 16 33 33 32 31 30 Bondholders 0 0 0 0 0 0 Commercial banks and others 16 33 33 32 31 30 Private nonguaranteed debt from: 0 208 157 106 56 125 Bondholders Commercial banks and others 0 208 157 106 56 125
Use of IMF credit and SDR allocations 190 124 121 120 125 366
Net debt inflows
Use of IMF credit -1
Long-term 107 44 32 -12 -55 133
Official creditors 107 53 84 39 -4 65 Multilateral 56 26 64 28 6 84 of which: World Bank 0 9 41 8 4 5 Bilateral 51 27 19 11 -9 -19 Private creditors 0 -10 -51 -51 -51 68 Bondholders 0 0 0 Banks and others 0 -10 -51 -51 -51 68
Short-term -125 -122 6 -7 5 2
Foreign direct investment 39 274 9571,5141,0871,162 Portfolio equity 0 0 0 0
External debt stocks to exports (%) 118 93 100 82 52 114
External debt stocks to GNI (%) 41 33 34 30 28 27
Debt service to exports (%) 3 6 9 7 5 7
Short-term to external debt stocks (%) 24 7 8 3 4 3 Multilateral to external debt stocks (%) 38 46 49 53 55 48 Reserves to external debt stocks (%) 56 36 32 37 45 42
Gross national income (GNI) 3,4464,7374,7605,1275,3157,104
(US$ million, unless otherwise indicated)
2010 2017 2018 2019 2020 2021
Total external debt stocks 9592,1702,2202,2142,3182,604
Use of IMF credit and SDR allocations 135 213 201 185 291 502 of which: SDR allocations 122 111 110 107 111 332
Long-term external debt 8241,9552,0192,0122,0272,102
Public and publicly guaranteed sector 8241,9542,0192,0122,0272,098
Public sector 8241,9542,0192,0122,0272,098 of which: General government 7781,9231,9901,9872,0042,078 Private sector guaranteed by public sector
Private sector not guaranteed 1 0 0 0 4
Short-term external debt 0 2 0 16 0 0
Disbursements (long-term) 288 16 40 3 87
Public and publicly guaranteed sector 288 16 40 3 83 Public sector 288 16 40 3 83 of which: General government 288 16 40 3 83 Private sector guaranteed by public sector Private sector not guaranteed 4
Principal repayments (long-term) 122 9 5 7 7 12
Public and publicly guaranteed sector 122 6 5 6 7 12 Public sector 122 6 5 6 7 12 of which: General government 121 3 2 3 4 9 Private sector guaranteed by public sector Private sector not guaranteed 4 0 0
Interest payments (long-term) 8 5 3 3 2 3
Public and publicly guaranteed sector 8 5 3 3 2 3 Public sector 8 5 3 3 2 3 of which: General government 8 4 3 2 2 3 Private sector guaranteed by public sector Private sector not guaranteed 0 0 0
Summary external debt stock, by creditor type
Long-term external debt stocks 8241,9552,0192,0122,0272,102
Public and publicly guaranteed debt from: 8241,9542,0192,0122,0272,098 Official creditors 7741,9091,9731,9681,9842,057 Multilateral 557 101 99 96 92 86 of which: World Bank 0 Bilateral 2171,8081,8741,8721,8911,971 Private creditors 50 45 45 44 43 41 Bondholders
Commercial banks and others 50 45 45 44 43 41 Private nonguaranteed debt from: 1 0 0 0 4 Bondholders Commercial banks and others 1 0 0 0 4
Use of IMF credit and SDR allocations 135 213 201 185 291 502
Use of IMF credit 125 -6 -10 -11 98 -10
Long-term 165 7 35 -3 -7 75
Official creditors 165 11 35 -2 -6 73 Multilateral 42 15 -2 1 -3 -6 of which: World Bank -36 Bilateral 123 -4 37 -3 -3 80 Private creditors -4 0 -1 -1 2 Bondholders
Banks and others -4 0 -1 -1 2 Short-term 0 0 0 0 0 0
Foreign direct investment 178 375 105 75 25 51 Portfolio equity 0
External debt stocks to exports (%) 91 125 120 123 218 203
External debt stocks to GNI (%) 8 14 13 15 16 12
Debt service to exports (%) 13 1 1 1 2 2 Short-term to external debt stocks (%) 0 0 0 1 0 0 Multilateral to external debt stocks (%) 58 5 4 4 4 3 Reserves to external debt stocks (%) 201 103 99 102 107 102
Gross national income (GNI) 11,88215,09416,50514,83514,53720,967
(US$ million, unless otherwise indicated)
Total external debt stocks
2010 2017 2018 2019 2020 2021
4,0088,7429,1679,74511,02611,850
Use of IMF credit and SDR allocations 220 176 172 171 6641,103 of which: SDR allocations 191 176 172 171 178 508
Long-term external debt 3,4138,0728,2938,7959,7339,734
Public and publicly guaranteed sector 2,8347,1267,3517,7518,5898,627 Public sector 2,8347,1267,3517,7518,5898,627 of which: General government 2,6786,7936,9677,3798,3058,378
Private sector guaranteed by public sector 0
Private sector not guaranteed 579 946 9421,0441,1451,107 Short-term external debt 374 493 702 778 6281,013
Disbursements (long-term) 9061,6951,0131,0792,058 833
Public and publicly guaranteed sector 4541,160 523 6931,604 389 Public sector 4541,160 523 6931,604 389 of which: General government 4521,061 466 6711,604 389 Private sector guaranteed by public sector Private sector not guaranteed 452 535 490 386 454 445
Principal repayments (long-term) 453 713 730 5531,194 876
Public and publicly guaranteed sector 63 203 256 276 822 299 Public sector 63 203 256 276 822 299 of which: General government 54 199 251 242 732 267 Private sector guaranteed by public sector Private sector not guaranteed 390 510 474 277 372 576
Interest payments (long-term) 56 238 285 328 321 290
Public and publicly guaranteed sector 46 220 267 305 302 247 Public sector 46 220 267 305 302 247 of which: General government 43 206 256 286 286 246 Private sector guaranteed by public sector Private sector not guaranteed 10 19 18 23 19 44
Long-term external debt stocks 3,4138,0728,2938,7959,7339,734 Public and publicly guaranteed debt from: 2,8347,1267,3517,7518,5898,627 Official creditors 2,7044,9655,1835,6206,3926,489 Multilateral 1,9074,1354,3954,5645,4045,554 of which: World Bank 602 985 937 9081,0341,015 Bilateral 796 830 7881,056 988 935
Private creditors 1312,1612,1682,1312,1972,138 Bondholders ..1,7001,7001,7001,8001,800 Commercial banks and others 131 461 468 431 397 338 Private nonguaranteed debt from: 579 946 9421,0441,1451,107 Bondholders 300 Commercial banks and others 579 946 9421,0441,145 807 Use of IMF credit and SDR allocations 220 176 172 171 6641,103
Net debt inflows
Use of IMF credit -2 470 125
Long-term 454 982 283 526 864 -42 Official creditors 393 197 255 452 727 139 Multilateral 389 183 284 178 804 175 of which: World Bank 109 -4 -28 -23 95 2 Bilateral 3 14 -29 274 -77 -36 Private creditors 61 785 28 74 137 -182 Bondholders 700 0 0 100 300 Banks and others 61 85 28 74 37 -482
Short-term 124 55 210 76 -151 384
Foreign direct investment 592 862 766 716 297 957 Portfolio equity 0 0 0 0 0 0
External debt stocks to exports (%) 80 117 125 131 172 147 External debt stocks to GNI (%) 27 40 41 42 50 45 Debt service to exports (%) 10 13 14 12 24 15 Short-term to external debt stocks (%) 9 6 8 8 6 9 Multilateral to external debt stocks (%) 48 47 48 47 49 47 Reserves to external debt stocks (%) 67 54 52 59 73
Gross national income (GNI) 15,11021,72122,17323,10222,17026,172
(US$ million, unless otherwise indicated)
Summary external debt data, by debtor type
Total external debt stocks
290,428511,473521,030560,871565,053612,866
Use of IMF credit and SDR allocations 6,1275,6665,5335,5015,73023,160 of which: SDR allocations 6,1275,6665,5335,5015,73023,160
Long-term external debt 227,853408,198411,573448,590455,790475,076
Public and publicly guaranteed sector 100,563182,914180,395191,861192,613205,105 Public sector 100,507182,914180,395191,861192,613205,105 of which: General government 78,545141,985134,209140,056139,287144,710 Private sector guaranteed by public sector 56 Private sector not guaranteed 127,290225,284231,179256,729263,177269,972
Short-term external debt 56,44897,609103,924106,780103,533114,629
Disbursements (long-term) 43,40678,14152,13271,70868,61658,337
Public and publicly guaranteed sector 24,33739,42018,99024,61622,37230,093 Public sector 24,33739,42018,99024,61622,37230,093 of which: General government 18,71633,0347,86411,59613,97413,502 Private sector guaranteed by public sector 0
Private sector not guaranteed 19,06938,72133,14147,09346,24428,244
Principal repayments (long-term)
19,01838,66746,22934,76264,14235,142
Public and publicly guaranteed sector 5,16411,98221,01613,22024,34613,693 Public sector 5,14411,98221,01613,22024,34613,693 of which: General government 2,6304,18915,2445,82216,9585,192 Private sector guaranteed by public sector 20 Private sector not guaranteed 13,85426,68425,21321,54339,79621,449
Interest payments (long-term)
4,67510,34613,97512,88811,19712,264
Public and publicly guaranteed sector 1,0632,1512,6153,2831,6542,516 Public sector 1,0612,1512,6153,2831,6542,516 of which: General government 687 9521,2171,4961,2811,012 Private sector guaranteed by public sector 2 Private sector not guaranteed 3,6128,19511,3619,6059,5439,749
Long-term external debt stocks 227,853408,198411,573448,590455,790475,076
Public and publicly guaranteed debt from: 100,563182,914180,395191,861192,613205,105 Official creditors 72,49978,04481,00184,36695,95899,480
Multilateral 46,51352,97654,16556,40464,26267,536 of which: World Bank 37,06837,23436,46436,80939,57739,742 Bilateral 25,98625,06826,83627,96131,69631,944
Private creditors 28,065104,87099,394107,49596,655105,625 Bondholders 14,70081,99773,80981,35171,33375,093 Commercial banks and others 13,36422,87325,58526,14425,32230,532
Private nonguaranteed debt from: 127,290225,284231,179256,729263,177269,972 Bondholders 13,21714,64513,96219,19726,12429,479 Commercial banks and others 114,073210,639217,216237,532237,053240,493
Use of IMF credit and SDR allocations 6,1275,6665,5335,5015,73023,160
Net debt inflows
Use of IMF credit
Long-term 24,38839,4745,90336,9464,47523,195
Official creditors 5,2212,4503,4203,3019,0936,812
Multilateral 4,581 8851,7472,3816,9903,897 of which: World Bank 3,027 -369 -243 4651,985 706 Bilateral 6401,5641,673 9202,1032,916
Private creditors 19,16837,0252,48233,645-4,61816,382
Bondholders 10,33933,310-8,41712,784-3,1567,202
Banks and others 8,8293,71510,89920,861-1,4629,181
Short-term 9,84513,6766,3152,856-3,24611,096
Net equity inflows
Foreign direct investment 27,35737,09839,23443,13659,49641,121
Portfolio equity 30,4425,928-4,36113,76924,8545,223
External debt stocks to exports (%) 81 101 93 99 111 92
External debt stocks to GNI (%) 18 20 19 20 21 20
Debt service to exports (%) 7 10 11 9 15 7
Short-term to external debt stocks (%) 19 19 20 19 18 19
Multilateral to external debt stocks (%) 16 10 10 10 11 11
Reserves to external debt stocks (%) 95 76 72 77 97 97
Gross national income (GNI) 1,657,6602,622,8002,673,9942,804,3142,631,7583,123,967
(US$ million, unless otherwise indicated)
Summary external debt data, by debtor type
Total external debt stocks
2010 2017 2018 2019 2020 2021
198,278353,564379,589402,106417,046416,471
Use of IMF credit and SDR allocations 3,0502,8202,7542,7392,8529,007 of which: SDR allocations 3,0502,8202,7542,7392,8529,007
Long-term external debt 162,181304,012328,875354,569369,706358,846
Public and publicly guaranteed sector 102,748194,953215,072233,528247,933242,719 Public sector 102,748194,953215,072233,528247,933242,719 of which: General government 94,026175,600183,261199,076206,505200,021 Private sector guaranteed by public sector Private sector not guaranteed 59,433109,059113,802121,041121,773116,128
Short-term external debt 33,04746,73147,96044,79944,48848,617
Disbursements (long-term) 34,33578,61672,08694,77865,18254,743
Public and publicly guaranteed sector 13,69527,53531,06031,65630,34428,452 Public sector 13,69527,53531,06031,65630,34428,452 of which: General government 8,13924,69015,82225,95020,86525,152 Private sector guaranteed by public sector
Private sector not guaranteed 20,64051,08141,02663,12234,83826,292
Principal repayments (long-term) 26,20246,88442,90568,39252,57762,002
Public and publicly guaranteed sector 8,07211,76510,61413,23518,46930,067 Public sector 8,07211,76510,61413,23518,46930,067 of which: General government 7,8235,9617,85810,17815,90528,092 Private sector guaranteed by public sector
Private sector not guaranteed 18,12935,11932,29155,15734,10831,935
Interest payments (long-term)
4,94410,59510,70312,04613,51810,697
Public and publicly guaranteed sector 3,0346,5796,7677,8679,3487,750 Public sector 3,0346,5796,7677,8679,3487,750 of which: General government 2,8345,5205,8736,2816,7295,795 Private sector guaranteed by public sector
Private sector not guaranteed 1,9104,0153,9364,1794,1702,946
Long-term external debt stocks 162,181304,012328,875354,569369,706358,846
Public and publicly guaranteed debt from: 102,748194,953215,072233,528247,933242,719 Official creditors 66,18051,66653,07252,27657,93254,804 Multilateral 22,56728,36330,09931,44734,07733,970 of which: World Bank 11,36717,94118,50719,10919,66919,622 Bilateral 43,61323,30222,97320,82923,85520,834
Private creditors 36,568143,287162,000181,251190,001187,915 Bondholders 28,698135,396151,001173,224182,704181,822 Commercial banks and others 7,8707,89110,9998,0277,2976,093
Private nonguaranteed debt from: 59,433109,059113,802121,041121,773116,128 Bondholders 8,43714,38315,03816,51518,20817,464 Commercial banks and others 50,99694,67798,764104,526103,56598,664
Use of IMF credit and SDR allocations 3,0502,8202,7542,7392,8529,007
Net financial inflows
Net debt inflows
Use of IMF credit
Long-term 8,13431,73229,18226,38612,605-7,258
Official creditors 1,404 -9051,401 -9273,978 -609 Multilateral 1,367 7361,7851,3542,149 793 of which: World Bank 1,287 645 594 617 472 150 Bilateral 37-1,641 -384-2,2821,829-1,401
Private creditors 6,72932,63727,78027,3138,627-6,650
Bondholders 3,19821,25716,49623,76710,493 -674
Banks and others 3,53111,38011,2843,546-1,866-5,976
Short-term 8,9986,0461,229-3,161 -3114,130
Net equity inflows
Foreign direct investment 12,44718,83919,99325,06919,34820,566
Portfolio equity 2,132-2,538-3,668 -397-4,3623,131
Debt ratios
External debt stocks to exports (%) 118 177 172 194 227 164
External debt stocks to GNI (%) 27 36 38 37 40 36
Debt service to exports (%) 19 29 25 39 37 29
Short-term to external debt stocks (%) 17 13 13 11 11 12
Multilateral to external debt stocks (%) 11 8 8 8 8 8
Reserves to external debt stocks (%) 47 36 31 31 31 34
Gross national income (GNI) 734,988983,4381,011,2131,085,0791,030,4101,154,465
(US$ million, unless otherwise indicated)
2010 2017 2018 2019 2020 2021
Total external debt stocks 19,7696,8195,7744,8555,43310,349
Use of IMF credit and SDR allocations 2,1962,0311,9831,9722,0546,781 of which: SDR allocations 2,1962,0311,9831,9722,0546,781
Long-term external debt 5,960 5891,6371,2851,3131,060
Public and publicly guaranteed sector 5,960 589 437 370 419 332 Public sector 5,947 589 437 370 419 332 of which: General government 929 280 206 141 132 76 Private sector guaranteed by public sector 12 Private sector not guaranteed 0 0 1,200 915 894 727
Short-term external debt 11,6134,1992,1541,5992,0672,508
Disbursements (long-term) 249 123 0 29 116 21
Public and publicly guaranteed sector 249 123 0 29 116 21 Public sector 244 123 0 29 116 21 of which: General government 72 0 0 52 0 Private sector guaranteed by public sector 5 Private sector not guaranteed
Principal repayments (long-term) 1,532 387 138 256 263 254
Public and publicly guaranteed sector 1,532 387 138 93 84 88 Public sector 1,530 387 138 93 84 88 of which: General government 33 99 74 65 65 52 Private sector guaranteed by public sector 2 Private sector not guaranteed 163 178 167
Interest payments (long-term) 136 22 18 33 26 46
Public and publicly guaranteed sector 136 22 18 15 15 7 Public sector 135 22 18 15 15 7 of which: General government 13 7 6 7 4 1 Private sector guaranteed by public sector 0 Private sector not guaranteed 18 11 39
Long-term external debt stocks 5,960 5891,6371,2851,3131,060
Public and publicly guaranteed debt from: 5,960 589 437 370 419 332 Official creditors 2,068 520 413 325 300 225
Multilateral 833 342 272 199 190 119 of which: World Bank 801 271 206 141 132 76 Bilateral 1,234 177 141 126 110 106 Private creditors 3,892 70 24 45 118 107
Bondholders
Commercial banks and others 3,892 70 24 45 118 107 Private nonguaranteed debt from: 0 0 1,200 915 894 727 Bondholders Commercial banks and others 0 0 1,200 915 894 727
Use of IMF credit and SDR allocations 2,1962,0311,9831,9722,0546,781
Net debt inflows
Use of IMF credit
Long-term -1,283 -264 -138 -227 -146 -233
Official creditors -202 -88 -93 -86 -33 -64 Multilateral 78 -72 -67 -72 -18 -62 of which: World Bank 64 -84 -65 -65 -13 -52 Bilateral -281 -16 -26 -14 -15 -1 Private creditors -1,081 -176 -45 -141 -113 -169 Bondholders
Banks and others -1,081 -176 -45 -141 -113 -169 Short-term 2,826 886-2,047 -612 427 434
Net equity inflows
Foreign direct investment 3,6495,0192,3731,5081,3421,425
Portfolio equity
External debt stocks to exports (%) 20 6 5 7 10 13
External debt stocks to GNI (%) 4 1 2 2 2 Debt service to exports (%) 2 0 0 0 1 0
Short-term to external debt stocks (%) 59 62 37 33 38 24 Multilateral to external debt stocks (%) 4 5 5 4 4 1 Reserves to external debt stocks (%)
Gross national income (GNI) 486,887487,226332,579291,561231,042
(US$ million, unless otherwise indicated)
2010 2017 2018 2019 2020 2021
Total external debt stocks ..28,10327,79027,46826,29925,263
Use of IMF credit and SDR allocations ..5,0134,7414,0192,9444,126 of which: SDR allocations ..1,6161,5781,5691,6343,820
Long-term external debt ..22,00022,46722,68722,77520,516
Public and publicly guaranteed sector ..22,00022,46722,68722,77520,516
Public sector ..22,00022,46722,68722,77520,516 of which: General government ..20,76721,35221,68921,82319,601
Private sector guaranteed by public sector Private sector not guaranteed
Short-term external debt ..1,090 582 762 580 620
Disbursements (long-term) ..4,3491,8311,2831,683 816
Public and publicly guaranteed sector ..4,3491,8311,2831,683 816 Public sector ..4,3491,8311,2831,683 816 of which: General government ..4,3491,8311,2821,618 726 Private sector guaranteed by public sector Private sector not guaranteed
Principal repayments (long-term) 816 8991,0541,9672,509 Public and publicly guaranteed sector 816 8991,0541,9672,509 Public sector 816 8991,0541,9672,509 of which: General government 698 782 9371,8502,392 Private sector guaranteed by public sector Private sector not guaranteed
Interest payments (long-term)
579 855 848 803 676
Public and publicly guaranteed sector 579 855 848 803 676 Public sector 579 855 848 803 676 of which: General government 510 792 791 752 630 Private sector guaranteed by public sector Private sector not guaranteed
Summary external debt stock, by creditor type
Long-term external debt stocks ..22,00022,46722,68722,77520,516 Public and publicly guaranteed debt from: ..22,00022,46722,68722,77520,516 Official creditors ..17,33117,45017,02216,89615,147
Multilateral ..3,3923,4973,5683,6233,607 of which: World Bank ..3,3483,4663,5503,6183,606 Bilateral ..13,94013,95413,45313,27311,539
Private creditors ..4,6685,0175,6655,8795,370 Bondholders ..2,0002,0002,0002,0002,000 Commercial banks and others ..2,6683,0173,6653,8793,370
Private nonguaranteed debt from: Bondholders Commercial banks and others Use of IMF credit and SDR allocations ..5,0134,7414,0192,9444,126
Net debt inflows
Use of IMF credit 810 -158 -694-1,201 -983 Long-term ..3,534 932 229 -284-1,693
Official creditors ..1,540 583 -419 -484-1,200 Multilateral 81 113 73 43 14 of which: World Bank 94 126 86 56 17 Bilateral ..1,458 470 -493 -527-1,214 Private creditors ..1,994 349 648 200 -493 Bondholders ..2,000 0 Banks and others -6 349 648 200 -493
Short-term -180 -508 181 -182 51
Net equity inflows
Foreign direct investment ..-5,032-4,885-3,076-3,147-2,613 Portfolio equity 1 9 -3 8
External debt stocks to exports (%) 44 30 30 51
External debt stocks to GNI (%) 15 12 12 14 12 Debt service to exports (%) 2 2 3 8 Short-term to external debt stocks (%) 4 2 3 2 2 Multilateral to external debt stocks (%) 12 13 13 14 14 Reserves to external debt stocks (%) 162 219 230 185 232
Gross national income (GNI) ..185,777225,613232,470182,172206,087
(US$ million, unless otherwise indicated)
Summary external debt data, by debtor type
Total external debt stocks
2010 2017 2018 2019 2020 2021
14,19314,60517,08617,43016,87217,701
Use of IMF credit and SDR allocations 1,1881,1521,074 9781,4491,792 of which: SDR allocations 403 373 364 362 377 880
Long-term external debt 11,91611,65813,80814,18313,63813,650
Public and publicly guaranteed sector 7,6099,9299,7599,4079,1518,985
Public sector 7,6089,9299,7599,4079,1518,985 of which: General government 6,3919,1909,1158,7988,5758,586
Private sector guaranteed by public sector 1 Private sector not guaranteed 4,3071,7294,0494,7764,4884,665 Short-term external debt 1,0891,7942,2052,2691,7852,259
Disbursements (long-term)
2,3601,079 2941,609 485 381
Public and publicly guaranteed sector 1,2851,079 2941,009 260 381 Public sector 1,2851,079 2941,009 260 381 of which: General government 1,0541,073 285 993 257 378 Private sector guaranteed by public sector Private sector not guaranteed 1,075 600 225
Principal repayments (long-term) 345 709 4561,355 771 538
Public and publicly guaranteed sector 337 683 4561,355 521 538 Public sector 337 683 4561,355 521 538 of which: General government 226 595 3521,305 484 359 Private sector guaranteed by public sector Private sector not guaranteed 9 26 250
Interest payments (long-term) 829 639 671 740 689 647
Public and publicly guaranteed sector 489 558 591 607 552 519 Public sector 489 558 591 607 552 519 of which: General government 401 503 541 559 513 482 Private sector guaranteed by public sector Private sector not guaranteed 341 81 80 132 137 128
Long-term external debt stocks 11,91611,65813,80814,18313,63813,650
Public and publicly guaranteed debt from: 7,6099,9299,7599,4079,1518,985 Official creditors 3,2713,6093,6453,5853,5663,634 Multilateral 2,3522,9222,9402,9152,9473,013 of which: World Bank 579 862 865 886 9451,062 Bilateral 919 687 705 670 619 622
Private creditors 4,3386,3206,1145,8225,5855,351 Bondholders 3,7866,1636,0645,8105,5855,351 Commercial banks and others 552 157 50 12 0
Private nonguaranteed debt from: 4,3071,7294,0494,7764,4884,665 Bondholders 4,2901,1751,1751,7751,7501,750 Commercial banks and others 17 5542,8743,0012,7382,915
Use of IMF credit and SDR allocations 1,1881,1521,074 9781,4491,792
Use of IMF credit 778 -16 -53 -90 417 -133 Long-term 2,015 370 -162 254 -286 -157
Official creditors 863 -50 42 -54 -24 77 Multilateral 835 -49 18 -22 34 75 of which: World Bank 181 53 3 21 60 116 Bilateral 29 -1 24 -32 -58 2
Private creditors 1,151 420 -204 309 -262 -234 Bondholders 1,007 532 -100 347 -250 -234
Banks and others 145 -111 -104 -38 -12
Short-term 350 130 409 64 -441 475
Foreign direct investment 183 889 775 665 265 320
Portfolio equity 251 181 257 261 130
External debt stocks to exports (%) 334 281 278 274 457 371
External debt stocks to GNI (%) 112 102 113 113 126 134
Debt service to exports (%) 28 27 20 35 44 29
Short-term to external debt stocks (%) 8 12 13 13 11 13 Multilateral to external debt stocks (%) 17 20 17 17 17 17 Reserves to external debt stocks (%) 18 26 21 21 23 27 Gross national income (GNI) 12,72614,38615,13115,38613,35513,216
(US$ million, unless otherwise indicated)
external debt data, by debtor type
2010 2017 2018 2019 2020 2021
Total external debt stocks 16,89430,05131,92533,48238,01741,821
Use of IMF credit and SDR allocations 2571,500 981 7291,2712,215 of which: SDR allocations 250 231 225 224 233 687
Long-term external debt 7,58817,61919,43420,45522,66323,999
Public and publicly guaranteed sector 6,32315,15816,36316,84118,75819,968 Public sector 6,19015,08916,32916,81118,73019,942 of which: General government 5,75514,47915,73416,14218,08119,321
Private sector guaranteed by public sector 133 69 34 30 28 26 Private sector not guaranteed 1,2652,4603,0713,6143,9054,031 Short-term external debt 9,04910,93311,51112,29714,08415,606
(long-term)
1,5083,2302,7822,8124,0433,739
Public and publicly guaranteed sector 1,3582,9832,0132,0373,4393,324 Public sector 1,3582,9832,0132,0373,4393,324 of which: General government 1,0872,9381,8841,9283,4393,324 Private sector guaranteed by public sector 0 0 0 0 0 0 Private sector not guaranteed 150 247 769 775 604 415
Principal repayments (long-term) 506 651 7491,7772,0892,107 Public and publicly guaranteed sector 480 553 5911,5451,7751,817 Public sector 472 545 5831,5411,7731,815 of which: General government 464 507 5421,5061,7521,788 Private sector guaranteed by public sector 8 8 8 4 2 2 Private sector not guaranteed 26 98 158 231 313 289
Interest payments (long-term) 161 441 603 734 580 643
Public and publicly guaranteed sector 145 387 504 581 523 604 Public sector 139 383 501 579 523 604 of which: General government 130 363 481 557 508 587 Private sector guaranteed by public sector 6 3 3 1 1 1 Private sector not guaranteed 16 55 99 153 56 39
Long-term external debt stocks 7,58817,61919,43420,45522,66323,999 Public and publicly guaranteed debt from: 6,32315,15816,36316,84118,75819,968 Official creditors 5,2846,5637,0978,2039,42810,521
Multilateral 2,5263,4493,7954,7315,4916,593 of which: World Bank 1,0401,8762,2522,9853,3293,723 Bilateral 2,7573,1153,3013,4723,9373,927
Private creditors 1,0408,5959,2668,6389,3309,447 Bondholders 8818,4299,1158,5009,1989,340 Commercial banks and others 159 166 152 138 132 107 Private nonguaranteed debt from: 1,2652,4603,0713,6143,9054,031 Bondholders Commercial banks and others 1,2652,4603,0713,6143,9054,031
Use of IMF credit and SDR allocations 2571,500 981 7291,2712,215
Net debt inflows
Use of IMF credit -4 -416 -493 -246 495 529 Long-term 1,0022,5792,0331,0351,9551,632
Official creditors 151 438 7471,118 9791,381 Multilateral 152 101 371 941 6911,182 of which: World Bank -71 19 376 733 344 395 Bilateral -1 338 376 177 288 199
Private creditors 8512,1401,286 -83 976 251 Bondholders 7361,986 686 -615 700 142 Banks and others 116 155 600 531 276 109 Short-term 530 463 578 7871,7861,523
Net equity inflows
Foreign direct investment 1,6882,030 955 730 760 622 Portfolio equity -21 -476 41 -62 -95 -86
Debt ratios
External debt stocks to exports (%) 124 198 198 192 335 286 External debt stocks to GNI (%) 63 73 75 75 87 93 Debt service to exports (%) 6 12 14 19 27 20 Short-term to external debt stocks (%) 54 36 36 37 37 37 Multilateral to external debt stocks (%) 15 11 12 14 14 16 Reserves to external debt stocks (%) 77
Gross national income (GNI) 26,91941,20342,73244,51043,57445,011
(US$ million, unless otherwise indicated)
debtor type
2010 2017 2018 2019 2020 2021
Total external debt stocks 119,151159,239157,269159,248161,488159,755
Use of IMF credit and SDR allocations 529 489 478 475 4952,035 of which: SDR allocations 529 489 478 475 4952,035
Long-term external debt 109,757151,071148,425149,784150,959145,016
Public and publicly guaranteed sector 3,84521,58624,47225,00625,71826,490 Public sector 3,84521,58624,47225,00625,71826,490 of which: General government 3,71213,80614,65215,22015,66415,710 Private sector guaranteed by public sector Private sector not guaranteed 105,912129,486123,954124,779125,242118,526
Short-term external debt 8,8647,6788,3668,98910,03412,704
Disbursements (long-term)
45,05431,52533,91231,80134,18521,232
Public and publicly guaranteed sector 1,522 8923,5041,9751,5671,575 Public sector 1,522 8923,5041,9751,5671,575 of which: General government 1,508 2431,4471,5811,297 819 Private sector guaranteed by public sector Private sector not guaranteed 43,53230,63230,40829,82632,61819,657
Principal repayments (long-term)
34,63924,52929,80729,33427,12526,833
Public and publicly guaranteed sector 2781,042 5811,4331,082 461 Public sector 2781,042 5811,4331,082 461 of which: General government 991,028 5651,0031,066 440 Private sector guaranteed by public sector Private sector not guaranteed 34,36123,48729,22627,90126,04226,372
Interest payments (long-term) 4,5173,1963,5303,1883,3653,680
Public and publicly guaranteed sector 54 871 9131,0911,034 949 Public sector 54 871 9131,0911,034 949 of which: General government 48 507 525 586 516 430 Private sector guaranteed by public sector Private sector not guaranteed 4,4632,3252,6172,0982,3312,732
Long-term external debt stocks 109,757151,071148,425149,784150,959145,016
Public and publicly guaranteed debt from: 3,84521,58624,47225,00625,71826,490 Official creditors 3,8458,3618,3727,6348,0978,084 Multilateral 2,7856,9256,6386,0106,2656,044 of which: World Bank 1,8304,1853,9773,8023,6153,463 Bilateral 1,0601,4351,7341,6241,8332,039
Private creditors 0 13,22516,10017,37217,62018,406 Bondholders ..13,22516,10017,37217,62018,406 Commercial banks and others 0
Private nonguaranteed debt from: 105,912129,486123,954124,779125,242118,526 Bondholders 21,0449,2727,9086,6846,3615,638 Commercial banks and others 84,868120,213116,046118,094118,881112,889
Use of IMF credit and SDR allocations 529 489 478 475 4952,035
Long-term 10,4156,9954,1052,4677,060-5,601
Official creditors 1,244 350 9 -746 480 114 Multilateral 1,436 -250 -281 -629 295 -128 of which: World Bank 1,283 -128 -208 -175 -187 -152 Bilateral -192 600 290 -117 185 242
Private creditors 9,1706,6454,0963,2136,580-5,714 Bondholders -1,0531,4992,797 -1011,094 278 Banks and others 10,2245,1461,2993,3145,486-5,992 Short-term 1,879 929 661 6171,2312,656
Net equity inflows
Foreign direct investment 4,1625,7482,6496,4965,29710,362 Portfolio equity 134 24-1,518 482 901 111
Debt ratios
External debt stocks to exports (%) 175 283 225 233 297 234
External debt stocks to GNI (%) 93 107 100 100 103 96
Debt service to exports (%) 58 50 48 48 57 45
Short-term to external debt stocks (%) 7 5 5 6 6 8
Multilateral to external debt stocks (%) 2 4 4 4 4 4 Reserves to external debt stocks (%) 21 11 11 6 7 7
Gross national income (GNI) 128,672148,657157,279158,975156,099166,585
(US$ million, unless otherwise indicated)
Total external debt stocks
2010 2017 2018 2019 2020 2021
8,88526,95131,43434,96938,03641,201
Use of IMF credit and SDR allocations 8171,047 879 7201,3912,913 of which: SDR allocations 400 370 361 359 3741,092
Long-term external debt 7,02723,24828,00931,63034,35235,861
Public and publicly guaranteed sector 7,02722,39926,98830,81333,53135,218
Public sector 7,02722,39926,98830,81333,53135,218 of which: General government 6,58921,08825,47929,25831,97933,766
Private sector guaranteed by public sector Private sector not guaranteed 8491,021 817 821 644
Short-term external debt 1,0412,6572,5462,6192,2932,427
Disbursements (long-term)
5325,2176,6226,7223,4173,400
Public and publicly guaranteed sector 5325,1836,2486,7123,2733,400 Public sector 5325,1836,2486,7123,2733,400 of which: General government 5224,3436,0166,6373,2663,400 Private sector guaranteed by public sector Private sector not guaranteed 34 374 10 144
Principal repayments (long-term) 260 7091,5673,0111,4681,338 Public and publicly guaranteed sector 260 5681,3712,8011,3141,169 Public sector 260 5681,3712,8011,3141,169 of which: General government 233 5181,3322,7631,2611,159 Private sector guaranteed by public sector Private sector not guaranteed 141 196 210 154 169
Interest payments (long-term) 90 657 9961,2421,195 952
Public and publicly guaranteed sector 90 606 9411,1811,150 916 Public sector 90 606 9411,1811,150 916 of which: General government 81 602 9181,1571,125 915 Private sector guaranteed by public sector Private sector not guaranteed 51 55 61 45 36
Long-term external debt stocks 7,02723,24828,00931,63034,35235,861 Public and publicly guaranteed debt from: 7,02722,39926,98830,81333,53135,218 Official creditors 6,75417,54320,36423,72126,13326,888
Multilateral 4,1108,77010,10812,70915,11115,775 of which: World Bank 3,2385,3035,8027,1259,33410,228 Bilateral 2,6448,77310,25611,01211,02211,113
Private creditors 2734,8576,6247,0927,3988,329 Bondholders ..2,7504,7506,1006,1007,100 Commercial banks and others 2732,1071,874 9921,2981,229
Private nonguaranteed debt from: 8491,021 817 821 644 Bondholders Commercial banks and others 8491,021 817 821 644 Use of IMF credit and SDR allocations 8171,047 879 7201,3912,913
Net debt inflows
Use of IMF credit -26 -119 -146 -154 620 848 Long-term 2724,5085,0553,7111,9492,062
Official creditors 2703,6523,0823,4301,7391,219 Multilateral 2231,4301,5112,6411,9771,020 of which: World Bank 132 455 6311,3591,8661,168 Bilateral 472,2221,571 789 -238 199
Private creditors 3 8561,973 281 210 844 Bondholders ..2,0001,350 0 1,000 Banks and others 3 856 -27 -1,069 210 -156 Short-term 73 457 -132 146 -347 115
Net equity inflows
Foreign direct investment 891,436 535 547 496 520 Portfolio equity 22 -62 -251 8 -274 -97
External debt stocks to exports (%) 97 254 267 299 390 347 External debt stocks to GNI (%) 22 33 35 35 38 38 Debt service to exports (%) 4 15 24 38 29 21 Short-term to external debt stocks (%) 12 10 8 7 6 6 Multilateral to external debt stocks (%) 46 33 32 36 40 38 Reserves to external debt stocks (%) 49 27 26 26 22 23
Gross national income (GNI) 39,85280,47590,81298,77598,931108,691
(US$ million, unless otherwise indicated)
Total external debt stocks
2010 2017 2018 2019 2020 2021
1,4562,5042,3262,4283,0883,352
Use of IMF credit and SDR allocations 114 272 260 225 216 260 of which: SDR allocations 85 79 77 77 80 188
Long-term external debt 8861,3971,2651,3571,9111,990
Public and publicly guaranteed sector 319 313 305 320 517 596 Public sector 319 313 305 320 517 596 of which: General government 319 263 250 267 467 551 Private sector guaranteed by public sector 0 0 0 0 0 Private sector not guaranteed 5671,083 9611,0371,3941,394 Short-term external debt 455 836 800 846 9621,102
Disbursements (long-term) 169 196 225 283 567 647
Public and publicly guaranteed sector 0 25 25 44 192 152 Public sector 0 25 25 44 192 152 of which: General government 0 10 13 39 191 146 Private sector guaranteed by public sector Private sector not guaranteed 169 171 200 239 375 495
Principal repayments (long-term) 76 97 208 171 251 327
Public and publicly guaranteed sector 14 20 21 24 27 33 Public sector 14 20 21 24 27 33 of which: General government 14 15 16 17 21 26 Private sector guaranteed by public sector Private sector not guaranteed 61 78 187 148 224 293
Interest payments (long-term) 34 50 55 47 47 18
Public and publicly guaranteed sector 11 11 11 10 11 11 Public sector 11 11 11 10 11 11 of which: General government 11 9 9 9 9 10 Private sector guaranteed by public sector Private sector not guaranteed 23 39 45 37 36 7
Long-term external debt stocks 8861,3971,2651,3571,9111,990
Public and publicly guaranteed debt from: 319 313 305 320 517 596 Official creditors 319 305 297 304 488 557 Multilateral 319 239 240 254 441 521 of which: World Bank 319 239 225 220 314 313 Bilateral 0 66 56 50 46 36
Private creditors 8 8 16 30 39 Bondholders 7 Commercial banks and others 8 8 16 30 32 Private nonguaranteed debt from: 5671,083 9611,0371,3941,394 Bondholders Commercial banks and others 5671,083 9611,0371,3941,394
Use of IMF credit and SDR allocations 114 272 260 225 216 260
Use of IMF credit 29 64 -5 -34 -18 -61
Long-term 94 99 17 112 315 320
Official creditors -14 4 4 12 153 107 Multilateral -14 -4 11 17 161 114 of which: World Bank -14 -4 -5 -1 77 19 Bilateral 8 -7 -5 -8 -7 Private creditors 108 94 13 100 162 214 Bondholders 8 Banks and others 108 94 13 100 162 206
Short-term -366 215 -36 46 116 140
Foreign direct investment 439 262 309 266 370 458
Portfolio equity 0 0 0 0 0 0
External debt stocks to exports (%) 104 111 90 93 153 95
External debt stocks to GNI (%) 27 34 29 30 39 36
Debt service to exports (%) 8 9 11 10 19 12
Short-term to external debt stocks (%) 31 33 34 35 31 33 Multilateral to external debt stocks (%) 22 10 10 10 14 16 Reserves to external debt stocks (%) 56 33 38 40 35 37 Gross national income (GNI) 5,4337,3258,0128,0807,9049,212
(US$ million, unless otherwise indicated)
Total external debt stocks
2010 2017 2018 2019 2020 2021
4,1188,1318,1668,4568,6789,064
Use of IMF credit and SDR allocations 307 321 285 258 498 697 of which: SDR allocations 130 121 118 117 122 357
Long-term external debt 3,6167,4547,4247,6827,6547,826
Public and publicly guaranteed sector 2,4463,8923,6553,7133,8453,960 Public sector 2,4463,8923,6553,7133,8453,960 of which: General government 2,4463,8923,6553,7133,8453,960
Private sector guaranteed by public sector Private sector not guaranteed 1,1713,5623,7693,9683,8093,866 Short-term external debt 195 356 457 517 525 541
Disbursements (long-term) 672 529 681 898 391 625
Public and publicly guaranteed sector 151 286 144 189 166 289 Public sector 151 286 144 189 166 289 of which: General government 151 286 144 189 166 289 Private sector guaranteed by public sector Private sector not guaranteed 521 243 537 708 224 336
Principal repayments (long-term) 462 465 432 631 509 464
Public and publicly guaranteed sector 38 82 102 122 125 117 Public sector 38 82 102 122 125 117 of which: General government 38 82 102 122 125 117 Private sector guaranteed by public sector Private sector not guaranteed 424 383 331 509 384 347
Interest payments (long-term) 69 83 84 88 87 71
Public and publicly guaranteed sector 23 51 54 56 55 40 Public sector 23 51 54 56 55 40 of which: General government 23 51 54 56 55 40 Private sector guaranteed by public sector Private sector not guaranteed 46 32 30 32 32 31
Long-term external debt stocks 3,6167,4547,4247,6827,6547,826 Public and publicly guaranteed debt from: 2,4463,8923,6553,7133,8453,960 Official creditors 2,4463,8923,6553,7133,8453,960
Multilateral 1,2961,4521,4501,4631,5901,705 of which: World Bank 649 667 660 657 677 653 Bilateral 1,1502,4402,2052,2502,2552,255
Private creditors
Bondholders Commercial banks and others Private nonguaranteed debt from: 1,1713,5623,7693,9683,8093,866 Bondholders 0 0 0 0 Commercial banks and others 1,1713,5623,7683,9683,8093,866
Use of IMF credit and SDR allocations 307 321 285 258 498 697
Use of IMF credit 12 1 -29 -26 223 -26
Long-term 210 64 249 267 -118 161
Official creditors 113 204 42 67 41 172 Multilateral 8 19 32 22 64 163 of which: World Bank 5 -1 8 1 -7 -6 Bilateral 105 185 11 46 -23 9 Private creditors 97 -141 206 200 -159 -10 Bondholders 0 0 0 Banks and others 97 -141 206 200 -159 -10 Short-term -238 -6 101 59 8 16
Foreign direct investment 231 -17 86 490 -149 166 Portfolio equity -18 0 0 0 0 0
External debt stocks to exports (%) 181 312 294 269 353 270
External debt stocks to GNI (%) 92 111 102 105 115 116 Debt service to exports (%) 25 22 20 24 26 17 Short-term to external debt stocks (%) 5 4 6 6 6 6 Multilateral to external debt stocks (%) 31 18 18 17 18 19 Reserves to external debt stocks (%) 39 23 21 20 21 26 Gross national income (GNI) 4,4897,3318,0208,0927,5247,827
(US$ million, unless otherwise indicated)
Summary external debt data, by debtor type
2010 2017 2018 2019 2020 2021
Total external debt stocks 6,55414,69615,53316,57117,43117,188
Use of IMF credit and SDR allocations 88 72 70 70 73 213 of which: SDR allocations 78 72 70 70 73 213
Long-term external debt 6,41013,87915,05915,91616,37416,068
Public and publicly guaranteed sector 3,7518,4199,47110,19910,66010,271
Public sector 3,7518,4199,47110,19910,66010,271 of which: General government 3,5288,2529,30710,04110,50610,123
Private sector guaranteed by public sector 0 0 0 0
Private sector not guaranteed 2,6595,4615,5885,7175,7145,797 Short-term external debt 56 745 404 585 985 907
Disbursements (long-term)
4601,3321,8071,293 706 466
Public and publicly guaranteed sector 2671,1561,5591,169 706 356
Public sector 2671,1561,5591,169 706 356 of which: General government 2671,1561,5351,169 706 356 Private sector guaranteed by public sector 0 Private sector not guaranteed 193 176 248 124 110
Principal repayments (long-term) 217 446 537 506 443 544
Public and publicly guaranteed sector 59 298 417 504 439 539 Public sector 59 298 417 504 439 539 of which: General government 59 269 390 499 434 534 Private sector guaranteed by public sector Private sector not guaranteed 159 148 120 2 4 4
Interest payments (long-term) 78 281 328 301 235 166
Public and publicly guaranteed sector 28 176 222 268 201 125 Public sector 28 176 222 268 201 125 of which: General government 28 176 222 267 201 125 Private sector guaranteed by public sector Private sector not guaranteed 50 105 106 33 34 41
Summary external debt stock, by creditor type
Long-term external debt stocks 6,41013,87915,05915,91616,37416,068
Public and publicly guaranteed debt from: 3,7518,4199,47110,19910,66010,271 Official creditors 3,6526,6967,5848,0828,5258,585
Multilateral 2,0841,6001,5771,7071,8231,809 of which: World Bank 655 582 588 659 717 740 Bilateral 1,5695,0976,0076,3756,7016,777
Private creditors 981,7221,8872,1172,1351,686 Bondholders ..1,4841,5961,6061,368 981 Commercial banks and others 98 238 291 511 767 705
Private nonguaranteed debt from: 2,6595,4615,5885,7175,7145,797 Bondholders 510 560 691 692 779 Commercial banks and others 2,6594,9515,0285,0265,0225,018
Use of IMF credit and SDR allocations 88 72 70 70 73 213
Net debt inflows
Use of IMF credit -6
Long-term 243 8861,269 787 263 -78
Official creditors 202 461 975 505 289 149 Multilateral 13 36 13 139 48 36 of which: World Bank -13 60 19 74 30 45 Bilateral 189 425 962 366 241 113 Private creditors 41 425 294 282 -26 -227 Bondholders 309 158 63 -238 -199 Banks and others 41 116 137 220 211 -28
Short-term -148 23 -341 181 400 -78
Net equity inflows
Foreign direct investment 2791,6931,358 756 9681,072 Portfolio equity 54 -34 1 0 -1 0
External debt stocks to exports (%) 284 254 240 234 266 217 External debt stocks to GNI (%) 98 91 89 94 98 97 Debt service to exports (%) 13 13 13 11 11 9 Short-term to external debt stocks (%) 1 5 3 4 6 5 Multilateral to external debt stocks (%) 32 11 10 10 10 11 Reserves to external debt stocks (%) 12 7 6 6 8 9
Gross national income (GNI) 6,68016,17017,35617,65617,85417,690
(US$ million, unless otherwise indicated)
Summary external debt data, by debtor type
Total external debt stocks
2010 2017 2018 2019 2020 2021
47,81974,16579,65073,89368,86766,893
Use of IMF credit and SDR allocations 395 275 269 267 2781,120 of which: SDR allocations 298 275 269 267 2781,120
Long-term external debt 43,85765,12773,83468,66358,43552,916
Public and publicly guaranteed sector 20,38629,98733,07233,31933,36133,277
Public sector 20,38629,98733,07233,31933,36133,277
of which: General government 20,38629,98733,07233,31933,36133,277
Private sector guaranteed by public sector Private sector not guaranteed 23,47135,14040,76335,34325,07419,639
Short-term external debt 3,5678,7645,5474,96310,15412,857
Disbursements (long-term)
9,61516,06120,7468,597 202 145
Public and publicly guaranteed sector 2,1865,1525,7163,173 202 145
Public sector 2,1865,1525,7163,173 202 145 of which: General government 2,1865,1525,7163,173 202 145 Private sector guaranteed by public sector Private sector not guaranteed 7,43010,90915,0305,424
Principal repayments (long-term)
8,39512,49211,99613,76110,4655,638
Public and publicly guaranteed sector 2,4773,0302,5892,917 196 202
Public sector 2,4773,0302,5892,917 196 202 of which: General government 2,4773,0302,5892,917 196 202 Private sector guaranteed by public sector Private sector not guaranteed 5,9189,4629,40710,84410,2695,435
Interest payments (long-term)
2,7353,7794,2754,5972,2871,561
Public and publicly guaranteed sector 1,4061,7612,1502,142 157 47
Public sector 1,4061,7612,1502,142 157 47 of which: General government 1,4061,7612,1502,142 157 47 Private sector guaranteed by public sector
Private sector not guaranteed 1,3282,0182,1252,4552,1301,514
Long-term external debt stocks 43,85765,12773,83468,66358,43552,916
Public and publicly guaranteed debt from: 20,38629,98733,07233,31933,36133,277 Official creditors 2,3582,0261,9431,8751,9381,892
Multilateral 1,3681,3331,3691,3731,4611,469 of which: World Bank 321 441 510 536 615 663 Bilateral 990 692 574 502 476 423
Private creditors 18,02827,96131,12831,44431,42331,385 Bondholders 17,42227,76830,96431,31431,31431,314 Commercial banks and others 606 194 164 130 109 71
Private nonguaranteed debt from: 23,47135,14040,76335,34325,07419,639 Bondholders 500 300 600 600 600 600 Commercial banks and others 22,97134,84040,16334,74324,47419,039
Use of IMF credit and SDR allocations 395 275 269 267 2781,120
Net debt inflows
Use of IMF credit -19
Long-term 1,2213,5698,750-5,164-10,264-5,493
Official creditors -59 178 -51 -61 33 -26 Multilateral -13 265 53 7 72 19 of which: World Bank 3 186 70 26 75 51 Bilateral -45 -86 -105 -68 -38 -45
Private creditors 1,2793,3908,802-5,102-10,297-5,467 Bondholders -3961,7763,504 350 0 0 Banks and others 1,6751,6145,297-5,452-10,297-5,467 Short-term 568 909-3,217 -5843,106 650
Net equity inflows
Foreign direct investment 4,2802,5192,6542,0552,861 517 Portfolio equity 154 -294 -266 354 92 -65
External debt stocks to exports (%) 216 336 362 347 681 603
External debt stocks to GNI (%) 126 140 148 147 278 382 Debt service to exports (%) 50 75 75 87 127 66 Short-term to external debt stocks (%) 7 12 7 7 15 19 Multilateral to external debt stocks (%) 3 2 2 2 2 2 Reserves to external debt stocks (%) 66 59 51 52 36 28
Gross national income (GNI) 37,93552,81853,78950,25124,77717,524
(US$ million, unless otherwise indicated)
Total external debt stocks
2010 2017 2018 2019 2020 2021
7881,5041,4631,5831,7381,818
Use of IMF credit and SDR allocations 79 108 94 79 119 198 of which: SDR allocations 51 47 46 45 47 140
Long-term external debt 7091,3961,3691,5041,6161,617
Public and publicly guaranteed sector 709 828 809 856 931 962 Public sector 709 828 809 856 931 962 of which: General government 698 826 807 852 926 958 Private sector guaranteed by public sector
Private sector not guaranteed 568 560 648 685 655
Short-term external debt 0 0 1 0 2 3
Disbursements (long-term) 45 171 43 179 117 91
Public and publicly guaranteed sector 45 39 43 91 79 91 Public sector 45 39 43 91 79 91 of which: General government 45 38 42 89 79 91 Private sector guaranteed by public sector Private sector not guaranteed 132 0 88 38 0
Principal repayments (long-term) 19 33 51 37 44 67
Public and publicly guaranteed sector 19 33 42 37 44 37 Public sector 19 33 42 37 44 37 of which: General government 19 33 42 37 44 37 Private sector guaranteed by public sector Private sector not guaranteed 0 8 0 0 31
Interest payments (long-term) 8 16 17 24 16 262
Public and publicly guaranteed sector 8 16 17 24 16 262 Public sector 8 16 17 24 16 262 of which: General government 6 16 17 24 16 262 Private sector guaranteed by public sector Private sector not guaranteed 0 0 0 0 0
Long-term external debt stocks 7091,3961,3691,5041,6161,617
Public and publicly guaranteed debt from: 709 828 809 856 931 962 Official creditors 688 822 805 852 927 959 Multilateral 633 703 697 722 755 758 of which: World Bank 330 321 338 363 400 424 Bilateral 55 118 108 131 171 201
Private creditors 21 6 5 4 4 4 Bondholders
Commercial banks and others 21 6 5 4 4 4
Private nonguaranteed debt from: 568 560 648 685 655 Bondholders
Commercial banks and others 568 560 648 685 655
Use of IMF credit and SDR allocations 79 108 94 79 119 198
Use of IMF credit 4 -7 -12 -14 36 -12
Long-term 26 137 -8 142 73 24
Official creditors 27 6 1 55 35 55 Multilateral 24 12 10 31 3 29 of which: World Bank 22 21 25 28 21 36 Bilateral 3 -6 -8 24 33 25 Private creditors -1 131 -9 87 38 -31 Bondholders
Banks and others -1 131 -9 87 38 -31 Short-term -3 -38 0 0 1 -1
Foreign direct investment 47 -35 -39 -36 -32 -36 Portfolio equity 0 0 0 0 0
External debt stocks to exports (%) 47 90 77 93 122 111
External debt stocks to GNI (%) 27 57 51 57 69 64
Debt service to exports (%) 2 3 4 4 5 21
Short-term to external debt stocks (%) 0 0 0 0 0 0 Multilateral to external debt stocks (%) 80 47 48 46 43 42 Reserves to external debt stocks (%) 189 44 50 49
Gross national income (GNI) 2,8722,6202,8642,7762,5102,843
(US$ million, unless otherwise indicated)
2010 2017 2018 2019 2020 2021
Total external debt stocks 4191,1181,1581,2671,4571,846
Use of IMF credit and SDR allocations 235 402 389 396 473 798 of which: SDR allocations 191 177 172 171 179 520
Long-term external debt 183 716 768 870 9851,048 Public and publicly guaranteed sector 183 656 713 822 9431,015 Public sector 183 656 713 822 9431,015 of which: General government 183 656 713 822 9431,015 Private sector guaranteed by public sector
Private sector not guaranteed 61 55 49 41 33
Short-term external debt 0 0 0 0 0 0
Disbursements (long-term) 0 112 153 120 107 99
Public and publicly guaranteed sector 0 110 151 119 106 99 Public sector 0 110 151 119 106 99 of which: General government 0 110 151 119 106 99 Private sector guaranteed by public sector Private sector not guaranteed 2 2 1 1
Principal repayments (long-term) 4 11 13 14 22 16 Public and publicly guaranteed sector 4 5 5 6 14 8 Public sector 4 5 5 6 14 8 of which: General government 4 5 5 6 14 8 Private sector guaranteed by public sector Private sector not guaranteed 6 8 8 8 8
Interest payments (long-term) 1 6 8 8 11 10
Public and publicly guaranteed sector 1 5 7 7 10 9 Public sector 1 5 7 7 10 9 of which: General government 1 5 7 7 10 9 Private sector guaranteed by public sector Private sector not guaranteed 1 1 1 1 0
Long-term external debt stocks 183 716 768 870 9851,048
Public and publicly guaranteed debt from: 183 656 713 822 9431,015 Official creditors 183 656 713 822 9431,015
Multilateral 63 503 597 705 824 895 of which: World Bank 0 306 368 455 550 616 Bilateral 120 152 116 117 120 120 Private creditors 0 0 Bondholders
Commercial banks and others 0 0 Private nonguaranteed debt from: 61 55 49 41 33 Bondholders Commercial banks and others 61 55 49 41 33
Use of IMF credit and SDR allocations 235 402 389 396 473 798
Use of IMF credit 14 20 -3 9 58 -8
Long-term -4 101 140 106 85 82
Official creditors -4 106 146 113 92 90
Multilateral -4 87 105 111 93 92 of which: World Bank -2 60 69 89 75 81 Bilateral 19 41 2 -1 -1
Private creditors -4 -5 -7 -7 -8
Bondholders
Banks and others -4 -5 -7 -7 -8 Short-term 0 0 0 0 0 0
Foreign direct investment 1,769 188 59 19 87 69 Portfolio equity -1 0
External debt stocks to exports (%) 117 249 207 216 226 203
External debt stocks to GNI (%) 23 36 39 43 50 56
Debt service to exports (%) 2 4 4 7 11 6 Short-term to external debt stocks (%) 0 0 0 0 0 0 Multilateral to external debt stocks (%) 15 45 52 56 57 48 Reserves to external debt stocks (%) 106 52 49 43 23
Gross national income (GNI) 1,8193,0882,9862,9662,8883,275
(US$ million, unless otherwise indicated)
Total external debt stocks
2010 2017 2018 2019 2020 2021
2,7563,3833,7204,0454,8415,347
Use of IMF credit and SDR allocations 278 440 465 545 9561,304 of which: SDR allocations 180 167 163 162 169 492
Long-term external debt 2,0542,7662,9843,2183,6123,811
Public and publicly guaranteed sector 2,0392,7362,9013,1173,5083,715 Public sector 2,0382,7362,9013,1173,5083,715 of which: General government 2,0062,6712,8252,9873,3313,525 Private sector guaranteed by public sector 1 Private sector not guaranteed 15 30 84 101 104 95
Short-term external debt 425 177 271 281 273 232
Disbursements (long-term) 198 271 361 327 347 413
Public and publicly guaranteed sector 198 245 295 300 336 413 Public sector 198 245 295 300 336 413 of which: General government 180 245 283 246 297 389 Private sector guaranteed by public sector 0 Private sector not guaranteed 26 66 26 11
Principal repayments (long-term) 39 93 81 76 82 105
Public and publicly guaranteed sector 37 92 72 67 73 96 Public sector 37 92 72 67 73 96 of which: General government 29 77 72 67 73 96 Private sector guaranteed by public sector 0 Private sector not guaranteed 1 1 9 9 9 9
Interest payments (long-term) 16 23 33 36 37 39
Public and publicly guaranteed sector 16 23 29 30 31 32 Public sector 16 23 29 30 31 32 of which: General government 16 22 29 29 29 31 Private sector guaranteed by public sector 0 Private sector not guaranteed 0 0 4 6 6 6
Long-term external debt stocks 2,0542,7662,9843,2183,6123,811 Public and publicly guaranteed debt from: 2,0392,7362,9013,1173,5083,715 Official creditors 2,0312,6102,7372,9633,3623,598
Multilateral 1,5752,2552,3472,4882,8092,986 of which: World Bank 1,1611,5951,6481,6861,8742,010 Bilateral 456 355 390 475 553 612
Private creditors 8 127 164 154 146 118
Bondholders Commercial banks and others 8 127 164 154 146 118 Private nonguaranteed debt from: 15 30 84 101 104 95 Bondholders
Commercial banks and others 15 30 84 101 104 95
Use of IMF credit and SDR allocations 278 440 465 545 9561,304
Use of IMF credit -2 118 36 83 376 48
Long-term 159 178 281 251 265 308 Official creditors 160 110 183 242 275 342 Multilateral 106 133 143 154 214 269 of which: World Bank 75 77 93 48 117 193 Bilateral 54 -23 40 88 60 73 Private creditors -1 68 98 9 -10 -34 Bondholders Banks and others -1 68 98 9 -10 -34 Short-term -224 -26 94 11 -8 -41
Foreign direct investment 380 61 74 65 56 58 Portfolio equity 2 0 0 0 0 0
External debt stocks to exports (%) 124 81 83 98 184 158 External debt stocks to GNI (%) 28 26 28 29 38 37 Debt service to exports (%) 3 3 3 3 5 5 Short-term to external debt stocks (%) 15 5 7 7 6 4 Multilateral to external debt stocks (%) 57 67 63 62 58 56 Reserves to external debt stocks (%) 37 47 47 42 41 44
Gross national income (GNI) 9,83412,81713,21713,73712,84214,329
(US$ million, unless otherwise indicated)
Summary external debt data, by debtor type
Total external debt stocks
2010 2017 2018 2019 2020 2021
1,0212,1622,2662,4292,9433,185
Use of IMF credit and SDR allocations 248 319 314 339 528 673 of which: SDR allocations 102 95 92 92 96 279
Long-term external debt 7301,7901,9262,0212,2372,366
Public and publicly guaranteed sector 7301,7901,9262,0212,2372,366 Public sector 7301,7901,9262,0212,2372,366 of which: General government 7211,7751,9132,0092,2252,357 Private sector guaranteed by public sector Private sector not guaranteed
Short-term external debt 43 54 25 68 178 146
Disbursements (long-term) 81 240 223 168 193 231
Public and publicly guaranteed sector 81 240 223 168 193 231 Public sector 81 240 223 168 193 231 of which: General government 78 240 223 168 193 231 Private sector guaranteed by public sector Private sector not guaranteed
Principal repayments (long-term) 13 33 42 62 52 60 Public and publicly guaranteed sector 13 33 42 62 52 60 Public sector 13 33 42 62 52 60 of which: General government 12 32 41 61 51 58 Private sector guaranteed by public sector Private sector not guaranteed
Interest payments (long-term) 7 16 12 17 21 22 Public and publicly guaranteed sector 7 16 12 17 21 22 Public sector 7 16 12 17 21 22 of which: General government 7 16 12 17 21 22 Private sector guaranteed by public sector Private sector not guaranteed
Summary external debt stock, by creditor type
Long-term external debt stocks 7301,7901,9262,0212,2372,366
Public and publicly guaranteed debt from: 7301,7901,9262,0212,2372,366 Official creditors 7241,7901,9262,0212,2372,366
Multilateral 5861,3691,4871,6001,7991,922 of which: World Bank 243 862 917 9691,1041,177 Bilateral 138 420 439 421 438 444
Private creditors 5 Bondholders
Commercial banks and others 5 Private nonguaranteed debt from: Bondholders Commercial banks and others Use of IMF credit and SDR allocations 248 319 314 339 528 673
Use of IMF credit 21 5 3 27 169 -26
Long-term 68 207 181 106 141 172
Official creditors 68 207 181 106 141 172 Multilateral 46 221 150 120 139 171 of which: World Bank 34 180 78 58 92 106 Bilateral 22 -14 31 -14 2 0
Private creditors
Bondholders Banks and others
Short-term -24 5 -26 43 110 -33
Foreign direct investment 133 81 164 66 56 57 Portfolio equity 1 0 0 0
External debt stocks to exports (%) 83 193 190 165 228 204
External debt stocks to GNI (%) 15 25 23 22 25 26
Debt service to exports (%) 2 6 7 7 8 7
Short-term to external debt stocks (%) 4 2 1 3 6 5 Multilateral to external debt stocks (%) 57 63 66 66 61 60 Reserves to external debt stocks (%) 30 36 34 35 20
Gross national income (GNI) 6,8528,7909,71710,84211,99112,398
(US$ million, unless otherwise indicated)
2010 2017 2018 2019 2020 2021
Total external debt stocks 9171,5162,3402,6793,4543,847
Use of IMF credit and SDR allocations 28 12 11 11 42 69 of which: SDR allocations 12 11 11 11 11 39
Long-term external debt 7431,3922,0902,3322,9633,229
Public and publicly guaranteed sector 6281,2342,0042,2282,8463,092 Public sector 6161,2341,9502,1212,7242,971 of which: General government 6071,0781,3211,4331,6062,248 Private sector guaranteed by public sector 12 0 54 107 121 121 Private sector not guaranteed 115 158 86 104 118 137 Short-term external debt 146 111 238 337 449 549
Disbursements (long-term) 168 4201,124 613 787 919
Public and publicly guaranteed sector 142 3881,124 562 773 900 Public sector 142 3881,070 510 752 900 of which: General government 142 350 330 179 185 701 Private sector guaranteed by public sector 54 52 21 0 Private sector not guaranteed 26 32 51 14 19
Principal repayments (long-term) 60 145 374 364 196 656 Public and publicly guaranteed sector 51 102 334 331 196 656 Public sector 48 102 334 331 190 656 of which: General government 44 69 67 61 52 61 Private sector guaranteed by public sector 3 0 0 6 0 Private sector not guaranteed 9 42 40 33
Interest payments (long-term) 11 19 58 84 78 89
Public and publicly guaranteed sector 9 15 55 80 75 82 Public sector 9 15 54 75 69 82 of which: General government 8 12 31 40 35 62 Private sector guaranteed by public sector 1 1 5 6 0 Private sector not guaranteed 1 4 3 3 3 7
Long-term external debt stocks 7431,3922,0902,3322,9633,229 Public and publicly guaranteed debt from: 6281,2342,0042,2282,8463,092 Official creditors 536 9341,2941,4461,9821,781
Multilateral 301 276 340 384 411 441 of which: World Bank 99 90 85 92 106 101 Bilateral 236 659 9541,0621,5701,341
Private creditors 92 300 710 782 8641,311 Bondholders 250 350 350 350 850 Commercial banks and others 92 50 360 432 514 461
Private nonguaranteed debt from: 115 158 86 104 118 137 Bondholders Commercial banks and others 115 158 86 104 118 137 Use of IMF credit and SDR allocations 28 12 11 11 42 69
Use of IMF credit 7 -1 -1 -1 29 0
Long-term 109 276 750 249 591 263
Official creditors 79 35 379 158 495 -203
Multilateral 28 8 70 45 15 40 of which: World Bank 16 -2 -3 7 9 -1 Bilateral 51 27 309 113 480 -243 Private creditors 30 241 371 90 96 466 Bondholders 250 100 500 Banks and others 30 -9 271 90 96 -34
Short-term -460 -18 126 97 75 76
Foreign direct investment 216 458 576 961 441 443 Portfolio equity -10 -1 32 -30 112
External debt stocks to exports (%) 46 45 65 71 192 97 External debt stocks to GNI (%) 40 35 49 53 100 87 Debt service to exports (%) 4 5 12 12 16 19
Short-term to external debt stocks (%) 16 7 10 13 13 14 Multilateral to external debt stocks (%) 33 18 15 14 12 11 Reserves to external debt stocks (%) 38 39 30 28 29 21
Gross national income (GNI) 2,2774,3794,8095,0483,4374,429
(US$ million, unless otherwise indicated)
Total external debt stocks
2010 2017 2018 2019 2020 2021
2,4394,3264,6045,0095,8346,460
Use of IMF credit and SDR allocations 187 334 441 447 681 946 of which: SDR allocations 138 127 124 124 129 375
Long-term external debt 2,2463,9014,0554,4635,0815,428
Public and publicly guaranteed sector 2,2463,9014,0554,4635,0815,428 Public sector 2,2463,9014,0554,4635,0815,428 of which: General government 2,2423,8994,0534,4615,0805,427
Private sector guaranteed by public sector Private sector not guaranteed
Short-term external debt 6 92 109 100 72 85
Disbursements (long-term) 310 291 392 598 560 738
Public and publicly guaranteed sector 310 291 392 598 560 738 Public sector 310 291 392 598 560 738 of which: General government 310 291 392 598 560 738 Private sector guaranteed by public sector Private sector not guaranteed
Principal repayments (long-term) 47 109 122 143 192 210 Public and publicly guaranteed sector 47 109 122 143 192 210 Public sector 47 109 122 143 192 210 of which: General government 46 109 122 143 192 210 Private sector guaranteed by public sector Private sector not guaranteed
Interest payments (long-term) 21 37 41 47 37 59
Public and publicly guaranteed sector 21 37 41 47 37 59 Public sector 21 37 41 47 37 59 of which: General government 21 37 41 47 37 59 Private sector guaranteed by public sector Private sector not guaranteed
Long-term external debt stocks 2,2463,9014,0554,4635,0815,428
Public and publicly guaranteed debt from: 2,2463,9014,0554,4635,0815,428 Official creditors 2,2413,9004,0544,4635,0815,428
Multilateral 1,7882,9283,0643,4023,8113,835 of which: World Bank 8401,5741,6821,9702,1462,131 Bilateral 453 972 9901,0611,2691,593
Private creditors 5 0 0 0 Bondholders Commercial banks and others 5 0 0 0 Private nonguaranteed debt from: Bondholders Commercial banks and others Use of IMF credit and SDR allocations 187 334 441 447 681 946
Net debt inflows
Use of IMF credit 6 28 116 9 208 35
Long-term 263 182 270 455 367 527 Official creditors 264 183 270 455 367 527 Multilateral 229 190 223 367 214 203 of which: World Bank 151 123 149 298 70 72 Bilateral 36 -8 46 88 153 324 Private creditors -1 0 0 0 Bondholders
Banks and others -1 0 0 0
Short-term -18 12 19 10 -22 17
Foreign direct investment 374 366 358 618 816 660 Portfolio equity 1 2 -1 3 -1
External debt stocks to exports (%) 97 122 106 109 109 117 External debt stocks to GNI (%) 24 29 28 30 35 35
Debt service to exports (%) 3 5 4 5 5 5 Short-term to external debt stocks (%) 0 2 2 2 1 1 Multilateral to external debt stocks (%) 73 68 67 68 65 59 Reserves to external debt stocks (%) 55 Gross national income (GNI) 10,26914,86516,56116,58516,72718,576
(US$ million, unless otherwise indicated)
Total external debt stocks
2010 2017 2018 2019 2020 2021
3,5565,2415,2265,3705,7144,819
Use of IMF credit and SDR allocations 145 200 221 244 424 594 of which: SDR allocations 95 88 86 85 89 259
Long-term external debt 2,3264,0023,9524,0434,2154,031
Public and publicly guaranteed sector 2,3264,0023,9524,0434,2154,031 Public sector 2,3264,0023,9524,0434,2154,031 of which: General government 1,9933,2143,2383,3833,6113,735
Private sector guaranteed by public sector Private sector not guaranteed
Short-term external debt 1,0861,0401,0521,0831,075 193
Disbursements (long-term)
412 250 270 367 232 128
Public and publicly guaranteed sector 412 250 270 367 232 128 Public sector 412 250 270 367 232 128 of which: General government 262 248 270 345 232 128 Private sector guaranteed by public sector Private sector not guaranteed
Principal repayments (long-term)
77 224 270 266 211 339 Public and publicly guaranteed sector 77 224 270 266 211 339 Public sector 77 224 270 266 211 339 of which: General government 23 149 198 190 155 129 Private sector guaranteed by public sector Private sector not guaranteed
Interest payments (long-term) 35 80 92 88 59 58 Public and publicly guaranteed sector 35 80 92 88 59 58 Public sector 35 80 92 88 59 58 of which: General government 25 50 62 60 43 41 Private sector guaranteed by public sector Private sector not guaranteed
Long-term external debt stocks 2,3264,0023,9524,0434,2154,031 Public and publicly guaranteed debt from: 2,3264,0023,9524,0434,2154,031 Official creditors 2,3254,0023,9524,0434,2154,031
Multilateral 1,5012,3582,2842,3792,4822,349 of which: World Bank 316 390 382 388 418 415 Bilateral 8241,6441,6681,6641,7331,682
Private creditors 1 Bondholders Commercial banks and others 1 Private nonguaranteed debt from: Bondholders Commercial banks and others Use of IMF credit and SDR allocations 145 200 221 244 424 594
Net debt inflows
Use of IMF credit 34 9 26 24 165 9 Long-term 335 27 0 101 21 -211 Official creditors 346 27 0 101 21 -211
Multilateral 269 48 -45 99 -6 -146 of which: World Bank 39 2 2 8 14 9 Bilateral 77 -21 45 2 27 -65
Private creditors -11
Bondholders
Banks and others -11 Short-term 103 4 13 30 -8 32
Foreign direct investment 131 588 773 -884 928 22 Portfolio equity
External debt stocks to exports (%) 154 257 235 198 194 146
External debt stocks to GNI (%) 64 78 71 69 73 59
Debt service to exports (%) 5 16 17 14 10 13 Short-term to external debt stocks (%) 31 20 20 20 19 4 Multilateral to external debt stocks (%) 42 45 44 44 43 49 Reserves to external debt stocks (%) 8 16 18 19 26 42 Gross national income (GNI) 5,5606,7037,3147,7937,8108,143
(US$ million, unless otherwise indicated)
Summary external debt data, by debtor type
Total external debt stocks
2010 2017 2018 2019 2020 2021
7,92910,63011,23412,36112,62913,916
Use of IMF credit and SDR allocations 149 138 135 134 139 326 of which: SDR allocations 149 138 135 134 139 326
Long-term external debt 6,2945,2516,2446,5156,2226,176
Public and publicly guaranteed sector 1,0071,5551,4341,3862,1432,322
Public sector 1,0071,5551,4341,3862,1432,322
of which: General government 7351,2811,1561,1291,7651,904
Private sector guaranteed by public sector Private sector not guaranteed 5,2873,6964,8105,1304,0793,853 Short-term external debt 1,4855,2414,8555,7126,2677,414
Disbursements (long-term) 2,5682,1923,8612,7941,8632,455
Public and publicly guaranteed sector 356 76 64 1341,012 454
Public sector 356 76 64 1341,012 454 of which: General government 211 76 19 115 854 369 Private sector guaranteed by public sector Private sector not guaranteed 2,2122,1153,7972,660 8512,001
Principal repayments (long-term) 2,1182,6372,8492,4992,2432,392
Public and publicly guaranteed sector 69 244 150 159 341 166 Public sector 69 244 150 159 341 166 of which: General government 28 204 110 119 303 121 Private sector guaranteed by public sector Private sector not guaranteed 2,0492,3942,6992,3411,9022,227
Interest payments (long-term) 73 197 297 622 314 296
Public and publicly guaranteed sector 17 30 28 29 27 20 Public sector 17 30 28 29 27 20 of which: General government 13 22 22 23 21 16 Private sector guaranteed by public sector Private sector not guaranteed 56 167 269 593 287 277
Long-term external debt stocks 6,2945,2516,2446,5156,2226,176
Public and publicly guaranteed debt from: 1,0071,5551,4341,3862,1432,322
Official creditors 8881,5221,4111,3661,8832,009
Multilateral 501 815 757 789 790 702 of which: World Bank 204 263 231 207 189 158 Bilateral 387 706 654 5771,0931,307
Private creditors 119 33 24 20 260 314 Bondholders 8 5 7 234 300 Commercial banks and others 119 26 19 13 26 14
Private nonguaranteed debt from: 5,2873,6964,8105,1304,0793,853 Bondholders 294 309 468 399 381 Commercial banks and others 5,2873,4024,5014,6613,6813,472
Use of IMF credit and SDR allocations 149 138 135 134 139 326
Net debt inflows
Use of IMF credit
Long-term 450 -4461,012 295 -379 63
Official creditors 249 -167 -77 -22 430 209 Multilateral 137 -108 -42 38 -36 -57 of which: World Bank -4 -26 -25 -24 -24 -26 Bilateral 112 -59 -34 -60 466 266 Private creditors 201 -2781,089 316 -810 -146 Bondholders 40 12 163 159 74 Banks and others 201 -3181,077 154 -968 -221 Short-term 183 613 -383 857 5551,147
Net equity inflows
Foreign direct investment 430 480 461 444 225 253 Portfolio equity 7,8213,306 -691 4193,123 648
External debt stocks to exports (%) 78 62 79 80 109 144
External debt stocks to GNI (%) 80 73 71 79 106 109 Debt service to exports (%) 22 17 23 21 23 29 Short-term to external debt stocks (%) 19 49 43 46 50 53 Multilateral to external debt stocks (%) 6 8 7 6 6 5 Reserves to external debt stocks (%) 31 51 52 55 52 56
Gross national income (GNI) 9,91314,57315,88015,72211,90712,807
(US$ million, unless otherwise indicated) 2010 2017 2018 2019 2020 2021
Summary external debt data, by debtor type
Total external debt stocks
306,835578,105606,454610,189605,052605,700
Use of IMF credit and SDR allocations 4,3914,0603,9653,9434,10615,946 of which: SDR allocations 4,3914,0603,9653,9434,10615,946
Long-term external debt 259,383530,009545,337549,097551,540539,266
Public and publicly guaranteed sector 145,925289,216297,827306,433309,061290,868 Public sector 145,925289,016297,627306,233308,861290,668 of which: General government 91,010185,818191,327201,754200,492189,236 Private sector guaranteed by public sector 200 200 200 200 200 Private sector not guaranteed 113,458240,793247,510242,664242,479248,398
Short-term external debt 43,06144,03557,15157,15049,40550,487
Disbursements (long-term)
62,65168,52150,02855,19056,65854,298
Public and publicly guaranteed sector 41,81235,19125,73137,53233,03127,421 Public sector 41,81234,99125,73137,53233,03127,421 of which: General government 26,24613,4248,41718,30321,26014,063 Private sector guaranteed by public sector 200 0 0
Private sector not guaranteed 20,83933,33024,29717,65823,62726,876
Principal repayments (long-term)
21,68338,18532,56343,63847,81453,654
Public and publicly guaranteed sector 13,94117,63515,05125,17225,54835,863 Public sector 13,94117,63515,05125,17225,54835,863 of which: General government 2,5274,7691,4984,38616,27616,976
Private sector guaranteed by public sector 0 0 0 0 0
Private sector not guaranteed 7,74220,55017,51218,46622,26617,791
Interest payments (long-term)
8,65825,19423,58422,98221,67621,555
Public and publicly guaranteed sector 5,85918,71215,89917,12016,41516,155
Public sector 5,85918,71015,89217,11316,41116,152 of which: General government 3,97414,34710,92311,96411,10510,310 Private sector guaranteed by public sector 2 6 7 4 2 Private sector not guaranteed 2,7996,4827,6865,8625,2615,400
Long-term external debt stocks 259,383530,009545,337549,097551,540539,266
Public and publicly guaranteed debt from: 145,925289,216297,827306,433309,061290,868 Official creditors 25,38932,72332,60533,47634,87733,844 Multilateral 21,43329,30429,79430,98932,21531,144 of which: World Bank 12,46214,88714,61114,94215,71415,237 Bilateral 3,9563,4192,8112,4872,6622,699
Private creditors 120,536256,494265,222272,957274,184257,024 Bondholders 97,656225,580237,163247,179250,632237,190 Commercial banks and others 22,88030,91428,05925,77823,55219,835
Private nonguaranteed debt from: 113,458240,793247,510242,664242,479248,398 Bondholders 32,89896,90790,26396,45299,95097,286 Commercial banks and others 80,560143,885157,247146,212142,529151,112
Use of IMF credit and SDR allocations 4,3914,0603,9653,9434,10615,946
Net debt inflows
Use of IMF credit
Long-term 40,96830,33717,46511,5528,844 643
Official creditors 4,8751,344 -275 820 847 -332 Multilateral 4,0221,297 2691,118 803 -500 of which: World Bank 2,256 178 -278 298 816 -446 Bilateral 853 46 -544 -298 44 168
Private creditors 36,09328,99317,74110,7327,998 975 Bondholders 27,84320,0627,97316,37013,986-8,311
Banks and others 8,2508,9319,768-5,638-5,9889,286
Short-term 17,506-2,95513,115 -1 -7,7451,082
Net equity inflows
Foreign direct investment 20,94623,92624,61931,48322,73526,417 Portfolio equity 37310,3202,421 -10 186-3,163
Debt ratios
External debt stocks to exports (%) 95 129 123 120 136 114
External debt stocks to GNI (%) 29 51 51 50 58 48
Debt service to exports (%) 10 15 12 14 16 15 Short-term to external debt stocks (%) 14 8 9 9 8 8
Multilateral to external debt stocks (%) 7 5 5 5 5 5 Reserves to external debt stocks (%) 39 29 28 29 32 33
Gross national income (GNI) 1,045,2211,128,8231,189,3491,232,6041,051,1421,260,700
(US$ million, unless otherwise indicated)
Total external debt stocks
2010 2017 2018 2019 2020 2021
4,7256,9697,4407,5248,2289,288
Use of IMF credit and SDR allocations 509 562 496 458 669 912 of which: SDR allocations 181 168 164 163 170 396
Long-term external debt 2,7454,7564,9255,0745,2515,772
Public and publicly guaranteed sector 8391,4421,4501,4641,7611,819 Public sector 8391,4421,4501,4641,7611,819 of which: General government 8141,4371,4421,4501,7461,804
Private sector guaranteed by public sector Private sector not guaranteed 1,9063,3153,4763,6103,4903,953 Short-term external debt 1,4711,6502,0201,9922,3092,604
Disbursements (long-term) 464 596 551 549 8151,191
Public and publicly guaranteed sector 94 183 138 130 312 305 Public sector 94 183 138 130 312 305 of which: General government 89 180 134 122 309 300 Private sector guaranteed by public sector Private sector not guaranteed 370 413 413 419 503 886
Principal repayments (long-term) 306 249 375 427 544 508 Public and publicly guaranteed sector 55 50 89 101 122 140 Public sector 55 50 89 101 122 140 of which: General government 47 48 88 100 119 137 Private sector guaranteed by public sector Private sector not guaranteed 251 200 286 325 422 368
Interest payments (long-term) 49 55 67 63 65 110
Public and publicly guaranteed sector 16 20 22 23 20 21 Public sector 16 20 22 23 20 21 of which: General government 14 20 22 22 19 20 Private sector guaranteed by public sector Private sector not guaranteed 33 35 44 40 45 89
Long-term external debt stocks 2,7454,7564,9255,0745,2515,772 Public and publicly guaranteed debt from: 8391,4421,4501,4641,7611,819 Official creditors 8161,4171,4251,4401,7361,799
Multilateral 5651,0861,1521,2261,5741,700 of which: World Bank 479 696 712 716 792 813 Bilateral 251 331 273 214 163 99 Private creditors 23 25 25 24 24 20
Bondholders Commercial banks and others 23 25 25 24 24 20
Private nonguaranteed debt from: 1,9063,3153,4763,6103,4903,953 Bondholders 500 Commercial banks and others 1,9063,3153,4763,6103,4903,453
Use of IMF credit and SDR allocations 509 562 496 458 669 912
Use of IMF credit 175 -44 -54 -35 186 31
Long-term 159 347 175 122 271 683
Official creditors 44 134 48 29 192 167 Multilateral 49 51 100 85 252 223 of which: World Bank 42 28 31 8 38 55 Bilateral -5 83 -52 -57 -60 -55 Private creditors 115 213 127 94 79 515 Bondholders 500 Banks and others 115 213 127 94 79 15 Short-term 106 336 366 -20 282 286
Foreign direct investment 172 66 170 438 174 224 Portfolio equity 6 0 -1 0 0 -2
External debt stocks to exports (%) 174 174 167 161 202 183 External debt stocks to GNI (%) 63 68 62 60 67 66 Debt service to exports (%) 15 11 14 14 18 14 Short-term to external debt stocks (%) 31 24 27 26 28 28 Multilateral to external debt stocks (%) 12 16 15 16 19 18 Reserves to external debt stocks (%) 36 40 40 41 46 42
Gross national income (GNI) 7,48110,22112,00812,59512,25314,056
(US$ million, unless otherwise indicated)
external debt data, by debtor type
Total external debt stocks
2010 2017 2018 2019 2020 2021
5,92827,96329,78931,64432,36033,940
Use of IMF credit and SDR allocations 273 189 287 285 401 483 of which: SDR allocations 75 69 68 67 70 165
Long-term external debt 5,29024,61226,40428,39930,67832,283
Public and publicly guaranteed sector 1,7827,5118,0068,34811,18911,625
Public sector 1,7827,5118,0068,34811,18911,625
of which: General government 1,7637,5048,0008,3439,3469,637
Private sector guaranteed by public sector Private sector not guaranteed 3,50817,10118,39820,05019,48920,659 Short-term external debt 3653,1633,0982,9601,2811,174
Disbursements (long-term) 2,9294,3258,36312,7503,6043,929
Public and publicly guaranteed sector 672,3271,098 5201,6691,558 Public sector 672,3271,098 5201,6691,558 of which: General government 672,3271,098 5201,6691,459 Private sector guaranteed by public sector Private sector not guaranteed 2,8631,9977,26512,2291,9352,370
Principal repayments (long-term) 1392,7886,61411,1372,1932,168
Public and publicly guaranteed sector 121 68 630 171 817 964 Public sector 121 68 630 171 817 964 of which: General government 46 68 630 171 816 964 Private sector guaranteed by public sector Private sector not guaranteed 182,7205,98410,9661,3761,204
Interest payments (long-term) 89 8261,037 504 508 374
Public and publicly guaranteed sector 20 217 244 309 319 269 Public sector 20 217 244 309 319 269 of which: General government 19 217 244 308 319 269 Private sector guaranteed by public sector Private sector not guaranteed 70 609 793 196 189 105
Long-term external debt stocks 5,29024,61226,40428,39930,67832,283
Public and publicly guaranteed debt from: 1,7827,5118,0068,34811,18911,625 Official creditors 1,7763,8144,3344,7387,6367,772 Multilateral 1,0731,6441,8782,0992,6912,865 of which: World Bank 403 579 570 579 760 809 Bilateral 7032,1702,4572,6394,9454,907
Private creditors 7 3,6973,6723,6113,5523,853 Bondholders 0 3,4003,4003,4003,4323,637 Commercial banks and others 7 297 272 211 120 216
Private nonguaranteed debt from: 3,50817,10118,39820,05019,48920,659 Bondholders ..1,3171,8652,2281,3181,346 Commercial banks and others 3,50815,78316,53317,82218,17119,313
Use of IMF credit and SDR allocations 273 189 287 285 401 483
Use of IMF credit 19 116 104 0 101 -3
Long-term 2,7901,5361,7481,6131,4101,761
Official creditors 23 848 490 409 916 289 Multilateral 20 377 263 229 536 218 of which: World Bank 17 130 5 13 153 71 Bilateral 2 471 227 180 380 71
Private creditors 2,768 6881,2581,203 4951,472 Bondholders -75 1,232 525 440 -341 229 Banks and others 2,843 -544 733 763 8351,243
Short-term 117 574 -64 -138-1,683 -103
Net equity inflows
Foreign direct investment 1,331 828 7991,231 6811,165 Portfolio equity 680 -10 -7 7 6
External debt stocks to exports (%) 173 407 375 359 405 339
External debt stocks to GNI (%) 90 283 249 250 268 261
Debt service to exports (%) 7 54 98 133 35 26
Short-term to external debt stocks (%) 6 11 10 9 4 3 Multilateral to external debt stocks (%) 18 6 6 7 8 8 Reserves to external debt stocks (%) 37 10 9 10 13 11
Gross national income (GNI) 6,6109,87211,94412,63412,05313,021
(US$ million, unless otherwise indicated)
Summary external debt data, by debtor type
Total external debt stocks
2010 2017 2018 2019 2020 2021
4,5037,2198,0278,58510,52210,552
Use of IMF credit and SDR allocations 40 37 36 36 124 202 of which: SDR allocations 40 37 36 36 37 117
Long-term external debt 4,2777,0087,7768,27210,0819,964
Public and publicly guaranteed sector 1,3492,9783,4433,7264,8614,288 Public sector 1,3402,9353,4173,7174,8554,286 of which: General government 1,0362,6443,1633,4794,6224,099
Private sector guaranteed by public sector 9 44 26 9 6 2 Private sector not guaranteed 2,9284,0294,3334,5465,2205,675 Short-term external debt 186 174 215 277 316 386
Disbursements (long-term)
6761,6402,3151,6071,893 778
Public and publicly guaranteed sector 383 4561,175 7881,328 177 Public sector 374 4561,175 7881,328 177 of which: General government 297 4381,156 7651,311 170 Private sector guaranteed by public sector 9 Private sector not guaranteed 2931,1841,140 819 565 601
Principal repayments (long-term) 59 9531,4211,2931,0081,009
Public and publicly guaranteed sector 59 197 591 444 516 456 Public sector 59 186 575 428 513 453 of which: General government 47 142 527 392 476 413 Private sector guaranteed by public sector 11 17 16 4 3 Private sector not guaranteed 755 830 849 492 553
Interest payments (long-term) 33 208 267 229 249 392
Public and publicly guaranteed sector 33 96 102 105 109 239 Public sector 33 94 101 105 108 239 of which: General government 25 87 95 100 104 235 Private sector guaranteed by public sector 2 1 0 0 0 Private sector not guaranteed 113 165 123 140 153
Long-term external debt stocks 4,2777,0087,7768,27210,0819,964
Public and publicly guaranteed debt from: 1,3492,9783,4433,7264,8614,288 Official creditors 8181,3231,4591,5511,6941,652
Multilateral 546 634 589 556 673 645 of which: World Bank 306 297 271 243 252 232 Bilateral 271 689 871 9951,0211,008 Private creditors 5311,6551,9842,1753,1682,636 Bondholders 2671,2951,3941,7402,4271,982 Commercial banks and others 264 360 589 435 741 654 Private nonguaranteed debt from: 2,9284,0294,3334,5465,2205,675 Bondholders Commercial banks and others 2,9284,0294,3334,5465,2205,675
Use of IMF credit and SDR allocations 40 37 36 36 124 202
Net debt inflows
Use of IMF credit 84 0
Long-term 616 687 894 314 885 -231
Official creditors 2 133 167 116 74 22 Multilateral -5 -44 -22 -12 62 24 of which: World Bank -3 -26 -18 -12 -12 -2 Bilateral 8 177 190 128 12 -2 Private creditors 614 554 726 197 811 -252 Bondholders 265 0 163 370 490 -269 Banks and others 349 554 564 -173 321 17
Short-term -1,021 0 41 62 39 70
Foreign direct investment 566 386 342 232 220 476 Portfolio equity -8 14 0 3 -1 -27
External debt stocks to exports (%) 262 309 297 310 670 361 External debt stocks to GNI (%) 109 146 144 153 217 178 Debt service to exports (%) 6 50 63 55 80 48 Short-term to external debt stocks (%) 4 2 3 3 3 4 Multilateral to external debt stocks (%) 12 9 7 6 6 6 Reserves to external debt stocks (%) 12 14 15 18 20 19
Gross national income (GNI) 4,1144,9565,5725,6044,8575,932
(US$ million, unless otherwise indicated)
Summary external debt data, by debtor type
2010 2017 2018 2019 2020 2021
Total external debt stocks 27,29650,98250,37054,99365,72665,414
Use of IMF credit and SDR allocations 865 800 781 7763,9064,085 of which: SDR allocations 865 800 781 776 8091,986
Long-term external debt 23,68442,77442,14445,52153,67352,251
Public and publicly guaranteed sector 21,09534,66333,44436,48543,66542,149 Public sector 21,09234,66333,44436,48543,66542,149 of which: General government 13,05621,59520,74723,61829,92628,734 Private sector guaranteed by public sector 3 Private sector not guaranteed 2,5898,1118,7009,03610,00810,102
Short-term external debt 2,7477,4087,4468,6958,1469,079
Disbursements (long-term)
4,9994,4653,2566,6999,2365,264
Public and publicly guaranteed sector 3,8822,9521,7945,4468,1194,104 Public sector 3,8822,9521,7945,4468,1194,104 of which: General government 2,8791,8131,0044,3387,0541,885 Private sector guaranteed by public sector 0 Private sector not guaranteed 1,1161,5131,4621,2531,1171,160
Principal repayments (long-term)
2,4282,7972,7422,9173,9434,212
Public and publicly guaranteed sector 1,2742,3892,0602,0373,2663,421 Public sector 1,2712,3892,0602,0373,2663,421 of which: General government 7301,6111,1971,2082,4141,507 Private sector guaranteed by public sector 3 Private sector not guaranteed 1,154 408 682 880 677 790
Interest payments (long-term) 8501,0161,0881,0531,0421,159
Public and publicly guaranteed sector 820 927 932 947 9361,018 Public sector 819 927 932 947 9361,018 of which: General government 559 522 519 558 561 622 Private sector guaranteed by public sector 0 Private sector not guaranteed 31 88 155 106 106 141
Long-term external debt stocks 23,68442,77442,14445,52153,67352,251 Public and publicly guaranteed debt from: 21,09534,66333,44436,48543,66542,149 Official creditors 17,24924,18123,15823,66927,18625,944
Multilateral 10,18616,06915,69116,68619,67318,982 of which: World Bank 2,5185,5605,5296,4147,8868,118 Bilateral 7,0638,1127,4676,9847,5136,962 Private creditors 3,84610,48310,28612,81616,47916,205 Bondholders 1,3366,4996,3907,59010,91211,602 Commercial banks and others 2,5103,9843,8965,2265,5674,603
Private nonguaranteed debt from: 2,5898,1118,7009,03610,00810,102 Bondholders Commercial banks and others 2,5898,1118,7009,03610,00810,102
Use of IMF credit and SDR allocations 865 800 781 7763,9064,085
Use of IMF credit ..2,996 -927 Long-term 2,5711,668 5143,7825,2931,052
Official creditors 1,1231,217 -312 7901,876 326 Multilateral 6221,153 1341,2061,812 400 of which: World Bank 64 532 146 957 985 716 Bilateral 501 63 -446 -416 64 -75 Private creditors 1,448 451 8262,9933,417 727 Bondholders 1,327 0 0 1,2393,000 983 Banks and others 121 451 8261,754 417 -256 Short-term 537-1,515 381,250 -549 933 Net
Foreign direct investment 1,3691,9522,9261,3591,1151,614
Portfolio equity 132 -33 -184 280 -42 -398
External debt stocks to exports (%) 98 129 115 123 172 137 External debt stocks to GNI (%) 30 47 43 47 58 50
Debt service to exports (%) 12 10 9 9 14 14 Short-term to external debt stocks (%) 10 15 15 16 12 14 Multilateral to external debt stocks (%) 37 32 31 30 30 29 Reserves to external debt stocks (%) 83 50 47 46 53 53 Gross national income (GNI) 91,933107,533115,795117,528113,027130,652
(US$ million, unless otherwise indicated)
Total external debt stocks
2010 2017 2018 2019 2020 2021
11,36146,33550,21954,65959,05462,819
Use of IMF credit and SDR allocations 357 343 303 375 689 947 of which: SDR allocations 168 155 151 151 157 457
Long-term external debt 10,40044,90348,67952,62156,51360,094
Public and publicly guaranteed sector 3,39910,46710,63610,71710,78610,577 Public sector 3,39910,46710,63610,71710,78610,577 of which: General government 3,3008,8529,1419,4279,6439,532
Private sector guaranteed by public sector Private sector not guaranteed 7,00134,43638,04341,90345,72749,517 Short-term external debt 6041,0891,2371,6631,8521,778
Disbursements (long-term)
3,7932,5314,2094,5364,09410,182
Public and publicly guaranteed sector 403 720 603 675 271 444 Public sector 403 720 603 675 271 444 of which: General government 397 720 603 675 271 444 Private sector guaranteed by public sector Private sector not guaranteed 3,3911,8123,6063,8613,8249,738
Principal repayments (long-term) 43 240 281 552 4906,438
Public and publicly guaranteed sector 43 240 281 552 490 490 Public sector 43 240 281 552 490 490 of which: General government 40 130 163 347 340 393 Private sector guaranteed by public sector Private sector not guaranteed ..5,948
Interest payments (long-term) 1511,0871,5991,358 576 757
Public and publicly guaranteed sector 49 110 124 137 117 94 Public sector 49 110 124 137 117 94 of which: General government 47 107 121 119 108 93 Private sector guaranteed by public sector Private sector not guaranteed 102 9771,4741,220 459 663
Long-term external debt stocks 10,40044,90348,67952,62156,51360,094
Public and publicly guaranteed debt from: 3,39910,46710,63610,71710,78610,577 Official creditors 3,3038,7259,0339,3039,5049,310
Multilateral 2,1954,0734,2134,4244,6734,574 of which: World Bank 1,4912,8222,9043,0393,2243,147 Bilateral 1,1084,6524,8204,8794,8314,736
Private creditors 961,7421,6031,4141,2821,267 Bondholders 727 727 727 727 727 Commercial banks and others 961,015 877 688 556 540
Private nonguaranteed debt from: 7,00134,43638,04341,90345,72749,517 Bondholders Commercial banks and others 7,00134,43638,04341,90345,72749,517
Use of IMF credit and SDR allocations 357 343 303 375 689 947 Net
Net debt inflows
Use of IMF credit 21 -32 -32 73 288 -27 Long-term 3,7502,2923,9283,9843,6043,744
Official creditors 289 585 451 309 -68 -52
Multilateral 255 162 231 233 89 20 of which: World Bank 158 113 153 154 56 16 Bilateral 33 423 220 76 -158 -71 Private creditors 3,4621,7073,4773,6763,6733,796 Bondholders Banks and others 3,4621,7073,4773,6763,6733,796 Short-term -68 445 77 418 186 -71
Net equity inflows
Foreign direct investment 410 668 491 382 254 426 Portfolio equity -5 0 0 3 0
External debt stocks to exports (%) 419 835 806 9331,288 948
External debt stocks to GNI (%) 106 361 345 362 430 399 Debt service to exports (%) 7 25 31 34 24 109 Short-term to external debt stocks (%) 5 2 2 3 3 3 Multilateral to external debt stocks (%) 19 9 8 8 8 7 Reserves to external debt stocks (%) 19 7 6 7 7 6 Gross national income (GNI) 10,74512,83914,55915,11313,74215,760
(US$ million, unless otherwise indicated)
Total external debt stocks
2010 2017 2018 2019 2020 2021
9,99010,78310,72911,17813,40813,927
Use of IMF credit and SDR allocations 378 350 342 340 7261,761 of which: SDR allocations 378 350 342 340 3541,037
Long-term external debt 8,43310,33610,28310,77212,61412,135
Public and publicly guaranteed sector 8,43310,30710,26810,74412,57911,822 Public sector 8,28810,30710,26810,74412,57911,822 of which: General government 1,8995,4905,9396,7568,6398,297
Private sector guaranteed by public sector 146 Private sector not guaranteed 28 14 28 35 313 Short-term external debt 1,179 97 105 66 68 32
Disbursements (long-term) 714 440 7931,0401,676 847
Public and publicly guaranteed sector 714 440 793 9761,595 507 Public sector 714 440 793 9761,595 507 of which: General government 14 381 696 8651,546 487 Private sector guaranteed by public sector 0 Private sector not guaranteed 65 81 340
Principal repayments (long-term) 201 443 546 506 485 702 Public and publicly guaranteed sector 201 424 532 454 411 628 Public sector 201 424 532 454 411 628 of which: General government 25 41 84 52 132 257 Private sector guaranteed by public sector Private sector not guaranteed 19 14 51 74 74
Interest payments (long-term) 40 201 287 186 1121,606
Public and publicly guaranteed sector 40 201 287 176 971,599 Public sector 40 201 287 176 971,599 of which: General government 3 53 150 46 321,498 Private sector guaranteed by public sector Private sector not guaranteed 1 10 15 7
Long-term external debt stocks 8,43310,33610,28310,77212,61412,135 Public and publicly guaranteed debt from: 8,43310,30710,26810,74412,57911,822 Official creditors 7,4827,3717,6628,36510,1509,695
Multilateral 1,4471,7881,8592,0812,6292,676 of which: World Bank 7991,1921,2661,4681,8041,769 Bilateral 6,0355,5835,8046,2837,5217,019
Private creditors 9522,9372,6062,3802,4292,127 Bondholders Commercial banks and others 9522,9372,6062,3802,4292,127 Private nonguaranteed debt from: 28 14 28 35 313 Bondholders Commercial banks and others 28 14 28 35 313 Use of IMF credit and SDR allocations 378 350 342 340 7261,761
Net debt inflows
Use of IMF credit 360 368
Long-term 513 -3 247 5351,191 145
Official creditors 210 146 475 7041,324 106 Multilateral 0 226 207 232 458 115 of which: World Bank 214 181 208 271 16 Bilateral 210 -80 268 473 867 -9 Private creditors 303 -149 -228 -169 -133 39 Bondholders Banks and others 303 -149 -228 -169 -133 39 Short-term 0 0 0 0 0 0
Foreign direct investment 9012,9372,2011,9781,770 817 Portfolio equity 0 0 0
External debt stocks to exports (%) 127 73 63 59 87 106
External debt stocks to GNI (%) 28 18 16 17 18 22 Debt service to exports (%) 3 4 5 4 4 18 Short-term to external debt stocks (%) 12 1 1 1 1 0 Multilateral to external debt stocks (%) 14 17 17 19 20 19 Reserves to external debt stocks (%) 57 46 50 49 54 Gross national income (GNI) 36,07259,77665,14866,38976,40663,338
(US$ million, unless otherwise indicated)
Total external debt stocks
2010 2017 2018 2019 2020 2021
3,7874,9635,5116,5137,9068,856
Use of IMF credit and SDR allocations 219 168 156 147 370 560 of which: SDR allocations 105 97 95 94 98 306
Long-term external debt 3,5074,3745,1035,9637,1757,961
Public and publicly guaranteed sector 3,5074,2994,9745,8457,0577,794
Public sector 3,5074,2994,9745,8457,0577,794 of which: General government 3,4934,2944,9695,8417,0547,791
Private sector guaranteed by public sector Private sector not guaranteed 75 129 118 118 166 Short-term external debt 61 421 252 403 361 335
Disbursements (long-term) 126 6061,0171,0961,1571,183
Public and publicly guaranteed sector 126 591 9551,0961,1571,135 Public sector 126 591 9551,0961,1571,135 of which: General government 126 591 9551,0961,1571,135 Private sector guaranteed by public sector Private sector not guaranteed 15 63 48
Principal repayments (long-term) 148 195 181 205 202 201
Public and publicly guaranteed sector 148 172 174 194 202 201 Public sector 148 172 174 194 202 201 of which: General government 147 172 173 193 201 201 Private sector guaranteed by public sector Private sector not guaranteed 23 8 11
Interest payments (long-term) 32 38 45 57 60 64
Public and publicly guaranteed sector 32 36 41 52 54 62 Public sector 32 36 41 52 54 62 of which: General government 32 36 41 52 54 61 Private sector guaranteed by public sector Private sector not guaranteed 2 4 6 6 2
Long-term external debt stocks 3,5074,3745,1035,9637,1757,961 Public and publicly guaranteed debt from: 3,5074,2994,9745,8457,0577,794 Official creditors 3,5044,2994,9745,8457,0577,794
Multilateral 3,1303,9014,4585,0806,1526,751 of which: World Bank 1,4262,0222,4772,8773,4693,966 Bilateral 374 399 516 765 9051,044 Private creditors 3 0 0 0 0 0 Bondholders Commercial banks and others 3 0 0 0 0 0 Private nonguaranteed debt from: 75 129 118 118 166 Bondholders Commercial banks and others 75 129 118 118 166 Use of IMF credit and SDR allocations 219 168 156 147 370 560
Use of IMF credit 39 -12 -8 -8 210 -10
Long-term -22 411 836 891 956 982 Official creditors -22 419 781 902 956 934 Multilateral -19 386 658 651 853 774 of which: World Bank -32 211 512 415 459 611 Bilateral -3 34 123 251 103 160 Private creditors 0 -8 55 -11 48 Bondholders Banks and others 0 -8 55 -11 48 Short-term 17 43 -170 151 -42 -25
Foreign direct investment 196 68 186 127 196
Portfolio equity
Debt ratios
External debt stocks to exports (%) 213 166 163 190 347 297 External debt stocks to GNI (%) 23 17 17 19 23 24 Debt service to exports (%) 11 8 7 8 12 9 Short-term to external debt stocks (%) 2 8 5 6 5 4 Multilateral to external debt stocks (%) 83 79 81 78 78 76 Reserves to external debt stocks (%) 78 185 146 129 140 104 Gross national income (GNI) 16,12529,26333,32834,54033,83036,486
(US$ million, unless otherwise indicated)
Summary external debt data, by debtor type
Total external debt stocks
2010 2017 2018 2019 2020 2021
7,01712,70713,00313,19213,59314,354
Use of IMF credit and SDR allocations 359 219 195 181 369 705 of which: SDR allocations 192 177 173 172 179 523
Long-term external debt 5,25611,04411,43211,80512,05612,575
Public and publicly guaranteed sector 2,7044,7105,1085,4285,9036,407
Public sector 2,7044,7105,1085,4285,9036,407 of which: General government 2,0063,9274,1504,5165,0645,646
Private sector guaranteed by public sector 0
Private sector not guaranteed 2,5526,3346,3246,3786,1526,168 Short-term external debt 1,4021,4441,3761,2051,1691,074
Disbursements (long-term) 1,1812,7392,2862,2961,4821,837
Public and publicly guaranteed sector 267 539 572 509 652 811
Public sector 267 539 572 509 652 811 of which: General government 267 539 372 509 652 811 Private sector guaranteed by public sector Private sector not guaranteed 9142,2001,7141,787 8301,026
Principal repayments (long-term) 4592,3311,8651,9391,3661,180
Public and publicly guaranteed sector 56 122 135 176 230 257 Public sector 56 122 135 176 230 257 of which: General government 33 96 110 131 157 180 Private sector guaranteed by public sector Private sector not guaranteed 4032,2091,7301,7621,137 923
Interest payments (long-term) 103 274 268 305 279 181
Public and publicly guaranteed sector 34 83 94 119 117 112 Public sector 34 83 94 119 117 112 of which: General government 29 79 89 102 107 106 Private sector guaranteed by public sector Private sector not guaranteed 70 191 174 186 162 69
Long-term external debt stocks 5,25611,04411,43211,80512,05612,575
Public and publicly guaranteed debt from: 2,7044,7105,1085,4285,9036,407 Official creditors 2,6944,6965,0835,4025,8796,386
Multilateral 1,6613,5303,9144,2154,6535,193 of which: World Bank 447 595 624 692 771 872 Bilateral 1,0331,1661,1701,1871,2251,193
Private creditors 11 14 24 26 25 21
Bondholders Commercial banks and others 11 14 24 26 25 21 Private nonguaranteed debt from: 2,5526,3346,3246,3786,1526,168 Bondholders Commercial banks and others 2,5526,3346,3246,3786,1526,168
Use of IMF credit and SDR allocations 359 219 195 181 369 705
Net debt inflows
Use of IMF credit 20 -22 -19 -13 174 -2
Long-term 721 408 420 357 116 657
Official creditors 212 416 425 331 425 556 Multilateral 214 404 411 306 411 559 of which: World Bank 36 33 44 71 58 115 Bilateral -2 13 15 25 14 -3 Private creditors 509 -8 -5 26 -309 101 Bondholders Banks and others 509 -8 -5 26 -309 101 Short-term 389 15 -105 -193 -52 -101
Foreign direct investment 490 980 798 394 703 973 Portfolio equity 0 0 0 0 0 0
External debt stocks to exports (%) 197 219 230 227 253 216
External debt stocks to GNI (%) 82 97 105 109 116 109 Debt service to exports (%) 16 46 38 39 31 21 Short-term to external debt stocks (%) 20 11 11 9 9 7 Multilateral to external debt stocks (%) 24 28 30 32 34 36 Reserves to external debt stocks (%) 26 22 17 18 24 28
Gross national income (GNI) 8,51413,07412,37312,13011,76113,198
(US$ million, unless otherwise indicated)
Total external debt stocks
2010 2017 2018 2019 2020 2021
1,5343,0503,1913,5984,5674,984
Use of IMF credit and SDR allocations 158 287 311 346 498 687 of which: SDR allocations 97 90 88 87 91 265
Long-term external debt 1,2062,6982,8193,1694,0214,253
Public and publicly guaranteed sector 1,2062,6982,8193,1694,0214,253 Public sector 1,2062,6982,8193,1694,0214,253 of which: General government 1,2052,6972,8183,1684,0204,252
Private sector guaranteed by public sector Private sector not guaranteed 0
Short-term external debt 170 65 61 84 48 44
Disbursements (long-term) 279 361 278 422 746 559
Public and publicly guaranteed sector 279 361 278 422 746 559 Public sector 279 361 278 422 746 559 of which: General government 279 361 278 422 746 559 Private sector guaranteed by public sector Private sector not guaranteed
Principal repayments (long-term) 16 88 72 94 122 128
Public and publicly guaranteed sector 9 88 72 94 122 128 Public sector 9 88 72 94 122 128 of which: General government 9 88 72 94 122 128 Private sector guaranteed by public sector Private sector not guaranteed 7
Interest payments (long-term) 8 38 44 35 50 64
Public and publicly guaranteed sector 8 38 44 35 50 64 Public sector 8 38 44 35 50 64 of which: General government 8 38 44 35 50 64 Private sector guaranteed by public sector Private sector not guaranteed 0
Long-term external debt stocks 1,2062,6982,8193,1694,0214,253 Public and publicly guaranteed debt from: 1,2062,6982,8193,1694,0214,253 Official creditors 1,2052,6982,8193,1693,8024,051
Multilateral 6642,0372,0952,4653,0733,330 of which: World Bank 275 9881,0441,3471,6941,863 Bilateral 541 661 724 703 728 721
Private creditors 1 219 202 Bondholders
Commercial banks and others 1 219 202 Private nonguaranteed debt from: 0 Bondholders Commercial banks and others 0 Use of IMF credit and SDR allocations 158 287 311 346 498 687
Net debt inflows
Use of IMF credit 5 32 32 36 133 27
Long-term 263 273 206 328 624 431 Official creditors 270 273 206 328 420 431 Multilateral 62 240 127 341 429 431 of which: World Bank 14 159 87 257 259 253 Bilateral 208 33 79 -14 -9 0 Private creditors -7 204 0 Bondholders
Banks and others -7 204 0 Short-term 35 21 -11 16 -5 -4
Foreign direct investment 0 128 211 306 76 755 Portfolio equity 6 16 21 27 16
External debt stocks to exports (%) 115 197 201 236 308 330
External debt stocks to GNI (%) 19 26 24 27 35 33
Debt service to exports (%) 2 9 8 9 13 15 Short-term to external debt stocks (%) 11 2 2 2 1 1 Multilateral to external debt stocks (%) 43 67 66 69 67 67 Reserves to external debt stocks (%) 50 Gross national income (GNI) 8,28411,60013,40613,47913,15615,188
(US$ million, unless otherwise indicated)
external debt data, by debtor type
2010 2017 2018 2019 2020 2021
Total external debt stocks 18,82245,78054,20360,04170,52476,215
Use of IMF credit and SDR allocations 2,5802,3862,3302,3175,9489,073 of which: SDR allocations 2,5802,3862,3302,3172,4135,637
Long-term external debt 16,24143,39451,87257,72464,57667,142
Public and publicly guaranteed sector 4,68618,83025,25027,56629,70434,385 Public sector 4,68618,83025,25027,56629,70434,385 of which: General government 4,68618,50424,85927,16629,26233,956 Private sector guaranteed by public sector 0 Private sector not guaranteed 11,55624,56426,62230,15834,87332,757
Short-term external debt 0 0 0 0 0 0
Disbursements (long-term)
1,11112,11912,6509,2069,9749,811
Public and publicly guaranteed sector 1,0517,1317,3742,6892,1246,073 Public sector 1,0517,1317,3742,6892,1246,073 of which: General government 1,0517,0797,3002,6782,0946,073 Private sector guaranteed by public sector 0 Private sector not guaranteed 604,9885,2776,5177,8493,738
Principal repayments (long-term)
1,1892,7073,9543,2753,6716,772
Public and publicly guaranteed sector 248 137 735 295 4411,011 Public sector 241 137 735 295 4411,011 of which: General government 227 137 735 295 4411,011 Private sector guaranteed by public sector 7 Private sector not guaranteed 9422,5703,2192,9803,2305,760
Interest payments (long-term) 59 8221,4121,8321,8461,731
Public and publicly guaranteed sector 59 207 6991,0961,1151,113 Public sector 59 207 6991,0961,1151,113 of which: General government 58 205 6971,0931,1121,110 Private sector guaranteed by public sector 1 Private sector not guaranteed 615 713 737 731 618
Long-term external debt stocks 16,24143,39451,87257,72464,57667,142
Public and publicly guaranteed debt from: 4,68618,83025,25027,56629,70434,385 Official creditors 4,68612,53014,08216,39818,53519,717 Multilateral 4,30410,11010,93212,51914,28015,193 of which: World Bank 3,7057,9138,5579,95911,41512,310 Bilateral 3812,4203,1503,8784,2564,524 Private creditors 0 6,30011,16811,16811,16814,668 Bondholders ..6,30011,16811,16811,16814,668 Commercial banks and others 0
Private nonguaranteed debt from: 11,55624,56426,62230,15834,87332,757 Bondholders ..6,9426,0176,3675,8175,900 Commercial banks and others 11,55617,62220,60523,79129,05526,857
Use of IMF credit and SDR allocations 2,5802,3862,3302,3175,9489,073
Net debt inflows
Use of IMF credit ..3,419 0 Long-term -79 9,4128,6965,9306,3033,039
Official creditors 8072,1941,7702,3941,6841,562 Multilateral 8651,7131,0411,6661,3251,270 of which: World Bank 905 858 8511,4751,0581,228 Bilateral -58 480 729 728 358 292
Private creditors -8867,2186,9263,5364,6191,477 Bondholders ..5,8003,943 350 -5503,583 Banks and others -8861,4182,9833,1865,169-2,105 Short-term 0 0 0 0 0 0
Net equity inflows
Foreign direct investment 5,9661,150 -563 851 9302,447 Portfolio equity 2,1531,3601,259-1,548 -255 72
External debt stocks to exports (%) 22 87 80 83 169 144
External debt stocks to GNI (%) 6 13 14 14 17 18
Debt service to exports (%) 2 7 8 7 13 16
Short-term to external debt stocks (%) 0 0 0 0 0 0
Multilateral to external debt stocks (%) 23 22 20 21 20 20 Reserves to external debt stocks (%) 172 87 79 64 52
Gross national income (GNI) 342,044364,254378,867433,449416,521423,828
(US$ million, unless otherwise indicated)
Total external debt stocks
2010 2017 2018 2019 2020 2021
5,1598,5448,6679,00010,52610,840
Use of IMF credit and SDR allocations 101 93 91 91 297 476 of which: SDR allocations 101 93 91 91 95 280
Long-term external debt 3,8407,1337,2387,5068,7388,721
Public and publicly guaranteed sector 1,8803,8294,0624,1715,1105,099 Public sector 1,8803,8294,0614,1635,1025,092 of which: General government 1,6602,9203,1423,1523,9933,973
Private sector guaranteed by public sector 0 1 7 8 7 Private sector not guaranteed 1,9593,3043,1763,3363,6293,622 Short-term external debt 1,2181,3181,3391,4031,4911,642
Disbursements (long-term)
5961,0201,401 8271,8031,752
Public and publicly guaranteed sector 197 221 795 3891,2021,178 Public sector 197 221 794 3831,2021,178 of which: General government 123 110 672 1811,0321,006 Private sector guaranteed by public sector 1 6 1 0 Private sector not guaranteed 399 798 606 438 600 574
Principal repayments (long-term) 443 6451,077 513 9481,241
Public and publicly guaranteed sector 98 262 406 219 625 830 Public sector 98 262 406 219 625 829 of which: General government 87 177 317 118 505 715 Private sector guaranteed by public sector 0 1 Private sector not guaranteed 344 383 671 293 323 411
Interest payments (long-term) 128 177 159 151 149 191
Public and publicly guaranteed sector 56 112 105 115 112 129 Public sector 56 112 105 115 112 129 of which: General government 51 100 92 101 97 114 Private sector guaranteed by public sector 0 Private sector not guaranteed 71 65 54 36 36 62
Long-term external debt stocks 3,8407,1337,2387,5068,7388,721
Public and publicly guaranteed debt from: 1,8803,8294,0624,1715,1105,099 Official creditors 1,3691,9211,8652,0512,3902,391 Multilateral 1,1271,3361,2451,3871,7351,770 of which: World Bank 681 658 614 732 856 799 Bilateral 242 585 620 665 655 621
Private creditors 5121,9072,1972,1192,7202,708 Bondholders 4341,4631,8651,8372,6462,669 Commercial banks and others 77 444 332 283 74 39 Private nonguaranteed debt from: 1,9593,3043,1763,3363,6293,622 Bondholders Commercial banks and others 1,9593,3043,1763,3363,6293,622
Use of IMF credit and SDR allocations 101 93 91 91 297 476
Net debt inflows
Use of IMF credit 195 0
Long-term 153 375 324 315 855 511 Official creditors 101 22 1 206 199 142 Multilateral 101 -40 -39 161 219 165 of which: World Bank 53 -24 -21 125 66 0 Bilateral 0 62 39 46 -20 -23 Private creditors 53 352 324 109 655 369 Bondholders 0 483 6 596 236 Banks and others 53 352 -160 102 59 133 Short-term -229 230 8 56 51 164
Net equity inflows
Foreign direct investment 202 246 471 444 110 377 Portfolio equity -4 -12 -34 -16 -8 -3
External debt stocks to exports (%) 136 133 111 113 143 117
External debt stocks to GNI (%) 56 79 71 75 90 82 Debt service to exports (%) 16 14 17 9 16 16 Short-term to external debt stocks (%) 24 15 15 16 14 15 Multilateral to external debt stocks (%) 22 16 14 15 16 16 Reserves to external debt stocks (%) 38 29 35 37 35 34
Gross national income (GNI) 9,27610,85912,15112,02511,64713,217
(US$ million, unless otherwise indicated)
Summary external debt data, by debtor type
Total external debt stocks 63,12491,66299,224107,883115,695130,433
Use of IMF credit and SDR allocations 10,2587,6647,2768,0978,90210,841 of which: SDR allocations 1,5221,4081,3751,3671,4244,108
Long-term external debt 48,19975,28983,86090,26099,563110,610
Public and publicly guaranteed sector 43,72666,69872,95478,17785,91794,670 Public sector 43,68166,66872,92778,15385,89494,650 of which: General government 43,56760,24364,92868,25275,36682,313 Private sector guaranteed by public sector 46 29 26 24 23 20 Private sector not guaranteed 4,4738,59110,90612,08313,64715,940
Short-term external debt 4,6678,7098,0889,5267,2308,983
Disbursements (long-term)
3,95814,00712,86213,29213,89718,363
Public and publicly guaranteed sector 1,86711,17910,10711,50911,42516,887 Public sector 1,86711,17910,10711,50911,42516,887 of which: General government 1,86710,8738,22610,65210,33415,108 Private sector guaranteed by public sector 0 0 0 0 0 Private sector not guaranteed 2,0912,8282,7551,7822,4721,476
Principal repayments (long-term)
3,0224,9623,3147,4816,3608,666 Public and publicly guaranteed sector 2,1394,6002,8756,8755,4527,756 Public sector 2,1374,5982,8726,8725,4507,754 of which: General government 2,1064,3442,6086,6495,2226,576 Private sector guaranteed by public sector 2 1 2 2 2 2 Private sector not guaranteed 883 362 439 606 907 910
Interest payments (long-term) 8831,5632,2662,7002,2852,224 Public and publicly guaranteed sector 7841,3231,8322,1571,7211,729 Public sector 7831,3221,8322,1571,7211,728 of which: General government 7801,3051,7111,9841,4851,445 Private sector guaranteed by public sector 0 0 0 0 0 0 Private sector not guaranteed 100 240 434 543 564 496
Long-term external debt stocks 48,19975,28983,86090,26099,563110,610
Public and publicly guaranteed debt from: 43,72666,69872,95478,17785,91794,670 Official creditors 42,07650,39156,40962,18767,85172,443
Multilateral 24,67027,84527,88030,14133,81735,209 of which: World Bank 11,80615,30015,16215,30517,17618,262 Bilateral 17,40522,54628,52832,04734,03437,234
Private creditors 1,65116,30716,54515,99018,06622,227 Bondholders 1,5507,3007,3005,3005,3008,300 Commercial banks and others 1019,0079,24510,69012,76613,927
Private nonguaranteed debt from: 4,4738,59110,90612,08313,64715,940 Bondholders 250 12 12 12 12 12 Commercial banks and others 4,2238,57910,89412,07113,63515,928
Use of IMF credit and SDR allocations 10,2587,6647,2768,0978,90210,841
Net debt inflows
Use of IMF credit 1,360 0 -212 862 453 -544 Long-term 9369,0459,5485,8117,5389,697
Official creditors 4023,2066,9526,4583,6624,663 Multilateral 4521,173 4822,4182,8442,026 of which: World Bank 78 491 183 2231,2691,541 Bilateral -50 2,0336,4694,040 8182,637
Private creditors 5345,8392,596 -6473,8755,034 Bondholders -1,2001,750 0 -2,000 ..3,000 Banks and others 1,7344,0892,5961,3533,8752,034 Short-term 3,2011,588 -6211,438-2,2961,753
Net equity inflows
Foreign direct investment 2,0222,5831,4791,9811,8371,851 Portfolio equity 511 -391 -528 22 -542 -359
External debt stocks to exports (%) 220 304 315 346 417 360
External debt stocks to GNI (%) 36 27 28 34 39 38 Debt service to exports (%) 15 22 19 36 36 34 Short-term to external debt stocks (%) 7 10 8 9 6 7 Multilateral to external debt stocks (%) 39 30 28 28 29 27 Reserves to external debt stocks (%) 23 17 9 12 13 15 Gross national income (GNI) 173,884334,192350,691315,299294,847341,730
(US$ million, unless otherwise indicated)
Summary external debt data, by debtor type
Total external debt stocks
2010 2017 2018 2019 2020 2021
5,98717,22417,72418,74518,01716,983
Use of IMF credit and SDR allocations 193 179 175 174 560 897 of which: SDR allocations 193 179 175 174 181 529
Long-term external debt 5,38016,96817,08517,91417,05915,823
Public and publicly guaranteed sector 1,0422,3063,4114,3135,1126,041
Public sector 1,0422,3063,4114,3135,1126,041 of which: General government 1,0382,3033,4084,3115,1096,038
Private sector guaranteed by public sector Private sector not guaranteed 4,33714,66313,67413,60111,9479,782 Short-term external debt 414 77 464 657 399 263
Disbursements (long-term) 3,1531,3203,0461,5011,5542,552
Public and publicly guaranteed sector 37 3941,2341,2011,5541,539 Public sector 37 3941,2341,2011,5541,539 of which: General government 37 3941,2341,2011,5541,539 Private sector guaranteed by public sector Private sector not guaranteed 3,116 9261,812 300 ..1,013
Principal repayments (long-term) 7582,1112,0291,5681,0953,716
Public and publicly guaranteed sector 67 84 93 281 845 538 Public sector 67 84 93 281 845 538 of which: General government 67 84 93 281 845 538 Private sector guaranteed by public sector Private sector not guaranteed 6912,0271,9371,286 2503,178
Interest payments (long-term) 50 673 741 772 201 326
Public and publicly guaranteed sector 16 51 88 149 143 100 Public sector 16 51 88 149 143 100 of which: General government 16 51 88 149 143 100 Private sector guaranteed by public sector Private sector not guaranteed 33 622 653 623 58 226
Long-term external debt stocks 5,38016,96817,08517,91417,05915,823
Public and publicly guaranteed debt from: 1,0422,3063,4114,3135,1126,041 Official creditors 1,0091,9572,3743,1614,1815,447 Multilateral 7121,2781,6331,8532,5652,923 of which: World Bank 225 277 446 446 480 562 Bilateral 297 679 7411,3071,6162,524 Private creditors 33 3491,0371,152 931 594 Bondholders 500 500 500 500 Commercial banks and others 33 349 537 652 431 94 Private nonguaranteed debt from: 4,33714,66313,67413,60111,9479,782 Bondholders Commercial banks and others 4,33714,66313,67413,60111,9479,782
Use of IMF credit and SDR allocations 193 179 175 174 560 897
Net debt inflows
Use of IMF credit 367 0
Long-term 2,395 -7911,017 -66 458-1,164
Official creditors -23 181 452 804 9381,331 Multilateral -2 68 373 232 670 390 of which: World Bank -6 4 174 8 16 96 Bilateral -21 114 79 572 268 941 Private creditors 2,418 -972 565 -870 -479-2,494 Bondholders 500 Banks and others 2,418 -972 65 -870 -479-2,494 Short-term 302 -383 235 334 -243 -143
Foreign direct investment 35 99 168 335 112 87 Portfolio equity 0 0 0
External debt stocks to exports (%) 98 168 167 159 192 159
External debt stocks to GNI (%) 45 77 75 79 74 65 Debt service to exports (%) 13 27 26 20 14 38 Short-term to external debt stocks (%) 7 0 3 4 2 2 Multilateral to external debt stocks (%) 12 7 9 10 14 17 Reserves to external debt stocks (%) 51 10 12 12
Gross national income (GNI) 13,18222,29423,49223,70724,39925,938
(US$ million, unless otherwise indicated)
Summary external debt data, by debtor type
Total external debt stocks
2010 2017 2018 2019 2020 2021
15,90315,92915,79916,38819,76321,353
Use of IMF credit and SDR allocations 147 136 132 132 137 403 of which: SDR allocations 147 136 132 132 137 403
Long-term external debt 11,38311,17311,02611,54315,01316,295
Public and publicly guaranteed sector 2,3905,6096,4027,18310,25811,347 Public sector 2,3905,6056,3837,14810,21211,302 of which: General government 2,1485,4216,1966,97810,05811,113
Private sector guaranteed by public sector 4 19 35 46 45 Private sector not guaranteed 8,9925,5644,6254,3604,7554,949 Short-term external debt 4,3734,6204,6404,7134,6144,654
Disbursements (long-term)
1,912 9961,5351,4534,3342,013
Public and publicly guaranteed sector 308 9781,003 9943,2811,669 Public sector 308 978 988 9783,2701,669 of which: General government 298 945 969 9733,2681,618 Private sector guaranteed by public sector 0 15 16 12 Private sector not guaranteed 1,605 18 533 4591,053 344
Principal repayments (long-term) 3141,3381,680 924 630 703
Public and publicly guaranteed sector 240 209 208 207 218 552 Public sector 240 209 208 207 218 551 of which: General government 210 194 193 187 198 537 Private sector guaranteed by public sector 0 0 0 0 1 Private sector not guaranteed 751,1291,472 717 412 150
Interest payments (long-term) 131 356 553 390 414 444
Public and publicly guaranteed sector 65 211 254 330 359 365 Public sector 65 211 254 329 358 365 of which: General government 58 206 249 323 353 363 Private sector guaranteed by public sector 0 0 1 1 1 Private sector not guaranteed 66 145 299 60 55 79
Long-term external debt stocks 11,38311,17311,02611,54315,01316,295
Public and publicly guaranteed debt from: 2,3905,6096,4027,18310,25811,347 Official creditors 2,1232,6902,9793,2734,8985,490 Multilateral 1,5102,5012,7903,0624,6535,230 of which: World Bank 270 605 636 619 852 882 Bilateral 613 189 189 211 245 260
Private creditors 2672,9193,4233,9105,3605,856 Bondholders ..2,8803,4103,9105,3605,856 Commercial banks and others 267 39 13 0 0 0
Private nonguaranteed debt from: 8,9925,5644,6254,3604,7554,949 Bondholders 600 600 6001,1501,450 Commercial banks and others 8,9924,9644,0253,7603,6053,499
Use of IMF credit and SDR allocations 147 136 132 132 137 403
Net debt inflows
Use of IMF credit
Long-term 1,598 -342 -145 5293,7051,311
Official creditors 83 295 290 3001,614 621 Multilateral 146 330 293 2801,588 590 of which: World Bank -26 62 31 -11 233 30 Bilateral -63 -35 -2 20 25 31 Private creditors 1,515 -637 -435 2292,091 690 Bondholders 300 530 5002,000 796 Banks and others 1,515 -937 -965 -271 91 -106 Short-term 312 24 20 72 -99 41
Foreign direct investment 401 336 451 70 82 25
Portfolio equity
Debt ratios
External debt stocks to exports (%) 143 112 109 122 165 149
External debt stocks to GNI (%) 62 42 41 45 58 56
Debt service to exports (%) 5 12 16 10 9 8 Short-term to external debt stocks (%) 28 29 29 29 23 22 Multilateral to external debt stocks (%) 9 16 18 19 24 24 Reserves to external debt stocks (%) 26 47 47 45 44 43
Gross national income (GNI) 25,73037,70238,87136,80534,27538,024
(US$ million, unless otherwise indicated) 2010 2017 2018 2019 2020 2021
Summary external debt data, by debtor type
Total external debt stocks
42,15467,60466,76964,24773,54987,464
Use of IMF credit and SDR allocations 939 869 848 843 8782,644 of which: SDR allocations 939 869 848 843 8782,644
Long-term external debt 34,82258,04055,92354,83762,38774,536
Public and publicly guaranteed sector 20,00918,97818,14518,60628,02739,854
Public sector 19,56318,97818,14518,60628,02739,854 of which: General government 19,55416,82315,99016,45125,87237,699 Private sector guaranteed by public sector 445 Private sector not guaranteed 14,81339,06237,77836,23134,36034,682
Short-term external debt 6,3938,6959,9988,56710,28410,285
Disbursements (long-term)
5,4255,3713,5133,29111,45715,597
Public and publicly guaranteed sector 3,8622,631 5691,8669,42712,592 Public sector 3,8622,631 5691,8669,42712,592 of which: General government 3,862 481 5691,8669,42712,592 Private sector guaranteed by public sector 0 Private sector not guaranteed 1,5632,7402,9451,4252,0303,005
Principal repayments (long-term)
4,0608,7184,5834,3274,1912,779
Public and publicly guaranteed sector 3,4903,7461,2631,356 290 396 Public sector 3,3723,7461,2631,356 290 396 of which: General government 3,3703,7451,2631,356 290 396 Private sector guaranteed by public sector 118 Private sector not guaranteed 5704,9733,3202,9723,9012,382
Interest payments (long-term)
2,5502,1512,3282,1032,0492,293
Public and publicly guaranteed sector 1,096 969 982 979 9191,109
Public sector 1,084 969 982 979 9191,109 of which: General government 1,083 914 872 870 810 999 Private sector guaranteed by public sector 12 Private sector not guaranteed 1,4541,1821,3461,1241,1301,184
Long-term external debt stocks 34,82258,04055,92354,83762,38774,536
Public and publicly guaranteed debt from: 20,00918,97818,14518,60628,02739,854 Official creditors 10,6724,9194,4474,9167,1749,131 Multilateral 7,8703,8673,4263,8436,1238,271 of which: World Bank 2,9651,0931,1451,5643,4414,685 Bilateral 2,8021,0531,0211,0741,051 860
Private creditors 9,33714,05913,69813,69020,85330,722 Bondholders 9,31114,05913,69813,69020,85330,722
Commercial banks and others 26 0
Private nonguaranteed debt from: 14,81339,06237,77836,23134,36034,682 Bondholders 72716,34015,51016,28517,80018,345 Commercial banks and others 14,08622,72322,26819,94616,56016,338
Use of IMF credit and SDR allocations 939 869 848 843 8782,644
Use of IMF credit
Long-term 1,365-3,347-1,070-1,0367,26612,818
Official creditors -1,384-3,265 -448 4742,1912,036 Multilateral -528-2,822 -431 4192,2832,152 of which: World Bank 119-1,516 51 4231,8771,246
Bilateral -856 -442 -16 55 -92 -116 Private creditors 2,749 -83 -622-1,5105,07510,782 Bondholders 1,7644,615-1,077 8128,46111,004
Banks and others 985-4,698 455-2,322-3,386 -222 Short-term 1,608 9301,304-1,4321,717 1
Net equity inflows
Foreign direct investment 7,7627,2406,6843,356 5616,890 Portfolio equity 87 -172 -442 -511 -209 -154
Debt ratios
External debt stocks to exports (%) 105 127 116 112 154 130
External debt stocks to GNI (%) 31 34 32 29 37 42
Debt service to exports (%) 17 21 12 12 14 8 Short-term to external debt stocks (%) 15 13 15 13 14 12
Multilateral to external debt stocks (%) 19 6 5 6 8 9 Reserves to external debt stocks (%) 101 92 88 103 99
Gross national income (GNI) 136,693201,299211,618220,067196,348207,248
(US$ million, unless otherwise indicated)
Total external debt stocks 65,35073,10678,96783,62598,494106,428
Use of IMF credit and SDR allocations 1,2901,1931,1651,1591,2073,913 of which: SDR allocations 1,2901,1931,1651,1591,2073,913
Long-term external debt 53,54857,63861,73465,25883,07887,425
Public and publicly guaranteed sector 45,08636,50238,35541,73556,39459,284 Public sector 45,02036,47638,33141,71456,37659,270 of which: General government 36,72031,71433,79037,06852,12655,677 Private sector guaranteed by public sector 66 26 24 21 18 14 Private sector not guaranteed 8,46221,13623,37923,52426,68428,141
Short-term external debt 10,51214,27516,06817,20814,20915,090
Disbursements (long-term)
10,9286,4879,86711,35421,12716,846
Public and publicly guaranteed sector 8,2513,4634,9917,03415,03711,462 Public sector 8,2513,4634,9917,03415,03711,462 of which: General government 8,0323,4104,9336,19714,98111,162 Private sector guaranteed by public sector 0 0 0 0 0 0 Private sector not guaranteed 2,6773,0254,8764,3206,0905,384
Principal repayments (long-term) 8,3418,2466,2377,3656,3769,330
Public and publicly guaranteed sector 6,8133,0272,3824,1063,4365,512 Public sector 6,8093,0242,3794,1033,4325,509 of which: General government 5,2382,8302,2012,7072,9104,893 Private sector guaranteed by public sector 4 3 3 3 3 3 Private sector not guaranteed 1,5275,2193,8553,2592,9413,817
Interest payments (long-term) 3,1122,9532,5643,2112,9742,866
Public and publicly guaranteed sector 2,9772,2372,3012,4162,2952,101 Public sector 2,9752,2362,3002,4162,2952,100 of which: General government 2,4501,9321,9972,1242,0351,884 Private sector guaranteed by public sector 2 1 1 1 1 0 Private sector not guaranteed 135 716 264 795 679 765
Long-term external debt stocks 53,54857,63861,73465,25883,07887,425
Public and publicly guaranteed debt from: 45,08636,50238,35541,73556,39459,284 Official creditors 23,20919,08020,05021,53229,39032,333 Multilateral 8,37211,01312,05413,17319,66422,888 of which: World Bank 2,7385,1325,8426,4568,1009,740 Bilateral 14,8378,0677,9958,3599,7269,445
Private creditors 21,87717,42218,30520,20327,00526,951 Bondholders 20,59016,71817,63619,08126,06226,256 Commercial banks and others 1,287 704 6691,122 943 695
Private nonguaranteed debt from: 8,46221,13623,37923,52426,68428,141 Bondholders 1,6514,0125,1877,0419,65110,942 Commercial banks and others 6,81117,12318,19216,48317,03317,199
Use of IMF credit and SDR allocations 1,2901,1931,1651,1591,2073,913
Net debt inflows
Use of IMF credit
Long-term 2,587-1,7593,6303,98914,7517,517
Official creditors -447 109 8831,4297,2613,898
Multilateral -180 4811,0421,1506,3823,321 of which: World Bank 52 443 709 6151,6411,653 Bilateral -267 -371 -159 279 879 577
Private creditors 3,035-1,8682,7472,5607,4903,618 Bondholders 1,700 -8792,9322,8987,1383,575
Banks and others 1,335 -989 -185 -338 352 44 Short-term 6,509 -2521,7931,140-3,000 881
Net equity inflows
Foreign direct investment -2144,2613,2423,4272,6514,575 Portfolio equity 833 496-1,0311,764-2,541 -975
External debt stocks to exports (%) 107 75 77 77 107 107
External debt stocks to GNI (%) 28 20 21 20 25 26
Debt service to exports (%) 19 12 9 10 10 12
Short-term to external debt stocks (%) 16 20 20 21 14 14 Multilateral to external debt stocks (%) 13 15 15 16 20 22 Reserves to external debt stocks (%) 85 100 90 95 100 93
Gross national income (GNI) 231,747364,719383,817414,552389,166408,174
(US$ million, unless otherwise indicated)
Total external debt stocks
417,886519,203477,785485,793460,934481,418
Use of IMF credit and SDR allocations 8,7358,0777,8887,8438,16925,248 of which: SDR allocations 8,7358,0777,8887,8438,16925,248
Long-term external debt 348,938455,167415,696409,644390,911369,952
Public and publicly guaranteed sector 165,665216,167195,226201,325193,502176,769 Public sector 165,665216,167195,226201,325193,502176,769 of which: General government 34,34654,26754,62769,76565,19962,610 Private sector guaranteed by public sector Private sector not guaranteed 183,273239,000220,470208,319197,409193,184
Short-term external debt 60,21455,95854,20168,30661,85486,218
Disbursements (long-term)
70,30183,35551,28572,02572,35058,603
Public and publicly guaranteed sector 49,80550,92832,40639,08443,56910,262 Public sector 49,80550,92832,40639,08443,56910,262 of which: General government 10,48517,04517,20518,76219,46110,262 Private sector guaranteed by public sector
Private sector not guaranteed 20,49632,42718,87832,94128,78048,341
Principal repayments (long-term)
42,97461,77390,54878,40592,29879,085
Public and publicly guaranteed sector 30,00120,53553,05132,97552,26326,363 Public sector 30,00120,53553,05132,97552,26326,363 of which: General government 7,1361,03416,7533,58024,22612,686 Private sector guaranteed by public sector
Private sector not guaranteed 12,97341,23837,49745,43040,03552,722
Interest payments (long-term)
12,29119,00919,05117,25917,32416,264
Public and publicly guaranteed sector 1,7076,5558,9307,3068,1827,725 Public sector 1,7076,5558,9307,3068,1827,725 of which: General government 8731,6582,7631,9233,4364,385 Private sector guaranteed by public sector Private sector not guaranteed 10,58412,45510,1219,9539,1428,539
Long-term external debt stocks 348,938455,167415,696409,644390,911369,952
Public and publicly guaranteed debt from: 165,665216,167195,226201,325193,502176,769 Official creditors 7,6371,176 966 772 8001,084
Multilateral 3,087 617 476 353 261 194 of which: World Bank 2,618 551 428 315 236 178 Bilateral 4,550 559 489 420 539 890
Private creditors 158,028214,991194,260200,553192,702175,685 Bondholders 25,51061,08164,59482,77279,08273,922 Commercial banks and others 132,518153,910129,666117,781113,620101,763
Private nonguaranteed debt from: 183,273239,000220,470208,319197,409193,184 Bondholders 2,10016,87919,89027,12629,32425,451 Commercial banks and others 181,173222,121200,580181,193168,085167,733
Use of IMF credit and SDR allocations 8,7358,0777,8887,8438,16925,248
Net debt inflows
Use of IMF credit
Long-term
27,32721,582-39,264-6,379-19,948-20,482
Official creditors 227 -969 -210 -192 29 284 Multilateral -656 -127 -140 -122 -91 -66 of which: World Bank -596 -95 -123 -111 -79 -58 Bilateral 883 -842 -70 -70 120 350
Private creditors 27,10022,551-39,053-6,188-19,977-20,767 Bondholders 3,67420,3266,84125,427-2,401-8,292
Banks and others 23,4262,225-45,894-31,615-17,575-12,474 Short-term 7,5384,908-1,75714,105-6,45224,364
Net equity inflows
Foreign direct investment 28,68426,6019,91328,84712,84039,383
Portfolio equity -4,885-7,940-4,164-4,320-14,794-11,036
External debt stocks to exports (%) 87 114 85 91 108 76
External debt stocks to GNI (%) 28 34 30 30 32 28
Debt service to exports (%) 12 18 20 18 26 16
Short-term to external debt stocks (%) 14 11 11 14 13 18
Multilateral to external debt stocks (%) 1 0 0 0 0 0
Reserves to external debt stocks (%) 106 69 80 91 99 103
Gross national income (GNI) 1,477,8131,532,1461,616,9381,639,5931,453,3171,732,532
(US$ million, unless otherwise indicated)
Total external debt stocks
2010 2017 2018 2019 2020 2021
1,2335,0765,6816,5158,1948,994
Use of IMF credit and SDR allocations 133 291 308 306 520 678 of which: SDR allocations 118 109 107 106 111 322
Long-term external debt 1,0864,4795,0195,8667,2957,897
Public and publicly guaranteed sector 7592,8333,2493,9295,1225,586 Public sector 7592,8333,2493,9295,1225,586 of which: General government 7582,8333,2493,9285,1225,585
Private sector guaranteed by public sector Private sector not guaranteed 3271,6451,7691,9372,1732,312 Short-term external debt 14 307 354 343 378 418
Disbursements (long-term) 182 718 8521,0441,3681,354
Public and publicly guaranteed sector 63 411 497 7271,0861,185 Public sector 63 411 497 7271,0861,185 of which: General government 63 411 497 7271,0861,185 Private sector guaranteed by public sector Private sector not guaranteed 119 306 355 318 282 169
Principal repayments (long-term) 41 155 155 185 102 610
Public and publicly guaranteed sector 8 28 29 31 52 592 Public sector 8 28 29 31 52 592 of which: General government 8 28 29 31 52 592 Private sector guaranteed by public sector Private sector not guaranteed 33 128 126 154 50 18
Interest payments (long-term) 10 83 101 133 148 148
Public and publicly guaranteed sector 6 46 51 56 61 55 Public sector 6 46 51 56 61 55 of which: General government 6 46 51 56 61 55 Private sector guaranteed by public sector Private sector not guaranteed 4 38 50 78 87 93
Long-term external debt stocks 1,0864,4795,0195,8667,2957,897 Public and publicly guaranteed debt from: 7592,8333,2493,9295,1225,586 Official creditors 7592,4332,8493,4654,3774,727
Multilateral 6392,0812,4672,9793,7373,912 of which: World Bank 2591,4041,6101,8972,4322,575 Bilateral 120 353 382 486 640 815
Private creditors 400 400 464 745 859 Bondholders 400 400 421 475 775 Commercial banks and others 43 270 84 Private nonguaranteed debt from: 3271,6451,7691,9372,1732,312 Bondholders Commercial banks and others 3271,6451,7691,9372,1732,312
Use of IMF credit and SDR allocations 133 291 308 306 520 678
Use of IMF credit 0 73 24 0 195 -43
Long-term 141 562 696 8591,266 744
Official creditors 55 384 468 631 753 479 Multilateral 36 349 429 524 625 291 of which: World Bank 10 288 241 295 434 228 Bilateral 19 34 38 108 128 188 Private creditors 86 179 229 228 513 265 Bondholders 0 21 54 300 Banks and others 86 179 229 207 459 -34 Short-term 4 80 48 -11 35 40
Foreign direct investment 105 180 251 151 44 158 Portfolio equity 8 0 6 3 3 0
External debt stocks to exports (%) 172 264 276 287 422 423
External debt stocks to GNI (%) 20 57 61 65 82 83 Debt service to exports (%) 7 13 13 14 15 38 Short-term to external debt stocks (%) 1 6 6 5 5 5 Multilateral to external debt stocks (%) 52 41 43 46 46 43 Reserves to external debt stocks (%) 65 23 24 22 22 21 Gross national income (GNI) 6,0708,9619,29510,0089,94810,844
(US$ million, unless otherwise indicated)
2010 2017 2018 2019 2020 2021
Total external debt stocks 325.1443.1427.5408.6437.3443.3
Use of IMF credit and SDR allocations 26.0 27.4 24.3 21.0 43.5 62.4 of which: SDR allocations 17.1 15.8 15.4 15.3 16.0 37.3
Long-term external debt 299.1415.7403.2387.6393.8380.9
Public and publicly guaranteed sector 299.1415.7403.2387.6393.8380.9
Public sector 299.1415.7403.2387.6393.8380.9 of which: General government 297.5415.5403.1387.6393.8380.9
Private sector guaranteed by public sector Private sector not guaranteed
Short-term external debt 0.0 0.0 0.0 0.0 0.0 0.0
Disbursements (long-term)
78.9 21.0 22.0 9.3 3.1 0.0
Public and publicly guaranteed sector 78.9 21.0 22.0 9.3 3.1 0.0 Public sector 78.9 21.0 22.0 9.3 3.1 0.0 of which: General government 78.9 21.0 22.0 9.3 3.1 0.0 Private sector guaranteed by public sector Private sector not guaranteed
Principal repayments (long-term)
7.2 18.3 21.9 21.3 18.1 11.3
Public and publicly guaranteed sector 7.2 18.3 21.9 21.3 18.1 11.3 Public sector 7.2 18.3 21.9 21.3 18.1 11.3 of which: General government 7.1 18.1 21.7 21.3 18.1 11.3 Private sector guaranteed by public sector Private sector not guaranteed
Interest payments (long-term)
3.3 5.7 6.1 5.6 3.8 2.6 Public and publicly guaranteed sector 3.3 5.7 6.1 5.6 3.8 2.6 Public sector 3.3 5.7 6.1 5.6 3.8 2.6 of which: General government 3.3 5.7 6.1 5.6 3.8 2.6
Private sector guaranteed by public sector Private sector not guaranteed
Long-term external debt stocks 299.1415.7403.2387.6393.8380.9 Public and publicly guaranteed debt from: 299.1415.7403.2387.6393.8380.9 Official creditors 299.1415.7403.2387.6393.8380.9
Multilateral 219.2215.0208.1205.8206.1189.2 of which: World Bank 99.3103.4104.9110.3114.6107.8 Bilateral 79.9200.7195.1181.8187.8191.7
Private creditors
Bondholders Commercial banks and others Private nonguaranteed debt from: Bondholders Commercial banks and others Use of IMF credit and SDR allocations 26.0 27.4 24.3 21.0 43.5 62.4
Net debt inflows
Use of IMF credit -1.6 -2.5 -3.2 21.0 -1.7
Long-term 71.6 2.8 0.1 -12.0 -14.9 -11.3 Official creditors 71.6 2.8 0.1 -12.0 -14.9 -11.3 Multilateral 40.6 -0.1 -2.0 -1.2 -7.7 -11.3 of which: World Bank 19.9 5.2 4.0 6.0 -0.1 -3.6
Bilateral 31.1 2.9 2.1 -10.9 -7.3 0.0
Private creditors
Bondholders
Banks and others
Short-term 0.0 0.0 0.0 0.0 0.0 0.0
Net equity inflows
Foreign direct investment 0.3 9.2 16.7 2.7 4.4 8.9
Portfolio equity 0.0 0.0 0.0 0.7 0.0 0.0
External debt stocks to exports (%) 154.0155.8139.4118.9347.0402.9
External debt stocks to GNI (%) 50.5 55.0 54.0 50.1 56.3 57.3
Debt service to exports (%) 5.0 9.0 9.9 8.8 18.7 14.2
Short-term to external debt stocks (%) 0.0 0.0 0.0 0.0 0.0 0.0
Multilateral to external debt stocks (%) 67.4 48.5 48.7 50.4 47.1 42.7
Reserves to external debt stocks (%) 53.2 27.9 38.0 43.4 63.4 66.5
Gross national income (GNI) 643.3806.1792.2816.2776.6773.5
(US$ million, unless otherwise indicated)
2010 2017 2018 2019 2020 2021
Total external debt stocks 181.1269.5252.6251.6291.2306.4
Use of IMF credit and SDR allocations 15.9 16.8 16.8 18.8 37.0 60.5 of which: SDR allocations 10.9 10.1 9.9 9.8 10.2 29.8
Long-term external debt 145.3245.5226.3225.2240.9234.4
Public and publicly guaranteed sector 145.3245.5226.3225.2240.9234.4 Public sector 140.3241.2222.0220.6236.3229.9 of which: General government 140.3241.2222.0220.6236.3229.9 Private sector guaranteed by public sector 5.0 4.2 4.2 4.6 4.6 4.6 Private sector not guaranteed
Short-term external debt 19.9 7.2 9.6 7.6 13.3 11.4
Disbursements (long-term) 19.8 12.2 5.6 4.4 5.3 2.3
Public and publicly guaranteed sector 19.8 12.2 5.6 4.4 5.3 2.3 Public sector 19.8 12.2 5.6 4.4 5.3 2.3 of which: General government 19.8 12.2 5.6 4.4 5.3 2.3 Private sector guaranteed by public sector Private sector not guaranteed
Principal repayments (long-term)
1.2 2.1 2.7 4.8 0.7 1.5
Public and publicly guaranteed sector 1.2 2.1 2.7 4.8 0.7 1.5 Public sector 1.2 2.1 2.7 4.8 0.7 1.5 of which: General government 1.2 2.1 2.7 4.8 0.7 1.5 Private sector guaranteed by public sector Private sector not guaranteed
Interest payments (long-term)
0.3 1.1 1.3 3.4 1.0 0.5
Public and publicly guaranteed sector 0.3 1.1 1.3 3.4 1.0 0.5
Public sector 0.3 1.1 1.3 3.4 1.0 0.5 of which: General government 0.3 1.1 1.3 3.4 1.0 0.5
Private sector guaranteed by public sector Private sector not guaranteed
Long-term external debt stocks 145.3245.5226.3225.2240.9234.4
Public and publicly guaranteed debt from: 145.3245.5226.3225.2240.9234.4 Official creditors 145.3235.5216.3215.2230.9224.4
Multilateral 37.3 44.9 46.9 46.2 53.0 51.8 of which: World Bank 14.2 12.0 11.5 11.1 11.3 10.7 Bilateral 108.0190.6169.4169.0177.8172.6
Private creditors 10.0 10.0 10.0 10.0 10.0
Bondholders
Commercial banks and others 10.0 10.0 10.0 10.0 10.0
Private nonguaranteed debt from: Bondholders Commercial banks and others Use of IMF credit and SDR allocations 15.9 16.8 16.8 18.8 37.0 60.5
Net debt inflows
Use of IMF credit 0.6 1.2 0.4 2.2 16.8 4.8
Long-term 18.6 10.1 2.9 -0.4 4.6 0.8
Official creditors 18.6 10.1 2.9 -0.4 4.6 0.8
Multilateral 1.1 2.9 2.9 -0.4 4.6 0.8 of which: World Bank 0.1 -0.3 -0.3 -0.3 -0.3 -0.3 Bilateral 17.4 7.2 0.0 0.0
Private creditors Bondholders Banks and others
Short-term 3.0 -2.1 2.4 0.1 0.2 -2.5
Foreign direct investment 50.6 32.9 22.7 20.8 47.1 58.6
Portfolio equity 0.0 0.1 0.0 0.0 0.0 0.0
External debt stocks to exports (%) 690.9284.3257.1331.7522.3373.5
External debt stocks to GNI (%) 91.8 72.0 61.3 59.1 61.0 55.4
Debt service to exports (%) 6.3 4.1 4.7 11.7 4.3 3.2
Short-term to external debt stocks (%) 11.0 2.7 3.8 3.0 4.6 3.7
Multilateral to external debt stocks (%) 20.6 16.7 18.6 18.3 18.2 16.9
Reserves to external debt stocks (%) 26.6 21.9 17.3 18.7 25.9
Gross national income (GNI) 197.2374.5412.4425.9477.5552.8
(US$ million, unless otherwise indicated)
Summary external debt data, by debtor type
Total external debt stocks
2010 2017 2018 2019 2020 2021
4,65014,24618,98219,24323,28628,931
Use of IMF credit and SDR allocations 451 283 242 219 6891,285 of which: SDR allocations 238 220 215 214 223 651
Long-term external debt 4,19812,29116,54917,29320,97624,856
Public and publicly guaranteed sector 3,1518,35711,14612,26714,02514,437
Public sector 3,1518,35711,14612,26714,02514,437 of which: General government 3,1468,35711,14612,26714,02514,437
Private sector guaranteed by public sector Private sector not guaranteed 1,0483,9345,4035,0266,95210,418 Short-term external debt 0 1,6732,1911,7311,6212,791
Disbursements (long-term)
1,0452,3464,8071,6503,4305,545
Public and publicly guaranteed sector 3551,8993,3381,6501,5042,078 Public sector 3551,8993,3381,6501,5042,078 of which: General government 3551,8993,3381,6501,5042,078 Private sector guaranteed by public sector Private sector not guaranteed 690 4471,469 ..1,9263,467
Principal repayments (long-term) 84 147 307 806 4231,063
Public and publicly guaranteed sector 84 147 307 429 4231,063 Public sector 84 147 307 429 4231,063 of which: General government 83 147 307 429 4231,063 Private sector guaranteed by public sector Private sector not guaranteed 377
Interest payments (long-term) 101 387 433 4971,333 650
Public and publicly guaranteed sector 64 293 293 3671,153 379 Public sector 64 293 293 3671,153 379 of which: General government 63 293 293 3671,153 379 Private sector guaranteed by public sector Private sector not guaranteed 37 94 140 131 181 271
Long-term external debt stocks 4,19812,29116,54917,29320,97624,856
Public and publicly guaranteed debt from: 3,1518,35711,14612,26714,02514,437 Official creditors 2,9516,1326,6707,8159,3609,517 Multilateral 1,9733,6253,7614,8455,9326,188 of which: World Bank 1,0231,9992,0702,6573,1023,257 Bilateral 9782,5072,9092,9703,4283,330 Private creditors 2002,2244,4764,4524,6654,920 Bondholders 2002,0254,1514,1224,1584,235 Commercial banks and others 0 199 325 330 506 685
Private nonguaranteed debt from: 1,0483,9345,4035,0266,95210,418 Bondholders Commercial banks and others 1,0483,9345,4035,0266,95210,418
Use of IMF credit and SDR allocations 451 283 242 219 6891,285 Net
Official creditors 272 647 7111,2101,045 567 Multilateral 204 315 2461,127 740 581 of which: World Bank 110 224 123 604 281 302 Bilateral 68 333 465 83 305 -14 Private creditors 6891,5523,790 -3661,9623,915 Bondholders ..1,1002,181 0 -104 226 Banks and others 689 4521,608 -3662,0663,689 Short-term 0 153 518 -460 -1101,170
Foreign direct investment 273 368 4391,0651,8462,232 Portfolio equity 23 13 15
External debt stocks to exports (%) 136 289 331 330 459 466 External debt stocks to GNI (%) 29 70 84 84 97 107 Debt service to exports (%) 5 12 15 24 35 28 Short-term to external debt stocks (%) 0 12 12 9 7 10 Multilateral to external debt stocks (%) 42 25 20 25 25 21 Reserves to external debt stocks (%) 44 Gross national income (GNI) 15,97120,41022,51522,78823,90127,042
(US$ million, unless otherwise indicated) 2010 2017 2018 2019 2020 2021
Summary external debt data, by debtor type
Total external debt stocks
32,90730,93731,05432,10938,01641,144
Use of IMF credit and SDR allocations 2,720 634 619 615 6411,501 of which: SDR allocations 685 634 619 615 6411,501
Long-term external debt 27,38929,29428,80229,33135,47337,649
Public and publicly guaranteed sector 9,47716,42215,08815,34118,34620,596
Public sector 9,47616,30815,08815,34118,34620,596 of which: General government 7,76215,14014,18314,46717,46419,819 Private sector guaranteed by public sector 1 114 0 Private sector not guaranteed 17,91212,87213,71313,99017,12717,053
Short-term external debt 2,7981,0091,6332,1621,9021,993
Disbursements (long-term)
4,5945,8134,7097,8468,2268,274
Public and publicly guaranteed sector 1,3651,4391,5023,1254,1835,105 Public sector 1,3651,4391,5023,1254,1835,105 of which: General government 1,2071,2941,3942,9924,0865,007 Private sector guaranteed by public sector Private sector not guaranteed 3,2304,3743,2074,7214,0433,169
Principal repayments (long-term)
3,4314,0864,8136,1504,4114,956
Public and publicly guaranteed sector 3512,1952,5012,7452,2191,713 Public sector 3502,1622,3892,7452,2191,713 of which: General government 2211,8622,0562,5942,0601,575 Private sector guaranteed by public sector 1 34 112 Private sector not guaranteed 3,0811,8912,3123,4062,1933,243
Interest payments (long-term)
759 773 734 718 593 694
Public and publicly guaranteed sector 321 576 546 515 479 404
Public sector 321 571 542 515 479 404 of which: General government 233 542 522 502 467 393 Private sector guaranteed by public sector 0 5 4 Private sector not guaranteed 438 197 188 203 114 289
Long-term external debt stocks 27,38929,29428,80229,33135,47337,649 Public and publicly guaranteed debt from: 9,47716,42215,08815,34118,34620,596 Official creditors 8,01111,70811,56511,76812,02112,021
Multilateral 4,8486,2465,8615,7436,0445,758 of which: World Bank 2,4992,9392,7992,7082,8912,655 Bilateral 3,1635,4625,7046,0255,9786,263
Private creditors 1,4664,7143,5233,5736,3248,575 Bondholders ..4,5003,5003,5526,3038,287 Commercial banks and others 1,466 214 23 21 21 289
Private nonguaranteed debt from: 17,91212,87213,71313,99017,12717,053 Bondholders 165 Commercial banks and others 17,74712,87213,71313,99017,12717,053
Use of IMF credit and SDR allocations 2,720 634 619 615 6411,501
Net debt inflows
Use of IMF credit 458 Long-term 1,1631,727 -1051,6963,8143,317
Official creditors 867 421 191 335 -367 557
Multilateral 708 206 -117 -9 -210 175 of which: World Bank 188 226 -17 -38 -58 -24 Bilateral 159 215 307 344 -157 381
Private creditors 2951,306 -2951,3604,1822,761 Bondholders -750-1,000 462,3332,554 Banks and others 2952,056 7051,3151,849 207 Short-term -442 199 724 497 -261 190
Net equity inflows
Foreign direct investment 1,0401,6573,5153,4451,8792,574 Portfolio equity 84 -7 -28 -64 -10 -4
External debt stocks to exports (%) 250 137 121 120 145 120
External debt stocks to GNI (%) 80 75 65 66 74 68 Debt service to exports (%) 33 22 22 26 19 16 Short-term to external debt stocks (%) 9 3 5 7 5 5 Multilateral to external debt stocks (%) 15 20 19 18 16 14 Reserves to external debt stocks (%) 39 36 39 42 38 40 Gross national income (GNI) 40,93041,32048,05648,72951,69460,659
(US$ million, unless otherwise indicated)
Summary external debt data, by debtor type
2010 2017 2018 2019 2020 2021
Total external debt stocks 9311,7531,7571,8562,1092,453
Use of IMF credit and SDR allocations 266 509 501 503 652 959 of which: SDR allocations 153 142 138 138 143 417
Long-term external debt 6611,0481,0681,1661,2731,313
Public and publicly guaranteed sector 6611,0481,0681,1661,2731,313 Public sector 6611,0481,0681,1661,2731,313 of which: General government 6611,0481,0681,1661,2711,306 Private sector guaranteed by public sector Private sector not guaranteed
Short-term external debt 4 195 189 187 184 181
Disbursements (long-term) 66 74 61 142 129 95
Public and publicly guaranteed sector 66 74 61 142 129 95 Public sector 66 74 61 142 129 95 of which: General government 66 74 61 142 129 95 Private sector guaranteed by public sector Private sector not guaranteed
Principal repayments (long-term) 5 23 29 40 45 48 Public and publicly guaranteed sector 5 23 29 40 45 48 Public sector 5 23 29 40 45 48 of which: General government 5 23 29 40 45 48 Private sector guaranteed by public sector Private sector not guaranteed
Interest payments (long-term) 4 13 7 10 6 7
Public and publicly guaranteed sector 4 13 7 10 6 7 Public sector 4 13 7 10 6 7 of which: General government 4 13 7 10 6 7 Private sector guaranteed by public sector Private sector not guaranteed
Summary external debt stock, by creditor type
Long-term external debt stocks 6611,0481,0681,1661,2731,313
Public and publicly guaranteed debt from: 6611,0481,0681,1661,2731,313
Official creditors 450 855 874 9791,0941,145 Multilateral 371 675 687 759 856 893 of which: World Bank 155 276 284 348 432 464 Bilateral 78 180 187 221 238 252 Private creditors 211 193 193 187 179 168 Bondholders Commercial banks and others 211 193 193 187 179 168 Private nonguaranteed debt from: Bondholders Commercial banks and others Use of IMF credit and SDR allocations 266 509 501 503 652 959
Use of IMF credit 41 38 4 5 124 48
Long-term 62 50 32 102 84 47
Official creditors 62 50 32 108 92 58 Multilateral 56 48 22 74 77 47 of which: World Bank 32 37 16 65 72 43 Bilateral 6 3 10 34 15 12
Private creditors -6 -8 -11 Bondholders
Banks and others -6 -8 -11 Short-term -19 -6 -7 -2 -3 -15
Foreign direct investment 225 390 215 301 135 218 Portfolio equity 0 0 0 0 0
External debt stocks to exports (%) 218 204 179 172 295
External debt stocks to GNI (%) 36 48 46 46 53 60 Debt service to exports (%) 3 7 6 7 14 Short-term to external debt stocks (%) 0 11 11 10 9 7 Multilateral to external debt stocks (%) 40 38 39 41 41 36 Reserves to external debt stocks (%) 44 31 29 29 34 39
Gross national income (GNI) 2,6063,6303,7984,0253,9854,058
(US$ million, unless otherwise indicated)
2010 2017 2018 2019 2020 2021
Total external debt stocks 230.8376.7323.5350.5428.9483.2
Use of IMF credit and SDR allocations 24.9 21.0 17.1 15.0 25.3 71.7 of which: SDR allocations 15.3 14.1 13.8 13.7 14.3 41.8
Long-term external debt 201.9327.8263.4299.3376.8359.8
Public and publicly guaranteed sector 125.3 96.5 96.0 98.1124.0140.8 Public sector 125.3 96.5 96.0 98.1124.0140.8 of which: General government 125.3 96.5 96.0 98.1124.0140.8 Private sector guaranteed by public sector Private sector not guaranteed 76.6231.3167.4201.3252.8219.0 Short-term external debt 4.0 27.9 43.0 36.2 26.8 51.7
Disbursements (long-term)
36.8177.0 36.8 18.0 95.3 28.7
Public and publicly guaranteed sector 0.0 11.1 6.1 7.6 27.4 25.9 Public sector 0.0 11.1 6.1 7.6 27.4 25.9 of which: General government 0.0 11.1 6.1 7.6 27.4 25.9 Private sector guaranteed by public sector Private sector not guaranteed 36.8165.9 30.7 10.4 67.9 2.8
Principal repayments (long-term)
17.5 17.1 29.5 9.8 5.7 9.1
Public and publicly guaranteed sector 8.6 5.2 4.8 5.1 5.2 5.1 Public sector 8.6 5.2 4.8 5.1 5.2 5.1 of which: General government 8.6 5.2 4.8 5.1 5.2 5.1
Private sector guaranteed by public sector Private sector not guaranteed 8.9 11.9 24.7 4.7 0.5 4.0
Interest payments (long-term) 3.2 4.0 6.0 3.2 2.6 2.1
Public and publicly guaranteed sector 1.7 1.1 1.1 1.1 1.1 1.4 Public sector 1.7 1.1 1.1 1.1 1.1 1.4 of which: General government 1.7 1.1 1.1 1.1 1.1 1.4 Private sector guaranteed by public sector Private sector not guaranteed 1.5 3.0 4.9 2.1 1.5 0.7
Long-term external debt stocks 201.9327.8263.4299.3376.8359.8
Public and publicly guaranteed debt from: 125.3 96.5 96.0 98.1124.0140.8 Official creditors 125.2 96.5 96.0 98.1124.0140.8 Multilateral 105.6 86.8 87.5 90.7117.8113.8 of which: World Bank 41.7 36.1 36.6 38.5 47.8 46.7 Bilateral 19.6 9.7 8.5 7.4 6.3 27.0
Private creditors 0.1
Bondholders
Commercial banks and others 0.1
Private nonguaranteed debt from: 76.6231.3167.4201.3252.8219.0
Bondholders
Commercial banks and others 76.6231.3167.4201.3252.8219.0
Use of IMF credit and SDR allocations 24.9 21.0 17.1 15.0 25.3 71.7
Net debt inflows
Use of IMF credit 9.5 -3.8 -3.5 -2.0 9.4 -0.3
Long-term 19.4159.9 7.3 8.1 89.6 19.6
Official creditors -8.4 6.0 1.3 2.5 22.2 20.7 Multilateral -6.8 7.1 2.4 3.6 23.3 -0.9 of which: World Bank -1.2 0.5 1.4 2.2 7.4 0.1
Bilateral -1.6 -1.1 -1.1 -1.1 -1.1 21.7
Private creditors 27.8154.0 6.0 5.7 67.4 -1.1
Bondholders
Banks and others 27.8154.0 6.0 5.7 67.4 -1.1
Short-term -1.0 -6.8 15.2 -6.9 -9.4 24.9
Net equity inflows
Foreign direct investment 77.6 31.4 32.4 39.0 -2.7 -9.8
Portfolio equity 0.0 0.0 0.0 0.0 0.0
External debt stocks to exports (%) 68.9 59.3 44.7 54.7 88.4103.2
External debt stocks to GNI (%) 28.7 25.9 20.8 22.6 27.1 29.2
Debt service to exports (%) 6.2 4.0 5.6 2.6 1.9 2.8
Short-term to external debt stocks (%) 1.7 7.4 13.3 10.3 6.2 10.7
Multilateral to external debt stocks (%) 45.8 23.1 27.0 25.9 27.5 23.6
Reserves to external debt stocks (%) 115.2144.2181.2152.7154.1141.7
Gross national income (GNI) 802.91,454.21,554.01,553.51,581.81,657.4
(US$ million, unless otherwise indicated)
Total external debt stocks
2010 2017 2018 2019 2020 2021
2,9342,8345,5585,6214,6604,836
Use of IMF credit and SDR allocations 244 225 220 219 444 650 of which: SDR allocations 72 66 65 64 73 290
Long-term external debt 1,8791,7872,0802,0772,6382,966
Public and publicly guaranteed sector 1,8791,7872,0802,0772,6382,966
Public sector 1,8791,7872,0802,0772,6382,966 of which: General government 1,8541,7642,0552,0532,6312,960
Private sector guaranteed by public sector Private sector not guaranteed
Short-term external debt 811 8213,2593,3251,5781,220
Disbursements (long-term) 0 0 0 0 0 0
Public and publicly guaranteed sector 0 0 0 0 0 0 Public sector 0 0 0 0 0 0 of which: General government 0 0 0 0 0 0 Private sector guaranteed by public sector Private sector not guaranteed
Principal repayments (long-term) 0 0 0 0 350 15
Public and publicly guaranteed sector 0 0 0 0 350 15 Public sector 0 0 0 0 350 15 of which: General government 0 0 0 0 333 15 Private sector guaranteed by public sector Private sector not guaranteed
Interest payments (long-term) 0 0 0 0 131 1
Public and publicly guaranteed sector 0 0 0 0 131 1 Public sector 0 0 0 0 131 1 of which: General government 0 0 0 0 111 1 Private sector guaranteed by public sector Private sector not guaranteed
Long-term external debt stocks 1,8791,7872,0802,0772,6382,966
Public and publicly guaranteed debt from: 1,8791,7872,0802,0772,6382,966 Official creditors 1,8791,7872,0802,0772,6382,966 Multilateral 773 725 716 714 373 366 of which: World Bank 443 420 413 411 138 122 Bilateral 1,1061,0621,3631,3632,2642,600
Private creditors
Bondholders Commercial banks and others Private nonguaranteed debt from: Bondholders Commercial banks and others Use of IMF credit and SDR allocations 244 225 220 219 444 650
Net debt inflows
Use of IMF credit 203 0 Long-term 0 0 0 0 -350 -15 Official creditors 0 0 0 0 -350 -15 Multilateral 0 0 0 0 -350 -15 of which: World Bank 0 0 0 -278 -13 Bilateral 0 0 0 0
Private creditors
Bondholders Banks and others
Short-term 0 0 0 0 0 0
Net equity inflows
Foreign direct investment 112 369 408 447 464 456 Portfolio equity
External debt stocks to exports (%) 286 478 478
External debt stocks to GNI (%) 51 96 87 67 67 Debt service to exports (%) 0 0 0
Short-term to external debt stocks (%) 28 29 59 59 34 25 Multilateral to external debt stocks (%) 26 26 13 13 8 8 Reserves to external debt stocks (%)
Gross national income (GNI) ..5,5765,8176,4416,9297,252
(US$ million, unless otherwise indicated)
Total external debt stocks
115,304175,007180,180190,735175,411170,015
Use of IMF credit and SDR allocations 2,7502,5432,4832,4696,96610,862 of which: SDR allocations 2,7502,5432,4832,4692,5716,592
Long-term external debt 80,481131,579129,829143,770131,368122,861
Public and publicly guaranteed sector 36,31190,62588,663102,05199,43095,176 Public sector 36,31190,62588,663102,05199,43095,176 of which: General government 32,58273,66265,28777,83475,07873,944
Private sector guaranteed by public sector Private sector not guaranteed 44,17040,95441,16641,71931,93927,686
Short-term external debt 32,07340,88647,86844,49637,07736,292
Disbursements (long-term)
12,11229,59818,26721,65012,83011,683
Public and publicly guaranteed sector 8,88917,05112,23714,5513,8093,198 Public sector 8,88917,05112,23714,5513,8093,198 of which: General government 8,05213,1154,05511,3361,3031,467 Private sector guaranteed by public sector Private sector not guaranteed 3,22412,5486,0297,0989,0208,485
Principal repayments (long-term)
3,4738,63521,65313,79620,61319,847
Public and publicly guaranteed sector 1,6802,26711,3923,3926,4507,014 Public sector 1,6802,26711,3923,3926,4507,014 of which: General government 1861,61010,265 9314,2062,461 Private sector guaranteed by public sector Private sector not guaranteed 1,7926,36710,26110,40314,16312,833
Interest payments (long-term)
2,1775,2636,2416,5636,2415,856
Public and publicly guaranteed sector 1,5583,2654,3084,2814,6614,270 Public sector 1,5583,2654,3084,2814,6614,270 of which: General government 1,4022,4633,4112,9033,4823,323
Private sector guaranteed by public sector Private sector not guaranteed 6181,9981,9332,2821,5791,587
Long-term external debt stocks 80,481131,579129,829143,770131,368122,861
Public and publicly guaranteed debt from: 36,31190,62588,663102,05199,43095,176 Official creditors 1,2197,1406,7937,7069,25810,355
Multilateral 1,1395,5524,8664,8705,8596,646 of which: World Bank 3842,6862,2772,2392,0821,853 Bilateral 801,5881,9272,8363,3983,709
Private creditors 35,09283,48581,87094,34590,17284,820 Bondholders 30,67675,19369,41183,26279,68676,223 Commercial banks and others 4,4168,29212,45811,08410,4868,597
Private nonguaranteed debt from: 44,17040,95441,16641,71931,93927,686 Bondholders 8,7863,7684,5214,7372,7003,450 Commercial banks and others 35,38437,18636,64536,98229,23924,236
Use of IMF credit and SDR allocations 2,7502,5432,4832,4696,96610,862
Net debt inflows
Use of IMF credit ..4,251 0 Long-term 8,64020,964-3,3877,854-7,784-8,164
Official creditors 8741,978 347 8431,6061,422 Multilateral 873 927 -71 -53 1,0191,080 of which: World Bank 363 230 -46 -90 -42 -76 Bilateral 1 1,051 419 897 587 342
Private creditors 7,76618,985-3,7347,011-9,390-9,586 Bondholders 6,49611,044-2,92311,905-5,685-2,600 Banks and others 1,2707,942 -812-4,894-3,704-6,986 Short-term 2,8893,6866,982-3,372-7,419 -785
Net equity inflows
Foreign direct investment -4,194 -2661,3781,7923,12941,282
Portfolio equity 5,8267,5882,946-4,289-5,160-27,434
External debt stocks to exports (%) 102 159 151 167 172 120
External debt stocks to GNI (%) 28 47 46 50 53 41
Debt service to exports (%) 6 13 24 19 27 19
Short-term to external debt stocks (%) 28 23 27 23 21 21
Multilateral to external debt stocks (%) 1 3 3 3 3 4 Reserves to external debt stocks (%) 33 26 26 26 27 30
Gross national income (GNI) 409,234370,873393,553378,251329,819411,932
(US$ million, unless otherwise indicated)
Total external debt stocks
21,68450,76652,92056,11856,29956,592
Use of IMF credit and SDR allocations 1,9201,3291,5451,8641,9272,593 of which: SDR allocations 609 563 550 547 5701,330
Long-term external debt 17,34941,42643,19445,81245,97745,377
Public and publicly guaranteed sector 16,43032,62434,35536,98637,16836,520
Public sector 16,43032,62434,35536,98637,16836,520 of which: General government 16,34230,84733,78636,65536,80636,164
Private sector guaranteed by public sector Private sector not guaranteed 9198,8028,8398,8268,8098,857
Short-term external debt 2,4168,0118,1818,4428,3968,622
Disbursements (long-term)
3,0915,3387,2567,0712,9922,978
Public and publicly guaranteed sector 2,9944,3575,0976,2352,4562,695 Public sector 2,9944,3575,0976,2352,4562,695 of which: General government 2,9944,2475,0166,1842,3942,652 Private sector guaranteed by public sector Private sector not guaranteed 97 9812,158 836 536 283
Principal repayments (long-term)
7272,7135,5234,4313,4983,035
Public and publicly guaranteed sector 5822,4863,1903,5822,8612,799 Public sector 5822,4863,1903,5822,8612,799 of which: General government 5741,4771,9023,2942,8232,757 Private sector guaranteed by public sector Private sector not guaranteed 145 2272,333 849 636 235
Interest payments (long-term)
6161,0301,5461,5421,5901,512
Public and publicly guaranteed sector 596 9701,2471,3841,4921,327 Public sector 596 9701,2471,3841,4921,327 of which: General government 595 8521,1531,3651,4891,323 Private sector guaranteed by public sector Private sector not guaranteed 20 59 300 159 97 185
Long-term external debt stocks 17,34941,42643,19445,81245,97745,377 Public and publicly guaranteed debt from: 16,43032,62434,35536,98637,16836,520 Official creditors 13,40018,81718,95219,39620,34220,173
Multilateral 6,0897,8538,0608,2549,1359,750 of which: World Bank 2,5313,2443,2103,2263,4923,740 Bilateral 7,31110,96410,89211,14211,20710,423
Private creditors 3,02913,80715,40317,59016,82616,347 Bondholders 2,00011,15012,40015,05014,05013,050 Commercial banks and others 1,0292,6573,0032,5402,7763,297
Private nonguaranteed debt from: 9198,8028,8398,8268,8098,857 Bondholders 0 362 262 175 0 Commercial banks and others 9198,4408,5778,6518,8098,857
Use of IMF credit and SDR allocations 1,9201,3291,5451,8641,9272,593
Net debt inflows
Use of IMF credit 597 174 252 327 -14 -57 Long-term 2,3642,6251,7332,640 -506 -56
Official creditors 1,314 644 289 457 425 316 Multilateral 299 340 343 228 662 772 of which: World Bank 83 118 34 33 153 330 Bilateral 1,015 304 -54 229 -237 -456 Private creditors 1,0491,9801,4442,183 -931 -372 Bondholders 1,0001,0001,1502,563-1,175-1,000
Banks and others 49 980 294 -380 244 628 Short-term -1,138 490 166 251 -55 222
Net equity inflows
Foreign direct investment 240 532 463 370 211 317
Portfolio equity -1,049 359 -4 -4 -217 -236
External debt stocks to exports (%) 190 264 258 285 424 375
External debt stocks to GNI (%) 39 60 62 69 72 69
Debt service to exports (%) 12 22 36 32 39 31
Short-term to external debt stocks (%) 11 16 15 15 15 15 Multilateral to external debt stocks (%) 28 15 15 15 16 17 Reserves to external debt stocks (%) 31 14 12 12 9 5
Gross national income (GNI) 56,10985,11485,56581,43378,69082,474
(US$ million, unless otherwise indicated)
2010 2017 2018 2019 2020 2021
Total external debt stocks 584.8621.9615.5638.9733.8887.6
Use of IMF credit and SDR allocations 33.0 28.5 24.8 21.7 52.4 79.0 of which: SDR allocations 22.4 20.7 20.3 20.1 21.0 49.1
Long-term external debt 326.4489.6499.5542.2603.6716.5
Public and publicly guaranteed sector 326.4489.6499.5542.2603.6716.5 Public sector 308.8486.8498.1542.1603.6716.5 of which: General government 296.4475.8487.5525.4580.2674.6 Private sector guaranteed by public sector 17.7 2.8 1.4 0.1 0.0 Private sector not guaranteed
Short-term external debt 225.3103.8 91.1 75.0 77.9 92.1
Disbursements (long-term)
36.4 16.6 10.8 48.2 94.3143.0
Public and publicly guaranteed sector 36.4 16.6 10.8 48.2 94.3143.0 Public sector 32.7 16.6 10.8 48.2 94.3143.0 of which: General government 32.7 12.7 9.8 40.9 86.1123.0 Private sector guaranteed by public sector 3.7 0.0 0.0 0.0 Private sector not guaranteed
Principal repayments (long-term)
30.5 19.0 19.1 19.8 17.7 18.7
Public and publicly guaranteed sector 30.5 19.0 19.1 19.8 17.7 18.7 Public sector 28.0 17.6 17.8 18.5 17.5 18.7 of which: General government 25.4 16.3 16.5 17.2 16.1 17.3 Private sector guaranteed by public sector 2.4 1.4 1.3 1.3 0.1
Private sector not guaranteed
Interest payments (long-term) 10.8 23.4 24.9 26.1 24.7 25.0
Public and publicly guaranteed sector 10.8 23.4 24.9 26.1 24.7 25.0 Public sector 10.2 23.2 24.8 26.1 24.7 25.0 of which: General government 9.7 22.8 24.4 25.7 24.2 24.0 Private sector guaranteed by public sector 0.6 0.2 0.2 0.0 0.0
Private sector not guaranteed
Long-term external debt stocks 326.4489.6499.5542.2603.6716.5
Public and publicly guaranteed debt from: 326.4489.6499.5542.2603.6716.5
Official creditors 263.2253.0242.6270.7351.2473.0 Multilateral 242.5218.2211.3222.7277.9335.9 of which: World Bank 80.3 85.6 85.6 86.6108.3150.2 Bilateral 20.7 34.7 31.3 48.0 73.4137.1
Private creditors 63.2236.6256.9271.5252.4243.6 Bondholders 63.2236.6256.9271.5252.4243.6
Commercial banks and others
Private nonguaranteed debt from: Bondholders Commercial banks and others Use of IMF credit and SDR allocations 33.0 28.5 24.8 21.7 52.4 79.0
Net debt inflows
Use of IMF credit 0.0 -3.0 -3.0 -3.0 28.7 -0.5
Long-term 6.0 -2.4 -8.3 28.4 76.6124.3
Official creditors 17.9 -1.8 -8.1 28.6 76.8124.5 Multilateral 20.2 1.2 -4.9 11.9 51.5 60.7 of which: World Bank 11.8 1.7 2.0 1.4 18.1 44.6
Bilateral -2.3 -3.0 -3.2 16.7 25.2 63.8
Private creditors -11.9 -0.6 -0.2 -0.2 -0.2 -0.2
Bondholders -11.9 -0.6 -0.2 -0.2 -0.2 -0.2
Banks and others
Short-term 138.0 22.3 -12.7 -16.1 2.9 14.2
Foreign direct investment 67.9 74.8 76.1 59.5 38.1 50.0
Portfolio equity 0.5 0.5 0.6 0.6 2.7
External debt stocks to exports (%) 93.3 58.1 52.7 50.6152.9 95.7
External debt stocks to GNI (%) 40.4 32.9 31.5 32.2 46.3 51.2
Debt service to exports (%) 7.1 4.5 4.3 4.1 9.3 4.9
Short-term to external debt stocks (%) 38.5 16.7 14.8 11.7 10.6 10.4
Multilateral to external debt stocks (%) 41.5 35.1 34.3 34.9 37.9 37.8
Reserves to external debt stocks (%) 35.3 51.7 46.4 40.8 31.5 48.8
Gross national income (GNI) 1,447.21,890.01,952.71,984.61,584.31,734.5
(US$ million, unless otherwise indicated)
2010 2017 2018 2019 2020 2021
Total external debt stocks 295.9335.4323.3351.7414.0526.1
Use of IMF credit and SDR allocations 17.9 21.9 18.0 15.4 31.3 56.3 of which: SDR allocations 12.2 11.3 11.0 10.9 11.4 26.8
Long-term external debt 278.0313.2305.4336.3382.8469.8
Public and publicly guaranteed sector 278.0313.2305.4336.3382.8469.8 Public sector 278.0313.2305.4336.3382.8469.8 of which: General government 260.7306.6299.0330.8377.0464.3 Private sector guaranteed by public sector Private sector not guaranteed
Short-term external debt 0.0 0.3 0.0 0.0 0.0 0.0
Disbursements (long-term)
78.1 31.0 23.3 59.0 68.2112.1
Public and publicly guaranteed sector 78.1 31.0 23.3 59.0 68.2112.1 Public sector 78.1 31.0 23.3 59.0 68.2112.1 of which: General government 78.1 29.7 20.9 57.5 67.7111.8 Private sector guaranteed by public sector Private sector not guaranteed
Principal repayments (long-term)
26.2 26.3 30.3 27.9 24.4 23.3
Public and publicly guaranteed sector 26.2 26.3 30.3 27.9 24.4 23.3 Public sector 26.2 26.3 30.3 27.9 24.4 23.3 of which: General government 24.3 24.4 27.8 25.5 24.0 22.8 Private sector guaranteed by public sector Private sector not guaranteed
Interest payments (long-term)
10.0 6.2 7.1 8.2 7.2 6.6
Public and publicly guaranteed sector 10.0 6.2 7.1 8.2 7.2 6.6
Public sector 10.0 6.2 7.1 8.2 7.2 6.6 of which: General government 9.0 6.0 6.7 8.0 7.1 6.6 Private sector guaranteed by public sector Private sector not guaranteed
Summary external debt stock, by creditor type
Long-term external debt stocks 278.0313.2305.4336.3382.8469.8
Public and publicly guaranteed debt from: 278.0313.2305.4336.3382.8469.8 Official creditors 229.2298.9294.9328.4378.8465.9 Multilateral 211.0250.5241.1271.2321.1408.2 of which: World Bank 26.5 32.7 31.8 69.1117.1202.0 Bilateral 18.2 48.5 53.8 57.2 57.6 57.7
Private creditors 48.7 14.3 10.5 7.9 4.0 3.9 Bondholders 10.4 9.1 7.9 4.0 2.7 Commercial banks and others 48.7 3.9 1.3 0.0 0.0 1.2
Private nonguaranteed debt from: Bondholders Commercial banks and others Use of IMF credit and SDR allocations 17.9 21.9 18.0 15.4 31.3 56.3
Net debt inflows
Use of IMF credit -2.3 -3.5 -2.5 14.8 10.4
Long-term 51.9 4.6 -7.0 31.1 43.8 88.8 Official creditors 63.0 -2.3 -3.2 33.7 47.8 88.9 Multilateral 66.7 -10.0 -8.5 30.3 47.3 88.9 of which: World Bank 3.1 -0.5 -0.2 37.5 45.5 86.5 Bilateral -3.7 7.7 5.3 3.4 0.5 0.0
Private creditors -11.1 7.0 -3.8 -2.6 -3.9 0.0 Bondholders 10.4 -1.2 -1.2 -3.9 -1.2
Banks and others -11.1 -3.4 -2.6 -1.3 1.2
Short-term 0.0 0.0 0.0 0.0 0.0 0.0
Foreign direct investment 63.1152.3 51.8 72.3 28.0 62.4
Portfolio equity -0.1 -0.4 -1.2 -0.2 -0.2
External debt stocks to exports (%) 151.1111.9 98.6104.8213.0400.3
External debt stocks to GNI (%) 41.8 39.7 36.6 39.0 47.7 59.5
Debt service to exports (%) 18.5 11.7 12.5 11.5 17.1 23.7
Short-term to external debt stocks (%) 0.0 0.1 0.0 0.0 0.0 0.0
Multilateral to external debt stocks (%) 71.3 74.7 74.6 77.1 77.6 77.6
Reserves to external debt stocks (%) 38.1 54.3 52.4 55.0 49.6 59.3
Gross national income (GNI) 708.2844.1883.8902.7867.5885.0
(US$ million, unless otherwise indicated)
Total external debt stocks
2010 2017 2018 2019 2020 2021
22,59321,90921,73822,47623,44522,165
Use of IMF credit and SDR allocations 664 555 542 528 5482,505 of which: SDR allocations 274 253 248 246 2561,117
Long-term external debt 14,63815,92615,70016,43216,70815,305
Public and publicly guaranteed sector 14,63815,92615,70016,43216,70815,305 Public sector 14,63815,92615,70016,43216,70815,305 of which: General government 14,60415,90615,67916,41216,68815,303
Private sector guaranteed by public sector Private sector not guaranteed
Short-term external debt 7,2925,4275,4975,5166,1894,355
Disbursements (long-term) 935 89 62 853 0 0
Public and publicly guaranteed sector 935 89 62 853 0 0 Public sector 935 89 62 853 0 0 of which: General government 935 89 62 853 0 0 Private sector guaranteed by public sector Private sector not guaranteed
Principal repayments (long-term) 400 139 159 139 1141,174
Public and publicly guaranteed sector 400 139 159 139 1141,174 Public sector 400 139 159 139 1141,174 of which: General government 400 139 159 139 1141,155 Private sector guaranteed by public sector Private sector not guaranteed
Interest payments (long-term) 84 86 50 39 30 447 Public and publicly guaranteed sector 84 86 50 39 30 447 Public sector 84 86 50 39 30 447 of which: General government 84 86 50 39 30 443 Private sector guaranteed by public sector Private sector not guaranteed
Long-term external debt stocks 14,63815,92615,70016,43216,70815,305 Public and publicly guaranteed debt from: 14,63815,92615,70016,43216,70815,305 Official creditors 11,99211,31011,10311,80211,88210,554 Multilateral 3,3783,4553,4113,6723,7312,580 of which: World Bank 1,2901,2251,2061,2011,234 346 Bilateral 8,6147,8557,6938,1308,1517,974
Private creditors 2,6454,6164,5964,6304,8264,751 Bondholders Commercial banks and others 2,6454,6164,5964,6304,8264,751
Private nonguaranteed debt from: Bondholders Commercial banks and others Use of IMF credit and SDR allocations 664 555 542 528 5482,505
Use of IMF credit -6 -7 -11 -3 1,125 Long-term 535 -50 -96 714 -114-1,174 Official creditors 535 -50 -96 714 -114-1,174 Multilateral 63 2 1 268 -21 -1,100 of which: World Bank 0 0 0 0 -873 Bilateral 472 -52 -98 445 -93 -74 Private creditors 0 0 0 0 0 Bondholders Banks and others 0 0 0 0 0
Short-term 251 60 51 -78 63 -15
Foreign direct investment 2,0641,0651,136 825 717 523
Portfolio equity 7 0 0 3 3
External debt stocks to exports (%) 192 372 424 432 457 368 External debt stocks to GNI (%) 33 18 71 74 92 68 Debt service to exports (%) 4 4 4 4 3 50 Short-term to external debt stocks (%) 32 25 25 25 26 20 Multilateral to external debt stocks (%) 15 16 16 16 16 12 Reserves to external debt stocks (%) 5 1 Gross national income (GNI) 68,911124,52930,44130,33525,51432,561
(US$ million, unless otherwise indicated)
Total external debt stocks
2010 2017 2018 2019 2020 2021
5,2774,6044,5844,5904,7635,029
Use of IMF credit and SDR allocations 430 398 388 386 402 785 of which: SDR allocations 430 398 388 386 402 785
Long-term external debt 4,2843,6543,6473,6353,7513,632
Public and publicly guaranteed sector 4,2843,6543,6473,6353,7513,632 Public sector 4,2843,6543,6473,6353,7513,632 of which: General government 3,7083,1443,1503,1423,2403,134
Private sector guaranteed by public sector Private sector not guaranteed
Short-term external debt 562 553 548 569 610 612
Disbursements (long-term) 286 0 60 0 0 0
Public and publicly guaranteed sector 286 0 60 0 0 0 Public sector 286 0 60 0 0 0 of which: General government 263 0 60 0 0 0 Private sector guaranteed by public sector Private sector not guaranteed
Principal repayments (long-term) 509 0 19 1 0 0 Public and publicly guaranteed sector 509 0 19 1 0 0 Public sector 509 0 19 1 0 0 of which: General government 451 0 17 0 0 Private sector guaranteed by public sector Private sector not guaranteed
Interest payments (long-term) 111 0 1 0 0 0
Public and publicly guaranteed sector 111 0 1 0 0 0 Public sector 111 0 1 0 0 0 of which: General government 94 0 1 0 0 Private sector guaranteed by public sector Private sector not guaranteed
Long-term external debt stocks 4,2843,6543,6473,6353,7513,632
Public and publicly guaranteed debt from: 4,2843,6543,6473,6353,7513,632 Official creditors 4,2613,6353,6303,6193,7343,616 Multilateral 1,6981,5121,4721,4591,5291,467 of which: World Bank 15 14 14 14 14 14 Bilateral 2,5632,1232,1582,1602,2052,149
Private creditors 23 19 17 16 17 16 Bondholders Commercial banks and others 23 19 17 16 17 16 Private nonguaranteed debt from: Bondholders Commercial banks and others Use of IMF credit and SDR allocations 430 398 388 386 402 785
Net debt inflows
Use of IMF credit
Long-term -222 0 41 -1 0 0 Official creditors -220 0 43 0 0 0 Multilateral 87 0 1 0 0 0 of which: World Bank -1 0 0 0 0 Bilateral -307 0 41 0 0 0 Private creditors -2 0 -2 -1 0 0 Bondholders
Banks and others -2 0 -2 -1 0 0 Short-term -209 0 1 -1 2 -2
Foreign direct investment 1,469 Portfolio equity
External debt stocks to exports (%) 26
External debt stocks to GNI (%) 2 29 22
Debt service to exports (%) 3
Short-term to external debt stocks (%) 11 12 12 12 13 12 Multilateral to external debt stocks (%) 32 33 32 32 32 29 Reserves to external debt stocks (%) 369 Gross national income (GNI) 236,13715,74720,655
(US$ million, unless otherwise indicated)
Total external debt stocks
2010 2017 2018 2019 2020 2021
3,5615,8686,0906,6376,9537,046
Use of IMF credit and SDR allocations 227 204 170 144 330 545 of which: SDR allocations 126 117 114 114 118 348
Long-term external debt 2,7334,6725,0375,1295,5015,612
Public and publicly guaranteed sector 1,8062,8252,8482,8313,1143,186 Public sector 1,8062,8252,8482,8313,1143,186 of which: General government 1,7932,8212,8422,8253,1063,176
Private sector guaranteed by public sector Private sector not guaranteed 9271,8472,1902,2982,3872,427 Short-term external debt 601 991 8821,3641,122 889
Disbursements (long-term) 924 975 540 455 530 530
Public and publicly guaranteed sector 251 708 184 123 322 259 Public sector 251 708 184 123 322 259 of which: General government 251 708 182 122 318 257 Private sector guaranteed by public sector Private sector not guaranteed 673 267 356 332 209 271
Principal repayments (long-term) 631 595 402 383 726 395 Public and publicly guaranteed sector 37 112 128 129 106 164 Public sector 37 112 128 129 106 164 of which: General government 35 112 127 129 105 163 Private sector guaranteed by public sector Private sector not guaranteed 593 482 274 254 620 230
Interest payments (long-term) 54 60 121 109 152 115
Public and publicly guaranteed sector 23 38 72 75 61 78 Public sector 23 38 72 75 61 78 of which: General government 23 37 72 75 61 78 Private sector guaranteed by public sector Private sector not guaranteed 31 22 49 33 91 37
Long-term external debt stocks 2,7334,6725,0375,1295,5015,612 Public and publicly guaranteed debt from: 1,8062,8252,8482,8313,1143,186 Official creditors 1,8002,3012,3252,3092,5892,663 Multilateral 943 9691,0151,0391,2601,395 of which: World Bank 377 326 333 342 356 358 Bilateral 8561,3321,3091,2691,3291,268 Private creditors 6 524 523 522 525 523 Bondholders 500 500 500 500 500 Commercial banks and others 6 24 23 22 25 23
Private nonguaranteed debt from: 9271,8472,1902,2982,3872,427 Bondholders Commercial banks and others 9271,8472,1902,2982,3872,427
Use of IMF credit and SDR allocations 227 204 170 144 330 545
Use of IMF credit 60 -25 -30 -25 174 -9
Long-term 294 380 138 72 -196 135
Official creditors 215 96 56 -6 216 95 Multilateral 131 46 65 28 185 162 of which: World Bank 11 3 15 10 0 12 Bilateral 83 49 -9 -35 30 -66 Private creditors 79 284 82 79 -412 40 Bondholders 500 Banks and others 79 -216 82 79 -412 40 Short-term 527 177 -109 482 -242 -233
Foreign direct investment 82 68 142 104 23 123 Portfolio equity 7 0 0 -73 0 0
External debt stocks to exports (%) 158 217 229 230 236 167
External debt stocks to GNI (%) 51 68 68 69 73 67
Debt service to exports (%) 31 25 21 18 30 12 Short-term to external debt stocks (%) 17 17 14 21 16 13 Multilateral to external debt stocks (%) 26 17 17 16 18 20 Reserves to external debt stocks (%) 9 11 6 8 20 34
Gross national income (GNI) 6,9708,6378,9919,6319,51610,567
(US$ million, unless otherwise indicated)
external debt data, by debtor type
Total external debt stocks
2010 2017 2018 2019 2020 2021
8,93721,43022,36224,17325,54528,490
Use of IMF credit and SDR allocations 647 459 364 301 2741,357 of which: SDR allocations 293 271 265 263 274 800
Long-term external debt 6,92218,35319,41621,08022,11823,568
Public and publicly guaranteed sector 5,69814,56215,31016,85217,62718,917
Public sector 5,69814,56215,31016,85217,62718,917 of which: General government 5,63114,52815,27716,82017,59218,884
Private sector guaranteed by public sector Private sector not guaranteed 1,2243,7914,1054,2284,4914,651 Short-term external debt 1,3682,6182,5822,7923,1533,565
Disbursements (long-term)
1,3472,0531,7832,5021,4483,027
Public and publicly guaranteed sector 1,1311,6591,6012,3601,1692,843 Public sector 1,1311,6591,6012,3601,1692,843 of which: General government 1,1311,6591,6012,3601,1692,843 Private sector guaranteed by public sector Private sector not guaranteed 216 393 183 143 279 184
Principal repayments (long-term) 132 475 640 784 8661,243
Public and publicly guaranteed sector 52 452 620 764 8511,219 Public sector 52 452 620 764 8511,219 of which: General government 52 452 620 764 8511,219 Private sector guaranteed by public sector Private sector not guaranteed 79 23 20 20 15 25
Interest payments (long-term) 51 254 309 381 350 329
Public and publicly guaranteed sector 33 250 301 375 348 325 Public sector 33 250 301 375 348 325 of which: General government 33 250 301 375 348 325 Private sector guaranteed by public sector Private sector not guaranteed 17 4 8 6 2 4
Long-term external debt stocks 6,92218,35319,41621,08022,11823,568
Public and publicly guaranteed debt from: 5,69814,56215,31016,85217,62718,917 Official creditors 5,56313,05913,64414,28415,30115,470
Multilateral 4,4128,8669,38510,08811,17611,449 of which: World Bank 3,2486,4676,8157,3418,1488,290 Bilateral 1,1524,1934,2594,1964,1254,022
Private creditors 1351,5031,6672,5692,3253,446
Bondholders Commercial banks and others 1351,5031,6672,5692,3253,446
Private nonguaranteed debt from: 1,2243,7914,1054,2284,4914,651 Bondholders Commercial banks and others 1,2243,7914,1054,2284,4914,651
Use of IMF credit and SDR allocations 647 459 364 301 2741,357
Net debt inflows
Use of IMF credit 30 -84 -85 -61 -37 567 Long-term 1,2161,5781,1431,718 5821,784
Official creditors 1,0711,032 803 690 588 482 Multilateral 856 738 711 748 737 553 of which: World Bank 691 519 517 568 488 396 Bilateral 215 294 92 -58 -149 -71
Private creditors 145 546 3401,029 -6 1,302 Bondholders Banks and others 145 546 3401,029 -6 1,302 Short-term -53 -19 -236 16 -7 157
Foreign direct investment 1,038 856 4781,096 4521,033
Portfolio equity 3 4 1 6 6 -8
External debt stocks to exports (%) 137 253 264 245 295 285 External debt stocks to GNI (%) 28 41 40 39 41 42 Debt service to exports (%) 3 10 12 13 15 20 Short-term to external debt stocks (%) 15 12 12 12 12 13 Multilateral to external debt stocks (%) 49 41 42 42 44 40 Reserves to external debt stocks (%) 44 27 23 Gross national income (GNI) 31,43752,10756,21161,90862,34767,562
(US$ million, unless otherwise indicated)
Summary external debt data, by debtor type
2010 2017 2018 2019 2020 2021
Total external debt stocks 106,358161,647172,494179,773200,015210,982
Use of IMF credit and SDR allocations 1,4941,3821,3491,3421,3975,667 of which: SDR allocations 1,4941,3821,3491,3421,3975,667
Long-term external debt 54,20791,528107,740118,649123,803131,101
Public and publicly guaranteed sector 15,92929,52135,87839,20735,40836,136 Public sector 15,92929,52135,87839,20735,40836,136 of which: General government 10,45626,79433,06536,70332,61532,813 Private sector guaranteed by public sector Private sector not guaranteed 38,27862,00771,86279,44288,39594,965
Short-term external debt 50,65768,73863,40559,78274,81474,214
Disbursements (long-term) 16,83821,09240,53728,25924,05324,300
Public and publicly guaranteed sector 5,2406,6007,1894,211 5422,430 Public sector 5,2406,6007,1894,211 5422,430 of which: General government 4,7486,3276,8883,875 1921,680 Private sector guaranteed by public sector Private sector not guaranteed 11,59714,49233,34824,04923,51221,870
Principal repayments (long-term)
9,38613,45216,89124,92718,73416,653
Public and publicly guaranteed sector 803 396 913 9414,5111,397 Public sector 803 396 913 9414,5111,397 of which: General government 199 208 659 2664,3871,282 Private sector guaranteed by public sector Private sector not guaranteed 8,58213,05615,97923,98614,22315,257
Interest payments (long-term) 1,076 8181,1621,6051,568 768
Public and publicly guaranteed sector 199 389 6951,024 997 86 Public sector 199 389 6951,024 997 86 of which: General government 81 340 642 954 943 25 Private sector guaranteed by public sector Private sector not guaranteed 877 429 467 581 571 682
Long-term external debt stocks 54,20791,528107,740118,649123,803131,101
Public and publicly guaranteed debt from: 15,92929,52135,87839,20735,40836,136 Official creditors 6,8815,5925,0944,4454,4285,359
Multilateral 1871,2611,3131,1911,0682,440 of which: World Bank 1281,0251,018 927 837 750 Bilateral 6,6934,3313,7813,2543,3592,918
Private creditors 9,04823,92930,78334,76230,98030,777 Bondholders 8,00423,92930,78334,76230,98030,777
Commercial banks and others 1,045 0 0
Private nonguaranteed debt from: 38,27862,00771,86279,44288,39594,965 Bondholders 4,26510,04312,72313,19315,84017,747 Commercial banks and others 34,01251,96459,13966,24972,55577,218
Use of IMF credit and SDR allocations 1,4941,3821,3491,3421,3975,667
Use of IMF credit
Long-term 7,4527,64023,6463,3335,3197,646
Official creditors -375 -39 -579 -709 -1871,236 Multilateral -21 -43 52 -122 -1221,372 of which: World Bank -5 -7 -7 -90 -90 -87 Bilateral -353 4 -630 -587 -65 -136
Private creditors 7,8277,67924,2244,0425,5066,410 Bondholders 4,4707,0999,5384,449-1,1821,747 Banks and others 3,356 58014,686 -4076,6884,663 Short-term 17,37914,276-5,333-3,62315,032 -600
Net equity inflows
Foreign direct investment 15,3059,05913,4535,323-5,05610,412 Portfolio equity 2,398 598-7,101 56-8,019-1,892
Debt ratios
External debt stocks to exports (%) 46 52 51 54 74 68
External debt stocks to GNI (%) 33 37 36 34 41 43
Debt service to exports (%) 5 5 6 8 8 6 Short-term to external debt stocks (%) 48 43 37 33 37 35 Multilateral to external debt stocks (%) 0 1 1 1 1 1
Reserves to external debt stocks (%) 158 121 116 121 124 110
Gross national income (GNI) 326,815435,913482,208523,870488,208488,180
(US$ million, unless otherwise indicated)
external debt data, by debtor type
2010 2017 2018 2019 2020 2021
Total external debt stocks ..124.5158.1203.4231.8278.6
Use of IMF credit and SDR allocations 11.0 10.7 10.7 11.1 45.2 of which: SDR allocations 11.0 10.7 10.7 11.1 45.2
Long-term external debt ..110.5144.7191.2220.2232.4
Public and publicly guaranteed sector ..110.5144.7191.2220.2232.4
Public sector ..110.5144.7191.2220.2232.4 of which: General government ..110.5144.7191.2220.2232.4
Private sector guaranteed by public sector Private sector not guaranteed
Short-term external debt 3.0 2.6 1.5 0.4 1.1
Disbursements (long-term)
35.7 40.0 49.7 30.1 22.6
Public and publicly guaranteed sector 35.7 40.0 49.7 30.1 22.6
Public sector 35.7 40.0 49.7 30.1 22.6 of which: General government 35.7 40.0 49.7 30.1 22.6 Private sector guaranteed by public sector Private sector not guaranteed
Principal repayments (long-term)
0.3 0.7 3.3 3.9 6.4
Public and publicly guaranteed sector 0.3 0.7 3.3 3.9 6.4
Public sector 0.3 0.7 3.3 3.9 6.4 of which: General government 0.3 0.7 3.3 3.9 6.4 Private sector guaranteed by public sector Private sector not guaranteed
Interest payments (long-term)
1.5 2.5 3.8 4.1 3.2
Public and publicly guaranteed sector 1.5 2.5 3.8 4.1 3.2
Public sector 1.5 2.5 3.8 4.1 3.2 of which: General government 1.5 2.5 3.8 4.1 3.2 Private sector guaranteed by public sector Private sector not guaranteed
Summary external debt stock, by creditor type
Long-term external debt stocks ..110.5144.7191.2220.2232.4
Public and publicly guaranteed debt from: ..110.5144.7191.2220.2232.4 Official creditors ..110.5144.7191.2220.2232.4 Multilateral ..101.4131.5166.3189.4200.6 of which: World Bank 27.0 33.5 43.2 47.6 50.7 Bilateral 9.1 13.2 24.9 30.9 31.8
Private creditors
Bondholders
Commercial banks and others
Private nonguaranteed debt from: Bondholders
Commercial banks and others
Use of IMF credit and SDR allocations 11.0 10.7 10.7 11.1 45.2
Net debt inflows
Use of IMF credit
Long-term 35.5 39.3 46.4 26.2 16.3
Official creditors 35.5 39.3 46.4 26.2 16.3 Multilateral 28.7 35.4 34.9 21.7 12.3 of which: World Bank 11.4 7.5 9.7 4.1 3.4 Bilateral 6.7 3.9 11.5 4.5 3.9
Private creditors
Bondholders
Banks and others
Short-term 0.0 3.0 -0.4 -1.1 -1.1 0.6
Foreign direct investment 28.5 6.7 47.9 74.6 72.4 66.0 Portfolio equity 0.0 0.0 0.0 0.0 0.0
External debt stocks to exports (%) 14.2 15.7 15.5 31.1 58.0
External debt stocks to GNI (%) 5.4 7.0 7.4 9.7 11.7
Debt service to exports (%) 0.2 0.3 0.5 1.1 2.0
Short-term to external debt stocks (%) 0.0 2.4 1.6 0.7 0.2 0.4
Multilateral to external debt stocks (%) 0.0 81.4 83.2 81.8 81.7 72.0
Reserves to external debt stocks (%) ..437.2426.4322.6283.2335.5
Gross national income (GNI) 3,325.12,288.42,263.72,731.02,382.62,378.4
(US$ million, unless otherwise indicated)
Summary external debt data, by debtor type
Total external debt stocks
2010 2017 2018 2019 2020 2021
1,2791,6511,7252,0132,5353,467
Use of IMF credit and SDR allocations 241 226 266 319 459 642 of which: SDR allocations 108 100 98 97 101 295
Long-term external debt 9991,1571,1811,3701,7552,415
Public and publicly guaranteed sector 9991,1571,1811,3701,7551,765 Public sector 9991,1571,1811,3701,7551,765 of which: General government 9901,1531,1771,3671,7521,762 Private sector guaranteed by public sector Private sector not guaranteed 650
Short-term external debt 39 268 278 324 320 410
Disbursements (long-term) 91 156 115 264 339 790
Public and publicly guaranteed sector 91 156 115 264 339 140 Public sector 91 156 115 264 339 140 of which: General government 91 156 115 264 339 140 Private sector guaranteed by public sector Private sector not guaranteed 650
Principal repayments (long-term) 28 52 57 62 54 69 Public and publicly guaranteed sector 28 52 57 62 54 69 Public sector 28 52 57 62 54 69 of which: General government 28 51 57 62 54 69 Private sector guaranteed by public sector Private sector not guaranteed
Interest payments (long-term) 8 23 27 26 32 89 Public and publicly guaranteed sector 8 23 27 26 32 37 Public sector 8 23 27 26 32 37 of which: General government 8 23 27 26 32 37 Private sector guaranteed by public sector Private sector not guaranteed 52
Summary external debt stock, by creditor type
Long-term external debt stocks 9991,1571,1811,3701,7552,415
Public and publicly guaranteed debt from: 9991,1571,1811,3701,7551,765 Official creditors 9991,1461,1771,2541,4461,479 Multilateral 852 532 557 649 811 803 of which: World Bank 554 50 66 165 265 288 Bilateral 147 614 620 604 635 677
Private creditors 11 4 116 309 286
Bondholders
Commercial banks and others 11 4 116 309 286 Private nonguaranteed debt from: 650 Bondholders 650 Commercial banks and others
Use of IMF credit and SDR allocations 241 226 266 319 459 642
Use of IMF credit 44 43 46 54 123 -1
Long-term 63 104 58 202 285 721
Official creditors 63 115 66 89 116 70 Multilateral 26 65 44 100 111 40 of which: World Bank -22 9 17 100 83 42 Bilateral 37 49 21 -10 5 30
Private creditors -10 -7 112 169 651 Bondholders 650
Banks and others -10 -7 112 169 1 Short-term 12 210 10 46 -4 90
Foreign direct investment 78 -87 -88 371 112 130 Portfolio equity 5 -89 -184 -180 -174
External debt stocks to exports (%) 92 89 88 105 126 177
External debt stocks to GNI (%) 38 26 24 28 33 41
Debt service to exports (%) 3 6 6 6 5 9 Short-term to external debt stocks (%) 3 16 16 16 13 12 Multilateral to external debt stocks (%) 67 32 32 32 32 23 Reserves to external debt stocks (%) 56 Gross national income (GNI) 3,4066,4007,1327,2437,5918,436
(US$ million, unless otherwise indicated)
2010 2017 2018 2019 2020 2021
Total external debt stocks 153.7193.1187.0186.6194.6223.6
Use of IMF credit and SDR allocations 10.1 9.4 9.2 9.1 9.5 37.4 of which: SDR allocations 10.1 9.4 9.2 9.1 9.5 27.7
Long-term external debt 143.5183.7177.8177.5185.1186.2
Public and publicly guaranteed sector 143.5183.7177.8177.5185.1186.2
Public sector 143.5183.7177.8177.5185.1186.2 of which: General government 143.5183.7177.8177.5185.1186.2
Private sector guaranteed by public sector Private sector not guaranteed
Short-term external debt 0.0 0.0 0.0 0.0 0.0 0.0
Disbursements (long-term)
40.9 10.1 7.5 4.9 1.3 1.0
Public and publicly guaranteed sector 40.9 10.1 7.5 4.9 1.3 1.0 Public sector 40.9 10.1 7.5 4.9 1.3 1.0 of which: General government 40.9 10.1 7.5 4.9 1.3 1.0 Private sector guaranteed by public sector Private sector not guaranteed
Principal repayments (long-term)
2.7 2.8 6.2 2.7 4.7 2.7
Public and publicly guaranteed sector 2.7 2.8 6.2 2.7 4.7 2.7 Public sector 2.7 2.8 6.2 2.7 4.7 2.7 of which: General government 2.7 2.8 6.2 2.7 4.7 2.7
Private sector guaranteed by public sector Private sector not guaranteed
Interest payments (long-term)
2.4 2.7 4.1 2.7 1.3 0.8 Public and publicly guaranteed sector 2.4 2.7 4.1 2.7 1.3 0.8 Public sector 2.4 2.7 4.1 2.7 1.3 0.8 of which: General government 2.4 2.7 4.1 2.7 1.3 0.8
Private sector guaranteed by public sector Private sector not guaranteed
Long-term external debt stocks 143.5183.7177.8177.5185.1186.2 Public and publicly guaranteed debt from: 143.5183.7177.8177.5185.1186.2 Official creditors 142.4183.7177.8177.5185.1186.2
Multilateral 70.8 71.4 74.2 75.9 77.5 73.7 of which: World Bank 23.6 37.2 39.1 42.9 45.0 43.6 Bilateral 71.7112.3103.6101.6107.6112.6
Private creditors 1.1 Bondholders Commercial banks and others 1.1
Private nonguaranteed debt from: Bondholders Commercial banks and others Use of IMF credit and SDR allocations 10.1 9.4 9.2 9.1 9.5 37.4
Net debt inflows
Use of IMF credit 9.8
Long-term 38.2 7.3 1.4 2.2 -3.4 -1.7
Official creditors 38.1 7.3 1.4 2.2 -3.4 -1.7 Multilateral -1.0 7.3 4.5 2.2 -1.4 -1.7 of which: World Bank 0.8 6.2 2.8 4.1 0.3 -0.1
Bilateral 39.1 -3.2 -2.0
Private creditors 0.1 Bondholders Banks and others 0.1
Short-term 0.0 0.0 0.0 0.0 0.0 0.0
Foreign direct investment 4.5 -2.6 19.1 2.0 3.5 0.2
Portfolio equity 0.0 0.0 0.0 0.0 0.0
External debt stocks to exports (%) 283.9138.3120.1111.2127.6230.2
External debt stocks to GNI (%) 40.6 40.3 36.0 33.7 36.7
Debt service to exports (%) 9.3 4.0 6.6 3.3 3.9 3.6
Short-term to external debt stocks (%) 0.0 0.0 0.0 0.0 0.0 0.0
Multilateral to external debt stocks (%) 46.1 37.0 39.7 40.7 39.8 33.0
Reserves to external debt stocks (%) 68.0102.8115.1117.0153.6161.8
Gross national income (GNI) 378.8478.6518.9553.7530.2
(US$ million, unless otherwise indicated)
Total external debt stocks 22,66633,50135,03339,38141,04741,608
Use of IMF credit and SDR allocations 4202,1052,2802,1322,8243,396 of which: SDR allocations 420 388 379 377 3931,113
Long-term external debt 17,26723,93724,65925,81827,59124,723
Public and publicly guaranteed sector 14,86522,29622,57723,75025,70323,064 Public sector 14,59621,99722,33223,54725,51522,962 of which: General government 11,36715,41815,89016,85518,59317,021 Private sector guaranteed by public sector 269 299 245 203 188 102 Private sector not guaranteed 2,4021,6412,0822,0671,8881,658 Short-term external debt 4,9797,4588,09311,43110,63213,489
Disbursements (long-term)
1,6714,4132,6173,7432,4361,791
Public and publicly guaranteed sector 1,5743,8992,3753,3212,3051,744 Public sector 1,5043,8512,3753,3212,3051,742 of which: General government 8671,1281,7362,2511,8561,335 Private sector guaranteed by public sector 70 47 1 2 Private sector not guaranteed 97 514 242 422 130 47
Principal repayments (long-term)
1,6312,0461,7181,9312,1603,405
Public and publicly guaranteed sector 1,4111,7781,3991,9311,8142,904 Public sector 1,3871,7261,3581,8941,7812,827 of which: General government 1,1071,278 7951,1531,1181,859 Private sector guaranteed by public sector 24 52 42 37 32 77 Private sector not guaranteed 220 268 319 346 501
Interest payments (long-term) 672 514 603 666 659 622 Public and publicly guaranteed sector 548 456 550 573 583 557 Public sector 539 451 545 569 581 555 of which: General government 435 334 353 393 420 407 Private sector guaranteed by public sector 9 5 4 4 3 2 Private sector not guaranteed 124 58 53 94 76 65
Long-term external debt stocks 17,26723,93724,65925,81827,59124,723 Public and publicly guaranteed debt from: 14,86522,29622,57723,75025,70323,064 Official creditors 10,38914,75414,60615,82418,19917,278 Multilateral 6,98511,01410,99611,29112,77411,736 of which: World Bank 1,3993,2753,5153,4894,1964,063 Bilateral 3,4043,7403,6104,5335,4255,541 Private creditors 4,4767,5427,9717,9267,5045,787 Bondholders 3,8196,7057,2397,2786,8775,275 Commercial banks and others 657 837 732 648 626 512 Private nonguaranteed debt from: 2,4021,6412,0822,0671,8881,658 Bondholders Commercial banks and others 2,4021,6412,0822,0671,8881,658
Use of IMF credit and SDR allocations 4202,1052,2802,1322,8243,396 Net
Use of IMF credit 0 228 -135 583 -81
Long-term 402,367 8991,811 276-1,614
Official creditors 634 845 4641,4151,269 158
Multilateral 566 810 504 466 649 -271 of which: World Bank 74 581 486 31 410 159 Bilateral 68 35 -40 949 620 429 Private creditors -5941,521 435 396 -993-1,771 Bondholders ..1,260 591 49 -707-1,250 Banks and others -594 262 -156 347 -287 -521 Short-term 144 764 6353,338 -7992,857
Net equity inflows
Foreign direct investment 1,339 815 998 817 600 540 Portfolio equity -26 -64 -41 13 -31 -33
External debt stocks to exports (%) 100 186 176 200 247 204
External debt stocks to GNI (%) 51 82 84 97 100 91
Debt service to exports (%) 11 17 15 16 20 21 Short-term to external debt stocks (%) 22 22 23 29 26 32 Multilateral to external debt stocks (%) 31 33 31 29 31 28 Reserves to external debt stocks (%) 42 17 15 19 23 20
Gross national income (GNI) 44,13940,93441,55240,51341,02245,528
(US$ million, unless otherwise indicated) 2010 2017 2018 2019 2020 2021
Total external debt stocks 300,869457,282447,923444,540441,150435,451
Use of IMF credit and SDR allocations 7,2771,5261,4901,4811,5437,749 of which: SDR allocations 1,6501,5261,4901,4811,5437,749
Long-term external debt 216,361335,893329,939319,957301,169306,532
Public and publicly guaranteed sector 93,281118,562123,161128,690137,653140,645 Public sector 92,987118,216122,875128,446137,442140,482 of which: General government 76,68692,23693,20399,590106,563108,382 Private sector guaranteed by public sector 293 346 286 244 210 163 Private sector not guaranteed 123,080217,331206,778191,267163,517165,887
Short-term external debt 77,232119,863116,494123,102138,438121,170
Disbursements (long-term)
48,83288,88369,89360,80059,54366,269
Public and publicly guaranteed sector 14,79318,14317,16919,13117,87422,369 Public sector 14,66418,14317,16919,13117,87422,369 of which: General government 13,30512,0469,46713,42310,82113,605 Private sector guaranteed by public sector 128 0 0 0 0
Private sector not guaranteed 34,03970,73952,72541,66941,66943,900
Principal repayments (long-term)
45,50369,69767,97469,22968,69356,633
Public and publicly guaranteed sector 6,02711,83910,82212,91612,39015,928 Public sector 6,02311,78810,77712,87912,33815,896 of which: General government 5,3297,5957,3876,6146,6329,161
Private sector guaranteed by public sector 4 51 45 37 52 32
Private sector not guaranteed 39,47657,85857,15256,31356,30340,705
Interest payments (long-term) 8,86912,09811,53712,67212,75112,080
Public and publicly guaranteed sector 4,6924,8754,8905,5435,7276,015 Public sector 4,6904,8714,8865,5395,7256,014 of which: General government 4,0484,2844,2904,5794,8815,150 Private sector guaranteed by public sector 2 4 4 4 3 1 Private sector not guaranteed 4,1777,2236,6477,1297,0246,065
Long-term external debt stocks 216,361335,893329,939319,957301,169306,532
Public and publicly guaranteed debt from: 93,281118,562123,161128,690137,653140,645 Official creditors 26,92934,71634,64634,45534,86631,165 Multilateral 19,92428,62528,38426,95827,82325,621 of which: World Bank 11,60512,03911,68511,36211,92511,179 Bilateral 7,0056,0916,2637,4977,0435,543
Private creditors 66,35283,84688,51594,235102,786109,480 Bondholders 45,77474,43678,30683,80689,85092,362 Commercial banks and others 20,5789,41110,20910,42912,93717,119
Private nonguaranteed debt from: 123,080217,331206,778191,267163,517165,887 Bondholders 6,20241,60238,89438,37337,13136,186 Commercial banks and others 116,878175,729167,884152,893126,386129,701
Use of IMF credit and SDR allocations 7,2771,5261,4901,4811,5437,749
Net debt inflows
Use of IMF credit -2,171
Long-term 3,32819,1861,919-8,429-9,1519,636
Official creditors 4,030 925 971 209-1,590-1,827 Multilateral 3,831 461 745-1,024 -812 -701 of which: World Bank 2,088 185 5 -172 -99 -149 Bilateral 199 464 2261,233 -778-1,126 Private creditors -70218,261 948-8,638-7,56011,463 Bondholders 5,9708,9662,7643,752 5792,455 Banks and others -6,6729,294-1,816-12,390-8,1399,009 Short-term 28,25518,620-3,3696,60815,336-17,268
Net equity inflows
Foreign direct investment 8,71510,17512,14410,4918,35513,001 Portfolio equity 3,4682,971-1,131 406-4,255-1,434
Debt ratios
External debt stocks to exports (%) 185 201 184 177 210 151
External debt stocks to GNI (%) 39 54 58 59 62 54 Debt service to exports (%) 37 38 35 35 42 25 Short-term to external debt stocks (%) 26 26 26 28 31 28
Multilateral to external debt stocks (%) 7 6 6 6 6 6 Reserves to external debt stocks (%) 27 18 16 18 11 16
Gross national income (GNI) 770,477847,836766,528748,179710,565803,240
(US$ million, unless otherwise indicated)
Total external debt stocks
2010 2017 2018 2019 2020 2021
1,6828,6508,1606,5165,6364,851
Use of IMF credit and SDR allocations 108 99 97 97 101 418 of which: SDR allocations 108 99 97 97 101 418
Long-term external debt 1,5208,1357,7576,4195,3944,433
Public and publicly guaranteed sector 1,5138,0887,7226,3765,3424,386 Public sector 1,5138,0887,7226,3765,3424,386 of which: General government 1471,3131,5281,6291,8211,855
Private sector guaranteed by public sector Private sector not guaranteed 7 47 35 43 51 47 Short-term external debt 54 416 306 0 142 0
Disbursements (long-term)
1,0511,5301,095 518 747 552
Public and publicly guaranteed sector 1,0441,5011,089 498 729 540 Public sector 1,0441,5011,089 498 729 540 of which: General government 3 290 305 315 345 290 Private sector guaranteed by public sector Private sector not guaranteed 8 29 7 20 18 12
Principal repayments (long-term) 1481,3811,4601,8041,8501,447 Public and publicly guaranteed sector 1351,3661,4371,7931,8391,423 Public sector 1351,3661,4371,7931,8391,423 of which: General government 18 15 83 165 188 214 Private sector guaranteed by public sector Private sector not guaranteed 13 15 23 12 11 23
Interest payments (long-term)
50 339 364 355 240 205
Public and publicly guaranteed sector 50 339 363 354 239 204 Public sector 50 339 363 354 239 204 of which: General government 3 20 47 63 69 82 Private sector guaranteed by public sector Private sector not guaranteed 0 1 1 1 1 1
Long-term external debt stocks 1,5208,1357,7576,4195,3944,433 Public and publicly guaranteed debt from: 1,5138,0887,7226,3765,3424,386 Official creditors 1,5137,8717,3565,8754,7263,778
Multilateral 96 441 432 471 673 805 of which: World Bank 11 0 15 Bilateral 1,4177,4296,9245,4044,0532,973
Private creditors 0 217 367 501 616 608 Bondholders Commercial banks and others 0 217 367 501 616 608 Private nonguaranteed debt from: 7 47 35 43 51 47 Bondholders Commercial banks and others 7 47 35 43 51 47 Use of IMF credit and SDR allocations 108 99 97 97 101 418
Net debt inflows
Use of IMF credit
Long-term 903 149 -364-1,287-1,103 -895
Official creditors 924 -76 -507-1,433-1,197 -900 Multilateral -2 10 -9 88 202 132 of which: World Bank -1 -1 15 Bilateral 926 -86 -498-1,521-1,399-1,032
Private creditors -21 225 142 147 94 5 Bondholders Banks and others -21 225 142 147 94 5 Short-term -30 263 -110 -306 142 -142
Net equity inflows
Foreign direct investment 3,6322,0861,9972,1291,1691,453
Portfolio equity
External debt stocks to exports (%)
External debt stocks to GNI (%) 8 24 21 15
Debt service to exports (%) Short-term to external debt stocks (%) 3 5 4 0 3 0 Multilateral to external debt stocks (%) 6 5 5 7 12 17 Reserves to external debt stocks (%) Gross national income (GNI) 20,68936,35239,04443,576
(US$ million, unless otherwise indicated)
external debt data, by debtor type
Total external debt stocks
2010 2017 2018 2019 2020 2021
2,97511,67312,31513,97117,20719,217
Use of IMF credit and SDR allocations 275 246 241 239 7691,484 of which: SDR allocations 267 246 241 239 249 726
Long-term external debt 2,67310,95311,56612,78015,24715,961
Public and publicly guaranteed sector 2,6736,8907,7018,63811,33511,974
Public sector 2,6686,8867,6978,63411,33211,971 of which: General government 2,6676,8857,6968,63411,32711,966
Private sector guaranteed by public sector 5 4 4 3 3 3 Private sector not guaranteed ..4,0643,8654,1423,9113,987 Short-term external debt 26 473 509 9521,1911,772
Disbursements (long-term)
4891,5681,1671,4112,4861,386
Public and publicly guaranteed sector 4891,2591,1671,1342,4861,311 Public sector 4891,2591,1671,1342,4861,311 of which: General government 4891,2591,1671,1342,4811,311 Private sector guaranteed by public sector 0 Private sector not guaranteed 309 277 76
Principal repayments (long-term)
40 97 422 166 402 337
Public and publicly guaranteed sector 40 97 224 166 171 337 Public sector 40 97 224 166 171 337 of which: General government 40 97 224 166 171 337 Private sector guaranteed by public sector 0 0 0 Private sector not guaranteed 199 231
Interest payments (long-term)
21 80 98 115 266 380
Public and publicly guaranteed sector 21 80 98 115 141 252 Public sector 21 80 98 115 141 252 of which: General government 21 80 98 115 141 252 Private sector guaranteed by public sector 0 Private sector not guaranteed 125 128
external
Long-term external debt stocks 2,67310,95311,56612,78015,24715,961 Public and publicly guaranteed debt from: 2,6736,8907,7018,63811,33511,974 Official creditors 2,6736,8817,6508,55510,81611,487 Multilateral 2,4164,8675,0395,6547,2157,858 of which: World Bank 1,6822,9803,0953,4434,3004,453 Bilateral 2572,0142,6122,9013,6013,630 Private creditors 0 8 50 83 519 487 Bondholders Commercial banks and others 0 8 50 83 519 487 Private nonguaranteed debt from: ..4,0643,8654,1423,9113,987 Bondholders Commercial banks and others ..4,0643,8654,1423,9113,987
Use of IMF credit and SDR allocations 275 246 241 239 7691,484
Net debt inflows
Use of IMF credit 0 503 257
Long-term 4491,471 7451,2452,0841,049
Official creditors 4501,155 900 9341,911 973 Multilateral 424 538 285 6401,291 877 of which: World Bank 326 245 190 366 689 280 Bilateral 26 617 615 294 620 96 Private creditors 0 316 -155 311 173 76 Bondholders Banks and others 0 316 -155 311 173 76 Short-term -209 -29 36 443 240 581
Net equity inflows
Foreign direct investment 248 708 710 955 674 881 Portfolio equity -70 15 66 15 4 6
External debt stocks to exports (%) 84 227 201 220 301 312 External debt stocks to GNI (%) 11 39 38 41 47 48 Debt service to exports (%) 2 4 9 5 12 12 Short-term to external debt stocks (%) 1 4 4 7 7 9 Multilateral to external debt stocks (%) 81 42 41 40 42 41 Reserves to external debt stocks (%) 91 32 27 Gross national income (GNI) 26,23130,02132,00134,43736,96439,761
(US$ million, unless otherwise indicated)
Summary external debt data, by debtor type
Total external debt stocks 124,527123,870121,873124,879132,313135,643
Use of IMF credit and SDR allocations 16,26214,00112,99711,32812,82414,505 of which: SDR allocations 2,0171,8651,8211,8111,8864,531
Long-term external debt 81,00187,60988,18591,52596,08398,870
Public and publicly guaranteed sector 25,32737,23836,98939,18842,18644,628
Public sector 25,32737,23836,98939,18842,18644,628 of which: General government 24,81533,71835,12635,25238,11438,818 Private sector guaranteed by public sector Private sector not guaranteed 55,67450,37151,19752,33753,89754,241
Short-term external debt 27,26422,25920,69022,02523,40622,268
Disbursements (long-term) 32,2408,2359,16411,19916,48612,796
Public and publicly guaranteed sector 7,9695,8173,7275,3637,0426,349 Public sector 7,9695,8173,7275,3637,0426,349 of which: General government 7,9355,4463,3573,0616,8264,478 Private sector guaranteed by public sector Private sector not guaranteed 24,2722,4185,4375,8369,4446,447
Principal repayments (long-term)
22,8858,5828,9218,35012,4458,990
Public and publicly guaranteed sector 1,4463,5313,6783,0754,9872,938 Public sector 1,4463,5313,6783,0754,9872,938 of which: General government 1,1653,4391,6572,8514,8862,827 Private sector guaranteed by public sector Private sector not guaranteed 21,4395,0515,2435,2757,4586,052
Interest payments (long-term)
3,5322,9882,8243,1873,3483,645
Public and publicly guaranteed sector 5941,5161,4791,6991,8692,123 Public sector 5941,5161,4791,6991,8692,123 of which: General government 5521,3471,4361,6521,6921,724 Private sector guaranteed by public sector Private sector not guaranteed 2,9381,4731,3451,4881,4791,523
Long-term external debt stocks 81,00187,60988,18591,52596,08398,870
Public and publicly guaranteed debt from: 25,32737,23836,98939,18842,18644,628 Official creditors 14,96115,00313,76013,13314,63815,656
Multilateral 13,56012,24111,06310,45712,12213,265 of which: World Bank 3,2125,3625,3355,3605,7416,623 Bilateral 1,4002,7622,6982,6772,5162,392
Private creditors 10,36622,23523,22826,05427,54828,972 Bondholders 9,05822,06722,46724,48525,55326,941 Commercial banks and others 1,308 167 7611,5691,9962,031
Private nonguaranteed debt from: 55,67450,37151,19752,33753,89754,241 Bondholders 4,3134,4194,5195,6355,2944,833 Commercial banks and others 51,36145,95246,67846,70248,60349,409
Use of IMF credit and SDR allocations 16,26214,00112,99711,32812,82414,505
Net debt inflows
Use of IMF credit 3,433 146 -689-1,593 992 -667 Long-term 9,355 -347 2432,8494,0413,806
Official creditors 3,767 863 -974 -537 9221,626 Multilateral 3,915 643 -924 -5061,1381,668 of which: World Bank -85 -149 -27 25 381 882 Bilateral -149 220 -50 -32 -215 -43
Private creditors 5,589-1,2101,2173,3873,1192,180 Bondholders 2,1931,589 -2752,551 9421,189 Banks and others 3,396-2,7991,492 8362,176 990 Short-term 6,3701,114-2,0881,191 348 -283
Net equity inflows
Foreign direct investment 5,5503,0254,0694,909 2725,502 Portfolio equity 290 110 -9 49 173 -73
External debt stocks to exports (%) 177 196 172 162 182 142 External debt stocks to GNI (%) 92 109 92 80 83 70 Debt service to exports (%) 38 21 21 18 24 15 Short-term to external debt stocks (%) 22 18 17 18 18 16 Multilateral to external debt stocks (%) 11 10 9 8 9 10 Reserves to external debt stocks (%) 27 14 16 19 21 22 Gross national income (GNI) 135,959113,718132,165155,795160,040195,033
(US$ million, unless otherwise indicated)
Summary external debt data, by debtor type
Total external debt stocks
2010 2017 2018 2019 2020 2021
7,98116,35217,60922,40732,34338,995
Use of IMF credit and SDR allocations 405 374 365 363 7751,493 of which: SDR allocations 405 374 365 363 3781,107
Long-term external debt 7,15415,23816,34621,37129,18133,958
Public and publicly guaranteed sector 3,4237,2049,28512,79317,35120,148 Public sector 3,4197,2049,28512,79317,35120,148 of which: General government 2,5345,0856,77010,16214,35016,185
Private sector guaranteed by public sector 4 Private sector not guaranteed 3,7308,0357,0618,57911,82913,810 Short-term external debt 423 740 897 6732,3873,544
Disbursements (long-term)
1,1912,1282,8336,7798,59710,038
Public and publicly guaranteed sector 4551,1472,5043,9324,8753,968 Public sector 4551,1472,5043,9324,8753,968 of which: General government 258 8521,9143,6254,2572,606 Private sector guaranteed by public sector Private sector not guaranteed 736 981 3302,8463,7226,069
Principal repayments (long-term)
4931,436 6911,9502,4283,753
Public and publicly guaranteed sector 370 341 383 429 585 804 Public sector 368 341 383 429 585 804 of which: General government 165 178 198 233 291 487 Private sector guaranteed by public sector 2 Private sector not guaranteed 1231,095 3091,5211,8422,950
Interest payments (long-term) 118 449 284 669 756 799
Public and publicly guaranteed sector 63 118 144 257 303 323 Public sector 63 118 144 257 303 323 of which: General government 47 68 95 196 243 247 Private sector guaranteed by public sector 0 Private sector not guaranteed 55 331 141 412 453 476
Long-term external debt stocks 7,15415,23816,34621,37129,18133,958
Public and publicly guaranteed debt from: 3,4237,2049,28512,79317,35120,148 Official creditors 3,1976,9229,08611,56214,65915,897
Multilateral 1,2103,8605,4107,0309,24610,086 of which: World Bank 373 9101,9072,7233,7344,328 Bilateral 1,9873,0623,6774,5325,4135,812
Private creditors 226 281 1991,2312,6924,251 Bondholders ..1,0002,0483,618 Commercial banks and others 226 281 199 231 644 633
Private nonguaranteed debt from: 3,7308,0357,0618,57911,82913,810 Bondholders 300 600 900 Commercial banks and others 3,7308,0357,0618,27911,22912,910
Use of IMF credit and SDR allocations 405 374 365 363 7751,493
Net debt inflows
Use of IMF credit 384 0
Long-term 698 6922,1424,8286,1696,284
Official creditors 184 8292,1932,4672,8501,587 Multilateral 110 4821,5821,6282,153 886 of which: World Bank 5 1011,013 820 978 618 Bilateral 74 348 611 839 698 701
Private creditors 514 -138 -51 2,3613,3194,698 Bondholders ..1,3001,3481,870 Banks and others 514 -138 -51 1,0611,9712,828 Short-term -120 351 157 -2321,7141,152
Foreign direct investment 1,4871,914 6392,1481,5751,663
Portfolio equity 1 3 13 29 32 15
External debt stocks to exports (%) 60 109 102 112 201 208 External debt stocks to GNI (%) 16 26 33 37 54 56
Debt service to exports (%) 5 13 6 13 20 25 Short-term to external debt stocks (%) 5 5 5 3 7 9 Multilateral to external debt stocks (%) 15 24 31 31 29 26 Reserves to external debt stocks (%) 86 71 57 45 36 Gross national income (GNI) 50,62063,29454,14160,64559,70369,440
(US$ million, unless otherwise indicated)
Total external debt stocks
2010 2017 2018 2019 2020 2021
177.7401.4402.2441.3459.6515.2
Use of IMF credit and SDR allocations 25.1 47.4 43.3 37.2 34.4 63.0 of which: SDR allocations 25.1 23.2 22.6 22.5 23.4 54.7
Long-term external debt 102.6287.6313.8362.0386.7412.4
Public and publicly guaranteed sector 102.6287.6313.8362.0386.7412.4 Public sector 102.6287.6313.8362.0386.7412.4 of which: General government 102.1287.4313.8362.0386.7412.4
Private sector guaranteed by public sector Private sector not guaranteed
Short-term external debt 50.0 66.4 45.1 42.1 38.4 39.9
Disbursements (long-term)
3.3 68.7 46.4 55.0 14.4 31.6
Public and publicly guaranteed sector 3.3 68.7 46.4 55.0 14.4 31.6 Public sector 3.3 68.7 46.4 55.0 14.4 31.6 of which: General government 3.3 68.7 46.4 55.0 14.4 31.6 Private sector guaranteed by public sector Private sector not guaranteed
Principal repayments (long-term)
3.6 5.0 12.0 4.7 10.0 10.5
Public and publicly guaranteed sector 3.6 5.0 12.0 4.7 10.0 10.5 Public sector 3.6 5.0 12.0 4.7 10.0 10.5 of which: General government 3.5 5.0 11.8 4.7 10.0 10.5 Private sector guaranteed by public sector Private sector not guaranteed
Interest payments (long-term)
1.6 3.5 4.2 4.3 4.4 4.2 Public and publicly guaranteed sector 1.6 3.5 4.2 4.3 4.4 4.2 Public sector 1.6 3.5 4.2 4.3 4.4 4.2 of which: General government 1.6 3.5 4.2 4.3 4.4 4.2 Private sector guaranteed by public sector Private sector not guaranteed
Long-term external debt stocks 102.6287.6313.8362.0386.7412.4 Public and publicly guaranteed debt from: 102.6287.6313.8362.0386.7412.4 Official creditors 102.6287.6313.8362.0386.7412.4
Multilateral 68.8 76.1101.8135.0145.2148.4 of which: World Bank 11.7 29.1 54.7 83.0 91.6 97.9 Bilateral 33.8211.5212.0227.0241.5263.9
Private creditors
Bondholders Commercial banks and others Private nonguaranteed debt from: Bondholders Commercial banks and others Use of IMF credit and SDR allocations 25.1 47.4 43.3 37.2 34.4 63.0
Net debt inflows
Use of IMF credit 0.0 -3.0 -5.9 -4.1 -2.4
Long-term -0.3 63.7 34.4 50.3 4.4 21.1 Official creditors -0.3 63.7 34.4 50.3 4.4 21.1
Multilateral -3.3 19.6 27.1 33.5 4.4 8.4 of which: World Bank -0.5 15.8 26.8 28.7 5.0 9.1 Bilateral 3.0 44.0 7.2 16.8 0.0 12.7
Private creditors
Bondholders
Banks and others
Short-term 21.0 28.6 -21.3 -3.1 -3.7 1.5
Foreign direct investment 50.6 34.2 34.0 34.6 23.7 32.8
Portfolio equity 0.4 0.7 0.5 0.5 0.1
External debt stocks to exports (%) 48.9 91.1 79.4 82.0174.2197.5
External debt stocks to GNI (%) 27.4 45.5 42.7 43.7 46.6 50.6
Debt service to exports (%) 1.6 2.3 4.0 3.0 7.3 6.8
Short-term to external debt stocks (%) 28.1 16.6 11.2 9.5 8.4 7.7
Multilateral to external debt stocks (%) 38.7 19.0 25.3 30.6 31.6 28.8
Reserves to external debt stocks (%) 90.8 98.4104.6115.9133.5129.0
Gross national income (GNI) 649.2882.4941.91,010.7986.51,018.8
(US$ million, unless otherwise indicated) 2010 2017 2018 2019 2020 2021
Summary external debt data, by debtor type
Total external debt stocks 44,941104,091106,855117,338125,065136,213
Use of IMF credit and SDR allocations 529 448 438 435 4531,987 of which: SDR allocations 485 448 438 435 4531,987
Long-term external debt 37,47981,74486,83392,50698,008100,993
Public and publicly guaranteed sector 32,79951,79052,11551,78252,20048,536
Public sector 32,79951,62051,97151,66352,10648,467 of which: General government 26,99536,16036,73936,67236,97634,201 Private sector guaranteed by public sector 170 145 120 94 69 Private sector not guaranteed 4,68029,95434,71740,72345,80852,457
Short-term external debt 6,93221,89819,58524,39726,60433,233
Disbursements (long-term)
6,92218,66120,33618,67417,46723,371
Public and publicly guaranteed sector 5,6374,2703,2102,4042,2651,853 Public sector 5,6374,2703,2102,4042,2651,853 of which: General government 4,3092,7472,1471,4431,3111,071 Private sector guaranteed by public sector 0 0 0 Private sector not guaranteed 1,28514,39117,12616,27115,20221,518
Principal repayments (long-term)
1,05511,25014,71413,04013,78518,114
Public and publicly guaranteed sector 1,0552,3292,5872,7753,6673,245 Public sector 1,0552,3042,5612,7503,6423,220 of which: General government 6961,2731,4071,5802,4611,906 Private sector guaranteed by public sector 25 25 25 25 25 Private sector not guaranteed ..8,92012,12710,26510,11814,869
Interest payments (long-term)
7072,0592,7212,6781,8701,515
Public and publicly guaranteed sector 563 9401,0171,062 886 702 Public sector 563 9351,0111,056 883 701 of which: General government 382 527 574 597 524 413 Private sector guaranteed by public sector 5 5 6 3 1 Private sector not guaranteed 1441,1191,7041,616 984 812
Long-term external debt stocks 37,47981,74486,83392,50698,008100,993
Public and publicly guaranteed debt from: 32,79951,79052,11551,78252,20048,536 Official creditors 27,31444,61845,73646,07747,82444,750 Multilateral 12,57323,28623,71824,06625,33824,613 of which: World Bank 7,74314,68314,96815,32716,37816,008 Bilateral 14,74121,33222,01722,01022,48720,137
Private creditors 5,4857,1736,3805,7064,3763,786 Bondholders 2,0201,5161,5111,506 756 751 Commercial banks and others 3,4655,6574,8694,1993,6203,035
Private nonguaranteed debt from: 4,68029,95434,71740,72345,80852,457 Bondholders 235 351,0141,0941,444 Commercial banks and others 4,68029,71834,68239,70944,71451,013
Use of IMF credit and SDR allocations 529 448 438 435 4531,987
Net debt inflows
Use of IMF credit -38
Long-term 5,8677,4115,6225,6353,6825,257
Official creditors 2,9732,6911,392 294 -35 -834 Multilateral 1,9531,145 839 458 491 -123 of which: World Bank 1,543 885 592 443 499 25 Bilateral 1,0201,545 553 -164 -527 -710
Private creditors 2,8944,7204,2305,3413,7176,091 Bondholders 981 -5 -205 974 -671 345
Banks and others 1,9124,7254,4354,3674,3885,746 Short-term 2,1499,178-2,3134,8122,2076,629
Net equity inflows
Foreign direct investment 7,1018,41813,97711,98013,21213,868 Portfolio equity 2,383
Debt ratios
External debt stocks to exports (%) 56 45 41 41 43 40
External debt stocks to GNI (%) 31 39 36 37 38 39 Debt service to exports (%) 2 6 7 6 6 6
Short-term to external debt stocks (%) 15 21 18 21 21 24
Multilateral to external debt stocks (%) 28 22 22 21 20 18 Reserves to external debt stocks (%) 28 47 52 67 76 80
Gross national income (GNI) 142,783264,357292,881313,593327,628346,676
(US$ million, unless otherwise indicated)
2010 2017 2018 2019 2020 2021
Total external debt stocks 6,5047,1937,0377,0557,1217,587
Use of IMF credit and SDR allocations 436 508 469 440 4101,021 of which: SDR allocations 358 331 323 321 335 978
Long-term external debt 5,9456,3176,2056,1886,2516,108
Public and publicly guaranteed sector 5,9456,3176,2056,1886,2516,108
Public sector 5,9456,3176,2056,1886,2516,108 of which: General government 5,9455,3175,2055,1885,2515,108
Private sector guaranteed by public sector Private sector not guaranteed
Short-term external debt 124 368 362 427 460 459
Disbursements (long-term) 297 4 19 66 38 13
Public and publicly guaranteed sector 297 4 19 66 38 13 Public sector 297 4 19 66 38 13 of which: General government 297 4 19 66 38 13 Private sector guaranteed by public sector Private sector not guaranteed
Principal repayments (long-term) 155 66 71 72 75 80 Public and publicly guaranteed sector 155 66 71 72 75 80 Public sector 155 66 71 72 75 80 of which: General government 155 66 71 72 75 80 Private sector guaranteed by public sector Private sector not guaranteed
Interest payments (long-term) 74 13 13 12 11 11
Public and publicly guaranteed sector 74 13 13 12 11 11 Public sector 74 13 13 12 11 11 of which: General government 74 13 13 12 11 11 Private sector guaranteed by public sector Private sector not guaranteed
Long-term external debt stocks 5,9456,3176,2056,1886,2516,108
Public and publicly guaranteed debt from: 5,9456,3176,2056,1886,2516,108 Official creditors 5,9416,3176,2056,1886,2516,108
Multilateral 3,2943,1103,0042,9873,0272,910 of which: World Bank 2,1801,6951,5861,5051,4881,368 Bilateral 2,6473,2073,2013,2013,2243,198
Private creditors 3 Bondholders Commercial banks and others 3 Private nonguaranteed debt from: Bondholders Commercial banks and others Use of IMF credit and SDR allocations 436 508 469 440 4101,021
Net debt inflows
Use of IMF credit 26 -18 -27 -26 -47 -31
Long-term 143 -62 -52 -7 -38 -67 Official creditors 144 -62 -52 -7 -38 -67 Multilateral 159 -62 -51 -7 -38 -67 of which: World Bank 28 -66 -71 -72 -75 -80 Bilateral -15 0 0 0 0 0 Private creditors -1 Bondholders
Banks and others -1
Short-term -390 50 -82 36 1 -28
Foreign direct investment 43 -270 -282 -371 Portfolio equity 0
External debt stocks to exports (%) 70
External debt stocks to GNI (%) 22 27 33 32 38
Debt service to exports (%) 3
Short-term to external debt stocks (%) 2 5 5 6 6 6 Multilateral to external debt stocks (%) 51 43 43 42 43 38 Reserves to external debt stocks (%) 90 10 33 20 13 Gross national income (GNI) 29,08826,80221,59021,87018,821
(US$ million, unless otherwise indicated)
Summary external debt data, by debtor type
Total external debt stocks
2010 2017 2018 2019 2020 2021
4,25322,95523,52627,25426,69024,046
Use of IMF credit and SDR allocations 1,117 794 715 667 6781,969 of which: SDR allocations 722 668 652 649 6761,969
Long-term external debt 1,98621,26022,18925,75225,33520,811
Public and publicly guaranteed sector 1,1928,7869,88811,01712,26012,498
Public sector 1,1928,7869,88811,01712,26012,498 of which: General government 1,1418,7659,87111,00312,25012,491
Private sector guaranteed by public sector 0 0 0 Private sector not guaranteed 79412,47412,30114,73613,0748,313
Short-term external debt 1,150 901 623 835 6761,266
Disbursements (long-term)
1777,8574,8845,5012,481 427
Public and publicly guaranteed sector 1501,7541,4561,6301,339 427
Public sector 1501,7541,4561,6301,339 427 of which: General government 1501,7541,4551,6301,339 427 Private sector guaranteed by public sector 0 0 Private sector not guaranteed 276,1033,4283,8711,143
Principal repayments (long-term) 86 367 6671,7581,4581,391
Public and publicly guaranteed sector 47 152 282 480 274 161 Public sector 47 152 282 480 274 161 of which: General government 41 148 279 477 270 158 Private sector guaranteed by public sector 0 0 0 Private sector not guaranteed 40 215 3851,2771,1841,230
Interest payments (long-term) 29 387 535 776 428 208
Public and publicly guaranteed sector 11 341 444 442 296 80 Public sector 11 341 444 442 296 80 of which: General government 11 341 444 442 296 80 Private sector guaranteed by public sector Private sector not guaranteed 18 45 91 334 132 127
Summary external debt stock, by creditor type
Long-term external debt stocks 1,98621,26022,18925,75225,33520,811
Public and publicly guaranteed debt from: 1,1928,7869,88811,01712,26012,498 Official creditors 1,1894,2274,6705,6146,5296,839 Multilateral 9241,6221,8182,1132,4872,626 of which: World Bank 430 8941,0031,1081,2961,377 Bilateral 2652,6062,8513,5014,0424,213
Private creditors 2 4,5585,2195,4035,7315,659 Bondholders ..3,0003,0003,0003,0003,000 Commercial banks and others 2 1,5582,2192,4032,7312,659
Private nonguaranteed debt from: 79412,47412,30114,73613,0748,313 Bondholders Commercial banks and others 79412,47412,30114,73613,0748,313
Use of IMF credit and SDR allocations 1,117 794 715 667 6781,969
Use of IMF credit 55 -66 -61 -44 -15 -3 Long-term 907,4904,2173,7431,024 -964
Official creditors 105 340 510 963 745 331 Multilateral 71 133 234 303 298 201 of which: World Bank 30 86 132 112 139 119 Bilateral 35 207 275 660 448 130 Private creditors -15 7,1503,7072,780 278-1,295 Bondholders 0 0 0 0 0 Banks and others -15 7,1503,7072,780 278-1,295 Short-term 704 81 -225 196 -163 552
Foreign direct investment 1,228 547 -502 -306 -201 -301 Portfolio equity 101 -3 -5 -1 -1 -1
External debt stocks to exports (%) 53 251 235 328 311 205 External debt stocks to GNI (%) 22 93 91 119 152 125
Debt service to exports (%) 2 9 13 31 22 14 Short-term to external debt stocks (%) 27 4 3 3 3 5 Multilateral to external debt stocks (%) 22 7 8 8 9 11 Reserves to external debt stocks (%) 49 9 7 5 5 11 Gross national income (GNI) 18,90324,72725,90522,90417,60219,281
(US$ million, unless otherwise indicated)
Total external debt stocks
2010 2017 2018 2019 2020 2021
6,76312,51312,62312,24712,74313,739
Use of IMF credit and SDR allocations 529 482 471 468 4881,422 of which: SDR allocations 419 482 471 468 4881,422
Long-term external debt 4,4058,3058,7688,2588,4048,581
Public and publicly guaranteed sector 3,8004,3224,2904,3694,5804,627 Public sector 3,8004,3224,2904,3694,5804,627 of which: General government 3,1233,7153,7453,8354,0184,096 Private sector guaranteed by public sector Private sector not guaranteed 6053,9834,4783,8893,8253,954 Short-term external debt 1,8293,7263,3843,5213,8523,736
Disbursements (long-term) 847 818 980 972 906 810
Public and publicly guaranteed sector 4 156 280 91 60 214 Public sector 4 156 280 91 60 214 of which: General government 4 153 280 91 60 214 Private sector guaranteed by public sector Private sector not guaranteed 843 662 700 881 845 596
Principal repayments (long-term) 338 387 2811,214 930 528
Public and publicly guaranteed sector 2 114 76 52 21 61 Public sector 2 114 76 52 21 61 of which: General government 1 61 26 42 21 60 Private sector guaranteed by public sector Private sector not guaranteed 336 273 2051,163 910 466
Interest payments (long-term) 32 267 254 313 22 28
Public and publicly guaranteed sector 14 27 14 13 17 24 Public sector 14 27 14 13 17 24 of which: General government 13 24 13 13 17 24 Private sector guaranteed by public sector Private sector not guaranteed 18 240 240 301 5 4
Long-term external debt stocks 4,4058,3058,7688,2588,4048,581 Public and publicly guaranteed debt from: 3,8004,3224,2904,3694,5804,627 Official creditors 3,3513,8883,8723,9564,1494,219 Multilateral 1,6141,4151,2141,2081,2461,212 of which: World Bank 976 907 896 890 910 893 Bilateral 1,7382,4732,6582,7482,9033,006
Private creditors 448 435 418 412 431 408 Bondholders 0 0 0 0 0 0 Commercial banks and others 448 435 418 412 431 408 Private nonguaranteed debt from: 6053,9834,4783,8893,8253,954 Bondholders Commercial banks and others 6053,9834,4783,8893,8253,954
Use of IMF credit and SDR allocations 529 482 471 468 4881,422
Net debt inflows
Use of IMF credit -4
Long-term 510 431 699 -243 -25 282
Official creditors 2 53 204 45 43 159 Multilateral 0 -60 -41 0 2 -5 of which: World Bank 0 -5 0 -3 0 -3 Bilateral 2 113 245 44 41 164
Private creditors 507 378 496 -287 -67 123 Bondholders 0 0 0 0 0 Banks and others 507 378 496 -287 -67 123
Short-term 160 452 -412 63 205 -124
Foreign direct investment 123 307 718 250 150 166 Portfolio equity 63 -101 55 4 -82
External debt stocks to exports (%) 73 269 243 232 242 209 External debt stocks to GNI (%) 57 72 71 65 73 54
Debt service to exports (%) 4 15 12 30 19 9 Short-term to external debt stocks (%) 27 30 27 29 30 27 Multilateral to external debt stocks (%) 24 11 10 10 10 9 Reserves to external debt stocks (%) 11 2 1 1 0 6
Gross national income (GNI) 11,89217,27617,81018,89717,44825,562
International Debt Report 2022 focuses on financial flows, trends in external debt, and other major financial indicators for low- and middle-income countries. The analysis and data in the International Debt Report (IDR) are based on data sourced from the International Debt Statistics database. The country tables in the IDR offer a more condensed presentation (analytical) of the principal indicators. The longer version of the table presentation (standard) will be found in the online tables.
The aggregate tables are labeled by region name. Data are shown for all low- and middle-income countries and for six regional groups (East Asia and Pacific, Europe and Central Asia, Latin America and the Caribbean, Middle East and North Africa, South Asia, and Sub-Saharan Africa).
Country tables are labeled by country name and ordered alphabetically. Data are shown for 121 low- and middle-income countries that report public and publicly guaranteed external debt to the World Bank’s Debtor Reporting System. The tables also include key debt ratios and the composition of external debt stocks and flows for each country.
Each table shows a time series with the most recent five years, as well as 2010 as a comparison year. Full time series data are available for all countries in the World Bank’s Open Data website ( https://datacatalog.worldbank.org/dataset/ international-debt-statistics).
The general cutoff date for countries to report data for this publication was end-July 2022. The economic aggregates presented in the tables are prepared for the convenience of users. Although debt ratios can give useful information about developments in a debt-servicing capacity, conclusions drawn from them will not be valid unless accompanied by careful economic evaluation.
The macroeconomic data provided are collected from national statistical organizations, which in some cases may be subject to a considerable margin of error. The usual care must be taken in interpreting the ratios, particularly for the most recent years, because figures may be preliminary and subject to revision.
Specific country notes describing the sources of information that are not provided by the country are summarized in the “Data Documentation” section. Unless otherwise specified, data on longterm public and publicly guaranteed external debt for 2021 are based on reports provided by the country.
More detailed information on data sources, methodology, and compilation is provided in the remaining sections of this appendix.
Aggregate measures for income groups and regions include the 121 low- and middle-income countries that report public and publicly guaranteed external debt to the World Bank’s Debtor Reporting System, whenever data are available. The aggregate “All lowand middle-income countries” is the sum of data for 121 countries.
For operational and analytical purposes, the World Bank’s main criterion for classifying countries is gross national income (GNI) per capita (calculated by the World Bank Atlas method). Every country is classified as low-income, middleincome, or high-income. Low- and middle-income countries are sometimes referred to as developing countries. The term is used for convenience; it is not intended to imply that all countries in the group are experiencing similar development or that other countries have reached a preferred or final stage of development. Because GNI per capita changes over time, the country composition of income groups may change from one edition of IDR to the next. Once the classification is fixed
for an edition, based on GNI per capita in the most recent year for which data are available, all historical data presented are based on the same country grouping.
Symbols 0 or 0.0 means zero or small enough that the number would round to zero at the displayed number of decimal places.
.. means that data are not available or that aggregates cannot be calculated because of missing data in the years shown.
$ indicates current US dollars unless otherwise specified.
The country tables in the International Debt Report are sourced from the International Debt Statistics database. Using an automated query process, these reference tables will be updated on the basis of the revisions to the International Debt Statistics database.
Users can access all the online tables, download the PDF version of the publication, and view the report as an eBook on the ISSUU platform (https://www.issuu.com/), as well as access the database and download the archived editions of the publication by going to https://www.worldbank.org/en/programs/debt-statistics /idr/products. You can also access all of the publications through the Debt Statistics website at https://www .worldbank.org/en/programs/debt-statistics/publications.
To access the online tables, visit https://www.worldbank.org/en/programs/debt-statistics/ids and select from “Country,” “Region,” or “Topic.” Click on “Analytical” to view the table with a select number of indicators as reported in the IDR publication, or “Standard” to view the tables with the full list of indicators available in the database. To access the Debt Service Suspension Initiative (DSSI) debt service payments due table, visit https://www.worldbank.org/en/programs/debt-statistics/dssi and select “Monthly presentation” for monthly projections or “Annual presentation” for yearly projections and actual deferrals.
To access a specific country table directly without going through the above landing page, use the URL https://www.worldbank.org/en/programs/debt-statistics/ids and click on a country name to view the table. Similarly, to view the regional table, click on the “Region” tab and select one of the listed regions. The data can be filtered by Counterpart-Area (the creditor) and by Country (the debtor) using the drop-down filters.
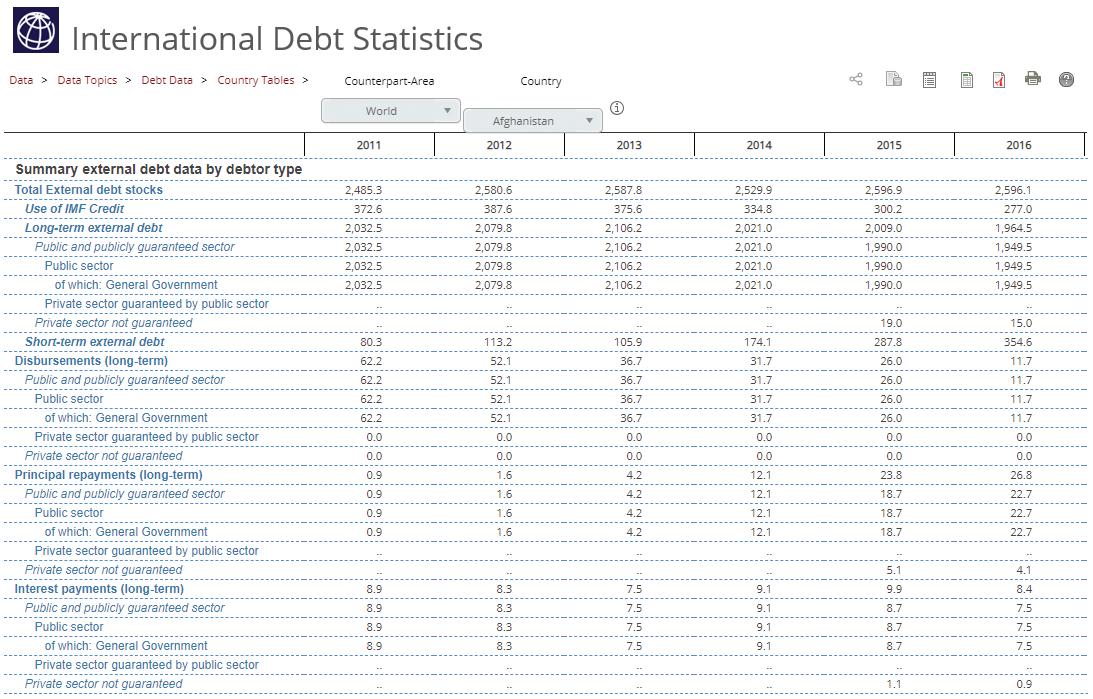
The table below lists some of the main indicator codes available online. To view a specific indicator online, go to https://data.worldbank.org/indicator/ and add the indicator code at the end of the URL; for example, to view a page for total debt stocks, this line should be in your browser: http://data.worldbank.org/indicator/DT.DOD.DECT.CD.
External debt stocks
DT.DOD.DECT.CD External debt flows
Long-term external debt DT.DOD.DLXF.CD Disbursements DT.DIS.DLTF.CD
Public and publicly guaranteed DT.DOD.DPPG.CD Long-term external debt DT.DIS.DLXF.CD Private nonguaranteed DT.DOD.DPNG.CD IMF purchases DT.DIS.DIMF.CD
Use of IMF credit and SDR allocations DT.DOD.DIMF.CD Principal repayments DT.AMT.DLTF.CD SDR allocations DT.DOD.DSDR.CD Long-term external debt DT.AMT.DLXF.CD
Short-term debt DT.DOD.DSTC.CD IMF repurchases DT.AMT.DIMF.CD
Interest arrears on long-term DT.IXA.DPPG.CD Net flows DT.NFL.DECT.CD Long-term external debt DT.NFL.DLXF.CD
Memorandum items Short-term external debt DT.NFL.DSTC.CD Principal arrears on long-term DT.AXA.DPPG.CD Interest payments DT.INT.DECT.CD
Long-term public sector debt DT.DOD.DPPG.CD Long-term external debt DT.INT.DLXF.CD Long-term private sector debt DT.DOD.PRVS.CD IMF charges DT.INT.DIMF.CD
Public & publicly guaranteed commitments DT.COM.DPPG.CD Short-term external debt DT.INT.DSTC.CD
Foreign direct investment (net equity inflows) BX.KLT.DINV.CD.WD
Portfolio equity flows BX.PEF.TOTL.CD.WD
Euro DT.CUR.EURO.ZS
Japanese yen DT.CUR.JYEN.ZS
Pound sterling DT.CUR.UKPS.ZS
Swiss franc DT.CUR.SWFR.ZS
US dollars DT.CUR.USDL.ZS
Official creditors
Interest (%)
DT.INR.OFFT
Maturity (years) DT.MAT.OFFT
Grace period (years) DT.GPA.OFFT
Private creditors
Interest (%)
DT.INR.PRVT
Maturity (years) DT.MAT.PRVT
Grace period (years) DT.GPA.PRVT
Gross national income (GNI) NY.GNP.MKTP.CD Exports of goods, services, and primary income BX.GSR.TOTL.CD Personal transfers and compensation of employees BX.TRF.PWKR.CD.DT Imports of goods, services, and primary income BM.GSR.TOTL.CD
Primary income on foreign direct investment (payments) BX.KLT.DREM.CD.DT International reserves FI.RES.TOTL.CD
External debt stocks to exports (%) DT.DOD.DECT.EX.ZS
External debt stocks to GNI (%) DT.DOD.DECT.GN.ZS Debt service to exports (%) DOD.DECT.GN.ZS
Short-term to external debt stocks (%) DT.DOD.DSTC.ZS
Multilateral to external debt stocks (%) DT.DOD.MLAT.ZS Reserves to external debt stocks (%) FI.RES.TOTL.DT.ZS
Current account balance BN.CAB.XOKA.CD Reserves to imports (months) FI.RES.TOTL.MO
Debt outstanding and disbursed DT.DOD.DLXF.CD Interest payments DT.INT.DLXF.CD Public and publicly guaranteed DT.DOD.DPPG.CD Public and publicly guaranteed DT.INT.DPPG.CD Official creditors DT.DOD.OFFT.CD Official creditors DT.INT.OFFT.CD Multilateral DT.DOD.MLAT.CD Multilateral DT.INT.MLAT.CD of which: IBRD DT.DOD.MIBR.CD of which: IBRD DT.INT.MIBR.CD IDA DT.DOD.MIDA.CD IDA DT.INT.MIDA.CD Bilateral DT.DOD.BLAT.CD Bilateral DT.INT.BLAT.CD Private creditors DT.DOD.PRVT.CD Private creditors DT.INT.PRVT.CD of which: Bonds DT.DOD.PBND.CD of which: Bonds DT.INT.PBND.CD Commercial banks DT.DOD.PCBK.CD Commercial banks DT.INT.PCBK.CD Private nonguaranteed DT.DOD.DPNG.CD Private nonguaranteed DT.INT.DPNG.CD of which: Bonds DT.DOD.PNGB.CD of which: Bonds DT.INT.PNGB.CD
Disbursements
DT.DIS.DLXF.CD Principal repayments
DT.AMT.DLXF.CD
Public and publicly guaranteed DT.DIS.DPPG.CD Public and publicly guaranteed DT.AMT.DPPG.CD Official creditors DT.DIS.OFFT.CD Official creditors DT.AMT.OFFT.CD Multilateral DT.DIS.MLAT.CD Multilateral DT.AMT.MLAT.CD of which: IBRD DT.DIS.MIBR.CD of which: IBRD DT.AMT.MIBR.CD IDA DT.DIS.MIDA.CD IDA DT.AMT.MIDA.CD Bilateral DT.DIS.BLAT.CD Bilateral DT.AMT.BLAT.CD Private creditors DT.DIS.PRVT.CD Private creditors DT.AMT.PRVT.CD of which: Bonds DT.DIS.PBND.CD of which: Bonds DT.AMT.PBND.CD Commercial banks DT.DIS.PCBK.CD Commercial banks DT.AMT.PCBK.CD Private nonguaranteed DT.DIS.DPNG.CD Private nonguaranteed DT.AMT.DPNG.CD of which: Bonds DT.DIS.PNGB.CD of which: Bonds DT.AMT.PNGB.CD
Total change in external debt stocks DT.DOD.DECT.CD.CG Net flows on external debt DT.NFL.DECT.CD
Total amount rescheduled DT.DXR.DPPG.CD Total amount forgiven DT.DFR.DPPG.CD Debt buyback DT.DSB.DPPG.CD
Official creditors Principal DT.AMT.OFFT.CD Interest DT.INT.OFFT.CD Private creditors Principal DT.AMT.PRVT.CD Interest DT.INT.PRVT.CD
DataBank (http://databank.worldbank.org) is an online web resource that provides simple and quick access to collections of time series data. It has advanced functions for selecting and displaying data, performing customized queries, downloading data, and creating charts and maps. Users can create dynamic, custom reports based on their selection of countries, indicators, and years. All these reports can be easily edited, shared, and embedded as widgets on websites or blogs. For more information, see https:// datahelpdesk.worldbank.org/.
Click to share the table using either the embed code or the URL.
Click to edit and revise the table in DataBank.
Click to export all metadata to Excel.
Click to export the table to Excel.
Click to export the table and corresponding indicator metadata to PDF.
Click to print the table and corresponding indicator metadata.
Click to access the IDR Online Tables Help file.
The principal sources of information for the tables in International Debt Report 2022 are from the International Debt Statistics (IDS) database, which is based on reports to the World Bank through the World Bank’s Debtor Reporting System (DRS) from member countries that have received either International Bank for Reconstruction and Development (IBRD) loans or International Development Association (IDA) credits. The DRS has its origin in the World Bank’s need to monitor and assess the financial position of its borrowers. Since 1951, borrowers have been required to provide statistics on their public external debt and private sector debt that benefit from a public guarantee. Reporting countries submit reports on the annual status, transactions, and terms of the long-term external debt of public agencies and that of private ones guaranteed by a public agency in the debtor country. The DRS maintains these records on a loan-by-loan basis. In 1973, coverage of the DRS was expanded to include private sector nonguaranteed borrowing; however, for this category of debt, data are provided by borrowers in aggregate rather than loan by loan.
Data submitted to the DRS are processed in the World Bank External Debt (WBXD) system, along with additional information received from the African Development Bank, the Asian Development Bank, the Inter-American Development Bank, the International Monetary Fund (IMF), institutions of the World Bank Group (IBRD and IDA), and the European Bank for Reconstruction and Development. The WBXD is an internal system of the World Bank. Among its outputs is the IDS database, from which the
tables in this publication and online database are produced.
Data on exports and imports (on a balance of payments basis), international reserves, current account balances, foreign direct investment (FDI) on equity, portfolio equity flows, and primary income on FDI are drawn mainly from the IMF, supplemented by United Nations Conference on Trade and Development reports and country data. Balance of payments data are presented according to the sixth edition of the IMF’s Balance of Payments Manual Official aid flows come from data collected and published by the Development Assistance Committee of the Organisation for Economic Co-operation and Development. Short-term external debt data are as reported by debtor countries or are estimates based on the Bank for International Settlements (BIS) quarterly series of commercial banks’ claims on low- and middle-income countries. For some countries, estimates were prepared by pooling creditor and debtor information. Data on the gross national income of most low- and middle-income countries are collected from national statistical organizations or central banks by visiting and resident World Bank missions.
Every effort has been made to ensure the accuracy and completeness of the external debt statistics. Coverage has been improved through the efforts of the reporting agencies and close collaboration between the Bank and our partners, the Commonwealth Secretariat and United Nations Conference on Trade and Development, which provide debt recording and reporting systems across the globe, as well as through the work of the World Bank missions, which visit member countries to gather data and to provide technical assistance on debt issues. Nevertheless, quality and coverage vary among debtors and may also vary for the same
debtor from year to year. Data on long-term external debt reported by member countries are checked against, and supplemented by, data from several other sources. Among these sources are the statements and reports of several regional development banks, government lending agencies, and official government websites.
Total debt stock and other aggregate measures are derived from the summation of loan-level data on stocks and flows after conversion to a common currency. Other tabulations are compiled using terms and conditions reported in the loan-level data, such as currency composition, cancellations, rescheduling of other liabilities into long-term public and publicly guaranteed external debt, and debt buybacks.
Aggregates for regional and income groups are based on the World Bank’s operational classifications, which may differ from common geographic usage or income groups used by other organizations. Country classifications of DRS reporting countries in 2021 are shown in the country groups section. The same classification is used for all historical data shown in the IDR and the online tables and database.
Data on external obligations are normally reported to the World Bank in the currency of repayment and are converted into a common currency (US dollars) using official exchange rates published by the IMF.
Commitments, disbursements, and debt service payments (flows) are converted to US dollars at the annual average exchange rate for the year. Debt outstanding (disbursed and undisbursed) at the end of a given year (stock) is converted at the exchange rate in effect at the end of the relevant year. Consequently, year-to-year changes in debt outstanding and disbursed may not equal net flows (disbursements less principal repayments); similarly, changes in debt outstanding (including undisbursed debt) may not equal commitments less repayments. Discrepancies will be particularly significant when exchange rates have moved sharply during the year. Projected debt service is converted to US dollars at rates in effect at the end of December 2021.
Beginning with 1991, all ruble debt owed to the former Soviet Union has been converted at a rate of US$1 = 0.6 ruble, except in cases where a bilateral agreement specifying a different conversion rate is in place. Adoption of this methodology does not constitute an endorsement by the World Bank staff of the appropriateness or validity of the exchange rate used. That matter must be resolved bilaterally between the Russian Federation and its debtor countries.
Starting with the 1988–89 edition of World Debt Tables (a predecessor of IDR), all data pertaining to IBRD loans from 1985 onward are recorded at their current market value. Starting with the 1991–92 edition, all data pertaining to Asian Development Bank loans from 1989 onward are recorded at their current market value. Starting with the 1998 edition, all data pertaining to African Development Bank and African Development Fund loans from 1997 onward are recorded at their current market value.
Because of currency conversions and the timing of transactions, there may be differences between the change in aggregate stocks from one period to the next and flows during the relevant period; changes in debt outstanding, including undisbursed amounts, will therefore differ from commitments less repayments.
Changes in the stock of debt from one period to the next can be attributed to five factors: the net flow of debt, the net change in interest arrears, the capitalization of interest, a reduction in debt resulting from debt forgiveness or other debt reduction mechanisms, and cross-currency valuation effects. Any residual difference in the change in stock not explained by one of those five factors may indicate inconsistencies in the reported data or specific phenomena prevailing in an individual country (for example, an incomplete historical series for all categories of debt). Starting in 1989, the IDR publication and IDS database include the debt stock reconciliation, but not all components are shown in the IDR book edition and online tables.
Starting in 1985, the WBXD includes information on the restructuring of debt by official creditors in the context of the Paris Club, restructuring
by commercial creditors, debt swap operations, buybacks, and bond exchanges. It attempts to capture accurately the effect of debt restructuring on both external debt stocks and external debt flows, consistent with the terms on which the restructuring takes place. In the compilation and presentation of external debt data, a distinction is made between cash flows and imputed flows. According to this criterion, restructured service payments and the shift in liabilities from one financial instrument to another as a result of debt restructuring are considered to be imputed flows. Both cash flows and imputed flows are recorded separately in WBXD.
The imputed flows and stock changes associated with debt restructuring are included in the database and tables to complement the cashbasis transactions recorded in the main body of the data. Such data encompass information on the debt stock and debt flows restructured each year, the amount of principal forgiven (interest forgiven is shown as a memorandum item), and the amount of external debt stock reduced either by forgiveness or by a debt buyback operation. Changes in creditors and debtors that result from debt restructuring are also reflected. For example, when insured commercial credits are rescheduled, the creditor classification shifts from private to official (bilateral), reflecting the assumption of the assets by the official credit insurance agencies in the creditor country. The data in the IDR publication and IDS database will show a reduction in the external debt owed to the original private creditors equal or similar to the amount of debt restructured and a corresponding increase in the debt owed to the new official creditor. Similarly on the debtor side, when a government accepts responsibility for the payment of restructured debt previously owed by a private enterprise, the relevant change in the debtor category will be reflected. Likewise, if short-term external debt is restructured into a long-term obligation, the stock of short-term external debt will decline and the stock of longterm external debt will rise by the amount of short-term debt restructured. In the event of a debt swap of long-term external debt (external debt to equity, external debt for nature, or external debt for development), the face value of the external debt swapped will be recorded as a decline in longterm external debt stock, but no flow transaction (principal repayment) will be recorded.
The WBXD system projects future disbursements and future debt service payments on the assumption that every existing loan commitment will be fully used and repaid in full.
Disbursement projections are made using one of the following methods:
• Specific schedules. Debtor countries are requested to submit a schedule of future disbursements, if available, at the time each new loan is first reported.
• Standard schedules. In the absence of specific schedules, the WBXD system projects the future disbursement schedule according to the undisbursed balance of each loan at the end of the most recent reporting period.
These projected schedules are based on profiles derived from the disbursement pattern of comparable loans that fully disbursed. Thirty different profiles have been compiled corresponding to each category of creditor and, in the case of official creditors, for concessional and nonconcessional loans. Each profile is derived by applying regression analysis techniques to a body of data on actual disbursements for each fully disbursed loan in the WBXD system. The profiles are periodically updated to take into account the evolving pattern of disbursements observed for fully disbursed loans.
Future principal payments are generated by the WBXD system according to the repayment terms of each loan. Principal repayments (amortization) are based on the amount of the loan commitment. If the amortization schedule follows a set pattern (for example, equal semiannual payments), the WBXD system calculates repayments automatically using the loan commitment amount, the first and final payment dates, and the frequency of the payments. If future payments are irregular, the WBXD system requires a schedule.
Future interest payments are generated by the WBXD system according to the disbursed and outstanding balance of the loan at the beginning of the period. Using the interest rate specified in the loan contract, the first and final interest payment dates, and the frequency of payments, the WBXD system calculates the stream of future interest
payments due. If interest payments are irregular, the WBXD system requires a schedule.
Future debt service payments are the sum of future principal and interest payments due on existing commitments, including the undisbursed portion. They do not include debt service payments that may become due as a result of new loans contracted in subsequent years, nor do they take into account the effect of any change to future debt service obligations resulting from actions such as prepayment or rescheduling or from cancellations that occurred after the most recent year-end data reported to the DRS.
Both projected disbursements and future debt service payments are converted into US dollars using end-December 2021 exchange rates. Likewise, future interest payments on loans with a variable interest rate (for example, loans from commercial banks tied to the London Interbank Offered Rate are based on the interest rate prevailing at end-December 2022.
The DRS collects information on arrears of both principal and interest. Principal in arrears is included in the amount of long-term external debt outstanding and is shown separately. Interest in arrears on long-term external debt and interest in arrears on the use of IMF credit are included as part of short-term external debt outstanding and are shown separately. Clearance of interest in arrears by repayment will be recorded as an interest payment in the relevant creditor category of the loan (or loans) on which the arrears were incurred, as a corresponding reduction in the level of shortterm debt outstanding, and as a net reduction in interest arrears. Clearance of interest arrears through debt restructuring or forgiveness will be recorded as a reduction in the level of short-term debt outstanding and a net reduction in interest arrears. When interests are rescheduled, they will be capitalized: this change will be recorded as an increase in long-term debt outstanding equal to the amount of interest capitalized and the reduction in short-term debt outstanding noted previously.
This section describes the compilation of the major components of external debt included
in the tables and database and the relationship between them, as shown in figure A.1. Information about general methods of compiling external debt data is discussed in the previous section titled “Methodology.” For concise definitions, see the glossary.
Total external debt shown in the IDR publication and IDS database is the sum of long-term external debt, short-term debt, and IMF credit. It represents the total debt owed to nonresident creditors and is repayable in both foreign and domestic currency.
Short-term debt is defined as external debt with an original maturity of one year or less. The DRS requires debtor countries to report only on their long-term external debt. However, to gain a comprehensive picture of total external obligations, the World Bank encourages debtor countries to voluntarily provide information on their shortterm external obligations.
By its nature, short-term external debt is difficult to monitor: loan-by-loan registration is normally impractical, and monitoring systems typically rely on information requested periodically by the central banks from the banking sector. The World Bank regards the debtor country as the authoritative source of information on its shortterm debt. Unless otherwise specified in the country tables, the data for short-term debt are derived from the data provided by the Quarterly External Debt Statistics database (QEDS; see https://www .worldbank.org/en/programs/debt-statistics/qeds). BIS data on international bank lending is the second source of information on short-term debt. These data are reported on the basis of residual maturity, but an estimate of short-term external liabilities by original maturity can be derived by deducting from claims due in one year those that, 12 months earlier, had a maturity of between one and two years. However, not all commercial banks report to the BIS in a way that allows the full maturity distribution to be determined, and the BIS data include liabilities only to banks within the BIS reporting area. Consequently, the results should be interpreted with caution.
The flow of short-term debt may be derived from the change in claims (stock) data in the BIS quarterly series over consecutive periods, but
Source: World Bank Debtor Reporting System.
Note: IMF = International Monetary Fund.
valuation adjustments resulting from exchange rate movements will affect the calculations, as will prepayment and refinancing of long-term maturities falling due. When short-term external debt has been rescheduled, lags in reporting and differences in the treatment of the rescheduled external debt by debtors and creditors may result in double counting.
Interest in arrears on long-term external debt and interest in arrears on the use of IMF credit are added to short-term debt and are separately identified.
Data related to the operations of the IMF are provided by the IMF Treasurer’s Department. They are converted from special drawing rights (SDRs) into dollars using end-of-period exchange rates for stocks and average-over-the-period exchange
rates for flows. IMF trust fund operations under the Enhanced Structural Adjustment Facility, Extended Fund Facility, Poverty Reduction and Growth Facility, and Structural Adjustment Facility (Enhanced Structural Adjustment Facility in 1999) are presented together with all of the IMF’s special facilities (buffer stock, supplemental reserve, compensatory and contingency facilities, oil facilities, and other facilities). SDR allocations are also included in this category. According to the sixth edition of the Balance of Payments and International Investment Position Manual, SDR allocations are recorded as the incurrence of a debt liability of the member receiving them (because of a requirement to repay the allocation in certain circumstances, and also because interest accrues). This debt item was introduced for the first time in IDR 2013 (formerly IDS 2013) with historical data starting in 1999.
Long-term debt has an original maturity of more than one year. It comprises the obligations of both public and private debtors. Private nonguaranteed debt comprises the external obligations of private debtors that are not guaranteed for repayment by a public entity in the debtor country.
Public and publicly guaranteed debt comprises the external obligations of public debtors and has two components: (a) public debt, which is borrowing by the national government or agency, by a political subdivision or agency, or by autonomous public bodies; and (b) publicly guaranteed debt, which is borrowing by a private agency that is guaranteed for repayment by a public entity.
The DRS reporting requirements were expanded in 1973 to include long-term private nonguaranteed debt. Data are reported annually on an aggregate basis and include, for the reporting year, the total amount of disbursed and outstanding debt; the amount of disbursements, principal repayments, and interest payments; the principal and interest rescheduled; and the projected principal and interest payments for future years. The aggregate data are usually reported in US dollars, and no information on the underlying currency composition is given.
DRS reporting countries recognize the importance of monitoring borrowing by their private sector, particularly when it constitutes a significant portion of total external debt, but many countries acknowledge the difficulty of this process. Detailed data are available only when countries have registration requirements for private nonguaranteed debt in place, most commonly in connection with exchange controls. When formal registration of private nonguaranteed debt is not mandatory, compilers must rely on balance of payments data and financial surveys.
The data on private nonguaranteed debt in this publication are as reported or as estimated for countries where this type of external debt is known to be significant. The estimation of private nonguaranteed debt is based on the national data on quarterly external debt statistics (from QEDS) or IMF data. Flows are derived from the change in stock over consecutive periods and are adjusted for the effects of exchange rate movements (assuming the currency composition mirrors that of public and publicly
guaranteed debt) and for any known debt restructuring. Principal repayments are estimated on the basis of the average maturity observed for loans to private sector borrowers in countries reporting to the DRS and on the basis of the stock of debt outstanding. Interest payments are estimated on the basis of the stock of debt outstanding and interest rates prevailing in international capital markets.
Balance of payments data provide a useful guideline in the estimation process: private nonguaranteed external debt may be derived as a residual between net long-term external borrowing recorded in the balance of payments and net long-term public and publicly guaranteed external debt reported to the DRS.
Public and publicly guaranteed debt
Data related to public and publicly guaranteed debt are reported to the DRS on a loan-by-loan basis. The data provide annual information on the disbursed and outstanding balance and the undisbursed balance of each loan, the cumulative disbursements, the principal and interest paid and principal and interest restructured in the reporting year, and the stock of any outstanding payment’s arrears of principal and interest. Detailed information on the terms and conditions of each loan is also reported. Public debt and private debt publicly guaranteed are shown separately in this publication. Public sector debt is disaggregated by government and “other public” and further disaggregated by creditor type.
Official creditors include multilateral and bilateral lenders. In general, official creditors provide loans (and, in some cases, provide grants) to public bodies, although in some cases they may lend to other entities with a public guarantee.
Multilateral creditors are international financial institutions such as the World Bank, regional development banks, and other multilateral and intergovernmental agencies whose lending is administered on a multilateral basis. Funds administered by an international financial organization on behalf of a single donor government constitute bilateral loans (or grants). For lending by a number of multilateral creditors, the data presented in this publication are taken from the creditors’ records. Such creditors include the African Development Bank, Asian Development Bank, Inter-American Development Bank, IBRD, and IDA.
Bilateral creditors are governments and their agencies, including central banks, aid agencies, official export credit agencies, and autonomous agencies such as the US Department of Agriculture or the Federal Home Loan Bank. Member countries of the Organisation for Economic Co-operation and Development’s Development Assistance Committee and some other countries also report information on loans extended bilaterally or officially guaranteed to that organization’s Creditor Reporting System.
Private creditors include commercial banks, bondholders, and other private creditors. This line includes only publicly guaranteed creditors.
Country-specific notes on debt
Nonguaranteed private creditors are shown separately.
Bonds include publicly issued or privately placed bonds.
Commercial bank loans are loans from private banks and other private financial institutions.
Credits of other private creditors include credits from manufacturers, exporters, and other suppliers of goods, plus bank credits covered by a guarantee of an export credit agency. This line is included in the online database but is not shown in the published tables. It can be obtained as the difference between (a) credits of total private creditors and (b) bonds and commercial bank loans.
Afghanistan Long-term public and publicly guaranteed and short-term debt for 2021 are World Bank staff estimates. Short-term debt before 2015 is based on data from the BIS. Data include the effects of Paris Club debt restructuring agreements signed in 2010 and HIPC and MDRI debt relief. DSSI eligible and participated in 2020 and 2021.
Angola Long-term private nonguaranteed debt data are estimates based on central bank data and are not available before 2009. Short-term debt before 2012 is based on data from the BIS. DSSI eligible and participated in 2020 and 2021.
Argentina Long-term private nonguaranteed debt data before 2008 are World Bank staff estimates. Short-term debt before 2010 is based on data from the BIS.
Azerbaijan Long-term private nonguaranteed debt data are World Bank staff estimates based on market data. Shortterm debt is based on data from the BIS.
Bangladesh Short-term debt before 2012 is based on data from the BIS. Long-term private nonguaranteed debt data from 2007 to 2018 are World Bank staff estimates based on reports provided by the country and are not available before 2007. DSSI eligible and did not participate in 2020 or 2021.
Belarus Long-term private nonguaranteed debt data before 2014 are World Bank staff estimates based on reports provided by the country; the data from 2014 onward are sourced from QEDS.
Belize Long-term private nonguaranteed debt data for 2021 are based on central bank data.
Benin Short-term debt is based on data from the BIS. Data include the effects of the Paris Club debt restructuring agreement and HIPC and MDRI debt relief. DSSI eligible and did not participate in 2020 or 2021.
Bhutan Short-term debt is based on data from the BIS. DSSI eligible and did not participate in 2020 or 2021.
Bolivia Long-term private nonguaranteed debt data for 2021 are World Bank staff estimates based on reports provided by the country.
Bosnia and Herzegovina
Since 2005, private nonguaranteed debt data are World Bank staff estimates. Long-term private nonguaranteed debt was revised for the 2018–20 period. Short-term debt before 2018 is based on data from the BIS.
Botswana Short-term debt is based on data from the BIS.
Bulgaria Long-term private nonguaranteed debt data from 2020 onward are reported by the country. Short-term debt data for 2021 are sourced from QEDS. The data include long-term public and publicly guaranteed debt owed by the state-owned railway.
Burkina Faso Long-term private nonguaranteed debt data before 2018 and after 2020 are World Bank staff estimates based on reports provided by the country. Data include HIPC and MDRI debt relief. DSSI eligible and participated in 2020 and 2021.
Burundi Data include the effects of the Paris Club debt restructuring agreement and HIPC and MDRI debt relief. DSSI eligible and participated in 2020 and 2021.
Cambodia Data include MDRI debt relief. DSSI eligible and did not participate in 2020 or 2021.
Cameroon Short-term debt is based on data from the BIS. Data include the effects of HIPC and MDRI debt relief. DSSI eligible and participated in 2020 and 2021.
Central African Republic Short-term debt is based on data from the BIS. Data include the effects of HIPC and MDRI debt relief. DSSI eligible and did not participate in 2020 but participated in 2021.
Chad Short-term debt is based on data from the BIS. Data include the effects of the Paris Club debt restructuring agreement and HIPC and MDRI debt relief. DSSI eligible and participated in 2020 and 2021.
China Long-term public and publicly guaranteed and long-term private nonguaranteed debt are World Bank staff estimates based on the aggregate reports provided by the country and market data.
Comoros Data include the effects of Paris Club debt restructuring agreements signed in 2010 and 2013, and HIPC debt relief. DSSI eligible and participated in 2020 and 2021.
Congo, Democratic Republic of
Short-term debt is based on data from the BIS. Data include the effects of the Paris Club debt restructuring agreement and HIPC and MDRI debt relief. DSSI eligible and participated in 2020 and 2021.
Congo, Republic of Short-term debt is based on data from the BIS. Data include the effects of the Paris Club debt restructuring agreement and HIPC and MDRI debt relief. Prepurchased debts for oil to private creditors were first reported to the DRS in 2020 and 2021 after rescheduling, which accounts for the jump in debt stock outstanding from 2020 to 2021. DSSI eligible and participated in 2020 and 2021.
Costa Rica Long-term private nonguaranteed debt and short-term data for 2021 are based on reports provided by the country’s central bank.
Côte d’Ivoire Long-term private nonguaranteed debt data are World Bank staff estimates. Short-term debt is based on data from the BIS. Data include the effects of Paris Club agreements signed in 2011 and 2012, and HIPC and MDRI debt relief. DSSI eligible and participated in 2020 and 2021.
Djibouti Short-term debt before 2017 is based on data from the BIS. Data include the effects of the Paris Club debt restructuring agreement signed in 2008. DSSI eligible and participated in 2020 and 2021.
Dominican Republic Long-term private nonguaranteed debt data from 2018 are World Bank staff estimates based on reports provided by the country. Short-term debt before 2009 and from 2014 onward is based on data from the BIS. Data include the effects of the Paris Club debt restructuring agreement signed in 2005.
El Salvador Long-term private nonguaranteed debt data are World Bank staff estimates based on reports provided by the country.
Eritrea Long-term public and publicly guaranteed debt from 2010 are World Bank staff estimates. Short-term debt for 2021 is based on data from the BIS.
Eswatini Long-term private nonguaranteed debt data are World Bank staff estimates based on the International Investment Position statistics from the IMF. Short-term debt is based on data from the BIS.
Ethiopia Short-term debt is based on data from the BIS. Data include the effects of HIPC and MDRI debt relief. DSSI eligible and participated in 2020 and 2021.
Fiji Long-term private nonguaranteed debt data for 2012 are World Bank staff estimates. Short-term debt is based on data from the BIS. DSSI eligible and participated in 2020 and 2021.
Gabon Long-term public and publicly guaranteed debt data before 2008 are World Bank staff estimates based on reports provided by the country. Short-term debt is based on data from the BIS. Data include the effects of the Paris Club debt buyback agreement signed in 2007.
Gambia, The Short-term debt is based on data from the BIS. Data include the effects of HIPC and MDRI debt relief. DSSI eligible and participated in 2020 and 2021.
Ghana Short-term debt is based on data from the BIS. Data include the effects of MDRI debt relief. DSSI eligible and did not participate in 2020 or 2021.
Grenada Short-term debt is based on data from the BIS. DSSI eligible and participated in 2020 but did not participate in 2021.
Guatemala Long-term private nonguaranteed debt data before 2014 are World Bank staff estimates based on reports provided by the country. The short-term debt data from 2014 onward are sourced from QEDS.
Guinea Long-term public and publicly guaranteed debt for 2016 are World Bank staff estimates. Short-term debt is based on data from the BIS. Data include the effects of Paris Club debt restructuring agreements signed in 2010 and 2012, and HIPC debt relief. DSSI eligible and participated in 2020 and 2021.
Guinea-Bissau Short-term debt before 2019 is based on data from the BIS. Data include the effects of the Paris Club debt restructuring agreement and HIPC and MDRI debt relief. DSSI eligible and did not participate in 2020 or 2021.
Guyana Long-term private nonguaranteed debt data after 2014 are World Bank staff estimates based on market data. Short-term debt is based on data from the BIS. Principal payments shown from 2012 include rice for oil deal. Data include the effects of HIPC and MDRI debt relief. DSSI eligible and did not participate in 2020 or 2021.
Haiti Long-term private nonguaranteed debt data cover only Inter-American Development Bank loans. Short-term debt is based on data from the BIS. Data include the effects of Paris Club restructuring agreements signed in 2006 and 2009, and HIPC and MDRI debt relief. DSSI eligible and did not participate in 2020 or 2021.
Honduras Data include the effects of HIPC and MDRI debt relief. DSSI eligible and did not participate in 2020 or 2021.
India External debt data before 2003 are revised from fiscal year to calendar year. Long-term public and publicly guaranteed bonds include foreign institutional investor debt as reported by the Reserve Bank of India.
Indonesia Long-term private nonguaranteed debt data are World Bank staff estimates based on reports provided by the country.
Iran, Islamic Republic of Short-term debt data are based on central bank data.
Iraq Short-term debt is based on data from the BIS.
Jamaica Short-term debt data for 2021 are based on reports provided by the country’s central bank.
Jordan Long-term private nonguaranteed debt data for 2021 are based on reports provided by the country’s central bank. Short-term debt data for 2021 are sourced from QEDS.
Kenya Long-term private nonguaranteed debt data are World Bank staff estimates based on market data. Shortterm debt is based on data from the BIS. DSSI eligible and did not participate in 2020 but participated in 2021.
Kosovo DSSI eligible and did not participate in 2020 or 2021.
Kyrgyz Republic
Lao People’s Democratic Republic
Long-term private nonguaranteed debt data are World Bank staff estimates based on reports provided by the country. DSSI eligible and did not participate in 2020 but participated in 2021.
Long-term private nonguaranteed debt data are World Bank staff estimates. Short-term debt is based on data from the BIS. DSSI eligible and did not participate in 2020 or 2021.
Lebanon Long-term private nonguaranteed debt data from 2008 to 2012 are World Bank staff estimates based on the 2013–17 debt stock. Short-term debt before 2013 is based on data from the BIS.
Lesotho A large interest payment was made in 2007 to a creditor country to settle a long-standing claim. Long-term private nonguaranteed debt data are World Bank staff estimates based on the International Investment Position statistics from the IMF. Short-term debt data are based on data from the BIS. DSSI eligible and participated in 2020 and 2021.
Liberia Long-term private nonguaranteed debt data are World Bank staff estimates based on market data. Data include the effects of Paris Club rescheduling agreements signed in 2008 and 2010, and HIPC and MDRI debt relief. DSSI eligible and did not participate in 2020 or 2021.
Madagascar Long-term private nonguaranteed debt data from 2017 to 2021 are World Bank staff estimates based on market data. Short-term debt from 2017 is based on data from the BIS. Data include the effects of HIPC and MDRI debt relief. DSSI eligible and participated in 2020 and 2021.
Malawi Short-term debt is based on data from the BIS. Data include the effects of the Paris Club rescheduling agreement signed in 2006 and HIPC and MDRI debt relief. DSSI eligible and did not participate in 2020 or 2021.
Maldives
Long-term private nonguaranteed and short-term debt data from 2006 are World Bank staff estimates based on reports provided by the country. Short-term debt is based on data from the BIS. DSSI eligible and participating in 2020 and 2021.
Mali Short-term debt is based on data from the BIS. Data include the effects of HIPC and MDRI debt relief. DSSI eligible and participating in 2020 and 2021.
Mauritania
Short-term debt is based on data from the BIS. Data include the effects of MDRI debt relief. DSSI eligible and participating in 2020 and 2021.
Mauritius Long-term private nonguaranteed debt data from 2009 to 2010 and from 2017 to 2021 are based on reports provided by the country and do not include offshore liabilities; 2011–16 data are World Bank staff estimates based on reports provided by the country. Short-term debt is based on reports provided by the country and includes offshore liabilities.
Moldova DSSI eligible and did not participate in 2020 or 2021.
Mongolia Long-term private nonguaranteed debt data before 2016 are World Bank staff estimates based on reports provided by the country. Short-term debt before 2008 is based on data from the BIS. DSSI eligible and did not participate in 2020 or 2021.
Montenegro Long-term private nonguaranteed debt data for the period 2010–20 are revised. From 2005 to 2009, private nonguaranteed debt data are World Bank staff estimates. Short-term debt for 2020 and 2021 is based on data from the BIS and for prior years is based on country reports.
Morocco Short-term debt before 2009 is based on data from the BIS.
Mozambique Long-term private nonguaranteed debt data before 2011 are World Bank staff estimates based on reports provided by the country. Short-term debt is based on data from the BIS. Data include HIPC and MDRI debt relief. DSSI eligible and participated in 2020 and 2021.
Myanmar Long-term public and publicly guaranteed debt data before 2018 are World Bank staff estimates based on the original terms of the loans. Long-term private nonguaranteed debt data are World Bank staff estimates based on market data. DSSI eligible and participated in 2020 and 2021.
Nepal Long-term private nonguaranteed debt data are World Bank staff estimates based on reports provided by the country. DSSI eligible and participated in 2020 and 2021.
Nicaragua Short-term debt before 2007 is based on data from the BIS. Data include the effects of HIPC and MDRI debt relief. DSSI eligible and did not participate in 2020 or 2021.
Niger Short-term debt is based on data from the BIS. Data include the effects of HIPC and MDRI debt relief. DSSI eligible and participated in 2020 and 2021.
Nigeria Long-term private nonguaranteed debt data from 2005 are estimates based on market data. DSSI eligible and did not participate in 2020 or 2021.
Pakistan Debt rescheduling reflected in the DSSI is World Bank staff estimates using the partial reports from the country. Short-term debt before 2012 is based on data from the BIS. Long-term private nonguaranteed debt data from 2006 to 2015 are World Bank staff estimates based on the reports provided by the country. DSSI eligible and participated in 2020 and 2021.
Papua New Guinea Short-term debt is based on data from the BIS. DSSI eligible and participated in 2020 and 2021.
Peru Short-term debt and long-term private nonguaranteed debt data for 2021 are sourced from QEDS.
Philippines Long-term private nonguaranteed debt data no longer include unregistered debt and are revised from 2005 on the basis of reports provided by the country.
Russian Federation
Long-term public and publicly guaranteed and long-term private nonguaranteed debt are World Bank staff estimates based on Balance of Payments and International Investment Position statistics from the IMF.
Rwanda Data include the effects of HIPC and MDRI debt relief. DSSI eligible but did not participate in 2020 or 2021.
Samoa Short-term debt data are excluded because BIS data include debt liabilities of offshore centers located in the country. BIS short-term debt amounts for 2019, 2020, and 2021 are US$4.5 billion, US$3.9 billion, and US$3.8 billion, respectively. DSSI eligible and participated in 2020 and 2021.
São Tomé and Príncipe
Short-term debt is based on data from the BIS. Data include HIPC and MDRI debt relief. DSSI eligible and participated in 2020 and 2021.
Senegal Long-term private nonguaranteed debt and short-term debt are based on data from the Central Bank of West African States. DSSI eligible and participated in 2020 and 2021.
Serbia Beginning in 2006, the data for Serbia exclude Montenegro. Short-term debt is based on reports provided by the country.
Sierra Leone Short-term debt before 2016 is based on data from the BIS. Data include the effects of the Paris Club debt restructuring agreement and HIPC and MDRI debt relief. DSSI eligible and participated in 2020 and 2021.
Somalia Long-term public and publicly guaranteed debt before 2018 are World Bank staff estimates based on the original terms of the loans. Beginning in 2018, the data reflect the outstanding debt stock, principal, and interest arrears, and include late interest payments and penalty amounts following the reconciliation exercise by the government of Somalia with respective creditors. DSSI eligible and did not participate in 2020 or 2021.
South Africa Long-term public and publicly guaranteed and long-term private nonguaranteed debt data before 2019 are World Bank staff estimates.
St. Lucia Short-term debt before 2012 is based on data from the BIS. DSSI eligible and did not participate in 2020 but participated in 2021.
St. Vincent and the Grenadines Short-term debt data are excluded because BIS data include debt liabilities of offshore centers located in the country. BIS short-term debt amounts for 2017, 2018, 2019, 2020, and 2021 are US$787 million, US$532 million, US$363 million, US$321 million, and US$242 million, respectively. DSSI eligible and did not participate in 2020 but participated in 2021.
Sudan Long-term public and publicly guaranteed data for 2021 are World Bank staff estimates. Data include the effects of HIPC debt relief from the World Bank, IMF, and African Development Bank. Long-term public and publicly guaranteed debt data exclude penalty interest that has accumulated over an extended period and is extensive. Short-term debt is based on data from the BIS.
Syrian Arab Republic Long-term public and publicly guaranteed debt data are World Bank staff estimates. Short-term debt is based on data from the BIS.
Tajikistan Long-term public and publicly guaranteed debt data for 2021 are World Bank staff estimates. Shortterm debt before 2015 is based on data from the BIS. Data include MDRI debt relief. DSSI eligible and participated in 2020 but did not participate in 2021.
Tanzania Long-term public and publicly guaranteed debt data include debt liabilities of Zanzibar. Short-term debt is based on data from the BIS. Data include the effects of HIPC and MDRI debt relief. DSSI eligible and participated in 2020 and 2021.
Timor-Leste Short-term debt is based on data from the BIS. DSSI eligible and did not participate in 2020 or 2021.
Togo Short-term debt is based on data from the BIS. Data include the effects of the Paris Club debt restructuring agreement and HIPC and MDRI debt relief. DSSI eligible and participated in 2020 and 2021.
Tonga DSSI eligible and participated in 2020 and 2021.
Tunisia Long-term private nonguaranteed debt data from 2008 to 2014 are estimates based on reports provided by the country.
Turkmenistan Country resumed reporting of long-term public and publicly guaranteed debt from 2008 onward; time series has been revised. Long-term private nonguaranteed debt data (excluding bonds) cover only European Bank for Reconstruction and Development lending.
Uganda Long-term private nonguaranteed debt data are World Bank staff estimates based on market data. Data include the effects of HIPC and MDRI debt relief. DSSI eligible and did not participate in 2020 or 2021.
Uzbekistan Short-term debt before 2009 is based on data from the BIS. DSSI eligible and did not participate in 2020 or 2021.
Vanuatu Short-term debt for 2021 is based on data from the BIS. DSSI eligible and did not participate in 2020 or 2021.
Vietnam Short-term debt before 2016 is based on data from the BIS.
Yemen, Republic of Long-term public and publicly guaranteed debt data from 2019 onward are World Bank staff estimates based on the original terms of the loans. Short-term debt is based on data from the BIS. DSSI eligible and participated in 2020 and 2021, but country has not reported data.
Zambia Long-term private nonguaranteed data before 2016 are World Bank staff estimates based on reports provided by the country. Short-term debt is based on data from the BIS. Data include the effects of HIPC and MDRI debt relief. DSSI eligible and participated in 2020 and 2021.
Zimbabwe Long-term private nonguaranteed data are World Bank staff estimates based on reports provided by the country. Data from 2001 include late interest fees owed to the Paris Club and commercial creditors. Short-term debt is based on data from the BIS. Reserve Bank of Zimbabwe assumed external debt is not included in the data.
The macroeconomic data are prepared by the World Bank from a variety of sources. Data on personal transfers and compensation of employees are prepared by World Bank staff based using IMF balance of payments statistics.
Data on foreign direct investments and current account balance are prepared by World Bank staff using IMF balance of payments statistics and United Nations Conference on Trade and Development publications. Other macroeconomic data are from IMF balance of payments statistics.
Data on current account balance are based on countries’ balance of payments statistics for the following countries:
Benin (2021)
Burkina Faso (2021) Burundi (2021)
Central African Rep. (2021) Chad (2021)
Congo, Dem. Rep. (2021) Congo, Rep. (2017–21)
Côte d’Ivoire (2021) Eritrea (2021) Gabon (2021) Ghana (2021)
Guinea-Bissau (2021) Guyana (2020–21) Iran, Islamic Rep. (2020–21) Lebanon (2021) Liberia (2020–21) Mali (2021) Mauritania (2021) Mongolia (2021) Myanmar (2021) Niger (2021) Papua New Guinea (2021)
Rwanda (2021) Senegal (2021) Sierra Leone (2021) Somalia (2013–21) Sri Lanka (2021) Tanzania (2021) Timor-Leste (2021) Togo (2021) Uganda (2021) Zimbabwe (2021)
Data on exports of goods, services, and primary income are based on countries’ balance of payments statistics for the following countries:
Benin (2021) Burkina Faso (2021) Burundi (2019–20) Côte d’Ivoire (2021) Ethiopia (2021) Ghana (2021) Guinea-Bissau (2021) Guyana (2021) Iran, Islamic Rep. (2001–21)
Lebanon (2021) Liberia (2020–21) Mali (2021) Mauritania (2006–11, 2021) Mongolia (2021) Myanmar (2020–21) Niger (2021) Rwanda (2021) Senegal (2019–21)
Somalia (2013–19) Sri Lanka (2021) Tanzania (2021) Timor-Leste (2021) Togo (2021) Uganda (2021) Zimbabwe (2021)
Data on imports of goods, services, and primary income are based on countries’ balance of payments statistics for the following countries:
Benin (2021) Burkina Faso (2021) Burundi (2019–20)
Côte d’Ivoire (2021) Ethiopia (2021) Ghana (2021) Guyana (2021)
Iran, Islamic Rep. (2001–21) Lebanon (2021)
Liberia (2020–21) Mali (2021) Mauritania (2006–11, 2021) Mongolia (2021) Myanmar (2020–21) Niger (2021) Papua New Guinea (2021) Rwanda (2021) Senegal (2019–21)
Somalia (2013–18) Sri Lanka (2021) Tanzania (2021) Timor-Leste (2021) Togo (2021) Uganda (2021) Zimbabwe (2021)
Data on personal transfers and compensation of employees are based on countries’ balance of payments statistics for the following countries:
Burundi (2019–20) Ghana (2021) Lebanon (2021) Myanmar (2020)
Rwanda (2021) Somalia (2013–19, 2021) Sri Lanka (2021) Timor-Leste (2021)
Uganda (2021) Zimbabwe (2021)
Data on primary income on foreign direct investment are based on countries’ balance of payments statistics for the following countries:
Burundi (2019–20) Lebanon (2021) Rwanda (2021) Sri Lanka (2021)
Tanzania (2021) Uganda (2021)
Data on foreign direct investment are based on countries’ balance of payments statistics for the following countries:
Jamaica (2012–21) Lebanon (2021) Liberia (2020–21) Mongolia (2021)
Myanmar (2020–21) Rwanda (2021) Sri Lanka (2021) Tanzania (2021)
Timor-Leste (2021) Uganda (2021) Zimbabwe (2021)
Data on portfolio equity are based on countries’ balance of payments statistics for the following countries:
Bhutan (2021) Jordan (2021) Lebanon (2021)
Rwanda (2021) Sri Lanka (2021) Tanzania (2021)
Uganda (2021)
Data on international reserves are based on countries’ international reserve statistics for the following countries:
Congo, Rep. (2020–21) Peru (2021) Sri Lanka (2021) Tanzania (2019–21) Uganda (2020–21)
East Asia and Pacific Cambodia (A) China (P) Fiji (A) Indonesia (A)
Lao PDR (A) Mongolia (A) Myanmar (A)
Papua New Guinea (A) Philippines (A) Samoa (A) Solomon Islands (A) Thailand (A) Timor-Leste (A) Tonga (A) Vanuatu (A) Vietnam (A)
Europe and Central Asia Albania (A) Armenia (A) Azerbaijan (A) Belarus (A)
Bosnia and Herzegovinaa (A) Bulgaria (A) Georgia (A) Kazakhstan (A) Kosovo (A) Kyrgyz Republic (A) Moldova (A) Montenegro (A)
North Macedonia (A) Russian Federation (E) Serbiaa,b (A)
Tajikistan (E) Türkiye (A) Turkmenistan (A) Ukraine (A) Uzbekistan (A)
Latin America and the Caribbean Argentina (A) Belize (A) Bolivia (A) Brazil (P) Colombia (A) Costa Rica (A) Dominica (A) Dominican Republic (A) Ecuador (A) El Salvador (A) Grenada (A) Guatemala (A) Guyana (A) Haiti (A) Honduras (A) Jamaica (A) Mexico (A) Nicaragua (A) Paraguay (A) Peru (A) St. Lucia (A) St. Vincent and the Grenadines (A)
Middle East and North Africa Algeria (A) Djibouti (A)
Source: World Bank Debtor Reporting System.
Egypt, Arab Rep. (A) Iran, Islamic Rep. (A) Iraq (A) Jordan (A) Lebanon (A) Morocco (A) Syrian Arab Republic (E) Tunisia (A) Yemen, Rep. (E)
South Asia Afghanistan (E) Bangladesh (A) Bhutan (A) India (A) Maldives (A) Nepal (A) Pakistan (A) Sri Lanka (A)
Sub-Saharan Africa Angola (A) Benin (A) Botswana (A) Burkina Faso (A) Burundi (A) Cabo Verde (A) Cameroon (A) Central African Republic (A) Chad (P) Comoros (A) Congo, Dem. Rep. (A) Congo, Rep. (A) Côte d’Ivoire (A)
Eritrea (E) Eswatini (A) Ethiopia (A) Gabon (A) Gambia, The (A) Ghana (A) Guinea (A) Guinea-Bissau (A) Kenya (A) Lesotho (A) Liberia (A) Madagascar (A) Malawi (A) Mali (A) Mauritania (A) Mauritius (A) Mozambique (A) Niger (A) Nigeria (A) Rwanda (A) São Tomé and Príncipe (A) Senegal (A) Sierra Leone (A) Somalia (A) South Africa (A) Sudan (E) Tanzania (A) Togo (A) Uganda (A) Zambia (A) Zimbabwe (A)
Note: Letters in parentheses indicate Debtor Reporting System (DRS) reporters’ status: (A) as reported, (P) preliminary, and (E) estimated. The status “as reported” indicates that the country was fully current in its reporting under the DRS and that World Bank staff are satisfied that the reported data give an adequate and fair representation of the country’s total public debt. “Preliminary” data are based on reported or collected information; however, because of incompleteness or other reasons, an element of staff estimation is included. “Estimated” data indicate that countries are not current in their reporting and that a significant element of staff estimation has been necessary in producing the data tables.
a. For Bosnia and Herzegovina, total debt before 1999, excluding International Bank for Reconstruction and Development and International Monetary Fund obligations and short-term debt, is included under Serbia.
b. Data before 2006 include Montenegro.
Low-income countries
Afghanistan Burkina Faso Burundi Central African Republic Chad Congo, Dem. Rep. Eritrea Ethiopia Gambia, The Guinea Guinea-Bissau Liberia Madagascar Malawi Mali Mozambique Niger Rwanda Sierra Leone Somalia Sudan Syrian Arab Republic Togo Uganda Yemen, Rep. Zambia
Middle-income countries
Albania Algeria Angola Argentina Armenia Azerbaijan Bangladesh Belarus Belize Benin Bhutan Bolivia Bosnia and Herzegovina Botswana Brazil Bulgaria Cabo Verde Cambodia Cameroon China Colombia Comoros Congo, Rep. Costa Rica Côte d’Ivoire Djibouti Dominica Dominican Republic Ecuador Egypt, Arab Rep. El Salvador
Eswatini Fiji Gabon Georgia Ghana Grenada Guatemala Guyana Haiti Honduras India Indonesia Iran, Islamic Rep. Iraq Jamaica Jordan Kazakhstan Kenya Kosovo Kyrgyz Republic Lao PDR Lebanon Lesotho Maldives Mauritania Mauritius Mexico Moldova Mongolia Montenegro Morocco Myanmar
Nepal Nicaragua Nigeria North Macedonia Pakistan Papua New Guinea Paraguay Peru Philippines Russian Federation Samoa São Tomé and Príncipe Senegal Serbia Solomon Islands South Africa Sri Lanka St. Lucia St. Vincent and the Grenadines Tajikistan Tanzania Thailand Timor-Leste Tonga Tunisia Türkiye Turkmenistan Ukraine Uzbekistan Vanuatu Vietnam Zimbabwe
Source: World Bank.
Note: Low-income countries are those with a GNI per capita of US$1,085 or less in 2021. Middle-income countries are those with a GNI per capita equal to or more than US$1,086 but equal to or less than US$13,205. Italicized countries are IDA-only countries as of July 1, 2022; IDA-only excludes blend and IBRD countries. República Bolivariana de Venezuela is unclassified according to the World Bank FY2022 income classification owing to a lack of available data; thus, it is not included in this report or the International Debt Statistics database. FY = fiscal year; GNI = gross national income; IBRD = International Bank for Reconstruction and Development; IDA = International Development Association.
Bilateral official creditors are official agencies that make loans on behalf of one government to another government or to public (and, in some cases, private) borrowers in another country.
Bonds are debt instruments issued by public and publicly guaranteed or private debtors with durations of one year or longer. Bonds usually give the holder the unconditional right to fixed money income or contractually determined, variable money income.
Central bank is the country’s financial institution that exercises control over key aspects of the financial system. It carries out activities such as issuing currency, managing international reserves, transacting with the International Monetary Fund, and providing credit to deposit-taking corporations.
Commitments of public and publicly guaranteed debt constitute the total amount of new long-term loans to public sector borrowers or borrowers with a public sector guarantee extended by official and private lenders and for which contracts were signed in the year specified.
Concessional debt conveys information about the borrower’s receipt of aid from official lenders at concessional terms as defined by the World Bank, that is, loans with an original grant element of 35 percent or more. Loans from major regional development banks—the African Development Bank, Asian Development Bank, and Inter-American Development Bank—are classified as concessional according to World Bank classification.
Contractual obligations on outstanding long-term external debt are the anticipated debt service payments on long-term external debt contracted up to December 31 of the reporting year.
Debt buyback is the repurchase by a debtor of its own debt, either at a discount price or at par value. In the event of a buyback of long-term debt, the face value of the debt bought back will be recorded as a decline in stock outstanding of long-term debt, and the cash amount received by creditors will be recorded as a principal repayment. For example, if a country buys back longterm external debt of face value B at a price P, then long-term external debt will decline by B, and principal repayment will increase by P. The difference between the price at which the debt was bought back and the face value is recorded as a debt stock write-off (the related transactions are not separately identified in the International Debt Report publication but are available in the International Debt Statistics database).
Debt forgiveness grants include both debts canceled by agreement between debtor and creditor and reductions in the net present value of official nonconcessional loans resulting from concessional rescheduling or refinancing.
Debt outstanding and disbursed is the value at year’s end of long-term external debt owed by public and publicly guaranteed debtors and private nonguaranteed debtors.
Debt restructurings are revisions to debt service obligations agreed on by creditors and debtors. Such agreements change the amount and timing of future principal and interest payments.
Debt service to exports is the ratio of the sum of principal repayments and interest paid on total long-term debt (public and publicly guaranteed debt and private nonguaranteed debt) to the value of exports of goods and services and receipts of primary income from abroad.
Debt Service Suspension Initiative (DSSI) took effect on May 1, 2020, and allowed 73 eligible countries to apply for a temporary suspension of debt-service payments owed to official bilateral creditors. The suspension period, originally set to end on December 31, 2020, has been extended through December 2021.
Debt stock-flow reconciliation shows the indicators that affect the change in debt stocks from one period to the next.
Disbursements are drawings during the year specified on loan commitments contracted by the borrower.
Exports of goods, services, and primary income constitute the total value of exports of goods and services, and primary income.
External debt flows are debt-related transactions during the year specified. They include disbursements, principal repayments, and interest payments.
External debt stocks comprise public and publicly guaranteed long-term external debt, private nonguaranteed long-term external debt, use of International Monetary Fund credit and special drawing rights allocation, and short-term external debt.
External debt stocks to exports is the ratio of outstanding external debt to the value of exports of goods and services and receipts of primary income from abroad.
External debt stocks to GNI is the ratio of outstanding external debt to gross national income.
Foreign direct investment refers to direct investment equity flows in the reporting economy. It is the sum of equity capital, reinvestment earnings, and other capital. Direct investment is a category of cross-border investment associated with a resident in one economy having control or a significant degree of influence on the management of an enterprise that is resident in another economy. Ownership of 10 percent or more of the ordinary shares or voting stock is the criterion for determining the existence of a direct investment relationship.
Foreign currency swaps with other central banks are reserve-related liabilities defined as foreign currency liabilities of monetary authorities. These
debt liabilities are recorded as central bank debt obligations.
Government sector debt consists of all external debt obligations of all levels of the government and its departments, branches, agencies, foundations, institutes, nonmarket and nonprofit institutions controlled by the government, and other publicly controlled organizations engaging in nonmarket activities.
Grace period is the time between the date on which a loan is committed and the date on which the first principal payment is due. The information presented in the International Debt Statistics database is the average grace period on all public and publicly guaranteed debt committed during the specified period.
Grants are legally binding commitments that obligate a specific value of funds available for disbursement for which there is no payment requirement. They include debt forgiveness grants and grants from bilateral and multilateral agencies (such as the International Development Association).
Gross national income (GNI) is the sum of value added by all resident producers, plus any product taxes (less subsidies) not included in the valuation of output, plus net receipts of primary income compensation of employees and property income from abroad. Yearly average exchange rates are used to convert GNI from local currency to US dollars.
Heavily Indebted Poor Country (HIPC) Initiative is a program of the World Bank and the International Monetary Fund to provide debt relief to qualifying countries with unsustainable debt burdens.
Imports of goods, services, and primary income constitute the total value of goods and services imported and income payable to nonresidents.
Interest arrears are due and payable immediately and are therefore regarded as short-term obligations. Thus, an increase in interest arrears on long-term debt will be recorded as an increase in short-term debt. Interest in arrears on the use of International Monetary Fund credit is also considered to be part of short-term external debt.
Interest payments are the amounts of interest paid in foreign currency, goods, or services in the year specified.
Interest rate is the interest rate applicable to a loan commitment as specified in the loan contract. The information presented in the International Debt Statistics database is the average interest on all public and publicly guaranteed debt committed during the specified period.
IMF charges are the amounts of interest paid in foreign currency in the year specified for transactions with the International Monetary Fund.
IMF purchases are the total drawings on the general resources account of the International Monetary Fund during the year specified, excluding drawings in the reserve tranche.
IMF repurchases are the amounts of principal (amortization) paid in foreign currency in the year specified for transactions with the International Monetary Fund.
International reserves constitute the sum of a country’s monetary authority’s holdings of special drawing rights, its reserve position in the International Monetary Fund, its holdings of foreign exchange, and its holdings of gold (valued at yearend London prices).
Long-term external debt is debt that has an original or extended maturity of more than one year and that is owed to nonresidents by residents of an economy and is repayable in currency, goods, or services.
Maturity is the date on which the final principal repayment on a loan is due. It is the sum of the grace and repayment periods. The information presented in the International Debt Statistics database is the average maturity on all public and publicly guaranteed debt committed during the specified period.
Multilateral Debt Relief Initiative (MDRI) is a program of the World Bank, the International Monetary Fund, the Inter-American Development Bank, and the African Development Bank that provides additional debt relief to countries that have completed the Heavily Indebted Poor Country Initiative process.
Multilateral official creditors are official agencies owned or governed by more than one country that provide loan financing. They include international financial institutions such as the World Bank, regional development banks, and other intergovernmental agencies.
Multilateral to external debt stocks is the ratio of the stock of debt owed to multilateral creditors to total external debt.
Net flows on external debt are disbursements on long-term external debt and International Monetary Fund (IMF) purchases minus principal repayments on long-term external debt and IMF repurchases. Up to 1984, this calculation included only long-term external debt and IMF flows. Since 1985, the calculation includes the change in stock of short-term debt (excluding interest arrears on long-term external debt).
Official creditors are governments or other bilateral public entities, such as export-import agencies, development agencies, and multilateral financial institutions, such as the World Bank and regional development banks.
Personal transfers and compensation of employees is the sum of personal transfers and compensation of employees. Personal transfers consist of all current transfers in cash or in kind made or received by resident households to or from nonresident households. Personal transfers thus include all current transfers between resident and nonresident individuals. Compensation of employees refers to the income of border, seasonal, and other shortterm workers who are employed in an economy where they are not resident and of residents employed by nonresident entities.
Portfolio equity is the category of international investment that refers to portfolio equity inflows and covers investment in equity securities. Equity securities include shares, stocks, participation, or similar documents (such as American depositary receipts) that usually denote ownership of equity.
Present value of debt outstanding is the nominal value of all future debt service obligations on existing debt discounted at prevailing market rates of interest. The interest rates used in this calculation are the Commercial Interest Reference Rates (CIRRs) for each relevant currency compiled and published by the Organisation for Economic Co-operation and Development.
Primary income on FDI are payments of direct investment income (debit side), which consist of income on equity (dividends, branch profits, and reinvested earnings) and income on the intercompany debt (interest).
Principal arrears on long-term debt are principal repayments due but not paid on long-term external debt, shown on a cumulative basis.
Principal repayments are the amounts of principal (amortization) paid in currency, goods, or services in the year specified with respect to long-term external debt.
Private creditors are bondholders, commercial banks, and other trade-related lenders.
Private nonguaranteed debt is debt owed by private sector borrowers to external creditors on loans that do not benefit from a public sector guarantee by the debtor country.
Public and publicly guaranteed debt outstanding and disbursed is the value of debt at year’s end of public sector borrowers and private sector borrowers with a public sector guarantee, owed to official and private lenders.
Public and publicly guaranteed external debt comprises public debt (an external obligation of a public debtor, such as the general government or agency, the central bank, a political subdivision or agency, or an autonomous public body) and publicly guaranteed external debt (an external obligation of a private debtor that is guaranteed for repayment by a public entity).
Public debt is an external obligation of a public debtor, including all levels of government, the central bank, state-owned enterprises, public corporations, development banks, and any other autonomous public bodies of government.
Publicly guaranteed debt is an external obligation of a private debtor that is guaranteed for repayment by a public entity.
Reserves to external debt stocks is the ratio of international reserves to outstanding external debt.
Reserves to imports (months) is the ratio of international reserves to the value of imports of goods, services, and primary income in the year shown and is expressed in months:
Short-term external debt has an original maturity of one year or less. Available data permit no
distinction among public, publicly guaranteed, and private nonguaranteed short-term external debt.
Short-term to external debt stock ratio is the ratio of short-term external debt to total outstanding external debt.
Special drawing rights (SDRs) refer to an international reserve asset that was created by the International Monetary Fund (IMF) in 1969 to supplement its member countries’ official reserves. The value of SDRs is based on a basket of four key international currencies: the US dollar, the pound sterling, the Japanese yen, and the euro. In addition to playing a role as a supplementary reserve asset, SDRs serve as the unit of account for the IMF and some other international organizations.
SDR allocations are reserve-related liabilities. The SDR (special drawing rights) allocations are included in the gross external debt position and classified as long-term, special drawing rights.
Technical cooperation grants include (a) freestanding technical cooperation grants, which are intended to finance the transfer of technical and managerial skills or of technology for the purpose of building up general national capacity without reference to any specific investment projects, and (b) investment-related technical cooperation grants, which are aimed at strengthening the capacity to execute specific investment projects.
Total amount forgiven is the total amount of principal and interest due, principal and interest in arrears, and debt stock forgiven in the year specified.
Total amount rescheduled is the total amount of external debt rescheduled, including principal and interest due, principal and interest in arrears, charges, penalties, and debt stock in the year specified.
Total change in external debt stocks is the difference in the external debt stock between two consecutive years.
Use of IMF credit denotes members’ drawings on the International Monetary Fund (IMF) other than amounts drawn against the country’s reserve tranche position. Use of IMF credit includes purchases and drawings under Stand-By, Extended, Structural Adjustment, Enhanced Structural Adjustment, and Systemic Transformation Facility Arrangements as well as trust fund loans.
The World Bank Group is committed to reducing its environmental footprint. In support of this commitment, we leverage electronic publishing options and print-on-demand technology, which is located in regional hubs worldwide. Together, these initiatives enable print runs to be lowered and shipping distances decreased, resulting in reduced paper consumption, chemical use, greenhouse gas emissions, and waste.

We follow the recommended standards for paper use set by the Green Press Initiative. The majority of our books are printed on Forest Stewardship Council (FSC)–certified paper, with nearly all containing 50–100 percent recycled content. The recycled fiber in our book paper is either unbleached or bleached using totally chlorine-free (TCF), processed chlorine–free (PCF), or enhanced elemental chlorine–free (EECF) processes.
More information about the Bank’s environmental philosophy can be found at http://www.worldbank.org/corporateresponsibility
The International Debt Report (IDR), formerly International Debt Statistics (IDS), is a longstanding annual publication of the World Bank featuring external debt statistics and analysis for the 121 low- and middle-income countries that report to the World Bank Debtor Reporting System. IDR 2022 includes (1) analyses of external debt stocks and flows from 2010 to 2021 for these countries; (2) an assessment of the evolution of the creditor composition of external debt over the past decade with particular emphasis on the emergence of nontraditional bilateral creditors and private creditors and how this has impacted the structure of borrowers’ public debt portfolios and debt servicing costs, which complicates the debt restructuring process; (3) a focus on how the World Bank has sought to enhance data quality and transparency against the backdrop of rapidly changing global debt dynamics (including an increase in commercial borrowing, nontraditional lenders, and new instruments) that contribute to debt transparency issues; (4) tables and charts detailing debtor and creditor composition of debt stock and flows, terms volume, and terms of new commitments, maturity structure of future debt service payments and debt burdens, measured in relation to gross national income and export earnings for each country; and (5) a one-page summary for each country, plus global, regional, and income-group aggregates showing debt stocks and flows, relevant debt indicators, and metadata for 6 years (2010 and 2017–2021).
Unique in its coverage of the important trends and issues fundamental to the financing of low- and middle-income countries, IDR 2022 is an indispensable resource for governments, economists, investors, financial consultants, academics, bankers, and the entire development community. For more information on IDR 2022 and related products, please visit the World Bank’s Debt Statistics website at www.worldbank .org/debtstatistics.
ISBN 978-1-4648-1902-5