
KERUGOYA-KUTUS MUNICIPALITY URBAN ECONOMIC PLAN (UEP ) 1 Kerugoya-Kutus Municipality Urban Economic Plan (UEP) Sustainable Urban Economic Development Programme SUED October 2021


The development of the Kerugoya-Kutus Municipality Urban Economic Plan (UEP) has been made possible by funding from the UK government through UKaid’s Sustainable Urban Economic Development Programme (SUED) that is managed by Tetra Tech Company Coffey.
This report was developed by Atkins.
2

KERUGOYA-KUTUS MUNICIPALITY URBAN ECONOMIC PLAN (UEP ) 3 AD Anaerobic Digestion ASTGS Agriculture Sector Transformation and Growth Strategy CBD Central Business District CBO Community-based organisation CIDP Kirinyaga County Integrated Development Plan 2018 - 2022 CECM County Executive Committee Member CEREB Central Region Economic Bloc CoG Council of Governors CSP (Draft) County Spatial Plan 2015 - 2025 ECDE Early Childhood Development Education EIA Environmental Impact Assessment FA Focus Area FCDO Foreign, Commonwealth and Development Office FGDs Focus Group Discussions FTE Full-Time Equivalent GBD Green Blue Development GBI Green Blue Infrastructure GBV Gender Based Violence GCP Gross County Product GDI Gender Development Index GEI Gender Equality Index GDP Gross Domestic Product GeSI Gender and Social Inclusion GVA Gross Value Added IDeP Kerugoya – Kutus Municipality Integrated Development Plan (2018 – 2022) IFI International Financing Institutions KC Kirinyaga County KES Kenya Shillings KeBS Kenya Bureau of Standards KeNHA Kenya National Highways Authority KeRRA Kenya Rural Roads Authority KIDA Kirinyaga Investment Development Authority KIHBS Kenya Integrated Household Budget Survey KII Key Informant Interview KKM Kerugoya – Kutus Municipality KOM Kick-off Meeting KIRIWASCO Kirinyaga Water and Sanitation Company KNBS Kenya National Bureau of Statistics KISIP Kenya Informal Settlement Improvement Programme KPLC Kenya Power and Lighting Company KURA Kenya Urban Roads Authority KUSP Kenya Urban Support Programme KRC Kenya Railways Corporation KyU Kirinyaga University LPLUDP Local Physical Land Use Development Plan MB Municipal Board MM Municipal Manager MSW Municipal Solid Waste Mt Mount NEMA National Environment Management Authority NIA National Irrigation Authority NCPWD National Council for Persons with Disability NGOs Non-Government Organisations NMT Non-motorised transport NSP National Spatial Plan PWD People Living with Disabilities PMT Tetra Tech Programme Management Team PSG Kerugoya – Kutus UEP Project Steering Group PSV Public Service Vehicle PV Photovoltaic SACCO Savings and Credit Cooperative Organizations SAPAD Strategies for Agro-Pastoralists Development SEZ Special Economic Zone SIG Special Interest Group SME Small and Medium Enterprises SWOT Strengths, Weaknesses, Opportunities, And Threats SuDS Sustainable Urban Drainage Systems SUED Sustainable Urban Economic Development Programme TBP Technical Briefing Paper UN United Nations UNIDO United Nations Industrial Development Organisation USAID United States Agency for International Development UEP Urban Economic Plan VC Value Chain WSP Water Service Provider WASREB Water Services Regulatory Board Abbreviations and Acronyms
4 Table 2.1 SIGs and Exclusion Manifestation Table 31 Table 2.2 Business Identified Challenges to Growth 34 Table 4.1 Trade, Services and Eco-Tourism: SWOT 51 Table 4.2 Agriculture Action Plan 52 Table 4.3 Agri-Processing and Industry: SWOT 58 Table 4.4 Agri-Processing and Industry Action Plan 59 Table 4.5 Trade, Services and Eco-Tourism: SWOT 64 Table 4.6 Trade, Services and Eco-Tourism: Action Plan 64 Table 4.7 Process Volumes for Banana Flour 72 Table 4.8 Value Added 73 Table 4.9 Production Inputs and Volumes for Husk Lumber 81 Table 4.10 Production Inputs and Volumes for Husk Tableware 81 Table 4.11 Value Added 82 Table 5.1 GBI Proposals Overview for Each Focus Area 89 Table 5.2 Project 1 Summary Information 99 Table 5.3 Project 1 Basic Analysis and Timeline 99 Table 5.4 Project 2 Summary Information 101 Table 5.5 Project 2 Basic Analysis and Timeline 101 Table 5.6 Project 3 Summary Information 104 Table 5.7 Project 3 Basic Analysis and Timeline 104 Table 5.8 Project 4 Summary Information 107 Table 5.9 Project 4 Basic Analysis and Timeline 107 Table 5.10 Project 5 Summary Information 110 Table 5.11 Project 5 Basic Analysis and Timeline 110 Table 5.12 Project 6 Summary Information 116 Table 5.13 Project 6 Basic Analysis and Timeline 116 Table 5.14 Project 7 Summary Information 128 Table 5.15 Project 7 Basic Analysis and Timeline 128 Table 5.16 Project 8 Summary Information 138 Table 5.17 Project 8 Basic Analysis and Timeline 138 Table 5.18 Project 9 Summary Information 143 Table 5.19 Project 9 Basic Analysis and Timeline 143 Table 5.20 Project 10 Summary Information 154 Table 5.21 Project 10 Basic Analysis and Timeline 154 Tables
KERUGOYA-KUTUS MUNICIPALITY URBAN ECONOMIC PLAN (UEP ) 5 Table 5.22 Project 11 Summary Information 158 Table 5.23 Project 11 Basic Analysis and Timeline 158 Table 5.24 Project 12 Summary Information 163 Table 5.25 Project 12 Basic Analysis and Timeline 163 Table 5.26 Project 13 Summary Information 166 Table 5.27 Project 13 Basic Analysis and Timeline 166 Table 5.28 Comparison of Sanivation Briquettes to Wood and Charcoal 168 Table 5.29 Project 14 Summary Information 170 Table 5.30 Project 14 Basic Analysis and Timeline 170 Table 5.31 Project 15 Summary Information 174 Table 5.32 Project 15 Basic Analysis and Timeline 174 Table 5.33 Project 16 Summary Information 178 Table 5.34 Project 16 Basic Analysis and Timeline 178 Table 5.35 Project 17 Summary Information 182 Table 5.36 Project 17 Basic Analysis and Timeline 182 Table 5.37 Project 18 Summary Information 186 Table 5.38 Project 18 Basic Analysis and Timeline 186 Table 5.39 Project 19 Summary Information 190 Table 5.40 Project 19 Basic Analysis and Timeline 190 Table 5.41 Project 20 Summary Information 194 Table 5.42 Project 20 Basic Analysis and Timeline 194 Table 5.43 Project 21 Summary Information 198 Table 5.44 Project 20 Basic Analysis and Timeline 198 Table 5.45 Project 22 Summary Information 202 Table 5.46 Project 21 Basic Analysis and Timeline 202 Table 5.47 Project 23 Summary Information 209 Table 5.48 Project 23 Basic Analysis and Timeline 209 Table 6.1 Summary implementation costs estimates 216 Table 6.2 Implementation Costs and Delivery Mechanisms 217
6 Figure 1.1 Purpose of the Plan 15 Figure 1.2 Climate change and poverty interactions 16 Figure 1.3 SUED Principles 18 Figure 1.4 Climate change and poverty interactions 20 Figure 2.1 Map Illustrating the Municipality within CEREB and Kenya 27 Figure 2.2 Planning Context 28 Figure 2.3 Kerugoya Town Character 31 Figure 2.4 Kutus Town Character 33 Figure 2.5 The Three Dimension of Inclusion 35 Figure 2.6 Gross County Product per Capita, 2019 (in KES) 36 Figure 2.7 Kirinyaga GCP Breakdown 37 Figure 3.1 UEP Green Blue Development Framework 43 Figure 3.2 Multi-Benefits and Multi-Disciplinary Approach to GBD of KKM 47 Figure 4.1 Economic Development Plan 54 Figure 4.2 Banana Flour Processing 75 Figure 4.3 Operating Costs, 2026 77 Figure 4.4 Social inclusion recommendation for banana flour VC 80 Figure 4.5 Process Flow for Husk Lumber 84 Figure 4.6 Process Flow for Husk Tableware 84 Figure 4.7 Operating Costs, 2026 86 Figure 4.8 Social inclusion recommendations for husk products VC 89 Figure 5.1 Map Showing the Three Main Focus Areas 91 Figure 5.2 Map showing all GBI Proposals and Interventions 94 Figure 5.2a – Map with all projects in Sagana FA 95 Figure 5.3 Sagana Focus Area Overview 96 Figure 5.4 Phase 1 Sagana Green Industrial Hub 102 Figure 5.5 Map of Focus Area 2: Kutus 121
Figure 5.10 Existing view looking north-east from the B25 showing the existing Livestock Market 134 Figure 5.11 Proposed view looking north-east from B25 showing the proposed urban park and community centre 134 Figure 5.12 Existing view looking east from River Thiba showing the existing Livestock Market 135 Figure 5.13 Proposed view looking east from River Thiba showing the proposed urban park and community centre 135 Figure 5.14 Existing high-level view looking west showing the existing Livestock Market 136 Figure 5.15 Proposed high-level view looking west showing the proposed urban park and community centre 136 Figure 5.16 Proposed ground level view looking south-east showing the proposed urban park and community centre 137 Figure 5.17 Proposed east-west section showing the various levels, terraces and the proposed community centre 138 Figure 5.18 Proposed aerial view showing the proposed urban park connections with the wider CBD area 139 Figure 5.19 Suggested road for improvement 144 Figure 5.20 GBI proposals in Focus Area 3 Kerugoya 148 Figure 5.21 High-level green space connectivity concept 150 Figures
Figure 5.6 Plan Showing Existing Land Uses, Primary Roads and Key Functions in the Pilot Area 123 Figure 5.7 Plan Showing Ongoing Interventions and Opportunities 125 Figure 5.8 Recommended Densities and Land Uses 127 Figure 5.9 Plan showing proposed layout and functions for the Urban Park and community centre 133
7
KERUGOYA-KUTUS MUNICIPALITY URBAN ECONOMIC PLAN (UEP )
Figure 5.22 Existing high level view of the central park looking south-east 151 Figure 5.23 Proposed high level view of the central park looking south-east 151 Figure 5.24 Existing high level view of the central park looking north-west 152 Figure 5.25 Proposed high level view of the central park looking north-west 152 Figure 5.26 Existing view of the central park looking south from the internal areas 153 Figure 5.27 Proposed view of the central park looking south from the internal areas 153 Figure 5.28 Proposed illustrative section of the central square showing various elements of the new park 154 Figure 5.29 Proposed thematic connectivity diagram showing the linkages between the bus park, the central park, and the urban forest 155 Figure 5.30 Proposed detailed connectivity diagram showing the linkages between the bus park, the central park, and the urban forest 155 Figure 5.31 Current parking arrangement (top) and access road to the park (bottom) 159 Figure 5.32 Map with GBI proposals beyond the Focus Areas 162 Figure 5.33 Household Water Access Challenges 163 Figure 5.34 Low-income areas in KKM 164 Figure 5.35 Small-scale treatment and reuse system comprising of treatment tank, mixer, roller press, drying beds and burning briquettes 169 Figure 5.36 Critical rural links in fair to poor condition requiring improvement 197 Figure 5.37 Priority routes to upgrade NMT facilities in Kutus (left) and Kerugoya (right) 201 Figure 6.1 UEP Development Framework Schedule 224
8

1. Introduction 12 1.1 Background 12 1.2 Purpose of the Plan 13 1.3 Approach 14 1.4 Key Principles 16 1.5 Climate Change, Social Exclusion and Poverty 18 1.6 Structure of this Report 23 2. Kerugoya-Kutus Urban Diagnostics 24 2.1 Study Area 25 2.2 Planning Context 26 2.3 State of Kerugoya-Kutus 27 2.4 Infrastructure Overview 35 2.5 Environment and Climate Change Risk Profile 36 2.6 Diagnostics Conclusion: Drivers and Barriers for Growth 37 3. Green Blue Development Concept 38 3.1 Introducing the Development Concept 38 3.2 UEP Vision 40 3.3 Economic Development – Sector Plans and VCs 41 3.4 Green Blue Development (GBD) Approach 42 4. Economic Development Plan 48 4.1 Economic Sector Action Plans 51 4.2 Value Chain Projects 69 5. Green Blue Infrastructure Development Framework 86 5.1 Introduction 86 5.2 Focus Area 1: Sagana Green Industrial Hub 91 5.3 Focus Area 2: Kutus 118 5.4 Focus Area 3: Kerugoya 145 5.5 KKM and KC-Level Proposals 160 6. Implementation Plan 212 6.1 Introduction 212 6.2 Stakeholders and institutional structures 214 6.3 Implementation Costs and Potential Funding Sources 216 6.4 Scheduling 226 6.5 Funding including Climate Funds 227 6.6 Recommendations for Capacity Building 230 6.7 Recommendations for Social Inclusion 231 6.8 Recommendations for Climate Change and Resilience 232 6.9 Next Steps 233 Contents KERUGOYA-KUTUS MUNICIPALITY URBAN ECONOMIC PLAN (UEP ) 9
The purpose of the plan is to:
Stakeholders’ interests and insights have been considered throughout the development of the UEP.
Chapter 2 sets out the diagnostic assessment of KKM, where the social, economic, planning, infrastructure, environmental and climate risk baseline has provided an understanding of the barriers and drivers to sustainable economic growth.
The UEP is an advisory document that builds on existing work and priorities identified under the County Integrated Development Plan (CIDP), the Mountain Cities Blueprint, the Draft County Spatial Plan (CSP), the Draft Local Physical and Land Use Development Plan (LPLUDP), and Integrated Development Plan (IDeP), as well as aligning and complementing work done by other donors. In doing so, it will provide a focused economic plan for the Municipal Board (MB) and Municipal Departments to enable them to deliver economic development within the Municipality and the County.
WS Atkins International Limited was commissioned to develop the Urban Economic Plan for Kerugoya – Kutus Municipality (KKM) as part of the UK’s Foreign, Commonwealth and Development Office (FCDO) Sustainable Urban Economic Development Programme (SUED). The aim of the programme is to support market-driven growth in emerging towns and cities in Kenya.
> Prioritise economic activities and Green Blue Infrastructure (GBI) that can maximise benefits and support the development of a sustainable economic future for KKM;
10 Executive Summary
> Identify and prepare value chain (VC) projects that can be considered further in terms of their feasibility and bankability before SUED seed financing is committed.
The Municipality comprises the two main towns of Kerugoya and Kutus, which are 10 km apart and linked by the B27 road and Rutui River. KKM is the Kirinyaga County (KC) headquarters and administrative centre together, as well as the health, financial, commercial, retail and wholesale market hub. Lack of proper planning, poor implementation of plans and poor enforcement of regulations have led to uncontrolled urban growth and informal settlements with inadequate access to basic services, as well as poor road conditions with limited accessibility and environmental degradation.
> Bring together stakeholders on deciding the economic future of KKM and implementing it; and
The Municipality and the County are relatively small in size and population but have a sound economy and are leading producers of rice and other agricultural produce such as tea, coffee and tomatoes. KKM is mostly rural in character, with land use predominantly agricultural.
The Gender and Social Inclusion Study (GeSI) was a key part of the diagnostic, providing recommendations for meeting the aims of the SUED Programme to advance inclusion of people with disabilities (PWD) and youth. The Wezesha Development Programme has been a key driver to inclusive growth in KC which has empowered smallholder farmers, and particularly women, youth, and other vulnerable groups.
> Provide an inclusive economic strategy that can guide future development towards increasing prosperity in KKM;

of the economy, through these key sectors, will be the improvement of infrastructure particularly in areas affecting production potential such as roads and transport accessibility, insufficient water supply to support growing population and businesses, poor solid waste management, sanitation and drainage. The cost of electricity is very high, and most people use firewood and charcoal for cooking.
> Trade, services and eco-tourism, reflecting the existing commercial activity in KKM and its strategic location, as well as the future growth opportunities presented by Criticaleco-tourism.forthedevelopment
The bespoken approach recognises the multi-functional, multi-benefits and multi-disciplinary inputs to GBD in order to achieve KKM’s UEP economic vision, which has been developed with key stakeholders: “A well-planned, integrated, vibrant and greenwhilstopportunitiesindustrialMunicipalitysustainablewithagreenhub,thatprovidesforallitscitizensenhancingitsuniqueblueresources.”
> Industry and agri-processing, driven by Kirinyaga Investment Development Agency (KIDA) and Kenya’s Agricultural Sector Transformation Growth Strategy (ASTGS).
KERUGOYA-KUTUS MUNICIPALITY URBAN ECONOMIC PLAN (UEP ) 11
1. Polycentric development means to develop multiple towns / urban centres with a specialised urban function instead of a single town The County is greatly influenced by Mt Kenya, determining three main ecological zones: the highlands in the north, the midlands, and lowlands or plains in the south. Climatic conditions range from cool and higher rainfall in the highlands to drier and warmer conditions in the plains. KC is well-endowed with water resources thanks to rivers emanating from the mountain system. Key climate risks are drought and rainfall variability (including onset and duration of rainfall), localised flooding, particularly for informal settlements, and increased temperatures accelerating reduction in snow and glacier cover at Mt Kenya, which has in turn decreased the reliability of river flows into KKM and KC. Chapter 3 presents the Green Blue Development (GBD) concept, overarching the economic sector plans, VC opportunities and the implementation of the Development Framework of Green Blue Infrastructure (GBI) projects and initiatives. This GBD concept is also a response to the polycentric1 development suggested in the main planning documents. The GBD approach is a significant opportunity for both KKM and KC to drive sustainable economic development, protect its unique water and natural resources and enhanced environmental resilience, whilst also improving the health and wellbeing of its citizens.
The diagnostic stage identified three key economic sectors that KKM should prioritise for development, as: > Agriculture, the local population largely rely on this sector as the main economic subsistence activity.
> Focus Area 2: Kutus town, the wholesale trading centre and well-known university town as it hosts the Kirinyaga University (KyU). The proposed interventions aim at supporting the development of the trade and services sectors, particularly the existing student population.
12
To realise the vision and KKM’s role, the development framework proposals are organised around three main Focus Areas: > Focus Area 1: Sagana green industrial hub, a site identified by KC and KIDA with benefits of good accessibility and connectivity by both road and railway with the wider regional area. The site presents an opportunity to cluster at the same location the two priority VCs, all potential VCs and other industrial businesses, to allow for economies of scale, and to share facilities and infrastructure. The industrial site will be developed as a green industrial park in line with the GBD approach to avoid inefficient use of resources, and to limit pollution and damage to the natural environment.
> Banana flour would also capitalise on the growing international niche market for banana flour and KC being one of the leading producers of banana in Kenya.
>
Chapter 4 sets out the Economic Development Plan in response to the economic vision and the sectoral SWOT assessment undertaken at diagnostic stage and aims to strengthen synergies between the different areas of the County by creating complementarities rather than competition between them. Action Plans include economic ambitions and a list of interventions for each of the key sectors. The plans are aligned and support the GBD through developing a resilient agriculture system; growing the agri-processing and industrial sector; establishing a developed service economy and improve the eco-tourism offer. The plans will complement and provide an enabling environment for the prioritised value chain (VC) opportunities.
Chapter 5 sets out the GBI development framework, which structures, prioritises and phases urban development in the most suitable locations in a coherent and coordinated manner considering the limited availability of developable land across the Municipality.
> Capacity building specialists to enhance the local capacity to implement the projects and ensure revenue generation;
> Husk products: lumber and tableware would capitalise on the high production of rice in the County, which currently generates about 24,000 tonnes of rice husk each year, and the increasing volume of husk from coffee and macadamia nuts providing about 4,000 tonnes of husk per year.
> Investment climate experts to address policy and regulatory constraints; and
The UEP is an advisory document owned and administered by the Municipality and the main responsible authority for its future implementation. Similarly, the Municipality is responsible to agree appropriate funding from the County budget as well as seeking any additional funding from IFIs, donors, and/or private sector to support the implementation of the VC and GBI projects.
Following the completion of the UEP, during the next phase of the SUED programme, the identified projects will be developed further by:
Chapter 6 provides the Implementation Plan, which presents relevant considerations across partnerships, funding and scheduling for the proposed VC and climate-resilient and inclusive infrastructure projects, including estimated delivery costs. This section also presents recommendations for capacity building, social inclusion and climate resilience, as crucial elements for implementing the UEP.
These VCs are:
Kutus could become a knowledge cluster with a better urban environment, offering a range of accommodation opportunities and supporting local employment.
Eight potential VC projects were shortlisted and further assessed for inclusion to the UEP. Their assessment included consideration of target market, costs and revenues, competitiveness, land and infrastructure requirements, and climate vulnerability and social inclusion assessment. All of these opportunities would be suitable for development in Kerugoya-Kutus. However, two priority VC opportunities have been selected to maximise benefits with their ability to catalyse the industrial sector, utilising synergies to existing assets and the opportunity to implement a circular economy.
Focus Area 3: Kerugoya town, the second largest town within KC and main provider of health, financial and retail services. The proposed interventions aim to support the fast-growing population and consolidate its role as service provider by improving green open spaces, public realm and enabling infrastructure.
> Investment experts to develop feasibility studies, business cases and investment promotion strategies for the projects.
Other GBI interventions have been proposed outside these Focus Areas to address issues that benefit KKM and its economic role, however, the County or the location is not defined yet due to limitations on land availability including utilities projects, upgrading of critical roads, improvement to the livelihoods of farmers and conservation of key natural assets such as Mt Kenya.
KERUGOYA-KUTUS MUNICIPALITY URBAN ECONOMIC PLAN (UEP ) 13 LandfillsKKM19 AND KIRINYAGA COUNTY GENERAL INTERVENTIONS Kerugoya and Kutus Water Supply12 Kerugoya and Kutus Sanita�on Provision2213 NMT and Urban Street Improvements Cri�cal Rural Feeder Roads21 Micro-Hydro Projects14 Solar Refrigera�on (Cold Stores)15 Solar Irriga�on16 Streetligh�ng17 Waste Collec�on18 Catchment Management in Mt. Kenya20 Donkey Management23 21 21 21 21 21 21 21 21 21 21 21 21 12221319 12221319 19 FOCUS AREA: SAGANA GREEN INDUSTRIAL HUB1 FOCUS AREA: KUTUS BUILT-UP AREA2 FOCUS AREA: BUILT-UPKERUGOYAAREA 3 FOCUS AREA 2: KUTUS BUILT-UP AREA Kutus Pilot Area Urban Regenera�on7 Kutus Urban Park and Community Centre8 Improved Access to Kutus Markets9 87 9 FOCUS AREA 1: SAGANA GREEN INDUSTRIAL HUB Sagana Green Indutrial Park1 Water, Wastewater and Drainage Service Provision for Phase 1 Sagana2 Energy Solu�ons for Phase 1 Sagana4 Organic Waste Processing for Phase 1 Sagana3 Access Road to Phase 1 Sagana5 Sagana Railway Sta�on Upgrade6 1 2 4 3 5 6 FOCUS AREA 3: KERUGOYA BUILT-UP AREA Kerugoya Central Park10 Kerugoya Bus Park Improvements11 10 11 KerugoyaKutus Kagio Sagana MunicipalityTowns Boundary Key toCriticalFocusFocusFocusCountyRailwayThibaRiversRoadsDamBoundaryArea1Area2Area3FeederRoadsbeimproved


14 1. Introduction
1.1 Background WS Atkins International Limited was commissioned to develop the Urban Economic Plan (UEP) for Kerugoya - Kutus Municipality (KKM) as part of the UK’s Foreign, Commonwealth and Development Office (FCDO) Sustainable Urban Economic Development Programme (SUED). The aim of the programme is to support market-driven growth in emerging towns and cities in Kenya. Supporting these smaller centres provides an environment to create economic opportunities and job creation in a way that balances growth across the country, develops economic sectors that can contribute towards increasing the national output, and provides an incentive for minimising uncontrolled migration.

KERUGOYA-KUTUS MUNICIPALITY URBAN ECONOMIC PLAN (UEP ) 15
Combining local knowledge and international expertise, the Kerugoya-Kutus Urban Economic Plan: Figure 1.1 Purpose of the Plan Provides an inclusive economic strategy that can guide future development towards increasing prosperity in KKM; Prioritises economic activities and climate resilient infrastructure that can maximise benefits and support the development of a sustainable economic future of KKM and introduce international best practice and Bringsinnovation;together stakeholders on deciding the economic future of KKM and implementing it; and Identifies and prepares value chain projects that can be considered further in terms of their feasibility and bankability before SUED seed financing is committed.
The UEP is an advisory document that builds on existing work and priorities identified under the County Integrated Development Plans (CIDP), Municipality Integrated Development Plans (IDeP), the Mountain Cities Blueprint 2032, Draft Local Physical and Land Use Development Plan (LPLUD) and the Draft County Spatial Plan (CSP) as well as aligning and complementing work done by other donors. In doing so, it will provide a focused economic strategy for the Municipal Board and Municipal Departments to enable them to deliver economic development within the Municipality.
1.2 Purpose of the Plan
Source: Atkins


Source: Atkins (note: KOM – Kick-off Meeting)
/=, /-, IdentificationK of
1.3 Approach
Diagnostics Phase UEP BriefingTechnicalPhase UEP Phase International/NationalFrameworktrends Analysis of Strengths, ThreatsOpportunitiesWeaknesses,andofkeyeconomicsectors
The Kerugoya-Kutus UEP has been developed utilising primary and secondary research and analysis, ranging from the review of local and national strategies and international studies to statistical analyses, to focus group discussions with stakeholders and surveys. A key component has been consultation with local stakeholders.
the
ValueresilientFrameworkDevelopmentactions&ClimateinfrastructureAnchorprojects:chainopportunities
> Phase 4 – Development of the Final UEP which sets out in detail economic opportunities and actions and prioritises climate-resilient infrastructure projects for implementation.
Interest
The approach and methodology have been developed in response to the FCDO terms of reference and in consultation with the SUED Team and FCDO and have been tailored to consider local conditions in Kerugoya-Kutus. The aim was to enable a collaborative approach between different local stakeholders and the consultant team to assess Kerugoya-Kutus’ economy in a systematic way, develop an agreed economic vision and prioritise actions that will have maximum impact and are ready to attract donor co-financing.
The preparation of the UEP comprised four main phases:
> Phase 1 – Inception Phase which focused on the Kick-off Meeting. The aim was to present the approach of the UEP and capture key opportunities and challenges affecting economic growth in KKM as defined by local stakeholders
EvaluatingUEPandprioritisingVCopportunities
16
Evaluatingopportunitiesclimateresilientgreeninfrastructureopportunities short listed VC opportunities and climate resilient infrastructure with Municipal Board, Municipality & County officers, Businesses, Special Groups
Consultation
> Phase 2 – The Diagnostics Phase was developed to provide a comprehensive and wide-ranging assessment of Kerugoya-Kutus’ economy, demographics, infrastructure, environment and climate change risk profile against national and international context.
throughcommentsinitialstakeholderengagement-KOMInceptionPhase
Economic EnvironmentalInfrastructureDemographicandandTransportationprovision&Climatechangeriskprofile
Assessing requirements &
Setting Vision & key economic sector
Figure 1.2 Climate change and poverty interactions Gather
impact of shortlisted VC
> Phase 3 – The Technical Briefing Paper set out a development framework for Kerugoya-Kutus and identified, assessed and prioritised economic growth opportunities and their requirements.
Setting the principles for the development of
Policy
The aim is to ensure the PSG is representative of the needs and challenges associated with the Municipality whilst being aligned and familiar with existing County and Municipal policies and regulations.
> To ensure that the development of the Urban Economic Plan is inclusive and is undertaken in a manner that fits with Kerugoya-Kutus’ business and community culture; > To ensure that all stakeholders are clear on the purpose, scope, recommendations and outcomes of the Urban Economic Plan as well as meeting key stakeholders’ aspirations and gain buy-in from them; > To understand better the interests of specific groups and how the Urban Economic Plan can benefit them, and
> To provide a regular flow of information to and from key stakeholders.
A business consultation was also undertaken to understand how businesses operate in KKM and their views on future growth opportunities and constraints. This consultation was composed of 1:1 interviews with 57 businesses, reflecting KKM’s main sectoral activities. Many of these were small businesses or independent workers – given the nature of the local economy. Each interview was supported with a detailed questionnaire.
The KKM stakeholders include:
KERUGOYA-KUTUS MUNICIPALITY URBAN ECONOMIC PLAN (UEP ) 17
A Project Steering Group (PSG) was formed to enable the exchange of ideas and information between the Municipal Board and the SUED technical team. The PSG was formed of the following members: > Municipal Manager; > County Governor’s Office Representative; > County Physical Planner; > County Engineer; > County Economist; > Special Interest Groups Representative; > Chamber of Commerce Representative; > Climate Change Champion; > Municipal Board Representatives.
The PSG, under an elected representative, also facilitated the dissemination of information on the various components and progress of the UEP and the broader SUED Programme, including liaison with the County Government, the Municipality, and the Municipal Board. It includes champions on SUED’s key themes of climate change and social inclusion.
The PSG was also tasked with arranging meetings and workshops as and when required by the SUED team, as part of the overall Programme roll out. The PSG was updated on a weekly basis on progress in the UEP process and the following meetings between the PSG and the SUED team took place.
The Gender and Social Inclusion study (GeSI) involved a related literature review and primary research, covering interviews with key project informants and four focus group discussions. This resulted in the identification of socially-excluded groups, of how their exclusion manifests, and processes that perpetuate the exclusion and development of the inclusion interventions as proposed in this UEP.
The purpose of stakeholder engagement was to ensure that stakeholders’ interests are taken into consideration throughout development and reflected in the Kerugoya-Kutus Urban Economic Plan. More specifically, the aims were:
Stakeholder Engagement
> County Government including the County Director; CECM Lands and Physical Planning; Chief Officers, County Administration and County Assembly members, KIDA; > Municipal Board including Chairperson, Vice-Chair, Municipal Manager and Board Members; > Business Representatives including Chamber of Commerce (KNCCI), organised business groups, traders and Jua Kali, SACCOs, banks and finance organisations, Industrial and Commercial Development Cooperation (ICDC), farmers and coffee millers; > Utilities and Service Providers including the Water Resource Authority (WRA), KIRIWASCO and the matatu owner’s and boda boda associations; KURA, KENHA, KPLC, and > Special Interest Groups (SIGs) including representatives for youth and people living with disability (PWD), representative Wezesha Kirinyaga Project. A critical process in developing the UEP report has been stakeholder management including: > Project Steering Group meetings; > Stakeholder workshops; > Formal social inclusion consultations; and > Business consultations.
The second virtual workshop with the PSG and MB in February 2021 included discussions on the sectoral SWOTs and identification of emerging economic opportunities. Following the submission of the Diagnostics Report, another virtual workshop was conducted in April 2021 to focus on gathering feedback from the PSG and wider stakeholders on the findings of the diagnostics assessment. A wider stakeholder workshop in May 2021 comprised a visioning exercise for the UEP, emerging development concept and development framework, and reaching consensus with the PSG, Municipality and key stakeholders.
Virtual and physical stakeholder workshops were undertaken depending on the Covid-19 restrictions in place at the time, including the Kick-off Meeting (KOM) to gather feedback from stakeholders throughout the project. The first workshop (KOM), in December 2020, presented the project and process and collated information from 45 stakeholders in terms of key characteristics, strengths and challenges (captured within the Inception Report). Stakeholders included the Municipal Board, Municipality and County officers, private sector, civil society groups and non-government organisations and representatives from Special Interest Groups (SIGs).
18 1.4
The development of the UEP and identification and prioritisation of proposed projects are grounded on key principles that support the Programme’s aim to create market-driven growth and build resilience. The Atkins SUED Team has defined these principles as: Figure 1.3 SUED Principles Source: Atkins
Key Principles

All proposed projects (VCs and infrastructure projects) contained within the UEP have been screened and refined for their contribution to improving livelihoods by considering: availability; accessibility; affordability; acceptability; and adaptability, across special interest groups as well as low-income groups, the urban poor and informal sector. The aim is to minimize inequalities and improve access to job opportunities for optimum benefits to the community. Social exclusion makes it difficult to achieve social objectives, such as reducing poverty, due to often hidden barriers in reaching those who are socially marginalised. Exclusion also causes conflict, and it is almost impossible to achieve economic gains in conflict environments.
KERUGOYA-KUTUS MUNICIPALITY URBAN ECONOMIC PLAN (UEP ) 19
Socially Inclusive – The UEP will be socially inclusive building on the thorough analysis of the status of social inclusion within KKM through stakeholder meetings and focus group discussions. Especially, the identified excluded groups of PWD and youths are included in the UEP development process, the VCs and infrastructure projects to ensure that their impacts will equitably benefit all members of the community.
Sustainable –The UEP will promote Green Blue Infrastructure that supports the development of KKM while minimising the environmental impacts of increased population and economic activity in the future, as well as protecting the abundant water resources within the County.
Resilience – The prioritised projects will have to be resilient against shifts in the economy, both for domestic and international markets, to remain competitive. They will also need to be adaptive to the climate change impacts specific to the area, such as lesser rainfalls and higher temperatures, while ensuring that technological advancement through smart solutions can be introduced where possible.
Resource Efficiency –To preserve the environmental assets and agricultural land, the UEP will be directing economic growth towards resource efficiency, by integrating the VCs to establish a circular economy, promoting minimisation of waste and optimising water and energy use, whilst aiming to promote rural-urban linkages. While these principles are closely linked and overlap in their definition, each one of them emphasises a different aspect that is not fully captured by the others. Thus, it is important that all four principles are embedded and balanced in the UEP and its implementation. In addition to these principles, it is critical to ensure the UEP develops the competitiveness of the town. At its core the UEP seeks to create employment opportunities accessible to all, and set out economic measures and supporting actions and projects that can help directly or indirectly lift the local population out of poverty whilst supporting crucial livelihoods such as the informal sector.
Persons with Disability (PWD) and youth in KKM face challenges that are either caused by, or lead to, exclusion, and recommendations for their inclusion are fully integrated in the UEP. People who are excluded are not ‘just like’ the rest of the poor, only poorer. They are also disadvantaged by who they are or where they live, and as a result are locked out of the benefits of development.

Climate Change, Social Exclusion and Poverty
Source:
Figure 1.4 Climate change and poverty interactions
20 1.5
At the time of preparing this UEP, the COVID-19 pandemic continues to disrupt societies and economies around the globe. The impacts, both health and economic, have been felt across different geographies and locally in Kerugoya-Kutus. While governments are trying to address current challenges, this pandemic has brought to the fore the need to understand better the connection between vulnerable groups, livelihoods, and shocks from critical events such as climate change. Climate change poses a serious risk to livelihoods and poverty reduction efforts. Climate hazards and the depletion of natural resources disproportionally affect women, PWD, the elderly, and people with chronic illnesses. Low-income households that rely on weather-sensitive subsistence livelihoods such as agriculture are especially vulnerable. Harmful social norms pose additional challenges, by limiting the participation of these groups in formal risk reduction and climate adaptation programmes. Atkins
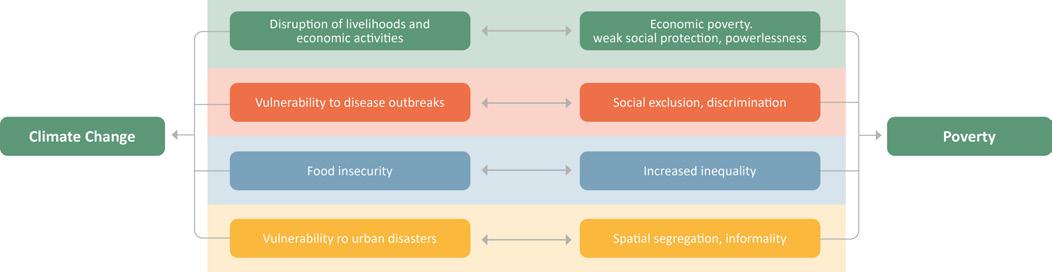
In KKM, youth and PWD are often excluded from socio-economic activities; they lack access to information, assets, and finance; and they do not participate in decision-making processes. This makes them more vulnerable to the impacts of climate change and other shocks such as the COVID-19 Statistically,pandemic.PWDare more likely to have lower levels of education, be illiterate or unemployed. Due to discrimination, they usually have less access to support networks and social capital than their able-bodied counterparts. These social networks are recognised as a key factor that enables groups to prepare for, respond to, and recover from, climate variability and shocks, and this lack of access increases the vulnerability of PWD to climate change. In KKM, PWD often operate small businesses, yet they lack access to finance and adequate spaces to develop their economic activities and to invest in measures that would better prepare their businesses for extreme events and climate hazards. This makes them more exposed to climate change and extreme events. PWD also face limitations in their access to infrastructure and mobility and climate events such as flooding can severely affect their livelihoods and daily routines. Young people lack access to capital or assets to manage the impacts of climate change and other similar shocks. While young men and women are heavily engaged in agricultural livelihoods, their work is often not well regarded. Limited access to credit and financial resources and reduced social safety nets critically affect their ability to recover from disasters such as floods or droughts. Those who engage in transportation services also see their access to markets and their sales or income disrupted when there are extreme weather events. Similarly, the COVID-19 pandemic severely affected youth-owned businesses. People who live on informal settlements are also identified as a vulnerable group within this context in KKM. Rapid, unplanned urbanisation increases the vulnerability to climate hazards for the urban poor. Informal settlements are often located in hazard-prone areas and are excluded from formal risk reduction and climate adaptation programmes. They are often settled on marginal land and have limited drainage and sanitation infrastructure. Flooding is a significant issue, in particular regarding contamination of water sources, and associated health impacts. Their livelihoods, most often in the informal sector, are reliant on being able to trade every day and are more vulnerable to disruption, be it a pandemic, or an environmental disaster. In addition, they face similar problems with access to credit and financial resources as youth and PWD, which limits their ability to proactively adapt to climate variability and change.
Increasing the resilience of current and future livelihoods and infrastructure is key to poverty reduction and has been addressed systematically throughout the UEP to avoid creating polarisation and further exclusion. Similarly, ensuring that infrastructure projects, VC opportunities and development policies are climate-resilient will not only help the built environment to better respond to future climate risk but also communities and excluded groups to be less affected by climate change events.
KERUGOYA-KUTUS MUNICIPALITY URBAN ECONOMIC PLAN (UEP ) 21
Consequently, it is imperative to understand exposure, and vulnerabilities, to build resilience into future projects through appropriate adaptation measures including green blue infrastructure. In particular it is important to ensure that adaptation measures do not act to reinforce or deepen existing inequalities, but need to be accessible to groups that are already marginalised. For example, climate-resilient technologies need to be affordable, accessible to all, and culturally appropriate. Their implementation needs to be accompanied by capacity building and technical support. As well as considering inclusion and poverty elements of all adaptation and climate risk management measures, excluded groups may require targeted interventions designed to help build their resilience to climate change.

> Increased awareness of hygiene signifies increased demand for limited resources like water, as well as increased demand for disinfectant used for hand cleaning and sanitization, with additional costs to society, particularly where access is not straightforward.
22
> Road freight and logistics have been interrupted as long-distance truck drivers are suspected to be a major source of imported infections and transmission. This has had implications for trade and cross-border activities. Goods take longer to reach destinations. For perishable agricultural commodities, post-harvest loses become rampant.
1.5.1 COVID-19 Impacts in Kenya In Kenya, the impact of COVID-19 has been real and devastating. The pandemic has significantly impacted all aspects of life such as health, institutional revenues and livelihoods. COVID-19 has hit the most vulnerable the hardest, particularly the densely populated informal settlements, as well as other people lacking access to adequate housing and basic services. The informal economy employing about 70% of Kenyans has been drastically affected as lockdowns and curfews were introduced to curb the transmission of the virus. Low wage earners have been hit the hardest because they rely on the informal sector and daily wages. Mostly they lack the option to work from home as they are mostly in the service industries and more exposed to the virus. Despite the low wages, some have also received pay cuts, and some have lost their jobs all together. There has also been loss of revenue due to reduced activities in other sectors like industry, commerce and hospitality with the effects felt throughout their supply chains.
The COVID 19 outbreak has affected people differently based on their age, gender, ability or disability, sexual orientation, health status, migrant status, and ethnicity among other aspects. Crises exacerbate existing gender inequalities, exclusion, and discriminative practices, and vulnerable groups are highly likely to be more adversely affected by the outbreak and the consequences of the response.
Travel restrictions have led to a sharp and substantial fall in demand for movement and subsequent impacts on supply chains:
> Kenya is the world’s number 2 exporter of tea and the world’s number 4 exporter in flowers, and both these critical industries have experienced a negative impact from COVID related restrictions. For instance, tea prices declined by 18% year-over-year in May, reaching the lowest point since 2014 and fresh cut flower sales declined by about 40% in March versus the previous month.
> Disruptions in global supply chains have also led to shortages or delays for critical inputs for agriculture ultimately disrupting production and food supply and manufacturing, leading to price increases.

COVID-19 Impacts in KKM
Emerging evidence on the impact of COVID-19 suggests that women’s economic and productive lives have been affected disproportionately in comparison with men. This is because women earn less, save less, and are more likely to be employed in the informal sector. Their capacity to absorb economic shocks is therefore less than that of men. Women are also the majority of front-line health workforce and caregivers and therefore at higher risk. Cultural factors may restrict women’s access to information and services, and some women may be particularly affected, e.g. Older women living alone, and isolation may lead to an increased risk of violence in the are already among the most affected by the socio-economic impacts of COVID-19. In addition to losing employment, the closure of businesses, and the need to keep away from schools and universities, the youth are also at high risk of increased anxiety and mental health problems. Additionally, the youth make up more than 30% of the migrants and refugees’ population who are likely disproportionately affected due to limited movement and fewer employment opportunities caused by the pandemic. Young women and girls are also at high risk of many forms of domestic and gender-based violence during the pandemic.
Persons with disability have been left without vital support and advocacy due to social distancing. The majority of PWD in SUED Municipalities operate small businesses in market centres, which have been adversely affected therefore they have experienced loss of livelihood. For PWD that rely on their hands for walking and are sole breadwinners, the question of not touching surfaces is not applicable and they therefore are at high risk of being infected with COVID-19. Street families are also highly exposed to the danger of the virus because they lack shelter. Many of them rely on market centres where they ferry goods for a wage, and with the closure of markets they have lost livelihoods.
A business survey and engagement with local stakeholders has revealed that COVID-19 has had an impact on the entire economy. Trade on the markets have been reported to have significantly declined. One trader indicated a 90% drop in revenues, and a restock every 1 or 2 months instead of every 3 weeks before the pandemic. Another trader said they went from selling 8 to 10 bags of cereals per day to just 1 to 2 on market days. The closure of schools and universities has led many young people to try to work on the market, despite the lack of demand. Lack of demand for agricultural products has created an overproduction of most products, leading to price drops and considerable wastage. Farmers and traders have had difficulties repaying loans, leading to financial instability at the macroeconomic level.
KERUGOYA-KUTUS MUNICIPALITY URBAN ECONOMIC PLAN (UEP ) 23
Younghome.people
> Prioritising policies to confront spatial, social and economic exclusion with the aim of cushioning the vulnerable in the face of another shock.
24
> Redefining green spaces and the way town centres are designed for business.
> Ensuring resilient supply chains for agricultural and manufacturing sectors focusing on local inputs to ensure food security, and safeguard export-oriented products.
1.5.2 Lessons from COVID-19 Drawing upon the lessons learned from the current COVID-19 crisis, these have informed the proposed GBI projects (in Chapter 5) and Sector Action Plans (section 4.1) to ensure long-term planning, green recovery and resilience is embedded in the UEP. This is an opportunity to get insights into a future fully-fledged climate change crisis and KKM has a critical role to play in addressing these challenges. Some initial key lessons include:
> Through the Wezesha Programme, continue mobilising and empowering women, youth, and other vulnerable groups by creating new employment opportunities and engaging them in economic activities through technical support and financing.
> Emphasising the need for adaptive, urban integrated plans to ensure sustainable urban development and infrastructure provision, including appropriate housing for all that can help minimise impact from high risks.
> Strengthening preparedness and emergency response capacity is critical. This means better preparedness in terms of financing, service delivery and business continuity, including budgeting for future crises, emergency operations centres, capacity building, drills, and human resources redeployment plans.
> Leveraging information technology (IT) systems to better match the required transport demand with excess supply in real time and provide travel pattern visibility, helping passenger and logistics operations become nimbler considering a quickly evolving context.
> Making sure public awareness campaigns are consistently available to all in a format and language understandable to all.
> Improving marketing efficiency through adoption of innovative processes that connect buyers and sellers. This may include adoption of technology to promote marketing and information sharing, formalizing product delivery services etc.
> Chapter 4 set outs the Economic Development Plan. Each of the key sectors is presented with a summary of its SWOT analysis and a Sector Action Plan. The priority Value Chain (VC) projects are then set out in detail.
This has been undertaken to outline the climate vulnerability context for the selected infrastructure projects to be developed in Kerugoya-Kutus. The Climate Vulnerability Assessment will complement associated pre-feasibility and feasibility study.
Appendix C – KKM Gender and Social Inclusion Study
KERUGOYA-KUTUS MUNICIPALITY URBAN ECONOMIC PLAN (UEP ) 25
This captures the process followed from identification to assessment of growth opportunities for Kerugoya-Kutus and provides recommendations on those with the greatest potential to maximise benefits and to be developed further.
This study was a key part of the diagnostic process and engaged with special interest groups through interviews and focus group discussions. The study identified the groups that are excluded in socio-economic activities in Kerugoya-Kutus and explored how and why they are excluded. The Study made a series of recommendations for the SUED programme to ensure inclusion and to address the multiple barriers (communication, physical, attitudinal and organisational) that these groups face.
1.6 Structure of this Report
Appendix D – Climate Vulnerability Assessment
The report is supported by a series of appendices, in which:
Appendix A – KKM Diagnostic Report
Appendix B – Technical Briefing Paper
> Chapter 2 provides a summary of key findings from the Diagnostics Report, which forms the basis for the development of the UEP. Summaries of the planning context, the demographic and economic profiles and the infrastructure and environmental assessments are presented. The section details the key challenges and drivers for growth, identifying Kerugoya-Kutus’ key sectors.
Following this introduction, the report is structured as follows:
> Chapter 5 outlines the Development Framework of the Green Blue Infrastructure projects and interventions that have been identified for enabling urban and economic growth within Kerugoya-Kutus.
> Chapter 3 introduces the Kerugoya-Kutus’ development concept introducing the Green Blue approach and how it aligns to economic actions and infrastructure proposals. It is supported by the economic vision developed by local stakeholders.
> Chapter 6 presents a range of implementation considerations to support the next stages of the SUED Programme.
The purpose of the report is to assess the current position of the economy and state of infrastructure, alongside the regional, national and international context, before the consideration of emerging economic growth opportunities and infrastructure needs.
The contents of this report will form the backbone of the UEP.

DiagnosticsKutusKerugoya-Urban Before any proposed interventions are developed it is important to understand the local development context and potential opportunities and barriers to growth. The Municipality’s assessment has been undertaken in the UEP diagnostic process, as presented in Appendix A. The diagnostics phase was a critical process to establish a solid foundation for identifying solutions that can deliver economic, social and environmental benefits. This section provides a summary of the diagnostic report’s assessment of: KKM’s planning and regional context, its socio-economic profile, with urban and economic conditions and trends; The state of existing infrastructure; and climate risks.
26 2.
>
> Environmental
>

22. Draft LPLUPD (2030) 23. Draft CSP Figure 2.1 Map Illustrating the Municipality within CEREB and Kenya Source: Atkins
The geographical focus of the UEP is KKM, comprising the towns of Kerugoya and Kutus, and covering approximately 70.5km222. KKM is geographically located in the centre of Kenya, approximately 100km north of Nairobi and about 30km west of Embu. KKM is situated within the Central Region Economic Bloc (CEREB) that aims to enhance trade and investment opportunities through collaboration. KKM is the headquarters and administrative centre of Kirinyaga County (KC). Kirinyaga is one of the smallest counties in Kenya, covering approximately 1,482km223. As shown in Figure 2.1, the County borders Nyeri to the north and west, Muranga to the south, Embu to the east and south and Mount Kenya to the north. Mount Kenya National Park covers about 20% of land within KC. It is a protected area, where development is not permitted, which makes it a potential asset to further explore ecotourism opportunities.
2.1 Study Area
KERUGOYA-KUTUS MUNICIPALITY URBAN ECONOMIC PLAN (UEP ) 27

The Kirinyaga County Integrated Development Plan 2018 –2022 aims to coordinate development and allocate budgets at a County level. The strategic goals of the CIDP are: 1. Job creation through new industries and diversification; 2. Affordable and accessible health care; 3. Increased income through competitive and efficient productivity and market accessibility, 4. Improved urban planning and infrastructure, 5. Enhanced knowledge and skills to create a talented and unique work force.
Figure 2.2 Planning Context trendsInternational
RecoveryGreenRevolution4thImpactsClimateresourcesDepletiontrendsUrbanisationofchangeoftheIndustrialpost-Covid
Kerugoya –PrioritiesMunicipalityKutuschange KIDA support to industrial development to add value to abundant agriculture produce Continue to be the main rice producer in Kenya and improve value Adequateadditionprovision of infrastructure to fulfil needs of local population and Protectionvisitors,and conservation of unique water and natural resources such as Mt Kenya and Mt Kenya BenefitsNational from its central location and good connection with the rest of the ImproveCountrylivelihood of residents through creation of green jobs National Polices and Strategies Kenya Constitution 2010 (Chapters 5 & 12) County Governments Act No. 17 of 2012 (revised Urban2017) Areas and Cities Act of 2011 (revised 2019) The Physical and Land Use Planning Act (2019) Kenya Vision 2030 National Spatial Plan Kenya(NSP) Green Growth MediumStrategy Term Plan (MTP III) and the Big Four Agenda Source: Atkins
County (LPLUDP)PlanLandDraftPlanDevelopmentMunicipalityBlueprintMountainPlanDraft2018DevelopmentIntegratedPlan–2022,CountySpatial2015–2025(CSP)Cities2032Integrated2018–2022(IDeP)LocalPhysicalandUseDevelopment2020–2030
The IDeP is the guiding instrument for the Municipal Board to achieve the vision “to enhance a vibrant, innovative and sustainable Municipality, characterised by holistic growth and equitable opportunities for all” through proper management of the environment and natural resources. The plan is anchored by the main programmes of solid waste management, natural resource management and mainstreaming climate change into development plans.
At a local level, the planning policy and development framework in KKM is mainly guided by the Municipality Integrated Development Plan 2018 – 2022 (IDeP) and the Draft Local Physical and Land Use Development Plan 2020 – 2030 (LPLUDP). The Draft LPLUDP seeks to guide future growth, providing an integrated physical development by setting out the zoning and proposed land uses and development control regulations, prioritising infrastructure projects and budget.
The Mountain Cities Blueprint 2032 is the conceptual model for polycentric development of KC, with a vision and guiding principles. The plan proposes to brand and differentiate each constituency with an economic function grounded on existing activities and future opportunities. The suggested function for each constituency were identified through public participation forums.
The Draft County Spatial Plan 2015 – 2025 (CSP) is the long-term land use and spatial planning framework that aims to guide the allocation and distribution of resources to promote sustainable growth. The Draft Plan identifies the towns of Sagana, Wang’uru, Kerugoya, Kutus and Kagio as the main urban centres, earmarking the vision for KC to “be an agriculturally viable, industrialised and economically prosperous County with reliable infrastructure, utility and social service provision’’.
Local Plans
28 2.2 Planning Context
The Planning Context sets the basis for the development of the UEP. The Diagnostic Report in Appendix A covers key international and national trends likely to influence the sustainable growth trajectory of KKM; national strategies and policies, and; KKM’s own priorities and ambitions.
2.1 State of Kerugoya-Kutus
2.1.1 Municipality Character KKM is mostly rural in character, with agricultural land use predominantly occurring through the Municipality, which is similar to KC. The Municipality contains two main towns: Kerugoya in the north and Kutus in the south, which are about 10 km apart and linked by the B27 road and Rutui river. There are other smaller built-up areas such as Kibingo, Mukinduri, Kiamwenja, Ithareini, Karia and Kiamirici spread across the TheMunicipality.Municipality widely benefits from its strategic location, due to its close proximity to Nairobi, located within the Central region and Mt Kenya climatic zones, the existing railway station at Sagana and its rich agricultural land and resources. The Municipality and the County are relatively small, but have a sound economy and are leading producers of rice and other agricultural produce such as tea, coffee and tomatoes. Given its predominant land use across KC and KKM, agriculture has been identified as the main economic activity, with 87% of the population relying on agriculture for their livelihoods and 72% of household income.
KERUGOYA-KUTUS MUNICIPALITY URBAN ECONOMIC PLAN (UEP ) 29
Lack of proper planning, poor implementation of plans and poor enforcement of regulations have led to uncontrolled growth and informal settlements. These settlements across KKM and KC are characterised by higher residential and population densities, inadequate housing, land tenure insecurity, poor roads and accessibility, inadequate access to basic services and environmental degradation. These neighbourhoods also suffer from social deprivation, including high levels of unemployment, lack of schooling, security issues and drug and alcohol abuse.
> Financial hub, where many banks, financial institutions and insurance companies are settled; and > Retail, commercial enterprises and markets, Kerugoya market has recently been upgraded and is the largest in the SimilarCounty.totheother urban centres in KC, Kerugoya is reliant on agricultural-related activities due to its rich agricultural hinterland. Agri-processing or light industries such as milling, the slaughterhouse and coffee factories (Rutui and others) are located in the town.
Kerugoya Town Character Kerugoya is located in the north of the Municipality and is the second largest town in KC, with a population of 30,045. The town has mainly been developed as a district headquarters and administrative centre, including the provision of key urban services such as:
30
> Health centre, hosting private and public hospitals such as ACK Mt Kenya, Kerugoya Referral Hospital and the on-going construction of Kerugoya Multipurpose Medical Complex;

KERUGOYA-KUTUS MUNICIPALITY URBAN ECONOMIC PLAN (UEP ) 31 Figure 2.3 Kerugoya Town Character Source: Atkins

32 Kutus Town Character Kutus has a population of 9,143. The town is the wholesale trading centre and also serves as an administrative centre, owing to the relocation of the KC headquarters, which was enabled when gaining Municipality status in 2018. Kutus is growing rapidly due to the establishment of Kirinyaga University (KyU), which has influenced its development as a university town. There are more than 2,500 students at the university and the number is expected to grow, which means increasing pressure from students seeking accommodation, employment opportunities, entertainment, and other social Theactivities.town is centrally located and easily accessible from all parts of KC. It is a transit town and a regular stop for many when travelling from Nairobi to Meru. A high proportion of the urban area is comprised of educational and public land, largely land owned by the KyU and other public institutions.

KERUGOYA-KUTUS MUNICIPALITY URBAN ECONOMIC PLAN (UEP ) 33 Figure 2.4 Kutus Town Character Source: Atkins

34 2.1.2 Socio-Economic and Demographic Profile Population inhabitants39,188in KKM in 2019 –including 30,045 in Kerugoya and 9,143 in Kutus.
KC urban population has been growing fast, but less in KKM than in other urban areas. KKM is projected to have nearly 44,000 inhabitants by 2030 if current growth rates continue 26% of those living in KC were below the poverty line (135,000 Comparedinhabitants)with45%nationally
Despite this rapid urbanisation, Kirinyaga represents the 6th smallest County in Kenya and the smallest of the CEREB in terms of land area, and the 13th least populated County in TheSocialKenya.InclusionvisionoftheKKM IDeP is to enhance a vibrant, innovative and sustainable Municipality, characterised by holistic growth and equitable opportunities for all. Leaving no one behind is a central theme that underlines both this vision and the UN Sustainable Development Goals adopted in 2015.
The population of KKM is estimated to be 39,188, which accounts for 6% of the County’s population. This comprises 30,045 in Kerugoya and 9,143 in Kutus. Within the County’s population, 22% of the population was classified as urban, which is less than the CEREB average of 34%. Most of the urban population in Kirinyaga live in eight urban centres: Kerugoya, Kutus, Wanguru, Kagio, Sagana, Kimbimbi, Kagumo and Kianyaga. The population density of the County is 413 inhabitants per km2, making it the 6th most densely populated County in Kenya. The County has experienced one of the fastest urbanisation rates in Kenya in recent years, with the urban population increasing by 40% between 2009 and 2019. However, this growth was not evenly spread across the County, as KKM absorbed just 5% of population growth – increasing at a very slow rate of 1% per annum between 2009 and 2019.
KKM:63% Nationally:48% Lower levels of poverty: growth:Population
KKM:1.0%Urban5.2%population: Nationally:35%KKM:42%
The approach to gender and social inclusion (GeSI) was guided by the SUED Programme’s need for age, gender, persons with disability (PWD) and refugees’ inclusion, and the Consultant’s use of a three-dimensional approach covering social, economic and spatial dimensions of inclusion as illustrated in Figure 2.5 The Three Dimension of Inclusion.
Demographic Profile
Annual population growth: Secondary andhigher education: population:Working KC:1.5% KC:38%
Source: Atkins
In addition, PWD and youth from the informal settlements of KKM face more challenges such as poor water and sanitation services, insecurity, limited access to power in most settlements, and land ownership issues. All these exacerbate youth and PWD challenges as they generally operate from poor non-inclusive infrastructure, businesses and living environments.
> Lack of involvement in decision-making: Often youth and PWD are hardly involved in planning for projects. They are even left out decision-making on matters that concern them. This creates a gap between the SIGs and the government and projects because the SIGs do not get opportunities to express their views about projects or matters that concern them.
> Lack of implementation of disability laws: Lack of governments, projects and programmes’ goodwill to implement disability-related laws that lead to PWD being left out in job and procurement opportunities allocation, cash transfers and use of demeaning language against PWD.
Youth Lack of Youth involvement in vital decision making, even regarding matters that directly concern them.
Youth in business and farming find it difficult to do large scale trade or farming due to limited access to capital. Underpayment of youth in employment because they are desperate for jobs. High unemployment rates amongst Youth, often leaving them idle and predisposed to substance abuse. Source: Atkins
The Three Dimension of Inclusion
KERUGOYA-KUTUS MUNICIPALITY URBAN ECONOMIC PLAN (UEP ) 35
Lack of inclusive infrastructure that limits their mobility and access to vital socioeconomic spaces and services.
Processes that perpetuate exclusion in KKM were identified as:
The Study sought to understand KKM’s special interest groups (SIGs) through GeSI – a related literature review, key informant interviews, focus group discussions and observation. Further, SIGs’ representatives have attended all the UEP development workshops and participated in the business survey; and youth and PWD now have a representative (Inclusion Champion) in the PSG. KC recorded the highest Gender Equality Index at 56%, out of 10 counties that were assessed by the Council of Governors in collaboration with UN Women in 2019. This finding was validated by the primary data collection exercise where key informant interviews established that women in KC have the same opportunities as men and can participate in both the economy and decision-making processes. The “Wezesha” programme has been key to KC’s gender inclusion efforts, enabling women and other vulnerable groups to achieve their best in different economic activities. Nevertheless, the study established that PWD and youth are often excluded in socio-economic activities in KKM. The two groups face challenges that are either caused by, or lead to, exclusion, as indicated in Table 2.1 below.
barriers for the hearing and visually impaired, meetings do not have sign language interpreters or Braille material, health officers and medics are not trained on sign language.
Table 2.1 SIGs and Exclusion Manifestation Table SIG Exclusion Manifestation Persons Disabilitywith Partial to complete lack of implementation of disability laws. Lack of PWDs involvement in vital decision making, even regarding matters that directly concern them. Discriminated against for employment Communicationopportunities.
> Discriminatory design processes: Lack of inclusive infrastructure accessible by everyone, this has limited PWD’ mobility and access to vital socio-economic spaces and services. Such spaces include public transport, government offices and markets. In public transport, wheelchair users are also charged more than the rest of the passengers.
> Information barriers: Both the County and national governments do not develop communication plans with PWD in mind e.g. communication barriers for people who are deaf are rampant as most meetings do not have sign Opportunitieslanguage.for inclusion in the SUED Programme include involvement of all in decision-making and in the development of safe, inclusive and climate-resilient infrastructure. This will enable better access to capacity building initiatives, seed capital and employment opportunities – especially through participation in the VC projects. Special attention will need to be given to the informal settlements within the Municipality.
Figure 2.5
Spatial Inclusion Improving access to infrastructure, affordable land & housing Economic Inclusion Ensuring opportunities for all and sharing of benefits Multi-Dimensional Approach to Inclusive Cities Social Inclusion Improving the terms for individuals and groups to take part in society /=, /-, K
Figure 2.6 Gross County Product per Capita, 2019 (in KES)
Nyandarua MarakwetElgeyo Nairobi Mombasa Nakuru Lamu Kiambu Nyeri Machakos Embu Bomet NithiTharaka Kisumu Kirinyaga Narok Muranga 100,000150,000200,000250,000300,000350,000400,00050,0000
As36 raised in Section 1.5, there are interlinkages between climate change and poverty, as climate change will have an impact on income security and quality of life. It is important to understand where the burden of climate change impacts may fall and how societal groups can be included in proposed mitigation measures. Social inclusion is cognisant of this relationship. The UEP has adopted climate adaptation approaches, as well as inclusivity in all forms, to avoid exclusion of certain groups and to reduce inequality. Similarly, it has sought to address how infrastructure and VCs can be made more resilient to climate shocks, with the understanding that climate impacts hit vulnerable groups the hardest. Economic Profile The CEREB region contributes towards 28% of national output, with a combined GDP of KES 2,115,565. Half of CEREB’s economic activity is driven by three counties: Nakuru, Kiambu and Meru. In contrast, Kirinyaga represents one of the smallest economies in CEREB. In 2017, it accounted for just 5% of the Bloc’s GCP, with only Laikipia and Tharaka Nithi accounting for Kirinyaga’sless.
Laikipia Busia Meru Nyamira Kericho TavetaTaita Uasin-Gishu Baringo Nandi Kajiado Kisii NzoiaTrans RiverTana Marsabit Makueni Kwale Isiolo BayHoma Bungoma Kakamega Siaya Vihiga Kitui Samburu Garissa Migori Kilifi Wajir Turkana PokotWest Mandera
GCP per capita (2017) Kenya average Source: Atkins
GCP per capita was slightly higher than the national average in 2019, at KES 162,666 – compared to Kes 161,499 nationally. Figure 2.7 demonstrates that most of the counties in CEREB, including KC, also had a higher GCP per capita than the national average. While Kirinyaga remains a small economy in absolute terms, its GCP relative to its size, per capita, is on par with the Kenyan average.
KERUGOYA-KUTUS MUNICIPALITY URBAN ECONOMIC PLAN (UEP ) 37
Figure 2.7 Kirinyaga GCP Breakdown Source:
The CEREB region is heavily reliant on agriculture, which accounts for 52% of GCP. This is followed by technical services – such as ICT, finance and real estate (15%), and construction and logistics (11%). Focusing on Kirinyaga’s internal economy, GCP analysis indicates some individual differences with these CEREB sector specialisations, as highlighted in Figure 2.7. While agriculture is the largest sector of KC’s economy (40% of GCP), this is lower than the Bloc’s average (52%), with only Embu and Kiambu being less reliant on agriculture. Nevertheless, a significant proportion of Kirinyaga’s residents are employed in agriculture, especially in rice-related businesses, and the sector remains the backbone of the County’s economy. In 2009, about a third of the Kenyan workforce (32%) worked in family agricultural holdings, while this was significantly higher in Kirinyaga County (45.7%) and Kirinyaga Central (41.2%). This could suggest that the agriculture sector is less productive in KC, and therefore would account for a smaller share of the County’s output compared to some other counties. Mining activities, as well as utilities, account for 9% of the County GCP, which is higher than the CEREB average (4%). However, those two sectors remain very small in absolute terms. Technical services (ICT, finance and real estate) are well represented in Kirinyaga (16%), on par with the CEREB average (15%). Importantly, the vast majority of employment in KC and KKM is likely to be in the informal sector. In 2019, almost 83% of employment in Kenya was in the informal sector. While no statistics are directly available at smaller geographies, employment composition and GCP specialisation in agriculture suggests a similar pattern in KC and KKM. Atkins

and agri-processing businesses that buy from local farmers are sometimes unable to guarantee a price to farmers. Access to finance
Table 2.2 Business Identified Challenges to Growth Main Challenge
Hotels and jua kali workers referred to the high cost of taxes and various licences. A business selling in another County might also be required to get certain licenses or permits, resulting in a double charge.
Both markets at Kerugoya and Kutus towns were described as being too congested, and lacking facilities including shelter, shade, toilets and water.
Hotels indicated that they were facing regular water and electricity disruptions.
Several farmers mentioned the high cost of input such as fertilisers, seeds and other sourcing products, which ultimately lead to high production costs.
Lack of storage
Fluctuation in market prices was mentioned as a constraint across various industries. The COVID-19 pandemic has created uncertainty among buyers and consumers, which has disrupted the supply chain and affected prices. For instance, one trader said the value of restock (cereals) went down from Kes 50,000 to Kes Cooperatives20,000.
Many products experience significant variations of supply across the year. November to February is the high season where many crops are being harvested. However, many traders mentioned the lack of storage that resulted in considerable waste and uneven revenues.
One trader mentioned that they would benefit in having access to short-term loans to buy non-perishable products at harvesting season when supply is high and price is low, such as cereals, and sell throughout the year, but this was seen as risky by the bank.
Source: Atkins
Description Cost of input, taxes and licences
Fifty-seven businesses, reflecting KKM main sectoral activities, were consulted with in-depth interviews to inform the understanding of the business environment and socio-economic inclusion. Many of these were small businesses or independent workers – given the nature of the local economy – but large employers were also consulted, including banks, health and education facilities, and processing plants. Businesses in KKM are usually small and with markets centred within the County. There are typically few linkages with other businesses, upstream or downstream. Of the business linkages reported, most were with local suppliers or distributors, though rice production presents a longer value chain. As KC produces more than 60% of Kenyan rice, rice grains from KC are sold everywhere in the country.
Some products could however be easily stored, such as rice, where supply is high and costs lower in TheftsDecember.were also mentioned, in particular in the coffee industry. Market price fluctuations
The38 State of Business in Kerugoya-Kutus
Many respondents indicated they had access to finance through banks and loans. However, some farmers and traders were mentioning more difficulties – mostly because they have little collateral.
More generally, some respondents mentioned the poor state of the roads, in particular rural roads.
Many farmers get their supply locally and sell on local markets in KKM, or sell to local traders who then operate on the market. A large proportion of trade in Kutus market also seems to be for wholesale rather than retail. The proximity to Nairobi, the diverse variety of produce and the availability of rice is likely to explain why many brokers travel to the market. Services tend to be more local in KKM, using local suppliers and catering for local customers, such as banks, administration, etc. Most businesses consulted indicated that they were expected to grow in the next couple of years. However, COVID-19 was mentioned at various occasions as a hindrance to growth, alongside several common identified barriers to growth. A consensus on the key challenges to growth for business was identified:
There is also a general trading charge for County-to-County trade. Machine maintenance For agri-processing, the cost of maintenance of machinery was highlighted as a key constraint. Machines typically come from outside of the County or even Kenya, meaning that spare parts are difficult to source and costly to import.
State of infrastructure
Finding people with the right skills to repair machines can also be a challenge, and businesses reported they sometimes had to hire someone from outside of Kenya.
Infrastructure Overview
Water Wastewater and Sanitation
Significant lack of cold storage and available machinery to boost the economy and add value.
KERUGOYA-KUTUS MUNICIPALITY URBAN ECONOMIC PLAN (UEP ) 39
Drainage Drainage infrastructure does not form a drainage network. Increasing urban river pollution, mainly due to runoff of pollutants from urban areas and combined sewer overflows caused by incapacities in the combined sewer network. Main natural hazard is flooding during heavy rains, as well as associatedwhichwithinspacesInadequatelandslides.parkingintownandbusparks,isinadequate for the matatus operating in the area.
Non-revenue water is estimated at 60%. Losses are high due to leakage from the aging pipe network, illegal connections and a lack of consumer meters.perday neither meet the quality standards. Nationally 58% 8,000m3
It is acknowledged that current practices cause air and water pollution and pose risk to public health and the
Solid Waste Only a small percentage of all total waste is collected and transferred to designated dumpsites.
areoutbreaksandDiarrhoeaenvironment.choleracommon.Dumpsites
Transportation Poor road surface conditions within KC. Most access/feeder roads are earth surfaced and do not provide for all-weather access, including lack of storm water drainage. Lack of NMT facilities in urban areas that pose safety concerns to road users and makes urban areas inaccessible by PWDs. Current level of energy infrastructure in more rural areas is fairly sparse. Areas needed to support agri-processing are mainly remote and likely to be unserved by the grid.
The Municipality’s infrastructure has been assessed and evaluated in its current provision and state to identify strengths and critical gaps. The assessments also reviewed proposed or planned projects, for how they respond to KKM’s infrastructure challenges. Overall, to address the existing infrastructure challenges and barriers to growth, KKM will need to upgrade existing infrastructure and commit to new projects to support economic growth and development. Key infrastructure gaps identified are: of populationthe have access to at least a basic water supply. Water supply deficit is approx. Septic tanks and pit latrines are used widely in households and institutions.
Energy Cost of electricity is very high. Most people continue to use firewood and charcoal for cooking as LPG and paraffin are too expensive.
There is no centralised sewerage system. Poor agricultural practices contribute to waterSmallpollution.sludgetreatment facility, located outside Kutus town, can only handle 3-4 sewage exhauster trucks per day.
2.2
typically do not have NEMA licences and waste is often burned.
Key climate risks are drought and rainfall variability, including onset and duration of rainfall, localised flooding, particularly for informal settlements, and increased temperatures accelerating a reduction in snow and glacier cover at Mt Kenya.
Environment and Climate Change Risk Profile
Climate projections show that average, minimum and maximum temperatures will increase in the County. Overall, annual rainfall is likely to increase, however, there is potential for an earlier end to the Long Rains, and less reliable rainfall during both rainy seasons. The intensity of rainfall is also expected to increase. On average, rainfall events will be heavier, and rainfall currently considered extreme will occur more often. Climate risks to the agricultural sector will remain high, as increases in drought stress are likely, and rainfall intensity is expected to increase, meaning that flood risk is likely to increase.
24. County Government, 2018. CIDP.
There is an opportunity in Kirinyaga to work with the significant natural assets of the County in order to both increase resilience to these climate risks, as well as enhancing biodiversity, and improving leisure and recreational activities.
Poor and marginalised groups tend to be disproportionately vulnerable to climate risks, as outlined in Section 1.5, due to a reliance on natural resources for livelihoods, housing which is more likely to be in areas at risk of flooding, and other climate hazards, and a lack of access to social and financial resources.
The CIDP recognises climate variability and climate change as an emerging threat to the sustainable development of the County. The impact of drought and floods is reported to have increased, and farmers have seen less reliable rainfall, with more variability between years and within seasons.
Without explicitly considering the climate risk faced by these groups, economic growth and poverty reduction initiatives that target these groups may be undermined. Equally, if climate adaptation and resilience programmes do not explicitly include and consider marginalised communities, they risk reinforcing existing inequalities.
The GBD approach outlined as the development concept further below has been developed as a way to increase climate resilience – for example by increasing flood storage while also providing recreational areas – while at the same time increasing the resilience of marginalised groups. Framing the development in the County around the GBD concept will also position the county and municipality to attract green investment flows, including climate finance, but also sustainable finance and impact investment more generally.
The highest altitude within the County is around 5,200m above sea level, at the peak of Mt Kenya. KKM is largely located within the lowland ecological zone. The climate of the County is heavily influenced by Mt Kenya, and conditions range from cool and wet on its slopes, to warm and drier in the semi-arid areas around Mwea District. KKM is generally well-endowed with water resources, however, there has been an increase in variability and climate extremes, with increased temperatures significantly reducing snow and glacier cover on Mt Kenya, which has in turn decreased the reliability of river flows into KKM.
40
2.3
The topography of the County is greatly influenced by the presence of Mt Kenya at its northern axis. From the plains of Mt Kenya to the south, the topography gradually rises towards the peak of the mountain to the north. The County has 35,876ha of forest, covering 23.7% of its territory. Major forests within the Municipality include Mt Kenya forest and Njukiini West Forest, which are very diverse with exotic and undisturbed indigenous trees. Most wildlife is found in Mt Kenya National Park and Reserve, which provides a habitat for a rich diversity of animals, including a number of threatened species. The County has three distinct ecological zones24: The highlands 3,400m above sea level, the midland areas (ranging from 2,000m to 3,400m) above mean sea level and the lowlands or plains (1,158m to 2,000m above mean sea level).

Barriers to Growth Poor and limited infrastructure within KKM has been a key barrier to economic growth. KKM will need to upgrade existing infrastructure and commit to successful implementation of low carbon, climate resilient and inclusive infrastructure projects to support economic growth and sustainable development.
Ensuring that the right pool of skills and technical knowledge is available will be crucial to ensuring that key market sectors can be further developed.
2.4 Diagnostics
Trade, services and eco-tourism, reflecting the existing commercial activity in KKM and its strategic location, as well as the future growth opportunities presented by eco-tourism.
Lack of specialised skills, meaning experts often have to come from Nairobi or even outside Kenya at significant cost.
Private sector companies are interested in building facilities in KC, however their land requirements cannot be met locally at present.
The Municipality is able to grow a great variety of agricultural products due to its location across the three main ecological zones, with potential for economic growth.
To promote diverse economic development within an attractive investment and business environment, KKM will need to focus on its key economic sectors and competitive advantages that can support growth within the Municipality, and throughout the County. The economic profile supported by business consultations includes the following: Agriculture, the local population largely rely on this sector as the main economic subsistence activity. Industry and agri-processing, driven by KIDA and Kenya’s Agricultural Sector Transformation Growth Strategy (ASTGS).
Limited land availability for development is one the biggest barriers for industrialisation in KC, with intensifying levels of urbanisation increasing pressure on land in urban areas.
Conclusion: Drivers and Barriers for Growth
Drivers for Growth KKM benefits from a strategic location in central Kenya, owing to its proximity to Nairobi and other large regional hubs.
Adopting a Green Blue Development (GBD) approach will help KKM to preserve its unique water and natural resources while allowing a sustainable economic growth.
It has the potential to upscale the agricultural sector, by investing in agri-processing value chains (VCs) to retain more value addition at the local level, reduce wastage caused by overproduction or poor access to markets, and ensure consistent revenues to farmers. Institutional support, through involvement of KIDA, will be a critical driver in this process.
Competition from major cities or regional hubs, which are often larger and where the service industry can be more developed. Finding the Municipality’s unique selling point and assessing both competition and synergies across the counties is crucial.
Future urbanisation pressures will also exacerbate resource depletion and uncontrolled development if not well planned and managed.
Development of climate-resilient projects will help farmers adapt to changing conditions and preserve KC’s strong agricultural position.
Tourism and eco-tourism can play a key role in the future development of KC and KKM, particularly due to key natural assets such as the Mt Kenya Natural Park and the County’s forests and rivers.
Development of services will be pivotal to transforming the economies of KC and KKM. Improved education and learning programmes that aligns with the economic needs of the County and Municipality will be critical to developing a skilled and technically enabled workforce tailored to local needs.
Key historic climate-related hazards affecting KKM and future climate change could result in loss of life, crops, natural assets and property as well as damage in water, transport, waste, sewerage and energy infrastructure that is critical to economic growth.
KERUGOYA-KUTUS MUNICIPALITY URBAN ECONOMIC PLAN (UEP ) 41
The Municipality benefits from strong accessibility by road and rail, which gives both KKM and KC a significant boost and advantage for all its sectors.
42 3. Green ConceptDevelopmentBlue
Introducing DevelopmenttheConcept The UEP vision for KKM outlined in Section 3.2, and developed with stakeholders, emphasises the need for a green approach that preserves natural resources while enhancing everyone’s wellbeing and access to economic opportunities. In line with this vision and existing challenges outlined in Chapter 2, particularly the intensifying pressure on natural resources from rapid urbanisation and climate change, a Green Blue Development (GBD) approach represents a significant opportunity for both KKM and KC to drive sustainable economic development and enhanced environmental resilience, whilst also improving the health and wellbeing of its citizens.
3.1

Figure 3.1 UEP
Framework
KERUGOYA-KUTUS MUNICIPALITY URBAN ECONOMIC PLAN (UEP ) 43
Source: Atkins
The UEP provides an overarching Development Concept, focused on a bespoke GBD approach, to guide and support the realisation of economic opportunities as economic sector development plans (Section 4.1), value chain opportunities (Section 4.2) and the implementation of a Development Framework of Green Blue Infrastructure (GBI) projects and initiatives (Section 5). A number of VC projects have been identified and assessed to act as anchor projects for KKM, while the Development Framework (Section 5) prioritises the GBI projects that will be required to support economic growth. Additionally, the Development Concept is grounded on the main planning documents steering development across the Municipality and the County, highlighted in Section 2.2. While some of the documents are yet to be legally adopted, it is important to note these plans suggest a polycentric development. This means a network of designated functional centres across KC to strengthen the rural – urban linkages, therefore KKM UEP is focused on three main areas for development: Sagana industrial site, Kerugoya town and Kutus town (further described in Section 5.1.1). This Chapter presents the UEP Development Concept and overview to these elements, as demonstrated in Figure 3.1. Green Blue Development

The UEP sets out an economic vision to guide the economic and urban development of the Municipality. A visioning exercise was undertaken at the TBP workshop. PSG members, MB members and wider stakeholders were asked to consider the key elements of the UEP vision, where proposed vision statements were submitted by around 50 stakeholders. The team have analysed the responses to identify common objectives. The following key elements were mentioned and articulated by the PSG, MB members and wider stakeholders for KKM to be: > Green and environmentally friendly; > Distinctive green blue resources to be protected such as Mt Kenya, rivers and green areas; > Well-connected and integrated; > Sustainable and prosperous; > Vibrant, thriving, liveable and attractive; > Beautiful and clean; > Organised and spaced out; > Modern, industrialised, and industrial hub; > Economic hub; > Residential hub; > Adequate infrastructure provision; > Health, welfare and wellness centre.
44
The vision statement that best represents the MB, PSG and wider stakeholder’s aspirations is stated below: “A well-planned, integrated, vibrant and greenwhilstopportunitiesindustrialMunicipalitysustainablewithagreenhub,thatprovidesforallitscitizensenhancingitsuniqueblueresources.”
3.2 UEP Vision
A GBD approach could form a key element of this shared vision, requiring a holistic approach that permeates every level of the planning, design, and management process, to be adopted at every stage of development. A positive and proactive approach to GBD will enable KKM to make sustainable use of its natural resources, providing tangible returns on investment and increased functionality, together with an increased focus on the health and wellbeing of its citizens.
The vision for economic development in KKM focuses on a green approach that preserves the Municipality’s valuable natural resources and achieves both economic and environmental resilience, whilst also improving the wellbeing of the population.
The model for GBD for KKM aims to strengthen the Municipality’s economic role, based on its competitive and comparative advantages, while taking a citizen-centred approach to green growth and sustainable investment. The Economic Development Plan for KKM is based on the economic vision and sectoral action plans, set out in Section 4.1. These action plans respond to the diagnostics phase, where the Municipality’s key economic sectors – industry and agri-processing, agriculture and livestock, and trade, services, and eco-tourism – were assessed according to a SWOT framework that utilised data gathering, stakeholder engagement and business consultation to identify the opportunities and threats for each sector. These action plans build on this to ensure the realisation of economic opportunities and the mitigation of threats in an inclusive and resilient way. The Economic Development Plan will support the MB and the Municipality to deliver a more cohesive, holistic and sustainable economic future for KKM, with a focus on GBD.
Value Chain projects have been assessed to select two agri-processing VCs for KKM, of banana flour and husk products. These VCs, and further VC and industrial opportunities, sit within the wider Economic Development Plan for KKM (as set out in Section 4.2) as anchor projects.
KERUGOYA-KUTUS MUNICIPALITY URBAN ECONOMIC PLAN (UEP ) 45
A number of key outcomes are identified to establish VCs which drive an economic ecosystem that can grow and ensure opportunities for KKM’s residents, in particular its youth and PWD, who have previously been excluded from more formal employment.
3.3
Economic Development – Sector Plans and VCs

Crucially, water resources need to be regarded as a holistic and integrated system. Provision of potential soft and hard solutions should aim to manage a set of interlinked challenges, which could be achieved by adopting a GBD approach.
The dual benefits created have the potential to increase the cost-effectiveness of infrastructure and result in maintenance reductions for KKM. However, it is important to recognise that the multifunctional nature of GBD means that an integrated and multi-disciplinary appoach will be crucial to its successful implementation. Figure 3.2 below presents the multi-benefits and multi-disciplinary inputs to GBD to achieve the KKM UEP’s vision.
Critical to KKM’s future development are its unique water and natural resources, which are currently under significant stress. Pressures come from rapid and uncontrolled urbanisation, poor agricultural practices, pollution and degradation of resources, as well as climate change – which is increasingly affecting water levels and causing more frequent natural hazard events such as floods and droughts, as detailed in Chapter 2. KC is well-endowed with water resources, as well as natural assets, including Mt Kenya Natural Park and fertile soils for agricultural production, especially rice, which is a water-dependant crop). KKM is located on the flanks of Mt Kenya, one of the main water towers in Kenya, known as “the heart and lungs of the country”. The rivers that emanate from Mt Kenya are tributaries of Tana and Ewaso Ng’iro rivers, the two largest river basins in the country. The ongoing pressure on Mt Kenya’s rich ecosystems increasingly threatens people’s livelihoods and the economy of both KC and KKM, along with its habitats and biodiversity resources.
6. European Environment Agency (2015) Exploring Nature-Based Solutions: The Role of Green Infrastructure in Mitigating the Impacts of Weather and Climate Change-Related Natural Hazards.
3.4 Green Blue Development (GBD) Approach
The County Government is in the process of developing the Mountain Cities Blueprint, a long-term plan that aims to develop the County in a sustainable way and protect these unique natural resources such as mountains, rivers and fertile soil. A proactive response is required to address the increasing pressure on KKM’s water and natural resources.
5. Wouters, P., Dreiseitl, H., Wanschura, B., Wörlen, M., Moldaschl, M., Wescoat, J. and Noiva, K. (2017) ‘Strengthening Blue-Green Infrastructure in Our Cities’, Ramboll Environ [Online] Available at: (Accessed:http://download.ramboll-environ.com/environcorp/Blue%20green%20infrastructures.pdf20June2021)
The main driver of GBD is to approach water resources as a holistic and integrated system, in order to achieve economic and environmental resilience. Together green and blue infrastructures can encourage multifunctionality, meaning that the same spatial area is able to perform various functions and deliver multiple benefits to society6
Luxembourg: Publications Office
3.4.1 Setting the Scene
46
There is a growing global interest in the potential of nature-based solutions, in particular the incorporation of GBI, and the multiple socio-economic and environmental benefits they may offer to cities such as KKM. A GBD approach involves the integration of natural systems that offer the potential to increase resilience to floods and drought, while at the same time enhancing the ecological and amenity value associated with urban greening, along with water security and stormwater management5.
KERUGOYA-KUTUS MUNICIPALITY URBAN ECONOMIC PLAN (UEP ) 47 Figure 3.2 Multi-Benefits and Multi-Disciplinary Approach to GBD of KKM Socio-economic benefits Less expensive to build Social cohesion Improvedproductivityandfoodsecurity;Povertyalleviationand(green)jobcreation; Recreationandamenity; Additionalfundingoptions, and maintain than andempowerment suchasClimateFundsImprovedrural–urbanrurallinkagesCarbonsequestration;Carbonreductionand contributiontolowcarbon;Enhancedurbanresilience;Coolinge ffects; Natural hazard riskreduction(including flood Improvedwaterquality;Preven tionofsoilerosionandlandcontamination; Reductioninpollutionandimprovedairquality; Energyandwatersavings; Restorationofhabitats andecosystems;Increasedbiodiversity.Environment and resourceefficiency benefiStsocio-economicbene fi tsClimatechangeadaptationbenefits UEP Vision: To be andsustainableintegrated,green,inclusive Landscapeandplacemaking Watermanagement Soildwastemanagement Green Industries and Agriculture Environmentprotection and drought risk); grey infrastructure; ofcommunities; Source: Atkins
> Natural hazard risk reduction, including flood and drought risk; > Cooling effects; > Enhanced urban resilience; > Carbon reduction and contribution to low carbon; > Carbon sequestration;
Healthy ecosystems are significant tools in advancing the wellbeing of citizens and fostering long-term socio-economic resilience through a variety of ecosystem services. This is aligned with the Mountain Cities Blueprint 2032 objectives to improve people’s wellness. However, the integrity of these ecosystems is increasingly endangered by climate change, which in turn will increasingly impact those who rely on these ecosystems, especially the urban and rural poor7. Climate change poses long-term consequences for sustainable development and human wellbeing – including increasing poverty, intensifying public health issues and negatively impacting economies. Equally, healthy ecosystems have the potential to enhance environmental and socio-economic resilience to climate change. A GBD approach will seek to ensure that KKM is healthy, prosperous and resilient. GBD is designed to maintain and enhance the delivery of benefits to economic development in the form of clean water, clean air, climate regulation, flood prevention, pollination, and recreation, amongst others. These benefits are often termed ‘ecosystem services’. Having access to the benefits these services provide is particularly important for growing urban areas such as KKM8.
48 3.4.2 Benefits of Green Blue Development (GBD) Approach
10. Maksimovic, C., Mijic, A., Suter, I. and Van Reeuwijk, M. (2017) Blue-Green Solutions. A Systems Approach to Sustainable, Resilient and Cost-Effective Urban Development. London, UK: Imperial College Socio-Economic Benefits Implementation of GBI can be low-cost, and cost-effective, helping enhance the economic efficiency of infrastructure investments. Its multiple benefits could generate both monetary values and non-monetary gains for KKM9. Simultaneously GBI has an important social dimension including significant benefits for public health. The operators of GBI could be local communities, responsible for implementing land stewardship practices and for maintaining the project over the long term. A selection of the key potential socio-economic benefits of GBI for the urban population of KKM are detailed below: > Improved public health and wellbeing; > Less expensive to build and maintain than grey infrastructure; > Social cohesion and empowerment of communities; > Improved productivity and food security; > Poverty alleviation and ‘green’ job creation; > Recreation and amenity; > Additional funding options, such as Climate Funds.
Research suggests that green and blue infrastructure is more flexible and resilient to climate change than traditional grey infrastructure, especially when used in combination. Studies indicate that implementation of GBI can improve air and water quality; enhance carbon storage; increase flood and temperature regulation; reduce noise; and improve resource efficiency, biodiversity and amenity value10. These characteristics, in turn, have the potential to improve KKM’s resilience to climate change impacts, especially to increasing temperatures, flooding and droughts already experienced in KKM and KC. Certain potential key benefits for KKM relating to climate change adaptation and resilience are presented below:
> Improved rural – urban rural linkages.
7. Swanepoel, E. and Sauka, S. (2019) ‘Ecosystem-based Adaptation in South African Coastal Cities’, South African Institute of International Affairs, Occasional Paper 297
8. European Environment Agency (2020) ‘What is Green Infrastructure?’ [Online] Available at: www.eea.europa.eu/themes/sustainability-transitions/urban-environment/urban-green-infrastructure/what-is-green-infrastructure (Accessed: 21 June 2021)
Climate Change Adaptation Benefits
9. Browder, G., Ozment, S., Rehberger Bescos, I., Gartner, T. and Lange, G.M. (2019) Integrating Green and Gray: Creating Next Generation Infrastructure. Washington, DC: World Bank and World Resources Institute.
The following section presents several examples of the different categories of GBI which could be considered for implementation in KKM as part of the Development Framework described in Chapter 5. Building on these potential measures and interventions, the specific requirements for KKM are comprehensively assessed in the Economic Development Plan in Chapter 4, whilst the GBD Framework in Chapter 5 presents the specific proposals and interventions recommended for KKM.
> Improved water quality; > Prevention of soil erosion and land contamination; > Reduction in pollution and improved air quality; > Energy and water savings; > Restoration of habitats and ecosystems; > Increased biodiversity. A high-level assessment has been undertaken to understand how each economic sector action plan in Section 4.1 and infrastructure proposals in Section 5 could contribute to GBD benefits.
> Water treatment capacity, utilising natural processes to filter local water supplies and reduce pollutants entering water bodies; > Water storage capacity to provide detention of stormwater.
Regardless of scale, these systems will generally share these common components14:
KERUGOYA-KUTUS MUNICIPALITY URBAN ECONOMIC PLAN (UEP ) 49
Environmental and Resource Efficiency Benefits
Whilst enhancing climate change adaptation and resilience, development of GBI also has the potential to unlock new opportunities for environmental prosperity. GBI can play an important role in protecting the natural resources, particularly water, that are increasingly threatened by urbanisation and climate change in KKM. Furthermore, introduction of a GBD approach could enhance the Municipality’s biodiversity, whilst improving ecological connectivity through creation and restoration of habitats11. As discussed, GBI can be multifunctional, potentially generating numerous positive environmental impacts for the Municipality, including:
12. Victoria State Government Department of Environment, Land, Water and Planning (2017) ‘Planning a Green-Blue City: Urban Greening and Enhanced Stormwater Management in Victoria’ [Online] Available at: https://www.water.vic.gov.au/__data/assets/pdf_file/0029/89606/Green-blueInfrastructure-Guidelines-Feb17.pdf (Accessed: 20 June 2021)
Consequently, effective GBI planning for KKM has taken into account potential interventions across all scales, as well as their collective impact as an integrated system.
Previously ‘green’ assets, such as parks, greenbelts and gardens, and ‘blue’ assets, including drainage systems, aquifers, reservoirs, and flood storage, had typically been planned separately. However, often the same asset can provide multiple ecosystem services that benefit both ‘green’ and ‘blue’ objectives12. GBD marries these two types of infrastructure, and their individual values, in a union that can be more efficient and resilient. By purposely planning for GBD that achieves multiple benefits, KKM will benefit from climate-resilient infrastructure, greater protection of unique natural resources, and maximised socio-economic benefits.
GBI can be integrated at a range of scales, from building or street level interventions such as green roofs or street trees up to Municipality or even County and regional measures13. Similarly, the measures and interventions associated with the GBD approach can range from soft initiatives, for instance, promotion of local greening and other information and communication schemes, to significant infrastructure proposals.
> Larger-scale systems may also offer additional water management functions, such as:
11. Winch, R., Clough, J., Mant, A., Hamilton-Russell, E., Barker, A., Payne, S., Gilchrist, A, Tantanasi, I., Clay, G. and Rothwell, J. (2020) Making the Case for Green Infrastructure: Lessons from Best Practice. London, UK: UK Green Building Council
14. Ibid.
> Vegetation, offering amenity and habitat;
> Soil, of adequate volume, nutrient content and drainage characteristics; > A link to rainwater, stormwater or recycled water supply, with a frequency and quantity sufficient to support vegetation and soil health.
13. Victoria State Government Department of Environment, Land, Water and Planning (2017) ‘Planning a Green-Blue City: Urban Greening and Enhanced Stormwater Management in Victoria’ [Online] Available at: https://www.water.vic.gov.au/__data/assets/pdf_file/0029/89606/Green-blueInfrastructure-Guidelines-Feb17.pdf (Accessed: 20 June 2021)
3.4.3 Delivering Green Blue Infrastructure (GBI)
> Road upgrades to enhance rural-urban linkages;
Solid Waste Management
The infrastructure overview in Section 2.4 identifies several issues with the waste management system in KKM. It is acknowledged that current practices cause air and water pollution and pose a significant risk to public health. In order to address this issue, waste management interventions which could be considered for implementation in KKM include:
> Appropriate waste collection systems; > Segregation, sorting and recycling facilities;
> Landfills aligned with NEMA standards and international best practices.
> Greening public realm such as streets and corridors;
> Incorporation of water sports such as canoeing, fishing, and sailing. Water Management KKM is well-endowed with water resources. Implementation of GBI may allow KKM to capitalise on the advantages presented by these resources in a sustainable and efficient manner. Water management measures deemed suitable to KKM include: > Sustainable drainage and stormwater management – SuDS; > Management of water quality and water supply treatment for groundwater and surface water; > Integrated river catchment management; > Establishment of wastewater treatment plans;
> Provision of green spaces;
> Improved land use efficiency, including relocation of uses, densification and urban regeneration;
> Provision of sustainable and active transport modes;
Placemaking50 and Landscape GBI represents a valuable tool for establishing high-quality and sustainable places. A GBD has the potential to strengthen the identity, character and distinctiveness of KKM, whilst improving land use efficiency through its various multi-functional and multi-benefits. Placemaking and landscaping interventions which could be implemented in KKM include:
> Improvement of sewage and sanitation networks and last mile connectivity;
> Gazetted and legal protection to water resources.
GBD presents a number of opportunities for a greener economy in KKM, aimed at reducing environmental risks and ecological scarcities. This includes the potential for growth in the green industries and increased clean production practices. GBD initiatives relating to green industries and agriculture include: > Sustainable irrigation systems such as solar pumping or other greener alternatives for irrigation;
> Circular economy initiatives as exemplified in the VCs;
As detailed in Chapter 2, natural resources are critical to KKM’s future development, which are increasingly threatened by rapid urbanisation, pollution and climate change. GBD introduces a significant opportunity to protect these valuable resources for the long term. Critical environmental protection measures for KKM could include: > Legal protection of natural resources; > Forestry management and tree and vegetation planting.
Environmental Protection
Green Industries and Agriculture
> Green and smart technologies.
> Renewable energy options, for instance hydropower or solar; > Promotion of eco-friendly products;
KERUGOYA-KUTUS MUNICIPALITY URBAN ECONOMIC PLAN (UEP ) 51
> Clean industrial processing and production to avoid or minimise liquid effluents, solid waste and gaseous emissions;

52 4. PlanDevelopmentEconomic
One of the key distinctive aspects of the Municipality is that it sits within a very small, yet highly diverse and functionally organised, County. The south, endowed with significant water resources, is home to the largest rice production in Kenya. The north, on the slopes of Mt. Kenya, is specialised in tea, coffee and nuts production and has potential for eco-tourism. In the east, Sagana benefits from good road and rail access that make it an excellent location for industrial development. KKM is located in the centre of the County and is roughly 30 minutes’ drive away from these different locations.

KERUGOYA-KUTUS MUNICIPALITY URBAN ECONOMIC PLAN (UEP ) 53
> In Sagana, the comparative advantage of the area is its excellent location for transport and logistics within and outside the County, with the presence of the Nyeri-Nairobi highway and the freight railroad. This means that agri-processing and industrial investments are likely to be more successful if they are located in Sagana rather than somewhere else in the County.
> In KKM, the comparative advantage is the presence of trade infrastructure as well as various services. This makes it a good area for new tertiary businesses to grow, as they can benefit from local assets such as educational facilities, workers, financial services, business support, and transport links. This is also a good location for existing and new residents; they can enjoy quick access to services such as educational and health facilities, and convenient transport services and infrastructure to travel across the County and outside. This suggests that land should be used for housing, office buildings and services.
This means that the KKM Economic Development Plan must truly be integrated to the economic and spatial planning ambitions of the entire County. As a result, investments should be located where they are likely to be most efficient, even if this means outside the limits of the Municipality. In turn, those investments can have positive spill-over effects to KKM through the growth of supporting services – which benefit from an urban location. This includes trading places like wholesale and retail markets, the provision of education and skills infrastructure, business support, financial, health and transport services, and housing. In doing so, the Economic Development Plan aims to strengthen synergies between the different areas of KC by creating complementarities rather than competition between them. Figure 4.1 overleaf summarises the Economic Development Plan through seven economic ambitions, three Sector Action Plans (section 4.1), 15 specific actions and an array of wider GBD benefits as detailed in Section 3.4.2.
There is a clear opportunity to generate higher economic and social benefits by making the most of each area’s comparative advantage.
Section 4.2 then presents the prioritised VCs of banana flour and husk products in detail.
> In the Mwea region, the comparative advantage of the land is that the right characteristics are met for rice culture, which is rare in Kenya and makes the region the largest producer in Kenya. This suggests that land should be preserved for this activity, and encroachment for other uses, such as other crops, or housing, should be limited.
Section 4.1 details the Economic Development Plan for KKM by setting out specific development recommendations for the Municipality’s key sectors of 1. Agriculture; 2. Agri-processing and Industries; and 3. Trade, Services and Eco-tourism.
54 ECONOMIC AMBITION GREEN BLUE BENEFITS ACTIONS: AGRICULTURE ACTIONS: AGRI-PROCESSING AND INDUSTRY ACTIONS: TRADE, SERVICES AND ECOTOURISM Improvedresilienceagriculturaltowardsclimatechange Productivity and food EnergyPreventionsecurityofsoilerosionandlandcontaminationRestorationofhabitatsandecosystemsIncreasedbiodiversityandwatersavings A1: Develop a holistic water management strategy A2: Introduce technology to improve resilience A3: Reduce produce waste and post-harvesting losses Better commercialisation of producesagricultural Productivity and food security Poverty alleviation A4: Encourage farmers to join training centres C1: Improve infrastructure in Kerugoyaa and Kutus town centres C3: An entrepreneursCentreEntrepreneurshiptosupportandsmallbusinessesB2: Plan for a green industrial park B1: Develop a educationjoined-upand training strategy A5: Organise farmers into groups to share resources and services C2: Develop an affordable housing policy that targets all vulnerable groups C4: Improve eco-tourism offer to align with Green Blue objectives B3: Provide access to local entrepreneurs and the local labour force A6: Develop a compliance framework for contract farming B4: An inclusive approach to industrial park development B5: A promotion and marketing strategy for Sagana A skilled workforce that has access to job opportunities PovertyGreenalleviationjobs A sustainable and attractive industrial cluster in Sagana Poverty alleviation and Green jobs Low carbon EnergyReductionPreventiondevelopmentofsoilcontaminationinpollutionImprovedairqualityandwatersavingsLimitedimpactonbiodiversity Better attractivenessliving,and trade in Municipalitythe Social cohesion Recreation and amenities Improved public health Low carbon development Cooling effects Urban EnergyReductionresilienceinpollutionImprovedairqualityandwatersavings Encourage a developmentpolycentricbalancedofthecounty Social PreservationImprovedcohesionrural-urbanlinkagesUrbanresilienceofhabitatsandecosystemsIncreasedbiodiversityPreservationofnaturalresources Sustainablesectoralgrowth Green jobs Social cohesion Recreation and amenities Low carbon Preservationdevelopmentofhabitatsandecosystems Figure 4.1 Economic Development Plan Source: Atkins
4.1 Economic Sector Action Plans
› Strategic location within the country
KERUGOYA-KUTUS MUNICIPALITY URBAN ECONOMIC PLAN (UEP ) 55
› High cost of farming inputs (fertilisers, etc.)
› Collaboration and partnerships with research institutions
› Improve water management by adapting and improving access to reliable water sources Threats › Climate change: increasing floods, droughts, rainfall, change of temperature, new pests and diseases
The close proximity to Nairobi and other regional hubs such as Embu and Meru provide farmers with access to well-established markets to sell their produce. Rice is the main crop in the lower part of the County. A key weakness is the seasonality of the sector that affects market prices.
› Thiba River dam under construction
› Rapid urbanisation putting increasing pressure on limited land available Source: Atkins
Importantly, the Economic Sector Action Plan is design to align and support the GBD. There are clear economic benefits in developing GBI – better health and wellbeing, better water efficiency leading to higher crop yield, facilitated transportation and trade, etc. Conversely, economic development actions, if well-designed, can facilitate the development of GBI.
Three key sectors have been identified for further assessment, with an Action Plan formulated for each sector. The Action Plans are premised on the SWOT analysis undertaken at the Diagnostics Reporting stage (Appendix A). Summaries of the SWOTs are presented below for each sector. These Action Plans have been informed through the SUED business consultation exercise (Section 1.3), workshops with local stakeholders, and data analysis.
Table 4.1 Trade, Services and Eco-Tourism: SWOT
› High-value, high potential crops such as rice (largest producer), tea, coffee, tomato, etc. Weaknesses › Product oversupply during the high season
There is also a lack of value addition in the sector, with most products being sold in their raw form. Despite generally favourable conditions, KKM already suffers from the effects of climate variability and climate change, specifically through impacts on agricultural commodities such as coffee, and flood or drought events, and these impacts will likely increase in the future. The UEP provides an opportunity to develop climate-resilient value chains and help farmers adapt to changing conditions while preserving Kirinyaga’s strong agricultural position. From the Diagnostic Report analysis, the following key strengths, weaknesses, opportunities and threats were established. These were used to determine the actions proposed in the following section.
› Industrial and agri-processing development
Strengths › Favourable and diverse environment for agriculture
4.1.1 Agriculture Agriculture is one of Kenya’s Big 4 sectoral priorities, with a crucial role in Vision 2030 development programme accounting for approximately 25% of annual GDP with a further 25% through the supply chains. Agriculture accounts for 70% of informal employment in rural areas.
The agricultural sector in KC is very strong, accounting for 41% of GCP and approximately 87% of population in KC rely on agriculture. The climate, environment, and soils currently create optimal conditions for farming which result in the County being one of the largest producers of agricultural and livestock products in the region.
› Inadequate skills and knowledge (e.g. Soil management, post-harvesting technique)
› High competition between farmers Opportunities
A1: Develop a holistic water management strategy in line with GBD A2: Introduce technology to improve resilience A3: Reduce produce waste and postharvesting losses commercialisationBetter of agricultural produces A4: Encourage farmers to join training centres A5: Organise farmers into groups to share resources and services A6: Develop a compliance framework for contract farming
Improved agricultural resilience towards climate change
Improving water capacity during the dry season would therefore allow farmers to grow a wider range of produce during this time, and in larger quantities. There are several ways to promote water harvesting: collecting run-off, improving the infiltration of rain in soils, and managing land and crops to increase water storage in soils, wetlands and the water table.15
Soil moisture can be preserved by promoting the use of organic manure that improves water retention capacity.
Crop management techniques can help improve yields.
Land management techniques such as terracing are also used to retain soil moisture. Infrastructure such as dams and ditches can channel run-off into fields. Storage systems such as ponds or tanks can also improve water reserves.
For instance, ploughing has proven to cause the burning of soil carbon by exposing it to sun and oxygen, and is less recommended nowadays.16
Economic ambition Action
With the construction of the Thiba Dam, which should have repercussions on water capacity, a green water management strategy for agriculture could be put in place to take a holistic approach about water capacities, including land management, absorption and storage, and farming practices to efficiently use water resources.
56
Table 4.2 Agriculture Action Plan
The Climate Vulnerability Assessment study (Appendix D) shows that this situation is likely to worsen over time.
Action Plan Table 4.2 lists the actions to be undertaken to develop and support the agricultural sector, taking account of the Municipality’s strengths and weaknesses. Each action is then described under the table.
The bimodal rainfall pattern gives the potential for farmers to benefit from two harvests per year, however, changes in climate are reducing water availability and impacting on the yield of the second harvest. In addition, most farmers tend to grow the same products, creating duplication on markets.
Source: Atkins 15. J. Rockstrom, M. Falkenmark (2015), Agriculture: Increase water harvesting in Africa, Nature. Accessed at: Agriculture: Increase water harvesting in Africa | Nature 16. ibid A1: Develop a holistic water management strategy in line with GBD Crops’ seasonality is a major issue for agriculture in KC.
The Water Fund is a financial mechanism to fund land-conservation measures upstream, with downstream users and donors contributing to conservation upstream.
The strategy is based on investing in GBI, using natural systems to trap sediment and regulate water. Investment planning and watershed modelling tools were used to identify key locations to implement interventions, such as: > Vegetation buffer zones; > Agro-forestry; > Terracing of steep farmlands; > Reforestation for degraded lands at forest edges; and > Mitigation of erosion from dirt roads. Crucially, the strategy takes a holistic approach to water management and land use. For instance, crop suitability modelling allows us to understand how changes in temperature and rainfall can drive land-use change. Partners can then advise farmers on smart cropping interventions and possible alternatives for diversification, to avoid soil run-off and ensure best practice. The scheme expects a 15% increase in annual water yields during the dry season, up to US$ 3 million per year in increased agricultural yields for smallholders and US$ 250,000 in cost savings a year from avoided filtration, lowered energy consumption and reduced sludge disposal costs. Overall, it is estimated that a US$ 10 million investment will return US$ 21.5 million in economic benefits over the 30-years’ timeframe
KERUGOYA-KUTUS MUNICIPALITY URBAN ECONOMIC PLAN (UEP ) 57
The Upper Tana River basin is critical to the Kenyan economy. It covers one of the most important agricultural areas and supplies 95% of Nairobi’s water. It is also home to areas of unique biodiversity. However, since the 1970s forests on steep hillsides and areas of wetlands have been converted to agriculture. This has resulted in various serious environmental issues. Upstream, water retention is affected, and during the rainy season the rain takes the soil and manure away, affecting crops, and putting constructions at risk. Downstream, sediments in the water reduce reservoirs’ capacity and increase the cost for water treatment, affecting Nairobi’s residents and industries.
Case Study: An overall water strategy: The Upper Tana-Nairobi Water Fund17,18 17. TNC (2015), Upper Tana-Nairobi Water Fund Business Case. Version 2. The Nature Conservancy: Nairobi, Kenya 18. Thrive, Africa’s first Water Fund (2015). Accessed at: https://wle.cgiar.org/thrive/2015/03/20/africa%E2%80%99s-first-water-fund
58 A2: Introduce technology to improve resilience Various technologies can improve sectoral climate resilience, these include:
> Improved crop varieties that are more resilient to climatic shocks and insufficient soil moisture. For instance, KALRO has developed a new rice variety called Komboka which requires less water and has a good tolerance of diseases. Other crop varieties are promoted by KALRO including banana, pineapples, tomatoes, etc.; > Greenhouses, allowing to diversify production and reduce seasonality issues. Greenhouses provide better performance in terms of water and nutrient management, and protection against pests and diseases which could increase due to the changing climate;
> Drip irrigation that can offer significant increases in water use efficiency compared to surface water; > Better practices for livestock including fodder production and conservation for the dry season, and the selection of more resilient breeds e.g. The Fleckvieh breed that was recently introduced in Kenya, plus enhanced feeding;
TheIrrigation%20in%20Kenya.pdfRenewableEnergy
> Renewable energy options such as solar energy at farm level to support small-scale activities, described in Section 5.5.6 This action will particularly benefit SIGs, smallholder farmers, and vulnerable groups who are disproportionally affected by the impacts of climate change. Yet, it is recommended to prioritise culturally-appropriate and affordable options, or to provide financial and technical support to these groups. The incorporation of climate-smart technologies can also represent new employment opportunities for SIGs.
REEEP produced a model estimating the wealth and health benefits related to the additional yields of these technologies, also taking account of the negative impacts of additional irrigation. The model finds that over 10 years, the project can generate US$ 13 million of wealth benefits with only about US$ 150,000 investment. This is mainly due to the threefold increase in productivity resulting from better irrigation, and meaning that 95% of additional food is not required for consumption but ready for sale. In addition, the project is modelled to result in around 570 disability-adjusted life years (DALYs) among a project population of 603 individuals, representing about 3,800 DALYs per invested million USD.
Case Study: More efficient use of water: solar-powered irrigation in Kenya19 19. REEEP, Case study: health, wealth and solar irrigation in Kenya (2016). Accessed at: https://www.reeep.org/sites/default/files/REEEP%20IMPAQT%20Case%20Study%20Solar%20 and Energy Efficiency Partnership (REEEP) has developed a programme to support solar-powered irrigation systems in Kenya. REEEP selected two companies: Futurepump and SunCulture. SunCulture sells an Agro Solar Irrigation Kit which combines a solar pumping technology with a high-efficiency drip irrigation system, as well as an agronomic-based financial support model. Futurepump sells a solar powered irrigation pump only. Solar pumping can withdraw deeper groundwater compared to treadle pumping, and produce far fewer GHG emissions than petrol and diesel pumps.

In addition to storage (described in Section 5.5.5), another way to reduce waste is to transform fresh products into less perishable food. Similar to storage facilities, encouraging the development of community or commercial milling for grains and starch like potato or banana would also be beneficial. The reduction in post-harvest losses would support key livelihoods in the County and increase resilience to climate change. The UEP also proposes several VC opportunities in relation to this (see Section 4.2).
A3: Reduce produce waste and post-harvesting losses
Another drawback of seasonality is that, as most crops are harvested during the rainy season, there is an oversupply of products on markets during this period. Business surveys mentioned that much produce goes to waste as a result of this and increases in both average and maximum temperatures, as well as floods which can block roads and access to market, all of which are likely to increase problems with post-harvest losses. Various farmers and market traders mentioned the lack of storage facilities. These are, however, particularly appropriate for grains, which account for a significant proportion of agricultural crops in the County (rice, maize, peas). Farmers and traders should be incentivised to form cooperatives to install common storage facilities, with support from the Municipality or the County. The National Cereals and Produce Board (NCPB) could be used as a model to develop post-harvesting facilities, whereby farmers pay a small membership fee to access shared warehouses. SIGs and other marginalised groups are often excluded from storage opportunities since they lack access to information and resources. Lack of affordability is also one of the main constraints for inclusion. Consequently, it would be important to promote and include SIGs groups in this action, and to provide affordable storage facilities. Accessible infrastructure e.g., Step-free storage facilities, should be considered.
It is also recommended to design a digital communication strategy to inform farmers, and particularly target SIGs, about storage availability. This strategy should be in a format accessible to all and could also be used to divulge market information, weather issues, etc. Doing this will particularly benefit those groups who face challenges to access agricultural information. There are several examples of digital programmes and platforms that could be promoted.
This includes AgriFin Accelerate, a programme that aims to increase digital access to financial and informational services for farmers; Mkulima Young, a social media platform encouraging young people to get into farming; and Wefarm, an SMS-based knowledge-sharing platform.
KERUGOYA-KUTUS MUNICIPALITY URBAN ECONOMIC PLAN (UEP ) 59
20. See OECD (2018), The Future of Rural Youth in Developing Countries: Tapping the Potential of Local Value Chains. OECD Publishing, Paris.
21. Chiyoge B. Sifa, Role of cooperatives in agriculture in Africa, UN (2014). Accessed at: Role of cooperatives in agriculture in Africa (un.org) Given that some farmers and remote communities can have difficulties going to training centres because of transport cost or time availability, training centres should also consider going out to local communities to give day or half-day sessions. The location, timing, and length of trainings should be compatible to young women’s care and community responsibilities. Moreover, training formats and materials should be accessible to all. Local media can also be used to spread knowledge. It is recommended to train a cohort of young people as peer educators since people are more likely to become engaged in training if they are developed by peers.20 Training a cohort of youth trainers could also represent an opportunity for additional income. This system could also be implemented with PWD.
A5: ORGANISE FARMERS INTO GROUPS TO SHARE RESOURCES AND SERVICES
If this is carried out alongside activities to support training centres in their ability to advise on climate-smart agricultural practices, there is an opportunity to drive adoption of more climate-resilient farming techniques. It is not clear whether farmers are aware of the existence and benefits they can get from training centres. A clear and well-designed communication strategy should be put in place to inform farmers about training opportunities and the benefits they can get in terms of higher yield and revenues.
> Resources and services that could be coordinated include the supply of agricultural input, delivery services, sharing of best practices, and marketing strategy, including price determination and branding. Beyond the financial and non-financial benefits of these shared services and infrastructure, cooperatives can also be structured to fully engage women, PWD, and youth in agricultural development activities and decision-making.21
For business development and SME support in the agricultural sector, the Entrepreneurship Centre (Action C3) can provide support regarding business development, finance, marketing, production, export, digital skills, etc. To include out-of-school youth and people with low-literacy levels, it is recommended to implement specific trainings, for example on functional literacy and numeracy.
This needs to be accompanied by awareness sessions at the community level about the importance of including SIGs in decision-making processes.
Various infrastructure, resources and services could be shared between farmers: > Equipment and infrastructure that can be shared include cold storage (Section 5.5.5), storage facilities for grains and crops, farming tools, delivery vehicles, etc. Digital technologies can be used to leverage this. For instance, the platform Hello Tractor allows farmers to have access to ploughing tractors temporarily.
60 A4: Encourage farmers to join training centres Poor farming and harvesting practices were noted as an issue for agriculture in the County. There are a few training centres across KC, including Kamweti Agricultural Training Centre and AHITI Ndomba for livestock. Training centres provide classes about seedling use, harvesting practices, land and water management, crop productivity improvements, livestock management practices, etc. However, the attendance at those centres is low, and there is scope to incentivise farmers to join training sessions.
Compliance is often a key issue with contract farming due a limited legal framework that is in place. There have been cases of farmers breaking the deal by selling products to other buyers at a higher price as well as cases of buyers refusing to purchase at the pre-agreed price.
Contract farming is an arrangement whereby a buyer agrees in advance with a farmer to buy a specific quantity of a product in the future, under a set price. This also often includes support for growing the product, such as supplying input, or to provide advice or support with transportation. The main benefit for farmers is that the contract gives them the guarantee of access to a market and to sell their products at a fair Farmersprice.also learn better agricultural practices through training that the buyer, usually an agri-industrial company, tends to provide. Companies such as Twiga have been using contract farming to create a marketplace that gathers more than 4,000 farmers and 35,000 vendors across Kenya. Other examples include agro-seed companies like Kenya Seed and the East African Potato Consortium.
KERUGOYA-KUTUS MUNICIPALITY URBAN ECONOMIC PLAN (UEP ) 61
For remote or excluded populations, the creation of groups can facilitate access to market information and access to finance, for example through table banking. It is recommended to promote collaboration among SIGs, and to inform them about available support and funds, such as The Youth Fund, Uwezo Fund and the Women Enterprise Fund.22 Some problems identified with shared structures include poor management, lack of capital resources, inadequate training, and lack of communication between members. This means that support must come from KKM or KC to develop those groups, in particular through 1. Formal and informal training about management and human resources 2. Support to developing commercial partnerships and joint venture with private enterprises and 3. Support to marketing and agri-processing (as per the VCs in chapter 4.2).23
Kirinyaga’s Wezesha programme, that already provides support and delivers empowerment programmes for women and youth, can play a key role in supporting community and cooperative development. Lack of access to land is another barrier to social inclusion. Young people often access land through their parents – or spouses, in the case of young women. It is recommended to support SIGs, and SIGs groups and associations, leasing land, through cooperatives or existing government programmes. 22. Chamasoft, Table bamking: the concept of table banking (2015). Accessed at: https://blog.chamasoft.com/table-banking-the-concept-of-table-banking/ 23. ibid A6: DEVELOP A COMPLIANCE FRAMEWORK FOR CONTRACT FARMING
To ensure trust from both parties and contract compliance, an intervention from KC is needed, by developing a contract farming compliance framework. This framework would clarify the concept of contract farming to all parties and define the role that the County would play in ensuring contract compliance. KC could commit to managing negotiations between buyers and farmers, monitoring crops’ progress and ensuring contract enforcement. This framework could show potential investors some reassurance to invest in the County and would also guarantee legal and institutional support for farmers.
24. Kenya’s Ministry of Agriculture, Livestock, Fisheries and Irrigation (2019), Agricultural Sector Transformation and Growth Strategy
The industrial sector is currently relatively limited in KKM, although it accounts for 7% of the County’s GCP. There is a small but existing industry base that mostly focuses on agri-processing. Rice milling is the main processing activity followed by tea processing, coffee processing and small-scale animal feed plant. However, there are clear opportunities for the sector to grow, thanks to a diverse agricultural production that includes crops that have high potential to grow in demand, including rice, tomato, banana, nuts, tea, and coffee, and institutional support from KIDA. KIDA has identified key VC opportunities taking advantage of the County resources and land for industrial use at Sagana. This site benefits from its good linkages to Nairobi via the Nairobi-Nyeri highway and through railway.
› Limited solid waste and sewerage infrastructure, and risk related to water and electricity supply
Weaknesses › Shortage of land for industry and agri-processing development
From the Diagnostic Report analysis, the following key strengths, weaknesses, opportunities, and threats were established and reported in Table 4.3. These were used to determine the actions proposed in the following section.
› Future demand for power due to industrialisation
› Inadequate skills and knowledge (machine operation and maintenance)
› KIDA as an exemplary agency to promote and coordinate investments
Threats › Limited land available that could drive businesses to locate elsewhere
› Small but existing industry base, focused on agri-processing
There is an opportunity to grant the site Special Economic Zone status, which would boost investments in the area. The development of the industrial sector will however require careful planning, as it will impact the demand for energy, water, waste and transport infrastructure, which could impede the sector’s expansion and have a negative impact on natural resources and biodiversity. Therefore, the sectoral action plan is based on the GBD approach described in Section 3.4 that emphasises climate change resilience and resource efficiency, taking into account the environmental impact of new assets and new activities. In addition, social inclusion should be a focus to allow vulnerable groups to have access to job opportunities.
› Sagana Industrial Park is proposed as a Special Economic Zone (SEZ)
› Lack of drainage and flooding issues that result in impassable roads
› Outdated workforce skills and gaps in skill sets
› Agricultural products that have opportunities to upscale to processing (dairy, tomato, banana, avocado, cotton, etc.)
Source: Diagnostic report
Table 4.3 Agri-Processing and Industry: SWOT Strengths
› Strategic location and transport infrastructure (Nairobi-Nyeri highway, railway station at Sagana for freight)
Opportunities › Agri-processing opportunities identified by KIDA
› Inadequate or low water supply to meet demand
There is significant emphasis in developing agri-processing nationally with the aim to creating 200,000 jobs and to triple production, with the higher values on the global market as a key incentive. Kenya’s ASTGS aims to increase the contribution of agri-processing to GDP by 50%.24
62 4.1.2 Agri-Processing and Industry
› Some VC opportunities are happening outside of the County
› Cotton ginnery reopening in Mwea. Textile factory being developed as a social enterprise
› Opportunities to improve linkages between Kirinyaga higher education facilities and agri-processing sector

Table 4.4 lists the actions to be undertaken to develop and support the agri-processing and industrial sector, taking account of the Municipality’s strengths and weaknesses. Each action is then described under the table.
B1: Develop a joined-up education and training strategy
Agri-Processing and Industry Action Plan
KERUGOYA-KUTUS MUNICIPALITY URBAN ECONOMIC PLAN (UEP ) 63 Action Plan
> Tailor education and training programmes based on the County’s economic strategy. This will require to work with businesses and targeted industries to identify missing skills, so the right skill force can be developed;
Table 4.4
B1: Develop a joined-up education and training strategy
Local businesses would benefit from this approach: they would get a say in the content of training programmes to ensure the right skillsets are being developed, allowing them to recruit from the local labour pool. Students would also benefit, as they would develop the most accurate skills needed in the local market, which higher job prospect.
Education providers would benefit from offering more accurate training, that could be supported by businesses if they agree to provide specialised teaching or offer traineeship to some students This joined-up strategy would also help to support businesses in Sagana Green Industrial Park and ensure new job opportunities are accessible to the KC’s local workforce (as described under action B3) Skills development must target every community group, including vulnerable and marginalised groups. This is why the Wezesha programme must also be included in the strategy so that training aligns with wider sectoral development objectives and local businesses’ need.
A lack of skills, in particular relating to machine operation and maintenance, was identified as a challenge for businesses currently operating in the agri-processing industry. Various training programmes exist at KyU and TVET institutions. In addition, the Wezesha programme gives access to training to women, youth and vulnerable groups. However, it will be important to strengthen and coordinate these initiatives with the County’s industrial strategy, to ensure that the right skills needed by local industries are being developed.
A joined-up education and training strategy would consist of a programme of work that includes key education and employment stakeholders, such as education and training providers, KIDA and local businesses. The aim is to:
> Emphasise career opportunities to new applicants to encourage them to pursue training programmes that are more likely to lead to job opportunities because they correspond to needed skills;
> Increase local businesses’ involvement in curriculum development, for instance by supporting teaching and providing traineeships to students;
B5: A promotion and marketing strategy for Sagana Source: Atkins
A sustainable and attractive industrial cluster in Sagana B2: Plan for a green industrial park B3: Provide access to local entrepreneurs and the local labour force B4: An inclusive approach to industrial park development
> Design on-the-job training and apprenticeship, including available training for contractual work.
Economic ambition Action A skilled workforce that has access to job opportunities
> Social performance: develop practices that have a positive social impact, including constant improvement to workers’ conditions, such as fair pay, security, social infrastructures, and gender equality, local community outreach;
A green industrial park may be defined as ‘a dedicated area for industrial use that supports sustainable economic development through the integration of social, economic and environmental aspects into its design, planning, management and operations’.25 The aim is not just to increase economic performance, but also to enhance environmental performance, i.e. Better management of resources and smaller footprint of the park, and improve social performance, i.e. Better labour rights and working conditions, gender and community inclusiveness.
25. United Nations Industrial Development Organisation (UNIDO), An international framework for Eco-Industrial Parks (2021). Accessed at: An international framework for eco-industrial parks v2.0.pdf (unido.org)
> Local business involvement: the park must be an opportunity to support local SMEs by providing new procurement contracts, knowledge sharing, and workspaces for SMEs. This is further detailed under action B4;
In the future, there is an opportunity to consider applying to SEZ status. SEZs give local businesses exemption from VAT, tax exemption or discount (e.g. Corporate tax rates), duty exemption (e.g. License fees, stamp duty), investment deduction, and work permit facilitation. A lot of work will be needed to prepare the land before the industrial cluster can be developed. This includes studies (feasibility study, environmental impact assessment, market demand analysis, etc.) which are required to obtain the SEZ status as well as land preparation (earthworks, water and energy infrastructure, etc.).
> Economic performance: ensure the creation of new jobs, promote local businesses and linkages with local SMEs as described in action B3, and create economic value.
> Economic value creation: in order to ensure the park is successful, a robust market demand and feasibility study, supported by a business plan, should be developed at early development stages. This is detailed in section 5.2.
> Inclusive park development: in order to tailor local businesses and workers’ needs, and provide opportunities locally, the park development should strongly engage local residents. This is further detailed under action B4;
B2: PLAN FOR A GREEN INDUSTRIAL PARK
26. United Nations Industrial Development Organisation (UNIDO), Implementation handbook for eco-industrial parks. (2017)
A key concept of a green industrial park is industrial symbiosis.26 This describes a system where, similar to a natural ecosystem, industries and organisations work in synergy to share and reuse resources by interconnecting their production lines.
It is often a case of using a production line’s waste as another production line’s input. For instance, reusing waste heat from manufacturing to supply a greenhouse for food production is an example of industrial symbiosis that limits waste and creates a circular economy. There is an opportunity to support industrial symbiosis in the VC proposed: for example, banana peels from the banana flour VC can be used as an input for animal feed production.
Focusing on the economic and social dimensions, several ambitions should be pursued with specific targets:
27. United Nations Industrial Development Organisation (UNIDO), An international framework for Eco-Industrial Parks (2021). Accessed at: An international framework for eco-industrial parks v2.0.pdf (unido.org)
> Environmental performance: design mechanisms and practices that improve resource efficiency and reduce pollution and support symbiosis between activities, e.g. One industry’s waste becomes another’s input;
64
Guidelines relating to construction and development of a green industrial park are further developed in Section 5.2.3.
> Park management performance: implement a management framework that assists tenants, monitor and report performances and assesses risks;
For an industrial park to be green and sustainable, four themes must be targeted:27
> Employment generation: the park should have plans to generate specific numbers and types of jobs including considerations on diversity and implementation of PWD quotas. In particular, the park should provide job opportunities to the local workforce. This is the reason why there should be a closer relationship between local businesses and education providers, to help develop a workforce that has the right skillsets to work on the park. This is further detailed under action B1;
B3: Provide access to local entrepreneurs and the local labour force
The industrial park should also provide flexible spaces for entrepreneurs and SMEs. This could take the form of a makerspace, which is a community space with shared equipment and tools for members to use as needed, on a membership or pay-as-you-go basis. The space typically includes various tools, such as a soldering iron, saws, milling machine, 3D printers, laser cutters or even sewing machines.
A new industrial park is an opportunity to support the local economy, by creating new jobs and providing opportunities to existing businesses and SMEs. However, a proactive strategy is needed to ensure that local workers and entrepreneurs, even those that are currently marginalised, have access to these Improvingopportunities.accessto work for local workers can be promoted through action B1 described above. By understanding what sort of skills businesses require in the park, training programmes can adjust and create a tailored skill base across all types of workers. Businesses can also provide internships and training on-site to facilitate this. In addition, target participation rates for PWD, youth, women and other vulnerable groups should be set. Local businesses and entrepreneurs must be involved in the local supply chain. In the case that the industrial park attracts one or several “anchor tenants” that is, a leading business in the park, they will need various suppliers upstream and downstream such as raw materials, marketing, packaging, logistics, and deliveries, etc. It is recommended to actively promote local businesses and workers, so they have access to procurement. This could include registration lists of local businesses and networking events. A system that incentivises local procurement could be established, where companies that hire local businesses are rewarded through discounts on park services.
Case Study: Collaborating to reduce waste through industrial symbiosis: Oserian Two Lakes Industrial Park, Kenya
The point is to allow entrepreneurs including jua kali workers to have access to specific tools when they need them and share best practice with others. The space could also include shared working space for entrepreneurs to work together and meet.
Oserian Two Lakes Industrial Park is a new 150-hectare sustainable industrial park in Nakuru County.28 The site is expanding from a flower farm and is set to become a “Sustainable Special Economic Zone”.29 The ambition is to create a park that encourages the circular economy, renewable energy and sustainable construction. A key element in the development of the master planning is the understanding of the possible needs of new companies, to create industrial symbiosis. For instance, partners are considering a system where wastewater from industries could be treated and reused for the flower farm, hence developing a circular water system with limited waste.
65
28. Africa’s most sustainable flower farm to transform into an sustainable industrial park with new masterplan (stateofgreen.com) 29. Oserian Two Lakes Industrial Park, Kenya — Savo Project Developers 30. Fertilizer plant to come to Oserian industrial park, Kenya (thinkgeoenergy.com)
The management of the industrial park itself will require contractual work, for instance, when it comes to general maintenance, or cleaning services. Local workers should also be favoured. There is an opportunity to hire workers from the informal sector, which could professionalise their work and generate new opportunities for income generation.
One of the first tenants will be a fertiliser plant powered by solar energy sources produced on-site.30 The facility will reduce carbon emission with approximately 100,000 tons of CO2 per annum compared to a gas-based fertiliser plant. The project will also reduce the dependency of imported nitrogen fertilisers. The project will utilise approximately 70MW of renewable power.
Energy is provided by a large geothermal plant and a 1MW solar park, allowing for cheap and reliable renewable energy.
> Working in partnership with education providers (universities, TVTE, Wezesha) to develop inclusive programmes that are tailored to the needs of local businesses in the park (Action B1); > Provide support to local entrepreneurs, by setting procurement targets and developing shared space that they can have access to on the park (Action B3); > Engage, throughout the development of the park and after it has been developed, with local workers, local businesses, SIGs and other users of the park, to ensure it provides a solution to local issues and to ensure all views have been transparently taken into consideration;
> Ensure a good relationship with the community. Develop programmes to improve social aspects within the local community and provide accessible communication platforms; > Develop users’ satisfaction and complaints forms as feedback mechanisms for stakeholders within the park and for the local community, e.g. Complaint boxes or hotlines;
> Maintain health and safety in workspaces and implement regular training and audits;
> Provide opportunities for skills development, particularly targeting SIGs and other vulnerable groups (Action B1).
The Association of Lady Entrepreneurs of India (ALEAP) developed, with support from the German Development Agency (GIZ), a green industrial park of 82.55 acres of land that hosts 170 women entrepreneurs. The master planning of the park took into consideration the special needs and requirements of women entrepreneurs and employees. To identify their needs, a series of workshops, meetings and field visits were organised. A site master plan was developed and reviewed at various stage by stakeholders, especially the women entrepreneurs and ALEAP. Along with environmental considerations, workers’ specific needs and requests have been taken into account, including the development of services such as crèches, rest houses, and first aid facilities.
> Provide social infrastructure e.g. Accessible toilets and infrastructure, childcare services, and mothers’ rooms, and follow social performance standards in relation to social inclusion, gender equality, labour conditions, and community dialogue;
31. United Nations Industrial Development Organisation (UNIDO), An international framework for Eco-Industrial Parks (2021). Accessed at: An international framework for eco-industrial parks v2.0.pdf (unido.org)
66 B4: An inclusive approach to industrial park Theredevelopmentareseveralways to ensure that the park adopts an inclusive approach in its development. Ultimately, the aim is that the park provides equal opportunities to all residents, supports local entrepreneurs and boosts education and training development. To summarise, some actions to be done include:
> Ensure adequate working conditions in line with national and local laws and standards. Guarantee equal working opportunities for all people e.g. Respect the 5% quota for PWD inclusion. Provide accessible infrastructure and equipment;
Case Study: A bottom-up and inclusive approach to developing an eco-industrial park: ALEAP Green Industrial Park, Telangana, India31
KERUGOYA-KUTUS MUNICIPALITY URBAN ECONOMIC PLAN (UEP ) 67
> Targeted market and aftercare service: in addition to the points above, a proactive approach targeting specific countries, industries or companies should be put in place. Promotional events can help identify potential investors that can then be approached more directly by mail, telephone, or direct marketing. Ideally, the park will want to find an “anchor tenant”, a leading business in the park that can attract various subcontractors; this will significantly help the park to take-off as it will have a spin-off effect on the local business ecosystem. Once investors have shown interest in the park, an “aftercare” service must be in place to assist them in the process, such as to identify joint-venture partners, and registration.
32. Atkins, Lamu Port City Agreed Investment Framework (2017) > Coordination and marketing: various types of promotional support and materials can be developed, such as investment prospectuses, regular newsletters, market studies and project profiles. Coordination with other agencies is critical to ensure this support is being shared to the relevant businesses. Agencies could include national organisations (e.g. KenInvest), national government ministries, and regional Chambers of Commerce.
B5: A promotion and marketing strategy for Sagana KIDA has already developed some documentation about investing in KC and Sagana Industrial Park. As the industrial park further develops, it will be critical to continue to promote the park within and outside of the County, through advertising, branding, and networking. A clear promotion and marketing programme should be set out. This could include the following components:32 > Understanding of the market and identifying investors: on the supply side, work should be done to understand the comparative advantages of the park, e.g. Labour cost, location, infrastructure, market access. On the demand side, understanding what the demand for industrial parks looks like, as well as trade data and trend, will help identify which specific sectors and companies to target. Interviews and surveys with investors could also be used.
Source: Diagnostic report
Opportunities › Investments in agriculture, infrastructure and agri-processing will increase trade opportunities › Improvement and potential expansion of markets › Increase freight opportunities › Tourism opportunity, especially with Mt Kenya National Park Threats › Water and electricity threats on agriculture and agri-processing would have an impact on the sector › Neighbouring cities with larger and better positioned service industry and universities
Table 4.6 Trade, Services and Eco-Tourism: Action Plan Economic ambition Action Better
C4: Improve the eco-tourism offer to align with Green Blue objectives
Encourage a balanced Countydevelopmentpolycentricofthe
Municipalityandattractiveness,living,tradeinthe
Trade, Services and Eco-Tourism
Table 4.5 Trade, Services and Eco-Tourism: SWOT Strengths › Advantageous location in Central Kenya. Good accessibility by road and rail › Large markets in KKM – including wholesale and retail › A hub for County and regional transport › Two higher education institutions in KKM Weaknesses › Overcrowded market facilities › Transport infrastructure need improvement › Difficulty to access finance › Competition with Embu as a regional service centre
The location of KKM in the geographical centre of KC, its size as one of the main urban areas in the County, and its role as the administrative capital, make it the main tertiary sector hub of the County. Trade is the main activity in the Municipality, which hosts two formal markets and a number of informal markets. Brokers from Nairobi and across central Kenya come to KKM due to its proximity and easy access from the main national trade centres, as well as its diversity of produce.
C1: Improve infrastructure in Kutus and Kerugoya town centres to support the Municipality
C2: Develop affordable housing to support economic development Sustainable sectoral growth C3: An Entrepreneurship Centre to support entrepreneurs and small businesses
68 4.1.3
The tourism and eco-tourism sectors are currently very limited but have significant opportunities to grow. The Municipality should further strengthen this role as a trading, services and housing hub, but this must be done in a sustainable way following the GBD approach (Chapter 3). To do so, investment must focus on improving existing infrastructure and facilities such as roads, markets, water and sewerage and preserve GBI such as rivers, parks, forests. These investments in GBI will support socio-economic benefits, such as better traffic, facilitated trade, and more housing, reduce carbon emissions and more incentives to walk and cycle, and will improve residents’ wellbeing. Steps must also be taken to support local entrepreneurs and SMEs. From the Diagnostic Report analysis, the following key strengths, weaknesses, opportunities, and threats were established and reported in Table 4.5. These were used to determine the actions proposed in the following section.
Source: Atkins
ACTION PLAN
The Municipality also provides an array of services, including financial services (banks, insurance), administrative services (County headquarters), education services (university and higher education facilities) and health services (private and public hospitals). Public transport, including buses and matatus, are also key to KKM with most routes in the County starting or ending in the Municipality.
Table 4.6 lists the actions to be undertaken to develop and support trade, services, and eco-tourism, taking account of the Municipality’s strengths and weaknesses. Each action is then described under the table.

KERUGOYA-KUTUS MUNICIPALITY URBAN ECONOMIC PLAN (UEP ) 69
C1: Improve infrastructure in Kerugoya and Kutus town centres Each main town within KKM has a distinctive specialisation, and both play a crucial role to the local economy: > Kutus is the main trading centre in KC, with a wholesale market that attracts traders from Nairobi and neighbouring counties. The town also hosts KyU and therefore has a large student population; > Kerugoya is the second largest town in KC and gathers key financial, education, health services. Infrastructure improvements are needed in both town centres to support their role as trading and services centres and allow the tertiary sector to grow. For instance, despite Kutus’ crucial role in trade, the market infrastructure is very limited, causing traffic congestion and potentially deterring the competitiveness of Kutus as a trading spot in Central Kenya. Providing better facilities for traders, along with investment in the public realm around markets to facilitate mobility and reduce congestion, will support the trading sector in the Municipality. In Kerugoya, improved public facilities around the main bus station and central square could improve the connectivity and attractiveness of the town as a place to live and set up a business – therefore consolidating its role as a service hub. Section 5 provides details on the nature of the infrastructure to be developed in Kerugoya and Kutus.
> Housing for other segments of the population, in particular SIGs and other vulnerable groups such as informal settlement dwellers, unemployed or underemployed people should be prioritised, and access should not be conditional to working in the formal sector.
Kerugoya already benefits from an affordable housing programme but this could be extended to respond to growing demand and target more people in need of housing.
C2: Develop affordable housing to support economic development Given the high population growth rate in KC, pressure on housing provision is likely to increase significantly in the near However,future.population has been growing the fastest in the Mwea region, with housing encroaching on high-value agricultural land and rice fields. Ultimately, this could have a detrimental effect on the local economy, and other locations for housing development must be explored.
It is recommended that these housing projects consider adaptation and mitigation measures such as climate-appropriate designs. Community-based knowledge is fundamental for the development of urban projects that are climate-resilient. Planning is also key to prevent urban growth in hazard-prone areas. Various institutions have been working on developing housing programmes for lower- and middle-income residents, as well as helping to transform informal settlements into sustainable homes and supporting access to micro finance.
> Housing for students: youth and students typically have difficulties accessing the housing market and are particularly vulnerable. Their needs in terms of housing also differ from the rest of the population: individual rooms, and temporary accommodation). In 2018 the Kenyan Government launched a plan to target private investors to raise funds to build hostels to serve the growing student demand. However, uptake has been poor owing to the effects of COVID-19, the high cost of land, insufficient lending and inadequate expertise in development and management of purpose-built student hostels. The model sees a developer build a hostel, operate it for about 20 years to recoup investment before handing it over to the university. Fully private investments have also taken place in Nairobi, where demand is higher than elsewhere in the country.
KKM presents a good case for housing development. As an urban area and County headquarters, its comparative advantage is that it can offer residents and workers access to various services, administrative, educational, health, and transport, and good connection to quickly reach every part of the County. This makes KKM an attractive place to live, providing the right infrastructure is in place. In addition, the growth of KyU means that there is a need to provide more student accommodation, predominantly in Kutus, where the campus is located, but also in Kerugoya.
Building on the affordable programme in Kerugoya, a larger scale affordable housing programme should be developed in KKM. There should be two streams to the programme:
70 Case Study: Providing housing to low-income communities: Reall and National Cooperative Housing Union (NACHU) partnership 33. Reall website, accessed at: We are Building an Affordable Homes Movement | Reall 34. Reall website, Nanyuki project. Accessed at: https://www.reall.net/data-dashboard/kenya/nanyuki/ 35. Reall website, Alfa-Mwanda project. Accessed at: Alfa-Mwanda Housing — Reall—Affordable Housing Charity 36. Reall website, Nyalenda project. Accessed at: Nyalenda Housing Cooperative — Reall—Affordable Housing Charity Reall, a housing development scheme, has been working in partnership with Kenya’s NACHU, with the aim of providing affordable and decent housing and infrastructure to the urban low and modest-income communities.33 This approach also includes community mobilisation and training, technical support, housing finance, lobbying and advocacy. The partnership has seen more than 1,500 homes constructed, with NACHU also engaging with national and regional governments, helping to shape current housing policy to consider people on low incomes. The partnership focused on commercial low-income housing developers, and negotiations with government-backed mortgage providers and commercial banks on end-user finance.
> Alfa-Mwanda – a project to provide homes for those previously living in densely-populated informal settlements. All tenants previously resided in unsuitable conditions with little access to safe and reliable water or sanitation. They were provided with end-user finance by NACHU in the form of micro mortgages.35
C3: An Entrepreneurship Centre to support entrepreneurs and small businesses Qualitative research revealed that the Municipality has a young, dynamic and tech-savvy population, supported by various higher education institutions (KyU and Polytechnics). However, unemployment is high among youth, with limited job opportunities. There is a lack of initiatives to support individuals to develop their own businesses including aspects of marketing, product design, sales, finance, strategy, digital and e-market opportunities. Hence, there is an opportunity to develop an Entrepreneurship Centre for small businesses in KKM to provide support for entrepreneurs, students, and graduates. Support can include technical assistance, business advice, access to investors, and access to a co-working space. The structure should be well-linked with local educational institutions, so that entrepreneurs can learn from professors and collaborate with other students in various disciplines such as marketing, computer science, actuarial science, or engineering, In turn, this provides students with real-life application of their knowledge.
Some examples of work include:
> Nanyuki – a community-based partnership that saw NACHU construct housing and sanitation whilst the community facilitated roads, electricity, fencing and landscaping. The scheme was backed by a savings and credit cooperative that provided financial assistance, enabling micro-mortgages for those housed.34
> Nyalenda – a project to house some small-scale business traders from the local slum comprising 10,000 rented temporary structures made of substandard materials. They were provided with end-user finance by NACHU in the form of micro mortgages.36
Various entrepreneurship and business support networks exist in Africa, such as the African Incubator Network, 2Scale or ILO’s C-BED programme that are able to provide resources and support.37,38,39
The Entrepreneurship Centre should also develop low-cost and accessible opportunities for out-of-school youth and PWD with low literacy levels. For example, business and marketing training should be available to support those who are already own businesses, and those who would like to start one.
CURAD answers two main issues that face agri-business entrepreneurs. First, entrepreneurs lack specific support for the first years of their business, where they need to build a cash flow and do not always have the expertise to grow their business. Second, agri-business entrepreneurs lack the provision of production spaces, greenhouse space or farmland, and more traditional incubators tend to provide workspace and desks instead. CURAD provides support to students’ interested in starting agri-business, existing agri-business SMEs wishing to develop innovative technologies, scientists looking to commercialise their technologies, and wholesale and retail SMEs along the value chain.41 40. Agribusiness incubation in Uganda and sub Saharan Africa, the missing links | iBAN (inclusivebusiness.net) 41. CURAD Incubator – My source of wealth 42. C-BED Community-based enterprise development https://cb-tools.org/
71
The Kenyan Ministry of Industrialization, through the department of micro and small industries (MSI) also implements incubation programmes through partner support. Given the economic specialisation of KC and the plans to develop agri-processing and industry, there is potential for this centre to help entrepreneurs mainly in the agri-business sector, however this should not necessarily be limited to these activities. This offer would complement the joined-up education strategy (Action B1) that focuses more specifically on providing skills related to agri-processing and industrial development.
Case Study: An agri-business incubator: CURAD, Uganda
37. African Incubator Network website, accessed at: AAIN | INCUBATING INCUBATORS FOR JOB AND WEALTH CREATION (africaain.org) 38. Scale website, accessed at: Our partnerships create genuine impact and accelerate inclusi - 2scale 39. C-BED website, accessed at: TRAINING TOOLS | CB-TOOLS.ORG
The Consortium for Enhancing University Responsiveness to Agribusiness Development limited (CURAD) is a public-private organisation and one of the six agri-business incubators in Africa that was initiated by the Forum for Agricultural Research in Africa. CURAD has supported 71 SMEs with more than 5 technologies commercialised, 2 organisational models developed and up-scaled, and more than 2,000 jobs created.40
The Community-Based Entrepreneurship development (C-BED) is an International Labour Office (ILO) initiative that provides training programmes to help entrepreneurs and micro-businesses improve their business. The key aspect of C-BED is that training can be carried out without external trainers or resources and it has been designed to be used by marginalised and vulnerable communities. Only a facilitator is required, and participants work together in small groups to solve problems and share existing knowledge and experiences. The programme is therefore action-based and combines local insights with analysis. All C-BED resources are free to access.
KERUGOYA-KUTUS MUNICIPALITY URBAN ECONOMIC PLAN (UEP )
Case Study: Learning entrepreneurship without a trainer: C-BED programme42

> Develop a marketing strategy: once the County’s unique offer and target market is well-known, a marketing strategy can be developed. These elements will help guide the type of marketing support, such as a prospectus, radio, magazine, and online advertising, branding and strategy, to adopt.
C4: IMPROVE THE ECO-TOURISM OFFER TO ALIGN WITH GREEN BLUE BENEFITS
> Design a skills and employment strategy.
> Assessing tourism demand: the point here is to understand tourism in the region – who tourists are, their age, and socio-economic background, where they come from, are they locals, from neighbouring counties, Nairobi, the rest of Kenya, or outside Kenya, why they come to the County, for leisure, or business, and what assets are most visited. Neighbouring counties where tourism is more developed – in particular those around Mt Kenya – could also be used as a good benchmark to understand demand. Identifying best practices from other parts of the country will also be interesting.
KC has several assets that can be further emphasised and promoted to encourage eco-tourism. This includes Kamweti trekking route to Mt Kenya, Kerugoya urban forest, the Rutui River, and water sports activities across the County.
72
KIDA has developed plans to further develop eco-tourism, including ambitions to improve the trekking route in Kamweti to attract new tourists, and the development of one or several eco-lodges along the route. However, a strengthened, more global, and coordinated strategy would need to be proposed to ensure the development of the sector. This strategy should be developed by a working group gathering key stakeholders in the tourism industry, such as national park managers, hotel business owners, and KIDA, to ensure a plural representation that accounts for various needs and expertise. The strategy should take the following approach:
> Create an action plan: based on the two above assessments, a tourism action plan should be developed that identifies (i) a targeted market; (ii) targeted assets to focus on; (iii) key infrastructure and sectoral gaps to improve; (iv) improvement policies including skills and employment. Considerations with regards to job creation and training, e.g. For hotel employees, drivers, tour guides are fundamental and could support the inclusiveness principles, such as youth inclusion.
> Assessing tourism offer: this consists in identifying tourism assets in the County and evaluating their potential for development. Some assets might be prioritised because they act as a “flagship” destination, with spill-overs on nearby secondary assets. In addition to assets, there should be an evaluation of infrastructure, e.g. Roads, hotels, and restaurants, and the hospitality sector, such as the type of employment and skills it has.

> Avocado processing: opportunity for a processing plant to produce avocado oil through extraction process as first step and charcoal briquettes from waste materials (stone, skin and pulp).
> Rice beer: use low-value broken rice grains to make a range of alcohol products including wine (sake), beer, vinegar and gin. The first step could be to produce rice beer as there is no need to develop the market.
> UEP selection: Eight short-listed VCs were further assessed in detail, including their costs and revenues, competitiveness and land and infrastructure requirements, utilising the wider SUED assessments.
> Integrated chicken farming: to fully integrate the farming operation including a hatchery, broiler pens and slaughterhouse with packing. The focus will be on chicken meat production, supplying day-old-chicks (layers and broilers) to local farmers, and taking in broilers and old layers for slaughter.
> Banana papyrus: this covers the production of fibreboards and veneered boarding from banana pseudo-stems, for use in construction and furniture production.
4.2 Value Chain Projects
Identifying the UEP value chain opportunities for KKM was a four-stage process: > Long-list process: an extensive list of economic opportunities, reflecting government policies, VC studies, exports and imports assessment, inputs requirement, outputs and processes, linkages with key policies and programmes, and market linkages.
> Feed mill: using by-products from agri-processing. Then focus on chicken feed mixes to support the expansion in egg production across KC, fish feeds as well as mixes for dairy cow and goat on zero-graze regimes.
The remaining six shortlisted VC opportunities were selected for further assessment as presented in The Technical Briefing Paper (Appendix B). These VCs have high potential to be considered as next stage VC developments and could utilise the infrastructure provision, collection network and waste systems put in place for the prioritised VCs at Sagana green industrial park. These VCs include:
> Evaluation: the SUED evaluation framework was used to sift the opportunities, including criteria for the SUED principles (included within Appendix B). The PSG, the Municipal Board and other stakeholders identified the relative importance of each criteria for KKM, to provide weightings for final evaluation and identification.
Husk products and banana flour have been prioritised due to their ability to develop the agri-processing sector within KKM. The husk products: lumber and tableware would capitalise on the high production of rice in the County, which currently generate about 24,000 tonnes of rice husk each year, and the increasing volume of husk from coffee and macadamia nuts providing about 4,000 tonnes of husk per year. This VC is a great example of circular economy opportunities in line with the SUED principles described in Section 1.4. The banana flour VC would also capitalise on the growing international niche market for banana flour, and KC being one of the leading producers of banana in Kenya. These two prioritised VCs are detailed in the sections below. These VCs have been assessed against climate resilience and social inclusion, scoring highly. They have also been assessed to have higher readiness for investment than the other shortlisted VCs, and as such are suitable as initial projects to spur further growth, given County’s competitive advantages.
KERUGOYA-KUTUS MUNICIPALITY URBAN ECONOMIC PLAN (UEP ) 73
> Diagnostic alignment: the long-list was assessed against the SWOT analysis and other factors identified in the Diagnostics stage. The resulting list was presented to stakeholders.
> Fruit and vegetable canning: mixed fruit (tomato, mango, passion fruit, melon, pawpaw, etc.) canning facility, with potential for processing some vegetables (French beans, sweetcorn).
The waste banana peel and stems from flour production can be used for animal feed, and works well in formulated mixes for both chicken and dairy cattle. There is also potential to produce flour from banana peel (both green and yellow).
Banana peel flour is a relatively new product, but is being used increasingly in bakery products, in combination with traditional grain flours.
The key outcomes of this VC include:
> Creating direct employment for around 122 full-time employees, with high potential for employing SIGs, including PWD.
> Adding value to a key crop in KC; > Providing a stable offtake and prices for farmers;
43. Carboxymethyl cellulose (CMC). Widely used in food processing and oil drilling. Base Assessment KC is one of the leading producers of banana in Kenya. The annual harvest in the County is estimated at around 200,000 tonnes, and production in the neighbouring counties is also substantial: Meru, Embu, Tharaka Nithi and Muranga have combined banana production of over 600,000 tonnes per year, and these four counties together with Kirinyaga account for nearly 60% of Kenya’s total production. Supplies from these neighbouring counties could also feed into this VC opportunity.
> Scope for other banana products from fruit (starch), peel and stems (starch and flour);
> A good link to other banana (and fruit) processing for joint collection and composting of waste material;
4.2.1 VC 1: Banana Flour
74
This VC project is for a commercial-scale banana flour production facility that would source fruit from across KC and the wider region, producing flour for both domestic and export markets. The facility would process both green and ripe bananas, supporting the production of a range of different flours. Once flour production is established there is potential to expand into other products (starch, chips, CMC43, flakes, etc.).
Flours from banana peel have a lower starch content than flour from the fruit, but are higher in dietary fibre and protein.
> Providing waste peel suitable for animal feed and stems good for composting;
As with all fresh produce, banana prices, both on the export and local markets, can be volatile, and post-harvest losses during periods of glut are considerable. For bananas, local sales fall during the mango season. While there are a number of processing options for bananas that could provide some measure of price stability and offer a stable offtake throughout the year, almost all bananas produced in Kenya are eaten as fruit. There is no commercial-scale banana processing in KC and very little across the region.
Bananas can be processed into flakes and chips (crisps), they can be dried whole or sliced, and used to produce banana flour and Givenstarch.thesubstantial volumes produced in KC there is potential for the commercial-scale production of flour. Green fruit is generally used for banana flour production, but there are processing options for ripe or overripe fruit, which could target short term gluts. Flour from green bananas has a higher starch and protein content than ripe or yellow banana flour, which is higher in dietary fibre.
> Reducing post-harvest losses (with potential to use ripe fruit as well as green);

> Kirinyaga CIDP: prioritises the development of agricultural VC, identifying bananas specifically;
45. Heat pump drying of fruits and vegetables: principles and potential for sub-Saharan Africa. Annals of Faculty Engineering Hunedoara – IJE, (2016) Production Process Producing banana flour is relatively simple and just requires peeling, drying, grinding and sifting. To speed up the drying, the peeled fruit is sliced, and it is also soaked in a mild acid solution (usually citric acid, sodium metabisulfite or sodium hypochlorite) to stop the pulp from browning during the dehydration process. The process for producing banana peel flour is similar.
Heat pump drying is a relatively new technology and there are issues with its use on a small scale. However, there is considerable scope for using it in commercial-scale processing.45
44. Drying process and energy economics, SINTEF Energy Research paper, (2014)
Development of the banana VC is supported by:
KERUGOYA-KUTUS MUNICIPALITY URBAN ECONOMIC PLAN (UEP ) 75
> Big Four Agenda: prioritises the manufacturing sector which covers all areas of agri-processing; > National Banana Development Strategy: supports value addition and reduction in post-harvest losses.
Banana is a staple crop that is grown throughout KC by most farmers. With over 70% of citizens of KC relying directly or indirectly on agriculture, developing this VC will subsequently have a broad impact.
The general flow of produce is towards Nairobi and Mombasa. There is the potential for a processing facility in KC to tap into the existing flow of produce from Meru, Tharaka Nithi and Embu to these main markets. However, to ensure flows of sufficient bananas to the VC, it is proposed that a network of depot points be established, serviced by regular daily collection by trucks. This could be built around some of the existing consolidation points in the County.
The supply chain between farm gate and final market is fragmented, with some produce being taken directly to local markets, while the rest is consolidated, sometimes in several stages, for taking to the markets in the main urban centres or through to Nairobi.
Bananas are grown across the County, predominantly in Kirinyaga Central and Mwea East and West. As with most agriculture in KC, production is dominated by smallholdings.
To produce 1 kg of banana flour requires around 8 kg of banana, unpeeled. Around one third of the weight of a banana bunch is skin and stem, with the rest of the weight reduction being due to the dehydration process. In this way, for each tonne of flour produced, some 4.5 tonnes of water are removed.
Peeling Rinsing Drying Grinding Slicing Soaking Bagging Screening
SECTOR SUPPLY CHAIN
There are a number of options for the drying process: solar, hot air, vacuum, microwave, freeze spray, heat pump. Given the volumes of fruit to be processed, heat pump drying represents the best option as it gives a high drying efficiency at the lowest energy input, at less than 1 kWh of electricity per tonne of fruit compared with 25 kWh per tonne for traditional hot air drying44.
Figure 4.2 Banana Flour Processing Source: Atkins The peeling process is labour intensive, with the other steps in processing being largely mechanical.
Starch extraction is the other commodity volume product, but extraction of starch can be water-intensive, and flour production represents a good first step in processing.
To ensure a ready supply of fruit for processing, some cold storage at the facility is required. This will also support the purchase of surplus supplies.
There is no large-scale banana processing in the County.
The VC would benefit from co-location with other agri-processing activities. This could support co-processing of wastewater and bi-products, and possibly a joint collection network.
49. Production, application and health effects of banana pulp and peel flour in the food industry, Journal of Food Science and Technology, Feb 2019 Prices and Margins Banana prices vary by location and season. Farm gate prices can be as low as KES 5 per kg, though this price represents a minimum for farmers as it is barely sustainable. Average farm gate prices in KC have been around KES 10 per kg46, while prices in Nairobi can be twice this level47. With a banana price of KES 10 per kg, the cost of the fruit required to make a kilo of flour is KES 80. Currently banana flour is being sold in Kenya for KES 300 per kg and substantially more in European markets (e.g. KES 4,000 per kg for 10kg bag). For assessing the viability of this VC, an average base purchase price of KES 20 per kg for banana and a sales price of KES 250 per kg for flour have been used. The project economics are sufficiently robust to support these prices.
> Banana flour is high in resistant starch, especially when made from green bananas, which is of increasing appeal as a dietary aid. In addition, there is increasing interest in using banana peel flour in bakery goods in combination with grain flours. The resulting products have similar characteristics to grain flour breads and cakes, with higher fibre and resistant starch contents. 49
The market for banana flour has developed from being a niche product to a more mainstream component in the food processing sector. The market for banana flour is valued at over US$ 50 million worldwide and is forecast to grow by at least 4% per year48. Demand for banana flour is growing in high-income countries due to two characteristics: > Banana flour can be used as a gluten-free substitute for wheat flour, of benefit to people with coeliac disease;
ToCAPACITY76capturea
The flour for export markets could be transported by rail to Mombasa. Flour production of the plant, at around 24 tonnes per day, is equivalent to one forty-foot container per day.
The other key market is North America, but this is supplied by banana processors in Central and South America.
Land Requirement
The skins and stem waste will find a ready market in the animal feed sector. Demand for both chicken and dairy cattle feeds are increasing in KC and neighbouring counties, as milk and egg production are expanded.
It is expected that by providing a stable local offtake for fruit, farmers could invest in expanding their banana crop through improved varieties, fertilisers, sustainable water management techniques, and irrigation.
The target markets will be in Europe, where demand for banana flour is growing rapidly, both as a dietary aid and for those with coeliac disease.
Banana bunches 200 50,000 Peeled fruit 133 33,333 Flour 24 6,000 Waste peel and stems 67 16,667 Source: Atkins 46. KC Statistical Abstract 47. Earning good money through banana farming in Kirinyaga, Hortfreshjournal 30-05-20
WhileMarketsthere will be potential to sell some of the flour into the local market, most of the output will be for export markets.
The total land requirement for the VC is around 1,400m2, comprising 600m2 of light industrial style buildings, and the rest for external storage and loading and unloading.
48. Zion Market Research (2020) Banana Flour Market [Online] Available at: https://www.zionmarketresearch.com/report/banana-flour-market [Accessed 20 April 2021]
A key issue in large-scale banana processing is to secure steady volumes of fruit.
high level of economies of scale, the VC would have a target capacity of around 200 tonnes per day of bananas, equivalent to 50,000 tonnes per year. This volume represents around one quarter of the current banana production in KC, but less than 10% of the production in the region of Kirinyaga, Meru, Tharaka Nithi and Embu counties.
With a capacity to process 50,000 tonnes of banana per year, the plant would produce around 24 tonnes of flour per day, equating to some 6,000 tonnes per year.
Table 4.7 Process Volumes for Banana Flour Production Target and Volumes Flows perTonnesday perTonnesyear
Demand Outlook
KERUGOYA-KUTUS MUNICIPALITY URBAN ECONOMIC PLAN (UEP ) 77
> Head count of 122 FTE in total; > Monthly salaries of KES 13,000 to KES 25,000 depending on skills; > Additional employment costs estimated at 25% of salary. > Raw Materials include: > Average purchase price of bananas, covering both green and yellow, is KES 20 per kg, paid at the collection points across the County; > Other material costs such as packaging, citric acid or sodium metabisulfite, and micronutrients, are costed at a total of KES 6.5 per kg of flour.
Table 4.8 Value Added KES per kg of banana equivalent Purchase price 15 Other inputs 1 Value added 14 Sales price 30
Investment costs – The total investment required is estimated at KES 730 to KES 800 million. Some 56% of this total is for machinery and vehicles, and 25% is for working capital (covering the gap between paying farmers for the bananas and receiving payment for the flour). The remainder covers buildings and site preparation, marketing and initial training.
Indicative Costs and Revenues
Figure 4.3 Operating Costs, 2026 Source: Atkins Human Resources – Banana processing is labour intensive, with significant jobs required for peeling and packing.
Source: Atkins Recommendations for Enabling Business Environment and/or Other Catalysts The VC would benefit from close cooperation with farming cooperatives to establish a collection network that meets the needs of farmers and the VC.
MillionKES 9001,1501,1001,0501,000950 Packaging and additivesOtherManBananaspoweropex 1,000393266
Other OPEX – This covers electricity, water and other utilities, maintenance of machinery, marketing and training. The opex also covers transport fuels and vehicle maintenance costs, on the assumption that a fleet of five 20-tonne trucks will collect the fruit from depots across KC. Revenues – Annual revenues are estimated at KES 1,500 million by 2026. This is based on an average sales price of KES 250 per kg of standard banana flour, the core product. Prices will be slightly higher for fortified flour and other mixes e.g. Porridge, or baby foods. This estimate excludes any revenues from selling the banana peel and stems for animal fodder or other uses.
Operating Costs – Total operating costs are expected to approach KES 920 to KES 1,000 million, with 80% of these costs being for the purchase of bananas.
There is potential to work with some of the existing small-scale banana flour producers, such as Stawi Food and Fruits in Meru.
Value Added – The added value, calculated as sales revenues less the cost of the bananas and other inputs, is estimated at the equivalent of KES 14 per kg of bananas purchased, representing a near doubling in the value of the fruit.
This is a 100% agricultural VC, dependent on substantial banana crop in region, and as such a drop in banana crop could impact on future expansion. Though dependant on a single crop, the volume required compared to the volume available in KC and neighbouring counties is low, and sensitivity to climate change is rated as Medium.
Water: Use is estimated at one cubic metre per tonne of fruit for rinsing and soaking peeled fruit and washing machinery. Transport: While existing banana collection networks can be used, for costing purposes it is assumed that the fruit is collected from a number of depots across KC. Collecting the required 200 tonnes per day of fresh fruit would need an estimated 20 trips by 20-tonnes trucks operating at 50% capacity. With an estimated 50km per return trips, this could be achieved with a fleet of five vehicles.
Lead-acid batteries are appropriate technology, and an appropriate storage capacity of around 350kWh.
Infrastructure78 Assessment Power demand for the process load, buildings and refrigerated storage could be in the region of 250 - 350kW, including a heat demand of around 60 - 150kW for drying, depending on the type and efficiency of equipment installed. Electric process equipment is preferred, and heat pump fruit drying should specifically be considered (refer to p58) to minimise demand. High efficiency motors and drives and other low energy equipment such as LED lamps should be installed throughout to ensure the demand is at the lower end of projections.
> It is less likely that climate change will impact the viability of the VC.
50. Fruit preservation, North Dakota State University, online source: https://www.ag.ndsu.edu/publications/food-nutrition/food-preservation-drying-fruits
Climate Adaptation and Environmental Options
Climate Resilience Assessment
The facility will have a dedicated 11kV supply and 11/0.4kV transformer on site (1 x 400kVA), with the service extended from the KPLC substation that serves Sagana, 3km to the Solareast.PV should be installed on-site. An appropriate capacity would be around 70 kW, requiring an area of about 450m2, which could reduce the cost of electricity by up to KES 28,000 per week. Battery storage should be included to help with any power cuts or general fluctuations in supply quality.
> Soil and water conservation measures;
Waste: Peel waste and stem (around 67 tonnes per day) could be used for animal feed, biogas – compost production, or compost production. In the longer term, there is potential to produce flour from the peel, a similar process to the banana pulp flour, which would reduce the solid waste flow substantially. Wastewater from washing fruit: Wastewater from soaking fruit in an acid solution: citric acid, sodium metabisulfite or sodium hypochlorite. The concentration is around 5gm citric acid per 1kg water.50
> Intercropping with other plant species in an agroforestry system to mitigate potentially damaging effects of mono-cropping; > Awareness of banana pest and diseases and how to control or avoid them; > Obtaining planting materials from clean / certified sources; and > Using drought and pest/disease resistant/tolerant cultivators.
There is good potential for better agricultural practice to support Green Blue Development, with the following identified as adaptation options that could increase the resilience of supply: > Irrigation to provide more consistent water supply;
(Accessed 17/06/2021)
Healthy stems are required as an input to the VC. Banana crops require consistent water to grow well, and moisture stress can kill seedlings, cause yellowing and disease and weak stems, and reduce crop yield. Extreme weather events can also damage crops, and block access to markets, while warmer temperatures increase the prevalence of pests and diseases, impacting crop health and vigour, and thus production. Crop models show, however, that banana yields are projected to increase in Kenya, while decreasing in many core banana producing areas, so climate change may actually give Kenya a competitive advantage[1]. Balancing projected increases in yield, and losses from extreme events, the overall impact of climate change on the VC can be classified as WithNeutral.asensitivity rating of medium, and an impact rating of neutral, the banana flour VC is given a vulnerability rating of Medium.
Social Inclusion Assessment
KERUGOYA-KUTUS MUNICIPALITY URBAN ECONOMIC PLAN (UEP ) 79
The development of the banana flour value chain offers an important opportunity to generate economic growth, reduce poverty and increase food security. This VC contributes to increasing employment opportunities and developing skills, particularly for women, youth and PWD. Success stories in the country (see Case Study Stawi Foods and Fruits below) could help showcase agriculture as an economically viable activity for the youth and attract young graduates to engage in farming and agri-businesses.
As described in Action A4, it is recommended to train a cohort of young peer educators who could later offer training for a fee. This could increase youth participation in agriculture-related training and represents an opportunity of additional income for trainers. To maximise social benefits for SIGs and other marginalised groups, it is important to address challenges such as lack of skills, access to land or capital, and lack of involvement in decision-making processes. The Wezesha model has been key in the inclusive development of VCs in KC, and it is recommended to extend it to the banana flour value chain. Wezesha provides equipment, financing, and technical support to smallholders, and particularly to women, youth and vulnerable groups, with the aim to increase the VC productivity and their economic self-sufficiency. Despite women having not been identified as a vulnerable group for this project, the implementation of this VC should not impact their lives negatively, for example contributing to women’s time poverty. Hence, agri-businesses should have ‘mothers’ rooms’ within the factory and inform women about community day-care facilities. It would also be important to generate incentives for women’s participation, by facilitating direct payments, for example through M-Pesa, and supporting women in opening bank accounts.
Some additional social inclusion recommendations for each link of the VC include:
80 Figure 4.4 Social inclusion recommendation for banana flour VC Source: Atkins

Key programme elements Women’s and youth inclusion: Stawi works with women’s groups (chamas). They act as ‘community influencers’ and they engage with other women. Stawi trains these women as distributors and retailers, boosting their capacity to sell within their community, contributing to their empowerment, and helping them earn additional income. These women’s groups sell Stawi products in local markets and implement door-todoor campaigns with ‘brand ambassadors’. Stawi also provides opportunities for employing women and youths at the processing units, for example, cleaning and semi-processing bananas into chips.
KERUGOYA-KUTUS MUNICIPALITY URBAN ECONOMIC PLAN (UEP ) 81 Case Study: Stawi Foods and Fruits Limited in Kenya51 51. Interview, YALI (2020) Contributing to Food Security through Agro-processing: The Story of Stawi Foods and Fruits Limited, Available at: https://www.yalieastafrica.org/blog/index.php?entryid=65 (Accessed on 17/06/2021) Stawi is a youth-owned inclusive business founded in 2012 in Nairobi, by the Kenyan entrepreneur Eric Muthomi. The company creates employment for the youth and enables smallholder farmers to access a market their produce. The company’s main pillars are: a) supporting smallholders’ access to markets, b) affordable, nutritious food for consumers, c) creating jobs for youth and women. It is an innovative start-up that sources grains and bananas from smallholder farmers in several parts of Kenya for processing into nutritious flour products. The idea is to support smallholders who have not accessed the market for a long time, have been exploited by middlemen or who face challenges such as post-harvest losses. The company’s leading brands are Stawi Junior Baby Porridge and Stawi Family Porridge, which have primarily been distributed through mainstream retail outlets across major Nairobi suburbs and neighbouring counties. Stawi’s products are precooked and also fortified with Vitamin A. In 2014, Eric Muthomi joined the Young African Leaders Initiative (YALI) from USAID and in 2019 partnered with the USAID-funded Feed the Future Kenya Crops and Dairy Market Systems Activity and the United States Africa Development Foundation (USADF). This, for example, supported the purchase of solar and hot air dryers to minimize post-harvest losses, increased the volume of banana flour processed and improved the quality of the final product. USAID also provided training, mentorship, and funding.
Currently, the company has diversified its products and now engages in several value chains (e.g. Sorghum, millet, amaranth, maize, wheat and soya beans).
> Provides good value-added options for rice, coffee and macadamia husk;
This VC project is for a husk processing facility using husk from rice milling as well as coffee and macadamia husk. Primarily the facility would produce husk lumber and later expand into producing a range of tableware.
> Provides an end-use for recycled plastics, which can be used in some of the formulations;
> Husk lumber is an extruded profile wood substitute.
> Has good potential for future expansion as markets and product ranges develop; > Creates direct employment for around 48 full-time employees in husk lumber production, with a similar number in tableware, with high potential for employing people from special interest groups and those with disabilities.
82
4.2.2 VC 2: Husk Products
A range of profiles can be produced, either hollow or solid, depending on the application. The finished lumber can be handled in the same way as wood, by drilling and sawing, and it has greater durability; it will not rot and it is resistant to pests. Due to its great durability, husk lumber is often used in exposed outdoor applications, where it is subject to sun, sand and rain.
> Provides potential for exports (tableware);
> Supplies a weather resistant, low-cost construction material (lumber) to reduce pressure on local forestry resources;
> Husk tableware covers plates, bowls, cups, including reusable cups, and cutlery. The material is similar to melamine. It has good heat resistance, can be reused and is dishwasher-safe. The husk tableware is also fully biodegradable, and just needs to be broken to let water through the outer layer to activate the process.
> Provides an alternative for single-use coffee cups;
The key outcomes of this VC include:

Currently rice husk in KC is either composted or left to rot, or burnt, with the ash used in cement production. Rice husk contains a high level of silica and after burning is highly porous and lightweight, making it a good material for bulking cement. Macadamia and coffee husk are rarely used for any applications beyond composting. Reviewing the options available for utilising husks, the two stand-out options are the production of husk lumber and tableware. The husk lumber provides a good value, high volume use of husk suitable for the local construction sector, while the tableware is a higher value product with lower overall volumes suitable for some local use and exports. This VC is then for a facility combining production of these two husk products, initially focussing on the husk lumber before expanding into producing the more technical tableware Developmentproducts.ofthe husk VC is supported by:
> Additive to organic fertiliser, to improve aeration; > Fibre additive for composites extruded plastics (e.g. Composite boards and planks); > Tableware, similar to melamine, but biodegradable; > Lumber (timber profiles).
KERUGOYA-KUTUS MUNICIPALITY URBAN ECONOMIC PLAN (UEP ) 83 Base Assessment KC produces substantial volumes of husk each year. The 120,000 tonnes per year of paddy rice produced generates up to 24,000 tonnes of rice husk each year. This volume is set to double with completion of the new dam and irrigation areas. In addition to rice husk, KC also grows coffee and macadamia nuts in significant volumes, providing a further 4,000 tonnes of husk per year (based on 2013 volumes). There are also significant volumes of rice, coffee and macadamia husk produced in neighbouring counties. Husk can be used for a large range of applications and products including: > Insulation material; > Energy from direct burning (fluidised bed); > Pyrolysis gas production; > Charcoal briquettes or wood-type blocks for burning;
The lumber would be sold into the local construction market, alongside other building products. The husk tableware is a high value item, and most of it would be for the export market, especially to Europe.
> Big Four Agenda: prioritises the manufacturing sector which covers all areas of agri-processing, including bi-products;
> Affordable housing programme: targeting the construction of 500,000 homes by 2022. Sector Supply Chain
The husk would be sourced from rice millers, coffee processors, and macadamia processors (once established) across KC. There is potential to source husk from neighbouring counties as well.
> Kirinyaga Government: processing husk has been identified as a potential VC and the County Government has reviewed a range of processing options;
Lumber
Figure
PROCESS Husk lumber is made by mixing graded husk with a binder and other fillers. There are several technologies available, with Resysta being one of the leading ones. With the Resysta method, rice is mixed with salts and a polymer, in the ratio of roughly three parts husk to one part of both salt and polymer. For the polymer, post-consumer recyclable plastic can be used. The production process comprises grinding, mixing and heated extrusion of the lumber profiles, which are then cut to length. The initial output would focus on standard profiles for roofing “A” frames and rafters for the local construction sector. (Figure 4.5) Husk based tableware can be made from just husk (HuskUp use this for their cups), but more usually the husk is mixed with lignin. The Verdant technology uses the lignin mix to provide a wide range of tableware. The husk is ground, mixed with lignin, and then pressed into shape and trimmed. Lignin is a biopolymer that can be extracted from rice straw or banana stem. Depending on the availability of lignin, it could be produced in-house. (Figure 4.6) 4.5 Flow for Husk Source: Atkins Figure 4.6 Flow for Husk Tableware Source: Atkins
PRODUCTION84
Process
Process
Pelletizingoptional Wash,Saltsdryandshred Plastic waste Crushing and Extrusionmixing Dispatch Coffee husk Rice Macadamiahuskhusk Grindsieveand Coffee husk Rice husk Lignin from rice straw or banana stem Printing optional Macadamia husk Grinding and TrimmingPressingmixingand finishing Packingdispatchand
TheCapacitytarget capacity for lumber production is 20 tonnes of lumber profiles per day (5,000 tonnes per year). This requires an input of 12 tonnes of husk per day. This is less than 10% of just the rice husk potential from Mwea region before Thiba dam is built.
Table 4.9 Production Inputs and Volumes for Husk Lumber Production Target and Volumes Flows (tonnes) Inputs per day per year Husk 12.0 3,000 Salts 4.4 1,100 Waste plastics 3.6 900 Output Lumber profiles 20.0 5,000 Source: Atkins The target capacity for husk tableware is 10,000 items per day. Based on an average sized product (e.g. A bowl or plate) weighing 250 grams, this then requires 2.4 tonnes of husk per day plus 100 kg of lignin.
52. Housing Construction Value Chain Mapping, Kenya. Habitat 2017 53. Centre for Affordable Housing Finance in Africa Yearbook, 2015 54. 360 Research Report, online at: and-investment-analysis-by-360-researchhttps://www.wboc.com/story/43653991/melamine-tableware-market-size-with-top-countries-industry-chain-structure-competitive-landscape-new-projects-Thetimberrequirementforroofingforasmallhouse(50m2floorarea)isestimatedataround0.7m3.IfhousingdemandgrowthinKCandneighbouringcountiesistobemetthroughtheconstructionofsmallhousesalone,thisequatestoaneedforjustunder10,000m3peryearoftimbertrusses.Thisisroughlythetargetoutputofthehusklumberfactory.Overtentimesthisvolumewillbeneededtomeetthebacklogofhousingdemand.ClearlythereisastrongmarketforconstructiontimberinKC,neighbouringcountiesandacrossKenya.Husklumberhasmanyadvantagesovertraditionaltimberasitdoesnotrotorgeteatenbytermites,thequalityisconsistent,andcancompeteonprice,thoughsomeeducatingofbuildersandconsumerswillberequiredaspartofthemarketingprogramme.Thehusklumberwouldthenbesoldintothelocalconstructionmarket,alongsideotherbuildingproducts.
Husk tableware – For husk tableware, the existing market demand in Kenya and internationally is relatively small, as this is a new product. The main market to date has been in reusable cups, marketed by the coffee house chains. However, the full addressable market is that for melamine tableware, which is substantial. The global melamine tableware market has an estimated value of just over US$ 1 billion in 2019 and is forecast to grow at 8% per year until 2016 at least54. In volume terms, global production of melamine tableware is estimated at around 1 million tonnes per year. The husk tableware is a relatively high value item, and most of it would be for the export market, especially to Europe.
Table 4.10 Production Inputs and Volumes for Husk Tableware Production Target and Volumes Flows Inputs per day per year Husk 2.4 600 Salts 0.1 25 Output Items (number) 10,000 2,500,000 Tonnes 2.5 625 Source: Atkins Demand Outlook Demand growth for both lumber and husk tableware is strong and growing, with KC and the region being the key market for husk lumber, and Europe being the key market for the tableware. Husk lumber – Kenya has strong and growing demand for lumber for its construction sector, particularly in the housing sector. While there are options for reducing the use of timber in house construction, replacing timber and block partitions with blockwork or panels, timber is used extensively in roofing supports. According to the 2012 World Bank report Addressing Climate Change with Low-Cost Green Housing, virtually all roofing supports in Kenya consist of large sections (200mm x 50mm and 100mm x 50mm) of timber frames52.
KERUGOYA-KUTUS MUNICIPALITY URBAN ECONOMIC PLAN (UEP ) 85
While some construction timber is sourced locally, increasing volumes are imported, and the ban on logging in February 2018 accelerated this trend. Total wood imports averaged US$ 52 million for the period 2015 to 2017, before rising by an average of 38% per year to reach US$ 140 million in 2020. Lumber imports come mainly from Tanzania, Uganda and Congo, but as these markets begin to overexploit their resources, increasing volumes are being sourced from China. Demand for construction timber is expected to remain high. Kenya has a substantial housing deficit, estimated at over 1.8 million units in 201553. This shortage is being addressed, in part, by the national target of developing at least 500,000 affordable new houses by 2022.
Land Requirements The total land requirement for the husk processing is around 1,100m2 with up to an additional 900m2 being required for the tableware production.
It is estimated that KC has a housing shortage of over 40,000 units and annual demand growth of around 3,000 units (assuming the national shortage and growth is allocated in line with household shares). For KC and neighbouring counties (Embu, Muranga and Nyeri) the overall backlog is 200,000 units with annual demand growth of over 14,000 units.
Source: Atkins
Figure 4.7 Operating Costs, 2026
OtherManRawElectricitymaterialspoweropex 50401446 MillionKES 016014012010080604020
Raw Materials include: > Average husk price of KES 1,000 per tonne has been assumed, based on collection from the mills. This is above the current price for rice husk, but some increase is expected in order to secure supplies;
Other OPEX – Covers electricity, water and other utilities, maintenance of machinery, marketing and training. The opex also covers transport fuels and vehicle maintenance costs, on the assumption that a fleet of three 20-ton trucks collects husk and other raw materials and delivers lumber to building material depots.
Revenues – Annual revenues are estimated at KES 250 million by 2026. This is based on an average sales price of KES 750 per standard roofing truss (50mm x 100mm by 6 metres in length). This price is in line with market price for wood (pine) of the same dimensions and excludes any premium for husk lumber.
Table 4.11 Value Added KES per tonne of husk equivalent Husk purchase price 1,000 Other inputs 9,000 Other opex (power, fuel) 17,288 Value added 44,712 Sales price 72,000
> Monthly salaries of KES 13,000 to KES 25,000 depending on skills; > Additional employment costs estimated at 25% of salary.
Value Added – The value added (calculated as sales revenues less the cost of the husk, salt, plastics, electricity and other inputs) is estimated at the equivalent of around KES 45,000 per tonne of husk purchased.
Investment costs – The total investment required for the husk lumber is estimated at KES 500 to KES 550 million. Around half of this is for machinery and vehicles, and around 10% is for working capital. The remainder covers buildings and site preparation, marketing and initial training.
Source: Atkins
Human Resources – The key manpower factors for the husk lumber production alone include: > Head count of 48 FTE in total;
Indicative86 Costs and Revenues
Operating Costs – Total operating costs per year are expected to approach KES 150 to KES 175 million. The major costs are raw materials (husk, salts and recycle plastic), accounting for around one third of total, and electricity costs, accounting for a further 25% of opex.
> Salt price of KES 10,000 per tonne, based on average bulk salt import prices plus margin. Local supply should reduce this cost; > Plastic recyclate price of KES 40,000 per tonne, based on international pellet prices for post-consumer hdPE plus margin. Local sourcing of mixed plastics waste should reduce this cost.
The VC would benefit from close cooperation with the milling companies to ensure a stable supply of husk. This should include the rice millers as well as coffee and macadamia processors.
Infrastructure Assessment Power demand – General power and lighting demand for the buildings and process load could be in the region of 450 - 600 kW, made up of 300 - 400 kW for lumber production and 150 - 200 kW for tableware, including a heat demand of around 60 - 90 kW for drying, depending on the type and efficiency of equipment installed. Electric equipment is preferred for drying. High efficiency motors and drives and other low energy equipment such as LED lamps should be installed throughout to ensure the demand is at the lower end of projections.
Water –Water is not required for the production process, just for personnel.
Accessed 18-06-2021
There is a need to work with the broader construction sector, including contractors, developers, Kenya Bureau of Standards and Architectural Association of Kenya, to ensure that the husk lumber meets the technical requirements for roofing materials. Given the high volumes of lumber to be produced, good links with building material suppliers are required both to provide a steady offtake and ensure that the VC manufactures the optimal range of profiles.
There is potential to link into the UK Government’s support for low-cost housing development in Kenya. Through the UKCI55 a prospective commitment of £30 million has been announced56, to be used for financing the construction of affordable homes and showcasing new technologies and materials.
55. UK Climate Investment, a joint venture between the Green Investment Group and the UK Government’s Department for Business, Energy and Industrial Strategy 56. Property Funds Worlds. Available at: https://www.propertyfundsworld.com/2020/01/20/282130/ukci-commits-gbp30m-provide-green-affordable-housing-kenya.
Recommendations for Enabling Business Environment and/or Other Catalysts
The facility will have a dedicated 11kV supply and 11/0.4kV transformer on site (1 x 1,000kVA), with the service extended from the KPLC substation that serves Sagana, 3km to the Solareast.PV should be installed on the site. An appropriate capacity would be around 120kW, requiring an area of about 780m2, which could reduce the cost of grid electricity by up to KES 48,000 per week. Battery storage should be included to help with any power cuts or general fluctuations in supply quality. Lead-acid batteries are appropriate technology, and a suitable storage capacity is around 600kWh.
Waste – It should be possible to recycle any waste cuttings and trimmings back into the extrusion line. Production costs can be reduced by sourcing post-consumer plastics waste locally. The extrusion process can work with a range of polymer mixes (hdPE, lldPE and PET, but usually not PVC), and the plastics will just need sorting, washing, drying and shredding.
Transport – The husk would be sourced from rice millers, coffee processors, and macadamia processors (once established) across KC. There is potential to source husk from neighbouring counties as well.
The lumber would be sold into the local construction market, alongside other building products.
KERUGOYA-KUTUS MUNICIPALITY URBAN ECONOMIC PLAN (UEP ) 87
Extreme rainfall may disrupt the transport supply of husks to the processing facility. Overall, the impact is rated as Neutral, and the overall vulnerability of the value chain as Low/Moderate.
Case Study: Promoting Inclusion of People with Disabilities in Cocoa, Coffee and Palm Oil VCs in Tanzania57 57. Interview, Traidcraft Exchange (2018), Disability Inclusion in the Coffee and Cocoa Value Chains in Tanzania, Available at: https://traidcraftexchange.org/project-disability-inclusion (Accessed 17/06/2021)
> Switching to more drought-tolerant varieties; > Adoption of water-saving practices; > Increased and more efficient use of irrigation;
It is recommended to liaise with local NGOs and organisations such as Friends of Persons with Disability, Association for the Physically Disabled of Kenya (APDK), and the National Council for Persons with Disability (NCPWD) to implement these campaigns with different stakeholders, particularly with actors involved in the VC.
88 Climate Resilience Assessment
> Agroforestry and inter-cropping.
PWD’ groups should participate in that training. Due to social stigma, PWD are more likely to have low levels of education, be unemployed or have low self-esteem.
Several options are also available to further increase the resilience of production, including:
Social Inclusion Assessment
The development of the husk lumber and husk tableware value chain could contribute to reduce competition between large-scale and small-scale millers. Supporting aggregation of small-scale millers will facilitate their sales.
The project, currently under implementation, aims at: a) providing PWD sustainable livelihood opportunities, b) improving PWD access to markets, and c) generating awareness about the importance of PWD inclusion at the community level. Key programme elements PWD’ inclusion: The involvement of PWD starts in the production stage, engaging PWD and disability organisations. For the processing of raw materials, PWD work with equipment that is accessible. For marketing and trading, PWD and PWoDs (people without disability) are organised as economic groups. The programme trains PWD in soft skills such as leadership, entrepreneurship and business skills. It also links them to providers of financial and business development services, and existing government programmes.
Rice production is affected by high temperatures and drought, as well as storms and extreme events. High temperatures can limit the amount of biomass accumulated, by speeding up growth. Although temperatures in KKM will rise, they are not expected to pose a significant threat to production.
In particular, for irrigated rice, recent modelling shows that climate change may be of net benefit to production in Kenya58. However, climate extremes and drought may present challenges in some years. Although a major drought would likely affect production of coffee, macadamia and rice together, the potential to take inputs from these different sources increases the resilience of the value chain, as does the presence of a significant volume of irrigated rice.
58. van Oort, P. and Zwart, S. (2017) ‘Impacts of climate change on rice production in Africa and causes of simulated yield changes, Global Change Biology’, 24(3), pp.1029-1045
In particular, the husk tableware VC has the potential to include PWD, if the adequate equipment and infrastructure is incorporated. The lessons from the Case Study below indicates that to include PWD in VCs, it is important to develop awareness sessions at the community level, to inform people about existent regulations, and to work towards removing cultural barriers and changing mentalities that prevent the inclusion of PWD in different activities of the PWDVCs.and
Social awareness: sensitisation campaigns, guided by a Behavioural Change Communication (BCC) strategy, were developed to overcome the preconception that PWD cannot successfully engage in agriculture, targeting the general public and PWD themselves. Moreover, the project implemented awareness campaigns to develop solidarity among PWD. Finally, the programme also learned that local knowledge is key to developing successful inclusion measures, for example, sign language might not be used in rural areas, but family members can act as interpreters.
The development of this training could contribute to their empowerment and help them see themselves as capable of participating in the VC and other economic activities.

recommendations for
additional social inclusion recommendations for each
Figure 4.8 Social
Some link of include: inclusion husk products Source:
the VC
Atkins
VC
KERUGOYA-KUTUS MUNICIPALITY URBAN ECONOMIC PLAN (UEP ) 89

5.1
90 5. Green FrameworkDevelopmentInfrastructureBlue
Introduction While the development concept in Chapter 3 focuses on the vision and aspirations of the Municipality and how it can be achieved through a GBD approach, this GBI framework brings in the spatial dimension of the proposals and interventions. Based on the urban diagnostics summarised in Chapter 2 and detailed in Appendix A, this chapter includes the GBI proposals that can support economic growth, maximise impact, and tackle the most urgent needs to build resilience within KKM.

Figure 5.1 Map Showing the Three Main Focus Areas Kerugoya Kutus Embu Kagio Sagana FOCUS AREA: SAGANA GREEN INDUSTRIAL HUB1 FOCUS AREA: KUTUS BUILT-UP AREA2 FOCUS AREA: BUILT-UPKERUGOYAAREA 3 MunicipalityTowns boundary Key RailwayRoadsline Source: Atkins
KERUGOYA-KUTUS MUNICIPALITY URBAN ECONOMIC PLAN (UEP ) 91
Key Elements and Rationale Following the proposed polycentric development, the primary urban centres for the UEP are Kerugoya, Kutus and Sagana. These are the main Focus Areas to address key challenges and to enable opportunities for sustainable economic development. Kerugoya and Kutus towns are located within the Municipality while Sagana is approximately 20 km south west of KKM as shown in Figure 5.1. The main reasons to select a Focus Area outside the Municipality boundary are the limited land for development within KKM, the need for an industrial site to co-locate the identified VCs, and the potential for sharing infrastructure and services to spill over benefits from economies of scale, its strategic location and the fact that the County has secured the land for industrial development.
5.1.1
> Focus Area 1: Sagana green industrial hub > Focus Area 2: Kutus built-up area > Focus Area 3: Kerugoya built-up area

92
GBI projects are presented within each Focus Area with their rationale, sub-components, estimated costs, impacts and benefits associated, with key stakeholders and potential delivery mechanisms identified. Chapter 6 sets out the approach to implementation in more detail for this GBI Development Framework. These proposals have been extensively discussed with the KKM PSG and key stakeholders, utilising the SUED engagement process to inform their development. The infrastructure proposals have been developed to build on, enhance and refine ongoing works and current plans by the Municipality, County, IFIs and other organisations. These proposals, as Development Framework elements, can enable KKM to meet its vision and provide sustainable socio-economic opportunities, as set out in Section 3.
The GBI proposals identified below within the three Focus Areas will support the role of KKM urban functionality and the development of key economic sectors. In addition, a series of interventions and infrastructure projects have been identified to address challenges across the wider Municipality and County area, in line with the list of measures to deliver GBI described in section 3.4.3.
The UEP structures, prioritises, and phases urban development coherently with respect to the three proposed Focus Areas. VCs and GBI projects are sequenced based on optimising their individual and collective impacts whilst aiming to minimise costs. Whilst each proposal may be implemented as a standalone project, effective linking and sequencing will create the highest impacts on future private and public investment potential.
The proposed projects have been assessed against social inclusion and climate vulnerability, with a number of GBI measures identified to embed resilience and suitable approaches for including SIGs and providing income security across groups. The Gender and Social Inclusion Study and the Climate Vulnerability Assessment are appended to this report in Appendix C and D respectively. Further, a high-level assessment was undertaken to determine how each proposal is contributing to the benefits of GBD listed in Section 3.4.2
5.1.2
Green Blue Infrastructure Proposals Overview

KERUGOYA-KUTUS MUNICIPALITY URBAN ECONOMIC PLAN (UEP ) 93 Focus Area ProjectNo. GBI Project Title GBI Category HubIndustrialGreenSagana 1 Sagana IndustrialGreenPark Placemaking and Landscape 2 Water, Wastewater and Drainage Service Provision for Phase 1 Sagana Water Management 3 Organic Waste Processing for Phase 1 Sagana Waste Management 4 Energy Solutions for Phase 1 Sagana Green Industries and Agriculture 5 Access Road to Phase 1 Sagana Placemaking and Landscape 6 Sagana Railway Station Upgrade Placemaking and Landscape Kutus 7 Kutus Pilot Area Urban Regeneration Placemaking and Landscape, Environmental Protection 8 Kutus Urban Park and Community Centre Placemaking and Landscape, Environmental Protection 9 Improved Access to Kutus Markets Placemaking and Landscape Kerugoya 10 Kerugoya Central Square Placemaking and Landscape, Environmental Protection 11 Kerugoya Bus ImprovementsPark Placemaking and Landscape Focus Area ProjectNo. GBI Project Title GBI Category KKM and KC Level 12 Kerugoya and Kutus Water Supply Water Management 13 Kerugoya and Kutus Sanitation Provision Water Management 14 Micro-Hydro Projects Green Industries and Agriculture 15 Solar Refrigeration (Cold Stores) Green Industries and Agriculture 16 Solar Irrigation Green Industries and Agriculture 17 Streetlighting Green Industries and Agriculture 18 Waste Collection Waste Management 19 Landfills Waste Management 20 inManagementCatchmentMtKenya Environmental Protection, Water Management 21 Critical Rural Feeder Roads Placemaking and Landscape 22 NMT and Urban Street Improvements Placemaking and Landscape 23 Donkey Management Green Industries and Agriculture Table 5.1 GBI Proposals Overview for Each Focus Area
94 Figure 5.2 Map showing all GBI Proposals and Interventions LandfillsKKM19 AND KIRINYAGA COUNTY GENERAL INTERVENTIONS Kerugoya and Kutus Water Supply12 Kerugoya and Kutus Sanita�on Provision2213 NMT and Urban Street Improvements Cri�cal Rural Feeder Roads21 Micro-Hydro Projects14 Solar Refrigera�on (Cold Stores)15 Solar Irriga�on16 Streetligh�ng17 Waste Collec�on18 Catchment Management in Mt. Kenya20 Donkey Management23 21 21 21 21 21 21 21 21 21 21 21 21 12221319 12221319 19 FOCUS AREA: SAGANA GREEN INDUSTRIAL HUB1 FOCUS AREA: KUTUS BUILT-UP AREA2 FOCUS AREA: BUILT-UPKERUGOYAAREA 3 FOCUS AREA 2: KUTUS BUILT-UP AREA Kutus Pilot Area Urban Regenera�on7 Kutus Urban Park and Community Centre8 Improved Access to Kutus Markets9 87 9 FOCUS AREA 1: SAGANA GREEN INDUSTRIAL HUB Sagana Green Indutrial Park1 Water, Wastewater and Drainage Service Provision for Phase 1 Sagana2 Energy Solu�ons for Phase 1 Sagana4 Organic Waste Processing for Phase 1 Sagana3 Access Road to Phase 1 Sagana5 Sagana Railway Sta�on Upgrade6 1 2 4 3 5 6 FOCUS AREA 3: KERUGOYA BUILT-UP AREA Kerugoya Central Park10 Kerugoya Bus Park Improvements11 10 11 KerugoyaKutus Kagio Sagana MunicipalityTowns Boundary Key toCriticalFocusFocusFocusCountyRailwayThibaRiversRoadsDamBoundaryArea1Area2Area3FeederRoadsbeimproved

5.2.1 Overview Industrial development is an important driver of economic growth as described in section 4.1.2. Approximately 254 acres59 in Sagana has been identified by KC and KIDA for industrial development. The County has signed an MoU with KIDA and the Industrial and Commercial Development Corporation (ICDC) to develop Sagana Industrial Park as a designated SEZ, which is mentioned in action B2. Sagana benefits from good accessibility and connectivity by both road and railway with the wider regional area as shown in Figure 5.2a. The site presents an opportunity for KKM and KC to cluster all potential VCs and other industrial businesses at the same location to allow for economies of scale, where water, energy, waste and transport infrastructure can all be used by the different developers and operators. Co-locating all VCs and associated industrial development opportunities in Sagana will also allow the capture of wider supply chains outside the County. A poorly planned and operated industrial area could overuse or waste natural resources and severely negatively impact the environment, employees and people living nearby. In order to avoid inefficient use of resources, and limit pollution and damage to the natural environment, the industrial site should be developed as a green industrial park in line with the GBD approach described in Chapter 3. The overall industrial site mostly spreads across greenfield land. A phased development is required, therefore a smaller pilot area of 2.5 ha will be proposed to develop in Phase 1, which is described in Section 5.2.4. Prior to this pilot development, the site should be prepared, and a few studies need to be undertaken, such as geotechnical, hydrological and environmental assessments (further described in Section 5.2.2).
FOCUS AREA: SAGANA GREEN INDUSTRIAL HUB 1 1 2 3 4 56 5 FOCUS AREA 1: SAGANA GREEN INDUSTRIAL HUB Sagana Green Indutrial Park1 Water, Wastewater and Drainage Service Provision for Phase 1 Sagana2 Energy Solu�ons for Phase 1 Sagana4 Organic Waste Processing for Phase 1 Sagana3 Access Road to Phase 1 Sagana5 Sagana Railway Sta�on UpgradeGENERAL6 INTERVENTIONS Micro-Hydro Projects14 Solar Refrigera�on (Cold Stores)15 Solar Irriga�on16 Streetligh�ng17 Waste Collec�on18 Catchment Management in Mt. Kenya20 Donkey Management23 00 225050 550000 775050 1,000 m m
KERUGOYA-KUTUS MUNICIPALITY URBAN ECONOMIC PLAN (UEP
5.2
59. The County Government has expressed the site is about 250 acres (100 ha), however when measuring the site file in KML provided by the Municipality the land is about 150 ha. Accurate delimitation of the site needs to be carried out.
Moreover, guidelines on infrastructure requirements, cleaner production and design principles have been outlined to ensure the site is developed as a green industrial park (Section 5.2.3). These guidelines have already been applied to the Phase 1 –Development of Pilot Site to demonstrate how to approach development in a sustainable way to safeguard KKM’s Other urban interventions include the upgrading of Sagana railway station to support the future development of Sagana green industrial hub and the need to transport processing and production inputs to the site and end-products to their markets.
Focus Area 1: Sagana Green Industrial Hub

96 Figure 5.3 Sagana Focus Area Overview

Environmental and Social Impact Assessment (ESIA): To be developed in accordance with the local regulations. This should include an assessment of the activities as well as provision of management, mitigation and minimisation of potential adverse environmental and social impacts, such as pollution control systems to mitigate industrial production and operation, or communication strategies to avoid negative impacts on the lives and economic activities of the local community. Consultation with stakeholders needs to be described and properly communicated. The ESIA process will also identify the requirement to obtain the respective environmental licensing and permits for the park to operate.
60. http://kirinyaga.go.ke/governor-waiguru-receives-title-deed-for-repossessed-250-acres-county-land/ 61. 150 ha site is the size calculated based on the KML file shared by the Municipality 62. SEZ Authority website, accessed at: Developer-Road-Map | Special Economic Zones Authority
> Determine and communicate the cut-off date to receive compensation/assistance and the implementation schedule in an accessible and timely manner. Clearly indicate the valuation methods utilised to determine compensation/assistance;
> Implement a grievance redress mechanism for disputes that might emerge during the resettlement process;
> Consult affected populations about the relocation site/alternatives, the implementation schedule and compensation and assistance measures. Relocation alternatives should at least be comparable, and preferably improve, the livelihoods and standards of living affected populations had before the displacement;
5.2.2 Preparation of the Site
Detailed master plan: This should include key ancillary facilities and land uses, buildings layout, plot sizes, utilities provision, parking and loading bays, GBI including buffer zones to protect rivers Ruguti and Saga bordering the site, with a phased action plan to guide the development of the site. This may be accompanied by a Strategic Environmental Assessment (SEA) in line with the local regulations.
The KC Government has recently obtained title deed60, for the contested 254-acre land. This designates Sagana Industrial Park in line with the Mountain Cities Blueprint 2032 proposal and therefore a suitable location for the selected VC projects described in Section 4.2. However, the site will require some level of preparation to be ready to receive investment. Some of the immediate tasks include: > Appropriate demarcation of the site in line with the title deed. The KC news articles suggest the site is 254 acres (100 ha) whilst the site boundary provided indicated 150 ha61; > Site investigation survey and technical studies to determine baseline and identify site constraints and opportunities; > Site clearance; > Feasibility study report; > Development of a detailed master plan to guide the development of the site; > Development of an Environmental and Social Impact Assessment and Environmental and Social Management Plan; > A Resettlement Action Plan also needs to be developed in order to relocate individuals who are currently settled at the site and farming activities within the site to allow room for the industrial park; > Provision of enabling infrastructure i.e. Access road, improvements to the bridge over River Ragati. Site investigation survey and technical studies: A walkover survey should be carried out to identify if there is any particular area of environmental sensitivity and ecological value within the site, if any hazardous waste has been dumped there in the past, and to remove it before main site preparation.
(sezauthority.go.ke)Althoughthe site is relatively flat, a topography analysis, geotechnical and hydrogeological studies as well as flood risk assessment (described above) should be carried out to identify the characteristics and properties of the soils and ground conditions, and drainage patterns, to support the future infrastructure. Site clearance: Vegetation of no biodiversity and ecological value should be cleared from the site and could be composted or used for charcoal or briquettes rather than sent to the dumpsites. No waste is to be burned or buried on site or dumped in the rivers. Any other waste or materials identified could be used in construction of the industrial park, such as bricks and rubble that can be crushed and used as aggregate.
> Identify affected populations and potential negative impacts associated to the displacement through a census survey. Identify groups who may be particularly vulnerable to displacement and consider specific measures to support them (e.g.: PWD, the elderly);
The displacement of communities and economic activities should be avoided whenever possible. When resettlement is unavoidable, a Resettlement Action Plan (RAP) should be prepared to mitigate adverse socio-economic impacts and the disruption of social safety nets. This plan should, at a minimum:
KERUGOYA-KUTUS MUNICIPALITY URBAN ECONOMIC PLAN (UEP ) 97
> Monitor and evaluate the resettlement process and the adequate implementation of compensation/assistance measures.
Feasibility study: This should be carried out to include a market demand analysis, a conceptual master plan, an economic impact assessment, a financial model, a Strategic Environmental Assessment (see below) and any other applicable regulation or guidelines including SEZA regulations if required62.
> Provide opportunities for skills development, particularly for the youth and PWD i.e. Technical and vocational training (TVET) and apprenticeships.
98 5.2.3 Development Guidelines for the Green Industrial Hub Climate resilience and social inclusion considerations are not only a core focus of this UEP but also critical for the development of KKM and Sagana green industrial park as sustainable, resilient and inclusive places. Moreover, the social inclusion and climate resilience consideration would be complemented with sustainable design and cleaner production principles in line with the GBD approach. Key climate resilience and social inclusions consideration for Sagana site are listed Climatebelow.Resilience
As there will be a need to reserve some land adjacent to the rivers, to ensure that infrastructure is not built in areas at risk of flooding, there is an opportunity to turn these riparian areas into attractive green spaces on the site, which could be used by site workers on breaks. These areas could not only provide recreational space, but also useful shaded areas to reduce exposure to high temperatures. The area would also benefit from the provision of litter bins and awareness campaigns so people avoid throwing litter into the river or flood zone areas. Allowing space where the river can safely flood will also have the benefit of reducing downstream flood risk. These areas, if designed in a flood-sensitive manner, could also form a part of the overall GBI network for KKM and KC.
> Develop users’ satisfaction and complaints forms as feedback mechanisms for stakeholders within the park and for the local community, such as complaint boxes or hotlines.
> Ensure adequate working conditions in line with national and local laws and standards. Guarantee equal working opportunities for all people, e.g. Respect the 5% quota for PWD’ inclusion;
63. Global Climate Change - HypeWeb (smhi.se)
> Provide social infrastructure e.g. Accessible toilets and infrastructure, childcare services and mother’s rooms, and follow social performance standards in relation to social inclusion, gender equality, labour conditions, and community dialogue64; > Ensure a good relationship with the community. Develop programmes to improve social aspects within the local community and provide accessible communication platforms;
The key climate risks for the Sagana site relates to flooding, with the site being bounded in the south and the east by Ragati and Saga rivers. Flood frequency and magnitude is expected to increase, although there is uncertainty over the size of increase63. Flooding not only affects the boundaries of the site itself, but can potentially impact on access to the site, for example the Ragati River Bridge. To ensure that flooding does not affect the functioning of the site there is a need for a full flood risk assessment to be carried out. This assessment needs to include increases in flood size arising from climate change and should not simply be based on historical flood data. It should include both the site itself, but also key access routes. In addition to river flood risk, site drainage needs to take into account the likely increases in heavy rainfall in order to reduce the disruption on the site during extreme rainfall events. To mitigate this risk and build resilience, a range of SuDS features such as detention ponds, swales and bio-retention systems can be used to collect and slow the runoff in addition to providing storage and treatment. Maximum temperatures will increase, as will the incidence of heatwaves. Where possible, shade is to be maintained, or enhanced as below.
> Provide accessible infrastructure and equipment;
Social Inclusion Considerations
Considerations
64. See The World Bank, An International Framework for Eco-Industrial Parks (2017)
The new green industrial park will provide an opportunity to support the local economy by creating new jobs and businesses opportunities. To be an inclusive green industrial park, it should: > Communicate in a timely manner with local residents and adjacent businesses about the implementation schedule of the project to mitigate the disruption of traffic and transport services, everyday life, and economic activities. This communication should be in a format and language accessible for all;
> Maintain health and safety at working spaces and implement regular training and audits;
> To use locally sourced and sustainable construction materials; > To reduce carbon footprint.
Low carbon or carbon neutral principles
Sustainable Design and Cleaner Production Principles
> Promote tailored strategies for the industrial park in order to take advantage of its unique characteristics and to address local climatic conditions, such as mitigating climate change effects like flooding;
> Integrate greening and landscape as a key element to help improving the air condition and pollution.
Shared utilities and logistics > The clustering of business and industries within the park promotes the shared use of facilities such as warehouses and logistics, training and meeting facilities, and parking areas. This allows the park to benefit from economies of scale and achieve efficient infrastructure services and economic gains by reducing overhead costs;
Water management > To promote sustainable urban water cycles by implementing rainwater collection, storm water retention and harvesting techniques and wastewater recycling; > To promote the efficient use of water resources and ensure good water quality while protecting environmental assets. Sustainable transport > To design an urban layout which optimises the network infrastructure, reducing vehicle movements while promoting walking and cycling and the use of electric vehicles within the industrial park;
> To promote the use of smart technologies to digitalise transport infrastructure allowing the exchange of information in between vehicles, drivers, passengers and transfer hubs. An example of these are streetlights capable of monitoring parking spaces as well as traffic patterns.
> Accommodate remanufacture, restore, or repair shops to rescue waste and support a circular economy.
KERUGOYA-KUTUS MUNICIPALITY URBAN ECONOMIC PLAN (UEP ) 99
> To foster the implementation of smart technologies to achieve a good and efficient management of the shared facilities, such as providing sustainable public transport for employees. Circular economy and zero-waste
A well-planned and organised green industrial park is defined by a set of principles that should guide the planning and design, construction, operation and maintenance of the park. These principles are grouped under a) sustainable design principles and b) resource efficiency and cleaner production. Sustainable Design Principles to guide future on-site infrastructure, utilities and building facilities. Climate resilience and passive design principles
> Rethink the waste management system to turn waste into resources such as the husk products VC. To minimize the generation of waste by reorganizing industries in a way that one could use the waste from another as an input into a process or as a source of energy;
> Promote the design of passive buildings to reduce electrical cooling, heating, ventilation and lighting while guaranteeing comfortable conditions for all users;
> The urban design needs to focus on improving the public space network with a streetscape which promotes healthy and active lifestyles where residents and workers are encouraged to walk rather than travel by car;
> To encourage sharing facilities resulting in a reduction of private car usage;
> To foster industries which reduce industrial environmental footprint by minimising waste and emissions; > To encourage industries to reuse and recycle water to reduce water consumption; > Waste generated in the production to be recovered when possible through sorting, cleaning, conditioning, that can be used as raw material for other industries and businesses;
> To identify opportunities for common energy and heat exchange networks. For example, at some point in the future this area could be a potential location for an incinerator that would reduce miles that waste is transferred from the industrial park as well as providing heat and electricity, if it is a combined heat and power incinerator.
> To re-use the by-product from one industry as an input for another. Clean air and low pollution > To support industries which minimise emissions;
Case Study: Hawassa Industrial Park in Ethiopia was designed, constructed and operated as a Green Industrial Zone Hawassa is a large industrial park (1.3 million sq ft) developed 200 miles south of the Addis Ababa with a specialisation on textile and apparel.65 The park has been designed to be environmentally friendly and limit its impact on the local ecosystem. For instance, textile activities tend to be water-intensive and generate large amounts of wastewater that is polluted with chemicals and is too often unsafely released in the environment. At Hawassa, 85% of sewerage disposal water will be recycled through their Zero Liquid Discharge programme. What is interesting with this case study is that the design of the park and its infrastructure is directly driven by the activities that are planned to take place on the site, making sure that the right type of sustainable approach is adopted.66
65. Making Industrialization in Africa Sustainable | United Nations 66. Hawassa Industrial Park goes fully operational as Ethiopia pushes to become manufacturing hub | Embassy of Ethiopia, London (ethioembassy.org.uk)
100 Local and inclusive community employment to enhance the social performance by: > Creating local jobs; > Providing better working and labour conditions; > Fostering gender, age and (dis)ability sensitivity in the green industrial park’s operations; > Providing better security by embedding security features in the park’s design; > Providing social infrastructure to the workers and community; > Improving occupational health and safety. Cleaner production guidelines and principles to be followed by industries and businesses on the site during the industrial process, products and services: Renewable energy and energy efficiency > To use renewable energy sources such as solar energy, wind power, biomass or hydroelectric power;
> To encourage industries to generate as little as possible of hazardous materials; > Waste to be appropriately disposed and treated.
Resource efficiency and circular economy > To encourage the use of smart technologies and automation to achieve an efficient use of natural resources and industry outcomes;
The Sagana industrial site takes advantage of its strategic location which lies along the east-west B25 corridor that connects to Kagio, Kutus and rest of the County and north-south A2 corridor linking to Nairobi. The site is also located at a 10-minute drive to and from the Sagana Railway station, which connects to major urban centres north and south of KC. This proposal includes the upgrade of the access road F2174 (shown in Figure 5.3) which runs through the central axis of the site and connects to B25 and the railway station. It also proposes the upgrade of the railway station to complement the industrial development. The remainder of the pilot site (beyond the banana flour and husk processing sites) is split into 7 industrial units of 1200 sqm and 1 unit of 2000 sqm and is reserved for future industrial development, KIDA VC opportunities or co-location of other shortlisted VCs described in section 4.2. There is scope for future expansion all around the site, however, the area north of the site does not host any existing settlement so it could be prioritised. A loop road and a water treatment plant for industrial effluents will add to the immediate and inherent attractiveness of the site for businesses to locate there.
KERUGOYA-KUTUS MUNICIPALITY URBAN ECONOMIC PLAN (UEP ) 101
5.2.4
Phase 1 Development of Pilot Site
The Phase 1 as development identifies land requirements for utilities such as wastewater treatment, power and waste collection and outline infrastructure requirements to support the operation of the VCs including the upgrade of the access road and Sagana railway station upgrade. 5.2.4.1.
Project 1: Sagana Green Industrial Park
The site has scope to expand further northwards in the immediate future (identified as future development in Figure 5.4). The pilot site will also accommodate the two shortlisted VCs of husk products (lumber and tableware) and banana flour and allow for future expansion of these VCs.
The pilot site for Phase 1 is located 2.3 km from the railway station and B25, on a relatively level site. This site has been chosen due to its location away from the seasonal streams that lie to the south of the axial road. It is also not occupied by any farms or locals and will not require immediate consultation.
The site will benefit from the opportunity of lying on the north-south A2 corridor to and from Nairobi. The industrial zone will benefit from a primary frontage along this corridor which will allow for smaller scale retail, office, and light industry units to be in that zone and further contribute to business vibrancy in Sagana. Further amenities can be provided by employing GBI features such as detention ponds and swales, these will contribute to create a desirable and attractive business and working environment that further attract investors and ensure natural site features are integrated in the development plans. Linkages > KIDA plan to develop an industrial site in Sagana > SUED agri-processing and industry sector plan described in Section 4.1.2 Projects 2, 3, 4, 5, 6, 21 GBI category: Placemaking and landscape
>
Source: Atkins
102 Figure 5.4 Phase 1 Sagana Green Industrial Hub Existing settlements Existing settlements Existing settlements Existing settlements 00 5500 110000 115050 200 m FUTUREDEVELOPMENT PHASE 1BananaFlour HuskProductsIndustrialUnitType2IndustrialUnitType1 Industrial Cluster Phase 1 New ExistingRoadsRoad Upgrade Husk WaterBananaProductsFlourTreatment Plant Industrial Unit Type 1 Industrial Unit Type 2 403.2 m 2.3 2000kmsqm. (incl. future expn.) 3000 sqm. (incl. future expn.) 1200 sqm. 2000 sqm. (1 unit) 1200 sqm. (each - 3 units) WaterIndustrialTreatment Plant Open ExistingProposedSeasonalExistingSpaceSettlementsStreamsRoadsRoad

Project 1 Summary Information
Project 1 Basic Analysis and Timeline Challenges Data gaps Time frame, key dependencies
Table 5.3
GBD Benefits Climate Change Adaptation Benefits Urban resilience Carbon reduction Low Carbon Development Improved rural – urban linkages Environment and Resource Efficiency Benefits Reduction pollution Improved air quality Energy
Short to medium term to facilitate early stages of VC projects and enable further development &
Estimated cost (KES range) Benefits and impacts Financing options and delivery mechanisms
Note: Water treatment plant is costed as part of Project 2 Enhances the local economy with modern manufacturing, and mixed-use Opportunityamenities for immediate investment and Introducesdevelopmentastrong value addition to the industrial zone in KKM and KC Opportunity to provide local employment for a relatively suburban community
water savings
On-site internal roads and network infrastructure (water, power, sanitation, ICT, drainage) GBI network integrating seasonal streams as well as two major rivers and topography.
Masterplan to be developed for the wider site before progressing May require some RAP or land re-acquisition where the land is encroached for future phases Funding Pre-feasibility study Site surveys and technical studies Market study
KIDA, KC to lead Private investor: Design Build Operate Maintain (DBOM) Enabling infrastructure: Public Authorities › Implementation agency / leading partner: KIDA, private Investor › Supporting Maintenancestakeholders:responsibility of Municipal Government
KERUGOYA-KUTUS MUNICIPALITY URBAN ECONOMIC PLAN (UEP ) 103
Sub-components
Implementation agency and stakeholders
Table 5.2
Total cost = KES 667 m New internal roads = KES 63 m VC1 and VC2 buildings = KES 195 m Industrial units = KES 408 m
It is assumed that a maximum of 85% of water used (approximately 121m3/day) will be discharged as wastewater. A reed bed system for wastewater treatment is proposed in line with the GBI explained in section 3.4. The system is a combination of primary treatment and reedbeds/natural wetland70. Reedbed technology features low construction costs and minimal day-to-day operation and maintenance costs71. The system reduces wastewater contaminants, minimises solids, and provides sufficient storage time for stabilisation of bio-solids prior to disposal72. It also provides habitat for local wildlife. Once water has passed through the reedbed system it can be reused for watering green areas in the industrial park or for washing machinery or cars.
67. Kenyan Ministry of Water and Agriculture. 2005. Practice Manual for Water Supply Services.
It is suggested that groundwater investigations are undertaken to determine a suitable location for and depth of the borehole.
5.2.4.2.104
Wastewater generated from toilets will be treated using septic tanks. Liquid waste will be treated in the reedbed system and an anaerobic digestor used to treat solid human waste. More details on an anaerobic digestor and supporting infrastructure are provided under Project 3.
Project 2: Water, Wastewater and Drainage Service Provision for Phase 1
It is important to consider future space requirements for water and wastewater infrastructure to enable potential future growth in industry. For example, space for an additional borehole or additional wastewater treatment infrastructure.
70. Afifi, S., Bazazew, N., Arakelyan, K., Nassar, A., & Wise, T. 2013. Using Reed-Bed System for Wastewater Treatment and Reuse in Urban Semi/Urban Community in Gaza-Palestine. 36th WEDC International Conference, Nakuru, Kenya. Delivering Water, Sanitation and Hygiene Services in an Uncertain Environment.
Based on a hydrogeological and geophysical survey conducted in Wachoro, the minimum depth is estimated at 80m and the maximum depth at 120m68. As part of investigations, the quality of the groundwater should be tested to ensure it meets drinking water standards. A drilling permit must be applied for from the Water Resources Management Authority offices in Kerugoya under the Ministry of Water and Irrigation69
68. Meteoric Water Limited. 2019. Hydrogeological Survey Report for One Production Borehole on LR NO: 1530.
There is an opportunity for the water and wastewater management of the site to be operated by an SME but there will need to be outside investment in order to develop the Staffassets.toilets should be connected to septic tanks and an aerobic digestor used to treat solid human waste. More details the anaerobic digestor and supporting infrastructure are provided under Project 3.
There is currently no public water and wastewater service provision at the proposed Sagana Industrial Site. This project covers the provision of water and wastewater services on-site to enable the operation of the selected VCs. An initial estimate of water and wastewater requirements for the production of banana flour and husk products is summarised below. In addition, an estimate of water requirements for the industrial units is provided based on the current estimate of the footprint of the industrial units. Water used for the production of banana flour is estimated at 26.4m3/day and water demand for staff at the plant is estimated at 2.5m3/day (a total water requirement of Water29m3/day).demand for staff at the husk lumber plant is estimated at 0.5m3/day, while water demand for staff at the husk tableware plant is estimated at 1.25m3/day. Water for the production of husk lumber and tableware will be minimal.
71. Keefer K. S. 2000. Treating Biosolids in Reed Beds Could Short-Sheet Your Budget. Water Environment and Technology, Vol. 12, No. 2, pp61-65.
For Phase 1, the footprint of the site occupied by industrial units is estimated at 5,600m2, which is equivalent to 0.56 hectares. It is estimated that an industrial unit of 1 ha uses approximately 20,000 litres/ha/day67. Therefore, the industrial units located on-site will require approximately 10,000 litres of water per day. This is equivalent to 10m3 of water per day. In summary, the total water requirement for Phase 1, including for the VCs (31m3/day) and industrial units (10m3/day), equates to 41m3/day.
72. Afifi, S., Bazazew, N., Arakelyan, K., Nassar, A., & Wise, T. 2013. Using Reed-Bed System for Wastewater Treatment and Reuse in Urban Semi/Urban Community in Gaza-Palestine. 36th WEDC International Conference, Nakuru, Kenya. Delivering Water, Sanitation and Hygiene Services in an Uncertain Environment.
The borehole will also be subjected to EIA study and NEMA approval. If quality and quantities from boreholes are not sufficient to meet the demands from the subsequent phase of the green industrial park, then water could be abstracted from the Sagana River and stored in a small earth dam with appropriate shading to prevent evaporation provided on site. If groundwater can be used, water quality will need to be tested but chlorine treatment is likely to be sufficient. If surface water is used, a package treatment plant will be required.
69. Meteoric Water Limited. 2019. Hydrogeological Survey Report for One Production Borehole on LR NO: 1530
Saga River flows are variable; therefore, it is proposed that water is abstracted from an on-site borehole. Based on borehole records in the vicinity of Wachoro, approximately 25 km from the Industrial Site, the expected yield of a borehole is expected to be within a range of 6.6 – 9m3/hour, a mean value of 7.6m3/hour, which is described as ‘good’ by Meteoric Water Limited and meets the water requirements of the Site. A borehole with a yield of 7.6m3/hour would only require one well but a back-up well is advised to ensure continuity of supply. A storage facility of a day’s water demand is also recommended. A renewable solar power supply is proposed for the Sagana site and this can also be used to power the borehole pumps.
GBI category: Water management
Table 5.4
Water supply: Borehole, pump and chlorination Wastewater:systemPre-treatment and reed bed hydro-geotechnical investigation
Project 2 Summary Information Sub-components
Total cost = KES 23,4 m Water supply = KES 10 m Wastewater = KES 13 m ESIA = KES 400,000 m Groundwater supply more resilient than surface water supply Funding through development partners like World Bank or Water Sector Trust Fund KIDA or local government for capital investment Employ local SMEs for the operations and maintenance of the water and wastewater services
Table 5.5 Project 2 Basic Analysis and Timeline Challenges Data gaps Time frame, key dependencies
If sufficient groundwater is not available, then surface water will have to be used. This will add to the cost and energy requirements as water will need to be pumped and treatment increased
ESIAsystemincluding
Groundwater depths, yields and water quality– to confirm feasibility and design parameters
Estimated cost (KES range) Benefits and impacts Financing options and delivery mechanisms
KERUGOYA-KUTUS MUNICIPALITY URBAN ECONOMIC PLAN (UEP ) 105
Implementation agency and stakeholders
To manage surface water, sustainable drainage systems features such as rainwater harvesting systems could be utilised to collect surface water from the new industrial buildings rooftops. The water collected could be reused for the selected VCs. To manage the surface water runoff from the proposed footpaths, a combination of filter strips and rain gardens can be utilised throughout the site and directed to the reedbed system. Exact locations of SuDS features can be finalised as part of the detailed design stages of the industrial site. Linkages > The water and wastewater services will service the proposed VC projects; > There are links between this project and projects 3 and 4 the Solid Waste Management and Energy infrastructure proposals respectively. The installation of a reed bed treatment system to treat wastewater will contribute to the town’s GBD Approach.
Requirements106 for Implementation Climate Resilience Recommendations
Social Inclusion Recommendations
The improvement of water provision in Sagana will contribute to the economic activities in the industrial site, supporting the activities of the VCs. Better water provision and wastewater treatment will improve the health of staff and local communities.
GBD Benefits Socio-Economic Benefits Public health Productivity & food security Green jobs Climate Change Adaptation Benefits Risk reduction Urban resilience Environment and Resource Efficiency Benefits Water quality Energy & water savings Restoration of habitats & ecosystems Biodiversity
The layout of all water and wastewater features should be taken in conjunction with the flood risk assessment to be carried out for the Sagana site (see Section 5.2.1). In addition, while the borehole is not expected to have a significant impact on the level of groundwater at the site, scenarios for the sustainability of groundwater if further expansion of groundwater pumping is required for the site should be included in the groundwater assessment and should be stress-tested to ensure sustainability, even if there is a reduction in precipitation. Groundwater is more resilient to climate variations than surface water and combined with storage. Drainage features for the site need to be designed to accommodate increases in the frequency and magnitude of heavy rainfall events. The scheme plans to reuse reed bed treated water to reduce the amount of water resource required to be abstracted.
5.2.4.3. Project 3: Organic Waste Processing for Phase 1 Sagana This project will support the initial proposed VCs and future VCs as well as any other businesses on the site that generate organic waste by providing a sustainable solution to manage organic solid waste and reduce the volume of waste sent to the dumpsites. This in turn leads to less impact on the environment through degradation of land and pollution in line with the GBI approach. This project relies on organic waste being segregated at source and collected separately from other waste streams. Once the organic waste is collected it would be processed through anaerobic digestion (AD) which can produce liquid and solid fertiliser, heat and electricity. At present it is estimated that the banana flour VC will generate 16,667 tonnes a year of waste. It is important to consider future space requirements for organic waste processing to support potential future growth in the VCs. For example, space for either additional AD units or a single larger unit.
Linkages > This is a new project; > It would support the VCs, environmental resilience, and climate change, as it would reduce or eliminate the volume of organic waste going to dumpsites which generates methane (a greenhouse gas); > There are links between this project and project 2 wastewater and project 4 energy infrastructure proposals. In particular it will be important to ensure necessary arrangements are in place to sell electricity (if it is generated); > There are also links with transportation infrastructure proposals and the Sagana Industrial Park proposal to upgrade the access road as vehicles will bring in organic waste and take out liquid and solid fertiliser.
GBI category: Waste management
107
Case Study: Stabilisation pond and reed bed73 Welcome Break Oxford Motorway Services in the UK use a modified stabilisation pond and reed-bed system in conjunction with a basic SAF sewage treatment plant to treat the wastewater from the whole site. The plant produces high quality effluent that meets the required discharge standards. The site has also become a wild-life haven and sanctuary. Attracting birds, ducks, deer, butterflies and dragon flies. Oxford motorway service reedbed system Source: accessedcresswater.co.uk/case-studies/oxford-motorway-services/https://21June2021 73. https://cresswater.co.uk/case-studies/oxford-motorway-services/

m
Assessment of waste arisings based on final choice of VCs and adoption of door-to-door segregated waste collection (from outside FA 1)
begins › Waste
established developers/operators › Funding and
Potential
› Throughput
› To
Table 5.7 Project 3 Basic Analysis and Timeline Challenges Data gaps Time
partners › Short
known › Limited
and
and
Total cost = KES 100 m to KES 300 Reduction of waste to landfill and methane production in the landfill source of renewable energy Better alignment to circular economy Supply of fertiliser to local agricultural market
and
› Limited
108 Table 5.6 Project 3 Summary Information Sub-components Estimated cost (KES range) Benefits and impacts Financing options and delivery mechanisms Implementation agency and stakeholders
AD plant developer or operator AD plant developer/operator to implement and maintain frame, key dependencies number of proven and bankability guarantees off-take agreements for heat, electricity fertiliser provide the AD plant when the VCs come on stream door-to-door waste collection quantity and composition currently not fully knowledge of suitable developers/ operators/ to medium-term
Development of AD plant
KERUGOYA-KUTUS MUNICIPALITY URBAN ECONOMIC PLAN (UEP ) 109
Socio-Economic Benefits Public health Green jobs Climate Change Adaptation Benefits Risk reduction Urban resilience Carbon reduction Environment and Resource Efficiency Benefits Prevention of soil erosion & land contamination Reduction pollution Improved air quality
GBD Benefits
Both processes, organic waste collection and its processing into fertilisers, represent employment opportunities, providing salary, equipment, and training. > The project presents employment opportunities for SIGs. Many young men already work in transportation and they could be engaged in waste collection. There are also employment opportunities for PWD, for example in back-office activities to manage collection operation and logistics.
Requirements for Implementation Climate Resilience Recommendations
Social Inclusion Recommendations
The site of the processing would need to be chosen to reduce the risk of flooding and ensure good access. Indirect resilience benefits of this project are an increased supply of fertilizer to farmers, which could help enhance yields, while mitigation benefits are clear in the reduction of methane.
Linkages > This is a new project, to enable all of the proposed VC but in particular the green industrial park.
5.2.4.4. Project 4: Energy Solutions for Phase 1
The Thecogas Senegal AD plant is located at the abattoir owned by the Société de gestion des abattoirs du Sénégal (SOGAS) on the south side of the capital city Dakar, about 10 km east of the airport. It is the largest abattoir in Senegal, slaughtering about 200 cows and 1,300 sheep and goats daily, and creating 200 tonnes of waste in the process. The plant was commissioned in July 2013 at a cost of around EUR 750,000 (US$ 990,000), funded jointly by Thecogas Senegal, a private operator (40%) and a grant from the Dutch government (60%).
74. Bioenergy for Sustainable Energy Access in Africa, Technology Country Case Study Report (incorporating Country Scoping Reports), E4tech, 7th August 2017 e4tech.com/wp-content/uploads/2018/03/Technology-Country-Case-Study-Report.pdf><http://www.
110 Case Study: Thecogas, Dakar, Senegal74
> A feasibility study to determine preferred potential locations, required size including phasing, technical arrangements including preferred technology, and local network connections, commercial arrangement options; > Outline design of solar park; > Development of procurement and deployment plan. This will include:
> Deployment plan – upskilling of local marginalised groups to work as contractors;
The initial proposal is to develop a solar PV site with a capacity of 6 to 8 MW, incorporating energy storage, and with the potential to expand further in the future when required. It will potentially split into two parts, where one part serves the green industrial park directly, and the second part connects into the distribution network to serve Sagana town in general.
The proposed industrial site is located around 3 km to the north-west of the existing main KPLC substation that serves Sagana. The closest service to the site is two 11kV circuits that run along the C71. The available capacity of the substation and circuits is unknown, but it is likely that it will not be enough to meet the demands of the industrial site in the medium or long term. It is proposed to install a new solar renewable energy facility in the green industrial park. This project will provide a significant amount of renewable energy to support the development.
GBI category: Green industries and agriculture
> Development of maintenance plan, focussing on upskilling of local marginalised groups to work as maintenance staff.
> Procurement route – best options for engagement with solution providers/ finance providers/contractors;
This project has several proposed components:
Table 5.8
Financing options and delivery mechanisms
By improving the provision and resilience of power in Sagana, the project will have an indirect effect on improving social conditions. This will contribute to reducing power outages which will in turn contribute to improved industrial and commercial activities, improved ability to deliver services and improved safety at night. There is the potential for the creation of jobs, e.g. Contractors, and maintenance staff, some of which could be targeted at employing youths and other vulnerable groups through an upskilling programme.
Short-term GBD Benefits Socio-Economic Benefits Public health Poverty alleviation Green jobs Climate Change Adaptation Benefits Risk reduction Urban resilience Carbon reduction Low Carbon Development Environment and Resource Efficiency Benefits Water quality Reduction pollution Improved air quality Energy & water savings
Implementation agency and stakeholders
Total cost = KES 1.150 bn KES 15 m to complete study/ design, KES 850 m – 1.1 bn to complete installation Reliable, resilient and green energy supply for the industrial park and town Partner with the green industry park developer to coordinate activities and develop the energy proposition Partner with renewable energy technology specialists to determine procurement solutions Maintenance – capacity building programme to ensure continued operation of systems Route will involve the park owner/ operator developing an initial design, obtaining relevant permitting and buyin from the regulator and utility. Then attracting suitable finance before engineering, procurement and construction, with final interconnection to the power transmission/distribution system.
Sub-components
Estimated cost (KES range) Benefits and impacts
Developing a suitable proposition and ensuring participation from suitable solar solution providers, both technical and commercial
Complete initial feasibility study and outline Developmentdesignof finance, procurement and deployment plan Maintenance plan
Confirmation of location, details of KPLC, other sector stakeholder development plans
Social Inclusion Recommendations
Table 5.9 Project 4 Basic Analysis and Timeline Challenges Data gaps Time frame, key dependencies
KERUGOYA-KUTUS MUNICIPALITY URBAN ECONOMIC PLAN (UEP ) 111
Requirements for Implementation Climate Resilience Recommendations
Project 4 Summary Information
This project meets SUED principles on climate change and sustainability in a number of ways. Firstly, by providing energy for pumping irrigation water from renewable sources and secondly through assessment of the depletion of groundwater resources to ensure it is extracted at a level that ensures the will be available.
75. Eldosol Solar PV Project, accessed 20th June 2020 <https://frontier.dk/eldosol-solarpv-project-kenya/>
The road is in earth condition with a varying right of way of 15 to 30 m and a carriageway of 7 m. It traverses an agricultural area with scattered settlements and acts as a critical link for farmers and residents. Along its alignment, the road crosses River Ragati via a low-lying bridge that is prone to flooding when it rains. The lack of all-weather access and storm water drainage make the road unsuited to handling potential traffic generated to and from the industrial site. A phased road upgrade is proposed with priority being given to the initial 4 km of road needed to provide access to Phase 1 of the industrial site. A loop road that provides direct access to Phase 1 site will be needed. The rest of the network will be developed in line with the expansion of the industrial site and development of surrounding areas. These upgrades should be paired with a new elevated bridge at the crossing with River Ragati of sufficient capacity to handle frequent traffic from heavy goods vehicles. Additionally, the junctions with the B25 should be improved to allow for turning of HGVs accessing the industrial site. Along the stretch of road, pedestrian and public transport facilities, storm water drainage and street lighting should be provided to support mobility of workers and visitors to the site as well as storm water drainage facilities.
5.2.4.5. Project 5: Access Road to Phase 1 The proposed industrial site is located 2 km west of Sagana Railway station. The most direct access to the site is provided by the F2174 road which runs through the central axis of the site and connects to the B25 and the railway station.
GBI category: Placemaking and landscape
112 Case Study: Eldosol Solar PV Project, Kenya75 Eldosol solar PV project is a 40MW solar power plant located in the African Economic Zone SEZ, located near Kerugoya in Uasin Gishu County. It is funded partly by a European Investment Bank loan and jointly by a consortium comprising Frontier Investment Management, Selenkei Investment Ltd, Cedate Ltd, Interpro International LLC and Paramount Universal Bank of Kenya. The construction cost is US$ 78m. It will provide power directly into the national grid under a 20-year power purchase agreement with KPLC. It is expected that a lot of the power will be consumed locally by the SEZ, as this area has limited current energy supply, an increasing demand and expanding population.
Upgrade of 4 km of road from earth to bitumen standards with dedicated walking facilities and storm water
GBD Benefits Socio-Economic Benefits Poverty alleviation Green jobs Recreation & amenity Climate Change Adaptation Benefits Risk reduction Urban resilience Improved rural – urban linkages
Well-designed NMT and transport facilities along the stretch of the road will offer safe, affordable and accessible transport options to local communities, workers, and visitors to the industrial site and surrounding areas. It is recommended that NMT and transport facilities follow principles of inclusive design and ensure PWD accessibility.
Requirements for Implementation Climate Resilience Recommendations
Funding through development partners like World Bank, USAID Maintenance through Kenya Road Board – Road Maintenance Fuel Levy Fund (RMLF) Road is currently a County Government Road but would need reclassification to national road due to industrial activity.
KERUGOYA-KUTUS MUNICIPALITY URBAN ECONOMIC PLAN (UEP ) 113
of 5 bus stops and 5 boda boda sheds New bridge over River Ragati Develop 400m loop road within the site Total cost = KES 640.4 m Road upgrade = KES 400 m Bus shelters = KES 375,000 m Bridge = KES 200 m Internal loop road = KES 40 m
The upgrading of the road and transport infrastructure will improve access to the industrial site and surrounding markets, which is essential for a strong and thriving economy at Sagana.
Short term. Road to be developed in staged construction of Enablingpavement.infrastructure development for the industrial cluster.
Table 5.11 Project 5 Basic Analysis and Timeline Challenges Data gaps Time frame, key dependencies Funding Pre-feasibility and feasibility studies
The upgrading of the road to all-weather access will provide a much more resilient road surface, and significantly reduce disruption due to surface water flooding, road surface deterioration and costly damage to infrastructure brought about by adverse weather. As precipitation intensity and extreme rainfall events are expected to increase, upgrading the road surface and including storm drainage designed to accommodate more frequent rainfall events will significantly increase the resilience of the road to climate change impacts.
Social Inclusion Recommendations
Implementation agency and stakeholders
Ease access to the industrial site Improve mobility for surrounding residents
Provisiondrains
Financing options and delivery mechanisms
Table 5.10 Project 5 Summary Information Sub-components
Estimated cost (KES range) Benefits and impacts
Source: uploads/2018/01/Tilisi-E-brochure.pdf/https://www.chigwellholdings.com/wp-content/accessedon21st June 2021
114 Case Study: Tilisi Industrial Park, Kenya Tilisi is a 400-acre mixed-use development in Limuru, approximately 25 km from Westlands and 10 minutes from the Southern and Northern Bypass. Its masterplan proposes a mixed land use including logistics, residential, educational, medical, recreational, hospitality, commercial and retail uses, ultimately offering an all-encompassing corporate and community experience. Overall, Tilisi is distinctly zoned into residential, works, and commercial precincts. Tilisi, as the master developer, provides fully serviced land parcels to investors to purchase and develop. Infrastructure on site include: 1) high quality paved roads with footpaths, cycle lanes and streetlighting; 2) water supply to each parcel; 3) power supply and a connection point to each parcel; 4) high standard sewage treatment plant and internal security including perimeter wall and CCTV cameras along the major roads. Its first phase, the logistics park, offers investors land parcels for light industrial and logistics development. The site is accessed from two key roads, the Nairobi-Nakuru Highway and Ngecha Chunga Mali road and the Southern and Northern bypasses are both less than 10 minutes away. The industrial precinct is accessed by a single carriageway access road with a right of way of 25 m, supporting pedestrian, cycle lanes and streetlighting on the edges. The logistics park is supported by facilities such as matatu lay-bys, a refuelling station and localised shops and canteens to further benefit the staff, operations and visitors at Tilisi.
Impression of infrastructure development at Tilisi Logistics Park Source: https://tilisi.co.ke/develop-at-tilisi.php/ accessed on 21st June 2021
KERUGOYA-KUTUS MUNICIPALITY URBAN ECONOMIC PLAN (UEP ) 115
Africa Logistics Properties at Tilisi Logistics Park Source: https://tilisi.co.ke/africa-logistics-properties.php/ accessed on 21st June 2021 Typical cross-section of the industrial access
Source: Atkins Consulting Engineers Limited


The main road link to Tatu city is Ngenda road (D399) and has been designed with a right of way of 25m to allow for turning of large vehicles, landscaping, pedestrian and cycling zones.
116 Case Study: Tatu City Industrial Park, Kenya Tatu city is a 5,000-acre, new city in Kenya located five kilometres from exit 11 on the Thika Superhighway and two kilometres from both the Northern and Eastern Bypasses, along the Ruiru - Kamiti Road. The masterplan proposes a comprehensive mix of land uses including low, medium and high residential developments, industrial, commercial, educational and recreational developments, tourism and social facilities, infrastructure and transport networks, public utilities and open spaces including natural green zones and water bodies.
Source: https://modelmakersolution.com/modelsmaker/tatu-city/
Source: https://www.tatucity.com/gallery/gallery-2020/


In future phases, as Sagana town grows, there may be enough footfall that demands passenger trains. This can be looked at in later stages of the masterplan. A passenger area and relevant infrastructure such as booking offices and waiting areas can be developed. This will then require visitor parking and associated public realm spaces as well. Such increased in demand may attract real estate investment opportunities and act as a catalyst for development of a new station neighbourhood. Linkages > KIDA plan to develop an industrial site in Sagana;
> Sagana Green Industrial Park and access road upgrade.
GBI category: Placemaking and landscape
5.2.4.6. Project 6: Sagana Railway Upgrade Sagana Railway Station is located on the western fringe of KC. It is connected to major hubs such as Nairobi to the south and Nanyuki to the north. The railway station is a 5 minute drive from the proposed Sagana industrial site. Sagana railway station was recently refurbished by Kenya Railways including upgrades to reactivate and increase the handling capacity of the station, there is a daily freight service running. The station is an essential piece of infrastructure that offers opportunities to connect to the rest of KC and the country. This station has the potential to act as a main point of access for the manufacturers to transfer raw material and finished products to and from the site. The introduction of the green industrial hub alone means the station’s infrastructure and operation is inadequate for the intended use. As the use of the station may potentially increase, the current structure as well as the frequency of service are currently unsuitable. To accommodate their needs, and support the industrial development of Sagana, a station upgrade is recommended. A feasibility study should be undertaken to assess the potential upgrades required for the intended use. Following the study, a phased development can be proposed. A masterplan can be developed to use the station in Phase 1 as a goods station or a freight station. Initially, key tasks would include an upgrade to the station building and platforms. The masterplan could include elements such as a goods yard or depot, storage spaces and a logistics area. Depending on the results of the feasibility study, an expanded rail siding and logistics centre might be proposed. The frequency of the trains also might need to be reassessed to better suit the new requirements.
> SUED agri-processing and industry sector plan described in section 4.1.2;
KERUGOYA-KUTUS MUNICIPALITY URBAN ECONOMIC PLAN (UEP ) 117
Feasibility study to be undertaken to assess the scope of improvement Masterplan to be developed for train station outlining proposed operations, resilience to growth Total cost = KES 200 m Feasibility study = KES 10 m Concept master plan = KES 15 m KES 35,000 per sqm for construction improvements assuming 5000 sqm of station and adjacent land to be improved = 175m Opportunity to accommodate future Opportunitygrowth to provide more efficient operations such as access and safety Potential to become a centre on the Nanyuki-Nairobi railway corridor Will add value to adjacent land KC or a mixed entity between public and private where public body funds infrastructure and real estate is built and operated by private investors.
Project 6 Basic Analysis and Timeline Challenges Data gaps Time frame, key dependencies May cause initial disruption to currently operating service Upgrade will require further consultation Funding Pre-feasibility study Site Publicsurveyconsultation Long-term
Table 5.13
Estimated cost (KES range) Benefits and impacts
Implementation agency and stakeholders
Project 6 Summary Information
118 Table 5.12
Site freeholder (Kenya Railway) will be the leading Alternativelystakeholder.setupadedicated Special Purpose Vehicle (SPV) which could include private sector entities. Supporting stakeholders include county government stakeholders, NGOs and LocalCBO. business and industrial park. Opportunity to employ local SMEs for specialist services (i.e. Smart logistics, industrial experts, etc.
Financing options and delivery mechanisms
Following completion: revenue from boda boda parking, Value Capture via increased land value of buildings and land surrounding the station Delivery via KC in coordination with KKM, local landowners, and community stakeholder groups
Sub-components
KERUGOYA-KUTUS MUNICIPALITY URBAN ECONOMIC PLAN (UEP ) 119
Social Inclusion Recommendations
GBD Benefits
Requirements for Implementation Climate Resilience Recommendations
Maximum temperatures have increased in the County, and will continue to do so, with increased incidence of conditions currently considered to be very hot. The upgrade to the existing station provides an opportunity to incorporate cooling and shading measures which will improve the comfort of passengers and staff during hot weather. Assessment should also be made on whether existing drainage is adequate given increasing heavy rainfall events, and if there is an opportunity to use rainwater harvesting to provide a portion of the station’s water requirements.
> Communication to local residents about the implementation schedule of the project to mitigate the disruption of current railway services and economic activities. Involvement and consultation of communities about the different phases of the project. All communication should be timely, and in a format and language that is accessible for all.
The improvement of the railway station and associated transport infrastructure will benefit the economic development of the new industrial site. It will also contribute to better connect economic activities and regions. This requires:
Socio-Economic Benefits Social cohesion Poverty alleviation Green jobs Recreation & amenity Climate Change Adaptation Benefits Cooling effects Urban resilience Carbon reduction Improved rural – urban linkages Environment and Resource Efficiency Benefits Reduction pollution Improved air quality
> Adopting inclusive design standards that allow easy access and use for everyone, e.g. Consider parking lots for PWD and adequate space alongside them; provide public PWD-friendly toilet facilities; install ramps, lifts, and escalators.
The community’s aspirations are underpinned by a series of documents and tools including investment strategies, urban development projects and a draft comprehensive LPLUDP. The UEP has identified a series of opportunities to contribute and augment the UEP vision by rationalising the land uses and integrating the GBD approach at its core.
In the medium to long-term, Kutus could become a knowledge cluster benefiting from its strategic location and excellent connectivity, offering a range of accommodation opportunities, from student accommodation to affordable housing, and to support local employment.
Kutus is an emerging town whose aspiration is to become a well-planned, integrated, and sustainable Municipality that grows into a vibrant resilient economic centre. It also aims to become a thriving, liveable and attractive residential hub. Its location, along the B25 corridor is very central to KC and offers the community a prime opportunity to adopt and implement innovative and sustainable development principles.
5.3.1 Overview
Kutus is a well-known university town, as it hosts the KyU campus that is located on the junction of the B25 and C74. KyU has an ambitious plan to launch more degree programmes and is expected to grow from its current 2,500 students76. Such growth will increase pressure on the already stretched local infrastructure, accommodation and transport but will also create opportunities for local employment, entertainment and other social activities. This Focus Area has the potential to leverage the KyU higher education offer in KC and build on the knowledge spill-overs.
120
Kutus is one of the main towns within KKM and is centrally located within KC. Despite being the wholesale trading centre, the market infrastructure is very limited. The proposed interventions aim at supporting the development of the key economic sector of trade and services, particularly the existing student population. Moreover, a better urban environment is likely to catalyse investment which will benefit both existing landowners and businesses.
5.3 Focus Area 2: Kutus 76. Kirinyaga University (2016) Kirinyaga University Strategic Plan 2017 – 2022

KERUGOYA-KUTUS MUNICIPALITY URBAN ECONOMIC PLAN (UEP ) 121 Figure 5.5 Map of Focus Area 2: Kutus Pilot PriorityAreaStreets for Upgrade Pedestrian only Streets Priority Streets for NMT Facili�es Newly Developed NMT Streets Cri�cal rural feeder road 7 9 9 9 8 22 22 22 12 13 19 21 FOCUS AREA: KUTUS BUILT-UP AREA 2 LandfillsKKM19 AND KIRINYAGA COUNTY Kerugoya and Kutus Water Supply12 Kerugoya and Kutus Sanita�on Provision2213 NMT and Urban Street Improvements Cri�cal Rural Feeder RoadsFOCUS21 AREA 2: KUTUS BUILT-UP AREA Kutus Pilot Area Urban Regenera�on7 Kutus Urban Park and Community Centre8 Improved Access to Kutus Markets9 Source: Atkins


Project 7: Kutus Pilot Area Urban Regeneration
Figure 5.4 shows the current land use zones and existing key functions in the pilot site, and existing walking routes taken by users to get to key destinations. A mix of uses can be observed in the area which has responded to demand. The location of the livestock market impacts on traffic congestion especially during market days and creates a pinch point on the B25 bridge. These challenges have been recognised by local stakeholders. The current bus park is at maximum capacity and it is spread across three different sites. There are also scattered commercial areas, shops, and hotels along the northern area of the Kiangueyi-Gatuto-Mikarara Road (B25).
The pilot site has been chosen due to its location adjacent to the KyU and to the junction of the two main transport corridors in KC. The site is naturally enclosed by the Thiba River to the north and the B25 to its south. This node of the CBD has grown organically and presents a good mix of functions such as housing, hospitality, market, transport, and public uses. This site presents itself as a potential future model neighbourhood development, where proposals can be demonstrated and then rolled out across the rest of KKM and KC. Ranging from higher density and compact urban form to inclusive design, these principles are outlined later in this section.
Existing Situation When arriving to Kutus from the west, the visitor is greeted by a mixed landscape of the major road’s junction, the Thiba river bridge, the livestock market, the university campus, and some residential areas. This presents the first impression of the town. The pilot area lies within these functions. This route is an important link that runs across the east-west axis of the County. It connects Sagana, Kagio, Kutus and Embu towns. Further east, a bus park fronts the main road, this is another fundamental function in the town centre.
The banks of the Thiba River accommodate good quality resorts and private properties.
The recommendations for Focus Area 2 aim at enhancing the urban environment and being a leading example of urban growth for the town centre and beyond.
The perception of a town is mostly given by the images that visitors and residents alike retain when using and visiting it. The arrival experience, the ease of movement and security, cleanliness, quality space of the public realm and good quality architecture are all elements that combine to deliver a good urban environment that stimulates repeat visits and creates a good economic opportunity for investment and business. It is an added advantage if these amenities are accessible at walkable or cyclable distances. When such principles are satisfied, cities and neighbourhoods become fully integrated destinations where most of the daily needs of the community can be fulfilled, this is known as the ‘15-minute cities’ principle.
A good urban environment should strive to achieve full integration across the community regardless of income or culture through balanced and integrated land uses, transportation, GBI, and community design. The goal is to create ‘a town of proximities’ not only between physical structures but also people. The urbanism projects are multidisciplinary and integrate a wide range of diverse inputs into a strong, coordinated vision that underpins development.
In Kutus, urban growth has focused around the KyU to the north of B25 and around the wholesale market to the south.
122 5.3.2
KERUGOYA-KUTUS MUNICIPALITY URBAN ECONOMIC PLAN (UEP ) 123 Figure 5.6 Plan Showing Existing Land Uses, Primary Roads and Key Functions in the Pilot Area B25 B27 GatutoKithiritiCatholicEcd Kiangueyi-Gatuto-Mikarara Mixed OldCommercialWalking/CyclingWoodedLivestockRetail/ShoppingPrimarySecondaryPinchPedestrianOtherRiverUndevelopeduseCommercialandRetailResidentalPublicUtilitiesRecreationalRoadsPathspointsRoadsRoadsareaMarketAreaPolicePostPathsBuildingsMunicipalMarketStudent/ Private HousingKirinyagaExistingRiverfrontResort/HospitalityMixedPrivateuseBusStationUniversity Educational Source: Atkins

124
The Proposal
The County government is considering various development interventions in this area. The livestock market and the police post are being relocated. These actions will free up good sized plots of land in prime locations. Part of the ex-livestock market site is being used to propose a fire station. A new and larger bus park is being proposed on the exiting bus park site which expands northwards towards the river. Figure 5.5 shows the currently proposed interventions as well as further opportunities in the pilot area. A land ownership analysis (Figure 5.5) suggests that a series of publicly-led initiatives could act as a catalyst to development and set good development standards for the pilot area and the privately owned plots. In order to enable a more integrated and ambitious vision, this proposal articulates a series of interventions across two main typologies: anchors and supporting projects.
Key anchors initiatives include improvement of the retail market area, with the creation of a new civic square; an upgraded transport hub offering opportunities for business; a new riparian park with small food and beverage spaces that could be leased to the private sector. A revised and more flexible land use framework will enable suitable development and effective interaction between functions across Focus Area 2. Strategic actions, such as the relocation of the livestock market or re-classification of streets will be needed and would result in the freeing-up of land to cater for GBI such as newly introduced green public spaces and much-needed public realm.
Supporting projects include infrastructure proposals addressing critical gaps such as water supply deficit, lack of drainage, waste management and traffic congestion.
Complemented with an upgraded, people-centred street network, the north node neighbourhood in Kutus will be well-positioned to become a vibrant place for residents and students to live, work, learn, play, socialise and even, innovate.
Opportunities 1-5 (Figure 5.5) recommend revisions to land uses to support Kutus’ future growth and expected influx of students. The framework assesses the potential increase in density and accommodates a mix of uses to increase resilience and future-proofing. Opportunities 6 to 10 look at integrating the GBD approach into the proposal; it assesses opportunities such as walking trails, waterfront development, ecological island park, and potential use of SuDS on streets to improve climate and flood resilience.
KERUGOYA-KUTUS MUNICIPALITY URBAN ECONOMIC PLAN (UEP ) 125 Figure 5.7 Plan Showing Ongoing Interventions and Opportunities B25 B27 GatutoKithiritiCatholicEcd Kiangueyi-Gatuto-Mikarara CountyPrivate FormalBridgeWaterfrontAfforadableUrbanPedestrianAfforadableCommunity,UndevelopedownedAfforadableHousingHousing,MixedUseonlystreetSquareHousing,MixedUsedevelopmentUpgradeWalkways/CycleRoutes43215678 Island Park/Waterfalls/Ecology9 Potential SUDs10 OPPORTUNITIES Bus Park Upgrade ONGOINGPoliceFireLivestockINTERVENTIONSMarketRelocationStationPostRelocation4321 General Green-BlueInterventionsInterventions1 1 2 2 2 2 3 4 5 6 6 6 6 9 8 8 8 7 7 7 10 10 5 5 5 1 1 3 4 2 Source: Atkins

It is proposed that the remaining area north of the fire station can be used as an urban park and community centre. It is recommended that within the renovated bus park, a real estate component (retail and commercial) can be included to augment its primary function to become a vibrant revenue generating TOD (transit-oriented development).
The GBI development framework ties together new and existing proposals as well as recommending improvements to some of them. Green features are weaved into the urban fabric at root level. Figure 5.6 demonstrates the recommended land uses and densities for the blocks. Key proposals such as the new fire station and the new bus park are also shown.
An east-west green link is proposed, which connects the KyU to the north node neighbourhood and further connects to the wider Green Blue network across KKM and KC. This link also connects the urban park and urban square and passes through the proposed pedestrianised street within the student housing quarter. The Thiba river, west of the pilot area, has a natural island which could be developed into an island green park for people to enjoy and relax. The banks of the river itself present some good waterfront development opportunities. Water-based sports such as boating and fishing can be proposed, and tie-up with the adjoining resorts. A riverwalk or boardwalk can be developed as a part of the wider GBD. Walking trails can connect to the wider hiking trails going to and from Mt Kenya. SuDS interventions can be adopted along roads to address localised flooding issues and improve climate resilience in line with the GBD benefits.
126
The old dilapidated retail market plot, lying in the centre of the pilot area, can be converted into a new market, including a multi-use activity hub and urban square to serve the growing population. The densities and uses of the existing local centre blocks can be developed to blend a balanced mix of residential, student accommodation, and affordable housing supported by food and beverage outlets and retail as appropriate.

KERUGOYA-KUTUS MUNICIPALITY URBAN ECONOMIC PLAN (UEP ) 127 Figure 5.8 Recommended Densities and Land Uses Source: Atkins

Climate Resilience and Passive Design
> The urban design should focus on improving the public space network and designing cities with a streetscape which promotes healthy and active lifestyles where residents are encouraged to walk rather than travel by car.
The proposed principle reinforces the need for this cluster to be conceived as “inclusive neighbourhoods”, where daily activities can be fulfilled and therefore accommodate a range of uses for everyone to access. The proposals above will contribute to fulfilling the vision of a well-planned node and sets an example for the rest of KKM. Additionally, because of the interconnectedness, its variety of uses and the seamless fitting with nature-based solutions as described in Section 3.4, urban resilience will be deeply rooted in the neighbourhood’s blueprint.
Compact Urban Form and Mixed Use > Polycentric and diversified land uses by creating mixed use neighbourhoods which become sustainable and self-sufficient.
> Provide ways to facilitate management of risks and disaster reduction through smart technologies, inclusive to all, in order to achieve resilient and sustainable developments. Flexible Design > Foster the design of flexible uses and spaces to create resilient cities to physical, social and economic challenges.
> Maximise the resilience of the ecosystems through landscape, using plants for cooling and air purification. Increase the number of tree planting to absorb CO2.
Local and Sustainable Materials > Encourage the shortening of supply chains by using local materials and food, manufacturers and techniques, activating the local economy, minimising transport requirements, and promoting local knowledge and experience.
> Mixed use and compact urban development will reduce the demand for motorised mobility requirements, helping to reduce carbon emissions and from a demographic perspective will encourage social integration and diversity.
Urban128 Design Principles to Guide Future Development
Zero-Waste > Rethink the waste management system to turn waste into resources.
> Promote the use of smart technologies by using information to digitalise transport infrastructure allowing the exchange of information in between vehicles, drivers, passengers and transfer hubs, optimising traffic flows. An example of these are streetlights capable of monitoring parking spaces as well as traffic patterns.
> Promote the design of passive buildings and districts to reduce electrical cooling, heating, ventilation, and lighting while guaranteeing comfortable conditions for all users.
The UEP has accounted for both the local plan directions and stakeholders’ aspirations, as well as integration with innovative urbanism concept and best practices, namely the “15-minute neighbourhood” and the GBD approach and principles in a way that high aspirations find an immediate application on the ground and benefit people’s day-to-day lives.
> Encourage the urban revitalisation and regeneration in favour of the new development. Landscape and Biodiversity
Cities are able to face and adapt to local but also global changes and dynamics, such as current social distanced measures due to the COVID-19 pandemic which require a flexible use of space.
> Smart integrated renewable energy systems should be implemented to achieve an efficient use of natural resources by distributing surpluses based on demand.
> Measures including recycling, up-cycling and composting waste to produce energy, i.e. Plant and animal waste to produce energy sources, biomass. Special attention and studies need to be given around the reuse of industrial waste.
The following design principles guide the development of infrastructure proposals and the “15-minute neighbourhood” concept is naturally weaved across projects:
> Promote responsible consumption to residents. Sustainable Transport > Promote and prioritise public transport, cycling and pedestrian circulation over vehicular.
> Promote a sustainable and efficient manufacturing and agricultural industry, fostering innovation.
> Promote tailored strategies for each localised development and take advantage of their unique characteristics and to address local climate conditions, such as reducing urban heat island (UHI), and mitigating global climate change effects.
> Invest in green and open spaces to increase public safety and quality of life for the community. Clean Energy > Utilise local renewable energy sources such as solar energy, wind power, biomass, or hydroelectric power to reduce the demand of fossil fuels.
> Promote efficient use of water resources, such as in drip irrigation, and ensuring good water quality while protecting environmental assets.
Water Management > Promote sustainable urban water cycles by implementing rainwater collection, storm water retention, harvesting techniques and wastewater recycling.
> Promote the use of smart technologies to achieve healthy and inclusive communities. Examples of these are apps on phones which support people to navigate within cities and buildings, and the use of street lighting that can monitor air quality and temperature. Linkages > This is a new project, links with: Project 8, Table, Services and Eco-Tourism Action Plan in Section 4.1.3.
KERUGOYA-KUTUS MUNICIPALITY URBAN ECONOMIC PLAN (UEP ) 129
> Data driven smart city technologies should be part of the water management strategy improving its resilience.
GBI category: Placemaking and landscape GBI category: Environmental Protection GBI category: Water Management
Inclusive, Diverse and Healthy Communities > Integrate a diverse range of economic and cultural activities maximising social diversity and interaction of users within each zone. This could be achieved by promoting mixed-used districts, which can benefit from 24-hour liveable cycles.
> Ongoing proposals for bus park in Draft PLUDP.
> Promote social equity by providing affordable housing and student accommodation.
› Feasibility study to be undertaken to assess the scope of improvement Concept masterplan to be developed for the pilot area
›
›
130 Table 5.14 Project 7 Summary Information Sub-components
› Ongoing Local Plan projects might be overly ambitious in terms of density Currently proposed bus station takes up higher value land (by the river) without adopting a TOD approach
›
›
Estimated cost (KES range) Benefits and impacts
›
Table
Implementation agency and stakeholders
Financing options and delivery mechanisms
›Government:Employlocal
› Fire station location on prime land and on a gateway location. Alternative location slightly further away might be more beneficial Infrastructure and public realm upgrade will require further consultation Funding Pre-feasibility study Flood risk assessment Site PublicSurveyConsultation Medium to long-term
›
›
Total cost = KES 25 m Feasibility study = KES 10 m Concept master plan = KES 15 m › Opportunity to accommodate future growth › Opportunity to provide more efficient operations such as access and safety Will add value to adjacent land › KC or a mixed entity between Public and Private where Public body funds infrastructure and real estate is built and operated by private investors
Project 7 Basic Analysis and Timeline Challenges gaps Time frame, key dependencies
Data
› Delivery via KC in coordination with KKM, local landowners, and community stakeholder groups Opportunity to adopt the Business Improvement District approach Urban Plan infrastructure:andMunicipality › BIDs (Business improvement district): localized areas, public realm and Maintenanceanimationresponsibility of Municipal SME’s for waste services › NGOs and CBO for maintenance 5.15
GBD Benefits Socio-Economic Benefits Public health Social cohesion Productivity & food security Poverty alleviation Green jobs Recreation & amenity Climate Change Adaptation Benefits Risk reduction
Cooling effects Urban resilience Carbon reduction Low DevelopmentCarbon sequestrationCarbon Environment and Resource Efficiency Benefits Prevention of soil erosion & contaminationland Reduction pollution Improved air quality Energy & water savings Biodiversity Recreation & amenity
The Thiba River is central to the character of the proposed pilot area, and the proposals plan to make full use of its recreational and amenity value. There is, however, a need to include a detailed flood risk assessment in the feasibility study in order to inform suitable development of the site. The flood risk assessment will need to explicitly account for projected changes in flood frequency and magnitude as a result of climate change, and should also incorporate an assessment of the B25 bridge structure. The planned inclusion of SuDS features within the development should reduce the risk of surface flooding, and improve the resilience of the pilot area to increases in extreme rainfall. Green spaces and tree coverage, in addition to their recreational and amenity value, will provide shade and cooling during episodes of extreme heat.
Social Inclusion Recommendations
> Ensure there is a meaningful consultation process with local communities and relevant stakeholders about the different supporting projects. Information should be presented in a format that is accessible to all people. Ensure SIGs and other vulnerable groups are being represented and consulted.
Requirements for Implementation Climate Resilience Recommendations
The urban regeneration of Kutus and its supporting projects will contribute to local communities’ social cohesion and increased sense of belonging. Well-designed urban regeneration projects contribute to local economic development, for example, by increasing revenues of the adjacent hospitality offer, leading to new employment opportunities.
> Communicate to local residents the implementation schedule of the different supporting projects to mitigate the disruption of traffic, everyday life and economic activities. This communication should be timely, and in a format and language that is accessible to all people.
KERUGOYA-KUTUS MUNICIPALITY URBAN ECONOMIC PLAN (UEP ) 131
Recommendations:
Project 8: Kutus Urban Park and Community Centre
5.3.3
The community centre and urban park proposal is located on the former livestock market site on the east bank of the Ritui River along the B25 corridor. After the relocation of the livestock market, this site represents a great opportunity for public use. This project proposal acknowledges the draft land use from the Kutus Detailed Development Plan (June 21). KKM has designated this site for an urban park of approximately 3200sqm readily available for development. Given its strategic location, the site has great potential to become an attractive gateway park to the Ritui River and Green Blue links and to KyU campus. The gateway park will help to revitalise Kutus town centre and provide a dedicated publicly-accessible green space that visitors, residents, and students alike can enjoy during their free time and have direct access to the river. The proposal aims to deliver a vibrant and attractive community space with various recreational elements. Leveraging from the topography, the park doubles up the available area for public use. A stepped, multi-level platform approach emphasises views toward the river, whilst creating accessible public spaces and more sheltered, intimate small spaces. The proposals include food and beverage pods on the higher level with some community facilities and further food and beverage outlets to be leased beneath the terraces that could accommodate more traders.
132
The scheme complements the resorts and hospitality available on the river front north of the site and opens the river to direct public access. Featuring a variety of shaded outdoor seating areas, picnic spots, water sports, playground areas and viewing terraces, the site offers the ideal location for people to enjoy a fresh, uncontaminated, river breeze, and much-needed access to water.
KERUGOYA-KUTUS MUNICIPALITY URBAN ECONOMIC PLAN (UEP ) 133 Figure 5.9 Plan showing proposed layout and functions for the Urban Park and community centre 0 10 20 30 40 50m Floodinglandscapebarrieratriver’sedge B25 Link to university RituiRiver RiverIsland Riverfront PlazaPark SurfaceShared Fire Station Plot RiverfrontregionF&BonRiverAmphitheatreLandscapedviewparkStreetLevelonstreetlevelofpark+lowerlevel Source: Atkins

134 Figure 5.10 Existing view looking north-east from the B25 showing the existing Livestock Market Source: Atkins Figure 5.11 Proposed view looking north-east from B25 showing the proposed urban park and community centre Source: Atkins 50m403020100


KERUGOYA-KUTUS MUNICIPALITY URBAN ECONOMIC PLAN (UEP ) 135 Figure 5.12 Existing view looking east from River Thiba showing the existing Livestock Market Source: Atkins Figure 5.13 Proposed view looking east from River Thiba showing the proposed urban park and community centre Source: Atkins 50m403020100


136 Figure 5.14 Existing high-level view looking west showing the existing Livestock Market Source: Atkins Figure 5.15 Proposed high-level view looking west showing the proposed urban park and community centre Source: Atkins 50m403020100


KERUGOYA-KUTUS MUNICIPALITY URBAN ECONOMIC PLAN (UEP ) 137 Figure 5.16 Proposed ground level view looking south-east showing the proposed urban park and community centre Source: Atkins

Art work on Percolatory Paving used for Riverfront Plaza Flooding Barrier
Resurfaced Road converted to Shared Surface Source: Atkins
Percolatory Paving in Amphitheatre for place making without harming the ground porosity of the site.
138


KERUGOYA-KUTUS MUNICIPALITY URBAN ECONOMIC PLAN (UEP ) 139 Figure 5.18 Proposed aerial view showing the proposed urban park connections with the wider CBD area B25 B27 GatutoKithiritiCatholicEcd Kiangueyi-Gatuto-Mikarara thi at ExistingInsitute Student/AffordableResort Housing Fire ProposalNewStudent/Multi-useOffice/Retail/CommercialStationHubBusPark-RiverfrontUrban Park Existing key road Link to University Shared Surface Fire Station Site Proposed pedestrian links to river Future OutdoorPhasescommercial space F&B Proposed Riverfront Plaza Proposed River front Park Proposed Riverview Park (Street Level) Landscape Ampitheater Flooding MixedResidentialCommercialEducationalProtectionUse C74 C73 Source: Atkins Linkages > This is a new project that will be linked to Project 7 and, Economic Action Plan in Section 4.1.3. GBI category: Placemaking and landscape GBI category: Environmental Protection

›
›
›
›
Challenges
›
›
Total cost = KES 24,07m Feasibility study incl flood risk assessment and ecology assessment = KES 5m F&B areas + utilities = KES 11.58m Built areas - park surfaces, pathways and podium = KES 5.7m Art wall = KES 126.750 GBI (landscape + planting) = KES Street508.950/park furniture = KES 1.15m Enhances quality of life and healthier communities Well-planned park will create a space for people to enjoy and relax Improved drainage from the SuDS elements Improved land value adjacent to the park Space for seasonal activities such as pop-up markets › Typically, public funded projects Potentially: in partnership with local business Private sector funding for development (e.g. Business Improvement Districts) Municipality › BIDs (Business improvement district) responsibility of Municipal SMEs for waste services Light touch maintenance and CBO
140 Table 5.16 Project 8 Summary Information Sub-components Estimated cost (KES range) Benefits and impacts Financing options and delivery mechanisms Implementation agency and stakeholders › Overall strategy to outline location of activities and routes › Planting and removing of trees and plants where required › Coordinate with waste and water management › Detail flood risk assessment and rainfall quantities › Ecology assessment
›
› Medium-term
Table 5.17
›
Maintenance
Project 8 Basic Analysis and Timeline Data gaps Time frame, key dependencies Ongoing proposal of fire station might be at odds with the idea of a freely accessible river front Dependent on the relocation of the exiting livestock market Funding › Masterplan to be developed for the wider town centre area before progressing Pre-feasibility study Detailed site survey required and land ownership information Seasonal water flows and flooding
›
›
›
›Government:Employlocal
›
›
›animation:NGOsand
›
Cooling of & air quality Restoration of habitats & ecosystems Biodiversity
Social Inclusion Recommendations
effects Urban resilience Carbon reduction Carbon sequestration Environment and Resource Efficiency Benefits Prevention
The park provides an opportunity to create natural flood storage that can act to reduce downstream flooding during high flood events. The river is a key part of the character of the park, and design will take into account the need to accommodate flooding. With green space and shading, the park will also increase resilience to extreme temperatures.
soil erosion
amenity Climate Change Adaptation Benefits
> Install benches in every circulation route for people with mobility impairments to rest. Consider benches that are appropriate for the elderly and people with reduced mobility. Leave space alongside benches for wheelchair users to sit next to their companions.
> Footpaths should consider materials that are firm and non-slippery, particularly during wet weather.
GBD Benefits Socio-Economic Benefits &
land contamination Reduction pollution Improved
> Liaise with local cooperatives, local SMEs, or with the National Hygiene Program (NHP) Kazi Mtaani (a programme that employs informal settlement dwellers, particularly the youth, whose economic activities were interrupted/affected by the global pandemic) for the maintenance of the park. Liaise with conservation NGOs or co-operatives to engage in tree planting.
KERUGOYA-KUTUS MUNICIPALITY URBAN ECONOMIC PLAN (UEP ) 141
Inclusive public spaces are fundamental for communities’ social cohesion, recreation, civic participation, and sense of belonging. Effective lighting contributes to reducing crime and reducing the fear of crime. Green spaces improve local communities’ mental and physical health and contribute to their general wellbeing. Access to green spaces is particularly relevant for those living in cramped and overcrowded spaces or settlements.
> Implement signage that is appropriate to people with hearing and visual impairments or learning disabilities. It is recommended to utilise easy-to-read text or simple symbols. Avoid reflective material that could cause confusing glare. > Provide public PWD-friendly toilet facilities with adequate space for caregivers. It is also recommended to install baby-changing facilities.
Requirements for Implementation Climate Resilience Recommendations
> Adopt inclusive design standards that allow easy access and use for everyone: > Avoid graded routes and when changes in levels are unavoidable, include ramps. Include tactile paving at crosswalks.
Public health Social cohesion Recreation
> Develop a timely, well-informed, participatory strategy for the implementation of the pop-up market and the allocation of stalls. Reserve stalls for youth and PWD-owned businesses.
> The relocation of the current livestock market should be planned in advance, consulted with the affected populations, and communicated in an appropriate, accessible and timely manner to avoid potential negative impacts on livelihoods or income-generation sources.
Designed by Townshend Landscape Architects, this is part of the 600m long Canal Corridor in the heart of King’s Cross along the Regent’s Canal, connecting the surrounding urban context to a public riverfront. The project emphasises the reclamation of the riverfront for an accessible, biodiverse, public realm that can be enjoyed by everyone. With a focus on inclusive design, the urban park is a series of winding green pause spaces, and ramps and walkways for movement. Placed within an urban room setting with an active frontage of numerous places to eat and drink, it is an active public space for the community to gather and experience the riverside. With respect to the Kutus Urban Park proposal, the relevant learnings from this precedent are placemaking and reclaiming a part of riverfront for the community to access and experience with focus on leisure activity and enjoying the natural river front. The inclusion of on-site food and beverage commercial space with the Kutus urban park is a value addition in terms of both fostering community interest in the park as well as generating revenue. Taking learnings from riverfronts reclaiming space for public from earlier private land uses, the Kutus proposal is proactive by its site placement, reserving a green community space, while the city grows around it in future.
142 Case Study: Inclusive Urban Park: Wharf Road Gardens, King’s Cross, London77
77. Townshend Landscape Architects, Canal Corridor, King’s Cross. Available at: http://townshendla.com/projects/canal-corridor-kings-cross-91/ (Accessed: 01/07/2021)


Case Study: Art as Anchor Point for UrbanCommunitystreetarthas a rich history in both the culture and economics of the cities it is created in. In recent years, public art has expanded its reach both in terms of its broader applications and also its range within the public realm. This expansion of public art can be attributed to an increasingly engaged civic population, where the constituency participates in artistic direction and decisions81.
79. Nairobi Railway Museum Initiative, https://www.bbc.com/news/world-africa-48906331 , (Accessed: 02/07/2021
Nairobi Railway Museum Initiative 79 Nairobi’s growing graffiti scene 80
Bonnaroo Music Festival Fountain Mural and Williamsburg Brooklyn NY Plaza Mural 78 78. Bonnaroo Music Festival Fountain Mural & Williamsburg Brooklyn NY Plaza Mural by queen Andrea, https://www.superfreshdesign.com/ , (Accessed: 02/07/2021)
82. Why Nairobi’s street art is more prevalent — and important — than ever, https://www.gadventures.com/blog/nairobi-street-art (Accessed: 02/07/2021)
More locally, Kenya has an ongoing tradition of street arts as a tool for community upliftment through graffiti art through different neighbourhoods - be it the Nairobi Street Art Initiative on Kenyatta Avenue, the Nairobi Railway Museum Initiatives, or the towns of Jericho and Maringo. Taking the example of street art in Nairobi, urban art initiatives are revamping once-neglected sites into spaces that are starting to see greater public use. Now, people come from all over the city to visit neighbourhoods in Nairobi from which they previously would have shied away, just to see the artwork, while African musicians will film music videos in front of their favourite murals, bringing exposure and traffic to streets rarely visited82.
From testing urban innovation ideas to bringing communities together, to further attaching a sense of ownership to the co-designed urban stages, urban street art creates an anchor point in urban places. In our context, getting inspired by works of global public art spaces and Kenya’s own active art scene, the Kutus urban park proposal integrates urban street art spaces as a mural wall and a street art plaza.
81. Urban Street Art: Fostering Innovation in Cities, https://www.smartcitiesdive.com/ex/sustainablecitiescollective/urban-street-art-fostering-innovation-cities/212816/ , (Accessed: 02/07/2021)
KERUGOYA-KUTUS MUNICIPALITY URBAN ECONOMIC PLAN (UEP ) 143
80. Nairobi’s growing graffiti scene, DW Africa, https://youtu.be/H3YYV7MfThE (Accessed: 02/07/2021)


144 5.3.4
Project 9: Improved Access to Kutus Markets
Kutus market is the major wholesale market that attracts buyers and traders from Kerugoya and other towns within and outside the County. Roads to the market are currently unpaved and in poor condition. These roads experience heavy traffic on market days especially from freight vehicles, which are often parked haphazardly along road shoulders and sidewalks where they obstruct other road users and intensify traffic congestion. Road upgrades along with dedicated parking, loading and offloading zones are needed to manage congestion and maintain access to the market. The improvements suggested include the upgrade of 4 km of road to bitumen standards to accommodate heavy goods vehicles (HGVs). Storm water drains and NMT provision will also be provided together with parking management to avoid encroachment on pedestrian facilities and direct parking in dedicated spaces. Linkages > Kutus pilot area urban regeneration, Action C1 in Section 4.1.3. GBI category: Placemaking and landscape Figure 5.19 Suggested road for improvement Source: Atkins

Market access interruption during construction Traffic impact understanding of new road Short-term
Implementation
Table 5.19
Total = KES 242.5 m Improved road paving = KES 220 m Pedestrianised links = KES 20 m Loading zone demarcation = KES 2.5 m
Project 9 Basic Analysis and Timeline Challenges
Data gaps Time frame, key dependencies
Kirinyaga County Government delivered by Kerugoya Kutus Municipality Maintenance responsibility, Municipality
KERUGOYA-KUTUS MUNICIPALITY URBAN ECONOMIC PLAN (UEP ) 145 Table 5.18 Project 9 Summary Information Sub-components
Financing
Benefits
Improvement of paving of 4 km of road to bitumen standards with pedestrian facilities and storm water drains New 300m long pedestrianised links Demarcation of loading and offloading zones
Improved market access County Government Kenya Urban Support Program (KUSP)
Estimated cost (KES range) and impacts options and delivery mechanisms agency and stakeholders
Requirements146 for Implementation Climate Resilience Recommendations
> Prioritise the employment of local communities for the construction and maintenance of roads.
> It is recommended that NMT and transport facilities follow principles of inclusive design and ensure PWD accessibility. Consider parking spaces for PWD.
Drainage features will need to be designed taking into account increases in rainfall intensity, thus increasing resilience to climate change.
> Considering climate resilience recommendations for the design of roads and NMT facilities is fundamental to ensure the security of farmers’ incomes and households’ food supplies.
Social Inclusion Recommendations
GBD Benefits Socio-Economic Benefits Less expensive Social cohesion Productivity & food security Green jobs Recreation & amenity Climate Change Adaptation Benefits Risk reduction Urban resilience Improved rural – urban linkages
Being the lowest point in the area, Kutus Town experiences frequent flooding during the rainy season due to increased surface runoff from the Thiba River. Storm drainage provision and management can mitigate urban flooding risks and lessen infrastructure damage and associated maintenance costs.
Improved transport infrastructure is essential to support community livelihoods and socio-economic development. Good transport infrastructure improves access to markets for traders, residents and vehicles, as well as agricultural productivity. Reducing traffic congestion improves road safety and reduces costs of vehicle and motorbike maintenance.
83. KC in partnership with the Department of Housing from the Ministry of Lands are currently developing an affordable housing programme for government staff working in KKM. The initial pilot includes 6 acres in Kerugoya targeting about 200 units of 1, 2 and 3 bedrooms for civil servants. The County is processing the title of the land (currently it is unallocated land), once this is done the Department of Housing will enrol the project into Boma Yangu portal to be shared with potential investors. 5.4.1 Overview Kerugoya is one of the main towns within KKM and the second largest town in KC. It is the main provider of public services such as health and welfare facilities, and a financial and retail centre. Key issues and infrastructure gaps include traffic congestion, lack of NMT facilities and open spaces, limited solid waste collection and disposal and water supply deficit. These key urban infrastructure provisions need to be put in place in order to enable the development and establishment of KKM as a key economic growth hub within and beyond KC as well as to support the fast-growing local population.
This Focus Area will therefore support the functionality of KKM as the main service provider and support the wider urban environment by improving and providing open public spaces and public facilities around the main bus station, the central square and the proposed Kerugoya urban forest which is to be legally protected. Moreover, NMT, SuDS and solar-powered streetlighting will be provided to ensure the town is resilient to climate change. These NMT and SuDS facilities could be interconnected to create a Green Blue corridor with Kerugoya urban forest and river Rutui. There is potential to roll out and expand the ongoing affordable housing programme in Kerugoya to other parts within KKM83. For instance, the expected influx of students to Kutus will mean further pressure on infrastructure and services.
KERUGOYA-KUTUS MUNICIPALITY URBAN ECONOMIC PLAN (UEP ) 147 5.4 Focus Area 3: Kerugoya
Accommodation for students and university staff could be provided as PPP models to develop and maintain student accommodation, residence halls, and rented housing.
148 Figure 5.20 GBI proposals in Focus Area 3 Kerugoya FOCUS AREA: KERUGOYA BUILT-UP AREA 3 10 11 Priority Streets for NMT Facili�es Newly Developed NMT Streets 22 22 12 13 19 LandfillsKKM19 AND KIRINYAGA COUNTY GENERAL INTERVENTIONS Kerugoya and Kutus Water Supply12 Kerugoya and Kutus Sanita�on Provision2213 NMT and Urban Street Improvements Cri�cal Rural Feeder Roads21 Micro-Hydro Projects14 Solar Refrigera�on (Cold Stores)15 Solar Irriga�on16 Streetligh�ng17 Waste Collec�on18 Catchment Management in Mt. Kenya20 Donkey ManagementFOCUS23 AREA 3: KERUGOYA BUILT-UP AREA Kerugoya Central Park10 Kerugoya Bus Park Improvements11 Source: Atkins


5.4.2 Project 10: Kerugoya Central Square
Although the town boasts a very unique urban forest, it lacks a formally-planned public open space where residents and visitors can enjoy their free time. Further to that, there is a lack of connectivity between these open spaces. The central park along the B24 corridor is well located but infringed by parking and motorised vehicles on all sides. Aligning with the vision for the KKM, the Kerugoya Central Square proposal aims to deliver an upgraded well-designed formal public space in the centre of town which addresses the above issues as well as creates a vibrant open space which benefits the adjoining businesses and provides social amenities. The proposal suggests pedestrianising the eastern side of the square, carefully managing access to essential services and for emergency vehicles, to make additional space for people. The proposals retain existing trees and aims to plant over 20 more to create shaded spaces for people to walk, relax and enjoy, as well increasing its aesthetic appeal in line with the GBD initiative. The proposals also integrate SuDS elements in the design which will help the park be climate-resilient and obviate any localised future flooding events. It also proposes recreational elements such as climbing boulders and timber play equipment for children to play and other soft surfaces and seating areas. A ‘painted pavements’ feature is also included to add culture and vibrancy to the park. This follows the ‘tactical urbanism’ concept which provides low-cost, temporary changes to the built environment, intended to improve local neighbourhoods and gathering places. Up to 10 informal pop-up market stalls can be set up in the upgraded space as well. The proposal also looks at the adjacent street section to the west and recommends raised pedestrian crossings at appropriate locations connecting the east and west parts of Kerugoya which are severed by the main road. This new high-quality place will support pedestrian movement and attract footfall which will make the adjoining businesses more attractive, resilient and worthy of investment. The proposal also looks at a high-level green space connectivity concept linking the urban forest (Figure 5.8), the central square, and other green open spaces. It identifies green links and walkable and cyclable streets in Focus Area 2. This square will thus help with the long-term vision of making Kerugoya a beautiful, clean and liveable town. A wider area connectivity study can be taken forward to develop and include this park into the Green Blue masterplan.
KKM is a fast-growing Municipality; urbanisation is taking over the most attractive developable land and encroaching on the green public spaces and productive farmland. Kerugoya is one of the main towns within KKM and the second largest town in KC. The town is a key provider of public services such as health and welfare facilities, finance, and retail. It also has an ongoing affordable housing pilot programme. This, along with some of the spill-over of the student population from Kutus, will create an influx of inhabitants into Kerugoya. This ongoing increase in population will exacerbate the current pressure on its existing infrastructure and public spaces.
KERUGOYA-KUTUS MUNICIPALITY URBAN ECONOMIC PLAN (UEP ) 149
Flexible community square for market stalls and events
150 Figure 5.21
Climbing boulder play feature Sheltered seating areas Urban Draiange (SUDs) stormwater retention basins with naturalistic planting
Pedestrian crossing point to link the avenue with the market areas and bus station to the south B27 B27 tent shade
Tree-lined avenue with space for outdoor ground level dining and controlled vehicle access Central amenity lawn area for sports and leisure activities
Tensile
structure 0 10 20 30 40 50m Source: Atkins
High-level green space
Resurfaced road with vibrant painted artwork and pedestrian crossings to link the square with the surrounding street network
Sustainable
connectivity concept

Existing high level view of central park looking south-east
KERUGOYA-KUTUS MUNICIPALITY URBAN ECONOMIC PLAN (UEP ) 151 Figure 5.22
the
Source: Atkins 5.23 high level view of the central park looking south-east
Source: Atkins
Figure
Proposed


Proposed
Atkins Figure
152 Figure 5.24 Existing high level view of the central park looking north-west
Source: 5.25 high level view of central park looking north-west
the
Source: Atkins


Proposed
Existing view of the central park looking south from the internal areas
Source: Atkins
KERUGOYA-KUTUS MUNICIPALITY URBAN ECONOMIC PLAN (UEP ) 153 Figure 5.26
Source: Atkins 5.27 view of the central park looking south from the internal areas
Figure


Source:
154 Figure 5.28 Proposed illustrative section of the central square showing various elements of the new park
Existing Vegetated slope with drainage at base Widenedfootpath Refurfacedroad Swale basin to capture surface run-off with gapped kerb, planting & seating edge Porous pedestrianasphaltpath Amenity grass area with climbing boulders and tensile tent shade shelter Shared surface vehicle access route Tree-lined pedestrianised avenue with outdoor seating and raised planters Fall Fall Atkins
155 Figure 5.29 Proposed thematic connectivity diagram showing the linkages between the bus park, the central park, and the urban forest Enhanced connectivity Uplifted town centre Civic LeisureTransportCommercialsquareNature (4 minutes) (5 minutes) B27 Source: Atkins Linkages > SUED Transport projects, namely public transport improvement and NMT and urban street improvements. GBI category: Placemaking and landscape GBI category: Environmental Protection Figure 5.30 Proposed detailed connectivity diagram showing the linkages between the bus park, the central park, and the urban forest B27 Existing Enhancedroadroad surface Enhanced pedestrian avenue Proposed pedestrian links Existing commercial streets Active building frontage KUSP KerugoyaimprovementsUrbanForest boundary Outdoor commercial space Proposed market/flexible events square Proposed amenity park space Opportunity area for market regeneration Sustainable Urban Drainage (SUDs) PedestrianpedestrianProposedcrossingcrossing crossingPedestrian STATIONBUS ENTRANCE TO KERUGOYAFORESTURBAN Pedestriancrossing pedestrianProposedcrossing Source: Atkins


›
156 Table 5.20 Project 10 Summary Information Sub-components Estimated cost (KES range) Benefits and impacts Financing options and delivery mechanisms Implementation agency and stakeholders › Reconfiguring current access and loading arrangements › Integration of SuDS to improve climate resilience › Street-side parking to be relocated to appropriate locations › Adding street trees and planting to support SuDS implementation to contribute to GBD benefits › Permeable paving on most hard surfaces and footpaths › Art, children’s play equipment and benches installation
›
›
› Installation
upgrades › Short
›Government:Employlocal
›
›
Light
›
Challenges Data
›
› Municipality ›
›
Table
Project
›
›
›
› Funding ›
maintenance and ›animation:NGOsand
› Impact
›
Total cost = KES 21.7 m Soft landscape including swale planting trees, shrub, trees = KES 3.05 m Hard landscape (asphalt paving, kerbs, concrete seating edge, artwork painting) = KES 16.58 m Street furniture = KES 2.05 m Well-planned park will create a space for people to enjoy and relax Dedicated playground will create a safer environment for children to enjoy Improved drainage from the SuDS elements Improved land value adjacent to the park Higher revenue from increased footfall Safer pedestrian crossings Space for seasonal activities such as pop-up markets Enhances quality of life and healthier communities Typically, public funded projects Potentially: in partnership with local business Private sector funding for development (e.g.: Business Improvement Districts) The project will be carried out in 3 phases Phase 1 – the central park area only Phase 2 – adjoining street to the east of the park Phase 3 – initial test on a smaller section of the C74 corridor. Start with raised crossings only. Access pros-cons and then implement to the full length of the road BIDs (Business improvement district) responsibility of Municipal SMEs for waste services touch CBO 5.21 10 Basic Analysis and Timeline gaps Time frame, key dependencies Existing trees and public realm may need to be removed; this needs to be evaluated to minimise risk likely to interrupt traffic flows and adjacent businesses Pre-feasibility study Site Survey Market Study on access to local businesses due to to medium-term
›
Maintenance
›
›
›
› Appropriate
›
> Avoid graded routes and when changes in level are unavoidable, include ramps. Include tactile paving at crosswalks;
Inclusive public spaces are fundamental for communities’ social cohesion, recreation, civic participation, and sense of belonging. The project will incentivise walking and cycling which contributes to improving sustainable mobility and the overall health and wellbeing of the local community. Increased pedestrian movement contributes to increasing the revenue of adjacent businesses. Pop-up market stalls represent an affordable way for vendors to get exposure and increase revenues.
Prevention of
Improved
> Work with the Municipality’s gender, culture, social services and youth and sports departments to engage local youth in the development of painted pavements; this also contributes to social cohesion and an increased sense of belonging;
Social Inclusion Impacts and Recommendations
> Liaise with local cooperatives, local SMEs, or with the National Hygiene Program (NHP) Kazi Mtaani (a programme that employs informal settlement dwellers, particularly the youth, whose economic activities were interrupted/affected by the global pandemic) for the maintenance of the square.
GBD Cooling effects Urban resilience Carbon Development Resource Efficiency Benefits soil erosion & land contamination Reduction pollution air quality
Environment and
> Communicate with local residents and adjacent businesses about the implementation schedule of the project to mitigate the disruption of traffic, everyday life, and economic activities. This communication should be timely, and in formats and languages that are accessible for all;
Recommendations:
> Consider inclusive parking lots and adequate space alongside them when relocating the existing parking space. Provide bicycle parking space.
> Adopt inclusive design standards that allow easy access and use for everyone:
> Install appropriate lighting for people with visual impairments and to create a safer environment;
Requirements for Implementation Climate Resilience Recommendations
SuDS and green infrastructure features have been utilised throughout this proposal to provide climate-resilient solutions to manage local stormwater runoff. Options include local vegetated bio-retention areas planted with native plants and trees. The proposal also suggests improving the existing roadside ditches to drain the adjacent road and the footpath. This could be done by either providing flushed kerb edges (or opening in the kerbs as inlets) to allow the water to enter the ditch from all sides. In addition, widening some of the ditches has also been proposed in order to improve their interception and conveying capacity as well as to provide attenuation and treatment to the runoff before it reaches the receiving watercourse.
> Install benches in every circulation route for people with mobility issues to rest. Consider benches that are appropriate for the elderly and people with reduced mobility. Leave space alongside benches for wheelchair users to seat next to their companions;
Low
> Footways should consider materials that are firm and non-slippery, particularly during wet weather: > Design playgrounds that are accessible for children with disabilities;
KERUGOYA-KUTUS MUNICIPALITY URBAN ECONOMIC PLAN (UEP ) 157
> Implement signage that is appropriate to people with hearing and visual impairments or learning disabilities. It is recommended to utilise easy-to-read text or simple symbols. Avoid reflective material that could cause confusing glare?
> Develop a timely, well-informed, participatory strategy for the implementation of the pop-up market and to assign stalls. Reserve stalls for youth and PWD-owned businesses.
Benefits Socio-Economic Benefits Public health Social cohesion Recreation & amenity Climate Change Adaptation Benefits Risk reduction
158 Case Study: Inclusive Squares: Woolwich Squares, London84 85
84. Gustafson Porter + Bowman, Woolwich Squares. Available at: http://www.gp-b.com/woolwich-squares/ (Accessed: 19/06/2021)
This project has been designed by Gustafson Porter + Bowman as part of the Woolwich Masterplan (Royal Borough of Greenwich). The project’s vision was to create an accessible public space for all that, at the same time, it is particular to the historic background of Woolwich. The squares were designed to enhance the experience of local communities and respond to their needs. To ensure the accessibility and usability of the square, the design incorporated terracing with level routes. It also considered best practice for lighting, seating, ramps and planting, and an accessible water feature. The project also incorporates soft landscaping that, while functional, provides a sense of relaxation. From the design phase, the project team had regular meetings and consultation with key users e.g. PWD organisations, and youth groups, to inform decision-making processes and to accommodate different needs. During the construction, these groups were invited to test the usability of the space.
85. Designing Buildings Wiki, New Woolwich Squares (2020) Available at: https://www.designingbuildings.co.uk/wiki/New_Woolwich_Squares#Inclusive_Design (Accessed: 18/06/2021)

Case Study: Inclusive Playgrounds: Play Park, Exeter, UK86 87
5.4.3 Project 11: Kerugoya Bus Park Improvements
Kerugoya main bus park is relatively better organised than Kutus’ bus park with clearly marked and designated parking bays, dedicated vending areas, and a design alignment that reinforces matatu circulation. However, the bus park is missing crucial facilities such as waiting areas, bus shelters, toilets and other amenities that can enhance the attractiveness and usability of the park. Sections of the access roads are covered with potholes or completely eroded in some cases. Poor solid waste management is resulting in the accumulation of garbage and accompanying stench along the approach streets to the bus Upgradespark. to the bus park are needed to meet demand along with management of operations to limit long-stay parking. Critical interventions needed are focused around improving bus shelters, provision of vending, public space facilities and improved management of traffic circulation. The bus park needs to be comfortable with seating, adequate weather protection and to be well-integrated with the footpath network with crossings at each stop to enhance accessibility and safety for pedestrians. Operational strategies that restrict vehicle access to matatus only in combination with limits to the duration of matatu waiting times can support maximisation of the existing capacity. Linkages > Kerugoya Central square, Streetlighting.
The park was an initiative of the learning disability charity Mencap, and the aim was to design a playground that could be accessible for children of all abilities. It has received contributions from private donors and the UK Big Lottery Fund. The park’s equipment encourages co-operative play, and includes a seesaw, a trampoline and swings that are suitable for children with restricted mobility. It also has sensory equipment and signage for children with visual impairments.
86. The Play Park Exeter, https://www.theplaypark.co.uk/about (Accessed: 18/06/2021)
Figure
159
87. Special Education Degrees, The Top 30 Best Accessible Playgrounds Around the World (No date) accessible-and-inclusive-playgrounds/https://www.special-education-degree.net/30-most-impressive-(Accessed:18/06/2021)
GBI category: Placemaking and landscape 5.31 Current parking arrangement (top) and access road to the park (bottom)


160 Table 5.22 Project 11 Summary Information Sub-components Estimated cost (KES range) Benefits and impacts Financing options and delivery mechanisms Implementation agency and stakeholders › 10 New bus shelters › 10 Boda boda stands › 20 Refurbished vendor stalls › 1 km Access roads improvements (pothole filling and recarpeting) › Traffic calming and pedestrian crossing facilities at access points › Road signage and way finding Total cost = KES 22,25 m Bus shelters = KES 1 m Boda boda shelters = KES 1 m Access roads = KES 20 m Road signage = KES 250,000 m › Improved access and safety › Support future growth and public transport demand increase › Increased footfall to support adjacent businesses › Increase revenue for businesses adjacent to the bus park › Increase of sustainable transport options › Increase revenue for Municipality/ County County Government Kenya Urban Support Program (KUSP) Could be operated through Private Public Partnerships (PPP) where private investor receive concession to finance, design construct and operate facility with eventual transfer to KKM once desired internal rate of return is achieved (typically 15 – 20 years) County Government would be Municipalityimplementersresponsible for management Table 5.23 Project 11 Basic Analysis and Timeline Challenges Data gaps Time frame, key dependencies › Will cause disruption to public transit › Upgrade likely to interrupt traffic flow › Funding Public consultation Management measures can be implemented immediately Bus park upgrades can be implemented in the short-term
GBD Benefits Socio-Economic Benefits Social cohesion Poverty alleviation Green jobs Recreation & amenity Climate Change Adaptation Benefits Urban resilience Carbon reduction Improved rural – urban linkages Environment and Resource Efficiency Benefits Reduction pollution Improved air quality
Social Inclusion Recommendations
> It is recommended that the bus park improvements follow principles of inclusive design to ensure easy access and use for everyone;
Passengers’ thermal comfort needs to be considered, particularly as climate change is expected to bring higher temperatures and an increased severity of droughts to the region. The inclusion where possible of shaded areas adjacent to the bus shelters, using tree cover, would not only increase the amenity value of the area but would provide cooler areas for passengers waiting. The refurbishment of roads should include drainage that accounts for increases in rainfall intensity, and the sighting of bus and boda boda shelters should avoid areas at risk of surface flooding.
> It is important for the project implementing body to ensure equal distribution of vending bays to men and women of all ages, and specifically consider spaces for PWD.
Requirements for Implementation Climate Resilience Recommendations
Good quality, accessible public transport facilities support access to jobs, education, and health for all residents irrespective of gender, age or disability.
KERUGOYA-KUTUS MUNICIPALITY URBAN ECONOMIC PLAN (UEP ) 161
Additionally, the provision of vending spaces supports small business which create employment opportunities for residents, especially for women, youths and PWD. Provision of boda boda sheds will also resolve the long-standing challenge of lack of parking and conflict with between boda boda operators and town council law enforcers.
Overview
>
>
This section outlines GBI projects which will address issues that benefit the Municipality area; the County or the location is not defined yet due to limitations on land availability. The purposes of these projects are to: Enable infrastructure to support current and future needs of the growing population and local businesses as well as the economic role of the Municipality as administrative centre, HQ and service providers, Present utility related proposals for power, water, sanitation and waste management that are aligned with the GBD approach; Upgrade critical roads to enhance rural-urban linkages by improving connectivity between main towns, markets, and farms and improve productivity; Increase agricultural productivity and climate resilience to support the livelihoods of the small-scale farming sector; Protect key natural assets such as the Mt Kenya water tower that will benefit not only KC but also the entire country. 5.32 Map with
162 5.5 KKM and KC-Level Proposals
>
Figure
>
5.5.1
>
GBI proposals beyond the Focus Areas LandfillsKKM19 AND KIRINYAGA COUNTY GENERAL INTERVENTIONS Kerugoya and Kutus Water Supply12 Kerugoya and Kutus Sanita�on Provision2213 NMT and Urban Street Improvements Cri�cal Rural Feeder Roads21 Micro-Hydro Projects14 Solar Refrigera�on (Cold Stores)15 Solar Irriga�on16 Streetligh�ng17 Waste Collec�on18 Catchment Management in Mt. Kenya20 Donkey Management23 21 21 21 21 21 21 21 21 21 21 21 21 12221319 12221319 19 FOCUS AREA: SAGANA GREEN INDUSTRIAL HUB1 FOCUS AREA: KUTUS BUILT-UP AREA2 FOCUS AREA: BUILT-UPKERUGOYAAREA 3 FOCUS AREA 2: KUTUS BUILT-UP AREA FOCUS AREA 1: SAGANA GREEN INDUSTRIAL HUB FOCUS AREA 3: KERUGOYA BUILT-UP AREA KerugoyaKutus Kagio Sagana MunicipalityTowns Boundary Key toCriticalFocusFocusFocusCountyRailwayThibaRiversRoadsDamBoundaryArea1Area2Area3FeederRoadsbeimproved Source: Atkins


Figure 5.33 Household Water Access Challenges91 29.8%
163
5.5.2
88. County Government of Kirinyaga. n.d. Kutus Municipality Local Physical and Land Use Development Plan, 2020-2030: Situation Analysis Report. 89. County Government of Kirinyaga. n.d. Kutus Municipality Local Physical and Land Use Development Plan, 2020-2030: Situation Analysis Report. 90. Atkins. 2021. Kerugoya Technical Briefing Paper.
The water supply system in KKM is inadequate; demand currently exceeds supply and the water supply network does not cover the entire Municipality, forcing residents to use other sources or connect to other community-led water supply systems88. Most of the low-income areas within KKM are served with piped water, but only few households have individual connections. According to KIRIWASCO this is attributed to the high cost of connecting to the system (Figure 5.10). A survey conducted in 2020, showed that 55% of households are connected to a piped water supply and many still take water from unprotected sources such as rivers and shallow wells89 There is an ongoing AfDB-funded water supply project to supply 30,000m3/day to KKM by gravity90; however, there is a need to connect customers to the system. With increased water available the water company should focus on expanding their customer base in order to bring in further revenue. New water connections should be metered to discourage water wastage and to save resource (water and energy for treatment and distribution). In more affluent areas, the customer can meet the cost of connecting to the system but in low-income areas the cost of connection can be unaffordable and alternative water supply options should be considered to ensure that the increase in treated water available benefits the entire population, including poor and marginalised groups.
Long distance Low quality High cost Source: County Government of Kirinyaga and Kutus Municipality Local Physical and Land Use Development Plan, 2020-2030: Situation Analysis Report. Connecting low-income areas: Kaitheri, Kibingo, Kiaritha and Mukinduri in Kerugoya and Mjini in Kutus have been identified as low-income areas (shown in Figure 5.36) that could benefit from improved water supply. The water company should consider subsidising connections or developing a loan system to support low-income households to connect to the piped water system. Kiosks could be small business opportunities, where the water company bulk sells the water to the kiosk vendor, who in turns sells the water to the community with a small mark up.
91. County Government of Kirinyaga. n.d. Kutus Municipality Local Physical and Land Use Development Plan, 2020-2030: Situation Analysis Report.
NonesupplyUnreliable
20.8%10.4%17.3% 20.8%
Project 12: Kerugoya and Kutus Water Supply
>
Kiriwasco water
Water Management
Linkages There are links between namely the AfDB-funded and supply project described above; There are links between this project and the Solid Waste Management and Energy infrastructure proposals. category:
this project and existing projects,
GBI
164 Figure 5.34 Low-income areas in KKM Key InformalUrbanRiversRoadsForestSettlementsRutuiNgaci B27 B27 C527 D1380 Kibingo Kiaritha Kaitheri Mukinduri Source: Atkins
>

› A status update on the AfDB-funded projects. It is understood that the water supply project completion date was April 2021. The completion date of the sanitation project is not known.
92. Cost of connection is from information
› Additional information on the implementation of the Kiriwasco water sanitation project. Medium-term. This project cannot be implemented until the completion of the AfDB project which will ensure there is enough water resource to expand distribution. supplied from KIRIWASCO
› Availability of public land for water kiosks
within informal settlements
KERUGOYA-KUTUS MUNICIPALITY URBAN ECONOMIC PLAN (UEP ) 165 Table 5.24 Project 12 Summary Information Sub-components Estimated cost (KES range) Benefits and impacts Financing options and delivery mechanisms Implementation agency and stakeholders Household connections for 1000 Rolling10householdsWaterkiosksloanfund to support the connection of 1000 low-income households Total cost = KES 40 m KES 19 m KES 10 m KES 11 m92 Improve public and environmental health and ensure that low-income areas have access to water IFI or Water Sector Trust fund Water company Small business opportunity to run the kiosks Table 5.25 Project 12 Basic Analysis and Timeline Challenges Data gaps Time frame, key dependencies
The last-mile connections planned under this investment would need to be designed, and routes planned, to ensure that they are resilient to flooding. Metering new water supply connections means customers pay for the volume of water they use and can discourage water wastage. Care needs to be taken, however, that poorer, more vulnerable households are not priced out of a consistent supply as there is potential to increase the gap between better-off households that are relatively well prepared for climate change, and poorer households that are not.
Access to water is critical for socio-economic development and the improvement of public health. The provision of better-quality water should reduce the occurrence of water borne diseases, which largely impact children under five years old, alongside frail, elderly and poor people, who often struggle to afford healthcare, and therefore suffer disproportionally. Collection of water is often a women’s duty. By providing better access closer to homes through affordable connections or kiosks, women free-up time for other activities such as income generation or caring for families. Closer services will also benefit PWD.
> It is recommended to integrate water vendors who might lose their livelihoods due to the expansion in the public water supply. > Ensure there are strategies (subsidies or loans) to support low-income populations with the connection to the piped water system.
Requirements166 for Implementation Climate Resilience Recommendations
It is assumed that the AfDB water supply project has conducted appropriate due diligence to ensure that it can maintain an adequate water supply during drought events, and that any river intakes are designed to be resilient to flooding.
Social Inclusion Recommendations
GBD Benefits Socio-Economic Benefits Public health Green jobs Productivity & food security Poverty alleviation Climate Change Adaptation Benefits Risk reduction Urban resilience Environment and Resource Efficiency Benefits Water quality Energy & water savings
Source: Création de la nouvelle société de l’eau (Sonede) (centerblog.net)
167
5.5.3 Project 13: Kerugoya and Kutus Sanitation Provision
KKM does not have a sewer reticulation system; however, there is an ongoing AfDB-funded sanitation project to construct a 9,000m3/day capacity wastewater treatment plant and 34 km of sewer reticulation93. This project should also be designed to receive liquid waste from exhauster trucks94 and investigate sludge reuse options such as converting sludge to briquettes (see case study Solid Fuel Briquettes as a Reuse Product in Kakuma below). The sale of such a product could add an additional income stream and would also reduce the use of additional resources and environmental damage caused by charcoal (briquettes) and other fertilisers. The development of a resource reuse treatment plan would need to be implemented in conjunction with a community sensitisation programme to ensure acceptability of the use of human by-products. To maximise the benefit of the new treatment works a programme to support low-income households to connect to the sewer system - through the provision of loans or subsidies - is recommended to support cases where it is not possible to connect to the systems, due to cost or geographical location, and a campaign to improve on-site sanitation should be implemented. For example, Kiriwasco through the Water Sector Trust Fund has constructed: > 800 subsidised toilets for individual households;
Case Study: Loan scheme for water connection In Tunisia the water company, Société Nationale d’Exploitation et de Distribution des Eaux (SONEDE) has managed to expand by around 70,000 connections a year through the use of a connection loan scheme. Customers can pay the cost of the connection on a quarterly basis over five years. New customers, who opted for a credit connection, receive a bill each quarter that includes the tariff for consumption during the previous quarter, and a loan repayment instalment.
> An on-site treatment facility within the project area to treat the sludge waste from these toilets and individuals’ septic tanks; and > An ablution block in Kutus95. 93. Atkins. 2021. Kerugoya Technical Briefing Paper. 94. Exhauster truck is a truck that has a pump and a tank designed to suck liquids, sludges or slurries. 95. Kiriwasco. 2021. Improvement of water and sanitation situation within the Municipality. This covers approximately 1% of total households within the Municipality. It is suggested that this initiative is implemented more widely in KKM. It is recommended that public toilets and ablution blocks are designed to be accessible to people with disabilities and include facilities for menstrual hygiene management. Location Focus Area 2 Kutus and Focus Area 3 Kerugoya Linkages
> There are links between this project and existing projects, namely the AfDB-funded and Kiriwasco sanitation projects described above; > There are links between this project and the Solid Waste Management and Energy infrastructure proposals. GBI category: Water Management

Improved sanitation improves public health and reduces healthcare-associated costs, which is often a significant burden on low-income groups. Access to toilets protects the dignity of those who previously did not have a private and clean place to go. > It is recommended to implement a subsidies scheme to make the connection to the sewer systems and the construction of a good quality toilet affordable.
Climate Resilience Recommendations
Requirements for Implementation
Total public and health
environmental
Implementation
and ensure that low income areas have access to water Water Sector Trust Fund KIRIWASCO
› Additional information on the implementation of the Kiriwasco water sanitation project. Short-term
agency and stakeholders 800 subsidised toilets 10 Public ablution blocks
cost = KES 45 m KES 10 m KES 35 m Improve
Onsite sanitation uses less water than conventional sewage systems and is therefore more resilient to water shortages that may become more common due to climate change. The design of public toilets and ablution blocks should take into account areas prone to surface flooding, and likely increases in the frequency and magnitude of heavy rainfall events. Ideally, the planning of these facilities should link with the rehabilitation of key roads in order to ensure that access for exhauster trucks is maintained even during periods of heavy rainfall.
Table 5.27 Project 13 Basic Analysis and Timeline Challenges Data gaps Time frame, dependencieskey
› Availability of public land for ablution blocks within informal settlements
› A status update on the AfDB-funded projects. It is understood that the water supply project completion date was April 2021. The completion date of the sanitation project is not known.
GBD Benefits Socio-Economic Benefits Public health Less expensive Social cohesion Poverty alleviation Climate Change Adaptation Benefits
Risk reduction Urban resilience Carbon reduction Environment and Resource Efficiency Benefits Prevention of soil erosion & land contamination Reduction pollution Improved air quality
168 Table 5.26 Project 13 Summary Information Sub-components Estimated cost (KES range) Benefits and impacts Financing options and delivery mechanisms
Social Inclusion Recommendations
Emissions (CO ppm) 118ppm NA 82ppm (PM2.5Emissionsppm) 213ppm NA 196ppm In Kakuma briquettes are sold for US$ 0.20 per kg which is equivalent to the cost of charcoal. The cost per year was estimated at US$ 172 per year per household and revenue at US$ 210.
KERUGOYA-KUTUS MUNICIPALITY URBAN ECONOMIC PLAN (UEP ) 169
Figure 5.35 Small-scale treatment and reuse system comprising of treatment tank, mixer, roller press, drying beds and burning briquettes
Case Study: Solid Fuel Briquettes as a Reuse Product in Kakuma, Kenya96
Source: Sanivation and UNHCR Sanivation briquettes have been shown to have a calorific value higher than wood and with less smoke emissions than charcoal (see Table 5.25).
Table 5.28 Comparison of Sanivation Briquettes to Wood and Charcoal Charcoal Wood briquettesSanivation
96. Sanivation and UNHCR. Container-based Toilets with Solid Fuel Briquettes as a Reuse Product. Best Practice Guidelines for Refugee Camps. Accessed: https://data2.unhcr.org/en/documents/download/64297
Calorific value 29MJ/kg 15MJ/kg 22MJ/kg Burning time 3 Hours 1 Hour 4.5 Hours
Sanivation has developed a briquette production system for human waste and it is used in Kakuma, Kenya. Treated faeces has a high energy content and can be utilized as a biomass fuel like charcoal and wood. In the Sanivation system the faeces act as a binder for other biomass waste streams such as charcoal dust, agricultural residues, and carbonized prosopis (a woody invasive weed found in East Africa). Treated faeces mixed with crushed high-carbon co-waste (other bio-mass as above) at a ratio of around 10-30% wet faecal sludge by mass. Water is added as required to produce the required consistency for mixing and pressing. When it reaches the required consistency, it is transferred to a roller press, which presses the mixture into briquettes. Pressed briquettes are spread onto drying racks and dried in the sun for 3 days. The briquettes are checked in a quality control process for burn time, water boiling time, and resistance to breaking when dropped from a height of 1m.


Project 14: Micro-Hydro projects 97. UNIDO World Small Hydropower Development Report 2016 p9 KC has very limited power infrastructure in remote rural areas. Small hydropower as a renewable energy resource is extremely underutilised in East Africa, with only around 3% of total potential being used for power generation97. Kirinyaga has significant micro hydro potential due to rainfall run-off from Mt Kenya creating numerous rivers, including the Thiba river. These opportunities are captured in the Hydropower Resources Atlas of Kenya, published by the Ministry of Energy and Petroleum in 2015. This energy infrastructure project aims to install micro-hydro systems in suitable areas to support remote communities (up to 50 systems), and to train a small local workforce to be able to provide maintenance and repair to the systems. Support for a system would depend on an assessment of community needs including population, economic activity, and proximity to a suitable river resource.
GBI category: Water Management
170 5.5.4

Total cost = KES 500 m Benchmark = KES 15 m for 15 kW KESsystem;18.5 m for 20 kW system
Improved access to electricity in rural areas Donor funding is available from numerous sources, including: › Energy4impact grant support for small hydro developers › Africa Renewable Energy Fund and Sustainable Energy Fund for Africa, both managed by the African Development Bank Public sector funding may be available from the central government via development, climate or public finance funds administered by the Energy Regulator (EPRA)98
Table 5.29
Table 5.30
Project 14 Summary Information Sub-components
KERUGOYA-KUTUS MUNICIPALITY URBAN ECONOMIC PLAN (UEP ) 171
Implementation agency and stakeholders
Estimated cost (KES range) Benefits and impacts Financing options and delivery mechanisms
Determine suitable hydro resources in SelectionCounty of suitable sites based on needs and proximity to hydro resources Selection of suitable technology Development of new commercial plan (procurement, deployment, implementation, maintenance)
Actual total: KES 500m based on 30 systems (15 x 15 kW, 15 x 20 kW)
Project 14 Basic Analysis and Timeline Challenges Data gaps Time frame, key dependencies
Effort needed to obtain comprehensive data on current situation Obtaining funding No knowledge of current situation Mid-term 98. Energy and Petroleum Regulatory Authority – Financing Renewable Energy, accessed 17th June 2021, <https://renewableenergy.go.ke/resources/financing-renewable-energy/
Design and site selection – local/ national hydrological specialists, UNIDO, Kenya Association of Manufacturers, social/ economic development specialist Construction – specialist national contractors with assistance from international experts as needed Supporting stakeholders: Support from KKM, KC or other local authorities to fund operation and maintenance costs
Support from local communities to identify productive uses of electricity Operation and maintenance responsibility of local communities
GBD Benefits Socio-Economic Benefits Productivity & food security Poverty alleviation Green jobs
The micro-hydro projects will provide electricity for remote rural communities. The provision of electricity allows an improvement in the number and volume of economic activities that can take place. It contributes to improved commercial activity, improved ability to deliver services and education, and improved Electricitysafety.isanessential service, for PWD its benefits are not limited to light and heat; it also powers life-support equipment and devices that provide mobility, communication, and independence. The project represents new job opportunities for a small local workforce, particularly for the youth, who could be trained to provide maintenance and repair the systems.
Climate Change Adaptation Benefits Risk reduction Carbon reduction Low Carbon Development Environment and Resource Efficiency Benefits Reduction pollution Improved air quality Energy & water savings
Social Inclusion Recommendations
Requirements172 for Implementation Climate Resilience Recommendations
This project will generate renewable energy for remote or underserved communities, however run-off river hydropower schemes can be vulnerable to both droughts and floods, both of which are significant climate hazards for the County. The project design needs to ensure that the potential effects of climate change on precipitation have been considered, and in particular to make sure that the schemes are adequately protected against flooding and would be able to operate during major Reliancedroughts.onpower sources that are damaged or not able to function during these extremes could increase the vulnerability of these communities, however, if the design is climate-smart then the provision of power to rural communities provides good opportunities to increase resilience.
KERUGOYA-KUTUS MUNICIPALITY URBAN ECONOMIC PLAN (UEP ) 173
Case Study: UNIDO Ultra low head micro-hydro project in Mwea, Kenya
The United Nations Industrial Development Organisation (UNIDO) and the Ministry of Economy, Trade and Industry of Japan implemented a collaborative global programme to promote the rapid deployment of clean energy technology through demonstration projects, capacity building, and knowledge management between 2013 and 2017. The Low Carbon Low Emission Clean Energy Technology Transfer (LCET) project would focus on micro-hydro, solar, and waste-to-energy technologies. The micro-hydro programme would concentrate on small projects in India, Ethiopia and Kenya. After completing a pilot project in India, the programme then completed a project in Mwea, Kenya in October 2016, however due to a drought it didn’t start operation until September 2018. Two systems are installed on the irrigation channel that comes from the Thiba river. Each system has two dual axis crossflow turbines capable of working in less than 3 meters of head, producing 10 kW of electricity, therefore total output is 20 kW. The system is a simple fabrication and comprises generic replaceable parts that can be easily machined locally and assembled on site. On-site maintenance is also quite simple for a trained operator. The beneficiary of the scheme is Kiuria village. It is located about 6 km north-west of Wang’uru village and has around 4,700 inhabitants. Part of the community is already electrified, via the grid, but this scheme supplies some facilities owned and managed by the community and others not yet connected. The project was fully funded by UNIDO. The only consideration for the local community was to develop plans for productive use of the electricity. The installation will achieve annual greenhouse gas emission reductions of 82 tCO2e99 however the project only has an expected operational lifetime of 9 years.
99. UNIDO Low Carbon Low Emission Clean Energy Technology Transfer (LCET) Programme, accessed 15th April 2021 <https://www.unido.org/sites/default/files/2014-11/LCET_Factsheet_0.pdf >

Post-harvest losses are a significant problem across the agricultural sector. Cold stores can extend the shelf life of perishable food by between 2 and 21 days, reducing post-harvest losses by up to 80% and increasing small farmers’ income by 25%100. The need for cold storage will probably increase due to the likely improved agricultural output caused by the Thiba dam irrigation scheme. This infrastructure project aims to provide solar powered cold store systems in strategic hub locations to support local farmers who currently have no access to a cold store and therefore lose part or all of their product due to spoilage.
Modular solar-powered refrigeration systems or cold stores are becoming popular in small farming communities where grid electricity is not available or expensive. They work on a subscription model whereby farmers pay a flat daily rate for each crate of food they store. Some providers use mobile phone apps to communicate to farmers about the availability of space in the store and to process payments. The revenue created goes towards maintenance of the facility and employment of a facility manager. Many providers target job creation for women. This project will provide a number of small, solar-powered refrigeration systems (a half to full-size shipping container) that will act as hubs to local farmers who currently have no access to a cold store and lose part or all of their product due to spoilage. All farmers can use the facilities whether they are linked to the VCs or not.
https://www.coldhubs.com/Thisproject
> Establishment of the towns and villages that would benefit from a small solar refrigeration system;
> Preparation of designs for solar refrigeration systems as well as a procurement and deployment plan;
GBI category: Green industries and agriculture
174 5.5.5
Project 15: Solar Refrigeration (Cold Stores)
> Deployment of systems to selected agricultural holdings, including construction of facility, roll-out of payment mechanism, selection, and training of managers;
> Capacity building with selected locals to ensure maintenance and operation of systems. Location These projects will be located County-wide, aiming to assist micro, small and medium-sized farms in rural areas where provision of refrigeration services is currently non-existent or too expensive for the farmer. Linkages > Linkages to some SUED VCs, fruit canning in particular, to minimise tomato spoilage. Uncooked rice and unripe avocados and bananas do not need to be refrigerated.
> A baselining exercise to determine the number, size and location of arable farms and livestock holdings and their seasonal outputs, the current status of their storage facilities and their refrigeration needs, and their current produce sales practices;
100. Cold Hubs solution and social impact. Accessed 30th July 2019. Available at has several proposed components:
Develop training plan, for management, operation and maintenance
Implementation agency and stakeholders
Development of procurement and deployment plan
Recommendations: > Ensure communication strategies about the availability of space in the store are available and accessible to all people, particularly to SIGs and SIGs organisations engaging in agriculture; > Ensure the employment opportunities associated to the project, such as maintenance staff, and a facility manager, are available for SIGs and other vulnerable groups.
Establishmentfacilities of needs for solar refrigeration systems
Mapping of ownership of all local agri and livestock holdings and their product outputs, mapping of current distribution hubs and status of their product storage
Table 5.32 Project 15 Basic Analysis and Timeline Challenges Data gaps Time frame, key dependencies
KERUGOYA-KUTUS MUNICIPALITY URBAN ECONOMIC PLAN (UEP ) 175
Climate resilience and social inclusion recommendations
Donor funding is available from numerous sources, including Self Help Africa and AGRA Public sector funding may be available from the central government via the Ministry of Agriculture and Irrigation Site selection – KKM with assistance from national agricultural specialists Equipment selection – KKM with assistance from cold chain specialists
Total cost = KES 11,25 m Benchmark = KES 750,000 per Actualsystemcost = KES 11.25 m based on max 15 systems Reduced crop spoilage leading to higher revenues for small forEmploymentfarmersopportunitieswomen
Construction and implementationOperationKKM and maintenance –responsibility of KKM Requirements for Implementation
Effort needed to obtain comprehensive data on current situation Obtaining funding No knowledge of current situation Short to mid-term GBD Benefits Socio-Economic Benefits Social cohesion Productivity & food security Poverty alleviation Climate Change Adaptation Benefits Risk reduction Urban resilience
Estimated cost (KES range) Benefits and impacts Financing options and delivery mechanisms
Preparation of design brief for refrigeration systems
This project contributes to both climate change and social inclusion objectives. The project targets smallholder farmers who currently suffer losses in potential earnings, and adverse effects on their livelihoods, from spoilage of produce before it can reach market. As both extreme, and average, temperatures in Kerugoya have increased, and will continue to do so under all emissions scenarios, the incidence of high temperatures causing products to spoil is likely to increase. Providing a refrigeration solution that is powered by renewable energy and which targets small-scale farmers will help increase the resilience of these farmers to climate change, and as such strengthen their livelihoods.
Table 5.31 Project 15 Summary Information Sub-components
176 Case Study: Solar cold stores in Wakatobi and Pacitan, Indonesia101
Contained Energy successfully developed and deployed stand-alone, off-grid, 100% solar-powered cold storage facilities with thermal energy storage technology in combination with ultra-efficient compressor packages. The 20 m3 unit was designed to keep 500 kg of fish at -2ºC, with the capacity of adding and cooling 200 kg of ‘un-iced’ fish per day (for a total cooling load of 30 kWh per day). It is powered by a 6.4 kW solar array backed up by a relatively small 10 kWh valve regulated lead-acid battery bank. The unique feature of the system is that it deploys a large volume of Phase Change Material in the ceiling, capable of storing and releasing 15 kWh of cooling capacity at -4ºC. This thermal energy storage technology allows the compressor package to do most of its ‘cooling work’ during the day, when the solar power is available, saving a substantially larger quantity of battery storage that would otherwise be required. The cold storage helps local fishermen to keep their catch fresh for longer once they have returned from fishing.
101. Renewable energy and reducing food loss and waste in fish value chains, accessed 23rd April 2021, <http://www.fao.org/flw-in-fish-value-chains/flw-in-fish-value-chainsresources/articles/renewable-energy-and-reducing-food-loss-and-waste-in-fish-value-chains/es/ >


GBI category: Green industries and agriculture
This will support all farmers, not just those growing crops that support the SUED agri-processing VCs. This will make irrigation easier and affordable and so it should improve the economics for farmers, but water abstraction needs to be monitored to ensure sustainability of groundwater supplies.
This infrastructure project aims to provide solar irrigation pumps and systems to local farmers, potentially numbering 3,000, and particularly smaller scale farmers who currently have irregular or no access to water supplies, or who are currently paying an unsustainable amount for water, and who will not be served by the Thiba dam irrigation project.
KERUGOYA-KUTUS MUNICIPALITY URBAN ECONOMIC PLAN (UEP ) 177
Location These projects will be located County-wide, aiming to assist micro, small and medium-sized farms in rural areas where provision of refrigeration services is currently non-existent or too expensive for the farmer. Linkages > Potential link to avocado, banana and tomato farmers who will contribute to various VCs.
5.5.6 Project 16: Solar Irrigation
This project is intended to improve the output of local micro, small and medium-sized farms by providing them with a consistent water supply for crop irrigation and also to improve their finances by reducing costs associated with the provision of water. It will simultaneously reduce greenhouse gas emissions associated with irrigation by utilising solar power in line with the GBI approach.
The proposal is to provide pumping kits that i) pump water through an above-ground distribution network, where the farmer has adequate rainwater storage but gravity irrigation will not work, or ii) pump water up from a borehole where the farmer does not have any rainfall water storage, or iii) do both.
178 Table 5.33 Project 16 Summary Information Sub-components
102. FAO The benefits and risks of solar-powered irrigation – a global overview (2018), accessed 30th July 2019 <http://www.fao.org/3/I9047EN/i9047en.pdf>
103. GAFSP Small-Scale Irrigation and Value Addition Project, accessed 17th June 2021 <https://www.gafspfund.org/projects/small-scale-irrigation-and-value-addition-project-sivap >
Implementation agency and stakeholders
Operation and maintenance –responsibility of the smallholder recipients
Development of procurement and deployment Maintenanceplanplan
Estimated cost (KES range) Benefits and impacts Financing options and delivery mechanisms
Review of abstraction volumes from each borehole to ensure sustainability of water Establishmentresourcesofneeds for solar irrigation and borehole systems Preparation of design brief for boreholes/irrigation systems
Mapping of ownership of all local agricultural and livestock holdings and their irrigation needs, current status of their irrigation facilities
Consistent service provision for farmers with no powered irrigation
Effort needed to obtain comprehensive data on current situation Obtaining funding No knowledge of current situation Short to mid-term
Lower costs for farmers where current system is on grid Reduced carbon emissions associated with agricultural sector
Table 5.34 Project 16 Basic Analysis and Timeline Challenges Data gaps Time frame, key dependencies
Donor funding is available from numerous sources, including smallscale irrigation and value addition project run by the Global Agriculture and Food Security Program103
Total cost = KES 225 m Benchmark = KES 75,000 per system Actual = KES 225 m based on max 3,000 Actualsystems102=KES225 m based on max 3,000 systems
Public sector funding may be available from the central government via funding from the Ministry of Agriculture and Irrigation Site selection – KKM with assistance from national agricultural specialists Equipment selection, construction and implementation – KKM with assistance from irrigation specialists
GBI Benefits Socio-Economic Benefits Less expensive Productivity & food security Poverty alleviation Green jobs Climate Change Adaptation Benefits Risk reduction Urban resilience Carbon reduction Environment and Resource Efficiency Benefits Reduction pollution Energy & water savings
KERUGOYA-KUTUS MUNICIPALITY URBAN ECONOMIC PLAN (UEP ) 179
Rainfall has become more variable in KC, with farmers less able to rely on traditional timings of the rainy seasons, and consistent rainfall throughout the season. This variability is expected to increase, and it is possible that there may be an earlier end to the Long Rains. By increasing access to irrigation this project will improve the resilience of smallholder farmers to both rainfall variability and drought. Groundwater resources in the County are generally good, however, it is recommended that the project takes into account its potential impacts on groundwater reserves. Social inclusion recommendations Improving the financial sustainability of agriculture could provide significant improvements to the livelihoods of the local agriculture community. An expanding sector could lead to increased employment opportunities across the community. It is recommended to ensure irrigation opportunities and information are available for SIGs, and specifically target SIGs groups, by including them in communication strategies, consulting their preferences, and involving them in training.
Requirements for GBI Implementation Climate resilience recommendations
180 Case Study: Valle family farm, Matagalpa, Nicaragua104 Grid Alternatives International Program has been helping farmers in Nicaragua with sustainable irrigation solutions for the last 5 years. One such solution helped the Valle family of Matagalpa. They grew squash, passion fruit and tomatoes on two acres of land to sell at the local market but had trouble making a profit due to high irrigation costs. The average monthly electricity bill to run their pump was as much as the equivalent of KES 3,300, but their income was only US$ 103 (KES10,300). Also, the supply quality was poor, meaning they could only irrigate on three days instead of every day. Other expenditure reduced their earnings to KES 2,500 per month. Working with Grid Alternatives and local company Suni Solar, they installed a solar irrigation system. The total cost was US$ 10,000 (KES 1,000,000), but the Valle family was only asked to pay US$ 2,000 (KES 200,000) which they financed via Unión Nacional de Agricultores y Ganaderos, a national agricultural organisation. Two solar panels power a pump that abstracts water from a nearby river into a cement tank and to a gravity-fed pole mount system that drips onto the plants. With adequate water supply to the plants, they can now irrigate other crops, including onions, pipian and pasturage and raise tilapia. They increased their livestock from 8 cows to 12 cows, and also use the water for domestic purposes, whereas previously they had to walk to the community well to get drinking water. Their monthly electricity bill is now US$ 3 (KES 300), whilst their monthly earnings have now increased to US$ 546 (KES 54,600).
104. Solar Drip Irrigation Case Study – The Valle Family, accessed 29th July 2019 <https://gridalternatives.org/sites/default/files/International%20Valle%20irrigation%20case%20study.pdf>

Location This project will target Focus Areas 2 and 3 with an aspiration to provide streetlighting to 100% of the main roads and in particular the roads mentioned in Projects 9 and 22 of this UEP. Linkages > Solar streetlighting installation identified in the Kerugoya-Kutus Municipality Integrated Development Plan with a budget in the Public Works Sector of KES 20m.
KERUGOYA-KUTUS MUNICIPALITY URBAN ECONOMIC PLAN (UEP ) 181
> Augment to ensure coverage of all main streets in Kerugoya and Kutus towns, markets and areas of public congregation;
> Review of current streetlighting plans to ensure coordination with proposed urban development plans;
5.5.7 Project 17: Streetlighting
GBI category: Green industries and agriculture
This infrastructure project aims to provide streetlighting to Kerugoya and Kutus towns. The main issues are the high cost of traditional grid-powered lights provided by KPLC versus theft and vandalism of solar streetlights. Part of the purpose of this is to optimise the technology solution, particularly with respect to finding a robust solar-powered solution, and implementation model for KKM to ensure climate resilience, and financial and operational sustainability.
> Review of the technology choices for streetlighting to find suitable product for the environment in line with the GBI approach, i.e. Use of solar and robust construction;
This project has several components:
> Review and update current contractual arrangements between KKM and KPLC, with the aspiration to improve the economic situation for the Municipality and KPLC and ensure long-term maintenance of installed streetlights.
Site selection – KKM Equipment selection – street lighting design
182 Table 5.35
Project 17 Summary Information
Project 17 Basic Analysis and Timeline Challenges Data gaps Time frame, key dependencies
Detailed maps showing current street lit areas; Detailed implementation schedule for new streetlighting; Currently selected technology
Finding suitable robust solar streetlighting technology
Sub-components
Achieving buy-in from KKM, KPLC, KENHA
Implementation agency and stakeholders
total = KES 40 -50 m based on 10 km of road covered Improved finances for municipalities Improved safety and security Longer operational hours at commercial centres Financing can be sourced from a number of options, including World Bank funded Kenya Urban Support Programme, which has funded streetlighting in Thika, Ruiru and Limuru106TheWorld Bank also offers advice, sample legal documents and further reading on using a Public Private Partnership route for street lighting, detailing projects completed in Brazil, Mexico and India107
Table 5.36
Total cost = KES 50 m Benchmark = KES 150,000 per pole105, KES 4 – 5m per km depending on Estimatedspacing total based on part coverage to new areas, part reworking of existing Actualareas
Design study to ensure suitable coverage of target area Equipment review and selection Development of new commercial plan (procurement, deployment, implementation, maintenance)
Current commercial arrangements between KKM, KPLC, KENHA Short-term to complete coordination, mid-term to complete implementation 105. Africa and solar powered street lights, accessed 29th July 2019 <https://www.engoplanet.com/single-post/2019/07/22/Africa-and-Solar-powered-Street-lights> 106. Municipality street lighting projects, accessed 17th June 2021<https://kiambu.go.ke/2020/06/municipality-street-lighting-projects/ 107. Energy-efficient street lighting PPPs, accessed 17th June 2021, <https://ppp.worldbank.org/public-private-partnership/energy-and-power/energy-efficient-street-lighting-ppps>
Estimated cost (KES range) Benefits and impacts Financing options and delivery mechanisms
Constructionspecialist and implementation –OperationKKM and maintenance –responsibility of KKM
Review current implementation plan Review current commercial and technical arrangements
KERUGOYA-KUTUS MUNICIPALITY URBAN ECONOMIC PLAN (UEP ) 183
GBD Benefits
The potential to use solar-powered light fittings will reduce the use of grid electricity and therefore reduce greenhouse gas Increasesemissions.inextreme temperatures, and potential increases in solar radiation, may cause the streetlight assets to decay more rapidly, requiring more regular maintenance. This should be considered when planning operational maintenance for the project.
Requirements for Implementation Climate resilience recommendations
Less expensive Social cohesion Recreation & amenity Climate Change Adaptation Benefits Carbon reduction Low Carbon Development Environment and Resource Efficiency Benefits Energy & water savings
Social inclusion recommendations Street lighting reduces street harassment, crime, and fear of crime, contributing to the safety of women, PWD and other vulnerable groups. Better lighting allows markets and businesses to operate for longer hours, improving the economic outlook of vendors and market traders.
Socio-Economic Benefits
The study compared the potential costs and benefits of three technologies: ceramic metal-halide lamps, induction lamps, and LEDs. It concluded that ceramic induction lamps would be a suitable replacement for existing street lighting, while LED luminaires, which were quite expensive at the time of the study, would only be suitable for new installations.
184 Case Study: Quezon City, Public Lighting Delivery Models, Philippines108 Quezon City (QC) had been actively exploring and implementing upgrades to its street lighting system. Many streets and roads were not lit at night, so public safety was an ongoing concern. The Mayor created a Task Force to look at installation, repair and maintenance of streetlighting. This body was charged with overseeing an initiative to expand night-time lighting coverage across the city. QC subsequently embarked on a city-wide street lighting programme to illuminate 80 percent of the public road network. It involved installing 3,000 new streetlights, with an additional 1,000 streetlights retrofitted by Meralco, a private electricity utility. In the past, QC had relied on traditional lighting technologies. However, the emergence of the first generation of LED streetlights prompted a rethinking, since any improvements in energy efficiency would translate into desirable budget savings. The city funded a study to determine the feasibility of upgrading their streetlighting to more efficient technology.
108. Proven delivery models for LED public lighting: Municipal financing delivery model, Quezon City Case Study Accessed 14th June 2021 <https://www.esmap.org/sites/esmap.org/files/DocumentLibrary/Quezon%20City%20-%20Proven%20LED%20Delivery%20Models8_Optimized_Final.pdf>
A constraint arising from the conversion of QC’s streetlights to LEDs was the split ownership of the assets and the flat rate charged by Meralco on a portion of the assets, as identified in the study. To solve this, the Mayor signed a Memorandum of Agreement with Meralco that turned over the nearly 3,000 ornamental streetlights owned by the utility to the QC government for a price of PHP 5.7 million (KES 12.6m).
Meanwhile, the City installed meters on all of the ornamental streetlights so that savings from the retrofit of LEDs would yield energy cost savings. For the remaining pole-mounted streetlights that are owned by Meralco, the utility on its own authority has undertaken a project to convert the streetlights in its ownership to LEDs. Since QC continues to pay Meralco a flat rate per pole, the LED retrofit undertaken by Meralco increases their profit, and the city benefits from better lighting.
5.5.8
It has been identified in the CIDP that door-to-door waste collection is needed to improve waste management practices. This project would aim to create a better system for the collection of waste, discouraging informal dumping and open-burning, as well as significantly reducing the health and environmental impacts of open waste deposits. This would offset the effects of improper waste management on the environment, water resources, and subsequent climate effects in line with the GBI approach.
Project 18: Waste collection
A door-to-door waste collection system would include procurement of new waste receptacles for residents and businesses, which encourage source segregation: organic, recyclables, residual. Segregated organic waste will be able to be processed by the AD at the industrial site, which will have increasing modular capacity as more VCs start up and more organic waste is collected. The Municipality will need to engage with recycling organisations in order for them to buy and use the segregated recyclable waste and the residual waste will be disposed of at the existing and new dumpsites or sanitary landfills.
This project relies on a strong transportation network, with the use of more waste collection vehicles and more collection routes. This would increase traffic on the roads and emission of CO2 into the environment, which can be mitigated with good collection route planning and scheduling and use of vehicles with stringent emissions standards, and/or using biofuels. Waste collection vehicles do not have to be large nor carbon-intensive, they can be a combination of bicycles with trailers, boda bodas with trailers, three-wheeled rickshaw and larger collection vehicles. It is noted that the waste receptacles and the waste collection vehicles would need to be compatible.
> The waste collection system relies on a good transportation network including roads, vehicles, and traffic routes therefore there are links between this project and the transportation infrastructure proposals. GBI category: Waste Management
As well as the procurement of new waste receptacles and new collection vehicles the project would also need storage space for the recyclables before they are collected by recycling organisations - organic waste would go directly to the AD plant at the industrial site and residual waste to the dumpsites/ sanitary landfill – and staff and offices to manage collection operations and logistics. This would include public awareness and education campaigns to encourage recycling and reuse, and proper waste disposal. Linkages > The CIDP highlights the need for upgrading the solid waste management collection system in KKM. The project would support the VCs, urbanisation and community health by reducing or eliminating open dumping and burning of waste as well as reducing the volume of waste going to the dumpsites which could lead to a reduction in the size and number of dumpsites required. This would free up space for housing and other land use.
KERUGOYA-KUTUS MUNICIPALITY URBAN ECONOMIC PLAN (UEP ) 185
Project 18 Basic Analysis and Timeline gaps Time frame, key formal recycling in place systems in place for collecting and sorting waste by informal sector (waste pickers) do not comply with appropriate health and safety standards capacity of system unable to serve future community needs and waste quantities low levels of containerisation of wastes deposited for collection causing nuisance and negative health and environmental impacts Waste generation and compositional study to identify how many collection vehicles would be required. Obtain funding for new collection infrastructure Provide adequate training and support systems public awareness campaign Short-term/ongoing
› Launch
Total cost = KES 10.6 m KES 5.3 m to KES 10.6 m annually Revenue generating aspects: valuable waste streams to be segregated e.g. Metals, plastic Reduced wild dumping of waste and improved sanitation Provides an increased level of service and engages community Encourage source-segregation (residual, recyclables, organic) therefore reducing volume of waste to Improveslandfill sanitation and flood and surface water management ability. Higher quality materials which can be sold to recycling brokers
Introduction of Private Public Partnership (PPP) and/or private waste services into waste collection effort
dependencies › No
Upgraded waste collection system
Challenges Data
186 Table 5.37 Project 18 Summary Information Sub-components
Implementation agency and stakeholders
›
Financing options and delivery mechanisms
Estimated cost (KES range) Benefits and impacts
› Current
› Very
›
›
› Current
Table 5.38
Employment and training by Municipality or private entity/ CBOs Funding for Personal Protective Equipment (PPE), collection carts, training and wages for the CBOs Support from NGOs, community groups, waste pickers Maintenance responsibility of Municipal EmployGovernmentlocal SMEs for waste services
Recommendations:
Requirements for Implementation Climate resilience recommendations
There are no direct climate resilience considerations for the project. There is, however, a clear benefit that the reduction in solid waste and wild dumping will reduce the amount of waste which is swept into drainage systems and rivers and streams, and which can cause blockages, and localised flooding. As such, a solid waste collection system should help to increase resilience to flooding. As mentioned above, the collection system is dependent on a strong road network, and ideally the roads used should undergo upgrades in both road surface and drainage to ensure that they remain passable, and that collection can continue, even during heavy rainfall events.
Social inclusion recommendations
> Mitigate the disruption of waste pickers’ livelihoods by integrating them in the new waste management system; this will contribute to providing secure income and reducing occupational risks; > Waste collectors should receive training in safe working methods, road safety, and receive the adequate PPE. They should also be trained on how to segregate the waste, and on how to handle waste properly to avoid dropping it on the way from households to the collection point and negatively affect local communities; > Engage local communities and NGOs in sensitisation campaigns to generate awareness about the importance of source segregation and appropriate waste disposal. GBI Benefits
Improved waste management practices and the discouragement of informal dumping will bring significant benefits in public health. Source segregation reduces costs in waste handling and recycling represents potential revenues for the Municipality. A cleaner environment contributes to the commercial and tourism development of the area. The project also presents employment opportunities for SIGs. Many young men already work in transportation and they could be engaged in waste collection. There are also employment opportunities for PWD, for example in back-office activities to manage collection operation and logistics.
KERUGOYA-KUTUS MUNICIPALITY URBAN ECONOMIC PLAN (UEP ) 187
Socio-Economic Benefits Public health Poverty alleviation Green jobs Climate Change Adaptation Benefits Risk reduction Urban resilience Carbon reduction Environment and Resource Efficiency Benefits Prevention of soil erosion & land contamination Reduction pollution Improved air quality
188 Case Study: Developing an integrated waste management system (Kampala, Uganda109) 109.
https://globalrec.org/organization/waste-pickers-alliance-uganda-apau/ In Kampala, Uganda, the development of an integrated waste management system was prompted by the lack of formalisation in the waste sector. Previously, much of the waste was disposed informally by dumping, burning or burying. Only 55% of the city’s solid waste was officially collected and transported to the city’s landfill by the Kampala Capital City Authority (KCCA). Several standalone CBOs existed offering financial incentives to informal settlements for the collection of recyclable materials, however, the KCCA were not aware of many of these organisations. The KCCA developed a new Kampala City Integrated Waste Management System to improve the collection, transportation and treatment of the city’s waste and to incorporate the informal sector, predominately the landfill pickers and CBOs, as part of an integrated approach across the waste management value chain. As a result of the Integrated Waste Management System, a strategy was developed to identify, inform and consult stakeholders; clear objectives and measurable targets for education and knowledge sharing were created; activities were undertaken to educate waste pickers; a new contract was developed to ensure that new landfill operators would formally integrate registered waste pickers; and CBOs were encouraged to form partnerships with the KCCA in order make the system more integrated.

The project also supports urbanization, community health and environmental resilience through better management of waste.
> There are links between this project and the transportation infrastructure proposals. This project is dependent on good road links, the location of the new landfills requires a well-managed feeder road for transport of waste. Additionally, collection of biogas links with energy infrastructure proposals. GBI category: Waste Management
This project covers the rehabilitation of Kerugoya, Kutus, Kagio and Murubara dumpsites and provision of new engineered sanitary landfills in Thiguku, Gitaku and a location within Mwea. Locations of the new engineered sanitary landfills will need to be away from sensitive receptors like residential areas, schools and rivers as well as taking into consideration future developments, so the landfill does not constrain development.
The existing dumpsites pose a health risk, degrade natural resources with the pollution of surface water bodies, groundwater aquifers and soils, and are contributing to GHG emissions through the production of methane from decomposition of waste. Rehabilitating existing dumpsites and commissioning new engineered sanitary landfills will reduce risks to human health and the environment by installing appropriate liners for leachate containment and collection as well as a landfill gas capturing system, which can be processed and used as biofuel.
5.5.9
Project 19: Landfills
Linkages > Rehabilitation of existing dumpsites and provision of new engineered sanitary landfills is proposed in the Draft CSP.
KERUGOYA-KUTUS MUNICIPALITY URBAN ECONOMIC PLAN (UEP ) 189
> The project supports the VCs as most will generate some waste which will require safe management at a landfill.
Estimated cost (KES range) Benefits and impacts
Constructioncells of landfill gas collection and process system for biofuels
ReductionProvidesdumpsitesemploymentindeforestation for fuel (instead biogas generation) Protects public health
IFI/ Donor Finance Revenue generating aspects: biofuel is a marketable product
190 Table 5.39 Project 19 Summary Information Sub-components
Table 5.40
Project 19 Basic Analysis and Timeline Challenges Data gaps Time frame, key dependencies
› Ensuring dumpsites do not become uncontrolled/ unmanaged Undertake appropriate surveys and site investigations to ensure good quality of works Need to integrate existing informal waste pickers into new landfill sites
› Obtain funding for construction of new engineered landfill
Financing options and delivery mechanisms
Construction of new engineered landfill
›
Total cost = KES 479 m KES 3 m initial feasibility study KES 106 m to KES 426 m (dependent on the size and number of cells) KES 25-50 m initial start-up costs for landfill gas collection and processing
›
Implementation agency and stakeholders
› Exact location of the new landfills will need to consider future developments
Improved ground and water quality around existing and new dumpsites Reduces methane emissions from the
› Waste being dumped on the road verges, uncontrolled fires and pollution of surrounding water bodies.
Implementation and maintenance responsibility of Municipality Employment and training by Municipality or private entity/ CBOs Support from NGOs, community groups Use of local SMEs for waste services
› Designated size of the new landfill area (i.e. Capacity) vs. Volume of waste that is produced in the Municipality and lifetime of the landfill Short to mid-term
Socio-Economic Benefits Public health Poverty alleviation Green jobs Climate Change Adaptation Benefits Urban resilience Carbon reduction Environment and Resource Efficiency Benefits Water quality Prevention of soil erosion & land contamination Reduction pollution Improved air quality
GBI Benefits
Landfill sites need to be designed to minimise flood risk, and to ensure that heavy rainfall events do not lead to excess leaching, and contamination of water resources. Site investigations for the new landfill sites should take into account increases in the risk of both surface and river flooding under climate change, as well as the potential destabilising effect of increases in heavy rainfall. The rehabilitation of existing landfill sites should, where possible, include stabilisation measures, and measures to reduce leaching.
KERUGOYA-KUTUS MUNICIPALITY URBAN ECONOMIC PLAN (UEP ) 191
Requirements for implementation Climate resilience recommendations
Recommendations: > Mitigate the disruption of waste pickers’ livelihoods by integrating them in the new waste management system; this will contribute to providing secure income and reducing occupational risks; > Develop training on occupational health and safety for all employees. Provide adequate PPE; > Engage local communities and NGOs in sensitisation campaigns to generate awareness about the importance of source segregation and appropriate waste disposal.
Well-engineered landfill facilities contribute to the improvement of public health. They also have the potential to contribute to social inclusion and economic development through new employment opportunities and the involvement of local communities and NGOs.
Social inclusion recommendations
Informal sector waste collectors who were originally working at the Akreuch dumpsite were organised into a cooperative called Attawafouk, supported by the World Bank. This cooperative consists of 176 employees, 22 of whom are women. These employees are organised into teams that pick out different types of recyclables from the conveyor belt. Each employee is paid the same monthly salary of ~2,600 Dirhams per month, receives formal training, professional equipment, protective clothing, health insurance, access to a bank account and a low mortgage rate. Selected employees also receive vocational and career development via established diplomas in waste management.
The cooperative plays a strong role in the management of waste, governing whom the recyclables are sold to, and at what price. The private operator funded the initial machines however, the landfill now turns over more than 460,000 Euros per year from recycling, from which the cooperative has been able to buy more equipment.
The Oum Azza landfill also derives value from the large organic waste stream (60%) by capturing the biogas from waste decomposition and converting it to electricity at a nearby cement factory furnace, for onward sale onto the national electricity grid.
110. What a Waste 2.0: A Global Snapshot of Solid Waste Management to 2050. Urban Development;. Washington, DC: World Bank. https://openknowledge.worldbank.org/handle/10986/30317 111. The World Bank, Morocco lets nothing go to waste (2016); Country report on the solid waste management in Morocco (2014). https://www.worldbank.org/en/news/feature/2016/02/16/morocco-lets-nothing-go-to-waste
Case Study: Oum Azza landfill, Meghreb, Morocco111
192 Case Study: Remediation of open dumpsites in South Asia110 Open dumping is common in South Asia with most open dumpsites lacking any form of leachate collection and treatment, landfill gas collection and many also lack any form of liner. However, the remediation of existing dumpsites and the construction of new engineered landfills is underway with the newer official and well operated landfills generally being privately operated. The Maldives is currently mitigating dumping of its waste by improving waste collection systems and constructing new engineered disposal sites that can serve a number of islands.
After the Akreuch dumpsite near Rabat, Morocco became uncontrolled and over-capacity, polluting local groundwater and rivers, it was closed, and a new sanitary landfill commissioned a few kilometres away. Oum Azza landfill was developed with the assistance from the World Bank but is managed by private landfill operator Pizzorno. It receives waste that is collected from 13 communes in the region and has an annual capacity of 850,000 tonnes. Oum Azza is exemplary for this region, where waste is seen as a resource rather than trash, combining recycling with the generation of value chains, and jobs. There is an organised system at the landfill, integrated with waste collection. Waste is shovelled onto a metal conveyor belt and spread evenly over a drum, where biomass is separated from the rest. Residual waste feeds into further conveyor belts where it is sorted manually. Valuable waste streams include cardboard, bottles, plastic, foil, and metals.
5.5.10
> Increasing soil infiltration: enhancing the soil structure to increase the levels of water that can be absorbed into the soil. This reduces the effects of drought as a result of healthy soil retaining water for longer in dry periods.
GBI category: Environmental Protection GBI category: Water Management
113. Degradation of Kenya’s Water Towers Contribute to Growing Water Crisis | Globalwaters.org Location
Project 20: managementCatchmentinMtKenya
Linkages > This project will have an indirect effect on improving social conditions. By providing employment opportunities and enhancing opportunities for an ecosystem services approach within the County as indicated in the GBI approach. > The project can also be linked to the numerous tree planting initiatives in the CIDP and IDeP.
The project will be County-wide, specifically focused at the highlands 3,400 m, midland area 2,000 m to 3,400 m and the lowland 1,158 m to 2,000 m above sea level.
112. http://www.fwr.org/WQreg/Appendices/The-Guide.pdf
> Afforestation: trees and shrubs are planted to reduce soil erosion and to smooth rainfall run-off by impeding water flow. Increased vegetation can reduce the frequency of flash flood and stabilises base flow in rivers. Reducing erosion also decreases siltation in rivers;
KERUGOYA-KUTUS MUNICIPALITY URBAN ECONOMIC PLAN (UEP ) 193
Improved management of the catchment would not only improve water availability in KC but also the bordering counties (Embu County, Tharaka Nithi County, Meru County, Laikipia County and Nyeri County) and provide opportunities for County collaboration. In addition to water resource benefits, improvements to the catchment would increase biodiversity and could act as a carbon sink, reducing climate change. The catchment management options appropriate for the Mt Kenya catchment area include:
This project would adopt land and water management initiatives for the Mt Kenya catchment area in order to reduce the risk of flooding and drought and to balance environmental, economic and social demands to bring long-term improvements to the catchment area112. Mt Kenya is one of Kenya’s five major forest ‘water towers’, which supply around 75% of the country’s water resources. However, the Mt Kenya water tower catchment is degraded due to settlement development, overgrazing and deforestation113
Financing options and delivery mechanisms
Total cost = KES 25.5 m KES 500 per tree. Number of trees dependant on land and funding available (>51,000 and above). Total based on 51,000 trees = KES 25 m Reduce soil erosion and increase resistance to water flow. Increase soil infiltration, reducing the effects of drought as a result of healthy soils retaining water for longer in dry periods
› Mt Kenya National Park is a nationally gazetted park. This would require consultation with governmental agencies (e.g. Kenya Water Towers Agency and Kenya Forest Service) and enforcement of regulation to stop tree cutting and slash and burn farming.
› Information about land use › Topographical surveys
194 Table 5.41 Project 20 Summary Information Sub-components
› Expansion of the initiative across the County in the medium-term (5 years >).
Estimated cost (KES range) Benefits and impacts
Project 20 Basic Analysis and Timeline Challenges Data gaps
Table 5.42
› Funding could be a challenge if the initiative is not well planned, considering there are competing initiatives across the world.
Implementation agency and stakeholders
› The planning, setting up of the coordination team and initiative design and pilot should be conducted in the immediate term (0-2years).
Trees and seedlings planting
Time frame, key dependencies
› Unifying approach across all agencies and partners for implementation and catchment management.
The financing option can be a cross-collaboration between the private sector, public sector, County/ Municipality budget, Donors/ IFI and Climate Funds
The initiative should be coordinated by the County, with inputs during the design phase and implementation phase by governmental agencies (e.g. Kenya Water Towers Agency), the private sector, donors/IFI and climate funding bodies
› Procuring of finance and setting tree planting targets should be short-term (2-5 years).
Flood reduction will benefit surrounding communities and farmers. It will particularly benefit informal settlements’ dwellers, who are more vulnerable to the impacts of climate change.
This project has both environmental and climate resilience benefits. Afforestation will help reduce erosion, and lower flood peaks, and as such, if done at sufficient scale, would have significant downstream flood reduction benefits. Care should be taken that the selection of tree types is appropriate (and indigenous) and considers steadily rising temperatures. Mixed forest will lead to greater biodiversity, and also increase the resilience of the forest to climate change.
Recommendations:
Requirements for GBI Implementation Climate resilience recommendations
> Relevant government agencies like KFS should take lead in raising the seedlings;
> To increase survival and/or success rates for the planted trees, planting to be timed during the onset of rains.
Social inclusion recommendations Local communities will enjoy the benefits to their health and wellbeing associated to the initiative.
>Recommendations:
Active and deliberately involve local conservation groups, youth and women in planting and caring for the planted trees until they are well established; this will also contribute to communities’ increased sense of ownership.
KERUGOYA-KUTUS MUNICIPALITY URBAN ECONOMIC PLAN (UEP ) 195
GBI Benefits Socio-Economic Benefits Public health Social cohesion Green jobs Recreation & amenity Climate Change Adaptation Benefits Risk reduction Cooling effects Carbon reduction Carbon sequestration Environment and Resource Efficiency Benefits Prevention of soil erosion & land contamination Reduction pollution Improved air quality Restoration of habitats & ecosystems Biodiversity
> The afforestation initiative should adopt indigenous tree species for planting;
196 Case Study: Water catchment protection in Australia At Nevallen Farm, Australia, cultivating trees in parallel and upwards from any contour water is distributed within the landscape reducing flooding downstream.
Source: http://permaculturenews.org/resources_files/KeylineArticle.pdf

KERUGOYA-KUTUS MUNICIPALITY URBAN ECONOMIC PLAN (UEP ) 197
5.5.11
Project 21: Critical rural feeder roads
The first stage of agriculture to produce movement from farm to roadside, and finally market, can be the most expensive, especially where the terrain is difficult and there is no reliable road. During the rainy season these rural proactive areas can become completely inaccessible, which raises the cost of transport and increases post-harvest losses. These could restrain the development of agriculture. By improving critical rural-urban linkages, farmers will have better access to markets, reduce transport costs and post-harvest loss. Kerugoya has a higher rural access index with over 87% of the population living within 2 km of an all-season road . The priority is to improve rural roads that are likely to have the largest impact on agricultural productivity and market access. The key regions identified for promotion of agri-business in the CSP are Ndia and Mwea. These areas are the primary productive areas of raw inputs for the shortlisted VCs and are within reasonable reach of market areas. While the feeder roads in Ndia and Mwea areas need upgrading to ease access to markets and farming areas, this proposal suggests focusing on improving those in the worst condition. The development covers improvement of existing agricultural roads and safeguarding works against impending deterioration and annual routine maintenance. These are shown in Figure 5.36. Linkages Agri-processing category: 5.36
VCs GBI
Placemaking and landscape Figure
Critical rural links in fair to poor condition requiring improvement Kerugoya Kutus Embu Kagio Sagana BarichoB25 C526 G26756 B24 C527 D1368 B27 B25 Key MunicipalityRailwayTownsRoadsline boundary Existing Road Roads Proposed to be Upgraded Source: Atkins

Rural road investment program required to inform phasing of investment
198 Table 5.43 Project 21 Summary Information Sub-components Estimated cost (KES range) Benefits and impacts Financing options and delivery mechanisms Implementation agency and stakeholders Rehabilitation and upgrade of 56 km of rural feeder roads Total cost = KES 3 bn Improved market access Reduced post-harvest losses Reduce transport cost FundingKeRRA through development partners Maintenance through Kenya Road Board – Road Maintenance Fuel Levy Fund (RMLF) FarmersKeRRA and farmer cooperatives
Incomplete information on rural road network coverage, condition and traffic data Cost benefit analysis needed Medium term
Table 5.44 Project 20 Basic Analysis and Timeline Challenges Data gaps Time frame, key dependencies
While road inventory of main and secondary road networks is mapped, rural road network data is much more partial.
KERUGOYA-KUTUS MUNICIPALITY URBAN ECONOMIC PLAN (UEP ) 199
One of the proposed priority roads crosses a small river. During project planning, an assessment should be made as to whether there is a need to upgrade the bridge crossing in order to accommodate larger flood flows in future.
The frequency and intensity of heavy rainfall events is likely to increase, and as such, in order to increase resilience to climate change, and ensure that the new roads remain passable, drainage features will need to be designed to accommodate more extreme rainfall events.
Climate resilience recommendations Landslides and erosion are among the key environmental challenges identified in the Kerugoya diagnostics report. The transport sector, and roads in particular, is sensitive to landslides, which can be exacerbated by climate change in the case of flash flooding. Infrastructure planning therefore needs to include the consideration of climate change and how it may exacerbate the risk of landslides already present in the area.
Social inclusion recommendations Improved transport infrastructure is essential to support community livelihoods and socio-economic development.
Requirements for GBI implementation
Good transport infrastructure improves access to markets for traders, residents and vehicles, as well as agricultural productivity.
Recommendations:
> Considering climate resilience recommendations for the design of roads is fundamental to ensure the security of farmers’ incomes and households’ food supplies.
Flooding due to extreme rainfall events may affect the operation of the refurbished roads. Storm drainage provision and management can reduce flood risks and lessen infrastructure damage and associated maintenance costs.
> Prioritise the employment of local communities for the construction and maintenance of roads. GBD Benefits Socio-Economic Benefits Less expensive Social cohesion Poverty alleviation Climate Change Adaptation Benefits Urban resilience Improved rural – urban linkages
Outcome: In Polk County the BASE ONE® surface stabilised gravel roads have in been able to support increased load-bearing capacity, reduced routine maintenance, and reduced gravel loss hence lengthened the re-gravelling cycles.
https://www.baseone.net/, https://www.baseone.net/projects/367/project-profile-3-3/.
BASE ONE® is a base and aggregate surface stabilizer that is designed to improve the strength and stability of aggregate and reclaimed asphalt pavement (RAP) materials. It is a concentrated liquid stabilizing agent that is added to the water used to bring the base material to optimum moisture content for compaction.
Accessed on 18th June 2021
Applying BASE ONE Final Output 200 Case Study: Gravel road surface stabilization using BASE ONE® in Polk County, Minnesota, USA Minnesota State has a total of 229,996 km (142,913-mile) road network system with gravel surface roads covering 49% of the network system. Most of these gravel surface roads are in poor condition and get muddy and impassable during the spring season. The poor road conditions within the State have been exacerbated by the low budget allocation and lack of upgrade prioritisation because of low traffic volumes and according to the Department of Transportation, most of these roads are likely to remain unpaved for a long time. In a bid to provide a long-lasting affordable solution on these gravel roads, various Minnesota County engineers have been testing out the BASE ONE® surface stabilization technique during routine maintenance to make the surfaces resilient to harsh climatic conditions and various loading types. So far three counties in Minnesota i.e. Polk, Wilkin, and Wadena County, have tried this technique and have achieved great outcomes in terms of increase load bearing capacity, reduced routine maintenance and consequently time and cost savings.
BASE ONE® was developed in the early eighties, throughout years of research and development it has become a valuable cost saving, road building base stabilizer for many projects throughout the United States. Over time, Polk County has been undertaking a 5-year gravel stabilization programme with the aim of reducing the re-gravelling cycles and annual blading maintenance. Each year, the County has been selecting 24-32 km (15-20 miles) of gravel to be stabilised with BASE ONE®. Before the start of the 5-year programme, the cost of routine road maintenance was high. For instance, the County was using approximately 250-275 tonnes per mile of aggregate surfacing material per year and road blading was done once a week. As a result, road maintenance was KES 3 million (US$ 27,650) (aggregate and motor grader) per mile every year. After adoption of the BASE ONE® technique, the County’s gravel road surfaces have improved and there has been an overall reduction in maintenance costs. With this technique, the County blades only three times per season (every three months) and annual maintenance cost is KES 555,245 (US$ 5,145) down from KES 3 million (US$ 27,650) per mile every year.


KERUGOYA-KUTUS MUNICIPALITY URBAN ECONOMIC PLAN (UEP ) 201 5.5.12 Project 22: NMT and urban street improvements
Figure 5.37 Priority routes to upgrade NMT facilities in Kutus (left) and Kerugoya (right)
Walking is the dominant mode of transport in KKM. The main corridors passing through Kerugoya and Kutus town are the roads B27 and B25 which are missing essential urban street features. These main roads and adjoining streets need safe and universally accessible pedestrian facilities, pedestrian crossings, traffic calming features, green infrastructure and dedicated vending space where the activity is taking place. This proposal seeks to expand the pedestrian network and increase its convenience, accessibility, comfort and safety to encourage zero carbon transport modes and support healthier travel behaviour among residents. Improvements to the pedestrian network are being funded by the World Bank, and the Kenya Urban Support Programme to expand the network. The proposal supports existing NMT improvements by extending the interventions to include critical streets in the CBD and market access routes – to ultimately provide a continuous and comprehensive network of walking spaces that promote active transport, support business growth and general accessibility within the town. Location Focus Area 2 Kutus and Focus Area 3 Kerugoya Linkages > Kutus town regeneration. > Kerugoya central square. GBI category: Placemaking and landscape
Source: Atkins


GBD Benefits Socio-Economic Benefits Public health Social cohesion Recreation & amenity Climate Change Adaptation Benefits Risk reduction Urban resilience Carbon reduction Low Carbon Development Environment and Resource Efficiency Benefits Reduction pollution Improved air quality
Implementation agency and stakeholders
Project 22 Summary
Funding › Pre-feasibility
Requirements for Implementation
202 Table 5.45
› Public consultation
Pedestrian facilities and street Kerugoya:furniture 3 km Kutus: 5 km Total cost = KES 16 m Kerugoya streets = KES 6 m Kutus streets = KES 10 m
> Timely communication to local residents and adjacent businesses about the implementation schedule of the different projects to mitigate the disruption of traffic, everyday life, and economic activities. This communication should be in formats and languages that are accessible for all.
Financing options and delivery mechanisms
Table 5.46 Project 21 Basic Analysis and Timeline Challenges Data gaps Time frame, key dependencies Protecting against encroachment from two-wheelers and street Constructionvendors likely to interrupt traffic flow. A traffic management plan would need to be developed which is usually part of an EMP study Short-term
Increased safety and accessibility for Reducepedestriansvehicle use in favour of walking Improve air quality by increased Walkingwalking can improve health and fitness
Social inclusion recommendations Provision of a safe, accessible NMT and public transport facilities will enable equitable access for all by addressing inequalities associated with motorised transport. Good quality NMT provides basic mobility, is affordable and has health and recreation benefits.
Information Sub-components
Climate resilience recommendations Provision of shade along the routes is an important consideration, with the expectation of higher temperatures due to climate change. There may be an opportunity to include sustainable urban drainage features along the routes, both to enhance amenity and reduce the likelihood of surface flooding.
Increased footfall to businesses along the network County government Kenya Urban Support Program (KUSP) County government would be the main implementing agency and Municipality would be responsible for their maintenance
Source: https://www.baseone.net/, https://www.baseone.net/projects/367/project-profile-3-3/. Accessed on 18th June 2021
> It is recommended that NMT and transport facilities follow principles of inclusive design and ensure PWD accessibility.
Estimated cost (KES range) Benefits and impacts
Case Study: La Jolla Boulevard in Bird Rock, San Diego La Jolla Boulevard is in Bird Rock, San Diego, California, a town with a population of about 16,000 and La Jolla Boulevard as the main primary route connecting to a network of streets and urban roads. There were numerous concerns of safety and air pollution problems in the area. The residents raised concerns to the city about the high speeds (38-42 mph), difficulty of crossing, and peak hour traffic congestion. In addition, a shortage of parking in the area, and a lack of comfortable public spaces and aesthetic conditions, and financial stagnation of the businesses area.
1.Results
KERUGOYA-KUTUS MUNICIPALITY URBAN ECONOMIC PLAN (UEP ) 203
Traffic count remained approximately the same (23,000 vehicles per day before, 22,000 after), but walking, bicycling, transit use, on-street parking and retail sales all climbed to much higher levels.
4. Retail sales rose 30% and noise levels dropped 77% due to traffic moves were slower therefore businesses had higher visibility.
Road section of La Jolla Boulevard
AfterBefore
2. Traffic crashes fell by 90%.
1.Problems
Safety (inadequate crossings) 2. Air pollution 3. Financial stagnation 4. Lack of comfortable public spaces 5. Difficult crossing during peak hours 6. Shortage of parking areas
In response to these challenges, a comprehensive traffic management plan was developed, addressing residents’ concerns about potential congestion and spill-overs due to reduced road capacity. Through a number of community meetings, the plan was developed and approved by the community in 2003 and the City Council approved the plan the following year. After three years of design process, the first phase of construction began in 2007. The plan included a series of roundabouts, medians, diagonal parking on the west side and parallel parking on the east side
On La Jolla Boulevard, the project reduced the travel lanes from 5 to 2 (capable of carrying existing traffic of 23,000 vehicles per day, as well as additional growth in traffic up to 25,000 vehicles per day), added 5 roundabouts, improved sidewalks and landscape, and increased angle parking. In addition, traffic calming measures were installed on less busy sides and parallel streets to avoid potential traffic diversion and pedestrian refuge areas were incorporated. Parallel street improvements included installation of 4 traffic circles designed like roundabouts but lacking splitter islands on the approaches. Diagonal parking was included on the west of the Boulevard and parallel on the east side. The project incorporated green infrastructure i.e. Landscaping with shrubs, flower, trees and other plants in the centre median, roundabout and both sides of the street including the Thebulb-outs.streetdesign also included relocation and reconfiguration of bus stops and including new bus pads and benches.
3. As a result of the roundabouts and traffic calming, speeds were reduced from 40–45 mph to 19 mph.


204 Before: La Jolla Boulevard before road diet (2007) After: After road diet (2018) Cross-section for La Jolla Boulevard Before Crossection After Crossection Source: https://www.cnu.org/publicsquare/2018/01/10/road-diet-bridges-barrier-boosts-safety


1. The city catalogued available surface parking and found out that one curb of angle parking could be converted to parallel parking, with a net loss of 15 slots. This allowed for wider sidewalks
4. The community wanted to reduce truck congestion from the downtown area while accommodating deliveries thus rerouting plan was developed and clear signage installed clearly showing new routes and restricted areas.
2. The city installed street furniture, trees and landscaping elements along widened sidewalks, enabling increased pedestrian activities. A pocket park was added to reinforce the local character.
Grandview worked with the consultant to develop a schematic concept for Division and West 2nd Street that could be applied over the entire six-block area.
Streetscape treatments include flowerpots, textured paving, street trees and shrubs.
The plan achieved the following:
KERUGOYA-KUTUS MUNICIPALITY URBAN ECONOMIC PLAN (UEP ) 205
Downtown core: Division and 2nd Street
AfterBefore
Grandview is a town of 9,100 inhabitants located South Central Washington State, at the heart of Yakima Valley. One of the key arterials through the downtown core, Wine Country road, was once a state highway. In 2006, the city of Grandview developed an action plan themed ‘Downtown Alive!’ to reinvigorate the downtown core. By 2008, they had got KES 400 m in funding from at least different sources. The plan created a streetscape that was welcoming, comfortable, and safer to use as a place for people to explore and interact.
Case Study: Grandview City’s Division and West 2nd Street, Washington State
3. Pedestrian walkways were marked with textured paving. Bold stripes and bulb-outs made crosswalks more visible


Division206 Street Before: Narrow sidewalks, minimal streetscaping, congestion West 2nd street Before After: Wider sidewalks, parking rearrangement, more streetscape features, traffic calming After Source: Complete-Streets.pdf.https://wsdot.wa.gov/sites/default/files/2015/02/24/ATP_WA-Accessedon18thJune2021


Project 23: Donkey management
Donkeys are a popular choice for transport by small-scale farmers who use them to transport produce from fields to farmsteads, nearby markets or farmer aggregation points. In Kirinyaga, the most common product transported is rice from farms to millers. Donkeys are also kept for the production of manure which is used as fertiliser. In urban centres, donkeys are primarily used to carry water, building materials and hardware. Owners of these donkeys also derive income from these activities either directly by hiring out their donkeys for transport services or selling manure or indirectly through cost savings made through the substitution of hired labour or vehicle use for donkey. Therefore, they also have an economic role. Donkeys face many challenges ranging from disease, theft for slaughter, abuse, malicious injuries and road accidents. The latter is becoming a growing concern in KC with incidences of stray donkeys invading farms in rural areas or causing road accidents in urban streets becoming more commonplace. Demand for donkey skin and meat in markets in European and Asian markets also fuels theft of donkeys for slaughter and attempts to ban the trade have not been successful. As the use of donkeys increases, specific management practices need to be devised that allow them to fully maximize their health and utility and avoid conflict with human activity. Improving donkey management would entail addressing safety and welfare issues through a combination of good care practices, training of owners, and providing veterinarian services and sanctuaries for sick or neglected animals. Sensitisation campaigns around proper handling of the animals, proper feeding, appropriate working conditions and general donkey welfare are an important start in improving management practices amongst owners.
Local initiatives such as Heshimu Punda (Respect the Donkey) programme is leading this front by campaigning for positive change in behaviour and practices of donkey-owning communities and advocating for supporting policy and legislative changes to mandate the practices. Together with the overall care and management sensitisation, maintaining a registry of donkeys after inspection by a registered veterinary can ensure donkeys in use are healthy and capable of undertaking the work required of them. Such a registry would also aid tracing ownership of stray or abandoned donkeys. Location Municipal wide Linkages This project will support transport management for Focus Areas 2 and 3. GBI category: Placemaking and landscape GBI category: Environmental Protection
5.5.13
KERUGOYA-KUTUS MUNICIPALITY URBAN ECONOMIC PLAN (UEP ) 207
Donkey welfare awareness and training registry of donkeys
Implementation agency and stakeholders
Development of donkey sanctuary Total cost = KES 50 m KES 20 m – 40 m annual budget for sensitisation campaigns, training, and registry maintenance KES 10 m for setting up a sanctuary
No current systems in place for registering and managing donkey population, health and safety
Lack of training of donkey handling practices
Requirements for Implementation
Bylawcampaignsrequiring
Climate resilience recommendations Improving donkey management will increase the overall health of the animals, and will mean that they are better placed to withstand issues such as heat stress which will become worse with climate change. The registry will also help to identify any new and emerging diseases that could enter the County as temperatures and precipitation patterns change, at an early stage. There are no climate risks related to the implementation of the programme itself.
Support from donkey welfare NGOs Municipal Government to pass bylaws that mandate donkey registration Support from NGOs, community groups
Table 5.48 Project 23 Basic Analysis and Timeline Challenges Data gaps Time frame, key dependencies
Estimated cost (KES range) Benefits and impacts
Financing options and delivery mechanisms
208 Table 5.47 Project 23 Summary Information Sub-components
› Lack of information on donkey livestock population and owners Short-term/ongoing GBD Benefits Socio-Economic Benefits Public health Job creation Recreation & amenity Environment and Resource Efficiency Benefits Reduction pollution Animal welfare
Social inclusion recommendations > Engage community groups and NGOs such as Heshimu Punda and Tunza Punda in the development of training and awareness on good animal husbandry.
Improved donkey welfare and management Annual budget allocation by County government for sensitisation and management initiatives
Case Study: Heshimu Punda Programme Heshimu Punda is a programme that currently runs in 8 Counties namely, Kirinyaga, Nairobi, Kiambu, Nyandarua, Laikipia, Meru, Tharaka Nithi and Embu. The programme aims at improving the welfare of working donkeys through positive change in behaviour and practices of donkey owning communities, improving the quality of animal health services, and creating a conducive policy and legislative environment that support donkey welfare and community livelihood development. Since 2001, the project has trained and mentored over 2,000 veterinary professionals on animal welfare, donkey health and husbandry practices, and trained over 35,000 donkey owners. It has supported improved healthcare for 50,000 donkey owners through vaccination campaigns and built over 110 secure and lockable donkey shelters in Kiambu, Nyandarua and Kirinyaga which have provided shelter for over 296 donkeys. Their activities are helping improve donkey welfare and management practices.
209

6.1 Introduction Effective urban and economic planning by strong, empowered municipal governments is critical to the success of cities in responding to current and future challenges. The Municipality government’s central role in the coordination of actors that shape urban development and economic growth is becoming even more important as devolved governments are required to address increasingly complex challenges. Planning plays a critical role in directing and controlling land use, urban form, infrastructure and service delivery as well ensuring resilience of the urban system. A number of other factors also have an impact on the ability of cities to respond to risks and development needs. These include the skills available in the workforce and within the local authorities, an effective and transparent governance structure, issues shaped by national and regional economic policies and dynamics, as well as access to global financial markets and the global governance of environmental issues.
210 6.
PlanImplementation

The following sections discuss relevant considerations across partnerships, funding and scheduling for the proposed VC and GBI projects and the wider economic development plan.
Crucial aspects to the implementation of these are capacity building, and recommendations for social inclusion, and climate resilience, which are provided further below.
> Added value to the agri-processing and industry sector with deployment of the two prioritised VCs of banana flour and husk products at the Sagana green industrial park (Focus Area 1) and anchor projects. Potential for the identified VCs and other industrial units could be co-located in the park;
> Increase in formal employment in the sectors of industrial/ agricultural processing, retail and wholesale, hospitality and potentially tourism. Improve socio-economic opportunities across society, providing employment opportunities and accessibility to facilities to those from SIGs who currently face a lack of income security;
The IDeP 2018 – 2022 is the guiding instrument for the MB to deliver basic services, promote investment with greater socio-economic impact and endorse environmental protection. However, this plan needs to be aligned with a long-term spatial strategy to ensure optimisation of limited developable land, well-coordinated infrastructure delivery and economic development. This long-term plan is currently being developed, the LPLUDP to guide future growth, providing an integrated physical development by setting out the zoning and proposed land Followinguses. the polycentric development approach within KC as suggested by the Mountain Cities Blueprint 2032, the CIDP and the Draft CSP, it is important to recognise the differentiated role of KKM as main service provider to strengthen urban-rural linkages and links with other towns as well as its opportunity to deliver GBI that will benefit the entire population.
> Improved attractiveness of KKM as a retail and wholesale centre, health and education hub, with attractive green open public spaces, supporting the visitor experience and entertainment destination where people are encouraged to spend more time and increase footfall, improve the range of accommodation opportunities from student accommodation to affordable housing; > Improve resilience to climate change by adopting a Green Blue Infrastructure Development approach to maintain the green character of Kerugoya and Kutus towns, allow citizens, students, and visitors alike to enjoy a better urban environment, preservation of critical agricultural and protection of key water resources and natural assets.
The UEP is an advisory document aligned with the existing regulations and planning policy framework and is built upon the priorities of both the County and Municipality to boost development. The UEP will then support the realisation of benefits, including:
> Value uplift to the retail and wholesale trade through better market infrastructure in Kerugoya and Kutus and improved facilities to host more traders, training Entrepreneurship Centres regulations and potential for specialised sports and tourism retail;
> Value uplift of the agricultural sector and better income security for farmers, with training centres for additional skills and diversification of produce, access to shared resources and service groups with optimal machinery, and best practice techniques that enhanced production, better storage facilities and collection centres, to increase shelf life of perishable products;
It will be critical to identify potential risks to the implementation of the UEP, including risks and impacts from the current COVID-19 crisis or other external shocks, as well as increasing stresses from the effects of climate change. This will need to be a continuous process of reviewing identified risks starting from planning and design to implementation stages. The proposed UEP and projects within the GBI Development Framework have considered the existing and emerging economic and urban context including institutional and financial capacity of the County and Municipality.
KERUGOYA-KUTUS MUNICIPALITY URBAN ECONOMIC PLAN (UEP ) 211
UNIDO is supporting micro-hydro power projects in Mwea and the AfDB is supporting water supply and sanitation projects in BusinessKKM.
Horizontal governance recommendations
Improvement Districts
Stakeholders and institutional structures
> Other thematic working groups or project teams could be established, drawn from representatives from the government and community stakeholders to develop particular actions and track its implementation. These groups could be formed around the key sectors and urban elements, such as: markets and trade, waste management, sustainable transport, land use and planning permissions, environmental protection. These working groups and project teams should report back to the Municipality.
> The Municipality could establish partnerships with Kamweti Agricultural Training Centre and AHITI Ndomba, KyU, TVET institutions, NIB to incentivise farmers to join training sessions or courses on climate-smart agricultural practices and techniques.
The strength of urban governance is one of the biggest issues affecting the ability of cities to respond to major economic and environmental challenges. There are two different aspects of multi-level governance: 1. Vertical governance which refers to the strength of coordination across multiple levels of government at national, regional and local levels, and 2. Horizontal governance referring to the coordination of activities across different sectors of society from local governments to the private sector, civil society, academia and grassroots organisations.
> The Municipality should engage with key organisations such as KIDA, Kenya Investment Authority and others to ensure investments are focused on areas where KKM has a competitive advantage.
> The Municipality should establish partnerships with cooperatives and SMEs similar to the ones established by the County though the Wezesha programme to provide access to jobs to the most vulnerable.
> A mapping exercise should also be undertaken to identify the relationships and partnerships that exist at both Municipality and County level.
In the context of KKM, the nature of partnership can be enhanced with public sector involvement and Jua Kali cooperatives to help direct and attract additional funding for public realm and infrastructure improvements.
the World Bank’s Kenya Urban Support Programme (KUSP), which could provide an important partnership, supporting proposed urban improvements.
Vertical governance recommendations Devolution is the backbone of Kenya’s planning policy to transfer power, funds and resources to accountable, transparent and inclusive local governments. KC is one of the two-tier governance systems with granted powers in terms of overarching planning and development within the County territory and also in relation to management and governance of KKM. The MB administers and manages the Municipality on behalf of the County government. The MM is the administrative head of KKM who is responsible for the implementation of decisions made by the MB. KKM and its newly-created departments maintain good relations with the County Government and various communication channels exist vertically. Nonetheless, the Municipality should implement a plan of regular communication, e.g. Periodic meetings and/or reporting to keep the County Government appraised of progress and developments on SUED projects and to ensure that efforts are coordinated across the County. Failure to put such structures and processes in place will cause significant delays in project formulation and implementation, along with direct impacts on the future roll-out of supporting climate-resilient and inclusive infrastructure and their associated costs.
Existing relationships with multilateral institutions, bilateral institutions, NGOs and think tanks can all be leveraged to support SUED projects. The mapping exercise will also be conducive to building greater coordination between the existing partnerships as well as identification of opportunities for partnerships with new and emerging entities.
The KUSP has already supported roads upgrade to Tarmac standards and parking lots within Kutus and Kerugoya towns.
Synergies with other development programmes FCDO, the World Bank, the AfDB, UNIDO and other multilateral institutions have ongoing programmes within the County which will provide synergy with the SUED programme and potential for Examplespartnerships.include
212 6.2
A popular concept for the establishment of zonal organisation is the formation of Business Improvement Districts (BID). A BID is a business-led partnership (non-profit organisation) run by and for its members in a defined geographical area with a remit to invest collectively to improve their environment. These organisations are funded by a mandatory levy agreed between members, and set priorities for local investment such as cleaning, safety, improvement of the local area and promotion, and building local networks supporting local supply chains.
The following are likely to support the effective implementation of the UEP: > Involvement of stakeholders in steering committees and working groups: the MB and a continued PSG should involve a broad range of stakeholders throughout the lifecycle of any SUED VC and GBI projects, sharing information and monitoring progress on intended outcomes for different stakeholders.
KIDA has developed a value-added strategy, that has identified and prioritised value-added pipelines, including dairy milk processing, banana processing, rice wine processing, tomato processing, an animal feed factory, an apparel factory and coffee and tea appellation.
KERUGOYA-KUTUS MUNICIPALITY URBAN ECONOMIC PLAN (UEP ) 213
> International sales and distribution, food industry partners such as Unilever.
> Final husk lumber product can be used as construction material, therefore partnership with local construction companies would be beneficial;
Key benefits of this approach are an accountable, proactive and flexible approach, whilst bringing wider regeneration benefits. BIDs have often been implemented with regard to retail and trade areas, to ensure the area remains appealing to customers and supports businesses’ operation within this space. The Kutus Pilot Area Urban Regeneration (project 7), Kutus Urban Park Community Centre (project 9) and proposed Kerugoya Central Square (project 10) could be a suitable pilot for a BID delivery mechanism where this would help to realise the potential benefits of an improved urban fabric with enhanced footfall, active mode access and flexible leisure offerings which support business revenue. It would be in the business communities’ interests to coordinate and ensure that an appealing environment is maintained for residents, students, and visitors from the wider region.
> Bakeries to promote the use of banana flour replacement of other grain flours in local products;
> International sales and distribution to support the commercialisation of plant-based tableware.
115. KIDA Investment Opportunities Pitch
Value Chain partners
> Small-scale banana farmers producers and cooperatives in KC; > Stawi Food and Fruits in Meru and cooperatives in neighbouring counties to ensure consist supply;
In Kenya, Twiga Foods is an example of a business that manages its aggregation. It has set up several collection centres across the country targeting small-scale farmers and supplies to retailers and wholesalers in Nairobi city. The Municipality could formalise the relationship with Twiga Foods or similar to manage the collection centres within the County.
For the husk products VC, there would be benefits in establishing partnerships with: > Rice millers, coffee cooperatives and macadamia nuts cooperatives to ensure supply of husk;
The banana flour VC would further benefit from establishing partnerships with:
KIDA is an essential partner in the implementation of the UEP KIDA is a public body created in 2018 to promote and coordinate investment and development in KC. Its mission is to “become the principal investment vehicle for internal and external resource development and deployment in Kirinyaga”. KIDA operates as a corporate body capable of acquiring or disposing of movable and immovable property, borrowing money or making investments, and entering contracts.115
KIDA is also investing in operational improvements to increase existing sector’s efficiency, including improved traceability and farm produce aggregation.
The success of the banana flour processing plant and husk products processing facility VCs outlined in section 4.2, depends on establishing close partnerships with suppliers of the required agricultural produce such as banana, rice, coffee, and macadamia nuts. Close collaboration with farming cooperatives to establish collection networks could support both VCs facilitating and formalising the relationship between VC facilities (or the green industrial park operator) and farmers. The collection model and solar-refrigerated storages (project 15) could either be managed entirely by a business to support sourcing of bananas or husk materials or by an outsourced third-party agent supplying to manufacturers, retailers and markets.
KIDA will be a key partner in the implementation of the UEP through its involvement in the planning, design, development, construction and operation of Sagana green industrial hub where the prioritised banana flour VC (Section 4.2.1) and husk products VC (Section 4.2.2) , and other identified VCs (Section 4.2 and Appendix B) are ready to be developed and additional industrial units (Section 5.2.4.1) could be co-located.
Short – to medium-term CAPEX: KES 4,635 million Medium – to long-term CAPEX: KES 4,339 million
214
The UEP is an advisory document owned and administered by the Municipality and the main responsible authority for its future implementation. Similarly, the Municipality is responsible to agree appropriate funding from the County budget, as well as seeking any additional funding from IFI, donors, and/or private sector to support the implementation of the VC and GBI projects. Table 6.1 summarises the implementation costs and delivery for the VCs, GBI projects across the main FAs and the Municipality. Each project is considered by its sub-components; delivery partners and funding sources; capital costs and key cost elements; expected benefits to be realised; and timescale. This brings together from the project information set out in Section 5. It is important to note that these costs do not include various cost items including land acquisition, design and planning (unless stated, where this could reflect 10-30% of the CAPEX costs). Inflation and optimism bias have not been included at this stage, where this would uplift the cost estimates. There will also be often sizeable operational expenditure which will need to be factored in. At a development concept level, the project implementation is summarised in the table.
Table 6.1
Summary implementation costs estimates
Total estimated CAPEX for the UEP Development Framework: VCs CAPEX: KES 1,350 million Focus Area 1 – Sagana Green Industrial Hub CAPEX: KES 2,946 million Focus Area 2 – Kutus CAPEX: KES 292 million Focus Area 3 – Kerugoya CAPEX: KES 44 million Municipality-wide CAPEX: KES 4,452 million In terms of the funding scale between private (PPP), public and other sources, the following is provisionally estimated: 21% public sector led (County, CGoK, providers and donors), 57% private and PPP, 22% IFI and donor funding
In terms of the cost scale over time, the following breakdown is estimated given the individual project schedules: Immediate CAPEX: KES 108 million
6.3 Implementation Costs and Potential Funding Sources

3
Potential Sources of Financing / Funding and Delivery Mechanisms
2
Implementation Costs and Delivery Mechanisms Title GBI Category Project Sub-Components Implementation Agency and Stakeholders
IFI / Donor Finance, Public Sector Funding through development partners like World Bank or Water Sector Trust Fund. KIDA or local government for capital investment.
Total cost = KES 23.4 m Borehole, pump and chlorination system = KES 10 m Pre-treatment and reed bed system = KES 13 m ESIA = KES 400,000 Short-term
4
Estimated Costs (in KES)
SolutionsEnergy for Phase 1 Sagana Green Industries and Agriculture Feasibility study and outline Developmentdesign of finance, procurement and deployment Maintenanceplanplan Park systemtransmission/interconnectionconstruction,procurementfinanceThenandandobtainingdevelopingowner/operatoraninitialdesign,relevantpermittingbuy-infromtheregulatorutilityattractingsuitablebeforeengineering,andwithfinaltothepowerdistribution
# Project
6.2
Public and Private Sector Partner with the green industrial park developer to coordinate activities and develop the energy Partneringpropositionwith renewable energy technology specialists to determine procurement solutions Maintenance – capacity building programme to ensure continued operation of systems
Timescale Focus Area 1: Sagana Green Industrial Hub 1 Sagana IndustrialGreenPark andPlacemakingLandscape On-siteMasterplaninternal roads and network infrastructure BGI network KIDA/KC to lead on Supporting Maintenancestakeholders:responsibility of Municipal Government PPP, Public Sector Private investor: Design Build Operate Maintain (DBOM) Enabling infrastructure: Public Authorities Total cost = KES 667 m Short medium-termto
Table
PhaseProvisionServiceandWastewaterWater,Drainagefor1Sagana ManagementWater Water supply: Borehole, pump and chlorination Wastewater:system Pre-treatment and Reed bed system ESIA including hydrogeotechnical studies Employ local SMEs for the operations and maintenance of the water and wastewater services.
Organic PhaseProcessingWastefor1Sagana ManagementWater Assessment of waste Developmentarisings of AD plant AD plant developer / operator to implement and maintain Private Sector AD plant developer or operator Total cost = KES 300 m Short medium-term.to
Total cost = KES 1,115 bn KES 15 m to complete study/ design. KES 850 m to KES 1.1 bn to complete installation. Short-term
KERUGOYA-KUTUS MUNICIPALITY URBAN ECONOMIC PLAN (UEP ) 215
Public and Private Sector KC or a mixed entity between Public and Private where public body funds infrastructure and real estate is built and operated by private Followinginvestorscompletion: revenue from boda boda parking, increased land value of buildings and land surrounding the station Delivery via KC in coordination with KKM, local landowners, and community stakeholder groups
Total cost = KES 200 m Feasibility study = KES 10 m Concept master plan = KES 15 m KES 35,000 per sqm for construction improvements assuming 5000 sqm of station and adjacent land to be improved = KES 175 m Long-term.
Estimated Costs (in KES)
VC1 Banana Flour Value Chain Green Industries and Agriculture Commercial-scale banana flour production facility for both domestic and export markets. The facility would process green and ripe bananas, supporting the production of a range of different flours KIDA/KC SUED programme with potential for other public and private funding involvement The total investment required is estimated KES 800 m Some 56% of this total is for machinery and vehicles, and 25% is for working capital. The remainder covers buildings and site preparation, marketing and initial training Short-term.
216 # Project Title GBI Category Project Sub-Components Implementation Agency and Stakeholders Potential Sources of Financing / Funding and Delivery Mechanisms
IFI/Donor Finance, Public Sector Funding through development partners like World Bank, USAID Maintenance through Kenya Road Board – Road Maintenance Fuel Levy Fund (RMLF)
Total cost = KES 640 m Road upgrade = KES 400 m Bus shelters = KES 375,000 Bridge = KES 200 m Internal loop road = KES 40 m Water and wastewater treatment plan costed as part of Project 2 constructionindevelopedShort-termRoadtobestaged of clusterindustrialfordevelopmentinfrastructureEnablingpavementthe
Timescale 5 Access Road to Phase 1 Sagana Green Industries and Agriculture Upgrade of 4km of road from earth to bitumen standards with dedicated walking facilities and storm water Provisiondrainsof5 bus stops and 5 boda boda sheds New bridge over River DevelopRagati. 400m loop road within the site Road is currently a County Government Road but would need reclassification to national road due to industrial activity
6 RailwaySagana UpgradeStation andPlacemakingLandscape Feasibility Masterplanstudy Site Freeholder (i.e Kenya AlternativelyRailway) set up a dedicated SPV which could include private sector entities Supporting stakeholders include KC stakeholders, NGOs and industrialserviceslocalOpportunityorganisationcommunity-based(CBO)toemploySMEsforspecialist(i.e.:Smartlogistics,experts)
Concept
Opportunity to adopt the Business Improvement District approach
Short-term Focus
This VC project is for a husk processing facility using husk from rice milling as well as coffee and macadamia husk. Primarily the facility would produce husk lumber and later expand into producing a range of tableware
Potential Sources of Financing / Funding and Delivery Mechanisms
Estimated Costs (in KES)
Public and Private Sector KC or a mixed entity between Public and Private where Public body funds infrastructure and real estate is built and operated by private DeliveryinvestorsviaKCin coordination with KKM, local landowners, and community stakeholder groups
Timescale VC2 Husk
The total investment required for the husk products is estimated KES 550 Aroundm half of this is for machinery and vehicles, and around 10% is for working capital. The remainder covers buildings and site preparation, marketing and initial training Area 2: Kutus Feasibility study masterplan to be developed for pilot area Master plan
KERUGOYA-KUTUS MUNICIPALITY URBAN ECONOMIC PLAN (UEP ) 217 # Project Title GBI Category Project Sub-Components
KIDA / KC SUED programme with potential for other public and private funding involvement
ValuetablewarelumberProducts:andChain Green Industries and Agriculture
Implementation Agency and Stakeholders
7 Kutus Pilot Area RegenerationUrban ProtectionEnvironmentalandPlacemakingLandscape,
animation:LightservicesEmployMunicipalMaintenancepublicdistrict):BIDsMunicipalityinfrastructure:and(BusinessimprovementLocalizedareas,realmandanimationresponsibilityofGovernmentlocalSMEsforwastetouchmaintenanceandNGOsandCBO
Total cost = KES 25 m Feasibility study = KES 10 m Concept Masterplan = KES 15 m Medium long-termto
BIDsMunicipality(Business improvement Maintenancedistrict)
responsibility of Municipal Government: Employ local SMEs for waste Lightservicestouch maintenance and animation: NGOs and CBO Public TypicallySectorpublic funded projects Potentially: In partnership with local Privatebusinesssector funding for development (e.g. Business Improvement Districts)
Estimated Costs (in KES)
Timescale 8 Kutus Urban Park CentreCommunityand ProtectionEnvironmentalandPlacemakingLandscape, Masterplan to be developed for the wider town centre area before progressing Overall strategy to outline location of activities and Plantingroutes and removing of trees and Coordinateplantswith waste and water management Detail flood risk assessment and rainfall quantities Ecology assessment
Total cost = KES 24 m Feasibility study including flood risk assessment and ecology assessment = KES 5 m F&B areas + utilities = KES 11.6 m Built areas - park surfaces, pathways and podium = KES 5.7 m Art wall = KES 126,750 GBI (landscape + planting) = KES Street508,950/parkfurniture = KES 1.15 m Short medium-to term 9 KutusAccessImprovedtoMarkets andPlacemakingLandscape Improvement of paving of 4 km of road to bitumen standards with pedestrian facilities and storm water Newdrains300m Demarcationpedestrianisedlonglinksofloading and offloading zone KC Government delivered by MaintenanceKKM responsibility: Municipality Public KenyaCountySectorGovernmentUrbanSupport Program (KUSP)
218 # Project Title GBI Category Project Sub-Components Implementation Agency and Stakeholders Potential Sources of Financing / Funding and Delivery Mechanisms
Total cost = KES 242.5 m Improved road paving = KES 220 m Pedestrianised links = KES 20 m Loading zone demarcation = KES 2.5 m Short-term
Potential Sources of Financing / Funding and Delivery Mechanisms
Timescale Focus Area 3: Kerugoya 10 CentralKerugoyaSquare ProtectionEnvironmentalandPlacemakingLandscape, Reconfiguring current access and StreetIntegrationarrangementsloadingofSuDSsideparkingto be Addingrelocatedstreet trees and planting to support SuDS Permeable paving on most hard surfaces and footpaths Art, children’s play equipment and benches installation.
Total cost = KES 21.7 m Soft landscape including swale planting trees, shrub, trees = KES 3 m Hard landscape (asphalt paving, kerbs, concrete seating edge, artwork painting) = KES 16.58 m Street furniture = KES 2 m Short medium-to term 11 ImprovementsBusKerugoyaPark andPlacemakingLandscape 10 New bus shelters 10 Boda boda stands 20 Refurbished vendor 1stallsKm Access findingRoadatpedestrianTrafficfillingimprovementsroads(potholeandre-carpeting)calmingandcrossingfacilitiesaccesspointssignageandway County Government would be Municipalityimplementers.responsible for management IFI/Donors Finance and Public CountySector Government. Kenya Urban Support Program For(KUSP)operation, Private Public Partnerships (PPP) where private investor receive concession to finance, design construct and operate facility
BIDsMunicipality(Business improvement Maintenancedistrict) responsibility of Municipal Government Employ local SMEs for waste Lightservicestouch maintenance and animation: NGOs and CBO Public and Private Sector Typically public funded projects. Potentially: In partnership with localPrivatebusiness.sector funding for development (e.g. Business Improvement Districts). The project will be carried out in 3 Phasephases:1 – the central park area Phaseonly 2 – Adjoining street to the east of the park Phase 3 – initial test on a smaller section of the C74 corridor.
implementedcanupgradesBusimmediately.implementedcanmeasuresManagementbeparkbe in the short term
Estimated Costs (in KES)
KERUGOYA-KUTUS MUNICIPALITY URBAN ECONOMIC PLAN (UEP ) 219 # Project Title GBI Category Project Sub-Components Implementation Agency and Stakeholders
Total cost = KES 22.25 m Bus shelters = KES 1 m Boda boda shelters = KES 1 m Access roads = KES 20 m Road signage = KES 250,000
Total cost = KES 40 m Household connections = KES 19 m Water kiosks = KES 10 m Rolling loan fund = KES 11 m Medium- term 13
IFI / Donor Finance, Public Sector
Total cost = KES 500 m Benchmark = KES 15 m for 15kW KESsystem.18.5 m for 20kW system. Actual total = KES 500 m based on 30 systems (15 x 15kW, 15 x 20kW) Medium-term
Estimated Costs (in KES)
220 # Project Title GBI Category Project Sub-Components Implementation Agency and Stakeholders Potential Sources of Financing / Funding and Delivery Mechanisms
12 Kerugoya and Kutus SupplyWater ManagementWater Household connections for 1000 households 10 water kiosks Rolling loan fund to support the connection of 1000 lowincome households
KKM and KC Level Proposals
ProvisionSanitationandKerugoyaKutus ManagementWater 800 subsidised toilets 10 public ablution blocks Kiriwasco IFI / Donor Finance Water Sector Trust Fund
IFI or Water Sector Trust fund
Timescale
Total cost = KES 45 m Subsidised toilets = KES 10 m Public ablution blocks = KES 35 m Short-term 14 ProjectsMicro-Hydro Green Industries and Agriculture Determine suitable hydro resources in County Selection of suitable sites Selection of context suitable technologyDevelopment of new commercial maintenance)implementation,(procurement,plandeployment, Design and site selection –local/ national hydrological specialists, UNIDO, KAM, social/ communitiesresponsibilityOperationproductivecommunitiesSupportcostsoperationSupportexpertsassistancenationalConstructiondevelopmenteconomicspecialist–specialistcontractorswithfrominternationalasneededfromKKMtofundandmaintenancefromlocaltoidentifyusesofelectricityandmaintenanceoflocal
Donor funding is available from numerous sources, including: Energy4impact grant support for small hydro developers. Africa Renewable Energy Fund and Sustainable Energy Fund for Africa, both managed by the African Development Bank Public sector funding may be available from the central government
SmallKiriwascobusiness opportunity to run the kiosks IFI/Donor Finance
IFI / Donor Finance, Public Sector Donor funding is available from numerous sources, including small-scale irrigation and value addition project run by the Global Agriculture and Food Security ProgramPublicsector funding may be available from the central government via funding from the Ministry of Agriculture and Irrigation
KERUGOYA-KUTUS MUNICIPALITY URBAN ECONOMIC PLAN (UEP ) 221 # Project Title GBI Category Project Sub-Components Implementation Agency and Stakeholders
Timescale 15 (ColdRefrigerationSolarStores)
Total cost = KES 225 m Benchmark = KES 75,000 per Actualsystem= KES 225 m based on max 3,000 systems Short medium-termto
Estimated Costs (in KES)
IFI/Donor Finance, Public Sector
Potential Sources of Financing / Funding and Delivery Mechanisms
Site selection – KKM with assistance from national agricultural specialists Equipment selection – KKM with assistance from cold chain implementationConstructionspecialistsand– KKM Operation and maintenance – responsibility of municipalities
Green Industries and Agriculture Mapping - site selection Establishment of needs for solar refrigeration systems. Preparation of design brief Development of procurement and deployment plan Develop training plan, for management, operation and maintenance
Donor funding is available from numerous sources, including Self Help Africa and AGRA Public sector funding may be available from the central government via the Ministry of Agriculture and Irrigation
Total cost = KES 11.25 m Benchmark = KES 750,000 per Actualsystemcost = KES 11.25 m based on max 15 systems Short medium-to term 16 Solar Irrigation Green Industries and Agriculture Mapping - site selection Review of abstraction volumes from each borehole Establishment of needs for solar irrigation and borehole Preparationsystems. of design brief Development of procurement and deployment Maintenanceplan.plan
Site selection – KKM with assistance from national agricultural specialists Equipment implementationconstructionselection,and–KKM with assistance from irrigation specialists.Operationand maintenance – responsibility of the smallholder recipients
Upgraded waste collection system Support from NGOs, community groups, waste Maintenancepickers
Introduction of Private Public Partnership (PPP) and/or private waste services into waste collection Employmenteffortand training by Municipality or private entity/ FundingCBOs for Personal Protective. Equipment (PPE), collection carts, training and wages for the CBOs
Use of local SMEs for waste services
Solid managementwaste
Construction of new engineered landfill cells
implementationcurrent plan Review current commercial and technical arrangements Design study to ensure suitable coverage of target areaEquipment review and selectionDevelopment of new commercial maintenance)implementation,(procurement,plandeployment, Site selection – KKM Equipment selection – street lighting design specialist. Construction implementationand– KKM Operation and maintenance – KKM IFI / Donor Finance, Public Sector, FinancingPPP can be sourced from a number of options, including World Bank funded Kenya Urban Support PublicProgrammePrivate Partnership route for Climatestreetlightingfunds
18
Total cost = KES 479 m KES 3 m initial feasibility study KES 106 m to KES 426 m KES 25 m to 50 m initial start-up costs for landfill gas collection and Totalprocessingcost= KES 479 m Short medium-termto
Total cost = KES 50 m Benchmark = KES 150,000 per pole, KES 4 m to 5 m per km depending on Actualspacing.total = KES 40 m to 50 m based on 10km of road covered
CollectionWaste
responsibility of Municipal Government Employ local SMEs for waste services
222 # Project Title GBI Category Project Sub-Components Implementation Agency and Stakeholders Potential Sources of Financing / Funding and Delivery Mechanisms
17
19
implementationtomid-termcoordination,toShort-termcompletecomplete
Estimated Costs (in KES)
Timescale
Streetlighting Green Industries Review
Landfills Solid managementwaste
Construction of landfill gas collection and process system for biofuels Implementation and maintenance responsibility of EmploymentMunicipality and training by Municipality or private entity/ CBOsSupport from NGOs, community groups
IFI / Donor Finance. Revenue generating aspects: biofuel is a marketable product
Public and Private Sector
Total cost = KES 10.6 m Revenue generating aspects: valuable waste streams to be segregated e.g. Metals, plastic ongoingShort-term/
23
Public and Private Sector FundingKeRRA through development partners.Maintenance through Kenya Road Board – Road Maintenance Fuel Levy Fund (RMLF) Total = KES 3 bn ofinformrequiredprograminvestmentRuralMedium-termroadtophasinginvestment
Total cost = KES 25.5 m KES 500 m per tree Number of trees dependant on land and funding available Total based on 51,000 trees = KES 25.5 m Short-term
22 NMT ImprovementsUrbanandStreet andPlacemakingLandscape Pedestrian facilities Kerugoya: 3km Kutus: 5km KC Government would be the main implementing agency and KKM would be responsible for their maintenance Public Sector, IFI County government Kenya Urban Support Program (KUSP)
ManagementDonkey Green Industries and Agriculture Donkey welfare awareness and training campaigns Bylaw requiring registry of Developmentdonkeys of donkey sanctuary Municipal Government to pass bylaws that mandate donkey communitySupportregistrationfromNGOs,groups
ManagementWaterProtection,Environmental Trees and seedlings planting The initiative should be coordinated by KC, with inputs during the design phase and implementation phase by governmental agencies (e.g. Kenya Water Towers Agency), the private sector, donors/IFI and climate funding bodies
Potential Sources of Financing / Funding and Delivery Mechanisms
Estimated Costs (in KES) Timescale 20
Public Sector, IFI The financing option can be cross-collaboration between public sector, County/ Municipality budget, Donors/ IFI / Climate Funds and the private sector
Total cost = KES 50 m KES 20 m to 40 m annual budget for sensitisation campaigns, training, and registry maintenance KES 10 m for setting up a sanctuary Short ongoingterm/
21
ManagementCatchment in Mt Kenya
KERUGOYA-KUTUS MUNICIPALITY URBAN ECONOMIC PLAN (UEP ) 223 # Project Title GBI Category Project Sub-Components Implementation Agency and Stakeholders
Critical Rural Feeder Roads andPlacemakingLandscape Rehabilitation and upgrade of 56 km of rural feeder roads FarmersKeRRA and farmer cooperatives
Public AnnualSectorbudget allocation by county government for sensitisation and management Supportinitiativesfrom donkey welfare NGOs
Total cost = KES 16 m Kerugoya streets = KES 6 m Kutus streets = KES 10 m Short-term
224 6.4 Scheduling Section 5 sets out a scheduling plan for each respective Focus Area, reflecting the key interactions between different projects. The synergies for each Focus Area are also described in relation to the whole Development Framework. Figure 6.1 below demonstrates the full set of proposed VC and infrastructure projects, showing where implementation would suitably begin. Figure 6.1 UEP Development Framework Schedule Value Chain Group Short termImmediate Medium term Long term Focus Area 1: Sagana Green Industrial Hub (1) Sagana Green Industrial Hub (2) Water, Wastewater and Drainage Provision for Phase 1 Sagana (3) Organic Waste Processing for Phase 1 Sagana (4) Energy Solutions for Phase 1 Sagana (5) Access Road to Phase 1 Sagana (6) Railway Station Upgrade Focus Area 3: Kerugoya (10) Kerugoya Central Square (11) Kerugoya Bus Park Improvements Focus Area 2: Kutus (7) Kutus Pilot Area Urban Regeneration (9) Improved Access to Kutus Markets (8) Kutus Urban Park and Community Centre KKM and KC Level Proposals (12) Kerugoya and Kutus Water Supply (17) Street lighting (18) Waste Collection (19) Landfills (20) Catchment Management in Mt Kenya (21) Critical Rural Feeder Roads (22) NMT and Urban Street Improvements (23) Donkey Management (13) Kerugoya and Kutus Sanitation Provision (14) Micro-Hydro Projects (16) Solar Irrigation (15) Solar Refrigeration (Cold Stores) Source: Atkins
KERUGOYA-KUTUS MUNICIPALITY URBAN ECONOMIC PLAN (UEP ) 225
Funding including Climate Funds
6.5
116. Browder, G., Ozment, S., Rehberger Bescos, I., Gartner, T. and Lange, G.M. (2019) Integrating Green and Gray: Creating Next Generation Infrastructure. Washington, DC: World Bank and World Resources Institute 117. Brown, K. and Mijic, A. (2019) ‘Integrating Green and Spaces into our Cities: Making it Happen’, Grantham Institute Briefing Paper, 30, Imperial College
The investment experts, as part of the SUED programme, will develop feasibility studies for the proposed projects which will include estimated capital expenditure and operating expenditure requirements. It will likely be necessary to blend and combine a range of different sources of financial and non-financial support to meet the projects’ expenditure requirements. Careful consideration will have to be given to the differing eligibility criteria of the various sources in order to successfully structure blended finance arrangements.
grant funding could also be leveraged through initiatives such as businesses dedicating 1% of profits to corporate social responsibility (CSR) initiatives.
Examples of projects could include tree planting, provision of or access to recreational facilities such as green spaces and SuDS development also aligned with the GBI approach.
The World Bank’s Kenya Urban Support Programme (KUSP) has also been identified as a source of potential funding support for some of the UEP projects, including public realm improvements and urban drainage solutions. Private sector finance for a range of sectors is available in East Africa from both local and international sources. Existing investors in the region include impact investors, venture capitalists and private equity funds who are able to provide relevant instruments for the value chain projects such as equity, quasi-equity (mezzanine finance) or concessionary debt. Access to private finance will be contingent on the concrete demonstration of viable business models and strong governance structures. Projects will also benefit by blending in non-financial support in the form of social capital, such as volunteer efforts from the community. Actions to build social capital include mobilising community organisations and volunteers to be involved with the development and implementation of projects. The most successful mobilisation of human and social capital resources occurs for projects where there is a demonstrated, direct and visible relationship between the project and the future benefits for community and volunteer stakeholders. Examples of projects could include raising awareness campaigns for more efficient use of water and solid waste collection and management.
Green Blue Infrastructure funding In order to successfully implement the GBD approach in KKM, there is a need to identify potential funding mechanisms and delivery pathways. Due to its aforementioned environmental and socio-economic advantages, GBD has the potential to introduce new funding prospects from both public (via grants and subsidies) and private sources116. There is a growing appetite among the investment community to identify investments that have sustainability at their core. In addition to traditional climate funds, such as the Green Climate Fund, there is a growing number of opportunities to access funding targeted at both climate resilience, and natural capital. In this regard, the GBI projects are well placed to attract investment and will be able to clearly demonstrate climate resilience Innovationbenefits.inthegreen finance sector could offer opportunities for potential funding mechanisms for KKM. In recent years, development partners and governments have established several new initiatives to promote the use of GBD worldwide, including the UN World Water Assessment Programme and the European Natural Capital Facility117. Identification of such sources of green finance for multi-benefit projects currently represents a key enabler for innovation in the application of GBI, particularly for KKM. The GBI Development Framework in Chapter 6 explores potential funding sources and delivery mechanisms for the implementation of each GBI project in more Mobilisingdetail.the scale of resources to address the identified climate change adaptation measures to be implemented, and ensure that the selected VC and infrastructure projects are climate-resilient and inclusive, the Counties need to consider the full spectrum of potential funding sources available.
Grant funding can help improve the financial viability of projects which have significant, upfront capital expenditures, improving the overall investment appeal of a project and attracting additional private investment as a result. The proportion of grant finance of the total project finance amount should be carefully justified, as simply seeking a maximised grant finance proportion can seed doubts in the private sector about the long-term financial sustainability of the project. Grant funding is also available to less commercially-viable projects with significant socio-economic or environmental benefits, particularly relating to climate change and resilience. They may also be focused on certain activities such as technical assistance in project preparation or capacity Philanthropicdevelopment.andNGO
The Strategy identifies County governments as critical co-financiers who can take the role of Executing Entities and/ or Implementing Entities of climate-resilient and low-carbon initiatives. The Strategy provides a roadmap for stakeholders in harnessing resources from the GCF.
119. The Kenya National Green Climate Fund (GCF) Strategy https://www.gcfreadinessprogramme.org/sites/default/files/GCF%20Coordination%20Strategy%20Report.pdf
NEMA is the National Implementing Entity (NIE) for Adaptation Fund in Kenya.
Presented below is a snapshot of the available climate change funds that cover climate adaptation and mitigation. It is important to note the following:
> Include a statement of purpose or intent to address or improve climate resilience in order to differentiate between adaptation to current and future climate change and good development; > Set out a context of climate vulnerability (climate data, exposure and sensitivity), considering both the impacts from climate change as well as climate variability related risks, where the UEP Climate Vulnerability Assessment (Appendix D) provides important considerations here; > Link project activities to the context of climate vulnerability e.g. Socio-economic conditions and geographical location, reflecting only direct contributions to climate resilience.
118. http://pubdocs.worldbank.org/en/222771436376720470/010-gcc-mdb-idfc-adaptation-common-principles.pdfIMPLEMENTATION PLAN 126
The Adaptation Fund (AF): The AF finances projects and programmes that help vulnerable communities in developing countries adapt to climate change. Initiatives are based on country needs, views and priorities. The financial instrument/ delivery mechanism used by the Adaptation Fund is grants.
> Successfully accessing resources from these funds depends on a good understanding of the funder’s perspective and procedures. A comprehensive grasp of funding criteria as well as the different financial mechanisms and the extent to which they can be combined is important. Existing guidance presents the following principles that need to be generally adhered to. The project activity must:118
The National Treasury: This is the Kenyan National Designated Authority (NDA) for the GCF and developed the Kenya National Green Climate Fund (GCF) Strategy119 which has a vision to increase financial flow from the GCF for a climate-resilient society and low-carbon economy.
Green Climate Fund (GCF): The GCF seeks to promote a paradigm shift to low emission and climate-resilient development, taking into account the needs of nations that are particularly vulnerable to climate change impacts including Africa and Small Island Developing States (SIDs). The GCF aims to deliver equal amounts of funding to mitigation and adaptation and its activities are aligned with the priorities of developing countries through the principle of country ownership. The financial instrument/delivery mechanism for the GCF is grants, loans, equity or guarantees.
> The VCs and GBI projects have had climate change resilience actions embedded in their proposals, and further recommendations have been made, as per Sections 4.2 and 5. This will aid the projects in accessing funding by demonstrating their significant contribution to climate change actions.
226
The Least Developed Countries Fund (LDCF): The LDCF was established to meet the adaptation needs of least developed countries (LDCs). Specifically, the LDCF has financed the preparation and implementation of National Adaptation Programs of Action (NAPAs) to identify priority adaptation actions for a country, based on existing information. The financial instrument/delivery mechanism used by the LDCF is grants. The Global Environment Facility (GEF) administers the LDCF and Operational Focal Points (OFPs) are responsible for coordination in country. The Ministry of Environment and Forestry is Kenya’s GEF Operational Focal Point.
The Kenya County Climate Change Fund (CCCF) Mechanism:
The Special Climate Change Fund (SCCF): The SCCF was established to address the specific needs of developing countries under the UNFCCC with respect to covering incremental costs of interventions to address climate change relative to a development baseline. Adaptation to climate change is the top priority of the SCCF and in addition to this, it finances projects relating to technology transfer and capacity-building in the energy, transport, industry, agriculture, forestry, and waste management sectors. The SCCF is administered by the GEF and its financial instrument/ delivery mechanism is grants. The Ministry of Environment and Forestry is Kenya’s GEF Operational Focal Point.
The Climate Change Act, 2016 further created a Climate Change Fund to facilitate climate action. The National Treasury is the National Designated Authority (NDA) for climate finance in Kenya and oversees the implementing entities for various climate finance streams.
The Climate Change Act, 2016 requires that deliberate Climate Change considerations are made to ensure mainstreaming in all government plans, policies and programmes, resulting into inbuilt public climate financing of all sectors of the economy.
The Africa Climate Change Fund (ACCF): the ACCF aims to support African countries transition to climate-resilient and low carbon mode of development, as well as scale-up their access to climate finance. The ACCF serves as a catalyst with a scope broad enough to cover a wide range of climate-resilient and low-carbon activities across all sectors.
Priority for funding is given to the following themes: supporting small-scale or pilot adaptation initiatives to build resilience of vulnerable communities; and supporting direct access to climate finance. The ACCF gives grants and launches calls for proposals periodically. The Secretariat is housed at the African Development Bank. The financing of climate action is anchored on the Kenyan constitution.
KERUGOYA-KUTUS MUNICIPALITY URBAN ECONOMIC PLAN (UEP ) 227
This improves a County’s readiness to access and disburse national and global climate finance to support community-prioritised investments to build climate resilience, and 5 Counties have so far established CCCFs. The CCCFs are aligned with national priorities set out in Kenya’s National Adaptation Plan (NAP) and enable these County governments to strengthen and reinforce national climate change policies while delivering on local adaptation priorities. The expansion of the CCCF across the country is one of the priorities in the Kenya National Climate Change Action Plan, 2018-2022.
The Pilot Program for Climate Resilience (PPCR): The PPCR provides funding for climate change adaptation and resilience building. It aims to pilot and demonstrate ways in which climate risk and resilience may be integrated into core development planning and implementation by providing incentives for scaled-up action and initiating transformational change. It is a targeted program of the Strategic Climate Fund (SCF), which is one of two funds within the Climate Investment Funds (CIF) framework. The financial instrument/ delivery mechanism for the PPCR is grants and loans. The CIF Secretariat is housed at the World Bank.

Effective data gathering and analysis will support the monitoring of strategic objectives for the Municipality, including UEP project implementation, where capturing stakeholder information can be a key element of this. Data management of Municipality services, such as waste management, public transport service and open space maintenance, will support the Municipality in responding to its resident and business needs as well as monitoring the impact of these services. It is also recommended that digital platforms be developed, with business and community involvement, to better coordinate and deliver in the first instance, boda boda services and support online trading and supply chain linkages.
It is recommended that the Municipality and its departments are supported in their understanding and upskilling around social inclusion, including Social Inclusion Awareness Creation for the Municipality and its stakeholders to embed a shift in attitudes and reduce discrimination. This is important to open up socio-economic opportunities and infrastructure and services to all groups, improving social cohesion and addressing the significant outcomes of exclusion. This capacity building within the Municipality would suitably support the better application of inclusive contracts such as the Access to Government Procurement Opportunities (AGPO) policy. More specific recommendations provided further in Appendix D.
Several areas are recommended for capacity building for the UEP implementation, with the Municipality and departmental upskilling alongside partnerships and institutional structuring. These would support the effective and integrated approach to sustainable and inclusive economic sector development; infrastructure delivery, operation, and maintenance; and climate resilience future-proofing development.
Recommendations for Capacity Building
It will be important for the Municipality to develop an understanding of climate change impacts across different sectors, and exposure to risks and vulnerabilities. Such knowledge should be mainstreamed throughout services and projects to ensure resilience is embedded. The capacity and capability to access available funds (set out in section 7.4) should be improved. Building capacity among key planners and decision-makers so that climate change can be more widely integrated into County sector and development plans will help ensure that climate risks are adequately considered, and that the Municipality is well-positioned to identify any potential opportunities arising.
The Economic Sector Action Plans (Section 4.1) present recommendations around institutional structures and capacity to successfully develop the key sectors and realise the opportunity from the VC projects. Capacity building for the Action Plans incorporates the County’s educational facilities, the County Government and Municipality, the business community, local community and sectoral partners, where an Entrepreneurship Centre is aspired to as local capacity is built.
Social inclusion
Climate resilience
Economic opportunities and Value Chains
Project implementation Capacity building in project preparation, project management, and delivery and maintenance from the Municipality, particularly when it comes to revenue generating activities and how to ensure revenue is received and used, is recommended.
Data and digital tools
The need to work with the private sector for the delivery of urban services and projects is increasing in importance and requires knowledge and skills to support effective implementation of market-driven solutions including PPP mechanisms. The UEP promotes an integrated approach to development and there is a need to ensure silo thinking is removed from planning and delivery. This enables an understanding of what needs to come first in the development process, and the wider dependencies and synergies involved.
Strengthening preparedness and emergency response capacity is critical. This means better preparedness in terms of financing, service delivery and business continuity including budgeting for future crises, emergency operations centres, capacity building, drills, and human resources redeployment plans. This capacity building is recommended for KKM, where a cross-sector taskforce would be a recommended structure.
228 6.6
COVID-19 lessons and emergency response
Opportunities might take the form of attracting investment for climate-resilient investment programmes, or proactively identifying and supporting new business ventures which respond to changing conditions and consumer demand. More specific recommendations are provided further below in Appendix C.
6.7
> Ensure quotas for PWD (established by the Persons with Disabilities Act, 2003) are implemented and prioritise SIGs for the programme’s employment and capacity-building opportunities. Ensure all infrastructure adopts inclusive design standards.
> The introduction of new climate-resilient approaches and technologies that support income generation, such as crops and for farming, should be affordable to avoid exclusion of low-income groups. Green jobs should also be available to SIGs by providing them with the adequate training.
> For the GBI, involve local community groups, NGOs, agri-businesses and other private companies engaging in corporate social responsibility in the construction phase and for its maintenance.
> Establish a Gender and Social Inclusion Implementation Unit, which will work under the leadership of the UEP implementation manager to ensure inclusivity proposals in the UEP are implemented and monitored.
Recommendations for Social Inclusion
> Commit to always engage SIGs and give them a chance to be informed, to contribute to decision-making, and actively give views on and participate in matters that affect them. This needs to consider that SIGs are not homogeneous groups and that they face different challenges according to their age, gender, ethnicity, education levels, and ableness.
KERUGOYA-KUTUS MUNICIPALITY URBAN ECONOMIC PLAN (UEP ) 229
> Always communicate to local residents and adjacent businesses about the implementation schedule of the different projects to mitigate the disruption of socio-economic activities. Provide accessible channels to receive and address complaints.
Considerations for social inclusion have been embedded into the development, design, prioritisation and proposed implementation of the Development Framework and the Economic Development Plan and VC projects. Apart from the specific recommendations for the different projects, key recommendations include: > Continue supporting and expand local programmes such as Wezesha, which have contributed to the empowerment and new economic opportunities for women, youth, and other vulnerable groups. > Ensure participation of all in the UEP planning, development, implementation, monitoring and decision-making. Stakeholder engagement should be a live process of the programme.
> Ensure all communication is timely, and in formats and languages that are accessible for all. This may include material for visually impaired people (audio, Braille), for people with learning disabilities and literacy difficulties (audio, easy-to-read written material), for people with hearing impairments (written material, Sign Language), and for people with co-ordination difficulties (easy-to-read written material, audio). The material should also consider people with low-literacy levels.
230 6.8
Recommendations for Climate Change and Resilience
Future developments in the county need to be designed to be resilient to climate change, or they risk not meeting development objectives. This requires the establishment of a clear process for including climate risk assessment within development decisions. We recommend targeted capacity-building to increase knowledge and skills of the relevant departments and developing simple approaches that can be used to ensure that climate risks are well considered in future development.
This report has highlighted important linkages between poverty, exclusion, and climate change, and there is a need to establish the mechanisms so that traditionally marginalised groups are included in decisions about both the development and implementation of the GBI development framework, as well as wider decision-making processes on climate risk and resilience. Ensuring that there is representation from groups particularly vulnerable to climate change will reduce the risk that activities designed to increase resilience have unintended consequences, and exacerbate existing vulnerabilities and Althoughinequalities.theselected VCs are agriculturally focussed, assessment shows that they are not highly vulnerable to climate change, and there are opportunities to integrate appropriate adaptation measures, as detailed for each prioritised VC in sections below.
Key climate risks relate to rainfall variability and water availability. However, the husk VCs will draw largely from irrigated rice crops, while the volume of produce needed for the banana VCs are low compared to production. Additionally, crop modelling suggests that banana production in Kenya may actually increase relative to other countries, in particular if simple adaptation measures are integrated, as outlined in the resilience assessment below for the VC.
The creation of a climate-resilient agriculture policy, building on existing county agricultural plans, and national policies such as the Kenya Climate Smart Agriculture Strategy (2017-2026), could help to coordinate these efforts and build institutional capacity on climate-resilient agriculture.
The projects outlined in this report will help to strengthen the resilience of the Municipality to climate change, and the GBI development framework presented can provide an approach to mainstream climate resilience within the development priorities for the county. While the projects and interventions outlined in this report represent strong foundations on which to build, much more will be needed, both in terms of infrastructure investment, and strengthening institutional capacity, to ensure that KKM can reach its goals despite challenging climate conditions. Key to increasing the resilience of KKM is the ability to attract funding to implement climate adaptation projects. Several Kenyan Counties have created, or are in the process of creating, County-level climate change funds, designed to be used to finance key climate change activities in the County, and deliver locally on the priorities of Kenya’s National Adaptation Plan. Initial evidence shows that these funds are effective not only in terms of finance, but also for the coordination of climate resilience programmes among different actors. We recommend that the County explores whether it is feasible to establish a similar fund for KKM, or a body designed to attract inward investment of climate and sustainable finance. The projects presented in here have undergone a climate screening process and are designed to meet the basic funding criteria for climate finance, although specific requirements will vary, and full project concepts would be needed.
The GDI approach provides an opportunity to build resilience at the landscape and catchment scale.
Itresilience.isclearthat a climate-resilient agricultural sector will be essential both for driving growth in the County, as well as improving livelihoods and reducing poverty. Initiatives such as the Kenya Climate Smart Agriculture Programme provide important learning opportunities and can start to lay the foundations for a resilient agricultural sector. Scaling-up the lessons from this and similar programmes will require a coordinated programme of investment, with potential Focus Areas on: > Training programmes on Climate Smart Agriculture;
> Increased awareness of appropriate insurance products (e.g. Weather-based index insurance); > Reducing post-harvest losses.
There are significant climate resilience benefits that could be achieved through improved catchment management measures, with water sensitive land management in the upper catchments around Mt Kenya helping to both reduce flood risk, and increase the quality and quantity of water available downstream. A variety of approaches to catchment restoration and protection can be explored, including Payment for Ecosystem Services projects, where upstream landowners are paid for good environmental practices by downstream beneficiaries, which could also help to increase catchment
> Improved access to seasonal and 10-day forecasts;
Next Steps
> Will help remove or amend policy and regulatory constraints to private sector led urban development and growth. Investment experts to help: > Develop feasibility studies and business cases for specific projects to establish their bankability, and; > Develop investment promotion strategies to draw in investment (including seed financing through the programme).
KERUGOYA-KUTUS MUNICIPALITY URBAN ECONOMIC PLAN (UEP ) 231 6.9
Following the completion of the UEP, during the next phase of the SUED Programme the proposed projects will be developed further by: Capacity building specialists to help: > Enhance municipal and local capacity to implement the identified projects, and; > Enable revenue generation to ensure financial sustainability beyond the programme. $ $ Investment climate advisers:
KERUGOYA-KUTUS MUNICIPALITY URBAN ECONOMIC PLAN (UEP )
