Who Profits From War: How Gas Corporations Capitalise on War
in Ukraine
Gas Industry and Governments capitalise on Russia’s invasion of Ukraine and lock Europe and the US into fossil fuels reliance
A report by Greenpeace International April 2023
Authors
Tim Donaghy (Ph.D.)
Amadeo Ghiotto
Céline Préaux (Ph.D.).
Contributors
Niv Hachlili, Paul Horsman, Mathieu Soete, Anusha Narayanan and John Noel
Editor Lauren Kemp
Designed By Kyle McKibbin
Cover image by Bob Pearson
Greenpeace is an independent campaigning organization that uses peaceful protest and creative communication to expose global environmental problems and to promote solutions that are essential to a green and peaceful future.
using
“The gas industry is
today’s news — the war and the energy crisis — to try to lock in more gas for decades, even though the industry knows it’ll be disastrous for the climate and international stability.”
— Ben Franta
Summary
Who Profits From War - How Gas Corporations Capitalise on War in Ukraine
Gas Industry and Governments capitalise on Russia’s invasion of Ukraine and lock-in Europe and the US into fossil fuels reliance
The 2022 Russian invasion of Ukraine shocked the world. It quickly resulted in an energy crisis as European States tried to secure non-Russian energy supplies for the winter.
What followed was one of the most blatant examples of ‘shock doctrine,’ where gas operators quickly shifted their public messaging and lobbying from “energy transition” to “energy security” and cynically used the opportunity to frighten governments into massive, unneeded investment into and expansion of fossil gas imports and infrastructure. These tactics have resulted in a short-term energy supply crisis being answered by long-term fossil fuel lock-in in the form of new infrastructure, decades long contracts, and environmental impact in the US, as well as in the EU. This overreaction jeopardises the EU’s and US’ energy transition and their agreed climate goals.
The shift was instant and effective. The REPowerEU plan, the EU answer to the gas crisis, included around €10 billion ($20.9 billion) in funding for gas infrastructure.1 Eight liquefied gas terminals are under construction, and 38 more have been proposed.2
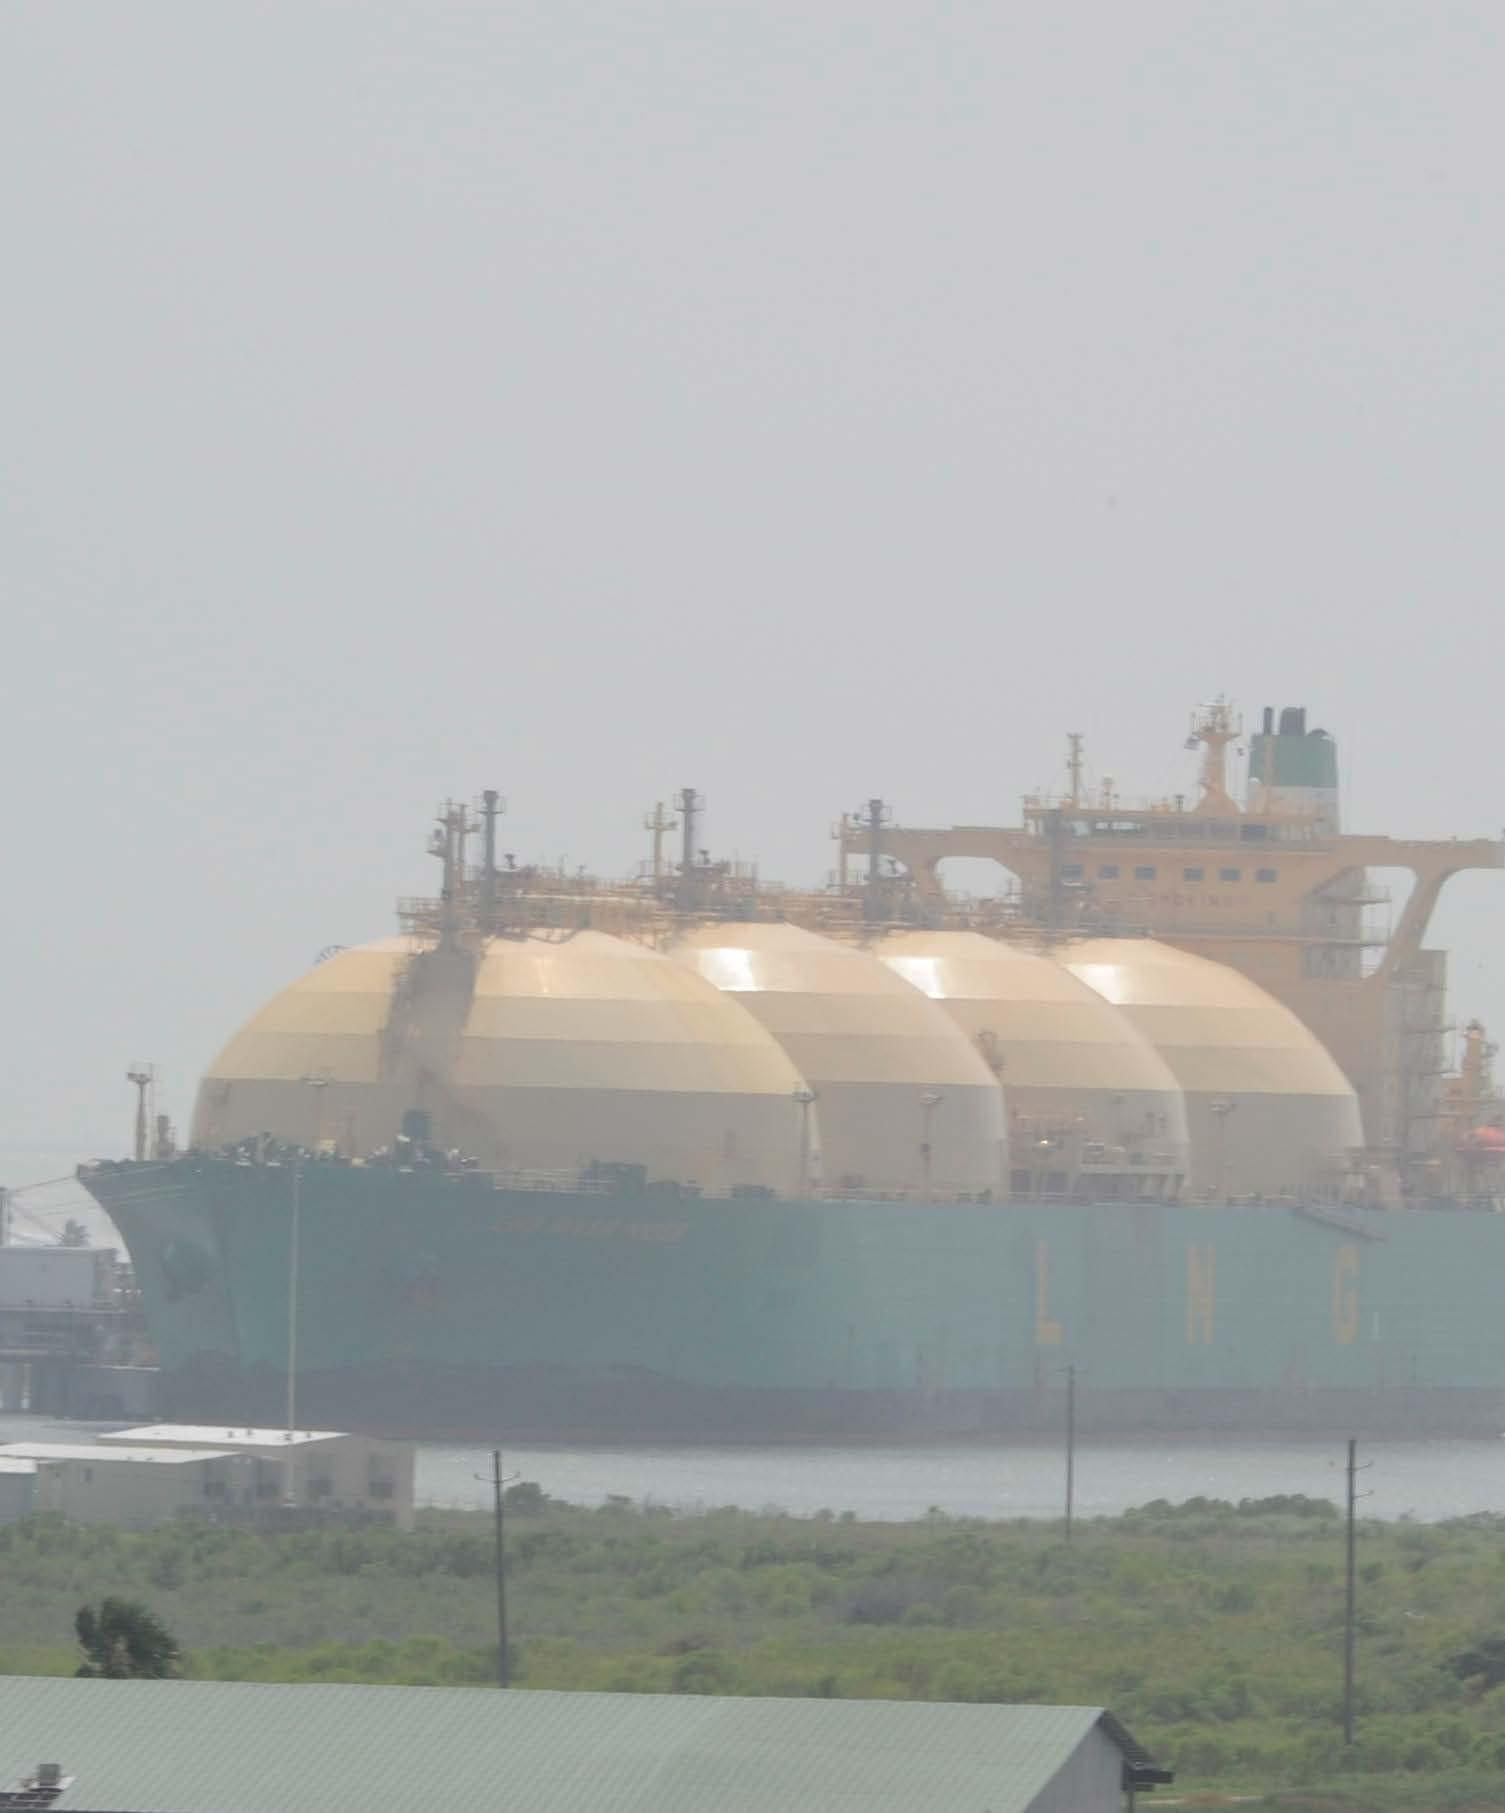
Replacing Russian pipeline gas led to a surge of shipments of liquefied gas (also known as LNG) from the US. As a result, gas infrastructure operators, portfolio traders, and gas companies have declared that imported liquefied gas is the answer to the crisis and will remain so for decades to come. This LNG expansion threatens the health of communities living near these export terminals, extraction sites, and pipelines, while potentially pushing planet warming emissions past levels to meet global climate goals.
Shareholders of the world’s top five oil and gas companies saw record profits of €192 billion ($209 billion)3 and distributed $102 billion (€93 billion)in the form of dividends and share-buy-backs in 2022.4
Why The Gas Is Not Needed KEY FINDINGS
• Gas companies are capitalising on the shock of the Russian invasion of Ukraine to weaken regulations and push new proposals for increasing liquefied gas imports and locking both the US and Europe into contracts that would last for 15 to 20 years. This threatens climate goals, communities and investors.
• The reality is that most of the proposed projects would not be operational in time to address shortterm energy shortages arising from the war in Ukraine. Most projects will only come online by 2026, far too late to respond to the current supply crunch.
• The US has approved projects that, if built, would double liquefied gas export capacity to 439 bcm per year – with annual lifecycle emissions equivalent to 393 million cars.5 By 2030, US liquefied gas exports alone could exceed the Net Zero Emissions (NZE) estimate by the IEA for global liquefied gas trade.6
• US liquefied gas imports to Europe increased by 140% in 2022.7 France accounted for nearly a quarter of these imports, with the UK and Spain following closely. At the same time plans for a raft of new import terminals are being pushed through.
• Currently in Europe eight liquefied gas terminals are under construction and 38 more have been proposed. These terminals, if built, would add 950 million tonnes of CO2-eq per year.8
WHO PROFITS FROM WAR – HOW GAS CORPORATIONS CAPITALISE ON WAR IN UKRAINE i
Executive
• Despite this massive surge in imports and infrastructure plans, EU liquefied gas regasification utilisation rate was only 63% in 2022.9
• European climate change policies should include phasing out liquefied gas before 2030 and all fossil gas by 2035.
A Fossil Fuel Disaster
The EU’s energy crisis has been driven by the shortterm need to get off Russian oil and gas. But this scenario ignores the much larger existential crisis of climate disruption. The climate protection pathways consistent with keeping the average global temperature increase to below 1.5°C (2.7°F) show that Europe must phase out gas consumption by 203510. We need to get off all gas, not just that from Russia.
Despite this, European States have announced plans for an additional liquefied gas import capacity of 227 bcm per year over the coming years11 – more than doubling existing capacity.12
The US has similar ambitions with approved projects that could more than double US export capacity and many more are proposed.13 This proliferation of US export terminals has been mostly financed by European banks,14 and made possible by negotiating long-term supply agreements with European purchasers and portfolio traders.15
This buildout is irrelevant to Europe’s real short-term needs. Without any extra measures, the US can already increase its liquefied gas exports to Europe as a temporary measure to cover a short-term supply crunch.16 Any liquefied gas terminal coming online in 2026 or later does not help the current crisis – although it will make the climate crisis much worse and will, of course, increase profits of fossil fuel companies.
Who Pays The Price?
In 2022, while the world was recovering from Covid-19 and facing multiple wars, famines and other climate-related catastrophes, the big five energy companies (BP, Chevron, Exxon, Shell and TotalEnergies) generated €192 billion ($209 billion) in record profits17; roughly twice what they made in 2021.18
Around the world, families were forced into poverty, government subsidies were announced, and aid packages were offered. In the EU reportedly 71% of people cut back on food and everyday items,19 and in the US a quarter of poll respondents said they had forgone necessities like food or medicine to pay their energy bills.20
This LNG expansion also has substantial health and safety impacts on communities. European countries have banned methods like fracking at home,21 yet encourage these methods in the US to satiate their energy demand. The extraction and transporting of liquefied gas in Texas, New Mexico, and Louisiana has resulted in worsening air quality, contaminated water, and increases the risk of respiratory diseases, birth issues, and cancer in these communities, many of which are predominantly Black, Brown, Indigenous, and have low incomes.22
Breaking the Climate
Investments in pipelines, terminal infrastructure and long-term contracts are all forms of “carbon and methane lock-in” that will make it harder politically, economically, and socially to decarbonize. Liquefied gas has higher lifecycle greenhouse gas emissions than pipeline gas. According to the Global Energy Monitor, if the EU LNG terminals that are under construction or proposed start production would result in 950 million tonnes of CO2-eq per year from these terminals.23
The environmental and climate impacts of these contracts makes them contentious which has resulted in a swathe of greenwashing on both sides of the Atlantic such as gas “certification” schemes24, “hydrogen ready” rhetoric,25 and repeated claims of “clean energy”. As this report shows, liquefied gas is not “clean”, “needed” or “wanted”.
While it will take significant work and investment to achieve the change needed, reality shows26 that reducing demand together with increasing energy efficiency and ever cheaper renewable sources is the clear way forward.
It is equally clear that the liquefied gas buildout being foisted upon the US and Europe is a long-term disaster rather than a short-term solution.
ii WHO PROFITS FROM WAR – HOW GAS CORPORATIONS CAPITALISE ON WAR IN UKRAINE
Outsourced hypocrisy
One of the most outrageous features of the liquefied gas boom is its source. US liquefied gas comes mainly from fracking.27 Many of the European banks that are financing US liquefied gas terminals have policies that exclude fracking from their banking activities. The case study in this report, identifies that all but one of the banks involved have such a policy.28 And almost all the European countries that are importing US liquefied gas have banned fracking on their own land.29 That’s because a growing body of research has associated proximity to oil and gas activity with health problems30 such as respiratory impacts (e.g. asthma),31 cancer,32 poor birth outcomes,33 and more.
In the US, all the operating and under-construction terminals except one are located near a “disadvantaged community” as determined by the Sierra Club.34
A compendium of scientific and medical research on the impacts of fracking in the US summarised its findings by saying, “Our examination uncovered no evidence that fracking can be practised in a manner that does not threaten human health directly and without imperilling climate stability upon which public health depends.”35
Data from the US EPA’s Air Toxics Screening Assessment shows that 236 counties with a total population of 14 million “face cancer risk exceeding EPA’s one-ina-million threshold level of concern, just due to oil and gas pollution.”36
In the words of John Beard, a community advocate in the Port Arthur area: “Europeans shouldn’t think gas exported from my community is ‘freedom gas’. Nothing’s really free… It’s going to cost you. It’s going to cost you more and it’s going to cost you in the long run. Because the more you use it, the more peril it places on your life and health, and the life and health of people across this entire planet. Climate change is real ”37
Recommendations
Phasing out fossil fuel exports from the US must be paired with strong demand-side policies to end fossil fuel use in Europe and other importing markets. Stopping the expansion of gas requires strong policies both to reduce harms where drilling occurs and all along the supply chain to decrease the demand for gas and incentivize the rapid buildout of renewables.
For Europe:
CHANGE THE SYSTEM
1. Remove fossil fuels from politics, by: ending their access to decision-making; ending conflicts of interest; excluding fossil fuel industry representatives from climate negotiations; rejecting partnerships with the fossil fuel industry.
2. Revoke the privileged role of gas lobby group ENTSOG in EU decision-making processes.
3. Ensure full transparency on all available data on gas flowing into, through, and out of the EU.
4. Further strengthen, adopt and enforce due diligence legislation at European and nationals levels.
PHASE OUT GAS
1. Set mandatory gas reduction targets at EU and national levels,
2. Set targets for climate neutrality by 2040 in the EU and the US,
3. Pursue an active fossil gas phase-out by 2035. Due to its higher carbon intensity and risk of methane leaks, imports of LNG should be phased out first.
4. Cancel all projects for the construction of new LNG import terminals and expansion of existing terminals
5. Halt new long-term contracts for the delivery of LNG, and ban extension of existing contracts.
6. Properly account for the higher lifecycle emissions of LNG compared to pipelined gas.
7. Critically assess hydrogen projections and projects pushed by the fossil fuel industry.
WHO PROFITS FROM WAR – HOW GAS CORPORATIONS CAPITALISE ON WAR IN UKRAINE iii
REDUCE CONSUMPTION, BOOST EFFICIENCY AND EXPAND RENEWABLE ENERGY
Policies and measures are needed to support urgent measures that provide the services required from energy but do not rely on fossil gas through rapid expansion of systems and mechanisms that reduce consumption, expand efficiency and renewable energy sources.
Energy Saving and Conservation measures to reduce demand:
Efficiency (incl. insulation) - in Building and Industry: Renewable heating (like heat pumps); Building renovation heater efficiency in buildings; efficiency in industrial processes.
1. Financial support schemes for vulnerable people to meet their basic energy needs
2. Ban disconnections e.g. energy providers should not have the right to cut off customers who fail to pay their bills, in particular vulnerable ones
3. Drive deep building renovations and sufficiency that can realise the potential to permanently cut demand by improving the energy performance of buildings.
Power production – Maximise measures for renewable power sources at all public, commercial, and industrial sites and operations. E.g. solar panels on rooftops, install heat pumps and undertake renovation measures.
Industry – where possible be fully electrical and more circular, while always prioritising energy saving
Tax fossil fuel profits: to help meet the investment needs of the energy transition, ensuring the burden does not fall on citizens and the rest of the economy.
For the US:
US policy makers must take the following steps to align LNG exports with strong climate goals:
1. Stop approving permits for any new infrastructure projects that would increase GHG emissions or worsen the climate crisis. This requires that any new pipelines or new LNG export terminals be rejected.
2. Reject federal approval for any LNG export shipments from existing or approved terminals that are inconsistent with 1.5°C pathways, worsen domestic energy poverty, or pose health threats to nearby communities.
3. President Biden must wield his global leadership and support ending international public finance for fossil fuels, including LNG, at the G7, G20 and COP28.
Both Biden and Congress must take further steps to protect the climate and communities living on the fence lines of the fossil fuel supply chain. Such policies include:
1. Establish a national plan and targets to wind down existing fossil fuel production and infrastructure.
2. Eliminate federal fossil fuel subsidies.
3. Ban new fossil fuel leasing and permitting on public lands and waters, and phase out existing leases.
4. Enact regulations to eliminate methane emissions and flaring from oil and gas facilities.
5. Require air and water pollution reductions in polluted communities by implementing a comprehensive “No Pollution Hotspots” policy.
6. Pass the Environmental Justice for All Act to provide legal remedies to citizens, improve equity mapping tools, expand grant programs, and strengthen consultation with impacted communities.
7. Build on the renewable energy incentives in the IRA to enact a Green New Deal that will direct trillions of dollars in public investments to create millions of green union jobs, rectify past injustices, and ensure that energy-dependent workers and communities are left better off through the transition.
iv WHO PROFITS FROM WAR – HOW GAS CORPORATIONS CAPITALISE ON WAR IN UKRAINE
WHO PROFITS FROM WAR – HOW GAS CORPORATIONS CAPITALISE ON WAR IN UKRAINE v Table of Contents Executive Summary . . . . . . . . . . . . . . . . . . . . . . . . . . . . . . . . . . . . . . . . . . . . . . . . . . . . . . . . . . . . . . . . . . . i Why The Gas Is Not Needed ........................................................................ i Key Findings .................................................................................... i A Fossil Fuel Disaster ii Who Pays The Price? ii Breaking the Climate............................................................................... ii Outsourced hypocrisy ............................................................................ iii Recommendations ............................................................................... iii For Europe: iii CHANGE THE SYSTEM ....................................................................... iii PHASE OUT GAS ............................................................................ iii REDUCE CONSUMPTION, BOOST EFFICIENCY AND EXPAND RENEWABLE ENERGY ............... iv For the US: ..................................................................................... iv List of abbreviations . . . . . . . . . . . . . . . . . . . . . . . . . . . . . . . . . . . . . . . . . . . . . . . . . . . . . . . . . . . . . . . . vii Introduction . . . . . . . . . . . . . . . . . . . . . . . . . . . . . . . . . . . . . . . . . . . . . . . . . . . . . . . . . . . . . . . . . . . . . . . . . . 1 LNG: an introduction ....................................................................... 1 Gas operators pushing for shock “solutions” ....................................................... 2 Gas operators leading the dance 4 Embracing a US fossil future 5 The Fluxys tentacles that lock us into LNG .................................................. 7 US LNG flooding Europe . . . . . . . . . . . . . . . . . . . . . . . . . . . . . . . . . . . . . . . . . . . . . . . . . . . . . . . . . . . . . . 11 Europe becoming the first customer for US LNG .................................................. 12 Dunkirk terminal: The entry point for US gas into Europe .................................. 14 LNG terminals spreading over Europe ............................................................. 15 Unneeded lock-in 16 Locking us in using trojan horses 19 Tankers lock-in ........................................................................... 20 Contracted lock-in - tackling a short-term problem with long-term contracts .............................................................................. 21 Dunkirk LNG: pushing for long-term contracts 24 US LNG, Chinese profits 25 Export terminals in the US - backed by European contracts...................................... 25 Dunkirk: surging emissions in the US . . . . . . . . . . . . . . . . . . . . . . . . . . . . . . . . . . . . . . . . . . . . . . . . . . . . . . 31 Toxic snowball effect . . . . . . . . . . . . . . . . . . . . . . . . . . . . . . . . . . . . . . . . . . . . . . . . . . . . . . . . . . . . . . . . 33 Profits for the gas industry ....................................................................... 33 Portfolio traders made a killing in 2022 . . . . . . . . . . . . . . . . . . . . . . . . . . . . . . . . . . . . . . . . . . . . . . . . . . . . . . . 33 Shareholder profits instead of renewables 34 What could one do with these massive profits 34
vi WHO PROFITS FROM WAR – HOW GAS CORPORATIONS CAPITALISE ON WAR IN UKRAINE Costs to European and US consumers ........................................................... 35 Paying the bill three times .................................................................... 35 1. Devastating energy bills ................................................................ 35 EU’s energy import bill invested in renewable energy. 35 LNG is an inherently expensive fuel................................................. 36 2. The tax bill: LNG expansion is made possible using our taxes ............................37 3. Our future bill: the stranded assets ......................................................37 Stranded assets - Paying twice .................................................... 38 Costs for the Global South 39 How replacing pipelined gas by LNG jeopardises EU climate targets ............................ 40 CO2 footprint ................................................................................. 40 Operating time of new infrastructure is longer than climate targets allow .................... 41 Methane leakage all across the US gas system, making US fields the dirtiest in the world .... 42 Outsourcing pollution . . . . . . . . . . . . . . . . . . . . . . . . . . . . . . . . . . . . . . . . . . . . . . . . . . . . . . . . . . . . . . . 45 We know fracking is harmful, we banned it ...................................................... 45 Our banks are still investing in fracking 46 Messing with emissions ......................................................................... 48 Cheniere’s dirty business .................................................................49 Suffocating communities ......................................................................... 51 It’s not over . . . . . . . . . . . . . . . . . . . . . . . . . . . . . . . . . . . . . . . . . . . . . . . . . . . . . . . . . . . . . . . . . . . . . . . . . 53 Due diligence - holding them accountable . . . . . . . . . . . . . . . . . . . . . . . . . . . . . . . . . . . . . . . . . . 55 Conclusions . . . . . . . . . . . . . . . . . . . . . . . . . . . . . . . . . . . . . . . . . . . . . . . . . . . . . . . . . . . . . . . . . . . . . . . . . . 61 Recommendations . . . . . . . . . . . . . . . . . . . . . . . . . . . . . . . . . . . . . . . . . . . . . . . . . . . . . . . . . . . . . . . . . . 63 Demands For Europe 63 Demands For the US 65 Annex 1 . Research Methods . . . . . . . . . . . . . . . . . . . . . . . . . . . . . . . . . . . . . . . . . . . . . . . . . . . . . . . . . . 67 Annex 2 . Transcript of John Beard’s Interview . . . . . . . . . . . . . . . . . . . . . . . . . . . . . . . . . . . . . . . 71 Endnotes . . . . . . . . . . . . . . . . . . . . . . . . . . . . . . . . . . . . . . . . . . . . . . . . . . . . . . . . . . . . . . . . . . . . . . . . . . . . . 79
List of abbreviations
ACER - European Agency for the Cooperation of Energy Regulators
BCM - Billion Cubic Metres
BUILDER - Building United States Infrastructure through Limited Delays and Efficient Reviews
DESFA - Hellenic Gas Transmission System Operator (company based in Greece)
DoE - Department of Energy (US)
EACOP - East African Crude Oil Pipeline
EIA - Energy Information Administration
EIG - Global Energy Partners (company based in US)
ENTSOG - European Network of Transmission System Operators for Gas (EU)
EPA - Environmental Protection Agency (US)
EU - European Union
FERC - Federal Energy Regulatory Commission (US)
FID - Final Investment Decision
FSRU - Floating Storage and Regasification Unit (FSRU)
FSU - Floating Storage Unit
GHG - Greenhouse Gas
GIE - Gas Infrastructure Europe
IEA - International Energy Agency
IEEFA - The Institute for Energy Economics and Financial Analysis
IPCC - Intergovernmental Panel on Climate Change
IRA - Inflation Reduction Act (US)
IRENA - International Renewable Energy Agency
LNG – Liquefied Natural Gas
MARAD - Maritime Administration (US)
MTPA - Million Tonnes Per Annum
NOx – Nitrogen Oxides
NZE - Net-Zero Emissions
PA-CAN - Port Arthur Community Action Network (US)
PCI - Projects of Common Interest (EU)
PM2.5 – Fine Particulate Matter
RRF - Recovery and Resilience Facility (EU)
TAP - Trans Adriatic Pipeline
TEN-E - Trans-European Energy Infrastructure (regulation)
TYDP - Ten-Year Development Plan
US – United States of America
VOCs – Volatile Organic Compounds
The research methods and more clarification on the used databases can be found in Annex 1.
WHO PROFITS FROM WAR – HOW GAS CORPORATIONS CAPITALISE ON WAR IN UKRAINE vii

© Les Stone / Greenpeace
Introduction
The unprecedented energy crisis the world is facing has been analysed through many different lenses. Geopolitical shifts, market shifts, social crisis, record corporate profits, industry lobbying, regulatory changes and forecasts. In all these reports and briefings, one crucial group of industry actors continues to stay under the radar: fossil gas infrastructure operators. These middle men of the gas industry are often considered to be mere executors: they build pipelines and terminals, to be used by other - key - actors of the fossil industry. Pascal De Buck, the CEO of Fluxys - one of the largest gas operating companies in Europe - states it clearly: they have little responsibility, they are not the ones deciding, controlling, or pushing for gas contracts.38 If anything, gas operators have been praised for their role in tackling the current energy crisis, serving the common good by developing the infrastructure that will keep us warm throughout the coming winters.
Our analysis will debunk these misconceptions. We will show that gas operators are driving the expansion of the gas industry and risking increased catastrophic climate impacts. We will also inspect the plans they put on the desks of decision-makers, showing these are not based on a rigorous assessment of the current situation, but constitute irrational proposals which, if fully implemented by our representatives, would lead us to miss our climate targets while shifting the bill onto citizens.
LNG: an introduction
We will focus on the biggest geopolitical shift in the fossil landscape: Europe’s detachment from Russia and its new reliance on the United States of America. We will analyse gas flows, contracts, finances, infrastructure expansions, emissions, regulatory changes, political agreements, and industry lobbying. We will confront all of this with the data that should have been the basis for the steps and decisions taken in 2022-23. We will also give a platform to the communities fighting against this fossil fuel invasion of their lands and, through their battles, defending a sustainable future for us all. We will illustrate global trends and figures with concrete examples on both sides of the Atlantic.
In the US, we will highlight the export terminals delivering the most gas to Europe: especially Sabine Pass LNG, owned by Cheniere, which is the biggest export terminal in the US.39 The petrochemical and fossil fuel industry continues to sacrifice the health and safety of communities on the US Gulf Coast by ramping up the build-out of fossil fuel infrastructure. In Europe, we will focus on Dunkirk LNG, owned by Fluxys, which is the second-largest LNG terminal in continental Europe and the prime entry-point of US gas to Europe. We will uncover the plans of Fluxys and show that, far from being follow-up plans, they are both executive and inconsiderate.
Liquefied Natural Gas (LNG) is fossil gas, mostly methane, that has been cooled down to its liquid state for ease of transportation and storage. Unlike pipeline gas, LNG is usually transported over long distances using highly specialised tankers. The liquefaction process reduces the volume of fossil gas by a factor of around 600, by keeping it at extremely low temperatures. However, LNG liquefaction, transportation and regasification require a significant amount of energy, resulting in a higher carbon footprint compared to pipeline gas. LNG can be up to 4 times more CO2 intensive than pipeline gas in the EU.40 LNG sourced from fracked gas in parts of the US is among the most environmentally destructive sources of fossil energy in the world.41
WHO PROFITS FROM WAR – HOW GAS CORPORATIONS CAPITALISE ON WAR IN UKRAINE 1
Gas operators pushing for shock “solutions”
Once it was clear that Europe would undergo a major shift as a consequence of the Russian invasion of Ukraine, the gas operators (see our box “Gas operators leading the dance”) started an intense lobbying blitz to ensure this shift reflected their priorities. This blitz was a classic example of the “shock doctrine,” described by Naomi Klein as “the brute tactic of systematically using the public’s disorientation following a collective shock—wars, coups, terrorist attacks, market
crashes, natural disasters—to push through radical pro-corporate measures, often called ‘shock therapy’.”42
An investigation by DeSmog, who analysed the narrative shift of four big industry groups throughout 2022, among which gas operators play a strategic role.43 These groups, led by Gas Infrastructure Europe (GIE), a lobby group representing the interests of gas operators, moved their discourse away from ‘energy transition’ to ‘energy security.’

2 WHO PROFITS FROM WAR – HOW GAS CORPORATIONS CAPITALISE ON WAR IN UKRAINE
Source: DeSmog
Figure 1: The narrative shift from “energy transition” to “energy security” by gas industry lobby groups
Whereas posts emphasising energy security, or the prospect of an energy shortage or crisis, accounted for about three percent of the tweets from these industry groups in the 10 months prior to the invasion, according to DeSmog’s findings, that proportion shot up more than tenfold after the war started, with messaging related to energy security appearing in about a third of tweets from late February to December.
To Ben Franta, senior research fellow at the Oxford Sustainable Law Programme, the purpose of this narrative shift is obvious: “The gas industry is using today’s news — the war and the energy crisis — to try to lock in more gas for decades, even though the industry knows it’ll be disastrous for the climate and international stability.”44
This shock doctrine was also pushed onto the desks of European decision-makers. On 4th May 2022, two weeks before the European Commission published REPowerEU - launched to find solutions to move away from Russian fossil fuels45 Gas Infrastructure Europe (GIE) prepared a shock package for REPowerEU. It also reportedly lobbied the European Commission on the topic.46 Its “solutions” are presented as “Making REPowerEU successful with gas infrastructure.”47 This shock plan argues for the need to invest in LNG infrastructure, multiply LNG terminals for “European security of supply,” put in place a “fast-track approval procedure” for planned and future LNG projects, multiply pipelines to connect those terminals and “accelerate investments in infrastructure.” The link with fear and confusion is also very well illustrated in GIE’s long paper:48 the geopolitical shift led to the “need for security” to replace “climate” on top of the pyramid of key factors in the energy market. “The balance of the EU Energy Trilemma has to be refunded,” it states explicitly.
Furthermore, GIE argues that focus on 2050 and our climate targets, should be replaced by the “now”, stating “The extreme energy prices of last year, and the current threats to security of supply require a focus on the shorter term.”

ENTSOG (see our box “Gas operators leading the dance”) who is, in the provisions of REPowerEU, responsible for “identifying gaps in the gas infrastructure” is also pushing for additional gas infrastructure, even though such infrastructure will not alleviate the short-term energy crisis. As a result, €10 billion have already been allocated to replace gas infrastructure orientated towards Russia,49 and the procedures for PCI (Projects of Common Interest, see our box “Gas operators leading the dance”) approval and environmental impact assessments have reportedly been accelerated.50

WHO PROFITS FROM WAR – HOW GAS CORPORATIONS CAPITALISE ON WAR IN UKRAINE 3
Figure 2: The EU Energy Trilemma
Source: Gas Infrastructure Europe51
Figure 3: The shift from long term planning to short term focus
Source: Gas Infrastructure Europe52
Gas operators leading the dance
Gas operators, who build, maintain and operate pipelines and LNG terminals, play a major role in the perennity and expansion of the fossil fuel industry. They are driving the market, predicting future “needs,” advising the European Commission on these and securing public money for their members to build the infrastructure they proposed.

4 WHO PROFITS FROM WAR – HOW GAS CORPORATIONS CAPITALISE ON WAR IN UKRAINE
Figure 4: European map of infrastructure for gas – PCIs and additional projects identified through REPowerEU, including hydrogen corridors.
Source: REPowerEU53
That is precisely the purpose of the European Network of Transmission System Operators for Gas (ENTSOG), which was created in 2009 by the European Commission itself and brings together 45 gas operators.54 ENTSOG would go on to shape the future gas market of the European Union and demand public money to finance the plans of its members.
The lobby group got a launching platform in 2013 when, to put an end to purely national strategies about gas pipelines and terminals, the European parliament voted on the Trans-European Energy Infrastructure (TEN-E) Regulation.55 The objective was to develop a common European approach on infrastructure planning based on regional cooperation with Member States. This came with the identification of “projects of common interest” (PCI) - projects serving European citizens across borders - which would benefit from European subsidies, and which were based on a PCI list renewed every two years. The European Commission appointed ENTSOG to lead this new mission: the PCI list is compiled on the basis of a bi-annual report written by ENTSOG,56 who then submits its estimations in terms of future needs to its members, who in turn assess how much should be invested in the pipelines and terminals they will “have to” build. This list is then sent to the Directorate-General Energy,57 developing the EU energy policy, who gathers representatives of Member States, ENTSOG and gas operators to decide on the final list.58
As Pascoe Sabido, researcher at Corporate Europe Observatory notes:59 “There could not be a more obvious conflict of interest. Unsurprisingly, the group has consistently overestimated60 future gas demand; as a result, between 2013 and 2020 the EU spent €4.5 billion on 44 new gas infrastructure projects, with 90 per cent of the money going to ENTSOG members.”61 Also the European Agency for the Cooperation of Energy Regulators (ACER) draws this logical conclusion: “The problem is that ENTSOG consists of companies whose business model is to own as many pipelines as possible. At the same time they advise which pipelines to build. It appears that there is a clear conflict of interest ”62 This conflict of interest is leading us towards a massive gas lock-in and dependency, led by gas operators and their fossil clients, while our policy-makers are appointing them as the solution-makers to the global energy crisis that they co-created.
Embracing a US fossil future
For all the activities mentioned in this section, see our interactive map 2
While REPowerEU was attempting to secure Europe away from Russia (Europe imported 40% of its gas from Russia in 2021, see our chapter “US LNG flooding Europe”),63 it also created new alliances and sought new suppliers. In this geopolitical shift, the US became a major player. As we can see in this excerpt from a paper by the European Commission from late February 2022, right after the beginning of the war in Ukraine, both regions had compatible interests:64
While attending an EU summit in Brussels in March 2022,65 US President Joe Biden announced that 15 billion cubic metres (bcm) of LNG would be immediately redirected and delivered to the EU to help replace Russian gas.66 Starting in 2023, the goal was to scale this up to an additional 50 bcm of US LNG annually by 2030 (by the end of 2022, an additional 32.6 bcm had already been delivered to the EU).67 Biden called on the EU and its member states to expand their LNG infrastructure.
WHO PROFITS FROM WAR – HOW GAS CORPORATIONS CAPITALISE ON WAR IN UKRAINE 5
The same day, the European Commission and the US also made a joint statement on European Energy Security.69 “Through the Joint European action for more affordable, secure and sustainable energy (REPowerEU), the EU confirmed its objective to reach independence from Russian fossil fuels well before the end of the decade, replacing them with stable, affordable, reliable, and clean energy* supplies for EU citizens and businesses.” While declaring that “The United States and the EU are committed to meeting the goals of the Paris Agreement, achieving the objective of net zero emissions by 2050, and keeping a 1.5 degrees Celsius limit on temperature rise within reach,” both allies assert that “natural gas remains an important part of the EU energy system in the green transition.*” They announce they will immediately start a joint “Task Force on Energy Security.”
The plan is for the “European Commission (to) work with the governments of EU Member States to accelerate their regulatory procedures* to review and determine approvals for LNG import infrastructure*,


to include onshore facilities and related pipelines to support imports using floating storage regasification unit vessels, and fixed LNG import terminals.” Additionally, the European Commission will “support long-term contracting* mechanisms and partner with the US to encourage relevant contracting to support final investment decisions on both LNG export and import infrastructure.*” It will also “work with EU Member States toward ensuring stable demand for additional US LNG until at least 2030 of approximately 50 bcm/annum. ”
This clinched the deal on the massive LNG boom coming from the US to Europe, which risks worsening human and environmental misery along its way and locking us into a fossil fuel future. This lock-in would lead to a world where a select few make record profits, while many others see their lands, waters and communities destroyed, face serious health issues and struggle to make ends meet. But how did we get here?
6 WHO PROFITS FROM WAR – HOW GAS CORPORATIONS CAPITALISE ON WAR IN UKRAINE
Table 1: Comparison of US and EU gas markets
Source: ec.europa: EU-US LNG TRADE US liquefied natural gas (LNG) has the potential to help match EU gas needs, European Commission, February 202268
* emphasis added
The Fluxys tentacles that lock us into LNG
Related to this box, see our interactive maps 2 and 3
One of the key protagonists in the gas lock-in is Fluxys, a gas operator which is owned at 77.4% by Belgian municipalities and another 2.13% by the national investment vehicle FPIM70. It operates 12,000 km of pipelines across Europe and Brazil,71 and in early 2023 took over a 24.1% stake in the 12,000 km pipeline network of Open Grid Europe, the biggest gas operator in Germany.72 Fluxys operates the LNG import terminal in Zeebrugge, Belgium, which is the prime re-exporting platform for Russian LNG,73 and according to IEEFA accounting for 72% of these re-exports within the EU in 2022, of which 93% went to non-EU (mostly Asian) markets.74 Fluxys also operates the second-largest LNG terminal in continental Europe in Dunkirk, France.75 Dunkirk is also the largest single entry-point for LNG from the US into Europe (according to our research done using MarineTraffic). Its other activities in Europe include pipelines, the Revithoussa LNG terminal and the Alexandroupolis Floating Storage and Regasification Unit (FSRU) terminal in Greece,76 as well as a key stake in the Trans Adriatic Pipeline (TAP)77. In 2021 it acquired a 29.12% stake in the Gasbol pipeline connecting Bolivia and Brazil,78 and in 2022 acquired 80% of the shares in the biggest LNG terminal of Chile, Quintero.79

WHO PROFITS FROM WAR – HOW GAS CORPORATIONS CAPITALISE ON WAR IN UKRAINE 7
Figure 5: Global activities of the Fluxys Group
Source: Fluxys
Through its CEO, Pascal De Buck, and Chief Commercial officer, Arno Büx, Fluxys has a seat on the boards of both ENTSOG and GIE, respectively.80
Fluxys has multiple stakes in the shift of the fossil fuel industry. The energy crisis represents a unique opportunity to expand, preferably with public money. A key example is the development of the Southern gas corridor, presented as an alternative Russian gas for Southeast Europe81, with the TAP being a major expansion opportunity for Fluxys. As a key shareholder since the very beginning in 2013,82 Fluxys reportedly already put the massive pipeline on the PCI list and secured European money for it twice.83 While the project was contested in courts in different places across Europe84 and is still under trial now in Italy,85 the expansion of the TAP was one of the early projects identified by REPowerEU as necessary and eligible for accelerated European fundings.86 On 18th July 2022, European Commission President Ursula von der Leyen and Energy Commissioner Kadri Simson travelled to Baku in Azerbaijan, where they closed a deal to double Azerbaijan’s gas exports to Europe through the TAP.87 Three months later, the construction of submarine parts of the pipeline started.88 In January 2023, Fluxys announced an increase of its share in the TAP,89 just days before the first phase of the expansion was officially launched.90
Fluxys is also keen to work on the diversification of Greek gas imports, as Greece was historically very reliant on Russian gas (covering up to 40% of its annual energy needs).91 Co-owning Greece’s only onshore LNG terminal, Revithoussa92, Fluxys has the infrastructure ready to make the shift towards LNG and other suppliers. In the first three months of 2022, the Revithoussa terminal was covering 43% of Greece’s total fossil gas imports.93 In April 2022, DESFA (co-owned by Fluxys through the Senfluga consortium94) announced95 it was going to expand the Revithoussa terminal96 with a floating storage unit (FSU), despite the terminal historically operating far under its capacity, according to GEM.97 The argument to push for an extension was that Greece had to be able to absorb the LNG needed to phase out Russian gas.98 The new supplier was mainly the US, considered by the European Commission as key to securing South-Eastern Europe and which increased its exports to Greece.99
This came as an addition to another floating terminal in Greece, the Alexandroupolis FSRU terminal, which is also co-owned by Fluxys and was pushed by the US to supplant Gazprom’s influence in the Balkans with its own.100 This terminal was funded as a PCI and received European public money.101 It will be connected to the TAP.102
Charles Michel, the president of the European Council and former Belgian Prime Minister, inaugurated the Alexandroupolis terminal in May 2022, framing it clearly into the war context and the need to secure Europe:
8 WHO PROFITS FROM WAR – HOW GAS CORPORATIONS CAPITALISE ON WAR IN UKRAINE
“Russia’s war in Ukraine is a moment of urgency – a moment of truth– for the European Union. We must build our European sovereignty. We must be more strategic. And we must forge our new energy independence. And now it’s clear for all to see. That’s exactly what you are doing and exactly what we are doing together. I firmly believe we are seeing a new dawn for European energy independence. This project clearly contributes to the EU’s security of energy supply and also to our long-term climate change goals. (...) It is a geopolitical investment and this is a geopolitical moment. (...) This project that we inaugurate today sends a clear signal: we are taking our destiny into our own hands ”103
This European future in Greece will lead to a highway for US LNG. But the biggest stake for Fluxys plays out in Northern Europe. The company is expecting the delivery of an FSRU by the end of 2023104 and awaiting a Final Investment Decision (FID) on a new onshore LNG terminal in Germany (the Stade LNG terminal105) which was reportedly conceived to get gas from the US to Germany.106 In March 2022, in the face of the war, the consortium of which Fluxys is part107 - the Hanseatic Energy Hub - reportedly got an “early municipal approval.”108 While waiting for this FID, Fluxys is betting on Dunkirk, in France, where it holds the second-largest LNG terminal of continental Europe and offers the biggest entry-point to US gas on the continent.

WHO PROFITS FROM WAR – HOW GAS CORPORATIONS CAPITALISE ON WAR IN UKRAINE 9
© Christian Åslund / Greenpeace
 © Aaron Sprecher / Greenpeace
US LNG flooding Europe
It is not surprising gas imports into Europe changed dramatically in 2022. According to data from ENTSOG, Europe imported 20 bcm less gas in 2022 compared to 2021.110 In 2021, Russian fossil gas accounted for 153 bcm, representing 41% of the EU’s total gas imports of 373 bcm. This influx dropped drastically from the end of February, when Russia invaded Ukraine. Russia decreased its imports into the EU by 56% to 67 bcm, and only accounted for 19% of total gas imports in 2022, becoming the third most important source of gas. With 133 bcm, ‘Global LNG’ accounted for 37% of all EU gas imports in 2022, as opposed to only 20% in 2021.111 Ironically, LNG importing countries have increased their Russian LNG imports too, which increased by 27% to 16.6 bcm.112
The total volume of LNG imports to the EU is possibly even higher, since the significant increase of gas imports from the UK is in large part thanks to their increase of US LNG imports, which are then regasified and in part pipelined to Zeebrugge in Belgium, and Balgzand in the Netherlands,113 and from those places sent to the rest of the continent. In 2022, the UK tripled its gas exports to the EU, compared to 2021.114 And while LNG has become more important in the European gas market in recent years, 2022 was the year it really boomed, becoming the single most important source of gas for Europe, and making the EU the largest global LNG importer, overtaking China and Japan.115
WHO PROFITS FROM WAR – HOW GAS CORPORATIONS CAPITALISE ON WAR IN UKRAINE 11
Figure 6: Natural gas flows in the European market, first half 2022 vs first half 2021
Source: Bruegel109
According to data from GIE116, LNG imports have increased substantially across Europe. In total, the amount regasified in LNG terminals and sent out to the European gas grid, increased from 76.7 bcm in 2021 to 132.7 bcm in 2022. This is an increase of 73% in just one year. The largest percent rise in the EU can
be attributed to Belgium and France, with increases of 175% and 103% respectively. These LNG hubs have become, in tandem with the Netherlands and the UK, the supplier for gas-starved Germany, which relied heavily on Russian pipeline imports until 2022.117
Europe becoming the first customer for US LNG
For the flows of US LNG in 2022, see our interactive map 1
Today, no country supplies more LNG to Europe than the United States of America.118 The import of so-called “Freedom gas”119 surged in 2022, although it is the culmination of a trend which started in 2016.120 US LNG exports began during the Obama era, and really took off under the Trump administration.121 Emblematic for this increase was the eighth Energy Council between the United States and the EU Commission in 2018122 where EU President Juncker and President Trump agreed to enhance strategic cooperation between the European Union and the United States in the field of energy. As part of this effort, the EU would increase its imports of LNG from the US to improve the diversification and security of its energy supply. To achieve this goal, both parties would collaborate to simplify the trade of LNG.123 Over the next four years, US LNG exports into Europe and the UK increased by 1767%.124
12 WHO PROFITS FROM WAR – HOW GAS CORPORATIONS CAPITALISE ON WAR IN UKRAINE
Figure 7: US imports of LNG into the EU 27 + UK 2018 - 2022
Source: Greenpeace International from EIA data, converted to bcm
Figure 8: US imports of LNG into the Belgium 2018 - 2022
Source: Greenpeace International from EIA data, converted to bcm
Figure 9: US imports of LNG into the France 2018 - 2022
Source: Greenpeace International from EIA data, converted to bcm
0 10 20 30 40 50 60 70 80 EU27+UK 2022 2021 2020 2019 2018 0.0 0.5 1.0 1.5 2.0 2.5 Belgium 2022 2021 2020 2019 2018 0 5 10 15 20 France 2022 2021 2020 2019 2018
Italy
France
Spain
United
Belgium
The above graph shows the increase in US LNG imports from 3.69 bcm in 2018, to 68.96 bcm in 2022.125 Over the past four years, the US has grown from a
marginal gas exporter to Europe and the UK, to one of the most important. On average, these imports have grown by 470% annually since 2018.
WHO PROFITS FROM WAR – HOW GAS CORPORATIONS CAPITALISE ON WAR IN UKRAINE 13
Figure 11: LNG import into the EU27 2021-2022
Source: Greenpeace International, based on data from the EIA and GIE, converted to bcm
Figure 10: US LNG import into the EU27+UK 2018 - 2022
Source: Greenpeace International from EIA data, converted to bcm
0 5 10 15 20 25 30 35 40 OTHER LNG US LNG 2022 Rest of EU 2021 2022 Italy 2021 2022 Netherlands 2021 2022 Poland 2021 2022 Spain 2021 2022 France 2021 2022 Belgium 2021 0 10 20 30 40 50 60 70
EU countries
Other
Poland Netherlands
Kingdom
2022 2021 2020 2019 2018 TIME
The graph above shows the astronomical growth of US LNG imports into Europe after the start of the war in Ukraine compared to the year before. Of this 2022 US LNG boom, no country imported more than France: 16 bcm in 2022, of which 13.4 bcm came in the period of March till December. The second largest importer in 2022 was the UK, with Spain and the Netherlands following closely. The biggest percentage increase was in Belgium, which noted a nearly 1337% increase in US LNG imports in 2022 compared to 2021. The EU and UK grew their US LNG imports by 140% in 2022 compared to 2021. In total, the EU and UK have imported 57.8 bcm of US LNG since the start of the war, which was 35.85 bcm more than the same period in the previous year. In total, the EU increased its US LNG imports by 32.6 bcm, doubling the 15 bcm target set out by the Biden administration.126 In the case of the Netherlands, Belgium, the UK and France, a significant share of their increased gas imports were related to the acute supply crunch in Germany, with a lot of the imports leaving the importing country eastwards.
In 2022, France accounted for nearly a quarter of all US LNG imports, with the UK and Spain importing 19% and 17% respectively. And while Belgium only
accounted for a small portion of the direct US LNG imports, a large chunk of US gas still ended up in the Belgian pipelines thanks to the French Dunkirk LNG terminal, and the UK LNG terminals which then transport it through pipelines127 (both the Dunkirk LNG terminal and UK-Belgium pipeline are owned by Fluxys, see our box “The Fluxys tentacles that lock us into LNG”). See our website for an interactive map with shares of US LNG versus total LNG imports per European country (map 1).
Figure 12: US LNG exports to Europe in 2022
Dunkirk terminal: The entry point for US gas into Europe
Dunkirk LNG was founded on the initiative of Électricité de France (EDF) (which is owned at 96% by the French State),128 TotalEnergies and Fluxys after a final investment decision in 2011129. It started operations in 2017.130 In October 2018,131 EDF and TotalEnergies sold their shares to Fluxys, which already held 25% of shares132 of Dunkirk LNG. Since then, the Belgian company is the main owner (30.39%), through its majority share in the FluxDune consortium which owns 60.76% of the terminal.133 It is operated by Gaz-Opale, another company of the Fluxys family, co-owned by Dunkirk LNG (51%) and Fluxys (49%).134
Dunkirk benefits from a strategic location thanks to the 74 km pipeline Fluxys built in May 2016,135 connecting it to the Fluxys Zeebrugge LNG terminal and providing it with a 8 bcm/y access to Belgium, Germany, the Netherlands and the UK.136
The French terminal began importing US gas as soon as it started operating.137 These imports are primarily owned by EDF, which holds a 8 bcm/y regasification contract with Dunkirk LNG until 2036 (representing 61.5% of the current 13 bcm/y regasification capacity of the terminal).138 EDF was the first French company to sign a contract with a US LNG company, Cheniere Energy, back in July 2014.139 This 20-year contract came with an option to extend for another 10 years. One year later,
14 WHO PROFITS FROM WAR – HOW GAS CORPORATIONS CAPITALISE ON WAR IN UKRAINE
Source: Greenpeace International from from EIA data
Other EU 12.1% Italy 4.7% Poland 5.2% Netherlands 15.4% France 23.2% Spain 17.3% United Kingdom 18.9% Belgium 3.3%
EDF signed another contract with Cheniere for deliveries to Dunkirk.140 It became the largest LNG terminal for
US gas entering France.
Using MarineTraffic, we tracked all ships leaving the US to France between February and December 2022. Out of a total of 140 tankers, 80 went to Dunkirk, representing 57% of US tankers going to France.
LNG terminals spreading over Europe

The US LNG boom to Europe came with a rush of plans to build new import terminals. According to the Global Energy Monitor (GEM), European states have announced plans for an additional LNG capacity of 227 bcm per year to come online in the coming years. In total 8 projects are under construction, and 38 more development and expansion projects have been announced.141 See our interactive map 3.
Of these projects, seven consist of floating storage and regasification units (FSRU) coming online by the end
of 2023 in Germany, the Netherlands, Estonia, and Finland, and 38 more LNG terminals (onshore and floating) are proposed for the coming years.144 Germany outpaced other countries in the 2022 LNG frenzy, with an announced increase of 94.3 bcm/y145. Having no LNG terminals of its own, the country feared gas shortages in the aftermath of the closure of the Russian pipelines. In 2021, Russia accounted for 55% of German gas imports.146 Experts have pointed out that due to decades of cheap Russian gas imports Germany could produce cheap exports and remain the heart of European industry.147 This dependence would come crashing down in 2022, notably with the closure of the Nord Stream pipeline.148
WHO PROFITS FROM WAR – HOW GAS CORPORATIONS CAPITALISE ON WAR IN UKRAINE 15
Figure 13: Operational, and planned LNG terminals in Europe142 Coloured by year of operation143
UNNEEDED LOCK-IN
This infrastructure buildout is irrational. European decision-makers, blinded by the panic created by the Russian invasion of Ukraine and fear for Europe’s security of supply, outsourced the analysis of energy market forecasts to the gas operators who prescribed
to build more terminals, in fast-tracking mode. Reports stating European LNG terminals were running at full speed in 2022 are overstating the actual utilisation rate of these terminals. The graph below shows how European LNG terminals have been underutilised throughout 2021 and 2022:

16 WHO PROFITS FROM WAR – HOW GAS CORPORATIONS CAPITALISE ON WAR IN UKRAINE
Figure 14: Europe’s LNG rush in 2022
Source: Data from GEM149
Figure 15: Regasification utilisation of EU27 LNG terminals in 2021 vs 2022
0 20 40 60 80 100 2022 2021 Europe Croatia Greece Italy Lithuania PolandNetherlands Portugal Spain France Belgium Percentage
Source: Greenpeace International, based on data from GIE150
According to data compiled through the transparency database of GIE, in 2021, EU LNG terminals had a technical regasification utilisation rate of only 37.8%, meaning 62.2% of technical regasification capacity was unused that year. Countries like Belgium (22.31%), Greece (25%) and Spain (27%) were performing even lower, whereas Portugal was already nearing its limit with 83.5% utilisation in 2021.
Even in the 2022 surge of LNG to Europe, EU LNG regasification utilisation only rose to 63%. Meaning that in total, LNG terminals in the EU had a leftover capacity of 77 bcm in 2022, or about half of the 153 bcm imports of Russian gas in 2021. While big LNG importers such as France and the Netherlands were nearing full technical capacity with utilisation rates of 80% and 86% respectively, many LNG importers had plenty of unused regasification capacity in 2022. Notably Spain, which has a well known historical overcapacity issue, had a leftover capacity of 60%. Over the last 20 years, the annual utilisation rate of Spanish terminals has never reached 50%, and the average utilisation rate of all Spanish import capacity (LNG and pipelines) has been 34%, according to research done by IEEFA.151 In absolute numbers, Spain had a regasification surplus of nearly 42 bcm in 2022. But also France and Belgium had notable leftover technical regasification capacity. The Belgian Zeebrugge LNG terminal had a 22% technical regasification utilisation rate in 2021, and 61% in 2022. Whereas the French terminals had a utilisation rate of 40% in 2021, and 80% in 2022.152 In 2021 the Dunkirk LNG terminal only had a regasification utilisation of 27%, which spiked to 75% in 2022.153 However, this still left a quarter of technical regasification capacity unused in what was probably the most historic LNG year to date. Fluxys is still adding regasification capacity in Zeebrugge, where expansion plans will raise nameplate capacity by 8.16 bcm/y capacity (6 mtpa LNG) by 2026.154
This low utilisation rate, indicates that massive buildout of new LNG terminals, to more than double capacity155, to replace the Russian pipelines is not needed. Big LNG import terminals like the ones proposed normally take around five years to build and put online.156 The pipelines needed to connect these terminals to the gas grid also take several years to build. This is far too late for the short-term need to reduce Russian gas imports by two-thirds by the end of 2022.157 FSRUs are ready to supply the European gas grid faster than traditional onshore LNG terminals, and some have indeed entered service at the end of 2022 and in 2023, but it will still take years for the majority of them to come online according to current projections.158 In the case of Germany, the proposed floating terminals alone would equate to the total gas imported from Russia, and the onshore terminals coming online later in 2026 would add another 50 bcm/y, according to journalists who were able to access a leaked document from the German government.159
These new projects, with a combined annual capacity of 227 bcm, are expected to more than double existing LNG capacity (157 bcm/y).160 In total, existing and proposed capacity would account for about 98% of the 392 bcm annual European gas demand. To put this in perspective: the EU imported 153 bcm of gas in 2021 from Russia.161 Added to these LNG imports and terminal expansions, new pipelines have been built and expanded, maximising the Norwegian162 and UK export163 capacity. In short, in a Green Deal future where EU gas demand will need to decrease, EU member states are increasing their gas infrastructure on a substantial scale, locking us into new, expensive and unneeded infrastructure. IEEFA concludes that “Assuming the REPowerEU targets are achieved and that gas consumption in Turkey does not fall, then total European demand for LNG would only be approximately 150 bcm in 2030, down from roughly 175 bcm in 2022— implying that the utilisation rate of Europe’s LNG terminals would fall below 40%. ”164
WHO PROFITS FROM WAR – HOW GAS CORPORATIONS CAPITALISE ON WAR IN UKRAINE 17
Source: IEEFA165
Even in a business as usual scenario where EU gas demand remains the same as in 2022, these announced LNG projects will add more capacity than Europe needs. As a result, these proposed LNG expansion projects could end up exceeding future demand and result in costly, underutilised terminals. IEEFA projected that over half of Europe’s LNG infrastructure assets could be left unused by 2030.166 This analysis is being shared by politicians signing off on these plans. As revealed by a leaked document167 from the German
Federal Ministry for Economic Affairs and Climate Action, the Ministry also assumes a sizable overcapacity in the planned LNG terminals in Germany. This occurs while the Ministry assumes consumption in Germany will have to fall from the previous high of 96 bcm in 2021 to around 70 bcm in 2030 and 20 bcm in 2040, in order to meet climate targets. But due to longterm contracts made, the onshore terminals would operate in addition to the floating terminals and not instead of them.

18 WHO PROFITS FROM WAR – HOW GAS CORPORATIONS CAPITALISE ON WAR IN UKRAINE
Figure 17: EU gas demand and supply 2021-2030 in TWh
Source: Bruegel168
Figure 16: Europe’s LNG outlook: planned terminals buildout and LNG demand forecast
Bruegel, a European economic think tank, predicts that by 2030, the decline in European gas demand could be so drastic that most of the continent’s LNG import infrastructure will become unnecessary because enough gas would be available through pipelines, which is far cheaper and less CO2-intensive than LNG.169 This would leave the countries that are hastily building new LNG terminals with very costly stranded assets.
This intended LNG infrastructure boom has been announced while a series of studies proposed scenarios for the EU energy future that would exclude the need for new fossil infrastructure. A March 2022 study by the think tanks Ember, E3G, and Bellona170 found the EU could end Russian gas imports not with an LNG rush, but simply through implementing the EU ‘Fit for 55’171 climate and energy package. Meaning that by the time these new LNG terminals and pipelines could go into service, they will not be necessary if these ‘Fit for 55’ initiatives are completely implemented.
Locking us in using trojan horses
Given that costly fossil fuel projects would be difficult to justify in a future EU Green Deal which aims to reduce reliance on fossil fuels,172 proposals for new LNG terminals are often justified by the possibility of eventually retrofitting them to import liquefied “green” hydrogen instead of fossil gas. However, green hydrogen (meaning produced through electrolysis using renewable electricity) is far from a reality at the moment. According to the IEA Global Hydrogen Outlook, hydrogen production using electricity accounted for just 0.04% of the global hydrogen production mix in 2021. The largest share of hydrogen produced was still using fossil gas (62%), and coal (19%). Even in their 2030 forecast, the IEA counts on gas and coal to produce the vast majority of hydrogen, with only 14 Mt out of 115 Mt being renewable hydrogen.173 This is the trojan horse aspect of the hydrogen-ready promises of the fossil fuel industry. It’s a way for the gas industry to continue producing fossil gas in the future.
German Chancellor Olaf Scholz has been particularly vocal about his ambitions to position Germany as the leading importer of hydrogen in Europe,174 reportedly investing billions of euros of taxpayer money towards this end. Belgian energy minister Tinne van der Straeten also hopes for Belgium to become the primary entry point for hydrogen in Europe.175 And France is advocating for hydrogen produced using nuclear energy.176
The narrative of “nearly-hydrogen-ready” LNG terminals implies that converting LNG terminals into hydrogen terminals is quick and simple. In reality the proposed transition from LNG terminals to liquefied hydrogen terminals is technically challenging and fraught with uncertainties. Retrofitting a liquefied hydrogen tank at an LNG terminal would require insulation with ten times higher thermal resistance than for LNG, according to the IEA,177 posing a major challenge and likely making it more economical to build a new tank. Reusing components of LNG terminals for liquefied hydrogen is possible only if a concept for conversion has been considered during the terminal’s construction phase, meaning that especially older LNG terminals won’t have a future in a fossil-free EU. But even for new LNG terminals that are supposedly “hydrogen-ready,” only about 50% of initial LNG investments could be reused, and any conversion of existing or planned LNG infrastructure is technically challenging and requires the replacement or drastic modification of most of the equipment.178 The potential overlap in infrastructure between LNG and liquefied hydrogen infrastructure is far smaller than policy-makers and fossil fuel companies make it out to be.
Faced with the difficult chemical properties of liquefied hydrogen,179 several proposed LNG terminals have shifted to a future where they will transport hydrogen through ammonia. This is inefficient due to energy losses throughout the process.180 Additionally, ammonia is a very corrosive product, which means new infrastructure would be required for ammonia transport and storage.181
By betting on the widespread use of liquefied hydrogen, countries risk locking themselves into an expensive and energy inefficient future. These complaints have been reinforced by studies done by the International Renewable Energy Agency (IRENA)182 , Wood Mackenzie183, and Bloomberg, which argue that liquefied hydrogen will only play a marginal role in the global hydrogen trade.184
WHO PROFITS FROM WAR – HOW GAS CORPORATIONS CAPITALISE ON WAR IN UKRAINE 19
Tankers lock-in
Figure 18: Global orders of new LNG tankers 2011-2022
Source: Greenpeace International from Refinitiv data
The 2022 LNG boom to Europe prompted proposals for new LNG terminals, but these also need specialised LNG tankers to transport the gas.185 With LNG freight rates skyrocketing, this led to an increase in fleet values and a surge in new orders within the LNG industry. In 2022 alone, 213 new orders were placed, almost 2.5 times more than the 87 orders placed in 2021.186 LNG carriers are one of the most expensive types of vessels, surpassing the cost of simpler tankers and container ships. Only cruise ships cost more. The average cost of a large LNG carrier has now reportedly increased to around €220 million,187 which is twice the cost of a tanker or container ship.188 At this price, the LNG tankers ordered in 2022 amount to a staggering bill of 47 billion euros. This steep price is attributable to the highly specialised needs for these ships, which require extremely low temperatures (-162°C) and high pressure to keep the gas liquefied.
In total, when the ordered vessels are ready, 56 million tonnes of LNG could then be transported across the world at the same time according to Refinitiv data. This is equal to 76.5 billion cubic metres of gas,189 or about 7 days’ worth of average global gas consumption (11 bcm/day).190
These highly specialised LNG tankers, however, are only able to transport LNG and it would take millions of dollars more to transform them to carry other products.191 This means that the carbon lock-in effect that can be observed with the new LNG terminals would also be observed with the fleet of LNG vessels which will either transport fossil fuels across the oceans for decades to come, or will end up as stranded assets due to a decrease in gas demand. Either way it will be a costly affair for both the climate and the investors funding the shipping companies.
20 WHO PROFITS FROM WAR – HOW GAS CORPORATIONS CAPITALISE ON WAR IN UKRAINE
0 10 20 30 40 50 60 0 5 10 15 20 25 2011 2012 2013 2014 2015 2016 2017 2018 2019 2020 2021 2022 Year Gross tons Aggregate tonage
Contracted lock-in - tackling a short-term problem with long-term contracts
For the contracts mentioned in this section, see our interactive map 2
The long-term contracts signed between European gas companies and US LNG terminals are another form of
fossil lock-in that goes beyond the purely short-term needs in the frame of a shift away from Russian gas.
US Export Capacity (Opr+Cons)
N American LNG under IEA Net-Zero
Global LNG under IEA Net-Zero Latin America Asia Europe Unspecified
Source: Greenpeace International, based on data from BloombergNEF192
When compiling the total contracted volume of US LNG since 2011,193 the largest volume contracted is for unspecified markets. This means gas purchased by traders and portfolio buyers who then sell to the highest bidder. Asian markets have been the primary destination for US LNG producers due to their growing energy demand and willingness to pay a premium for LNG imports. However, the European energy crisis has caused EU countries to become the most important market for US LNG producers, mainly due to the
fact that European gas companies are willing to pay the high prices portfolio traders have been asking. So while portfolio traders have signed the most contracts, they have been selling to European consumers the most since 2022. While the European shift to diversify away from Russian gas started with the 2014 Russian invasion of Crimea, it took on record speeds in 2022, and an array of new long-term contracts were signed with European gas companies.
WHO PROFITS FROM WAR – HOW GAS CORPORATIONS CAPITALISE ON WAR IN UKRAINE 21
Figure 19: Contracted Volumes from US LNG Projects (BNEF)
Billion cubic meters per year (bcm/y) 2015 0 50 100 150 200 250 2020 2025 2030 2035 2040 2045 2050
UK companies such as Shell and BP have been involved in this trade since the beginning of US LNG exports.194 These companies ship LNG to ports in the UK, the Netherlands, and Belgium, among other destinations.195 French companies have taken the second place in contracted capacity, with TotalEnergies, Engie, and EDF leading the dance. In third place is Spain, with Naturgy and Endesa signing some of the first LNG export deals already back in 2011. A first boom in US LNG contracts with European companies can be observed in 2014, when UK, Spanish, and French companies made the first significant deals for US LNG, effectively kickstarting the US LNG growth spurt.
In 2018 there was another notable boom in contract agreements, when a range of new LNG projects on the US Gulf Coast received their FID, increasing export capacity in the following years.196 The third, and most important surge in new US LNG contracts was in 2022, when a total of 17.65 million tonnes per annum (mtpa) of new LNG was agreed for sales to European gas companies.197 This equals 24 billion cubic metres of gas, or as much as 65%198 of the 2022 French gas consumption. It should be noted that this extra supply will be additional to already contracted supply of gas, and the uncontracted spot market supply.
22 WHO PROFITS FROM WAR – HOW GAS CORPORATIONS CAPITALISE ON WAR IN UKRAINE
Figure 20: Contracted Volumes from US LNG Projects (BNEF)
Source: Greenpeace International, based on data from BloombergNEF
Billion cubic meters per year (bcm/y) 2015 0 50 100 150 200 250 2020 2025 2030 2035 2040 2045 2050
Global
Portfolio
National oil
gas companies Gas suppliers Utilities Industrial
US Export Capacity (Opr+Cons) N American LNG under IEA Net-Zero
LNG under IEA Net-Zero
Buyers + Traders
&
Source: Greenpeace International based on data extracted from the Sierra Club LNG Tracker, converted to bcm/y
Long-term contracts are being pushed as a definitive solution to the short-term issue of European gas market instability. However, for most deals it is not clear yet when they will start delivering. We will see a peak in actual deliveries of this LNG probably only around 2026.199 From then onward, apparently these companies will be contractually obligated to buy this LNG capacity for the next 15 or 20 years, essentially locking European energy supply in a costly and environmentally destructive future. For the short-term supply crunch, these deliveries will come too late.
Furthermore, these new EU LNG contracts are only one part of the story. Rystad assesses that, in 2023, 60% of the additional LNG going to Europe will be coming from portfolio traders: these are entities buying LNG from a wide range of suppliers across the world for resale to various customers.200 They align with the nature of the US LNG industry, founded on supply agreements that provide flexibility for the destination of LNG shipments. These contract holders, and not the liquefaction companies or the US government, have the authority to dictate the destination of the LNG
shipments.201 European companies Shell and TotalEnergies, took the biggest part of the 2022 contracts, with half of them entering their portfolios. In absolute terms, they were also the ones signing the most contracts, with 20 portfolio contracts signed with US LNG producers, worth 34.4 mtpa. This is more than a quarter of all portfolio contracts signed.
The 2022 rush for contracts also pushed companies and portfolio traders to sign agreements with US terminals which are still at an early stage, awaiting their final investment decision (FID).
BNEF shows that US projects have been the largest beneficiaries of recent market shifts, making up all but one of the top nine projects by contracts signed in 2022.202 This means that due to these contracts, these projects might reach their FID in the coming months. Note that in the table below, dating from January 2023 and showing projects in a pre-FID phase, Port Arthur LNG did get its FID in March 2023.203 We may soon witness an expansion boom in US LNG infrastructure, which would aim to operate for decades to come.
WHO PROFITS FROM WAR – HOW GAS CORPORATIONS CAPITALISE ON WAR IN UKRAINE 23
LNG Project Title Purchaser Purchaser Country Agreement Term (Years) Bcm/year Per Project Agreement Date Plaquemines LNG Phase I Shell UK 20 2.72 2/25/22 Lake Charles LNG Gunvor Group Switzerland 20 2.72 5/2/22 Rio Grande LNG Engie France 15 2.38 5/2/22 Port Arthur LNG RWE Germany 15 3.06 5/25/22 Corpus Christi LNG Stage I Equinor Norway 15 0.2448 6/8/22 Corpus Christi LNG Stage II Equinor Norway 15 0.1224 6/8/22 Corpus Christi LNG Stage III Equinor Norway 15 0.2448 6/8/22 Corpus Christi LNG Midscale 8-9 Equinor Norway 15 1.1968 6/8/22 Sabine Pass LNG Phase I Equinor Norway 15 0.3944 6/8/22 Sabine Pass LNG Phase II Equinor Norway 15 0.204 6/8/22 CP2 LNG Phase I EnBW Germany 20 1.36 6/10/22 Plaquemines LNG Phase II EnBW Germany 20 1.36 6/10/22 Delfin LNG Vitol Switzerland 15 0.68 7/12/22 Lake Charles LNG Shell UK 20 2.856 8/23/22 Port Arthur LNG INEOS UK 20 1.904 12/1/22 Port Arthur LNG Engie France 15 1.1968 12/6/22 Rio Grande LNG Galp Portugal 20 1.36 12/20/22
Table 2: US LNG contracts signed in 2022
Port Arthur (Phase 1)
Lake Charles
Rio Grande (Phase 1)
Plaquemines (Phase 2)
CP2
Cameron (Phase 2)
Dunkirk LNG: pushing for long-term contracts
Fluxys is determined to remain a major player in the European gas imports from the US through Dunkirk LNG. What the company needs for its stability in this market is also what will lock us into a fossil future: long-term commitments from the gas industry. Dunkirk LNG took a first step in this direction in February 2022, pushing for measures which would favour long-term deals, possibly until 2046.204 Dunkirk LNG has two fixed long-term regasification contracts with EDF (8 bcm/y, see our box “Dunkirk terminal: The entry point for US gas into Europe”) and with TotalEnergies (1.5 bcm/y), both running until 2036. The remaining capacity of 3.5 bcm is put on sale each year.205 In 2022, Dunkirk LNG asked permission from the French Commission for the Regulation of Energy206 to put its remaining primary annual capacity on sale for a period up to 2036, with the possibility to extend until 2046, with the selection of candidates hinging on the length of their offers. It also asked to increase the maximum amount Engie, one of its key users, could legally book, above 1 bcm. Furthermore it added to its selection criteria, enabling it to exclude demands for capacity coming from regions which could be subject to sanctions207. The Commission for the Regulation of Energy gave a favourable ruling on this proposal in April 2022.
And while a slowing economy due to strict Covid measures dampened China’s energy demand, another reason it required less LNG from the US was the cheaper gas it could get from Russia. Chinese gas companies moved towards Russian LNG at prices below market rates in the weeks following the Russian invasion in Ukraine as reported by the Wall Street Journal.208
According to Chinese customs data, between February and April of 2022, China’s imports of LNG from the US declined by 95% compared to the same period in the previous year, while its purchases of Russian LNG increased by 50%. Although there was a modest recovery in China’s demand for US LNG in May, it remained significantly lower than in 2021.209
24 WHO PROFITS FROM WAR – HOW GAS CORPORATIONS CAPITALISE ON WAR IN UKRAINE
Figure 21: LNG contract signings in 2022 for pre-FID projects in the US
Source: Greenpeace International based on data from BloombergNEF, converted to bcm
0 5 10 15 20 in
bcm
Commonwealth LNG
Delfin LNG
Saguaro LNG
US LNG, Chinese profits
China has reportedly been reselling contracted US LNG cargoes to European buyers at a significant profit, benefitting from the price differential between the US and European markets. According to reports from both the Wall Street Journal210 and Bloomberg,211 China benefits from the increasing flexibility and liquidity of the global LNG market, which has made it easier for buyers to move cargoes between different regions.
Export terminals in the US - backed by European contracts
For all the terminals mentioned in this section, see our interactive map 3.
The shifts in global and European energy markets have kicked off an increase in LNG liquefaction capacity worldwide, with the United States – now the world’s largest LNG exporter – leading this trend.212 Several new US LNG export terminals are likely to get the greenlight in 2023, with many more waiting in the wings. The long-term LNG supply contracts – discussed in the previous chapter – are the key factor driving the construction of LNG export terminals in the US.
Turning methane gas into a supercooled and much denser liquid and loading it onto tankers is a complex, energy-intensive process which requires the construction of expensive units called liquefaction “trains.” As a result, LNG exports are limited by liquefaction capacity. Because of their high building costs, in general, these projects must obtain significant financing packages to proceed to FID.
To reach FID, the project needs to show it has obtained the proper permits, lined up equity investors, and has signed the necessary construction and gas supply
contracts. The most important permits to build and operate an export terminal are those from the Federal Energy Regulatory Commission (FERC) and the Department of Energy (DOE). Most crucially, lenders want to see a significant volume of long-term contracts signed with purchasers of the LNG, thereby guaranteeing future sales and cash flow sufficient to cover the debt payments. There is a fierce competition among the proposed projects to lock down long-term sales contracts, and hence be the first to reach FID.
Starting in 2016, exports of LNG from the United States have increased as fast as the industry can build export capacity. The shale revolution in the US ensured that sufficient gas supply is available for export, largely limited by the economics of building expensive liquefaction facilities. Relatedly, the 2015 decision to revoke the long-standing crude oil export ban213 spurred a new boom in oil (and associated gas) drilling that was also destined for export markets. The figure below shows that Asia and Europe are key destinations for LNG exports, with a big surge of shipments to Europe in 2022.
WHO PROFITS FROM WAR – HOW GAS CORPORATIONS CAPITALISE ON WAR IN UKRAINE 25
Figures 22 and 23: Increase in LNG exports from the United States.
2021 2022 2017 0 0 20 40 60 80 100 120 First LNG Shipment Sabine Pass Asia South Korea China Japan India Spain United Kingdom Netherlands France Other Countries Europe Rest of World 20 40 60 80 100 120 2018 2019 2020 2021 2022 2023 2015 2014 2017 2016 2018 2019 2020
Source: Greenpeace International, based on US EIA data, converted to bcm/y214
Billion
Billion
US LNG Vessel Exports, by destination US LNG Vessel Exports, by region
Cubic Meters (bcm/y)
Cubic Meters (bcm/y)
Seven LNG export terminals currently operate in the US, with a peak capacity of 145 bcm. The five largest of these terminals are located on the Gulf Coast of Texas and Louisiana (Sabine Pass, Corpus Christi, Cameron, Freeport, and Calcasieu Pass), with two smaller terminals (Cove Point and Elba Island) on the Atlantic coast. Two new Gulf Coast terminals (Golden Pass and Plaquemines LNG) are currently under construction,
as is an expansion of Cheniere’s existing Corpus Christi terminal. Completion of these three projects would increase US export capacity to over 200 bcm by 2025.215 Port Arthur LNG is moving towards construction on two trains which could start production in 2027 and 2028. This would add another 18 bcm per year to US LNG export capacity.216
The figure above shows the increase in US LNG export capacity over time as more liquefaction trains are brought online.217 The green line shows the IEA’s estimate of LNG exports from North America under its 1.5C-aligned Net-Zero Emissions (NZE) Scenario.218 Under that scenario, global LNG trade peaks in 2025
and then declines rapidly, and estimated US LNG build-out is already significantly larger than those estimated traded volumes.
26 WHO PROFITS FROM WAR – HOW GAS CORPORATIONS CAPITALISE ON WAR IN UKRAINE
Figure 24: US LNG Export Capacity 2016 - 2026
Source: Greenpeace International, based on US EIA liquefaction capacity data. Note: assumes terminals under construction will start production over the course of 2024. Not shown: Port Arthur LNG and Plaquemines Phase 2 have also moved to start construction, but operation start dates are uncertain and likely post-2024.
2016 0 25 50 75 100 125 150 Calcasieu Pass Golden Pass
(phase
Operating Under Construction North American LNG under IEA Net-Zero Freeport Elba Island Corpus Christi Cove Point Sabine Pass Cameron Billion cubic meters per year (bcm/y) 175 200 2018 2020 2022 2024 2026
Plaquemines
1)
The table below shows the nine operating (blue) or under construction (green) LNG export terminals in the US. Several of these projects also have proposed
expansions that have not yet been approved (red) or financed (yellow).
Table 3: LNG Export Terminals: Operating or Under Construction (as of March 2023)
Project State Owners Status
Sabine Pass Louisiana Cheniere
Operating
Additional expansion in pre-filing with FERC
Corpus Christi Texas Cheniere Operating
Stage 3 Under Construction
Additional expansion in pre-filing with FERC
Freeport Texas Freeport LNG Operating
Train 4: FERC approved, awaiting FID
Cameron Louisiana Sempra LNG, Mitsui Group, TotalEnergies, Mitsubishi Corp, NYK Operating Train 4: FERC approved, awaiting FID
Cove Point Maryland Dominion, Berkshire Hathaway, Brookfield Asset Management Operating
Elba Island Georgia Kinder Morgan, Blackstone Operating
Calcasieu Pass Louisiana Venture Global Operating
Golden Pass Louisiana Qatar Petroleum, ExxonMobil Under Construction
Port Arthur Texas Sempra, ConocoPhillips
Trains 1&2 - FERC Approved, FID March 2023
Trains 3&4 - Under FERC Review
Plaquemines Louisiana Venture Global Under Construction
Source: Greenpeace International, from data provided by FERC,219 EIA, and company press releases.
If the gas industry gets its way, this is just the start. Numerous other export projects along the Gulf Coast have been proposed (or revived) to take advantage of higher demand for gas due to the Ukraine crisis. The table below lists LNG terminal projects that have been proposed, but are not yet under construction, either because they have not yet been approved or have not
yet reached FID. Even more projects could reach FID in 2023, with the most likely being Rio Grande LNG,220 and Lake Charles LNG.221 The recent contracts listed above in Table 2 illustrate the current momentum of these projects.
WHO PROFITS FROM WAR – HOW GAS CORPORATIONS CAPITALISE ON WAR IN UKRAINE 27
Operating Under Construction Approved In Review
* = Planned Expansion
Freeport *
Corpus Christi *
Fourchon LNG
Gulf LNG
Delta Plaquemines
West Delta
Rio Grande
Texas LNG
Delfin
Sabine Pass *
Golden Pass
Port Arthur LNG *
Cameron *
Calcasieu Pass
Lake Charles LNG
Driftwood
Magnolia
Commonwealth CP2
New Fortress FLNG
Not shown on map
Cove Point, MD
Elba Island, GA
Alaska Gasline
Eagle LNG, FL
Source: Greenpeace International, from data provided by FERC,222 EIA, and company press releases.
The vast majority of these projects are located along the Gulf Coast with high potential to export LNG to Europe (the main exception being the Alaska Gasline
project). We also note Sempra’s Energía Costa Azul project, which is under construction in Mexico, and will utilise gas sourced from the US.223
28 WHO PROFITS FROM WAR – HOW GAS CORPORATIONS CAPITALISE ON WAR IN UKRAINE
Figure 25: Map of operating and planned LNG terminals in the US Gulf Coast
ALABAMA
TEXAS LOUISIANA
MISSISSIPPI
Table 4: LNG Export Terminals: Proposed, Awaiting Approval or FID (as of March 2023)
Project State Owners Status
Rio Grande Texas Next Decade FERC Approved, but delayed by court order, FID expected 2023
Lake Charles Louisiana Energy Transfer FERC approved, FID expected 2023
Driftwood Louisiana Tellurian FERC approved, some construction has begun, but project lost suppliers and FID has been long-delayed
Grand Isle FLNG Gulf of Mexico offshore New Fortress Energy Under MARAD224 review, self-financed
Texas LNG Texas Texas LNG FERC Approved, but delayed by court order, awaiting FID
Magnolia Louisiana Glenfarne Group FERC approved, awaiting FID
Eagle LNG Florida Energy & Minerals Group FERC approved, awaiting FID
Delfin LNG Gulf of Mexico offshore Fairwood, Enbridge MARAD approved, awaiting FID
Commonwealth Louisiana Commonwealth LNG FERC approved, awaiting FID
Alaska Gasline Alaska Alaska Gasline Dev Corp FERC approved, awaiting FID
Gulf LNG Mississippi Kinder Morgan +others FERC approved, awaiting FID
CP2 Louisiana Venture Global Under FERC review
West Delta Gulf of Mexico offshore West Delta LNG Under MARAD review
Delta Louisiana Venture Global FERC pre-filing
Fourchon Louisiana Energy World FERC pre-filing
Source: Greenpeace International, from data provided by FERC,225 EIA, and company press releases.
These proposed and approved projects collectively would represent a massive increase in US LNG export capacity. It is not certain that all of these projects will be built, but the projects that have already been approved could more than double peak US export
capacity to 439 bcm.226 The estimated timeline for this additional LNG buildout,227 in the figure below, shows that by 2030, US LNG by itself could be larger than the IEA’s NZE estimate for global LNG trade.
WHO PROFITS FROM WAR – HOW GAS CORPORATIONS CAPITALISE ON WAR IN UKRAINE 29
The signing of long-term supply contracts, including by European companies, is a critical factor in the build-out of US export terminals. Which is ironic, as this additional export capacity is not required to satisfy European demand. The Institute for Energy Economics and Financial Analysis (IEEFA) reported that the US can temporarily increase its LNG exports for the short-term supply crunch, without the need
for new long-term contracts or infrastructure.228 The combined capacity of the existing LNG export terminals in the US is more than adequate in order to meet the targets of an additional 15 billion cubic metres by the end of 2022 and 50 billion by 2030, as set out by US President Joe Biden. The market has already begun to accomplish this outcome, thus negating the need for any new LNG infrastructure.229
30 WHO PROFITS FROM WAR – HOW GAS CORPORATIONS CAPITALISE ON WAR IN UKRAINE
Figure 26: Comparison of planned LNG capacity to IEA net-zero emissions
Source: Greenpeace International based on IEA, EIA and Sierra Club data
0 100 200 300 400 500 Billion cubic meters per year (bcm/y) 2050 2045 2040 2035 2030 2025 2020
Global Inter-Regional LNG US Approved
US Under Construction
North American LNG Exports
US Operating
Dunkirk: surging emissions in the US
Europe is a key actor enabling the US fracking industry to continue its rapid expansion, whether through political alliances or regulatory adaptations, through direct financial support from European banks (see our chapter “Our banks are still investing in fracking though”), long-term contracts signed by European companies or the expansion of import terminals in Europe meant to store or regasify more LNG. The example of Dunkirk LNG, the biggest entry-point for US shale gas into Europe, allows us to connect these dots clearly and to showcase the snowball effect of imports in Europe on the expansion of the fracking industry in the US. This Fluxys facility is a historical entrypoint for Cheniere’s gas into Europe. All the contracts arranging the supply of US LNG to Dunkirk LNG are supporting the expansion of existing terminals or projects of new terminals in the US.
EDF, holding 61.5% of the regasification capacity of Dunkirk LNG,230 has a 20-year deal with Cheniere in the US. It signed a first contract in 2014,231 becoming “the first foundation customer on Train 3 of the Corpus Christi” and playing a crucial role in the FID on that part of the project (finalised in 2017).
One year after closing this deal, EDF closed other deals with Cheniere,232 in order to ship additional LNG to Dunkirk, coming from Sabine Pass LNG. EDF is now the 9th biggest client233 of the Corpus Christi Liquefaction Project.
Among Cheniere’s clients importing to Dunkirk, we also count Engie, Corpus Christi’s 6th biggest client.234 In the 2022 race for US LNG, Engie also stands out with major deals. It was the first European company to announce a major gas deal with a US company in the frame of the global energy crisis: on 2nd May, it closed a 1.75 mpta deal with NextDecade for their Rio Grande LNG project.235 This purchase agreement made much more noise than the discrete extension of the EngieCheniere contract right after the start of the war and involving the Corpus Christi LNG facility (see our chapter “Messing with Emissions”). In June 2022,236 Cheniere announced its FID to start stage 3 of the expansion of Corpus Christi LNG in order to produce more than 10 mpta additionally. At the end of the year, on 6th December, Engie also signed a 15-year contract237 with Sempra Energy for its proposed Port Arthur LNG project. A FID for Phase 1 of this project was decided in March 2023, after signing contracts for its total capacity.238 Port Arthur LNG will build239 with two fossil gas liquefaction trains capable of producing, under optimal conditions, up to 13.5 mtpa in the aggregate, or approximately 18.36 bcm240 of gas per year.
Finally, at the time of writing, NextDecade was negotiating a deal with TotalEnergies241 for its Rio Grande LNG project, which will likely result in a positive FID, currently projected for Q2 in 2023. TotalEnergies would receive an equity investment and would push the contracted capacity from 64% to 86%.
WHO PROFITS FROM WAR – HOW GAS CORPORATIONS CAPITALISE ON WAR IN UKRAINE 31

© Les Stone / Greenpeace
Toxic snowball effect
Profits for the gas industry
Despite the unprecedented challenges faced by the world in 2022, including rising inflation, climate-driven disasters, and conflict, the fossil fuel industry reaped enormous profits. These were fueled by the world’s first truly global energy crisis, which was sparked by Russia’s invasion of Ukraine and resulted in sky-high wholesale gas prices, driving historic gains for oil and gas producers. According to Fatih Birol, the head of the International Energy Agency, the global oil and gas industry made a staggering $4 trillion (€3.68 trillion) in profits in 2022,242 a remarkable increase from the average profit level of $1.5 trillion (€1.38 trillion) in recent years. Such profits led to accusations of “war profiteering” by US President Biden and warnings from UN Secretary-General Guterres that fossil fuel companies “have humanity by the throat.”243
While millions of people are suffering from high energy bills, US LNG companies, are reportedly emerging as big victors in Europe’s supply crisis248. Due to record volumes of exports to the EU, record prices paid, and record contracts signed in 2022, the year has been nothing less than historic for US LNG companies.
According to Reuters, prominent American gas companies such as Cheniere Energy Inc LNG, which is the largest US exporter, are among the primary beneficiaries due to their extensive long-term contracts to supply LNG signed in recent months.249 Cheniere reported it doubled its revenues from 2021 to 2022.250 Other major LNG players such as Sempra Energy have a similar story, reporting €13.3 billion in revenue in 2022, and an increase in net profits from 2021.251
PORTFOLIO TRADERS MADE A KILLING IN 2022
The “Big Five” oil and gas companies (ExxonMobil, Chevron, Shell, BP, and TotalEnergies) revealed that 2022 was their most profitable year in history. This was due to increasing prices of oil and gas, which significantly boosted their revenues. In total, these five companies made €192 billion profit in 2022245, up 95% from their €99 billion profit in 2021246247. ExxonMobil and BP reaped the most reward, with Exxonmobil increasing their 2022 profits by 141% compared to 2021.
Not having to worry about production costs going up due to inflation or domestic policies impacting extraction sites, the middle men in the EU-US LNG trade are perhaps the ones who really held the golden ticket in 2022. At the peak in summer, a single LNG shipment could bring in €185 million in profits,252253 with gas traders raking in huge profits as a result. These traders include divisions of the big fossil fuel companies (such as Shell, BP, and TotalEnergies who have many portfolio contracts with US LNG producers), but also specialised energy trading companies such as Gunvor or Trafigura. These middle men in the energy business have a remarkably simple business model, and essentially exploit the differences between the energy prices on the American market and the European market.254
On average, US LNG is traded at prices linked to the Henry Hub index, the US reference gas price index. This means these traders could fill a tanker and send it across the Atlantic for around €55.31 million,255 purchased at the low Henry Hub prices. On the other side of the Atlantic, this same shipment is sold on the spot market at the European prices of the Amsterdam TTF gas price index, fetching around €254 million.256257
WHO PROFITS FROM WAR – HOW GAS CORPORATIONS CAPITALISE ON WAR IN UKRAINE 33
Figure 27: Profits “Big Five” fossil fuel companies active in the US LNG trade
Source: Greenpeace International, data from the financial statements of the listed companies244
0 10 20 30 40 50 60 Profits 2022 Profits 2021
Thousands in mln USD
Chevron BP TotalEnergies Shell Exxonmobil
Companies
Using this business model, gas traders such as Trafigura and Gunvor have doubled their profits258259 in 2022, making it their most profitable year ever. In total, the three largest LNG portfolio players made more than €92 billion260 in profits in 2022 according to S&P Global, with their market share rising from 17% in 2021 to 59% in 2022.261
SHAREHOLDER PROFITS INSTEAD OF RENEWABLES
BP’s CEO, Bernard Looney, has previously referred to the company as a “cash machine” due to its financial returns. BP’s finance chief, Murray Auchincloss, has also reportedly admitted that the company may be receiving more cash than it knows what to do with.262 2022 truly has been a bumper year for these companies.
paid €1.3 billion in dividends, while Cheniere paid €355 million in dividends and €3.3 billion in share buybacks.267 Even companies such as Engie, a large purchaser of US LNG at high prices was able to pay a €2.5 billion dividend to its shareholders.268
Added to this, respective stock values went up massively in 2022, generating an astronomical amount of wealth for their shareholders. ExxonMobil grew by 167% from 1 January 2021 to 31 December 2022, adding €259 billion in value for its shareholders.269 Cheniere comes second with a 150% stock increase, adding €20 billion in value for its 83 stockholders.270 Sempra Energy had the most modest growth of these companies, but still saw steady growth with a 21% increase.271 To put this in perspective, the S&P 500, an American stock index used as reference, only grew by 2% that period.272 In total, the Big Five plus Cheniere and Sempra added €622 billion in value for their shareholders.273
266
It seems a lot of the profits made from high energy bills are going straight to shareholders’ pockets in the form of dividends and share buybacks. Despite the oil and gas industry’s claims of taking action on the climate crisis and shifting their business models, their enormous profits mostly benefitted their shareholders. Opponents argue that these amounts could have been better invested in renewables. Shell, the biggest European fossil fuel company, paid €24 billion in profits to its shareholders, but invested only €3.2 billion in renewable energy in 2022.263264 The top five oil and gas companies, as a group, paid €94 billion of their 2022 profits directly to their investors. According to Global Witness, this includes distributing €44.25 billion in dividends and utilising €50 billion to buy back shares.265 US LNG
producer Sempra Energy
What could one do with these massive profits
The €94 billion in 2022 dividends and share buybacks paid to shareholders would be better invested into increasingly affordable renewable energy. This amount of money is equivalent to the levelized cost of 3090 TWh of onshore wind energy, at USD 0.033/ kWh (0.030 EUR) according to IRENA, the agency for renewable energy.274 This is equivalent to 79% of the 2021 US electricity consumption275 and to 111% of the 2021 EU electricity consumption.276
Alternatively it could cover almost 30% of the €322 billion bill needed to rebuild Ukraine from the war according to the World Bank277 278 .
34 WHO PROFITS FROM WAR – HOW GAS CORPORATIONS CAPITALISE ON WAR IN UKRAINE
Figure 28: Stock value increase selected fossil fuel companies January 2021 - December 2022
Source: Greenpeace International, data from Google Finance
0% 50% 100% 150% 200%
Cheniere ChevronSempraEnergy BP ShellTotalEnergies Exxonmobil Companies
Costs to European and US consumers
PAYING THE BILL THREE TIMES
1. Devastating energy bills
One of the most crucial aspects to emphasise in this report is the actual impact on energy consumers who were burdened with exorbitant costs due to record-high gas prices. The gas and electricity price crises, coupled with soaring inflation, has resulted in an increasing number of people being forced to make difficult choices, such as prioritising between buying essentials like schoolbooks and clothing, or providing food for their children. In the UK, a survey revealed that a quarter of respondents were intending to prioritise purchasing food over heating their homes during the winter months.279 Similarly, in Europe, studies report that more than 50 million individuals or 25% of households may find it challenging to pay their energy bills.280 In an October 2022 survey, three out of four Europeans responded to have cut back on food and everyday items in order to pay the rising bills.281 At a time when fossil corporations were raking in huge profits, those most vulnerable to volatility saw an increasingly large proportion of their monthly income disappear. According to Eurostat trade data,282 the EU’s energy import bill was €221 billion in 2020. In 2021, the bill almost doubled to €390 billion. And in 2022, the year of record prices, the EU energy import bill more than doubled again to €834 billion. All while consuming less energy than ever in Europe.283
These painful energy bills have not been limited to European consumers. A quarter of US respondents who were polled in the summer of 2022 said they had forgone necessities like food or medicine to pay their energy bill.288 In the bidding war of Asian and European companies for US LNG, American domestic consumers end up as collateral damage. This rapid price increase exposed Americans to higher prices and increased volatility.289 The most apparent example of how the US domestic market is linked to global LNG trade was the explosion at the Freeport LNG terminal in June 2022. The day after the explosion, the US domestic gas price “tumbled” reportedly because the closure of this export terminal left more supply for American consumers.290 In Europe, the markets made a reverse move and the price rose substantially after the news of the explosion.291 Both markets jumped up and down during the weeks after in reaction to updates regarding the plant’s restart.
And while prices in the EU have stabilised since their peak in August 2022, they are still twice as high as 2010-2020 averages, with reports indicating this is likely to remain the case for the foreseeable future.292 Even though prices are lower now, the European energy crisis is far from over, with winter 2023-24 being predicted to be even more difficult to weather.293
EU’s energy import bill invested in renewable energy .
The total €834 billion EU 2022 energy import bill284 would also be better dedicated to renewable energy. Renewables are cheaper than ever, with levelized costs of USD 0.033/kWh for onshore wind according to IRENA.285 The EU’s energy import bill is equivalent to the costs of a whopping 27648 TWh of electricity. This is 10 times the amount of the current 2785 TWh electricity generation in the EU (2021),286 or 4 times the total 6674 TWh total energy production in the EU.287 While it will take a huge effort of the EU to reach its energy transition targets, these comparisons show that the high prices paid by Europeans this year could have been better invested in the future.
WHO PROFITS FROM WAR – HOW GAS CORPORATIONS CAPITALISE ON WAR IN UKRAINE 35
It seems that Europe is not returning to cheap and plentiful gas, and one reason is our newfound reliance on LNG, and new US contracts providing it. LNG has been a costly alternative for Russian pipelined exports mainly due to two reasons: first, transporting LNG across the globe is an energy and capital intensive process; and second, the flexibility of LNG also means its prices are pumped up due to bidding wars. LNG supply is loyal only to the highest bidder.
Source: ICE Ltd and Bloomberg
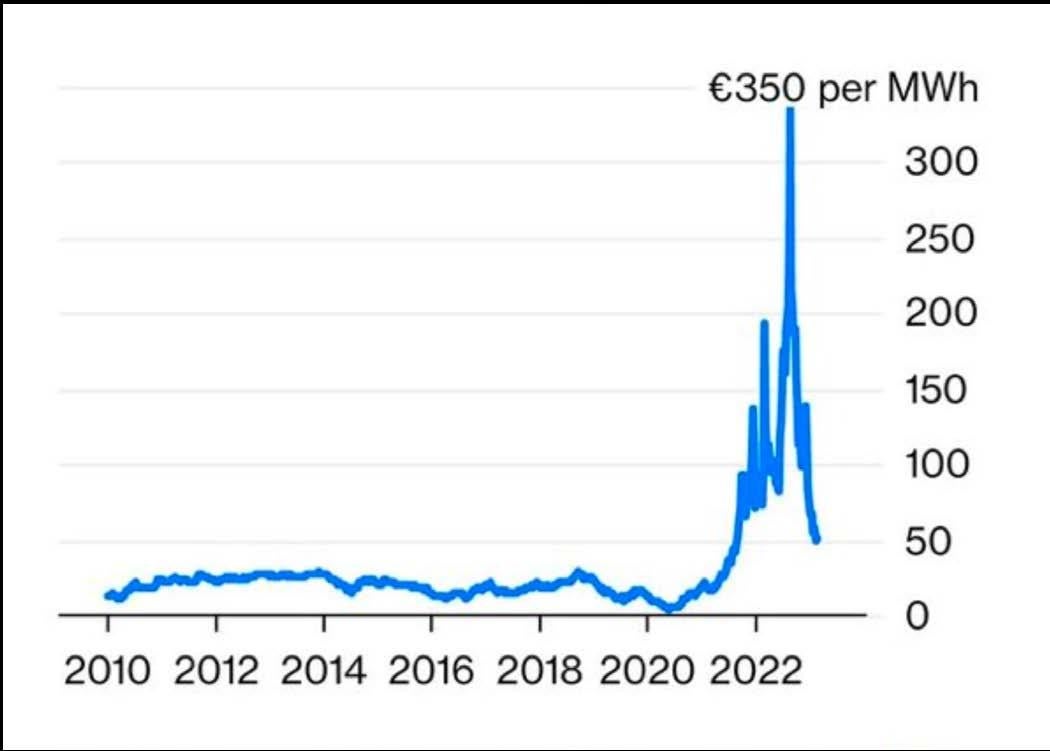
LNG is an inherently expensive fuel
There are three phases in the production of LNG, each of which are very expensive:
1. Liquefaction plant
The first step in the US LNG chain is a liquefaction plant which liquefies shale gas into LNG. These plants are massively expensive, running into billions of dollars per terminal. The total cost of the Sabine Pass and Corpus Christi LNG terminals, both essential for the export to European markets, is projected to be €44 billion.294295
2. LNG tankers
The second step is the transport across oceans in specialised LNG tankers. Due to the special tanks used to keep the LNG at a temperature of -162°C, these vessels are notoriously expensive. A standard 135,000 ton LNG tanker costs €220 million,296 compared to €78 million for a standard 280,000 ton crude oil tanker.297 298
3. Regasification plant
The third step consists of reheating the LNG back into a gas for injection into the grid. Besides being very energy intensive, these plants cost about $1 billion (€0.92 bln) apiece and take several years to build.299 In Germany, the planned LNG import terminals will reportedly already cost double than first projected: €6.56 billion up from €3 billion in the 2022 budget.300
LNG only comes close to being cost-competitive with pipelines over long distances. Depending on several factors, this break-even point occurs between 3,000 to 7,000km.301 While no-one is proposing a pipeline across the Atlantic Ocean, it is important to realise that LNG is inherently expensive due to this process, and consumers in the US and Europe are paying the price.
36 WHO PROFITS FROM WAR – HOW GAS CORPORATIONS CAPITALISE ON WAR IN UKRAINE
Figure 29: Gas price evolution in the EU 2010 - 2023
This high production cost is exacerbated by the flexibility LNG transport offers. Import countries are no longer reliant on fixed pipelines but can import from across the world. However, this flexibility brings competition, and LNG answers only to the highest bidder. For a limited supply of global LNG, Europe is currently competing with buyers from the rest of the world, mainly wealthy Asian countries such as Japan and South Korea. In typical years, Asian buyers outbid European ones, who then buy the leftover capacity. But in 2022 this was reversed. European countries were willing to pay higher prices, despite the social costs following that buying spree. Due to the ensuing bidding war, LNG spot prices reached record highs in the winter of 2021 and the early months of 2022.302
As a result, global LNG volumes rose by only 5.5% in 2022, but doubled in value to an all-time high of $450 billion (€415 bln)303 according to the IEA. Average spot prices rose to six times their historical norms, while France’s net import costs for gas almost quadrupled from €9.4 billion between January-October 2021 to €36.6 billion for the same period in 2022.304
The estimated cost of the LNG terminals in construction and proposed would be a whopping €22.1 billion according to the 2023 Gas Tracker Report. Adding to this another estimated €31.4 billion in proposed pipelines to connect it all and the EU ends up with a total bill of €53.5 billion in new gas infrastructure305.
2. The tax bill: LNG expansion is made possible using our taxes
While fossil fuel companies have been making historical windfall profits during the EU energy crisis, at the same time a lot of public money has been going to them in direct support or indirect support for the EU consumers to help them pay their energy bills. First of all, the policies implemented to soften the energy crisis end up on tax bills. Bloomberg calculated the energy crisis has cost the EU roughly €920 billion in bailouts, subsidies, energy purchases, etc. and it is still expected to last years.306 Meanwhile, national governments committed roughly €758 billion in aid packages to offset the rising cost of energy according to Bruegel research,307 at a time of rising interest rates and thin fiscal capacity. In economics this is known as a recipe for accumulating debt, enforcing austerity and cutting back on public services.
Second, fossil fuel companies receive public money in the form of tax breaks and subsidies. A report by Climate Action Network found that European countries spend more than €112 billion per year subsidising oil, gas and coal production or consumption.308
And third, research done by Investigate Europe uncovered that the EU will be spending billions of euros from the post-Covid recovery fund on new fossil fuel infrastructure. A significant portion of the subsidised loans available through the recovery plans - up to 30% or €67.5bn out of €225bn - could end up being used to fund new LNG terminals and pipelines connecting them to the grid.309
3. Our future bill: the stranded assets
A recent study by researchers from a group of UK Universities310 sheds light on the ownership of over 43,000 oil and gas assets, revealing the parties that will ultimately suffer the consequences of misguided investments that result in stranded assets.
The study shows stranded assets (see box “Stranded assets - Paying twice”) lead to significant losses for their owners. Globally, a considerable portion of future stranded assets is owned by pension funds that invest their members’ savings directly into other companies. When an asset becomes stranded, the anticipated payback for the owner is lost. In such cases, the cost of extracting the fossil fuel exceeds the selling price, resulting in significant losses for the company’s shareholders.
WHO PROFITS FROM WAR – HOW GAS CORPORATIONS CAPITALISE ON WAR IN UKRAINE 37
The study also found private individuals own more than 50% of the assets at risk, and a surprisingly large part of the losses are borne by ordinary people with pensions and savings invested in managed funds, which could potentially exceed a quarter of all losses. These shareholders include individuals and companies, which, in turn, have their own shareholders. In essence this means consumers in Europe and in the United States tomorrow will be paying for the reckless investments of gas companies today.
Stranded assets - Paying twice
The consumer pays three times
The high cost for energy has been paid first by European and American consumers throughout 2022, with painfully high energy bills, which will remain high for years. A second bill will be paid through the taxes used to finance the myriad of energy policies and fossil subsidies. And finally, a third bill will be presented to EU and US consumers when the new LNG projects prove to be stranded assets and their losses will be paid through our pension funds and banks. This will be a ‘bitter bill’ to swallow.
Constructing numerous new LNG terminals poses a significant drawback due to their incompatible timelines, climate objectives and the pace of the energy transition. The construction of new LNG terminals takes years, raising doubts about their relevance to the current energy crisis. Furthermore, once built, LNG terminals have an anticipated operating lifespan of several decades, which means anything built in the mid-2020s could potentially continue to operate until the second half of this century. This would undoubtedly thwart our global climate objectives. Alternatively, if the terminals are decommissioned before the end of their anticipated lifetime, investors will be left with stranded assets. So building a series of new terminals effectively leads to a lose-lose situation. Europe has concrete climate goals it wants to reach by 2030, and wants to become net-zero by 2050. On the one hand, the new LNG import terminals in the EU will become worthless in a net-zero Europe, while on the other, gas demand from the EU will decrease, rendering the new US LNG export terminals equally useless.
Research from the University of Cambridge indicates roughly half of the world’s fossil fuel assets may become worthless by 2036 in the context of a net-zero transition.311 Countries that are slow to decarbonise are expected to suffer, while early adopters of renewable energy will profit. This shift highlights the risk of producing more oil and gas than future demand requires, potentially creating stranded assets, costing people across the world $11 trillion (€10.14 tln) in value that could become worthless.312
The most vulnerable assets are unconventional oil and gas fields in remote or technically challenging environments, such as Canadian tar sands, US shale, and the Russian Arctic. In a worstcase scenario, investing in fossil fuels until demand falls could lead to a financial crisis on the scale of 2008 according to the researchers.313 A net-zero scenario, which is the US government’s314 as well as the EU’s315 target for 2050, would render 62% of all US fossil fuel assets stranded. This would shrink their value from €5,178 billion now, the highest amount in the world, to €3,228 billion316. Furthermore, researchers are seeing a “rat race” to sell as much fossil fuel as possible before assets are stranded, which may result in unconventional sources of fossil fuels, such as shale gas, being stranded first.
38 WHO PROFITS FROM WAR – HOW GAS CORPORATIONS CAPITALISE ON WAR IN UKRAINE
Costs for the Global South
But if the main costs of the current LNG expansion for the Global North countries are in the long term due to the stranded assets and broken climate targets, the immediate costs have already been hitting the Global South hard.
While Europe has not seen blackouts this winter, as Russian President Vladimir Putin had threatened,317 the high prices Europe was willing to pay for the LNG that replaced the piped Russian gas, have resulted in a price competition which saw countries from the Global South outbid in the race to secure their energy needs.
The Ecowrap research report that was published in September 2022 by the State Bank of India (SBI) has clarified that “(s)udden shortage of gas in EU27 has impacted the price of natural gas and concomitantly disrupting the supply in other regions. In South Asia, India, Pakistan, Sri Lanka, and Bangladesh are experiencing difficulty in sourcing gas.”
By October 2022, a power outage in Bangladesh plunged around 80% of its population into darkness. Three quarters of the country’s electricity came from imported gas. But the hike in prices meant the country could not afford to buy as much gas as needed. The people of Bangladesh started facing frequent power cuts in an attempt of the government to ration supplies318
In Sri Lanka, a nation vulnerable to disruption in supply chains, skyrocketing inflation, corruption, debt, and socio-economic challenges, the spike in prices saw its energy and economic sectors hit the hardest, pushing the country into economic collapse.319
Pakistan, the fifth most populous country in the world, agreed on long-term contracts with Italian and Swiss gas traders over ten years ago, to protect itself from extreme international price hikes, only to see those companies defaulting on their contracts to deliver LNG to the country.320 This arbitrary behaviour of the global gas companies saw parts of Pakistan experiencing planned blackouts of more than 12 hours, during the heatwave of 2022.321 In January 2023, a breakdown in the grid triggered yet another outage leaving 220 million people without electricity at the peak of winter.322 The electricity shortage added to the estimated €37 billion323 in damage caused by catastrophic flooding in 2022, a budget deficit, and a debt load that is bringing Pakistan to its knees.
The ease with which fossil fuel companies allegedly breach a contractual obligation,324 illustrates again that LNG supply is loyal to the highest bidder no matter the economical, social and environmental costs.
Faced with similar gas shortages, India, the world’s most populous nation, increased coal imports, diluted environmental laws to make it easier for some mines to raise production, and used emergency laws to reopen coal-fired power plants.325
China has also turned back to coal,326 embarking on a renewed coal power boom in the second half of 2022,327 while countries in Africa, Asia and Latin America increased their use of coal and had to evaluate their energy sources and supply. Those emergency steps taken by countries who can’t afford the violent price race for energy, have led the IEA to announce in the summer of 2022, that “global coal demand is set to return to its all-time high in 2022.”328
Across the Global South, vulnerable households have been hit the hardest. Even before the Covid pandemic and the war in Ukraine, across sub-Saharan Africa and South Asia, according to the Clean Cooking Alliance some 733 million people still lacked access to electricity and 2.4 billion people had no access to clean cooking.329 Today, these figures are reportedly even worse, as household budgets have been constricted and families returned to using dirtier technologies,330 which often impacts women and girls the most.331
The energy price shock wave did not spare Latin America either. Even though some oil exporting economies could have benefitted from high energy prices, the immediate effect has been rising energy prices all over the continent, hitting low-paid workers the most and increasing poverty.332 Growing public anger forced politicians to limit price hikes, cut taxes, and increase fuel subsidies in an attempt to restrain the crisis.
The current economic situation, combined with a return to, and expansion of the most polluting fossil fuels is bad news first and foremost to the Global South. Those directly affected, not just by the lack of access to electricity, but also by the local pollution, climate crisis and lack of mobility, are situated in Africa, Asia and Latin America.333
Ultimately, the Global South will also pay the higher price in the future, facing higher debts, climate change vulnerability, pollution, and poverty. As Europe expands its support for destructive development of
WHO PROFITS FROM WAR – HOW GAS CORPORATIONS CAPITALISE ON WAR IN UKRAINE 39
new fossil fuel extractions, particularly in Africa334, the wealthiest nations in the world, tightening their monetary policies335 and driving up the cost of debt, also make it harder for countries in the Global South to borrow money for development of renewable energy.
How replacing pipelined gas by LNG jeopardises EU climate targets
The LNG boom replacing pipelined gas raises grave concerns about the EU energy transition away from fossil fuels, and the energy future of the continent.336 EU climate targets are being jeopardised by the expansion of LNG infrastructure and contracts, in contradiction with the ideas at the heart of the REPowerEU plan,337 which aim at reducing dependence on Russian fossil fuels and fast forwarding the green transition. This plan would build further upon other EU climate policies such as the EU Green Deal,338 and the EU’s long-term growth plan to make Europe climate neutral by 2050. This target is enshrined in the European Climate Law,339 as well as the legally binding commitment to reduce net GHG emissions by at least 55% by 2030, compared to 1990 levels. The European Commission presented its ‘Fit for 55’ package340 of legislation
in July 2021 to implement these targets; these proposals would lower gas consumption by 30% by 2030, with more than a third of such savings coming from meeting the EU energy efficiency target.
The European shift to LNG in 2022 entails three main obstacles for the EU climate goals. First, LNG is more CO2 intensive than the current EU gas imports. Second, the timing of the newly signed contracts and proposed infrastructure is running afoul of the timeline of the climate targets. And third, the fracked LNG from the United States is among the most polluting and dirty forms of energy in the world, according to satellite research that measured its methane leakage.341

CO2 FOOTPRINT
According to a recent analysis by Rystad Energy, the rise of imported LNG will drive up European CO2 emissions by 35 million tonnes the coming year, due to the extra emissions attributed to the energy intensive LNG process.342 This is equivalent to the annual CO2 emissions of EU countries such as Slovakia or Denmark.343 Only looking at LNG’s carbon dioxide (CO2) footprint, Rystad finds it has the highest emission intensity among fossil gas sources.
40 WHO PROFITS FROM WAR – HOW GAS CORPORATIONS CAPITALISE ON WAR IN UKRAINE
Figure 30: CO2 Emission intensity (from wellhead to market) for gas supplies to Europe
Source: Rystad Energy research and analysis, in kg CO2 per barrel of oil equivalent344
The LNG value chain is inherently carbon intensive, with liquefaction and transport across oceans contributing to a carbon footprint that is up to four times higher than pipelined gas, according to Rystad Energy, depending on the source of the gas and the distance from wellhead to market. In 2020, LNG cargoes coming into Europe ranged from 40 kg of CO2 per barrel of oil equivalent (boe) to more than 150 kg CO2/boe, with an average of 75 kg CO2/boe. European domestic production (30 kg CO2/boe) and pipeline imports (35 kg CO2/boe or lower) are thus less than half the average of LNG imports.345
The Sierra Club developed a US LNG tracker,346 which, among others, gives an estimate of projected emissions for future projects, like the Port Arthur LNG project which features in the case-study for this report.347
Currently, Corpus Christi and Sabine Pass have an annual project capacity of 45 million tonnes LNG, which equates to 273 million tonnes CO2eq348, or the equivalent of the annual emissions of 60.7 million cars.349 For all operating US LNG terminals this equals the emissions of 124 million cars.
However, with the planned expansion of these two terminals plus the expected emissions of the Port Arthur terminal, their carbon footprint would skyrocket. The LNG to be shipped from these three LNG terminals (85 mtpa) could lead to annual lifecycle emissions of 516 million tonnes CO2eq. This equates to about 114 million cars, and exceeds the combined GHG emissions of France and Belgium in 2020.350
Adding up all operating, under construction and approved LNG terminals in the United States, with a project capacity of 301 mtpa, current GHG emissions would more than triple and be equal to the annual emissions of 488 coal plants, or 393 million cars.
When looking at the environmental cost of the imported US LNG to France and Belgium, the impact on the planet is striking. In 2022, Belgium and France imported 18.25 billion cubic metres of LNG from different US LNG terminals, which is equal to 30% of the combined Belgian and French gas consumption in 2021.351 When we account for the average 6 million metric tonnes of CO2e per million tonnes of LNG that Sierra Club calculated, we end up with a massive footprint of 80.46 million tonnes of CO2 equivalent. This is as much as 20% of the total combined CO2 Belgian-French GHG footprint.352
If the EU LNG terminals that are under construction or proposed would start production, this would result in a whopping 950 million tonnes of CO2-eq per year associated with these terminals.353 This is the equivalent to the annual emissions of 211 million cars354 or about a third of the EU GHG emissions in 2019.355
OPERATING TIME OF NEW INFRASTRUCTURE IS LONGER THAN CLIMATE TARGETS ALLOW
Europe’s plans to build new LNG import terminals and sign long-term import deals could hinder the continent’s decarbonisation targets and impede the energy transition.356 As detailed earlier, the vast majority of new LNG capacity will not be available in time to address energy security issues for this and next winter, which is the critical period. Furthermore, the demand for LNG is not expected to grow at the same pace as the new LNG facilities are expected to be built.357 In addition, 15-20 year-long gas deals signed recently run contrary to EU law, which targets a 35% decrease in gas demand by 2035.358 The rush for new, non-Rus-
WHO PROFITS FROM WAR – HOW GAS CORPORATIONS CAPITALISE ON WAR IN UKRAINE 41
LNG terminal Project capacity (mtpa) Annual GHG emissions (Mton CO2e/y) Equivalent: Coal plants Equivalent: Cars Corpus Christi 15 91 24 20,250,255 Sabine Pass 30 182 48 40,500,511 Total annual emissions of operating US LNG terminals 92 557 149 123,949,365 Future annual emissions of US LNG terminals, including operating, under construction and approved terminals 301 1824 488 393,127,263
Table 5: Total emissions attributable to US LNG
Source: Greenpeace International based on data extracted from the Sierra Club LNG Tracker
sian gas supplies could lead to unnecessary gas lock-in for too long. According to Climate Action Tracker, the expansion plans will compromise meeting the 1.5°C limit, with the capacity now under construction coupled with expansion plans potentially increasing emissions by over 1.9 GtCO2eq per year in 2030 above emission levels consistent with the IEA’s Net Zero by 2050 scenario.359
METHANE LEAKAGE ALL ACROSS THE US GAS SYSTEM, MAKING US FIELDS THE DIRTIEST IN THE WORLD
The CO2 emissions attributed to LNG are only the beginning. While CO2 involved in the energy intensive LNG process constitutes a large share of the total carbon footprint of LNG, it is only a part of the story. LNG
The figure below from BP Energy Outlook details the proposed LNG need for 2030 and 2050 in three different scenarios.360 The “New Momentum” scenario shows the projected European LNG imports if the current LNG boom persists. The “Accelerated” scenario is broadly in line with the legally binding Paris Agreement. Whereas the “Net Zero” scenario is even more ambitious and shows how little LNG Europe can import if it wants to keep its net zero emissions target by 2050.361
is mainly composed of methane (CH4), which releases CO2 when it is burned for energy. But at every stage of the lifecycle, from extraction to power generation, gas leaks occur.362 When this methane leaks into the atmosphere it has more than 80 times the warming potential of CO2363 in the short term, and thus becomes a significant global warming contributor.

42 WHO PROFITS FROM WAR – HOW GAS CORPORATIONS CAPITALISE ON WAR IN UKRAINE
Figure 31: European LNG imports by scenario
Source: BP Energy Outlook 2023
This video shows the methane leaks from Corpus Christi: https://www.youtube.com/watch?v=3AzNTty7WdU

This video shows the methane leaks from Sabine Pass: https://www.youtube.com/watch?v=qSaMieGUn-U


WHO PROFITS FROM WAR – HOW GAS CORPORATIONS CAPITALISE ON WAR IN UKRAINE 43
Cheniere - Corpus Christi LNG Facility view 4, San Patricio County, TX (September 2022) - Video courtesy of Earthworks
Cheniere - Sabine Pass LNG View 3, Cameron Parish, lA (June 2022) - Video courtesy of Earthworks
Figure 32: The LNG process, from the field to the user
Source: Greenpeace International
The fundamental argument of gas being a cleaner burning energy source than other fossil fuels fails to take into account the powerful greenhouse effect of leaked fossil gas. When the leakage rate exceeds just 1% of the total gas collected,364 the maths does not stand anymore and fossil gas becomes as bad as other fossil fuels. With a 3% leakage rate it becomes as damaging to the climate as coal-fired power plants.365
Methane emissions from oil and gas production vary widely by location, operator, and over time. Nationally, US methane emissions have been estimated at about
2.3% of gross gas production,366 while some regions (such as the Permian Basin) are among the most polluting in the world.367 A recent survey of the New Mexico Permian Basin estimated an alarming 9.4% methane leakage rate, which was 6.5 times larger than the official EPA data for the region.368 Also, fracking requires huge amounts of water and chemicals, which are injected into geological formations during a violent and extremely polluting extraction process. In Europe, we are familiar with the destructive impacts of fracking: many countries even banned it.

44 WHO PROFITS FROM WAR – HOW GAS CORPORATIONS CAPITALISE ON WAR IN UKRAINE
© Les Stone / Greenpeace
Outsourcing pollution
We know fracking is harmful, we banned it
After the energy shock due to the first Ukraine-Russia conflict in 2014, there was a renewed interest in fracking in Europe. A study by the EU Commission found 13.3 trillion cubic metres of shale gas reserves in Europe, mostly clustered in France and Poland, who account for 60% of all EU shale gas reserves.369 However, the impact on local communities of shale gas extraction in the US brought to life a political debate across Europe, which led to the banning of fracking across several EU member states. European countries who outlawed fracking, temporarily or permanently, because of environmental and geological concerns, include France370 (2011), Denmark371, Bulgaria372 and the Czech Republic373 (2012), the Flemish Region of Belgium374 (2014), the Netherlands375 (2015), Germany376 and Ireland377 (2017), the UK378 (2019), and Sweden379 (2022, banning fossil fuel extraction altogether). Others, like Norway380, deemed it to be uneconomical, while in Poland,381 where extensive exploration was done, gas companies gave up due to unsatisfactory drilling findings. Together, these countries make up 88% of estimated available shale gas reserves in Europe.382 On the map below, the red countries in Europe represent countries that either banned fracking, have a temporary moratorium, or have abandoned fracking plans due to economic unviability.
steep. As a result, the EU is far from becoming a gas extracting power house.383 This juxtaposition of opposing the extraction of shale gas in Europe but increasing US shale imports is remarkable, with France, the UK, and the Netherlands among the largest importers of US LNG. With its impact externalised beyond EU borders, EU leaders do not hesitate to import fracked gas on a massive scale. This hypocrisy is pointed out to us by Frida Kieninger, director of EU Affairs for Food & Water Action Europe:
“
Dirty, fracked US gas runs in ever-increasing amounts in Europe’s pipes and towards industries, homes and other users. A majority of US LNG importing countries in Europe have bans or moratoria on fracking on their territory, but they seem to have no issues whatsoever with opening the floodgates for fracking gas imports. This is a clear hypocrisy and flies in the face of communities in the US that suffer from health impacts, air and water pollution, noise and earthquakes which fracking causes on the other side of the Atlantic.”384
Also John Beard, who we interviewed on March 24th about his fights in Port Arthur (see our chapter “Suffocating communities”), highlights this contradiction:
“European countries have outlawed fracking because they saw the effects of it and the effects largely were earthquakes, polluted and contaminated underground water sources, aquifers and springs. All of these were adversely affecting what people need. You need water more than you need oil because you certainly can’t drink oil. But you definitely need fresh clean water to live. That’s essential. They stopped it over there, but they still want our gas and to get them that gas we’ve got to frack. Because of the way the industry operates. They’re not required to police or take care of their business where they should. And a lot of that methane that they’re trying to get out of the ground is released directly into the air. It either leaks off or it’s burned off by flaring.
Source: Greenpeace International, and DW Research
Even though these countries are rich in shale gas, the cost of extraction to people and nature is deemed too
I think it’s very short-sighted for Europe to feel comfortable using our gas while we take on the additional burden of fracking and while this also adversely affects our climate. Europe has to up their game also. They have to have a better understanding that their need for our gas
WHO PROFITS FROM WAR – HOW GAS CORPORATIONS CAPITALISE ON WAR IN UKRAINE 45
Figure 33: Status of legality of fracking in Europe
is going to hurt both of us. What happens here is going to eventually happen to you. The fracking that’s happening here to give you that gas is going to contribute to climate change and global warming and sea level rise and the extremes of weather and all that come with it. Is that a price that Europe wants to pay for? We have to challenge them. We have to tell them that what you’re doing to help you now is hurting us.”385
Our banks are still investing in fracking
The Cheniere terminals, Sabine Pass and Corpus Christi LNG, are by far the biggest providers of US gas to Europe, including to France, the European entry-point of shale gas, landing in its vast majority in Dunkirk.386 This is an interdependence: reportedly 70% of Cheniere’s exports went to Europe in 2022.387 Both Cheniere’s terminals have been granted loans from financial institutions across the world. According to data gathered by Sierra Club in their LNG tracker,388 Cheniere has been able to attract more than $80 billion in financing in the form of loans, underwriting of bonds, and loan guarantees.389
when the terminals were expanded.390 It is worth noting that the current cost of these two projects is projected to be $47.7 billion according to S&P Global, as opposed to the original estimation of $31 billion.391
According to the data from the Sierra Club, of the 67 banks involved in these LNG terminals, 22 are European, accounting for 40% of the total financing with $32 billion in loans and underwriting spread across seven European countries. This puts Europe ahead of North America in terms of financial support to these export terminals in the US. The earliest loans found are from 2012, at the start of these projects, but the majority of the finance was allocated between 2019 and 2022
This group of countries also includes those who have imported the most US LNG recently, with France and the UK at the top, and Spain and the Netherlands not far behind (see our chapter “Europe becoming the first customer for US LNG”). Also, the same countries who banned fracking in their own territories, are investing heavily to enable the expansion of US fracked gas exports as LNG. French banks, with their strict rules on fracking and investing into unconventional oil and gas,392 stick out especially, with $8.85 billion in loans and underwriting, according to the Sierra Club. The five French banks involved in Sabine Pass and Corpus Christi account for 11% of the total financing of these projects, which ranks France third, right behind the USA and Japan.
46 WHO PROFITS FROM WAR – HOW GAS CORPORATIONS CAPITALISE ON WAR IN UKRAINE
Figure 34: Financiers of Sabine Pass and Corpus Christi LNG terminals divided by region
Source: Greenpeace International based on data from the Sierra Club LNG tracker
Figure 35: European financiers of Sabine Pass and Corpus Christi LNG terminals divided by country
Source: Greenpeace International based on data from the Sierra Club LNG tracker
Financial institution Country Total (in $ mil) Société Générale France 4,775.72 Credit Agricole France 2,251.93 Natixis France 711.20 BNP Paribas France 636.02 Crédit Mutuel France 476.87
Table 6: French financiers of Sabine Pass and Corpus Christi, loans and underwriting of bonds
Australia ($1.6 billion) 2.0% North American ($26 billion) 25.6% Asia ($20.6 billion) 32.3% Europe ($32 billion) 40.1% Italy ($1.67 B) 5.2% Netherlands ($4.53 B) 14.0% Switzerland ($3.61 B) 11.2% France ($8.85 B) 27.4% Spain ($3.99 B) 12.3% United Kingdom ($7.67 B) 23.7% Germany ($2.03 B) 6.3%
Source: Greenpeace International based on data extracted from the Sierra Club LNG Tracker393
Interestingly enough, the financial institutions involved in these terminals seem to acknowledge the detrimental impact of fracking, with many banks already excluding these types of investments in one way or another. According to the Oil and Gas Policy Tracker from the French NGO, Reclaim Finance, 18 banks financing these two terminals have at least some policy excluding fracking from their banking activities.394 They either exclude its extraction in project finance, exclude companies with substantial fracking activities in their investment policies, or choose to exclude particularly harmful projects. According to the data we extracted from the Sierra Club LNG tracker, these 18 banks account for 32% of the total financing to Corpus Christi and Sabine Pass, and all of these banks, apart from the National Australia Bank, are European. These account for 80% of the European financiers, with only Credit Suisse and Standard Chartered having no investment policy around fracking at this moment.
However, the financing data found for these LNG terminals showcases the gaps left in the policies around unconventional oil and gas of these financial institutions. Because while almost all European banks listed below have some sort of policy on fracking, Reclaim Finance evaluated all these policies as ‘weak’ or ‘very weak’. They argue395 that far too often, these policies are too flawed, leaving banks with ample opportuni-
ties396 to invest in the fracking boom. This is evidenced in the fact that banks might have policies excluding the extraction of fracked gas, but show no restraints in financing the LNG terminals built especially for the export of this highly impactful gas such as Corpus Christi and Sabine Pass LNG terminals (see our box “Cheniere’s dirty business”).
Table 7: Top 10 European financiers of Sabine Pass and Corpus Christi, loans and underwriting of bonds
Activists in France and the US win battle against French banking giant.
Société Générale, the largest financier for Sabine Pass and Corpus Christi LNG terminals, recently announced its withdrawal from the controversial Rio Grande LNG shale gas export project in South Texas397
“After years of mobilization by activists and communities on both sides of the Atlantic, this announcement is a victory for civil society and a defeat for Rio Grande LNG. It comes at a time when far too many governments and companies in Europe are rushing into US LNG, locking us into dependencies that are already costing the climate and citizens far too much.” Says Lorette Phillippot of Friends of Earth France.
The French bank had been the target of a coalition of US and French organisations since 2017, when it was engaged as a financial advisor by the project sponsor, NextDecade. These organisations welcome Société Générale’s decision and urge other financial institutions to avoid the LNG project altogether.
WHO PROFITS FROM WAR – HOW GAS CORPORATIONS CAPITALISE ON WAR IN UKRAINE 47
Top 10 European Financiers Country Value ($ mil) Société Générale France 4,775.72 Credit Suisse Switzerland 3,617.49 HSBC UK 3,256.06 ING Netherlands 3,024.56 Crédit Agricole France 2,251.93 Standard Chartered Bank UK 2,144.03 Lloyds Banking Group UK 1,916.19 BBVA Spain 1,804.20 Intesa Sanpaolo Italy 1,667.45 ABN AMRO Netherlands 1,502.37 Santander Spain 1,472.84
Source: Greenpeace International based on data extracted from the Sierra Club LNG Tracker
Messing with emissions
As set out above, European companies signing contracts with US export terminal owners like Cheniere, play a significant role in the FIDs leading to the expansion of these terminals or the construction of new terminal projects. They are thus encouraging the development of the fracking industry in the US. This is being pointed out by NGOs in Europe, denouncing the hypocrisy of European countries banning fracking from their soil and nevertheless allowing their companies to sign mega contracts pushing for more fracking in the US. European companies, under public scrutiny, try to mitigate this reputational risk by getting non-rigorous green labels on their US contracts - greenwashing their business abroad - or by negotiating them under the radar, away from public attention. Engie reportedly adopted both tactics in its recent US deals.398
The French company reportedly had been negotiating a €5.9 billion deal with NextDecade for two years before finally closing it in 2022.399 Engie had been forced to put it on ice in November 2020,400 after facing massive criticism from the French State - holding 23.6% of Engie’s shares401 - and the environmental movement, raising climate concerns linked to methane leaks in the Permian basin and the fracking process the negotiated gas would require. A recent report exposes what happened behind the scenes for the deal to still be closed: NextDecade started negotiations with Engie, guaranteeing the French company it could provide it with a certificate stating NextDecade’s gas was low-carbon gas.402 In order to do so, the American company would go through a newly founded third company, Project Canary, which would carry out an “independent” assessment of the life-cycle emissions of NextDecade’s gas.403
An investigation by Earthworks and Oil Change International raises serious questions about Project Canary’s methodology.404 Earthworks used Optical Gas Imaging (OGI) cameras to survey oil and gas sites that were also monitored using Project Canary’s technology (Continuous Emissions Monitors, or CEMs). They found CEMs failed to capture every significant pollution event that was detected with the OGI cameras, and spoke with experts who were sceptical of claims made about gas certification.405 The report also raised concerns around a lack of transparency, conflicts of interest, and noted misleading claims in their marketing that
amount to greenwashing. Other reports have noted that Project Canary allows its clients to select which wells and facilities are subjected to monitoring and certification, a practice which could lead to the best sites being cherry-picked.406
However, Engie went along with this offer. Ken Robinson, the head of Engie’s US energy marketing business, reportedly declared this certification made the contract more “palatable” to its opponents in France.407
Meanwhile, in the midst of the NextDecade contract turmoil, in June 2021, Engie signed a 11-year deal with Cheniere Energy, which was extended to a 20-year deal right after the start of the Ukraine war.408 The initial deal was reportedly closed without warning the Board of Engie and thus the French State,409 which was reportedly confirmed by the French government,410, its biggest shareholder. In a reaction to Le Monde, reporting on this negotiation, Engie reportedly states “this contract represents 2% of the projected volumes served by Engie at the horizon of 2030. The usual internal rules of the group regarding the approval of a contract of that size, limited, have of course been followed.”411
The Internal Regulations of the Engie Board of Directors stipulate:
“The Chief Executive Officer shall obtain prior authorisation from the Board to carry out the following transactions:
– enter into any long-term power purchase agreements on behalf of the Group for quantities exceeding the following per transaction;
– 30 billion kWh of gas per year, including the conditions of transport.”412
The initial contract between Engie and Cheniere was for a volume varying between 0.4 million tons (5.4 billion kWh) and 0.9 million tons (12 billion kWh) from 2023 to 2032.413 These amounts did not have to pass by the Board of Directors. The press release announcing increased volumes is not clear as the volumes mentioned there are the same as the ones in the 2021 contract. 414 Bloomberg estimates there is a possibility it was raised to 1.2 million tons a year (16 billion kWh).415 The contract was also prolonged by nine years and now runs until 2041.416
French NGO Les Amis de la Terre accessed confidential documents leading up to the signature of the initial
48 WHO PROFITS FROM WAR – HOW GAS CORPORATIONS CAPITALISE ON WAR IN UKRAINE
contract. They shared those (unpublished) documents with us. In the Investment Note submitted to the Development Committee, it appears Engie was worried about the negotiations with Cheniere, which started in the last quarter of 2020. The project gets a code name: Mustang, a nickname given to Cheniere. In the note, Engie recommends: “no publicity should be made around the transaction to keep it under the radar.” The company says they have to be “always taking into account the lessons learned from BU LNG and the NextDecade process.”417
According to the confidential documents, Engie identifies multiple risks in its collaboration with Cheniere. First it stresses this is about shale gas, which caused trouble in the public opinion when the NextDecade contract was made public. On the other side of the Atlantic though, Engie reassures: there seems to be “no major local controversy found against Mustang apart from Sierra Club and opponents to pure export of LNG.” Engie is also worried about the way Cheniere handles its reduction of GHG emissions along the supply chain: “it only relies on the supplier’s commitment to reduce their emissions (through participation to voluntary initiatives like ONE Future) and on the requirements set by the local regulation for GHG reporting.” According to the
Cheniere’s dirty business
documents, the American company has “no upstream commitments,” while at the same time it “sources from approx 70 producers in various states.” Also, Cheniere “reports no dedicated water management system, nor performance target.” On the GHG reporting, Engie sees a mitigation factor in the fact that Cheniere “announced in February 2021 the significant commitment to provide GHG performance certificates from wellhead to liquefaction for 100% of its LNG production from 2022 onwards.” In Le Monde, reporting about this negotiation, Engie reportedly comments: Cheniere “is committed to a major effort of transparency, traceability of the carbon content of its gas chain and continuous improvement in the management of methane and carbon dioxide emissions.”418
In the above mentioned investigation,419 however, it appears Engie was aware this was not sufficient, as the low-carbon certificates would be issued by Cheniere itself, a conflict of interests which Engie made a point to escape from in its public deal with NextDecade.420 Indeed, Cheniere’s “green tags” are everything but green (see our box “Cheniere’s dirty business”). Nevertheless, Engie and Cheniere continued their negotiations to settle down to Cheniere’s conditions in June 2021.421
The surge in demand for fossil gas – coupled with a public increasingly supportive of climate goals – has initiated intense greenwashing. There is a rush among companies to present their gas as “greener” and more climate-friendly than the alternatives. These “green LNG” schemes often rely on carbon offsets and, in some cases, proposed Carbon Capture and Storage (CCS) projects, but one key factor has been dealing with the problem of methane emissions in the supply chain.422
In June 2022, Cheniere Energy – the largest LNG exporter in the US – started supplying “cargo emissions tags” (CETs or CE Tags) to its customers purporting to quantify lifecycle emissions of its LNG shipments.423 However, an investigation by Greenpeace USA and Oil Change International found that these tags were based on a flawed methodology.424
Key findings of this investigation include:
• The published methodology paper425 builds on flawed EPA data on the methane emissions of its upstream suppliers. Studies have found that EPA data substantially underestimates methane emissions by relying on outdated emissions factors that do not accurately capture emissions from large “super-emitter” events.
WHO PROFITS FROM WAR – HOW GAS CORPORATIONS CAPITALISE ON WAR IN UKRAINE 49
• A sensitivity analysis found in the paper’s supplemental information shows that when more accurate emissions factors that better incorporate high-emissions events are used, the full lifecycle emissions increase significantly. This finding was not incorporated into the paper’s result and conclusions.
• Despite claims that the methodology is “supplier-specific,” only 58% of the gas supply assessed in the paper is sourced from known suppliers, while 42% comes from marketed gas for which no supplier-specific data exists. The authors note that the complexity of the gas network and the lack of data make it “difficult” (even for industry insiders) to track the “exact pathway” gas travels from wellhead to terminal. As a result, it seems unlikely the current iteration of the CETs will be able to provide granular enough information to associate a given LNG shipment with a specific subset of upstream suppliers.
• The paper only analyses the company’s Sabine Pass LNG plant and does not provide any information about the supply chain for its Corpus Christi LNG plant.426 On an earnings call in November 2021, CEO Jack Fusco reportedly told analysts, “about 100% of the gas at Corpus Christi right now is coming out of the Permian Basin,”427 which has earned a reputation for having one of the highest methane venting and leakage rates in America.428 As a result, the discrepancy with EPA data could be even more pronounced with Corpus Christi than with Sabine Pass, and the total lifecycle emissions for Corpus Christi cargoes could be very large.
• Cheniere’s CETs may have incomplete or limited data on super-emitter events in their supply chain. As one example, in 2019 Apache Corporation signed a 15-year contract to supply gas to the Corpus Christi Stage III expansion.429 (In 2021, Apache was reorganised as a subsidiary of APA Corp.) On December 24, 2022, a large methane plume was observed (by satellite) coming from an APA facility in the New Mexico Permian. Reportedly, either the state regulator nor the company itself was aware of the leak until contacted by a Bloomberg reporter.430 The plume reportedly had an emissions rate of 5 metric tons of methane per hour, and was later found to be caused by a faulty flare. While it is unknown whether APA is a current supplier to Corpus Christi (as the Stage III expansion has not yet started commercial operation), this example is indicative of some of the significant unknowns lurking behind Cheniere’s CETs.431
In the May 2022 edition of LNG Industry Magazine, Cheniere’s Senior Vice President for Corporate Development and Strategy Tim Wyatt stated that, “CE Tags will be a necessary prerequisite to credible carbon offsetting.”432 This clearly indicates that customers who receive CETs with their LNG cargo may use the emissions estimate to buy carbon credits to offset the emissions associated with the cargo. But the $1 billion unregulated carbon offset market has been widely discredited by experts, academics, banks, and regulators for failing to reduce carbon emissions.433 The potential role of Cheniere’s CETs in bolstering a discredited and destructive carbon offset market threatens to undermine company efforts to reduce emissions in its operations by creating a veil of carbon neutrality around a product that is anything but.434
50 WHO PROFITS FROM WAR – HOW GAS CORPORATIONS CAPITALISE ON WAR IN UKRAINE
Suffocating communities
Oil and gas are produced in a number of different regions across the US Midwest. The Permian Basin in Texas and New Mexico is the largest oil producing region in the US, but the largest gas producing region is the Appalachian Basin (in Pennsylvania, Ohio and West Virginia), with significant producing areas also in North Dakota, Colorado, Oklahoma, Louisiana and elsewhere.435 A vast network of pipelines transports much of this oil and gas south to the Gulf Coast for processing and (increasingly) export.

Each stage of the life cycles of oil and gas — extraction, processing, transport, and combustion — generates toxic air and water pollution, as well as GHG emissions that drive the global climate crisis. Exposure to this pollution is linked to negative health impacts for people living near these pollution sources. The impacts of climate change are also strongly linked with rising health risks. In the context of the United States,
it is well-established that the public health hazards from air and water pollution, and the risks associated with climate change, fall disproportionately on Black, Brown, Indigenous, and poor communities.437
The Gulf Coast – especially Texas and Louisiana – is home to a great concentration of oil refineries, petrochemical facilities, and crude oil and LNG export terminals. Certain parts of the region are among the most polluted in the nation – notably the “Cancer Alley” region (on the Mississippi River between New Orleans and Baton Rouge) and the Houston Shipping Channel.438 Communities like these that have been significantly harmed by pollution are often called “sacrifice zones”.439 The build-out of LNG export infrastructure adds new burdens on top of existing pollution for many of the communities where these projects are located. This is due to pollution from the terminals themselves, but also the increase in oil and gas drilling, and the expanded pipeline network built to facilitate these exports.
WHO PROFITS FROM WAR – HOW GAS CORPORATIONS CAPITALISE ON WAR IN UKRAINE 51
Figure 36: Map of the most significant oil and gas producing regions in the US
Source: EIA436
In addition to high GHG emissions, LNG export terminals are significant sources of air and water pollution that are associated with local health risks. Pollutants include both criteria air pollution, such as fine particulate matter (PM2.5) and nitrogen oxides (NOx), and air toxics, including volatile organic compounds (VOCs) and carcinogens such as benzene.440 A 2020 report by the Environmental Integrity Project found that proposed and existing terminals, and their associated pipelines and compressor stations, would lead to thousands of tons of increased air pollutant emissions.441 Flaring of excess gas is common at many terminals and is a source of much of this pollution.442
This local pollution can result from routine operations,443 and can greatly increase in the event of breakdowns, failures, explosions or other catastrophic events. In June 2022, the Freeport LNG terminal suffered a serious explosion that was later found to be due to “inadequate operating and testing procedures, human error and fatigue.”444 No one was killed or injured in the blast, but the plant reportedly had previously had a record of safety issues, and such LNG explosions are potentially very destructive events with risks for nearby communities.445 Hurricanes impacting the Gulf Coast also raise the risk of flooding at terminal sites446 and the need to flare off excess gas in the event of emergency shutdowns.447
Cheniere’s Corpus Christi terminal was found to have exceeded its air pollution permit limits “hundreds of times,” which the state regulator reportedly addressed by weakening those limits and allowing double the initial permitted emissions of VOCs.448 Cheniere even reportedly petitioned the Biden administration to exempt it from rules limiting emissions of cancer-causing pollutants, claiming the rules could limit LNG shipments to Europe.449
As with all other stages of fossil fuel lifecycles, the pollution harms from LNG terminals are not shared equally. Analysis by the Sierra Club concluded the “majority of the planned and under construction terminals are in communities that have higher air toxics cancer risk, higher air toxics respiratory hazard index, and higher minority populations and/or low income populations than 75% of the country.”450
All the operating and under-construction terminals except one in the US are located near a “disadvantaged community” as determined by the Sierra Club.451 Notably, the Corpus Christi and Freeport terminals have a large population living within three miles of the site, that are disproportionately low-income and people of colour.452 A cluster of three terminals (Sabine Pass, Golden Pass, and Port Arthur LNG) is located near Port Arthur, Texas – a town of 50,000 (majority people of colour) that is already home to three oil refineries, including the largest in the US. Other terminals have been proposed in regions that are disproportionately low-income communities of colour – notably Rio Grande LNG, Texas LNG, and Plaquemines LNG.453
In addition to pollution harms from LNG terminals themselves, the surge of LNG exports has sparked an increase in oil and gas extraction, transport and processing to meet the demand. A compendium of scientific and medical research on the impacts of fracking in the US summarised its findings by saying, “Our examination uncovered no evidence that fracking can be practised in a manner that does not threaten human health directly and without imperilling climate stability upon which public health depends.”454 A growing body of research has associated proximity to oil and gas activity with health problems455 such as respiratory impacts (e.g. asthma),456 cancer,457 poor birth outcomes,458 and more. Data from the EPA’s Air Toxics Screening Assessment shows that 236 counties with a total population of 14 million “face cancer risk exceeding EPA’s one-in-a-million threshold level of concern, just due to oil and gas pollution.”459
In all of this, poor communities and communities of colour repeatedly suffer the most. In south Texas, there is evidence that fracking wastewater disposal wells are disproportionately located in Black, Brown, Indigenous, and poor communities.460 Similarly, south Texas oil and gas flaring is found to disproportionately occur in Hispanic communities,461 and the risk of birth complications has been found to be higher among Hispanic women.462 In the Permian and Eagle Ford basins in Texas, a majority of the population living near gas flares are people of colour.463
52 WHO PROFITS FROM WAR – HOW GAS CORPORATIONS CAPITALISE ON WAR IN UKRAINE
not over
The lock-ins and the associated LNG boom we witnessed in 2022 are set to further increase in 2023. The latest monthly Short-Term Energy Outlook from the US Energy Information Administration (EIA) forecasts that US LNG exports will keep growing in 2023 and in 2024, to average 12.1 billion cubic feet per day (Bcf/d) in 2023, a 14% (1.5 Bcf/d) increase compared with 2022,464 and increase by an additional 5% (0.7 Bcf/d) in 2024. The main reasons for this pursued surge are the return to service of the Freeport LNG export terminal and the continued “need to displace pipeline natural gas exports from Russia to Europe.”
This increase of LNG flooding Europe is backed by policy measures and industry lobbying advocating for additional lock-ins in the coming years. On 14th February 2023, executives from US and European LNG companies reportedly met with European Commission officials in Washington to discuss the EU’s plans to form a buying consortium to help member countries meet their gas needs.465 Maroš Šefčovič, one of the Commission’s Vice-Presidents, declared the plan is for European countries to “use their combined purchasing power to buy at least 15 percent of the region’s natural gas inventory needs.”466 This would “prevent the EU members from bidding against each other and driving up the price of natural gas, which skyrocketed last year as European companies scrambled to replace their gas supply after Russia invaded Ukraine.”467
On 15th February, Greece’s DESFA (co-owned by Fluxys through the Senfluga consortium, cfr. supra) launched the public consultation on its Ten-Year Development Plan (TYDP) 2023-2032.468 DESFA’s new TYDP includes projects with a total budget of €1.27 billion, a significant increase (+55%) compared to the corresponding previous investment plan. Its purpose is to “consolidate the country as a natural gas supply gateway for Southeast and Central Europe.”469 The TYDP includes new projects amounting to €458 million, of which €430 million concern investments to increase the capacity of the Greek gas network, such as a €290 million and 215 kilometre new pipeline. It also comes with a 100 kilometre pipeline to connect to the Dioriga FSRU awaiting its FID.470
This was saluted six days later by US Secretary of State Antony J. Blinken, who published a Joint Statement on the fourth US-Greece Strategic Dialogue, together with the Greek Minister of Foreign Affairs Nikos Dendias.471 The US underscored Greece’s role in securing Europe “particularly in the wake of Russia’s war against Ukraine.” This on the military front (together with US and NATO support) as well as on the energy front, with connections to Azerbaijan and the US who are both “contributing to Europe’s peace, stability and independence.”472
On 16th February, US senators473 introduced a bill to increase US LNG exports.474 The Natural Gas Export Expansion Act aims at “remov(ing) federal regulatory bottlenecks to increase LNG exports,” as stated in Senator Kennedy’s press release. To those senators, “LNG exports (...) promote America’s energy independence and reduce global emissions.” “We should make it easier — not harder — to export American LNG, and that’s what this bill would do,” said Kennedy. Here as well, the dependence on Russian gas is used as a scarecrow to promote American “freedom” and “clean” gas in solidarity with European consumers: “Thanks to the United States’ innovation and use of clean natural gas, America leads the world in reducing carbon emissions. By exporting US LNG, the United States creates thousands of jobs at home, reduces global emissions, and promotes energy independence from those who use it as a weapon to exert control over importing countries,” declared Senator Cruz in the same press release. They conclude: “This legislation would bolster America’s energy independence at home and supply our allies abroad, especially our European allies, who are acutely affected by strains on reliable fuel supply because Russia invaded Ukraine. Increasing LNG exports would broaden access to clean, affordable energy with American trading partners and counter
WHO PROFITS FROM WAR – HOW GAS CORPORATIONS CAPITALISE ON WAR IN UKRAINE 53
It’s
This increase of LNG flooding Europe is backed by policy measures and industry lobbying advocating for additional lock-ins in the coming years.
the Biden administration’s full-frontal assault on the US fossil fuel industry in the process.”
On 23rd February, Cheniere announced its intention to expand Sabine Pass LNG in order to add 20 mtpa of gas export capacity, up 66 per cent from the facility’s current capacity of 30 mtpa.475 The company is betting on the 2022 LNG boom to Europe to last for decades, as outlined by Anatol Feygin, Cheniere’s Chief commercial officer: “The need for further investment in LNG capacity was again laid bare last year. Over the next few decades, both the supply and demand side trends are supportive of new liquefaction infrastructure.”476 Indeed, this is a very long-term project, as the new facilities in Sabine Pass would reportedly start operation only by the end of the decade.477 Such an injection of money (estimated by the Financial Times at $10 billion478) shows the company is confident the return on investment will spread over decades. The Financial Times also reports Feygin acknowledged Cheniere is already looking to European and Asian buyers to secure its project.479
On 27th February, the EU adopted Regulation (EU) 2023/435,480 reforming the Recovery and Resilience Facility (RRF) regulation, the financial leg of its €750 billion post-Covid fund. Out of this fund, €67.5 billion would be allowed to finance urgent projects related to the energy crisis, among which Investigate Europe identified at least 41 LNG terminal or gas pipeline developments.481
On 28th February, ahead of the annual CERAWeek,482 gas lobby groups sent a letter to the US Secretary of Energy, addressing the upcoming G7 (Hiroshima, 1921 May 2023) which should prioritise “ending dependence on Russian natural gas” and “stabilising global

energy markets” by “encourage(ing) public and private investment in all segments of the natural gas supply chain,” “review(ing) and modify(ing), as appropriate, existing guidelines and practices with respect to public financing of natural gas infrastructure” and “review(ing) and modify(ing), as appropriate, existing regulatory regimes and practices to facilitate timely approval of requests to develop and operate natural gas infrastructure.”483
On 8th March 2023, at the CERAWeek, Didier Holleaux, president of Eurogas (co-signer of the letter to the US Secretary of Energy) and Executive Vice-President of the Engie group, reportedly made it clear that European companies needed to sign more long-term contracts to “secure a significant share of the replacement gas we need to replace Russian gas.”484
On 13th March, Plaquemines LNG announced it reached its FID for phase 2.485
On 17th March, European Commission President Ursula von der Leyen announced Norway’s Equinor would join the EU’s joint scheme for gas procurement as a supplier. Together with this declaration, she clarified that, “in a bid to improve security of energy supply” the common goal of the EU was to “have more longterm contracts.”486
On 20th March, Port Arthur LNG announced it reached its FID for phase 1.487
On both sides of the Atlantic, however, communities and civil society are fighting these accelerated fossil expansion projects, and regulators are developing tools which might put a spoke in the wheel of these inconsiderate plans.
54 WHO PROFITS FROM WAR – HOW GAS CORPORATIONS CAPITALISE ON WAR IN UKRAINE
© Florian Manz / Greenpeace
Due diligence - holding them accountable
The passage of the Inflation Reduction Act (IRA) in August 2022 marks a turning point in US Climate Policy. For the first time, the US Congress has acted to curb demand for fossil fuels, though has largely left fossil fuel supply unconstrained. As a candidate for president, Joe Biden promised to ban “new oil and gas permitting on public lands and waters” and end fossil fuel subsidies.488 Biden also pledged to “engage in community-driven approaches to develop solutions for environmental injustices affecting communities of colour, low-income, and indigenous communities.”
While the IRA is an historic achievement, Biden’s early moves to halt federal leasing were stymied by the courts489 and Congress.490 With his recent approval of the massive Willow oil-drilling project in Alaska,491 Biden seems to be breaking his campaign promise to end federal permitting. His administration has also given the green light to oil and gas export projects, and has lent its diplomatic and policy support to the surge of LNG shipments to Europe.492
As a result, the US continues as the global leader in oil and gas production, yet finds itself in the trap described in a 2019 report by Greenpeace USA on the need for a fossil fuel phase-out.493 Namely, policies to reduce domestic demand coupled with high production resulting in a surge of exports.494 These exports not only represent “emissions leakage” but, more importantly, a growing threat to the health of communities all along the oil and gas supply chain.
Both President Biden and Congress must take further steps to ramp down fossil fuel production, which would bring immediate benefits to fenceline communities and plug the emissions leakage problem.
Local communities living near these existing, under construction, and proposed LNG terminals have organised campaigns of resistance to the build-out.495 Concerns about local pollution, environmental racism, and climate breakdown have sparked opposition in Corpus Christi,496 NextDecade in Brownsville,497 and the glut of projects near Lake Charles and Port Arthur.498
We interviewed John Beard, the founder, president and executive director of the Port Arthur Community Action Network (“PA-CAN”)499, serving the Port Arthur/Southeast Texas area as a community advocate, focusing on environmental issues and community development (online video and addendum 2 to the report with full transcript). He is fighting the petrochemical and fossil fuel expansion plans his community is facing in Port Arthur, as it is home to the biggest export terminal in the US (Sabine Pass LNG), a terminal under construction (Golden Pass LNG), and the Port Arthur LNG project, all in a 10km radius. We interviewed him on 24th March 2023, the week the Port Arthur LNG project reached its FID.
He stresses the difficulty for people in his community to gather the information they need to fight the projects that are imposed on them:
“For people who are not trained in permitting processes, it can be very daunting to overcome these processes. Most of the time you have the public comment period, or you have the opportunity to request a public hearing. But rather than [the public] having to request these hearings, these federal and state agencies need to seek out to engage and work with the communities where these projects are. I think that would serve the greater good a lot better than simply having the companies do their thing. Our communities are left to figure out how to get involved in these processes. Where do they fit in? How do they say what they think? We don’t want that pipeline. We don’t want that LNG facility. Or we don’t want this next door to our houses. How do we have a role in this, and be heard and be effective? I don’t think the system works or is even designed to work for the people that are affected the most. If it were, then we wouldn’t have sacrifice zones ”
WHO PROFITS FROM WAR – HOW GAS CORPORATIONS CAPITALISE ON WAR IN UKRAINE 55
“I don’t think the system works or is even designed to work for the people that are affected the most. If it were, then we wouldn’t have sacrifice zones.”
— John Beard
To John Beard, the industry is taking advantage of the difficulty for these communities to access information and contest expansion plans that will hijack their lands:
“If the system was working well, LNG facilities and other petrochemical plants wouldn’t just be here in Port Arthur or in Lake Charles or in Freeport. They’d be in places like Beverly Hills. They’d be in places like Madison Avenue. They’d be in places like in Houston, in River Oaks or in other places of affluence and wealth because those people have the means to fight back. They can hire lawyers. They have the tools to be able to address these things when it happens. That’s why you notice none of these projects happen in areas like that. They happen basically where there are poor people because as one of the heads of industry I heard once said, “that’s the path of least resistance: that is where people have the least ability to fight back.” But these processes need to be, as we say, “of, for and by the people,” [meaning] who it may affect. It’s not just about the company. The company’s goal is only to make money and seek the best return for its stock and shareholders. But this should not happen at the risk and the forsaking of the lives and the health of the people who are going to be impacted by these projects. If people don’t want it, [then] it shouldn’t go there. If that area has been adversely impacted, like my hometown has been for over 12 decades, then it shouldn’t go there. No project should do harm. If it adds to, or contributes to, or does harm or creates a threat that is deemed locally to be too great a risk, then it should go elsewhere.
We need to have a say in this. And not just a say to be heard, but a say to be listened to too. And if we don’t want it, it shouldn’t be forced on us. Our representatives should remember they are elected by the people and they have to serve them. We shouldn’t be sacrificed on the altar of big oil and gas profits. We are not going to sacrifice our health for their profits.” “We’ve been sacrificed so Europe and the rest of the world can have that very toxic gas.”
In Europe, legal initiatives are being taken to put an end to these toxic effects of the fossil fuel industry (and other polluting industries). Debates around the due diligence of European companies arise in many member states as well as at overarching levels in the EU.
In February 2022, the European Commission proposed a directive on corporate sustainability due diligence.500 The aim of this directive was to implement “comprehensive mitigation processes for adverse human rights and environmental impacts in their value chains, integrating sustainability into corporate governance and management systems, and framing business decisions in terms of human rights, climate and environmental impact.”
In December 2022, the European Council adopted its negotiating position ‘general approach’ on this directive.501 “For the EU to reach its climate and sustainability goals and to ensure the protection of human rights, it is important that companies identify and prevent, bring to an end or mitigate the impact of their activities on human rights and the environment,” declared Jozef Síkela, the Czech Minister for Industry and Trade. The due diligence directive sets out rules for companies to minimise the adverse impacts on human rights and the environment, with respect to their own operations, those of their subsidiaries, and those carried out by their business partners. These rules would apply to large EU companies (over 1,000 employees and €300 million net turnover globally) and to non-EU companies active in the EU.
In the directive, human rights are referred to as (among others):
“
The prohibition of causing harmful soil change, water or air pollution, harmful emissions or excessive water consumption or other impact on natural resources, such as deforestation, that: (a) substantially impairs the natural bases for the preservation and production of food; (b) denies a person access to safe and clean drinking water; (c) makes it difficult for a person to access sanitary facilities
56 WHO PROFITS FROM WAR – HOW GAS CORPORATIONS CAPITALISE ON WAR IN UKRAINE
“For the EU to reach its climate and sustainability goals and to ensure the protection of human rights, it is important that companies identify and prevent, bring to an end or mitigate the impact of their activities on human rights and the environment.”
— Jozef Síkela, Czech Minister for Industry and Trade.
or destroys them; (d) harms the health of a person”502 The directive should be voted on in plenary session on 8th May 2023.503 It will then be discussed in a trilogue between the Parliament, the Commission and the Council before possibly being finalised under the Belgian presidency of the Council in the first half of 2024.
At the national level, the two European countries we focussed on in our case-study were France and Belgium. Both, whether through their banks supporting the expansion of the fracking industry in the US, through companies signing contracts decisive in the FIDs of US LNG terminals or through the Dunkirk LNG terminal providing a privileged platform for the US LNG to spread across Europe, also are ahead on the due diligence issues.
France was amongst the first European countries to vote on a due diligence law, back in 2017.504 Before this, no other law had such a vast binding obligation for parent companies and contracting companies towards their subsidiaries or their value chain (subcontractors, suppliers), in their original country and abroad. This law obliges multinationals operating in France, who have more than 5,000 employees in France or 10,000 employees worldwide, to publish a diligence plan mitigating the risks in terms of violations of human rights (including rights to health) and preservation of the environment.505 This diligence plan should come with a mapping of risks, procedures to evaluate the situation in the whole value chain, actions to mitigate the risks, an alert mechanism to collect reportings of possible risks, and a follow-up plan for the implemented mitigation measures.
The law targets companies and their whole chain: parent companies, holding companies, subsidiaries, subcontractors and suppliers. It allows victims, NGOs and unions to file complaints against companies breaching the due diligence law. Also victims abroad can file a complaint in front of a French judge for activities of companies targeted by this law. The complaint can be filed before the damage is caused, based on the due diligence plan the companies have to publish. The burden of proof, however, is on the plaintiffs. The law has already led to multiple initiatives, like the EACOP campaign506 or the BNP campaign.507
In Belgium, debates started after the UN Human Rights Council adopted an historical resolution on due diligence in June 2014.508 After multiple negotiations rounds, the Belgian parliament adopted a resolution in January 2021, asking the federal government to take measures to speed up the process in Belgium, in order to develop a national due diligence law. A first proposal was introduced to Parliament in April 2021.509 The authors of the proposal stressed the need to move forward with this law regardless of the evolution of discussions at European level on this topic:
“Waiting for EU action only has the effect of prolonging a situation of unfair competition to the detriment of many Member States. On the contrary, a law would give Belgian companies the necessary impetus to adapt in anticipation of the implementation of an EU regulation, thus allowing them to get a head start in a market where political decision makers, consumers and investors are increasing their expectations of corporate social responsibility. ”510 The intention of this proposal is thus for Belgium to be a pioneer in the due diligence landscape, following the French law cited as an example to follow.
The proposal explicitly targets “high-risk sectors of economic activity (...) likely to fuel, directly or indirectly, armed conflicts, human rights violations,” among which it singles out “sectors of the extractive industries.”
Following some remarks from the State Council,511 a new proposal was introduced, with amendments, in August 2022.512 If this proposal gets approved, companies will have to draw up a detailed diligence plan, mapping their suppliers and customers, as well as the risks along their business activities, and implementing the same steps as those mentioned in the French due diligence law (art. 8).513 A surveillance body will make sure companies are complying with the law (art. 12-13), and sanctions could apply if this is not the case (art. 14). Companies active in Belgium could be sued in Belgium for violations in their business chain abroad, with the burden of proof here being on the companies (art. 28).
WHO PROFITS FROM WAR – HOW GAS CORPORATIONS CAPITALISE ON WAR IN UKRAINE 57
The law would apply to companies with headquarters in Belgium, companies active on Belgian soil (providing products to final users living in Belgium or delivering products from Belgium), and - differently from the French law targeting multinationals only - companies with more than 250 employees and a total balance sheet over €43 million (art. 2, 2°-5°). It also would apply to subsidiaries over which a company defined as before has a controlling power (art. 2, 7°), and to associated companies or its subsidiaries in which it has shares (art. 2, 8°). Finally, it targets the whole value chain of a company514.
Art. 2, 14° of the law proposal outlines that due diligence with regard to the environment has to be understood as the principle of sustainable investment as defined in the EU 2019/2088 regulation on sustainability-related disclosures in the financial services sector,515 and is assessed based on the requirements for technical screening criteria as defined in the EU 2020/852 regulation on the establishment of a framework to facilitate sustainable investment.516 A sustainable investment should thus contribute to an environmental objective, measured with indicators like waste generation and management as well as the GHG emissions the activity would generate. It would also need to benefit socially disadvantaged communities or, at least, not harm them. The investment would be assessed based on criteria which would exclude all activities which are not taking into account the full lifecycle impacts of an economic activity and the products resulting from this activity, as well as activities which would lead to lock-ins and stranded assets resulting from a non-alignment with European environmental goals.
Art. 2, 11° lists the international human rights conventions safeguarding the rights to health517 and of non-racial discrimination.
The law proposal also comes with sanctions in case of breaches: if the company or its subsidiaries cause or contribute to negative consequences on human rights or on the environment, and is not able to stop the toxic effects of its activities, it needs to stop its activities. If one of its business partners is causing this toxic snowball effect, the company has to phase out its business with them.518
The parties allowed to file a complaint for breaching the due diligence law are local communities, NGOs, workers, and shareholders.519
The Belgian due diligence law is currently on hold though, with the Belgian liberals pulling the brakes and waiting for the adoption of the European directive before moving forward at national level. Belgium should thus have a national due diligence law by 2024.
These (proposed) due diligence laws are an undeniable call to action. In France, NGOs are already taking steps to enforce the French due diligence law. Just like Les Amis de la Terre are taking TotalEnergies and BNP to court for their involvement in fossil projects abroad, companies like Engie could be sued for its blatant lack of diligence by signing contracts with US gas companies using harmful extraction methods like fracking, which cause catastrophic damage to both the environment and communities. In this report we saw how Engie, using a code word for their negotiations with Cheniere, appeared to know that company did not have a proper waste management system, nor did it have control over the emissions policy of its suppliers. In its Investment Note, Engie also expresses concerns about the requirements of Cheniere towards “community involvement and human development,” saying the US company does not seem to have clear requirements on those matters towards its suppliers. Also, Engie clearly states “the project under discussion is not susceptible to increase job creation.” The French company moved on signing the contract with Cheniere anyway, even extending its terms the year after.520
58 WHO PROFITS FROM WAR – HOW GAS CORPORATIONS CAPITALISE ON WAR IN UKRAINE
This is another perfect example of the application of the shock therapy by gas operators, pushing for the continuation of their business model by using the confusion and fear of black-outs generated by the global energy crisis, and pushing for gas as the only possible solution.
Once the Belgian and the European due diligence laws get through, gas operators like Fluxys will also be able to be held accountable. The Belgian company has a neat “Health, Safety and Environment” policy, with a commitment towards climate targets and a declared ambition to invest in the reduction of its GHG emissions, as well as in the improvement of its carbon footprint.521 This however is not aligned with its actual investments. Since the beginning of 2023 alone, Fluxys reportedly directed at least €867 million towards buying up shares in existing fossil gas pipelines in Europe.522
Also, through its key position in the boards of ENTSOG and of GIE, we could question the involvement of Fluxys in the push for gas lock-ins to be the solution to the energy crisis, whether by having the TAP expansion included in the REPowerEU plan (leading to human misery along its trajectory for the sake of “Europe’s security”523), or by pushing recommendations to REPowerEU for “fast-track approval procedure” for planned and future LNG projects and for “accelerat(ing) investments in infrastructure” (see our chapter “Gas operators pushing for shock ‘solutions’”).

On a company level, Fluxys plays a central role in the surge of fracked gas coming to Europe, pushing for Dunkirk LNG, the second-largest LNG terminal in continental Europe, to favour long-term contracts. In
Greece, through DESFA, Fluxys expanded the reportedly equally underutilised Revithoussa LNG terminal, in order to import more US LNG. and “secure” South-Eastern Europe.524 This came in addition to the Alexandroupolis FSRU, also inaugurated in the “security of supply” frame. In these projects again, “European energy independence” turned out to be nothing more than a new dependence, namely on “freedom gas” from the US That same gas is supposed to arrive at the Stade LNG terminal in Germany,525 another project involving Fluxys, which has started construction on a floating terminal and is applied for approval for its onshore terminal.526
Pascal De Buck, CEO of Fluxys, frames these pushes as a need to “secure Europe,” guaranteeing there will be no stranded assets deriving from these investments.527 He is overstating the utilisation rates of his terminals, saying they are used at their maximum capacity.528 We showed this wasn’t the case.529 Also, he is not considering the evolution of demand in a gas phase-out landscape shaped by the need to meet climate targets.530 This is yet another perfect example of the application of the shock therapy by gas operators, pushing for the continuation of their business model by using the confusion and fear of black-outs generated by the global energy crisis, and pushing for gas as the only possible solution.
WHO PROFITS FROM WAR – HOW GAS CORPORATIONS CAPITALISE ON WAR IN UKRAINE 59
© Les Stone / Greenpeace

© Tim
/ Greenpeace
Aubry
Conclusions
US leaders went over the heads of local communities, who would have to be sacrificed, their lands and waters ravaged by these gas terminals which would spew their toxic emissions into their skies. European decision-makers rolled out the red carpet for LNG from harmful fracking which they had banned in their own countries.
2022 will be remembered as one of the most consequential energy crises the world has ever seen. This crisis could have been a unique opportunity: decision-makers could have gathered experts from all fronts - scientists, think tanks, NGOs - to make a thorough assessment of the risks we would face, implement immediate temporary mitigation measures, develop solid plans with climate targets in sight, and make the long-awaited shift to energy efficiency and renewable energy. Instead, the people we elected to represent our common good, and lead the shift to a sustainable future, appointed representatives of the gas industry to show us the way out of the energy crisis. This gave gas operators a golden opportunity to push for the continuation - and even expansion - of their business model. Gas was the problem. Gas would be the solution.
This cognitive dissonance was transformed into a logical rhetoric with the relentless use of shock therapy: the gas industry kept hammering on the fear and confusion caused by the war in Ukraine, in order to obscure its own toxicity and present itself as the answer to all concerns. In this gaslighting strategy, the gas industry also used the technique of divide and conquer: there would now be “bad Russian gas” from which to run away, and to be replaced by “good freedom gas” coming from the United States of America. The instability Russian gas precipitated us into would be remedied by American gas which would guarantee us security. In other words, our dependence on Russian gas would be solved by a decades-long commitment towards American gas. In parallel to US gas, companies like Fluxys successfully pushed for Azerbaijani gas to be part of the freedom package, with the European Union injecting public money into the expansion of the Trans Adriatic Pipeline (in which Fluxys conveniently holds 20% of the shares).531 Those “geopolitical investments”
(dixit Charles Michel, the president of the European Council) were going to radically redesign the fossil fuel market and change our energy future.
European companies have signed a record number of long-term contracts with US companies, betting on LNG export terminals not yet built and just at proposal stage, pushing for the final investment decisions these terminals need in order to get started. This is mirrored on the other side of the Atlantic, by a mushrooming of proposals from gas operators for import terminals to be built or expanded, from Greece over France to Germany. These projects have been supported by European banks, investing in fossil fuel lock-ins. These hasty developments have been lauded in the US by decision-makers telling their citizens they are rescuing their European allies, and by European leaders applauding Europe’s recovered independence.
The architects of this ‘salvation plan’, however, completely omitted the reality, which shows none of this Atlantic ratchet was needed. They turned a blind eye to the utilisation rates of existing European LNG terminals which, even at the peak of imports - when it was being reported they were running at full speedwere far from being saturated. They completely glossed over the mismatch between immediate needs and long-term contracts and terminals unable to answer these needs because they would take years to make operational. They lost climate targets from sight, and forgot about the logical evolution of demand, which would condemn those terminals in advance and turn them into stranded assets to be paid for by citizens. They gobbled up the future hydrogen conversion plans the industry waved at them to get their fossil infrastructure signed off, without looking into the technical challenges.
WHO PROFITS FROM WAR – HOW GAS CORPORATIONS CAPITALISE ON WAR IN UKRAINE 61
US leaders went over the heads of local communities, who would have to be sacrificed, their lands and waters ravaged by these gas terminals which would spew their toxic emissions into their skies. European decision-makers rolled out the red carpet for LNG from harmful fracking which they had banned in their own countries.

This lock-in plan will come at a high price for US and EU citizens who, already facing an unparalleled social crisis, will have to pay for the decommissioning of these unneeded projects on which their money has been and will be spent. In addition, these investments come at the expense of real solutions which would benefit citizens - and the climate - immediately (like the insulation of their homes), while also being a guaranteed investment in a sustainable future.
Or to conclude with the words of John Beard, community advocate in the Port Arthur area: “Europeans shouldn’t think gas exported from my community is ‘freedom gas’. Nothing’s really free. If it means freedom because you’re independent of a former source, the Soviet Union, then you’re just trading one form of slavery for another. Because now, even though you have a good relationship with America, you’re still being enslaved by this gas that causes so many problems and troubles. All of this trouble was behind gas. It’s not freedom gas because you’re really not free. It’s going to cost you. It’s going to cost you more and it’s going to cost you in the long run. Because the more you use it, the more peril it places on your life and health, and the life and health of people across this entire planet. Climate change is real. We see it here every day ”
62 WHO PROFITS FROM WAR – HOW GAS CORPORATIONS CAPITALISE ON WAR IN UKRAINE
© Tim Aubry / Greenpeace
Recommendations
The latest IPCC (Intergovernmental Panel on Climate Change) report is clear532. This decade is critical for making rapid, deep cuts to emissions and protecting people from dangerous climate impacts533. These warnings are reinforced by UN Secretary-General António Guterres: “Fossil fuels are a dead end – for our planet, for humanity, and yes, for economies”.534
We cannot afford any more fossil fuels. Our communities – especially those already on the frontline of climate disruption, pollution, and extreme weather –and our environment cannot take more projects that extract, process, ship, or burn coal, oil, or gas.
Yet, when Russia invaded Ukraine on 24 February 2022, and the resulting energy crisis hit, the gas industry and decision-makers quickly found each other in framing this as a ‘supply crisis’. They dusted off or drew up reckless plans for new and expanded polluting infrastructure, and rushed them through under the pretext of ‘security of supply’. If left unchallenged, the result will be decades more of fossil gas lock-in, with devastating impacts on people and the planet.
This crisis, born from our dependence on fossil gas with its inherent price volatility, its disastrous impact on our communities, climate and environment, should be a golden opportunity to rise to the challenge of what is really a ‘demand crisis’. Belatedly the European Union put in place a voluntary demand reduction target of 15%, though limited in time and not part of the needed trajectory of phasing out gas entirely.
This marks a failure to look seriously at our energy system and its impacts, and translate climate objectives into short and mid-term energy reduction and transition targets. A failure that hands over power to the fossil fuel industry rather than have it regulated.
We have no time to waste. From now on, every policy process and investment decision, every permit granted or withheld, every bit of infrastructure built, every use of public money, must be a step towards a fair and just energy system fully liberated from fossil fuelsincluding gas.
Firstly, this requires cutting the ties between politics and the gas industry, setting and enforcing stronger transparency and due diligence policies. Secondly, it needs a new horizon for climate neutrality by 2040, both in Europe and in the US; a rational assessment of emissions and industry proposals like hydrogen and carbon capture technologies (CCS/U); and no new longterm contracts or infrastructure voiding that ambition. Finally, it means redesigning our heating and cooling, our electricity and industry, using renewable energy sources together with technologies and expertise that reduce demand.
Demands For Europe A . CHANGE THE SYSTEM
For decades the gas industry has had easy access to our political decision-making processes. From meetings with policy-makers, to over-estimating gas demand and proposing infrastructure to meet it, to outright holding the pen on crucial legislation, the industry holds sway. This contrasts starkly with the murky veil it maintains over its own operations and its value chain.
A.1. Remove fossil fuels from politics535, by:
1. instituting a firewall to end their access to decision-making including through lobby meetings and seats on expert, advisory, or public research bodies;
2. ending conflicts of interest, revolving doors between public office and industry, hirings of industry consultants, and other ways of protecting and facilitating vested interests;
3. excluding fossil fuel industry representatives from climate negotiations, government delegations, trade missions, or other positions of co-opted influence; and
4. rejecting partnerships with the fossil fuel industry, including sponsorships, appearances at each other’s events, and organising industry occasions on government premises including parliaments.
WHO PROFITS FROM WAR – HOW GAS CORPORATIONS CAPITALISE ON WAR IN UKRAINE 63
A.2. End ENTSOG’s lobbying on behalf of the gas industry. ENTSO-G - created to ensure, inter alia, “optimal management” has a privileged relationship with European policy-makers which presents a conflict of interest, through its role to predict future gas use and propose the infrastructure projects to meet it. ENTSOG has consistently overestimated future gas demand536 and projects backed by ENTSOG members have raked in the vast bulk of European public funds for such infrastructure537.
A.3. Ensure full transparency of all available data on gas flows into, within and out of the EU, including and separating into import, export, re-export and transshipments (including ship-toship transfers), as well as on utilisation rates of regasification capacity and trans-border pipeline connections.
A.4. Further strengthen, adopt and enforce due diligence legislation at European and nationals levels.
B . PHASE OUT GAS
By 2050 Europe wants to be the first net-zero continent. Factoring in both historical responsibility and modern solidarity, it should be climate-neutral by 2040. This is a long-standing demand of the climate movement, supported by UN Secretary-General Guterres538 on the back of the latest IPCC report. More investments in gas infrastructure and long-term contracts risk derailing this objective, which is vital for keeping the 1.5°C target alive.
B.1. Set targets for climate neutrality by 2040 in the EU and the US, and develop pathways (including detailed greenhouse gas budgets) to get us there. In the EU in particular, work throughout 2023 must lay proper foundations for an ambitious proposal to be presented in Spring 2024539, under the Belgian EU presidency and in a context of European parliamentary elections.
B.2. Pursue an active fossil gas phase-out by 2035 This requires not only proactive phase-out policies at the national level including measures such as banning instead of subsidising gas boilers and providing tailored financial incentives, but also
coordinated action to stem the flow of gas into Europe, phase-out existing gas import and transport infrastructure, and prevent future lock-in by stopping new construction and banning long-term contracts. Due to its higher carbon intensity and risk of methane leaks, imports of LNG should be phased out first
1. Set mandatory gas reduction targets at EU and national levels, gradually increasing the current (still voluntary) target of -15%540. In order to reduce energy demand fairly, energy savings must be sought in industrial sectors first, then commercial sectors, and then at the level of wealthy households and individuals, while supporting and protecting the most vulnerable, through financial support schemes to meet their basic energy needs, and a ban on disconnections.
2. Cancel all projects for the construction of new LNG import terminals and expansion of existing terminals across the EU. Current capacity is being underutilised, EU gas demand is set to fall under climate targets541, leading to even lower utilisation rates and higher risks of stranded assets542, and reports even show no new LNG infrastructure is required to meet Europe’s energy needs if the EU ‘Fit for 55’ climate and energy package is implemented and ambition is ramped up543.
3. Halt the conclusion of new long-term contracts for the delivery of LNG, and ban extension of existing contracts. No gas supply contract should be allowed to run beyond 2035, nor create a barrier for the development of renewables.
B.3. Properly account for the higher lifecycle emissions of LNG compared to pipelined gas, in developing pathways and efforts in order to get us to climate neutrality by 2040. With European LNG imports being responsible for up to four times more CO2 than pipelined gas, as well as the increased risk of methane leakage in the more complex production chain, not accounting for these impacts of the recent increase in LNG imports through more efforts elsewhere, risks jeopardising our climate targets.
64 WHO PROFITS FROM WAR – HOW GAS CORPORATIONS CAPITALISE ON WAR IN UKRAINE
B.4. Critically assess hydrogen projections and projects pushed by the fossil fuel industry, including claims of “hydrogen readiness” (which may be technically feasible, but not necessarily justify the construction of additional gas infrastructure), “terminal conversion” (which has been shown to be a technical and financial challenge544), and “green” or even “renewable” hydrogen (for which detraction of direct electricity use it would be hard to see a meaningful application before 2030).
C . REDUCE CONSUMPTION; BOOST EFFICIENCY; EXPAND RENEWABLE ENERGY
Policies and measures are needed to support urgent measures that provide the services required from energy but do not rely on fossil gas through rapid expansion of systems and mechanisms that reduce consumption, expand efficiency and renewable energy sources.
Energy Saving and Conservation measures to reduce demand:
Efficiency (incl. insulation) - in Building and Industry: Renewable heating (like heat pumps); Building renovation heater efficiency in buildings; efficiency in industrial processes.
1. Financial support schemes for vulnerable people to meet their basic energy needs
2. Ban disconnections e.g. energy providers should not have the right to cut off customers who fail to pay their bills, in particular vulnerable ones
3. Drive deep building renovations and sufficiency that can realise the potential to permanently cut demand by improving the energy performance of buildings.
Power production – Maximise measures for renewable power sources at all public, commercial, and industrial sites and operations. E.g. solar panels on rooftops, install heat pumps and undertake renovation measures.
Industry – where possible be fully electrical and more circular, while always prioritising energy saving.
Tax fossil fuel profits: to help meet the investment needs of the energy transition, ensuring the burden does not fall on citizens and the rest of the economy.
Demands For the US
The passage of the Inflation Reduction Act (IRA) marks a turning point in the U.S. Climate Policy. For the first time, Congress has acted to curb demand for fossil fuels, but has left fossil supply unconstrained. As a result, the U.S. finds itself in a trap where declining domestic demand coupled with high production could fuel a surge of exports. These exports are a form of “carbon leakage” and if left unconstrained could erode the emissions reductions in the IRA.545 What’s more, continued domestic production is a threat to the health of communities all along the fossil fuel supply chain. A more robust climate policy would pair demand-side reductions with policies to phase out fossil fuel production.
Long-term gas supply contracts will lock-in both the U.S. and EU into decades of emissions at the expense of our climate and the health and safety of communities. LNG companies right now are signing export agreements that risk locking the US into decades more drilling, infrastructure buildout, and exporting. On the buyer side, these contracts lock import countries into decades more fossil gas consumption, and delay investment in renewable energy and efficiency. Leaders from these nations have the climate and moral imperative to cut off the gas industry’s decades-long hold on our energy future.
US policy makers must take the following steps to align LNG exports with strong climate goals:
• Reject federal permits for any new infrastructure projects that would increase greenhouse gas emissions or worsen the climate crisis. This requires that any new pipelines or new LNG export terminals be rejected.
• Reject federal approval for any LNG export shipments from existing or approved terminals that are inconsistent with 1.5°C pathways, worsen domestic energy poverty, or pose health threats to nearby communities.
The Department of Energy (DOE) has the authority to overhaul its “public interest” determination (which governs LNG exports to non-free trade agreement countries) to explicitly consider climate change, environmental justice and energy justice.
WHO PROFITS FROM WAR – HOW GAS CORPORATIONS CAPITALISE ON WAR IN UKRAINE 65
–
– DOE should hold hearings and take the necessary steps to document that the cumulative lifecycle emissions associated with LNG exports are inconsistent with our climate goals and contrary to the public interest. Where needed, DOE should revoke approvals or set time limits for exports from existing terminals.
• DOE should make public the long-term contracts signed between LNG sellers and buyers.
• President Biden must wield his global leadership and support ending international public finance for fossil fuels, including LNG, at the G7, G20 and COP28.
Both Biden and Congress must take further steps to protect the climate and communities living on the fence lines of the fossil fuel supply chain. Such policies include:
• Establish a national plan and targets to wind down existing fossil fuel production and infrastructure.
• Eliminate federal fossil fuel subsidies.

• Ban new fossil fuel leasing and permitting on public lands and waters, and phase out existing leases.
• Phase out exports of crude oil and reject federal permits for any new crude oil export terminals.
• Enact regulations to eliminate methane emissions and flaring from oil and gas facilities.
• Require air and water pollution reductions in polluted communities by implementing a comprehensive “No Pollution Hotspots” policy.
• Pass the Environmental Justice for All Act to provide legal remedies to citizens, improve equity mapping tools, expand grant programs, and strengthen consultation with impacted communities.
• Build on the renewable energy incentives in the IRA to enact a Green New Deal that will direct trillions of dollars in public investments to create millions of green union jobs, rectify past injustices, and ensure that energy-dependent workers and communities are left better off through the transition.
66 WHO PROFITS FROM WAR – HOW GAS CORPORATIONS CAPITALISE ON WAR IN UKRAINE
© Les Stone / Greenpeace
Annex 1 . Research Methods
Natural Gas Conversion Factors
Natural gas volumes at national scales are typically reported in units of billion cubic feet (bcf) or billion cubic metres (bcm) of gas. Cubic feet are commonly used in the US while cubic metres are used in Europe. Rates of natural gas exports are often reported (i.e. by the US Energy Information Administration, or EIA) in units of billion cubic feet per day (bcf/d). When natural gas is liquefied it is often reported in units of tonnes (also known as a metric ton, which is a unit of mass and is equal to 1000 kg). A common unit for LNG contracts or exports is million tonnes per annum (mtpa).
We use the following factors to convert between different units of natural gas and LNG:
• 1 cubic metre = 35.3147 cubic feet
• 1 billion cubic feet per day (bcf/d) = [1 bcf/d] * [365 d/y] * [1 cm / 35.3147 cf] = 10.34 billion cubic metres per year (bcm/y)
• 1 million tonnes per annum (mtpa) of LNG = 48.028 billion cubic feet (bcf) of natural gas546
Analysis of LNG import into the EU
The analysis of LNG import into the EU + UK was done using 3 different databases. The first one used is the ENTSOG Transparency Platform547, which uses data directly provided by its members the European gas operators. From this dataset we were able to extract the physical flows of gas into the EU by compiling the sum of the flows in each import point in 2021 and 2022. Secondly, added to this dataset was the ALSI (Aggregated LNG Storage Inventory) database548 from Gas Infrastructure Europe. This database provided historical and real time data on the send-out, storage, and maximum capacity of all LNG terminals across Europe with data provided by the gas operators. And thirdly we used the EIA database on US gas exports549 by country. This gave us the needed historical data for US exports to the EU and UK from 2018 - 2022. These three databases were then used to compile the total
imports of US LNG, total LNG, total pipelined gas, and other numbers throughout the report. Figure 7-10, and 12 used the sum of US imports of LNG 2018-2022, converted to bcm. Figure 11 combined the GIE total LNG import data with the EIA data to have a full view of the total LNG imports.
Analysis of EU LNG infrastructure
For the analysis of new EU LNG infrastructure we used the valuable information provided by the Global Energy Monitor, in their wiki mapping the global gas infrastructure,550 but also in their recent reports such as the EU 2023 Gas Tracker.551 This, combined with other sources gave us up to date information about the buildout of LNG infrastructure in the EU.
For determining the utilisation rate of EU LNG import terminals in 2021 compared to 2022, the ALSI database of Gas Infrastructure Europe552 was the starting point to obtain the data for ‘yearly send-out’ and ‘yearly maximum capacity’. These values were then divided to obtain utilisation rates for 2021 and 2022. Due to the consequences of Brexit on GIE’s monitoring, data for the UK are not fully available and not included. The results are shown in figure 15.
Analysis of LNG Purchase Contracts
For our analysis of LNG contracts we utilized the Bloomberg NEF Global LNG Contracts database (version Q4 2022, current up to December 31, 2022). We selected all contracts with “Export Market” as the United States, and excluded any contracts marked Expired, Inactive, or which did not specify start year, end year, or volume. This left 130 contracts in the subset used here. This subset does not include new contracts signed in 2023, some of which are discussed elsewhere in the report.
WHO PROFITS FROM WAR – HOW GAS CORPORATIONS CAPITALISE ON WAR IN UKRAINE 67
This subset includes contracts for operating, under construction and proposed LNG export terminals in the US The subset primarily consists of Sales and Purchase Agreements (SPAs), but also includes Heads of Agreements, Tolling Agreements and other types of agreements. Figures 19 and 20 show total contracted volumes from this subset from 2015 to 2050, as broken down by Import Market region (Figure 19) and Buyer type (Figure 20). Volumes are reported in mtpa and converted to bcm/y using the factors above. The figures assume that annual contracted volumes begin in the adjusted start year and continue until the end of the contract period.
These contracted LNG volumes are compared against US peak LNG export capacity for operating and under construction terminals (see below), and against estimates of LNG trade taken from the International Energy Agency’s Net Zero by 2050 report.553 Figure 4.17 from the IEA report estimates global LNG inter-regional trade and LNG exports from North America out to 2050 in their Net-Zero Emissions Scenario (data taken from tables available on IEA website).
US LNG Exports by Destination
Figures 22 and 23 show US EIA data on LNG exports by destination.554 Figure 22 breaks the data out by region, dating back to the first LNG shipments from US terminals. Figure 23 shows exports to the top 4 countries in both Asia and Europe.
US LNG Export Capacity
Figures 24 and 26 show the approximate timeline of peak US LNG export capacity. These figures are based on the US EIA’s liquefaction database.555 Figure 24 focuses on operating and under construction terminals, and attempts to recreate and update figures previously published by the EIA.556 Figure 26 extends Figure 24 to include all approved terminals and expansion projects, but does not include proposed projects that have not been approved. For existing and under construction terminals we plot “peak nameplate capacity”, whereas for approved terminals we plot “proposed design capacity” as reported by the EIA.
For operating terminals the timeline is given by the EIA’s reported In-Service and Start of Commercial Service dates for each liquefaction train. For approved terminals and those under construction we estimate start dates based on media reports557 and estimates from the Sierra Club LNG tracker,558 although we note that all such dates are highly uncertain and should be considered rough estimates. It is possible that many approved terminals will never be built. Export capacity is also compared with the IEA’s NZE estimates for global and North American LNG exports.
US LNG Exports Terminals
Tables 3 and 4 and the map in Figure 25 represent our best current understanding of the state of play for US LNG export terminals, as of March 2023. Table 3 summarises the status of seven operating terminals, three under construction terminals, and their various proposed expansions. Table 4 summarises the status of ten approved terminals and five terminals that are currently under review by regulators. It does not include various proposed projects that have not yet advanced to review. Status information is taken primarily from FERC,559 MARAD,560 and EIA, as well as company press releases and media reporting.
Analysis of Big Oil’s profits
To analyse the the profits of the The “Big Five” oil and gas companies (ExxonMobil, Chevron, Shell, BP, and TotalEnergies), the annual reports of each of these companies was reviewed to compare the profits that they made in 2021 and in 2022 in figure 27.561 Regarding the stock value increase of these companies in figure 28, the respective difference in stock value of these companies was reviewed from 1/1/21 versus 31/12/22. The data was extracted from Google Finance which has up to date stock value information about these companies.562
68 WHO PROFITS FROM WAR – HOW GAS CORPORATIONS CAPITALISE ON WAR IN UKRAINE
Financing fracking
For the chapter on the financiers of two selected LNG terminals, Sabine Pass and Corpus Christi, data was used from the finance dataset of the Sierra Club LNG tracker.563 These were then geographically divided according to the financial institution, and compiled to have a view for who is investing in these LNG terminals by giving loans or underwriting their bonds. Added to this, the Oil and Gas Policy Tracker564 was used to compare the policies of these banks on financing fracking, and their actions by investing in these shale gas supplied LNG terminals.
Cheniere LCA Methodology
The discussion of Cheniere Energy’s cargo emissions tags and the published lifecycle methodology paper565 is drawn from previous analysis published by Greenpeace USA and Oil Change International. This work was published as a report,566 and as a Letter to the Editor of the journal ACS Sustainable Chemistry & Engineering 567 The original authors also responded to our critique in the journal.568
Environmental Justice
The discussion of fossil fuel racism and the public health impacts from LNG export terminals is based on a previous report published by Greenpeace USA, Gulf Coast Center for Law and Policy, and the Movement for Black Lives.569 That work was supplemented by recent regionally-focused reports and media articles detailing impacts from specific LNG projects. We also made use of environmental justice metrics collected by the Sierra Club LNG tracker that makes use of CEQ’s Climate and Economic Justice Screening Tool570 and the EPA’s EJScreen tool.571
Equivalent in emissions in cars and renewable energy
Throughout the report, various comparisons were made using the EPA’s Greenhouse Gas Equivalencies Calculator.572 To calculate an LNG terminal’s equivalent emissions in the amount of cars per year (X), the EPA proposes a formula: 4.640 metric tons CO2 emissions/vehicle /year. To rephrase the formula, the emissions in MMT were divided by the EPA’s formula to obtain X.
In terms of the calculations for the equivalent costs of new onshore renewable wind energy in megawatt-hours (mWh), IRENA573 estimates that the global weighted average Levelised Cost of Electricity (LCOE) for onshore wind in 2021 was 0.033 USD/kWh. On page 24, IRENA defines the LCOE of a given technology as “the ratio of lifetime costs to lifetime electricity generation, both of which are discounted back to a common year using a discount rate that reflects the average cost of capital.” To reiterate, monetary sums are multiplied by the formula (taking into account exchange rates (GPB, EUR, US, SWE)) then multiplied by 1000 to obtain the result in megawatt-hours.
WHO PROFITS FROM WAR – HOW GAS CORPORATIONS CAPITALISE ON WAR IN UKRAINE 69
 © Tim Aubry / Greenpeace
Annex 2 . Transcript of John Beard’s Interview
Destiny Watford is a climate campaigner with Greenpeace USA. She leads the organisation’s work to partner and campaign with local and frontline organisations in the Permian Basin – located in West Texas and New Mexico –and Gulf South regions. Destiny founded Free Your Voice and leads the fight to prevent the nation’s largest wasteto-energy incinerator from being built in her community of Curtis Bay, Baltimore. After four years of organising, the students of Free Your Voice successfully pressured both Baltimore City and Baltimore City Public Schools to terminate their energy contract with the company and currently the company’s plans are stalled. Destiny won the 2016 Goldman Environmental Prize for her work and continues to push the Maryland Department of the Environment to return control of the proposed incinerator site to the community.
John Beard, Jr. is the founder, president, and executive director of the Port Arthur Community Action Network (PA-CAN). He serves as a community advocate focused on environmental issues and community development in the Port Arthur/Southeast Texas area, sits on numerous boards and commissions with the City of Port Arthur, and has over 32 years of public service as an elected official–9 as city councilman and mayor pro-tem.
John worked in the petrochemical industry for 38 years, with practical training and experience specifically in maintenance services, process operations, health, safety and environmental issues, emergency management and incident command systems.
John was educated in the Port Arthur public school system, and attended Lamar University, with a concentration in the areas of political science and economics. As an active member of his community, John has dedicated his life and career to serving the public.
Timestamp: 00:00
Destiny:
My name is Destiny Watford and I’m a climate campaigner with Greenpeace USA. I am joined by John Beard who is an amazing activist in Port Arthur, Texas working with the Port Arthur Community Action Network. John, I will let you introduce yourself before we get to the questions.
John:
Timestamp: 00:25
Thank you for that gracious and lovely introduction. John Beard here. I am in Port Arthur, Texas and what I call the “Belly of the Beast,” in the heart of the petrochemical corridor of Southeast Texas. In the “belly of the beast” so to speak. If you look at a map or look at the Weather Channel, Port Arthur Texas is where the southern part of Texas meets the southern part of Louisiana on the west side and the Gulf of Mexico all come together. And why I say we’re in the “belly of the beast” is because everything that’s in play in this movement–from carbon sequestration to hydrogen hubs–is being talked about here.
The largest petrochemical refinery in the country is here in Port Arthur along with several other smaller companies, but they are still some of the largest (companies) in the world. The second largest refinery in the country is located only 15 short miles away from Port Arthur. And then we have numerous other chemical plants and other types of refining and petrochemical and plastics production facilities here.
Along with that is rampant pollution over 12 decades of industrial pollution that has affected the lives and health of many people here in my community, myself included. So this whole issue with regard to the petrochemical buildout, with regard to shipping gas–LNG–and crude oil to other parts of the world is of extreme interest not just to me but to others here because of what it means for our community, for the lives and health of our people, and what it also means for the entire planet. So we think it’s very important to have these kinds of discussions that talk about it. I’m looking forward to your questions, Destiny, and see if I can give them good answers and and hopefully give people some information that they
WHO PROFITS FROM WAR – HOW GAS CORPORATIONS CAPITALISE ON WAR IN UKRAINE 71
can really use to better understand as I like to say, “why we fight, why we push back” against the expansion of using more and more fossil fuels and why we advocate for the phase out of those fossil fuels and an equitable transition to clean, green, renewable energy for all.
Destiny:
Timestamp: 02:37
John, what are the impacts of LNG development on your community?
John:
Timestamp: 02:41
Well, there have been a number of factors involved with that but I’d have to preface talking about the impacts of LNG development by saying that first of all, this expansion is coming into an area that has already been overrun, as I said earlier, for over 120 years by petrochemical industrial pollution. So the worst polluters in the country are here. The third highest emitter of benzene in this country, who is also an LNG exporter, Total, and Total’s Port Arthur Refinery are located here. And then you also have Valero, which over a five-year period had over 600 air quality violations. And then to top that off, you have Oxbow Calcining, a Koch Brothers company that is what I call a “serial polluter.” They’ve been grandfathered in for the last 20-25 years or better. They have emissions that are well over 11,800 tons of highly toxic sulphur particles: sulphur dioxide, sulphur trioxide and particulate matter…particulate matter so fine that if you could scoop some of it up from that pile of over 11,000 tons, you could take it and pour it like you would pour a glass of water. It’s just that fine and just that miniscule.
Into that mix, here comes Exxon Mobil’s Golden Pass LNG, when they were talking about importing gas from Qatar and the other Middle East countries to America. Now it’s being converted to an export facility. Right across the ship channel, Sabine nature’s waterway in Louisiana–we are on the border with them–is one of the largest exporter’s the country, Cheniere’s Sabine Pass LNG. But then just recently final
investment approval has been given to a third LNG to come into Port Arthur, less than five miles from my house. And that is Sempra’s Port Arthur LNG. But we’re going to call it Sempra’s LNG because I don’t want something as deadly as that and the effect is going to have on my community, named after my community. So it’s Sempra’s LNG, as far as I’m concerned.
But all of that coming here creates severe health problems when those things are built. We are already seeing the effects of some of it with the Cheniere plant. They’re trying to get an extension or a waiver on their formaldehyde emissions that come from their plant. Well everybody knows that pretty much formaldehyde is what’s used in embalming fluid. So now we’re breathing in air that has embalming fluid technically in it so to speak. Particulates that have that. And the bad part about having those particulates in the air, if you breathe it or ingest it because of the structure of those things and structure our bodies, that it gets into your bloodstream through the air that you breathe. So that’s how we get these toxins and those toxins cause mutagenic changes in our body’s cellular structure which can cause cancer and other diseases or it can also cause pathogenic problems that affect your health and affect the physiology of the body like respiratory disease, COPD, asthma, allergies, you name it. A lot of people here suffer from that.
The impact of LNG on this community will be serious and far-reaching, and it will touch everyone that lives here. But I tell folk all the time, “Don’t take my word for it, come and see for yourself.” And in a matter of hours, you’ll begin to say, “why is my nose itchy or feel like my throat scratchy? My eyes are kind of irritated, like I’m coming down with something. I’m perfectly well. I haven’t been sick in a while and I wasn’t sick when I left home to come here.” But in a matter of hours, that’s what’s going to happen. You’ll feel the effect of that. And when you leave, pretty soon after, the effects will go away. I’ve had a number of people tell me that have come to visit. So you know that’s going to just add to a problem that is already extremely severe.
72 WHO PROFITS FROM WAR – HOW GAS CORPORATIONS CAPITALISE ON WAR IN UKRAINE
So essentially what we can say is we’re being sacrificed so Europe and other parts of the world can have this very toxic gas that is not only going to hurt us–in terms of its production out in the Permian and brought to the Gulf of Mexico for export from here–but it’s going to, in the process of doing that, make the atmosphere, make the air and conditions in the environment worse here for people in Port Arthur. It will exacerbate climate change, and being that we’re on the Gulf of Mexico, sea level rise is a great concern.
As a matter of fact, Port Arthur is protected by a storm lift. And that storm lift is already being discussed to be raised two to three feet because of climate change. Now if our own government can recognize that and recognize the need to protect areas and cities like Port Arthur, then why are they allowing this to continue anyway? Why are they doing more of what’s causing the problem instead of doing less.
So we’ve got to find a way out of this and you can’t, as they say, “decarbonize”—stop putting carbon in the atmosphere–by recarbonizing or doing more of the same thing that’s put the carbon in the air in the first place.
We’ve got to be a lot smarter than that. I hope we are.
Destiny:
Timestamp: 08:10
Wow, on that note, of a lot of these policies getting passed that perpetuate the problems in Port Arthur, I’m curious about how you’re engaging with local authorities and decision makers?
John:
Timestamp: 08:24
Well we’re working on that to some degree, but largely our battle is with the people. It’s about educating people, about educating the community, about hearing from them the very concerns I told you about–the health effects. We’ve got to somehow tie those health effects into what these companies are doing, and it hasn’t been done yet.
In 2010, Port Arthur was selected by the US EPA as an environmental showcase city. And what
that means, I don’t know. They did say in the course of this big meeting they had at our civic center for the entire city, that Port Arthur had over twice the state and national average for not only cancer, but heart, lung, and kidney disease. And those are some of the diseases that are really rampant here. What makes it worse is that 80% of the folk here in this town, who are economically disadvantaged, do not have medical insurance So, how are they going to get treatment? How are they going to get the help that they need?
Our battle is not just with the people but also with elected officials too–educating and informing them. In the case of some of these projects, they see dollar signs because it’s more tax revenue for the city that’s going to enable them to do more to help the citizens, but that’s not happening either. It’s not working that way for some for whatever reason.
Being a former elected official I’m a bit puzzled by it, but we can’t sacrifice people’s lives and health just so we can run the mechanisms and the wheels of government. We have to do something different. We have to do something better. So our job is not only to educate the people but to educate the elected officials and hold them accountable when these companies don’t comply with the law, when these companies have fires or explosions that affect the lives and health of people. We have to constantly raise those questions, raise that flag, call community meetings together, invite those elected officials to hear from us and see the evidence and see the information and then challenge them to do better. When you know better, you do better. We’re gonna give you all the information you need so you can know.
The industry does the same thing. They love to go and sit down and invite [elected officials] to lunch and talk with them about it and talk about how they can do these different things. But they always give you this one pitch, Destiny. They always talk about the fact that “oh, this project is going to bring jobs.” Well if it’s bringing jobs and there’s over 80 billion dollars of industrial expansion going on in Southeast Texas, then why does Port Arthur have such high
WHO PROFITS FROM WAR – HOW GAS CORPORATIONS CAPITALISE ON WAR IN UKRAINE 73
unemployment? Our unemployment is the third highest in the state on average. The only places that [have higher unemployment] are down in the valley, Brownsville and Edinburg, and those cities near the Mexico border who don’t have a petrochemical industry. You know what their base industry is? Tourism. And here we are with these high paying jobs, they like to say, and it’s the petrochemical industry that oils the world, that does all these great wonderful things but if you come visit Port Arthur, you’ll see that all those great and wonderful things ain’t here.
I hate to say it reminds me of a phrase I’ve heard a comedian say, “Port Arthur looks like Beirut or Iraq or some places that have been bombed out and depleted with a lot of vacant homes and houses, vacant lots, dilapidated structures, poor infrastructure, bad streets.” To say that we’re in the midst of all of this wealth, there’s so much poverty here. Two-thirds of the people here are economically disadvantaged. That’s a family of four making less than $35,000 a year. The poverty rate here is between 27% and 30%. It’s a family of four again making less than $18,000 a year. So you can imagine in the city of 55,000, that’s a substantial number. But yet, with all of this wealth from the petrochemical industry that’s not doing us any good. And in the meantime we’re suffering because of the pollution that’s already in the air and now the additional pollution that will come from three LNGs potentially being in very close proximity to this city. That’s unacceptable in my mind. We’re going to have to do better. We’re gonna have to challenge our elected officials, we’re going to have to challenge ourselves to do better and to change what’s going on for the better. Not just for Port Arthur but for all the other cities in the Gulf South.
Destiny:
Timestamp: 12:44
So you say that we need to challenge ourselves and challenge our policy makers to do better and decision makers to do better, and I’m curious about what you think about Europe banning fracking for domestic production while also closing deals with companies in your very own community?
Timestamp: 13:08
John:
That’s interesting. That’s really very interesting because to get that extra gas and why we have such a great abundance of it now, we had to use fracking to do it. And they’ve outlawed fracking way before we did because they saw the effects of it. And the effects largely were earthquakes, polluted and contaminated underground water sources–aquifers and springs. All of those were adversely affecting what people need. You need water more than you need oil because you certainly can’t drink oil. But you definitely need fresh clean water to live. That’s essential.
They stopped it [in Europe], but they still want our gas and to get them that gas we’ve got to frack to do it. Because of the way the industry operates–they’re not required to police or take care of their business where they should–a lot of that methane that they’re trying to get out of the ground is released directly into the air. It either leaks off or it’s burned off by flaring.
For Europe to feel comfortable using our gas while we take on the additional burden of fracking–and also the fact that that gas is going to adversely affect our climate and theirs–I think that’s very short sighted. Europe has to up their game also. They have to have a better understanding that just because they have a need that we can supply, that need is going to hurt both of us. The commonality of us all living on this one planet, sharing this one piece of Earth, a rock we’re on, and the air and water that’s here, what happens here is going to eventually happen to you. The fracking that’s happening here to give you that gas is going to in part–because of the use of that gas in your country–contribute to climate change, and global warming, and sea
74 WHO PROFITS FROM WAR – HOW GAS CORPORATIONS CAPITALISE ON WAR IN UKRAINE
level rise, and the extremes of weather and all that comes with it.
Is that a price to pay that Europe wants to pay for itself? Is that a price that they want us to have to pay so they can have that kind of, you know, lifestyle or be able to do that? I don’t think so. We have to challenge them. We have to tell them that what you’re doing to help you do this is hurting us.
But like I always say, Destiny, don’t take my word for it. Come to Texas and see. Come to the Permian Basin and see where they are drilling and how they’re flaring. Look up some information from “Texas Sharon,” Sharon Wilson, that does these optical gas imaging photography of these various facilities and see how much is just leaking away into the air. Not to mention burned into the air, but leaking from well heads, from tanks and other pieces of equipment. And that, too, contributes to climate change and global warming. And now we’re going to take that same gas and send it to Europe for them to do more of the same.
There’s a saying for that, “doing the same thing while expecting a different outcome is insanity,” to keep doing what you know is not good for you, but you do it anyway. That’s not very smart, may not be insane, but it’s definitely not very smart. So we’ve got to change that. We’ve got to get Europe to look at not just banning fracking domestically for them, but ban the use of a toxic fossil fuel called methane or natural gas.
We’ve got to stop doing it. If you stop [Europe] from using it, if they decide not to use it and phase it out and other fossil fuels out, then that leaves less of a market for [companies in the US] to sell to. And with that lessening of that market, we get other nations to say “we ain’t accepting it either.” Then we can stop this thing. We can get a grip on it because we have way more than enough gas for our own use and we need to phase that out too. So you know that’s just part of the challenge that we have before us.
We’ve got to rise up to it. Everyone has a part to play in it, whether you’re at home or whether you’re in this movement like we are, everyone has part to play and can make a difference.
Destiny:
Timestamp: 17:20
What would you say to people that are referring to gas getting exported from your community as “freedom gas”?
John:
Timestamp: 17:43
Well, it depends on what you mean by freedom gas. Because nothing’s really free, and if it means freedom because you’re independent of a former source, which is the Soviet Union if we’re talking about overseas and Ukraine, then you’re just trading one form of slavery for another. Because now, even though you have a good relationship with America, you’re still being enslaved by this gas that causes so much problems and causes so much trouble.
All of this trouble was behind natural gas. That’s in part why Russia invaded Ukraine: to have access to the Caspian, and those other seas and shipping lanes to be able to export this gas. That’s why they seized Crimea, so they would have an outlet so they would not be landlocked and stuck in it. This goes all the way back to WWII, when the Germans were finally defeated, and the spoils of war were supposed to be divided up between Russia, and the United States, and England. And the United States and England carved out their part and said, “I got mine and you get the rest,” and left them with crumbs. And that’s why they were constantly trying to get back some of these various nations that were in the eastern part of the Soviet block. But that’s kind of digressing and giving you a little brief history lesson.
But it’s not freedom gas because you’re really not free. It’s going to cost you. It’s going to cost you more and it’s going to cost you in the long run because the more you use it, the more peril it places on your life and health, and the life and health of people across this entire planet. Climate change is real. We see it here every day. It’s seen all over the world on newscasts every day. It is happening and it is because of our behaviour using these fossil fuels that make that happen.
WHO PROFITS FROM WAR – HOW GAS CORPORATIONS CAPITALISE ON WAR IN UKRAINE 75
And you know something else they like to say too, Destiny, they like to say, “It’s cleaner. It’s not as bad as the other stuff we use. It’s not as bad as coal.” But what you have to remember, and my science teaches me this and my background in this is that: anytime you combust or break apart a carbon molecule, hydrocarbons or carbon-based molecules, virtually everything on this planet that is not metallic that has an organic origin is a hydrocarbon or a carbon-based molecule. So anytime you break those molecular bonds that hold that carbon together, you release some of these gases, you release toxins and toxics, you release particulate matter and you also release some moisture. But all of those things individually, create this problem that we have.
So how do we get out of it? You know what? What do we do?
We got to phase out the use of them and the best way to do that is to do what my Indigenous brothers and sisters say, “Keep it in the ground.” It’s buried in the ground for a reason. That’s to get rid of it. That’s why it’s in the ground. So let’s keep it there. And let’s do something that honors and cherises the Earth that we all share, that will help us clean the air that we have and breathe better and live better. And then let’s make the transition be equitable and fair so that no one is left behind. So that there are good paying, union jobs that can help everybody take care of their families and feed themselves and live the type of life they want to be able to live. So that there’s no want in a country that’s prosperous as this, and doesn’t have that kind of poverty anymore.
That’s a transition that people should be able to engage or believe in and want to be a part of. And that’s the challenge that we have. It’s not free, but what we can do is free ourselves from the problems that come from using this gas while at the same time, have a cleaner, safer, fairer, more equitable world for everyone. That’s our mission. That’s our job. That’s our challenge. And I think as I say all the time, “It’s the greatest challenge of the age.” And it’s a great time to be alive now being part of that.
Very few times that you have a challenge or something coming to your life that really brings out your best that you’ve got to do something not just for you, not just for your neighbors, but for everyone, for the whole world. So we’re faced with this challenge, and we need to rise up and meet it. And we need to meet it square on, and we need to not be discouraged by some of the little small setbacks because, I’m not saying I’ve been to the mountaintop, please let’s not go there. I believe we’re going to win. I believe we have already won this battle but there are things we have to do in the interim to get to that point where victory is won. But we are going to win that victory.
Those companies have billions of dollars, but there are billions of us. And if we join hands at hearts, we can make a difference. We can move mountains that people said weren’t possible. All we have to do is to look at that mountain, believe and trust in each other, and say “mountain be moved.” And it will move. We will change it. I believe that with every fiber of my being. I want to be part of it, and I hope you do too and I hope whoever sees this wants to do the same.
Let’s go get it. Let’s get after it. Let’s make it happen, because it won’t happen without us. It won’t happen without each other. And we can make the difference, all we got to do is come together and work for it, pray for it and it will come to be.
Destiny:
Timestamp: 00:04
John, how transparent are the processes for new LNG infrastructure?
John:
Timestamp: 00:13
That’s an interesting question. For people who work in this space and deal with it, dealing with the federal agencies and the permitting with that and the local estate agencies, it’s difficult, but not impossible. But for people who are not as trained in it or exposed to the various agencies and who have authority over what, based on what type of project it is, it can be very daunting to overcome those processes.
76 WHO PROFITS FROM WAR – HOW GAS CORPORATIONS CAPITALISE ON WAR IN UKRAINE
Most of the time, you have the public comment period or you have the opportunity to request a public hearing on those things. But I think rather than us having to request them, that these federal and state agencies need to seek out those communities where these projects are and engage and work with them with regard to the projects. I think that would do a lot more and serve the greater good a lot better than simply having the companies do their thing and the government does its thing and you’re left to figure out, well how do I get involved in these processes? Where do I fit in? How do I say I don’t want that pipeline? I don’t want that LNG facility? Or I don’t want this next door to our houses? How do you have a role in this, and be heard and be effective? I don’t think the system works or is even designed to work for the people that it affects most. If it were, then we wouldn’t have sacrifice zones.
LNG facilities and other petrochemical plants wouldn’t just be here in Port Arthur or in Lake Charles or in Freeport. They’d be in places like Beverly Hills. They’d be in places like Madison Avenue. They’d be in places like in Houston, in River Oaks or in other places of affluence and wealth because those people have the means to fight back. They can hire lawyers. They have the tools to be able to address these things when it happens. That’s why you notice none of these things happen in areas like that.
They happen, basically, where there are poor people because, as one of the heads of industry I heard say once, “that’s the path of least resistance.” That is where people have the least ability to fight back. And [the companies] can have [its] way and manipulate the government side of it, [the companies] can manipulate the public opinion. [The companies] can do a number of things like that.
But these processes need to be, as we say, “of, by, and for the people,” who they affect. It’s not just about the company. The company’s goal is only to make money and seek the best return for its stock and shareholders. But this should not happen at the risk and the forsaking of the lives and the health of the people who are going to be impacted by these projects. If people don’t
want it, it shouldn’t go there. If that area has been adversely impacted, as my hometown has been for over 12 decades, then it shouldn’t go there. Because, what we should do, no project should do harm. If it adds to, or contributes to, or does harm or creates a threat that is deemed locally to be too great a risk, then it should go elsewhere. That’s my opinion of it.
We’re not going to stop it completely. Now when there’s the day that comes and we can get the policy change and we can just say, “no and we ain’t going to do it at all.” That we can transition out of fossil fuels and that’s why that is so important, that it won’t become it won’t be an issue in that fashion, then so be it, I’m all for it. But until that date, we need to have a say in this. Not just a say to be heard, but a say to be listened to. And not just respected, but also that if they don’t want it, we’re not gonna force it on them. Because we represent the people. We’re elected by the people and we have to serve them. And we’re not going to sacrifice them on the altar of big oil and gas profits. We’re not going to sacrifice our health for their profits. And that’s the way it should be, but it’s not, so we’ve got to work to do that.
But those processes are not transparent. If you’re going to fight that, you’re going to have to lawyer up. You’re gonna have to get people that have the expertise and the background at every phase of this thing to be able to get you in the game, so you can not just play, but fight and win. And that requires money. It requires the right expertise. And that also requires a community that knows that’s what they need and willing to work for it. Some places don’t know, so they rely on people from the outside, and that’s why organizing is important.
But going back to that question once again. Those processes don’t work to serve our good. They need to be changed. They need to be modified. They need to be updated to reflect the current reality of the places where these projects are going to go. And to respect the needs of the people there and they’re concerns. Not to mitigate those concerns but to acknowledge them and say, “if you don’t want it we’re not coming.”
WHO PROFITS FROM WAR – HOW GAS CORPORATIONS CAPITALISE ON WAR IN UKRAINE 77

© Les Stone / Greenpeace
Endnotes
1 EU Commission, REPowerEU Plan (2022) https://eur-lex.europa.eu/legal-content/EN/TXT/?uri=COM%3A2022%3A230%3AFIN&qid=165303374248
2 Global Energy Monitor, Europe Gas Tracker Report (2023) https://globalenergymonitor.org/wp-content/uploads/2023/03/GEM-Europe-Gas-Tracker-Report-2023.pdf
3 See our report, chapter “Profits for the gas industry”.
4 Global Witness, Crisis year 2022 brought $134 billion in excess profit to the West’s five largest oil and gas companies (2023) https://www.globalwitness.org/en/campaigns/fossil-gas/crisis-year-2022-brought-134-billion-in-excess-profitto-the-wests-five-largest-oil-and-gas-companies
5 Sierra Club US LNG Export Tracker https://www.sierraclub. org/dirty-fuels/us-lng-export-tracker
6 https://www.iea.org/reports/net-zero-by-2050, Figure 4.17
7 See our report, chapter “Europe becoming the first customer for US LNG ”.
8 Global Energy Monitor, Europe Gas Tracker Report (2023) https://globalenergymonitor.org/wp-content/uploads/2023/03/GEM-Europe-Gas-Tracker-Report-2023.pdf
9 See our report, chapter “Unneeded Lock-in”.
10 https://climateactiontracker.org/countries/eu/
11 https://globalenergymonitor.org/wp-content/uploads/2023/03/GEM-Europe-Gas-Tracker-Report-2023. pdf https://globalenergymonitor.org/wp-content/uploads/2022/12/GEM-EU-LNG-Briefing-2022.pdf
12 https://www.consilium.europa.eu/en/infographics/lng-infrastructure-in-the-eu/
13 Current export capacity stands at 145 bcm and the three projects under construction would increase it to 203 bcm. Adding Port Arthur LNG, Plaquemines Phase 2, the approved expanded trains at Freeport and Cameron, and the 10 approved terminals in Table 4 would add 236 bcm bringing the total to 439 bcm. Based on peak nameplate capacity for existing terminals and proposed design capacity for proposed terminals, as reported to US EIA Liquefaction Capacity database, converted to bcm/y. EIA, https://www.eia.gov/todayinenergy/ detail.php?id=53719
14 See our report, chapter “Our banks are still investing in fracking”.
15 See our report, chapters “Contracted lock-in - tackling a short-term problem with long-term contracts” and “Export terminals in the US - backed by European contracts”.
16 IEEFA, The US Can Increase LNG Exports to Europe (2022) https://ieefa.org/wp-content/uploads/2022/04/The-US-Can-Increase-LNG-Exports-to-Europe_April-2022.pdf
17 https://www.globalwitness.org/en/campaigns/fossil-gas/ crisis-year-2022-brought-134-billion-in-excess-profit-to-thewests-five-largest-oil-and-gas-companies/ Converted from 209 bln USD to EUR on 29/03/23 https://www.ecb.europa.eu/ stats/policy_and_exchange_rates/euro_reference_exchange_ rates/html/eurofxref-graph-usd.en.html
18 See our report, chapter “Profits for the gas industry”.
19 Corporate Europe Observatory, How the gas lobby is fuelling the cost-of-living crisis (2022) https://corporateeurope.org/en/2022/11/how-gas-lobby-fuelling-cost-livingcrisis and Bloomberg, Soaring Cost-of-Living Crisis Brings Back 1970s Shopping Habits (2022) https://www.bloomberg. com/news/articles/2022-10-24/soaring-cost-of-living-crisis-brings-back-1970s-shopping-habits?leadSource=uverify%20wall
20 US Census Bureau, Week 48 Household Pulse Survey: July 27 - August 8 (2021) https://www.census.gov/data/tables/2022/ demo/hhp/hhp48.html
21 See our report, chapter “We know fracking is harmful, we banned it”.
22 See our report, chapter “Suffocating Communities”.
23 Global Energy Monitor, Europe Gas Tracker Report (2023) https://globalenergymonitor.org/wp-content/uploads/2023/03/GEM-Europe-Gas-Tracker-Report-2023.pdf
24 See our report, box “Cheniere’s dirty business”.
25 See our report, box “Locking us in using trojan horses”.
26 https://www.greenpeace.org/static/planet4-sweden-stateless/2022/12/a582612c-eu-crisis-scenario-_2022_12_15_final_ gp.pdf
27 https://www.foodandwatereurope.org/wp-content/uploads/2023/03/Fracking_Coming_To_Your_Doorstep2022-1. pdf
28 See our report, chapter “Our banks are still investing in fracking”.
29 See our report, chapter “We know fracking is harmful, we banned it”.
30 D. Michanowicz, E. Lebel, J. Domen, L.A. Hill, J. Jaeger, J. Schiff, E. Krieger, Z. Banan, J. Goldman, C. Nordgaard, S.B.C. Shonkoff, Methane and Health-Damaging Air Pollutants from the Oil and Gas Sector: Bridging 10 Years of Scientific Understanding, 2021. [Online] PSE Healthy Energy, Available at: https://www.psehealthyenergy.org/our-work/publications/ archive/methane-and-health-damaging-air-pollutants-fromthe-oil-and-gas-sector-bridging-10-years-of-scientific-understanding/ (Accessed 17 March 2023).
31 B. Shamasunder, A. Collier-Oxandale, J. Blickley, J. Sadd, M. Chan, S. Navarro, M. Hannigan, N.J. Wong, Community-Based Health and Exposure Study around Urban Oil Developments in South Los Angeles, Int. J. Environ. Res. Public Health 15:1 (2018) 138. https://doi.org/10.3390/ijerph15010138
32 L.M. McKenzie, B. Blair, J. Hughes, W.B. Allshouse, N.J. Blake, D. Helmig, P. Milmoe, H. Halliday, D.R. Blake, J.L. Adgate, Ambient Nonmethane Hydrocarbon Levels Along Colorado’s Northern Front Range: Acute and Chronic Health Risks, Environ. Sci. Technol. 52:8 (2018) 4514-4525. https://doi. org/10.1021/acs.est.7b05983.
WHO PROFITS FROM WAR – HOW GAS CORPORATIONS CAPITALISE ON WAR IN UKRAINE 79
33 D.J.X. Gonzalez, A.R. Sherris, W. Yang, D.K. Stevenson, A.M. Padula, M.; Baiocchi, M. Burke, M.R. Cullen, G. Shaw, Oil and gas production and spontaneous preterm birth in the San Joaquin Valley, CA: A case–control study, Environmental Epidemiology, 4:4 (2020) e099. http://doi.org/10.1097/ EE9.0000000000000099.
34 Sierra Club, LNG Export Tracker, Environmental Justice and Emissions tab. https://www.sierraclub.org/dirty-fuels/us-lngexport-tracker
35 Physicians For Social Responsibility (PSR), Compendium of Scientific, Medical, and Media Findings Demonstrating Risks and Harms of Fracking and Associated Gas and Oil Infrastructure (2022) https://psr.org/resources/fracking-compendium-8/
36 H. Patel, L. Feldman, Fossil Fumes (2022 update): A public health analysis of toxic air pollution from the oil and gas industry, 2022. [Online] Clean Air Task Force, Available at: https://cdn.catf.us/wp-content/uploads/2016/06/14175846/ fossil-fumes-report-2022.pdf
37 See our report, chapter “Conclusions”.
38 L’Echo interview with Pascal De Buck (2022) https://www. lecho.be/entreprises/energie/pascal-de-buck-ceo-de-fluxysla-crise-ukrainienne-a-montre-que-la-securite-d-approvisionnement-n-allait-pas-de-soi/10396656.html
39 EIA Today In Energy (Sept 6, 2022) https://www.eia.gov/ todayinenergy/detail.php?id=53719
40 Rystad Energy Commentary, LNG import boom could drive up European emissions by 35 million tonnes
41 Bloomberg Study (2022) https://ieefa.org/articles/studyfinds-dirtiest-oil-and-gas-fields-russia-turkmenistan-and-texas
42 Naomi Klein, The Shock Doctrine (2007) https://naomiklein. org/the-shock-doctrine/
43 De Smog, (2023) Europe’s Gas Lobby Exploits Energy Security Fears in Year Since Ukraine War https://www.desmog. com/2023/02/24/european-gas-lobby-tweets-ukraine-war/
44 Ibidem
45 REPowerEU: A plan to rapidly reduce dependence on Russian fossil fuels and fast forward the green transition, (2022) https://ec.europa.eu/commission/presscorner/detail/en/ IP_22_3131
46 Lobby Facts, GIE Data Card https://www.lobbyfacts.eu/ datacard/gas-infrastructure-europe?rid=76130992074-15&s id=146696
47 GIE, Making REPowerEU successful with gas infrastructure (2022) https://www.gie.eu/press/making-repowereu-successful-with-gas-infrastructure/
48 GIE, REPowerEU Strengthening EU Security of Supply with gas infrastructure https://www.gie.eu/wp-content/uploads/ filr/7051/GIE_response_to_the_REPowerEU.pdf
49 EU Commission, REPowerEU Plan (2022) https://eur-lex.europa.eu/legal-content/EN/TXT/?uri=COM%3A2022%3A230%3AFIN&qid=1653033742483
50 Follow The Money, European Gas Lobby Still Sets The Agenda (2022) https://www.ftm.nl/artikelen/europese-gaslobbybepaalt-nog-steeds-de-agenda
51 Ibidem.
52 Ibidem.
53 EU Commission, REPowerEU Plan (2022) https://eur-lex.europa.eu/legal-content/EN/TXT/?uri=COM%3A2022%3A230%3AFIN&qid=1653033742483
54 About ENTSOG https://www.entsog.eu/about-entsog
55 EU Regulation amendments (2013) https://eurlex.europa.eu/LexUriServ/LexUriServ.do?uri=OJ:L:2013:115:0039:0075:en:PDF
56 ENTSOG, Ten Year Network Development Plan https://www. entsog.eu/tyndp
57 EU Commission, Directorate-General for Energy https:// commission.europa.eu/about-european-commission/departments-and-executive-agencies/energy_en
58 EU Regulation amendments (2022) https://eurlex.europa.eu/legal-content/EN/TXT/?uri=uriserv%3AOJ.L_.2022.152.01.0045.01.ENG
59 Social Europe, Why EU Can’t Break Free From the Gas Lobby (2022) https://www.socialeurope.eu/why-europe-cantbreak-free-from-the-gas-lobby
60 Corporate Europe Observatory, The Great Gas Lock-In (2017) https://corporateeurope.org/sites/default/files/the_ great_gas_lock_in_english_.pdf
61 Global Witness, Pipe Down (2020) https://www.globalwitness.org/en/campaigns/oil-gas-and-mining/pipe-down/
62 Follow The Money, European Gas Lobby Still Sets The Agenda (2022) https://www.ftm.nl/artikelen/europese-gaslobbybepaalt-nog-steeds-de-agenda
63 European Commission: with “a plan to rapidly reduce dependence on Russian fossil fuels and fast forward the green transition (...) through energy savings, diversification of energy supplies, and accelerated roll-out of renewable energy to replace fossil fuels in homes, industry and power generation.” https://ec.europa.eu/commission/presscorner/ detail/en/IP_22_3131
64 European Commission website: https://energy.ec.europa. eu/system/files/2022-02/EU-US_LNG_2022_2.pdf
65 The White House, Briefing Room Remarks and Speeches (March 2023) https://www.whitehouse.gov/briefing-room/ speeches-remarks/2022/03/25/remarks-by-president-bidenand-european-commission-president-ursula-von-der-leyenin-joint-press-statement/
66 EU Commission, Save Gas For a Safe Winter (2022) https:// ec.europa.eu/commission/presscorner/detail/en/ip_22_4608
67 Calculations from data taken from EIA, https://www.eia.gov/ dnav/ng/NG_MOVE_EXPC_S1_M.htm
68 Ibidem.
69 EU Commission, Joint Statement between the European Commission and the United States on European Energy Security (2022) https://ec.europa.eu/commission/presscorner/ detail/en/statement_22_2041 *Excerpts marked in bold by us.
70 Fluxys website: https://www.fluxys.com/en/company/fluxys-group/about-fluxys
71 Fluxys website: Approximately 9.400km in Europe and 2.600 km in Brazil. https://www.fluxys.com/en/careers/discover-us and https://www.fluxys.com/en/company/fluxys-brasil
80 WHO PROFITS FROM WAR – HOW GAS CORPORATIONS CAPITALISE ON WAR IN UKRAINE
72 Fluxys website: It bought 24.1% of the shares of Open Grid Europe in February 2023 https://www.fluxys.com/en/ press-releases/fluxys-group/2023/230127_press_open_grid_ europe_macquarie
73 Greenpeace, Il Est Grand Temps De Parler Du Gaz (It’s Time To Talk About Gas) ( 2023) https://www.greenpeace.org/static/planet4-belgium-stateless/2023/02/add54128-greenpeaceil_est_grand_temps_de_parler_du_gaz.pdf
74 IEEFA, European LNG Tracker, https://ieefa.org/european-lng-tracker#Russian-LNG-Flows-to-Europe
75 Statista website: https://www.statista.com/statistics/1101321/largest-lng-import-terminals-europe/
76 Fluxys website: Through the Senfluga consortium holding 66% of the shares in the Greek gas operator DESFA. https://www.fluxys.com/fr/press-releases/fluxys-group/2018/180720_press_desfa_acquisition
77 Trans Adriatic Pipeline, TAP’s Shareholders https://www. tap-ag.com/about-tap/taps-shareholders
78 Fluxys, Annual Financial Report (2021) https://www.fluxys. com/-/media/project/fluxys/public/corporate/fluxyscom/documents/fluxys-group/corporate/annual-report/en/2021_annualreport_fluxys_uk.pdf
79 Fluxys website: https://www.fluxys.com/fr/press-releases/ fluxys-group/2022/220328_press_eig_fluxys_decarbonization_chile
80 GIE Board, https://www.gie.eu/dna/gie-board/ and ENTSOG, Press release (Dec 2021) https://www.entsog.eu/sites/default/ files/2021-12/PR0262-21_211216_Press%20Release%20ENTSOG%20announces%20President%20and%20Board%20 Members%20for%20new%20term%20January%202022%20 to%20Dec%202024_0.pdf
81 De Tijd, Interview with Pascal De Buck, (2022) https://www. tijd.be/ondernemen/chemie/geen-enkele-gasleiding-zal-overbodig-worden/10396700.html
82 Trans Adriatic Pipeline, Enagás announcement (2014) https://www.tap-ag.com/news/news-stories/enagas-joins-trans-adriatic-pipeline-fluxys-increases-its-shareholding-to-19 Wiki Global Energy Monitor, TAP https:// www.gem.wiki/Trans-Adriatic_Gas_Pipeline
83 Lobby Facts EU, Fluxys lobbied the European Commission in 2017 and 2018 on the topic, before the TAP was awarded the PCI status (2017, 2019). https://www.lobbyfacts.eu/datacard/ fluxys-sa?rid=236409524439-34 and https://www.tap-ag.com/ about-tap/the-big-picture/eu-status
84 Open Democracy website: https://www.opendemocracy.net/ en/can-europe-make-it/greek-pipeline-tap/ and Wiki Global Energy Monitor: https://www.gem.wiki/Trans-Adriatic_Gas_ Pipeline#In_Albania_and_Greece
85 Lecce Cronaca, L’udienza Di Questa Mattina Del Processo Tap. E’ Battaglia Legale Sulla Validita’ Dei Permessi, (March 2023) http://www.leccecronaca.it/index.php/2023/03/23/ ludienza-di-questa-mattinadel-processo-tap-e-battaglia-legale-sulla-validita-delle-autorizzazioni/?fbclid=IwAR0oZMg5KuVWkQQm353BeT3dOgFNZgO_S9Bod_LTB8TlG1NMLyFNiUejbhc
86 EU Commission, REPowerEU Plan (2022) https://eur-lex.europa.eu/legal-content/EN/TXT/?uri=COM%3A2022%3A230%3AFIN&qid=1653033742483
87 EU Commission, Statement (2022), https://ec.europa.eu/ commission/presscorner/detail/da/statement_22_4583
88 Azvision, La construction du tronçon sous-marin de TAP est lancée en Albanie (2022), https://fr.azvision.az/news/66494/ la-construction-du-tron%C3%A7on-sous-marin-de-tap-estlanc%C3%A9e-en-albanie.html
89 Fluxys Group, Fluxys and Trans-Atlantic Partnership partner to transport LNG to Europe (2023) https://www.fluxys. com/en/press-releases/fluxys-group/2023
90 Natural Gas Intel, Initial Expansion of TAP Natural Gas System Launches Bid to Double Azerbaijan Exports to Europe (2022), https://www.naturalgasintel.com/initial-expansionof-tap-natural-gas-system-launches-bid-to-double-azerbaijan-exports-to-europe/
91 Hellenic Shipping News, Greece to upgrade only LNG terminal in preparation for energy supply disruptions https:// www.hellenicshippingnews.com/greece-to-upgrade-only-lng-terminal-in-preparation-for-energy-supply-disruptions/ and Eurostat, Data browser https://ec.europa.eu/ eurostat/databrowser/bookmark/9e5e2353-97c3-4a14-a7699d0caa867030?lang=en
92 DESFA website: https://www.desfa.gr/en/company/shareholders
93 https://www.desfa.gr/en/press-center/press-releases/lngtruck-loading-h-energeia-pantoy
94 DESFA website: https://www.desfa.gr/en/company/shareholders
95 Reuters, Greece’s sole LNG terminal ramps up imports to replace Russian gas (2022), https://www.reuters.com/business/ energy/greeces-sole-lng-terminal-ramps-up-imports-replacerussian-gas-2022-09-23/
96 The Revithoussa terminal was co-funded by the EU, giving more than 50 million euros to the project. European Commission, State aid SA.43767 (2015/C) (ex 2014/NN) — Greece — Revithoussa LNG Terminal (2015), https://ec.europa.eu/ competition/state_aid/cases/247194/247194_1517529_163_2. pdf
97 Global Energy Monitor, Revithoussa LNG Terminal, https:// www.gem.wiki/Revithoussa_LNG_Terminal
98 Hellenic Shipping News, Greece to upgrade only LNG terminal in preparation for energy supply disruptions (2021) https://www.hellenicshippingnews.com/greece-to-upgrade-only-lng-terminal-in-preparation-for-energy-supply-disruptions/
99 LNG Prime, DESFA Revithoussa FSRU gets first LNG cargo (2021) https://lngprime.com/europe/desfa-revithoussa-fsugets-first-lng-cargo/65844/
100 Formiche, Alexandroupolis Gas Balcani (2021) https://formiche.net/2021/04/alexandroupolis-gas-balcani/ and Ekathimerini, US envoy welcomes milestone in Alexandroupolis LNG station project (2021) https://www.ekathimerini.com/ economy/1176507/us-envoy-welcomes-milestone-in-alexandroupolis-lng-station-project/
101 Climate Action Network Europe, Unveiling the costs of future fossil gas infrastructure (2021) https://caneurope.org/ content/uploads/2021/06/unveiling-the-costs-of-future-fossil-gas-infrastructure_CANE_FWAE_June2021-1.pdf
WHO PROFITS FROM WAR – HOW GAS CORPORATIONS CAPITALISE ON WAR IN UKRAINE 81
102 Formiche, Italgas, mercato greco ed euromediterraneo (2022) https://formiche.net/2022/09/italgas-mercato-greco-euromediterraneo/
103 The Council of the European Union, Remarks by President Charles Michel at the inauguration of the construction of a liquefied natural gas terminal in Alexandroupolis (2022) https://www.consilium.europa.eu/en/press/press-releases/2022/05/03/remarks-by-president-charles-michel-at-the-inauguration-of-the-construction-of-a-liquefied-natural-gas-terminal-in-alexandroupolis/
104 Hanseatic Energy Hub, Erster Rammschlag für neues Importterminal in Stade (2022) https://www.hanseatic-energy-hub.de/en/news/detail/erster-rammschlag-fuer-neues-importterminal-in-stade/
105 Fluxys, Fluxys and Hanseatic Energy Hub start engineering works on their joint LNG project in Stade (2022) https://www. fluxys.com/en/news/fluxys-group/2022/20220720_heh_fsru_ stadev2
106 Food and Water Europe, Germany’s Gas Lobby - an obstacle to climate action (2019) https://www.foodandwatereurope.org/wp-content/uploads/2019/09/Germany_FactSheet_2019-final.pdf
107 Energate Messenger, Dow becomes new shareholder in the Stade LNG terminal (2022) https://www.energate-messenger. com/news/221641/dow-becomes-new-shareholder-in-the-stade-lng-terminal
108 Hanseatic Energy Hub, Presseinformation des GAA Lüneburg (2022) https://www.hanseatic-energy-hub.de/en/news/ detail/presseinformation-des-gaa-lueneburg/
109 Bruegel, A grand bargain to steer through the European Union’s energy crisis (2022) https://www.bruegel.org/sites/ default/files/2022-09/PC%2014%202022_2.pdf
110 ENTSOG Transparency Platform, data on physical flow into the EU27 https://transparency.entsog.eu/#/map
111 Bruegel and ENTSOG, calculations from data on European imports https://www.bruegel.org/dataset/european-natural-gas-imports
112 Eurostat data, https://ec.europa.eu/eurostat/databrowser/ bookmark/b36db707-d269-4650-8ace-228799c9e5e0?lang=en
113 Eurostat data, https://ec.europa.eu/eurostat/databrowser/ bookmark/f5b5a2d6-471d-413f-81a4-470b6e69d4c6?lang=en
114 Eurostat data, https://ec.europa.eu/eurostat/databrowser/ bookmark/1999ee76-b74d-4752-9ef7-9ec9bfe2e854?lang=en
115 Financial Times, Europe Leads Pack on LNG (2022) https:// www.ft.com/content/3b48c327-978d-4a82-9349-c4228fdf99bd
116 Gas Infrastructure Europe, Aggregated LNG Storage Inventory https://alsi.gie.eu/
117 In 2021, Russia accounted for 55% of German gas imports. World Economic Forum, The energy crisis in Europe (2022) https://www.weforum.org/agenda/2022/08/energy-crisis-germany-europe
118 EIA, US natural gas exports, (2022) https://www.eia.gov/todayinenergy/detail.php?id=51358
119 Wall Street Journal, Before Ukraine Standoff, US Pitched Its ‘Freedom Gas’ to Europe and Found Few Takers, (2022) https://www.wsj.com/articles/before-ukraine-standoff-us-pitched-its-freedom-gas-to-europe-and-found-few-takers-11643538604
120 Offshore Energy, Europe gets first Sabine Pass LNG export cargo, (2016) https://www.offshore-energy.biz/europe-getsfirst-sabine-pass-lng-export-cargo/
121 Texas Tribune, How Washington unleashed fossil-fuel exports and sold out on climate, (2018) https://www.texastribune.org/2018/10/16/how-washington-unleashed-fossil-fuelexports-and-sold-out-climate/
122 European External Action Service, EU-US Energy Council: Joint statement, (2018) https://www.eeas.europa.eu/ node/48322_en
123 European Commission, EU and US joint statement (2018) https://ec.europa.eu/commission/presscorner/detail/en/ IP_18_4920
124 EIA, data used for calculations taken from https://www.eia. gov/dnav/ng/NG_MOVE_EXPC_S1_M.htm
125 EIA, Natural Gas Exports by Country, (2021) https://www.eia. gov/dnav/ng/NG_MOVE_EXPC_S1_M.htm)
126 White House, US and EU Joint Press Statement, (2022) https://www.whitehouse.gov/briefing-room/speeches-remarks/2022/03/25/remarks-by-president-biden-and-european-commission-president-ursula-von-der-leyen-in-jointpress-statement/
127 UK Government, Supply of LNG in the UK (2022), https://assets.publishing.service.gov.uk/government/uploads/system/ uploads/attachment_data/file/1147129/Supply_of_Liquefied_ Natural_Gas_in_the_UK__2022.pdf
128 At the time of writing the French Senate was discussing a law proposal to nationalise EDF. L’Express (2022) https:// www.lexpress.fr/politique/edf-comment-le-gouvernement-sest-fait-coincer-sur-la-nationalisation-OLTCEFBXQRDPLIIVFEQM4WTAKE/
129 EDF, Dunkerque LNG https://www.edf.fr/sites/default/files/ Lot%203/DUNKERQUE%20LNG/dunkerque_lng_presentation.pdf.
130 Fluxys, Dunkirk LNG Terminal, (2018) https://www.fluxys. com/fr/press-releases/fluxys-group/2018/180629_press_ dunkirk_lngterminal
131 Ibidem.
132 Ibidem.
133 Fluxys website, https://www.fluxys.com/fr/company/fluxys-group/about-fluxys
134 Fluxys, Dunkirk LNG Terminal, (2018) https://www.fluxys. com/de/press-releases/fluxys-group/2018/181030_press_ core_shareholder_dunkirk
135 RTBF, De Dunkerque à Zeebruge en pipeline https://www. rtbf.be/article/de-dunkerque-a-zeebruge-en-pipeline8987614?id=8987614
136 Fluxys website, Specifications of Zeebrugge and Dunkirk https://www.fluxys.com/en/products-services/activities/lng/ specifications-of-zeebrugge-and-dunkirk
82 WHO PROFITS FROM WAR – HOW GAS CORPORATIONS CAPITALISE ON WAR IN UKRAINE
137 According to Bloomberg NEF.
138 Fluxys website, LNG in France https://www.fluxys.com/fr/ products-services/supplying-europe/france/lng-in-france
139 Source: Bloomberg.
140 Source: Bloomberg.
141 Global Energy Monitor, Europe Gas Tracker Report (2023) https://globalenergymonitor.org/wp-content/uploads/2023/03/GEM-Europe-Gas-Tracker-Report-2023.pdf
142 IEEFA, European LNG Tracker, https://ieefa.org/european-lng-tracker
143 The LNG terminals in light blue indicated as “2021” are all existing terminals before the EU energy crisis and not their start year in 2021.
144 Global Energy Monitor, Europe Gas Tracker 2023 https:// globalenergymonitor.org/wp-content/uploads/2023/03/GEMEurope-Gas-Tracker-Report-2023.pdf
145 Global Energy Monitor, EU LNG Briefing (2022) https:// globalenergymonitor.org/wp-content/uploads/2022/12/GEMEU-LNG-Briefing-2022.pdf
146 WEF, How Europe’s energy crisis is affecting Germany – and why it matters, (August 30, 2022) https://www.weforum.org/ agenda/2022/08/energy-crisis-germany-europe
147 Ibidem.
148 BBC News, Energy crisis: Russia and Ukraine cut gas supplies to Europe, (January 5, 2022) https://www.bbc.com/news/ world-europe-60131520
149 Global Energy Monitor, EU LNG Briefing (2022) https:// globalenergymonitor.org/wp-content/uploads/2022/12/GEMEU-LNG-Briefing-2022.pdf
150 This is the sum of the annual data on the daily send-out of gas in EU LNG terminals, compared with the daily DTRS (declared total reference sendout) reported by that LNG terminal, from data of the Transparency Database of Gas Infrastructure Europe(GIE). The DTRS is the technical maximum capacity as reported to GIE, which might differ from nameplate capacity.
151 Enagás, the Spanish gas operator cited “security and diversity of supply” to defend new projects, and the 2022 energy crisis resuscitated proposals for pipelines connecting Spain to the rest of Europe. However, data compiled by Greenpeace International through ENTSOG showed that the Spain - France interconnector only transported 64% of its maximum capacity in 2022. The fact that Enagás, in the Spanish regulatory system, receives a fixed rate of return on its gas infrastructure investments, explains according to IEEFA the overcapacity in LNG infrastructure in Spain. This system leads to absurd situations with Enagás building terminals regardless of the demand for gas, like the EI Musel LNG terminal which was immediately mothballed by Royal decree (in 2012), “until gas demand rises.” Spanish gas bills being among the highest in Europe is a painful result of this investment policy. IEEFA (2021), https://ieefa.org/wp-content/ uploads/2021/09/Gas-in-Spain-Oversupplied-and-Overcompensated_September-2021.pdf, European Commission, (2018) https://ec.europa.eu/commission/presscorner/detail/ fr/MEMO_18_4622 and ENTSOG Transparency Platform, https://transparency.entsog.eu/#/map
152 This is the compiled data on the daily send-out of gas in Zeebrugge LNG terminal, compared with the daily DTRS (declared total reference sendout) reported, from data of the Transparency Database of Gas Infrastructure Europe. Converted from GWh to bcm using the BP Conversion numbers. https://www.bp.com/content/dam/bp/business-sites/en/ global/corporate/pdfs/energy-economics/statistical-review/ bp-stats-review-2022-approximate-conversion-factors.pdf
153 Greenpeace International, calculations based on data provided by the GIE database about the Send-out vs DTRS of the Dunkirk LNG terminal.
154 Fluxys, Investment Decision to Increase Regasification Capacity at Zeebrugge Terminal (2021) https://www.fluxys.com/ en/press-releases/fluxys-belgium/2021/210215_press_investment_decision_regasification_capacity
155 Global Energy Monitor, EU LNG Briefing (2022) https:// globalenergymonitor.org/wp-content/uploads/2022/12/GEMEU-LNG-Briefing-2022.pdf
156 Energy Monitor, Europe’s Rush for Energy Security Through LNG Risks Fossil Fuel Lock-In (2023) https://www.energymonitor.ai/tech/decarbonising-gas/europes-rush-for-energysecurity-through-lng-risks-fossil-fuel-lock-in/
157 Energy Monitor, Commission Readies EU Energy Rethink Following Ukraine War (2022) https://www.energymonitor. ai/policy/green-deals/commission-readies-eu-energy-rethink-following-ukraine-war/
158 Global Energy Monitor, EU LNG Briefing (2022) https:// globalenergymonitor.org/wp-content/uploads/2022/12/GEMEU-LNG-Briefing-2022.pdf
159 Mathias Koch, Twitter account (2022) https://twitter.com/ MathiasKoch183/status/1603719898034749440
160 Council of the European Union, LNG Infrastructure in the EU https://www.consilium.europa.eu/en/infographics/lng-infrastructure-in-the-eu/
161 Greenpeace, calculations done from data of Bruegel and Entsog. https://www.bruegel.org/dataset/european-natural-gas-imports
162 European Commission, Launch of Baltic Pipe (2022) https:// commission.europa.eu/news/launch-baltic-pipe-2022-09-27_ en
163 S&P Global, Ukraine War (2022) https://www.spglobal.com/ commodityinsights/en/market-insights/topics/ukraine-war
164 IEEFA, Global LNG Outlook 2023-27 (2022) https://ieefa.org/ resources/global-lng-outlook-2023-27
165 IEEFA, Over Half Europe’s LNG Infrastructure Assets Could Be Left Unused by 2030 (2021) https://ieefa.org/articles/ over-half-europes-lng-infrastructure-assets-could-be-left-unused-2030
166 Ibidem.
167 Mathias Koch, Twitter account (2022) https://twitter.com/ MathiasKoch183/status/1603719898034749440
WHO PROFITS FROM WAR – HOW GAS CORPORATIONS CAPITALISE ON WAR IN UKRAINE 83
168 Bruegel, Europe’s Gas Security Crisis: An Analysis of Russian Gas Flows and EU Resilience (2022) https://www.bruegel.org/ sites/default/files/2022-09/PC%2014%202022_2.pdf
169 Ibidem.
170 Ember, EU Can Stop Russian Gas Imports by 2025 (2022) https://ember-climate.org/insights/research/eu-can-stop-russian-gas-imports-by-2025/
171 Council of the European Union, Fit for 55: The EU Plan for a Green Transition (2021) https://www.consilium.europa. eu/en/policies/green-deal/fit-for-55-the-eu-plan-for-a-greentransition/
172 Energy Monitor, Europe’s Rush for Energy Security Through LNG Risks Fossil Fuel Lock-in (2021) https://www.energymonitor.ai/tech/decarbonising-gas/europes-rush-for-energysecurity-through-lng-risks-fossil-fuel-lock-in
173 IEA, Global Hydrogen Review (2022) https://iea.blob.core. windows.net/assets/c5bc75b1-9e4d-460d-9056-6e8e626a11c4/ GlobalHydrogenReview2022.pdf
174 Euractiv, Scholz Ups Global Hydrogen Ambitions, Dwarfs EU (2022) Initiative https://www.euractiv.com/section/energy-environment/news/scholz-ups-global-hydrogen-ambitions-dwarfs-eu-initiative/
175 Tinne Van der Straeten, België: Waterstofpoort naar Europa (2023) https://www.tinnevanderstraeten.be/belgie_waterstofpoort_naar_europa
176 Reuters, France leads push in EU to boost nuclear-produced hydrogen (2022) https://www.reuters.com/business/energy/ france-leads-push-eu-boost-nuclear-produced-hydrogen-2023-02-03/
177 IEA, Global Hydrogen Review (2022) https://iea.blob.core. windows.net/assets/c5bc75b1-9e4d-460d-9056-6e8e626a11c4/ GlobalHydrogenReview2022.pdf
178 Fraunhofer Institute for Systems and Innovation Research ISI, Conversion of LNG Terminals for Liquid Hydrogen or Ammonia (2022) https://www.isi.fraunhofer.de/ content/dam/isi/dokumente/cce/2022/Report_Conversion_of_ LNG_Terminals_for_Liquid_Hydrogen_or_Ammonia.pdf
179 Bloomberg, Michael Liebreich, The Unbearable Lightness of Hydrogen (2021) Hydrogen has significantly different physical properties to fossil fuels and therefore presents unique challenges for transport. Liquefying hydrogen is both challenging and costly, consuming 30-40% of its energy content compared to less than 10% for LNG. Hydrogen also has a lower liquid energy density than LNG, requiring 2.4 LH2 (liquefied hydrogen) ships for every LNG ship to transport the same amount of energy, which adds cost and energy intensity to the shipping process. The challenges in transporting hydrogen make a transition from LNG to LH2 complex and expensive. https://about.bnef.com/blog/liebreich-the-unbearable-lightness-of-hydrogen/
180 This essentially means that - if we are speaking about renewable (or ‘green’) hydrogen - renewable energy will be used to produce hydrogen, which will then be converted into ammonia, liquefied, and transported across oceans to arrive at the import terminal. There the ammonia can either be used as feedstock in industrial processes, or be cracked back into hydrogen for use as feedstock in industry or to be burned for energy. The entire process of conversion of ammonia back into hydrogen is energy-intensive, requiring around 30% of the energy content of the ammonia. And while it is deemed more efficient than liquefied hydrogen, and could have some potential in specific industrial applications, it is not viewed as a practical solution for widespread transport of energy. It is less energy-dense than LNG by volume and requires even more energy to liquefy, store, and transport. ACS Energy Letters, “Renewable Hydrogen from Seawater: Challenges and Opportunities.” (2022) https://pubs.acs.org/doi/10.1021/acsenergylett.1c02189 and Natural Resources Defense Council, Hydrogen-Ready LNG Infrastructure: An Uncertain Way Forward (2023) https://www.nrdc.org/experts/ade-samuel/ hydrogen-ready-lng-infrastructure-uncertain-way-forward
181 Fraunhofer Institute for Systems and Innovation Research ISI, Conversion of LNG Terminals for Liquid Hydrogen or Ammonia (2022) https://www.isi.fraunhofer.de/ content/dam/isi/dokumente/cce/2022/Report_Conversion_of_ LNG_Terminals_for_Liquid_Hydrogen_or_Ammonia.pdf
182 IRENA, World Energy Transition Outlook 2022 - Summary. https://www.irena.org/-/media/files/irena/agency/publication/2022/mar/irena_weto_summary_2022.pdf
183 Recharge News, Energy Transition (Dec 2021) https://www. rechargenews.com/energy-transition/more-than-85-of-export-oriented-low-carbon-hydrogen-projects-plan-to-shipammonia-not-h2/2-1-1144059
184 Natural Resources Defense Council, Hydrogen-Ready LNG Infrastructure: An Uncertain Way Forward (2023) https:// www.nrdc.org/experts/ade-samuel/hydrogen-ready-lng-infrastructure-uncertain-way-forward
185 Energy Education, LNG carrier https://energyeducation.ca/ encyclopedia/LNG_carrier
186 Data retrieved from the Refinitiv Eikon terminal, commodities data.
187 Converted from 240 mln USD to EUR on 29/03/23 https:// www.ecb.europa.eu/stats/policy_and_exchange_rates/ euro_reference_exchange_rates/html/eurofxref-graph-usd. en.html
188 Maritime Executive, LNG Carriers Continue to Lead Newbuilds with Further $2.6B in Orders, (Sept 2021) https://maritime-executive.com/article/lng-carriers-continue-to-leadnewbuilds-with-further-2-6b-in-orders
189 BP, Statistical Review of World Energy 2022: Approximate Conversion Factors https://www.bp.com/content/dam/bp/ business-sites/en/global/corporate/pdfs/energy-economics/ statistical-review/bp-stats-review-2022-approximate-conversion-factors.pdf
190 Statista, Global natural gas consumption from 1980 to 2021 (in billion cubic meters) (2022) https://www.statista.com/statistics/282717/global-natural-gas-consumption/
84 WHO PROFITS FROM WAR – HOW GAS CORPORATIONS CAPITALISE ON WAR IN UKRAINE
191 Fraunhofer Institute for Systems and Innovation Research ISI, Conversion of LNG Terminals for Liquid Hydrogen or Ammonia (2022) https://www.isi.fraunhofer.de/ content/dam/isi/dokumente/cce/2022/Report_Conversion_of_ LNG_Terminals_for_Liquid_Hydrogen_or_Ammonia.pdf
192 We downloaded the BNEF Global LNG Contracts database as of Q4 2022. We selected all contracts with Export Market as United States, and excluded any contracts marked Expired, Inactive, or which did not specify start year, end year, or volume. This left 130 contracts in the sample used here.
193 Data extracted from Bloomberg terminal
194 All the following is our analysis based on data from BloombergNEF.
195 Mentioned in their contracts according to BloombergNEF.
196 GIS Reports Online, The Future of LNG Europe (2019) https://www.gisreportsonline.com/r/lng-europe/
197 According to data from BloombergNEF.
198 Eurostat, Consumption of natural gas by country or territory (2022) https://ec.europa.eu/eurostat/databrowser/bookmark/418b40ca-5a83-49a1-b93a-aa78ce45b2d4?lang=en
199 Friends of the Earth (FOE), Liquefied Cash (2023) https:// foe.org/wp-content/uploads/2023/02/Liquified_Cash_Report_2023_v6.pdf
200 Westlaw, Practical Law Glossary https://content.next. westlaw.com/Glossary/PracticalLaw/I97d322ae38ba11ebbea4f0dc9fb69570?transitionType=Default&contextData=(sc. Default)&firstPage=true
201 The location of the LNG shipments is unspecified in the contracts, meaning that the contract holder can choose where to ship the LNG.
202 LNG Project Final Investment Decisions 2023: US Encore, BNEF, January 10, 2023.
203 PR Newswire, Sempra Launces Port Arthur LNG (March 2023) https://www.prnewswire.com/news-releases/sempralaunches-port-arthur-lng-project-301776512.html
204 Commission de régulation de l’énergie (CRE), Dunkerque LNG Terminal: Operating Scenarios and Economic Analysis 2023-2036 (2022) https://www.cre.fr/content/download/25504/file/220428_2022-121_OS_Dunkerque_2023-2036. pdf
205 Fluxys, Dunkerque LNG, press release (2022) https://www. fluxys.com/-/media/project/fluxys/public/corporate/fluxyscom/company/dnk/press-kit/dunkerquelng_dossierdepresse_2023.pdf
206 CRE (2022), Operating Strategy of Dunkerque LNG Terminal 2023-2036, https://www.cre.fr/content/download/25504/ file/220428_2022-121_OS_Dunkerque_2023-2036.pdf
207 Ibidem.
208 The Wall Street Journal, US Gas Sales to China Dry Up as Ukraine War Disrupts Energy Trade (2022) https://www.wsj. com/articles/u-s-gas-sales-to-china-dry-up-as-ukraine-wardisrupts-energy-trade-11655988154?mod=article_inline
209 EIA, LNG will continue to lead growth in US natural gas exports (2023) https://www.eia.gov/todayinenergy/detail. php?id=55741
210 The Wall Street Journal, US Gas Sales to China Dry Up as Ukraine War Disrupts Energy Trade (2022) https://www.wsj. com/articles/u-s-gas-sales-to-china-dry-up-as-ukraine-wardisrupts-energy-trade-11655988154?mod=article_inline
211 Bloomberg, China Sells Some Spare US Gas to Europe for a Hefty Profit (March 2022) https://www.bloomberg.com/news/ articles/2022-03-15/china-sells-some-spare-u-s-gas-to-europefor-a-hefty-profit
212 LNG Project Final Investment Decisions 2023: US Encore, BNEF, January 10, 2023.
213 The export of crude oil was banned from the US during the oil crisis of the 1970s. The ban was lifted by Congress and the Obama administration in 2015. Greenpeace US & Oil Change International, Policy Briefing: Carbon Impacts of Reinstating the US Crude Export Ban (2020) https://www. greenpeace.org/usa/reports/carbon-impacts-of-reinstatingthe-us-crude-export-ban/
214 EIA, Natural Gas Exports By Country, https://www.eia.gov/ dnav/ng/ng_move_expc_s1_a.htm
215 EIA, US LNG export capacity to grow as three additional projects begin construction (Sept, 2022) https://www.eia.gov/ todayinenergy/detail.php?id=53719
216 Sempra, Launches Port Arthur LNG (2021) Project https:// www.sempra.com/sempra-launches-port-arthur-lng-project#:~:text=The%20Port%20Arthur%20LNG%20Phase%20 1%20project%20is%20fully%20permitted,tonnes%20per%20 annum%20(Mtpa).
217 Based on data from US EIA, e.g. https://www.eia.gov/todayinenergy/detail.php?id=53719
218 IEA NZE. Figure 4.17
219 Federal Energy Regulatory Commission (FERC). North American LNG Export Terminals: Existing, Approved, Not Yet Built, and Proposed (2021) https://cms.ferc.gov/media/northamerican-lng-export-terminals-existing-approved-not-yetbuilt-and-proposed-8
220 LNG Project Final Investment Decisions 2023: US Encore, BNEF, January 10, 2023.
221 Reuters, US LNG Producers Poised to Leapfrog Rivals with Three New Projects. (2023) https://www.reuters.com/business/energy/us-lng-producers-poised-leapfrog-rivals-withthree-new-projects-2023-02-16/
222 Federal Energy Regulatory Commission (FERC). North American LNG Export Terminals: Existing, Approved, Not Yet Built, and Proposed (2021) https://cms.ferc.gov/media/northamerican-lng-export-terminals-existing-approved-not-yetbuilt-and-proposed-8
223 Sempra, Sempra Energy Announces FID For Landmark Energía Costa Azul LNG Export Project (2022) https://www. sempra.com/sempra-energy-announces-fid-landmark-energia-costa-azul-lng-export-project
224 The lead approving agency for offshore terminals is the Maritime Administration (MARAD).
225 FERC, North American LNG Export Terminals: Existing, Approved, Not Yet Built, and Proposed (2021) https://cms.ferc. gov/media/north-american-lng-export-terminals-existingapproved-not-yet-built-and-proposed-8
WHO PROFITS FROM WAR – HOW GAS CORPORATIONS CAPITALISE ON WAR IN UKRAINE 85
226 Current export capacity stands at 145 bcm and the three projects under construction would increase it to 203 bcm. Adding Port Arthur LNG, Plaquemines Phase 2, the approved expanded trains at Freeport and Cameron, and the 10 approved terminals in Table 4 would add 236 bcm bringing the total to 439 bcm. Based on peak nameplate capacity for existing terminals and proposed design capacity for proposed terminals, as reported to US EIA Liquefaction Capacity database, converted to bcm/y. EIA, https://www.eia.gov/todayinenergy/ detail.php?id=53719
227 Capacity data from US EIA. Estimated start dates from Sierra Club LNG tracker. https://public.tableau.com/app/profile/johanna.heureaux.torres/viz/LNGTracker/Story1?publish=yes
228 IEEFA, The US Can Increase LNG Exports to Europe (2022) https://ieefa.org/wp-content/uploads/2022/04/The-US-Can-Increase-LNG-Exports-to-Europe_April-2022.pdf
229 Ibidem.
230 Fluxys, LNG in France https://www.fluxys.com/fr/products-services/supplying-europe/france/lng-in-france
231 Cheniere Energy, Cheniere and EDF Sign 20-Year LNG Sale and Purchase Agreement, press release (2018) https://lngir. cheniere.com/news-events/press-releases/detail/127/cheniere-and-edf-sign-20-year-lng-sale-and-purchase
232 Cheniere Energy, Cheniere Marketing Signs Additional LNG Sales Agreement with EDF (2019) https://lngir.cheniere. com/news-events/press-releases/detail/141/cheniere-marketing-signs-additional-lng-sales-agreement and Cheniere Energy, Cheniere Marketing Enters into LNG Sales Arrangements with EDF (2015) https://lngir.cheniere.com/newsevents/press-releases/detail/139/cheniere-marketing-enters-into-lng-sales-arrangements-with
233 Tableau Public, LNGTracker by Johanna Heureaux-Torres https://public.tableau.com/app/profile/johanna.heureaux. torres/viz/LNGTracker/Story1?publish=yes
234 Ibidem.
235 NextDecade Corporation, NextDecade and ENGIE Execute 1.75 MTPA LNG Sale and Purchase Agreement (2020) https:// investors.next-decade.com/news-releases/news-release-details/nextdecade-and-engie-execute-175-mtpa-lng-sale-andpurchase
236 Offshore Energy, Cheniere Takes FID on Corpus Christi Stage 3 LNG Project, (2020) https://www.offshore-energy.biz/cheniere-takes-fid-on-corpus-christi-stage-3-lng-project/
237 Reuters, Sempra Energy Strikes LNG Supply Deal with France’s Engie (2019) https://www.reuters.com/article/sempra-usa-lng-engie/update-1-sempra-energy-strikes-lng-supply-deal-with-frances-engie-idUSL4N32W2EL?
238 Sempra Energy, 2020 Form 10-K (2023) https://investor.sempra.com/static-files/ebd66551-691c-418e-9014-9bb57c401f9b
239 Port Arthur LNG, Liquefaction (2023) https://portarthurlng. com/liquefaction/
240 Converted using BP, Statistical Review of World Energy 2022: Approximate Conversion Factors https://www.bp.com/ content/dam/bp/business-sites/en/global/corporate/pdfs/energy-economics/statistical-review/bp-stats-review-2022-approximate-conversion-factors.pdf
241 Poten & Partners, LNG in World Markets: US Export Projects in Pole Position for FIDs (2022) https://www.poten.com/lngin-world-markets-us-export-projects-in-pole-position-forfids/
242 Reuters, Oil and Gas Industry Earned $4 Trillion Last Year, Says IEA Chief, (2023) https://www.reuters.com/business/ energy/oil-gas-industry-earned-4-trillion-last-year-says-ieachief-2023-02-14/
243 Global Witness, The Crisis Year 2022 Brought $134 Billion in Excess Profit to the West’s Five Largest Oil and Gas Companies (2023) https://www.globalwitness.org/en/campaigns/fossil-gas/crisis-year-2022-brought-134-billion-in-excess-profitto-the-wests-five-largest-oil-and-gas-companies/
244 ExxonMobil, Full Year 2022 Results, (January 31, 2023) https://corporate.exxonmobil.com/news/news-releases/2023/0131_exxonmobil-announces-full-year-2022-results. Shell, Statement of Income (2022) https://reports.shell.com/ annual-report/2022/consolidated-financial-statements/ statement-of-income.html. TotalEnergies, 4Q22 Results, (February 8, 2023) https://totalenergies.com/system/files/documents/2023-02/TotalEnergies_4Q22_Results.pdf
BP, Annual Report and Form 20-F (2022) https://www. bp.com/content/dam/bp/business-sites/en/global/corporate/ pdfs/investors/bp-annual-report-and-form-20f-2022.pdf
Chevron, 4Q22 Earnings (February 2, 2023) https://www. chevron.com/-/media/chevron/stories/documents/4Q22-earnings-press-release.pdf
245 Converted from 209 bln USD to EUR on 29/03/23 https://www. ecb.europa.eu/stats/policy_and_exchange_rates/euro_reference_exchange_rates/html/eurofxref-graph-usd.en.html
246 Converted from 107 bln USD to EUR on 29/03/23 https://www. ecb.europa.eu/stats/policy_and_exchange_rates/euro_reference_exchange_rates/html/eurofxref-graph-usd.en.html
247 Data compiled from the financial statements in the annual reports of the listed companies
248 Reuters, US LNG exporters emerge big winners in Europe natgas crisis (2022) https://www.reuters.com/business/energy/us-lng-exporters-emerge-big-winners-europe-natgas-crisis-2022-03-09/
249 Ibidem
250 Cheniere, Cheniere Reports Fourth Quarter and Full Year 2022 Results https://lngir.cheniere.com/news-events/ press-releases/detail/273/cheniere-reports-fourth-quarterand-full-year-2022-results
251 Sempra, Sempra Reports Fourth Quarter 2022 Business Results https://www.sempra.com/sempra-reports-fourth-quarter-2022-business-results
252 Business Insider, US natural gas exports to Europe surge amid energy crisis, leading to trader profits (2022) https:// markets.businessinsider.com/news/commodities/us-natural-gas-exports-europe-surge-energy-crisis-trader-profits-2022-8
253 Converted from 200 mln USD to EUR on 29/03/23 https:// www.ecb.europa.eu/stats/policy_and_exchange_rates/ euro_reference_exchange_rates/html/eurofxref-graph-usd. en.html
86 WHO PROFITS FROM WAR – HOW GAS CORPORATIONS CAPITALISE ON WAR IN UKRAINE
254 Politico, Cheap US gas cost a fortune for Europe, Russia and Ukraine energy (2022) https://www.politico.eu/article/cheapus-gas-cost-fortune-europe-russia-ukraine-energy/
255 Converted from 60 mln USD to EUR on 29/03/23 https://www. ecb.europa.eu/stats/policy_and_exchange_rates/euro_reference_exchange_rates/html/eurofxref-graph-usd.en.html
256 Business Insider, US Natural Gas Exports Surge, (2022) https://markets.businessinsider.com/news/commodities/ us-natural-gas-exports-europe-surge-energy-crisis-trader-profits-2022-8
257 Converted from 275 mln USD to EUR on 29/03/23 https:// www.ecb.europa.eu/stats/policy_and_exchange_rates/ euro_reference_exchange_rates/html/eurofxref-graph-usd. en.html
258 Pipeline & Gas Journal, Commodities trader Trafigura doubles profit to hit new record in 2022 (2023) https://pgjonline.com/news/2022/december/commodities-trader-trafigura-doubles-profit-to-hit-new-record-in-2022
259 Reuters, Commodities trader Gunvor’s half-year revenue jumps 86% (2022) https://www.reuters.com/markets/ europe/commodities-trader-gunvors-half-year-revenue-jumps-86-2022-07-21/
260 Converted from 92 bln USD to EUR on 29/03/23 https://www. ecb.europa.eu/stats/policy_and_exchange_rates/euro_reference_exchange_rates/html/eurofxref-graph-usd.en.html
261 S&P Global Market Intelligence, Changing places: Shifting participation and growing intervention in LNG markets (2023) https://www.spglobal.com/commodityinsights/en/ market-insights/blogs/lng/021523-changing-places-shifting-participation-and-growing-intervention-in-lng-markets
262 The Guardian, Profits surge for energy firms amid fossil fuel resurgence (2023) https://www.theguardian.com/environment/2023/feb/09/profits-energy-fossil-fuel-resurgence-climate-crisis-shell-exxon-bp-chevron-totalenergies
263 The New York Times, Shell Reports Record Profit Despite Green Pressure (2023) https://www.nytimes.com/2023/02/02/ business/shell-earnings-record-profit.html and Shell plc, Annual Report and Form 20-F (2022) https://www.shell.com/ about-us/annual-publications/annual-reports-download-centre.html
264 All numbers in this paragraph were converted from USD to EUR on 29/03/23 https://www.ecb.europa.eu/stats/policy_ and_exchange_rates/euro_reference_exchange_rates/html/ eurofxref-graph-usd.en.html
265 Global Witness, Crisis year 2022 brought $134 billion in excess profit to the West’s five largest oil and gas companies (2023) https://www.globalwitness.org/en/campaigns/fossil-gas/crisis-year-2022-brought-134-billion-in-excess-profitto-the-wests-five-largest-oil-and-gas-companies
266 Nasdaq, Sempra Energy (SRE) Dividend History https://www. nasdaq.com/market-activity/stocks/sre/dividend-history
267 Cheniere, Form 10-K for the fiscal year ended December 31, 2022 https://lngir.cheniere.com/sec-filings/all-sec-filings/content/0000003570-23-000042/lng-20221231.htm#ic1131b9e5c5b41368c2dbfdabf35915e_292
268 Engie, Full Year 2022 Results https://www.engie.com/sites/ default/files/assets/documents/2023-02/ENGIE%20FY%20 2022%20PR%20_%20VDEF.pdf
269 Google Finance, Exxon Mobil Corporation (XOM) https:// www.google.com/finance/quote/XOM:NYSE?hl=en
270 Google Finance, Cheniere Energy, Inc. (LNG) https://www. google.com/finance/quote/LNG:NYSEAMERICAN?hl=en
271 Google Finance, Sempra Energy (SRE) https://www.google. com/finance/quote/SRE:NYSE?hl=en
272 Google Finance, S&P 500 Index (.INX) https://www. google.com/finance/quote/.INX:INDEXSP?sa=X&ved=2ahUKEwiloaWW2Nv9AhWNNuwKHWiJCakQ3ecFegQIJhAY&window=5Y
273 All numbers in this paragraph were converted from USD to EUR on 29/03/23 https://www.ecb.europa.eu/stats/policy_ and_exchange_rates/euro_reference_exchange_rates/html/ eurofxref-graph-usd.en.html
274 International Renewable Energy Agency (IRENA), Renewable Power Generation Costs in 2021 (2022) https://www. irena.org/publications/2022/Jul/Renewable-Power-Generation-Costs-in-2021
275 EIA, Use of Electricity, Energy Explained (2022) https://www. eia.gov/energyexplained/electricity/use-of-electricity.php
276 Eurostat, Statistics Explained (2021) https://ec.europa.eu/ eurostat/statistics-explained/index.php?title=Electricity_production,_consumption_and_market_overview
277 Global Witness, “Crisis year 2022 brought $134 billion in excess profit to the West’s five largest oil and gas companies (2022) https://www.globalwitness.org/en/campaigns/fossil-gas/crisis-year-2022-brought-134-billion-in-excess-profitto-the-wests-five-largest-oil-and-gas-companies/
278 All numbers in this paragraph were converted from USD to EUR on 29/03/23 https://www.ecb.europa.eu/stats/policy_ and_exchange_rates/euro_reference_exchange_rates/html/ eurofxref-graph-usd.en.html
279 Enlit, Heat or Eat: Rising Energy Poverty in Europe (2021) https://www.enlit.world/democratisation/heat-or-eat-risingenergy-poverty-in-europe/
280 FOE, LNG: The liquefied path to climate chaos (2022) https:// friendsoftheearth.eu/wp-content/uploads/2022/05/LNG_ Liquified_path_climate_chaos.pdf
281 Corporate Europe Observatory, How the gas lobby is fuelling the cost-of-living crisis (2022) https://corporateeurope.org/en/2022/11/how-gas-lobby-fuelling-cost-livingcrisis and Bloomberg, Soaring Cost-of-Living Crisis Brings Back 1970s Shopping Habits (2022) https://www.bloomberg. com/news/articles/2022-10-24/soaring-cost-of-living-crisis-brings-back-1970s-shopping-habits?leadSource=uverify%20wall
282 Eurostat, Electricity Prices for Households, First Half-Year 2022 https://ec.europa.eu/eurostat/databrowser/bookmark/ a25e4fe7-3a8a-48f4-8458-6241d1ef89fc?lang=en
283 Eurostat, Natural Gas Supply Statistics (2021) https://ec.europa.eu/eurostat/statistics-explained/index.php?title=Natural_gas_supply_statistics
WHO PROFITS FROM WAR – HOW GAS CORPORATIONS CAPITALISE ON WAR IN UKRAINE 87
284 Eurostat, Electricity Prices for Households, First Half-Year 2022 https://ec.europa.eu/eurostat/databrowser/bookmark/ a25e4fe7-3a8a-48f4-8458-6241d1ef89fc?lang=en
285 International Renewable Energy Agency (IRENA), Renewable Power Generation Costs in 2021 (2022) https://www. irena.org/publications/2022/Jul/Renewable-Power-Generation-Costs-in-2021
286 Eurostat, Statistics Explained (2021) https://ec.europa.eu/ eurostat/statistics-explained/index.php?title=Electricity_production,_consumption_and_market_overview
287 Eurostat, Statistics Explained (2022) https://ec.europa.eu/ eurostat/statistics-explained/index.php?title=Energy_statistics_-_an_overview
288 US Census Bureau, Week 48 Household Pulse Survey: July 27 - August 8 (2022) https://www.census.gov/data/tables/2022/ demo/hhp/hhp48.html
289 FOE, Liquefied Cash: How the LNG Industry Fuels Climate Chaos and Drives Inequality (2023) https://foe.org/wp-content/uploads/2023/02/Liquified_Cash_Report_2023_v6.pdf
290 Bloomberg, US Natural Gas Prices Plunge After Fire at Texas LNG Terminal (2022) https://www.bloomberg.com/ news/articles/2022-06-08/us-natural-gas-prices-plunge-after-fire-at-texas-lng-terminal?sref=qm26bHqj
291 Energy Monitor, US LNG is becoming a zero-sum game (2022) https://www.energymonitor.ai/sectors/opinion-us-lngis-becoming-a-zero-sum-game/
292 ICIS, “Podcast: High gas prices, shortages here to stay; Europe chemicals must adapt (2022) https://www.icis.com/explore/resources/news/2022/11/29/10830822/podcast-high-gasprices-shortages-here-to-stay-europe-chemicals-must-adapt/
293 Time, Europe Is Struggling Through an Energy Crisis This Winter. Next Year Could Be Even Worse (2021) https://time. com/6226587/energy-crisis-next-winter/
294 Sierra Club, US LNG Export Tracker, https://www.sierraclub. org/dirty-fuels/us-lng-export-tracker
295 Converted from 47.7 USD to EUR on 29/03/23 https://www. ecb.europa.eu/stats/policy_and_exchange_rates/euro_reference_exchange_rates/html/eurofxref-graph-usd.en.html
296 MarEx News, LNG Carriers Continue to Lead Newbuilds with Further $2.6B in Orders (2021) https://maritime-executive. com/article/lng-carriers-continue-to-lead-newbuilds-withfurther-2-6b-in-orders
297 Gaille Energy Blog Issue 66, LNG vs. Pipeline Economics (2018) https://gaillelaw.com/2018/05/16/lng-vs-pipeline-economics-gaille-energy-blog-issue-66/
298 All numbers in this paragraph were converted from USD to EUR on 29/03/23 https://www.ecb.europa.eu/stats/policy_ and_exchange_rates/euro_reference_exchange_rates/html/ eurofxref-graph-usd.en.html
299 Financial Times, How the US is becoming a power in liquefied natural gas. (2019) https://www.ft.com/content/8a84275ce9e3-11e9-aefb-a946d2463e4b
300 Euractiv. Twice as Expensive: The High Cost of Germany’s Floating LNG Terminals (2022) https://www.euractiv.com/ section/energy/news/twice-as-expensive-the-high-cost-ofgermanys-floating-lng-terminals/
301 Liquefied Natural Gas Infrastructure and Market Development, published by Springer (2022) https://link.springer. com/chapter/10.1007/978-3-030-86884-0_2
302 IEEFA, The US Can Increase LNG Exports to Europe (2022) https://ieefa.org/wp-content/uploads/2022/04/The-US-Can-Increase-LNG-Exports-to-Europe_April-2022.pdf
303 Converted from USD to EUR on 29/03/23 https://www.ecb. europa.eu/stats/policy_and_exchange_rates/euro_reference_ exchange_rates/html/eurofxref-graph-usd.en.html
304 Columbia University Center on Global Energy Policy, Could Europe’s supply gap herald a golden age of LNG? (2023) https://www.energypolicy.columbia.edu/could-europes-supply-gap-herald-a-golden-age-of-lng
305 Global Energy Monitor, Europe’s Gas Tracker Report (2023) https://globalenergymonitor.org/wp-content/uploads/2023/03/GEM-Europe-Gas-Tracker-Report-2023.pdf
306 Bloomberg, Europe’s $1 Trillion Energy Bill Only Marks Start of the Crisis (2022) https://www.bloomberg.com/news/articles/2022-12-18/europe-s-1-trillion-energy-bill-only-marksstart-of-the-crisis
307 Bruegel, National policies shield consumers from rising energy prices (2022) https://www.bruegel.org/dataset/national-policies-shield-consumers-rising-energy-prices#:~:text=Since%20the%20start%20of%20the,from%20the%20 rising%20energy%20costs.
308 Euractiv, Transport sucks up nearly half of Europe’s fossil fuel subsidies (2021) https://www.euractiv.com/section/energy-environment/news/transport-sucks-up-nearly-half-of-europes-fossil-fuel-subsidies-report-finds/
309 Investigate Europe, €60bn earmarked for Europe’s Covid recovery could go to fossil fuel projects (2023) https://www. investigate-europe.eu/en/2023/gas-lng-fossil-fuel-projectsfunding/
310 Nature, Stranded fossil-fuel assets translate to major losses for investors in advanced economies (2022) https://www. nature.com/articles/s41558-022-01356-y
311 Nature, Reframing incentives for climate policy action (2021) https://www.nature.com/articles/s41560-021-00934-2
312 Converted from USD to EUR on 29/03/23 https://www.ecb. europa.eu/stats/policy_and_exchange_rates/euro_reference_ exchange_rates/html/eurofxref-graph-usd.en.html
313 Guardian, Half world’s fossil fuel assets could become worthless by 2036 in net zero transition (2021) https://www. theguardian.com/environment/ng-interactive/2021/nov/04/ fossil-fuel-assets-worthless-2036-net-zero-transition
314 The White House, The Long-Term Strategy of the United States. Pathways to Net-Zero Greenhouse Gas Emissions by 2050 (2021) https://www.whitehouse.gov/wp-content/uploads/2021/10/US-Long-Term-Strategy.pdf
315 European Commission, 2050 Lont-Term Strategy https://climate.ec.europa.eu/eu-action/ climate-strategies-targets/2050-long-term-strategy_en#:~:text=The%20EU%20aims%20to%20be,AgreementEN%E2%80%A2%E2%80%A2%E2%80%A2.
88 WHO PROFITS FROM WAR – HOW GAS CORPORATIONS CAPITALISE ON WAR IN UKRAINE
316 Converted from 5,517 and 3,501 USD to EUR on 29/03/23 https://www.ecb.europa.eu/stats/policy_and_exchange_rates/ euro_reference_exchange_rates/html/eurofxref-graph-usd. en.html
317 Reuters, Putin says Russia to stop supplying energy if Western price caps imposed (2022) https://www.reuters.com/ business/energy/putin-blames-germany-west-nord-stream-1shutdown-2022-09-07/
318 Reuters, Bangladesh plunged into darkness by national grid failure (2022) https://www.reuters.com/world/asia-pacific/ large-parts-bangladesh-without-power-after-national-gridfailure-daily-star-2022-10-04/
319 Friedrich Naumann Foundation for Freedom, Impact of war in Ukraine on Sri Lanka (2023) https://www.freiheit.org/ south-asia/impact-war-ukraine-sri-lanka
320 IEEFA, LNG boom in Europe isn’t all good news for US exporters (2022) https://ieefa.org/resources/liquefied-naturalgas-lng-boom-europe-isnt-all-good-news-us-exporters
321 NDTV, Pakistan’s 12-Hour Blackouts Linked To A Massive Shift In Europe (2022) https://www.ndtv.com/world-news/ pakistans-12-hour-blackouts-linked-to-a-massive-shift-in-europe-3064863
322 Reuters, Pakistan begins restoring power after second major grid breakdown in months (2023) https://www.reuters.com/ world/asia-pacific/pakistan-suffers-major-power-outage-after-grid-failure-2023-01-23/
323 Converted from 40 bln USD to EUR on 29/03/23 https://www. ecb.europa.eu/stats/policy_and_exchange_rates/euro_reference_exchange_rates/html/eurofxref-graph-usd.en.html
324 Center on Global Energy Policy, Could Europe’s Supply Gap Herald a Golden Age of LNG? (2023) https://www.energypolicy.columbia.edu/could-europes-supply-gap-herald-a-goldenage-of-lng/
325 PRIO Policy Brief, The Energy Crisis Hits Europe: Resonances for the Global South and Climate Change (2022) https:// www.prio.org/publications/13176
326 Global Energy Monitor, Why China’s Coal Mine Boom Jeopardizes Short-Term Climate Targets (2022) https://globalenergymonitor.org/report/why-chinas-coal-mine-boom-jeopardizes-short-term-climate-targets/
327 E3G, China’s new coal boom takes it on a detour, while rest of world drives forward (2023) https://www.e3g.org/news/ china-s-new-coal-boom-takes-it-on-a-detour-while-rest-ofworld-drives-forward/
328 IEA, Global coal demand is set to return to its all-time high in 2022 (2022) https://www.iea.org/news/global-coal-demand-isset-to-return-to-its-all-time-high-in-2022
329 Clean Cooking Alliance, Clean cooking industry snapshot (2022) https://cleancooking.org/reports-and-tools/2022-cleancooking-industry-snapshot/
330 Bloomberg, Europe’s Rush to Buy Africa’s Natural Gas Draws Cries of Hypocrisy (2022) https://www.bloomberg.com/news/ features/2022-07-10/europe-s-africa-gas-imports-risk-climate-goals-leave-millions-without-power
331 The World Bank, Moving The Needle on Cooking for All (2023) https://www.worldbank.org/en/results/2023/01/19/ moving-the-needle-on-clean-cooking-for-all
332 United Nations, Repercussions in Latin America and the Caribbean of the war in Ukraine (2022) https://www.cepal.org/ en/publications/47913-repercussions-latin-america-and-caribbean-war-ukraine-how-should-region-face-new
333 CREA, Year In Review (2022) https://energyandcleanair.org/ year-in-review-pitfalls-and-progress-for-air-pollution-andclean-energy-in-2022/
Environmental Defense Fund, Climate change and a looming cooking oil crisis (2022) https://www.edf.org/ blog/2022/05/05/climate-change-and-looming-cooking-oil-crisis-heres-what-we-can-do
The Guardian, A just transition depends on energy systems that work for everyone (2022) https://www.theguardian.com/ environment/2022/nov/12/cop27-dash-for-gas-africa-energy-colonialism
334 PRIO Policy Brief, The Energy Crisis Hits Europe: Resonances for the Global South and Climate Change (2022) https:// www.prio.org/publications/13176
335 US Department Of The Treasury, G7 Finance Ministers and Central Bank Governors´ Statement on the global economic impact of Russia’s war of aggression against Ukraine and G7 support to Ukraine (2022) https://home.treasury.gov/news/ press-releases/jy1016
336 Ghent University, LNG: Saviour or a New Problem in the Making? (2023) https://www.ugent.be/ps/politiekewetenschappen/gies/en/research/publications/gies_papers/2023-global-energy-crisis/lng-saviour-or-a-new-problem-in-the-making
337 European Commission, REPowerEU plan https://ec.europa. eu/commission/presscorner/detail/en/IP_22_3131
338 European Commission, A European Green Deal https:// ec.europa.eu/info/strategy/priorities-2019-2024/european-green-deal_en
339 European Commission, European Climate Law https://ec.europa.eu/clima/eu-action/european-green-deal/european-climate-law_en
340 European Commission, Delivering the European Green Deal https://ec.europa.eu/info/strategy/priorities-2019-2024/european-green-deal/delivering-european-green-deal_en
341 Bloomberg, World’s Dirtiest Oil and Gas Fields Are in Russia, Turkmenistan and Texas (2022) https://www.bloomberg.com/ news/articles/2022-06-23/world-s-dirtiest-oil-and-gas-fieldsare-in-russia-turkmenistan-and-texas?sref=qm26bHqj
342 Rystad Energy Commentary, LNG import boom could drive up European emissions by 35 million tonnes
343 Worldometer, CO2 emissions by country https://www.worldometers.info/co2-emissions/co2-emissions-by-country/
344 According to Rystad Energy, the wellhead-to-regasification emissions are estimated to be around 10-30% of the total emissions when including the final combustion of the gas. Rystad Energy Commentary, LNG import boom could drive up European emissions by 35 million tonnes
345 Ibidem.
346 Sierra Club, LNG Export tracker https://www.sierraclub.org/ dirty-fuels/us-lng-export-tracker
WHO PROFITS FROM WAR – HOW GAS CORPORATIONS CAPITALISE ON WAR IN UKRAINE 89
347 The methodology used by Sierra Club includes all emissions attributable to LNG terminals during its lifecycle to give an approximation of its total scope 1-2-3 carbon footprint. This includes emissions from the LNG process and direct emissions by the LNG terminals but also gas extraction and methane leakage, as well as transport across the ocean and consumption in the importing countries.
348 Sierra Club, LNG Export tracker https://www.sierraclub.org/ dirty-fuels/us-lng-export-tracker
349 All conversion to cars has been done using EPA conversion numbers. https://www.epa.gov/energy/greenhouse-gases-equivalencies-calculator-calculations-and-references
350 A total of 505.8 million tonnes CO2eq: OECD.org, GHG emissions https://stats.oecd.org/Index.aspx?DataSetCode=AIR_ GHG#
351 Eurostat, Supply, transformation and consumption of gas (2023) https://ec.europa.eu/eurostat/databrowser/bookmark/ d2aba4b6-8d23-4bbf-94d9-2a69a19a9a7b?lang=en
352 World Economics, Carbon Emissions Environmental Factors (2022) https://www.worldeconomics.com/Indicator-Data/ ESG/Environment/Carbon-Emissions/
353 Global Energy Monitor, Europe Gas Tracker Report (2023) https://globalenergymonitor.org/wp-content/uploads/2023/03/GEM-Europe-Gas-Tracker-Report-2023.pdf
354 EPA, GHG Equivalencies Calculator https://www.epa.gov/ energy/greenhouse-gas-equivalencies-calculator
355 Climate Watch, Historical GHG Emissions https://www.climatewatchdata.org/ghg-emissions?breakBy=regions&end_ year=2019®ions=EUU&source=Climate%20Watch&start_ year=1990
356 Politico, LNG expansion in Europe opposes climate goals, says research (2023) https://www.politico.eu/sponsored-content/lng-expansion-in-europe-opposes-climate-goals-says-research/
357 Bruegel, Policy Contribution Issue n ̊14/22, A grand bargain to steer through the European Union’s energy crisis (2022) https://www.bruegel.org/sites/default/files/2022-09/PC%20 14%202022_2.pdf
358 European Commission, European Climate Law https://ec.europa.eu/clima/eu-action/european-green-deal/european-climate-law_en
359 Climate Action Tracker, Massive gas expansion risks overtaking positive climate policies (2022) https://climateactiontracker.org/publications/massive-gas-expansion-risks-overtaking-positive-climate-policies
360 Center On Global Energy Policy, Could Europe’s Supply Gap Herald a Golden Age of LNG? (2023) https://www.energypolicy.columbia.edu/could-europes-supply-gap-herald-a-goldenage-of-lng/
361 BP, Energy Outlook (2023) https://www.bp.com/content/dam/ bp/business-sites/en/global/corporate/pdfs/energy-economics/energy-outlook/bp-energy-outlook-2023.pdf
362 Lifecycle GHG emissions means the aggregate quantity of GHG emissions (including direct emissions and significant indirect emissions) related to the full fuel lifecycle, including all stages of fuel production and distribution, from extraction through the distribution and delivery and use of the finished fuel to the ultimate consumer, where the mass values for all greenhouse gases are adjusted to account for their relative global warming potential. https://www.lawinsider.com/dictionary/lifecycle-greenhouse-gas-emissions
363 EPA, Understanding Global Warming Potentials https://www. epa.gov/ghgemissions/understanding-global-warming-potentials
364 National Geographic, Natural gas is a much ‘dirtier’ energy source than we thought (2020) https://www.nationalgeographic.com/science/article/super-potent-methane-in-atmosphere-oil-gas-drilling-ice-cores
365 The Proceedings of the National Academy of Sciences (PNAS), Greater focus needed on methane leakage from natural gas infrastructure (2019) https://www.pnas.org/ doi/10.1073/pnas.1202407109
366 Alvarez et al. “Assessment of methane emissions from the US oil and gas supply chain,” Science, 2018, 361, 6398, 186-188
367 Earthworks, Texas Permian Basin Now Ranks No. 1 for Worst Oil and Gas Polluter in the World (2022) https://earthworks.org/releases/texas-permian-basin-now-ranks-no-1for-worst-oil-and-gas-polluter-in-the-world/
368 Chen, Y.; Sherwin, E. D.; Berman, E. S. F.; Jones, B. B.; Gordon, M. P.; Wetherley, E. B.; Kort, E. A.; Brandt, A. R. Quantifying Regional Methane Emissions in the New Mexico Permian Basin with a Comprehensive Aerial Survey. Environ. Sci. Technol. 2022, 56 (7), 4317-4323.
369 EPRS European Parliamentary Research Service, Shale gas and EU energy security (2014) https://www.europarl. europa.eu/RegData/etudes/BRIE/2014/542167/EPRS_ BRI(2014)542167_REV1_EN.pdf
370 Legifrance, LAW No. 2011-835 of July 13, 2011 aimed at prohibiting the exploration and exploitation of liquid or gaseous hydrocarbon mines by hydraulic fracturing and at repealing exclusive research permits involving projects using this technique (1) https://www.legifrance.gouv.fr/loda/id/JORFTEXT000024361355
371 Vinson & Elkins, Global Fracking Resources, Shale and Fracking Tracker, Denmark https://www.velaw.com/ shale-fracking-tracker/resources/denmark/
372 BBC News, Bulgaria bans shale gas drilling with ‘fracking’ method (2012) https://www.bbc.com/news/world-europe-16626580
373 Maierean, A. What went wrong? Fracking in Eastern Europe. https://link.springer.com/article/10.1007/s43937-021-00003-5
374 Bond Beter Leef Milieu, Vlaams moratorium op schaliegas (2014) https://www.bondbeterleefmilieu.be/artikel/ vlaams-moratorium-op-schaliegas
375 Reuters, Dutch government bans shale gas drilling for 5 years (2015) https://www.reuters.com/article/netherlands-energy-shale-idUSL8N0ZQ2S720150710
90 WHO PROFITS FROM WAR – HOW GAS CORPORATIONS CAPITALISE ON WAR IN UKRAINE
376 The Guardian, German government agrees to ban fracking after years of dispute (2016) https://www.theguardian.com/ environment/2016/jun/24/germany-bans-fracking-afteryears-of-dispute
377 Shale Gas Bulletin, President Higgins signs Irish fracking ban into law (2017) https://sites.google.com/site/shalegasbulletinireland/all-previous-issues/issue-no-108---july-152017#President_Higgins_signs_Irish_fracking_ban_into_law
378 The Guardian, Rishi Sunak will keep ban on fracking in UK, No 10 confirms (2022) https://www.theguardian.com/environment/2022/oct/26/rishi-sunak-ban-on-fracking-uk-no-10
379 Energy-Pedia, Sweden bans extraction of coal, oil and natural gas and tightens rules on extraction from alum shale (2022) https://www.energy-pedia.com/news/sweden/swedenbans-extraction-of-coal--oil-and-natural-gas-and-tightensrules-on-extraction-from-alum-shale-187087
380 Global Energy Monitor, Norway and Fracking https://www. gem.wiki/Norway_and_fracking
381 Global Energy Monitor, Poland and Fracking https://www. gem.wiki/Poland_and_fracking
382 European Parliament, Shale gas and EU energy security (2014) https://www.europarl.europa.eu/RegData/etudes/ BRIE/2014/542167/EPRS_BRI(2014)542167_REV1_EN.pdf
383 Oil Price website, Why Europe Won’t Exploit Its Huge Gas Reserves (2022) https://oilprice.com/Energy/Energy-General/ Why-Europe-Wont-Exploit-Its-Huge-Gas-Reserves.html
384 In an interview on 3rd March 2023.
385 See our “Annex. Transcript of John Beard’s Interview.”
386 See the data from the US Department of Energy, LNG Monthly (pp. 9-56) (December 2022): https://www.energy. gov/sites/default/files/2023-02/LNG%20Monthly%20December%202022_0.pdf
387 Reuters, CERAWEEK- Asia demand to drive Cheniere’s LNG shipments this year (2023) https://www.reuters.com/business/energy/ceraweek-asia-demand-drive-chenieres-lngshipments-this-year-2023-03-06/
388 Sierra Club, LNG Export Tracker https://www.sierraclub.org/ dirty-fuels/us-lng-export-tracker
389 Cheniere didn’t comment on this in the opportunity to comment we sent to them.
390 In the Sierra Club LNG tracker under the ‘Terminal/Project Financing’ tab https://www.sierraclub.org/dirty-fuels/us-lngexport-tracker
391 Ibidem. Cheniere didn’t comment on this in the opportunity to comment we sent to them.
392 In the Oil and Gas Policy Tracker, French banks have noticeably more policies on fracking compared to their European and American counterparts. This can be linked to the strict domestic French rules on fracking. https://oilgaspolicytracker.org/
393 Data collected from Sierra Club LNG Tracker. Greenpeace compiled the data for relevant banks and combined loans and underwriting of bonds for ease of explanation under the umbrella term of ‘financing’. https://www.sierraclub.org/ dirty-fuels/us-lng-export-tracker
394 Ibidem.
395 Bank Track, The Oil and Gas Policy Tracker by Reclaim Finance (2022) https://www.banktrack.org/news/the_oil_and_ gas_policy_tracker_a_tool_to_detect_greenwashing_practices_in_the_finance_sector
396 Bank Track, Fracking Fiasco (2020) https://www.banktrack. org/download/fracking_fiasco_the_banks_that_fueled_ the_u_s_shale_bust/ran_oci_fracking_fiasco.pdf
397 Les Amis De La Terre France, French bank Société Générale withdraws from Rio Grande LNG (2023) https://www.amisdelaterre.org/communique-presse/french-bank-societe-generale-withdraws-from-rio-grande-lng/
398 Engie didn’t comment on this in the opportunity to comment we sent to them.
399 Le Monde, Shale gas: Engie renounces an American mega-contract, under pressure from the State and NGOs (2020) https://www.lemonde.fr/economie/article/2020/11/03/gaz-deschiste-engie-renonce-a-un-megacontrat-americain-sous-lapression-de-l-etat-et-des-ong_6058335_3234.html
400 Ibidem.
401 Engie website: Shareholder Stucture https://www.engie.com/ actionnaires/action-engie/structure-de-lactionnariat
402 Canary Media, Inside the high-dollar race to sell natural gas as low-carbon (2023) https://www.canarymedia.com/articles/ liquefied-natural-gas/inside-the-high-dollar-race-to-sell-natural-gas-as-low-carbon
403 Engie didn’t comment on this in the opportunity to comment we sent to them.
404 Oil Change International and Earthworks, Certified Disaster: How Project Canary & Gas Certification is Misleading Markets & Governments (2023)
405 Emphasised by us.
406 Canary Media, Inside the high-dollar race to sell natural gas as low-carbon (2023) https://www.canarymedia.com/articles/ liquefied-natural-gas/inside-the-high-dollar-race-to-sell-natural-gas-as-low-carbon
407 Ibidem.
408 Cheniere, Cheniere and Engie Increase Volume and Extend Term of LNG Sale and Purchase Agreement (2022) https:// lngir.cheniere.com/news-events/press-releases/detail/242/ cheniere-and-engie-increase-volume-and-extend-term-of-lng
409 Le Monde, Energy: Engie’s discreet gas agreement in the United States (2021) https://www.lemonde.fr/economie/article/2021/12/03/energie-le-discret-accord-gazier-d-engie-auxetats-unis_6104565_3234.html
410 Les Amis De La Terre France, “Mustang” contract: Engie secretly signs a new shale gas import contract in France (2021) https://www.amisdelaterre.org/communique-presse/ contrat-mustang-engie-signe-en-secret-un-nouveau-contratdimportation-de-gaz-de-schiste-en-france/
411 Le Monde, Energy: Engie’s discreet gas agreement in the United States (2021) https://www.lemonde.fr/economie/article/2021/12/03/energie-le-discret-accord-gazier-d-engie-auxetats-unis_6104565_3234.html
WHO PROFITS FROM WAR – HOW GAS CORPORATIONS CAPITALISE ON WAR IN UKRAINE 91
412 Engie, Internal Regulations of the Board of Directors (2020) https://www.engie.com/sites/default/files/assets/documents/2021-06/GB%20-%20Re%CC%80glement%20Inte%CC%81rieur%202020%2007%2030%20.pdf
413 The Docket Room, Cheniere, LNG Sale and Purchase Agreement Major Provisions Summary (2021) https://www.energy. gov/sites/default/files/2021-07/Engie%20DOE%20LNG%20 submission%20for%20CM%20%20CCL.pdf
414 Cheniere, Cheniere and Engie Increase Volume and Extend Term of LNG Sale and Purchase Agreement (2022) https:// lngir.cheniere.com/news-events/press-releases/detail/242/ cheniere-and-engie-increase-volume-and-extend-term-of-lng
415 BloombergNEF.
416 Cheniere, Cheniere and Engie Increase Volume and Extend Term of LNG Sale and Purchase Agreement (2022) https:// lngir.cheniere.com/news-events/press-releases/detail/242/ cheniere-and-engie-increase-volume-and-extend-term-of-lng
417 Engie didn’t comment on this in the opportunity to comment we sent to them.
418 Le Monde, Energy: Engie’s discreet gas agreement in the United States (2021) https://www.lemonde.fr/economie/ article/2021/12/03/energie-le-discret-accord-gazier-d-engieaux-etats-unis_6104565_3234.html#:~:text=L’ex%2DGDF%20 Suez%20a,informer%20au%20pr%C3%A9alable%20le%20 gouvernement.
419 Canary Media, Inside the high-dollar race to sell natural gas as low-carbon (2023) https://www.canarymedia.com/articles/ liquefied-natural-gas/inside-the-high-dollar-race-to-sell-natural-gas-as-low-carbon
420 Ibidem.
421 https://www.energy.gov/sites/default/files/2021-07/Engie%20 DOE%20LNG%20submission%20for%20CM%20%20CCL.pdf Engie didn’t comment on this in the opportunity to comment we sent to them.
422 Cheniere didn’t comment on this in the opportunity to comment we sent to them.
423 Cheniere, Cheniere Reports Second Quarter 2022 Results and Raises 2022 Financial Guidance, Press Release, August 04, 2022 https://lngir.cheniere.com/news-events/press-releases/ detail/258/cheniere-reports-second-quarter-2022-resultsand-raises
424 Greenpeace & Oil Change, Madness Is The Method: How Cheniere is Greenwashing its LNG With New Cargo Emissions Tags (2022) https://www.greenpeace.org/usa/wp-content/uploads/2022/08/Cheniere-final-v1.pdf Cheniere didn’t comment on this in the opportunity to comment we sent to them.
425 Roman-White et al. 2021
426 Global Energy Monitor, Corpus Christi LNG Terminal https://www.gem.wiki/Corpus_Christi_LNG_Terminal
427 Via CQ-Roll Call Inc. Q3 2021 Cheniere Energy Inc Earnings Call - Final. November 04, 2021
428 Y. Chen, et al, “Quantifying Regional Methane Emissions in the New Mexico Permian Basin with a Comprehensive Aerial Survey,” Environmental Science & Technology 2022 56 (7), 4317-4323. DOI: 10.1021/acs.est.1c06458
429 Cheniere, Cheniere Corpus Christi Stage III and Apache Sign Long-Term Gas Supply Agreement Indexed to Global LNG Prices (2019) https://lngir.cheniere.com/news-events/ press-releases/detail/183/cheniere-corpus-christi-stage-iiiand-apache-sign-long-term
430 Bloomberg, New Mexico Investigates Permian Basin Methane Cloud Spotted by Satellite (2023) https://www. bloomberg.com/news/articles/2023-01-30/new-mexico-investigates-methane-cloud-spotted-by-satellite#xj4y7vzkg
431 Cheniere didn’t comment on this in the opportunity to comment we sent to them.
432 LNG Industry Magazine, “Cheniere Cargo Emission Tags. Coming to an LNG vessel near you”, May 2022. https:// issuu.com/palladianpublications/docs/lng74jprt?fr=sMzA2OTE5NzA3NDk
433 Inside Climate News, The Climate Solution Actually Adding Millions of Tons of CO2 Into the Atmosphere (2021) https:// insideclimatenews.org/news/05052021/the-climate-solutionactually-adding-millions-of-tons-of-co2-into-the-atmosphere/ and Pro Publica, An (Even More) Inconvenient Truth (2019) https://features.propublica.org/brazil-carbon-offsets/ inconvenient-truth-carbon-credits-dont-work-deforestation-redd-acre-cambodia/
434 Cheniere didn’t comment on this in the opportunity to comment we sent to them.
435 EIA, Drilling Productivity Report (2023) https://www.eia.gov/ petroleum/drilling/
436 Ibidem.
437 Greenpeace, Fossil Fuel Racism (2021) https://www.greenpeace.org/usa/reports/fossil-fuel-racism/
438 NRDC, Toxic Air Pollution in the Houston Ship Channel (2021) https://www.nrdc.org/resources/toxic-air-pollution-houston-ship-channel-disparities-show-urgent-need-environmental
439 The Guardian, What are ‘sacrifice zones’ and why do some Americans live in them? (2021) https://www.theguardian. com/commentisfree/2021/nov/16/what-are-sacrifice-zonesand-why-do-some-americans-live-in-them
440 Sky Truth, NRC Report: Benzene near Hackberry, LA (2022) https://alerts.skytruth.org/report/a5ced035-b6fb-6f5c-b8f19d8cad02c6c2/
441 https://environmentalintegrity.org/wp-content/uploads/2020/10/LNG-Report-10.5.20-updated.pdf
442 Louisiana Illuminator, LNG export terminals pose a growing and invisible threat: air pollution (2023) https://lailluminator.com/2023/02/06/lng-export-terminals-pose-a-growingand-invisible-threat-air-pollution/
443 Environmental Integrity Project (EIP), Troubled Waters for LNG (2020) https://environmentalintegrity.org/wp-content/ uploads/2020/10/LNG-Report-10.5.20-updated.pdf
444 Reuters, US regulator releases report blaming Freeport LNG blast on inadequate processes (2022) https://www.reuters. com/business/energy/freeport-lng-provides-no-timeline-texas-export-plant-restart-2022-11-15/
92 WHO PROFITS FROM WAR – HOW GAS CORPORATIONS CAPITALISE ON WAR IN UKRAINE
445 Energy Wire, LNG plant had history of safety issues before explosion (2022) https://www.eenews.net/articles/lng-planthad-history-of-safety-issues-before-explosion/
446 Energy Wire, US LNG surge may have a flood problem (2022) https://www.eenews.net/articles/u-s-lng-surge-may-have-aflood-problem/
447 DeSmog, After Ida, Toxic Smoke From Shell’s Norco Plant in Louisiana Creates Apocalyptic Landscape (2021) https://www. desmog.com/2021/08/31/hurricane-ida-smoke-shell-norco-refinery-louisiana-apocalyptic/
448 Reuters, Texas repeatedly raises pollution limits for Cheniere LNG plant (2022) https://www.reuters.com/business/ environment/texas-repeatedly-raises-pollution-limits-cheniere-lng-plant-2022-06-24/ Cheniere didn’t comment on this in the opportunity to comment we sent to them.
449 Reuters, EXCLUSIVE Top US LNG producer Cheniere asks Biden admin to drop pollution rule (2022). https://www. reuters.com/business/energy/exclusive-top-us-lng-producercheniere-asks-biden-admin-drop-pollution-rule-2022-07-08/ Cheniere didn’t comment on this in the opportunity to comment we sent to them.
450 Sierra Club, Climate and Public Health Impacts of LNG Exports (2022) https://www.sierraclub.org/articles/2022/08/ climate-and-public-health-impacts-lng-exports
451 Sierra Club, LNG Export Tracker, Environmental Justice and Emissions tab. https://www.sierraclub.org/dirty-fuels/us-lngexport-tracker
452 Ibidem.
453 Ibidem.
454 Physicians For Social Responsibility (PSR), Compendium of Scientific, Medical, and Media Findings Demonstrating Risks and Harms of Fracking and Associated Gas and Oil Infrastructure (2022) https://psr.org/resources/fracking-compendium-8/
455 D. Michanowicz, E. Lebel, J. Domen, L.A. Hill, J. Jaeger, J. Schiff, E. Krieger, Z. Banan, J. Goldman, C. Nordgaard, S.B.C. Shonkoff, Methane and Health-Damaging Air Pollutants from the Oil and Gas Sector: Bridging 10 Years of Scientific Understanding, 2021. [Online] PSE Healthy Energy, Available at: https://www.psehealthyenergy.org/our-work/publications/ archive/methane-and-health-damaging-air-pollutants-fromthe-oil-and-gas-sector-bridging-10-years-of-scientific-understanding/ (Accessed 17 March 2023).
456 B. Shamasunder, A. Collier-Oxandale, J. Blickley, J. Sadd, M. Chan, S. Navarro, M. Hannigan, N.J. Wong, Community-Based Health and Exposure Study around Urban Oil Developments in South Los Angeles, Int. J. Environ. Res. Public Health 15:1 (2018) 138. https://doi.org/10.3390/ijerph15010138.
457 L.M. McKenzie, B. Blair, J. Hughes, W.B. Allshouse, N.J. Blake, D. Helmig, P. Milmoe, H. Halliday, D.R. Blake, J.L. Adgate, Ambient Nonmethane Hydrocarbon Levels Along Colorado’s Northern Front Range: Acute and Chronic Health Risks, Environ. Sci. Technol. 52:8 (2018) 4514-4525. https://doi. org/10.1021/acs.est.7b05983
458 D.J.X. Gonzalez, A.R. Sherris, W. Yang, D.K. Stevenson, A.M. Padula, M.; Baiocchi, M. Burke, M.R. Cullen, G. Shaw, Oil and gas production and spontaneous preterm birth in the San Joaquin Valley, CA: A case–control study, Environmental Epidemiology, 4:4 (2020) e099. http://doi.org/10.1097/ EE9.0000000000000099.
459 H. Patel, L. Feldman, Fossil Fumes (2022 update): A public health analysis of toxic air pollution from the oil and gas industry, 2022. [Online] Clean Air Task Force, Available at: https://cdn.catf.us/wp-content/uploads/2016/06/14175846/ fossil-fumes-report-2022.pdf (Accessed 19 March 2023).
460 J.E. Johnston, E. Werder, D. Sebastian, Wastewater disposal wells, fracking, and environmental justice in southern Texas, American J. Public Health 106:3 (2016) 550-556. https://doi. org/10.2105/AJPH.2015.303000
461 Environmental Justice Dimensions of Oil and Gas Flaring in South Texas: Disproportionate Exposure among Hispanic communities, Jill E. Johnston, Khang Chau, Meredith Franklin, and Lara Cushing Environmental Science & Technology 2020 54 (10), 6289-6298 https://www.ncbi.nlm.nih.gov/pmc/ articles/PMC8915929/
462 L.J. Cushing, K. Vavra-Musser, K. Chau, M. Franklin, J.E. Johnston, Flaring from Unconventional Oil and Gas Development and Birth Outcomes in the Eagle Ford Shale in South Texas, Env. Health. Pers. 128 (2020) 7. https://doi.org/10.1289/ EHP6394.
463 L.J. Cushing, K. Chau, M. Franklin, J.E. Johnston, Up in smoke: characterising the population exposed to flaring from unconventional oil and gas development in the contiguous US. Environ. Res. Lett. 16 (2021) 034032. http://doi.org/10.1088/17489326/abd3d4
464 EIA, Liquefied natural gas will continue to lead growth in US natural gas exports (2023) https://www.eia.gov/todayinenergy/detail.php?id=55741
465 Politico Pro, EU officials huddle with US LNG companies to discuss buyers club (2023) https://subscriber.politicopro. com/article/2023/02/eu-officials-huddle-with-u-s-lng-companies-to-discuss-buyers-club-00082789
466 Ibidem.
467 Ibidem.
468 DESFA, Ten Year Development Plan (2023) https://www. desfa.gr/en/press-center/press-releases/se-dhmosia-diaboyleysh-to-dekaetes-programma-anaptyjhs-toy-desfa-20232032-erga-1-27-dis-gia-thn-edraiwsh-ths-elladas-ws-pylhsefodiasmoy-gia-thn-eyryterh-perioxh
469 Ibidem.
470 Ibidem.
471 US Department of State, Joint Statement on the US -Greece Strategic Dialogue https://www.state.gov/joint-statement-onthe-u-s-greece-strategic-dialogue/
472 In quotes by us. https://www.state.gov/joint-statement-onthe-u-s-greece-strategic-dialogue/
473 John Kennedy, Ted Cruz, Shelley Moore Capito and Kevin Cramer.
WHO PROFITS FROM WAR – HOW GAS CORPORATIONS CAPITALISE ON WAR IN UKRAINE 93
474 Senator John Kennedy website: https://www.kennedy. senate.gov/public/press-releases?ID=FE69700C-871B-45DDAAF7-DA435C035367
475 Cheniere, Initiates Permitting Process for Significant Expansion of LNG Export Capacity at Sabine Pass (2023) https:// lngir.cheniere.com/news-events/press-releases/detail/272/ cheniere-initiates-permitting-process-for-significant and https://www.cheniere.com/where-we-work/sabine-pass
476 Financial Times, US gas exporter Cheniere bets on lasting demand with expansion plan (2023) https://www.ft.com/content/e5e0d287-029f-4c20-a41a-d668e18fe85e?
477 Ibidem.
478 Ibidem.
479 Ibidem.
480 European Sources Online, Regulation (EU) 2023/435 amending Regulation (EU) 2021/241 as regards REPowerEU chapters in recovery and resilience plans and amending Regulations (EU) No 1303/2013, (EU) 2021/1060 and (EU) 2021/1755, and Directive 2003/87/EC (2023) https://www.europeansources. info/record/proposal-for-a-regulation-amending-regulationeu-2021-241-as-regards-repowereu-chapters-in-recoveryand-resilience-plans-and-amending-regulation-eu-20211060-regulation-eu-2021-2115-directive/
481 Investigate Europe, €60bn earmarked for Europe’s Covid recovery could go to fossil fuel projects (2023) https://www. investigate-europe.eu/en/2023/gas-lng-fossil-fuel-projectsfunding/
482 CERAWeek is an annual energy conference organised by the information and insights company S&P Global, bringing together executives, government officials, and thought leaders from the energy, policy, technology, and financial industries to Houston, Texas.
483 Politico Pro, Document (2023) https://subscriber.politicopro. com/eenews/f/eenews/?id=00000186-b85f-d147-a7f7-fe7f7aa20000
484 Sergio Chapa, Twitter https://twitter.com/SergioChapa/status/1633521695142100997
485 Reuters, Venture Global LNG to go ahead with phase 2 of Plaquemines, La., export plant (2023) https://www.reuters. com/business/energy/venture-global-lng-go-ahead-withphase-2-plaquemines-la-export-plant-2023-03-13/
486 Reuters, Norway’s Equinor to supply EU gas procurement scheme (2023) https://www.reuters.com/business/energy/ equinor-join-eus-joint-gas-procurement-scheme-von-derleyen-says-2023-03-17/
487 Sempra Energy, Launching Port Arthur LNG (2023) https:// www.sempra.com/sempra-launches-port-arthur-lng-project
488 The Biden Plan for a Clean Energy Revolution and Environmental Justice. https://joebiden.com/climate-plan/
489 E&E News, Judge revives block on Biden leasing pause https://www.eenews.net/articles/judge-revives-block-onbiden-leasing-pause/
490 US Department of the Interior, Interior Department Announces Next Steps for Offshore Oil and Gas Leasing to Comply with Provisions in Inflation Reduction Act (2022) https://www.doi.gov/pressreleases/interior-department-announces-next-steps-offshore-oil-and-gas-leasing-comply
491 CNN Politics, The Willow Project has been approved (2023) https://edition.cnn.com/2023/03/14/politics/willow-project-oil-alaska-explained-climate/index.html
492 Offshore Energy, Sabine Pass and Corpus Christi approved for extra LNG exports amidst energy crisis (2022) https:// www.offshore-energy.biz/sabine-pass-approved-for-extra-lng-exports-amidst-energy-crisis/#:~:text=Each%20 train%20can%20produce%20approximately,agreement%2C%20including%20all%20of%20Europe.
493 Greenpeace Reports, Real Climate Leadership (2019) https:// www.greenpeace.org/usa/reports/fossil-fuel-phaseout/
494 Repeat Project, Preliminary Report: The Climate and Energy Impacts of the Inflation Reduction Act of 2022
https://repeatproject.org/docs/REPEAT_IRA_Prelminary_Report_2022-08-12.pdf
495 Houston Public Media, Environmental activists protest in Houston during 2023 CERAWeek energy conference (2023) https://www.houstonpublicmedia.org/articles/news/energy-environment/2023/03/08/445673/environmental-activists-protest-in-houston-during-2023-ceraweek-energy-conference/
496 Sierra Club, Corpus Christi LNG Is An Environmental Injustice In Texas’ Coastal Bend https://web.archive.org/ web/20220617115242/https:/www.sierraclub.org/articles/2022/06/corpus-christi-lng-environmental-injustice-texas-coastal-bend
497 Sierra Club, Rio Grande Valley at risk from fracked-gas export terminals (2022 update) https://www.sierraclub.org/ sites/www.sierraclub.org/files/2022-10/RGV_LNG_2022_FINAL_WEB_0.pdf
498 Common Dreams, Exploiting Ukraine Crisis to Ramp Up Fossil Fuel Expansion Is Dangerous and Deadly (2022) https://www.commondreams.org/views/2022/04/07/exploiting-ukraine-crisis-ramp-fossil-fuel-expansion-dangerous-and-deadly
499 Port Arthur Community Action Network https://www.pacan.com/
500 Eur Lex, Proposal for a DIRECTIVE OF THE EUROPEAN PARLIAMENT AND OF THE COUNCIL on Corporate Sustainability Due Diligence and amending Directive (EU) 2019/1937 https://eur-lex.europa.eu/legal-content/EN/TXT/?uri=CELEX%3A52022PC0071
501 Council of the EU, Council adopts position on due diligence rules for large companies (2022) https://www.consilium.europa.eu/en/press/press-releases/2022/12/01/council-adoptsposition-on-due-diligence-rules-for-large-companies/
502 Council of the EU, Interinstitutional File: 2022/0051(COD) https://data.consilium.europa.eu/doc/document/ST-150242022-REV-1/en/pdf
503 European Parliament, Legislative Observatory, Corporate Sustainability Due Diligence Procedure file 2022/0051(COD) https://oeil.secure.europarl.europa.eu/oeil/popups/ficheprocedure.do?reference=2022/0051(COD)&l=en
504 Before this, in 2016, the UK voted the Anti-Slavery Act and the Netherlands voted a law banning child labour in February 2017. https://www.amisdelaterre.org/wp-content/ uploads/2017/07/faq-devoir-de-vigilance-juillet2017-web.pdf
94 WHO PROFITS FROM WAR – HOW GAS CORPORATIONS CAPITALISE ON WAR IN UKRAINE
505 Amis de la Terre France https://www.amisdelaterre.org/ wp-content/uploads/2019/09/infographie-loidevoirdevigilance-amis-de-la-terre-france.pdf
506 Amis de la Terre France, A campaign against the plans of TotalEnergies regarding the East African Crude Oil Pipeline in Uganda and Tanzania https://www.amisdelaterre.org/campagne/total-rendez-vous-au-tribunal/ A first ruling on 28th February rejected the complaints of the civil society organisations involved in the case because of default in procedures. https://www.amisdelaterre.org/communique-presse/projets-tilenga-et-eacop-de-total-le-tribunal-judiciaire-de-parisbotte-en-touche/
507 Amis de la Terre France, A campaign against the investments of the BNP bank in fossil fuels projects, BNP being the first European bank in terms of direct and indirect investments in fossil fuels projects worldwide. https://www. amisdelaterre.org/communique-presse/climat-bnp-paribas-mise-en-demeure-de-stopper-ses-soutiens-aux-nouveaux-projets-denergies-fossiles/
508 United Nations, General Assembly Human Rights Council, 26/9 Elaboration of an international legally binding instrument on transnational corporations and other business enterprises with respect to human rights https://documents-dds-ny.un.org/doc/UNDOC/GEN/G14/082/52/PDF/ G1408252.pdf?OpenElement
509 Chambre Des Représentants De Belgique, https://www. lachambre.be/FLWB/PDF/55/1903/55K1903001.pdf
510 Chambre Des Représentants De Belgique, https://www. lachambre.be/FLWB/PDF/55/1903/55K1903001.pdf
511 Chambre Des Représentants De Belgique, https://www. lachambre.be/FLWB/PDF/55/1903/55K1903002.pdf
512 Chambre Des Représentants De Belgique, https://www. lachambre.be/FLWB/PDF/55/1903/55K1903003.pdf
513 Chambre Des Représentants De Belgique, https://www. lachambre.be/FLWB/PDF/55/1903/55K1903001.pdf
514 “all the entities with which the company has a business relationship, because these entities: (a) directly or indirectly provide products, including financial services, which contribute to the production of the company’s products, or b) receive products, including financial services, from the company” (art. 2, 9°)
515 “‘sustainable investment’ means an investment in an economic activity that contributes to an environmental objective, as measured, for example, by key resource efficiency indicators on the use of energy, renewable energy, raw materials, water and land, on the production of waste, and GHG emissions, or on its impact on biodiversity and the circular economy, or an investment in an economic activity that contributes to a social objective, in particular an investment that contributes to tackling inequality or that fosters social cohesion, social integration and labour relations, or an investment in human capital or economically or socially disadvantaged communities, provided that such investments do not significantly harm any of those objectives and that the investee companies follow good governance practices, in particular with respect to sound management structures, employee relations, remuneration of staff and tax compliance.” Art. 2, §17 https://eur-lex.europa.eu/legal-content/EN/TXT/ HTML/?uri=CELEX:32019R2088&from=fr#d1e514-1-1
516 https://eur-lex.europa.eu/legal-content/EN/TXT/HTML/?uri=CELEX:32020R0852&from=EN These criteria shall consider both short- and long-term impact of a given economic activity on environmental objectives (art. 19, b), build upon Union methodologies for assessing environmental footprint (art. 19, d), take into account the life cycle understood as both the environmental impact of the economic activity itself and the environmental impact of the products and services provided by that economic activity, be certain the activity “does not lead to a lock-in of assets that undermine long-term environmental goals, considering the economic lifetime of those assets” and “has a substantial positive environmental impact, on the basis of life-cycle considerations” (art. 16 referred to in art. 19, h), take into account the potential market impact of the transition to a more sustainable economy, including the risk of certain assets becoming stranded as a result of such transition, as well as the risk of creating inconsistent incentives for investing sustainably (art. 19 i)
517 For a comprehensive analysis of the right to health: https:// www.ohchr.org/sites/default/files/Documents/Publications/ Factsheet31.pdf
518 “If the activities of the company or those of its subsidiaries actually cause or contribute to adverse consequences for human rights, international humanitarian law, labour rights or the environment, the company is, in any event, obliged to stop these activities insofar as these negative consequences cannot be prevented or stopped by other means. If the activities of associated companies or entities in the company’s value chain actually cause or contribute to adverse human rights, international humanitarian law, labour rights or environmental consequences, the company is, in any event, required to terminate its participation in an associated company or its business relationship with a value chain entity in a responsible manner, if attempts to prevent and mitigate serious negative consequences are unsuccessful, if the negative consequences cannot be remedied, if there is no reasonable prospect of change or if the company or entity concerned does not take measures to prevent, mitigate and stop the negative consequences.” (Art. 8, §5)
519 “persons and groups of persons whose rights or interests may be affected by a breach by the company of its duty of vigilance, as well as organisations defending human rights, international humanitarian law, labour rights or environment, including, but not limited to, workers, unions, local communities, children, end users of company goods or services, civic associations, civil society organisations and company shareholders” (art. 2, 10°)
520 Engie didn’t comment on this in the opportunity to comment we sent to them.
521 Fluxys website: https://www.fluxys.com/fr/company/fluxys-group/about-fluxys
WHO PROFITS FROM WAR – HOW GAS CORPORATIONS CAPITALISE ON WAR IN UKRAINE 95
522 Greenpeace Belgium, Fluxys, l’entreprise gazière belge par excellence, en 10 chiffres-clé (2023) https://www.greenpeace. org/belgium/fr/blog/51612/fluxys-lentreprise-gaziere-belgepar-excellence-en-10-chiffres-cle/ In an opportunity to comment Fluxys specified “Fluxys investments are perfectly aligned with its strategy”. They specify their 24% acquisition of Open Grid Europe (OGE) - the biggest gas operator in Germany (ndlr) - as well as their additional share in the Trans Adriatic Pipeline (TAP) are particularly strategic. Regarding OGE, Fluxys commented : “Fluxys and OGE are frontrunners in decarbonisation solutions and as such are actively developing hydrogen and CO2 infrastructure connecting into hydrogen import and CO2 export projects”. Regarding the TAP, Fluxys commented : “TAP is pursuing opportunities to transport carbon neutral energy sources”. The company concluded : “In 2022, Fluxys Belgium approved its indicative investment programme for the period 2023-2032. The programme as a whole encompasses investments totalling over €2.8 billion. The estimated investments in the development of the hydrogen and CO2 infrastructure, the reduction of our own greenhouse gas emissions and other investments in sustainable economic activities amount to around 75% of that total.” Greenpeace is not analysing “estimated investments” which haven’t been acted. We also can’t fact-check a total percentage related to unspecified “sustainable economic activities”. For the investments in gas infrastructure OGE and TAP and unforeseeable decarbonisation plans, we are referring to our box “Locking us in using trojan horses” as a reply to this justification.
523 Bankwatch Network, Southern Gas Corridor https://bankwatch.org/project/southern-gas-corridor-euro-caspian-mega-pipeline
524 European Commission, Upgrade of the Liquefied Natural Gas (LNG) Terminal in Revithoussa https://ec.europa.eu/ competition/state_aid/cases/247194/247194_1517529_163_2. pdf and Global Energy Monitor, https://www.gem.wiki/Revithoussa_LNG_Terminal
525 Dow Corporate, Dow takes minority stake in consortium constructing LNG import terminal in Germany, diversifying European energy supply (2022) https://corporate.dow.com/ en-us/news/press-releases/dow-takes-minority-stake-in-consortium-constructing-lng-import-t.html
526 Hanseatic Energy Hub, First ramming for new import terminal in Stade (2023) https://www.hanseatic-energy-hub.de/ en/news/detail/erster-rammschlag-fuer-neues-importterminal-in-stade/
527 De Tijd, interview with Pascal De Buck (2022) https://www. tijd.be/ondernemen/chemie/geen-enkele-gasleiding-zal-overbodig-worden/10396700.html In an opportunity to comment Fluxys specified: “In the above-mentioned press articles Pascal De Buck stressed the need for infrastructure both in the phase-out period of natural gas, and, in the future, for transporting carbon-neutral molecules or CO2. As confirmed by different studies and market consultations, the demand in infrastructure for both hydrogen and CO2 is increasing rapidly. And the role of Fluxys is to ensure that this infrastructure is or will be available as solution for large-scale decarbonisation.” We are referring to our box “Locking us in using trojan horses” as a reply to this justification.
528 Ibidem.
529 In an opportunity to comment, Fluxys said it differentiated between “nameplate capacity” and “technical capacity”. The nameplate capacity (9 bcm/year) is the conversion into m³ gas of the maximum number of slots it can offer to the market over a long term (110 slots, which could be increased due to planning optimisation). It confirmed the installed technical capacity is 541 GWh/d (22.5 GWh/h), which covers the 110 slots as well as its own operational needs, flexibility services and redundancy. It is this technical capacity, also used by the GIE database, that we have used in our calculations for the utilisation rate, leading to a 22% utilisation rate in 2021, and 61% in 2022 for the Zeebrugge LNG terminal.
530 L’Echo interview with Pascal De Buck (2022) https://www. lecho.be/entreprises/energie/pascal-de-buck-ceo-de-fluxysla-crise-ukrainienne-a-montre-que-la-securite-d-approvisionnement-n-allait-pas-de-soi/10396656.html
531 Fluxys, TAP partnership press release (2023) https://www. fluxys.com/en/press-releases/fluxys-group/2023/230127_ press_trans_atlantic_partnership and De Tijd, interview with Pascal De Buck (2022) https://www.tijd.be/ondernemen/chemie/geen-enkele-gasleiding-zal-overbodig-worden/10396700. html
532 https://www.ipcc.ch/report/sixth-assessment-report-cycle/
533 https://www.greenpeace.org/aotearoa/story/ipcc-report-theworld-must-cut-emissions-and-urgently-adapt-to-the-newclimate-realities/
534 https://www.un.org/en/climatechange/fossil-fuels-are-deadend-warns-un-chief
535 https://www.fossilfreepolitics.org/
536 https://corporateeurope.org/sites/default/files/the_great_gas_ lock_in_english_.pdf
537 https://www.globalwitness.org/en/campaigns/oil-gas-andmining/pipe-down/
538 https://www.politico.eu/article/climate-change-report-un-antonio-guterres-demand-eu-us-new-target/
539 Regulation 2021/1119 of the European Parliament and of the Council of 30 June 2021, Art. 4
540 https://www.greenpeace.org/eu-unit/issues/climate-energy/46525/analysis-tackle-wasteful-consumption-now-to-alleviate-the-energy-crisis/
541 https://www.bruegel.org/sites/default/files/2022-09/PC%20 14%202022_2.pdf
542 https://ieefa.org/articles/over-half-europes-lng-infrastructure-assets-could-be-left-unused-2030
543 https://ember-climate.org/app/uploads/2022/03/EU-can-stopRussian-gas-imports-by-2025-1.pd
544 https://www.isi.fraunhofer.de/content/dam/isi/dokumente/ cce/2022/Report_Conversion_of_LNG_Terminals_for_Liquid_Hydrogen_or_Ammonia.pdf
545 Donaghy, T. 2019. Real Climate Leadership: Why The Next President Must Prioritize A Fossil Fuel Phase Out. Greenpeace USA, June. https://www.greenpeace.org/usa/reports/ fossil-fuel-phaseout/
96 WHO PROFITS FROM WAR – HOW GAS CORPORATIONS CAPITALISE ON WAR IN UKRAINE
546 https://www.bp.com/content/dam/bp/business-sites/en/ global/corporate/pdfs/energy-economics/statistical-review/ bp-stats-review-2022-approximate-conversion-factors.pdf
547 https://transparency.entsog.eu/#/map
548 https://alsi.gie.eu/
549 https://www.eia.gov/dnav/ng/NG_MOVE_EXPC_S1_M.htm
550 https://www.gem.wiki/Main_Page
551 https://globalenergymonitor.org/wp-content/uploads/2023/03/GEM-Europe-Gas-Tracker-Report-2023.pdf
552 https://www.gie.eu/transparency/
553 https://www.iea.org/reports/net-zero-by-2050
554 https://www.eia.gov/dnav/ng/ng_move_expc_s1_a.htm
555 https://www.eia.gov/naturalgas/importsexports/liquefactioncapacity/USliquefactioncapacity.xlsx
556 https://www.eia.gov/todayinenergy/detail.php?id=53719
557 Gathered from secondary sources such as https://www.gem. wiki/Main_Page
558 https://www.sierraclub.org/dirty-fuels/us-lng-export-tracker
559 https://cms.ferc.gov/media/north-american-lng-export-terminals-existing-approved-not-yet-built-and-proposed-8
560 https://www.maritime.dot.gov/ports/deepwater-ports-and-licensing/approved-applications
561 https://corporate.exxonmobil.com/news/news-releases/2023/0131_exxonmobil-announces-full-year-2022-results. https://reports.shell.com/annual-report/2022/consolidated-financial-statements/statement-of-income.html
https://totalenergies.com/system/files/documents/2023-02/ TotalEnergies_4Q22_Results.pdf
https://www.bp.com/content/dam/bp/business-sites/en/ global/corporate/pdfs/investors/bp-annual-report-and-form20f-2022.pdf.
https://www.chevron.com/-/media/chevron/stories/documents/4Q22-earnings-press-release.pdf
562 https://www.google.com/finance/?hl=en
563 https://www.sierraclub.org/dirty-fuels/us-lng-export-tracker
564 https://oilgaspolicytracker.org/
565 https://pubs.acs.org/doi/10.1021/acssuschemeng.1c03307
566 https://www.greenpeace.org/usa/reports/madness-is-themethod-how-cheniere-is-greenwashing-its-lng-with-newcargo-emissions-tags/
567 https://pubs.acs.org/doi/full/10.1021/acssuschemeng.2c04146
568 https://pubs.acs.org/doi/10.1021/acssuschemeng.2c05197
569 https://www.greenpeace.org/usa/reports/fossil-fuel-racism/
570 https://screeningtool.geoplatform.gov
571 https://www.epa.gov/ejscreen
572 https://www.epa.gov/energy/greenhouse-gas-equivalencies-calculator
573 https://www.irena.org/publications/2022/Jul/Renewable-Power-Generation-Costs-in-2021
WHO PROFITS FROM WAR – HOW GAS CORPORATIONS CAPITALISE ON WAR IN UKRAINE 97
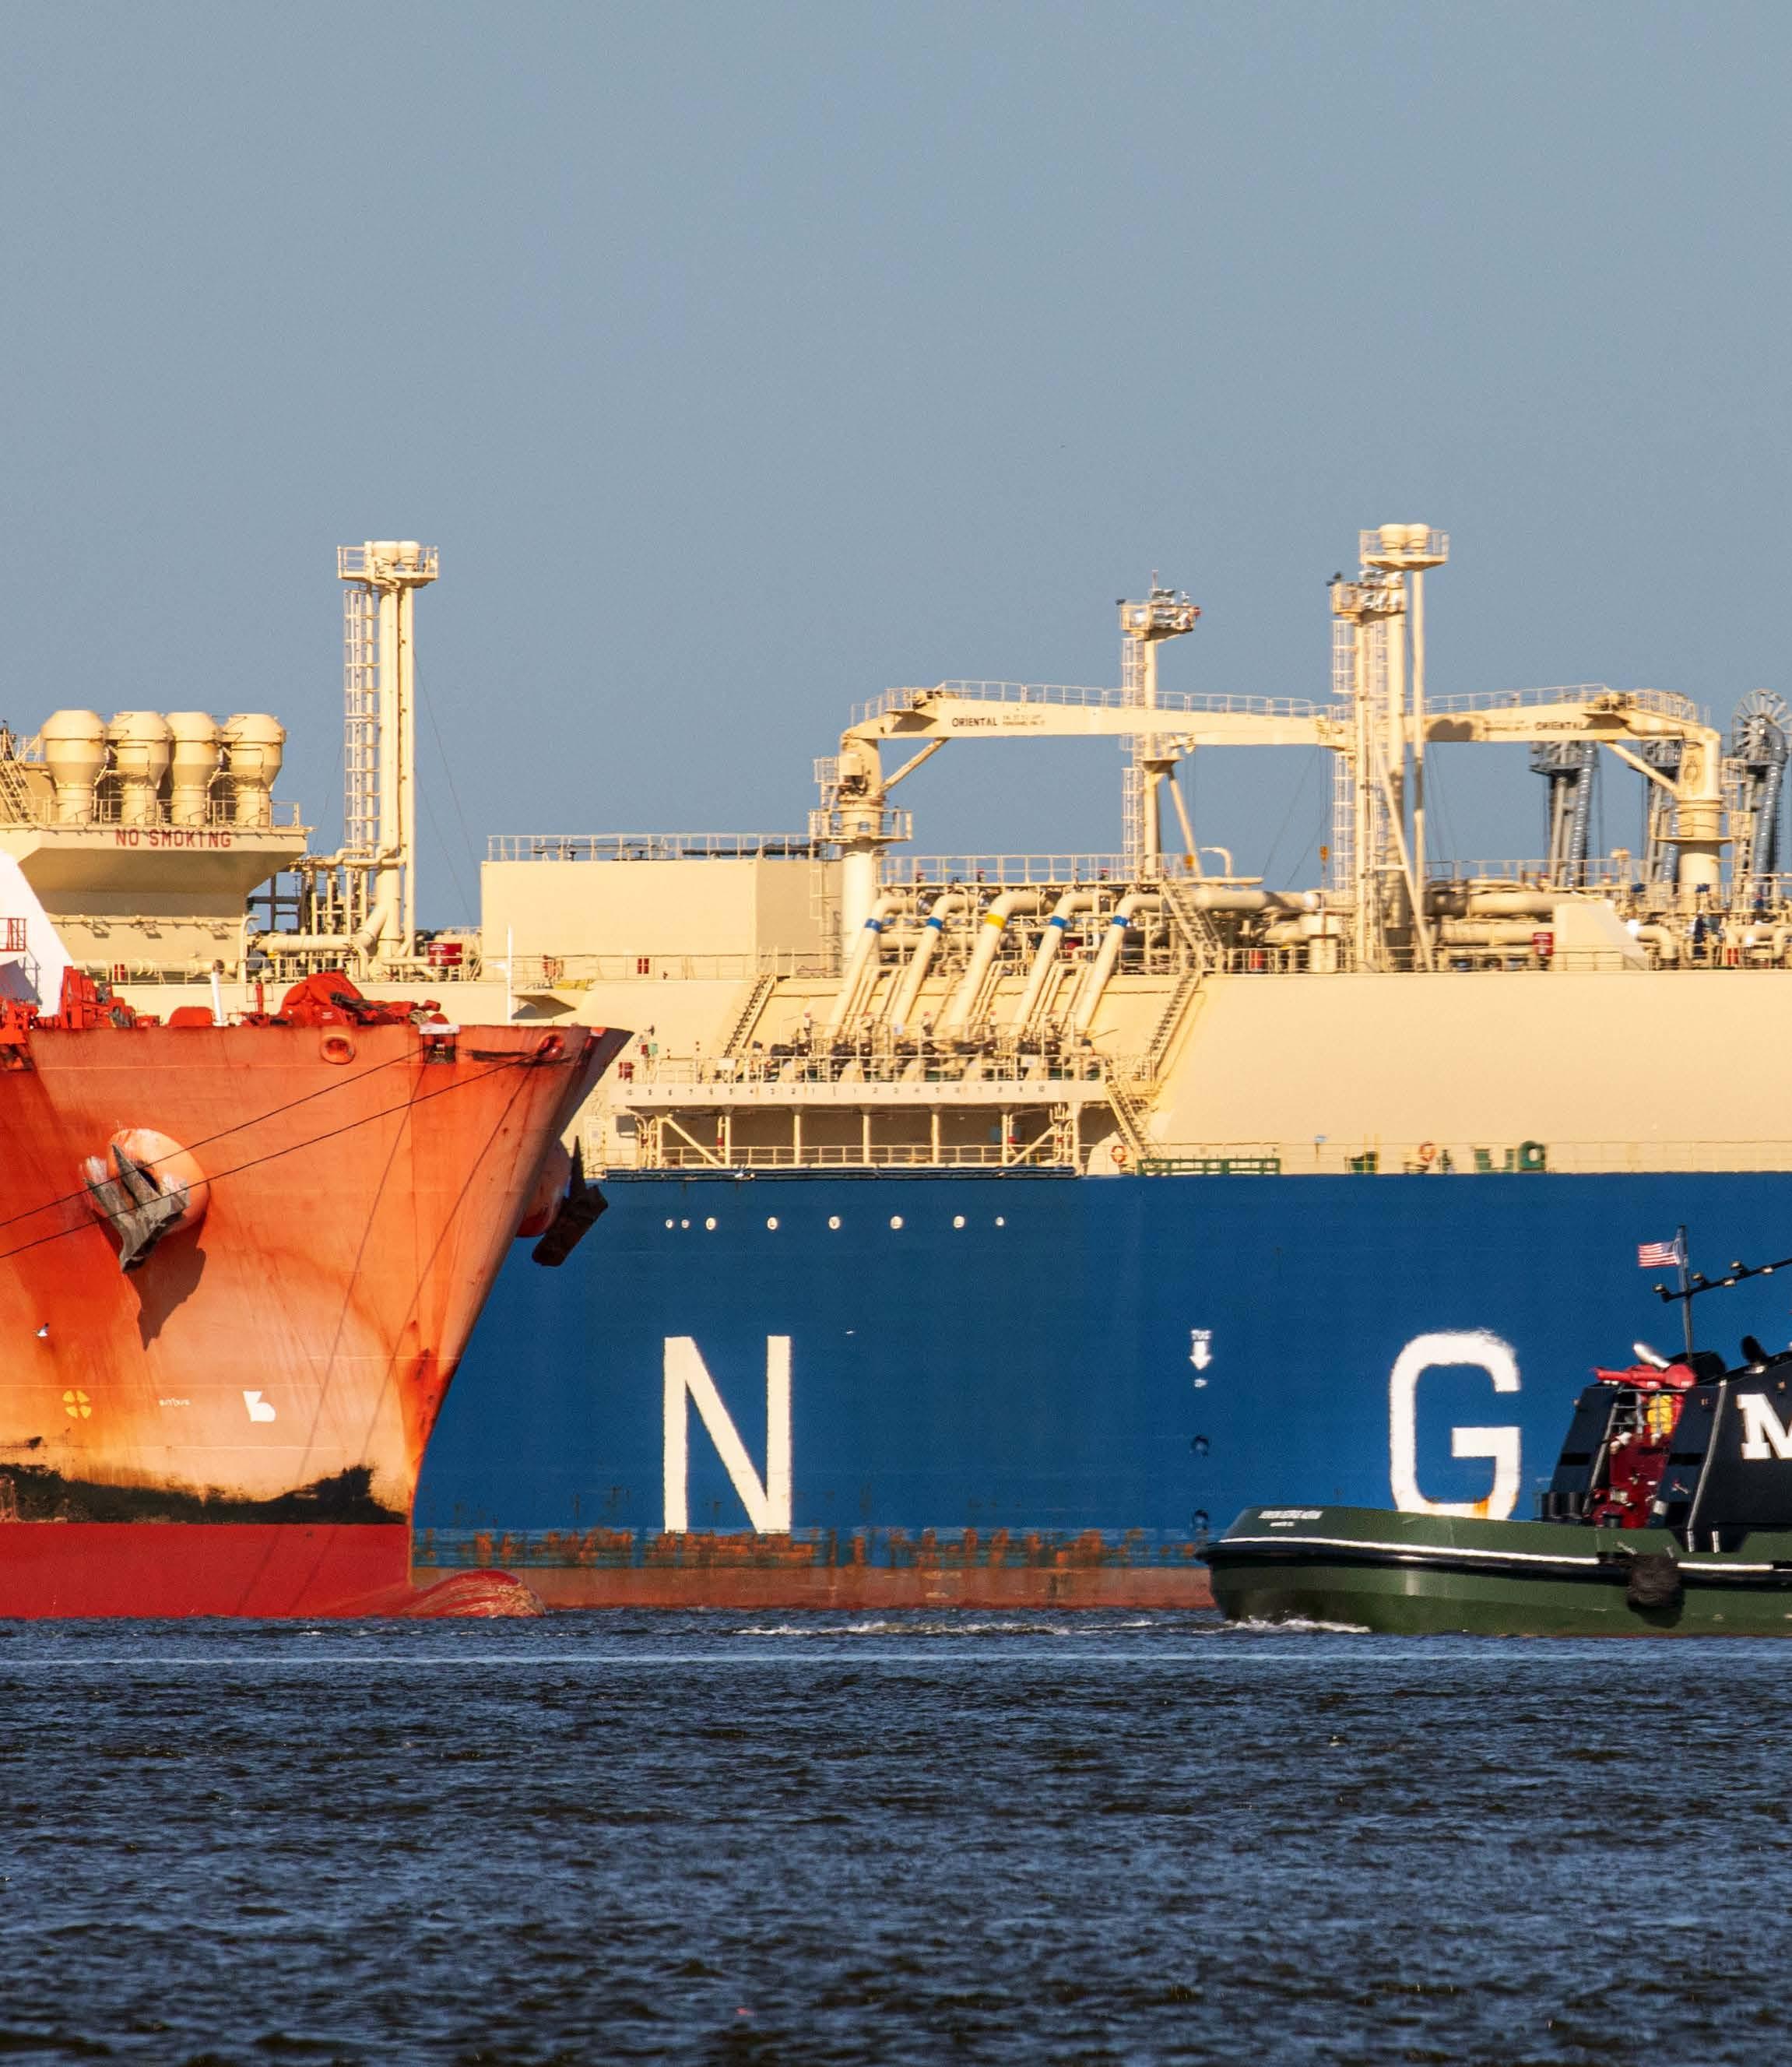 © Tim Aubry / Greenpeace

