Bankrolling ecosystem destruction The EU must stop the cash flow to businesses destroying nature

Published by Greenpeace International, Milieudefensie and Harvest and supported by 18 other organisations
a

Published by Greenpeace International, Milieudefensie and Harvest and supported by 18 other organisations
co-signed by…


Other organisations supporting this report: Finanzwende, Federación de Consumidores y Usuarios

a new report by a coalition of NGOs, Bankrolling ecosystem destruction, shows that 135 key actors in ecosystem risk sectors have received more than one-fifth of their total global credit since the 2015 Paris Agreement, and just under one-tenth of their current global investment, from EUbased1 financial institutions. The report lays out the importance of EU regulation of the financial sector to align finance with the global 1.5°C and biodiversity targets, including ending any new provision of financial services to groups that contribute to nature destruction.
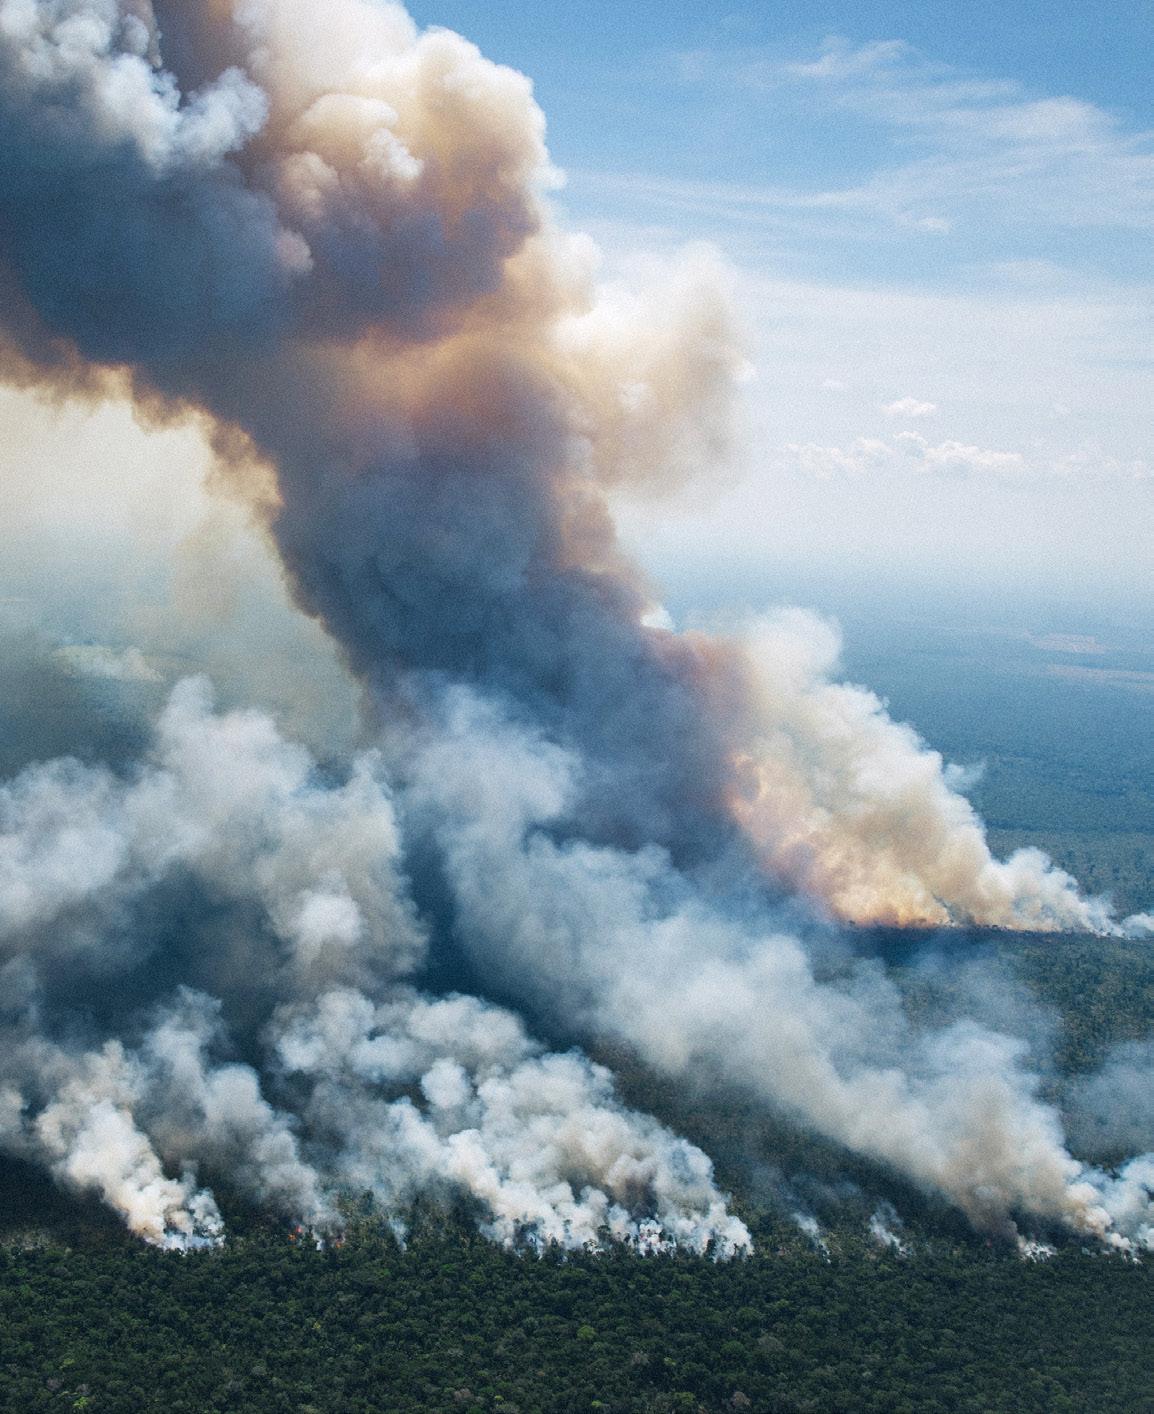
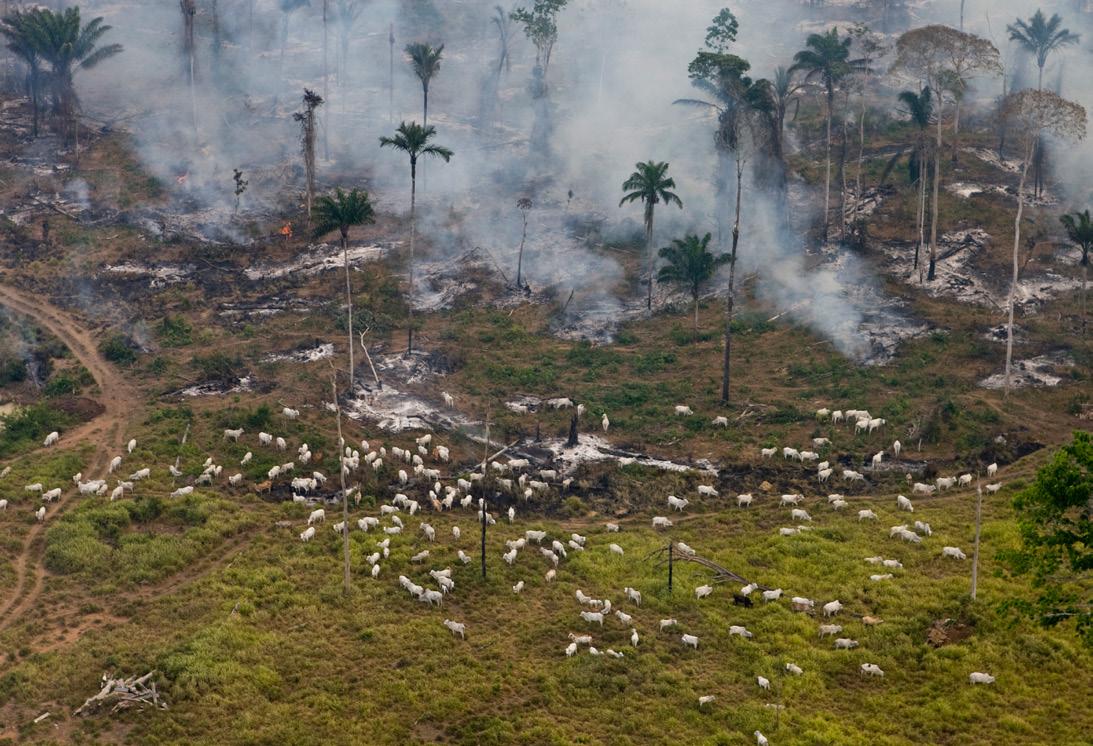
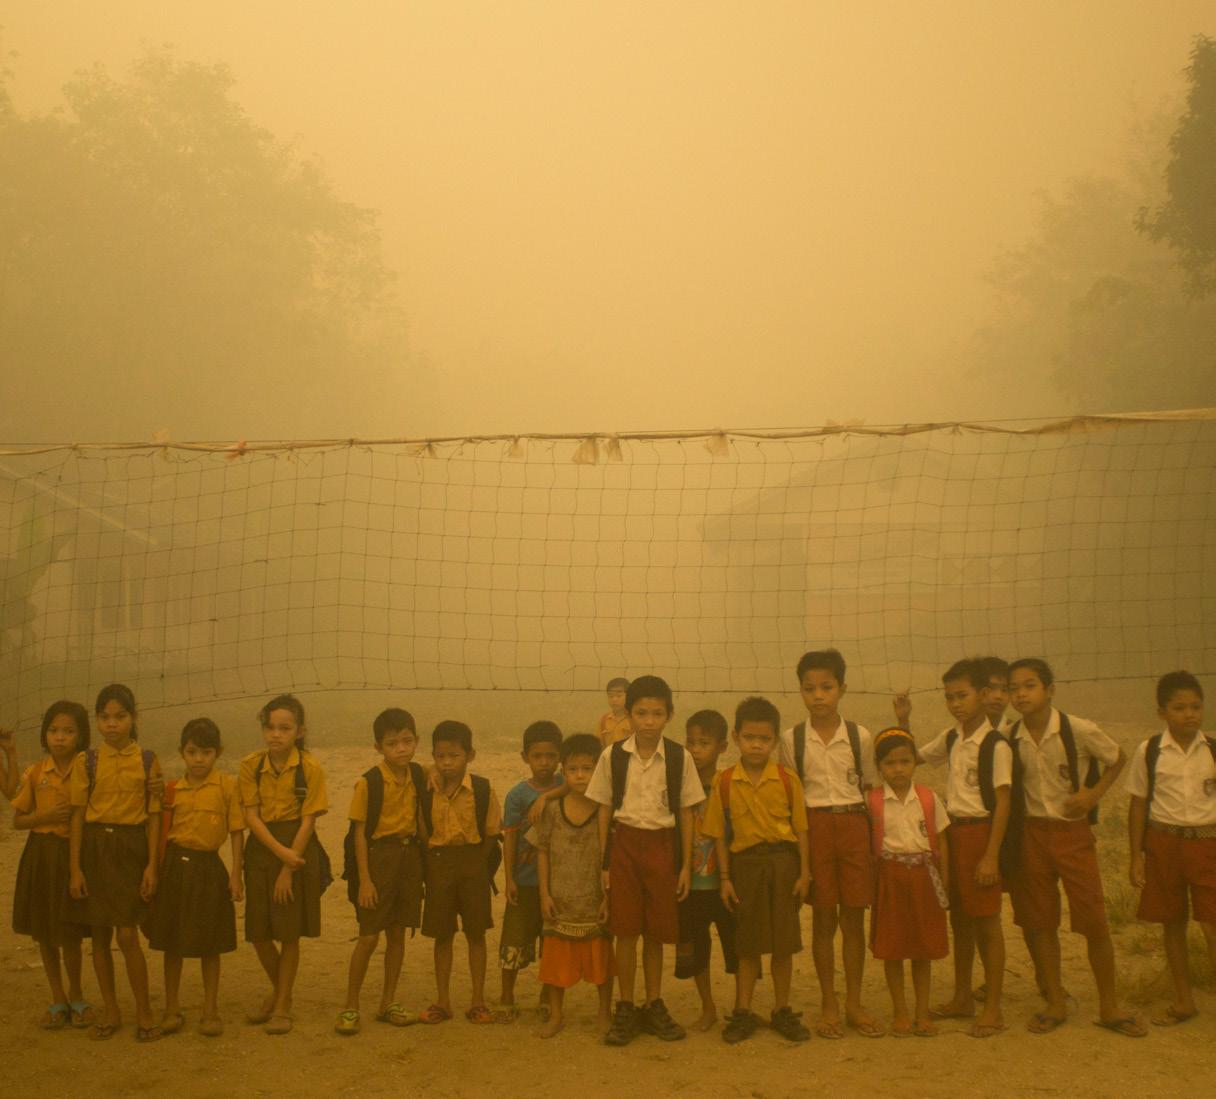
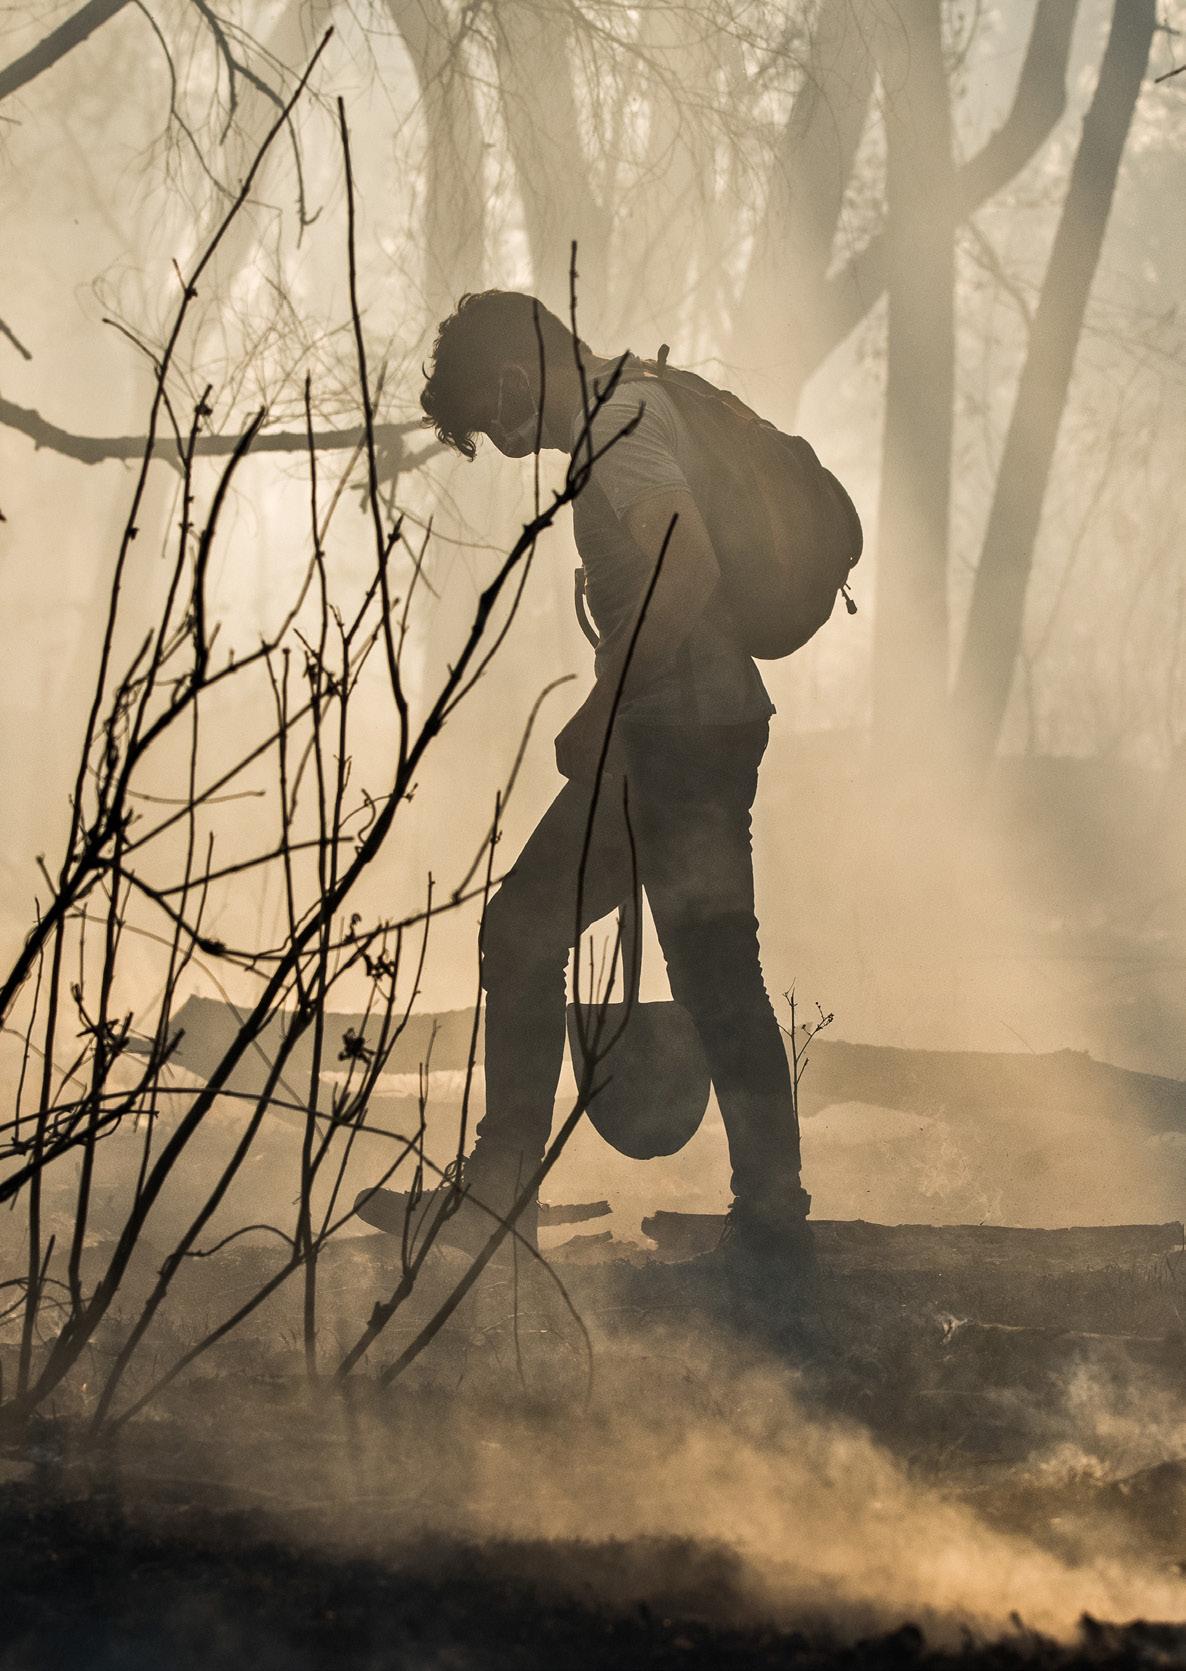
Six of the nine planetary boundaries that earth scientists have defined as needing to be respected in order to ensure a stable global environment have already been breached,2 causing interlinked crises – notably climate change, ecosystem collapse and biodiversity loss – with industrial agriculture3 and other land-use activities as key contributors. As these crises intensify around the world, people in the Southern hemisphere are experiencing extreme food and water shortages, while Indigenous communities fight the violation of their human rights. Industrial agriculture is not only a key driver of environmental destruction but is also pushing millions of small- and medium-scale farmers into destitution, and the situation is likely to get worse unless people and ecosystems are put before profits.
Through consumption of products from cleared and degraded land and through finance of companies profiting from this, the EU contributes to the destruction of forests and other ecosystems both within and outside its borders. A WWF report estimated that in 2017 EU consumption was responsible for 16% of tropical deforestation linked to international trade in agricultural commodities, totalling 203,000 hectares (ha) and emitting 116 million tonnes of CO2 4 Over the 12 years to 2017 the global deforestation footprint of EU imports was largely associated with soya and palm oil, followed by beef, wood plantation products and cocoa.5 The EU is not only a key market for these products but also the second-largest global financial hub bankrolling these activities. This report shows that EU financial institutions (FIs) provided a staggering 22.1% of total global credit between 2016 and early 2023 to key actors in ecosystem risk sectors, and currently continue to provide 9.4% of global investments.
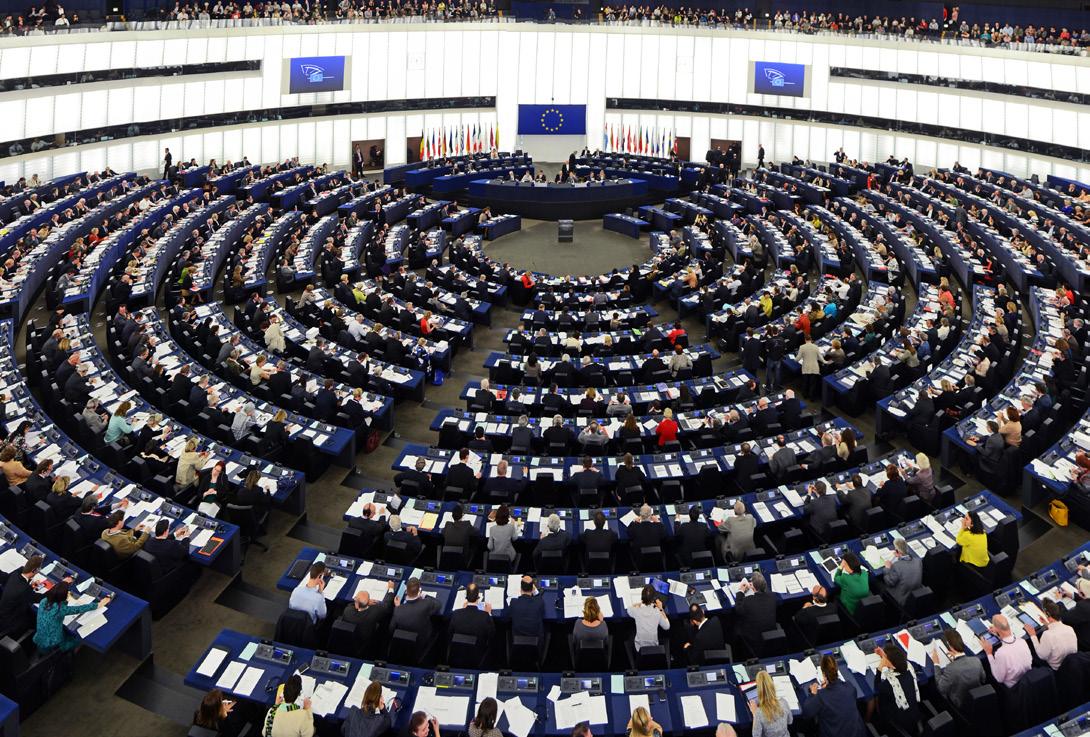
The EU Regulation on Deforestation-free products (EUDR),6 adopted in May 2023, is a first step towards meeting the EU’s global commitment to tackling deforestation and forest degradation and transforming its impact on ecosystems from being part of the problem – driving and profiting from destruction – to being part of the solution. The landmark legislation strategically uses the power of the single market to reduce the impact of EU consumption, by requiring companies to sell only deforestation-free and legally produced products within the EU.
However, the current legislation does not address the financial flows associated with ecosystem destruction, only physical products placed on the EU market. The EUDR requires the European Commission to review the role of finance in deforestation and – if necessary – come up with a legislative proposal before July 2025.7 This review represents a crucial opportunity to close the gap and regulate these financial flows. If this opportunity is missed, the EU will find itself in a paradoxical situation where its financial sector continues to enable – and profit from – the destructive activities of companies supplying global markets with products linked to ecosystem destruction, while the EUDR bars those products from sale in the EU.
The analysis in this report is based on a financial dataset compiled by the research institute Profundo, covering links between global FIs and major corporate players in agricultural commodities associated with deforestation risk, such as palm oil and soya; sectors using large inputs of such commodities to produce animal feed/aquafeed, or consuming large quantities of this feed; and timber and wood pulp.8 The analysis takes a group-level approach, treating finance to any part of a corporate group with major operations in ecosystem risk sectors as finance to the whole group.
1. The report finds that since the adoption of the Paris Climate Agreement in December 2015, well over $1 trillion ($1,257bn / €1,156bn9) in global credit has gone to major corporate groups operating in these ecosystem risk sectors, along with $693bn (€638bn) in current investment. The EU financial sector (including non-EU subsidiaries) provided 22.1% ($278bn / €256bn) of this credit, while EU FIs also hold 9.4% ($65bn / €60bn) of investment in the groups concerned.
2. More than four-fifths (86.6%) of the credit from EUbased FIs to major players in ecosystem risk sectors was provided by FIs based in four countries: France, the Netherlands, Germany and Spain.
3. All of the EU’s largest banks and many other EUbased FIs have relationships with many of the largest corporate groups in a range of sectors with recognised ecosystem risks, including groups with reported links to ecosystem destruction after 2020. The EU financial sector’s links to ecosystem risks are widespread and systemic.
The figures given in the report provide a conservative estimate of the true volume of financial flows from EUbased FIs to ecosystem risk sectors: the data covers only

a sample of large corporate groups, not whole sectors; it covers only certain types of finance; and it does not include finance from non-EU-based FIs operating in the EU. Opportunity to Comment (OTC) letters were sent to the profiled company groups and profiled FIs. Replies received and any feedback were considered in the finalisation of the report. These replies can be found here
The report profiles six corporate groups which are key players in one or more ecosystem risk sectors. These include:
• Bunge and Cargill, two of the world’s largest traders of multiple ecosystem risk commodities (soya, maize, cocoa, sugar etc, and derivatives such as animal feed);
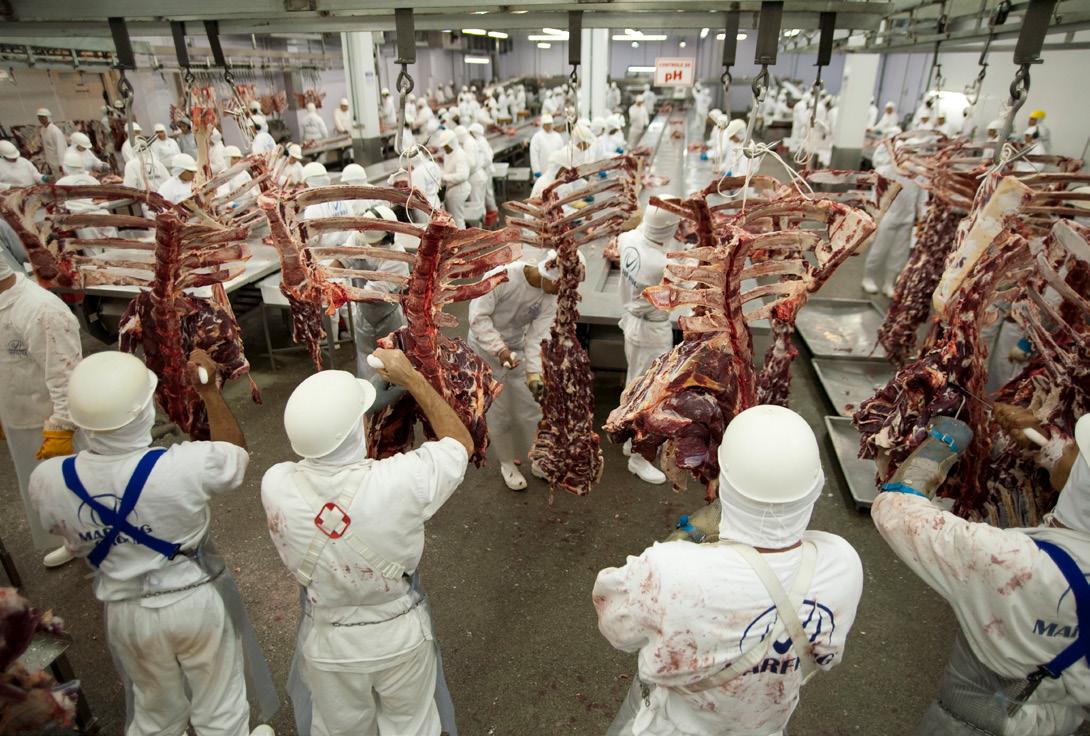
• JBS and Marfrig, two of the world’s largest meat producers;10 and
• Royal Golden Eagle (RGE) and Sinar Mas, globally significant producers and processors of palm oil and pulpwood.
All of these groups are widely reported to have direct or supply chain links to recent deforestation, primarily in South America and Southeast Asia, including after December 2020, the cut-off date set by the EUDR for the compliance of products with its deforestation-free standard.11 Collectively, these six groups have benefited from $26.5bn (€24.4bn) in credit from EU-based FIs since 2016, and $1.7bn (€1.6bn) in ongoing investments.
As an example of the scale of ecosystem risk linked to EU-based finance, real-time deforestation monitoring reports by AidEnvironment have identified possible supply chain links

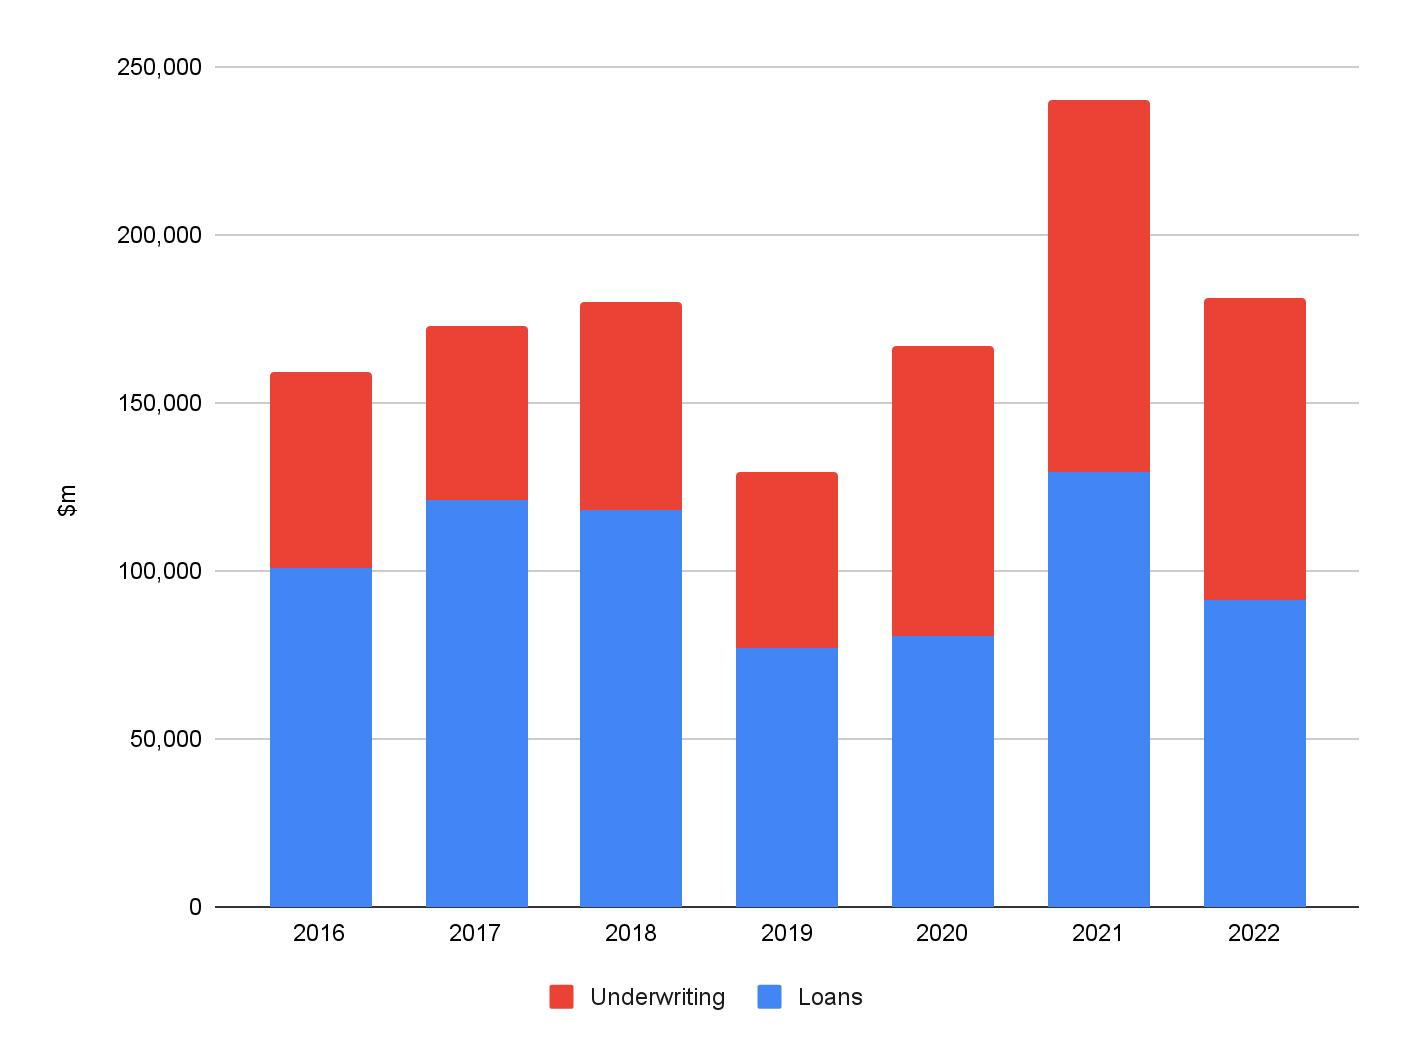
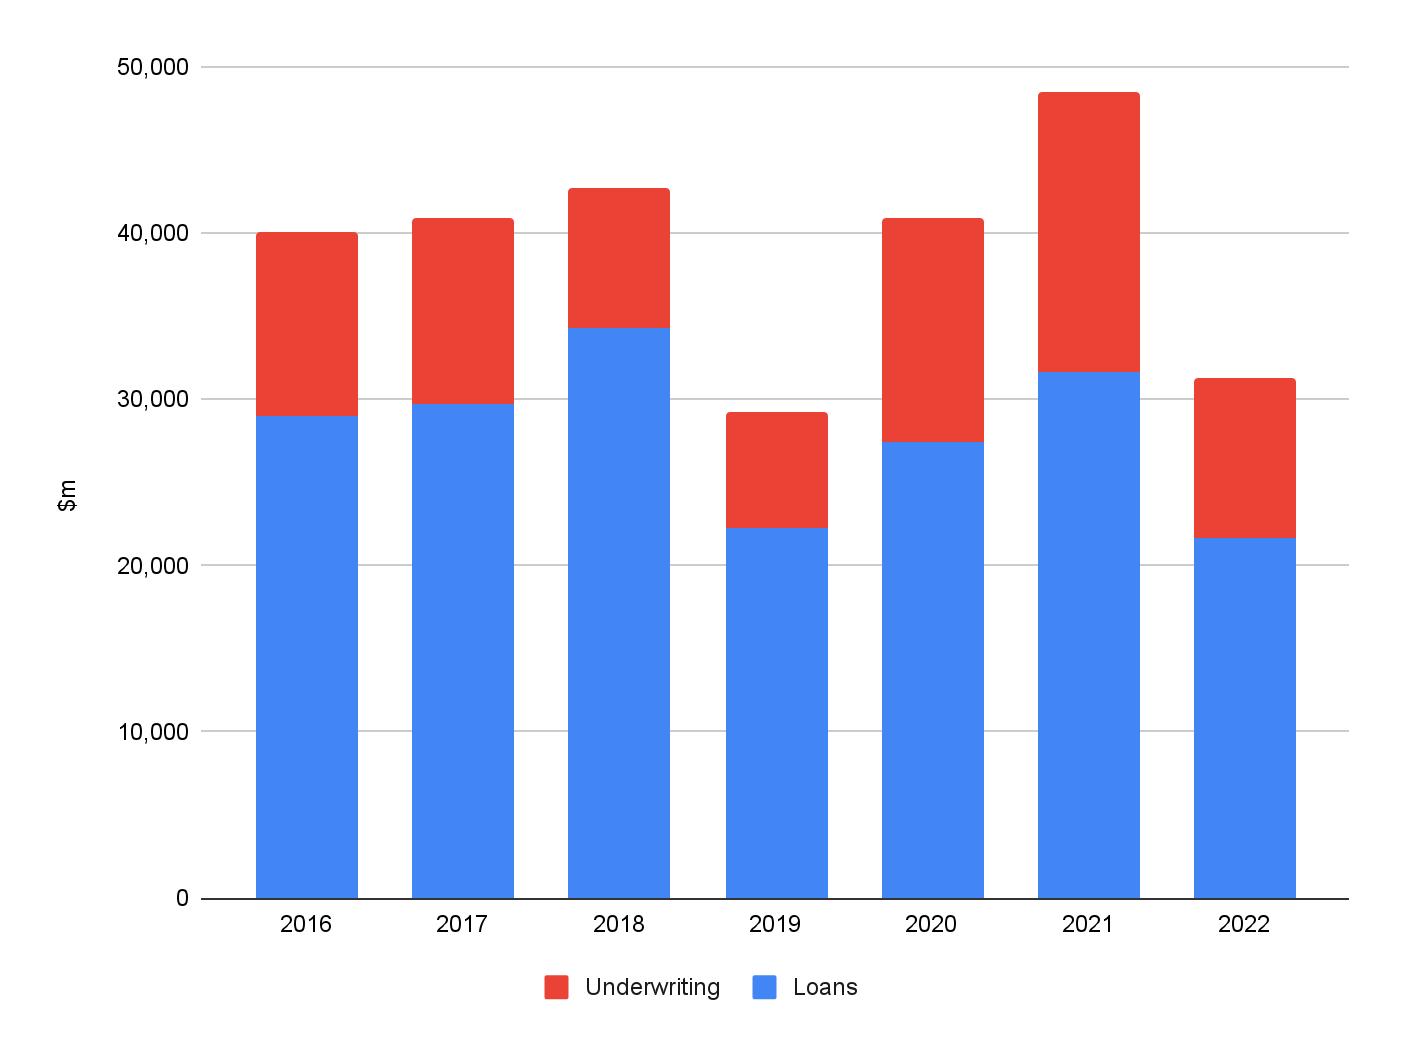
Credit from FIs based in the EU to profiled groups, over time
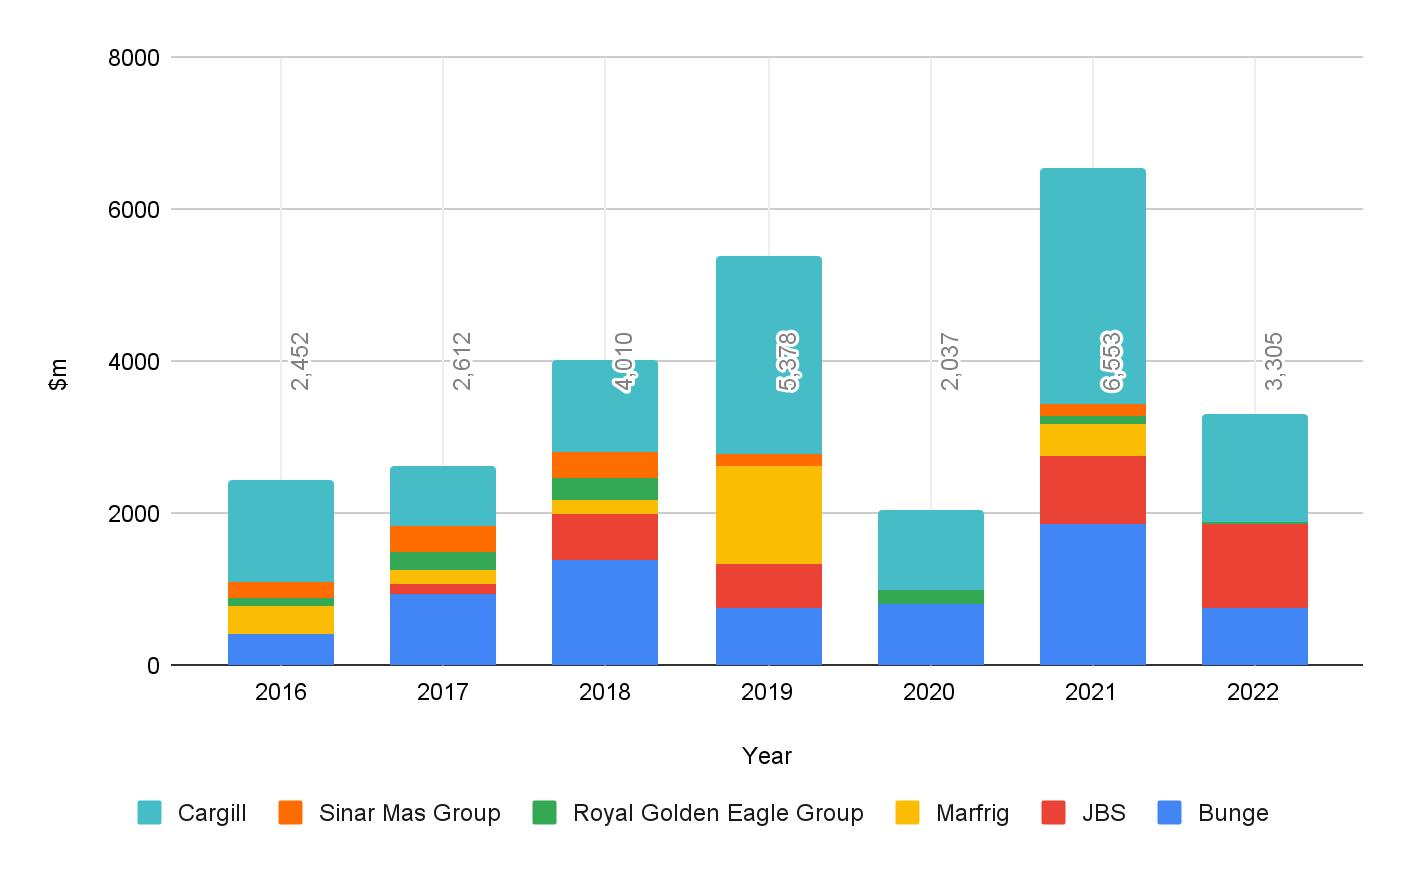
from four of these groups (Bunge, Cargill, JBS and Marfrig) to over 270,000 ha of deforestation in Brazil alone since the start of 2021.12
These findings suggest that existing voluntary undertakings by both FIs and commodity sector groups are failing to stop EU finance from contributing to ecosystem destruction. A historical analysis suggests that without regulation, finance to ecosystem risk sectors will not be reformed.
The EU should fully embrace its global leadership role, as new EU legislative measures for FIs are likely to be incorporated by the other European Economic Area states (Norway, Iceland, Liechtenstein) and possibly Switzerland, as well as having a potential impact on the UK. European countries outside the EU are also significant contributors to the financing of key players in ecosystem risk sectors, accounting for $160bn (€147bn) in credit since 2016 (12.7% of the global total) and $103bn (€94.8bn) in current investment (14.8% of the global total).
Taking these figures together with the EU totals, Europe as a whole accounts for more than a third of global FI credit since 2016 to major players in ecosystem risk sectors (33.8%) and almost a quarter of current global investment by FIs (24.2%) in these groups. EU rules therefore have a potential leverage effect on a large proportion of global finance.
The planned EUDR review relating to finance provides a critical opportunity to advance long-needed legislative action to prevent direct and indirect financial flows to ecosystem destruction.
The EU should introduce specific obligations for FIs to ensure that their financial flows do not contribute, directly or indirectly, to ecosystem conversion or degradation and related human rights abuses.
These obligations should also cover other financial services, such as insurance.
In particular, these obligations should prevent FIs from providing financial services to any groups whose activities pose a non-negligible risk of contributing to ecosystem destruction, so that these groups cannot benefit from the EU financial system.

At the COP28 climate summit in December 2023, the world’s governments emphasised the importance of ‘conserving, protecting and restoring nature and ecosystems’ and ‘halting and reversing deforestation and forest degradation by 2030’.13 This matches the existing commitment under the UN Convention on Biological Diversity (CBD) 2030 mission ‘to take urgent action to halt and reverse biodiversity loss to put nature on a path to recovery for the benefit of people and planet’.14 The CBD targets for 2030 include identifying and halting financial incentives, including subsidies, that drive biodiversity loss and scaling up incentives for conservation.15
EU governments have committed to these objectives and have a huge responsibility to protect ecosystems in the EU and globally. EU consumption is linked to the destruction and degradation of forests and other natural ecosystems worldwide. Multiple studies have identified land-use changes connected to expanding industrial agriculture (commodities such as soya and palm oil) and tree plantations as the most important drivers of permanent loss of native vegetation.16
A WWF report estimated that in 2017 EU consumption was responsible for 16% of tropical deforestation linked to international trade in agricultural commodities, totalling 203,000 ha and an estimated 116 million tonnes of CO2 emissions17 (close to the annual CO2 emissions of the Netherlands18).
The same report found that between 2005 and 2017 the EU’s deforestation footprint was largely attributable to soya and palm oil, followed by beef, wood plantation products and cocoa.19 A separate 2022 study estimated that around 35% of all commodity-driven deforestation is linked to international demand.20 The 2021 European Commission impact assessment document accompanying the EUDR proposal21 references a 2013 Commission-funded study that estimated the EU was responsible for 10% of total global embodied deforestation as of 2004, or 732,000 ha/year.22 Comparable data on conversion and degradation of natural ecosystems other than forests (peatlands, savannah etc) for commodity production is not available, although numerous reports have documented the EU as a market for commodities from such areas.23
The EU Regulation on Deforestation-free products (EUDR), adopted in May 2023,24 is a first step in addressing the EU’s contribution to ecosystem destruction and damage. It covers the import, sale and export of ‘commodities and products associated with deforestation and forest degradation’.25 The new law will apply to seven commodities – soya, palm oil, cattle, wood, cocoa, coffee and rubber – and products made with them, such as chocolate, tyres and wooden furniture.26 To sell these commodities and products in the EU, suppliers will have to show that they do not come from land where forest has been destroyed or degraded after 31 December 2020, and that they were produced legally.27 The law will apply to larger operators and traders from 30 December 2024.28 The regulation currently
aims to protect forests from EU consumption impact, while other wooded land and other land with high carbon stocks and with a high biodiversity value (which will presumably include savannahs, wetlands, peatlands, grasslands and mangroves) are to be considered in planned reviews of the EUDR.29
Crucially, the current legislation does not apply to financial flows linked to ecosystem destruction, only to physical products placed on the EU market, although finance was included in earlier discussions of the regulation by the European Parliament.30
The Corporate Sustainability Due Diligence Directive (CSDDD), on which the EU Council and Parliament have to give their green light after trilogue negotiations ended in December 2023,31 includes the financial sector, but only to a limited extent; it would require financial institutions (FIs) to conduct due diligence on their own operations and their upstream value chains (eg suppliers of office equipment), but not on the operations of their clients or investees.32
Two recent reviews by think tanks33 have found that other relevant existing and forthcoming EU regulations covering the financial sector34 do not effectively prevent financial flows from contributing to deforestation or other ecosystem destruction and damage, noting that there are no comprehensive environmental due diligence obligations for FIs and no particular regulatory measures in relation to deforestation and forest degradation. This means there is still no EU law to prevent financial institutions from bankrolling actors linked to ecosystem destruction.
The EUDR stipulates that the European Commission will conduct a review by 30 June 2025 that will evaluate the role of FIs in preventing financial flows that contribute to deforestation and forest degradation and assess the need to provide for specific legal obligations for FIs. 35 This review offers a key opportunity for the EU to act to prevent its financial sector from continuing to profit from the climate and biodiversity crises and the human and societal costs that come with them. This issue is not new: as early as 2003 the European Commission wrote in the FLEGT Action Plan, in relation to the forestry sector: ‘Financing and investment safeguards: Banks and financial institutions which invest in the forest sector should be encouraged to develop due diligence procedures which take account of the environmental and social impact of forest sector lending.’36 The lack of regulations covering financial flows to companies engaging in ecosystem destruction and damage is at odds with the overall environmental and human rights objectives the EU is pursuing. This gap must be plugged, or the EU risks finding itself in a paradoxical situation where its financial sector continues funding the destructive activities of companies supplying global markets with commodities and products linked to ecosystem destruction, while these same products cannot be sold in the EU.
The preamble to the EUDR recognises the severe problem of deforestation: ‘The Food and Agriculture Organization of the United Nations (FAO) estimates that 420 million hectares of forest – about 10% of the world’s remaining forests, equalling an area larger than the European Union – have been lost worldwide between 1990 and 2020. … Yet, every year the world continues to lose 10 million hectares of forest.’ It also acknowledges deforestation’s role in driving the climate and biodiversity crises.37
Meanwhile, around $5 trillion (€4.6 trillion) of global private sector finance flows annually to activities with a direct negative impact on nature, according to a recent UN Environment Programme report.38 This includes finance for fossil fuels, construction, and forest and agricultural commodities, among other sectors.39 This total dwarfs the $200bn (€184bn) of (primarily public sector) finance annually funding nature-based solutions to the climate and biodiversity crises.40
As an example of the scale of ecosystem risk linked to EU-based finance, real-time deforestation monitoring reports by AidEnvironment have found possible supply chain links from four of the six corporate groups profiled in this report (Bunge, Cargill, JBS and Marfrig) to over 270,000 ha of deforestation in Brazil alone – an area slightly larger than Luxembourg41 – which took place after the EUDR deforestation cut-off date of 31 December 202042 (see the section ‘EU finance links to specific ecosystem destruction’). The financial analysis for this report identified that these four corporate groups have received over $9.7bn (€8.9bn) in credit from EU-based FIs over the period January 2021 to March 2023.
A recent review of literature relating to the EU’s 20 largest banks found NGO reports linking recipients of finance with deforestation for 17 of the 20 banks,43 demonstrating that the problem is systemic; most large FIs are at risk of contributing to ecosystem destruction.
Reports have suggested that some FIs are failing to carry out due diligence to exclude very high-risk clients with reported links to deforestation from receiving finance. In 2020, the NGO Earthsight published a high-profile report on cattle ranchers clearing thousands of hectares of forest and illegally grabbing Indigenous land in the Gran Chaco forest in Paraguay during 2018–2019, to supply international demand for beef and leather.44 The report accused two large meat-packing companies, Minerva and Frigorífico Concepción, of purchasing cattle from the illegally cleared areas.45 Following up on the Earthsight investigation, in 2023 Global Witness looked into the financing of these companies and reported that major FIs including Spanish-based bank Santander, HSBC (UK) and JP Morgan (US) had increased their shareholdings in or provided financial services to one or other of the two meat-packing companies in the period since the initial investigation;46 for example, Bank of America underwrote a $285m (€262m) bond issuance to Frigorifico Concepción in June 2021,47 despite the fact that the findings in Earthsight’s report were available in the public domain at the time.
Financial flows to ecosystem destruction are not limited to the large corporate groups the current analysis focuses on. For example, a November 2023 investigation by Dutch newspaper Het Financieele Dagblad reported that Netherlands-based Rabobank had made loans to 326 farmers in Brazil who are under embargo by the federal environment agency IBAMA for a total of 84,000 ha of illegal deforestation in the Amazon and Cerrado biomes.48
The EU is aware of the shortcomings of the current EUDR, and the regulation includes provisions for review. By 30 June 2025, the European Commission is due to present an impact assessment addressing ‘the role of financial institutions in preventing financial flows contributing directly or indirectly to deforestation and forest degradation’49 and assessing the need to provide for specific legal obligations for FIs.
This offers a crucial opportunity for legislative action to stop the EU financial sector from contributing to forest and ecosystem destruction for commodities – a demand already made by the European Parliament,50 parts of the financial sector itself,51 220 NGOs52 and almost 1.2 million Europeans who took part in the European Commission’s online consultation in 2020.53
The Commission has hired consultants to gather and analyse evidence and deliver the assessment. This report offers a contribution to this process with:
• a proposed definition of ecosystem risk finance;
• an analysis of financial flows from EU-based FIs to major corporate players in sectors carrying a risk of contributing directly or indirectly to the conversion or degradation of natural ecosystems (‘ecosystem risk sectors’); and
• preliminary suggestions on how to address the impacts of the financial sector when legislating on ecosystem risk, with regard to group-level responsibility and the type of due diligence required.
The EUDR takes a risk-based approach to assessing specific commodities’ and products’ links to forest destruction and degradation, with products carrying ‘non-negligible risk’ barred from the market.54 This is significant as it requires actors to carry out due diligence and prove compliance before products can be placed on the market, and it means products face exclusion from the market even if they carry only a risk of, rather than a proven link to, deforestation or forest degradation. This is much more stringent than due diligence approaches merely requiring disclosure of assessed risks and monitoring or engagement with suppliers.
Coupled with the EUDR’s review provisions regarding financial flows and non-forest ecosystems, this riskbased approach provides a framework for extending the regulation’s focus to cover ecosystem risk finance.
This is defined here as ‘financial flows which carry a non-negligible risk of contributing directly or indirectly to the conversion or degradation of natural ecosystems by financing actors involved in sectors and activities associated with such conversion and degradation’
The EU should complement the EUDR with an additional regulatory framework to address ecosystem risk finance, defined as above, and bar FIs from providing such finance, making them liable for violations.
This initiative would also serve the broader conservation aims of the CBD, including the specific target calling for financial institutions to ‘reduce negative impacts on biodiversity’55 and the goal of ‘aligning financial flows with the Kunming-Montreal Global Biodiversity Framework and the 2050 Vision for biodiversity’.56
With 24 of the world’s 100 largest banks based in the EU, it is a major player in global finance.57 This report examines how these and other EU-based FIs lend to, underwrite securities issuances for and invest in the activities of global corporate groups active in ecosystem risk sectors (including companies with reported links to specific recent deforestation), and assesses the global significance of the EU in financing these sectors.
The research is based on a financial dataset compiled by Profundo (‘the dataset’), covering links between global FIs and major corporate players in agricultural commodities associated with deforestation risk; sectors using large inputs of such commodities to produce animal feed/aquafeed, or consuming large quantities of such feed; and timber and wood pulp.
This report aims to estimate the relative significance of ecosystem risk finance from EU-based FIs to the industrial agriculture and forestry sectors. It covers the latest-reported investments and credit provided since 2016, roughly including credit provided since the Paris Climate Agreement was adopted in December 2015.58
FIs based in the EU have collectively provided $278bn (€256bn) of credit to major corporate players in ecosystem risk sectors since 2016 and are responsible for $65bn (€60bn) of current investment, accounting for 22.1% of the global credit and 9.4% of global investment in these sectors.
All of the 24 EU-based FIs featuring among the world’s largest 100 banks appear in the dataset, providing credit to or investing in corporate groups active in ecosystem risk sectors. This shows that financing ecosystem risk sectors is systemic to the EU financial sector; regulation is needed to stop this finance contributing to further destruction.
This report provides a snapshot of the significance of EU-based FIs in areas for which data was available. The EUDR review does not specify which types of finance or institutions could potentially be covered by future revisions of the EUDR or follow-up legislation.
Inclusion of corporate groups active in ecosystem risk sectors in this report, and of finance to these groups, does not imply that all of the corporate groups covered are contributing to ecosystem destruction. Inclusion indicates that some of the sectors in which these groups operate are associated with ecosystem risk and therefore should be subject to additional due diligence.
Some of the corporate groups and FIs covered have sustainability or other policies in place relating to the risks associated with these sectors; the report does not attempt to assess such policies. Global Canopy’s 2023 Forest 500 report found that 40% of the 500 companies and FIs with the most exposure to tropical deforestation have yet to set a single
policy on deforestation.59 Moreover, the existence of a policy is not sufficient in itself to indicate an absence of risk, hence the need for regulations that can hold commodity sector actors and FIs to account.
The current EUDR rules on products and commodities require assessment of individual consignments of goods. This approach is not transferable to the provision of financial services, which usually relate to projects, companies or other actors rather than batches of products. This means a new approach is required for finance.
Assessing how finance is linked to ecosystem risk requires consideration of the nature of the finance and of the recipient. A regulation covering only project finance linked to specific ecosystem risks would not capture most of the financial flows to ecosystem risk sectors. The majority of the finance identified in research for this report was provided at the corporate group level, particularly among multi-sector conglomerates (see ‘Methodology’ and Annex C). A group-level responsibility approach applied to both corporate groups receiving finance and FIs operating in the EU is necessary to address this reality. Finance to large corporate groups is fungible:
• General finance can be transferred within a company or between companies in the same group, to parent companies, subsidiaries, affiliated companies etc.
• Project-specific finance effectively supports the whole group, by freeing up general finance for other operations.
• Finance is cross-border and goes beyond specific jurisdictions and commodities, via conglomerate groups and integrated value chains – see the Cargill case study.
• Finance may go beyond formal acknowledged corporate group structures, for example to ‘shadow’ companies with the same beneficial owner – see the RGE case study.
These factors mean that to address the dangers of ecosystem risk finance effectively, a group-level approach is required, in which finance to one part of a group is treated as finance to the whole group.
An example of how finance spreads through groups can be seen in a 2017 Reuters investigation which reported that banks with pledges to divest from coal were still financing an energy company building a coal-fired power plant in Poland. An anonymous banking source was quoted as saying ‘Banks agree to provide financing for energy groups only on condition that it will be spent on distribution networks or renewables. But this helps the energy companies to find money for the coal projects.’60
Group-level responsibility means applying rules consistently to the whole of a corporate group, not just to the particular company or project in receipt of finance. This is necessary to capture finance to ecosystem risk sectors
effectively, particularly when large actors in commodity sectors are considered. This means that before providing financial services to, or investing in, any part of a complex group with significant activities in ecosystem risk sectors, FIs are under an obligation to undertake group-wide due diligence. Not only clients whose own direct operations entail a non-negligible risk of ecosystem conversion or degradation, but also clients whose fellow group members are carrying out operations entailing such a risk should be excluded from receiving finance.
Groups may go beyond legal ownership structures. This is acknowledged in the definition of ‘corporate group’ developed by the Accountability Framework initiative (AFi): ‘The totality of legal entities to which the company is affiliated in a relationship in which either party controls the actions or performance of the other’.61 A group may obscure its beneficial ownership of subsidiaries by means of opaque structures involving offshore secrecy jurisdictions, shell companies, nominee shareholders and/or power of attorney agreements. Financial or operational arrangements, such as loans, exclusive supply agreements or contracts to run a facility, may also allow control to be exerted, formally or informally, over a company’s operations without actual ownership. A corporate control due diligence methodology developed by a Greenpeace-led coalition addresses how to implement the AFi definition.62 The Financial Action Task Force (FATF), the money laundering and terrorist financing watchdog of which many EU countries are members,63 also calls for countries and FIs to monitor concealed beneficial ownership by clients.64 FIs carrying out due diligence on their clients need to capture suspected ‘shadow companies’ outside legal or declared group ownership structures. Lack of transparency around group control should be viewed as a red flag for ecosystem risk finance.
Some elements of group-level responsibility are already established in EU law, particularly responsibility along supply chains and between parent and subsidiary. The EU’s agreement on the Corporate Sustainability Due Diligence Directive (CSDDD)65 creates a corporate due diligence duty requiring larger companies to identify, prevent and mitigate negative human rights and environmental impacts, both in their group’s operations – including those of subsidiaries –and in their supply or value chains.66
Here are two hypothetical examples of what group-level responsibility would mean for corporate groups receiving finance from EU-based financial institutions:
1. An EU-based chocolate producer with a subsidiary that produces and sells in the US would have to prove compliance with EU ecosystem risk rules for the commodities used in its US production (as well as its EU
production) in order to receive finance from an EU-based FI. The production takes place outside the EU, by an entity other than the one receiving finance. However, any risk affecting the activity of the US-based subsidiary must be considered as part of the risk profile of the EU-based parent company. The EU-based FI would therefore have a duty to assess such risk.
2. A loan from a Dutch bank to a Dutch subsidiary of a Brazilian beef producer with links to deforestation would amount to ecosystem risk finance, even if this Dutch subsidiary exclusively produces vegan burgers in the EU and the relevant products it uses (eg soya or palm oil) are compliant with EU ecosystem risk rules. The Dutch subsidiary directly in receipt of finance may not represent an ecosystem risk, but the group to which it belongs carries significant ecosystem risk and would benefit indirectly from the finance provided.
The approach used in this report also applies group-level responsibility to FIs for compliance with EU ecosystem risk finance rules. This means that EU-based FIs should apply EU rules on ecosystem risk finance to all of their operations globally, including those of any parent companies and subsidiaries based outside the EU.
This is in line with the agreement on the CSDDD, which includes non-EU companies active in the EU market,67 as does the Corporate Sustainability Reporting Directive (CSRD), which requires larger subsidiaries or branches of non-EU groups operating in the EU to report on the entire group’s sustainability.68
Here are two hypothetical examples of what grouplevel responsibility with respect to EU rules would mean when applied to FIs:
1. A banking group with headquarters in Singapore and subsidiaries based and operating in France would be responsible for ensuring that it carried on business in compliance with EU ecosystem risk finance rules.
2. A Hong Kong subsidiary of an EU-based bank that intends to provide finance to a Chinese furniture maker buying timber from Indonesia for the Chinese market would have to check that this beneficiary could prove the compliance of the timber with EU ecosystem risk rules prior to making any finance available. Even if the product is not to be used in the EU and the finance is not to be sourced in the EU, the EU-based FI would have to ensure that its Hong Kong subsidiary complied with EU rules on ecosystem risk finance.
1. Direct contribution to ecosystem damage:
a. Project-specific finance to a destructive operation, eg a loan to finance a palm oil mill on a plantation carrying out deforestation.
b. General finance to a specific actor with destructive operations, eg underwriting a bond issue by a palm oil company that owns plantations carrying out deforestation.
2. Indirect contribution to ecosystem damage: Finance to any part of a group that includes entities engaged in destructive operations, eg a loan to a construction company that is part of a corporate group including palm oil companies carrying out deforestation.
3. Direct risk of ecosystem damage: Project-specific or general finance to an actor in an ecosystem risk sector, eg a revolving credit facility to a company operating a palm oil refinery. The company operating the refinery should be required to prove compliance with EU ecosystem risk rules for all its raw materials.
4. Indirect risk of ecosystem damage: Finance to any part of a group with operations in ecosystem risk commodities and/or jurisdictions, eg investment in a European real estate subsidiary of a group that owns a palm oil refinery. The parent group should be required to prove compliance with EU ecosystem risk rules for all its raw materials.
Land-use change connected to expanding commodity agriculture and tree plantations is the most important driver of deforestation. This land conversion is centred in tropical forests in Southeast Asia and South America, while the main commodity-related risk to temperate and boreal (northern) forests is logging.69 The World Resources Institute (WRI) found that from 2002 to 2022 Brazil had the highest area of primary tropical forest loss, followed by Indonesia and the Democratic Republic of the Congo.70 Cattle, oil palm and soya have been identified as having replaced the most forest between 2001 and 2015.71 Around 35% of commoditydriven deforestation is linked to international demand, although the proportion varies significantly for different commodities, with a much larger proportion of palm oil, soya and cash crops such as coffee, cocoa and rubber destined for international trade than is the case for beef or cereals.72
A 2020 analysis by WWF found that after the commodities covered by the current EUDR, the next most significant drivers of deforestation linked to EU consumption between 2005 and 2017 were rapeseed, maize and sugar.73 The analysis in this report includes maize and sugar in its scope, in line with the planned EUDR review which will assess the need for and feasibility of extending the EUDR to cover ‘further commodities, including maize … as indicated by scientific evidence’.74
Finance from the EU financial sector contributes to commodity production and trade linked to ecosystem destruction even when the physical products never reach the EU. For example, a Trase report found that transnational commodity trader Cargill (see profile and case study) is estimated to have links through its supply chain to over 15,000 ha of deforestation and other ecosystem conversion for soya cultivation in Bolivia in 2021 alone,75 with almost all of the production destined for South American markets.76 The analysis for this report revealed that Cargill has received $11.5bn (€10.6bn) in credit since 2016 and benefits from $195m (€179m) in current investment from EU-based FIs. Regulating ecosystem risk finance offers a chance to reach this type of activity, where regulation of physical imports to the EU cannot. Future analysis may identify additional commodities with significant ecosystem risk globally that are not currently considered in EU legislation but to whose production EU finance nevertheless contributes.
Converting land from natural ecosystems such as forest to agriculture, and setting up infrastructure to transport and process the commodities produced, requires finance. Often, this takes the form of loans or the issuance of securities (shares and bonds), with the consequent involvement of FIs. A case in point is the plan of Brazilian meat giant JBS (see profile and case study) to pursue a listing on the New York Stock Exchange (NYSE), which would give it the opportunity to fundraise through issuing shares in the future.77 While the
current EUDR aims to block commodities and products linked to ecosystem destruction from the EU market, regulating finance offers a chance to stop destruction before it happens, by stopping the flow of finance to commodity sector actors with inadequate systems to prevent deforestation and ecosystem conversion.
Beyond immediate expansion of land use for specific commodities, indirect land-use change occurs when demand for a commodity expands due to new uses or markets for it, such as using oilseed crops to produce biodiesel. This displaces other demand (eg oilseeds for animal feed) onto substitute commodities, thereby creating pressure to expand production of the substitute commodities, leading to additional land use and knock-on effects for ecosystems without a direct link to the original commodity. Indirect land-use change is very hard to quantify and may be best addressed as part of overall land conversion for agriculture.
An additional problem is leakage. By focusing on forests alone, the current EUDR does not directly address the pressure EU consumption places on other natural ecosystems. This carries the risk of displacing land conversion: if forests become less appealing for conversion due to exclusion of deforestation-linked products from EU markets, while demand for land remains the same, pressure on other ecosystems not protected by the current EUDR is likely to increase. Another form of leakage occurs when rules cover supply only to particular markets, such as the EU, which allows global commodity sector actors to supply ‘clean’ products to regulated markets while continuing to profit from ecosystem destruction by diverting ‘dirty’ products to other markets. This problem has been documented in the palm oil industry for a number of years.78 At present, FIs operating in the EU can continue to finance both these forms of leakage.
The current EUDR does not affect most of these types of activities or their associated impacts. Revising the EUDR to include non-forest ecosystems and to encompass the financial sector – or developing a new finance regulation –would give the EU a chance to take a globally leading position and reform its financial system so as to reduce ecosystem destruction beyond that caused by direct EU consumption.
Depending on the commodity, primary producers can be small- and medium-scale farmers or large-scale agribusinesses. For primary producers, it is usually only feasible to identify direct links from large agribusinesses to FIs. Further downstream, commodity traders are prominent in production regions of ecosystem risk commodities and play an essential role as aggregators of output from large numbers of producers. Due to ongoing vertical integration, there is a broad overlap between production, trading and processing in some industries, notably palm oil, soya and sugarcane. Traders and processors are often the first identifiable beneficiaries of finance from large FIs to commodity supply chains and the first link in the chain to hold significant market share. As such, they are prominent in the following analysis.
The analysis for this report is based on a financial dataset compiled by Netherlands-based independent research organisation Profundo79 (‘the dataset’), covering links between global FIs and major corporate players in agricultural commodities associated with deforestation risk; sectors using large inputs of such commodities to produce animal feed/aquafeed, or consuming large quantities of such feed; and timber and wood pulp. Profundo used the Forests & Finance data as a key source to establish the dataset. For Profundo’s detailed methodology for identification of financial relationships, see Annex C.
For the current report, Greenpeace, Milieudefensie and Harvest have analysed the dataset to extract figures relating to ecosystem risk finance provided by specific FIs and by all FIs based in the EU or in certain countries, and finance to specific corporate groups active in ecosystem risk sectors. All financial data included in this report is extracted from the Profundo dataset except where other sources are given in citations. Opportunity to Comment (OTC) letters were sent to all profiled company groups and FIs. Any replies and feedback received were considered in the finalisation of the report. These replies can be found here.
Sectors covered in this analysis consist of:
1. Commodities included in the current EUDR:
a. cattle
b. cocoa
c. coffee
d. palm oil
e. pulp (wood)
f. rubber
g. soya
h. timber (wood)
2. Derivative sectors manufacturing products using large amounts of current EUDR commodities:
a. animal feed
b. aquafeed
3. Livestock sectors using feed that includes large amounts of current EUDR commodities:
a. pork
b. poultry
c. dairy
d. aquaculture
4. Additional commodities with substantial ecosystem risk that may be considered in the EUDR review (see the ‘Impacts of finance’ section above):
a. maize
b. sugarcane
Many of the corporate groups covered are active in more than one commodity sector, and the analysis for this report assesses finance at group level (see ‘How to address ecosystem risk finance: Group-level responsibility’). This means that the value of finance cannot be broken down by sector without doublecounting. The sector analysis lists which sectors corporate groups are active in but does not allocate amounts of finance to sectors.
The 135 corporate groups covered in the dataset include the most significant players in upstream and midstream segments of the sectors listed above, based on a relevant production, trading or processing metric. The ten largest players in each sector are covered, plus a sample of other known significant players, along with actors with known or suspected links to specific recent ecosystem destruction.
The proportion of trade in each sector represented by the corporate groups in the dataset varies due to different levels of market fragmentation. The median minimum level of coverage is 19%.
Downstream sector engagement, such as use of large quantities of palm oil for consumer goods manufacturing or wood pulp for packaging, is not captured in the dataset. Sector listings may not include all relevant sectors where a group has smaller interests.
In addition to the sectors outlined in the previous section, sector listings note where groups have involvement in biofuel production. This applies only to groups also involved in one or more of the sectors listed above; significant players in the biofuel industry are not covered systematically.
See Annex A for a table of corporate groups covered and sectors in which the Profundo dataset shows they have significant upstream or midstream involvement.
The data collection process utilised financial databases (Bloomberg, Refinitiv, Trade Finance Analytics and IJGlobal) and company reports (annual, interim, quarterly), as well as other company publications, company register filings, pension fund portfolio disclosures, and media and analyst reports.
Finance is attributed to source regions and countries according to the location of the headquarters of the FI’s parent, because data is often not available for the location of the specific branch or subsidiary issuing the finance. In consequence of this, where ‘finance from EU’ is considered, this represents finance from all branches of FIs headquartered in the EU, including branches outside the EU. This is in line with the principle of grouplevel responsibility, which would suggest all such finance
should be covered by a revision to the EUDR or follow-up legislation. However, because of the lack of data on branch locations, this analysis does not adequately capture finance from EU-based subsidiaries of FIs with parent companies outside the EU. Such finance would also need to be covered by future legislation, as a minimum for a level playing field.
The analysis looks at:
1. The financial institution providing finance
2. The beneficiary: a corporate group active in one or more ecosystem risk sectors
Finance is attributed at group level to both FIs and beneficiaries. No attempt is made to attribute finance to a particular commodity sector or subsidiary of a group.
This approach differs from that used in the Forests and Finance database,80 which aims to estimate finance to ‘forest-risk’ sectors in selected regions and countries. Forests and Finance reduces the recorded amounts of financing to companies also active outside forest-risk sectors, according to its formulas, aiming ‘to more accurately present the proportion of financing that can be reasonably attributed to the forest-risk sector operations of the selected company’.81 This approach is not applicable to EU regulation of ecosystem risk finance, which needs to start from the FI; therefore, the current analysis looks at the value of relationships between FIs and corporate groups active in ecosystem risk sectors, without assigning value to particular sectors.
In the case of financial arrangements involving more than one FI, such as syndicated loans, Profundo divided the value among the FIs in proportion to their contribution; the amount quoted is the calculated value that the specific investor contributed to the deal. See the detailed methodology in Annex C for how these calculations were carried out.
The analysis covers the following types of finance when provided by financial institutions:
1. Lending: corporate loans, revolving credit facilities
2. Underwriting: bond issuance underwriting, share issuance underwriting
3. Investment: bond holdings, shareholdings
Lending and underwriting are added together under ‘Credit’ for analysis. Investment is counted separately because adding this to underwriting could involve doublecounting of the value of bonds and shares, which may be both underwritten when issued and later invested in.
Figures include investment held by the FI as a nominee. This is in line with legal opinion provided by the UN High Commissioner for Human Rights, which held that such shareholdings constitute a ‘business relationship’ between the FI and the investee company.82
The period considered for credit is January 2016–March 2023 (some corporate groups are covered to June 2023 – see Annex B).
Investments are based on data at the most recent filing date (reviewed October 2023). This includes filing dates from as early as 2020 that have not been updated or adjusted by the investor and/or the financial database. This may be due to differences in regulatory requirements, and/or it may indicate that there is no change in position, ie the number of shares held has not changed.
All amounts are in US dollars ($) unless otherwise stated. Amounts are generally rounded to the nearest $1m; amounts that round to zero are not shown in breakdowns.
Some of the data analysed is likely to be incomplete and/or out of date. In particular, bond- and shareholders identified during this research may have sold their position, or in other ways changed the composition of their portfolio, since the data was gathered. Similarly, recent name changes, mergers, acquisitions and divestments of subsidiaries affecting either FIs or beneficiaries may not be reflected in the data.
All figures given in this report should be considered as highly conservative estimates of the size of financial flows to the ecosystem risk sectors included.
The dataset is not a comprehensive review of total financing to these sectors, as it covers only a selection of the corporate groups active in each sector, not the whole industry. In addition, it excludes most private companies and all small and medium-sized actors; these are also likely to be dependent on bank financing, but little or no public information is available on them.
Even for the selected corporate groups, not all finance is covered; only that provided by FIs, as recorded in published sources, is included.
In relation to the EU, the figures given include only FIs based in an EU country, not finance from EU branches or subsidiaries of other FIs, or finance issued outside the EU by non-EU-based FIs that also operate in the EU.
Finance categories not covered in the dataset include but are not limited to:
• insurance,
• private equity,
• government support, such as subsidies and export credit guarantees, and
• derivatives.
The sectors covered in the analysis exclude:
• some derivative sectors relevant to the EUDR, eg leather;
• sectors that are significant to ecosystem destruction and damage more broadly but that are not included in the current EUDR, eg fossil fuel extraction and mining; and
• sectors that are significant to ecosystem destruction and damage for agriculture generally but that lie outside the scope of the EUDR, eg fertilisers, pesticides and animal pharmaceuticals.
This is due to a lack of resources for data collection and in order to maintain relevance to the current EUDR. None of these exclusions constitute a recommendation for exclusion from revision of the EUDR or follow-up legislation.
The analysis for this report identified well over a trillion dollars ($1,257bn / €1,156bn) of credit since 2016 and $693bn (€638bn) of current investment from global FIs to major corporate groups with operations in one or more ecosystem risk sectors (sectors carrying a risk of contributing directly or indirectly to the conversion or degradation of natural ecosystems).
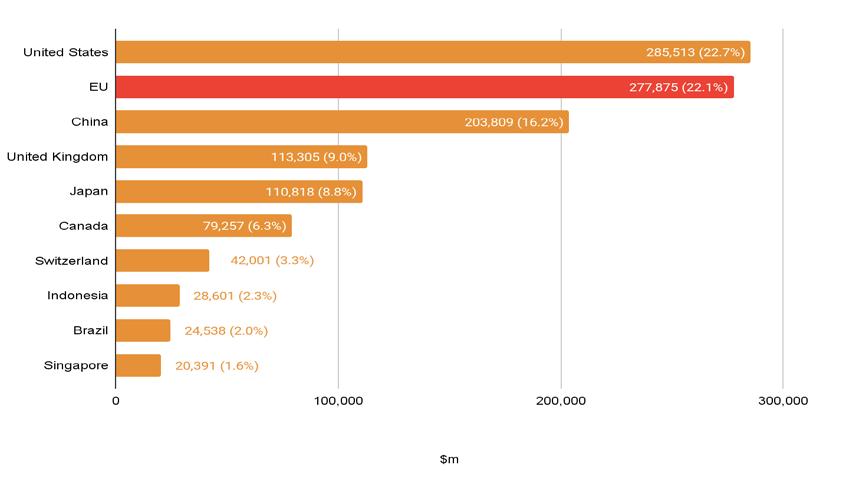
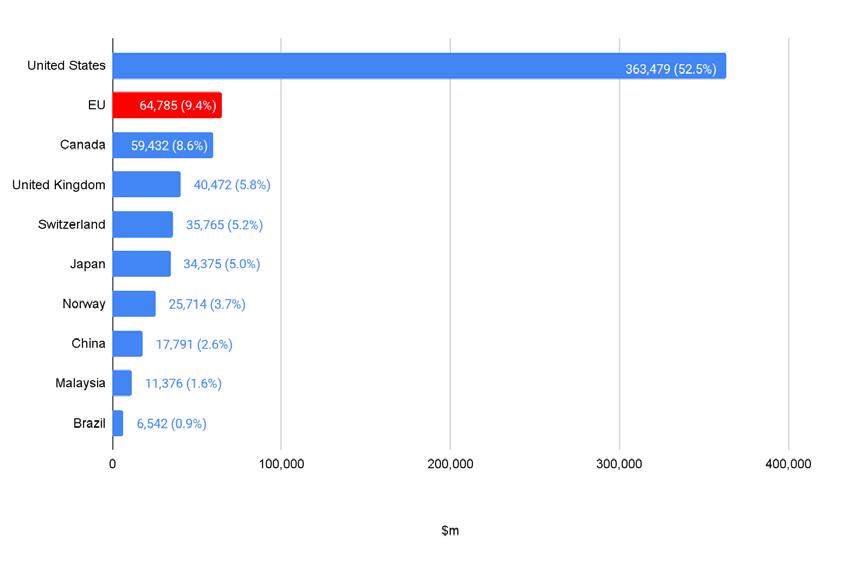
The analysis for this report found that the EU’s financial sector has provided $278bn (€256bn) of credit since 2016 to major corporate groups active in ecosystem risk sectors and currently holds $65bn (€60bn) of investment in these groups – more than a fifth (22.1%) of the total global credit and just under a tenth of global investment by financial institutions (9.4%) identified in the analysis. These figures suggest that the EU’s financial sector is almost equal in size to the US’s as a source of credit to major players in ecosystem risk sectors and is the world’s second-largest investor in these groups.
Largest provision of ecosystem risk finance by financial sectors
Global credit to major players in ecosystem risk sectors since 2016
For individual EU countries, see ‘Finance by country – EU’ below.
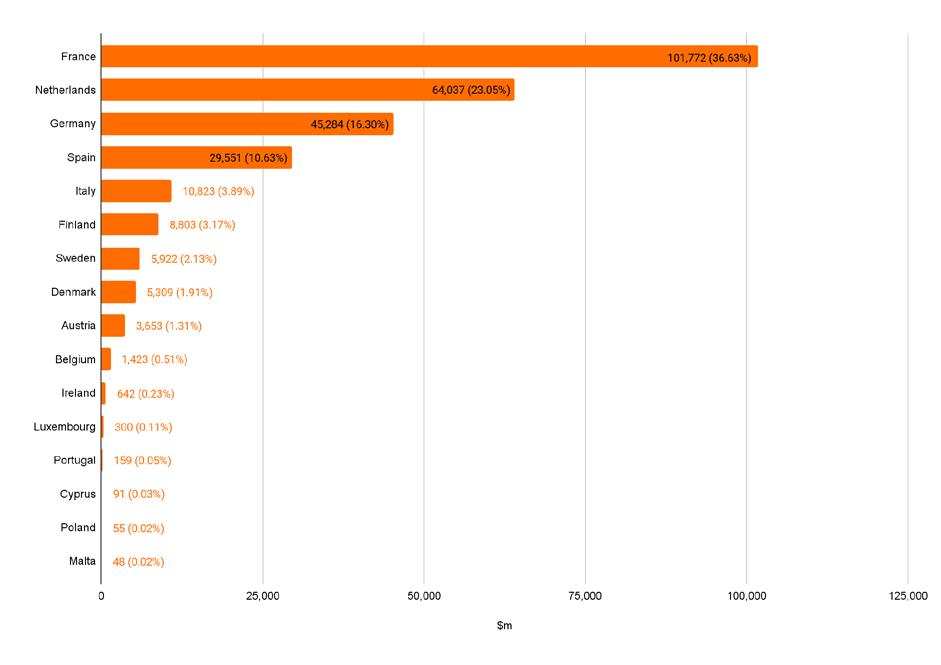
More than four-fifths (86.6%) of the credit provided by EU-based FIs to major players in ecosystem risk sectors since 2016 has come from FIs based in four countries: France, the Netherlands, Germany and Spain.
Credit from EU-based FIs to major players in ecosystem risk sectors since 2016, by member state
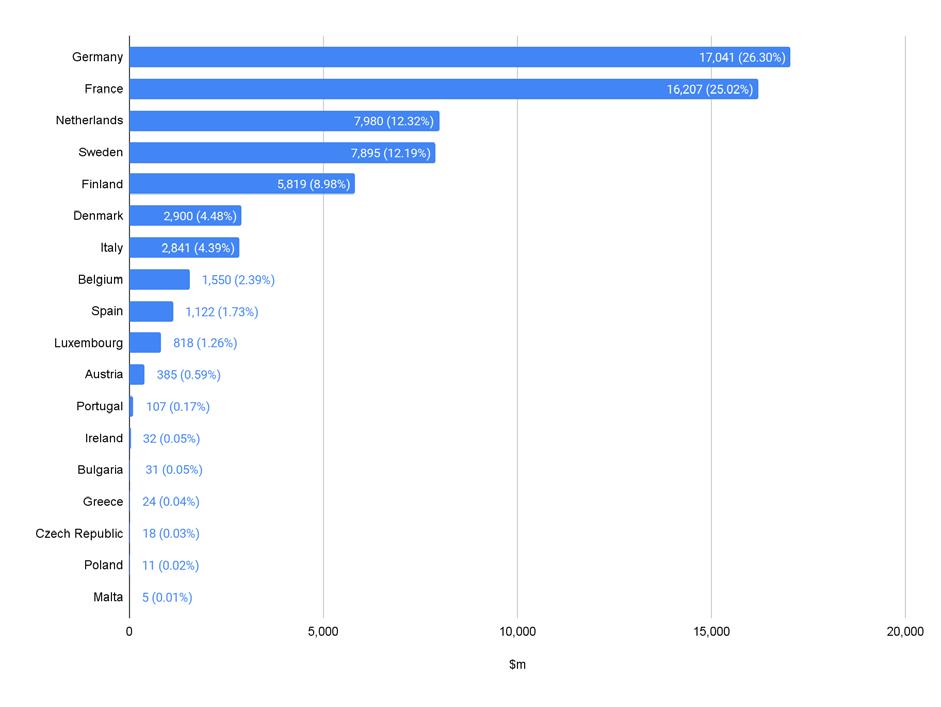
Investment by EU-based FIs in major players in ecosystem risk sectors, by member state
Financial sectors in Europe outside the EU are also significant contributors of financing to major players in ecosystem risk sectors, providing $160bn in credit since 2016 (12.7% of the global total) and $103bn in current investment (14.8% of the global total). The vast majority of this credit and most of the investment comes from UK and Swiss FIs, while the Norwegian financial sector is particularly significant for investment, holding $25.7bn in corporate groups active in ecosystem risk sectors – more than any single EU country’s financial sector. Nearly three-quarters (73.6%) of this investment is held through Norway’s Government Pension Fund Global, the country’s sovereign wealth fund based on investment of oil and gas sector income.83
Taking these figures together with the EU totals shows that FIs in Europe as a whole have provided over a third of global credit to major players in ecosystem risk sectors since 2016 (33.8%, $438bn) and account for nearly a quarter of currently held global investment in these companies (24.2%, $168bn).
Since many of the larger FIs based in non-EU European countries also have operations in the EU, any revisions to the EUDR or follow-up legislation covering the financial sector will also have an impact in Europe beyond the EU.
Iceland, Liechtenstein and Norway, together with the EU member states, form the European Economic Area (EEA).84 The EEA Agreement sets out the procedures for the incorporation and adaptation of EU legal acts into EEA law.85 When these procedures are completed, EU legislation also becomes binding on Iceland, Liechtenstein and Norway.
While Switzerland is not part of the EEA, it is part of the European Free Trade Agreement (EFTA), and incorporation and adaptation of EU law in Switzerland is possible on the basis of bilateral agreements with the EU.86 The EEA and EFTA thus represent possible avenues for future EU rules on ecosystem risk finance to impact a larger proportion of global finance.
The UK’s financial sector is globally significant: it is the fourth-largest source of both credit to and investment in significant players in ecosystem risk sectors (behind the US, the EU and, respectively, China and Canada), according to the current analysis. This makes it particularly important that the UK also adopt legislation on ecosystem risk finance to tackle these financial flows.
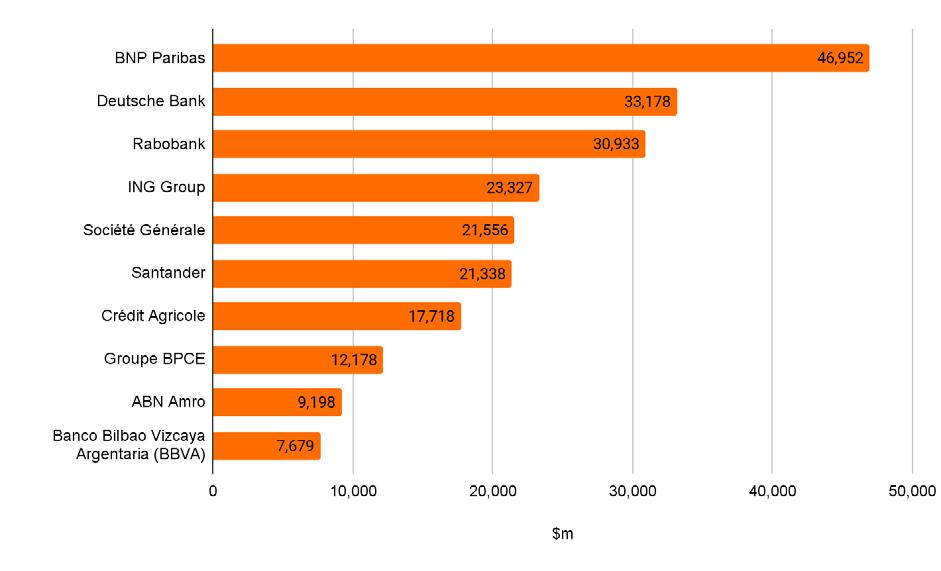
These are the EU-based FIs providing the largest amounts of finance to corporate groups active in ecosystem risk sectors.
Credit since 2016
EU-based FIs providing most credit to ecosystem risk sectors
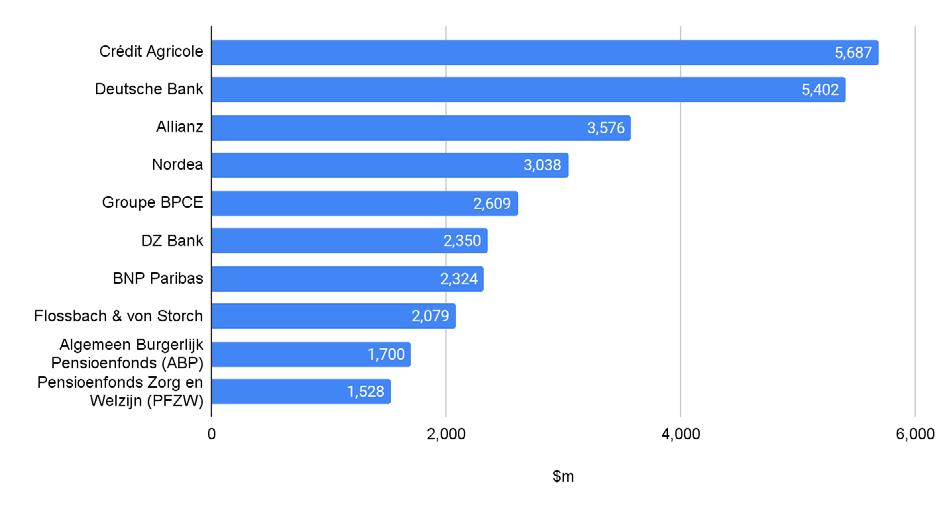
Investment
EU-based FIs providing most investment to ecosystem risk sectors
1 Although this report details financing activities from 2016–2023, it focuses on the 27 EU member states as of the time of publication. All references to the EU should be taken as inclusive of only those 27 countries.
2 Richardson et al (2023)
3 Pacheco et al (2021) p.7; Curtis et al (2018)
4 WWF (2020)
5 WWF (2020) pp.22-23
6 European Parliament and Council of the European Union (2023)
7 European Parliament and Council of the European Union (2023) Article 34 paragraphs 2, 4
8 The full list of commodities/sectors considered includes cattle, cocoa, coffee, palm oil, pulp (wood), rubber, soya, timber (wood), animal feed, aquafeed, pork, poultry, dairy, aquaculture, maize and sugarcane (see also Methodology).
9 USD/EUR conversions in this report are based on a conversion rate of 1 USD to 0.92 EUR, as of 15 March 2024.
10 JBS describes itself as the world’s largest beef and poultry and second-largest pork producer (JBS (2023d) p.10). Marfrig describes itself as the world’s secondlargest beef producer (Marfrig, ‘Our operations’).
11 In accordance with Article 2 paragraph 13 of the EUDR, only products that ‘were produced on land that has not been subject to deforestation after 31 December, 2020’ or made from or containing ‘wood [that] has been harvested from the forest without inducing forest degradation after 31 December, 2020’ are deemed to be compliant with the deforestation-free standard. Source: European Parliament and Council of the European Union (2023)
12 Based on AidEnvironment’s Realtime Deforestation Monitoring Reports (see AidEnvironment, ‘Our research’). For full references and explanation, see the section ‘EU finance links to specific ecosystem destruction’.
13 UN Framework Convention on Climate Change (2023) p.6 paragraph 33
14 UN Convention on Biological Diversity, ‘GBF home: 2050 vision and 2030 mission’
15 UN Convention on Biological Diversity, ‘GBF home: 2030 targets (with guidance notes)’ Target 18
16 Pacheco et al (2021) p.7; Curtis et al (2018)
17 WWF (2020) p.16, drawing on data from Pendrill, Persson & Kastner (2020) and Trase
18 135 Mt in 2022. Source: European Commission (2023)
19 WWF (2020) pp.22-23, drawing on data from Pendrill, Persson & Kastner T (2020) and Trase
20 Pendrill et al (2022)
21 European Commission (2021) Section 2.3
22 European Commission (2013) pp.26, 29
23 See eg Greenpeace International (2021), Greenpeace International (2018c) and Earthsight (2020).
24 European Parliament and Council of the European Union (2023)
25 European Parliament and Council of the European Union (2023)
26 European Parliament and Council of the European Union (2023) Article 1, Annex 1
27 European Parliament and Council of the European Union (2023) preamble paragraph 46, Article 2 paragraph 13
28 European Parliament and Council of the European Union (2023) Article 38 paragraph 2. Smaller undertakings have a further six months before they must comply with the regulation (Article 38 paragraph 3).
29 Inclusion of ‘other wooded land’ to be reviewed by July 2024, ‘other natural ecosystems’ by July 2025. European Parliament and Council of the European Union (2023) Article 34 paragraphs 1-2
30 See eg European Parliament (2020) p27 and European Parliament (2022), in particular Amendments 40 and 105.
31 European Council (2023)
32 Gambetta (2023). In a joint statement published on 24 January 2024, the Council and Parliament agreed on the need for ‘appropriate sustainability due diligence requirements for regulated financial undertakings as regards the activities of their clients, investees and business partners’ and have asked the Commission to submit a report that will form the basis of a new legislative proposal. See Schwartzkopff (2024).
33 Simon et al (2022); Better Europe Public Affairs (2023)
34 The Corporate Sustainability Reporting Directive (CSRD) (European Parliament and Council of the European Union (2022)), the Corporate Sustainability Due Diligence Directive (CSDDD) (forthcoming), the Sustainable Finance Disclosure Regulation (SFDR) (European Parliament and Council of the European Union (2020)), the Capital Requirements Regulation/Directive (CRR/CRD) (European Parliament and Council of the European Union (2024a and 2024b)), Solvency II (European Parliament and Council of the European Union (2024c) and the Investment Firms Regulation (IFR) (European Parliament and Council of the European Union (2024d))
35 European Parliament and Council of the European Union (2023) Article 34 paragraph 4
36 European Commission (2003) Section 1
37 European Parliament and Council of the European Union (2023) preamble paragraphs 2-3
38 UN Environment Programme (2023) p.xi
39 UN Environment Programme (2023) p.12
40 UN Environment Programme (2023) p.xi
41 Luxembourg covers 258,600 ha (2,586 km2). CIA World Factbook, ‘Luxembourg’.
42 Bunge, Cargill, JBS and Marfrig. Based on AidEnvironment’s Realtime Deforestation Monitoring Reports (see AidEnvironment, ‘Our research’). For full references and explanation, see the section ‘EU finance links to specific ecosystem destruction’.
43 Global Witness (2024)
44 Earthsight (2020)
45 Earthsight (2020) p.22
46 Global Witness (2023b) p.2
47 Global Witness (2023b) p.13
48 Been & Groot (2023a, 2023b)
49 European Parliament and Council of the European Union (2023) Article 34 paragraph 4
50 European Parliament (2020) p.27; European Parliament (2022), in particular Amendments 40 and 105
51 Triodos Bank et al (2022). See also Triodos Bank (2022)
52 Together4Forests, list of supporters
53 Greenpeace European Unit (2020); Together4Forests, ‘Our response to the European Commission’s public consultation for a strong law against deforestation, nature destruction and human rights violations’
54 European Parliament and Council of the European Union (2023) Article 4 paragraph 4
55 UN Convention on Biological Diversity, ‘GBF home: 2030 Targets (with guidance notes)’ Target 15
56 UN Convention on Biological Diversity, ‘GBF home: 2050 Goals’ Goal D
57 S&P Global (2023)
58 UN Framework Convention on Climate Change, ‘The Paris Agreement’
59 Global Canopy (2023)
60 Barteczko & Lewis (2017)
61 AFi, ‘Definitions’
62 Greenpeace International (2023a)
63 Financial Action Task Force, ‘Who we are’
64 Financial Action Task Force (2012–2023) p.22, Recommendations 24-25
65 On 15 March 2024, the Permanent Representatives Committee (Coreper) agreed on the draft overall compromise on the CSDDD that was agreed by the European Parliament, European Commission and Council of the EU on 13 December 2023. See European Council (2024).
66 European Parliament (2023)
67 European Parliament (2023)
68 European Parliament and Council of the European Union (2022) preamble paragraph 20
69 Curtis et al (2018)
70 World Resources Institute (2023)
71 Goldman et al (2020)
72 Pendrill et al (2022)
73 WWF (2020) pp.22-23, based on Pendrill, Persson & Kastner (2020)
74 European Parliament and Council of the European Union (2023) Article 34 paragraph 2
75 Reis et al (2023); Trase Supply Chains, ‘Bolivia soy supply chain’
76 Czaplicki Cabezas (2023)
77 JBS (2023c)
78 See eg Chain Reaction Research (2018a).
79 Profundo, home page
80 Forests & Finance, home page
81 Forests & Finance, ‘Methodology’
82 UN Office of the High Commissioner for Human Rights (2021) pp.3-4
83 Norges Bank Investment Management, ‘About the fund’
84 European Free Trade Area, ‘EEA Agreement’
85 European Economic Area, Standing Committee of the EFTA States (n.d.)
86 European Free Trade Area, ‘EEA Agreement’
These profiles of EU-based FIs cover the nine largest EUbased providers of credit to major players in ecosystem risk sectors and the seven largest EU-based investors; some FIs feature in both categories.
all financial data included in these profiles is extracted from the Profundo dataset, except where other sources are given in citations. Opportunity to Comment (OTC) letters were sent to all profiled FIs. Any replies and feedback received were considered in the finalisation of the report. These replies can be found here.
ABN AMRO Bank N.V.
Allianz Group
BNP Paribas
Crédit Agricole
Deutsche Bank AG
DZ Bank Group
Groupe BPCE
ING Group
Nordea Bank Abp
Rabobank
Santander Group
Société Générale S.A.
• Type of institution: Corporate institutional and private bank focused on Northwest Europe, plus global clearing activities and retail (personal and business) banking in the Netherlands and Germany1
• Stock listing: Euronext Amsterdam (depositary receipts)2
• Ultimate beneficiaries: As of 31 December 2022, all shares in ABN AMRO were held by two foundations: Stichting Administratiekantoor Continuïteit ABN AMRO Bank (STAK AAB), with 50.1% of the shares in the issued capital, and Stichting Administratiekantoor beheer financiële instellingen (NLFI), with 49.9% of the shares3 (falling to 49.5% by October 20234). NLFI is a standalone shareholder owned by but independent of the Dutch state.5 STAK AAB was set up by ABN AMRO to allow its stock to be offered and traded in the form of depositary receipts while protecting it from hostile takeovers and other unwanted influences.6 NLFI is gradually reducing its stake in ABN AMRO, selling shares to STAK AAB, which then issues tradeable depositary receipts for the shares transferred to it;7 however, as of 31 December 2022 NLFI held a proportion of these depositary receipts equivalent to 6.4% of the issued capital, taking its overall holding at the time to 56.3%.8
• Headquarters: Amsterdam, Netherlands9
• Total assets end 2022: €379.6bn ($413.8bn10)11
• Turnover 2022: Operating income for 2022 was €7.841bn ($8.547bn).12
• Profit 2022: Net profit for 2022 was €1.867bn ($2.035bn).13
ABN Amro is the ninth-largest EU-based FI provider of credit since 2016 to major corporate groups active in ecosystem risk sectors:
Credit since 2016: $9.2bn
Investment: $93m
ABN Amro has financed four of the six corporate groups with direct or supply chain links to recent ecosystem destruction profiled in this report. It is one of only two out of the 12 FIs profiled here to provide finance to Royal Golden Eagle Group, and the largest EU-based financer of this group since 2016. ABN Amro claims to have begun ‘winding down … all of our Trade and Commodities Finance worldwide’ as of 2020 and that ‘this winddown had been virtually completed by the end of 2022’.14
• Type of institution: Asset manager and insurance provider15
• Stock listing: Frankfurt Stock Exchange16
• Ultimate beneficiaries: Allianz SE, the group’s parent company, ‘is not aware of any direct or indirect interests in the share capital that exceed 10% of the voting rights’17 (the legal threshold for reporting in Germany).
• Headquarters: Munich, Germany18
• Total assets end 2022: €1,022bn ($1,114bn)19
• Turnover 2022: Total income for 2022 was €122.7bn ($133.7bn).20
• Profit 2022: Net income for 2022 was €7.182bn ($7.828bn), with €6.738bn ($7.344bn) attributable to shareholders.21
Allianz is the third-largest EU-based FI in terms of investment in major corporate groups active in ecosystem risk sectors, with $3.6bn in current investment.
It does not provide credit.
Allianz describes its ‘sensitive business areas’ as including agriculture, fisheries and forestry; hydro-electric power; infrastructure; mining; and oil and gas.22 Its sustainability guidelines for these areas state that ‘investments labelled as sustainable must comply with the following three criteria: 1. Positive contribution to an environmental and/or social objective; 2. Do no significant harm; and 3. Follow good governance practices’.23 However, the effectiveness of the application of these criteria is questionable, given the evidence of harm by the corporate groups profiled in this report.
Allianz has investments in four of the six corporate groups with direct or supply chain links to recent ecosystem destruction profiled in this report. It has the second-largest investment in Cargill and JBS among EU-based FIs.
• Type of institution: Multinational bank and investment services provider24
• Stock listing: Euronext Paris (CAC 40 component), London Stock Exchange25
• Ultimate beneficiaries: As of 31 December 2022, Société Fédérale de Participations et d’Investissement, a public-interest limited company acting on behalf of the Belgian state, owned 7.8% of BNP Paribas’s shares, with Amundi and BlackRock owning 6% each. Other institutional investors (including the Grand Duchy of Luxembourg at 1%) owned 70.3% of the shares.26
• Headquarters: Paris, France27
• Total assets end 2022: €2,666bn ($2,906bn)28
• Turnover 2022: Group revenue for 2022 was €50.42bn ($54.96bn).29
• Profit 2022: Group share of net income for 2022 was €10.20bn ($11.12bn).30
BNP Paribas is the largest EU-based FI provider of credit since 2016 to major corporate groups active in ecosystem risk sectors and the seventh-largest investor:
Credit since 2016: $37bn
Investment: $2.3bn
BNP Paribas has financed five of the six corporate groups with direct or supply chain links to recent ecosystem destruction profiled in this report. It has provided more than $4bn in credit to Cargill alone since 2016, making BNP Paribas Cargill’s largest EUbased financer over this period. Despite progressive policies by BNP Paribas31 and its high rating in Global Canopy’s Forest 500,32 the bank continues to finance corporate groups with reported links to deforestation after 2020.
• Type of institution: Cooperative international retail bank, asset manager and insurance provider33
• Stock listing: Crédit Agricole S.A. is listed on Euronext Paris and is a CAC 40 component.34
• Ultimate beneficiaries: As of 31 December 2022 the stock-listed entity, Crédit Agricole S.A., was 56.8% owned by SAS Rue La Boétie, a holding company majority-owned by the Crédit Agricole Group’s 39 regional banks, which were in turn owned by 2,401 local banks, themselves owned by their 11.5m mutual shareholders. The remainder of Crédit Agricole S.A. was owned by institutional investors (29.6%), individual investors and staff.35
• Headquarters: Montrouge, France36
• Total assets end 2022: Not given in results
• Turnover 2022: Crédit Agricole Group reported 2022 revenue of €38.2bn ($41.6bn), while Crédit Agricole S.A. reported 2022 revenue of €23.8bn ($25.9bn).37
• Profit 2022: Crédit Agricole Group reported 2022 net income (group share) of €8.1bn ($8.8bn), while Crédit Agricole S.A. reported 2022 net income (group share) of €5.4bn ($5.9bn).38
Crédit Agricole is the largest EU-based FI investor in major corporate groups active in ecosystem risk sectors and the seventh-largest provider of credit since 2016:
Credit since 2016: $17.7bn
Investment: $5.7bn
Crédit Agricole has financed four of the six corporate groups with direct or supply chain links to recent ecosystem destruction profiled in this report and is the largest EU-based investor in Bunge. According to Crédit Agricole, regarding JBS ‘our investment management arm, Amundi downgraded the internal ESG rating for this company to “G” in Q4 2023 which means it will be excluded from our investments’ and regarding Bunge ‘our investment exposure is lower than stated’.39 However, the bank’s forestry and palm oil policy and statement on biodiversity and natural capital are both weak, with conversion of forest and natural ecosystems absent from the exclusion criteria.40
• Type of institution: Corporate, investment and private bank, asset manager41
• Stock listing: Frankfurt Stock Exchange, New York Stock Exchange42
• Ultimate beneficiaries: As of 31 December 2022, Deutsche Bank was unaware of any shareholder directly or indirectly holding more than 10% of voting rights (the legal threshold for reporting in Germany).43 The bank appears not to provide a percentage breakdown of shareholders by type.
• Headquarters: Frankfurt, Germany44
• Total assets end 2022: €1,337bn ($1,457bn)45
• Turnover 2022: Total revenue for 2022 was €27.21bn ($29.66bn).46
• Profit 2022: Net income for 2022 was €5.659bn ($6.168bn).47
Deutsche Bank is the second-largest EU-based FI provider of both credit (since 2016) and investment to major corporate groups active in ecosystem risk sectors:
Credit since 2016: $33.2bn
Investment: $5.4bn
Deutsche Bank48 has financed four of the six corporate groups with direct or supply chain links to recent ecosystem destruction profiled in this report, providing over $3bn in credit since 2016 to Cargill alone. Deutsche Bank has an Environmental and Social Policy Framework that states that the bank ‘will not finance activities where there is clear and known evidence of clearing of primary tropical forests, areas of HCV or peatlands, illegal logging, or uncontrolled and/or illegal use of fire’49 and expects certification for palm oil and timber companies.50 However, this policy is insufficient to prevent deforestation (eg there is no restriction on clearing secondary tropical forest), and it is questionable how effective its application is given the bank’s continued financing of groups reportedly associated with deforestation.
• Type of institution: Corporate and investment bank; central institution of the Volksbanken Raiffeisenbanken Cooperative Financial Network of 700 cooperative banks in Germany51
• Stock listing: None
• Ultimate beneficiaries: DZ Bank is mainly owned by Germany’s over 700 cooperative banks, for which it acts as the central institution.52 As of 31 December 2022, 99.5% of shares in DZ Bank were held by cooperative enterprises, including ‘the cooperative banks and other legal entities and trading companies economically associated with the cooperative movement or cooperative housing sector’.53 DZ Bank acts as a holding company for the entities in the DZ Bank Group.54
• Headquarters: Frankfurt am Main, Germany55
• Total assets end 2022: €627.0bn ($683.4bn)56
• Turnover 2022: Operating income for 2022 was €6.549bn ($7.138bn).57
• Profit 2022: Net profit for 2022 was €1.073bn ($1.170bn).58
DZ Bank is the sixth-largest EU-based FI investor in major corporate groups active in ecosystem risk sectors:
Credit since 2016: $2.1bn
Investment: $2.4bn
DZ Bank has financed three of the six corporate groups with direct or supply chain links to recent ecosystem destruction profiled in this report. The bank has ‘exclusion’ and sector criteria for financing but does not have a specific exclusion on conversion of forests or natural ecosystems for agriculture and for palm oil companies only requires certification by 2030.59
• Type of institution: Cooperative universal banking and insurance group60
• Stock listing: None
• Ultimate beneficiaries: ‘BPCE SA, the central institution of Groupe BPCE, is wholly owned by the 14 Banques Populaires and 15 Caisses d’Epargne’, which are banks in their own right.61 ‘The Banques Populaires and the Caisses d’Epargne are owned by nine million cooperative shareholders.’62
• Headquarters: Paris, France63
• Total assets end 2022: €1,531bn ($1,669bn)64
• Turnover 2022: Net banking income for 2022 was €25.71bn ($28.02bn).65
• Profit 2022: Net income for 2022 was €4.022bn ($4.383bn), with €3.951bn ($4.307bn) attributable to equity holders of the parent.66
Groupe BPCE is the fifth-largest EU-based FI provider of credit since 2016 to major corporate groups active in ecosystem risk sectors and the eighth-largest investor:
Credit since 2016: $12.2bn
Investment: $2.6bn
Groupe BPCE has financed three of the six corporate groups with direct or supply chain links to recent ecosystem destruction profiled in this report. BPCE claims that this data contains inaccuracies.67
• Type of institution: Multinational retail and wholesale bank68
• Stock listing: Euronext Amsterdam and Brussels, New York Stock Exchange (American depositary receipts)69
• Ultimate beneficiaries: As of 31 December 2022, ING Group was aware of four shareholders or investors with potential holdings of 3% or more: BlackRock, the Goldman Sachs Group, Norges Bank and Artisan Investments GP LLC. The percentages held by each are not specified.70
• Headquarters: Amsterdam, Netherlands71
• Total assets end 2022: €967.8bn ($1,054.9bn)72
• Turnover 2022: Total income for 2022 was €18.56bn ($20.23bn).73
• Profit 2022: Net profit (‘net result’) for 2022 was €3.777bn ($4.117bn).74
ING Group is the fourth-largest EU-based FI provider of credit since 2016 to major corporate groups active in ecosystem risk sectors:
Credit since 2016: $23.3bn
Investment: $138m
Finance to corporate groups profiled in this report
ING Group has financed four of the six corporate groups with direct or supply chain links to recent ecosystem destruction profiled in this report and is the largest EU-based provider of credit to Bunge since 2016. ING declined to comment on the accuracy and completeness of this report.75 ING’s position on deforestation is weak as it has no cut-off date, focuses only on primary forest and, contrary to the EUDR, does not consider wood and rubber to be potentially high-risk commodities.76
• Type of institution: Nordic universal banking group providing personal, business, corporate and institutional banking and asset management77
• Stock listing: Nasdaq Helsinki, Nasdaq Stockholm, Nasdaq Copenhagen78
• Ultimate beneficiaries: As of 31 December 2022 the following registered shareholders held a stake of more than 2% in Nordea: BlackRock (5.2%), Cevian Capital (4.9%), Nordea-fonden (4.3%), Norges Bank (3.5%), Vanguard (3.5%) and Swedbank Robur Funds (2.4%).79
• Headquarters: Helsinki, Finland80
• Total assets end 2022: €594.8bn ($648.3bn)81
• Turnover 2022: Total operating income for 2022 was €9.796bn ($10.678bn).82
• Profit 2022: Net profit for 2022 was €3.595bn ($3.919bn), with €3.576bn ($3.898bn) attributable to shareholders.83
Nordea is the fourth-largest EU-based FI investor in major corporate groups active in ecosystem risk sectors:
Credit since 2016: $7.1bn
Investment: $3bn
Nordea has financed only one of the six corporate groups with direct or supply chain links to recent ecosystem destruction profiled in this report, with $5m investment in Bunge. According to Nordea, ‘We certainly agree that there are challenges related to Bunge’s practices. In many aspects, we believe that Bunge can and should do more to alleviate deforestation and conversion risks.’84
All credit beneficiaries identified are included in the table.
• Type of institution: Cooperative multinational banking and financial services company85
• Stock listing: None
• Ultimate beneficiaries: Rabobank is owned by its members (of whom there are currently over 2 million) rather than by shareholders.86
• Headquarters: Utrecht, Netherlands87
• Total assets end 2022: €628.5bn ($685.1bn)88
• Turnover 2022: Income for 2022 was €12.08bn ($13.17bn).89
• Profit 2022: Net profit for 2022 was €2.786bn ($3.037bn).90
Rabobank is the third-largest EU-based FI provider of credit to major corporate groups active in ecosystem risk sectors, providing $30.9bn credit since 2016.
Rabobank does not operate as an investor.
Rabobank has financed five of the six corporate groups with direct or supply chain links to recent ecosystem destruction profiled in this report. It is the largest EU-based provider of credit to JBS and Sinar Mas since 2016. According to Rabobank, the bank ‘does not want to finance any form of deforestation done by our clients, even if legally allowed’ but ‘cannot preclude having at any moment in time clients in our portfolio accused of illegal deforestation’ as they take a participation approach with clients.91 On a positive note, Rabobank does claim to do client sustainability assessments at a group level.92
• Type of institution: Multinational ‘financial services platform’ including retail and corporate banking93
• Stock listing: Bolsa de Madrid, New York Stock Exchange (American depositary receipts), Mexican Stock Exchange (BMV), Warsaw Stock Exchange, London Stock Exchange (CREST depository interests)94
• Ultimate beneficiaries: As of 31 December 2022
Norges Bank held a direct shareholding of 3.006% of voting shares in Banco Santander, which was the only reported direct shareholding of over 3% at that date. However, a number of institutions reported shareholdings of over or just under 3% belonging to funds or portfolios that they managed or held on behalf of other investors, with none of these funds or investors holding more than 3% individually: State Street Bank (14.23%), Chase Nominees Limited (6.88%), BlackRock (5.426%), The Bank of New York Mellon Corporation (4.82%), Citibank New York (3.90%), BNP Paribas (3.28%), EC Nominees Limited (3.04%), Dodge & Cox (3.038%) and Amundi, S.A. (2.881%).95
• Headquarters: Santander (legal) and Madrid (operational), Spain96
• Total assets end 2022: €1,735bn ($1,891bn)97
• Turnover 2022: Total income for 2022 was €52.12bn ($56.81bn).98
• Profit 2022: Profit for 2022 was €10.76bn ($11.73bn), of which €9.605bn ($10.469bn) was attributable to the parent.99
Santander is the sixth-largest EU-based FI provider of credit since 2016 to major corporate groups active in ecosystem risk sectors:
Credit since 2016: $21.3bn
Investment: $255m
Santander has financed five of the six corporate groups with direct or supply chain links to recent ecosystem destruction profiled in this report. It is the largest EU-based provider of credit to Marfrig since 2016.
• Type of institution: Multinational retail bank and financial services company100
• Stock listing: Euronext Paris (CAC 40 component)101
• Ultimate beneficiaries: As of 31 December 2022
Société Générale had the following significant shareholders: BlackRock (7.63% of capital, equivalent to 7.39% of voting rights exercisable at general meetings), Amundi (5.37%/5.21%), BNPP AM (2.42%/2.35%) and Caisse des Dépôts et Consignations (2.19%/2.77%). European institutional shareholders were estimated to hold 41% of the capital.102
• Headquarters: Paris, France103
• Total assets end 2022: €1,487bn ($1,621bn)104
• Turnover 2022: Net banking income for 2022 was €28.06bn ($30.59bn).105
• Profit 2022: Consolidated net income for 2022 was €2.947bn ($3.212bn), of which the group share was €2.018bn ($2.120bn).106
Société Générale is the fifth-largest EU-based FI provider of credit since 2016 to major corporate groups active in ecosystem risk sectors:
Credit since 2016: $21.6bn
Investment: $52m
Société Générale has financed two of the six corporate groups with direct or supply chain links to recent ecosystem destruction profiled in this report.
All investments identified are included in the following table.
1 ABN AMRO Bank N.V. (2023) pp.8-9
2 ABN AMRO Bank N.V. (2023) p.47
3 ABN AMRO Bank N.V. (2023) p.205
4 STAK AAB (2023)
5 NLFI, ‘About NLFI’
6 STAK AAB, ‘Frequently asked questions’
7 ABN AMRO Bank N.V. (2023) p.206; STAK AAB (2023)
8 ABN AMRO Bank N.V. (2023) p.205
9 ABN AMRO Bank N.V. (2023) p.45
10 EUR/USD conversions based on a conversion rate of 1 EUR to 1.09 USD, as of 15 March 2024.
11 ABN AMRO Bank N.V. (2023) p.239
12 ABN AMRO Bank N.V. (2023) p.237
13 ABN AMRO Bank N.V. (2023) p.238
14 ABN AMRO Bank N.V. (2024)
15 Allianz Group, ‘At a glance’
16 Börse Frankfurt, ‘Allianz SE’
17 Allianz Group (2023) p.24
18 Allianz Group, ‘Allianz contacts’
19 Allianz Group (2023) p.124
20 Allianz Group (2023) p.125
21 Allianz Group (2023) p.125
22 Allianz Group (2024a)
23 Allianz Group (2024b) p.36
24 BNP Paribas, ‘Our businesses and expertise’
25 Euronext, ‘BNP Paribas Act.A’; London Stock Exchange, ‘BNP Paribas SA’
26 BNP Paribas (2023b) p.67
27 BNP Paribas, LinkedIn profile
28 BNP Paribas (2023a) p.23
29 BNP Paribas (2023b) p.42
30 BNP Paribas (2023b) p.42
31 BNP Paribas, ‘Financing and investment policies’
32 Global Canopy (2023) p.40
33 Crédit Agricole, ‘Discover the Crédit Agricole Group’
34 Crédit Agricole, ‘Shares and dividend’
35 Crédit Agricole (2023a) p.4
36 Crédit Agricole, ‘Head office Crédit Agricole’
37 Crédit Agricole (2023a) p.6
38 Crédit Agricole (2023a) p.6
39 Crédit Agricole (2024)
40 Crédit Agricole (n.d.); Crédit Agricole (2023b)
41 Deutsche Bank, ‘What we do’
42 Deutsche Bank, ‘Share price information’
43 Deutsche Bank (2023a) p.190
44 Deutsche Bank, ‘Addresses and contact’
45 Deutsche Bank (2023a) p.206
46 Deutsche Bank (2023a) p.204
47 Deutsche Bank (2023a) p.204
48 In its OTC response to this report (Deutsche Bank (2024)), Deutsche Bank stated: ‘DWS sets its own sustainability strategy. We would also like to ask that you distinguish accordingly between information relating to Deutsche Bank and DWS in the report.’ However, due to the relationship between Deutsche Bank and DWS, for the purposes of this report they are considered one group and thus analysed together.
49 Deutsche Bank (2023b) p.11
50 Deutsche Bank (2023b) p.10
51 DZ Bank AG, home page
52 DZ Bank Group (2023a) p.1
53 DZ Bank Group (2023b) p.290
54 DZ Bank Group (2023a) p.1
55 DZ Bank AG, ‘DZ Bank Frankfurt am Main’
56 DZ Bank Group (2023b) p.45
57 DZ Bank Group (2023b) p.29
58 DZ Bank Group (2023b) pp.28-29
59 DZ Bank Group (2023c) pp.5-6
60 Groupe BPCE, home page
61 Groupe BPCE (2023) p.20
62 Groupe BPCE (2023) p.20
63 Groupe BPCE (2022)
64 Groupe BPCE (2023) p.263
65 Groupe BPCE (2023) p.261
66 Groupe BPCE (2023) p.261
67 Groupe BPCE (2024)
68 ING Group, ‘ING at a glance’
69 ING Group, ‘Share information’
70 ING Group (2023) p.9
71 ING Group, ‘ING in your area’
72 ING Group (2023) p.188
73 ING Group (2023) p.189
74 ING Group (2023) p.189
75 ING Group (2024)
76 ING Group, ‘Deforestation’
77 Nordea, ‘Who we are’
78 Nordea, ‘Shareholders’
79 Nordea (2023) p.53
80 Nordea, ‘Our history’
81 Nordea (2023) p.97
82 Nordea (2023) p.95
83 Nordea (2023) p.95
84 Nordea (2024)
85 Rabobank, ‘Rabobank at a glance’
86 Rabobank (2023) p.10
87 Rabobank, ‘Contact Rabobank Group’
88 Rabobank (2023) p.138
89 Rabobank (2023) p.139
90 Rabobank (2023) p.139
91 Rabobank (2024)
92 Rabobank (2024)
93 Santander, ‘Our business model’
94 Santander, ‘Shareholders and investors: Santander share’; Grupo BMV, ‘Listed issuers: Profile: Banco Santander México, S.A., institución de banca múltiple, Grupo Financiero Santander’; MarketWatch, ‘Banco Santander S.A. ADR’
95 Santander (2023) p.167
96 Santander, ‘Legal notice’; Santander, ‘Contact’
97 Santander (2023) p.515
98 Santander (2023) p.519
99 Santander (2023) p.519
100 Société Générale, ‘An integrated and diversified model’
101 Euronext, ‘CAC 40’
102 Société Générale (2023) p.639
103 Société Générale, ‘How to contact Société Générale’
104 Société Générale (2023) p.374
105 Société Générale (2023) p.376
106 Société Générale (2023) p.376
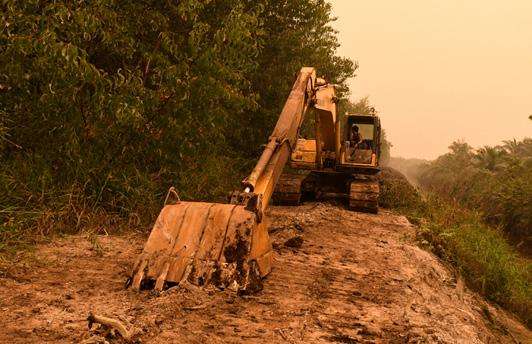
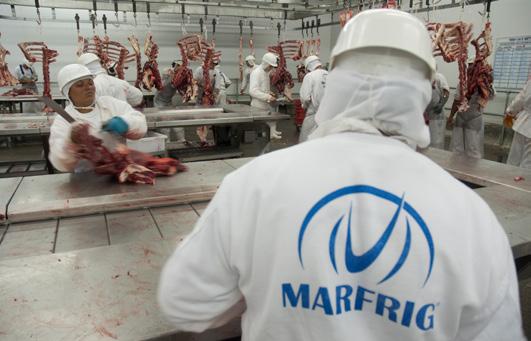
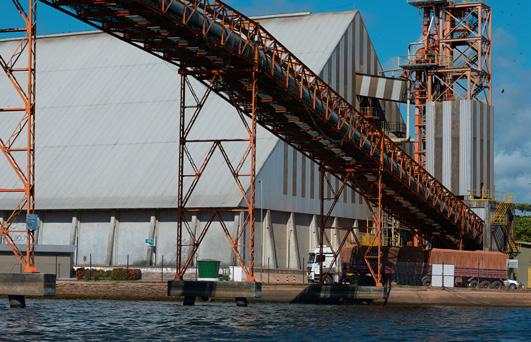
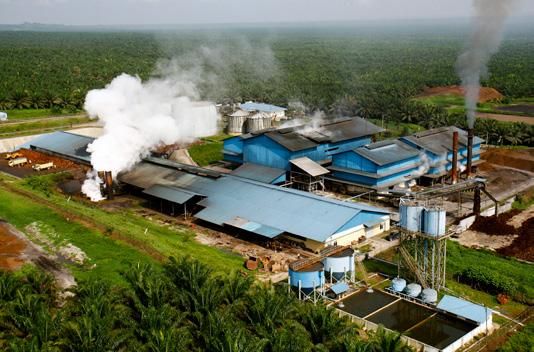
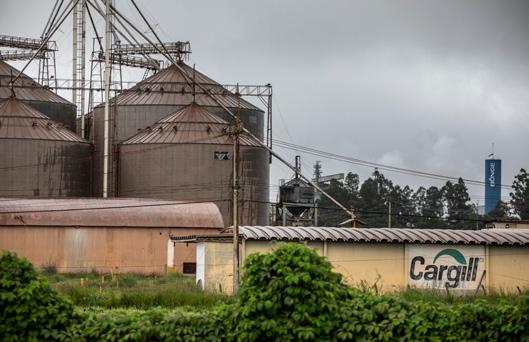
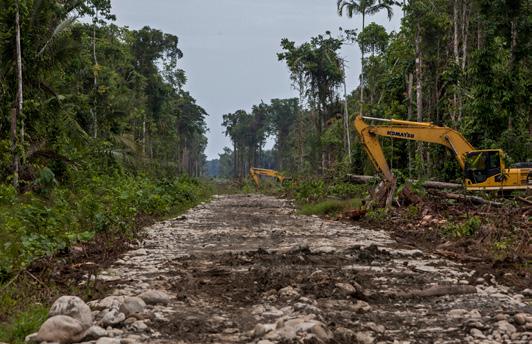
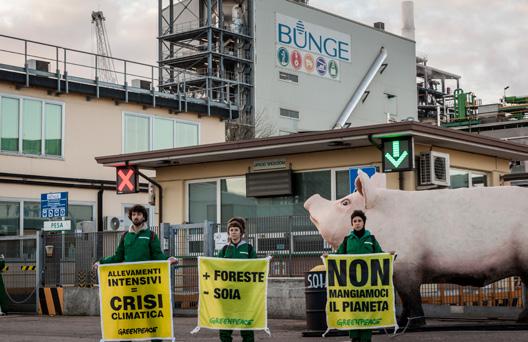
This section profiles six major transnational corporate groups with reported recent direct or supply chain links to specific ecosystem destruction. All of them receive extensive finance from EU-based FIs: jointly, these six groups have benefited from $26.5bn in credit from financial institutions based in the EU since 2016 and $1.7bn of current investment.
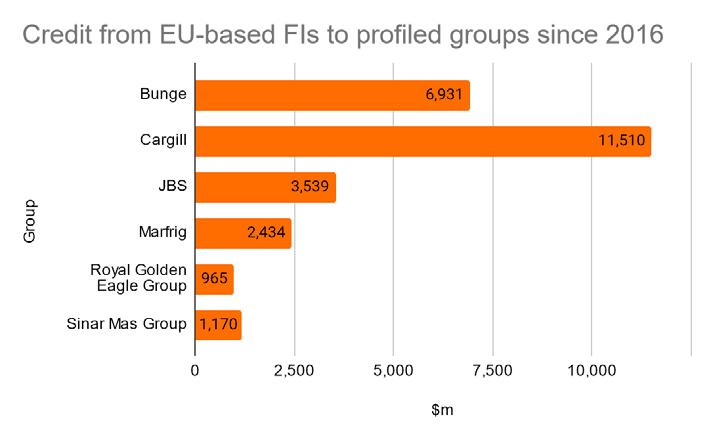
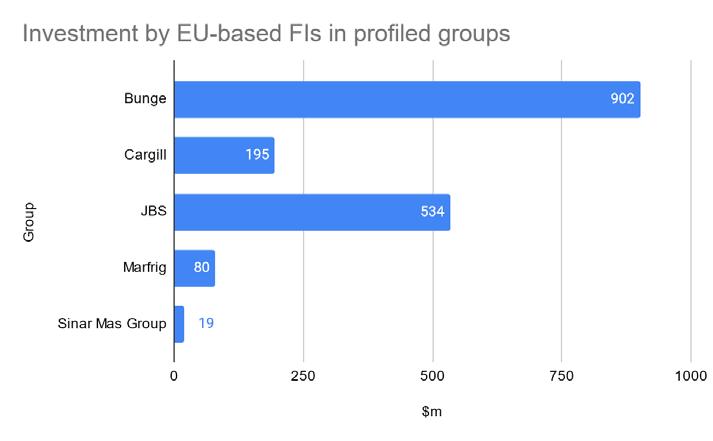
The corporate groups profiled here include two of the world’s largest traders of multiple ecosystem risk commodities (soya, maize, cocoa, sugar etc, and derivatives such as animal feed), two globally significant producers and processors of palm oil and pulpwood and two of the world’s largest meat producers.1
All are therefore key players in ecosystem risk sectors. Recent NGO or media investigations have reported links between each of them and producers associated with specific instances of deforestation that took place after the end of 2020. The producers in question are usually direct or indirect suppliers of the corporate groups, though in some cases ownership or control of a producer by one of the groups is suspected. The date is significant because when the EUDR comes into force from
the end of 2024, compliance will prohibit the sale and export of commodities and products that were produced on land deforested or degraded after 31 December 20202 or that were not produced ‘in accordance with the relevant legislation of the country of production’.3
Real-time deforestation monitoring reports by AidEnvironment have linked the supply chains of the two multi-commodity traders (Bunge and Cargill) and two meat producers (JBS and Marfrig), with varying degrees of confidence, to a staggering total of 278,335 ha of deforestation – an area slightly larger than Luxembourg4 –since 1 January 2021 in Brazil’s Amazon and Cerrado biomes alone, driven by expansion of cattle ranching and soya production.5 This includes many cases of illegal deforestation. As detailed in the following profiles and case studies, the commodity traders are also linked to deforestation in Southeast Asia, including by the palm oil industry. Meanwhile, the two palm oil and pulpwood giants (RGE and Sinar Mas) profiled here have been linked to tens of thousands of hectares of deforestation in Indonesia since 2013, with both
of their supply chains continuing to be tainted by destruction after the 2020 cut-off date (including in supposedly protected areas).
Three of the groups have made pledges to completely remove deforestation from their supply chains in the future (by 2025 or 2030). Such policies may threaten to worsen deforestation in the short term, by encouraging suppliers to clear land in the intervening period.6
In spite of mounting evidence of these six groups’ involvement with deforestation and other ecosystem destruction over a number of years, the analysis for this report found no evidence that EU-based FIs are moving away from providing them with finance (see chart below).
The case studies which accompany some of the profiles demonstrate some of the ways in which finance can potentially contribute to ecosystem destruction: by spreading along supply chains, across commodities and jurisdictions (Cargill); by reaching ‘shadow’ companies beyond the publicly acknowledged group structures (RGE); and by financing groups expanding at the cost of ecosystems (JBS).
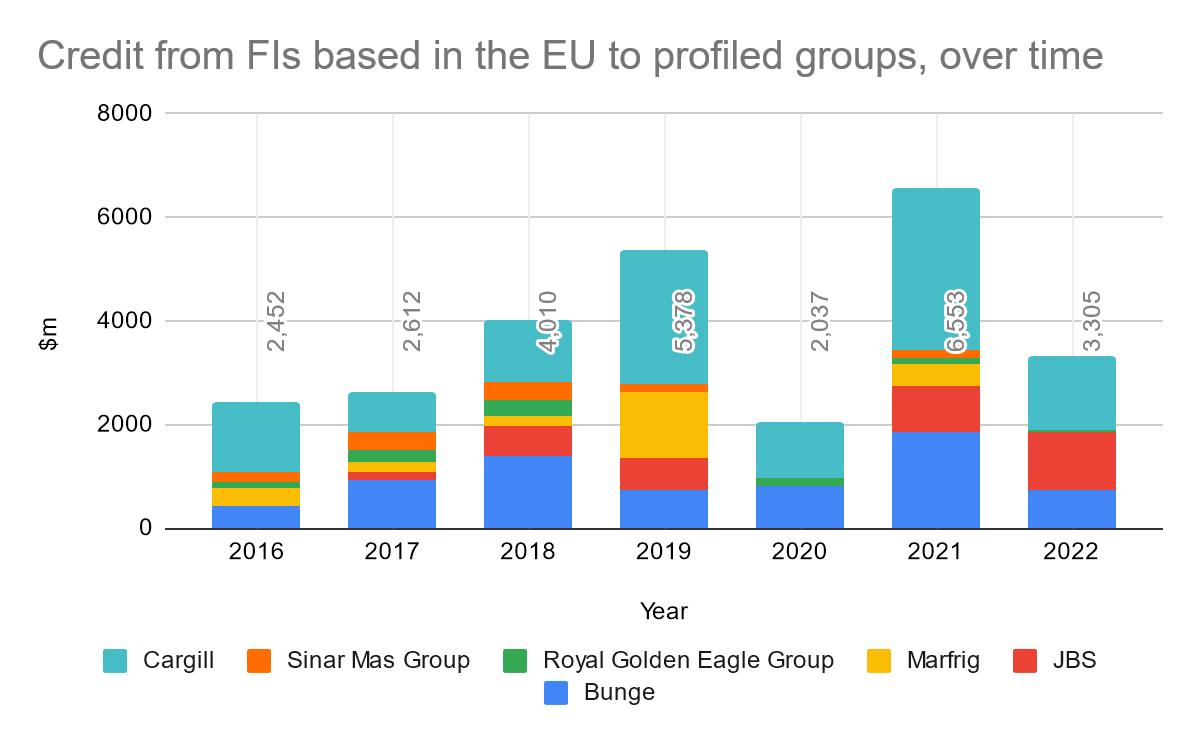
All financial data included in these profiles is extracted from the Profundo dataset, except where other sources are given in citations. Listings for ‘significant ecosystem risk sectors’ are taken from the current analysis; they may not include all relevant sectors where the group has smaller interests. Opportunity to Comment (OTC) letters were sent to all profiled company groups. Replies received and any feedback were considered in the finalisation of the report. These replies can be found here.
• Type of company: Food commodities trader and processor (grains, oilseeds etc); producer and supplier of plant-based products including oils, fats and proteins to the food and animal feed sectors as well as for biofuel and industrial applications7
• Stock listing: New York Stock Exchange,8 S&P 500 component9
• Ultimate beneficiaries: As of 13 March 2023, beneficial owners of over 5% of common shares included Capital World Investors (13.3%), Vanguard Group (10.1%) and BlackRock (8.5%).10
• Headquarters: St Louis, Missouri, US11
• Turnover 2022: Net sales of $67.2bn12
• Profit 2022: Net income attributable to Bunge of $1.61bn13
• Significant ecosystem risk sectors (from current analysis): Biofuel, maize, palm oil trader, soya trader, sugarcane processor
A June 2023 report by Mighty Earth (based on an investigation conducted in partnership with Repórter Brasil) links Bunge to nearly 26,000 ha of recent land clearance in the highly threatened Cerrado savannah ecoregion,14 which for the first time since 2019 appears to have overtaken the Amazon as the frontline of ecosystem destruction in Brazil.15 The report suggests that over 11,000 ha of this clearance has been carried out since 2021 by three farms from which Bunge sourced soya in 2022 and 2023, while the remaining land was identified by Mighty Earth’s partner AidEnvironment as having been cleared in early 2023
‘in high-risk municipalities where Bunge is the leading soya exporter’.16 Moreover, the Realtime Deforestation Monitoring Reports that AidEnvironment has published several times a year since 2022 have so far identified over 196,000 ha of deforestation since the start of 2021 on Amazon and Cerrado properties owned by suppliers that AidEnvironment suspects with varying degrees of certainty of having recent supply chain links to Bunge.17 Nevertheless, Bunge claims that ‘over 96% of our Brazil soybean volumes are deforestation and conversion-free’.18
Bunge has made a public commitment to achieve deforestation-free and native vegetation conversion–free supply chains by 2025,19 but the company does not specify in its policy a cut-off date after which deforestation or conversion by a supplier is not permitted20 and claims it offers suppliers custom cut-off dates.21 Mighty Earth reports stakeholder anxiety that Bunge’s announcement of its 2025 target without establishing a universal cut-off date may actually be encouraging deforestation by its suppliers during the intervening period.22 It also puts the company at odds with the EUDR’s December 2020 cut-off.
Bunge’s palm oil operations have also reportedly been linked to recent deforestation. In December 2022, the Environmental Investigation Agency listed Bunge among traders purchasing palm oil from two Indonesian mills which it said had sourced palm fruit until earlier that year from two plantations in Kalimantan and Sumatra that had engaged in deforestation. These plantations were respectively said to have been responsible for 3,750 ha of deforestation between 2020 and mid-2022 (with the mill supplying Bunge reportedly continuing to source from the plantation until August 2022) and 1,010 ha between 2021 and 2022 (350 ha of this in 2021, before this mill reportedly ceased to source from the plantation early in 2022).23 Bunge claims these two mills ‘have been blocked as far back as 2018’.24
Finance identified from EU-based FIs:
Credit since 2016: $6.9bn
Investment: $0.9bn
Total global finance identified:
Credit since 2016: $22.6bn
Investment: $15.1bn
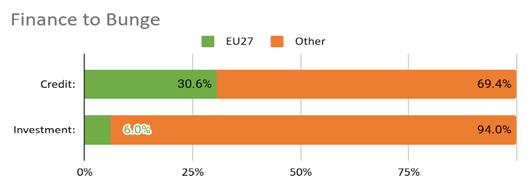
The EU financial sector is Bunge’s second-largest source of both credit from and investment by FIs.
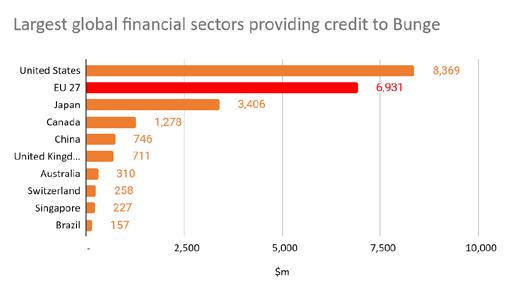
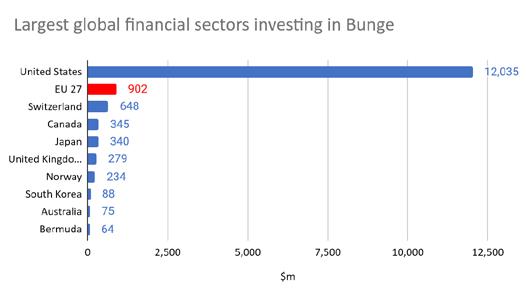
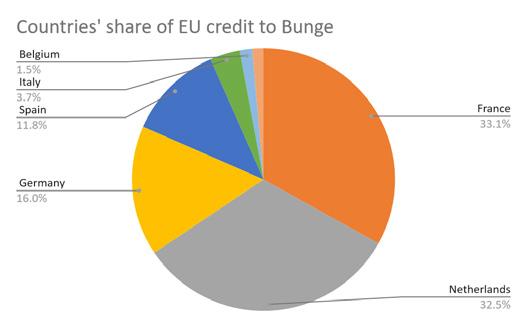
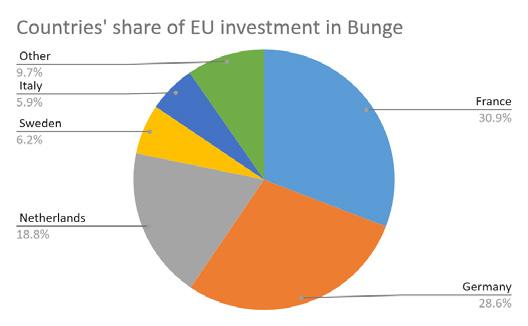
Two EU-based FIs, ING Group and BNP Paribas, are among the ten largest global providers of credit to Bunge since 2016. The following table shows the ten largest EU-based credit providers investors. (Note that one of the leading credit providers is also an investor and one of the leading investors has also provided credit; these amounts are included in the table for completeness.)
• Type of company: Food commodities trader and processor (grains, oilseeds, cotton, beef, eggs etc); poultry producer, processor and supplier; producer and supplier of ingredients and biochemicals to the food, animal feed, beauty, health, pharmaceutical and industrial sectors; metals trader; and provider of financial, data and transport services25
• Stock listing: None (family-owned)26
• Ultimate beneficiaries: According to an article published by a Canadian firm of financial advisors, as of 2019 around 100 members of the Cargill and MacMillan families were said to control about 90% of Cargill’s shares, with the rest accounted for by ‘an employee stock ownership plan and shares owned by management’. Fourteen Cargill family members were said to be billionaires.27 According to a 2022 Guardian article, ‘The extended family controls about 87% of the company and is ranked as the 11th richest family in the world, with a collective fortune of about $50bn.’28
• Headquarters: Minneapolis, Minnesota, US29
• Turnover 2022: $165bn (fiscal year to 31 May 2022)30
• Profit 2022: Reported by a Bloomberg financial journalist to be $6.68bn (fiscal year to 31 May 2022) ‘according to a copy of its accounts reviewed by Bloomberg Opinion’31
• Significant ecosystem risk sectors (from current analysis): Animal feed, aquafeed, beef, biofuel, cocoa, maize, palm oil producer, palm oil trader, poultry, soya trader, sugar trader
As set out in more detail in the case study below, since 2015 NGO and media reports have linked Cargill to deforestation and other ecosystem conversion via producers across a number of regions and commodities, including Southeast Asian palm oil, cocoa from Côte d’Ivoire, Brazilian maize and soya from Brazil and Bolivia. AidEnvironment has identified 35 Brazilian deforestation cases (11 in the Amazon and 24 in the Cerrado) potentially linked to Cargill between 2019 and
2022 alone, with the company confirming that it had trading links to 14 of these cases.32 By the end of 2023, the Realtime Deforestation Monitoring Reports that AidEnvironment has published several times a year since 2022 had identified 66,914 ha of deforestation since the start of 2021 on Amazon and Cerrado properties owned by suppliers that AidEnvironment suspected with varying degrees of certainty of having recent supply chain links to Cargill.33
A recent report by Trase estimated that in 2021 Cargill’s supply chain was linked with over 15,000 ha of deforestation and other ecosystem conversion related to soya production in Bolivia.34 A September 2023 Global Witness report focusing on Bolivia’s unique and threatened Chiquitano tropical dry forest not only identifies several farms in the region responsible for deforestation since 2017 from which it states that Cargill purchased soya in early 2023, but also presents evidence suggesting that as of 2018 the company was considering sourcing soya from up to 3 million ha in Bolivia that are currently still forested.35
Finance identified from EU-based FIs:
Credit since 2016: $11.5bn
Investment: $195m
Total global finance identified:
Credit since 2016: $40bn
Investment: $5.1bn
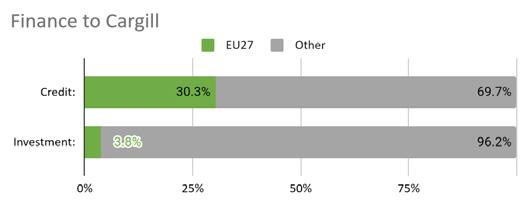
The EU financial sector is Cargill’s second-largest provider of credit and third-largest investor.
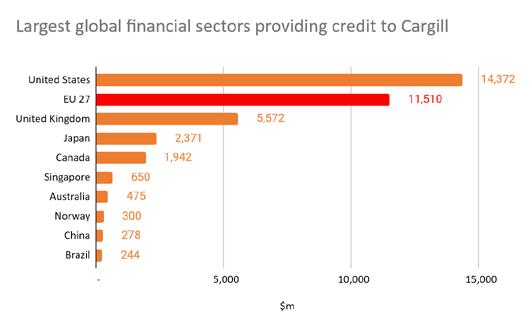
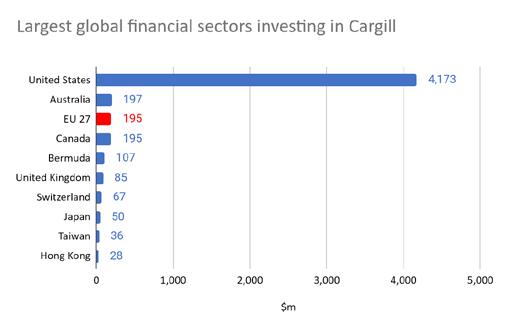
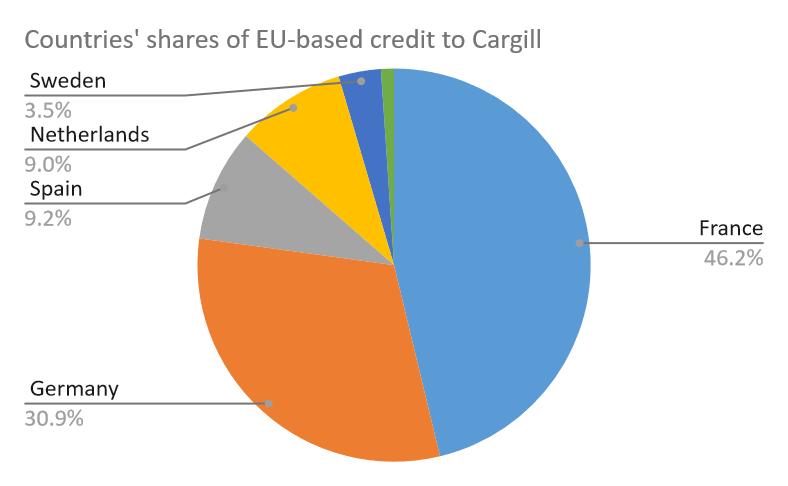
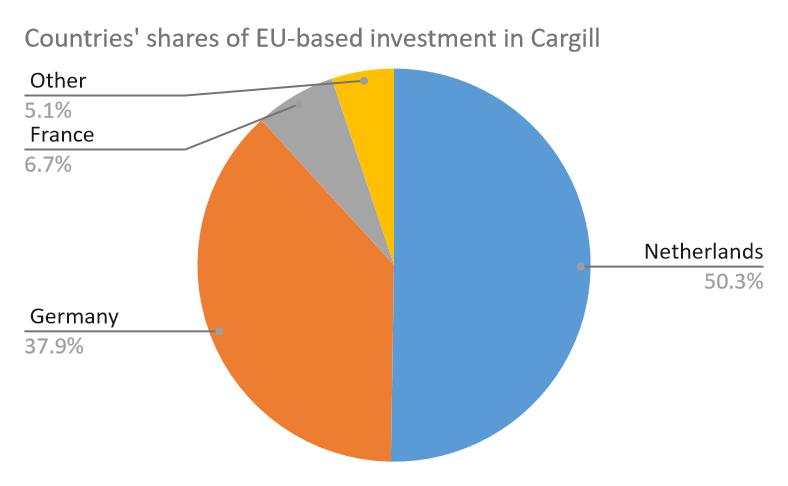
An EU bank, BNP Paribas, is the largest global provider of credit to Cargill since 2016, and Deutsche Bank is fourth. The following table shows the ten largest EU-based credit providers and investors.
Operating in 70 countries worldwide,36 Cargill is said to be the world’s largest agribusiness. The so-called ‘ABCD companies’, Cargill and its competitors ADM, Bunge and Louis Dreyfus, are estimated to control between 70% and 90% of the world’s grain supply.37 Cargill trades and processes (and in some cases produces) a large number of agricultural commodities, including palm oil, soya, rapeseed, maize, wheat, barley, sorghum, cocoa and cotton,38 and sells a vast range of processed ingredients.39 It produces and markets feeds for beef and dairy cattle, pigs, poultry and aquaculture40 and raises, processes and markets poultry across four continents,41 as well as being one of North America’s largest beef processors.42
Part of what makes Cargill so powerful is its vertical integration across certain commodity supply chains, including the control of key infrastructure. For example, as illustrated in a 2023 report by Mighty Earth, Cargill buys soya from Brazilian farmers, stores it in its own silos, then ships it from its own Santarém export facility to destinations including its own Liverpool (UK) import terminal and processing facility, where it crushes the beans and makes them into feed to be supplied to chicken farms contracted to Avara Foods, a Cargill joint venture, which then processes the birds before selling them to supermarket and fast food chains.43
Already a participant in the 2006 Amazon Soy Moratorium,44 at the 2014 UN Climate Summit Cargill signed the New York Declaration on Forests, pledging to ‘support and help meet the private-sector goal of eliminating deforestation from the production of agricultural commodities … by no later than 2020’45 and making clear that its contribution would involve protecting forests across all its agricultural supply chains worldwide.46 However, over the following seven years multiple investigations concluded that the company continued to purchase commodities linked to deforestation.
In 2015, Greenomics Indonesia found that Cargill was purchasing palm oil linked to deforestation in Indonesia’s West Papua province.47 Analysis by AidEnvironment estimated that Southeast Asian palm oil suppliers with a high or medium certainty of being linked to Cargill were responsible for 59,280
ha of deforestation between 2015 and 2022, including 6,620 ha since 2020.48 In 2017, an investigation by Mighty Earth found evidence of the company sourcing cocoa grown inside a protected area in Côte d’Ivoire.49 A year later, Mighty Earth’s follow-up investigation found that despite Cargill having signed on to a cocoa sector–wide deforestation commitment in November 2017, farmers engaged in deforestation were still able to sell their cocoa without facing sanctions or even a warning from the buyers in the company’s supply chain.50
Investigations by Repórter Brasil and others have concluded that in 2019 Cargill purchased soya from a trader sourcing from a company that satellite and other evidence revealed to have grown soya on Brazilian Amazon land embargoed after being illegally deforested,51 and that between 2019 and 2022 the company also bought soya directly from another Amazon property, the Santa Ana estate in Mato Grosso, where satellite analysis showed that soya was being grown in an illegally deforested and embargoed area.52 Though Cargill apparently purchased soya grown on unembargoed portions of the estate, the company offered investigators no evidence that it took steps to avoid soya from the embargoed area being laundered into its supply chain.53 In any event, even if no soya actually grown on the cleared land entered Cargill’s supply chain, according to the investigation the company was buying from an estate that has engaged in illegal Amazon deforestation – and where a further 400 ha was deforested by fire in the second half of 2022.54
In 2018, Cargill and four other soya traders were fined a total of $6.75m (R$24.6m) for purchasing soya reportedly linked to illegal clearance in the Cerrado savannah ecoregion.55 A 2019 Greenpeace International investigation found that Cargill had a storage facility inside the Agronegócio Estrondo estate in the Cerrado – an estate where illegal soya cultivation had occurred, and that held a permit for nearly 25,000 ha of further deforestation. Cargill was shown to have purchased and exported soya from the estate between 2017 and 2019.56
Analysis by AidEnvironment estimated that Brazilian soya suppliers with a high or medium certainty of being linked
to Cargill were responsible for 66,650 ha of deforestation between 2015 and 2022, at least 34,550 ha of this since 2020. The research identified 35 Brazilian deforestation cases (11 in the Amazon and 24 in the Cerrado) totalling 48,913 ha potentially linked to Cargill between 2019 and 2022. The company itself confirmed trading links to 14 of these cases, representing 29,786 ha of deforestation.57
Elsewhere in South America, new data from Trase has highlighted Cargill’s role in soya expansion in Bolivia, which Mighty Earth first investigated in 2017.58 The country’s soya industry is highly destructive: Trase has calculated that it involves almost seven times as much deforestation per tonne produced as in Brazil59 and reports that it threatens areas such as the biodiverse Chiquitano dry forest.60 According to Trase, most Bolivian soya is exported to Colombia and Peru, with little or none going to the EU, meaning that there is scant supply chain pressure on Bolivian producers to stop clearing forest.61
Trase cites the strong correlation between the geographical spread of soya production and that of deforestation as showing that deforestation is associated with most of Bolivia’s soya production, which was linked to over 100,000 ha of deforestation and conversion in 2021 alone.62
According to Trase, in 2021 Bolivia exported around 2.5 million tonnes of soya, or around 70% of its production, with Cargill – the only large global trader among the country’s top five exporters – responsible for over 8% of these exports (210,000 tonnes). Trase’s analysis found that these exports exposed the company to nearly 6,000 ha of deforestation.63 Cargill, being active as both an exporter and importer, also imported a further 236,000 tonnes of soya from producers without zero deforestation commitments.64 Collectively, as a result of its own exports and its imports from third parties, Trase’s researchers have estimated that Cargill was exposed to over 15,000 ha of deforestation and conversion in Bolivia in 2021.65
Cargill has pledged to remove deforestation from its soya, maize, wheat and cotton supply chains in Brazil, Argentina and Uruguay by 2025 and from all its commodity supply chains worldwide by 2030,66 already well outside
the 2020 cut-off date for compliance with the current EUDR. Despite its many commitments to no deforestation over the last 10 years,67 Cargill’s own Environmental Social Governance (ESG) reporting in 2023 gives a red flag to deforestation as a fail needing more attention.68 Furthermore, while Cargill claims the ‘Agriculture Sector Roadmap to 1.5°C’ for conversion-free soy as a success69 and states that it is on track to meet the commitments in it,70 a September 2023 report by Mighty Earth alleges that throughout 2022 Cargill, along with ADM, was instrumental in undermining negotiations on the soya chapter of the Roadmap that was ultimately agreed at COP27. According to Mighty Earth, resistance by these companies was largely responsible for the omission from the Roadmap of an immediate 2020 cut-off date after which deforestation of land subsequently used for soya cultivation would result in exclusion from signatories’ supply chains, as well as for the adoption of wording that failed to exclude destruction of non-forest habitats – bad news for ecoregions such as the Cerrado, most of which does not meet the narrow FAO definition of forest adopted in the Roadmap (and much less of which is legally protected than is the case for the Amazon).71 In 2019, Cargill had already stated that it would not support an industry-wide moratorium on buying soya from newly cleared areas of the Cerrado on the model of the Amazon moratorium that has been in place since 2006.72
Cargill’s case illustrates the importance of financial institutions assessing deforestation risk in terms of specific actors rather than commodity sectors. Cargill operates in, and has reported links to deforestation in, multiple commodity sectors across several continents; so, finance provided to the company ostensibly in the context of one commodity and locality may, at least indirectly, be helping to drive deforestation in other sectors or regions. The group’s control of value chains via vertical integration means it has direct contact with primary producers, which puts it in a better position to implement effective ecosystem protection than purely downstream actors, yet it has failed to uphold its commitments to do so.
• Type of company: Producer, processor and supplier of meat (beef, lamb, pork), poultry, fish and prepared/ processed products based on these; processor and supplier of leather; producer and supplier of plant-based protein products and margarines, personal care and beauty products, biodiesel and metal packaging; and trader of raw materials such as fats, oils and chemical products to the food and hygiene sectors73
• Stock listing: B3 (São Paulo), Ibovespa component.74 Dual listing on B3 and the New York Stock Exchange planned.75 Subsidiary Pilgrims Pride listed on NASDAQ.76
• Ultimate beneficiaries: As of 15 August 2023, according to the company’s filing to the US Securities and Exchange Commission in connection with its proposed dual stock market listing (see case study below), 48.83% of JBS S.A. was owned by the controlling shareholders, the Brazilian corporation J&F Investimentos S.A. and the Brazilian investment fund Fundo de Investimento em Participações Multiestratégia Formosa, both in turn owned by the brothers Joesley and Wesley Batista (sons of JBS founder José Batista Sobrinho77); 20.81% by Brazil’s state-owned development bank BNDES; and the remaining 30.36% by other non-controlling shareholders.78 The latter are not identified, but according to a 2020 report by ((o))eco, drawing on research by Forests & Finance, the largest at that time was BlackRock, with a stake of at least 2.06% worth $330m (R$1.8bn), followed by Itaú Unibanco (1.53%), Vanguard (1.35%) and Fidelity Investments (1.31%).79
• Headquarters: São Paulo, Brazil80
• Turnover 2022: Net revenue of $72.6bn (R$374.9bn)81
• Profit 2022: Net income of $3bn (R$15.5bn)82
• Significant ecosystem risk sectors (from current analysis): Animal feed, aquaculture, beef, biofuel, pork, poultry
As noted in the case study below, JBS has long been reported to have supply chain links to deforestation in Brazil. According to one investigation by Chain Reaction Research (CRR), based on available data the company may have been exposed to as much as 200,000 ha of deforestation in its direct supply chain and 1.5 million ha in its indirect supply chain in the country between 2008 and 2020 – and these are potentially underestimates, as they exclude two Amazon states in which JBS had slaughterhouses.83 This deforestation exposure was in spite of JBS’s 2009 commitment to the Greenpeace-sponsored G4 Cattle Agreement, by which it undertook to buy only from producers located within the Amazon biome (including, from 2011, indirect suppliers) that could provide proof of zero deforestation since the date it signed the agreement.84 Not only is JBS’s role in driving Amazon deforestation reported to have continued, but its impact on other biomes has also been severe. In fact, some 70% of the deforestation identified by the CRR investigation (and from which its overall estimates were extrapolated) was in the Cerrado.85
Public allegations of links to deforestation have not persuaded JBS to clean up its act. A 2023 analysis by Mighty Earth and AidEnvironment found that an incomplete sample of the direct and indirect suppliers of JBS’s 27 slaughterhouses in seven states within the Amazon and Cerrado were responsible for 447,913 ha of deforestation between 2009 and 2023, with 83,478 ha cleared between 2021 and 2023.86 At the end of 2022, Mighty Earth confronted the company with evidence that its meat supply chain was linked to no fewer than 68 cases of Amazon and Cerrado deforestation between January 2019 and September 2022, totalling over 125,000 ha (with nearly 75,000 ha of this total being potentially illegal). Though the clearance was identified using a satellite monitoring system from the Brazilian government space agency INPE, JBS refused to investigate the
cases, stating that it relies solely on data from an earlier satellite monitoring system developed by INPE.87
By the end of 2023, the Realtime Deforestation Monitoring Reports published several times a year by AidEnvironment had identified over 102,000 ha of deforestation in the Brazilian Amazon and Cerrado after the EUDR cut-off date of 31 December 2020 on properties owned by suppliers with suspected recent supply chain links to JBS.88
JBS’s reported deforestation impacts in these vital biomes are not limited to its beef supply chain. Research by Repórter Brasil found that a poultry breeding and slaughtering facility in Mato Grosso State operated by JBS subsidiary Seara has purchased soya for chicken feed from a Bunge crushing plant. During 2019, this plant reportedly sourced soya from a farm in the Cerrado where there had been recent legal and illegal deforestation as well as a farm in the Amazon where Repórter Brasil identified a risk of soya ‘laundering’ from an adjacent deforested property. Between 2018 and 2020, according to Repórter Brasil, Seara also sourced maize directly from several farms in the Cerrado that had recently engaged in illegal deforestation.89
Beyond the Amazon and the Cerrado, JBS also sources cattle from suppliers in the highly sensitive Pantanal wetland. In 2021, Greenpeace International showed that JBS had purchased cattle from Pantanal ranches affected by the devastating fires of July–October 2020.90 Ranchers in the region regularly use fire to clear land, but the report showed that the severe drought that year caused huge fires – in most cases probably lit deliberately, in defiance of federal and state-level prohibitions – to burn out of control, ultimately consuming nearly a third of the region’s vegetation.91 Although the JBS supply chain links identified by Greenpeace preceded the 2020 fires,92 according to subsequent research by the Environmental Justice Foundation the company was still buying cattle from at least two of the affected ranches in 2023.93
Finance identified from EU-based FIs:
Credit since 2016: $3.5bn Investment: $530m
Total global finance identified:
Credit since 2016: $31.3bn Investment: $10bn
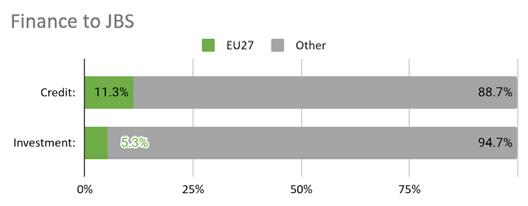
The EU financial sector is JBS’s fourth-largest provider of credit and third-largest investor.
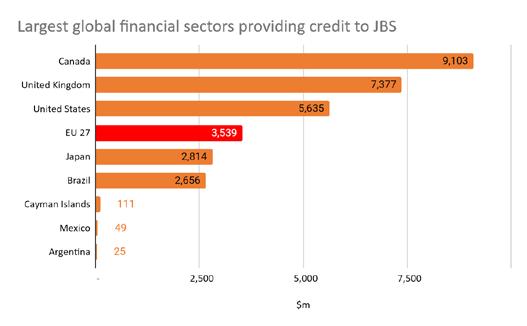
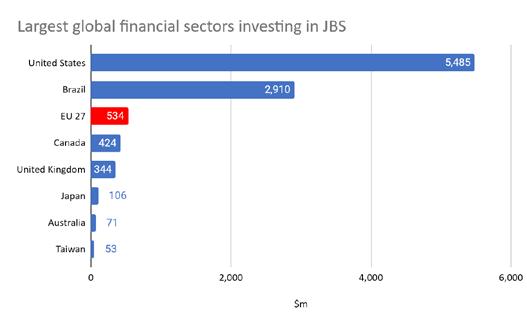
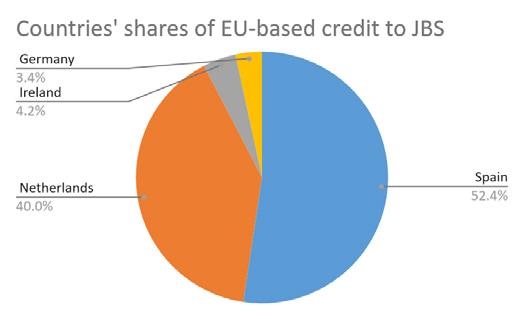
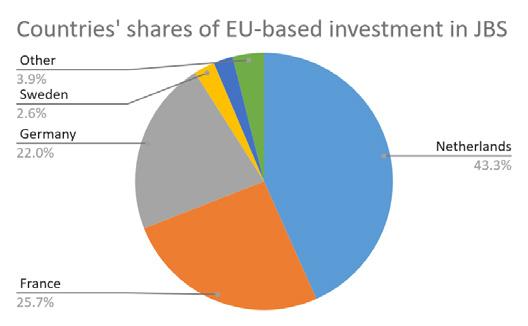
Three of the ten largest global providers of credit to JBS since 2016 are based in the EU: Rabobank, Santander and Banco Bilbao Vizcaya Argentaria (BBVA). The following table shows all the credit providers and the ten largest investors among EU-based FIs.
In July 2023, the world’s largest beef and poultry and secondbiggest pork producer,94 JBS S.A., announced a plan (currently postponed to 202495) to pursue a dual stock-market listing on the São Paulo B3 and New York stock exchanges.96 JBS is already listed on B3, but the company hopes that an NYSE listing will provide opportunities for it to ‘expand investment capacity to strengthen the conditions for growth and competition with global competitors … increase its visibility among the global investor community … broaden the access to a wider base of investors’ and ‘increase the flexibility to use equity as source of funding, paving the way to fundraising through issuing shares’ rather than through incurring debt.97 In other words, the dual listing is likely the prelude to an IPO. Though the announcement has not been tied to any immediate proposal to raise investment capital in this or any other way, it is clear that the opportunities for attracting investment that the dual listing would provide are central to the company’s plans for further expansion. No doubt, JBS also hopes that these ambitions will be helped along by the veneer of prestige and respectability that the NYSE listing would bring to a company notorious for corruption and linked to suspected human rights violations as well as large-scale ecosystem destruction.98
In its 2022 sustainability report JBS hints at its strategy for growth, noting that the global population is projected to increase by 1.7 billion people by 2050 and that this will go hand in hand with a 70% rise in demand for animal protein, driven by urbanisation and rising incomes as well as the growing population. While the report also refers to ambitions to expand in ‘plant-based, and alternative protein businesses’, it is specifically this predicted surge in animal protein demand that the company sees as ‘support[ing]’ its ‘future growth story’, with aquaculture singled out as another sector where it aims to ‘strengthen our position’ alongside its dominance of the beef, pork and poultry sectors.99
However, any massive expansion of animal protein production would be utterly at odds with the Paris Agreement
goals of reducing global GHG emissions to net zero by or before 2050 and limiting global heating to 1.5°C, as well as the aim of ending deforestation and other ecosystem conversion. Food and agriculture account for up to a third of all anthropogenic GHG emissions.100 In the scope of the challenge it poses to planetary boundaries, industrial meat and dairy production can be seen as the food sector’s answer to the coal industry, driving ecosystem destruction for both pasture and feed production (often with devastating impacts on Indigenous and traditional communities), while producing massive emissions both directly (through livestock’s methane output in the case of ruminants such as cattle and sheep) and indirectly through the aforementioned land-use change.
Even sectors calculated as having much smaller methane outputs per kilo of food product, such as pork, chicken (whose output is negligible) and aquaculture,101 still rely on feed ingredients such as soya,102 a key direct and indirect driver of ecosystem conversion in South America.103 According to one study, production of even the least carbon-intense forms of animal protein, such as eggs, farmed fish and chicken, results in between four and 15 times as much emissions in CO2e terms as beans or peas for an equivalent quantity of protein, while beef from a dedicated beef herd is responsible in weight-forweight protein terms for over 100 times the emissions of peas.104 Another study suggests that some 57% of emissions from the global food production system arise from the production of animal-based food, including feed, compared with 29% for plant-based food.105 In land use terms, livestock farming (including feed production) has been calculated to account for 83% of global farmland, although it produces only 18% of the world’s calories and 37% of protein.106
Predicted global population growth puts these figures into even sharper relief. A recent meta-analysis of over 50 global food security studies reports that total global food demand is likely to rise between 30% and 62% between 2010 and 2050.107 In this context, the 70% increase in animal protein production of which JBS hopes to be part is clearly untenable without catastrophic ecosystem destruction – instead, there needs to be a large-scale switch from livestock and feed to growing plant food for direct human consumption. A September 2023 article in Nature highlighted the potential for ‘substantial reduction in the global environmental impacts by 2050 if globally 50% of the main animal products (pork, chicken, beef and milk) are substituted [by plant-based alternatives] –net reduction of forest and natural land is almost fully halted and agriculture and land use GHG emissions decline by 31% in 2050 compared to 2020’.108 Further pressure against livestock expansion is likely following the global agreement at COP28 in 2023 to bring food and agriculture within the scope of mandatory UNFCCC target setting via Nationally Determined Contributions, to support the delivery of the 1.5°C target.109
In this context, investment in a company whose business model is predicated on expanding animal protein production would seem reckless, threatening the global community’s efforts to keep warming under 1.5°C and posing both reputational and financial risks to investing institutions. In the case of JBS, these risks are underlined by the company’s past performance. As a signatory of the 2009
G4 Cattle Agreement,110 JBS undertook to avoid purchasing cattle directly (or, from 2011, indirectly) from Brazilian Amazon suppliers that had engaged in legal or illegal deforestation – a voluntary commitment reinforced by the legally binding agreements that it and other beef processors signed the same year with the public prosecutor’s offices in relevant states requiring them to avoid purchasing cattle linked to illegal deforestation occurring since 2008.111
In the following years, the company continued to expand, both in Brazil and around the world.112 Yet, in November 2022, JBS demonstrated that it had not honoured its deforestation commitments under the G4 Cattle Agreement when it announced new target dates of 2023 and 2025, respectively, to eliminate direct and indirect suppliers linked to legal or illegal Amazon deforestation from its supply chains (with even later targets for other biomes).113 These cut-off dates are well outside the rules for compliance with the current EUDR.
One study that looked at all of JBS’s recorded suppliers as of 2019 and extrapolated from those that could actually be located estimated that the company may have been linked to as much as 200,000 ha of deforestation in its direct supply chain and 1.5 million ha in its indirect supply chain in Brazil between 2008 and 2020.114 According to Brazilian federal prosecutors, more than one in six cattle (16.7%) JBS purchased in Pará State from mid-2019 to mid-2020 were not compliant with the company’s legal obligations, mostly due to post-2008 illegal deforestation in their direct supply chain.115 Global Witness reports this as almost 94,000 head of cattle.116 JBS disputes the deforestation cut-off date applied, but even according to the company’s data, 8.85% of cattle purchased were not compliant. In 2022, a Bloomberg investigation concluded that JBS was still ‘one of the biggest drivers of Amazon deforestation’.117
The Institute for Agriculture and Trade Policy (IATP) and Changing Markets estimate that JBS’s 2021 GHG emissions exceeded those of Spain.118 While the company has set a target to achieve net zero emissions by 2040, its interim target for 2030 covers only Scope 1 and 2 emissions.119 According to IATP, however, as much as 97% of JBS’s emissions may be Scope 3,120 ie originating in the company’s supply chain, including from feed production (fertiliser, land-use change) and the rearing of animals by suppliers (on-farm emissions from livestock and manure; land-use change again).121
Early in 2023, JBS’s 2021 issue of sustainability-linked bonds became the subject of a complaint to the US Securities and Exchange Commission, alleging that the publicity for the issue tied it to the 2040 net zero pledge even though the key performance indicator for the bonds refers only to the interim 2030 Scope 1 and 2 target, and that the issue was therefore fraudulent. The complaint further alleges that JBS has concealed
the true scale of its emissions by failing to disclose the number of animals it slaughters each year (from which a Scope 3 emissions estimate could be extrapolated) and that it omitted material information about the recent growth in its Scope 3 emissions from its bond offering and investor presentations.122 In February 2024, the Wall Street Journal reported that New York’s Attorney General had filed a lawsuit against JBS USA, alleging fraud on the basis that the company’s net zero pledge is unattainable due to the methane and other carbon emissions inherent in beef production (exacerbated by the company’s links to deforestation), and that JBS’s claims to be working towards net zero are therefore misleading to consumers.123
JBS’s environmental performance has already begun to sap investor confidence. In 2020, Nordea Asset Management reportedly announced its divestment from JBS ‘over its ties to farms involved in Amazon deforestation’.124 PFZW, the secondlargest Dutch pension fund, reportedly divested from its JBS bond holdings in 2021, citing ‘land use and biodiversity incidents’.125
In agricultural commodity and other ecosystem risk sectors, any finance intended to facilitate expansion of a company’s operations has the potential to drive land-use change, and therefore deforestation or other habitat destruction, whether directly or indirectly. In the case of sectors where this impact is more or less inevitable (including animal protein sectors such as meat, dairy and aquaculture, as well as plantbased biofuel other than that using waste products), financial institutions committed to the Paris climate goals should therefore avoid lending to or investing in companies proposing such expansion – whether it involves direct geographical expansion of agricultural production or downstream expansion that will increase upstream pressure for land-use change.
Conversely, financial institutions have an opportunity and a responsibility to help fund the global transition from animal protein to plant protein in the human diet by not only avoiding funding expansion of the former but actively seeking to fund expansion of the latter. Even here, though, due diligence is necessary to ensure that the land requirement for such expansion is met by reducing land use for animal protein and feed production rather than via new conversion of forest or other natural habitat, and moreover does not simply displace animal protein and feed production, leading to further conversion by these sectors.
• Type of company: Producer, processor and supplier of beef and associated prepared products; processor and supplier of lamb; processor and supplier of other processed and frozen foods, including plant-based protein products; and processor and supplier of leather126
• Stock listing: B3 (São Paulo), Ibovespa component127
• Ultimate beneficiaries: As of 11 July 2023, 53.1% of Marfrig’s shares were owned by MMS Participações Ltda. and its individual partners. MMS Participações Ltda. is jointly owned (50% each) by Marcos Antonio Molina dos Santos (Marfrig’s founder128 and Controller and Chair of the Board129) and his wife130 Marcia Aparecida Pascoal Marçal dos Santos.131
• Headquarters: São Paulo, Brazil132
• Turnover 2022: Net revenue of $25.3bn (R$130.6bn)133
• Profit 2022: Net profit of $807m (R$4.166bn)134
• Significant ecosystem risk sectors (from current analysis): Animal feed, beef
As with its larger rival, JBS, reports by various environmental NGOs have linked Marfrig’s beef supply chain to deforestation in Brazil’s Amazon, Cerrado and Pantanal ecoregions. In the Amazon, analysis by Global Witness concluded that between 2017 and 2019 Marfrig sourced cattle from 89 ranches that had illegally deforested a collective total of over 3,300 ha, with the deforestation occurring during the time period covered by the G4 Cattle Agreement (signed by Marfrig in 2009; see JBS profile for details) in 39 of these cases.135 Repórter Brasil also identified several Amazon ranches from which Marfrig sourced cattle in 2018–19 despite their having been subject to fines or embargoes (prohibiting agricultural activity on specified areas of newly cleared land) for illegal deforestation within the previous few years.136
A 2023 investigation by Forbidden Stories in partnership with Repórter Brasil and the Bureau of Investigative Journalism found that an Amazon rancher whose illegal deforestation and links to JBS had previously been uncovered by the murdered journalist Dom Phillips is now supplying Marfrig. It also reported evidence of continued grazing on the cleared and embargoed land as well as of ‘laundering’ of cattle from the sanctioned ranch to a ‘clean’ feedlot that supplied Marfrig in January 2023.137
In the Cerrado, Repórter Brasil identified two ranches from which Marfrig sourced cattle in 2018–19 despite their having engaged in illegal deforestation.138 A 2023 analysis by Mighty Earth and AidEnvironment concluded that an incomplete sample of the direct and indirect suppliers of Marfrig’s six slaughterhouses in seven states within the Amazon and Cerrado were responsible for 114,443 ha of deforestation between 2009 and 2023, with 20,145 ha of this occurring between 2021 and 2023.139 By the end of January 2024 the Realtime Deforestation Monitoring Reports published several times a year by AidEnvironment had identified 58,441 ha of deforestation since 1 January 2021 on properties owned by suppliers that AidEnvironment suspected with varying degrees of certainty of having recent supply chain links to Marfrig; apart from 3,168 ha in the Cerrado, all of this was in the Amazon.140
Greenpeace International’s investigation of the catastrophic Pantanal fires of 2020 – many of which are believed to have originated in deliberate and illegal fire-setting by ranchers – found that during the previous two years Marfrig had sourced cattle directly or indirectly from at least eight fire-affected ranches within whose boundaries over 32,000 ha of vegetation had burned.141 Four of these ranches had been subject to fines and/or embargoes for unlicensed clearance or other infractions in the few years prior to Marfrig’s documented sourcing.142 Research by Repórter Brasil identified two further ranches from which Marfrig had sourced cattle as the ignition points of fires that destroyed nearly 40,000 ha.143
Finance identified from EU-based FIs:
Credit since 2016: $2.4bn Investment: $80m
Total global finance identified:
Credit since 2016: $10.6bn Investment: $704m
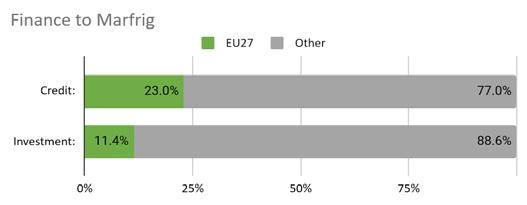
The EU financial sector is Marfrig’s second-largest provider of credit and fourth-largest investor.
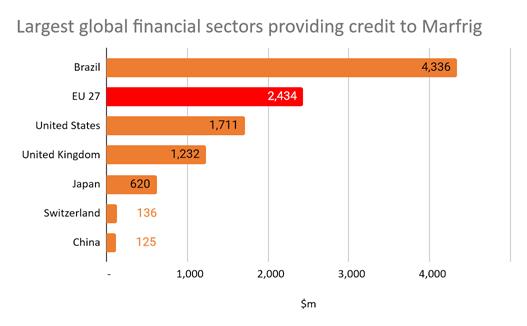
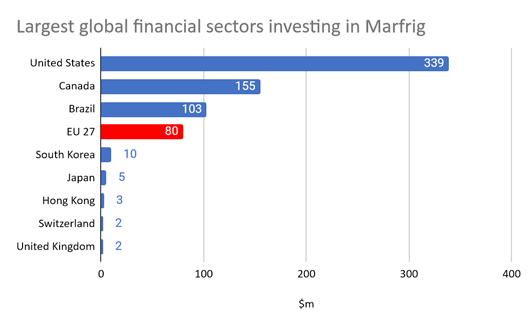
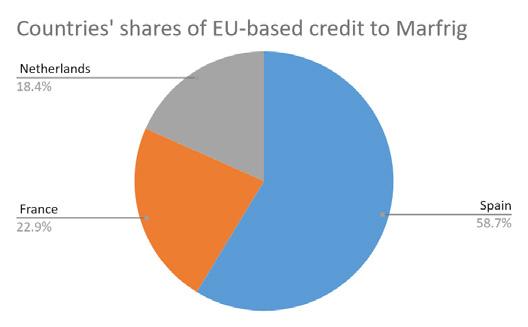
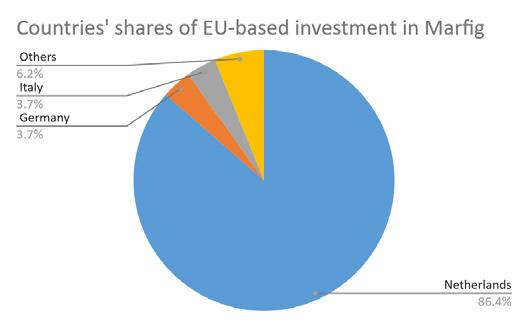
A single EU-based FI, Santander, is responsible for 13% of the total global identified credit to Marfrig since 2016. BNP Paribas is also among the company’s ten largest global providers of credit. The following table shows all the credit providers and the ten largest investors among EU-based FIs.
• Type of company: Conglomerate whose interests include growing and processing of palm oil and supply of derived products including in the food, oleochemicals and biofuel sectors; growing and processing of pulpwood and supply of pulp, paper, cellulose and viscose; and extraction and processing of natural gas and energy generation144
• Stock listing: None (privately owned)145
• Ultimate beneficiaries: RGE itself is owned personally by Sukanto Tanoto, the group’s founder and chairman, and his family. According to the RGE website, ‘Each business group is independently run, owns its assets, and manages its finances autonomously.’146 However, the constituent companies of the group are also wholly owned by Tanoto and his family: ‘All RGE Group companies are fully owned by the Tanoto family shareholders’.147
• Headquarters: Singapore148
• Turnover 2022: No recent information on RGE’s financial performance or that of most of its group companies appears to be publicly available. In 2015 a news article reproduced on RGE’s website reported the group’s annual revenue to be $10bn, a figure not disputed by RGE, though it added an ambiguous clarification: ‘Additional information to the USD 10 billion revenue of the company, we would like to note that USD 4 billion comes from the Indonesian operations’ (it is unclear whether this $4bn is to be considered as part of the $10bn estimate or as additional to it).149 Two years later, RGE’s revenue was reported by an independent source to be $17bn.150 Paper business unit Asia Symbol reports its sales revenue for 2022 as $3.2 bn (21.5bn RMB).151 According to RGE itself, the companies’ overall assets currently exceed $30bn.152
• Profit 2022: No information on RGE’s recent profits or those of its group companies appears to be publicly available.
• Significant ecosystem risk sectors (from current analysis): Palm oil producer, palm oil trader, pulp
As noted in the case study below, recent investigations have identified tens of thousands of hectares of deforestation in Kalimantan (the Indonesian part of the
island of Borneo) since 2016 by pulpwood plantation companies in a group, Nusantara Fiber, suspected of being connected to RGE (though with opaque ownership structures) – some 26,100 ha between 2016 and late 2020, according to analysis by AidEnvironment, and at least a further 16,900 ha between the start of 2021 and January 2024, according to data from forest monitoring platform Nusantara Atlas.153 RGE is also alleged to have links to 33,000 ha of deforestation and endangered orangutan habitat in Indonesia since 2021 by PT Mayawana Persada.154 Despite the evidence provided about the respective links, the group has denied being related to either Nusantara Fiber155 or PT Mayawana Persada.156
NGO reports have also implicated the palm oil side of RGE’s operations in Indonesian rainforest destruction and links to illegal production. In 2018, an investigation by Indonesian NGO coalition Eyes on the Forest reported that during the first half of 2017 a mill operated by RGE’s palm oil production arm Asian Agri had processed palm oil fruit illegally grown within Tesso Nilo National Park, Sumatra, and that in April to June of that year two processing facilities belonging to RGE’s palm oil trading and processing arm, Apical, had purchased palm oil both from this mill and from several others sourcing illegally grown fruit from the national park and a second conservation hotspot in central Sumatra, the Bukit Tigapuluh landscape.157 Eyes on the Forest had previously documented illegal purchases involving the same and other RGE mills as far back as 2011.158
In 2020, a Rainforest Action Network investigation into deforestation in the globally important Leuser Ecosystem in Northern Sumatra (home to Sumatran elephants, tigers, rhinos and orangutans159) concluded that Apical had been buying palm oil from a mill supplied by a plantation company that had cleared at least 269 ha of forest in the ecosystem since January 2018, when the Indonesian government declared a moratorium on deforestation for palm oil. The clearance continued into 2020.160 In April 2021, Rainforest Action Network exposed a further supply chain link between the same Apical-owned refinery and another rogue plantation company which it had documented destroying rainforest within the Leuser Ecosystem since 2014 and into 2021.161
Finance identified from EU-based FIs:
Credit since 2016: $965m
Total global finance identified:
Credit since 2016: $20.9 bn
Investment: none identified from global FIs, probably because RGE is not a listed company and does not issue bonds
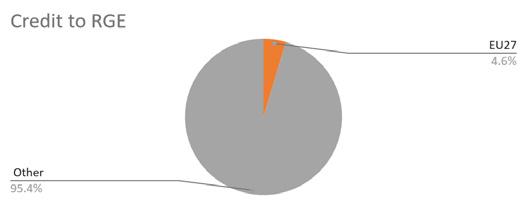
The EU financial sector is RGE’s fifth-largest provider of credit.
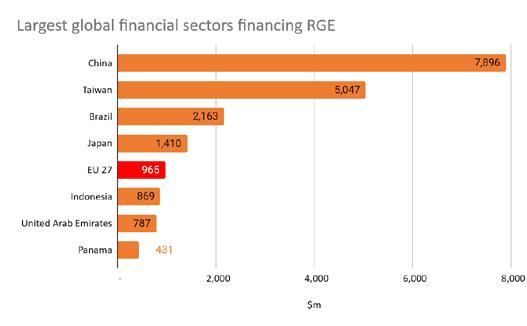
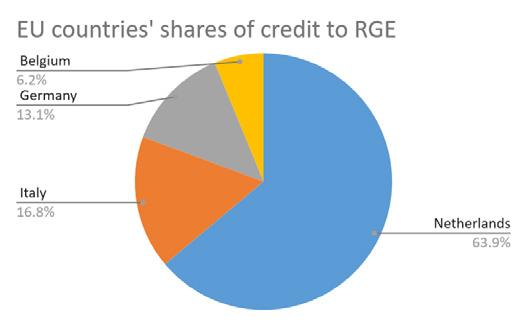
The following table lists the EU-based FIs that have provided credit to RGE since 2016.
Over the last decade, multiple investigations by Greenpeace organisations and others162 into the activities of large-scale producers and processors in forest-risk commodity sectors such as palm oil and wood pulp, particularly in Southeast Asia, have made clear the extent to which formal corporate group structures based on acknowledged legal parent–subsidiary relationships fall short of giving a complete picture of the control exerted by such groups. This results in part from the tendency for companies owned by various different members of the same family or their associates, without a single overall ownership structure, to operate as more or less unified conglomerates. However, it also suggests a desire by some groups active in forest-risk sectors to avoid accountability by concealing their links to companies that they own or control and whose operations cause deforestation or other environmental or social harms, in contravention of the no deforestation, peatland development or exploitation (NDPE) or similar policies to which the groups and their acknowledged companies have publicly committed.
Groups wishing to achieve this have a number of methods of concealment to choose from. A group may obscure its beneficial ownership of subsidiaries by means of opaque structures involving offshore secrecy jurisdictions, shell companies, nominee shareholders and/ or power of attorney agreements. Financial or operational arrangements, such as loans, exclusive supply agreements or contracts to run a facility, may also allow control to be exerted, formally or informally, over a company’s operations without actual ownership.
The commodities produced or processed by such shadow companies may directly enter the supply chains of the controlling group, but even if they do not, the companies are still likely to be funded by the group and to contribute to its revenues. Tracing such finance is inherently difficult. Shadow arrangements may also offer opportunities for money laundering and tax evasion. For financial institutions aiming to lend to or invest in businesses in ecosystem risk sectors while ensuring compatibility with the 1.5°C climate target and minimising their exposure to deforestation (or other environmental harms) and to financial crime, it is therefore vital to have an awareness of these shadowy wider group structures. Outwardly respectable corporate
groups with publicly listed members that have made well-publicised NDPE commitments and whose operations and facilities are certified by sustainability bodies such as the Roundtable on Responsible Palm Oil (RSPO) and Forest Stewardship Council (FSO) may yet turn out to be linked to extensive ecosystem destruction.
Allegations against the Singapore-based Royal Golden Eagle (RGE) well illustrate the potential for shadow ownership structures to conceal group links to deforestation. As mentioned in the profile above, the publicly acknowledged group (according to the RGE website) consists of a number of autonomous business units,163 including in the pulp and palm oil sectors, all of whose member companies have been declared as ultimately owned by family members of founder Sukanto Tanoto164 (ownership is concealed via offshore holding companies, making this difficult to check). In 2015, RGE adopted a sector-wide NDPE framework (albeit not excluding development of unforested peatland) applying to all its timber, pulp, paper and fibre companies and their suppliers,165 while its main sector business units, APRIL166 and Asia Symbol,167 have policies of their own reflecting this (though Asia Symbol’s wood and pulp sourcing policy does not mention peatland at all). APRIL, RGE’s Indonesian vertically integrated timber, pulp and paper unit, was FSC certified until it withdrew and was then disassociated by FSC in 2013 following allegations of deforestation, and is currently seeking to end this disassociation.168
RGE is reported to have obtained over $3bn in sustainability-linked loans (SSLs) for its various business groups since 2021169 and has stated that at the group level it is committed to raising all its financing needs via SSLs.170 However, there are multiple allegations that companies controlled by RGE but not officially acknowledged as part of the group have either engaged in deforestation, purchased raw materials linked to deforestation or contributed to growing demand for raw material that is likely to be met by deforestation.
A 2021 report by AidEnvironment claims on the basis of satellite imagery analysis that between 2016 and 2020, 26,124 ha of forest in Kalimantan were cleared by timber plantation companies belonging to the Nusantara Fiber group, making it ‘by far the largest deforester among company groups with industrial tree concessions in
Indonesia, between 2016 and the end of October 2020’.171 A more recent report suggests nearly 7,000 ha of further deforestation and 1,000 ha of peat conversion by Nusantara Fiber companies in 2022 alone, although this relates to a slightly different set of companies from that covered in the AidEnvironment report, so the figures are not directly comparable.172 Based on its findings regarding RGE’s business relationships with all 27 mill- or crusher-owning palm oil companies that AidEnvironment has linked to past and present Nusantara Fiber directors, as well as the historic ownership of most of Nusantara Fiber’s plantation companies by a company previously linked to Sukanto Tanoto and RGE and the finding that two of the Nusantara Fiber holding company’s first three directors were former RGE employees, AidEnvironment concludes that Nusantara Fiber is ‘connected in various ways to Royal Golden Eagle (RGE)’.173 AidEnvironment stops short of saying that Nusantara Fiber is controlled by RGE, which reflects the difficulty of establishing who does control Nusantara Fiber, given that its operating companies are owned by a structure of holding companies whose ultimate known parent is registered in a secrecy jurisdiction.174 In a brief response to a draft of AidEnvironment’s report, RGE denied being related to the companies to which AidEnvironment had linked it, but according to AidEnvironment the group did not reply to a subsequent request to provide a more extensive response.175
One of the plantation companies mentioned by AidEnvironment as part of Nusantara Fiber, PT Industrial Forest Plantation (PT IFP), is separately reported by Environmental Paper Network (EPN) to have been among three indirect suppliers of wood to Asia Symbol, all operating in Kalimantan, which collectively reportedly cleared over 37,000 ha of forest between 2016 and 2022 –with PT IFP being the worst culprit, having cleared 21,800 ha of forest, all identified as orangutan habitat (nearly a third of that in 2022 alone). EPN’s report identifies these three companies as having supplied timber to a wood chip mill, PT Balikpapan Chip Lestari (PT BCL), which in turn sent at least 90% of its 2021 and 2022 exports (nearly 97% of its total output) to Asia Symbol.176 However, the report by a coalition of NGOs alleges that PT BCL is itself linked to RGE in ways suggestive of common control, with evidence including the mill’s colocation with an Apical (RGE) palm oil refinery, the near-exclusive supplier relationship with Asia Symbol, past and present management links to RGE and a PT BCL employee describing it as an RGE company in his LinkedIn profile.177 RGE itself appears to acknowledge this link, with its response to the findings in this report describing how Asia Symbol has directed PT
BCL to align its sourcing policy with Asia Symbol’s and how it has addressed PT BCL sourcing from PT IFP and other companies that may be engaging in deforestation. These statements clearly contradict the company’s assertion, in the same reply, that it ‘exercises no form of control over Nusantara Fiber, PT IFP and PT BCL’.178
Another mill currently under construction – PT Phoenix Resources International (PT PRI), a vast pulp mill that is predicted to drive increased deforestation in Kalimantan179 – has also been connected to RGE (partly via PT BCL) through management links and shared office locations.180 RGE has denied links with PT PRI.181 However, if PT PRI is under common control with RGE, given the group’s opaque internal structures and financing, some of RGE’s $3bn in sustainability-linked loans (see above) could be indirectly financing a new facility driving deforestation.
In relation to palm oil, in June 2022 an oil palm plantation company, PT Usaha Sawit Unggul, stated by Mighty Earth three years previously to be owned by RGE group company PT Asianagro Lestari,182 was reported to have cleared over 350 ha of forest in Sumatra since the start of the year, with operations still ongoing.183 Analysis by AidEnvironment put the figure much higher, at ‘as much as 1,500 ha’ in the first half of 2022, while noting that the company has a new owner registered in the British Virgin Islands,184 making any continuing links to RGE impossible to confirm. RGE claims that ‘Apical has suspended sourcing from PT Usaha Sawit Unggul (PT USU) since May 2022.’185
None of these companies that are reported to be contributing (or threatening to contribute) to the destruction of Indonesia’s rainforests is an acknowledged member of the RGE group. Yet all have reported links to the group which, to a greater or lesser degree, imply that RGE may control them, and RGE has acknowledged the AFi definition of ‘corporate group’186 (see the section ‘How to address ecosystem risk finance: Group-level responsibility’). As a result, it is difficult to take RGE’s environmental policies and claims of sustainable practice at face value.
The implications of such situations for financial institutions proposing to lend to or invest in businesses in ecosystem risk sectors are obvious. It is not enough to accept a client’s assurances as set out in its sustainability policies and reports, or to conduct due diligence only on its publicly acknowledged operations. If they have not already done so, financial institutions must adopt due diligence procedures to identify unacknowledged ‘shadow companies’ under common control with the main group which may expose them to ecosystem risks, using the AFi definition of ‘corporate group’ or an equivalent.
• Type of company: Conglomerate whose interests include growing and processing of pulpwood and supply of pulp and paper;187 growing and processing of palm oil and supply of derived products in the food, oleochemical and biofuel sectors;188 property and development;189 financial services;190 communications and technology;191 energy and infrastructure (including coal mining and energy generation);192 and healthcare193
• Stock listing: Sinar Mas has no formal legal existence as a group, though many Sinar Mas group companies are individually listed. The group’s main palm oil company, Golden Agri-Resources (GAR), is listed on the Singapore Exchange.194 Its operating entity195 PT Sinar Mas Agro Resources and Technology Tbk (PT SMART Tbk)196 and at least two companies under the pulp and paper business unit Asia Pulp and Paper (APP) Sinar Mas197 are listed on the Indonesia Stock Exchange, as is energy and mining company PT Dian Swastatika Sentosa Tbk (DSS),198 while property developer Sinar Mas Land is listed in both Jakarta and Singapore.199
• Ultimate beneficiaries: Sinar Mas is said to be owned by the Widjaja family, descendents of founder Eka Tjipta Widjaja, who died in 2019.200According to APP and GAR, they are independent legal entities, with distinct management controls and ownership structures.201 As of March 2023, a Widjaja family trust had a controlling interest of 50.56% in GAR, held through several intermediaries. GAR’s major shareholders included Raffles Nominees (Pte) Ltd (28.56%), HSBC (Singapore) Nominees Pte Ltd (20.27%), Massingham International Ltd (15.98%) and Citibank Nominees Singapore Pty Ltd (8.49%). (Massingham holds shares as an intermediary of the Widjaja family trust and at least
one of the other firms named must do so on behalf of the trust’s other intermediaries.)202 GAR owns 92.4% of PT SMART and wholly owns the vast majority of its other palm oil production, processing and trading subsidiaries.203
All ten APP Sinar Mas companies shown on an organogram provided on the entity’s website204 are wholly or majority-owned by PT Purinusa Ekapersada, a holding company 91% owned (as of 31 December 2022) by Eka Tjipta Widjaja’s eldest son205 Oei Tjie Goan (also known as Teguh Ganda Widjaja206).207 The stocklisted companies PT Indah Kiat Pulp and Paper Tbk and PT Pabrik Kertas Tjiwi Kimia Tbk are shown as being respectively 53.25% and 59.67% owned by PT Purinusa Ekapersada, which owns (directly or indirectly) at least 99% of all the other companies shown, with the exception of PT OKI Pulp & Paper Mills, of which it owns 78%.208Headquarters: Jakarta, Indonesia209
• Turnover 2022: Group financial figures are not published. The group’s pulp and paper business unit, APP Sinar Mas, reports 2022 net sales of $9.363bn.210 GAR reports 2022 consolidated revenue (i.e. including subsidiaries) of $11.44bn.211
• Profit 2022: Group financial figures are not published. APP Sinar Mas does not report an overall profit figure; however, it publishes financial results for its five companies that are stock-listed or have been the subject of bond issues, which had a combined total net profit of at least $2.09bn in 2022.212 GAR reports a consolidated profit for 2022 of $846.5m, of which $782.1m is attributable to the owners of the company.213
• Significant ecosystem risk sectors (from current analysis): Palm oil producer, palm oil trader, pulp, sawn wood
APP Sinar Mas has a long history of involvement in deforestation in Indonesia. In February 2013 the company committed to removing deforestation and peatland clearance from its supply chain from that date,214 but it has repeatedly breached its commitments.215 According to APP, ‘In 2022, we updated our SERA [Supplier Evaluation and Risk Assessment] process to better align our commitments and policies with the global movement to end deforestation … which includes bringing forward the cut-off date to end deforestation to 2020.’216
A report released by WWF in 2018 concluded that the previous year APP’s flagship pulp and paper mill in Riau and an APP-affiliated mill in East Kalimantan had sourced pulpwood from two plantation concessions in East Kalimantan, both of which had engaged in deforestation every year from 2013 to 2017, with the total area deforested in that period reaching 32,000 ha.217 The same year, analysis by Greenpeace International showed that 8,000 ha of forest in Kalimantan had been cleared since 2013 by two other pulpwood plantation companies linked to Sinar Mas, one owned by a mining subsidiary of the group and the other by two employees of APP’s sister company Sinar Mas Forestry.218 An investigation by Mongabay subsequently reported that APP had arranged for the company to be put in the names of the employees in an attempt to obscure its links to it.219 According to a Nusantara Atlas analysis based on data from the University of Maryland, deforestation by APP supplier concessions between 2013 and 2022 totalled nearly 75,000 ha.220 Additionally, analysis by Greenpeace Southeast Asia identified some 3,500 ha of peatland clearance in Sumatra between 2018 and 2020, in APP’s own concessions and those of its major suppliers.221 Such infractions appear to continue. A 2022 investigation by Indonesian NGO coalition Eyes on the Forest focused on two of APP’s long-term wood suppliers (which according to Eyes on the Forest are owned by APP/Sinar Mas), both located within the Giam Siak Kecil-Bukit Batu Biosphere Reserve
in Riau, Sumatra. It found that between September 2021 and January 2022, in one concession an area of forest on deep peatland (where new plantation development is prohibited) had been cleared, while in the other around 50 ha of regenerating natural vegetation had been cleared, despite it lying within the home range of a Sumatran elephant population and therefore meeting the definition of a High Conservation Value (HCV) 1 area. In both areas, newly planted acacia (pulpwood) seedlings were found.222 APP admits that the area is HCV1 but denies conversion of natural forest.223
Sinar Mas’s palm oil operations have also been linked to illegality and ecosystem destruction. In 2018, an investigation by Eyes on the Forest found that between April and June 2017 a bulking station and a refinery belonging to GAR were supplied with palm oil by two mills sourcing illegally grown fruit from the Tesso Nilo National Park in Sumatra.224 More recently, according to reports from Chain Reaction Research (drawing on AidEnvironment analysis) and the Environmental Investigation Agency, GAR has purchased palm oil from mills supplied by two of the top ten deforesters among Southeast Asian palm oil companies in the first half of 2022, one in West Kalimantan and the other in North Sumatra, which between them cleared some 1,960 ha during that period (and at least another 2,800 ha over the previous two years).225 GAR has claimed that it has since stopped sourcing from these two companies.226
GAR has also been linked to deforestation in Africa. In 2021, an independent panel convened by the High Carbon Stock Approach (HCSA) anti-deforestation initiative found that Golden Veroleum, a Liberian company ultimately owned by GAR,227 had cleared over 1,000 ha of High Carbon Stock forest in Liberia (and probably additional areas of High Conservation Value forest, including areas frequented by chimpanzees and pygmy hippos), in contravention of its no deforestation commitments.228 Two years later GAR withdrew from the HCSA, of which it had been a founding member, sparking accusations – including from Greenpeace Indonesia – that it was reneging on its zero deforestation commitment.229
Finance identified from EU-based FIs:
Credit since 2016: $1.1bn
Investment: $19m
Total global finance identified:
Credit since 2016: $35.6bn Investment: $900m
Figures for finance to Sinar Mas include finance to the Canadian company Paper Excellence, based on evidence previously published by Environmental Paper Network and others that Sinar Mas controls this company.230
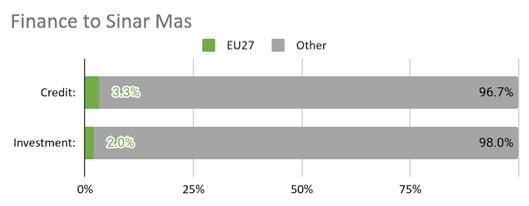
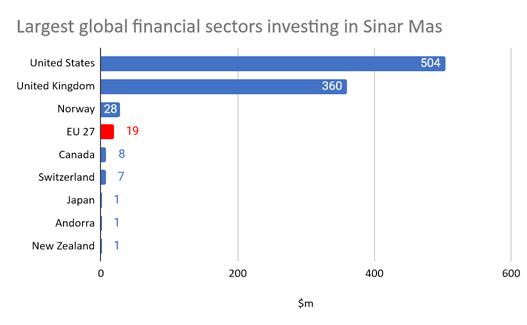
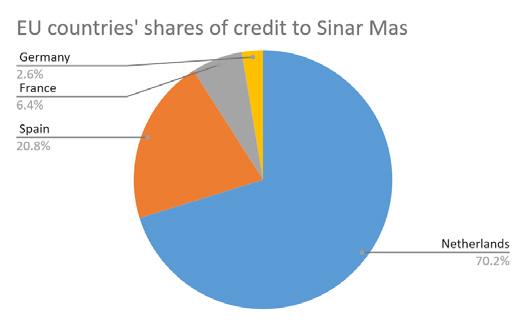
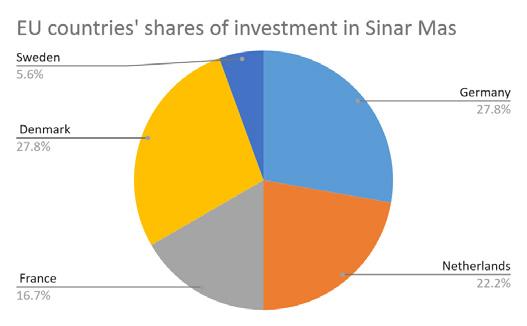
There are no EU-based FIs among the ten global FIs providing the largest amounts of finance to Sinar Mas; the highest is Rabobank at number 17 on the list of top credit providers since 2016. The following table lists all of the EU-based FIs that have provided credit to Sinar Mas since 2016, and the ten largest EUbased investors.
1 JBS describes itself as the world’s largest beef and poultry and second-largest pork producer (JBS (2023d) p.10). Marfrig describes itself as the world’s secondlargest beef producer (Marfrig, ‘Our operations’).
2 European Parliament and Council of the European Union (2023) Article 3, Article 2 paragraph 13
3 European Parliament and Council of the European Union (2023) Article 3 (b)
4 Luxembourg covers 258,600 ha (2,586km2). CIA World Factbook, ‘Luxembourg’.
5 Evidence of potential links includes known supply chain relationships between one or more of the corporate groups under discussion and the proprietors of deforested properties (potentially through different or unspecified properties), and the operation by one or more of the corporate groups of warehouses or slaughterhouses in the vicinity of deforested properties.
AidEnvironment (2022a) pp.3-14; AidEnvironment (2022b) pp.3-18; AidEnvironment (2022c) pp.3-24; AidEnvironment (2022d) pp.3-8, 1320; AidEnvironment (2022e) pp.3-8, 13-17; AidEnvironment (2022f) pp.3-11, 14-17; AidEnvironment (2022g) pp.321; AidEnvironment (2022h) pp.4-9, 11-19; AidEnvironment (2023a) pp.320; AidEnvironment (2023b) pp.3-19; AidEnvironment (2023c) pp.3-14, 1923; AidEnvironment (2023e) pp.3-19; AidEnvironment (2023f) pp.5-6, 13-19; AidEnvironment (2023g) pp.3-12, 17-20, 26-27; AidEnvironment (2023h) pp.3-10, 1819, 22-23; AidEnvironment (2023i) pp.3-17, 22-23; AidEnvironment (2023j) pp.3-9, 16-17
6 As noted in Mighty Earth (2023d) pp.27-28
7 Bunge, ‘We are Bunge’; Bunge, ‘Key commodities’; Bunge, ‘Markets we serve’
8 Bunge, ‘Investors’
9 S&P Dow Jones Indices (2023)
10 Bunge (2023b) p.36
11 Bunge, ‘Investors’
12 Bunge (2023a) p.F-4
13 Bunge (2023a) pp.33, F-4
14 Mighty Earth (2023d) p.3
15 In the first five months of 2023, clearance in the Cerrado reached 3,532 km2, 35% up on the corresponding period in 2022, compared with 1,986 km2 of deforestation in Brazil’s Legal Amazon, which was 31% down on the corresponding period in 2022. Source: Gabriel (2023)
16 Mighty Earth (2023d) pp.3, 8-24; Campos & Dallabrida (2023)
17 Evidence of potential links includes known supply chain relationships between Bunge and the proprietors of deforested properties (potentially through different or unspecified properties), and the operation by Bunge of warehouses in the vicinity of deforested properties.
AidEnvironment (2022a) pp.5-14; AidEnvironment (2022b) pp.9-10, 13-18; AidEnvironment (2022c) pp.3-9, 13-16, 21-24; AidEnvironment (2022d) pp.5-6, 13-17; AidEnvironment (2022e) pp.3-8, 13-15; AidEnvironment (2022f) pp.5-9, 14-17; AidEnvironment (2022g) pp.1721; AidEnvironment (2022h) pp.15-19; AidEnvironment (2023a) pp.11-12, 1520; AidEnvironment (2023b) pp.7-8; AidEnvironment (2023c) pp.3-8, 19-23;
AidEnvironment (2023e) pp.3-9, 14-19; AidEnvironment (2023f) pp.5-6, 13-19; AidEnvironment (2023g) pp.8-12, 17-20; AidEnvironment (2023h) pp.3-10, 18-19; AidEnvironment (2023i) pp.3-17, 22-23; AidEnvironment (2023j) pp.5-9, 16-17
18 Bunge (2024)
19 Bunge (2022) pp.28-29
20 Letter from Bunge to Mighty Earth, dated 6 June 2023, included in Mighty Earth (2023d) p.65
21 Bunge (2024)
22 Mighty Earth (2023d) pp.27-28
23 Environmental Investigation Agency (2022)
24 Bunge (2024)
25 Cargill, ‘Agriculture’; Cargill, ‘Beef business’; Cargill, ‘Poultry’; Cargill, ‘Products & services’
26 Reid (2019)
27 Reid (2019)
28 Neate (2022)
29 Cargill, ‘Contact us’
30 Cargill (2022) p.3
31 Blas (2022)
32 AidEnvironment (2023d)
33 Evidence of potential links includes known supply chain relationships between Cargill and the proprietors of deforested properties (potentially through different or unspecified properties), and the operation by Cargill of warehouses in the vicinity of deforested properties. AidEnvironment (2022a) p.3-4, 9-10; AidEnvironment (2022b) pp.11-12, 1516; AidEnvironment (2022c) pp.3-9, 15-16; AidEnvironment (2022d) pp.56; AidEnvironment (2022e) pp.7-8; AidEnvironment (2022f) pp.10-11; AidEnvironment (2022g) pp.5-6, 17-19; AidEnvironment (2023c) pp.9-14, 19-23; AidEnvironment (2023e) pp.12-13, 17-19; AidEnvironment (2023g) pp.3-4, 8-10, 17-20; AidEnvironment (2023h) pp.18-19; AidEnvironment (2023i) pp.3-9, 13-14
34 Reis et al (2023); Trase Supply Chains, ‘Bolivia soy supply chain’
35 Global Witness (2023c) pp.5-7
36 Cargill (2021)
37 Food Processing (2022); World Bio Market Insights (2023)
38 Cargill, ‘Agricultural trading & processing’; Cargill, ‘Agriculture’; Cargill, ‘Cargill cocoa and chocolate’
39 Cargill, ‘Food & beverage’
40 Cargill, ‘Animal nutrition’
41 Cargill, ‘Meat & poultry’
42 Cargill, ‘Beef business’
43 Mighty Earth (2023b) pp.11-12, 14-15; Jordan et al (2020)
44 Cargill, ‘Statement of soy sourcing’
45 Climate Summit 2014 (2014) p.1
46 Cision PR Newswire (2014)
47 Greenomics Indonesia (2015)
48 AidEnvironment (2023d)
49 Higonnet, Bellantonio & Hurowitz (2017) p.11
50 Higonnet et al (2018) pp.2-3
51 Campos et al (2021)
52 Hofmeister & Campos (2023); Mighty Earth (2023b) pp.5-7, 9-10
53 Mighty Earth (2023b) pp.9-10
54 The investigation revealed that the Mato Grosso Environmental Department (Sema-MT) identified the landowner as responsible for the fire, but that he blamed it on a neighbouring settlement – said to be a common excuse, though usually untrue. See Mighty Earth (2023b) pp.7-8
55 Spring (2018)
56 Greenpeace International (2019) pp.17, 39
57 AidEnvironment (2023d)
58 Mighty Earth (2017) pp.6-11
59 Reis et al (2023)
60 Czaplicki Cabezas (2023)
61 Czaplicki Cabezas (2023)
62 Reis et al (2023)
63 Reis et al (2023)
64 Reis et al (2023)
65 Reis et al (2023); Trase Supply Chains, ‘Bolivia soy supply chain’
66 Radwin (2023)
67 Cargill, ‘Protecting forests’; Mighty Earth (2019a); Stauffer (2019)
68 Cargill (2023) p.11
69 Cargill (2023) p.21
70 Cargill (2024)
71 Mighty Earth (2023e) pp.1-2, 4, 8-10
72 Sax (2019)
73 JBS (2023a) p.21; JBS, ‘Know the value chain of JBS in the pork segment’; JBS, ‘Know the value chain of JBS in the poultry segment’
74 B3, ‘Bovespa Index (Ibovespa)’
75 JBS (2023c)
76 JBS, ‘Business unit’
77 Forbes, ‘Joesley Batista’
78 JBS B.V. (2023) pp.vi, 49, 19
79 Wenzel, Hofmeister & Papini (2020)
80 JBS (2023b) p.16
81 JBS (2023a) p.21. ‘Net revenue’ here means revenue net of discounts, returns and sales tax (JBS (2023b) p.59).
82 JBS (2023a) p.22
83 Steinweg, Rijk, & Piotrowski (2020) pp.1, 9-10
84 Greenpeace International (2020) pp.20-21
85 Steinweg, Rijk, & Piotrowski (2020) p.7
86 Mighty Earth (2023f) pp.6-10
87 Mighty Earth (2023c)
88 Evidence of potential links involves known supply chain relationships between JBS and the proprietors of deforested properties, in some cases via different or unspecified properties.
AidEnvironment (2022b) pp.3-8; AidEnvironment (2022c) pp.10-12, 17-22; AidEnvironment (2022d) pp.3-8, 18-20; AidEnvironment (2022e) pp.3-4, 16-17; AidEnvironment (2022f) pp.3-4, 7-9; AidEnvironment (2022g) pp.3-4, 7-16; AidEnvironment (2022h) pp.6 -19; AidEnvironment (2023a) pp.3-10, 13-14; AidEnvironment (2023b) pp.3-6, 9-19; AidEnvironment (2023e) pp.1011; AidEnvironment (2023f) pp.13-15; AidEnvironment (2023g) pp.5-7, 11-12, 26-27; AidEnvironment (2023h) pp.3-6, 22-23; AidEnvironment (2023i) pp.3-7, 10-12, 15-17; AidEnvironment (2023j) pp.3-9
89 Repórter Brasil (2022a) pp.8-9, 12-21
90 Greenpeace International (2021) pp.34-83
91 Greenpeace International (2021) pp.22-25, 33
92 Greenpeace International (2021) p.34
93 The properties in question are Fazenda Olhos d’Água and Fazenda Várzea Funda. A third property that supplied JBS as recently as 2022, Fazenda Vitória, was not directly affected by the fires but was identified by Greenpeace’s report as an intermediary for the supply of cattle from its fire-affected sister ranch, Fazenda Recreio.
See Greenpeace International (2021) pp.50-52, 74-77; Environmental Justice Foundation (2023) pp.18, 23, 26-27
94 JBS (2023d) p.10
95 Thomas (2024)
96 JBS (2023c)
97 JBS (2023c) p.1
98 As summarised in Greenpeace International (2020) pp.27, 30-35, 42-43
99 JBS (2023d) p.10
100 Crippa et al (2021)
101 Ritchie (2020), drawing on data from Poore & Nemecek (2018)
102 Ritchie (2021), citing an analysis by the University of Oxford’s Food Climate Research Network, in turn based on the US Department of Agriculture’s PSD database
103 Song et al (2021); Kimbrough (2021); Schneider et al (2021)
104 Ritchie H (2020), drawing on data from Poore & Nemecek T (2018)
105 Xu et al (2021). The remaining 14% was attributed to ‘other utilizations’.
106 Poore & Nemecek (2018)
107 van Dijk et al (2021)
108 Kozicka et al (2023
109 COP28 (2023)
110 JBS-Friboi, Bertin, Minerva & Marfrig (2009)
111 Ministério Público Federal no Pará (2022)
112 JBS, ‘History’
113 JBS Global (UK) Ltd (2023)
114 Steinweg, Rijk & Piotrowski (2020) pp.1, 9-10
115 Global Witness (2023a); Ministério Público Federal no Pará (2022)
116 Global Witness (2023a)
117 Bloomberg (2022)
118 IATP, Changing Markets Foundation (2022) p.22
119 JBS (2023d) p.40
120 IATP estimates JBS’s total (Scopes 1–3) 2021 emissions at 287.9m tonnes CO2e in 100-year global warming potential terms (IATP, Changing Markets Foundation (2022) pp.23, 41-42, 48), while JBS reports its own Scope 1 and 2 emissions for that year as 6.2m tonnes CO2e (JBS (2023d) p.41).
121 IATP, Changing Markets Foundation (2022) p.25
122 Mighty Earth (2023a); ISS ESG (2021) pp.6-7
123 Thomas (2024)
124 Freitas & Adghirni (2020)
125 Pensioenfonds Zorg & Welzijn (2022)
126 Marfrig (2023b) pp.25, 27-28, 90
127 B3, ‘Bovespa Index (Ibovespa)’
128 Mendes (2022)
129 Marfrig, ‘Boards, directors and committees’
130 Mendes (2022)
131 Marfrig, ‘Composição acionária’
132 Marfrig (2023b) p.15
133 Marfrig (2023b) p.8
134 Marfrig (2023a) p.3
135 Global Witness (2020) p.17
136 Repórter Brasil (2022b) p.22; Campos (2019); Campos & Locatelli (2020)
137 Youssef (2023)
138 Repórter Brasil (2022b) p.22; Alessi et al (2022); Campos & Barros (2020)
139 Mighty Earth (2023f) pp.6-10
140 Evidence of potential links involves known supply chain relationships between Marfrig and the proprietors of deforested properties, in some cases involving different or unspecified properties. AidEnvironment (2022b) pp.3-8; AidEnvironment (2022c) pp.10-12, 1922; AidEnvironment (2022d) pp.3-6, 18-20; AidEnvironment (2022f) pp.7-9; AidEnvironment (2022g) pp.3-4, 9-16; AidEnvironment (2022h) pp.4-5, 8-9; AidEnvironment (2023a) pp.3-5, 13-14; AidEnvironment (2023b) pp.3-4, 11-13; AidEnvironment (2023g) pp.8-12, 26-27; AidEnvironment (2023j) pp.5-9
141 This figure excludes areas burned beyond the boundaries of the ranches concerned but as part of the same fire. See Greenpeace International (2021) pp.34, 4661, 68-69, 72-75, 78-79
142 Greenpeace International (2021) pp.46-49, 54-61, 68-69
143 Camargos & Campos (2020)
144 RGE, ‘Apical’; RGE, ‘APR’; RGE, ‘APRIL’; RGE, ‘Asia Symbol’; RGE, ‘Asian Agri’; RGE, ‘Bracell’; RGE, ‘Improving lives through our companies: What we stand for’; RGE, ‘Pacific Energy’; RGE, ‘Sateri’
145 RGE, ‘Frequently asked questions’
146 RGE, ‘Frequently asked questions’
147 RGE (2022) p.1
148 RGE, LinkedIn page
149 GlobeAsia (2015)
150 Legal500.com (2017)
151 Asia Symbol (2023b) p.10
152 RGE, ‘Frequently asked questions’
153 AidEnvironment (2021) pp.18-27; Nusantara Atlas, home page. Searches on the Nusantara Atlas database returned five of the six plantation companies listed by AidEnvironment (with the exception being PT Permata Hijau Khatulistiwa). However two of the five, PT Santan Borneo Abadi and PT Mahakam Persada Sakti, were shown as having had zero deforestation since 2001, apparently because they are considered already to have been fully deforested by that date, though AidEnvironment shows them as having the highest and thirdhighest deforestation of the six companies between 2016 and 2020. The reasons for this discrepancy are unclear. The figures given by Nusantara Atlas were as follows: PT Industrial Forest Plantation – 2021 1,562ha, 2022 7,099ha, 2023 7,048ha; PT Bakayan Jaya Abadi – 2021 1,021ha, 2022 121ha, 2023 34ha; PT Nusantara Kalimantan Lestari – 2021 16ha, 2022 0.6ha, 2023 4ha. The figures given here as for 2023 are actually for the 360 days to 11 January 2024.
154 Auriga et al (2024) p.3
155 AidEnvironment (2021) p.44
156 Auriga et al (2024) p.3
157 Eyes on the Forest (2018) pp.6-9, 13
158 Eyes on the Forest (2018) pp.8, 11
159 Global Conservation, ‘Leuser Ecosystem, Sumatra, Indonesia’
160 Forests & Finance (2020)
161 Rainforest Action Network (2021)
162 Environmental Paper Network et al (2022); AidEnvironment (2021); Greenpeace International (2018b); Chain Reaction Research (2018b)
163 RGE, ‘Frequently asked questions’
164 RGE (2022) p.1
165 RGE (2015); Daemeter and Tropical Forest Alliance (2020) p.85
166 APRIL (2015)
167 Asia Symbol (2023a, 2023c)
168 FSC, ‘Asia Pacific Resources International Holdings Ltd. Group (APRIL)’
169 Apical (2021); RGE (2023a); Tay (2023)
170 RGE (2024)
171 AidEnvironment (2021) pp.18-27
172 TheTreeMap (2023)
173 AidEnvironment (2021) pp.7, 14, 30-36, 44, 48-49
174 AidEnvironment (2021) pp.14-15
175 AidEnvironment (2021) p.44
176 Environmental Paper Network et al (2023) pp.14-22
177 Environmental Paper Network et al (2023) pp.27-32
178 RGE (2024). ‘Asia Symbol advised PT Balikpapan Chip Lestari (BCL) to suspend sourcing from PT Industrial Forest Plantation (IFP) indefinitely, following an internal investigation. Asia Symbol also explicitly directed PT BCL to align its wood and fibre sourcing policy with Asia Symbol’s Wood Chip and Pulp Sourcing Policy and strictly adhere to Asia Symbol’s zero tolerance for deforestation. PT BCL put in place a robust due diligence system.’
179 Environmental Paper Network et al (2023)
pp.48-51
180 Environmental Paper Network et al (2023) pp.37-47
181 RGE (2023b)
182 Mighty Earth (2019b) p.24
183 Nusantara Atlas (2022)
184 Chain Reaction Research (2022)
185 RGE (2024)
186 RGE (2024)
187 Sinar Mas, ‘Pulp and paper products’
188 Sinar Mas, ‘Agribusiness and food’; Golden Agri-Resources, home page
189 Sinar Mas, ‘Developer and real estate’
190 Sinar Mas, ‘Financial services’
191 Sinar Mas, ‘Communication and technology’
192 Sinar Mas, ‘Energy and infrastructure’
193 Sinar Mas, ‘Healthcare’
194 Golden Agri-Resources (2023) p.2
195 Golden Agri-Resources, ‘Our business’
196 Sinar Mas, ‘Agribusiness and food’
197 PT Indah Kiat Pulp and Paper Tbk and PT Pabrik Kertas Tjiwi Kimia Tbk. Source: APP Sinar Mas, ‘Investor relations’
198 DSS, home page
199 Sinar Mas, ‘Developer and real estate’
200 Tharawat Magazine (2020)
201 APP Sinar Mas (2024); Golden AgriResources (2024)
202 Golden Agri-Resources (2023)
203 Golden Agri-Resources (2023) pp.150-162
204 APP Sinar Mas (n.d.)
205 MyHeritage, ‘Teguh Ganda Widjaja’
206 MyHeritage, ‘Teguh Ganda Widjaja’
207 APP Sinar Mas (2023a)
208 APP Sinar Mas (n.d.)
209 Sinar Mas, home page
210 APP Sinar Mas (2023b) p.21
211 Golden Agri-Resources (2023) p.86
212 Financial summaries for 2022 available on the APP Sinar Mas website (APP Sinar Mas, ‘Investor relations’, under the heading ‘Financial highlights’ for each company) list the following figures: PT Indah Kiat Pulp and Paper Tbk: $857.5m (APP Sinar Mas (2023c)); PT Pabrik Kertas Tjiwi Kimia Tbk: $463.3m (APP Sinar Mas (2023f)); PT Pindo Deli Pulp and Paper Mills: $765.9m (APP Sinar Mas (2023g); PT Lontar Papyrus Pulp & Paper Industry: $228.2m (APP Sinar Mas (2023d)); PT Oki Pulp & Paper Mills: $789.6m (APP Sinar Mas (2023e)). However, as PT Lontar Papyrus is said to be 99.92% owned by PT Pindo Deli and PT Oki 49.08% owned by each of PT Pindo Deli and PT Pabrik Kertas Tjiwi Kimia (APP Sinar Mas (n.d.)), it is unclear whether their reported financial results should be assumed to be included within those of their parent companies. They have therefore been excluded from the above totals, which should be treated as estimates.
213 Golden Agri-Resources (2023) p.86.
214 APP Sinar Mas, ‘Forest Conservation Policy’
215 Greenpeace International (2023b)
216 APP Sinar Mas (2023b) p.121
217 WWF (2018) pp.2-3
218 Greenpeace International (2018a)
219 Jacobson (2018)
220 Greenpeace International (2023b) p.10
221 Jong (2020)
222 Eyes on the Forest (2022)
223 APP Sinar Mas (2022)
224 Eyes on the Forest (2018) p.13
225 Chain Reaction Research (2022); Environmental Investigation Agency (2022)
226 Golden Agri-Resources (2024)
227 Golden Veroleum, ‘Frequently asked questions’
228 Mukpo (2021)
229 Greenpeace Indonesia (2023)
230 Environmental Paper Network et al (2022)
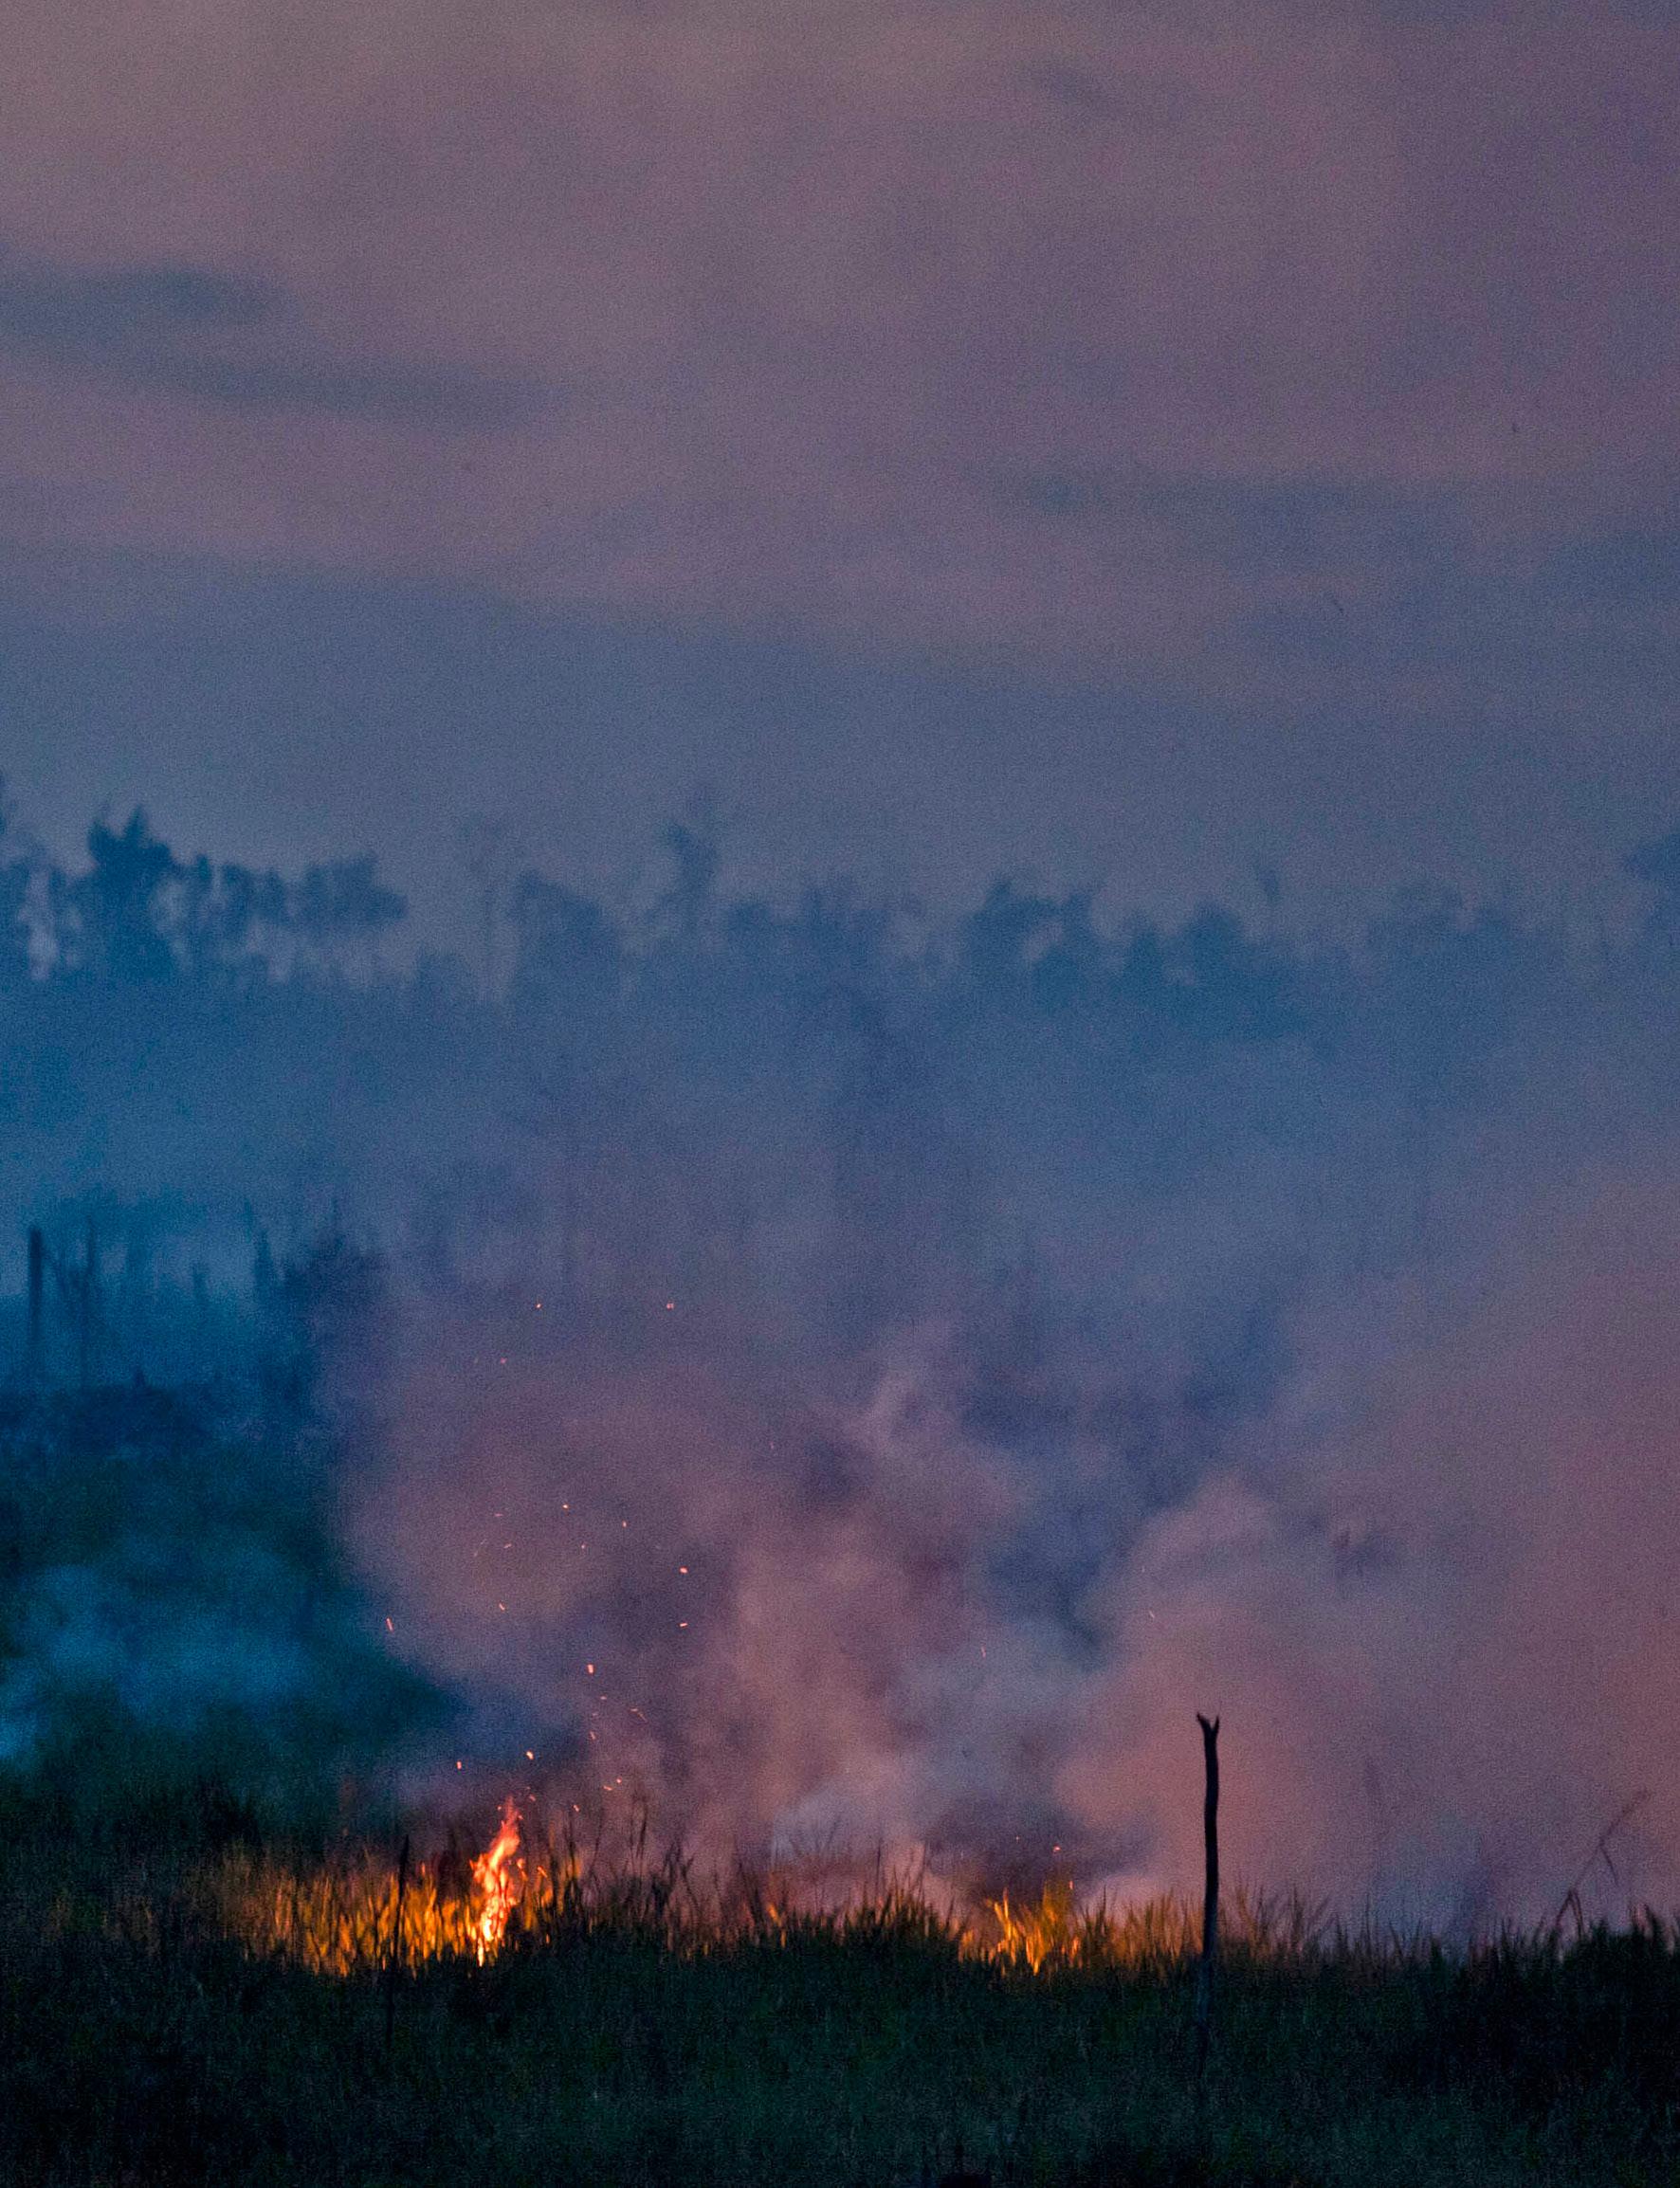
ABN AMRO Bank N.V. (2023) ‘Integrated annual report 2022’. https://assets.ctfassets. net/1u811bvgvthc/3tn2c2U6QjiBj1IWRNX9cl/ c2dde83a535488509bbf0c37726fa407/ ABN_AMRO_____Integrated_Annual_Report_2022.pdf
ABN AMRO Bank N.V. (2024) OTC reply, 14 March AFi, ‘Definitions’. https://accountability-framework.org/use-the-accountability-framework/definitions/ accessed 21 September 2023
AidEnvironment (2021) ‘The industrial tree operations of the Nusantara Fiber group’. https://www.aidenvironment.org/wp-content/uploads/2021/02/Nusantara-Fiber-Report-Aidenvironment.pdf
AidEnvironment (2022a) ‘Realtime Deforestation Monitoring System 1’, February (updated July). https://bit.ly/RDM1-Feb2022-Updated
AidEnvironment (2022b) ‘Realtime Deforestation Monitoring System 2’, April (updated July). https://bit.ly/rdm2-april2022-updated
AidEnvironment (2022c) ‘Realtime Deforestation Monitoring System 3’, June (updated July). https://bit.ly/rdm3-june2022-updated
AidEnvironment (2022d) ‘Realtime Deforestation Monitoring System 4’, August (updated December). https://bit.ly/rdm4-august-2022-updated
AidEnvironment (2022e) ‘Realtime Deforestation Monitoring System 5’, September (updated December). https://bit.ly/rdm5-September2022-updated
AidEnvironment (2022f) ‘Realtime Deforestation Monitoring System 6’, October (updated December). https://bit.ly/rdm6-october2022-updated
AidEnvironment (2022g) ‘Realtime Deforestation Monitoring System 7’, November (updated May 2023). https://bit.ly/RDM-NOV-2022
AidEnvironment (2022h) ‘Realtime Deforestation Monitoring System 8’, December. https:// bit.ly/rdm-december-2022
AidEnvironment (2023a) ‘Realtime Deforestation Monitoring System 9’, January (updated May). https://bit.ly/rdm-jan-2023
AidEnvironment (2023b) ‘Realtime Deforestation Monitoring System 10’, February (updated October). https://bit.ly/rdm10-feb2023
AidEnvironment (2023c) ‘Realtime Deforestation Monitoring System 12’, May (updated October). https://bit.ly/rdm12-may2023
AidEnvironment (2023d) ‘Analysis of deforestation and human rights abuses since 2014’, Appendix B in Stand.Earth (2023) ‘A grain of truth’. https://burninglegacy.org/evidence/ analysis-by-aidenvironment/
AidEnvironment (2023e) ‘Realtime Deforestation Monitoring System 13’, June (updated October). https://bit.ly/RDM-JUNE-2023
AidEnvironment (2023f) ‘Realtime Deforestation Monitoring System 14’, July (updated October). https://bit.ly/rdm14-july2023
AidEnvironment (2023g) ‘Realtime Deforestation Monitoring System 15’, August (updated
October). https://bit.ly/rdm15-august2023
AidEnvironment (2023h) ‘Realtime Deforestation Monitoring System 16’, September (updated January 2024). https://bit.ly/rdm16-september2023
AidEnvironment (2023i) ‘Realtime Deforestation Monitoring System 17’, October (updated January 2024). https://bit.ly/rdm17-october2023
AidEnvironment (2023j) ‘Realtime Deforestation Monitoring System 18’, November (updated January 2024). https://bit.ly/rdm18-november2023
AidEnvironment, ‘Our research’. https://aidenvironment.org/news-and-insights/research/ accessed 5 February 2024
Alessi G et al (2022) ‘Nova “lista suja” do trabalho escravo inclui empregadores que receberam auxílio emergencial’, Repórter Brasil, 5 April. https:// reporterbrasil.org.br/2022/04/nova-lista-suja-do-trabalho-escravo-inclui-empregadores-que-receberam-auxilio-emergencial/
Allianz Group (2023) ‘Building confidence in tomorrow: Annual report 2022’. https://www. allianz.com/content/dam/onemarketing/ azcom/Allianz_com/investor-relations/en/ results-reports/annual-report/ar-2022/ en-Allianz-Group-Annual-Report-2022.pdf
Allianz Group (2024a) OTC reply, 14 March
Allianz Group (2024b) ‘Courage to move forward: Sustainability report 2023’. https:// www.allianz.com/content/dam/onemarketing/azcom/Allianz_com/sustainability/ documents/Allianz_Group_Sustainability_Report_2023-web.pdf
Allianz Group, ‘Allianz contacts’. https://www. allianz.com/en/about-us/company/contact.html#corporate-contacts accessed 1 February 2024
Allianz Group, ‘At a glance’. https://www.allianz. com/en/about-us/company/at-a-glance. html accessed 1 February 2024
Apical (2021) ‘Apical secures its first sustainability-linked loan facilities of US$750 million’, news release, 31 August. https://www.rgei.com/attachments/ article/1677/20210831%20Apical%20secures%20sustainability-linked%20loan%20 facility%20of%20US$750%20million.pdf
APP Sinar Mas (2022) ‘Asia Pulp & Paper (APP) Sinar Mas responds to Eyes on Forest’s “APP expands pulpwood plantation by clearing HCV areas in a UNESCO Biosphere Reserve, Sumatra”’, news release, 8 August. https:// app.co.id/-/asia-pulp-paper-app-sinarmas-responds-to-eyes-on-forest-s-appexpands-pulpwood-plantation-by-clearing-hcv-areas-in-a-unesco-biospherereserve-sumatra-
APP Sinar Mas (2023a) ‘Share ownership of the Board of Commissioners and the Board of Directors [PT Oki Pulp & Paper Mills]’. https://asiapulppaper.
com/documents/20123/4328435/ AR+OKI+2022+-+Struktur+Kepemilikan.pdf
APP Sinar Mas (2023b) ‘2022 sustainability report’. https://asiapulppaper.com/policies-and-documents
APP Sinar Mas (2023c) ‘Financial summary [PT Indah Kiat Pulp and Paper Tbk]’. https://asiapulppaper.com/documents/20123/4327415/AR+IK+2022+-+Ikhtisar+Keuangan.pdf/1552c5cd-4f3c-87b9462b-29e4cf1c803e?t=1686543688507
APP Sinar Mas (2023d) ‘Financial summary [PT Lontar Papyrus Pulp & Paper Industry]’. https://asiapulppaper. com/documents/20123/4328540/ AR+LP+2022+-+Ikhtisar+Keuangan. pdf/8722efc0-9edd-2c29-32117404d443be90?t=1686544413905
APP Sinar Mas (2023e) ‘Financial summary [PT OKI Pulp & Paper Mills]’. https://asiapulppaper.com/documents/20123/4328435/ AR+OKI+2022+-+Ikhtisar+Keuangan. pdf/062b2ecf-4422-6838-d2b2-a8ec0410ef78?t=1686544064452
APP Sinar Mas (2023f) ‘Financial summary [PT Pabrik Kertas Tjiwi Kimia Tbk]’. https://asiapulppaper.com/documents/20123/4328520/AR+TK+2022+-+Ikhtisar+Keuangan.pdf/04fb3ee5-8fb5-7bb83da9-229072b77da5?t=1686544350685
APP Sinar Mas (2023g) ‘Financial summary [PT Pindo Deli Pulp and Paper Mills]’. https://asiapulppaper.com/documents/20123/4328450/AR+PD+2022+-+Ikhtisar+Keuangan.pdf/a1035d90-5ee7-c196331d-4368bd8ced75?t=1686544301851
APP Sinar Mas (2024a) OTC reply, 14 March
APP Sinar Mas (n.d.) ‘Struktur grup emiten’. https://asiapulppaper.com/documents/20123/4475337/Group-Structure.pdf/b9d098ef-251e-7bb7-e3d753d34153176e?t=1687159771471
APP Sinar Mas, ‘APP Indonesia’s pulpwood suppliers’. https://sustainability-dashboard.com/supplier-management/pulpwood-suppliers accessed 23 February 2024
APP Sinar Mas, ‘Forest Conservation Policy’ https://app.co.id/forest-conservation-policy accessed 23 February 2024
APP Sinar Mas, ‘Investor relations’. https://asiapulppaper.com/investors accessed 7 August 2023
APRIL (2015) ‘APRIL Group’s Sustainable Forest Management Policy 2.0’. https://www. aprilasia.com/en/sustainability/sustainability-policy/sfmp-2-0
Asia Symbol (2023a) ‘Asia Symbol human rights policy’. https://www.asiasymbol.com/en/ sustainability/human-rights-policy
Asia Symbol (2023b) ‘Improving lives by developing resources sustainably: Sustainability report 2022’. https://www.asiasymbol. com/en/images/pdf/asia-symbol-sustainability-report-2022-en.pdf
Asia Symbol (2023c) ‘Wood and pulp sourcing policy’. https://www.asiasymbol.com/en/ sustainability/wood-pulp-sourcing-policy
Auriga et al (2024) ‘Deforestation anonymous: Rainforest destruction and social conflict driven by PT Mayawana Persada in Indonesian Borneo’, March. https://issuu.com/ greenpeaceinternational/docs/deforestation_anonymous
B3, ‘Bovespa Index (Ibovespa)’. https://www. b3.com.br/en_us/market-data-and-indices/indices/broad-indices/indice-ibovespa-ibovespa-composition-index-portfolio.htm accessed 31 January 2024
Barteczko B & Lewis B (2017) ‘Polish coal-burning companies find ways to win big bank backing’, Reuters, 26 April. https://www. reuters.com/article/poland-coal-banksidUSL8N1HR21C/
Been J & Groot J (2023a) ‘Rabobank en de ontbossers’, Het Financieele Dagblad (FD), special report. https://specials.fd.nl/rabobank-en-de-ontbossers
Been J & Groot J (2023b) ‘Rabobank financierde honderden illegale ontbossers in Brazilië’, Het Financieele Dagblad (FD), 3 November. https://fd.nl/bedrijfsleven/1495003/ rabobank-financierde-honderden-illegale-ontbossers-in-brazilie
Better Europe Public Affairs (2023) ‘Analysis of existing EU legislation in view of potential specific obligations for the financial sector in context of the review of the EU Regulation on deforestation-free products (EUDR)’, report for Global Witness, available upon request to Global Witness.
Blas J (2022) ‘Look at all the money Cargill made’, VettaFi Advisor Perspectives, 7 October. https://www.advisorperspectives. com/articles/2022/10/07/look-at-all-themoney-cargill-made
Bloomberg (2022) ‘How big beef is driving deforestation of the Amazon’, 21 January. https://www.bloomberg.com/news/videos/2022-01-21/how-big-beef-is-drivingdeforestation-of-the-amazon-video
BNP Paribas (2023a) ‘Results as at 31 December 2022’, news release, 7 February. https://invest.bnpparibas/en/document/4q22-pr
BNP Paribas (2023b) ‘2022 integrated report’. https://invest.bnpparibas/en/document/2022-integrated-report
BNP Paribas, ‘Financing and investment policies’. https://group.bnpparibas/en/ our-commitments/transitions/financing-and-investment-policies accessed 1 February 2024
BNP Paribas, LinkedIn profile. https://www.linkedin.com/company/bnp-paribas accessed 1 February 2024
BNP Paribas, ‘Our businesses and expertise’. https://group.bnpparibas/en/group/ our-businesses-and-expertise accessed 1 February 2024
Börse Frankfurt, ‘Allianz SE’. https://www. boerse-frankfurt.de/equity/allianz-se accessed 1 February 2024
Bunge (2022) ‘Connecting for a better tomorrow: 2022 global sustainability report’. https://delivery.bunge.com/-/media/ Files/2022/pdf/2022_global_sustainability_report.ashx
Bunge (2023a) ‘2022 annual report (Form 10-K)’. https://investors.bunge.com/investors/ financial-information/annual-reports
Bunge (2023b) ‘Proxy statement: Notice of 2023 annual general meeting of shareholders’, 31 March. https://investors.bunge.com/~/ media/Files/B/Bunge-IR/documents/ shareholder-meeting-materials/bunge2023-proxy-statement.pdf
Bunge (2024) OTC reply, 14 March
Bunge, ‘Investors’. https://investors.bunge.com/ accessed 31 January 2024
Bunge, ‘Key commodities’. https://www.bunge. com/Sustainability/Our-Commodities accessed 31 January 2024
Bunge, ‘Markets we serve’. https://www.bunge. com/Markets-We-Serve accessed 31 January 2024
Bunge, ‘We are Bunge’. https://www.bunge. com/We-are-Bunge accessed 31 January 2024
Camargos D & Campos A (2020) ‘Fogo no Pantanal mato-grossense começou em fazendas de pecuaristas que fornecem para gigantes do agronegócio’, Repórter Brasil, 22 September. https://reporterbrasil. org.br/2020/09/fogo-no-pantanal-mato-grossense-comecou-em-fazendas-de-pecuaristas-que-fornecem-para-gigantes-do-agronegocio/ Campos A (2019) ‘JBS, Marfrig e Frigol compram gado de desmatadores em área campeã de focos de incêndio na Amazônia’, Repórter Brasil, 31 August. https://reporterbrasil.org.br/2019/08/jbsmarfrig-e-frigol-compram-gado-dedesmatadores-em-area-campea-defocos-de-incendio-na-amazonia/ Campos A & Barros CJ (2020) ‘Deforestation in the Cerrado: Control by meatpackers is worse than in the Amazon’, Repórter Brasil, 10 June. https://reporterbrasil.org. br/2020/06/deforestation-in-the-cerradocontrol-by-meatpackers-is-worse-thanin-the-amazon/
Campos A & Dallabrida P (2023) ‘Bunge promete desmate zero em 2025, mas seus fornecedores derrubaram 11 mil hectares de Cerrado em 2 anos’, Repórter Brasil, 19 May. https://reporterbrasil.org.br/2023/05/ bunge-promete-desmate-zero-em2025-mas-seus-fornecedores-derrubaram-11-mil-hectares-de-cerrado-em-2anos/
Campos A & Locatelli P (2020) ‘Como a Morgan Stanley está ligada ao desmatamento na Amazônia’, Repórter Brasil, 16 September. https://reporterbrasil.org.br/2020/09/ como-a-morgan-stanley-esta-ligada-ao-desmatamento-na-amazonia/
Campos A et al (2021) ‘“Soja-pirata” cultivada na Amazônia acelera desmatamento e tem participação de gigantes do agro’, Repórter Brasil, Bureau of Investigative Journalism and Unearthed, 19 May. https:// reporterbrasil.org.br/2021/05/soja-pirata-cultivada-na-amazonia-acelera-desmatamento-e-tem-participacao-de-gigantes-do-agro/
Cargill (2021) ‘Cargill at a glance’, factsheet. https://www.cargill.com/ doc/1432077689073/cargill-at-a-glance. pdf
Cargill (2022) ‘What matters most: 2022 annual report’. https://www.cargill.com/ doc/1432215917376/2022-cargill-annual-report.pdf
Cargill (2023) ‘2023 ESG report’. https:// www.cargill.com/sustainability/ doc/1432249635993/2023-esg-report.pdf
Cargill, ‘Agricultural trading & processing’. https://www.cargill.com/agriculture accessed 5 September 2023
Cargill, ‘Agriculture’. https://www.cargill.co.uk/ en/agriculture accessed 5 September 2023
Cargill, ‘Animal nutrition’. https://www.cargill. com/animal-nutrition accessed 5 September 2023
Cargill, ‘Beef business’. https://www.cargill.com/ meat-poultry/beef-business accessed 5 September 2023
Cargill, ‘Cargill cocoa and chocolate’. https:// www.cargill.com/food-beverage/cocoa-chocolate accessed 5 September 2023
Cargill, ‘Contact us’. https://www.cargill.com/ page/cargill-contact-us accessed 31 January 2024
Cargill, ‘Food & beverage’. https://www.cargill. com/food-beverage accessed 5 September 2023
Cargill, ‘Meat & poultry’. https://www.cargill. com/meat-poultry accessed 5 September 2023
Cargill, ‘Poultry’. https://www.cargill.com/sustainability/poultry/sustainable-poultry accessed 31 January 2024
Cargill, ‘Products & services’. https://www. cargill.com/products accessed 31 January 2024
Cargill, ‘Protecting forests’. https://www.cargill. com/sustainability/protecting-forests accessed 1 February 2024
Cargill, ‘Statement of soy sourcing’. https:// www.cargill.com/story/statement-of-soysourcing accessed 1 February 2024
Chain Reaction Research (2018a) ‘The financing of leakage refiners’. https:// chainreactionresearch.com/report/ report-the-financing-of-leakage-refiners-shareholders-and-loan-issuers-include-international-financial-institutions-with-palm-oil-policies/
Chain Reaction Research (2018b) ‘Shadow companies present palm oil investor risks and undermine NDPE efforts’. https:// chainreactionresearch.com/report/shadow-companies-present-palm-oil-investor-risks-and-undermine-ndpe-efforts/
Chain Reaction Research (2022) ‘The chain: Top ten deforesters clear 8,100 hectares on oil palm concessions during 1H 2022, a significant increase versus 2021’, 26 September. https://chainreactionresearch.com/ the-chain-top-ten-deforesters-clear8100-hectares-on-oil-palm-concessionsduring-1h-2022-a-significant-increaseversus-2021/
CIA World Factbook, ‘Luxembourg’. https://www. cia.gov/the-world-factbook/countries/ luxembourg/#geography accessed 24 January 2024
Cision PR Newswire (2014) ‘Cargill pledges to protect forests in all agricultural supply chains’, news release, 23 September. https://www.prnewswire.com/ news-releases/cargill-pledges-to-protect-forests-in-all-agricultural-supply-chains-276479761.html
Climate Summit 2014 (2014) ‘New York Declaration on Forests’. https://forestdeclaration. org/wp-content/uploads/2021/08/NYDF_ Declaration.pdf
COP28 (2023) ‘COP28 UAE Declaration on Sustainable Agriculture, Resilient Food Systems, and Climate Action’. https://www. cop28.com/en/food-and-agriculture
Crédit Agricole (2023a) ‘2022 key figures’. https://www.credit-agricole.com/en/ content/download/178601/file/CASA_CHIFFRES_CLE_3V_165x240_UK_pap_230406. pdf?version=16
Crédit Agricole (2023b) ‘Statement on biodiversity and natural capital’, 15 September. https://www.credit-agricole. com/en/responsible-and-committed/ our-csr-strategy-be-an-actor-of-a-sustainable-society/our-positions/2023/ statement-on-biodiversity-and-natural-capital
Crédit Agricole (2024) OTC reply, 14 March
Crédit Agricole (n.d.) ‘CSR sector policy – Forestry & palm oil’. https://www.credit-agricole. com/en/pdfPreview/122252
Crédit Agricole, ‘Discover the Crédit Agricole Group’. https://www.credit-agricole.com/ en/group/discover-the-credit-agricole-group accessed 1 February 2024
Crédit Agricole, ‘Head office Crédit Agricole’.
https://www.credit-agricole.com/en/footer/head-office-credit-agricole accessed 1 February 2024
Crédit Agricole, ‘Shares and dividend’. https:// www.credit-agricole.com/en/finance/ shares-and-dividend accessed 1 February 2024
Crippa M et al (2021) ‘Food systems are responsible for a third of global anthropogenic GHG emissions’, Nature Food 2, pp.198-209. https://doi.org/10.1038/s43016-021-00225-9
Curtis PG et al (2018) ‘Classifying drivers of global forest loss’, Science 361, pp.1108-1111. https://www.science.org/doi/10.1126/science.aau3445
Czaplicki Cabezas S (2023) ‘The hidden crisis of deforestation in Bolivia’, Trase Insights, 23 August. https://insights.trase.earth/ insights/the-hidden-crisis-of-deforestation-in-bolivia/
Daemeter and Tropical Forest Alliance (2020) ‘Decade of progress: Reducing commodity driven deforestation in Indonesia and Malaysia’. https://www.tropicalforestalliance. org/assets/Uploads/TFA_Design_210921-1. pdf
Deutsche Bank (2023a) ‘Annual report 2022’. https://investor-relations.db.com/files/ documents/annual-reports/2023/Annual-Report-2022.pdf
Deutsche Bank (2023b) ‘Environmental and social policy framework – Summary’. https://www.db.com/files/documents/csr/ sustainability/Deutsche-Bank-ES-PolicyFramework-English.pdf
Deutsche Bank (2024) OTC reply, 14 March Deutsche Bank, ‘Addresses and contact’. https://www.db.com/who-we-are/global-network/addresses-and-contact?language_id=1 accessed 1 February 2024
Deutsche Bank, ‘Share price information’. https://investor-relations.db.com/share/ share-information/share-price-information?language_id=1&kid=shareprice. redirect-en.shortcut accessed 1 February 2024
Deutsche Bank, ‘What we do’. https://www. db.com/what-we-do/ accessed 1 February 2024
DSS, home page. https://dssa.co.id/en/home accessed 7 August 2023
DZ Bank AG, ‘DZ Bank Frankfurt am Main’. https:// www.dzbank.com/content/dzbank/en/ home/international-network/frankfurtam-main.html accessed 4 February 2024
DZ Bank AG, home page. https://www.dzbank. com/ accessed 24 August 2023
DZ Bank Group (2023a) ‘Facts and figures: Financial year 2022’. https://www.dzbank. com/content/dam/dzbank/dokumente/ en/dz-bank/profile/DZ_BANK_Faltblatt_ Online_Adaption_EN_final.pdf
DZ Bank Group (2023b) ‘2022 annual report’. https://www.dzbank.com/content/dam/ dzbank/dokumente/en/dz-bank/investor-relations/reports/archive/2022/ DZ_BANK_Group_GB_2022_EN.pdf
DZ Bank Group (2023c) ‘Exclusion criteria, sector criteria and sustainability checklist of DZ Bank’, December. https://www.dzbank. com/content/dam/dzbank/dokumente/ en/dz-bank/investor-relations/sustainability/DZ_Exclusion_Criteria_Sector_Criteria_en.pdf
Earthsight (2020) ‘Grand theft Chaco’. https:// www.earthsight.org.uk/grandtheftchaco-en
Environmental Investigation Agency (2022) ‘Some of the worst palm oil deforesters in 2022 are supplying major international companies’, 13 December. https://eia-international.org/news/some-of-the-worstpalm-oil-deforesters-in-2022-are-supplying-major-international-companies/
Environmental Justice Foundation (2023)
‘Impact of EU supply chains on deforestation and biodiversity in Brazil’s Pantanal: A global wetland under threat’. https://ejfoundation.org/reports/impact-of-eu-supply-chains-on-deforestation-and-biodiversity-in-brazils-pantanal-a-global-wetland-under-threat-2
Environmental Paper Network et al (2022)
‘Papering over corporate control: Paper Excellence’s relationship with Asia Pulp & Paper and the Sinar Mas Group’. https:// environmentalpaper.org/wp-content/ uploads/2022/10/Papering-over-corporate-control-Oct.-24-2022.pdf
Environmental Paper Network et al (2023)
‘Pulping Borneo: Deforestation in the RGE Group’s supply chain and RGE’s hidden links to a new mega-scale pulp mill in North Kalimantan, Indonesia’. https:// environmentalpaper.org/wp-content/ uploads/2023/05/20230523_Pulping_Borneo.pdf
Euronext, ‘BNP Paribas Act.A’. https://live. euronext.com/en/product/equities/ FR0000131104-XPAR accessed 1 February 2024
Euronext, ‘CAC 40’. https://live.euronext.com/ en/product/indices/FR0003500008-XPAR/ market-information accessed 28 February 2024
European Commission (2003) ‘Communication from the Commission to the Council and the European Parliament – Forest Law Enforcement, Governance and Trade (FLEGT) – Proposal for an EU Action Plan’, Document 52003DC0251. https://eur-lex.europa. eu/legal-content/EN/TXT/?uri=CELEX:52003DC0251
European Commission (2013) ‘The impact of EU consumption on deforestation: Comprehensive analysis of the impact of EU consumption on deforestation: Final report’. https://op.europa.eu/en/publication-detail/-/publication/c1d3ef3e-d07e-422991e5-41001b47dba8/language-en European Commission (2021) ‘Commission staff working document. Impact assessment: Minimising the risk of deforestation and forest degradation associated with products placed on the EU market’. https:// eur-lex.europa.eu/legal-content/EN/TXT/?uri=SWD%3A2021%3A0326%3AFIN European Commission (2023) ‘EDGAR – Emissions Database for Global Atmospheric Research. GHG emissions of all world countries: 2023 report’. https://edgar. jrc.ec.europa.eu/report_2023?vis=co2tot#emissions_table European Council (2023) ‘Corporate sustainability due diligence: Council and Parliament strike deal to protect environment and human rights’, press release, 14 December https:// www.consilium.europa.eu/en/press/ press-releases/2023/12/14/corporate-sustainability-due-diligence-council-and-parliament-strike-deal-to-protect-environment-and-human-rights/ European Council (2024). ‘Proposal for a Directive of the European Parliament and of the Council on Corporate Sustainability Due Diligence and amending Directive (EU) 2019/1937’, letter from General Secretariat to Delegations, 15 March. https://data. consilium.europa.eu/doc/document/ST6145-2024-INIT/en/pdf
European Economic Area, Standing Committee of the EFTA States (n.d.) ‘The two-pillar structure of the EEA Agreement – Incorporation of new EU acts’. https://www.efta. int/sites/default/files/documents/eea/ eea-institutions/The-Two-Pillar-Structure-Incorporation-of-new-EUacts.pdf
European Free Trade Area, ‘EEA Agreement’.
https://www.efta.int/eea/eea-agreement accessed 6 February 2024
European Parliament (2020) ‘Report with recommendations to the Commission on an EU legal framework to halt and reverse EU-driven global deforestation (2020/2006(INL)), A9-0179/2020’. http:// www.europarl.europa.eu/RegData/ seance_pleniere/textes_deposes/rapports/2020/0179/P9_A(2020)0179_EN.pdf
European Parliament (2022) ‘Amendments adopted by the European Parliament on 13 September 2022 on the proposal for a regulation of the European Parliament and of the Council on making available on the Union market as well as export from the Union of certain commodities and products associated with deforestation and forest degradation and repealing Regulation (EU) No 995/2010 (COM(2021)0706 –C9-0430/2021 – 2021/0366(COD))’. https:// www.europarl.europa.eu/doceo/document/TA-9-2022-0311_EN.html
European Parliament (2023) ‘Corporate due diligence rules agreed to safeguard human rights and environment’, news release, 14 December https://www. europarl.europa.eu/news/en/pressroom/20231205IPR15689/corporate-duediligence-rules-agreed-to-safeguardhuman-rights-and-environment
European Parliament and Council of the European Union (2020) ‘Consolidated text: Regulation (EU) 2019/2088 of the European Parliament and of the Council of 27 November 2019 on sustainability‐related disclosures in the financial services sector’, Document 02019R2088-20200712. https:// eur-lex.europa.eu/legal-content/EN/TXT/?uri=CELEX%3A02019R2088-20200712
European Parliament and Council of the European Union (2022) ‘Directive (EU) 2022/2464 of the European Parliament and of the Council of 14 December 2022 amending Regulation (EU) No 537/2014, Directive 2004/109/EC, Directive 2006/43/ EC and Directive 2013/34/EU, as regards corporate sustainability reporting’, Document 32022L2464. https://eur-lex.europa. eu/legal-content/EN/TXT/?uri=CELEX%3A32022L2464
European Parliament and Council of the European Union (2023) ‘Regulation (EU) 2023/1115 of the European Parliament and of the Council of 31 May 2023 on the making available on the Union market and the export from the Union of certain commodities and products associated with deforestation and forest degradation and repealing Regulation (EU) No 995/2010’, Document 32023R1115. https://eur-lex.europa.eu/legal-content/EN/TXT/?uri=CELEX%3A32023R1115&qid=1687867231461
European Parliament and Council of the European Union (2024a) ‘Consolidated text: Regulation (EU) No 575/2013 of the European Parliament and of the Council of 26 June 2013 on prudential requirements for credit institutions and amending Regulation (EU) No 648/2012’, Document 02013R0575-20240101. https://eur-lex.europa.eu/legal-content/EN/TXT/?uri=CELEX%3A02013R0575-20240101
European Parliament and Council of the European Union (2024b) ‘Consolidated text: Directive 2013/36/EU of the European Parliament and of the Council of 26 June 2013 on access to the activity of credit institutions and the prudential supervision of credit institutions, amending Directive 2002/87/EC and repealing Directives 2006/48/EC and 2006/49/EC’, Document 02013L0036-20240109. https://eur-lex.eu-
ropa.eu/legal-content/EN/TXT/?uri=CELEX-
%3A02013L0036-20240109
European Parliament and Council of the European Union (2024c) ‘Consolidated text: Directive 2009/138/EC of the European Parliament and of the Council of 25 November 2009 on the taking-up and pursuit of the business of Insurance and Reinsurance (Solvency II) (recast)’, Document 02009L0138-20240109. https://eur-lex.europa.eu/legal-content/EN/TXT/?uri=CELEX%3A02009L0138-20240109
European Parliament and Council of the European Union (2024d) ‘Consolidated text: Regulation (EU) 2019/2033 of the European Parliament and of the Council of 27 November 2019 on the prudential requirements of investment firms and amending Regulations (EU) No 1093/2010, (EU) No 575/2013, (EU) No 600/2014 and (EU) No 806/2014’, Document 02019R203320240109. https://eur-lex.europa.eu/ legal-content/EN/TXT/?uri=CELEX%3A02019R2033-20240109
Eyes on the Forest (2018) ‘Enough is enough: Time for the palm oil market to start the real work to stop driving deforestation’. https://www.eyesontheforest.or.id/reports/investigative-report-enough-is-enough-jun-2018
Eyes on the Forest (2022) ‘APP expands pulpwood plantation by clearing HCV areas in a UNESCO Biosphere Reserve, Sumatra’. https://eyesontheforest.or.id/uploads/ default/report/APP_expand_pulpwood_ plantation_by_clearing_HCV_areas_ in_a_UNESCO_Biosphere_Reserve_(EoF_ Aug2022).pdf
Financial Action Taskforce (2012–2023) ‘International standards on combating money laundering and the financing of terrorism & proliferation: The FATF recommendations’, updated November 2023. https:// www.fatf-gafi.org/en/publications/Fatfrecommendations/Fatf-recommendations.html
Financial Action Taskforce (FATF), ‘Who we are’. https://www.fatf-gafi.org/en/the-fatf/ who-we-are.html accessed 29 January 2024
Food Processing (2022) ‘Grain companies slammed for “windfall profits”’, 24 August. https://www.foodprocessing. com/ingredients/fibers-flours-grainsrice/news/11415165/grain-companiesslammed-for-windfall-profits Forbes, ‘Joesley Batista’. https://www.forbes. com/profile/joesley-batista/?sh=5c1fad5257b4 accessed 2 February 2024
Forests & Finance (2020) ‘Royal Golden Eagle Group links global brands and financiers to deforestation in the Leuser Ecosystem’, 21 September. https:// forestsandfinance.org/news/royal-golden-eagle-group-links-global-brands-and-financiers-to-deforestation-in-the-leuser-ecosystem/ Forests & Finance, home page. https://forestsandfinance.org accessed 31 October 2023
Forests & Finance, ‘Methodology’. https:// forestsandfinance.org/methodology accessed 31 October 2023
Freitas T & Adghirni S (2020) ‘Nordic fund divests $45 million from JBS on Amazon concerns’, Bloomberg, 28 July. https://www.bloomberg.com/news/articles/2020-07-28/nordic-fund-divests-45-million-from-jbs-onamazon-concerns
FSC, ‘Asia Pacific Resources International Holdings Ltd. Group (APRIL)’. https://connect.fsc. org/asia-pacific-resources-international-holdings-ltd-group-april accessed 25 January 2024
Gabriel J (2023) ‘Desmatamento no cerrado cresce 83% em maio; acumulado é recorde’, Folha de S. Paulo, 7 June. https:// www1.folha.uol.com.br/ambiente/2023/06/ desmatamento-no-cerrado-tem-novorecorde-e-cresce-83-em-maio.shtml
Gambetta G (2023) ‘CSDDD informal agreement: a mixed bag on financial sector requirements’, Responsible Investor, 14 December. https://www.responsible-investor.com/csddd-informal-agreement-a-mixed-bag-on-financial-sector-requirements/
Global Canopy (2023) ‘2023: A watershed year for action on deforestation’. https:// forest500.org/publications/2023-watershed-year-action-deforestation Global Conservation, ‘Leuser Ecosystem, Sumatra, Indonesia’. https://globalconservation. org/projects/leuser-national-park-indonesia/ accessed 6 February 2024
Global Witness (2020) ‘Beef, banks and the Brazilian Amazon: How Brazilian beef companies and their international financiers greenwash their links to Amazon deforestation’. https://www.globalwitness.org/en/ campaigns/forests/beef-banks-and-brazilian-amazon/
Global Witness (2022) ‘Slash and sell: How financial giant Brookfield and its big bank backers profited from deforestation and the abuse of Indigenous peoples’ rights in Brazil’. https://www.globalwitness.org/en/ campaigns/forests/slash-and-sell/
Global Witness (2023a) ‘Global Witness calls on financiers to bankrolling rainforest beef, after official audit reflects our findings about JBS’, 14 March. https:// www.globalwitness.org/en/campaigns/ forests/global-witness-calls-financiers-stop-bankrolling-rainforest-beef/
Global Witness (2023b) ‘Cash, cattle and the Gran Chaco: How financiers turned a blind eye to Paraguay’s deforestation crisis’.
https://www.globalwitness.org/en/ campaigns/forests/cash-cattle-and-thegran-chaco/
Global Witness (2023c) ‘Empty promises: Cargill, soy, banks and the destruction of Bolivia’s Chiquitano forest’. https://www.globalwitness.org/documents/20573/Empty_Promises_Cargill_Soy_Banks_September_2023.pdf
Global Witness (2024) ‘The credit chainsaw: A review of how EU-based banks are pouring billions into deforestation’. https://www. globalwitness.org/en/blog/credit-chainsaw/ GlobeAsia (2015) ‘The resource king – Sukanto Tanoto’, 7 September. https://www. inside-rge.com/Sukanto-Tanoto-Resource-King-GlobeAsia
Golden Agri-Resources (2023) ‘Annual report 2022’. https://www.goldenagri.com.sg/investors/financial-highlights-reports-presentations/annual-reports/
Golden Agri-Resources (2024) OTC reply, 14 March
Golden Agri-Resources, home page. https:// www.goldenagri.com.sg/ accessed 1 February 2024
Golden Agri-Resources, ‘Our business’. https:// www.goldenagri.com.sg/about-us/ our-business/ accessed 7 August 2023
Golden Veroleum, ‘Frequently asked questions’. https://goldenveroleumliberia.com/frequently-asked-questions/ accessed 7 February 2024
Goldman E et al (2020) ‘Estimating the role of seven commodities in agriculture-linked deforestation: Oil palm, soy, cattle, wood fiber, cocoa, coffee, and rubber’, Technical Note, World Resources Institute. https://www.wri.org/research/
estimating-role-seven-commodities-agriculture-linked-deforestation-oil-palm-soy-cattle
Greenomics Indonesia (2015) ‘Cargill's supply chain linked to deforestation in Papua’. https://www.greenomics.org/docs/IPOP_ Implementation_Report-05_Greenomics. pdf
Greenpeace European Unit (2020) ‘Over 1 million people tell EU to stop funding forest destruction’, news release, 14 December. https://www.greenpeace.org/eu-unit/ issues/nature-food/45406/over-1-millionpeople-tell-eu-to-stop-funding-forestdestruction/
Greenpeace Indonesia (2023) ‘GAR (Golden Agri Resources) backs away from its commitment to No Deforestation’, news release, 24 February. https://www.greenpeace.org/ southeastasia/press/58171/gar-goldenagri-resources-backs-away-from-itscommitment-to-no-deforestation/
Greenpeace International (2018a) ‘Greenpeace slams APP/Sinar Mas over links to deforestation, ends all engagement with company’, news release, 16 May. https://www. greenpeace.org/international/press-release/16535/greenpeace-slams-appsinar-mas-over-links-to-deforestationends-all-engagement-with-company/
Greenpeace International (2018b) ‘Rogue trader: Keeping deforestation in the family’. https://www.greenpeace.org/international/publication/17241/rogue-trader-indonesia-deforestation-wilmar-gama/
Greenpeace International (2018c) ‘Final countdown: Now or never to reform the palm oil industry’. https://www.greenpeace. org/international/publication/18455/ the-final-countdown-forests-indonesia-palm-oil/
Greenpeace International (2019) ‘Under fire: How demand for meat and dairy is driving violence against communities in Brazil’. https://www.greenpeace.org/static/planet4-international-stateless/2020/04/86b5fe06-greenpeace_underfire_artwork_ pages.pdf
Greenpeace International (2020) ‘How JBS is still slaughtering the Amazon’. https:// www.greenpeace.org.uk/wp-content/uploads/2020/08/Greenpeace_StillSlaughtering_Spreads.pdf
Greenpeace International (2021) ‘Making mincemeat of the Pantanal’. https://www. greenpeace.org/international/publication/46577/pantanal-brazil-fires-jbsmeat-cattle/
Greenpeace International (2023a) ‘Shining light on the shadows: Towards a uniform methodology for establishing common corporate control’. https://www.greenpeace.org/ international/publication/58702/shininglight-on-the-shadows/
Greenpeace International (2023b) ‘APP Sinarmas: Forest promises pulped’. https://www. greenpeace.org/static/planet4-international-stateless/2023/10/5267ad2c-app-10 -year-report_241023_rev.pdf
Groupe BPCE, home page. https://groupebpce. com/ accessed 18 August 2023
Groupe BPCE (2022) ‘Official opening day for the Group's new headquarters’, news release, 23 September. https://groupebpce.com/ en/all-the-latest-news/news/2022/official-opening-day-for-the-group-s-newheadquarters
Groupe BPCE (2023) ‘Universal registration document of Groupe BPCE 2022 and annual financial report’. https://groupebpce. com/en/content/download/33307/file/ BPCE2022_URD_EN_BAT_MEL1_23-03-31. pdf
Groupe BPCE (2024) OTC reply, 14 March
Grupo BMV, ‘Listed issuers: Profile: Banco Santander México, S.A., institución de banca múltiple, Grupo Financiero Santander’. https://www.bmv.com.mx/en/issuers/profile/BSMX-6998 accessed 4 February 2024
Higonnet E, Bellantonio M & Hurowitz G (2017) ‘Chocolate’s dark secret: How the cocoa industry destroys national parks’, Mighty Earth. https://www.mightyearth.org/ wp-content/uploads/2017/09/chocolates_ dark_secret_english_web.pdf
Higonnet E et al (2018) ‘Behind the wrapper: Greenwashing in the chocolate industry’, Mighty Earth. https://www.mightyearth. org/wp-content/uploads/Chocolate-Report_english_FOR-WEB.pdf
Hofmeister N & Campos A (2023) ‘Cargill, Amaggi e Cofco compram soja de família com área embargada e incendiada no Mato Grosso’, Repórter Brasil, 12 April. https://reporterbrasil.org.br/2023/04/ cargill-amaggi-e-cofco-compram-soja-de-familia-com-area-embargada-e-incendiada-no-mato-grosso/
IATP, Changing Markets Foundation (2022) ‘Emissions impossible: How emissions from big meat and dairy are heating up the planet (Methane edition)’. https:// www.iatp.org/sites/default/files/2022-11/ Emissions%20Impossible_Methane%20 Edition_%20FINAL.pdf
ING Group (2023) ‘ING Group annual report 2022’. https://www.ing.com/Investor-relations/Financial-performance/Annual-reports.htm
ING Group (2024) OTC reply, 14 March
ING Group, ‘Deforestation’ https://www.ing.com/ Sustainability/Our-Stance/Deforestation. htm accessed 18 March 2024
ING Group, ‘ING at a glance’. https://www.ing. com/About-us/ING-at-a-glance.htm
accessed 1 February 2024
ING Group, ‘ING in your area’. https://www.ing. com/ING-in-your-area.htm accessed 1 February 2024
ING Group, ‘Share information’. https://www. ing.com/Investors/Share-information.htm
accessed 1 February 2024
ISS ESG (2021) ‘Second party opinion (SPO): Sustainability quality of the issuer and sustainability-linked securities: JBS S.A.’ https://api.mziq.com/mzfilemanager/v2/d/043a77e1-0127-4502-bc5b21427b991b22/af313c51-0d16-63ce-e999e6a31cf27f83?origin=1
Jacobson P (2018) ‘Revealed: Paper giant’s ex-staff say it used their names for secret company in Borneo’, Mongabay, 10 July. https://news.mongabay.com/2018/07/ revealed-paper-giants-ex-staff-say-itused-their-names-for-secret-companyin-borneo/
JBS (2023a) ‘Management report 2022’. https://api.mziq.com/mzfilemanager/v2/d/043a77e1-0127-4502-bc5b21427b991b22/0736c1c5-95fb-8ede-c8dcbff01407fad2?origin=1
JBS (2023b) ‘Financial statements and independent auditors’ report: As of December 31, 2022 and 2021’. https://api.mziq.com/ mzfilemanager/v2/d/043a77e1-0127-4502bc5b-21427b991b22/0736c1c5-95fb-8edec8dc-bff01407fad2?origin=1 (continuation of same document as JBS (2023a) with separate pagination and title)
JBS (2023c) ‘Material fact: JBS proposes dual listing in Brazil and the United States’, shareholder/market notice, 12 July. https://api.mziq.com/mzfilemanager/v2/d/043a77e1-0127-4502-bc5b21427b991b22/f932b052-3fca-edfe-62e5-1e70ee04321f?origin=1 JBS (2023d) ‘2022 JBS sustainability report’. https://jbsesg.com/wp-content/up-
loads/2023/08/2022-JBS-SUSTAINABILITY-REPORT.pdf
JBS, ‘Business unit’. https://ri.jbs.com.br/en/jbs/ business-unit/ accessed 31 January 2024 JBS, ‘History’. https://ri.jbs.com.br/en/jbs/history/ accessed 31 January 2024
JBS, ‘Know the value chain of JBS in the pork segment’. https://jbs.com.br/en/pork/ accessed 31 January 2024
JBS, ‘Know the value chain of JBS in the poultry segment’. https://jbs.com.br/en/about/ our-business/poultry/ accessed 31 January 2024
JBS, ‘Our brands’. https://jbs.com.br/en/brands/ accessed 31 January 2024
JBS B.V. (2023) ‘Amendment no. 1 to Form F-4 Registration Statement under the Securities Act of 1933, United States Securities and Exchange Commission’, 1 September. https://www.sec.gov/Archives/edgar/data/1791942/000119312523227736/ d419054df4a.htm
JBS Global (UK) Ltd (2023) ‘JBS brings forward zero deforestation targets as it ramps up action towards 1.5°C roadmap’, news release, 18 April. https://www.jbsglobal.co.uk/ news/2023/04/jbs-brings-forward-zero-deforestation-targets/
JBS-Friboi, Bertin, Minerva & Marfrig (2009) ‘Minimum criteria for industrial scale cattle operations in the Brazilian Amazon biome’. https://www.greenpeace.org/usa/ wp-content/uploads/legacy/Global/usa/ report/2010/1/minimum-criteria-for-i.pdf
Jong HN (2020) ‘Paper giant APP linked to Indonesia peat clearing despite sustainability vow’, Mongabay, 1 September. https:// news.mongabay.com/2020/09/asia-pulppaper-peat-clearing-greenpeace/
Jordan L et al (2020) ‘Cargill: The company feeding the world by helping destroy the planet’, Unearthed, 25 November. https:// unearthed.greenpeace.org/2020/11/25/ cargill-deforestation-agriculture-history-pollution/
Kimbrough L (2021) ‘Soy and cattle team up to drive deforestation in South America: Study’, Mongabay, 12 July. https://news. mongabay.com/2021/07/study-showshow-soy-cattle-team-up-to-drive-deforestation-in-south-america/ Kozicka M et al (2023) ‘Feeding climate and biodiversity goals with novel plant-based meat and milk alternatives’, Nature Communications 14: 5316. https://doi. org/10.1038/s41467-023-40899-2 Legal500.com (2017) ‘Rose Kong’, The GC Powerlist: Southeast Asia 2017. https:// www.legal500.com/gc-powerlist/southeast-asia-2017/rose-kong/ London Stock Exchange, ‘BNP Paribas SA’. https://www.londonstockexchange.com/ market-stock/0HB5/bnp-paribas-sa/ overview accessed 1 February 2024 Marfrig (2023a) ‘Release de resultados 4T22’, 1 March. https://api.mziq.com/mzfilemanager/v2/d/b8180300-b881-4e6c-b97012ad72a86ec8/c5046d78-a024-e0ff599d-2638b1aae164?origin=1 Marfrig (2023b) ‘2022 sustainability report’. https://www.marfrig.com.br/en/Lists/CentralConteudo/Attachments/3/Sustainability%20Report%202022.pdf
Marfrig, ‘Boards, directors and committees’. https://www.marfrig.com.br/en/ board-boards-committees accessed 3 August 2023.
Marfrig, ‘Composição acionária’. https://ri.marfrig.com.br/governanca-corporativa/ composicao-acionaria/ accessed 3 August 2023
Marfrig, ‘Our operations’. https://ri.marfrig.com. br/en/grupo-marfrig/global-capacity/ our-operations/ accessed 24 January
2024
MarketWatch, ‘Banco Santander S.A. ADR’. https://www.marketwatch.com/investing/ stock/san accessed 4 February 2024
Mendes LH (2022) ‘Founder now owns 50% of Marfrig’, Valor International, 31 May. https:// valorinternational.globo.com/agribusiness/news/2022/05/31/founder-nowowns-50percent-of-marfrig.ghtml
Mighty Earth (2017) ‘Still at it: Major soy suppliers caught in continued deforestation linked to fast food, supermarkets’. https:// www.mightyearth.org/wp-content/uploads/2017/05/StillAtIt.pdf
Mighty Earth (2019a) ‘Cargill: The Worst Company in the World’. https://stories. mightyearth.org/cargill-worst-companyin-the-world/
Mighty Earth (2019b) ‘Rapid response: Palm oil, Report 17’. https://www.mightyearth. org/wp-content/uploads/Rapid-Response-Report-17_corrected_updated_20191218.pdf
Mighty Earth (2023a) ‘Mighty Earth files complaint with US Securities and Exchange Commission against JBS “green bonds”’, news release, 18 January. https:// mightyearth.org/article/mighty-earthhas-filed-a-whistleblower-complaintto-the-securities-and-exchange-commission-against-the-worlds-largestmeat-processor-jbs-we-are-calling-forthe-sec-the-usas-primary-financial-re/
Mighty Earth (2023b) ‘Tesco: A basket of problems for the Amazon’, April. https://www. mightyearth.org/wp-content/uploads/ MET2314_Report_6-2_FNL.pdf
Mighty Earth (2023c) ‘JBS refusal to investigate 68 cases of Amazon and Cerrado deforestation exposed ahead of meat giant’s AGM’, news release, 24 April. https:// mightyearth.org/article/jbs-refusal-toinvestigate-68-cases-of-amazon-andcerrado-deforestation-exposed-aheadof-meat-giants-agm/
Mighty Earth (2023d) ‘Saving the Cerrado: Why Bunge, supermarkets and governments must act fast’, June. https://www. mightyearth.org/wp-content/uploads/ BUNGE_Saving_the_Cerrado.pdf
Mighty Earth (2023e) ‘Cargill: Still the worst: How a single American company sabotaged the world’s biggest breakthrough for forests’, September. https://mightyearth.org/ wp-content/uploads/Cargill_report_final_12SEPT.pdf
Mighty Earth (2023f) ‘Rapid response #1 – Cattle: Monitoring deforestation in Brazilian supply chains’. https://www.mightyearth. org/wp-content/uploads/2023/12/RR_Report1_VF_Mighty_8DEC2023.pdf
Ministério Público Federal no Pará (2022) ‘MPF anuncia medidas contra frigoríficos que prejudicam os acordos de combate ao desmatamento no Pará (atualizada)’, news release, 16 December. https://www. mpf.mp.br/pa/sala-de-imprensa/noticias-pa/resultados-4o-ciclo-auditorias-tac-pecuaria-pa
Mukpo A (2021) ‘Review finds palm oil firm Golden Veroleum cleared carbon-rich Liberian forests’, Mongabay, 3 March https://news. mongabay.com/2021/03/review-findspalm-oil-firm-golden-veroleum-clearedcarbon-rich-liberian-forests/
MyHeritage, ‘Teguh Ganda Widjaja’. https:// www.myheritage.com/research/record-10182-3104649/teguh-ganda-widjaja-in-biographical-summaries-of-notable-people accessed 7 August 2023
Neate R (2022) ‘Soaring food prices push more Cargill family members on to world’s richest 500 list’, The Guardian, 17 April. https:// www.theguardian.com/news/2022/apr/17/
soaring-food-prices-push-more-cargillfamily-members-on-to-world-richest500-list
NLFI, ‘About NLFI’. https://www.nlfi.nl/en/aboutnlfi/ accessed 1 February 2024
Nordea (2023) ‘Annual report 2022’. https://www. nordea.com/en/doc/annual-report-nordea-bank-abp-2022.pdf
Nordea (2024) OTC reply, 14 March
Nordea, ‘Our history’. https://www.nordea.com/ en/about-us/who-are-we/our-history accessed 4 February 2024
Nordea, ‘Shareholders’. https://www.nordea. com/en/investors/shareholders-0 accessed 4 February 2024
Nordea, ‘Who we are’. https://www.nordea.com/ en/about-us/who-we-are accessed 4 February 2024
Norges Bank Investment Management, ‘About the fund’. https://www.nbim.no/en/ the-fund/about-the-fund/ accessed 15 January 2024
Nusantara Atlas (2022) ‘Palm oil giant using ‘shadow companies’ to hide links to deforestation of tiger habitat in Sumatra?’, 19 June. https://nusantara-atlas.org/palmoil-giant-using-shadow-companies-tohide-their-links-to-deforestation-of-tigerhabitat-in-sumatra/
Nusantara Atlas, home page. https://map. nusantara-atlas.org/ accessed 11 January 2024
Pacheco P et al (2021) ‘Deforestation fronts: Drivers and responses in a changing world’, WWF. https://www.worldwildlife.org/ publications/deforestation-fronts-driversand-responses-in-a-changing-worldfull-report
Pendrill F, Persson UM & Kastner T (2020) ‘Deforestation risk embodied in production and consumption of agricultural and forestry commodities 2005–2017’ (1.0), dataset, Zenodo. https://zenodo.org/records/4250532
Pendrill F et al (2022) ‘Disentangling the numbers behind agriculture-driven tropical deforestation’, Science 377(6611). https:// www.science.org/doi/10.1126/science. abm9267
Pensioenfonds Zorg & Welzijn (2022) ‘Aanpassingen beleggingen’, news release, 1 April. https://www.pfzw.nl/over-pfzw/actueel/aanpassingen-beleggingen1.html
Poore J & Nemecek T (2018) ‘Reducing food’s environmental impacts through producers and consumers’, Science, 360(6392): 987992. https://www.science.org/doi/10.1126/ science.aaq0216
Profundo, home page. https://www.profundo.nl accessed 1 February 2024
Rabobank (2023) ‘Annual report 2022’. https:// media.rabobank.com/m/467790ff0c0d80c6/original/Annual-Report-2022-EN.pdf
Rabobank (2024) OTC reply, 14 March Rabobank, ‘Rabobank at a glance’. https:// www.rabobank.com/about-us/in-short accessed 1 February 2024
Rabobank, ‘Contact Rabobank Group’. https:// www.rabobank.com/support/contact accessed 1 February 2024
Radwin M (2023) ‘Cargill widens its deforestation-free goals, but critics say it’s not enough’, Mongabay, 29 November. https:// news.mongabay.com/2023/11/cargill-widens-its-deforestation-free-goals-butcritics-say-its-not-enough/
Rainforest Action Network (2021) ‘Indonesian forestry titan Royal Golden Eagle remains a major roadblock to progress in saving Leuser Ecosystem’, Leuser Watch, 23 June. https://www.ran.org/leuser-watch/indonesian-forestry-titan-royal-golden-eagle-remains-a-major-roadblock-to-pro-
gress-in-saving-leuser-ecosystem/
Reid S (2019) ‘Inside the Cargill family’, Creaghan McConnell Group, 14 June. https:// cmgpartners.ca/cargill/
Reis T et al (2023) ‘Soy expansion drives deforestation in Bolivia’, Trase Insights, 23 August. https://insights.trase.earth/ insights/soy-expansion-drives-deforestation-in-bolivia/
Repórter Brasil (2022a) ‘Forest turned into animal feed: Soy and corn used as animal feed are increasing deforestation in Brazil’, Monitor 17, October. https://reporterbrasil.org.br/wp-content/uploads/2022/10/220927-Monitor-Ra%C3%A7%C3%A3o-Animal-EN-03.
Repórter Brasil (2022b) ‘Infamous connections: The relationship between the French financial system and deforestation in Brazil’, Monitor 19, November. https://reporterbrasil.org.br/wp-content/ uploads/2022/11/221126-Monitor-Bancos-Franceses-EN-08.pdf
RGE (2015) Royal Golden Eagle (RGE) ‘Forestry, fibre, pulp & paper sustainability framework’ (updated April 2022). https://www. rgei.com/images/pdf/RGE-Sustainability-Framework-English.pdf
RGE (2022) ‘Statement on RGE’s engagement with TPL’, 25 April. https://www.rgei.com/ attachments/article/1805/RGE%20statement%20on%20TPL_25%20April%202022. pdf
RGE (2023a) ‘RGE closes inaugural US$550 million sustainability-linked derivative with MUFG’, news release, 2 February. https:// www.rgei.com/attachments/article/1863/ rge-closes-inaugural-us$550-million-sustainability-linked-derivative-with-mufg.pdf
RGE (2023b) ‘RGE statement on EPN report “Pulping Borneo” – May 2023’. https://www.rgei. com/attachments/article/1893/rge-statement-on-epn-report-23-may-2023.pdf
RGE (2024) OTC reply, 14 March
RGE, ‘Apical’. https://www.rgei.com/our-business/apical#business accessed 1 February 2024 RGE, ‘APR’. https://www.rgei.com/our-business/ asia-pacific-rayon#business accessed 1 February 2024
RGE, ‘APRIL’. https://www.rgei.com/our-business/ april accessed 1 February 2024
RGE, ‘Asian Agri’. https://www.rgei.com/ our-business/asian-agri#business accessed 1 February 2024
RGE, ‘Asia Symbol’. https://www.rgei.com/ our-business/asia-symbol#business accessed 1 February 2024
RGE, ‘Bracell’. https://www.rgei.com/our-business/bracell#business accessed 1 February 2024
RGE, ‘Frequently asked questions’. https://www. rgei.com/about/faqs accessed 4 August 2023
RGE, ‘Improving lives through our companies: what we stand for’. https://www.rgei.com/ about/our-company accessed 1 February 2024
RGE, LinkedIn page. https://sg.linkedin.com/ company/rgegroup accessed 1 February 2024
RGE, ‘Pacific Energy’. https://www.rgei.com/ our-business/pacific-energy#business accessed 1 February 2024
RGE, ‘Sateri’. https://www.rgei.com/our-business/sateri#business accessed 1 February 2024
Richardson K et al (2023) ‘Earth beyond six of nine planetary boundaries’. Science Advances 9 (37). https://www.science.org/ doi/10.1126/sciadv.adh2458
Ritchie H (2020) ‘The carbon footprint of foods:
are differences explained by the impacts of methane?’, Our World in Data, 10 March. https://ourworldindata.org/carbon-footprint-food-methane
Ritchie H (2021) ‘Is our appetite for soy driving deforestation in the Amazon?’ Our World in Data, 7 February. https://ourworldindata. org/soy
S&P Dow Jones Indices (2023) ‘Bunge set to join S&P 500’, news release, 13 March. https:// www.spglobal.com/spdji/en/documents/ indexnews/announcements/20230313-146 3166/1463166_5-sbny.pdf
S&P Global (2023) ‘The world’s 100 largest banks, 2023’, 26 April. https://www.spglobal.com/ marketintelligence/en/news-insights/ research/the-world-s-100-largestbanks-2023
Santander (2023) ‘For a brighter tomorrow: 2022 annual report’. https://www.santander. com/content/dam/santander-com/en/ documentos/informe-financiero-anual/2022/ifa-2022-consolidated-annual-financial-report-en.pdf
Santander, ‘Contact’. https://www.santander. com/en/landing-pages/contact accessed 1 February 2024
Santander, ‘Legal notice’. https://www.bancosantander.es/en/aviso-legal accessed 1 February 2024
Santander, ‘Our business model’. https://www. santander.com/en/about-us/our-business-model accessed 1 February 2024
Santander, ‘Shareholders and investors: Santander share’. https://www.santander. com/en/shareholders-and-investors/ santander-share#price accessed 1 February 2024
Sax S (2019) ‘Cargill rejects Cerrado soy moratorium, pledges $30 million search for ideas’, Mongabay, 10 July. https://news.mongabay.com/2019/07/cargill-rejects-cerrado-soy-moratorium-pledges-30-million-search-for-ideas/
Schneider M et al (2021) ‘The commodity report: Soy production’s impact on forests in South America’, Global Forest Watch, blog post, 3 December. https://www.globalforestwatch.org/blog/commodities/soy-production-forests-south-america/
Schwartzkopff F (2024) ‘Banks set to lose reprieve from EU’s toughest ESG rule’, Bloomberg, 29 January. https:// www.bloomberg.com/news/articles/2024-01-29/banks-set-to-lose-temporary-reprieve-from-eu-s-toughestesg-rule
Simon L et al (2022) ‘Sustainability due diligence and reporting obligations for financial institutions: The coverage of the financial sector across a core set of EU regulatory measures: The case of deforestation, Climate & Company and Germanwatch’. https://issuu.com/climateandcompany/ docs/2022.11.24_disclosureandduediligenceobligationsoff
Sinar Mas, home page. https://www.sinarmas. com/en/index.php accessed 1 February 2024
Sinar Mas, ‘Agribusiness and food’. https://www. sinarmas.com/en/agribusiness-and-food. html accessed 1 February 2024
Sinar Mas, ‘Communication and technology’. https://www.sinarmas.com/en/communication-and-technology.html accessed 1 February 2024
Sinar Mas, ‘Developer and real estate’. https:// www.sinarmas.com/en/sinarmas-land. html accessed 1 February 2024
Sinar Mas, ‘Energy and infrastructure’. https:// www.sinarmas.com/en/energy-and-infrastructure.html 1 February 2024
Sinar Mas, ‘Financial services’. https://www. sinarmas.com/en/financial-services.html
accessed 1 February 2024
Sinar Mas, ‘Healthcare’. https://www.sinarmas. com/en/healthcare.html accessed 1 February 2024
Sinar Mas, ‘Pulp and paper products’. https:// www.sinarmas.com/en/pulp-and-paper. html accessed 1 February 2024
Société Générale (2023) ‘Universal registration document 2023/Annual financial report 2022’. https://www.societegenerale.com/sites/default/files/documents/2023-03/2023-Universal-Registration-Document_EN.pdf
Société Générale, ‘An integrated and diversified model’. https://investors.societegenerale. com/en/strategy-and-governance/model-of-value-creation accessed 1 February 2024
Société Générale, ‘How to contact Société Générale’. https://www.societegenerale. com/en/contact-us accessed 1 February 2024
Song X-P et al (2021) ‘Massive soybean expansion in South America since 2000 and implications for conservation’, Nature Sustainability 4: 784-792. https://www.nature. com/articles/s41893-021-00729-z
Spring J (2018) ‘Brazil fines five grain trading firms, farmers connected to deforestation’, Reuters, 23 May. https://www. reuters.com/article/us-brazil-deforestation-bunge-carg-idUKKCN1IO1NV
STAK AAB (2023) ‘STAK AAB issues depositary receipts for the sixth time’, news release, 16 October. https://www.stakaab.org/en/ news/stak-aab-issues-depositary-receipts-for-the-sixth-time
STAK AAB, ‘Frequently asked questions’. https://www.stakaab.org/en/frequently-asked-questions accessed 10 January 2024
Stauffer C (2019) ‘Cargill says food industry will miss zero deforestation goal’, Reuters, 13 June. https://www.reuters.com/article/ idUSKCN1TE34L/
Steinweg T, Rijk G & Piotrowski M (2020) ‘JBS: Outsized deforestation in supply chain, COVID-19 pose fundamental business risks’, Chain Reaction Research. https://chainreactionresearch.com/report/jbs-outsizeddeforestation-in-supply-chain-covid-19pose-fundamental-business-risks/
Tay V (2023) ‘RGE’s Asia Symbol obtains 1 billion yuan sustainability-linked loan’, Business Times, 18 May. https://www.businesstimes.com.sg/esg/rges-asia-symbol-obtains-1-billion-yuan-sustainability-linked-loan
Tharawat Magazine (2020) ‘Widjaja family’, 12 September. https://www.tharawat-magazine.com/fbl/widjaja-family/
TheTreeMap (2023) ‘Pulp-and-paper driven deforestation in Indonesia accelerates in 2022’, Nusantara Atlas, 13 January. https:// nusantara-atlas.org/pulp-and-paper-driven-deforestation-in-indonesia-accelerates-in-2022/
Thomas P (2024) ‘New York Attorney General sues meatpacker JBS over climate claims’, Wall Street Journal, 28 February. https:// www.wsj.com/business/new-york-attorney-general-sues-meatpacker-jbs-overclimate-claims-e900f75d
Together4Forests, list of supporters. https:// together4forests.eu/about/supporters accessed 5 February 2024
Together4Forests, ‘Our response to the European Commission’s public consultation for a strong law against deforestation, nature destruction and human rights violations’. https://together4forests.eu/news-resources/answers accessed 5 February 2024
Trase Supply Chains, ‘Bolivia soy supply chain’. https://trase.earth/explore/supply-chain/
bolivia/soy?chartType=sankey&year=2021&indicator=commodity_deforestation_total_exposure&dimension=region_production_1&dimension=exporter_group&dimension=importer_group&dimension=country_of_destination accessed 8 February 2023
Triodos Bank (2022) ‘Triodos Bank supports call to include the financial sector in the EU-Deforestation Regulation’, news release, 9 November. https://www.triodos. com/en/articles/2022/triodos-bank-supports-call-to-include-the-financial-sector-in-the-eu-deforestation-regulation
Triodos Bank et al (2022) ‘The inclusion of the financial sector in the Deforestation Regulation’, open letter to the EU Environment Commissioner, 29 November. https://www. triodos.com/binaries/content/assets/ tbho/other/open-letter-deforestation/ open-letter-deforestation-regulation.pdf
UN Convention on Biological Diversity, ‘GBF home: 2050 vision and 2030 mission’.
https://www.cbd.int/gbf/vision/ accessed 5 February 2024
UN Convention on Biological Diversity, ‘GBF home: 2030 targets (with guidance notes)’. https://www.cbd.int/gbf/targets/ accessed 5 February 2024
UN Convention on Biological Diversity, ‘GBF home: 2050 goals’. https://www.cbd.int/ gbf/goals/ accessed 5 February 2024
UN Environment Programme (2023) ‘State of finance for nature 2023’. https://www.unep. org/resources/state-finance-nature-2023
UN Framework Convention on Climate Change (2023) ‘Decision -/CMA.5 Outcome of the first global stocktake’, advance unedited version. https://unfccc.int/documents/636584
UN Framework Convention on Climate Change, ‘The Paris Agreement’. https://unfccc.int/ process-and-meetings/the-paris-agreement accessed 25 January 2024
UN Office of the High Commissioner for Human Rights (2021) ‘OHCHR response to request from BankTrack and OECD Watch for advice regarding the application of the UN Guiding Principles on Business and Human Rights where private sector banks act as nominee shareholders’, 30 August. https:// www.ohchr.org/sites/default/files/Documents/Issues/Business/finance-2021-response-nominee-shareholders.pdf
van Dijk M et al (2021) ‘A meta-analysis of projected global food demand and population at risk of hunger for the period 2010–2050’, Nature Food 2: 494-501. https:// doi.org/10.1038/s43016-021-00322-9
Wenzel F, Hofmeister N & Papini P (2020) ‘BlackRock’s $400m stake in Amazon meatpackers defies sustainability cred’, ((o)) eco, 4 September. https://oeco.org.br/ english/97145/
World Bio Market Insights (2023) ‘The ABCD agro-giants: Hidden movers in biobased scaling’. https://worldbiomarketinsights. com/the-abcd-agro-giants-hiddenmovers-in-biobased-scaling/
World Resources Institute (2023) ‘Top 10 lists: The top 10 countries for total tree cover loss from 2001 to 2022’. https://research.wri.org/ gfr/top-ten-lists
WWF (2018) ‘APP and APRIL violate zero-deforestation policies with wood purchases from Djarum Group concessions in East Kalimantan’. https://wwfint.awsassets. panda.org/downloads/app_and_april_violate_zero_deforestation_policies_with_ wood_purchases_from_djarum_group_. pdf
WWF (2020) ‘Stepping up? The continuing impact of EU consumption on nature worldwide’. https://www.wwf.eu/?2965416/
Stepping-up-The-continuing-impact-ofEU-consumption-on-nature
Xu X et al (2021) ‘Global greenhouse gas emissions from animal-based foods are twice those of plant-based foods’, Nature Food 2: 724-732. https://doi.org/10.1038/s43016021-00358-x
Youssef Y (2023) ‘The Amazon cut: How beef linked to deforestation is exported to Europe by major companies’, Forbidden Stories, 2 June. https://forbiddenstories. org/the-amazon-cut-how-beef-linkedto-deforestation-is-exported-to-europeby-major-companies/
This report has sought to quantify the scale and global significance of the EU financial sector’s contribution to ecosystem risk finance. Analysis of the data shows that EUbased FIs have provided 22.1% of global credit since 2016 to major corporate groups active in ecosystem risk sectors and are responsible for 9.4% of current global investment. This includes billions of dollars in credit to and investment in just six corporate groups with reported direct or supply chain links to recent ecosystem destruction. These findings clearly demonstrate the need for the introduction of comprehensive due diligence obligations on FIs operating in the EU in order to prevent financial flows from these institutions from contributing directly or indirectly to ecosystem destruction.
As the analysis in this report reveals, all of the EU’s largest banks and many other EU-based FIs are providing finance to multiple ecosystem risk sectors and have relationships with many of the largest corporate groups active in these sectors, including those with reported recent links to specific ecosystem destruction. This implies that existing voluntary undertakings by both FIs and commodity sector groups are not proving effective in preventing EU finance from contributing to ecosystem destruction. Analysis of the provision of finance to ecosystem risk sectors strongly suggests that reform will not happen without regulation.
The present analysis covers the commodities listed in the current EUDR, plus derived products and similar agricultural commodities that contribute to deforestation, which may be covered in the forthcoming review of the EUDR. A future regulation on finance linked to ecosystem conversion and degradation could also include other sectors with substantial ecosystem risk, such as mining and fossil fuels.
The planned EUDR review relating to finance offers a crucial opportunity to bring forward long-needed legislative
action to prevent direct and indirect financial flows to ecosystem destruction.
The EU should introduce specific obligations for financial institutions (FIs) to ensure that their financial flows do not contribute, directly or indirectly, to ecosystem conversion and degradation and associated human rights abuses. Other financial services, such as insurance, should also be covered by these obligations.
The obligations should apply to all EU-based FIs and should include financial services provided by any of their operations globally, including those of their parent companies and subsidiaries based outside the EU.
These obligations should include a duty for FIs to carry out due diligence on the activities of clients and investees, including all of the client or investee’s corporate group’s activities in relevant commodity sectors.
At a minimum, FIs should be required to perform due diligence before carrying out the following transactions:
• Future credit arrangements and underwriting services
• Renewal of existing credit arrangements or underwriting services
• New investment
Any groups found to carry a non-negligible risk of contributing to ecosystem destruction should be excluded from finance.
The following table lists the corporate groups covered in this report and the ecosystem risk sectors where the Profundo dataset shows they have significant upstream or midstream involvement.
Countries are listed based on HQ location, which may not reflect operational locations: eg most groups shown in the data as based in Singapore are mainly active in Indonesia and Malaysia, while US-based groups include major transnational actors.
Corporate group
HQ country active ecosystem risk sectors
AAK Sweden
Palm oil trader, soya trader
ABF – Associated British Foods United Kingdom Sugarcane processor
ACA Argentina Biofuel, maize, soya trader
Adecoagro Luxembourg Biofuel, dairy, soya producer, sugarcane processor
ADM – Archer Daniels Midland United States Animal feed, biofuel, maize, palm oil trader, soya trader
Agropur Canada Dairy
Alltech United States Animal feed, aquafeed
Almarai Saudi Arabia Dairy
Arla Foods Denmark Dairy
Austevoll Seafood Norway Aquaculture
Bakkafrost Faroe Islands Aquaculture
Barry Callebaut Switzerland
Cocoa
Batu Kawan Group Malaysia Biofuel, palm oil producer, palm oil trader, rubber
Beijing Shunxin Agriculture China Pork
Bolloré France Palm oil producer, rubber
Bom Jesus Brazil
Soya producer
BRF – Brasil Foods Brazil Animal feed, pork, poultry
Brookfield Canada Soya producer
Bunge United States Biofuel, maize, palm oil trader, soya trader, sugarcane processor
Cargill United States Animal feed, aquafeed, beef, biofuel, cocoa, maize, palm oil producer, palm oil trader, poultry, soya trader, sugar trader
Cermaq Japan
Aquaculture
China Mengniu Dairy Cayman Islands Dairy
China Yurun Food Group China Animal feed, pork
CHS United States Biofuel, maize, soya trader
CMPC Chile Pulp, sawn wood, wood-based panels
COFCO Group China Animal feed, biofuel, coffee, maize, palm oil trader, pork, soya trader, sugar trader, sugarcane processor
Conagra Brands United States Maize, soya trader
Cooke Aquaculture Canada Aquaculture
Copersucar Brazil Biofuel, sugar trader, sugarcane processor
CP Group Thailand Animal feed, aquafeed, dairy, pork, poultry
Cresud Argentina
Soya producer
Danish Crown Denmark Beef, pork
Danone France Dairy
De Heus Netherlands Animal feed
DFA – Dairy Farmers of America United States Dairy
Corporate group
HQ country
active ecosystem risk sectors
DMK Deutsches Milchkontor Germany Dairy
Duratex Brazil Pulp, wood-based panels
Ecom Agroindustrial Switzerland Cocoa, coffee
ED&F Man Sugar United Kingdom Coffee, sugar trader
Egger Group Austria Sawn wood, wood-based panels
Felda Group Malaysia Biofuel, palm oil producer, palm oil trader, rubber, sugarcane processor
First Resources Singapore Palm oil trader, rubber
Fonterra Cooperative Group New Zealand Dairy
ForFarmers Netherlands Animal feed
FrieslandCampina Netherlands Dairy
Fuji Oil Japan Cocoa
Fujian Sunner China Poultry
General Mills United States Dairy, maize, sugar trader
Genting Group Malaysia Biofuel, palm oil producer, palm oil trader
Georgia-Pacific Group (Koch Industries) United States Pulp, sawn wood, wood-based panels
Glanbia Ireland Dairy
Grieg Seafood Norway Aquaculture
Groupe Bigard France Beef, pork
Groupe Sodiaal France Dairy
Grupo Amaggi Brazil
Biofuel, maize, soya producer, soya trader
Grupo Bom Futuro Brazil Soya producer
Grupo Los Grobo Argentina Soya producer
Guangdong Guangken Rubber Group China Rubber
Guangdong Haid Group China
Animal feed, aquafeed
Guangdong Wens Foodstuff Group China Animal feed, pork, poultry
Guangdong Yuehai Feeds Group China Aquafeed
Hainan State Farms Group China Rubber
Harita Group Indonesia Palm oil trader
Hayel Saeed Anam Group United Arab Emirates Palm oil trader
Hilton Food United Kingdom Beef, pork
Hormel Foods United States Beef, pork, poultry
Ilim Group Russia Pulp, sawn wood, wood-based panels
Inalca Italy Beef
Industrias Bachoco Mexico
Animal feed, pork, poultry
Inner Mongolia Yili China Dairy
IOI Group Malaysia
Palm oil producer, palm oil trader
Itochu Japan Rubber
Corporate group
HQ country
JBS Brazil
active ecosystem risk sectors
Animal feed, aquaculture, beef, biofuel, pork, poultry
Koch Foods United States Animal feed, poultry
Kronospan Austria Wood-based panels
Land O'Lakes United States Animal feed
Le Groupe Lactalis France Dairy
Louis Dreyfus Company Netherlands Coffee, maize, soya trader, sugar trader
Louisiana Pacific United States Wood-based panels
Marfrig Brazil Animal feed, beef
Maruha Nichiro Japan Aquaculture, beef, pork, poultry
Meiji Japan Dairy
Mercer International Canada Pulp, sawn wood, wood-based panels
Mercon Coffee Netherlands Coffee
Metsä Finland Pulp, sawn wood
MHP Ukraine Maize, poultry, soya trader
Minerva Brazil Beef
Mowi Norway Aquaculture, aquafeed
Müller Group Germany Dairy
Musim Mas Group Singapore Biofuel, palm oil producer, palm oil trader
Muyuan Foodstuff China Animal feed, pork
Nestlé Switzerland Cocoa, coffee, dairy
Neumann Gruppe Germany
New Hope Group China
NH Foods Japan
Coffee
Animal feed, pork
Beef, pork, poultry
Nutreco Netherlands Animal feed, aquafeed
Olam Group Singapore
Cocoa, coffee, palm oil trader, rubber
Perdue Farms United States Animal feed, poultry
Perkebunan Nusantara Group Indonesia
Biofuel, palm oil producer, rubber, sugarcane processor
Pfleiderer Germany Wood-based panels
Royal Agrifirm Group Netherlands Animal feed
Royal Golden Eagle Group Singapore Palm oil producer, palm oil trader, pulp
Salim Group Indonesia Palm oil trader
SalMar Norway Aquaculture
Sanderson Farms United States Poultry
Saputo Canada Dairy
Savencia Fromage and Dairy France Dairy
Scheffer & Cia Brazil Soya producer
Schreiber Foods United States Dairy
Seaboard United States Pork
Sigma Alimentos Mexico Beef, dairy, pork, poultry
Sime Darby Plantations Malaysia Beef, biofuel, palm oil producer, palm oil trader, sugarcane processor
Corporate group
HQ country
active ecosystem risk sectors
Simmons Foods United States Animal feed, poultry
Sinar Mas Group Indonesia Palm oil, pulp, sawn wood
Sinochem Group China Rubber
SLC Agricola Brazil Soya producer
Sri Trang Agro-Industry Thailand Rubber
Stora Enso Finland Pulp, sawn wood
Sucafina Switzerland Coffee
Sucden France Cocoa, coffee, sugar trader
Suzano Brazil Pulp
Thai Union Thailand Aquaculture
Tongwei China Animal feed, aquafeed
Touton France Cocoa, coffee
Tyson Foods United States Animal feed, beef, pork, poultry
Unilever United Kingdom Dairy, pork, poultry
UPM Finland Pulp, sawn wood
Vicentin Argentina Soya trader
Vietnam Rubber Group Vietnam Rubber
Vion Food Group Netherlands Beef, pork
Viterra Netherlands Biofuel, maize, soya trader, sugar trader, sugarcane processor
Wellhope Agri-Tech China Animal feed, poultry
West Fraser Timber Canada
Pulp, sawn wood, wood-based panels
WH Group China Pork, poultry
Wilmar International Singapore Biofuel, palm oil trader, sugar trader, sugarcane processor
Because of how the data collection process was carried out, for some corporate groups data on loans and underwriting was collected up to June 2023. These are shown in the following table. All other groups have data to March 2023 only. All financial data is from the Profundo dataset (see ‘Methodology’ and Annex C).
Financial institutions provide business enterprises with the financial means that enable them to conduct their commercial activities. Therefore, this research identified the relationships between financial institutions and the selected companies active in forest-risk sectors. This annex outlines the types of finance included in our analysis, the calculated elements in the corporate financing research and financial research data sources. Moreover, it describes some of the limitations of the financial research.
This section outlines the different types of financing, how they were researched and the implications for the analysis. Financial institutions can invest in companies through a number of modalities. First, financial institutions can provide credit to a company. This includes providing various types of short- and long-term loans and credit facilities. Second, financial institutions can facilitate companies’ access to credit in the broader financial market by underwriting share and bond issuances. Third, financial institutions can invest in the equity and debt of a company by holding shares and bonds. This analysis focused on credit and underwriting.
Corporate loans are generally issued by commercial banks and can be either short-term or long-term in nature. Short-term loans (including trade credits, current accounts, leasing agreements etc) have a maturity of less than a year. They are mostly used as working capital for day-today operations. Short-term debts are often provided by a single commercial bank, which does not ask for substantial guarantees from the company.
A long-term loan has a maturity of at least one year, but generally three to ten years. Long-term corporate loans are particularly useful for financing expansion plans, which only generate rewards for borrowers after some period of time.
A borrowing company may use a corporate loan (also known as corporate financing) to support any of the company’s activities. Often, long-term loans are extended by a loan syndicate, which is a group of banks brought together by one or more arranging banks. The loan syndicate will only undersign the loan agreement if the company can provide certain guarantees that interest and repayments on the loan will be fulfilled.
One specific form of corporate loan is project finance. This is a loan earmarked for a specific project, or ‘use of proceeds’.
Often, a company will receive a loan for general corporate purposes or for working capital. On occasion, such a loan’s ‘use of proceeds’ is reported as ‘general corporate purposes’, while the loan is, in fact, earmarked for a certain project. This is difficult to ascertain.
Issuing shares on the stock exchange gives a company the opportunity to increase its equity, either by attracting many new shareholders or by increasing the equity of its existing shareholders.
When a company offers its shares on the stock exchange for the first time, this is called an initial public offering (IPO). When a company’s shares are already traded on the stock exchange, this is called a secondary offering of additional shares.
To arrange an IPO or a secondary offering, a company needs the assistance of one or more (investment) banks, which will promote the shares and find shareholders. The role of investment banks in this process is very important. However, this role is temporary. The investment bank purchases the shares initially and then promotes the shares and finds shareholders. This is the process of underwriting an IPO or secondary offering.
Underwriting is a crucially important service for companies. It provides a company with access to capital markets and provides a guarantee that its shares will be bought at a predetermined minimum price.
Once the underwriting financial institution has sold all issued shares it has underwritten, these shares are no longer included in the balance sheet or the portfolio of the financial institution.
Issuing bonds can best be described as cutting a large loan into small pieces and selling each piece separately. Bonds are issued on a large scale by governments, but also by corporations. Like shares, bonds are traded on the stock exchange. To issue bonds, a company needs the assistance of one or more (investment) banks, which underwrite a certain amount of the bonds. Underwriting bonds means, in effect, buying these securities with the intention of selling them to investors. If a bank fails to sell all the bonds it has underwritten, it will end up owning the bonds.
Financial institutions can, through the funds they are managing, buy shares of companies, making them equity owners, or co-owners, of those companies. Shareholding gives financial institutions a direct influence on a company’s strategy. The magnitude of this influence depends on the size of the shareholding.
Financial institutions can also buy companies’ bonds. The main difference between owning shares and bonds is that the owner of a bond is not a co-owner of the issuing company; rather, the owner of a bond is a creditor of the company. The buyer of each bond is entitled to repayment after a certain number of years and to a certain interest during each of those years.
For each of the subsidiaries of the selected companies for
which financing was identified, we determined whether the subsidiary was engaged in the relevant sector. Borrowing/ issuing subsidiaries that were engaged in sectors outside of the scope of this research were excluded from the further financial analysis. It should be noted, however, that the majority of financing is attracted at the company group level, particularly among multi-sector conglomerates.
The financial data collection process utilised financial databases (Bloomberg, Refinitiv, Trade Finance Analytics and IJGlobal) and company reports (annual, interim, quarterly), as well as other company publications, company register filings and media and analyst reports.
Corporate loans, credit and underwriting facilities provided to the selected companies were researched for the period January 2016 to March 2023.
Financial databases often record loans and issuance underwriting when these are provided by a syndicate of financial institutions (databases generally do not provide information on bilateral transactions). Company reports and publications, company register filings and the media will also provide information on loans provided bilaterally, ie between one bank and the company in question.
The level of detail per deal often varies. Some financial databases and other sources may omit the maturity date or term of the loan, the use of proceeds or even the exact issue date. Financial databases often do not report on the proportions of a given syndicated loan that can be attributed to the participants in it. In such instances, this research calculated an estimated contribution based on the rules of thumb described below:
Individual bank contributions to syndicated loans and underwriting (bond and share issuance underwriting) were recorded to the greatest extent possible where these details were included in financial databases or company or media publications.
In many cases, the total value of a loan or issuance is known, as is the number of banks participating in this loan or issuance. However, the amount each individual bank commits to the loan or issuance often must be estimated.
This research attempted to calculate each bank’s commitment based on the fee it received as a proportion of the total fees received by all financial institutions. This proportion (eg Bank A received 10% of all fees) was then applied to the known total deal value (eg 10% x US$10 million = US$1 million for Bank A). Where deal fee data was missing or incomplete, this research used the book ratio. The book ratio (see formula below) determines the spread over bookrunners and other managers.
Book ratio:
number of participants - number of bookrunners number of bookrunners
The following table shows the commitment assigned to bookrunner groups with our estimation method. As the number of total participants in relation to the number of bookrunners increases, the share that is attributed to bookrunners decreases. This prevents very large differences in amounts attributed to bookrunners and other participants.
The number and value of bonds held by financial institutions are reported in financial databases. They were not subject to adjustment.
The financial research is subject to a few limitations:
Information from the financial databases used primarily includes syndicated lending, ie two or more financial institutions providing a loan to one company together. The financial databases do not have data on bilateral lending, ie direct loans between one bank and one company.
Bilateral lending was researched using company reports, company registries and media archives, among other sources. However, these sources have data gaps. Many companies do not disclose their bankers, or not in sufficient detail to include in the analysis. This is the result of different requirements in different jurisdictions, and whether or not the company is listed on the stock exchange.
The financial databases collect data on bond and shareholdings from fund filings, company reports and stock exchanges. As a result, the coverage of bond- and shareholding data is generally more complete for asset managers and the asset management arms of insurance companies and banking groups.
Other financial institutions, such as pension funds and insurance companies that do not offer asset management activities, are not required to publish their investment portfolios. Those that do publish their portfolios aren’t always covered by the financial databases.
Profundo maintains a database of pension fund portfolio disclosures. These are updated at least once a year.
* In the case of deals with a book ratio of more than 3.0, we use a formula which gradually lowers the commitment assigned to the bookrunners as the book ratio increases. The formula used for this is:
1
bookratio 1.443375673
The number in the denominator is used to let the formula start at 40% in the case of a book ratio of 3.0. As the book ratio increases, the percentage will decrease. In the case of issuances, the number in the denominator is 0.769800358.
The number and value of shares held by financial institutions are reported in financial databases. They were not subject to adjustment.
For all bond- and shareholdings, actual positions are constantly changing. Bond- and shareholders identified during this research may have sold their positions, or in other ways changed the composition of their portfolio, since the data was gathered.
This report is published by Greenpeace International, Milieudefensie (Friends of the Earth Netherlands) and Harvest. The publishers retain all rights to the content of this publication. The content of this publication may not be used, either in whole or in part, for commercial purposes without the prior approval of the publishers.
The analysis presented in this report is based on a financial dataset compiled by Profundo, covering links between global financial institutions and major corporate players in agricultural commodities associated with deforestation and ecosystem risk; sectors using large inputs of such commodities to produce animal feed/aquafeed, or consuming large quantities of such feed; and timber and wood pulp.
This report is supported by AidEnvironment, Association of Ethical Shareholders Germany, Bank Track, Bos+, Deutsche Umwelthilfe, Environmental Paper Network, FairFin, Federación de Consumidores y Usuarios - CECU, Feedback EU, Finanzwende, Global Witness, Groen Pensioen, OroVerde, Rainforest Action Network, Südwind-Institut and WALHI (Friends of the Earth Indonesia) and Ecologistas en Acción.
Disclaimer: the content of this publication is the sole responsibility of Greenpeace International, Vereniging Milieudefensie and Harvest.
Please consider the environment before printing this publication.
(c) March 2024, Greenpeace / Milieudefensie / Harvest
All photos are listed below left to right and from top to bottom of the relevant pages:
Page 2 and 3: © Christian Braga / Greenpeace; © 2015 TTstudio/ Shutterstock; © 2017 symbiot/ Shutterstock; © Werner Rudhart / Greenpeace
Page 4 and 5: © Greenpeace; © 2013 TATSIANAMA/Shutterstock; © Christian Braga / Greenpeace
Page 6: © 2020 Songquan Deng/ Shutterstock; © Greenpeace / Daniel Beltrá
Page 7: © Ricardo Funari / Lineair / Greenpeace; © 2017 Ikars/Shutterstock
Page 8: © Ardiles Rante / Greenpeace
Page 9: © 2013 Pressmaster/ Shutterstock
Page 28: © Eduardo Bodiño / Greenpeace
Page 54: © Muhammad Adimaja / Greenpeace; © Victor Moriyama / Greenpeace; © Marco Antonio Rezende / Lineair / Greenpeace; © Oscar Siagian / Greenpeace; © Greenpeace / John Novis; © Greenpeace / Francesco Alesi; © Greenpeace / Oka Budhi; © Greenpeace / Rodrigo Baleia
Page 80: © Ulet Ifansasti / Greenpeace
Page 88: © Greenpeace / Eduardo Issa