

VOLUME 123 NO. 4 APRIL 2023 Ukwazi SAIMM Outside Cover Print ready.pdf 1 16/05/2023 7:41:56 AM


Honorary President
Nolitha Fakude
President, Minerals Council South Africa
Honorary Vice Presidents
Gwede Mantashe
Minister of Mineral Resources and Energy, South Africa
Ebrahim Patel
Minister of Trade, Industry and Competition, South Africa
Blade Nzimande
Minister of Higher Education, Science and Technology, South Africa
President
Z. Botha
President Elect
W.C. Joughin
Senior Vice President
E. Matinde
Junior Vice President
G.R. Lane
Incoming Junior Vice President
T.M. Mmola
Immediate Past President
I.J. Geldenhuys
Honorary Treasurer
W.C. Joughin
Ordinary Members on Council
W. Broodryk G. Njowa
Z. Fakhraei S.J. Ntsoelengoe
R.M.S. Falcon (by invitation) S.M. Rupprecht
B. Genc M.H. Solomon
K.M. Letsoalo A.J.S. Spearing
S.B. Madolo A.T. van Zyl
F.T. Manyanga E.J. Walls
M.C. Munroe
Co-opted to Members
K. Mosebi
A.S. Nhleko
Past Presidents Serving on Council
N.A. Barcza C. Musingwini
R.D. Beck S. Ndlovu
J.R. Dixon J.L. Porter
V.G. Duke M.H. Rogers
R.T. Jones D.A.J. Ross-Watt
A.S. Macfarlane G.L. Smith
M.I. Mthenjane W.H. van Niekerk
G.R. Lane–TPC Mining Chairperson
Z. Botha–TPC Metallurgy Chairperson
M.A. Mello–YPC Chairperson
K.W. Banda–YPC Vice Chairperson
Branch Chairpersons
Botswana Being established
DRC Not active
Johannesburg N. Rampersad
Namibia Vacant
Northern Cape I. Tlhapi
North West I. Tshabalala
Pretoria Vacant
Western Cape A.B. Nesbitt
Zambia J.P.C. Mutambo (Interim Chairperson)
Zimbabwe A.T. Chinhava
Zululand C.W. Mienie
* W. Bettel (1894–1895)
* A.F. Crosse (1895–1896)
* W.R. Feldtmann (1896–1897)
* C. Butters (1897–1898)
* J. Loevy (1898–1899)
* J.R. Williams (1899–1903)
* S.H. Pearce (1903–1904)
* W.A. Caldecott (1904–1905)
* W. Cullen (1905–1906)
* E.H. Johnson (1906–1907)
* J. Yates (1907–1908)
* R.G. Bevington (1908–1909)
* A. McA. Johnston (1909–1910)
* J. Moir (1910–1911)
* C.B. Saner (1911–1912)
* W.R. Dowling (1912–1913)
* A. Richardson (1913–1914)
* G.H. Stanley (1914–1915)
* J.E. Thomas (1915–1916)
* J.A. Wilkinson (1916–1917)
* G. Hildick-Smith (1917–1918)
* H.S. Meyer (1918–1919)
* J. Gray (1919–1920)
* J. Chilton (1920–1921)
* F. Wartenweiler (1921–1922)
* G.A. Watermeyer (1922–1923)
* F.W. Watson (1923–1924)
* C.J. Gray (1924–1925)
* H.A. White (1925–1926)
* H.R. Adam (1926–1927)
* Sir Robert Kotze (1927–1928)
* J.A. Woodburn (1928–1929)
* H. Pirow (1929–1930)
* J. Henderson (1930–1931)
* A. King (1931–1932)
* V. Nimmo-Dewar (1932–1933)
* P.N. Lategan (1933–1934)
* E.C. Ranson (1934–1935)
* R.A. Flugge-De-Smidt (1935–1936)
* T.K. Prentice (1936–1937)
* R.S.G. Stokes (1937–1938)
* P.E. Hall (1938–1939)
* E.H.A. Joseph (1939–1940)
* J.H. Dobson (1940–1941)
* Theo Meyer (1941–1942)
* John V. Muller (1942–1943)
* C. Biccard Jeppe (1943–1944)
* P.J. Louis Bok (1944–1945)
* J.T. McIntyre (1945–1946)
* M. Falcon (1946–1947)
* A. Clemens (1947–1948)
* F.G. Hill (1948–1949)
* O.A.E. Jackson (1949–1950)
* W.E. Gooday (1950–1951)
* C.J. Irving (1951–1952)
* D.D. Stitt (1952–1953)
* M.C.G. Meyer (1953–1954)
* L.A. Bushell (1954–1955)
* H. Britten (1955–1956)
* Wm. Bleloch (1956–1957)
* H. Simon (1957–1958)
* M. Barcza (1958–1959)
* R.J. Adamson (1959–1960)
* W.S. Findlay (1960–1961)
* D.G. Maxwell (1961–1962)
* J. de V. Lambrechts (1962–1963)
* J.F. Reid (1963–1964)
* D.M. Jamieson (1964–1965)
* H.E. Cross (1965–1966)
* D. Gordon Jones (1966–1967)
* P. Lambooy (1967–1968)
* R.C.J. Goode (1968–1969)
* J.K.E. Douglas (1969–1970)
* V.C. Robinson (1970–1971)
* D.D. Howat (1971–1972)
* J.P. Hugo (1972–1973)
* P.W.J. van Rensburg (1973–1974)
* R.P. Plewman (1974–1975)
* R.E. Robinson (1975–1976)
* M.D.G. Salamon (1976–1977)
* P.A. Von Wielligh (1977–1978)
* M.G. Atmore (1978–1979)
* D.A. Viljoen (1979–1980)
* P.R. Jochens (1980–1981)
* G.Y. Nisbet (1981–1982)
A.N. Brown (1982–1983)
* R.P. King (1983–1984)
J.D. Austin (1984–1985)
* H.E. James (1985–1986)
H. Wagner (1986–1987)
* B.C. Alberts (1987–1988)
* C.E. Fivaz (1988–1989)
* O.K.H. Steffen (1989–1990)
* H.G. Mosenthal (1990–1991)
R.D. Beck (1991–1992)
* J.P. Hoffman (1992–1993)
* H. Scott-Russell (1993–1994)
J.A. Cruise (1994–1995)
D.A.J. Ross-Watt (1995–1996)
N.A. Barcza (1996–1997)
* R.P. Mohring (1997–1998)
J.R. Dixon (1998–1999)
M.H. Rogers (1999–2000)
L.A. Cramer (2000–2001)
* A.A.B. Douglas (2001–2002)
S.J. Ramokgopa (2002-2003)
T.R. Stacey (2003–2004)
F.M.G. Egerton (2004–2005)
W.H. van Niekerk (2005–2006)
R.P.H. Willis (2006–2007)
R.G.B. Pickering (2007–2008)
A.M. Garbers-Craig (2008–2009)
J.C. Ngoma (2009–2010)
G.V.R. Landman (2010–2011)
J.N. van der Merwe (2011–2012)
G.L. Smith (2012–2013)
M. Dworzanowski (2013–2014)
J.L. Porter (2014–2015)
R.T. Jones (2015–2016)
C. Musingwini (2016–2017)
S. Ndlovu (2017–2018)
A.S. Macfarlane (2018–2019)
M.I. Mthenjane (2019–2020)
V.G. Duke (2020–2021)
I.J. Geldenhuys (2021–2022)
Editorial Board
S.O. Bada
R.D. Beck
P. den Hoed
I.M. Dikgwatlhe

R. Dimitrakopolous*
L. Falcon
B. Genc
R.T. Jones
W.C. Joughin
A.J. Kinghorn
D.E.P. Klenam
H.M. Lodewijks
D.F. Malan
R. Mitra*
H. Möller
C. Musingwini
S. Ndlovu
P.N. Neingo
M. Nicol*
S.S. Nyoni
M. Phasha
P. Pistorius
P. Radcliffe
N. Rampersad
Q.G. Reynolds
I. Robinson
S.M. Rupprecht
K.C. Sole
A.J.S. Spearing*
T.R. Stacey
E. Topal*
D. Tudor*
F.D.L. Uahengo
D. Vogt*
*International Advisory Board members
Editor /Chairman of the Editorial Board
R.M.S. Falcon
Typeset and Published by
The Southern African Institute of Mining and Metallurgy

PostNet Suite #212
Private Bag X31
Saxonwold, 2132
E-mail: journal@saimm.co.za
Printed by Camera Press, Johannesburg
Advertising Representative
Barbara Spence
Avenue Advertising
Telephone (011) 463-7940
E-mail: barbara@avenue.co.za

ISSN 2225-6253 (print)
ISSN 2411-9717 (online)
Directory of Open Access Journals

Journal Comment: Lithium – Many metallurgical challenges by M. Dworzanowski ......................................................... iv President’s Corner: The Carbon Tax Conundrum by Z. Botha ................................................................. v
Optimizing of gas-shielded metal arc welding parameters for 10.5-12.5% chromium steel using 308L electrodes
A.M. Maleka, V.J. Matjeke, and J.W. van der Merwe 157
The 10.5–12.5% chromium, titanium-stabilized ferritic stainless steel (FSS) plates used to fabricate coal line jumbo wagons are susceptible to undesirable chromium depletion during welding with 309L electrodes. In this work, non-stabilized FSS plates were welded using 308L welding electrodes. The objective was to weld non-stabilized FSSs using gas-shielded metal arc welding without causing sensitization. Non-stabilized FSS plates were successfully welded using gas metal arc welding.
THE INSTITUTE, AS A BODY, IS NOT RESPONSIBLE FOR THE STATEMENTS AND OPINIONS ADVANCED IN ANY OF ITS PUBLICATIONS.
Copyright© 2023 by The Southern African Institute of Mining and Metallurgy. All rights reserved. Multiple copying of the contents of this publication or parts thereof without permission is in breach of copyright, but permission is hereby given for the copying of titles and abstracts of papers and names of authors. Permission to copy illustrations and short extracts from the text of individual contributions is usually given upon written application to the Institute, provided that the source (and where appropriate, the copyright) is acknowledged. Apart from any fair dealing for the purposes of review or criticism under The Copyright Act no. 98, 1978, Section 12, of the Republic of South Africa, a single copy of an article may be supplied by a library for the purposes of research or private study. No part of this publication may be reproduced, stored in a retrieval system, or transmitted in any form or by any means without the prior permission of the publishers. Multiple copying of the contents of the publication without permission is always illegal.
U.S. Copyright Law applicable to users In the U.S.A. The appearance of the statement of copyright at the bottom of the first page of an article appearing in this journal indicates that the copyright holder consents to the making of copies of the article for personal or internal use. This consent is given on condition that the copier pays the stated fee for each copy of a paper beyond that permitted by Section 107 or 108 of the U.S. Copyright Law. The fee is to be paid through the Copyright Clearance Center, Inc., Operations Center, P.O. Box 765, Schenectady, New York 12301, U.S.A. This consent does not extend to other kinds of copying, such as copying for general distribution, for advertising or promotional purposes, for creating new collective works, or for resale.
This paper summarizes a conceptual technique and preliminary fieldwork to develop a concept that can be used to mathematically quantify the trajectory of flyrock resulting from a blast. The results show conclusively that a modified photogrammetric technique is capable of capturing flyrock data for further processing and analysis. Further development will provide a method whereby future flyrock studies will be comparable and entailing only limited assumptions.
M. Handley
South Africa was the world’s largest producer of gold but since 2000, the country has fallen back several positions. Declining gold resources in the Witwatersrand Basin is not one of the reasons. This paper collects mining data from several sources and then attempts to estimate the amount of gold remaining in the Witwatersrand Basin. It is estimated that a further 48 100 t remain underground, 1 600 t on the surface in tailings, and an unknown amount in rock dumps. Nearly all of this gold will remain inaccessible with current mining methods. The mining industry will have to rethink its approach to mining, and of preventing gold theft.
This paper discusses the inclusion of various South African mining industry stakeholders, particularly employees, in equipment design and development processes. Data was acquired through a literature review and inputs from South African mining industry stakeholders through focus group discussions, interviews, and an online survey. Several stakeholders were suggested for inclusion, and areas that could be improved by the inclusion of employees in the process identified, as well as barriers to inclusion. The study identified several economic and social benefits of including stakeholders in the early stages of design and development process. A guideline was developed for worker inclusion in equipment design and development processes that could be used by the South African mining industry.
165
175
193
About 40 years ago lithium was a metal of curiosity. Its production was limited due to limited demand. Lithium was only produced from spodumene concentrate. Then, of course, along came lithium-ion batteries. As the demand for lithium-ion batteries has grown exponentially, so has the need to extract lithium from different sources.

Lithium is the only metal for which production from naturally-occuring solutions is as important as production from hard rock deposits. Dissolved lithium occurs in brines across many parts of the world, in the form of lithium chloride, which has an extremely high solubility. The primary source is salar (salt lake) deposits in South America. Dissolved lithium also occurs in oil and gas field brines as well as geothermal brines. The most important form of hard rock lithium is spodumene (lithium aluminium silicate), with Australia being the leading producer.
The metallurgical extraction of lithium from these different sources poses many challenges. The most important point to remember, is that purity is king! Battery-grade lithium carbonate and lithium hydroxide require purities of >99.8% and >99.9% respectively. This places enormous demands on selectivity and purification during the processing of the various sources of lithium.
Let us start with lithum in brine. It is easy to imagine that because the lithium is already dissolved, a large part of the metallurgical work has already been done. Well, you would be mistaken. Unfortunately, all the various brines contain many impurities. When production of lithium from brine started in South America, evaporation ponds were (and still are) used to concentrate the lithium. The concentrated brine then reports to a lithium carbonate plant where a long sequence of purification steps leads to the production of battery-grade lithium carbonate.
The location and lower lithium concentration of oil and gas field brines as well as geothermal brines means that evaporation ponds are a non-starter. Over the last 5 years there has been a significant development of direct lithium extraction (DLE) technologies, using ion-sieve, ion exchange, or solvent extraction. These techniques allow the selective extraction of the lithium from the brine, and are followed also by a sequence of purification steps. DLE plants are in operation in China and there is one in Argentina. There are many DLE projects in development and its application looks promising.
The issue with extracting lithium from hard rock deposits is that it is very energy intensive. Crushing and grinding are required, followed by DMS and/or flotation, to produce a spodumene concentrate. The concentrate then requires calcining and roasting steps before leaching and purification. Alternative less energy-intensive options are being studied but their possible application is still on the horizon.
Production of waste streams is also an issue for lithium extraction. In the case of salars, the evaporation ponds produce huge stockpiles of sodium, potassium, magnesium, and calcium salts. There are no markets close enough for these salts. Hard rock lithium extraction produces DMS or flotation tailings, which require tailings dams. It also produces a sodium sulphate by-product for which there is not always a market. The beauty of DLE is that the waste product, brine minus most of the lithium, can be reinjected back into the brine reservoir.
Given the very stringent purity requirements for battery -lithium hydroxide, many lithium projects are considering the electrolytic production of lithium hydroxide from purified lithium chloride, which is based on the chlor-alkali process used for producing sodium hydroxide from sodium chloride. The problems with this approach are the significant energy consumption and the large volumes of concentrated hydrochloric acid byproduct, for which there is not always a market.
In summary, lithium metallurgical extraction faces many challenges in terms of producing the required product purities for lithium batteries, reducing waste production, and also the reduction of carbon footprints.
M. Dworzanowski

In a moment of complete honesty, I want to admit that I am writing about something that I know absolutely nothing about, and I want to invite you to join this conversation with me.
One of the challenges that I recently became aware of is the policy, which was introduced by the government in June 2019, aimed at reducing the country’s greenhouse gas emissions and mitigating the impact of climate change. I am of course talking about the South African Carbon Tax. This is a price set on carbon dioxide emissions that companies and industries generate during their operations. The tax is levied on the amount of carbon dioxide equivalent (CO2e) emissions that are released into the atmosphere. The aim of the tax is to encourage companies to reduce their emissions by switching to cleaner technologies and adopting sustainable practices.
The tax is aimed at creating a financial incentive for companies to reduce their emissions, and the revenue generated from the tax should be used to fund initiatives that promote energy efficiency and renewable energy. In short, it should be a policy instrument in line with international commitments, a source of revenue that can be used to support initiatives that promote renewable energy, which will in turn create new opportunities for businesses and boost job creation. However, the implementation of the tax has faced criticism from some quarters. Since January 2022, the carbon tax rate has been around US$8.3 per ton of CO2e. In line with South Africa’s commitments at COP26, the carbon tax rate is set to progressively increase every year to reach US$20 per ton by 2025. In the second phase from 2026 onwards, the carbon tax rate will have larger annual increases to reach at least US$30 per ton by 2030.
In a study published in the Mail & Guardian during 2022, Bohlmann et al. show that the possible negative impact of the carbon tax on economic growth is minimized when the revenue is recycled back into the economy. Another study by Bohlmann, published in the South African Journal of Economic and Management Sciences in 2016, shows that recycling of carbon tax revenue will only reduce the extent of emissions if tax revenue recycling supports economic growth. According to their model, the manner in which carbon tax revenue is recycled back into the economy is therefore important in terms of the extent of emissions reductions achieved. Is the South African carbon tax revenue being recycled efficiently? Or even correctly?

This provoked quite a few other questions in my mind. Are we, in the minerals and metals industry, adequately informed to answer questions about any carbon tax policy, national or global? Or are we projecting negativity due to the general discontent with the current state of affairs – economic, social, and political?
What is our definition of recycling tax revenue ‘efficiently’? Does this depend on perspective? If carbon tax revenue is recycled into the general fiscus to support the Basic Income Grant in a country with an unemployment rate of 35% to 50%, does this make sense to us?
Is the minerals and metals industry clear on their expectations of and from the South African Carbon Tax policy? What exactly do we want as professionals and as an Industry?
I believe the SAIMM should be creating a platform to open discussions around this. We should be assisting our industry through educating, informing, and providing thought leadership on topics crucial to the success of sustainable transition.
I want to call on our members and stakeholders who clearly understand the national carbon taxation strategy to become involved in the conversation. I want to understand what the options are that we as an Industry have. Do we have an option to influence the policy and the tax revenue recycling at all? Can we ask for assistance to analyse the positive and negative aspects of our current strategy and its execution?
I believe that the carbon tax is necessary to change user behaviour and to reduce climate impact. However, we can still develop ways to ensure business viability while doing so. The SAIMM will be hosting a Carbon Tax Colloquium where we will be asking these questions, and we invite everyone to become a part of the conversation.
Z. Botha President, SAIMMThe race is on amongst major mining companies to secure green metal deposits and to bring them into production as quickly as possible. Although the focus has been on lithium, cobalt, rare earths, and nickel, the smart money has been directed towards copper.
Rio Tinto announced in March 2023 that it will invest $7 billion to transition its Oyu Tolgoi mine in Mongolia from an open pit mine to an underground operation, using block caving as one of the preferred mining methods. The copper concentrator used in this operation will adhere to international environmental, social and governance (ESG) standards and the Mongolian Government will hold a 34% stake in the mine.
So, what exactly is interesting about this? Well, it falls in line with major battery metal trends: the commodity, the mining method, the transition from open pit to underground and the integration of ESG, particularly for the concentrator design and operations.
In addition to its various industrial and construction applications, copper is also recognized as a battery metal due to its distinctive ability to conduct electricity and be recharged. According to research carried out in October 2022 by the International Copper Association, a standard petrol/ diesel combustion engine vehicle requires approximately 23kg of copper; a plug- in hybrid electric vehicle 40kg of copper and a plug-in battery electric vehicle 72kg of copper. This excludes battery charging infrastructure.
Some analysts believe copper prices are an indication of the underlying economic health of the global economy. Like all commodities, copper prices are subject to geopolitical factors, supply, and demand issues as well as the regional dynamics in markets where copper is mined e.g., Zambia, DRC, and South America e.g., Peru.
During an interview with CNBC, a business news television station, on February 6, 2023, Robin Griffin, Vice President of Metals and Mining at Wood Mackenzie, stated that they are already predicting significant copper deficits until 2030. The undersupply of copper may have a material impact from a cost perspective on renewables and electric vehicle (EV) production. Costs my increase from about $6500 to $9500 per tonne. The supply deficit was confirmed and may be as much as 50 million tonnes between 2022 and 2030 according to the CEO of Glencore, Gary Nagle in an interview with Bloomberg on 6 December 2022.

In the spirit of the circular economy, copper producers like Glencore in the DRC are reprocessing tailings.
As mines reach maturity, they often undergo a transition from open pit to underground mining due to physical surface constraints such as infrastructure, community settlements, environmentally sensitive areas, or it becomes more cost-effective to mine underground.
Most underground mining methods struggle to compete with open pit mining methods in terms of production rate and economies of scale. High production caving mining methods such as block caving could be favoured if the mineralized zones are amenable to caving. These are capital intensive and highly specialized developments with risks that are very different from the risks of open pit mining. Mining companies do not only have to transition in terms of the mining method, but also in terms of the skills to design and develop cave mines, but also the skills to operate the infrastructure and equipment and support services for theses specialized mining methods.
Mining companies have had to alter their perspective on inclusivity, moving away from solely prioritising shareholders to also encompassing stakeholders. As mentioned, the Rio Tinto mine in Mongolia includes the Mongolian Government as a shareholder and also accepts that a contribution to local economic development is essential to the overall project’s success. Closer to home, Orion Minerals, which is developing the copper-zinc deposit near Prieska in the Northern Cape, won the prestigious Emerging ESG Leader award at the 2020 Australian-Africa Minerals & Energy Group. The accolade was received in recognition of the company’s community engagement model, which focuses on local community engagement, procurement, employment, and subcontracting.
For the purposes of green metals in particular and mining in general, we believe the following trends are important: decarbonization; the circular economy; the manner in which EGS is being integrated into projects; how AI and cloud-based technologies are likely to drive innovation; how systems thinking and inclusive collaboration of multiple stakeholders in the mining and metal production ecosystems will improve project valuations, operational efficiency, and safety. The Rio Tinto and Orion projects above illustrate the point.
In a World Bank report on Africa’s Resource Future published earlier this year, it indicated that: ‘…the transition from fossil fuels to clean energy is likely to create demand for 3 billion tonnes of minerals and metals needed to deploy solar, wind, and geothermal energy by 2050. Lithium, cobalt, and vanadium are critical for energy storage, and copper, indium, selenium, and neodymium are essential for manufacturing wind and solar power generators.’
So, from a strategic perspective, it suggests that South Africa, in particular, and Africa, in general, have a significant comparative competitive advantage when it comes to supplying green metals and contributing to the energy transition, both locally and globally. Having said this, the question remains whether political short sightedness, poor government policy and weak institutions will conspire against the mining industry benefiting from the current commodity boom.
Affiliation:
1Transnet Engineering, Kilnerpark, South Africa.
2School of Chemical and Metallurgical Engineering, University of the Witwatersrand, Johannesburg, South Africa.
Correspondence to: A.M. Maleka
Email: Audrey.Maleka@transnet.net
Dates:
Received: 28 Feb. 2022
Revised: 18 Aug. 2022
Accepted: 30 Mar. 2023

Published: April 2023
How to cite:
Maleka, A.M., Matjeke, V.J. and van der Merwe, J.W. 2023
Optimizing of gas-shielded metal arc welding paramenters for 10.5-12.5% chromium steel using 308L electrodes. Journal of the Southern African Institute of Mining and Metallurgy, vol. 123, no. 4. pp. 157–164
DOI ID: http://dx.doi.org/10.17159/24119717/2037/2023
ORCID:
A.M. Maleka http://orcid.org/0009-0004-3939-8439
Synopsis
The 10.5–12.5% chromium, titanium-stabilized ferritic stainless steel (FSS) plates used to fabricate coal line jumbo wagons is susceptible to undesirable chromium depletion during welding with 309L electrodes. In this work, non-stabilized FSS plates were welded using 308L welding electrodes. The objective was to weld non-stabilized FSSs using gas-shielded metal arc welding without causing sensitization. The welding process was optimized by lowering the heat input. Sensitization was assessed by rigorous etching techniques and anodic polarization scans. In addition, the welds were subjected to tensile testing, and their fracture surfaces were examined for intergranular cracking. Non-stabilized FSS plates were successfully welded using gas metal arc welding.
Keywords
Titanium-stabilized ferritic stainless steel, welding parameters, 308L welding electrode, gas metal arc welding, heat input.
Titanium-stabilized ferritic stainless steels (FSSs) are widely used for structural and railway wagon applications due to their excellent corrosion and wear resistance (van Warmelo, Nolan, and Norrish, 2007). Yet many railway operators use coal wagons fabricated with mild steel due to its affordability. Mild steel readily corrodes in an environment that contains sulphur dioxide (Allen, Ball, and Protheroe, 1982; Morcillo et al., 2013; Taban, Kaluc, and Dhooge, 2009; Zhang et al., 2014). Titanium-stabilized FSSs are a good substitute for regular austenitic and mild steels due to their superior mechanical properties and corrosion resistance, respectively (Mursalo, Tullmint, and Robinson-, 1988; Rossi, 2010; Shojaati and Beidokhti, 2017). Furthermore, coal wagons built from titanium-stabilized FSS have lower life-cycle costs than wagons fabricated with mild steel and austenitic stainless steel (Allen, Ball, and Protheroe,1982). One of the biggest cost drivers for manufacturing railway vehicles with FSSs is the welding operation and consumables. Since 1985, railway wagons have been successfully welded with gas metal arc welding (GMAW) using titaniumstabilized FSS and 309L welding electrodes (van Warmelo, Nolan and Norrish., 2007).
Coal wagons in South Africa and Australia are currently built using titanium-stabilized FSS plates with a low carbon content, 10.5–12.5% chromium, and a maximum of 0.6% titanium (van Warmelo, Nolan, and Norrish, 2007). Titanium-stabilized FSS and the non-stabilized FSSs are produced according to EN 1.4003 classification, with the only difference being the amount of titanium (du Toit and Naudé, 2011). Using non-stabilized FSSs in the railway industry was unsuccessful due to sensitization. The function of titanium in this stainless steel is to form titanium carbides during welding to avoid chromium depletion on the grain boundaries by lowering the carbon concentration, since titanium has a higher affinity for carbon than does chromium (Sundqvist et al., 2018). This reduces the possible precipitation of chromium carbides on the grain boundaries (Keskitalo et al., 2015). Chromium depletion (sensitization) often results in the loss of corrosion resistance within the heat-affected zone (HAZ) along the grain boundaries (Dahmen, Rajendran, and Lindner, 2015). The non-stabilized stainless steel does not contain titanium; therefore it is more prone to sensitization during welding (Moslemi et al., 2015). Laser welding of non-stabilized grade is successful due to the arc efficiency and the ability to produce a functional weld with a lower heat input (Dahmen, Rajendran, and Lindner, 2015; Pekkarinen and Kujanpää, 2010; Sundqvist et al., 2018).
Generally, many stainless steels have good corrosion resistance and mechanical properties; however, precautions to avoid sensitization must be taken during welding (Sundqvist et al., 2018). The EN 1.4003 grade has good formability and is cheaper than the austenitic stainless steel grades (Keskitalo et al., 2015). The 308L welding electrode was selected over other welding consumables due to its distinct properties and cost efficiency (Allen, Ball, and Protheroe, 1982). The cost of 309L and 308L welding elctrodes is 17.5
and 13.9 US dollars per kg, respectively. Both the 308L and 309L welding consumables produce an austenitic microstructure. 308L welding wire and non-stabilized FSS plates have not been used to manufacture rail wagons.
GMAW generates heat from the arc between the welding electrode and the substrate with an externally supplied shielding gas (Ghosh et al., 2018). This study investigated the welding properties of non-stabilized FSS (EN 1.4003) using the 308L welding electrode with GMAW. Du Toit and Naudé (2011) investigated the role of heat input on EN 1.4003 sensitization using gas tungsten arc welding. Their results showed that a low heat input may retard sensitization in non-stabilized FSS. In the current study, the welding parameters were optimized to achieve the arc efficiency that can produce quality joints in non-stabilized FSS using 308L welding electrodes, without causing sensitization during welding.
Sensitization due to continuous cooling after welding at low heat input occurs in the coarse-grained region adjacent to the fusion line in material where the HAZ is predominately ferritic (Amuda, 2011). It occurs when low heat input during welding leads to very fast cooling rates at the early stage of the weld thermal cycle. This rapid cooling can restrict or prevent austenitic nucleation as the HAZ cools through the dual phase (ἀ+γ) field, resulting in almost fully ferritic microstructures (Amuda, 2011).

Optimizing the welding parameters regulates the heat input sufficiently to produce an acceptable weld without compromising the joint quality. This paper presents the mechanical and metallurgical properties of the welded non-stabilized FSS plates without substantial dilution and chromium depletion on the HAZ. Furthermore, this study explored the susceptibility of the 1.4003/308L joints to galvanic corrosion.
Non-stabilized FSS plates supplied in the rolled and annealed condition and 308L welding electrodes were used for welding experiments. A 4 mm square butt joint with a 2 mm gap was welded using alternating current GMAW with a 1 mm diameter solid filler metal acting as an electrode. Figure 1 shows the plates before and after welding. The edges were cleaned with acetone to remove potential contaminants. The molten weld pool was protected using argon shielding gas at a flow rate of 18 L/min. A single run was deposited to join the square butt weld. The welding parameters are shown in Table I. Heat inputs of 0.45 and 0.54 kJ/mm were used to produce the respective welds.

The welded plates were sectioned and prepared for macroscopic examination, which entailed cutting, grinding and polishing the weld transverse section, followed by etching with ammonia persulphate. The weld assessment was undertaken using a stereoscope equipped with OLYMPUS Stream essential analysis software to evaluate the weld joint quality and to measure the deposition area.
The chemical analysis of the parent metal was performed using a Bruker Q4 TASMAN optical emission spectrometer. The parent metal was ground to prepare it for chemical analysis. Furthermore, chemical analysis of the weld and weld joint, i.e., HAZ and weld, was conducted using a Carl Zeiss scanning electron microscope equipped with an Oxford energy-dispersive spectrometer (EDS) for the map and line scan method, respectively. The samples were polished to a 1 μm surface finish before EDS analysis. The accelerated voltage was 20 kV and the exposure time was 45 seconds. The EDS point method aimed to determine the chemical composition (without carbon) of the weld, while the line scan was used to detect chromium depletion.
Transverse sections from the butt-welded joints were prepared for metallographic examination. The samples were sectioned, mounted, ground and polished to surface finish. The microstructures of the weld, parent metal, and HAZ of the welded samples were prepared for examination by grinding and polishing followed by etching with Vilella’s reagent (1 g picric acid, 100 ml ethanol, and 5 ml HCl). The etched samples were examined using optical and scanning electron microscopy to detect possible cracking and weld decay. The Olympus optical microscope is equipped with Stream essential analysis software to quantify the phases of the microstructures.
The as-polished samples were tested for hardness using a DuraScan micro-Vickers hardness tester. The hardness profile measurements were taken at intervals of 0.5 mm, with a load and dwelling time of 5 kg-f and 10 seconds, respectively. The welded samples, two per welding parameter and a validation sample, were tested for tensile properties.

The polished samples were also immersed in a mixture of 3 ml sulphuric acid and 60 g copper sulphate in 100 ml of distilled water for 72 hours at boiling temperatures for intergranular corrosion testing. An Allihn condenser was used for the Strauss test experiment. This test was done in accordance with ASTM A262 practise E standard to expose the sensitized area to aggravated corrosion.
The steel welded joint was exposed to a solution of 3.5% sodium chloride and the corrosion characteristics were determined by first considering the open circuit potential for a short period. The electrochemical potential was then scanned from an active potential to a more noble potential than the corrosion potential. A Metrohm Autolab 302 potentiostat with a silver reference electrode and a carbon counter-electrode was used to perform the test. The scan rate was 0.1 mV/s. These characteristics were used to determine the corrosion rate of the steel when exposed to the environment as well as its electrochemical potential. Figure 2 shows the set-up for electrochemical corrosion test.
In addition, the galvanic current was determined between the weld metal and the non-stabilized FSS substrate under open circuit potentials by connecting the weld metal to the working electrode and the substrate to the counter-electrode. This was done according to the ISO 3651-2 method A standard.
Results and discussion
Visual examination
The welded plates revealed full penetration of the weld with no defect. Figure 3 shows macroscopic samples of the plates welded using 0.45 and 0.54 kJ/mm heat inputs. More weld deposition was observed on a macroscopicscale using a heat input of 0.54 kJ/mm.

Chemical composition and analyses
FSS containing 10.5–12.5% chromium is most likely to experience sensitization (chromium content below the required level) on the grain boundaries. The chemical compositions of the parent metal and the weld are reported in Table II. The chemical composition of the parent metal and the weld were typical of FSS and austenitic stainless steel, respectively. Composition of the weld is reported without carbon due to the inability of EDS to determine carbon.
The chromium line scan counts per second are shown in Figure 4. No sample showed any sign of chromium depletion, therefore no sensitization occurred during welding.
Non-stabilized FSSs are generally prone to sensitization during welding. The microstructures of the parent metal and weld were used to evaluate the possible presence of sensitization (Figure 5a). The parent metal microstructure was confirmed to be ferritic.

The microstructures revealed complete fusion between the parent metal and the weld. The weld microstructures showed a needle-like lamellar austenitic texture (Figure 5b). The higher heat input corresponded with an increase in HAZ width (Figure 6).The HAZ distance measurements are shown in Table III. The general microstructures of the HAZ were found to consist of coarser ferrite grains with martensite embedded on the grain boundaries.
The formation of martensite in the HAZ is due to the temperature increase introduced by the weld pool followed by rapid
cooling. Although martensite can introduce metallurgical notches, for wagon wear plates, the harder phase promotes wear resistance. Martensite was predominately observed on microstructures welded using 0.54 kJ/mm heat input. Figure 7 shows the 0.45 and 0.54 kJ/ mm phase analyses. The quantitative analysis of martensite on the 308L at a heat input of 0.45 and 0.54 kJ/mm is presented in Table III.

Sensitization in FSSs is generally difficult to examine by etching and evaluation under the optical microscope. Ten per cent oxalic acid has been favoured by some researchers for both FSSs and austenitic stainless steel. In our other work, we found that Vilella’s reagent (1 g picric acid,100 ml ethanol, and 5 ml HCl) revealed FSS microstructures in more detail than 10% oxalic acid. No sensitization was detected with either Vilella or oxalic reagent (Figure 8). The Strauss test was used to eliminate any doubt about the absence of sensitization. Figure 9 shows the secondary backscattered images of samples that were subjected to the Strauss test. Although details of the grain boundaries are visible, there was no sign of a ditch or dual.

Table


The weld strength and integrity were further investigated by tensile testing and fracture surface examination. The samples were machined to dimensions of 12.5 mm in width and 50 mm gauge length following the ASTM E8 machining standard. An MTS Criterion® model 45 equipped with an MTS video extensometer was used to test the samples in accordance with the SANS 6892-1:2010 standard testing method. All the tensile pieces failed on the parent metal. The tensile test results are summarized in Table IV. The fracture surfaces revealed a ductile fracture mode (Figure 10). The tensile properties of the samples welded with 0.45 and 0.54 kJ/mm heat inputs were comparable.
Tensile properties of the ferritic stainless steel plates welded at 0.45 kJ/mm and 0.5 kJ/mm heat inputs


The hardnesses of the parent metal, HAZ, and weld were determined. The transverse hardness test profile across the weld is shown in Figure 11. The weld metal had a higher hardness than the parent metal (Table V).
The potentiodynamic scans of the substrate and two weld metals after exposure to a 3.5% sodium chloride solution at 40°C are shown in Figure 12. The corrosion potentials of the weld metals and the substrate are close, indicating that the galvanic effects will be small.
The effect of the galvanic action was investigated by recording the galvanic current between the weld metal (anode) and the
Average hardness values for the parent metal, heat-affected zone (HAZ), and the weld

substrate (cathode) in the 3.5% sodium chloride solution at 40°C (Figure 13). The results are consistent with the polarization characteristics, indicating that the 308L weld metal is slightly more noble than the substrate, inducing a more negative current. All samples revealed that the complete fusion between the parent metal and the weld was more noble than the substrate, inducing a more negative current. However, the 309L weld metal starts at a negative current and then increases to become positive.
We have shown that GMAW can produce a weld without causing sensitization. This was achieved because of the rapid cooling associated with low heat input. The rapid cooling process is further confirmed by the formation of martensite. For other applications, the presence of martensite may be undesirable; however, for wagon wear plates, this phase is beneficial because of the improved hardness. Sensitization assessments were conducted using exhaustive etching techniques, microstructural analysis, and the electrochemical potentio-kinetic reactivation technique. The tensile test fracture samples did not show any intergranular cracking.
The wider HAZ and larger grain sizes are attributed to the higher heat input. However, the effect of these notches is less than that introduced by titanium carbides. Dahmen, Rajendran, and Lindner (2015) found no sensitization in grain boundarues layered with martensite. It has been observed that the percentage martensite increases with an increase in heat input due to the wider HAZ.
This study proves that FSSs can be welded using GMAW without causing sensitization. This achievement benefits productivity because GMAW has higher arc efficiency and deposition rates. The successful welding of non-stabilized FSS and 308L electrodes is a breakthrough in the advancement of cost-effective production. Based on the tests conducted and results obtained, both 0.45 and 0.54 kJ/mm heat inputs allowed the production of full penetration and good fusion welds with no sensitization observed in any of the samples.
References
Allen, C., Ball, A., and Protheroe, B.E. 1982. The abrasive-corrosive wear of stainless steels. Wear, vol 74, no. 2. pp. 287–305. https://doi.org/10.1016/00431648(81)90169-1
Amuda, M.O.H. 2011. An overview of sensitization dynamics in ferritic stainless steel welds. International Journal of Corrosion, vol. 2011. Article 305793. http://dx.doi.org/10.1155/2011/305793

Dahmen, M., Rajendran, D.K., and Lindner, S. 2015. Sensitization of laser-beam welded martensitic stainless steels. Physics Procedia, vol. 78. pp. 240–246. https://doi.org/10.1016/j.phpro.2015.11.034
Du Toit, M. and Naudé, J. 2011. The influence of stabilization with titanium on the heat-affected zone sensitization of 11 to 12% chromium ferritic stainless steels under low heat input welding conditions. Welding in the World, vol. 55, pp. 38–47.
Ghosh, N., Pal, P.K., Nandi, G., and Rudrapati, R. 2018. Parametric optimization of gas metal arc welding process by PCA based Taguchi method on austenitic stainless steel. Materials Today: Proceedings, vol. 5, no. 1. pp. 1620–1625. https:// doi.org/10.1016/j.matpr.2017.11.255
Keskitalo, M., Sundqvist, J., Mäntyjärvi, K., Powell, J., and Kaplan, A.F.H. 2015. The influence of shielding gas and heat input on the mechanical properties of laser welds in ferritic stainless steel. Physics Procedia, vol. 78. pp. 222–229. https://doi.org/10.1016/j.phpro.2015.11.032
Morcillo, M., Chico, B., Díaz, I., Cano, H., and de la Fuente, D. 2013. Atmospheric corrosion data of weathering steels. A review. Corrosion Science, vol. 77. pp. 6–24. https://doi.org/10.1016/j.corsci.2013.08.021
Moslemi, N., Redzuan, N., Ahmad, N., and Hor, T.N. 2015. Effect of current on characteristic for 316 stainless steel welded joint including microstructure and mechanical properties. Procedia CIRP, vol. 26. pp. 560–564. https://doi. org/10.1016/j.procir.2015.01.010
Mursalo, N., Tullmint, M., and Robinson, F.P.A. 1988. The corrosion behaviour of mild steel, 3CR12, and AISI type 316L in synthetic minewaters. Journal of the South African Institute of Mining and Metallurgy, vol. 88, no. 8. pp. 249–256.
Pekkarinen, J. and Kujanpää, V. 2010. The effects of laser welding parameters on the microstructure of ferritic and duplex stainless steels welds. Physics Procedia, vol. 5. pp. 517–523. https://doi.org/10.1016/j.phpro.2010.08.175
Rossi, B. 2010. Mechanical behavior of ferritic grade 3Cr12 stainless steel—Part 1 : Experimental investigations. Thin-Walled Structures, vol. 48, no. 7. pp. 553–560. https://doi.org/10.1016/j.tws.2010.02.008
Shojaati, M. and Beidokhti, B. 2017. Characterization of AISI 304/AISI 409 stainless steel joints using different filler materials. Construction and Building Materials, vol. 147. pp. 608–615. https://doi.org/10.1016/j. conbuildmat.2017.04.185
Sundqvist, J., Manninen, T., Heikkinen, H.-P., Anttila, S., and Kaplan, A.F.H. 2018. Laser surface hardening of 11% Cr ferritic stainless steel and its sensitisation behaviour. Surface and Coatings Technology, vol. 344. pp. 673–679. https://doi.org/10.1016/j.surfcoat.2018.04.002
Taban, E., Kaluc, E., and Dhooge, A. 2009. Hybrid (plasma + gas tungsten arc) weldability of modified 12% Cr ferritic stainless steel. Materials & Design, vol. 30, no. 10. pp. 4236–4242. https://doi.org/10.1016/j.matdes.2009.04.031
Van Warmelo, M., Nolan, D., and Norrish, J. 2007. Mitigation of sensitisation effects in unstabilised 12%Cr ferritic stainless steel welds. Materials Science and Engineering: A, vol. 464, no. 1–2. pp. 157–169. https://doi.org/10.1016/j. msea.2007.02.113
Zhang., X, Yang, S., Zhang, W., Guo, H., and He, X. 2014. Influence of outer rust layers on corrosion of carbon steel and weathering steel during wet–dry cycles. Corrosion Science, vol. 82. pp. 165–172. https://doi.org/10.1016/j. corsci.2014.01.016 u


Through GIW® Slurry Pumps, KSB is an innovative partner that provides you with the best and longest wearing slurry solutions. We are your partner over the entire lifecycle of your GIW® slurry pump.

KSB Pumps South Africa is a globally recognized pu mp solutions provider that manufactures globally recognized products locally to the highest quality standards both internationally and locally.
We not only manufacture and service your slurry pumps, we offer total slurry solutions to your industry.
One team - one goal.
KSB Pumps and Valves (Pty) Ltd


Tel: +27-11-876-5600
www.ksb.com/en-za
Level 1 B-BBEE Supplier

Affiliation:
1Department of Mining Engineering University of Pretoria, South Africa.
Correspondence to: J. Van der Walt
Email: jennifer.vanderwalt@up.ac.za
Dates:
Revised: 30 Aug. 2022
Accepted: 14 Apr. 2023
Published: April 2023
How to cite:
Van der Walt, J. and Spiteri, W. 2023
A conceptual technique to mathematically quantify the trajectory of flyrock.
Journal of the Southern African Institute of Mining and Metallurgy, vol. 123, no. 4. pp. 165–174
DOI ID: http://dx.doi.org/10.17159/24119717/2168/2023
Synopsis
Flyrock remains a significant threat to the health and safety of mine employees and integrity of infrastructure, as well as to the safety of the neighbouring communities and their property. This investigation was motivated by the general lack of fundamental research and mathematically quantifiable data in the literature regarding the relationship between blast design parameters and their impact on flyrock. The focus was to develop a concept that can be used to mathematically quantify the trajectory of flyrock resulting from a blast, which can be used for future research. The ultimate goal for this technique, once it has been fully developed, is to:
➤ Enable mining operations to generate a database with accurate historical flyrock measurements resulting from their blasting operations
➤ Allow research teams to conduct scientific investigations into flyrock and the impact of various blast design parameters
➤ Generate point-cloud data to visualize blasts and flyrock in a virtual reality environment for training and education purposes.
This paper summarizes a conceptual technique and preliminary fieldwork that was carried out to determine the technique’s feasibility and motivate further development. The results show conclusively that a modified photogrammetric technique is capable of capturing flyrock data for further processing and analysis. The data acquisition procedure can, at this point, be used to meet the first aim of the project, namely to gather a field database of historical flyrock generation. Further development of the technique is ongoing and it is envisioned that the scientific-based technique will provide a method whereby future flyrock studies will be comparable and that assumptions will be limited.
Keywords flyrock, prediction, trajectory, measurement, environmental blasting, blast analysis, blast damage.
Drilling and blasting of a rock mass remain essential phases in the production cycles of most mining operations and continue to be the preferred method of rock breaking in the South African mining industry. Rock fragments projected beyond the planned or expected throw distance are often a product of this almost instantaneous release of explosive energy required to fracture a rock mass to the desired fragmentation and yield the desired muckpile profile. These fragments are known as flyrock.
In the past, flyrock has seriously, and sometimes fatally, injured people in the vicinity of the blast and has, otherwise, caused substantial damage to mine assets such as equipment and infrastructure (Bajpayee et al., 2003). Injury to mine employees as well as injury to residents, livestock, structures, and/or equipment in in surrounding communities can result in high penalties for the mine. These penalties may be legislative, financial, or reputational, or possibly a combination thereof.
An initial literature review concluded that existing predictive models may not be sufficient to constitute a global technique that can be considered during the blast design process (van der Walt and Spiteri, 2020). The multiple studies reviewed and analysed concluded that ‘there are major research gaps into the phenomena of flyrock and that this concept is not well understood’ (Raina, Murthy, and Soni, 2015). The biggest concern is the inconsistent parameters used in various prediction models and the estimated impact of these parameters on the model’s output. Using the data presented by Raina, Murthy, and Soni (2015), the theoretically causative factors of flyrock are compared to the factors taken into account in the predictive models and equations (Figure 1).
As it stands, the effect of the causative factors on the travel distances of flyrock must be investigated, and this should be supported by actual quantitative field data that has been collected scientifically. Only once the effect of blast parameters on flyrock can be accurately determined and the relationship between flyrock and these parameters is incorporated into prediction models will it be possible to develop a new or revised model to increase the precision of the predicted flyrock distances calculated for different environments. The ideal would be to have one globally applicable flyrock prediction model where site-specific conditions can be compensated for through site-specific constants.
To successfully investigate the realistic effect of blast parameters on flyrock and develop such a globally applicable prediction model, a significantly large data-set is required which must be interpreted mathematically. However, during a literature review of recent work in the field of flyrock and flyrock prediction, no specific method of quantitatively measuring flyrock could be identified (van der Walt and Spiteri, 2020). For this reason, this study was aimed at investigating and developing a concept to mathematically quantify the trajectory (i.e. describe the flight path by means of an equation) of random flyrock fragments resulting from a surface blast and be able to calculate the final landing positions of the fragments relative to the blast as well as their positional origins on the bench. Once flyrock, its origins, and contributing factors can be accurately measured and mathematically quantified, it will be possible to develop a globally applicable predictive model for the international mining industry.

The purpose of this exercise is to gather data on individual fragments in mid-flight in an attempt to eliminate the need for launch velocity and launch angle as required in traditional ballistic equations. In other words, the mid-flight data (∆x, ∆y, ∆z, ∆t) along with drag considerations will be used to calculate the trajectory equation for each fragment, which can then be used to calculate the origin (coordinate) and landing position (coordinate) of each fragment.
It is important to note that the proposed concept is not linked or limited to a specific technology (such as unmanned aerial vehicles or UAVs), thereforethe use of new and emerging technologies was not eliminated for future integration with the proposed technique.
Several recent (i.e. since 2010) publications were identified that focused on flyrock and flyrock prediction. The authors of these publications proposed a variety of approaches and techniques
that were used to either predict or investigate flyrock events. The approaches used to develop the various models can be grouped according to one of the following five categories:
1. Artificial neural network (ANN)
2. Adaptive neuro-fuzzy inference system (ANFIS)
3. Rock engineering system (RES)
4. Empirical and statistical analysis

5. Forensic or ballistics approach.
The approaches or techniques implemented in the recent studies are summarized in Figure 2 and were comprehensively analysed by van der Walt and Spiteri (2020).
These various studies proposed viable models for predicting and analyszing flyrock based on presumed causative parameters as inputs and their estimated impact on flyrock as weights assigned to each input. However, all of these papers concluded that the respective models were site-specific and could not be applied to other environments (van der Walt and Spiteri, 2020).
Based on the analysis of these publications, the following conclusions were made (van der Walt and Spiteri, 2020):
Empirical and statistical approaches can only be used to produce site-specific models and cannot be implemented as universal solutions or models.
• Artificial Intelligence (AI) principles may be implemented in an attempt to minimize uncertainties; however, these models are highly dependent on the input parameters and the assumed relationship between these inputs and the desired output.
A conceptual technique to mathematically quantify the trajectory of flyrockFigure 1—Flyrock causative parameters versus predictive parameters considered in existing prediction models (data from Raina, Murthy, and Soni, 2015) Figure 2—Approaches or techniques used in recent flyrock prediction studies (van der Walt and Spiteri, 2020)
• The application of ballistics principles for flyrock prediction may not be ideal. However, using ballistics principles to analyse flyrock events presents exciting new opportunities.
• An investigation of the various parameters considered to be causative or most influential in the proposed models supports the argument that the flyrock causative blast parameters and their effect on flyrock distance are not fully known or understood.
The biggest knowledge gap seems to be the uncertainties associated with which blast and environmental parameters contribute to flyrock and to what degree (van der Walt and Spiteri, 2020). These uncertainties create the opportunity for developing new concepts or techniques for analysing the flyrock after it has been generated, rather than predicting it, to gain a better understanding of the factors leading up to actual flyrock events.
The techniques used to collect field data and measure the actual distance travelled by the flyrock fragments in these studies were found to be subjective and highly dependent on the judgement of the researcher. This implies that there is an opportunity for some degree of subjectivity that may influence the field data collected (van der Walt and Spiteri, 2020). Collecting and recording objective data is a critical component of any scientific investigation.
Since the results of the proposed models were evaluated by comparing the predicted and measured (or actual) data, some margin of error can be expected from the findings based on the transferred error from the testing methodology (van der Walt and Spiteri, 2020).
To present results that are objective and uncriticizable; an accurate, quantitative, and objective method of measuring the actual travel distance of flyrock is required. This conclusion emphasizes the need to investigate the potential for developing such a measuring technique that will yield unbiased field data, which can be used to evaluate the results from existing and future flyrock prediction models.
Various techniques and technologies are available to monitor processes and measure performance or deterioration within the process. Since this investigation was aimed at developing a concept that can be used to mathematically quantify the trajectories of multiple ‘random’ flyrock pieces, it can be assumed that a noncontact technique would need to form the basis of the final model. The reason for this assumption is the inherent danger associated with blasting activities.
Initially, the use of drones was considered for recording pre- and post-blast survey data by flying over the blast area and scanning the topographical surface, either photographically or using LiDAR, in an attempt to identify new fragments on the ground. This would have been done by overlaying the point data generated from the image data or scans and identifying the topographical differences. Control points would have been placed within this area to ensure that the acquired data could be georeferenced.
However, some critical problems became apparent while exploring this option further:
➤ The blast area must be cleaned of all loose materials on the ground before the fly-over. This is not feasible at an operational mine.
➤ The blast area can be very large and would require the drone to fly at a high altitude to timeously acquire the necessary data. An increase in altitude will result in lower resolution scans or image data.
➤ Equipment cannot move within the area before the drone has completed the data acquisition, as this may result in loose rocks or material on the ground that was not a result of the blast.
➤ Highly vegetated areas within the blast area could result in missed rocks or targets within or below the vegetation.
➤ Finally, if successful, the data acquired with this technique could only be used to determine the final landing positions and overall travelling distances of rock fragments, i.e. including rolling distance. No other information can be deduced from the data.
The technique can still potentially produce useful data; however, it will not produce the data-sets required for this study and was not pursued further.
The following techniques were investigated further with the outcome of this study in mind:
• High-speed photography
• Photogrammetry;\
• Radar;
• LiDAR;
• ViDAR
• Other systems, including:
• Hawk-eyeTM Innovations’ ball tracking technology
• Visual or optical detection and tracking
• Active infrared systems.
These techniques were evaluated in a comparative analysis to identify which could form the optimal foundation for the development of the proposed technique.
Each technique or technology was evaluated against the following criteria:
1) Non-contact or remote method
Due to the safety risk associated with blasting activities, the proposed method should be able to acquire data from a safe distance. Therefore, a non-contact or remote approach or sensor system is a necessity.
2) Passive system
The flight path and physical properties of flyrock are typically very random. Therefore, a passive system is essential to minimize the consequence of varying physical properties since a passive system records the existing, natural electromagnetic energy.
3) Remote triggering
Similar to the motivation for a non-contact system, initiating the proposed method should be possible from a safe distance. This means that the operator should not be required to be near the equipment.
4) Multiple projectile detection
Multiple fragments are thrown simultaneously from a blast, each with the potential of causing significant damage or harm. It is, therefore, essential that the proposed method is capable of recording the data from multiple fragments concurrently.
5) Flexible system
The proposed method should be flexible enough to easily adapt to the different topographies and layouts of mining operations.
6) Independent of the physical properties of the target
The physical properties of flyrock fragments are often unknown before the blast and cannot be accurately estimated or predicted. The system should, therefore, not be reliant on physical properties such as surface characteristics or reflectance.
The purpose of the study is to mathematically quantify the flight path of flyrock. Therefore, the proposed concept must include a technique for obtaining quantitative measurements from the acquired field data.
The different techniques and technologies were evaluated using a weighting assigned for each criterion. The detailed decision matrix is given in Table I.
Following the comparative analysis, the top three available technologies were identified as:

i. Photogrammetry
ii. ViDAR
iii. Optical detection and tracking.
Based on this analysis, it is apparent that a visual or optical approach is the best option to acquire flyrock flight data that can be analysed and quantified mathematically. An essential criterion is, therefore, to obtain quantitative data or measurements from the field data collected. Photogrammetry is a technology that has a well-established quantitative element is, and data processing using photogrammetry is also relatively manual compared to automated detection and tracking technologi es. This is so as to enable the operator to measure and control any measurement or calculation errors throughout the process, and not only at the end of the process. The main drawback is that photogrammetry may not be very flexible in terms of commercially available software.
The purpose of this comparative study was to identify a technique or technology that can establish a foundation only. Photogrammetry was, therefore, chosen as the base technology that will, most likely, produce a successful outcome in terms of the objectives of this study.
Photogrammetry integrates the data captured in multiple still images, taken in a stereo configuration, to represent or model the data as a stereo model (three-dimensional representation). This means that the environment captured in still images can be
transformed into a three-dimensional environment, relative to the surveyed control points.
Based on the previous studies, it was concluded that empirical approaches have generally not produced reliable prediction results and these prediction models were only applicable as site-specific solutions. However, the laws of physics and principles of ballistics remain true and relevant for objects moving through a medium. For this reason, a ballistic and projectile physics approach was determined to be the best in terms of mathematically quantifying the trajectory of flyrock (i.e. a projectile) based on the image data (field data) acquired.
The proposed concept model is given in Figure 3.
The model consists of three main components or phases and is designed to incorporate both photogrammetric techniques and ballistics principles.
The field data acquisition methodology was designed using a modified photogrammetric technique.
A conceptual technique to mathematically quantify the trajectory of flyrock
Traditional photogrammetry, specifically for mine surveying purposes, involves a series of overlapping high-quality images taken of a specific stationary structure, feature, or terrain. The sensor (camera) is, therefore, the mobile component moving over or around the target object or area to capture as many overlapping still images as necessary. By overlapping multiple images, the photogrammetric software is able to combine the image data and the surveyed control points in these images to create a threedimensional representation of the target, from which specific measurements can be taken and the required calculations made.
Due to the environment and process of blasting on a mine site, this traditional photogrammetric approach is not possible. A modified photogrammetric approach was therefore developed and used. The main modification, in this case, was to essentially reverse the data acquisition process of traditional photogrammetry. Instead of moving a single mobile sensor over or around a stationary target, multiple stationary sensors (cameras) were used to capture and record an event in motion. However, to be able to use existing software and obtain reliable results from the process, the foundation principles and considerations of photogrammetry still had to be adhered to.
To maintain the accuracy of traditional photogrammetry, highquality still images are required. Since a blast is an event of relatively short duration, high-speed video, commonly used to record and analyse blasts, was considered for acquiring field data. However, high-speed video footage cannot be converted into the required high-quality still images. According to photography experts, even a 4K HD video will only produce approximately 6 MP still images or frames. Consequently, it was decided that the necessary still images should be acquired using standard DSLR cameras, such as the 24.2 MP Canon 77D. The high-speed burst shot function in these cameras enables the maximum number of still images to be captured at the full quality available from the camera and lens.
Based on previous studies (Stojadinović, Pantović, and Žikić, 2011; Stojadinović et al., 2013), it was estimated that fragments between 20 cm and 35 cm in diameter will likely travel the furthest. In essence, the authors argued that smaller fragments with a smaller cross-sectional area and higher velocities will experience a larger drag force and, due to their lower mass, will not be able to overcome these drag forces, limiting the total travel distance. Larger fragments, with more mass, have the potential to overcome the drag forces and travel further. However, lower travel velocities will also limit their travel distances (Stojadinović, Pantović, and Žikić, 2011).
Considering this size range (approximately the size of a frisbee) of the fragments that will (theoretically) travel the furthest, quality DSLR cameras are fully capable of capturing the level of detail (ground resolution) required from a safe distance (approximately 300 m). The ground resolution of the images refers to the clarity of specific features at a distance – at 300 m from the blast, standard DSLR camera images can yield a ground resolution of 3 cm per pixel. This further supports the decision to use standard and commercially available cameras for the development of this conceptual technique.
The critical components within phase 1 include the following.
Since photogrammetry forms the foundation of the field technique and existing photogrammetric software is used in phase 2, the specific camera orientation and placement required by the software should be adhered to so that the image data can be successfully processed. For this study, uSmart Softcopy software from the South
African company SmartTech was selected and used for phase 2 of the process.
To use existing photogrammetric software in phase 2, the following field considerations are essential:
➤ Images must be taken in a landscape orientation, which also allows one to capture the maximum field of view (information) in each image.
➤ The software also requires that the images are taken parallel to one another, i.e. the angle of view of the lenses was adjusted to ensure the overlap required for stereo modelling.
➤ A decision was made to use a minimum of three cameras to acquire the necessary image data, using fixed focal length lenses. This is essential to minimize variabilities in the system.
➤ Finally, to georeference the acquired images, surveyed ground control points must be placed within the fields of view of the cameras.
To accurately georeference the image data, is it essential to calibrate each lens to eliminate the influence of slight internal and external variables on the data-set. Even if identical cameras are used, manufacturing inherently results in minor internal differences in each camera. It is essential to calibrate each lens on-site before the blast to eliminate small errors that may be magnified in subsequent phases.
Traditional photogrammetry requires calibration images to be taken perpendicular to the target surface. The target surface, whether the surface of a structure, object, or topographical area, is customarily heterogeneous which enables optical recognition within existing photogrammetric software. Once the surface captured in the image data becomes more homogenous, the software struggles to create a reliable three-dimensional representation of the site. For this study and the application of the modified photogrammetric technique, it is essential to ensure that the acquired calibration data does not contain excessive homogenous backgrounds, such as blue sky.
Existing photographic remote triggers, PocketWizard PlusX, were used to initiate each camera’s high-speed burst shot function. These triggers offer the fastest communication between triggers with a maximum line-of-sight range of about 80 m, based on field tests conducted to verify the manufacturer’s specifications.
To initiate the triggers from a safe distance, a communication system was required to simultaneously trigger the receivers connected to each camera from a single transmitter unit. An

expert communications company was commissioned to design and develop a long-distance trigger system using the PocketWizard PlusX triggers as its foundation.
The final product, shown in Figure 4, is capable of communicating with the receiving transmitter (or transceiver) at a line-of-sight distance of over 1 km.
Synchronization between cameras to ensure the images align in terms of their timing
The synchronization between the cameras, i.e. the point in time when each image is taken, is a critical element of this technique. The goal is to capture the movement of each flyrock fragment through the air by creating a stereo model of each time step in this motion. Therefore, the accuracy of the measurements taken from these stereo models will significantly depend on the exact time each camera triggers.
Various time studies were conducted to determine what the actual internal delays are between identical cameras separated by a distance of 5 m to 25 m. Screens were connected to a single source, a laptop that projected a stopwatch. Any delay in the projection was determined to be negligible. While the stopwatch was activated, the three cameras were triggered. The photographed times on each screen were analysed and compared to the other screens.
A maximum variation of 2 ms was recorded between the cameras. It is important to note that this variation is not consistent throughout the image acquisition process, i.e. the error is not cumulative. This 2 ms average error is insignificant at this point and can be minimized by averaging the positional measurements acquired from a combination of the stereo models (created by the multiple cameras) in phase 2.
The image processing and data analysis phase includes the identification of critical projectiles in the captured images and measuring the positions (x-, y-, and z-coordinates) at different points in time using photogrammetric software. The positional measurements are highly dependent on the on-site calibration of the cameras’ lenses on the day of the blast.


The site calibration of the lenses was based on the calibration of aerial photogrammetry cameras. These principles were rotated to a horizontal perspective and applied to this study. Calibration is done by marking each ground control point (GCP) (shown in Figure 5) in every image and linking the GCPs to their surveyed coordinates in the software (Pix4D), shown by the yellow markers in Figure 5. The key output of this process is to determine the internal and external parameters and orientation of the cameras.
Once all the GCPs are marked and referenced to the relative coordinates, the software is allowed to process the data. During processing, the software uses the marked GCPs on each image and the surveyed coordinates to create tie-points between the images. These tie-points represent specific features that the software recognizes in different images, creating a relationship between the location where the image was taken, the specific feature in the image, and the known GCPs.
The creation of these tie-points will determine the accuracy of the point-data and three-dimensional representation of the scene. This will directly influence the error applicable when taking the positional (coordinate) measurements of the highlighted fragments or projectiles.
The process of obtaining these measurements has been tested using existing stereo mapping software. Initial concept tests proved that is it possible to obtain positional coordinates of a projectile travelling through the air. This process is being refined as part of ongoing development work.
A series of concept tests was conducted from 2018 to 2019. The initial tests were tightly controlled with only a single projectile (a clay pigeon) as the target object. The layout of these tests is illustrated in Figure 6.
The purpose of these simplified tests was to prove the concept of using a modified photogrammetric technique to gain reliable data that can be used in further trajectory calculations. The focus elements and desired and actual outcomes for the initial proof of concept tests are summarized in Table II.
For the controlled proof of concept tests, the positional measurements were simply obtained by marking the centre-point of a feature within each stereo model to measure its position. Measurements were taken from a stationary feature (in this case the top of a powerline pole in the background of the images) to give an estimate of the error within the stereo model.
Following the initial proof of concept tests, two small-scale blast tests were conducted at a local quarry to determine the flexibility of the data acquisition technique and its application on an operational mine site. The quarry tests were carried out to determine the following:
1 Evaluate the horizontal (rotated aerial) calibration technique. Internal and external camera parameters before the blast or event can be determined with the Pix4D software.
2 Generation of point-cloud data of the scene.
The calibration data from the Pix4D software is exported in the form of external and internal camera parameters and summarized in a .csv file that can be imported into the stereo mapping software. The calibration process was successful but very time-consuming.
Sufficient point-cloud data of the environment can be generated using the calibration images. A point cloud of the environment was successfully generated. This point cloud can be used for further data processing and interpretation, as well as potential visualization of the data in virtual reality.
3 Capturing a high-quality image of a moving object. High-quality images without significant motion blur will allow clear and accurate measurements to be taken.
4 Capturing a moving object in flight and visually tracking that object’s motion in successive images.
5 Creating a stereo model of an object in motion from images taken from two separate cameras.
6 Obtaining positional measurements (x-, y-, and z-coordinates) using existing stereo mapping software.
Identifying and tracking the same object in successive images. The physical characteristics of the object will assist with this.
The point cloud of the scene based on the calibration data is combined with the event data (‘blast’ images) to create stereo models (two cameras per model) for each camera combination.
Once the stereo models are successfully generated, the coordinates of a point within the images can be acquired.
This was accomplished by using good quality cameras and lenses and applying photographic principles. However, these specific camera settings will vary with each environment and are therefore not presented as results.
In the proof of concept tests, it was decided to only record the motion of a single projectile, in an attempt to simplify the test methodology and limit the potential variables. Future tests will involve the motion of multiple projectiles simultaneously.
For the proof of concept tests, it was possible to create these stereo models in the mapping software (uSMART Softcopy) to within an accuracy of a couple of centimetres. To prove the concept, this error was considered to be acceptable; however, further testing and refining of the procedure will enable the reduction of this error to an acceptable margin for actual field application.
Once the stereo model has successfully been created, measurement of any feature within this model can be acquired. This is simply done by marking the centre-point of a feature to measure its position or using the Softcopy software (similar to any CAD software) to measure the distance or the circumference of an object. The process of creating an accurate stereo model is still under investigation. Further testing and investigation of the improvement of the entire phase 2 process and its accuracy is ongoing.
➤ Whether the camera site calibrations were possible outside of a controlled environment
➤ Whether the cameras would capture flyrock in flight from an actual blast, considering the likelihood of a homogenous background that may increase the difficulty of visual detection of individual fragments
➤ Whether the synchronization between the cameras remains acceptable, i.e. all cameras captured the same point in time (within an acceptable tolerance).
Site calibration of the cameras at the quarry tests was done in the same way as in the controlled concept tests, i.e. by creating a point-cloud data-set of the site before or after the blast to determine the internal and external specifications of the cameras on the day.
While taking these calibration images, special attention was given to exclude as much homogenous or ‘blue sky’ background as possible to facilitate the processing of these images. Figure 7 shows the point cloud generated from the calibration images, which was used to determine and export the camera specifications, which were used for the stereo model during the data analysis phase. This pointcloud data-set also forms the foundation of the VR models that can be created based on the data and analysis inherent in this technique. Figure 8 shows that some fragments were successfully captured and could be visually identified and tracked in subsequent images taken by the cameras. This may not be ideal or the most efficient way of tracking these fragments, but it is sufficient for the purpose of proving the concept and motivating further research and development.

Figure 9 illustrates the synchronization between adjacent cameras actuated via the remote triggering system approximately 500 m from the cameras. By comparing the dust plumes from each image, it is evident that three of the four cameras (cameras 2, 3, and 4) are very closely aligned. Camera 1 seemed to have taken its image slightly earlier than the other cameras; however, the error produced by this can be reduced by averaging the measurements taken per stereo model (i.e. images of the same point in time taken by two adjacent cameras) for each point in time. If four cameras are used for a blast, a total of six stereo models can be created per point in time, from which positional measurements of key fragments can be taken.
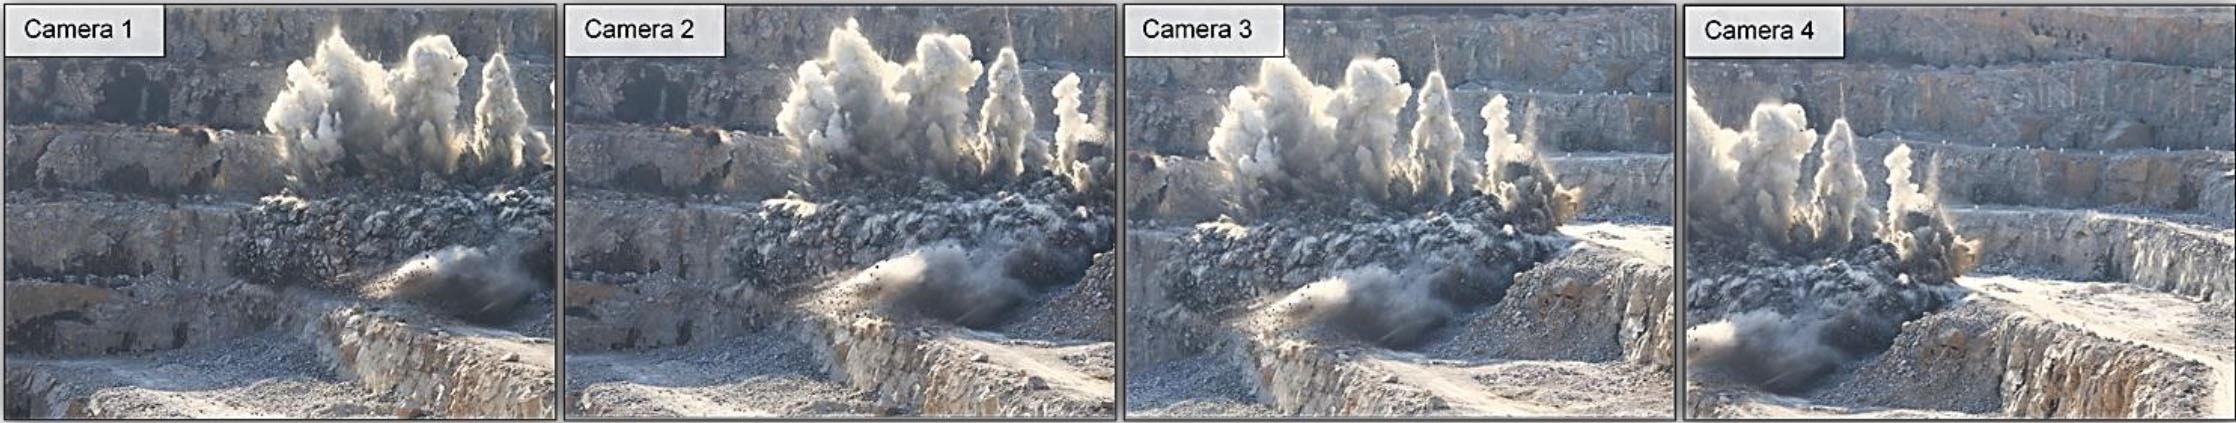
Phase 3
The data interpretation phase consists of combining the data collected in phases 1 and 2 and incorporating it into existing ballistics equations. These equations are based on the principles of projectile physics and Newton’s laws of motion, which remain valid for all moving objects.
The application of ballistics equations to the acquired positional data is an ongoing investigation. However, the significance of certain parameters within these equations that relate to specific circumstances or external factors is a key focus point.
To achieve accurate trajectory equations for the recorded fragments, it is essential to investigate the following:
➤ An accurate estimation of the drag coefficient of different rock types
➤ The effect of the shape of each rock type on its drag coefficient
➤ The effect of rotation or spin of the fragment on the drag force experienced.
The focus of this study was to develop a concept that can mathematically quantify the trajectory of flyrock from a blast, with the aim of enabling future researchers to mathematically quantify the impact of the different blast design parameters on the flyrock
throw distance. After a comparative analysis of various technologies, it was decided to use photogrammetry as the foundation of the proposed technique. A modified version of traditional photogrammetry was required to fit the objective of the research. The proposed technique consists of three main phases:
1. Data acquisition
2. Image processing and data analysis
3. Data interpretation. Only the first phase was developed up to an implementable technique – phases 2 and 3 are conceptual only and work is ongoing to improve phase 2 to obtain accurate data to be used in phase 3. The key outcomes of phase 1 are as follows.
➤ The positioning and orientation of the cameras relative to one another as well as the target area was determined using photogrammetric principles.
➤ The site calibration of the cameras is based on the calibration of aerial photogrammetry cameras, but the principles were rotated to a horizontal perspective for this study.
➤ A long-range remote trigger system was designed and manufactured to trigger the cameras from the same distance from the blast.
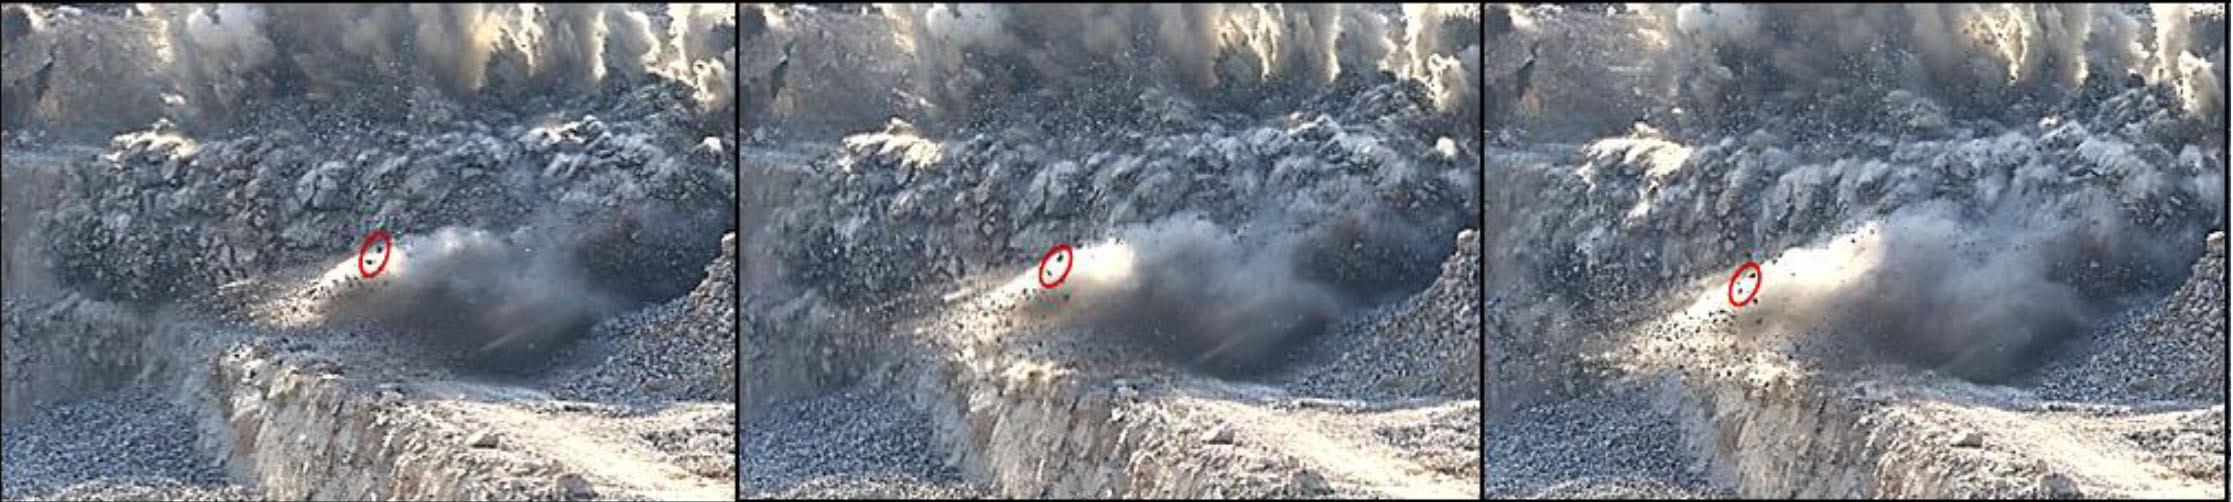
➤ The camera synchronization was found to be within acceptable ranges when using top-of-the-range triggers. Identical cameras were used to minimie this variance.
Phase 2 has been tested to the point of on-site calibration of the camera lenses and creation of point-cloud data of the environment before or after the ‘blast’. Initial controlled proof-of-concept tests enabled the team to take reliable coordinate measurements of a moving projectile at different times.
To include the measurements from phase 2 in phase 3, some key variables need to be further investigated. These include the drag coefficient for each projectile (including the impact of size and shape) and the effect of the environment or weather.
The concept has been developed with the objective to record, measure, and calculate reliable trajectories for fragments thrown
A conceptual technique to mathematically quantify the trajectory of flyrockFigure 8—Quarry test blast image data, showing the same projectiles at different time intervals Figure 9—Quarry test blast image data, showing the synchronization between adjacent cameras
from a blast with few or no assumptions. Initial tests proved that this concept is capable of mathematically quantifying the motion of random projectiles that originated from a relatively unknown position. Further development of the technique is ongoing. In order to ensure that future studies on flyrock and its causative factors are based on scientific principles, it is envisaged that the technique would form a common thread between these studies – making the results comparable and limiting assumptions made in the field.
The ultimate goal is to develop this technique to the point where it can be used for three purposes.
• Mines will be able to generate a database containing accurate historical flyrock data (did they experience flyrock and how far did it travel?). This database can be used to assign clearance distances.
• The technique can be used to guide research into flyrock and the impact of different blast design parameters on flyrock, without the need to make assumptions that may alter field data or the interpretation thereof.
• Point-cloud data combined with ballistics calculations can be used to visualize blasts and flyrock in virtual reality environments for training and educational purposes. The modified photogrammetric technique developed thus far can already be used to meet the first of these aims, namely data acquisition. Work on the aspects, challenges, and further development of the technique is under way.
Specific acknowledgement is extended to the following organizations and individuals that made this research possible:
• AECI Mining Explosives for their financial support through their Research Chair at the Department of Mining Engineering at the University of Pretoria, and their assistance with industry participation.
• Mr Robin Kock and Mr Gordon McGill (Premier Mapping).
• Mr Hans Grobler (EECE Department, University of Pretoria).
• Professor Walter Meyer (Physics Department, University of Pretoria).
Armaghani, D.J., Mahdiyar, A., Hasanipanah, M., Faradonbeh, R.S., Khandelwal, M., and Amnieh, H.B. 2016. Risk assessment and prediction of flyrock distance by combined multiple regression analysis and Monte Carlo simulation of quarry blasting. Rock Mechanics and Rock Engineering, vol. 49, no. 9. pp. 3631–3641.
Armaghani, D.J., Tonnizam Mohamad, E., Hajihassani, M., Alavi Nezhad Khalil Abad, S.V., Marto, A., and Moghaddam, M.R. 2016. Evaluation and prediction of flyrock resulting from blasting operation using empirical and computational methods. Engineering with Computers, vol. 32, no. 1. pp. 109–121.
Bajpayee, T.S., Bhatt, S.K., Rehak, T.R., Mowrey, G.L., and Ingram, D.K. 2003. Fatal accidents due to flyrock and lack of blast area security and working practices in mining. Journal of Mines, Metals and Fuels, vol. 51, no. 11/12. pp. 344–350.
Dehghani, H. and Shafaghi, M. 2017. Prediction of blast-induced flyrock using differential evolution algorithm. Engineering with Computers, vol. 33, no. 1. pp. 149–158.
Faramarzi, F., Mansouri, H., and Farsangi, M.A. 2014. Development of rock engineering systems-based models for flyrock risk analysis and prediction of flyrock distance in surface blasting. Rock Mechanics and Rock Engineering, vol. 47, no. 4. pp. 1291–1306.
Ghasemi, E., Amini, H., Ataei, M., and Khalokakaei, R. 2014. Application of artificial intelligence techniques for predicting the flyrock distance caused by blasting operation. Arabian Journal of Geosciences, vol. 7, no. 1. pp. 193–202.
Ghasemi, E., Sari, M., and Ataei, M. 2012. Development of an empirical model for predicting the effects of controllable blasting parameters on flyrock distance in surface mines. International Journal of Rock Mechanics and Mining Sciences, vol. 52. pp. 163–170.
Hasanipanah, M., Faradonbeh, R.S., Armaghani, D.J., Amnieh, H.B., and Khandelwal, M. 2017. Development of a precise model for prediction of blastinduced flyrock using regression tree technique. Environmental Earth Sciences, vol. 76, no. 1. Id. 27.
Hudson, J.A. 1992. Rock Engineering Systems: Theory and Practice. Ellis Horwood, Chichester.
Hudson, J.A. 2014. A review of rock engineering systems (RES) applications over the last 20 years. Rock Characterisation, Modelling and Engineering Design Methods Feng, X., Hudson, J.A., and Tan, F, (eds). Ellis Horwood, Chichester. pp. 419–424.
ISEE 2011. Flyrock. Blasters' Handbook. Stiehr, J.F. (ed.). International Society of Explosives Engineers, Cleveland, OH. pp. 383–410.
Kukreja, H., Bharath, N., Siddesh, C.S., and Kuldeep, S. 2016. An introduction to artificial neural network. International Journal of Advance Research and Innovative Ideas in Education, vol. 1, no. 5. pp. 27–30.
Lundborg, N., Persson, P.A., Ladegaard-Pedersen, A., and Holmberg, R. 1975. Keeping the lid on flyrock in open-pit blasting. Engineering and Mining Journal, vol. 176. pp. 95–100.
Marto, A., Hajihassani, M., Armaghani, D.J., Mohamad E.T., and Makhtar A.M. 2014. A novel approach for blast-induced flyrock prediction based on imperialist competitive algorithm and artificial neural network. The Scientific World Journal, vol. 5. doi: 10.1155/2014/643715
Monjezi, M., Amini Khoshalan, H., and Yazdian Varjani, A. 2010. Prediction of flyrock and backbreak in open pit blasting operation: A neuro-genetic approach. Arabian Journal of Geosciences, vol. 5, no, 3. pp. 441–448.
Monjezi, M., Mehrdanesh, A., Malek, A. and Khandelwal, M. 2012. Evaluation of effect of blast design parameters on flyrock using, artificial neural networks. Neural Computing and Applications, vol. 23, no. 2. pp. 349–356.
Prakash, A. 2014. ANFIS (Adaptive Neural Fuzzy Inference Systems). [Interview] 14 September 2014.
Raina, A.K. and Murthy, V.M.S.R. 2016. Importance and sensitivity of variables defining throw and flyrock in surface blasting by artificial neural network method. Current Science, vol. 111, no. 9. pp. 1524–1531.
Raina, A.K., Murthy, V.M.S.R., and Soni, A.K. 2013. Relevance of shape of fragments on flyrock travel distance: An insight from concrete model experiments using ANN. Electronic Journal of Geotechnical Engineering, vol. 18. pp. 899–907.
Raina, A.K., Murthy, V.M.S.R., and Soni, A.K. 2015. Flyrock in surface mine blasting: Understanding the basics to develop a predictive regime. Current Science, vol. 108, no. 4. pp. 660–665.
SAS Institute Inc. 2019. Artificial intellegence: What it is and why it matters. https://www.sas.com/en_us/insights/analytics/what-is-artificial-intelligence.html [accessed 3 September 2019].
Stojadinović, S., Lilić, N., Obradović, I., Pantović, R., and Denić, M. 2016. Prediction of flyrock launch velocity using artificial neural networks. Neural Computing and Applications, vol. 27, no. 2. pp. 515–524.
Stojadinović, S., Lilić, N., Pantović, R., Žikić, M., Denić, M., Čokorilo, V., Svrkota, I., and Petrović, D. 2013. A new model for determining flyrock drag coefficient. International Journal of Rock Mechanics and Mining Sciences, vol. 62. pp. 68–73.
Stojadinović, S., Pantović, R., and Žikić, M. 2011. Prediction of flyrock trajectories for forensic applications using ballistic flight equations. International Journal of Rock Mechanics and Mining Sciences, vol. 48, no. 7. pp. 1086–1094.
Trivedi, R., Singh, T.N., and Gupta, N. 2015. Prediction of blast-induced flyrock in opencast mines using ANN and ANFIS. Geotechnical and Geological Engineering, vol. 33. pp. 875–891.
Van der Walt, J. and Spiteri, W. 2020. A critical analysis of recent research into the prediction of flyrock and related issues resulting from surface blasting activities. Journal of the Southern African Institute of Mining and Metallurgy, vol. 120, no. 12. pp. 701–714. u
Whatdoes it take to open mindsets to embrace innovation and alternative solutions in mining? How do we ensure our workforce (now and tomorrow) is the best it can be? Why do we allow for even one person to not feel safe in our industry? To achieve the global vision of a safe, sustainable and productive mining industry of tomorrow will require a cultural shift across the industry – safety culture, innovation culture, change management, diversity and inclusion and more. Culture is the core element that will define success.
This in-person forum will delve into the industry’s top priority areas common to most mining operations today, through the lenses of operations, maintenance and safety. We will hear case studies and demonstrations from innovators, implementers and operators, peers will share experiences and expertise to define opportunities, and together we look across and outside the mining industry for new ways to better how we mine. This interactive forum features workshops, open discussion sessions, and presentations. The focus is on sharing knowledge of what is actually working in our mines and what is coming down the pipeline, as well as building relationships and collaborating with peers.
COVERED WILL INCLUDE:
• Decarbonization and energy management
• Safety
• Operational best practices
• Getting the best use out of our data
• Integration and interoperability
• Autonomous mining
• Cybersecurity

conceptual technique to mathematically quantify the trajectory of flyrock
Tomorrow’s mining: innovating to improve the way we mine
Affiliation:
Retired
Correspondence to: M. Handley
Email: handley@icon.co.za
Dates:
Received: 12 Nov. 2021
Revised: 7 Nov. 2022
Accepted: 19 Apr. 2023
Published: April 2023
How to cite:
Handley, M. 2023
Where is all the gold?
Journal of the Southern African Institute of Mining and Metallurgy, vol. 123, no. 4. pp. 175–192
DOI ID:
http://dx.doi.org/10.17159/24119717/1902/2023
Synopsis
The Witwatersrand Basin contains by far the most gold ever found, and has hosted mining from its discovery in 1886 to the present. For many years, South Africa was the world’s largest producer of gold, nearly all of which came from the Witwatersrand. Since 2000, South Africa has fallen back several positions because of declining gold output. There are many complex and varied reasons for this; however, declining gold resources in the Witwatersrand Basin are not one of them. As far as the author knows, there are no qualified estimates in the literature of gold remaining in the Witwatersrand Basin. This paper collects mining data from several sources and then, using elementary gold accounting and error analysis, attempts to estimate the amount of gold remaining in the Witwatersrand Basin. It includes gold underground in existing and defunct mines, in evaluated ore resources, and dumps. Compiled data from 1887 to 2019 shows that 50 200 t of gold were produced by Witwatersrand mines, while it is estimated that a further 48 100 t remain underground, both within and outside of mine leases, a further 1 600 t on the surface in tailings, and an unknown amount in rock dumps. Nearly all of this gold will remain inaccessible with current mining methods, and major technical developments in mining will be necessary before any of the gold can be categorized as a code-compliant resource or reserve. To win this prize, the mining industry will have to rethink its approach to mining, both in old mining leases and in the unexploited ground. It will also have to find effective means of preventing gold theft and informal mining, which are on the rise.
Keywords gold, Witwatersrand Basin, remaining resources.
Introduction
The Witwatersrand Supergroup contains arguably the largest known economically extractable resource of gold in the world, perhaps even more than that dissolved in the oceans and the rocks and sediments on the ocean floor. Seawater contains approximately 50 fmol/l or 10-11 g/l gold in solution (about 13 500 t in all the oceans (Faulkner and Edmond, 1990), and an unknown amount in ocean floor sediments and the oceanic crust, while the Witwatersrand has so far yielded approximately 50 200 t of gold with at least a further 48 100 t remaining. This paper addresses the question of the remaining gold contained in the known reefs, which have been exposed since the discovery of gold on the Witwatersrand in 1886. There was no significant production of gold from the Witwatersrand before 1887, the year that the first mining companies on the Witwatersrand were formed (Handley, 2004). This synthesis includes 1886, even though gold production from the Witwatersrand in that year amounted to little more than a few hundred kilograms obtained from early crushing of outcrop rocks and panning the fines for demonstration, evaluation, and to attract investment.
Since 1886, there has been unbroken production of gold from Witwatersrand ores to the present day. The rise of informal production of gold from defunct as well as producing mines, mergers between existing mines and gold mining companies in South Africa, and the formation of new companies have impaired accurate record-keeping of gold production from the Witwatersrand. Hence, publicly available statistics for gold mines producing from Witwatersrand Basin ores became more difficult to collect in the mid-1990s, to the point that reliable statistics after 2005 could not be compiled. To bring the discussion up to date, estimates of Witwatersrand gold mine production, with significantly increased error for the years 2006 to 2019, supplement the statistics to 2005, with insignificant increases in the overall error of estimating the remaining gold in the Witwatersrand Basin.
The Witwatersrand Supergroup, comprising the upper and younger Central Rand Group (deposited between 2914–2714 Ma) and the lower and older West Rand Group (deposited between 2970–2914 Ma) is
an ancient sedimentary deposit (Hayward et al., 2005, McCarthy, 2006; Tucker, Viljoen, and Viljoen, 2016). Its outline appears in Figure 1 within a grid spanning latitudes 25.5° S to 29.0° S, and longitudes 25.5° E to 29.5° E. Section A-Aʹ in Figure 1 lies in the plane of the great circle with a dip 27° S and dip direction 24° E – if the Earth’s equatorial plane and the Greenwich Meridian are used as references – and appears in Figure 2.
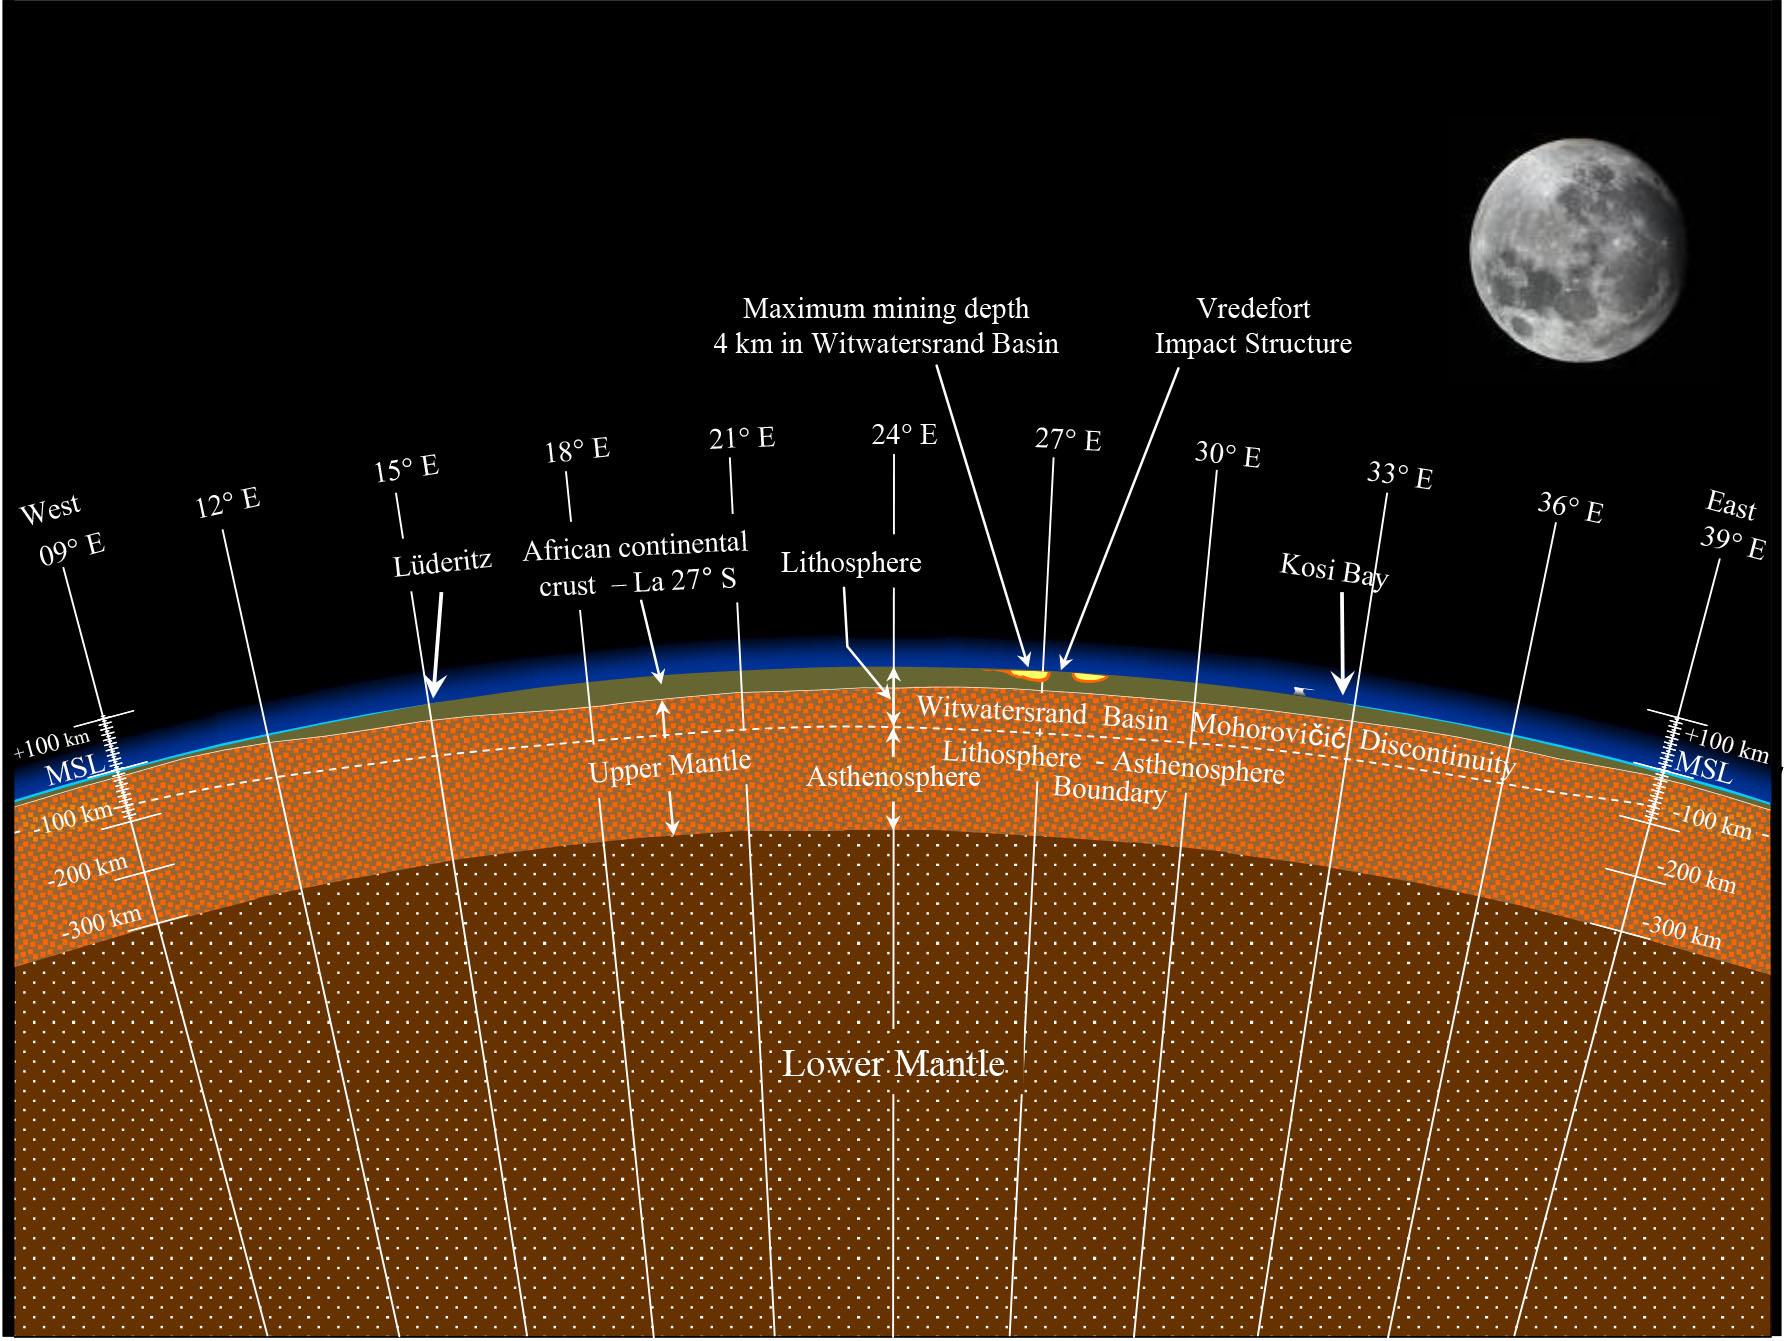

Figure 2 shows that the Witwatersrand Supergroup occupies a very small volume of the Earth’s crust, yet it contains such a large concentration of gold. The grid in Figure 1 is enlarged in Figure 3 to show the surface geology, the mine leases, and important cities and towns in the region. Figure 3 shows that much of the Witwatersrand
Supergroup is covered by younger rocks, outcropping only in the Johannesburg-Soweto region, to the east of Klerksdorp on the western rim of the Vredefort impact structure (Reimold, 2006), and the south-southeast of Johannesburg in the Balfour region. The Vredefort structure brings the deep-lying rocks in the centre of the basin back to the surface, where it is evident that gold is still present in conglomerate reefs there.
The Central Rand Group rocks, known to be the main gold carriers, span approximately 300 × 120 km, covering an area of approximately 33 600 km2, or 0.0066% of the Earth’s surface (Handley, 2004). The gold mine leases were established along approximately one-third of the basin edge where the gold-bearing
reefs are shallowest and richest. The mining leases cover an estimated 2 700 ± 300 km2, appearing in Figures 3 and 4. They are fluid as new areas are incorporated into or dropped from them. Figure 4 shows the Witwatersrand Supergroup with the surface rocks stripped away, along with the mine leases on the basin edges as best as they can be drawn with available data and at the scale for the diagram. The leases as shown are by no means completely current, but they do roughly outline the seven major goldfields that have been discovered and exploited to date.

The diagram shows, by the distribution of mine leases, that economic gold concentrations occur mainly along the basin edges. The gold was concentrated and then remobilized in conglomerate bands, or ‘reefs’ of sedimentary origin (see Minter et al., 1986; Hayward et al., 2005; McCarthy, 2006; Tucker, Viljoen, and Viljoen, 2016 for more on the nature of the reefs). Palaeocurrent studies reveal that the sediments and gold were brought into the basin from the outside. Gold was concentrated by sedimentary processes and remobilized by later hydrothermal events once the sediments had

consolidated into rock. These hydrothermal events coincided with the deposition of the lower portion of the Transvaal Supergroup (approximately 2 500 Ma), the deposition of the upper portion of the Transvaal Supergroup (approximately 2 300 Ma), and the emplacement of the Bushveld Complex followed by the Vredefort impact structure (approximately 2 050–2 000 Ma, Robb and Meyer, 1995). Most features of the Witwatersrand Basin are currently best explained by a modified placer theory (Hayward et al., 2005), although the origin and quantity of the gold found in it are still enigmatic. Discussion of the origin of the gold is beyond the scope of this paper; interested readers should refer to the rich and varied literature that has been published on the subject, beginning with the authors cited above.
The reefs at the basin edge dip toward the centre of the basin, the gold concentration declining with increasing distance from the basin margin. They probably lie no deeper than 8 000 to 10 000 m
below the surface at their deepest point before rising towards the surface around the Vredefort impact structure. Mponeng mine in the south-central Carletonville Goldfield is the deepest mine in the world, reaching 4 000 m below the surface. On the scale of Figure 2, this is still little more than ‘a scratch on the surface’ of the planet. This brief introduction to the Witwatersrand Supergroup hardly does justice to this remarkable resource, or the many great gold mines that produced from it.
Table I contains statistics spanning the 120 years of continuous mining from 1886 to 2005 for the seven goldfields that have been discovered to date. Overall, almost 6 × 10⁹ t of gold-bearing reefs have been mined and processed in this period, at an average grade of 8.07 g/t. The major gold-carrying reefs mined are the Basal Reef (Free State), Carbon Leader Reef (Carletonville), Kimberley Reef (Evander), Main Reef (West Rand, Central Rand, East Rand), Main Reef Leader (Central and East Rand), Middelvlei

Gold produced by Witwatersrand mines from the seven major goldfields in the 120 years 1886–2005
* Excludes all gold produced by small operations and dump reprocessors who were non-members of the Chamber of Mines of South Africa, such as the Boschoff Group of Companies, Consolidated Modderfontein, Crown Gold, Golden Dumps, Knights Gold, and Lindum Reefs, amongst others. The figures include gold produced by reprocessing dumps where this was done by Chamber members, for example the OFS Joint Metallurgical Scheme. Omitting nonmember gold production is expected to fall within the uncertainties, see Table VIII and discussion below.
Reef (stratigraphically related to the Main Reef, Carletonville), South Reef (Central and West Rand), Vaal Reef (Klerksdorp), and Ventersdorp Contact Reef (Carletonville and Klerksdorp). The amount of ore and grade of these reefs far exceeds any other gold deposit in the world, and South Africa became the world’s largest gold producer from the late nineteenth century to approximately 2006. South Africa has slipped back in recent years from being the world’s largest gold producer because of declining production from the Witwatersrand Basin. Figure 5 shows the gold production from 1887 to the present. This plot does not suggest that the gold resource of the Witwatersrand Basin has been depleted; far from it, there is probably more gold to be won than has been recovered in the 136 years since mining began.
The author estimates that just over half of the known gold reserve in the Witwatersrand Supergroup had been extracted by the end of 2019, with slightly less than half remaining to be mined. Three unquantified losses are gold theft, informal mining, and gold-bearing ore sent to surface rock dumps. Theft has persisted throughout the history of mining, while informal mining has accounted for an increasing proportion of gold won from both producing and defunct mines in the Witwatersrand Basin. Since these losses cannot be quantified (see Gastrow, 2001; Minerals Council, 2019) the author has been forced to ignore them. Goldbearing ore can be sent to surface waste rock dumps instead of processing for a variety of reasons not explored in this paper. Like theft and informal mining, there are no records of the amount of gold sent to waste rock dumps, so this loss remains unaccounted for until discussion of the mine call factor. The net effect is an underestimate of the amount of gold produced by the Witwatersrand mines, and possibly a corresponding over-estimate of the amount of remaining gold.
The author concludes that current mining methods will not be able to extract more than a fraction of the remaining inferred to measured gold resources, and that gold theft and informal mining will continue to play an important role in limiting future production unless more effective controls are implemented. Gold mining companies and research institutions should collaborate to improve future gold extraction methods and to minimize gold theft so that the huge remaining prize can be won for the benefit of all.
An estimate of remaining gold is made in this paper using mining data from the Witwatersrand mines from 1886 to 2019 and gold exploration data from the Witwatersrand Basin up to the end of 1998 (Handley, 2000, p. 2). For this analysis, it is assumed that no significant new gold finds were made in the Basin between 1998 and 2019. An enormous amount of mining and production data have been collected and recorded, the best of which comes from the listed producing gold mines themselves and the Chamber of Mines, which compiled and summarized the data from its member mines.
The Chamber of Mines (renamed the Minerals Council South Africa in 2016) was first formed at a meeting of representatives on Saturday 5 October 1889 and named the Witwatersrand Chamber of Mines. It succeeded the ‘The Old Chamber’, which was formed in December 1887, but failed because of a lack of support from the mines and some of the mining houses. One motivation for the formation of the current Chamber was to compile ‘authoritative information on the output of the Witwatersrand goldfield that would be acceptable to the financial capitals of the world’ (Lang, 1986).
The Chamber and its forerunners certainly adhered to that objective, producing mining statistics for its gold mining members
that are amongst the finest anywhere in the world (Handley, 2004, p. 78). It must not be forgotten that the quality of the Chamber statistics is a direct result of the quality of reporting by all its members, namely the producing mines of the Witwatersrand. The Chamber of Mines, followed by the Minerals Council South Africa, has continued as representative organization for mines and miningrelated activities in South Africa for the last 133 years. This paper will refer to it as the Chamber, or the Chamber of Mines because the references for nearly all the data used came from the earlier-named Chamber of Mines.
The statistics used with confidence in this paper were compiled from the Chamber of Mines of South Africa (1990), Lourens (1998), Handley (2000, 2004), and Conradie (2000, 2001a, 2001b, 2003, 2004, 2005, 2006). The second and fourth authors collected and published gold mining data for the Department of Minerals and Energy, which will collectively be referred to as ‘government data’. The initial discussion covers a period of 120 years from 1886 to 2005 inclusive, since this is the period covered by the most reliable data. Although the statistics for gold production in South Africa for the last 136 years are very good, uncertainties remain because early records from 1886 to 1910 are incomplete (Chamber of Mines, 1990, p. 8S). In the mid- to late 1990s, the quality and availability of data declined because of sweeping changes in South Africa and the mining industry.
The production statistics compiled by the Chamber of Mines were obtained from the gold mining companies listed on the Johannesburg Stock Exchange, and who were members of the Chamber. As far as the author knows, no industry before or since has produced such transparent, accurate, and comprehensive reports as did the gold mining companies of the Witwatersrand. Quarterly reports, or gold quarterlies as they became known, were published in the morning edition broadsheet–format Rand Daily Mail, the Business Day after the dissolution of the Rand Daily Mail, the Saturday Star, and the tabloid–format Citizen in the days following the end of each quarter (31 March, 30 June, 30 September, and 31 December). The reports appeared in tranches, as they were published by the different mining houses that administered the individual gold mines (see Handley, 2004 pp. 51–92 for a history of the development of the gold mines and mining houses on the Witwatersrand). For example, Gold Fields of South Africa Limited would publish the quarterly reports for its seven producing gold mines (West Driefontein, East Driefontein, Doornfontein, Venterspost, Libanon, Kloof, and Deelkraal) on a pre-arranged day in the morning daily newspapers named above. The other mining houses, namely Anglo American Corporation of South Africa Limited, Union Corporation Limited, Johannesburg Consolidated Investment Company Limited, Rand Mines Limited, General Mining and Finance Corporation Limited, and Anglo Transvaal Limited would all do the same on pre-appointed, but different days in the same dailies. As far as the author can recall, the Saturday Star published summaries of the gold quarterlies, while the weekday evening newspaper, The Star did not publish any gold quarterlies.
The gold quarterlies usually appeared in tabular form for each mine, reporting at least the following (this list is not complete):
➤ Area mined in square metres
➤ Average stope width
➤ Number of tons of ore that had been milled in the quarter
➤ Amount of gold produced
➤ Gold yield in g/t
➤ Cost per ton milled
➤ Average gold price received for the quarter
➤ Gold and other revenue generated per ton milled
➤ Profit/loss for the quarter for the mine, and taxation according to the lease area formula
➤ Ore reserves and measured grade of reserves
➤ Dividends declared (if there was a dividend for shareholders)
➤ Capital expenditure, and a description of where capital had been spent during the quarter, and where it was planned for the following quarter
➤ Comment on the gold market and factors affecting it, and the outlook for the coming quarter.
These reports were not trivial; the tranche of quarterly reports from one mining house would occupy up to a complete spread in the broadsheet newspapers and possibly more in the Citizen
In addition to the quarterlies, each mine would publish an audited annual report at the end of each financial year. Most of the gold mines had financial years ending either in June or in December. The annual reports were more detailed than the quarterlies and were usually published in full-colour magazine format with good quality matt or gloss paper from the 1960s onward. A full-colour surface plan of the mine showing shafts, dumps, and other infrastructure together with a full-colour plan of underground workings – both usually 1:30 000 scale – accompanied or were bound into the report. These annual reports were 30–100 pages, containing all the information described above, but in more detail than in the quarterlies. The annual report typically published and discussed audited figures for the mine, auditor’s statements, and a history of production and financial results from the inception of the mine. During the war years (the late 19th, and early 20th centuries) the annual reports were not always this elaborate; they were unembellished 10–20 page reports printed on recycled paper. Sometimes an underground plan of mine workings printed in monochrome or single–colour accompanied the reports.
The Chamber of Mines compiled all this information and much more into its annual Statistical Tables. This publication was informative and accurate. The best years stretched from 1910 to 1989, when virtually 100% of gold production came from mines that were members of the Chamber. Although the author has no access to any meaningful quantitative information, the Witwatersrand gold production from non-members of the Chamber – including the periods before 1910 and after 1989 – was truly insignificant, estimated at less than 1% of that of Chamber members (see also the footnotes to Table I).
With the major restructuring of the South African mining industry beginning in the early 1990s, this flow of information began to falter. The break-up of the mining houses, the delisting of mines from the Johannesburg Stock Exchange, and the incorporation of the delisted mines into newly formed gold-focused mining companies hastened the process. The break-up of the mining houses and the delisting of mines compromised the funding of the Chamber of Mines, severely hampering its ability to collect and compile annual mining data from about 1996, after which the Chamber no longer had such good access to gold mining data from the Witwatersrand. These events led to a gradual deterioration in both the quality and detail of Witwatersrand gold mining statistics.
Mining data reported by the Chamber before 1910 are by its admission incomplete (Chamber of Mines, 1990). Early mining data from the Witwatersrand mines were thoroughly researched by Handley (2004), who had compiled from various sources records of ore processed, gold production, and grade for the years 1886–1909. From 1910–1989 inclusive the data for the Witwatersrand gold mines, members of the Chamber, are consistent and reconcilable with small errors, and are considered reliable. The only omissions from these data is gold produced by operators who were not members of the Chamber of Mines. Figure 6 contains a graphic representation of listed gold mining companies, gold producers, and Chamber of Mines members from 1880 to the present, together with representations of major world events, and important local events that influenced mines and mining in the Witwatersrand Basin. The nominal gold price in US dollars forms a background to the plot.

The author had to resort to other sources for mining statistics from 2005 to the present, with decreasing confidence in the data obtained. Handley (2004) collected data to 2002; however. revision of Chamber of Mines statistics shows discrepancies with that data from 1990, for both tonnage treated and gold produced. These differences amount only to a difference in judgment between the author and Handley (2004).
In addition to compiling annual data for the gold mines of the Witwatersrand, the Chamber of Mines maintained records of total mine production from inception to closure for all member mines, unless they amalgamated with an existing mine or terminated Chamber membership. Cumulative records of total production for all closed and producing member mines appear in Chamber of Mines, (1990, Tables I and II, pp. 11S–12S. These data, as well as the annual data already discussed, were used by the author to estimate gold remaining in the Witwatersrand Basin and the uncertainties associated with the calculation.
The government data (Lourens, 1998; Conradie, 2000–2006) separated gold production annually from the seven major Witwatersrand goldfields, without producing similar statistics for the number of tons milled or the gold grades. The producers were not named, so reconciliation with the Chamber of Mines (1990) and Handley (2004) data was not possible. These data included gold production from non–members of the Chamber, and in addition there are other discrepancies arising from the time of declaration of gold produced in the mines and the time when these declarations were recorded by the government. There were therefore unexplained discrepancies between data from these two sources.
There are very few data publicly available on gold production from the Witwatersrand Basin by non-members of the Chamber, aside from that included in the government statistics. Companies for whom there are few or no public statistics are the Boschoff Group of Companies (Meiring, 1963), Consolidated Modderfontein Mines, Lindum Reefs, East Rand Gold and Uranium (ERGO), Knights Gold, Crown Gold, Golden Dumps, and more recently DRDGold, which has consolidated several gold mine dump retreatment operations. Although this list is by no means complete, the output from these operations is small (<1%) in relation to that of the Witwatersrand mines that were members of the Chamber of Mines.
Aside from the fact that the data produced both by the South African government and the Chamber of Mines cannot be reconciled, there are occasions from approximately 2000 where the records suggest that tonnage treated and gold produced by Witwatersrand mines exceeded the output for South Africa as a whole. This came about because foreign production by Chamber members was not – or could not be – separated from production from Witwatersrand mines. After 2005, the data become so unreliable that tonnage treated by the Witwatersrand mines had to be omitted, so grade calculations together with gold residue sent to mine dumps could not be included in the statistics.
The correct figures for tonnage milled, gold produced, and grade are not known. The figures from the Chamber of Mines (1990), Handley (2004), and minor revisions during the compilation of this paper are compared in Table II. Since there are no indications of which figure is the more accurate, all must be accepted as
statistics of Witwatersrand mine production with percentage residuals determined from differences between different methods of accounting
2004)
4 Chamber of Mines cumulative statistics by mine name from 1886 to 2005 (this paper)
5 Chamber of Mines accumulated annual statistics for member mines 1886 – 2005 (after Handley 2004)
Normalized residuals between different sets of figures
6 Expected normalized residual between 1 and 2 (%)
* Percentages in the column under grades are actually errors found by treating the residuals in tonnage and gold produced as percentage errors and finding the uncertainty in grade by combining them in quadrature and expressing the result as a percentage – see Appendix.
equally good, and are assumed measurements from a hypothetical population of normally distributed Witwatersrand gold mining statistics that has a mean and a standard deviation. The purpose of Table II is to illustrate the determination of the residual between two comparable statistics so that an error can be defined for them for the estimations that will be discussed later.
The standard deviation is the most widely used estimate of dispersion and standard error. However, in very small samples it is biased, even if Bessel’s correction for variance computed from a sample with an unknown mean is applied. The population standard deviation computed from a sample containing only two data-points is underestimated by about 20% when computed this way. This is a well-known shortcoming of the standard deviation, but is confined to very small samples, which are of particular importance to laboratory experiments and quality control in industrial processes (see for example Duncan, 1979). Expected normalized residuals expressed as percentages have been computed for different sets of figures of tons milled and gold produced in rows 1 to 5 of Table II, and listed in rows 6 to 8 below the changed headings. The methods of computing these residuals, which can be considered standard errors, is described in the Appendix.
The Chamber of Mines (1990) has acknowledged that data before 1910 are incomplete for annual tonnages milled and gold produced by Witwatersrand mines, yet it has a complete record of tonnages and production for all its member mines since inception – many of which had started production in the period 1887 to 1910. The differences between the Chamber figures in rows 1 and 2 are relatively small, even though the comparisons do not cover the same period. The other two comparisons do cover the same period but show larger differences. Table II suggests the errors in tonnage and production are roughly 1% and 2% respectively. It would take a lifetime of dedicated work reconstructing all the records from the data available and gold mine annual reports – if these could all be found – to obtain better error estimates. It may be possible to do so using the quarterlies from the archives of the Business Day, Citizen, and The Star
As far as the author is aware, uncertainty in the actual tonnage processed by any mine has never been reported publicly. All the mines in the Witwatersrand Basin used conveyor belts in the final stage of ore transfer to the crushing and milling circuits, where belt scales measured tonnage input. Morrison (2008, p. 95) observes that the in-service precision of belt scales is ± 0.5–2.0%. Assuming an industry-wide mean belt scale error of ± 1.0% over the last 133 years, and a secondary error of 1% for incomplete tonnage data from the Witwatersrand from Table II, the author assumes for error analysis that the two uncertainties are linearly additive (the maximum possible uncertainty, see Appendix). This results in an overall uncertainty of tonnage treated of 2%. The tonnage of ore milled during the 120 years from 1886 to 2005, to three significant figures with a 2% uncertainty, is 5.87 ± 0.12×10⁹ t. This comes from row 4 of Table II, appears without an error or rounding in Table I, and with a 2% uncertainty in row 1 of Table VIII. The uncertainty of approximately 120 Mt amounts to a very large Witwatersrand mine, yet it represents only a 2% uncertainty in total tonnage treated by mines in the Witwatersrand Basin!
The gold production data are expected to be more accurate than the tonnage milled and should include all small operations in data submitted to, and reported by, the South African government. Gold
data declared to the government is collected for South Africa as a whole, and even though it is reported for the six major goldfields separately, the author was unable to separate the proportions produced by member mines of the Chamber and small operations.
Besides the output of small operators, most if not all Witwatersrand mines re-ground and re-treated relatively high-grade tailings material. They also reprocessed sorted or unsorted waste rock dump material towards the end of their lives to supplement the declining production from underground, if gold-bearing ore had been sent to the rock dumps during the life of the mine. They also cleaned up processing equipment (stamp mills, tube mills, settling tanks, pumps, orepasses, conveyor belts, and other equipment) in the milling and treatment circuits to retrieve captured gold during and at the end of their lives. The gold was included in their declarations, while the extra tonnage milled when processing dump rock was also captured and reported.
In many mines, the tonnage treated exceeds the tonnage milled as they re-treated some of the previously milled tailings. Bearing all these factors in mind, and assuming that the gold declared by all the mines is accurate, an uncertainty of roughly 2% is applied to the produced gold, as was determined in Table II. This should also account for dump retreatment operations and small operators who were not covered by the Chamber of Mines. If not, there will be a small under-estimation of gold produced from the Witwatersrand, of the order of 1% or less. Therefore, the total amount of gold produced from the Witwatersrand Basin to 2005 appears in row 4 of Table II, repeated in Table I without error or rounding, and given in row 2 of Table VIII as 4.74 ± 0.09×10⁴ t (a 2% uncertainty). This accumulated uncertainty over 120 years amounts to 947 t, the total gold production of a large Witwatersrand mine.
The average grade of the ore is obtained from the above two quantities, with the two uncertainties in tonnage milled and gold output now being added in quadrature for a quotient, since we assume that the errors in the data for tonnage milled and gold produced are independent and random (see Appendix). The average grade of all the gold-bearing ore treated by the Witwatersrand mines is given in row 4 of Table II, repeated in Table I, and in row 3 of Table VIII as 8.07 ± 0.23 g/t, for an uncertainty of 2.83%. These three uncertainties form the foundation of all the estimates that follow.
After 2005, ore tonnage data were unreliable to the point that they could not be used, and gold production data were becoming increasingly unreliable, and so South African production figures from the US Geological Survey (2022) and the World Gold Council (2022) were used (see Table III). Neither of these data-sets was considered much more reliable than data from local sources, but they could be averaged and an error determined in the same way as was done for Chamber data up to 2005. There was an average 10% disparity between data from each organization for each year (see Table III), which is assumed as the error for reported gold production from 2010–2019. The analysis assumes the same level of uncertainty for the Chamber of Mines (2010) figures for the years 2006–2009. An amount of 13 t for by-product gold from the platinum mines and gold from the Barberton gold mines, amongst other sources, was subtracted from figures for South African production from 2006–2019 to arrive at an estimate for the Witwatersrand production. The annual 13 t deduction was determined by averaging the differences between South African production and Witwatersrand production from the decade ending in 2005. The larger uncertainty in Witwatersrand gold production figures from 2006 has little influence on the overall uncertainty in gold production for the period 1886–2019.
Table III
Witwatersrand gold mine production statistics deduced from the Chamber of Mines (2010), the US Geological Survey (2022) and the World Gold Council (2022)
Year SA gold production: Chamber of Mines (t)
SA gold production: USGS (t)
SA gold production: WGC (t)
Expected percentage standard error between USGS and WGC data
gold mine production
The Chamber of Mines (2010) figures for SA gold production minus 13 t for non-Witwatersrand gold production. The average of the USGS (2022) and WGC (2022) figures minus 13 t for non-Witwatersrand gold production.
* An error of roughly 10% is assumed for all Witwatersrand gold mine production for the years 2006 – 2019 inclusive
1886–2005: Step 1
The estimates were produced in two steps:
➤ The first is for the period 1886–2005, where estimates for gold remaining in tailings and left underground in mine leases up to 2005 are included (the quantity of gold in waste rock dumps remains unknown)
➤ A second – less reliable – estimate of gold production only from 2006–2019, since there were insufficient data to estimate gold left underground and in tailings. This step includes the evaluated gold resource within and between mine leases declared by mining and exploration companies up to the end of 1998 (Handley, 2000). The second step culminates in an estimate of the remaining gold in the Witwatersrand Basin. It includes the gold left behind in the current mining leases from step 1, the evaluated gold resource after Handley (2000), and the gold lost during the mining process from 2005–2019, although the latter figure cannot be quantified because of the poor data.
The preliminary stage of the first step Involves computing the grade and size of the mineral reserve in which the Witwatersrand mines were worked. The tonnage milled and gold declared as given above are part indicators only of the size of the mineral reserve exploited, because they exclude gold not recovered in the mining and metallurgical processes, residual gold in mine tailings, and gold in waste rock dumps. The discussion that follows details the calculations as they appear in Table VIII. The losses during the
mining process include gold lost during mining and transport and never retrieved and unrecovered gold ore sent to waste rock dumps; they do not include losses from gold theft, and informal mining. To include these, the term broken gold is used, but theft and informal mining remain excluded:
broken gold = declared gold + gold not recovered in metallurgical extraction + gold in tailings + gold in waste rock dumps)×(1/(1-fraction of gold lost in mining))
The multiplication factor at the end of the gold sum is none other than the reciprocal of the mine call factor (MCF), expressed as a decimal fraction, so rewriting the above equation (the MCF will be discussed later):
broken gold = (declared gold + gold not recovered in metallurgical extraction + gold in tailings + gold in waste rock dumps) / (MCF expressed as a decimal fraction)
The first term in the above sum has been dealt with, is known with reasonably good accuracy, and has an assumed uncertainty of ± 2% as discussed previously. The second, metallurgical term, has been addressed throughout the history of mining and has resulted in improving extraction efficiency, while some of the gold lost in the extraction process has been retrieved by retreatment of high-grade slimes and sand, and cleaning of metallurgical extraction equipment during active mine life. Gold lost in the metallurgical process is therefore assumed negligible, aside from the gold in tailings dumps which represents a small fraction of the broken gold resource that could not be extracted from the crushed ore.
Data for the residual grade of tailings sent to tailings impoundments is usually contained in the mines’ annual financial statements and reports. However, most annual reports are no longer available. In the late 19th century, ore was crushed in stamp mills and then split into sand (approximately 11% –75 μm) and slime (about 95% –75 μm) fractions, after which the sand-sized residue was treated by percolation cyanidation, and the slime fraction impounded without treatment (Bosch, 1987). In 1894, the decantation process was introduced, and both accumulated and run-of-mill slime were leached, leaving a residue of 0.05–0.5 g/t after the gold had been extracted. The sand fraction typically carried 0.3–1.5 g/t gold after percolation cyanidation (Bosch, 1987). The introduction of tube mills in 1904 to regrind the stamp mill sand fraction reduced the sand-to-slime ratio. Up to 1936 a substantial fraction of gold ore (the author estimates 35%) was still being treated in sand plants, but after 1946 nearly all the ore was ground to slime in tube mills with a residual grade of 0.1–0.5 g/t (Bosch, 1987).
The author assumes that before 1946 all Witwatersrand mining had taken place only in the East, Central, and West Rand. According to Table I, these goldfields processed about 44% of the ore, with a diminishing contribution after 1946, when the newly discovered and developing Carletonville, Orange Free State, Klerksdorp, and Evander goldfields produced the lion’s share of South Africa’s gold. The mines developed in the new goldfields used an all-sliming process with residual grades of 0.1–0.5 g/t. Using the Bosch (1987) data and weighting residual grades appropriately for the entire mining history of the Witwatersrand result in an average grade for tailings of 0.36 g/t. Van Rensburg (2016) quoted the average gold content in tailings for the East Rand, Central Rand, West Rand, and Free State goldfields (67% of all Witwatersrand ore processed) of 0.34 g/t. These data did not cover the entire Witwatersrand Basin; therefore, the author uses the average of 0.36 g/t computed after Bosch (1987) but allows for an uncertainty of 0.1 g/t because of the wide margins for residual gold concentrations given by Bosch (1987). The residual grade with its uncertainty is given in row 4 of Table VIII. The average grade of ore sent for processing was therefore the average yield of mined reef plus the average gold grade of tailings, with its uncertainty determined in quadrature in row 5 of Table VIII and given as 8.43 ± 0.25 g/t.
The amount of gold sent to tailings impoundments is the average residual grade of the tailings (row 4, Table VIII) multiplied by the tons treated (row 1, Table VIII), indicating that a total of 2.11 ± 0.59×10³ t gold were sent to tailings impoundments from 1886 to 2005 (row 6, Table VIII). The uncertainty is nearly 28%, dominated by the relatively large uncertainty in residual grade set in row 4 of Table VIII. The percentage of dump material treated and given in row 8 of Table VIII cannot be determined from publicly available data. The author estimates that up to 2005, about 40% of tailings impoundments had been re-treated for their gold content by producers who were non-members of the Chamber of Mines. Examples are East Rand Gold and Uranium (ERGO), the Crown Gold (CM3) reprocessing plant at Crown Mines, Golden Dumps, Knights Gold, reprocessing at Stilfontein on the Klerksdorp goldfield, and the DRDGold dump reprocessing at Blyvooruitzicht and Doornfontein in the Carletonville goldfield. Their collective production amounts to 5.07 ± 2.08×10³ t of gold by 2005, appearing in row 10 of Table VIII. The output of dump retreatment operations such as the OFS Joint Metallurgical Scheme is included in the Chamber’s data as gold declared by the mines that were members of the Chamber.
The gold produced by small operators re-opening closed mines, but who were not members of the Chamber, is not included (see footnote to Table I). The uncertainty introduced for tonnage milled and gold declared in rows 1 and 2 in Table VIII may cover this. If not, the amount of gold produced from the Witwatersrand Basin will be underestimated by an unknown, but relatively small amount of approximately 1%. The total mined and treated gold resource is the sum of the gold declared, gold recovered from dumps, and gold in dumps (rows 2, 10 and 11, Table VIII), with an uncertainty of 2.29%, namely 4.95 ± 0.11×10⁴ t (row 12, Table VIII).
The amount of gold that remains in untreated waste rock dumps is unknown; it is likely to represent a small fraction of the reserve mined because the dumps received waste rock mined from tunnels and other off-reef mine excavations used to access the ore. There were occasions when ore was mistakenly sent to the waste dumps, and waste was treated in the metallurgical plant. The details of managing such problems are beyond the scope of this paper; thus, the amount of ore and its grade, as well as waste in waste rock dumps, is unknown. All mines sampled their waste rock dumps from time to time to determine the amount of gold that might be present. They would certainly have decided to sort the ore from the waste in cases where the amount of ore in the dumps was small or process the entire dump if there were relatively large concentrations of gold. Examples of this took place at Blyvooruitzicht, West Driefontein, and Western Deep Levels among the modern mines, and it certainly took place to some degree in all the Witwatersrand mines. In such cases, this gold would have been included in gold declared by the mine, and the tonnage of sorted or unsorted dump rock material milled would have been reported and captured by the mines themselves and later by the Chamber of Mines. The author assumes that the gold content of unprocessed waste rock dumps is approximately zero because there are no data for this. This assumption does not alter the overall picture significantly, and the mine call factor – discussed next – accounts for gold lost during the mining process, including gold lost in surface rock dumps.
The mine call factor (MCF) is the ratio, expressed as a percentage, of the total quantity of recovered and unrecovered mineral product after processing to the amount estimated in the ore based on sampling. It is therefore the ratio of the expected gold minus gold lost in the mining and transportation process divided by the expected gold. The gold lost in the mining and transport processes includes the following:
➤ Gold fines created by blasting and left in the stopes in cracks in the footwall, and embedded in stope supports
➤ Fines not properly removed from stopes (sweepings)
➤ Broken ore and fines not removed from stopes or abandoned in collapsed stopes, either in rockbursts or aseismic collapses
➤ Gold fine accumulations in orepasses over extended periods of use, in orepasses that were never properly emptied, and in collapsed or abandoned orepasses
➤ Unmined gold-bearing reef left in the footwall or hangingwall
➤ Gold fine accumulations in haulages, shaft infrastructure (belts, silos, spillage arrangements), and surface transport and tipping arrangements
➤ Ore and gold fines sent to waste rock dumps instead of metallurgical processing.
The Witwatersrand mines instituted many management controls to minimize these losses, such as grade control, geological control, mining sequence control, blasting control, and underground
Mining process gold losses computed as difference between computed reserve and gold produced – the mine call factor for two Witwatersrand gold mines
* Both mines listed the gold grade of tailings sent to tailings impoundments every year in their annual reports.
support. The controls were more effective in ensuring that broken ore did come out of the mine, but were generally unable to deal with the loss of fines effectively, especially where the reef was rich and friable. The theory that fines were lost in footwall cracks was not borne out by de Jager (1997) in a thorough study of the mine call factor at Western Holdings Mine in the Free State. The MCF cannot be discussed in detail for the Witwatersrand mines as a whole because its application varied both over time and from mine to mine.
In this paper the total gold losses are estimated by comparing the expected gold to be extracted from a sampled orebody and the actual gold declared by the mine when mining in that orebody, using company annual reports. Every listed Witwatersrand mine did record in every annual report the grade and gold content of the proved mineral reserves that it expected to mine in the ensuing 2−3 years. Two examples, Blyvooruitzicht Gold Mining Company Limited and its down-dip neighbour Western Deep Levels Limited, are analysed for gold losses.
If the ore reserve evaluations were accurate, and all the gold was extracted with zero loss, then the annual gold production would vary randomly above and below the expected output. Over years, the mean of the annual difference between the two would be zero, with a standard error related to the spread of the gold production data around the mean of zero. Expressed in terms of the mine call factor, it would have fluctuated above and below 100%, but would have averaged 100% over the long term. In the case of Blyvooruitzicht, there were 13 years where gold losses were negative (actually a gold gain) and 42 years with gold losses, for a net gold
loss of 110 145 kg. Western Deep Levels recorded one gold gain in 21 years, and gold losses in the remaining 20 years for a net loss of 113 294 kg (see Table IV). Western Deep Levels has the higher measured percentage gold loss because it is the deepest mine in the world with the highest rockburst potential. The author notes from personal experience (1984−1999), that on any day following the blast, up to 50% of the mining panels were closed or partially closed either because of a collapse or a rockburst. Blyvooruitzicht is situated directly up-dip of Western Deep Levels and is therefore shallower, with a correspondingly lower tendency for rockbursts and loss of mining panels. This would undoubtedly have led to smaller gold losses underground than at Western Deep Levels.
There is discussion in the literature about the reliability of proven mineral reserve estimates obtained from chip sampling of stope faces in gold mines (see for example Fourie and Minnitt, 2016). The biases of chip sampling and evaluation may render perceived mineral losses non-existent, but on the other hand they may mask real mineral losses. The mine call factor can be misleading if the sampling and evaluation methods show any bias (de Jager, 1997). Table V provides a simple model that shows how mineral valuation bias can influence the measurement of gold losses without affecting the mine call factor at all.
The author does not intend Table V to provide any further insight into the problem, except that it is unlikely that ore reserve estimates based on chip sampling could have been biased more than a few per cent either way. Secondly, all the mines of the Witwatersrand can’t have extracted all the gold with 100% efficiency (i.e. a mine call factor of 100%, based on accurate and precise
ore evaluation figures). Since the gold losses computed for the two mines in Table V cover a long period and a large tonnage of processed ore, they are considered representative of the real value of the ore reserves of the two mines, and the losses recorded are real losses. It is likely that there will always be a real gold loss because no mine can be 100% efficient, regardless of the mine call factor, real or perceived, as illustrated in Table V. The average percentage loss for the two mines in Table IV will represent the percentage of gold lost in the mining process for the Witwatersrand Basin as a whole, with an uncertainty of 10% (i.e. losses ranged from 9–1% for an average mine call factor of 89–91%, see row 13, Table VIII).
This figure and the associated uncertainty will most likely be revised if a wider sample of mines were assessed for gold losses in the mining process, or a more detailed study of gold losses was undertaken for the Witwatersrand Basin as a whole. From this analysis, approximately 10 ± 1% of gold is lost in the mining and ore transportation process – including unrecovered gold-bearing ore in surface waste rock dumps. The amount of broken gold that reflects as a sum of gold declared, gold lost in the metallurgical process, gold in tailings impoundments, and unrecovered gold in waste rock dumps must be multiplied by a factor of 10/9 (100/MCF), to 5.50 ± 0.56 × 10⁴ t if the measured average 10% loss is real (row 14, Table VIII). This figure has a 10.3% uncertainty, while the amount of gold lost to mining in the Witwatersrand Basin is 5.50 ± 0.58 × 10³ t with a 10.5% uncertainty (row 15, Table VIII). Finally, the actual grade of reef mined is therefore the amount of broken gold divided by the tons milled (assuming that it was mostly the fine fraction of broken rock lost during the mining process, not large volumes of gold-bearing rock) to give an in situ grade of 9.36 ± 0.98 g/t (row 16, Table VIII). The mine call factor now accounts for unrecovered gold in waste rock dumps, even though it remains unknown.
The next category of gold left underground is unmined reef. Safe mining practices sometimes require gold-bearing reef pillars to stabilize the underground workings. On other occasions, the reef grade may be too low for economic mining; in such instances, the ore remains underground. Reef pillars take on many forms, of which the following are examples:
➤ Shaft pillars to protect shafts
➤ Bracket pillars on either side of geological features such as faults or dykes to stabilize them
➤ Barrier pillars between mine leases
➤ Water barrier pillars (the Carletonville goldfield has examples)
➤ Regularly spaced stabilizing pillars
➤ Remnants that could not be mined because their grade was low or the stress and resulting rockbursting problem in the remnant was too severe
➤ Low-grade areas of reef left to form pillars.
Geological losses in bracket pillars are not included in pillar area losses, since these pillars normally contain no gold. When planning the mining layout, mine planners strive to leave the lowest grade reef underground in pillars and remnants, so that the highest possible grade reef is extracted. This is done by planning to leave pillars and remnants in the lowest-grade areas as far as possible. This policy is not always successful, so the author has assumed that the average grade of all pillars and remnants left underground is 75 ± 10% of the average actual grade of the reef for the Witwatersrand Basin, given above as 9.36 ± 0.98 g/t (row 18, Table VIII). The expected average grade of all unmined ground in all the Witwatersrand mines is therefore 7.02 ± 1.19 g/t (row 19, Table VIII).
The author assumes further that 20 ± 10% of all reef exposed in the Witwatersrand mines was left unmined; in the shallow mines, this figure is lower, while in the deeper mines it is higher. Thus, on average, throughout the history of mining in the Witwatersrand Basin, four out of five parts of the reef accessed underground were mined, while a fifth of all gold-bearing reef was left unmined, amounting to 1.47 ± 0.74×10⁹ t in pillars or remnants (row 20, Table VIII). At an average grade of 7.02 ± 1.19 g/t, this amounts to 1.03 ± 0.55 × 10⁴ t gold (row 22, Table VIII). The total resource of goldbearing reef available to the Witwatersrand mines amounted to the sum of the total milled (row 1) and the total left underground (row 20) with uncertainties determined in quadrature for a total of 7.34 ± 0.74 × 10⁹ t of reef (row 21, Table VIII). The total gold resource available to the Witwatersrand mines was the sum of gold broken and unbroken gold (rows 14 and 22, Table VIII), with uncertainties in these two rows added in quadrature, and totalling 6.53 ± 0.78 × 10⁴ t (row 23). The average grade of all reef mined is the quotient of rows 21 and 23, namely 8.90 ± 1.40 g/t (row 24, Table VIII). The Witwatersrand mines, therefore, had access to a gold resource of 65300 ± 7800 t of gold (row 23), from which they were able to produce 47 400 ± 947 t gold, with the remainder of 17 400 ±
*These figures follow Table A1. A more acceptable way of reporting them appears in Table VIII
7900 t of gold never extracted (row 25, Table VIII8), amounting to a percentage never extracted of 26.7 ± 12.5% (row 26, Table VIII). Table VI summarizes these figures, which appear as the raw quantities from Table A1.
Table VI indicates the challenges posed by mining the deeplying narrow tabular gold-bearing reefs of the Witwatersrand. The gold mines are not amenable to mechanization, or rather engineering and technological innovation have so far not been able to make them amenable, despite substantial research (see Pogue, 2008). The drill-and-blast practice for excavating the ore has never been successfully replaced by gentler mechanical extraction methods because of the strength, hardness, and abrasiveness of the quartzitic rocks that host the gold. Mechanical extraction of the reef would substantially reduce the mining gold losses of 10% that have been estimated for the Witwatersrand mines, but would not contribute to minimizing the amount of ore that is left behind in remnants and pillars to stabilize the mines. These two losses amount to a clear mandate to revisit and research new mining methods for the Witwatersrand mines since the large amount of gold remaining in current mining leases is unlikely to be extracted by current methods. Therefore, this gold may not meet the principle of Reasonable Prospect of Eventual Economic Extraction (RPEEE), which forms the core of the SAMREC Code (2009, 2016, Clause 24 for solid ore), and which is clearly explained by Lock (2020). Further research is necessary to make these resources efficiently and economically extractable. The author briefly outlines new research objectives in the discussion and conclusions below.
This step follows from the previous step and includes gold left behind in the current mining leases from step 1. The evaluated gold resource after Handley (2000) has been included, while the gold lost during the mining process from 2006–2019 cannot be quantified because of the poorer data. The previous section establishes that there are 17 400 ± 7 900 t of gold that was never extracted from the mine leases of the Witwatersrand gold mines (Table VIII, row 25). The gold mines still operational in 2000 had also indicated that the total resource within their leases − current at the time − was 15 400 t gold. In addition to this resource, Handley (2000) has carefully documented another 19 700 t of gold present outside mine leases and in parts of the Witwatersrand basin between goldfields. The evaluations from within and beyond leases took place at least a decade before the development of the SAMREC Code (2009, –2016). The author assumes that the mining companies concerned would not have made these declarations unless they believed that
Table VII
they could exploit these resource economically at some point in the future. Handley (2000) would not have documented them so carefully if they were inaccessible. Therefore, the author believes that they comply with the RPEEE principle outlined above, and can be included as unmined resources in the Witwatersrand Basin.
There is little doubt that most of the exploration evaluations compiled by Handley (2000) contain data from multiple intersections from surface drills, knowledge of the local geological structure, sedimentology, and continuity of the Witwatersrand reefs intersected. A few may be more speculative. It is difficult to separate the two, since Handley (2000) did not assign any quantitative confidence levels or errors to these estimates. The SAMREC Code does not provide any confidence guidelines besides those for PreFeasibility and Feasibility studies (see SAMREC, 2016, p. 77 and Table 1, pp. 43-65).
The author assumes that the exploration evaluations for gold between mine leases were at an exploration or pre-feasibility level, where the amount of gold had been evaluated to an approximate 20% uncertainty. Therefore gold outside and between mine leases is estimated by the author from Handley (2000) to be 19 700 ± 3 940 t (row 33, Table VIII). The gold within existing mine leases was also not assigned any confidence limits by Handley (2000) but should be known with higher confidence. The author set the confidence in these estimates at the Pre-Feasibility – Feasibility level of approximately 10% uncertainty, or 15 400 ± 1 540 t (row 30, Table VIII). These estimates and their associated uncertainties do not constitute an estimate compliant with the SAMREC (2016) Code, but are intended to provide a better answer than the estimates of gold in the Witwatersrand Basin given in the literature, as well as an error for those estimates.
This analysis is global in nature and serves as a guide to the Witwatersrand Basin as a whole. It should not be applied to parts of the basin only, and it excludes low-grade gold-bearing reefs described below. It considers exploration results compiled by Handley (2000), which cover areas within mine leases and between mine leases along the edges of the basin, or in down-dip extensions to reefs currently being mined. It does not consider reefs at depth toward the centre of the basin, where gold is known to be present. Therefore, this estimate of gold remaining in the Witwatersrand Basin is likely to be far less than the amount of gold actually remaining, because of the sub-economic gold resource left largely untouched in the minor reefs in the existing mine leases, and between mine leases, all of which are low grade (≤ 3–5 g/t). The higher-grade sub-economic reefs, namely the Leader Reef, ‘A’, and ‘B’ Reefs (Free State), the Middelvlei Reef and North Leader (Carletonville), the many minor reefs on the West and Central
Resources reported by Witwatersrand mines and exploration companies (after Handley, 2000) Category
Rand, and the Kimberley Reef (East and Central Rand) all fall into this category. There are other sub-economic reefs which remain excluded, and perhaps some − both economic and sub-economic − that are still unknown. Finally, gold theft and informal mining are ignored, for reasons already stated. The effect of omitting these two is to underestimate the amount of gold that has been extracted from the Witwatersrand with a potential overestimate of gold remaining in and around the existing mine leases.
The figures given in the third and fourth rows of Table VII appear in rows 31 and 32 of Table VIII. Added to the gold resource never extracted by the Witwatersrand mines, they amount to 48 100
Table VIII
± 9 000 t known gold that might be extractable from within existing mine leases and between mine leases (row 35, Table VIII).
Discussion and conclusion
The known extractable gold resource in the Witwatersrand Basin based on data up to 2005 has been estimated as 98 300 ± 8 900 t, of which 50 200 ± 1 200 t had been extracted to 2019, leaving 48 100 ± 9 000 t to be extracted. Since 2006, a further estimated amount of 2 340 ± 234 t has been mined, and this has already been accounted for in Table VIII and the figures above by subtracting it from the non-SAMREC resources listed by the Witwatersrand mining and
Estimate of total gold resource and gold remaining in the Witwatersrand Basin
exploration companies in 1999 (Handley 2000). Gold losses for the period 2006 – 2019 have not been computed, but are automatically included in the gold not extracted from the Witwatersrand Basin. The remaining gold, amounting to 48 100 ± 9 000 t, consists of the following:
➤ 1 600 ± 600 t in surface tailings impoundments up to 2005
➤ 5 500 ± 600 t lost underground and on the surface during mining and ore transportation to 2005
➤ 10 300 ± 5 500 t left underground in pillars and remnants up to 2005
➤ 11 000 ± 1 700 t in mining leases at the end of 2019
➤ 19 700 ± 3 900 t identified by pre-SAMREC (2016) exploration outside mining leases and between mining leases in the Witwatersrand Basin up to 2019.
The gold remaining in mine leases in 2019 automatically includes gold sent to tailings impoundments, gold lost during the mining and transportation process, and gold left underground in pillars and remnants in the years 2006–2019. It is assumed that none of the gold between mine leases was mined in the years 2006–2019.
A significant amount of the gold remaining in mine leases –approximately 30% of 11 000 t, or 3 300 t – will not be accessible to economic extraction using the current labour-intensive mining methods because most of it is relatively deep. The surface tailings impoundments are likely to release about 60% of their gold using modern metallurgical extraction techniques; DRDGold has already launched several projects to extract some of this gold. Currently, Witwatersrand mines and dump reprocessing operations could be expected to yield a further 8 000 t gold, leaving about 40 000 t underground in pillars, remnants, and outside the current mining leases. The effect of the current illegal extraction of gold from existing and defunct mines is unknown and has been ignored. Informal mining could access and extract a significant fraction of the gold in pillars, gold lost during mining and transport, and the lost portion of the remaining resources identified on current mining leases, amounting to approximately 16 400 t. This is made up of 15 800 t left in mines to 2005 (see rows 11 and 25 in Table VIII). It is assumed that tailings impoundments are too low in grade to be effectively exploited by informal mining techniques. An approximate further 600 t has been left underground during mining in the years 2006-2019 (25% of 2 300 t, see row 28, Table VIII). The illegal miners have at least recognized the size of the prize to be won, and are working hard at making a living mining gold in whichever Witwatersrand mines they have been able to enter. The remaining gold outside mining leases and between goldfields is unlikely to be exploited because of the risks involved. The resource within leases is accessible by current means if a total loss of approximately 30% is acceptable. This will not change appreciably unless the industry adopts a new approach to mining. With further research aimed at achieving the 11 goals outlined below, all the remaining gold could fall within reach of the RPEEE principle of the SAMREC Code (2009, 2016):
➤ Much lower mining costs (10−25% of current costs)
➤ Much lower mining losses (3% of the gold content)
➤ Much lower capital costs (25% of current capital)
➤ Mining methods that are less vulnerable to gold theft
➤ Mining methods with low, and controllable, environmental impact
➤ Communities affected by mining enjoying benefits that far outweigh the disadvantages
➤ No lasting scars on the surface such as pits and dumps
➤ No expensive or long periods of research and development
➤ Mining or extraction methods that are adaptable to the gold left underground in closed mines, existing mines, and in the known resources between goldfields
➤ Methods flexible enough to cope with complex geological structures, depth, and heat
➤ Safe and seismicity-free mining to 10 km below the surface.
It is obvious that all surface and underground mining methods used to date fall far short in nearly every attribute described. A completely new approach is needed; this is a challenge for the South African mining industry to take the lead again. Rita Mae Brown is credited with saying through the fictional character Jane Fulton: Insanity is doing the same thing over and over again, but expecting different results (Brown, 1983). We have to think again. Further economic extraction of gold from the Witwatersrand Basin must use an approach different from the labour-intensive methods that have prevailed to date.
References
A. Goerz and Company, Limited, 1905. Map of the Witwatersrand Goldfields. (Detailed fold-out map of Central Rand gold mining interests drawn to a scale of 1 inch to 500 Cape Roods). Johannesburg.
Anglo American Corporation of South Africa Limited. 1985. Free State Geduld Mines Limited Annual Report, Johannesburg.
Anglogold. 1996. Freegold 49th Annual Report December 1996. Johannesburg. Anglogold Ashanti. 1998. Annual Report Supplementary Statistics, 1998. Johannesburg.
Bosch, D.W. 1987. Retreatment of residues and waste rock. Extractive Metallurgy of Gold. Stanley G.G. (ed.). South African Institute of Mining and Metallurgy, Johannesburg. pp. 707–743.
Brown, R.M. 1983. Sudden Death. Bantam, New York. p. 68.
Chamber of Mines of South Africa. 1990. One Hundredth Annual Report 1989. Johannesburg.
Chamber of Mines of South Africa. 1991-2000. Statistical Tables. Johannesburg.
Chamber of Mines of South Africa. 2009. Facts and Figures 2008. Johannesburg.
Chamber of Mines of South Africa. 2010. Facts and Figures 2010. Johannesburg.
Chamber of Mines of South Africa. 2013. Facts and Figures 2012. Johannesburg.
Chamber of Mines of South Africa/ 2017. Facts and Figures 2016. Johannesburg.
Chapman, K.M., Tucker, R.F., and Kidger, R.J. 1986. The Klerksdorp Goldfield. Witwatersrand Gold – 100 Years. Antrobus, E.S.A. (ed.). Geological Society of South Africa, Johannesburg.
Cleverly, A.J. 1927. The South Africa map of the Witwatersrand Gold Fields showing the controls of the chief mining houses. [Undated fold-out map published by the Offices of South Africa, London. Date estimated from the fact that the listings of the mines on the map give dividends for 1926].
Conradie, A.S. 2000. Gold. South Africa’s Mineral Industry 1998-1999. In: Department of Minerals and Energy, Pretoria. pp. 31–37.
Conradie, A.S. 2001a. Gold. South Africa’s Mineral Industry 1999-2000. Department of Minerals and Energy, Pretoria. pp. 27–31.
Conradie, A.S. 2001b. Gold. South Africa’s Mineral Industry 2000-2001. Department of Minerals and Energy, Pretoria. pp.30–33.
Conradie, A.S. (2003. Gold. South Africa’s Mineral Industry 2002-2003. Department of Minerals and Energy, Pretoria. pp. 30–34.
Conradie, A.S. 2004. Gold. South Africa’s Mineral Industry 2003-2004. Department of Minerals and Energy, Pretoria. pp. 39–44.
Conradie, A.S. 2005. Gold. South Africa’s Mineral Industry 2004-2005. Department of Minerals and Energy, Pretoria. pp. 30–33.
Conradie, A.S. 2006. Gold. South Africa’s Mineral Industry 2005-2006. Department of Minerals and Energy, Pretoria. pp. 29–32.
De Jager, E.J. 1997. The analysis of the mine call factor in gold mining, with specific reference to Western Holdings Mine. PhD thesis, Faculty of Engineering, University of the Witwatersrand, Johannesburg.
Duncan, A.J. 1979. Quality Control and Industrial Statistics. 4th edn. R.D. Irwin, Homewood, IL.1047 pp.
Faulkner, K.K. and Edmond, J.M. 1990. Gold in seawater. Earth and Planetary Science Letters, vol. 98, no. 2, May 1990. pp. 208–221.
Fourie, A. and Minnitt, R.C.A. 2016. Review of gold reef sampling and its impact on the mine call factor. Journal of the Southern African Institute of Mining and Metallurgy, vol. 116, no. 11. pp. 1001–1009.
Gastrow, P. 2001. Theft from South African mines and refineries: The illicit market in gold and platinum. Institute of Security Studies, Cape Town.
Gillan, R. 1990. Winkelhaak Mines Limited Mine Valuation. Frankel, Kruger, Vinderine Incorporated, Johannesburg. February 1990.
Gold Fields of South Africa, Limited. 1984. Driefontein Consolidated Limited Annual Report, 1984. Johannesburg.
Gold Fields of South Africa, Limited. 1992. Map of the West Wits Line. Johannesburg. [1:100 000 scale surface map of the mines of the Carletonville Goldfield showing local towns, topography, and mining leases as they were in 1992].
Google Earth. 2014. Southern Africa centered approximately on 27°S, 24°E, eye altitude 3000 km. SIO, NOAA, US Navy, NGA, GEBCO, © 2014 AfricaGIS (Pty) Ltd, US Dept. of State Geographer. 15 October 2014.
Hammerbeck, E.C. 1986. New geological map of Southern Africa. Mineral Deposits of Southern Africa Vol. II. Anhaeusser, C.R. and Maske, S. (eds.). Geological Society of South Africa, Johannesburg. pp. 2323–2324.
Handley, J.R.F. 2000. World gold resources – A global view in space and time. PhD thesis, University of the Witwatersrand, Johannesburg.
Handley, J.R.F. 2004. Historic Overview of the Witwatersrand Goldfields. Published by the author 224 pp.
Hayward, C.L., Reimold, W.U., Gibson, R.L., and Robb, L.J. 2005. Gold mineralization within the Witwatersrand Basin, South Africa: Evidence for a modified placer origin, and the role of the Vredefort impact event. Mineral Deposits and Earth Evolution. McDonald, I., Boyce, A.J., Butler, I.B., Herrington, R.J.. and Polya, D.A. (eds.). Special Publications 248. The Geological Society, London. pp. 31–58.
Janse van Rensburg, S. 2016.): Guidelines for retreatment of SA gold tailings: Mintek’s learnings. Proceedings of the 23rd WasteCon Conference, Emperor’s
Palace, Johannesburg, 17-21 October 2016. Internationa; Solid Waste Association, Rotterdam. pp. 367–376.
Jeppe, C.B. 1946. Gold Mining on the Witwatersrand Volumes I and II. Transvaal Chamber of Mines, Johannesburg. pp. 48–49.
Lang, J. 1986. Bullion Johannesburg. Jonathan Ball, Johannesburg. 509 pp.
Lock, N. 2020. RPEEE (Reasonable Prospects for Eventual Economic Extraction): The critical core to the SAMREC Code. Journal of the Southern African Institute of Mining and Metallurgy, vol. 120, no. 9. pp. 497–504.
Lourens, J.P. 1998. Gold. South Africa’s Mineral Industry 1997-1998. Department of Minerals and Energy, Pretoria. pp. 26–33.
McCarthy, T.S. 2006. The Witwatersrand Supergroup. The Geology of South Africa. Johnson, M.R., Anhaeusser, C.R., and Thomas, R.J. (eds). Geological Society of South Africa, Johannesburg and Council for Geoscience, Pretoria. pp. 155–186.
Meiring, P. 1963. Goud vir die Soeker. Tafelberg, Cape Town. 143 pp.
Minerals Council South Africa. 2019. Illegal mining fact sheet. Johannesburg.
Minter, W.E.L., Hill, W.C.N., Kidger, R.J., Kingsley, C.S., and Snowden, P.A. 1986. The Welkom Goldfield. Mineral Deposits of Southern Africa Vol. I. Anhaeusser, C.R. and Maske, S. (eds) Geological Society of South Africa, Johannesburg. pp. 497–539.
Mooney, W.D., Laske, G., and Masters, T.G. 1998. CRUST 5.1: A global crustal model at 50 × 50 Journal of Geophysical Research, vol. 103 B1. pp.722–747.
Pogue, T.E. 2008. Missed opportunities? A case study from the South African mining sector. Resource Intensity, Knowledge and Development. Human Sciences Research Council, Pretoria. Chapter 5, pp. 179–213.
Pretorius, D.A. 1986. The compilation of the map of the Witwatersrand Basin. Mineral Deposits of Southern Africa, Vol. 1. Annhaeusser, C.R., and Maske, S. (eds). Geological Society of South Africa, Johannesburg. pp.1019–1020.
Reimold, W.U. 2006. Impact structures in South Africa. The Geology of South Africa. Johnson, M.R., Anhaeusser, C.R., and Thomas, R.J. (eds). Geological Society of South Africa, Johannesburg and Council for Geoscience, Pretoria. pp. 629–649.
Robb, L.J. and Meyer, F.M. 1995. The Witwatersrand Basin, South Africa: Geological framework, and mineralization processes. Ore Geology Reviews, vol. 10. pp. 167–194.
SAMREC. 2009. South African Mineral Resource Committee. The South African Code for Reporting of Exploration Results, Mineral Resources and Mineral Reserves (the SAMREC Code). 2007 Edition as amended July 2009. http://www.samcode.co.za/downloads/SAMREC2009.pdf
SAMREC. 2016. South African Mineral Resource Committee. The South African Code for the Reporting of Exploration Results, Mineral Resources and Mineral Reserves (the SAMREC Code. 2016 Edition. http://www.samcode.co.za/codes/ category/8-reporting-codes?download=120:samrec
Sauer, H. 1934. The Witwatersrand Goldfield – A Vital Asset of the British Empire. Financial Times, London.
Taylor, J.R. (1997. An Introduction to Error Analysis. 2nd edn. University Science Books, Sausalito, CA. 327 pp.
Tucker, R.F., Viljoen, R.P., and Viljoen, M.J. 2016. A review of the Witwatersrand Basin – The world’s greatest goldfield. Episodes, vol. 39, no.2. pp. 105–133.
USGS. 2022. Mineral Commodity summaries 2021. https://pubs.usgs.gov/periodicals/mcs2021/mcs2021.pdf
World Gold Council 2022. Global Mine Production. www.gold.org/goldhub/data/historical-mine-production u
If one has two quantities (two independent measurements in an experiment, for example) which are disparate and differ by an independently random amount, then the best estimate of the measured quantity is the arithmetic mean of the two quantities. The best estimate of the dispersion, hence an indication of the error of the measurements, is the standard deviation. For a sample containing only two measurements the arithmetic mean remains an unbiased estimator, while the standard deviation, even if Bessel’s n/ (n–1) correction has been applied, is still biased. In normal practice, samples contain many more than two data points, so this bias disappears.
The arithmetic mean for a sample containing two data points is given by:


The standard deviation with Bessel’s correction for an n = 2 sample is given by:


This can be treated as a standard error for the population of normally distributed cumulative mine production statistics, and is used as a means to provide an unbiased estimate of the expected error in the published statistics.
When several quantities x, y, z, ... w are measured with small uncertainties δx, δy, δz, .....δw, and the measured values are used to calculate another quantity q, then the uncertainty in q will depend on the uncertainties in x, y, z, .....w as described below, if and only if the uncertainties δx, δy, δz, .....δw are both random, and independent of each other.
If q is a sum of two or more variables, i.e. q = x + y + z + ... + w, then uncertainties add in quadrature.


or
The standard deviation for a two–data sample is underestimated by about 20%, so it must be corrected by a variable known in industrial quality control as c4, and is given by:
If q is the difference of two or more variables, i.e. q = x – y – z –... – w, then the uncertainties add in quadrature.
The means to calculate c4 can be found in Duncan (1979) or on the internet. Applying c4 to the standard deviation makes it an unbiased estimator of the population variance, provided that the sample is random and the population is normally distributed. It is reasonable to assume that the cumulative mine production statistics contain many random errors in the form of omissions, incorrectly recorded statistics, double-counting, and so on. Furthermore, the compiled statistics are sums of multiple mines’ production over their lifetimes, or the sum of all producing mines’ production per annum over a number of years. Both of these statistics, if computed again and again, will behave in exactly the same way as the sampling distribution of means and will, by the central limit theorem, be normally distributed. When comparing two cumulative mine production figures computed different ways, r is used to estimate an expected normalized residual expressed as a percentage:
so that the expected normalized residual expressed as a percentage is
The above formula was simplified for the calculations of residuals in Table II by the following approximation:


If q is a product or quotient of several variables, i.e.
then the fractional uncertainties add in quadrature or [3]
The uncertainties are expressed as positive quantities, and the sum in quadrature is always less than or equal to the sum of the uncertainties expressed as positive fractions. The above equations are used to determine all the uncertainties in Table VIII.
Table VIII is repeated in Table A1 in figures similar to the way the mines reported them. The author notes here that all of the figures except those in rows 1–3 are estimates from sparse data, and are not scientifically acceptable as estimates in the form reported. They are repeated here in their raw form so that the reader can follow the author’s calculations as they were done in a spreadsheet. The rounded estimates made to three significant figures with their uncertainties reported in Table VIII above are more acceptable.

Table AI
Estimate of total gold resource and gold remaining in the Witwatersrand Basin as measured and calculated before rounding in Table VIII
* All reef tonnages reported to the nearest 1000 t, as the mines have always done; gold production is reported to the nearest ton because of the large quantities involved (the mines reported to the nearest 100 g), and grades to the nearest 0.01 g/t.
Affiliation:
1CSIR Mining Cluster, Johannesburg, South Africa.
2Enterprises University of Pretoria, Pretoria, South Africa.
Correspondence to: S. Ngobese
Email: sngobese1@csir.co.za
Dates:
Received: 1 Aug. 2022
Published: April 2023
How to cite:
Ngobese, S., Pelders, J., Botha, W., Magweregwede F., and Schutte, S. 2023
Stakeholder inclusion in the design and development of equipment for the modernizing mining sector in South Africa.
Journal of the Southern African Institute of Mining and Metallurgy, vol. 123, no. 4. pp. 193–202
DOI ID:
http://dx.doi.org/10.17159/24119717/2253/2023
ORCID:
S. Ngobese
http://orcid.org/0000-0001-8125-9927
J. Pelders http://orcid.org/0000-0003-4671-1951
F. Magweregwede http://orcid.org/0000-0002-4824-2266
Synopsis
A people-centric, systematic approach that involves different stakeholders is considered necessary to successfully address changes associated with modernizing the South African mining industry. In this paper we discuss the inclusion of various South African mining industry stakeholders, particularly the employees, in equipment design and development processes. Data was acquired through a literature review and inputs from South African mining industry stakeholders through focus group discussions, interviews, and an online survey. It was suggested that some of the areas that could be improved by the inclusion of employees in the process are design quality, ergonomics, equipment acceptance by the workforce, safety, efficiency, skills, insight into context of use, and early design iterations and identification of problems. Among the issues considered to be barriers to inclusion were lack of buy-in, lack of resources, difficulty in manufacturers accessing the mines, difficulties in involving too many people, intellectual property concerns, and unavailability of mine employees due to their key responsibilities. Identified critical factors in the equipment design and development process include iterative design, stakeholder participation throughout the process, needs analysis through consultation, and change management. A guideline was developed for worker inclusion in equipment design and development that could be used by the South African mining industry. The study identified several economic and social benefits of including stakeholders in the early stages of design and development. It is recommended that the South African mining industry considers using the developed guideline.
Keywords ergonomics, human-centred design, systems engineering, original equipment manufacturers, end-users.
Introduction
The mining industry has been one of the strategic economic development vehicles of the South African economy for more than a century (Magweregwede, Mpofu, and Ngobese, 2019). However, over the past few years, the viability of the mining sector has been under threat due to challenges such as increasing operational costs, fluctuating commodity prices and foreign currency exchange rates, depletion of highgrade ores, increasing mining depths, and stringent legislative requirements (Magweregwede, Mpofu, and Ngobese, 2019). A people-centric modernization approach presents an opportunity to progressively introduce new technologies into the mining sector and subsequently realize benefits such as improved occupational health and safety (OHS), improved productivity and mining efficiencies, and reduced operating costs (Fraser, 2017; Minerals Council South Africa, 2020; Pelders et al., 2021). A people-centric, systematic approach that involves different stakeholders is considered necessary to successfully address changes associated with modernization across the whole value chain in the South African mining industry. Modernization refers to the process of transformation of the mining industry to make it safer, more efficient, cost-effective, and sustainable (Minerals Council South Africa, 2019). Modernization involves changes to people, processes, and technologies, and aims to address challenges facing the mining industry, including increased costs, decreased productivity, and OHS, environmental, and social issues. Moreover, modernization takes place in the context of the Fourth Industrial Revolution (4IR or Industry 4.0), which is increased characterized by the heightened use of innovative technologies (Pelders, 2019).
Improved inclusion of stakeholders is related to the successful adoption of new technologies. Stakeholder (including employee) inclusion in equipment design and development can result in improved product quality and increased buy-in and ownership (Pelders et al., 2019). Human-centred design approaches are recommended (Horberry, Burgess-Limerick, and Steiner, 2015; ISO 9241-210, 2010).
This paper is based on research commissioned by the Mandela Mining Precinct, with funding from the Department of Science and Innovation, as part of the Successful Application of Technology Centred Around People (SATCAP) Programme of the South African Mining Research, Development and Innovation (SAMERDI) strategy. The work package was titled ‘People-centric modernisation’ (Pelders et al., 2021). This work also built on a previously conducted project which aimed to draft a ‘Globally benchmarked strategy for the engagement of workers in Original Equipment Manufacturer (OEM) equipment development processes’ (Pelders et al., 2019; Pelders and Schutte, 2021). The objectives of the project were as follows:
➤ To understand the benefits and shortcomings of stakeholder inclusion in equipment design and development
➤ To gain insight into the (current and best practice) process for inclusion of employees in equipment design, applicable for mining modernization
➤ To develop a guideline for worker inclusion in equipment design and development, applicable for mining modernization. The aim of this paper is to inform approaches, methods, and processes for the inclusion of stakeholders in equipment design and development.
Literature review
This literature review provides an overview of an approach, process, and methods for stakeholder inclusion in equipment design and development. Additionally, an indication is provided of potential benefits and barriers to stakeholder inclusion in equipment design and development in the South African minerals industry. Local and international studies, including previous research conducted in the SATCAP programme, were reviewed.
Human-centred design has been identified as a good practice approach for equipment design and development (ISO 9241-210, 2010; Maguire, 2001). This approach is seen to be aligned with the view of Minerals Council South Africa (2019), who stated that for modernization to be successful, it needs to be addressed in a holistic manner while adopting a systems and people-centric approach. Human-centred design is understood to provide economic and social benefits for users, employers, and suppliers (ISO 9241-210, 2019; ISO 9241-220, 2019). Human-centred design is defined as:
‘An approach to interactive systems development that aims to make systems usable and useful by focusing on the users, their needs and requirements, and by applying human factors/ ergonomics, and usability knowledge and techniques. This approach enhances effectiveness and efficiency, improves human well-being, user satisfaction, accessibility and sustainability; and counteracts possible adverse effects of use on human health, safety and performance’ (ISO 9241-210, 2010, p. vi).
The referenced term, ergonomics, or the study of human factors, is defined as the ‘scientific discipline concerned with the understanding of interactions among humans and other elements
of a system, and the profession that applies theory, principles, data and methods to design in order to optimise human well-being and overall system performance’ (ISO 9241-210, 2019, p. 2). A -systems engineering model ‘provides a paradigm for enabling a structured, systematic human-centred design approach, incorporating ergonomics knowledge and allowing ergonomists to contribute throughout the system development process’ (Samaras and Horst, 2005, p. 73).
The principles of human-centred design, as detailed in ISO 9241-210 (2019) and Horberry, Burgess-Limerick, and Steiner (2015), include the following.The design is based upon an explicit understanding of users, tasks, and environments (i.e. the context of use)
➤ Users and other stakeholders are involved throughout design and development
➤ The design fits the equipment/system to the user, not vice versa
➤ The design is driven by user-centred evaluation
➤ The process is iterative
➤ The design addresses the whole user experience, and is integrated with the wider work system organization
➤ The design team includes multidisciplinary skills and perspectives
➤ The design process is customizable.
Human-centred design can be incorporated throughout the product life-cycle, as technology or equipment design and development extends to implementation and use (ISO 6385, 2016). Key human-centred design activities, as indicated in ISO 9241-210 (2019), include:
➤ Planning the human-centred design process
➤ Understanding and specifying the context of use
➤ Specifying the user and organizational requirements
➤ Producing design solutions
➤ Evaluating the design against requirements.
There are numerous methods that can be used for humancentred design. Table I shows some of these methods, categorized according to each human-centred design phase as listed by Maguire (2001). The methods and tools used can be tailored according to the criticality and complexity of the system (Samaras and Horst, 2005). The Earth Moving Equipment Safety Round Table (EMESRT) working group has developed an engagement process that could be emulated in the South African minerals industry. This process involves mining companies, equipment designers, and other stakeholders (EMESRT, 2019). EMESRT has further developed the Operability Maintainability Assessment Technique (OMAT), which is a user-engagement process in mining equipment design that uses a structured task-based methodology, and the EMESRT Design Evaluation for Earth Moving Equipment Procurement (EDEEP) process (EMESRT, 2012, 2019).
Preliminary work conducted in the South African mining industry has indicated that there is limited participation of stakeholders, including mining company management and employees, in equipment design and development (Pelders and Schutte, 2021). The research found that barriers to participation include the historical context and organizational culture of the sector. Further barriers include performance and remuneration implications, difficulties with problem prioritization, inadequate change management, skills and development requirements, and a lack funding for research and
Methods for human-centred design (Maguire, 2001, p. 590)

development. Benefits of early stakeholder (particularly end-user) engagement included a better understanding of needs, improved equipment design, buy-in and ownership of the equipment, reduced cost and time to market, customization to local conditions, and the provision of opportunities for skills development (Pelders et al., 2019; Pelders and Schutte, 2021). Further research was recommended towards the development of a guideline for the inclusion of stakeholders in equipment design and development processes in the South African mining sector.
This research was cross-sectional and used a mixed methods approach. Qualitative and quantitative data were collected using interviews, focus group discussions (FGDs), and online surveys. Workshop engagements were also held to discuss and gain inputs into the project.
A range of stakeholders were invited to participate in the project. These stakeholders included representatives from the Mandela Mining Precinct, research institutions, consultants, mining companies, organized labour, original equipment manufacturers (OEMs), and mining-related institutions such as Mining Equipment Manufacturers of South Africa (MEMSA), Minerals Council South Africa; Mine Health and Safety Council (MHSC), and Mining Qualifications Authority (MQA). Participants were invited based on their interest in and relevance to the project topic. Different stakeholders participated in different phases of the study, and possibly in more than one component, with participation remaining anonymous for some of the tools used.
An initial stakeholder workshop was held with over 30 attendees, including Mandela Mining Precinct Programme Managers, researchers, consultants, technical experts, mining
companies, organized labour, and OEM representatives. During this workshop, a short online questionnaire was presented. There were 11 attendees who responded to this questionnaire, of which four (36%) were mining companies’ representatives, three (27%) union representatives, two (18%) represented the MHSC, one (9%) an industry expert, and one (9%) a researcher.
Discussions (one interview and three FGDs) were held with a total of eight individuals from stakeholder groupings including organized labour, research organizations and consultancies, developers, and industry. An online survey was distributed to OEMs, researchers, and industry partners. This survey was completed by 17 participants, of which 12 (71%) were from OEMs, three (18%) were researchers, one (6%) was an industry expert, and one (6%) a mine employee. Three stakeholder validation workshops were held, and approximately 18 participants, in addition to the project team members, attended these sessions.
The project took place from October 2020 to March 2021. Data collection was conducted online, on virtual platforms, to minimize risks associated with the COVID-19 pandemic. Interviews, FGDs, and workshop engagements were held using the Microsoft Teams platform, while surveys were completed on SurveyMonkey. Semistructured questions were compiled to guide the discussions. During the discussions, which were facilitated by research team members, attendees were given a chance to discuss, name, and list their points to and beyond the questions asked. To avoid leading discussions and data gathering in a particular direction, the research team minimized their inputs to the discussions. The online survey questions were developed with the inputs from research partners and MEMSA, who assisted with ensuring brevity and clarity of the survey. The electronic questionnaires comprised mostly multiplechoice or ‘tick-box’ questions, while space was provided for openended responses for elaboration or comment. The main questions included in the tools are listed in Table II.
Table II
Themes discussed under results and discussion and questions asked during workshop, discussions, and online survey
The qualitative data was analysed using thematic analysis, and the quantitative data using descriptive statistical analyses on Excel software. The qualitative and quantitative data were triangulated to compare and confirm the project findings. Project validation took place through documentation review and workshops during which stakeholders were invited to review and comment on the findings.
Ethics approval for this project was granted by the CSIR Research Ethics Committee (REC) (reference number: 332/2020).
This section describes the findings from the data gathered from various industry stakeholders through workshops, interviews, FGDs, and online survey. The questions used were drafted by the research team based on project aims, the outcomes of the literature review, and inputs from research partners and OEMs. The questions asked during the workshop, discussions and online survey are grouped per theme in Table II. The online survey used questions with either a Likert scale or multiple-choice options; the topics are included in Table II along with the themes under which the result are discussed. The study findings are described according to the

main themes, which related to equipment design and development approaches, stakeholders, barriers, benefits, processes, and critical factors to consider. Due to the similarity of questions and the limited number of interviews conducted, the analysis and discussion from interviews and FGDs are combined.
Several approaches to equipment design and development were listed by study participants in the workshop questionnaire, discussions, and online survey:
➤ Iterative design
➤ Stakeholder participation from the start of the process
➤ Needs analysis through consultation with workers
➤ Proper change management
➤ Gap analysis
➤ Recognized system design and engineering.
The participants in the discussions noted that an important factor to consider in equipment design and development is that of ‘market pull’ versus ‘market push’. Market pull refers to the case where equipment design and development would be initiated and driven by the industry as opposed to market push, which is the initiative of the OEMs, researchers, and/or designers. In market pull, the mine would normally identify the required equipment, which would likely mean the mine would identify the development house and provide other required resources, including its operators. In market push, the OEMs, researchers, and/or designers might have a challenge getting access to stakeholders such as operators and artisans whose daily work revolves around that equipment.
The study participants further noted that another important factor in the inclusion of some of the stakeholders is whether the equipment is being designed from scratch or upgraded incrementally to the next version of an existing piece of equipment. In the latter case (step change) the process is relatively straightforward, while the implementation of a new system (fundamental change) requires deeper analysis and change management.
The participants mentioned that approaches to inclusion in equipment design and development would need to consider several contextual factors, such as the type of mine, company, and technology or equipment. Another factor that should be considered for equipment design and development in the South African context is level of education and culture.
The discussion participants mentioned two approaches for equipment design and development. One approach is concurrent engineering, described by one of the participants as ‘a process for involving every speciality from the start, so that all the downstream lifecycle phase requirements are accounted for upfront in the design’. The second approach -is human-centred, described by the participant as ‘a set of techniques for engaging with the non-designers and different types of users’. For both approaches, early involvement of users and appropriate change management structure were recommended.
Stakeholders from the workshop suggested that the following stakeholders should be part of the equipment design and development process. They further suggested that each stakeholder should be involved at the stage which required their expertise:
➤ Mining operations / company representatives, including:
- Senior production personnel (such as production managers), senior mechanical, electrical, and even industrial engineers, occupational hygienists, and training officials
- Atypical/nonconventional mine worker profiles, such as industrial engineers, business process people, data scientists/engineers, mechatronics engineers etc
- Workers or operators who are using current equipment and those who will be using the new equipment
➤ People who used to be employed as miners and shift bosses
➤ Contractors
➤ OEMs
➤ Design and development team experts
➤ Local service providers who are subject matter experts in the mining industry
➤ Service departments or specialists
➤ Unions/organized labour
➤ The Department of Mineral Resources and Energy (DMRE)
➤ Communities, in some cases.
Participants in the discussions stressed that OEMs do not get much stakeholder input into the design and development of equipment. Stakeholders involved in design/development would normally include management and/or small teams such as service teams, engineering staff, and procurement. Furthermore, engagements revealed that previously, mine operators were usually not meaningfully engaged in the equipment design and development process. Mine operators are usually included during the testing stage of equipment development. Examples were provided where the interactions in the prototype stage were limited to those in the research and development technical teams. On the other hand, organized labour was said to be involved as part of the new technology forums in the mines, which means they would be involved from inception until implementation.
The stakeholders who are sometimes involved during the development stage are those that play a regulatory role such as the DMRE. It should be noted that these bodies usually become part of the process during the testing of the prototype, and only for consultation regarding issues such as health, safety, and risk. It is recommended that with modernization and 4IR taking place, these bodies should also be consulted regarding legal matters that might arise as a result, such as privacy issues relating to introduction of the internet of things (IoT).
The online survey results showed that the participants agreed that the inclusion of workers and other stakeholders would improve product quality, usability, and acceptance. Furthermore, 53% of participants mostly agreed, and 41% strongly agreed, that mine employees should be included in the equipment design and development procss. On the other hand, only 41% of online survey participants noted that mine employees were currently included in equipment design and development.
The online survey further sought to obtain inputs regarding the necessary level of involvement of stakeholders in equipment design and development. The survey showed that 94% of participants said OEMs should be involved throughout the process. Meanwhile, 88% of participants said mine employees should be involved in most if not all stages. Other stakeholders that should be frequently involved in the process include technology transfer facilitators, researchers and developers, mine management, suppliers, and training personnel. Study participants believed that stakeholders such as
labour representatives, government, and mine communities should be involved at some stages when necessary. Study participants further noted that the stakeholders and their level of involvement will also depend on the technology being developed. The stakeholders that the participants thought should be involved in the equipment design and development process, as identified from the online survey, were in line with those identified in the workshop, discussions.
During consultation with various mining industry stakeholders, it was noted that at times there are some factors that act as barriers to the inclusion of stakeholders in the equipment design and development process.
According to the findings from the discussions, one of the most common beliefs is that since most of the employees and/or operators do not have technical skills, they cannot meaningfully contribute to the equipment design and development process. Some of the stakeholders, however, noted that the role of operators, artisans and other workers is not necessarily technical, but their inputs are on the practicality of the design and technology. Workers or operators could give insight into the conditions and practices at the mine and be able to describe practical implications relating to the use of the equipment. One of the participants stated ‘Speaking to the appropriate people throughout the design process, which should be an iterative process, will forestall any long-term risks for the implementation of that technology’. Another participant stated, ‘We are going to be the users of the machinery, so surely we should have a say in it’. The lack of design skills was also identified as a barrier by the workshop participants, and by 63% of the participants in the online survey.
The discussions identified another barrier to the inclusion of employees in the equipment design and development process. Sometimes employees have a negative attitude towards the implementation of new technologies; and they resist change. Approximately 56% of the online survey participants also identified this as one of the possible reasons for not including employees in the equipment design and development process.
Organizational culture was also identified as one of the barriers to the inclusion of employees. This was also indicated by 63% of participants in the online survey.
Study participants in the workshop discussions noted that a lack of time for mine workers to be involved in the equipment design and development process was a further challenge. Factors such as production demands make it difficult to get operators away from their production-related key responsibilities areas. Taking operators from the mine would mean loss of production. Study participants also noted that funding for research and development was among the barriers.
Other barriers to inclusion listed by study participants during discussions include:
➤ OEMs are removed (far) from the mines. Logistical matters, such as the distance to travel, getting necessary clearances, including medicals, and the time involved, can make it difficult to test equipment in a mine
➤ Lack of buy-in from the mines, i.e. technology push versus technology pull
➤ Having too many people involved in the decision-making process can lead to process delays
➤ At the introduction of new technologies, sometimes
efficiencies can be low, thus making it difficult to realize the benefits and leading to lack of buy-in
➤ Involvement in the equipment design and development process might require certain levels of clearances due to intellectual property issues.
Study participants from the online survey further indicated their level of agreement with the following list of barriers to equipment design and development, where the percentages of participants who agreed on each of the barriers are shown in parentheses.
➤ Lack of resources (e.g. time, materials, and personnel) (81%)
➤ Inadequate communication (75%)
➤ Lack of a systematic plan or approach (75%)
➤ Production requirements (63%)
➤ Inadequate leadership (44%)
➤ Poor working relations (38%)
➤ Lack of support for the intervention (38%).
development
Potential benefits of inclusion in the equipment design and development process that were listed by participants during the online survey and discussions are summarized as follows:
➤ Improved product quality
➤ Improved productivity, efficiency, profitability, and ergonomics
➤ Improved health and safety
➤ Improved understanding of pain points and practicality of design
➤ Increased insight into the context of use
➤ Competitive advantage
➤ Fewer design iterations and early identification and detection of problems
➤ Getting to market faster
➤ Improved acceptance, ownership, and uptake
➤ Increased skills
➤ Reduced downtime
➤ Improved morale, commitment of workers, and organizational culture.
Additional benefits of inclusion in equipment design and development, and the percentages of participants from the online survey that agree on them, were:
➤ Improved trust between stakeholders (75%)
➤ Improved product quality and design (75%)
➤ Increased accessibility of a wider range of people and capabilities (69%)
➤ Reduced training and support costs as equipment is easier to understand and use (63%).
The commonly followed process of inclusion in equipment design and development, as described by participants during discussions, comprises various phases. Those phases relate to product specifications, concept design, design and development, prototyping and trialling, verification and validation, and implementation or commercialization. It was noted that the process followed during equipment design and development would vary based on the context. For example, it would depend on whether the eqipment was new or an upgrade, as well as the type of equipment/technology. In either case, it was highly recommended that the process should be systematic and involve all relevant stakeholders.
In the online survey, participants identified the factors they deemed critical in the equipment design and development processes:
➤ Evaluation, feedback, and redesign
➤ Addressing the whole user experience
➤ Skills development
➤ Understanding of the users, tasks, and environment
➤ Multidisciplinary skills and perspectives in the design team
➤ Specifying the user and organizational requirements
➤ Systematic, step-by-step approach
➤ Employee involvement throughout design and development
➤ Change management.
A guideline for the inclusion of stakeholders in equipment design was required as one of the study outputs. The guideline was developed from the findings in the various engagement sessions and should be viewed as a practical handbook to the inclusion process. The guideline includes a five-step process, with each step title supported by a title description. The various steps in the process are underpinned by activities which support the practical application of the guideline. The guideline further includes suggested methodologies to support the underpinning activities. Lastly, the guideline also identifies possible stakeholders that need to be included for each step.
As a departure point to stakeholder inclusion it was necessary to define who constitutes stakeholders. For the purposes of this guideline, a stakeholder is a party that has an interest in a mining company and can either affect or be affected by the business (mining operations). At a typical mining operation, stakeholders include the board of directors, all management levels, frontline supervisors, all employees (workers), organized labour (unions), contractors, service providers, government (particularly the DMRE), other mining companies, communities surrounding the mine, non-governmental organizations, and local authorities. The developed guideline is appropriate for a ‘market pull’ position where there is drive behind equipment design and manufacturing from an operations perspective. Once equipment is required by an operation there will be operational interaction and management drive. Even during this ‘market pull’ scenario it was evident that workers are usually only involved when the equipment is being rolled out or trialled at the mine.
In the development of the guideline, it was necessary to understand who the various stakeholders would be during equipment design. The following groups were identified:
➤ OEMs
➤ Researchers, designers, and developers
➤ Mining company management or representatives, such as senior production personnel, technical services, engineers (mechanical, electrical, mining, industrial, and mechatronics), business process personnel, data scientists, human resources (HR), finance, procurement, occupational hygienists, and training officials
➤ Contractors and local service providers
➤ Workers or operators (end-users of the equipment)
➤ Frontline supervisors (foremen), miners, and shift bosses
➤ Unions
➤ The DMRE, or legislation and policy writers
➤ Communities, in some cases.
While inclusion has been shown to improve aspects such as product quality and buy-in, there is a lack of inclusion of workers or employees (end-users) throughout the design and development process in the South African mining sector. Since this is the case, why do product developers not include employees in equipment design? The following are some of the major barriers to worker inclusion in equipment design and development:
➤ A knowledge gap between the designers or manufacturers and the end-users
➤ A lack of resources (e.g. time, budget, materials, and personnel)
➤ Challenges releasing workers (mining industry employees) for inclusion in equipment design and development
➤ Logistical constraints
➤ Challenges managing requirements of numerous stakeholders
➤ Lack of a systematic plan or approach
➤ Lack of integrated systems thinking
➤ Lack of technical and design skills
➤ Inadequate communication
➤ Intellectual property (IP) and legislative concerns
➤ Organizational culture or climate
➤ Attitudes or mindsets of mines, OEMs, and workers
➤ Lack of acceptance (resistance to change)
➤ Dealing with perceptions and engaging people to obtain buy-in at all levels
➤ Concerns about the impact (e.g. job losses and skills requirements)
➤ Lack of appropriate change management strategy.
From the above it is evident that there was the need to identify essential elements of the design and development process to ensure that the guideline addresses the needs of the sector. The following essential elements for an effective design and development process were identified.
➤ Understanding of the users, tasks, and environment (system context)
➤ Addressing the whole user experience
➤ Specifications of user and organizational requirements
➤ Needs analysis (through consultation)
➤ Cost-benefit analysis
➤ Stakeholder participation early and throughout the design and development process
➤ Multidisciplinary skills and perspectives
➤ Equipment designed to be easy to use, fit for purpose, and fit to the user
➤ Understanding of regulations or legislative framework
➤ Iterative design feedback, evaluation, and redesign)
➤ Systematic, step-by-step design process
➤ Systems mapping and integration
➤ Skills development
➤ Effective change management.
Based on the above, a basic process model was developed to serve as a framework. highlighting process stages where workers can be incorporated in the equipment design and development process. The process model is depicted in Figure 1. The backwardpointing arrows refer to examples of loops to reflect on whether the requirements of previous steps have been adequately met. This type of verification should take place for each step in the guideline.
Five basic stages are proposed in the recommended guideline, and are listed below.
➤ Demand analysis: The guideline is initiated by various changes/drives in the environment (regulatory requirements, best practice developments, production methodology changes, etc.)
➤ Product specifications: This stage focuses on technical specifications that need to align to best practice, regulatory requirements, safety, health, environment, and quality (SHEQ) specifications and other technical requirements around human-centred design
➤ Equipment design and development: There is a focus on the development of a technical guideline for users which is aligned to best practice and the development of a prototype;
➤ Demonstration, piloting, review, and refinement: User interaction is evaluated and ergonomics factors evaluated in the use of the equipment. Digital/physical interfaces are evaluated during this step
➤ Adoption: Would be either per operation (if economically viable), per company, per commodity, or for the sector as a whole. Business cases would have had to be used as a basis for this (see step 1).
The descriptions, sub-processes, and potential methods for each step are indicated in Table III. Factors underpinning the guideline are also incorporated, and include the need for loop learning, and change management throughout the process. Loop learning serves as a continuous improvement tool where gaps and lessons learnt are identified at each stage of the process, for subsequent development and implementation of an action plan to close the identified gaps. Loop learning within the guideline refers to the theory of organizational learning that takes place. Loop learning also closely relates to project management success and contributes to greater success in project implementation (McClory, Read, and Labib, 2017). Loop learning theory thus applies to the project management approach to equipment design.
The guideline is designed as an iterative process, linking back to the theory of loop learning, and utilizes project management as a foundation to the implementation. The ‘golden threads’ of the guideline are stakeholder engagement, change management, and feedback (monitoring and evaluation) structures.
The guideline is contained in five steps, with descriptions of each step. There are process underpins that outline what is required within each step. These can also be referred to as sub-steps. The guideline also provides methodologies for the implementation of each of the steps. Further to this, the guideline also provides a list of the stakeholders to be engaged/involved within each step. Lastly, the underpinning factors outline the essential factors across all the steps in the guideline.
Successful execution of the project scope was susceptible to potential risks and limitations. The research depended on the participation and buy-in from stakeholders. Assistance from the Mandela Mining Precinct and early engagements with stakeholders assisted in facilitating this involvement. Potential risks resulting from the COVID-19 pandemic were mitigated using online platforms for engagement, and adherence to related health and safety protocols. Pre-identified themes used for the questions in the data collection tools could be a potential source of bias in the data gathered. Open communication, feedback, and collaboration were sought to optimize the co-creation outcomes of this project.
A people-centric technology design and development approach is reccomended to facilitate successful implementation and adoption of technology in the South African mining sector. The study identified several economic and social benefits of early inclusion of stakeholders in the technology design and development process.

The benefits include improved product quality, OHS, productivity, and acceptance. In the context of the South African mining sector, the timeous and adequate inclusion of stakeholders in the technology design and development process has been obstructed by factors such as lack of resources (human resources, time, and funds), difficulty accessing mines, organizational culture, and inadequate communication. The barriers have resulted in the development of equipment that was not fit-for purpose and have constrained progressive modernization of the mining industry. Recommendations arising from this project, include the following.
➤ Involvement of all stakeholders, including end-users, in the early stages and throughout the technology design and development process is critical for successful introduction of technology in the South African mining sector. Identified critical enablers of the technology design and development process include the use of an effective two-way communication strategy (with timeous feedback), use of a structured change management process, development and implementation of a skills development plan to support the design, development, and implementation of the new technology, and continuous monitoring and evaluation of the process. It is also important to assess the organizational impacts of the technology, including the effect on jobs, skills, and SHEQ.The mining industry is advised to consider using the guideline for the inclusion of stakeholders in equipment design (Table II) to develop a site-specific and customized process for stakeholder

inclusion in the design and development of equipment. The process should be customized to suit a particular context of use, taking cognisance of factors such as target end-users, tasks, technology and environment. To enhance buy-in and ownership, efforts should also be made to solicit inputs from all key stakeholders during the customization of the guideline.
➤ The mining industry should co-create innovative solutions to address some of the challenges that might hinder successful design, development, and implementation of new technology. Challenges include lack of research and development funding, unavailability of close to real-life test sites, and intellectual property and confidentiality issues.
This work was commissioned by the Mandela Mining Precinct. The Mandela Mining Precinct is a public-private partnership between the Department of Science and Innovation and the Minerals Council South Africa. The Precinct is co-hosted by the Council for Scientific and Industrial Research (CSIR) and the Minerals Council. We would like to thank the Mining Equipment Manufacturers of South Africa (MEMSA), for their support and assistance with the project survey. We would also like to thank Gillian Michalowski from Enterprises University of Pretoria for her assistance with conducting this research. Finally, we would like to express appreciation to each of the research participants and to all the stakeholders involved in the project workshops and validation.
EMESRT. 2012. Design Operability and Maintainability Analysis Technique –Design OMAT. Process and Skill Development Manual. Version 4. Earth Moving Equipment Safety Round Table, Queensland, Australia.
EMESRT. 2019. 2018 Annual Report. Earth Moving Equipment Safety Round Table, Queensland, Australia.
Fraser, P.D. 2017. What does “Modernisation” mean for South African Mines? Proceedings of the 7th International Platinum Conference, Polokwane, South Africa. Southern African Institute of Mining and Metallurgy, Johannesburg.

Horberry, T., Burgess-Limerick, R., and Steiner, L. 2015. Human centred design for mining equipment and new technology. Proceedings of the 19th Triennial Congress of the IEA, Melbourne 9-14 August 2015, pp. 1–6.
ISO 6385. 2016. Ergonomics principles in the design of work systems. International Standard, ISO 6385:2016(E).
ISO 9241-210. 2010. Ergonomics of human-system interaction – Part 210: Humancentred design for interactive systems. International Standard, ISO 9241210:2010(E).
ISO 9241-210. 2019. Ergonomics of human-system interaction – Part 210: Humancentred design for interactive systems. International Standard, ISO 9241210:2019(E).
ISO 9241:220. 2019. Ergonomics of human-system interaction – Part 220: Processes for enabling, executing and assessing human-centred design within organisations. International Standard, ISO 9241-220:2019(E).
Maguire, M. 2001. Methods to support human-centred design. International Journal of Human-Computer Studies, vol. 55. pp. 587–634.
Magweregwede, F., Mpofu, M., and Ngobese, S. 2019. Investigate blasting methodologies for underground narrow reef mines. Mandela Mining Precinct, Johannesburg.
McClory, S., Read, M., and Labib, A. 2017. Conceptualising the lessons-learned process in project management: Towards a triple-loop learning framework. International Journal of Project Management, vol. 35, no. 7. pp. 1322–1335.
Minerals Council South Africa. 2019. Modernisation: Towards the Mine of Tomorrow. https://www.mineralscouncil.org.za/industry-news/publications/ fact-sheets [accessed 21 October 2020].
Minerals Council South Africa. 2020. Facts and figures pocketbook 2019. https://www.mineralscouncil.org.za/industry-news/publications/facts-andfigures [accessed 10 October 2020]
Pelders, J. Botha, W., Michalowski, G., Ngobese, S., Magweregwede, F., and Schutte, S. 2021. People-Centric Modernisation. Guideline to Include Stakeholders in Equipment Design and Development. SATCAP WP 3. Mandela Mining Precinct, Johannesburg.
Pelders, J., Murambadoro, M., Letsoalo, S., and Schutte, S. 2019. Globally Benchmarked Strategy for the Engagement of Workers in Original Equipment Manufacturer (OEM) Equipment Development Processes. Successful Application of Technology Centred Around People (SATCAP). Work Package 1.9. Mandela Mining Precinct, Johannesburg.
Pelders, J. and Schutte, S. 2021. Worker inclusion in equipment development processes in the modernizing minerals sector in South Africa. Journal of the Southern African Institute of Mining and Metallurgy, vol. 121, no. 2: pp. 63–70.
Samaras, G.M. and Horst, R.L. 2005. A systems engineering perspective on the human-centred design of health information systems. Journal of Biomedical Informatics, vol. 38. pp. 61–74. u
1-5 May 2023 — ALTA 2023
Perth, Australis
Contact: alta@encanta.com.au
Website: https://www.altamet.com.au/conferences/alta-2022/ alta-2023/
11-14 June 2023 — 12TH European Metallurgical Conference 2023
Abstracts are to be completed online on https://bit.ly/ Enter2021YPLCfinals
12-16 June 2023 — Copper Cobalt Africa in association with the 10TH Southern African Base Metals Conference 2023
Avani Victoria Falls Resort, Livingstone, Zambia
Contact: Camielah Jardine
Tel: 011 538-0237
E-mail: camielah@saimm.co.za
Website: http://www.saimm.co.za
19-22 June 2023 — Introduction to Multiple-Point Statistics
Online Course
Contact: Gugu Charlie
Tel: 011 538-0238
E-mail: gugu@saimm.co.za
Website: http://www.saimm.co.za
25-28 June 2023 — SME APCOM 2023
Intelligent Mining: Innovation, Vision, and Value Rapid City, South Dakota, USA
E-mail: Andrea.Brickey@sdsmt.edu
Website: https://www.smenet.org/Conferences/SME-APCOM
26-29 June 2023 — 26TH World Mining Congress 2023
Brisbane Australia
Website: https://www.wmc2023.org/
28-29 June 2023 — Digital Transformation in Mining 2023
Putting digital technologies to work
The Canvas, Riversands, Fourways
Contact: Gugu Charlie
Tel: 011 538-0238
E-mail: gugu@saimm.co.za
Website: http://www.saimm.co.za
12-13 July 2023 — GMG-SAIMM in-person-Forum
innovating to improve the way we mine
54 on Bath, Rosebank, Johannesburg, South Africa
Contact: Gugu Charlie
Tel: 011 538-0238
E-mail: gugu@saimm.co.za
Website: http://www.saimm.co.za
25-26 July 2023 — Diamonds Source to Use 2023 Conference
New Beginnings A brave new (diamond) world
Emperors Palace Conference Centre, Kempton Park, Johannesburg
Contact: Camielah Jardine
Tel: 011 538-0237
E-mail: camielah@saimm.co.za
Website: http://www.saimm.co.za
21-22 August 2023 — HMC 2023 Twelth International Heavy Minerals Conference 2023
The Capital Zimbali, Ballito, KwaZulu-Natal
Contact: Gugu Charlie
Tel: 011 538-0238
E-mail: gugu@saimm.co.za
Website: http://www.saimm.co.za
23-24 August 2023 — Amira Global Exploration Manager’s Conference 2023
London, United Kingdom
E-mail: owena.duckworth@amira.global
Website: https://mininginnovationnetwork.swoogo.com/ DMA22
4-7 September 2023 — Geometallurgy Conference 2023
Geomet meets Big Data
Hazendal Wine Estate, Stellenbosch, Western Cape
Contact: Gugu Charlie
Tel: 011 538-0238
E-mail: gugu@saimm.co.za
Website: http://www.saimm.co.za
4-7 September 2023 — 10TH World Gold Conference Promote high-quality development with green technology innovation
Shenyang New World EXPO, China
E-mail: world@china-gold.org
Website: http://world.china-gold.org/en/
12-14 September 2023 — 10TH International Conference on Ground Support in Mining and Underground Construction Perth, Western Australia
Website: https://www.acggroundsupport.com/
20-21 September 2023 — 6TH Young Professionals
Conference 2023
The Canvas, Riversands, Fourways
Contact: Gugu Charlie
Tel: 011 538-0238
E-mail: gugu@saimm.co.za
Website: http://www.saimm.co.za
26-27 September 2023 — DIMI SAIMM Diversity and Inclusion Dialogue 2023
Intersectionality in the Minerals Industry From Awareness to Action
Avianto, Muldersdrift Johannesburg
Contact: Camielah Jardine
Tel: 011 538-0237
E-mail: camielah@saimm.co.za
Website: http://www.saimm.co.za
11-13 October 2023 — 11TH International Ground Freezing Symposium
London
E-mail: events@iom3.org
Website: https://www.iom3.org/events-awards/11thinternational-symposium-on-ground-freezing.html
The following organizations have been admitted to the Institute as Company Affiliates
3M South Africa (Pty) Limited
acQuire Technology Solutions
AECOM SA (Pty) Ltd
AEL Mining Services Limited
African Pegmatite (Pty) Ltd
Air Liquide (Pty) Ltd
Alexander Proudfoot Africa (Pty) Ltd
Allied Furnace Consultants
AMEC Foster Wheeler
AMIRA International Africa (Pty) Ltd
ANDRITZ Delkowr(Pty) Ltd
ANGLO Operations Proprietary Limited
Anglogold Ashanti Ltd
Arcus Gibb (Pty) Ltd
ASPASA
Aurecon South Africa (Pty) Ltd
Aveng Engineering
Aveng Mining Shafts and Underground
Axiom Chemlab Supplies (Pty) Ltd
Axis House Pty Ltd
Bafokeng Rasimone Platinum Mine
Barloworld Equipment -Mining
BASF Holdings SA (Pty) Ltd
BCL Limited
Becker Mining (Pty) Ltd
BedRock Mining Support Pty Ltd
BHP Billiton Energy Coal SA Ltd
Blue Cube Systems (Pty) Ltd
Bluhm Burton Engineering Pty Ltd
Bond Equipment (Pty) Ltd
Bouygues Travaux Publics
Caledonia Mining South Africa Plc
Castle Lead Works
CDM Group
CGG Services SA
Coalmin Process Technologies CC
Concor Opencast Mining
Concor Technicrete
Council for Geoscience Library
CRONIMET Mining Processing
SA Pty Ltd
CSIR Natural Resources and the Environment (NRE)
Data Mine SA
DDP Specialty Products South Africa (Pty) Ltd
Digby Wells and Associates
DRA Mineral Projects (Pty) Ltd
DTP Mining - Bouygues Construction
Duraset
EHL Consulting Engineers (Pty) Ltd
Elbroc Mining Products (Pty) Ltd
eThekwini Municipality
Ex Mente Technologies (Pty) Ltd
Expectra 2004 (Pty) Ltd
Exxaro Coal (Pty) Ltd
Exxaro Resources Limited
Filtaquip (Pty) Ltd
FLSmidth Minerals (Pty) Ltd
Fluor Daniel SA ( Pty) Ltd
Franki Africa (Pty) Ltd-JHB
Fraser Alexander (Pty) Ltd
G H H Mining Machines (Pty) Ltd
Geobrugg Southern Africa (Pty) Ltd
Glencore
Gravitas Minerals (Pty) Ltd
Hall Core Drilling (Pty) Ltd
Hatch (Pty) Ltd
Herrenknecht AG
HPE Hydro Power Equipment (Pty) Ltd
Huawei Technologies Africa (Pty) Ltd
Immersive Technologies
IMS Engineering (Pty) Ltd
Ingwenya Mineral Processing (Pty) Ltd
Ivanhoe Mines SA
Kudumane Manganese Resources
Leica Geosystems (Pty) Ltd
Loesche South Africa (Pty) Ltd
Longyear South Africa (Pty) Ltd
Lull Storm Trading (Pty) Ltd
Maccaferri SA (Pty) Ltd
Magnetech (Pty) Ltd
Magotteaux (Pty) Ltd
Malvern Panalytical (Pty) Ltd
Maptek (Pty) Ltd
Maxam Dantex (Pty) Ltd
MBE Minerals SA Pty Ltd
MCC Contracts (Pty) Ltd
MD Mineral Technologies SA (Pty) Ltd
MDM Technical Africa (Pty) Ltd
Metalock Engineering RSA (Pty)Ltd
Metorex Limited
Metso Minerals (South Africa) Pty Ltd
Micromine Africa (Pty) Ltd
MineARC South Africa (Pty) Ltd
Minerals Council of South Africa
Minerals Operations Executive (Pty) Ltd
MineRP Holding (Pty) Ltd
Mining Projections Concepts
Mintek
MIP Process Technologies (Pty) Limited
MLB Investment CC
Modular Mining Systems Africa (Pty) Ltd
MSA Group (Pty) Ltd
Multotec (Pty) Ltd
Murray and Roberts Cementation
Nalco Africa (Pty) Ltd
Namakwa Sands(Pty) Ltd
Ncamiso Trading (Pty) Ltd
Northam Platinum Ltd - Zondereinde
Opermin Operational Excellence
OPTRON (Pty) Ltd
Paterson & Cooke Consulting Engineers (Pty) Ltd
Perkinelmer
Polysius A Division Of Thyssenkrupp
Industrial Sol
Precious Metals Refiners
Rams Mining Technologies
Rand Refinery Limited
Redpath Mining (South Africa) (Pty) Ltd
Rocbolt Technologies
Rosond (Pty) Ltd
Royal Bafokeng Platinum
Roytec Global (Pty) Ltd
RungePincockMinarco Limited
Rustenburg Platinum Mines Limited
Salene Mining (Pty) Ltd
Sandvik Mining and Construction
Delmas (Pty) Ltd
Sandvik Mining and Construction
RSA(Pty) Ltd
SANIRE
Schauenburg (Pty) Ltd
Sebilo Resources (Pty) Ltd
SENET (Pty) Ltd
Senmin International (Pty) Ltd
SISA Inspection (Pty) Ltd
Smec South Africa
Sound Mining Solution (Pty) Ltd
SRK Consulting SA (Pty) Ltd
Time Mining and Processing (Pty) Ltd
Timrite Pty Ltd
Tomra (Pty) Ltd
Traka Africa (Pty) Ltd
Trans-Caledon Tunnel Authority
Administarator
Trace Element Analysis Laboratory
Ukwazi Mining Solutions (Pty) Ltd
Umgeni Water
Webber Wentzel
Weir Minerals Africa
Welding Alloys South Africa
Worley
20-21 SEPTEMBER 2023
The “Empowering Young Professionals for Sustainable and Innovative Mining and Processing Practices” conference promises to be an engaging and informative event that will explore the latest trends, ideas, and innovations in the minerals industry. This conference offers young professionals the opportunity to network with peers and industry experts, establish professional relationships, and collaborate on future projects. A conference dedicated to young professionals emphasises the importance of empowering young professionals to lead the way in driving innovation and sustainability in the South African minerals industry.
• During the conference, attendees can expect to participate in engaging sessions, informative talks, and interactive workshops covering a broad range of topics. These sessions will explore innovative technologies, sustainable mining practices, and the role of young professionals in driving positive change in the industry.
• In addition to the informative sessions, there will be ample opportunities to network with peers and industry experts, share ideas, and collaborate on projects. The conference will provide a platform for attendees to showcase their work, gain feedback, and receive recognition for their contributions.
• To promote diversity and inclusion in the mining industry by creating an environment that supports and celebrates individuals from all backgrounds.


Overall, the “Empowering Young Professionals for Sustainable and Innovative Mining and Processing Practices” conference is a must-attend event for young professionals in the minerals industry. Whether you are an early-career professional or an experienced industry expert, this conference is an excellent opportunity to learn, network, and contribute to the future of the minerals industry in South Africa.
29 May 2023 – Submission of abstracts
12 June 2023 – Acceptance of abstracts
17 July 2023 – Submission of papers
20-21 September 2023 – Conference
ECSA AND SACNASP CPD POINTS WILL BE ALLOCATED TO ALL ATTENDING DELEGATES
The Southern African Institute of Mining and Metallurgy in collaboration with the Zululand Branch are organising:
2023
TWELFTH INTERNATIONAL HEAVY MINERALS CONFERENCE
21-22 AUGUST 2023
THE CAPITAL ZIMBALI, BALLITO, KWAZULU-NATAL


The HMC series of conferences has previously been focused on mining and processing of heavy minerals. Whilst this conference will still focus on these important issues, there is a shift in focus to include some of the more strategic risks affecting this industry. With the recent global changes such as climate change and its effect on operations close to sea level, the energy crisis and its effect on the economics of smelting and geopolitical risk and its effect on supply chains dependent on unfriendly countries. The future of the industry is now at risk from such changes which are outside of its immediate control. Failure to recognise these significant risks could impact the entire future of the heavy minerals industry. There are also time constraints on finding solutions to such issues. This conference will attempt to high light some of those risks and to suggest possible mitigation measures.
This series of conferences was started in 1997 and has run since that date. The Conference alternates between South Africa and other heavy mineral producing countries. It provides a forum for an exchange of knowledge in all aspects of heavy minerals, from exploration through processing and product applications. This is a strictly technical conference, and efforts by the Organizing Committee are aimed at preserving its technical nature. The benefit of this focus is that it allows the operators of businesses within this sector to discuss topics not normally covered in such forums. The focus on heavy minerals includes the more obvious minerals such as ilmenite, rutile and zircon; and also other heavy minerals such as garnet, andalusite, and sillimanite.
Located in a luxury eco estate with insanely beautiful Indian Ocean views, less than 15 minutes from King Shaka International Airport. SET IN A TROPICAL FOREST that unfurls into the ocean, the resort blends organically into a lush natural landscape. A magnet for fun seekers, families, couples, solo explorers and business travellers; the resort is far enough removed to allow you to step back and take time to enjoy the tranquil surroundings.
FOR FURTHER INFORMATION, CONTACT:
Professionals specialising or working in the areas of:
• Renewable energy
• Water purification
• Infrastructure
• Desalination plants
As well as the following industry professionals are invited to participate:
• Academics
• Business development managers
• Concentrator managers
• Consultants
• Engineers
• Exploration managers
• Geologists
• Hydrogeologists
• Innovation managers
• Mechanical engineers
• Metallurgical managers
• Metallurgical consultants
• Metallurgists

• Mine managers
• Mining engineers
• New business development managers
• Planning managers
• Process engineers
• Product developers
• Production managers
• Project managers
• Pyrometallurgists
• Researchers
• Scientists
Prospective authors are invited to submit abstracts of not more 500 words, in English. Please email abstracts and requests to be added to the conference mailing list to Gugu Charlie: Conference Co-ordinator, SAIMM at gugu@saimm.co.za
27 March 2023 – Submission of abstracts
10 April 2023 – Acceptance of abstracts
15 May 2023 – Submission of papers
21-22 August 2023 – Conference
Charlie, Conference co-ordinatorGugu
E-mail: gugu@saimm.co.za
Tel: +27 11 538-0237, Web: www.saimm.co.za
