5 minute read
A conceptual technique to mathematically quantify the trajectory of flyrock

from Saimm 202304 apr
by SAIMM
Next Article

Table II
The focus elements, and desired and actual outcomes for the initial proof of concept tests
1 Evaluate the horizontal (rotated aerial) calibration technique. Internal and external camera parameters before the blast or event can be determined with the Pix4D software.
2 Generation of point-cloud data of the scene.
The calibration data from the Pix4D software is exported in the form of external and internal camera parameters and summarized in a .csv file that can be imported into the stereo mapping software. The calibration process was successful but very time-consuming.
Sufficient point-cloud data of the environment can be generated using the calibration images. A point cloud of the environment was successfully generated. This point cloud can be used for further data processing and interpretation, as well as potential visualization of the data in virtual reality.
3 Capturing a high-quality image of a moving object. High-quality images without significant motion blur will allow clear and accurate measurements to be taken.
4 Capturing a moving object in flight and visually tracking that object’s motion in successive images.
5 Creating a stereo model of an object in motion from images taken from two separate cameras.
6 Obtaining positional measurements (x-, y-, and z-coordinates) using existing stereo mapping software.
Identifying and tracking the same object in successive images. The physical characteristics of the object will assist with this.
The point cloud of the scene based on the calibration data is combined with the event data (‘blast’ images) to create stereo models (two cameras per model) for each camera combination.
Once the stereo models are successfully generated, the coordinates of a point within the images can be acquired.
This was accomplished by using good quality cameras and lenses and applying photographic principles. However, these specific camera settings will vary with each environment and are therefore not presented as results.
In the proof of concept tests, it was decided to only record the motion of a single projectile, in an attempt to simplify the test methodology and limit the potential variables. Future tests will involve the motion of multiple projectiles simultaneously.
For the proof of concept tests, it was possible to create these stereo models in the mapping software (uSMART Softcopy) to within an accuracy of a couple of centimetres. To prove the concept, this error was considered to be acceptable; however, further testing and refining of the procedure will enable the reduction of this error to an acceptable margin for actual field application.
Once the stereo model has successfully been created, measurement of any feature within this model can be acquired. This is simply done by marking the centre-point of a feature to measure its position or using the Softcopy software (similar to any CAD software) to measure the distance or the circumference of an object. The process of creating an accurate stereo model is still under investigation. Further testing and investigation of the improvement of the entire phase 2 process and its accuracy is ongoing.
➤ Whether the camera site calibrations were possible outside of a controlled environment
➤ Whether the cameras would capture flyrock in flight from an actual blast, considering the likelihood of a homogenous background that may increase the difficulty of visual detection of individual fragments
➤ Whether the synchronization between the cameras remains acceptable, i.e. all cameras captured the same point in time (within an acceptable tolerance).
Site calibration of the cameras at the quarry tests was done in the same way as in the controlled concept tests, i.e. by creating a point-cloud data-set of the site before or after the blast to determine the internal and external specifications of the cameras on the day.
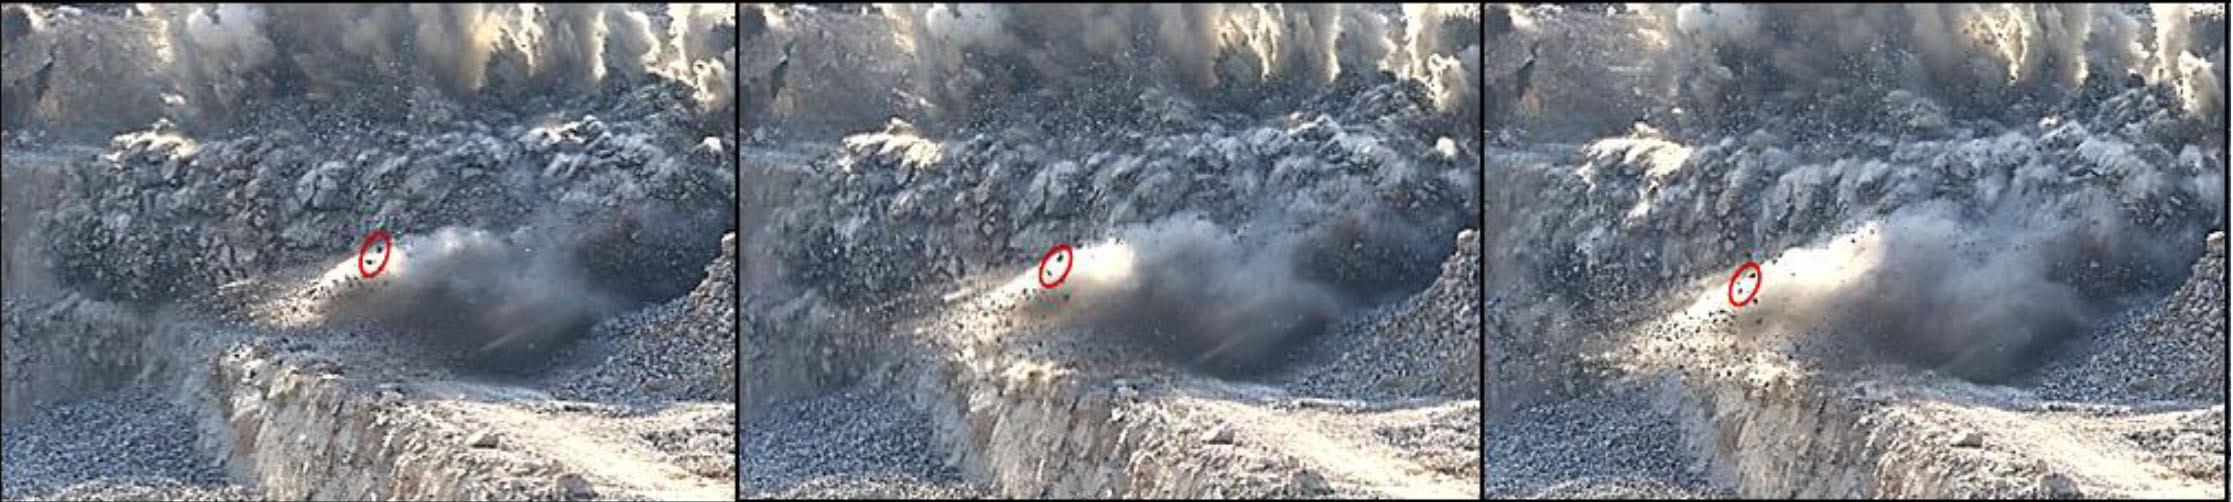
While taking these calibration images, special attention was given to exclude as much homogenous or ‘blue sky’ background as possible to facilitate the processing of these images. Figure 7 shows the point cloud generated from the calibration images, which was used to determine and export the camera specifications, which were used for the stereo model during the data analysis phase. This pointcloud data-set also forms the foundation of the VR models that can be created based on the data and analysis inherent in this technique. Figure 8 shows that some fragments were successfully captured and could be visually identified and tracked in subsequent images taken by the cameras. This may not be ideal or the most efficient way of tracking these fragments, but it is sufficient for the purpose of proving the concept and motivating further research and development.
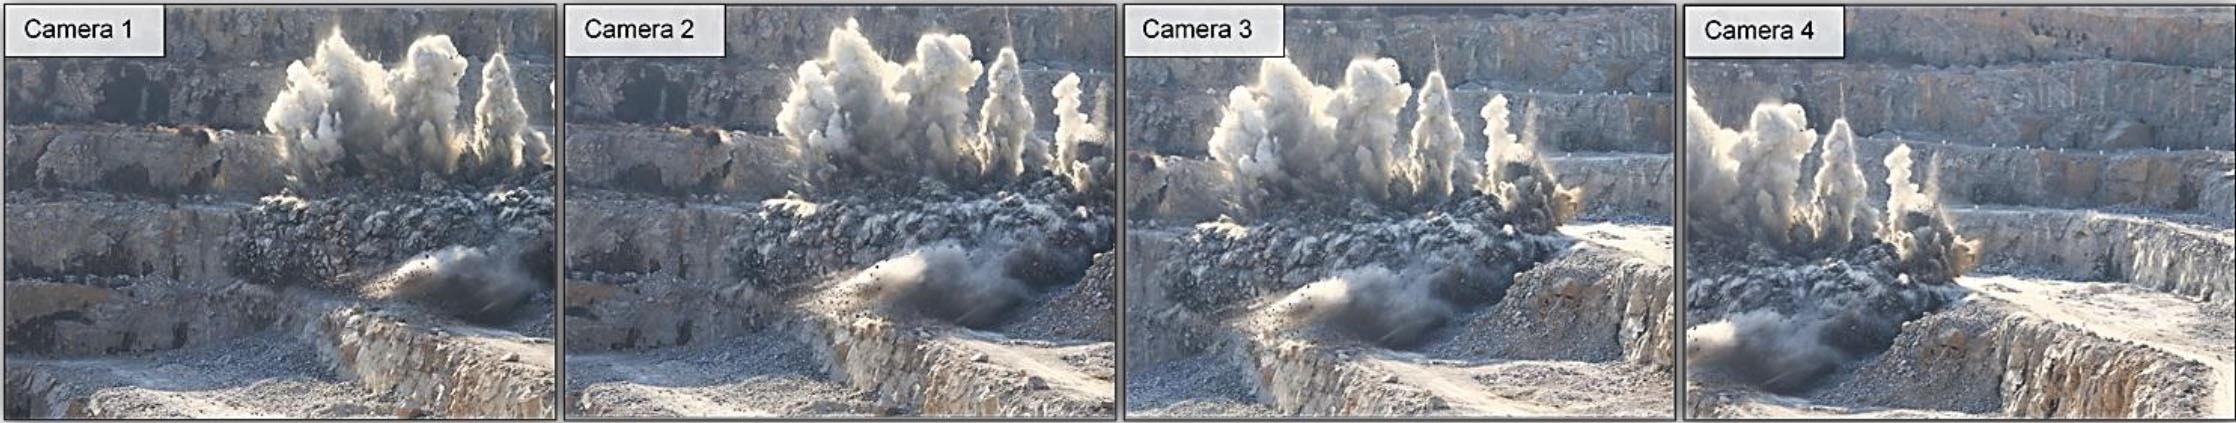
Figure 9 illustrates the synchronization between adjacent cameras actuated via the remote triggering system approximately 500 m from the cameras. By comparing the dust plumes from each image, it is evident that three of the four cameras (cameras 2, 3, and 4) are very closely aligned. Camera 1 seemed to have taken its image slightly earlier than the other cameras; however, the error produced by this can be reduced by averaging the measurements taken per stereo model (i.e. images of the same point in time taken by two adjacent cameras) for each point in time. If four cameras are used for a blast, a total of six stereo models can be created per point in time, from which positional measurements of key fragments can be taken.
Phase 3
The data interpretation phase consists of combining the data collected in phases 1 and 2 and incorporating it into existing ballistics equations. These equations are based on the principles of projectile physics and Newton’s laws of motion, which remain valid for all moving objects.
The application of ballistics equations to the acquired positional data is an ongoing investigation. However, the significance of certain parameters within these equations that relate to specific circumstances or external factors is a key focus point.
To achieve accurate trajectory equations for the recorded fragments, it is essential to investigate the following:
➤ An accurate estimation of the drag coefficient of different rock types
➤ The effect of the shape of each rock type on its drag coefficient
➤ The effect of rotation or spin of the fragment on the drag force experienced.
Conclusion
The focus of this study was to develop a concept that can mathematically quantify the trajectory of flyrock from a blast, with the aim of enabling future researchers to mathematically quantify the impact of the different blast design parameters on the flyrock throw distance. After a comparative analysis of various technologies, it was decided to use photogrammetry as the foundation of the proposed technique. A modified version of traditional photogrammetry was required to fit the objective of the research. The proposed technique consists of three main phases:
1. Data acquisition
2. Image processing and data analysis
3. Data interpretation. Only the first phase was developed up to an implementable technique – phases 2 and 3 are conceptual only and work is ongoing to improve phase 2 to obtain accurate data to be used in phase 3. The key outcomes of phase 1 are as follows.
➤ The positioning and orientation of the cameras relative to one another as well as the target area was determined using photogrammetric principles.
➤ The site calibration of the cameras is based on the calibration of aerial photogrammetry cameras, but the principles were rotated to a horizontal perspective for this study.
➤ A long-range remote trigger system was designed and manufactured to trigger the cameras from the same distance from the blast.
➤ The camera synchronization was found to be within acceptable ranges when using top-of-the-range triggers. Identical cameras were used to minimie this variance.
Phase 2 has been tested to the point of on-site calibration of the camera lenses and creation of point-cloud data of the environment before or after the ‘blast’. Initial controlled proof-of-concept tests enabled the team to take reliable coordinate measurements of a moving projectile at different times.
To include the measurements from phase 2 in phase 3, some key variables need to be further investigated. These include the drag coefficient for each projectile (including the impact of size and shape) and the effect of the environment or weather.
The concept has been developed with the objective to record, measure, and calculate reliable trajectories for fragments thrown


