
OCTOBER 2023 SURVEYING AND MAPPING, ELEVATED AI GIS UAVs GNSS The Complex Issue of AI and GIS 20 The New OPUS Projects INSIDE What’s Inside Your GNSS Rover? 26 Virtual Reality and Planning 12

Looking Forward
By Jeff Thoreson
Virtual Reality and City Planning
WHAT IS NODAR?
AERIAL MAPPING AND GOOD WINE SPOTTING WILDFIRES FROM SPACE NEW PRODUCTS / NEW SOLUTIONS
Engaging citizens to participate actively in urban development projects can often be difficult. But rendering designs in 3D city models and transforming them into immersive virtual reality spaces might just do the trick.
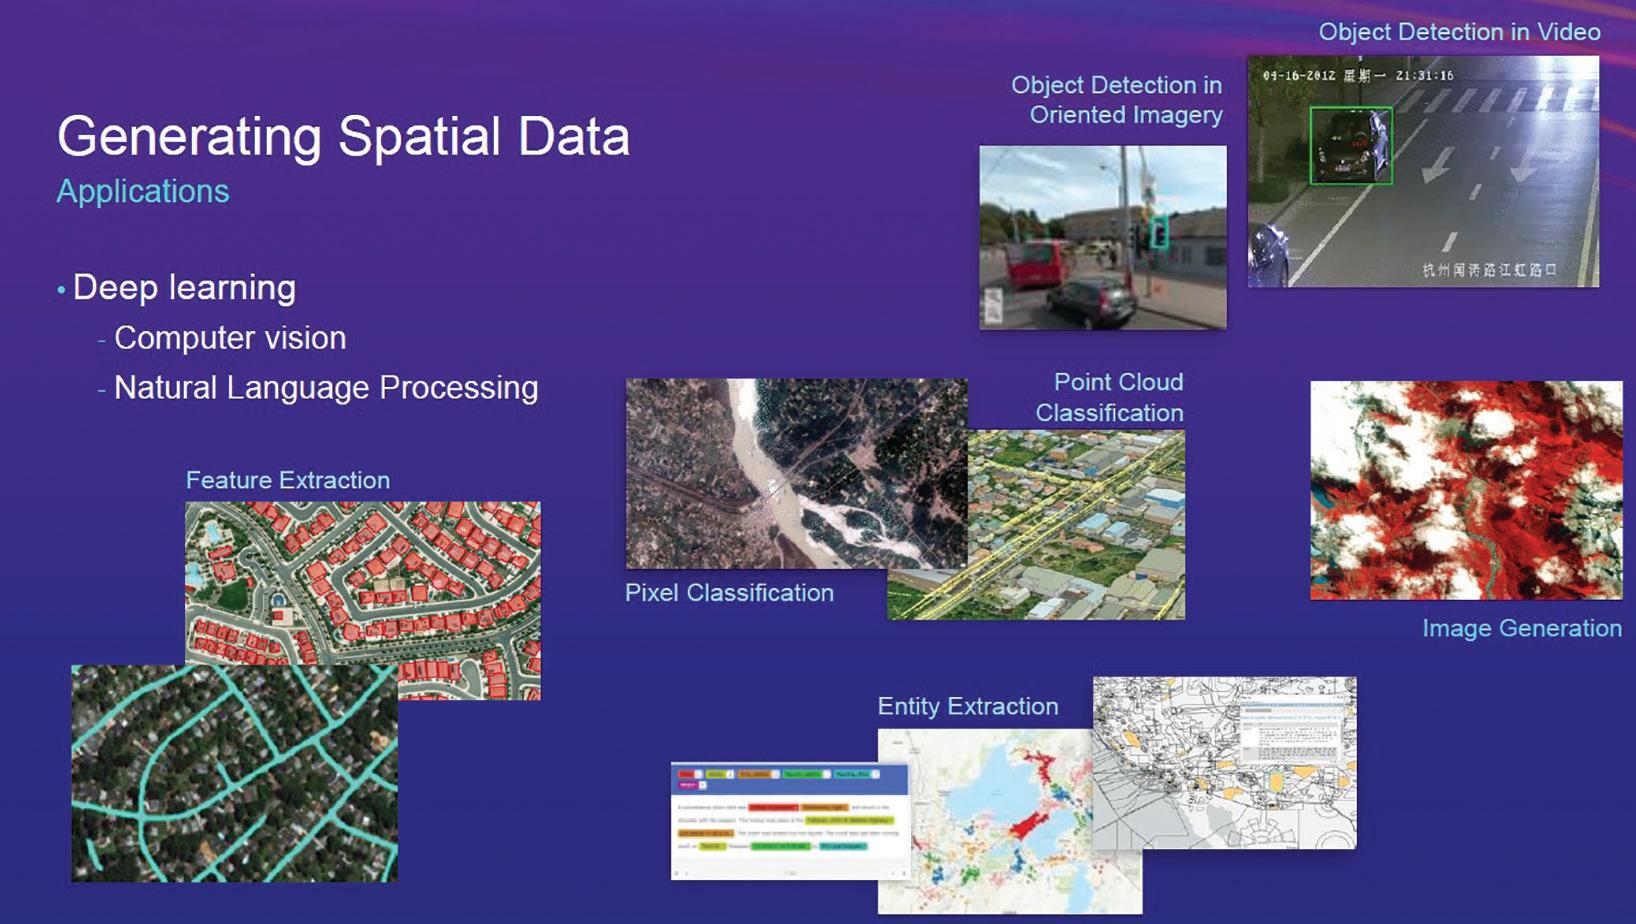
AI and GIS
As geospatial behemoth ESRI integrates artificial intelligence into is flagship ArcGIS platform, AI is uniquely positioned to help organizations leverage the value of geographic data for the benefit of all.
NGS Revamps OPUS Projects

NOAA’s National Geodetic Survey (NGS) continues to improve its suite of Online Position User Service (OPUS) tools. How much will the latest version help surveyors?
Drones and a New Perspective
Geotechnical engineers say drones offer a safer, faster method of data collection to identify potential geohazards and assist with mitigation along vulnerable transportation corridors.
What’s Inside Your Rover?
ON THE COVER: Artificial intelligence and geographic information systems are two geospatial entities that haven't played nicely together in the past. Now, geospatial giant ESRI is integrating the two and it may have huge impacts on all of us.

The GNSS rover has evolved into an essential part of a surveyor’s toolkit, although some mystery remains as to what that magic box does and how it does it. This three-part series will demystify the rover’s inner workings.
Legal Boundaries
Jeff Lucas takes a look at the importance of surveyors testifying in court as experts.
October 2023 Volume 10 Number 9
Publisher Shawn Dewees shawn.dewees@xyht.com
Editor-in-Chief Jeff Thoreson jeff.thoreson@xyht.com

Director of Sales and Business Development Chuck Boteler chuck.boteler@xyht.com
Creative Director Ian Sager ian.sager@xyht.com
Accounting and Classifieds Angie Duman angie.duman@xyht.com

Circulation subscriptions@xyht.com Phone: 301-662-8171
Editor, Located Jeff Salmon jeff.salmon@xyht.com
Editor, Field Notes Eric Gladhill eric.gladhill@xyht.com
Contributing Writers Marc Delgado Linda Duffy Philippe Hensel Jeff Lucas Giulio Maffini Juan Plaza Gavin Schrock
Copyright © 2023 xyHt magazine. Printed in U.S.A. No material may be reproduced in whole or in part without written permission from the publisher. The publisher assumes no responsibility for unsolicited material, the accuracy of information supplied by manufacturers, or opinions expressed by contributors.
Partners and Affiliates
xyHt 3 OCTOBER 2023 xyHt [ISSN 2373-7018 (print), ISSN 2373-7735 (online), CPC CPM No. 41437548] is free upon request to qualified subscribers in the United States. The Canadian subscription rate is US $20/year. The International subscription rate is US $40/ year. Periodicals postage paid at Frederick, MD and additional post offices. xyHt is published 12 months a year by xyHt LLC, 6 N. East Street, Frederick, MD 21701. POSTMASTER: Send changes of address to: xyHt Subscriptions, 6 N. East Street, Frederick, MD 21701. Send Canadian changes of address to: Box 697 STN A, Windsor, ON N9A 6N4, Canada. For advertising, editorial, or other information, write to xyHt LLC, Inc. or call 301-662-8171. CONTENTS OCTOBER 2023 FEATURES 12
30
20 24
5
LOCATED 6
OCTOBER 2023 SURVEYING AND MAPPING, ELEVATED AI GIS UAVs GNSS The Complex Issue of AI and GIS 20 TheNewOPUSProjects INSIDE What’s Inside Your GNSS Rover? 26 VirtualRealityandPlanning 12
16 26
THE IMAGING & GEOSPATIAL INFORMATION SOCIETY
Looking Forward
By Jeff Thoreson
Where is Technology Taking Us?
WELL, HERE’S A NEWS FLASH FOR YOU. Technology in the geospatial professions is advancing. Rapidly. In a headspinning, dizzying, frenzied sort of way. I make this “observation” (a bit of humor, actually) because this month’s issue of xyHt seems to be a convergence of stories about game-changing technologies in various geospatial arenas.
Some technologies are creeping out into the general public, so Marc Delgado writes about architects and city planners who are engaging citizens with virtual reality to participate in urban development projects. VR can walk them through spaces and buildings rather than just having them look at plans and designs on paper.
Philippe Hensel concludes his series explaining the new technologies that have advanced OPUS Projects to make it easier for surveyors to submit a GPS project to NGS
for review and publication via NGS Datasheets, greatly simplifying the process of submission.
Gavin Schrock continues his three-part series taking a deep dive into the inside of your GNSS rover. If you thought you knew what defines a GNSS signal that the rover tracks, you’d better take a look through Gavin’s story.

And our cover story by Juan Plaza and Giulio Maffani begins a series that will take an in-depth look at how artificial intelligence and geographic information systems are now working together.
Enjoy the issue.
xyHt 5 OCTOBER 2023
JT – JT
What is Nodar and is it Better than Lidar?
THE NEVER-ENDING BATTLE BETWEEN LIDAR AND PHOTOGRAMMETRY HAS OPENED A NEW FRONT. Nodar, a Somerville, Massachusetts, startup is claiming its camera-based technology outperforms lidar in autonomous vehicle applications.
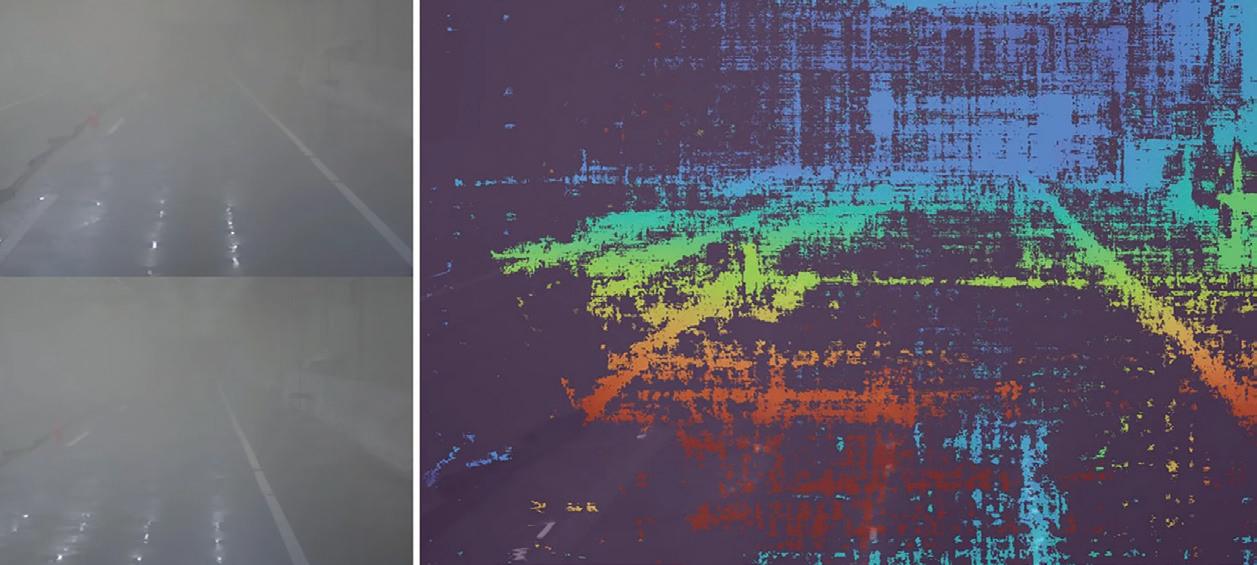
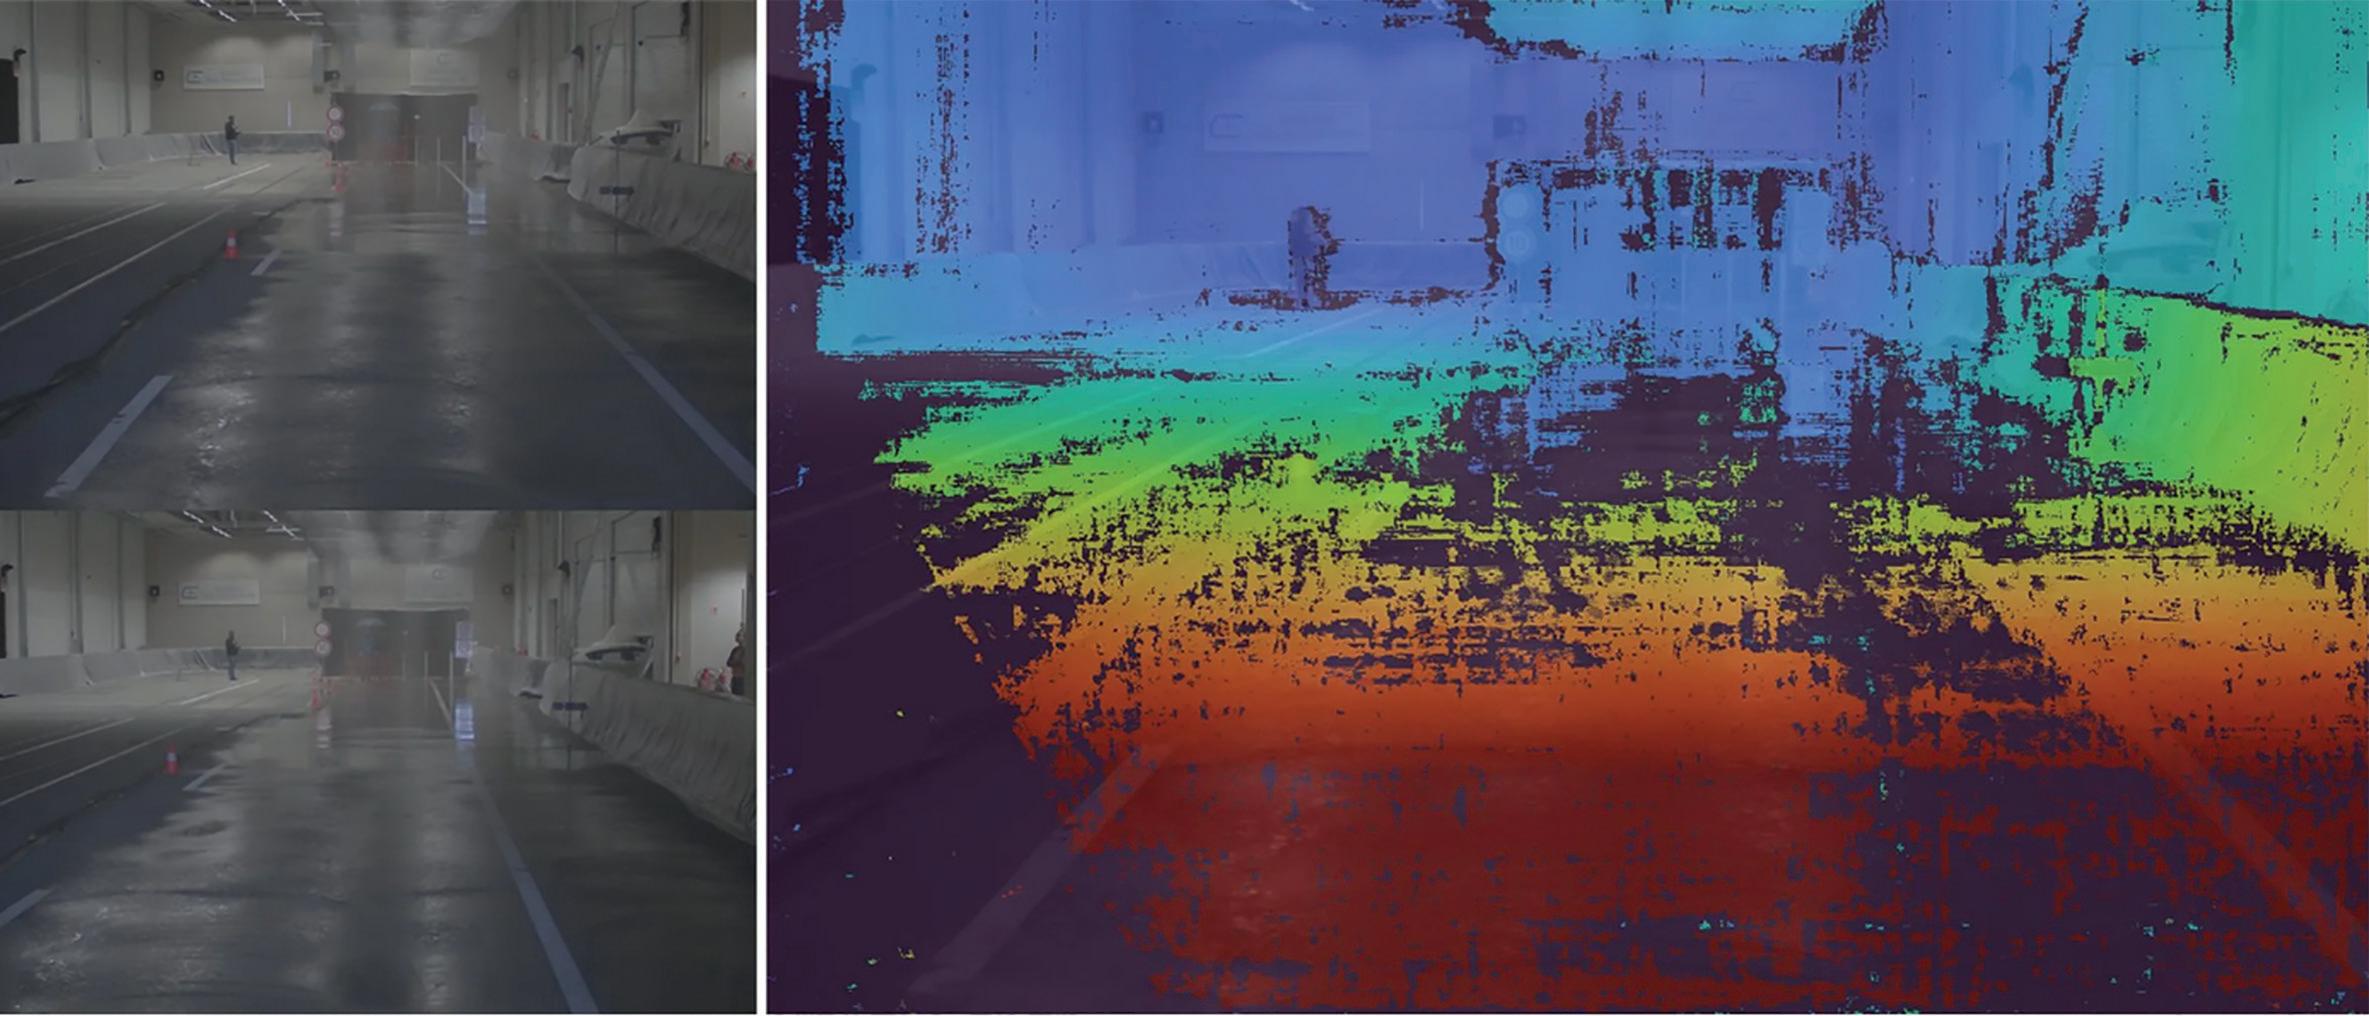
Using advanced automotive camera technology and Nodar’s proprietary software, Nodar claims to be able to detect small objects, such as pieces of lumber or traffic cones, at twice the distance of lidar. The technology works at night and in heavy fog and costs far less than lidar-based systems.
Nodar captures stereoscopic images from two cameras spaced 1.2 meters apart and then compares their views to construct a triangle, with the object at the far apex. It then calculates the distance between the object and the vehicle.
Testing in broad daylight, Nodar’s setup generated 40 million 3D data points per second compared to a high-end 1,550-nanometer automotive lidar’s 600,000. In extremely heavy rain the number of valid data points dropped by only around 30 percent, for lidar the drop was roughly 60 percent. And in fog with visibility of roughly 45 meters they found that 70 percent of their distance measurements were still accurate, compared to just 20 percent for lidar.
Could this technology be harnessed for geospatial applications? One consideration is the required distance between the stereoscopic cameras, the above automotive example shows 1.2 meters. This could easily work with fixed-wing, crewed aircraft, in fact, by increasing the distance between
cameras Nodar claims it is possible to triangulate to objects as far out as 1,000 meters. Adapting the system to the much smaller footprint of a typical multirotor UAV would require the addition of a 1.2-meter boom to the craft. Probably not a showstopper in terms of engineering.
One of the criticisms of re-purposing automotive lidar to geospatial applications is that the end goals of each differ greatly. The goal of automotive lidar is very simple, object detection and avoidance. The objective of geospatial technology, on the other hand, is much more robust: to capture the environment and provide precise location data and accurate measurements. This applies to non-lidar automotive technology as well. With this in mind, let’s look at the last two elements of the Nodar system: the camera and software.
Adapting the Nodar camera platform seems quite doable as the system uses comparatively low-res 5.4-megapixel cameras, upgrading to 20+ megapixel cameras should boost accuracy considerably.
Nodar’s proprietary stereo matching algorithm software is designed to run on off-the-shelf automotive chips, upgrading to purpose-built GPUs would be another option for boosting accuracy and performance.
These “thought experiments” are a bit premature as Nodar is in the startup stage. We’ll have to wait and see how the system develops, but Nodar is definitely a technology to watch.
xyHt 6 OCTOBER 2023
Send your Located items to located@xyht.com Mapping Your World | UAV/UAS | Space | New Products
Located Located Located
Compiled by Jeff Salmon
EVENTS
InterGeo
October 10–12
Berlin, Germany
NACIS
October 11–14
Columbus, OH
GIS-Pro (URISA)
October 16–19
Pittsburgh, PA
FOSS4G North America
October 23–25
Baltimore, MD
GoGeomatics Expo
November 6–8
Calgary, Alberta, Canada
Trimble Dimensions

November 6–8
Las Vegas, NV
Smart GEO Expo
November 8–10
Gyeonggi Province, Republic of Korea
Pacific GIS & Remote Sensing User Conference
November 27–December 1
Suva, Fiji
2nd Ramon International Geospatial Intelligence 360 Conference
December 4–5
Tel Aviv, Israel
Geospatial World Forum

May 13–16, 2024
Rotterdam, Netherlands
GeoWeek
February 11–13, 2024
Denver, CO
FIG Working Week 2024

May 19–24, 2024
Accra, Ghana
xyHt 7 OCTOBER 2023
Airborne Technology Helps Create Good Wine
IS THERE A WAY TO DETECT A DEBILITATING GRAPE PLANT DISEASE BEFORE IT SPREADS out to other healthy vines? Yes, according to NASA scientists, and it can be done from the sky.
Using the Airborne Visible/InfraRed Imaging Spectrometer (AVIRIS-NG) from NASA’s Jet Propulsion Laboratory, grape growers can now know if their vineyards are infected by the Grapevine leafroll-associated virus complex 3 (GLRaV-3), a disease that costs the wine and grape industry billions of dollars each year.
Spread largely by insects, GLRaV-3 not only causes low harvests, but it can also lead to lower wine quality. Manual detection is usually done by checking the vine leaves for symptoms and performing confirmatory lab tests, but doing so in large areas of vineyards can be tedious. Capturing spectroscopic imagery of the leaves from the sky using AVIRIS-NG is a better alternative because it speeds up the disease detection process, especially when combined with machine learning models that can scan the captured imagery for tell-tale symptoms before they can be seen by the naked eye.
“Like humans, sick plants may not exhibit outward symptoms right away, making early detection the greatest challenge facing growers,” said Katie Gold, an assistant professor at Cornell University and plant pathologist.
Her team used the AVIRIS-NG to detect infected vineyards in California with 87 percent accuracy, allowing growers to intervene promptly and improve future grape harvests. Let’s say cheers to that!
 — Marc Delgado, marc.delgado@xyht.com
GeoCue Introduces Three New, High-End, TrueView 3D Imaging Systems
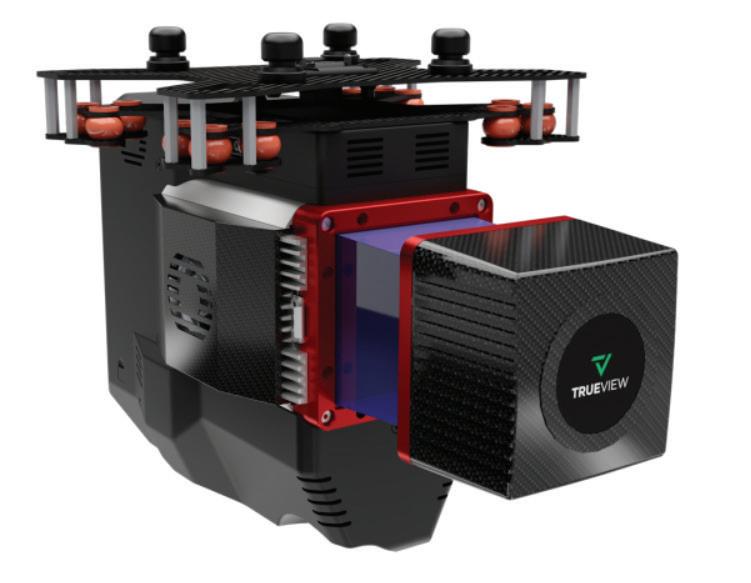
GEOCUE, PROVIDER OF GEOSPATIAL SOLUTIONS FOR LIDAR MAPPING HARDWARE AND SOFTWARE, has released three new, high-end TrueView 3D Imaging Systems. The all-new TV625, TV680, and TV680LR are set to redefine the standards of aerial imaging technology.
These new systems, designed and manufactured in the United States, combine a very lightweight and compact laser scanner with three cameras to deliver accuracy and efficiency in geospatial data collection. Besides integrating state-of-the-art components and cutting-edge technologies, the new systems are NDAA compliant, empowering professionals across a wide range of industries, including surveying, construction, infrastructure management, and environmental monitoring.
Leica Introduces BLK2FLY Autonomy Upgrade: Indoor Mode
LEICA HAS ANNOUNCED THE BLK2FLY’S NEW INDOOR MODE. This sought-after feature opens new scanning possibilities in indoor spaces such as arenas, manufacturing plants, warehouses, and other facilities. To scan these spaces, Indoor Mode accomplishes three things: it does not require GNSS, obstacle avoidance is reduced effectively and safely to 1.5 meters, and it flies slower for maneuverability, which enables it to get closer to objects and fly in tight spaces.
Thanks to the Indoor Mode’s reduced flight speed and increased obstacle avoidance, built on improvements in the BLK2FLY’s visual SLAM system, the BLK2FLY can fly manually up and around ceiling rafters, rods, and other structures that would otherwise not have been possible to capture in such close detail.
The result? A complete dataset of the entire interior of the area with all features included.

xyHt 8 OCTOBER 2023
Overture Launches
First-Ever Mapping Dataset
OVERTURE MAPS FOUNDATION (OMF) RELEASED ITS MUCH-AWAITED OPEN MAP DATA THIS SUMMER. Covering some 60 million places around the world, OMF’s inaugural data deployment is a clear signal that it wants to be taken as a serious player in the geospatial and location-based services sector.

This latest version has four unique map layers (places of interest, buildings, transportation network, and administrative boundaries), with the bulk of the data coming from the geospatial repositories of Meta, Microsoft, and Esri, all OMF founding members. Maps for the building footprints and road network, meanwhile, have been largely derived from the OpenStreetMap project.
“The Overture release is a significant step in establishing a comprehensive, market-grade open map dataset for our constantly changing world,” said Marc Prioleau, executive director of Overture Maps Foundation. Hatched late last year, the OMF aims to build the next generation of interoperable open map products through a collaborative effort among top tech companies including Amazon, Microsoft, and Meta, as well two leading geospatial companies TomTom and Esri. The latest Overture Maps data can be accessed on the cloud (from both Azure and AWS, of course).
— Marc Delgado,
marc.delgado@xyht.com
Digital Twin Market Worth $110.1 Billion by 2028
A NEW REPORT BY MARKETS AND MARKETS, PREDICTS EXPLOSIVE GROWTH for the digital twin space in the very near future.
The report entitled "Digital Twin Market by Application (Predictive Maintenance, Business Optimization, Performance Monitoring, Inventory Management), Industry (Automotive and Transportation, Healthcare, Energy and Utilities), Enterprise and Geography — Global Forecast to
2028" predicts the global digital twin market size will grow from $10.1 billion in 2023 to $110.1 billion by 2028 at a compound annual growth rate of 61.3 percent. The key factors fueling the growth of this market include the rising emphasis on digital twins in manufacturing industries to reduce costs and improve supply chain operations and the increasing demand for digital twins from the healthcare industry.
Topcon Introduces Aptix Integration Platform
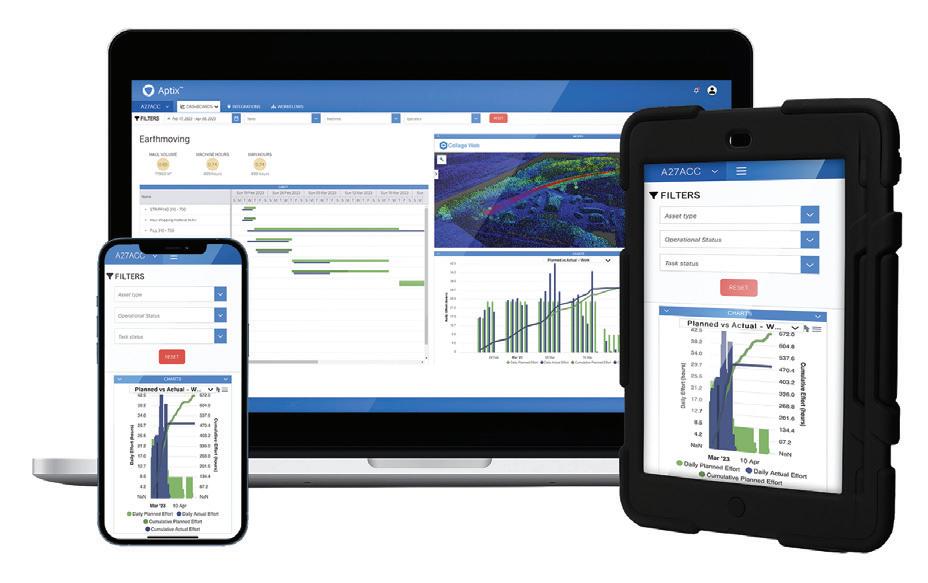
TOPCON POSITIONING SYSTEMS HAS INTRODUCED APTIX, a new integration-platformas-a-service (iPaaS) to optimize how heavy civil construction projects are managed. Aptix seamlessly integrates Topcon solutions with multiple third-party applications to automate and orchestrate data connections between the office and job site. It streamlines processes and generates insights for construction teams within one platform, ensuring the as-built is as-planned and the project meets profitability goals.
Aptix automates and orchestrates the distribution of data, including machine control files, constructible models, project schedules, and reports on actuals. It shows, in near real-time, the location of machines with the ability to aggregate as-built data from mixed fleet telematics. It provides real-time reports on people, materials, machines, and carbon dioxide emissions, creating greater visibility for carbon footprint and sustainability initiatives.
xyHt 9 OCTOBER 2023
xyHt 10 OCTOBER 2023
Wildfire Spotting From Space
SEVERAL COUNTRIES HAVE GRAPPLED WITH WILDFIRES THIS SUMMER, but some are worse than others. Canada, for example, has seen an increase in wildfire incidents this year compared to previous periods on record. That’s according to the World Fire Atlas, a platform developed by the European Space Agency to track the distribution of wildfires taking place around the world.
Using night-time thermal data captured from the Copernicus Sentinel3A satellite, the World Fire Atlas detects wildfires by tallying all the pixels on the Earth’s land surface where hot spots of higher-than-normal thermal infrared radiation are occurring.
From January to July this year, the satellite’s sensors spotted more than 11,000 fire pixels in Canadian forest lands. That amounts to a staggering 705 percent increase in wildfire occurrence compared to the same period from 2017 to 2022.

With more than 10 million hectares of forest lands going up in smoke this year alone, Canada will need to learn new ways to prevent catastrophic wildfires in the future. And that’s a big challenge as global temperatures continue to rise.
Carlson’s Precision3D Hydrology 2023 Released
THE NEW RELEASE INCLUDES A HOST OF NEW FEATURES, most notably full storm sewer design in addition to the standard culvert design, channel liner design, and peak flow calculations of previous releases.
A large and expanding library of headwalls, inlets, and manholes is provided as standard with Precision3D Hydrology 2023. With the new release, users can design in 3D using precise Digital Terrain Models as made in Carlson Civil 2023 or as imported from other CAD software products in the form of LandXML files.
Precision3D Hydrology 2023 benefits greatly from “Intelligent TINs” of DTM files that include the land covers. These Intelligent TINs can be made in Carlson commands such as Road Network within the Carlson Civil module or updated by the Define Watershed Layers command within the Hydrology module.
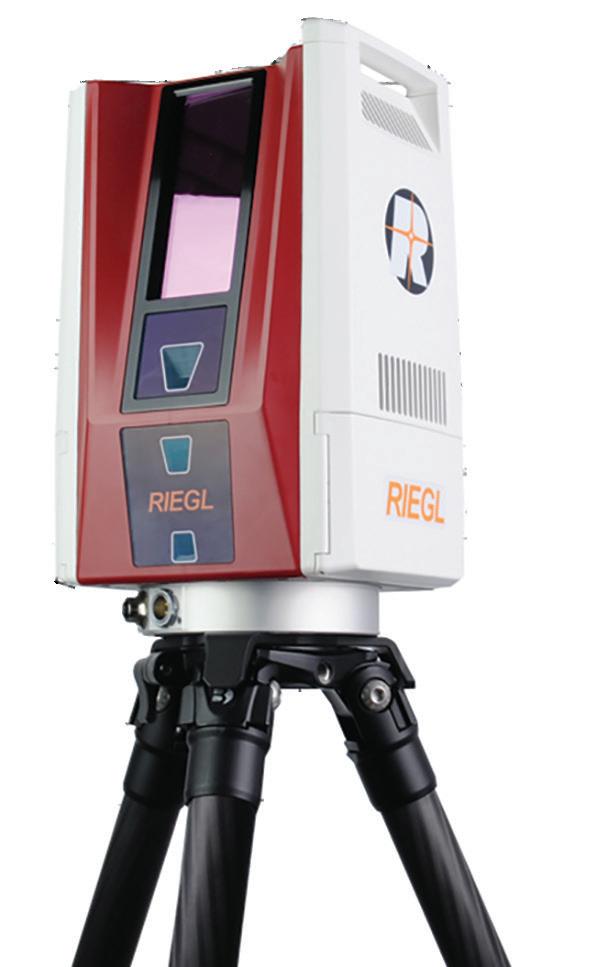
RIEGL’s New VZ-600i
THE RIEGL VZ-600I OFFERS A BROAD RANGE CAPABILITY from 0.5 m up to 1,000 m and is suitable for indoor and outdoor 3D mapping applications. 3D position accuracy of 3 mm, less than 30 second scan time for high-resolution scans with 6 mm point spacing at 10 m, enabling more than 60 scan positions per hour with realtime registration, weight less than 6 kg (13 pounds), 2.2 MHZ PRR, three internal cameras and GNSS integrated, and also prepared for mobile mapping applications— these key features will speed up workflows in indoor and outdoor applications like AEC (Architecture, Engineering, Construction), BIM (Building Information Modeling), as-built surveying, forensic and crash scene investigation, archeology and cultural heritage documentation, forestry, and many more.
 — Marc Delgado, marc.delgado@xyht.com
Out of This World Lidar
ONE OF THE IMPORTANT LESSONS THAT WE LEARNED FROM THE NEAR SHUTDOWN of the Global Ecosystem Dynamics Investigation mission (GEDI) is that there is genuine demand for spacebased lidar mapping. After petitions from the scientific community, NASA has decided to continue operating the GEDI from the International Space Station (ISS). GEDI’s high resolution lasers are being used to capture the 3D topography of the Earth, including its remaining forests, allowing researchers to improve our understanding of our changing planet and its climate.
While the GEDI mission will most likely end with the planned decommissioning of the ISS in 2031, a new player is positioning itself in the opening space.
NUVIEW, an Earth observation and geospatial technology company based in Florida, is building the world's first commercial lidar satellite constellation to provide a continuously updated 3D point cloud of the entire Earth surface.
“Our space-based lidar technology can revolutionize how we monitor Earth’s resources and ecosystems, providing us with the data necessary to make informed decisions and implement effective solutions,” said Clint Graumann, CEO and co-founder of the company. NUVIEW already has $1.2 billion in early adopter agreements, with actor and environmentalist Leonardo DiCaprio as one of its investors.
— Marc Delgado, marc.delgado@xyht.com
xyHt 11 OCTOBER 2023
INTERACTIVE CITY PLANNING
people behind, especially when citizen involvement falls short.
Take for example the conventional way of presenting design proposals to the public. Urban planners normally employ 2D drawings as well as paper cut-out 3D scale models to help citizens visualize how new urban projects will impact their landscape. Due to the nature of their jobs, urban planners are very skillful in imagining these diagrams in bigger and true-to-life dimensions.
But to the untrained eyes of the citizenry, it may be more difficult to perceive and derive insights from simply looking at printed maps, paper drawings, or model cut-outs. This basic spatial limitation is one important factor that reduces the effectiveness of public participation in the urban design process.
When it comes to reshaping cities and constructing new structures, modern architects consider public participation an essential part of creating sustainable and livable areas.
By Marc M. Delgado, PhD
From Sweden to Singapore, more and more places are shifting away from the traditional top-down approaches in urban planning and are now embracing civic engagement. Yet even the most well-intentioned urban changes can leave many
So how can we improve citizen engagement in urban development projects and make the experience less passive? Several digital tools are already being used around the world, such as GIS maps and 3D city models. These mapping platforms can be viewed on wide computer screens or projected on large walls to make them seem life-like, a typical solution that is being employed in many town hall presentations.
xyHt 12 OCTOBER 2023
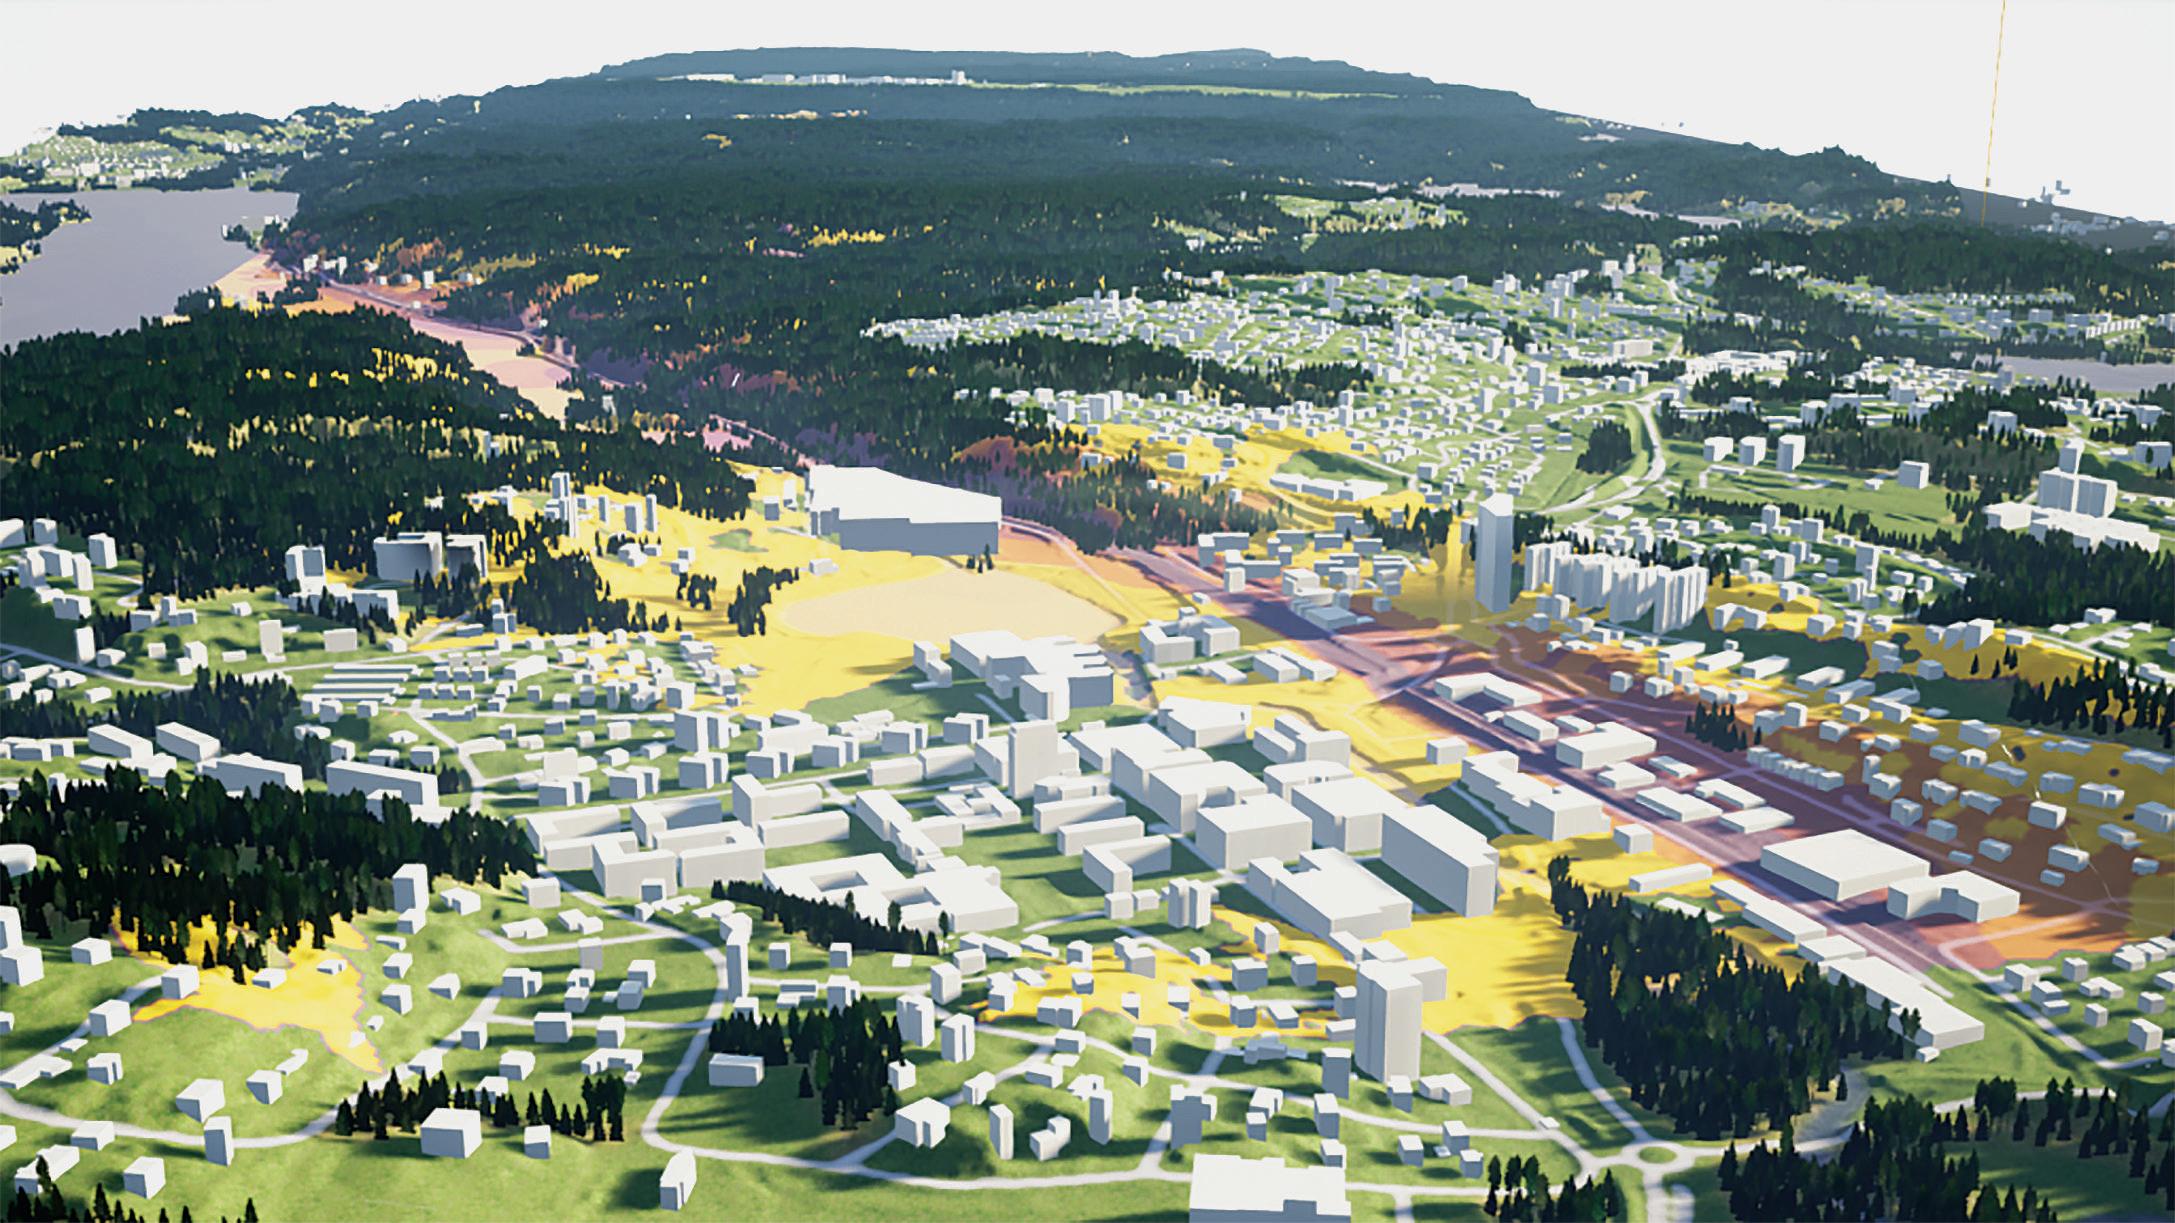
Engaging citizens to participate actively in urban development projects can often be difficult. But rendering designs in 3D city models and transforming them into immersive virtual reality spaces might just do the trick.
A portion of Gothenburg 3D city model created by the Digital Twin City Centre (DTCC) at Chalmers University of Technology in Gothenburg, Sweden.
Yet they also fall flat in terms of interaction because merely displaying the Earth’s curved and uneven surface on a screen, however big the screen is, will still distort how reality is perceived by a normal person. Putting that person inside the map could be a better alternative.
That’s what virtual reality (VR) technology is doing. VR can simulate real environments by placing the users within the context of any design project using 3D-rendering VR headset devices. By wearing a VR headset, anyone can have the opportunity to experience the envisioned design in an immersive environment, allowing them to have a richer interaction with the project before it is built.
With virtual reality technology, planners can convey their urban design projects in a simulated manner where people can walk through a map or a master plan, view and understand the proposed construction in their exact dimensions and topology, and have an interactive experience with the future building or landscape. The viewer’s instantaneous interaction with the design can then offer important feedback that can be used to improve or modify it.
One such project that aims to make virtual reality a useful tool in urban planning is Twinable, a research activity that is part of the Digital Twin City Centre (DTCC) at Chalmers University of Technology in Gothenburg, Sweden. Twinable is using the 3D model of Gothenburg, the city’s digital twin, which was created by the DTCC to
support large-scale urban simulations and visualizations.
“Digital twins are becoming more and more available but are still quite abstract for most people,” says Alexander Hollberg, an associate professor for Computational Sustainable Design at Chalmers and also an architectural engineer by training.
“The same is true with other digital technologies, such as virtual reality and augmented reality, which are also becoming more available but are not yet that readily usable for everyone,” adds Hollberg, who along with colleague Liane Thuvander want to make use of these new technologies as a “way to understand and explore how digital twins of cities can be made accessible to researchers, designers, and the general public.”
Thuvander, an architect and professor in Architecture and Sustainable Building at Chalmers, and Hollberg lead the Twinable project.
“In my research, I study how digital tools can support stakeholder dialogue and participatory processes in planning, design, and transformation of the built environment,” says Thuvander.
Hollberg and Thuvander had a perfect case study to test their virtual idea. In the outskirts of Gothenburg, there is a plan to construct a new town for 10,000 inhabitants in an area that today is dense forest. As was anticipated, many people objected to the plan, so the project developers wanted to show that there will still be a lot of trees in the new town while also allowing the citizens to participate in the planning process.
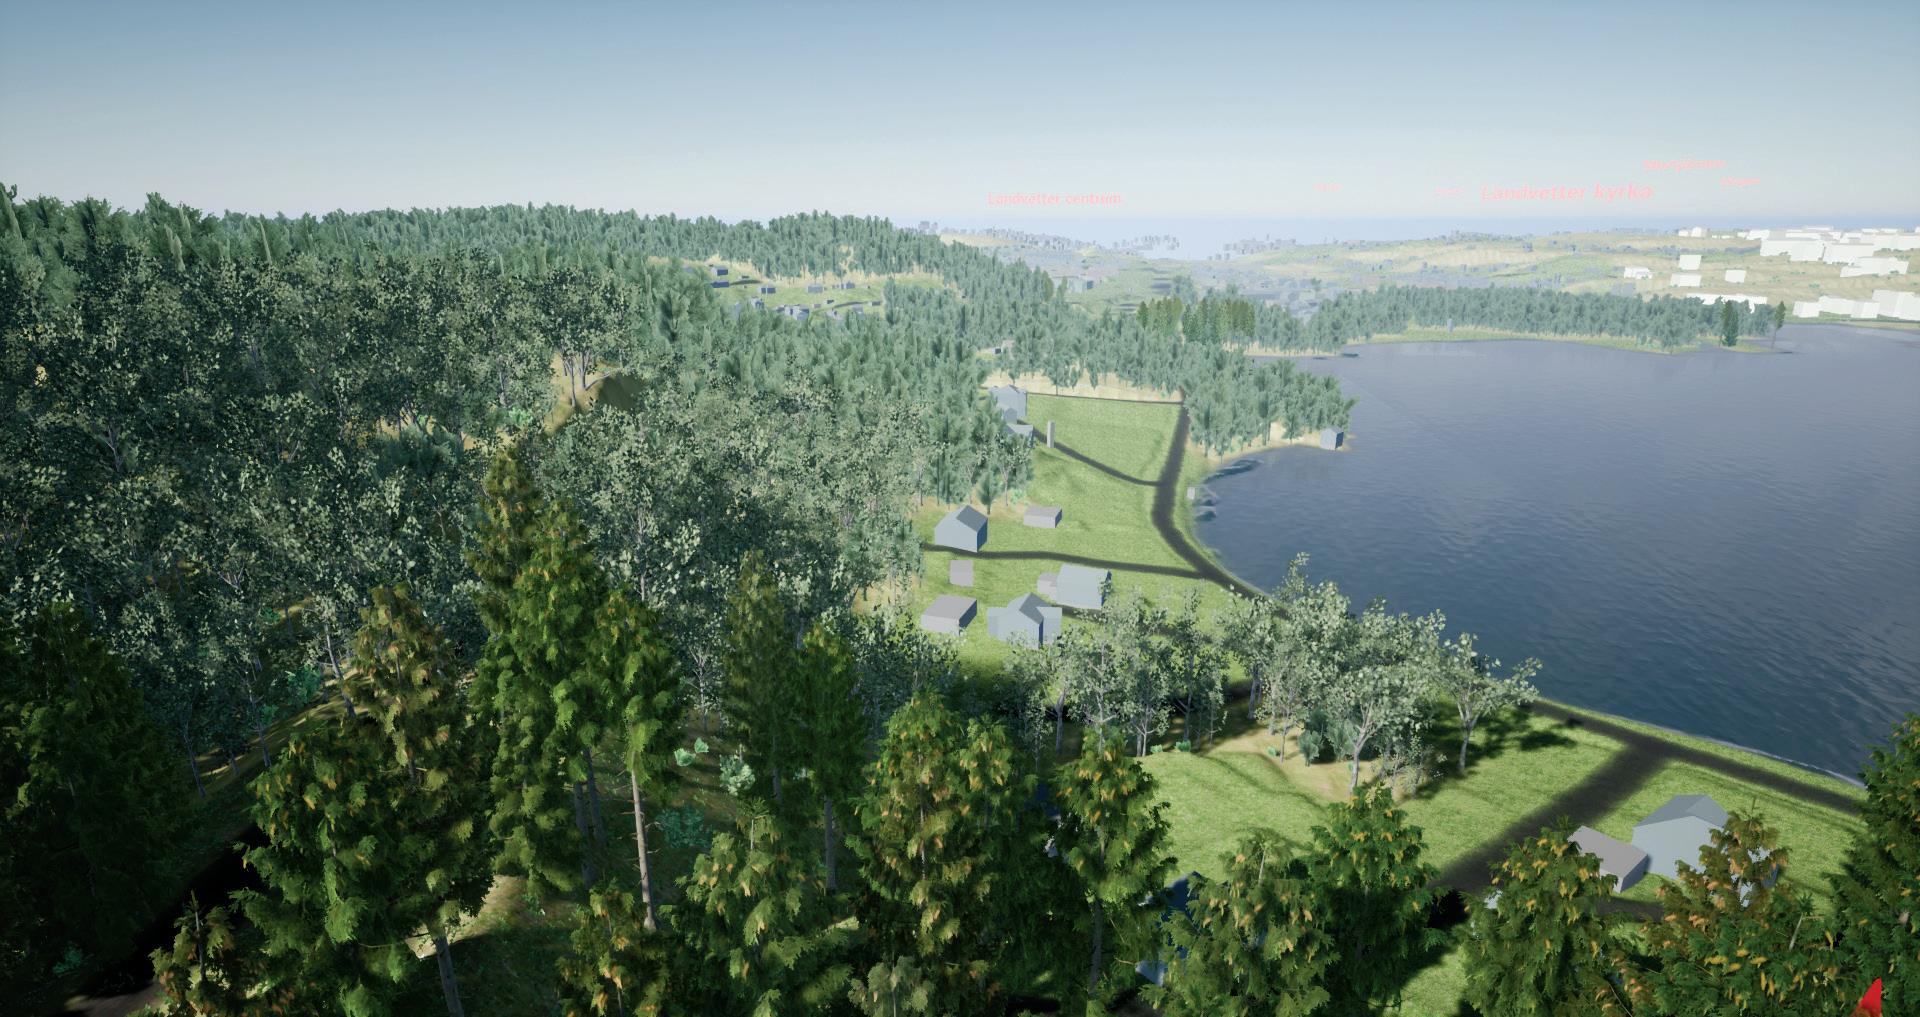
“For this project, our virtual reality platform has been developed with a focus on efficient and realistic visualization of the forest and vegetation in order to show how the future urban development will look like,” says Thuvander. “This includes visualizing new buildings and their potential impacts on recreation areas. But most importantly, the VR platform is envisioned to invite the residents to give feedback on the development, as well as to interact and comment on the proposals.”
Hollberg believes that although one can try to convince citizens with maps and presentations, there is a better alternative. “Letting people explore the new town by themselves in VR is much more powerful,” he says.
Virtual reality has been around for many years, and it has very strong roots in the video gaming industry. Gamers have been enjoying immersive gaming experiences since the release of commercial VR headsets by companies such as Oculus, Sony, and Nintendo in the mid-2010s. Back then, some of the very-first VR games like Arkham and Final Fantasy XV, were slow and lagged a lot. But they already looked great due to the enhanced realism of the game’s surroundings.
Despite the latency and technical glitches, virtual reality gaming increasingly became popular because it provided gamers with better visual sensory stimuli and promoted active play interaction like never before.
So maybe the Twinable team members are virtual reality gamers themselves?
“No, we are not VR gamers at all,” says Hollberg. “Actually, I have never used a VR headset before this project.”
Hollberg, however, thinks that it sometimes helps to have an outsider perspective while doing research. He explains that when he joined the DTCC and met all the mathematicians and computer scientists who were developing the digital twin city platform, he was amazed by their work. And yet he thought something was missing.
“This new technology needs to be understandable to ordinary people like me. Personally, I need to see something to be able to understand it, and I assume that many people are the same,” says Hollberg. “So, I thought, why not try to allow others
xyHt 13 OCTOBER 2023
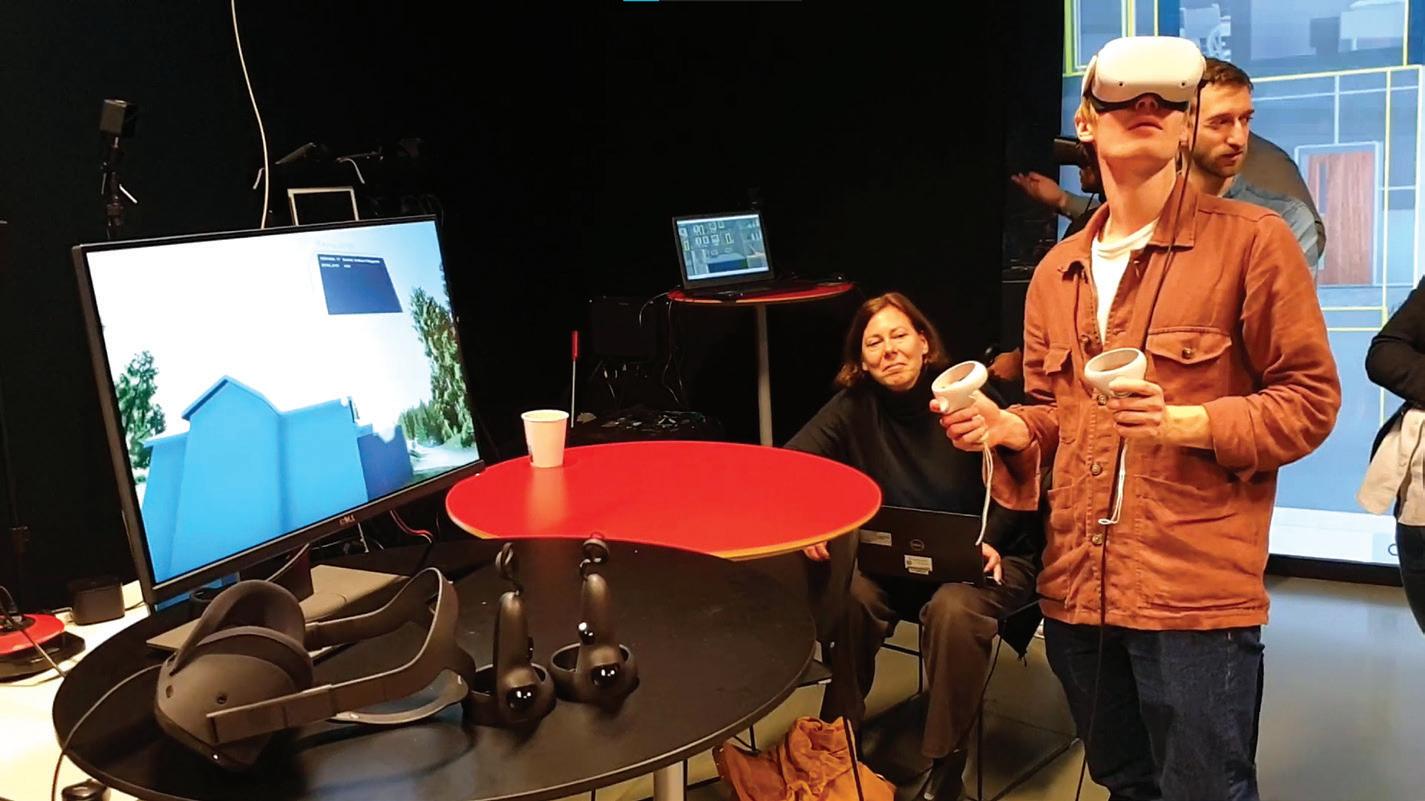
A participant wearing a VR headset and holding its controller while taking part in Twinable’s Virtual Reality project.
to see both the new design proposals and the power of the digital twin platform in the virtual world? I knew that Liane was experienced with participation studies, while at the same time VR headsets have become much cheaper. And other colleagues had the computational skills. So, I was convinced this should work.”
One of those colleagues is Sanjay Somanath, a PhD student at Chalmers whose research looks at how digital tools can support architects and urban planners with social sustainability. “For the Twinable project, my role was to build the pipeline combining real-world data from different sources and getting them into Unreal Engine,” he says.
Unreal Engine (UE) is a powerful 3D computer-graphics design software developed by Epic Games, an American video game company best known for the game Fortnite. UE is an example of a low-code game engine that allows people with basic programming skills to develop three-dimensional features of buildings and landscapes from scratch using the software’s own Visual Scripting system. Since 2015, the UE platform has been made available to anyone at no cost, a boon not only to game developers but also to architects and computational designers like Somanath.
“To be honest, I can’t imagine another way we would be able to achieve our project,” replies Somanath when asked about how the 3D computer graphics game engine was beneficial to create the immersive environment that they needed.
“We are not professional game developers or programmers, but platforms like Unreal Engine have democratized this way of visual communication that is otherwise inaccessible to a lot of people,” says Somanath. “I think that this is a really powerful thing.”
The Twinable team also had to access other geospatial files to build the 3D virtual city model of their study area. For instance, they tapped the open mapping dataset of Gothenburg and processed it on the DTCC platform.
“The Lantmäteriet (the Swedish mapping, cadastral, and land registration authority) was our main source of real-world data,” says Somanath. “We used the DTCC platform to generate a JSON representation of the existing buildings and their attributes so that we could then visualize them in Unreal Engine.”

The team was also able to make use of other valuable datasets from the transport, urban development, and forestry depart-
ments. “These provided as much detail to our VR project as possible,” adds Somanath.
And indeed, a quick view of their simulated landscape shows realistic-looking trees and foliage, evident of the meticulous work that was put into their VR environment.
But not everything was a walk in the virtual park. Somanath says one of the hardest parts of their work was bringing together all the different datasets. “We had GIS data on the various land uses, species of trees and plants as boundary regions, as well as lidar scans of the area,” he says. “But we had to determine which regions had what vegetation and how to communicate all that to Unreal Engine.”
xyHt 14 OCTOBER 2023
Two virtual reality scenes show buildings, landscapes, and almost real-life depictions of vegetation of a plan to construct a new town for 10,000 inhabitants in an area that today is dense forest in Sweeden.
In the end, the solution that they settled on was to compress all this geospatial information into raster masks. “This is a technique that game developers have been using for a long time, but it was new to us,” says Somanath. “Once we could do that, Unreal Engine did much of the heavy lifting. We used the world composition and procedural foliage spawner inside Unreal Engine to manage the millions of trees that went into the forests.”
Anyone with experience in creating landscapes, may it be with maps or 3D city models, will always look at the level of detail of each element as an important factor to consider in visualizing simulated places. The same is also true in making virtual reality scenes.
“Getting the level of detail (LoD) just right was a challenge because we wanted users to have an immersive experience and really get a feel for the nature and the scale of the forests, while still being able to run our VR platform on a regular laptop,” says Somanath. “This required a lot of tweaking on the foliage assets that we used. In the end, we manually went into each LoD of the foliage assets and optimized them so users wouldn’t be pulled out of the experience.”
Once the VR platform was ready, the Twinable team invited two groups of participants to test it. The first group was composed of professionals (architects, software developers, consultants, urban developers, municipal officers), and the second group was 15-year-old students.
Donning an Oculus Quest VR headset, the participants walked and interacted with the VR scenes, while the Twinable team observed their behavior throughout the process. Afterward, the participants were interviewed to get to know how they perceived the virtual landscape and vegetation, as well as how they navigated and interacted within the VR environment.
Judging from the answers of the participants, Thuvander observed that the
virtual reality experience was a bit different for the two groups.
“Generally, both the professionals and the students were enthusiastic to use VR,” says Thuvander. “But it was more straightforward for the students as they are more used to gaming and moving around in virtual environments. As soon as the students wore the headsets, they started directly to explore the functions and different settings and helped each other when getting stuck. They played around quite independently,” she says. “The professionals, however, had a longer starting process to get familiar with the VR equipment and its functionalities. We needed to help them from time to time.”
the content with focus on interactivity,” she says.
While their Twinable project is still on-going, and with upcoming improvements in mind, Thuvander already anticipates that there is an important sector that will surely value their VR efforts.
“We see architects as one group of professionals who can benefit from using VR and digital twins. VR can provide a rich level of detail in an immersive environment, it is interactive, and you can move around,” she says. “VR can convey a better feeling of the future places and can support the architect’s communication with clients. This way clients might feel more involved in the process. Aside from that, a more realistic VR can also help the architect's own design process as it can visualize the consequences of different design solutions.”

So, what did the participants think about the urban development project as it was rendered in VR?
“The participants appreciated the high level of detail of the trees, especially as the leaves moved in the wind. Also, most users would have liked more details on the buildings,” says Hollberg. “The students, on the other hand, had lots of fun exploring the virtual buildings, moving them to other places and proposing new amenities, such as an ice rink or shopping mall, which they would like to put in place.”
According to Thuvander both the adult and student groups showed interest to continue using the VR platform, although she adds that “we still have to improve the VR’s usability.” She explains that this can be done by developing more functionalities, as well as adding additional details about the buildings, and making users move more smoothly in the VR environment.
“In the future, we would like to do more tests with different user groups and work with comparable versions of
While the Twinable team acknowledges that more work needs to be done, they are also quite optimistic on the role that digital twins, 3D city models, and virtual reality can play in making urban planning more interactive.

For Hollberg, the main advantage of these new digital tools is the way they make data more easily accessible for urban planners. “It provides a platform to test, simulate and optimize various scenarios,” he says.
Thuvander agrees and sums it up by stating that digital twins can make complex data understandable to the public in support of civic engagement. “Through digital twins, data can be collected about the perception and opinions from the public in a participatory way,” she says. “This will allow citizens to be actively involved in the planning, design, and transformation of their own neighborhoods and city.” ■

xyHt 15 OCTOBER 2023
Marc Delgado, PhD, is a GIS specialist who crisscrosses continents teaching GIS in Asia, Europe, South America, and Africa.
The Twinable Team (from left to right): Alexander Hollberg, Liane Thuvander, and Sanjay Somanath.
The Complex Issue of AI and GIS
By Juan B. Plaza and Giulio Maffini
Part 1
We attended remotely the ESRI User’s Conference (UC) held in San Diego on July 10th and, for the first time, saw and heard how the leading commercial GIS software company in the world positioned itself for the use of AI in its products. It is reasonable to assume that AI can make GIS and spatial thinking accessible to everyone at levels not imagined before, but this can only be possible if— and only if—we have ESRI, the leader of the industry on board.
This is what we plan to explain in this first installment of a three-part series about the complex relationship between AI and
GIS. In the next two issues we will bring experts to help us explain “How AI Can Benefit GIS” (Part 2) and then “What GIS can do for AI” (Part 3).

THE ESRI POSITION
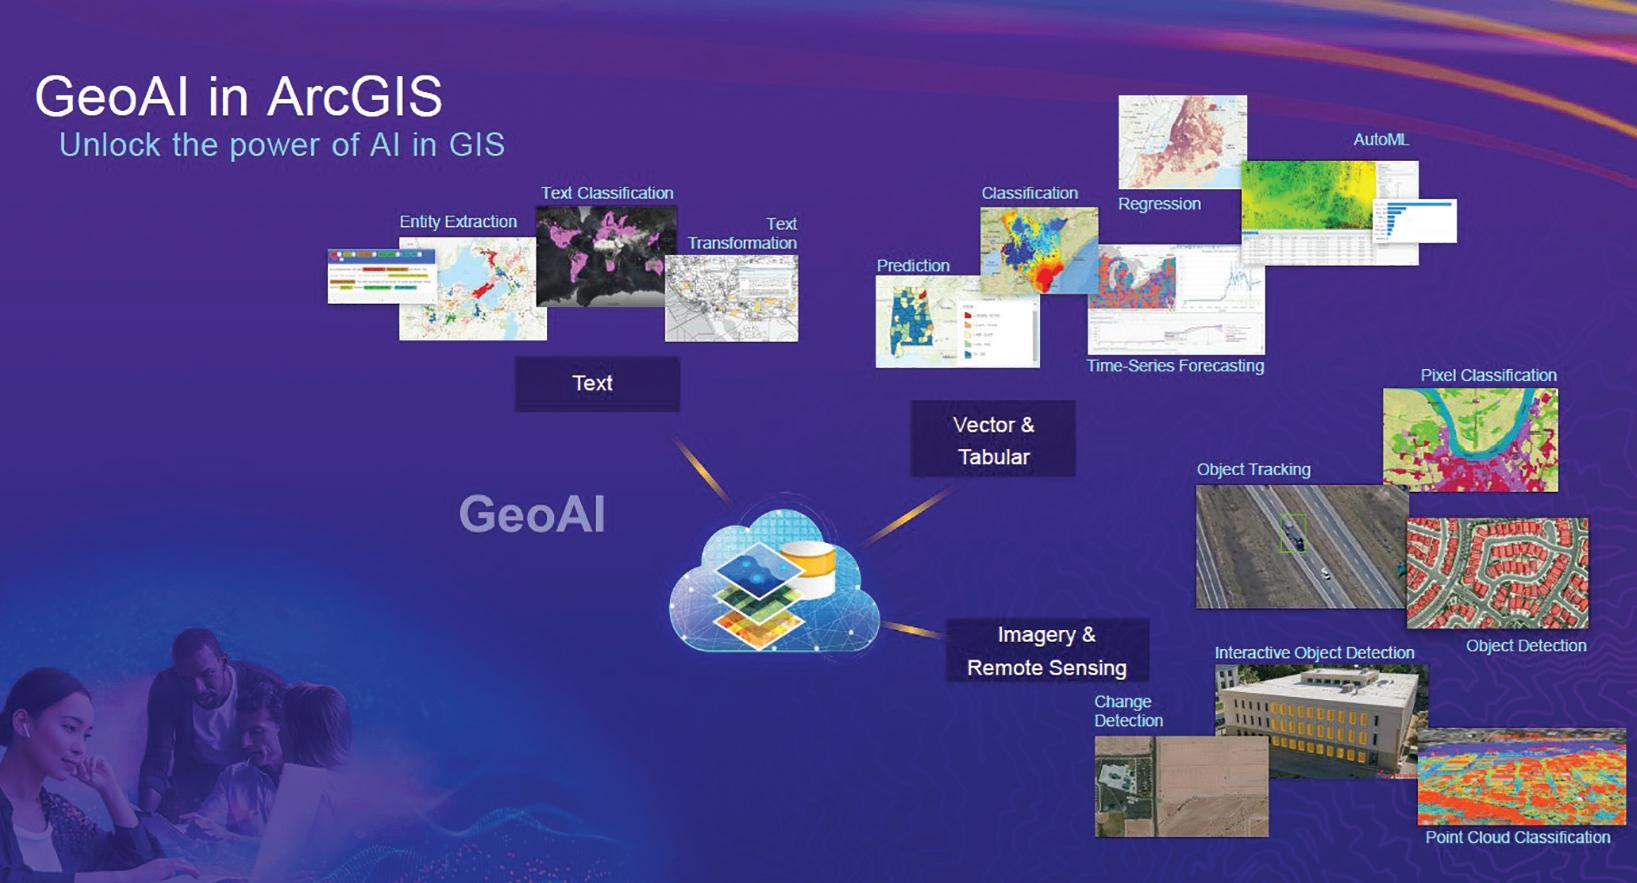
In a one-hour session entitled “GeoAI in ArcGIS” lead by Lauren Bennet and assisted by Nick Giner and Vinau Viswambharam, the group focused on the benefits of adding AI to the ESRI’s flagship product, ArcGIS. Bennet masterfully showed
xyHt 16 OCTOBER 2023
how AI is uniquely positioned to help organizations leverage the value of geographically located data for the benefit of the entire organization.
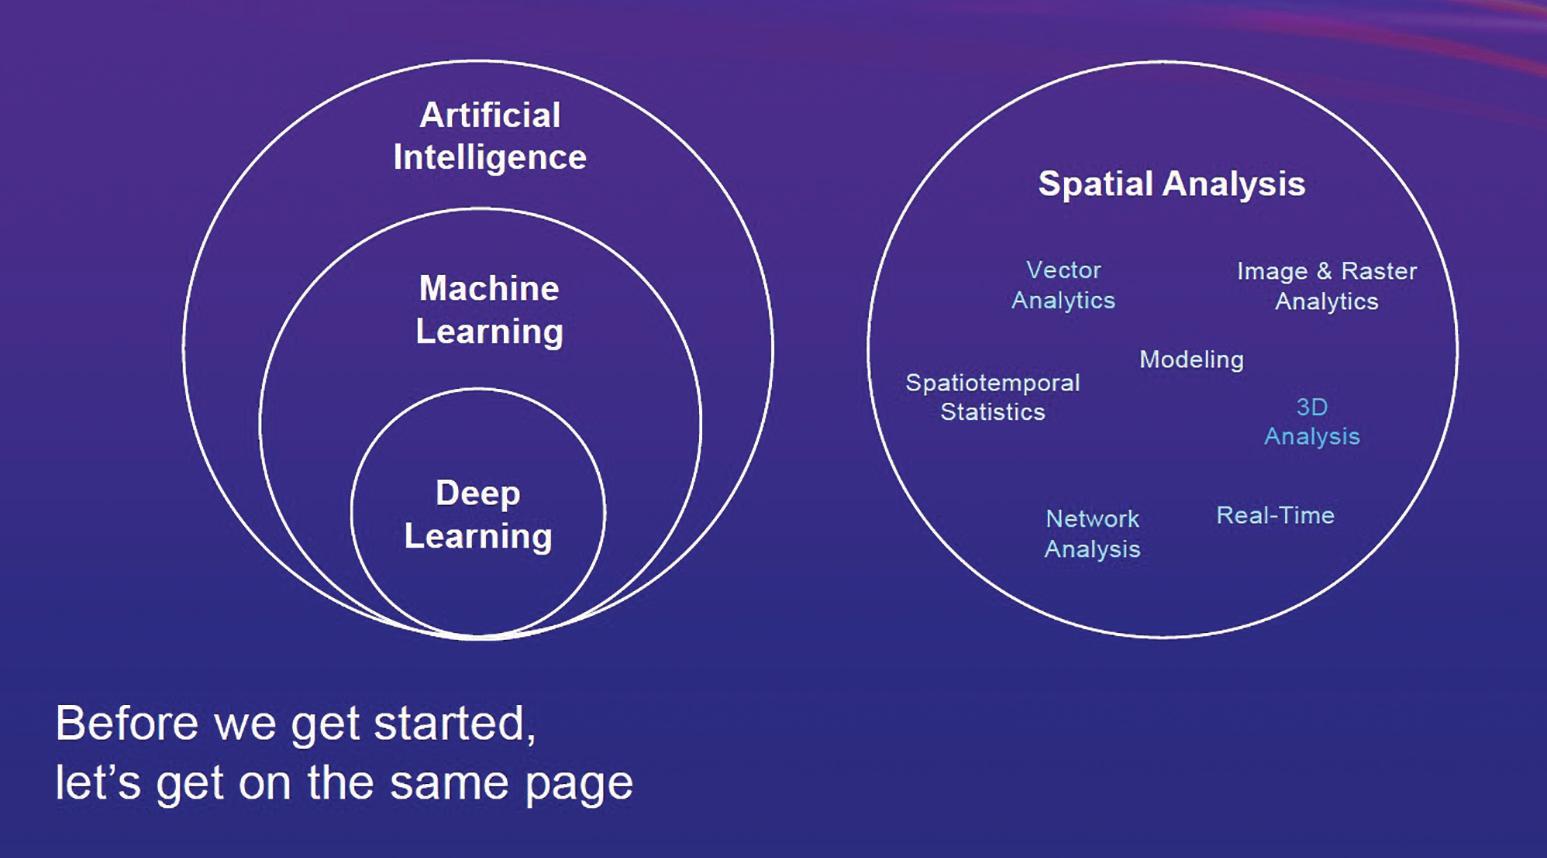
At the end of her presentation, she asked audience members to raise their hands if they were proud of a certain data analysis result that they had done in ArcGIS. Everyone raised a hand. Then she asked them: Do you consider yourselves data analysis scientists? Nobody raised a hand.
“You are all data analysis scientists,” Bennet said. “You have the technology and the tools to make incredibly valuable contributions to your organizations by adding AI-empowered geographical analysis to daily information technology operations.”
Then she solidified the point: “How many of you are in an organization that has a data science group that you are not part of?”
The audience remained silent, so she made her point “I challenge our community to increasingly see ourselves as the spatial data analysists that we are. We deserve to have a seat at the table, and we will not be invited. We need to be proactive and seek out that seat.”
After five decades of telling its customers and the world how GIS software was “special and different” from the usual software of IT departments, ESRI is now challenging ArcGIS users to join the IT world of AI. That this is being encouraged by the leading commercial GIS software company, is a very positive development and a good thing for both GIS and AI.
But why is this shift to IT happening now, and why has AI triggered it? The short answer is that the role of GIS in the IT world has been underway for a long time. A brief review of the origins of GIS and previous IT revolutions will help explain this and will set the table for future discussions on the topic.
THE BEGINNING
Before GIS existed, there were just paper maps and tracing paper. GIS science and technology emerged more than 60 years ago at the same time as digital computing. GIS was invented and driven forward by an eclectic group of bright minds drawn from different disciplines, including pilots, surveyors, architects, geographers, cartographers, mathematicians, and yes, software developers.
In the early 1960s, Dr. Roger Tomlinson dubbed as the “Father of GIS,” conceived of combining land-use mapping by means of emerging computer technology and initiated, planned, and directed the development of the Canada Geographic Information System (CGIS). This was the first computerized national scale GIS in the world.
Independently, Chicago architect Howard T. Fisher saw computer maps on urban planning and civil engineering graphics produced by Edgar Horwood's group at the University of Washington. He conceived a computer mapping software program SYMAP (Synergistic Mapping) to produce conformant, proximal, and contour maps using a line printer.
initiated the Odyssey project with the aim to produce a vector-based GIS with spatial analysis capabilities within a single system. The key technologist of Odyssey, Scott Morehouse, joined ESRI in the early 80s to develop Arc/Info the software platform that became the leading industry GIS platform.
These early stages of GIS happened at a time when software development and computer platforms were in their infancy. There were no standard affordable hardware platforms. Storage of data was limited and expensive. The pixel resolution and color range of monitors were limited. There were no standard devices for capturing or printing and plotting maps, but there was a rapid explosion of new devices.
With seed funding from the Ford Foundation that established the Harvard Laboratory for Computer Graphics, (the lab), Fisher and Betty Benson (the programmer), completed SYMAP for distribution in 1966. This was followed with other software programs developed by the lab, including SYMVU, GRID, CALFORM, and POLYVRT. Interestingly, the lab’s operational model was very similar to the way the open-source community of today works. It distributed software, and later data, at cost or free, to encourage academic experimentation and collaboration.
Jack Dangermond who, in 1969, founded the Environmental Systems and Research Institute (ESRI), worked as a research assistant at the lab in 1968 and 1969, the year he founded ESRI. In 1975, the lab
As a result, GIS developers had to spend a disproportionate amount of development effort to write code to use input and display peripherals. There was no standard way for computers to communicate with each other. The Internet only emerged in 1983. The Web browser source code for public use only became available in 1993.
When maps were on paper and data and programs were stored on punch cards and computer tapes, linking a digital vector map to attribute data was a novel concept. During this time ESRI was solidifying the concept of storing spatial (geographical) data in proprietary .SHP files (pronounced shape) and the related attribute data in .DBF files. The concept was solid and the advances in computer technology processing and storage capacity made the GIS idea feasible in the
xyHt 17 OCTOBER 2023
early 80s, creating an industry and turning ESRI into a privately held behemoth.
Unfortunately, the early innovation period was also a time of intense competition and an ill-advised commitment to proprietary data formats and hence the isolation of the newly created industry from itself and the larger IT world.
THE RDBMS DATABASE REVOLUTION
In parallel to the GIS industry growth, the rest of the IT world was also evolving, but in exactly the opposite direction. The database science and software technologies were significantly improving particularly for enterprise IT-networked environments. Companies such as IBM and Oracle were successfully developing new relational models where the database’s schema and logical organization of the database could be sepa-
rated from their physical information storage devices using communications networks.
RDBMS became the science of storing everything, anywhere, and relational databases that could be analyzed using a generic SQL query and programming language became the norm.
This RDBMS approach opened the door to an explosion of applications that revolutionized the way the IT business worldwide has worked. Companies such as SAP in Germany and IBM in the U.S. developed applications that allowed the enterprise to be more efficient, streamlining operations and enhancing productivity at levels that made these RDBMS systems indispensable and the bedrock of IT departments.
The IT-driven shift began. Every new application that was brought into the enterprise had to be based on RDBMS concepts
in order to be approved by the strict parameters of the IT department, and therefore compatible with the rest of the organization.
However, RDBMS applications were also big and expensive and if adopted by GIS companies would require reengineering their entire platforms. ESRI’s was the market leader in GIS at the time their own and other proprietary GIS data formats were becoming a standard in different vertical markets. That unnegotiable difference isolated GIS implementations from the enterprise scale IT departments in organizations all over the world.
Initially this was not a major impediment to GIS growth. Most GIS users were spatial scientists, conducting boutique scale projects and not of concern to the mainstream of the IT departments. A brilliant strategy that more than compensated for the loss of IT department mindshare was the leadership role that ESRI adopted to promote the new science in colleges and universities.
Jack Dangermond championed R&D development in academia and donated ArcGIS software to many academic geography, geodesy, mapping, and land surveying institutions. This created several generations of professionals who graduated knowing only one way to do GIS, the ESRI way.
In the early 90s things changed and IT departments of large electric, water, gas, telecom companies, and municipal governments, which had to manage and grow large networks of physical assets over vast territories, were looking to add a geographical component to their operations. The leading GIS of the time were too proprietary and difficult to scale up to meet their needs. Doug Seaborne, the founder of GeoVision in Canada, developed and launched an enterprise GIS solution that was using an embedded Oracle RDBMS as the database engine.
This new GIS model, to store both geographic and attribute data in an SQL-accessible secure enterprise environment, was followed by other companies, including ESRI. Finally, an enter-
xyHt 18 OCTOBER 2023
prise could associate their profitable and essential databases with a GIS, proving that the geographic component could be a valuable tool to increase the efficiencies of enterprise day-to-day operations.

THE WEB AND OPEN GIS STANDARDS
The explosive growth of the Web and the success of enterprise GIS in industry and government created a demand for the GIS industry to become more open and interoperable, based on well-defined open standards. Governmental agencies, industry, and academia inspired the formation of a non-profit organization called Open Geospatial Consortium (OGC). The OGC, founded in 1994, is an international voluntary consensus standards organization for geospatial content and location-based services, sensor Web and Internet of Things, GIS data processing and data sharing.
The web and open geospatial standards again changed everything. They fueled a new wave of end users, free webbased GIS applications, and databases that brought GIS to anyone in the world who had a PC or a mobile phone.
Google Maps, Google Earth, Street View provided once-unimaginable access to immense and accurate information for organizing, tagging everything, and finding and navigating to all the natural features and human infrastructure of our world. Everyone became a GIS user. The providers of these foundational tools started building massive Big Databases, rich with information to be mined for commercial and scientific benefit.
NOW THE REVOLUTION
The year 2023 began with headlines exulting the potential benefits and threats of OpenAI and ChatGPT. We all are now able to interact and familiarize ourselves with AI applications using plain language with accessibility on our mobile phones. Every new generation of a new AI platform is more powerful than the previous one.
Having ESRI as an ally for the final integration of GIS into mainstream IT is key to the success of the endeavor. With hundreds of thousands of ArcGIS users all over the world preparing to empower and enable the geographical component into their respective IT organizations, the world will be a better managed place.
GIS data is uniquely designed to be analyzed and rendered in hundreds, if not thousands of different ways and AI will be a powerful ally in upcoming years to find new ways to do so. ■
Giulio Maffini started his career in the 70s as an urban and regional planner. Later he founded a company (TYDAC) to build Spatial Analysis PC desktop software (SPANS). In the early 90s he was part of team that commercialized an all-relational, multi user, Oracle-based enterprise GIS (VISION*) for Utilities, Telecom’s, and Municipalities. He is now an advisor to spatial technology companies. Juan B. Plaza is the CEO of Plaza Aerospace, a drone and general aviation consultant firm that specializes in modern uses for manned and unmanned aviation in the areas of mapping, lidar, and precision GNSS.
In the next two parts, we will try to give readers a way to jump ahead of the data analysis revolution that, as an industry, is ahead of us.
xyHt 19 OCTOBER 2023
— Part 2 of 2 — OPUS Projects Streamlines Submitting GPS Surveys to National Geodetic Survey
BY PHILIPPE HENSEL
With Dan Gillins, Dan Martin and Julie Prusky
“Texas Special Reference Center (TSRC) of Conrad Blucher Institute is leading the efforts toward modernization of the horizontal and vertical datums in the State of Texas, particularly in the subsidence zone in southeast Texas. Horizontal and vertical datum modernization is conducted through multiple GPS survey campaigns utilizing the available NGS geodetic tools and techniques as in OPUS Projects, which include session processing, network adjustments, and publishing the data to the NGS database. Since the fall of 2021, TSRC managed to process and publish two GPS survey projects which provided a densified and reliable geodetic network in the region.”
NGS’ Online Position User Service (OPUS) Projects software is a tool to process and adjust campaign-style GPS survey data to create high-accuracy geometric coordinates and heights, in alignment with NAD 83 and NAVD 88 (or other local vertical datum). OPUS Projects now integrates the requirements needed to submit a GPS
—Ibraheem Ali, geodist, Conrad Bulcher Institute
project to NGS for review and publication via NGS Datasheets, greatly simplifying the process of submission.
It also allows users to upload their Real-Time Kinematic (RTK) vectors into their project. This second article in the series on OPUS Projects discusses the benefits of publishing your GPS project.
Already, OPUS Projects seems to be ingraining itself into surveyor’s daily work lives. Participants in a recent OPUS Projects training course registered a three-fold increase in their interest in submitting a project to NGS using the new features available in OPUS Projects.
THE NATIONAL SPATIAL REFERENCE SYSTEM
According to the Office of Management and Budget’s draft circular “Coordination of Geographic Information and Related Spatial Data Activities,” the National Spatial Reference System (NSRS) is “the fundamental geodetic control for the United States.” The NSRS is a consistent coordinate system that defines latitude, longitude, height, scale, gravity, and
xyHt 20 OCTOBER 2023
SURVEYOR’S CORNER
orientation throughout the United States.
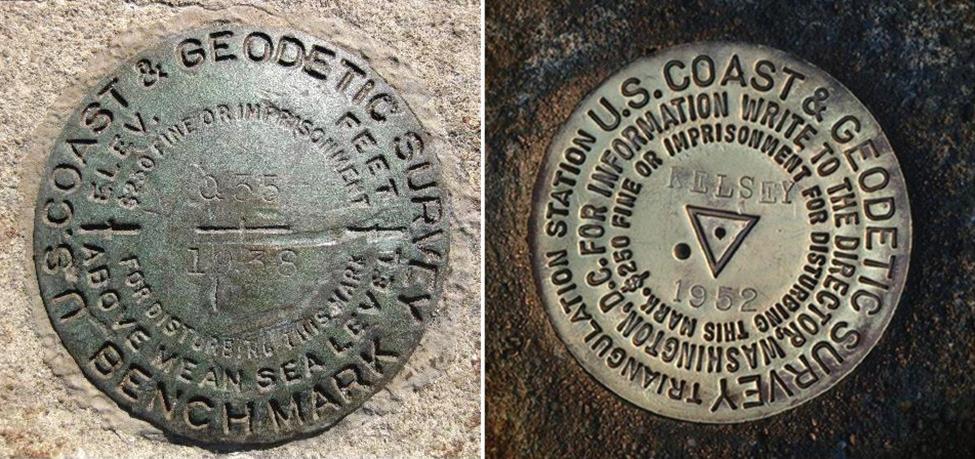
If you are working on a project funded by a civilian federal agency, you will be required to work within the NSRS. Even if you do not work directly for a federal agency, it is likely that state or local laws will require you to tie your survey to the NSRS. This is historically done by tying to geodetic control in the form of local survey marks (Figure 1) that have adjusted positions and/or heights published on NGS Datasheets.
Back in the day, the U.S. Coast & Geodetic Survey (predecessor to NGS) was the federal agency charged with the task of setting geodetic control across the nation. Since the mid-1990s, and with the advent of GPS, states and municipalities began establishing new geodetic control by submitting their data to NGS for review and inclusion to the NGS database, making it available through NGS Datasheets to the entire surveying community.
NGS remains responsible for managing the national database of geodetic control, but the responsibility for maintaining existing or setting new geodetic control has been passed on to states and local governments, and to surveyors who need to tie to authoritative geodetic control. By submitting your GPS project to NGS, you are creating or updating geodetic control where you need it.
ADDED BENEFITS OF SUBMITTING YOUR PROJECT TO NGS
Keeping Your Coordinates Accurate: If your survey data are submitted for publication, they will likely be included in future national readjustments, so the coordinates will stay accurate for as long as possible. As time passes, and Earth’s land masses slowly move due to crustal motion, coordinates will eventually no longer represent the true locations of the marks.
For this reason, the entire network of survey control in the NSRS is periodically readjusted, so that the marks remain aligned with the NOAA Continuously Operating GPS Reference System (CORS) Network (also called the NCN). The NCN serves as the primary control for the NSRS.
Aligning your control to the New Datums: Submitting your survey data to NGS today will also ensure that the marks observed in the project will be aligned with the new modernized datums when they are released in the near future. According to the Federal Register Notice (FRN)

xyHt 21 OCTOBER 2023
Figure 1: On the left: example of a US Coast & Geodetic Survey bench mark. On the right: example of a US Coast & Geodetic Survey triangulation station mark
16084, “NGS is considering imposing age limits on the observations that will be used in the creation of 2020.00 Reference Epoch Coordinates (RECs), as part of the modernization of the National Spatial Reference System (NSRS).”
When the FRN was published in 2020, the idea was to ensure a maximum number of “fresh” observations on geodetic control marks across the nation. The proposed age limit for the first 2020.00 REC would extend back to January 1, 2010. NGS is currently accepting observations for the 2020 REC through September 2023.
As the FRN goes on to explain, new observations are important to maintain accurate heights, which are critical to the understanding of floods, and the failure to compute heights accurately can have negative impacts on both lives and property.
Helping NGS Build Better Models and Tools for the surveying community:
By submitting your project to NGS, you are also helping NGS build better models and tools for the surveying community. Examples of these would include the NGS Coordinate Conversion and Transformation Tool (NCAT), which enables the user to convert coordinates across a variety of datums, realizations, and units.
In the U.S., hybrid geoid models (e.g., GEOID18) rely on the relationship between GPS-derived ellipsoid heights on bench marks with published orthometric heights referenced to a vertical datum. Similarly, NOAA’s Vertical Datum Transformation (VDatum) tool relies on new GPS-based observations on survey marks with orthometric or tidal vertical datums.
Finally, new GPS-based observations in specific areas of rapid land motion help support the NGS Horizontal
Time-Dependent Positioning (HTDP) model used to align current GPS-based observations back to the reference epoch of the current geometric datum.
All of these models and tools developed and maintained by NOAA’s NGS rely extensively on user-contributed data, and submitting your project through OPUS Projects is an excellent way to ensure that these tools are kept relevant and useful to you.
OPUS Projects
Streamlines Submitting your Project to NGS: Prior to the new version of OPUS Projects, submitting to NGS was a rather laborious and complex process involving a number of different PC executables, downloading CORS data, and having to process and run adjustments on your own. There was a pretty steep learning curve to mastering all of the steps involved in the traditional “bluebooking” process.
The latest version of OPUS Projects gets rid of this cumbersome process. Table 1 summarizes many of the key advantages of OPUS-Projects over traditional bluebooking methods. Only for quick comparison purposes, Table 1 also highlights the differences between OPUS Projects and OPUS Share
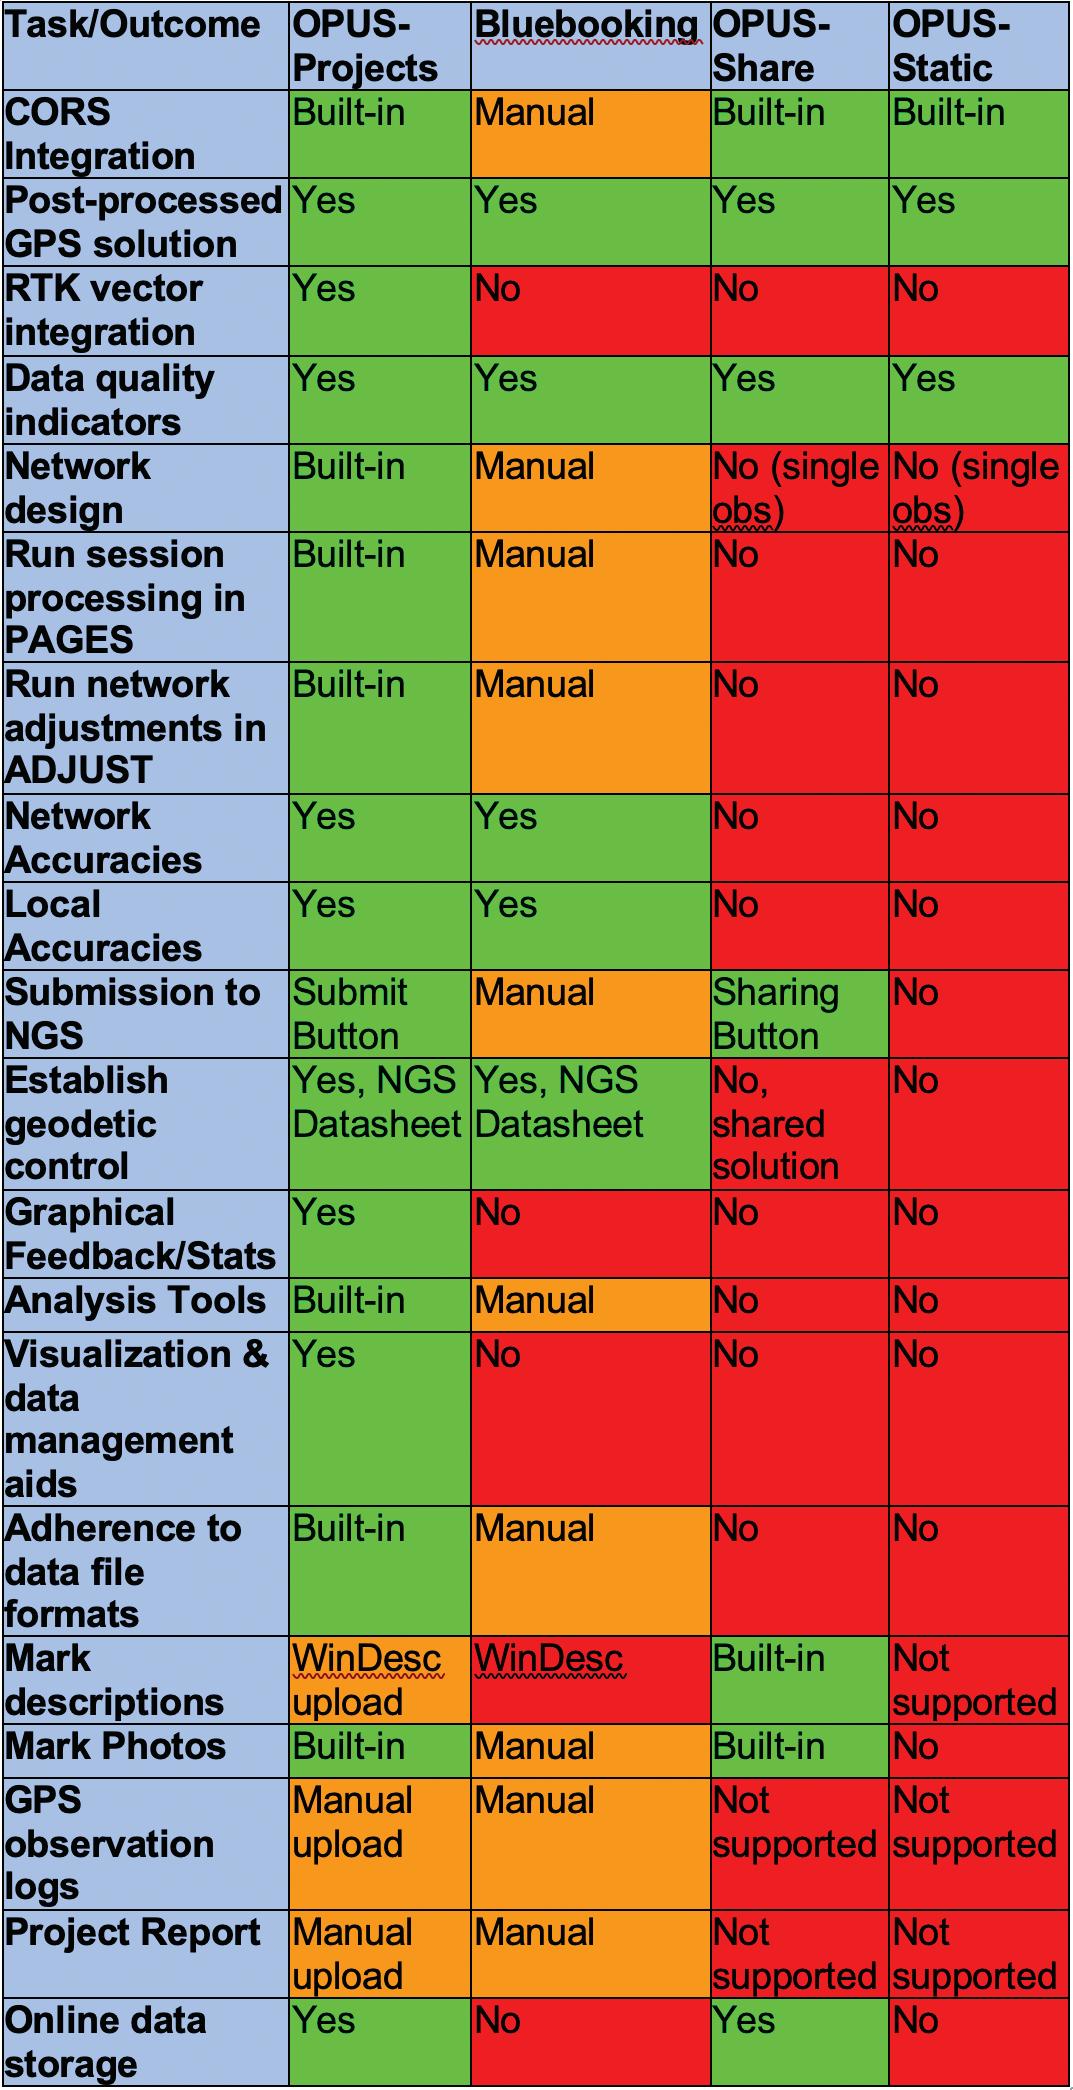
OPUS S, although neither of these latter two variants of OPUS can be used for submitting GPS projects to NGS for the establishment of geodetic control.
NGS still accepts projects using manufacturer's reduction software, but with this latest version, users find using OPUS Projects from start to finish has provided a streamlined way of processing, adjusting, and organizing data for submission to NGS.
So, what does it take to submit your project to NGS?
• Submit a survey proposal. This will alert NGS so staff members have the
xyHt 22 OCTOBER 2023
and
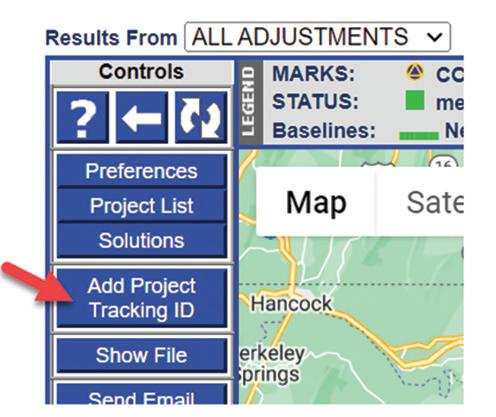
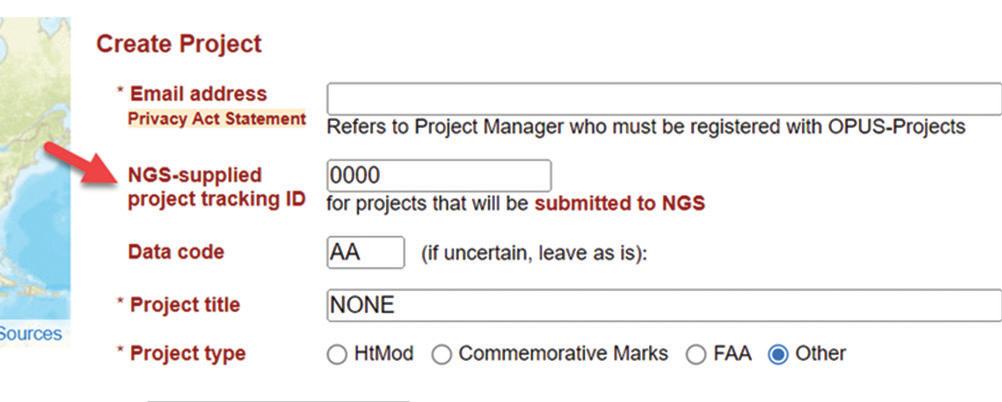
Figure 2: The NGS-supplied project tracking ID can be associated with your project at its inception (top panel), as well as at any other time within the project itself (bottom panel).
Table 1: Comparison between traditional “Bluebooking” and the different OPUS tools
opportunity to weigh in and provide feedback prior to your planned field observations. When your proposal is accepted, you are issued an official NGS Project Tracking ID, which is required to submit your project to NGS (Figure 2).
• Create your project in OPUS-Projects
• Complete and upload a description file for all marks observed in your project (using WinDesc). A detailed tutorial is included in the OPUS-Projects User Guide, and there are other training materials available (see the NGS Testing and Training web page), including a video.
• Upload your GPS observation files and run session and network adjustments
• Upload observation log sheets, photos, and a final project report

• Click on the “Submit to NGS” button
CONCLUSIONS
Recent enhancements to OPUS Projects have greatly streamlined and simplified the process of submitting your GPS project to NGS. Although a few additional steps are required to submit the project to NGS, the user can reap a multitude of benefits, including high local accuracies, updated, authoritative geodetic control where it is needed, alignment with current and future datums, and better geodetic models and tools for the geo-positional activities and needs of the nation.
If you are interested in using OPUS Projects to submit your GPS project to NGS, please visit the OPUS Projects web site, where you will find links to the comprehensive user guide, training videos, and a calendar of upcoming training courses. Also consider contacting your Regional Geodetic Advisors for assistance. ■
Philippe Hensel is the supervisory geodesist with NOAA’s National Geodetic Survey and project analysis branch chief. Dan Gillins is an NGS geodesist. Dan Martin is Northeast Regional Geodetic Advisor for NGS. Julie Prusky is an NGS geodesist.
xyHt 23 OCTOBER 2023
A New Perspective with DRONE PHOTOGRAMMETRY
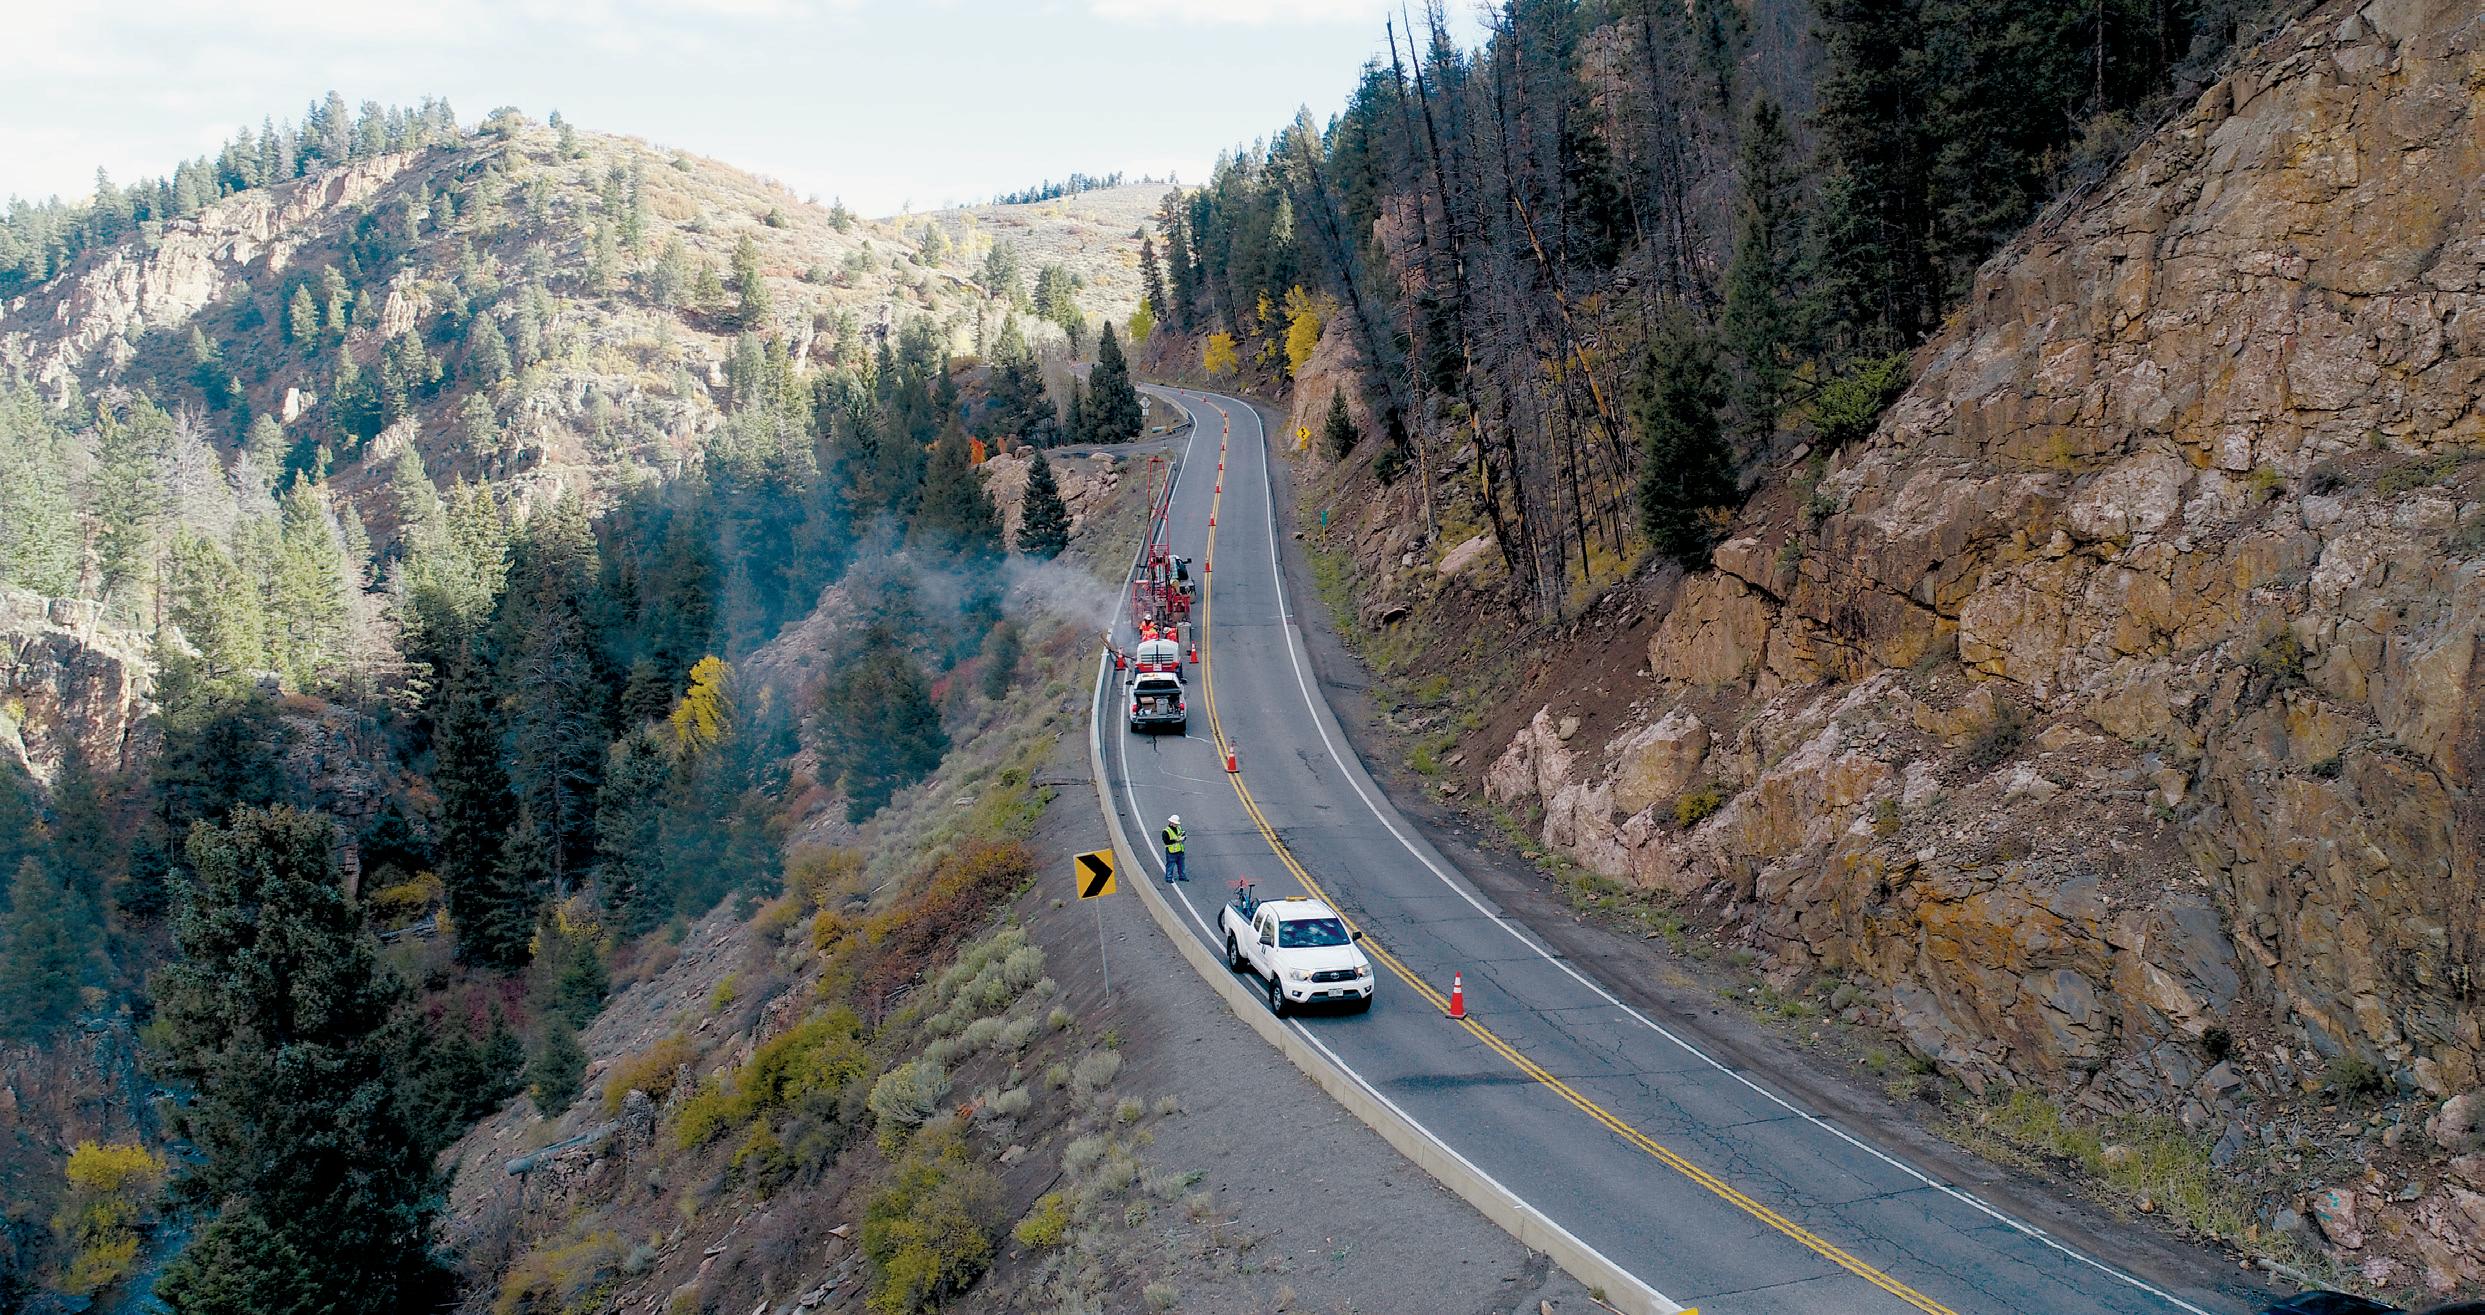
Geotechnical engineers say drones offer a safer, faster method of data collection to identify potential geohazards and assist with mitigation along vulnerable transportation corridors.
BY LINDA DUFFY
Mountain roadways are prime locations for geohazards, such as rockfalls, landslides, and debris flows. These events result in road closures, injuries, and property damage, sometimes triggered by thaw/freeze cycles or heavy rainfall, especially in wildfire areas where the absence of vegetation allows uncontrolled run-off.
Transportation agencies are tasked with analyzing the natural landscape and topography prior to road construction to identify and mitigate geohazards. After construction, it is an ongoing challenge to monitor land and rock deformation and schedule proactive mitigation activities, as well as respond to emergencies.
Mapping these areas with drones offers several advantages over traditional methods, such as ultra-high-resolution datasets that are useful for multiple disci-
plines, minimal traffic interruptions, and faster mobilization and data collection.
MAPPING UNPREDICTABLE GEOHAZARDS
Many mountain roads in Colorado pose rockfall and rockslide hazards, so transportation projects require geohazard assessment before, during, and after construction. The Colorado Department of Transportation (CDOT) Geohazard Program utilizes a modified Colorado Rockfall Hazard Rating System (CRHRS) to help predict where problems will occur and prioritize mitigation efforts.
There are currently 750 sites labeled as chronic rockfall hazards statewide. CDOT has incorporated aerial imagery into its work since the 1990s and more recently has added drones to its data collection options.
Jon Altschuld, RLA and principal at Chinook Landscape Architecture based
in Centennial, Colorado, has extensive experience in environmental restoration and reclamation. By continuously experimenting with emerging technology, Altschuld adopts safer and faster techniques that deliver the best information possible for a wide range of projects.
For new roadway design, he captures drone data for pre-construction geohazard impact assessments and contributes to volume calculations for rock removal and modeling geohazard mitigation, such as rockfall netting. When responding after-the-fact, the drone captures current conditions, and the data provides guidance for further mitigation.
“I specialize in landscape architecture, trail and river restoration, and transportation projects that require a thorough understanding of topography, drainage, and geohazards,” says Altschuld. “Advances in drone technology, 3D visualization, and animation have changed how we document and communicate potential hazards, such as rockfalls, rockslides, floods, and other adverse events. The drone can get to hard-to-reach areas without putting humans at risk.”
EFFICIENT ACQUISITION OF COMPREHENSIVE DATA
As drone capabilities have advanced, col-
xyHt 24 OCTOBER 2023
Mapping transportation projects with a drone is faster than traditional methods, which reduces lane closures and risk to personnel. Courtesy J. Altschuld.
lecting aerial data for critical transportation projects has become an important service area for Chinook. The dense point clouds extracted from very high-resolution digital drone imagery provide 1:1 scale models that are detailed and accurate enough for geotechnical engineers to assess rockface stability and identify geohazards.
In 2022, Highway 119 in Boulder County experienced a rockfall overnight that completely shut down the road. Although the area was cleared of debris quickly, Altschuld provided data for a geohazard assessment to support additional mitigation work by Yeh and Associates, geotechnical engineers based in Denver.
Traditional data collection for a transportation project usually involves ground-based lidar scanners set up along the highway to scan the rock wall. To see above overhangs, workers may rappel from the top to gather more detail about notable features with rangefinders, GNSS receivers, and a Brunton compass to measure angles of the rock. For the safety of workers and the traveling public along busy roads adjacent to rock walls, this type of data collection requires closing lanes of traffic and deploying additional personnel and equipment.
Imagery collected with a drone is more complete and higher resolution than groundbased lidar and fewer people are at risk while data is being collected. Lanes of traffic may be closed for only a short time or not at all.
RUSH JOB TO MITIGATE HAZARD
Altschuld conducted the drone data collection in less than an hour of flying, followed by photogrammetric processing in the office with Pix4D software and delivering point clouds and 3D mesh for geotechnical engineers to complete an assessment.
Due to the limited take-off space in the narrow canyon, a DJI Phantom 4 drone was used to collect 0.3-inch GSD imagery with approximately 0.3 to 0.5-inch-relative accuracy on the rockfaces. For this rush project to assess local rockface stability, ground control was not used. For other geohazard projects with an absolute accuracy requirement, Altschuld would use post-processed kinematic (PPK) correction data and ground control points collected by a surveyor.
“With a complete 3D model of the rockface collected by the drone, we have a multi-purpose dataset,” explains Altschuld. “More people can use the data to create different deliverables, such as a visualization or animation to use for stakeholder outreach. In less time, we collect more data at a higher resolution. Yeh and I have estimated drone data collection is a quarter to a third less expensive (both in terms of time and money) than the traditional methods.”
A variety of mitigation techniques are used to protect transportation corridors, including rock bolts, steel mesh drapes, and scaling. In this case, the geotechnical engineers at Yeh and Associates used the dataset to help assess the stability of the rock slope. The next steps will be
to develop a remediation plan and determine potential bolt locations and lengths. The dataset is a key factor in ensuring the bolts extend past the anticipated failure zones/joints into competent rock.
EVOLVING GEOHAZARD ANALYSIS
Altschuld is looking forward to continued developments in hardware and software that advance his work.
“Today with Pix4D, I am able to upload 2D and 3D files to the cloud so anyone can view in Chrome or whatever browser they use, and the data is accessible for more applications,” said Altschuld. “I’m expecting even more functionality in the software, as well as more automation in drone flying.
“Right now, rock walls are mostly manual flying because preplanned flights do not provide the necessary flexibility. In the future, AI may allow the drone to adjust in real time to changing conditions, and an onboard lidar sensor will keep the distance from the rock consistent. These developments will make data collection even faster.”
The high-resolution and level of detail provided in point clouds extracted from drone data provides new opportunities for analysis and improves the process of identifying geohazards to reduce risk on transportation corridors. As statewide geohazard programs continue to develop, additional deformation monitoring to support change detection will also help prioritize mitigation activities. ■
xyHt 25 OCTOBER 2023
Linda Duffy is president of Apropos Research, an independent firm providing market research and marketing communication services to the geospatial and remote sensing community since 2003.
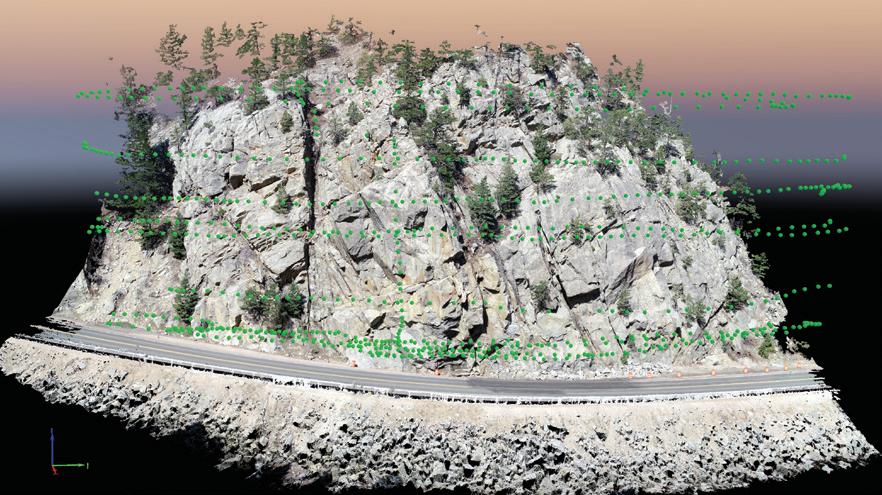
Along Highway 119 in Boulder County, the point cloud dataset with the location of images collected with the drone are marked in green. Courtesy J. Altschuld.
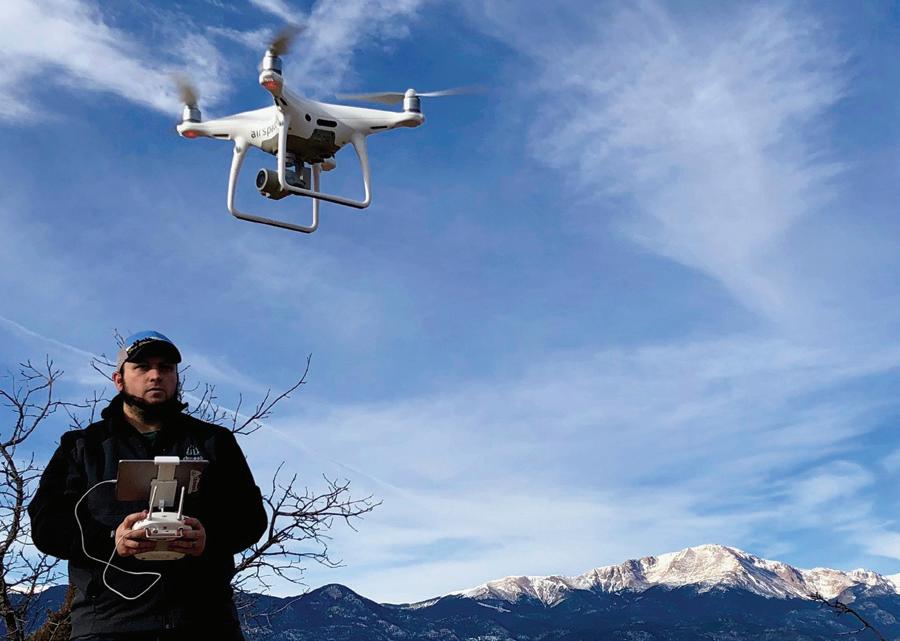
Jon Altschuld flies a small DJI Phantom 4 drone when take-off space is limited and a DJI M300 for larger projects. Courtesy J. Altschuld.
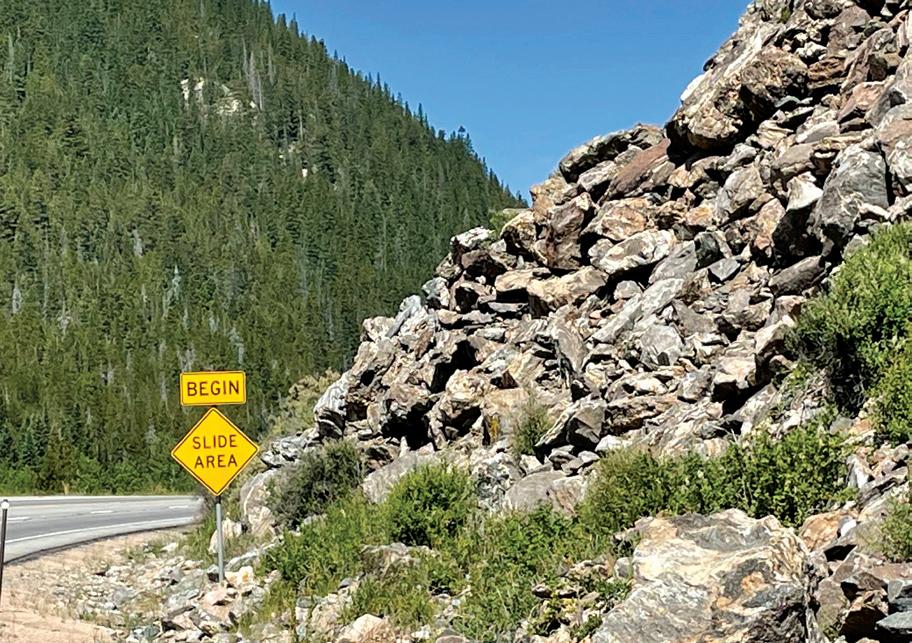
Many mountain roads require geohazard mitigation due to falling rocks and landslides.
Part Two:
What’s Inside YOUR GNSS ROVER?

In Part One of this series ( xyHt magazine, September 2023 issue) we focused on the antenna, amplification, and housing elements of rovers. This installment continues with channels, boards, and gates.
CHANNELS
There is a lot of misunderstanding about what receiver “channels” are and how they are counted. A modern rover can track 40 to 50 GNSS satellites, as well as SBAS sats, and communications satellites like those broadcasting PPP services via L-band. And across the GNSS satellites there are 21-plus signals; two, three, four, or more each. For example, GPS L1, L2, and L5. And Galileo E1, E5a, E5b, E6, etc., and there can be variants of each. Counting how many channels you should have for three-signal processing should seem as simple as say, 40 x 3, or 120 channels. However, it is not quite that simple.
“Channels has no industry standard definition,” said Dr. Stuart Riley, vice president of technology/GNSS at Trimble. “The way Trimble defines a channel is that it is a piece of hardware. It’s digital hardware with some software on top of it, that is capable of tracking one signal from one satellite and creating a set of measurements: pseudo range, phase, etc.”
For example, if you wanted to track from a single satellite, GPS L1C, L2C, and L5, those three signals, you would dedicate three channels to it. Then, if you want to do that, for two satellites, there'll be six channels, and so on.
“There are some locations presently in Asia where you can get 70-plus satellites,” said Riley. “So, we took a look at an upper bound of say 100 satellites, with five or six signals per satellite, and so that's how we got to the large channel counts.
“Some within the industry, I don’t know how they define a channel, I don’t
think there’s necessarily a common definition, because I do see some receivers with 1,000 channels or 2,000 channels,” said Riley. “And it’s not clear what they would do with that once you’ve tracked the signal with a single channel. Within a Trimble channel, we not only have the hardware to track the satellite, we also have additional hardware (correlators) for multipath mitigation, so using our definition of a channel, what are you going to do with those other channels? For example, to track Galileo AltBOC, that’s just one channel for us. Maybe some of these other receivers need to parallelize multiple channels to be able to track AltBOC, or for multipath mitigation, which is included in our regular channel, I don’t know.”
The subject of channels can get a bit fuzzy for end users. How many channels do we need? How many of say 1,500 or more channels stated on datasheets are actually used? Sheer numbers can be misleading. I remember a period about a decade ago when there was a lot of one-upmanship over who had the most channels touted in marketing materials.
Ironically, some who touted the most channels were not yet using more than just GPS and Glonass (at the time). The num-
xyHt 26 OCTOBER 2023
The second installment of a three-part look at the inner workings of high-precision surveying rovers.
Gavin Schrock
ber of channels is not a sole indicator of the capabilities of the rover. More important is to look at what signals are supported. For instance, a low-cost board in a drone or low-cost rover may state four or five constellations, however it may only be using two signals per constellation, missing out on the power of the other signal solutions.
Third-signal processing is powerful on many levels. For decades, GPS brought only one, then two signals: L1 and L2. Now, L5 has been added to newer satellites. Newer constellations started with three, four, five, or more signals. Besides being modernized and sometimes stronger, 3+ signals enable new approaches like AltBOC, and some carry messages for precise point positioning, such as the Galileo High Accuracy Service (HAS) in the E6 signal (bit.ly/3rMrgbG) and the B2B signal of Beidou. Modern rovers take advantage of 3+ signal processing.
“A third signal is better for a number of reasons,” said Neil Gerein, long-time GNSS engineer who is now vice president of marketing at Hexagon’s autonomy and positioning division. “Because the ionosphere is going to affect that third frequency different than just on the two
frequencies, this provides you another measure of the local ionospheric error. And that’s an important thing in a rover because you’re within a certain distance from your base station. It’s important in terms of overall resiliency.”
“And third signal can be good for dealing with interference,” added Gerein. “If you have an interferer on one of the frequencies, then you can rely on the other ones, giving higher availability. And once you get down into the carrier phase tracking and resolving the ambiguities, it provides a fast way to do that, because you take combinations of the different frequencies to get what we call narrow lanes.”
Channels are a hardware/software feature of application-specific integrated circuits (ASIC), which is an essential part of the GNSS “board” (more on this later). Typically, this means one channel per each signal from each satellite. There can be approaches that seek to track each signal multiple times on separate channels, however, as Riley points out, they have more than enough correlators already to be able to track each individually, along with deploying multipath mitigation. There can be approaches to, for instance, for multipath mitigation that can take advantage of multiplexed signals, but this can be done without tracking a signal multiple times on separate channels.
There are other things going on in the processors of a typical rover. For instance, algorithmic approaches to mitigating or rejecting multi-path.
“In addition to multipath rejection in the physical elements of the
rover design, there is lot that can be done in the channel tracking and signal matching steps,” said Gerein. “Since we’ve moved into highspeed signal processing, we can remove code phase and code-carrier phase multipath.”
The new modernized signals have opened a lot of options for doing this. In particular, the Galileo AltBOC, a complex signal composed of four codes multiplexed to have constant envelope signal (bit. ly/3Os838p).
“One characteristic of AltBOC is a sharp correlation peak,” said Gerein.
AltBOC, as implemented for Galileo, is essentially two signals processed together making it a wide bandwidth signal that makes for a very steep correlation peak. “That is what you are tracking in the high-speed signal processing and can help detect and reject multipath,” he said.
BOARDS
The “board” is the heart of the GNSS system, and in some ways, it is the “currency” of the GNSS industry. A board typically is comprised of an ASIC, or in limited instances, Field Programmable Gate Arrays (FPGAs). More and more, boards are including IMUs and micro electromechanical (MEMS) components to measure acceleration and tilt. Boards are designed by GNSS manufacturers for their own rovers or sold as original equipment manufacturer (OEM) components to other manufacturers for integration into their own rovers.
For a period, years ago, nearly every rover manufactured around the world
xyHt 27 OCTOBER 2023
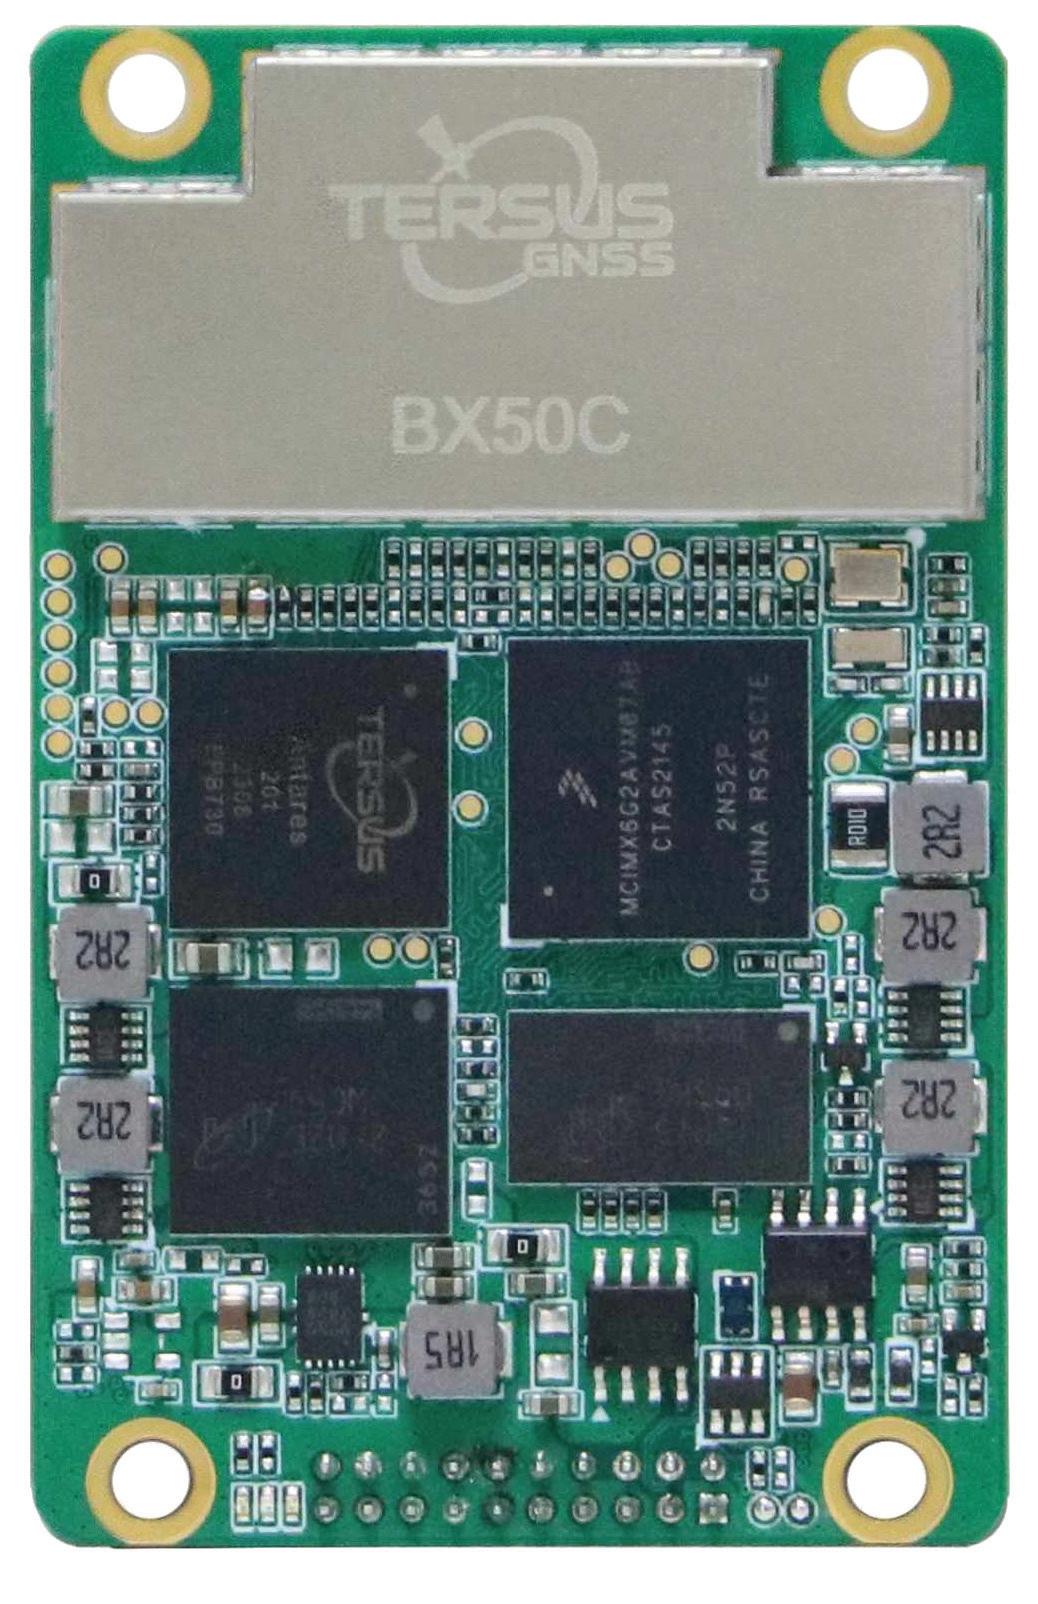
Example of GNSS boards for RTK Rovers: Tersus BX50C Source: Tersus
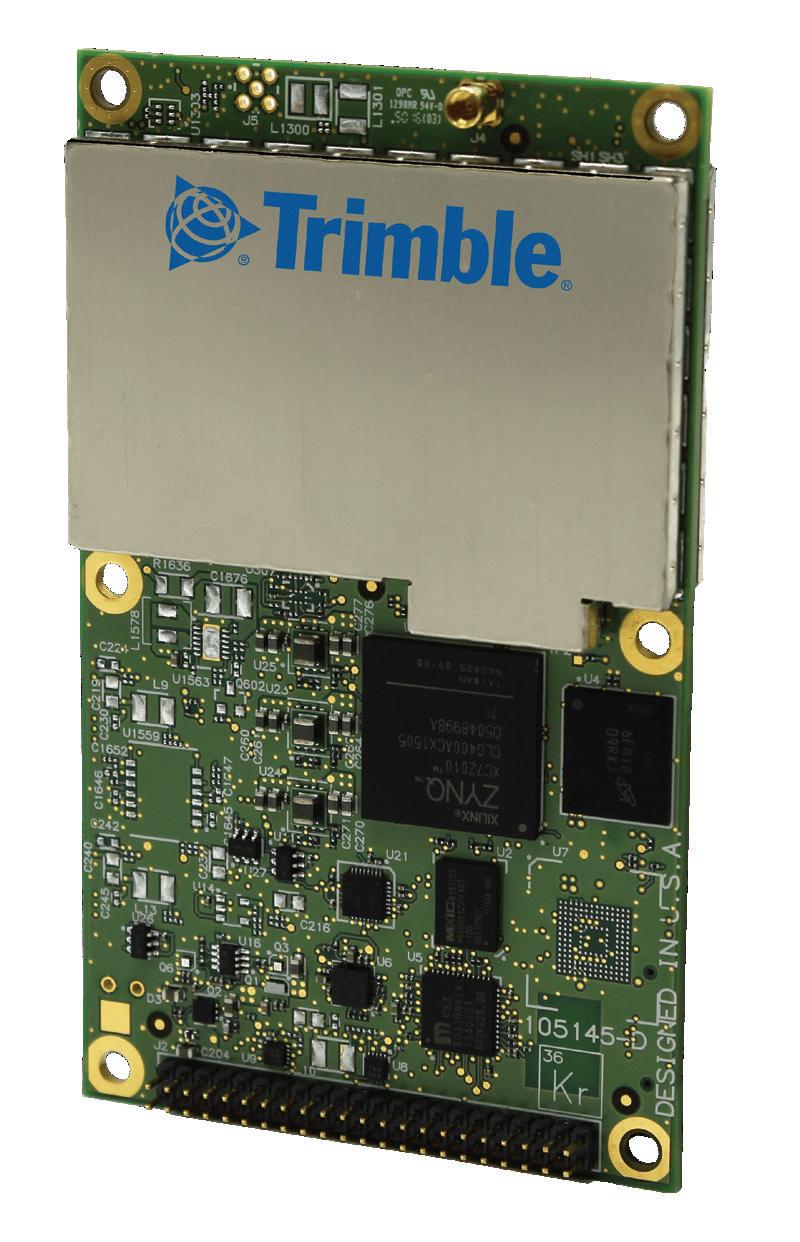
Example of GNSS boards for RTK Rovers: Trimble BD900 Source: Trimble
had OEM components from a handful of sources. Presently, many of the former OEM customers have begun developing their own boards.
The actual ASIC component of a board is relatively small. “These days, a digital ASIC is physically about 10 millimeters-by-10 millimeters with a much smaller internal die,” said Riley. “Yet it’s got millions of gates inside. Because of Moore’s Law about shrinking and doubling the number of transistors, you get into a new paradigm every few years. Size is not much of an issue, though the cost is pretty high because it’s a custom part and it’s very expensive to develop a custom ASIC.”
There are some inexpensive boards out there that rovers and drones and build-your-own folks tend to use, so be aware of the limitations (as discussed previously).
“The advantages of an ASIC for GNSS include lower power consumption, smaller size, and cheaper for high-volume manufacture,” said Ce Huang, research and development director at Tersus GNSS. “The disadvantages: it’s expensive and time-consuming to design and create the photomask (for mass manufacture) and the design/functions of the ASIC are fixed once put to manufacture. For FPGA, the biggest advantage is you can build a system with it (relatively) quickly, without very high cost, and you can modify the design/functions on the fly.”
In common practice in the industry, FPGA are used mainly for R&D, to work everything out before committing to the design of an ASIC.
There are software defined receivers (akin to software defined radios, or SDR) that put some or all of the functions that would otherwise be handled in an ASIC into standard processors. For instance, the Trimble DA2 antenna (bit.ly/DA2) for their Catalyst system is a low-cost, powered antenna that you connect via Bluetooth to a phone or tablet. There are processors in the antenna to run the SDR. In this example, a pay-as-you-go plan activates the SDR and positioning services.
An SDR might also be used in conjunction with an ASIC, for instance, to enable reception of L-Band broadcasts of
PPP data, instead of adding in a separate physical receiver for that. While SDR are evolving, it is generally accepted that they do not yet provide the same robustness and capabilities of the dedicated and purpose designed gates of an ASIC.
“It’s a continuum, there is not one size fits all. It all depends on your product and what you’re trying to do,” said Trimble’s Riley. “On one level, you could have a software defined radio, and that’s defined as you have RF followed by an ADC to create digital signal. That runs into processors, a CPU, a GPU, or maybe a combination, with software.
“On the other hand, you’ve got an ASIC, which is custom gates that you develop. And
number of gates as an ASIC can be quite expensive. If you are not selling in huge volumes, like for specialized applications, it may pencil out. However, presently, for mass-manufactured systems for rovers, an ASIC is in many ways the best option.
GATES
These are the logic operations, that can run into the millions. Numbers of gates is an older metric, as the current gauge of logic operations may be expressed in terms of the area of the silicon chips. The fundamentals are the same as with older ASIC, however, designers are tapping so much more, by orders of magnitude.
Riley contrasts how things were done years ago: “It was done through schematic capture. Somebody actually went through and designed the whole logic using a schematic capture approach. There, you’re defining all gates, flip flops, XOR, etc. And you’re actually going through the CAD package and defining this; that’s fine if you don’t have that much logic, but it’s really not scalable to the systems now where we have millions of gates on the device.”
once you’ve developed, it’s a locked design. And then somewhere in between, you’ve got an FPGA, which is this array of gates that you can, through software, reprogram. And they all have the pros and cons.”
Riley explained that if you take a software defined radio, in terms of power and cost, it’s a lot more expensive than an ASIC, as those can be mass manufactured with a per-piece price that is relatively low.
There are other pros and cons. “For example, in our first-generation DA1 for Catalyst, we leveraged spare CPU cycles in Android phones, and ran the SDR there,” he said. “However, dealing with so many variations among smart phone processors, putting some processor chips in the second generation, DA2 was a good move.”
An FPGA is somewhere in between. Flexible to configure, yet there is a cost associated with that. To have the same
Today, they use a high-level programming language; essentially coding in a high-level hardware description language.
“Think of it as analogous to writing something in a programming language to put it to a compiler to take that to machine code,” said Riley. “It’s very similar, you’re writing a high-level description language; VHDL or Verilog are the two common ones. And then you use a compiler to translate that into gates.
“There are many extra steps for ASICs, such as meeting timing and physical layout. That’s a good analogy to the development phase where the functionality is defined.” ■
Part Three will appear in xyHt ’s November 2023 issue. Gavin Schrock is a professional land surveyor who writes on surveying, mapping, GIS, data management, reality capture, satellite navigation, and emerging technologies.
xyHt 28 OCTOBER 2023
Example of GNSS boards for RTK Rovers: NovAtel OEM770 Source: NovAtel
Instrument Repair Education
College of the Canyons
Land Surveying
26455 Rockwell Canyon Road
Santa Clarita, CA 91355 (661) 362-5096
Email: Regina.Blasberg@canyons.edu
Website: www.canyons.edu/SURV
Associate of Science Degree Courses offered ONLINE (Video Conferencing)
New Mexico State University
Geomatics Department 1060 Frenger Mall – Room 130 Las Cruces, NM 88003
Equipment
Positions Available
Phone: (575) 646-6748
Email: kwurm@nmsu.edu or elaksher@nmsu.edu
Website: https://et.nmsu.edu/geomaticssurveying//
Fully online program and +2 option.
BS Degree
Troy University
Surveying and Geomatics Sciences Program
Geospatial Informatics Department 344 Wallace Hall Troy, AL 36082
Phone: (334) 808-6727
Fax: (334) 670-3796
Email: geospatial@troy.edu

Website: www.troy.edu/geospatial
Education
Instrument Repair
Navigation Electronics, Inc. 124 Toledo Drive Lafayette, LA 70506
(337) 237-1413
Website: www.neigps.com
Georgia Office: (770) 729-8005
Alabama Office: (256) 665-5589

Mississippi Office: (662) 347-1117
Arkansas Office: (870) 273-6333
Florida Office: (850) 228-2070

Seiler Instrument Geospatial Offices in IL, IN, KS, KY, MI, MO, NE, WI 877-330-6303

Email: servicedept@seilerinst.com
Website: www.seilergeo.com
BS Degree, ABET-ASAC accredited www.instagram.com/troygeospatial www.tiktok.com/@troy_geospatial
University of Maine
Surveying Engineering Technology Program 5711 Broadman Hall, Room 119 Orono, ME 04469-5711
(207) 581-2340
Email: um.set@maine.edu
Website: http://www.umaine.edu/set/svt/ Bachelor Degree. abet-taac
Contact
angie.duman@xyht.com
xyHt 29 OCTOBER 2023 CLASSIFIED ADVERTISING CONTACT ANGIE DUMAN TO PLACE YOUR AD
Angie Duman to place your listing here!
Title Insurance and Boundary Surveys
By Jeffery N. Lucas, JD, PLS, Esq.
What many surveyors might not know about title insurance and boundary surveys is they are intricately intertwined, due primarily to the unilateral efforts of the title companies issuing title insurance policies. Unilateral in the sense that the title company can issue a title policy with what is refers to as “survey coverage,” on any boundary survey map proffered by the landowner in conjunction with the issuance of a title policy.
This could be without the input of the land surveyor and regardless of the surveyor’s willingness to be the guarantor of the survey results. This usually happens through an ALTA/NSPS Land Title Survey, but the title policy only specifies that the survey be “complete and accurate,” an ALTA survey is not required.
What I mean by “survey results” is the on-the-ground location of the property lines as represented on the map of survey being underwritten by the title company. Rest assured, if the title company provides “survey coverage” and there is something wrong with the location of the property lines as represented by the surveyor, the insurance company will presumably pay out on the policy and will then seek indemnification from the surveyor for any mistakes in that representation.
This is what insurance companies are supposed to do—payout on colorable claims and seek indemnification from those who caused the policy coverage to be invoked. In such a situation involving
a boundary survey, the surveyor will be the ultimate guarantor of the property lines. In other words, what we are talking about here is “boundary insurance.”
Most landowners do not understand the importance of these two documents (especially the survey) or why they are significant. To be sure, most buyers of real property will purchase a title insurance policy, because they will be required to buy, at the very least, a “Lender’s Policy” of title insurance for the mortgage company. Simply put, the mortgage company isn’t going to lend the money without having its interest protected at the expense of the borrower.
Presumably, most homeowners will also obtain an “Owner’s Policy” of title insurance, but that is not a foregone conclusion or a requirement of the transaction.
If landowners truly understood the dynamic between the owner’s title policy and the boundary survey, it is hard to image why, for the price of a survey and some additional premium, they wouldn’t also opt for “survey coverage,” resulting in both title insurance and boundary insurance. This would be akin to Torrens Title.
In the commercial context the word is out on boundary insurance, which could help explain the explosion in the requests for ALTA surveys over the past several years. Sophisticated clients are being advised to pay an extra premium to purchase “survey coverage.” Actually, under the default coverage on page one of a standard Owner’s Policy, “Covered Risks” includes:
“Any encroachment, encumbrance, violation variation, or adverse circumstance affecting the Title that would be disclosed by a complete and accurate survey of the land.” [Emphasis added.]
For “survey coverage” not to be included under the policy, the title company must specifically exclude it in Schedule B, through what is commonly referred to as the “survey exception.” The survey exception counteracts and otherwise excludes the survey coverage offered on page one.
This is the whole purpose of the ALTA/NSPS Land Title Survey, to provide a complete and accurate survey to the title company whereby the company will cover the survey under the policy. Whether you know it or not, when you perform an ALTA survey you are in the insurance business. Congratulations.
I’m not sure too many surveyors fully understand the relationship between the insurance policy and the boundary survey. There are at least two factors that make me think this.
First, is the wide-eyed, deer-in-theheadlights look I get from surveyors when I explain this insurance-survey relationship in a live seminar. Second, is the relatively low fees surveyors continue to charge for ALTA surveys. This tells me that surveyors do not know that they are providing insurance coverage as well as surveying services. You might want to reconsider your fees for ALTA surveys. Paying out on a policy may be in your future.
The purpose of this column is to encourage your questions on boundary surveying issues that we will address in future installments. As such, you are invited to send your questions to the Editor of xyHt
Jeff Lucas is an attorney and land surveyor in private practice in Birmingham, Alabama. Jeff is an author, columnist, lecturer, seminar presenter, and continuing education provider. He writes a monthly newsletter, The Lucas Letter , dealing with legal issues and the practice of surveying. More information about Jeff and his continuing education courses can be found at www.lucasandcompany.com
xyHt 30 OCTOBER 2023
LEGAL BOUNDARIES
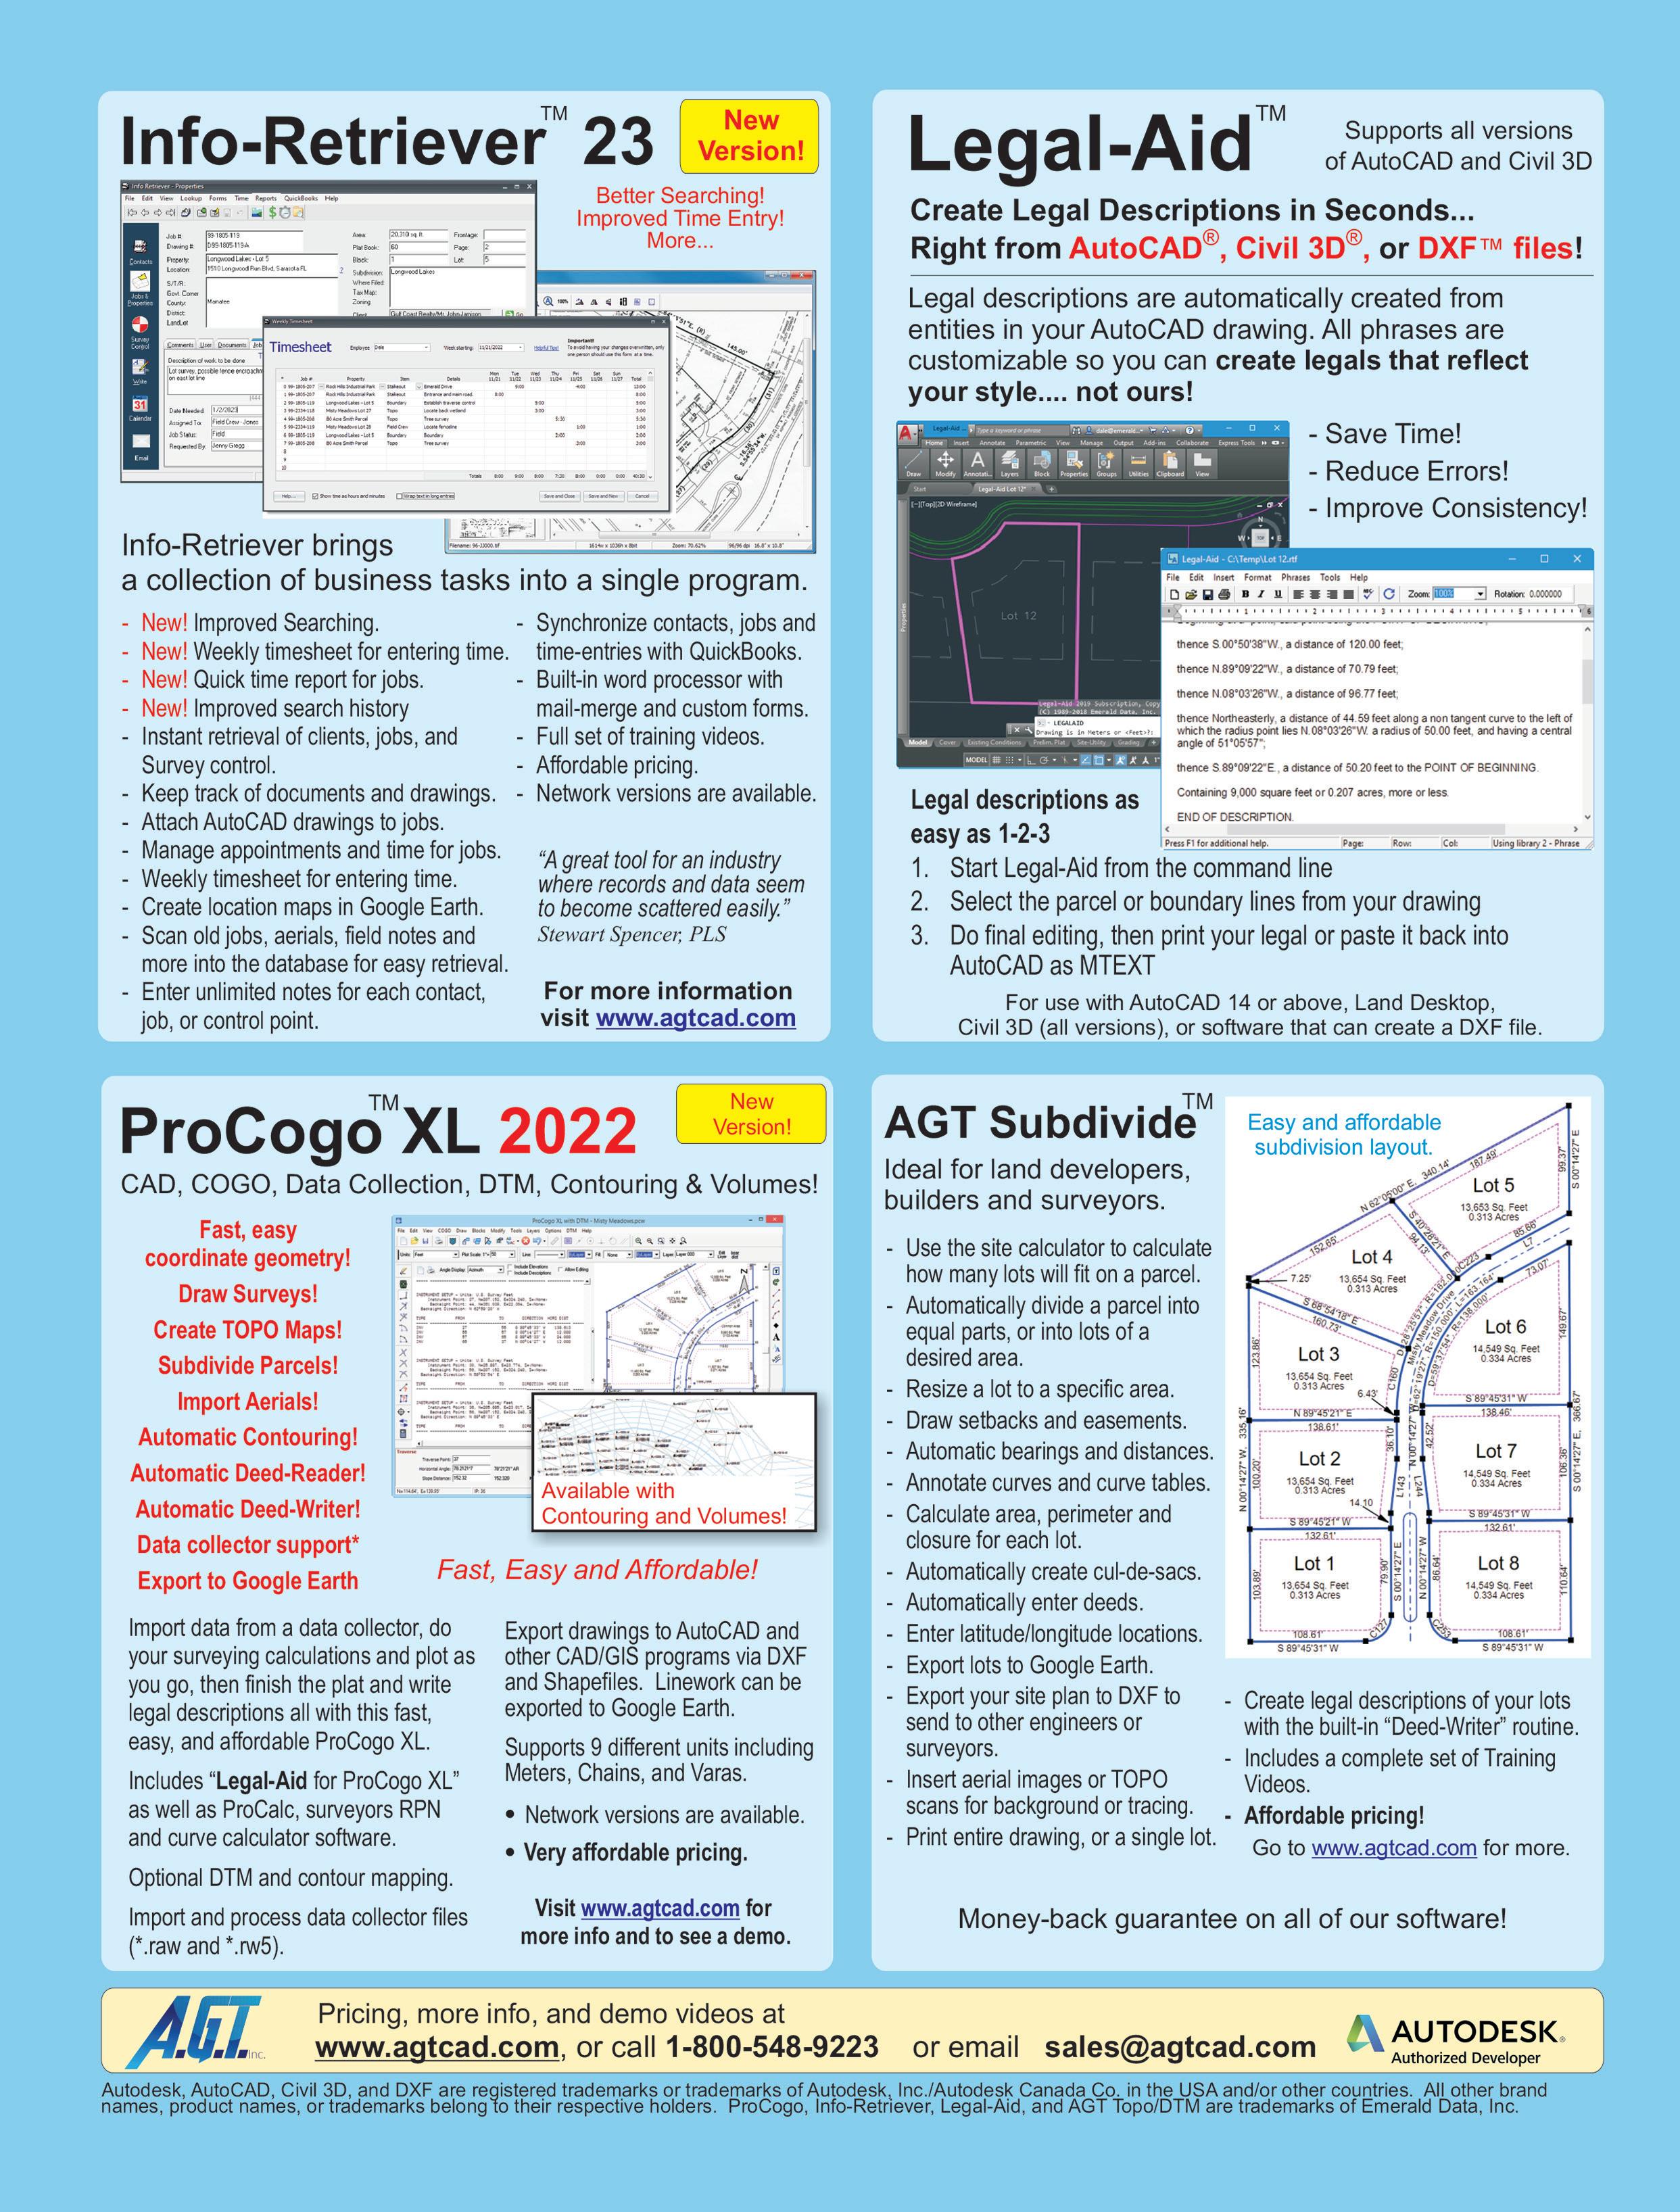


WWW.ALLENPRECISION.COM 1-866-727-1820 WWW.ALLENPRECISION.COM 1-866-727-1820 ADDRESS: 1550 BOGGS RD. DULUTH GA 30096 SURVEY SALES SUPPORT
STARTING AT

Best-in-class Robotic total station for the widest variety of measurement tasks and applications: including one-person or two-person instrument operation for surveying and stakeout, topographic, mapping, control point measurements, adjustments, computations, and data collection with powerful coding and line work routines.
 Leica CS30 Leica GS18
PER MONTH
STARTING AT $480.00
• The original tilt compensated RTK Rover.
• Available with imaging & tilt compensation.
• 7-Inch Sunlight-readable multi-touch screen tablet with Leica Captivate software.
$5400.00
Leica CS30 Leica GS18
PER MONTH
STARTING AT $480.00
• The original tilt compensated RTK Rover.
• Available with imaging & tilt compensation.
• 7-Inch Sunlight-readable multi-touch screen tablet with Leica Captivate software.
$5400.00
2 CONTACT US AT 1-866-727-1820 OR VISIT ALLENPRECISION.COM
LEICA CORNER

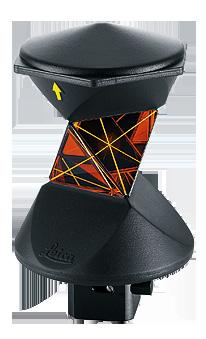
Leica TS10 $1,195.00 $7695.00 $200.00 $21,995.00 STARTING AT CALL FOR PRICE Leica 360 Prism PER MONTH STARTING AT Leica Service Center Leica MS60 Service Center support@allenprecision.com Demo Leica TS07 Leica TS13 Authorized Features • Powerful Captivate software onboard • 1 year CCP included Features • Suitable for all robotic TPS work • Target tracking range up to 2000ft (600m) Features • Fully Robotic instrument • Includes LRBT Handle Features • Multistation with reflectorless EDM • Automatic target recognition • PowerSearch Features • 3” + 5” Options • Manual Total Station • Reflectorless OUR PRICE STARTING AT CONTACT US AT 1-866-727-1820 OR VISIT ALLENPRECISION.COM 3
Two

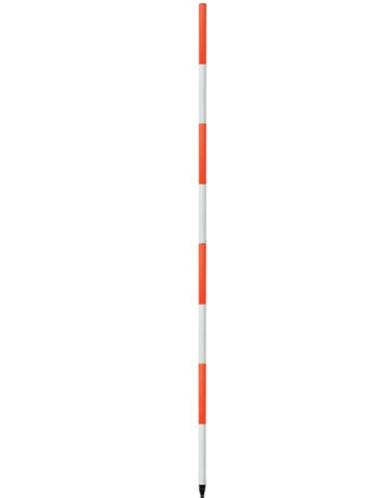
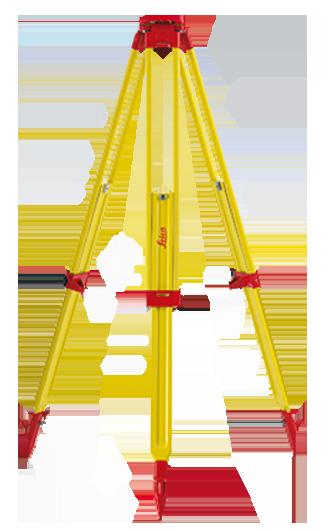

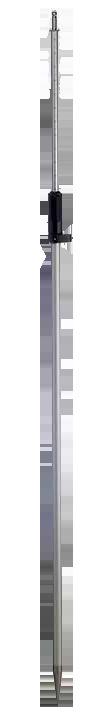
•

$139.00
$339.95 8’ Prism Pole
8FT
Twist Lock
Dual Graduations Leica
Seco
10ths-graduated
Waterproof and non-conductive
6 feet, collapsable
Quick release clamp
Rapid height adjustment
$159.95 $189.95 $486.95
#200508 •
•
•
GLS11 Prism Pole GST120-9 Wood Tripd Dual Clamp Tripod
35’ Level Rod #1119 •
•
•
#106755 •
•
#106720
duty
• Heavy
• Self-closing
strap
• Includes carrying
#200518
Quick Clamp &
Screw
Wing
Seco
• Large round head
8’ Range Pole $69.95 #099280
4ft sections
Carrying
Point CONTACT US AT 1-866-727-1820 OR VISIT ALLENPRECISION.COM 4
Includes
Bag &
Spectra SP60
Nikon XS Total Station
SP60
This GNSS receiver offers a high level of flexibility to cover any demand from GIS all the way up to sophisticated RTK.
$249.00
Ranger 5 Data Collector
Features
• 5” Anti-glare Screen
• Android 10 OS
• Origin Software


$4300.00
Zoom95 is a perfect Robotic total station. Pair with X-pad or Carlson software for a one person set up.

$440.00
Nikon XS has a compact design and easy setup. The Nikon XS mechanical total station makes survey work fast, efficient and easy.
$8,595.00
Nikon Auto Levels
Features
• Compact & lightweight
• Water-resistant
• Detachable eyepiece lens
$369.95
Carlson RT4
• is designed for surveying, stakeout, construction layout, and GIS mapping and is bundled with Carlson SurvPC.


$4150.00
PER MONTH PER MONTH STARTING AT STARTING AT STARTING AT STARTING AT
Geomax Zoom95
Carlson RT4
CONTACT US AT 1-866-727-1820 OR VISIT ALLENPRECISION.COM 5 STARTING AT STARTING AT


CONTACT US AT 1-866-727-1820 OR ALLENPRECISION.COM 2 12’ Prism Pole • Twist-lock • Adjustable-tip • 12 Foot #106135 $58.95 Tall Triple-Prism Bag #827 • Padded • 15 x 7 x 2.5 $129.95 Single Prism Assembly #200504 • 0/-30mm offset • Tilting Mount Seco Black Tribrach W/OP #106065 Includes optical plummet Mini Prism System #200505 • 25.4mm diameter prism • Onboard circular bubble Mini Stakeout Pole • 1.28 ft tall • 5/8-11 thread • Built-in level #200537 $199.95 $82.95 $179.95 $110.95 CONTACT US AT 1-866-727-1820 OR VISIT ALLENPRECISION.COM 6
S TARTING AT

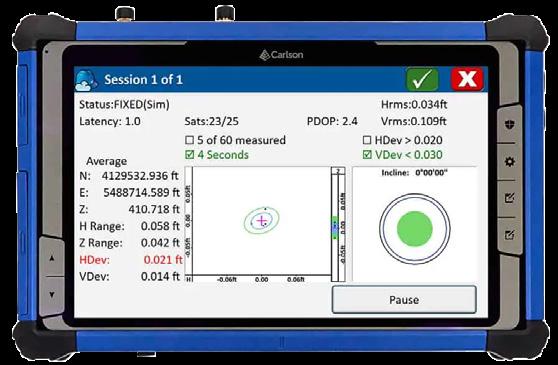


$4,150.00
Call
to upgrade today!
NIKON N&K offer an advanced EDM in an innovative package, including flexible charging and connectivity options, and are backed by the great service and dealer support you expect from Nikon. Both the Nikon N and Nikon K have a new charger, featuring a USB-C on the go connection that lets you recharge via a power bank or car plug, so you can recharge batteries even in remote areas.

STARTING AT
$4,095.00
SurvPC V.7 Software
Carlson RT5, Ruggedized Tablet
CONTACT US AT 1-866-727-1820 OR VISIT ALLENPRECISION.COM 7
#105695
Adjustable anticrush head Thumb-Release
Dutch Hill Tripod


#107802
• Extra wide frame
• Aluminum frame
• Max work load: 50 lbs
$159.95
Prism Pole Tripod
#107877
• Lightweight
• Supports range poles, prism poles & rover rods
$299.95
Thumb Release Mini Bipod
#200719
• Collapses to 25”
• Extends to 35”
• Thumb release
$136.95
Heavy Duty Tripod
Seco

#200500
• Large head
• Double banded aluminum legs
$157.95
#106045
• Topload
• Water-resistant
• Rhinotek™ bottom
$84.95
$449.95
Thumb Release Bipod
CONTACT US AT 1-866-727-1820 OR VISIT ALLENPRECISION.COM 8
Robotics Backpack


$18.95 $17.95 25’ Pocket Tape #109762 10ths Only Yellow Clad Fiberglass Tape • 100’ Fiberglass Tape • 10ths/100ths • 3:1 gear ratio #200450 $11.95 Plain Marking Flags 100ct. wire staff Spray Can Holster & Wand $9.95/24.95 #112940 • Seco Spray Can Holster #113290 • Rust-Oleum Marking Wand $8.95 Dixon Lumber Crayons #DIXON Crayons • Available in various colors $24.95 24” Martindale Machete #114080 Carbon steel Plastic handle CONTACT US AT 1-866-727-1820 OR VISIT ALLENPRECISION.COM 9
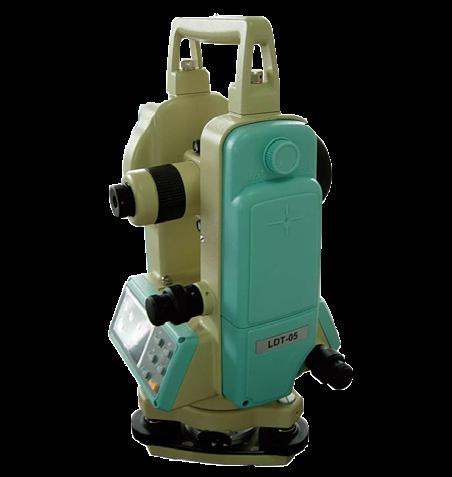


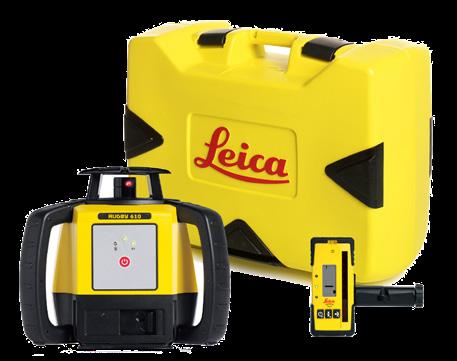


Magna-Trak Locator MT102 $1495.00 $669.95 $259.95 Digital Theolodite #107729 5” digital theolodite 30x mag Dual LCD display #101715 • Water resistant housing • Waterproof Tube • LCD Display • Soft case Motorola BPR40 • 8 channel • 150-174MHZ • Includes battery, charger & antenna #101767 #112660 $149.95 Rolatape Measuring Wheel #200497 Length: 13-ft 10ths Easy-grip design Non-conductive, lightweight $899.95 Leica Rugby 610 #107854 • Rotating laser • Rod-Eye 140 sensor/receiver • Alkaline battery 13’ Levelling Rod $79.95 • 32-400 15-1/2’’ • Single Wheel • In Feet CONTACT US AT 1-866-727-1820 OR VISIT ALLENPRECISION.COM 10


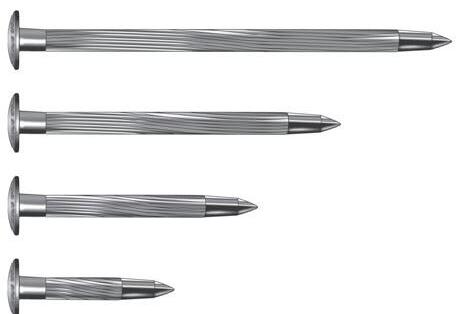

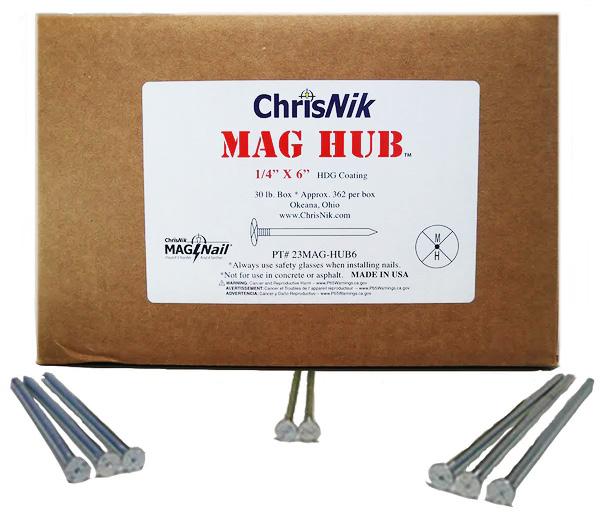
$1.89 $4.40 Texas Flagging ChrisNik MAG NAILS APE Marking Paint • 12 per box • Orange GLO • Pink GLO • Blue GLO • White • Lime Glo • Red Colors • 17oz Can • Inverted Tip • Water-Based • 100 Per box CONTACT US AT 1-866-727-1820 OR VISIT ALLENPRECISION.COM 11 $14.95/39.95 Hub Discs + Hammerless Nails 100 each #121690 #121695 MagSpikes by ChrisNik 8” 119930 APE PRICE $48.95 6” 119925 APE PRICE $41.95 4-1/2” 119920 APE PRICE $39.95 3” 119910 APE PRICE $32.95 1” 119950 APE PRICE $9.95 1-1/4” 119960 APE PRICE $14.95 1-1/2” 119970 APE PRICE $19.95 2” 119980 APE PRICE $23.95 $99.95 Mag Hubs • 4”, 6” & 8” sizes available
Spectra Precision’s
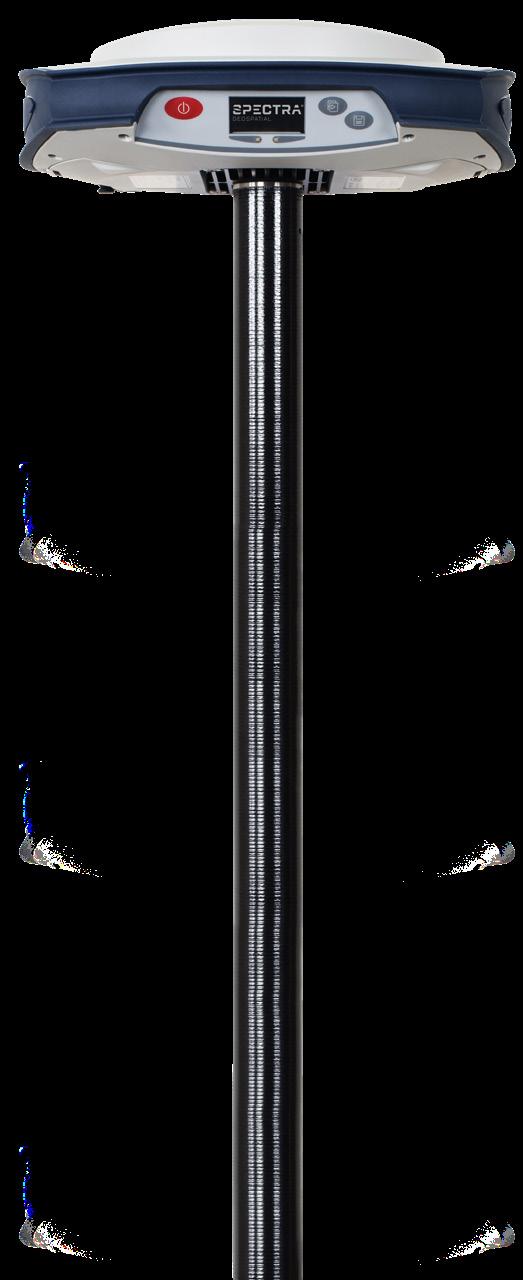

Geospatial® SP85 is a next generation GNSS receiver that combines decades of GNSS RTK technology with revolutionary new GNSS processing. Featuring the new 600-channel “7G” chipset combined with the patented Z-Blade™ technology, the SP85 system is optimized for tracking and processing signals from all GNSS constellations in challenging environments.

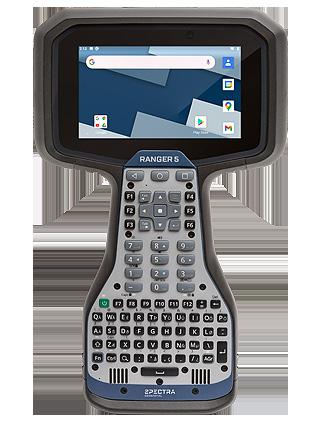

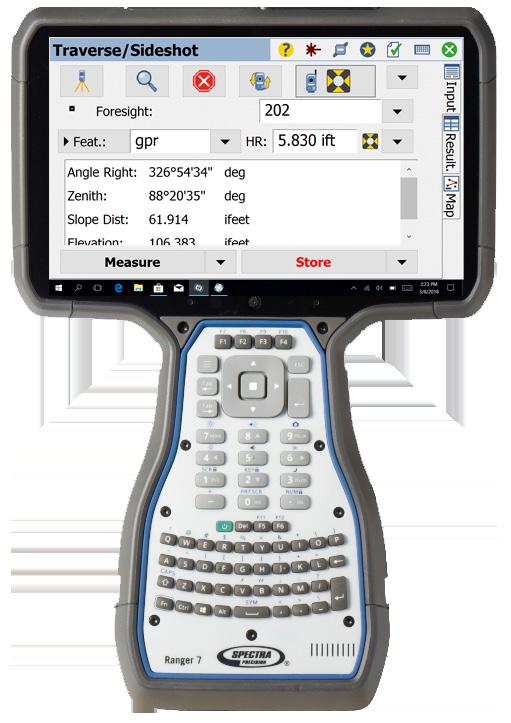
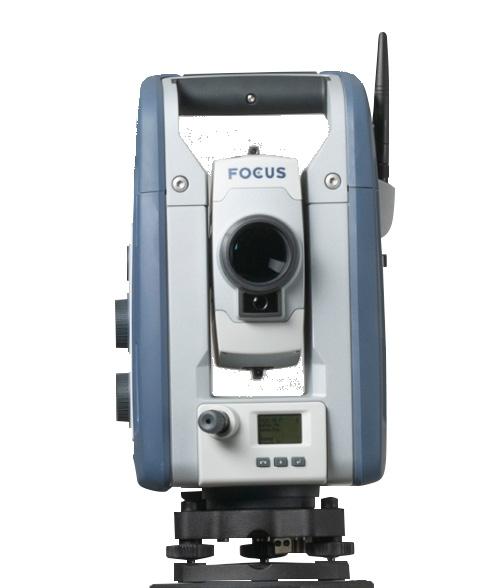
STARTING AT Spectra Focus50 Robotic Spectra Ranger 5
Ranger 7 Data Collector
CALL FOR QUOTE
With ORIGIN software
CONTACT US AT 1-866-727-1820 OR VISIT ALLENPRECISION.COM 12
$4300.00

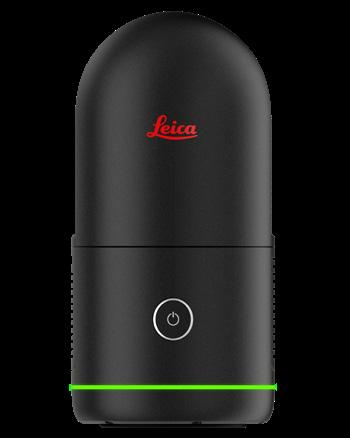
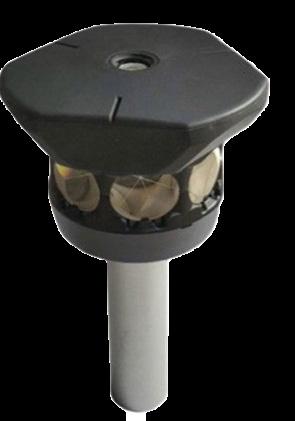
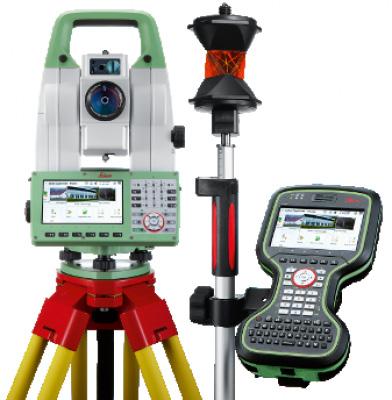


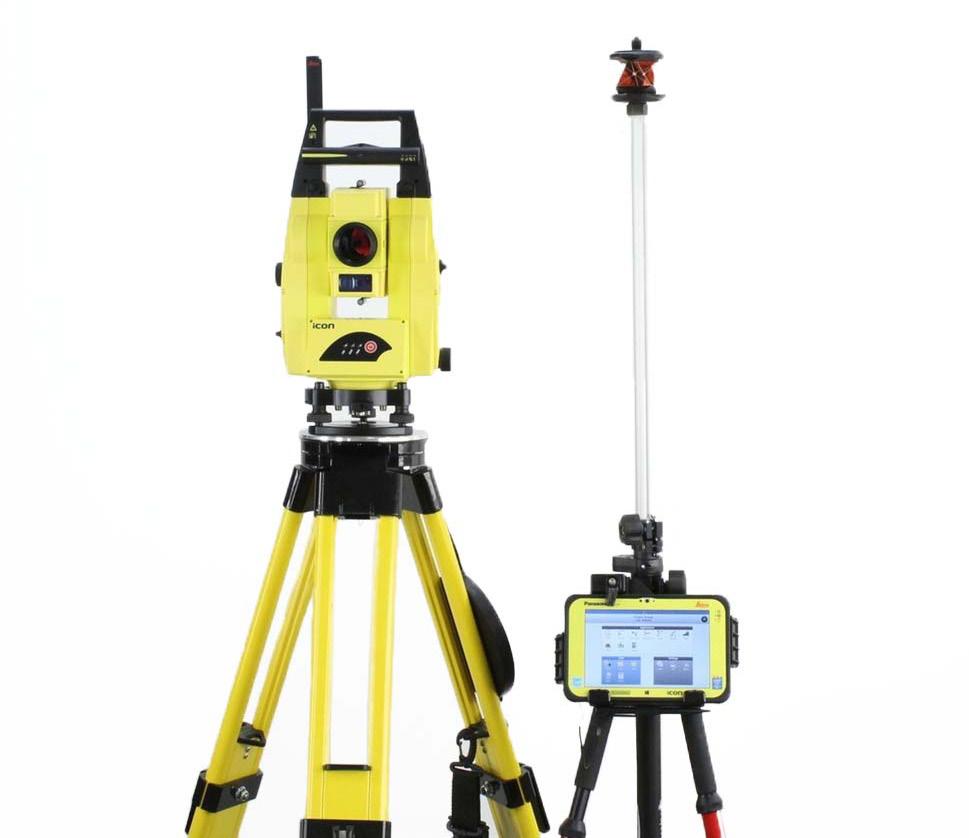
APEUSED
USED Leica BLK360 G1 DEMO FOCUS 360 PRISM
USED Leica TS13 5”
USED Leica TS16 Robotic DEMO LDT-05 Theolodite
CONTACT US AT 1-866-727-1820 OR VISIT ALLENPRECISION.COM 13
USED ICR55 Package
#750569
#080596
#750196
$850.00
#107729 #750195 $13,995.00
$15,495.00 $12,495.00 $18,495.00 $1,150.00
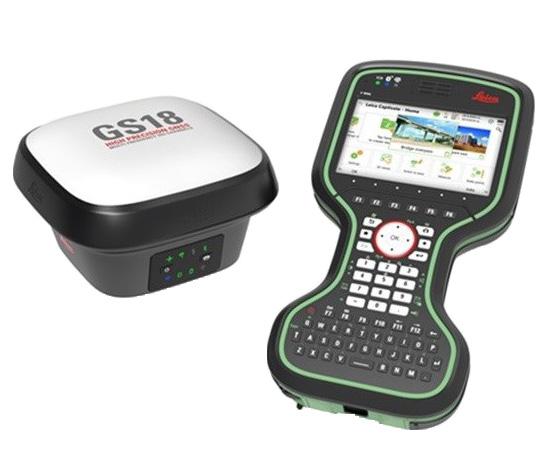
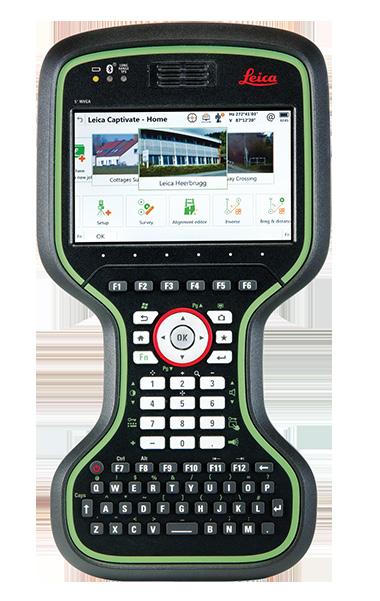
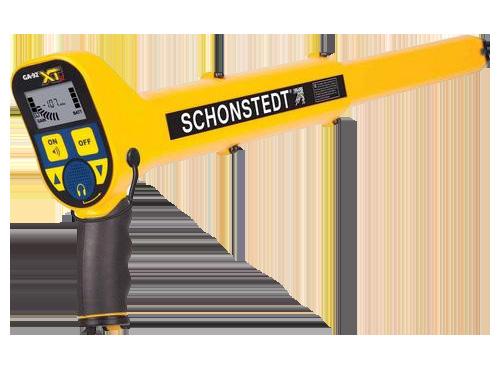
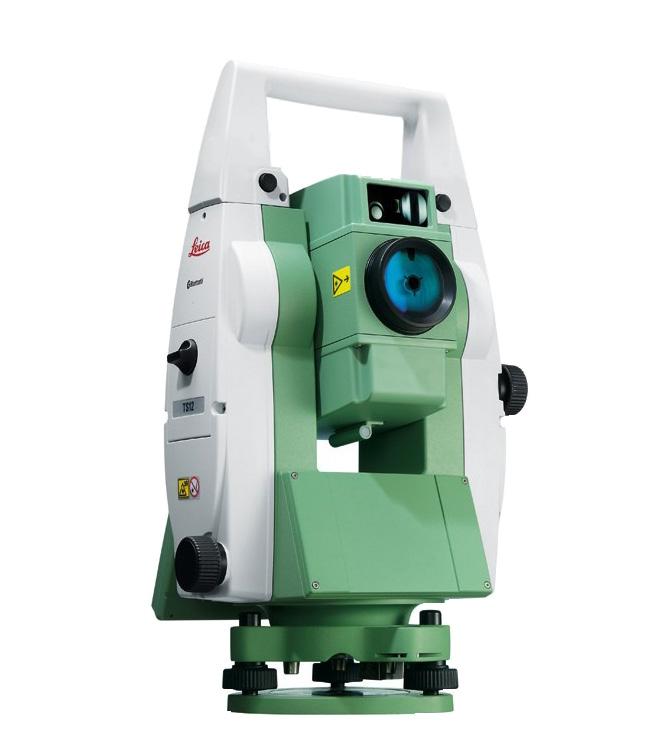

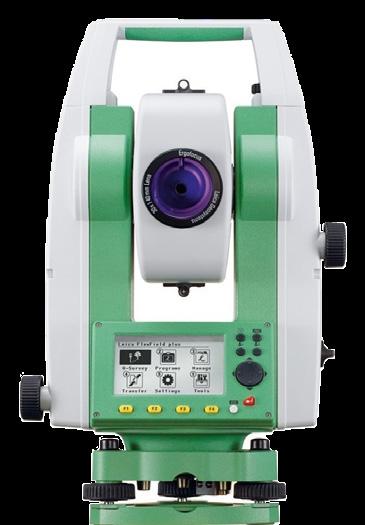

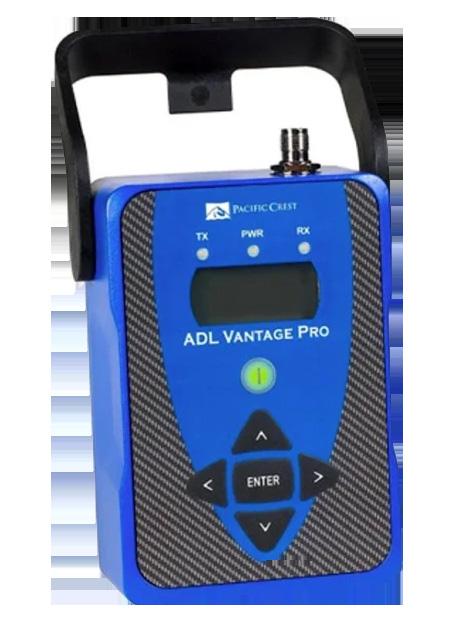
APEUSED USED Leica GS18T w/CS20 $1,950.00 USED CS20 3.5G w/Captivate #174416 #750160 USED GA-92XTD LOCATOR USED TS02 5” USED Pacific Crest Pro Radio USED Leica TS12P 3” #750233 #101968 #750192 #750568 $24,495.00 $2,895.00 $957.00 $11,495.00 $3495.00 CONTACT US AT 1-866-727-1820 OR VISIT ALLENPRECISION.COM 14
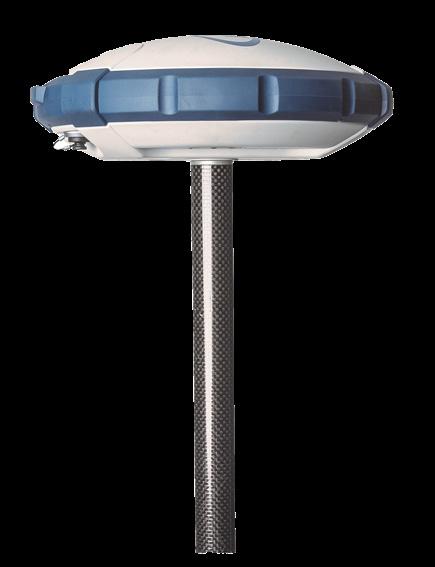
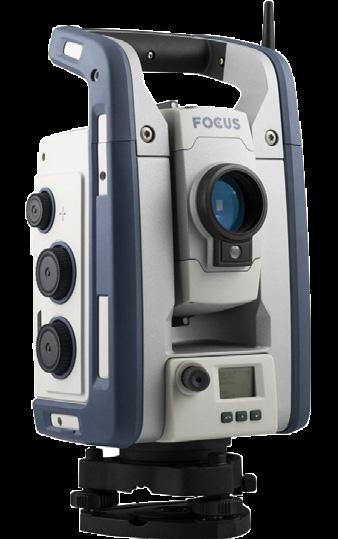


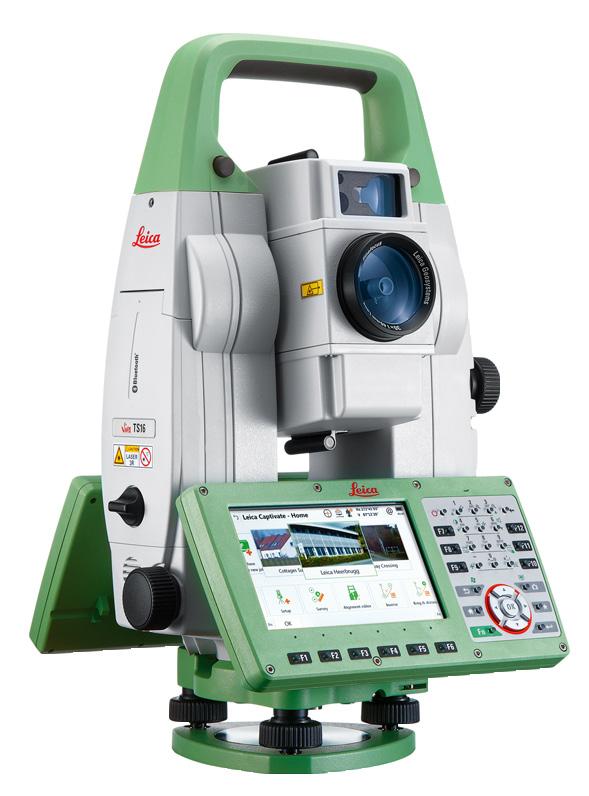
CONTACT US AT 1-866-727-1820 OR ALLENPRECISION.COM 2 DEMO SP60 GNSS Receiver $14,995.00 $7495.00 $22,995.00 DEMO Focus50 3” Robotic #080672 USED Leica MS60 USED GS18T LTE Reciever USED TS16i Imaging Robotic USED Robotic FOCUS 35 2” #750213 #750058 750214 #750198 CONTACT US AT 1-866-727-1820 OR VISIT ALLENPRECISION.COM 15 $15,995.00 CALL FOR PRICE $11,495.00 APEUSED

1-866-727-1820
