
MAY 2024 SURVEYING AND MAPPING, ELEVATED UAVS SURVEYING MAPPING SCANNING 26 Digital Levels, Part II INSIDE Natural Hazards and Scanning 20 Fiber to the Home 16


Saving Alcatraz
Under attack on multiple fronts, the island of Alcatraz plays a historic role in America. But rising sea levels, climate change, and Father Time are taking their toll. Can scanning and mapping the island and its buildings save it?


Scanning and Natural Hazards
A team of academics and professionals based at the University of Washington is showing how laser scanning is shaping our resiliency to natural hazards.
Which are You?
Jeff Lucas addresses the age-old question of whether surveyors are professionals or merely technicians.

Digital Levels, Part 2
For nearly three decades, the foundational technology and design of precision levels for surveying has not changed much. It hasn’t had to. When something is done right, sometimes it’s best to just go with it.
Maps as Art
A whimsical map of the stars of the northern hemisphere is not only a work of art but was an instrumental navigational chart.
xyHt 3 MAY 2024 xyHt [ISSN 2373-7018 (print), ISSN 2373-7735 (online), CPC CPM No. 41437548] is free upon request to qualified subscribers in the United States. The Canadian subscription rate is US $20/year. The International subscription rate is US $40/ year. Periodicals postage paid at Frederick, MD and additional post offices. xyHt is published 10 months a year by xyHt LLC, 6 N. East Street, Frederick, MD 21701. POSTMASTER: Send changes of address to: xyHt Subscriptions, 6 N. East Street, Frederick, MD 21701. Send Canadian changes of address to: Box 697 STN A, Windsor, ON N9A 6N4, Canada. For advertising, editorial, or other information, write to xyHt LLC, Inc. or call 301-662-8171. CONTENTS MAY 2024 FEATURES 12
5 LOCATED 6 Looking Forward By Jeff Thoreson MORE 2024 SURVEYING AND MAPPING, ELEVATED UAVS SURVEYING MAPPING SCANNING 26 DigitalLevels,PartII INSIDE NaturalHazardsandScanning 20 FibertotheHome 16 ON THE COVER: A mapping drone flies over the iconic lighthouse on Alcatraz Island as part of a mapping expedition by a team of geospatial professionals.
to the Home
Fiber
is providing a
solution for an
in
high-speed
16 EARTH DATA IN THE CLOUD AIRPORTS AND DIGITAL TWINS MAPPING CORAL NEW PRODUCTS/NEW SOLUTIONS
Mobile mapping
reality capture
ambitious fiber-to-the-home initiative
Ontario, Canada. Its success might mean
Internet for everyone.
26 30 20
25

Looking Forward
By Jeff Thoreson
Alcatraz from Above and Below

WHEN XYHT AUTHOR JUAN B. PLAZA PHONED ME AND SAID HE HAD ACCESS TO INFORMATION and data generated from a recent geospatial project on Alcatraz Island and that he wanted to provide the magazine with a story, I thought, well, that’s pretty cool. In our February issue this year I had written a story about Lidar USA scanning Dracula’s castle in Romania. So now adding Alcatraz means we have provided our readers with an inside look at two of the spookiest places on Earth. My only regret is that the timing for neither worked for the October issue.
On Alcatraz, as you will read, a team of geospatialists gathered to spend three weeks on the island, sleeping in cells once occupied by some of the nation’s most hardened criminals. Plaza’s story is a fascinating account of the project, detailing everything from the misquotes the team fought to the experience of being in the creepy hollows of a place with such a haunting history and where no one else has been for decades.
In another interesting, though much less scary, piece, writer Linda Duffy takes a look at the geospatial role in getting high-speed connectivity to everyone by running fiber-optic cable all the way to your house. In Ontario, Canada, a project is underway to get this capability to all, including the 1.4 million residents who are underserved or have no internet at all in their homes.
I also want to thank the many readers who stopped by the xyHt booth at GeoWeek in Denver this year to say how much they appreciate the work we do to bring them the magazine each month. We continue our long-time business plan of not charging the reader any subscription fee for the magazine. We mail it directly to you for free, and we appreciate your interaction with our advertisers, who make the magazine possible.
Thanks for reading.


xyHt 5 MAY 2024
Publisher Shawn Dewees shawn.dewees@xyht.com Editor-in-Chief Jeff Thoreson jeff.thoreson@xyht.com Director of Sales and Business Development Chuck Boteler chuck.boteler@xyht.com Creative Director Ian Sager ian.sager@xyht.com Accounting and Classifieds Angie Duman angie.duman@xyht.com Circulation subscriptions@xyht.com Phone: 301-662-8171 Editor, Located Jeff Salmon jeff.salmon@xyht.com Editor, Field Notes Eric Gladhill eric.gladhill@xyht.com Contributing Writers Jonathan Barnes Marc Delgado Jodie Hartnell Juan Plaza Ben Shinabery May 2024 Volume 11 Number 4 Copyright © 2024 xyHt magazine. Printed in U.S.A. No material may be reproduced in whole or in part without written permission from the publisher. The publisher assumes no responsibility for unsolicited material, the accuracy of information supplied by manufacturers, or opinions expressed by contributors. Partners and Affiliates THE IMAGING & GEOSPATIAL INFORMATION SOCIETY JT – JT
Compiled by Jeff Salmon

to Head to
Cloud The It's Time
THE LARGEST PUBLICLY AVAILABLE EARTH DATA REPOSITORY is moving to cloud computing, and NASA is encouraging you to do the same. The agency’s Earth Observing System Data and Information System (EODIS), which scores of mapmakers rely upon to create base maps and perform geospatial analyses, will reach to about 247 petabytes of geospatial data by 2025, effectively making it impractical to handle such a huge amount of information on a local computer.
Yet many geospatial practitioners are still hesitant to work on the cloud, citing their lack of skills and data security concerns, as well as the complexity of using their own legacy software applications with newer cloud services.
NASA aims to help them to adapt to cloud computing with its Earthdata

Cloud Cookbook. Released in March, the Cookbook (available on Github) contains tutorials that will guide users on how to work with NASA Earthdata on the cloud. Basic programming Python or R coding skills are a must, so beginners might want to learn that first before diving in. Aside from reducing hardware and data storage costs, creating maps on the cloud allows seamless team collaboration and provides data accessibility anywhere in the world.
Cloud-based mapping is not new. Esri, the GIS company, has been selling its ArcGIS for Server (now Enterprise) since 2004, while OpenStreetMap has pioneered web-based mapping almost during the same period. But since NASA is offering its bigger geospatial dataset to a wider public, expect a new mapping revolution in the offing.
— Marc Delgado, marc.delgado@xyht.com
Optech Teledyne Intros CL-360 Marine for USVs
THE CL-360 MARINE 360-DEGREE LONG-RANGE LASER SCANNER combines a scan speed of 250 lines per second with two mm range resolution, a plug-and-play solution, and an IP67 marine grade sensor making it the first of its kind high-accuracy marine-grade laser scanner. The lidar sensor can be seamlessly integrated with high-resolution multibeam systems and the CARIS Ping-to-Chart workflow, allowing for full above-and-below-water image capture with survey grade accuracy in a single workflow. The sensor’s 360-degree scanner and high collection rate provides a premier solution for mapping coastal infrastructure. The CL-360 Marine is the only lidar system designed for use on an uncrewed surface vessel (USV) that provides survey grade range and accuracy. At 3.5 kilograms, the CL-360 marine can be integrated onto most USVs that are capable of being equipped with multibeam sonar. A 10-meter cable kit also allows the system to be easily mounted on crewed vessels.
xyHt 6 MAY 2024
Send your Located items to located@xyht.com
| UAV/UAS | Space | New Products
Located Located Located
Mapping Your World

SCOTLAND’S
LARGEST CITY AND THE COUNTRY’S CULTURAL HUB is looking forward to modernizing its main airport via digital twinning. The Glasgow International Airport, which handles more than 9 million passengers per year and serves more than 120 destinations worldwide, will soon have its virtual replica thanks to an open contest launched by Connected Places Catapult, the UK government’s innovation accelerator for cities and transport, and the city’s airport authorities.
Contenders to the “The Living Lab Digital Twin Competition” are expected to design state-of-the-art digital twin solutions to enhance the operations at Glasgow Airport. The three main design challenges will focus on airport asset replacement and monitoring, maximize passenger movement in terminals, and improve energy management for electric vertical take-off and landing (eVTOL) aircraft operations.
“It is an exciting time at Glasgow as we look at how to harness new technologies, not only to enhance the passenger experience and our operations, but to create the next revolution in aviation through zeroemission flight,” said Jon Matthews, group head of capital investment and planning at AGS Airports, which owns the Glasgow Airport.
Several airports around the world already have digital twins.

Amsterdam’s Schiphol Airport, the second largest in the world in terms of hub connectivity, relies on its digital twin to run simulations on potential operational failures throughout the entire complex, saving its operator both time and money. Qatar’s Hamad Airport uses its digital twin to deliver faster and data-driven decision-making using 3D modeling techniques, data-analytics, and artificial intelligence. In Canada, the Vancouver International Airport is leveraging digital twin technology to visually track and analyze aircraft carbon emissions from landing to takeoff.
The winner of the Glasgow competition will collect up to £70,000 of funding, aside from receiving technical support from digital twin specialists at Connected Places Catapult.
“This innovative facility fosters advancements in passenger experience and accelerates decarbonization through electrification, hydrogen utilization, automation, data analytics, and integrated surfacelevel access solutions,” said Andrew Chadwick, interim ecosystem director for air mobility and airports at Connected Places Catapult.
— Marc Delgado, marc.delgado@xyht.com
Stonex’s New XFLY Lidar Solution
THE NEW XFLY LIDAR SERIES INTEGRATES A HIGH-PERFORMANCE Inertial Navigation System (INS) with camera and lidar for point cloud generation. A wide range of applications can be addressed by selecting Hesai Lidar XFLY120, XFLY300, or other sensors.
The processing platform contains a Wi-Fi interface, an embedded cellular modem for RTCM corrections, data logging software, and a gigabit Ethernet network.
Equipped with a high-performance INS, it delivers clean point clouds even at high AGL. As a small, lightweight, and low-power system, it allows the user to fly longer, adapting to the needs of any project. The postprocessing software provides fully automatic point cloud generation.
xyHt 7 MAY 2024
New Globalscale Map Shows Bigger Coral Area

THANKS TO THE USE OF THE LATEST SATELLITE IMAGERY and advanced machine learning technology, remote sensing experts and marine scientists from Australia and the U.S. found out that there are more coral reefs than previously measured. Results of the work done by researchers from the University of Queensland and Arizona State University reveal that coral reefs around the world cover around 348,361 square kilometers (134,502,934 square miles), an increase from previous global-scale estimates that range from 154,049 to 301,110 square kilometers.
The researchers are confident of their estimates, which they based on 5-meter pixel-resolution data leading satellite imagery providers Planet Dove CubeSat and Sentinel-2. Some 100 trillion pixels of imagery captured by the remote sensing satellites were matched and cross-checked with more than 1.6 million samples of training and validation classes to produce the highly detailed coral map.
“We can now confidently say there are almost 350,000 square kilometers of coral reef, which is about 50,000 to 100,000 kilometers more than previous estimations,” said Dr. Mitchell Lyons from the University of Queensland’s School of the Environment, in an interview with Australian Geographic.
The initiative was named after Paul Allen, the late Microsoft co-founder and philanthropist who supported the project. The coral maps can be freely viewed and downloaded via the Allen Coral Atlas website (www.allencoralatlas.org) or through the Google Earth Engine platform.
“The Allen Coral Atlas is a paragon example of a digital public good,” said Andrew Zolli, Planet’s vice president for sustainability and global impact. “By putting the data in many peoples’ hands, the Atlas is enabling countless new forms of collaboration, scientific research, and conservation.”
— Marc Delgado, marc.delgado@xyht.com
EVENTS
Geospatial World Forum
May 13-16
Rotterdam, Netherlands
FIG Working Week
May 19-24
Accra, Ghana
GeoBusiness
June 5-6
London, England
FOSS4G Europe 2024
July 1-7
Tartu, Estonia

Esri User Conference
July 15-19
San Diego, CA
MAPPS Summer Conference
July 28-31
Park City, UT
Commercial UAV Expo
September 3-5
Las Vegas, NV
Intergeo
September 24-26
Stuttgart, Germany

Flyability Intros Elios 3 UT Payload for Indoor Inspections
DEVELOPED IN PARTNERSHIP WITH CYGNUS INSTRUMENTS, the UT Payload turns the Elios 3 into a flying UTM (Ultrasonic Thickness Measurement) gauge that can take accurate thickness measurements backed up with high-resolution A-scans in the most challenging areas. Equipped with the Elios 3 UT, industry professionals can perform regular integrity inspections in minutes—reducing the probability of unplanned downtimes.
Trimble Dimensions
November 11-13
Las Vegas, NV
The Elios 3 can accommodate the UT Payload in parallel with the lidar payload enabling precise localization of the measurements on a digital twin of an asset during data capture.
Combined with the Asset Management software extension and Cockpit’s Live Map widget, the location-tagged UT measurements provide exceptional situational awareness, allowing the user to easily track the completeness of your inspection.
xyHt 8 MAY 2024


xyHt 9 MAY 2024
Day to Celebrate Lidar Tech Chosen
IF GIS HAS A DAY ON THE CALENDAR (THAT’S EVERY THIRD WEDNESDAY OF NOVEMBER), why not have one for another mapping technology as important as lidar? During this year’s GeoWeek event in Colorado, the U.S. Geological Survey and several partners proposed to celebrate World Lidar Day every February 12.
Light detection and ranging, which uses lasers to measure distance and make accurate 3D maps and models, are now extensively applied in the geospatial sector and in architecture, engineering, and construction (AEC) projects. The value of the global lidar market reportedly reached $2.6 billion in 2023 and is expected to grow to more than $12 billion by 2032, according to a study conducted by the International Market Analysis
Research and Consulting Group.
Aside from the USGS, the founders of World Lidar Day include the National Oceanic and Atmospheric Administration’s National Geodetic Survey, American Society for Photogrammetry and Remote Sensing, National Society of Professional Surveyors, U.S. Army Corps of Engineers’ Joint Airborne Lidar Bathymetry Technical Center of Expertise, U.S. Geospatial Intelligence Foundation, Woolpert, Hexagon, RIEGL, Teledyne Optech, and LIDAR Magazine.
“World Lidar Day is not only to promote awareness of this technology but to develop an annual platform for learning and collaboration,” the USGS said in a press release. Time to mark your calendars.
— Marc Delgado, marc.delgado@xyht.com

New AUV Makes Big Splash (UNDERWATER)
AUSTRALIAN COMPANY ADVANCED NAVIGATION IS PLANNING TO MAKE A BIG SPLASH with its new Hydrus autonomous underwater vehicle (AUV). The Hydrus AUV, designed to do for underwater exploration what drones have accomplished in the aerial segment, is already making waves in its native Australia. Hydrus debuted in 2022 and has been mapping and monitoring Australia’s endangered coral reefs and searching for shipwrecks.
“Hydrus produces stunning imagery, even in challenging low light and turbid conditions. Through its innovative combination of a 4K camera, dynamic lighting, and AI image processing, Hydrus delivers high-quality georeferenced footage. The high 60 frames per second allows fast movements to be captured and enhances machine vision capability, allowing for AI classification and analysis to be performed onboard. Hydrus can create 3D RGB point clouds by combining imagery with its sonar and navigation data,” Advanced Navigation said.

Locating and Mapping Underground Utilities
THROUGH THE INTEGRATION OF THE TRIMBLE CATALYST DA2 GNSS SYSTEM and Radiodetection’s RD Map+ application and precision locator products, the software and hardware integration streamlines utility-locating workflows to provide high-accuracy measurement capabilities for the creation of underground utilities maps in a single field operation.
Traditionally, field technicians manually mark their measurements onsite or rely on data entries to provide to office staff for map creation after a site visit. Data collected with the Trimble Catalyst DA2 GNSS system can now be simultaneously synced with Radiodetection RD Map+ and precision locators that find and mark buried utilities. By streamlining this connection, workers can efficiently and accurately digitize utility-line locations and reduce costly reporting errors.
“Accurate geolocation is critical to the operation and maintenance of underground utilities and public infrastructure,” said Stephanie Michaud, strategic marketing manager at Trimble Surveying & Mapping Field Solutions. “By adding survey-grade capabilities to existing utility workflows, this collaboration creates a connected solution that provides confidence and reliability during the data capture process.”
This integration advances utility measurement workflows by giving workers the capability to accurately represent the utility asset in a digital format. This streamlines the operation, maintenance, and construction process whenever utilities are involved.

xyHt 11 MAY 2024
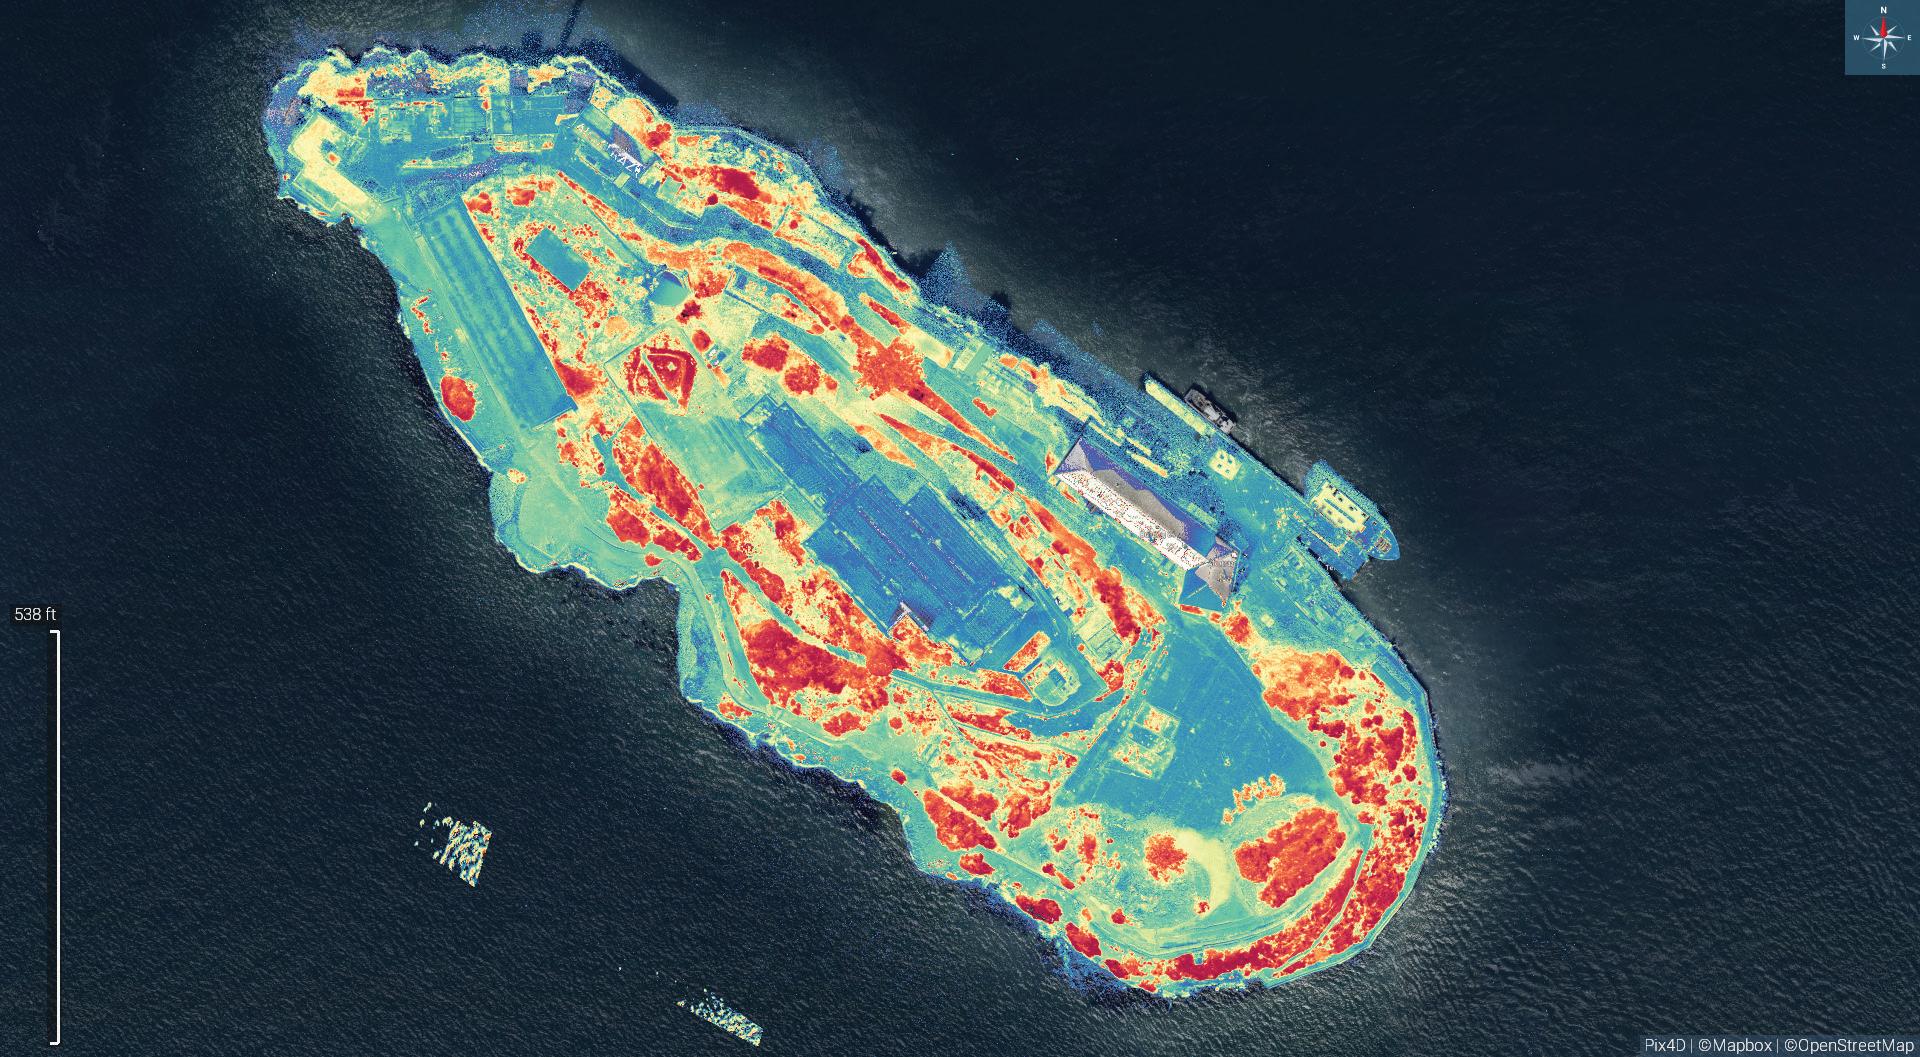
Saving ALCATRAZ (Digitally)

WThe infamous island is under attack by climate change, rising sea levels, and old age. Can scanning it from the sky and on the ground preserve it?
By Juan B. Plaza
hen the first functional photogrammetry uncrewed aviation vehicles (UAVs) became mainstream technology around 2013, geodesists and land surveyors around the world adopted these flying wonders as an innovative way to map certain areas of the globe without having to spend millions of dollars in expensive aircraft and full-format cartographic cameras.
Originally it was the small multi-copters with small-format cameras and limited flying time that caught the imagination of the geospatial profes-
xyHt 12 MAY 2024

sionals, but eventually a new generation of fixed-wing aircraft with heavier useful payloads and longer flying times turned uncrewed photogrammetry from a nice-tohave into a must-have piece of equipment.
A perfect example of why fixed-wing uncrewed aviation is here to stay is the recent mapping of Alcatraz, the small, isolated, infamous island in the San Francisco Bay one mile north of the city of San Francisco.
Pete Kelsey, owner of VCTO Labs was the leader of the endeavour, which involved not only aerial images to create a perfect, centimeter-accuracy map of the exterior, but also laser scanners and many other sensors mounted in various crafts to digitally recreate every nook and cranny inside of the macabre prison.
Kelsey and I worked together at Autodesk in the 2000s when the software company was seriously investing in creating products for geospatial professionals. It was an exciting time to be in the industry because hardware vendors were manufacturing land surveying instruments capable of producing millions of
highly accurate points per second. The bottleneck in those days was the software to turn these point clouds into actionable information and the computing power to process the massive amounts of data, which was seriously lacking.
We reached out to Kelsey for an exclusive conversation about his effort to map Alcatraz, now part of the Golden Gate National Parks Conservancy, to preserve it digitally for future generations.
“The idea came to me because of my love for national parks and the fear that climate change, specifically in the San Francisco Bay area will erode this historical monument before we have time to document every piece of it for posterity,” Kelsey said. “We set out to assemble a team of experts (see chart) in aerial mapping and ground laser scanning that would collaborate, for a non-for-profit effort to create a digital model of the entire island with centimeter accuracy.
Infamous for the maximum-security prison that once held the likes of Al Capone, George “Machine Gun” Kelly, and Robert “Birdman of Alcatraz” Stroud, the island was a military fort in the 1850s, home to the first lighthouse on the West Coast, and an important bird-nesting habitat.
xyHt 13 MAY 2024
Doug Wiedman (left), Bill Granados (middle), and Bobby Valentine flew the eBee X UAV on the mission to scan Alcatraz Island from above.
“I love national parks, and I’m always looking for ways to help them out. I have worked in many, including the USS Arizona, Dinosaur National Monument, etc. The National Park Service (NPS) was keen to understand the effects of sea level rise on the island, so we decided to help. For a national park, Alcatraz was manageable in terms of size (22.5 acres).”
The team spent three weeks in December 2023 using an AgEagle eBee X, laser scanners, and a robotic dog. The selection of the aerial platform was based on the fact that the eBee X is a National Defense Authorization Act (NDAA) drone and only NDAA UAVs are allowed for use within the NPS properties. It is also cleared to fly over people and was used basically to capture photogrammetry and multispectral data.
“To me the greater story is that there has never been a gathering of state-of-theart sensors as there was for this project—all tied into a survey control network,” Kelsey says. “There has never been this kind of cooperation on a project from competitive vendors, all showing up at their own
expense and focusing on the solution of capturing every space on Alcatraz, inside and out. AMD even donated a supercomputer for the post processing. The data is nothing short of spectacular.”
In about 21 days of data collection, the team gathered about four trillion bytes of data to build the first 3-D map of the entire island in full color. The resulting product will be an invaluable tool for local organizations to track the potential effects of climate change, not only on the island, but also throughout the San Francisco Bay area. NPS officials can now visualize potential flooding at Alcatraz and protect the island against future damage.
“We used a lot of different sensors, for example the camera Sony A7RIV, a Phoenix LiDAR Ranger 120, 2x Emesent Hovermap ST-X’s, Riegl VZ 600i, Riegl VZ-2000i all tying to a survey control network of more than 70 ground control points that came in at three millimeters. On the eBee X, we flew the Duet M, an innovative dual-purpose RGB and multispectral mapping camera rig. We used it to create geo-accurate multispectral maps
and high-resolution digital surface models (DSMs) of the external structures.”
As usual, we tend to romanticize field work. When asked about the challenges of spending three weeks on Alcatraz, Kelsey was explicit in his recollection of the event.
“Access was the first roadblock,” he said. “There are a lot of pad locks, locked doors, locked cells on Alcatraz. Being given the keys to the island was the single most important fact to the project’s success.”
Not disrupting visitors and staff while the team was working was also a key component of the project. This is why we slept in cells on the island for three weeks, so we could be up early working before the first staffers and visitors arrived. We had to bring in all our own food as no food is allowed on the island. So, it was camping. No showers, no hot water.
“The first night the bugs ate us alive in our cells. I went into San Francisco and bought every mosquito net I could find to put over our bunks in the cells. We got very lucky with the weather. On the days we had marked to fly, the weather was perfect. This was a bit of a miracle as San Francisco Bay

WHO HELPED SCAN ALCATRAZ
This is a list of companies that participated in the project to create a digital twin of Alcatraz and what they provided.
AGEAGLE
Multispectral survey
AMD
Supercomputer for post processing
BOSTON DYNAMICS
SPOT the robot dog for getting the Hovermap into hazardous areas (lead and asbestos) and staff
CINTOO
Data collaboration
EMESENT
2x Hovermap ST-X’s for SLAM scanning interiors and exteriors and staff
EPIC GAMES
Reality capture for post processing
ESRI
Site scan and site scan for ArcGIS for drone mission planning
FLYABILITY
Elios 3 drone with lidar for confined spaces
FREEFLY SYSTEMS
Astro drone for photogrammetry and staff
INSPIRED FLIGHT
IF 1200A drone to deploy RANGER 120 LiDAR and staff
NUBIGON
Point cloud display, rendering, visualizations
PCL CONSTRUCTION
Setting survey control network, ground control points, and staff
PHOENIX LIDAR
RANGER 120 LiDAR scanner for aerial surveys and staff
PIX4D
Data capture (viDoc & Catch)
Postprocessing (Mapper, Fields, Matic) and staff
RIEGL
Terrestrial laser scanning (vz 600i, vz 2000i) and staff
The following companies provided staff: Sierra Skyworks; 107 Video and Photo Productions; UAS Inc; Valentine Brand; VCTO Labs
in December is typically wet, cold, and windy.”
Like many National Park Service properties, Alcatraz is at risk on numerous fronts. It faces a possible earthquake. It is vulnerable to fires or floods. It also suffers from plain old wear and tear from its 1.5 million annual visitors, with some of its buildings and equipment badly deteriorating.
While the UAV flew over Alcatraz, much scanning was taking place inside the “The Rock,” including in some creepy places.
“The most disturbing part of Alcatraz to me is the hospital. The prison doctor was a drunk. The holding cells in the hospital for the psychiatric patients were particularly disturbing. It was right out of The Shining. We scanned all of it, but no one really liked being in there. Very spooky. I just kept imagining the screams,” Kelsey said somewhat graphically.
The interior scans were completed with two Emesent Hovermaps and with Riegl vz 600i and vz 2000i terrestrial laser scanners. The results produced about 200 individual scans that have to be cleaned, colorized, and merged with the drone-based lidar and all tied into the survey control network, which came in at three millimeters across the entire island.
“We are deep into the postprocessing now and parts of Alcatraz are revealing themselves that have never been seen by any living person,” Kelsey said.
We asked him what was particularly eerie about being in such infamous place for so long.
“The north gun gallery where the Battle of Alcatraz began in 1946 was fascinating.” Kelsey said. “There is graffiti there from the guards and the rioters who took over the gun gallery. The graffiti left by the rioters is particularly pornographic. There are bullet holes from the battle up there. We scanned all of that, too. The gun gallery is off limits to visitors so scanning areas like this that someday might be made available for virtual tourism and study is exciting.”
When asked about the timeframe and restrictions on the amount of days they could stay, Kelsey was clear about the timing.
“We had three weeks to complete the data capture,” he said. “This would not have been possible without the cooperation of the entire team. Team members who might typically view other team members as competitors out in the workplace tabled all of that and came together to focus on the project, the workflow, the interoperability. It was amazing; a once-in-a-lifetime gathering of talent and technology. All credit goes to the team. I cannot thank them all enough.”
The National Park Service will maintain the rights to the 3-D map, and no money changed hands in the making of the map.
“I believe the 3-D map provides the National Park Service with endless opportunities,” Kelsey says. “It could be used by movie studios, which wouldn’t need to film on Alcatraz but could instead use the 3-D data with a green screen. It could be turned into a video game or a virtual reality experience using Apple Vision Pro or Meta headsets. It could be replicated with a 3-D printer. My selfish dream is that it’s the world’s first virtual national park.” ■
Juan B. Plaza is the CEO of Plaza Aerospace, a drone and general aviation consulting firm specializing in modern uses for manned and unmanned aviation in mapping, lidar, and precision GNSS.
xyHt 15 MAY 2024

The Growing Role of GEOSPATIAL TECHNOLOGY in HIGH-SPEED CONNECTIVITY for All
How mobile mapping is providing a reality capture solution for an ambitious fiber-to-thehome initiative in Ontario, Canada
BY LINDA DUFFY
Investments in fiber-to-the-home or FTTH support digital equity to provide new economic, education, and public health opportunities in rural and remote areas. They also present a potential growth market for surveying companies and utilities service providers as countries across the globe race to meet ambitious broadband expansion goals supported by
government investments.
FTTH refers to the use of fiber optic cable to deliver broadband internet connections from a central location directly to the home, known as “the last mile.” FTTH replaces existing copper infrastructure, such as telephone wires and coaxial cable, to deliver higher data speeds, greater bandwidth, and improved reliability for customers.
GLOBAL INVESTMENT DRIVING OPPORTUNITY
In North America, the Broadband Equity, Access and Deployment (BEAD) program is providing $42.45 billion to expand highspeed internet in the 50 states, District of Columbia, Puerto Rico, and other territories, while in Canada, the Universal Broadband Fund is investing $3.225 billion in FTTH to reach 95 percent of Canadian households by 2026 and 100 percent by 2030.
In Ontario, as many as 700,000 households—approximately 1.4 million Ontarians—lack access to high-speed internet or have no internet connection at all. To help address this issue, in 2021 the Government of Ontario committed nearly $4 billion to
xyHt 16 MAY 2024
achieve 100 percent coverage for unserved or underserved homes in every region by the end of 2025. With eight Internet Service Providers (ISPs) responsible for different regions of the province, work on the Accelerated High Speed Internet Program (AHSIP) is underway.
Background mapping data is fundamental to the network architecture design, according to the FTTH Handbook (Edition 9) from the FTTH Council Europe. While that data can come from national mapping agencies and GIS vendors, an increasingly common source of data is mobile mapping systems, capable of collecting positional data at posted speeds with centimeter-level accuracy.
Mobile mapping data enables planners and designers based in an office to work with a comprehensive view of the real-life situation in the field, thereby avoiding the cost of extra field visits. Information is up-to-date and can be embedded into a GIS for maximum benefit in an integrated environment.
LANDBASE DETAILS FOR FTTH
Planview Utility Services Ltd., with offices in Markham, Ottawa, and London, Ontario, provides engineering services, GIS and mapping services, subsurface utility engineering and asset management services to some of the largest utilities and municipalities in Ontario, including several of the ISPs participating in the AHSIP.
Using a Trimble MX50 mobile mapping system, Planview USL has collected more than 18,000 kilometers of comprehensive point clouds and imagery to build a landbase used to design the fiber network for underserved rural communities. The success of

the project relies on careful pre-planning to identify potential infrastructure gaps (such as inadequate telephone poles and underground conduits) and difficult terrain, and schedule work within the time constraints of a short construction season.
“It’s a challenge to get survey teams out to remote areas in our vast province, so we need to minimize the number of field visits,” says Tony D’Amico, director GIS services, solutions, and mobile mapping at Planview USL. “Mobile mapping allows us to gather a significant amount of data quickly during the summer months.”
“Our Landbase as a Service (LaaS) offering leverages mobile lidar to efficiently collect data and provide a comprehensive landbase to our clients to support their design work,” D’Amico said. “We spend the winter months creating 360-degree imagery with Trimble Business Center and extracting up to 36 layers of data.”
The data layers include anything above ground that could impact installation of the fiber, including sidewalks, curbs (top of curb, bottom of curb, and back of curb), edge of pavement, ditch lines, tree lines, bush lines, building fronts, fence lines,
poles, manholes, catch basins, pedestals, and vaults. The tree component includes tree height, trunk diameter, and canopy diameter. If open-source data is available, parcel maps, zoning, CAD drawings of water pipes, etc., are added to the landbase to provide even more valuable information.
Planview USL’s end-to-end workflow is tailored to the specific challenges and opportunities within FTTH deployments. The resulting street-level imagery and landbase layers support planning, design, build, operate/maintain, and expand phases of the FTTH project:
• Planning: 360-degree imagery allows the ISPs to analyze existing conditions and identify potential routes and obstacles without a site visit. By viewing point cloud and imagery data within Trimble MX Publisher, planners gain insight into what equipment is already attached to an existing pole and whether the pole meets the minimum requirements for adding fiber.
• Design: The extracted landbase provides the foundation for FTTH design work, including house and building counts, road conditions, infrastructure locations, and field survey verification. Completing work on budget and on schedule relies on an accurate design.
• Build: Post-construction restoration efforts are backed by the rich data and imagery that documents conditions prior to construction. Additionally, the accurate landbase allows for seamless integration with as-built records.
• Operate & Maintain: Data are used to manage and operate the live network and to support future maintenance, vegetation management, and network upgrades.

• Expand the Network: Ongoing growth is supported through existing datasets available in SHP CAD or through Trimble MX Publisher.
MOBILE MAPPING FOR EFFICIENCY AND REDUCED COST
Collecting data with a mobile mapping system offers many operational advantages. The georeferenced point clouds and imagery are collected once but used many times for various tasks, including visual asset inspections, ad-hoc measurements, and vegetation management. The landbase captures service area data, generates maps and 360-degree imagery,
xyHt 17 MAY 2024
Planning includes taking inventory and measuring equipment attached to existing poles and assessing whether the pole meets the minimum requirements for adding fiber. Photo credit Planview USL.
Detailed data is collected to provide a complete picture of the surroundings. Photo credit Planview USL.

adds asset attributes, and integrates into a GIS platform.
A vehicle carrying a mobile mapping system like the MX50 operates at normal posted speeds with a two-person team capable of collecting on average 150 to 200 km per day. In five days in the field, 750 to 1,000 km can be collected as compared to several hundred kilometers with traditional terrestrial equipment. Data collection of large areas in a shorter timeframe with a smaller crew results in lower costs for
the most user-friendly setup, mounting, software, and navigation and the software is quite intuitive,” says D’Amico. “Even more important is reliability. After driving hours to reach our target area, we really need the unit to work correctly. And if something does go wrong, Cansel, our local dealer, can quickly provide a loaner and send us back to work.”
set management for customers. The mobile lidar team, part of the GIS Team, has also grown both in size and resources to meet project demand from telecommunications companies and other engineering firms. Between the collection team, and the data processing and extraction team, employment fluctuates around 65 depending on current project needs.
CREATING OPPORTUNITIES FOR UNDERSERVED COMMUNITIES

lodging, meals, and travel time, especially when working in remote rural areas.
“Compared to other mobile mappers that we’ve owned, we feel the MX50 offers
Mobile mapping has unlocked new customer opportunities for Planview USL and driven hiring within the firm. The telecommunication design teams have significantly grown in recent years, as well as the GIS team that supports the design process and post construction data and as-
High-speed internet connectivity to every home and business helps to level the playing field for remote and rural communities left out of the growing digital economy. The Government of Ontario’s commitment to invest in FTTH will improve access and create new opportunities for video streaming, cloud computing, virtual reality, remote work, online schooling, and more. Planview USL is contributing to AHSIP by collecting thousands of kilometers of location-based information with its mobile mapping system, and creating the detailed landbase necessary for effective planning, design, and construction of the high-speed fiber optic network in Ontario. ■
Linda Duffy is president of Apropos Research, an independent market research firm that provides market research and marketing communications services to the geospatial and remote sensing community.
xyHt 18 MAY 2024
The Trimble MX50 mobile mapping system collects lidar data and 360-degree imagery while driving at posted speeds. Photo credit Planview USL.
The landbase provides a foundation for FTTH design work. Photo credit Planview USL.


xyHt 19 MAY 2024
Pioneering for Tomorrow
The role of laser scanning in shaping our resiliency to natural hazards
BY MACK KOWALSKI
Would you believe me if I told you that there is a real-life geomatics version of Indiana Jones? These quiet professionals specialize in laser scanning instead of archaeology, and their “Holy Grail” is data.
The Natural Hazard and Disaster Reconnaissance Facility (RAPID) helps researchers utilize lidar sensors to comprehensively scan and document the aftermath of natural disasters. If you are unfamiliar with this groundbreaking program let me introduce you to the group that uses geomatics to support science to make the world a better place.
In the face of escalating natural disasters, it has never been more critical for advanced research into infrastructure to bolster community resilience. The RAPID facility, part of the Natural Hazards Engineering Research Infrastructure (NHERI), is spearheading innovative approaches to comprehend, respond to, and recover from various natural hazards. This collaborative effort, funded by the National Science Foundation (NSF), brings together experts from diverse disciplines to create a comprehensive and groundbreaking strategy for natural hazards engineering.
OVERVIEW OF THE NHERI PROGRAM
The RAPID is part of the broader NHERI initiative, which addresses a spectrum of natural hazards. These hazards include earthquakes, hurricanes, tornadoes, wildfires, and other extreme events that threaten infrastructure and community resilience. NHERI aims to develop a holistic understanding of natural hazards and their impact on the built environment.

Among their objectives are: Rapid Response Research: The primary goal of the RAPID is to facilitate swift, on-the-ground research immediately following natural hazard events. By deploying interdisciplinary teams equipped with stateof-the-art equipment and tools, researchers aim to gather critical data that can inform
xyHt 20 MAY 2024
Data collection in Death Valley National Park following Hurricane Hilary. An array of terrestrial lidar scanners, including the Leica RTC360 (pictured), were used to capture damage from the extraordinary precipitation event.

future engineering practices and improve building codes. Hybrid Simulation Techniques: Hybrid simulation combines experimental testing with advanced computational models, allowing researchers to better understand the complex interactions between structures and various natural hazards. The NHERI program leverages hybrid simulation techniques to simulate real-world scenarios, providing valuable insights into failure mechanisms and vulnerabilities in the natural and built environments.
Community Resilience Enhancement: Beyond the technical aspects, the program also focuses on enhancing community resilience. By integrating social and economic factors into their research, the RAPID seeks to develop holistic solutions that consider the broader impact of natural hazards on communities.
Education and Outreach: The program places a strong emphasis on education and outreach, aiming to disseminate knowledge and best practices to various stakeholders, including
xyHt 21 MAY 2024

engineers, policymakers, and the public. This educational component is crucial to fostering a culture of preparedness and informed decision-making.
I recently got to sit down with Michael Grilliot, Ph.D., the operations manager for the RAPID facility at the University of Washington, to get a better understanding of the program and its purpose. During the interview I inquired as to his favorite part of what they do. He responded with enough conviction and sincerity that you could feel it in the room.
“We’re doing this exciting work and all these really cool projects that have an honest and meaningful impact,” Grilliot said. “All these disasters that we're going to, all of these buildings that we're scanning, all of this data gets processed and analyzed for one reason. To just try and build it better. And you know all of the projects that get published are going to be helpful.”
UNIQUE USE OF LIDAR
The utilization of lidar technology within the RAPID facility plays a pivotal role in enhancing the precision and efficiency of data collection, particularly in the context of natural hazards such as earthquakes. Here are some key aspects of how lidar is employed within the program:
High-Resolution Mapping: Lidar technology provides a rapid and high-resolution mapping of the earth's surface. This is particularly valuable for assessing the impact of natural hazard events on infrastructure, terrain, and the built environment. The ability to create detailed 3D
maps allows researchers to visualize and analyze the effects of natural hazards on structures and landscapes. Structural Damage Assessment: Lidar is instrumental in conducting
detailed structural damage assessments after natural hazard events. By quickly capturing precise images of affected buildings and infrastructure, researchers can identify areas of damage, assess the severity, and understand failure mechanisms. This information is crucial for improving building codes and designing structures with enhanced seismic resilience.
Terrain and Landscape Analysis: Beyond structural assessments, lidar technology aids in analyzing changes to the existing landscape caused by natural hazards. This includes the identification of fault lines, landslides, and other geological alterations. Understanding these changes contributes to a comprehensive understanding of the broader impact of earthquakes on the environment.
Rapid Response Capabilities: One of the strengths of lidar technology is its rapid data acquisition capabilities. In the aftermath of a natural hazard, quick response and data collection are essential. Lidar allows researchers to efficiently gather information, aiding in the timely assessment of damage and informing emergency response efforts.
Simulation and Modeling Support: Lidar data serves as a valuable input for simulation and modeling activities within the RAPID facility. By integrating lidar-generated 3D maps into computational models, researchers can simulate the effects of natural hazards more accurately. This enhances the reliability of predictions regarding structural behavior and vulnerabilities in the face of natural events.
Multi-Hazard Applications: the versatility of lidar technology allows its application across various natural hazards. Whether assessing hurricane damage or analyzing tornado impact zones, lidar's ability to quickly generate detailed topographic information proves invaluable for multi-hazard resilience research.
Long-Term Monitoring: Lidar technology facilitates long-term monitoring of changes to the built environment. Continuous monitoring of structural stability and landscape alterations over time provides valuable data for understanding the long-term impacts of natural hazards and improving resilience strategies.
The toolkit available to RAPID professionals is broad, and laser scanners represent only one aspect of it. Andrew Lyda, an engineer involved in RAPID operations, said, “The appeal lies in the diversity of equipment. It’s not confined to laser scanners alone. We engage with total stations, survey instruments, as well as specialized gear for geo-technical, coastal, and marine purposes.”
COLLABORATIVE EFFORTS AND EDUCATIONAL PARTNERSHIPS
The success of the NHERI program relies on collaboration among researchers, engineers, emergency responders, and

Researchers using the Leica RTC360 LiDAR scanner in Mayfield, Kentucky, following the 2021 Western Kentucky Tornado. The data was used to create digital twins and model tornado loading on historic masonry buildings.
xyHt 22 MAY 2024
Preparing the Freefly Alta X UAS and Phoenix Miniranger LiDAR payload on the Cle Elum Ridge in Washington State. The aerial lidar system was used to investigate the impact of forest fire mitigation techniques on snowpack.
community leaders. Partnerships with academic institutions play a crucial role in achieving program objectives.
The RAPID facility, based at the University of Washington, is a collaboration between the UW, Oregon State University, Virginia Tech, and the University of Florida, where researchers and students contribute their expertise to advance multi-hazard resilience. Some students who have contributed have moved on to PhD studies, reaching as far as Nepal. The researchers are excited to see that a few students have come full circle and are preparing to become faculty members.
IMPACT AND FUTURE DIRECTIONS
researchers with a comprehensive understanding of various natural hazards.
Looking ahead, the program aims to further refine its methodologies, expand its
the economic impact of these events.
The NHERI network, including the RAPID facility, is a beacon of progress in natural hazards engineering research.

Since its inception, the RAPID facility has made significant strides in advancing natural hazards engineering research. The integration of lidar technology and a broader multi-hazard focus enhances the precision and efficiency of data collection, providing
network of collaborators, and develop innovative technologies to improve multi-hazard resilience. The goal is to create a more resilient built environment that can withstand and recover from a spectrum of natural disasters, ultimately saving lives and reducing

By combining rapid response capabilities, cutting-edge simulation techniques, and the innovative use of lidar technology, the program is making invaluable contributions to our understanding of various natural hazards and their impact on infrastructure and communities.
As the program continues to evolve, its findings will play a crucial role in shaping the future of disaster resilience and engineering practices in hazard-prone regions. When I started digging into this program, I approached it as if it was just a fascinating use of laser scanning. What I found is a group of people who appreciate lidar and laser scanning but have a true passion for helping us build a better world. Their efforts will ensure that our future will be less hazardous and more resilient to a world that is constantly trying to tear itself apart. ■
Mack Kowalski has more than 16 years of experience in layout management and laser scanning to provide innovative solutions and services to our clients and partners. His passion to push the boundaries of technology and delivering high-quality results in every project led him to co-found LiDAholics consulting firm.
xyHt 23 MAY 2024
3D model of a catastrophic landslide that occurred in Haines, Alaska. The underlying point cloud was created using data from the Phoenix Mini Ranger aerial lidar system and partially colorized with RGB from images captured with the Trinity F90+ fixed-wing UAS.

Are Surveyors Professionals or Merely Technicians?
By Jeffery N. Lucas, JD, PLS, Esq.
This is a question that has haunted the surveying profession for years if not decades. A second related question is: What’s the difference? Curtis Brown addressed this issue in an article he wrote that in 1961 that was published in the ACSM’s Surveying and Mapping magazine, entitled “The Professional Status of Land Surveyors.” In that article he pegged the land surveyor’s professional status on being subject to liability.
“Since we as surveyors are liable, one of the greatest deterrents to substandard work is the liability,” he wrote. “While liability to the individual may be considered a disadvantage, it is an advantage to a profession as a whole. Without liability, I fear that those willing to do poorer work for less money would soon ruin the professional standing of all land surveyors. And so, I say, professional liability is a privilege tending to prove the land surveyor’s professional standing.”
The question is a little more complicated than that. Historically speaking the term “professional” only applied to theology, law, and medicine. (Black’s) These three professions are what I have often referred to as the “Big Three.” Obviously, the term has expanded to other occupations over time but for this discussion we will stick with these three because of their shared unique characteristics and universal acceptance of their status as professions.
We will call these unique characteristics the “hallmarks of professionalism” that separate the Big Three from the crowd. We
can’t consider all the characteristics in this short piece, so we will look at three that clearly create separation.
To begin with, the practitioners see their work as a calling as opposed to just a vocation. The practitioners take vows to render service whether paid or not. That’s an indication of how they view the importance of their work—it can’t be withheld when needed. Similarly, many surveyors feel they were called into the profession. While our work is consequently important, it can ethically be withheld if not compensated.
Next, they all sell the very same service. The stock-in-trade of these professions and in the final analysis the only thing they have to offer their clients is an opinion—an opinion on issues important to the client.
That’s not true of most other professions. There has been debate in court opinions as to whether engineers and architects render opinions (professionals) or warrant their work (technicians). There has never been that same debate over surveyors because the courts recognize surveyors as professionals because they render opinions on the location of property boundaries. Surveying is not an engineering project.
Finally, there is a special relationship between the practitioner and the client. For the clergy it’s spiritual, for the doctor it’s personal, and for lawyer it’s called the “attorney-client privilege.” These special relationships go to some of the core issues of life as we know it: spiritual well-being, physical well-being, and legal well-being.
Once these valuable assets are taken care of what is the next most important treasure most landowning Americans have on God’s green Earth? Their private property and associated property rights.
With the hallmarks of true professionalism in mind, is the surveyor a professional rendering well-reasoned opinions on the location of property boundaries that represent the limits of the associated property rights, or a mere technician slavishly staking out deeds, breaking down sections, moving property corners around, and measuring correct results with a closure ratio?
I have often referred to Brown as the father of deed staking, which he freely admitted in his 1979 article “Land Surveyors Liability to Unwritten Rights,” in which he wrote: “In my early writings, I generally advocated that surveyors should locate land boundaries in accordance with a written deed.”
However, in that same article he reversed his philosophy, writing: “What did the client have in mind when he asked the surveyor to locate his boundaries? Was he asking the surveyor to locate his ownership? Or just the deed lines? As all surveyors should know, there is a vast difference between ownership and written deed rights…From my experience with clients, very few know that there is a difference between the two; most clients want to know what they own.”
After the article was published in Surveying and Mapping, Brown was accused of being a fence-line surveyor in a rebuttal article. Staking out deed lines can be accomplished by a trained technician. Professionals render well-reasoned opinions on issues important to their clients. Which are you?
Jeff Lucas is an attorney and land surveyor in private practice in Birmingham, Alabama. Jeff is an author, columnist, lecturer, seminar presenter, and continuing education provider. He writes a monthly newsletter, The Lucas Letter , dealing with legal issues and the practice of surveying. More information about Jeff and his continuing education courses can be found at www.lucasandcompany.com
xyHt 25 MAY 2024
LEGAL BOUNDARIES
There are several manufacturers of excellent digital levels. While visiting the Deutsches Optisches Museum (optics museum) in Jena to research this article, a side visit to the Zeiss campus nearby provided an opportunity to examine the history and manufacture of one of these lines of digital levels, Trimble’s DiNi® (Digital Nivellier). This is just one of many digital levels I’ve used, and they all perform well.
Torsten Kludas, managing director of Trimble Jena GmbH, graciously gave a tour of the facilities located in the main Zeiss building and provided a history of the evolution of the various Zeiss companies. He has held various R&D and management roles within these companies for many years, having the opportunity to witness and participate in this evolution.
The history of the Zeiss companies is fascinating, including the disruption of
World War II. At the war’s end, the Jena facility was essentially dismantled with U.S. and Russian forces successively taking most of the tech (and many of the engineers). The company then split between East and West Germany, development and production continued on both sides, and the company reconstituted following reunification.
From 1982 to 1988 research projects between VEB Kombinat Carl Zeiss Jena and Dresden Technical University
developed automated rod reading by using a digital barcode. The first prototypes were based on the Ni-002.
By 1988, the Zeiss RENI 002A semi-automated the workflow, with optical visual observations entered and stored onboard the instrument. In 1990, WILD launched the NA2000 auto-level, the first of the new wave of digital levels on the market. In 1994, the Zeiss DiNi 10/20 was launched providing a CCD line for automated code measurement, enduring
We continue our look at the foundational technology and design of precision levels for surveying with an examination of the evolution of the Digital Nivellier.
BY
JODIE
HARTNELL
The Enduring Technology of


 The DiNi manufacturing at Carl Zeiss Jena GmbH in Jena, Germany.
– Photo: xyHt
The DiNi manufacturing at Carl Zeiss Jena GmbH in Jena, Germany.
– Photo: xyHt
through various iterations until the present day. A deep dive into this development and testing is in the paper: “Development of Levels during the Past 25 Years, with Special Emphasis on the NI 002 Optical Geodetic Level and the DiNi Digital Level” (bit.ly/3tHLQLQ) by Matthias Menzel (Dipl.-Ing.) and Carl Zeiss of Jena GmbH.
The most stable place inside the main Zeiss building is where Carl Zeiss Jena and Trimble Jena have manufactured the DiNi since 1994. In a cleanroom environment, 16 highly skilled workers assemble and test the instruments. Many of the team had attended one of the technical schools in Jena, or if hired from elsewhere, they undergo a one-year on-the-job training program. Like any optical instrument, collimation tests must be performed as well as calibration of the pendulum-compensator, beam splitter, and CCD. The optics are also made in-house.

“We did a lot to make production lean and with clean-room conditions,” said Kludas. “Failure rates are among the lowest in the industry.” Electronics are “aged” in environmentally controlled enclosures. Tens of thousands of units have been shipped to countries all over the world over the years—impressive numbers as digital levels are not as common in surveying firm inventories as are GNSS rovers or total stations.
Upstairs, Kludas and Trimble Jena GmbH engineer other elements found in a wide variety of surveying instruments
under the Trimble Umbrella. Zeiss had changed from the grey color (Zeiss West) and orange color (Zeiss East) to blue (re-united Zeiss Geodetic Instruments), and later to yellow for Trimble developed and manufactured instruments.
Specs can be one thing, but I always look for examples of independent testing, by academia, firms, or agencies. For example, control levels for an underground rail line in New Zealand (bit.ly/48GHpj7) closed 10 km with a 4 mm residual. A leveling crew in the Pacific Northwest submitted a 20 km DiNi run to the National Geodetic Survey with a 1 mm residual (that can’t all be pure luck).
The nice thing about digital levels is that you can rough-pre-check errors along the way, avoiding most blunders and for the most part see if you will meet distance-residuals while still on site.
Another example came up in discussion at a conference with engineers working on high-speed and Maglev rail lines in China. I asked if there were any domestic manufacturers of digital levels. They said that there was no real need to; the units now on the market were of high quality, and at a good price.
One engineer related that through their own testing, they determined that the DiNi was the only unit that (at the
xyHt 27 MAY 2024
The pioneering Zeiss Ni 002 analog level. It achieved a precision of ±0.2mm/km and is still used as a reference instrument to this day. Some early digital level prototypes were based on the Ni 002. – Photo: xyHt
time) met their needs for a specific phase of a high-speed rail project. And while on tour of the CERN Large Hadron Collider campus in Switzerland to interview the Large-Scale Metrology team about their geodetic infrastructure and procedures (bit. ly/3NSWRB4), an all-PhD survey crew, they related their own internal testing and at the time had settled on the DiNi.
Wayne Johnston, of Trimble surveying and mapping optical market manager, has been involved in the Trimble Jena site for the past 15 years.
“Digital levels are an important tool in the surveyor’s arsenal,” he said. “They do a specific job very well, to the extent that no practical technology has replaced it outright over the years. We’re very proud of the longevity of our DiNi for providing what our customers want in this product line; ruggedness, dependability, and above all, accuracy."
There have been incremental improvements over the years, though some design elements have remained the same.
“You never would touch the measurement principle,” said Kludas. “Yes, in many ways it is perfect. On the one hand, it’s a relatively simple instrument. You have focus lens, you have your main objective, you have your eyepiece, you can make visual readings, and the CCD makes the rod readings. But on the other hand, things like

weight balancing the vertical axis, the very precise compensator, stable optical design, and the processing—based on more than 100 years of level instrument experience.”

The display size was increased, the communication interface and other improvements were made in the software, but for the most part, the DiNi has stood the test of time since 1994.
Over the years, I have asked surveyors what additional features they would like to see on the DiNi and other digital levels. A QWERTY keyboard is a common wish list item, and/or a way to connect to an external data controller. And perhaps we might someday see smart instruments, like the smart speakers in our homes. “Hello DiNi, are you level and ready for the next observation?” But beyond that, such instruments are viewed as a reliable, consistent, very high precision, and essential tools. If a design isn’t broken, don’t fix it. ■
Jodie Hartnell is a geographer, chef, freelance writer, and winner of the Chartered Institution of Civil Engineering Surveyors publishing award. Jodie studied geography on both sides of the Atlantic and has settled in beautiful British Columbia.
xyHt 28 MAY 2024
In 2019, a set of stamps commemorating the 150th anniversary of modern surveying in Japan was issued. Note the attention to detail of best practices; the use of a bipod for the invar rod, and an umbrella to keep the digital level (a DiNi) out of direct sunlight. Photo: Kludas
Torsten Kludas, Managing Director Trimble Jena GmbH poses with a selection of instruments with design input from Zeiss and Trimble. – Photo: xyHt
Instrument Repair Education

Instrument Repair Equipment

Contact Angie Duman to place your listing here! angie.duman@xyht.com
Navigation Electronics, Inc.
124 Toledo Drive
Lafayette, LA 70506 (337) 237-1413
Website: www.neigps.com
Georgia Office: (770) 729-8005
Alabama Office: (256) 665-5589
Mississippi Office: (662) 347-1117
Arkansas Office: (870) 273-6333
Florida Office: (850) 228-2070
Seiler Instrument Geospatial Offices in IL, IN, KS, KY, MI, MO, NE, WI 877-330-6303
Email: servicedept@seilerinst.com
Website: www.seilergeo.com

College of the Canyons
Land Surveying
26455 Rockwell Canyon Road
Santa Clarita, CA 91355
(661) 362-5096
Email: Regina.Blasberg@canyons.edu
Website: www.canyons.edu/SURV
Associate of Science Degree Courses offered ONLINE (Video Conferencing)
New Mexico State University
Geomatics Department
1060 Frenger Mall – Room 130
Las Cruces, NM 88003
Phone: (575) 646-6748
Email: kwurm@nmsu.edu or elaksher@nmsu.edu
Website: https://et.nmsu.edu/geomaticssurveying//
Fully online program and +2 option.
BS Degree
Troy University
Surveying and Geomatics Sciences Program
Geospatial Informatics Department
344 Wallace Hall
Troy, AL 36082
Phone: (334) 808-6727
Fax: (334) 670-3796
Email: geospatial@troy.edu
Website: www.troy.edu/geospatial
BS Degree, ABET-ASAC accredited www.instagram.com/troygeospatial www.tiktok.com/@troy_geospatial
University of Maine
Surveying Engineering Technology Program
5711 Broadman Hall, Room 119
Orono, ME 04469-5711
(207) 581-2340
Email: um.set@maine.edu
Website: http://www.umaine.edu/set/svt/ Bachelor Degree. abet-taac
xyHt 29 MAY 2024 CLASSIFIED
CONTACT ANGIE DUMAN TO PLACE YOUR AD
ADVERTISING
Stay Connected www.xyht.com

The NORTHERN HEMISPHERE of the CELESTIAL GLOBE (1515)
This whimsical map full of imaginary beasts and creatures is the oldest star map (or star chart) printed in Europe. It is based on the woodcuts by the great German painter Albrecht Dürer (1471-1528) who lived at a time when cartography was considered both as a work of art and a navigational tool.
Before GPS, star maps were used by early explorers to plot their course in unknown lands and oceans. A close look reveals that it represents the constellations as seen from the Northern Hemisphere. Can you find the Ursa Minor (Little Dipper) with the Polaris (North Star) at its tip? How about the radial lines that divide the
map in 30-degree intervals which overlap with the actual location of the stars?
If you are sailing or walking north of the Equator, the Polaris is an ideal reference point for navigation because it is directly above the Earth's northern axis of rotation (North Pole).
The accuracy of this map, despite the technological limitations of the period, is impeccable. That’s because to create his woodcuts, Dürer relied on previous charts already drawn by ancient Roman and Arab astronomers.
But to be able to sell his work to a wider market and not just to navigators, he embellished his star maps with characters

found in the ancient Roman zodiac tradition. Check out the Twins (Gemini) and the Water-Bearer (Aquarius), as well as other mythological figures.
Aside from their artistic value, the star maps of Dürer were also influential in the work of the Flemish cartographer Gerardus Mercator (1512-1594). The Mercator map projection is widely used in navigation charts to this day, while the Web Mercator or WGS 84/Pseudo-Mercator is the de facto standard for Web mapping used by Google Maps and other way-finding platforms.
Only a few original copies of these celestial maps remain, and they are mostly found in private collections and museums. In 2011, a pair of authentic Dürer star maps were sold at auction for $578,542.
— Marc Delgado, marc.delgado@xyht.com
xyHt 30 MAY 2024 MAPS AS ART


