Berwyn Development Corporation

Commercial Vacancy Report 2022 (Q3 & Q4) Printed: 4/20/2023
The BDC recognizes Kendra Shaw, Genesis Valencia, Michelle Valle-Flores, and Marcos Martinez for data collection, graphic design, map creation and production of charts and graphs.
TABLE OF CONTENTS 3 I. Executive Summary II. Total Commercial Square Feet, By Corridor 4-5 III. Total Commercial Vacancy, By Corridor 6-7 8 9-12 13-15 16-18 19-21 22-25 26-30 31-33 34-37 IV. Commercial Vacancy Health, By Corridor V. Roosevelt Road VI. Harlem Avenue VII. Oak Park Avenue VIII. Ridgeland Avenue IX. 16th Street X. Cermak Road XI. 26th Street XII. Depot District XIII. Ogden Avenue XIV. Total Commercial Square Feet, By Ward XV. Total Commercial Vacancy, By Ward XVI. Commercial Vacancy Health, By Ward 38-40 43-44 46-48 49-51 52-54 55-57 58-60 61-64 65-68 69-71 72 XVII. Ward 1 XVIII. Ward 2 XIX. Ward 3 XX. Ward 4 XXI. Ward 5 XXII. Ward 6 XXIII. Ward 7 XXIV. Ward 8 XXV. Recommendation /Tools XXVI. City Zoning & Ward Maps 41-42 45 73-74
EXECUTIVE SUMMARY I

The Berwyn Development Corporation has developed a dynamic tracking map for vacant properties. This report contains maps for Q3 & Q4 of 2022. Since the most recent publishing, the BDC worked closely with Aldermen and the City of Berwyn Fire Department to accurately identify vacant properties. The BDC also worked with City Council to amend the Vacancy Ordinance, which requires property owners to register their vacant properties and obtain adequate insurance. With the base map established, the BDC will continue to update the vacancy map on a semi-annual basis, providing for up-todate reporting about the commercial property health, new tenancy, and target areas for resources and redevelopment.
At the end of the 4th quarter of 2023, Berwyn’s total commercial property vacancy sat at 11.44%. This is a slight increase from Quarter 2 of 2022, which finished at 10.78%. The BDC has broken down this report both by corridor (Oak Park, 26th St, 16th St, Roosevelt, Harlem, Cermak, Ogden, Ridgeland and Depot), as well as by Ward. Some areas have more commercial property, and thus have a larger percentage of the total community vacancy. However, for each page of this report, we will lay out a metric for commercial vacancy “health,” based on how each corridor or Ward compares to others. In this way we can identify priority areas for assistance, as well as develop strategies to help mitigate extended periods of property vacancy.
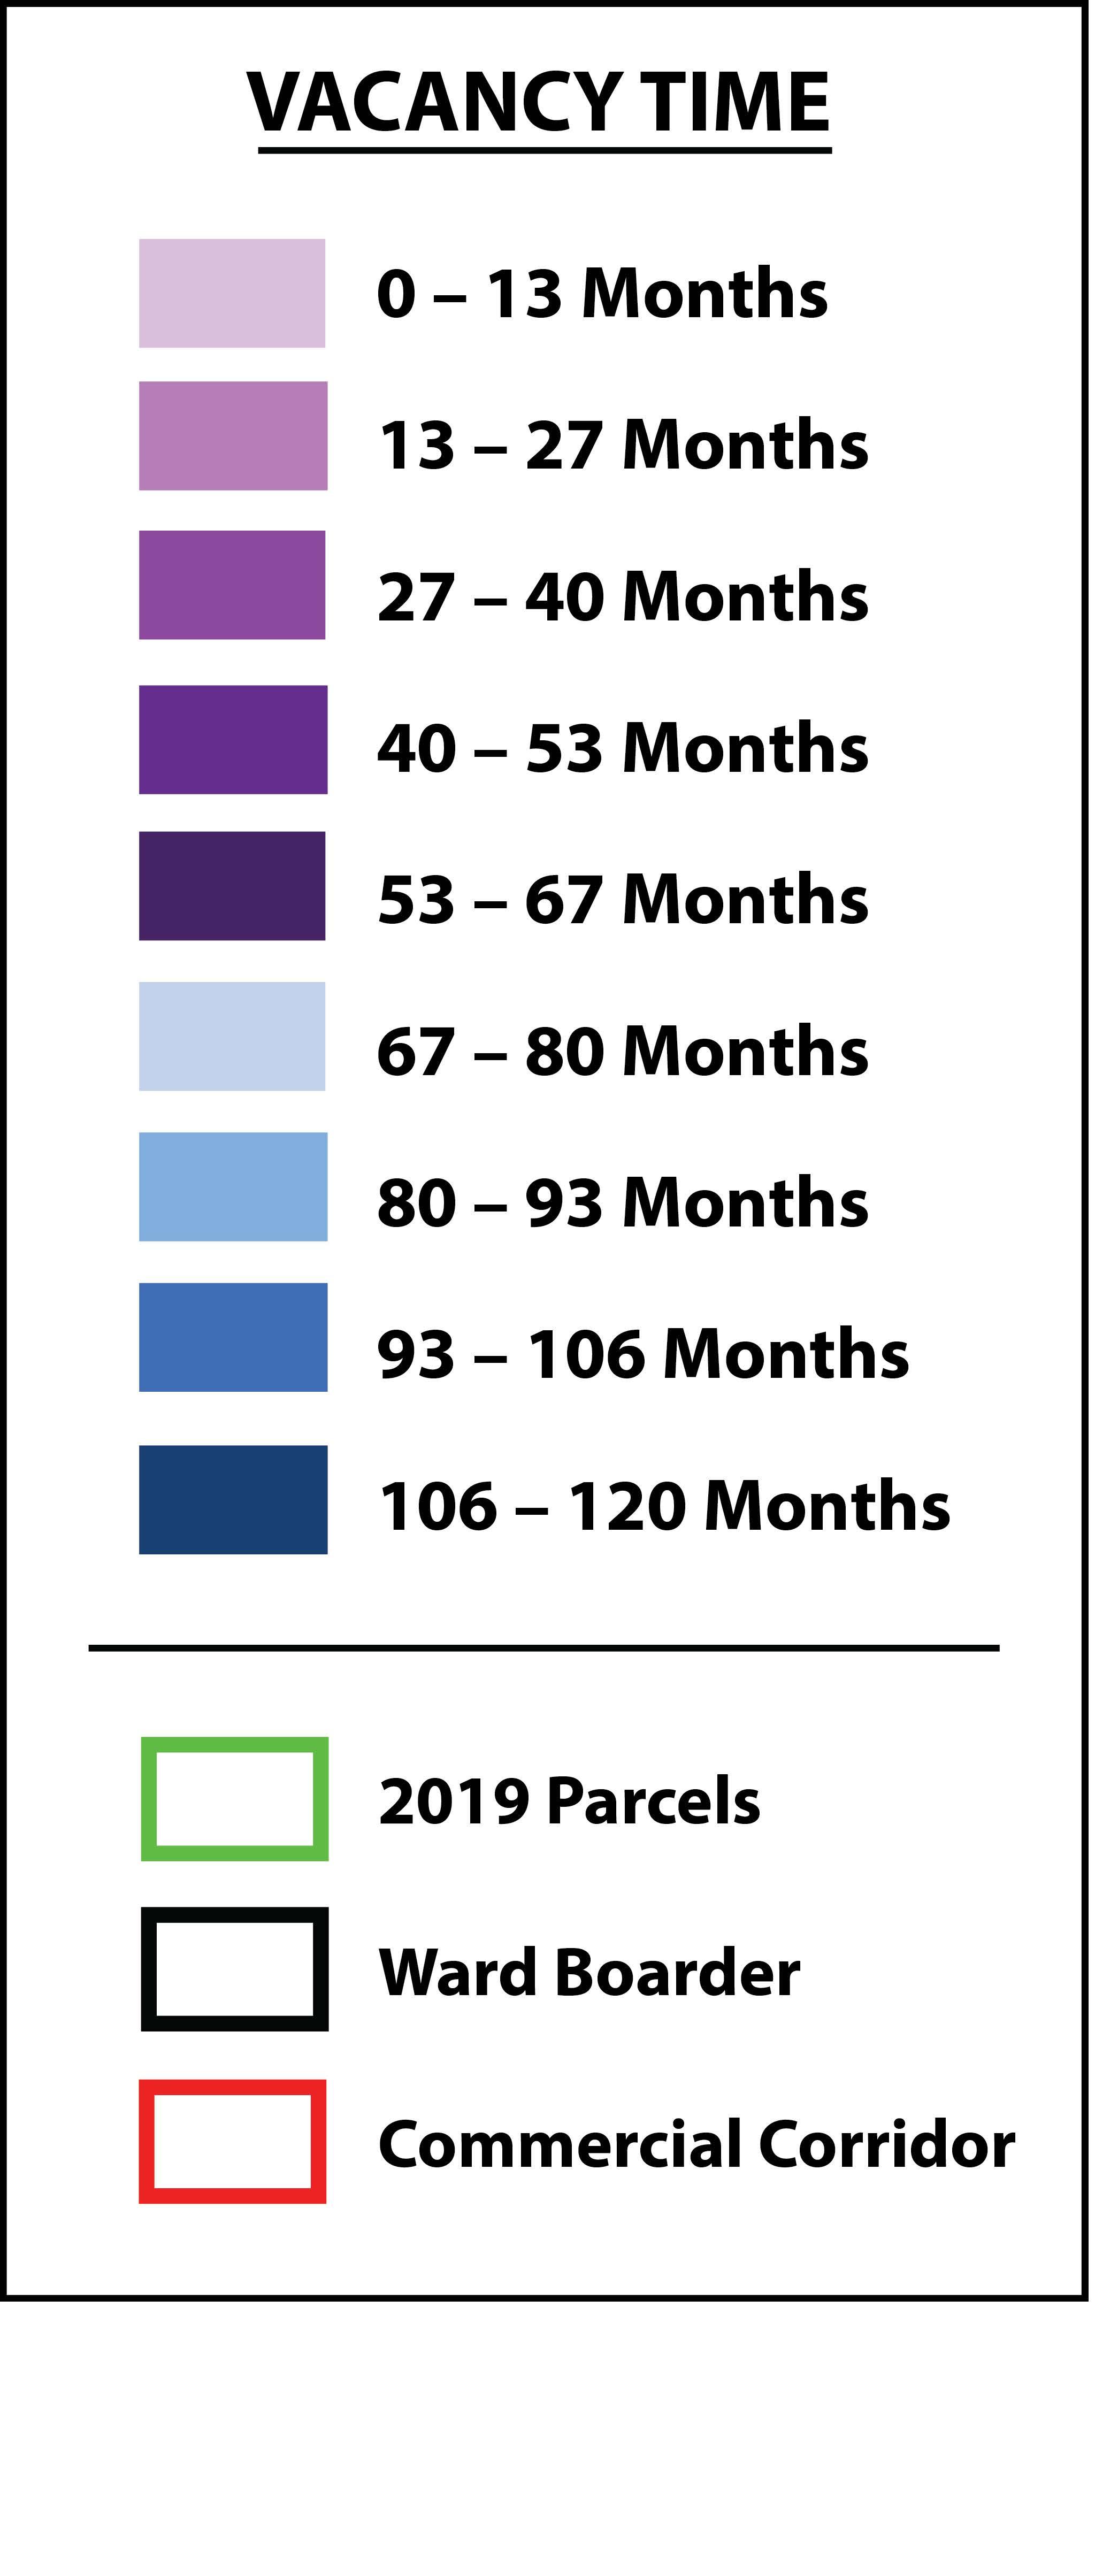
The BDC has also color coded our maps to indicate time vacant. The darker the shade, the longer the property has remained vacant.
It is important to note a distinction in our count of commercial property vacancies. Organizations that track vacancies, such as Costar, placed Berwyn’s commercial vacancy rate at approximately 3.1% for Q4 2022 (approximately 74,879 of commercial square feet). This vacancy has remained relatively constant throughout the last few years.
However, Costar only tracks properties that it knows to be available and on the market. This is both good news and bad news for Berwyn. The good news is that available commercial properties do not sit on the market for long. There is plenty of demand for built-out and well-positioned commercial property in our community. However, this also indicates that many building owners are unable or unwilling to rehabilitate, reposition, or otherwise market their commercial properties. This challenge appears to have been exacerbated over the past three years.
This gap between what is “available” and what is vacant offers great insight into the health of our commercial property market here in Berwyn. It also allows both the City and the BDC to identify opportunities and strategies to mitigate long periods of vacancy.
In the final section of this report, the BDC lays out a number of potential tools that could help in our efforts. These include but are not limited to: Berwyn's Vacant Property Ordinance, sales tax sharing agreements, property tax abatements, rezoning, and TIF incentive programs.
3 Commercial Vacancy Report 2022
TOTAL COMMERCIAL SQUARE FEET, BY CORRIDOR II
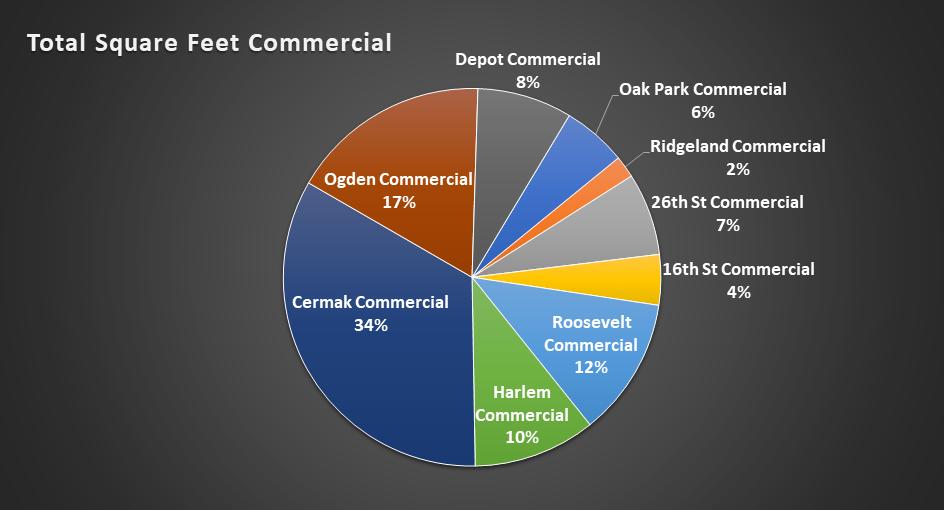
By the BDC’s estimate, Berwyn has approximately 2,862,819 square feet of commercial property*. As seen in the table below, over a third of Berwyn’s commercial property is located in the Cermak corridor. The smallest commercial corridor is Ridgeland, with just 1.88% of all properties.
Top 10 Commercial Vacancies:
1. 6631-6633 Ogden Ave - 12,350 square feet.
2. 6220 Cermak Rd - 12,000 square feet.
3. 6800-6808 Windsor Ave – 10,950 square feet.
4. 6627 Stanley Ave – 10,800 square feet.
5. 6639-6645 Stanley Ave – 9,750 square feet.
6. 6500-6504 W 16th Street – 9,600 square feet.
7. 6609 Stanley Ave – 9,300 square feet.
8. 6613-6621 Ogden Ave - 8,650
4
feet.
6739 Ogden
8,000 square feet. 10. 6431 Cermak Rd – 6,500 square feet.
commercial properties only, excluding MacNeal Hospital Corridor Total Square Feet Commercial Percentage Oak Park Commercial 157,542 5.50% 26th St Commercial 202,085 7.06% 16th St Commercial 123,641 4.32% Roosevelt Commercial 340,348 11.89% Harlem Commercial 299,814 10.47% Cermak Commercial 961,725 33.59% Ogden Commercial 491,337 17.16% Depot Commercial 232,364 8.12% Ridgeland Commercial 53,963 1.88% Total Commercial 2,862,819 4 Commercial Vacancy Report 2022
square
9.
Ave –
*First floor
5 Commercial Vacancy Report 2022
TOTAL COMMERCIAL VACANCY, BY CORRIDOR III
By the BDC’s estimate, Berwyn has approximately 327,442 square feet of vacant commercial property. As seen in the table below, about 30% of Berwyn’s vacant commercial properties are located in the Cermak corridor. Some corridors have a much lower than expected vacancy rate compared to their total commercial square footage (Harlem, as an example) while others have much larger that would be expected (Depot District
Corridor Square Feet Vacant Percentage Oak Park Vacancy 9,196 2.30% 26th St Vacancy 31,755 9.70% 16th St Vacancy 23,522 7.18% Roosevelt Vacancy 30,948 9.45% Harlem Vacancy 14,300 4.37% Cermak Vacancy 100,964 30.83% Ogden Vacancy 44,600 14.05% Depot Vacancy 55,096 13.62% Ridgeland Vacancy 5,231 1.60% Total Vacancy 327,442 6 Commercial Vacancy Report 2022

7 Commercial Vacancy Report 2022
COMMERCIAL VACANCY HEALTH, BY CORRIDOR IV
Using the total square footage and the vacancy rate for each of the corridors, we can look at the “health” of each corridor compared to how the community is doing. If each corridor performed equally, then we would expect their percentage of commercial space to match up with their percentage of commercial vacancy. As an example, we would expect Roosevelt, with 11.89% of the total commercial square footage in Berwyn, to have 11.89% of the overall vacancy. This would give Roosevelt a 0% “Health” metric. But Roosevelt only contains 9.45% of the overall vacancy in Berwyn, which leads us to conclude that it is healthier than the norm. This is demonstrated by its positive 25.79% metric, indicating that the corridor is performing slightly better than we would expect.
In the below table, positive values in black represent corridors that are performing better than the norm. Negative values in red represent corridors that are performing worse than the norm.
8
Vacancy “Health” Oak Park 95.95% A 26th St -27.21% C16th St -39.88% D Roosevelt 25.79% BHarlem 139.80% A+ Cermak 8.95% C Ogden 26.00% BDepot -60.29% D Ridgeland 17.99% C 8 Commercial Vacancy Report 2022
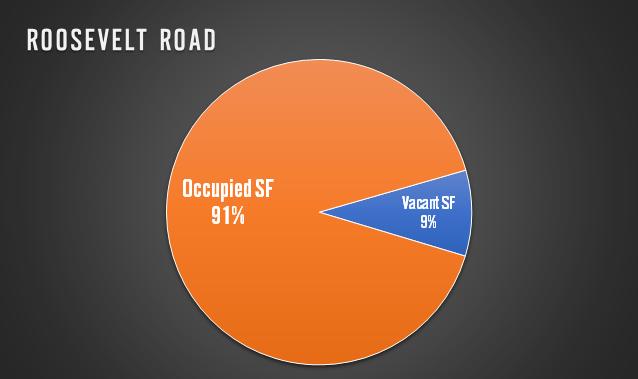
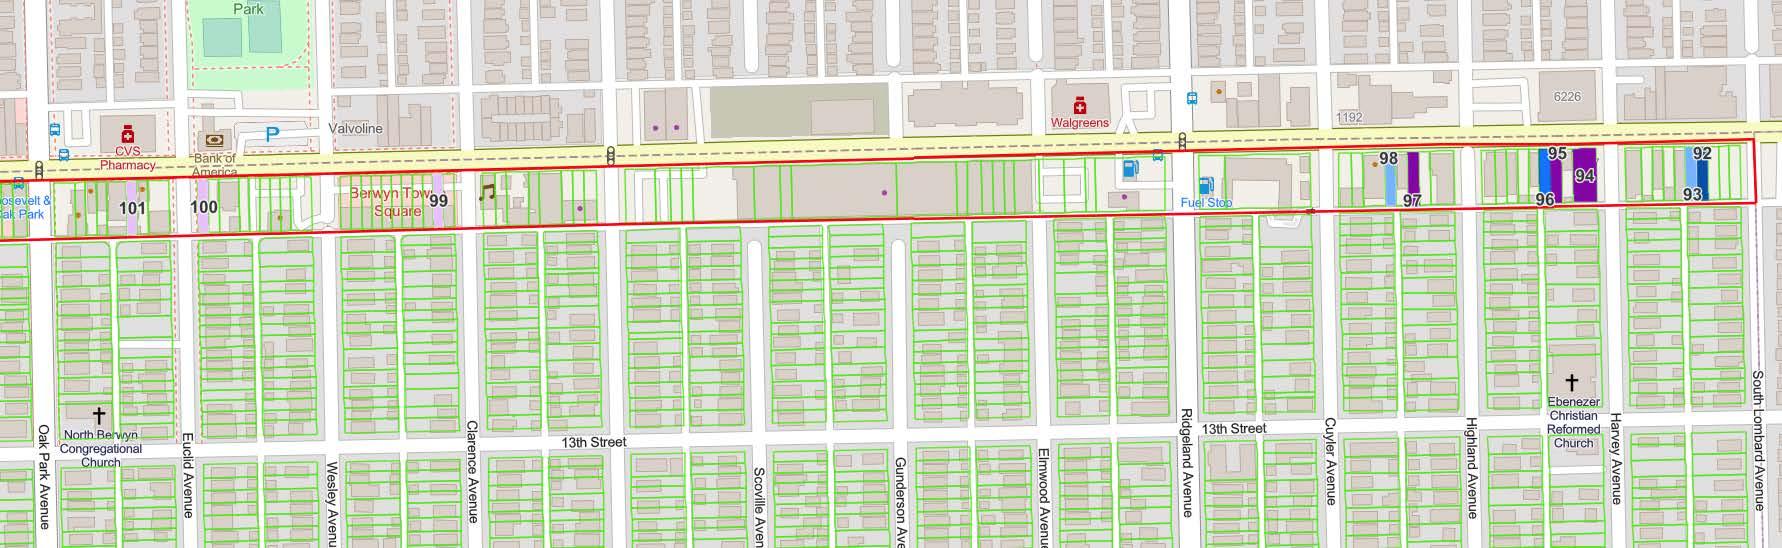
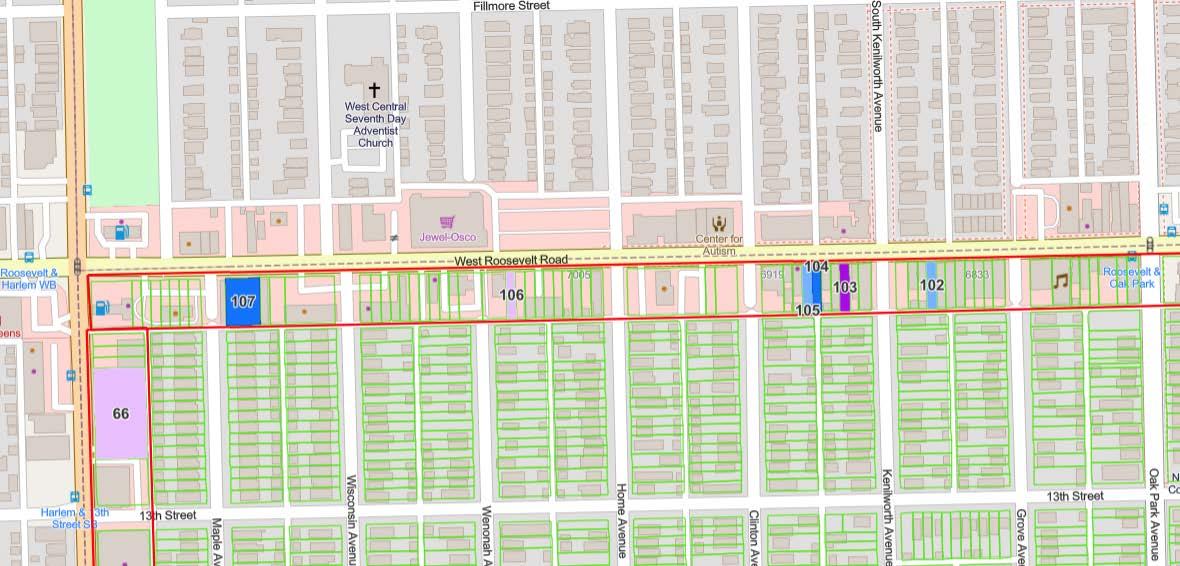
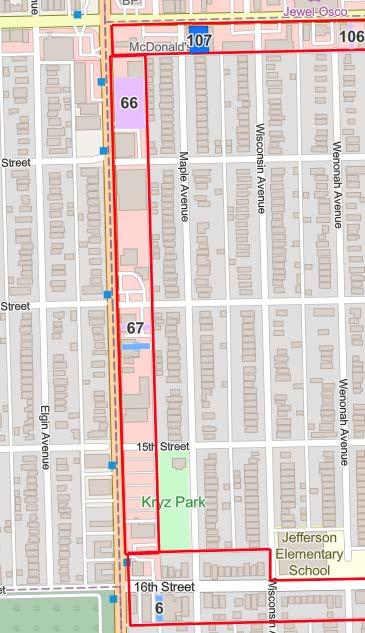
ROOSEVELT ROAD V
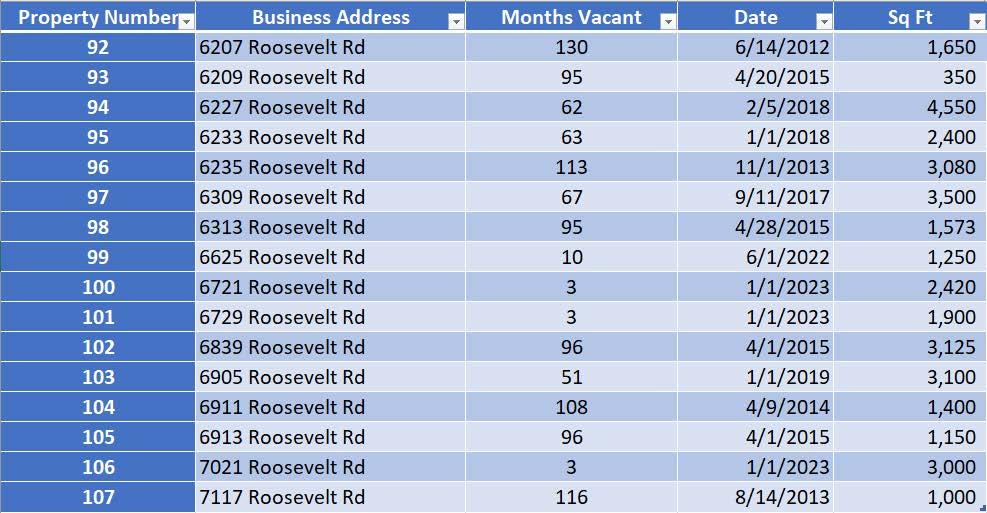
The Roosevelt Road Corridor is improving compared to Q1 & Q2. With 340,348 square feet of commercial space, Roosevelt Road has approximately 30,948 square feet of vacant space. This 9.09% commercial vacancy rate is in the middle of the pack compared to the overall community.
Top 3 Largest Commercial Vacancies, Roosevelt:
• 6227 Roosevelt Road – 4,550 SF.
• 6839 Roosevelt Road – 3,125 SF.
• 6905 Roosevelt Road – 3,100 SF.

9 Commercial Vacancy Report 2022
ROOSEVELT ROAD EAST
10 Commercial Vacancy Report 2022
ROOSEVELT ROAD WEST
11 Commercial Vacancy Report 2022
ROOSEVELT ROAD TABLE
12 Commercial Vacancy Report 2022
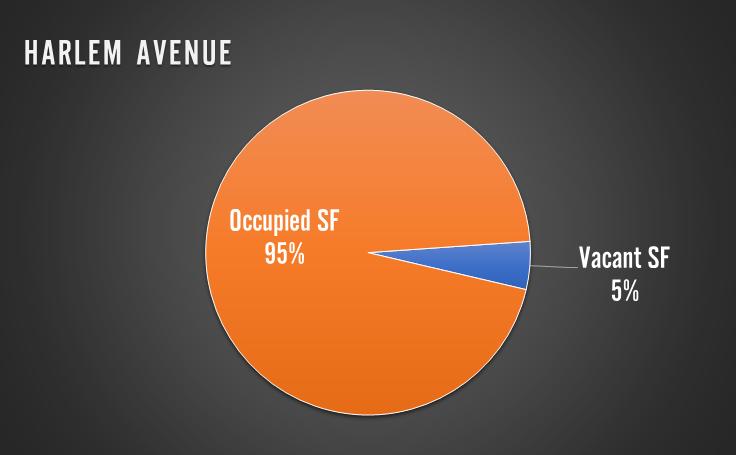
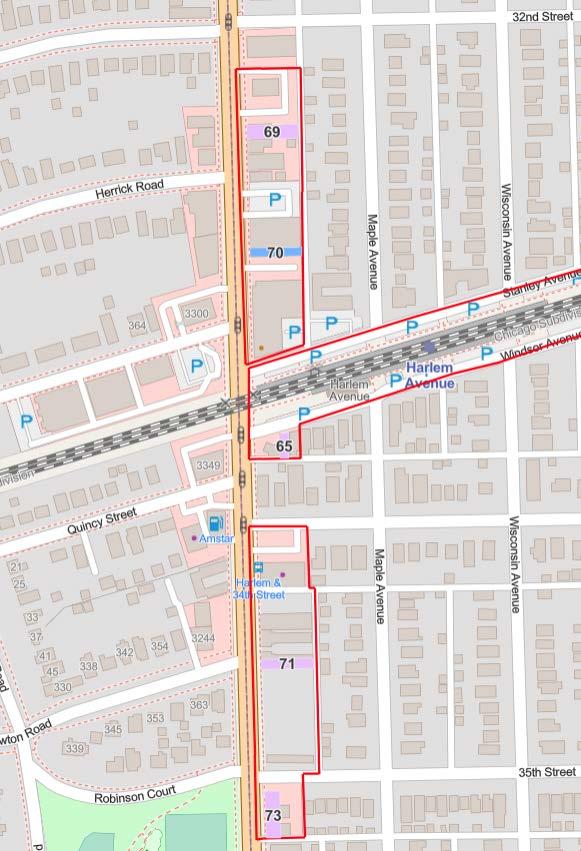
HARLEM AVENUE VI
The Harlem Corridor is one of the best performing corridors in the overall community. With 299,814 square feet of commercial space, Harlem has only 14,300 square feet of vacant space. This 4.77% is better than the overall commercial vacancy of 11.44%
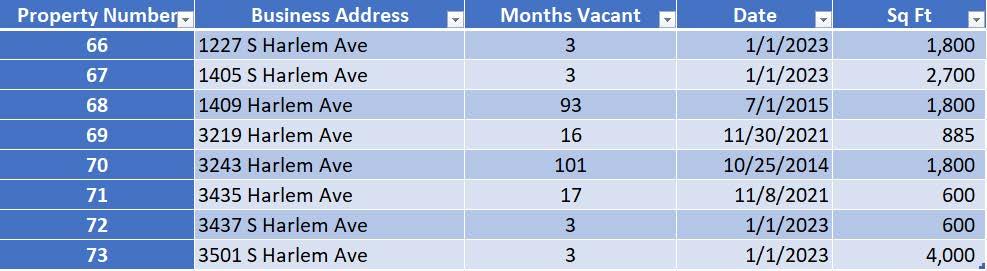
Top 3 Largest Commercial Vacancies, Harlem:
• 3501 S Harlem Ave – 4,000 SF.
• 1405 S Harlem Ave - 2,700 SF.
• 3219 S Harlem Ave - 1,800 SF.
13 Commercial
Report 2022
Vacancy
HARLEM AVENUE
14 Commercial Vacancy Report 2022
*Harlem Ave North
*Harlem Ave South
*Only areas with vacancies represented
HARLEM AVENUE TABLE
15 Commercial Vacancy Report 2022
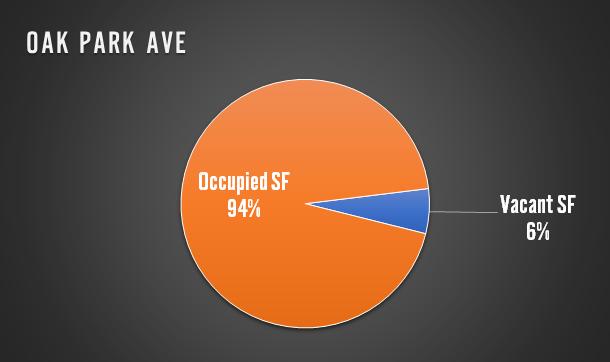
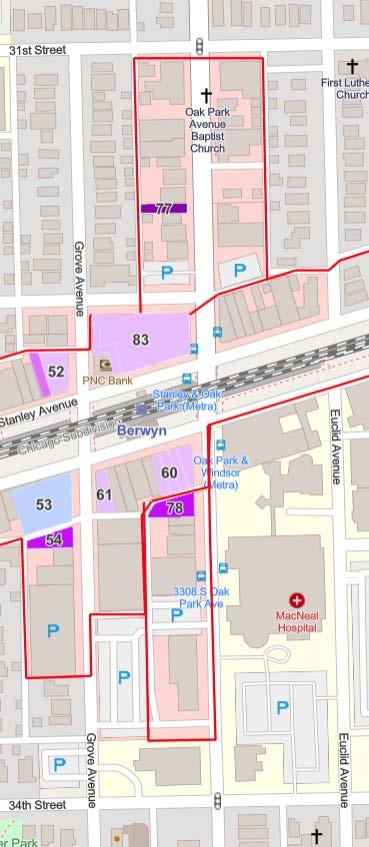
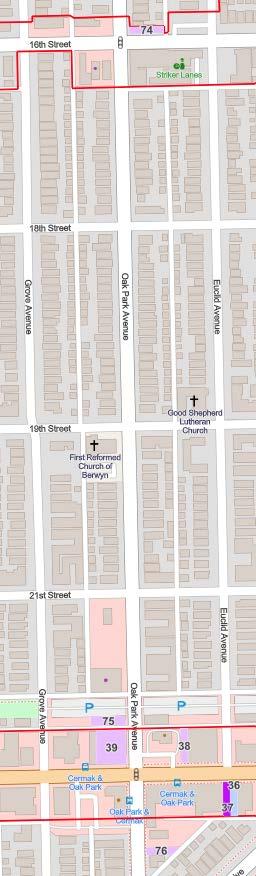
OAK PARK AVENUE VII
The Oak Park Corridor is performing better than we would expect compared to the overall community. With 157,542 square feet of commercial space, Oak Park has approximately 9,196 square feet of vacant space, which is the least amount of any of Berwyn’s corridors. This 5.84% is the 2nd lowest rate in the community overall.
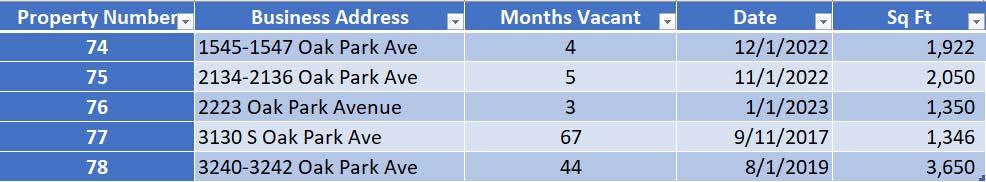
Top 3 Largest Commercial Vacancies, Oak Park: • 3240-3242 Oak Park Ave - 3,650 SF. • 2134-2136 Oak Park Ave – 2,050 SF. • 2223 Oak Park Ave – 1,350 SF.
16 Commercial Vacancy Report 2022
OAK PARK AVENUE
17 Commercial Vacancy Report 2022
*Oak Park Ave North
*Oak Park Ave South
*Only areas with vacancies represented
OAK PARK AVENUE TABLE
18 Commercial Vacancy Report 2022
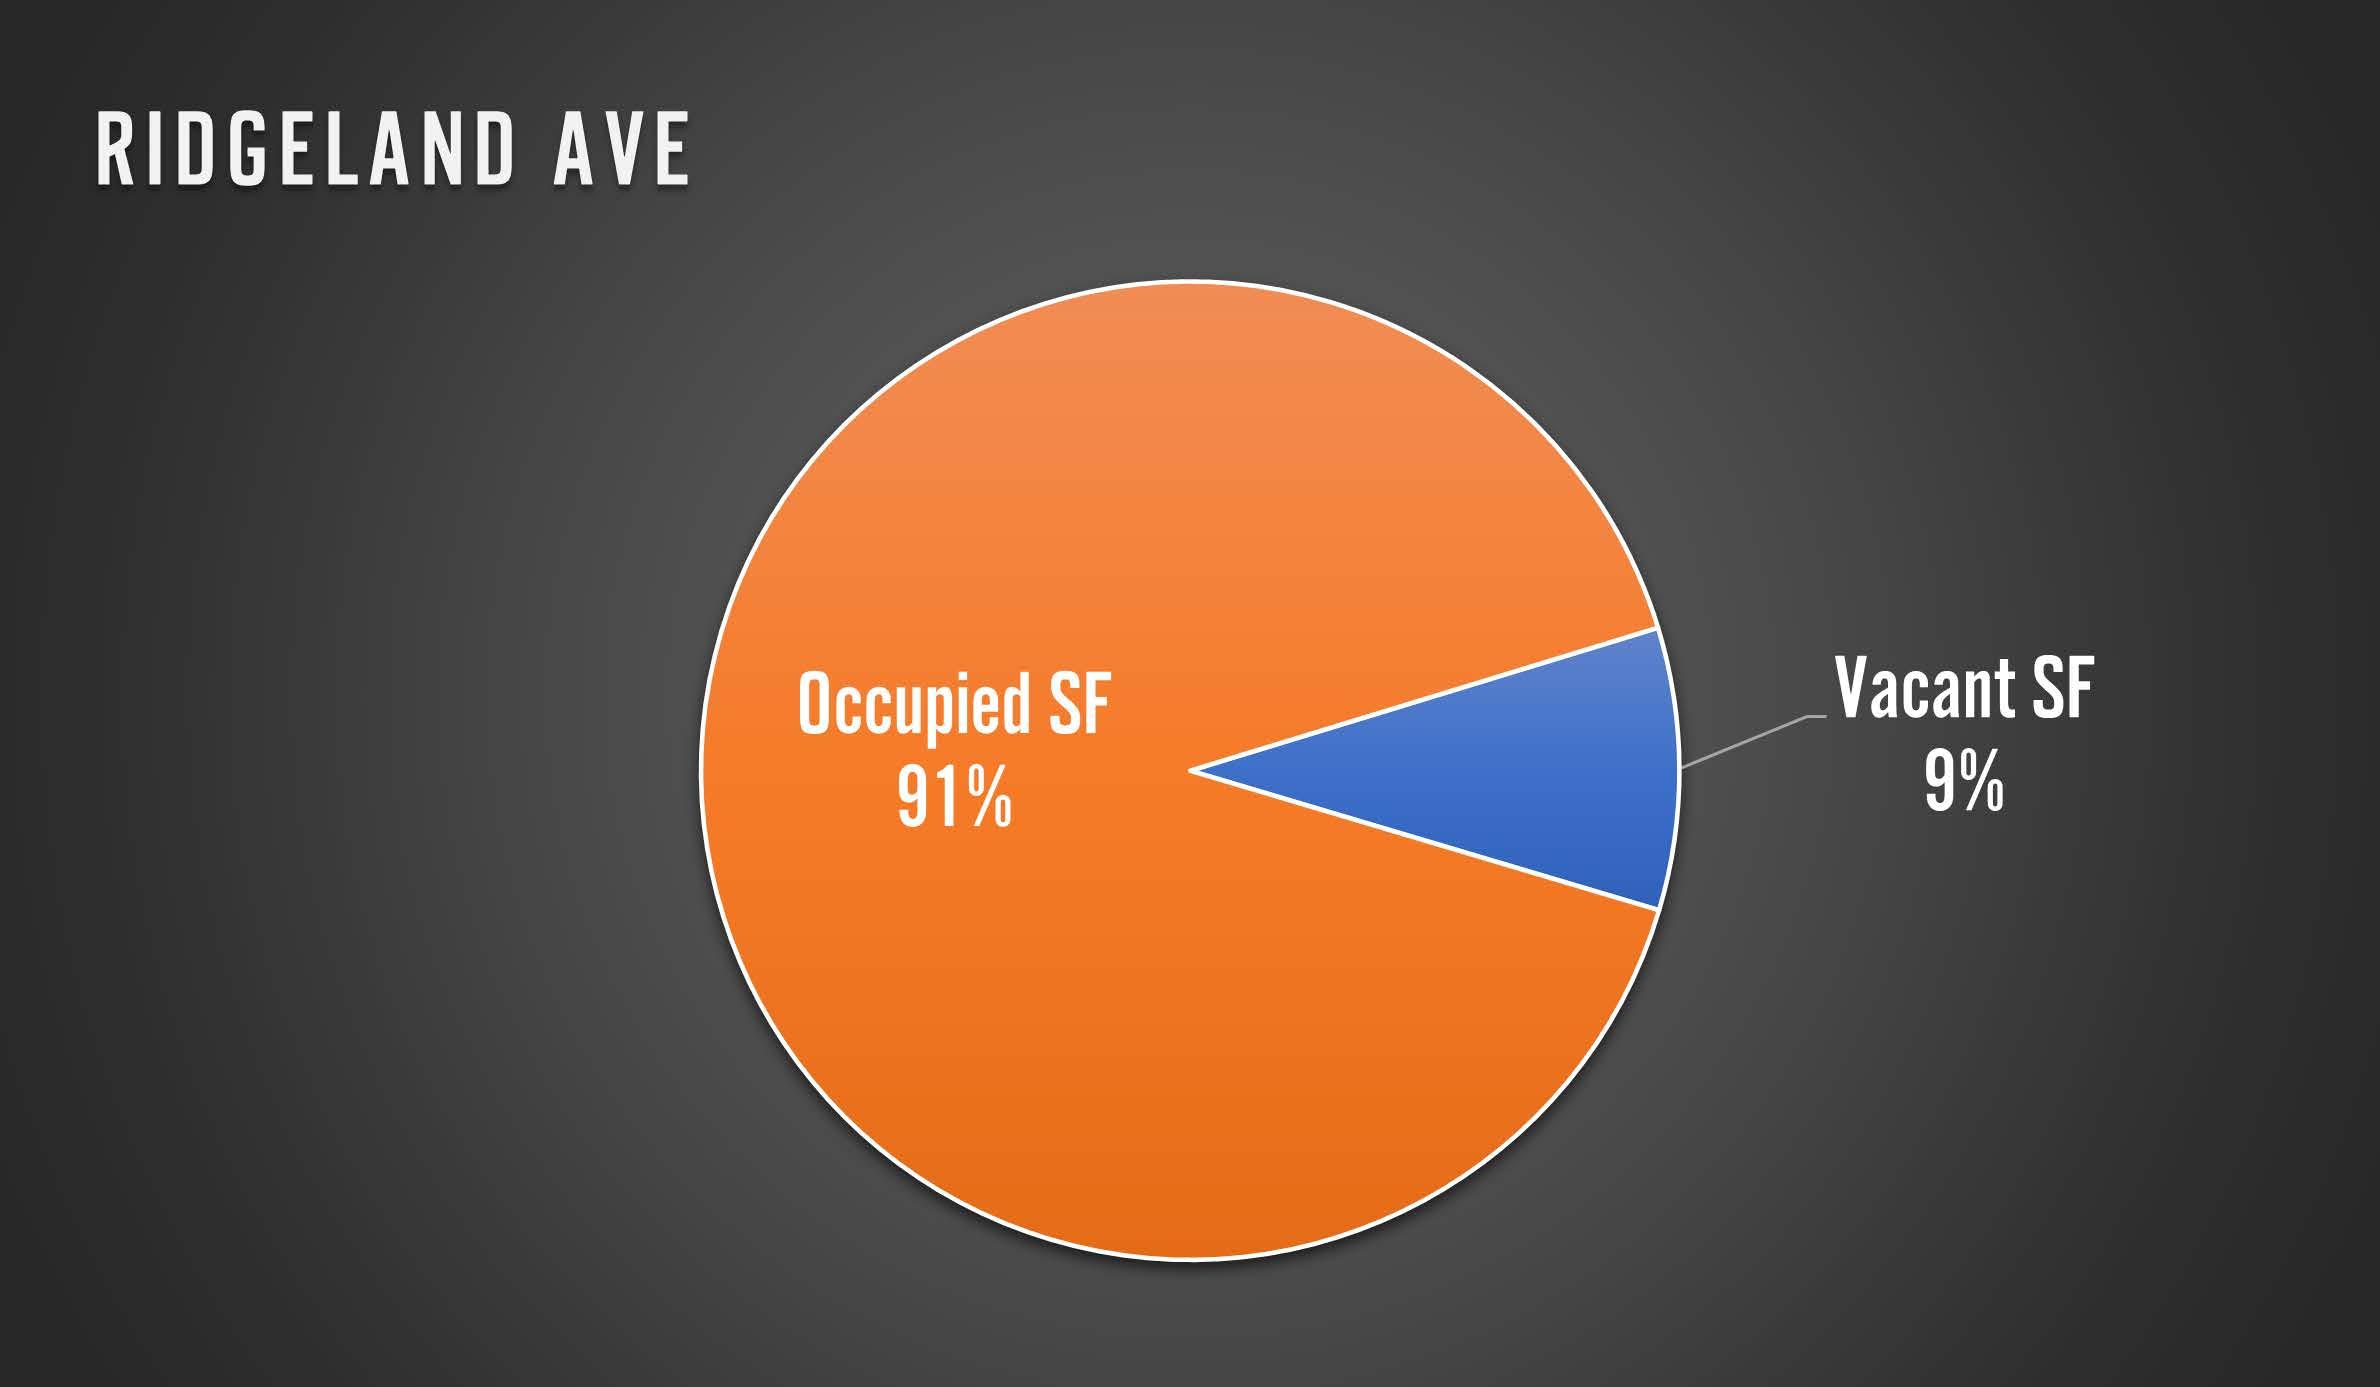
RIDGELAND AVENUE VIII
The Ridgeland Corridor is the best performing corridor in the Berwyn, with respect to vacancy. With 55,163 square feet of commercial space, Ridgeland has only around 5,145 square feet of vacant space. This 9.33% is better than the overall commercial vacancy of 11.54%.
Top 3 Largest Commercial Vacancies, Ridgeland:
• 2801 Ridgeland Ave – 2,105 SF.
• 2615 Ridgeland Ave – 1,840 SF.
• 2630 Ridgeland Ave – 1,286 SF.
19 Commercial Vacancy Report 2022
RIDGELAND AVENUE
*Only areas with vacancies represented
20 Commercial Vacancy Report 2022
RIDGELAND AVENUE TABLE
21 Commercial Vacancy Report 2022
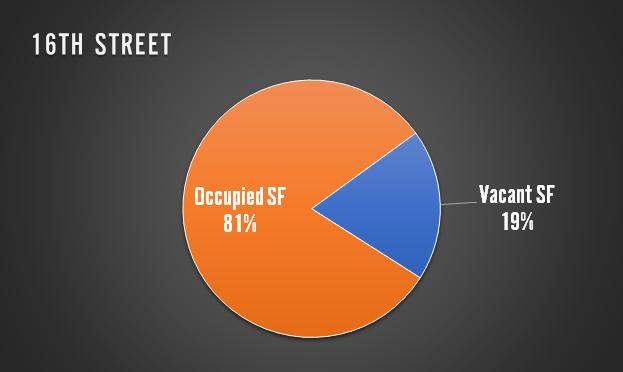
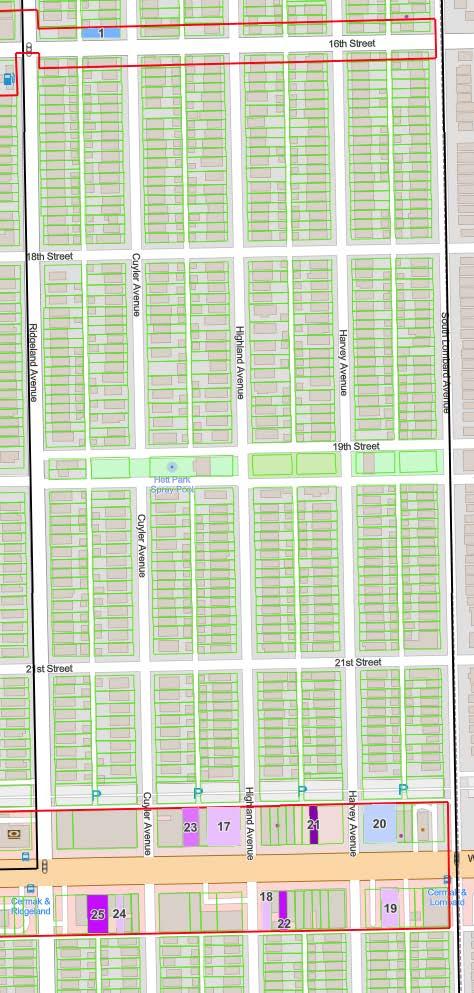
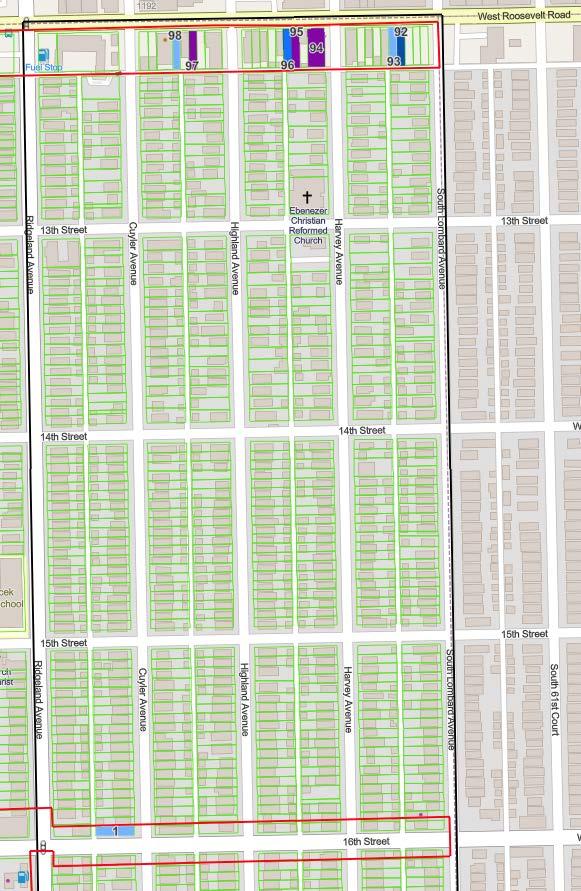
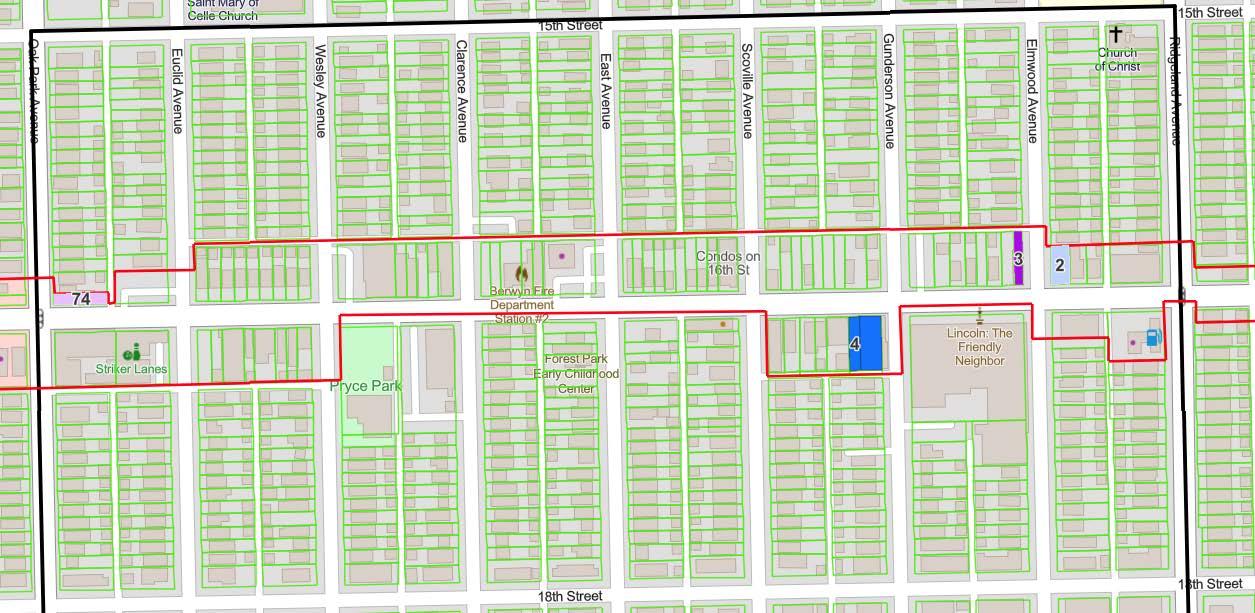
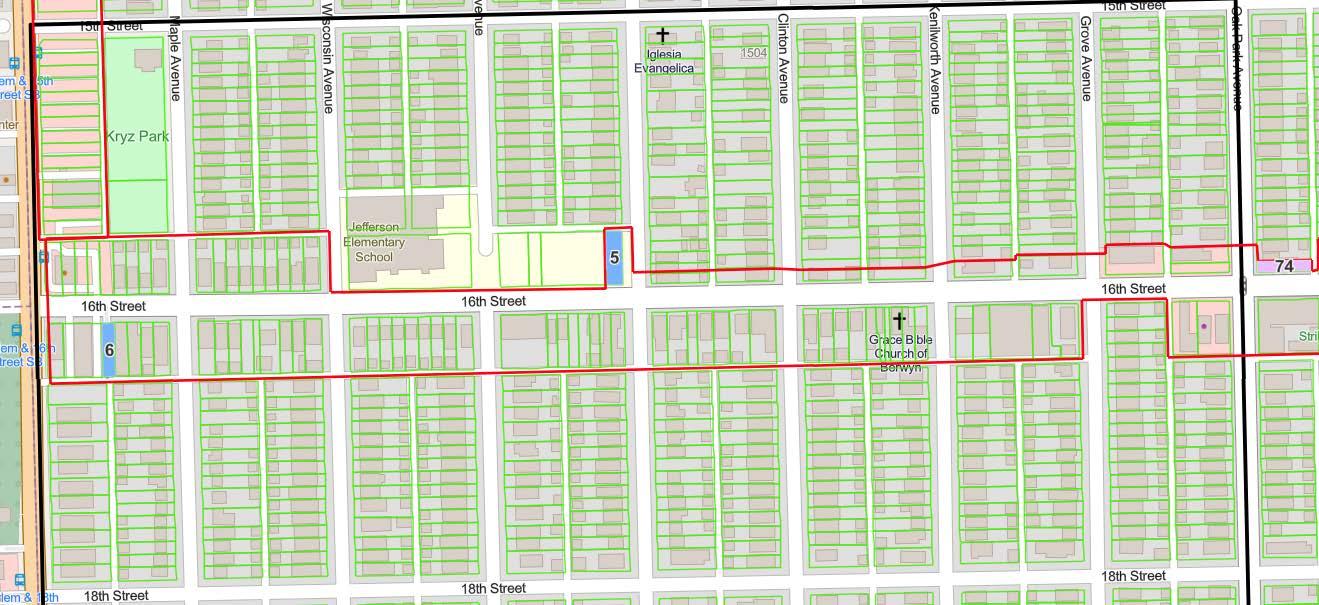
16TH STREET IX
The 16th Street Corridor is one of the most challenged in our community. While 16th Street has the 2nd least amount of commercial space of any corridor, with 123,641 square feet, approximately one in five properties, or 23,522 square feet is vacant. This 19.02% vacancy rate is more than the overall commercial vacancy of 11.44%.
Top 3 Largest Commercial Vacancies, 16th Street:
• 6500-6504 W 16th Street – 9,600 SF. Former Carniceria Cinco.
• 7001-7003 W 16th Street - 4,000 SF.
• 7140 W 16th Street - 3,333 SF
22 Commercial Vacancy Report 2022
16TH STREET EAST
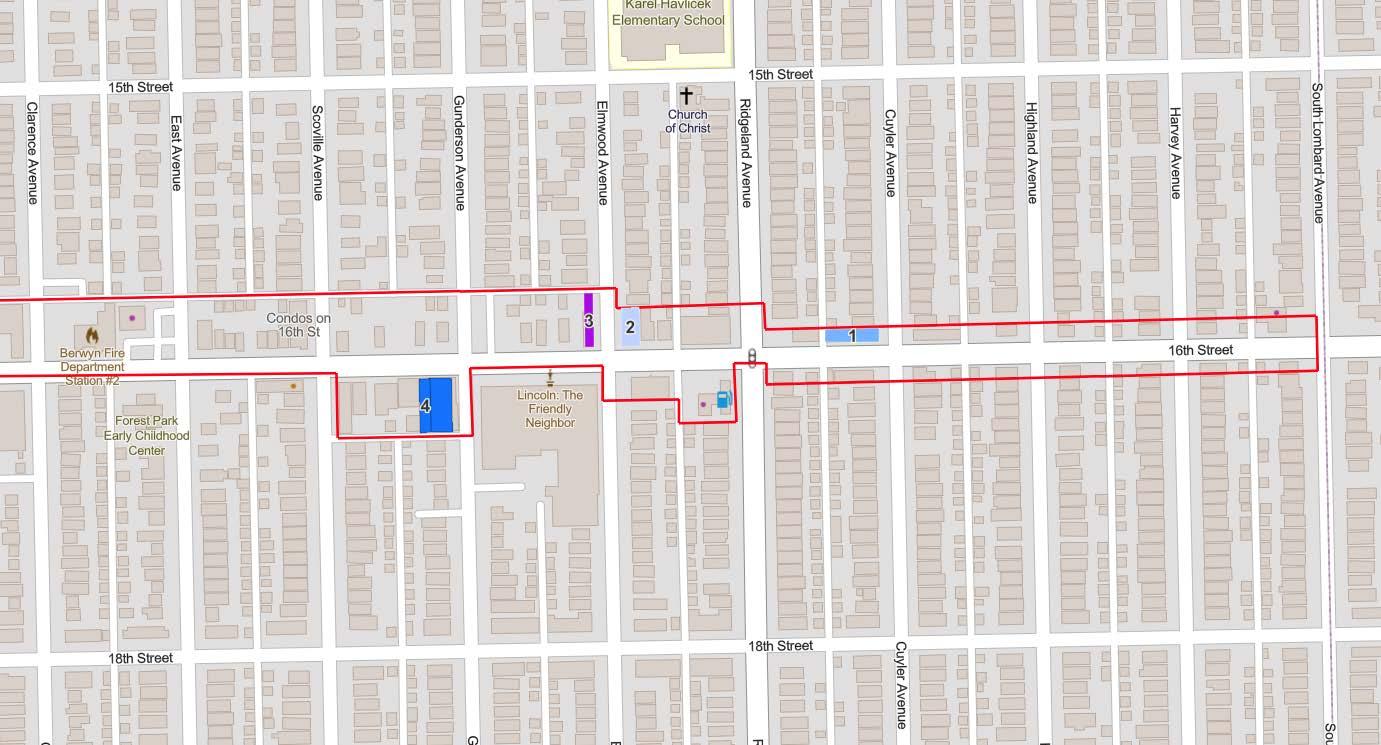
*Only areas with vacancies represented
23 Commercial Vacancy Report 2022
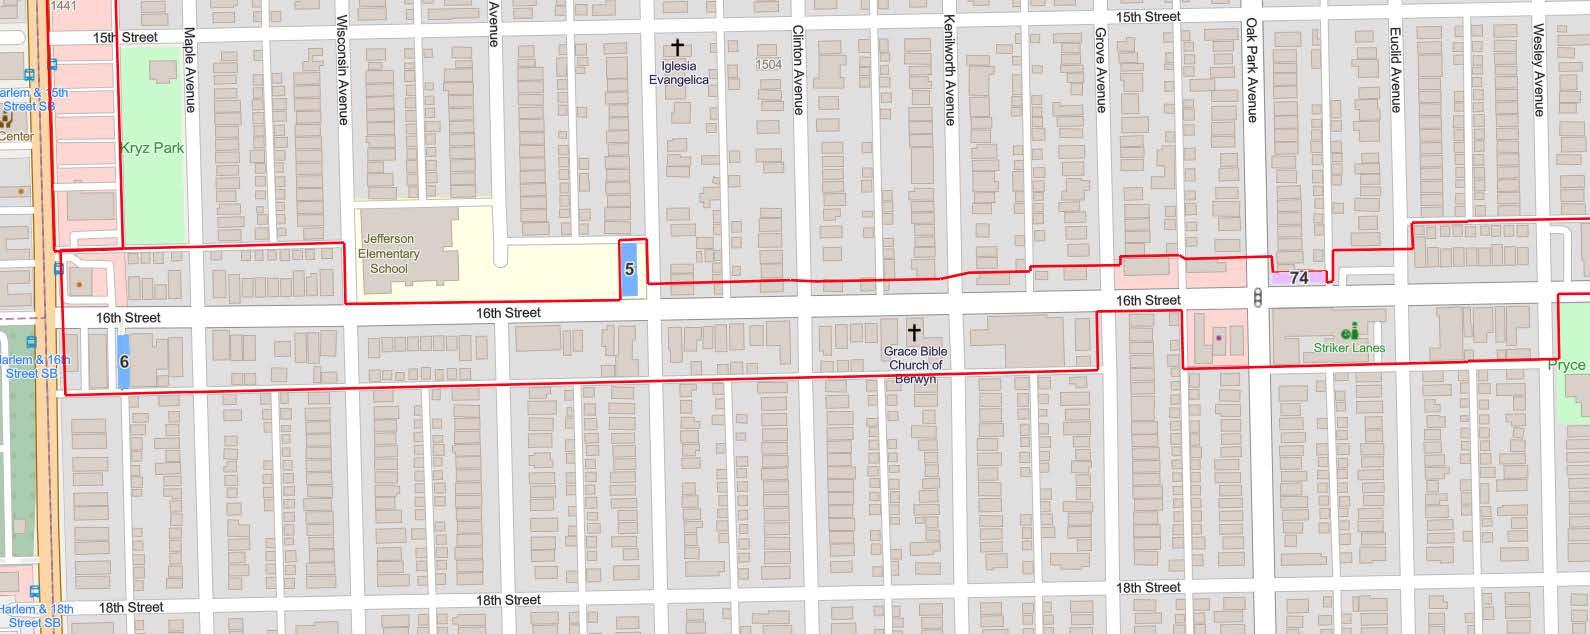
16TH STREET WEST
24 Commercial Vacancy Report 2022
*Only areas with vacancies represented
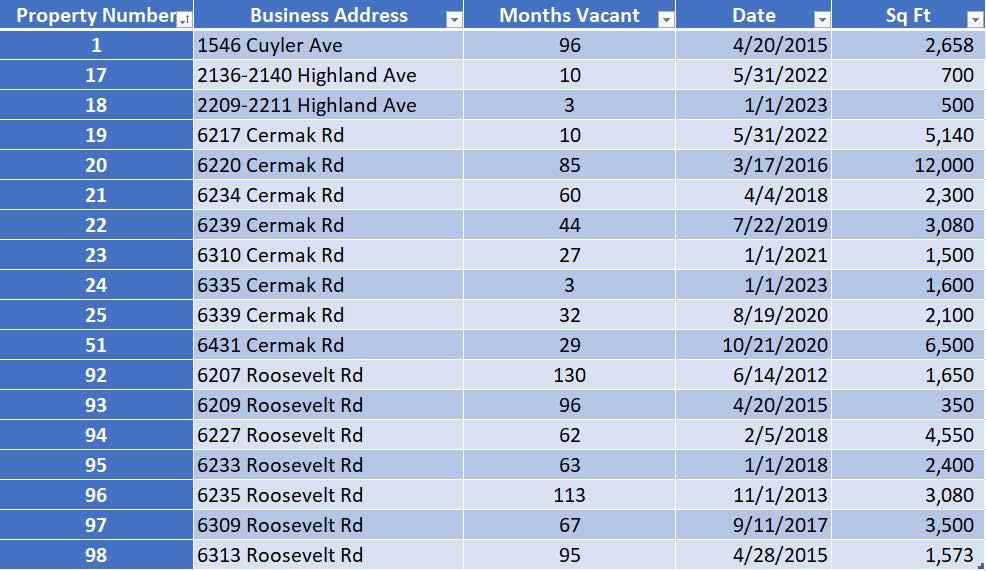
16TH STREET TABLE

25 Commercial Vacancy Report 2022
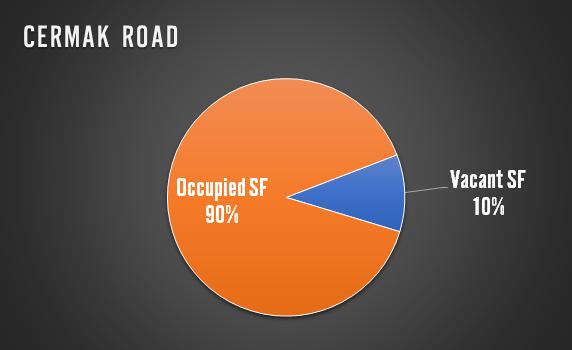
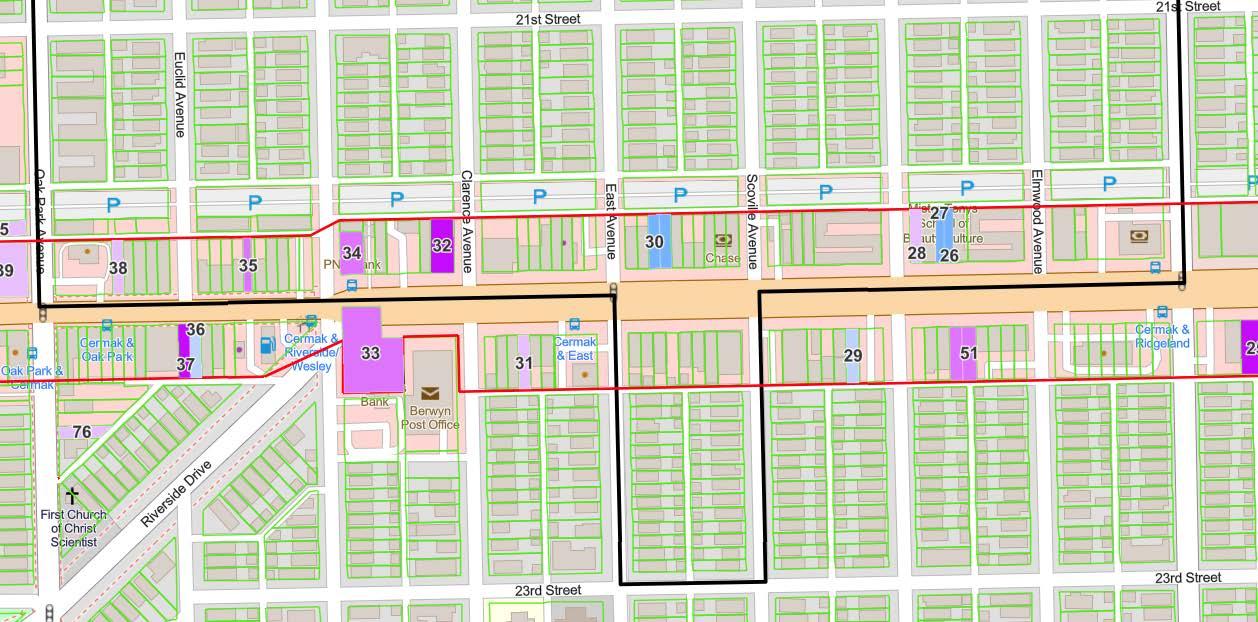
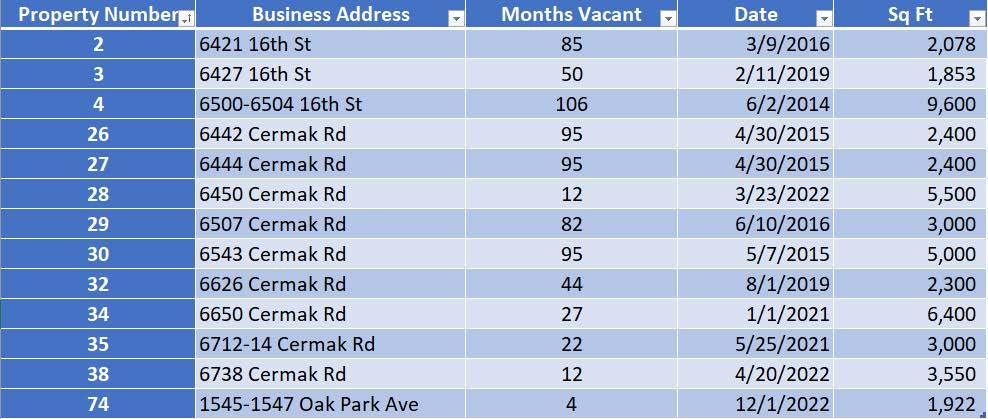
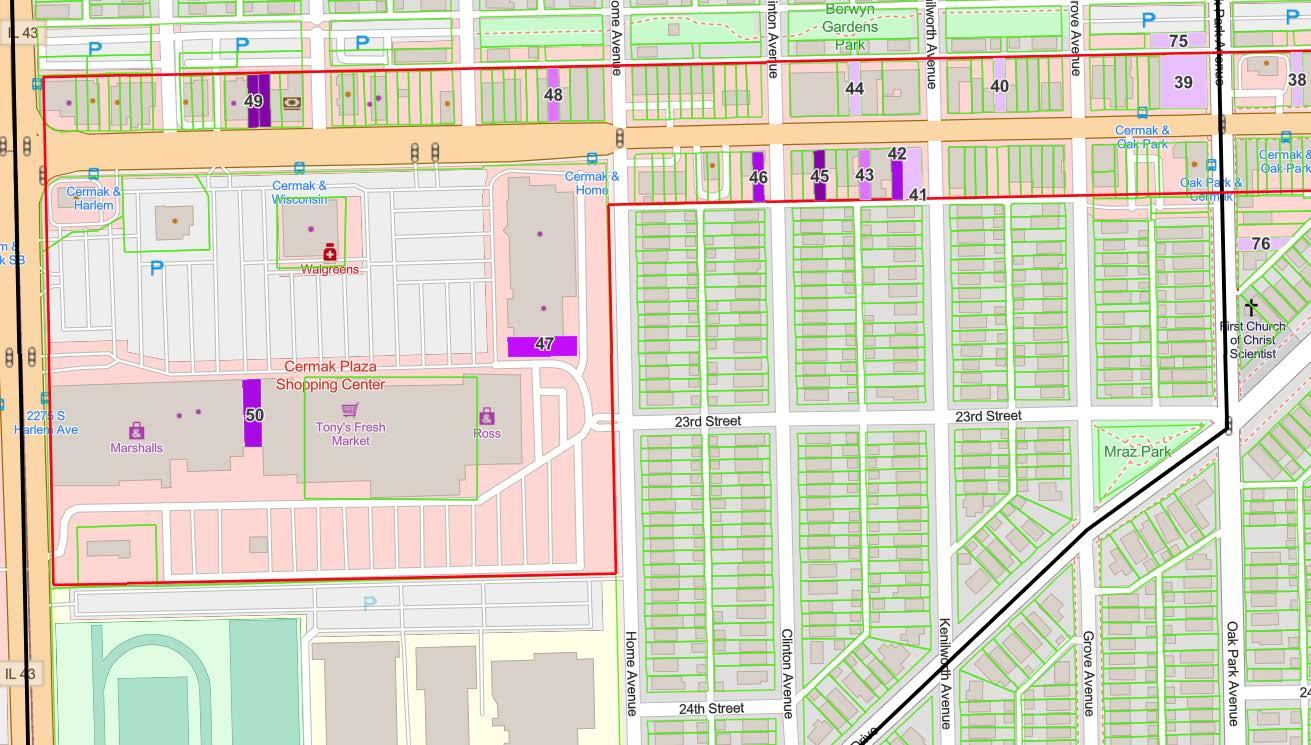
CERMAK ROAD X
The Cermak Corridor is tracking very close to par with the overall community. With 961,725 square feet of commercial space, Cermak represents the single largest commercial corridor in Berwyn. Cermak has approximately 100,964 square feet of vacant space, giving a vacancy rate of 10.50%. This rate is very close to the overall commercial vacancy of 11.44%. in Berwyn.
Top 3 Largest Commercial Vacancies, Cermak:
•6440-6450 Cermak Rd - 12,000 SF.
•6431 Cermak Rd- 6,500 SF.
•6650 Cermak Rd - 6,400 SF.
26 Commercial Vacancy Report 2022
CERMAK ROAD EAST
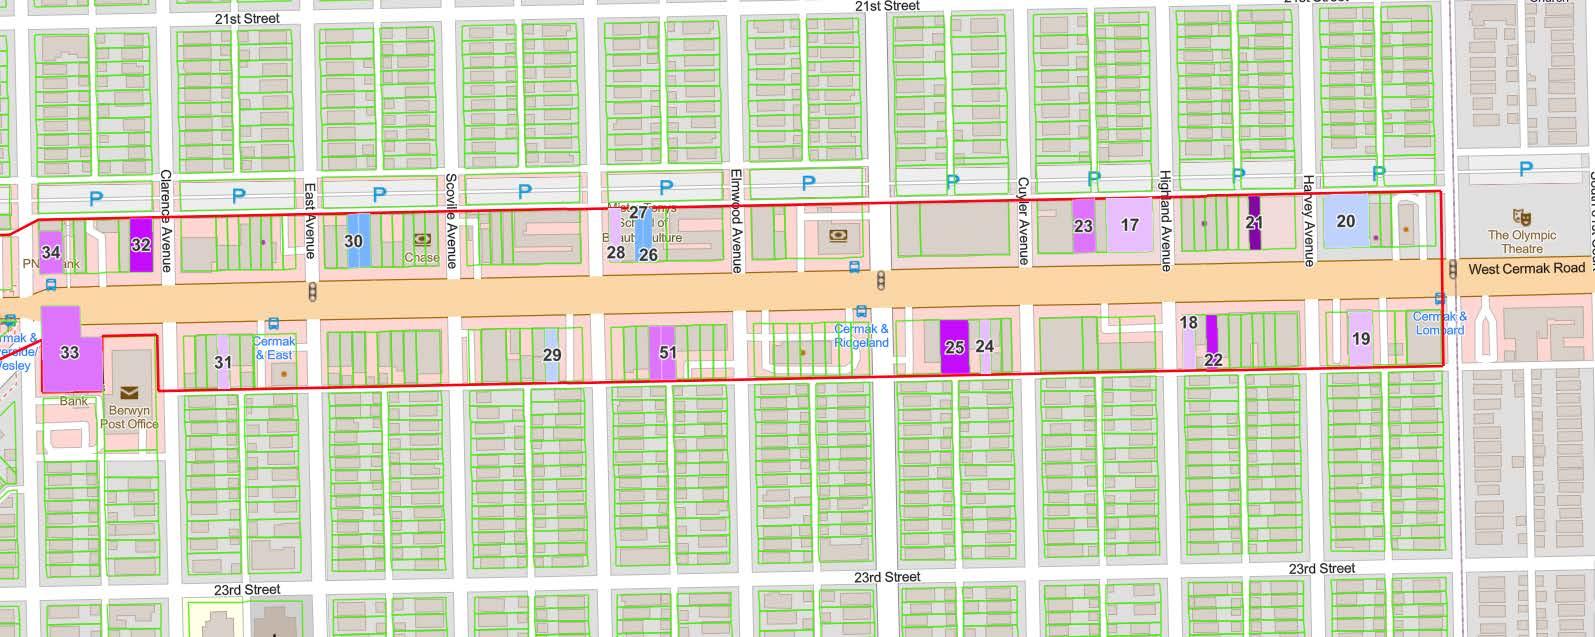
27 Commercial Vacancy Report 2022
*Euclid Ave -Lombard Ave
CERMAK ROAD WEST
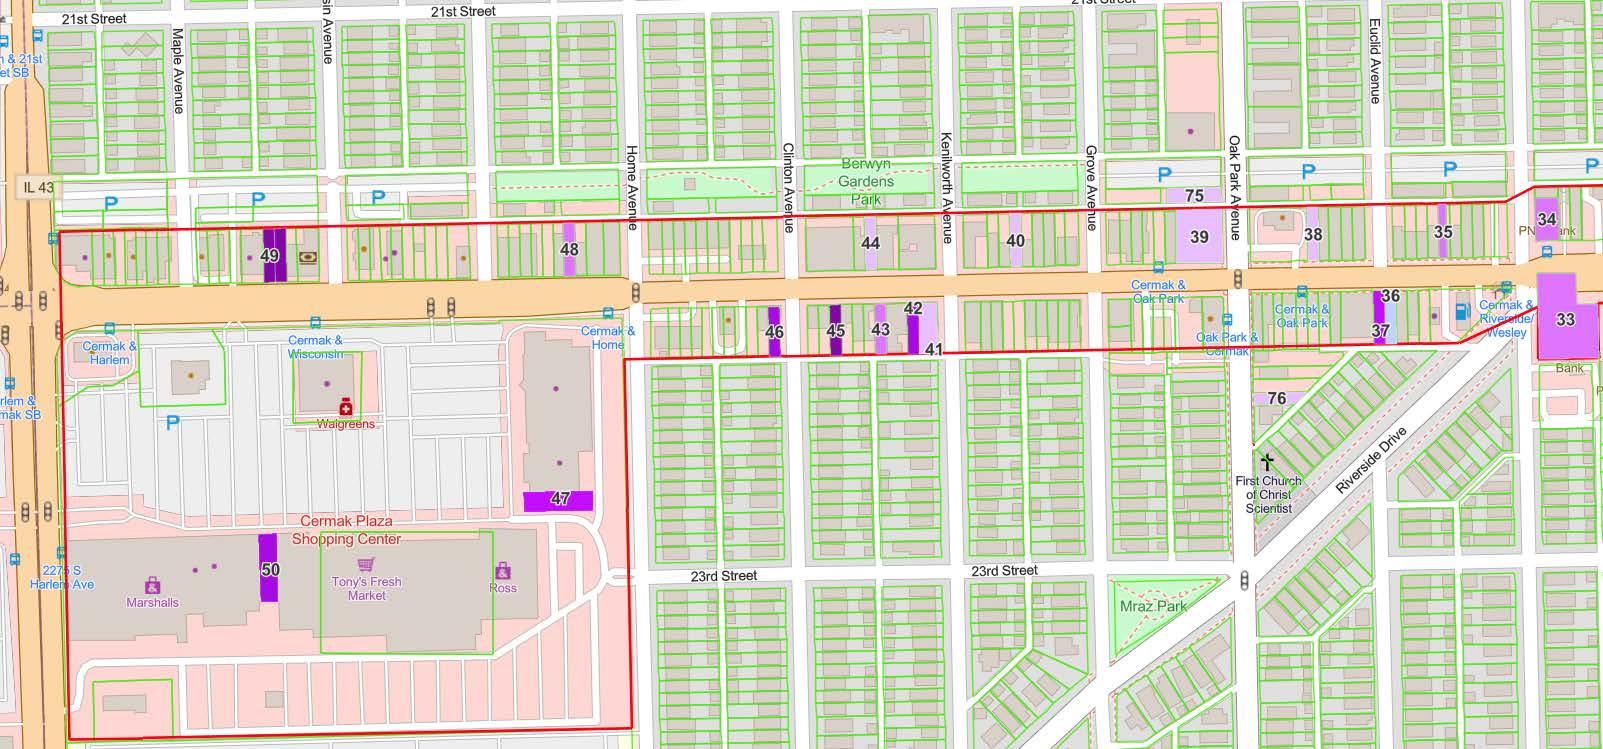
28 Commercial Vacancy Report 2022
*Harlem ave- Wesley ave
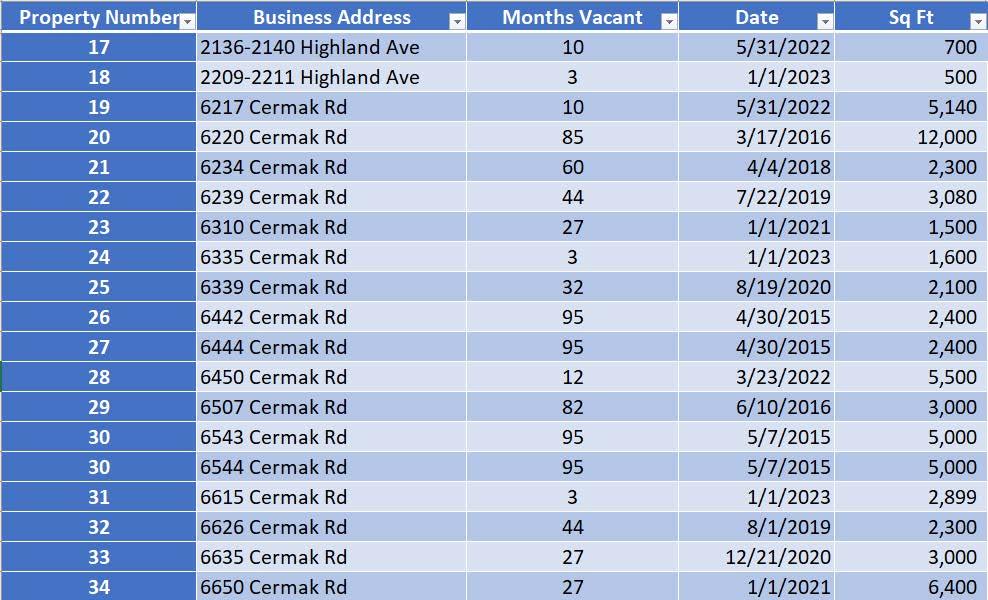
CERMAK ROAD TABLE
*Legend Continues on Next Page
29 Commercial Vacancy Report 2022
CERMAK ROAD TABLE
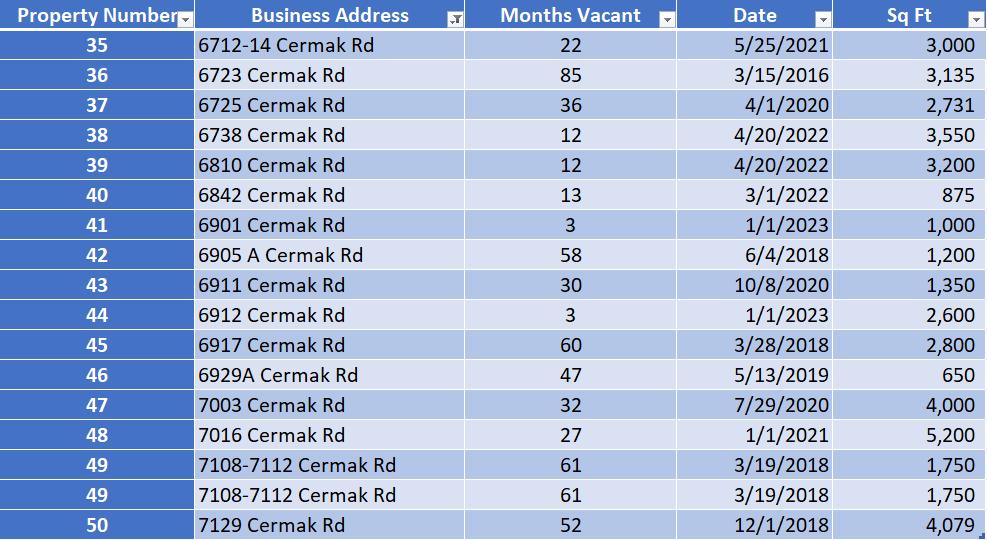
30 Commercial Vacancy Report 2022
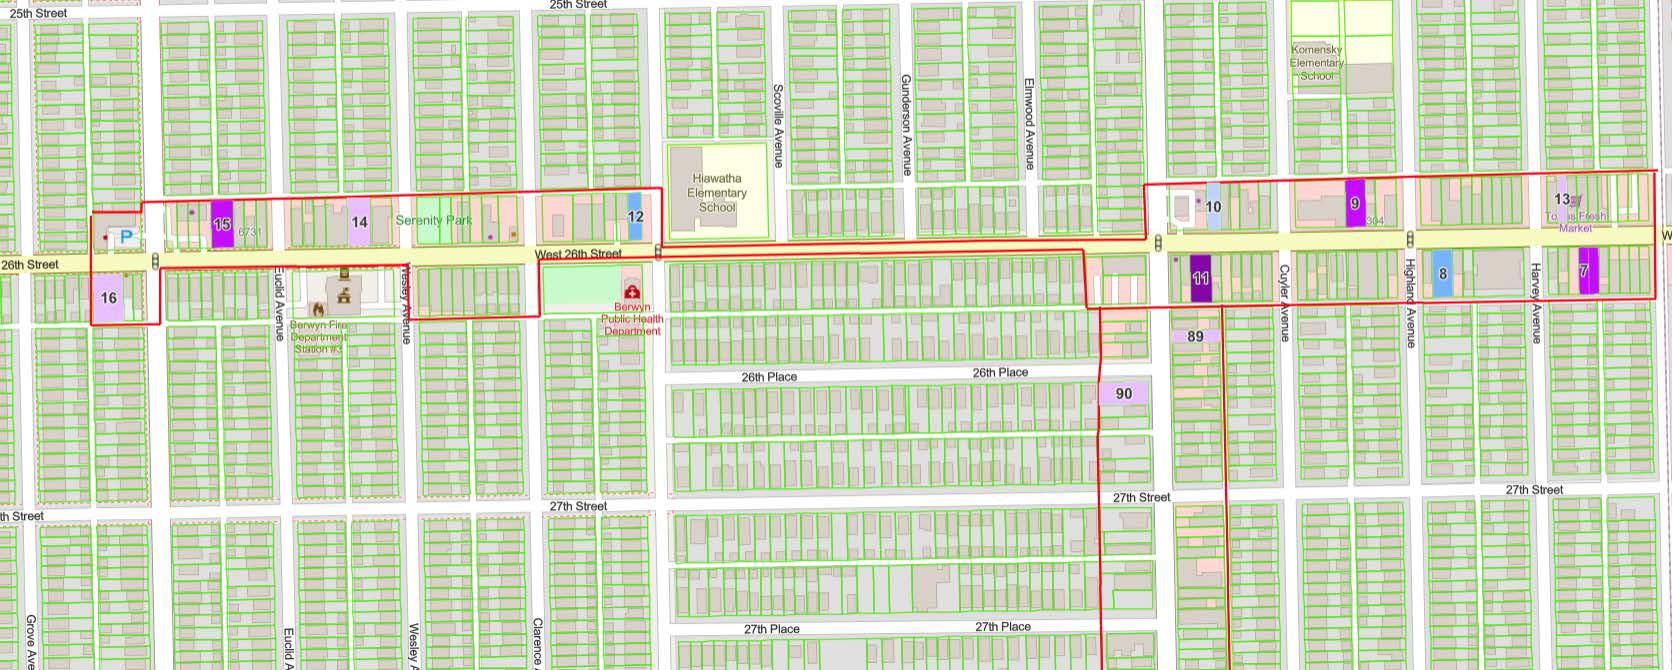
26TH STREET XI
The 26th Street Corridor is struggling compared to the overall community. With 202,085 square feet of commercial space, 26th Street has approximately 31,755 square feet of vacant space. This 15.71% is a challenged commercial vacancy rate.
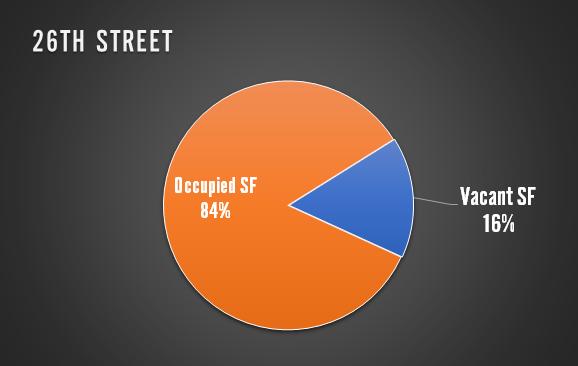
Top 3 Largest Commercial Vacancies, 26th Street:
• 6307 W 26th St - 6,495 SF.
• 6215 W 26th St - 4,795 SF.
• 6340 W 26th St - 4,000 SF.
31 Commercial Vacancy Report 2022
26TH STREET
32 Commercial Vacancy Report 2022
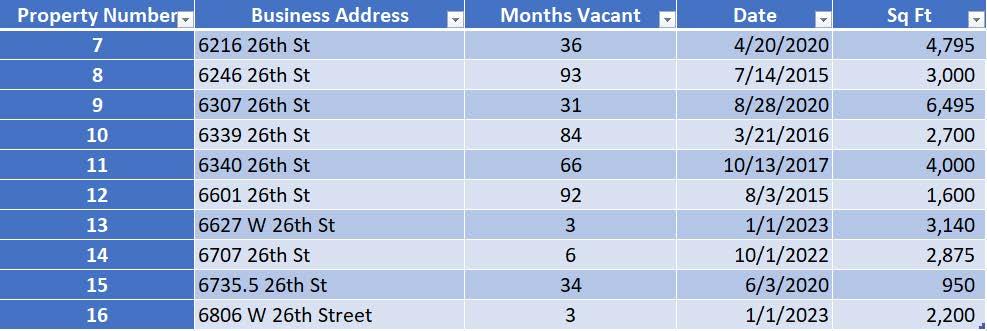
26TH STREET TABLE
33 Commercial Vacancy Report 2022
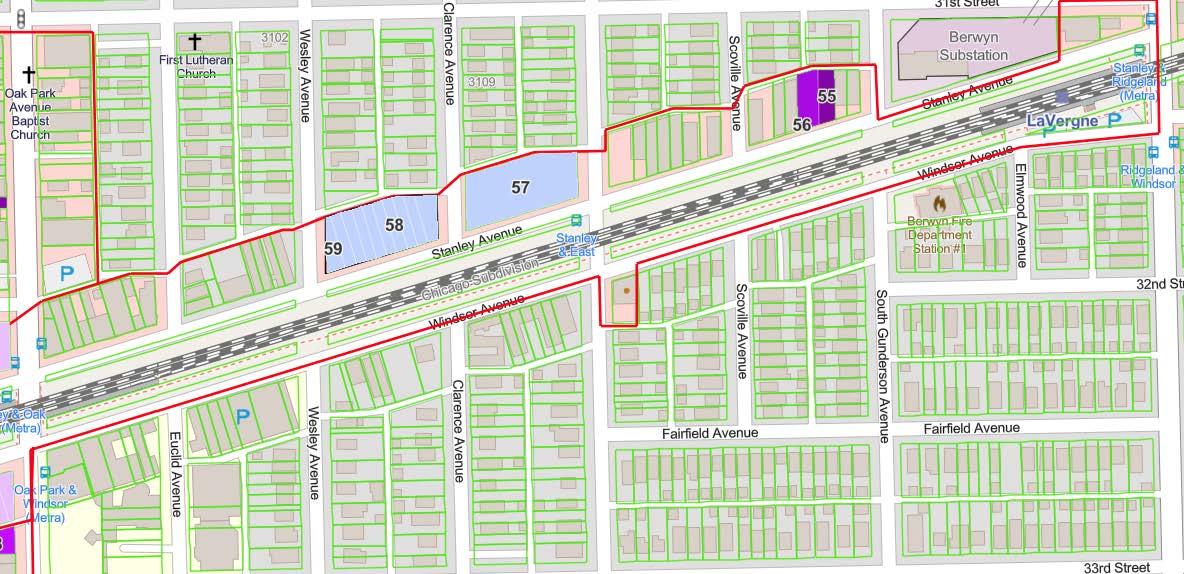
DEPOT DISTRICT XII
The Depot District Corridor is struggling compared to the overall community. With 232,346 square feet of commercial space, the Depot has approximately 66,926 square feet of vacant space. This 28.80% is the worst commercial vacancy rate.
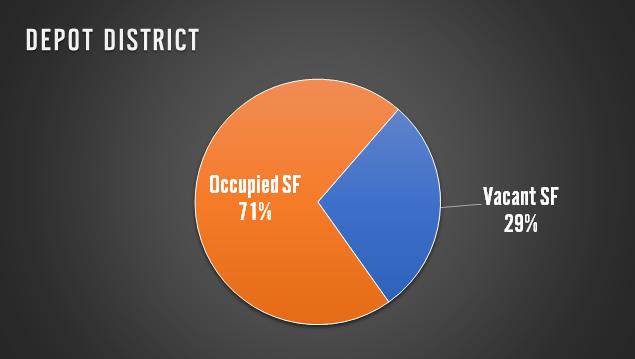
Top 3 Largest Commercial Vacancies, Depot:
• 6800-6808 Windsor Ave. – 10,950 SF.
• 6627 Stanley Ave – 10,800 SF.
• 6639-6645 Stanley Ave – 9,750 SF.
34 Commercial
Report 2022
Vacancy
DEPOT DISTRICT EAST
35 Commercial Vacancy Report 2022
*Oak Park ave - Ridgeland ave
DEPOT DISTRICT WEST
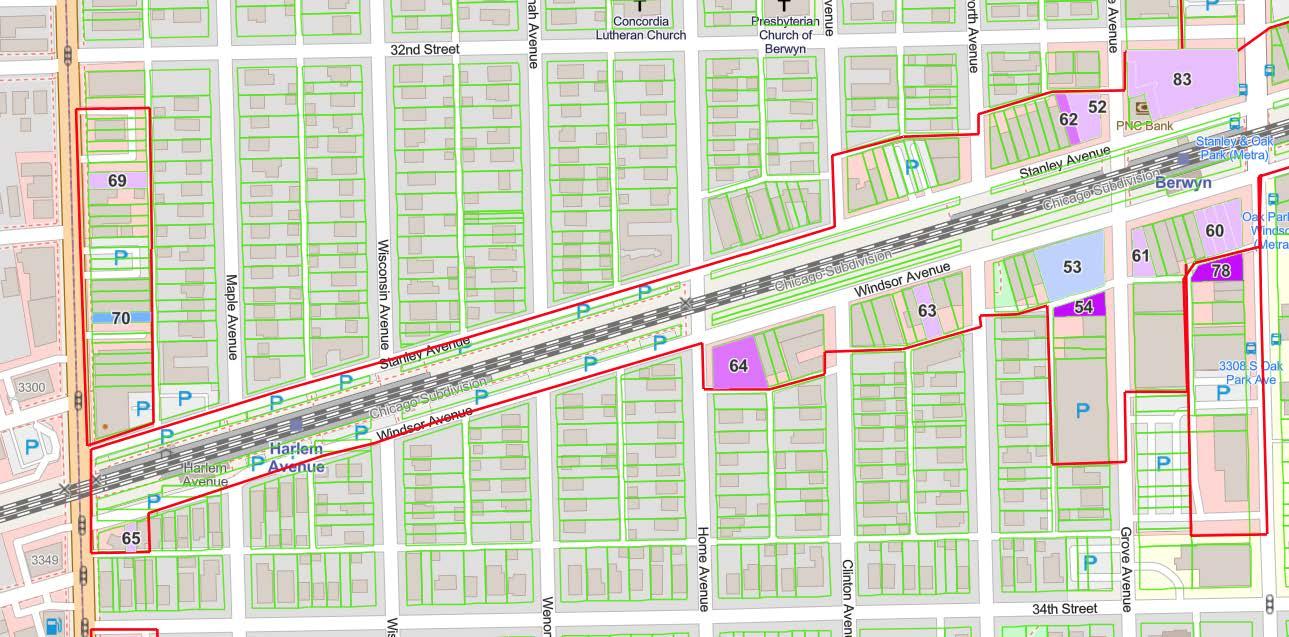
36 Commercial Vacancy Report 2022
*Harlem ave – Oak Park ave
DEPOT DISTRICT TABLE
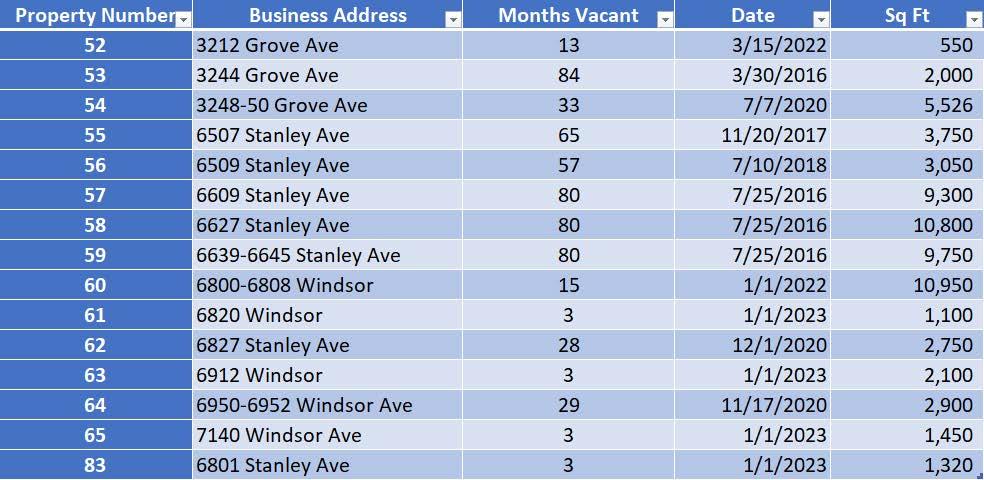
37 Commercial Vacancy Report 2022
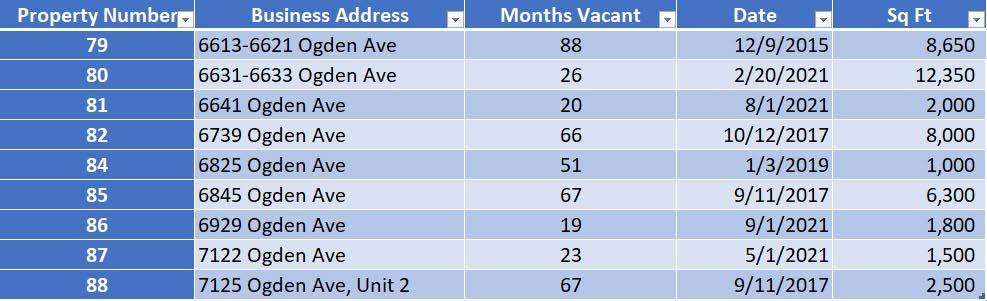
OGDEN AVENUE XIII
The Ogden Corridor is the second largest commercial corridor in the community, and the single best performing in Berwyn. With 491,337 square feet of commercial space. Ogden has approximately 44,600 square feet of vacant space, giving a vacancy rate of 9.08%
Top 3 Largest Commercial Vacancies, Ogden:
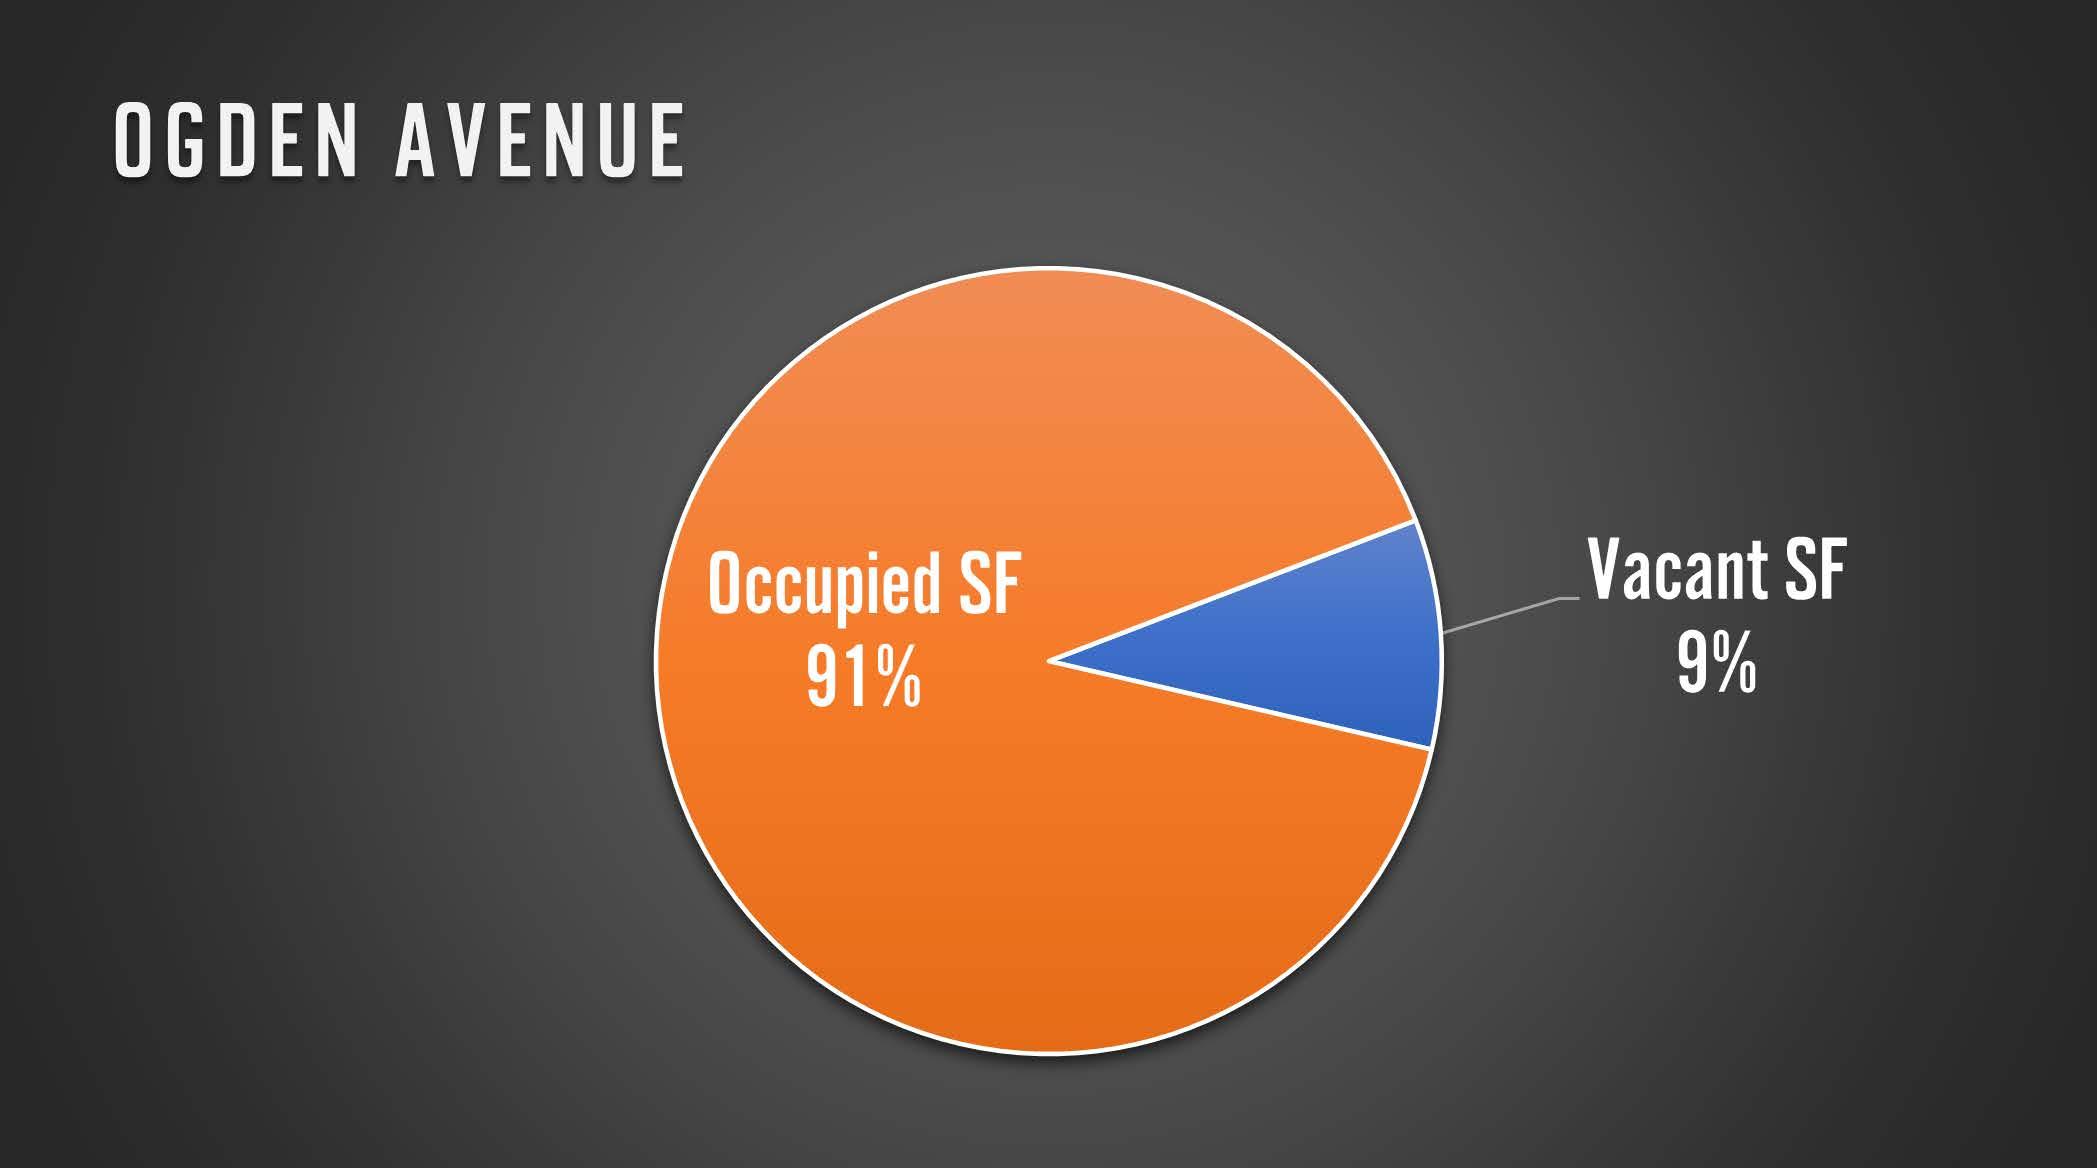
• 6631-6633 Ogden Ave - 12,350 SF.
• 6613-6621 Ogden Ave- 8,650 SF.
• 6739 Ogden Ave - 8,000 SF.
38 Commercial Vacancy Report 2022
OGDEN AVENUE
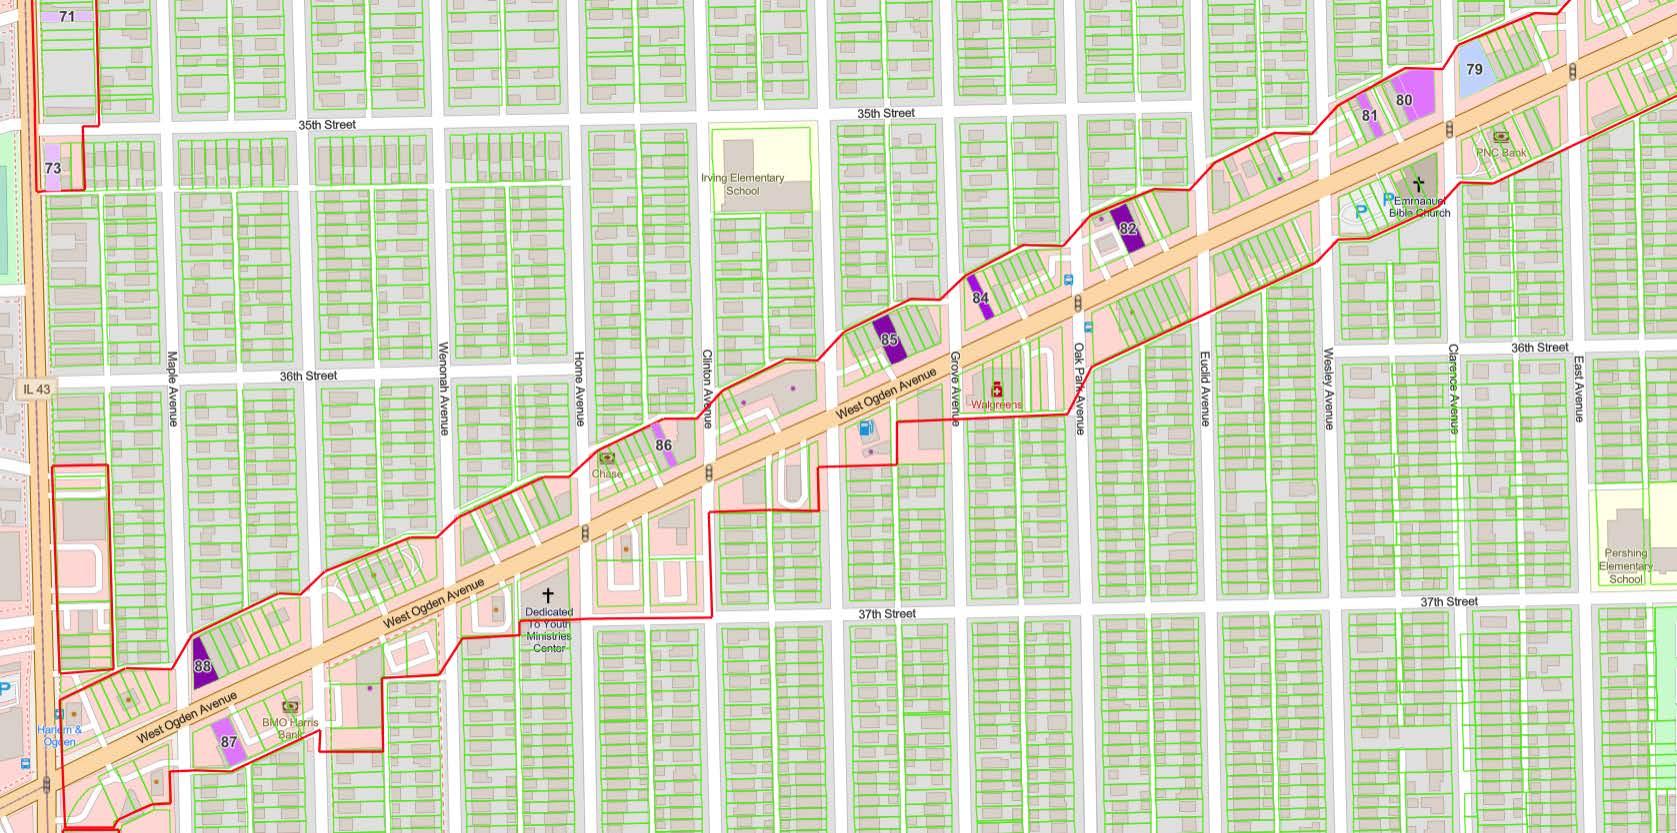
*Only areas with vacancies represented
39 Commercial Vacancy Report 2022
OGDEN AVENUE TABLE
40 Commercial Vacancy Report 2022
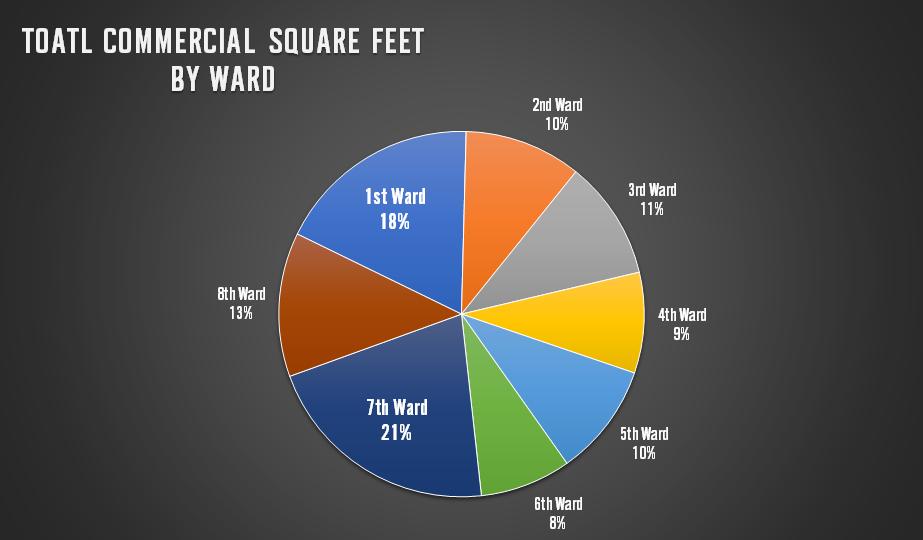
TOTAL COMMERCIAL SQUARE FEET, BY WARD XIV
As stated before in this report, Berwyn has approximately 2,862,819 square feet of commercial property. As seen in the table below, about two fifths of Berwyn’s commercial property are in the 1st & 7th Wards. The smallest commercial corridor is 6th Ward, with just over 8% of all properties. The commercial property by Ward is much more evenly distributed than by Corridor.

Ward Total Square Feet Commercial Percentage Ward 1 520,558 18.18% Ward 2 296,700 10.36% Ward 3 301,939 10.55% Ward 4 254,893 8.90% Ward 5 286,048 9.99% Ward 6 230,439 8.05% Ward 7 21.21% Ward 8 365,031 12.75% Total Commercial 2,862,819 607,211 41 Commercial Vacancy Report 2022
42 Commercial Vacancy Report 2022
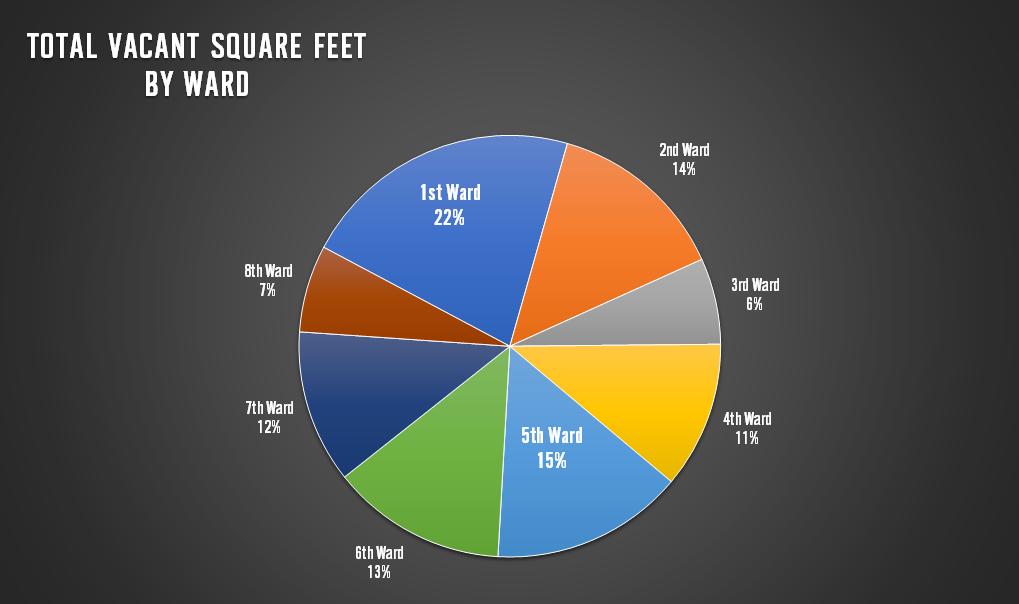
TOTAL COMMERCIAL VACANCY, BY WARD XV
As stated before in this report, Berwyn has approximately 327,442 square feet of vacant commercial property. As seen in the table below, commercial vacancy is much more evenly distributed by Ward than Corridor. Some Wards have a much lower than expected vacancy rate (Ward 3 and Ward 8, as an example). And some have much larger than would be expected (Ward 5, as an example).
Ward Square Feet Vacant Percentage Ward 1 70,826 13.61% Ward 2 45,300 15.27 % Ward 3 21,637 7.17% Ward 4 36,860 14.46% Ward 5 48,423 16.93% Ward 6 44,031 19.11% Ward 7 38,462 6.33% Ward 8 21,903 6.00% Total Vacancy 327,442 43 Commercial Vacancy Report 2022
44 Commercial Vacancy Report 2022
COMMERCIAL VACANCY HEALTH, BY WARD XVI
Using the total square footage and the vacancy rate for each of the Wards, we can look at the “health” of each Ward compared to how the community as a whole is going. If each Ward performed equally, then we would expect their percentage of commercial space to match up with their percentage of commercial vacancy. As an example, we would expect Ward 7, with 21.32% of the total commercial square footage in Berwyn, to have 21.32% of the overall vacancy. This would give Ward 7 a 0% “Health” metric. But Ward 7 only contains 11.80% of the overall vacancy in Berwyn, which leads us to conclude that it is much healthier than the norm. This is demonstrated by its positive 80.65% metric, indicating that the corridor is doing more than half again as well as we would expect.
In the below table, positive values in black represent Wards that are performing better than the norm. Negative values in red represent Wards that are performing worse than the norm
Vacancy “Health” Ward 1 CWard 2 CWard 3 B Ward 4 -15.93% -20.91% CWard 5 -32.43% CWard 6 D Ward 7 A Ward 8 -40.14% 80.57% 90.62% A 45 Commercial Vacancy Report 2022 -25.09% 59.61%
WARD 1 XVII

Ward 1 is performing on average compared to the overall community. With 520,558 square feet of commercial space, Ward 1 has approximately 70,826 square feet of vacant space. This 13.61% is the 4th lowest of the 8 wards, yet worse than the overall commercial vacancy of 11.44%.

•
•
•
46 Commercial Vacancy Report 2022 Top 3 Largest Commercial Vacancies, Ward 1:
6631-6633 Ogden Ave – 12,350 SF.
– 6808 Windsor Ave – 10,950 SF.
6800
6739 Ogden Ave – 8,000 SF.
WARD 1
47 Commercial Vacancy Report 2022
WARD 1 TABLE
48 Commercial Vacancy Report 2022
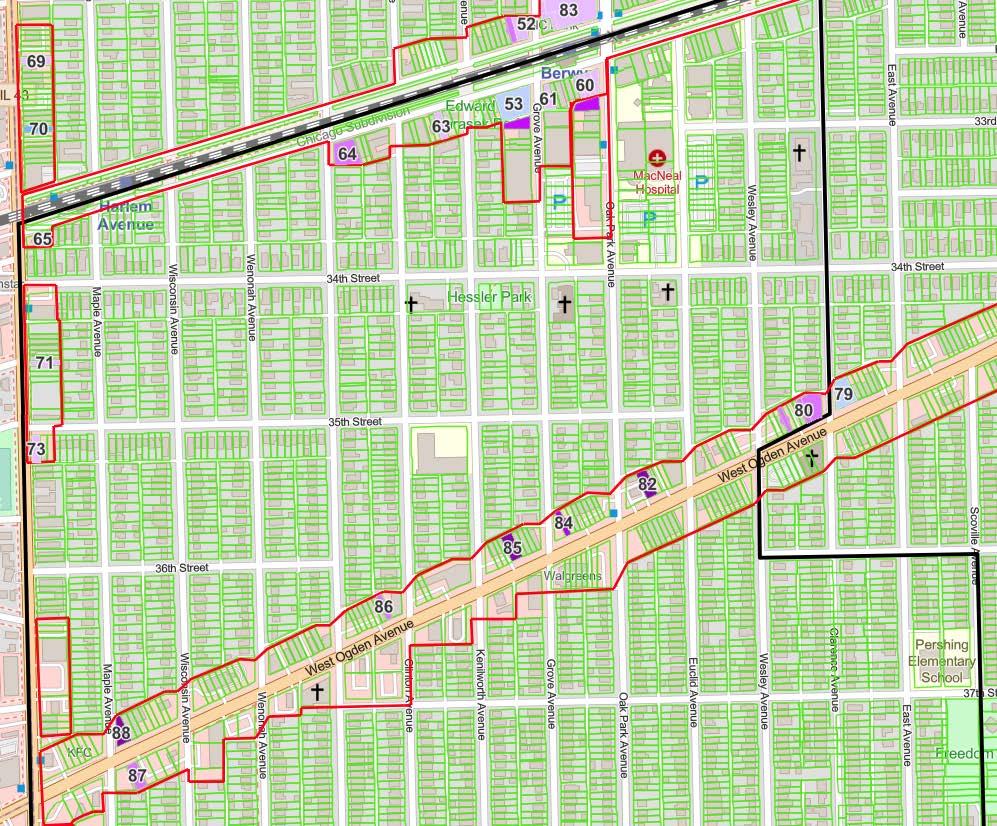
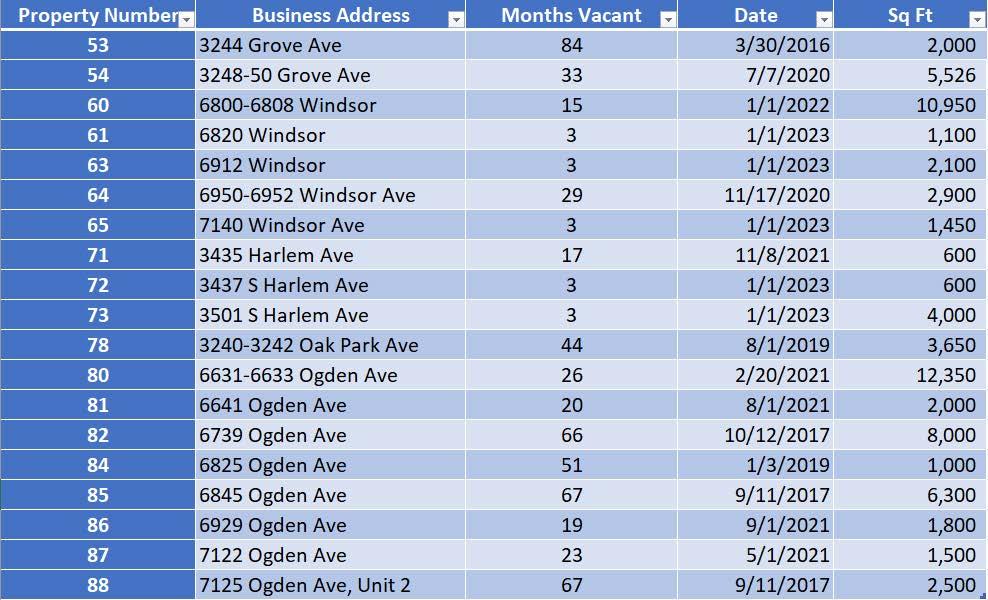
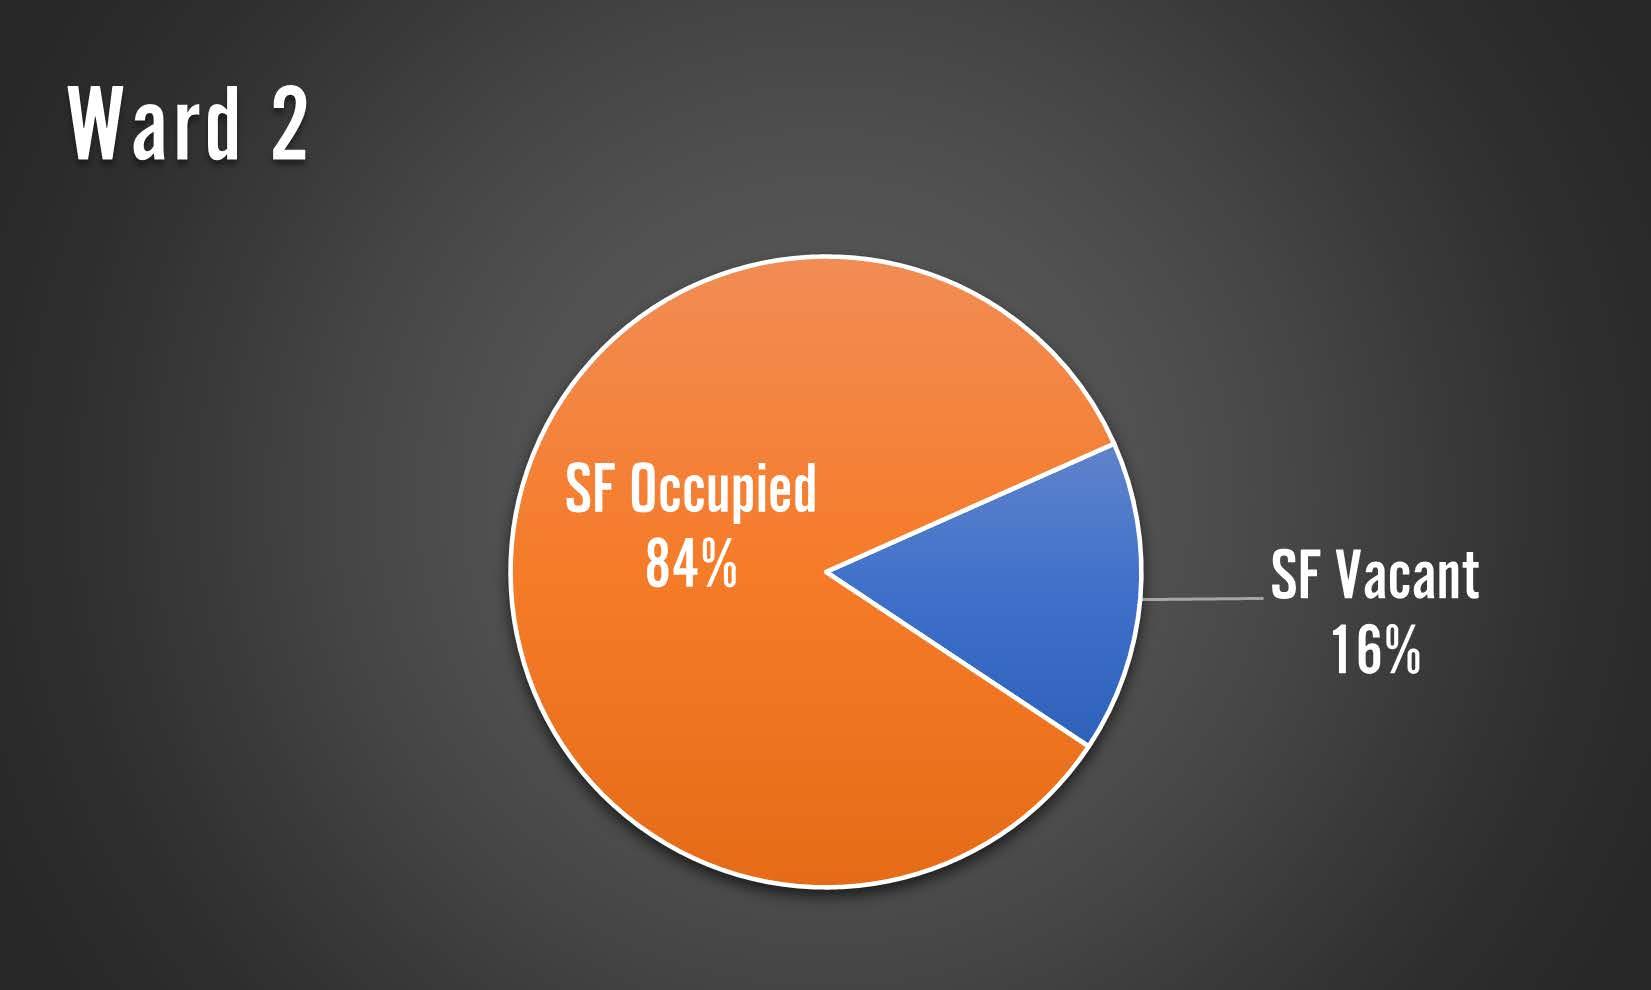
WARD 2 XVIII
Ward 2 is struggling compared to the overall community. With 296,700 square feet of commercial space, Ward 2 has approximately 43,500 square feet of vacant space. This 15.27%is just higher than the overall commercial vacancy of 11.44%.
Top 3 Largest Commercial Vacancies, Ward 2:
• 6627 Stanley Ave – 10,800 SF.
• 6639-6645 Stanley Ave – 9,750 SF.
• 6609 Stanley Ave – 9,300 SF.
49 Commercial Vacancy Report 2022
WARD 2
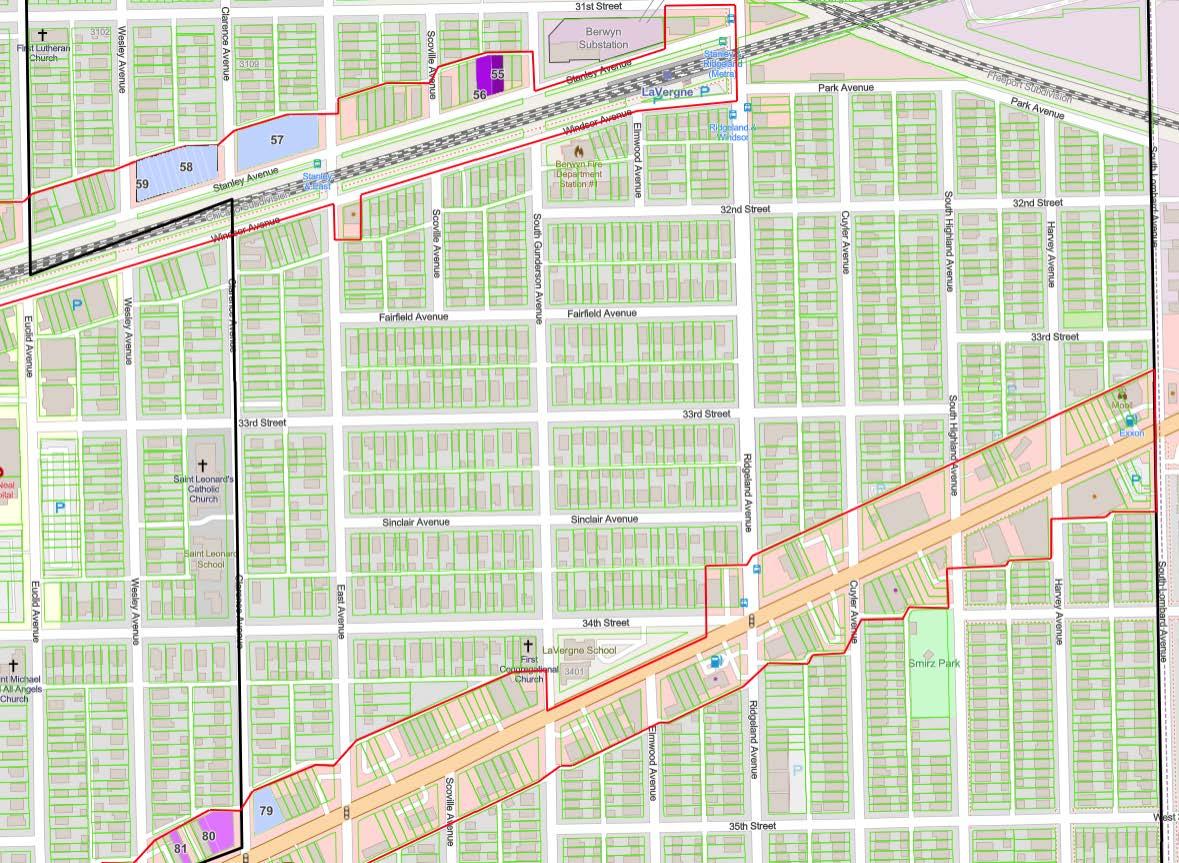
*Only areas with vacancies represented
50 Commercial Vacancy Report 2022
WARD 2 TABLE
51 Commercial Vacancy Report 2022
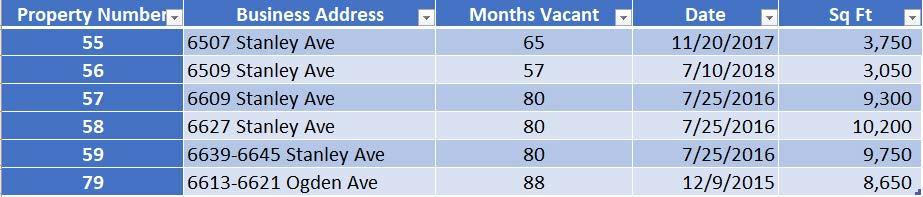
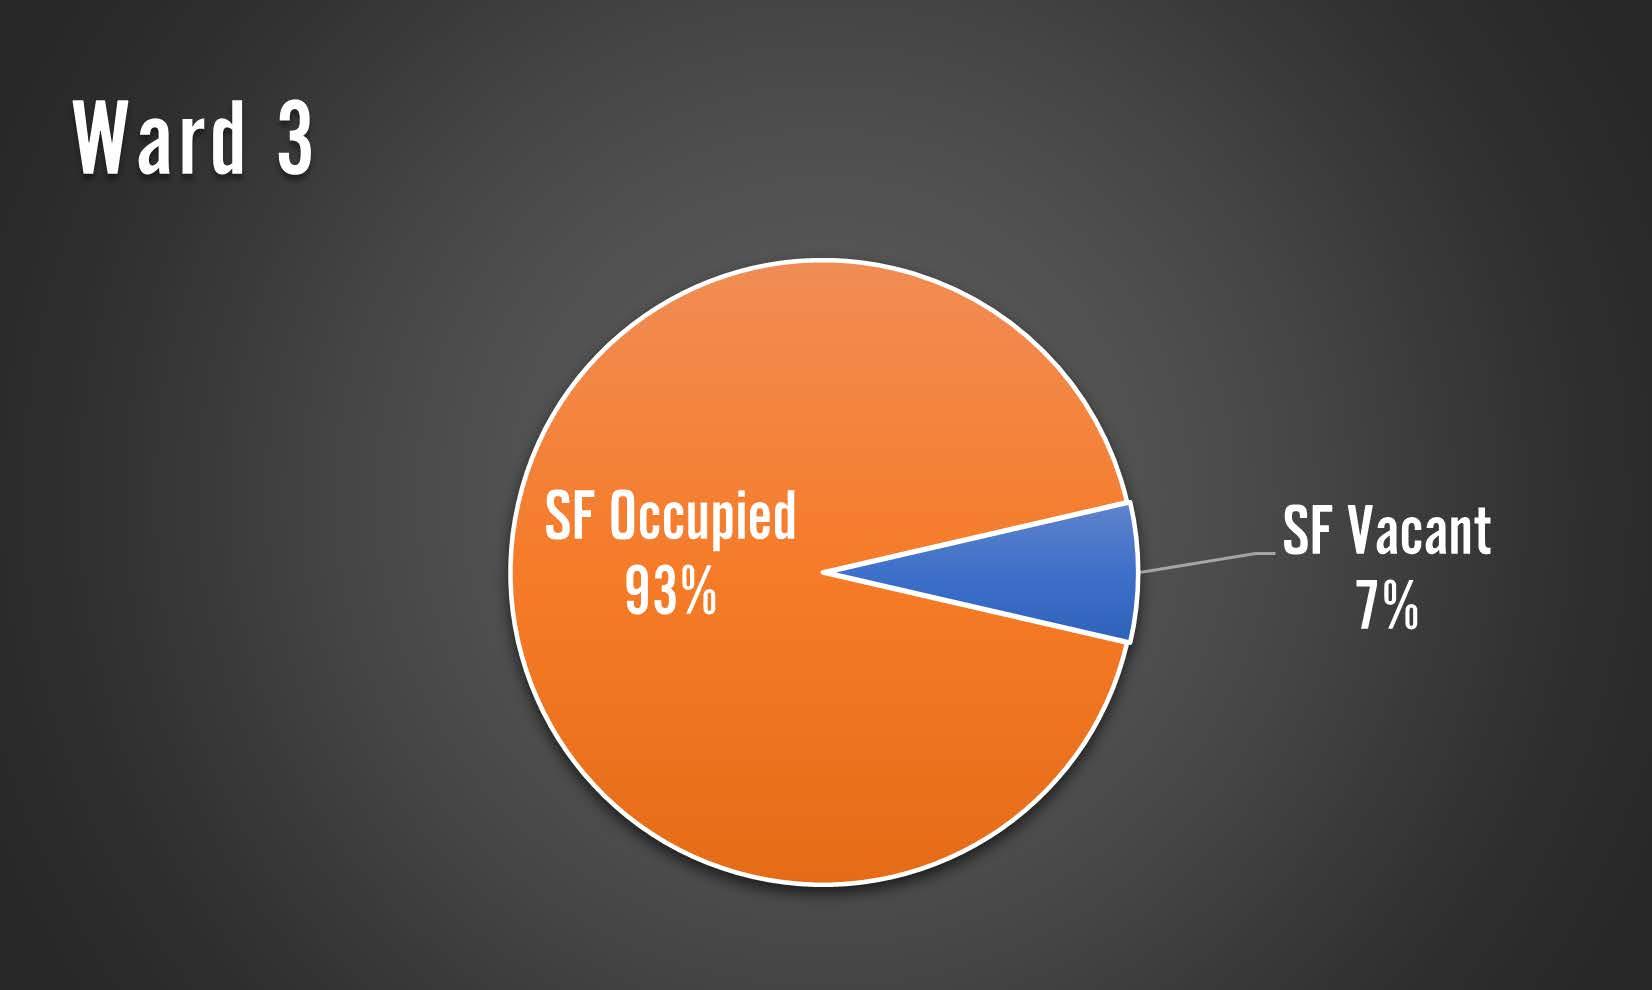
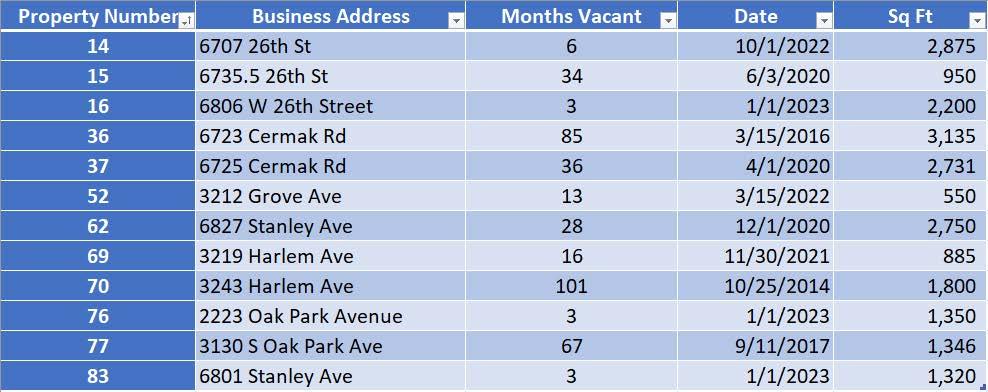
WARD 3 XIX
Ward 3 is performing better than the overall community. With 301,939 square feet of commercial space, Ward 3 has approximately 21,637 square feet of vacant space. This is the third lowest amount of vacant space in Berwyn. This 7.17% is better than the overall commercial vacancy of 11.44 %.
Top 3 Largest Commercial Vacancies, Ward 3:
• 6723 Cermak Rd – 3,135 SF.
• 6707 26th St – 2,875 SF.
• 6827 Stanley Ave – 2,750 – SF.
52 Commercial Vacancy Report 2022
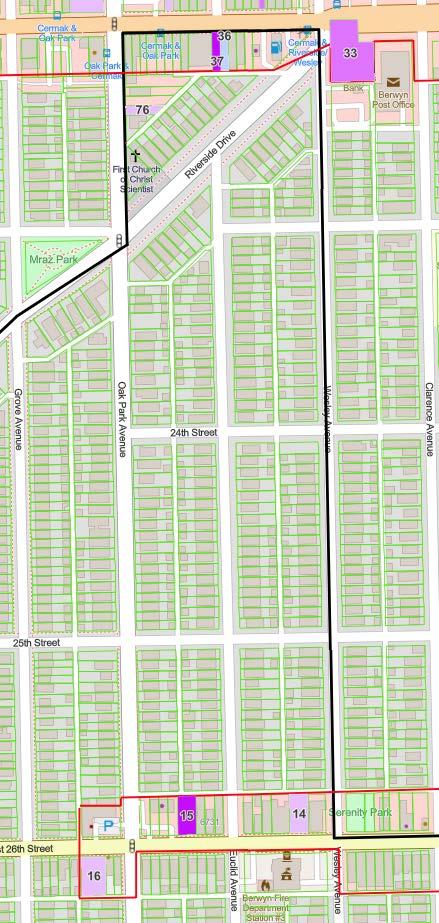
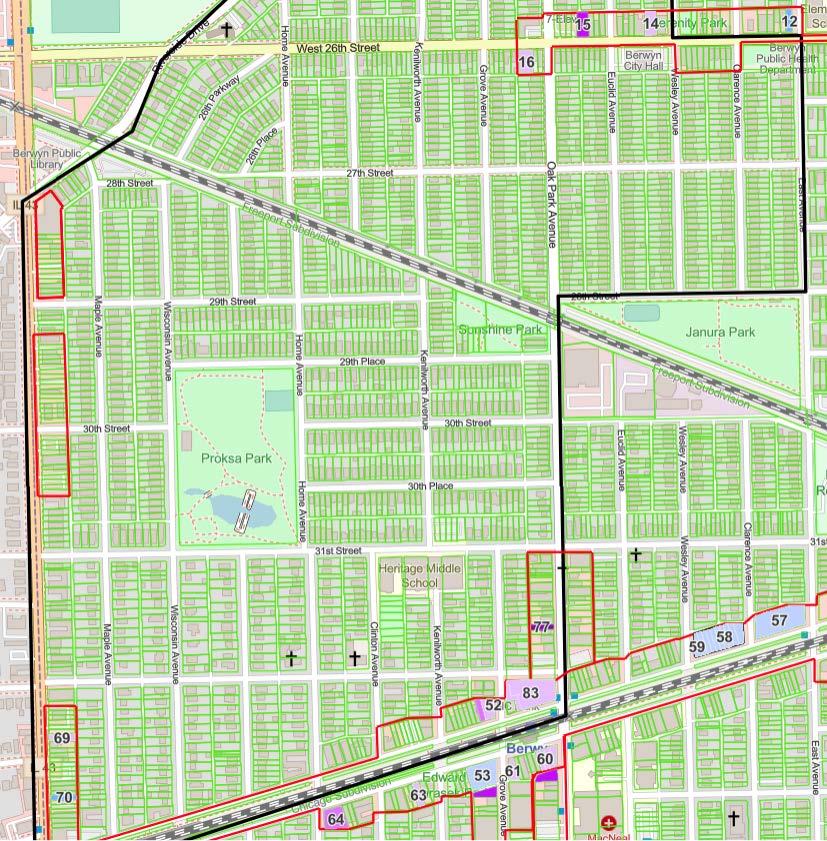
WARD 3


53 Commercial Vacancy Report 2022
*Ward 3 Southwest
*Ward 3 Northeast
WARD 3 TABLE
54 Commercial Vacancy Report 2022
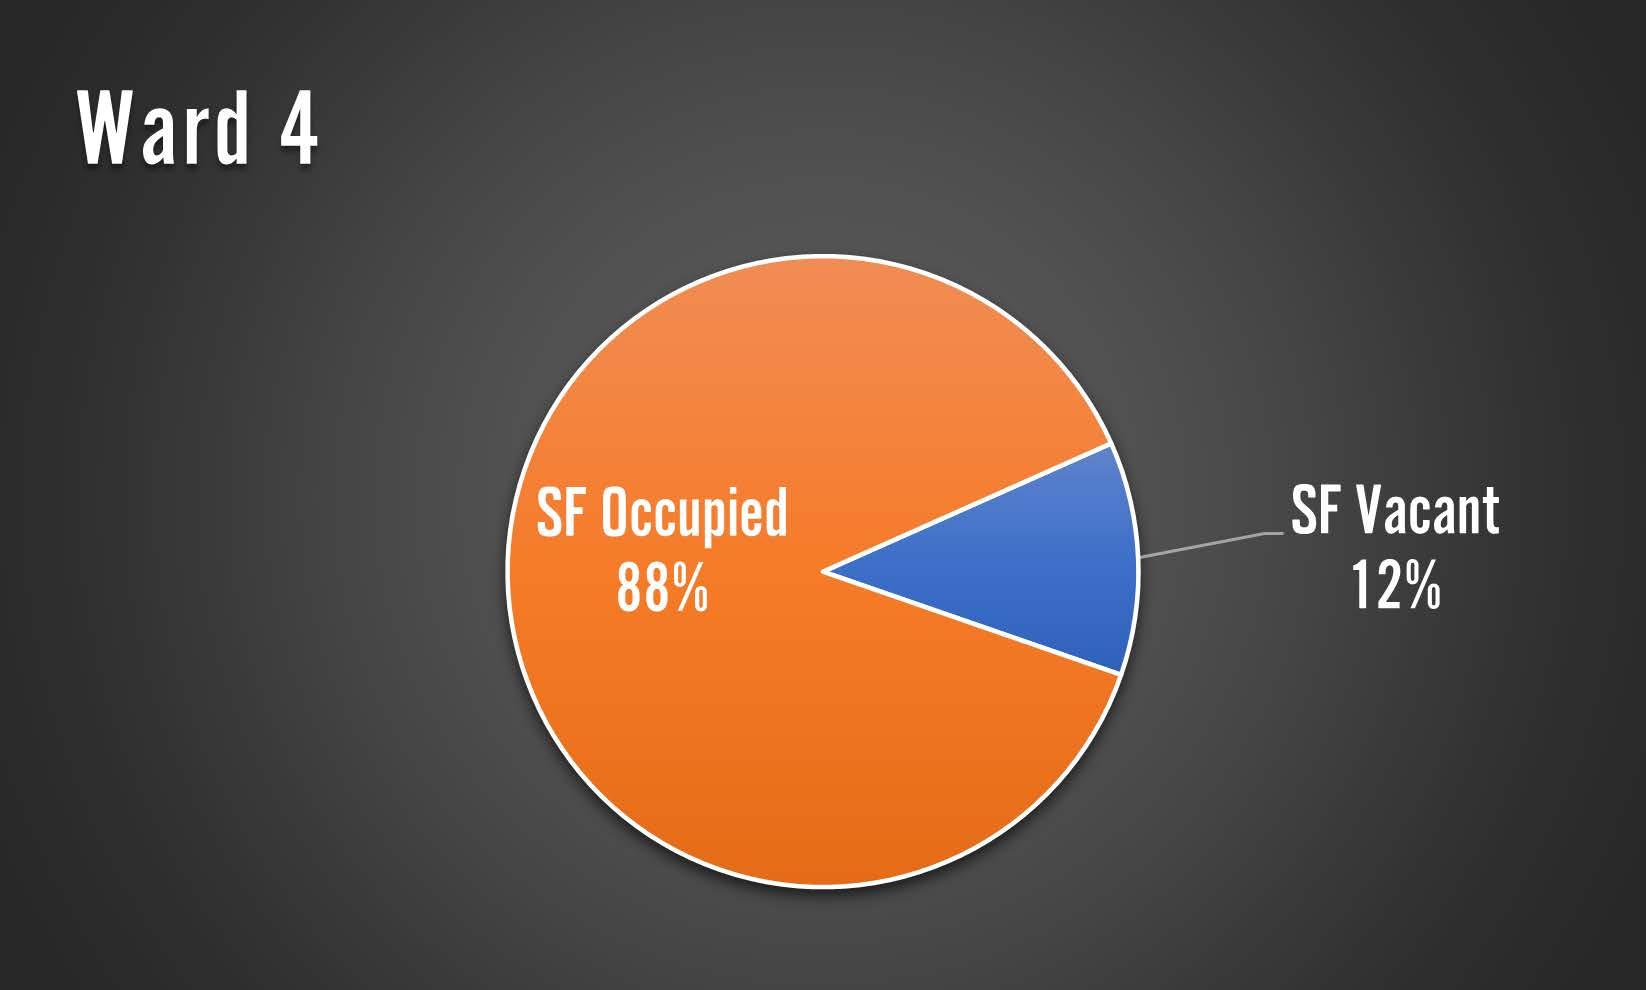
WARD 4
Ward 4 is on par compared to the overall community. With 254,893 square feet of commercial space, Ward 4 has approximately 36,860 square feet of vacant space. This 14.46% is higher than the overall 11.44%
Top 3 Largest Commercial Vacancies, Ward 4:
• 6307 26th St– 6,495 SF.
• 6215 26th St– 4,795 SF.
• 6340 26th St– 4,000 SF.
55 Commercial
Report 2022
XX
Vacancy
WARD 4

*Only areas with vacancies represented
56 Commercial Vacancy Report 2022
WARD 4 TABLE
57 Commercial Vacancy Report 2022
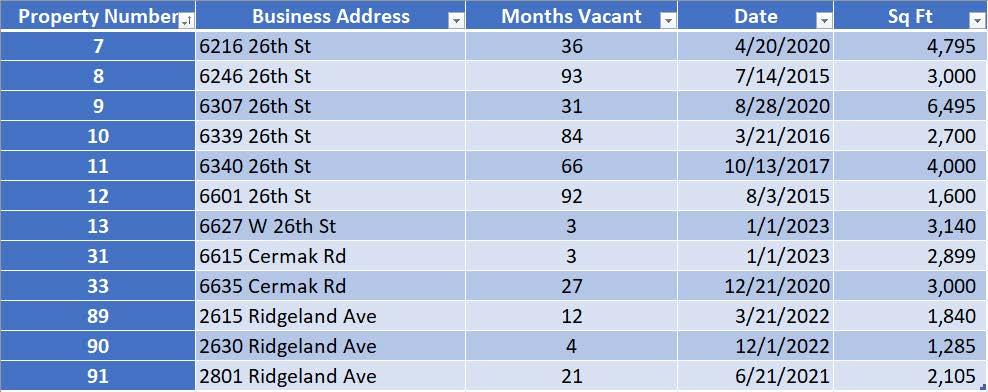
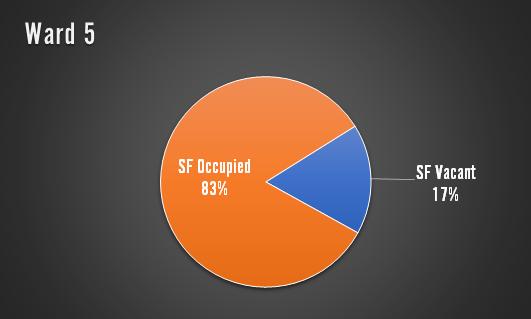
WARD 5 XXI
Ward 5 is a challenged Ward in Berwyn. With 286,048 square feet of commercial space, Ward 5 has approximately 48,423 square feet of vacant space. This gives Ward 5 the 2nd highest vacancy rate of 16.93% & the 2nd highest total vacant square footage.
Top 3 Largest Commercial Vacancies, Ward 5:
• 6220 Cermak Rd – 12,000 SF.
• 6431 Cermak Rd– 6,500 SF.
• 6217 Cermak Rd – 5,140 SF.
58 Commercial Vacancy Report 2022
WARD 5
59 Commercial Vacancy Report 2022
*Ward 5 North
*Ward 5 South
WARD 5 TABLE
60 Commercial Vacancy Report 2022
WARD 6 XXII
Ward 6 is struggling compared to the overall community. With 213,710 square feet of commercial space, Ward 6 has approximately 46,653 square feet of vacant space. This 21.83% is a challenged commercial vacancy rate.

Top 3 Largest Commercial Vacancies, Ward 6:
• 6500-6504 16th St– 9,600 SF.
• 6650 Cermak Rd– 6,400 SF.
• 6450 Cermak Rd– 5,500 SF.
61 Commercial Vacancy Report 2022
WARD 6 NORTH
*Only areas with vacancies represented
62 Commercial Vacancy Report 2022
WARD 6 SOUTH
*Only areas with vacancies represented
63 Commercial Vacancy Report 2022
WARD 6 TABLE
64 Commercial Vacancy Report 2022
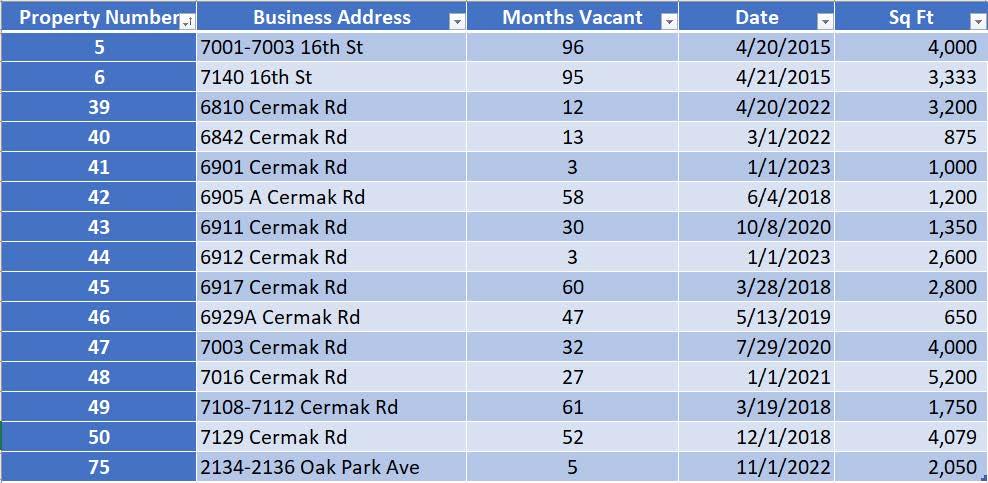
WARD 7 XXIII
Ward 7 is performing better than we would expect compared to the overall community. With 607,211 square feet of commercial space, Ward 7 has the largest overall commercial square footage in Berwyn. That said, Ward 7 has approximately 38,462 square feet of vacant space. This 6.33% vacancy rate is better than the overall 11.44% for Berwyn.
Top 3 Largest Commercial Vacancies, Ward 7:

• 7016 Cermak Rd– 5,200 SF.
• 7129 Cermak Rd– 5,010 SF.
• 7001-7003 16th St– 4,000 SF.
65 Commercial Vacancy Report 2022
WARD 7 NORTH
66 Commercial Vacancy Report 2022
*Only areas with vacancies represented
WARD 7 SOUTH
67 Commercial Vacancy Report 2022
*Only areas with vacancies represented
WARD 7 TABLE
68 Commercial Vacancy Report 2022
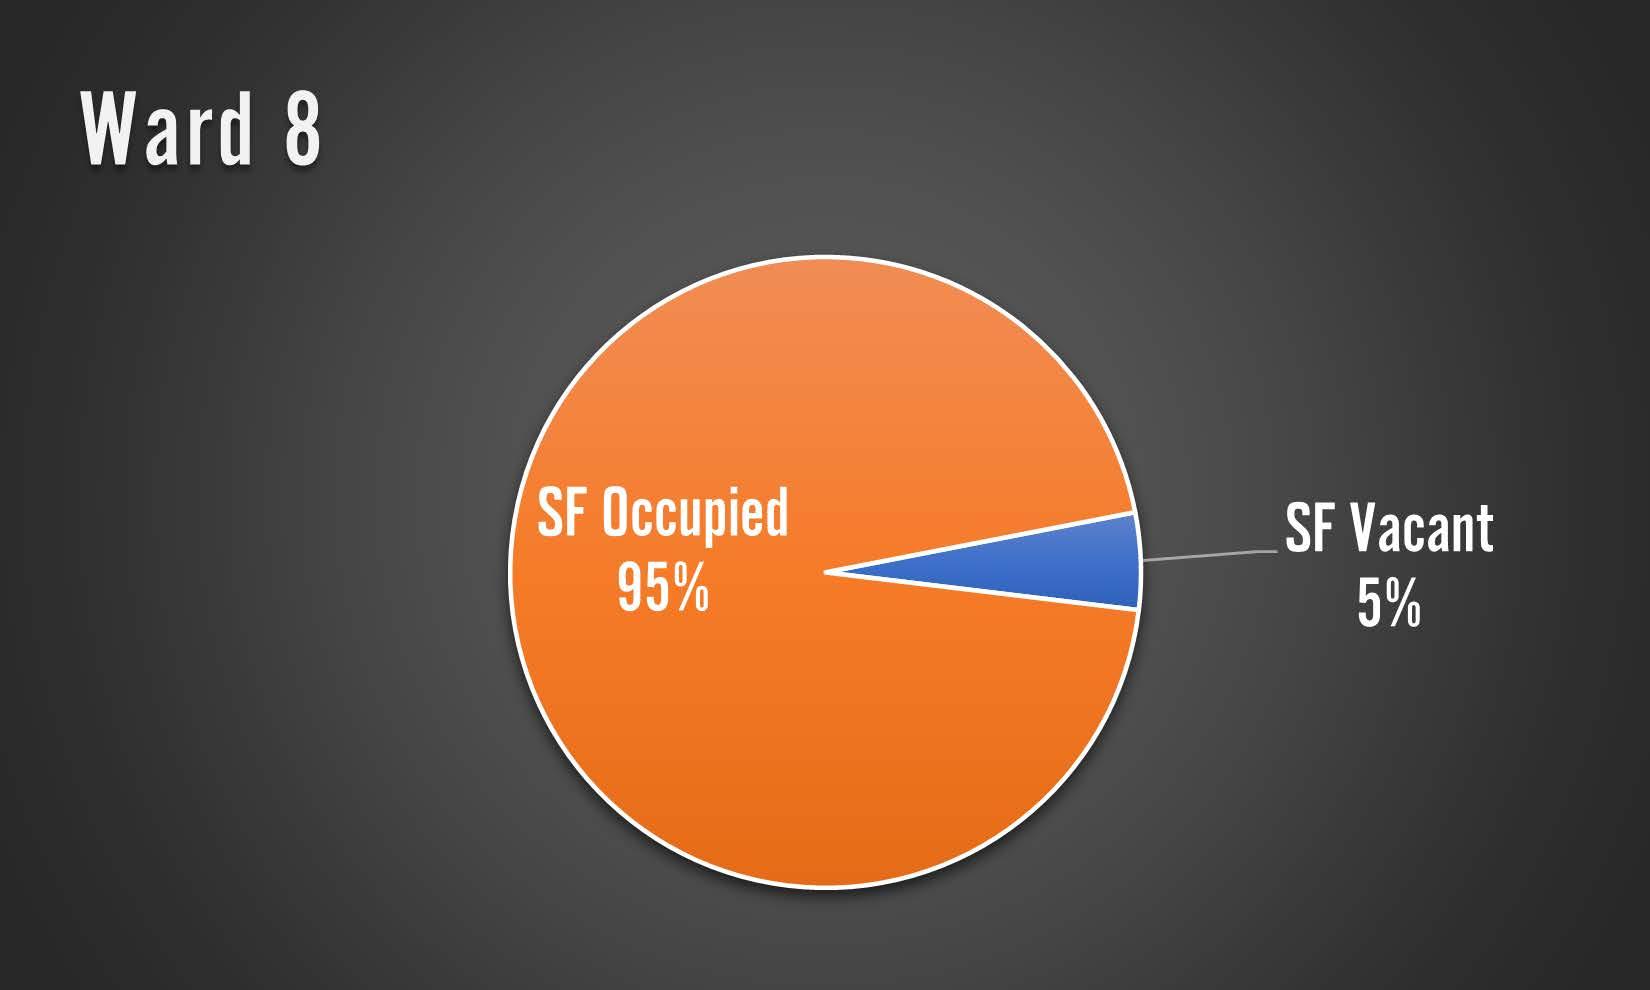
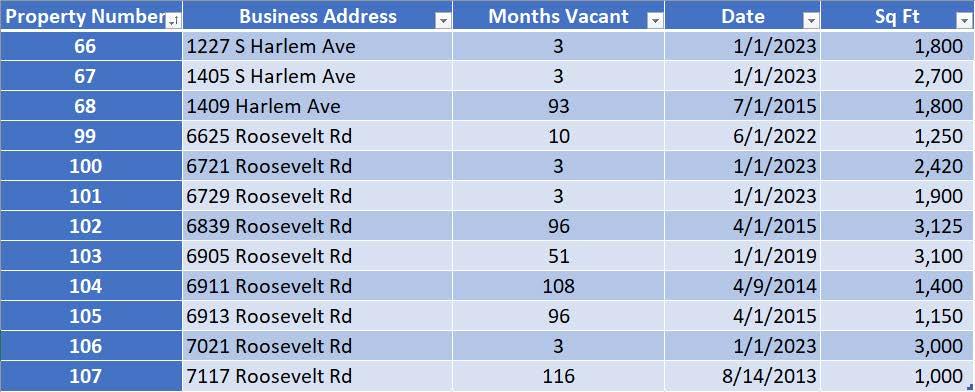
WARD 8 XXIV
Ward 8 is performing better than we would expect compared to the overall community. With 365,031 square feet of commercial space, Ward 8 has approximately 21,903 square feet of vacant space. This 6.00% vacancy rate is much better than the 11.44% for Berwyn.
Top 3 Largest Commercial Vacancies, Ward 8:
• 6839 Roosevelt Rd– 3,125 SF.
• 6905 Roosevelt Rd– 3,100 SF.
• 7021 Roosevelt Rd - 3,00 SF.
69 Commercial
Report 2022
Vacancy
WARD 8
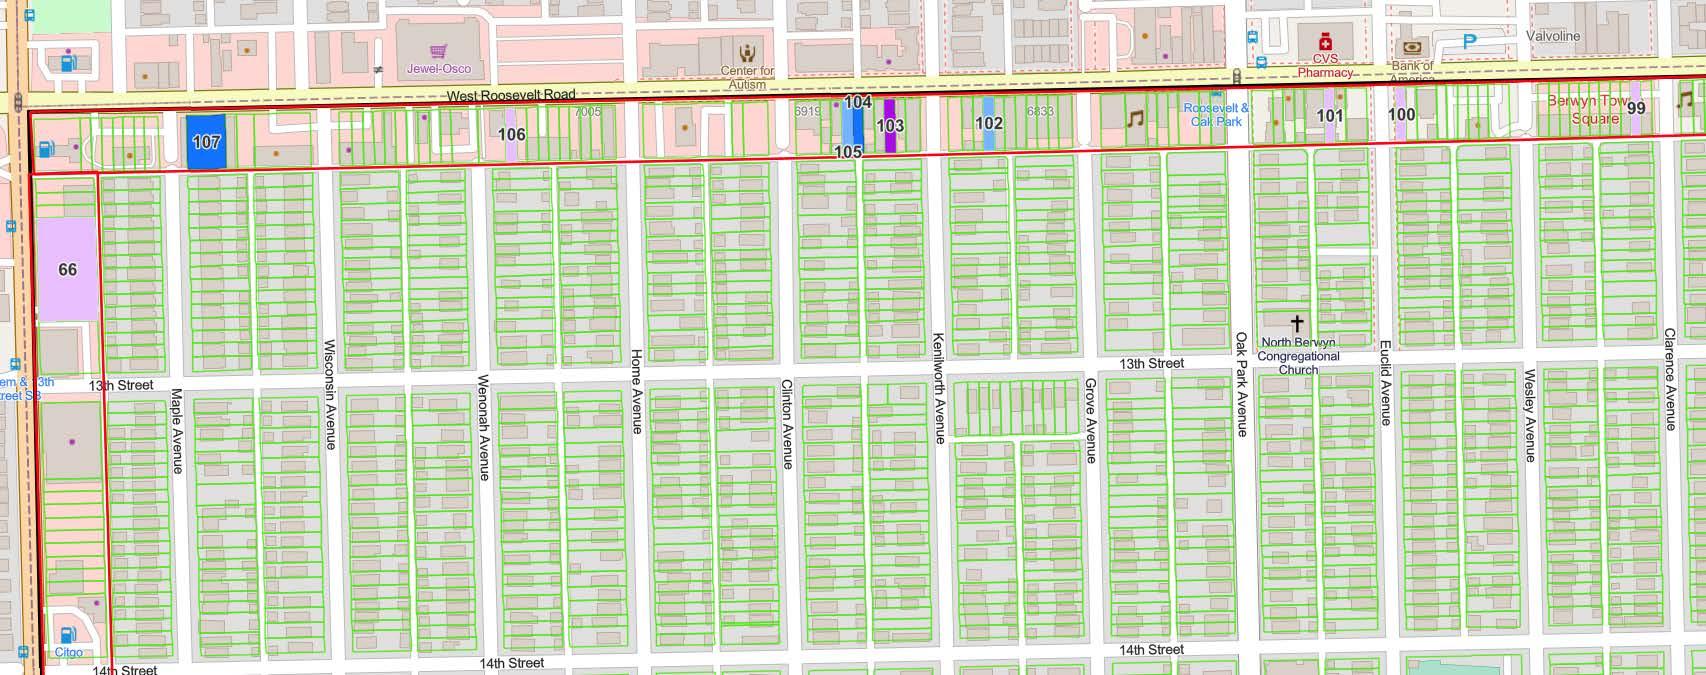
*Only areas with vacancies represented
70 Commercial Vacancy Report 2022
WARD 8 TABLE
71 Commercial Vacancy Report 2022
RECOMMENDATION XXV
The Berwyn Development Corporation recommends that the City of Berwyn evaluate a number of tools to address levels of vacancy.
• Sales Tax Sharing Agreement – For commercial properties that generate a significant amount of sales tax, the City could enter into a sharing agreement whereby a portion of sales tax collected would be rebated to the business.
• Cook County 7A/7B Property Tax Abatement – Commercial projects in areas determined to be “in need of commercial development,” that would not be economically feasible without the incentive, are eligible for this tax abatement. This “need” standard is open to interpretation, and can be established at the discretion of the municipality. The incentive can be granted for reutilization of vacant structures abandoned for at least twenty-four (24) months, or shorter if stipulated by the municipality. The incentive would reduce a property’s taxes to ten percent (10%) for the first ten years, fifteen percent (15%) for the eleventh year, and twenty percent (20%) for the twelfth year.
• TIF Programs – Pay As You Go, Finish Line Grant. These existing programs are only for eligible projects located in Berwyn’s TIF Districts. Finish Line Grant is a matching program, paying for 50% of rehabilitation costs on a property. Funding is based on annual avail-ability in each TIF. Pay As You Go is a program for larger redevelop-ment projects, and can rebate up to 25% of eligible project costs. The funds are reimbursed as they are earned through increased property taxes in the ensuing years.
• Forgivable Loan Program – The City of Berwyn could consider the creation of a forgivable loan program to complement the existing TIF programs. A forgivable loan would be issued like a typical BDC Commercial Loan, but with cancellation provisions if the user meets benchmarks. This program could be used to assist with startup costs associated with targeted business types (restaurants, as an example).
• Vacancy Registration Program - In 2022, the City of Berwyn charged the BDC with administration of the Vacancy Ordinance. As such, the BDC hired a part-time Vacancy Coordinator, who works closely with the City of Berwyn to inspect the exterior of properties and ensure that all owners of vacant commercial properties register their vacant properties. To receive a registration certificate, each property owner must pay a fee, obtain adequate insurance, and submit a plan for occupancy, sale and/or redevelopment. The data gathered by the Vacancy Coordinator will be used to inform and update the 2023 Vacancy Reports.
• Rezoning – Berwyn City Council could consider rezoning portions of our commercial corridors to provide alternative opportunities. Though not always the case, chronic vacancy could be an indication that our commercial properties are overbuilt, or market conditions have changed in comparison to our population.
These tools have the potential to assist the City of Berwyn to address challenged properties, chronic vacancy, and mitigate commercial va-cancies in the future.
4
72 Commercial Vacancy Report 2022
HARLEM AVE OAK PARK (6800) RIDGELA ND (6400) HO ME (7000) 1 3 T H S T 1 5 T H S T 1 4 T H S T 1 6 T H S T 2 1 S T S T P E R S H I N G R D 1 8 T H S T 1 9 T H S T 2 6 T H S T 3 8 T H S T C E R M A K R D GROVE (6850) 2 7 T H S T 3 1 S T S T 3 4 T H S T 3 7 T H S T OGDEN AVE 2 5 T H S T ELMWOOD (6450) GUNDERSO N (6500) R O O S E V E L T R D STANLEY AVE CUYLER (6350) WINDSOR AVE HARVE Y (6250) EUCLID (6750) 3 5 T H S T WESLEY (6700) RIVERSIDEDR HIG HLAND (6300) 3 2 N D S T MA PLE AVE (7150) 2 8 T H S T CLINTON (6950) WENONAH (7050) 2 9 T H S T 2 9 T H P L KENILWO RTH (6900) 3 0 T H P L 2 8 T H P L 2 6 T H P L 2 7 T H P L S I N C L A I R A V E F A I R F I E L D A V E 26THPKY 1 9 T H S T GROVE (6850) 2 4 T H S T 2 9 T H S T WISCONSIN (7100) 3 3 R D S T SCO VILLE (6550) 2 3 R D S T CLINTON (6950) KENILWO RTH (6900) WISCONSIN (7100) SCO VILLE (6550) CUYLER (6350) CLARENCE (6650) HO ME (7000) 3 5 T H S T WENONAH (7050) 3 0 T H S T GUNDERSO N (6500) LO MBARD AVE 3 2 N D S T 26THPL EUCLID (6750) MA PLE (7150) ELMWOOD (6450) 3 6 T H S T 3 6 T H S T 3 8 T H S T 3 4 T H S T HARVE Y ( 6250) HIG HL AN D (6300) RID GE LA ND (6400) EA ST ( 6600) EA ST ( 6600) CLA RE NCE (6650) WES L EY (6700) OA K PA RK (6800) 1 3 T H S T 1 4 T H S T 1 5 T H S T 1 6 T H S T 1 8 T H S T 2 1 S T S T 2 6 T H S T Berwyn Zoning Districts New Zo ning Districts C-1 Neighbor hood Mixed-Use District C-2 Traditional Mixed-Use District C-3 Depot Mixed-Use District C-4 Corr idor Com mercial District I Industrial District P Public A reas District R-1 Single- Family R esidence District R-2 Bungalow District R-3 Two-F amily Residence District R-4 Multi- F am ily R esidence District ± 0 0.25 0.5 0.75 1 0.125 Miles Se pte mb er 2017 City of Berwyn , CMAP/JDS
City of B erwy n Z oning M ap
City of Berwyn Ward Boundaries - Límites de los Distritos
Legend 1st Ward 2nd Ward 3rd Ward
4th Ward 5th Ward 6th Ward
7th Ward 8th Ward City Block Outlines
Disclaimer: This map is for reference only. Data provided is derived from multiple sources. The City of Berwyn disclaims all responsibility for the accuracy or completeness of the data shown herein.
Sources: Ward Boundaries and City Block Outlines - City of Berwyn
33rd St 31st St 37th St Pershing 26th St 25th St 34th St 35th St 21st St Cermak 24th St 19th St 14th St 18th St 16th St 15th St 36th St 33rd St Stanley 32nd St 27th St 38th St 38th St 34th St Windsor 28th St 36th St 32nd St 35th St Ogden Clarence Scoville 30th Pl Lombard Home Harvey 30th St East Kenilworth Grove Harlem Highland Clinton Wesley Ridgeland Maple Oak Park Euclid Elmwood Wenonah Cuyler Gunderson Wisconsin Fairfield Sinclair 27th Pl 26th Pl 28th Pl 29th St Riverside 28th St Park 29th Pl 29th St Pershing Clarence Scoville Lombard Home Harvey East Kenilworth Grove Harlem Highland Clinton Wesley Ridgeland Maple Oak Park Euclid Elmwood Wenonah Cuyler Gunderson Wisconsin 14th St 18th St 16th St 15th St 21st St Cermak 19th St 23rd St 26th St Ogden Roosevelt 13th St 13th St Roosevelt ¯ 0 0.5 1 0.25 Miles

