1 minute read
COMMERCIAL VACANCY HEALTH, BY CORRIDOR IV
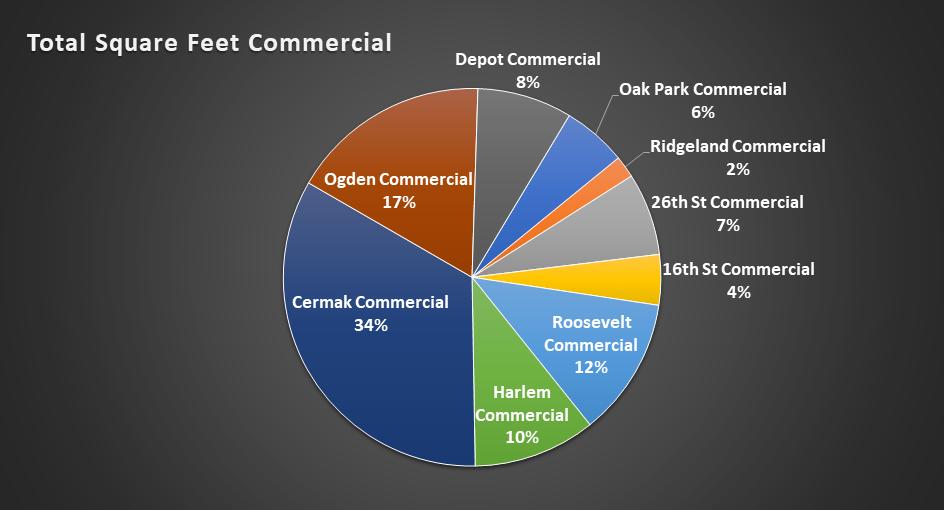

Using the total square footage and the vacancy rate for each of the corridors, we can look at the “health” of each corridor compared to how the community is doing. If each corridor performed equally, then we would expect their percentage of commercial space to match up with their percentage of commercial vacancy. As an example, we would expect Roosevelt, with 11.89% of the total commercial square footage in Berwyn, to have 11.89% of the overall vacancy. This would give Roosevelt a 0% “Health” metric. But Roosevelt only contains 9.45% of the overall vacancy in Berwyn, which leads us to conclude that it is healthier than the norm. This is demonstrated by its positive 25.79% metric, indicating that the corridor is performing slightly better than we would expect.
In the below table, positive values in black represent corridors that are performing better than the norm. Negative values in red represent corridors that are performing worse than the norm.
