Water Management in Oil and Gas Operations
Industry Practice and Policy Guidelines for Developing Countries
Einar H. Bandlien, Sander De Kruijf, Eilen Arctander Vik, Ole Fredrik Ekern, Johan Bernhard Siqueland Knudsen, Geoffrey Dyce, Silvana Tordo, and François Bertone
INTERNATIONAL DEVELOPMENT IN FOCUS
INTERNATIONAL DEVELOPMENT IN FOCUS
Water Management in Oil and Gas Operations
Industry Practice and Policy Guidelines for Developing Countries
EINAR H. BANDLIEN, SANDER DE KRUIJF, EILEN ARCTANDER VIK, OLE FREDRIK EKERN, JOHAN BERNHARD SIQUELAND KNUDSEN, GEOFFREY DYCE, SILVANA TORDO, AND FRANÇOIS BERTONE
© 2024 International Bank for Reconstruction and Development / The World Bank 1818 H Street, NW, Washington, DC 20433
Telephone: 202-473-1000; internet: www.worldbank.org
Some rights reserved
1 2 3 4 27 26 25 24
Books in this series are published to communicate the results of World Bank research, analysis, and operational experience with the least possible delay. The extent of language editing varies from book to book.
This work is a product of the staff of The World Bank with external contributions. The findings, interpretations, and conclusions expressed in this work do not necessarily reflect the views of The World Bank, its Board of Executive Directors, or the governments they represent. The World Bank does not guarantee the accuracy, completeness, or currency of the data included in this work and does not assume responsibility for any errors, omissions, or discrepancies in the information, or liability with respect to the use of or failure to use the information, methods, processes, or conclusions set forth. The boundaries, colors, denominations, and other information shown on any map in this work do not imply any judgment on the part of The World Bank concerning the legal status of any territory or the endorsement or acceptance of such boundaries.
Nothing herein shall constitute or be construed or considered to be a limitation upon or waiver of the privileges and immunities of The World Bank, all of which are specifically reserved.
Rights and Permissions

This work is available under the Creative Commons Attribution 3.0 IGO license (CC BY 3.0 IGO) http:// creativecommons.org/licenses/by/3.0/igo. Under the Creative Commons Attribution license, you are free to copy, distribute, transmit, and adapt this work, including for commercial purposes, under the following conditions:
Attribution—Please cite the work as follows: Bandlien, Einar H., Sander De Kruijf, Eilen Arctander Vik, Ole Fredrik Ekern, Johan Bernhard Siqueland Knudsen, Geoffrey Dyce, Silvana Tordo, and François Bertone. 2024. Water Management in Oil and Gas Operations: Industry Practice and Policy Guidelines for Developing Countries. International Development in Focus. Washington, DC: World Bank. doi:10.1596/978-1-4648-2047-2. License: Creative Commons Attribution CC BY 3.0 IGO
Translations—If you create a translation of this work, please add the following disclaimer along with the attribution: This translation was not created by The World Bank and should not be considered an official World Bank translation. The World Bank shall not be liable for any content or error in this translation.
Adaptations—If you create an adaptation of this work, please add the following disclaimer along with the attribution: This is an adaptation of an original work by The World Bank. Views and opinions expressed in the adaptation are the sole responsibility of the author or authors of the adaptation and are not endorsed by The World Bank.
Third-party content—The World Bank does not necessarily own each component of the content contained within the work. The World Bank therefore does not warrant that the use of any third-partyowned individual component or part contained in the work will not infringe on the rights of those third parties. The risk of claims resulting from such infringement rests solely with you. If you wish to re-use a component of the work, it is your responsibility to determine whether permission is needed for that re-use and to obtain permission from the copyright owner. Examples of components can include, but are not limited to, tables, figures, or images.
All queries on rights and licenses should be addressed to World Bank Publications, The World Bank, 1818 H Street, NW, Washington, DC 20433, USA; e-mail: pubrights@worldbank.org
ISBN: 978-1-4648-2047-2
DOI: 10.1596/978-1-4648-2047-2
Cover photo: Nimr Water Treatment Plant Oman © Bauer Nimr LLC. Used with the permission of Bauer Nimr LLC. Further permission required for reuse.
Cover design: Debra Naylor / Naylor Design Inc.
iii Contents Acknowledgments ix About the Authors xi Report Context xv Executive Summary xvii Glossary xxv Abbreviations xxix CHAPTER 1 Facts and Trends in Freshwater Abstraction and Produced Water Generation and Use 1 Overview 1 Introducing the issue 1 Oil and gas in a global water demand perspective 2 Water use in upstream oil and gas activities 3 Produced water 5 Other water returns 7 Injected water 7 Water use and water returns heat map for exploration and production activities 7 Note 8 References 8 CHAPTER 2 Industry Water Management Practice in Upstream Oil and Gas Operations 11 Overview 11 Company policy and water management systems 11 Industry approaches to water management 14 Water uses in upstream operations 14 Water efficiency measures 18 Produced water 18 Injected water for pressure support 19 Identification of water sources 21 Tools for water risk assessment 21 Treatment and scope for PW reuse and recycling 23 Summary of possible water uses and associated quality requirements 25 Residual waste management 26 Water efficiency reporting 27 Water management in refinery operations 27 Notes 30 References 31
CHAPTER
CHAPTER
CHAPTER 5 Legal, Regulatory, and Contractual Framework for Water Management
CHAPTER 6
Industry Practices Illustrated by Case
PETRONAS (Malaysia): business continuity in water-stressed conditions
Saudi Aramco (Kingdom of Saudi Arabia): use of TSE in cooling systems 126
Eni (Italy): Eni Rewind Blue Water technology and Its application 131
Petrobras (Brazil): internal reuse of PW 141
Ecopetrol (Colombia): reuse of PW in agroforestry and livestock activities
PDO (Oman): reedbed treatment of PW and reuse for irrigation purposes
iv | WATER M ANA GEMENT IN O IL AND G AS O PERATION S
National Level 33 Overview 33 Broader water management context 34 Hydrological processes and groundwater 34 Institutional functions and legal framework 38 ESIA process 38 Risk analysis 39 National water assessment 40 Required data, collection, and processing 41 Water resource assessment 44 Water supply risks 47 Building blocks of water management and governance 48 Concluding observations 49 References 50
3 Assessment of Water Sources and Supply Risks at the
on Water Management Options 53 Overview 53 Water treatment introduction 53 Water treatment requirements for internal use of water by oil and gas companies 55 Water treatment requirements for external use of water by oil and gas companies 62 Reducing freshwater extraction 68 Concerns with external use of PW 70 Treatment technology possibilities for external use 72 Concluding observations 78 Notes 79 References 79
4 Water Treatment Technologies and Their Possible Impact
83 Overview 83 Regulatory and contractual regime for petroleum operations 83 Legal and regulatory framework for water management 90 Freshwater and PW management in selected countries 93 IWRM 107 Lessons learned 112 Notes 113 References 114
Leading
Studies 117 Overview 117 Case studies overview 117
121
Petrobras (Brazil): water source assessment and water risk establishment
124
143
148
Saudi Aramco (Kingdom of Saudi Arabia): treatment of saline PW with broad reuse potential 152
Notes 160
References 160
CHAPTER 7 Policy Guidelines for Regulating Water Management in Petroleum Upstream Operations 163
Overview 163
National water resource management framework 163
Oil and gas sector framework 167
Well drilling: from exploration to commercial discovery 172
PfDO 173
Freshwater use and water returns in oil and gas operations 176
Produced water 179
Figures
ES.1
1.1
1.2
1.3
1.4
and key components of policy guidelines for water management xix
consumption in power generation and primary energy production 3
Contents | v
References 187 APPENDIX A Water Management in New South Wales, Australia 189 APPENDIX B Integrated Water Resources Management 197 Boxes 2.1 Key elements of IPIECA’s water management framework 12 2.2 Facts on water in hydrocarbon reservoirs 20 2.3 Eni’s approach to assessing water risk 22 2.4 Excerpts from the Carbon Disclosure Project Water Security 2022 Questionnaire 28 2.5 Khartoum Refinery in Sudan 29 3.1 Key elements of an ESIA and ESIA report 40 3.2 Minimizing the surface footprint of petroleum operations 41 3.3 Examples of programs for national hydrography 42 3.4 Regional water assessment of Lake Chad Basin 45 4.1 Preserving fresh water: the Dawson Creek reclaimed water project 69 5.1 Production-sharing agreement 86 5.2 Model for petroleum and environment authorities’ regulator y interaction 89 5.3 Key integrated water resource management principles 108 5.4 Insights from countries’ experience with integrated water management 111 6.1 Information available in the Aqueduct Water Risk Atlas 125 6.2 Petronas’s Water for Life Program 126
Key characteristics of the full-scale Blue Water Plant 138 A.1 Roles and responsibilities of key New South Wales agencies 190 A.2 Major elements of a water-sharing plan 192 A.3 Aspects specified in groundwater-sharing plans 194 B.1 Key integrated water resource management principles 198
Cross-cutting issues 183 Note 187
6.3
Structure
Global water demand by sec tor, 2014−40 3
Freshwater
Range
of water use for key upstream operations 4
Total volume
1 million operating oil and
in the United States 5
of oil, gas, and PW from the approximately
gas wells
vi | WATER M ANA GEMENT IN O IL AND G AS O PERATION S 1.5 Distribution of reuse and disposal of PW in the United States 6 1.6 Typical oil and water production profile and volume of injected water during the life of a conventional oil field 7 1.7 Heat map of water-using activities and return flows in oil and gas upstream operations 8 2.1 Typical elements of a health, safety, and environment management system 12 B2.1.1 Key elements of IPIECA’s water management framework 13 2.2 Schematic of mud and cuttings treatment and disposal 16 2.3 Schematic of produced water use in conventional oil produc tion 17 B2.2.1 How water, oil, and gas fill the pore space in reservoir rock 20 2.4 Typical water profile over the life cycle of an oil and gas field 22 3.1 Food-energy-water nexus 34 3.2 Hydrological cycle 35 3.3 Distribution of freshwater resources 36 3.4 Schematic of subsurface water system in unconfined and confined aquifers 37 3.5 Steps of the ESIA process 39 B3.2.1 Comparison of separate ver tical production wells with cluster of deviated production wells 41 3.6 Example of a river basin and groundwater model 44 B3.4.1 Illustration of Lake Chad Basin freshwater shor tage concerns and the associated environmental and social impacts 46 3.7 Multiple dimensions of water management and governance 49 4.1 Typical water source and application schematic for treating PW in upstream operations 54 4.2 Typical seawater treatment line-up 57 4.3 Typical PW treatment line-up for PW reinjection 58 4.4 Typical PW treatment line-up for chemical EOR 59 4.5 Typical PW treatment line-up for thermal EOR 59 4.6 Horizontal drilling in oil- and gas-rich shale 60 4.7 Typical produced water treatment line-up for unconventional operations 61 4.8 Removal steps for use of seawater and PW in oil and gas operations 61 4.9 Fit-for-purpose reuse evaluation process 62 4.10 Possible uses of produced water 63 4.11 Estimated resource range in wastewater from unconventional oil and gas formations in the United States 67 4.12 Distribution of Earth’s water 68 4.13 OSPAR convention’s risk-based approach for discharging produced water overboard 71 4.14 Treatment technologies for PW 73 4.15 Total cost of schemes used in produced water treatment (including membranes) 74 4.16 Example of water treatment for municipal use in Cape Verde 76 4.17 Technologies tested for PDO’s Nimr Water Treatment Plant 77 5.1 Scope of components of the petroleum regime 85 B5.1.1 Structure of a production-sharing contrac t 86 5.2 Typical government functions and institutional structure for petroleum sector management 87 5.3 Upstream oil and gas activities and associated environment and water assessments 88 6.1 WSRI subindexes and categories or risk levels 123 6.2 COC of the cooling system operating with TSE 130 6.3 Block flow diagram of the pilot plant 136 B6.3.1 Physical design of the Blue Water Plant 139 6.4 Blue Water Plant general layout (project under permitting procedure) 140 6.5 Cross-section of the reedbed at the NWTP 150 6.6 PW reuse: process schematic 153 6.7 Technology readiness levels 154
6.8 Pretreatment (de-oiling) and desalination schematic for PW reuse 155
6.9 PW desalination: membranes 156
6.10 PW desalination: membranes process scheme 156
6.11 PW desalination: high salinity (<150,000 mg/l) 157
6.12 PW desalination: mechanical vapor compression process schematic 158
6.13 PW desalination: mechanical vapor compression principle 158
6.14 PW reuse: water circularity 159
7.1 Structure and key components of policy guidelines for water management 164
7.2 Main steps in the PfDO process 173
7.3 Main steps in the ESIA process 176
7.4 Example of water-to-oil ratio toward the end of a conventional oil field’s production life 179
B.1 IWRM thematic areas and elements of regulation and compliance 199
Maps
1.1 World map of water shor tage areas, expressed as the number of months in which freshwater demand exceeds water availability 2
4.1 Distribution of drylands and main oil and gas production zones in these areas 64
4.2 Desalination capacity map 76
6.1 Geographical location of case studies 118
6.2 Locations of Petrobras’s upstream ac tivities 122
6.3 Malaysia’s oil and gas infrastructure 125
6.4 Location of Eni’s Centro Olio Val D’Agri (COVA) 132
6.5 Location of Ecopetrol’s PW for agroforestry and livestock project 144
Photos
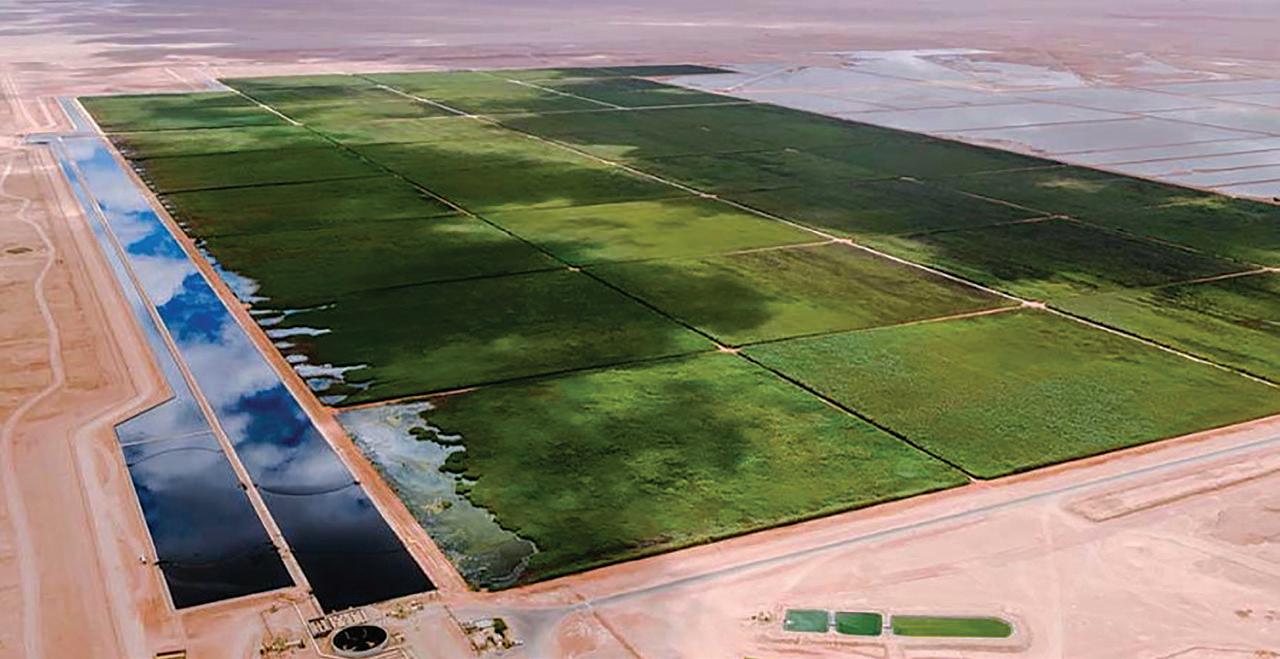
2.1 Bioremediation facility with settling lagoons and engineered wetlands (Heglig, Sudan) 24
2.2 Well pads, central processing facility, and water treatment ponds (Palouge, South Sudan) 24
B2.5.1 Wastewater ponds at the Khartoum Refinery 30
4.1 Miraah solar plant delivers first steam to Amal West Oil Field 60
B4.1.1 Dawson Creek lagoon 69
6.1 Cooling tower and pilot setup at a Saudi Aramco facility 127
6.2 Scale deposits on condenser
Contents | vii
surface with use of groundwater 128 6.3 Scale deposits on condenser surface with use of TSE 130 6.4 Some sections of the pilot plant installed and run, 2013–14 137 6.5 Structure for the assembly and installation of pumps and filters in an offshore production unit that was not initially designed for PW reinjection 142 6.6 Change in the ASA after environmental rehabilitation, planting, and irrigation 146 6.7 Aerial view of the NWTP 149 6.8 PW desalination: membranes at field site 157 6.9 PW desalination: mechanical vapor compression at field site 159 Tables 2.1 Solutions for the efficient use of water in water-stressed areas 19 2.2 Water uses and quality required for oil and gas upstream operations 25 2.3 Water quality requirement by type of beneficial uses 26 3.1 ESIA risk analysis matrix 40 3.2 Water data sources 43 4.1 Key characteristics of external water sources or produced water to consider to support the oil and gas industry 55 4.2 Injection water quality parameters 56 4.3 FAO-UN guidelines for irrigation water quality parameters 64
4.4
4.5
4.6
4.7
of successful irrigation of non–food crops with PW
viii | WATER M ANA GEMENT IN O IL AND G AS O PERATION S
Cases
65
FAO
66
water quality guidelines for livestock and poultry uses
Guidelines
drinking water 66
for upper levels of toxic substances in livestock
Cost of alternative desalination technologies 77
Pakistan’s legal, regulator y, and contractual framework 99 5.2 Uganda’s legal, regulator y, and contractual framework 101 5.3 Sudan’s legal, regulator y, and contractual framework 104 5.4 Standard limits for PW (mg/l) 105 5.5 Discharge limits for PW in HSE requirements and guidance, GDESH 2016 106
Comparison of groundwater and TSE characteristics 129 6.2 Chemical characterization of PW af ter primary treatment (BW feed) 135 B6.3.1 Main operation units and associated treatment sequence of the full-scale Blue Water Plant 138
Main features of the Blue Water Plant 139
Blue Water Plant capital expenditures 140 6.4 Comparison of water quality of treated PW and groundwater 145 6.5 NWTP project per formance 150 6.6 Operational energy requirements for wetland plant and deep disposal wells 151 6.7 PW desalination technology readiness level 154 6.8 PW quality overview with target quality 155
5.1
6.1
B6.3.2
6.3
Acknowledgments
This report was commissioned by the World Bank with funding from the Extractives Global Programmatic Support, a multidonor trust fund administered by the Energy and Extractives Global Practice of the World Bank. The report was prepared by a team of consultants from COWI A/S—Eilen Arctander Vik, Geoffrey Dyce, Johan Bernhard Siqueland Knudsen, and Sander De Kruijf—and from Bridge Consult—Einar H. Bandlien and Ole Fredrik Ekern, with the contribution and under the guidance of Silvana Tordo, lead energy economist, Energy and Extractives Global Practice, the World Bank, and François Bertone, senior groundwater specialist, Water Global Practice, the World Bank.
Special thanks go to peer reviewers Sven Renner, manager of the World Bank’s Extractives Global Programmatic Support; Pier Francesco Mantovani, lead water specialist; Marcus J. Wishart, lead water resources management specialist; Nick Dyer, environment senior manager, the International Petroleum Industry Environmental Conservation Association (IPIECA); and Mohammad Badruzzaman, environmental specialist, Saudi Aramco.
We also thank IPIECA for advancing environmental and social performance, particularly Madeleine Grey, senior manager-environment, IPIECA Secretariat, London, and Krish Ravishankar (Oxy), chair, IPIECA Water Working Group, for mobilizing their network to identify case studies for this report and authorizing the use of supporting materials prepared by IPIECA.
Case studies were provided by the following:
• Ecopetrol, Colombia, by Juan Diego Ramírez Castro, Ana Cristina Sanchez Thorin, Sandra Yamile Alvarez Aceros, Edwinder Bolaños, Andrea Guarin, Carlos Medina, and Giovanni Annichiarico.
• Eni, Italy, by Alessandro Nardella and Manlio Rossini.
• PDO, Oman, by Mahmood Al-Shaibani, Younis Al-Rawahi, and Ulrich Emmer.
• Petrobras, Brazil, by Mariana Taranto P. T. Leite, Claudio Jose Alves Furtado, and Rafael Costa Guerreiro.
ix
• PETRONAS, Malaysia, by Nurfarhana Abdul Rahim, Noor Suhailah Othman, Mohd Nizam Basiron, and Thayananthan Balakrishnan.
• Saudi Aramco, Kingdom of Saudi Arabia, by Mohammad Badruzzaman and Syed Ahmed.
Roar Solland and David Heywood from COWI A/S facilitated data gathering and preparation of the report. The editorial and production aspects of this report were managed by Christina Davis; the report was edited by Kathie Porta Baker and was proofread by Ann O’Malley.
x | WATER M ANA GEMENT IN O IL AND G AS O PERATION S
About the Authors
Eilen Arctander Vik, research manager with Aquateam COWI A/S, specializes in water treatment technology; environmental and health risk assessment; ecotoxicological assessment of chemicals and environmental impact assessment of discharges; water and sludge treatment and recovery; and technology development for industry, municipalities, and the drinking water sector. She has more than 30 years of experience in the oil and gas industry, working on prefeasibility and feasibility studies on water treatment and water resource management, environmental and resource impact assessments, produced water management and reinjection, injection water treatment and hygiene control, and technical solutions for increased oil recovery and enhanced oil recovery. Arctander Vik has a master’s degree in chemical engineering from Norwegian Technical University, Trondheim, and an MSc and PhD in environmental engineering from the University of Washington, Seattle.
Einar H. Bandlien, chairman of Bridge Consult AS, specializes in policy, regulatory, and contractual frameworks for national petroleum sector development. He has more than 40 years of international petroleum sector experience from operating oil companies, as well as petroleum service sector and consulting companies. He formerly was head of a publicly listed oil company with oil and gas exploration and production operations in Norway and the United Kingdom. Bandlien has petroleum sector management experience from about 25 countries in Africa, Asia, the Commonwealth of Independent States, and the Middle East, with a recent focus on Sub-Saharan Africa, and he has extensive experience with development cooperation programs on petroleum sector management. Bandlien has an MSc in petroleum geology from the Norwegian Institute of Technology in Trondheim.
François Bertone, senior groundwater specialist in the World Bank’s Water Global Practice, specializes in water management. With more than 30 years of experience in groundwater resource management, he has worked in more than 40 countries worldwide for private engineering consulting firms, industrial companies, drilling contractors, several United Nations agencies, and various donors. Bertone joined the World Bank in 2020 and is now leading groundwaterrelated activities in analytics, policy dialogue, and lending. His current focus is
xi
on strengthening the sustainable use of groundwater resources worldwide while supporting the emergence of the next generation of national groundwater experts. Bertone has an engineering degree from the National Superior School of Geology in Nancy, France.
Sander De Kruijf, oil and gas water production specialist with De Kruijf Energy Consultancy, specializes in upstream oil and gas production chemistry in general and in enhanced oil recovery, produced water treatment, and geothermal operations in particular. He currently is advising ZL EOR Chemicals in their Middle East operations in relation to chemical enhanced oil recovery and is also a parttime production engineer in the geothermal industry for Ennatuurlijk Aardwarmte BV in the Netherlands. He is an experienced production chemist, working for 36 years in the oil and gas industry for Shell International. De Kruijf has an MSc in chemical engineering from the University of Twente.
Geoffrey Dyce, a freelance economist, specializes in development economics. He has experience in demand forecasting, cost estimation, finance, quantitative risk modeling, tariff design, and financial and economic analysis. He has worked across a range of sectors, including water and wastewater systems, water resources, agriculture and rural development, natural resources, and energy. He has worked in various roles over 35 years on projects financed by international development banks and agencies in more than 30 countries, with contributions to more than 70 projects. Dyce has a bachelor’s degree in natural resources from the University of New England, Australia, and an MSc in agricultural economics from the University of Reading, United Kingdom.
Ole Fredrik Ekern, a managing partner with Bridge Consult AS, specializes in petroleum economics and resource management. He has more than 40 years of experience in the petroleum sector and has been engaged in all parts of the upstream petroleum value chain through positions in PGS, Saga Petroleum, and the World Bank. He has worked in more than 25 countries, with a focus on East Africa. For Bridge Consult, Ekern’s primary focus has been on development cooperation, with the goal to strengthen governments’ capacity to manage their petroleum resources. He has worked extensively on the framework and institutional models for the sector, has wide knowledge of economics and fiscal systems, and has worked actively with the governments in several countries on the development and amendment of their legal framework and contracts to strengthen their position in cooperation with the industry. Ekern has an MSc in petroleum geology from the Norwegian Institute of Technology and an MBA from the Norwegian School of Management.
Johan Bernhard Siqueland Knudsen, senior specialist for water planning and climate adaptation, COWI A/S, specializes in water resources and environmental assessments and planning, hydrogeology and water rock quality evaluations, economic and institutional studies for strengthening the management and financing of water and energy services, and monitoring and evaluating donor programs and projects. His 20 years of professional experience have evolved from the design and construction of groundwater supply and feasibility studies for hydropower dams and transmission lines to economic and institutional studies aimed at policy development for management of water and energy resources. Since 2011, he has supported the petroleum industry in Sudan and South Sudan
xii | WATER M ANA GEMENT IN O IL AND G AS O PERATION S
by assessing pollution risk and devising mitigation measures and by working on changes to regulations and capacity building for regulatory agencies to monitor and enforce an improved regime in health, safety, and the environment. Siqueland Knudsen has an MSc in groundwater engineering from the University of Newcastle Upon Tyne, United Kindgom; a master’s degree in economics from the Norwegian School of Commerce; and a PhD in hydrogeology from the University of Oslo, Norway.
Silvana Tordo, lead energy economist in the World Bank’s Energy and Extractives Global Practice, specializes in the institutional, legal, contractual, and fiscal frameworks of the petroleum sector; national oil companies; and oil and gas value chains, as well as auctions, local content policies, sovereign wealth funds, strategic investment funds, and climate finance. For the World Bank she leads the Extractives-led Local Economic Development program, an industrial policy program that promotes sustainable local value creation in mining and hydrocarbons regions. Her publications cover a wide range of topics, including value creation by national oil companies, allocation of petroleum rights, oil and gas taxation, strategic investment funds, industrial policy, and climate-smart policies. Tordo has an MBA and is a doctor in business economics from Bocconi University, Milan, Italy.
About the Authors | xiii
Report Context
WHAT THIS REPORT AIMS TO DO
This report aims to raise awareness of the challenges and opportunities associated with the use of fresh water and the reuse of water produced in oil and gas operations, with the view to support evidence-based policy making and regulation. To that end, the report proposes a list of operational and policy guidelines for the use and reuse of water in petroleum operations. It focuses on the water-hydrocarbons nexus, but most of the insights and findings are relevant to mining activities in general.
WHOM THIS REPORT ADDRESSES
This report addresses policy makers in emerging and developing economies seeking to devise policies to mitigate the impact of oil and gas operations on the environment. It also aims to help them identify what can be done to integrate climate resilience into investment and economic policies to support in-country value creation and the development of diversified sources of green growth. The report also may be useful to donor organizations, institutional investors, private foundations, and fund managers—as potential mitigation and adaptation project funders—to help them understand how finance mechanisms may be tailored to support climate-sensitive sector and industrial policies.
WHAT WATER STEWARDSHIP MEANS
Water stewardship, a key principle underpinning good practices in water management, refers to the idea of going beyond simply managing risks and impacts from water use and moving toward water use that is socially equitable, environmentally sustainable, and economically beneficial and achieved through a stakeholder-inclusive process. This report includes case studies of water stewardship applied to oil and gas operations, such as the Nimr Water Treatment Plant in Oman. The Nimr Plant provides an alternative solution to the issue of produced water management from the Nimr oil fields in the southern Oman desert.
xv
Climate change is making droughts more frequent, severe, and pervasive. In this context, water stewardship can address access to water for communities in remote areas where public utilities struggle to maintain reliable service. It can also shore up economic recovery by promoting beneficial reuse options that protect and support labor-intensive activities such as agriculture.
xvi | WATER M ANA GEMENT IN O IL AND G AS O PERATION S
Executive Summary
BACKGROUND
Steadily increasing demand makes freshwater scarcity a threat to sustainable development, and an increasing number of regions are chronically short of water. Putting caps on water consumption, increasing water use efficiencies, and better sharing of limited freshwater resources will be critical to reducing the threat to biodiversity and human welfare posed by water scarcity. Particularly in remote, underdeveloped, and water-stressed areas, sound water management can contribute to addressing social tension.
Freshwater demand in oil and gas operations is a small fraction of global water demand, but oil and gas fields are commonly clustered in smaller areas where their operations often dominate water abstraction and wastewater discharge. At the same time, oil production generates large amounts of produced water (PW), which may be reused in oil and gas operations and, possibly, serve beneficial purposes outside the petroleum sector.
Oil and gas production is very much about water, and the critical need for efficient water management is a shared concern among oil companies, authorities, and stakeholders. Oil and gas upstream operations requiring freshwater abstraction also generate wastewater returns. The most important operations in terms of water volumes are as follows:
• Conventional oil production using freshwater injection to maintain production rates and generating PW, which toward the end of production totally dominates the produced liquids. Over the life of an oil field, three barrels of PW are typically generated for each barrel of oil produced.
• Gas production, in which fresh water is used for gas processing to strip impurities from the gas. This process is called gas scrubbing, and used scrubbing water is a waste that must be treated.
• Tight oil and gas production, in which hydraulic fracturing has made it possible to economically extract oil and gas from tight formations. The freshwater volumes required for hydraulic fracturing are substantial, and flowback water mixed with produced formation water represents a significant waste issue.
These qualitative statements reflect the fact that water use and water production vary over the life of an oil or gas field, and reliable statistics are unavailable
xvii
for most countries. Although this issue would appear to make it difficult to design policies and regulations, a better understanding of the possible water volumes involved and of the realistic scope for regulatory interventions is a good place to start. In particular,
• Depending on oil field size, water use in a conventional field could reach 50,000 cubic meters per day during secondary production, and water production could peak at similar levels;
• Water use in gas field processing could be in the range of 9,000 to more than 50,000 cubic meters per day; and
• Water volumes required for hydraulic fracturing could be from 4,000 to 60,000 cubic meters per well.
Significant scope exists for reduced freshwater abstraction through different water efficiency measures. Examples include lowering freshwater use in different activities; replacing fresh water with alternative water sources, such as nonfresh groundwater or wastewater from municipalities; and treating return water to be reused for the same or alternative purposes.
PW represents the largest volume of water returns and, therefore, is of particular interest. Production operations in the United States generated close to 4 billion cubic meters of PW in 2017. About 44 percent was reused for injection to maintain and increase production, but nearly half was injected for disposal in deep underground formations, never to be used again. Technical, economic, and regulatory obstacles hold back better PW reuse, but efforts are being made to find viable solutions for reuse both within and outside oil and gas operations.
PW may have a salinity level 5–10 times that of seawater and contains potentially harmful and difficult-to-treat organic constituents and naturally occurring radioactive materials—all of which make both treating the water and handling the residuals a challenge. Salinity is a key consideration in selecting water treatment equipment because high salinity levels can negatively affect the efficiency of a technology and influence costs. For instance, high salinity levels limit the use of conventional membrane processes and increase solid waste management. Along with the need to remove salinity for equipment efficiency, most reuse applications require salinity removal.
The treatment of wastewater and PW depends on the intended use. Capital and operational costs for treatment facilities usually are not disclosed, but a rare study in 2012 estimated the total cost of separation, treatment, and disposal of water in the oil industry worldwide to be about US$50 billion per year.
Leading oil companies strive to reduce and, ideally, eliminate freshwater intake by increasing PW recycling and using municipal water when appropriate. The realism of this approach depends on the capability to treat nonfresh and wastewater to the required specification for water injection, hydraulic fracturing, or other purposes. Each water source may contain different compounds, which must be altered according to water quality requirements. Nonetheless, the possibility of replacing fresh water with alternative water sources means that, although oil and gas operations are water intensive, they are not necessarily freshwater intensive.
Historically, the costs of water treatment have been increasing with the need to remove dissolved salts. A combination of cheaper renewable energy (for example, solar energy, battery storage, and heat pumps), improved desalination technologies, and cost-efficient automation have the potential to bring about important cost reductions.
xviii | WATER M ANA GEMENT IN O IL AND G AS O PERATION S
Although petroleum production is very much about water, the legal, regulatory, and contractual framework for oil and gas appears to be a world apart from the broader water management framework at the national or regional level. Most countries’ water management framework focuses on the main water users, which are dominated by agricultural users, followed by municipal and small-scale industrial users. These frameworks were often established before the start of the petroleum sector.
Good governance of the water sector is not achieved through the legal and regulatory framework alone. The framework must be implemented, monitored, and enforced by competent government institutions. Water is a national resource commonly under the responsibility of a ministry of the environment, whereas the ministry responsible for petroleum will have sector responsibility. A dispersed and overlapping responsibility is challenging, and oil-producing countries often resort to the one-stop-shop model in which the petroleum regulator is the government point of contact for all matters related to oil and gas operations.
POLICY GUIDELINES
Optimal policy for and regulation of the use and reuse of water generated by oil and gas operations depends on a range of geographic, geological, technical, and economic factors. As such, no blueprint solution exists for all countries and all circumstances. Nonetheless, based on the research carried out for this report, common policy principles, organized around key regulatory functions and critical links in the oil and gas value chain (refer to figure ES.1), are proposed to guide policy makers and regulators seeking to minimize the environmental impact of oil and gas operations and to promote sustainable cross-sectoral economic linkages.
Executive Summary | xix
and key components of policy guidelines for water management Source: This figure is original to this publication. Note: PfDO = Plan for Development and Operation; PSA = petroleum-sharing agreement. Water resource management framework
Water policy and legislation
Water resource and risk assessment
Abstraction and discharge regulations
Water institutions
Water allocation Oil and gas sector framework • Legislation • Regulations • Model agreement • Oil and gas regulatory institutions
Strategic environmental assessment License agreement (PSA or other)
Licensing terms and conditions Plan for development and operation
Feasibility study
Concept evaluations
Environmental and social impact assessment
Environmental and social management plan Well drilling Drill fluid water Injection water Produced water Mud waste Wastewater Wastewater Scrubbing water Blue = Water in Red = Water out Field processing Refining Field processing Field processing Gas production Secondary oil production Primary oil production Pressure injection water Tight oil and gas production Wastewater Wastewater Flowback water Process and cooling water Well drilling Well drilling Government framework Oil and gas production and processing Exploration PfDO
FIGURE
ES.1 Structure
•
•
•
•
•
•
•
•
•
•
•
The research described in this book has generated the following insights:
• Evidence-based documentation of water resources and supply risk are the essential basis for sustainable water resource management and for formulating regulations about water-using activities in all sectors.
• In planning alternative resource development solutions, oil companies rely on water resource data available from the national authorities. The host government should ensure that the water resource assessment is completed as a preparatory activity to inform the decision to open areas for petroleum activities.
• Water abstraction policy and regulations must be based on the sustainable resources of rivers and aquifers and use a holistic approach in which demands from several users are recognized and balanced.
• The coordinated efforts of competent institutions are key to good governance and efficient water resource management.
• Surface and groundwater resources are linked to drainage basins and aquifers that typically cross administrative and national boundaries. The management of such joint resources requires regional and cross-border cooperation.
• Water resource management usually implies overlapping responsibilities among several government entities. A commonly used model to achieve regulatory efficiency is for the petroleum sector regulator to function as a one-stop shop in which the regulator is the key point of contact between oil companies and various government entities. As such, the regulator handles regulatory issues on behalf of and in close coordination with the relevant regulatory authorities, including those responsible for environment, safety, and water management.
• Complex regulatory frameworks could hinder water management when implementation capacity is scarce. Regulatory ambitions should be balanced against institutional capacity, and a long-term plan should be made for institutional development. However, to the extent possible, regulation should reflect good industry practice so that international oil companies are held to the same water management standards that they apply across jurisdictions.
• A water management framework specific to oil and gas operations is required. National water management frameworks are often inadequate to deal with the challenges of petroleum exploration and production, and petroleum sector management frameworks usually do not cover water management.
• The authorities should assess each industry separately and ensure that environmental regulations include limitations for pollutant parameters specific to the upstream petroleum sector.
• Wastewater results from all industrial activities, but the effluents from different sectors will have different compositions and challenges. Detailed regulation is required for the treatment and safe disposal of drilling waste, and special regulations should apply to oil-based and synthetic muds.
• Permanent disposal of residual mud and cuttings at drill sites should be prohibited.
• The government must exercise appropriate influence and optimize national interests at key phases of and milestones in petroleum activities.
• Regulatory provisions and incentives should be undertaken to make oil companies implement strategies to reduce current freshwater withdrawals.
xx | WATER M ANA GEMENT IN O IL AND G AS O PERATION S
• A significant potential exists for the increased reuse of PW in oil operations, primarily in replacing fresh water for injection. Regulatory restrictions on disposal of PW will promote increased reuse in oil and gas operations. Government may define specific rules and threshold values or refer to a recognized international standard.
• Only companies with the required competence and resources should be allowed as participants in petroleum sector activities.
• To ensure fulfilment of national policies and regulatory requirements, government institutions should develop or procure competence and capacity to interact with the operating companies in the key steps of assessment and planning for development and operation.
• The Environmental and Social Impact Assessment (ESIA), prepared by oil companies as part of the documentation required for permitting of exploration and development activities, is particularly important for water management and requires active contribution and participation by national regulators and stakeholders.
• Planning of ESIA stakeholder engagement should begin in the scoping phase, and a stakeholders’ engagement plan should be an integral part of the ESIA terms of reference.
• The key to reducing freshwater abstraction is to use alternative water sources for injection purposes.
• Conventional oil production is by far the largest consumer of fresh water because water injection is required to maintain reservoir pressure and production. Injection volumes increase during production and may exceed the volume of produced liquids toward the end of field life. Volume restrictions on water abstraction can bring about this change.
• Regulatory requirements for treatment and reuse of scrubbing water can significantly reduce water consumption in gas processing.
• Where there are clearly untapped unconventional resources, a dedicated policy, legal, and regulatory framework should be established for tight oil and gas. The current framework for conventional oil and gas production is not sufficient.
• The reuse of PW outside oil and gas operations is still in the research and pilot phases, and in the materials reviewed in this report, no good examples of larger-scale and commercial applications were found.
• Successful pilot studies of the use of PW for irrigation of non-food crops and for livestock drinking water are encouraging and give reason to pursue the increased use of PW in these areas.
• Although a longer-term goal, policies and regulatory frameworks in support of external reuse of PW are necessary for these efforts to succeed.
• In addition to regulatory facilitation, the external use of PW requires private-public partnership structures and innovative financing mechanisms tailored to a specific site, basin, and environment. Additional research is needed in this area.
• Water efficiency reporting requirements in many host countries clearly fall short of the reporting formats adhered to by leading oil companies.
• Reporting requirements should be updated as part of the regulatory and contractual terms.
• Pressures on water resources and ecosystems will continue to increase because of climate change, population growth, urbanization, and demand for energy and food security, leading to increased competition among water users.
Executive Summary | xxi
• Petroleum projects typically have durations of 25 years or more and will experience the impact of climate change and increased pressure on water resources.
• Regulatory action is urgently needed in the face of climate change and increased water demand. This work should include development scenarios for the life of the project and obligatory contingency plans for water management.
ORGANIZATION OF THIS PUBLICATION
This report is organized into seven chapters:
1. “Facts and Trends in Freshwater Abstraction and Produced Water Generation and Use” contains an overview and heat map of water generation and use in upstream oil and gas activities.
2. “Industry Water Management Practice in Upstream Oil and Gas Operations” reviews the water management practices of a sample of leading oil companies, based on desk reviews and interaction with the International Petroleum Industry Environmental Conservation Association and some of its member companies.
3. “Assessment of Water Sources and Supply Risks at the National Level” discusses national water management tasks, responsibilities, and regulations that apply to all sectors.
4. “Water Treatment Technologies and Their Possible Impact on Water Management Options” outlines current and new technologies for the treatment of wastewater and PW for reuse both inside and outside oil and gas operations.
5. “Legal, Regulatory, and Contractual Framework for Water Management” reviews water management frameworks in a sample of developed and emerging economies and proposes regulatory tools such as integrated water resource management (IWRM) and various incentives and penalties.
6. “Leading Industry Practices Illustrated by Case Studies” illustrates cuttingedge approaches and pilot programs conducted by leading oil companies:
Ecopetrol, Colombia
Eni, Italy
Petrobras, Brazil
Petrobras, Brazil
Petroleum Development Oman, Oman
Reuse of PW in Agroforestry and Livestock Activities
Eni Rewind Blue Water Technology and Its Application
Internal Reuse of PW
Water Source Assessment and Water Risk Establishment
Reedbed Treatment of PW and Reuse for Irrigation Purposes
PETRONAS, Malaysia Business Continuity in Water-Stressed Conditions
Saudi Aramco, Kingdom of Saudi Arabia
Saudi Aramco, Kingdom of Saudi Arabia
Treatment of Saline PW with Broad Reuse Potential
Use of TSE in Cooling Systems
xxii | WATER M ANA GEMENT IN O IL AND G AS O PERATION S
7. “Policy Guidelines for Regulating Water Management in Petroleum Upstream Operations” proposes guidelines for the main blocks of water management regulation organized around the oil and gas value chain.
In addition, Appendix A contains a description of the water management framework in New South Wales, Australia, which aims to ensure that the sharing of surface and groundwater resources is equitable and that water entitlements and allocations are secure and tradeable. Appendix B contains a description of the IWRM principles—a process that promotes the coordinated development and management of water, land, and related resources to maximize the impact on economic and social welfare equitably without compromising the sustainability of vital ecosystems.
Executive Summary | xxiii
Glossary
aquifer Rock or sediment in a formation, group of formations, or part of a formation that is saturated and sufficiently permeable to transmit economic quantities of water to wells and springs.
aquitard
conventional oil and gas resources
A low-permeability unit that can store groundwater and transmit it slowly from or to an aquifer. An aquitard may be permeable enough to transmit water in significant quantities as part of regional groundwater flow, but permeability is not sufficient to allow for the completion of production wells.
Concentrations of oil or gas occurring in discrete accumulations or pools. Rock formations hosting these pools traditionally have high porosity and permeability and are found below impermeable rock formations. These impervious layers form barriers to hydrocarbon migration, resulting in oil and gas being trapped below them. Conventional oil and gas pools are developed using vertical wellbores and using minimal stimulation.
cuttings
Small pieces of rock that break away because of the action of the bit teeth. Cuttings are screened out of the liquid mud system at the shale shakers and are monitored for composition, size, shape, color, texture, hydrocarbon content, and other properties by the mud engineer, the mud logger, and other onsite personnel. The mud logger usually captures samples of cuttings for subsequent analysis and archiving.
decommissioning Describes the final stage of an energy project. In oil and gas, when a field production cycle comes to an end and all the usable fuel has been processed, the facilities must be dismantled, and the surrounding area must be returned to its natural condition.
xxv
effluent
enhanced oil recovery
exploration
An outflow of water or gas to a natural body of water from a structure such as a sewage treatment plant, sewer pipe, industrial wastewater treatment plant, or industrial outfall.
An oil recovery enhancement method using sophisticated techniques that alter the original properties of oil. Once ranked as a third stage of oil recovery to be carried out after secondary recovery, the techniques used during enhanced oil recovery can be initiated at any time during the productive life of an oil reservoir. Its purpose is not only to restore formation pressure but also to improve oil displacement or fluid flow in the reservoir.
The initial phase in petroleum operations that includes generation of a prospect, play, or both and drilling of an exploration well. Appraisal, development, and production phases follow successful exploration.
fresh water
hydraulic fracturing
management system
Water that contains less than 1,000 milligrams per liter (mg/L) of total dissolved solids (TDS). Generally, drinking water has less than 500 mg/L of TDS. More than 1,200 mg/L is unacceptable for drinking.
A well stimulation technique involving the fracturing of bedrock formations by a pressurized liquid. This process involves the high-pressure injection of fracturing fluid (primarily water containing sand or other proppants suspended with the aid of thickening agents) into a wellbore to create cracks in the deep rock formations through which natural gas, petroleum, and brine will flow more freely.
How an organization manages the interrelated parts of its business to achieve its objectives. For example, these objectives can relate to topics such as product or service quality, operational efficiency, environmental performance, and health and safety in the workplace.
mud A term that is generally synonymous with drilling fluid and that encompasses most fluids used in hydrocarbon drilling operations, especially fluids containing significant amounts of suspended solids, emulsified water, or oil. Mud includes all types of water-based, oil-based, and synthetic-based drilling fluids.
potentiometric surface
productionsharing agreement
The level to which water will rise in tightly cased wells. For example, the water table is a potentiometric surface for an unconfined aquifer.
An agreement between one or more investors and the government in which rights to exploration and extraction of mineral resources from a specific area over a specified period of time are determined.
xxvi | WATER M ANA GEMENT IN O IL AND G AS O PERATION S
recycling Bringing water back into use through treatment to improve water quality.
reuse Use of water for the same or alternative process with or without minimal treatment.
scrubbing
shale gas
tight oil
Removing impurities, water, liquid hydrocarbons, or traces of other gases by passing the gas flowstream through a scrubber, a device in which the gas is mixed with a suitable liquid that absorbs or washes out the constituent to be removed.
Natural gas found in shale deposits, where it is trapped in microscopic or submicroscopic pores. This natural gas is a mixture of naturally occurring hydrocarbon gases produced from the decomposition of organic matter (plant and animal remains). Typically, shale gas consists of 70–90 percent methane.
Crude oil contained in petroleum-bearing formations of low permeability, often shale or tight sandstone. Economic production from tight oil formations requires the same hydraulic fracturing and often uses the same horizontal well technology used in the production of shale gas.
Glossary | xxvii
Abbreviations
AC air conditioning
AOP advanced oxidation processes
API American Petroleum Institute
ASA agroenergy sustainability area
ATSDR Agency for Toxic Substances and Disease Registry (US)
bcm billion cubic meters
BEIS Department for Business, Energy & Industrial Strategy (UK)
BOD biochemical oxygen demand
BOE barrel of oil equivalent
BTEX benzene, toluene, ethylbenzene, and xylene
BWPD barrels of water per day
BWRO brackish water reverse osmosis
CAPEX capital expenditures
CBM coalbed methane
CDP Carbon Disclosure Project
CNOOC China National Offshore Oil Corporation
COC cycle of concentration
COD chemical oxygen demand
COVA Centro Olio Val d’Agri (Italy)
CPF central processing facility
CRL cost recovery limit
CSM Colorado School of Mines (US)
DAF dissolved air flotation
DEG German Development Finance Institution
DGF dissolved gas flotation
DPIE Department of Planning, Industry and Environment (Australia)
EC electrical conductivity
ED electrodialysis
EDI electrodeionization
EIA Environmental Impact Assessment/US Energy Information Administration
EIF environmental impact factor
EOR enhanced oil recovery
EPA Environment Protection Agency (US)
xxix
ESIA Environmental and Social Impact Assessment
ESMP Environmental and Social Management Plan
EU European Union
FAO Food and Agriculture Organization (UN)
FO forward osmosis
GAC granular activated carbon
GDESH General Directorate for Environment, Safety and Health (Sudan)
GEMI Global Environmental Management Initiative
GIS Geographical Information System
GOSP gas-oil separation plant
GRI Global Reporting Initiative
GWP Global Water Partnership
GWPC Ground Water Protection Council (US)
HC hydrocarbon
HF hydraulic fracturing
HSE health, safety, and environment
H2S hydrogen sulfide
IA impact assessment
IEA International Energy Agency
IOGP International Association of Oil and Gas Producers
IPCC Intergovernmental Panel on Climate Change
IPIECA International Petroleum Industry Environmental Conservation Association
IUCN International Union for Conservation of Nature
IWA International Water Association
IWRM integrated water resource management
KOC Kuwait Oil Company
LSI Langelier Saturation Index
M&E monitoring and evaluation
MBR membrane biological reactor
MD membrane distillation
MDB Murray-Darling Basin (Australia)
MED multieffect distillation
MF microfiltration
MVC mechanical vapor compression
MVR mechanical vapor recompression
NAHRIM National Water Research Institute of Malaysia
NASA National Aeronautics and Space Administration (US)
NF nanofiltration
NORM naturally occurring radioactive material
NPDES National Pollutant Discharge Elimination System (US)
NRAR Natural Resources Access Regulator
NSW New South Wales (federal state in Australia)
NWTP Nimr Water Treatment Plant
OECD Organisation for Economic Co-operation and Development
OiW oil in water
OPEX operating expenditures
OSPAR Oslo and Paris Convention
PA petroleum agreement
PDO Petroleum Development Oman
xxx | WATER M ANA GEMENT IN O IL AND G AS O PERATION S
PES payments for environmental services
PfDO plan for development and operation
P/PET aridity index (the ratio of average annual precipitation, P, and the potential evapotranspiration, PET)
ppm parts per million
PSA production-sharing agreement
PSC production-sharing contract
PW produced water
RBMP River Basin Management Plan
RCRA Resource Conservation and Recovery Act (US)
RO reverse osmosis
SAGR Submerged Attached Growth Reactor
SASB Sustainability Accounting Standard Board
SEA Strategic Environmental Assessment
SESA Strategic Environmental and Social Assessment
SPE Society of Petroleum Engineers
SWRO seawater reverse osmosis
TDS total dissolved solids
TOC total organic carbon
TRL technology readiness level
TRMM Tropical Rainfall Measuring Mission
TSE treated sewage effluent
TSS total suspended solids
TXPWC Texas Produced Water Consortium
UIC Underground Injection Control (US)
UF ultrafiltration
UN United Nations
UNCCD United Nations Convention to Combat Desertification
UNEP UN Environment Programme
UN-Water United Nations Task Force on Water Security
USGS US Geological Survey
UV ultraviolet (light)
VSEP vibratory shear enhanced processing
WFD Water Framework Directive (EU)
WHO World Health Organization
WMO World Meteorological Organization
WOSEP water-oil separator
WRAP water reform action plan
WRI World Resources Institute
WSP water-sharing plan
WSRI Water Scarcity Risk Index
WWAP World Water Assessment Programme
WWF World Wildlife Fund
ZLD zero liquid discharge
Abbreviations | xxxi
1
Facts and Trends in Freshwater Abstraction and Produced Water Generation and Use
OVERVIEW
Oil and gas production operations require large amounts of fresh water and generate similar volumes of wastewater and water that is produced together with the hydrocarbons. This chapter discusses the water volumes associated with exploration and production activities and the trend toward more efficient water management.
INTRODUCING THE ISSUE
Steadily increasing demand makes freshwater scarcity a threat to sustainable development, and an increasing number of regions are chronically short of water. Map 1.1 shows a world map of water shortage areas. The main driving forces for the rising global demand for water are the increasing world population, improving living standards, changing consumption patterns, and expanding irrigated agriculture.
Putting caps on water consumption by river basin, increasing water use efficiencies, and better sharing of the limited freshwater resources will be key to reducing the threat to biodiversity and human welfare posed by water scarcity.
Some major oil- and gas-producing areas are in water-stressed regions. The Kingdom of Saudi Arabia and Oman are examples that, among others, will be discussed in this report.
Oil and gas exploration and production, commonly referred to as upstream operations, use large volumes of water for injection during conventional oil production and for hydraulic fracturing in tight reservoirs. These same operations generate large volumes of wastewater, of which produced formation water and flowback water predominate.
The most effective way of reducing freshwater abstraction is to treat and reuse the water returns. The oil and gas industry has developed technologies and procedures for recycling wastewater for use in their operations, but there is still
1
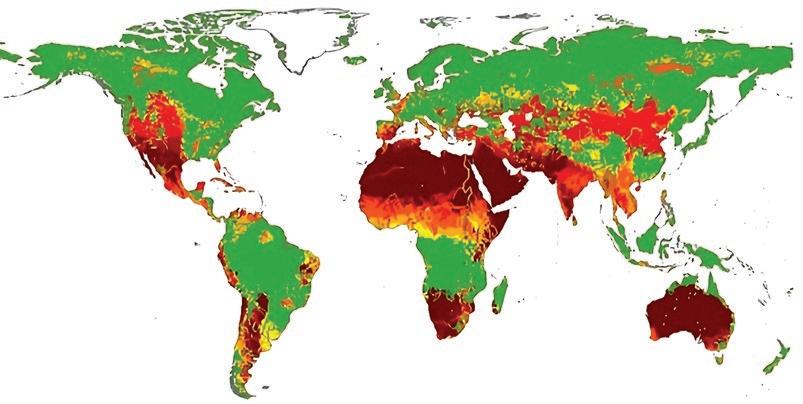
Number of months per year in which water scarcity is >100 percent
a way to go; in the United States, some 48 percent of produced water (PW) is injected for disposal deep underground, never to be used again.
This report reviews mechanisms and options for increased beneficial use of PW. Leading oil companies are pursuing responsible policies and practices to this end, but effective progress also depends on national policies and regulatory frameworks, which should both specify and facilitate the desired change.
OIL AND GAS IN A GLOBAL WATER DEMAND PERSPECTIVE
In global freshwater consumption, the agriculture sector dominates, followed by industry and municipal use. Water consumption in primary energy production is, by comparison, very small (refer to figure 1.1).
Water withdrawn is the total volume removed from a water source, such as a lake or river, a portion of which is often returned to the source and is available to be used again. Water consumed is the amount of water removed for use and not returned to its source. The energy sector, which includes power generation and primary energy production, makes up around 10 percent of total worldwide water withdrawals and around 3 percent of total water consumption. As shown in figure 1.2, water consumption in oil and gas activities makes up around 16 percent of total consumption in the energy sector. Apart from oil and natural gas, primary energy production includes coal and irrigated crops grown as feedstock for biofuels.
2 | WATER M ANA GEMENT IN O IL AND G AS O PERATION S
MAP 1.1
World map of water shortage areas, expressed as the number of months in which freshwater demand exceeds water availability
0 1 2–3 4–5 6–7 8–9 10–11 12 No data
Source: Mekonnen and Hoekstra 2016.
Biofuels, 25%
Power fossil fuels, 28%
Power renewables, 1%
Power nuclear, 8%
Oil and gas, 16%
WATER USE IN UPSTREAM OIL AND GAS ACTIVITIES
Although freshwater use in upstream oil and gas activities makes up a small fraction of global water use, the oil and gas industry can be a significant user of fresh water on a local or regional scale. Upstream operations also involve the handling and management of large volumes of PW and wastewater.
Facts and Trends in Freshwater Abstraction and Produced Water Generation and Use | 3
1.1
FIGURE
Source: IEA 2016. Note: bcm = billion cubic meters. 5,000 4,000 3,000 2,000 1,000 2014 2025 2040 0 2,500 2,000 1,500 1,000 500 2014 bcm b. Consumption a. Withdrawal bcm 2025 Year Year 2040 0 Primary energy production Power generation Industry Municipal Agriculture
1.2
Global water demand by sector, 2014−40
FIGURE
Freshwater consumption in power generation and primary energy production
Source: This figure is original to this publication, based on data from IEA 2016.
Coal, 22%
FIGURE 1.3
Water needs for conventional oil production vary considerably over the life of a field. After the initial primary production phase, water injection may be necessary to maintain reservoir pressure and improve oil recovery. The volume of water required during secondary production and enhanced oil recovery is significant. The amount of water needed for extraction of conventional natural gas is minor compared with that for other fossil fuels, but large volumes of water are used for gas processing, in which water-based chemical solutions are used to strip impurities from the gas. Unconventional oil and gas production that requires hydraulic fracturing, such as tight oil and shale gas, is very water intensive.
It is important to note that oil and gas operations do not always require high-quality fresh water. Brackish water and treated seawater that has been filtered and treated to control corrosion and biofouling can also be used as an alternative to fresh water. Fresh water should only be used when no other water supplies are available and alternative water sources are too expensive and detrimental to the environment because of the energy intensity of treating and pumping the water over long distances. A water optimization study should always be part of the Environmental Impact Assessment carried out by the operator as part of the documentation required to apply for a construction permit for any oil and gas upstream project.
Figure 1.3 illustrates the typical range of water use for oil and gas upstream activities.1 The water use varies dramatically with the characteristic of the reservoir and over the life of a producing field. Exploration drilling and field development are marginal in this context, but production operations will consume large amounts of water, particularly toward the end of production.
Exploration drilling
Construction or commissioning
Process and operations
Gas production
Primary oil production
Secondary oil production
Enhanced oil recovery
Source: This figure is original to this publication, based on data from IPIECA 2014.
4 | WATER M ANA GEMENT IN O IL AND G AS O PERATION S
Range of water use for key upstream operations
Water use in m3 per day Type
operation
of
010,000 20,00030,00040,00050,00060,000 70,000 010,000 Tight oil or gas production 20,00030,00040,00050,00060,000 70,000 High Low Water use in m3 per well High Low
PRODUCED WATER
Produced water is water trapped in underground formations that is brought to the surface during oil and gas production. PW is highly saline and may contain a mix of mineral salts, oil and grease, suspended solids, dispersed oil, and other contaminants. PW associated with oil production is by far the largest volume of wastewater to be managed in upstream oil and gas operations.
Statistics on PW volume and how it is managed are often unavailable. A recent publication (Veil 2020) estimates the total volume of PW in the United States to be 3.9 billion cubic meters, based on data from the approximately 1 million operating oil and gas wells (refer to figure 1.4). Over a 10-year period (2007–17), US PW volumes increased by 16.2 percent, and total hydrocarbon production increased at a faster pace. The resulting water-to-barrel of oil equivalent ratio declined from 3.4 to 2.5 over the same period, reflecting the overall trend of less water being generated per unit of hydrocarbon. Nevertheless, the volumes of PW remain considerable. Over the life of a field, three barrels of water will typically be generated for each barrel of oil produced.
In the United States, nearly all PW is managed in one of the following ways:
• Reservoir injection to maintain or increase production (44.0 percent);
• Injection to a non-hydrocarbon-bearing formation for disposal (38.0 percent);
• Disposal, mainly injection, by commercial operators other than oil companies (10.0 percent);
• Discharge to surface water bodies (5.0 percent);
• Evaporation (<1.0 percent);
• Reuse for oil and gas operations, such as drilling fluids and fracturing fluids (1.7 percent); and
• Beneficial reuse outside oil and gas operations (1.3 percent).
Facts and Trends in Freshwater Abstraction and Produced Water Generation and Use | 5
FIGURE 1.4
Total volume of oil, gas, and PW from the approximately 1 million operating oil and gas wells in the United States
Oil 0 1 2 Billion m 3 3 4 Gas PW
Source: This figure is original to this publication, based on data from Veil 2020. Note: For illustration purposes, natural gas volumes are expressed in an energy-equivalent basis: 1 Mmcf of gas has the same magajoule value as 181.59 barrels of oil; 1 barrel of oil = 0.159m3 of gas. Mmcf = million cubic feet. PW = produced water.
Discharge means sending the water back to surface water bodies or into aquifers and incidentally replenishing the natural water resource. Disposal means water discarded and injected deep underground for no further use. The distribution of reuse and disposal of PW is illustrated in figure 1.5.
It is worth noting that the amount of PW beneficially reused outside of oil and gas operations is very small (1.3 percent). Efforts are, however, being made to test further reuse options, as published by the US Ground Water Protection Council (GWPC 2019). Realistic options depend on local factors, such as the following:
• Availability of PW with lower-than-average salinity;
• Limited, costly, or nonexistent disposal options;
• Defined need for additional water;
• Reasonable costs to transport and treat PW relative to the cost of other options for water sourcing or disposal; and
• Appropriate permitting schemes and associated regulatory requirements that can be met within the boundaries of acceptable costs.
Although these opportunities and constraints are typical for oil and gas projects in the United States, they are relevant in identifying issues generally associated with the beneficial use of PW outside of oil and gas operations.
Distribution of reuse and disposal of PW in the United States
6 | WATER M ANA GEMENT IN O IL AND G AS O PERATION S
FIGURE 1.5
Injection to increase production, 44% Injection for disposal, 38% Commercial disposal (mainly injection), 10% Evaporation Discharge to surface water bodies, 5% Reuse and discharge Disposal Internal and external use, 3%
Source: This figure is original to this publication, based on data from Veil 2020.
OTHER WATER RETURNS
Although PW is the largest water return in volume, other water returns are also significant, such as used scrubbing water from natural gas processing, used drilling fluids, pipeline hydrotest water, and flowback from hydraulic fracturing. These returns are fresh but contaminated waters with a combined volume similar to that of the original freshwater abstractions, depending on the level of water reuse.
INJECTED WATER
As normal formation pressure drops because of production, injection of external fluids to maintain that pressure is required. Water, including steam, is the most common medium, and injection increases significantly toward the end of the production period. Figure 1.6 shows a typical production and injection profile for a conventional oil field. The figure clearly illustrates that oil production is very much about water. Good water management is key to efficient oil production.
WATER USE AND WATER RETURNS HEAT MAP FOR EXPLORATION AND PRODUCTION ACTIVITIES
Figure 1.7 summarizes the key water-using activities and the associated return water flows in upstream operations. Water management challenges for different activities are illustrated by heat map colors from green (negligible challenge) through yellow (moderate challenge) and orange (significant challenge) to red (very significant challenge). Although colors for water-using activities simply reflect the water volumes required, colors for water returns
FIGURE 1.6
Facts and Trends in Freshwater Abstraction and Produced Water Generation and Use | 7
90,000 80,000 70,000 60,000 50,000 40,000 30,000 20,000 10,000 510 Oil field operating time (year) Production and injection volumes m 3 per day 15 20 0 0 Produced water Oil Injectedwater
Typical oil and water production profile and volume of injected water during the life of a conventional oil field
Source:
This figure is original to this publication, based on Igunnu and Chen 2014.
Totalliquidproduction
FIGURE 1.7
Water-using activity Heat Heat
Personnel
Exploration and drilling
Construction commissioning
Process and operations
Conventional gas production
Conventional oil primary production
Conventional oil secondary production
Enhanced oil recovery production
Shale or tight oil and gas production
Coal bed methane production
Negligible challenge
Significant challenge
Source: This figure is original to this publication.
Water returns
Black water, gray water
Drilling fluid pits
Wash water, hydrotest water
Drainage condenser
Scrubbing water
Produced water
Produced water
Produced water
Flowback water, produced water
Flowback water, produced water
Moderate challenge
Very significant challenge
reflect both volume and contaminants that make disposal or reuse difficult. Conditions vary between producing fields, and the water uses and water returns vary over the life of an exploration and production operation. Figure 1.7 is a qualitative representation of water management challenges associated with upstream activities to help to quickly identify areas deserving particular attention.
NOTE
1. Indicated volumes for conventional oil and gas production activities are for (middle-range) fields that have many wells. Water for oil fields is primarily for injection, and water for gas fields is primarily for processing (scrubbing). The range for tight oil and gas production is for hydraulic fracturing per well, and a field will have many wells.
REFERENCES
GWPC (Ground Water Protection Council). 2019. Produced Water Report: Regulations, Current Practices, and Research Needs. Oklahoma City, OK: GWPC. https://www.gwpc.org/wp -content/uploads/2019/06/Produced_Water_Full_Report___Digital_Use.pdf
IEA (International Energy Agency). 2016. Water Energy Nexus. Paris: IEA. https://iea.blob.core. windows.net/assets/e4a7e1a5-b6ed-4f36-911f-b0111e49aab9/WorldEnergy Outlook2016ExcerptWaterEnergyNexus.pdf
Igunnu, Ebenezer T., and George Z. Chen. 2014. “Produced Water Treatment Technologies.” International Journal of Low-Carbon Technologies 9 (3): 157–77. https://doi.org/10.1093/ijlct /cts049.
8 | WATER M ANA GEMENT IN O IL AND G AS O PERATION S
Heat map of water-using activities and return flows in oil and gas upstream operations
IPIECA (International Petroleum Industry Environmental Conservation Association). 2014. Efficiency in Water Use: Guidance Document for the Upstream Onshore Oil and Gas Industry London: IPIECA. https://www.ipieca.org/resources/good-practice/efficiency -in-water-use-guidance-document-for-the-upstream-onshore-oil-and-gas-industry/ Mekonnen, Mesfin M., and Arjen Y. Hoekstra. 2016. “Four Billion People Facing Severe Water Scarcity.” Science Advances 2 (2): e1500323. https://doi.org/10.1126/sciadv.1500323. Veil, John. 2020. U.S. Produced Water Volumes and Management Practices in 2017 . Oklahoma City, OK: Ground Water Research and Education Foundation. https://www.gwpc.org /wp-content/uploads/2020/02/pw_report_2017___final.pdf
Facts and Trends in Freshwater Abstraction and Produced Water Generation and Use | 9
2
Industry Water Management Practice in Upstream Oil and Gas Operations
OVERVIEW
Realistic policy guidelines for water management must start with an assessment of what oil companies are able to do to economize with freshwater resources. This chapter reviews leading oil company practices in the different activities associated with exploration and production of oil and gas. The chapter contains individual company references but also refers to best practices as documented in publications by the International Petroleum Industry Environmental Conservation Association (IPIECA), whose contributing members include the world’s leading oil and gas companies.
COMPANY POLICY AND WATER MANAGEMENT SYSTEMS
Under standard regulatory frameworks in developing countries, oil and gas operators are required to establish and implement a management system for health, safety, and environment (HSE) in accordance with what is often termed best industry practices. It is a cyclical process that usually includes the key components illustrated in figure 2.1.
An HSE management system for water focuses on reduction and prevention of pollution and efficient use of resources in general. It typically includes strategies to ensure due consideration of rights and interests of nearby communities.
Because water is a critical resource, many oil and gas companies have developed a risk-based water management framework in which key elements mirror the cyclical approach to HSE management shown in figure 2.1. It is a process of planning, implementation, evaluation, and review that can be implemented throughout the life cycle of an oil and gas project. IPIECA (2021) has documented the risk-based water management framework (refer to box 2.1). Its application would contribute to achieving UN Sustainable Development Goal 6 targets 6.3 and 6.4 (UN Department of Economic and Social Affairs 2015), reducing pollution from wastewater discharge and efficiency in water use, respectively.
11
BOX 2.1
Key elements of IPIECA’s water management framework
IPIECA’s water management framework is built around the following five key elements (refer to figure B2.1.1).
Stakeholder and regulatory engagement
Communicate with stakeholders to develop a common understanding and seek agreement on issues of concern. Establish the regulatory environment within which activities are taking place, water governance in the local jurisdiction, and the project’s geographic and social sphere of influence.
Planning
• Risk assessment. Assess physical, regulatory, and reputational risk.
• Water sources and routes for discharge and disposal. Define water demands and wastewater volumes; identify baseline conditions and current and future water status; and assess
impact risks, opportunities and uncertainties, options appraisal, and business case development.
• Watershed-level approach. Take into account the range of stakeholders, domestic and industrial activities, processes, and factors that play a role in determining the availability, quality, distribution, management, and use of water in a watershed.
• Monitoring systems. Monitor and report on water use and discharge.
Implementation and operation
• Operational water efficiency opportunities. Lower freshwater demands through water conservation measures, change to a nonfresh water source for certain operations, and reuse or recycle water within the operation or transfer it for possible external use.
12 | WATER M ANA GEMENT IN O IL AND G AS O PERATION S
FIGURE 2.1
Typical elements of a health, safety, and environment management system
Source: This figure is original to this publication.
Leadership and commitment
Policy and strategy objectives
Organization of resources and documentation Audit
Review
Evaluation and risk management
Planning and procedures
Implementation and monitoring
continued
Box 2.1, continued
Source: IPIECA 2021.
• Water synergies and trade-offs. Develop water efficiency opportunities with cobenefits, such as reduced greenhouse gas emissions and reduced impacts on biodiversity.
• Monitoring. Monitor water efficiency measures as a basis for reporting and performance management.
• Supply chain. Encourage and facilitate suppliers and subcontractors to assess and report on water usage and impacts.
Evaluation
• Water data reporting. Perform sustainability reporting, reflecting climate, environmental, and social impacts arising from oil and gas exploration and production.
• Risk management review. Establish whether the risk management mitigation and adaptation measures have achieved the desired level of risk reduction.
Management review
• Review performance. Evaluate whether the water management actions taken address water-related business risks.
• Set direction for next cycle. Benchmark standard reporting and assessment of performance against other operations across the industry.
• Governance. Set water management objectives and strategies going forward.
Industry Water Management Practice in Upstream Oil and Gas Operations | 13
FIGURE B2.1.1
Key elements of IPIECA’s water management framework
Planning Management review
Implementation and operation
Stakeholder and regulatory engagement Evaluation
INDUSTRY APPROACHES TO WATER MANAGEMENT
Leading oil companies, such as Occidental, are adopting a risk-based approach to water management as an integral part of company policy and management systems. Water management methodology, such as that described in box 2.1, may go well beyond existing regulatory requirements for oil and gas operations.
Following is a brief description of common industry approaches. Not surprisingly, safe, efficient, and sustainable operations are the key priority for operating companies.
Operational efficiency
To underpin long-term operational efficiency, risk assessment is required at an early planning stage to identify present or future constraints in water resource availability. Stops in production caused by interrupted water supplies can be very costly, and risk management would involve seeking to lower water requirements by reducing the use of fresh water and reusing or recycling water within the operation. This is even more important in water-stressed environments.
Compliance management
The water management framework varies significantly from one country to the other. Emerging and developing economies often have poorly established policies and regulatory frameworks. Even in countries with established national water management frameworks, regulation of water use in oil and gas is usually lacking. In these countries, optimizing water management procedures within the boundaries of inadequate regulatory and contractual requirements would comply with local laws and regulations but will not necessarily result in responsible water management.
Water stewardship
The Alliance for Water Stewardship (2023) defines water stewardship as “the use of water that is socially and culturally equitable, environmentally sustainable, and economically beneficial, achieved through a stakeholderinclusive process that includes both site and catchment-based actions.” A water stewardship approach requires oil and gas companies to engage with other water users, local regulators, and policy makers to develop shared solutions to water resource constraints. Mutually acceptable water-sharing solutions are necessary to sustain long-term operations.
WATER USES IN UPSTREAM OPERATIONS
Chapter 1 provides a heat map (figure 1.7) of water use and return flows in oil and gas upstream operations. This section contains a brief analysis of the determinants of water use and water returns by activity.
14 | WATER M ANA GEMENT IN O IL AND G AS O PERATION S
Drilling and completion
Both exploration and production wells need water, primarily for water-based drilling fluid (commonly referred to as mud) but also for cementing of casing and the maintenance of drilling rigs.
Mud is a heavy, viscous fluid mixture that serves several purposes:
• Pressure control, providing hydrostatic head that balances the formation pressure;
• Lubrication of the pipe turning against the sidewall;
• Cooling of the drill bit and drill string;
• Sealing the wellbore to prevent material from sloughing off; and
• Transporting drill cuttings to the surface.
Mud volumes vary with the total depth of a well but can amount to several thousand barrels. The problem is not the water consumption but rather that the chemical composition of the mud and various additives make drilling mud a disposal challenge.
The mud is, in varying degrees, toxic. Water-based mud has at the outset very little toxicity because it is normally made up of water, bentonite, and barite. However, certain chemical additives that are used in water-based muds can be corrosive and toxic. Of particular concern are the deflocculants, in which chrome lignite and chromium lignosulfonate are used to reduce flow resistance. Use of chromium lignosulfonate in drilling fluids has been discontinued in certain areas because of possible harm to the environment. It is generally accepted throughout the drilling industry that drilling fluid additives containing hexavalent chromium are toxic to the environment (Green Agrochem 2018).
The common approach to drilling waste management includes the following:
• Separation of mud from cuttings,
• Recycling muds and using cuttings for other purposes, and
• Onsite burial or central treatment and disposal.
Several technology options are available for treatment of sludge and cuttings before safe and final disposal, but well-site disposal in pits still occurs (refer to figure 2.2). This is problematic because it leaves pits with possibly toxic material in hundreds of well locations. Toxic substances in mud pits may leach into the soil and contaminate groundwater in case of rupture of the liners. Pits are covered after abandonment of the well, but the buried material remains.
Construction and commissioning
The typical uses for water during construction include dust suppression, washing down fleet vehicles, road preparation, concrete batching for foundations and buildings, and integrity testing (hydrotesting) of pipelines and pipework during the commissioning process.
The quality of water needed will range from slightly brackish, which is used for tasks such as dust suppression, to fresh water, which is used for hydrotesting (to minimize corrosion and maximize the effectiveness of the
Industry Water Management Practice in Upstream Oil and Gas Operations | 15
chemical additives). Water used in construction activities is generally lost to the environment or bound within the product (concrete); in both cases this limits the generation of return water. Water used for hydrotesting becomes return water once it has passed through the pipework. The quality is altered because of the addition of chemicals and other contaminants introduced during the commissioning process. Treatment is required before reuse or disposal.
Production and processing
In a conventional hydrocarbon reservoir such as a porous sandstone or limestone, production will soon start to reduce the formation pressure. In the primary production stage, the initial formation pressure drives the oil to the wellhead. As production continues, the formation pressure drops and becomes insufficient to sustain economic production rates. Stimulation methods are required to maintain reservoir pressure and fluid mobility to help bring the oil to the surface. This is often termed secondary recovery, and the most common method is water injection for pressure support.
Water is also used for upstream processing of produced hydrocarbon streams before export, which may include the following:
• Water in desalters to strip out soluble contaminants,
• Cooling water, and
• Steam generation for use in turbines.
Return water flows commonly encountered from upstream processing stages include hydrocarbon dew-point condensation and blowdown water and condenser water from the boilers, along with cooling water, which can be recirculated.1
16 | WATER M ANA GEMENT IN O IL AND G AS O PERATION S
FIGURE 2.2
figure is original to this publication. Note: The simple shortcut is within the dotted line.
and
Wet
Separation Disposal
solid
or reuse Treated
treatment
construction
in
cuttings
cuttings
treatment
Schematic of mud and cuttings treatment and disposal
Source: This
Recycled mud Mud
cuttings
cuttings
options Small volume
waste Discharge
water Cuttings
Deposited in designated landfill or used in
or other Deposited
lined pit at well site Cuttings Wet
Wet
Sludge Sludge
Conventional oil production
Reservoir pressure support in secondary recovery, as described earlier, can be achieved by injecting water into the reservoir, known as waterflood. If gas is available, this is an alternative or supplementary medium for the same purpose. Over time, greater injection rates are required to recover the oil, and the amount of water produced at the production well increases. The secondary recovery stage ends when produced water (PW) dominates to the extent that it becomes uneconomical to continue production. Figure 2.3 illustrates the use of PW in conventional oil production.
Enhanced oil recovery
Enhanced oil recovery (EOR) techniques are used to increase the recovery rate and prolong the productive life of reservoirs. EOR techniques using water include steam flooding, in which steam is injected into the reservoir to lower oil viscosity, and chemical flooding, in which water mixed with chemicals is injected to release oil attached to the formation particles and improve migration.
Steam flooding and chemical flooding can require the use of fresh water to prevent scale and corrosion and to allow chemical solutions to operate effectively. Produced and return water may include chemicals used as part of the EOR production process and may represent a disposal challenge.
Conventional gas production
Gas in conventional reservoirs flows naturally to the production well, and no additional stimulus is required. Significant volumes of water are used for gas processing, in which water-based chemical solutions are used to strip impurities from the gas. Water is also used for cooling and steam generation. Although fresh water is needed for steam generation, saline water may be used for cooling.
Industry Water Management Practice in Upstream Oil and Gas Operations | 17
FIGURE 2.3
Source: This
is original to this publication. Gas export Oil export Oil and formation water Separation Water treatment Water Water Water Water Reservoir
disposal in
formation
or other Discharge or reuse
Schematic of produced water use in conventional oil production
figure
Injection for
non-hydrocarbon-bearing
Reservoir injection for pressure maintenance
Unconventional production
Unconventional production includes shale or tight oil and gas, as well as coalbed methane.
Shale or tight oil and gas
Low permeability in tight reservoirs means that stimulation techniques are required for economic production. A common technique is to use water as a medium for hydraulic fracturing. Water returns will mainly consist of hydraulic fracturing fluids returning to the surface (flowback water).
In the United States the number of hydraulically fractured wells increased from approximately 36,000 in 2010 to more than 300,000 in 2015.2 In 2018, the United States became the top producer of oil and natural gas in the world, ahead of Russia and the Kingdom of Saudi Arabia. This is due to hydraulically fractured horizontal wells, which in 2019 accounted for 71 percent of all oil and natural gas wells drilled, according to EIA.3
Although fracking has the potential to provide more oil and gas resources to consumers, the process of extraction has long-lasting negative impacts on the surrounding environment. Air pollution and water contamination from the toxic chemicals used in hydraulic fracturing are the greatest concerns at fracking sites, and the need for wastewater disposal and shrinking water supplies are also pressing issues directly related to the procedure.
Coalbed methane
Coalbed methane is the production of gas from coal seams. The use of water for hydraulic fracturing to increase gas production is common.
WATER EFFICIENCY MEASURES
The approach to water efficiency is analogous to the hierarchy commonly used in waste management, that is, the three Rs: reduce, reuse, and recycle. In water management a fourth R, replace, is included:
• Reduce. Lowering water use in different activities;
• Replace. Substitution for fresh water with a different water resource;
• Reuse. Reusing water for the same or alternative purpose without, or with minimal, treatment; and
• Recycle. Treatment to improve quality and bring water back into use.
In water-stressed areas, efficient use of water can be critical to the operation’s viability. Table 2.1 outlines water efficiency measures for the upstream activities described here.
PRODUCED WATER
At depth porous sedimentary rocks (such as sandstones) are saturated with water, either trapped within the pore spaces during deposition or migrated into the formation later. Formation waters in hydrocarbon reservoirs are regarded as connate waters with little or no influence from meteoric conditions (that is, percolation from rainfall). PW is water extracted at the same time as
18 | WATER M ANA GEMENT IN O IL AND G AS O PERATION S
Construction
Drilling
Gas production
Oil production
Shale and tight oil and gas and CBM
Use drilling fluids that minimize water losses. Use treated gray water instead of fresh water.
Source: This table is original to this publication.
Note: n.a. = not applicable; CBM = coalbed methane; PW = produced water.
Use hydrotest water for site preparation, dust suppression, and other purposes.
Recirculate scrubbing water for further scrubbing.
Use PW for pressure maintenance.
Use flowback and PW for subsequent hydraulic fracturing.
the hydrocarbon resource and may consist of both formation water and flowback from injected water.
PW associated with oil production represents by far the largest volume of wastewater to be managed in upstream oil and gas operations. As mentioned earlier, over the life of a field, three barrels of water may typically be generated for one barrel of oil produced. Figure 1.6 illustrates a typical production profile for oil and water, where the water cut (water as a percentage of total liquids) exceeds 90 percent toward the end of the field’s commercial life.
Natural formation water is typically saline, and most PWs have salinities greater than that of seawater (3.1–3.8 percent). PW will be a mix of natural formation water and injection water and will include reservoir constituents as well as chemicals used in drilling and production (refer to box 2.2).
SPE (2010) highlights the following contaminants of concern in PW:
• High level of total dissolved solids (TDS);
• Oil and grease;
• Suspended solids;
• Dispersed oil;
• Dissolved and volatile organic compounds;
• Heavy metals in solution;
• Naturally occurring radioactive material (NORM);
• Dissolved gases and bacteria; and
• Chemicals (additives) used in production, such as biocides, scale and corrosion inhibitors, and emulsion and reverse-emulsion breakers.
INJECTED WATER FOR PRESSURE SUPPORT
As normal formation pressure drops because of production, injection of external fluids to maintain the pressure is required. As outlined in Chapter 1, injection increases during the secondary recovery process and will typically exceed the
Recover drilling fluids for use in subsequent drilling operations.
Allow PW to be used by third parties.
Industry Water Management Practice in Upstream Oil and Gas Operations | 19
ACTIVITY REDUCE REPLACE REUSE RECYCLE
TABLE 2.1 Solutions for the efficient use of water in water-stressed areas
and commissioning n.a. n.a.
n.a.
n.a.
n.a. n.a.
n.a.
n.a. n.a.
n.a. n.a.
Facts on water in hydrocarbon reservoirs
• Oil reservoirs are usually sedimentary rocks (refer to figure B2.2.1).
• Water was present from “day one” when the sediments were deposited.
• Hydrocarbons have normally not been generated in the reservoir rock but have migrated over geological time from a deeper source rock.
• Hydrocarbons are lighter than water and will migrate upward until trapped by an impermeable cap rock.
• The hydrocarbons will (largely) replace the water that was originally present in the reservoir rock.
• The fluid and rock properties determine the wettability of the reservoir (that is, whether the fluid film around the formation particles is water or oil).
• The content of minerals (ions) in the formation water depends on the composition of the sediments.
• Bacteria are not normally present in the formation fluid but may be introduced via injected substances.
• Free (dissolved) oxygen is not normally present in the formation water. All oxygen (from organic sediments) will react with metals in the rocks (primarily iron) to form oxides.
• Production from the oil zone will activate the water of the deeper water zone, the aquifer, provided there is pressure communication.
• During production, water will move toward the producer well and, at some point, enter the well and cause an increase in water cut.
Impermeable cap rock
Gas Oil Water
Gas and oil contact
Oil and water contact
Permeable reservoir rock Water
total volume of produced liquids (oil and PW) toward the end of the field’s life (refer to figure 1.6).
Saline water can be used for pressure support or waterflood, and PW is commonly used for this purpose. A low-level treatment is usually required to remove suspended, dissolved, and biological components that could create a risk of reducing well injectivity or blocking or clogging pore spaces in the reservoir during injection.
20 | WATER M ANA GEMENT IN O IL AND G AS O PERATION S
BOX 2.2
FIGURE B2.2.1
How water, oil, and gas fill the pore space in reservoir rock
Source: Developed by Bridge and Norconsult 2016.
Hydrocarbon migration upward from source rock
IDENTIFICATION OF WATER SOURCES
Typical water sources for oil and gas operations are as follows:
• Fresh water (<1,000 milligrams per liter TDS), such as in shallow aquifers, lakes, and rivers4;
• Brackish water (>1,000 milligrams per liter TDS), occurring in the natural environment in estuaries where fresh water mixes with seawater or in deep aquifers;
• Seawater (35,000 milligrams per liter TDS);
• Fresh or brackish groundwater (<30,000 milligrams per liter TDS), often found in deep aquifers;
• Nonfresh groundwater (>30,000 milligrams per liter TDS), common in very deep aquifers; and
• Wastewater from municipalities or industries.
Identification of potential water sources takes place before or during the initiation phase of an oil and gas project. It implies a review of the component parts of the hydrological system in the project area, the water-related infrastructure, and existing water users. Elements assessed include the following:
• Drainage basins and their watersheds;
• Annual precipitation to the drainage basin;
• Surface water bodies;
• Aquifers and associated recharge and discharge mechanisms; and
• Existing water uses, allocations, and entitlements.
Oil companies develop water management plans based on an assessment of water needs during the life of the planned project. This is particularly important in areas of water scarcity. Leading oil companies have broad experience with different operating environments and are able to build water management models based on predictions of the following key components:
• Total water requirement,
• Total flowback plus PW,
• Recycled water,
• Required fresh water, and
• Disposal water.
TOOLS FOR WATER RISK ASSESSMENT
Leading oil companies may have customized internal tools for water risk assessment, but many open-source water tools are available, some of which are kept up to date and provide information that is relevant at a global level. Following are three examples of free water management tools.
• Local Water Tool for Oil and Gas (GEMI n.d.). This tool is for companies to evaluate the external impacts, risks, opportunities, and management plans related to water use and discharge at a specific site or operation.
Industry Water Management Practice in Upstream Oil and Gas Operations | 21
Figure 2.4 illustrates how these components determine the estimated life cycle of fresh water needs based on modeled assumptions of how much flowback and PW can be recycled.
Required fresh water Total water requirement Flowback + produced water Recycled water Disposal water
Source: World Bank–based data from IPIECA 2014.
BOX 2.3
Eni’s approach to assessing water risk
Eni has more than 270 sites operating in 80 countries (as of 2011) where water availability is low or predicated to become increasingly scarce. Eni applied a range of water stress identification tools, including GEMI’s Local Water Tool for Oil and Gas, to assess water-related risks, increase internal awareness of water issues, and shape water management plans. The approach allowed the water risk for the portfolio of assets to be mapped by country and drainage basin.
Source: IPIECA 2014.
A key lesson learned was that clear policy, guidelines, and knowledge transfer through a community of practice within the company are important factors for achieving improvements in water management. Each project or facility, guided by consistent tools, can thus generate solutions appropriate to local basin and site-specific conditions.
• Water Risk Filter (WWF and DEG 2023). This tool helps screen for waterrelated challenges arising from a company’s activities and for environmental and social issues. The tool allows country water risk assessments, portfolio water risk screening, and facility water risk assessment.
• Water Risk Monetizer (ECOLAB 2021). This tool helps to assess water-related risks in financial terms on the basis of readily available information about current water use and production projections at individual facility and enterprise levels. Designed to understand and quantify in monetary terms potential water quantity and quality risks at a facility.
Box 2.3 provides an example of the application of the GEMI tool and company proprietary tools to assess water risk.
22 | WATER M ANA GEMENT IN O IL AND G AS O PERATION S
FIGURE 2.4
Typical water profile over the life cycle of an oil and gas field
05 10 15 20 25 Timeline (years) 100,000 200,000 300,000 Average water rates m 3 ·yr –1 400,000 500,000 600,000 700,000 800,000
TREATMENT AND SCOPE FOR PW REUSE AND RECYCLING
How PW is treated and disposed of varies from country to country and depends on the regulatory framework, level of economic development, infrastructure, climate, and water availability, to mention a few examples. This section provides brief examples of PW treatment and disposal in two very different regions, the United States and Africa.
United States
US regulators recognize that the desired increase in PW reuse may require regulatory or legislative solutions to several issues, including ownership of PW, transfer of ownership, and determination of liability if there is a spill or other environmental damage. The current US regulatory framework for PW management is further discussed in Chapter 5.
According to official statistics (refer to figure 1.5), 44.0 percent of water produced in oil and gas operations in the United States is injected to maintain reservoir pressure, 5.0 percent (with low salinity) is discharged to surface waters, 1.7 percent is reused in oil and gas operations, and 1.3 percent is used for beneficial purposes. The rest, 48.0 percent, is disposed of through injection into nonhydrocarbon reservoirs in the subsurface.
Efforts are made, however, to test further reuse options, as published by GWPC (2019). Four general categories of beneficial use are identified:
• Land application (replace or supplement fresh water or other brines in irrigation and dust suppression)
• Water discharges (replenish water resources through discharge to surface water or injection into subsurface zones)
• Industrial uses:
• Replacement of fresh, saline, or otherwise degraded water or feed stream for an industrial process
• Mining, processing, or manufacturing of other products from the treatment of PW, which contains chemicals that may be extracted in economically useful quantities
• Consumption as drinking water, although limited primarily to the context of livestock or wildlife.
Sudan and South Sudan
Handling of PW is identified as a main challenge for the Sudanese oil sector. Before being discharged, the water is treated biologically in bioremediation plants, which occupy land areas up to 60 square kilometers (refer to photo 2.1).
In Sudan and South Sudan, petroleum operations tend to dominate the surface areas because well pads and associated pits and water ponds are not reclaimed (refer to photo 2.2).
The Heglig oil field in Sudan Block 4 has the longest production history. The fields are producing at tail end with a current water cut of around 85 percent and increasing with production at 55,000 cubic meters per day (Bridge and Norconsult 2016).
Industry Water Management Practice in Upstream Oil and Gas Operations | 23
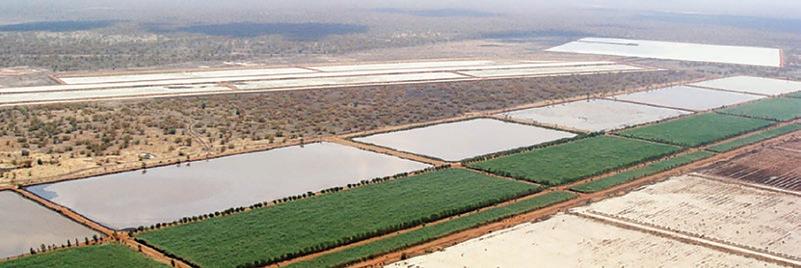
Source: © COWI A/S. Used with the permission of COWI A/S. Further permission required for reuse.
Note: The 6,400-hectare reed bed treatment facility in Heglig uses Oceans-ESU Ltd.’s engineered wetlands proprietary system (http://www.oceans-esu.com/reed-beds/).
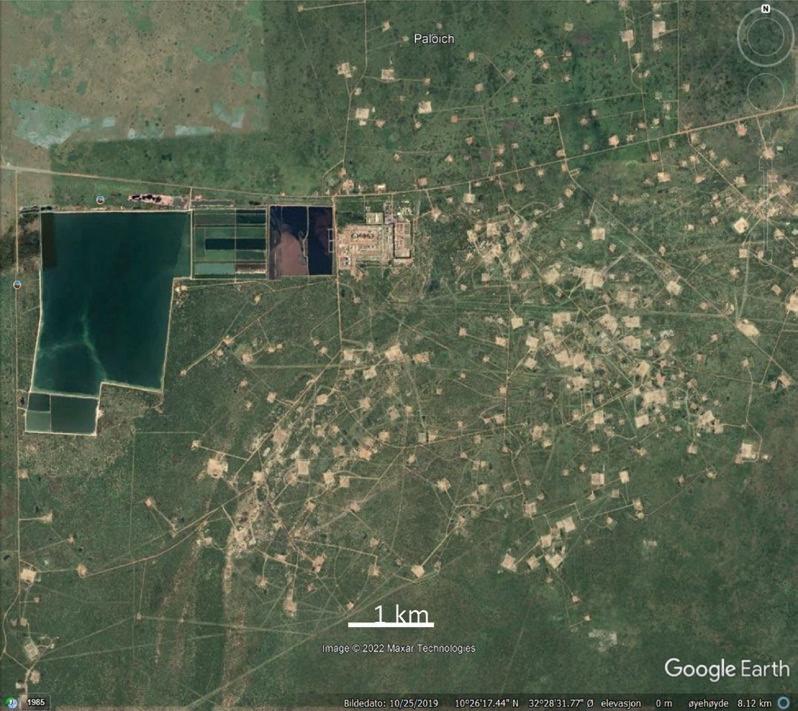
24 | WATER M ANA GEMENT IN O IL AND G AS O PERATION S
PHOTO 2.1
Bioremediation facility with settling lagoons and engineered wetlands (Heglig, Sudan)
PHOTO 2.2
Well pads, central processing facility, and water treatment ponds (Palouge, South Sudan)
Source: © Bildedato 2022 Google Earth, Maxar Technologies.
Initial separation of water from oil takes place in a central processing facility (CPF), after which the PW is moved to skimming tanks and ponds, where dispersed oil is removed by gravity, and separation is enhanced by use of water treatment chemicals. Further treatment in the polishing stage (that is, the bioremediation units) is designed to achieve final effluent quality. Oxygen for biological degradation is partly provided by the root system of the reed plants. After the reed beds, balancing lagoons supply treated water to irrigation channels in a nearby forestry area (about 400 hectares) and discharge to a 5-kilometerlong discharge channel.
A study undertaken by the Sudanese Ministry of Petroleum, General Directorate of Environment and Safety in 2015 (UNCTAD 2015) examined groundwater samples from wells near the CPF and the PW ponds at Heglig oil field. Elevated concentrations, as compared with threshold values of fluoride, iron, ammonia, and amines in the groundwater, indicated possible contamination from the PW. Recommendations were made for the authorities to demand drilling of groundwater monitoring wells to establish whether such contamination occurs.
A similar and larger reed bed treatment facility in Oman is described in a case study by Petroleum Development Oman in Chapter 6.
SUMMARY OF POSSIBLE WATER USES AND ASSOCIATED QUALITY REQUIREMENTS
Petroleum upstream operations require large amounts of water, but not all of it needs to be fresh water. At the same time, the operations generate large volumes of PW, which is a key source for reuse. For comparison, TDS may serve as a proxy for overall water quality, but other parameters and contaminants may dictate how water can be used without treatment. Table 2.2 summarizes the water quality requirements for use in oil and gas upstream operations.
Note:
=
Industry Water Management Practice in Upstream Oil and Gas Operations | 25
SECTOR ACTIVITY WATER USE QUALITY REQUIREMENT (TDS MG/L) Common across oil and gas resource types Personnel Drinking, personal hygiene, food preparation Laundry, toilet flushing, and cleaning <600 Exploration drilling Drilling fluids and well linings Well stimulation fluids and well flushing <4,000 Construction and commissioning Integrity (hydrotesting) of pipelines Concrete batching, dust control, road surfacing, etc. <2,000–>15,000 Process and operations Boiler feed, pump seals, firewater, wash down, cooling water <2,000–>15,000 Conventional gas Production Water for chemical solutions used to strip impurities from the gas >30,000 Conventional oil Production Water injection for pressure support >30,000 Enhanced oil recovery Production Chemical or steam injection <2,000–15,000 Shale and tight oil and gas Production Water for hydraulic fracturing fluids <2,000–30,000
IPIECA 2014.
TABLE 2.2 Water uses and quality required for oil and gas upstream operations
Source:
TDS
total dissolved solids.
PW
Beneficial reuse of PW outside of oil and gas operations has yet to become mainstream. Data from pilot projects and water quality regulation show large variability. Table 2.3 outlines water quality requirements for the main waterusing activities. Most data points refer to the United States, where research and regulatory activity are most active. It is important to note that the amount of TDS as a quality parameter for PW discharge and beneficial reuse outside of oil and gas operations does not show the full picture. PW typically includes contaminants such as oil and grease, suspended solids, heavy metals, volatile organic compounds, NORM, and various chemical additives used in production. Several of the applications listed in table 2.2 will require contaminants to be removed before use.
RESIDUAL WASTE MANAGEMENT
Treatment processes generate their own waste by-products, such as effluent reject, sludge, and solid waste. In certain instances, the quantities of these waste by-products can be substantial and, depending on the source of the water, may contain hazardous compounds.
As recognized by the GWPC (2019) beneficial reuse of the waste by-products may be possible, depending on the project setting. Salt may have value to other industries (for example, solutions rich in magnesium chloride have several important uses as a raw material for magnesium oxide and other magnesium-containing chemicals), and sludge may be used in agriculture.
•
•
•
•
•
Non-food crops:
with groundwater in cotton pilots in the
• Lithium extraction (US Smackover brines have up to 500 mg/l of Li)h
• Extraction of salts and minerals
Source: This table is original to this publication and is a compilation based on sources listed in the table footnotes. aAyers and Westcot 1985. bMitchell-McCallister et al. 2020. cPrigent et al. 2016. dGWPC 2019. eManitoba Agriculture 2023. fUS Department of the Interior 2011. gTXPWC 2022. hKumar et al. 2019.
Note: FAO-UN = United Nations Food and Agriculture Organization; Li = lithium; TDS = total dissolved solids.
26 | WATER M ANA GEMENT IN O IL AND G AS O PERATION S
SECTOR ACTIVITIES WATER USE QUALITY REQUIREMENT (TDS MG/L) Land application Irrigation Food crops (FAO-UN guidelines)a <450–2,000
TABLE 2.3 Water quality requirement by type of beneficial uses
Blending
USb
Cotton,
2,500 7,000–8,000 Road spreading
perennial trees, and turfgrass in Omanc
Dust suppression
control <40,000 Water discharge Discharge to surface water Surface water discharge permit:
Winter ice
Wyoming exampled <1,000–5,000 Aquifer recharge Water quality issues limit viability <600 Drinking water Human Water quality issues limit viability <600 Livestock Poultry at low TDS level; dairy and beef cattle, sheep, and swine at higher TDS levelse, f <1,000–7,000 Industrial use Replacing fresh water in industry processes Steel reinforced concreteg <2,000 Extraction
of minerals and chemicals from
High
TDS (no limits)
WATER EFFICIENCY REPORTING
Quantitative reporting on water withdrawal by source and water discharge by destination, along with details on water treatment and reuse, are key to sustainable water management. What is not measurable or measured cannot be regulated or managed.
Leading oil companies subscribe to comprehensive reporting formats irrespective of the regulatory requirements where they operate. The reference for such reporting lies with shareholders, finance institutions, and generally accepted standards for environmentally responsible behavior.
Several formats are available, four of which are listed here:
• Carbon Disposal Project (CDP) is an international nonprofit organization that helps companies disclose their environmental impact. Of particular interest in the water management context is the CDP Water Security Questionnaire,5 which provides companies (and stakeholders) with an insight into current and future water-related risks and opportunities and helps drive improvements in water management. In 2021 leading companies such as Eni, Occidental, and TotalEnergies all completed this questionnaire. The scope of the CDP Water Security Questionnaire is described in box 2.4.
• SASB (Sustainability Accounting Standard Board) is also a nonprofit organization with a focus on sustainability accounting and environmental, social, and corporate governances. Its initial aim (in 2011) was to develop standards for use in corporate filings to the US Securities and Exchange Commission, but it later encouraged companies (public and private) around the world to report using SASB disclosure topics and metrics in all communications with investors. Oil companies reporting in SASB format include Cairn Energy, ConocoPhillips, and Hess Corporation.
• GRI (Global Reporting Initiative) is an international independent standards organization that helps businesses, governments, and other organizations understand and communicate their impacts on issues such as climate change, human rights, and corruption. First launched in 2000, GRI’s sustainability reporting framework is now widely used by multinational organizations, governments, small and medium enterprises, nongovernmental organizations, and industry groups around the world.
• IPIECA, API, and IOGP’s (2020) sustainability reporting guidance for the oil and gas industry includes reporting modules on governance and business ethics, climate change and energy, and the environment, including water, safety, health, and security and social issues.
The oil and gas industry’s own recommendations about water management reporting have yet to be implemented in many areas. Regulatory reporting obligations will increase the attention to quantifiable water management.
WATER MANAGEMENT IN REFINERY OPERATIONS
Many oil-producing countries refine indigenous crude oil into higher-value petroleum products for domestic and export markets. It is the first step in what is called downstream operations and is typically regulated as an industrial activity, separate from the contractual regime that applies to upstream exploration and production.
Industry Water Management Practice in Upstream Oil and Gas Operations | 27
BOX 2.4
Excerpts from the Carbon Disclosure
Project Water Security 2022 Questionnaire
• Give total volumes of water withdrawn, discharged, and consumed
Water aspect Volume
Total withdrawals
Total discharges
Total consumption
• Indicate whether water is withdrawn from water stress areas and provide proportion
Withdrawals from areas with water stress %
Yes/no
• Provide total water withdrawal data by source
Source Volume
Fresh surface water
Brackish surface water or seawater
Groundwater—renewable
Groundwater—nonrenewable
• Provide total water discharge data by destination
Destination Volume
Fresh surface water
Brackish surface water or seawater
Groundwater
• Indicate the highest level(s) to which you treat your discharge
Highest treatment level Volume
Tertiary treatment
Secondary treatment
Primary treatment only
Discharge to environment without treatment
Source: Adapted from CDP 2022.
• Provide a figure for your organization’s total water withdrawal efficiency.
• What proportion of suppliers do you request to report on their water use?
• Has your organization experienced any detrimental water-related impacts?
• How does your organization identify and classify potential water pollutants?
• Describe how your organization minimizes the adverse impacts on water ecosystems.
• Describe your procedures for identifying and assessing water-related risks.
• Provide details of risks with a potential impact on your business.
• Describe the scope and content of your water policy.
• Do you engage in activities that could either directly or indirectly influence public policy on water?
• Are water-related issues integrated into any aspects of your long-term strategic business plan?
• Does your company use an internal price on water?
• Describe your approach to setting and monitoring water-related targets and goals.
28 | WATER M ANA GEMENT IN O IL AND G AS O PERATION S
Although this report focuses on water management in upstream oil and gas operations, the challenges of freshwater abstraction and wastewater treatment and disposal are much the same in refinery operations.
Water use
Several processes in petroleum refineries use water, and the most important are as follows:
• Process water. Used for various purposes where water is in close contact with hydrocarbons;
• Boiler feed water. Required for the generation of steam; and
• Cooling water. Water-cooled condensers, product coolers, and other heat exchangers that use a large amount of water.
Wastewater
A significant portion of the water used can be continually recycled within a refinery. Understanding water balance for a refinery is key to optimizing water usage and reducing final wastewater volumes. In any case, refineries generate significant amounts of wastewater, which have in part been in contact with hydrocarbons. Box 2.5 shows data from the Khartoum Refinery in Sudan, which draws water from the Nile River.
Khartoum Refinery in Sudan
The refinery is operated by the Khartoum Refinery Company (refer to photo B2.5.1), which is a joint-venture between the state company, Sudanese Petroleum Corporation, and China National Petroleum Corporation. It is located about 70 kilometers north of Khartoum and some 12 kilometers east of the Nile River.
The refinery was developed in two phases:
• Phase 1. Established in 2000 with a capacity of 50,000 barrels per day for Nile Blend, and
• Phase 2. Expansion in 2006 with a capacity of 40,000 barrels per day for the high-acid and high-calcium heavy Fula crude.
The high-acid Fula crude requires special precautions to reduce corrosion, which include the use of
corrosion inhibitors such as lime, caustic substances, and other additives.
The Khartoum Refinery draws water at a rate of 1,350 barrels per hour from the Nile River through a 12-kilometer pipeline. Oil-contaminated water goes through a separation process, and the generated oil sludge is collected and dumped at a designated disposal site east of the refinery, together with waste alkaline from the Fula crude process.
The total wastewater flow is 300 tons (equaling 2,560 barrels) per hour. Three lagoons have been constructed, with a total surface area of about 800,000 square meters where the wastewater is left to evaporate.
Industry Water Management Practice in Upstream Oil and Gas Operations | 29
continued
BOX 2.5
Box 2.5, continued
PHOTO B2.5.1
Wastewater ponds at the Khartoum Refinery
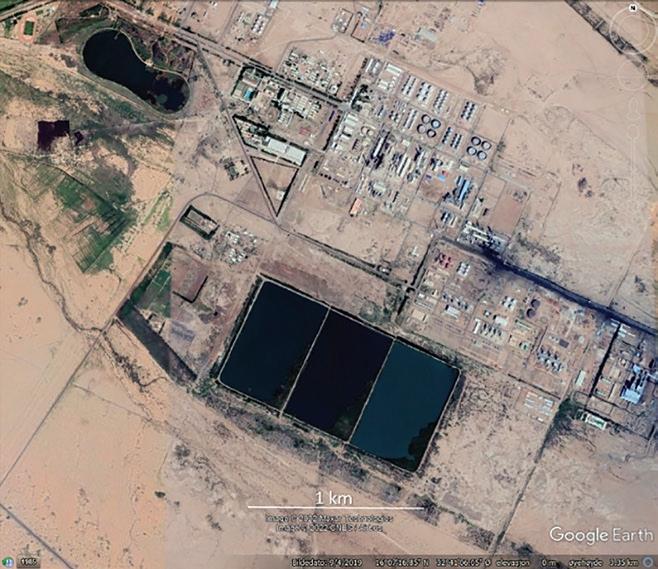
Source: © 2022 Google Earth, Maxar Technologies.
In summary, the Khartoum Refinery in Sudan, with an output capacity of 90,000 barrels per day, generates some 60,000 barrels per day of wastewater. The sludge
Sources: Ahmed et al. 2018; Bridge and Norconsult 2016.
NOTES
and wastewater disposal practices have been subject to criticism.
1. Hydrocarbon dew point is the temperature at which heavy hydrocarbon components begin to condense out of the gaseous phase when the gas is cooled at constant pressure. It is sometimes referred to as hydrocarbon liquid drop-out.
2. Hydraulically fractured wells provided two-thirds of US natural gas production in 2016 (EIA 2016).
3. In 2019 US crude oil and natural gas production hit records with fewer rigs and wells (EIA 2020).
4. A limit of 1,000 milligrams per liter of TDS (the limit set by the World Health Organization for drinking water) is the guidance for categorization of fresh and nonfresh for surface and groundwater. IPIECA’s definition of fresh water states that the TDS concentration of this water type is up to 2,000 milligrams per liter (IPIECA, API, and IOGP 2020).
5. CDP uses scoring methodologies to incentivize companies to measure and manage environmental impacts through participation in CDP’s climate change, forests, and water security questionnaires. Each of CDP’s questionnaires has an individual scoring methodology.
30 | WATER M ANA GEMENT IN O IL AND G AS O PERATION S
REFERENCES
Ahmed, Mohieldeen A. M., Osman M. M. Ali, Muzmmel M. M. Ibrahim, and Omar M. A. Al Ghabshawi. 2018. “Risks Management for Liquid Waste Disposal Area in the Khartoum Refinery-Sudan.” IRA International Journal of Education and Multidisciplinary Studies 11 (1): 13–31. https://doi.org/10.21013jems.v11.n1.p2
Alliance for Water Stewardship. 2023. “About the Alliance for Water Stewardship.” Accessed June 8, 2022, at https://a4ws.org/about/.
Ayers, R. S., and D. W. Westcot. 1985. Water Quality for Agriculture. FAO Irrigation and Drainage Paper Water 29. Rome: Food and Agriculture Organization. https://www.fao.org/3/t0234e /t0234e.pdf
Bridge and Norconsult. 2016. Options for Management of Produced Water in Sudan’s Oil Industry Unpublished report.
CDP (Carbon Disposal Project). 2022. “CDP Water Security 2022 Questionnaire,” accessed October 20, 2023. https://guidance.cdp.net/en/guidance?cid=35&ctype=theme&idtype =ThemeID&incchild=1µsite=0&otype =Questionnaire &tags=TAG -597%2CTAG -13069 %2CTAG-593%2CTAG-592%2CTAG-586%2CTAG-13070%2CTAG -587%2CTAG -13071 %2CTAG-596%2CTAG-595%2CTAG-585%2CTAG-598%2CTAG -13072%2CTAG -594%2CTAG -645%2CTAG-590%2CTAG-588%2CTAG-646%2CTAG -607%2CTAG-600
ECOLAB. 2021. “Water Risk Monetizer.” https://about.smartwaternavigator.com/
EIA (US Energy Information Administration). 2016. “Hydraulically Fractured Wells Provide Two-Thirds of U.S. Natural Gas Production.” Today in Energy, May 5, 2016. https:// downloads.regulations.gov/NHTSA-2021-0054-0001/attachment_25.pdf
EIA (US Energy Information Administration). 2020. “U.S. Crude Oil and Natural Gas Production in 2019 Hit Records with Fewer Rigs and Wells.” Today in Energy, June 25, 2020. https:// www.eia.gov/todayinenergy/detail.php?id=44236
GEMI (Global Environmental Management Initiative). n.d. “GEMI ® Local Water Tool™.” Washington, DC: GEMI. http://gemi.org/localwatertool/, accessed September 10, 2023
Green Agrochem. 2018. “Chrome Lignosulfonate Used in Oil Drilling Study.” July 11, 2018. https://www.ligninchina.com/chrome-lignosulfonate-used-in-oil-drilling-study/.
GWPC (Ground Water Protection Council). 2019. Produced Water Report: Regulations, Current Practices, and Research Needs. Oklahoma City, OK: GWPC. https://www.gwpc.org/sites /gwpc/uploads/documents/Research/Produced_Water_Full_Report___Digital_Use.pdf
IPIECA (International Petroleum Industry Environmental Conservation Association). 2014. Efficiency in Water Use: Guidance Document for the Upstream Onshore Oil and Gas Industry. London: IPIECA. https://www.ipieca.org/resources/good-practice/efficiency -in-water-use-guidance-document-for-the-upstream-onshore-oil-and-gas-industry/
IPIECA (International Petroleum Industry Environmental Conservation Association). 2020. Sustainability Reporting Guidance for the Oil and Gas Industry. 4th ed., rev. 2023. London: IPIECA. https://www.ipieca.org/resources/sustainability-reporting-guidance#
IPIECA (International Petroleum Industry Environmental Conservation Association). 2021. Water Management Framework: A Risk-Based, Cyclical Process for Effective Water Management. London: IPIECA.
https://www.ipieca.org/resources/good-practice/water -management-framework/
IPIECA (International Petroleum Industry Environmental Conservation Association), API (American Petroleum Institute), and IOGP (International Association of Oil & Gas Producers). 2020. “Sustainability Reporting Guidance for the Oil and Gas Industry.” Fourth edition, accessed October 20, 2023.
https://www.api.org/-/media/files/ehs/climate-change /ipieca_sustainability-guide-2020.pdf
Kumar, Amit, Hiroki Fukuda, T. Alan Hatton, and John H. Lienhard V. 2019. “Lithium Recovery from Oil and Gas Produced Water: A Need for Growing Energy Industry.” ACS Energy Letters 4 (6): 1471–4.
https://doi.org/10.1021/acsenergylett.9b00779
Manitoba Agriculture. 2023. Evaluating Water Quality for Livestock. Winnipeg: Manitoba Agriculture. https://www.gov.mb.ca/agriculture /livestock/production/pork/evaluating -water-quality-for-livestock.html
Industry Water Management Practice in Upstream Oil and Gas Operations | 31
Mitchell-McCallister, Donna, Ryan B. Williams, James Bordovsky, Joseph Mustian, Glen Ritchie, and Katie Lewis. 2020. “Maximising Profit Via Irrigation for Capacity-Constrained Cotton Production.” Agricultural Water Management 229: 105932. https://doi.org/10.1016/j .agwat.2019.105932
Prigent, Stephane, Asma Al-Hadrami, Thomas Headley, Wail Al-Harrasi, and Alexandros I. Stefanakis. 2016. “The Reuse of Wetland-Treated Oilfield Produced Water for Saline Irrigation.” Paper presented at the International Desalination Association Conference on Water Reuse and Recycling, Nice, France, September 25–27, 2016. https://www.researchgate .net/publication/308777946
SPE (Society of Petroleum Engineers). 2010. “Challenges in Reusing Produced Water.” Society of Petroleum Engineers. https://www.spe.org/en/industry/challenges-in-reusing -produced-water/?_ga=2.13984127.970351937.1653683331-1395431688.1653683331.
TXPWC (Texas Produced Water Consortium). 2022. Beneficial Use of Produced Water in Texas: Challenges, Opportunities and the Path Forward. Lubbock, TX: TXPWC. https://www.depts .ttu.edu/research/tx-water-consortium/downloads/22-TXPWC-Report-Texas-Legislature .pdf
UNCTAD (United Nations Conference on Trade and Development). 2015. “Extractive Industries, Sustainable Job Creation, and Environmental Management in the Sudan Oil and Gas Industry.” 17th Africa OILGASMINE, Khartoum, November 23–26, 2015. https:// unctad.org/system/files/non-official-document/17OILGASMINE%20Mustafa%20 Abdalla%20Abuagla%20S3.pdf
UN Department of Economic and Social Affairs. 2015. “Sustainable Development Goal 6.” https://sdgs.un.org/goals/goal6#targets_and_indicators
US Department of the Interior, Bureau of Reclamation. 2011. Oil and Gas Produced Water Management and Beneficial Use in the Western United States Science and Technology Program Report No. 157. Denver, CO: US Department of the Interior. https://www.usbr.gov /research/dwpr/reportpdfs/report157.pdf
WWF (World Wildlife Fund) and German Development Finance Institution (DEG). 2023. “Water Risk Filter,” accessed September 10, 2023. https://riskfilter.org/water/home.
32 | WATER M ANA GEMENT IN O IL AND G AS O PERATION S
Assessment of Water Sources and Supply Risks at the National Level 3
OVERVIEW
Chapters 1 and 2 described the large volumes of fresh water required during oil and gas operations and leading industry practices in water management, including the adoption of a risk-based approach to assessing sources and routes for discharge and disposal. Identifying potential water sources is therefore one of the most important feasibility aspects of planning possible exploration and production operations.
This chapter introduces the key concepts in water resource assessment, with an emphasis on groundwater, which is by far the largest resource available. It does so from the perspective of the national authority, which is mandated to assess and determine water resource availability and usage. Evidence-based documentation of water resources and supply risk is the essential basis for sustainable water resource management at the national level and for formulating regulations for water-using activities in all sectors. For oil and gas companies, the primary source for water resource data is the national authority.
Starting with the concept of the water nexus as a rationale for management intervention, this discussion examines the tenets of a water management system, focusing on the following elements:
• Hydrological processes and key issues;
• Institutional functions and legal basis;
• Environmental and Social Impact Assessment (ESIA) and assessment steps
• National Water Assessment;
• Required data and information and resources available for collection and storage; and
• Methodology for assessing resource availability, development options, and supply risk.
The chapter culminates with an overview of the main building blocks of effective water management.
33
BROADER WATER MANAGEMENT CONTEXT
National water management must interact with the management of other resources that are essential for human well-being. The key resources are food, energy, and water, and the systems by which these resources are produced, refined, distributed, and consumed are closely linked. The complex interactions among these systems are often referred to as the food-energy-water nexus (figure 3.1). A key concern is security because changes in one will have an impact on the other two. Perhaps the most critical resource in the nexus is water, which further emphasizes the importance of sustainable water management at the national level.
Water security is the capacity of a population to safeguard sustainable access to adequate quantities of acceptable-quality water for sustaining livelihoods, human well-being, and socioeconomic development; to ensure protection against waterborne pollution and water-related disasters; and to preserve ecosystems in a climate of peace and political stability (UN Water 2013).
HYDROLOGICAL PROCESSES AND GROUNDWATER
The hydrological cycle (figure 3.2) determines the quantity and quality of available water resources in time and space. It describes the movement and storage of all forms of water under, on, and above the earth’s surface.
The drainage basin is the area from which all surface runoff flows through a sequence of streams and rivers to the same outlet. Any given drainage basin will have a series of associated water storage units (for example, the atmosphere, snow and ice, rivers and lakes, soil moisture, groundwater, and vegetation). Water moves continuously through and between these storage units. The nature and size of the storage units and the transfers between them will vary depending on factors such as climate, soil type, and geology.

34 | WATER M ANA GEMENT IN O IL AND G AS O PERATION S
FIGURE 3.1
University of Florida 2019. FOOD WATER ENERGY
Food-energy-water nexus
Source:
Transpiration
Evaporation
Precipitation
Direct runoff
Soil moisture
Infiltration
Groundwater
Source: Shaver et al. 2007.
Evaporation
Evaporation
Direct runoff
Surface storage
Sur face waters
The aerial extent of an aquifer (discussed in the next section) may be larger than the drainage basin and receive recharge in areas that do not necessarily coincide with the drainage basin.
Groundwater
The distribution of water on the earth’s surface is extremely uneven. Only 3 percent of water on the surface is fresh; the remaining 97 percent resides in the oceans. Of fresh water, 69 percent resides in glaciers, and less than 1 percent is located in lakes, rivers, and swamps. Nonfrozen water resources are totally dominated by groundwater, as illustrated in figure 3.3.
Nature and properties
Groundwater is stored in and flows through aquifers, which are layers of fractured rock, gravel, sand, or limestone with enough space between the particles to hold water and allow it to flow through. Porosity and the degree to which pores are connected are the main physical properties that determine how much water an aquifer can store and transmit. Aquitards are rock or sedimentary layers with low permeability that can store groundwater and transmit it slowly from one aquifer to another. Aquicludes, such as tightly compacted claystone, are layers that cannot store or transmit water.
Unconfined and confined aquifers
Unconfined aquifers are those in which the porous rock is directly open at the surface of the ground, and groundwater is directly recharged, for example by rainfall or snowmelt. The upper water surface (water table) is at atmospheric pressure and can thus rise and fall.
Evaporation
Assessment of Water Sources and Supply Risks at the National Level | 35
FIGURE 3.2
Hydrological cycle
Distribution of freshwater resources
Lakes, rivers, and swamps, 1%
Groundwater, 30% Frozen water, 69%

When an aquifer is overlaid by an aquitard it is known as a confined aquifer. Confined aquifers may become artesian in areas located below the “potentiometric surface”—that is, the hydrogeological surface that represents the total hydraulic head of groundwater from a confined aquifer or semiconfined aquifer that is under pressure (Pacle 2020).
Aquifers are replenished naturally by precipitation and many surface water bodies. In confined aquifers, recharge often takes place where a part of the formation is exposed to direct infiltration of rainfall. This may be far away from a point of discharge, such as a well. Figure 3.4 is a schematic illustration of the different types of aquifers.
Groundwater properties are determined by the physical and chemical properties of the aquifer formation. Respective controls are as follows:
• Quantity: aerial extent, thickness, volume, and interconnected nature of pores and fractures; and
• Quality: residence time and chemical and redox equilibrium among dissolving minerals.
Advantage
Groundwater’s dominant and ubiquitous presence, with the added advantage of its being protected from contamination because it is filtered through a porous medium, often makes it the preferred source of drinking water supply. Its reliability also makes it important for ecosystems that depend on it (during dry periods or throughout the year).
Concerns
A main concern with groundwater is that water is often drawn faster than it naturally replenishes, especially in agriculture-intense countries such as China, India, and the United States, which results in groundwater depletion. Withdrawal rates have increased rapidly in the past century, with global water withdrawal increasing sevenfold and per capita water withdrawal having quadrupled (Miller and Hackett 2013).
36 | WATER M ANA GEMENT IN O IL AND G AS O PERATION S
FIGURE
3.3
Source: This figure is original to this publication, based on Water Science School 2019.
FIGURE 3.4
Bedrock aquifer (fractured)
Source: Utah Geological Survey n.d.
Water table well
Water table
Potentiometric surface of confined aquifer
Flowing artesian well
Lake Stream
Unconfined (water table) aquifer
Confined (artesian) aquifer Aquitard (confining layer)
Aquitard (confining layer)
Confinedaquifer
Aquitard(confininglayer)
The overexploitation of water resources also results in falling groundwater levels, meaning that one needs to go deeper to find the expected groundwater volume. This often leads to upconing of deeper saline water and deterioration of water quality. Declines in groundwater levels are usually slow and often difficult to detect. This is especially true when several wells are pumping at the same time. The first sign of decline is typically dry wells, followed by a loss of water in deeper wells.
Management
Groundwater may be monitored by a network of observation bores (piezometers). Other information, such as metered groundwater use and rainfall, can be used to help interpret flow rates over time.
Groundwater may be managed in a licensing framework that records user information, measures and records groundwater levels, meters use, and applies rules, such as caps on allocation, restrictions in dry seasons, and transfers. Uncertainty regarding aquifer properties and the nature of recharge areas and how accessible these are to infiltration is a key challenge for effective groundwater management.
Assessment of Water Sources and Supply Risks at the National Level | 37
Schematic of subsurface water system in unconfined and confined aquifers
INSTITUTIONAL FUNCTIONS AND LEGAL FRAMEWORK
Key government functions for management of water resources include the following:
• Assessing surface and groundwater resources;
• Maintaining and monitoring a national network of gauging stations for surface water flow and weather data;
• Issuing licenses, permits, and fees for water usage and effluent discharge;
• Conducting analyses on water availability and supply risk;
• Evaluating impacts and pollution risk;
• Planning for development and conservation of water resources; and
• Ensuring dam safety and emergency preparedness.
The institutional structure as well as the legal and regulatory framework for the execution of these functions vary from country to country, which is further discussed in Chapter 5. A key observation is that advanced and comprehensive regulatory provisions require several competent and resourceful institutions and cannot be easily copied in emerging economies.
Key principles are commonly expressed in two laws:
• Water law. Establishes water as an economic and public good and sets out the policies and principles for its efficient management, development, and protection. It also identifies the competent authorities for management and licensing and the regulatory body for sector oversight.
• Environmental law . Establishes polices for protection of the environment. This includes surface and groundwater resources, ecosystems, and all aspects of the social environment, including human welfare, social fabric, and cultural heritage. Among other aspects, it sets requirements and procedures for assessment of environmental and social impacts (of which establishment of baseline conditions is an integral part), engagement of stakeholders, compensation, and restoration of livelihoods.
ESIA PROCESS
As discussed in chapter 2, oil and gas operations require access to water. The process of assessing water sources and the associated supply risk is usually part of an ESIA carried out by the operator as required by applicable environmental law, hydrocarbon law, and petroleum contract.
The ESIA relates to the project’s area of influence and aims to identify the social and environmental impact of project operations, including opportunities and impacts on other water users. It is a consultative process involving several iterations among nearby communities and other stakeholders. Figure 3.5 summarizes the critical steps of the ESIA process.
38 | WATER M ANA GEMENT IN O IL AND G AS O PERATION S
ESIA follows the host country’s statutory process for licensing. It starts with screening to determine the level of seriousness and is followed by scoping to determine study focus. This leads to the assessment, which establishes existing conditions and evaluates impacts, mitigation measures, and alternative development options. The next step is the management plan, which describes how the proposed mitigation measures will be carried out. The ESIA report describes the assessment process and forms the basis from which to seek an environmental permit from the government.
The key elements of an ESIA and ESIA report are listed in box 3.1.
The significance of risks is established by combining likelihood and expected impact (consequence) of a risk event, as illustrated in table 3.1. The significance rating signals how much attention the risk event will require during project development and implementation and the extent of control actions to be put in place.
Assessment of Water Sources and Supply Risks at the National Level | 39
RISK ANALYSIS
FIGURE 3.5
Source: Lesotho Water Commission 2018. Note: ESIA = Environmental and Social Impact Assessment. Screening Scoping Baseline studies Impact prediction and evaluation Assesment Mitigation Environmental social and management plan Environmental impact statement No assessment required Public consultation Consultation Consideration of alternatives Public consultation 1 2 3 4 5 7 6 8 No significant impact Impacts likely Decision to proceed or not
Steps of the ESIA process
BOX 3.1
Key elements of an ESIA and ESIA report
• Nontechnical summary. Summarizes significant impacts in a way that can be easily understood by a nontechnical audience.
• Project description. Concisely describes the main parameters of the proposed project or activity.
• Analysis of policy, legal, and administrative framework. Analyzes the policy, legal, and administrative framework within which the project or activity takes place.
• Stakeholder identification and analysis. Describes the potential impacts on stakeholders, and defines their involvement in the ESIA process.
• Environmental and social baseline. Outlines the environmental and social context in which the project operates.
• Assessment of environmental and social impacts (the heart of the ESIA). Describes the identified impacts, makes predictions of their probability, and assesses their significance.
• Analysis of alternatives. Assesses and compares feasible, less adverse, alternative technologies or operations.
• ESMP. Contains the strategy for managing risks and mitigating impacts.
• Results of stakeholder consultations. Outlines the results of consultations, with a focus on potentially affected groups, Indigenous peoples, and civil society.
Note: ESIA = Environmental and Social Impact Assessment; ESMP = Environmental and Social Management Plan.
Source: IUCN 2020.
Note: ESIA = Environmental and Social Impact Assessment.
NATIONAL WATER ASSESSMENT
A government assessment of available water resources within its area of jurisdiction applies the same approach as an ESIA but to a larger area, such as an entire river basin, aquifer system, or nation. In contrast to the company- or project-level impact assessment, the national-level assessment entails consideration of multiple and cumulative effects. The premise is that such higher-level assessments should be—but often are not—conducted before awarding licenses for specific oil and gas projects and is therefore an important basis for defining the framework conditions within which project-specific ESIAs and management plans can operate.
In Europe, the requirement to consider cumulative impacts as part of any ESIA process is specified in European Union-Energy Information Administration directive 85/337/EEC on the assessment of the effects of certain public and private projects on the environment, which came into force in 1985. Even though due consideration of cumulative impacts is enshrined in environmental protection laws worldwide, its application varies.
40 | WATER M ANA GEMENT IN O IL AND G AS O PERATION S
IMPACT LIKELIHOOD OF OCCURRENCE VERY UNLIKELY TO OCCUR (1) NOT EXPECTED TO OCCUR (2) LIKELY—COULD OCCUR (3) KNOWN TO OCCUR— ALMOST CERTAIN (4) COMMON OCCURRENCE (5) Severe (5) Moderate Substantial High High High Major (4) Low Moderate Substantial Substantial High Medium (3) Low Moderate Moderate Moderate Substantial Minor (2) Low Low Moderate Moderate Moderate Negligible (1) Low Low Low Low Low
TABLE 3.1 ESIA risk analysis matrix
Box 3.2 illustrates how alternative engineering solutions for petroleum production result in different environmental impacts, underscoring the importance of strategic planning and that authorities carry out such work to determine the appropriate terms and conditions that will apply in a given area or for a given petroleum license.
REQUIRED DATA, COLLECTION, AND PROCESSING
Collection and inventorying of climate and hydrological data enable subsequent assessments of resource availability and vulnerability to floods and droughts and is part of a country’s information management system for characterization and monitoring of its natural resources. For water resources, this consists of a network of monitoring points (gauging stations and boreholes) and a database of hydrological data, such as the following:
• Rainfall;
• Wind direction (short duration);
• Relative humidity;
• Solar radiation (hours per day);
• Temperature;
• Streamflow current meter measurements;
BOX 3.2
Minimizing the surface footprint of petroleum operations
New oil and gas well technologies make it both possible and economical to drill clusters of deviated wells from a single surface location. The illustration in Figure B3.2.1, panel a, shows vertical production wells in a field in Sudan, with a multitude of well pads and mud pits on the surface.
In the case of the fields to be developed in the vulnerable Murchison Falls National Park in Uganda,
FIGURE B3.2.1
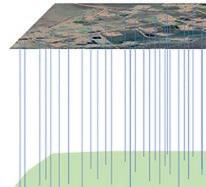
a limited number of well cluster locations have been defined to reduce the footprint and environmental impact of drilling and production operations (figure B3.2.1, panel b). Such alternative approaches will typically be established through an Environmental and Social Impact Assessment in conjunction with the approval of the plan for development and operation.
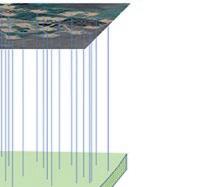
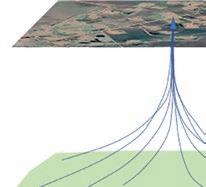

Assessment of Water Sources and Supply Risks at the National Level | 41
Comparison of separate vertical production wells with cluster of deviated production wells
Source: Developed by Bridge Consult, 2019.
a. Separate ver tical wells
b. Cluster of deviated wells
• Stage-discharge ratings;
• Water level (short duration);
• Mean daily discharge;
• Monthly runoff;
• Groundwater levels and pumping rates; and
• Water quality (electrical conductivity, turbidity, pH, and alkalinity).
Network and database design
Using network analyses or other statistical methods, the hydrometric network is designed to capture natural variations in meteorological and hydrological conditions. River-gauging stations are sited where the stage discharge relationship is stable over time. Groundwater observation wells are distributed to capture the zone of influence of relevant production wells.
Several vendors offer software solutions for archiving and analyses of national data. Solutions can be both stand-alone and available for multiple users via online access. Box 3.3 provides typical features and examples of two such systems.
Data acquisition and processing
A typical challenge in developing country settings is discontinuous and poor-quality data because decentralization, civil conflicts, or both have caused monitoring stations to lapse into various states of disrepair. Analyses of data consistency and patching of missing data may be done using modeling tools in the water resource system software. The challenge is even more compelling when it comes to groundwater data, given that this resource is invisible, not easily accessible, and understanding these data results from interpretations and incorporates a high degree of uncertainty.
Examples of programs for national hydrography
Key modules often found in applications for national hydrography:
• A time-series data management module that allows development of the climate and hydrology data archive
• A mapping interface to the central archive that allows access to time-series data at a particular location
• An interface for importing data from monitoring locations via telemetry in real time
• A system for managing groundwater data from wells and boreholes, including construction details, casing, screens, aquifers penetrated, lithology, geology, and other related information
• A task server module that provides for the automation of tasks, such as automated data auditing and report generation.
Examples of software solutions:
• The US Geological Survey manages national hydrography in the United States. The ongoing 3D Hydrography Program initiative not only integrates climate, surface, and groundwater data but also includes the capability for terrain and hydraulic modeling ( https://www.usgs.gov /national-hydrography/).
• In comparison, Hydata (version 4.2; https:// hydata.software.informer.com/) is a free-access, relatively simple system that has been adopted by many developing countries.
• The Southern Africa Development Community countries used Hydata 4.2 until 2012 when they began switching to Hydstra ( https://www.kisters .com.au/hydstra/) to upgrade analytical capacity and to facilitate the exchange of data between neighboring countries.
42 | WATER M ANA GEMENT IN O IL AND G AS O PERATION S
BOX 3.3
If recent rainfall data are hard to find, they can be acquired through the Tropical Rainfall Measuring Mission (TRMM) and used to support available local data. TRMM is an initiative of NASA (2018), and it provides daily and subdaily data on a 0.25 degree grid between the Tropic of Cancer and Tropic of Capricorn. Historical hydrometric records are assembled and processed and consist of the following:
• Recorded water levels at hydrometric sites (logger and manual),
• Mean daily discharge and short-duration flow at hydrometric sites (logger and manual),
• Stage-discharge rating curves for hydrometric stations and gauging measurements,
• Information on the type and characteristics of hydrometric stations, and
• Recorded sediment data and variation in water quality parameters. Information, design reports, and data can also be acquired from the water resources infrastructure. These data include the following:
• Dam inflows and releases,
• Dam operating rules,
• Irrigation abstraction amounts and seasonal profile,
• Water supply abstraction and seasonal profile, and
• Industrial abstraction and wastewater discharge.
• Earth Explorer (https://earthexplorer.usgs.gov/) and Shuttle Radar Topography Mission (https://lpdaac.usgs.gov /search/?query=SRTM+user+guide)
• Tropical Rainfall Measuring Mission (https://gpm.nasa.gov /missions/trmm)
• USGS Hydrosheds database (https://ww w.hydrosheds.org/)
• Google Earth (https://ww w.google.co.uk/intl/en_uk/earth /index.html)
• EROS Center (https://ww w.usgs.gov/centers/eros)
• GEMI Local Water Tool (http://w ww.gemi.org/localwatertool)
• University of Maryland’s Global Land Cover Facility (https:// geog.umd.edu/feature/global-land-cover-facility -%28glcf%29)
• IPCC projections of future climate change (https://ww w.ipcc .ch/)
Source: This table is original to this publication.
• Worldwide digital elevation data, previously available at 90-m × 90-m resolution but now upgraded to 30-m × 30-m resolution. Used to make a digital terrain model in ArcGIS or other GIS software as a basis for rainfall runoff modeling.
• Precipitation and weather radar measurements by satellite for tropics and subtropics (1997–2015). Input rainfall runoff model plus a wide range of other meteorological applications.
• Hydrological data and maps (watershed boundaries and drainage network) based on shuttle elevation derivatives at multiple scales
• Useful to gather aerial overview and location mapping
• Land satellite data for mapping and analyses of changes to land use (vegetation cover, urban expansion, industry development, etc.)
• Free tool for companies and organizations to evaluate the external impacts, business risks, opportunities, and management plans related to water use and discharge at a specific site or operation
• Repository of geospatial information for various terrestrial mapping applications
• Assessment reports on worldwide climate projections. Basis for country-specific regional and local projections.
Note: GIS = Geographical Information System; IPCC = Intergovernmental Panel on Climate Change; USGS = US Geological Survey.
Assessment of Water Sources and Supply Risks at the National Level | 43
Table 3.2 provides an overview of data sources that can be used to complement local data.
SOURCE DESCRIPTION
TABLE 3.2 Water data sources
WATER RESOURCE ASSESSMENT
Water resource assessment included hydrological modeling, area of influence, and development options.
Hydrological modeling
The basin forms a conceptual model of physical processes that can be represented in a numerical model for surface and groundwater, as illustrated in figure 3.6. Infiltrating water from precipitation and leakage from water bodies provide flux boundaries from which the model can be calibrated.
Which data and parameters to include depends largely on the part of the hydrological system being studied; they typically include hydrometeorological data, such as streamflow, groundwater levels, rainfall, temperature, humidity, wind speed, land cover, and demographic data.
Modeling is used to calculate storage and the rate of transfer of water between different compartments in the hydrological cycle, to analyze the quality of the data for consistency and gaps in the record, to extend the length of records, and to create a uniform time base for the streamflow data available in the river basin. Simulations are then conducted to determine yield and water balance, flood and drought characteristics, and impact of climate and land use changes.
Area of influence
Central to any river basin or system approach to modeling of water resources is the need to define areas of influence, which in turn will determine the nature and severity of impacts on the existing users and the environment. This entails
• Network flow model simulates prior appropriations–rules-based frameworks including reservoir operations
• Physically based hydrologic model simulates groundwater–surface water interaction resulting from dynamically determined network flows
• Conjunctive water use modeling
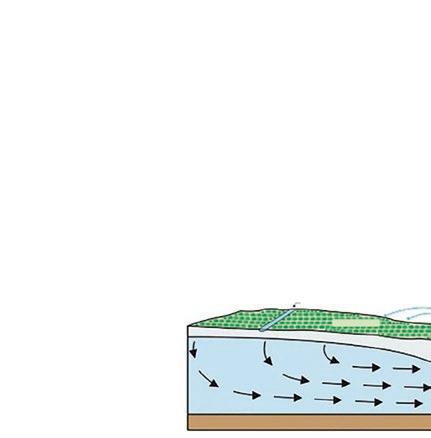
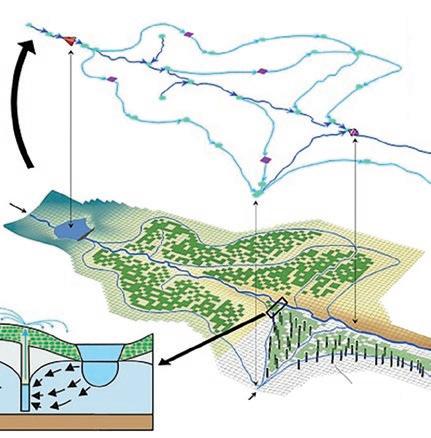

Source:
44 | WATER M ANA GEMENT IN O IL AND G AS O PERATION S
FIGURE 3.6
Example of a river basin and groundwater model
Morway, Niswonger, and Trianac 2016.
Unconfined aquifer Confining bed Water table Irrigation canal Main inflow Land surface Main river Tributary inflow Pumps Exit flow Points of common reference Legend Demand node System sink Reservior node with storage accounting Flow-through demand Main river, drains, and tributaries Canals Nonstorage node
that water demands and discharges for potential development options are compared with amounts available from the assessment of water balances in the drainage basin as a whole.
It is important to note that the degree to which a hydrological balance approach will work will depend on the timescale in which the system is replenished in relation to the timescale of the development under scrutiny. A yearly time step for a typical economic lifetime of 30 years will not work if the rate of recharge, such as for a deep aquifer, is on the order of hundreds of years or even thousands of years. In such cases, one will have to use methods that target the degree of change in groundwater drawdown, ensuring that it is acceptable in relation to other withdrawals.
The area of influence associated with water discharge points should also be considered, because discharged water may affect the hydrological functioning of the drainage basin or the quality of the water, thereby affecting the viability of water sources. For example, sourcing water from a river and disposing of waste to the subsurface is likely to have a very different effect on surface flows than using the same source but returning treated water to the river. These constraints and opportunities need to be considered where relevant and, in turn, may drive selection of the treatment processes and discharge arrangements.
Development options
The identification of development options starts with system simulations to mimic current behavior in the river basin, aquifer, or both. Analyses of yield to determine the recurrence interval of failure then follows. By applying expected changes in near-surface temperature and rainfall (from Intergovernmental Panel on Climate Change projections), the impact on streamflow and groundwater recharge from climate change is examined. Together with establishing inventories of users and their demand profiles, this provides the basis for defining development scenarios.
The water resources study that was carried by UNEP (2004) for the Lake Chad Basin illustrates this methodology. Water users are represented by the different hydrological compartments on which impacts occur, for example relevant river stretches, wetlands, lakes, and underlying aquifers. The regional water assessment for the Lake Chad Basin is summarized in box 3.4.
BOX
3.4
Regional water assessment of Lake Chad Basin
• The Lake Chad Basin is located in central Africa. It covers 8 percent of the surface area of Africa and is shared among the countries of Algeria, Cameroon, Central African Republic, Chad, Libya, Niger, Nigeria, and Sudan. The Chad Basin
consists of a number of transboundary waters that include three main aquifers and a network of catchment rivers.
Assessment of Water Sources and Supply Risks at the National Level | 45
• The Lake Chad Basin Commission has the responsibility to regulate and control the continued
utilization of water and other natural resources in the basin. Member countries are Chad, Niger, Nigeria, Cameroon, Central African Republic, and Sudan.
• The water problems are evident, with a 75 percent decrease in Chari River–Logone River flows, a 40 percent reduction in wetlands, and a 90 percent reduction in Lake Chad’s original surface area. It is also suspected that the Paleocene aquifer contributes to the lake water through upward discharge, with still unquantified but changing volumes.
• Under a UN Environment Programme project, Global International Waters Assessment performed an assessment of the Lake Chad Basin in 2004; the findings are illustrated in figure B3.4.1. The assessment recommended the following actions in priority order:
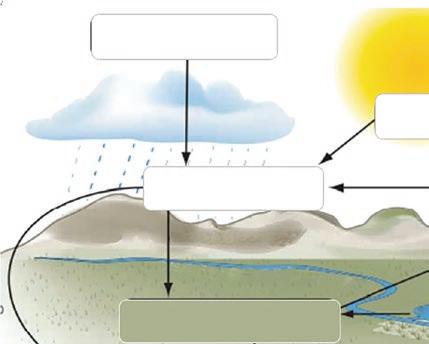
• Continued development of recommendations made by the Master Plan and Strategic Action Plan (1998)
• Implementation of the Global Environmental Facility’s Reversal of Land and Water Degradation Trends in the Lake Chad Basin Ecosystem project
• Negotiation, finalization, and ratification of a draft agreement on the equitable and reasonable allocation of water resources by member states
• Reinundation of the wetlands
• Maintenance and improvements in safety and efficiency of dams and streamflow to ensure effective implementation of the water allocation agreement
• Feasibility study of water conservation techniques suitable for selected project sites.
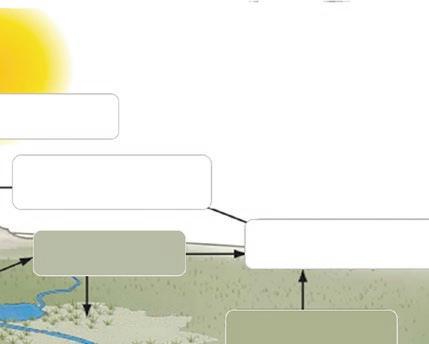

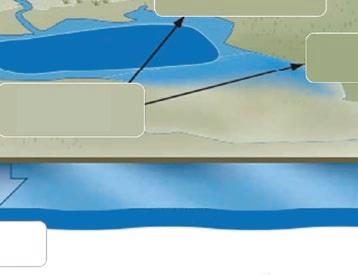
46 | WATER M ANA GEMENT IN O IL AND G AS O PERATION S
Box 3.4, continued
FIGURE B3.4.1
Illustration of Lake Chad Basin freshwater shortage concerns and the associated environmental and social impacts
LA KE CHAD C H A R I - L O G O N E R I V E R A Q U I F E R Natural climate variability Decreased rainfall Global climate change Reduced moisture rec ycling Reduced wetlands Habitat modification Changing fish species Decreased fish stocks Drying out of northern basin Reduced lake size Reduced streamflow 75% decrease in flows 40% reduction in area 20% reduction Irrigation and water supply Decreasing aquifer recharge W AZA - LO G ONE MA GA DA M Y aérés A D A MAW A M O U N T A I N S
Source: UNEP 2004.
WATER SUPPLY RISKS
For any water user, and, indeed, for oil and gas operations, the identification of sustainable freshwater sources is a key feasibility aspect of activity planning. Water security over time is critical because the life cycle of an oil- and gas-producing field could be 30 years.
Future variability
External factors controlling the availability of water over the lifetime of an oil and gas project are generally outside the project’s control. To ensure operational resilience, the potential range of variability in these factors should be understood, and appropriate mitigation of significant risks should be incorporated into the project design. Important factors to be considered include the following:
• Long-term changes to the local hydrological cycle. Climate change may have significant impacts on the quantity or quality of water resources in the area of interest.
• Demographic change, in terms of population density and distribution. Competition for local water resources is likely to be greater in the future because of increasing demand by agriculture, communities, or industrial water users, which may be given overriding interest.
• New or amended legislation that may affect permitted abstractions or discharges. Legislation or regulatory provisions can be subject to change, especially when the current regulatory framework is at a relatively low level of maturity. Increasingly restrictive legislation may be established in response to increasing pressure on resources.
Assessment of risks and impacts
Each potentially viable water supply option needs to be assessed separately. The impacts associated with the project can be quite different depending on the type of water source being considered: for example, desalination of brackish groundwater will have a different set of costs and benefits than use of treated municipal wastewater.
Depending on the regulatory environment, some form of ESIA may be required by legislation before a project can proceed. In this case, water aspects will form an integral part of the assessment process. Several possible water-related issues may affect water access; some are listed next.
Environmental impacts
Environmental impacts include the following:
• Streamflow reduction,
• Groundwater recharge capacity,
• Saltwater intrusion into freshwater supplies, and
• Flood retention capacity.
Assessment of Water Sources and Supply Risks at the National Level | 47
Economic impacts
Economic impacts include the following:
• Value of competing activities: agricultural production, hydropower generation, and others;
• Costs for cleaning poor-quality water;
• Regulatory fines for improper waste discharge and associated litigation, insurance, and so forth; and
• Business costs of standards, laws, and the like that affect the ability to operate, viability, and bottom line.
Social, cultural, and health impacts
Social, cultural, and health impacts include the following:
• Loss of access to shallow groundwater for farming, drinking, and cooking;
• Abundance of commercial fish species; and
• Loss of or establishment of floodplain or lakeshore farming opportunities.
BUILDING BLOCKS OF WATER MANAGEMENT AND GOVERNANCE
On the one hand, well-managed water resources can be a significant driver for growth and can generate huge benefits for human health, the environment, and the economy. On the other hand, badly governed water resources can significantly hinder growth, reduce opportunities for further development, put ecosystems at risk, cause societal disruption, create political instability, and impose economic costs.
Because water is an integral issue, it touches on different fields and disciplines, such as water system analysis, economics, water law, and public administration, which all need balanced attention. Integrated and sustainable water management is a complex challenge that needs the knowledge and experience of people in all these disciplines and the input of all interested stakeholders. Such an integrated approach would help achieve key management objectives, such as the following:
• Protection of water resources,
• Equitable access to clean water and sanitation,
• Protection against flooding,
• Protection of vulnerable ecosystems, and
• Economically sustainable development.
Obviously, each river basin, region, country, or water problem requires tailor-made solutions, but some common criteria make up the building blocks of sustainable water management. In 2014 a team from the Netherlands headed by Marleen van Rijswick of the Utrecht Centre for Water, Oceans and Sustainability Law documented 10 building blocks that make up an integrated framework for water management and governance (van Rijswick et al. 2014). The framework varies with different legislations and institutional structures, but the principal components remain a useful generic reference. The 10 building blocks are shown in figure 3.7.
48 | WATER M ANA GEMENT IN O IL AND G AS O PERATION S
CONCLUDING OBSERVATIONS
National authorities have the definite responsibility to assess and determine water resource availability and usage. Evidence-based documentation of water resources is the essential basis for sustainable water resource management at the national level and for formulating regulations for water-using activities in all sectors.
In terms of nonfrozen water volumes, there is about 30 times more groundwater than surface water on Earth. Because groundwater is generally present everywhere and is protected from contamination by filtration through porous rock layers, it is often a preferred drinking water source.
For oil and gas companies and other significant users of water, the primary source for water resource data are the national authorities, whose responsibilities are as follows:
• Assess surface and groundwater resources,
• Plan for development and conservation of water resources,
• Determine water availability and supply risk,
Assessment of Water Sources and Supply Risks at the National Level | 49
FIGURE
3.7
Multiple dimensions of water management and governance
Water management and governance Content
Water system knowledge 2. Values, principles, policy 3. Water allocation trade-offs 4. Stakeholder involvement 5. Responsibilit y, authorit y, means 6. Regulations and agreements 7. Financial arrangements 8. Engineering and monitoring 9. Compliance and enforcement 10. Conflict prevention and resolution Organization Implementation
Source: van Rijswick et al. 2014.
1.
• Issue licenses and fees for water usage and effluent discharge, and
• Evaluate impacts and pollution risk.
National authorities must develop institutions with the competence, tools, and capacity to execute these responsibilities.
The management of water must interact with the management of other resources that are essential for human well-being. Key resources include food, energy, and water and the systems through which these resources are produced, refined, distributed, and consumed. Key resources are closely linked in what is commonly referred to as the food-energy-water nexus. At the same time, government must balance the interests of different users of water, mainly agriculture, municipalities, and industries.
Because water is a cross-cutting sector, it touches on different fields and disciplines, such as water system analysis, economics, water law, and public administration, which all need balanced attention. Integrated and sustainable water management is a complex challenge that needs the knowledge and experience of people in all these disciplines and the input of all interested stakeholders.
It follows that water abstraction and discharge in the oil and gas sector cannot be left to the oil companies, however competent they are. In the planning of oil and gas field development and production, the process of assessing water sources and the associated supply risk is usually part of an ESIA. The ESIA is an essential tool a government has at its disposal to support the implementation of regulations. When applied to policies and regional development plans through Strategic or Cumulative Impact Assessments, the ESIA helps to set terms and conditions for how oil and gas companies seeking to develop specific projects can operate in an environmentally and socially sound manner.
REFERENCES
Bridge Consult. 2019. “Drill Waste and Hazardous Waste.” Unpublished report submitted to the Sudan Ministry of Petroleum and Gas, General Directorate of Environment, Safety and Health, as part of a Sudan Petroleum Waste Management Project funded by the Norwegian Environment Agency. Nesøya, Norway: Bridge Consult.
IUCN (International Union for Conservation of Nature). 2020. Assessment, Management and Monitoring of Environmental and Social Risks: Guidance Note. Gland, Switzerland: International Union for Conservation of Nature. https://www.iucn.org/sites/default /files/2022-05/esms-assessment-management-and-monitoring-of-environmental-and -social-risks-guidance-note.pdf
Lesotho Water Commission. 2018. ESIA for Zones 2 and 3 of the Lesotho Lowlands Water Development Project. Washington, DC: World Bank Group. https://documents1.worldbank .org/curated/en/949961554111424140/pdf/ESIA-for-Zones-2-and-3-Executive-Summary .pdf
Miller, G. Tyler, Jr., and Dave Hackett. 2013. Living in the Environment. 3rd ed. Toronto: Nelson College Indigenous.
Morway, Eric D., Richard G. Niswonger, and Enrique Trianac. 2016. “Toward Improved Simulation of River Operations through Integration with a Hydrologic Model.” Environmental Modelling & Software 82: 255–74. https://doi.org/10.1016 /j.envsoft.2016 .04.018
NASA (National Aeronautics and Space Administration), Goddard Space Flight Center. 2018. “TRMM: Tropical Rainfall Measuring Mission.” http://trmm.gsfc.nasa.gov/.
50 | WATER M ANA GEMENT IN O IL AND G AS O PERATION S
Pacle, Karen. 2020. “Potentiometric Surface.” Geo Forward. https://www.geoforward.com /potentiometric-surface/
Shaver, Earl, Richard Horner, Joseph Skupien, Chris May, and Graeme Ridley. 2007. Fundamentals of Urban Runoff Management: Technical and Institutional Issues. 2nd ed. Madison, WI: North American Lake Management Society. http://www.lake.wateratlas.usf .edu/upload/documents/Fundamentals%20of%20Urban%20Runoff%20Management%20 Technical%20and%20Institutional%20Issues.pdf
UNEP (United Nations Environment Programme). 2004. Global International Waters Assessment: Lake Chad Basin, GIWA Regional Assessment 43. Kalmar, Sweden: University of Kalmar. https://wedocs.unep.org/20.500.11822/8808
University of Florida. 2019. “The Water-Food-Energy Nexus.” Gainesville: College of Design, Construction and Planning, University of Florida. https://dcp.ufl.edu/urp/food-water -energy-nexus-grant/
UN-Water (United Nations Task Force on Water Security). 2013. Water Security and the Global Agenda: Summary for Decision-Makers. Geneva: UN-Water. https://www.unwater.org /app/uploads/2017/05/water_security_summary_Oct2013.pdf
Utah Geological Survey. n.d. “Groundwater & Aquifers.” Accessed September 6, 2023. https://geology.utah.gov/water/groundwater/groundwater-aquifers/
van Rijswick, Marleen, Jurian Edelenbos, Petra Hellegers, Matthijs Kok, and Stefan Kuks. 2014. “Ten Building Blocks for Sustainable Water Governance: An Integrated Method to Assess the Governance of Water.” Water International 39 (5): 725–42. https://doi.org/10.1080/0250 8060.2014.951828.
Water Science School. 2019. “The Distribution of Water on, in, and above the Earth.” US Geological Survey. https://www.usgs.gov/media/images/distribution-water-and -above-earth
Assessment of Water Sources and Supply Risks at the National Level | 51
4
Water Treatment Technologies and Their Possible Impact on Water Management Options
OVERVIEW
This chapter discusses how new and emerging technologies may affect water management options. Oil companies strive to reduce and ideally eliminate freshwater intake by increasing recycling of produced water (PW) and using municipal water when appropriate. The realism of this approach depends on the capability to treat nonfresh water and wastewater to the required specification for water injection, hydraulic fracturing, or other uses. Each water source may contain different compounds, which must be altered according to water quality requirements. A particular issue is the treatment required to reuse PW outside oil and gas operations. Realistic options include irrigation for food crops, irrigation for non–food crops, livestock and wildlife, and aquifer discharge.
WATER TREATMENT INTRODUCTION
The treatment of PW depends on the intended use. A study of the US PW treatment sector contains an assessment of 54 technologies (original and combined treatment processes) based on intended use and associated cost (CSM 2009). Capital costs for treatment facilities are rarely disclosed, as are operation and maintenance costs. In a rare study on the topic, the total cost of separation, treatment, and disposal of water in the oil industry worldwide was estimated to be about US$50 billion per year (Hill, Monroe, and Mohanan 2012).
In water-stressed areas, the surplus produced should, if possible, be made available for external use (outside of oil and gas operations). In the United States, a mere 1.3 percent of PW is reused for external purposes (refer to chapter 1, “Facts and Trends in Freshwater Abstraction and Produced Water Generation and Use”).
53
Source: Zhang 2019.
The availability of fresh water is a growing challenge in some regions of the world. Major oil companies take these challenges seriously and recognize their need to preserve fresh water for multiple beneficial uses. They report operations in water-scarce areas in their annual sustainability reports. They strive to reduce and ideally eliminate freshwater intake for their operations by increasing recycling capacity and using municipal water when appropriate. From an oil- and gas-producing company’s point of view, two types of risks related to water can be identified:
• Risk of water unavailability for the project and operations, and
• Risks from projects and operations to external water resources.
Addressing both risks relies heavily on the capability to treat the water to the required specification to support hydrocarbon production (such as waterflooding) or to discharge PW, for instance, to surface water. Each water source, either external water or PW, contains many different compounds that might need to be altered on the basis of water quality requirements.
Figure 4.1 illustrates the relationship among water source, treatment, and discharge or reuse of water. There is a range of possible water sources, with a variety of water characteristics, contributing to the exploration and production of oil. The key characteristics to consider when evaluating an external or internal water source for PW are availability, transport requirement, and water quality (the capability to treat the water to a certain specification), as per table 4.1.
54 | WATER M ANA GEMENT IN O IL AND G AS O PERATION S
FIGURE 4.1
External reuse Further treatment Oil or TSS removal PW for injection PW chemical EOR PW for steam generation, boiler, or stimulation Discharge PW, flowback water, or wastewater Ex ternal water for injection Water for steam or EOR Injec tion water for fracturing and stimulation External water source Municipal wastewater River Well water Sea Exploration & Production
Typical water source and application schematic for treating PW in upstream operations
PW
produced water; TSS
total suspended solids.
Note: EOR = enhanced oil recovery;
=
=
KEY CHARACTERISTICS DESCRIPTION
Availability How much water can be sourced, and where and when, without causing undesirable impacts on other water users?
Transport Balance water source availability and project and operations requirements.
Brine content, temperature, and pressure
Solids loading
Dissolved gases
Microbial content
Radionuclides (NORM)
Dispersed hydrocarbon
May lead to interaction with process facility and reservoir formation water (for example, corrosivity, precipitation, and water–rock interactions).
The impact of heavy metals concentration (for example, mercury, lead, arsenic, and chromium) needs to be considered.
May lead to process facility blockages and reservoir impairment during injection.
Gases such as oxygen, hydrogen sulfide, and carbon dioxide and the hydrocarbon gas methane are related to toxicity, precipitation, and corrosivity.
Seaweed and algae can be a considerable issue for seawater intakes and for some rivers and lakes as well. Seasonal plankton bloom can disturb filtration operations. Microbial content could lead to the formation of hydrogen sulfide (which is toxic and corrosive) in the reservoir and at the surface facilities.
Reservoir waters may contain concentrations of radionuclides that could end up as scale precipitation and may require special removal and disposal measures.
These oil droplets can impair a production reservoir near a wellbore.
Source: This table is original to this publication.
Note: NORM = naturally occurring radioactive material.
WATER TREATMENT REQUIREMENTS FOR INTERNAL USE OF WATER BY OIL AND GAS COMPANIES
Different water sources are used in the oil and gas industry. Depending on the composition of the water source and the required water quality to produce oil and gas, dedicated water treatment equipment is required. Additionally, water treatment is required to sustain the integrity of the facility and conform to environmental regulations. The applications that use large volumes of water to improve oil and gas recovery are as follows:
• Water injection for waterflooding (secondary recovery);
• Water injection for enhanced oil recovery (EOR; chemical and thermal); and
• Water for hydraulic fracturing for unconventional production (ultratight reservoir rocks).
Besides these three water reuse applications, onshore surplus PW is discharged into non-hydrocarbon-bearing reservoirs, typically deep saline aquifers. For this purpose, similar water treatment equipment is required for waterflooding. When defining the design basis for waterflooding, EOR, and hydraulic fracturing, the following factors should be addressed and mitigated:
• Injectivity impairment and formation damage,
• Scaling (fluid-fluid incompatibility),
• Reservoir souring (formation of hydrogen sulfide by microbial organisms),
• Compatibility with EOR and fracturing chemicals (not required for waterflooding), and
• Mobility compared with the hydrocarbons in the reservoir (EOR only).
These general factors have a direct impact on the water quality and the system design, specifically equipment selection and the production chemicals applied. When focusing on injection water quality, the parameters in table 4.2 should be included as a minimum.
Water Treatment Technologies and Their Possible Impact on Water Management Options | 55
TABLE 4.1 Key characteristics of external water sources or produced water to consider to support the oil and gas industr y
PARAMETERS
Suspended solids
Ionic composition
Oxygen
Microorganisms
Temperature
WATER SOURCE
All water sources
All water sources
Mainly surface water
All water sources
All water sources
Production chemicals (to meet regulatory requirements) All water sources
Dispersed oil (to meet regulatory requirements) Produced water only
Dissolved oil components (to meet regulatory requirements)
Source: This table is original to this publication.
Produced water only
The variety of parameters depends on the source of the water and its composition. It is important to carefully characterize this water, which is relatively easy for surface water but more difficult for reservoir waters, which are often sampled at elevated pressure or temperature and undergo compositional changes when brought to the surface. The following sections discuss the main combinations of water sources and their application for internal use:
• Seawater treatment for waterflooding,
• PW treatment for waterflooding,
• PW treatment for chemical and thermal EOR, and
• PW treatment for hydraulic fracturing.
Seawater treatment for waterflooding
Seawater is commonly used for water injection to produce more hydrocarbons in offshore locations, but it is also used for coastal conventional oil production in onshore facilities. An example is seawater injection through a 48-kilometer pipeline for waterflooding in the North Kuwait reservoirs (Al-Marri et al. 2009). Figure 4.2 shows a typical seawater treatment line-up. The sulfate removal step is optional and only used when severe inorganic scaling or reservoir souring is present.
As can be seen in figure 4.2, seawater treatment not only involves equipment, such as solids filtration and an oxygen removal step, but also includes several production chemicals to condition the water for injection and facility integrity. It is important to execute a monitoring program to control water quality, especially because seawater is likely to vary in quality depending on the time of the year. The contaminants removed from seawater end up in the waste streams, such as the filter backwash and membrane reject streams.
PW treatment for waterflooding
Because most oil-producing fields require waterflooding to extend their production, onshore fields mostly rely on PW as their water source during the lifetime of an oil-producing operation. The early stage of waterflooding could be executed with other water sources, such as seawater or deep aquifer water, to make up the required injection volumes, but eventually PW will be sufficient because this water source is available when the water-to-hydrocarbon ratio (water cut) starts to increase.
56 | WATER M ANA GEMENT IN O IL AND G AS O PERATION S
TABLE 4.2 Injection water quality parameters
lift pumps
Solids filtration: screens and cartridge
Hypochlorite generator
Multiple production chemicals
Ox ygen removal tower
Sulphate removal membranes
Only applied in case of severe scaling and souring
Cleaning PW for reinjection purposes is more cumbersome because more compounds are present in the PW, as indicated by the key characteristics of PW for injection purposes (refer to table 4.2). The main issue is the combination of solids and oil in the PW because these two constituents often interact with each other and form a sticky substance (schmoo) that is difficult to remove by any treatment equipment.
Figure 4.3 shows that several production chemicals are required to enhance the separation of the water from the oil and solids to prevent or reduce impairment during injection and to safeguard the integrity of the facility. In general, the majority of the PW reinjection schemes only require primary separation, such as skim tanks, plate interceptors, gas flotation vessels, or hydrocyclones to obtain the specified injection water quality.
However, if the reservoir requires cleaner water, additional water treatment filters could be added, such as nutshells, media, and cartridge filters. Media and cartridge filters are less successful (and have very limited applications) with PW because oil is present. To complement the water treatment equipment for PW, a hydrogen sulfide stripping tower can sometimes be included in the case of sour PW.
PW treatment for chemical and thermal EOR
When oil production declines even with waterflooding practices, an additional step can be included to enhance oil recovery. This step is called tertiary recovery, better known as EOR. Two types of EOR are applied that require water: (1) chemical EOR and (2) thermal EOR. These operations can only be executed when the oil price is sufficiently high enough to cover the cost of the additional equipment and chemicals required. According to IEA (2018), only 2 percent of the global oil supply is produced by EOR, and that percentage has been stable even when oil prices are high. EOR remains a niche business.
Seawater injection pumps
Reservoir
Water Treatment Technologies and Their Possible Impact on Water Management Options | 57
FIGURE 4.2
Typical seawater treatment line-up
Source: This figure is original to this publication.
Seawater
Seawater
Gas, oil, and water separation
Multiple production chemicals
Oil removal: skim tanks and plate interceptors
Oil removal: gas flotation vessels or hydrocyclone
Only applied with difficult water and low-permeable reservoir
Solids removal: nutshell filter vessel, media filter vessel, and cartridge filter
PW injection pumps
Chemical EOR involves flooding a reservoir with a chemical cocktail of alkali, surfactants, polymers, or all of these. Most chemical EOR applications are temporary pilots. There are examples of full-field applications in China and Oman. In comparison with typical PW treatment, chemical EOR’s only addition is hardness removal equipment to reduce calcium and magnesium levels for chemical compatibility purposes (refer to figure 4.4).
IEA (2018) estimates that production of thermal EOR is twice that of chemical EOR. Thermal EOR usually involves burning natural gas to produce steam, which is injected into the reservoir to heat heavy oil and reduce its viscosity and increases the recovery from the reservoir.
Figure 4.5 shows the two options to generate steam for injection. Both require de-oiled PW, which can be achieved by the process line-up shown in figure 4.3. The next steps are to remove compounds in the PW that would hamper the generation of steam. This can be executed either by removing compounds through softening and filtration or by evaporation. Again, multiple production chemicals are required to execute these processes.
Solar evaporation–generated steam is currently used in EOR as well (Palmer and O’Donnell 2014). Mirrors are used to reflect and concentrate sunlight, which is converted to heat (refer to photo 4.1). This heat is then used to produce steam directly from locally produced PW. It combines evaporation and steam generation in one system. One of the principal benefits of using solar energy for thermal EOR is the reduced energy costs and carbon footprint of the crude oil produced.1
PW treatment for hydraulic fracturing
To produce unconventional hydrocarbons from ultratight rock, hydraulic fracturing activities are required to extend the drainage area by connecting artificial and natural fractures that establish sufficient permeability for production. Water treatment is required to enhance the compatibility of the PW with fracturing fluid chemicals. The PW from unconventional operations contains
58 | WATER M ANA GEMENT IN O IL AND G AS O PERATION S
FIGURE 4.3
Typical PW treatment line-up for PW reinjection
Source: This figure is original to this publication. Note: PW = produced water.
PW from reservoir Reservoir
FIGURE 4.4
Multiple production chemicals
Gas, oil, and water separation
PW from reservoir
Oil removal: skim tanks and plate interceptors
Oil removal: gas flotation vessel or hydrocyclone
Applied with difficult water and low-permeable reservoir
Solids removal: nutshell filter vessel, media filter vessel, and cartridge filter
Hardness removal (sof tener)
Alkaline, sur factant, and polymer facility
PW injection pumps
Reservoir
Source: This figure is original to this publication.
Note: EOR = enhanced oil recovery; PW = produced water.
FIGURE 4.5
Multiple production chemicals
Reservoir
Multiple
chemicals
Reservoir
Source: This figure is original to this publication.
Note: EOR = enhanced oil recovery; PW = produced water.
Water Treatment Technologies and Their Possible Impact on Water Management Options | 59
Typical PW treatment line-up for chemical EOR
Typical PW treatment line-up for thermal EOR
production
Lime softening De-oiled PW De-oiled PW Solids filters Evaporation system Steam generation Weak acid cationic exchange sof tening Steam generation Vapor liquid separator

Land surface
Coalbed methane
Conventional gas
Conventional oil
Confining layer
Sandstone
components remaining from previous hydraulic fracturing operations (that is, polymeric gels), and these components must often be removed to be able to use the PW as mixing water for new hydraulic fracturing treatments. The latter results in additional water treatment equipment compared with conventional PW treatment. Horizontal drilling has enabled wider use of oil- and gas-rich shale, and it typically requires hydraulic fracturing operations to enable production (refer to figure 4.6) and a typical line-up for unconventional operations (refer to figure 4.7).
60 | WATER M ANA GEMENT IN O IL AND G AS O PERATION S
PHOTO 4.1
Miraah solar plant delivers first steam to Amal West Oil Field
Source: © Petroleum Development Oman. Used with the permission of Petroleum Development Oman. Further permission required for reuse.
FIGURE 4.6
Horizontal drilling in oil- and gas-rich shale
Source: US EPA 2015.
Oil- or gas-rich shale
Tight sand oil
Tight sand gas
FIGURE 4.7
Typical produced water treatment line-up for unconventional operations
Multiple production chemicals
Gas, oil, and water separation
Oil removal: skim tanks and plate interceptors
Oxidation, coagulation, or flocculation
Oil and solids removal: gas flotation vessel
Solids removal: media filter vessel, car tridge or bag filter
PW from reservoir
Source: This figure is original to this publication.
FIGURE 4.8
Removal steps for use of seawater and PW in oil and gas operations
Seawater injection
Solids
PW reinjection
PW chemical EOR injection
Solids
PW thermal EOR injection
Solids
PW hydraulic frac turing injection
Solids Removal steps
Increasing costs per m3 water
Source: This figure is original to this publication.
Note: EOR = enhanced oil recovery; PW = produced water.
Calcium, magnesium, and iron
Calcium, magnesium, and iron Alkalinity and silica
Calcium, magnesium, and iron
Alkalinity and silica Salt
When all these water treatment steps are combined for these main internal reuse applications, it is obvious that EOR and hydraulic fracturing requires more removal steps and will therefore be more costly per cubic meter of water injected (refer to figure 4.8).
Applied in case of incompatibility with fracturing fluid
Hardness removal (sof tener)
Desalination treatment
Hydraulic fracturing in reservoir
Water Treatment Technologies and Their Possible Impact on Water Management Options | 61
Oil
Solids Oil
Oil Oil
WATER TREATMENT REQUIREMENTS FOR EXTERNAL USE OF WATER BY OIL AND GAS COMPANIES
The use of PW outside the oil and gas industry tends to add water treatment steps. To evaluate reuse applications, the process flow diagram depicted in figure 4.9 has been proposed by the New Mexico Produced Water Research Consortium and used to structure and test proposed treatment systems (Hightower et al. 2022). A similar decision tree could be used to identify fitfor-purpose water treatment equipment requirements in connection with oil and gas operations.
When it is known what chemical compounds must be removed to meet a certain maximum limit, then dedicated water treatment equipment can be sourced. This chapter describes the different reuse applications and the required water treatment equipment. The following sections discuss in detail the categories and typical applications for PW:
• Irrigation for food crops,
• Irrigation for non-food crops,
• Livestock and wildlife,
• Aquifer recharge,
• Winter ice control and dust control, and
• Lithium production
Figure 4.10 illustrates the typical decisions an oil company faces when considering the use of PW: disposal (surface water discharge, groundwater recharge), internal use (for example, hydraulic fracturing), or external use by local stakeholders (irrigation, municipal, and industrial use). This section discusses the main examples of external uses of PW.
62 | WATER M ANA GEMENT IN O IL AND G AS O PERATION S
FIGURE
4.9
Fit-for-purpose reuse evaluation process
Infrastructure for delivery and treatment Water quality sampling and analysis Treatment, pre- and posttreatments Monitoring cost, water quality, and waste generation Toxicology or risk assessment Make changes and reassess No YesApplication Sufficient performance ?
Source: Hightower et al. 2022.
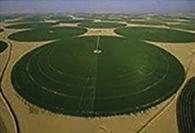
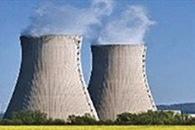
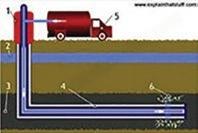
Irrigation for food crops

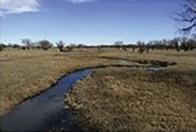
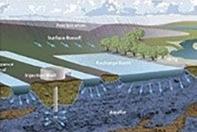
Drylands occur on all continents and cover 41 percent of the earth’s landmass (Millennium Ecosystem Assessment 2005). In drylands, agriculture is a major economic activity. Many drylands contain hydrocarbon resources, as shown in map 4.1 (Echchelh, Hess, and Sakrabani 2018). Examples in which PW from the oil and gas industry have been used for small- and large-scale irrigation are found in different parts of the world.
Conventional oil and gas treatment shows that oil can be removed to sufficiently low values and is a minor hazard for soil compared with salt and heavy metals. Additionally, oil will be further biologically degraded in the soil. The most challenging components of PW are dissolved minerals, such as salts, including sodium and other metal ions, because these elements can accumulate in the soil during agriculture irrigation. The latter can create salinization and sodification of soils. Unsustainable levels of minerals for crops can be the result if the PW used in irrigation is not applied properly. Table 4.3 shows the guidelines for irrigation water quality parameters as described by the Food and Agriculture Organization of the United Nations (FAO-UN).
Besides salinity, which can inhibit food growth, the accumulation of heavy metals, such as boron, copper, and zinc, can be harmful for humans when they accumulate in the food being produced. According to FAO-UN standards, the two main solutions to obtain acceptable water are to blend PW with low-salinity fresh water or desalinated PW. In areas in which water is scarce, the value of water is high, and desalination can be justified. Selecting salt-tolerant crops can
Water Treatment Technologies and Their Possible Impact on Water Management Options | 63
FIGURE 4.10
Possible uses of produced water
Source: Scanlon et al. 2020.
Surface water discharge
Groundwater recharge
Hydraulic fracturing
Industrial use
Irrigation use
Produced water
Municipal
use
MAP 4.1
Distribution of drylands and main oil and gas production zones in these areas
Aridity zones (P/PET <0.05) (P/PET = 0.05–0.20) (P/PET = 0.20–0.50) (P/PET = 0.50–0.65) (P/PET ≥0.65)
Hyperarid
Arid
Semiarid
Dry subhumid
Excluded presumed drylands
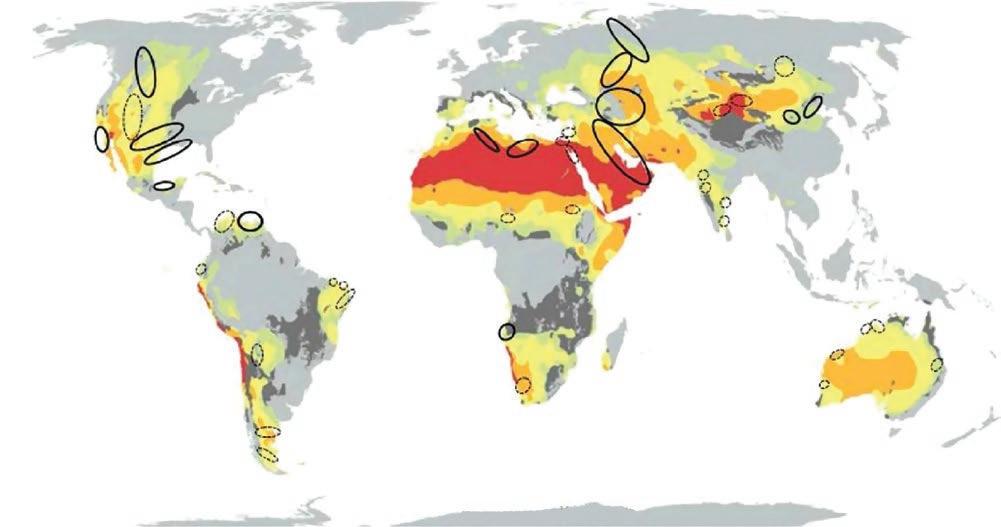
Some major O&G production areas in drylands
Some minor O&G production areas in drylands
Coal seam gas and coal to liquid are included.
Source: Echchelh, Hess, and Sakrabani 2018.
Note: O&G = oil and gas; P/PET = average annual precipitation/potential evapotranspiration.
TABLE 4.3 FAO-UN guidelines for irrigation water quality parameters
Source: Bhatti et al. 2019.
Note: dS/m = deciSiemens per meter, which indicates the salinity of water on the basis of its conductivity; EC = electrical conductivity; meq/l = milliequivalent per liter, which measures the concentration or equivalent weight of an ion or substance in a given volume of water and is calculated by dividing the milligrams per liter by the equivalent weight of the ion or substance; FAO-UN = Food and Agriculture Organization of the United Nations; SAR = sodium adsorption ratio.
64 | WATER M ANA GEMENT IN O IL AND G AS O PERATION S
POTENTIAL IRRIGATION PROBLEM PARAMETERS DEGREE OF RESTRICTION ON USE NONE SLIGHT TO MODERATE SEVERE Salinity Electrical conductivity dS/m <0.7 0.7–3.0 >3.0 Total dissolved solids <450 450–2,000 >2,000 Infiltration based on SAR and EC SAR EC (dS/m) 0.3 >0.7 0.7–0.2 <0.2 3–6 >1.2 1.2–0.3 <0.3 6–12 >1.9 1.9–0.5 <0.5 Toxicity Sodium (meq/l) <0.3 3–9 >9 Chloride (meq/l) <4 4–10 >10 Miscellaneous effects Bicarbonate (meq/l) <1.5 1.5–8.5 >8.5 Potassium (mg/l) 0–2 pH 6.5–8.4
increase the use of PW. Adding soil ameliorants, such as gypsum and sulfur, can help to mitigate the undesirable effect of high salinity as well.
Irrigation for non–food crops
Growing salt-tolerant non–food crops has been the topic of many studies. Most of these studies to date are pilots, based on the available literature. Each of the non–food crops (as with food crops) have their PW intolerances. Table 4.4 shows successful crop irrigation examples and the water quality required, based on oil and salinity. Table 4.4 also shows other crops that were less successful.
Livestock and wildlife
An example of the use of PW for livestock and wildlife is the Powder River Basin (Montana and Wyoming), where irrigation using treated PW from coalbed methane wells is used to restore overgrazed rangeland or produce livestock forage. Some treated coalbed methane water is used to provide drinking water for livestock and wildlife. Livestock can tolerate a range of contaminants in their drinking water, although at some concentrations the animals will begin to show some impairments. However, at high levels some salts and elements may reduce animal growth and production or may cause illness and death. An abrupt change from low-salinity water to high-salinity water may cause animals harm, whereas a gradual change would not. Animals can consume high-salinity water for a few days without harm if they are then given low-salinity water. Animal tolerance also varies with species, age, water requirement, season of the year, and physiological condition. From a salinity standpoint, livestock drinking water can be arranged according to table 4.5.
COUNTRY (REGION) QUALITY OF PW CROP IRRIGATED WATER TREATMENT SOURCE
Oman 7,000–8,000 mg/l TDS <0.5 mg/l oil
Qatar 45,000 mg/l NaCL ~700 mg/l TOC
Cotton, perennial trees, turfgrass (Paspalum vaginatum, Distichlis spicata)
Turfgrass (Cynodon dactylon and Paspalum sp.)
United States (Texas) 2,470 mg/l TDS Cotton
Yemen 15,000 mg/l NaCl <0.25 mg/l oil Cotton
Full oil removal by reedbed; pilot
Prigent et al. 2016
Blending of 30% PW with 70% tap water; pilot
Full oil removal and desalination and blending with groundwater; pilot
Full oil removal by reedbed in greenhouse; pilot
Source: This table is original to this publication, based on sources cited in the table.
Shaikh et al. 2020
MitchellMcCallister et al. 2020
Rambeau et al. 2004
Note: NaCl = sodium chloride; PW = produced water; TDS = total dissolved solids; TOC = total organic carbon.
Water Treatment Technologies and Their Possible Impact on Water Management Options | 65
TABLE 4.4 Cases of successful irrigation of non–food crops with PW
TDS (MG/L)
<1,000 (EC < 1.5 dS/m)
LIVESTOCK WATERING COMMENTS
Excellent for all classes of livestock
1,000–2,999 (EC = 1.5–5 dS/m) Very satisfactory for all classes of livestock. May cause temporary mild diarrhea in livestock not accustomed to it.
3,000–4,999 (EC = 5–8 dS/m)
Satisfactory for livestock but may cause temporary diarrhea or be refused at first by animals not accustomed to it.
5,000–6,999 (EC = 8–11 dS/m) Can be used with reasonable safety for dairy and beef cattle, sheep, swine, and horses. Avoid use with pregnant or lactating animals.
7,000–10,000 (EC = 11–16 dS/m) Considerable risk in using for pregnant or lactating cows, horses, or sheep or for the young of these species. In general, use should be avoided, although other ruminants, horses, poultry, and swine may subsist on it under certain conditions.
>10,000 (EC > 16 dS/m)
Considered unsatisfactory for all classes of livestock.
Source: Adapted from Tanji and Kielen 2002.
Note: EC expressed in micromhos per centimeter at 25ºC can be substituted for TDS without introducing a great error in interpretation EC = electrical conductivity; TDS = total dissolved solids.
Source: Adapted from Tanji and Kielen 2002.
Additionally, there is a limit to the concentration of toxic ions for animals. Tanji and Kielen (2002) prepared guidelines on the safe level of toxic inorganic elements in livestock drinking water, as presented in table 4.6.
Aquifer recharge
In some areas, groundwater withdrawal occurs at a faster rate than recharge, which is not sustainable. Depletion can reduce groundwater quality, quantity, or both. Where feasible, use of treated PW could prove beneficial. In Wellington, Colorado, treated PW from conventional oil wells is used to augment shallow aquifers for storage and recovery projects to maintain groundwater supplies in the region (GWPRF 2003). To allow for shallow aquifer storage, the PW is treated through dissolved air floatation, prefiltration, ceramic microfiltration, and activated carbon. Other examples of groundwater recharge in the United States are Riverton, Wyoming (Tight Sands; Stewart, Stewart, and Gutherie 2017) and Savory, Wyoming (coalbed methane).
66 | WATER M ANA GEMENT IN O IL AND G AS O PERATION S
TABLE 4.5 FAO water quality guidelines for livestock and poultry uses
SUBSTANCE UPPER LIMIT (MG/L) SUBSTANCE UPPER LIMIT (MG/L) Arsenic 0.025 Nickel 1.0 Boron 5.0 Nitrate + Nitrite (NO3-N + No2-N) 100.0 Cadmium 0.05 Nitrite (NO2-N) 10.0 Chromium 0.05 Selenium 0.05 Copper 0.5 mg/l for sheep, 1.0 mg/l for cattle, and 5.0 mg/l for swine and poultry Uranium 0.2 Lead 0.1 Vanadium 0.1 Mercury 0.01 Zinc 24 Molybdenum 0.5
TABLE 4.6 Guidelines for upper levels of toxic substances in livestock drinking water
Winter ice control and dust control
Some states in United States (Connecticut, North Dakota, and Ohio) have allowed the spreading of highly saline PW on roads for winter ice control (oil and gas well brine). The US EPA has recommended against this practice because the water may contain other pollutants in addition to salt. Michigan has the longest practice (from the early days of oil and gas development) until the early 1950s, when the industry demand ended. Highly saline water has also been allowed for dust control in summer on unpaved roads. The ineffectiveness and environmental and health impacts of this practice are discussed in the “Concerns with External Use of PW” section.
Lithium production
Another application for the reuse of PW besides treated water is the extraction of metal lithium for use in batteries for electrical vehicles and other electronics. With the growing deployment of lithium, demand for it is increasing; lithium can be recovered from oil and gas PW using adsorbents, membranes, and electrolysis-based systems (GWPRF 2003). The advantage of lithium from PW is that no additional wells need to be drilled. Important for the region is the ownership of the PW to establish who will benefit from the lithium revenue—the oil and gas companies or the local authorities and communities. To illustrate, estimates of the resource range of lithium in unconventional oil and gas fields in the United States are provided in Kumar et al. (2019). Lithium can be produced from conventional oil production as well, where larger PW volumes are often generated. The total amount of lithium shown in figure 4.11 can be compared with small
FIGURE 4.11
Water Treatment Technologies and Their Possible Impact on Water Management Options | 67
Source: Kumar et al. 2019. Note: Estimates are expressed in metric tonnes of Li metal equivalent. Li = lithium. 0 MississippiLime Estimated resource range (metric tonnes Li metal equivalent) US oil and gas formations WoodfordMarcellusAvalonandBoneSpringDelawareDevonian(TX)WolfcampPicturedCliffsTuscaloosaAustinChalkEagleFordEdwardsBakken 50 100 150 200 250
Estimated resource range in wastewater from unconventional oil and gas formations in the United States
lithium deposits (several thousand tonnes of lithium). It is important to analyze the quality of PW and investigate whether recovering the lithium is cost effective.
REDUCING FRESHWATER EXTRACTION
Reducing freshwater extraction is a key issue to consider when planning a new injection water source. Figure 4.12 shows the distribution of the earth’s available water sources. Fresh water accounts for 3 percent of the earth’s water. The rest is saline water (3.3 percent salinity). More than 68 percent of fresh water is found in ice caps and glaciers, and just more than 30 percent is found in groundwater. Only about 0.3 percent of the earth’s fresh water is found in surface water in lakes, rivers, and swamps. This means that, for any oil- and gas-producing location by the ocean, the primary source for water would normally be saline water, which would imply that treatment of this saline water is often required. More than one-half of the world lives in urban areas, and it is expected that more than two-thirds of the global population of 9 billion will be living in cities in 2050 AQUATEC 2023b). Reuse of wastewater is expected to become an important source for water as well as for injection water.
At some sites reusing municipal wastewater could be an acceptable replacement in case of surplus availability. Box 4.1 offers an example of recovering municipal wastewater to meet an oil company’s water needs for fracturing, as well as benefiting local communities.
68 | WATER M ANA GEMENT IN O IL AND G AS O PERATION S
FIGURE 4.12
Earth’s water Fresh water
surface water (liquid) Saline (oceans) 97% Ice caps and glaciers 68.7% Lakes 87% Fresh water 3% Groundwater 30.1% Swamps 11% Rivers 2% Other 0.9% Surface water 0.3%
Distribution of Earth’s water
Source: Shiklomanov 1993. Note: Numbers are rounded.
Fresh
Preserving fresh water: the Dawson Creek reclaimed water project
Objective
• Shell Canada Ltd. was looking for alternative sources of water to minimize the impact on the environment and the community. At the same time, the city of Dawson Creek was also seeking industry support for improving treatment of their wastewater. Shell Canada Ltd. came forward with a proposal to partner with the city and set up a project that would benefit both parties.
Project overview
• As part of the project, wastewater is treated to a standard that allows the city to use it to water lawns and to service industrial users—one of them being Shell Canada Ltd.
• The city of Dawson Creek’s wastewater is piped to a municipal sewage treatment plant where it passes through a multistep lagoon filtration process (photo B4.1.1). Approximately 4,000 cubic meters per day is then sent through the city of Dawson Creek’s reclaimed water plant for final treatment to meet local regulations for industrial use and for irrigation of the city’s green areas.
• Shell Canada Ltd. then pumps 3,400 cubic meters per day from the facility’s pump house through an underground 48-kilometer pipeline to storage ponds used in hydraulic fracturing and completions in Shell’s Groundbirch operations.
• The water system draws wastewater from the city’s existing aerated lagoon wastewater treatment system. It then treats the water using Submerged Attached Growth Reactors (SAGR), where microbiology treats the water.
Effluent from the SAGR system is further polished using coagulation and disc filtration equipment housed in a new building on the project site. The treated water is disinfected and stored in a wet well below the building.
The business case
• On the one hand, the original sewage treatment plant discharged treated effluent into Dawson Creek. This effluent had been supplementing flows in the creek downstream of the plant for more than 30 years. Diversion of flows to the water reclamation facility will return Dawson Creek to natural baseline flows. Although this project will result in the benefits of improved water quality in Dawson Creek and Pouce Coupe River, as well as reduced water withdrawal from Kiskatinaw River (the city’s source of municipal water), it will dewater a portion of the creek and reduce habitat access for fish.
• On the other hand, the Dawson Creek Reclaimed Water Project has allowed operations at Groundbirch to reduce its use of fresh water and has created a revenue stream for Dawson Creek. A pipeline is pumping water to Groundbirch, and the carbon dioxide footprint of transporting water has been significantly reduced. Utilization of the pipeline removes more than 100 water hauling trucks per day from local roads that would otherwise be required to transport water to the Groundbirch operations. Taking these trucks off the road reduces area traffic—and thus road safety risks—as well as dust and noise for the local community.
Water Treatment Technologies and Their Possible Impact on Water Management Options | 69
4.1
Source: OGJ Editors 2012.
BOX
Source: Hume 2012.
PHOTO B4.1.1
Dawson Creek lagoon
CONCERNS WITH EXTERNAL USE OF PW
The main question to answer is this: Is PW safe to use for irrigation of food and non-food crops or to hydrate livestock, and what kind of water treatment equipment is cost-efficient to use? To answer the first part of this question, an assessment to identify and quantify the chemical compounds present in the PW is needed (DiGiulio and Shonkoff 2017). The chemical constituents of PW are as follows:
• Indigenous constituents, including salts, oil, naturally occurring radioactive material, inorganic substances, metals, volatile gases, hydrocarbons, and bacteria; and
• Multiple chemicals needed to produce hydrocarbons from the reservoir (such as hydraulic fracturing) and chemicals to safeguard the facility’s integrity (corrosion and scale inhibitors) and to separate the hydrocarbons from water and solids (demulsifiers and flocculants).
Some of these indigenous and added chemicals are understandably hazardous and can be harmful to the reuse application outside the oil and gas industry (Danforth et al. 2020). Some of the chemicals added to support production do not have disclosure requirements. Additionally, using PW for external reuse requires an improved sampling and analysis program because the standard methods used by governmental agencies are often developed for drinking, municipal, and industrial wastewater and not for PW compositions (Jiang et al. 2021). The selection of water treatment is fully based on the removal of these indigenous and added chemical constituents. Two major chemical composition groups—namely salts and radioactive components—are briefly discussed in more detail as is their toxicity.
Salts
Salts in PW are reflected in total dissolved solids (TDS), measured as grams per liter. When it comes to finding a good application for PW, elevated levels of TDS is an important parameter. In the United States, the large volumes (15–20 billion barrels per year) and high salinity (5–270 grams per liter of TDS) of PW are a significant challenge. For comparison, seawater contains about 34 grams per liter of TDS. Irrigation waters that have a high level of TDS can reduce the availability of water for plants, diminish the ability for roots to take up water, and reduce crop yield. Payne (2018) has documented the information available on oil and gas well brines used for dust control on unpaved roads. He concluded that the sodium ions resulted in increased dustiness and weakening of the soil structure and that saline PW is ineffective even for dust control. Salt removal is often expected when using PW for external use based on the high salinity of PW.
Uncertainty regarding exposure to radioactivity
Naturally occurring radioactive elements such as uranium, radium, and radon can be present in PW. As the salinity of PW increases, chloride concentration increases, which enhances the dissolution of radioactive elements, such as radium. When these saline waters are brought to the surface during hydrocarbon production and external reuse is considered, the health and environmental issues should be assessed. When, for instance, irrigation is considered, one
70 | WATER M ANA GEMENT IN O IL AND G AS O PERATION S
should stay from below the limit to about 30 percent of the annual background radiation dose (Zielinski and Otton 1999). Radium is a known carcinogenic material (ATSDR 1999), and concerns related to health and the environment should be considered.
Risk-based approach: toxicity concern
A whole-effluent toxicity assessment to address known and potential unknown contaminants has been proposed by GWPC (2019), IOGP (2020), and the BEIS (2020), which adapted guidelines from the Oslo and Paris Convention (OSPAR Convention 2001) for the Protection of the Marine Environment of the NorthEast Atlantic.
The OSPAR Convention was initiated by 15 governments to regulate the discharge of water in the Northeast Atlantic Sea. These governments agreed on a risk-based approach to be used when considering the total environmental impact of PW, including heavy metals and organic compounds of relevance (see figure 4.13). This risk characterization is based on the predicted no-effect concentration values, jointly developed by the industry, including the hazardous components in the hydrocarbons produced and the chemicals required for production. Denmark and Norway use the substance-based approach, applying the
Water Treatment Technologies and Their Possible Impact on Water Management Options | 71
FIGURE 4.13
Data collectio n
Exposure assessment
Hazard assessment 4. Risk characterization 5. Risk management 6. Monitoring
OSPAR convention’s risk-based approach for discharging produced water overboard
Source: BEIS 2020. Note: OSPAR = Convention for the Protection of the Marine Environment of the North-East Atlantic. 1.
3.
2.
environmental impact factor (EIF; Smit, Frost, and Johnsen 2011). This EIF tool can model the dispersion of discharged chemical components in the PW.
Similar approaches could be considered to investigate whether PW is safe to reuse outside the oil and gas industry, along with the Directive for Protecting Groundwater, the European Union Water Framework Directive, or similar guidelines for protecting drinking water, lakes, and rivers in the countries in question.
TREATMENT TECHNOLOGY POSSIBILITIES FOR EXTERNAL USE
Treatment technology possibilities for external use include applied and investigated technologies and emerging developments in desalination technologies.
Applied and investigated technologies
Because the main purpose is to prepare PW for reuse purposes outside oil and gas operations, this section describes the water treatment equipment required and the costs involved, as well as new and emerging technologies that may widen the scope for reuse. PW treatment presents unique challenges. As discussed in the previous sections, it can have a salinity level 5–10 times that of seawater (~34 milligrams per liter), have significant variability over time and geography, and contain potentially harmful and difficult-to-treat organic constituents and naturally occurring radioactive materials—all of which make both treating the water and handling the residuals a challenge (Zielinski and Otton 1999).
Salinity is a key consideration in selecting water treatment equipment because high salinity levels can negatively affect the efficiency of a technology and influence costs. For instance, high salinity levels limit the use of conventional membrane processes and increase the solids waste management. Aside from the need to remove the salinity for equipment efficiency, most of the reuse applications require salinity removal as well.
Figure 4.14 shows a summary of the water treatment equipment required for treatment of PW for reuse outside oil and gas operations. The vertical axis gives the salinity range in TDS (milligrams per liter) at which equipment is operational. The membrane technologies (electrodialysis [ED], nanofiltration [NF], brackish water reverse osmosis, seawater reverse osmosis) show a salinity limit at which these technologies are operational. The thermal technologies (multieffect distillation [MED], mechanical vapor compression [MVC], mechanical vapor recompression), however, are almost independent of the source water salinity.
Figure 4.15 shows the type of constituent removal in a certain sequence: (1) a first separation of oil, grease, and suspended solids (for PW injection), (2) a second separation to prepare water for hydraulic fracturing activities (if required), (3) a third separation required to remove salinity to the required level for agricultural uses, and (4) a fourth separation to restabilize the water for groundwater recharge and potable use.
Emerging technologies are being developed to improve aspects of the performance of existing desalination processes (Hightower et al. 2022). These technologies are thermal (membrane distillation [MD]) and physical (forward osmosis [FO]; Millennium Ecosystem Assessment 2005).
72 | WATER M ANA GEMENT IN O IL AND G AS O PERATION S
FIGURE 4.14
Treatment technologies for PW
PW treatment costs increase with higher salinity in PW and product water quality improvement
Separation of oil, grease and suspended solids
• Hydrocyclone
• Gas flotation
>125
• Oil and water separator
• Settling tank
• Media filtration (sand, walnut shell, etc)
• Cartridge filtration
• Membrane filtration
Removal of target constituents (for example, organics, Fe, Ba, Ca, Mg, Sr, SiO2, SO4, microbes)
• Biological treatment
• Electrocoagulation and flotation
• Adsorption (carbon, zeolite, etc.)
• Chemical oxidation
• Disinfection (CIO2, UV, etc.)
Desalination—removal of dissolved solids
Posttreatment and restabilization (for example, B)
Source: Scanlon et al. 2020.
1 2 3 4 E m e r g i n g F O M D M V R M V C M E D S W R O B W R O N F E D
Clean brine for HF
• Ion exchange
• AOP
• pH adjustment and remineralization
• Disinfection (Cl2, UV)
Note: Treatment technologies for PW, including minimal treatment of PW for HF (clean brine), desalination for beneficial uses in various sectors, surface water discharge and groundwater recharge, and posttreatment technologies. AOP = advanced oxidation processes; B = boron; BWRO = brackish water reverse osmosis; ED = electrodialysis; FO = forward osmosis; HF = hydraulic fracturing; MD = membrane distillation; MED = multieffect distillation; MVC = mechanical vapor compression; MVR = mechanical vapor recompression; NF = nanofiltration; PW = produced water; SWRO = seawater reverse osmosis; TDS = total dissolved solids; UV = ultraviolet light.
The advantage of MD is that any level of TDS in the feed can be treated and low-grade heat (60ºC–80ºC) can be applied, which reduces the operational costs. This is a promising technology, but some pretreatment softening to reduce scaling potential and remove volatile organic compounds is required (Zhang et al. 2019).
FO equipment does not require the external high pressure that reverse osmosis (RO) equipment does. FO can desalinate higher-saline water than RO and does not require expensive high-pressure equipment. The main disadvantage is the removal of fouling because less pressure is available for cleaning.
Different water treatment equipment is required on the basis of water quality and destination of the PW, as indicated in figure 4.15. Absolute costs will vary because of location, volume of water treated, and complexity of the water qualities delivered and required. The handling of PW for reinjection purposes mainly requires oil and solids removal. The literature quotes values such as US$0.6 per cubic meter (National Research Council, Subcommittee on Nutrient and Toxic Elements in Water 1974) and US$0.27 per cubic meter (Siagian et al. 2018).
Water Treatment Technologies and Their Possible Impact on Water Management Options | 73
Figure 4.15 compares the total cost of different schemes and purposes used in PW, including discharge to surface water and reinjection for waterflood or disposal. It clearly shows that treatment costs increase along with the increasing 100 Applicable TDS range (g/L) 75 50 25
Industrial uses Agricultural uses Groundwater recharge, potable uses
FIGURE 4.15
1 A primary sedimentation + oil and water separator + DAF system + 1 µm cartridge filter + 0.2 µm ceramic MF + activated carbon + RO
2 DAF with coagulation, flocculation polymer + granular activated carbon fluidized bed biological reactor + ED
3 Warm softening (pH 9.5; 71°C) + cooling (40°C) + equalization storage + pressure filtration + cartridge filtration + reverse osmosis (pH 9.5; 40°C) + disinfection + sludge handling reject + disposal
4a Three-phase-separator + gravity separator + dissolved gas flotation + metal removal unit + sand filters + VSEP membrane system + ammonia absorption column + cartridge filter (5 µm) + RO; TDS in feed = 35,803 mg/l
4b Three-phase-separator + gravity separator + dissolved gas flotation + metal removal unit + sand filters + VSEP membrane system + ammonia absorption column + cartridge filter (5 µm) + RO; TDS in feed = 106,670 mg/l
5a MF + activated carbon + MD; estimated for a 100 m³/h designed capacity. Tfeed = 50°C
5b MF + activated carbon + MD; estimated for a 100 m³/h designed capacity. Tfeed = 20°C
6 Warm softening (pH 9.5; 71°C) + cooling (40°C) + equalization storage + pressure filtration + cartridge filtration + reverse osmosis (pH 10.8; 40°C) + pH adjustment + ion exchange for ammonia (pH 7.7; T ambient) + disinfection + sludge handling + reject disposal
7 Warm softening + cooling + MBR + RO (two-pass)
8 Warm softening (pH 7.7; 71°C) + equalization storage + pH adjustment + sludge handling
9 Warm softening (pH 8.6; 71°C) + equalization storage + pH adjustment + sludge handling
10 Microfiltration (zirconia oxide membrane)
Source: Siagian et al. 2018.
Note: DAF = dissolved air flotation; ED = electrodialysis; MBR = membrane biological reactor; MD = membrane distillation; MF = microfiltration; RO = reverse osmosis; TDS = total dissolved solids; VSEP = vibratory shear enhanced processing.
quality of the end product, such as irrigation and drinking water. Because membranes have a maximum salinity limitation, thermal applications are required for higher salinities. For waters of similar salinity, such as seawater, thermal applications cost roughly twice as much as membrane-based water treatment schemes, and membranes are therefore preferred (Bhojwani et al. 2019). For thermal applications beyond membrane handling salinities, a treatment cost of US$21 per cubic meter has been quoted for treatment of very saline produced fracturing water (Bhojwani et al. 2019). Thermal approaches have high energy requirements and are generally used when waste heat is available. Costs for the emerging technologies (MD and FO) are not yet available for comparison.
Emerging developments in desalination technologies
Desalination refers to a process that involves taking salt out of water to increase its reuse. For PW, there are many opportunities to improve the use of PW, in both industrial applications and agriculture (refer to figure 4.14). Desalination
74 | WATER M ANA GEMENT IN O IL AND G AS O PERATION S
4.54 Discharge Irrigation Drinking water Industrial process water Reinjection 1.7 2.58 0.69 5.8 0.72 1.28 2.58 0.95 0.57 0.63 0.27 0
Treatment or water cost (US$/m ³ ) 2 4 6 8 123 4a4b5a Scheme 5b 6789 10
Total cost of schemes used in produced water treatment (including membranes)
involves treating either seawater or brackish water to create fresh water. In 2018, more than 20,000 desalination plants had been contracted around the world, but, according to the Moore (2018), desalination provided only 1 percent of the world’s drinking water needs. However, because seawater is the greatest water resource, the opportunities are large. Desalination processes include (1) membranes (RO and NF), (2) thermal (including MED, multistage flash distillation, and MVC), as well as other technologies and processes, including ED, FO, and MD. In the oil and gas processing industry, NF membranes are increasingly being used to treat injection water when calcium sulfate is a likely scale and reservoir souring is a threat. The major challenges are equipment fouling caused by biofilm, which can be reduced by new technologies being developed (Leiknes and Ødegaard 2005; Pedenaud 2022; Vik 2019), including pretreatment with adsorbents, ceramic membranes, and coagulants.
Membrane-based desalination continues to provide most of the installed desalination capacity (in 2017, it made up 95.6 percent of annual contracted capacity, and thermal processes made up 4.4 percent). RO and NF are the leading pressure-driven membrane processes, primarily including polymeric material in spiral wound membranes.
Desalination has historically been perceived as a more expensive option than traditional water treatment for groundwater and surface water, with prices of about US$1 per cubic meter. However, recent developments have reduced both operational and capital costs. From 2008 to 2018, costs were reduced by 80 percent as a result of advances in the technology for both equipment and instrumentation. With the cost of seawater desalination at US$0.4 per cubic meter, it is approaching the costs of indirect potable reuse , which are in the range of US$0.3–US$0.4 per cubic meter. From 2019 to 2022, the costs have further been reduced.
One of the wider environmental challenges associated with desalination is managing the by-product brine—a high-TDS waste produced by the process. Another concern is the impingement and entrainment of organisms small enough to be pushed through the intake screen (for example, algae) from the open sea.
Heavy oil extraction requires steam of a certain quality, and in the first phase of the Kuwait Oil Company’s (KOC’s) Lower Fars Heavy Oil Project, RO reject from municipal wastewater was used to feed boilers 120 kilometers away. This reduced the costs for KOC. AQUATECH supplied a source water treatment based on experiences gained from large reuse plants.
Around 44 percent of the global desalination capacity is in the Middle East and North America, but hot spots for accelerated desalination capacity include Asia, Latin America, and the United States (map 4.2).
The massive development of and reduced costs of energy-efficient equipment has opened up the use of solar energy to develop efficient water makers. Elemental Water Makers has developed systems able to treat drinking water for islands and groundwater in areas without any external source of energy by using solar power, and in some cases heat pumps have increased energy efficiency. Elemental Water Makers has become a major player (for example, the Cape Verde municipality project; refer to figure 4.16). Heat pumps and wind and solar energy used for desalination of seawater or groundwater have become a viable option. Decentralized solar power desalination has been recommended to provide more sustainable water for Greece’s 6,000 islands.
In 2004, Shell and Petroleum Development Oman (PDO) presented results from the PDO-operated field, which produces 200,000 cubic meters of brackish
Water Treatment Technologies and Their Possible Impact on Water Management Options | 75
MAP 4.2
Desalination
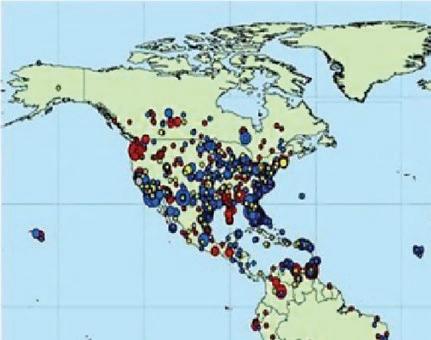
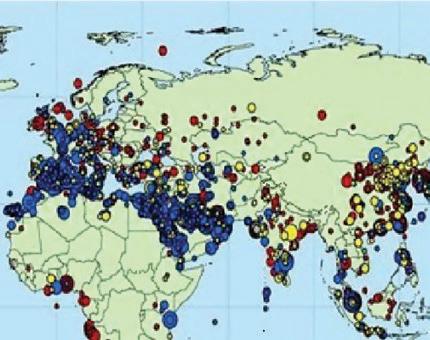
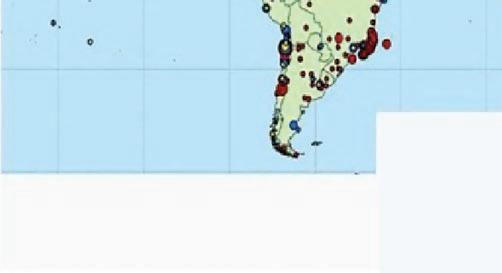
Source: Based on AQUATECH 2023a.
FIGURE 4.16
Capacity (m3/d)Customer type
1,000–10,000 10,000–50,000 50,000–100,000 100,000–250,000 >250,000 –80%
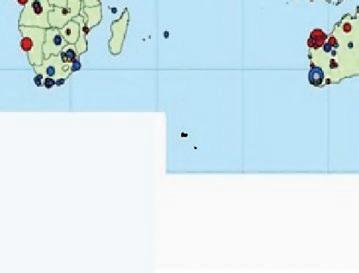
Municipal Industry
Irrigation Power
Other

Cape Verde
Municipality using solar desalination:
• 50 KW solar panels
• 50 m3 per day of fresh water
• 80% total savings
• 100 t per year CO2 savings
Source: Elemental Water Makers 2015. Note: CO2 = carbon dioxide; KW = kilowatt.
water per day. Most of the water was reinjected into a deep reservoir (Sluiterman et al. 2004). A pilot was operated, based on the possible treatment of water in reed beds, followed by a Solar Dew membrane system. Figure 4.17 shows the buildup of the system. The Solar Dew system included evaporation using solar energy. The system received water from the reed beds, and the quality was sufficient for freshwater agriculture. Table 4.7 shows the comparative cost of
76 | WATER M ANA GEMENT IN O IL AND G AS O PERATION S
capacity map
Example of water treatment for municipal use in Cape Verde
Source: Sluiterman et al. 2004.
Note: PDO = Petroleum Development Oman; ppm = parts per million.
Water
Open
Source: Sluiterman et al. 2004.
Note: – = not affected; 0 = slightly affected; + = moderate efficiency; ++ = high efficiency; TDS = total dissolved solids.
aRemoves oil, but with a detrimental effect on performance, therefore not intended to remove oil.
bEstimated no experience with commercial operation.
Water Treatment Technologies and Their Possible Impact on Water Management Options | 77
agriculture
Biosaline
agriculture Evaporation pond B Evaporation pond A B1A1 B2 B3 B4 C Spray pond Scale: 6 hectares in total Small scale biosaline
Solar Dew water plant Freshwater
disposal line
Oil in water ~300 ppm Salinity ~7,000 ppm Cover foil Wind 3 2 1 4 5 6 7
(32")
Membrane evaporator Spacer
condensation
space
FIGURE 4.17
Technologies tested for PDO’s Nimr Water Treatment Plant
TABLE 4.7
TECHNOLOGY OIL TDS METAL BORON COST (US$/M3) Reed beds ++ - ++ - 0.30-0.80b Dissolved air flotation + - - - 0.02 Nanofiltrationa 0a + + 0 0.70-0.90 Reverse osmosisa - ++ ++ 0 0.50-1.00 Solar Dew® 0 ++ ++ + 1.00b
Cost of alternative desalination technologies
treatment alternatives. With the development seen in recent years and experiences gained, it is likely that the NF, RO, and Solar Dew technologies have become much cheaper.
Passive water distillation—an alternative to the Solar Dew system—uses energy from the sun to separate clean water from dissolved salts and other contaminants and can provide clean drinkable water in remote or arid regions. A solar still consists of a blackened basin filled with brackish or saline water up to a certain depth and covered by an inclined glass to facilitate transmission of solar radiation and condensation (Sharon and Reddy 2015). Passive solar stills are suitable for small-capacity (~5 liters per square meter per day) self-reliant water supply systems but cannot treat large amounts of PW. Evaporation of PW has been tested in a single-effect passive solar still (Sousa et al. 2009).2 Although the initial results look promising, the volumes are small.
Another promising technology involves the cultivation of halophyte (a salt-tolerant plant). This application was briefly discussed earlier in the chapter. Although halophyte plants can grow in a saline environment and are capable of removing salt from saline soils, the data on their use for desalination treatment of saline water is limited. Another halophyte application is the use of algae to remove salt from water. Depending on their salt tolerance, algae have the potential to lower the salt content in water, and they work in brackish water up to seawater salinity. A benefit is that the spent algae could be harvested to generate biofuel or as a source for protein. The use of algae to reduce the salinity of oil PW has been investigated in the laboratory by Nadersha (2021), and acclimated algae showed a reduction of salinity of about 20 percent. More research is required to move to larger-scale operations.
CONCLUDING OBSERVATIONS
About 97 percent of the earth’s water is saline (3.3 percent salinity). Of the earth’s freshwater resources, 69 percent resides in glaciers. Nonfrozen freshwater resources are totally dominated by groundwater, at 30 percent, and less than 1 percent is located in lakes, rivers, and swamps. More than one-half of the world’s population lives in urban areas, and this is expected to increase to two-thirds by 2050. Given this, reducing freshwater abstraction is a key issue to consider when planning water sources for oil and gas operations.
Despite the general recognition that surplus PW in water-stressed areas should be made available for external use (outside the oil industry), this is rarely the case. In 2017, a mere 1.3 percent of PW in the United States was reused for external purposes (Veil 2020).
In water management, oil companies face two types of risk: the risk of unavailability of water for their projects and operations and the risk posed by their projects and operations to external water sources. This chapter discussed planning and mitigation measures associated with the management of these risks.
Large volumes of water are applied for waterflooding, EOR, and hydraulic fracturing. Different water treatment steps are required for the reuse of flowback and PW from these applications, and EOR and hydraulic fracturing require the most removal steps.
Using PW outside the oil and gas industry has the tendency to intensify water treatment requirements, which in turn affect the treatment costs. When the
78 | WATER M ANA GEMENT IN O IL AND G AS O PERATION S
chemical compounds that must be removed or recovered are defined (often in regulations), the dedicated water treatment equipment can be identified (fit-for-purpose reuse). Examples of PW for external reuse include irrigation for food and non-food crops, livestock and wildlife, aquifer recharge, and lithium production.
When considering PW for external reuse, it is important to establish whether it will be safe to use for irrigation of food and non-food crops or for livestock and what kind of water treatment equipment would be cost-efficient. Indigenous and added chemicals in the PW could be hazardous and harmful in certain applications outside the oil and gas industry. Salts and radioactive components are parameters of particular concern, and they must be reviewed before decisions are made regarding external reuse. Adequate regulations must be in place and include requirements for sampling and analysis. To this end, this chapter discussed a risk-based approach suggested by IOGP, IPIECA, and OSPAR.
Historically, the costs of water treatment have increased with the need to remove TDS. A combination of cheaper renewable energy (solar energy, battery storage, heat pumps, etc.), improved desalination technologies (although still based on evaporation and RO, including proper pretreatment), and cost-efficient automation has the potential to bring about important cost reductions. Although passive solar treatment of saline water can provide clean drinking water, solar stills are only suitable for small-capacity applications. Biodesalination using halophyte algae has been shown to reduce the salinity of water and has added potential because spent algae could be harvested to generate biofuel or as a source for protein. However, more research is required to move from the laboratory to larger-scale application of these methods.
NOTES
1. PDO’s (2017) press release provides an overview of solar technology applied to the Miraah solar plant.
2. In a single-effect solar still, the active still deals with an external source of heat, such as industrial waste heat or solar collectors (Essa et al. 2022).
REFERENCES
Al-Marri, Salem, Saad F. Alkafeef, Hom B. Chetri, Asma’a Al-Ghabdan, and Ealian H. D. Al-Anzi. 2009. “Opportunistic Fluid Sampling and Analysis to Track Reservoir Souring in Water Flooded Operations in North Kuwait Reservoirs C—Implications for the Future.” Paper presented at the SPE Middle East Oil and Gas Show and Conference, Manama, March. https:// doi.org/10.2118/120055-MS
AQUATECH. 2023a. “Our Essential Guide to Desalination and the Water Scarcity.” https:// www.aquatechtrade.com/news/desalination/desalination-essential-guide.
AQUATECH. 2023b. “Sustainable Water: Our Essential Guide to Sustainable Water Resource Management Solutions & Strategies.” 11 September 2023. https://www.aquatechtrade.com /news/water-treatment/sustainable-water-essential-guide/ (accessed, November 6, 2023).
ATSDR (Agency for Toxic Substances and Disease Registry). 1999. “Radium.” https://www .atsdr.cdc.gov/toxfaqs/tfacts144.pdf.
BEIS (Department for Business, Energy & Industrial Strategy). 2020. The United Kingdom RiskBased Approach Programme. Version 3.1. London: BEIS. https://assets.publishing.service .gov.uk/government/uploads/system/uploads/attachment_data/file/941162/RBA _Guidance_December_2020_v3.1.pdf
Water Treatment Technologies and Their Possible Impact on Water Management Options | 79
Bhatti, Ejaz-ul-Hassan, Mudasser Muneer Khan, Syyed Adnan Raheel Shah, Syed Safdar Raza, Muhammad Shoaib, and Muhammad Adnan. 2019. “Dynamics of Water Quality: Impact Assessment Process for Water Resource Management.” Processes 7 (2): 102. https://doi .org/10.3390/pr7020102
Bhojwani, Sumay, Kevin Topolski, Rajib Mukherjee, Debalina Sengupta, and Mahmoud M. El-Halwagi. 2019. “Technology Review and Data Analysis for Cost Assessment of Water Treatment Systems.” Science of the Total Environment 651 (Part 2): 2749–61. https://doi .org/10.1016/j.scitotenv.2018.09.363
CSM (Colorado School of Mines). 2009. An Integrated Framework for Treatment and Management of Produced Water. Technical Assessment of Produced Water Treatment Technology . Golden, CO: CSM. http://aqwatec.mines.edu/research/projects/Tech _Assessment_PW_Treatment_Tech.pdf.
Danforth, Cloelle, Weihsueh A. Chiu, Ivan Rusyn, Kim Schultz, Ashley Bolden, Carol Kwiatkowski, and Elena Craft. 2020. “An Integrative Method for Identification and Prioritization of Constituents of Concern in Produced Water from Onshore Oil and Gas Extraction.” Environment International 134: 105280. https://doi.org/10.1016/j.envint .2019.105280
DiGiulio, Dominic, and Seth Shonkoff. 2017. “Is Reuse of Produced Water Safe? First, Let’s Find Out What’s in It.” The Magazine for Environmental Managers , August. https://www .psehealthyenergy.org/wp-content/uploads/2018/11/Produced-Water-Reuse-EM -Magazine.pdf
Echchelh, Alban, Tim Hess, and Ruben Sakrabani. 2018. “Reusing Oil and Gas Produced Water for Irrigation of Food Crops in Drylands.” Agricultural Water Management 206: 124–34. https://doi.org/10.1016/j.agwat.2018.05.006.
Elemental Water Makers. 2015. “Desalination Driven by Renewable Energy.” YouTube. https:// www.youtube.com/watch?v=26eyaXYIBuI
Essa, Fadl A., Mohamed Elasyed Abd Elaziz, Shanmugan Sengottain, and Ammar H. Elsheikh. 2022. “Artificial Neural Network and Desalination Systems.” In Artificial Neural Networks for Renewable Energy Systems and Real-World Applications, edited by Ammar H. Elsheikh and Mohamed Elasyed Abd Elaziz, 159–87. New York: Elsevier. https://doi.org/10.1016 /C2019-0-01290-3
GWPC (Ground Water Protection Council). 2019. Produced Water Report: Regulations, Current Practices, and Research Needs. Oklahoma City, OK: GWPC. https://www.gwpc.org/sites /gwpc/uploads/documents/Research/Produced_Water_Full_Report___Digital_Use.pdf
GWPRF (Ground Water Protection Research Foundation). 2003. Handbook on Coal Bed Methane Produced Water: Management and Beneficial Use Alternatives. Oklahoma City, OK: Ground Water Protection Research Foundation, US Department of Energy, National Petroleum Technology Office, and Bureau of Land Management. https://www.ela-iet.com /EMD/CoalBedMethaneWater.pdf
Hightower, Mike, Pei Xu, Jeri Sullivan Graham, and Deborah Dixon. 2022. A Gap Analysis Plan for the Reuse of Produced Water Addressing the Technical, Economic, and Health and Safety Risks of Fit-for-Purpose Reuse. Las Cruces: New Mexico, Produced Water Research Consortium, New Mexico State University. https://nmpwrc.nmsu.edu/_assets/public _information/NMPWRC-Research-Plan-1-12-22-Final.pdf
Hill, Freeman, Steve Monroe, and Reshmy Mohanan. 2012. “Water Management—An Increasing Trend in the Oil and Gas Industry.” Paper presented at the SPE/EAGE European Unconventional Resources Conference and Exhibition, Vienna, March 20–22. https://doi .org/10.2118/154720-MS
Hume, Mark. 2012. “Dawson Creek and Shell Elude Water Shortage Crisis.” Globe and Mail, September 9, 2012. https://www.theglobeandmail.com/news/british-columbia/dawson -creek-and-shell-elude-water-shortage-crisis/article4531896/ IEA (International Energy Agency). 2018. World Energy Outlook. Paris: IEA. https://iea.blob .core.windows.net/assets/77ecf96c-5f4b-4d0d-9d93-d81b938217cb/World_Energy _Outlook_2018.pdf.
IOGP (International Association of Oil and Gas Producers). 2020. Risk Based Assessment of Offshore Produced Water Discharges . Report 633. London: IOGP. https://www.iogp.org /bookstore/product/risk-based-assessment-of-offshore-produced-water-discharges/
80 | WATER M ANA GEMENT IN O IL AND G AS O PERATION S
Jiang, Wenbin, Lu Lin, Xuesong Xu, Xiaoxiao Cheng, Yanyan Zhang, Ryan Hall, and Pei Xu. 2021. “A Critical Review of Analytical Methods for Comprehensive Characterisation of Produced Water.” Water 13(2): 183. https://doi.org/10.3390/w13020183
Kumar, Amit, Hiroki Fukuda, T. Alan Hatton, and John H. Lienhard. 2019. “Lithium Recovery from Oil and Gas Produced Water: A Need for a Growing Energy Industry.” ACS Energy Letters 4 (6): 1471–4. https://doi.org/10.1021/acsenergylett.9b00779.
Leiknes, TorOve, and Hallvard Ødegaard. 2005. “The Development of a Biofilm Membrane Bioreactor.” Desalination 202(1–3): 135–43. https://doi.org/10.1016/j.desal.2005.12.049
Millennium Ecosystem Assessment. 2005. Ecosystems and Human Well-Being: Desertification Synthesis. Washington, DC: World Resources Institute. https://www.millenniumassessment .org/documents/document.355.aspx.pdf.
Mitchell-McCallister, Donna, Ryan B. Williams, James Bordovsky, Joseph Mustian, Glen Ritchie, and Katie Lewis. 2020. “Maximizing Profit via Irrigation for Capacity-Constrained Cotton Production.” Agricultural Water Management 229: 105932. https://doi.org/10.1016/j .agwat.2019.105932
Moore, Scott. 2018. Sea Change: Desalination and the Water-Energy Nexus . Philadelphia: Kleinman Center for Energy Policy. https://kleinmanenergy.upenn.edu/research/publications /sea-change-desalination-and-the-water-energy-nexus/
Nadersha, Shibin. 2021. “Biological Treatment of Produced Water Using Algae: A Proof of Concept.” Master’s Thesis No. 2022:3, Department of Civil and Environmental Engineering, College of Engineering, United Arab Emirates University. https://scholarworks.uaeu.ac.ae /cgi/viewcontent.cgi?article=1884&context=all_theses.
National Research Council, Subcommittee on Nutrient and Toxic Elements in Water. 1974. Nutrients and Toxic Substances in Water for Livestock and Poultry: A Report. Washington, DC: National Academy of Sciences.
OGJ Editors. 2012. “Shell Using Treated Wastewater for Groundbirch Gas Field Fracturing.” Oil & Gas Journal, September 12, 2012. https://www.ogj.com/drilling-production/production -operations/article/17273742/shell-using-treated-wastewater-for-groundbirch-gas -field -fracturing
Palmer, Daniel, and John O’Donnell. 2014. “Construction, Operations and Performance of the First Enclosed Trough Solar Steam Generation Pilot for EOR Applications.” SPE 169745 2014. Paper presented at the SPE EOR Conference at Oil and Gas West Asia, Muscat, Oman, March. https://doi.org/10.2118/169745-MS
Payne, Bryce F. 2018. “Oil and Gas Well Brines for Dust Control on Unpaved Roads—Part 1: Ineffectiveness.” European Scientific Journal 14 (27).
https://doi.org/10.19044/esj.2018.v14n27p398
PDO (Petroleum Development Oman). 2017. “Miraah Solar Plant Delivers First Steam to Amal West Oilfield.” Press Release, November 1, 2017. https://www.pdo.co.om/en/news/press -releases/Pages/Miraah%20Solar%20Plant%20Delivers%20First%20Steam%20to%20 Amal%20West%20Oilfield.aspx
Pedenaud, Pierre. 2022. “Sulfate Removal 20 Year Operational Experience.” Paper presented at the TEKNA Produced Water Management Conference, virtual, January 26–27.
Prigent, Stephane, Asama Al-Hadrami, Thomas Headley, Wail Al-Harrasi, Alexandros I. Stefanakis. 2016. “The Reuse of Wetland-Treated Oilfield Produced Water for Saline Irrigation.” Paper presented at the International Desalination Association International Conference on Water Reuse and Recycling, Nice, France, September. https://www .researchgate.net/publication/308777946.
Rambeau, O., R. de Lafond, P. M. Baldoni, J. P. Gosselin, and J.-C. Baccou. 2004. “Low Salt Petroleum Produced Water Reuse: A Farming Alternative Outside the Food Chain.” Water Science and Technology 50 (2): 139–47. https://doi.org/10.2166/wst.2004.0109
Scanlon, Bridget R., Robert C. Reedy, Pei Xu, Mark Engle, J. P. Nicot, David Yoxtheimer, Qian Yang, and Svetlana Ikonnikova. 2020. “Can We Beneficially Reuse Produced Water from Oil and Gas Extraction in the U.S.?” Science of the Total Environment 717: 137085. https://doi .org/10.1016/j.scitotenv.2020.137085
Shaikh, Sameera S., Mohammed H. Abu-Dieyeh, Fatima A. Al Naemi, Talaat Ahmed, and Mohammad A. Al-Ghouti. 2020. “Environmental Impact of Utilisation of ‘Produced Water’ from Oil and Gas Operations in Turfgrass Systems.” Scientific Reports 10: 15051. https://doi .org/10.1038/s41598-020-72069-5.
Water Treatment Technologies and Their Possible Impact on Water Management Options | 81
Sharon, H., and K. S. Reddy. 2015. “A Review of Solar Energy Driven Desalination Technologies.” Renewable and Sustainable Energy Reviews 41: 1080–118. https://doi.org/10.1016/j.rser .2014.09.002
Shiklomanov, L. A. 1993. “World Freshwater Resources.” In Water in Crisis: A Guide to the World’s Fresh Water Resources, edited by Peter H. Gleick, 13–24. New York: Oxford University Press.
Siagian, Utjok W. R., Setyo Widodo, Khoiruddin, Anita K. Wardani, and I. Gede Wenten. 2018. “Oilfield Produced Water Reuse and Reinjection with Membrane.” MATEC Web of Conferences 156: 08005. https://doi.org/10.1051/matecconf/201815608005
Sluiterman, A. C., Y. Al-Lawati, S. Al-Asmi, P. H. J. Verbeek, M. A. S. Schaapveld, and J. Cramwinckel. 2004. “Opportunities for Reuse of Produced Water around Desert Oil Fields.” SPE 88667. Paper presented at the 11th Abu Dhabi International Petroleum Exhibition and Conference, Abu Dhabi, United Arab Emirates, October 10–13. https:// onepetro.org/SPEADIP/proceedings-abstract/04ADIPEC/All-04ADIPEC/SPE-88667-MS /70985?redirectedFrom=PDF
Smit, Mathijs G. D., Tone K. Frost, and Ståle Johnsen. 2011. “Achievements of Risk-Based Produced Water Management on the Norwegian Continental Shelf (2002–2008).” Integrated Environmental Assessment and Management 7 (4): 668–77. https://doi.org/10.1002/ieam.215. Sousa, M. A. S. B., J. L. S. Melo, H. N. S. Melo, O. Chiavone-Filho, A. O. Nunes, and M. C. Borges. 2009. “A Single-Effect Solar Still for Desalination of Treated Oil Production Water.” Brazilian Journal of Petroleum and Gas 3 (4): 139–47.
Stewart, David R., Andrew D. R. Stewart, and R. Forbes Guthrie. 2017. “Utilizing Produced Water as a New Water Resource.” https://19january2017snapshot.epa.gov/sites/production /files/documents/stewart_1.pdf
Tanji, Kenneth K., and Neeltj C. Kielen. 2002. Agricultural Drainage Water Management in Arid and Semi-arid Areas. Rome: Food and Agriculture Organization of the United Nations. https://www.fao.org/3/Y4263E/y4263e00.htm#Contents
US EPA (Environmental Protection Agency). 2015. Assessment of the Potential Impacts of Hydraulic Fracturing for Oil and Gas on Drinking Water Resources. Washington, DC: US EPA. https://www.epa.gov/sites/default/files/2015-07/documents/hf_es_erd_jun2015.pdf
Veil, John. 2020. U.S. Produced Water Volumes and Management Practices in 2017. Ground Water Research and Education Foundation. https://www.gwpc.org/wp-content/uploads /2020/02/pw_report_2017___final.pdf
Vik, Eilen A. 2019. “HAOPs—A Novel Anti-Fouling Material for Membranes Treating Surface Water to Drinking Water Quality.” Paper presented at the 16th IWA Leading Edge Conference on Water and Wastewater Technologies, Edinburgh, Scotland, June 10–14.
Zhang, L. 2019. “Discussion on Influencing Factors of Oilfield Periodic Water Injection Development.” AIP Conference Proceedings 2066 (1): 020024. https://doi.org10.1063 /1.5089066
Zhang, Zuoyou, Xuewei Du, Kenneth H. Carlson, Cristian A. Robbins, and Tiezheng Tong. 2019. “Effective Treatment of Shale Oil and Gas Produced Water by Membrane Distillation Coupled with Precipitative Softening and Walnut Shell Filtration.” Desalination 454: 82–90. https://doi.org/10.1016/j.desal.2018.12.011
Zielinski, Robert A., and James K. Otton. 1999. Naturally Radioactive Materials (NORM) in Produced Water and Oil-Field Equipment—An Issue for the Energy Industry. US Geological Survey.
82 | WATER M ANA GEMENT IN O IL AND G AS O PERATION S
Legal, Regulatory, and Contractual Framework for Water Management 5
OVERVIEW
The legal, regulatory, and contractual framework for water management is complex on many levels. To begin with, it regulates the use of a critical resource that is in part poorly understood and is exposed to stress from growing populations, increased economic activity, and intense urbanization. Evidence-based policies, comprehensive legislation, and enforcement mechanisms are required to meet this challenge.
Surface watershed resources and groundwater resources may have widely different areal extent and often cross national boundaries, requiring the harmonization of regulations across jurisdictions. The Lake Chad Basin in Africa, which is shared among eight countries, is a prominent example of such cross-boundary resources.
At a national level, several regulatory authorities may have a stake in water management, sometimes with conflicting interests, such as the competition between environmental concerns and oil and gas resource management. This chapter reviews legal and regulatory frameworks for national water management and the regulatory and contractual terms that apply to oil and gas operations. These regimes are not necessarily the same, and there appears to be a need to bridge the gap between them.
Five countries are reviewed as examples of widely different levels of development and water challenges. Furthermore, key aspects of the European Union (EU) Water Framework Directive (WFD) are presented. This is followed by a discussion of practical approaches to water management, as represented by the concept of integrated water resource management (IWRM) and the use of economic instruments in water regulation.
REGULATORY AND CONTRACTUAL REGIME FOR PETROLEUM OPERATIONS
The petroleum sector covers a broad scope of essential activities that may have substantial economic, social, and environmental impacts. The overall objective
83
of the sector’s activities is to develop the country’s oil and gas resources, which should be governed to benefit the nation as a whole. The water sector, however, is also of critical importance for the economy and is fundamental to citizens’ lives.
Both water and petroleum resource management in a country will be subject to a web of laws and regulations known as the water regime and petroleum regime, respectively. As underscored and documented previously, both the sourcing and production of water are essential parts of petroleum operations. Hence, the two regimes need to be closely integrated.
The foundation for the water and petroleum regimes is the nation’s constitution, which establishes the authority for a government to make and enforce laws. It may also address key principles for the country’s natural resources, including both water and petroleum, and it typically establishes that the natural resources are under the ownership of the nation and should be used in a sustainable manner for its citizens.
The government should prepare sector policies that also reflect key principles in the constitution. Ideally, both a water policy and a petroleum policy will be prepared, although many countries lack these documents. Building on these policies and key constitutional principles, water laws and petroleum laws will be developed. Regulations may be prepared in accordance with these laws, containing provisions that are becoming increasingly detailed.
As one moves further down the hierarchy of the legal framework, one will encounter the petroleum agreement (PA). The PA will be even more specific than the regulations and will stipulate provisions that apply to the individual license or concession.
Petroleum agreement
The PA should meet the requirement of establishing a coherent petroleum regime. The agreement serves two main purposes. First, the PA defines the specific terms that apply to an individual license or concession and its operator, whereas laws and regulations leave these terms as negotiable items. This will normally relate to some of the fiscal terms, as well as the work program and duration of the exploration phases.
Second, the PA may also state provisions for petroleum operations and related processes. This may serve as a restatement of and emphasis on important stipulations in the law or regulations. Nevertheless, in situations in which the formal legal framework has not been fully developed, the contract may serve in lieu of certain regulations. Hence, the scope of the PA may be different across countries and time by choice or by necessity (refer to figure 5.1).
Petroleum fiscal regimes covered by agreements or fiscal arrangements are commonly grouped into two main families: the contractual system and the concessionary system. In the contractual-based system and with production-sharing agreements as the dominant type, the government retains the title to the mineral resources up to the physical point at which sharing is taking place. In concessionary systems, however, the concessionaire holds title to the mineral resources in the subsurface.
Furthermore, the fiscal terms that historically applied to a concessionary regime were limited to royalty and tax. The production-sharing regime has a sharing mechanism for the profit oil as the main fiscal element (refer to box 5.1). Time has, however, erased some of the traditional distinctions, and
84 | WATER M ANA GEMENT IN O IL AND G AS O PERATION S
concessionary systems may include production-sharing mechanisms. Likewise, both taxes and royalties are common elements of contractual systems. Hence, mathematically identical revenue profiles for the government can be established with both types of fiscal regimes.
In general, all costs directly related and necessary to petroleum operations are accepted as eligible cost elements to be recovered from the cost oil and deducted before establishing the profit bases for taxation. This will normally also be the case for all investments and operational costs related to the management of water in petroleum operations. Hence, both the cost of water supply as well as the cleaning cost of produced or used water are eligible costs of petroleum operations. Similar to the taxation of other industrial activities, eligible costs are deducted from revenue for the purpose of determining the taxable income, the profit oil, or both to be shared between the investor and the state. The consequence is that the government will carry a part of the cost in accordance with the tax rate when the profit is reduced. But although a typical tax rate for industrial activities may be 20–30 percent, the tax rate for petroleum activities is often substantially higher.
Institutional arrangement and functions of government
In reviewing water regulatory regimes around the world, it is apparent that national water regulations and the regulatory and contractual regimes that apply to water management in oil and gas operations are not necessarily the same. There may be several reasons for this lack of harmonization, one being that national water regulation has a natural focus on the main water users, which are dominated by agriculture, followed by industry and municipalities (refer to figure 1.1). Furthermore, oil and gas operations are limited to certain regions and are otherwise unique in the sense that they have the potential to generate government revenues like no other activity. The regulatory focus has therefore been on resource management and optimizing the government’s share of the value creation.
Legal, Regulatory, and Contractual Framework for Water Management | 85
5.1
FIGURE
Scope of components of the petroleum regime
agreement Regulations Petroleum
Constitution
Regulations Petroleum
Source:
Adapted
from Open Oil 2012.
Petroleum
law
Country A
law Constitution Country B Petroleum agreement
Production-sharing agreement
The production-sharing agreement (PSA) is the most common fiscal regime found in developing countries today. The key fiscal element in a PSA is an agreed sharing of the profit oil, but, as pointed out, it often includes royalty and tax just like concession agreements.
The royalty will normally constitute a percentage of the production (or revenue) to be paid to the government. The oil volumes net of royalty will be allocated to cover eligible petroleum costs. The remaining oil volumes will be shared as profit oil between the government and the contractor (refer to figure B5.1.1).
In general, all costs for investments and operations of the petroleum field will be covered through future production. In addition, some general and administrative costs may be covered. The principles for what are considered eligible costs to be covered are stipulated in an accounting agreement.
There will normally be a cost recovery limit (CRL) for the portion of the available production (net after royalty) that can be used for cost recovery. To the extent that the cost recovery oil is not sufficient to cover all accumulated costs, the balance will be transferred to the subsequent year. In a similar way as royalties, the CRL ensures that the government receives revenues from the start of production.
The volume available after cost recovery is the profit oil (or profit gas), which will be shared between the government and the contractor according to an agreed-upon sharing mechanism. The principles for the sharing mechanism may be based on the production volumes or the profitability of the production, with a set of tiers reflecting an increased share to the government according to an increase in the production or profitability of the field. Finally, the contractor may pay a tax on their profit share, unless implicitly included in the production-sharing mechanism.
It would make sense to bridge the gap between national water management and the regulatory provisions that apply to oil and gas. Apart from updating regulatory frameworks, a key to achieving such harmonization lies in cooperation among the relevant regulatory authorities. Figure 5.2 illustrates a typical institutional framework for the petroleum sector. It includes several government institutions that play a role in petroleum sector development.
86 | WATER M ANA GEMENT IN O IL AND G AS O PERATION S
BOX 5.1
Source: © Bridge Consult. Used with the permission of Bridge Consult. Further permission required for reuse.
FIGURE B5.1.1
Royalty Cost recovery oil Profit oil Total oil produced Company share of profit oil Government share of profit oil Corporate tax Cost Company profit Government take
Structure of a production-sharing contract
Parliament
Cabinet
Petroleum regulatory authority
Regulatory relations
Private oil companies
National
Regulatory relations
State oil company
Apart from the ministry responsible for petroleum, the Ministry of Environment and in some cases the Ministry of Water are the key institutions in water management. Water and environment are sometimes organized in one ministry. This is the case in Uganda, in which the Ministry of Energy and Mineral Development and the Ministry of Water and Environment together provide the legal and regulatory framework for water management in oil and gas operations. Regulatory roles may be assigned to specific government entities. In Uganda, these entities are the National Environment Management Authority and the Petroleum Authority of Uganda.
Key functions of the petroleum sector regulatory authorities typically include the following:
• Advise government on sector strategy, licensing, and field development plans.
• Manage national database.
• Manage license contracts and regulatory compliance.
• Approve budgets and audit costs.
• Perform resource assessment.
• Execute technical and commercial field evaluation.
• Carry out activity monitoring and reporting.
Legal, Regulatory, and Contractual Framework for Water Management | 87
FIGURE 5.2
Typical government functions and institutional structure for petroleum sector management
Source: This figure is original to this publication.
Ministry Transport Ministry Water and Environment Ministry Petroleum Ministry Labor Ministry Finance
Policy functions
regulatory functions Oil and gas regulatory functions Commercial functions
Transport authority
Water and environment authority
Occupational health and safety authority
Revenue authority
• Promote local content.
• Fulfill petroleum safety regulatory functions.
• Fulfill petroleum environmental regulatory functions.
Many countries have a national state-owned oil company that manages the state’s direct equity interest in oil and gas activities. Such companies should have no regulatory functions but will contribute hands-on commercial and technical experience. Good governance principles imply that policy, regulatory, and commercial functions of government should be executed through separate institutions, as indicated in figure 5.2, although capacity constraints may limit the applicability of the so-called “trinity model.”
When a petroleum regulatory authority is established, it should normally function as the main point of interaction between oil companies and the government. This is often called the “one-stop-shop” model, because issues related to the environment, occupational health, safety, and other regulatory issues are resolved through contact with one government institution, which coordinates with other national regulators as required.
In practice, this means that the petroleum regulatory authority has technical and administrative capacity for water and environmental regulation of oil and gas activities. As such, there is potential for overlap in competence and functions between the national and sector regulators. The challenge is to establish efficient cooperation between these institutions and prevent conflict and competition, which unfortunately is not uncommon. Long-term sustainability of production operations depends on effective control and mitigation of environmental impacts. However, cost-efficient extraction of oil and natural gas may from time to time come in conflict with environmental restrictions. Therefore, coordination is required to find the right balance.
Decisions pertaining to water and the environment are linked to operations and decision gates in petroleum sector development. As such, they are integral parts of a much wider assessment of technical, safety, and economic significance. The key steps in upstream activities are indicated in figure 5.3.
FIGURE 5.3
Upstream oil and gas activities and associated environment and water assessments
Evaluation, planning, and preparation
Promotion and negotiation SEA
Exploration licence (PSC)
Companies do seismic assessments and drilling
Discovery is made
Plan Development and Operation
The field is developed
Production starts
Water requirements
Water returns and disposal
Production rehabilitation, EOR
Production stops
Abandonment and clean up
~30 years
Source: This figure is original to this publication.
Note: EIA = Environmental Impact Assessment; EOR = enhanced oil recovery; PSC = productionsharing contract; SEA = Strategic Environmental Assessment.
88 | WATER M ANA GEMENT IN O IL AND G AS O PERATION S
EIA EIA
EIA
EIA
Host countries rely on the competence and capital of international oil companies to develop their oil and gas potential. Apart from a continuous monitoring of compliance, government can influence and determine the terms and conditions for oil and gas operations at three key stages:
• Activity planning before licensing,
• Negotiation of petroleum licenses (production-sharing contracts or other), and
• Approval of plans for development and operation (PfDOs).
The terms and conditions applicable to water management can be established at these stages. The process stipulated for the preparation of a PfDO commonly requires the operator to undertake an Environmental and Social Impact Assessment (ESIA). For example, the ESIA prepared by TotalEnergies for its Tilenga field development in Uganda includes life-cycle projections of freshwater abstraction, produced water (PW) and injection volumes, and plans for waste disposal (TotalEnergies 2019).
Because environmental management is part of a much wider decision process in petroleum development, continuous interaction between the national regulator and the petroleum authority is required. Box 5.2 proposes a model for such interaction to ensure coordinated regulation of oil and gas activities. The one-stop-shop principle applies at key decision gates, but the national environment authority will perform audits and inspections in direct contact with the operating oil companies.
It is important that the necessary institutional cooperation be detailed either in the regulatory framework or through dedicated agreements between institutions.
BOX
Model for petroleum and environment authorities’ regulatory interaction
Petroleum Sector Authority
Environment Considerations at Key Decision Gates
Coordinate preparations for the government position at key decision gates, ensuring that environmental requirements and precautions are covered in the relevant decisions and approvals.
Key decision gates include:
• License awards,
• Plan for development and operation, and
• Abandonment.
Strategic Environmental Assessment
The Strategic Environmental Assessment (SEA) considers environmental protection and sustainable development with respect to national activity plans and thus is a Ministry of Petroleum responsibility. The petroleum authority would have the task of coordinating preparations for the government decision (with input from the environment authority and other government entities).
Environmental Impact Assessment
The Environmental Impact Assessment (EIA) is the evaluation of possible environmental impacts of operational activities such as exploration drilling, installation of fixed platforms, pipeline construction, and the like.
Although conducting an EIA is a specific environment authority responsibility, EIA approval will most often be part of a broader approval or consent by the petroleum authority, which should maintain a coordinating role.
Legal, Regulatory, and Contractual Framework for Water Management | 89
continued
5.2
Box 5.2, continued
National Environment Authority
Environment Considerations at Key Decision Gates
The environment authority shall provide input to the petroleum authority’s coordinated preparations for the government’s position at key decision gates.
SEA
The national environment authority will recommend environmental requirements, precautions, and mitigating measures as input into SEA. (The petroleum authority would have the task of coordinating preparations for the government decision.)
EIA
The environment authority is responsible for overseeing EIAs and will review and approve the EIAs submitted by the operators.
EIA approval will most often be part of a broader approval or consent by the petroleum authority, which should maintain a coordinating role.
Permits and Associated Audits and Inspections
The environment authority should be responsible for the granting of necessary permits and for environmental audits and inspections in this regard. These responsibilities may be executed through direct regulatory relations with the oil companies, without being channeled through the petroleum authority.
Agreement
A formal agreement of cooperation and coordination should be established between the petroleum authority and the environment authority to ensure efficient execution of their complementary functions.
LEGAL AND REGULATORY FRAMEWORK FOR WATER MANAGEMENT
The implementation of proper management of water resources can be challenging because it involves dividing a critical and often scarce resource among different interest groups and sectors. The petroleum sector is only one of many stakeholders in the water equation. Therefore, it is obvious that principles pertaining to water use in the petroleum sector must be addressed as part of a comprehensive water resource management policy and regulated based on a national framework.
This section reviews two prominent examples of advanced water management frameworks, the New South Wales water regulations and the EU Water Framework Directive. Later in the chapter, the principles of IWRM will be discussed.
• New South Wales, Australia, water regulations rank among the most advanced in the world today because they encompass provisions to dynamically regulate water availability with user demands through water-sharing arrangements.
• The EU Water Framework Directive was introduced at the turn of the century. Based on the recognition by member states of the need to harmonize water management, the principles of integration and equity and an aim to restore ecological status,1 the directive has since contributed to shaping the discourse on and measures of governance of water and environmental resources.
90 | WATER M ANA GEMENT IN O IL AND G AS O PERATION S
• IWRM represents a holistic approach to water resource management that recognizes that there are many different and interdependent uses of limited and finite water resources. IWRM is a cross-sectoral policy approach different from the traditional fragmented sector-based approach.
Water management in New South Wales, Australia
Australia is a federation of six states that have a high degree of autonomy, manifested by their own constitutions, parliaments, and laws. The federal constitution outlines how the federal and state Parliaments share power, and it identifies the law-making powers of the federal Parliament. The management of water resources is not included among these areas and is in principle an issue to be regulated by the state.
It is recognized, however, that water does not distinguish state boundaries and that the holistic management of water resources is essential for the society at large. One such area is the Murray–Darling Basin (MDB) in southeast Australia, which covers 75 percent of New South Wales, more than 50 percent of Victoria, 15 percent of Queensland, 8 percent of South Australia, and all of the Australian Capital Territory. The MDB is the home of 2.4 million people and 40 percent of all Australian farms. In recognition that the water in the MDB is a precious and limited resource, agreements have been in place for more than 100 years, setting out rules and plans for sharing water.
The Federal Water Act 2007 provides the legislative framework for ensuring that the MDB is managed in the best national interest. The Water Act also provides the basis for establishment of the Murray–Darling Basin Authority as a federal institution responsible for overseeing water resource planning in the basin as a whole. The recognition of challenges nurtured an understanding that a comprehensive plan was required to bring the basin back to a healthier and sustainable level and protect it for future generations. Hence, in 2012 the Murray–Darling Basin Plan was developed as a means to establish the amount of water that can be taken from the MDB each year.
New South Wales is one of the states sharing the MDB. New South Wales conducts its water management based on its Water Management Act 2000. The act reflects the same perspective as the federal Water Act with an objective of sustainable and integrated management of the water for present and future generations. The act also stipulates principles for water sharing, water use, drainage management, floodplain management, controlled activities, and aquifer interference activities.
Despite this well-developed framework and agreements for water management, major misconduct and mismanagement of water resources in New South Wales was revealed in 2017. In response to the recommendations arising from the review of this situation, the government developed a water reform action plan (WRAP) based on four water goals:
• Introduce best practices for water management.
• Build a compliance and enforcement regime that ensures strong and certain regulation.
• Ensure transparency in how water is shared, allocated, and managed.
• Build capability to support implementation of water reforms.
The best-practice approach involved a new regulatory framework and new institutional structures. The need for a strong regulator that could ensure
Legal, Regulatory, and Contractual Framework for Water Management | 91
compliance was recognized, and the New South Wales Natural Resource Access Regulator was established in response to this requirement.
A cornerstone for the management of the state’s water resources is the Water Sharing Plan (WSP). This is a tool envisaged in the Water Act but is also emphasized as an important instrument in the WRAP. The purpose of the WSP is as follows:
• Provide water users with a clear picture of when and how water will be available for extraction,
• Protect the fundamental environmental health of the water source, and
• Ensure the water source is sustainable in the long term.
The WSP reflects a long-term perspective for water management by setting rules for how water is allocated for the next 10 years. This provides security and predictability for both the environment and the water users. The WSP also provides a strengthening of water trading.
Further information on the New South Wales regulatory framework is found in appendix A.
EU Water Framework Directive
The freshwater resources in the European Union are under pressure because of increased economic activity, population growth, and urbanization. Water is an essential resource for agriculture, and 44 percent of the fresh water in the European Union is used for this purpose. The amount of land requiring irrigation has been increasing and is now 20 percent larger than it was in 1985. Europe is in general not regarded as an arid continent. Even so, one-half of EU countries are labeled as “water stressed,” and 11 percent of the population is subject to water scarcity.
The development of the EU water legislation commenced in the 1970s with an objective of protecting human health and the environment. A 1988 review identified major gaps in the framework that needed to be filled (European Commission 1988), and directives were prepared to accommodate these deficiencies:
• 1991 Urban Wastewater Treatment Directive and Nitrates Directive,
• 1996 Directive for Integrated Pollution and Prevention Control, and
• 1998 Drinking Water Directive
It became evident, however, that more comprehensive legislation was required. This resulted in the Water Framework Directive, adopted in 2000. The directive covers all surface waters as well as groundwater and was developed with the following four main pillars:
• Coordinated action to achieve “good” status from both qualitative and quantitative perspectives for all EU waters, including surface and groundwater;
• Set-up of a water management system based on natural river basin districts, crossing regional and national boundaries;
• Integrated water management, bringing different water management issues into one framework; and
• Active involvement of interested parties and consultation of the public.
For a water body to be classified as good status, the surface water will be assessed on ecological and chemical statuses and the groundwater on chemical and quantitative statuses. The standards to be met are further defined in the
92 | WATER M ANA GEMENT IN O IL AND G AS O PERATION S
Groundwater Directive issued in 2006 and the Environmental Quality Standards Directive issued in 2008.
The WFD sets up a clear timetable that reflects key milestones up to 2027. An essential tool for implementing the WFD is the River Basin Management Plan (RBMP). The RBMP is based on the recognition that river basins are defined based on geographical and hydrological aspects, not administrative or political boundaries. The RBMP is updated every 6 years. An essential milestone in the WFD occurred in 2009 when the EU member states released 160 RBMPs for 2009–15 that aimed to protect and improve the water environment. The second set of RBMPs covering 2016–21 were completed in 2016–17.
The WFD also provides a legislative basis for introducing pricing and nonpricing measures to reduce water consumption. Hence, Article 9 of the WFD requires the member states to take account of the principle of recovery of the costs of water services, including environmental and resource costs. Water pricing and nonpricing measures have been acknowledged to have a high potential to provide an incentive for more efficient water use and to achieve the environmental objectives under the WFD.
Although the introduction of the WFD and support from other legislation resulted in clear improvements in the chemical quality of EU waters, challenges remain concerning both the quality and the quantity of water. To deal with these challenges, the European Commission issued the “Blueprint to Safeguard Europe’s Waters” in 2012 to improve the implementation of the WFD. The Water Blueprint was based on a three-tier strategic approach:
• Improve the implementation of current EU policy by making full use of the opportunities provided by the current law.
• Increase the integration of water policy objectives into other relevant policy areas.
• Fill the gaps in the current framework.
FRESHWATER AND PW MANAGEMENT IN SELECTED COUNTRIES
The first part of this chapter discussed water resource management from a national perspective through the examples of New South Wales, Australia, and the European Union. Petroleum regulations and petroleum contract terms are often silent on water management issues, and attempts should be made to bridge the gap between general water management regulations at the national (or state) level and the regulatory regime that applies to oil and gas.
A related and equally important precondition for efficient water management is the development of competent institutions to implement and enforce the legal and regulatory provisions. Interaction between petroleum sector institutions (in particular, the petroleum authority) and national and regional water management institutions is key to harmonizing practices for water abstraction and discharge.
In developed economies with a significant petroleum sector, the regulatory framework is typically mature and includes proper regulatory measures for water management in the petroleum sector. A prominent example is the United States, which has the world’s largest oil production and the highest associated water volumes in terms of both freshwater abstraction and water production.
Legal, Regulatory, and Contractual Framework for Water Management | 93
In developing countries, the framework is often incomplete, and the institutional structure is not well developed. There is a general lack of integration between the water and petroleum regimes, meaning that the water and petroleum regulatory frameworks are often disjointed. In these countries the emphasis is often on water use for agriculture or municipal uses. To the extent to which water use in the industry is recognized, the focus is on rather small-scale activities and not the operational scope of the petroleum sector. However, there also good exceptions to this rule, with Uganda as a good example.
Also, the petroleum legal framework recognizes to a very limited degree that water use and water discharge are an essential part of petroleum operations. The petroleum contract addresses operational aspects that are not covered by the laws and regulations. Water management, however, has not been identified as a focus area in any of the contracts reviewed for the purpose of this chapter. A summary of the regulatory frameworks in two developed countries (the United Kingdom and the United States) and three developing countries (Pakistan, Sudan, and Uganda) is presented.
United Kingdom: a major offshore oil and gas producer with significant onshore operations
The United Kingdom is a major international producer of oil and gas. With a daily oil production of 1.03 million barrels in 2020, the United Kingdom ranks as number 18 in the world. In 2020 gas production totaled 39.5 billion cubic meters, covering 55 percent of UK consumption. The bulk of the production comes from offshore fields. There are also 120 onshore oil and gas sites with 250 operating wells, producing in total between 20,000 and 25,000 barrels of oil equivalent per day.
Since 2007 the United Kingdom has also had an increased focus on shale gas onshore. The estimates are uncertain but could possibly cover about 20 percent of the gas demand for the next two decades. To establish shale gas production, hydraulic fracturing of the shale gas layers is required. The observation of earthquakes resulting from these operations caused a moratorium to be placed on shale gas operations in November 2019. The international energy crisis emerging in 2022, however, has caused initiatives to be taken to reassess the scientific basis for the moratorium.
To conduct onshore oil and gas operations in the United Kingdom, a wide range of permits is required, also related to water management. The key authority that grants these permits is the Environment Agency, which is sponsored by the Department for Environment, Food and Rural Affairs but has the status of an executive nondepartmental public body. In this position, the Environment Agency is not a part of a government department and operates at an arm’s length from the minister. It answers to the public through Parliament.
The permits required for water-related operations are stated in the Environmental Permitting Regulations 2016. This includes the general environmental permit required for all industrial activities as well as water abstraction permits granted under the Water Resources Act 1991. Permits for groundwater activities and radioactive substances activities can also be required.
Environmental permit
An environmental permit is required for onshore petroleum operations. This mining waste permit covers all types of waste generated by the permitted operations and is based on the project’s waste management plan. The permit also
94 | WATER M ANA GEMENT IN O IL AND G AS O PERATION S
applies to the injection or reinjection of PW. If waste hydraulic fracturing fluid is left in the rock formation after injection, the area will be classified as a mining waste facility. However, the reinjection of PW does not result in the area being classified as a mining waste facility.
Water abstraction permit
An operator that plans to directly abstract more than 20 cubic meters of water per day must apply for a water abstraction license. This threshold applies to the total amount of water the operator plans to abstract, not to each abstraction point from the same water source. The abstraction for water to be used for hydraulic fracturing requires the operator to furnish a range of additional details on well patterns and other operational aspects.
Produced water
Of particular interest are the regulations pertaining to formation water. A distinction is made between PW and flowback fluid. Produced water is any water that is produced by exploring and extracting hydrocarbons from a well with oil and gas, except for flowback fluid. Flowback fluid refers to a mixture of water, sand, and chemicals that returns to the surface after high-volume hydraulic fracturing.
Another dimension that will dictate requirements for PW management is naturally occurring radioactive material (NORM), which relates to the radiation safety perspective. Oil and gas production is categorized as a NORM industrial activity and must not exceed the allowed radioactivity level for every radioactive substance.
PW reinjection to facilitate production To encourage optimum hydrocarbon reservoir depletion, operators can reinject PW into geological formations from which hydrocarbons have been extracted, subject to obtaining a groundwater activity permit.
Generating and reinjecting PW at the same site requires a permit for a radioactive substance activity if the PW contains NORM that has a concentration of radioactivity exceeding the out-of-scope values. This is because the PW supports production and is not waste.
However, if the operator intends to reinject PW at a different site for which it is the operator and the concentration of NORM waste in the PW exceeds the scope values, a radioactivity substances activity permit is required.
If the PW is intended to be transferred to another operator for reinjection to encourage production at a different site, and the PW contains a concentration of NORM above the out-of-scope values, both operators must obtain radioactive substances activity permits.
Reinjection of PW for disposal Where the PW contains a concentration of NORM waste above the out-of-scope values, it can be reinjected for disposal at the original site or at a different site into geological formations from which hydrocarbons were extracted.
The PW may also be reinjected into geological formations that for natural reasons have been determined by the operator as permanently unsuitable, in which case the burden of proof is on the operator. Contamination from human activity is not a valid reason for a determination of permanently unsuitable. The formation will not be determined as permanently unsuitable for other purposes if any current or potential future uses of that formation exist. An initial
Legal, Regulatory, and Contractual Framework for Water Management | 95
assessment using published, conservative data may be enough to identify whether the proposal for permanently unsuitable is valid. If the initial assessment does not identify this, the operator will need to prepare a detailed risk assessment with site-specific data, which in turn requires obtaining permits for groundwater and radioactive substances activities.
If the PW contains below–out-of-scope NORM waste values, it is not considered radioactive waste. As such, it can then be reinjected for disposal at the original site under a groundwater activity permit. Should PW be proposed for reinjection or disposal at a different site, such use can only be authorized by a groundwater activity permit if the formation to which the PW is being disposed is a geological formation from which hydrocarbons have been extracted or is a geological formation with a permanently unsuitable status. This is also the case when PW is transferred to another operator for disposal at a different site.
Where hydrocarbons have not been extracted from the geological formation, or where a formation is not permanently unsuitable for natural reasons, reinjection of PW for disposal is not allowed. In these cases, PW must be taken to an appropriately permitted waste facility.
Reinjection
of flowback fluids
Flowback fluid can be treated and reused as fresh injection fluid for the purpose of hydraulic fracturing. Reused flowback fluid will be regulated in the same way as fresh injection fluid because until the flowback fluid no longer serves a useful purpose, it is not considered waste.
Flowback fluid that is not reused is considered by the Environment Agency to be an extractive waste and may contain a concentration of NORM waste above the out-of-scope values. It will then require a radioactive substances activity permit for its disposal and should be sent to an appropriate permitted waste facility for treatment or disposal.
The Environment Agency will generally not permit the reinjection of flowback fluid for disposal into any formation, whether it contains a concentration of NORM waste above the out-of-scope values or not. Although the reinjection of flowback fluid for disposal is not necessarily prohibited, the Environment Agency takes a precautionary approach to this activity and does not consider reinjection in these circumstances to have been demonstrated as the best available technology.
United States: the world’s largest oil and gas producer
The United States experienced a continuous production decline from 1985 to 2008 but has since reversed this production trend and increased production by more than 140 percent. In 2020 US oil production amounted to 16.5 million barrels per day, almost 37 percent more than that of the Kingdom of Saudi Arabia. Sourced water and PW are integral and essential parts of petroleum operations. The total volume from more than 1 million wells is substantial (refer to Chapter 1). However, during 2007–2017 the volume of PW increased significantly less than the increase in oil volume. This decrease in the ratio of water to oil production can be ascribed to the decommissioning of many old conventional wells and an increase in production from unconventional formations, which have a different water production profile than conventional wells. The bulk of the PW in the
96 | WATER M ANA GEMENT IN O IL AND G AS O PERATION S
United States in 2017 was reinjected, and less than 3 percent was reused, either onsite or outside the oil and gas industry (refer to figure 1.5).
Most aspects of the PW resulting from petroleum operations is regulated by federal, state, or local agencies. The overall legal system consists of three tiers. All legislative power in the government is vested in Congress, meaning that it is the only part of the government that can make new laws or change existing laws (Tier 1).2 At Tier 2, the federal Environmental Protection Agency (EPA) will implement the requirements of the laws by establishing necessary regulations and regulatory programs. Permits (Tier 3) are issued either by EPA itself or by states that have been delegated by EPA to issue their own permits, including for PW discharges (GWPC 2019).
The primary law in the United States governing the disposal of solid and hazardous waste is the Resource Conservation and Recovery Act (RCRA), which amended the Solid Waste Disposal Act of 1965. RCRA was passed in 1976 to address the increased challenges from municipal and industrial waste with an objective of protecting human health and the environment. A hazardous waste program outlining a cradle-to-grave system was included in RCRA as Subtitle C. The general scope of this program also covered the PW from petroleum operations.
In 1988, however, EPA determined that waste from petroleum exploration and production, including PW, would not to be subject to Subtitle C of the RCRA. This decision was made under the realization that imposition of this part of the RCRA on the large volumes of water produced in oil operations would have resulted in substantial negative economic impact on the industry. EPA also found that most existing state regulations were generally adequate for protecting human health and the environment. EPA concluded that alternative, costeffective ways of managing PW could be considered. This exception from RCRA applies to PW that is directly derived from primary field operations, leaving room for interpretation as to the extent of its applicability to treated water in the context of reuse outside oil and gas operations.
For water management issues that fall outside RCRA’s scope, two other federal regulatory programs are relevant to PW from oil and gas operations: the National Pollutant Discharge Elimination System (NPDES) and the Underground Injection Control (UIC) program.
NPDES was created by EPA under the direction of Congress, based on the Clean Water Act. NPDES is a permitting, compliance, and enforcement program that regulates discharges of PW to lakes and rivers. The Clean Water Act also gives EPA the authority to delegate authority to the states that can demonstrate the necessary capacity.
NPDES requires a permit to be issued for any discharge of PW. The permit is issued based on the calculation of technology-based limits in which the type of discharge, its treatment, and its cost are considered. The permit mandates the application of national discharge standards (effluent limitation guidelines), unless more restrictive state standards apply. The general requirement for onshore wells prohibits any water discharge. There is, however, an exemption for stripper wells (wells producing less than 10 barrels per day), for which no federal discharge standards exist. There is also a different limit for onshore facilities west of the 98th meridian. For this generally very water-scarce part of the United States, PW of good-enough quality (maximum oil content of 35 milligrams per liter) may be used for agricultural purposes.
Legal, Regulatory, and Contractual Framework for Water Management | 97
The other important federal regulatory program that applies to PW is the UIC program. The establishment of the UIC was directed by Congress through the Safe Drinking Water Act, which directed EPA to develop a program to regulate disposal of PW in injection wells with the objective of protecting underground sources of drinking water. Under this program, EPA is mandated to delegate authority to the states. The program applies to all types of wastes injected into the subsurface and is divided into different well classes. Wells used for injecting PW are classified as class II. The water that is injected into class II wells can have the purpose of maintaining the pressure or sweeping the hydrocarbon-bearing formation to produce additional oil. These injection wells are named class II-R as enhanced recovery wells. Another category is class II-D wells, which are used for injection of PW only for disposal. Elements considered and included in a class II permit include well location, construction requirements, evaluation of the affected area, operations, monitoring and reporting, and closure requirements.
PW has largely been regarded as a waste product, and in 2017 more than 180,000 wells had received a class II UIC permit to inject for disposal. Only 2.7 percent of the PW was reused, and only 1.3 percent was reused outside the oil and gas industry (Veil 2020). The use of PW has been limited because of the risks involved; the high costs of transportation, treatment, and distribution; and location. The regulatory framework addressing the reuse of water has also been limited. Very few states have included PW as a part of their state water planning process. It is expected, however, that with increasing scarcity of water and more research on the opportunities for using PW, the use will increase, and additional regulations be developed.
Pakistan: a long production history and a large unrealized shale gas potential
Pakistan’s petroleum sector dates back 70 years to when the first exploration activities took place. The first commercial gas production started in 1955, and the first oil came onstream 12 years later. The country’s petroleum reserves are modest. The gas reserves in 2020 are estimated at 13.6 trillion cubic feet (BP 2021). The assessment of shale gas potential, however, suggests that Pakistan may have an additional estimated 62.2 trillion cubic feet of risked recoverable reserves (EIA 2015). Pakistan’s legal, regulatory, and contractual framework is outlined in table 5.1.
Oil production in 2020 was 83,000 barrels per day, which is less than 20 percent of the country’s annual consumption, and Pakistan is a major net importer of crude oil. Regarding natural gas, Pakistan was self-sufficient up to 2015, after which time it began importing liquified natural gas. In 2020, Pakistan’s annual natural gas production was 2.95 billion cubic feet per day, covering about 75 percent of its annual consumption. Despite the rather extensive set of policy and legal framework documents (as summarized in table 5.1), a review has not identified any specific regulations pertaining to water use for petroleum operations.
The Petroleum Exploration and Production Policy 2012 (amended in 2020) is highly focused on acceleration of exploration and production activities and limits their environmental concern to a general objective:
To undertake exploitation of oil and gas resources in a socially, economically and environmentally sustainable and responsible manner.
98 | WATER M ANA GEMENT IN O IL AND G AS O PERATION S
POLICY AREA REGULATORY REFERENCE
Petroleum policy
Environmental policy
Water policy
Petroleum legislation
Environmental legislation
Water legislation
Petroleum upstream regulations
Environmental regulations
Petroleum contractual regime
Other relevant documents
• Petroleum Exploration and Production Policy 2012, amended January 2020
• Tight Gas Exploration and Production Policy 2011a
• National Environmental Policy 2005b
• National Water Policy 2018c
• National Drinking Water Policy 2009d
• Petroleum Act 1934
• Regulation of Mines and Oil-Fields and Mineral Development (Federal Control) Act 1948
• Environmental Protection Act 1997
• Punjab Water Act 2019
• Offshore (Exploration and Production) Rules 2003
• Onshore Petroleum (Exploration and Production) Rules 2013
• Policies and procedures for environmental assessment 1997
• Model Petroleum Concession Agreement for Onshore Area 2013e
• Offshore Model Production Sharing Agreement, 2003f
• National Environmental Quality Standards Rules 2001
Sources: This table is original to this publication, with reference citations as indicated in the table body and footnotes.
a. Government of Pakistan, Ministry of Petroleum and Natural Resources 2011.
b. Government of Pakistan, Ministry of Environment 2005.
c. Government of Pakistan, Ministry of Water Resources 2018.
d. Government of Pakistan, Ministry of Environment 2009.
e. Government of Pakistan, Ministry of Energy (Petroleum Division) 2013.
f. Government of Pakistan, Ministry of Energy (Petroleum Division) n.d.
The Onshore Petroleum (Exploration and Production) Rules 2013 stipulate that the development plan should include the following:
(f) anticipated adverse impact on environment, measures proposed to be taken for the prevention thereof and for the general protection of the environment.
Furthermore, the license holder should in their operations (section 58[2])
(d) . . . prevent the entrance of water through wells to petroleum bearing strata, except when approved by the Authority for the purposes of secondary recovery; and
(e) . . . prevent the escape of petroleum into any waters in or in the vicinity of the said area.
The Model Petroleum Concession Agreement for Onshore Area 2013 (Government of Pakistan, Ministry of Energy [Petroleum Division]) is also very limited with reference to water. Section 29.5 of the agreement stipulates that a report be prepared before drilling operations that contains the details of the measures required to be taken to minimize environmental damage, which shall include the following:
(g) liquid and solid waste disposal;
(k) protection of freshwater horizons.
Section 11(1) of the Environmental Protection Act 1997 stipulates very general principles on the prohibition of discharges:
Subject to the provisions of this Act and the rules and regulations made there under no person shall discharge or emit or allow the discharge or emission of
Legal, Regulatory, and Contractual Framework for Water Management | 99
TABLE 5.1 Pakistan’s legal, regulatory, and contractual framework
any effluent or waste or air pollutant or noise in an amount, concentration or level which is in excess of the National Environmental Quality Standards Rules or, where applicable, the standards established under sub clause 6(1)(g)(ii).3
The National Environmental Quality Standards Rules appear to define the parameters to be measured without providing specific values for the allowed limits.
The National Water Policy 2018 recognizes industry as a prioritized user of water. The petroleum sector is classified under mining and quarrying according to Pakistan’s Standard Industrial Classification.4 In section 15, the policy states,
15.1 Industry is recognized as an important instrument of economic growth and provider of employment opportunities on a large scale. The Water Policy accordingly classifies Industry as an important user of water, and the provision of its water needs shall be facilitated. A study shall be undertaken for enactment of legislation to formally allow and define the use of water abstraction licenses and water rates for industrial use.
15.2 Industry shall be required to carry out in-house treatment of their wastewater before transfer to municipal sewer as per NEQ [National Environmental Quality] standards and the “Polluter Pays” principle shall be strictly enforced. Existing rules shall be strengthened for effective monitoring/ control of pollution as per international standards. The standards of effluent disposal shall be strictly enforced.
No further legal stipulations are identified that concretize these general policy statements. Apparently, as stated in section 15(1), a process is ongoing to establish further legislation.
It is our understanding that water management in Pakistan is subject to legislation in the different regions. The Punjab Water Act 2019 assigns responsibilities and rights related to the water supply, but the stipulations are very general and have no specific reference to petroleum operations. The act stipulates that both abstraction and disposal licenses are required (sections 43 and 44). It is assumed that these general requirements will also apply to the petroleum sector, but it is difficult to see how, in practice, they will apply to petroleum operations.
Uganda: on the threshold of major oil field developments
Although petroleum exploration efforts in Uganda date back more than 100 years, it was not until 2006 that the first commercial discovery was made. Since then, more than 20 additional discoveries have been made in the Albertine Graben in the western part of the country. The current estimated recoverable reserves are 1.4 billion barrels.
After a series of transactions regarding license interests, TotalEnergies and China National Offshore Oil Corporation (CNOOC) now operate the first phase of development with the Uganda National Oil Company as a partner. TotalEnergies will be responsible for the Tilenga field complex and CNOOC for the Kingfisher field. The total plateau production is estimated at 230,000 barrels per day. The Final Investment Decision for the development was signed on February 1, 2022, and, in addition to the field developments, the development will include an export pipeline to the East African coast at Tanga in Tanzania. The first oil is scheduled for 2025. The planning of a Uganda refinery with a capacity of 60,000 barrels per day is ongoing.
100 | WATER M ANA GEMENT IN O IL AND G AS O PERATION S
POLICY AREA
Petroleum policy
Environmental policy
Water policy
Petroleum legislation
Environmental legislation
Water legislation
Petroleum upstream regulations
Environmental regulations
National water regulations
Petroleum contractual regime
Other relevant documents
REGULATORY REFERENCE
• National Oil and Gas Policy for Uganda 2008a
• Environment and Social Safeguards Policy 2018b
• National Environment Management Policy 1995c
• National Water Policy 1999d
• Petroleum (Exploration, Development and Production) Act 2013
• Petroleum (Refining, Conversion, Transmission and Midstream Storage) Act 2013
• National Environment Act 2019
• Water Act 1997
• Petroleum (Exploration, Development and Production) Regulations 2016
• Petroleum (Exploration, Development and Production) HSE Regulations 2016
• Petroleum (Waste Management) Regulations 2019
• National Environment (Environmental and Social Assessment) Regulations S.I. No. 143 of 2020
• National Environment (Standards for Discharge of Effluent into Water or Land) Regulations 2020
• Water Resources Regulations 1998
• Water (Waste Discharge) Regulations 1998
• Model Production Sharing Agreement 2015e
• None found
Sources: This table is original to this publication, with reference citations as indicated in the table body and footnotes. Note: HSE = health, safety, and environment.
a. Petroleum Authority of Uganda 2008.
b. Government of Uganda, Ministry of Water and Environment 2018.
c. Government of Uganda 1994.
d. Government of Uganda, Ministry of Water, Lands and Environment 1999.
e. Uganda National Oil Company 2021.
Issues related to water management are to a very small extent addressed in the policy document and legal framework for the petroleum sector, which is summarized in table 5.2.
The National Oil and Gas Policy for Uganda 2008 recognizes the potential impact of petroleum activities on the environment only in general terms and, in connection with this, that transboundary water resources may also be affected:
6.2.4 Impact on the Environment
Oil and gas activities in the country can impact the environment from several angles. They may affect human beings, wildlife and biodiversity, together with the associated tourism. Transboundary water resources and the economy of the Albertine Graben ecosystem where production is anticipated may also be affected.
The Petroleum (Exploration, Development and Production) Act 2013, also in very general terms, states that preventing pollution of water resources is an operating principle for all petroleum licensees.
Article 88. Work practices for licensees.
(2) Notwithstanding the general effect of subsection (1), a licensee shall take all reasonable steps necessary to secure the safety, health, environment, and welfare of personnel engaged in petroleum activities in the license area including:
(a) controlling the flow, and preventing the waste or discharge, into the surrounding environment, of petroleum, gas which is not petroleum or water;
(b) preventing the escape of any mixture of water or drilling fluid, and petroleum or any other matter;
Legal, Regulatory, and Contractual Framework for Water Management | 101
TABLE 5.2 Uganda’s legal, regulatory, and contractual framework
(f) preventing the pollution of any water well, spring, stream, river, lake or reservoir by the escape of petroleum, water, drilling fluid, chemical additive, gas not being petroleum or any other waste product or effluent.
The act states that further regulations may be issued for the possible disposal of water in the subsurface as well as the production rate of water and its measuring. Whether such regulations have been issued could not be verified.
Article 183. Regulations
(3) Without limiting the general effect of subsection (1), the Minister may make regulations relating to:
(m) the use of wells and the use of the subsurface for the disposal of petroleum, water and other substances produced in association with the exploration for or the recovery of petroleum;
(n) the rates, or the method of setting the rates, at which petroleum and water may be recovered from any well or reservoir;
(o) the methods, measurement points and equipment to be used for measuring petroleum, water and other substances in relation to petroleum activities.
The Petroleum (Exploration, Development and Production) Regulations 2016 is also silent on the issue of water management and has only one reference to water for the preparation of the field development plan:
Article 22. Field Development Plan
(1)(f)(iv) a brief description of systems for collecting and treating oil, water and other discharges.
Likewise, the Model Production Sharing Agreement 2015 has no sections addressing water use. Water is mentioned only in the context of water systems and that cost related to water systems is recoverable.
Uganda has a National Water Policy from 1999 that presents broad and general principles, but in the latest IWRM survey Uganda admits that the policy is still not adequately implemented: “There is still low awareness of the policy and its inter-linkage with other policies.” The policy was formulated well before the petroleum sector was established. Hence, no reference is made to oil and gas activities, and only a general policy statement for the industrial use of water is found:
Paragraph 7.2 Water for industrial use
Adequate and appropriate water supply systems will be identified and developed to meet the current and future industrial water demands. Supply of adequate quantities of water to the major rural towns should be promoted as a means of attracting various economic activities, particularly industrial development. Recycling of industrial water will be encouraged. The discharge of effluent from industrial areas will be subject to a permit in line with the Environment and Water Statutes. Environmental impact assessment will be required for all industrial developments.
The more recent Environment and Social Safeguards Policy 2018 provides further guidance on how projects should be regulated:
Paragraph 4.2.1 Compliance with the Law
The Ministry of Water and Environment as an implementing entity will provide, when relevant, a description of the legal and regulatory framework for any project activity that may require prior permission such as environmental permits, water abstraction/extraction permits especially during the construction of water Irrigation Schemes and water for production facilities.
102 | WATER M ANA GEMENT IN O IL AND G AS O PERATION S
Oil and gas projects often entail a broad set of impacts, requiring an ESIA as a part of the decision process. The National Environment Act 2019 also underscores this requirement from the perspective of utilization of water resources and stipulates a mandatory ESIA for projects exceeding defined limits:
Article 4. Utilisation of water resources and water supply.
(a) Abstraction or utilisation of surface water for agricultural, industrial or urban use of more than 1,000 m3/day.
(b) Abstraction or utilisation of groundwater of more than 1,000m3/day.
(c) Diversion of water from a river or stream, where the water discharged is more than 400m3/day or 30% of Internal Renewable Water Resources over the river catchment.
The Water Act 1997 is a very general legal framework and has no specific references to the industrial use and management of water resources. The act provides a basis for governance of this area, which is further detailed in regulations.
The Water (Waste Discharge) Regulations 1998 provides details on the permit process for water discharge. The application for a discharge permit pertains to the following:
Article 5.b.(iv) the owner or occupier of any premises specified in the Third Schedule[5] from which waste may come into contact with water, directly or indirectly; may apply to the Director for a waste discharge permit.
The position of the petroleum sector is not clear from the referred schedule, but “mineral extraction and processing” and “oil factories” are included, and it is assumed that this also will cover oil and gas operations. The discharge permit requires a fee to be paid:
Article 18. (1) The holder of a waste discharge permit shall pay an annual waste discharge fee.
Article 18. (2) Discharge fees. The fee referred to in sub-regulation (1) of this regulation shall be fixed having regard to—(a) the volume, characteristics and components of waste to be discharged; (b) the principle that the true and total costs of environmental pollution should be borne by the polluter.
The cost of the discharge permit is rather modest at U Sh 650,000 (US$200) and a similar annual monitoring fee. Furthermore, there is a discharge fee according to the biochemical oxygen demand (BOD)6 load per year with an upper level of U Sh 13,000,000 (US$3,600). Whether this is applicable to PW is questionable. There are also regulations on freshwater use that may apply to petroleum activities, as stipulated by the Water Resources Regulations 1998. The fee for the permit is marginal at U Sh 450,000 (US$125). Moreover, there is also a fee on the volume of freshwater used. The highest of three tiers applies to all volumes above 1,000 cubic meters per day and will generate an annual fee of U Sh 3,000,000 (US$850).
A rather new set of standards for discharge has been defined in the National Environment (Standards for Discharge of Effluent into Water or Land) Regulations 2020. The following principles are stipulated:
Article 4. General obligation to prevent and mitigate pollution (1) A person whose activities are likely to produce effluent shall put in place measures to prevent and mitigate pollution . . . , including by—(a) employing the best available technologies and cleaner production techniques; and (b) installing effluent treatment equipment and facilities for effluent emanating from the activities of their industry or any other facility.
Legal, Regulatory, and Contractual Framework for Water Management | 103
POLICY AREA
Petroleum policy
Environmental policy
Water policy
Petroleum legislation
Environmental legislation
Water legislation
Petroleum upstream regulations
Environmental regulations
National water regulations
Petroleum contractual regime
Other relevant documents
Article 9. Application for an effluent discharge permit (1) . . . a person who intends to discharge effluent shall apply to the lead agency responsible for water resources for an effluent discharge permit.
The regulations further include specific standards for a large group of substances and chemicals, specifically,
• Standards for general chemicals and microbiological discharge,
• Standards for inorganic substances effluent discharge, and
• Standards for organic substances effluent discharge.
However, because oil production has still not started in Uganda, whether all discharge limits will fully apply to petroleum operations must be verified.
Sudan: managing oil resources through political unrest
Sudan has been a region of unrest and turmoil since it gained its independence more than 65 years ago, including two periods of civil war. The last civil war ended in 2005 with the signing of a Comprehensive Peace Agreement, followed by a referendum in 2011 that resulted in the establishment of South Sudan as an independent state.
Sudan began producing oil in 1999, reaching peak production in 2007 in excess of 480,000 barrels per day. However, 75 percent of the oil reserves are located in South Sudan. Oil produced in South Sudan is routed to Sudan, where it is processed and sent on to the international market. Disputes over tariffs and armed conflicts have caused significant disruption to oil production during the past decade. In 2020 the total production was 256,000 barrels per day, of which 86,000 barrels per day came from Sudan. Table 5.3 outlines Sudan’s legal, regulatory, and contractual framework.
REGULATORY REFERENCE
Not available
• Interim National Constitution of the Republic of Sudan 2005
• National Water Policy 1999a
• Water Supply and Environmental Policy 2010b
• National Drought Plan 2018c
• Petroleum Wealth Act 1998
• Environmental Protection Act of 2001
• Environmental Health Act of 2009
Not available
Not available
• Regulations for Protection of the Environment in the Petroleum Industry 2002–2005d
Not available
• Sudan Exploration and Production Sharing Agreement, Model 2012e
• Sudan Drinking Water Safety Strategic Framework 2017f
Sources: This table is original to this publication, with reference citations as indicated in the table body and footnotes.
a. Republic of Sudan, Ministry of Irrigation and Water Resources 1999.
b. Republic of Sudan 2010.
c. UNCCD and National Council for Combating Desertification 2018.
d. Abuagla 2014.
e. Ministry of Petroleum and Gas, Sudanese Petroleum Corporation, and OPEA 2016.
f. Republic of Sudan, Ministry of Water Resources, Irrigation and Electricity and Federal Ministry of Health 2017.
104 | WATER M ANA GEMENT IN O IL AND G AS O PERATION S
TABLE 5.3 Sudan's legal, regulatory, and contractual framework
The basic principle of protecting the environment is vested in the Interim National Constitution of the Republic of Sudan 2005 and states that “the people of the Sudan shall have the right to a clean and diverse environment.” Furthermore, it states that the sustainable utilization of oil should be consistent with national environmental policies.
The Petroleum Wealth Act 1998 is the current petroleum law. The act contains no explicit statements concerning water use and discharge and only a general statement on preventing pollution:
Article 13 (4): The contracting companies shall give due regard to environmental health, safety measures and take such measures as may be necessary for prevention of pollution of the environment, as a result of performing any of the petroleum operation, in implementation of the agreements concluded therewith.
The Petroleum Wealth Act 1998 provides a general mandate to issue regulations as necessary to implement the act. The Regulations for Protection of the Environment in the Petroleum Industry 2002–2005 are issued under this mandate. The regulations provide details on disposal of waste, requiring hydrogeological studies before disposal to avoid leaks.
The reuse of mud used for drilling operations is required, as are the collection and treatment of all waters used for cooling. Drilling methods should prevent pollution of subterranean water reservoirs.
The regulations contain firm principles and discharge requirements for PW:
Article 20. Disposal of Formation Waters
(a) When performing petroleum operations, the surface disposal of produced formation waters shall be in a sound manner and after treatment comply with the provisions of annex 3 of the regulations [which are summarized in table 5.4].
(b) In the situation of injection or reinjection of formation waters, this should be carried out without causing pollution of other layers.
Legal, Regulatory, and Contractual Framework for Water Management | 105
TABLE 5.4
ITEM VALUE (AVERAGE) Oil and grease 7–1,300 (200) Total organic carbons 30–1,600 (400) Total suspended solids 20–400 (400) Total dissolved solids 30,000–200,000 (100,000) Biological oxygen demand 120–340 Chemical oxygen demand 180–580 Phenols 50 Cadmium 0.7 Chromium 2.4 Copper 0.4 Lead 0.2 Mercury 0.1 Nickel 0.4 Source: This table is original to this publication, based on the Regulations for Protection of the Environment in the Petroleum Industry 2002–2005. Note: PW = produced water.
Standard limits for PW (mg/l)
The 2002−05 Regulations for Protection of the Environment in the Petroleum Industry (Articles 25–26) stipulate principles for operations of vessels and the discharge of waste and water from these. The requirements and limits for the discharge are detailed in annexes 5 and 6 to the regulations.
The establishment of refining and petrochemical plants will in general not be allowed in environmentally sensitive areas, and any discharge from such plants has to be within the limits stipulated in annexes 7–10 of the regulations.
The Environmental Protection Act of 2001 is another very general legal document underscoring protection of the environment as a national concern but without specific stipulations for the petroleum industry. The Environmental Health Act of 2009 reflects a general concern with clean air and waters and the disposal and handling of waste to prevent pollution.
The Ministry of Petroleum and Gas and its General Directorate for Environment, Safety and Health (GDESH) issued the Health, Safety and Environmental Requirements and Guidance for the Oil and Gas Industry in 2016. The document does not seem to be directly mandated by the legal framework but is intended to promote compliance with laws and regulations. The guidance serves as a framework for the development of management systems, underscores the responsibility of regular reporting to the GDESH, and contains discharge limits for PW as one of the performance indicators (refer to table 5.5). It should be noted that the allowed discharge limits set forth in the guidance are widely different from those set forth in the 2002–05 Regulations for Protection of the Environment in the Petroleum Industry.
The guidance documents also underscore the requirement for permits and licenses, stating,
Permits/licenses shall be obtained for release to water, land, air and water disposal in excess of limits specified in the environmental law, SSMO [Sudanese Standards and Metrology Organization] or any other local or state environmental protection bodies or standards and regulations.
The status of water policy in Sudan is unclear. A policy document with the title “Sudan National Water Policy” was issued in 1999. According to the latest IWRM status report (UNEP 2020), however, this policy was never ratified, and no new policy document has been approved.
This draft policy recognizes water as a scarce and valuable resource that must be equitably, economically, and efficiently used. At the time of this chapter’s preparation, however, the petroleum sector was still in its infancy, and petroleum activities were not explicitly mentioned. For industrial activities in general,
Source: Data based on GDESH 2016.
Note: GDESH = General Directorate for Environment, Safety and Health; HSE = health, safety and environment; ppp = parts per million; TDS = total dissolved solids.
106 | WATER M ANA GEMENT IN O IL AND G AS O PERATION S
DESCRIPTION DEFINITION/FORMULA MONTH ACTUAL TARGET Produced water Average monthly oil content (ppm) 5 No of discharges to the environment 0 Heavy metal (ppm) 1 Radioactive material (ppm) 0 TDS (ppm) <1,200
TABLE 5.5 Discharge limits for PW in HSE requirements and guidance, GDESH 2016
the policy emphasizes the value of treating wastewater before its discharge and the reuse of wastewater for cooling purposes. The policy subscribes to the “polluter pays” principle and refers to the need to develop adequate legislation.
According to the UNEP (2020), there is an approved Water Resources Law (1995). Moreover, there is a country policy on IWRM (2007) and a water supply and sanitation policy (2010). These documents, however, are not publicly available and could not be assessed.
IWRM
Water management in most low- and medium-income countries is still fragmented and inadequate, which continues to be a major cause of concern for many nations (Carrillo-Rivera, Ouysse, and Kuri 2021). Inadequate water management practices worldwide, including water contamination, result in more than 2 billion people living in water-stressed countries and lacking access to safe drinking water and sanitation. Despite recent declines in attributable mortality, inadequate water and sanitation services remain an important determinant of the global disease burden, especially among young children (Prüss-Ustün et al. 2019). A total of 3.5 billion people lack access to safely managed sanitation services (UN 2023), which also leads to the spread of waterborne diseases. According to WHO (2019), 2.2 billion people lack access to safe drinking water, and 3.6 billion people had inadequate access to water for at least 1 month per year in 2018 (WMO 2021). By 2050, this last figure is expected to rise to more than 5 billion. Inadequate water management can also have a significant impact on agriculture and food security. In countries in which agriculture is the main source of livelihood for many people, water scarcity can lead to crop failure and food shortages.
IWRM is now a widely accepted principle for the management of water resources. It rests on a holistic approach and is built on the realization that many different uses of finite water resources are interdependent. IWRM combines views and techniques regarding sustainable and integrated management of water resources. IWRM has been defined by the GWP (2018) as a process which promotes the coordinated development and management of water, land and related resources, in order to maximize the resultant economic and social welfare in an equitable manner without compromising the sustainability of vital ecosystems
IWRM builds on the Dublin Water Principles, the guiding principles for managing freshwater resources that were adopted at the 1992 Dublin Conference on Water and the Rio de Janeiro Summit on Sustainable Development. These principles represent the first major international effort to concisely state the main issues and thrust of water management in the world:
• Water is a finite and vulnerable resource, essential to sustain life, development, and the environment.
• Water development and management should be based on a participatory approach, involving users, planners, and policy makers at all levels.
• Women play a central part in the provision, management, and safeguarding of water.
• Water has an economic value in all its competing uses and should be recognized as an economic good.
Legal, Regulatory, and Contractual Framework for Water Management | 107
IWRM is not, therefore, a prescriptive description of how water should be managed but rather a broad framework with which decision-makers can collaboratively decide on the goals of water management and coordinate the use of different instruments to achieve those goals. Given that each country differs in terms of history, socioeconomic conditions, cultural and political context, and environmental characteristics, there is no single blueprint for IWRM, and it can be adapted to resolve the problems faced in each local context.
The basis of IWRM is that the many different uses of finite water resources are interdependent. IWRM is a cross-sectoral policy approach, designed to replace the traditional, fragmented sectoral approach to water resources and management that led to poor services and unsustainable resource use. IWRM is based on the understanding that water resources are an integral component of the ecosystem, a natural resource, and a social and economic good.
IWRM principles
IWRM offers a broad set of principles, tools, and guidelines that must be tailored to the specific context of a country, region, or river basin to implement efficient and effective water resource management (Meran, Siehlow, and von Hirschhausen 2021). A basic set of principles is outlined in box 5.3 and further discussed in appendix B.
To support the application of IWRM principles in practice, the GWP (2018) has created a set of organizing perspectives covering the thematic areas of IWRM: enabling environment, institutional roles, and management instruments. This breakdown is useful because it sets the regulatory management framework within IWRM.
BOX 5.3
Key integrated water resource management principles
Key integrated water resource management principles are as follows:
• Integration of water and environmental management;
• Full participation by all stakeholders, including workers and the community;
• Capacity building;
• Full-cost pricing complemented by targeted subsidies;
• Central government support through the creation and maintenance of an enabling environment;
• Adoption of the best existing technologies and practices;
• Reliable and sustained financing;
• Equitable allocation of water resources;
• Recognition of water as an economic good; and
• Strengthening the role of women in water management.
Source: IWA 2002.
108 | WATER M ANA GEMENT IN O IL AND G AS O PERATION S
Organizational framework for regulation and compliance
The state, through its regulatory powers, has the responsibility to establish policies and regulations in relation to physical water resources, and both water quantity and quality must be carefully considered.
Given that both watersheds and aquifers often cross state boundaries, many different types of institutions take part in integrating water resources management, ranging from very large, transboundary or international entities to local and regional governments and community organizations.
Organizations whose primary function is not water management are sometimes responsible for sectors in which the impact on water resources can be enormous; agriculture, industry, trade, and energy are examples. For the regulation and compliance functions to be adequately performed, all these actors, whether they have a direct or indirect connection to water, must be accounted for by the legislative frameworks. This also applies to cross-sectoral entities that integrate and coordinate water institutions.
Economic instruments, incentives, and penalties
An IWRM approach focuses on four pillars:
• Enabling an environment of suitable policies, strategies, and legislation for sustainable water resources development and management;
• Putting in place the institutional framework through which to put into practice policies, strategies, and legislation;
• Setting up the management instruments these institutions require to do their job; and
• Creating the financial tools needed to implement the instruments developed.
The Global Water Partnership (GWP) has designed 84 different tools to further explain the interconnection among the pillars and support the implementation of IWRM.
As a part of the management instruments, GWP has also assembled a set of economic policy instruments that can significantly improve an existing policy framework by incentivizing, rather than commanding, behavioral changes that may lead to environmental improvement. They may have several additional benefits, such as creating a permanent incentive for technological innovation, stimulating the efficient allocation of water resources, generating revenues to maintain and improve the provision of water services, and promoting water use efficiency.
Economic instruments for water management include the following:
• Tariffs and charges, which are paid by water users (households, industries, farmers) to their service providers. These tariffs and charges can vary according to the volume of water used, its source, or the time of day or the season in which it is used. The tariff signals the economic cost of providing and using water, thereby discouraging wasteful or low-value use and encouraging its deployment to more useful ends. To be effective, tariffs need to be volumetric, based on the amount of water consumed. Tariffs apply to both freshwater abstraction or service and wastewater treatment charges.
• Abstraction charges, which are levied on the extraction of raw water from rivers, lakes, and aquifers by municipal service providers, farmers, and industrial and mining companies. Their purpose is to help regulate the overextraction of
Legal, Regulatory, and Contractual Framework for Water Management | 109
water from these sources, to avoid environmental and ecological damage, and to reflect the opportunity cost of the water (one person’s use deprives some other user of its benefits).
• Water markets, which make it possible for users to buy the right to use water from others holding these legal rights. These markets can involve either permanent or annual or seasonal transfers. Water markets are well established in Australia, Chile, parts of Spain, and some western states of the United States.
• Tradable pollution permits, which can be bought and sold by users (typically industries or mines) as an alternative to either closing operations or installing costly pretreatment facilities. These permits are a way of enforcing local water pollution controls that is more efficient than the preceding alternatives. However, in practice these schemes are more common for the management of air pollution than for water, for which they are more problematic.
• Pollution charges, which penalize the discharge of contaminated water by water authorities and companies into public water bodies or aquifers. If these charges are set high enough, they will encourage potential polluters to change their use habits, reducing their discharges or treating their effluent before discharge. Tradable pollution permits and pollution charges are based on economic incentives to limit pollution. Other ways to do this are “commandand-control” regulations that set a limit on the quantity and type of pollutants that a company, for example, is allowed to discharge in a set time frame.
• Subsidies, which provide positive inducements to behavior considered to be in the public interest, such as for connections to a public water system, promotion of safe household sanitation, and companies installing water-efficient processes or pretreatment of effluent. These kinds of targeted subsidies should not be confused with unintended subsidies that arise from a failure to charge full cost-recovering tariffs or ex post debt write-offs for a poorly performing utility.
• Payments for environmental services (PES), which are subsidies given to farmers and other land users when they follow environmentally friendly practices, such as organic farming, tree planting, catchment protection, and the like. Such practices, often desirable in themselves, help to preserve watersheds and improve water quality and are often much cheaper than other methods of treating water for drinking and industrial purposes. PES can also be viewed as compensation for abstaining from environmentally harmful practices.
Some economic instruments, notably tariffs, as well as pollution and abstraction charges, also have the purpose of raising revenue, which can be returned to national fiscal revenues, retained by the service provider, or earmarked for specific purposes, such as environmental spending. A well-designed tariff or charge can serve fiscal and economic incentive purposes simultaneously; however, these motives can be in conflict, for example, when a pollution charge successfully eliminates pollution and thereby destroys its revenue base. Economic instruments complement institutional, regulatory, technical, and other kinds of tools used in water management. They offer some advantages over other tools: they provide incentives to change behavior, raise revenue to help finance necessary adjustments, establish user priorities, and achieve overall IWRM management objectives at the least overall cost to society. However, economic instruments are not substitutes for other tools of water governance, such as monitoring, regulation, and enforcement of public health and environmental standards.
110 | WATER M ANA GEMENT IN O IL AND G AS O PERATION S
Economic instruments normally work best in combination with other supporting measures; they are unlikely to be effective alone. The adage “the market is a good servant but a bad master” applies here. Governments must set the right legal and institutional framework, including regulation, within which individual economic agents can operate—the unfettered market will not provide this. However, properly confined and regulated, markets can produce the required adjustments very efficiently.
The use of prices and market mechanisms for water management does not occur in a vacuum, and their effectiveness depends on wider economic forces operating in society. Economic levels of tariffs may be difficult to achieve in conditions of widespread poverty or when the prices of other essential goods and services are rising at the same time. For example, charging farmers more for their water may not be feasible (or fair) if producer prices are artificially depressed or may be negated by high subsidies for fertilizer and energy.7
The GWP Toolbox provides a useful compilation of lessons learned in establishing and operating the regulatory and compliance elements described here. These lessons are presented in box 5.4. Further elaboration on the IWRM approach is included in appendix B.
Insights from countries’ experience with integrated water management
Regulatory bodies and enforcement agencies
• Sufficient staff of adequate capability are essential to enforce regulations (enforcement agencies) and take appropriate measures about water management needs (regulatory bodies).
• Statutes must be practical, enforceable, and based on accurate knowledge of resource management and environmental impacts.
• To limit the risk of regulatory capture, regulatory agencies must be adequately resourced and staffed, and principles of transparency and good governance should apply to their financial management.
• Meaningful indicators for technical, economic, and social issues and appropriate benchmarks for assessment are essential.
• Enforcement and regulatory agencies must be free from political and economic interference so that their actions are not biased in any specific direction.
Local authorities
• Because integrated water resource management is context specific, local leadership is needed to initiate sustainable processes in communities.
• Local authorities must understand that their actions not only affect their own locality but will also have some implications for the broader region and should seek to join or initiate local cooperation networks.
• Local enforcement authorities should be financially independent to avoid compromising local enforcement of water-related rules and regulations.
• The principle of subsidiarity depends on strong local leaders and leadership. In other words, institutional decentralization cannot happen without having people at the local level who are willing and show the capacity to take action in the context of water governance.
Monitoring and evaluation
• Monitoring and evaluation (M&E) bodies are normally governmental but may on some occasions involve private and community-based partners.
• Water resource monitoring is about assessing the physical quantity and quality of water in any of its phases and may take place during one or several phases of the hydrological cycle.
Legal, Regulatory, and Contractual Framework for Water Management | 111
continued
BOX 5.4
• M&E bodies also need to take socioeconomic activities into consideration because they have such an influence on water resources.
• It is important that M&E also happens at the project level, especially when dealing with water infrastructure.
• The work done by M&E bodies holds informative and prescriptive value for the development of better and more sustainable water policies.
• Assessing water resources requires sufficient resources, particularly human, technical, and financial.
• M&E bodies should receive directives and be financed by the same authority so that they do not have intra- and interinstitutional coordination problems.
Impact assessment
• Impact assessments (IAs) act as a safeguard to determine whether the infrastructure not
Source:
only matches the short-term objectives but also corresponds to the long-term goal of sustainable development.
• If an IA determines that an infrastructure project directly contradicts the socioeconomic and environmental balance of an area, then the project should not go through.
• IAs and their recommendations have a form of soft power and support a more comprehensive policy and legal environment.
• IAs need to be composed by relevant specialists with adequate training and technical means.
• Timing is crucial; impact assessment committees (IACs) need to be set up before the project starts and need to continue their assessment functions throughout the project’s phases.
• Infrastructure investments are often driven by political agendas; thus, IACs need to be established and protected as independent authorities.
LESSONS LEARNED
Although petroleum production is very much about water, this chapter has illustrated that the legal, regulatory, and contractual frameworks for oil and gas often appear to be a world apart from the broader water management framework at the national or regional level. The legal framework for the petroleum and water sectors was reviewed for three developing countries in different phases of petroleum sector development and two industrialized countries with welldeveloped regulatory regimes. Ideally, every country should have a current policy, a water act, and adequate regulations for each sector as a basis for good governance. This is often not the case.
In the countries analyzed in this chapter, the management of water resources has very limited space in petroleum legal and regulatory frameworks. The water management framework in general focuses on the main water users, which are dominated by agricultural followed by municipal and small-scale industrial users. National frameworks were often established before the petroleum activity started or gained momentum.
Although adequate principles for the management of both water and petroleum are defined, the necessary and harmonized regulations are commonly absent. For example, Pakistan has policies as well as acts in place to address both water and petroleum, but adequate regulations guiding their implementation are missing.
112 | WATER M ANA GEMENT IN O IL AND G AS O PERATION S
continued
GWP 2018. Box 5.4,
The lack of harmonization across frameworks is evidenced by the unrealistic targets set for the discharge of PW from petroleum operations. As an example, a Sudanese guidance document on health, safety, and environment sets a target for a reduction in the oil content of disposed water by more than 97 percent and in dissolved solids by more than 99 percent, compared with the limits stipulated by the Regulations for Protection of the Environment in the Petroleum Industry. Achieving such figures is not likely, implying that all PW must be reinjected, potentially preventing reuse.
The Ground Water Protection Council (USA) has recognized the use of financial instruments to enhance the implementation of policies on water resource management by incentivizing behavioral changes. To this end, the tariffs and charges for water abstraction are stipulated according to the sector to which they will apply. By contrast, Uganda Water Resources Regulations 1998 stipulate an annual tariff of US$850 for a freshwater supply exceeding 1,000 cubic meters per day. This may be an adequate level for agriculture and small-scale businesses, but it will likely not be a deterrent for the petroleum sector.
Good governance of the water sector is not achieved through the legal and regulatory framework alone. The framework must be implemented, monitored, and enforced by competent government institutions. For example, New South Wales has a detailed Water Management Act, but major misconduct and mismanagement of the water resources were outlined earlier in this chapter. As a consequence, a new institutional structure with a substantially stronger enforcement capacity was established.
Efficient water resource management can only be achieved when relevant government regulatory institutions interact. Uganda approved its National Water Policy in 1999. However, the Uganda Country Survey Instrument (UNEPDHI 2020) states that awareness of the national policy and its interlinkages with other policies is still low, suggesting that communication between departments and authorities is insufficient.
Water is a national resource that commonly falls under the responsibility of a ministry of environment, whereas the ministry responsible for petroleum will have sector responsibility. A dispersed and overlapping responsibility is challenging, and oil-producing countries often resort to the one-stop-shop model in which the petroleum regulator is the entry point for industry for all matters related to oil and gas operations. In any case institutional cooperation and coordination are essential. Institutional arrangements for effective governance and regulatory enforcements are further discussed in chapter 7.
NOTES
1. Ecological status is calculated using assessments of biological, physiochemical, and hydromorphological elements of individual water bodies.
2. For details on the powers of the US legislative and executive branches, refer to White House (n.d.).
3. The subclause states, “Different standards for discharge or emission from different sources and for different areas and conditions may be specified.”
4. Further details can be found in Pakistan’s “Standard Industrial Classification,” as amended in 2010 (Government of Pakistan, Statistics Division, Federal Bureau of Statistics 2010).
5. The Third Schedule identifies the prescribed trades and premises that may apply for a discharge permit.
Legal, Regulatory, and Contractual Framework for Water Management | 113
6. BOD is a measure of how much dissolved oxygen is being consumed as microbes break down organic matter. A high value indicates a falling level of dissolved oxygen and risk to a river´s biodiversity.
7. Further descriptions of economic instruments are discussed in Delacámara et al. (2013).
REFERENCES
Abuagla, Mustafa Abdalla. 2014. “Environmental Management in Sudan Oil & Gas Industry.” https://unctad.org/system/files/non-official-document/17OILGASMINE%20Mustafa%20 Abdalla%20Abuagla%20S3.pdf
BP. 2021. “BP Statistical Review of World Energy.” https://www.bp.com/content/dam/bp /business-sites/en/global/corporate/pdfs/energy-economics/statistical-review/bp-stats -review-2021-full-report.pdf
Carrillo-Rivera, José Joel, Samira Ouysse, and Gonzalo Hatch. “Groundwater Mismanagement: Impacts on Society Due to a Response Lacking Geoethics in Mexico.” In Advances in Geoethics and Groundwater Management: Theory and Practice for a Sustainable Development: Proceedings of the 1st Congress on Geoethics and Groundwater Management (GEOETH&GWM’20), Porto, Portugal, 2020, edited by Manuel Abrunosa, António Chambel, Silvia Peppoloni, and Helder I. Chaminé, 451–53. Cham, Switzerland: Springer.
Delacámara, Gonzalo, Thomas Dworak, Carlos Mario Gómez, Manuel Lago, Alexandros Maziotis, Josselin Rouillard, and Pierre Strosser. 2013. “EPI-Water Deliverable 5.3: Guidance on the Design and Development of Economic Policy Instruments in European Water Policy.” EPI-Water—Evaluating Economic Policy Instruments for Sustainable Water Management in Europe. https://www.ecologic.eu/sites/default/files/publication/2015/epiwater_2014 guidance_on_use_of_epi_in_water_management.pdf
EIA (US Energy Information Administration). 2015. Technically Recoverable Shale Oil and Shale Gas Resources: India and Pakistan. Washington, DC: EIA. https://www.eia.gov/analysis /studies/worldshalegas/pdf/India_Pakistan_2013.pdf
European Commission. 1988. “Developing Community Water Policy: Conclusions of Water Policy Conference—Frankfurt, June 27–28 1988.” Press release IP/88/413, June 29, 1988. https://ec.europa.eu/commission/presscorner/detail/en/IP_88_413
Government of Pakistan, Ministry of Energy (Petroleum Division). 2013. “Model Petroleum Concession Agreement for Onshore Area.” https://petroleum.gov.pk/SiteImage/Misc/files /Final-Model-PCA-Part-II-Amended-January-2020.pdf
Government of Pakistan, Ministry of Energy (Petroleum Division). n.d. “Offshore Production Sharing Agreement.” https://petroleum.gov.pk/SiteImage/Misc/files/Model-Production -Sharing-Agreement--2003.pdf
Government of Pakistan, Ministry of Environment. 2005. National Environmental Policy. https://pbit.punjab.gov.pk/system/files/National%20Environmental%20Policy%202005 .pdf
Government of Pakistan, Ministry of Environment. 2009. National Drinking Water Policy. http:// waterbeyondborders.net/wp-content/uploads/2018/07/Pakistan-National-Drinking -Water-Policy-2009.pdf
Government of Pakistan, Ministry of Petroleum and Natural Resources. 2011. Tight Gas (Exploration and Production) Policy –2011. https://policy.asiapacificenergy.org/sites/default /files/Tight%20Gas%20%28Exploration%20%26%20Production%29%20Policy%202011 .pdf
Government of Pakistan, Ministry of Water Resources. 2018. National Water Policy. http:// waterbeyondborders.net/wp-content/uploads/2018/07/Pakistan-National-Water-Policy -2018.pdf.
Government of Pakistan, Statistics Division, Federal Bureau of Statistics. 2010. “Pakistan Standard Industrial Classification of All Economic Activities (PSIC): Revision 4 (2010),” accessed November 10, 2023. https://www.pbs.gov.pk/sites/default/files/other/documents /PSIC_2010.pdf
114 | WATER M ANA GEMENT IN O IL AND G AS O PERATION S
Government of Uganda. 1994. “National Environment Action Plan.” Kampala: National Environment Action Plan Secretariat, Ministry of Natural Resources.
Government of Uganda, Ministry of Water, Lands and Environment. 1999. A National Water Policy, accessed November 10, 2023. https://www.parliament.go.ug/cmis/browser?id =a995c06c-dc3f-4c40-be84-ec1cc424cb28%3B1.0.
Government of Uganda, Ministry of Water and Environment. 2018. Environment and Social Safeguards Policy, accessed November 10, 2023. https://www.mwe.go.ug/sites/default/files /library/MWE-ESS-Policy.pdf.
GWP (Global Water Partnership). 2018. “GWP Toolbox: ISRM Action Hub.” https://www.gwp .org/en/learn/iwrm-toolbox/About_IWRM_ToolBox/.
GWPC (Ground Water Protection Council). 2019. “Produced Water Report: Regulations, Current Practices, and Research Needs.” https://www.gwpc.org/wp-content/uploads/2019 /06/Produced_Water_Full_Report___Digital_Use.pdf.
IWA (International Water Association). 2002. “Industry as a Partner for Sustainable Development: Water Management.” London: IWA and UN Environment Programme. https://wedocs.unep.org/bitstream/handle/20.500.11822/29595/WaterMgt_.pdf ?sequence=1&isAllowed=y
Meran, Georg, Markus Siehlow, and Christian von Hirschhausen. 2021. “Integrated Water Resource Management: Principles and Applications.” In The Economics of Water, 23−121. Cham, Switzerland: Springer. https://doi.org/10.1007/978-3-030-48485-9_3
Ministry of Petroleum and Gas, Sudanese Petroleum Corporation, and OPEA (Oil Exploration and Production Authority). 2016. Exploration and Production Sharing Agreement. https:// s3.amazonaws.com/rgi-documents/72bd018d62b56483c7deeb981704d2a0ce41f51d.pdf
Open Oil. 2012. “Oil Contracts. How to Read and Understand Them.” http://openoil.net/wp /wp-content/uploads/2016/12/oil-contracts-v1.2-dec-13.pdf
Petroleum Authority of Uganda. 2008. National Oil and Gas Policy for Uganda, accessed November 10, 2023. https://www.pau.go.ug/download/the-national-oil-and-gas-policy -for-uganda-2008/
Prüss-Ustün, Annette, Jennyfer Wolf, Jamie Bartram, Thomas Clasen, Oliver Cumming, Matthew C. Freeman, Bruce Gordon, Paul R. Hunter, Kate Medlicott, and Richard Johnston. 2019. “Burden of Disease from Inadequate Water, Sanitation and Hygiene for Selected Adverse Health Outcomes: An Updated Analysis with a Focus on Low- and Middle-Income Countries.” International Journal of Hygiene and Environmental Health 222 (5): 765–77. https://doi.org/10.1016/j.ijheh.2019.05.004
Republic of Sudan. 2010. “Water Supply and Environmental Sanitation Policy,” accessed November 10, 2023.
https://faolex.fao.org/docs/pdf/sud197681.pdf
Republic of Sudan, Ministry of Irrigation and Water Resources. 1999. “Sudan National Water Policy,” accessed November 10, 2023. IRC. https://www.ircwash.org/resources/sudan -national-water-policy
Republic of Sudan, Ministry of Water Resources, Irrigation, and Electricity, and Federal Ministry of Health. 2017. Sudan Drinking Water Safety Strategic Framework (SDWSSF). https://www.unicef.org/sudan/media/1016/file/Sudan-Drinking-Water-Safety-Strategic -Framework-2017.pdf.
TotalEnergies. 2019. “Tilenga Project: Environmental and Social Impact Assessment—NonTechnical Summary.” https://totalenergies.com/sites/g/files/nytnzq121/files/documents /2021-03/Tilenga_esia_non-tech-summary_28-02-19.pdf.
Uganda National Oil Company. 2021. “[Model] Production Sharing Agreement for [Petroleum Exploration, Development and Production] or [Petroleum Development and Production] in the Republic of Uganda by and between the Government of the Republic of Uganda and Company X Company Y Company Z,” accessed November 10, 2023. https://www.unoc.co .ug/wp-content/uploads/2021/07/MPSA.pdf
UN (United Nations). 2023. “The Sustainable Development Goals Report: Special Edition.” https://unstats.un.org/sdgs/report/2023/The-Sustainable-Development-Goals-Report -2023.pdf
Legal, Regulatory, and Contractual Framework for Water Management | 115
UNCCD (United Nations Convention to Combat Desertification) and National Council for Combating Desertification. 2018. “Sudan National Drought Plan.” https://knowledge.unccd .int/sites/default/files/country_profile_documents/1%2520FINAL_NDP_Sudan.pdf
UNEP (United Nations Environment Programme). 2020. “Integrated Water Resources Management: Good Practices in Sudan—Adapt for Environment and Climate Resilience in Sudan (Adapt!),” accessed November 10, 2023. https://wedocs.unep.org/20.500.11822/31981.
UNEP-DHI (United Nations Environment Programme) Centre on Water and Environment. 2020. “Country Survey Instrument for SDG Indicator 6.5.1: Uganda.” UNEP-DHI Centre on Water and Environment. http://iwrmdataportal.unepdhi.org/country-reports
Veil, John. 2020. “U.S. Produced Water Volumes and Management Practices in 2017.” Oklahoma City, OK: Ground Water Research and Education Foundation. https://www.gwpc.org /wp-content/uploads/2020/02/pw_report_2017___final.pdf
White House. n.d. “Our Government.” Accessed April 5, 2022. https://www.whitehouse.gov /about-the-white-house/our-government/
WHO (World Health Organization). 2019. Progress on Household Drinking Water, Sanitation and Hygiene 2000–2017: Special Focus on Inequalities . Geneva: WHO. https://iris.who.int /bitstream/handle/10665/329370/9789241516235-eng.pdf?sequence=1
WMO (World Meteorological Organization). 2021. 2021 State of Climate Services. Geneva: WMO.
116 | WATER M ANA GEMENT IN O IL AND G AS O PERATION S
6Leading Industry Practices Illustrated by Case Studies
OVERVIEW
The key challenges in petroleum sector water management are to reduce the need for freshwater abstraction and to handle large volumes of produced water (PW). Alternative sources of water include treated industrial effluent recycling, seawater desalination, treated municipal wastewater recycling, and others. PW may be reinjected into the producing reservoir to maintain or increase production or be reinjected into a different reservoir as a method of final disposal. It may also be discharged into surface water bodies or subsurface aquifers, in compliance with the applicable environmental regulations. To a lesser extent, PW can be recycled in operational processes or be reused for purposes outside oil and gas operations, such as irrigated agriculture.
This chapter illustrates the key aspects of water management through several illustrative case studies prepared by representatives of leading oil companies.
CASE STUDIES OVERVIEW
Five main themes capture key aspects of water management in oil and gas operations:
• Assessment of water sources and establishment of water risk,
• Water management framework and efficiency in water use,
• Internal reuse of PW,
• External reuse of PW, and
• Stakeholder engagement.
The case studies presented in this chapter discuss a broad range of water management aspects, such as the following:
• Water management strategy;
• Project characteristics, water stress situations, and life-cycle water needs;
• Applied technologies;
• Applicable regulatory and contractual regimes;
• Cooperation with authorities and stakeholder engagement; and
• Economic and environmental impacts.
117
Map 6.1 shows the contributing companies and case study geographical locations and also identifies countries for which legal and regulatory frameworks were reviewed in chapter 5. Highlights from the case studies are provided next.
Petrobras: water source assessment and water risk establishment
The Brazilian company Petrobras operates a daily production of 2.8 million barrels, mostly offshore, and operates 13 refineries nationwide. In view of the water volumes required in its activities and the concern with sustainable use of natural resources, the company has developed a Water Scarcity Risk Index (WSRI) motivated by the need to have objective criteria to guide the company’s actions regarding water risks.
The index has been applied every 2 years since 2015, and its last cycle (in 2021) included 45 installations (upstream and downstream), which account for about 94 percent of the freshwater withdrawal from operations in Brazil. Application of the WSRI was incorporated into Petrobras’s water risk management system, and its results make it possible to understand and compare the water risk levels for different facilities, as well as mitigation and risk management actions.
PETRONAS: business continuity in water-stressed conditions
PETRONAS, the national oil company of Malaysia, operates offshore production and associated onshore refineries and other downstream activities, which make up some 90 percent of total company freshwater withdrawals. With a focus on
118 | WATER M ANA GEMENT IN O IL AND G AS O PERATION S
MAP 6.1
Colombia
Italy
Saudi Arabia Sudan
Oman Pakistan Malaysia
Geographical
location of case studies United States
Brazil United Kingdom European Union
Kingdom of
Uganda
New South Wales, Australia Regulatory review Case study
Source: This map is original to this publication.
its domestic operations in Malaysia, PETRONAS used the Aqueduct water risk screening tool developed by WRI in 2019 to identify priority locations with respect to future water stress. Projections of future water availability were based on downscaled climate scenarios sourced from the National Water Research Institute of Malaysia (NAHRIM). Current and projected future water demand (until 2050) were examined for domestic, industrial, and agriculture sectors within the identified water catchment areas.
Saudi Aramco: Use of TSE in cooling systems
With its roots in the Kingdom of Saudi Arabia’s desert climate, Saudi Aramco has long recognized the importance of preserving water. From an early stage, water management has been a key pillar of the company’s long-term strategy. The company’s comprehensive water conservation efforts entail supplementing water supply with alternative sources, implementing water-efficient practices, maximizing wastewater reuse, and minimizing water losses.
In this pilot study, utilization of treated sewage effluent (TSE) as cooling tower makeup water was assessed for operational performance, biohazards, and groundwater conservation. TSE from an activated sludge biological treatment process was used as makeup water, instead of raw groundwater, for a cooling tower. The results indicate that disinfection and biocide treatment were effective in controlling biological growth and associated risks to human health. Overall, the outcome of this pilot study indicated that TSE is a viable alternative to groundwater for industrial cooling systems applications.
Eni: Rewind Blue Water technology and its application
This case study illustrates the development of a modular plant for the treatment of PW from an oil field located in a water-stressed area of southern Italy, the Val d’Agri. The treated water will be used in the Centro Olio Val d’Agri (COVA) as industrial water, with savings on freshwater withdrawals. Blue Water technology was conceived with an innovative approach aimed at treating and reusing PW in line with international management guidelines and Eni’s circular economy strategy. The full-scale plant (which produces 72 cubic meters of water per hour) currently under approval will make water available to the oil center, eliminating the current practice of transporting PW to external waste treatment facilities, thus saving a precious natural resource and avoiding traffic and truck emissions. The Blue Water Project is part of a development vision for the Val d’Agri described by the Energy Valley Program. A payout time of less than 2 years is expected for the investment.
Treated water is also sufficiently clean for possible use outside the oil and gas operations, but current regulations set strong restrictions on such external reuse. The comprehensive case study provides an overview of Italy’s regulatory framework, the stakeholders’ engagement process, and the project’s economics, as well as a technical description of the Blue Water technology.
Petrobras: internal reuse of PW
PW generation is inherent to oil production activities and is considered the main industry’s effluent. The volume of PW and the potential impact of its discharge is leading to more rigid requirements to allow discharge, which pushes all major oil companies to invest in PW reinjection. In general, PW treatment offshore is a challenge because of treatment facilities’ large footprint
Leading Industry Practices Illustrated by Case Studies | 119
and platform weight limits. According to IOGP (2017), around 27 percent of offshore PW worldwide is reinjected. Onshore operations do not have these restrictions, which makes it possible to reinject practically the entire generated volume. Because of the search for better environmental performance, aligned with industry best practices, Petrobras has been increasing PW reinjection volumes. In 2021, the company reinjected about 23 percent of its PW offshore, a 180 percent increase over 2020.
Ecopetrol: reuse of PW in agroforestry and livestock activities
Ecopetrol is the state company of Colombia and the third largest producer of oil and gas in Latin America. In its search for balance between oil production and protection of the environment by reducing discharges, Ecopetrol produced research on the treatment of PW for reuse in irrigation of agricultural crops and pastures and for consumption by livestock and poultry. This successful research was carried out in the agroenergy sustainability area (ASA), located in the vicinity of the Castilla field.
The ASA has 228.72 hectares of land, 188.17 of which have agroforestry crops and more than 90 of which are dedicated to environmental rehabilitation, ecological recovery, and riparian forest. During the first quarter of 2022, an average of some 72,000 barrels of PW per day was reused in the ASA. Ecopetrol has an environmental permit to reuse up to 99,000 barrels per day during the dry season.
Petroleum development Oman: reedbed treatment of PW and reuse for irrigation purposes
The Nimr Water Treatment Plant (NWTP) project is in the south of the Sultanate of Oman. This successful water treatment project was coexecuted by Petroleum Development Oman (PDO) and Bauer Resources of Germany. The Nimr oil field generates 240,000 cubic meters of PW per day, and the NWTP has a treatment capacity of 175,000 cubic meters per day. The PW goes through an oil and water separator and is then distributed into wetland reedbed terraces. In 2014, the NWTP started using treated PW for the irrigation of test plots for biosaline agriculture, and the reuse of water has developed significantly in recent years. A 25-hectare farmland has been installed on site, and water is now used for irrigation of plants such as cotton, ricinus, and jojoba to produce either valuable products downstream or biological oils for further processing. The amount of cleaned water delivered to the farmland varies between 170 and 670 cubic meters per day.
The NWTP was constructed to replace energy-intensive underground disposal by high-pressure pumps. Compared with deep disposal wells, the wetland approach has much lower energy requirements and a smaller carbon footprint. Since the start of operation, a total of approximately 2.150 million tonnes of carbon dioxide emissions have been saved.
Saudi Aramco: treatment of saline PW with broad reuse potential
The treatment facilities and irrigation projects in Colombia and Oman are blessed with PW with brackish characteristics. The Saudi Aramco case study investigates treatment technologies for both low (<15,000 milligrams per liter)
120 | WATER M ANA GEMENT IN O IL AND G AS O PERATION S
and high (<120,000 milligrams per liter) salinity levels, which are representative of many PWs. The main purpose is reuse of PW in oil and gas operations to reduce the abstraction of the Kingdom of Saudi Arabia’s scarce and nonrenewable groundwater reserves.
Saudi Aramco conducted a comprehensive field-testing program of PW desalination technologies, primarily targeted at reuse of PW with low total dissolved solids (TDS; <1,000 milligrams per liter) as process or utility water and for other industrial purposes. The effectiveness of the treatment technology implies that the treated PW may be reused for a variety of purposes across Saudi Aramco and the Kingdom of Saudi Arabia and reduces reliance on groundwater resources. Among other purposes, the water can be used in agroforestry for cash crops, for industrial purposes, and for use in the green energy program at Saudi Aramco to generate biofuels and carbon dioxide sequestration.
PETROBRAS (BRAZIL): WATER SOURCE ASSESSMENT AND WATER RISK ESTABLISHMENT
Prepared by Mariana Taranto P. T. Leite, Vitor Gaudencio de A. Passos, André Bueno Portes, and Rafael Costa Guerreiro, Petrobras.
Introduction
Petrobras is a Brazilian company that operates in exploration and production, refining, generation, and commercialization of energy. It has acquired expertise in exploration and production in deep and ultradeep waters in the presalt layer resulting from more than 50 years of developing Brazilian offshore basins.
Petrobras’s upstream activities are spread across 13 Brazilian states and along the coast between Ceará and Paraná, as shown in map 6.2. Offshore operations are the company’s core business, and 67 platforms are currently operating and responsible for most of the daily production of 2.8 million barrels of oil equivalent per day (Petrobras company representatives, https:// www.petrobras.com.br).
Water is an essential resource for oil and gas industry operations, and it is vital for society. All oil and gas activities use water and generate effluents, which makes the theme of water source assessment and water risk establishment strategically relevant to the business’s sustainability.
According to OECD (2012) projections for industrial production, electricity generation, and domestic use, world water demand is expected to grow by 55 percent by 2050 compared with 2001. Intensified water use and increased demand could lead to water scarcity in several of the world’s watersheds. According to the United Nations, by 2030 the world will face a global water deficit of 40 percent in a business-as-usual scenario (WWAP 2015).
Water crisis risks are among the most important ones the world will face in upcoming years. Thus, ensuring access to the water supply necessary for the continuity of its activities, in an environmentally sustainable way, must be one of the oil and gas industry’s priorities regarding water resources management.
Developing the WSRI
In this context, in partnership with the Water Resources and Environment Laboratory of the Instituto Alberto Luiz Coimbra de Pós-Graduação e Pesquisa em Engenharia, Universidade Federal do Rio de Janeiro, Petrobras developed
Leading Industry Practices Illustrated by Case Studies | 121
MAP 6.2
Source: Petrobras (https://petrobras.com.br/en/our-activities/main-operations/basins/, accessed August 29, 2023).
the WSRI, a practical tool of quick application and comparable metric between different facilities, with the objective of guiding its risk mitigation actions. The tool considers not only the facilities’ susceptibility to the physical scarcity of water resources but also river basin vulnerabilities and resilience actions developed in the facilities.
The creation of its own index, specific to Petrobras, was motivated by the need to have objective criteria to guide the company’s actions regarding water risks, the need to optimize costs and efforts related to the development of water availability studies, and the low applicability and adherence of the existing methodologies to the reality perceived by the company. The index result varies from 0 to 100 percent; the higher the percentage is, the greater the risk of water scarcity to the installation. The index is produced by a mathematical calculation that aggregates the results of the several indicators that make up three subindexes:
• Availability, which evaluates the available flows for use in the watershed, considering the facility and other users’ demands;
• Vulnerability, which considers the maturity and completeness of the management system and the preservation state of the watershed where the facility is located; and
• Resilience, which verifies the facility’s reaction or resistance capacity in the face of water-scarcity events.
122 | WATER M ANA GEMENT IN O IL AND G AS O PERATION S
Locations of Petrobras’s upstream activities
WSRI results are shown on a significance scale, divided into five categories or risk levels. Thus, application of the index allows the identification and prioritization of locations and facilities where Petrobras must direct the development of water availability studies or even where it must implement other mitigation or risk-monitoring measures. Figure 6.1 presents a summary of the WSRI subindexes and the categories or risk levels.
Applying the WSRI
Between 2015 and 2016, Petrobras applied the index (first cycle) in a set of operational units that accounted for about 90 percent of total fresh water withdrawn by its operations in Brazil and classified such units according to the above-mentioned risk categories. The results were evaluated together with the financial representativeness of each unit and supported the prioritization of critical facilities (classes D and E) to develop actions aimed at water security.
In 2017, Petrobras established and initiated the implementation of the corporate action plan for water risk mitigation and monitoring for the prioritized facilities. At that time, the plan was composed of 40 actions of different natures, involving, for example, engagement with public water resource management bodies; intensification of Petrobras’s participation in water resource forums (such as water basin committees); corporate follow-up on specific workgroups focusing on water security, conducted at local levels in the units; development and updating of local water availability studies and identification of alternative supply sources; and development of studies of new opportunities to rationalize water use in the units and research conducted with a focus on technological development to optimize water use.
In 2019, the second WSRI cycle occurred, including new installations in the calculation. In 2021, Petrobras carried out the third cycle using the tool, covering 45 installations (upstream and downstream), which corresponded to about 94 percent of the freshwater withdrawal from operations in Brazil. The results of the different WSRI cycles were consolidated and discussed internally at Petrobras, considering the values of the total index and the three subindexes
Hydrology and water uses balance
Relation between water demands and available water
River basin’s characteristics
Vulnerabilty
Exposure level, damge susceptibility
Facility characteristics
Resilience
Ability to react/resist/recover
Source: Water at Petrobras (https://petrobras.com.br/data/files/78/94/6C/57/ D94426100E7FA126675391A8/Water_at_Petrobras.pdf, accessed August 29, 2023).
Note: The index is produced by a mathematical calculation that aggregates the results of the several indicators that make up the three subindexes. WSRI = Water Scarcity Risk Index.
Leading Industry Practices Illustrated by Case Studies | 123
FIGURE 6.1
WSRI subindexes and categories or risk levels
Water scarcity risk index: A B C D E Low risk level 0–20% Follow-up level 20–40% Warning level 40–60% Concerning risk level 60–80% Critical risk level 80–100%
Availability
(separately), to carry out an evolution analysis of the index results, based on previous rounds.
The regular application of the WSRI (every 2 years) was incorporated into Petrobras’s water risk management system, and its results make it possible to understand and compare the water risk levels for different facilities, as well as to identify the most important sites and facilities at which to direct detailed local water availability studies (water availability assessment and alternative sources studies), as well as mitigation and risk management actions. This initiative can be considered a good practice for the oil and gas industry and allows continued management of water security issues by the company.
PETRONAS (MALAYSIA): BUSINESS CONTINUITY IN WATER-STRESSED CONDITIONS
Prepared by Nurfarhana Abdul Rahim, Noor Suhailah Othman, Mohd Nizam Basiron, and Thayananthan Balakrishnan, Environment and Natural Resource Management, PETRONAS.
Introduction
Fresh water is an important natural resource for PETRONAS, especially for onshore downstream businesses, such as refining and petrochemical facilities, where it can make up to 90 percent of PETRONAS’s total freshwater withdrawal. Map 6.3 provides an overview of Malaysia’s oil and gas infrastructure.
Risk assessment and planning
Focusing on its domestic local operations in Malaysia, PETRONAS uses the Aqueduct water risk screening tool developed by WRI in 2019 to identify priority locations with respect to future water stress. Based on the risk screening exercise, four locations were identified as future water stressed, and a detailed water risk assessment was initiated, focusing on current and future freshwater availability and demand on a local level for each of the identified locations.
The risk assessment involves a projection of future water availability in which climate models were used, based on downscaled climate scenarios sourced from NAHRIM. The assessment examined information such as current and future water demand (until 2050) for domestic, industrial, and agriculture sectors in the identified water catchments as well as public infrastructure planning and sourcing works to ensure the accuracy of the results in objectively projecting the availability of fresh water in the future.
The assessments completed thus far reveal future water shortages for PETRONAS’s downstream facility because of projected longer and more frequent droughts resulting from climate change. Challenges in the form of aging public water infrastructure maintenance and development of water infrastructure at a pace that is not commensurate with demand growth are risk factors that need to be addressed. Water is a subsidized utility in Malaysia.
The results of these assessments are now being used to formulate plans at the corporate level to find the optimal solution and remove the need to use fresh water for PETRONAS operations in the identified locations. A review of possible alternative water sources is ongoing, and recommendations that are currently being considered include treated industrial effluent recycling, seawater desalination, and treated municipal wastewater recycling.
124 | WATER M ANA GEMENT IN O IL AND G AS O PERATION S


Box 6.1 provides further sources of information available in the Aqueduct Water Risk Atlas (WRI 2019), the tool used in the water risk screening stage.
Box 6.2 provides details of PETRONAS’s (2023) Water for Life community empowerment program.
BOX
Information available in the Aqueduct Water Risk Atlas
Physical risks—quantity:
• Water stress,
• Water depletion,
• Interannual variability,
• Seasonal variability,
• Groundwater table decline,
• Riverine flood risk,
Source: World Resources Institute n.d.
• Coastal flood risk, and
• Drought risk.
Physical risks—quality:
• Untreated connected wastewater, and
• Coastal eutrophication potential.
Regulatory and reputational risks:
• Unimproved or no drinking water, and
• Unimproved or no sanitation.
Leading Industry Practices Illustrated by Case Studies | 125
MAP 6.3
Source: Copyright © Petronas Nasional Berhad (PETRONAS). Note: LNG = liquid natural gas; LPG = liquefied petroleum gas; NGV = natural gas vehicle. *Mapisfor illustrationonlyand notto scale. Floating LNG LNGRegasification Terminal Legend PetrochemicalPlant Refinery LNGProcessingPlant GasFields Oil Fields Bintulu Miri Labuan KEDAH PERLIS PERAK KELANTAN TERENGGANU PAHANG JOHOR SELANGOR Kertih Gebeng MELAKA NEGERI SEMBILAN PULAU PINANG SOUTH CHINA SEA STRAITS OF MELAKA Kimanis SA RAWA K SABAH SAMUR, Sipitang PasirGudang Gurun LahadDatu SABAH-SARAWAK GASPPELINE PETRONAS LNG COMPLEX Regasification Terminal Sg. Udang PENGERANG INTEGRATED COMPLEX Train9 Depot PowerPlant Regasification Terminal Pengerang 8 LPG Bottling Plants 13 Aviation Terminals 3 Refineries 17 Fuel Terminals ServiceStations 1,065 Regasification Terminals 2 NGV Fueling Stations NGV 100 Producing Fields 157 Offshore and Subsea Structures 373 10 BunkeringFacilities Floaters 25 Onshore Terminals 13
Malaysia’s oil and gas infrastructure
6.1
Petronas’s Water for Life Program
Water for Life, a program initiated by a PETRONAS subsidiary, PETRONAS Dagangan Berhad, in Malaysia, is an effort to provide a consistent supply of clean water to communities, especially those in rural areas with inadequate access, and to educate communities on the importance of water conservation.
The program developed the necessary infrastructure to enable a clean water supply for communities, which includes installation of piping, filtration systems, and water tanks and in turn contributed to improved overall hygiene of the affected villages.
Source: PETRONAS 2023b.
Since its start in Malaysia in 2013, the program has also been implemented in Iraq and South Sudan, building reverse osmosis water station facilities and installing solar-powered submersible pumps to provide communities with access to clean water.
Through collaborations with nongovernmental organizations, such as the Malaysian Nature Society in Malaysia and Nile Hope in South Sudan, the Water for Life program has benefited more than 100,000 people in three countries, contributing to achieving PETRONAS’s statement of purpose as a progressive energy and solutions partner enriching lives for a sustainable future.
SAUDI ARAMCO (KINGDOM OF SAUDI ARABIA): USE OF TSE IN COOLING SYSTEMS
Prepared by Mohammad Badruzzaman and Syed Ahmed, Saudi Aramco.
Introduction
Open recirculating evaporative cooling towers are the most commonly used and cost-effective cooling technology for commercial air conditioning and industrial processes. Water evaporation in the cooling tower accounts for most of the heat rejected, typically 75–80 percent of the total heat removed. Cooling towers can make up 20–30 percent of a facility’s total water use. Thus, to minimize the dependence on freshwater sources for cooling tower operations, industries are increasingly considering use of alternative water supplies and water reuse initiatives (Badruzzaman et al. 2018; Oppenheimer et al. 2015).
TSE can be considered as an alternative water supply for industrial operations. However, there are concerns that TSE may pose challenges to cooling tower operations with respect to enhanced biofouling, corrosion, and scaling (San Diego County Water Authority 2009). The water quality also determines the cycle of concentration (COC; also known as the concentration ratio) of the operation, indicating how efficiently water is recirculated in a cooling tower before being lost to wastewater generation (blowdown). An increase in the COC reduces water consumption by reducing makeup water volume and blowdown. Understanding the water quality and operational performance of a cooling system using TSE as makeup water is critical and requires long-term pilot testing and research.
The findings of a long pilot study on the application of TSE for cooling tower operations follows.
Method
This section describes the pilot plant and water quality monitoring.
126 | WATER M ANA GEMENT IN O IL AND G AS O PERATION S
BOX 6.2
Pilot plant description
TSE was generated from an activated sludge wastewater treatment process, followed by filtration and disinfection. Major water quality parameters of TSE are as follows: 1,500 milligrams per liter of TDS, 106 milligrams per liter calcium, 41 milligrams per liter magnesium, 300 milligrams per liter sulfate, 105 milligrams per liter bicarbonate, 310 milligrams per liter sodium, 528 milligrams per liter chloride, 5 milligrams per liter total organic carbon (TOC), and 8 milligrams per liter phosphate. The pilot test was conducted with an open-loop system cooling tower, as shown in photo 6.1. Continuous disinfection of the recirculating water was achieved with a 12.5 percent sodium hypochlorite solution as the primary biocide. In addition, a proprietary corrosion inhibitor was injected into the cooling tower cells to manage corrosion control. Also, a nonoxidizing biocide, isothiozoline, was used to control algal growth. Online analyzers were used to monitor residual chlorine, pH, and temperature of the recirculating water. Chlorine residual in the range of 1.5–2.5 milligrams per liter and pH in the range of 6.8–7.9 were maintained.
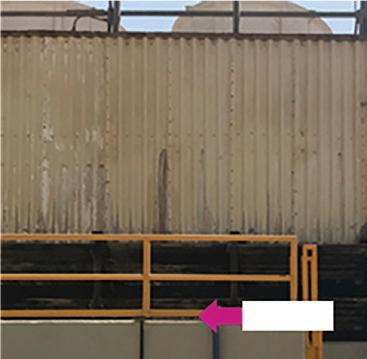
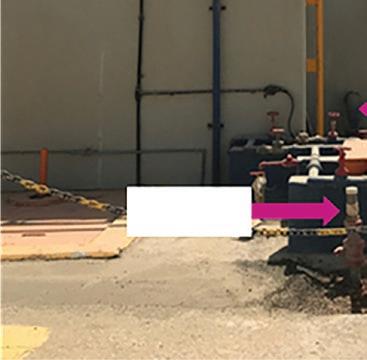

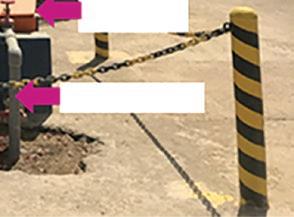
Leading Industry Practices Illustrated by Case Studies | 127
PHOTO 6.1
Cooling tower and pilot setup at a Saudi Aramco facility
Source: © Saudi Aramco. Used with the permission of Saudi Aramco. Further permission required for reuse.
Makeup Overflow Blowdown Flowmeter TSE connection Raw water disconnected
Note: TSE = treated sewage effluent.
Water quality monitoring
The water quality of the TSE feed line and circulating line were monitored and subjected to a complete geochemical analysis monthly. In addition, microbiological characteristics were monitored for biohazard assessment, including Legionella sp., Klebsiella pneumoniae, and coliforms, with samples collected from the back end of the recirculating process to reflect the worst-case condition. All analyses were conducted by an accredited local third-party laboratory. In addition, an assessment of enteric viruses was performed by King Faisal Hospital and Research Center to evaluate the associated risks during the 8-month pilot study.
Results
This section describes the results of this case study.
Cooling tower operation with groundwater
Before the pilot testing with TSE, groundwater was used for the cooling tower. The groundwater characteristics consisted of a TDS level of 3,040 milligrams per liter, including scale-forming ions such as calcium (233 milligrams per liter), magnesium (97 milligrams per liter), sulfate (558 milligrams per liter), and bicarbonate (226 milligrams per liter). The COC of groundwater was limited to 2 because of a higher concentration of scale-forming ions. Cooling system condensers operated with groundwater were visually inspected, as shown in photo 6.2. Severe scaling was observed on the condenser surfaces when groundwater was used as makeup. The formation of scale could potentially reduce heat transfer through the exchanger and the cooling load and increase pressure drop

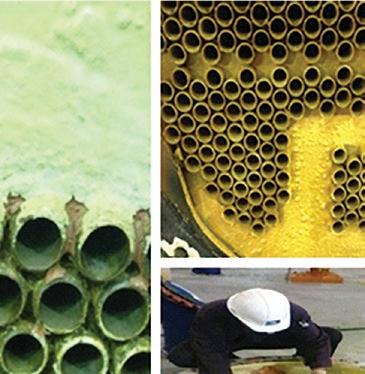


128 | WATER M ANA GEMENT IN O IL AND G AS O PERATION S
PHOTO 6.2
Scale deposits on condenser surface with use of groundwater
Source: © Saudi Aramco. Used with the permission of Saudi Aramco. Further permission required for reuse.
and condensing pressure. An increase in condensing pressure may increase the compressors’ load to achieve the lift between the evaporator and the condenser, which will reduce the chiller’s coefficient of performance.
Cooling tower operation with TSE
The inorganic chemical water quality of TSE was better than that of groundwater, with a lower TDS of 1,500 milligrams per liter. The Langelier Saturation Index (LSI)1 values varied from 0 to 0.5, indicating that the scale-forming tendency of TSE is low; consequently, the cooling tower can be operated at a higher COC (refer to table 6.1). The pilot study results suggested that the COC of cooling tower operations could be almost doubled (from 2.0 to 3.5) with TSE as makeup water, as shown in figure 6.2. Higher COC means less blowdown frequency and a reduction in water demand. This operational improvement can be explained based on inorganic scaling formed on air conditioning (AC) plant accessories. The condenser surfaces during the use of TSE are shown in photo 6.3. When TSE was used, the condenser surface was clean, without mineral deposit formation. A visual comparison of photos 6.2 and 6.3 clearly shows the potential operational benefits of using TSE as makeup water.
Source: Saudi Aramco.
Note: n.a. = not applicable; BOD = biochemical oxygen demand; CaCO3 = calcium carbonate; TDS = total dissolved solids; TOC = total organic carbon; TSE = treated sewage effluent; TSS = total suspended solids.
Leading Industry Practices Illustrated by Case Studies | 129
CONSTITUENTS CONCENTRATION (MG/L) RAW GROUNDWATER RECLAIMED WATER Sodium 680 310 Potassium 41 25 Calcium 233 106 Magnesium 97 41 Strontium 5 2 Chloride 1,170 528 Sulphate 558 301 Bicarbonate 226 105 Carbonate 0 0 Hydroxide 0 0 TDS 3,040 1,500 Phosphate n.a. 8.15 Nitrate n.a. 13.0 Conductivity (µS/cm) 4,770 2,350 pH 7.82 7.48 Alkalinity (mg/l as CaCO3) 186 86 Hardness (mg/l as CaCO3) 981 n.a. Ammonia n.a. 0.2 TSS n.a. <5 BOD n.a. <5 TOC (mg/l) n.a. 5.12
TABLE 6.1 Comparison of groundwater and TSE characteristics
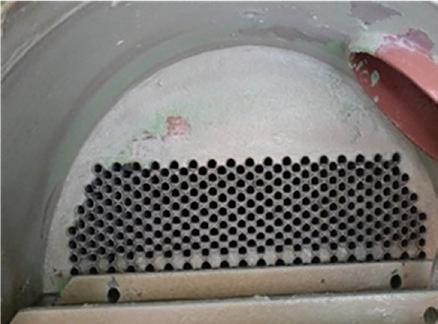

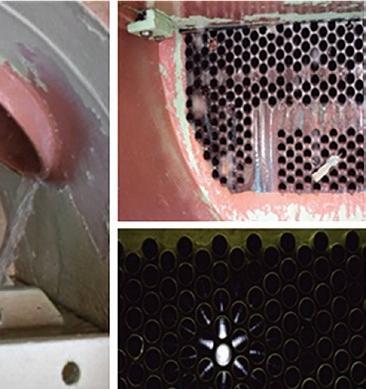

Biohazard assessment of use of TSE with cooling system
Water samples were collected from raw sewage, the sewage treatment plant posttreatment, makeup TSE water, and the cooling tower circulating line. During the pilot, representative water samples from the cooling tower were analyzed monthly for Legionella sp., Klebsiella pneumoniae, and total coliforms. The analytical results showed that all water samples were negative for these critical pathogens (none observed). An assessment of enteric viruses (for example, norovirus, adenovirus, astrovirus, rotavirus, or sapovirus) was also conducted
130 | WATER M ANA GEMENT IN O IL AND G AS O PERATION S
4.0 3.5 3.0 2.5 2.0 1.5 1.0 0.5 0 Month AprMayJunJulAugSepOctNov COCs
FIGURE 6.2
COC of the cooling system operating with TSE
Source: Saudi Aramco.
Note: COC = cycle of concentration; TSE = treated sewage effluent.
PHOTO 6.3
Scale deposits on condenser surface with use of TSE
Source: © Saudi Aramco. Used with the permission of Saudi Aramco. Further permission required for reuse.
Note: TSE = treated sewage effluent.
during the pilot study. Enteric virus analyses were conducted biweekly during the 8-month period. All the raw sewage samples contained enteric viruses. However, none of the samples collected from the operation of the cooling tower system indicated the presence of enteric viruses. The results demonstrate that the disinfection and biocide treatment was effective in controlling risks to human health.
Conclusion
The outcome of this pilot study indicates that TSE is a viable and sustainable alternative to groundwater as cooling water makeup in an industrial cooling system. The biohazard assessment indicated that the disinfection treatment was effective in controlling risks to human health. Application of TSE could save a significant amount of water, energy, and costs for the operation of the cooling tower. The increase in COC resulted in a 27 percent reduction in water demand from the current groundwater baseline. The annual expected makeup water savings for the 1,200-ton AC plant is estimated at 16,501 cubic meters. Consequently, and based on the positively achieved performance during the pilot testing, several AC plants with a total cooling capacity of 6,000 tons are currently being considered for the application of TSE, which will equate to an annual savings of 82,505 cubic meters of groundwater. The annual expected energy savings is 82,505 kilowatt hours. However, any facility that intends to use TSE in open cooling systems should go through an evaluation step for proper selection of chemicals and biocides, proper understanding of TSE water quality, and optimization of the cooling operation treatment accordingly.
ENI (ITALY): ENI REWIND BLUE WATER TECHNOLOGY AND ITS APPLICATION
Prepared by Alessandro Nardella, Eni, and Manlio Rossini, Eni Rewind.
Introduction
Eni operates in countries with varying ecological, social, and geopolitical contexts, and, having identified water as a strategic resource, it adopts sustainable water management during all stages of its activities (Eni n.d.-d). In June 2021, Eni committed to minimizing its freshwater withdrawals in water-stressed areas by seeking improved solutions, for example, the use of low-quality water, such as PW, for its operations (Eni n.d.-c). Eni’s internal procedures, elaborated based on IPIECA guidance, such as the “Water Management Framework” (IPIECA 2021) and the fact sheet “Reuse of Produced Water from the Onshore Oil and Gas Industry” (IPIECA 2020), state that extraction of PW toward the surface should be minimized, and the use and reuse of PW should be maximized. Use and reuse include (1) reinjection of PW into depleted reservoirs; (2) discharge of PW to the sea or to a surface water body after appropriate treatment and in accordance with company policies, local legislation, and relevant permits; and (3) management of PW as liquid waste, with choice (1) being the best option.
The case study described here is located in southern Italy’s Agri river basin (refer to map 6.4), which is classified as an extremely high water stress area according to the Aqueduct baseline water stress analysis (WRI n.d.).
Leading Industry Practices Illustrated by Case Studies | 131


Source: Google Earth, Maxar Technologies.
Note: COVA = Centro Olio Val d’Agri.
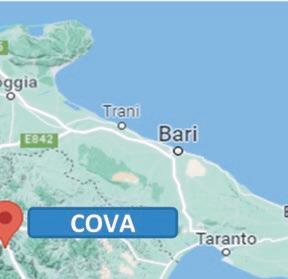


Since 2012, Eni has managed the growing level of PW in COVA by combining the reinjection practice with a water treatment plant designed to obtain water to be recycled for industrial uses. Eni Rewind has developed a proprietary technology for PW treatment and recovery, with the aim of producing water suitable for industrial reuse. The research and development project, which began in 2012, was called the Blue Water Project.
The Blue Water Project is tailored to meet specific COVA needs and is focused on treatment of PW exceeding the reinjection capacity. Other waters from the oil center (oily water, semi-oily water, rainwater, and black water) are managed in the oil center in dedicated facilities and discharged to the external industrial consortium treatment plant within the authorized permitting limits as liquid discharge. Currently, the PW from COVA exceeding the reinjection capacity is disposed of by tank trucks to suitable and authorized external wastewater treatment plants.
132 | WATER M ANA GEMENT IN O IL AND G AS O PERATION S
MAP 6.4
Location of Eni’s Centro Olio Val D’Agri (COVA)
The driving forces of the Blue Water Project are in tune with Eni’s mission and vision:
• Fostering sustainability and circular economy,
• Maximizing the reuse of the resource,
• Making Eni more self-sufficient in relation to the water supply in the area,
• Reducing road transport for the transfer and disposal of nonreinjectable water, and
• Maintaining current and future production levels.
The project was developed from a process defined by Eni Rewind after a thorough characterization of the PW from COVA, based on a technical and analytical historical baseline analysis and specific analytical sampling campaign. The treatment system was tested in 2014 with a semi-industrial pilot plant, treating about 800 cubic meters of PW from the oil center. The pilot test made it possible to consolidate and optimize the process and to evaluate its removal efficiency, recovery factors, main consumption factors, and waste estimates. Starting from the pilot plant results, the treatment scheme has been scaled up to a higher capacity.
Regulatory framework
Oil and gas extraction activities may be executed in Italy only under a mining concession issued at the end of a public authorization procedure called Conferenza dei servizi, a formal permitting procedure in which national and local public administration authorities directly involved with environmental and industrial regulations applicable to mining activities participate.
As reported in the environmental regulatory text (D.Lgs. 152/2006 art. 104 c .3), it is possible to authorize the reinjection of PW resulting from mining activities in the same deep formation in which it originated; the water cannot contain other discharge water or hazardous substances different in quality and quantity (if higher) than those coming from hydrocarbon (HC) separation activities. Furthermore, the reinjection must be performed and monitored to ensure that the reinjected water cannot reach other hydric systems or ecosystems.
In recent years, some concerns about the risk of microseismicity, which could be induced by uncontrolled and unmonitored reinjection activities, have led authorities to impose a periodic monitoring of seismicity, soil deformation, and pore pressure in reinjection areas (“Decree of the Ministry of Economic Development dec. 7th 2016”). Regulatory limitations and concerns about microseismicity resulted in a reduced number of reinjection authorizations and rate of reinjection in authorized wells.
As explained in the introduction to this case study, the most suitable strategy for PW management is reinjection in a deep geological unit or the use of properly treated PW for extraction activities (that is, improved oil recovery). During reservoir exploitation, the ratio of water to gas or oil increases, and without suitable and authorized wells for reinjection, the alternative is to treat and reuse PW or, as a last option, to dispose of it as a liquid waste by tank truck to a suitable external authorized waste treatment plant.
The objective of treating and reusing the PW can be achieved with a plant designed to obtain water with characteristics suited for industrial reuse and suitable—in case of the temporary unavailability of an external user—for
Leading Industry Practices Illustrated by Case Studies | 133
discharge to an external sewage system or surface water within the limits of environmental regulation.
In the case of industrial use, the treated water must comply with Ministerial Decree no. 185 jun. 12th 2003, “Regulation Containing Technical Standards for the Reuse of Wastewater.” The decree prescribes the admissible uses of recovered wastewater for irrigation or civil or industrial purposes.
The purity of treated water for industrial reuse must comply with the specific limits of the production cycles in which reuse takes place; in any case, it must fall within the values set for discharge into surface waters in table 3 of annex 5 of Italian legislative decree D.Lgs. 152/2006.
The admissible uses of recovered wastewater for industrial purpose are firefighting, process or washing water, and thermal cycles of industrial processes (with the exclusion of uses that involve contact between the recovered wastewater and food or pharmaceutical and cosmetic products).
Decree no. 185 does not regulate the reuse of wastewater in the same plant or industrial consortium that produced it; hence, in the case of a new oil and gas plant and first permitting procedure, it is of fundamental importance to determine—for the plant’s whole life cycle—both the treatment and the reuse of PW, whose volume naturally increases over the well’s lifetime.
Stakeholder engagement
The regulatory framework and the public concern about the environmental impact of industrial and mining activities must be thoroughly analyzed and evaluated before any new authorization for both new plants and the modification of existing plants.
All parties involved in the public permitting procedure and convened by the national and local authorities must receive clear and properly documented project design data. It is crucial to explain to local communities the principles of environmental, social, and economic sustainability at the base of a project located in Val d’Agri (as happens in any region with a significant concentration of industrial activities) to realize a PW treatment plant, obtain water for industrial reuse, and reduce freshwater withdrawals. To meet these requirements, Eni developed the Energy Valley Program (Eni n.d.-b).
Energy Valley is a new technological and agroenvironmental initiative for the Val d’Agri. It is a development model that focuses on innovation, technology, and sustainability to combine growth, stakeholder inclusion, and protection of the environment. The program relies on the identification and completion of challenging project initiatives following a set of technological and developmental pathways for the enhancement of the resources of Basilicata identified in an integrated regional study completed in collaboration with the stakeholders (university and research centers: Agenzia Lucana di Sviluppo e di Innovazione, Consiglio Nazionale delle Richerche, ENEA Centro Ricerche Trisaia, Fondazione Eni Enrico Mattei, Università degli Studi della Basilicata, and Università degli Studi di Napoli Federico).
Within these pathways lies the sustainable management of water resources through projects that apply innovative circular economic principles, such as the Viggiano Blue Water Project. In addition, a state-of-the-art environmental monitoring center has been active in Energy Valley since 2020. It continuously checks the health of the water, air, and soil of the Val d’Agri and makes the results available to the public. There are also two project platforms in the field
134 | WATER M ANA GEMENT IN O IL AND G AS O PERATION S
of smart farming and bioeconomy, Agrivanda and Centro Agricolo di Sperimentazione e Formazione (Eni n.d.-a), that support the redesign of water resources management and training and education in the field of agriculture, one of the main pillars of the Lucanian economy. Finally, all of Energy Valley’s project initiatives are designed according to a common landscape framework (Master Plan Energy Valley) developed based on a detailed study of the territory and aimed at further boosting the dialogue between new facilities and local communities and their heritage.
Project description
The term Blue Water Project is conventionally used in Eni to define the research and development project, started in 2012, that developed the Blue Water technology, a technology patented by Eni Rewind for the treatment and recovery of PW, with the aim of obtaining water suitable for industrial reuse.
Eni Rewind applied an experimental approach to evaluate, test, validate, and design an integrated process for the treatment of PW. The activity involved a sampling campaign of PW with accurate physical and chemical characterization and laboratory testing. The characteristics of PW from COVA have been investigated since 2012 and are continuously monitored.
The PW receives a first treatment within the oil center to recover HC and remove total suspended solids (TSS) and hydrogen sulfides to meet reinjection requirements. Table 6.2 gives the chemical characterization of COVA PW after the first treatment.
The salinity (represented by the TDS value) of PW from COVA is quite low compared with the average salinity of PW in the oil and gas industry. The boron
H2S
Hardness,
Silica
Boron
Ammoniacal
BTEX
BOD
COD
Source: Eni.
Note: BOD = biochemical oxygen demand; BTEX = benzene, toluene, ethylbenzene, and xylene; BW = Blue Water; COD = chemical oxygen demand; H2S = hydrogen sulfide; HC = hydrocarbon; TDS = total dissolved solids; TSS = total suspended solids.
a. Higher values in case of temporary upsets in water treatment facilities.
Leading Industry Practices Illustrated by Case Studies | 135
TABLE 6.2
PARAMETER OBSERVED DATA RANGE (MG/L) TDS ≤20,000 Chlorides ≤10,000 Sulphates ≤1,000
Up to 100a
150–500a
Chemical characterization of PW after primary treatment (BW feed)
TSS
HC
≤200
silica, metals Calcium ≤2,500
≤760
Magnesium
≤76
70–120
<0.005
Mercury
nitrogen ≤200
≤65
≤1,000
≤2,000a
content ranges from 70 to 120 milligrams per liter; the stabilization and treatment process inside the perimeter of COVA lowers the hydrogen sulfide content to 200 milligrams per liter; and the value of TSS, HC (free, dispersed, and dissolved), and chemical oxygen demand (COD) are influenced by the well’s extraction mix fed to the oil center and by its production levels. With this salinity level, it is quite advantageous to use membrane techniques to obtain water suitable for industrial reuse, with low energy consumption and low environmental impact.
The Blue Water technology is based on a sequence of preliminary treatments aimed at maximizing reliability and efficiency of membrane technology and obtaining high-purity water for steam boiler feed. The sequence of treatment has been developed, beginning with the quality and quantity of contaminant content in the liquid streams. Each unit’s operation has been selected as being among the best available techniques for the oil and gas industry, evaluated through Eni Rewind’s experience in water treatment plant design and management, and tested in a semi-industrial pilot plant after preliminary bench-scale experimental tests carried out with the contribution of Eni R&D Labs (Research Center for Non-Conventional Energies, Istituto Eni-Donegani, Novara, Italy).
Experimental activity
The Blue Water technology is not a newly conceived stand-alone operation but a sequence of specific operations for contaminant removal aimed at obtaining water suitable for industrial reuse in a sustainable way with particular attention to environmental impact, energy consumption, plant reliability, and waste management and disposal. The patent for the specific sequence treatment was approved by the European Patent Office on March 31, 2021 (app. no. 17727563.3).
Figure 6.3 shows the block flow diagram of the treatment sequence tested and managed by the pilot plant authorized as a wastewater treatment plant and fed by tank trucks for a specific treatment campaign according to Italian legislation specific to waste. A picture of the pilot plant is shown in photo 6.4.
The experimental campaign was developed in several steps. The first test was used to fine-tune and set the best operating parameters for each unit operation (for example, pH, chemical mix, stripping rate) and to define the right analytical set and sampling point at battery limits for the liquid in and out streams and emissions. After the fine-tuning operation, a first series of treatment campaigns was carried out to test the most efficient and reliable treatment sequence.
After each run, analytical results for in and out streams, chemicals, produced waste quantity and quality, technical operation data, and equipment inspection
136 | WATER M ANA GEMENT IN O IL AND G AS O PERATION S
FIGURE 6.3
Block flow diagram of the pilot plant
Source: Eni.
Oil removal API separator and DGF Sulfides removal Closed loop N2 stripping at low pH Metal removal and hardness reduction Coagulation Flocculation Setting Air stripping Absorption by granulated activated carbon Nitrogen (N-NH4) and dissolved organic removal Salinity removal UF, RO 1-2 Concentration unit (MVR) for saline reject
Note: API = American Petroleum Institute; DGF = dissolved gas flotation; MVR = mechanical vapor recompression; N2 = nitrogen; RO = reverse osmosis; UF = ultrafiltration.
Demineralized water
µS/cm
Produced water by tank trucks
<5

data were evaluated to define and confirm the most efficient, reliable, and sustainable sequence of treatment.
During the experimental run, it was observed that the standard coagulation and flocculation section and reverse osmosis (RO) techniques were not able to reduce the boron content below the limit (2 milligrams per liter) for surface water discharge. This value was set as a reference because even if the treatment plant is designed for water reuse, treated water must comply with discharge limits in case discharge cannot be avoided (for example, accidents, plant maintenance). For this reason, in the final Blue Water scheme, another section with ion exchange specific for boron removal was added after the RO unit. Furthermore, to meet the water quality requirements for steam generators (conductivity >0.2 microsiemens per centimeter), an electrodeionization section may be added.
The pilot plant successfully removed dissolved HC with granular activated carbon (GAC) units, but another suitable way to remove dissolved HC and COD is via biological oxidation with activated sludge, conceived in the Blue Water technology scheme as coupled with ultrafiltration in the typical membrane biological reactor (MBR) configuration. The biological treatment of PW has been partially tested at bench scale in external labs. Results from bench-scale tests and from reliability, availability, and maintainability analysis have suggested—for larger-sized plants—maintaining both the GAC unit and the MBR section in the scheme. The MBR unit takes a long time to perform because of the initial time needed to get the right quantity and quality of biomass in the reactor, and it is
Leading Industry Practices Illustrated by Case Studies | 137
PHOTO 6.4
Some sections of the pilot plant installed and run, 2013–14
Source: © Eni. Used with the permission of Eni. Further permission required for reuse.
Note: From left, NH3 stripping unit, GAC and SF unit, and DGF unit; behind the DGF unit is the compact coagulation flocculation unit. DGF = dissolved gas flotation; GAC = granular activated carbon; SF = sand filter.
NH3 stripper
GAC and SF
DGF
also susceptible to toxic shock that may kill the biomass. A GAC unit suitable for start-up or backup is the right solution to improve start-up readiness and reliability in the event of an MBR biomass upset.
According to the bench and pilot plant test results, Eni Rewind designed, at various engineering phases (for example, feasibility, basic, or feed), Blue Water plants of different capacities, equipped with both a biological treatment unit and a GAC unit, that can treat from 36 to 200 cubic meters per hour.
Full-scale project
Currently, a plant able to treat 72 cubic meters per hour (12,600 barrels of PW per day), Viggiano Blue Water, is undergoing permitting procedures to be installed in Viggiano (Potenza, Italy). It has a full zero liquid discharge (ZLD) approach aimed at avoiding any discharge into surface water and satisfying the industrial water needs for the oil treatment center. The key characteristics of the plant are summarized in box 6.3.
BOX 6.3
Key characteristics of the full-scale Blue Water Plant
The main operation units and associated treatment sequence are in Table B6.3.1 and the main features are
in Table B6.3.2. Figure B6.3.1 shows the plant’s physical design.
OPERATION UNIT
Equalization and dispersed oil removal
DGF
Closed-loop H2S stripping at low pH
Coagulation, flocculation, and settling
Filtration (dual media, under pressure)
Closed-loop NH3 stripping at high pH
GAC filtration
UF
RO—first pass on permeate
RO—second pass on permeate
Boron removal by ion exchange resins
EDI
Sludge thickening and dehydrating
MVR
Emissions and vents collection and treatment
ASSOCIATED TREATMENT SEQUENCE
Free and dispersed oil removal
H2S stripping
Hardness, metal, and silica reduction
NH3 stripping
Dissolved organic removal
SST removal and RO pretreatment
Desalination
Boron removal
Demipolishing by EDI
Plate and frame filter press
ZLD section for RO saline reject
One emission point for all venting and odorous substances
Note: DGF = dissolved gas flotation; EDI = electrodeionization; GAC = granular activated carbon; H2S = hydrogen sulfide; MVR = mechanical vapor recompression; NH3 = ammonia; RO = reverse osmosis; SST = separation system technology; UF = ultrafiltration; ZLD = zero liquid discharge.
138 | WATER M ANA GEMENT IN O IL AND G AS O PERATION S
continued
TABLE B6.3.1 Main operation units and associated treatment sequence of the full-scale Blue Water Plant
Main features of the Blue Water Plant
Treatment capacity
Recovered water for industrial uses (≈95%a)
Solid and liquid wastes (exhausted GAC, filtered sludge cakes, saline slurry from ZLD, scrubbing concentrated solutions, separated oils, eluates from ionic exchange resin regeneration)
Note: GAC = granular activated carbon; ZLD = zero liquid discharge.
a. High recovery factor with ZLD unit.
Physical design of the Blue Water Plant
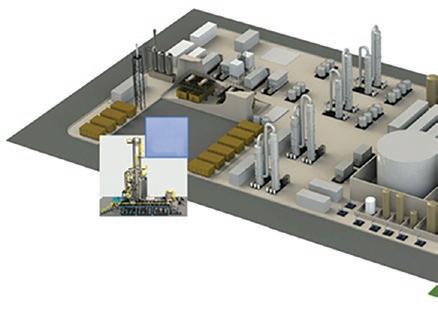
Source:
72 m3/h
≈1,700 m3/d
≈70 m3/h
(40 m3/h ultra demineralized at 0.2 µS/cm and ≈30 m3/h < 50 µS/cm)
≈100 m3/d
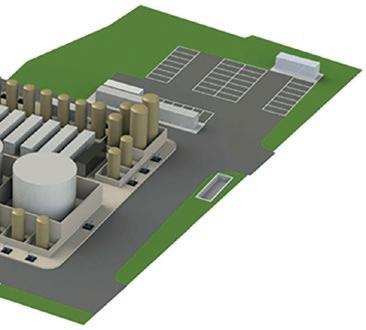
Once authorized, the Blue Water Plant will be built close to the oil center, and both the PW feed and treated water for recycling will be connected by a pipeline, as shown figure 6.4. A dedicated, continuous-operation pipeline connection between COVA and the Viggiano Blue Water Plant is legally required for the plant to be considered a water treatment plant as opposed to a liquid waste treatment plant.
During technical evaluation and review of the Blue Water Project, before financing, the process was compared with that of a treatment plant mainly using evaporation and concentration. The analysis led to the conclusion that at a level of 35–40 grams per liter of TDS content in the PW, the Blue Water technology is energetically more efficient and environmentally more sustainable than a technology based mainly on evaporator and concentrator units because, in the Blue Water treatment scheme, the highly expensive units (evaporator and concentrator) are sized for only a part of the inlet stream (the saline reject from the
Leading Industry Practices Illustrated by Case Studies | 139
Box 6.3, continued
FIGURE B6.3.1
ZLD
© Eni. Used with the permission of Eni. Further permission required for reuse. Note: MVR = mechanical vapor recompression; ZLD = zero liquid discharge.
MVR
TABLE B6.3.2
RATE/QUALITY
FEATURE

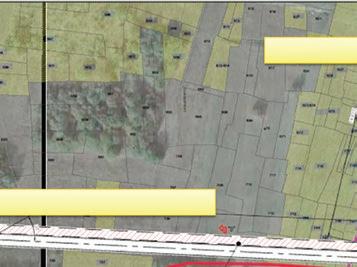
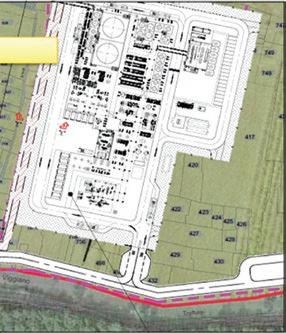
RO unit, about one-third of the inlet stream), and the plant produces disposable waste.
Economics
Table 6.3 shows the cost of the full-life capital expenditures (CAPEX) for the Blue Water Plant, estimated at front-end engineering design accuracy (±15 percent for engineering, equipment, and construction; ±40 percent for interconnecting COVA and the Blue Water Plant; refer to table 6.3).
The operating expenditure (OPEX) costs for the Blue Water Plant can be split as follows:
• Chemicals, 30–35 percent;
• Utilities, 15–20 percent; and
• Disposal of wastes from treatment, including transport cost, 45–55 percent.
These costs are strongly affected by fluctuations in energy costs and by the external disposal facility’s distance from the plant site.
These elements affect both future Blue Water Plant OPEX and current costs of PW disposal to an external authorized plant by tank trucks. These plants are distributed nationally over an area ranging from a minimum of 130 kilometers to a maximum of almost 1,000 kilometers from COVA, and they are normally used with a priority criterion, from nearest to farthest, depending on availability in terms of maximum allowed quantity for a single plant.
140 | WATER M ANA GEMENT IN O IL AND G AS O PERATION S
FIGURE 6.4
Blue Water Plant general layout (project under permitting procedure)
Source: © Eni. Used with the permission of Eni. Further permission required for reuse. Note: BW = Blue Water; COVA = Centro Olio Val d’Agri.
COVA battery limits
COVA-BW interconnecting
Blue Water Plant
TYPE OF EXPENDITURE COST (M€) Engineering and supervision 6 Equipment supply and transport 35 Site preparation and construction 12 Interconnecting 3 Source: Eni case study.
TABLE 6.3 Blue Water Plant capital expenditures
Currently, the average disposal cost of PW by tank trucks to external plants, at a daily rate of 1,700 cubic meters per day, is about €100–110 per cubic meter (disposal and transport). At this daily rate, the Blue Water treatment plant allows an OPEX reduction of at least 40–50 percent and less than 2 years payout time for the investment.
Conclusion
Eni Rewind applied an experimental approach to design, evaluate, test, and validate an integrated process for the treatment of PW aimed at obtaining treated water suitable for industrial reuse. The activity involved sampling and analyses of PW with a focus on physical and chemical characteristics, laboratory testing, and a semi-industrial pilot plant experimental campaign in which 800 cubic meters of PW from COVA was treated.
A new sequence for PW treatment, Blue Water technology, was developed, able to provide water suitable for industrial reuse. The Blue Water Plant, which can treat 72 cubic meters per hour, is currently undergoing permitting procedures to be installed in Viggiano, Potenza, Italy. It has a full ZLD approach aimed at avoiding any discharge to surface water and satisfying COVA’s industrial water needs. The Blue Water treatment plant will reduce the current OPEX for PW management at COVA by 40–50 percent.
Once the permitting procedure is completed and authorization is obtained to realize and execute the Blue Water Plant, Eni will evaluate the opportunity to extend Blue Water technology to other fields and plants in Italy and worldwide.
The Blue Water Plant will reduce freshwater withdrawals in a water-stressed area and will represent the development trajectory of the Energy Valley program as an activity aimed at the sustainable management of water resources through the application of the most innovative principles of the circular economy.
PETROBRAS (BRAZIL): INTERNAL REUSE OF PW
Prepared by Mariana Taranto P. T. Leite, Claudio Jose Alves Furtado, and Rafael Costa Guerreiro, Petrobras.
Introduction
The generation of PW is inherent in oil production activities and is considered the industry’s main effluent, in terms of both volume and complexity. The amount of PW generated depends on several factors, such as lifetime and reservoir characteristics. As oil fields mature, PW generation increases, whereas HC production declines (Ozgun et al. 2012).
According to the Brazilian National Agency of Petroleum, Biofuels and Natural Gas, in 2016 Brazilian offshore operators registered a PW volume of around 110 million cubic meters, for an oil production of 137 million cubic meters (Costa 2017). In view of the increasing volume of PW generated and the potential environmental impacts of its discharge, a trend has been observed for increasing rigor in the current legislation and the adoption of different approaches regarding PW management around the world. The more rigid requirements to allow PW discharge push all major oil companies to invest in PW reinjection.
Leading Industry Practices Illustrated by Case Studies | 141
PW reinjection and discharge
Increasing the amount of PW that is reinjected requires a balance between two challenges: design solutions to improve the ability of a well to receive water of lower quality compared with other sources of water normally used for oil recovery and the possibility of treating the PW to reduce or eliminate the damage caused to the well’s reservoir rock system. This treatment aims to remove solids and dispersed oil that can prevent the proper flow of water through the rock.
Because of the large volume of fluids to be treated, these facilities tend to have a large footprint, and the equipment is heavy. In an onshore environment, this challenge is minimized, and Petrobras has reinjected most of the water produced from its onshore oil fields. In an offshore environment, the ability to allow bulky, heavy equipment depends on the platform’s design and weight tolerance. Consequently, for offshore platforms that were not designed with PW treatment for reinjection in mind (refer to photo 6.5), it is often necessary to improve the wells’ capacity to receive PW, called injectivity. Because this is a remediation process, the procedure needs to be carried out periodically, with the time between operations being dependent on the quality of the PW and rock. The need for special boats and a large amount of chemicals, such as inorganic and organic acids, makes it hard to perform these operations at a high frequency. Until 2019, all Petrobras offshore production units that used reinjection as the destination of PW had originally been designed with this concept.
Offshore PW discharge is regulated in several countries around the world, and the main monitoring parameter is oil in water content (OiW). According to Lee and Neff (2011), OiW limits for PW discharge may differ around the world, and the results of analysis may vary according to the measurement method adopted.
In Brazil, the legislation that provides for continuous PW discharge offshore is Resolution No. 393 (CONAMA 2007). The OiW daily and monthly limits are,


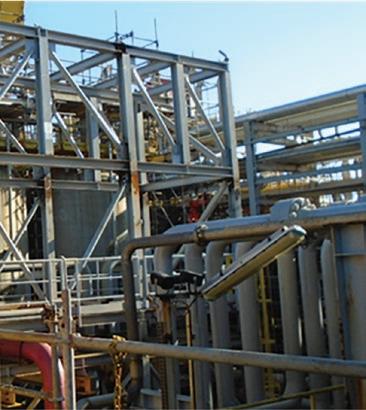
142 | WATER M ANA GEMENT IN O IL AND G AS O PERATION S
PHOTO 6.5
Structure for the assembly and installation of pumps and filters in an offshore production unit that was not initially designed for PW reinjection
Source: © Petrobras. Used with the permission of Petrobras. Further permission required for reuse.
respectively, 42 milligrams per liter and 29 milligrams per liter (article 5), which must be determined by a gravimetric method. In 2018, to improve alignment with industry best practices, Petrobras and the Brazilian Institute of Environment and Renewable Natural Resources made a commitment that included the implementation of PW reinjection systems in a group of eight of Petrobras’s platforms.
In this context, it is important to emphasize that PW reinjection is a strategy that represents great challenges around the world, especially for platforms that are already in operation, for which the initial project did not foresee this as a solution. As described by Veil et al. (2004), offshore operations have serious limitations (whether for PW disposal or reinjection), such as physical space and equipment weight restrictions. As a result, a PW reinjection strategy should be developed in the project planning phase, providing greater technical, economic, and environmental feasibility for the adoption of these practices.
For this reason, Petrobras included PW reinjection as a corporate guideline for new platforms and stated that basic projects must provide for reinjection as a PW management option, with the objective of disposal in reservoirs (geological storage) or secondary oil recovery or to meet environmental legislation requirements.
According to information from IOGP (2017), in global terms an average of 27 percent of the PW generated offshore is reinjected, which highlights the technical and economic restrictions of this solution. In 2021, Petrobras reinjected about 23 percent of PW offshore, with an increase of approximately 180 percent in the total volume of PW reinjected offshore between 2020 and 2021.
ECOPETROL (COLOMBIA): REUSE OF PW IN AGROFORESTRY AND LIVESTOCK ACTIVITIES
Prepared by Juan Diego Ramírez Castro, Ana Cristina Sanchez Thorin, Sandra Yamile Alvarez Aceros, Edwinder Bolaños, Andrea Guarin, Carlos Medina, and Giovanni Annichiarico, Ecopetrol.
Introduction
The oil and gas industry generates large amounts of PW during oil extraction. In Colombia, for each barrel of crude oil extracted, 13 barrels of water are produced on average; however, in some areas, especially the Orinoquía region, this ratio can increase to 1 to 30. This issue represents a great challenge for the industry, because facilities’ capacity for treatment and continuous evacuation of this water must be ensured to maintain oil production.
Ecopetrol S.A., in its search for alternative options to achieve a balance between oil production and conservation and protection of the environment by reducing discharges and in alliance with Agrosavia (formerly Corpoica), developed research aimed at evaluating the impact of using treated PW from the Apiay and Castilla fields in the irrigation of agricultural crops and pastures, as well as using it for the consumption of livestock and poultry. Agrosavia is a public research institute that works on knowledge acquisition through scientific research to strengthen agricultural sector capacities and technologies in Colombia.
Leading Industry Practices Illustrated by Case Studies | 143
Area description
This investigation was carried out in the ASA, located in the vicinity of the Castilla field, in the municipality of Acacías, Meta (refer to map 6.5). The landscape is characterized by an altitude that varies between 400 and 1,000 meters above sea level and an average temperature above 25°C.
During the dry season (December–March), there is normally a reduction in runoff (approximately 70 percent less in comparison with the annual average value) that significantly decreases the region’s available water supply. This situation poses a challenge for the different water users, especially for the agricultural and livestock sectors, which demand about 90 percent of the region’s water,2 who may see their production restricted during this period. In this sense, the PW from the oil and gas industry becomes an alternative to regional water, as well as a method of adaptation to climate variability and climate change.
PW from the Castilla and Apiay fields has good quality for its reuse in irrigation for agroforestry and pastures, especially because of its low dissolved salt (chlorides and sulfates) content. The PW treatment system, which consists of corrugated plate interceptor separators, floating cells, nut-husk filters, sprinkling pools, and stabilization pools, also decreases other compounds to the levels required by environmental regulation and, in some cases (such as for heavy metals, polycyclic aromatic HC, and phenolic compounds), to a nondetectable level. The current PW treatment setup for these fields does not reduce the salinity of PW because that would require additional treatment steps (for example, ultrafiltration [UF] or RO).
Phase 1: research in a controlled environment
The first phase of the research was carried out between 2006 and 2011 in a controlled environment located in the vicinity of the Castilla field and Agrosavia’s La Libertad Research Center in Villavicencio. Physical properties such as bulk density, porosity, and stability of aggregates were monitored, as were chemical properties (for example, calcium, magnesium, potassium, sodium, electrical
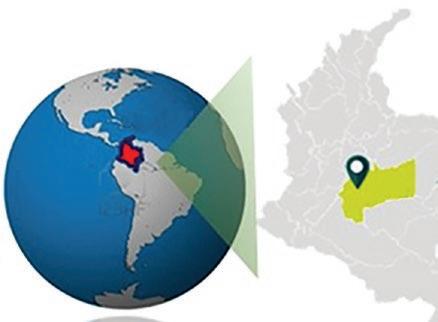

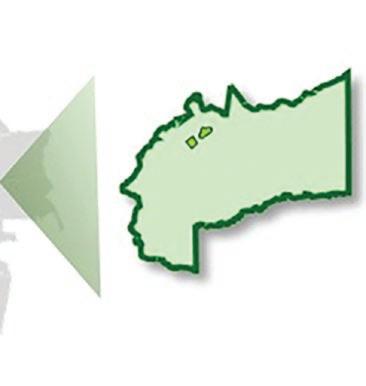
144 | WATER M ANA GEMENT IN O IL AND G AS O PERATION S
MAP 6.5
Location of Ecopetrol’s PW for agroforestry and livestock project
Apiay
Castilla
Meta
Colombia
Source: Ecopetrol.
conductivity, pH, and cation exchange capacity) of the soil and yield, in terms of green matter, sugarcane, and elephant grass crops when irrigated with treated PW and fresh groundwater.
The results of this phase provided evidence that irrigation with treated PW did not affect the physical or chemical conditions of the soil, and it had no accumulation of heavy metals or HC. Regarding crop development, no negative effect was observed from the use of PW; to the contrary, better yield rates were recorded in relation to crops irrigated with 100 percent fresh groundwater. Table 6.4 compares the quality of groundwater and treated PW.
Phase 2: experimental pilot
The second phase was developed between 2011 and 2015 in the ASA, where different types of crops were irrigated with PW from the Castilla field. Crops included native forest species, such as yopo (Anadenanthera peregrina), acacia (Acacia mangium), gmelina (Gmelina arborea), rubber (Ficus elastica), pine, and eucalyptus; ornamental plants such as heliconias and jatropha; and signalgrass (Brachiaria sp.). The effect on the quality and properties of the soil, surface and groundwater, ecosystem, and productive behavior of the species subject to irrigation were monitored. The effect of land use change on biodiversity and abundance of native species was also analyzed.
The research also analyzed the effect of the use of treated PW from the Castilla field on the diet of cattle and poultry, using water with different concentration gradients (100 percent, 50 percent, 25 percent, and 0 percent, in relation to fresh water from an underground well).
The results of this phase indicated the following:
• The six species studied had better behavior and growth in terms of height and diameter at chest height as compared with regional or international reference data.
Leading Industry Practices Illustrated by Case Studies | 145
TABLE 6.4
PARAMETER UNIT TREATED PW FRESH WATER Conductivity µS/cm 1.220 38.5 Chlorides mg/l 215 <3.3 Calcium mg/l 9.35 1.21 Magnesium mg/l 2.67 0.38 Sodium mg/l 104 1.58 Manganese mg/l 0.22 <0.079 Barium mg/l 1.04 <0.096 Cadmium mg/l <0.01 <0.01 Mercury mg/l <0.002 <0.002 Molybdenum mg/l <0.106 <0.106 Arsenic mg/l 0.0005 0.0004 Total petroleum HC mg/l 0.74 <0.67 Oil and grease mg/l 4.77 n.a. TSS mg/l 13.27 n.a.
Comparison of water quality of treated PW and groundwater
Source: Ecopetrol case study. Note: n.a. = not applicable; HC = hydrocarbon; PW = produced water; TSS = total suspended solids.
• The physical properties of soils, such as porosity, bulk density, hydraulic conductivity, and aggregate stability, showed no significant changes.
• There were no harmful effects on the quality of surface and groundwater.
• No negative effects resulted from the consumption of treated PW from the Castilla field with respect to meat, milk, and egg production, and there were no changes in postmortem tissues of cattle and poultry from conditions that affected their health.
The results of this research have become a key input for the water reuse regulation in Colombia, which was issued on July 25, 2014, by the Ministry of Environment and Sustainable Development (Resolution 1,207) and recently updated on November 23, 2021 (Resolution 1,256).
ASA: a biodiversity ecoreserve
In March 2022, the ASA was declared an ecoreserve as part of Ecopetrol’s effort to build an ecoreserve network as part of its nature-based efforts to increase biodiversity in its operations and in projects’ area of influence.
As noted earlier, the ASA has 228.72 hectares of land, 188.17 with agroforestry crops and more than 90 dedicated to environmental rehabilitation, ecological recovery, and riparian forest. It has 305 kilometers of sprinkler irrigation system, and 3.39 kilometers of surface channels guarantee 100 percent efficiency in the use of water. Between January 2015 and March 2022, more than 8.8 million cubic meters of PW were reused in the ASA averaging more than 72,000 barrels of water per day (BWPD). Ecopetrol currently has an environmental permit to reuse up to 99,000 BWPD during the dry season.
More than 10 years ago, the ASA was covered by degraded pastures, with fragmented forest remnants and low wildlife presence (among other impacts), a product of traditional livestock exploitation (refer to photo 6.6).
The different strategies for land use change and landscape management that have been developed in the ASA since 2011 have improved environmental conditions and soil quality, and microhabitats have been generated, suitable for the colonization of different wildlife groups, including endemic, threatened, and migratory species, which have found a refuge in the ASA. The ASA project
Before (2009)
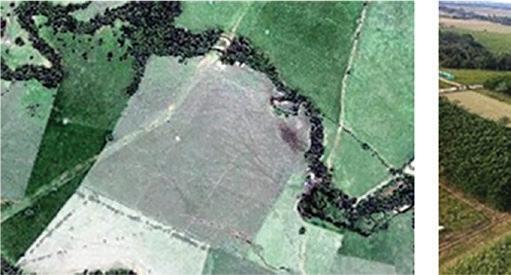
Today (2023)
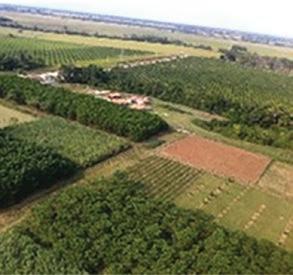
146 | WATER M ANA GEMENT IN O IL AND G AS O PERATION S
PHOTO 6.6
Change in the ASA after environmental rehabilitation, planting, and irrigation
Source: © Ecopetrol. Used with the permission of Ecopetrol. Further permission required for reuse. Note: The location is an ecoreserve in the vicinity of the Castilla field. ASA = agroenergy sustainability area.
naturally transformed a highly degraded site into a biodiverse refuge that achieved an increase of 84 percent in the fauna present in the area between 2010 and 2019, represented by 210 species.
As for birds, the number of species that visit and make use of the different plant covers has increased. In 2010, 20 species of birds were reported, whereas in 2019 this figure had increased to 148, including the record of 3 neotropical migratory species: the red warbler (Cardellina rubra), the American redstart (Setophaga ruticilla), and the Swainson’s thrush (Catharus ustulatus), which breed in North America and regularly migrate to the south during the nonbreeding season.
An increase in vertebrates was also evidenced. For amphibians, in 2010, 3 species were registered; in 2019, the number increased to 24 species. Reptiles increased from 4 species in 2010 to 38 species in 2019. With respect to mammals, the presence of the ornate titi monkey (mono zocay; Plecturocebus ornatus), a primate species endemic to the Department of Meta, has been confirmed, which has been classified as vulnerable on the International Union for Conservation of Nature red lists, as well as other threatened species, such as the anteater (Vermilingua).
Rehabilitation of forest ecosystems has also been undertaken in riparian forests along streams, such as Caño Bijao, Caño La Danta, and Caño NN, which are tributaries of the Orotoy River, aiming to assist biodiversity conservation and to boost ecosystem services, such as carbon storage and sequestration.
Stakeholder engagement
To identify alternatives that could harmonize agricultural production with the recovery and conservation of areas of environmental importance, forest-pasture systems were implemented on 106 properties in the area of influence (approximately 20,000 hectares) whose owners were interested in adopting, replicating, and transferring knowledge of and successful experiences in the management of forest-pasture systems generated during the years of the ASA project. Benefits were generated, on the one hand, to the producers, by increasing the productivity of the farms by 12–20 percent, as well as diversifying wood-based products and crops, and on the other hand, to the environment, through the recovery of degraded soils, reduction of erosion, protection of watersheds, and reduction of pressure on forests, among others. In total, more than 120,000 seedlings of native species were planted on these properties. In addition, more than 1,800 visitors were made aware of the project in 2018–20 through guided tours, technical courses, and forums.
Conclusion
PWs from the Orinoquía region are an alternative and safe source of water for crop irrigation, which could solve the problems of seasonal variability in rainfall in this region. This solution would generate benefits to Ecopetrol (as a generator, because it enables oil production), to farmers (as receivers, who could count on a guaranteed and constant supply of water throughout the year), and to the environment, because this volume of water will no longer be extracted or discharged, improving the region’s water security. Ecopetrol has demonstrated its benefits in the ASA, where nature and oil and gas production coexist in harmony. After labscale research, followed by an experimental pilot, and the current operation of
Leading Industry Practices Illustrated by Case Studies | 147
the ASA, no evidence of negative effects on soils, crops, or livestock has been found; on the contrary, crops have even increased biomass growth in comparison with reference data. With these results, Ecopetrol expects to scale this solution with a multisectoral approach in the region and is looking for individuals or companies near its operations that would be interested in this circular economy model. Ecopetrol is also working on new techniques for water treatment, not only to improve quality of treated PW (water polishing) destined for external reuse in Castilla, but also for use with those assets with PW of higher levels of salinity (desalination).
Scaling up the ASA project will also leverage the achievement of Ecopetrol’s commitment to reach water neutrality by 2045 as an alternative to offsetting the remaining water footprint in hydrographic basins of the Orinoquía region.
PDO (OMAN): REEDBED TREATMENT OF PW AND REUSE FOR IRRIGATION PURPOSES
Prepared by Mahmood Al-Shaibani, PDO; Younis Al-Rawahi; and Ulrich Emmer, Bauer.
Introduction
In Oman, a patchwork of lush green pastures stands out from the arid plains that dominate the vista. This is no recreational park or remote garden nursery but an innovative project that plays a unique role in the oil industry, the country’s most important economic export.
The NWTP project is in the south of the Sultanate of Oman. This water treatment project was coexecuted by PDO and Bauer Resources. PDO is owned by the government of Oman, the Shell Group, TotalEnergies, and PTT Exploration and Production. After a 2-year design, construction, and commissioning phase, the plant became commercially operational on January 16, 2011. The Nimr oil field requires the management of 240,000 cubic meters of water per day to keep oil production going. Deep disposal wells have been the main option thus far, but the NWTP can address the issues of loss of revenue from oil left in PW, meeting stricter environmental regulations, lowering high-energy costs during operation, and the carbon footprint associated with disposal wells.
Project overview
NWTP’s Phase 1 was initially designed to treat 45,000 cubic meters per day, which is less than one-fifth of the daily volume of PW generated by the Nimr oil field. It started as a design-build-own operate project under a 20-year operation and maintenance contract. This is a unique model for which Bauer Resources designed and built a wetland facility and has now been operating it successfully for 10 years. In 2018, the construction of the third expansion phase commenced and was completed in May 2019 to ensure water flow at a maximum capacity of 175,000 cubic meters per day. Bauer Resources has taken full liability for managing water from the oil and gas producer for 25 years, starting from the operational date in 2019.
The composition of the PW from the Nimr oil field is brackish, with TDS of 7,000–8,000 milligrams per liter. The recorded OiW concentration varies between 100 and 500 milligrams per liter. The plant layout includes a 17-kilometer pipeline, which enters the NWTP system and leads to an oil and water separator. The water is then distributed into a wetland facility, where it is channeled
148 | WATER M ANA GEMENT IN O IL AND G AS O PERATION S
through four wetland terraces by gravity feed and requires no pumping of water in the system (refer to photo 6.7). The overall area of the wetland has increased in time to approximately 5 million square meters (around 2,000 football fields). It is the world’s largest commercial reedbed treatment plant and can even be seen in satellite images. The environmental performance of the project is continuously monitored and reported on a quarterly basis to the Environment Authority of Oman.
The system uses only local wetland plant species. Despite the hot climate (maximum 50˚C [122˚F]), the area has temperatures that are suitable for the growth of Phragmites australis plants, which are the main species used in the wetland cells. To increase the NWTP’s resilience to plant diseases, other species such as Schoenoplectus littoralis, Cyperus spp., Typha domingensis, and Juncus rigidus have been used and have significantly improved the system’s functionality. All the plants were sourced locally in Oman and were then propagated in a nursery on site. In total, more than 2.5 million individual plants have been planted in the commissioning phases of the project, which established a functional treatment system in less than 3 months from the first irrigation of the plants. Now there are billions of reed plants. Periphyton—or algae and bacterial biofilms—attached to the submerged plant stems of the wetland plant species trap the oil and break down HC molecules, cleansing the water.
Finally, several evaporation ponds reduce the water volumes used for salt recovery, and the salt is reused for drilling operations in the oil fields of Oman. This makes the entire system a ZLD system with the option to generate added value such as salt or to reuse the treated PW for any kind of additional project. Water can be accessed easily from all ponds for any desired reuse. A portion of the treated water is already being reused for drilling purposes. A schematic representation of the NWTP is provided in figure 6.5.
Reducing the environmental footprint
The NWTP project is reducing the environmental footprint at an unexpected scale. The project has won several international awards, for example, the Global Water Award in 2011; the Abu Dhabi International Progressive Energy Congress
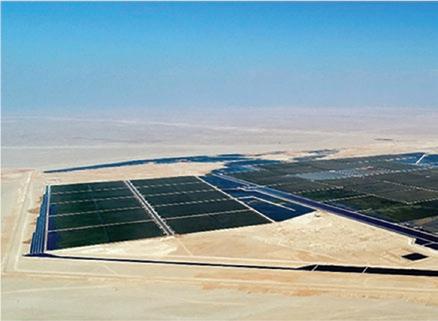
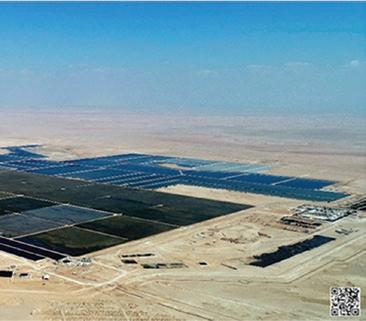
Leading Industry Practices Illustrated by Case Studies | 149
PHOTO 6.7
Aerial view of the NWTP
Source: © PDO. Used with the permission of PDO. Further permission required for reuse.
Note: NWTP = Nimr Water Treatment Plant.
Buffer pond Oil water separation Distribution Reedbed terraces
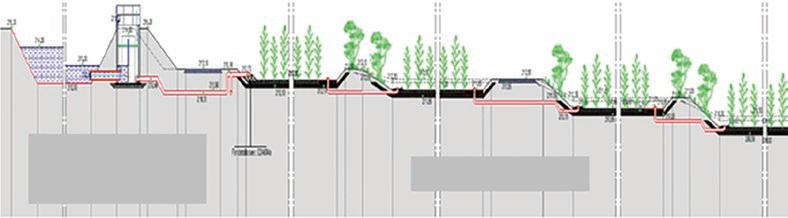
Source: PDO.
Note: NWTP = Nimr Water Treatment Plant.
INDICATOR
PW treated
Oil recovery
PERFORMANCE TO DATE (UP TO APRIL 2022)
450,000,000 m3
4,500,000 barrels in total
Power consumption saved ~ 2,500,000 MWh
Treatment performance Oil in water <0.5 ppm
Source: PDO case study.
Note: MWh = megawatt-hour; NWTP = Nimr Water Treatment Plant; ppm = parts per million; PW = produced water.
Best MENA Oil and Gas Health, Safety, and Environment Project Award in 2012; and the Excellence of Climate Action Award at the Qatar Sustainability Summit in 2019. The NWTP project can recover on average as much as 750 barrels per day of crude oil from the PW, and oil recovery has peaked at some 1,000 barrels per day in the past. Since the start of the project, more than 4 million barrels of crude oil have been recovered from the PW stream, and projections are that up to 8 million barrels can be recovered throughout the lifetime of the project. The concept of the plant was to have zero energy used for water treatment, thus reducing its energy footprint by installing a gravity flow system plant design, which means that the plant is constructed on a manmade slope, and the water can flow through the wetlands naturally without any further pumping required (refer to Table 6.5).
The concept has replaced an energy-intensive operation of underground disposal by high-pressure pumps and led to an energy savings of approximately 2,500,000 megawatt hours since the start of the project. Five high-pressure deep well disposal pumps have been shut down. High-pressure pumps require a lot of maintenance because of their stressful working regime, and any planned maintenance downtime, or, worse still, breakdowns, means that oil production must be suspended, which results in oil production loss. There has not been a day of downtime at NWTP since its commissioning, enabling PDO to press ahead with the development of the Nimr oil field. According to PDO’s 2017 sustainability report, this has saved 98 percent of the energy that is used for deep well disposal in the oil field. To protect aquifers, the wetland area is lined with a mineral sealing layer. Compared with deep disposal wells, this wetland approach has lower energy requirements and a smaller carbon footprint.
Table 6.6 shows the energy and carbon footprint associated with the two PW management methods. The NWTP alone contributed approximately 4.26 percent to Oman’s overall Intended Nationally Determined Contributions (according to the Paris Agreement) to reduce emissions by 2 percent by 2030.
150 | WATER M ANA GEMENT IN O IL AND G AS O PERATION S
FIGURE 6.5
Cross-section of the reedbed at the NWTP
TABLE 6.5 NWTP project performance
DISPOSAL OPTIONS
Source: PDO case study.
TO APRIL 2022) CARBON DIOXIDE
Note: kWH = kilowatt-hour; MWh = megawatt-hour; t = tonnes.
Since the start of operation, approximately 2.150 million tonnes of carbon dioxide emissions have been saved—the equivalent of the emissions from 25,000 cars over a 10-year period—and, according to Bauer Resources, by the end of the operations in 2044, it will save 4.5 million tons of carbon dioxide. NWTP was the first plant of its kind to successfully offset its carbon emissions from 2019 to this day.
Reuse of PW for saline irrigation
In 2014, NWTP started using treated PW for the irrigation of test plots for biosaline agriculture to evaluate a more sustainable reuse option for the treated effluent. Potential uses are to produce energy pellets, biofuels, cotton, or wood for construction purposes. The reuse of water has developed significantly in the past couple of years. A 25-hectare farmland has been installed on site using different types of irrigation systems, such as bubbler irrigation and flood irrigation, as well as different types of soil amendments and fertilizers. Now, the water is used for irrigation of plants such as cotton (Gossypium arboreum), ricinus (Ricinus communis), or jojoba (Simmondsia chinensis) to produce either valuable downstream products or biological oils for further processing. The cleaned water reused on the farmland varies between 170 and 670 cubic meters per day.
Ricinus is a plant from which castor oil is extracted. Castor oil is an important feedstock for sebacic acid, a natural chemical used in making high-performance engine oil and lubricants, adhesives, engine coolants, biodegradable packaging, subsea pipe and cable coatings, aerospace polymers, anticorrosion applications, and bioplastics. The Middle East’s first sebacic acid manufacturing plant is currently under construction in Duqm, and although this facility will initially use castor oil sourced from India, there is no reason why the hardy ricinus plant cannot be grown commercially in Oman.
Furthermore, some local tree species such as Eucalyptus camaldulensis and Conocarpus lancifolius are growing very well, giving hope that in a short period of time farming activities in Nimr can be upscaled, which will result in the complete reuse of the treated water from the wetlands.
Following the success of the trials, the development of a large-scale afforestation project is planned to further enhance the carbon sequestration footprint of the NWTP by using the maximum volume of treated PW. This project is intended to involve local contractors and the community during its operation.
Project success and outlook
Starting at a 45,000-cubic-meters capacity per day, the project has grown to a PW treatment capacity of 175,000 cubic meters per day, which demonstrates its technical and commercial success for both PDO and Bauer Resources. The OiW content in the PW has been reduced from 100–500 milligrams per liter when
Leading Industry Practices Illustrated by Case Studies | 151
TABLE 6.6 Operational energy requirements for wetland plant and deep disposal wells
POWER
TOTAL POWER
disposal
≤5.5 kWh/m3 5,200,000
4,400,000 t Wetlands
45,000
40,000 t
REQUIRED
USED IN PROJECT (UP
Deep
wells
MWh
<0.1 kWh/m3
MWh
entering the NWTP to <0.5 milligrams per liter when leaving the wetland system. A portion of the treated water is being reused for drilling purposes and has already reached a rate of up to 10,000 cubic meters per day. Successful trials have been set up to produce high-quality water via a RO system, providing drinking water meeting World Health Organization quality standards. Furthermore, agricultural trials have shown promising progress to enable full-scale farming activities in the near future. The system has become an ecosystem that attracts several species of fauna and flora, and the system’s plant structure was proven to have changed throughout the operational period to a natural plant association.
Given that the site is in the middle of the East Asia–East Africa flyway, more than 140 different bird species have been identified in and around the wetlands and ponds, and use the facility as a comfortable stopover during their migration. The wetlands have even become home to fish and reptiles. A biodiversity program will be conducted by internationally recognized experts in the next 2 years to assess the NWTP’s biodiversity value.
SAUDI ARAMCO (KINGDOM OF SAUDI ARABIA): TREATMENT OF SALINE PW WITH BROAD REUSE POTENTIAL
Prepared by Syed Ahmed and Mohammad Badruzzaman, Saudi Aramco.
Introduction
The objectives of the program were to evaluate PW desalination with a minimum 70 percent recovery factor for two configurations—that is, desalination of low-salinity (TDS) PW (<15,000 milligrams per liter) and high-salinity (TDS) PW (<120,000 milligrams per liter). US patent 10,703,989 was also granted for the concept of PW reuse. Variations in feed conditions, such as flow rate, temperature, inlet oil, hydrogen sulfide in water, and recovery factor, were introduced to establish operating envelopes for the PW desalination systems. The performance of two PW desalination technologies was evaluated by determining the salinity (TDS) and OiW concentration in different operating conditions. This case study presents the key results of the PW reuse program and two field tests, as well as a path forward to deployment of these technologies to unlock the value of PW as a resource in a circular economy.
Most oil-producing wells are free flowing, with a typical oil flow rate of 5,000 barrels per day, and this wet fluid (crude oil, gas, and PW) flows to gas-oil separation plants (GOSPs), where PW and gas are removed from the crude oil. PW is considered a waste product in conventional oil field operations and is injected after de-oiling into disposal reservoirs and not reused in any oil operations.
The program aims to treat PW for reuse, eliminate groundwater utilization, and promote water circularity and sustainability of oil operations. The PW reuse program was developed on the principles of a circular economy for water with a focus on the 5 Rs: reduce, recycle, reuse, restore, and recover. This program will eventually conserve up to several billion gallons of nonrenewable groundwater currently used for crude desalting in Saudi Aramco GOSPs and refineries. The program drove innovation to identify waste streams in oil operations and recycle them for reuse.
Two main waste streams were mapped and identified, as shown in figure 6.6. After crude washing, the desalter effluent stream with low salinity (<15,000 milligrams per liter) is ideal for de-oiling and desalination. The second stream
152 | WATER M ANA GEMENT IN O IL AND G AS O PERATION S
Groundwater
Mixing valve Desalter effluent API Sep.
Produced water WOSEP effluent

Wells Technology
Disposal Injection pump
Conception Produced water
identified was the American Petroleum Institute separator (water-oil separator [WOSEP]) with higher salinity (<120,000 milligrams per liter). These two streams were used by the in-house engineers to develop a technology flowchart and screening of technologies for PW reuse. The objective of the program was to determine a treatment scheme with process equipment for implementation. The program was supported with bench-scale verification for PW de-oiling and desalination. The program considered both summer and winter conditions and defined the limits for PW desalination.
Technology selection
The program identified several mature and emerging technologies to treat the two PW streams—low salinity (<15,000 milligrams per liter) and higher salinity (<120,000 milligrams per liter). Technologies to desalinate PW were evaluated, with a minimum 70 percent recovery factor in terms of performance and along with energy and utility costs (chemicals) for desalination.
Technology selection was categorized based on technology readiness level (TRL), a method of estimating technology maturity developed by the US National Aeronautics and Space Administration in the early 1970s. The use of TRLs, as shown in figure 6.7, enables consistent, uniform discussions of technical maturity across different types of technology. The TRL scale used in Saudi Aramco is also used in US Department of Defense technology readiness assessments.
Table 6.7 lists all the technologies identified by the program for pilot testing and deployment subject to entire life-cycle economic analysis with respect to net present value. The program also considered the reuse of membrane and other

Leading Industry Practices Illustrated by Case Studies | 153
FIGURE 6.6
PW reuse: process schematic
Source: Saudi Aramco.
Note: API sep. = American Petroleum Institute separator; PW = produced water; WOSEP = water-oil separator.
100% Wash water Dehydrator Desalter
FIGURE 6.7
Technology readiness levels
Ready for deployment
Source: Saudi Aramco.
TRL = technology readiness level.
Proven feasibility
Emerging developments
Source: Saudi Aramco.
Note: n.a. = not applicable; OiW = oil in water; PW = produced water; TDS = total dissolved solids; TRL = technology readiness level.
consumables with respect to circularity. Given the two waste streams—low salinity (<15,000 milligrams per liter) and higher salinity (<120,000 milligrams per liter)—several technologies for de-oiling and desalination were shortlisted. Based on the technology maturity shown in Table 6.7, the program developed a basic process scheme so that PW can be handled by any of the selected technologies. Figure 6.8 is an example of the process scheme that contains two main sections: pretreatment and desalination. PW desalination requires robust, reliable, and compact equipment for use in existing brownfield applications both onshore and offshore. Performance testing is the recommended way to confirm the feasibility of PW desalination technologies for PW reuse, and it demonstrated that, within a given operating envelope, the system can treat a PW stream with an OiW content of up to 400 parts per million, reducing it to 0 parts per million while reducing salinity, which is the target specification. In addition, the issue of sour water pretreatment can be addressed by designing the de-oiling system with hydrogen sulfate strippers and packed beds for contaminants such as benzene, toluene, ethylbenzene, and xylene and other organics.
154 | WATER M ANA GEMENT IN O IL AND G AS O PERATION S
TRL 9 TRL 8 TRL 7 TRL 6 TRL 5 TRL 4 TRL 3 TRL 2 TRL 1
Note:
TECHNOLOGY MATURITY SALINITY TDS (MG/L) OIW LIMIT OIL REMOVAL REQUIREMENT RECOVERY FACTOR (%) Mechanical vapor compression TRL 9 <150,000 No n.a. 70–90 Membranes TRL 8 <100,000 Sensitive Yes 70–90 Multiple effect distillation TRL 8 <150,000 No n.a. 70 Adsorption TRL 9 <150,000 No n.a. 70 Ion exchange TRL 6 <1,000 Sensitive Yes <90 Engineered wetlands TRL 8 <15,000 n.a. n.a. Variable
TABLE 6.7 PW desalination technology readiness level
FIGURE 6.8
Pretreatment (de-oiling) and desalination schematic for PW reuse
Source: Saudi Aramco case study.
Note: BTEX = benzene, toluene, ethylbenzene, and xylene; evap. = evaporation; H2 = hydrogen; H2S = hydrogen sulfide; PW = produced water; TOC = total organic carbon.
Source: Saudi Aramco.
Note: n.a. = not applicable; PW = produced water; TDS = total dissolved solids; TSS = total suspended solids.
PW feed quality and performance target
This section provides the PW feed quality from both case studies over the past few years, with defined target performances as shown in table 6.8. This section details the complete geochemical analysis of the two PW streams—low salinity (<15,000 milligrams per liter) and high salinity (<120,000 milligrams per liter)—which was the basis for the two pilot case studies conducted by Saudi Aramco.
Case study 1: desalination of low-salinity PW
One of the largest onshore Saudi Aramco GOSPs is located in the southern area of the country and processes 1,500 million barrels per day of stabilized Arab Light crude oil with API 38. This selected GOSP posed the technical challenge of a high-temperature feed stream (71ºC [160°F]) because the crude oil desalting had crude preheating to break stable emulsions, unlike other GOSPs in Saudi Aramco. A high-temperature desalination technology was required to avoid the need for cooling water during the field test phase. Figure 6.9 illustrates the process scheme at this GOSP, with the feed stream from the desalter effluent feeding the PW reuse unit denoted in blue and the brine sent to disposal pits. The target for the unit was to produce water with a salinity of <1,000 milligrams per liter.
Leading Industry Practices Illustrated by Case Studies | 155
Pretreatment Desalination 4 Membrane
Evap. Dissolved salts reduction 1 De-oiling Oil and solids removal 3 TOC TOC reduction 2 H2S H2S and BTEX removal
and
PARAMETER UNIT CASE STUDY 1 FEED CASE STUDY 2 FEED PERFORMANCE TARGET Salinity (TDS) mg/l 10,962 94,157 <1,000 Oil in water mg/l 10 1,000 <1 TSS mg/l 202 263 <1 Temperature °F 150 140 n.a. pH n.a. 7.7 7.4 6.0–7.5 Recovery factor % n.a. n.a. 70
TABLE 6.8 PW quality overview with target quality
FIGURE 6.9
PW desalination: membranes
Groundwater (Current situation)
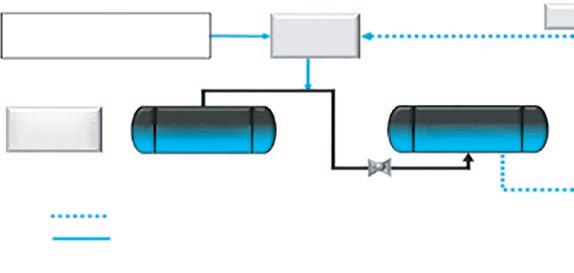
Desalter effluent
Wash water 100%
TDS 1,400 mg/l
Dehydrator
Reuse water
Wash water
Source: Saudi Aramco case study.
Mixing valve
Treated water
TDS 800 mg/l
Desalter
TDS 15,000 mg/l
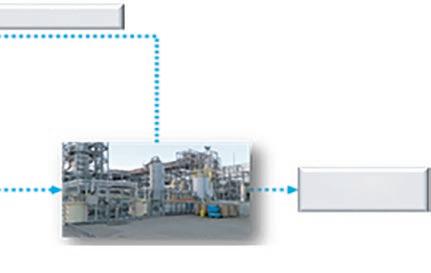
Brine to disposal
Membranes (CM, RO)
Note: CM = ceramic membrane; PW = produced water; RO = reverse osmosis; TDS = total dissolved solids.
FIGURE 6.10
PW desalination: membranes process scheme
Feed: Produced water
Salinity: 10,000 mg/l
Pretreatment
UF
Stripper
Organic scavenger
Product: Water
Salinity: <1,000 mg/l
Desalination
Reverse osmosis
Oil and solids removal
H2S and BTEX removal
TOC reduction
High temperature 140-150° F (60-65 °C)
Salinity reduction
Source: Saudi Aramco case study.
Note: H2S = hydrogen sulfide; BTEX = benzene, toluene, ethylbenzene, and xylene; PW = produced water; rec. = recovery; TOC = total organic carbon; UF = ultrafiltration.
The PW reuse unit feed was defined in table 6.8, along with the performance target requirements. The process scheme in figure 6.10 was developed with the support of technology and subject matter experts. The field test was conducted for 3 months with continuous (24 hours per day, 7 days per week) operations, with shutdowns to replace and test new membranes for UF.
The first module used ceramic UF membranes and was designed with an inlet feed of 1,000–2,500 milligrams per liter of oil and 200 milligrams per liter of TSS and an outlet feed of <1 milligram per liter of oil and TSS. The module was able to achieve an average performance of 86 percent oil removal efficiency and 70 percent TSS removal efficiency. The hydrogen sulfide stripper module was able to strip the hydrogen sulfide gas in sour feed and, with injection of sulfuric acid upstream, met an average performance of 1 part per million as feed to RO membranes. The overall efficiency of the hydrogen sulfide stripper was 99.5 percent. The organic scavenger module selected was strong base anion (polystyrene) resin, which removes 60–80 percent of the dissolved organics. The TOC was able to be reduced on average from 12 milligrams per liter to 1 milligram per liter.
156 | WATER M ANA GEMENT IN O IL AND G AS O PERATION S
The next module was desalination, in which high-temperature RO membranes were used. The RO module was designed with a recovery of 70 percent (low-TDS RO) permeate per product produced. The module was able to reduce the TDS inlet from 10,962 milligrams per liter to an average of 800 milligrams per liter with a TDS target of <1,000 milligrams per liter.
An average recovery factor of 70 percent was achieved with this field test with membranes. Photo 6.8 provides images of the field-testing unit on site at the onshore GOSP, showing all the major equipment along with feed and product.
Case study 2: desalination of high-salinity PW
The program shortlisted several GOSPs for field testing, based on the process scheme shown in figure 6.11. One technology supplier was shortlisted to provide and integrate all the components of the system for deployment. Figure 6.11 illustrates the process scheme at this GOSP with a stream from the WOSEP effluent feeding the PW reuse unit, denoted in blue; the brine is sent to disposal pits. The target for the unit was to produce water with a salinity of <1,000 milligrams per liter from a feed with a salinity of >100,000 milligrams per liter.
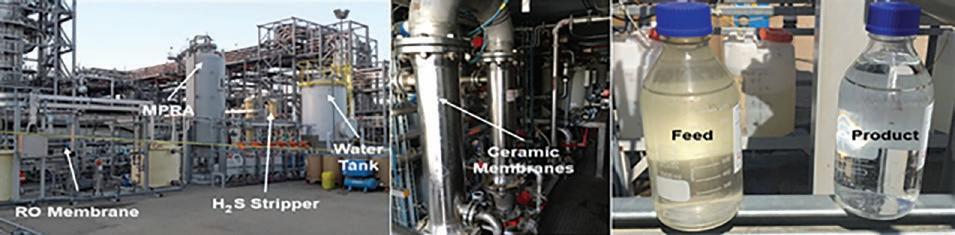
FIGURE 6.11
PW desalination: high salinity (<150,000 mg/l)
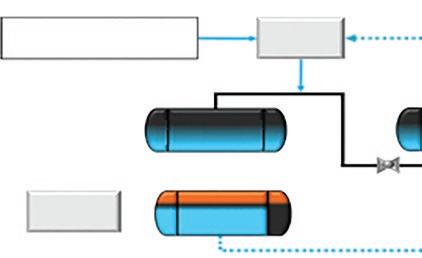
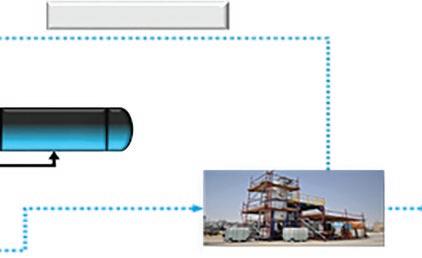

Leading Industry Practices Illustrated by Case Studies | 157
PHOTO 6.8
PW desalination: membranes at field site
Source: © Saudi Aramco. Used with the permission of Saudi Aramco. Further permission required for reuse. Note: H2S = hydrogen sulfide; MPRA = macroporous resin adsorption; PW = produced water; RO = reverse osmosis.
Source: Saudi Aramco.
Wash water 100% 70% Brine to disposal TDS 1,400 mg/l Dehydrator Desalter Treated water TDS 800 mg/l Mixing valve WOSEP WOSEP effluent TDS >100,000 mg/l MVC Groundwater (Current situation) Reuse water Wash water
Note: MVC = mechanical vapor compression; PW = produced water; TDS = total dissolved solids; WOSEP = water-oil separator.
Produced water
The PW reuse unit feed was defined in table 6.7, along with the performance target requirements. The process scheme in figure 6.12 was developed with the support of technology and subject matter experts. The field test was conducted for 1 month with continuous (24 hours per day, 7 days per week) operation, with shutdowns to clean heat exchangers.
Mechanical vapor compression (MVC) was selected for the field-testing technology after extensive review with technology suppliers to address the high salinity. In the pretreatment module, the stripper was used to remove the hydrogen sulfide gas. Figure 6.13 shows the simplified operating principle for the MVC.
PW from the WOSEP was routed to the MVC unit and mixed with a small volume of brine water at suction of the circulation pump. The average recovery factor was 54 percent and varied from 45 to 70 percent as compared with the target of 70 percent. Photo 6.9 shows images of the field-testing unit on site at the onshore GOSP with all the major equipment, along with feed, product, and concentrate.
Feed: Produced water
Salinity: 100,000 mg/l
Stripper >99.5% rec.
H2S and BTEX removal
Source: Saudi Aramco.
Product: Water
Salinity: <1,000 mg/l
Mechanical vapor compression 50–70% rec. Salinity reduction
High temperature 140-150° F (60-65 °C)
Note: H2S = hydrogen sulfide; BTEX = benzene, toluene, ethylbenzene, and xylene; PW = produced water; rec = recovery.
Rotary blower
Circulation pump
Source: Saudi Aramco.
Note: PW = produced water.
Concentrate (blowdown)
Steam
Condensate
Distillate Product
Cooling water
158 | WATER M ANA GEMENT IN O IL AND G AS O PERATION S
FIGURE 6.12
PW desalination: mechanical vapor compression process schematic
Pretreatment Desalination
FIGURE 6.13
PW desalination: mechanical vapor compression principle
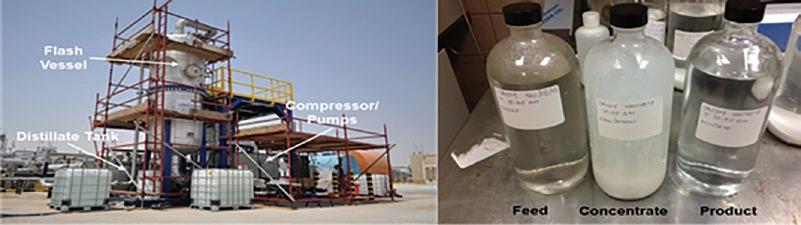

TDS removal
Salt by-product

Source: Saudi Aramco.
Agroforestry
Environment
Clean water
Green energy
Value opportunity: water circularity in oil operations
Injection wells
Cash crops
Water conservation
Industrial usesprocess and power
Biofuels CO2 sequestration
The program proved that technology was able to adeptly handle low-salinity (<15,000 milligrams per liter) and high-salinity (<120,000 milligrams per liter) PW and treat it to reach lower salinity (<1,000 milligrams per liter) for reuse. The PW is of the ideal quality to use in Saudi Aramco’s crude oil washing, well maintenance, and drilling operations. This approach transitions from a linear model of economic growth based on take-make-dispose to a circular economy model that closes the loop, recovers value from PW, and expedites the conservation of the Kingdom of Saudi Arabia’s precious nonrenewable groundwater reserves.
The implications of this technology and program success extend beyond Saudi Aramco. As shown in figure 6.14, the treated PW may be reused for a variety of purposes across Saudi Aramco and the Kingdom of Saudi Arabia and reduces reliance on groundwater. Among other things, the water can be used in agroforestry for cash crops, for industrial purposes, and for use in the green energy program at Saudi Aramco to generate biofuels and carbon dioxide sequestration.
Leading Industry Practices Illustrated by Case Studies | 159
PHOTO 6.9
PW desalination: mechanical vapor compression at field site
Source: © Saudi Aramco. Used with the permission of Saudi Aramco. Further permission required for reuse.
Note: PW = produced water.
FIGURE 6.14
PW reuse: water circularity
Note: API = American Petroleum Institute; PW = produced water; sep = separator; TDS = total dissolved solids.
PW separator API sep. Surge tank Pumps
NOTES
1. LSI is an index that determines water balance between being corrosive and being scale-forming. It measures calcium saturation.
2. Internal calculation using data from the National Water Study 2018 published by the IDEAM and COSUDE 2019.
REFERENCES
Badruzzaman, M., J. R. Anazi, F. A. Al-Wohaib, A. A. Al-Malki, and F. Jutail. 2018. Multipurpose Reuse of Reclaimed Water at an Electric Utility and for Wetlands Rehydration in Florida. Denver, CO: Water Research Foundation.
CONAMA (Conselho Nacional do Meio Ambiente). 2007. Resolução do Conselho Nacional do Meio Ambiente No 393 de 08 de agosto de 2007. Brasília, Brazil: Ministério do Meio Ambiente. https://www.cbhdoce.org.br/wp-content/uploads/2018/08/CONAMA_RES_CONS _2007_393.pdf
Costa, A. K. M. 2017. Produced Water Analysis for Disposal and Reinjection Purposes (Análise sobre a água de produção para fins de descarte e reinjeção). Rio de Janeiro, Brazil: Fluminense Federal University (Universidade Federal Fluminense). https://app.uff.br/riuff/bitstream / handle/1/5314/MONOGRAFIA_ANAKAROLINACOSTA_SCANEADO.pdf?sequence =1&isAllowed=y
Eni. n.d.-a. “Centro Agricolo di Sperimentazione e Formazione.” https://www.eni.com/eni -basilicata/it-IT/energy-valley/centro-agricolo-sperimentazione-formazione.html.
Eni. n.d.-b. “The Energy Valley Project Launched in Val d’Agri.” https://www.eni.com/en-IT /operations/italy-val-agri-energy-valley-project.html
Eni. n.d.-c. “Eni’s Position on Water.” https://www.eni.com/assets/documents/eng/just -transition/2021/eni-e-acqua-eng.pdf.
Eni. n.d.-d. “The Vital Importance of Water.” https://www.eni.com/en-IT/just-transition /water-resource-efficient-management.html
IDEAM (Instituto de Hidrología, Meteorologia y Estudios Ambientales) and COSUDE (Embajada de Suiza en Colombia Avuda Humanitaria v Desarrollo). 2019. “Estudio Nacional del Agua 2018.” https://cta.org.co/biblionet/estudio-nacional-del-agua-2018/
IOGP (International Association of Oil and Gas Producers). 2017. Environmental Performance Indicators 2017 Data. London: International Association of Oil and Gas Producers. IPIECA (International Petroleum Industry Environmental Conservation Association). 2020. “Reuse of Produced Water from the Onshore Oil and Gas Industry.” https://www.ipieca.org /resources/fact-sheet/reuse-of-produced-water-from-the-onshore-oil-and-gas-industry/ IPIECA (International Petroleum Industry Environmental Conservation Association). 2021. “Water Management Framework.” https://www.ipieca.org/resources/good-practice/water -management-framework/
Lee, Kenneth, and Jerry Lee Neff. 2011. Produced Water: Environmental Risks and Advances in Mitigation Technologies. New York: Springer.
OECD (Organisation for Economic Co-operation and Development). 2012. OECD Environmental Outlook to 2050: The Consequences of Inaction. Paris: OECD Publishing. https://www.oecd .org/g20/topics/energy-environment-green-growth/oecdenvironmentaloutlookto2050 theconsequencesofinaction.htm
Oppenheimer, J., M. Badruzzaman, C. Cherchi, J. Weakley, and J. Pohl. 2015. Drivers, Successes, Challenges, and Opportunities of Onsite Industrial Water Reuse: A Path Forward for Collaboration and Growth. Alexandria, VA: WateReuse Foundation.
Ozgun, Hale, Mustafa Evren Ersahin, Selime Erdem, Burcu Atay, Sema Sayili, Esra Eren, Pelin Hoshan, Doga Atay, Mahmut Altinbas, Cumali Kinaci, and Ismail Koyuncu. 2012. “Comparative Evaluation for Characterization of Produced Water Generated from Oil, Gas, and Oil–Gas Production Fields.” Clean Soil Air Water 41 (12): 1175–82. https://doi .org/10.1002/clen.201200204
160 | WATER M ANA GEMENT IN O IL AND G AS O PERATION S
PDO (Petroleum Development Oman). 2017. “Sustainability Report 2017.” https://www.pdo.co .om/en/news/publications/Publications%20Doc%20Library/_Annual-report-2018-04 -BothSN.pdf
PETRONAS. 2023. “Water for Life—Making Clean Water Accessible.” https://www.petronas .com/flow/sustainability/water-life-making-clean-water-accessible.
San Diego County Water Authority. 2009. “Technical Information for Cooling Towers Using Recycled Water.” https://www.sdcwa.org/sites/default/files/files/water-management /recycled/techinfo-cooling-towers.pdf
Veil, John A., Markus G. Puder, Deborah Elcock, and Robert J. Redweik, Jr. 2004. “A White Paper Describing Produced Water from Production of Crude Oil, Natural Gas and Coal Bed Methane.” https://publications.anl.gov/anlpubs/2004/02/49109.pdf.
WRI (World Resources Institute). 2019. “Aqueduct Water Risk Atlas.” https://www.wri.org /applications/aqueduct/water-risk-atlas/
WWAP (World Water Assessment Programme). 2015. The United Nations World Water Development Report 2015: Water for a Sustainable World. Paris: UNESCO.
Leading Industry Practices Illustrated by Case Studies | 161
Policy Guidelines for Regulating Water Management in Petroleum Upstream Operations
OVERVIEW
Freshwater demand in oil and gas operations is a small fraction of global water demand, which is dominated by agriculture. However, oil and gas fields are commonly clustered in smaller areas where their operations may dominate water abstraction and wastewater discharge. Moreover, oil production commonly generates a large amount of produced water (PW) that is either a challenge or a resource for other users, depending on how it is treated and regulated. National water management frameworks are often inadequate in dealing with the specific challenges of petroleum exploration and production. Countries hosting oil and gas activities are strongly advised to establish dedicated regulations for environmentally sustainable water management in petroleum operations.
This chapter outlines policy guidelines for the regulation of water use in petroleum operations, organized with reference to the oil and gas value chain, which is common for petroleum development policies and plans.
Regulations must be technically and operationally feasible and realistic from a cost-benefit perspective. Water management as conducted by leading oil companies in advanced jurisdictions is a useful reference for realistic regulations. This chapter draws on information from a review of leading industry practices as documented in chapter 2 and the case studies presented in chapter 6.
NATIONAL WATER RESOURCE MANAGEMENT FRAMEWORK
Figure 7.1 provides a graphical representation of the main blocks of water management regulation organized around the oil and gas value chain. The outline includes the preparation and planning of oil and gas exploration and production licenses, the actual licensing of oil and gas exploration and production rights, exploration activities, and discovery of potentially commercial accumulations, leading to the next important planning process—the plan for development and operation (PfDO). The PfDO informs field development activities and a production period that may last for several decades. If petroleum is refined in the
163
7
FIGURE 7.1
Structure and key components of policy guidelines for water management
Water resource management framework
• Water policy and legislation
• Water resource and risk assessment
• Abstraction and discharge regulations
• Water institutions
• Water allocation
and gas sector framework
• Legislation
• Regulations
• Model agreement
• Oil and gas regulatory institutions
• Strategic environmental assessment License agreement (PSA or other)
• Licensing terms and conditions
Plan for development and operation
• Feasibility study
• Concept evaluations
• Environmental and social impact assessment
• Environmental and social management plan
Process
Source: This figure is original to this publication.
Note: PfDO = Plan for Development and Operation; PSA = production-sharing agreement.
country of operation, refinery operations also represent a significant source of water abstraction and wastewater discharge.
Freshwater use and the volume and characteristics of wastewater and PW vary significantly across types of petroleum operations. Conventional oil, conventional gas, and tight oil and gas production are therefore discussed separately in the following sections.
Water policy and legislation
It is essential that development of water resources be governed by national perspectives and priorities. An adequate legal framework is a necessary tool to ensure good governance and should be built on the key principles of the nation’s constitution and conveyed through a national water policy. The key principles should be stipulated in a water act or equivalent primary legislation, and implementation should be laid out in water regulation.
National water policies and legislation should also be the foundation for water management in the petroleum sector. As noted in chapter 5, reference to the petroleum sector is largely absent in national water frameworks, which usually focus on the most prevalent water users, namely agricultural users, followed by municipal and small-scale industrial users. In many cases the national framework for water resource management was developed before the petroleum sector gained momentum. Petroleum sector policies are equally deficient when it comes to water management in oil and gas development. Petroleum legislation and regulatory and contractual frameworks focus on sector-specific issues, such as resource management, fiscal regime, operational safety, and local content. Because water is a joint national resource, the government must balance the interests of all users. Consistency should be the principle for water management across all sectors.
Policy principle:
To ensure a consistent approach to water management across uses, key principles of water management should be established in the national water management
164 | WATER M ANA GEMENT IN O IL AND G AS O PERATION S
Oil
Well drilling
fluid water Injection water
water Mud waste Wastewater Wastewater Scrubbing water
= Water in
= Water out Field processing Refining Field processing Field processing Gas production Secondary oil production Primary oil production
injection water Tight oil and gas production Wastewater Wastewater Flowback water
Drill
Produced
Blue
Red
Pressure
and cooling water Well drilling Well drilling Government framework Oil and gas production and processing Exploration PfDO
framework. The petroleum sector legal framework should incorporate these principles by reference and elaborate the sector-specific water management framework as required.
Water resource and risk assessment
National authorities have the responsibility to assess and determine water resource availability and usage. National water management is a comprehensive and complex task that requires a holistic approach, reflecting the interaction with multiple users and with other key resources that are essential for human well-being. Such key resources include food, energy, and water, and the systems by which these resources are produced, refined, distributed, and consumed are closely linked. This is commonly referred to as the food-energy-water nexus. Government duties include data acquisition and processing, water resource assessment, and assessment of water supply risks. Such studies require a comprehensive database established from a network of monitoring points and subject to further analysis using appropriate software solutions.
Water supply risks and possible impacts are essential to the formulation of policies and strategies at both national and river basin levels. In carrying out environmental assessments for their projects, oil companies have a more limited scope and will fully rely on data provided by the host government or national water resource in preparing their plan for water abstraction and discharge and to assess the risks pertinent to their projects.
Policy principles:
Evidence-based documentation of water resources and supply risk is the essential basis for sustainable water resource management at the national level and for formulating regulations for water-using activities in all sectors.
For oil and gas companies, the primary source for water resource data is the national authority.
The host government should ensure that the water resource assessment is completed as a preparatory activity to inform the decision to open areas for petroleum activities (prelicensing phase).
National water regulatory institutions
Implementation, monitoring, and enforcement of the legal and regulatory framework for water management and petroleum sector management rest with the respective regulatory institutions. For water management, there will be institutions with national responsibility and institutions with sector responsibility. This raises several issues about coordination and effective and efficient utilization of limited resources and is discussed further in subsequent sections of this chapter. Complex regulation has little meaning if the institutional capacity for implementation is inadequate. In this case, a simpler regulatory framework associated with a goal-oriented long-term program to strengthen institutions would be a preferable alternative.
Policy principles:
The coordinated efforts of competent institutions are key to good governance and efficient water resource management.
Regulatory ambitions should be balanced against institutional capacity, and a long-term plan should be made for institutional development.
Policy Guidelines for Regulating Water Management in Petroleum Upstream Operations | 165
Abstraction and discharge regulations
The fundamental starting point for the governance of water resources is the recognition that water is a precious resource that should be sustainably managed for the nation as a whole. This requires that the water resources be properly mapped, assessed, and understood (chapter 3). Management of the resources should be further based on the recognition that the water has several users who need predictable access.
Water does not recognize political borders, and drainage basins that provide the envelope of the water system often cross national and state boundaries. Consequently, a common framework at international, federal, and state levels (for federal states) is required to ensure good governance of shared water resources.
Chapter 5 contains an example of an international approach to water management—the European Union Water Directive—the objective of which is to implement common principles for river basin management in the 27 member countries in recognition that freshwater resources in the European Union are under pressure because of increased economic activity, population growth, and urbanization.
Another example is the New South Wales, Australia, water regulation, which ranks among the most advanced in the world because it encompasses provisions to dynamically regulate water availability with user demands through water-sharing arrangements and trading of water rights. The New South Wales state framework was developed and implemented under the federal framework, which applies to the Murray-Darling Basin that extends across several states. A cornerstone for the management of the New South Wales water resources is the water-sharing plan, with the purpose of the following:
• Providing water users with a clear picture of when and how water will be available for extraction,
• Protecting the fundamental environmental health of the water source, and
• Ensuring the water resource is sustainable in the long term.
Policy principles:
Water sharing and allocation is a challenging exercise, but in areas of water scarcity it will be necessary.
Water abstraction policy and regulations must be based on the sustainable resources of river basins, with a holistic approach that recognizes and balances the demands of several users.
Water management tools
The challenges associated with water resource management, largely because of many and conflicting demands, have historically been seen as a common international problem. This recognition led to a consensus that a holistic approach to water resource management was required, resulting in integrated water resource management (IWRM), which is now a widely accepted principle for the management of water resources and is further discussed in chapter 5.
The Global Water Partnership (GWP) was established as an international network to foster the implementation of IWRM. As a part of the measures to assist in this process, GWP designed 84 different tools that are grouped into
166 | WATER M ANA GEMENT IN O IL AND G AS O PERATION S
four categories: enabling environment, institutions and participation, management instruments, and finance (GWP 2020).
The management instrument tools include a set of economic instruments that can serve as an incentive to reach defined goals and as measures to ensure that regulatory compliance is achieved:
• Tariff for water delivery. For all services received through an infrastructure, the entity receiving services should pay an appropriate fee for the investment and operation of the infrastructure. This also applies to water resources, whether the organization providing for the delivery of water is a public entity or a private company. This is a basic tariff before any consideration of the value of water is made.
• Incentives to promote a certain behavior. For water resource management, incentives will typically be volume-based charges for abstraction or discharge of water. The goal would be to achieve a general reduction in water use or a reduction during certain hours of the day or season.
• Fees for administrative services. It is a well-established principle that the parties receiving services or subject to regulatory activities by governmental institutions will pay for these services. This includes the cost of evaluating applications and issuing required permits. It may also include payment for the resources used by governmental institutions to monitor and ensure compliance to the terms of a license or permit.
• Penalties and fines. These are among the tools available to regulators to ensure compliance with the terms of a permit. A response by the regulator to a breach in compliance may be an order to correct; in more severe cases it may generate a penalty or a fine.
Policy principles:
The IWRM offers tools that are useful to regulators to develop their country’s water resource management structure and ensure compliance
Of particular and practical interest are economic instruments, which can incentivize desired behavioral changes, stimulate the efficient allocation of water resources, and generate revenues to maintain and improve the provision of water services.
OIL AND GAS SECTOR FRAMEWORK
This section discusses the policy and legal framework, the legal and contractual framework, regulatory institutions, key phases and the government role, prelicense planning and preparation, strategic environmental and social assessment, and company qualification.
Policy and legal framework
The national policy for water management and the petroleum sector policy are two separate documents guiding the formulation of separate acts and regulations that provide the formal legal expression of how the policy should be implemented.
The regulations should be developed on a needs basis, and it may be prudent to use the experience of other countries in the process of developing
Policy Guidelines for Regulating Water Management in Petroleum Upstream Operations | 167
the framework. Still, it is important to refrain from transposing regulatory frameworks from one country to another.
The UK and US regulatory frameworks presented in chapter 5 are representative of mature economies and countries with well-established frameworks for water management and mature petroleum sectors. They have both developed clear principles and guidelines for the abstraction and discharge of water.
Pakistan, Sudan, and Uganda, also discussed in chapter 5, are emerging economies at different stages of petroleum sector development. To various degrees, their regulatory frameworks are incomplete and largely miss the link between water resource management and the petroleum sector. Forums for proactive dialogue and exchange of experiences are encouraged.
Policy principles:
Development of policies and legal frameworks should be guided by international experiences of both developed and emerging economies.
The complexity of the petroleum sector and the large multinational companies involved require an equally advanced legal and regulatory framework in keeping with international standards.
Legal and contractual framework
Petroleum agreements (PAs) are usually signed between the government and oil companies to govern the rights and obligations associated with exploration and production activities in a specific area. A common type of agreement is the production-sharing agreement (PSA), which provides the required details for the work program, fiscal terms, and specific operational issues. In some countries, PAs are comprehensive, with virtually no need for regulation. In others, PAs include only license-specific elements and are supplemented by a robust regulatory framework. None of the PAs issued by countries analyzed in chapter 5 includes details on water management. Yet not all countries have comprehensive water management regulations for the petroleum sector. There is no reason to not include such details in the PA if they are not well covered in other parts of the framework. In this regard the PA may represent an opportunity to shortcut lengthy legislation processes, because they are entered into separately for every new license.
Petroleum resources may have a very high value and provide a basis for substantial rent to the government. This rent is secured through a fiscal arrangement that will reflect high tax rates compared with other industries. In the traditional concessionary system, the fiscal elements would be a royalty and a tax on the net profit. In the PSA, the fiscal arrangement constitutes a sharing of the profit oil, but PSAs have commonly also included both tax and royalty.
Profit-sharing rates and tax rates will apply to the net profit after all eligible costs have been deducted. Costs related to water management in petroleum operations are part of the eligible operational cost. The higher the marginal tax rate, the higher the share of operational costs shouldered by the government. However, this should not deter the government from supporting procedures and processes that are required to manage water resources effectively and sustainably.
The term best industry practices is often used in framework documents. This is not recommended because the term has no unique legal definition and may lead to controversy and potential arbitration. Preferably, clear rules or reference to a recognized standard such as the American Petroleum Institute (API) standard should be set forth in regulations.
168 | WATER M ANA GEMENT IN O IL AND G AS O PERATION S
Policy principles:
Regulations or at least PAs should include provisions to ensure that petroleum operations and related water abstraction and discharge meet required standards.
Government may define specific rules and threshold values or refer to a recognized international standard such as the API’s.
Regulatory institutions
Execution of the legal and contractual framework relies on well-structured and competent regulatory institutions. The authorities with responsibility for the petroleum sector are there to ensure that oil and gas resources are developed to the best benefit of the entire nation. This means that the oil and gas resources shall be managed with an all-inclusive perspective of which environmental protection and water management are a part.
The value of oil and gas resources is realized when projects move through the petroleum value chain. The stages and activities of the value chain define the main stages of government monitoring and interaction with the operating companies. Both water abstraction and discharge have widely different challenges as one moves through the stages of the petroleum value chain. Chapter 5 provides a description of the institutional framework for the oversight of oil and gas operations.
A ministry of energy or petroleum is commonly assigned the policy responsibility for the petroleum sector, and a petroleum regulatory authority is commonly responsible for policy implementation and regulatory enforcement.
Several government institutions have roles to play in regulating petroleum operations. Examples include the national authority for occupational health and safety, national environment and water authority, wildlife authority, and maritime authority. At the sector level, the petroleum regulatory authority must interact with national authorities for environment and water on water management issues. However, most decisions on water management in oil and gas operations are linked to operational considerations for which the petroleum authority is responsible.
The water authorities and petroleum authorities often share overlapping roles, which calls for effective coordination. A model commonly used to achieve regulatory efficiency is for the petroleum regulator to function as a one-stop shop, in which the petroleum sector regulator serves as the key point of contact between oil companies and various government entities. As such, the petroleum regulator handles regulatory issues on behalf of, and in close coordination with, the relevant regulatory authorities, including those responsible for environment, safety, and water management (refer to figure 5.3).
There are alternative models for the institutional organization. One example is the United Kingdom, where the Environment Agency is the regulator responsible for all environmental issues, including water, and has dedicated petroleum sector responsibility. The UK Environment Agency has status as an executive nondepartmental public body, which means that it is not part of a government department and answers to the public through Parliament. This arrangement secures the agency’s independence and provides protection from undue political influence. It is also used in some emerging economies, in which the regulatory authority reports to a board rather than the minister in charge of the sector.
Policy Guidelines for Regulating Water Management in Petroleum Upstream Operations | 169
Policy principles:
Water resource management usually implies overlapping responsibilities between government authorities tasked with the management and oversight of water on a national level and those tasked with the management and oversight of petroleum operations.
To facilitate the necessary interaction between institutions, open channels of communication and effective cooperation procedures should be established.
Key activity phases and government role
The petroleum authority oversees the application of regulatory measures in all phases of the value chain, but there are three key phases or milestones where its influence is most pronounced:
• Prelicensing. The phase before licensing will eventually lead to a decision that an area is open for petroleum activities. Key conditions that will apply to future licenses are determined in this phase. Proper planning is the key to successful sector development, and its importance should never be underestimated.
• Negotiation. During the negotiation of a PA, the terms for the work program, operational aspects, and fiscal terms are defined.
• PfDO. The detailed description of field development solutions leading to production are defined in the PfDO, which also includes the oil company’s plans for water management. The PfDO is submitted to the petroleum authority for approval and requires a comprehensive assessment process, which is discussed later in the “PfDO” section.
Policy principles:
The government must exercise appropriate influence and optimize national interests at key phases or milestones in petroleum activities.
To this end, it must conduct its own assessments and evaluations and maintain a constructive dialogue with oil companies and other stakeholders in all phases of the petroleum value chain.
Prelicense planning and preparation
The prelicense phase can be extensive in terms of both resources and time. The value of the petroleum resources and the potential consequences of sector development are major in economic, environmental, and social terms, and the process should never be rushed.
Prelicense preparations typically include the following:
• Review of the legal and regulatory framework,
• Review of the model PA,
• Determination of the fiscal regime,
• Compilation of petroleum resource data,
• Performance of a petroleum resource assessment, and
• Conduct of a strategic environmental assessment.
Assessment of the oil and gas resource potential is key to the decision to open for licensing, but environmental considerations and the assessment of available water resources are also essential inputs into the preparation process. The term process should include broad stakeholders’ engagement and consultations as
170 | WATER M ANA GEMENT IN O IL AND G AS O PERATION S
prerequisites for sustainable outcomes. The prelicense preparation process is the responsibility of the government, which will also have to mobilize the resources required.
Policy principles:
The prelicense planning phase is essential for an optimized petroleum sector development.
The inclination to fast-track licensing is not uncommon, but government should take the required time and resources to ensure that a quality process is conducted up to the licensing decision point.
Strategic environmental and social assessment
The prelicense planning process is commonly conducted as a Strategic Environmental and Social Assessment (SESA). The SESA constitutes a decision support process based on an approach to integrating environmental considerations with proper linkages to social and economic aspects of the preparation of policies, programs, and plans. The petroleum act often stipulates that a SESA is required before an area is opened for licensing. In Article 47, “Opening Up of New Areas for Petroleum Activities,” the petroleum act in Uganda states,
The Minister shall, before opening up areas that have not been previously licensed with a view to allowing petroleum activities, ensure that . . . an assessment shall be made of the impact of the petroleum activities on trade, industry and the environment, and of possible risks of pollution, as well as the economic and social effects that may result from the petroleum activities.
The article provides no explicit reference to water resources, but there is no doubt that any reasonable interpretation of the scope of the required assessment would include water resource management as a cornerstone.
It is also well recognized that the implementation of IWRM will benefit from being analyzed and promoted through a SESA process (World Bank 2010).
Policy principles:
The government should ensure that a SESA is carried out as part of the prelicense planning process and used to inform any licensing decision.
The SESA should be a comprehensive evaluation of the potential environmental, industrial, economic, and social impacts of future petroleum activities, including an assessment of their impact on water resources and water management.
Company qualification
Oil and gas exploration and the subsequent field development and production are complex processes that require extensive technical competence and experience as well as financial resources. An oil company that aims to receive a petroleum license must document that it has all the required competences and resources to be a worthy candidate. The qualification criteria that apply should be clearly stated in any tender invitation to the industry. It may be prudent to conduct a prequalification process to ensure that only companies fulfilling the criteria will be allowed to apply.
The qualifications required typically include documentation of competence and systems to handle environmental and safety issues associated with petroleum operations. Chapter 5 concluded that an explicit requirement regarding oil companies’ experience in water management is not the practice. Nonetheless, there are
Policy Guidelines for Regulating Water Management in Petroleum Upstream Operations | 171
good reasons for such experience to be included in a company’s prequalification and qualification requirements.
Documentation of the company’s health, safety, and environment (HSE) management system should be included in the qualification documentation. The procedure for water management should be explicitly presented as a part of the company’s HSE system. A company should also be required to verify that the management system is fully implemented in company’s daily operations.
Policy principles:
Only companies with the required competence and resources should be allowed to participate in petroleum sector activities.
The government should request that oil companies document a management system that includes their approach to water management and provide proof that such a management system is indeed integrated into the company’s daily operations.
WELL DRILLING: FROM EXPLORATION TO COMMERCIAL DISCOVERY
As discussed in chapter 1, both exploration and production wells need water, primarily for water-based drilling fluid (commonly referred to as mud) but also for cementing of casing and general drilling site operations. Mud is a heavy, viscous fluid mixture that provides the necessary hydrostatic head to balance the formation pressure. It lubricates the drill string against the sidewall, cools the drill bit, and transports drill cuttings to the surface.
There are three types of drilling muds: water based, oil based, and synthetic based. Water-based mud is the traditional drilling fluid and still the most common. Oil-based mud was introduced for improved drilling performance, particularly when drilling water-sensitive shales or salt formations. Synthetic mud was developed as a more environmentally friendly alternative to oil-based mud with similar performance characteristics and is often used during drilling of directional wells.
The water consumption of a drilling operation that uses water-based mud is small and does not represent a problem. However, the chemical composition of the mud, which includes various chemical additives, makes water-based mud a disposal challenge. It is a mixture of natural and synthetic chemical compounds and should be regarded as a potentially hazardous waste. Mud may also pick up other contaminants from drilling operations and from the subsurface formations. The volume of drilling wastes (cuttings and mud) can range from 1,000 to 5,000 cubic meters per well (Biltayib et al. 2016). There are in principle two options for disposal of drilling fluid and drill cuttings:
• Treatment and safe disposal either by mobile treatment units or by transport to a central treatment facility (practiced by Uganda):
• Separate mud from cuttings.
• Treat and dispose of cuttings in a landfill or reuse them for other purposes (for example, construction).
• Reuse mud, and treat residual mud for safe disposal.
• Disposal in pits at the well site (practiced in neighboring Sudan):
• Cuttings and residual mud are permanently deposited in excavated pits at the well site.
172 | WATER M ANA GEMENT IN O IL AND G AS O PERATION S
• Pits have basal lining with a geomembrane of clay or high-density polyethylene and are capped after a period of evaporation to minimize infiltration of water into the waste. The basal liner is critical, and ruptures and leaks are not uncommon.
Central treatment of cuttings and residual mud appears to be the prudent approach, but transport distances and the need for temporary storage and handling also deserve consideration.
Policy principles:
Drilling mud is a mixture of natural and synthetic compounds that should be regarded as a potentially hazardous waste.
Detailed regulation is required for the treatment and safe disposal of drilling waste, and special regulation should apply to oil-based and synthetic muds.
Permanent disposal of residual mud and cuttings at drill sites should be prohibited.
P fDO
After successful exploration drilling and subsequent confirmation of a commercial discovery by delineation wells, the project moves to the PfDO stage. The PfDO is not just a report and a decision gate but a comprehensive assessment and planning process in which both the operating company and the government have roles to play. The key stages of the process are illustrated in figure 7.2.
The operator is, on behalf of the licensee, obligated to prepare and submit the PfDO to government, but the PfDO should also be a result of interaction between the operator and the regulatory authorities. The PfDO describes the operational consequence of the regulatory and contractual provisions defined for sustainable water management.
Environmental and social impact assessment
The Environmental and Social Impact Assessment (ESIA) is an integral part of the pre-PfDO assessments and results in an Environmental and Social Management Plan, which should include a strategy for managing risks and mitigating impacts. Preparation of the PfDO and associated ESIA is a company responsibility and pertains to the area in which oil and gas development will take place. The ESIA should cross-reference the prelicense SESA prepared by the government (where available).
The ESIA is a comprehensive process which should be prepared in accordance with the national legal and regulatory framework and in discussion with
Policy Guidelines for Regulating Water Management in Petroleum Upstream Operations | 173
FIGURE 7.2
Main steps in the PfDO process
Source: This figure is original to this publication.
Note: ESIA = Environmental and Social Impact Assessment; PfDO = plan for development and operation.
Preliminary engineering PfDO submission Authority decision Detailed engineering Construction and testing Production Concept studies Feasibility study
Assessment and planning ImplementationOperation
ESIA
key regulatory authorities, which may include the ministry in charge of environment and water, ministry in charge of petroleum, environment authority, petroleum authority, water authority, wildlife authority, and so forth. It should also be based on broad stakeholder consultations, as outlined further in this chapter. The operating company will typically put together a multidisciplinary team for the purpose of the assessment. Regarding water management, the following experts should be considered:1
• Hydrology expert,
• Groundwater expert,
• Waste expert,
• Geologist or soils expert,
• Aquatic biology expert,
• Social or socioeconomic expert,
• Surface water expert,
• Ecosystem services expert, and
• Social or stakeholder expert.
Water issues to be addressed in the ESIA
Water issues to be addressed in the ESIA include hydrology baseline assessment, groundwater impact assessment and mitigating measures, and surface water impact assessment and mitigating measures.
Hydrology baseline assessment Hydrology baseline assessment includes the following:
• Drainage basins and their watersheds,
• Annual precipitation to the drainage basin,
• Surface water bodies (for example, lakes, rivers, streams, and wetlands), and
• Groundwater and associated recharge and discharge mechanisms.
Groundwater impact assessment and mitigating measures Groundwater impact assessment and mitigating measures include the following:
• Impact of water abstraction on groundwater level and flow;
• Discharge impact on groundwater quality;
• Existing water uses, allocations, and entitlements;
• Water abstraction feasibility study and definition of abstraction limits;
• Water well monitoring for flow, water level, and water quality; and
• Worst-case water balance calculations.
Surface water impact assessment and mitigating measures Surface water impact assessment and mitigating measures include the following:
• Impact of land use and construction activities,
• Impact of surface water abstraction,
• Water quality and potential impact of accidental discharge, and
• Flood risk and morphology and impact of construction removal of floodplain and wetland.
174 | WATER M ANA GEMENT IN O IL AND G AS O PERATION S
Water management and monitoring plans should be established to retain the status quo for natural hydrological systems where possible, crossing seasonal wetlands and rivers in the dry season as much as possible, appropriately storing potentially hazardous materials and using secondary containment, using sediment control measures, implementing efficient water use practices, and designing drainage systems for surface runoff to avoid poor-quality water from directly entering watercourses.
Prediction of water abstraction requirements
The water management plans included in the PfDO should be based on the assessment of expected water needs throughout the life of the planned project. This is important particularly in areas of water scarcity. Leading oil companies have broad experience from different operating environments and can build water management models based on predictions of the following key components (chapter 2):
• Total water requirement,
• Total flowback and PW,
• Recycled water,
• Required fresh water, and
• Disposal water.
Even if flowback and PW are extensively reused for injection and other purposes, freshwater abstraction requirements are significant. For example, TotalEnergies’s field development for the Tilenga field in Uganda provides for all PW to be reinjected. Even so, PW will be supplemented by water abstraction from Lake Albert, with the peak surface water abstraction estimated at 13 million cubic meters per year.
Government participation in the ESIA
The environment authority normally takes an active role in defining the scope of the ESIA. The petroleum authority has a key role in overseeing the PfDO process and must also take active part in the ESIA process. Most ESIA issues are linked to field activities that require wider operational and economic considerations, and close cooperation between the two key institutions is essential.
Policy principles:
To ensure fulfilment of national policies and regulatory requirements, government institutions should develop (or procure) competence and capacity to interact with the operating companies in the key steps of assessment and planning of a PfDO.
The ESIA is of particular importance for water management and requires active contributions and participation by national regulators and stakeholders.
Stakeholder engagement in the ESIA process
Consultation with stakeholders is a key aspect of the ESIA process and essential to building a longer-term social license to operate. The consultation process should aim to give stakeholders an opportunity to comment on the proposed project and share their apprehensions, grievances, and concerns (figure 7.3). Stakeholders’ feedback should be an essential part of the process of identifying real and perceived impacts and suitable mitigation and enhancement measures.
Policy Guidelines for Regulating Water Management in Petroleum Upstream Operations | 175
preparation
reference
Baseline assessment Impact assessment Company review Government review and approval of ESIA
Engagement with stakeholders
Source: Modified after the 2018 Tilenga ESIA (Uganda).
Note: ESIA = Environmental and Social Impact Assessment.
The ESIA process should include a stakeholder engagement plan, which provides a framework for all engagement relating to the ESIA. Stakeholders typically include the following:
• Local, national, and regional governmental authorities;
• Project-affected communities and people;
• Project-affected users of water resources;
• Traditional and religious authorities;
• Local businesses and tourism operators;
• Developers of associated facilities;
• Civil society and nongovernmental organizations;
• Academic and research organizations; and
• Intergovernmental organizations.
Typical issues and concerns raised by stakeholders often relate to the impact of potential oil and gas projects on water, health, safety, and the environment; disruption to livelihoods (for example, fishing and farming); resettlement and compensation; and project-induced migration. Some stakeholders may have a separate agenda or be fundamentally opposed to the proposed project, but there is no alternative to including all stakeholders in the engagement plan.
Policy principle:
Planning of ESIA stakeholder engagement should start in the scoping phase, and a stakeholder engagement plan should be an integral part of the ESIA terms of reference.
FRESHWATER USE AND WATER RETURNS IN OIL AND GAS OPERATIONS
An analysis of freshwater volumes typically required in oil and gas operations is proposed by IPIECA (2014) and discussed in Chapter 1 (refer to figure 1.3). Following is a summary of the oil and gas operations that require significant volumes of water.
Conventional oil production
Conventional oil production includes construction, commissioning, and both primary and secondary production.
Construction and commissioning
During facility construction, significant volumes of water (1,000–3,000 cubic meters per day, depending on the size of facility) are used for integrity testing
176 | WATER M ANA GEMENT IN O IL AND G AS O PERATION S
FIGURE 7.3
Main steps in the ESIA process
ESIA terms of
ESIA scoping
(hydrotesting) of pipelines and pipework during the commissioning process. This requires fresh water to minimize corrosion and maximize the effectiveness of the chemical additives. Water used for hydrotesting becomes wastewater once it has passed through the pipework because of the addition of chemicals and other contaminants during the commissioning process. Reuse potential is limited, and treatment is required before disposal.
Primary production
At the start of production, oil commonly flows naturally toward the production well without pumping or pressure stimulation. This initial phase involves small amounts of PW (100–17,000 cubic meters per day; the amount varies with field size and production rates), and water injection is not required. This situation changes gradually as oil production starts to decline and water production increases, as discussed in chapter 2. Over the total production life of an oil field, three barrels or more of PW may typically be generated for each barrel of oil produced.
Secondary production
As production causes reservoir pressure to drop, injection for pressure support becomes necessary to maintain production rates, and the most common injection medium is water. During the secondary production phase, the water cut increases (10,000–50,000 cubic meters per day; the amount varies with field size and production rates), and oil production declines until the oil volume becomes a tiny fraction of the produced liquids. Toward the end of production life, injected water usually exceeds the combined volume of oil and PW.
Policy principles:
Conventional oil production is by far the largest consumer of fresh water because water injection is required to maintain reservoir pressure and production. Injection volumes increase during production and may exceed the volume of produced liquids toward the end of field life.
The key to reducing freshwater abstraction is to use alternative water sources for injection purposes. Volume restrictions on water abstraction can bring about this change.
Conventional gas production
Gas in conventional reservoirs flows naturally to the production well, and no additional stimulus is required. Significant volumes of water are used for gas processing, in which water-based chemical solutions are used to strip impurities from the gas. The process is called scrubbing, and volumes can remain constant for long periods of time and then increase as production matures and concentrations of impurities in the gas increase. Water is also used for cooling and steam generation. Water consumption in gas processing can be in the range of 9,000 to more than 50,000 cubic meters per day.
Policy principle:
Regulatory requirements for treatment and reuse of scrubbing water can significantly reduce water consumption in gas processing.
Policy Guidelines for Regulating Water Management in Petroleum Upstream Operations | 177
Tight oil and gas production
Hydraulic fracturing, in combination with advanced directional drilling techniques, has made it possible to economically extract oil and gas from unconventional resources, such as shale, tight formations, and coalbeds.
The hydraulic fracturing water cycle includes five main activities (US EPA 2015):
• Water acquisition: the withdrawal of groundwater or surface water needed for hydraulic fracturing fluids;
• Chemical mixing: the mixing of water, chemicals, and proppant on the well pad to create the hydraulic fracturing fluid;
• Well injection: the injection of hydraulic fracturing fluids into the well to fracture the geological formation;
• Flowback and PW: the return of injected fluid and water produced from the formation to the surface and subsequent transport for reuse, treatment, or disposal; and
• Wastewater treatment and waste disposal: the reuse, treatment and release, or disposal of wastewater generated at the well pad, including PW.
Environmental issues that are specifically related to hydraulic fracturing include the following (American Geosciences Institute n.d.):
• Water availability,
• Chemical spills at the surface,
• Impacts of sand mining for use in the hydraulic fracturing process,
• Surface water quality degradation from waste fluid disposal,
• Groundwater quality degradation, and
• Induced seismicity from the injection of waste fluids into deep disposal wells.
Not all these potential impacts occur at every site, and many impacts can be avoided or mitigated with the proper practices.
The water volumes required for hydraulic fracturing are substantial and range from 4,000 to 60,000 cubic meters per well (IPIECA 2014). Similar volumes of flowback water mixed with produced formation water represent a significant waste issue. The United States is a world leader in hydraulic fracturing, but the United Kingdom currently has a moratorium on tight gas production.
Policy principles:
If clearly untapped unconventional resources exist, a dedicated policy, legal, and regulatory framework should be established for tight oil and gas.
The current framework for conventional oil and gas production is not sufficient.
Refining operations
Many oil-producing countries refine indigenous crude oil into higher-value petroleum products for domestic and export markets. Although this chapter has focused on water management in upstream oil and gas operations, the challenges of freshwater abstraction and wastewater treatment and disposal are much the same in refinery operations.
178 | WATER M ANA GEMENT IN O IL AND G AS O PERATION S
Water use
Several processes in a petroleum refinery use water, and the most important are the following:
• Process water, used for various purposes in which the water is in close contact with hydrocarbons (HCs);
• Boiler feed water, required for the generation of steam; and
• Cooling water, for water-cooled condensers, product coolers, and other heat exchangers that can use a large amount of water.
Wastewater
A significant portion of the water used can be continually recycled within a refinery. Understanding water balance for a refinery is key to optimizing water usage and reducing final wastewater volumes. In any case, refineries generate significant amounts of wastewater, which has in part been in contact with HCs.
As an example, the Khartoum Refinery in Sudan draws fresh water from the Nile River and generates a total wastewater flow of some 300 tons per hour (refer to chapter 2, box 2.5)
Policy principles:
Refining is the first step in what are called downstream operations and is typically regulated as an industry activity, separate from the contractual regime that applies to upstream exploration and production.
The challenges in terms of freshwater abstraction and wastewater disposal are much the same, and regulations in this regard should be harmonized across upstream and downstream activities.
PRODUCED WATER
PW is water trapped in underground formations that is brought to the surface during oil and gas production. Most PW is saline and may contain a mix of natural formation water and injection water, plus a variety of contaminants. PW associated with oil production represents by far the largest volume of wastewater to be managed in upstream oil and gas operations.
Toward the tail end of production, the water cut increases, the water-to-oil ratio can become 98 percent water to 2 percent oil before final decommissioning. At this stage, injected water usually exceeds the liquid volume produced, as illustrated in figure 7.4.
Policy Guidelines for Regulating Water Management in Petroleum Upstream Operations | 179
FIGURE 7.4
This figure is original to this publication. Oil Produced water 2,000 m3/day 40,000 m3/day 50,000 m3/day Injected water
Example of water-to-oil ratio toward the end of a conventional oil field’s production life
Source:
The obvious solution would be to reuse the PW for injection purposes and reduce the need for freshwater abstraction. However, this solution has challenges because of the characteristics of PW, which includes mineral salts, oil and grease, suspended solids, dispersed oil, and various chemicals used in drilling and production.
This section discusses options for reuse of PW both for reservoir injection and for beneficial reuse outside oil and gas operations.
PW reuse for internal oil field operations onshore
Increasing the amount of PW reinjected requires a balance between two challenges:
• Design solutions to improve the ability of a well to receive water of lower quality than that of other sources of water normally used for oil recovery, and
• The possibility of treating the PW to reduce or eliminate the damage caused to the reservoir rock system.
This treatment aims to remove solids and dispersed oil that can prevent the proper flow of water through the rock (refer to the Petrobras case study in chapter 6). Industry practice varies significantly; the following are some onshore examples:
• The United States, with PW production from around 1 million wells, uses on average only 44 percent of the PW for reservoir injection, whereas some 48 percent is injected in non-HC-bearing formations for disposal, never to be used again (refer to chapter 1).
• TotalEnergies in Uganda has delivered a PfDO for six fields in which 100 percent of PW will be reinjected.
• Petroleum Development Oman’s (PDO’s) Nimr oil field in Oman presently generates 240,000 cubic meters of PW per day. The field has natural water drive, making water injection largely superfluous. Some 10,000 cubic meters per day of treated PW is reused for drilling purposes, and a small fraction is presently used for a pilot irrigation program. The rest is disposed of in evaporation ponds (refer to the PDO case study in chapter 6).
• Petrobras has reinjected most of the water produced from its onshore oil fields in Brazil (refer to Petrobras case study in chapter 6).
Policy principles:
There is significant potential for increased reuse of produced water in oil operations, primarily by replacing fresh water for injection. Note that most, but not all, oil fields need injection for pressure support.
Regulatory restrictions on produced water disposal will promote its increased reuse in oil and gas operations.
PW reuse for internal oil field operations offshore
Because of the large volume of fluids produced in oil and gas operations, treatment facilities tend to have a large footprint, and the equipment is heavy. This is not a problem onshore, but it could be a challenge offshore, where the use of bulky and heavy equipment is limited by the space and weight tolerance of older
180 | WATER M ANA GEMENT IN O IL AND G AS O PERATION S
platforms. According to the IOGP (2022), around 44 percent of offshore PW worldwide in 2022 was reinjected.
Traditionally, offshore operations discharge PW to the sea after separating it from oil, in line with stipulated requirements. Currently, the North Sea performance standard for dispersed oil is 30 milligrams per liter for PW discharged into the sea (OSPAR Recommendation 2001). Going forward, more stringent regulations are expected to be enacted in leading jurisdictions to limit the discharge of PW into the sea, which will require engineering solutions for PW reuse in offshore operations (refer to the Petrobras case study in chapter 6).
Policy principles:
Produced water volumes and the potential impacts of its discharge are leading to stricter environmental regulations, pushing oil companies to invest in produced water reinjection.
Regulatory requirements for the maximum reuse of produced water for injection and strict specifications on produced water discharge are expected to change current discharge practices offshore.
PW reuse for purposes outside oil field operations
As detailed in chapter 1, the annual PW in the United States in 2017 was close to 4 billion cubic meters, and nearly half was injected for disposal, leaving 2 billion cubic meters with no beneficial purpose. Only 1.3 percent is reused outside oil and gas operations. Key reasons for the extremely limited external reuse are as follows:
• Salinity of the PW,
• High treatment and transport costs,
• Limited need (few customers) for additional water,
• Limiting regulatory framework,
• Insurance and legal responsibility issues, and
• Stakeholders’ skepticism.
Despite the challenges, efforts are being made to test further reuse options (GWPC 2019). Four general categories of beneficial use have been identified:
• Land applications, including replacing or supplementing fresh water or other brines in irrigation and dust suppression
• Water discharges, including replenishing water resources through discharge to surface water or injection into subsurface zones
• Industrial uses
• Replacement of fresh, saline, or otherwise degraded water or feed stream for an industrial process, and
• Mining, processing, or manufacturing of other products from the treatment of PW, which contains chemicals that may be extracted in economically useful quantities
• Consumption as drinking water, although primarily limited to livestock or wildlife.
PW characteristics are such that there is no quick-fix solution to full recycling of this water resource for water needs inside or outside oil and gas operations. High salinity is the main challenge, and countries that have so far succeeded in using PW for irrigation are blessed with brackish rather than salt water. Technology improvements are under way that may change the situation, and
Policy Guidelines for Regulating Water Management in Petroleum Upstream Operations | 181
leading oil companies and water authorities are pursuing research and pilot programs to make better use of PW resources. Water shortages in many operating areas provide a strong incentive.
Chapter 6 reviewed current efforts to identify external options for PW reuse, which include irrigation of food and non-food crops.
Irrigation of food crops
Oil can be sufficiently removed and is a minor hazard for soil compared with salt and heavy metals. The most challenging components of PW are dissolved minerals, such as salts, including sodium and other metal ions. Blending PW with low-salinity fresh water or desalinated PW are possible solutions to obtain acceptable water quality. Selecting salt-tolerant crops can increase the use of PW, and adding soil ameliorants, such as gypsum and sulfur, can help mitigate the undesirable effect of high salinity. Documentation of sustainable programs for PW reuse for irrigation of food crops was not found.
Irrigation of non-food crops
Growing salt-tolerant non-food crops has been the topic of many pilot studies. Each non-food crop (like food crops) has its own PW intolerances. Two successful case studies in chapter 6 are of interest:
• PDO has established a 25-hectare farmland adjacent to the Nimr reedbed PW treatment plant that receives some 24,000 cubic meters per day of brackish PW (total dissolved solids [TDS] between 7,000 and 8,000 milligrams per liter). Different types of irrigation as well as different types of soil amendments and fertilizers are being tested. At present, the water is used for irrigation of plants such as cotton, ricinus, and jojoba to produce either valuable downstream products or biological oils for further processing. Local tree species such as eucalyptus are also growing well, giving hope that in a short period of time an upscaling of farming activities can take place in Nimr. At present the supply of cleaned water to the pilot farmland varies between 170 and 670 cubic meters per day.
• Saudi Aramco has conducted a comprehensive field-testing program of PW desalination technologies for both low- (<15,000 milligrams per liter) and high- (<120,000 milligrams per liter) salinity levels, which are representative of many PWs. The effectiveness of the treatment technology implies that the treated PW may be reused for a variety of purposes across Saudi Aramco and the Kingdom of Saudi Arabia and reduces reliance on groundwater resources. Among other uses, the water can be used in agroforestry for cash crops, for industrial purposes, and in the green energy program at Saudi Aramco to generate biofuels and carbon dioxide sequestration.
• Livestock can tolerate a range of contaminants in their drinking water. An abrupt change from low-salinity to high-salinity water may cause harm, whereas a gradual change would not. Animals can consume high-salinity water (TDS) for a few days without harm if they are then given low-salinity water (TDS). Animal tolerance also varies with species, age, water requirement, season of the year, and physiological condition.
• In Colombia, Ecopetrol produced research on treatment of brackish PW from the Castilla field for reuse in irrigation of agricultural crops and pastures. This research also analyzed the effect on the diet of cattle and poultry of treated PW in different concentration gradients (100 percent,
182 | WATER M ANA GEMENT IN O IL AND G AS O PERATION S
50 percent, 25 percent, and 0 percent, in relation to fresh water from an underground well). The six species studied had better behavior and growth in terms of height and diameter at chest height compared with regional reference data, and no negative effects were found on the development of meat, milk, and egg production. The successful research was carried out in an area of some 230 hectares near Ecopetrol’s Castilla field. During the first quarter of 2022, an average of some 70,000 barrels of PW per day was reused in the research area.
• A possible application for the reuse of PW is to extract the metal lithium, which is used in batteries for electrical vehicles and other electronics. The advantage of lithium from PW is that no additional wells need to be drilled.
In addition to a facilitating regulatory framework, scaling up the reuse of PW will require public-private partnership approaches for joint-use infrastructure and the active support of local communities and end users. Although not discussed in this report, innovative financing models and benefit-sharing mechanisms with local communities and end users could help to pave the way for greater integration of oil and gas operations in local water resource planning. Additional research on this topic is needed.
Policy principles:
Reuse of produced water outside of oil and gas operations is still in the research and pilot phases, and no good examples of larger-scale and commercial applications were found in the material reviewed for this project.
Successful pilot studies of irrigation of non-food crops and produced water for livestock drinking water are encouraging and give reason to pursue increased use of produced water in these areas.
Although this may still be a long-term perspective, policies and regulatory frameworks in support of external reuse of produced water are necessary for the efforts to succeed.
CROSS-CUTTING ISSUES
Cross-cutting issues include wastewater discharge regulations, alternative water sources, freshwater efficiency measures, water efficiency reporting, treatment technology advances, the impacts of climate change and increased pressure on water resources, and developing water management capacity.
Wastewater discharge regulations
PW and other water returns from oil and gas operations are classified as wastewater, and discharge requires a permit setting the conditions for discharge. Predefined standards and effluent limitations are in general stipulated for different pollutant parameters.
The requirements between offshore and onshore operations are logically different. In the sea, the issue of salinity (TDS) will not be a concern, and the diluting capacity of the ocean will have an impact on the effluent limitation level. The demands, however, in also moving toward a zero-discharge regime offshore are constantly becoming stricter.
Policy Guidelines for Regulating Water Management in Petroleum Upstream Operations | 183
Wastewater comes from many different industries and activities, and there are large variations in the extent to which frameworks are developed to accommodate these differences. The application of one standard to all sources of wastewater is not uncommon, and some effluent limitations may not be feasible for the petroleum sector.
The US legal framework for discharge permits is issued under the National Pollutant Discharge Elimination System. A set of effluent limitation guidelines for different industries and operations has been developed by the US EPA. These are incorporated as part of the permit.
The development of such regulations should be done in cooperation with the petroleum regulatory authority to ensure that the terms are realistic for operational implementation.
The general US requirement is zero PW discharge. There are, however, several exceptions to this general requirement, including discharge from stripper wells (less than 10 barrels per day of production), discharge from coalbed methane, PW used for agricultural purposes west of the 98th meridian, and PW received by central processing plants.
Policy principles:
Wastewater results from all industrial activities, but effluents from different sectors will have different compositions and challenges.
Authorities should assess each industry separately, and specific limitations for pollutant parameters that are specific to upstream petroleum operation should be stipulated in environmental regulations alongside those for other industries and incorporated into petroleum regulations by reference.
Alternative water sources
Typical water sources for oil and gas operations include the following:
• Potable water (<1,000 milligrams per liter TDS), that is, drinking water, to be used sparsely;
• Fresh surface water (<5,000 milligrams per liter TDS), such as lakes and rivers;
• Fresh groundwater (<15,000 milligrams per liter TDS), often found in shallow aquifers;
• Nonfresh groundwater (>15,000 milligrams per liter TDS), common in deep aquifers;
• Seawater (35,000 milligrams per liter TDS); and
• Wastewater from municipalities or industries.
It is important to note that the petroleum industry does not need to compete for abstraction from freshwater sources if alternative sources are available. Saudi Aramco, with its roots in the Kingdom of Saudi Arabia’s desert climate, has conducted a successful pilot study on the utilization of treated sewage effluent as cooling tower makeup water in refinery operations (refer to Saudi Aramco case study in chapter 6). PETRONAS has just concluded an assessment as a basis for plans to detach from the need to use fresh water for PETRONAS operations. Alternative sources being considered include treated industrial effluent recycling, seawater desalination, and treated municipal wastewater recycling (refer to PETRONAS case study in chapter 6).
184 | WATER M ANA GEMENT IN O IL AND G AS O PERATION S
Policy principle:
National authorities should take the leading role in making and sharing projections of future freshwater availability and promote the industry’s switch to alternative sources of water when possible.
Freshwater efficiency measures
Leading oil companies have water management strategies to reduce, replace, and recycle fresh water and reduce current freshwater abstraction. Documented opportunities include the following:
• Drilling
• Reduce. Use drilling fluids that minimize water losses.
• Replace. Use treated gray water instead of fresh water.
• Recycle. Recover drilling fluids for use in subsequent drilling operations.
• Construction and commissioning
• Reuse. Use hydrotest water for site preparation, dust suppression, and other purposes.
• Oil production
• Reuse. Use PW for pressure maintenance.
• Recycle: Third parties use PW.
• Gas production
• Reuse: Recirculate scrubbing water for further scrubbing.
Policy principle:
Regulatory provisions and incentives should be established to make oil companies implement strategies to reduce current freshwater withdrawals.
Water efficiency reporting
Quantitative reporting on water withdrawal by source and water discharge by destination, along with details on water treatment and reuse, are key to sustainable water management: “What is not measurable or measured cannot be regulated or managed.”
Leading oil companies subscribe to comprehensive reporting formats irrespective of regulatory requirements where they operate. The reference for such reporting lies with shareholders, finance institutions, and generally accepted standards for environmentally responsible behavior.
Common reporting formats used by leading oil companies include a carbon disclosure project, sustainability accounting standard board, and several others.
Policy principles:
Water efficiency reporting requirements in many host countries clearly fall short of the reporting formats adhered to by leading oil companies.
Reporting requirements should be updated as part of the regulatory and contractual terms.
Treatment technology advances
When treated, surplus PW has the potential to meet water needs outside of oil and gas operations. Costly water treatment processes are limiting factors contributing to the present marginal external reuse of PW.
Policy Guidelines for Regulating Water Management in Petroleum Upstream Operations | 185
Costs of water treatment increase with the need to remove dissolved salts, and improved desalination technologies will most likely continue to be based on evaporation and reverse osmosis, including proper pretreatment. However, a combination of cheaper renewable energy (for example, solar energy, battery storage, heat pumps) and cost-efficient automation have the potential to bring about important cost reductions.
Policy principle:
Significant increases in the reuse of produced water for external purposes will depend on legal and regulatory facilitation combined with the development of robust and cost-efficient water treatment technologies.
Impacts of climate change and increased pressure on water resources
The need for adequate water management will continue to increase in the future. New pressures on water resources and ecosystems will arise as demands increase, including water for biofuel production. As populations increase and become wealthier, there will be greater demand for foods that are more water intensive to produce. Climate change will also increase uncertainty and risk in agricultural systems. Indeed, increasing temperatures are resulting in global and regional precipitation changes, leading to shifts in rainfall patterns and agricultural seasons, which will have a major impact on food security and human health and well-being. Many highly populated locations are experiencing significant water losses in areas that traditionally provide a fair water supply, with major ramifications for water security. Since 2000, the number and duration of droughts have increased by 29 percent. Most drought-related deaths occurred in Africa, indicating a need for stronger end-to-end warning systems for drought in that region (WMO 2021).
Recommendations for the management of water resources at the national and territorial (often basin) levels have been established (for example, refer to Andriushchenko et al. 2019). These recommendations are often based on the dynamics of water use efficiency in the targeted territory, considering water development options, including those in the industry sector, that do not contradict the concept of sustainable development and consider the factors of external and internal influence on the socioeconomic system of the entire state. However, even when sound water management solutions are identified, such as those related to water reuse or water savings, their implementation remains limited, particularly in the industry sector.
Petroleum projects typically have durations of 25 years or more and will experience the impact of climate change and increased pressure on water resources.
Policy principle:
Regulatory action for the industry sector to consider the IWRM approach at the basin level should be implemented in the face of climate change and increased water demands. This should include development scenarios for the life of the project and obligatory contingency plans for water management.
Developing water management capacity: a long-term effort
Industrialized countries with a long-standing and mature oil and gas sector have over the years developed advanced contractual, regulatory, and institutional
186 | WATER M ANA GEMENT IN O IL AND G AS O PERATION S
structures to ensure industry compliance with water management regulations at both the national and the sector level. Getting there has taken decades, as well as a history of successful oil and gas exploration and production. Emerging markets and developing countries, particularly those with a young oil and gas sector, may benefit from the experience of more mature players, but replicating their advanced management structure is neither necessary nor realistic.
Water management adds to the regulatory complexity in that fresh water is a common but often scarce resource. Regulations and management of national water resources, water abstraction, and the regulation of discharge to surface and groundwater are made at the national level. The national legal and institutional framework should reflect country characteristics, including socioeconomic, cultural, and environmental conditions. The water regulatory framework should apply to oil and gas operations and should recognize the specificity of the oil and gas sector. In countries in which the oil and gas sector is nascent and not regulated in the water regulatory framework, oil and gas regulation for water management should consider the principles of the national water regulatory framework. To the extent possible, regulation should reflect good industry practice so that oil companies that often operate in multiple countries are held to the same water management standards that they apply in countries with a more advanced water management framework.
Governments must recognize the complexity that characterizes the evolution of water management frameworks and their link to regulatory capacity. Based on a well-considered policy, the starting point is regulatory frameworks at both the national and the sector levels and the establishment of competent regulatory institutions. Actual development in the oil and gas sector will both dictate and justify the building of institutional capacity, which is a long-term effort.
NOTE
1. As an example, the ESIA for the Tilenga field development in Uganda prepared by TotalEnergies (2018) was prepared by a team with broad expertise, including in water management.
REFERENCES
American Geosciences Institute. n.d. “What Environmental Issues Are Associated with Hydraulic Fracturing?” https://www.americangeosciences.org/critical-issues/faq/whaten vironmental-issues-are-associated-hydraulic-fracturing
Andriushchenko, Kateryna, Oleksandr Datsii, Olena Aleinikova, Alebri Mohamed Abdulla, and Alhemeiri Mohammed Ali. 2019. “Improvement of the Water Resources Management System at the Territorial Level.” Problems and Perspectives in Management 17 (3): 421–37. https://doi.org/10.21511/ppm.17(3).2019.34
Biltayib, Biltayib M., Mufazzai Kabuli, Dania Issa, Norah Ayyadand, and Daliris Ramires. 2016. “Management of Drilling Cuttings in Term of Volume and Economics in Oil Field.” International Journal of Engineering Research and Application 6 (10): 45–7.
GWP (Global Water Partnership). 2020. “GWP Annual Progress Review for 2020: Monitoring and Reporting Progress.”
https://www.gwp.org/contentassets/423b566e6334478595159bf0 274b2cbd/gwp-progress-review-2020.pdf
Policy Guidelines for Regulating Water Management in Petroleum Upstream Operations | 187
GWPC (Groundwater Protection Council). 2019. “Produced Water Report: Regulations, Current Practices, and Research Needs.” https://www.gwpc.org/wp-content/uploads/2019/06 /Produced_Water_Full_Report___Digital_Use.pdf
IOGP (International Association of Oil & Gas Producers). 2022. “IOGP Environmental Performance Indicators—2022 Data.” https://www.iogp.org/bookstore/product/iogp-envir onmental-performance-indicators-2022-data/.
IPIECA. 2014. “Efficiency in Water Use: Guidance Document for the Upstream Onshore Oil and Gas Industry.” https://www.ipieca.org/resources/efficiency-in-water-use-guidance- docum ent-for-the-upstream-onshore-2001. oil-and-gas-industry#.
OSPAR Convention. 2001. “OSPAR Recommendation 2001/1 for the Management of Produced Water from Offshore Installations.” https://www.ospar.org/documents?v=32591.
TotalEnergies. 2018. “Tilenga Project ESIA Report.” https://totalenergies.ug/projects/tilenga /tilenga-project-esia-report
US EPA (Environmental Protection Agency). 2015. “Assessment of the Potential Impacts of Hydraulic Fracturing for Oil and Gas on Drinking Water Resources.” https://www.epa.gov /sites/default/files/2015-07/documents/hf_es_erd_jun2015.pdf.
WMO (World Meteorological Organization). 2021. 2021 State of Climate Services. Geneva: WMO. World Bank. 2010. “Strategic Environmental Assessment: Improving Water Resources Governance and Decision Making.” Water P-Notes (48): 55280. https://openknowledge .worldbank.org/bitstream/handle/10986/11695/552800BRI0PN481SEA0Box34944 3B001PUBLIC1.pdf?sequence=1&isAllowed=y.
188 | WATER M ANA GEMENT IN O IL AND G AS O PERATION S
APPENDIX A
Water
Management in New South Wales, Australia
BACKGROUND
The New South Wales Department of Planning, Industry and Environment— Water (DPIE)1 is responsible for water security and managing New South Wales water resources, including surface and groundwater management. DPIE also ensures that sharing of surface and groundwater resources is equitable and that water entitlements and allocations are secure and tradeable. DPIE works together with WaterNSW and the Natural Resources Access Regulator (NRAR).2 The roles and responsibilities of these agencies are covered in an agreement (Government of New South Wales et al. 2021) that came into effect on June 30, 2021 (refer to box A.1)
In 2017 several reviews were initiated at the state and federal levels after allegations of mismanagement of water resources and misconduct. In response to recommendations arising from the Matthews investigation and the MurrayDarling Basin water compliance review (Australian Government, InspectorGeneral of Water Compliance 2022), the New South Wales government developed a Water Reform Action Plan (WRAP; Government of New South Wales 2017) that outlines the responses to the recommendations. WRAP focuses on (1) the introduction of best practice for water management; (2) the building of a compliance and enforcement regime that ensures strong and certain regulation; (3) ensuring transparency in how water is shared, allocated, and managed; and (4) building capability to support and implement water reforms.
GOVERNANCE
The New South Wales government is building a compliance and enforcement regime that ensures strong and certain regulations for water in the state. A new, independent regulatory body, the NRAR,3 has been established to oversee water management in the state. NRAR is responsible for adopting and implementing new monitoring and compliance techniques and technologies such as remote
189
Roles and responsibilities of key New South Wales agencies
The following agencies in New South Wales have key responsibilities for water:
Department of Planning, Industry and Environment—Water
• Performs surface and groundwater management, including ensuring water security for New South Wales.
• Ensures equitable sharing of surface and groundwater resources and that water entitlements and allocations are secure and tradeable.
• Manages New South Wales’s water resources through planning, policy, and regulation.
• Leads negotiations with the Commonwealth, including the Murray-Darling Basin Authority and other jurisdictions.a
WaterNSW
• Operates New South Wales bulk water assets and manages surface water and groundwater resources.
• Develops and operates infrastructure solutions for water supply security and reliability.
• Conducts customer-facing functions, such as the delivery of water and billing.
Office of Environment and Heritage
• Manages the state’s environmental water holdings.
• Develops a long-term environmental watering plan as required under the basin plan.
Source: https://www.awe.gov.au/water, accessed March 7, 2022.
a. https://www.mdba.gov.au/, accessed March 7, 2022.
b. https://www.dcceew.gov.au/water/cewo, accessed November 7, 2023.
A summary of the roles and responsibilities of the various federal state agencies follows.
Murray-Darling Basin Authority
• Manages the basin’s water resources, with all planning decisions made in the interests of the basin as a whole.
• Prepares, implements, and reviews integrated plans for the sustainable use of the basin’s water resources.
• Operates the Murray River system and efficiently delivers water to users on behalf of partner governments, as well as measuring, monitoring, and recording the quality and quantity of the basin’s water resources.
• Provides water rights information to facilitate water trading across the basin.
Commonwealth Environmental Water Holder
• Manages the Commonwealth’s environmental water holdings so as to protect or restore environmental assets in the Murray-Darling Basin and in other areas where environmental water is held.b
Department of Agriculture and Water Resources
• Manages use of water resources, including the National Water Initiative, the Murray-Darling Basin Plan, urban water policy and reform, and water quality improvement.
• Administers the key Commonwealth funding programs relevant to water management reforms.
sensing of crop growth and water holdings, back-to-base and remote meter reading and telemetry, and targeted operations. NRAR was created to return the focus to water law compliance in New South Wales. The focus is on delivering a fair, transparent, and enforceable water law compliance system to protect waterways and prevent water theft. This is achieved through targeted investigations, monitoring, and auditing. NRAR publishes annual progress reports to keep
190 | WATER M ANA GEMENT IN O IL AND G AS O PERATION S
BOX A.1
water users up to date on compliance activities and achievements in protecting water rights and allocations for communities and the environment.
LEGISLATION AND POLICIES
Managing New South Wales water resources relies on a range of legislation, initiatives, and cooperative arrangements with the Commonwealth and other state governments, which are summarized here.
Water Management Act 2000
The Water Management Act 2000 is the key piece of legislation for the management of water in New South Wales.4 Its objective is the sustainable and integrated management of the state’s water for the benefit of both present and future generations. The Water Management Act 2000 recognizes the need to allocate and provide water for the environmental health of rivers and groundwater systems while also providing license holders with secure access to water and greater opportunities to trade water through the separation of water licenses from land.
The Water Management Act 2000 is based on the following principles:
• Water sources and their dependent ecosystems should be protected and restored where possible, and land should not be degraded.
• The water quality of all water sources should be protected and, wherever possible, enhanced.
• The cumulative impacts of water management licenses and approvals and other activities on water sources and their dependent ecosystems should be considered and minimized.
• Geographical and other features of major cultural, heritage, or spiritual significance should be protected.
• The social and economic benefits to the community should be maximized.
• The principles of adaptive management should be applied and should be responsive to monitoring and improvements in the understanding of ecological water requirements.
The act also includes governing principles for water sharing, water use, drainage management, floodplain management, controlled activities, and aquifer interference activities.
Regulations, proclamations, and orders
A variety of regulations, proclamations, and orders have been developed to assist in implementing the provisions of the Water Management Act 2000. Water Management (General) Regulation 2018 specifies important procedural and technical matters related to administration of the act. For example, it applies a consistent identification of stream order (Government of New South Wales 2018) for the purposes of the regulation by reference to a stream order database that is published on the department’s website. Proclamations can be made under these regulations that declare the commencement of licenses and water-sharing plans (WSPs). The minister can publish orders to implement specific details of an act. Orders are published in the New South Wales Government Gazette. 5
Water Management in New South Wales, Australia | 191
WSPs
WSPs are the main tool envisaged in the Water Management Act 2000 for managing the state’s water resources. By setting the rules for how water is allocated for the next 10 years, a WSP provides security for the environment and water users. The major elements of WSPs are listed in box 5.6. This ensures that water is specifically provided for the environment through legally binding plans while allowing license holders, such as irrigators, who require large volumes of water, to plan their business activities. Approximately 60 percent of water licensed under the Water Management Act is for irrigation purposes. In inland New South Wales, all existing WSPs have been reviewed by the Natural Resource Commission to ensure consistency with the requirements of the Commonwealth’s Murray-Darling Basin Plan. WSPs set rules for water trading, that is, the buying and selling of water licenses and annual water allocations. For most new commercial purposes, water trading remains the primary way through which access to water can now be obtained, because in most areas of the state the available water is fully allocated.
The purpose of a WSP (refer to box A.2) is as follows:
• Provide water users with a clear picture of when and how water will be available for extraction,
• Protect the fundamental environmental health of the water source, and
• Ensure the water source is sustainable in the long term.
Impact on water users
WSPs set rules for sharing water between water users and the environment and bring water users into a single licensing system managed under the Water Management Act 2000. The plans clearly define shares of the available water for license holders. They also provide irrigators and farmers with continuing or perpetual licenses, which have a title separate from the land, enabling better water-trading opportunities. WSPs support the long-term health of rivers and aquifers by making water available specifically for the environment.
BOX A.2
Major elements of a water-sharing plan
Major elements of a water-sharing plan include the following:
• Provides water for the environment.
• Protects the water required to meet basic landholder rights.
• Sets annual limits on water extractions.
• Determines what types of additional licenses can be granted (for example, local water utility access).
• Determines how water is to be shared among the different types of licensed users.
• Specifies the rules in groundwater plans to minimize impacts.
• Specifies the rules for water trading or dealings.
• Sets out the mandatory conditions that apply to license holders.
• Sets out the monitoring and reporting requirements.
192 | WATER M ANA GEMENT IN O IL AND G AS O PERATION S
They recognize the following categories of use: (1) commercial water use, (2) water for the environment, (3) basic landholder rights and licensed domestic and stock use, (4) town water supplies, and (5) water for Aboriginal communities. In the context of this report, the most important use is commercial, for which users must be licensed. Examples of commercial uses are irrigation, animal husbandry, manufacturing, and other industrial activities.
WSPs define the rules for access to water by commercial users for 10 years. This supports greater business certainty and assists commercial license holders in planning for the future. The plans also strengthen water trading, which allows users to purchase water from licensed users who are not extracting their full entitlement or to sell the licensed water that exceeds their needs. Water trading may also allow new industries to develop in areas where they were previously restricted and new licenses were embargoed.
All WSPs include rules that apply when a river has very low flows. These rules tell commercial users when pumping is not permitted. Some unregulated river plans also specify daily limits on how much water can be taken during different flow levels. These rules create equity for licensed water users when they take water while still protecting environmental flows in rivers.
Water-sharing planning process
WSPs are a statutory obligation under the Water Management Act 2000. The first plan was developed in 2004, and since then 80 plans have been developed for rivers and groundwater systems. Currently, 56 plans are in force.6 WSPs are developed by the minister for lands and water, with concurrence from the minister for the environment. The plans remain in effect for 10 years and are audited every 5 years by DPIE to ensure the provisions of the plan are still appropriate. Upon review, if no changes are required plans are extended; otherwise they are replaced. The “Replacement Water Sharing Plan Manual” describes the process to be followed to replace a WSP (Government of New South Wales 2022).
Water-sharing rules
These rules articulate how water is distributed to various users. WSPs have been developed for a range of widely differing rivers and aquifers. Some of the issues considered in forming water-sharing rules include the following:
• In-stream values, such as threatened fish that are likely to be affected by flow extraction,
• Hydrologic stress—the amount of water extracted relative to river flow,
• Extraction value—the economic value of using the extracted water,
• Economic dependency of the local community on water extraction,
• Sensitivity of estuaries to the removal of fresh water.
NSW government policy
Indicative access rules were first developed by balancing the in-stream values with the economic dependence of local communities on extraction. The greater the risk to in-stream values, the stronger the environmental flow rules. The higher the economic dependency, the less stringent the access rule. When economic dependency and in-stream values are both high, more intensive
Water Management in New South Wales, Australia | 193
Aspects specified in groundwater-sharing plans
The following are aspects specified in groundwatersharing plans:
• Water sources covered by the plan;
• Environmental water provisions;
• Requirements for water for basic landholder rights;
• Requirements for water for extraction under access licenses;
• Limits to the availability of water, specified as long-term average annual extraction limits and groundwater storage extraction limits;
• Limits to and determinations of the availability of water;
• Rules for granting access licenses;
• Rules for managing access licenses;
• Rules for water supply work approvals;
• Access license dealing rules;
• Mandatory conditions on access licenses and water supply work approvals; and
• Rules on how the plan may be amended.
management is proposed. In the WSP, the stress from all upstream extraction is compared with in-stream values to determine a set of preliminary water-trading rules. Trading is not allowed for water sources that have high in-stream value. Trading is also limited for stressed water sources so as not to increase pressure on the river. Box A.3 lists the key elements specified in groundwater-sharing plans.7
NOTES
1. https://water.dpie.nsw.gov.au/home, accessed March 7, 2022.
2. https://www.waternsw.com.au/ and https://www.nrar.nsw.gov.au/ , both accessed March 7, 2022.
3. https://www.nrar.nsw.gov.au/, accessed March 7, 2022.
4. https://legislation.nsw.gov.au/view/html/inforce/current/act-2000-092, accessed March 7, 2022.
5. https://legislation.nsw.gov.au/gazette, accessed March 7, 2022.
6. The current status of the NSW WSPs and the details of each can be found at https://www .industry.nsw.gov.au/water/plans-programs/water-sharing-plans/status , accessed March 7, 2022.
7. Further details on the formulation of WSPs for groundwater and surface water can be found on the DPIE website ( https://www.industry.nsw.gov.au/water/plans-programs /water-sharing-plans/planning-process, accessed March 7, 2022).
REFERENCES
Australian Government, Inspector-General of Water Compliance. 2022. “Compliance and Enforcement across the Murray-Darling Basin.” https://www.igwc.gov.au/sites/default /files/2022-08/compliance-enforcement-across-murray-darling-basin.pdf
Government of New South Wales. 2017. “Securing Our Water: NSW Government Water Reform Action Plan,” accessed March 7, 2022. https://www.industry.nsw.gov.au/__data/assets/pdf file/0015/312144/nsw-government-water-reform-action-plan.pdf.
194 | WATER M ANA GEMENT IN O IL AND G AS O PERATION S
BOX A.3
Government of New South Wales. 2018. “Determining Stream Order: Fact Sheet,” accessed March 7, 2022. https://www.industry.nsw.gov.au/__data/assets/pdf_file/0020/172091/Dete rmining-Strahler-stream-order-fact-sheet.pdf
Government of New South Wales. 2022. “Replacement Water Sharing Plan Manual,” accessed March 7, 2022. https://www.industry.nsw.gov.au/__data/assets/pdf_file/0009/492453 /replacement-water-sharing-plan-manual.pdf.
Government of New South Wales, DPIE Water (Department of Planning, Industry and Environment), NRAR (Natural Resources Access Regulator), WAMC (Water Administration Ministerial Corporation), and Water NSW. 2021. “Roles and Responsibilities Agreement,” accessed March 7, 2022. https://www.industry.nsw.gov.au/__data/assets/pdf_file /0003/389100/roles-and-responsibilities-agreement.pdf
Water Management in New South Wales, Australia | 195
APPENDIX B
Integrated Water Resources Management
INTRODUCTION
Water management regulation is one element of an approach known as integrated water resources management (IWRM). An often-cited definition of IWRM is provided by the Global Water Partnership (2000):
IWRM is a process which promotes the coordinated development and management of water, land and related resources in order to maximize the resultant economic and social welfare in an equitable manner without compromising the sustainability of vital ecosystems.
IWRM should not be seen as a blueprint or product for good water management but rather as a paradigm with a broad set of principles, tools, and guidelines that must be tailored to the specific context of a country, region, or river basin to implement efficient and effective water resource management (Meran, Siehlow, and von Hirschhausen 2021). A basic set of principles is outlined in box B.1 (UNEP 2002).
ORGANIZING PERSPECTIVES FOR IWRM
To support the application of IWRM principles in practice, GWP has created a set of organizing perspectives covering the thematic areas of IWRM: enabling environment, institutional roles, and management instruments.1 This breakdown is useful because it sets the regulatory management framework within the integrated water management framework.
Enabling environment
A proper enabling environment establishes the rights and assets of all stakeholders. It essentially consists of rules of the game that are laid out to achieve a sustainable balance among the social, economic, and environmental needs for water. These rules can be defined using policies, legislative frameworks, and financing and investment structures.
197
Key integrated water resource management principles
The following are key principles of water resource management:
• Integration of water and environmental management;
• Full participation by all stakeholders, including workers and the community;
• Capacity building;
• Full-cost pricing complemented by targeted subsidies;
• Central government support through the creation and maintenance of an enabling environment;
• Adoption of the best existing technologies and practices;
• Reliable and sustained financing;
• Equitable allocation of water resources;
• Recognition of water as an economic good; and
• Strengthening the role of women in water management.
Institutional arrangements
Institutional arrangements focus on governance, which is defined as the range of political, social, economic, and administrative institutions that are in place (or need to be in place) to develop and manage water resources in sustainable ways. Four institutional roles that must be fulfilled for water governance systems to achieve sound IWRM practices are regulation and compliance, water supply and sanitation services, coordination and facilitation, and capacity building.
Management instruments
These instruments are specific methods that enable decision-makers to make rational and informed choices when it comes to water management and to tailor their actions to specific situations. Good water governance, according to IWRM principles, brings together perspectives and knowledge from different domains. Consequently, the instruments are based on a variety of disciplines, such as hydrology, hydraulics, environmental sciences, systems engineering, legal sciences, sociology, and economics.
These thematic areas and their underlying components are shown in Figure B.1. Elements of the regulation and compliance component are also indicated and discussed further.
ORGANIZATIONAL FRAMEWORK REQUIRED FOR REGULATION AND COMPLIANCE
The Dublin Water Principles proposed that water resources are to be firmly brought under the state’s function of clarifying and maintaining a system of property rights and that, through the principle of participatory management, the state asserts the relevance of meaningful decentralization at the lowest appropriate level.2 Therefore, regulatory and compliance powers have both the responsibility to establish policies and regulations in relation to physical water resources and the need to articulate how people and institutions manage these natural resources.
198 | WATER M ANA GEMENT IN O IL AND G AS O PERATION S
BOX B.1
Thematic area
Enabling environment
Institutional arrangements
Management instruments
Component
Policies
Legal framework
Investment and financing structures
Regulation and compliance
Water and sanitation services
Coordination and facilitation
Capacity building
Understanding water endowments
Assessment instruments
Modeling and decision-making
Planning for IWRM
Communications
Efficiency in water management
Economic instruments
Promoting social change
Regulatory bodies and enforcement agencies
Local authorities
Monitoring and evaluation bodies
Impact assessment
Regulation and enforcement of physical water resources may take different forms. Both water quantity and quality must be carefully considered. Ideally, water resource regulation should integrate water quantity and quality considerations, although this is difficult to achieve in practice. Therefore, water standards should focus as much on water supply issues as on pollution problems. Regulation and implementation powers should also recognize that water does not exist only as a liquid but can also be present in solid and gas states. Along those lines, legal and compliance mechanisms need be developed in ways such that surface and groundwater are equally incorporated into the legal frameworks.
Many different types of institutions take part in integrating water resources management, ranging from very large, transboundary or international entities to local and regional governments, much smaller civil society groups, and community organizations. It may be the case, however, that many organizations whose primary function is not water management are responsible for sectors in which the impact on water resources can be enormous; agriculture, industry, trade, and energy are examples. For the regulation and compliance functions to be adequately performed, all these actors, whether they have a direct or indirect connection to water, must be accounted for by the legislative framework. This also applies to cross-sectoral entities that integrate and coordinate water institutions.
Integrated Water Resources Management | 199
FIGURE B.1
IWRM thematic areas and elements of regulation and compliance
Source: This figure is original to this publication. Note: IWRM = integrated water resource management.
Regulatory and compliance bodies and their functions must be guided by a range of principles. If the goal is for institutions to work and for the people to believe in them, then regulatory and compliance agencies should do the following:
• Be transparent in their decision-making processes.
• Engage and promote stakeholders’ involvement.
• Show accountability and rationality.
• Be open to internal or external demands for institutional upgrade and reform.
One of the most important ideas behind these principles is that an institution cannot be the regulatory body for itself. Regulation and compliance refer to at least three steps. First, there needs to be an enabling environment, part of which includes setting up agencies that can effectively establish and enforce policies on water management. Second, because enforcement is mostly location specific, there is a need to precisely define the role of local-level authorities. Third, the effectiveness of enforcement depends heavily on the information provided by monitoring and evaluation bodies. Knowing what regulations need to be enforced is an important aspect. Another is knowing where and to what extent rules are or are not being respected.
NOTES
1. https://www.gwp.org/en/learn/iwrm-toolbox/About_IWRM_ToolBox/
2. The Dublin Statement on Water and Sustainable Development, also known as the Dublin Water Principles, was a meeting of experts on water-related problems at the International Conference on Water and the Environment, Dublin, Ireland, January 1992. The Dublin Statement on Water and Sustainable Development recognizes the increasing scarcity of water because of the different conflicting uses and overuses of water.
REFERENCES
GWP (Global Water Partnership). 2000. “Integrated Water Resources Management.” Technical Advisory Committee (TAC) Background Paper No. 4, Global Water Partnership, Stockholm. Meran, Georg, Markus Siehlow, and Christian von Hirschhausen. 2021. The Economics of Water Cham, Switzerland: Springer. https://doi.org/10.1007/978-3-030-48485-9_3
UNEP (United Nations Environment Program). 2002. Industry as a Partner for Sustainable Development: Water Management https://wedocs.unep.org/handle/20.500.11822/29595
200 | WATER M ANA GEMENT IN O IL AND G AS O PERATION S
ECO-AUDIT Environmental Benefits Statement
The World Bank Group is committed to reducing its environmental footprint. In support of this commitment, we leverage electronic publishing options and print-on-demand technology, which is located in regional hubs worldwide. Together, these initiatives enable print runs to be lowered and shipping distances decreased, resulting in reduced paper consumption, chemical use, greenhouse gas emissions, and waste.
We follow the recommended standards for paper use set by the Green Press Initiative. The majority of our books are printed on Forest Stewardship Council (FSC)–certified paper, with nearly all containing 50–100 percent recycled content. The recycled fiber in our book paper is either unbleached or bleached using totally chlorine-free (TCF), processed chlorine–free (PCF), or enhanced elemental chlorine–free (EECF) processes.
More information about the Bank’s environmental philosophy can be found at
http://www.worldbank.org/corporateresponsibility

Steadily increasing demand for water poses a threat to sustainable development, and an increasing number of regions are chronically short of water. Putting caps on water consumption, increasing water use efficiencies, and supporting improved sharing of water resources are now critical to reducing the perils posed by water scarcity to biodiversity and human welfare. Although freshwater demand in oil and gas operations is a small fraction of global water demand, oil and gas fields are commonly clustered in smaller areas, where their operations often dominate freshwater abstraction and wastewater discharge. At the same time, oil production generates large amounts of produced water that may be used to reduce freshwater abstraction and possibly serve beneficial purposes outside the petroleum sector.
In the most advanced countries, regulation promotes the sound use of freshwater in the oil and gas industry and incentivizes the reuse or beneficial use of treated produced water. Regulation is also used to prevent the contamination of freshwater resources from the disposal of unproperly treated produced water. In many developing and emerging economies, however, regulation to prevent water contamination is often lacking or nonexistent or, when present, is poorly enforced.
Optimal policy and regulation of the use of freshwater and the reuse of water generated by oil and gas operations depend on a range of geographic, geological, technical, and economic factors. Water Management in Oil and Gas Operations: Industry Practice and Policy Guidelines for Developing Countries identifies common policy principles organized around key regulatory functions and critical links of the oil and gas value chain. This report offers practical solutions to guide policy makers and regulators seeking to minimize the environmental impacts of oil and gas operations, to promote sustainable cross-sectoral economic linkages, and to reduce competition and potential conflicts over access to and use of water resources.
ISBN 978-1-4648-2047-2 SKU 212047
