Working Today for a Better Tomorrow in Ethiopia
Jobs for Poor and Vulnerable Households
INTERNATIONAL DEVELOPMENT IN FOCUS
Emily Weedon Chapman and Margaux Vinez, Editors
Jobs for Poor and Vulnerable Households
Working Today for
Better Tomorrow in
a
Ethiopia
INTERNATIONAL DEVELOPMENT IN FOCUS
Editors
EMILY WEEDON CHAPMAN AND MARGAUX VINEZ,
© 2023 International Bank for Reconstruction and Development / The World Bank
1818 H Street, NW, Washington, DC 20433
Telephone: 202-473-1000; Internet: www.worldbank.org
Some rights reserved
1 2 3 4 26 25 24 23
Books in this series are published to communicate the results of World Bank research, analysis, and operational experience with the least possible delay. The extent of language editing varies from book to book.
This work is a product of the staff of The World Bank with external contributions. The findings, interpretations, and conclusions expressed in this work do not necessarily reflect the views of The World Bank, its Board of Executive Directors, or the governments they represent. The World Bank does not guarantee the accuracy, completeness, or currency of the data included in this work and does not assume responsibility for any errors, omissions, or discrepancies in the information, or liability with respect to the use of or failure to use the information, methods, processes, or conclusions set forth. The boundaries, colors, denominations, and other information shown on any map in this work do not imply any judgment on the part of The World Bank concerning the legal status of any territory or the endorsement or acceptance of such boundaries.
Nothing herein shall constitute or be construed or considered to be a limitation upon or waiver of the privileges and immunities of The World Bank, all of which are specifically reserved.
Rights and Permissions

This work is available under the Creative Commons Attribution 3.0 IGO license (CC BY 3.0 IGO) http://creativecommons.org/licenses/by/3.0/igo. Under the Creative Commons Attribution license, you are free to copy, distribute, transmit, and adapt this work, including for commercial purposes, under the following conditions:
Attribution—Please cite the work as follows: Chapman, Emily Weedon, and Margaux Vinez, eds. 2023. Working Today for a Better Tomorrow in Ethiopia: Jobs for Poor and Vulnerable Households. International Development in Focus. Washington, DC: World Bank. doi:10.1596/978-1-4648-2020-5. License: Creative Commons Attribution CC BY 3.0 IGO
Translations—If you create a translation of this work, please add the following disclaimer along with the attribution: This translation was not created by The World Bank and should not be considered an official World Bank translation. The World Bank shall not be liable for any content or error in this translation.
Adaptations—If you create an adaptation of this work, please add the following disclaimer along with the attribution: This is an adaptation of an original work by The World Bank. Views and opinions expressed in the adaptation are the sole responsibility of the author or authors of the adaptation and are not endorsed by The World Bank.
Third-party content—The World Bank does not necessarily own each component of the content contained within the work. The World Bank therefore does not warrant that the use of any third-party-owned individual component or part contained in the work will not infringe on the rights of those third parties. The risk of claims resulting from such infringement rests solely with you. If you wish to re-use a component of the work, it is your responsibility to determine whether permission is needed for that re-use and to obtain permission from the copyright owner. Examples of components can include, but are not limited to, tables, figures, or images.
All queries on rights and licenses should be addressed to World Bank Publications, The World Bank Group, 1818 H Street, NW, Washington, DC 20433, USA; e-mail: pubrights@worldbank.org
ISBN: 978-1-4648-2020-5
DOI: 10.1596/978-1-4648-2020-5
Cover art: © Jihane El Khoury Roederer, World Bank. Used with permission; further permission required for reuse.
Cover design: Debra Naylor / Naylor Design Inc.
Contents
Acknowledgments xi
About the Editors and Authors xiii
Executive Summary xvii
Abbreviations xxix
PART I ETHIOPIAN LABOR MARKET
iii
CHAPTER 1: The Challenges of Job Growth in Ethiopia 3 Summary 3 Introduction 4 Service sector jobs are increasingly important in Ethiopia 6 Unemployment and inactivity are on the rise 12 Vulnerable groups face additional challenges in a difficult labor market 17 Conclusion 21 Note 22 References 22 SPOTLIGHT 1.1: Ethiopia’s Productive Safety Net Program 24 SPOTLIGHT 1.2: Ethiopia’s Urban Productive Safety Net and Jobs Project 26 PART II BARRIERS TO BETTER JOBS FOR POOR AND VULNERABLE WORKERS CHAPTER 2: Women in Rural Jobs: Constraints to Productivity 31 Summary 31 Introduction 32 Rural women in the Ethiopian labor market 33 Women in agriculture 36 Women in nonfarm enterprises 39 Women in wage employment 41 Limited access to financial services hinders rural women’s productivity 42 Designing safety nets to reduce gender gaps 44 Conclusion 45
Notes 47
References 47
Annex 2A: Productivity of male- and female-managed agricultural plots in Ethiopia 48
Annex 2B: Productivity of male- and female-managed nonfarm enterprises in Ethiopia 51
Annex 2C: Productivity of men and women in wage employment in Ethiopia 53
CHAPTER 3: Youth Employment in Urban Ethiopia: Aspirations in the Labor Market 55
Summary 55
Introduction 56 Employment trends among Ethiopian urban youth 57
62
67
Conclusion 72
Notes 72
References 73
CHAPTER 4: Disability and Work in Ethiopia: Supporting Access to Good Jobs 75
Summary 75
Introduction 76
Framework for understanding disability 76 Portrait of people with disabilities in Ethiopia 80
Promoting an enabling environment in Ethiopia 83
Conclusion 85
Notes 86
References 87
CHAPTER 5: Social Safety Nets and Labor Migration: Influencing, but Not Deterring, Urban Migration 91
Summary 91
Introduction 92
Migration, poverty reduction, and jobs 92 Evidence on social safety nets and migration 93 History of migration in Ethiopia 94 Migration patterns of the poor in rural communities 96
of PSNP on migration patterns 103
Conclusion 104
Notes 104
References 105
Annex 5A: Determinants of migration across PSNP and non-PSNP areas in Ethiopia 108
PART III SOCIAL SAFETY NET PROGRAMS TO INCREASE EARNINGS AND PRODUCTIVITY
CHAPTER 6: Creating Small Enterprise and Microenterprise Jobs in Ethiopia: The Role of Social Safety Nets 111
Summary 111
Introduction 112
Self-employment is the predominant form of work for poor households 112
Self-employment is critical for poverty reduction 114 Social safety nets and economic transformation for self-employed individuals 116
iv | W ORKING T ODAY FOR A B ETTER T OMORROW IN E THIOPIA
When the labor market works for Ethiopian youth
Role of aspirations in job status
Impact
Ethiopia’s rural social safety nets and self-employment for poor households 122
Social safety nets and self-employment in urban Ethiopia 126
Conclusion 128
Notes 130
References 130
SPOTLIGHT 6.1: Climate-Smart Self-Employment 133
CHAPTER 7: Wage Employment Interventions in Ethiopia’s Social Safety Net Programs: Matching Poor Workers to Wage Jobs 135
Summary 135
Introduction 136
Wage employment’s role in poverty reduction 136 Social safety net programs can help poor individuals into wage employment 137
Engaging rural Ethiopians in wage work in towns and small cities 142
Overcoming barriers for young job seekers in urban areas 143
Conclusion 147 Notes 148 References 149
CHAPTER 8: Conflict, Displacement, and Livelihoods in Ethiopia: Role of Social Safety Nets 153
Summary 153 Introduction 154
Pathways to support of displaced people 156
Overview of displacement in Ethiopia 157
Role of Ethiopia’s social protection system in supporting displaced people 167
Conclusion 173
Notes 174
References 177
CHAPTER 9: Labor Market Delivery Systems for Ethiopia and Beyond: A Framework Approach 181
Summary 181
Introduction 182
Steps in making labor market policies work 183
for employment and employability 184 Phases of a labor program delivery system 185
Conclusion 210
Notes 211
References 211
Annex 9A: Checklist for supporting apprenticeship program delivery systems 214
Boxes
ES.1 A durable solution: Livelihoods for internally displaced people in Ethiopia xxiv
1.1 Data sources and methodology 5
1.2 Income growth evades rural households in Ethiopia, particularly poor rural households 11
1.3
Contents | v
Programs
Data
the
Ethiopia’s
Service-led structural transformation 13 2.1
sources for
rural Ethiopian labor market 32 3.1
Urban Employment Unemployment Survey 57
3.2 Demand assessment for the Urban Productive Safety Net and Jobs Projec t’s apprenticeship program 67
4.1 Main conceptual models of disability 77
4.2 World Bank commitments and programs on disability-inclusive development: Haiti and Ethiopia 80
5.1 Methodology of the PSNP migration study 97
6.1 Lessons from the early graduation pilot in Ethiopia 120
6.2 A multidimensional approach to improve incomes among Niger’s poor population 120
6.3 Adapting the graduation approach for people with disabilities 122
7.1 An evidence-based approach to the Bikat Program’s design 144
8.1 Study methodology 155
8.2
9.1
9.2 Successes and challenges of Guinea’s Women Breaking Barriers outreach campaign 186
9.3 Awareness campaign for Ethiopia’s Bikat Program 188
9.4
9.5 Lessons from the Bikat Program’s registration process 191
9.6 Role of entrepreneurship aptitude tests in finding suitable training candidates 194
9.7 Enrolling firms in Ethiopia’s Bikat Program 195
9.8 Kenya’s Youth Employment and Opportunities Project: Assessing formal and informal training providers 196
9.9 Eligibility criteria for young entrepreneurs under Kenya’s
9.10
9.11
9.13
Figures
ES.1 Low-skill self-employment remains the most common type of work in Ethiopia xviii
ES.2 Ethiopia has seen slow shifts in its labor market, with services as the only growth sector xix
ES.3 Unemployment in Ethiopia has almost doubled since 2013, with women and rural areas hardest hit xx
ES.4 Across all sectors, women in Ethiopia earn less per month than men xxi
ES.5 Within Ethiopia’s service sector, most urban youths work in low-skill domestic jobs xxii
ES.6 Young people, particularly young women, are increasingly leaving the Ethiopian labor market xxii
ES.7 Wealthier households in Ethiopia have more diversity in how they earn a living xxiii
ES.8 Job support activities complement cash transfers for better labor outcomes in Ethiopia xxv
ES.9 From productive safety nets to produc tive jobs in Ethiopia xxvi
1.1 Service sector has driven job creation in Ethiopia for nearly two decades 7
1.2 Most people in Ethiopia are self-employed 8
1.3 Ethiopia has seen little shift away from low-skilled employment 9 1.4 Wage job creation fell and remained weak in rural areas of Ethiopia 10 1.5 Public sector accounts for half of wage employment in Ethiopia 10
1.6 For wage employment in Ethiopia, real wages rose regardless of education or gender 11
1.7 Unemployment in Ethiopia has almost doubled since 2013, increasingly affecting women and rural areas 14
vi | W ORKING T ODAY FOR A B ETTER T OMORROW IN E THIOPIA
Community-based health insurance in Ethiopia 168
Urban
Productive Safety Net and Jobs Project’s Bikat Program 183
Intake requires trained support staff 190
Opportunities
Youth Employment and
Project 198
Matching trainees with training providers in Kenya’s
Opportunities Project 199
Youth Employment and
Onboarding for Guinea’s Women Breaking Barriers Project 201 9.12 Using results-based contracts to enhance program effectiveness 203
Project monitoring and outcome tracking in Kenya’s Youth
Opportunities
209
Employment and
Project
1.8 Unemployment is rising across Ethiopia, regardless of age or educational attainment, with the burden falling disproportionally on young people 14
1.9 Rural underemployment in Ethiopia has doubled since 2005 15
1.10 People in Ethiopia are leaving the labor market 15
1.11 Inequitable distribution of household work affects women’s labor market participation in Ethiopia 16
1.12 Education partly explains lower labor market participation, but women are increasingly NEET 17
1.13 Four profiles of vulnerable groups cover a significant part of Ethiopian society 18
1.14 In Ethiopia, inactivity increased across the four profiles, especially for rural women 19
1.15 Unemployment and underemployment are on the rise among vulnerable groups in Ethiopia 20
1.16 Trends in, but not rates of, work in different sectors mirror national statistics in Ethiopia 20
1.17 Employment pathways have remained the same over the past two decades, with some small changes at the national level and for some groups 21
S1.1.1 Consumption expenditures doubled for PSNP households by 2014 25
S1.2.1 UPSNP labor-intensive public works demonstrated positive individual, household, and community impacts 27
2.1 Rural labor force participation in Ethiopia, by gender, 1999–2021 34
2.2 Reason for not seeking a job in Ethiopia, by gender and age group, 2021 34
2.3 Rural employment in Ethiopia, by sector and gender, 1999–2021 35
2.4 Self-employment in rural Ethiopia, by gender, 1999–2021 35
2.5 Informal employment in Ethiopia, by gender and education level, 2021 36
2.6 Monthly wages in Ethiopia, by gender and sector of employment, 2021 36
2.7 Weekly time spent on various activities in Ethiopia, by gender and age, 2018/19 37
2.8 Land size and livestock ownership in Ethiopia, by gender of household head, 2018/19 37
2.9 Number of productive agricultural assets owned in Ethiopia, by gender of household head, 2018/19 38
2.10 Use of improved seeds and fertilizer in Ethiopia, by gender of plot manager, 2018/19 38
2.11 Ownership of nonfarm enterprises in Ethiopia, by type of business and gender of household head, 2018/19 39
2.12 Income from nonfarm enterprises in Ethiopia, by gender of household head, 2018/19 40
2.13 Constraints to starting and growing a nonfarm enterprise in Ethiopia, by gender of household head, 2018/19 41
2.14 Proportion of employed population that engaged in paid work over the past 12 months in Ethiopia, by gender, 2018/19 42
2.15 Last reported month’s salary of those engaged in paid work in Ethiopia, by gender, 2018/19 42
2.16 Average hours worked per week in paid wage employment in Ethiopia, by gender, 2018/19 42
2.17 Proportion of population that owns an account in a financial institution in Ethiopia, by gender, 2018/19 43
2.18 Proportion of population that knows how to open a bank account in Ethiopia, by gender, 2018/19 43
2.19 Saving patterns in Ethiopia, by gender, 2018/19 44
2.20 Credit and loan rejection rates in Ethiopia, by gender of household head, 2018/19 44
3.1 Ethiopia’s rapidly growing youth and urban populations will magnify the challenge of urban youth employment 56
Contents | vii
3.2 Initial increase in Ethiopia’s youth labor force participation rate from 2010 to 2014 reversed after 2015 58
3.3 Despite increased school attendance in Ethiopia since 2014, the number of young people, especially women, left behind has grown 58
3.4 Increased access to education in Ethiopia is delivering more educated youth, but the vast majority do not make it beyond secondary school 59
3.5 Youth unemployment in Ethiopia has risen since 2015, with large gender disparities 60
3.6 Majority of Ethiopia’s unemployed youth has had consistently low levels of education 60
3.7 Ethiopia’s rising unemployment seems to be driven particularly by gender disparities 61
3.8 Duration of unemployment in Ethiopia has increased, particularly for women and those with less education 62
3.9 Urban youth in Ethiopia are more likely to have private wage employment and less likely to be self-employed 63
3.10 Ethiopian youth with higher education are more likely to have a permanent job 64
3.11 Urban youth in Ethiopia, especially women, are more likely to work in the service sector 65
3.12 Most service sector jobs in Ethiopia are in low-skill domestic services, which have limited scope for structural transformation 65
3.13 In Ethiopia, young people with higher education dominate the skill-intensive jobs that have potential for economic transformation 66
3.14 Majority of unemployed youth want to be in self-employment, but their employed peers are predominantly in wage employment 68
3.15 Although many of their less-educated peers work in low-skill jobs, few unemployed young people want such jobs 69
3.16 Income expectations of Ethiopian youth do not align with labor market realities, 2020 70
3.17 Wages offered by Ethiopian firms to junior employees with higher education are more in line with youth expectations, but wages offered for those with less education do not meet those expectations 71
3.18 Unemployed Ethiopian youth cite lack of jobs as the most common reason for not working 71
4.1 Vicious cycle of poverty and disability 78
4.2 In Ethiopia, the proportion of people with disabilities who have no education remains high, 2005, 2013, and 2021 82
4.3 In Ethiopia, people with disabilities engage in low-productivity sectors, by vulnerable groups, 1999–2021 82
5.1 International migration of Ethiopians, by stock and flows, 1990–2019 95
5.2 Migration status of PSNP and non-PSNP households in Ethiopia, 2021 97
5.3 Time spent away by migrating, PSNP and non-PSNP households in Ethiopia, 2021 98
5.4 Month of out-migration by PSNP and non-PSNP households in Ethiopia, 2021 98
5.5 Month of return of migrating PSNP and non-PSNP households in Ethiopia, 2021 99
5.6 Destinations of migrating PSNP and non-PSNP households in Ethiopia, 2021 99
5.7 Reasons for migrating, all migrants from PSNP and non-PSNP households in Ethiopia, 2021 100
5.8 Reasons for migrating, returning migrants from PSNP and non-PSNP households in Ethiopia, 2021 100
5.9 Reasons not to migrate, PSNP and non-PSNP households in Ethiopia, 2021 101
5.10 Reasons for returning, migrants from PSNP and non-PSNP households in Ethiopia, 2021 102
6.1 Household head’s employment type in Ethiopia, by area, PSNP participation, gender, and age, 2016 113
viii | W ORKING T ODAY FOR A B ETTER T OMORROW IN E THIOPIA
6.2 Self-employment in rural and urban areas in Ethiopia, by subsector, 2016 113
6.3 Industries accounting for self-employment in Ethiopia, by wealth quintile, 2016 114
6.4 Household head’s employment type in Ethiopia, by education level, 2016 115
6.5 Earnings in Ethiopia, by sector and compared to global averages 116
6.6 Comparison of factors affecting agricultural produc tion in PSNP and non-PSNP households in Ethiopia, 2016 118
B6.2.1 “Projet de filets sociaux” intervention cycle and suppor t services, Niger 121
7.1 Wage employment could help in Ethiopia’s structural transformation 137
7.2 Regardless of gender, poor households in Ethiopia have little access to wage jobs 138
7.3 Framework for integrated employment programs in Ethiopia 139
7.4 Employment record of Ethiopian youth consists of frequent unemployment 145
7.5 Most Ethiopian firms are interested in hosting an apprentice 145
7.6 Approximately one in three firms has previously hosted an apprentice, but few are currently hosting apprentices 146
7.7 One in three Ethiopian firms provides formal training 146
7.8 Most training provided by Ethiopian firms focuses on technical skills 147
8.1 Internal displacement in Ethiopia, by cause, 2012–21 158
8.2 Displacement in Ethiopia, by region, 2022 159
8.3 Number of internally displaced people in the northern Ethiopian crisis, by region, January 2021 to February 2022 161
8.4 Share of displaced people in selected Ethiopian regions, by site type 163
8.5 IDPs in range of each Ethiopian safety net, by IDP status and rural vs. urban 169
8.6 Entry points for social protection systems in Ethiopia along the displacement timeline 170
9.1 Delivery chain for labor programs 183
B9.5.1 Sample of Bikat Job Seekers Registration Form 191
9.2 Instruments and approaches for assessing and profiling labor program applicants 192
Maps
S1.1.1 Footprints of expanding new and old PSNP programs in Ethiopia 24
8.1 Internally displaced persons in Ethiopia, by zone 160
8.2 Number of internally displaced people in the northern Ethiopian crisis, by woreda 162
Tables
B1.2.1 Comparison of household income sources, Ethiopia and selected countries, 2019 12
2A.1 Field, field manager, and household characteristics, by gender of field manager, rural Ethiopia 48
2A.2 Gender gap in agricultural productivity, Blinder–Oaxaca decomposition results, rural Ethiopia 49
2B.1 Difference in enterprise, household head, and household characteristics of NFEs, by gender of manager, rural Ethiopia 51
2B.2 Gender gap in NFE sales, Blinder–Oaxaca decomposition results, rural Ethiopia 52
2C.1 Individual and household characteristics of wage-employed population, by gender, rural Ethiopia 53
2C.2 Gender gap in hourly wage, Blinder–Oaxaca decomposition results, rural Ethiopia 54
Contents | ix
3.1 Although starting from a low base, Ethiopia’s global innovator ser vices subsector has had encouraging jobs growth, 2004−20 66
5A.1 Probit model on determinants of migration across PSNP and non-PSNP areas in Ethiopia 108
8.1 Overlap of safety nets and displaced populations in Ethiopia, in millions of individuals 169
9.1 Overview of labor program categories 184
B9.6.1 Sample entrepreneurship aptitude test questions 194
9.2 Taxonomy of labor programs for selected risk groups 202
9.3 Labor program performance indicators 209
x | W ORKING T ODAY FOR A B ETTER T OMORROW IN E THIOPIA
Acknowledgments
The editors and chapter authors are grateful to the extensive team who wrote and contributed to this report. Special thanks to Robert Chase, Ousmane Dione, and Andrea Vermehren for their guidance, leadership, and vision in prioritizing and developing this report. Luc Christiaensen and Wendy Cunningham provided thoughtful peer review guidance on the original policy note and the report’s overarching framework and findings. We also appreciate the support of Christabel Dadzie, Ayuba Hussein, Michael Munavu, and Suleiman Namara throughout the preparation of this report. Candace Gebre wrote the spotlight on climate-smart self-employment, Carter Dougherty edited the report, and Jihane El Khoury Roederer designed the cover art.
The editors and chapter authors thank the following peer reviewers and providers of analytical support and general guidance: Girum Abebe, Tirsit Amha, Niklas Beuren, Berhe Mekonnen Beyene, Tom Bundervoet, Joanna de Berry, Alan de Brauw, Gustavo Demarco, Jymdey Mercedes Yeffimo Garcia, Paula Gonzalez, Melis Guven, Adiam Hagos Hailemicheal, Janet Heisey, Christian Meyer, Theodros Hailemariam Nigatu, Lucian Bucur Pop, Wout Soer, Roman Tesfaye, Samuel Weldeegzie, Christina Wieser, and Tesfaye Workineh. The editors and chapter authors also thank colleagues who provided thoughtful feedback and constructive inputs.
The chapter authors are as follows:
• Chapter 1, “The Challenges of Job Growth in Ethiopia,” was written by Koen Maaskant, Berhe Mekonnen Beyene, and Obert Pimhidzai.
• Chapter 2, “Women in Rural Jobs: Constraints to Productivity,” was written by Barbara Coello and Bezawit Adugna Bahru.
• Chapter 3, “Youth Employment in Urban Ethiopia: Aspirations in the Labor Market,” was written by Koen Maaskant.
• Chapter 4, “Disability and Work in Ethiopia: Supporting Access to Good Jobs,” was written by Simon Narbeth and Andrey Tretyak.
• Chapter 5, “Safety Nets and Labor Migration: Influencing, but Not Deterring, Urban Migration,” was written by Daisy Demirag.
• Chapter 6, “Creating Small Enterprise and Microenterprise Jobs in Ethiopia: The Role of Social Safety Nets,” was written by Margaux Vinez, Blene A. Betemariam, and Natnael Simachew Nigatu.
xi
• Chapter 7, “Wage Employment Interventions in Ethiopia’s Social Safety Net Programs: Matching Poor Workers to Wage Jobs,” was written by Koen Maaskant, Natnael Simachew Nigatu, and Margaux Vinez.
• Chapter 8, “Conflict, Displacement, and Livelihoods in Ethiopia: Role of Social Protection,” was written by Aditya Sarkar, Alfredo Manfredini Böhm, and Fasil Mulatu Gessesse.
• Chapter 9, “Labor Market Delivery Systems for Ethiopia and Beyond: A Framework Approach,” was written by Inés Rodríguez Caillava, Carola Gruen, Koen Maaskant, and Indhira Santos.
The editors further acknowledge the support of the Austrian Development Cooperation, the European Union, German Cooperation for International Cooperation, Global Affairs Canada, the Government of Ireland International Development Programme, KfW Development Bank, the Kingdom of the Netherlands, the Royal Danish Embassy, Sweden, the United Kingdom Foreign, Commonwealth & Development Office, UNICEF, USAID, the World Food Programme, and the World Bank.
These thanks and appreciation are noted without implication. The findings, interpretations, and conclusions herein are those of the editors and authors, not necessarily those of colleagues consulted in the preparation of the report.
xii | W ORKING T ODAY FOR A B ETTER T OMORROW IN E THIOPIA
About the Editors and Authors
ABOUT THE EDITORS
Emily Weedon Chapman is a senior human development economist at the World Bank. Her work focuses on human capital development, particularly jobs and livelihoods; human capital and climate change; women’s empowerment; nutrition; and governance and transparency in the delivery of basic services. She has managed World Bank Social Protection and Jobs lending portfolios in Ethiopia, Liberia, and Zambia and engaged in policy dialogue with and technical assistance for other governments in Africa and the Middle East. Her research includes qualitative methods to understand productive inclusion through human-centered design. Emily has an MA in international development from The George Washington University and a BA in international relations from Colgate University.
Margaux Vinez is a senior economist in the World Bank’s Social Protection and Jobs Global Practice Group. She works with governments in East and West Africa to support the design, implementation, and evaluation of programs in social protection, productive inclusion and jobs, shock-responsive safety nets and climate change, and food security and agriculture. She is currently working on a range of operations and research activities in the Democratic Republic of Congo, Ethiopia, Mauritania, and in the Sahel region. She has a master’s degree in management from HEC Paris and a PhD in economics from the Paris School of Economics.
ABOUT THE CHAPTER AUTHORS
Bezawit Adugna Bahru is a postdoctoral research fellow at the University of Hohenheim and an EASST fellow at the Center for Effective Global Action, University of California at Berkeley. She uses survey data and large-scale experiments to study the transformative effects of social protection programs and gender differences in agricultural productivity, time poverty, and women’s economic empowerment. Her current work focuses on Ethiopia, Indonesia, and Uganda. Bezawit has a PhD in agricultural economics from the University of Hohenheim.
xiii
Blene A. Betemariam is a skills and labor consultant with the World Bank’s Social Protection and Jobs East Africa Practice. She has supported the Ethiopian government around human capital and workforce development as an adviser with more than 20 years of combined experience as a program designer, developer and evaluator, educator, and operational manager in various environments. Blene has a PhD in education and leadership from Lynn University and an MBA from American International University.
Berhe Mekonnen Beyene is a senior economist in the World Bank’s Poverty and Equity Global Practice. He is an applied development economist whose areas of expertise include poverty analysis, migration, labor market, and program evaluation. Previously, he served as a consultant and researcher for various organizations in Ethiopia, including the Ethiopian Development Research Institute and United National Development Programme. He was a visiting scholar in the department of sociology at the University of California at Berkeley and a postdoctoral research fellow at the Abdul Latif Jameel Poverty Action Lab at the Massachusetts Institute of Technology. Berhe has a PhD in economics and an MPhil in environmental and development economics from the University of Oslo.
Alfredo Manfredini Böhm is an applied development economist in the World Bank’s Social Protection and Jobs East Africa Practice. His most recent work in Ethiopia and the Republic of Congo focused on researching and supporting the implementation of safety-net responses, promoting social cohesion, and expanding economic opportunities for refugees, internally displaced persons, and their hosting populations. He has worked as an economic adviser for the government of the United Kingdom in transport, local development, and agricultural trade and for Ethiopia’s Export Committee of the Prime Minister’s Office in trade and logistics policy. Alfredo has an MPhil in economic research from the University of Cambridge and a BA in philosophy.
Inés Rodríguez Caillava is a social protection specialist in the World Bank’s Social Protection and Jobs Global Practice. She is a core team member of the Delivery Systems Global Solutions Group, contributing to the global knowledge program on delivery systems. She coauthored the Sourcebook on the Foundations of Social Protection Delivery Systems (2020). She also has worked on social safety net programs and delivery systems in Angola, Burkina Faso, Djibouti, GuineaBissau, Mozambique, Peru, and the Republic of Congo. Inés has a BA and an MA in international relations from the Universidad de San Andrés and an MA in international development from The George Washington University.
Barbara Coello is a rural economist who has worked for the World Bank and other international institutions for more than a decade. The focus of her work relates to food systems at the nexus of agriculture, food security, and gender. She has worked in different regions on the design of operations, implementation, and evaluation. A French and Spanish national, Barbara has a PhD in development economics from the Paris School of Economics.
Daisy Demirag is an economist within the World Bank’s Human Capital Project. Previously, as a member of the World Bank’s Social Protection and Jobs team she worked in the South Asia Region and the East Africa Region, focusing on Bangladesh, Nepal, and Ethiopia, respectively. She has written on the linkages between social protection and migration, as well as on occupational choices of returning migrants. Daisy is a PhD researcher at Maastricht University.
xiv | W ORKING T ODAY FOR A B ETTER T OMORROW IN E THIOPIA
Candace Gebre is a writer and communications consultant for the World Bank’s Social Protection and Jobs Team in Ethiopia. She previously provided a range of communications support (writing, graphic design, and editorial) for various projects in the Energy, Water, Governance, and Poverty Global Practices. Candace has studied comparative literature and Africana studies at New York University and has an MFA in creative writing from Hollins University.
Fasil Mulatu Gessesse holds a teaching position at Addis Ababa University’s Centre for Human Rights (CHR) and is the chair of the CHR. His areas of expertise include human rights protection, children’s rights, migration law, refugee law, and human-trafficking law. He is a former visiting scholar at the University of Antwerp, the University of Graz, and the University of Lund, and has worked with the German Corporation for International Cooperation, Save the Children, the International Organization for Migration, the Norwegian Refugee Council, UNICEF, and World Bank in different capacities. Fasil has a PhD in human rights law from the University of Western Cape, South Africa.
Carola Gruen has served as a senior consultant in the World Bank’s Social Protection and Jobs Global Practice since 2014. An applied labor economist, she has provided analytical and policy support to client countries in Africa, East Asia and the Pacific, Europe and Central Asia, and South Asia, focusing on issues such as labor market disparities, job quality, employment promotion, informality, and underemployment. Carola has a PhD in economics from the University of Munich.
Koen Maaskant is a consultant in the World Bank’s Social Protection and Jobs Global Practice, focusing on the jobs analytical agenda and related operational projects in Ethiopia, South Africa, and globally. He has worked in Ethiopia in different roles for government and development partners, including as an ODI Fellow at the Ethiopian Investment Commission, where he coordinated several donor projects and sector strategies. Before his work for the government of Ethiopia, he managed a randomized controlled trial on labor market interventions in Addis Ababa for the University of Oxford. Koen has an MA in economics for development from the University of Oxford and a BA in economics and political science from University College Roosevelt.
Simon Narbeth was a senior social protection specialist at the World Bank. Before joining the World Bank, he was a senior social development adviser for the United Kingdom’s Foreign, Commonwealth and Development Office. He has worked across Africa, Asia, and the Balkans region, focusing on social inclusion in support of social development and social protection policy and reforms. Simon has a DPhil in human geography from the University of Bristol.
Natnael Simachew Nigatu is a consultant in the World Bank’s Social Protection and Jobs Global Practice. His current research focuses on the intersections of international trade and labor economics, online gig work, and youth employment. Before joining the World Bank, he worked as a postdoctoral researcher at Lund University, where he taught advanced courses in economic integration. In addition, he was a visiting scholar at Purdue University. Natnael has a BA in economics from Bahir Dar University and an MA and a PhD in economics from the University of Copenhagen.
Obert Pimhidzai is the lead economist in the World Bank’s Poverty and Equity Global Practice in Europe and Central Asia. He has extensive experience
About the Editors and Authors | xv
supporting World Bank analytical and technical assistance programs on povertyand equity-related issues. He has led pioneering project financing in statistical capacity building such as statistical modernization in Viet Nam and large multicountry statistics projects such as the Eastern Africa Regional Statistics Project, and he has contributed to the design of anti-poverty programs in low- and middle-income countries in Africa and East Asia. Obert has a PhD in economics from the University of Cape Town.
Indhira Santos is a senior economist at the World Bank, coordinating the human capital agenda in the Western Balkans. She is a specialist in labor markets, skills, and social protection. During her career at the World Bank, she has been the global lead for labor and skills and has worked on the Africa, Europe and Central Asia, and South Asia Regions since joining as a young professional in 2009. She also is a primary author of the World Development Report 2019: The Changing Nature of Work, and the World Development Report 2016: Digital Divides. Before joining the World Bank, she was a research fellow at Bruegel, a European policy think tank in Brussels, and worked for the Economic Research Center of Pontificia Universidad Católica Madre y Maestra and the Ministry of Finance in the Dominican Republic. A Fulbright Scholar, Indhira has an MA in public administration in international development and a PhD in public policy from Harvard University.
Aditya Sarkar is a PhD candidate at the Fletcher School at Tufts University and is an independent researcher. He has advised the International Labour Organization and the governments of Ethiopia, Somalia, and Sudan on developing national employment policies and has consulted with the World Bank and the Open Society Foundations. He is qualified as a lawyer in England, India, and Wales. He previously worked with Linklaters LLP, a global law firm, in London, as well as with the Ministry of Commerce in India. Aditya has an MA from the Fletcher School of Law and Diplomacy at Tufts University and is a graduate of the National Law School of India University.
Andrey Tretyak is a senior social protection specialist at the World Bank and is leading the work of disability inclusion in social protection and jobs in line with World Bank commitments. He has worked in the French social protection system for more than 20 years, with a focus on international cooperation projects supporting the expansion of social protection coverage. He has led the Social Protection and Decent Work Unit in Expertise France since 2015. Andrey has a PhD in economics focused on the impact of budgetary policies and speed of reforms on the economic growth and countries’ development.
xvi | W ORKING T ODAY FOR A B ETTER T OMORROW IN E THIOPIA
Executive Summary
INTRODUCTION
The government of Ethiopia prioritizes the jobs agenda in the country, but broadbased job creation remains elusive. Helping poor and vulnerable workers earn more in today’s labor market will require new efforts. Ethiopia’s 10-year Perspective Development Plan (2021–30) and National Plan for Job Creation (2020–25) recognize the country’s limited job growth and, as the 10-year plan says, make a “paradigm shift from state-led to private-sector-led growth.” The National Plan for Job Creation prioritizes job-rich macroeconomic policies, local enterprise development, and human capital development. What the 2021 Labor Force Survey (LFS) data lay clear, however, is that these policies are a long-term prospect. Creating an inclusive labor market—another priority of the National Plan for Job Creation—requires understanding the constraints of poor and vulnerable workers and supporting them within the realities of the current economy.
Since 1999, the structure of the Ethiopian labor market has changed incrementally. The 2021 LFS confirms prepandemic, preconflict data showing that widespread poverty reduction or expanding job opportunities did not accompany the country’s sustained economic growth. It also suggests that the concurrent crises facing Ethiopia may have reinforced the disconnect between economic growth and some agricultural productivity increases on the one hand and stagnant income levels, particularly in rural areas, on the other.
To promote more inclusive growth while long-term reforms take hold, the jobs agenda must invest in near-term measures to improve worker productivity in and connect people to jobs that already exist, such as in the service sector. Such policies can have meaningful near-term impacts and help Ethiopians get more out of currently available opportunities. Moreover, global evidence increasingly shows that employment in the service sector can also contribute to inclusive economic growth.
Ethiopia’s safety net programs present a platform to reach the working-poor population with targeted and tailored financing, training, networking, and other support that can increase their earnings. If implemented alongside macroeconomic reforms, social safety nets that adopt these complementary measures can promote self-employment productivity and links to existing wage jobs that reinforce long-term efforts toward structural transformation of the Ethiopian economy.
xvii
LABOR MARKET OVERVIEW
Job opportunities in Ethiopia have shifted slowly over the past two decades. The 2021 LFS is the first such survey since 2013 and provides insights on national labor market trends since 1999, including preliminary impacts of the COVID-19 pandemic and the conflict in Northern Ethiopia (refer to box 1.1 in chapter 1 for detailed information on LFS methodologies).
In 2021, like 1999, low-skilled self-employment was the most common type of work (refer to figure ES.1). Only 14 percent of Ethiopians held wage jobs in 2021, up just 5 percentage points from 1999. By contrast, 54 percent were selfemployed—39 percent in agriculture and 15 percent in nonagriculture. An even smaller shift occurred in the skill level of work. In 2021, 74 percent of workers had low-skill jobs as compared to 77 percent in 1999.
This labor market stagnation juxtaposes a nearly 40 percent increase in Ethiopia’s gross domestic product and a rise in agricultural yields since 2004. Maize yields more than doubled between 2004 and 2019; however, teff, which makes up the largest portion of the food basket, saw the slowest yield growth of cereals, increasing only 9 quintals per hectare over the same period (Dorosh and Minten 2020). Labor market stagnation and limited yield increases in key cereals may help contextualize why poor rural households have not experienced any increase in real income levels over the past 10 years (World Bank 2022b).
Now, concurrent crises have eroded economic growth trends and threaten negative repercussions within the labor market. In 2020, the COVID-19 pandemic closed markets, albeit relatively briefly, and had immediate, negative impacts on job opportunities. In 2021, real GDP growth contracted to 3.5 percent as the country dealt with the implications of the pandemic, the conflict in Northern Ethiopia, and severe drought (World Bank 2022b). Most recently,
xviii | W ORKING T ODAY FOR A B ETTER T OMORROW IN E THIOPIA
FIGURE ES.1
Low-skill self-employment remains the most common type of work in Ethiopia
Those classified as “employer”
owner-managers
businesses. Wage employee Self-employed (agriculture) Unpaid family worker Self-employed (nonagriculture) Employer Other Low Medium High Percent 0 20 40 60 80 100 b. Skill composition of employment, 1999–2021 Percent 0 20 40 60 80 100 a. Terms of employment, 2005–21 10 30 50 70 90 10 2005 2021 2013 1999 2021 20052013 30 50 70 90
Source: World Bank calculations using data from the Ethiopia Labor Force Survey, 1999–2021. Note:
are
of
global shocks have worsened food insecurity and contributed to high inflation, which was roughly 32 percent in Ethiopia as of October 2022 (World Bank 2022a).
Against this backdrop, the service sector is the one area of recent job growth, but it barely accommodates new labor market entrants. Nearly 3.5 million jobs were added in the service sector between 2013 and 2021 (refer to figure ES.2). By contrast, the agriculture and industrial sectors lost about 2 million and 0.5 million jobs, respectively. Moreover, between 2013 and 2021, wage employment grew only 2.9 percent, compared to growth of 7.4 percent between 2005 and 2013. Notably, the trends in decreasing growth of industrial and wage jobs predate the COVID-19 pandemic (Ambel et al. 2021).
The 2021 LFS shows that, over the same period, unemployment has increased (refer to figure ES.3), and people are leaving the labor market altogether. This trend could be due to the COVID-19 pandemic, conflict, and other crises affecting work opportunities. Better understanding of these trends will require further labor market data. Regardless of its cause, however, even a relatively short period of unemployment can reduce income levels for up to a decade afterward. Less-educated workers can take longer to recover. Recent data from high-frequency telephone surveys on COVID-19 in Sub-Saharan Africa, including Ethiopia, found that, one year after the pandemic, education levels were the strongest predictor of whether a household had rejoined the labor market (Ambel et al. 2021).
All workers need labor market policies tailored to the jobs currently available in the Ethiopian labor market—or they need support to invest in creating job opportunities through productive self-employment. Efforts should also support labor mobility and increase labor market participation. These interventions can help improve productivity and earnings in the near term while contributing to services-led structural transformation in the longer term (Diao et al. 2021; Nayyar, Hallward-Driemeier, and Davies 2021).
Executive Summary | xix
FIGURE ES.2
Source:
Agriculture Industry Services b. Net job creation, by sector, 2005–21 Percent Millions 0 20 40 60 80 100 a. Sectoral employment composition, 1999–2021 –3.0 0 3.0 6.0 9.0 –1.5 1.5 4.5 7.5 10 1999 2021 2013 2005 2005–13 2013–21 30 50 70 90
Ethiopia has seen slow shifts in its labor market, with services as the only growth sector
World
Bank calculations using data from the Ethiopia Labor Force Survey,
1999–2021.
FIGURE ES.3
Unemployment in Ethiopia has almost doubled since 2013, with women and rural areas hardest hit
BARRIERS TO GOOD JOBS
Within this context, vulnerable groups face additional and distinct barriers to improving their productivity or finding available jobs. The work experiences of rural women, urban youth, people with disabilities, and rural–urban migrants offer useful information for understanding how to tailor job policies to people’s specific needs. Because these four groups represent about half the Ethiopian population, the policy implications of including them in more productive jobs go well beyond the traditional reach of social safety net programs, which target the poorest decile in Ethiopia. Success in helping these groups can inform policies to encourage broad-based, inclusive job opportunities.
Rural women
Rural women make up 40 percent of the Ethiopian population, but only 34 percent of these women are active in the labor market, nearly identical to the proportion in 1999. Family responsibilities and pregnancy impede about 85 percent of women ages 25–44 from seeking jobs, whereas such responsibilities affect less than 35 percent of men. When women do work, they earn only 73 percent of what men do (refer to figure ES.4). Time constraints play a role, but lack of productive inputs, such as access to land or financial services, is the largest driver of women’s low productivity. Low education is another barrier: 61 percent of rural women have no schooling as compared to 34 percent of rural men.
Urban youth
Urban youth also face challenges in finding good jobs. Ethiopia will have an estimated 54 million youth by 2050, up from 34 million in 2020. Following current trends, in which more than 70 percent of young people do not advance beyond primary school and only 20 percent reach tertiary education, this
xx | W ORKING T ODAY FOR A B ETTER T OMORROW IN E THIOPIA
Source: World Bank calculations using data from the Ethiopia Labor Force Survey, 1999–2021.
2021 1999 2021 1999 2013 2005 20052013 0 10 20 25 5 15 Percent 0 10 20 25 5 15 Percent
Note: This figure uses the relaxed unemployment definition, counting people as unemployed if they are without work and available for work.
a. Unemployment rate, by location, 1999–2021
b. Unemployment rate, by gender, 1999–2021
Urban Rural National Men Women National
population will be unprepared for the labor market. Currently, 75 percent of working urban youth have jobs in services and mostly in low-skill domestic work (refer to figure ES.5). Within services, global innovator jobs—such as in finance, information and communication technology, and scientific fields— grew more in urban areas in percentage terms between 2004 and 2020 than any other service sector, albeit from a low base. This subsection of service jobs has the highest potential to contribute to structural transformation of the economy. Not surprisingly, the skills required for this caliber of job correlate directly with education levels.
Other challenges for youth include unemployment and inactivity. Youth unemployment is on the rise, and the increasing number of youths not in education, employment, or training reveals further gender disparities in the labor market. Young women are three times more likely to be inactive than young men (refer to figure ES.6). Data showing these trends come from the 2020 Urban Employment Unemployment Survey, which predates the COVID-19 outbreak and other crises now affecting the Ethiopia economy.
People with disabilities
Employment and decent work can break the cycle of poverty and exclusion for people with disabilities. Limited data exist on this population, and even estimates of the number of people with disabilities are unreliable, ranging from 1 percent to nearly 20 percent of the population. Nevertheless, the available data show that people with disabilities are poorer, less educated, and less likely to be employed. Enabling self-sufficiency is an important factor in restoring dignity.
Rural−urban migrants
Ethiopia has few rural–urban migrants. Between 2016 and 2021, only 6 percent of adults migrated, mostly to small towns. Nevertheless, internal migration has the potential to promote job opportunities, including for poor households. The country’s rural safety net does influence migration decisions, suggesting that the government could leverage this program to open pathways for rural people into better jobs.
Executive Summary | xxi
FIGURE ES.4
Across all sectors, women in Ethiopia earn less per month than men Monthly earnings, by gender and sector, 2021
Agriculture 1.9 1.3 4.3 4.9 3.6 2.7 Ethiopian birr (thousands) Industr yServices 6 4 2 0
Source: World Bank calculations using data from the Ethiopia Labor Force Survey, 2021.
Men Women
FIGURE ES.6
Within Ethiopia’s service sector, most urban youths work in low-skill domestic jobs
Source: World Bank calculations using data from the Ethiopia Urban Employment Unemployment Survey, 2020. Note: Global innovator services include finance; information and communication technology; and professional, scientific, and technical activities. Low-skill tradable services include transportation and storage, accommodation and food, and wholesale trade. Skill-intensive social services include education and health. Low-skill domestic services include retail trade; administrative and support; arts, entertainment, and recreation; and social, community, and personal services.
Young people, particularly young women, are increasingly leaving the Ethiopian labor market
a. LFPR, youth vs. rest of labor market, 2006–20
b. Number of youths, by activity status and gender, 2020
Source: World Bank calculations using data from the Ethiopia Urban Employment Unemployment Survey, 2006–20. Note: LFPR = labor force participation rate.
DIVERSIFYING SELF-EMPLOYMENT JOBS
Creating opportunities and increasing productivity in self-employment remain an untapped pathway for better, more profitable work for many Ethiopians. Selfemployment, largely in microenterprises, provides an important opportunity for poor households to earn more and build resilience. In rural areas, agriculture accounts for 87 percent of self-employment, with the small remaining share of
xxii | W ORKING T ODAY FOR A B ETTER T OMORROW IN E THIOPIA
FIGURE
ES.5
Number of youths with jobs in service subsectors, 2006–20
0 0.2 0.4 0.6 0.8 1.0 1.2 1.4 1.6 1.8 2006200820102012201420162018 2020 Millions Global innovator services Low-skill tradeable services Skill-intensive social services Low-skill domestic services
Youth (ages 15–29) Rest of labor market (ages 30–64) 50 55 60 65 70 75 80 200620082010 Percen t 20122014201620182020 0 0.2 0.4 0.6 0.8 1.0 1.2 1.4 1.6 Not working, not in school In school Working and in school Working only Millions 30% 24% 9% 37%
Female youth Male youth
employment in petty trade or personal services. In urban areas, self-employment is more diverse, split among trade (which is most common), services, and agriculture.
Diversification of income sources is closely linked to higher incomes and greater income resilience to shocks in Ethiopia (refer to figure ES.7). In the past decade, diversification into self-employment and the service sector helped drive poverty reduction in urban areas (World Bank 2020).
Social safety nets offer a concrete policy entry point to support people in diversifying their work activities to include microenterprise income. Global evidence, as well as small-scale interventions in Ethiopia, show that safety nets can effectively promote self-employment. A pilot program in Ethiopia catalyzed nearly 20 percent increases in the consumption of involved households (Banerjee et al. 2015). Productive economic inclusion uses the social safety net platform as a starting point to leverage self-employment opportunities. The project design adopts a comprehensive package of support, including training in life, business, and financial skills; capital infusions, whether through grants to improve access to credit or through savings options; psychosocial support; and often networking or mentoring opportunities.
Unfortunately, large-scale self-employment programs in Ethiopia have struggled. Their financing repeatedly shifts to cash transfers in the face of innumerable, recurrent crises. These programs face challenges in implementation, too. For example, nearly all rural clients have invested in livestock for savings rather than in productive activities. Social safety nets need to redouble efforts to promote and raise awareness of opportunities for nonfarm enterprise development, both in services and in agriculture. Success requires that support matches the unique barriers faced by different people and in different regions.
Wealthier households in Ethiopia have more diversity in how they earn a living
Source of household income, by sector and income quintile, 2016
Executive Summary | xxiii
ES.7
FIGURE
Sources: World Bank calculations using data from the Ethiopia Household Income, Consumption, and Expenditure Survey, 2016, and Welfare Monitoring Survey, 2016. Percent 0 10 20 30 40 50 60 70 80 90 100 Quintile 1Quintile 2Quintile 3Quintile 4Quintile 5 Other Hotels and restaurants Construction Manufacturing Transportation and storage Private households with employed person Other community social and personal services
and retail trade Mining Agriculture, forestry, and hunting
Wholesale
A durable solution: Livelihoods for internally displaced people in Ethiopia
Conflict and internal displacement have upended the livelihoods of millions of Ethiopians. In 2021, conflict displaced 5.1 million Ethiopians, the highest annual figure recorded for a country since 2003 (IDMC 2022).
Although they fear insecurity and a lack of livelihoods, most displaced individuals want to return home. During displacement, they rely on sparse food and cash distributions, as well as donations from the host community.
Efforts to support livelihood recovery for these Ethiopians could help during displacement, offering
income-generating opportunities and improving overstretched public infrastructure. Such efforts could also encourage return, helping people recover productive assets often lost during displacement.
In response to the conflict in Northern Ethiopia, the government of Ethiopia quickly retooled the urban safety net to provide cash to the displaced. With additional focus on self-employment and strengthening delivery systems of the country’s safety net programs, future efforts could more effectively reach the hardesthit individuals and facilitate the recovery of their livelihoods.
A harmonized framework for self-employment support could benefit the poor and nonpoor, rural and urban populations, as well as internally displaced people (refer to box ES.1). Such a framework, underpinned by strong delivery systems, can standardize the quality of programming and crowd in various actors—government, development partners, and civil society—financing these programs to maximize coverage and impact at scale. A holistic economic inclusion program would offer direct and immediate benefits to Ethiopian workers and create a multiplier effect that promotes broader local economic development (Andrews et al. 2021; Gassmann et al. 2023).
LINKS TO WAGE EMPLOYMENT
Wage employment remains out of reach for most Ethiopians. In 2021, wage work accounted for 14 percent of the labor market—up only 5 percentage points since 1999. Private sector firms employed just 1.6 million Ethiopians.
However, in some places—not only Addis Ababa but also small towns and cities—firms are currently looking for wage workers. Social safety nets can help bridge the gap between these employers and potential employees. Active labor market programs can help overcome information gaps, by connecting workers to existing jobs; skill gaps, by providing targeted training to workers; and location mismatches, by providing transportation subsidies. Like those for self-employment, active labor market programs for wage employment appear most successful when delivered as a multidimensional package of services (refer to figure ES.8).
SAFETY NETS CAN IMPROVE JOB OUTCOMES TODAY
Ethiopia’s 10-year Perspective Development Plan (2021–30) and National Plan for Job Creation (2020–25) demonstrate the government’s commitment to job creation. The World Bank’s 2022 Country Economic Memorandum reinforces that labor mobility and broader participation in the labor market are key to
xxiv | W ORKING T ODAY FOR A B ETTER T OMORROW IN E THIOPIA
BOX ES.1
A multidimensional package of services
Economic inclusion programs for self-employment
Capital grants
Business, financial, and life skills
Savings support
Networking
Mentoring
Active labor market programs for wage employment
Apprenticeships
Mobility grants
Skills training
Networking
Ethiopia’s continued growth and to making that growth more inclusive (World Bank 2022b). The labor market trends highlighted by the 2021 LFS show the need for Ethiopia to find job policies that complement longer-term reforms with near-term investments to achieve these objectives.
Investing in social safety nets can leverage better and more inclusive job outcomes in the near term. Social safety nets in Ethiopia already reach the poorest and have the tools to help them overcome the barriers they face in accessing better jobs. In self-employment, people often need relatively small levels of targeted and comprehensive support to increase their income levels. Providing capital grants or access to credit, alongside targeted financial and business training as well as mentoring and networking, can have lasting impacts. In wage work, evidence shows that support for mobility or a first work experience alongside training can improve access to wage work.
It is not just poor individuals who need this help. Most Ethiopian workers remain in low-productivity jobs and face similar barriers—whether lack of skills, capital, or networks—to improving their income opportunities.
Social safety nets also complement long-term job growth policies. These programs meet Ethiopian workers in the reality of today’s labor market. Through targeted support for self-employment productivity and connecting people with existing wage jobs, they can increase earnings and help shift the nature of work in the near term (refer to figure ES.9).
ABOUT THIS PUBLICATION
Working Today for a Better Tomorrow in Ethiopia: Jobs for Poor and Vulnerable Households provides further evidence and analysis about investing in today’s labor market to improve productivity and earnings in the jobs currently available to poor and vulnerable Ethiopians. Structured in three parts, the first part of the book analyzes Ethiopia’s labor market by comparing the latest 2021 LFS with LFS data from 1999, 2005, and 2013. The second part explores the unique challenges that
Executive Summary | xxv
FIGURE ES.8
Job support activities complement cash transfers for better labor outcomes in Ethiopia
Source: This figure is original to this publication.
FIGURE ES.9
From productive safety nets to productive jobs in Ethiopia
Self-employment generation
Social safety net systems
Capital Labor mobility Skills
Social support
Increased microenterprises
Labor market intermediation
Capital Labor mobility Skills
Networks
Improved labor productivity
Inclusive labor markets
Improved access to wage employment
Broad-based income growth
Poverty reduction
Service-led structural transformation
poor and vulnerable people face in securing good jobs. Rural women, urban youth, people with disabilities, and migrants make up about half of the Ethiopian population. Although not necessarily poor, they are prone to vulnerability in the labor market. The third and final part describes how social safety net programming can increase earnings and productivity of the poor population while simultaneously promoting inclusive and sustainable development in Ethiopia.
REFERENCES
Ambel, A. A., C. Sosa, L. Marcela, W. Y. Kassa, A. H. Tsegay, and C. Wieser. 2021. Monitoring COVID-19 Impacts on Households in Ethiopia: How COVID-19 Is Affecting Households— Results from the High-Frequency Phone Surveys of Households from April 2020 through January 2021. Washington, DC: World Bank.
Andrews, C., A. de Montesquiou, I. Arevalo Sanchez, P. Vasudeva Dutta, B. Varghese Paul, S. Samaranayake, J. Heisey, T. Clay, and S. Chaudhary. 2021. The State of Economic Inclusion Report 2021: The Potential to Scale. Washington, DC: World Bank.
Banerjee, A., E. Duflo, N. Goldberg, D. Karlan, R. Osei, W. Parienté, J. Shapiro, B. Thuysbaert, and C. Udry. 2015. “A Multifaceted Program Causes Lasting Progress for the Very Poor: Evidence from Six Countries.” Science 348 (6236). https://www.science.org/doi/10.1126 /science.1260799
Diao, X., M. Ellis, M. McMillan, and D. Rodrik. 2021. “Africa’s Manufacturing Puzzle: Evidence from Tanzanian and Ethiopian Firms.” NBER Working Paper 28344, National Bureau of Economic Research, Cambridge, MA.
Dorosh, P. A., and B. Minten, eds. 2020. Ethiopia’s Agrifood System: Past Trends, Present Challenges, and Future Scenarios. Washington, DC: International Food Policy Research Institute.
Gassmann, F., U. Gentilini, J. Morais, C. Nunnenmacher, Y. Okamura, G. Bordon, and G. Valleriani. 2023. “Is the Magic Happening? A Systematic Literature Review of the Economic Multiplier of Cash Transfers.” Policy Research Working Paper 10529, World Bank, Washington, DC.
xxvi | W ORKING T ODAY FOR A B ETTER T OMORROW IN E THIOPIA
Source: This figure is original to this publication.
IDMC (Internal Displacement Monitoring Center). 2022. “Figures Analysis 2021—Ethiopia: Displacement Associated with Conflict and Violence.” Fact Sheet. https://www.internal -displacement.org/sites/default/files/figures-analysis-2021-eth.pdf
Nayyar, G., M. Hallward-Driemeier, and E. Davies. 2021. At Your Service? The Promise of Services-Led Development. Washington, DC: World Bank.
World Bank. 2020. Ethiopia Poverty Assessment: Harnessing Continued Growth for Accelerated Poverty Reduction. Washington, DC: World Bank.
World Bank. 2022a. Ethiopia—Rural Income Diagnostics Study: Leveraging the Transformation in the Agri-Food System and Global Trade to Expand Rural Incomes. Washington, DC: World Bank.
World Bank. 2022b. Ethiopia’s Great Transition: The Next Mile—A Country Economic Memorandum. Washington, DC: World Bank.
Executive Summary | xxvii
Abbreviations
ALMP active labor market policy
Br Ethiopian birr
CBHI community-based health insurance
CRPD Convention on the Rights of Persons with Disabilities
DA development agent
DTM Displacement Tracking Matrix
EA enumeration area
EAT entrepreneurship aptitude test
ESA emergency site assessment
ESS Ethiopian Socioeconomic Survey
FGD focus group discussion
GDP gross domestic product
GRM grievance redress mechanism
IAP individualized action plan
IDP internally displaced person
ILO International Labour Organization
IOM International Organization for Migration
LFPR labor force participation rate
LFS Labor Force Survey
LIC low-income country
LMIS labor market information system
M&E monitoring and evaluation
MFI microfinance institution
MIC middle-income country
NEET not in education, employment, or training
NFE nonfarm enterprise
NITA National Industrial Training Authority
PES public employment service
PPP purchasing power parity
PSNP Productive Safety Net Program
SA site assessment
SACCO saving and credit corporation
SDG United Nations Sustainable Development Goals
SSN social safety net
xxix
TPLF Tigray People’s Liberation Front
TVET technical and vocational education and training
UPSNJP Urban Productive Safety Net and Jobs Project
UPSNP Urban Productive Safety Net Project
VAS village assessment survey
WEP wage employment pathway
WHO World Health Organization
xxx | W ORKING T ODAY FOR A B ETTER T OMORROW IN E THIOPIA
I Ethiopian Labor Market
1
The Challenges of Job Growth in Ethiopia 1
SUMMARY*
The Ethiopian labor market has experienced limited change in the past two decades. Job policies need to recognize this reality and include a focus on improving productivity in and connecting people to jobs that already exist. If adopted in parallel with reforms to promote long-term structural transformation, these two objectives can be mutually reinforcing.
• Ethiopia experienced steady economic growth for much of the past two decades. Yet, even before the concurrent crises now facing the country, economic growth did not transform the structure of the labor market, nor did it reduce rural poverty. The latest labor force data suggest that these crises have compounded the challenges that people face in finding good jobs.
• Between the early 2000s and 2021, the distribution of workers across sectors and geographies shifted little. Eighty percent of the population lives in rural areas, where about 75 percent of people work in agriculture. In urban areas, about 70 percent of people work in services.
• The service sector added 3.5 million jobs to the economy between 2013 and 2021; however, job creation has barely matched new labor market entrants. Over this period, industry and agriculture lost a combined 2.3 million jobs. Earlier positive trends in manufacturing began reversing even before the pandemic and conflict.
• Nationally, self-employment accounts for about half of jobs, with unpaid family work the second most common type of employment and wage work a distant third. The urban context is different: wage employment is prevalent, although opportunities are not expanding.
• Unfortunately, the labor market shows rising unemployment and people leaving the labor market altogether. Whether this situation is temporary— resulting from today’s concurrent crises—or a longer-term trend requires
By Koen Maaskant, Berhe Mekonnen Beyene,
3
and Obert Pimhidzai. The authors thank, without implicating, Tom Bundervoet and Christina Wieser for their helpful feedback, and Samuel Weldeegzie for analytical support.
further data. Even if temporary, this issue will exacerbate underlying inequities in access to good jobs and earning levels.
• Within this context, vulnerable populations face unique barriers to quality work. On average, rural women, urban youth, people with disabilities, and rural–urban migrants are more likely to be inactive and less likely to have seen a positive change in how they earn their living in the past two decades.
• all workers, especially vulnerable populations, need labor market policies tailored to the jobs currently available in Ethiopia. Such interventions can help improve productivity and earnings in the near term while contributing to service-led structural transformation in the longer term.
INTRODUCTION
Over the past 15 years, Ethiopia’s gross domestic product (gdP) per capita increased nearly 40 percent but without widespread poverty reduction. Between 2004 and 2020, Ethiopia’s gdP grew, on average, 10 percent per annum and helped reduce the poverty level by about 10 percentage points. The benefits of that growth, however, were unequally realized. Much of the poverty reduction occurred in urban areas, where less than 20 percent of the population lives; the average rural household did not experience any increase in real income level (World Bank 2022b).
Since 2020, concurrent shocks have eroded the growth trends and have increased poverty levels across the country. In 2021, real gdP growth contracted to 3.5 percent as the country dealt with the implications of the COVId-19 pandemic. The conflict in Northern Ethiopia and other parts of the country further hurt the economy and people’s well-being, as did severe droughts in the lowland regions. as a result, nearly one-fifth of the population requires humanitarian assistance. More recently, global shocks have worsened food insecurity and contributed to high inflation, which was roughly 32 percent as of October 2022.
Likewise, improvements in the labor market over the past decade are limited, and even these marginal gains seem threatened by the negative repercussions of the concurrent crises. data from the 2021 Labor force Survey (LfS) show that the high and longstanding economic growth between 2004 and 2020 did not result in a structural transformation of Ethiopia’s labor market (for more on LfS, refer to box 1.1 on data sources and methodology). Shifts in employment productivity and types of employment were moderate at best. Then, in 2020, the COVId -19 pandemic closed markets, albeit relatively briefly, and had immediate negative impacts on job opportunities. although most workers reentered the labor market, many shifted their engagement, not necessarily in positive ways.
Between 2013 and 2021, the service sector drove limited job growth as employment in agriculture and industry shrank. Nearly 3.5 million jobs were added in the service sector between the last LfS in 2013 and the most recent one in 2021. By contrast, the agricultural and industrial sectors lost 1.7 million and 0.6 million jobs, respectively. Moreover, between 2013 and 2021, wage employment growth was less than half that between 2005 and 2013—2.9 percent compared to 7.4 percent. Notably, the trends in decreasing growth of industrial and wage jobs predate the COVId -19 pandemic.
at the same time, more people—rural women in particular—are unemployed or leaving the labor market altogether. Nationally, unemployment doubled
4 | W O r KIN g T O daY f O r a B ETTE r T OMO rr OW IN E T h IOPI a
Data sources and methodology
Labor Force Survey 2021
Ethiopia’s national Labor force Survey (LfS), which is nationally representative, is designed to estimate employment and unemployment outcomes at the regional level by rural, major urban, and other urban categories. across years, the survey has used a twostage cluster sampling procedure, with enumeration areas (E a s) as the primary sampling units and households as the secondary sampling units. The 2021 LfS adopted a new cartographic frame for the upcoming fourth Population and housing Census, whereas the 2013 L f S used the 2 007 Population and housing Census as the sampling frame.
The E a s were selected using the probability proportionate to size in the first stage selection, and 30 households per Ea were selected using a systematic sampling approach. a total of 1,686 Eas (766 major urban, 380 other urban, and 540 rural) were selected for the 2021 LfS, giving a target sample size of 50,580 households. The 2013 L f S sample had 1,955 E a s (817 major urban, 296 other urban, and 842 rural) with a target sample size of 58,650. L f S has very high response rates, exceeding 99 percent in all localities and across surveys over time.
differences in sample coverage between the 2013 LfS and 2021 LfS do not appear to influence comparability significantly. The 2021 LfS did not cover the Tigray region, because of the ongoing conflict, but did include the whole of the afar and Somali regions, despite insecurity in those areas. The 2021 LfS also included pastoralist populations, concentrated in the lowland areas of the country, which the 2013 LfS did not cover. The population sizes of both the pastoralists and the Tigray regions are too small to drive any
differences between the two surveys. regional comparisons also indicate similar patterns (although in varying magnitudes) in labor market trends across countries. Nonetheless, when computing trends, this report excludes earlier survey data on Tigray.
Seasonality represents a comparability concern between the 2013 and 2021 surveys. d ata were collected during the peak season (May and June) in 2013 but during the slack season (January and february) in 2021. a lthough the questionnaire is broadly comparable, seasonal variation could influence the observed trends between 2013 and 2021; thus, such comparison should be treated with caution.
Ethiopian Socioeconomic Survey 2018/19
The Ethiopian Socioeconomic Survey (ESS) is a multimodule panel survey to better understand the relationship among agriculture, household welfare, and poverty. The ESS 2018/19 was the fourth round of the survey in Ethiopia but adopted a new panel rather than a follow-up to previous ESS waves. It covered all nine states and two cities, addis ababa and dire dawa. representative at the regional level by rural or urban area, the ESS 2018/19 collected data from 535 E a s (316 rural and 219 urban) with 12 and 15 households selected per E a in rura l areas and urban areas, respectively. The total sample was 7,527 households, of which 6,894 were eventually interviewed.
The ESS 2018/19 has individual-level modules collecting information on
• Ownership and right to selected physical and financial assets, and
• Education, health, labor, and financial inclusion status.
between 2013 and 2021; in rural areas, the figure tripled. Women and youth both saw particularly sharp increases in unemployment. The decrease in the labor force participation rate (LfPr), from 86 percent in 2013 to 74 percent in the 2021 LfS, is also notable against a steady LfPr increase in the two previous surveys.
The Challenges of Job Growth in Ethiopia | 5
BOX 1.1
Note: The labor module was updated to reflect concepts and definitions endorsed by the 19th International Conference of Labour Statisticians in 2013, which covers employment, volunteering, own-use production, and unpaid training, among other forms of work. The survey also captures household consumption and participation in social assistance programs, which enables analysis of labor market outcomes by socioeconomic status.
Like unemployment, the rural labor market was much more affected than the urban one by falling LfPr, and these trends are particularly striking for women.
The relationship between this observed increase in unemployment and inactivity, COVId -19, the conflict in Northern Ethiopia, and other crises remains unclear. high-frequency telephone surveys on COVId -19, conducted in Ethiopia between april 2020 and april 2021, showed that the percentage of people working over the previous week rebounded within just months of the initial shutdowns and other preventive measures. Loss of income from nonfarm enterprises, however, recovered much more slowly over 2020 and then saw another significant drop when Ethiopia’s COVId -19 caseload rose significantly in early 2021 (ambel et al. 2021). This rise in caseload began at the same time as data collection for the 2021 LfS.
regardless of the situation’s cause or longevity, however, policy attention is critical to prevent economic scarring from unemployment or inactivity and to limit exacerbation of labor market inequalities. data from developed economies have shown that unemployment, whether idiosyncratic or linked to economywide events, can have holdover implications on future earnings for a decade (Nilsen and reiso 2011; rothstein and Kahn 2020). In Latin america, analysis of past crises has shown that this scarring exacerbates inequality, with incomes of better-educated households recovering much more quickly (Silva et al. 2021). The high-frequency telephone surveys seemed to confirm this finding: one year after the pandemic, education levels were the strongest predicator of whether a household had rejoined the labor market (Contreras- gonzalez et al. 2022).
The government’s latest development planning policies mark a shift toward structural transformation through private sector growth and the creation of more and better jobs. The 10-year Perspective development Plan 2021–30 emphasizes economic growth by improving productivity and competitiveness, and promoting growth led by the private, rather than the public, sector. In line with the National Plan for Job Creation 2020–25, these reforms aim to spur the transitions necessary to create widespread opportunities for good jobs.
This chapter presents evidence to underpin how the Ethiopian government’s new job policies can reflect the realities of the country’s labor market and the challenges faced by workers in finding good and productive jobs. This chapter analyzes the new 2021 L f S, comparing it to earlier rounds of the same survey and complementing it with data from the Ethiopian Socioeconomic Survey (ESS). It begins by describing the nature of jobs currently available in the Ethiopian labor market. The next section discusses unemployed individuals and the types of work they seek. The chapter then examines a few specific vulnerable groups and how they have fared as compared to the rest of the labor market. The concluding section summarizes and suggests policy priorities.
SERVICE SECTOR JOBS ARE INCREASINGLY IMPORTANT IN ETHIOPIA
Over the past two decades, the service sector has driven job creation nationwide, while other sectors have stagnated. In 1999, service sector jobs accounted for only 5 percent of work nationally, about 30 percent in urban areas, and just 2 percent in rural ones. By 2021, the service sector had grown to employ 70 percent of the urban and 20 percent of the rural workforce (refer to figure 1.1, panel a). In rural areas, agriculture remains the largest sector of
6 | W O r KIN g T O daY f O r a B ETTE r T OMO rr OW IN E T h IOPI a
employment, 77 percent, but its share of the labor market has declined steadily as labor has slowly moved into the service sector. Industrial jobs remain an urban phenomenon. Over the past two decades, the share of rural households employed in industry has stayed at about 3–4 percent.
Since 2005, the service sector has added roughly 7 million jobs to the economy. This growth has been steady over the two decades. It is also relatively evenly spread across rural and urban divides, as well as between men and women (refer to figure 1.1, panel b). Overall, the service sector remains much more dominant in urban areas than in rural ones. Its growth rate, however, was similar across both between 2013 and 2021, up 8 percentage points in urban areas and 7 percentage points in rural areas.
agriculture, by contrast, saw a reversal in job growth over this same period. Whereas it had a net gain of over 4 million jobs between 2005 and 2013, agriculture had a net loss of 1.7 million such jobs between 2013 and 2021, partly because of rural workers becoming more engaged in off-farm segments of the food system. Moreover, regardless of earlier net gains, the importance of agriculture presents a steady downward trend. It accounted for 82 percent of the national labor market in 2005 compared to 65 percent in 2021. This downward share of employment suggests a stable trend that, although perhaps compounded by COVId -19 or conflict, is not driven primarily by these shocks.
Job growth in the industrial sector also slowed. Between 2005 and 2013, industry added 1 million jobs to the economy. Nearly 80 percent of these jobs were in urban areas, increasing industry’s share of urban employment from 21 percent to 24 percent. By 2021, however, industrial jobs had decreased by about 600,000, and industry’s share of the urban economy fell to 16 percent. as noted earlier, industry’s share of jobs in rural areas held steady at about 3–4 percent of jobs between 2005 and 2021.
The stagnation of industry appears to predate the COVId -19 pandemic but also appears to have worsened because of it. Considering specifically industrial
The Challenges of Job Growth in Ethiopia | 7
1.1 Service sector has driven job creation in Ethiopia for nearly two decades Sources: World Bank calculations using data from the Ethiopia Labor Force Survey, 1999–2021; World Bank calculations. Agriculture Industry Services 0 20 40 60 80 100 10 30 50 70 90 Percent UrbanRuralEthiopiaUrbanRuralEthiopiaUrbanRuralEthiopiaUrbanRuralEthiopia EthiopiaUrban Rural Men WomenEthiopiaUrban Rural Men Women 19992005
FIGURE
Sectoral employment composition, 1999–2021
a.
20132021 2005-13 2013-21 Millions –3.0 –1.5 0 1.5 3.0 4.5 6.0 7.5 9.0
b. Net job creation, by sector, 2005–21
wage jobs in urban areas, the ESS 2018/19 showed continued growth in absolute terms but a marked decline in share of this type of employment from the ESS 2013/14, from 12 percent to 5 percent (Wieser and Mesfin 2021). Even in early 2020, industrial parks—a flagship of job policy—registered only about 85,000 direct jobs created. despite significant policy focus on the indirect job creation impact of these parks, the limited evidence points to few indirect jobs created (Maaskant and Strokova 2021). Moreover, in 2021, as economywide employment rates rebounded from the pandemic, industry had not recovered to prepandemic levels, and industrial workers moved to other sectors instead (ambel et al. 2021).
rural women led the shifts away from agriculture and industry but not necessarily into more productive jobs. rural women account for more job losses in agriculture and industry than the total national net losses, made up by small gains for men and in urban areas (refer to figure 1.1, panel b). In total, more than 2.40 million women left jobs in agriculture and industry between 2013 and 2021, and about 1.65 million women took up service sector jobs over the same period. rising rural unemployment and falling LfPr in rural areas make up the balance. The shift away from agriculture often signals a broader, positive labor market shift. however, in this context, coupled with decreasing industrial work and reduced economic engagement, this shift does not seem to present a healthy economic transformation.
Low-skilled self-employment remains the dominant form of work, particularly in rural areas. Between 2005 and 2021, self-employment in agricultural and nonagricultural activities increased from 45 percent to 55 percent (refer to figure 1.2). Owing largely to the dominance of agriculture, 85 percent of workers in rural areas engage in low-skilled jobs. This share has fluctuated little in the past 20 years. In urban areas, despite a greater mix of low- and medium-skill
8 | W O r KIN g T O daY f O r a B ETTE r T OMO rr OW IN E T h IOPI a
1.2
FIGURE
Terms of employment, nationally and by location,
World
Note: Those classified as “employer” are owner-managers of businesses. Percent 0 20 40 60 80 100 10 30 50 70 90 UrbanRuralEthiopiaUrbanRuralEthiopiaUrbanRuralEthiopia 2005 2013 2021 Wage employee Self-employed (agriculture) Self-employed (nonagriculture) Unpaid family worker Employer Other
Most people in Ethiopia are self-employed
2005–21 Source:
Bank calculations using data from the Ethiopia Labor Force Survey, 2005–21.
occupations, high-skill jobs remain elusive, steady at about 20 percent between 2013 and 2021 (refer to figure 1.3).
driven largely by urban areas, wage job creation decelerated in recent years (refer to figure 1.4). The number of wage jobs increased at an annualized growth rate of 2.9 percent during 2013–21, compared to an annualized growth rate of 7.4 percent during 2005–13. The decline in wage employment growth was evident in both the public and private sectors, although it was more marked in private sector firms (refer to figure 1.5).
COVId -19 contributed to the reversal in private sector wage employment. In 2020 and 2021, high-frequency telephone surveys tracked, among other issues, labor impacts resulting from the pandemic. as of January 2021, the data gathered by these surveys show that private sector wage employment was 4 percentage points below employment reported by the same individuals in 2019. although further time and data are needed to understand various factors hindering wage job growth, the pandemic’s impact certainly helps explain the weak overall contribution of the private sector to wage employment.
for the limited number of wage workers, incomes increased by about 30 percent between 2013 and 2021 but remain low overall, particularly for women. The median real wage in 2021 was 3,213 Ethiopian birr (Br) per month, reflecting an increase of roughly 3.4 percent per year since 2013 (refer to figure 1.6). however, this growth is below the rate of economic growth during this period. Women’s wages averaged only Br 2,500 monthly in 2021—barely double the monthly poverty line of Br 1,242 adjusted for inflation.
Between 2013 and 2021, Ethiopia’s labor market did not experience the same growth as the country’s economy as a whole. despite some shift in workers transitioning from agriculture to services, that transition has occurred much more slowly than in regional comparators. as evidenced in box 1.2, over the past two decades, Tanzania and Uganda saw the proportion of income from agriculture drop to 55 percent and 59 percent, respectively. In Ethiopia, the proportion fell by only half that rate, to 79 percent. at the same time, Ethiopia experienced
Skill composition of employment, nationally and by location, 1999–2021
The Challenges of Job Growth in Ethiopia | 9
1.3
FIGURE
Ethiopia has seen little shift away from low-skilled employment
Source: World Bank calculations using data from the Ethiopia Labor Force Survey, 1999–2021. 0 10 20 30 40 50 60 70 80 90 100 199920052013202119992005201320211999200520132021 Urban Percent Rural Ethiopia Low Medium High
FIGURE 1.4
Wage job creation fell and remained weak in rural areas of Ethiopia
Net wage job creation, nationally and by gender and location, 2005–21
2005–13 2013–21
Source: World Bank calculations using data from the Ethiopia Labor Force Survey, 2005–21.
FIGURE 1.5
Wage employment composition, nationally and by location, 2005–21
Source: World Bank calculations using data from the Ethiopia Labor Force Survey, 2005–21.
Note: INGO = international nongovernmental organization; NGO = nongovernmental organization.
declines in industrial jobs, slowed growth in good-quality wage jobs, and increases in unemployment, underemployment, and inactivity.
as a result, workers in Ethiopia are mostly self-employed in agriculture and services—and, based on two decades of data, appear the main opportunities available for the foreseeable future. On one hand, improving productivity in agriculture remains critical and will require public investment that can reach rural farmers. This is a key conclusion of the 2020 rural Income diagnostic Study for Ethiopia (World Bank 2022a). On the other hand, the growth in service sector jobs presents an opportunity for both rural and urban households to increase their productivity. Shifts in global production and evidence from other
10 | W O r KIN g T O daY f O r a B ETTE r T OMO rr OW IN E T h IOPI a
0 0.2 0.4 0.6 0.8 1.0 1.2 1.4 1.6 1.8
Millions
EthiopiaUrbanRuralMen Women
Public sector accounts for half of wage employment in Ethiopia
0 1,000 2,000 3,000 4,000 5,000 6,000 200520132021200520132021200520132021
Thousands
Ethiopia Urban Rural
Government Private firms NGO/INGO Domestic work Others
Income growth evades rural households in Ethiopia, particularly poor rural households
The 2020 Ethiopian rural Income diagnostics Study analyzes livelihood strategies of rural households and identifies opportunities and challenges to increase their incomes, in support of the homegrown Economic r eform ag enda. Over the past decade, rural incomes in Ethiopia grew by only 6 percent on average, and the poorest rural households saw no income growth at all. By contrast, the entire economy grew by 39 percent p er capita. The study also contrasts Ethiopia with regional and international comparators, which rely less and less on rural agriculture (refer to table B1.2.1).
Several factors hinder rural income growth and reinforce the rural-urban divide. rural Ethiopians remain more reliant on subsistence agriculture. Their earnings and productivity are hamstrung by low human capital, agricultural technology adoption, and connectivity, as well as climate-induced shocks. Low local economic development also constrains off-farm
opportunities because of low connectivity, population density, and rural demand.
Multiple shocks from COVId -19, conflict, climate change, and inflation threaten even these marginal gains. Simulations from available data in 2020 suggest that rural poverty could have increased by 10 percent between 2019 and 2020. Inflation reached a 10-year high in May 2022 and, despite the dominance of subsistence farming, more rural households are net buyers of teff, maize, and sorghum, and thus experience food price increases. Moreover, because of conflict, about 5.5 million people in afar, amhara, and Tigray were experiencing acute food insecurity as of June 2021.
Improving productivity in agriculture and off-farm activities, as well as migration policy, could help bolster rural incomes. Through analysis of the rural economy, the 2020 r ural In come d iagno stics Study characterizes livelihood strategies of rural households
The Challenges of Job Growth in Ethiopia | 11 FIGURE 1.6
Source: World Bank
Note: Wages,
are
national
For wage employment in Ethiopia, real wages rose regardless of education or gender
calculations using data from the Ethiopia Labor Force Survey, 2013–21.
shown in Ethiopian birr,
adjusted using
Consumer Price Index.
2021
Women NoeducationLessthanprimaryCompletedprimaryCompletedsecondaryCompletedpost-secondary Total NoeducationLessthanprimaryCompletedprimaryCompletedsecondaryCompletedpost-secondary Total 0 2,000 4,000 6,000 1,000 3,000 5,000 Ethiopian birr 0 2,000 4,000 6,000 1,000 3,000 5,000 Ethiopian birr
2013
Men
Median
a.
wages, 2013–21 (at 2021 prices)
Median
b.
wages across gender in 2021 (at 2021 prices)
BOX 1.2 continued
Box 1.2, continued
Sources: World Bank estimates using data from the Cambodia Socioeconomic Survey, 2019/20; Rural Livelihoods Information System, 2021 (for Ethiopia, Tanzania, and Uganda); and the Vietnam Household Living Standards Survey, 2018.
Note: Share with income means the proportion of households earning income from a particular source (for example, the number of households with agriculture income as a percentage of the total number of households). Income share is the share of total income generated from each source (for example, agriculture income as a percentage of total income). Income data for Ethiopia, Tanzania, and Uganda are harmonized and comparable.
and identifies opportunities for and challenges to increasing their incomes through three complementary pathways:
1. Agriculture income growth, by increasing market orientation of smallholder farmers with support to raise productivity, mitigate shocks, and improve connections to markets;
Source: World Bank 2022a.
2. Growth in off-farm incomes, by fostering development of nonfarm segments of the food systems to create off-farm opportunities for livelihood diversification; and
3. Rural-urban migration, by reducing the costs of migration and expanding urban investment to create urban pull factors.
african economies suggest that skill-intensive and tradable services may play an increasing role in structural transformation of today’s developing economies (refer to box 1.3).
UNEMPLOYMENT AND INACTIVITY ARE ON THE RISE
Unemployment and inactivity have grown over the past two decades, particularly for women. In 2021, the unemployment rate in Ethiopia was 9 percent, driven by the tripling of unemployment in rural areas between 2013 and 2021—from 2 percent to 6 percent (refer to figure 1.7, panel a). at the same time, unemployment in urban areas increased by only 1 percentage point, from 17 percent in 2013 to 18 percent in 2021. Between 2013 and 2021, female unemployment increased from 7 percent to 13 percent (refer to figure 1.7, panel b). for men, the increase was much smaller, from 3 percent to 5 percent; as a result, women are now nearly three times as likely as men to be unemployed.
Youth also saw increased rates of unemployment. for those ages 15–24, the unemployment rate increased from 7 percent to 12 percent between 2013 and 2021 (refer to figure 1.8, panel b). for those ages 25–34, the unemployment rate doubled from 5 percent to 10 percent over the same period. The unemployment
12 | W O r KIN g T O daY f O r a B ETTE r T OMO rr OW IN E T h IOPI a
COUNTRY, YEAR AGRICULTURE NONFARM WAGE NONFARM BUSINESS SHARE WITH INCOME (%) INCOME SHARE (%) SHARE WITH INCOME (%) INCOME SHARE (%) SHARE WITH INCOME (%) INCOME SHARE (%) Cambodia, 2019/20 96 38 50 35 29 16 Ethiopia, 2018/19 97 79 22 9 14 3 Tanzania, 2015 94 55 49 14 41 29 Uganda, 2019 98 59 29 14 27 14 Viet Nam, 2018 78 34 66 39 27 14
TABLE B1.2.1 Comparison of household income sources, Ethiopia and selected countries, 2019
Service-led structural transformation
h istorically, manufacturing has played a key role in structural transformation, absorbing workers from agriculture into more productive jobs in factories. In today’s industrialized countries, and in many East a sian economies, labor-intensive manufacturing created better-quality, more-productive jobs. The landscape for manufacturing-led growth has changed, however, because of China’s scale of production, the greater levels of industrial automation in high-income countries, and the availability of labor-saving technologies that make industrialization less labor intensive. a frican countries across all levels of income are less industrialized than their a sian cou nterparts and, when they do industrialize, have less capital-intensive industries than nonregional comparators.
Skill-intensive and tradable services may play the role in economic transformation that industry previously played. The long-term development and job creation potential of any subsector depends on its capacity to achieve scale, foster innovation and productivity, and generate positive spillovers for the wider economy—features commonly associated with export-led manufacturing. however, the growth in digital technology could enable some service subsectors to also develop these features. for instance, information and communication technology has made services more storable, codifiable, and transferable and, therefore, more scalable. Information and communication technology services have also
Sources: Diao et al. 2021; Nayyar, Hallward-Driemeier, and Davies 2021.
increased links to other sectors. In addition, with the growing complementarity between manufacturing and services, policies that support growth in services can potentially help increase output and productivity both in services and in manufacturing.
The service sector can be divided into four groups of subsectors, with different features and potential for structural transformation and job creation:
1. Global innovator services (finance, information and communication technology, and professional, scientific, and technical activities) display the maximum scope for scale, innovation, and spillovers, but are also skill intensive.
2. Low-skill tradable services (transportation and storage, accommodation and food, and wholesale trade) are internationally traded and create jobs for unskilled labor.
3. Skill-intensive social services (education and health) are less traded internationally and tend to employ workers with better skills.
4. Low-skill domestic services (retail trade; administrative and support; arts, entertainment, and recreation; and other social, community, and personal services) provide little by way of productivityenhancing potential through scale, innovation, and linkage but employ relatively high shares of low-skilled workers.
rate for those ages 35–44 and 45–64 increased by 2 and 3 percentage points, respectively, although from a significantly lower base. Young people are thus twice as likely to be unemployed as are the older cohorts in the labor force.
Educational status, however, now has a weaker influence on unemployment prospects. The difference between the highest and lowest unemployment rates across different levels of educational attainment has steadily decreased over the past decades (refer to figure 1.8, panel a). Workers with a secondary school certificate have consistently been the most likely to be unemployed, whereas those without formal education are the least likely to be unemployed. The gap between the unemployment rates of these groups has decreased significantly since 2001, from 22 to 11 percentage points. Between 2013 and 2021, all groups, regardless of educational status, experienced an increase in unemployment of 3–4 percentage
The Challenges of Job Growth in Ethiopia | 13
BOX 1.3
FIGURE 1.7
Unemployment in Ethiopia has almost doubled since 2013, increasingly affecting women and rural areas
Unemployment is rising across Ethiopia, regardless of age or educational attainment, with the burden falling disproportionally on young people
points, except for those completing only primary school education, for whom the unemployment rate stayed the same.
Underemployment—defined as the proportion of those who worked less than 35 hours in the past 7 days but were willing and available to work—has increased, particularly in rural areas. at the national level, underemployment decreased from 31 percent in 1999 to 17 percent in 2005 but returned to 31 percent in 2021 (refer to figure 1.9, panel a). rural areas experienced the greatest shift, whereas underemployment in urban areas hardly changed over the same period. Unlike in unemployment, the gender gap in underemployment has almost vanished. Women were significantly more likely to be underemployed in 2013. By 2021, however, underemployment stood at roughly 30 percent for both women and men (refer to figure 1.9, panel b).
14 | W O r KIN g T O daY f O r a B ETTE r T OMO rr OW IN E T h IOPI a
Source: World Bank calculations using data from the Ethiopia Labor Force Survey, 1999–2021. Note: The unemployment rate in this figure uses the relaxed unemployment definition, counting people as unemployed if they are (1) without work and (2) available for work. 2021 1999 2021 1999 2013 2005 20052013 0 10 20 25 5 15 Percent 0 10 20 25 5 15 Percent a.
by location, 1999–2021
Urban Rural
FIGURE 1.8
Unemployment rate,
b. Unemployment rate, by gender, 1999–2021
National Men Women National
Source: World Bank calculations using data from the Ethiopia Labor Force Survey, 1999–2021. 2021 1999 2021 1999 2013 2005 20052013 0 10 20 25 5 15 Percent 0 10 20 25 5 15 Percent a. Unemployment
educational attainment, 1999–2021 b. Unemployment
Completed secondary Less than primary No education Completed primary Completed postsecondary 45–64 25–34 15–24 35–44
rate, by
rate, by age group, 1999–2021
Ethiopia has also experienced a decrease in labor force participation, particularly in rural areas and among women. Between 2013 and 2021, LfPr decreased from 86 percent to 74 percent (refer to figure 1.10, panel a). In rural areas, LfPr decreased from 88 percent to 74 percent, compared to a decrease from 76 percent to 72 percent in urban areas. In addition, the difference in LfPr between men and women increased from 11 percentage points in 2013 to 18 percentage points in 2021 (refer to figure 1.10, panel b).
for people outside the labor market, participation in education is the most common reason for inactivity. Nationally, education accounts for 45 percent of
The Challenges of Job Growth in Ethiopia | 15
FIGURE 1.9
World Bank calculations
Note: Underemployment is defined as the proportion of those who worked less than 35 hours in the last seven days but were willing and available to work. Urban Rural Total 0 10 20 30 40 Percent 1999 20052013 2021 Men Women Percent 0 10 20 30 40 199920052013 2021
Rural underemployment in Ethiopia has doubled since 2005 Source:
using data from the Ethiopia Labor Force Survey, 1999–2021.
a. Underemployment rate, by location, 1999–2021
b. Underemployment rate, by gender, 1999–2021
FIGURE 1.10
World Bank calculations
Note: LFPR = labor force participation rate. 60 65 70 75 80 85 90 95 Percent 1999200520132021 Percent 60 65 70 75 80 85 90 95 199920052013 2021 Men Women National Urban Rural National
People in Ethiopia are leaving the labor market Source:
using data from the Ethiopia Labor Force Survey, 2021.
a. LFPR, by location, 1999–2021
b. LFPR, by gender, 1999–2021
the inactive who choose not to pursue work. In urban areas, education has become slightly less important: the proportion of those who were inactive because they were engaged in education was 57 percent in 2021—a drop from 65 percent in 2005. In rural areas, however, the proportion increased significantly, from 29 percent in 2005 to 40 percent in 2021, likely reflecting the expansion of education in rural areas.
The importance of homemaking as a reason for inactivity increased in both urban and rural areas, with substantial gender variation. Nationally, the proportion of those who were inactive in the labor market because of their engagement in homemaking increased from 20 percent to 33 percent between 2013 and 2021. This shift is driven by an increase from 28 percent to 44 percent among women and reverses the drop realized between 2005 and 2013 (refer to figure 1.11, panel b). for men, education has remained the predominant reason for inactivity, at roughly 75 percent over the 2005–21 period (refer to figure 1.11, panel a).
Moreover, the number of women who are not in education, employment, or training (NEET) has increased substantially. as of 2021, nearly 33 percent of women are NEET, compared to less than 20 percent of women in 2013 (refer to figure 1.12, panel a). for men, by contrast, inactivity increased only from 5 percent to 9 percent (refer to figure 1.12, panel b).
The patterns observed indicate that the poor are likely harder hit by growing unemployment, underemployment, and inactivity, but understanding these observed increases will require more data. The ongoing, concurrent crises in the country suggest the likelihood that negative labor market trends will continue and, given the differences in labor market engagement between men and women, as well as between rural and urban areas, the potential for these crises to exacerbate current inequalities is worrisome. Of the data sources used for this analysis, LfS does not include consumption or socioeconomic data, but ESS data show that women and rural populations tend to be poorer than the national averages. FIGURE 1.11
16 | W O r KIN g T O daY f O r a B ETTE r T OMO rr OW IN E T h IOPI a
Source:
0 10 20 30 40 50 60 70 80 90 100 Percent 2005 20132021 Percent 0 10 20 30 40 50 60 70 80 90 100 200520132021 Homemaker Student Disability/illnessOther
Inequitable distribution of household work affects women’s labor market participation in Ethiopia
World Bank calculations using data from the Ethiopia Labor Force Survey, 2005–21.
a. Men’s reasons for inactivity, 2005–21b. Women’s reasons for inactivity, 2005–21
Education partly explains lower labor market participation, but women are increasingly NEET
Neither working nor in school In school, not working In school and working Working, not in school
Public investment is necessary to prevent these current labor market realities from having long-lasting negative impacts. International evidence shows that even short periods of unemployment or inactivity can have repercussions on people’s future productivity and earnings. In Latin America, for example, low-skilled workers who faced unemployment during previous crises had lower earnings for a decade afterward (Silva et al. 2021). Moreover, the high rates of inactivity of at-risk groups could foster feelings of exclusion not only from job opportunities but also from society more broadly. Public policy can help avoid such disengagement by reaching disadvantaged households with a comprehensive support package to spur their productive inclusion in the labor market.
VULNERABLE GROUPS FACE ADDITIONAL CHALLENGES IN A DIFFICULT LABOR MARKET
This section examines in greater detail four demographic groups that have vulnerabilities:
Each group faces its own challenges, which the upcoming chapters will describe in detail. This section compares a selection of indicators across these four groups and to the outcomes of the typical poor population (defined as those belonging to the lowest 40 percent of the income distribution) and also clients of the Productive Safety Net Program.1
The Challenges of Job Growth in Ethiopia | 17
1. Rural women,
2. Urban youth,
3. Rural–urban migrants, and
4. People with disabilities.
FIGURE 1.12
education, employment, or training.
Source: World Bank calculations using data from the Ethiopia Labor Force Survey, 2013–2021. Note: NEET = not in
0 10 20 30 40 50 60 70 80 Percent 2013 2021 Percent 0 10 20 30 40 50 60 70 80 2013 2021
a. Women’s activity status, 2013 vs. 2021
b. Men’s activity status, 2013 vs. 2021
although rural women make up the largest of these groups, the other three groups, although small, are rising in terms of their proportion of the Ethiopian population. rural women account for 39.0 percent of the Ethiopian population, and the other groups for 13.1 percent, with urban youth representing 7.0 percent; rural–urban migrants, 1.6 percent; and people with disabilities, 4.5 percent (refer to figure 1.13, panel b). The four groups are not necessarily mutually exclusive, nor are they collectively exhaustive (refer to figure 1.13, panel a). for example, people with disabilities might also be rural women, urban youth, or rural–urban migrants.
People in all four groups are less likely to participate in the labor market than the national average, and their rates fell further in recent years. Nationally, LfPr was 74 percent in 2021, compared to 86 percent in 2013 (refer to figure 1.14, panel a). rural women had the most pronounced decrease in LfPr, which declined from 83 percent to 65 percent. although other groups did not have such steep declines, these groups started with lower levels of LfPr. Nevertheless, declines were still significant for urban youth (from 69 percent to 61 percent) and rural–urban migrants (from 80 percent to 74 percent), whereas people with disabilities experienced a smaller decline (from 65 percent to 62 percent).
Education alone does not explain this disengagement from the labor market. for all four groups considered, especially people with disabilities, the rates of those who are NEET were already above the national level. for rural woman, NEET rates more than doubled, from 15 percent to 31 percent compared to a national increase from 12 percent to 21 percent (refer to figure 1.14, panel b). although the other groups experienced less significant increases, their high rates of NEET remain concerning. almost 25 percent of rural–urban migrants and urban youth are now NEET.
18 | W O r KIN g T O daY f O r a B ETTE r T OMO rr OW IN E T h IOPI a
FIGURE 1.13
Four profiles of vulnerable groups cover a significant part of Ethiopian society
39.0 7.0 1.6 4.5 0 5 10 15 20 25 30 35 40 45 Percent Rural women Urban youth Rural–urban migrants People with disabilities Women 2 4 3 1 Men Urban Rural
Source: World Bank calculations using data from the Ethiopia Labor Force Survey, 2021. Note: In panel a, 1 = rural women, 2 = urban youth, 3 = people with disabilities, and 4 = rural–urban migrants. In panel b, the arrow indicates the long-term trend of proportional change for each respective demographic group.
a. Profiles across gender and location
b. Groups as proportion of total population, 2021
In Ethiopia, inactivity increased across the four profiles, especially for rural women
a. LFPR, nationally and by profile, 1999–2021
b. NEET rate, nationally and by profile, 1999–2021
at the same time, unemployment has increased steadily for these vulnerable groups. The 2013 increase in unemployment is particularly high for rural women, nearly tripling from 3 percent to 8 percent (refer to figure 1.15, panel a). rural–urban migrants have also experienced a significant increase in unemployment—from 13 percent to 20 percent. Unemployment for urban youth has remained consistently well above national averages through the 2000s. Underemployment has also increased since 2013, although slightly. following a significant dip in underemployment in 2005, the underemployment rate at the national level increased from 44 percent in 2013 to 49 percent in 2021 (refer to figure 1.15, panel b).
for the employed among the vulnerable groups, shifts in the sector of employment largely mirror national trends. despite significant differences in levels across the four groups, the patterns of declining agricultural and manufacturing jobs and growing service sector jobs dominate (refer to figure 1.16).
More so than others, however, people in these four groups have seen little change in how they earn a living. Unpaid family work remained steady, or even increased, for these groups, while nationally it fell substantially (refer to figure 1.17, panel a). Similarly, the four groups experienced little change in selfemployment or wage employment. Wage employment remained static (refer to figure 1.17, panel b). Self-employment, which stayed constant for rural women and rural–urban migrants, declined from 67 percent in 2013 to 61 percent in 2021 for people with disabilities but rose slightly for urban youth—from 32 percent in 2013 to 35 percent in 2021 (refer to figure 1.17, panel c). rural women also experienced a particularly steep decrease in nonfarm self-employment over this period (refer to figure 1.17, panel d).
Twenty years of labor market data reinforce the need for public intervention to encourage better job outcomes for Ethiopia’s vulnerable populations. although the labor market has taken a turn downward for all, vulnerable groups
The Challenges of Job Growth in Ethiopia | 19
FIGURE 1.14
Source: World Bank calculations using data from the Ethiopia Labor Force Survey, 1999–2021. Note: LFPR = labor force participation rate; NEET = not in education, employment, or training. 50 55 60 65 70 75 80 85 90 Percent 1999200520132021 Percent 0 5 10 15 20 25 30 35 40 2013 2021 National Urban youth People with disabilities Rural women Rural–urban migrants
FIGURE 1.16
FIGURE 1.15
Unemployment and underemployment are on the rise among vulnerable groups in Ethiopia
a. Unemployment rate, nationally and by profile, 1999–2021
30 Percent 1999200520132021
25
20
15
10
5
0
Typical National Urban youth People with disabilities
b. Underemployment rate, nationally and by profile, 1999–2021
50
40
30
20
10
Percent 0
60 199920052013 2021
Rural women Rural–urban migrants National Urban youth People with disabilities
Rural women Rural–urban migrants
Source: World Bank calculations using data from the Ethiopian Socioeconomic Survey 2018/19 and Ethiopia Labor Force Survey, 1999–2021.
0 20 40 60 80 100 199920052013 a. Agriculture b. Industry c. Services 2021 Percent Percent Percent 0 20 40 60 80 100 1999200520132021 0 20 40 60 80 100 199920052013 2021 National Rural women Urban youth Rural–urban migrants People
disabilities
must grapple with these effects more than others and have less resilience for dealing with this downturn. rural women are a particularly important group, representing nearly 40 percent of the population but saddled with high inactivity, likely linked—at least in part—to inequity in the burden of household responsibilities. Moreover, given their limited educational attainment and market access, these groups are likely to be among the last to benefit from labor market
20 | W O r KIN g T O daY f O r a B ETTE r T OMO rr OW IN E T h IOPI a
Note: No underemployment data are available for the typical poor and PSNP beneficiaries because the Ethiopian Socioeconomic Survey does not capture underemployment. PSNP = Productive Safety Net Program. poor PSNP benificiaries
Trends in, but not rates of, work in different sectors mirror national statistics in Ethiopia Employment of vulnerable groups, by sector, 1999–2021 Source: World Bank calculations using data from the Ethiopia Labor Force Survey, 1999–2021.
with
Employment pathways have remained the same over the past two decades, with some small changes at the national level and for some groups
Employment of vulnerable groups, by type of employment, 1999–2021
policies focused on future job growth, which are often biased toward people in urban areas and with more education. It is urgent to invest in programs proven to reach these groups and help them work more productively.
CONCLUSION
Even as Ethiopia’s gdP per capita has increased steadily, macroeconomic growth has not translated into widespread job growth over the past two decades. New jobs in the service sector are a welcome development, but this shift has occurred much more slowly in Ethiopia than in its neighbors, and the country’s labor market remains dominated by agricultural work. at the same time, manufacturing opportunities began to decrease even before the COVId -19 pandemic and the conflict in the country. for key vulnerable groups, unpaid family work is the only type of work that has grown in recent years, whereas wage and self-employment opportunities have stagnated.
Moreover, unemployment has risen, and more people have dropped out of the labor market. Unemployment and inactivity have increased, particularly among women and youth. The percentage of unemployed women tripled between 2013 and 2021. although participation in education remains the most common reason that people do not work, household responsibilities were the fastest-growing explanation for women leaving the labor market.
The Challenges of Job Growth in Ethiopia | 21
FIGURE
1.17
Source: World Bank calculations using data from the Ethiopia Labor Force Survey, 1999–2021. 0 20 40 60 80 100 1999 2005 2013 2021 a. Unpaid family work 0 20 40 60 80 100 1999 2005 2013 2021 b. Wage employment 0 20 40 60 80 100 1999 2005 Percent Percent Percent Percent 2013 2021 c. Self-employment 0 20 40 60 80 100 1999 2005 2013 2021
d.
Nonagricultural self-employment as a proportion of self-employment National Rural women Urban youth Rural–urban migrants People with disabilities
Because of these entrenched labor market realities, people need assistance to work more productively within the limitations of the current labor market. The 10-year Perspective development Plan 2021–30 and National Plan for Job Creation 2020–25 have a consistent focus on structural transformation and widespread job opportunities. however, these efforts must be understood within the realities of the Ethiopian labor market, in terms of both the difficulties of sparking such transitions and the concurrent crises.
Existing government programs can leverage meaningful changes in the labor productivity of the poor in the immediate term. Such efforts are proven to improve individual income and well-being, promote investment in the human capital development of future generations, and have spillover effects in local economic development. These programs and investments, therefore, can have meaningful impacts while broader reforms help shape longer-term growth and development opportunities.
The concurrent crises faced by Ethiopia reinforce the urgency for targeted support to poor households in the labor market. The growth in unemployment and inactivity witnessed in the 2021 LfS requires further data points to fully understand. Still, substantial international evidence exists on the long-term scarring from even short disruptions in work, and Ethiopia should invest to limit the negative job impacts of these crises, particularly for already-poor households.
Labor market policies must include an emphasis on the working-poor population to achieve broader poverty reduction and contribute to broader structural transformation of the economy. The following chapters provide more detail on the challenges faced by the working-poor population and outline programmatic options and systems to facilitate their path to more productive employment. By facilitating productivity of poor individuals, such policies can even contribute to longer-term reform efforts toward structural transformation.
NOTE
1. data from the most recent Ethiopian Socioeconomic Survey (2018/19) provide this benchmark.
REFERENCES
ambel, a a ., C. Sosa, L. Marcela, W. Y. Kassa, a h. Tsegay, and C. Wieser. 2021. Monitoring COVID-19 Impacts on Households in Ethiopia: How COVID-19 Is Affecting Households— Results from the High-Frequency Phone Surveys of Households from April 2020 through January 2021. Washington, dC: World Bank.
Contreras- g onzalez, I., g. Oseni, a . Palacios-Lopez, P. Janneke, and M. Weber. 2022. “Inequalities in Job Loss and Income Loss in Sub-Saharan africa during the COVId-19 Crisis.” Policy research Working Paper 10143, World Bank, Washington, dC. diao, X., M. Ellis, M. McMillan, and d. rodrik. 2021. “africa’s Manufacturing Puzzle: Evidence from Tanzanian and Ethiopian firms.” NBEr Working Paper 28344, National Bureau of Economic research, Cambridge, Ma
Maaskant, K., and V. Strokova. 2021. More, Better, and More Inclusive Industrial Jobs in Ethiopia: Summary of Evidence Base and Knowledge Gaps. Washington, dC: World Bank.
Nayyar, g., M. hallward-driemeier, and E. davies. 2021. At Your Service? The Promise of Services-Led Development. Washington, dC: World Bank.
22 | W O r KIN g T O daY f O r a B ETTE r T OMO rr OW IN E T h IOPI a
Nilsen, O. a ., and K. h reiso. 2011. “Scarring Effects of Unemployment.” Nhh discussion Paper No. 26/2011, Norwegian School of Economics, Bergen. https://papers.ssrn.com/sol3 /papers.cfm?abstract_id=1972294
rothstein, J., and L. Kahn. 2020. “The Lasting Scars of graduating in a recession.” Econofact, d ecember 12, 2020. https://econofact.org/the-lasting-scars-from-graduating -in-a-recession.
Silva, J., L. d. Sousa, T. g. Packard, and r robertson. 2021. Employment in Crisis: The Path to Better Jobs in a Post-COVID-19 Latin America. Washington, dC: World Bank.
Wieser, C., and W. Mesfin. 2021. Ethiopia: Employment in Urban and Rural Ethiopia. Washington, dC: World Bank.
World Bank. 2022a. Ethiopia—Rural Income Diagnostics Study: Leveraging the Transformation in the Agri-Food System and Global Trade to Expand Rural Incomes . Washington, dC: World Bank.
World Bank. 2022b. Ethiopia’s Great Transition: The Next Mile—A Country Economic Memorandum. Washington, dC: World Bank.
The Challenges of Job Growth in Ethiopia | 23
SOUTH WEST
ETHIOPIA PEOPLES’ REGION

Spotlight 1.1: Ethiopia’s Productive Safety Net Program
To protect and improve fragile livelihoods, the Ethiopian government modified its emergency food aid system and launched the Productive Safety Net Program (PSNP) in 2005.
Now, in its fifth phase, PSNP is one of the largest national social safety net programs in Africa. It targets extremely poor and vulnerable households in food-insecure rural districts, or woredas, in Ethiopia (refer to the map).
PSNP WOREDA
EXPANSION PSNP WOREDA
NATIONAL CAPITALS
REGION BOUNDARIES
ETHIOPIA IBRD
INTERNATIONAL BOUNDARIES
24
CENTRAL ETHIOPIA REGIONAL STATE
ADDIS ABABA
SUDAN
SOUT H SUDAN
ER IT REA
SOMALIA
UGA NDA
KEN YA
DJIBOUTI
REP. OF YEMEN
SU DAN
Lake Tana Lake Turkana R ed S e a G u l f o f A d e n
UG ANDA
HARERI
BENESHANGUL GUMUZ
GAMBELA
OROMIA
ADDIS ABABA
AMHARA
DIRE DAWA
TIGRAY AFAR
SOMALI
SIDAMA
SOUTH ETHIOPIA REGIONAL STATE 47443 AUGUST 2023
PSNP has three main, interrelated components. Most clients receive cash or food payments through public works that also build local infrastructure or promote environmental protection. about 15 percent of clients with limited labor capacity receive unconditional payments, known as direct support. PSNP also provides complementary livelihood services to enable PSNP clients to enhance and diversify their incomes.
Through regular cash transfers, PSNP has reduced poverty by 7 percent (World Bank 2020). In the lowland areas, clients saw their food insecurity nearly halve, from 2.4 months to 1.3 months. In the highland areas, clients saw an increase in food diversity, from 3.8 to 4.3 food groups (Berhane et al. 2019, 2022).
REFERENCES
Berhane, G., D. Gilligan, K. Hirvonen, J. Hoddinott, N. Kumar, and A. S. Taffesse. 2019. The Productive Safety Net Programme IV Midline Survey. 2018 Highland Outcomes Report. Washington, DC: International Food Policy Research Institute.
Berhane, G., D. Gilligan, J. Hoddinott, N. Kumar, F. N. Bachewe, O. Nwabuikwu, A. S. Taffesse, H. Tesfaye, and A. Wondwosen. 2022. The Productive Safety Net Programme IV End-line Outcomes Report Highlands. Washington, DC: International Food Policy Research Institute. World Bank. 2020. Ethiopia Poverty Assessment: Harnessing Continued Growth for Accelerated Poverty Reduction. Washington, DC: World Bank.
Spotlight 1.1: Ethiopia’s Productive Safety Net Program | 25
S1.1.1
Source: This figure is original to this publication. 2006 100 200 300 309 251 452 567 608 400 500 600 700 2008 2010 2012 2014
FIGURE
Consumption expenditures doubled for PSNP households by 2014
ROYAL DANISH EMBASSY Addis Ababa ROYAL DANISH EMBASSY Addis Ababa ROYAL DANISH EMBASSY Addis Ababa ROYAL DANISH EMBASSY Addis Ababa With funding from
Spotlight 1.2: Ethiopia’s Urban Productive Safety Net and Jobs Project
The Urban Productive Safety Net Project (UPSNP) in Ethiopia, one of the first urban safety nets in africa, launched in 2016. The Urban Productive Safety Net and Jobs Project (UPSNJP) began in 2020 to expand the support for vulnerable urban Ethiopians both thematically and geographically.
UPSNP
Implemented in 11 cities across the country, the UPSNP addressed urban poverty by establishing a predictable safety net for targeted poor households and included four support packages tailored to the distinct needs of vulnerable Ethiopians living in targeted cities:
• Labor-intensive public works to improve the environment, including solid waste management and environmental cleaning, urban beautification and greenery, integrated watershed management, upgraded social infrastructure, and urban agriculture.
• Livelihood development to promote self-employment and wage employment through life-skills training, business plan preparation, and grant payments.
• Direct support for labor-constrained households, including cash grants without public works participation, as well as linkages with health insurance and other social services.
• Services for urban destitute populations, with the objectives of the social, economic, and educational reintegration of children, mothers with children, adults, and elderly individuals who are unhoused.
Between 2016 and 2022, UPSNP reached 1,416,700 people and responded quickly to provide cash transfers to more than 433,000 people with increased vulnerability due to COVId -19 and to almost 380,000 people displaced by the conflict in northern Ethiopia. Impacts of the labor-intensive public works component include the following:
26
UPSNJP
In 2020, the UPSNJP began a new phase to scale up, with the goal to reach 88 cities and more than 1.5 million Ethiopians. The UPSNJP also expanded the project’s emphasis on job outcomes with new innovative activities for apprenticeships, job centers, and refugees and hosting communities.
The Youth Employment component focuses on the school-to-work transition for 57,498 less-educated urban youth through an apprenticeship program that includes the development of life, digital, and job search skills.
The new national Jobs Centers under the Ministry of Labor and Skills will receive pilot support to build evidence and serve as the blueprint for Ethiopia’s future Public Employment Services.
Income generation and integration for refugees and hosting communities will promote new or rehabilitated public infrastructure through public works and livelihood development.
Spotlight: Ethiopia’s Urban Productive Safety Net and Jobs Project | 27
FIGURE S1.2.1
UPSNP labor-intensive public works demonstrated positive individual, household, and community impacts
Source: This figure is original to this publication.
25% increase of client incomes
60% female participation 93% satisfaction with community invesments
18% higher earnings
Women's
earnings increased by +30%
ROYAL DANISH EMBASSY Addis Ababa ROYAL DANISH EMBASSY Addis Ababa ROYAL DANISH EMBASSY Addis Ababa ROYAL DANISH EMBASSY Addis Ababa
II Barriers to Better Jobs for Poor and Vulnerable Workers
29
Women in Rural Jobs CONSTRAINTS TO PRODUCTIVITY 2
SUMMARY*
Across all jobs and types of work, rural women face significant disadvantages as compared to their male counterparts. Identifying their barriers to good, productive jobs, however, signals clear policy entry points that could support women’s economic empowerment and, in doing so, empower their contributions to broader goals of economic transformation in the rural Ethiopian economy.
• Rural women make up 40 percent of the Ethiopian population. Unfortunately, the potential of these women is impeded in nearly every facet of work.
• In all jobs, rural women earn less than their male counterparts. The gender gap is most pronounced in business, with an income differential of 79 percentage points. Yet female-headed households are more likely to work in business and, therefore, to rely more on business income than their male counterparts.
• Lack of productive inputs is the largest driver of low productivity. In farming, women have less access to land, fewer livestock, and less access to fertilizer and tools, among others. When trying to start or expand a business, women have less access to savings and face more barriers to securing credit.
• Personal and family responsibilities place an outsized burden on women. This investment has innumerable positive impacts on future generations but also negatively affects time allocation and productivity across all types of work.
• Women also have less education. Although access to school has expanded, it started from a low base. At present, 61 percent of rural women have not attended school, as compared to 34 percent of rural men. The relationship between education and earnings is well-established in Ethiopia.
• The confluence of these factors has wide-ranging implications. Women are less able to provide for their own well-being and for that of their children. They also contribute less to the broader economy than if they could achieve their full potential.
By Barbara Coello and Bezawit
31
Adugna Bahru. We are immensely grateful to Girum Abebe, Niklas Beuren, Paula Gonzalez, Adiam Hagos Hailemicheal, and Theodros Hailemariam Nigatu for valuable comments on this chapter. We are grateful to Emily Weedon Chapman for her guidance throughout and to Roman Tesfaye and Margaux Vinez for useful input.
INTRODUCTION
Two in five Ethiopians are rural women, and they face immense challenges in finding good jobs. only half of working-age women are engaged in paid work as compared to two-thirds of men. When unemployed, women experience greater difficulty in finding jobs and experience a longer unemployment period as compared to men. once employed, women are more likely than men to take on low-quality jobs and work longer hours because of the high burden of unpaid work. As a result, women earn wages that are 25 percent lower than those of men. Women are also less likely than men to participate in the labor market and more likely than men to be unemployed (ILo 2017).
Closing the gender gap in key sectors of the labor market could add nearly 5 percent to the country’s gross domestic product (GdP). The gender gap analysis presents clear evidence that the differences in access and returns to resources result in poorer economic outcomes for women in Ethiopia as compared to men: lower agricultural productivity (36 percent), business sales (79 percent), and wage income (44 percent). Economic gender gaps across these types of work do not exist independently of one another but rather stem from and are linked through an underlying set of contextual factors and social norms (World Bank 2019). Estimates suggest that this situation is associated with a $3.7 billion loss in annual GdP (Buehren, Gonzalez, and Copley 2019). Moreover, increased access to income by women is shown to have a multiplier effect on human capital formation, poverty reduction, and household resilience (Garikipati 2008, Sariyev et al., 2020; World Bank 2012).
This chapter examines what drives gender disparities in the rural Ethiopian labor market (refer to box 2.1 for a description of data sources). It begins with a broad introduction to women’s participation in the labor market and then provides deep dives into three important sources of employment in Ethiopia:
Data sources for the rural Ethiopian labor market
This chapter relies on two recent nationally representative surveys: the fourth round of the Ethiopian Socioeconomic Survey (ESS 2018/19) and Ethiopia’s national Labor force Survey (L fS). Thes e surveys provide complementary data to understand what women do for work in rural areas, what limits their productivity and success in the labor market, and how public investment could empower women toward better jobs.
ESS 2018/19
The ESS 2018/19 analysis presented in this chapter is limited to the rural sample of the survey, which was conducted in 2018/19. The ESS began in 2012/13. The
ESS 2018/19 used a two-stage probability sampling method. f irst, enumeration areas were selected in each region as a primary sampling unit, based on probabilities proportional to their sizes. Second, 12 households were selected from each enumeration area, with 10 of those 12 randomly selected from the sample of 30 agricultural households and 2 drawn from nonagricultural households. for each household, detailed plot-level data are gathered before planting and after harvest. The postplanting questionnaire includes information on household members, livestock and poultry production, the area planted with crops, and input use. The postharvest questionnaire gathers information on household members, crop harvest, and
32 | Wo R k ING Tod AY fo R A B ETTER To M o RR o W IN E THI o PIA
continued
BOX 2.1
decision-makers of the produced crop. The survey gathers data using the multit opic household, community, and agriculture (postplanting, postharvesting, and livestock) questionnaires. The household questionnaire elicits information on household demographics and socioeconomic characteristics including education, labor and time use, and nonfarm enterprise. The agriculture questionnaire gathers data on agricultural activities, inputs (labor, seed, and so on), labor contribution from family and other sources, and agricultural products. The module also gathers data on owners and decisionmakers of nonfarm enterprises, productive assets such as land, household durables, and plots, and outputs obtained from agricultural plots.a
2021 LFS
Box 2.1, continued agriculture, nonfarm enterprises, and wage employment. The analysis of each type of work focuses on gender disparities in productivity and factors contributing to the gender gap. The next sections present gender dimensions in public and private services, focusing on rural financial services—as a key input to labor productivity—and on the Productive Safety Net Program—as a potential entry point for improving the labor productivity of rural women. It concludes with a summary of findings to inform policy dialogue and programmatic designs to help close the gender gap in the rural labor market.
Likewise, the analysis here includes only the rural sample from the 2021 LfS. Beginning in 1999, and conducted roughly every 5 years since, L f S provides comprehensive labor force statistics on a representative sample of rural and urban populations. The survey gathers data on the size, distribution, socioeconomic and demographic characteristics, sectors of employment, and other details of the workforce already engaged or seeking to engage in productive activities during the given reference period. for the employed population, the survey gathers data on the distribution and characteristics of the population by occupation and industry, sector of employment, type of employment, and income.
a. For more details on the ESS 4, see https://microdata.worldbank.org/index.php/catalog/3823
b. For more details on LFS, see https://www.ilo.org/surveyLib/index.php/catalog/2363
RURAL WOMEN IN THE ETHIOPIAN LABOR MARKET
Women constitute a little over half of the working-age population in rural areas, yet only 34 percent were active in the labor market in 2021 (refer to figure 2.1). from 1999 to 2011, a lower proportion of women participated in the labor market as compared to men. Although participation levels gained parity between 2005 and 2013, the period from 2013 to 2021 marks an abrupt decline in women’s participation in the labor force, from 42 percent to 34 percent.
Women also experience a higher rate and longer duration of unemployment than do men, trends that have increased in recent years. The rate of rural unemployment has increased over time from about 1 percent in 1999 to 6 percent in 2021. for duration, in the most recent year, 73 percent of unemployed women were unemployed for more than 6 months as compared to 56 percent of men.
Personal and family responsibilities place an outsized burden on women and prevent them from seeking work. Among young people ages 15–24, young women are 3 times more likely than young men to give family responsibilities (that is, household chores) as a reason for not seeking work (refer to figure 2.2). Later in life, family responsibilities and pregnancy become the dominant reasons
Women in Rural Jobs | 33
why women do not seek employment. Between ages 35 and 44, family responsibilities and pregnancy impede roughly 85 percent of women from seeking jobs as compared to less than 35 percent of men who report that family responsibilities impede them from doing so.
In rural Ethiopia, although agriculture remains the dominate sector for men and women, women have moved steadily into services over the past two decades (refer to figure 2.3). Between 1999 and 2021, the prevalence of agricultural work has declined for both men and women, but more significantly for women, with the decrease for women about 5 percentage points higher. This decline coincided with a transition into the service sector, rising from only 5 percent of employment in 1999 to 39 percent in 2021. Starting from the same base in 1999, an estimated 22 percent of men now work in services.
Agricultural self-employment is the most common type of employment for men and women (refer to figure 2.4). Agriculture is the main occupation in rural areas, with men systematically participating more than women. Women are more
34 | Wo R k ING Tod AY fo R A B ETTER To M o RR o W IN E THI o PIA
2.1
FIGURE
Rural labor force participation in Ethiopia, by gender, 1999–2021
Percent 60 50 40 30 20 10 0 1999 2005 2013 2021 MenWomenMenWomen MenWomen MenWomen Active Inactive
Source: Ethiopia Labor Force Survey, 1999–2021.
2.2
FIGURE
Source: Ethiopia Labor Force Survey,
Pregnancy or delivery Personal or family responsibility Thought no paid private work available Illness or injury Education or training Other 100 Percent 90 80 70 60 50 40 30 20 10 0 MenWomen 15–24 25–34 35–44 45–64 MenWomenMenWomenMenWomen
Reason for not seeking a job in Ethiopia, by gender and age group, 2021
2021.
likely than men to engage in nonagricultural self-employment, but its prevalence declined between 2013 and 2021. Nevertheless, women’s participation in nonagricultural self-employment is still almost double that of men in 2021.
Women work more in the informal sector than men, although this gap narrows with higher levels of education. As shown in figure 2.5, women with a primary or lower level of education are more likely to work in the informal sector than men with the same level of education. The gap closes after completion of secondary school, almost reaching equality.
Nationally, and across all sectors, women earn only 73 percent of men’s wages (refer to figure 2.6). In rural Ethiopia, women earn their highest wages in services, three times as much as in agriculture. Still, a 27-percentage-point difference exists between the earnings of men and women. The gender wage gap is highest (37 percentage points) in the industrial sector, which employs a higher proportion of men as compared to women.
Women in Rural Jobs | 35
FIGURE 2.3
Source: Ethiopia Labor Force Survey, 1999–2021. Rural men Rural women Agriculture Industry Services AgricultureIndustry Services AgricultureIndustry ServicesAgricultureIndustry Services 100 Percent 90 80 70 60 50 40 30 20 10 1999 2005 2013 2021 0 FIGURE 2.4 Self-employment in rural Ethiopia, by gender, 1999–2021 Source: Ethiopia Labor Force Survey, 1999–2021. 16 14 12 10 6 6 4 Millions 1999 2005 2013 2021 2 0 Rural men Rural women
Rural
employment
in Ethiopia, by sector and gender, 1999–2021
AgriculturalNonagricultural AgriculturalNonagricultural AgriculturalNonagricultural AgriculturalNonagricultural
Informal employment in Ethiopia, by gender and education level, 2021
Source: Ethiopia Labor Force Survey, 2021.
Note: This figure presents national data; that is, it includes both rural and urban samples. Informal workers are those who work in enterprises or businesses that do not have a bank account or a license. Formal workers are those employed in government, nongovernment, and cooperatives. The estimation doesn’t include those who work in subsistence agriculture. Informal employment is measured only for urban areas because of the difficulty in defining informality in a rural context where most people are excluded from the estimation (particularly those in agriculture).
Source: Ethiopia Labor Force Survey, 2021.
Note: This figure presents national data, including both rural and urban samples. It presents simple average wages and thus should be interpreted with caution.
WOMEN IN AGRICULTURE
Agriculture still dominates the work done by men and women in rural Ethiopia (refer to figure 2.7). Across age cohorts, men and women spend 20–31 hours per week on household agricultural activities, 2–9 hours on firewood and water collection, and only 1–5 hours on nonagricultural activities.1 Women tend to spend notably more time than men collecting firewood and water, at the expense of agricultural activities. Nonfarm activities are markedly low across all groups, except for men ages 25–34.
on average, women are at a disadvantage in terms of land and livestock ownership (refer to figure 2.8). Although land size is among the major determinants of agricultural productivity, female-headed households own about half as much land as male-headed households. female-headed households also only own about two-thirds as much livestock as male-headed households.
36 | Wo R k ING Tod AY fo R A B ETTER To M o RR o W IN E THI o PIA
FIGURE 2.6
Monthly wages in Ethiopia, by gender and sector of employment, 2021
Agriculture 1.9 1.3 4.3 4.9 3.6 2.7 Ethiopian birr (thousands)
6 4 2 0
Industr yServices
Men Women
FIGURE 2.5
40 35 30 25 20 15 10 0 AllNo educationLess than primary Pe rcent Completed secondary Completed primary Completed postsecondary 5
Women
Men
FIGURE 2.7
Source: Ethiopian Socioeconomic Survey, 2018/19.
FIGURE 2.8
Men
Women
Parcel size (left axis) Livestock (right axis)
Source: Ethiopian Socioeconomic Survey, 2018/19.
Note: Tropical Livestock Unit is a common unit of measuring ownership of livestock that allows for the description of different livestock species in a single unit. Weights used for conversion are 0.5 for cattle and other farm animals, 0.8 for transport and drought animals, 0.1 for sheep and goat, and 0.01 for chicken.
female-headed households are also disadvantaged in ownership of other agricultural assets. female-headed households have on average half the number of ploughs and solar devices that male-headed households own. This gap decreases slightly for pickaxes (geso) and axes (gejera) (refer to figure 2.9).
Plots generally have limited adoption of improved seeds and fertilizer, but female-managed plots have even lower rates of adoption (refer to figure 2.10). overall, only 10 percent of plots use improved seeds and only about 30 percent use fertilizer. Among female-managed plots, only 7 percent use improved seeds and 20 percent use fertilizer. Male-managed plots have relatively higher adoption rates of improved seeds and fertilizer, at 11 percent and 28 percent, respectively. The adoption rate of improved seeds and fertilizer in jointly managed plots (shown as “Mixed” in figure 2.10) resembles the rate of adoption in plots managed solely by men.
Because of diverse inequities, female-managed agricultural plots produce only 85 percent of what male-managed fields produce. Comparison of differences in field, field manager, and field characteristics between male- and female-managed fields shows the inequities that rural women face in
Women in Rural Jobs | 37
Weekly time spent on various activities in Ethiopia, by gender and age, 2018/19
Agricultural work Other nonfarm Firewood and water collection MenWomen 18–24 25–34 35–49 ≥50 MenWomenMenWomenMenWomen Hours 15 20 25 30 35 40 10 5 0
Land size and livestock ownership in Ethiopia, by gender of household head, 2018/19
0.61 2.21 1.26 3.03 Hectares Tropical livestock units 1.5 2.0 2.5 3.0 3.5 1.0 0.5 0 1.5 2.0 2.5 3.0 3.5 1.0 0.5 0
agricultural production. Using the Blinder– oaxaca decomposition for linear models, decomposition of these various factors shows their statistical significance to influence productivity.
• one area for consideration is inequity in the land itself and the availability of tools to make the best use of it. As compared to male field managers, female field managers work on smaller plots that are closer to the homestead and have lower rental value. female field managers are also less likely to use irrigation, chemical fertilizer, herbicides, pesticides, fungicide, and labor in their fields.
• A second set of issues involves the characteristics of the female farmers, including their time allocation. female field managers are older, less educated, and less likely to be married than their male counterparts. In a typical week, female field managers also spend 6 hours less working in agriculture and 1 hour less in paid wage work as compared to men; their time is diverted into collecting firewood, fetching water, and doing casual and temporary work, which can reach as much as 4 more hours per week than men.
• Third, household characteristics also disadvantage female farmers. Compared to male field managers, female field managers live in households that are less likely to benefit from credit and agricultural extension services. Their households also own fewer livestock and durable assets.
38 | Wo R k ING Tod AY fo R A B ETTER To M o RR o W IN E THI o PIA
FIGURE 2.9
Number of productive agricultural assets owned in Ethiopia, by gender of household head, 2018/19
Number of assets 0.6 0.8 1.0 1.2 0.4 0.2 0
Source: Ethiopian Socioeconomic Survey, 2018/19.
Men Women All Axe (gejera) Pickaxe (geso) Plow (traditional) Solar device
FIGURE 2.10
Use of improved seeds and fertilizer in Ethiopia, by gender of plot manager, 2018/19
9.55 28.79 11.26 28.53 6.82 19.99 9.27 30.31 Percent 15 20 25 30 35 10 5 0
Source: Ethiopian Socioeconomic Survey, 2018/19.
Men Women Mixed All Use of improved seeds Use of fertilizer
for decomposition analysis, land size explains nearly half of the gender gap in agricultural productivity. of the total endowment effect on productivity, land size accounts for 49 percent of the productivity gap. The use of fertilizer and other agrochemicals explains 6 percent and 7 percent of the gap, respectively. Thus, reducing gender disparities in accessing land, fertilizers, and other agrochemicals could alleviate about 62 percent of the gender gap in agricultural productivity.
The difference in time that men and women devote to agriculture accounts for another fifth of the productivity gap. In a typical week, female field managers spend 6 fewer hours working in agriculture, 3 more hours collecting firewood and fetching water, and 0.1 more hour doing casual and temporary work as compared to men. In total, these differences explain 22 percent of the total explained gender gap in agricultural productivity. Policies to reduce time spent on chores by women, therefore, could narrow the gender productivity gap.
female field managers face numerous other constraints that also have a measurable and negative impact on productivity. Age and education, for example, jointly explain about 15 percent of the gender productivity gap. The rate of literacy is lower among female managers (16 percent) than among male managers (46 percent). A higher proportion of female field managers live in households with a lower stock of durable assets and livestock, smaller household sizes, and limited access to extension and credit services. All these variables are associated with a higher gender productivity gap.
Tables 2A.1 and 2A.2 in annex 2A provide a detailed breakdown of this decomposition analysis.
WOMEN IN NONFARM ENTERPRISES
Nineteen percent of rural female-headed households own nonfarm enterprises, or NfEs (refer to figure 2.11). That proportion compares to 14 percent of maleheaded households that own NfEs. for female-headed households, the activity of these enterprises is relatively equally split among nonagricultural business, agricultural business (that is, postharvest, agroprocessing, and so on), and bar or FIGURE 2.11
Women in Rural Jobs | 39
Source: Ethiopian Socioeconomic Survey, 2018/19. Nonagricultural business Prefessional service Agricultural business Transportation Trade and sales Bar or restaurant Other All Men Women Percent 15 20 10 5 0
Ownership of nonfarm enterprises in Ethiopia, by type of business and gender of household head, 2018/19
restaurant services. Male-headed households are more likely to engage in nonagricultural business.
Rural women earn less from NfEs than men but rely more on this source of income (refer to figure 2.12). on average, a household obtains 12,000 Ethiopian birr (Br) per year from NfEs. When disaggregated by gender, male-headed households earn Br 14,000 per year on average as compared to Br 6,000 per year for female-headed households. Income from NfEs represents a higher proportion of total household income for female-headed (36 percent) than for maleheaded households (23 percent), given their lower income earned from other sources such as wage employment and agriculture.
Women are twice as likely as men to face financial constraints to starting a business. female-headed households report finance as their main constraint to starting an NfE—57 percent as compared to 24 percent for male-headed households (refer to figure 2.13). Male-headed households report markets and transportation as the main constraint, and both male- and female-headed households see these issues as the biggest constraint to growing an NfE.
An overwhelming number of factors hinder the productivity of female-managed NfEs, like female-managed farms. Most female-managed enterprises are located inside the household residence. female managers are also younger, less educated, and less likely to be married. The largest contributing factor is that female managers spend more time working on household business and domestic tasks, whereas male managers spend more time on agriculture and wage work, or on apprenticeship. female managers also live in households with fewer members and with a lower stock of durable assets.
As a result, female-managed NfEs sell less than half of what male-managed ones sell. Using monthly enterprise sales as a proxy for productivity, a Blinder–oaxaca decomposition shows a productivity gap of 0.431 between male- and female-managed NfEs. Hours spent on collecting firewood and fetching water explain over 50 percent of the observed gender gap. Transportation costs contribute another 15 percent, possibly because, as noted earlier, women generally operate businesses based in the home rather than closer to markets or other commercial areas, which may increase the cost of transportation for procuring items needed for the enterprise.
Tables 2B.1 and 2B.2 in annex 2B provide more details on this analysis.
40 | Wo R k ING Tod AY fo R A B ETTER To M o RR o W IN E THI o PIA
FIGURE 2.12
Source: Ethiopian Socioeconomic
Note: NFE = nonfarm enterprise. Ethiopian birr (thousands) Percent 5 10 15 20 0 10 20 30 40 0 Men Women All 23.24 14.49 26.39 26.39 35.71 6.05 Income (left axis) NFE income as share of total income (right axis)
Income from nonfarm enterprises in Ethiopia, by gender of household head, 2018/19
Survey, 2018/19.
WOMEN IN WAGE EMPLOYMENT
Participation in wage employment is generally low in rural Ethiopia, and more so among women.2 only about 2.3 percent of working rural women engage in paid work, as compared to 5.8 percent of men (refer to figure 2.14). Among these few, women earn only about 70 percent of the average male wage but work about 90 percent of the hours that men do (refer to figures 2.15 and 2.16).
Women in wage work face similar disadvantages as women in other sectors—with similar negative impacts on their productivity. Their lesser productivity appears linked to demographics, including higher illiteracy rates; higher number of dependents in their households; and the likelihood of being widowed, divorced, or separated. Time allocation also appears to play a role in lowering productivity, as it does for women in agriculture and NfEs. Women spend significantly less time on paid employment and a relatively higher amount of time on household businesses and casual and temporary work. Women engaged in wage work still spend significantly higher amounts of time collecting water and firewood as compared to men.
As noted earlier, women in wage work earn less than their male counterparts. The estimated gender wage gap per year is 0.57. Individual-level factors explain a large proportion of the gender wage gap. Among all the explanatory factors, weekly time spent on firewood collection stands out, explaining about 52 percent of the gender gap in hourly wages. other factors such as time spent on household business, age, and marital status jointly explain 15 percent of the gender wage gap. Thus, reducing hours spent on these activities would help eliminate more than half of the gender gap in wages.
Tables 2C.1 and 2C.2 in annex 2C provide more details on this analysis.
Women in Rural Jobs | 41
FIGURE 2.13
Source: Ethiopian Socioeconomic
Percent 60 80 100 40 20 0 Grow Start All Women Grow Start Finance Markets and transportation Bureaucracy, tax, and governance Electricity, telecommunication, and water Technology Other Grow Men Start
Constraints to starting and growing a nonfarm enterprise in Ethiopia, by gender of household head, 2018/19
Survey, 2018/19.
LIMITED ACCESS TO FINANCIAL SERVICES HINDERS RURAL WOMEN’S PRODUCTIVITY
The impact of limited assets and endowments on women’s productivity signals the need for support services that could help unblock barriers to women’s earning potential. As seen in the previous gender gap analysis, access to assets and
42 | Wo R k ING Tod AY fo R A B ETTER To M o RR o W IN E THI o PIA
FIGURE 2.16
Average hours worked per week in paid wage employment in Ethiopia, by gender, 2018/19
Men Women 34 24 26 28 30 Number of hours 32 28 32
Source: Ethiopian Socioeconomic Survey, 2018/19.
FIGURE 2.15
Last reported month’s salary of those engaged in paid work in Ethiopia, by gender, 2018/19
2,500 2,000 1,500 1,000 500 Ethiopian birr 0 Women 1,521 Men 2,242
Source: Ethiopian Socioeconomic Survey, 2018/19.
FIGURE 2.14
Proportion of employed population that engaged in paid work over the past 12 months in Ethiopia, by gender, 2018/19
Percent 3 4 5 6 2 1 0 Women Men All 4.37 5.76 2.33
Source: Ethiopian Socioeconomic Survey, 2018/19.
endowments is an important factor in explaining the difference observed among men’s and women’s labor outcomes in the different sectors and types of employment. Ensuring women better access to financial services and social safety nets could mitigate these structural inequalities. However, as this section outlines, it appears that, like other endowments, women face disadvantages compared to men in their access to and benefit from such services.
only about 6 percent of women in rural Ethiopia access financial services as compared to over 20 percent of men (refer to figure 2.17); that is, 1 in 5 men owns an account versus only 1 in 16 women. Moreover, on average, only 1 in 4 individuals knows how to open a bank account, but for women this figure drops to nearly 1 in 10 (refer to figure 2.18). Men are also more than twice as likely as women to have access to microfinance or to participate in saving and credit corporations.
Women are about half as likely as men to have savings. Whereas 23 percent of men report saving in any form, only 11 percent of women do (refer to figure 2.19). Men save mostly in commercial banks, but women use informal options, such as family and friends, saving associations and Ekub,3 and at home. Regardless of gender, however, about three-quarters of savings is motivated by preparing for emergency needs rather than for productive investment.
for access to credit, men and women borrow little and do so mostly for agricultural investment. on average, only 15 percent of households report borrowing, typically from relatives or neighbors. Regardless of gender, about
FIGURE 2.17
FIGURE 2.18
Women in Rural Jobs | 43
Source: Ethiopian Socioeconomic Survey, 2018/19. Note: SACCO = saving and credit corporation. Private bank Public bank Microfinance institution SACCO All Percent 15 25 20 10 5 0 Men Women
Proportion
of population that owns an account in a financial institution in Ethiopia, by gender, 2018/19
Proportion of population that knows how to open a bank account in Ethiopia, by gender, 2018/19 Source: Ethiopian Socioeconomic Survey, 2018/19. Percent 15 20 25 30 35 40 10 5 0 All 24.03 Women 12.84 Men 35.73
75 percent of borrowing is for productive investment in agriculture. When applying for credit, however, female-headed households are more likely to be rejected (refer to figure 2.20). female-headed households have a higher rejection rate when applying for loans for productive investment in agriculture, whereas male-headed households have a slightly higher rejection rate for loans for investment in NfEs.
DESIGNING SAFETY NETS TO REDUCE GENDER GAPS
The Productive Safety Net Program (PSNP) is a public service designed to improve the well-being of the rural poor, but the success of gender-sensitive provisions varies across its different components. overall, about half of PSNP clients are women. for the main public works component, in addition to preferential targeting, the design also includes a work exception for pregnant and lactating women for up to a year after birth, links to social services for these women, and provision of childcare in some areas. Nevertheless, women continue to have limited engagement in the planning process of the program, which remains a barrier to their empowerment in the public works program.
PSNP livelihoods activities appear less effective in reaching and benefiting women. Across its various components, women represent less than half of
44 | Wo R k ING Tod AY fo R A B ETTER To M o RR o W IN E THI o PIA FIGURE 2.20
Source: Ethiopian Socioeconomic Survey, 2018/19. Percent 3 4 5 6 2 1 0 All 3.92 Women 5.08 Men 3.66
Credit and loan rejection rates in Ethiopia, by gender of household head, 2018/19
FIGURE 2.19
Socioeconomic Survey, 2018/19. Note: MFI = microfinance institution; SACCO = saving and credit corporation. Banks Informal (family or friends) MFIs and SACCOs Home (cash) All Percent 15 25 20 10 5 0 Women Men
Saving patterns in Ethiopia, by gender, 2018/19
Source: Ethiopian
beneficiaries: 48 percent for the grant, 46 percent for business plans, 45 percent for financial literacy training, 43 percent for savings activities, and only 20 percent in the wage employment pathway. A 2021 tracer study shows that most households receiving a grant decided to participate in the on-farm pathway. Clients reported that their decisions stemmed from that pathway’s longer repayment period and lower interest rate. The terms of the credit may have particularly influenced women, who own fewer assets (refer to figures 2.8 and 2.9) to use as collateral. The tracer study also found that the greater likelihood of women to have previous debts could have influenced their behaviors. Moreover, whereas men saw an increase in saving due to the program, women were less likely to have experienced a change in saving behavior (Laterite 2021).
Women participating in the PSNP livelihoods activities have less education than their male counterparts. In the livelihoods pathway, women also have lower stock of assets such as livestock, agricultural tools, and durables. Women in the wage employment pathway are typically younger, are more likely to be self-employed or unemployed, and have lower reservation wages (Laterite 2020, 2021).
In the fourth phase of PSNP (PSNP4), implementation of gender provisions in the livelihoods design remained a challenge. The design included a 50 percent quota for women, consideration for the provision of livelihoods services in locations that allow women’s participation, and promotion of nutrition-sensitive livelihoods as potential income-generation activities. However, implementation focused on the household, often to the exclusion of women, and most of the livelihoods transfers were for animal rearing, even though many women have reported preferring nonfarm livelihoods options. In addition, because men are assumed to take the lead in income-generating activities, the program lacked technical support and trainings geared specifically to women.
Launched in 2021, the program’s current, fifth phase aims to reduce the gender gaps in access to inputs and in ownership and control of assets, as well as in wage employment. Efforts include trying to target beyond the head of household, training development agents to provide gender-sensitive support, adjusting the trainings and coaching to the needs of female clients, offering a wider menu of self-employment opportunities that might be good options for women, and increasing the value of the livelihoods transfer to allow for large investments.
CONCLUSION
Current gender gaps in agricultural productivity, entrepreneurship, and wage employment limit rural women in Ethiopia from realizing their full economic potential. The 2018/19 Ethiopian Socioeconomic Survey and 2021 Labor force Survey provide an up-to-date picture of the disadvantages across all types of work for rural women, and the Labor force Survey reveals trends through comparison with earlier survey rounds. Educational levels have improved significantly since 1999, with a 30-percentage-point decrease in the proportion of people reporting that they have no education. The nature of this drop, however, means that the gender gap among those with no education has remained consistent, at 27 percentage points, over the past two decades. Women in rural Ethiopia also have limited assets and endowments as compared to men and are financially disadvantaged. only about 6 percent of women in rural Ethiopia can access financial services as compared to over 20 percent of men. Women are about half as likely as men to have savings and are more likely to be rejected when applying for credit.
Women in Rural Jobs | 45
The latest data also show a new and dramatic reversal in women’s labor force participation. o ver the past two decades, about 50 percent of rural Ethiopian women have participated in the labor market, but their levels of activity versus inactivity over this period have shifted. In 1999, 35 percent of women were active, and 15 percent were inactive. In 2005 and 2013, the proportion of active women grew to 42 percent. In 2021, however, that proportion dropped below its 1999 level—only 34 percent of women were active as compared with 18 percent inactive. This variability contrasts with male labor force participation, which remained between 42 percent and 45 percent over the same period (refer to figure 2.1).
The CoVId -19 pandemic had an outsized impact on women’s earnings and job status as compared to men. At its height, 44 percent of female-headed households reported decreased agricultural income resulting from the pandemic, whereas only 25 percent of male-headed households did (Ebrahim et al. 2020). Across Ethiopia, 13 percent of women experienced job losses as compared to 7 percent of men (Sanchez Martin et al. 2020). The pandemic had the greatest negative effect on the service sector, the growth rate of which halved compared to the preceding fiscal year. This drop likely contributed to the variance because of the greater likelihood of women in rural areas to work in services (figure 2.3) and hold informal jobs (see figure 2.5).
The pandemic increased women’s burden of care work, likely further affecting labor outcomes. d uring normal times, social norms place the responsibility for household and family care on women and girls. d uring C oVI d -19, women and girls most likely shouldered the increase in care demands brought about by the closure of schools, the confinement of elderly people, and the growing number of ill family members. This situation clearly increases the risk that many women worldwide will leave their jobs, especially those that cannot be performed remotely, with potentially long-lasting negative effects on female labor force participation. In addition, their caregiving roles both inside and outside the home disproportionately exposed women to C oVI d -19. Globally, women account for 88 percent of personal care workers and 69 percent of health professionals—frontline jobs that require patient contact and cannot be performed from home (World Bank 2020).
f inally, women’s agency might have experienced challenges from the pandemic, with violence against women presenting a particularly egregious example. The combination of patriarchal norms, economic uncertainty, and stress with confinement measures and disruptions in services has already triggered disturbing increases in domestic violence across countries affected by CoVId -19. Such increases prompted the UN Secretary-General’s urgent call to make the prevention and redress of violence against women a key part of national response plans (Grown et al. 2020).
These developments only compound the barriers to successful work that rural women face in Ethiopia. The analysis presented here shows that female-managed farms are only 85 percent as productive as those managed by men. The difference is even more pronounced for enterprise productivity. female-managed enterprises earn less than half what male-managed enterprises earn: roughly Br 6,000 as compared to Br 14,000 annually. Even in wage work, women earn only 70 percent as much as their male counterparts. Although discouraging, these findings are expected and help explain the gender productivity gap noted in this chapter.
46 | Wo R k ING Tod AY fo R A B ETTER To M o RR o W IN E THI o PIA
Public investment in better jobs for rural women could contribute to economic transformation. The rural economy in Ethiopia has stagnated. Before the onset of C oVI d -19 and the outbreak of conflict, domestically and internationally, the Ethiopian economy had experienced steady economic growth. Rural households, however, saw a decline in real income between 2016 and 2019, and low-productivity agriculture accounts for over 75 percent of earnings. only among rural women did a significant shift occur into the service sector; although still less common than agriculture, participation in services holds the potential to spark the economic transformation that has, thus far, eluded the rural economy.
The makeup of these inequities signals potential areas of policy intervention, including training and financial inclusion, that would improve women’s success. Looking at individual characteristics, educational differences between men and women require long-term investment to correct at a structural level, but targeted skills training could help reduce inequities in the immediate term. Time allocation represents another significant drain on female productivity. Interventions that allow women to devote more time to productive activities could have substantial impacts on their earnings. In addition, knowledge of and access to financial services make up another cross-cutting constraint. These three areas of inequity are highlighted not only because of their clear negative impact on productivity but also because they are within the realm of public policy to influence.
NOTES
1. Nonagricultural activities include household business, casual or temporary work, wage work, and unpaid apprenticeship related to the agriculture value chain (for example, postharvest) but not directly related to agricultural production.
2. In rural Ethiopia, wage employment accounts for roughly one-quarter of agricultural work and three-quarters of nonagricultural work. The latter comprises varied activities, including agroprocessing, manufacturing, mining, commerce, transportation, utilities, tourism, and other services (see Pimhidzai et al. 2022).
3. Ekub is a traditional savings and credit practice by which members contribute a fixed sum of money over a specified period and are randomly selected to receive the contribution of the members.
REFERENCES
Buehren, N., P. Gonzalez, and A. Copley. 2019. What Are the Economic Costs of Gender Gaps in Ethiopia? Washington, dC: World Bank.
Ebrahim, M., A. A. Ambel, N. Buehren, T. Bundervoet, A. H. Hailemicheal, G. A. Tefera, and C. Wieseret. 2020. Gendered Impacts of the COVID-19 Pandemic in Ethiopia: Results from a High-Frequency Phone Survey of Households. Monitoring CoVId -19 Impacts on Households in Ethiopia, Report No. 5. Washington, dC: World Bank. https://documents1.worldbank.org /curated/en/497871602828034155/pdf/Monitoring-CoVId -19-Impacts-on-Households -in-Ethiopia-Gendered-Impacts-of-the-CoVId -19-Pandemic-in-Ethiopia-Results-from-a -High-frequency-Phone-Survey-of-Households.pdf
Garikipati, S. 2008. “The Impact of Lending to Women on Household Vulnerability and Women’s Empowerment: Evidence from India.” World Development 36 (12): 2620–42.
ILo (International Labour organization). 2017. World Employment and Social Outlook: Trends for Women. Geneva: ILo.
Women in Rural Jobs | 47
Laterite. 2020. Productive Safety Net Program Wage Employment Pathway Tracer Study draft Report. Addis Ababa, Ethiopia: Laterite.
Laterite. 2021. Productive Safety Net Program Livelihoods Pathway Tracer Study. Addis Ababa, Ethiopia: Laterite.
Pimhidzai, o., E. Chigumira, W. Tesfaye, and M. Yonis. 2022. Leveraging the Transformation in the Agri-Food System and Global Value Chains to Expand Rural Incomes: Ethiopia Rural Income Diagnostics Study. Washington, dC: World Bank.
Sanchez M., M., S. Mulugeta, Z. Getachew, and C. Wieser. 2020. Ensuring Resilient Recovery from COVID-19. Ethiopia Economic Update, Vol. 8. Washington, dC: World Bank.
Sariyev, o., T. k. Loos, M. Zeller, and T. Gurung. 2020. “Women in Household decision-making and Implications for dietary Quality in Bhutan.” Agricultural and Food Economics 8: 1–20.
World Bank. 2012. World Development Report 2012: Gender Equality and Development. Washington, dC: World Bank. https://openknowledge.worldbank.org/entities/publication /51c285f6-0200-590c-97d3-95b937be3271
World Bank. 2019. Ethiopia Gender Diagnostic Report: Priorities for Promoting Equity Washington, dC: World Bank.
World Bank. 2020. Gender Dimensions of the COVID-19 Pandemic. Policy Note. Washington, dC: World Bank. https://documents1.worldbank.org/curated/en/618731587147227244/pdf /Gender-dimensions-of-the-CoVId -19-Pandemic.pdf
48 | Wo R k ING Tod AY fo R A B ETTER To M o RR o W IN E THI o PIA
CHARACTERISTIC MEN (n = 9,945) WOMEN (n = 1,858) p Field characteristics Value of crop production on the field, in Br, mean (SD) 2,646.0 (5,168.1) 2,215.5 (5,371.0) 0.002 Land size in hectares, mean (SD) 0.15 (0.2) 0.09 (0.15) <0.001 Has land certificate 6,479 (73.8%) 1,238 (78.3%) <0.001 Plot distance in kilometers to HH, mean (SD) 0.7 (1.2) 0.6 (1.1) <0.001 Value of rented land (household expenditures) in Br, mean (SD) 1,408.5 (3,115.3) 365.0 (1,573.8) <0.001 Uses irrigation 404 (4.1%) 58 (3.1%) 0.059 Uses inorganic fertilizer 3,197 (32.1%) 485 (26.1%) <0.001 Inorganic fertilizer used, value per hectare in Br, mean (SD) 1,142.7 (7,175.3) 866.3 (3,334.0) 0.10 Uses herbicide, pesticide, or fungicide 1,205 (12.1%) 153 (8.2%) <0.001 Total days of planting and harvest, hired and nonhired labor, mean (SD) 29.7 (26.2) 27.3 (25.5) <0.001 Field manager characteristics Age in completed years, mean (SD) 45.5 (14.4) 48.8 (14.3) <0.001 Can read and write in any language 2,945 (46.3%) 199 (16.4%) <0.001 Has completed primary education 3,866 (38.9%) 232 (12.5%) <0.001 Married 9,178 (92.3%) 538 (29.0%) <0.001 continued ANNEX 2A PRODUCTIVITY OF MALE- AND FEMALE-MANAGED AGRICULTURAL PLOTS
ETHIOPIA
TABLE 2A.1 Field, field manager, and household characteristics, by gender of field manager, rural Ethiopia
IN
Source: World Bank calculations using data from the Ethiopian Socioeconomic Survey, 2018/19.
Note: No significant difference found in exposure to drought, the elevation of the field, use of organic fertilizer, fertilizer used per hectare of land, whether the primary decision-maker is the head of the household, or hours spent on household businesses. Br = Ethiopian birr; DS = direct support; HH = household; PSNP = Productive Safety Net Program; PW = public works (component of PSNP); SD = standard deviation.
2A.2
Women in Rural Jobs | 49 TABLE 2A.1, continued CHARACTERISTIC MEN (n = 9,945) WOMEN (n = 1,858) p Widowed, divorced, or separated 257 (2.6%) 1,234 (66.4%) <0.001 Hours spent on agricultural work, mean (SD) 28.2 (17.5) 22.3 (17.0) <0.001 Hours spent on chores, mean (SD) 3.0 (7.2) 7.1 (9.4) <0.001 Hours spent on casual, part-time, or temporary work, mean (SD) 0.2 (2.7) 0.3 (3.5) 0.086 Hours spent on paid work, mean (SD) 1.1 (7.3) 0.4 (4.2) <0.001 Household characteristics Participates in the extension program 4,938 (49.7%) 817 (44.0%) <0.001 Gets credit service 1,156 (11.6%) 143 (7.7%) <0.001 Household size, mean (SD) 5.4 (2.1) 4.1 (2.0) <0.001 Dependency ratio, mean (SD) 1.1 (0.8) 1.0 (1.0) <0.001 Participates in PW or DS component of PSNP 1,280 (12.9%) 326 (17.5%) <0.001 Durable asset tertile for all sample Lower 7,651 (76.9%) 1,382 (74.4%) <0.001 Medium 2,105 (21.2%) 387 (20.8%) Higher 189 (1.9%) 89 (4.8%) Tropical livestock units as of the time of the survey, mean (SD) 3.0 (2.7) 2.0 (2.3) <0.001
CHARACTERISTIC MEN WOMEN DIFFERENCE Mean agricultural productivity 6.613*** (0.027) 6.271*** (0.086) 0.343*** (0.090) Explained Unexplained Aggregate decomposition 0.291*** (0.090) 0.051 (0.116) YES Field manager characteristics Explained Unexplained Age in completed years −0.007* (0.004) −0.066 (0.378) Can read and write in any language 0.038** (0.018) −0.008 (0.049) Has completed primary education 0.001 (0.017) 0.054 (0.038) Married 0.010 (0.086) 0.605*** (0.146) Widowed, divorced, or separated −0.003 (0.103) 0.664*** (0.205) Hours spent on agricultural work −0.019* (0.011) −0.243** (0.098) Hours spent on household business 0.000 (0.001) −0.074** (0.033) Hours spent on casual or temporary work −0.027** (0.013) 0.002 (0.021) Hours spent fetching water −0.006 (0.011) −0.056 (0.037) Hours spent collecting firewood 0.017* (0.009) 0.069 (0.042) Household characteristics Household reached by extension −0.001 (0.002) −0.019 (0.090) Has access to credit 0.003 (0.002) 0.092*** (0.026) continued
TABLE
Gender gap in agricultural productivity, Blinder–Oaxaca decomposition results, rural Ethiopia
TABLE 2A.2,
Decision-maker on the field is the head of the household
Household size
Household dependency ratio
Household benefits from PW or DS component of PSNP
Housing quality index
Durable asset index
Tropical livestock units as of the time of the survey
Affected by drought over the past 12 months
Field characteristics
(0.005) −0.216 (0.462)
(0.013) 0.291 (0.230)
(0.009) −0.105* (0.058)
(0.002)
(0.032)
(0.007) −0.076 (0.172)
(0.001) −0.336 (0.326)
(0.006) 0.049 (0.115)
(0.004) 0.008 (0.009)
(log) farm size (hectare) 0.143*** (0.025) 0.006 (0.081)
Has a land tenure document or certificate
(0.009) −0.865** (0.354)
(log) distance from farm to the household 0.021*** (0.006)
Uses irrigation
Uses inorganic fertilizer
Uses organic fertilizer
Uses herbicide, pesticide, or fungicide
Uses improved seeds
(0.000)
(0.006)
(0.005)
(0.002)
Total number of days of labor used on the field 0.007 (0.019)
(0.052)
(0.010)
(0.050)
(0.074)
(0.021)
(0.025)
(0.119) Tropic–warm/sub
(0.007)
Tropic–cool/humid vs. tropic–warm/arid
(0.046)
Source: World Bank calculations using data from the Ethiopian Socioeconomic Survey, 2018/19.
(0.171)
Note: The gender of the plot manager represents the gender of the primary decision-maker on plots. Hours spent on agriculture, household business, and casual/temporary work are collected over one-week recall period; hours spent collecting firewood and fetching water are collected over 24-hour recall period and are converted into weekly values. DS = direct support; PSNP = Productive Safety Net Program; PW = public works (component of PSNP); SD = standard deviation.
Standard errors in parentheses. *** p < 0.01, ** p < 0.05, * p < 0.1.
50 | Wo R k ING Tod AY fo R A B ETTER To M o RR o W IN E THI o PIA
CHARACTERISTIC MEN WOMEN DIFFERENCE
continued
0.004
−0.020
0.020**
0.002
−0.048
0.015**
−0.000
−0.003
−0.000
−0.035***
0.013
0.000
−0.023**
0.017***
−0.019
0.004
−0.023
(0.004)
0.020***
−0.025
−0.000
−0.008
humid vs. tropic–warm/arid −0.004
0.001
−0.034
0.075
humid
−0.016
0.038
−0.185
(0.005) Tropic–cool/semiarid vs. tropic–warm/arid
(0.029)
(0.102) Tropic–cool/sub
vs. tropic–warm/arid
(0.014)
(0.284)
0.129***
Constant 0.535 (0.887) 6,039 6,039
−0.039
ANNEX 2B PRODUCTIVITY OF MALE- AND FEMALE-MANAGED NONFARM ENTERPRISES IN ETHIOPIA
Source: World Bank calculations using data from the Ethiopian Socioeconomic Survey, 2018/19.
Note: We found no significant difference in the number of hired workers, number of years in operation, hours spent on household business, borrowing, dependency ratio, and participation in the PSNP. Br = Ethiopian birr; NFE = nonfarm enterprise; PSNP = Productive Safety Net Program; SD = standard deviation.
Women in Rural Jobs | 51
CHARACTERISTIC MEN (n = 336) WOMEN (n = 136) p Enterprise characteristics Average monthly sales, in Br, mean (SD) 2,639.4 (4,837.2) 1,162.6 (1,738.2) <0.001 Aggregate monthly enterprise cost, in Br, mean (SD) 2,760.9 (5,930.0) 1,040.8 (1,823.9) <0.001 Number of years in operation, mean (SD) 11.8 (5.5) 11.8 (5.6) 0.96 Borrowed for NFE purpose 0.0 (0.2) 0.1 (0.3) 0.001 Number of hired workers, mean (SD) 0.4 (2.3) 0.2 (0.8) 0.18 Primary area of operation Home, inside the residence 71 (21.1%) 52 (38.2%) 0.007 Home, outside the residence 83 (24.7%) 37 (27.2%) Traditional market 54 (16.1%) 15 (11.0%) Shop in a commercial area 15 (4.5%) 6 (4.4%) Roadside 38 (11.3%) 9 (6.6%) Mobile 46 (13.7%) 11 (8.1%) River, lake, or pond 5 (1.5%) 1 (0.7%) Construction site 17 (5.1%) 2 (1.5%) Other 7 (2.1%) 3 (2.2%) Household head characteristics Age in completed years, mean (SD) 41.7 (13.3) 38.7 (12.5) 0.025 Married 311 (92.6%) 45 (33.1%) <0.001 Widowed or divorced 6 (1.8%) 86 (63.2%) <0.001 Can read and write in any language 204 (60.7%) 43 (31.6%) <0.001 Hours spent on household business, mean (SD) 9.1 (16.7) 10.7 (18.9) 0.36 Hours spent on agriculture, wage work, and apprenticeship, mean (SD) 21.6 (21.8) 7.0 (16.0) <0.001 Hours spent collecting firewood and water, mean (SD) 3.4 (7.2) 7.6 (10.1) <0.001 Household characteristics Borrowed at least Br 150 in last 12 months 59 (17.6%) 29 (21.3%) 0.36 Household size 5.6 (2.3) 3.4 (1.9) <0.001 Household distance in kilometers to the nearest market, mean (SD) 70.6 (55.2) 87.4 (76.3) 0.008 Dependency ratio 1.1 (0.8) 1.1 (1.2) 0.62 Durable asset tertile 176 (52.4%) 46 (33.8%) <0.001 Lower 121 (36.0%) 72 (52.9%) Middle 39 (11.6%) 18 (13.2%) Upper 70.6 (55.2) 87.4 (76.3) 0.008 Participates in PSNP program 46 (13.7%) 23 (16.9%) 0.39
TABLE 2B.1 Difference in enterprise, household head, and household characteristics of NFEs, by gender of manager, rural Ethiopia
Source:
Bank calculations using data from the Ethiopian Socioeconomic Survey, 2018/19.
= Ethiopian birr; NFE = nonfarm enterprise; PSNP = Productive Safety Net Program.
52 | Wo R k ING Tod AY fo R A B ETTER To M o RR o W IN E THI o PIA
MEN (n = 335) WOMEN (n = 135) Mean value of annual sales 5.896*** (0.171) 5.464*** (0.201) Mean gender difference in the value of annual sales 0.431 (0.265) Explained Unexplained Aggregate decomposition −0.065 (0.309) 0.496 (0.358) Detailed decomposition results Explained Unexplained Monthly cost of salaries and wages, in Br −0.015 (0.025) 0.079 (0.109) Monthly cost of purchases of goods for sale, in Br 0.043 (0.036) 0.002 (0.221) Monthly cost of raw materials, in Br −0.012 (0.030) −0.072 (0.284) Monthly cost of transportation, in Br 0.077* (0.044) −0.325* (0.175) Monthly cost of rent, in Br −0.050 (0.037) 0.094 (0.063) Monthly cost of all other operating costs, in Br 0.010 (0.051) 0.017 (0.029) Yearly licenses cost, in Br 0.020 (0.053) 0.059 (0.846) Number of years in operation 0.005 (0.013) −1.217*** (0.443) Borrowed for NFE purpose 0.031 (0.034) 0.024 (0.088) Number of hired workers −0.040 (0.030) 0.042 (0.040) Primary area of operation is home 0.087 (0.057) −0.032 (0.425) Primary area of operation is market 0.003 (0.025) −0.034 (0.171) Head age −0.170** (0.083) 0.184 (0.980) Head is married 0.817 (0.555) 0.254 (0.640) Head is widowed or divorced −0.777 (0.583) 0.053 (0.660) Head can read and write −0.121 (0.085) 0.157 (0.169) (log) hours spent on agriculture, wage work, and apprenticeship 0.031 (0.154) 1.049*** (0.258) (log) hours spent collecting firewood and fetching water 0.224* (0.118) −0.030 (0.294) Borrowed at least Br 150 in last 12 months 0.013 (0.020) −0.035 (0.160) Household size −0.176 (0.181) −1.034* (0.536) Dependency ratio −0.002 (0.012) −0.273 (0.219) Asset index −0.059 (0.045) −0.077 (0.280) (log) distance in kilometers to the nearest market 0.000 (0.009) 0.292 (1.386) Participates in the PSNP program −0.004 (0.009) 0.014 (0.081) Constant 1.308 (2.088) 470 470
TABLE 2B.2 Gender gap in NFE sales, Blinder–Oaxaca decomposition results, rural Ethiopia
Note:
Standard errors in parentheses. *** p < 0.01, ** p < 0.05, * p < 0.1.
World
Br
ANNEX 2C PRODUCTIVITY OF MEN AND WOMEN IN WAGE EMPLOYMENT IN ETHIOPIA
Source: World Bank calculations using data from the Ethiopian Socioeconomic Survey, 2018/19. Note: Br = Ethiopian birr; PSNP = Productive Safety Net Program; SD = standard deviation.
Women in Rural Jobs | 53
TABLE 2C.1
CHARACTERISTIC MEN (n = 247) WOMEN (n = 74) p Hourly wage or salary, in Br, mean (SD) 42.9 (139.3) 29.1 (60.8) 0.41 Last payment for wages or salary, in Br, mean (SD) 2,242.2 (2,690.7) 1,520.9 (1,552.4) 0.029 Age in completed years, mean (SD) 32.9 (11.5) 32.6 (12.3) 0.84 Married 174 (70.4%) 54 (73.0%) 0.77 Widowed, divorced, or separated 10 (4.0%) 18 (24.3%) <0.001 Head of the household 182 (73.7%) 31 (41.9%) <0.001 Can read and write in any language 192 (77.7%) 43 (58.1%) 0.002 Education level category Preprimary and informal education 224 (91.1%) 58 (81.7%) 0.18 Primary education 8 (3.3%) 3 (4.2%) Secondary education 5 (2.0%) 3 (4.2%) Postsecondary education 2 (0.8%) 1 (1.4%) Diploma 4 (1.6%) 5 (7.0%) Graduate degree and above 3 (1.2%) 1 (1.4%) Hours spent on agricultural work 10.2 (15.5) 6.1 (13.8) 0.044 Hours spent on household business 2.7 (10.9) 3.0 (10.8) 0.83 Hours spent on casual or temporary work 0.3 (0.4) 0.3 (0.5) 0.71 Hours spent on paid wage work 21.6 (22.9) 18.7 (21.4) 0.34 Hours spent fetching water 0.2 (0.4) 0.4 (0.6) <0.001 Hours spent collecting firewood 0.4 (1.0) 0.7 (1.2) 0.030 Employed in PSNP public works 0.1 (0.3) 0.1 (0.3) 0.95 Borrowed Br 150 or above in the last 12 months 42 (17.0%) 8 (10.8%) 0.27 Household size 4.6 (2.2) 4.3 (2.1) 0.30 Household dependency ratio, mean (SD) 0.8 (0.7) 1.0 (0.9) 0.036 Durable asset index, mean (SD) 0.3 (1.5) 0.1 (1.6) 0.36
Individual and household characteristics of wage-employed population, by gender, rural Ethiopia
Detailed decomposition results Explained Unexplained
Source: World Bank calculations using data from the Ethiopian Socioeconomic Survey, 2018/19.
Note: Hours spent on agriculture, household business, and casual/temporary work are collected over one-week recall period and hours spent collecting firewood and fetching water are collected over 24-hour recall period, converted into weekly values. PSNP = Productive Safety Net Program. Standard
54 | Wo R k ING Tod AY fo R A B ETTER To M o RR o W IN E THI o PIA
MEN (n = 244) WOMEN (n = 71) DIFFERENCE (log) hourly wage 2.858*** (0.115) 2.287*** (0.261) 0.571** (0.285)
Unexplained Aggregate decomposition 0.730*** (0.205) −0.160 (0.287)
TABLE 2C.2 Gender gap in hourly wage, Blinder–Oaxaca decomposition results, rural Ethiopia
Explained
Age in completed years −0.007* (0.004) −0.066 (0.378) Married 0.038** (0.018) −0.008 (0.049) Widowed, divorced, or separated 0.001 (0.017) 0.054 (0.038) Head of the household 0.010 (0.086) 0.605*** (0.146) Can read and write in any language −0.003 (0.103) 0.664*** (0.205) Primary vs. preprimary education −0.001 (0.007) 0.140** (0.068) Secondary vs. preprimary education −0.001 (0.014) −0.009 (0.017) Postsecondary vs. preprimary education 0.007 (0.006) 0.001 (0.002) Diploma vs. preprimary education −0.002 (0.004) −0.011 (0.014) Graduate degree and above vs. preprimary education 0.003 (0.004) 0.001 (0.003) Hours spent on agricultural work 0.099* (0.055) 0.206 (0.168) Hours spent on household business −0.023 (0.028) −0.215** (0.093) Hours spent on casual or temporary work −0.064 (0.051) 0.160 (0.155) Hours spent on paid wage work 0.037 (0.034) 0.335* (0.191) Hours spent fetching water 0.380** (0.158) 0.853** (0.404) Hours spent collecting firewood 0.136 (0.107) 0.179 (0.374) Have access to credit −0.041 (0.047) 0.160* (0.093) Household size 0.002 (0.011) −2.115* (1.209) Household dependency ratio 0.022 (0.047) 0.650 (0.594) Durable asset index −0.017 (0.023) −0.407** (0.208) Employed in PSNP public works −0.109 (0.068) −0.074 (0.112) Constant −0.061 (1.498) 315 315
errors in parentheses. *** p < 0.01, ** p < 0.05, * p
0.1.
<
3
Youth Employment in Urban Ethiopia
ASPIRATIONS IN THE LABOR MARKET
SUMMARY*
Ethiopia’s urban labor market is dominated by low-skill service jobs and does not match the needs or aspirations of the country’s growing youth population. Welldesigned public policy can promote job opportunities for young people, particularly vulnerable youth, which also can drive structural transformation of the country’s economy.
• Between 2020 and 2050, Ethiopia’s youth population is expected to jump from 34 million to 54 million. On current trends, these young people will be unprepared for the labor market, and the labor market will not offer them good opportunities.
• Despite increased access to education, more than 70 percent of youth do not advance beyond primary school, and only 20 percent reach tertiary education.
• Youth unemployment is also on the rise; however, the makeup of the unemployed population has remained steady. Since at least 2006, 80 percent of unemployed youth have lower levels of education.
• The increasing number of youths who are not in education, employment, or training reveals gender disparities in the labor market. Young women are three times more likely than young men to be inactive.
• For working youth, the service sector dominates employment and accounts for nearly all job growth in recent years. Three-quarters of urban youth work in service sectors—mostly in low-skill, domestic services.
• Not surprisingly, better-paying service jobs correlate highly to better education levels, and only a small group of highly educated youth obtain better jobs. This issue leaves behind a vast group in need of support.
By Koen Maaskant.
Abebe,
55
The author thanks, without implicating, Girum
Christian Meyer, and Christina Wieser for helpful comments.
INTRODUCTION
The number of young people entering Ethiopia’s urban labor market is expected to accelerate rapidly in the coming years. Between 2020 and 2050, the number of youths ages 15–291 in the country is expected to increase from 34 million to almost 54 million (refer to figure 3.1, panel a). At the same time, both because of population growth and rural–urban migration, urbanization rates are rising rapidly (refer to figure 3.1, panel b; UNDESA 2019b). As a result, the urban population is expected to double, from 20 percent to nearly 40 percent of the total population, by 2050. Both demographics and urbanization will magnify the challenge of urban youth employment in the coming 25 years.
Understanding how Ethiopia’s urban labor market has changed over the past 15 years can help inform future policy decisions about urban youth employment. recent trends in youth unemployment do not suggest that the labor market can absorb the large cohort of youth. This chapter highlights these trends using data from the Urban Employment Unemployment Survey, Ethiopia’s primary survey to document changes in the urban labor market (refer to box 3.1 for details on the survey). The chapter begins by detailing the main trends in labor market indicators. The following section focuses on those for whom the labor market has not been delivering, those who are unemployed, and highlights how unemployment particularly affects women and less-educated youth (that is, those who have completed secondary education or less).2 The chapter then examines those who have reaped the benefits of labor market participation, again through an education-gender lens. After a discussion on the role of aspirations and how they might explain some of the differences between individuals who are employed or unemployed, the chapter concludes with a summary and discussion of suggested policy priorities.
56 | W O r K i NG T ODAY FO r A B ETTE r T OMO rr OW i N E T hi O pi A
0 05 10 15 20 25 30 35 0 10 20 30 40 50 60 70 200020252050 a. Youth population ages 15–29, actual and projected, 2000–2100 20752100 Millions Percent Percent Youth population (left axis) Youth as proportion of total population (right axis) 0 10 20 30 40 50 60 70 80 2000201020202030 b. Urban population as a percentage of total population, actual and projected, 2000–50 2040 2050 World Low-income countrie s Sub-Saharan Africa Ethiopia
FIGURE 3.1
Sources: UNDESA 2019a (panel a); UNDESA 2019b (panel b). Note: The dotted lines indicate projections.
Ethiopia’s rapidly growing youth and urban populations will magnify the challenge of urban youth employment
Ethiopia’s Urban Employment Unemployment Survey
The Urban Employment Unemployment Survey provides statistical data on the distribution, characteristics, size, and economic activity status of the urban population in Ethiopia. The survey has been implemented by the Ethiopian Statistical Service regularly since 2003. The analysis in this chapter focuses on the cross-sectional survey rounds from 2006, 2009, 2011, 2014, 2015, 2016, 2018, and 2020. The 2020 round predates the COV iD-19 outbreak and, therefore, does not show the impact of the pandemic.
The survey is representative for urban areas in Ethiopiaa and includes the following sections:
• household identification,
• Sociodemographic household characteristics,
• Economic activity during the past 7 days for each household member ages 5 years or older,
• Unemployment and characteristics of unemployed people ages 10 years or older, and
• Economic activity during the past 6 months for household members ages 5 years or older.
a. For all survey rounds up to 2020, the survey considered all urban parts of the country but excluded 3 zones of the Afar region and 6 zones of the Somali region, where the residents are pastoralists. In 2020, the survey covered all urban areas in the country, as defined by the 2007 Population and Housing Census. Most rounds of the survey used the 2007 census as a sampling frame, except for the 2006 round, which used the 2004 Urban Economic Establishment Survey.
EMPLOYMENT TRENDS AMONG ETHIOPIAN URBAN YOUTH
Young people are consistently less likely to participate in the urban labor market than older Ethiopians. Apart from a small increase reported between 2010 and 2014, the youth labor force participation rate has hovered around 62 percent, significantly lower than the rate of 76–77 percent for those ages 30 or older (refer to figure 3.2, panel a). Although young women are overall less likely than young men to participate in the labor market, the difference between the two groups has remained constant (refer to figure 3.2, panel b).
Two phenomena—education and inactivity—drive the reduction in Ethiopia’s youth labor force participation. Between 2014 and 2020, the largest shift occurred in the number of youth in school, which increased from 1.6 million to 2.3 million (refer to figure 3.3, panel a). This cohort accounts for 31 percent of youth, almost reaching parity with the 37 percent of youth already working. Over the same period, however, the number of young people not in education, employment, or training (NEET) also increased substantially, by 0.5 million, to about 24 percent of youth in 2020 (refer to figure 3.3, panel b). The significant increase in NEET since 2014 might be explained by the slowdown in economic growth and the political instability in large parts of Amhara and Oromia.
Young women account for most of the increase in the youth NEET population (refer to figure 3.3, panel b). By 2020, female youth were three times as likely as their male counterparts to be NEET. The many reasons for this gap include unequal care burdens and household responsibilities, gaps in educational attainment, and gender pay gaps (Klasen 2019).
Like low education levels, NEET status has well-documented, negative impacts over a lifetime. Early unemployment can have repercussions throughout people’s lives, through both monetary and nonmonetary channels. it can lead to “wage scarring,” whereby those who become unemployed not only lose out on
Youth Employment in Urban Ethiopia | 57
BOX 3.1
Initial increase in Ethiopia’s youth labor force participation rate from 2010 to 2014 reversed after 2015
Despite increased school attendance in Ethiopia since 2014, the number of young people, especially women, left behind has grown
income during the unemployment period but also tend to have lower wages in later jobs (Arulampalam, Gregg, and Gregory 2001). in addition, it can lead to dissatisfaction with their jobs and career progress (helbling and Sacchi 2014).
Despite increased access to education, most youth do not advance beyond primary school. in 2020, 71 percent of youth ages 15−29 had a primary education or less. Whereas the percentage of youth with no education within this group has shrunk slightly (by 3 percentage points), the total percentage remains the same as in 2006. The largest shift in educational attainment between 2006 and
58 | W O r K i NG T ODAY FO r A B ETTE r T OMO rr OW i N E T hi O pi A FIGURE 3.2
Source: Ethiopian Urban Employment Unemployment Survey, 2006–20. Note: LFPR = labor force participation rate. 50 55 60 65 70 75 80 200620082010 Percent Percent 2012
b.
2014201620182020 Youth Rest of labor market 50 55 60 65 70 75 80 2006200820102012201420162018 2020 Male youth Female youth FIGURE 3.3
a.
LFPR, youth (ages 15–29) vs. the rest of the labor market (ages 30–64), 2006–20
LFPR, female vs. male youth, 2006–20
Source: Ethiopian Urban Employment Unemployment Survey, 2014–20. Note: NEET = not in education, employment, or training. 0 0.5 1.0 1.5 2.0 2.5 3.0 2014 2016
a. Activity status of youth, 2014–20
2018 2020 Millions NEET Working and in schoo l In school Work only 0 0.2 0.4 0.6 0.8 1.0 1.2 1.4 1.6
working, not in school In school Working and in school Working only Millions
30% 24% 9% 37%
b. Activity status of youth, by gender, 2020
Not
Female youth Male youth
2020 is the percentage of youth who have achieved higher education (technical and vocational education and training [TVET] or university), which increased from 12 percent to 20 percent. Completing secondary education without continuing to higher education remains uncommon (refer to figure 3.4).
Limited primary education has direct consequences for youth productivity and earnings, yet public spending is skewed toward tertiary education. importantly, the positive returns to education that exist in urban Ethiopia rise sharply for those who complete primary education as compared to those who do not complete primary education. On average, individuals who completed primary education earn 2.5 times the amount earned by those who did not complete primary education (Nath and Wieser 2021). This fact has important implications for education policies in Ethiopia, where over 50 percent of education spending is allocated to the tertiary level.
Urban youth unemployment has also increased to its highest levels in over a decade. Not only are growing numbers of urban youth leaving the labor market, nearly 33 percent of those interested in working are now unemployed. Between 2015 and 2020, urban youth unemployment rose from 23 percent to 26 percent, as compared to a rise from 11 percent to 13 percent for the rest of the labor market (refer to figure 3.5, panel a).3 Despite a similar increase in rate for young men and women, female youth are significantly more likely to be unemployed than men; about 33 percent of young women are unemployed as compared to less than 20 percent of young men (refer to figure 3.5, panel b).
Unemployment is overwhelmingly and consistently linked to lower education levels. From 2006 to 2020, about 80 percent of unemployed youth had a secondary school education or less (refer to figure 3.6). This finding refutes the perception among many that the challenge of urban youth employment rests with university or TVET graduates who have difficulty transitioning into work. in fact, those with higher education represent only 20 percent of unemployed youth. Addressing this reality will require strengthening policies and programs that support labor market transition outside the educational system.
Youth Employment in Urban Ethiopia | 59
FIGURE 3.4
youth
15–29,
Source: Ethiopian Urban Employment Unemployment Survey, 2006–20. 0 5 10 15 20 25 30 35 40 45 200620082010201220142016 Percent 2018 2020 Primary completed No education Secondary Less than primary Higher
Increased access to education in Ethiopia is delivering more educated youth, but the vast majority do not make it beyond secondary school
Educational status of
ages
2006–20
Youth unemployment in Ethiopia has risen since 2015, with large gender disparities
of Ethiopia’s unemployed youth has had consistently low levels of
Secondary education or less Higher than secondary education
Unemployment rates, however, have increased most dramatically for those with higher education. The unemployment rates for less-educated youth increased from 25 percent in 2015 to 27 percent in 2020, whereas unemployment rates for youth with higher education increased from 18 percent to 22 percent, the highest level in nearly 15 years (refer to figure 3.7, panel a). For those with university degrees, unemployment rates more than doubled, from 12 percent in 2015 to 30 percent in 2020.4
Women face consistently higher unemployment rates than men, regardless of educational attainment. The gender disparity is particularly strong for those with less than primary education, 35 percent of women as compared to
60 | W O r K i NG T ODAY FO r A B ETTE r T OMO rr OW i N E T hi O pi A FIGURE 3.5
Source: Ethiopian Urban Employment Unemployment Survey, 2006–20. 0 5 10 15 20 25 30 35 40 200620082010 Percent Percent 20122014 a. Unemployment rate, youth vs. the rest of the labor market, 2006–20 201620182020 0 5 10 15 20 25 30 35 40 2006200820102012 b. Youth unemployment rate, by gender, 2006–20 2014201620182020 Youth Rest of labor market Male youth Female youth FIGURE 3.6
Educational status of
Source: Ethiopian Urban Employment Unemployment Survey, 2006–20. 0 10 20 30 40 50 60 70 80 90 100 2006200820102012 Percent 2014201620182020
Majority
education
unemployed youth, 2006–20
a. Unemployment rates, by educational attainment, 2006–20
14 percent of men (refer to figure 3.7, panel b). Similarly, the unemployment rate among women who have completed primary education is nearly twice as high as that of men who have done so (39 percent vs. 21 percent, respectively).
in contrast, people with no education have the lowest average levels of unemployment. Complex barriers to employment drive this trend. A commonly held theory interprets unemployment as job seekers waiting for higher-paying jobs (Fields 1975; harris and Todaro 1970; Lewis 1954). however, structural factors—such as the nature of labor demand in an economy at an early stage of development, the role of informality, and labor market frictions due to informational and spatial mismatch—likely play an important role as well (Abebe et al. 2021).
The length of time a person remains unemployed has also increased, particularly for those with less education. The percentage of urban youth who were unemployed for over 1 year nearly doubled from 28 percent in 2010 to 52 percent in 2020 (refer to figure 3.8, panel a). in absolute terms, in 2020, unemployment lasted more than 1 year for about 500,000 less-educated youth as compared to 113,000 highly educated youth (refer to figure 3.8, panel b). Over the same 2010–20 period, the percentage of youth who were unemployed for 3 months or less decreased from 36 percent to 11 percent. Thus, unlike the more temporary nature of urban youth unemployment in the past, a growing group of young people cannot enter or reenter the labor market.
Women are significantly more likely to remain unemployed for extended periods. Despite a nearly equal number of women and men who are unemployed for 3 months or less, gender disparity in unemployment length increases steadily the longer someone remains unemployed (refer to figure 3.8, panel c). For those unemployed for more than 4 months but less than 1 year, the number of women is nearly double that of men (280,000 vs. 151,000, respectively). The difference becomes even starker for those who are unemployed for over 1 year (435,000 women vs. 179,000 men, respectively).
b.
Youth Employment in Urban Ethiopia | 61
FIGURE 3.7
Ethiopia’s rising unemployment seems to be driven particularly by gender disparities
200620082010
Source: Ethiopian Urban Employment Unemployment Survey, 2006–20. Note: The dotted line in panel b indicates the average unemployment rate for male and female youth combined.
2018 2016 2014 2012 2020 Percent Secondary education or less Higher than secondary education No education Less than primary Primary completed
SecondaryHigher 0 5 10 15 20 25 35 40 30 Percent 0 5 10 15 20 25 35 40 30
Unemployment rates, by educational attainment and gender, 2020
Male youth Female youth
Duration of unemployment in Ethiopia has increased, particularly for women and those with less education
Men Women
Lengthy periods of youth unemployment raise the prospect of long-term effects on youth. Unemployment for longer periods can lead to negative effects that last significantly beyond the unemployment period, including previously discussed “wage scarring” effects whereby wages will remain lower for those who have been unemployed previously (Arulampalam et al. 2001). in addition, it can lead to individuals’ dissatisfaction with their job and career progress (helbling and Sacchi 2014). Last, the likelihood of obtaining good jobs with formal, full-time, or permanent contracts tends to diminish with extended periods of unemployment.
WHEN THE LABOR MARKET WORKS FOR ETHIOPIAN YOUTH
in 2020, about half of urban youth, 3.4 million people, had jobs. Of those, 650,000 were also still pursuing their education (figure 3.3, panel a). Of all working youth, 847,000 have reached higher education. Most working youth, however, transitioned to work before graduating from secondary school, and 66 percent did not even finish primary school.
62 | W O r K i NG T ODAY FO r A B ETTE r T OMO rr OW i N E T hi O pi A
3.8
FIGURE
Secondary education or less Higher than secondary education Percent 0 100 200 300 400 500 600 ≤ 3 months4 months to 1 year ≥ 1 year b. Duration of unemployment, by educational attainment, 2020 a. Duration of unemployment, 2010–20 2010 2012 2014 2018 2016 2020 Percent 4 months to 1 year ≤ 3 months ≥ 1 year 0 10 20 30 40 50 60 ≤ 3 months4 months to 1 year c. Duration of unemployment, by gender, 2020 ≥ 1 year Percent 0 100 200 300 400 500 600
Source: Ethiopian Urban Employment Unemployment Survey, 2010–20.
In urban areas, about half of employed youth are in wage employment and less likely than other age cohorts to be self-employed. In 2020, 55 percent of urban youth were in wage employment, with about three-fifths of those in the private sector and two-fifths in the public sector (refer to figure 3.9, panel a). Only 30 percent of youth were self-employed as compared to 42 percent of the rest of the labor market. These terms of employment have remained constant for urban, employed youth since 2010. That young people are more likely to have wage employment is encouraging, because wage jobs generally tend to provide better income and job security. In addition, wage employment tends to offer significant upskilling opportunities.
Moreover, unlike other age cohorts, youth are more likely to have wage work in the private rather than in the public sector. In 2020, 2.6 million jobs were in the private sector, whereas only 736,000 were in the public sector (refer to figure 3.9, panel b). In absolute numbers, jobs for youth have grown in the private sector, rising from 1.5 million in 2006 to 2.6 million in 2020, although that growth flattened after 2015. The proportion of jobs in the private sector has held at approximately 80 percent, with some decline observable since 2006. Although the public sector has maintained growth at the same pace as the private sector from 2010 to 2020, change is coming as Ethiopia reaches limits to public investment. The government’s Homegrown Economic Reform agenda focuses on tackling macroeconomic imbalances through a set of sectoral reforms, shifting the development strategy from a public sector–dominated to a private sector–oriented model. In line with this reform agenda, it will be crucial to position the private sector as the driver of economic growth and job creation for the decade to come (Sanchez-Martin et al. 2020).
Youth Employment in Urban Ethiopia | 63
Urban youth in Ethiopia are more likely to have private wage employment and less likely to be self-employed Source: Ethiopian Urban Employment Unemployment Survey, 2020. Note: NGO = nongovernmental organization. a. Terms of employment, youth vs. the rest of the labor market, 2020 Percent Private Public Percent private (right axis) 0 10 20 30 40 45 b. Sector of employment for youth, private vs. public, 2020 Percent Youth Rest of labor market 5 15 25 35 0 40 80 100 20 60 Public/ NGO wage employment Private wage employment Selfemployment Other 55 2008 2006 2012 2014 2018 2016 2020 2010 Millions 0 1.0 2.0 3.0 0.5 1.5 2.5
FIGURE 3.9
Within wage employment, only just over half of those employed have a permanent contract (refer to figure 3.10). This figure obscures a strong contrast along educational lines: 89 percent of youth with higher education have a permanent contract as compared to 37 percent of less-educated youth. The reverse gender divide here is striking; women are slightly more likely to have a permanent job (58 percent) than men (52 percent). in addition, men are significantly more likely to have a casual contract than women (16 percent vs. 5 percent, respectively).
The service sector dominates urban youth employment, even more so than the rest of the labor market. Seventy-four percent of urban youth are engaged in the service sector, 15 percent in industry, and 11 percent in agriculture (refer to figure 3.11). Young women are much more likely than young men to work in services (82 percent vs. 66 percent, respectively) and much less likely to work in industry (10 percent vs. 20 percent, respectively). Those with higher education are also more likely to work in the service sector (84 percent) than those with less education (71 percent). Unsurprisingly, only 4 percent of those with higher education work in urban agriculture. This growth in service sector employment fits with the emerging focus of policy makers and academics around service-led structural transformation in currently developing economies (refer to box 1.3 in chapter 1).
in urban Ethiopia, the fastest job growth has occurred in low-skill, less productive services—the most common type of work for urban youth. The number of young people with jobs in low-skill domestic services, such as retail and transportation, increased from 735,000 in 2006 to 1.6 million in 2020 (refer to figure 3.12). Jobs in services subsectors that have the potential for economic transformation, such as information technology and finance, are still limited, with slightly less than 130,000 youth employed by those sectors in 2020.
Ethiopian youth with higher education are more likely to have a permanent job
64 | W O r K i NG T ODAY FO r A B ETTE r T OMO rr OW i N E T hi O pi A
FIGURE 3.10
Contract
Source: Ethiopian Urban Employment Unemployment Survey, 2020. 0 10 20 30 40 50 60 70 80 90 100 Percent Permanent TemporaryCasual and other Contract
youth
terms, by gender and educational attainment, 2020
All
Male
youth
or less
Secondary education
Higher than secondary
education
Female youth
Urban youth in Ethiopia, especially women, are more likely to work in the service sector
Sectoral employment of young people, by gender and educational attainment, 2020 Source: Ethiopian Urban Employment Unemployment Survey, 2020.
Most service sector jobs in Ethiopia are in low-skill domestic services, which have limited scope for structural transformation
Source: Ethiopian Urban Employment Unemployment Survey, 2020.
Note: Global innovator services include finance; information and communication technology; and professional, scientific, and technical activities. Low-skill tradable services include transportation and storage, accommodation and food, and wholesale trade. Skill-intensive social services include education and health. Low-skill domestic services include retail trade; administrative and support; arts, entertainment, and recreation; and other social, community, and personal services.
Youth Employment in Urban Ethiopia | 65
FIGURE 3.11
41284 1217 71 1714 69 1115 74 01020304050 Percent 60708090 100 Higher than secondary education Secondary education or less 14 20 66 Male youth 81082 Female youth Rest of the labor market Youth Agriculture IndustryServices
3.12
FIGURE
Number of youths with jobs in services subsectors,
0 0.2 0.4 0.6 0.8 1.0 1.2 1.4 1.6 1.8 2006200820102012201420162018 2020 Millions Global innovator services Low-skill tradeable services Skill-intensive social services Low-skill domestic services
2006–20
Although still low overall, this group of subsectors grew 165 percent between 2004 and 2009, followed by growth of 41 percent and 24 percent for 2010–14 and 2014–20, respectively (refer to table 3.1). This growth is encouraging for Ethiopia’s economic transformation but, at the same time, low-skill domestic service jobs clearly will remain an important source of job creation.
Youth with higher levels of education dominate the few skill-intensive service sector jobs. in both global innovator services and skill-intensive social services, the number of youths with higher education outnumber youth with less education by a factor of 3 (refer to figure 3.13, panel a). To some extent, this outcome is no surprise considering the skills required by these types of jobs.
3.1
Ethiopian Urban Employment Unemployment Survey, 2020.
Note: Global innovator services include finance; information and communication technology; and professional, scientific, and technical activities. Skill-intensive social services include education and health. Low-skill tradable services include transportation and storage, accommodation and food, and wholesale trade. Low-skill domestic services include retail trade; administrative and support; arts, entertainment, and recreation; and other social, community, and personal services.
3.13
In Ethiopia, young people with higher education dominate the skill-intensive jobs that have potential for economic transformation
Male youth Female youth
Source: Ethiopian Urban Employment Unemployment Survey, 2020.
Note: Global innovator services include finance; information and communication technology; and professional, scientific, and technical activities. Skill-intensive social services include education and health. Low-skill tradable services include transportation and storage, accommodation and food, and wholesale trade. Low-skill domestic services include retail trade; administrative and support; arts, entertainment, and recreation; and other social, community, and personal services. The
and high occupational
66 | W O r K i NG T ODAY FO r A B ETTE r T OMO rr OW i N E T hi O pi A
TIME PERIOD GLOBAL INNOVATOR SERVICES (%) SKILLINTENSIVE SOCIAL SERVICES (%) LOW-SKILL TRADEABLE SERVICES (%) LOW-SKILL DOMESTIC SERVICES (%) 2004–09 165 119 58 41 2010–14 41 33 37 59 2015–20 24 8 −3 26 Source:
TABLE
Although starting from a low base, Ethiopia’s global innovator services subsector has had encouraging jobs growth, 2004−20
FIGURE
0 0.2 0.4 0.6 0.8 1.2 1.0 Global innovator services Skill-intensive social services
a. Number of youth working in services subsectors, by educational attainment, 2020
Low-skill
YouthSecondary education or less Higher than secondary education Millions 0 20 10 40 30 50 60 70 80 90 100 Percent Low Middle High Less educated Higher educated
b. Occupational skills required for youth, by gender and educational attainment, 2020
Low-skill tradeable services
domestic services
classification into low, middle,
skill levels follows the ISCO-08 categorization in line with ILO (2012).
Although nearly 70 percent of all young people with higher education have a job that requires high occupational skills, less than 5 percent of all youth with less education do (refer to figure 3.13, panel b). The skill divide appears driven by education rather than by gender: young men and women have similar skills profiles in service sector jobs (refer to figure 3.13, panel b).
ROLE OF ASPIRATIONS IN JOB STATUS
This section analyzes youth demand for work with private firms to understand how perceptions and aspirations affect their job search. Do young people hold out for good jobs that might not be feasible for them? Are they waiting for better-paid jobs that might be above what the labor market offers? Or do their expectations align with what the labor market offers?5
The surveys conducted under the Demand Assessment explained in Box 3.2 informed the design of the Urban productive Safety Net and Jobs project Bikat program. This program provides young, less-educated job seekers with an apprenticeship, offering a first work experience in a private company and a certificate at the end of the apprenticeship. it also offers young people a range of life, digital, and job search skills trainings, as well as mentorship within the firm and monthly peer group meetings. The experience and certificate are expected to improve both the skills of participants and their ability to demonstrate these skills to potential employers, thereby improving their employment prospects.
The Demand Assessment focuses on a particularly vulnerable group: lesseducated urban youth, ages 18–25, who are currently unemployed. To understand whether an apprenticeship program for young job seekers would align with the interests of job seekers, as well as of receiving firms, a telephone survey was deployed to interview many job seekers and firms toward the end of 2020. Box 3.2 further details the data collection and methodology used.
BOX
Demand assessment for the Urban Productive Safety Net and Jobs Project’s apprenticeship program
The demand assessment was conducted over the telephone by professional enumerators in November— December 2020. The survey reached 1,552 job seekers and 605 firms. representative sampling frames were used for both supply and demand sides.
• Job seekers. A sampling frame was taken from all job seekers registered at One-Stop Service Centers through the #etworks app, a job seeker registration app rolled out by the Jobs Creation Commission (now the Ministry of Labor and Skills). The sampling focused on Addis Ababa,
with job seekers drawn from all subcities, and was stratified along gender and educational attainment to ensure representativeness of data across these variables.
• Firms. A sampling frame was taken from a database of formal firms from the Ministry of Trade and industry. The sampling focused on Addis Ababa, with firms drawn from all subcities, and was stratified for the manufacturing and service sectors, with manufacturing oversampled. Telephone-based interviews were conducted in most cases (88 percent) with the firm’s manager.
Youth Employment in Urban Ethiopia | 67
3.2
A large discrepancy exists between the terms of employment that these job seekers prefer and what their similarly educated peers can obtain in the labor market. in urban areas, nearly half of employed youth with less education work in wage jobs (refer to figure 3.14). Although only 35 percent of less-educated youth are self-employed, 78 percent of unemployed survey respondents would prefer self-employment.
Few unemployed youth want to pursue low-skill jobs. Although 31 percent of youth (and 37 percent of less-educated youth) work in low-skill jobs, when asked what jobs they would like, 87 percent of job seekers would prefer to have a middle-skill job (refer to figure 3.15). Only 7 percent indicated they would like to have a low-skill job, and no difference appears to exist between young men and women in this regard (9 percent and 5 percent, respectively). Of all jobs, those in sales are preferred; nearly half of young people surveyed would like to pursue a sales job in a shop or in the street or market.
Wages represent the biggest misalignment between youth aspirations and reality in the labor market. Young people in wage employment earn an average of 2,346 Ethiopian birr (Br) per month,6 with less-educated youth earning Br 1,760 (refer to figure 3.16). however, when asked to estimate the average monthly starting salary from wage employment, less-educated youth indicated nearly double the actual wage (that is, they estimated Br 3,000). This perception may influence young people’s behavior and set reservation wages 7 above
Majority of unemployed youth want to be in self-employment, but their employed peers are predominantly in wage employment
Employment terms for youth ages 18–25, real vs. aspirational, by educational attainment, 2020
68 | W O r K i NG T ODAY FO r A B ETTE r T OMO rr OW i N E T hi O pi A
FIGURE 3.14
Sources: Ethiopian Urban Employment Unemployment Survey, 2020; Urban Productive Safety Net and Jobs Project Bikat Program Demand Assessment, 2020. 46 84 54 47 22 78 35 11 30 42 18 11 16 11 Wage employment Self-employment Other Rest of the labor market, 30+ Employed youth Unemployed youth with secondary education or less Employed youth with secondary education or less Employed youth with higher than secondary education Reality Aspiration 0102030405060708090 100 Percent
Although many of their less-educated peers work in low-skill jobs, few unemployed young people want such jobs
Occupational skills required for jobs, real vs. aspirational, by gender and educational attainment, 2020
market rates. Only a quarter of respondents had wage expectations that align with actual earnings. At the 25th percentile, the lowest monthly salary young people would accept is Br 1,600.
Firms, however, offer higher wages only to more highly educated young people. Firm managers were asked what the typical monthly wage is for a junior position, separately for workers with less and those with more education (refer to figure 3.17). The managers indicated a significant premium for education, with less-educated youth being offered Br 1,500 and more highly educated youth offered Br 3,000 on average. in addition, industry, a sector much less preferred by youth, offers much higher wages for those with less education than those workers could earn for similar positions in the service sector.
Young people have even more dramatic misperceptions about self-employment earnings than they do about wage work. They seem to believe that self-employment will earn them significantly more than wage employment. On average, respondents estimated that the average starting monthly income from a future business would be Br 5,000. A quarter of young people expected Br 10,000 or more. in stark contrast, proxying analysis of consumption data from the most recent Ethiopian Socioeconomic Survey (2018/19),8 the income from selfemployment is estimated at only approximately Br 2,000.
Earning aspirations, however, represent only a small part of why youth report not working. When young people were asked why they were currently not working, the most commonly cited reason (42 percent) is that they believe no jobs are available (refer to figure 3.18). This belief could reflect a true lack of jobs (that is, a depressed demand side of the labor market), but it could also reflect a broader misalignment in the types of jobs available and the fact that job seekers do not like the available jobs that they judge to be relevant to them and that job seekers do not like the jobs that fit their skill level.
Youth Employment in Urban Ethiopia | 69
FIGURE 3.15
7 37 31 87 60 54 9846 5895 6 15 3 0102030405060708090 100 Female youth Male youth All youth Employed youth with secondary education or less All youth Aspirations Percent Reality Low Middle High
Sources: Ethiopian Urban Employment Unemployment Survey, 2020; Urban Productive Safety Net and Jobs Project Bikat Program Demand Assessment, 2020. Note: The classification into low, middle, and high occupational skill levels follows the ISCO-08 categorization in line with ILO (2012).
FIGURE 3.16
Income expectations of Ethiopian youth do not align with labor market realities, 2020 Income (wage employment), consumption (self-employment), and aspirational earnings for youth ages 18–25
Youth
Wage Employment
Reality
Aspirations
Self- employment
Youth with secondary education or less Youth
Less-educated youth
Lowest monthly salary that job seekers would accept
Average monthly starting salary from wage employment Ethiopian birr
25th percentile
median
75th percentile
Sources: Ethiopian Urban Employment Unemployment Survey (UEUS), 2020; Ethiopian Socioeconomic Survey (ESS), 2018/19; Urban Productive Safety Net and Jobs Project Bikat Program Demand Assessment, 2020. Note: Wage and consumption estimates from the UEUS and ESS have been deflated with a Consumer Price Index to ensure comparability.
What is driving this vast misalignment in expectations? in part, social forces and behavioral patterns shape aspirations. Aspirations of youth are influenced by their background, level of education, income status, and access to economic opportunities. Aspirations are intricately linked with available information and the behavioral biases of job seekers in interpreting the data available. Several recent experiments, however, have yielded interventions that can change job seekers’ beliefs about the labor market or address workers’ behavioral biases (Abel et al. 2019; Falk, huffman, and Sunde 2006).
Limited exposure to the labor market likely also influences youth aspirations. An experiment by Abebe et al. (2017) organized a job fair to increase the exposure of job seekers to firms. They found that the job fair led to many interactions between youth and firms, and changed young people’s assumption that firms are not looking for labor. Although firms made 55 job offers to low-skilled workers, less than 15 percent of workers accepted those offers. After the job fair, however, low-skilled workers adjusted their reservation wages down, highlighting that the experience of the job fair made them realize their initial expectations were unrealistic.
70 | W O r K i NG T ODAY FO r A B ETTE r T OMO rr OW i N E T hi O pi A
1,000 2,000 3,000 4,000 5,000 6,000 7,000 8,000 9,000 10,000
Average monthly starting income from future business
FIGURE 3.17
Wages offered by Ethiopian firms to junior employees with higher education are more in line with youth expectations, but wages offered for those with less education do not meet those expectations
Monthly wage for a junior position in a firm, by educational attainment, 2020
01,0002,0003,0004,0005,000
25th
Unemployed Ethiopian youth cite lack of jobs as the most common reason for not working
Reasons for not working, unemployed youth ages 18–25, 2020
other (2.1 percent); vacation, holidays (1.1 percent); bad weather, natural disaster (0.7 percent); long-term disability (0.4 percent); shift work, flex time, nature of work (0.2 percent); and strike or labor dispute (0.1 percent). 42.2 13.1 7.8 6.0 5.8 4.2 3.9 3.4 3.3 0 5 10 15 20 25 30 35 40 45 Percent Jobsarenotavailable WorkbreakEducationortrainingWaitingtostartnewjoborbusinessOtherpersonalleaveMaternity/paternityleaveWaitingforbetteropportunitiestostart anewjoborbusinessSickness,illness,accidentTemporarylayoff,no clientsor materials
Youth Employment in Urban Ethiopia | 71
6,000 Services Industry Total Services Industry Total Secondary education or less Higher than secondary education Ethiopian birr Median
percentile
Source: Urban Productive Safety Net and Jobs Project Bikat Program Demand Assessment, 2020. Note: Firms were asked the following question: “What is the current average monthly wage in your firm for a junior position? [A junior position is the least paid position in an occupation category, which is typically offered to workers who have just joined the firm and have little previous work experience].” percentile
75th
FIGURE 3.18
Source: Urban Productive Safety Net and Jobs Project Bikat Program Demand Assessment, 2020. Note: The figure shows responses for just under 90 percent of respondents. The remaining respondents gave the following reasons: low or off-season (2.9 percent); work in family or household business without pay (2.9 percent);
CONCLUSION
Creating jobs for less-educated young Ethiopians must be a top policy priority. The growth of Ethiopia’s youth population by a potential 20 million people in the coming decades will present a major challenge in the country’s labor market. Action is needed now to prepare today’s youth and for future generations for job opportunities available in the labor market and matching their skill levels.
Contrary to public perception, urban youth unemployment is and will likely remain a challenge for those with less education. Since 2006, employment status has been closely linked to education levels, with at least 80 percent of unemployed youth having a secondary education or less. Although many believe that the challenge of urban youth employment involves those who enter the labor market as new university or TVET graduates, the Urban Employment Unemployment Survey data clearly show that this group represents only 20 percent of unemployed youth.
This trend points to the need to focus on job opportunities and transitions for urban youth who lack formal technical, vocational, or academic training. The government must continue its efforts to expand primary and secondary education to overcome the country’s underlying skills gap. At the same time, providing labor market entry to less skilled youth who have limited job opportunities is also necessary and will require strengthening policies and programs that support youth outside of the educational system.
Ethiopia’s safety net programs can reach less-educated youth with targeted support for better self-employment opportunities or match them with wage jobs. These programs can help young people navigate the challenges of the country’s current labor market. They can bridge educational gaps, with skills training programs tailored for young people. They can lower financial barriers to starting new enterprises or searching for wage work. Furthermore, they can offer a pathway of information between job seekers and the labor market. These concrete steps can build better opportunities to engage young people productively in the Ethiopian economy.
NOTES
1. There is no universally agreed-on definition of youth. The United Nations (1981) defined youth as those ages 15–24; however, the government of Ethiopia uses a slightly broader definition in its Youth policy, including those ages 15–29 (Federal Democratic republic of Ethiopia 2004). The analysis in this chapter follows the latter definition.
2. Throughout this chapter, less educated refers to all youth who did not receive any education, have incomplete or complete primary education, or have incomplete or complete secondary education; higher education refers to all youth who received a TVET or university education.
3. According to the international Labour Organization, the narrow definition of unemployed includes those who are without work, available for work, and seeking work (iLO 1982). in developing countries such as Ethiopia where no strong labor market information is available, labor absorption is inadequate, and the labor force is predominantly self-employed the standard definition with its emphasis on the seeking work criterion is somewhat restrictive and might not fully capture the prevailing employment situation. The analysis in this chapter, therefore, uses the “relaxed” unemployment definition that does not require the third criterion.
4. Given data limitations, this chapter combines TVET and university into a single group, higher education.
72 | W O r K i NG T ODAY FO r A B ETTE r T OMO rr OW i N E T hi O pi A
5. A large literature exists on aspirations in the labor market. Throughout this section, aspirations refer to the expectations that young people have about the labor market, both in monetary (that is, salary) and nonmonetary terms (for example, career progression, stability, or location).
6. This analysis uses medians for averages to ensure that outliers, especially on the higher end of the distribution, do not misrepresent the earnings for most of the youth.
7. A reservation wage is defined as the lowest wage at which an individual is willing to work or accept a job.
8. Under reasonable assumptions, consumption matches income in approximation. Unless significant income shocks occur, the main difference between income and consumption should be savings. Because wage and consumption data are available for those who have wage employment, an interesting comparison of these data is possible. The comparison shows that consumption is approximately 15 percent lower than income. As such, the comparison is not perfect but provides a conservative lower bound of income.
REFERENCES
Abebe, G., S. Caria, M. Fafchamps, p. Falco, S. Franklin, and S. Quinn. 2021. “Anonymity or Distance? Job Search and Labour Market Exclusion in a Growing African City.” Review of Economic Studies 88 (3): 1279–310.
Abebe, G., S. Caria, M. Fafchamps, p. Falco, S. Franklin, S. Quinn, and F. Shilpi. 2017. “Job Fairs: Matching Firms and Workers in a Field Experiment in Ethiopia.” policy research Working paper 8092, World Bank, Washington, DC.
Abel, M., r. Burger, E. Carranza, and p piraino. 2019. “Bridging the intention-Behavior Gap? The Effect of plan-Making prompts on Job Search and Employment.” American Economic Journal: Applied Economics 11 (2): 284–301.
Arulampalam, W., p. Gregg, and M. Gregory. 2001. “Unemployment Scarring.” Economic Journal 111: F577–84.
Falk, A., D. huffman, and U. Sunde. 2006. “Self-Confidence and Search.” iZA Discussion paper No. 2525, institute of Labor Economics, Bonn.
Federal Democratic republic of Ethiopia. 2004. National Youth Policy. Addis Ababa: Ministry of Youth, Sports and Culture.
Fields, G. S. 1975. “rural–Urban Migration, Urban Unemployment and Underemployment, and Job-Search Activity in LDCs.” Journal of Development Economics 2 (2): 165–87.
harris, J. r., and M. p. Todaro. 1970. “Migration, Unemployment and Development: A TwoSector Analysis.” American Economic Review 60 (1): 126–42.
helbling, L. A., and S. Sacchi. 2014. “Scarring Effects of Early Unemployment among Young Workers with Vocational Credentials in Switzerland.” Empirical Research in Vocational Education and Training 6 (12): 1–22.
iLO (international Labour Organization). 1982. “resolutions Concerning Economically Active population, Employment, Unemployment and Underemployment.” Adopted by the 13th international Conference of Labour Statisticians, October, para. 10. https://www.ilo.org /wcmsp5/groups/public/---dgreports/---stat/documents/normativeinstrument/wcms _087481.pdf
iLO (international Labour Organization). 2012. International Standard Classification of Occupations: ISCO-08. Geneva: international Labour Office.
Klasen, S. 2019. “What Explains Uneven Female Labor Force participation Levels and Trends in Developing Countries.” World Bank Research Observer 34: 161–97.
Lewis, W. A. 1954. “Economic Development with Unlimited Supplies of Labor.” Manchester School 22 (2): 139–91.
Mejía-Mantilla, C., and J. Walsh. 2020. Psychological Support and Labor Market Performance for Youth in Addis Ababa. policy Note. Washington, DC: World Bank. https://documents .worldbank.org/en/publication/documents-reports/documentdetail/786151591597904580 /psychological-support-and-labor-market-performance-for-youth-in-addis-ababa-policy -note.
Youth Employment in Urban Ethiopia | 73
Nath, S., and C. Wieser. 2021. What Explains Wage Differentials for the Urban Wage Earners: Returns to Education for Ethiopia’s Urban Wage Employed. Washington, DC: World Bank.
Sanchez-Martin, M., S. Mulugeta, Z. Getachew, and C. Wieser. 2020. Ensuring Resilient Recovery from COVID-19. Ethiopia Economic Update, Vol. 8. Washington, DC: World Bank.
United Nations. 1981. General Assembly, session 36/215
UNDESA (United Nations, Department of Economic and Social Affairs, population Division). 2019a. World Population Prospects 2019, Online Edition rev. 1, Comprehensive Tables. New York: United Nations. https://www.un.org/development/desa/pd/sites/www.un.org development.desa.pd/files/files/documents/2020/Jan/un_2019_wpp_vol1_comprehensive -tables.pdf
UNDESA (United Nations, Department of Economic and Social Affairs, population Division). 2019b. World Urbanization Prospects: The 2018 Revision. New York: United Nations.
74 | W O r K i NG T ODAY FO r A B ETTE r T OMO rr OW i N E T hi O pi A
4
Disability and Work in Ethiopia
SUPPORTING ACCESS TO GOOD JOBS
SUMMARY*
Good jobs offer a pathway to better social and economic inclusion for people with disabilities. In Ethiopia, like many countries, people with disabilities face multifaceted barriers in the labor market. A critical need exists to understand these barriers in more detail to inform evidence-based policies that engender better job outcomes.
• People with disabilities are marginalized in Ethiopian society and have few opportunities for good jobs. They are poorer, less educated, and less likely to be employed than those without disabilities. Employment opportunities are often limited to specialized shelters, handicraft works, and petty trade. Women with disabilities and other traditionally marginalized groups face an even worse situation.
• Employment and decent work can break the cycle of poverty and exclusion for people with disabilities. Enabling them to contribute to the self-sufficiency of their families—whether through productive activities or indirectly through generating a source of income—is an important factor in restoring dignity.
• Recent political reforms present an opening to holistically address the multiple barriers faced by people with disabilities. Ethiopia has existing policies supporting disability rights, and a newly created Disability Affairs Directorate in the Ministry of Women and Social Affairs is working on an Ethiopian Disability Act that could—if properly capacitated—reshape the government’s conceptualization of disability.
• Social safety nets are well-positioned to help alleviate poverty among and promote jobs for people with disabilities. Social insurance programs also provide income support to workers who become disabled, but high informality limits access to these programs to only a few workers.
By Simon Narbeth and Andrey Tretyak. The
Gustavo Demarco for
75
authors thank
constructive suggestions and comments.
• Success of reforms also requires the meaningful participation of people with disabilities and their representative organizations from the outset, in line with the implementation of the United Nations’ Convention on the Rights of Persons with Disabilities and the Disability Inclusion and Accountability framework developed by the World Bank.
INTRODUCTION
Globally, people with disabilities are disproportionately excluded from the workforce, as well as from other areas of life. having regular, gainful employment is closely linked to better health, well-being, self-esteem, access to lifelong education, and social inclusion. People with disabilities face serious barriers in all these areas (Wickenden et al. 2020). Lower labor force participation rates represent important pathways through which disability can lead to poverty (Who and World Bank 2011).
In Ethiopia, people with disabilities face disadvantages across various aspects of life, including work opportunities. Nationally, households that include a person with a disability are 5 percentage points more likely to be poor than households that do not. People with disabilities are only half as likely to be able to read and write as those without a disability. Sixty-four percent of people with disabilities have no education, and only 10 percent have completed primary, secondary, or postsecondary education. These disadvantages contribute to poor labor market outcomes for Ethiopians with disabilities.
This chapter explains why the promotion of disability-inclusive employment is an important human capital investment and catalyzer of economic and social development. following a framework discussion on positioning global concepts around people with disabilities, this chapter presents the evidence, although limited, on their current situation, focusing on employment barriers for them and their families. from there, the chapter discusses the policy and programming framework and concludes with reflections on how to better understand— and therefore better address—the barriers people with disabilities face in accessing decent work opportunities.
FRAMEWORK FOR UNDERSTANDING DISABILITY
Disability is not rare and is part of the human condition. A joint publication of the World health organization (Who) and the World Bank has estimated that 1 billion persons live with disabilities globally—approximately 15 percent of the world’s population (Who and World Bank 2011). According to the same source, an estimated 20 percent of the world’s poorest individuals have a disability. Understanding and addressing the needs of people with disabilities is critical to achieving the United Nations Sustainable Development Goals (SDGs) that pledge to leave no one behind.
Disability is a multifaceted concept that is difficult to define and measure. The United Nations Convention on the Rights of Persons with Disabilities (CRPD) does not explicitly define the word disability.1 Instead, the CRPD recognizes people with disabilities as those individuals “who have long-term physical, mental, intellectual, or sensory impairments which in interaction with various barriers may hinder their full and effective participation in society on an equal
76 | Wo R k ING To DAy fo R A B ETTER To M o RR o W IN E T h I o PIA
basis with others.”2 Moreover, the CRPD focuses on the negative social attitudes and physical barriers that prevent people with disabilities from participating fully in society rather than exclusively on individual impairments. Its preamble recognizes that “disability is an evolving concept and that disability results from the interaction between persons with impairments and attitudinal and environmental barriers that hinders their full and effective participation in society on an equal basis with others.”3 As of 2022, 164 countries, including Ethiopia, and regional integration organizations have ratified and signed the CRPD and thus recognize this common modern approach to disability.
how governments approach disability affects the lives of people with disabilities. The conceptual model of disability has evolved over time and shapes how disability is understood, what data on disability are collected, and how these data are then interpreted and acted on (refer to box 4.1). The focus on a conceptual model recognizes that people with disabilities are entitled to the same rights as other people but face many barriers in realizing those rights (Al Ju’beh 2015).
The conceptual models presented should be adapted to social safety net and social insurance programs for people with disabilities. The main strength of such programs is income protection, although not necessarily in the form of charity. They do not clearly fall under the medical model either, because rehabilitation is not always part of the benefits provided. Support to people with disabilities under these programs—as well as active labor market policies—should use the social model as a better foundation to support productive, economic, and social inclusion.
Disability can perpetuate a cycle of exclusion and poverty (Groce, kembhavi, et al. 2011; Jones, Seager, and yadete 2021; Mitra, Posarac, and Vick 2011; Mora et al. 2021; Walker 2013). The relationship between poverty and disability is
BOX 4.1
Main conceptual models of disability
The charity model focuses on the individual and tends to view people with disabilities as passive victims— objects of pity who need specific care (often segregated from society) and whose impairment is their main identifier.
The medical model constitutes progress as compared to the charity model and describes disability as a health condition, disease, or result of trauma. This model focuses on the prevention, treatment, or cure for the disabling condition. Under this model, medical rehabilitation is seen as the most effective response, enabling the individual to participate more fully in society. This approach is still prevalent in many societies today.
The social model or biopsychosocial model—based on the International Classification of Functioning,
Disability and Health —is a more recent approach to disability and is embraced in the United Nations Convention on the Rights of Persons with Disabilities. This model recognizes that disability is part of the human condition and that almost everyone will experience temporary or permanent impairment at some point in life. The social model highlights the interaction between people with impairments and their social environment. It emphasizes the capacities of people with disabilities and focuses on how society can adapt to these by changing attitudes, practices, and policies to remove barriers to participation, while also acknowledging the role of medical professionals.
Disability and Work in Ethiopia | 77
Sources: Al Ju’beh 2015; Rohwerder 2015; WHO and World Bank 2011.
commonly accepted as a vicious cycle: disability increases the risk of poverty, and the conditions of poverty increase the risk of disability—refer to figure 4.1 (Banks, kuper, and Polack 2017; DfID 2000). As a result, people with disabilities are usually among the poorest and can experience higher costs in their daily living expenses because of their disability, and these costs are often passed on to their families (Mitra et al. 2017). Although intersecting inequalities and personal factors can influence the experience of disability, breaking this cycle of poverty and disability is critical to bring about change in the lives of people with disabilities and their families and communities (Rohwerder 2015; W ho and World Bank 2011).
Multiple types of barriers contribute to the exclusion of people with disabilities. Social barriers result in stigmatization and discrimination, denying people with disabilities their dignity and potential. These barriers constitute a great obstacle to achieving equality of opportunity and social integration (Rohwerder 2018; UNICE f 2017). Environmental barriers can result from structural obstacles in the natural or built environment that limit participation and inclusion in society. Inaccessible communication systems prevent access to information, knowledge, and opportunities to participate. Institutional barriers include laws, policies, strategies, and practices that discriminate against people with disabilities. Many countries still have restrictive laws, particularly those affecting people with psychosocial or intellectual and developmental disabilities (Al Ju’beh 2015). Discrimination may be unintended, but systems can indirectly exclude people with disabilities by not considering their needs (Who and World Bank 2011).
These barriers create lasting disadvantages throughout people’s lives. People with disabilities face unequal access and development outcomes because of
78 | Wo R k ING To DAy fo R A B ETTER To M o RR o W IN E T h I o PIA
FIGURE 4.1
Vulnerability to poverty and ill health Disability Poverty Denial of opportunities for economic, social, and human development Deficits in economic, social, and cultural rights Reduced participation in decision-making and denial of civil and political rights Social and cultural exclusion and stigma
Vicious cycle of poverty and disability
Source: DFID 2000.
often-intersecting barriers in all sectors, including social protection and safety nets (kidd et al. 2019), and they face discrimination across legal, policy, and social structures, including within families and communities.4 People with disabilities have worse education and health outcomes, are more likely to be food insecure and have poor housing, and are more vulnerable to shocks (including CoVID-19 and conflict).
Removing barriers to the productive inclusion of people with disabilities can result in broad social and economic gains. Many people with disabilities who are capable of working cannot secure a job and thus remain part of an underutilized segment in the labor force and in the wider economy (ILo 2015; Rohwerder 2015). In 2009, an International Labour organization (ILo) study of 10 low- and middle-income countries estimated that costs from lower labor productivity and exclusion of people with disabilities amounted to approximately 3–7 percent of the gross domestic product (Buckup 2009). Another estimate suggests that, in the United States, adding an additional 1 percent of people with disabilities to the labor force could boost gross domestic product up to US$25 billion (Accenture 2018). Eliminating the barriers that exclude people with disabilities from jobs and economic opportunities would enable countries to expand their productive population and maximize their human resources in the long run.
Improving employment and decent work is one pathway to break the cycle of poverty and marginalization for people with disabilities (United Nations 2019). Decent work and employment are essential for the well-being and dignity of all, including people with disabilities. Being able to work has a positive impact on social inclusion and the quality of life of individuals and households (W ho and World Bank 2011). It is also essential for the economic empowerment and independent living of people with disabilities (United Nations 2019).
International policy frameworks inform approaches to work and disability. The 2030 SDGs call for increased attention to people with disabilities, including target 8.5 to achieve full and productive employment and decent work for all women and men, including people with disabilities, and equal pay for work of equal value. others include CRPD Articles 8, 9, 24, and 27, which promote disability inclusion and tackle discrimination faced by people with disabilities. In 2013, the human Rights Council’s General Assembly adopted a resolution on employment and people with disabilities, which calls on states to ensure that people with disabilities can fully enjoy the right to work on an equal basis with others and requests measures to prohibit discrimination, increase employment, promote entrepreneurship, eliminate barriers that hinder job seekers from accessing the workplace, and ensure reasonable accommodation, among others. Refer to Box 4.2 for the World Bank’s commitment to employment for people with disabilities.
In practice, however, people with disabilities have difficulty finding work. Globally, despite the growing number of people with disabilities in the workforce, people with disabilities, particularly women, remain more likely to be out of work than people without disabilities.5 Low school completion rates contribute to low literacy rates among people with disabilities and, in combination with discrimination in the labor market, conspire to deprive them of decent work opportunities (Mitra, Posarac, and Vick 2013; Who and World Bank 2011). Those who do have jobs are often underemployed or work part-time, earn lower wages (UNDESA 2019), and have fewer opportunities for career development because of the absence of inclusive skills development programs and access to technology.
Disability and Work in Ethiopia | 79
World Bank commitments and programs on disability-inclusive development: Haiti and Ethiopia
The World Bank’s 2018 commitments on disabilityinclusive development include ensuring that threequarters of social protection and jobs projects will be disability inclusive by 2025. a The following two examples highlight how specific attention to people with disabilities can improve their engagement in employment support programs.
Haiti
In haiti, the World Bank supports improved access of people with disabilities to employment services (World Bank 2022). The project includes the development of a disability module in the national social registry and the piloting and promotion of a skills training model to increase labor market access for people with disabilities, such as through capacity-building workshops for increasing private sector involvement, national
awareness events, and job fairs. This project highlights the importance of focusing on demand-driven skills, working with mainstream training providers, and engaging in proactive outreach to employers.
Ethiopia
In Ethiopia, the World Bank approved the Education and Skills for Employability Project in September 2023. The project aims to support Ethiopian youth (18–30 years old) in gaining a range of skills to prepare them for the job market. Specific policy considerations include provisions to ensure fair wages in line with local legislation, provide contractual hiring of workers, and ensure adequate payment for overtime. The project will prioritize the employment of women, people with disabilities, and other vulnerable groups.
a. For more information on World Bank commitments, refer to https://www.worldbank.org/en/topic/socialsustainability/brief /world-bank-group-commitments-on-disability-inclusion-development
Lack of data on disability has ripple effects on efforts to find solutions, the attitudes of policy makers, and the perceptions of the public. At an institutional level, the lack of rigorous and comparable data, combined with lack of evidence on programs that work, often impedes understanding and action on disability inclusion (Mitra 2018; Tiberti and Costa 2019). Lack of accurate primary data about disability may make policy makers and practitioners less likely to focus on disability matters than required. It may, in turn, be the reason for a common perception that people with disabilities are a small group that demands the specialized attention of health or rehabilitation professionals (Mitra, Posarac, and Vick 2013).
PORTRAIT OF PEOPLE WITH DISABILITIES IN ETHIOPIA
Estimates of the prevalence of people with disabilities in Ethiopia range from 1 percent to 18 percent of the population. According to Ethiopia’s 2007 National Population and housing Census, people with disabilities represent only 1.09 percent of the population. This census showed stark regional differences, from 0.54 percent in the Somali region to 1.6 percent in Tigray. More recent surveys with more limited samples suggest that people with disabilities are 4−17 percent of the population. The 2021 National Labor force Survey (LfS) estimates 4.5 percent of the population, whereas the 2015/16 household Consumption
80 | Wo R k ING To DAy fo R A B ETTER To M o RR o W IN E T h I o PIA
BOX 4.2
Expenditure Survey estimates 9.3 percent of the population. of these estimated numbers, up to 2.2 million people (2.4 percent) have very profound disabilities (UNICEf 2019). The highest estimate—of 17.6 percent of the population living with disabilities—comes from a report by the Who and World Bank (Who and World Bank 2011).
National surveys often fail to include indicators for disability. A 2020 report on the prevalence of disability statistics in Ethiopia notes that only 30 percent of 37 national surveys since 2000 have included indicators for disability (CSA 2020). Even recent surveys—such as the 2016 Demographic and health Survey and the 2019 Mini Demographic and health Survey—do not include disability indicators. Moreover, the World Bank Ethiopian Socioeconomic Dashboard has no disability-disaggregated statistics.6
The stigma associated with disability suggests its underreporting (kett and Twigg 2007). Individuals and families are reluctant to identify themselves for fear of being labeled and marginalized. Although evidence on the experiences of young Ethiopians with disabilities remains weak, young people with disabilities, as in many low- and middle-income countries, are often shunned by their communities and their families. Many people associate disability not only with misfortune and incompetence but also with evil and sin (Iyassu and Mckinnon 2021; Jones, Presler-Marshall, and Stavropoulou 2021; Jones, Seager, and yadete 2021; Sightsavers 2021). In Ethiopia, people frequently misunderstand the underlying causes of disability, often seeing it as a curse.
The data available give no specific indication of how many people with disabilities need public support. A more detailed analysis to evaluate the needs of people with disabilities and their families is necessary to identify the main barriers faced by them, assess their needs, and identify possible supporting programs. With about 80 percent of the population living in rural areas of Ethiopia,7 however, it can be assumed that most people with disabilities live in those areas, where basic services are limited and often inaccessible.8
The available data do, however, suggest that people with disabilities are likely poorer than people without disabilities, particularly in urban areas. The 2015/16 household Consumption Expenditure Survey estimates that the national poverty rate for households that include a person with a disability is more than 5 percent higher than for households without a person with a disability (29.4 percent vs. 22.8 percent). In urban areas, however, the extreme poverty rate is 41 percent higher, and children with disabilities have the highest risk of extreme poverty.
People with disabilities also have less education and a greater likelihood of illiteracy than national averages. They are only half as likely to be able to read and write as compared to people without disabilities, and only 15 percent of women with a disability are literate. LfS data from 2005, 2013, and 2021 show consistently that people with disabilities have less education than those without disabilities (refer to figure 4.2). Low literacy rates have a direct correlation to poor labor market inclusion and the ability to escape poverty.
People with disabilities have extremely limited employment opportunities in Ethiopia. The 2021 LfS shows that people with disabilities have employment levels above national averages only in self-employment (refer to figure 4.3). A 2020 United Nations Children’s fund and ILo study shows that specialized work shelters, handicraft works, and petty trade are often the only choices available to people with disabilities (Cancedda et al. 2020). A study in the oromia region found that, because of the high incidence of poverty and the limited
Disability and Work in Ethiopia | 81
In Ethiopia, the proportion of people with disabilities who have no education remains high, 2005, 2013, and 2021
In Ethiopia, people with disabilities engage in low-productivity sectors, by vulnerable groups, 1999–2021
82 | Wo R k ING To DAy fo R A B ETTER To M o RR o W IN E T h I o PIA FIGURE 4.2
Source:
Labor Force Survey, 2005–21. Persons without disabilities Persons with disabilities 0 10 20 Percent 30 40 50 60 70 80 90 NoeducationLessthanprimaryCompletedprimaryCompletedsecondaryCompletedpostsecondaryNoeducationLessthanprimaryCompletedprimaryCompletedsecondaryCompletedpostsecondaryNoeducationLessthanprimaryCompletedprimaryCompletedsecondaryCompletedpostsecondary 2005 2013 2021 FIGURE 4.3
Ethiopia
Source: World Bank calculations using data from the Ethiopia Labor Force Survey, 1999–2021. 0 20 40 60 80 100 1999 2005 2013 2021 a. Unpaid family work 0 20 40 60 80 100 1999 2005 2013 2021 b. Wage employment 0 20 40 60 80 100 1999 2005 Percent Percent Percent Percent 2013 2021 c. Self-employment 0 20 40 60 80 100 1999 2005 2013 2021 d. Nonagricultural self-employment as a proportion of self-employment National Rural women Urban youth Rural–urban migrants People with disabilities
employment opportunities, 55 percent of surveyed people with disabilities depend on family, neighbors, and friends for their living; the rest generate meager income through self-employment, begging, and providing housemaid services (ILo 2013b; Sanchez 2015). Unpaid family work among people with disabilities has increased in recent years (refer to figure 4.3, panel a).
People with disabilities who do work face inaccessible workplaces. The lack of accessible environments, such as entrances and transportation for wheelchair users, for people with certain types of disabilities represents a major barrier. In addition, the limited rehabilitation services are concentrated in larger towns and cities (UNICEf 2019). A recent study of employment opportunities for people with disabilities in Dire-Dawa notes multiple challenges, including poor physical infrastructure, negative perceptions by employers about the skills and competence of people with disabilities, a lack of access to vacancy announcements, and concerns about the additional costs associated with transportation. Any progress is largely limited to those living in urban areas, with less relevance for those living in rural areas (Seyoum 2017).
Moreover, people with disabilities are more likely not to be in education, employment, or training. The 2021 LfS shows an upward trend, from 35 percent in 2013 to 39 percent of people with disabilities not engaged in education, employment, or training. People with disabilities also have the lowest labor force participation rates among the four vulnerable groups surveyed (people with disabilities, rural women, urban youth, and rural–urban migrants); are less likely to be in wage employment; and are more likely to be self-employed, notably in agriculture (refer to chapter 1).
Women with disabilities are doubly disadvantaged and are more likely to be unemployed than men with disabilities. Analysis of the 2015/16 household Income Consumption and Expenditure Survey shows that, for all age groups, a significant gap in labor market participation rates exists between men and women with disabilities and their peers without disabilities (UNICEf 2019). Adolescent girls with disabilities in Ethiopia also face intersecting disadvantages because discriminatory gender norms and practices become increasingly salient in adolescence (Jones, Presler-Marshall, and Stavropoulou 2021). This situation creates additional barriers to education and likely reinforces fewer job opportunities later in life.
PROMOTING AN ENABLING ENVIRONMENT IN ETHIOPIA
Ethiopia has made multiple commitments to support the rights of those with disabilities in finding work and employment. These commitments include the 1995 Constitution and the 2007 signing and subsequent 2010 ratification of the CRPD. The five-year Growth and Transformation Plan (2010–15) was the first to identify disability as a cross-cutting issue, and the National Plan of Action for the Inclusion of Persons with Disabilities (2012–21), adopted in 2012, provides an ambitious policy framework that aims to mainstream disability issues in all fields of society, including in work and employment.
The Right to Employment of Persons with Disabilities Law (Proclamation No. 568/2008) prohibits discriminatory practices that limit equal employment opportunities for people with disabilities. Enacted to implement the CRPD, this proclamation requires public and private employers to provide equal employment opportunities to people with disabilities and make
Disability and Work in Ethiopia | 83
reasonable accommodations. however, analysis of the conditions of employment and work of people with disabilities is not provided because of a lack of reliable data (IL o 2013a). o ther important policies include the Ethiopian Building Proclamation (2009), which requires making public buildings accessible for use by people with disabilities; the Master Plan for Special Needs and Inclusive Education (2016); and the federal Civil Servants Proclamation No. 515/2007, calling for affirmative action for people with disabilities in the recruitment process.
The National Plan of Action for Job Creation (2020–25) also calls for improving the inclusivity of Ethiopia’s labor market. It includes provisions for services targeted specifically to workers with disabilities and aims to build “a disability-friendly labor market, by implementing affirmative actions for persons with disabilities, improving their employment opportunities by developing employment quotas in the public sector and providing incentives to the private sector, and providing targeted support within employment centers” (JCC 2020, 18). Much of this plan, however, remains largely unrealized.
The recently created Disability Affairs Directorate in the Ministry of Women and Social Affairs worked with the main stakeholders involved in protecting the rights of people with disabilities to prepare the Ethiopian Disability Act announced in 2020. This new legal framework should help prevent any types of discrimination and ensure equal participation, benefits, and opportunities for people with disabilities. It also offers an opening to redouble empowerment efforts.
The aspirations of existing legislation and programs do not track with the experiences of people with disabilities. As in other countries, these individuals clearly remain among the most vulnerable members of society (refer to Wickenden et al. 2020). Despite their recognition of the right of people with disabilities to work, policies have had negligible impact on providing access to work and employment opportunities. The confluence of factors described previously, among others, means that people with disabilities work in low-productivity jobs. Those who do work face inaccessible workplaces, but—at least in some regions—more than half rely on support networks for their well-being. Moreover, the conflict in the country exacerbates the challenges people with disabilities face in securing good jobs.
In this context, social protection has a critical role to play in enhancing the well-being of people with disabilities. The 2014 National Social Protection Policy calls for the expansion of services for people with disabilities, noting that they should receive special attention, and outlines the establishment and implementation of strategies to address the problems they experience. The only disability-specific social protection schemes in Ethiopia are the social insurance schemes for public servants (Public Servants Social Security Administration) and for private sector workers employed in the formal economy (Private organizations Employees Social Security Administration). Total coverage of these two schemes, however, reaches only 6 percent of the population, with limited income replacement for those workers exposed to disabling accidents or illness.
Social safety nets already reach poor households that include people with disabilities. The Productive Safety Net Program (PSNP) reaches the most vulnerable households, including those that have a person with a disability. Targeting analysis suggests that PSNP households are slightly more likely to have a person with a disability within the household (World Bank 2020). In the Urban
84 | Wo R k ING To DAy fo R A B ETTER To M o RR o W IN E T h I o PIA
Productive Safety Net Project (UPSNP) , only about 3,800 direct support clients, of 155,474 total, are people with disabilities; women with disabilities account for about 55 percent of those 3,800 clients.9 Moreover, both PSNP and UPSNP households that have a member with a disability are more likely to be in the lower quintiles of consumption.10
The poverty profile of people with disabilities justifies a clear prioritization of their needs, and PSNP and UPSNP provide strong entry points for such support. Both programs contain important design provisions to ensure inclusion of people with disabilities on an equal basis with everyone else. for extremely poor households with limited or no capacity to engage in wage labor or self-employment activities or public works activities, including people with disabilities, year-round income support, known as Permanent Direct Support, is available.
Both safety net programs reach people with disabilities through their cash transfer components but not through livelihood services. These services aim to build on the consumption smoothing and asset protection achieved through the timely and predictable safety net transfers by supporting public works clients to improve and diversify their livelihoods and find jobs. Livelihood services in PSNP and UPSNP aim to increase and diversify household-level incomes of the poor through self- and wage employment, enabling households to graduate from the program and move out of poverty. Although the programs do not explicitly exclude people with disabilities, they do exclude households benefiting from Permanent Direct Support. only households with at least one public works participant are eligible to participate in livelihood support. These services are not offered to people with disabilities, even those who may be able to work.
As noted previously, Ethiopia’s conflict will likely only increase the number of people with disabilities in the country and reinforce barriers to their productive inclusion in society (kett and Twigg 2007; Rohwerder 2017). Conflict generates injuries and trauma that can lead to disabilities. Delays in accessing care and rehabilitation for those with injuries can exacerbate their condition. People with preexisting disabilities are disproportionately affected by conflict and are less likely than community members without disabilities to benefit from interventions or humanitarian assistance in response to these shocks (Groce, kett, et al. 2011). In disasters, the mortality rate of people with disabilities is thought to be two to four times higher than that of people without disabilities (IASC 2019). The scale of the impact of the Ethiopian conflict on people with disabilities is not yet known.
CONCLUSION
People with disabilities face multiple barriers and are among the most marginalized and poorest in Ethiopian society. They are poorer, less educated, and less likely to be employed than their peers without disabilities, and women with disabilities are doubly disadvantaged. The poverty profile of people with disabilities, in both rural and urban areas, justifies a clear prioritization of their needs. Enabling people with disabilities to contribute to the self-sufficiency of their families—whether directly through productive activities or indirectly through generating a source of income—constitutes an important factor in restoring dignity.
Disability and Work in Ethiopia | 85
Although Ethiopia has made considerable progress on addressing the needs of people with disabilities, much remains to be done. It is time to move away from the medical and charity approaches to disability and to remove the multiple barriers that people with disabilities face in their daily lives and in accessing jobs. An inclusive, rights-based, and human-centered approach, with equality and nondiscrimination at its core, will be essential to reach those furthest behind. The analysis here shows clear barriers that would benefit from further policy and programmatic action.
At a national level, efforts are needed to overcome the dearth of data about people with disabilities. Disaggregating data by disability alongside other indicators (such as sex, geography, and age) is essential to identify gaps, measure progress, and ensure that people with disabilities are not left behind in future development interventions, including in the existing safety net and jobs programs. The Washington Group on Disability Statistics and the ILo designed the “WG ILo Labor force Survey Disability Module” to measure disability consistently worldwide, and the module is being used more widely.11
At a program level, research is needed to inform evidence-based policy decisions. Ethiopia’s social safety nets are reaching poor households that include people with disabilities, but this support could be better tailored to help overcome barriers to inclusion more effectively. The W ho Disability Assessment Schedule 2.0 methodology, for example, could be adapted for PSNP and UPSNP client households. In such work, it is important to analyze the needs not only of people with disabilities but also of household members who support those individuals.
Understanding the specific barriers that people with disabilities in PSNP and UPSNP households experience could help them find jobs. Well-informed employment support services more effectively provide dignified options to enable people with disabilities to participate on an equal basis with others. Appropriate design modifications will be multifaceted and may include adjusting intervention length, adjusting where and how the intervention is offered, and providing complementary measures to support caregivers. To combat the stigma related to disability employment, these programs also should develop communication campaigns that show potential employers positive examples of people with disabilities working in Ethiopian society.
Ethiopia, like other countries, needs to constantly raise awareness at all levels to convince people that disability is not an inability. In doing so, it will be important for the government to work closely with national and regional organizations for people with disabilities. Engaging directly with people with disabilities throughout the process of removing employment barriers and developing better job opportunities will be foundational to the success of these reforms.
NOTES
1. Ad hoc Committee on a Comprehensive and Integral International Convention on the Protection and Promotion of the Rights and Dignity of Persons with Disabilities, Convention on Rights of Persons with Disabilities, final Report, distributed December 6, 2006, https:// www.un.org/development/desa/disabilities/convention-on-the-rights-of-persons-with -disabilities.html
2. CRPD, Article 1.
3. CRPD, Preamble, paragraph (e).
4. on differences in outcomes, explore https://www.disabilitydataportal.com/.
86 | Wo R k ING To DAy fo R A B ETTER To M o RR o W IN E T h I o PIA
5. See the ILoSTAT data at https://ilostat.ilo.org/how-do-people-with-disabilities-fare-in -the-labour-market/
6. World Bank Ethiopian Socioeconomic Dashboard, https://www.worldbank.org/en/data /interactive/2020/06/24/ethiopia-socioeconomic-dashboards
7. World Bank data on rural population, https://data.worldbank.org/indicator/SP.RUR.ToTL .ZS?locations=ET
8. According to the 2013 L f S out of a total of 2,429,042 people with disabilities surveyed 2,015,195 (or 83 percent) lived in rural areas whereas 413,847 (17 percent) lived in urban areas.
9. According to UPSNP and UPSNJP administrative data.
10. The Living Standards Measurement Survey consumption module is not extensive and asks about the consumption of food groups rather than individual items (as the household Consumption Expenditure Survey does).
11. for more information, see https://www.washingtongroup-disability.com/question-sets /wg-ilo-labor-force-survey-disability-module-lfs-dm/
REFERENCES
Accenture. 2018. Getting to Equal: The Disability Inclusion Advantage https://www.accenture .com/_acnmedia/pdf-89/accenture-disability-inclusion-research-report.pdf
Al Ju’beh, k. 2015. Disability Inclusive Development Toolkit. Bensheim: CBM. http://www.cbm .org/article/downloads/54741/CBM-DID-TooLkIT-accessible.pdf
Banks, L. M., h kuper, and S. Polack. 2017. “Poverty and Disability in Low- and Middle-Income Countries: A Systematic Review.” PLoS One 12 (12): e0189996.
Buckup, S. 2009. The Price of Exclusion: The Economic Consequences of Excluding People with Disabilities from the World of Work. Geneva: International Labour organization. https:// www.ilo.org/wcmsp5/groups/public/---ed_emp/---ifp_skills/documents/publication /wcms_119305.pdf.
Cancedda, A., C. Minardi, J. Wolsey, V. Vinci, and A. Abdella. 2020. COVID-19 Socio-Economic Vulnerability Assessment of Ethiopia. Addis Ababa: UNICEf and International Labour organization.
CSA (Central Statistical Agency). 2020. Representation of Persons with Disabilities in the Ethiopian Labour Force: A Review of National Surveys on Disability Statistics. Addis Ababa: CSA.
D f ID (U k Department for International Development). 2000. Disability, Poverty and Development. London: DfID.
Groce, N., G. kembhavi, S. Wirz, R. Lang, J.-f. Trani, and M. kett. 2011. “Poverty and Disability—A Critical Review of the Literature in Low- and Middle-Income Countries.” Working Paper No. 16, Leonard Cheshire Disability and Inclusive Development Center, London. https:// assets.publishing.service.gov.uk/media/57a08af2e5274a31e0000880/WP16_Poverty_and Disability_review.pdf
Groce, N., M. kett, R. Lang, and J.-f. Trani. 2011. “Disability and Poverty: The Need for a More Nuanced Understanding of Implications for Development Policy and Practice.” Third World Quarterly 32 (8): 1493–513.
IASC (Inter-Agency Standing Committee). 2019. Guidelines: Inclusion of Persons with Disabilities in Humanitarian Action. IASC.
ILo (International Labour organization). 2013a. Decent Work Country Profile: Ethiopia. Addis Ababa: ILo
ILo (International Labour organization). 2013b. “Inclusion of People with Disabilities in Ethiopia.” fact Sheet, ILo. https://www.ilo.org/wcmsp5/groups/public/@ed_emp/@ifp skills/documents/publication/wcms_112299.pdf
ILo (International Labour organization). 2015. Decent Work for Persons with Disabilities: Promoting Rights in the Global Development Agenda. Geneva: ILo https://www.ilo.org /wcmsp5/groups/public/---ed_emp/---ifp_skills/documents/publication/wcms_430935 .pdf
Disability and Work in Ethiopia | 87
Iyassu, S. A., and f. Mckinnon. 2021. “Disability Rights are human Rights: Pushing Ethiopia Towards a Rights-Based Movement.” Northwestern Journal of Human Rights 19 (1). https:// scholarlycommons.law.northwestern.edu/njihr/vol19/iss1/5
JCC (Jobs Creation Commission). 2020. Plan of Action for Job Creation: Sustainable Jobs for All Briefing Document. Addis Ababa: JCC.
Jones, N., E. Presler-Marshall, and M. Stavropoulou. 2021. Adolescents with Disabilities: Enhancing Resilience and Delivering Inclusive Development. London: overseas Development Institute GAGE Programme office.
Jones, N., J. Seager, and W. yadete. 2021. “‘People Consider Us Devils’: Exploring Patterns of Exclusion facing Adolescents with Disabilities in Ethiopia.” European Journal of Development Research 33: 1303–27.
kett, M., and J. Twigg. 2007. “Disability and Disasters: Towards an Inclusive Approach.” In Focus on Discrimination, 86–111. World Disasters Report. Geneva: International federation of Red Cross and Red Crescent Societies. https://www.preventionweb.net/files/1720
WDR2007English.pdf
kidd, S., L. Wapling, R. Schjoedt, B. Gelders, D. Bailey-Athias, A. Tran, and h. Salomon. 2019. Leaving No-One Behind: Building Inclusive Social Protection Systems for Persons with Disabilities orpington: Development Pathways Limited. https://www.researchgate.net /publication/335467217_Leaving_No-one_Behind_Building_Inclusive_Social_Protection _Systems_for_Persons_with_Disabilities
Mitra, S. 2018. Disability, Health and Human Development. New york: Palgrave MacMillan.
Mitra, S., M. Palmer, h kim, D. Mont, and N. Groce. 2017. “Extra Costs of Living with a Disability: A Review and Agenda for Research.” Disability and Health Journal 10: 475–84.
Mitra, S., A. Posarac, and B. Vick. 2011. “Disability and Poverty in Developing Countries: A Snapshot from the World health Survey.” Social Protection Discussion Paper 1109, World Bank, Washington, DC.
Mitra, S., A. Posarac, and B. Vick. 2013. “Disability and Poverty in Developing Countries: A Multidimensional Study.” World Development 41: 1–18.
Mora, G., M. Elena, S. Schwartz orellana, and G. freire. 2021. Disability Inclusion in Latin America and the Caribbean: A Path to Sustainable Development. Washington, DC: World Bank.
Rohwerder, B. 2015. Disability Inclusion: Topic Guide. Birmingham, U.k.: GSDRC, University of Birmingham.
Rohwerder, B. 2017. Disability Inclusive Humanitarian Response operational Practice Paper 1. Brighton, U.k.: humanitarian Learning Center. https://opendocs.ids.ac.uk/opendocs / handle/20.500.12413/13404
Rohwerder, B. 2018. Disability Stigma in Developing Countries. k4D helpdesk Report. Brighton: Institute of Development Studies.
Sanchez, J. 2015. Moving towards Disability Inclusion: Stories of Change. Geneva: International Labour office.
Seyoum, Z. 2017. “Employment opportunities and Challenges of People with Disabilities in Dire-Dawa, Ethiopia: Policy and Practice.” Journal of Education, Society and Behavioural Science 22 (4): 1–11.
Sightsavers. 2021. Disability-Related Stigma and Discrimination in Sub-Saharan Africa and South Asia: A Systematic Literature Review haywards heath: Sightsavers.
Tiberti, M., and V. Costa. 2019. Disability Measurement in Household Surveys: A Guidebook for Designing Household Survey Questionnaires. Washington, DC: World Bank.
UNDESA (United Nations Department of Economic and Social Affairs). 2019. Disability and Development Report 2018: Realizing the Sustainable Development Goals by, for and with Persons with Disabilities. New york: United Nations. https://www.un-ilibrary.org/content / books/9789210479035
88 | Wo R k ING To DAy fo R A B ETTER To M o RR o W IN E T h I o PIA
UNICEf. 2017. “UNICEf Tackles the Stigma of Persons with Disabilities through an Innovative Public Campaign in Georgia: People See the Disability Before They See you as a Person.” Press release, february 23, 2017. https://www.unicef.org/georgia/press-releases/unicef-tac kles-stigma-persons-disabilities-through-innovative-public-campaign#:~:text =According%20to%20UNICE f ’s%20research%2C%20more,on%20fear%2C%20 myth%20and%20stereotypes
UNICEf. 2019. Situation and Access to Services of Persons with Disabilities in Addis Ababa Briefing Note. Addis Ababa: UNICEf https://www.unicef.org/ethiopia/reports /situation -and-access-services-homeless-and-people-disabilities
Walker, R. 2013. “Poverty in Global Perspective: Is Shame a Common Denominator?” Journal of Social Policy 42 (2): 215–33.
Who (World health organization) and World Bank. 2011. World Report on Disability. Geneva: Who
Wickenden, M., S. Thompson, P. Mader, S. Brown, and B. Rohwerder. 2020. Accelerating Disability Inclusive Formal Employment in Bangladesh, Kenya, Nigeria, and Uganda: What Are the Vital Ingredients? Brighton: Institute of Development Studies. https://opendocs.ids .ac.uk/opendocs/handle/20.500.12413/15198.
World Bank. 2020. Ethiopia Poverty Assessment: Harnessing Continued Growth for Accelerated Poverty Reduction. Washington, DC: World Bank.
World Bank. 2022. “Designing Employment Services for Persons with Disabilities: Experience from haiti.” S4yE knowledge Brief Series, Issue 18, Solutions for youth Employment, World Bank, Washington, DC.
Disability and Work in Ethiopia | 89
5Social Safety Nets and Labor Migration
INFLUENCING, BUT NOT DETERRING, URBAN MIGRATION
SUMMARY*
In Ethiopia, which remains highly rural and dependent on low-productivity agriculture, internal migration has the potential to promote job opportunities. The country’s social safety nets could be leveraged to facilitate such migration as one pathway for better work for poor households.
• Migration, particularly internal rural–urban migration, can help improve people’s access to jobs and increase incomes through higher wages. In Ethiopia, recent gains against poverty have been much more substantial in urban than in rural areas.
• Ethiopia remains predominantly rural and, between 2016 and 2021, only 6 percent of adults migrated, mostly to small towns.
• The Productive Safety Net Program (PSNP) does not appear to substantially affect the likelihood or duration of migration. Seasonal migration is common among PSNP and non-PSNP households, but PSNP households are marginally less likely to migrate.
• The motivations for migration—as well as for returning home—do appear different. Non-PSNP households are more likely to migrate for economic reasons, mainly driven by lack of job opportunities within the community and expectations of higher wages. They are more likely to return home for economic reasons as well.
• Across both PSNP and non-PSNP households, family obligations and a broader desire not to leave their community were the main drivers for choosing not to migrate. Overall, PSNP does not appear to deter migration, and people report different impacts of the program on their migration decisions.
This chapter was written by Daisy Demirag. The author thanks peer reviewers Berhe Mekonnen Beyene and Emily Weedon for their valuable feedback and Samuel Weldeegzie for his valuable contributions to the data analysis. This study would not have been possible without the valuable guidance of Lucian Bucur Pop, Jymdey Mercedes Yeffimo Garcia, and Alan de Brauw.
91
INTRODUCTION
Migration can promote the structural transformation of developing economies as people move from rural to urban settings in search of nonfarm jobs. In Ethiopia, 80 percent of the population lives in rural areas, a situation that has shifted little in recent years (World Bank 2020). The combination of a highly ruralized economy and frequent climate shocks results in a population that is extremely sensitive to falling into and remaining in poverty. As the country seeks a structural transformation, labor migration to more urban settings can offer a pathway for poor and vulnerable households to find better opportunities. This migration can also be an intrinsic part of a broader ecosystem of economic, political, cultural, technological, and demographic change (De haas 2021).
This chapter aims to understand migration patterns of rural households in PSNP. It looks at the differences between PSNP and non-PSNP household migration patterns, as well as what influences migration decisions. The first section explores the global evidence on safety nets and migration and examines global evidence on public works programs and migration. The next section examines the theoretical underpinning of how PSNPs can influence migration. The following sections provide the history and context of migration in Ethiopia to date and present findings from a recent study examining migration between PSNP and non-PSNP areas. The final section concludes with policy recommendations.
MIGRATION, POVERTY REDUCTION, AND JOBS
Well-documented evidence exists on the role of migration in improving productivity and welfare and reducing poverty in developing countries. A recent study in Indonesia found modest but significant impacts when barriers to internal migration were reduced, increasing labor productivity by 22 percent (Bryan and Morten 2019). In Bangladesh, migration subsidies benefited the most extreme poor by alleviating travel costs, suggesting that conditional migration transfers might be a useful way to raise welfare of poor rural households in developing countries (Lagakos, Mobarak, and Waugh 2018). In terms of actual impacts on poverty reduction, between 1995 and 2004, Nepal experienced a 20 percent decline in poverty attributed to labor migration; during a similar period, Tanzania saw a 4 percent drop in communities without migrants.
Migration reduces poverty through multiple pathways. The classic neoliberal model on migration suggests that people migrate from rural to urban areas due to the expectation of higher wages. This migration leads to labor scarcity in rural areas, which drives up the rural wage rate. As more people migrate to urban areas, the urban wage rate declines, reaching an equilibrium. higher wages in urban areas can contribute to improved nonfood consumption. In Ethiopia, internal migration from rural to urban areas increased nonfood consumption and diet among urban migrants as compared to nonmigrants (de Brauw et al. 2018). In addition, higher wages resulting from internal or international labor migration can be remitted home to smooth consumption, invest in livelihoods, and finance schooling and health-related expenditures. In Bihar, India, internal labor migration among the poorest unskilled laborers helped smooth incomes and improve food security (Deshingkar et al. 2006).
92 | W O rk ING T ODAY f O r A B ETTE r T OMO rr OW IN E T h IOPIA
Panel evidence from Uganda shows that remittances from labor migrants locally and abroad not only had positive effects on maize production complementing credit (Veljanoska 2022).
Migration also offers the opportunity to transfer skills accumulated at the destination and reinvest them in the local economy. In China, internal migration had a significant positive impact on wage employment upon return (Wang and Yang 2013). In Albania, returning migrants from overseas had a higher probability of engaging in entrepreneurial activities 1 year after reintegrating into the domestic economy, compared to nonmigrants with similar characteristics (Piracha and Vadean 2009). In addition, self-employment and entrepreneurial activities of the remaining Albanian migrants had positive implications for wages and employment of nonmigrant Albanians (hausmann and Nedelkoska 2018).
Ethiopia can capitalize on the potential positive effects of migration as an economic strategy. Ethiopia remains largely underurbanized: the share of the country’s population living in urban areas grew from 16.6 percent in 2011 to 19.1 percent in 2016, well below the average in Sub-Saharan Africa (World Bank 2020). Growth of secondary towns through rural–urban migration will be a crucial factor in Ethiopia’s poverty reduction. Already, rural–urban migrants, especially youth migrating for economic reasons, have better labor market outcomes and are more likely to have wage employment (Wieser et al. 2022). A case study on seasonal migrants in the Amhara region found that accumulated earnings from migration allowed rural households to supplement income from agriculture and indirectly helped overcome problems of farmland scarcity (Asfaw, Tolossa, and Zeleke 2010). Another study found that remittances received by rural households combined with local production conditions led to increases in crop income and land acquisition (redehegn et al. 2019).
EVIDENCE ON SOCIAL SAFETY NETS AND MIGRATION
An emerging body of evidence suggests the heterogeneous effects of different types of safety nets on migration. research to understand the links between safety nets and migration has materialized only within the past two decades. A 2012 review of 22 studies focusing explicitly on the impact of social protection on migration from Albania, India, South Africa, and countries in Central Europe and Latin America found that migration decisions depended on the type of transfer involved (hagen-Zanker and himmelstine 2012). Conditional cash transfers increased the propensity to migrate if transfer values sufficiently helped finance migration costs. In Mexico, households that had participated in the Opportunidades program for at least 2 years were more likely to access loans to fund international labor migration to the United States, suggesting that cash transfers help resolve liquidity constraints and can be used to achieve migration aspirations (Angelucci 2015).
A recent review of evaluations on the links between social protection and migration compared programs across Bangladesh, China, the United States, and Latin American countries from mid-2000 onward. Despite mixed results, the review found that the propensity to migrate was strongly linked to the design of the program. Interventions that removed liquidity constraints or reduced transaction costs through better access to urban areas increased the propensity to migrate (Adhikari and Gentilini 2018). A study on migration effects within Zambia’s Child Grant Program found that having access to the transfer affected
Social Safety Nets and Labor Migration | 93
long-term migration among men in pursuit of economic opportunities as compared to women who are caregivers (Mueller et al. 2020).
Evidence on the effect of public works, public employment safety nets, or livelihood programs on migration is based on few studies and makes generalized conclusions difficult. The Mahatma Gandhi National rural Employment Guarantee Act, which guarantees 100 days of paid public works to rural Indian households each year, had no clear impact on overall migration, except in the case of seasonal migration (hagen-Zanker and himmelstine 2012). One study found that public works crowded out incentives for regular seasonal migrants to work in the private sector (Imbert and Papp 2014, 2015). The authors conclude that, because workers are not firmly attached to urban labor markets and perceive migration costs to be high, short-term internal migration decisions could be easily influenced by rural safety net programs. Conversely, in the Comoros, migration increased among public works households as compared to non–public works households because of relieved liquidity constraints and decreased risks and constraints (Gazeaud, Mvukiyehe, and Sterck 2019).
HISTORY OF MIGRATION IN ETHIOPIA
historically, migration in Ethiopia was characterized by displacement resulting from famine and war. Government policies also have either directly or indirectly affected migration, including through land redistribution, partitioning the country into ethnic federal states, and implementing resettlement programs. In addition, rural development programs, such as the PSNP, may have further disincentivized rural–urban migration to prevent unrest caused by lack of jobs in urban areas (Ezra and kiros 2001; Lavers 2012, 2013, 2016). furthermore, despite more recent trends toward voluntary migration, as of 2020, 80 percent of the population still lived in rural areas (World Bank 2020). With a growing youth population and increased land fragmentation in rural areas, migration is increasingly a necessary and important livelihood strategy for the growing working-age population (World Bank 2020).
Internal migration in Ethiopia remains low but is increasingly directed toward urban areas. According to a recent World Bank study on voluntary migration in Ethiopia, between 2016 and 2021, 6 percent of the Ethiopian adult population migrated, a marginally smaller share than in 2005 (Wieser et al. 2022). however, despite the decreasing shares of migrants, the absolute number of migrants (both international and internal) increased from 3.6 million in 2013 to 4.7 million in 2021, with internal migration increasing toward urban areas. In this same period, two-thirds of all internal population movements went to urban areas. Increased land fragmentation, low landownership by the poor, and youth aspirations are creating a large cohort of young people who are functionally landless and in search of opportunities (Wieser et al. 2022). Migration will increasingly become a livelihood strategy for rural youth as they look for nonfarm employment opportunities.
Small towns and secondary cities are an important destination for migrants. Migration to Addis Ababa was lower than for secondary cities: only 8 percent of Addis Ababa residents were recent migrants in 2021. Addis Ababa hosted 11 percent of all rural–urban and 10 percent of urban−urban migrants, despite accounting for 8 percent of Ethiopia’s overall population. By contrast, small towns and secondary cities host twice as high a share of migrants as their overall
94 | W O rk ING T ODAY f O r A B ETTE r T OMO rr OW IN E T h IOPIA
share of the population. In 2021, 71 percent of rural–urban and 69 percent of urban–urban migration went to small towns, as compared to their population share of 63 percent (Wieser et al. 2022).
People migrate for economic reasons. In 2021, 43 percent of migrants mentioned economic reasons, such as job search and loss or shortage of land, as their main motivations for moving (Wieser et al. 2022). Migrating for education has become less important over time, but migrating because of shocks, such as conflict and natural disasters, has become increasingly important (Wieser et al. 2022). family reasons, including marriage-related reasons or joining a family, constituted another important motivator, reported by 31 percent of adult migrants moving between 2016 and 2021 (Wieser et al. 2022).
rural–urban migrants have higher education levels, are mainly youth, and are more likely female. Expansion of schooling in rural areas has resulted in rural youth with higher education levels and higher aspirations but with limited job opportunities (Schewel and fransen 2018). One study concluded that educational attainment plays a significant role in determining the propensity to migrate: rural dwellers who completed at least primary education had a 4-percentage-point higher likelihood of migrating to urban areas as compared to people with no education. Women are more likely to migrate from rural to urban areas, whereas men are slightly more likely to migrate from rural to rural or urban to rural areas. rural–urban youth migration usually occurs to small towns and represents 65 percent of youth migration. Of young rural–urban migrants, 72 percent were female.
International migration is marginal but likely underestimated given illegal migration pathways (Smith et al. 2020). for example, between 2015 and 2018, Ethiopia banned migration to Gulf Cooperation Council countries; however, United Nations data on destination countries indicate that migration flows continued during that period (refer to figure 5.1). According to United Nations
Social Safety Nets and Labor Migration | 95
FIGURE
5.1
1,689,955 816,429 445,891 522,889 664,819 781,368 871,747 –873,526 –370,538 76,998 141,930 116,549 90,379 –1,500,000 –1,000,000 –500,000 0 500,000 1,000,000 1,500,000 2,000,000 199019952000 Number of migrants 2005201020152019 Ethiopian emigration stock Ethiopian emigration flow
International migration of Ethiopians, by stock and flows, 1990–2019 Source: United Nations Department of Economic and Social Affairs, Population Division.
estimates, emigration has been concentrated to six main destination countries, in order of the number of migrants: the United States, Saudi Arabia, Israel, Sudan, kenya, and Canada.1 Before 2000, destinations were driven by displacement; however, as displacement flows declined, Somalia, kenya, and Sudan are no longer the main destinations for Ethiopian migrants. following 2000, the United States, Israel, and Saudi Arabia are the main destinations. As of 2021, nearly 850,000 Ethiopians lived abroad, mainly originating from rural areas, and most Ethiopians are concentrated in Gulf Cooperation Council countries (Smith et al. 2020).
MIGRATION PATTERNS OF THE POOR IN RURAL COMMUNITIES
Across Ethiopia, poor rural households are unlikely to migrate, and participation in PSNP appears linked to even lower migration rates. A study by the World Bank (2021) examined migration patterns of PSNP households, comparing them with households of similar wealth and in non-PSNP woredas (districts) in three highland regions of Ethiopia: Amhara; Oromia; and the Southern Nations, Nationalities and Peoples region (refer to box 5.1 and annex 5A for more information on the study). The study found that, on average, migration was very low among poor rural households: at the time of the study, 90 percent of all households did not have any migrants. PSNP households, however, migrated roughly 5 percent less, a statistically significant difference, than their non-PSNP counterparts (refer to figure 5.2). This finding confirms previous studies on migration in PSNP areas, which found that migration of PSNP households was exceptionally rare as compared to that of non-PSNP households; when it did occur, it was among youth whose migration was spontaneous and unannounced (Deshingkar, Godfrey-Wood, and Béné 2015).
There are nuances in the migration patterns between PSNP and non-PSNP households. More PSNP households stay away for 4−6 months, whereas more non-PSNP households stay away for 1−3 years (refer to figure 5.3). PSNP households experienced a slightly higher migration rate of 4−6 months (by 6 percent) as compared to non-PSNP households, but there was no significant difference between the two groups over longer-term migration periods of more than 3 years. These trends suggest migration among PSNP households is more likely to occur for shorter periods of time, perhaps because of on-farm labor demands. Similarly, other studies on rural–urban migration in Ethiopia have found that temporary migration is part of a livelihood diversification strategy that enables laborers to return home with their earnings to work in farm areas, thus preventing the lost-labor effect (redehegn et al. 2019).
Migration is seasonal for PSNP and non-PSNP households, suggesting it is linked to the agricultural cycle. The main rain seasons are the Belg, which takes place approximately from february to April, and the Meher, which takes place approximately from May to September. The major harvest period occurs between Meskerem (September-October) and Yekatit (february-March).2 for both PSNP and non-PSNP households, peak migration takes place during Meskerem (September–October), which is generally at the beginning of the harvest, as well as in Tirr (January-february) and Sene (June-July); however, in the latter periods, there are no significant differences between PSNP and nonPSNP households (refer to figure 5.4 and figure 5.5).3 During Tikimt (October),
96 | W O rk ING T ODAY f O r A B ETTE r T OMO rr OW IN E T h IOPIA
BOX 5.1 FIGURE 5.2
Methodology of the PSNP migration study
A cross-sectional mixed methods study was carried out on 2,250 households across three highland regions in Ethiopia (Amhara; Oromia; and the Southern Nations, Nationalities and Peoples region) to understand the migration dynamics between Productive Safety Net Program (PSNP) households and nonPSNP households.
To estimate the program’s effect, the study employed a spatial discontinuity design for the identification strategy, using administrative boundaries between PSNP and non-PSNP woredas to compare households enrolled in PSNP with households of similar characteristics in non-PSNP woredas. To ensure comparability of non-PSNP woredas with PSNP woredas, pairings of PSNP and non-PSNP woredas were selected by whether the non-PSNP woreda had received emergency food assistance within the previous 5 years and whether the non-PSNP woreda lacked other rural development interventions that could
Source: World Bank 2021.
influence migration behaviors. households in PSNP woredas were randomly selected from the PSNP targeting list. To ensure that PSNP households had a comparable control group of non-PSNP households, the bottom 50 extremely poor and poorest households were identified within each community (using similar characteristics—number of assets, household characteristics, and degree of food insecurity—as those used by PSNP to target households). Of those 50 households, 25 households were randomly selected for sampling.
In addition to a household survey, the study included 60 youth focus group discussions (fGDs), 30 with youth from PSNP households and 30 with youth from non-PSNP households. fGDs were also divided by gender to better understand the perspectives of male and female youth. The discussions focused on understanding qualitative aspects of aspirations, preferences, and barriers to migration.
Source:
out-migration is 4 percentage points higher from non-PSNP households, a statistically significant difference. This timing coincides with the start of the sowing period, which begins around Yekatit (february). In focus group discussions (fGDs) in non-PSNP woredas, youth reported that low land productivity makes
Social Safety Nets and Labor Migration | 97
Migration status of PSNP and non-PSNP households in Ethiopia, 2021
World Bank 2021. Note: PSNP = Productive Safety Net Program. 020 Migration status 4060 Percent 80 100 Nonmigrant Returning migrant Permanent migrant Temporary migrant (< 1 year) Non-PSNP PSNP
FIGURE
Meskerem(Sept/Oct)
Tikimt(Oct/Nov)Hidar(Nov/Dec)Tahisas(Dec/Jan)Tirr(Jan/Feb)Yekatit(Feb/March)Megabit(March/April)Miazia(April/May)Ginbot(May/June)Sene(June/July)Hamle(July/Aug)Nehase(Aug/Sept)
it hard for casual laborers to find work locally, driving out-migration. In PSNP woredas, land productivity may be slightly better, thereby increasing demand for casual labor within the community and reducing the need for poor landless households to seek employment outside of their communities.
Across PSNP and non-PSNP woredas, nearly all poor households migrate internally. Overall, the destinations of poor migrants differ little (refer to figure 5.6), and migration occurs along well-established channels. Although
98 | W O rk ING T ODAY f O r A B ETTE r T OMO rr OW IN E T h IOPIA
5.3
Source: World Bank 2021. Note: PSNP = Productive Safety Net Program. 0 5 10 15 20 25 30 35 Percent 3 months or l ess 4–6 months 7–12 months 1–3 years More than 3 years PSNP Non-PSNP FIGURE 5.4
Time spent away by migrating, PSNP and non-PSNP households in Ethiopia, 2021
Source: World Bank 2021. Note: PSNP = Productive Safety Net Program. 0 2 4 6 8 10 12 14 16 18
Month of out-migration by PSNP and non-PSNP households in Ethiopia, 2021
Percent
PSNP
Non-PSNP
Meskerem(Sept/Oct)Tikimt(Oct/Nov)
Hidar(Nov/Dec)Tahisas(Dec/Jan)Tirr(Jan/Feb)Yekatit(Feb/March)Megabit(March/April)Miazia(April/May)Ginbot(May/June)Sene(June/July)Hamle(July/Aug)Nehase(Aug/Sept)
many migrants struggle to transition to urban life (Bundervoet 2018), promoting employment links within this geographic scope could successfully promote more labor mobility and urban integration.
Migrants from non-PSNP households are more likely motivated to migrate due to the unavailability of work opportunities in their community and expectations of higher wages elsewhere (refer to figure 5.7). A total of 82 percent of returnees from non-PSNP households reported work as their reason for migrating, as compared to 62 percent of returnees from PSNP households, with a statistically significant difference of 20 percentage points (refer to figure 5.8). Moreover, 57 percent of non-PSNP households that had never migrated reported higher wages outside of the community and lack of job opportunities in their place of origin as potential reasons to migrate, as compared to 48 percent of
Social Safety Nets and Labor Migration | 99
FIGURE 5.5
Source: World Bank 2021. Note: PSNP = Productive Safety Net Program. 0 5 10 15 20 25
Month of return of migrating PSNP and non-PSNP households in Ethiopia, 2021
Percent
PSNP
Non-PSNP
FIGURE 5.6
Source: World Bank 2021. Note: PSNP = Productive Safety Net Program. PSNP Non-PSNP 0 20 40 60 80 100 120 Inside Ethiopia Percent Percent Outside Ethiopia
Internal and international migration b. Internal migration 010203040 Woreda town Zonal town Region al town Other urban
Destinations of migrating PSNP and non-PSNP households in Ethiopia, 2021
a.
FIGURE 5.7
Reasons for migrating, all migrants from PSNP and non-PSNP households in Ethiopia, 2021
Family reasons
Source:
FIGURE 5.8
Reasons for migrating, returning migrants from PSNP and non-PSNP households in Ethiopia, 2021
Other reasons
Family reasons
Source:
PSNP households. Clearly migration is an adaptive strategy to achieve better work opportunities, when other opportunities within the community are not available.
In poor rural Ethiopia, however, households make migration decisions for more than just economic reasons. In some cases, family obligations, place attachment, and negative perceptions about migration represent the primary reasons against migration. Both PSNP and non-PSNP households do not want to move because of the difficulty associated with living outside of their community, although non-PSNP households are 3 percentage points more likely to cite this reason, a statistically significant difference (refer to figure 5.9). reflecting a small but significant difference, individuals from PSNP households are more likely to report the availability of local work as a retention factor (by 1 percent). f GDs among youth from non-PSNP households in Amhara and Oromia confirmed that young people desire to stay within the
100 | W O rk ING T ODAY f O r A B ETTE r T OMO rr OW IN E T h IOPIA
World Bank 2021. Note: PSNP = Productive Safety Net Program. 0204060 10 30 50 70
Non-PSNP PSNP Percent
Education Economic Other reasons
World Bank 2021. Note: PSNP = Productive Safety Net Program. Non-PSNP PSNP 0204060 Percent 80 100
Education Work
health/amtoooldMyfamilymemberswillnotallowIhavework/Iworkonmyownland
community but can do so only with greater government support—for example, through access to finance or to inputs such as seeds (Demirag 2023). This finding contradicts historical theories that emphasize migration as a function of expected wages in urban areas.
Poor rural migrants from non-PSNP households are almost twice as likely as those from PSNP households to return home because of difficulty finding a job or earning an income. A total of 49 percent of return migrants from nonPSNP households reported not finding a job or earning money at the destination as the reason for returning home, compared to 27 percen t of return migrants from PSNP households (refer to figure 5.10). The latter is consistent with national data showing that end of contract or lack of employment accounted for 28 percent of migrants returning home (Smith et al. 2020).
Consistent with broader migration theory, the likelihood of migration is higher among male youth with higher education levels. This finding supports evidence in Ethiopia that youth rural–urban migration is 9 percent higher than is that of older cohorts (Weiser et al. 2022). Indeed, a consistent finding is that migration is dependent on a migrant’s stage in the life-cycle and is more likely to occur among younger generations than among older generations (Carling 2014). Males have a 2-percentage-point higher probability of migration, which aligns with global evidence that male youth have greater risk tolerance and, because of traditional social norms, fewer care-taking responsibilities.
Education level is also a major determinant in the probability of migrating. Among all households, those with less than primary education have a 3-percentagepoint higher probability of migrating than do those with no education. Primary education increases the probability of migrating by 9 percentage points, and completing secondary or tertiary education increases the probability of migrating by 20 percentage points. This finding is consistent with global evidence suggesting that higher education is a determinant of
Social Safety Nets and Labor Migration | 101 FIGURE 5.9
Source: World Bank 2021. Note: PSNP = Productive Safety Net Program. Percent 0 5 10 15 20 25 30
Livinginanotherplacewouldbedifficult
Other
Reasons not to migrate, PSNP and non-PSNP households in Ethiopia, 2021
Migrationisrisky
Iamthemain breadwinner/caregiverIworrythatIwillnotfindajob Idonothaveenoughmoney topaythecostsofmigratingIamstudyingIhavepoor
PSNP Non-PSNP
FIGURE 5.10
Reasons for returning, migrants from PSNP and non-PSNP households in Ethiopia, 2021
Completed studies
Illness or COVID-19
Difficult to find job or earn money
Look after other family members or land
Other Percent PSNP Non-PSNP
0102030405060
Source: World Bank 2021. Note: PSNP = Productive Safety Net Program.
migration due to education levels and employment opportunities at the place of origin. Also, as individuals become more educated, life aspirations evolve and migration becomes an instrument to achieve those objectives (Bundervoet 2018; Carling 2014; Clemens 2014; Wieser et al. 2022).
households with returnees have distinct differences from households with existing migrants. The probability of migrating is 7 percentage points higher in households with a returnee, consistent with findings that migration, especially among households living in poverty, is seasonal and constitutes part of a livelihood diversification strategy (Asfaw, Tolossa, and Zeleke 2010; redehegn et al. 2019). Among returnees, however, educational attainment was not a significant reason for migrating, perhaps because many returnees continue their education as students upon return (Wieser et al. 2022). With the proliferation of schools in rural areas, migrating to pursue education represents only 16 percent of all migration (Wieser et al. 2022).
Climate change is also a significant factor in migration decisions. NonPSNP youth groups highlighted drought and climate threats as reasons to migrate, especially because their communities do not receive food aid.4 PSNP youth reflected similar sentiments, but emphasized the unproductivity of agriculture and the need to search for jobs.5 Ethiopia’s history of food insecurity and the consequences of regional climate change mean that migration as a livelihood and risk coping strategy will continue and could result in large, unexpected migrant flows triggered by agricultural shocks (Wieser et al. 2022). In addition, security-related factors such as the onset of conflict in Amhara and Tigray and spillover effects on neighboring regions influence youth considerations for migrating between regions. Conflict gives rise to attachment to the land. Community kinship, especially in areas near conflict or that have experienced conflict in the past year, increases the desire not to migrate.6 At a national level, approximately 7 percent of all internal migrants left their homes because of shocks between 2016 and 2021 (Wieser et al. 2022).
102 | W O rk ING T ODAY f O r A B ETTE r T OMO rr OW IN E T h IOPIA
IMPACT OF PSNP ON MIGRATION PATTERNS
Participation in PSNP does not deter migration, even though migration rates are generally lower among PSNP households. A key design feature in targeting PSNP households is the criterion that PSNP households must not have a migrant, suggesting that households with migrants can smooth consumption through remittances and therefore do not need support from the program. however, most f GDs revea led that, if a member within the household migrates, the remaining household members continue to benefit from the PSNP. There was a clear understanding that PSNP transfers alone are insufficient to help support livelihoods; therefore, labor migration continues to have a role as a necessary economic strategy.
Within PSNP, migration is mainly driven by Public Works households rather than Direct Support households.7 PSNP migrants have a 4.7 percent higher probability of being from a Public Works household than from a Direct Support household, which was 1.0 percent and not statistically significant. This finding is expected given the characteristics of Direct Support households, which are usually smaller, are predominantly female-headed, and have a larger share of elderly people (Berhane et al. 2021). It is also consistent with previous studies on migration in Ethiopia, which found that internal migration was mainly driven by younger and better-educated rural dwellers rather than by the elderly (Bundervoet 2018).
Weak implementation of PSNP influences migration decisions, both encouraging and discouraging migration (Demirag 2023). Young people report that issues such as delayed payments and low caseload quotas influence their migration decisions. for example, delayed payments mean that households have to use up their savings to repay loans, leaving little capital to invest in existing livelihoods, which affects their ability to stay.8 In one community focus group, a participant claimed that people in the community migrated because of delayed payments from the program. 9 Similarly, low caseload quotas mean that wage benefits accruing to larger households have a diluted effect, especially in communities that do not adhere to the full family targeting rule.10 fGDs with youth revealed that wage benefits received by larger households are disproportionate to household size, diluting the impact of wage benefits on the households’ economic well-being. 11 In these cases, youth saw migration as an adaptive livelihood strategy to mitigate the negative or null effects of the PSNP.
Livelihood grants also have a mixed impact on migration preferences. Where available, PSNP livelihood grants seem to have diverging influences on preferences to migrate. Some fGDs reflected that receiving a livelihood grant or credit facilitated participants’ ability to stay by supporting incomegenerating activities within the community.12 In one community, youth groups reflected that their age group was excluded from receiving the grant and expressed frustration at the inability to create job opportunities for themselves. Despite this situation, it did not change their preferences to stay.13 In another community, male youth stated that, because the value of the grant was too low and did not bring about the changes desired, seasonal migration was a common strategy used during the public works offseason. 14 In the Amhara region, one female youth group reported that the livelihood grant did not change their livelihood, but this lack of change had no effect on their preferences to migrate.15
Social Safety Nets and Labor Migration | 103
CONCLUSION
Although migration among PSNP households is slightly lower than among nonPSNP households, participation in PSNP is not a perverse incentive in the decision to migrate. As such, poor households’ decisions to migrate likely involve other considerations beyond PSNP. The fGDs provided some insight into the qualitative aspects that factor into decision-making. Among some communities, the wage benefit and livelihood grants help improve income-generating activities within the community, which increase the aspirations of youth to stay. At the same time, weak program implementation prevents savings or does not create economic opportunities but results in mixed attitudes toward migration. NonPSNP households reported that poverty and lack of job creation and employment within their communities are strong push factors to migrate. In most of these cases, the concern over the lack of agricultural opportunities for youth in the community is significant, as are negative feedback loops of irregular migration, climate change, and conflict.
Youth must diversify employment in nonagricultural activities linked to urbanization. The study emphasized the concerns about climate change, namely drought, and the impact it will have on the future of agricultural productivity. With a land shortage and a growing youth population over the next decade, policy must support youth who seek opportunities outside agriculture. recent research shows that rural–urban migration presents an important pathway for both facilitating agricultural transformation and linking rural youth to off-farm employment opportunities (World Bank 2022).
Policies connecting PSNP youth to employment opportunities can reduce the frictions of high costs linked to job search for migrants. Lack of employment opportunities in the area and the desire for higher wages are the top reasons for wanting to migrate (Wieser et al. 2022). facilitating job search by streamlining administrative services through one-stop employment centers could help reduce the high social and economic costs of looking for a job. In addition, linking youth to wage employment opportunities in secondary cities can help facilitate urbanization, build new skills, and support integration and adjustment into urban life.
Policies should also work to remove negative perceptions about migration. Negative perceptions of rural–urban migration and temporary international labor migration are key in discouraging youth from migrating. Their main fears relate to the high costs associated with moving to urban areas, being displaced from ethnic land, dangers of international migration, and the risk of agricultural labor outflow from rural areas on landownership and productivity. Improving the dialogue about the challenges and benefits of rural–urban migration could support changing attitudes toward migration and encourage mobility from rural to urban areas.
NOTES
1. United Nations Population Division, International Migrant Stock 2020, https://www.un .org/development/desa/pd/content/international-migrant-stock.
2. Ethiopia follows the Ge’ez calender which has 12 months of 30 days each, plus 5 or 6 additional days (sometimes known as the 13th month).
104 | W O rk ING T ODAY f O r A B ETTE r T OMO rr OW IN E T h IOPIA
3. for more information on Ethiopia’s Climate and Agriculture, see https://www.prepdata .org/stories/ethiopia-climate-and-agriculture#:~:text=Ethiopia’s%20two%20grain%20 growing%20seasons,patterns%20during%20the%20belg%20season
4. from discussion with a non-PSNP female youth group, Girja woreda, Oromia.
5. from discussion with a PSNP female youth group, Balle Gasgar woreda, Oromia.
6. Based on comments by one PSNP female youth group participant, 25 years, Galana woreda, Oromia, and a non-PSNP community focus group discussion participant, 24 years, Mojan woreda, Amhara region.
7. The PSNP consists of two types of clients, Public Works and Direct Support, who represent 80 percent and 20 percent of the caseload, respectively. Public Works clients are assigned based on whether a household has able-bodied adults living in extremely poor and chronically food insecure households. Direct Support clients are targeted based on whether the household (in addition to being extremely poor and chronically food insecure) has an elderly, chronically ill, or disabled household member, and no able-bodied household members to carry out the public works. Direct Support clients receive unconditional transfers for 12 months, as opposed to Public Works clients who receive 6 months of transfers on the condition of performing public works.
8. Based on comments by a male youth fGD participant, 28 years, Maddawalabu woreda, Oromia.
9. Based on comments by one male youth fGD participant, 30 years, Merti woreda, Oromia.
10. full family targeting means that all members of the household receive a benefit. This policy was introduced in PSNP4, but implementation has been inconsistent because communities faced trade-off decisions about providing either a small amount of wage benefit to many families or a larger wage benefit to a few.
11. Based on comments by one PSNP male youth fGD participant, 22 years, Debark woreda, Amhara.
12. from one PSNP male youth fGD, Gorodola woreda, Oromia.
13. Based on comments by one PSNP male youth fGD participant, 20 years, Wuchale woreda, Oromia, and by one PSNP female youth fGD participant, 25 years, Debark woreda, Amhara.
14. Based on comments by one PSNP male youth fGD participant, 28 years, kimbibit woreda, Oromia.
15. Based on comments by one PSNP female beneficiary, 25 years, Debark woreda, Amhara region.
REFERENCES
Adhikari, S., and U. Gentilini. 2018. “Should I Stay or Should I Go: Do Cash Transfers Affect Migration?” Policy research Working Paper 8525, World Bank, Washington, DC.
Angelucci, M. 2015. “Migration and financial Constraints: Evidence from Mexico.” Review of Economics and Statistics 97 (1): 224–28.
Asfaw, W., D. Tolossa, and G. Zeleke. 2010. “Causes and Impacts of Seasonal Migration on rural Livelihoods: Case Studies from Amhara region in Ethiopia.” Norsk Geografisk Tidsskrift— Norwegian Journal of Geography 64 (1): 58–70.
Berhane, G., f. Bachewe, I. Birch, L. Cabral, D. Gilligan, J. hoddinott, N. kumar, et al. 2021. The Productive Safety Net Program IV, Endline Program Performance Report 2021 . Addis Ababa: International food Policy research Institute, Institute of Development Studies, Cornell University, Dadimos.
Bryan, G., and M. Morten. 2019. “The Aggregate Productivity Effects of Internal Migration: Evidence from Indonesia.” Journal of Political Economy 127 (5): 2229−68.
Bundervoet, T. 2018. Internal Migration in Ethiopia. Washington, DC: World Bank.
Carling, J. 2014. The Role of Aspirations in Migration. Determinants of International Migration Oxford: International Migration Institute, University of Oxford.
Clemens, M. A. 2014. “Does Development reduce Migration?” Chapter 6 in International Handbook on Migration and Economic Development , edited by r. E. B. Lucas. London: Edward Elgar Publishing Limited.
Social Safety Nets and Labor Migration | 105
de Brauw, A., and J. Giles. 2018. “Migrant Labor Markets and the Welfare of rural households in the Developing World: Evidence from China.” World Bank Economic Review 32 (1): 1–18. https://doi.org/10.1093/wber/lhx023
De haas, h. 2021. “A Theory of Migration: The Aspirations-Capabilities framework.” CMS 9: 8.
Demirag, D. 2023. The Role of Public Works on Youth Aspirations and Capabilities to Migrate Draft report.
Deshingkar, P., r. G. Godfrey-Wood, and C. Béné. 2015. “Adaptive Social Protection and Migration: The Case of Cash Transfers in Ethiopia, kenya, Tanzania and Malawi.” Migrating Out of Poverty research Programme Consortium, U k Department for International Development.
Deshingkar, P., S. kumar, h k. Chobey, and D. kumar. 2006. The Role of Migration and Remittances in Promoting Livelihoods in Bihar. London: Overseas Development Institute.
Ezra, M., and G.-E. kiros. 2001. “rural Out-Migration in the Drought Prone Areas of Ethiopia: A Multilevel Analysis.” International Migration Review 35 (3): 749–71.
Gazeaud, J., E. Mvukiyehe, and O. Sterck. 2019. “Cash Transfers and Migration: Theory and Evidence from a randomized Controlled Trial.” CSAE Working Paper WPS/2019-16. https://ssrn.com/abstract=3504553 or http://dx.doi.org/10.2139/ssrn.3504553
hagen-Zanker, J., and L. himmelstine. 2012. “how Does Access to Social Protection Programmes Affect the Decision to Migrate?” ODI Background Note, Overseas Development Institute, London.
hausmann, r., and L. Nedelkoska. 2018. “Welcome home in a Crisis: Effects of return Migration on the Non-Migrants’ Wages and Employment.” European Economic Review 101: 101–32.
Imbert, C., and J. Papp. 2014. “Short-Term Migration and rural Workfare Programs: Evidence from India.” https://sites.bu.edu/neudc/files/2014/10/paper_70.pdf
Imbert, C., and J. Papp. 2015. “Labor Market Effects of Social Programs: Evidence from India’s Employment Guarantee.” American Economic Journal: Applied Economics 7 (2): 233–63.
Lagakos, D., A. M. Mobarak, and M. E. Waugh. 2018. The Welfare Effects of Encouraging Rural− Urban Migration. Working Paper. Cambridge, MA: National Bureau of Economic research. https://www.nber.org/papers/w24193
Lavers, T. 2012. “‘Land Grab’ as Development Strategy? The Political Economy of Agricultural Investment in Ethiopia.” Journal of Peasant Studies 39 (1): 105–32.
Lavers, T. 2013. “food Security and Social Protection in highland Ethiopia: Linking the Productive Safety Net to the Land Question.” Journal of Modern African Studies 51 (3): 459–85.
Lavers, T. 2016. “Social Protection in an Aspiring ‘Developmental State’: The Political Drivers of Ethiopia’s PSNP.” ESID Working Paper No. 73, Effective States and Inclusive Development research Centre, University of Manchester, Uk
Mueller, V., C. Gray, S. handa, and D. Seidenfeld. 2020. “Do Social Protection Programs foster Short-Term and Long-Term Migration Adaptation Strategies?” Environment and Development Economics 25 (2): 135–58.
Piracha, M., and f. Vadean. 2009. “return Migration and Occupational Choice.” IZA Discussion Paper No. 3922, IZA Institute of Labor Economics, Bonn.
redehegn, M. A., D. Sun, A. M. Eshete, and C. N. Gichuki. 2019. “Development Impacts of Migration and remittances on Migrant-Sending Communities: Evidence from Ethiopia.” PLoS One 14 (2): e0210034.
Schewel, k., and S. fransen. 2018. “formal Education and Migration Aspirations in Ethiopia.” Population and Development Review 44 (3): 555.
Smith, r., Z. Cepla, D. Demirag, f hani, and C. Wieser. 2020. “Ethiopia Labor Mobility Diagnostic.” 0000A8056, World Bank, Washington, DC.
Veljanoska, S. 2022. “Do remittances Promote fertilizer Use? The Case of Ugandan farmers.” American Journal of Agricultural Economics 104 (1): 273−93.
106 | W O rk ING T ODAY f O r A B ETTE r T OMO rr OW IN E T h IOPIA
Wang, Z.-C., and W.-G. Yang. 2013. “Self-employment or Wage-employment? On the Occupational Choice of return Migration in rural China.” China Agricultural Economic Review 5 (2): 231−47.
Wieser, C., B. Mekonnen, L. Cardona-Sosa, and A. Abubakar. 2022. Voluntary Migration in Ethiopia. Washington, DC: World Bank.
World Bank. 2020. Ethiopia Poverty Assessment: Harnessing Continued Growth for Accelerated Poverty Reduction. Washington, DC: World Bank.
World Bank. 2021. “Understanding Migration in PSNP Areas.” Unpublished report. World Bank, Washington, DC.
World Bank. 2022. Ethiopia—Rural Income Diagnostics Study: Leveraging the Transformation in the Agri-Food System and Global Value Chains to Expand Rural Incomes. Washington, DC: World Bank.
Social Safety Nets and Labor Migration | 107
OF MIGRATION ACROSS PSNP AND NON-PSNP AREAS IN ETHIOPIA
Source: Original to this publication.
Note: The dependent variable in columns 1 and 2 is 1 if the person is a migrant including returnees and 0 for nonmigrants; the dependent variable in columns 3 and 4 is 1 if the person is a migrant but not a returnee and 0 for nonmigrants; the dependent variable in columns 5 and 6 is 1 if the person is a returnee and 0 otherwise (conditional on being migrated). Columns 1, 3, and 5 include a dummy variable of whether a household is on PSNP; columns 2, 4, and 6 disaggregate PSNP public works households from PSNP direct support households. DS = Direct Support; HH = household; PSNP = Productive Safety Net Program; PW = Public Works; — = not available. Standard errors in parentheses. *** p < 0.01, ** p < 0.05, * p < 0.1.
108 | W O rk ING T ODAY f O r A B ETTE r T OMO rr OW IN E T h IOPIA
5A DETERMINANTS
TABLE 5A.1
(1) (2) (3) (4) (5) (6) VARIABLES ANY_MIGRANT ANY_MIGRANT MIGRANT MIGRANT RETURNEE RETURNEE Age in years −0.001*** (0.000) −0.001*** (0.000) −0.001*** (0.000) −0.001*** (0.000) 0.008*** (0.002) 0.008*** (0.002) HH_size 0.008*** (0.002) 0.008*** (0.002) 0.009*** (0.001) 0.009*** (0.001) −0.042*** (0.009) −0.041*** (0.009) Gender=1 if male 0.020*** (0.006) 0.020*** (0.006) 0.008 (0.005) 0.008 (0.005) 0.070** (0.034) 0.072** (0.034) Gender_HH_head=1 if male −0.019*** (0.007) −0.020*** (0.007) −0.022*** (0.006) −0.023*** (0.006) 0.109*** (0.037) 0.108*** (0.037) Number of children under 6 years in HH −0.019*** (0.004) −0.019*** (0.004) −0.020*** (0.003) −0.020*** (0.003) 0.067*** (0.024) 0.065*** (0.024) Reference=No education Education=Less than primary 0.028*** (0.007) 0.028*** (0.007) 0.024*** (0.007) 0.024*** (0.007) 0.011 (0.049) 0.010 (0.049) Education=Completed primary 0.092*** (0.010) 0.092*** (0.010) 0.080*** (0.009) 0.080*** (0.009) −0.038 (0.052) −0.040 (0.052) Education=Completed secondary and above 0.203*** (0.019) 0.204*** (0.019) 0.179*** (0.017) 0.179*** (0.017) −0.035 (0.070) −0.033 (0.070) Own_nonfarm enterprise 0.012 (0.011) 0.013 (0.011) 0.013 (0.010) 0.014 (0.010) −0.025 (0.056) −0.028 (0.057) PSNP_PW_HH −0.047*** (0.006) −0.033*** (0.005) −0.053 (0.036) PSNP_DS_HH −0.014 (0.015) −0.013 (0.013) 0.032 (0.100) PSNP_HH −0.048*** (0.006) −0.035*** (0.005) −0.033 (0.034) Constant 0.055*** (0.014) 0.052*** (0.014) 0.037*** (0.012) 0.035*** (0.012) 0.162* (0.088) 0.168* (0.088) Observations 8,176 8,176 8,038 8,038 609 609 R-squared 0.048 0.048 0.046 0.045 0.099 0.101
ANNEX
Probit model on determinants of migration across PSNP and non-PSNP areas in Ethiopia
III Social Safety Net Programs to Increase Earnings and Productivity
109
Creating Small Enterprise and Microenterprise Jobs in Ethiopia
THE ROLE OF SOCIAL SAFETY NETS
SUMMARY*
The Ethiopian government has long prioritized productivity in self-employment. Across income levels, most Ethiopians are self-employed. However, it is the nature of self-employment that matters to one’s well-being. Social safety nets are well positioned to provide holistic support that can help shift how people engage in self-employment.
• Diversity of income sources is linked directly and positively to wealth, and diversification of self-employment into services was a key driver of poverty reduction between 2011 and 2016. Rural households, however, rely mostly on low-productivity agricultural self-employment.
• Increasing global research and evidence highlight the transformative potential of self-employment. In Ethiopia, World Bank analysis highlights the need for expanding off-farm self-employment, especially in rural areas, to help in the country’s continued economic transition.
• Global evidence, as well as that from small-scale interventions in Ethiopia, shows how adding productive components to social safety nets can deliver sustained impacts on earnings. A pilot in Ethiopia catalyzed a nearly 20 percent increase in the consumption of involved households.
• Unfortunately, larger efforts in Ethiopia have struggled. Financing for self-employment support repeatedly shifts to cash transfers in the face of innumerable, recurrent crises. Implementation challenges also exist. For example, nearly all rural clients have focused on agriculture—investing in livestock for savings rather than in productive activities.
• Learning from these experiences suggests the need to strengthen efforts around nonfarm enterprises; increase awareness of, training on, and financing for off-farm self-employment; and ensure flexibility to adjust the support people receive according to the unique barriers that they face.
111
This chapter was written by Margaux Vinez, Blene A. Betemariam, and Natnael Simachew Nigatu. The authors thank Janet Heisey, Wout Soer, and Tesfaye Workineh for their valuable comments in its preparation.
6
• A harmonized framework for self-employment support could benefit the poor and nonpoor populations, as well as rural and urban populations, alike. A holistic economic inclusion program would offer direct support to Ethiopian workers while encouraging local economic development that would contribute to broader economic growth.
INTRODUCTION
The government of Ethiopia has long aimed to complement the consumption smoothing and asset protection achieved by regular cash transfers with interventions to address the broader constraints that limit poor households’ ability to increase their productivity in self-employment and to sustainably move out of poverty. The first livelihoods interventions to complement cash and in-kind interventions to food-insecure households in rural areas, launched in 2002 with the other Food Security program, aimed to build household assets by providing credit for agricultural inputs through the extension system.
When the productive Safety Net program (pSNp) was launched in 2005, the other Food Security program was explicitly linked to pSNp beneficiaries. These interventions have evolved substantially over time, influenced by the knowledge generated by the government and the nonprofit sector in Ethiopia and around the world. They were introduced in urban areas in 2016 with the launch of the urban safety net. Despite their potential, these interventions have faced numerous challenges, including their complexity, the diversity of conditions among targeted populations, the scale of their implementation, and budget constraints.
This chapter highlights the importance of self-employment to poverty reduction in rural and urban Ethiopia and demonstrates that social safety nets (SSNs) are well positioned to support productive self-employment by combining regular cash transfers with economic inclusion programs. It explores the state of support for self-employment through SSNs across Ethiopia, reviews evaluations of rural and urban pSNps, and offers insight into the effectiveness and shortcomings of government interventions to date. It concludes with policy recommendations to improve the outcomes of future generations of this type of support.
SELF-EMPLOYMENT IS THE PREDOMINANT FORM OF WORK FOR POOR HOUSEHOLDS
over 90 percent of poor households in Ethiopia engage in self-employment. The 2016 Household Income, Consumption, and Expenditure Survey shows that 91 percent of household heads in the lowest two quintiles engage in self-employment activities as compared to 83 percent for nonpoor households. The dominance of self-employment for poor households is even higher in rural areas, jumping to 95 percent (refer to figure 6.1). For urban poor households, self-employment accounts for 68 percent of work and wage employment for 30 percent. Wage employment accounts for only 3 percent of work for rural poor households. Among p SN p households, unpaid family work is more common than wage work.
Nearly all poor self-employed households in rural areas work in agriculture, whereas urban households have greater diversity of self-employment.
112 | Wo R k ING To DAy F o R A B ETTER To M o RR o W IN E THI op IA
Female Young
Non-PSNP
PSNP
Urban poor
Rural poor
All poor
Other
Agriculture, forestry, and hunting
Construction Manufacturing
Transportation and storage
Other
Agriculture accounts for over 87 percent of self-employment in rural areas (refer to figure 6.2). In urban areas, wholesale and retail trade, including vehicle repairs, is most common but represents less than 40 percent of activities. personal services and agriculture together account for another 30 percent.
Diversity of income sources is limited and varies by wealth. However, as figure 6.3 illustrates, diversifying away from agriculture toward nonagricultural activities could potentially enhance overall welfare. In the poorest quintile, more than 80 percent of self-employed individuals earn their livelihood from agriculture, whereas in wealthier consumption quintiles, only half of these individuals are engaged in agriculture, with the rest working in various industries. This data highlight the potential of other sectors to improve consumption and earnings.
Creating Small Enterprise and Microenterprise Jobs in Ethiopia | 113
FIGURE 6.1
Ethiopia Household Income, Consumption, and Expenditure Survey, 2016. Note: PSNP = Productive Safety Net Program. Percent 020406080 100
Household head’s employment type in Ethiopia, by area, PSNP participation, gender, and age, 2016
Source:
Self-employment Wage employment Unpaid work
FIGURE 6.2
Self-employment in rural and urban areas in Ethiopia, by subsector, 2016
Private households with employed persons
Source:
Ethiopia Household Income, Consumption, and Expenditure Survey, 2016.
Hotels and restaurants
community,
personal services
and retail trade 020406080 100 Percent Urban Rural
social and
Wholesale
Agriculture, forestry, and hunting
Manufacturing
Construction
Hotels and restaurants
Mining
Wholesale and retail trade
Other community social and personal services
Private households with employed person
Transportation and storage
Other
SELF-EMPLOYMENT IS CRITICAL FOR POVERTY REDUCTION
Diversification into self-employment and work in the service sector were key drivers of the poverty reduction that Ethiopia achieved between 2011 and 2016. Urban areas accounted for two-thirds of poverty reduction realized during that time. A large share of the reduction resulted from increases in income among households with self-employed household heads. Regardless of the head of household’s occupation, the transition of any household member into self-employment is associated with the strongest levels of poverty reduction. Moreover, households deriving their livelihood from the service sector, whether through salaried employment or self-employment, had the lowest poverty rates (World Bank 2020).
Self-employment also remains the only option for most poor households. As chapter 1 explained, wage employment opportunities remain elusive and will not grow to match demand from existing workers or the vast number of youth entering the labor force. The largest share of the jobs created in the past decade was in the service sector, where self-employment is predominant. Moreover, wage employment correlates positively with educational attainment (refer to figure 6.4), which further limits the potential for such work among poor households, at least until broader structural transformation takes place.
Self-employment in agriculture and small enterprises has greater transformational potential than is often appreciated. The 2014 flagship World Bank report, Youth Employment in Sub-Saharan Africa, addressed directly the fundamental question of the value of self-employment (Filmer and Fox 2014). That report followed World Development Report 2013: Jobs, which highlighted the predominance of the informal sector and self-employment (World Bank 2012). Whereas the latter report focused on the low productivity of this work, the former noted its positive contributions:
114 | Wo R k ING To DAy F o R A B ETTER To M o RR o W IN E THI op IA
FIGURE 6.3
Sources:
Percent 0 10 20 30 40 50 60 70 80 90 100 Quintile 1Quintile 2Quintile 3Quintile 4Quintile 5
Industries accounting for self-employment in Ethiopia, by wealth quintile, 2016
Ethiopia Household Income, Consumption, and Expenditure Survey, 2016; Welfare Monitoring Survey, 2016.
Even if it is realistic to emphasize the role of the informal sector, does this mean that we are pessimistic about Africa’s future? That we are denying African workers the hope of emerging from informal employment? on the contrary, raising the productivity of smallholder farms and household enterprises is precisely what will enable the formal sector to develop and thrive. It was the key to structural transformation in Asia and Latin America, and it is the key to Africa’s future as well (Filmer and Fox 2014, 6).
Smallholder productivity and nonfarm enterprises are areas to which well-designed SSN programs can contribute. Clear policy entry points for improving livelihoods are relevant in the Ethiopian context as three critical pathways to improve employment opportunities against the reality of labor markets in Sub-Saharan Africa: basic education, productivity of smallholder farmers, and productivity of nonfarm enterprises. The Ethiopian Rural Income Diagnostics Study identified similar priorities: increasing market orientation of smallholder farmers, livelihood diversification into nonfarm opportunities, and rural–urban migration (World Bank 2022). This chapter focuses on overlap between those two reports. Chapters 5 and 7 also provide more details about the relevance of rural–urban migration for poor households and their labor outcomes.
Increasing productivity of labor in agriculture and promoting diversification are key to raising incomes. As seen in figure 6.5, Ethiopia’s agricultural productivity is low even compared to low-income countries. Moreover, pSNp households have lower labor and land productivity as compared to non- p SN p households. Improving agricultural productivity will be instrumental in uplifting millions of poor households working within the sector. At the same time, diversification can be achieved both within the agricultural sector, growing different crops or working with livestock, and by engaging in both on-farm activities and off-farm household enterprises.
Encouraging participation and increasing productivity of labor in nonfarm household enterprises can also raise incomes. Globally, owners of such enterprises generally derive more income from these activities than from agriculture (Fox and Sohnesen 2012). Typically informal, these enterprises often employ only one person, provide simple services, produce simple transformed products, or do artisanal activities. In urban areas, they mostly focus on retail trade.
Creating Small Enterprise and Microenterprise Jobs in Ethiopia | 115
6.4
FIGURE
Source: Ethiopia Household Income, Consumption, and Expenditure Survey, 2016. 0 10 20 30 40 50 60 70 No educationPrimary schoolSecondary schoolPostsecondary Percent Self-employment, formal Upaid work/unemployment Wage employment
Household head’s employment type in Ethiopia, by education level, 2016
FIGURE
Earnings in Ethiopia, by sector and compared to global averages Source:
a.
by sector, 2000–16
As noted in chapter 2, work in the service sector has increased steadily in rural Ethiopia, from only 5 percent in 1999 to 29 percent in 2021. These trends have helped drive poverty reduction in the country and their further encouragement offers a practical path out of poverty.
SOCIAL SAFETY NETS AND ECONOMIC TRANSFORMATION FOR SELF-EMPLOYED INDIVIDUALS
SSNs target the poorest households and are uniquely positioned to support increasing these households’ productivity and resilience. Although the primary objective of SSNs is often to increase consumption and promote investments in health and education, their role in helping households invest in more diversified and productive economic activities is increasingly recognized.
116 | Wo R k ING To DAy F o R A B ETTER To M o RR o W IN E THI op IA
6.5
Ethiopian birr
Adapted from Policy Studies Institute 2020.
Earnings
2000 2016200120022003200420052006200720082009201020112012201320142015 Agriculture Industry Services Economywide Ethiopia Sub-Saharan Africa Low income Lower-middle income Upper-middle income 2000 201820012002200320042005200620072008200920102011201220132014201520162017 30,000 35,000 40,000 0 10,000 20,000 25,000 5,000 15,000 30,000 35,000 0 10,000 20,000 25,000 5,000 15,000 Ethiopian birr
Earnings,
comparators, 2000–18
b.
Ethiopia and global
Understanding what limits productivity in self-employment is key to designing policies that help poor households increase their earnings. As noted earlier, SSNs target poor and vulnerable people who derive a large share of their income from low-productivity self-employment activities. poor households face multiple constraints at the household, individual, community, local economy, and formal institutional levels that limit their ability to invest in profitable investments in existing or new activities (Andrews et al. 2021).
Limited savings and access to financial services, as well as high exposure to uninsured risk, prevent poor Ethiopians from making productive investments. In Ethiopia, only about 6 percent of pSNp households report having access to microfinance institutions (MFIs), having borrowed money from the Micro and Small Enterprise program in the past, or having savings, which all limit their ability to make productive investments. Moreover, Ethiopia’s frequent weather shocks mean that households tend to respond by taking precautionary measures; for example, households with higher exposure to climate risks are most likely to invest in livestock for savings rather than for commercially oriented purposes (Abay and Jensen 2020).
poor Ethiopians are also disadvantaged by their educational levels and aspirations. poor households may lack the technical, business, transversal, or soft skills needed to manage their self-employment effectively. The 2016 Household Income, Consumption, and Expenditure Survey reveals that heads of households have 2.3 years of education on average and that 54.4 percent cannot read and write. Moreover, additional research has shown that poor people may be risk averse and have limited aspirations for their own possibilities and opportunities (Bernard et al. 2014). Simple interventions, easily integrated into SSN programs, could change this situation.
Lack of access to agricultural inputs further constrains poor households’ agricultural productivity. Using p SN p households as a proxy for poverty, figure 6.6 compares the differences across selected constraints. Although land reform represents a broader structural issue, government investment in SSN and productive inclusion programs could help improve access to fertilizer and livestock vaccinations, as well as positively influence household labor use.
SSN interventions have the potential to foster productive investments but not necessarily to have transformative impacts unless complemented by other policies. SSNs have a wide range of positive impacts on well-being. Cash transfers and other similar programs can increase consumption levels of beneficiaries (Grosh et al. 2008), help households invest more in productive assets (Alderman and yemtsov 2013; Bastagli et al. 2014; Gertler, Martinez, and Rubio-Codina 2012; premand and Stoeffler 2020), and protect households hit by a shock (premand and Stoeffler 2020). Less evidence exists, however, on their ability to increase assets and investments sufficiently to move households fully out of poverty, unless combined with other complementary interventions.
Because of the multifaceted nature of poverty, siloed programs have failed to bring about lasting improvements in the earnings of the working-poor population. poor households face a diversity of constraints to increasing their productivity and need multidimensional programs to overcome these barriers. Increasingly, SSN programs include productive components—such as training, savings, and information—that deliver sustained impacts (Andrews et al. 2021; Sedlmayr, Shah, and Sulaiman 2020). The inclusion of psychosocial support measures has also shown promising results (Barker et al. 2022;
Creating Small Enterprise and Microenterprise Jobs in Ethiopia | 117
FIGURE 6.6
Landsize Farmarea Accessto vaccinationsforanimalsInorganicfertlizerusage(cost)
TotalhouseholdlaboruseReachedbyextensionagents Sickness Noformaleducation
Bernard et al. 2014; Bossuroy et al. 2022; Campos 2017; Chioda 2021; karlan, k night, and Udry 2015). Successful programs begin by understanding the specific constraints faced by and needs of the target population (Bossuroy et al. 2022).
In addition, successful programs typically augment cash transfer support with business capital to facilitate productive investments. A targeted regular cash transfer gives participants greater flexibility in their daily lives and allows them to focus on developing and building income-generating activities. The modalities for business capital interventions vary widely, with programs providing from 35 percent of average per capita consumption to as much as 339 percent in Zambia. The first programs provided in-kind transfers directly for specific livelihoods, but cash grants are now most common, in use in 71 percent of programs reviewed in the 2021 State of Economic Inclusion Report (Andrews et al. 2021).
Training in life and business skills constitutes another key part of multidimensional programs. Modules on business skills and financial literacy and technical skills of specific livelihood options can all be part of the mix. Life skills training can help participants build the confidence to engage in program activities, launch a livelihood activity, and overcome obstacles faced during start-up or expansion of an economic activity. Training can be delivered in regular sessions over a relatively long period, more quickly via intensive training courses, or timed to match different stages of livelihood development. The trainings can be delivered directly by coaches or by other trainers including government staff, social workers, program staff, or private training providers. The trainings need to reflect the capacities and education levels of both trainers and trainees.
Support and savings education, often with financial literacy training, are critical. Village savings and loan associations, or variations thereof, are one
118 | Wo R k ING To DAy F o R A B ETTER To M o RR o W IN E THI op IA
Comparison of factors affecting agricultural production in PSNP and non-PSNP households in Ethiopia, 2016
Source: Ethiopian Socioeconomic Survey, 2015/16.
–1.0 –0.8 –0.6 –0.4 –0.2 0 0.2
Note: Land size measures total land owned by a household; farm area measures the amount of land used for farming purposes. Each variable is normalized by its mean for a better comparison. PSNP = Productive Safety Net Program.
Difference between PSNP and non-PSNP particpants
model. It is important that this support start from the beginning of the program and of the cash transfers to enable beneficiaries to benefit from several rounds of savings activities and give enough time for groups to solidify and be sustainable after the program ends.
Creating links, with markets and between actors along value chains, can also increase productivity. Seventy-one percent of all programs surveyed for the 2021 State of Economic Inclusion Report assist participants with integration into markets; this figure increases to 80 percent in rural areas. programs help participants link to existing value chains and markets, and some even support the creation of new value chains (local, regional, national, or international). These components are important to help the poor overcome the constraints they face in selling their products in the market at a good price, which is essential for increasing their profits.
Coaches engage participants and provide vital services through the interventions. Coaching can be delivered by community volunteers, government staff, or dedicated program staff. Coaches help potential beneficiaries understand the program and help identify people who are interested and able to join. Coaches also help in livelihood planning, taking stock of the household’s current livelihood portfolio and working with participants to develop a strategy for adding or expanding livelihood activities over the course of the program. Coaches sometimes deliver trainings directly but more often play a supporting role, reinforcing training messages, encouraging participants to stay on track, and ensuring they gain access to programs and services. Coaching visits are often tailored so that struggling participants can receive more active follow-up as needed and help minimize dropouts.
In 2016, the results from multidimensional programs—known as the graduation approach—in 6 low-income countries showed significant positive and sustained economic impacts. The approach is widely credited to BRAC, a nonprofit development organization that, in 2002, introduced a pathway for graduation to its Targeting the Ultra poor program in Bangladesh. Given promising early insights, the program launched a series of 10 graduation pilots in 8 countries between 2006 and 2014, including in Ethiopia, with funding from the Consultative Group to Assist the poor and the Ford Foundation. The program followed the steps described in box 6.1. Six of the pilots used randomized controlled trials to evaluate their programs, and these trials revealed strong impacts on incomes, food consumption, assets, and savings that were sustained 3 years after the asset transfers (Bandiera et al. 2013; Banerjee et al. 2015).
These pilots established the potential of multidimensional interventions to sustainably improve outcomes but were expensive to implement broadly. Targeting the Ultra poor interventions in Bangladesh, for example, cost US$1,120 per person and did not identify the value added of each program dimension. Also, most of the interventions evaluated were implemented by nongovernmental organizations, again raising questions about scalability (Bold et al. 2018; Muralidharan and Niehaus 2017).
Recent evidence shows the promise of sustained impacts through more sustainable government-led interventions. In Niger, a multifaceted government-led intervention had a strong and positive impact on consumption, household revenue, household income diversification, and food security about 18 months after the end of the interventions (Bossuroy et al. 2022)—see box 6.2. The full program cost US$584 per beneficiary, but the government also assessed the impacts of different aspects of the program. It found the highest internal rates of return
Creating Small Enterprise and Microenterprise Jobs in Ethiopia | 119
Lessons from the early graduation pilot in Ethiopia
Ethiopia was one of the eight countries to host a graduation approach pilot project. Between 2010 and 2012, the Relief Society of Tigray, in partnership with the microfinance institution Debit Credit and Savings Institution, provided a sequenced and timebound package of support to poor households in northern Tigray. This support included the following:
• Productive asset transfer participants received a one-time transfer of a productive asset valued at 4,724 Ethiopian birr, or Br (about US$1,228 in 2014 purchasing power parity [ppp]). Most (62 percent) participants chose sheep and goats, 24 percent selected oxen, and 10 percent selected bees.
• Technical skills training. participants received training on running a business and managing their chosen livelihood. For example, households that selected livestock were taught how to rear the livestock, including vaccinations, feed, and treatment of diseases.
• Consumption support. Regular food support is a component of the graduation approach and was
not unique to the treatment group. The entire sample received food support (valued at US$26 per month in 2014 ppp) through a separate foodfor-work program.
• Savings. Households had Debit Credit and Savings Institution bank accounts opened and were required to regularly deposit savings totaling Br 4,724 (US$1,228 in 2014 ppp) over the 2 years of the program; households could not withdraw funds until they reached this threshold.
• Home visits. Relief Society of Tigray staff conducted weekly home visits to provide accountability, coaching, and encouragement.
Monthly consumption increased by 18.2 percent, and asset values were 68 percent higher in treatment than in control households. The program cost per household was estimated at US$4,157 (2014 ppp) but led to an estimated consumption and savings increase of US$10,805 (2014 ppp) per household. Based on the positive results from this pilot, similar interventions were integrated into the p roductive Safety Net program 4 in 2015 at a much larger scale.
Source: J-PAL Africa and Innovations for Poverty Action, “Graduating the Ultra-Poor in Ethiopia” (https://www.povertyactionlab.org/evaluation /graduating-ultra-poor-ethiopia).
BOX 6.2
A multidimensional approach to improve incomes among Niger’s poor population
Beginning in 2016, Niger expanded its national cash transfer program “ projet de Filets Sociaux” to include a multidimensional package of services. All households in the randomized controlled study received cash transfers, as well as a group savings promotion, coaching, and entrepreneurship training. Three treatment variations built on this basic package: a lump-sum cash grant (capital intervention), psychosocial support (psychosocial intervention), or both the grant and support (full intervention).
The program improved economic and psychosocial outcomes for targeted beneficiaries. The study found strong and positive impacts on consumption, household revenue, household income diversification, and food
security 6 and 18 months after the interventions (figure B6.2.1). overall, the full intervention had the strongest impact. Beneficiaries increased their consumption by 15 percent from the interventions. The capital and psychosocial intervention had smaller impacts 6 months afterward; however, by 18 months afterward, the impacts from the psychosocial intervention were almost as strong as the full intervention—and at a fraction of the cost. Food insecurity significantly decreased in all interventions because of increases in off-farm business revenues as well as in revenues from livestock and agriculture. The program also helped households develop new income sources, contributing to the diversification of income sources and household resilience.
120 | Wo R k ING To DAy F o R A B ETTER To M o RR o W IN E THI op IA
BOX 6.1
continued
Box 6.2, continued
FIGURE B6.2.1


Group formation and coaching
Formation of groups of about 20 beneficiaries who participate together in program activities. Coaches provide support to groups and individual beneficiaries throughout the duration of the program.


Facilitation of community savings and loan groups
Adaptation of the Village Savings and Loan Association approach, which features: group savings with weekly meetings where contributions are made; possibility to take small loans; distribution of share-outs (savings + interest) after cycles of 9-12 months.
Community sensitization on aspirations and social norms


Screening of a short video showing how a married couple overcomes tensions and works together to diversify their livelihoods. The screening is followed by a facilitated discussion with the wider community.
Life-skills training


Group training spanning 3 to 7 half days. Covers topics such as self-confidence, gender relations, communication skills, risk-taking.
Micro-entrepreneurship training


Group-based training spanning 3 to 7 half days. Covers fundamental skills in micro-business management, relevant for both agricultural and non-agricultural activities.
Access to markets


Facilitation of group-buying of inputs with support from coaches.


Cash grants
One-off transfer of US$140–275 depending on the country.
with the psychosocial intervention, which included the core cash transfer and trainings. At a cost of US$263 per beneficiary, the intervention’s internal rate of return was 42 percent as compared to 21 percent for the full package.
In Zambia, the Supporting Women’s Livelihoods package includes life and business skills training, a one-time productive grant of US$225, group mentorship, and savings groups.1 A randomized evaluation showed large impacts on household consumption, which increased by 21 percent, also driven mainly by
Creating Small Enterprise and Microenterprise Jobs in Ethiopia | 121
Reprinted from World Bank, n.d. Beneficiaries receive regular cash transfers as part of national safety nets 18 months 12 months 6 months 0 months
“Projet de filets sociaux” intervention cycle and support services, Niger
Source:
Adapting the graduation approach for people with disabilities
Economic inclusion not only boosts incomes but also fosters social inclusion and self-confidence. As the graduation approach has expanded, programs have increasingly considered meeting the needs of people with disabilities. Lessons so far include the following:
• Be realistic about program duration. Graduation programs for people with disabilities should generally be longer than programs for those without disabilities.
• Support caretakers p rograms should target both people with disabilities and those who support them. For example, programs can invite household members to participate in training sessions alongside their family member with a disability.
Source: De Montesquiou and Victor 2017.
• Make community sensitization a priority. Addressing the deeper social and physical barriers that people with disabilities face is important.
• Build effective government partnerships. Graduation programs can be linked to appropriate health care and disability support programs.
• Bring training and coaching to the household
Because some people with disabilities cannot attend group meetings, include household-level coaching.
• Match asset transfers to different disabilities, including by recognizing potential differences in transfers between rural and urban areas.
• Recognize that disabilities affect people differently Better segmentation can help unpack heterogeneous groups, such as people with physical, mental, or psychosocial disabilities.
off-farm income-generating activities. The program’s effectiveness appears to derive from the financial capital influx of the productive grant, with limited value added from the training component.
Evidence is also emerging that multifaceted interventions can be effective in different contexts, including fragile settings and with people with disabilities. In Afghanistan, the Targeting the Ultra poor program2 had strong impacts on consumption, assets, psychological well-being, total time spent working, financial inclusion, and women’s empowerment (Bedoya et al. 2019). productive economic inclusion is also increasingly used as a tool to support displaced populations and host communities, with promising results (Heisey, Sánchez, and Bernagros 2022). About one-third of all productive economic inclusion interventions identified in the 2021 State of Economic Inclusion Report support displaced populations or their hosts. Box 6.3 discusses the potential for adapting multidimensional programs to support people with disabilities.
ETHIOPIA’S RURAL SOCIAL SAFETY NETS AND SELF-EMPLOYMENT FOR POOR HOUSEHOLDS
Complementing safety net support with transformative interventions in rural areas as a government priority predates pSNp. The interventions went through four main phases:
1. The other Food Security program was implemented between 2002 and 2009 as a separate program but had links to pSNp beginning in 2006 that helped it reach 1 in 5 safety net clients;
122 | Wo R k ING To DAy F o R A B ETTER To M o RR o W IN E THI op IA
BOX 6.3
2. The Household Asset Building program, implemented between 2010 and 2015, was also a separate program but more explicitly targeted p SN p beneficiaries;
3. Beginning in 2015 under pSNp4, livelihoods were integrated directly into the safety net; and
4. The pSNp5 livelihoods component builds on lessons from pSNp4 and international evidence. Although pSNp5 began in 2021, preparatory activities and a budget shortfall meant that the livelihoods component only started at scale in late 2022.
Results from the early livelihoods interventions showed promising results as well as key challenges. For example, pSNp households that also participated in the other Food Security program were more likely to use fertilizer and to invest in terracing on farmland, but with mixed effects on yields (Hoddinott et al. 2012). They saw their food security increase by 0.81 month (25 days) more than households participating only in the core pSNp public works program (Berhane et al. 2014). However, the menus of livelihood packages defined at the regional level were too rigid and not well adapted to the diversity of conditions at woreda levels. In addition, repayment rates were extremely low and beneficiaries had high levels of indebtedness (Berhane et al. 2021b).
Based on the experiences in Ethiopia, livelihoods support has evolved in terms of targeted clients and the package of support provided. Although earlier programs sought universal coverage, budget and capacity limitations have always challenged this aim. The program decided to focus on woredas with more capacity to implement, where enough credit was available to meet beneficiaries’ needs, and to focus on households that would better use the productive support. The package of support has evolved solely from agricultural productivity and financing through agricultural extension services to efforts toward household diversification into self- and wage employment. They include links to MFIs and rural savings and credit cooperatives, as well as to grants for the poorest clients. Similarly, the training package expanded beyond agricultural extension services to include a range of technical and nontechnical skills, as well as coaching and mentoring. The Graduation with Resilience to Achieve Sustainable Development program, funded by the US Agency for International Development and under the Household Asset Building program, also showed the impact of savings support.
The pSNp4 livelihood services brought together these lessons, as well as national and international evidence on productive inclusion, to scale up a multidimensional livelihoods approach. In line with other productive economic inclusion interventions, pSNp4 aimed to tackle the multiple barriers that prevent poor households from accessing better jobs and livelihood opportunities and to promote sustained increases in income, assets, and resilience. In p SN p 4, bene ficiaries self-selected into one of three options: on-farm, off-farm, and wage employment. o n-farm and off-farm activities made up the self-employment pathways. The sequenced package of services included group formation, financial literacy training, promotion of savings, technical training, assistance in preparing a business plan, a livelihood grant of US$200 for the poorest households (or referral to MFIs and rural savings and credit cooperatives for households not eligible for the livelihood grant), and follow-up mentoring and coaching. Beneficiaries who chose the wage
Creating Small Enterprise and Microenterprise Jobs in Ethiopia | 123
employment pathway participated in financial literacy training and skills training and received help in linking to the labor market.
Moreover, profiling analysis from pSNp4 showed the potential of clients to develop entrepreneurial activities. About 13 percent of pSNp beneficiary households relied on off-farm income and were predicted to have entrepreneurship potential. Another 50 percent of households relied on on-farm income but also had entrepreneurship potential. In addition, one-third or more of these households had a young person with some formal education (World Bank 2020).
Large implementation challenges, however, limited the program’s impact and the budget was too low to carry out the ambitious set of activities. The capital investment for the livelihood activities, which clients invested mostly in livestock, was used as a store of wealth.3 only 37.0 percent of pSNp4 public works households completed the livelihood skills training, only 13.0 percent of clients received a credit for their business plan, and only 2.4 percent received a grant for their business plan. Even with this relatively small group, the program cost was low: about US$20 per person as compared to US$263 for the lowest-cost package in the Sahel program and US$884 in the successful Tigray pilot. The limited budget was often unpredictable and released at the end of the fiscal year, further complicating implementation. o nly two-thirds of households that expected to receive the livelihood transfer reported receiving it (Berhane et al. 2021b, 2021c).
Among beneficiaries, the choice of self-employment activities was very limited, with 85 percent of people focusing on livestock. only 13 percent of participants in the self-employment pathway chose off-farm activities, mostly in petty trading, and the 10 percent of clients who chose the wage employment pathway had employment mostly in seasonal construction jobs. These proportions reflect familiarity by pSNp clients and capacity of the program implementers, both of whom were more comfortable with agricultural activities. In addition, business license requirements and loan conditions for off-farm activities discouraged pSNp households from engaging in those activities. Finally, the lack of detailed guidelines at the national level for the integration of the wide range of different stakeholders—including government ministries, training institutions, and small and medium enterprises—contributed to poor implementation (Berhane et al. 2021a, 2021c).
Lack of capacity—across government partners as well as financial institutions—also hindered effectiveness. pSNp4 further burdened the already overwhelmed development agents (DAs), many of whom lacked expertise and experience outside crop and livestock production. pSNp4 did not develop standardized training curricula and other program tools to help DAs deliver the program, nor did it engage off-farm experts to facilitate the diversification of activities (FAo 2020). In addition, the supply of credit was limited, especially for off-farm activities, which had unfavorable loan conditions. At the same time, 63 percent of clients who could secure a loan reported difficulties in repayment (Berhane et al. 2021c).
The livelihoods activities under pSNp5 reflect the lessons learned from earlier phases, although at a smaller scale than originally envisioned.4 Because of a large budget gap in pSNp5, the livelihoods component will target about 249,808 households (including 128,700 in government woredas). These targets are substantially reduced from the original aim of reaching one-third of public works clients (550,000 households in government woredas). As in pSNp4, selected clients have three options—on-farm, off-farm, and wage employment—but the
124 | Wo R k ING To DAy F o R A B ETTER To M o RR o W IN E THI op IA
design of these interventions and the program delivery reflect reforms made to overcome the challenges faced previously.
The rollout of livelihood interventions focuses on woredas with higher capacity. To participate, a woreda must have made timely cash transfer payments to more than 70 percent of beneficiaries for at least 1 year. The woreda must also have MFIs able to provide credit to at least 90 percent of the clients planned for the credit track.
The livelihood interventions also focus on a smaller number of public work clients, allowing for more intensive support per client. A new profiling guideline aims to identify households with potential and motivation to start or expand productive activities or find seasonal employment. The impact evaluation will further investigate what characteristics are associated with success to improve future targeting. In addition, more intensive support will include increasing the productive grant from the equivalent of US$200 to US$300 per client, based on assessment by the Food and Agricultural organization of the United Nations.
pSNp5 will encourage participation of youth and women. During pSNp4, youth and women represented only 28 percent and 43 percent of livelihood clients, respectively. In p SN p 5, DAs will receive training to provide gender-sensitive support, the livelihood grant has new youth and women quotas, and the different pathways include targets for youth and women. In addition, the assessment and revision of the curriculum for trainers and trainees will include adjustments to better address the constraints to productive inclusion that women face. The coaching will help female beneficiaries identify livelihood options that are well-suited for them. A menu of livelihood options, with a focus on off-farm activities, will be tailored for women’s needs.
Beneficiaries will be coached to make better-informed decisions about pathway selection and advised on more diverse options for livelihood activities. The menu of options of potential livelihood activities will be revised for each agroecological zone for the on-farm and off-farm pathways and will be used as a basis for coaching clients to choose appropriate and economically viable livelihood options. This menu of options will strive to make links with existing value chains (including nutrition-smart value chains), to identify options that are profitable and well-suited to women’s needs, and to promote off-farm options. An off-farm expert will be assigned at the woreda level to support clients in the off-farm and wage employment pathways.
Revision of the training curriculum was based on a thorough assessment by an external firm. The assessment consisted of qualitative surveys and key informant interviews to identify the key constraints faced by households in developing productive activities. The revision includes the timing and sequencing of activities as well as modules and content to reinforce business skills and microentrepreneurship, life skills, women’s empowerment, and market links.
Exploring new delivery mechanisms will help improve the quality of delivery. The program has introduced a new role of community facilitator to support DAs in delivering livelihood support. Based on recommendations from the assessment, the program will expand the use of digital tools for the delivery and monitoring. It also improved the operations manual to ensure effective collaboration and synergies between various implementation partners, clarify roles and responsibilities, and strengthen accountability.
An impact evaluation has been designed under the partnership for Economic Inclusion umbrella and in close collaboration with the Ministry of Agriculture and development partners. The impact evaluation will provide evidence on key
Creating Small Enterprise and Microenterprise Jobs in Ethiopia | 125
outcomes such as impact on assets, income, labor allocation, and resilience to shock. In addition, it will strive to identify which approaches are effective to implement interventions at scale for different types of beneficiaries and demonstrate that impact can be achieved in a cost-effective way. The study will investigate who benefits most from these interventions and will investigate general equilibrium effects and spillovers.
SOCIAL SAFETY NETS AND SELF-EMPLOYMENT IN URBAN ETHIOPIA
In 2015, the government of Ethiopia developed the Urban productive Safety Net project (UpSNp) to support poor households in building diversified and sustainable livelihoods. The program’s long-term objective is to support over 4.7 million urban poor living in 972 cities and towns, with a deliberate focus on women. UpSNp adopts a graduation approach to provide comprehensive support to ultra-poor households and address the root causes of poverty. It begins with consumption assistance through public works and introduces livelihood interventions to promote sustainable income and employment. The UpSNp graduation pathway builds on lessons from the rural safety net implementation in Ethiopia and worldwide experiences with graduation programs to reach the poorest and the most vulnerable.
The UpSNp provides clients with 3 years of dynamic, evolving support. In year 1, eligible households with able-bodied persons receive cash transfers conditioned on public works. In year 2, one beneficiary per household receives livelihood support comprising training, financial support, and technical advice to increase employability in wage and self-employment opportunities while the conditional transfers continue. In year 3, beneficiaries can continue in the public works and receive coaching and mentoring support to strengthen their livelihood activities.
At the end of its first phase, UpSNp had reached 1.4 million beneficiaries, more than double the initial target of 604,000. In total, 141,587 households received a one-time grant transfer and saved an average of 5,800 Ethiopian birr (Br) over the program period. The total grant value transferred was Br 2,414,553,397, with a cumulative savings of Br 862,293,438. In addition, 142,272 households received life skills and financial literacy training, with women accounting for 77 percent of these trainees. Nearly all clients progressed to training in business skills and the preparation of business plan training; about 15 percent of clients also received targeted technical training. At the community level, the program enhanced urban greenery, helped with solid waste removal, and built sanitary and kitchen facilities to transform neighborhoods.
Initial evidence from the UpSNp impact evaluation suggests that the program shifted clients into self-employment and away from temporary wage work. on average, the number of hours worked in self-employment increased from 31.3 hours at baseline to 44.1 hours after treatment, and clients reported their willingness to work more hours. At baseline, 36 percent engaged in self-employment and about 64 percent had wage employment, but only 10 percent of those had permanent wage employment. After the program interventions, 46 percent engaged in self-employment, with greater increases seen for those who had received mentoring and coaching support. Clients involved in wage employment decreased to 48 percent, with the shift resulting almost
126 | Wo R k ING To DAy F o R A B ETTER To M o RR o W IN E THI op IA
entirely from a decrease in temporary employment; in fact, permanent wage employment increased by 4 percentage points (Wiesser, Franklin, and Mestin 2023).
Self-employment in fixed-location cafes or shops generated the highest income levels, and men earned more than women. Men earned, on average, Br 36,121 from self-employment and Br 42,963 from wage employment annually, whereas women earned Br 25,088 and Br 24,130, respectively. And, although those with wage work had, on average, higher income levels than those in self-employment, those with self-employment in fixed-location cafes and shops had notably higher incomes, annually Br 41,263 and Br 39,819, respectively (Frontieri 2022).
Among participants, roughly 50 percent reported starting and maintaining a new business, and nearly 66 percent reported improvements in consumption. Eighty-five percent of study respondents indicated that they used livelihood grants to expand or start a business, and about 50 percent reported having started and still running small-scale businesses. In addition, 89 percent reported satisfaction with the grant amount of US$500. Respondents noted improved consumption, particularly food and utility expenses, and help in covering their children’s school fees and household medical expenses.
Despite these positive results, CoVID-19 significantly affected incomes and how people used the livelihood grant. Despite high levels of initial investment in small businesses, CoVID-19 restrictions complicated the business environment across Ethiopia and likely influenced beneficiaries’ behaviors. o ver one-quarter of participants used the livelihoods grant for household consumption (21.7 percent) and emergency household expenses (6.3 percent). Moreover, about 82 percent experienced a significant decline in income following the pandemic, with 19 percent of that decline resulting in business closure (Frontieri 2022).
In addition, flaws in program implementation appear linked to the low take-up of the livelihood grant. The report indicated that only 36 percent of UpSNp clients who responded to the survey participated in the livelihood grant, about three-quarters of them in self-employment and one-quarter in wage employment. The reasons for the low participation in the livelihood grant seem linked to implementation rather than to inadequate design. The most common response (34 percent) for lack of participation was that people were unaware of the program, and another 10 percent had not completed the prerequisite 2 years of public works. Regarding design, however, about 15 percent said the waiting period was too long and about 12 percent said the grant was too low. only 6 percent said that the requirements were too demanding, and another 6 percent reported that they did not want to start a new enterprise or expand an existing one (Wiesser et al. 2023).
The program’s second phase, the Urban productive Safety Net and Jobs project (UpSNJp), builds on the lessons from UpSNp, targeting an additional 816,500 clients in 84 cities and towns. UpSNJp will run between 2021 and 2025, and its design follows the same three-phase graduation process but reflects learnings from the program’s first phase. UpSNJp addresses cumbersome, ineffective training products by simplifying the training delivery. It also increases access to group coaching to reinforce new skills and influence behavioral changes in beneficiaries’ businesses savings and household consumption habits. New monthly group mentoring and coaching support throughout the 3 years (including individual mentoring and coaching when necessary) aim to empower the
Creating Small Enterprise and Microenterprise Jobs in Ethiopia | 127
poorest households and facilitate links and referrals to jobs throughout the program. For program delivery, UpSNJp places additional attention on timeliness of cash transfers and disbursing grants, including earlier grant disbursement (Alinea International 2022).
CONCLUSION
Social safety nets (SSNs) are uniquely positioned to reach poor households and provide services that support productive jobs in self-employment. Smallholder productivity and nonfarm enterprises have high transformative potential to reduce poverty and contribute to local economic development. Well-designed SSN programs can promote these objectives in the short and medium term. The operational and financial challenges highlighted in this chapter, however, have thus far limited the effectiveness of SSN programs. Achieving impact at scale could unlock the potential of Ethiopia’s safety nets to contribute to economic transformation through self-employment jobs for poor households.
Achieving impact at scale will require prioritizing investment in self-employment and livelihoods within the SSN programs. Although the government has long prioritized economic transformation within its safety net programs, the efforts implemented have yet to secure sufficient financing to yield substantial results. In pSNp4, the livelihoods component represented only 1 percent of overall expenditures. In pSNp5, a financing gap resulted in the reduction of the first annual target for the livelihood program from 170 to only 34 woredas. When limited resources are allocated, the basic cash transfers are prioritized to protect consumption levels. protecting the cash transfer benefit is a first-order priority but comes at the cost of complementary interventions to encourage self-employment.
Building a harmonized program framework is a practical first step toward large-scale investment in more productive jobs for the poor. The experience of the Household Asset Building program and pSNp operating as two separate programs has generated important lessons about the challenges associated with livelihoods and safety net activities operating separately. Moreover, given the financial crisis and competing fiscal priorities, a standalone program is unlikely to receive much financing. At the same time, as outlined in this chapter, substantial learning from Ethiopia and globally provides a solid foundation on which to create a set of common design parameters across the different existing livelihood operations in the country. This approach would help generate investment at scale and could provide an attractive platform to mobilize additional resources.
A harmonized framework also creates a platform to reach households outside the cash transfer programs. Although this chapter has focused on safety net clients, who are among the poorest, labor market data show that most households in Ethiopia face similar challenges to productive self-employment: 83 percent of the nonpoor work in self-employment. Even if those households do not need the base cash transfer of a safety net program, they would benefit from the productive interventions offered through such a program—perhaps streamlined with a less extensive design. A harmonized framework for self-employment support would create a mechanism from which this broader segment of the working population might benefit to improve productivity.
128 | Wo R k ING To DAy F o R A B ETTER To M o RR o W IN E THI op IA
Achieving impact at scale will also involve providing more targeted and more intensive support. Most graduation programs are layered on top of safety net programs and target most safety net beneficiaries. Given the heterogeneity in needs and the limited resources, the targeting of the livelihood support could focus on a narrower set of safety net clients. For instance, the program could focus on geographic areas and target groups with the strongest potential for productive outcomes to help promote broader transformation and ensure the efficient use of limited resources. The government’s efforts to revise the pSNp livelihoods curriculum and to refine targeting methods are a step in that direction. It is crucial to simplify and streamline the interventions to adjust to the reality of the capacity constraints and to focus on the elements that have demonstrated their effectiveness. Effectiveness will likely also involve an expansion of grants to reach a larger share of beneficiaries and diversification of the range of MFIs involved.
programs are most effective when tailored to the unique needs of different vulnerable populations. For example, rural women, who make up 39 percent of the population, are more likely than men to rely on self-employment and yet earn less in these efforts. They need support to overcome the specific barriers that they face, such as through tailored training and improved access to financial inclusion, reflecting the time constraints associated with household chores. Another vulnerable population, low-skilled urban youth, also needs support outside of the formal educational system. Finally, regions and city administrations need flexibility to identify priorities and tailor options that reflect the local context.
The quality and timeliness of service delivery are also critical. on the one hand, training delivered by private training providers is generally more expensive but is also associated with higher quality of the training. This higher quality often translates into higher impacts and thus, in the end, can be more cost-effective. on the other hand, community-based volunteers can play a key role in ensuring training follow-up, message reinforcement, and application of training content delivered in the main training modules. The introduction of community facilitators under pSNp5 aims to strike this balance. The success of this model will depend on safeguarding their time to focus most of their attention on livelihoods activities.
Finally, achieving impact at scale requires continuous evaluation to inform improvements of the design and make the case for additional financial resources. Through support from the partnership for Economic Inclusion and the World Bank’s Development Impact Evaluation Group, both the rural and urban safety net programs have rigorous evaluations of the current phase of activities. These evaluations will document key outcomes such as asset building, income, labor allocation, poverty, and resilience; establish the cost-effectiveness of the interventions; and help identify what parts of the interventions are most effective. They will also strive to identify the characteristics of the households that benefit most from these interventions. Monitoring data will facilitate clearer communication up and down the supervision chain to flag issues with program delivery and support data-driven decision-making.
productive self-employment can reduce poverty, promote local development, and contribute to the country’s broader economic transformation. A harmonized framework approach leverages existing capacity and financing for self-employment and livelihoods. It allows for necessary variation across
Creating Small Enterprise and Microenterprise Jobs in Ethiopia | 129
programs while also guaranteeing quality standards for content and service delivery. Most important, it can provide a platform for reaching Ethiopia’s poor—and informal workers more broadly—with services to increase their earnings and improve their quality of life.
NOTES
1. At the time of the impact evaluation, cash transfer beneficiaries were ineligible for Supporting Women’s Livelihoods support. The project has since been revamped to select Supporting Women’s Livelihoods beneficiaries among those on the national cash transfer scheme.
2. The package is similar to what was provided in the graduation approach presented earlier. The time-limited package combined a large investment in a productive asset, access to savings accounts, temporary cash support, skills training, coaching, and other complementary services related to education and health.
3. Between 2018 and 2020, four assessments were conducted that help to understand the effectiveness of the livelihood support provided in pSNp4 and the challenges with the delivery: a randomized impact evaluation of the livelihoods activity to assess the impact of the trainings and livelihood transfer; two tracer studies of 1,054 client households; and the performance evaluation to assess implementation of the program.
4. The design of the wage employment pathway has also been reshaped, as covered in chapter 7.
REFERENCES
Abay, k. A., and N. D. Jensen. 2020. “Access to Markets, Weather Risk, and Livestock production Decisions: Evidence from Ethiopia.” Agricultural Economics 51 (4): 577–93.
Alderman, H., and R. yemtsov. 2013. How Can Safety Nets Contribute to Economic Growth? Washington, DC: World Bank.
Alinea International. 2022. Enhancing Livelihood Support in Ethiopia’s Productive Safety Net Program 5. Unpublished Draft Livelihoods Assessment Report Version 2, submitted to the World Bank April 2022.
Andrews, C., A. De Montesquiou, I. A. Sanchez, p. V. Dutta, B. V. paul, S. Samaranayake, J. Heisey, T. Clay, and S. Chaudhary. 2021. The State of Economic Inclusion Report 2021: The Potential to Scale. Washington, DC: World Bank.
Bandiera, o., R. Burgess, N. Das, S. Gulesci, I. Rasul, and M. Sulaiman. 2013. “Can Basic Entrepreneurship Transform the Economic Lives of the poor?” SSRN Scholarly paper 2266813, Social Science Research Network, Rochester, Ny
Banerjee, A., E. Duflo, N. Goldberg, D. karlan, R. osei, W. pariente, J. Shapiro, B. Thuysbaert, and C. Udry. 2015. “A Multifaceted program Causes Lasting progress for the Very poor: Evidence from Six Countries.” Science 348 (6236): 1260799.
Barker, N., G. Bryan, D. karlan, A. ofori-Atta, and C. Udry. 2022. “Cognitive Behavioral Therapy among Ghana’s Rural poor Is Effective Regardless of Baseline Mental Distress.” American Economic Review: Insights 4 (4): 527–45.
Bastagli, F., J. Hagen-Zanker, L. Harman, V. Barca, G. Sturge, and T. Schmidt. 2014. “Cash Transfers: What Does the Evidence Say? A Rigorous Review of programme Impact and the Role of Design and Implementation Features.” overseas Development Institute, London.
Bedoya, G., A. Coville, J. Haushofer, M. Isaqzadeh, and J. p. Shapiro. 2019. “No Household Left Behind.” NBER Working paper 25981, National Bureau of Economic Research, Cambridge, MA.
Berhane, G., D. o. Gilligan, J. Hoddinott, N. kumar, and A. S. Taffesse. 2014. “Can Social protection Work in Africa? The Impact of Ethiopia’s productive Safety Net programme.” Economic Development and Cultural Change 63 (1).
130 | Wo R k ING To DAy F o R A B ETTER To M o RR o W IN E THI op IA
Berhane, G., D. Gilligan, J. Hoddinott, N. kumar, F. N. Bachewe, o. Nwabuikwu, A. Seyoum Taffesse, H. Tesfaye, and A. Wondwosen. 2021a. “The productive Safety Net program IV End-Line outcome Report—Highlands.” International Food policy Research Institute and Institute of Development Studies.
Berhane, G., F. Nisrane Bachewe, I. Birch, L. Cabral, D. Gilligan, J. Hoddinott, N. kumar, J. Lind, B. Mohammed, R. Sabates-Wheeler, A. Seyoum Taffesse, M. Tefera, H. Tesfaye, A. Weldegerima, and A. Wondwosen. 2021b. “The productive Safety Net program IV EndLine performance Report.” International Food policy Research Institute and Institute of Development Studies.
Berhane, G., F. Nisrane Bachewe, I. Birch, L. Cabral, D. Gilligan, J. Hoddinott, N. kumar, J. Lind, B. Mohammed, R. Sabates-Wheeler, A. Seyoum Taffesse, M. Tefera, H. Tesfaye, A. Weldegerima, and A. Wondwosen. 2021c. “The productive Safety Net program IV Livelihood Transfer End-Line outcomes Report.” International Food policy Research Institute and Institute of Development Studies.
Bernard, T., S. Dercon, k orkin, and A. S. Taffesse. 2014. “The Future in Mind: Aspirations and Forward-Looking Behaviour in Rural Ethiopia.” CSAE Working paper Series 2014–16, Centre for the Study of African Economies, University of oxford.
Bold, T., M. kimenyi, G. Mwabu, A. Ng’ang’a, and J. Sandefur. 2018. “Experimental Evidence on Scaling Up Education Reforms in kenya.” Journal of Public Economics 168: 1–20.
Bossuroy, T., M. Goldstein, B. karimou, D. karlan, H. kazianga, W. parienté, p premand, et al. 2022. “Tackling psychosocial and Capital Constraints to Alleviate poverty.” Nature 605: 291–97.
Campos, F., et al. 2017. “Teaching personal Initiative Beats Traditional Training in Boosting Small Business in West Africa.” Science 357, 1287–90.
Chioda, L. 2021. “Making Entrepreneurs: Returns to Training youth in Hard Versus Soft Business Skills.” NBER Working paper 28845, National Bureau of Economic Research, Cambridge, MA.
De Montesquiou, A., and M. Victor. 2017. “Adapting the Graduation Approach for people with Disabilities.” CGAP (blog), July 6, 2017. https://www.cgap.org/blog/adapting-graduation -approach-for-people-with-disabilities
FAo (Food and Agriculture organization of the United Nations). 2020. Livelihood Effectiveness Study, On-Farm and Off-Farm Pathways of the PSNP. Main report.
Filmer, D., and L. Fox. 2014. Youth Employment in Sub-Saharan Africa. Washington, DC: World Bank.
Fox, L., and T. p. Sohnesen. 2012. “Household Enterprises in Sub-Saharan Africa—Why They Matter for Growth, Jobs, and Livelihoods.” policy Research Working paper 6184, World Bank, Washington, DC.
Gertler, p. J., S. W. Martinez, and M. Rubio-Codina. 2012. “Investing Cash Transfers to Raise Long-Term Living Standards.” American Economic Journal: Applied Economics 4 (1): 164–92.
Grosh, M., C. del Ninno, E. Tesliuc, and A. ouerghi. 2008. For Protection and Promotion: The Design and Implementation of Effective Safety Nets. Washington, DC: World Bank.
Heisey, J., I. A. Sánchez, and A. Bernagros. 2022. “Working for Inclusion: Economic Inclusion in Contexts of Forced Displacement.” In practice Brief, World Bank, Washington, DC.
Hoddinott, J., G. Berhane, D. o. Gilligan, N. kumar, and A. S. Taffesse. 2012. “The Impact of Ethiopia’s productive Safety Net programme and Related Transfers on Agricultural productivity.” Journal of African Economies 21 (5) 761–86. doi:10.1093/jae/ejs023.
k arlan, D., R. k night, and C. Udry. 2015. “Consulting and Capital Experiments with Microenterprise Tailors in Ghana.” Journal of Economic Behavior and Organization 118: 281–302.
Muralidharan, k., and p. Niehaus. 2017. “Experimentation at Scale.” Journal of Economic Perspectives 31 (4): 103–24.
policy Studies Institute. 2020. Ethiopia Productively Report . Addis Ababa, Ethiopia: policy Studies Institute.
premand, p., and Q. Stoeffler. 2020. “Do Cash Transfers Foster Resilience? Evidence from Rural Niger.” policy Research Working paper 9473, World Bank, Washington, DC
Creating Small Enterprise and Microenterprise Jobs in Ethiopia | 131
Sedlmayr, R., A. Shah, and M. Sulaiman. 2020. “Cash-plus: poverty Impacts of Alternative Transfer-Based Approaches.” Journal of Development Economics 144: 102418.
Wieser, C., S. Franklin, and W. Mesfin. 2023. The Welfare and Labor Market Impacts of the Livelihoods Intervention of the UPSNP. Washington, DC: World Bank.
World Bank. 2012. World Development Report 2013: Jobs. Washington, DC: World Bank.
World Bank. 2020. Ethiopia Poverty Assessment. Washington, DC: World Bank. doi:10.1596 /34617.
World Bank. 2022. Ethiopia—Rural Income Diagnostics Study: Leveraging the Transformation in the Agri-Food System and Global Value Chains to Expand Rural Incomes. Washington, DC: World Bank.
World Bank. n.d. “productive Inclusion Measures in the Sahel—An Integrated Approach to promote the Activities of poor and Vulnerable Households.” World Bank, Washington, DC. https://documents1.worldbank.org/curated/en/586791601364391320/pdf/ p roductive -Inclusion-Measures-in-the-Sahel-An-Integrated-Approach-to-promote-the-Economic -Activities-of-poor-and-Vulnerable-Household.pdf.
132 | Wo R k ING To DAy F o R A B ETTER To M o RR o W IN E THI op IA
Spotlight 6.1: Climate-Smart Self-Employment*
Ali Adem joined the Productive Safety Net Program (PSNP) 15 years ago as a public works beneficiary and self-graduated 5 years later. Now he is chairperson of his neighborhood (kebele) and considers himself a successful businessman. He believes the PSNP public works not only helped him start his business but also helped restore the climate of his community.
When asked about his success, Ali speaks unequivocally about the transformative impact of the rural pSNp on his life and community. “I was a safety net beneficiary 15 years ago. The safety net program changed the lives of those who were able to make the most of it.”
According to Ali, his public works earnings planted the first seeds of his future success. “We took our earnings from 6 months of public works, and in our spare time, we worked extra jobs, and the combination of the two allowed us to cover our needs for the year.”
The pSNp has impacts at the community level, too. A 2019 pSNp public Works Impact Evaluation found that biophysical impacts of public works included a 36 percent reduction in soil loss on average, a more than 10 percent reduction in excess runoff over 14 years, regeneration of degraded farm or grazing lands, a 169 percent increase in woody biomass in nonpastoral areas, and sequestration of nearly 4 megatons per hectare of carbon dioxide (22 percent more than in 2015). Socioeconomic impacts included a 24 percent increase in crop yields in sampled watersheds, a rise in the proportion of households practicing small-scale irrigation from 12 percent to 26 percent, and a doubling of female-headed households from 6 percent to 12 percent. Better roads increased access to input and produce markets, with a reported rise in input use.
For Ali, the link between community public works and increased livelihood opportunities is personal. “Through the program, we accessed plants to make the area fertile and green. All of these roads that you see in the kebele, we built them using public works labor financed through the safety net. We connected communities using these roads and made the communities accessible to cars.”
Five years after Ali joined the safety net, the program administrators issued a call for beneficiaries to graduate from the program if they could. Ali took them up on it. By then, he had bought two oxen using his earnings from public works and odd jobs.
When I graduated from p SN p, I received a livelihood grant of Br 7,000 [Ethiopian birr, about 200 US dollars], which made me even stronger. I now breed oxen to sell and have dairy cows. I own a eucalyptus tree enclosure, and I sell a one-time harvest of wood for up to Br 100,000–150,000.
But what you must know is that there are countless people like me—both in my kebele and the neighboring kebeles. Many have used the safety net as their starting point. The safety net program opened our eyes—it gave us the strength to begin working. Before, you might have been able to think of something to do, but you did not have the tools to make it happen. But the pSNp became the yeast; it gave us the ability to give life to our dreams.

Many have used the safety net as their starting point. The safety net program opened our eyes—it gave us the strength to begin working.
written by Candace Gebre.
This story was
133
7
Wage Employment Interventions in Ethiopia’s Social Safety Net Programs
MATCHING POOR WORKERS TO WAGE JOBS
Wage employment remains out of reach for most Ethiopians. Because of limited private sector growth in recent years, wage employment opportunities have not grown. However, despite their limited scale, efforts to promote wage employment could play an important role in Ethiopia’s development, helping alleviate poverty and fostering broader growth.
• Both demand- and supply-side constraints can drive low wage employment. Integrated wage employment programs—addressing the two sides in a coordinated manner—are more complex to implement, but promising examples exist across Africa.
• Ethiopia’s current social safety net programs provide an entry point to overcome the barriers poor workers face in accessing wage jobs. These programs are evolving in response to lessons from earlier intervention and are focused on matching clients to existing wage work.
• The rural Productive Safety Net Program (PSNP) is shifting its focus to support migration of clients to small towns and cities and adopting a greater focus on areas with higher potential for wage work.
• Under the Urban Productive Safety Net and Jobs Project (UPSNJP), the Bikat Program leverages public-private partnerships and offers stipends, training, and apprenticeship opportunities to less-educated urban youth.
• As the programs build capacity in and evidence for these new approaches, their next phase could improve their impact through a coordinated, comprehensive approach to wage employment growth.
By Koen Maaskant, Natnael Simachew Nigatu, and Margaux Vinez.
and Tesfaye
135
SUMMARY*
The authors thank Tirsit Amha
Workineh for their review and helpful inputs to improve the chapter.
INTRODUCTION
despite the limited scale of wage employment in Ethiopia, innovative programs that help poor households into these jobs could reduce poverty and contribute to broader development goals. As shown in chapter 1, substantial growth in wage employment remains unlikely, especially for poor individuals. Still, wage employment is instrumental to poverty reduction and structural transformation. While private sector development and structural transformation take time to translate into new jobs, Ethiopia’s social safety net programs are well-positioned to expand the poor population’s access to existing wage employment opportunities.
Support for wage employment opportunities in Ethiopia’s safety net programs is relatively new. In 2016, the rural PSNP introduced the wage employment pathway; in the same year, the Urban Productive Safety Net Project (UPSNP) launched with a wage employment pathway. The two programs have distinct approaches to fostering wage employment, given how different the labor markets are in rural and urban Ethiopia. In rural areas, opportunities are limited, and support focuses on promoting migration to more urbanized areas. In urban areas, where wage employment is more prevalent, more scope exists to support supply- and demand-side interventions.
This chapter highlights the importance of wage employment for poverty reduction in rural and urban Ethiopia and the role of safety net programs to help achieve this objective. It explores the lessons from international evidence as well as from the first phase of such support under Ethiopia’s rural PSNP. The chapter then presents a view of the next generation of rural wage employment interventions and evidence on the demand for wage employment interventions under the new UPSNJP. It concludes with policy recommendations to improve the outcomes of future generations receiving such support.
WAGE EMPLOYMENT’S ROLE IN POVERTY REDUCTION
Historically, wage employment has driven structural transformation and poverty reduction in developing countries. At the individual level, wage employment tends to be more productive, resulting in higher wages, and often comes with more permanent contracts and nonmonetary benefits. At the societal level, structural transformation is a complex process that involves the movement of workers from low-productivity jobs to higher-productivity jobs, generally from the agriculture sector into the manufacturing sector and increasingly into the service sector, with the latter sectors more likely to be dominated by wage employment (Nayyar, Hallward-driemeier, and davies 2021). When countries grow richer, they tend to employ a larger portion of their labor force in wage employment (refer to figure 7.1, panel a), and this share is likely to increase substantially as Ethiopia undertakes reforms.
Private sector growth, which remains elusive in Ethiopia, is critical to expanding wage employment in a meaningful way. The Ethiopian government’s Homegrown Economic reforms identify the urgent need to strengthen the private sector. yet, as discussed in chapter 1, reform efforts have not yielded their intended outcomes. Wage employment remains dominated by the public sector, and the share of manufacturing wage jobs has decreased, even before the pandemic and conflict. As a result, only 9 percent of workers currently engage in
136 | Wor KIN g Tod Ay for A B ETTE r To M orro W IN E THI o PIA
FIGURE
Wage employment could help in Ethiopia’s structural transformation
b. Wage employment, regional comparison, 2021
Percent 20 40 60 80 100 0 12 23 25 46 51 Percent 0 10 20 30 40 50 60 Ethiopia
Nonagricultural unpaid Nonagricultural wage Agricultural worker
Nonagricultural employed
Nonagricultural self-employed
wage employment—less than half the 25 percent average for Sub-Saharan Africa (refer to figure 7.1, panel b).
Wage employment in Ethiopia is closely correlated to income levels. As figure 7.2 illustrates, the likelihood of working in wage employment rises with income. further more, poor households in rural areas have limited access to wage employment. Among PSNP households, only 5.7 percent report at least one member engaged in wage employment as their main occupation. In addition, this wage work is mainly through public employment, including national defense and public administration, agriculture, education, and administrative support.
SOCIAL SAFETY NET PROGRAMS CAN HELP POOR INDIVIDUALS INTO WAGE EMPLOYMENT
KenyaSub-SaharanAfrica Uganda Rwanda
Wage Employment Interventions in Ethiopia’s Social Safety Net Programs | 137
The safety net operations in Ethiopia can leverage their reach into poor households as an entry point for expanding their access to wage employment. Safety nets can contribute to broader reform efforts by testing innovative approaches that help disadvantaged people access existing wage job opportunities. 7.1
Sources: Merotto, Weber, and Reyes 2018 (panel a); Labor Force Survey, 2021, for Ethiopia and World Development Indicators 2019 for peer countries (panel b).
200 500 800 1,500 5,00010,0000 20,000045,0000 GDP per capita (US dollars)
Note: Panel a is based on the International Income Distribution Data Set for 141 countries for 1999−2016. Although Ethiopia’s wage employment rate in 2019 (the comparator year for the other countries) was 15 percent, panel b shows the updated rate, which reflects 2021 Labor Force Survey data.
a. Terms of employment, by GDP per capita, globally, 2018
jobs
Many countries have kickstarted their economic transformation process by stimulating the movement of lower-skilled labor into more productive jobs in the manufacturing and service sectors.
Labor market interventions aim to address numerous constraints that prevent people’s transition to better jobs, including wage employment. figure 7.3 highlights major demand- and supply-side constraints in labor markets and suggests potential labor market interventions to encourage both self- and wage employment.1 This section does not provide a comprehensive description of all employment programs but instead focuses on wage employment interventions relevant to the Ethiopian context and, specifically, on the country’s objective to strengthen its wage employment interventions.2
The supply side focuses on the challenges job seekers encounter when connecting to jobs, including social norms, skills, information, mobility, and relevant work experience. Employers expect employees to have the desired skills and experience to carry out their tasks effectively. Many job seekers from disadvantaged backgrounds, however, do not have the appropriate on-the-job or off-the-job training or basic education to acquire these skills. Moreover, job seekers sometimes do not have clear information on the potential gains from wage employment or the availability of wage employment opportunities. Mobility and networks—again lacking among the disadvantaged population—are also essential for obtaining information, job interviews, and recommendations. f inally, social norms impose restrictions on certain sections of society—especially women.3
d espite their mixed impact, skills programs, among the most common supply-side interventions, aim to overcome low skill levels and mismatches between the skills workers have and the skills employers are seeking. Common topics include training on entrepreneurship and business management; financial literacy; and technical, vocational, and life skills (Andrews et al. 2021). However, the evidence on the impact of these programs is mixed and depends on several factors, including curriculum content and quality (Card, Kluve, and Weber 2015; Escudero et al. 2019; Kluve et al. 2016).
138 | Wor KIN g Tod Ay for A B ETTE r To M orro W IN E THI o PIA
FIGURE 7.2
Regardless of gender, poor households in Ethiopia have little access to wage
Self-employment Wage employment Unpaid work/unemployment Percent 0 20 40 60 80 100
Source: Ethiopia Household Income, Consumption, and Expenditure Survey, 2016.
Percent 0 20 40 60 80 100
b. Employment type of female household heads, by consumption decile
Consumption decile Consumption decile 123456789 10 12345678 910 10 30 50 70 90 10 30 50 70 90
a. Employment type of male household heads, by consumption decile
Youth (active and inactive)
Gaps and mismatches in technical, cognitive, and noncognitive skills; low skill level; skills mismatch
Information gaps, mobility, and limited access to networks; lack of information on job opportunities among youth and skills of young applicants by employer
Little or no work experience among youth; low productivity compared to minimum wage and benefits
Connecting youth to jobs leveraging synergies between supply-side and demand-side interventions
Training and skills development programs
Technical, vocational, behavioral, and noncognitive skills (classroom and on-the-job training, including internships, apprenticeships)
Employment and intermediation services
Information systems, job search assistance, and counseling; transportation subsidies; mobility grants to youth
Subsidized employment Interventions
Wage subsidies (direct payment to employers or workers, tax deductions), public works
Demand
Informal and formal enterprises/firms/farms with current or future jobs
Supply Integrated bottom-up approaches that tailor solutions for a variety of youth segments and bridge ethnic/sectarian divides
Regulatory constraints (improving distorting labor regulations, and tax and benefit systems that discourage work)
Source: Reprinted from Datta et al. 2018.
Note: = constraint; = intervention.
Programs to address financing constraints
Lines of credit/guarantees, grants, asset-based finance, and other alternative forms of debt
Capacity building and information provision
Matching grants, training programs, consulting services; information provision
Sector-specific approaches
Lead firm-SME linkage programs, value chain development approaches (aggregator models), competitiveness reinforcement initiatives
Financing
To enable private sector investments with large jobs payoffs (positive social externalities)
Insufficient access to finance; high interest/cost of financing, short tenure, lack of collateral, or stringent collateral requirements (for example, youth entrepreneurship initiatives that may also address other constraints such as capacity)
Capacity and information gaps; lack of financial/business/managerial skills; lack of information on market opportunities
Coordination failures and learning spillovers; lack of quality standards
Jobs social externalities; underinvestment in jobs given social value of jobs is higher than private sector valuation
Fundamentals (enabling macroeconomic environment, investment climate, and business regulations)
Internship and apprenticeship programs, another common supply-side approach, can facilitate the transition to wage employment. Apprenticeships aim to overcome the lack of relevant employment experience that can impede safety net program beneficiaries in the labor market. In Liberia, for example, the Economic Empowerment of Adolescent girls and young Women provides 6 months of classroom-based technical and life skills training and a 6-month placement and support phase in which trainees transition to wage employment or start a business. Although this program adopted a performance-based payment methodology, participants saw a 47 percent increase in employment between baseline and midline (Adoho et al. 2014). A similar program in Kenya, youth Employment opportunities Project, had more success, helping 75 percent of participants secure employment within 6 months of completing their internship (World Bank 2020).
Wage Employment Interventions in Ethiopia’s Social Safety Net Programs | 139
FIGURE 7.3
Framework for integrated employment programs in Ethiopia
Transportation subsidies can increase formal employment opportunities, including by supporting rural–urban migration. for poor individuals, work-related costs, lack of information, skill gaps, and financing constraints present a critical barrier to entry to the labor market. High search costs often arise from spatial mismatches between jobs, typically located in the city center, and job seekers who live far away in rural areas or in low-income neighborhoods on the periphery of cities. In addition, evidence suggests that seasonal migration to nearby towns and secondary cities can help accelerate rural transformation and improve inclusive growth (Christiaensen and Todo 2013). finance constraints appear to limit migration, and destinations are chosen based on available social networks and without presecured employment (Bundervoet 2018; Herrendorf and Schoellman 2018; Hicks et al. 2017). for example, one study in Bangladesh found that providing transportortation subsidies can result in increased migration (Bryan, Chowdhury, and Mobarak 2014).
In addition, women may need support with childcare or other caregiving responsibilities. A review of 22 studies identified the causal impact of the provision of institutional childcare on maternal labor market outcomes in lower- and middle-income countries (Halim, Perova, and reynolds 2021). A correlation also exists between elderly people living in the household and female labor supply in some countries (Halim, Johnson, and Perova 2017).
demand-side constraints can limit the growth of the private sector to create more jobs. Lack of financing is the main factor hindering firms from scaling up and creating more jobs, especially in developing countries with poor financial and banking systems. Moreover, adopting advanced business practices is challenging for micro, small, and medium firms. Advanced business practices correlate with firm-level productivity and growth (Bloom and Van reenen 2007). firms’ coordination over the value chain is also crucial in determining labor demand. Lack of coordination by upstream and downstream firms along the value chain affects production scale, and thus, affects jobs. In addition, the misalignment of goals between the job creation agendas of governments and the private sector is challenging. The private sector bases its employment plans on profitability and often overlooks other positive externalities, such as lower crime and better social cohesion (datta et al. 2018).
one common form of demand intervention is financial support; however, such programs have had mixed success. A meta-analysis of 20 individual assessments of matching grants in low- and middle-income countries has suggested a positive impact on firms’ performance and employment (Piza et al. 2016). Moreover, a study covering 106 World Bank projects found that matching grants in the agriculture sector were more successful than in other sectors (World Bank 2016). However, another large evaluation found that financing interventions for small and medium enterprises led to mixed results (IEg 2019).
An innovative entrepreneurship program can stimulate labor demand. for example, the World Bank undertook a large experiment in Nigeria, the youth Entrepreneurship with Innovation in Nigeria (youWiN!), to answer whether high-growth entrepreneurs can be identified with a business plan competition and understand the role of capital injection in generating firm growth and increased hiring. for new firms, one study found that receiving capital resulted in a 37-percentage-point increase in the likelihood that an individual was operating a firm 3 years later and a 23-percentage-point increase in the likelihood that the firm had 10 or more workers (McKenzie 2017).
140 | Wor KIN g Tod Ay for A B ETTE r To M orro W IN E THI o PIA
Wage subsidies can help youth and disadvantaged groups find jobs but may do so at the cost of existing employees. for example, in South Africa, a 40 percent wage subsidy increased employment of previously unemployed beneficiaries by 25 percent 2 years later (Levinsohn et al. 2014). However, these interventions present the risk of replacing people currently employed (for whom employers cannot claim the subsidy) rather than creating new jobs, especially where the labor market is weak (Crépon et al. 2013).
other programs aim to overcome information mismatches in the labor market. Establishing a labor market information system assists in job searching, matching, and signaling; sharing knowledge about market needs, developing job profiles, and improving application skills. This type of system can reduce the costs of the job search, which are relatively higher for job applicants from disadvantaged backgrounds. Job fairs also seek to overcome information and networking gaps. In the Philippines, a 2016 study showed a 10-percentage-point increase in rural formal employment 10 months after attending a job fair (Beam 2016). A similar study in Ethiopia did not find significant effects, largely because of persistent information mismatches (Abebe et al. 2017).
Signaling instruments, such as reference letters or testing results, can help overcome information gaps. for example, job seekers in India who shared results of a personality test were more likely to be shortlisted for job postings (yamauchi et al. 2018). one study in South Africa found that including reference letters with an application increased employer callbacks by 60 percent on average and by nearly 90 percent for women (Abel, Burger, and Piraino 2020).
In most developing countries, low wage employment is driven by both demand- and supply-side constraints and requires coordinated intervention (datta et al. 2018). An integrated approach can bring both sides together. Although such interventions are more complex to implement, promising examples exist across Africa.
• In South Africa, The Jobs fund created about 225,000 jobs between 2011 and 2018. on the demand side, as of 2018, The Jobs fund has approved funding for 126 projects and allocated close to US$416 million to firms selected based on their potential capacity to create jobs. on the supply side, over 225,000 people received skills training to improve their employability and were matched to the jobs created. The government estimates that these investments have created 170,148 permanent and 55,654 short-term jobs (Allie-Edries 2019). A recent tracer study focusing on selected Enterprise development and Support for Job Seekers found promising results, especially for women and disadvantaged youth (The Jobs fund 2022).
• The Kenya youth Employment and opportunity Project offers training and internships, business coaching, and a business plan competition focusing on job creation potential. By mid-2021, 33,167 youth have attended training, and 64 percent of the youth who completed the training and internship have been employed (ochola, Mutuse, and okal 2021). About 9,956 enterprises received a grant and have created employment for the business owners and others.
• In Tunisia, a multisector youth economic inclusion program is expected to have better returns on its investment by combining supply- and demandside support.4 o n the supply side, the program supports disadvantaged youth by improving skills, increasing access to job search information, and helping them overcome mobility challenges, while also supporting value
Wage Employment Interventions in Ethiopia’s Social Safety Net Programs | 141
chains with a good hiring potential on the demand side. Economic analysis of the program’s design suggests that the integration of these two interventions can increase the social rate of return by 2.7 percentage points (World Bank 2017).
ENGAGING RURAL ETHIOPIANS IN WAGE WORK IN TOWNS AND SMALL CITIES
PSNP provides an entry point for rural households, especially youth, to access wage employment opportunities. According to the 2019 Household Income, Consumption, and Expenditure Survey, nearly 50 percent of PSNP household members are young, and 33 percent of these youth have some level of secondary education. In addition, as discussed in chapter 5, rural–urban migration is low in PSNP woredas, suggesting the potential to increase participation of PSNP clients in jobs in nearby cities and large towns.
Introduced in 2016, the wage employment pathway (WEP) provided training to upskill PSNP clients and then match them to available wage jobs (Laterite 2020). The WEP was introduced in PSNP4 as one pathway offered to livelihoods participants to support more diversification of income sources and client demand to access wage employment opportunities. development agents worked with the Woreda Labor and Social Affairs office to create links with potential employers, identify skill gaps for available jobs, and support tailored training of selected PSNP clients. Under PSNP4, 117,000 clients received support through the WEP, according to administrative data.
d espite those efforts, the PSNP4 WEP did not successfully improve employment outcomes. In a 2018 tracer study, less than 20 percent of WEP clients surveyed were linked to wage employment (World Bank 2020). Moreover, women represented only 25 percent of participants, and youth and landless households also had low levels of participation. The average WEP client was a 30-year-old man, married with 4 children, who had completed primary school. Most WEP clients (84 percent) found jobs in the construction industry, and most of those jobs (85 percent) were temporary opportunities.
Lack of jobs in targeted communities, complex implementation arrangements, and limited awareness of the program all contributed to poor outcomes. The institutional arrangements were complex with poorly integrated services from multiple providers, including the Ministry of Labor and Social Affairs, technical and vocational education and training institutions, and small and medium enterprises. Limited awareness of the program among PSNP clients and potential employers also appear prevalent. More fundamentally, however, the WEP did not consider the availability of wage employment opportunities in nearby secondary cities during the selection of intervention areas.
Under PSNP5, the redesigned WEP will pilot new, more targeted approaches in high-potential areas, focusing on addressing the main challenges encountered under PSNP4. The pilot program will provide employability training, labor market information, and transportation subsidies to overcome the financial constraints of youth living in poor rural households who want to search for a job in nearby urban areas. The program will focus on woredas identified as having the potential for the WEP based on the availability of labor, proximity to high job demand areas, availability of functional training, and the existence of job support institutions.
142 | Wor KIN g Tod Ay for A B ETTE r To M orro W IN E THI o PIA
The new WEP design also benefits from direct input by the potential employers surveyed to provide a better understanding of demand. Surveyed firms reported that effective use of hand and power tools, teamwork, time management, and industry knowledge were the most relevant skills for prospective employees. Moreover, despite popular belief, the results show that firms give relatively low weight to literacy and numerical skills. Besides employees’ hard and soft skills, most firms reported that their ability to recruit quickly also affects their decision (Alinea International 2022). In addition, 90 percent of employers expressed their willingness to contribute to workers’ transportation expenses, 65 percent to provide uniforms, and 50 percent to help cover training costs.
The WEP will coordinate with the government reform of its Public Employment Services and the establishment of job centers as a single-service delivery window for all job seekers. The Public Employment Services reform consists of rural and urban components. Job centers in rural areas will be smaller than their urban counterparts, with more limited services, and will include mobile job centers designed exclusively for rural contexts.
OVERCOMING BARRIERS FOR YOUNG JOB SEEKERS IN URBAN AREAS
Since its launch in 2016, the UPSNP aimed to address urban poverty by setting up safety net mechanisms across cities in Ethiopia. This program did so successfully, having reached over 600,000 people by its end, with the majority being relatively older beneficiaries. As urban youth unemployment rose across cities in Ethiopia, addressing the challenges of urban youth, especially for those who have had few opportunities previously to enter the labor market and so risk being scarred by the long-term effects of extended periods of unemployment at a young age, became necessary.
The Bikat Program under the UPSNJP aims to provide less-educated urban youth with a first work experience. This program is the first comprehensive attempt to provide wage employment opportunities for youth under an urban safety net program in Ethiopia. Under the former UPSNP, a livelihood program was set up to provide safety net program beneficiaries with either wage employment or self-employment opportunities. Because the vast majority chose the self-employment pathway, little evidence exists from this experience on how to help urban poor youth into wage employment.
The Bikat Program seeks to improve the signaling ability of young job seekers who have not completed secondary education. The program’s design centers around an apprenticeship to provide a first work experience, along with developing life and digital skills, and then job search training to selected beneficiaries. The project began in Addis Ababa in 2022 and will scale up to an additional 10 cities across Ethiopia in 2023, eventually reaching 78,000 youth.
The program’s design benefits from the direct input of job seekers and firms (refer to box 7.1). Between November and december 2020, a demand Assessment was conducted, with interviews of 1,552 job seekers (registered with the Ministry of Labor and Skills) and 605 firms (from a Ministry of Industry and Trade database of formal firms). A small pilot of the proposed Bikat design was also implemented for about 300 youth under UPSNP in 2022.
The youth interviewed in the demand Assessment largely were underemployed and faced challenges securing good jobs. only 42 percent had a job
Wage Employment Interventions in Ethiopia’s Social Safety Net Programs | 143
An evidence-based approach to the Bikat Program’s design
Before rolling out the Urban Net and Jobs Project (UPSNJP) Bikat Program to 11 cities across Ethiopia, a demand Assessment provided an understanding of the drivers of demand on the supply and demand sides of the project. A research firm was hired to undertake telephone surveys among job seekers and firms between November and december 2020.
Job seekers
A sampling frame was taken from job seekers registered at o ne-Sto p Service Centers through the #etworks app. The sampling focused on Addis Ababa, with job seekers drawn from all subcities. In addition, the sampling frame was stratified by gender and educational attainment. The survey firm interviewed 1,552 job seekers.
Job seekers were interviewed only if they met the basic program participation requirements: they were ages 18–25, were unemployed, and had a secondary school education or less. of this group, slightly less
Source:
than 1 in 4 was married, with women much more likely than men to be married (37 percent vs. 11 percent). The likelihood of having children also differed significantly by gender, with only 8 percent of men having at least 1 child and 34 percent of women having at least 1 child. Approximately half of the youth were born outside of Addis Ababa and had migrated to the city. Most had lived in Addis Ababa for several years: of the youth not born in the city, 79 percent arrived before 2016.
Firms
A sampling frame, taken from a Ministry of Industry and Trade database of formal firms, was almost exclusively from Addis Ababa, with firms drawn from all subcities. The sampling was stratified for manufacturing and services sectors, with manufacturing oversampled to ensure this sector was representatively captured. A total of 605 firms were interviewed. In most cases (88 percent), the manager was interviewed.
during the week before the interview. Their employment records were characterized by significant periods of unemployment, with some occasional work. About 50 percent worked 4 months or less the previous year (refer to figure 7.4). o nly 14 percent had worked all 12 months in the previous year, and only 6 percent had a permanent job at the time of the assessment. Among those who were working, 89 percent had a job in the service sector.
during registration for the pilot, youth overwhelmingly expressed interest in the program; 97 percent of youth asked to be called when the program launched. The youth were optimistic that the program would reduce their job search by 6 weeks, on average. Most youth interviewed were looking for self-employment rather than for wage employment. When asked what they would look for in their future job, 78 percent of the youth answered that they would like to be self-employed. only 22 percent expressed an interest in wage employment, with about half of those interested in public sector jobs. This result could reflect their understanding of the labor market depression in Ethiopia, thus shaping their preferences for jobs they see as available. The Bikat Program should, therefore, not only provide information about wage job opportunities but also why wage work might be preferable to self-employment.
Most firms interviewed indicated an interest in hosting apprenticeships. The program targets firms with at least 5 employees, which account for a small portion of firms in the country (Bundervoet, Abebe, and Wieser 2020). Within this small subset, only 4 percent of firms were uninterested in hosting at least 1 apprentice, and 45 percent were willing to host 5 or more apprentices (refer to figure 7.5).
144 | Wor KIN g Tod Ay for A B ETTE r To M orro W IN E THI o PIA
BOX 7.1
UPSNJP 2021a, 2021b.
furthermore, despite the limited number of firms, the Bikat pilot confirmed that these large manufacturing firms were ready to absorb large numbers of lowskilled labor.
Larger firms are more likely to hire more people, but only 40 percent hired workers over the previous year. Among firms that did hire someone, the likelihood of hiring increased from 35 percent of firms with 5–10 employees to 51 percent of firms with at least 10 employees. In addition, a small group of large firms seems to disproportionally hire many workers, which potentially points to the absorption capacity for apprentices in a small subset of larger firms.
Approximately one-third of firms have hosted an apprentice or intern, mostly for corporate social responsibility rather than with training objectives.5 Larger firms are much more familiar with hosting apprentices, with nearly half of these firms having hosted previously (refer to figure 7.6). However, only 6 percent were hosting at the time of the interviews. only 20 percent of firms
Wage Employment Interventions in Ethiopia’s Social Safety Net Programs | 145
FIGURE 7.4
Source: UPSNJP 2021a, 2021b. Note: UPSNJP = Urban Productive Safety Net and Jobs Project. 0 Number of months 12 3 45 67 89 101112 0 Percent 100 10 20 30 40 50 60 70 80 90
7.5
Employment record of Ethiopian youth consists of frequent unemployment Number of months worked over the past year, 2020
FIGURE
of apprentices
Source: UPSNJP 2021a, 2021b. Note: UPSNJP = Urban Productive Safety Net and Jobs Project. 4 14 34 16 10 10 12 4 17 40 18 8 8 5 5 6 19 12 14 16 29 Percent 0 5 10 15 20 25 30 35 40 0 1234 5≥6 5–10 employees Total > 10 employees
Most Ethiopian firms are interested in hosting an apprentice
Number
a firm is willing to host, 2020
Approximately one in three firms has previously hosted an apprentice, but few are currently hosting apprentices
experience with hosting apprentices, 2020
One in three Ethiopian firms provides formal training Firms providing formal training to apprentices, 2020
saw apprenticeships as a way to select and train future employees, and 70 percent considered them as part of their corporate social responsibility. Therefore, the UPSNJP Bikat Program emphasized corporate social responsibility during its outreach phase.
only one-third of firms offer training, mostly for technical skills, but they identify soft skills as a main challenge with their apprentices. When asked about these difficulties, firms mentioned low motivation and discipline (46 percent), lack of basic soft skills (45 percent), and lack of basic technical skills, although to a lesser extent (33 percent). Thirty-three percent of firms provide formal training (refer to figure 7.7), and 70 percent focus training on technical skills (refer to figure 7.8). These findings helped confirm the chosen design of the program, which provides the soft skills training demanded across the labor market; firms provide training on firm- and sector-specific technical skills.
Key lessons from the demand Assessment center on available opportunities and a potential mismatch between these opportunities and youth preferences.
146 | Wor KIN g Tod Ay for A B ETTE r To M orro W IN E THI o PIA
FIGURE 7.6
Source: UPSNJP 2021a, 2021b. Note: UPSNJP = Urban Productive Safety Net and Jobs Project. 10 4 6 37 26 29 52 71 65 >10 employees 5–10 employees Total 02040 Percent 60 80 100 Currently
Firms’
hosting Currently not hosting, but previously hosted Never hosted FIGURE 7.7
Source: UPSNJP 2021a, 2021b. Note: UPSNJP = Urban Productive Safety Net and Jobs Project. 41 59 29 71 33 67 >10 employees 5–10 employees Total 02040 Percent 60 80 100 Yes
No
The findings highlight important lessons on how the program should be implemented, including on the sectors in which apprenticeship placements are located. furthermore, findings reinforce the high dropout rates of youth in the pilot given their disinterest in the types of apprenticeships offered. despite young people’s clear interest in receiving training and firms’ eagerness to attract them, attention is needed to ensure that young people are attracted to firms that align with their sectoral preference and are in the vicinity of their homes.
The Bikat pilot appears to confirm this challenge, and job mismatches may have contributed to high attrition. In the pilot, 89 percent of interviewed youth wanted to work in services, with half of those preferring a sales job on the street or in a shop. Most firms, however, offered placements in the manufacturing sector, particularly in garment and leather. youth satisfaction with the pilot varied from 85 percent for those who received their first choice of placement to only 46 percent for those who did not. dissatisfaction with placements may have led to the attrition rate of 45 percent of participants, which is especially high when compared to the interest in the program expressed at registration.
The Bikat Program revised its firm mobilization strategy accordingly. on the supply side, to manage youth expectations, city officials highlighted that most opportunities are in the manufacturing sector. As a result, during registration in Addis Ababa, more youth indicated a preference for the manufacturing sector. on the demand side, implementers organized a series of events to attract more firms from the service sector. This effort has also shown results, with more and a greater diversity of firms attracted from the service sector during the firm mobilization in Addis Ababa.
The government also focused on larger firms, a decision driven in part by the evidence that most apprenticeship placements were available among a small group of firms and in part by implementation considerations. By adding a requirement of at least two apprentices per firm, the government hopes to simplify program monitoring.
CONCLUSION
Wage employment offers a path out of poverty and helps build broader economic growth; however, it remains elusive to most poor households. Wage employment
Wage Employment Interventions in Ethiopia’s Social Safety Net Programs | 147
7.8
FIGURE
Source: UPSNJP 2021a, 2021b. Note: UPSNJP = Urban Productive Safety Net and Jobs Project. 70 23 4 11 0 20 40 60 80 Percent Technical skills Soft skills Sales or marketing skills Management or business skills Entrepreneurial skills
Most training provided by Ethiopian firms focuses on technical skills Type of training provided, 2020
makes up only 12 percent of the labor market nationally and only about 6 percent for households below the poverty line. More opportunities exist in urban areas, and understanding how to link poor individuals from both rural and urban households to wage work could help reduce their poverty levels and contribute to broader structural transformation of the labor market.
Ethiopia’s productive safety net programs can help on the supply side of the wage employment challenge. The jobs support provided by PSNP5 and UPSNJP focuses on supply-side interventions: training and skills development programs, employment and intermediation services, and subsidized employment interventions. The programs aim to improve client suitability for available jobs, which can address some inefficiencies in the labor market but does not significantly increase the size of the overall pool of employed workers. As chapter 1 highlighted, job creation has significantly slowed in recent years, and this trend is likely to compound given the concurrent crises of conflict, climate shocks, and increasing living costs that Ethiopia continues to face.
given this reality, revisions to rural wage employment support a focus on placing youth into the jobs currently available in the labor market. Previous experience under the rural program reinforces the difficulty of linking people to wage jobs in rural areas. Therefore, the latest phase of the program focuses on opportunities for its clients in towns and secondary cities. The program will offer the wage employment component only in a few towns and secondary cities assessed to have the potential to absorb wage workers.
The urban program leverages public-private partnerships, actively matching youth with interested firms for better job outcomes. for the urban project, the Bikat Program can strengthen youth placement into jobs through the provision of stipends and ensuring that these youth remain in their apprenticeships. given youth interests, the program has explicitly sought to increase placement opportunities with service sector firms. A comprehensive evaluation will assess the impact on employment outcome, cost-effectiveness, and women’s participation.
As programs build their capacity and evidence on these new approaches, the government could strengthen coordination with the private sector toward a more comprehensive approach to wage employment growth. The World Bank group has significant experience in strengthening private sector development to expand the demand side of the labor market. Promising examples show how to pair these interventions with safety net support to improve employability more holistically, addressing financing constraints, building capacity, overcoming information gaps, and offering sector-specific approaches, among others. By pursuing collaboration with the demand side of the labor market, future safety net programs could contribute toward enlarging the number of job opportunities for poor and vulnerable workers rather than focusing on preexisting employment.
NOTES
1. This chapter defines wage employment as a mutual agreement between an employer and an employee in which the employee agrees to work for the employer under specific terms and conditions, and the employer agrees to pay the employee remuneration. This discussion excludes public works.
2. for a full review of the effectiveness of different (wage) employment interventions, refer to Card, Kluve, and Weber (2018); Escudero et al. (2019); and Kluve et al. (2016).
148 | Wor KIN g Tod Ay for A B ETTE r To M orro W IN E THI o PIA
3. Several labor market intervention policies have been implemented around the world to address supply-side constraints (for example, refer to Card et al. 2018; Escudero et al. 2019; Kluve et al. 2016).
4. The youth Economic Inclusion Project (P158138) is financed by the World Bank and managed by the Social Protection and Jobs global Practice and the finance, Competitiveness, and Innovation global Practice.
5. The questions grouped apprenticeships and internships, which are distinct concepts. firms in Ethiopia are more familiar with interns, who often are sent by educational institutions (university or technical and vocational education and training institutions). However, from a methodological point of view, it was difficult to separate these concepts, and a decision was made to group the two. This grouping might have introduced bias in firm responses by extrapolating the characteristics and expectations from internships to apprenticeships.
REFERENCES
Abebe, g. T., S. Caria, M. fafchamps, P. falco, S. franklin, S. Quinn, and f. Shilpi. 2017. “Job fairs: Matching firms and Workers in a field Experiment in Ethiopia.” Policy research Working Paper 8092, World Bank, Washington, dC.
Abel, M., r. Burger, and P. Piraino. 2020. “The Value of reference Letters: Experimental Evidence from South Africa.” American Economic Journal: Applied Economics 12 (3): 40−71.
Adoho, f., S. Chakravarty, d. T. Korkoyah, M. K. Lundberg, and A. Tasneem. 2014. “The Impact of an Adolescent girls Employment Program: The EPAg Project in Liberia.” Policy research Working Paper 6832, World Bank, Washington, dC.
Alinea International. 2022. Enhancing Livelihood Support in Ethiopia’s Productive Safety Net Program 5. Unpublished draft Livelihoods Assessment report Version 2, submitted to the World Bank April 2022.
Allie-Edries, N. 2019. “Jobs fund Update.” Presentation to the Standing Committee on Appropriations, March 5, 2019, The Jobs fund.
Andrews, C., A. de Montesquiou, I. A . Sanchez, P. V. dutta, B. V. Paul, S. Samaranayake, J. Heisey, T. Clay, and S. Chaudhary. 2021. The State of Economic Inclusion Report 2021: The Potential to Scale. Washington, dC: World Bank.
Beam, E. A. 2016. “do job fairs matter? Experimental evidence on the impact of job-fair attendance.” Journal of Development Economics 120: 32−40. https://doi.org/10.1016/j .jdeveco.2015.11.004
Bloom, N., and J. Van reenen. 2007. “Measuring and Explaining Management Practices Across firms and Countries.” Quarterly Journal of Economics 122 (4): 1351–408.
Bryan, g., S. Chowdhury, and A. M. Mobarak. 2014. “Underinvestment in a Profitable Technology: The Case of Seasonal Migration in Bangladesh.” Econometrica 82 (5): 1671–748.
Bundervoet, T. 2018. Internal Migration in Ethiopia: Evidence from a Quantitative and Qualitative Research Study. Washington, dC: World Bank. https://openknowledge.worldbank.org /server/api/core/bitstreams/2ff2cd74-f5e8-5e03-ac8d-ca0dbeefc59b/content
Bundervoet, T., g. Abebe, and C. Wieser. 2020. “Monitoring CoVId -19 Impacts on firms in Ethiopia, report No. 6: results from a High-frequency Phone Survey of firms.” World Bank, Washington, dC.
Card, d., J. Kluve, and A. Weber. 2015. What Works? A Meta Analysis of recent Active Labor Market Program Evaluations. NBE r Working Paper Series, Working Paper 21431. Cambridge, MA: National Bureau of Economic research. https://www.nber.org/system /files/working_papers/w21431/w21431.pdf
Card, d., J. Kluve, and A. Weber. 2018. “What Works? A Meta Analysis of recent Active Labor Market Program Evaluations.” Journal of the European Economic Association 16 (3): 894–931. https://academic.oup.com/jeea/article/16/3/894/4430618
Christiaensen, L., and y. Todo. 2013. “Pov erty reduction during the r ural–Urban Transformation—The role of the Missing Middle.” World Development 63: 43−58. https:// elibrary.worldbank.org/doi/abs/10.1596/1813-9450-6445.
Wage Employment Interventions in Ethiopia’s Social Safety Net Programs | 149
Crépon, B., E. duflo, M. gurgand, r rathelot, and P. Zamora. 2013. “do Labor Market Policies Have d isplacement Effects? Evidence from a Clustered r andomized Experiment.” Quarterly Journal of Economics 128 (2): 531–80.
datta, N., A. E. Assy, J. Buba, S. J. de Silva, S. Watson, et al. 2018. “Integrated youth Employment Programs: A Stocktake of Evidence on What Works in youth Employment Programs.” Jobs Working Paper, Issue No. 24, World Bank, Washington, dC.
Escudero, V., J. Kluve, E. L. Mourelo, and C. Pignatti. 2019. “Active Labour Market Programmes in Latin America and the Caribbean: Evidence from a Meta-Analysis.” Journal of Development Studies 55 (12): 2644–61.
Halim, d., H. Johnson, and E. Perova. 2017. “Could Childcare Services Improve Women’s Labor Market outcomes in Indonesia?” Policy Brief Issue 1, East Asia and Pacific gender Innovation Lab, World Bank, Washington, dC.
Halim, d., E. Perova, and S. reynolds. 2021. “Childcare and Mothers’ Labor Market outcomes in Lower- and Middle-Income Countries.” Policy research Working Paper 9828, World Bank, Washington, dC.
Herrendorf, B., and T. Schoellman. 2018. “Wages, Human Capital, and Barriers to Structural Transformation.” American Economic Journal: Macroeconomics 10 (2): 1−23. https://www .aeaweb.org/articles?id=10.1257/mac.20160236
Hicks, J. H., M. Kleemans, N. y. Li, and E. Miguel. 2017. Reevaluating Agricultural Productivity Gaps with Longitudinal Microdata. report no. w23253. Washington, dC: National Bureau of Economic research. https://www.nber.org/papers/w23253
IEg (Independent Evaluation group). 2019. “World Bank group Support for Small and Medium Enterprises: A Synthesis of Evaluative findings.” World Bank, Washington, dC.
Kluve, J., S. Puerto, d. A. robalino, J. M. romero, f rother, J. Stöterau, f. Weidenkoff, and M. Witte. 2016. “do youth Employment Programs Improve Labor Market outcomes? A Systematic review.” IZA discussion Paper No. 10263, Institute for the Study of Labor, Bonn.
Laterite. 2020. Productive Safety Net Program Wage Employment Pathway Tracer Study. draft report prepared for the World Bank, April 2020. Addis Ababa, Ethiopia: Laterite.
Levinsohn, J., N. rankin, g roberts, and V. Schöer. 2014. “Wage Subsidies and youth Employment in South Africa: Evidence from a randomised Control Trial.” Working Paper 2/2014, department of Economics, Stellenbosch University.
McKenzie, d. 2017. “Identifying and Spurring High- growth Entrepreneurship: Experimental Evidence from a Business Plan Competition.” American Economic Review 107 (8): 2278–307. Merotto, d., M. Weber, and A. reyes. 2018. Pathways to Better Jobs in IDA Countries: Findings from Jobs Diagnostics. Washington, dC: World Bank.
Nayyar, g., M. Hallward-driemeier, and E. davies. 2021. At Your Service? The Promise of Services-Led Development. Washington, dC: World Bank. ochola, g., f. Mutuse, and A. okal. 2021. Assessment of Public Employment Services and Active Labor Market Policies in Kenya. geneva: International Labour organization. https://www .ilo.org/global/programmes-and-projects/prospects/countries/kenya/WCMS_822595 /lang--en/index.htm
Piza, C., et al. 2016. “The Impact of Business Support Services for Small and Medium Enterprises on firm Performance in Low- and Middle-Income Countries: A Systematic review.” Campbell Systematic Reviews 12 (1): 1−167. https://onlinelibrary.wiley.com/doi/full/10.4073 /csr.2016.1
The Jobs fund. 2022. Creating Jobs and Supporting Businesses: Findings from a Three-Year Tracer Study of Selected Support for Work Seekers and Enterprise Development Projects. Pretoria, South Africa: National Treasury, government Technical Advisory Centre.
UPSNJP (Urban Productive Safety Net and Jobs Project). 2021a. UPSNJP Demand Assessment: Firms report. Addis Ababa, Ethiopia: UPSNJP.
UPSNJP (Urban Productive Safety Net and Jobs Project). 2021b. UPSNJP Demand Assessment: Job Seekers. report. Addis Ababa, Ethiopia: UPSNJP.
World Bank. 2016. “How to Make grants a Better Match for Private Sector development: review of World Bank Matching grants Projects.” World Bank, Washington, dC.
150 | Wor KIN g Tod Ay for A B ETTE r To M orro W IN E THI o PIA
World Bank. 2017. “Project Appraisal document.” report No. PAd2221, World Bank, Washington, dC. https://documents1.worldbank.org/curated/en/417361505354429120/pdf/Tunisia -youth-PAd2221-PAd -08222017.pdf
World Bank. 2020. “demand-driven Skills Training and results-Based Contracting: Lessons for youth Employment Programs.” World Bank, Washington, dC.
World Bank. 2020. Strengthening Ethiopia’s Adaptive Safety Net. Washington, dC: World Bank. https://documents.worldbank.org/en/publication/documents -reports/documentdetail /439371606618883564/ethiopia-strengthen-ethiopias-adaptive-safety-net-project yamauchi, f., S. Nomura, S. Imaizumi, A. Areias, and A. Chowdhury. 2018. Asymmetric Information on Non-Cognitive Skills in the Indian Labor Market: An Experiment Using an Online Job Portal. Washington, dC: International food Policy research Institute.
Wage Employment Interventions in Ethiopia’s Social Safety Net Programs | 151
Conflict, Displacement, and Livelihoods in Ethiopia
ROLE OF SOCIAL SAFETY NETS
SUMMARY*
Conflict and internal displacement have upended the livelihoods of millions of Ethiopians, especially in the past few years. Despite the unprecedented involvement of safety net programs in addressing this crisis, livelihood support for displaced people is weak. The Ethiopian social protection system should prepare now to respond better to future displacement shocks.
• In 2021, at the height of the crisis, Ethiopians experienced 5.1 million displacements due to conflict, the highest annual figure recorded for any country since 2003. Conflict uprooted people across the country, but most displacements occurred in the north and into urban areas.
• The displaced population experienced acute food insecurity, asset loss, widespread trauma, and violence, particularly targeted at women and girls. Damage to public infrastructure meant that displaced people struggled to access basic services in the communities sheltering them.
• Despite fearing insecurity and a lack of livelihood options back home, most wanted to return. Those displaced, mostly farmers and pastoralists, left behind productive assets when they fled. During displacement, they relied on sparse food and cash distributions, as well as host community donations.
• The traditional response to displacement in Ethiopia has been to provide food and cash in rural areas. Few efforts have focused on urban areas.
153
This chapter was written by Aditya Sarkar, Alfredo Manfredini Böhm, and Fasil Mulatu Gessesse. The authors thank Joanna de Berry for her comments on the draft.
8
• responses consistently fall short of needs, but livelihood support has been particularly limited. Inadequate budgets and preparedness constraints have led to an often ad hoc, uncoordinated response.
• The social protection system can do more to help displaced people and their hosting communities sustain and recover their livelihoods. In response to this latest crisis, the government of Ethiopia quickly retooled the urban safety net to provide cash to those displaced. With additional preparation, the response could have been more effective in reaching the hardest-hit areas and in facilitating recovery of livelihoods.
INTRODUCTION
In recent years in Ethiopia, conflict and internal displacement have significantly challenged the resilience of the people, the economy, and the social protection systems. Conflict-induced displacement was on the rise as drought, political tensions, CoVID-19, and the global economic slowdown put the brakes on Ethiopia’s impressive long-term growth record. Then, in 2021, internal displacement skyrocketed: more people were internally displaced in Ethiopia than in any other country in a single year in nearly two decades. Such displacement caused by conflict cannot only result in the loss of livelihoods, assets, and human capital but also can create new economic vulnerabilities among those displaced due to the trauma of the displacement process and the breakdown in social cohesion.
Ethiopia’s long-standing and far-reaching social protection system, built in peacetime to protect the poorest people from chronic poverty, was not designed for displaced people. The scale of the problem has forced the government of Ethiopia to hastily retrofit the urban safety net with a response to displacement. This change seems to have worked to a small extent, and social protection— particularly the rural safety net—has the potential to provide a more effective and structured response. Improvements will help rebuild the livelihoods lost by those displaced and support those fleeing emerging conflict situations, as Ethiopia works its way back to stability.
This chapter analyzes the scale and incidence of displacement in Ethiopia. It outlines the impact on livelihoods and the government and humanitarian response to date, while exploring the potential for an enhanced role of safety net programs and the national social protection system in responding to the livelihood needs of those displaced. The chapter draws on research and data collection efforts within ongoing operations.
The chapter first provides a brief overview of main conceptual and practical overlaps among humanitarian assistance, social protection, and the promotion of productive livelihoods for internally displaced persons (IDps). next, it summarizes the nature of displacement in Ethiopia as of early 2022—with attention to the conflict in northern Ethiopia—and discusses key aspects of IDp livelihoods and the livelihoods responses by various actors. The chapter then describes the role that Ethiopia’s burgeoning social protection systems could play in this response. It concludes with recommended policy priorities. Box 8.1 sets out the methodology used to prepare the chapter.
154 | Work I n G To DAy F or A B ETTE r To M orro W I n E T h I op IA
Study methodology
This chapter draws on a combination of secondary, quantitative, and qualitative data. The quantitative data come from the Displacement Tracking Matrix (DTM) databases collected by the International Organization for Migration (IOM). a Interviews were conducted with internally displaced persons (IDPs), community leaders, and federal and regional officials between late-2019 and mid-2021 in and from Addis Ababa, Amhara, Dire Dawa, Oromia (including both camps and the cities of Adama, Burayu, and Legetafo), Somali Regional State, and the Southern Nations, Nationalities and Peoples Region. b Additional interviews with policy makers and humanitarian partners were conducted in early 2022 to understand the effects of the conflict in northern Ethiopia.
The quantitative data are invaluable but limited in geographic scope. IOM periodically collects data using the following instruments:
• Site assessment (SA), which collects quarterly detailed data on demographics and needs in sites with more than 20 currently displaced households;
• Emergency site assessment (ESA), which collects similar data in areas affected by the conflict in northern Ethiopia;c and
• Village assessment survey (VAS), which collects data about IDP returns.d
Restrictions on access or logistical or security constraints mean that these data do not cover all areas of
the country that have been significantly affected by conflict and displacement.e
Disaggregated household data are not available on the preference of IDPs for durable solutions or on their areas of origin, living conditions, needs, aspirations, and livelihoods. IOM DTM data are collected from key informants (typically, site managers or community leaders) and presented by displacement site—in effect, obscuring differences within IDP communities living at the same site. For this reason, presenting a representative picture of needs and preferences for durable solutions is challenging. Further, little is known about the livelihood strategies or socioeconomic conditions of IDPs dispersed in urban areas who do not live in known IDP sites or who avoid contact with local authorities or of people displaced within cities.f
Patterns of displacement and underlying political conflict are shifting rapidly across Ethiopia. Levels of displacement change constantly, as do the precise needs of those displaced. As a result, a report of this nature runs the risk of being outdated almost as soon as it is written. More importantly, internal displacement in Ethiopia is context-specific: a great deal of variation exists between IDPs in different parts and sometimes in the same part of the country. Policy makers working on displacement must account for these contextual specificities, even as they draw on the broader conclusions outlined in this chapter.
a. For more information on the IOM DTM, see https://displacement.iom.int/ethiopia.
b. In 2021, considering the COVID-19 pandemic and associated travel restrictions, as well as deterioration of the security situation in some parts of the country, data collection was confined to areas near the capital.
c. The ESA was introduced as an emergency measure in response to the conflic t in northern Ethiopia. As of March–April 2022, IOM announced that it would merge the SA and ESA into a single data set.
d. As of March–April 2022, IOM announced that the VA would be fielded only in areas that witnessed the return of 20 or more internally displaced households.
e. Key exclusions are as follows: SA round 28 (data collected December 2021–January 2022) did not cover parts of the BenishangulGumuz region; ESA round 9 was not fielded in Tigray because of funding limitations and lack of cash and fuel. Based on availability, the quantitative picture provided in this chapter is based on assessments carried out between June 1, 2021, and September 7, 2021, in Tigray (ESA 8) and November 30, 2021, and February 15, 2022, everywhere else (ESA 9, SA 28, and VA 11).
f. Interview with IOM and the United Nations Office for the Coordination of Humanitarian Affairs, July 2021.
Conflict, Displacement, and Livelihoods in Ethiopia | 155
BOX 8.1
PATHWAYS TO SUPPORT OF DISPLACED PEOPLE
Conflict shapes people’s livelihoods directly by changing the assets and resources available to them and indirectly by shaping the institutions that influence how and to what effect they can use those assets (Levine 2014; see also Chambers and Conway 1991; Scoones 1998). 1 not only does violence directly target civilians, but it also alters the political and institutional environment within which people operate, affecting their livelihood outcomes (Collinson 2003; Lautze and raven-roberts 2006). For instance, IDps may face vulnerabilities such as catastrophic losses of assets or trauma because of displacement, which affects their ability to seize economic opportunities and can trap them in poverty (World Bank 2017).
policies and processes related to resettlement, local integration, and return also affect livelihood outcomes for those displaced. In Ethiopia, these include restitution of land and property, access to basic services, and essential documentation. The ownership of assets may also become a potential source of vulnerability for people during conflict. For instance, ownership of farmland may make a household or an individual susceptible to attacks by others who want to control that plot of land or in disputes over territory. Similarly, households with savings or other movable assets may become the target of looting.
Conflict can reinforce poverty and vulnerability, particularly for IDps, and humanitarian efforts cannot adequately respond to short-term crises and longterm needs (Sabates-Wheeler 2019).2 historically, humanitarian responses implicitly assumed that crises were discrete and exceptional incidents. however, as commonly acknowledged now, crises not only recur but also overlap and compound one another (Maxwell and Gelsdorf 2019). Further, their impacts are most severely felt by the chronically vulnerable and poor populations. As a result, in recent years, the emphasis has been on bridging the humanitarian- development divide, with a growing role for social protection (Brück et al. 2019; Doocy and Tappis 2017; Maxwell and Gelsdorf 2019, 111; Mosel and Levine 2014).
An effective social protection system can reduce vulnerability and poverty in the long term while also establishing a channel for effective responses in times of crisis (European Commission 2019). In most countries, the process of development is nonlinear and can be affected by a range of shocks. Long-term planning for social protection can provide insurance against these shocks and downturns and can help vulnerable people avoid slipping into destitution (Ulrichs and Sabates-Wheeler 2018). In a similar vein, the safety net system in Ethiopia was institutionalized by the Ethiopian people’s revolutionary Democratic Front to address, among other things, chronic food insecurity, which it associated with political instability (Lavers 2016, 2021; also refer to De Waal 2017; hoddinott and Taffesse 2019). When robust social protection mechanisms exist, the response through these systems in a crisis can be faster and more cost-effective than conventional humanitarian responses (European Commission 2019; Gentilini 2016).
however, limitations arise in using social protection systems as humanitarian response systems.3 First, despite policy interest, not a great deal of evidence exists from fragile contexts on what works, for whom, and why. Second, although safety net programs are not homogenous, they are more likely provided through government systems and embedded in national budgets (Gentilini 2016; also refer to Seyfert et al. 2019). They tend to adopt a longer-term view and are geared
156 | Work I n G To DAy F or A B ETTE r To M orro W I n E T h I op IA
toward addressing persistent poverty and need. In contrast, humanitarian programs tend to be designed with an emphasis on saving lives, including delivering under short time horizons, and in accordance with humanitarian principles. When a government is viewed as party to a conflict, these principles of neutrality, impartiality, and independence may be eroded, undermining the effectiveness of humanitarian interventions (Ulrichs and Sabates-Wheeler 2018).4
In addition, humanitarian aid has its shortcomings. Critically, it is often limited and inadequate, and its short-term focus may leave aside opportunities for longer-term poverty gains. Moreover, because it is delivered primarily by international actors, it could undermine national and local capacities and be detrimental to notions of state-building and the existing social contract (De Waal 1997).
Finally, those displaced may have specific vulnerabilities that set them apart. Existing safety net programs may be insufficient to support those displaced given the diversity and depth of their plight, as well as the evolution of their needs at different points in their displacement (De Berry and roberts 2018). In addition, when active conflict remains ongoing, safety net programs may remain suspended in some parts of the country, such as in Tigray state in Ethiopia, and therefore, unavailable to those displaced.
Social protection systems cannot replace humanitarian responses, but governments can harness their strength to cushion the damage of displacement. This chapter is forward-looking and focuses on the potential role of safety net programs immediately and in the medium term after the cessation of open conflict. It assumes that the government of Ethiopia will continue to have the political will and commitment necessary to protect the welfare of those displaced using the safety net systems.
OVERVIEW OF DISPLACEMENT IN ETHIOPIA
In 2021, Ethiopians experienced 5.1 million internal displacement events due to conflict, the highest annual figure recorded for a single country since 2003, when global records began (IDMC 2022).5 Conflict and displacement have long been interlinked in Ethiopia, shaped by a long history of mobility and migration, ethnic rivalry, colonialism, and the state’s formation (for instance, refer to pankhurst 2001; Zewde 2001). however, 2021 marked the peak of a 6-year surge in internal displacement, of which more than 80 percent was driven by conflict.
Recent history of internal displacement
The recent surge in displacement occurred in three waves, linked to droughts and political transition in Ethiopia. Figure 8.1 visualizes the waves of conflictdriven internal displacement that raised the tally from about 370,000 in 2012 to present-day numbers. A first wave in 2016–17, concentrated in the oromia and Somali borderlands, was followed by a second one in 2018, linked to widespread but localized outbreaks of violence, including on the border between oromia and the Southern nations, nationalities and peoples region.
political tensions in the oromia-Somali border areas, exacerbated by the 2015 drought, triggered a first wave of displacement (philip et al. 2018). The drought’s impacts were dire across northern and central Ethiopia, including in the northern part of the long-disputed border area between the oromia and Somali regions.6 In addition, in 2016 and 2017, widespread intercommunal violence
Conflict, Displacement, and Livelihoods in Ethiopia | 157
Internal displacement in Ethiopia, by cause, 2012–21
Source: Data for 2012–21 from IDMC 2022.
Note: Internal Displacement Monitoring Center (IDMC) data and International Organization for Migration Displacement Tracking Matrix (IOM DTM) data are based on different methodologies. IDMC draws on the figures produced by IOM DTM but also triangulates with other sources, humanitarian and governmental; applies algorithmic scenario-based estimates to disaster; and is generally considered to have higher-quality data. It does not, however, provide the richness of the IOM DTM data sets regarding demographics, needs, origin, and so on.
The IOM DTM data sets provide nuance (IOM 2021, 2022a, 2022b, 2022c). IDP = internally displaced person.
occurred in these border areas (hagmann and Abdi 2020), which triggered large-scale displacement. By the end of 2017, 1.5 million people had been displaced, largely oromos and Somalis.
A second wave of displacement resulted from the upsurge in localized conflict, after the nomination of Abiy Ahmed for prime Minister in April 2018. For almost three decades Ethiopia had been ruled by the Ethiopian people’s revolutionary Democratic Front, a coalition of ethnicity-based political parties dominated by the Tigray people’s Liberation Front (TpLF). Between 2014 and 2018, antigovernment protests multiplied throughout the country, culminating in Ahmed’s nomination. Although the new government initially enjoyed strong popular support, the TpLF left the governing coalition shortly after his appointment. Along with these national political changes, localized violence broke out in different parts of the country, triggering the second wave of displacement that crested at about 1 million IDps.
The third and largest wave of displacement occurred when fighting broke out between the federal government and Tigrayan forces.7 The relationship between the federal government and T pLF had deteriorated progressively since 2018 and transformed into intense military conflict in the Tigray region in november 2020. The conflict spilled over into Afar and Amhara in mid-2021, displacing more than 2 million people across the three regions.
By early 2022, over 7 million Ethiopians—6 percent of the population—were either displaced or returning from recent displacement. of that number, 4.5 million8 people were living in displacement, and 2.9 million IDps were returning or had just returned home. The main cause of displacement was conflict, which accounted for 83 percent of all those who were still displaced and for 95 percent of all returning IDps. Environmental shocks, mostly droughts and flooding,
158 | Work I n G To DAy F or A B ETTE r To M orro W I n E T h I op IA
FIGURE 8.1
Conflict Disaster Total 0.4 0.4 0.4 0.6 0.6 1.5 2.4 1.9 2.7 4.2 0 0.5 1.0 1.5 2.0 2.5 3.0 3.5 4.0 4.5 201220132014 Number of IDPs (millions) 2015201620172018201920202021 Wave 1 Wave 2 Wave 3
displaced most of the others.9 In absolute terms, Tigray has experienced the most acute displacement, particularly in the central and northwestern zone, followed at a distance by Somali (refer to figure 8.2 and map 8.1). Although not as high in absolute terms, displacement in Afar and Gambella affects a large share of the regional population.10
Deteriorating food security conditions across Ethiopia affect IDps and their hosts, too. Although no United nations–endorsed Integrated phase Classification Assessment has been conducted in Ethiopia since July 2021, available data suggest a worsening crisis (IpC 2021). 11 Because of challenging domestic and international macroeconomic conditions, the domestic price of food was about 32 percent higher in July 2022 than in the same month the previous year. 12 Moreover, an unprecedented fourth consecutive season of below-average rains has led to widespread drought. According to the latest reports, approximately 2.5 million livestock died between late 2021 and May 2022 in southern and southeastern pastoral areas (FEWSnET 2022). As the value of their herds decline, pastoralists across these areas face extreme constraints in purchasing sufficient food, leading to consumption gaps and internal migration.
Displacement in the northern conflict
The United nations estimated in early 2022 that 9.4 million people in Afar, Amhara, and Tigray required humanitarian assistance.13 The conflict has resulted in widespread internal displacement and increased humanitarian need in the northern parts of the country, including elevated levels of food insecurity. Banking and financial services were suspended in Tigray, and few supplies have entered Tigray, including food, aid, and fuel.
Conflict, Displacement, and Livelihoods in Ethiopia | 159
FIGURE 8.2
Displacement in Ethiopia, by region, 2022
Source: World Bank analysis of International Organization for Migration Displacement Tracking Matrix data: Site Assessment round 28 (for all regions but Afar, Amhara, and Tigray) and Emergency Site Assessment rounds 8 (for Tigray) and 9 (for Afar and Amhara).
Note: SNNP = Southern Nations, Nationalities and Peoples Region.
Afar, 175,264
Amhara, 462,529
Benishangul Gumuz, 26,852
Dire Dawa, 570 Gambella, 43,809
Harari, 3,124
Oromia, 792,686
Sidama, 40,637
SNNP, 198,493
Somali, 932,568
South West Ethiopia People's, 18,265
Tigray, 1,814,284
MAP 8.1
Internally displaced persons in Ethiopia, by zone
INTERNALLY DISPLACED PERSONS
223 800,000


SOUTH SUDAN


Asmara Sanaa


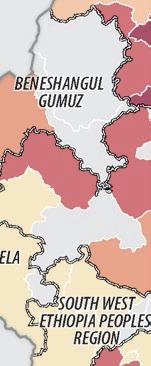
NATIONAL CAPITALS
ZONE BOUNDARIES


REPUBLIC OFYEMEN


SOUTH ETHIOPIA REGIONAL ST
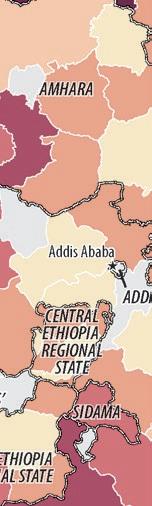


SUDAN Djibouti
DJIBOUTI


Red Sea RI
REGION BOUNDARIES
INTERNATIONAL BOUNDARIES

Golf ofAden


SOMALIA


Sources: Data on internal displacement is from the International Organization for Migration Displacement Tracking Matrix: Site Assessment round 28 and Emergency Site Assessment round 8 (for Tigray) and round 9 (for Afar and Amhara)—see box 8.1.
Note: The boundaries, colors, denominations, and any other information shown on this map do not imply, on the part of the World Bank Group, any judgment on the legal status of any territory, or any endorsement or acceptance of such boundaries.
The conflict caused successive waves of displacement in the areas affected by the armed groups’ offensives and counteroffensives. Using data from the International o rganization for Migration Displacement Tracking Matrix Emergency Site Assessments, figure 8.3 and map 8.2 show how displacement largely tracks the phases of the conflict. Displacement in Tigray surged between March and May 2021 and then peaked at 2 million individuals—almost a third of the region’s population—in June, reflecting advances made by the federal and allied forces. In July 2021, as Tigrayan forces gained control of large swathes of the region, IDp numbers started dropping but picked up again as Tigrayan forces then pushed into Afar and Amhara.14
Distinctive patterns of displacement and hosting arrangements are visible in each region. IDps in Tigray flocked to urban areas, particularly the regional capital Mekelle, as well as the main towns of the northwestern; central; and, to a
160 | Work I n G To DAy F or A B ETTE r To M orro W I n E T h I op IA
ERITREA
KENYA
AFAR
I SOMALI S
HARERI
GAMBELA
OROMIA
ADDIS ABABA
S’
DIRE
NO
47619 | NOVEMBER 2023
DATA IBRD
lesser extent, eastern zones. In September 2021, just 6 Tigrayan urban centers hosted 82 percent of the displaced regional population.15 In contrast, displacement in Amhara was more dispersed, with IDps mostly staying in rural areas and moving constantly depending on prevailing security conditions.16 In Afar, IDps sought refuge largely in spontaneous camps, whereas local communities hosted most IDps in Amhara and Tigray (refer to figure 8.4).
Livelihoods and food security have been severely affected as public infrastructure was damaged, food reserves looted, and the conflict rolled into the 2021 planting season. Despite limited data, assessments from January 2021 suggest that moderate or severe food insecurity in Tigray jumped by 38 percentage points after the conflict began, while employment rates plummeted, from almost 80 percent to below 50 percent on average and below 40 percent in urban areas (Abay et al. 2022).
A key challenge facing IDps, whether still displaced or returning, is the loss of productive assets and livestock. Although it is difficult to quantify the extent of losses, interviews suggest that IDps who earned a livelihood from farming have lost seeds, crops, and agricultural implements.17 Livestock and farm animals have been killed, stolen, or sold by displaced households to obtain cash. Farmland has been burned, health centers and educational institutions looted or destroyed, and irrigation and water facilities damaged. In the Afar region, where pastoralism and agro-pastoralism remain the predominant livelihoods, displacement and livestock loss have had severe impacts.18
Even when they can move with their herds, IDps are prevented from resuming their livelihoods in settlement areas by complex clan rules related to grazing land and water. relationships between IDps and host communities vary. In some places, residents are significant sources of support or, at the minimum, host IDps without acrimony. other areas have tense host-IDp relationships (Samuel hall and World Bank 2022).
Conflict, Displacement, and Livelihoods in Ethiopia | 161 FIGURE 8.3
Number of internally displaced people in the northern Ethiopian crisis, by region, January 2021 to February 2022
0 500,000 1,000,000 1,500,000 2,000,000 2,500,000 Jan-21 Feb-21 Mar-21 Apr-21 May-21 Number of displaced persons Jun-21 Jul-21 Aug-21 Sep-21 Oct-21 Nov-21 Dec-21 Jan-22 Feb-22
Source: World Bank analysis of International Organization for Migration Displacement Tracking Matrix data: Emergency Site Assessment rounds 8 (for Tigray) and 9 for (Afar and Amhara).
Afar Amhara (excl. West Gojjam) Tigray
MAP 8.2
Number of internally displaced people in the northern Ethiopian crisis, by woreda
INTERNALLY DISPLACED PERSONS
76 270,000


ERITREA
Asmara


NATIONAL CAPITALS
WOREDA BOUNDARIES

REGION BOUNDARIES


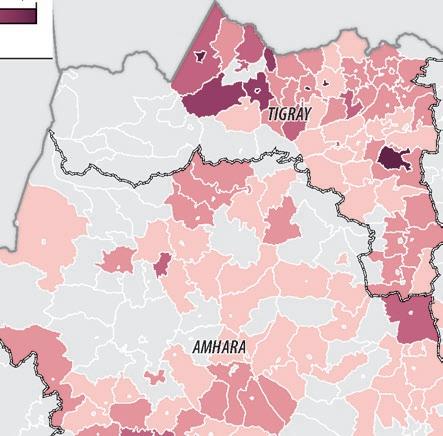


INTERNATIONAL BOUNDARIES


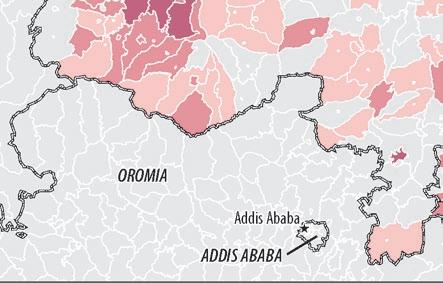


DJIBOUTI


Sources: Data on internal displacement is from the International Organization for Migration Displacement Tracking Matrix: Site Assessment round 28 and Emergency Site Assessment round 8 (for Tigray) and round 9 (for Afar and Amhara)—see box 8.1.
Note: The boundaries, colors, denominations, and any other information shown on this map do not imply, on the part of the World Bank Group, any judgment on the legal status of any territory, or any endorsement or acceptance of such boundaries. The displacement in southern Amhara is likely caused by violence in Benishangul-Gumuz (on the border with the Amhara region), whereas the displacement in southern Afar is likely caused by conflict on the border between Afar and Somali Regional State. Western Tigray remains inaccessible, and therefore appears blank on the map.
In Tigray, the suspension of banking services and poor functioning of markets have exacerbated the crises caused by the conflict.19 Weak supply lines into the region20 have made it difficult to move essential fuel, fertilizer, seeds, and other agricultural inputs into the region, hampering farm-based livelihoods. Even when farmers can produce goods, they struggle to find buyers and must resort to bartering.
humanitarian agencies report that some female-headed households have also moved to cities within Tigray where they are more likely to receive assistance. These conditions have led to secondary waves of movement, with households and individuals from southern Tigray moving into the Amhara region, which has relatively functional markets. rates of cyclical migration have also increased, as households send members to cities (and, in some cases, to the
162 | Work I n G To DAy F or A B ETTE r To M orro W I n E T h I op IA
SUDAN
Djibouti
M
BENESHANGUL GUMUZ
AWA
SOMALI
IBRD
NOVEMBER 202
NO DATA
47620
Amhara region) to sell produce and obtain essentials. Unsurprisingly, black marketeering has also increased, as has the prevalence of moneylending (at exorbitant rates) by those with some access to cash.
For women, in particular, psychosocial trauma and gender-based violence further affect livelihood options.21 Women who have experienced gender-based violence report feeling shame and reluctance at the thought of returning to their communities. The outbreak of violence has also had significant knock-on impacts on livelihoods. As in other parts of Ethiopia, women are disproportionately involved in petty trade, which relies on intercommunal relationships for transportation of goods and operation of markets. Violence has caused a breakdown in these relationships, impairing women’s ability to earn a living.22
Unfortunately, given these increased needs, the conflict has caused the interruption of safety net program operations, leaving a gap that social solidarity has sought to fill. Rural safety net operations in Tigray halted in late 2020 and paused indefinitely after the federal government lost control of most of the region. Rollout of the Urban Productive Safety Net and Jobs Project (UPSNJP) to cities in northern Afar, northern Amhara, and Tigray was also interrupted in 2021. Cities in Amhara managed to start operations in 2022, but normal urban safety net programs in northern Afar and in Tigray were still not functioning as of mid-2022, when this chapter was written. In this vacuum, support groups and social networks have played an essential role. For instance, salaries for humanitarian workers probably support several families, by some estimates as many as 40–50 individuals.23
Livelihoods of displaced people
Displacement puts additional pressure on already limited basic services in hosting communities. Government officials highlight how ensuring adequate provision of basic services to IDPs and hosts requires huge budgetary resources.24 Although 82 percent of IDPs have physical access to health centers, the cost of service may prevent them from using the centers in 6 of 7 sites. Moreover, on average, half of IDPs do not have access to primary education, and in Tigray IDPs have essentially no access.25
Conflict, Displacement, and Livelihoods in Ethiopia | 163
8.4
FIGURE
Source: World Bank analysis
International Organization
Migration Displacement Tracking Matrix data: Emergency Site Assessment rounds 8 (for Tigray) and 9 for (Afar and Amhara). Percent Afar Amhara Tigray 0 10 20 30 40 50 60 70 80 90 100 Spontaneous camp/site Collective center Host community/families Other
Share of displaced people in selected Ethiopian regions, by site type
of
for
Access to shelter is another major concern, especially in urban or peri-urban areas. In both Addis Ababa and oromia, some housing has been constructed under the aegis of the local government but only after long delays, and the extension of basic services has been slow. 26 In many cases, public infrastructure, including schools and training centers, has been used to house IDps, which has further strained local capacity for basic service delivery ( kaya research and Development pLC 2019).
The impact on women has been severe. In several IDp settlements, women and girls bear a larger burden of house and care work. Moreover, conflict-related increases in sexual and gender-based violence disproportionately affect women and girls, with trauma and mental health implications. The need for special services for pregnant women and young mothers is acute. Interviewees associated displacement with increased early marriage caused by, among other things, vulnerability and interruption of schooling. Finally, women who work in informal trading in parts of oromia and in Somali regional State have seen their livelihoods collapse because of increased securitization and breakdown in social cohesion.
Almost all IDps face prohibitive challenges in earning a livelihood, both locally and in their areas of return. Fewer than 1 in 10 IDps had access to income during their displacement.27 Lack of livelihoods is the most common recorded reason preventing IDp return.28 Some interviewees attributed livelihood challenges in displacement to IDps’ background as small-scale traders and farmers and to their unwillingness to ply new trades. others pointed to the challenges IDps face in adapting to local labor markets, as well as the shortage of capital, land, and skills. Although some livelihood support programs have been created, they provide limited resources to IDps on an ad hoc basis, are not backed by consistent skills training and support, and ended when IDps were considered resettled or locally integrated.29 only 6 percent of IDps live in sites with livelihood support programs.30
Likewise, self-reliance—whether through sale of assets or livestock, borrowing, or local cultivation—is not common: fewer than 1 in 10 IDps lived in sites where this was the most common way to obtain food—and they were mostly in pastoralist areas of Afar and Gambella regional states. Although food prices have skyrocketed, livestock prices have stagnated (FEWSnET 2022), suggesting that livestock sales are likely driven more by lack of alternatives than for self-reliance.
Without livelihood or job options, IDps rely on food and cash distributions to sustain themselves, but coverage varies substantially among regions. Almost 4 in 5 IDps lived in sites with some access to either food or cash distributions. Distributions did not typically cover the whole population in displacement sites, however, and regional disparities were marked. on average, the latest official data suggest that about 1 in 3 IDps across Ethiopia received food support.31 In Tigray, fewer than 1 in 5 IDps had received food distributions. Coverage in the Afar, oromia, and Somali regions was close to the national average.
The community hosting displaced people is another crucial support system, but such support can lead to friction. Approximately 1 in 5 IDps is hosted in a site where host community donations are the main source of food for those displaced. reliance on the local community is widespread, particularly in highland areas of Amhara, the Southern nations, nationalities and peoples region, and Tigray. The presence of IDps can, however, create social tension due to competition over access to services, resources or land, and jobs or economic opportunities, as well as to religion and ethnicity (kaya research and Development pLC 2019). Levels of cohesion and tension vary significantly across areas (Samuel hall and World Bank 2022).
164 | Work I n G To DAy F or A B ETTE r To M orro W I n E T h I op IA
Ending displacement
In general, IDps prefer to return to their place of origin. however, durable solutions for displacement can take three paths:
1. reintegration at the place of origin (return),
2. Integration in areas where IDps take refuge (local integration), or
3. Integration in another part of the country (resettlement).32
In Ethiopia, 61 percent of IDps prefer return. Local integration comes in a distant second (31 percent) but is more preferred in the older displacement sites.33 Different preferences also reflect treatment of IDps in hosting communities, conditions and reasons for displacement, insecurity (whether real or perceived) in areas of origin and settlement, and availability of services and ease of earning livelihoods in hosting sites, among others.
A key deterrent to return, however, is the lack of livelihoods to support returnees.34 Among the reasons preventing return, lack of livelihoods is cited in three-quarters of sites,35 pointing to an opportunity for livelihood support to complement durable solutions. IDps alleged that their houses and farmland had been burned; their livestock stolen or killed; and their stores of crops, fertilizers, and seeds destroyed or burned. In most areas, productive infrastructure— markets, farmer training centers, coffee pulping plants, livestock breeding centers, agriculture nurseries, and model farmers display centers—was also destroyed. Even when IDps can return to their areas of origin, they face difficulties in resuming their old livelihoods because of the loss of assets, insecurity, or their land having been taken by others.
IDps return to their typically agricultural livelihoods without structured support to resume them. For over 56 percent of IDps, the main livelihood strategy in their place of return is farming, with pastoralism, daily labor, and petty trade accounting for most of the rest. Food shortages are a major challenge to resuming livelihoods regardless of livelihood strategy, highlighting how displacement’s impacts on consumption reverberate even after return. Where farming is the main livelihood strategy,36 shortage of farmland is the key challenge, along with a lack of nonagricultural livelihood options. Despite available data on returning IDps, only piecemeal information exists on how local integration and relocation have concluded. Further data and research on livelihood outcomes in these cases are required.
Role of humanitarian and development partners
The humanitarian response to Ethiopia’s IDp crisis focuses predominantly on food distribution and cash assistance, with delivery organized into distinct thematic working groups reflecting the structure of the global humanitarian system. projects have also focused on capacity building at the local government level to support durable solutions, addressing drivers of displacement, increasing women’s empowerment, and promoting youth employment. A few interventions focus on increasing social cohesion, on countering violent extremism, and on increasing access to justice for and meeting the protection needs of IDps. Both national and international efforts are coordinated through the Ethiopian Disaster r isk Management Commission with working groups cascading down from federal to regional levels in nonoverlapping areas:
Conflict, Displacement, and Livelihoods in Ethiopia | 165
food and nutrition, protection, water and sanitation, emergency shelter and nonfood items, health, education, agriculture, camp coordination and camp management, and logistics.37
In most areas, support has predominantly focused on food assistance, cash support, and provision of emergency shelter and nonfood items along with emergency education and health support. Interviews suggest that the types of interventions vary across the three regional states affected by conflict.
In Tigray, given the large scale of need, most organizations have tried to respond on multiple fronts, but with limited effect.38 The broad focus of efforts has been to support farm production and nonfarm livelihoods, along with restoration and maintenance of basic services.39 The United nations Children’s Fund, in partnership with the Ministry of Women and Social Affairs and partially piggybacking on the delivery model of the Urban productive Safety net project (UpSnp), was able to field rapid cash transfers to a few IDps in Mekelle and Tigray and then in Afar, Amhara, and Benishangul-Gumuz.40 Government officials in Afar and Amhara noted that several schemes had been announced but that implementation has been uneven. These schemes include supporting IDps in settlements as well as in communities through provision of emergency food and nonfood items, sometimes channeled through community organizations.41 Interviewees also noted that the combination of climate crises and conflict impacts in Afar requires a comprehensive response that has not yet been mobilized.42
The urban safety net response in Amhara is the Ethiopian government’s most systematic and largest effort to mitigate the impact of the conflict in northern Ethiopia on those displaced. UpSnp’s response, led by the Federal project Coordination office, leveraged the systems and local capacity built under the urban safety net project to deliver cash transfers to IDps. Geographic and household targeting and data collection were carried out with strong regional, city, and community engagement. Financing came from leftover UpSnp funds. Existing payroll mechanisms, financial management, and reporting arrangements were used to quickly finalize the selection of beneficiaries and make transfers. households received 450 Ethiopian birr (Br) per household member (up to a maximum of 4) each month for 5 months, deposited exclusively into a bank account. The first cash transfers, to about 225,000 beneficiaries, went out in January, within 2 months of approval. The success of the scheme has prompted rollouts to Afar and Benishangul-Gumuz, where beneficiaries also received transfers by June 2022.
Given the scale of need across Ethiopia, however, the scope of the response has been inadequate. In various parts of the country, most interviewees pointed to inadequate budgets as the most significant government constraint, specifically in responding to IDp needs (kaya research and Development pLC 2019).43 Across Afar, Amhara, and Tigray, and despite significant differences in approach and implementation, interviewees involved in relief noted that the humanitarian and development response had been largely ad hoc and uncoordinated.44
Support for people displaced in urban areas remains limited. Before the urban impacts of the northern crisis became clearer, government and international organizations tended to treat internal displacement as a rural problem. In an interview, a Senior Advisor on Disaster relief and Management at Ethiopia’s Disaster risk Management Commission noted that “the situation and effect of internal displacement is extremely grave and dire in rural [as compared to] urban areas.” he
166 | Work I n G To DAy F or A B ETTE r To M orro W I n E T h I op IA
recommended focusing on rural areas and on how to contribute to durable solutions there, a sentiment echoed by other international organizations during interviews.45 Displacement to urban areas is seen largely as an issue of urban poverty and vulnerability.46 A long-standing challenge involves the difficulty in identifying people displaced to urban areas (Landau 2014; also refer to International Committee for the red Cross 2020).47 The lack of programs for self-settled IDps, especially those in urban or peri-urban areas, remains a major gap.
Moreover, in the few cases when it is provided, livelihood support has not been sustained. For instance, in oromia the regional government provided capital (Br 20,000) for IDps to start businesses or to work in their areas of preference, including trading.48 The government acted through Business Development Coordination offices and in collaboration with the oromia Credit and Saving Association. It also allocated land, used as collateral for issuance of the loans; promised small sheds for those establishing small businesses; and made efforts to obtain employment for IDp youth in local factories. however, IDps appear to have used much of the loan money for essential commodities. Livelihood support also varied substantially in duration across regions 49 and may have been discontinued after those displaced were thought to have assimilated or relocated away from settlements.50
ROLE OF ETHIOPIA’S SOCIAL PROTECTION SYSTEM IN SUPPORTING DISPLACED PEOPLE
Although Ethiopia has a clear policy framework to guide its social protection system,51 its framing documents do not mention support for displaced people. These documents were finalized by 2017, at the beginning of the first of the country’s recent waves of displacements. Until recently, no safety net programs had been created in response to displacement shocks. The UpSnp’s IDp response broke new ground in this space and showed the government’s willingness to use social protection systems to respond to displacement crises, as discussed in the preceding section. That response, however, was not a planned function of the safety net so much as a retrofitting of the safety net mechanism to an emergent need to support displaced populations.
By adopting specific considerations, Ethiopia’s social protection system can help restore livelihoods for the country’s increasingly displaced population. reforms must focus on mechanisms, objectives, geographic areas, and adaptations. of course, the best recourse against conflict is fostering peace. nevertheless, preparing for conflict and building the capacity of the social protection system to respond to it are critical for minimizing hardship when it does occur.
Mechanisms
Ethiopia’s social protection system has national programs that can support IDps. The UpSnp IDp response demonstrated the system’s capacity to channel support to IDps and the government’s willingness to use it to do so.52 The mostly mature national schemes are community-based health insurance, or CBhI (refer to box 8.2), and the rural and urban safety net programs, productive Safety net program (pSnp) and UpSnp. Because school-feeding programs and mandatory contributory pension schemes are less comprehensive, this discussion considers only the safety net programs and, to a lesser extent, CBhI.53
Conflict, Displacement, and Livelihoods in Ethiopia | 167
Community-based health insurance in Ethiopia
Community-based health insurance in Ethiopia is a voluntary, nonprofit, government-subsidized insurance scheme for the informal sector. The country launched the scheme first as a pilot in 2011 and has been scaling it up nationally since 2015 as part of its health care financing strategy. The program pools risk to reduce out-of-pocket expenditures and support access to health services. requirements include being a kebele resident, paying a membership registration fee, and paying an annual contribution.
Annual contributions of indigent community members, as identified by the woreda, are covered by the regional, city woreda, or other government entities. Contributions vary by region and range from Br 10.50 (US$0.56) to Br 15.00 (US$0.80) per month per household. The federal government provides a 25 percent general subsidy for all members. not more than 10 percent of the woreda’s population can be registered as indigent (World Bank 2022a).
Objectives
The social protection system in Ethiopia can be adapted to protect human capital and provide financial capital, both critical for improving IDp livelihoods and job potential. Human capital, defined in terms of an individual’s health, knowledge, skills, and resilience, is a key determinant of that individual’s economic productivity and income-generating capacity (World Bank 2018). Financial capital is an enabler for higher-productivity jobs and livelihoods, particularly for households at the lowest end of the income distribution, where it can help families overcome the self-reinforcing dynamics of poverty traps.54
Substantial scope exists for improving the nutritional, food security, and poverty outcomes of those displaced—particularly considering the previously discussed low coverage of food and cash support and the overwhelming demand for livelihood opportunities and financing in IDp sites. For CBhI, IDps in most sites have access to nearby health centers, but the cost of care acts as a barrier to using services. The recent IDp intervention under UpSnp demonstrated the potential to seize the opportunity to support IDps more holistically.
Social protection interventions increase household liquidity and build financial capital. Cash transfer programs can increase financial capital, key to improved livelihood opportunities and outcomes (for a recent meta-analysis, refer to kondylis and Loeser 2021). Multidimensional or “graduation” programs that complement financial support with basic and technical skills development, mentoring, and psychosocial support have been shown to materially increase assets and savings, decrease poverty, and offer diversified livelihoods, including in conflict-affected settings.55
Social protection interventions also have the potential to protect and build human capital, improving nutrition, facilitating access to health, and increasing asset generation. These interventions have been shown to improve nutritional and educational outcomes (Bastagli et al. 2016), including in Ethiopia. 56 research on CB h I suggests that it increases access to health services and can reduce the incidence of catastrophic health expenditure (for instance, refer to Demissie and negeri 2020). Although limited, available evaluations show that cash transfers can maintain and improve the food
168 | Work I n G To DAy F or A B ETTE r To M orro W I n E T h I op IA
BOX 8.2
security of displacement-affected households and can have large positive impacts on other aspects of human capital.57
Geographic areas
Ethiopia’s safety nets and CBhI cover a substantial proportion of the country, with CBhI reaching the largest number of beneficiaries. CBhI covers almost 7 million households, about 30 percent of the country’s population, and is active in 827 of about 1,084 woredas (World Bank 2022a). Therefore, IDps fall within CBhI’s geographic scope.
The overlap of safety nets with displacement is also large, although it varies by the phase of displacement. Approximately 5.3 million, or 72 percent, of IDps are within range of either the rural or the urban safety net, or both (refer to table 8.1).58 That proportion remains consistent across subgroups of returning IDps or IDps still living in displacement. however, figure 8.5 illustrates that the UpSnJp reaches substantial numbers of currently displaced individuals but that the rural program is three times more likely to cover returning IDps.59
Source: World Bank analysis of International Organization for Migration Displacement Tracking Matrix data, as of February 2022: Site Assessment 28, Village Assessment Survey 11, and Emergency Site Assessments 8 and 9.
Note: Bold values are the total (both returning and still displaced individuals), of which the subsequent rows offer breakdowns in two levels: returning vs. still displaced and among the still displaced, those affected by the northern conflict. IDP = internally displaced person; km = kilometer; PSNP = Productive Safety Net Program; UPSNJP = Urban Productive Safety Net and Jobs Project.
FIGURE 8.5
Northern conflict IDPs only
Source: World Bank analysis of International Organization for Migration Displacement Tracking Matrix data, as of February 2022: Site Assessment 28, Village Assessment Survey 11, and Emergency Site Assessments 8 and 9.
Note: The values inside the bars show the number of IDPs in millions. IDP = internally displaced person; RPSNP = Rural Productive Safety Net Project; UPSNJP = Urban Productive Safety Net and Jobs Project.
Conflict, Displacement, and Livelihoods in Ethiopia | 169
POPULATION COUNTRY TOTAL IN PSNP WOREDAS WITHIN 15 KM OF A UPSNJP CITY WITHIN RANGE OF EITHER WITHIN RANGE OF EITHER (%) IDP 7.36 4.16 1.60 5.27 72 Returning 2.85 1.86 0.31 2.09 73 Still displaced 4.51 2.29 1.29 3.18 70 Affected by northern conflict 2.45 0.94 1.11 1.73 71
TABLE 8.1 Overlap of safety nets and displaced populations in Ethiopia, in millions of individuals
IDPs in range of each Ethiopian safety net, by IDP status and rural vs. urban
0.620.33 0.79 0.72 1.89 0.41 0.88 1.33 1.78 0.08 0.23 0.76 3.67 0.49 1.11 2.09 0204060 Percent 80 100 All IDPs
IDPs
Still-displaced
only Returning IDPs only
Subpopulations RPSNP only Both UPSNJP only Neither
Adaptations
The unique needs of IDps require reassessment of the types of support—and how support is delivered—at the various stages of displacement. These recommendations benefit from hindsight on the urban safety net’s IDp response and consideration of global experience. relevant adaptations map to the chronology of displacement, as illustrated in figure 8.6.
Before displacement
Adaptations before displacement focus on preparing the system for a quick and effective response when displacement occurs. As with any resilient and adaptative safety net system, proper preparation for shocks allows for the system to respond most effectively in such eventualities. For example, pSnps are scalable in times of climatic shocks. For IDps, adaptations around registration and financing flows could improve the programs’ capacity to deliver benefits after displacement.
Digital registration, identification, and verification. The first key question is to determine who has been displaced and needs support. Avoiding double-dipping can be challenging, and distinguishing those displaced is challenging in urban areas without an organized camp structure. A smooth, objective system cannot only speed up targeting but also minimize tensions with hosting communities, many of whom may be poor and face increased burdens from the conflict.
Digital registration helps identify beneficiaries smoothly, minimizing duplication. During the northern conflict, reports exist of people registering multiple times at IDp sites, presumably to maximize the likelihood of receiving support.60 In a paper-based system, it is nearly impossible to prevent multiple registrations. Digital data entry, ideally using tablets, can help minimize double-dipping by automatically checking for duplicate entries.
•
170 | Work I n G To DAy F or A B ETTE r To M orro W I n E T h I op IA
FIGURE 8.6
displacement
Digital registration, identification, and verification
Flexible funding for regional and local implementers
displacement
Including those displaced in the rural PSNP's shock response
Removing barriers to inclusion for the poor population
displacement
Financing grants for livelihood recovery
Entry points for social protection systems in Ethiopia along the displacement timeline
Source: This figure is original to this publication. Note: PSNP = Productive Safety Net Program. Before
•
•
During
•
•
Ending
•
Public works for protracted displacements
Because the short time frame of an emergency response makes it difficult to procure tablets or train staff to use them, these systems should be in place before disaster strikes. regional authorities and major cities already have tablets to run targeting for the UpSnJp. Even in these places, the Disaster risk Management Commission or other government coordinating entities conduct paper-based registration. Cooperation agreements should be signed between UpSnJp implementers and regional Disaster risk Management offices enabling trained safety net officials to use these tablets for registration from the start, which would have the added benefit of aiding the humanitarian response. Zones not hosting a UpSnJp city but containing pSnp woredas could be prioritized for tablet procurement, and workers could be trained to administer a basic registration questionnaire to aid in shock response, whether through the rural pSnp or other means.
A second step involves developing links between social protection programs and Fayda, Ethiopia’s forthcoming national identification system. This system, currently progressing through a series of pilot registration phases, had more than 120,000 registered individuals at the latest tally.61 Fayda is slated for fullscale rollout between 2023 and 2025 to the resident population aged 16 years or older and will include a unique identification number and information on current address. Ministries overseeing safety net operations (the Ministry of Agriculture and the Ministry of Urban Development and Infrastructure) should prioritize the drafting of memorandums of understanding with the new national identification authority to ensure access to the Fayda database with digital devices used during field identification to verify residency and thus displacement status.
Flexible funding for regional and local implementers. Contingency financing arrangements can help in reallocating funding for IDps in times of crisis. pSnp and UpSnJp now incorporate Contingency Emergency response Components that allow for quick reallocation of funds. preparations that can be made before the need arises include training implementers on preparing key documents for activation, creating templates, agreeing on which data sources to use, and setting expectations. CBhI does not have such contingency financing arrangements and requires modification to ensure rapid expansion of free coverage in areas hosting IDps. The federal Ministry of Finance or regional Bureaus of Finance would have to plan contingency funding to cover IDps who cannot afford health care in hosting communities, as well as additional medical supplies in these areas.
During displacement
During displacement, saving lives and protecting human capital must be the focus. Expanding coverage of pSnps in host communities, increasing benefits available to IDp households, and ensuring proper outreach and communications could facilitate better outcomes for poor and vulnerable IDps.
Including displaced people in PSNP’s shock response. pSnp already has shock response mechanisms that could include IDps. As of early 2022, about half of IDps living in displacement were in pSnp woredas. Coverage of pSnp’s existing shock response component, designed to respond to drought when it occurs, has a horizontal expansion (covering more families) and a vertical expansion (increasing transfer values).
Conflict, Displacement, and Livelihoods in Ethiopia | 171
new targeting processes for those displaced could build on flexibilities within p S np. The ma jority of p S np suppor t involves a residence requirement: clients must have lived in the community and have faced chronic food shortages over the previous 3 years. Evidence from lowland areas of the country suggests that this requirement tends to exclude newly arrived resident households (Lind et al. 2018) and so can be expected to exclude ID ps, too. The shock response component in the latest phase of p S np ( p S np 5) provides flexibility on this targeting criterion and includes provisions to avoid double-dipping across humanitarian food and cash assistance. Designs for adapting these features must be studied closely to understand feasibility and effectiveness. one concern is the timeliness of transfers, a long-standing issue within p S np. Lessons from the first rounds of the drought response component of pSnp5 could provide useful information for considering support for IDps under pSnp
Removing barriers to inclusion for poor individuals. Emerging evidence from the UpSnp IDp response suggests that design tweaks could help reach the most vulnerable populations. Although it is early to draw conclusions on impacts, insights from telephone surveys of beneficiaries suggest the response was successful, as nearly all beneficiaries received their payments. however, evidence emerging from the program’s monitoring system and the analysis in this chapter suggests the need to adjust and broaden the design of the response.
IDp households often have more than 4 family members, the number beyond which the transfer size ceases to scale up. As a result, many larger households receive less support per capita (World Bank 2022b). Because larger households tend to be poorer and have more children (World Bank 2020), the cap may have an antipoor effect and diminish the protective effect on the particularly vulnerable human capital of children. The cap, copied from UpSnp’s public work program, should be raised or removed altogether.
Strong communications, including careful prioritization of sites by regions and cities, could promote registration of households whose income is most vulnerable to displacement. The share of beneficiaries in the public sector, rather than in farming or daily labor, with preexisting bank accounts and higher education was substantially higher than expected, suggesting the program may have struggled to reach the most vulnerable displaced populations. A stronger approach to outreach will also help provide beneficiaries and communities with clarity on the intervention’s scope and purpose, reducing the potential for grievances.
Ending displacement
As a household reaches a durable solution or displacement drags on, the focus of social protection can shift to resuming old livelihoods or starting new, more productive, or more location-appropriate ones and to helping households and communities weather the medium term.
Financing grants for livelihood recovery. Because most IDps report that a lack of livelihoods prevents their return, safety nets and their livelihood support programs could play a vital role in promoting durable solutions. return is most often the preferred durable solution for IDps and is the default solution for government. however, poor income-earning opportunities in IDp’s home communities are key drivers preventing return. The UpSnJp is designing and is expected to
172 | Work I n G To DAy F or A B ETTE r To M orro W I n E T h I op IA
implement a cash-based livelihoods response for IDps through the banking system. however, the vast majority of IDps will not have bank accounts.62
Given its geographic coverage, pSnp could reach a large portion of returning IDps and, with appropriate adjustments, a pilot of the livelihood program could work well. Three-quarters of pSnp woredas use cash as the payment method, suggesting the possibility of a lump-sum cash transfer for livelihood investment. The increasing use of electronic payments, including mobile money, also increases the likelihood of financial inclusion, a further benefit in promoting sustainable livelihood development. In addition, although logistically challenging, a pilot could also provide softer support, in the form of training, coaching, or counseling, in line with UpSnJp’s or pSnp’s livelihood components (see chapter 6). The geographic targeting of such a pilot should consider the overlap between these programs and areas with returning IDps.
Public works for protracted displacements. A simplified design for public works for those displaced over the long term could aid this population. Although research thus far has focused on more recent IDps, a substantial share of IDps in Ethiopia experience protracted displacement.63 public works could help in three ways. First, beneficiaries could rehabilitate or expand infrastructure affected by their displacement, for the benefit of the hosting community and their own. Second, that work could build social cohesion with the hosting community, if those displaced are seen as giving back to the host community. Third, the requirement for public works introduces an aspect of self-selection of the neediest to increase the inclusiveness of poorer households.
CONCLUSION
The analysis in this chapter highlights the potential of Ethiopia’s social protection system to support more sustainable solutions for IDps, including livelihood opportunities. It explains the salient aspects of recent displacement in Ethiopia, its negative impacts on IDps’ well-being and livelihoods, and how government and development partners are currently working to address the needs of IDps. The review also outlines how the UpSnp has already taken steps to field a response inclusive of IDps, the potential applicability of new shock-responsive components of the pSnp, and the learning from these activities. This research reveals key actions needed if these efforts are to scale up to meet current needs and prepare for future displacement events.
The needs and profiles of those displaced are underresearched in Ethiopia, which limits the evidence base for well-informed policy responses. Filling the knowledge gaps on internal displacement in Ethiopia will require additional analytical work, especially for urban areas. The iterative beneficiary monitoring exercise fielded for the UpSnp IDp response has provided one of the first quantitative surveys of internally displaced populations in Ethiopia, but the telephone-based format has limitations. other field-based surveys have been carried out, but these were typically site-specific.
The data gap could be filled with bespoke surveys or by including IDps in existing socioeconomic research such as the household Income, Consumption, and Expenditure Survey and the Ethiopian Socioeconomic Survey. Existing research efforts assessing needs and profiles of those displaced in the region could be adjusted and fielded with minimal adaptations to provide the
Conflict, Displacement, and Livelihoods in Ethiopia | 173
detailed household-level understanding missing from the available data sets. Furthermore, as safety nets and other social protection systems are expanded to cover IDps, the monitoring and evaluation mechanisms must be adapted to provide insights on outcomes of beneficiaries of these interventions.
Given the wide prevalence of displacement in recent years, many of pSnp’s and UpSnp’s future beneficiaries can be expected to have experienced displacement. Dedicated surveys could help understand how and whether the safety net has bolstered their resilience to shocks. Given the expectation of a large overlap with CBhI beneficiaries, these surveys could also provide insights into how and whether those displaced access CBhI and the nature of their challenges.
harmonizing and creating more sustainable support for IDp livelihood formation requires government leadership. Although underfunded, this field is crowded with government actors—the Ministry of Agriculture, the Ministry of Urban and Infrastructure Development, the Ethiopian Disaster risk Management Commission, and the Ministry of Women and Social Affairs. Consultations with a single institution taking the clear lead should take stock of the experience so far and devise a division of labor within the social protection system (rural, urban, and CBhI) and between social protection and humanitarian response that maximizes support to those displaced while avoiding overlaps and duplications.
Building systems preparedness and testing shock-responsiveness would then allow existing national programs to promote livelihood recovery of IDps and encourage durable solutions. These preparations would consider the adaptations as outlined earlier in this chapter. Government safety net structures across Ethiopia should then be equipped and their implementers trained for rapid digital registration. Furthermore, CBhI budgetary arrangements should be revisited to ensure that quick arrangements exist to roll out fee waivers to those displaced. Targeting of existing shock responses should be strengthened to focus on the most vulnerable. Safety nets should field pilots and quickly scale up interventions to fast-track the return to sustainable productive livelihoods for returning IDps, starting with the basics (cash, including grants) and, where feasible, developing the more comprehensive responses that have proven most effective.
NOTES
1. Institutions should be understood in the everyday sense of formal institutions of government and the extended sociological sense of the norms that govern societal functioning (see north, Wallis, and Weingast 2009).
2. refer also to Donini (2010), who argues there is no such thing as a “humanitarian crisis”; instead, all crises are political with humanitarian consequences.
3. The literature has further debates including the circumstances in which alignment between state safety nets and humanitarian assistance is appropriate, the modalities of such alignment, and the different design tweaks needed (for an overview, refer to oxford policy Management 2015; Seyfert et al. 2019; Ulrichs and Sabates-Wheeler 2018).
4. Also, some scholars argue that all intervention (humanitarian or developmental) is political, notwithstanding humanitarians’ stated commitment to neutrality (see Duffield 2001; Fassin 2010).
5. The 5.1 million figure is higher than the 4.2 million reported in figure 8.1, because the former accounts for all displacement events over 2021, whereas the latter is the year-end total number of displacements.
6. In general, academics agree that no direct causal relationship exists between climate change and conflict. Whether conflict breaks out because of climate change depends on several intermediate political factors including state intervention, functionality of local institutions, and
174 | Work I n G To DAy F or A B ETTE r To M orro W I n E T h I op IA
social cohesion outcomes which are highly context specific. Von Uexkull and Buhaug (2021) provide a good summary of the current state of knowledge on this relationship.
7. The Ethiopian government refers to the Tigray forces as the TPLF, but those forces refer to themselves as the Tigray Defence Force (TDF). This chapter uses the term Tigrayan forces, especially when referring to the context after november 2020.
8. note the slight discrepancy with the Internal Displacement Monitoring Center tally of 4.2 million, due to both the different time frame (end of 2021 vs. early 2022) and the methodology. This discussion uses the International organization for Migration Displacement Tracking Matrix (IoM DTM) to look behind the total, so that the reference figure for total displacement is DTM’s 4.5 million rather than the Internal Displacement Monitoring Center’s 4.2 million.
9. A substantial minority also have fled “social tensions,” particularly in the Borena, Guji, and West Guji zones of oromia.
10. IoM DTM data on Benishangul-Gumuz are unavailable for the period of interest because of lack of access. According to regional government estimates, Benishangul-Gumuz had over 400,000 IDps and Afar over 350,000 as of mid-February 2022. Those estimates would have made the prevalence of displacement in Benishangul-Gumuz even higher than in Tigray, and the prevalence in Afar is just under that in the Somali region.
11. These findings were not endorsed by the Ethiopian government. Food security assessments continue to be extremely politically sensitive (for a discussion, refer to Maxwell and hailey 2020).
12. Ethiopian Statistics Service data, https://www.statsethiopia.gov.et/
13. United nations o ffice for the Coordination of humanitarian Affairs (U no C h A), “Ethiopia northern Ethiopia humanitarian Update (Situation report),” https://reports. unocha.org/en/country/ethiopia/.
14. Emerging reports suggest that the first half of 2022 saw massive return operations in the Tigray region, but data collection halted there because of operational constraints.
15. This area includes the cities and towns of Adigrat, Alamata, Axum, Mekelle, Shiraro, and Shire.
16. Interview with UpSnp/UpSnJp monitoring and evaluation specialist, Amhara regional State, May 2022.
17. Interview with official in the Afar region Disaster prevention and Food Security Agency, May 2022; interview with UpSnp/UpSnJp monitoring and evaluation specialist, Amhara regional State, May 2022; interview with head of operations, international humanitarian agency, May 2022; interviews with officials at various United nations (Un) agencies working as part of the humanitarian response in northern Ethiopia, May 2022.
18. Interviews with officials at various Un agencies working as part of the humanitarian response in northern Ethiopia, May 2022; interview with head of operations, international humanitarian agency, May 2022.
19. This paragraph is based on interviews with key informants at humanitarian and Un agencies.
20. responsibility for the access restrictions remains disputed, but these restrictions appear to have eased after April 2022.
21. Interview with UpSnp/Jp Unit, Federal Urban Job Creation and Food Security Agency, May 2022.
22. Interviews with officials at various Un agencies working as part of the humanitarian response in northern Ethiopia, May 2022.
23. Interview with head of operations, international humanitarian agency, May 2022.
24. Interview with Director, Disaster r isk response and recovery Directorate, Somali regional State Disaster risk Management Bureau; interview with Senior Disaster risk recovery Expert and EU-Funded Disaster risk Management Decentralization project Manager, Snnpr Disaster risk Management Commission.
25. Eighty percent of IDps outside Tigray can access primary education.
26. Interview with oromia Disaster risk reduction and Early Warning Directorate and Commissioner, Addis Ababa Fire and Disaster risk Management Commission.
27. Estimated using central point of the reported range for northern Ethiopia sites.
28. Excludes Tigray, for which no information is recorded for reasons preventing return.
29. Interview with oromia Disaster risk reduction and Early Warning Directorate and Commissioner, Addis Ababa Fire and Disaster risk Management Commission.
30. This excludes the northern crisis (Site Assessment 28 only).
Conflict, Displacement, and Livelihoods in Ethiopia | 175
31. The remaining section pulls together the IoM data sets to provide an overall picture, focusing on ongoing sources of livelihoods during displacement, including access to distributions of food, cash, and nonfood items; loss of livelihood assets at the point of displacement; and preferences concerning durable solutions for the period in focus. Aggregate statistics in the following discussion stem from World Bank analysis of IoM DTM: Emergency Site Assessments 8 and 9 and Site Assessment 28 data.
32. These legal norms include the 2009 African Union Convention for the protection and Assistance of Internally Displaced persons in Africa (the kampala Convention), which Ethiopia signed and ratified in February–March 2020, and the Durable Solutions applicable to Internal Displacement in Ethiopia (which were adapted from international legal instruments). In practice, however, Ethiopian government policy has prioritized “return” without those returns necessarily reflecting “all aspects of voluntariness of the return decision” (protection Cluster Ethiopia 2019).
33. A simple regression of site age on whether return is the preferred durable solution suggests that an additional year of displacement is linked with an 8-percentage-point decrease in the likelihood of IDps preferring return.
34. This paragraph draws largely from kaya research and Development pLC (2019).
35. This excludes Tigray, for which no data are available on reasons preventing return.
36. Based on World Bank analysis of IoM DTM, Village Assessment Survey 11.
37. UnoChA, “Ethiopia northern Ethiopia humanitarian Update (Situation report),” https://reliefweb.int/report/ethiopia/ethiopia-northern-ethiopia-humanitarian-update -situation-report-16-june-2022
38. Interviews with key informants at humanitarian organizations and multiple Un agencies.
39. They include support for water, sanitation, and health care, and even provision of family reunification telephone call services, in response to the suspension of telecommunications in the region since the beginning of the war.
40. Discussions with United nations Children’s Fund.
41. Interview with Early Warning and response Directorate, prevention and Food Security program Coordination office, Amhara regional State, May 2022; interview with UpSnp/ UpSnJp monitoring and evaluation specialist, Amhara regional State, May 2022.
42. Interviews with key informants at humanitarian organizations and multiple Un agencies.
43. Interview with Director, Disaster r isk response and recovery Directorate, Somali regional State Disaster risk Management Bureau; interview with Senior Disaster risk recovery Expert and EU-Funded Disaster risk Management Decentralization project Manager, Snnpr Disaster risk Management Commission.
44. Interviews with key informants at humanitarian organizations and multiple Un agencies.
45. Interviews with World Vision International and UnoChA.
46. Telephone interview with UnoChA.
47. These IDps can be difficult to distinguish from migrant laborers, rural–urban migrants, and permanent residents. Some may wish to remain invisible for security reasons or to avoid discrimination, whereas others may be highly mobile because of continued insecurity or a lack of stable accommodation. Access to areas of settlement can be limited by insecurity or by the authorities, and people living within host communities may be dispersed across wide areas.
48. Interviews with the Director of the oromia Disaster risk reduction and Early Warning Directorate, national regional Government of o romia Disaster r isk response and Management Commission, March 2021.
49. For instance, livelihood support for IDps was discontinued in the cities of Burayu and Legetafo after July 2020. By contrast, in Adama, the municipality partnered with Save the Children to distribute a monthly transfer to all IDps from July 2020 to January 2021.
50. Interviews with the Director of the oromia Disaster risk reduction and Early Warning Directorate, national regional Government of o romia Disaster r isk response and Management Commission, March 2021.
51. The scope and ambition of Ethiopia’s social protection system is set out in the national Social protection policy (2014), Strategy (2016), and Action plan (2017).
52. This willingness was by no means a foregone conclusion. An earlier World Bank study (World Bank 2021) extensively documented the Ethiopian government’s skepticism toward harnessing the safety net systems to respond to displacement.
53. The pension scheme for public servants is known after the agency that manages it, the public Servants’ Social Security Agency; similarly, that for private individuals is known as private organizations’ Employees’ Social Security Agency (ILo 2021).
176 | Work I n G To DAy F or A B ETTE r To M orro W I n E T h I op IA
54. For a critical discussion, refer to kraay and Mckenzie (2014), who offer the pastoralist economies of Ethiopia’s lowlands as examples of where poverty traps realistically may exist.
55. please refer to Chapter 6, or on “cash plus” interventions, please refer to Bedoya et al. (2019) and Bossio et al. (2022).
56. For a summary of the impacts of rural pSnp in Ethiopia, refer to Filipski et al. (2017).
57. refer to Doocy and Tappis (2017) for a systematic review, Meral and Both (2021) for a more recent discussion, and Bedoya et al. (2019) for evidence of positive impacts on multiple human capital subindicators.
58. For UpSnp, the calculation includes people within 15 kilometers of UpSnp cities as the crow flies. Most IDps of the northern conflict are in Tigray, which is covered by UpSnp
59. This finding illustrates the tendency for displacement from the latest waves of conflict to go from rural to urban areas in line with global experience (see, for example, World Bank 2017), rather than staying in the rural sphere, as has often been the case, or perceived to have been the case, in Ethiopia.
60. In Dessie and kombolcha, two cities in northern Amhara very close to one another and highly affected by the conflict in the north, the concern with double registration was so severe as to cause IDp registration to be halted.
61. For the latest tally, see the national ID program website, https://id.gov.et
62. Financial inclusion is, however, low (38 percent, according to the Global Findex Database 2021) in Ethiopia and is typically lowest among the poorest households. World Bank, Global Findex Database, https://www.worldbank.org/en/publication/globalfindex/Data
63. Monitoring reports suggested that average duration of displacement for beneficiaries of the urban safety net’s cash transfer to IDps was about 5 months (World Bank 2022b).
REFERENCES
Abay, k. A., k. Tafere, G. Berhane, J. Chamberlin, and M. h. Abay. 2022. “near-real-Time Welfare and Livelihood Impacts of an Active Civil War: Evidence from Ethiopia.” IFprI Discussion paper 02108, International Food policy research Institute, Washington, DC. https://ebrary.ifpri.org/utils/getfile/collection/p15738coll2/id/135056 / filename /135267.pdf
Bastagli, F., J. hagen-Zanker, L. harman, V. Barca, G. Sturge, T. Schmidt, and L. pellerano. 2016. “Cash Transfers: What Does the Evidence Say? A rigorous review of programme Impact and of the role of Design and Implementation Features.” overseas Development Institute, London.
Bedoya, G., A. Coville, J. haushofer, M. Isaqzadeh, and J. Shapiro. 2019. “no household Left Behind: Afghanistan Targeting the Ultra poor Impact Evaluation.” policy research Working paper 8877, World Bank, Washington, DC.
Bossio, T., M. Goldstein, B. karimou, D. karlan, h. kazianga, W. parienté, p. premand, C. C. Thomas, C. Udry, J. Vaillant, and k. A. Wright. 2022. “Tackling psychosocial and Capital Constraints to Alleviate poverty.” Nature 605: 291–97.
Brück, T., J. Cuesta, J. De hoop, U. Gentilini, and A. peterman. 2019. “Social protection in Contexts of Fragility and Forced Displacement: Introduction to a Special Issue.” Journal of Development Studies 55 (Suppl. 1): 1–6.
Chambers, r., and G. Conway. 1991. “Sustainable rural Livelihoods: practical Concepts for the 21st Century.” IDS Discussion paper 296, Institute of Development Studies, Brighton.
Collinson, S. 2003. “power, Livelihoods and Conflict: Case Studies in political Economy Analysis for humanitarian Action.” hpG report 13, overseas Development Institute, London.
De Berry, J., and A. roberts. 2018. “Social Cohesion and Forced Displacement: A Desk review to Inform programming and project Design.” World Bank, Washington, DC.
Demissie, B., and k . G. negeri. 2020. “Effect of Community-Based health Insurance on Utilization of outpatient health Care Services in Southern Ethiopia: A Comparative Cross-Sectional Study.” Risk Management and Healthcare Policy 13: 141–53.
De Waal, A. 1997. Famine Crimes: Politics and the Disaster Relief Industry in Africa. oxford: James Currey.
Conflict, Displacement, and Livelihoods in Ethiopia | 177
De Waal, A. 2017. Mass Starvation: The History and Future of Famine. Cambridge: polity.
Donini, A. 2010. “The Far Side: The Meta Functions of humanitarianism in a Globalised World.” Disasters 34 (S2): S220–37.
Doocy, S., and h. Tappis. 2017. “Cash-Based Approaches in humanitarian Emergencies: A Systematic review.” Campbell Systematic Reviews 2017: 17.
Duffield, M. 2001. Global Governance and the New Wars. London: Zed Books.
European Commission. 2019. “Social protection across the humanitarian-Development nexus: A Game-Changer in Supporting people through Crises.” Tools and Methods Series: reference Document no. 26, European Commission, Brussels.
Fassin, D. 2010. “heart of humaneness: The Moral Economy of humanitarian Intervention.” In Contemporary States of Emergency, edited by D. Fassin and M. pandolfi, 269–93. new york: prospect Books.
FEWSnET (Famine Early Warning Systems network). 2022. “Increasing hunger-related Mortality Likely due to historic Drought and Unresolved Conflict.” May 27, 2022. https:// fews.net/east-africa/ethiopia/alert/may-27-2022
Filipski, M., J. E. Taylor, G. A. Abegaz, T. Ferede, A. S. Taffesse, and X. Diao. 2017. “General Equilibrium Impact Assessment of the productive Safety net program in Ethiopia.” 3ie Impact Evaluation report 66, International Initiative for Impact Evaluation, new Delhi.
Gentilini, U. 2016. “Sorting through the hype: Exploring the Interface between humanitarian Assistance and Safety nets.” Social protection and Labor policy note no. 19, World Bank, Washington, DC.
hagmann, T., and M. M. Abdi. 2020. “Inter-Ethnic Violence in Ethiopia’s Somali regional State, 2017–2018.” Conflict research programme policy Memo, Conflict research programme, London School of Economics and political Science, London.
hoddinott, J., and A. S. Taffesse. 2019. “Social protection in Ethiopia.” In The Oxford Handbook of the Ethiopian Economy, edited by F. Cheru, C. Cramer, and A. oqubay, 412–27. oxford: oxford University press.
IDMC (Internal Displacement Monitoring Center). 2022. “Figures Analysis 2021—Ethiopia: Displacement Associated with Conflict and Violence.” Fact sheet, IDMC. https://www .internal-displacement.org/sites/default/files/figures-analysis-2021-eth.pdf
ILo (International Labour organization). 2021. “Mapping of the national Social protection System in Ethiopia, Including Social health protection: Final report.” GLo/18/62/nLD. https://www.ilo.org/wcmsp5/groups/public/---dgreports/---ddg_p/documents /publication/wcms_821183.pdf
International Committee for the red Cross. 2020. Displaced in Cities: Experiencing and Responding to Urban Internal Displacement Outside Camps . Geneva: International Committee for the red Cross. https://www.icrc.org/en/publication/4344-displaced-cities -experiencing-and-responding-urban-internal-displacement-outside IoM (International organization for Migration). 2021. “Ethiopia Emergency Site Assessment – northern Ethiopia Crisis – round 8.” IoM, Ethiopia. https://dtm.iom.int/datasets/ethiopia -emergency-site-assessment-northern-ethiopia-crisis-round-8
IoM (International organization for Migration). 2022a. “Ethiopia Emergency Site Assessment – northern Ethiopia Crisis – round 9.” IoM, Ethiopia. https://dtm.iom.int/datasets/ethiopi a-emergency-site-assessment-northern-ethiopia-crisis-round-9
IoM (International organization for Migration). 2022b. “Ethiopia Site Assessment – round 28.” IoM, Ethiopia. https://dtm.iom.int/datasets/ethiopia-site-assessment-round-28 IoM (International organization for Migration). 2022c. “Ethiopia Village Assessment – round 11.” IoM, Ethiopia. https://dtm.iom.int/datasets/ethiopia-village-assessment-survey-11 IpC (Integrated Food Security phase Classification). 2021. “Ethiopia: Acute Food Insecurity Situation May–June 2021 and projection for July–September 2021.” IpC. https://www .ipcinfo.org/ipc-country-analysis/details-map/en/c/1154897/
kaya research and Development pLC. 2019. “Inclusive Development in Local Areas of Violence and IDp-hosting Areas in Ethiopia—risks and opportunities.” Woreda/Camp -Level reports, prepared in Connection with Assessment of prospects for Inclusive Development in Local Areas of Violence and IDp hosting Areas—risks and opportunities (p171356).
178 | Work I n G To DAy F or A B ETTE r To M orro W I n E T h I op IA
kondylis, F., and J. Loeser. 2021. “Intervention Size and persistence.” policy research Working paper 9769, World Bank, Washington, DC.
kraay, A., and D. Mckenzie. 2014. “Do poverty Traps Exist? Assessing the Evidence.” Journal of Economic Perspectives 28 (3): 127–48.
Landau, L. 2014. “Urban refugees and IDps.” In The Oxford Handbook of Refugee and Forced Migration Studies, edited by E. Fiddian-Qasmiyeh, G. Loescher, k. Long, and n. Sigona, 139–48. oxford: oxford University press.
Lautze, S., and A. raven-roberts. 2006. “Violence and Complex humanitarian Emergencies: Implications for Livelihoods Models.” Disasters 30 (4): 383–401.
Lavers, T. 2016. “Social protection in an Aspiring ‘Developmental State’: The political Drivers of Ethiopia’s pSnp.” WIDEr Working paper 2016/130, United nations University World Institute for Development Economics research and International Labour organization. https://www.wider.unu.edu/sites/default/files/wp2016-130.pdf
Lavers, T. 2021. “State Infrastructural power and Social Transfers: The Local politics of Distribution and Delivering ‘progress’ in Ethiopia.” In The Politics of Distributing Social Transfers: State Capacity and Political Contestation in Sub-Saharan Africa and South Asia, edited by T. Lavers, 59–89. oxford: oxford University press.
Levine, S. 2014. “how to Study Livelihoods: Bringing a Sustainable Livelihoods Framework to Life.” Secure Livelihoods research Consortium Working paper 22, overseas Development Institute, London.
Lind, J., r. Sabates-Wheeler, J. hoddinott, and A. S. Taffesse. 2018. “Targeting Social Transfers in pastoral Societies: Ethiopia’s productive Safety net programme revisited.” ESSp Working paper 124, Internatonal Food policy research Institute, Washington, DC.
Maxwell, D., and k h. Gelsdorf. 2019. Understanding the Humanitarian World. London: routledge.
Maxwell, D., and p. hailey. 2020. “The politics of Information and Analysis in Famines and Extreme Emergencies: Synthesis of Findings from Six Case Studies.” Feinstein International Center, Tufts University, Boston, MA.
Meral, A. G., and n. Both. 2021. “Social protection and Forcibly Displaced people: A Literature review.” oDI Working paper, overseas Development Institute, London.
Mosel, I., and S. Levine. 2014. Remaking the Case for Linking Relief, Rehabilitation and Development: How LRRD Can Become a Practically Useful Concept for Assistance in Difficult Places. humanitarian policy Group Commissioned report. London: overseas Development Institute
north, D. C., J. Wallis, and B. r. Weingast. 2009. Violence and Social Orders: A Conceptual Framework for Interpreting Recorded Human History. Cambridge: Cambridge University press.
oxford policy Management. 2015. “Shock responsive Social protection Systems: A research programme for DFID.” Working paper 1, oxford policy Management. https://www.opml.co .uk/projects/shock-responsive-social-protection-systems
pankhurst, r. 2001. The Ethiopians: A History. Malden, MA: Blackwell publishers.
philip, S., S. F. kew, G. J. van oldenborgh, F. otto, S. o’keefe, k. haustein, A. king, A. Zegeye, Z. Eshetu, k. hailemariam, r. Singh, E. Jjemba, C. Funk, and h. Cullen. 2018. “Attribution Analysis of the Ethiopian Drought of 2015.” Journal of Climate 31 (6): 2465–86. protection Cluster Ethiopia. 2019. “returns of Internally Displaced persons in Ethiopia.” position paper, Global protection Cluster. https://www.globalprotectioncluster.org/index .php/publications/791/communication-materials/advocacy-note/ethiopia-protection -cluster-position-paper#:~:text=More%20than%20three%20million%20persons,and%20 material%20safety%20upon%20return.
Sabates-Wheeler, r . 2019. “Mapping Differential Vulnerabilities and r ights: ‘o pening’ Access to Social protection for Forcibly Displaced populations.” Comparative Migration Studies 7 (38): 1–18.
Samuel hall and World Bank. 2022. “An Analysis of Social Cohesion in Conflict-Affected Communities in Ethiopia.” research conducted in connection with the p roject on “ response- recovery- resilience for Conflict Affected Communities in Ethiopia” (p172233). Unpublished report.
Conflict, Displacement, and Livelihoods in Ethiopia | 179
Scoones, I. 1998. “Sustainable rural Livelihoods: A Framework for Analysis.” Working paper 72, Institute of Development Studies, Brighton. www.ids.ac.uk/files/dmfile/Wp72.pdf
Seyfert, k., V. Barca, U. Gentilini, M. Luthria, and S. Abbady. 2019. “Unbundled: A Framework for Connecting Safety nets and humanitarian Assistance in refugee Settings.” Social p rotection and Jobs Discussion paper 1935, World Bank, Washington, DC. https:// openknowledge.worldbank.org/handle/10986/32467.
Ulrichs, M., and r. Sabates-Wheeler. 2018. “Social protection and humanitarian response: What Is the Scope for Integration?” IDS Working paper 516, overseas Development Institute, London. https://www.ids.ac.uk/publications/social-protection-and-humanitarian -response-what-is-the-scope-for-integration/
Von Uexkull, n., and h. Buhaug. 2021. “Security Implications of Climate Change: A Decade of Scientific progress.” Journal of Peace Research 58 (1): 3–17.
World Bank. 2017. Forcibly Displaced: Toward a Development Approach Supporting Refugees, the Internally Displaced, and Their Hosts. Washington, DC: World Bank. https://openknowledge .worldbank.org/handle/10986/25016
World Bank. 2018. “The human Capital project.” World Bank, Washington, DC. https:// openknowledge.worldbank.org/handle/10986/30498
World Bank. 2020. Ethiopia Poverty Assessment. Harnessing Continued Growth for Accelerated Poverty Reduction. Washington, DC: World Bank.
World Bank. 2021. Responding to Internal Displacement to Urban Areas in Ethiopia: Could the Urban Safety Net Help? Unpublished Working paper, World Bank, Washington, DC.
World Bank. 2022a. Ethiopia: Social Protection and Labor Public Expenditure and Institutional Review. Unpublished Working paper. (october 2022 Draft), World Bank, Washington, DC.
World Bank. 2022b. “UpSnJp Iterative Beneficiary Monitoring. round 3: Internally Displaced people.” Unpublished manuscript.
Zewde, B. 2001. A History of Modern Ethiopia: 1885–1991 oxford: James Currey.
180 | Work I n G To DAy F or A B ETTE r To M orro W I n E T h I op IA
Labor Market Delivery Systems for Ethiopia and Beyond
A FRAMEWORK APPROACH
Effective labor market policies depend not only on reaching the target population and reflecting the needs of the targeted group but also on how they are delivered. A framework approach outlines the series of steps needed to improve the employability and employment outcomes of targeted groups.
• Although labor and other social programs differ in scale, context, and services provided, they typically involve similar steps to implement. These commonalities constitute the core elements of delivery systems and can be summarized helpfully in a delivery chain framework.
• Ethiopia is investing in delivery systems for labor market interventions. The National Plan for Job Creation identifies modern employment centers and an efficient labor market information system (LMIS) as critical components to strengthen labor market intermediation and links.
• This chapter applies the delivery chain framework to selected active labor market policies and tailors it for low- and middle-income countries (LICs and MICs). An implementation checklist can guide policy makers and program staff, detailing how delivery systems for apprenticeship programs, as one example, can conform with best international practice.
By Carola Gruen, Koen Maaskant, Inés Rodríguez Caillava, and Indhira Santos. The authors
181
SUMMARY*
thank Melis Guven for her valuable comments and guidance.
9
INTRODUCTION
The government of Ethiopia has a renewed emphasis on improving the delivery systems for labor market interventions as a foundation for better job outcomes. The National Plan for Job Creation includes a strategic pillar on building modern employment centers (job centers) and an LMIS. despite the comprehensiveness of that national strategy, however, questions remain about how the exact delivery of labor market policies within these new job centers will look.
Systematic reviews of active labor market policies (ALMPs) show their effectiveness, but the impact of comparable program types can vary substantially across contexts and participants. Several comprehensive meta-analyses have shown that, on average, ALMPs have a small positive impact on labor market outcomes—a finding that holds for less developed countries or when informal employment is widespread (Escudero et al. 2019; Kluve et al. 2019). Program design, country-specific circumstances, macroeconomic context, or the time passed since program participation can contribute to the observed heterogeneity. Even within programs, impacts vary significantly across participants because women, young and older workers, people with disabilities, migrants, and unskilled workers often face unique barriers (World Bank 2022c).
Although the quality of implementation affects the success of ALMPs, little attention has been paid to the many steps and decisions involved in implementation. Most impact evaluation studies treat implementation as a black box and fail to systematically account for differences in program implementation. 1 Listening to practitioners, it becomes clear, however, that how programs are put into operation matters much for their effectiveness. A substantial extent of cross-context heterogeneity observed for labor programs is often (informally) attributed to differences in implementation. Similarly, failures to scale up successful programs are often linked to challenges in operating the same policy but at a larger scale. 2
Adapting an existing framework for social protection delivery systems, this chapter proposes a how-to approach for ALMPs in LICs and MICs.3 A delivery systems framework offers a practical way to organize the discussion about the implementation of labor market policies. Broadly, providing services involves passing through four main implementation stages: assess, enroll, provide, and manage. This chapter synthesizes existing practical knowledge on the implementation of labor programs in several countries and diverse settings to address the most common challenges that arise during implementation and that can have an important bearing on who benefits from the programs and to what extent.
The chapter begins with a brief overview of the labor market program delivery chain, types of programs, and main target groups considered in the discussion. It then details each implementation phase, highlighting best and promising practices, critical issues, and practical risks. The conclusion introduces a checklist (presented in annex 9A) summarizing key items that governments can consider when putting apprenticeship programs into operation.
Throughout, the chapter applies the framework using examples of training and apprenticeship programs (such as the Bikat Program, described in box 9.1), given the relevance of this type of program to Ethiopia’s current labor market programming.
182 | Wo RKING Tod Ay fo R A B ETTER To M o RR o W IN E T h I o PIA
Urban Productive Safety Net and Jobs Project’s Bikat Program
The apprenticeship program under the Urban Productive Safety Net and Jobs Project (UPSNJP) was designed to provide less-educated urban youth with a first work experience. The Bikat Program aims to improve the signaling ability of these young job seekers with relatively low levels of education (less than grade 12) by providing them with a first work experience in private sector firms. Besides on-the-job training, the program provides life skills, digital skills, and job search training to selected beneficiaries.
The UPSNJP Bikat Program is being implemented by the Ministry of Labor and Skills. To inform the program’s design, the ministry conducted a small pilot in 2 woredas (districts) in Kirkos, a subcity of Addis Ababa from March to September 2022. Following the pilot, the project reached more than 15,000 youth in 10 cities in its first phase. The second phase, which began in Addis Ababa in 2023, targets an additional 25,000 youth in those 10 cities as well as in Mekele in Tigray.
STEPS IN MAKING LABOR MARKET POLICIES WORK
Implementing labor market policies involves a series of closely linked steps that form the delivery chain. Programs may differ in their design, scale, context, or services provided but will still have similar phases of implementation. People, the private sector, and institutions are key actors along the delivery chain. Communications, information systems, and technology are enabling factors that facilitate these interactions. The commonalities along the delivery chain constitute the core elements of the delivery systems framework for labor programs.
Figure 9.1 illustrates a typical delivery chain for labor programs, highlighting four broad stages of implementation—assess, enroll, provide, and manage—and associated phases.
Delivery systems are only as strong as their weakest link. Problems in any part of the delivery chain will weaken the entire system. Inadequate outreach can result in the exclusion of intended beneficiaries (particularly the most vulnerable) or in key actors being partially uninformed, so that they fail to understand the program’s objectives or form unrealistic expectations about outcomes.
FIGURE 9.1
Source: Adapted from Lindert et al. 2020.
Labor Market Delivery Systems for Ethiopia and Beyond | 183
BOX 9.1
Delivery chain for labor programs
8 7 5 3 2 4 6 Intake and registration Case outcomes and program performance Notification and onboarding Assessment of needs and conditions Monitoring compliance Outreach Eligibility, enrollment, and placement decisions Provision of labor programs Enroll Provide Manage Assess 1
failures during intake and registration can cause errors of inclusion and exclusion, deter potential applicants, and result in low program take-up. A flawed assessment can result in missed opportunities to intervene early or can waste resources by assigning clients to programs they do not need. Eligibility, enrollment, and placement decisions determine which applicants qualify for what programs. Notification and onboarding ensure that people know about the outcome of their application and inform them about next steps. To be effectual, the provision of labor programs must meet preestablished service standards, and compliance must be monitored . After program completion, evaluating case outcomes (of program graduates) and program performance provides critical inputs for overall program assessment.
PROGRAMS FOR EMPLOYMENT AND EMPLOYABILITY
ALMPs include a wide range of interventions, all aimed at improving job seekers’ chances of finding employment and increasing productivity. Broadly, activation measures can be designed to improve job seekers’ employability or address demand-side barriers through expanding job opportunities. Services include the following:
• helping job seekers access relevant labor market information, as well as counseling and intermediation services;
• delivering short-term training courses to refresh or upgrade skills;
• Providing apprenticeship programs, focusing on both life skills and job-specific skills training;
• offering employment incentives; and
• Providing entrepreneurship support to promote job creation.
We categorize programs either as employment services, which connect people with jobs, or employability-enhancing services, which prepare workers for jobs and increase productivity (refer to table 9.1).
Target populations of labor programs include people from different backgrounds. Given changing job markets and the need for lifelong learning, many people may, over the course of their working life, require support. Limited resources require LICs and MICs to prioritize disadvantaged groups. Target groups are often defined by demographic characteristics, labor market status,
EMPLOYMENT SERVICES: HELPING PEOPLE
CONNECT WITH JOBS
Services that provide information
• Self-service tools with job information (for example, websites, online service windows, kiosks, and bulletins)
• Job-matching platforms
• Other employment promotion activities such as job and vacancy fairs and job clubs
Services that offer counseling and intermediation
• Job search assistance
• Career counseling
• Caseworker guidance and support
• Job referrals
Source: This table is original to this publication.
EMPLOYABILITY-ENHANCING SERVICES: PREPARING WORKERS FOR JOBS AND FOR RISING PRODUCTIVITY
• Skills training (cognitive, digital, technical, and socioemotional skills)
• Apprenticeship programs
• Entrepreneurship support
• Employment subsidy programs
• Public works programs
184 | Wo RKING Tod Ay fo R A B ETTER To M o RR o W IN E T h I o PIA
TABLE 9.1 Overview of labor program categories
employment history, education level, or earnings capacity. The main groups considered in this chapter include those who are unemployed or long-term unemployed, first-time job seekers, workers engaged in low-productivity activities, discouraged workers, and inactive individuals. The discussion focuses on vulnerable and marginalized groups facing additional barriers to productive employment: women, youth, rural residents, migrant workers, and refugees.
PHASES OF A LABOR PROGRAM DELIVERY SYSTEM
Eight phases are involved in a labor program delivery system: outreach; intake and registration; assessment of needs and conditions; eligibility, enrollment, and placement decisions; notification and onboarding; provision of labor programs; monitoring compliance with conditionalities; and case outcomes and program performance indicators.
Phase 1: Outreach
during outreach, the program notifies the intended population so that key actors are aware, informed, able, and encouraged to engage in labor programs. Key actors must understand the program’s scope, content, rules, eligibility criteria, expectations, and prospective outcomes. outreach activities need to provide all the information required for the intended population to register (where, when, and how), let registrants know about their rights and responsibilities, and advise participants how to file complaints, grievances, or appeals.
A successful outreach strategy pays attention to individual challenges of the target population. Labor programs aim to improve participants’ chances of finding productive employment. however, the likely heterogeneity of the target population means that different people face different challenges to reach this goal. A successful campaign will directly address these challenges and increase awareness among
• Unemployed workers, who may have misperceptions about the programs, face additional barriers, or simply not see the need;
• discouraged, inactive, or impaired workers, who may have given up on finding employment and are not registered with employment offices;
• Informal workers and workers engaged in low-productivity activities, who may think they are ineligible; and
• other less visible groups, including contributing family workers, older workers, forced or child laborers, and migrant or refugee workers.
other groups may require specific outreach strategies. for example, in some contexts, programs may have difficulty reaching women. doing so may require involving family or community members.
In addition, employers are important clients of employment services and, as such, require a tailored and deliberate approach during outreach. Employers can be in formal or informal sectors. for example, in high informality contexts, employment services may reach out to informal sector organizations that have the networks and experience in working with what are often geographically dispersed small enterprises.
outreach campaigns often combine traditional and modern communication strategies, providing messages aimed at the intended population and those close to them. Broadly, four outreach strategies are
Labor Market Delivery Systems for Ethiopia and Beyond | 185
1. direct outreach of program officers, government officers, or locally assigned committees;
2. Community-based outreach, relying on existing networks and local capacities to distribute information, including peer-to-peer contacts;
3. outreach via intermediaries, relying on personal referrals, schools, shelters, youth or women’s groups, and employer or trade associations to disseminate information; and
4. Indirect outreach through information tools such as printed media ( brochures), mass media (television and radio commercials, billboards), social media, or toll-free hotlines.
A tailored approach combining more than one strategy is often effective. for example, youth have been shown to be responsive to community-based strategies such as roadshows and peer-to-peer contacts, social media campaigns, an up-to-date website about the program, short video clips, and testimonials of former beneficiaries. Refer to box 9.2 for an example from Guinea; South Africa’s yES4youth program is another.4
Successes and challenges of Guinea’s Women Breaking Barriers outreach campaign
Guinea’s training and internship project encouraged female entrepreneurship in male-dominated sectors and trades in 2018–19. Women ages 18–35 with a minimum education level were targeted to obtain skills in six occupations: baking, handicrafts, painting, men’s barbering, brickmaking, and urban fish farming (aquaponics). The program included trades that met the following criteria: required limited number of training hours to become proficient, had relatively low start-up cost, and was in a male-dominated sector.
Through a successful and multifaceted outreach campaign, the program received more than 2,000 applications, well above its target of 1,500. As part of the campaign, a website was developed with relevant information about the program, and short videos introducing the trades were available on youTube and the program’s website, as were instructions for completing the online application form. The campaign also relied on street campaigning (posters, banners, billboards, flyers, and door-to-door marketing) and media coverage (radio, television, and social media). o utreach occurred in schools, youth
organizations, women’s groups, and government ministries, as well as with social media influencers, to ensure the program was widely known among stakeholders.
Two innovative outreach tactics involved successful female entrepreneurs, as well as male relatives and community members. Ahead of the program, several female entrepreneurs shared their personal experiences in interviews and participated in street campaigns. In addition, addressing the concerns and reservations of husbands, brothers, uncles, or fathers in an open and respectful way enabled more women to apply and participate in the training. however, the campaign navigated several challenges. Some of the print material needed revision to ensure (political) impartiality, which delayed the start. Many of the contacted youth and women’s organizations did not respond at all; others misinterpreted the project’s activities as a potential threat to their own agenda. only a few were willing to help share information about the Women Breaking Barriers project with their members.
186 | Wo RKING Tod Ay fo R A B ETTER To M o RR o W IN E T h I o PIA
Source: Dare to Innovate and World Bank 2019.
BOX
9.2
Methods may need adaptation to inform hard-to-reach or disadvantaged groups of the intended population. Vulnerable groups are best reached in familiar locations or through trusted contacts. for example, mobile outreach teams in remote communities can inform people in simple messages using local languages. Existing programs such as social assistance, social services, or disability benefits provide another platform to increase awareness about new programs. Administrative data can help providers track people who need support but who currently do not have direct contact with employment officers or caseworkers (oECd 2021).5
Programs in societies with defined gender roles may require an outreach strategy that also involves family members of eligible groups. for example, rather than addressing women alone, Côte d’Ivoire’s Agricultural Support Program invited couples to participate in agricultural trainings to offset gender norms and attitudes that often prevent women from program participation (World Bank 2020a). Similarly, a recent study in the Republic of Congo showed that women who received the information about traditionally maledominated and more profitable sectors were more likely to apply for training in those sectors; introducing male role models further increased the impact (World Bank 2022a).
having a broad-based outreach strategy to mobilize the private sector is equally important. Employer involvement is often a weak link in labor programs, despite tangible benefits.6 Many programs find engaging the private sector challenging, especially when these organizations are not taking the lead (Safir 2019). for example, in training programs, private employers often are unwilling to participate, regardless of clear benefits ( hoftijzer and Cunningham 2020). A well-designed information campaign can help clarify misperceptions about costs and inform employers about the benefits, requirements, and responsibilities of program participation. outreach to employers should start before program design so that firms can actively participate in and take ownership of the program’s scope, content, and objectives. Public employment services in advanced economies routinely reach out to employers in their work.
When micro and small businesses dominate labor demand, programs must include employers outside the formal economy. o utreach strategies that involve associations of informal sector workers, local community leaders, faithbased organizations, or nongovernmental organizations can help increase awareness among small-scale employers. one successful strategy to reach employers has used private sector organizations to act as intermediaries. for example, Kenya’s longstanding Jua Kali apprenticeship system provides training opportunities in the informal sector (Business daily Africa 2018).
developing a programmatic catch word or tagline can speak to the target population and boost recognition by a broader audience. yES4youth, South Africa’s business-led initiative to stimulate job creation through paid internships for disadvantaged youth, is also known as the yES Initiative, with yES being short for youth Employment Services. youWiN! is the well-known slogan of the youth Enterprise With Innovation in Nigeria program, a nationwide business plan competition for young entrepreneurs. Campaign slogans for Guinea’s Women Breaking Barriers project includes catchphrases such as “Not without her” and “No Woman Left Behind.”7 Ethiopia’s apprenticeship program also has a specific name and tag line (refer to box 9.3).
Labor Market Delivery Systems for Ethiopia and Beyond | 187
Awareness campaign for Ethiopia’s Bikat Program
A professional communications firm spearheaded the effort to speak to both the intended population and the private sector. This firm developed a name that resonated with the youth population and a range of slogans focused on youth and firms. It chose the Urban Productive Safety Net and Jobs Project Bikat Program, with Bikat meaning to enable or to activate. The tagline was “Zare lanega,” meaning “today for tomorrow.”
Traditional marketing tools, including brochures and flyers, television and radio commercials, billboard advertising, and information sessions, were aimed at the target population of unemployed youth ages 18–25 with a high school diploma or less.
In addition, targeted communication materials and information sessions were aimed at employers. Both highlighted the criteria for firms’ participation firm size, occupational safety and health compliance, mandatory mentorship, and the need to design and implement a training plan—and provided information on the registration and selection process and the anticipated timeline.
The program sought to manage expectations and ensure key actors’ understanding of the program’s scope, rules, and potential outcomes. In particular, the program was promoted to applicants as a learning opportunity rather than as a guarantee of obtaining a secure job.
The March to September 2022 pilot used only a few of the planned tools for reaching the target population. A roadshow gave interested youth the chance to
Source: World Bank, 2022b.
interact with local government officials. Also, an information session was held during which youth could register for the program. however, the limited scope of the outreach campaign may have limited its effectiveness. one lesson was that communication tools should be complemented with outreach through local structures that identify eligible youth. In addition, more effort should be spent to communicate core program details. A survey among participating youth found that 90 percent of those who registered but did not enroll were unaware of the program’s monetary stipend.
for employers, the Ministry of Labor and Skills held an information session to highlight the need for the program and share details on the selection process and participation requirements. Larger firms such as Ethiopian Airlines, Ethio-Telecom, Shoa supermarkets, and hotel chains received direct visits. Nevertheless, these firms seemed to have had limited awareness of many program aspects, including the need to sign a contract at placement and be interviewed and the number of required training hours. Information sessions seemed to focus mostly on mobilizing firms rather than communicating program participation requirements and responsibilities. The high-quality communications materials did not reach many firms. More importantly, outreach initiatives focused mainly on manufacturing firms, whereas youth prefer service sector jobs. After the pilot, the broader rollout of the program will consider these lessons.
Phase 2: Intake and registration
during intake, interested parties apply with the agency in charge, providing basic identifying information. Individuals provide information on full name, date and place of birth, identification number, and preferred contact method. other data points include educational attainment, current labor market status, registration status with an employment office, work history, previous enrollment in labor programs, and personal references. Basic information from the private sector typically includes firm size, organization type, formality and operational status, main economic activity, and workplace location.
188 | Wo RKING Tod Ay fo R A B ETTER To M o RR o W IN E T h I o PIA
BOX 9.3
Inputs are verified during registration through documents submitted by the applicant or, if compatible digital platforms are in place, with data retrieved from other administrative systems. Agencies should avoid collecting data that were provided earlier; rather, they should use links between (beneficiary) registries 8 or establish a database of applicants and private sector agents.
Client interface is central to phase 2, allowing the administering agency to initiate and maintain contact with interested parties. Modalities for intake and registration vary from an on-demand approach, whereby individual clients apply proactively at a time of their own choosing, with multiple channels available to them to start the application process (for example, employment office, service window, kiosk, or digital application), to an administrator-driven approach in which registration is initiated by the agency, is group-based, and happens at irregular or regular intervals through temporary service desks, registration camps, or door-to-door campaigns. for programs that target similar population groups, application windows may be aligned to improve intake efficiency. Ethiopia aims to align the application period of the Urban Productive Safety Net and Jobs Project (UPSNJP) Bikat Program with the general job seeker registration, which is administrator driven and organized twice a year.
Countries with an established network of public employment services or onestop service centers can use the existing infrastructure for client interface, approaching an on-demand system. for a limited network of employment offices, technology can complement limited in-person assistance, either through well-designed online applications with pop-up help windows, chatbots, and other forms of technology-assisted support or through hotlines that allow applicants to speak to trained staff. This latter approach may not be appropriate for low-skilled populations, when access to technology is limited, or with groups that face other barriers to accessing or using technology-based solutions.
When programs are not yet established, labor program intake will be administrator driven. In low-capacity environments or when dealing with common shocks, the administrator-driven approach may be the preferred choice. In resource- and capacity-constrained settings, or when labor services are standalone programs, an administrator-driven approach, possibly enhanced with on-demand elements, might be more applicable. A centralized approach to intake may also be preferable in the case of interventions devised to relieve adverse impacts of covariate shocks, such as public works programs after a natural disaster.
The process will need to accommodate people facing access barriers. Groups that may struggle to complete the application process include people with limited mobility, such as poor individuals who cannot afford the transportation costs to travel to registration offices, nonnative speakers, and those who are homeless. Teams that visit potential applicants at home can assist marginalized and vulnerable groups to complete the application form.
Intake and registration modalities are often managed by central agencies or local governments and can be labor-intensive. Whereas on-demand systems can be expected to have sufficient in-house capacities to manage regular intakes, contractors can boost systems relying on the administrator-driven approach. Contracting additional staff can efficiently register many people quickly, which may be critical for some programs. Relying on existing structures and staff can boost local ownership of programs. Enhancing local capacities for intake and registration is especially important when continuity of labor programs is envisioned.
Labor Market Delivery Systems for Ethiopia and Beyond | 189
Permanent or contracted staff must be well-trained. Intake officers should be familiar with the questionnaire, be able to anticipate difficulties, and be prepared to assist applicants with completing the intake process. Training materials (for example, instruction manuals and videos), roleplays, and pilot trials can help ensure that intake and registration occur accurately, efficiently, respectfully, and consistently.
Technology can reduce the amount of staff time spent on intake and registration but cannot substitute for human assistance. digital self-service windows allow applicants to directly register much of their information, and some selfsufficient clients may require only a brief in-person interview at a later stage. others may need additional support (refer to box 9.4).
Intake questionnaires must meet the principle of minimum information collection. Application forms should be simple, short, and easy for applicants to complete yet also must collect sufficient information that can serve as input for the next phase. forms must be carefully developed so that most answer options are precoded and answer options are described in a way that applicants can easily understand (refer to box 9.5).
Intake questionnaires for skills programs often collect additional information. Applicants for training programs may be asked what type of work they are seeking (manual, administrative, or specialized) and any occupation and sector preferences. Applicants may also be queried about potential barriers to program participation (and, later, to employment), including care responsibilities (for young children or elderly family members), mobility constraints (limited access to transportation), and personal impairments (disability or illness). Programs typically require private sector agents to submit a formal expression of interest in participating.
Adapted intake and registration procedures could encourage informal employers to apply. Informal employers often dominate the private sector in developing countries, but few complete the official intake and registration procedures. Micro businesses may lack the capacity (time and knowledge) to comply with intake requirements; some of the required information may not exist for firms that operate outside the formal sector. To better leverage the
Intake requires trained support staff
designing application forms that are easy to complete but that collect accurate and sufficient information can be challenging. The application process itself should be simple enough to encourage applications, with an on-demand approach and multiple ways to access the form. Intake questionnaires should be straightforward and collect relevant information. for Guinea’s Women Breaking Barriers project, applicants could complete the intake questionnaire online or submit a paper version. The agency in charge of intake anticipated difficulties with completing the application form, especially when
submitted online. Although the agency produced an instructional video about how to fill out the application, many applicants still had problems answering some of the questions. Applicants often did not understand that they could select more than one sector or trade for the technical training and should rank those choices. Applicants who submitted their forms in person encountered similar problems but received help from caseworkers, ensuring that these applicants provided accurate information about sector preference. Notably, almost 50 percent of the applications were submitted on paper.
190 | Wo RKING Tod Ay fo R A B ETTER To M o RR o W IN E T h I o PIA
Source: Based on Dare to Innovate and World Bank 2019. BOX 9.4
Lessons from the Bikat Program’s registration process
for the pilot phase of the Bikat Program, registration of job seekers was conducted using a spreadsheet (Microsoft Excel; refer to f igure B9.5.1), to be completed by one-stop service center staff, that collected personal information, contact details, labor market information, and preferred sectors of occupation.
Although staff at the one-stop service centers used spreadsheets for job seeker registration, several challenges arose:
• Many staff indicated that the form was too long and took too much time to complete.
• Many staff felt that the Excel sheet was too difficult to navigate, especially the multiplechoice questions.
• A problem arose on the section on preferred sectors of occupation, which asked youth about the sectors and occupations that most interested them. That section included sectors and occupations determined before the shortlisting of firms and, as a result, did not reflect actual placement possibilities. In addition, staff did not communicate to youth that revealed preferences would not necessarily guarantee placement in their sector of choice. Thus, youth had misaligned expectations, which led to grievances and dropout.
In the future, registration should focus on the basic data required for testing eligibility and should ask later for more detailed data on preferences once the program has identified the hosting firms and the youth have completed life skills training. Source: World Bank 2022b.
benefits of apprenticeship programs, intake and registration procedures should be simplified for informal firms and atypical employers.
Phase 3: Assessment of needs and conditions
The assessment phase involves systematic processes for profiling registered key actors. Applicants are classified by their job-readiness. After verification of an applicant’s formal entry criteria—such as age, education level, or labor market status—during registration, the assessment phase typically involves some form of profiling to determine the applicant’s suitability for labor programs. Using information collected during intake and additional assessment results,
Labor Market Delivery Systems for Ethiopia and Beyond | 191
BOX 9.5
FIGURE B9.5.1
Background information Data of birth Month Year Sex Full name No Day Age Marital status
children below age of 6?
Sample of Bikat Job Seekers Registration Form
Do you have
Do you have any disability?
an applicant’s job-readiness or distance to the labor market is determined. for every applicant, a labor profile is created, outlining potential eligibility for labor programs and the mix of employment services to improve employability. Suitability of private sector agents is often assessed through screening visits and evaluation of written proposals or bids.
Profiling instruments involve caseworker assessments, statistical profiling tools, or a combination of the two. Profiling tools are typically implemented by public employment services to support caseworkers and help deliver employment services more efficiently (desiere, Langenbucher, and Struyven 2019). four broad profiling approaches can be distinguished (refer to figure 9.2):
• Rule-based categorization differentiates applicants according to group characteristics such as age, work experience, and duration of unemployment.
• Statistical profiling generates individualized risk scores and enables agencies to distinguish between applicants who are easy to place in the labor market and those who need more intensive interventions.
• Caseworker assessments rely primarily on information obtained during interviews.
• Combining caseworker assessments with data-assisted profiling allows caseworkers to retain their central role in assessing applicants while ensuring the objectivity of the assessment through data-assisted analysis.
Testing and skills assessments are an essential component of client profiling in labor programs, particularly in training programs. Test results guide caseworkers’ assessments and can inform statistical profiling models. Standard profiling tools include aptitude tests to assess applicants’ general knowledge and skills, technical understanding, or working memory. Tests for socioemotional skills
Required human resource capacity and degree of caseworker discretion
Source: Lindert et al. 2020.
Required complexity of information, information systems, and statistical capacity
192 | Wo RKING Tod Ay fo R A B ETTER To M o RR o W IN E T h I o PIA
FIGURE 9.2
Instruments and approaches for assessing and profiling labor program applicants
assessments
categorization Statistical profilling
assessments with data-assisted profilling Low High High
Caseworker
Rule-based
Caseworker
evaluate the ability to communicate effectively, work in teams, or resolve conflicts. Competence and career choice tests can assist with making choices for training or apprenticeship programs that align with applicants’ abilities and interests. The design of the assessments and profiling tools largely depends on the agency’s capacity to manage human resources and process statistical information.
Increasingly, tests and career pathway toolkits are available online. for example, South Africa’s yES4youth initiative uses SkillCraft, a task-based online tool accessed through mobile phones or in neighborhood centers. In the Arab Republic of Egypt, Kenya, and Lebanon, the International Labour organization’s partnership for improving prospects for forcibly displaced people and host communities (called PRoSPECTS) piloted support for refugees through a profiling application that uses artificial intelligence to prioritize skills demand in host communities (ILo 2022).
Tests of practical skills can help identify the best fit given an applicant’s abilities, interests, and talents. Shadow days allow applicants to learn more about an occupation or trade. for one day, applicants shadow follow workers, observing the tasks and duties of a given profession. Alternatively, short videos can introduce the occupations for which applicants will receive training in an apprenticeship program. one day on-the-job initiatives can allow applicants to test their abilities and demonstrate commitment to a task or trade. Increasingly, entrepreneurship aptitude tests are used to distinguish job seekers with entrepreneurial potential from others who might be more suitable for wage employment (refer to box 9.6).
Applicants for apprenticeship programs often undergo additional testing to determine their suitability for job-specific skills training. Psychometric test results can match applicants with an appropriate apprenticeship according to their personality type. other tools can screen out participants who may not have the grit or disposition to complete the program. The Generation program, a youth employment program founded by McKinsey & Company in 2014 and currently operating in 16 countries, identifies suitable, intrinsically motivated candidates through a rigorous task-based approach.9 To see if they can master key job-specific tasks, applicants face realistic situations as they would happen in the job.
Using standardized test results and inputs from the applicants, caseworkers recommend candidate placement. Caseworkers collect relevant information during interviews and assess individual needs and conditions through close interactions with applicants. They review applicants’ abilities and interests and potential or actual barriers to training participation or employment, often through a series of interviews. for applicants with complex needs, an individualized action plan may be developed, outlining a combination of services provided before or along with a labor market program.10
however, although profiling tools provide valuable insights into an applicant’s needs and abilities, these tools are imperfect. The relationship between personal characteristics and success in labor market policies (or labor market outcomes in general) is not well understood (McKenzie and Sansone 2019; McKenzie and Woodruff 2021). Also, lack of familiarity with assessment tools may lead applicants from marginalized groups to provide inconsistent or inaccurate answers. These challenges can lead to misjudgment of applicants’ needs and conditions, resulting in misaligned services and inclusion and exclusion errors. Adequate tool pretesting ensure caseworker understanding and lack of bias is
Labor Market Delivery Systems for Ethiopia and Beyond | 193
Role of entrepreneurship aptitude tests in finding suitable training candidates
Given the limited opportunities of wage employment in many low- and middle-income countries, job seekers often have no choice but to start their own business. Although many countries offer some sort of entrepreneurship support, the success of those programs relies not only on what type of training is provided but also on who receives it.
A growing body of literature has examined the right mix of entrepreneurship support, the content of formal training programs, and the personal traits successful entrepreneurs have in common (for example, refer to Campos et al. 2017; McKenzie and Woodruff 2014; and Valerio, Parton, and Robb 2014). however, predicting winners of, for example, business plan competitions remains difficult (McKenzie and Sansone 2019).
Entrepreneurship aptitude tests (EATs) can identify workers with entrepreneurial potential. Personal characteristics such as determination, open-mindedness, creativity, perseverance, and strong people skills often set apart job seekers with entrepreneurial potential
from others. Table B9.6.1 shows the types of questions often included in EATs and the typical answer format.
The sum of EAT scores ranks respondents by their entrepreneurial potential. Rankings can assist caseworkers in selecting candidates suitable for entrepreneurship support. furthermore, answers to the questions can provide information about candidates’ strengths and weaknesses, which could help provide tailored training.
Although EATs can help identify suitable candidates for entrepreneurship training, results should be interpreted carefully because profiles of entrepreneurs likely differ by population group. for example, women often have a different motivation for starting their own business (for example, economic necessity) and may pursue different goals (for example, less focus on profit) than men (Carranza, dhakal, and Love 2018). EAT results can reflect differences in values, preferences, risk-taking behavior, and motivation.
I bounce back quickly from personal or professional failure.
I believe that you have to take risks to be successful.
I want to make lots of money.
Selling things or ideas to others is easy for me.
I have the ability to create my own opportunities.
When the situation changes, I adjust my plans.
I am able to complete unpleasant but necessary tasks.
I show up when I say I will.
I instinctively look for the silver lining when something bad happens.
I like to attend gatherings where I can meet new people.
I use everyday objects in creative ways to solve problems or fix things.
Source: Based on Psychology Today, Entrepreneurship Aptitudes Test (https://www.psychologytoday.com/us/tests/career/entrepreneurship -aptitudes-test)
194 | Wo RKING Tod Ay fo R A B ETTER To M o RR o W IN E T h I o PIA
BOX 9.6
NOT LIKE ME AT ALL NOT REALLY LIKE ME SOMEWHAT LIKE ME LIKE ME VERY MUCH LIKE ME 1 2 3 4 5
TABLE B9.6.1 Sample entrepreneurship aptitude test questions
considered best practice. Applicants should be informed, in a way compatible with the language they speak and their educational level, why they are being tested, how the test works, and what the test will show.11
Assessing employers requires a balanced approach. Although it sets standards that firms must meet, the assessment process should not be too rigorous or taxing for employers. Lengthy procedures involving numerous documents may discourage potential employers from continuing with their applications. Toostrict conditions may result in only a few firms meeting the requirements (refer to box 9.7).
overall, the assessment process should be simple. Identifying qualified employers often involves a two-step system. firms are invited to apply and, after meeting the initial selection criteria, encouraged to prepare a detailed business proposal or bid. during visits, program staff can verify basic employer information (firm size, workplace location, formal or informal business) and review capacities to provide training, including facilities, resources, and equipment. Available existing data (for example, obtained at regular labor inspections or from the business registry) should be used. furthermore, employers should be aware that, after the initial assessment process, subsequent rounds will be less onerous. for informal providers, a simplified assessment approach may be required (refer to box 9.8).
BOX 9.7
Enrolling firms in Ethiopia’s Bikat Program
The Bikat Program set relatively high benchmark criteria for firm participation in the program. To host apprentices, a registered firm must have 5 or more employees, be a formal or registered firm, and be willing to host at least 2 apprentices. Preselected employers must pass a screening visit focused on verifying registration data, work plan and mentor readiness, occupational health and safety standards, and the presence of a gender-based violence risk assessment. An external service provider screened firms using 4-page checklists that covered these areas.
Most preselected firms operated in the garment and, to a lesser extent, leather industries. Because outreach had not been stratified by sector or size, the service provider approached mostly large firms that could place 50 or more apprentices at a time. It remains unclear to what extent firm profiling was done in a
Source: World Bank 2022b.
structured way. Because most youth prefer jobs in the service sector, these issues led to significant mismatch of youth expectations, leading many to drop out of the program.
A crucial question during the screening visits was the level of rigor applied with respect to occupational, health, and safety standards. Some firms were disqualified because of noncompliance with such standards, especially in workshops and garages where youth would need to use tools and machinery that could pose a possible danger to their health and safety. Although the program must manage these risks, it must also consider the downside of being strict. Many young people want to work in these sectors; however, because few firms in Ethiopia could meet the program’s specified standards, the program failed to find placements.
Labor Market Delivery Systems for Ethiopia and Beyond | 195
BOX
Kenya’s Youth Employment and Opportunities Project: Assessing formal and informal training providers
Kenya’s youth often lack the skills and competencies to find employment. To address this skills gap and improve employability, Kenya’s youth Employment and opportunities Project offers training and work opportunities to eligible youth in two ways. first, in line with many labor programs, the project supports demand-driven training activities with formal training providers that partner with formal sector employers. Second, to better target low-skilled youth mainly living in rural areas, the project offers job-specific skills training in the informal sector.
The assessment of formal training providers follows a two-stage procedure. first, Kenya’s National Industrial Training Authority (NITA) outlines the key requirements formal training providers must meet:
• Be registered with the regulatory agency and have valid statutory documents (such as value added tax number and tax compliance certificate),
• have suitable facilities and equipment,
• Employ qualified instructors,
• have provided training for at least 3 years, and
• have a proven record of delivering relevant jobspecific skills training as shown by employment and placement records.
Interested parties submit a formal expression of interest, which NITA evaluates. Second, candidates meeting the initial requirements are invited to submit a
comprehensive proposal explaining how they will conduct the training. Providers are required to partner with formal employers to ensure demand-driven training. The partnering employer will assist with preparing appropriate training plans and providing internships for program participants.
NITA uses a simplified approach to assess informal training providers. Informal providers must show they have the experience, capacity, and ability to achieve the project’s objectives. Training will be provided by master craftspersons—informal workers who demonstrate high-level skills and competencies in their area of specialization. Master craftspersons can perform complex tasks and have organizational and managerial skills, providing on-the-job training in a traditional apprenticeship setup. during the evaluation stage, NITA will carry out due diligence visits to the proposed premises to
• Ensure the master craftsperson has the capacity to train a specific number of beneficiaries;
• Inspect the training facilities; and
• Assess available resources, such as staff, equipment, and tools.
NITA requests simplified proposals and evaluates them in line with standard procurement procedures to determine which master craftsperson it will contract for the project.
Phase 4: Eligibility, enrollment, and placement decisions
Eligibility is determined by comparing program-specific criteria with an applicant’s profile. Most programs use a combination of criteria to determine eligibility. Labor programs commonly use thresholds for age and education level; other criteria such as residency or certain proficiencies also may apply. The applicant’s labor force status is central: programs often require jobless candidates to formally register as unemployed at the local employment office. Some programs, particularly those in LICs and MICs, may prioritize workers who are detached from the labor market, such as first-time job seekers or long-term unemployed workers. Programs may target casual workers, because underemployment often is a more common issue than open unemployment. depending on the country context and program scope, services may also be available to wage workers or self-employed individuals who seek better jobs or upskilling.
196 | Wo RKING Tod Ay fo R A B ETTER To M o RR o W IN E T h I o PIA
Source: World Bank and NITA 2019. 9.8
Given sufficient resources, eligible applicants can enroll at the next possible date. for labor programs, that date could be the next available appointment with a career counselor, the next short-term training, or an interview with firms participating in an employment subsidy or apprenticeship program. for training or apprenticeship programs, applicants are matched with suitable employers.
for programs with limited space, decisions must be made about which eligible applicants to enroll and which to wait-list. Some employment services are offered at set times and are not available on a continuous basis. Program oversubscription is likely for services that are available only from time to time. Newly established labor programs often have sufficient capacities to enroll all eligible candidates (for example, the pilot for Ethiopia’s UPSNJP Bikat Program and Guinea’s Women Breaking Barriers project). Therefore, program oversubscription must be managed.
A guiding principle to manage demand is to give the highest priority to the neediest workers, but not all programs do so. To ensure efficiency, programs should allocate available resources to those workers who could potentially benefit the most. however, many labor programs are administered on a first-come, first-served basis. Although easier to administer and audit, the first-come, firstserved approach to wait-listing may encourage caseworker discretion and possibly favoritism, especially when filling spots that become available when previously enrolled people leave the program. furthermore, this approach unfairly biases enrollment decisions in favor of those with better awareness of the program, who may apply more quickly but not necessarily have the greatest needs. Thus, marginalized populations and others facing access barriers may be at a disadvantage.
An alternative way to manage insufficient supply involves randomly selecting participants from the applicant pool. This approach, which has clear system enrollment rules and provides all eligible applicants with an equal chance to get into the program, requires protocols to determine selection timing (applicants from the past month, past quarter, or other time frame), applicant grouping (those within a geographic area or all female applicants), and for selecting a replacement for a program vacancy.
Technology can support the process of determining eligibility and approving applicants. Technology-assisted systems can ensure fair and transparent enrollment decisions in the case of program oversubscription and allow excluded applicants to file a complaint promptly (refer to box 9.9).
Apprenticeship programs include an additional critical step of matching trainees to firms. Programs that offer training in several fields typically ask applicants to indicate their preference or rank available options. To make informed decisions, applicants must know about available training options, job-specific technical and soft skills requirements, local labor market conditions, and career prospects—information that should be shared not only with job seekers but also with all stakeholders. The implementing agency often makes the placement decisions (refer to box 9.10); however, some programs allow firms to select trainees from the pool of enrolled applicants, thereby shifting responsibilities and accountability toward the employers. furthermore, firms may start training with a work trial period to decide which candidates are suitable for them.
Programs should make great efforts to enroll applicants according to their preferences. Although it is unlikely that all candidates can be matched with their preferred choice, it is critical for the efficiency and effectiveness of training and apprenticeship programs that applicant preferences are considered as
Labor Market Delivery Systems for Ethiopia and Beyond | 197
Eligibility criteria for young entrepreneurs under Kenya’s Youth Employment and Opportunities Project
Kenya’s youth Employment and opportunities Project implements a combined strategy to promote job creation. This project supports young entrepreneurs (start-ups or existing businesses) through financial grants, subject to those entrepreneurs’ potential to create employment opportunities for vulnerable youth.
The project uses a two-stage process to select grant recipients. during a first screening, applicants are deemed eligible if they meet the following criteria: are ages 18−35, are of Kenyan nationality and intend to live
Source: KPMG International Development Advisory Services 2019.
and do business in Kenya over the long term, and have a minimum of a secondary education. In addition, businesses must be based in Kenya to be considered a local investment.
Eligible candidates undergo a second screening to determine economic viability and their potential to create jobs for vulnerable youth. The project ranks business plans by profitability, implementation capacity, alignment with Kenya’s Big four Agenda, and gender inclusion.
much as possible. for example, in Guinea’s Women Breaking Barriers project, the main factor contributing to a dropout rate of 30 percent was the candidates’ dissatisfaction with their assigned training field. furthermore, mismatched participants who completed the training were less likely to start a business (dare to Innovate and World Bank 2019).
Grievance redress mechanisms (GRMs) should be available for applicants to appeal eligibility or placement decisions (refer to the discussion in phase 7 of GRMs’ purpose and design features). When determining eligibility and placing candidates in training programs, programs make decisions that applicants should be able to contest. Applicants deemed ineligible may want to challenge their classification and provide additional information about their needs and conditions. Similarly, eligible candidates dissatisfied with program placement should have the ability to complain. Because often only a small window of time exists between placement and program start, efficient appeal mechanisms can allow for a quick resolution (refer to box 9.10).
Phase 5: Notification and onboarding
Applicants must be notified about their application, no matter the outcome, in a timely manner. Beneficiaries need information about what they will receive; when, where, and how they will receive it; and what next steps they must complete. Programs commonly send written notification letters, as hard copy or electronically, but those in LICs often use alternative means of communication such as public note boards. for those wait-listed or deemed ineligible, the notification should include the basis for the decision and instructions for filing grievances and appeals.
The onboarding process orients, integrates, and prepares beneficiaries for participation. After enrollment, beneficiaries should obtain a more detailed and operational understanding of how the program works; who to contact; where and how to receive services; who the service provider is; the service provision
198 | Wo RKING Tod Ay fo R A B ETTER To M o RR o W IN E T h I o PIA
BOX 9.9
Matching trainees with training providers in Kenya’s Youth Employment and Opportunities Project
Before the job-specific skills training in this project, beneficiaries complete two preparatory trainings on life skills and core business skills. To ensure that eligible candidates can make an informed decision, the National Industrial Training Authority (NITA) shares details about all three training components (life skills training, core business skills and job readiness skills training, and job-specific skills training) before enrollment, including how the trainings are delivered.
With this transparency, NITA hopes to enable eligible candidates to make informed decisions about program participation and thus reduce dropout rates. To take the technical training, participants must attend 80 percent of the preparatory classes. Beneficiaries who have not attended any classes by day 3 are excluded from the program and replaced by waitlisted applicants.
d uring the preparatory training, beneficiaries receive a list of job-specific skills training options available in their county and are asked for their preferred choice. To place beneficiaries with training providers, NITA considers several factors, including the following:
Source: World Bank and NITA 2019.
• Capacity of formal training providers and master craftspersons in relation to the demand for certain trades;
• Minimum number of beneficiaries for allocation to specific training providers or master craftspersons;
• distance between training facilities and beneficiaries’ place of residence; and
• Prioritization of certain groups, such as people with disabilities, mothers with children under age 5, and other vulnerable and marginalized groups
After NITA completes the allocation, beneficiaries receive a placement letter indicating their course program and training provider. NITA also informs the formal training providers and master craftspersons about the number of beneficiaries allocated to them. Beneficiaries receive this letter during the last week of the preparatory training, allowing them to review and perhaps appeal their admission. Appeals are directed to the Sub-County youth development officers who, together with NITA and the project coordination unit, review the placement decision or program allocation. Appeals are reviewed on a case-by-case basis, and NITA determines the outcome.
schedules; the timing and location of monitoring meetings; their rights, roles, and responsibilities; and where and how to file grievances.
o nboarding can take place in person or via printed communications. In-person onboarding sessions explain the program’s operations and objectives, as well as beneficiaries’ rights and responsibilities, while offering direct interactions between participants and program administrators. Printed communications involve less effort but rely on beneficiaries’ ability to fully comprehend the shared material. for example, during the onboarding for Ethiopia’s UPSNJP Bikat Program, printed communications proved to be of limited use because many young people required additional information or did not receive the materials.
depending on program type and operating model, as well as type of beneficiary, onboarding may rely on a combination of modalities; however, when onboarding youth, marginalized populations, or low literacy groups, in-person information sessions are often more appropriate despite their higher costs and administrative burdens. for training and apprenticeship programs, group
Labor Market Delivery Systems for Ethiopia and Beyond | 199
BOX 9.10
orientation sessions can efficiently inform new beneficiaries. Group onboardings (open house or orientation day) are often used with programs that use administrator-driven approaches to intake and registration, because beneficiaries are enrolled as a cohort at a dedicated start date.
onboarding events provide an opportunity to inform participants in more detail about available trainings and to collect additional information. orientation clarifies program-related details, including the program’s objectives, rules, and conditionalities; beneficiaries’ rights and obligations; payment schedule; and consequences for noncompliance and GRM procedures. Participants can also review and revise information they provided earlier (such as preferred sector choice or access to transportation).
onboarding sessions can probe applicants’ commitment and ability to participate. Typically, many eligible candidates do not show up at onboarding events; attending the event demonstrates commitment and willingness to engage. In addition, the additional information provided during onboarding can allow eligible candidates to make an informed decision about whether to follow through with the program. Making participants realize before enrollment that the program is not a suitable match can help minimize future dropouts and allow wait-listed candidates to enroll.
depending on cohort size and program type, a program may require several onboarding rounds per group enrollment. Extending onboarding over several days has some advantages. first, a single-day event may not be enough time to complete everyone’s enrollment. Activities required for onboarding (verifying information, completing registration, or issuing program Ids) often take time, even more so in low-capacity environments. A program with many beneficiaries usually has delays. Second, an additional round of onboarding can allow waitlisted beneficiaries to fill in for candidates who did not show up on the first day. Third, when provided with additional information about the program, beneficiaries can reflect on available training options and revise their preferred training choice (refer to box 9.11).
Phase 6: Provision of labor programs
delivering labor programs and labor services involves a set of actions and activities to boost beneficiaries’ employability and contribute to their overall wellbeing. The main objective of the provision of services phase is to ensure that enrolled beneficiaries receive the appropriate services and that delivery is conducted according to specified standards.
The heterogeneous needs and conditions of beneficiaries may require specialized services, making service provision the most idiosyncratic phase of the delivery chain. To improve labor market access and employability, some beneficiaries may require brief interventions, whereas others may face several challenges that should be addressed through multiple services. for example, labor activation packages for unemployed workers often combine employment services and employability-enhancing services, usually with the guidance of an individualized action plan (IAP) and mutually agreed responsibilities for the client and service provider. Thus, more face-to-face interactions with beneficiaries and a more complex institutional organization may be necessary.
Labor services vary by risk group or labor profile, which is determined during assessment. Labor programs can be grouped into two categories: (a) employment services that assist job seekers with a given skills set in finding employment
200 | Wo RKING Tod Ay fo R A B ETTER To M o RR o W IN E T h I o PIA
Onboarding for Guinea’s Women Breaking Barriers project
Guinea’s Women Breaking Barriers project organized its onboarding as an in-person group session, called open house, with three main objectives in mind:
1. Publicity. Well-attended by media representatives, including from radio and national television, the open house provided an ideal platform to promote female entrepreneurship in Guinea and to widely disseminate the project’s mission and objective.
2. Sector information. Participants received additional information about the different sectors and trades for which the project offered training. Short video clips produced for each trade discussed sample products and earnings prospects or highlighted environmental benefits. Training providers answered questions.
3. Sector selection. The open house gave participants a second, final opportunity to decide on their sector preference.
despite the success of the open house, organizers encountered several challenges. first, contacting 400 beneficiaries and registering over 300 of them in 3 days resulted in long waitlines, especially on the first day, and may have discouraged some women from attending. Second, the quality and focus of some of the sector presentations were deemed inadequate. Instead of providing an informative overview, some presentations were too technical. Sector presentations should present a realistic assessment of the actual demand and earnings potential. Concerns were voiced that these presentations may have contributed to some participants not completing the training. Third, the project missed an opportunity to update participants’ current labor force status, which for some had changed. Participants who had enrolled in classes or started working may no longer have been jobless, affecting their availability to participate in the training. Source: Dare to Innovate and World Bank 2019.
and (b) employability-enhancing services that improve the chance of finding employment through, for example, upskilling or reskilling (refer to table 9.2). Risk refers to the distance from the labor market, or how likely it is for the beneficiary to find (better) employment. Typical risk groups include first-time job seekers, working job seekers, short-term or long-term unemployed workers, underemployed workers, and discouraged or inactive workers. Age, gender, education level, or disability can further increase the distance from the labor market.
Numerous combinations are possible between risk groups and labor services. Beneficiaries who are closer to the labor market might receive basic services offered in a standardized approach (for example, job search assistance for high school graduates). for others, service packages are tailored (refer to table 9.2) to the underlying constraints of beneficiaries and the local labor market conditions. Labor programs in LICs often target low-productivity workers, supporting them in accessing better jobs or increasing their productivity in their current activities.
In many countries, public agencies initiate the labor programs; however, as services have expanded, so have the private sector’s role. A country’s public employment service (PES) often provides job counseling, intermediation, or job search assistance. In LICs, PESs often cannot offer the entire range of services and may give priority to vulnerable or marginalized population groups. Low PES coverage (especially outside a country’s capital or major cities) often means that
Labor Market Delivery Systems for Ethiopia and Beyond | 201
BOX 9.11
RISK GROUP
First-time job seekers
Low-productivity workers
CROSS-CUTTING CHARACTERISTICS
School dropouts
Long-term unemployed, discouraged workers, inactive population
High school or TVET graduates
EMPLOYMENT SERVICES
INFORMATION, ORIENTATION COUNSELING, INTERMEDIATION
Information on return to technical education
Self-service occupational tool
Job fair
Job-matching platform
Website or call center
Job fair
Low-skilled workers Job club
Job fair
Informal workers
Job club
Job fair
Women Information about job and earnings opportunities in male-dominated sectors
Job club
Rural residents
Information on return to technical education
Self-service tool
Career counseling
IAP
Mentoring
Job search assistance
Job referral
Career counseling
Job referral
Job referral
Comprehensive counseling, including on key employment barriers
IAP
Mentoring
Counseling about agricultural technology and management practices
Mentoring
EMPLOYABILITY-ENHANCING SERVICES
Occupational or technical skills training
Digital literacy
Job readiness and soft skills training
Wage subsidy program
Entrepreneurship support
Soft skills training
Wage subsidy program
Occupational or technical training
Soft skills training
Digital literacy
Occupational or technical training
Soft skills training
Entrepreneurship support
Occupational or technical training
Apprenticeships
Soft skills training
Entrepreneurship support
Occupational or technical skills training
Digital literacy
Entrepreneurship support
Public works
Migrant workers
Self-service tool
Website Job-matching platform
Job club
Source: Lindert et al. 2020.
Intensified counseling and caseworker guidance
Job search assistance
Job referral
Note: IAP = individualized action plan; TVET = technical and vocational education and training.
Entrepreneurship support
Apprenticeship
Public works
services do not reach local or rural areas (IdB, WAPES, and oECd 2015). To improve outcomes, especially for hard-to-serve clients, the provision of labor services has devolved to local authorities and the private sector.
Because labor services often require a higher level of administrative intensity, many programs rely on contractors or partnerships with private firms or foundations. Pressure to improve the efficiency of public spending and to ensure that service delivery is appropriate and adapted to local conditions require many PESs to work with private or nongovernmental entities (ILo 2018). Such public-private partnerships are administered through a variety of arrangements, such as the cooperation model (public and private providers share information on vacancies and services), the complimentary model (PES outsources some of its services), or the fully outsourced model (private firms or foundations are contracted to provide services). Before outsourcing the delivery of key services,
202 | Wo RKING Tod Ay fo R A B ETTER To M o RR o W IN E T h I o PIA
TABLE 9.2 Taxonomy of labor programs for selected risk groups
especially in LICs and MICs, programs must ensure that service providers have sufficient options for competition and that the public sector has adequate capacity to properly set up and monitor the outsourcing.
Effectively managing and regulating the provision of labor services always requires a significant involvement of the public sector. Even when services are fully outsourced, public entities still typically perform key functions along the delivery chain, such as intake, registration, assessment, enrollment, and beneficiary operations management. Public authorities also manage partnerships or contracts with firms or nongovernmental providers. Contracts must ensure that external providers focus on delivering outcomes that align with program objectives. Performance-based pay is increasingly used for the delivery of labor market and training services (refer to box 9.12).
furthermore, governments can be instrumental in encouraging private firms to engage. for example, in Ethiopia, government’s involvement in selecting and monitoring firms for the UPSNJP Bikat Program encouraged employers to participate, because the government emphasized how well the program resonated with their agenda on corporate social responsibility. More generally, regulation of service provision, through well-staffed agencies, must ensure appropriate coverage of and adequate services for target groups, including the hardest-toserve groups.
Using results-based contracts to enhance program effectiveness
When a financing agency contracts service provision to an external provider, that provider plays a decisive role in program effectiveness. output-based contracts that pay providers for delivering a defined number of services often fall short of achieving intended program objectives. Similarly, expectations for programs to have tangible impacts can create adverse incentives to prioritize easy-to-achieve goals and easy-to-serve clients. To improve program effectiveness, payments to providers are increasingly tied to predefined, verifiable milestones.
Results-based contracts incentivize providers to focus on achieving outcomes aligned with program objectives. Providers receive payment only when the program achieves predefined results. Appropriate incentives can encourage providers to reach out to and enroll people from the target population, provide high-quality training, and ensure that trainees attend regularly and acquire relevant skills and competencies to find and keep better jobs (Clarke, Sharma, and Bhattacharjee 2021).
for example, to promote inclusive employment for vulnerable youth and women, a Moroccan workforce development program used results-based financing to incentivize service providers to provide training and intermediation services, with three partial payments disbursed after beneficiaries completed the training, were placed in a job, and had retained their job for 6 months after program graduation (Instiglio 2023). In addition, training providers contracted for the Nepal Employment fund received full payment only after verification of graduates’ employment outcomes and minimum income level (Chakravarty et al. 2019).
Results-based contracts offer a promising alternative when outsourcing services because they transfer most of the risk of achieving the desired outcome to external providers. finding a reward structure that balances performance and risk for the provider is key: more emphasis on performance means a higher chance of nonpayment or reduced payment. for providers to better manage this risk, offering
Labor Market Delivery Systems for Ethiopia and Beyond | 203
continued
BOX 9.12
incentives to keep completion at a certain rate can be more effective than penalizing providers for dropouts (World Bank 2020b).
To incentivize providers to also focus on hard-toserve clients, contracts can offer higher rewards for disadvantaged target groups. for example, in countries such as Nepal and the United States, additional financial incentives have boosted the inclusion of disadvantaged groups that otherwise may have been excluded from participation (Clarke et al. 2021). however, participants from disadvantaged backgrounds may be more likely to drop out of the program or may have more difficulty reaching the program objectives for reasons beyond the provider’s control. Therefore, payment structures must consider that some trainees will fail to secure employment (World Bank 2020b).
finally, targets must be realistic, acknowledging local labor market conditions, and measurable in a transparent and objective way. Because monitoring results is required throughout and after the program, a reliable verification system must be established. however, monitoring and verification costs can be
substantial. Practical examples to balance the rigor and cost of verification include self-monitoring by training providers, hiring seasonal field monitors, and using sample surveys to verify employment (World Bank 2020b; World Bank, ILo, and UNESCo 2022). In addition, fostering a culture oriented toward results can reduce the cost of verification. for example, in the Philippines, instructors of department of Education–delivered programs had strong intrinsic incentives to deliver high-quality training because their professional careers were linked to their performance (Clarke et al. 2021).
o utsourcing services in low-capacity contexts presents additional challenges. To develop a market for service providers, reducing provider risk and placing less emphasis on performance in the beginning are advisable. Incentive payments can be introduced gradually, keeping in mind local constraints and existing risks. Because it is easier to monitor activities than outputs or outcomes, moving progressively toward monitoring outputs and outcomes may be preferrable (World Bank 2020b).
A key element for effective services is the quality of their provision. Given the wide-ranging risks and barriers that beneficiaries face, providing labor programs often involves a complex process. To ensure an adequate, specialized, and effective delivery, governments must define and enforce a set of quality standards for services. Although most governments prefer to set high standards for quality, many governments—especially in LICs and MICs—cannot easily afford operationalizing these standards. Countries should aim for realistic quality standards for service delivery, with rising quality levels. To ensure general quality standards, labor services should fulfill seven criteria by being
1. Available, by ensuring services are offered when people need them and provided sufficiently to serve all those in need;
2. Accessible, by facilitating program access to those who require services and addressing existing barriers for vulnerable and marginalized groups; 12
3. Affordable, so that programs enable those in need to participate;13
4. People-centered, by giving those in need a voice and considering their talents, abilities, and preferences with the aim of improving beneficiaries’ employability and earnings potential;
5. Comprehensive, by providing adequate service packages for those with multiple and overlapping barriers to employment;
204 | Wo RKING Tod Ay fo R A B ETTER To M o RR o W IN E T h I o PIA
Box
continued
9.12,
6. Continuous , by responding to the changing needs of beneficiaries and employers; and
7. Outcome-oriented, by focusing on tangible results for beneficiaries after program graduation, as well as implementing continuous evaluation and feedback processes to collect essential information for program administrators.
Several additional factors can shape the quality of labor services. Staffing is key. The provision of labor services requires qualified instructors who are well-trained and knowledgeable in their field. Staff accreditation and formal training are desirable but not always feasible. Alternatives include hiring highly skilled workers and training them to be instructors. Before delivery of services, effective IAPs must be developed. Preparing IAPs together with clients who need intensive support is becoming a best practice ( davern and Mwasikakata 2021) but requires caseworkers to have sufficient time and resources for this task. Because individual sessions have been shown to be more effective than group work, reasonable counselor-to-client ratios are crucial.14
facility standards (equipment, tools, materials, classrooms, workshops, and acceptable safety standards) are another important factor in assuring minimum standards of service quality. Similarly, providers should make the best use of available technology to improve quality. To ensure service provider accountability, in addition to aligning payments with results, the program should record and address complaints and grievances from beneficiaries in a timely manner. Generally, a complaint management system can offer a valuable source of learning about the unmet needs of clients and opportunities for improvement (refer to the following discussion of GRMs in phase 7).
Phase 7: Monitoring compliance with conditionalities
Throughout program delivery, information is collected to support three main functions: (a) managing beneficiary data, (b) monitoring conditionalities, and (c) implementing GRMs. Collecting and processing information, and making decisions based on this data, occurs continuously during program delivery. Information received from key actors, and bundled together, allows program administrators to follow the beneficiaries’ path through the program as well as to monitor the quality of program delivery.
Monitoring compliance with program-specific requirements is a key component of beneficiary operations management. In labor programs, applying conditions serves two purposes. first, conditions reduce the moral hazard of beneficiaries receiving services without showing any effort to find gainful employment. for example, programs may require job seekers receiving job search assistance to meet regularly with their caseworker to demonstrate employment seeking. Second, conditionalities can function as a targeting mechanism. When conditions are strict and monitored closely, those most in need are more likely to apply.
Conditionalities are usually specified in an IAP, stipulating co-responsibilities of both beneficiary and service provider. during the enrollment phase, an IAP (sometimes called job plan, employment plan, or career plan) is developed in consultation with a caseworker. The plan defines the activities expected from key actors, including a set of mutual obligations to be fulfilled during the program. o bligations vary by program type and across beneficiaries.
Labor Market Delivery Systems for Ethiopia and Beyond | 205
for example, low-skilled youth with little or no work experience may receive a combination of training elements, including life skills and job-specific skills training, to prepare them for entry-level jobs or self-employment. Beneficiaries from marginalized groups may require additional coaching to improve job readiness before technical training.
Kenya’s youth Employment and opportunities Project requires beneficiaries to complete 4 weeks of core business skills and job readiness training before the actual skills training. Participants are expected to attend the initial sessions full-time, with absences permitted only for exceptional reasons. Graduation and transition to job-specific skills training require 80 percent attendance. Participants who do not attend training on 3 consecutive days are terminated from the program (World Bank and NITA 2019). In Ethiopia’s Bikat Program, youth are expected to attend at least 80 percent of the life skills classes before placement.
A verification system must monitor conditionalities, which must be tracked at various points of interaction between beneficiary and service provider and then recorded and processed through a verification system. for example, job seekers receiving job search assistance often must report their search activities, including their reasons for rejecting job offers. for training programs, beneficiaries typically report their participation activities directly, using either a paper-based logbook or an online tool. Generally, labor programs involve frequent monitoring of compliance conditions, often weekly or biweekly.
Programs increasingly are involving external providers in the monitoring process. outcomes-based funding shifts the risk of nonperformance to external providers and incentivizes contractors to more actively monitor beneficiaries’ compliance with program rules. for example, providers may periodically transmit a file recording job seekers’ attendance or may use an offline or online system to convey participation details. In South Africa’s Expanded Public Works Program, nonprofit organizations contracted through the program record beneficiaries’ daily attendance, as well as their identification and payment information (Lindert et al. 2020).
Caseworkers formally report compliance failures. The first instance of noncompliance typically results in a warning; repeated failures can lead to tangible consequences, including sanctions.15 If a beneficiary reaches a threshold of noncompliance, the system may trigger an assessment process and action steps, such as adjusting an IAP, involving the caseworker, beneficiary, and service provider. how participants are monitored, when and how noncompliant behavior results in escalation, and the consequences of noncompliance must be clearly communicated to beneficiaries.
Technology-based monitoring systems can support both caseworkers and beneficiaries. Typically, an IAP outlines beneficiaries’ obligations and monitoring procedures. Beneficiaries submit documentation in person or online, and caseworkers verify the reports by selectively calling firms the job seeker claims to have contacted. In more advanced countries, job search relies on online job portals and digital search diaries, which caseworkers can check at their own discretion. In fact, many PESs in organisation for Economic Co -operation and development countries are moving away from in-person monitoring of all aspects of IAPs and relying on digital monitoring. Technology-based monitoring systems, such as text-message reminders, can also help beneficiaries track responsibilities.
206 | Wo RKING Tod Ay fo R A B ETTER To M o RR o W IN E T h I o PIA
GRMs, key components of any delivery system, can provide beneficiaries and the public with a voice and can allow program administrators to identify grievance hot spots. They can
• Respond to program-related queries, suggestions, or concerns;
• Resolve problems with implementation; and
• Address complaints efficiently and effectively.
Although grievances do arise along all phases of the delivery chain and can be filed by both beneficiaries and nonbeneficiaries, their redress is part of beneficiary operations management.16 decisions resulting from an appeal may feed back into earlier stages of the delivery chain, for example, reversing an applicant’s eligibility status or changing the training placement. Analyzing aggregate grievance data provides information about personnel performance, identifies procedures that need improvements, and allows insights on program efficiency and effectiveness.
Implementing an efficient GRM often involves six steps:17
1. Uptake refers to the methods by which grievances are collected. An effective GRM should have multiple uptake locations (at the community, village, district, regional, or national level) and channels (email, telephone, text, complaint box, or website). Although technology-based systems can reduce costs, managers should choose channels and locations appropriate to the situation in which they are operating.
2. Sorting and processing grievances are necessary activities because different types of grievances require different follow-up actions. Some grievances may be resolved by sharing program information, whereas others may require a thorough investigation. Each grievance is categorized, prioritized, and assigned to the relevant unit, department, or agency. Grievances should be logged to keep track of referrals or when escalated to a higher level.
3. Acknowledgement and follow-up involve clear communication to the complainants that their grievance was received and to share information about follow-up actions, including a timeline for resolution. Complainants receive a case number for future reference.
4. Verification, investigation, and taking appropriate actions for resolution come next. Verification involves collecting more information. Appropriate measures could involve referring or escalating grievances to another unit or higher level for further investigation and follow-up. Potential actions may include responding to program inquiries, requesting additional documents to determine eligibility, or escalating a grievance case from a local office to a higher level (for example, a regional or national office) to determine an appropriate response to repeated noncompliance.
5. Monitoring and evaluation involve tracking grievances and assessing the extent to which progress is made to resolve them. Monitoring may involve spot checks to ensure the quality of resolutions. Evaluation involves analyzing grievance data to inform program management about aggregate trends in grievances and GRM performance.
6. Providing feedback involves clear communication to complainants about the results of the investigation and measures taken for resolution. In multilevel systems, complainants can challenge the outcome advised at a lower level,
Labor Market Delivery Systems for Ethiopia and Beyond | 207
which escalates the case to the next level. disclosing performance-related information at the program level will increase transparency and reinforce beneficiaries’ and the public’s trust in the program.
Phase 8: Case outcomes and program performance indicators
A classic role of a PES is to collect and disseminate labor market information to improve the targeting and effectiveness of labor services. Monitoring regional and local employment trends, job openings, and sectoral performance is important to increase the relevance of employment services and activation programs. The required information is often collected through an LMIS that combines data on registered job seekers with job vacancies posted by employers. After processing this information, the PES makes key labor market indicators available to external stakeholders, including job seekers, employers, and training providers, enabling them to make informed decisions about labor market issues.
for programs having gone through several delivery cycles and maturing, program administrators and other stakeholders often shift their attention toward measuring the impact the programs have had on beneficiaries and employers. Therefore, many PESs now also focus on measuring performance indicators of employment services and activation programs.
Performance indicators for labor programs typically relate to inputs, outputs, and outcomes to assess the actual effect these services have had on beneficiaries. Administrative records of program parameters such as number of participants, placement rate, or program budget are fundamental and should be supplemented with indicators that measure outcomes rather than outputs. for example, although it is useful to learn what share of participants have found employment after completing a job-specific skills training, the share of graduates who work in jobs they were trained for conveys additional information useful to both job seekers and policy makers. Program performance may also be rated by post-training earnings and improved access to sustainable jobs in the private or formal sector. Table 9.3 shows the core indicators typically considered for program assessments and basic data requirements.
one challenge many programs face is tracing beneficiaries to obtain information on later employment status or earnings. Ideally, after beneficiaries graduate, programs should track them for some time and regularly collect information on basic labor market indicators, including employment status, job (formal or informal) and occupation type, and earnings. however, many programs find it difficult to contact former beneficiaries. follow-up surveys are often conducted via face-to-face interviews or through tracing apps, supplemented by telephone or web-based interviews to boost response rates (refer to box 9.13). for example, participants of South Africa’s yES4youth initiative receive a smartphone at enrollment and are required to complete weekly surveys using preloaded apps over 1 year.18 Alternatively, providers may conduct exit interviews just after program completion. financial incentives (gift cards or airtime vouchers) also could help motivate program graduates to provide the required information. Where available, administrative tax or employment data can help as well.
Performance indicators for programs in developing countries should reflect prevailing labor market realities. Work opportunities, employment trajectories, or payment patterns in developing countries often differ profoundly from those in advanced countries. Many workers hold informal jobs, move between
208 | Wo RKING Tod Ay fo R A B ETTER To M o RR o W IN E T h I o PIA
PERFORMANCE INDICATOR
Job placement rate: number of registered job seekers who are employed at a later time period
Filled vacancy rate: number of registered job vacancies filled by registered job seekers over a specific time period
Placement cost: number of registered job seekers who obtained a job, divided by the program budget in a given time period
Job retention rate: number of registered job seekers who remain employed in subsequent time periods
Average earnings: average earnings for registered job seekers who remain employed in a given time period
Adequacy rate: share of registered job seekers who completed training and are employed in a given time period in an occupation compatible with the training received
Qualification-related underemployment rate: share of registered job seekers who completed training and are employed in a given time period in an occupation that requires a lower education profile
Source: Based on Lindert et al. 2020. Note: LMIS = labor market information system; PES = public employment service.
ADMINISTRATIVE DATA
PES, LMIS
PES, LMIS
PES, LMIS
PES, LMIS (training related)
PES, LMIS (training related)
DATA FROM PROGRAM GRADUATES
Employment status
Earnings bracket
Occupational group, self-assessment
Education level, occupational group, self-assessment
BOX 9.13
Project monitoring and outcome tracking in Kenya’s Youth Employment and Opportunities Project
Kenya’s youth Employment and opportunities Project has monitoring and evaluation (M&E) processes firmly anchored in its delivery system, both during and after program delivery. Monitoring activities include collecting, collating, and processing data from formal training providers, master craftspersons, and youth beneficiaries on the progress of their training, internship, and employment. Beneficiaries report their daily presence through attendance sheets; training providers complete register sheets and submit them once a month to the M&E team. A strong and gender-sensitive M&E system highlights problems immediately and ensures that challenges are addressed as they emerge. Continuous capacity building of teams working in M&E and reporting and data ensures that they can address gaps and shortcomings in data collection, analysis, and reporting. during the job-specific skills training, trainees document their accomplishments in a diary, which allows the monitoring of trainees’ progress and performance
and ensures their acquisition of relevant skills. The provision and quality of training are also monitored through regular visits to training places by youth development officers and county project coordinators. These staff visit formal training places at least twice a month and master craftspersons once a week. Based on these visits, the M&E team prepares a summary report, highlighting areas in which formal training providers or master craftspersons failed to adhere to stipulated project guidelines and suggesting corrective measures. Contracts can be terminated for training providers who do not comply with set standards.
Assessments of achieving the project objective to enhance youth employability after program completion are based on several indicators, including the following:
• Number of young people graduating from each cycle,
• Number of young people finding employment within 6 months after training and internship,
Labor Market Delivery Systems for Ethiopia and Beyond | 209
TABLE 9.3 Labor program performance indicators
continued
• Number of training providers offering training and internships,
• Number of employers mobilized by training providers to offer internships, and
• Number of master craftspersons offering training and internships.
To determine the number of young people who transition to employment or self-employment after completing the job-specific skills training, an
Source: World Bank and NITA 2019.
employment tracking and verification exercise is conducted after each training cycle for up to 6 months. Tracking traces graduates through Short Message Service, telephone calls, or visits to employers and master craftspersons. findings from this tracking can help identify (a) challenges to achieving the project’s objective and (b) in-demand skills and trades. Results from these studies can provide critical information for the next program cycle.
joblessness and casual jobs, and receive irregular payments. In an environment where most jobs are in the informal sector, graduates of training programs will also face difficulties finding a formal sector job. Thus, performance indicators of labor programs in LICs and MICs must be selected with care.
CONCLUSION
To address their employment challenges, many LICs and MICs have introduced active labor market policies and are working to improve their delivery. Although program design, service quality, and local circumstances are critical factors, how programs are implemented is as important for their effectiveness. Evidence from earlier chapters in this book underscores this reality in Ethiopia.
delivering labor programs involves a series of closely linked steps. four main stages—assess, enroll, provide, and manage—typically describe the implementation process. The delivery chain is further differentiated into eight phases—with the output of each phase providing input to the next. The checklist in annex 9A provides guidance for governments, program administrators, and practitioners to ensure they appropriately address key features of the delivery chain for apprenticeship programs. Although checklists can help illustrate general requirements and propose context-specific options, they cannot substitute for sound judgment when deciding on specific elements and procedures involved in delivering apprenticeships.
for each phase, the checklist provides guidance on four main areas: (a) general concerns; (b) private sector engagement; (c) staff-related issues; and (d) institutional arrangements, international practice, and technology use. The appropriate level of complexity for the delivery chain depends on the country and program context. Apprenticeship programs may not require all the steps outlined in the checklist. however, the checklist can help programs ensure that delivery systems are based on international experience and incorporate lessons learned, increasing their effectiveness in reaching clients and of their package of job support services.
210 | Wo RKING Tod Ay fo R A B ETTER To M o RR o W IN E T h I o PIA
Box 9.13, continued
NOTES
1. In empirical models of impact evaluations, variations in program implementation are typically captured by the error term (for example, refer to Card, Kluve, and Weber 2018).
2. facilitating and refining the implementation of (economic inclusion) programs require a thorough documentation of effective operational models and delivery systems in different contexts.
3. The chapter relies in large part on the comprehensive work compiled in Lindert et al. (2020).
4. The yES4youth program creates work opportunities by matching youth with suitable employers, including nongovernmental organizations.
5. Estonia’s youth Guarantee Support System retrieves data from nine registries to identify vulnerable youth and provides the information to local case managers. The program reaches out to young people who are not in education, employment, or training and supports them in continuing with their education or integrating into the labor market.
6. on benefits to employers, refer to, for example, Crépon and Premand (2019), who show that youth in Côte d’Ivoire, 4 years after they had participated in an apprenticeship program, can perform more complex tasks.
7. The original slogans were in french.
8. These registries could include existing registries of social assistance programs or past labor programs.
9. for more information on the Generation program, refer to www.generation.org (refer also to World Bank, ILo, and UNESCo 2022).
10. An IAP, also referred to as a service plan or mutual responsibilities agreement, is an agreement between a caseworker and program participant that typically includes a summary of the individual assessment, goals, and agreed steps to achieve the goals; a list of assigned services; required actions and commitments of involved parties; and rules and procedures for noncompliance. for an in-depth discussion of IAPs, refer to Lindert et al. (2020).
11. Caseworkers in Ethiopia, for example, worried that young people might misinterpret the results of SkillCraft, the skills profiling tool developed and successfully implemented in South Africa.
12. This facilitation could include decentralized service provision. for example, providers of training programs for women increasingly emphasize delivering training close to where women live.
13. Ensuring affordability could involve providing small stipends to beneficiaries of training programs and apprenticeships, covering transportation costs, meals, and so on.
14. The International Labour organization recommends an average staff caseload of 100. In practice, programs often have a much higher ratio of beneficiaries to caseworker.
15. d epending on the circumstances, cash support can be temporarily or permanently suspended.
16. for example, grievances can relate to unclear program guidelines, lack of program awareness resulting from insufficient outreach, potential inclusion and exclusion errors, unsatisfactory placement in training programs, problems with the coresponsibilities outlined in IAPs, mistreatment by caseworkers, or the GRM itself.
17. for a comprehensive discussion of GRMs, refer to Lindert et al. (2020).
18. Refer to the home page at yes4youth.co.za.
REFERENCES
Business daily Africa. 2018. “Apprenticeship Key for Creating Jobs for youth.” Business Daily Africa , June 17, 2018. https://www.businessdailyafrica.com/bd/news/apprenticeship -key-to-creating-jobs-for-youth-2206960
Campos, f., M. frese, M. Goldstein, L. Iacovone, h. C. Johnson, d. McKenzie, and M. Mensmann. 2017. “Teaching Personal Initiative Beats Traditional Training in Boosting Small Business in West Africa.” Science 357 (6357): 1287–90.
Labor Market Delivery Systems for Ethiopia and Beyond | 211
Card, d., J. Kluve, and A. Weber. 2018. “What Works? A Meta Analysis of Recent Active Labor Market Program Evaluations.” Journal of the European Economic Association 16 (3): 894–931.
Carranza, E., C. dhakal, and I. Love. 2018. Female Entrepreneurs: How and Why Are They Different? Washington, dC: World Bank.
Chakravarty, S., M. K. A. Lundberg, P. V. Nikolov, and J. Zenker. 2019. “Vocational Training Programs and youth Labor Market o utcomes: Evidence from Nepal.” Journal of Development Economics 136: 71–110.
Clarke, M., M. Sharma, and P. Bhattacharjee. 2021. “Review of the Evidence on Short-Term Education and Skills Training Programs for out-of-School youth with a focus on the Use of Incentives.” Social Protection and Jobs d iscussion Paper No. 2103. World Bank, Washington, dC.
Crépon, B., and P. Premand. 2019. “ d irect and Indirect Effects of Subsidized d ual Apprenticeships.” IZA discussion Paper 12793, IZA Institute of Labor Economics, Bonn. dare to Innovate and World Bank. 2019. Femmes Sans Barrieres Project. final Report. Unpublished manuscript.
davern, E., and M. Mwasikakata. 2021. Guidelines on the Setting-Up of Effective Job Centres in Developing Countries with Reference to Sub-Saharan Africa, the Middle East and Northern Africa Regions. Geneva: International Labor organization.
desiere, S., K. Langenbucher, and L. Struyven. 2019. “Statistical Profiling in Public Employment Services: An International Comparison.” oECd Social Employment and Migration Working Paper 224, oECd, Paris.
Escudero, V., J. Kluge, E. L. Mourelo, and C. Pignatti. 2019. “Active Labor Market Programmes in Latin America and the Caribbean: Evidence from a Meta Analysis.” Journal of Development Studies 55 (12): 2644–661.
hoftijzer, M., and W. Cunningham. 2020. “Promoting Employer Engagement in Skills development. A framework to Address Constraints to Promote the Effective Engagement of Enterprises in Strengthening Workforce Skills.” Unpublished manuscript, Washington, dC, World Bank.
IdB (Inter-American development Bank), WAPES (World Association of Public Employment Services), and oECd (organisation for Economic Co-operation and development). 2015. “The World of Public Employment Services: Challenges, Capacity and outlook for Public Employment Services in the New World of Work.” IdB, WAPES, and oECd, Washington, dC.
ILo (International Labour organization). 2018. “Public Employment Services: Joined-Up Services for People facing Labor Market disadvantage.” ILo Briefs on Employment Services and ALMPs, Issue No. 1, ILo, Geneva.
ILo (International Labour organization). 2022. “Tracer Study: Skills Profiling Application in Egypt for Refugees and host Communities.” ILo Research Brief, ILo, Geneva.
Instiglio. 2023. “Tackling Systemic youth Unemployment in Morocco.” Bogotá, Colombia. https://www.instiglio.org/impact/workforce-development-in-morocco/ Kluve, J., S. Puerto, d. Robalino, J. M. Romero, f. Rother, J. Stoterau, f. Weidenkaff, and M. Witte 2019. “do youth Employment Programs Improve Labor Market outcomes? A Quantitative Review.” World Development 114: 237–53.
KPMG International development Advisory Services. 2019. MSEA Business Plan Competition, Operating Policies and Procedures. Unpublished manuscript.
Lindert, K., T. George Karippacheril, I. Rodriguez Caillava, and K. Nishikawa Chavez, eds. 2020. Sourcebook on the Foundations of Social Protection Delivery Systems. Washington, dC: World Bank.
McKenzie, d., and d. Sansone. 2019. “Predicting Entrepreneurial Success Is hard.” Journal of Development Economics 141: 102369.
McKenzie, d., and C. Woodruff. 2014. “What Are We Learning from Business Training and Entrepreneurship Evaluations around the developing World?” World Bank Research Observer 29: 48–82.
212 | Wo RKING Tod Ay fo R A B ETTER To M o RR o W IN E T h I o PIA
McKenzie, d., and C. Woodruff. 2021. “Training Entrepreneurs.” VoxDevLit, Volume 1, Issue 2, August 9, 2021. https://voxdev.org/sites/default/files/Training_Entrepreneurs_Issue_2.pdf.
oECd (organisation for Economic Co-operation and development). 2021. “Building Inclusive Labour Markets: Active Labour Market Policies for the Most Vulnerable Groups.” oECd Policy Responses to Coronavirus (CoVId -19), oECd, Paris.
Safir, A. 2019. “formal and Informal Apprenticeships in Kenya. Implementation Lessons.” Jobs, Labor & Migration Course, World Bank, Washington, dC, November 11, 2019. https:// thedocs.worldbank.org/en/doc/597641574377899982-0160022019/original/SPJCC19 JLMd6S3ApprenticeshipAblaSafir.pdf
Valerio, A., B. Parton, and A. Robb. 2014. Entrepreneurship Education and Training Programs around the World: Dimensions for Success. Washington, dC: World Bank.
World Bank. 2020a. “Adapting Skills Training to Address Constraints to Women’s Participation.” Jobs Notes, Issue No. 7, World Bank, Washington, dC.
World Bank. 2020b. “demand-driven Skills Training and Results-Based Contracting. Lessons for youth Employment Programs.” World Bank, Washington, dC.
World Bank. 2022a. “Addressing Gender-Based Segregation through Information Evidence from a Randomized Experiment in the Republic of Congo.” Policy Research Working Paper 9934, World Bank, Washington, dC.
World Bank. 2022b. “Bikat Pilot Project Process Evaluation.” World Bank, Washington, dC. World Bank. 2022c. “Charting a Course towards Universal Social Protection: Resilience, Equity, and opportunity for All.” World Bank, Washington, dC.
World Bank, IL o (International Labour organization), and UNESC o (United Nations Educational, Scientific and Cultural organization). 2022. Building Better TVET Systems: Principles and Practice in Low and Middle-Income Countries. Washington, dC, Paris, Geneva: World Bank, ILo, UNESCo
World Bank, and NITA (National Industrial Training Authority). 2019. “Kenya youth Employment and opportunities Project, operations Manual for Component 1: Improving youth Employability.” World Bank, Washington, dC.
Labor Market Delivery Systems for Ethiopia and Beyond | 213
ANNEX 9A CHECKLIST FOR SUPPORTING APPRENTICESHIP PROGRAM DELIVERY SYSTEMS
Outreach
General concerns:
• does the outreach campaign adequately provide the information required for the target population?
– outreach materials clearly communicate key program information and the application process.
– The program uses several communication channels to disseminate information.
– outreach strategies align with the target population’s communication habits and capabilities.
• Are proactive and inclusive strategies being used to overcome marginalized groups’ barriers to access?
– Materials are available in local languages.
– Appropriate strategies are in place to contact hard-to-reach and disadvantaged groups, ideally in coordination with organizations or individuals who regularly work with these groups.
Private sector engagement:
• does the campaign encourage the private sector to actively engage in the program?
– outreach to the private sector begins before program design is finalized.
– Relevant private sector organizations and formal and informal employer associations and networks are contacted, inviting all actors to determine key program parameters.
• Is the campaign designed to comprehensively inform employers about the program’s potential benefits, requirements, and responsibilities?
• does the campaign involve tailored strategies for large and small businesses and for formal and informal employers?
Staff-related issues:
• Are outreach staff familiar with the program’s details and application process?
– Program officers, government officials working in relevant departments, and local employment officers are knowledgeable.
• Are capacities and resources sufficient to reach out to marginalized groups? have teams been sensitized about the constraints of and available options for supporting these groups?
Institutional arrangements, international practice, and technology use:
• What other strategies can be applied to increase awareness by the target population?
– Existing programs or social registries can disseminate program information.
– Beneficiaries of previous program cycles can share their experiences.
• Is the timeline realistic and aligned with the steps of the delivery chain?
– All materials are ready at campaign launch.
– Long gaps between outreach, assessment, and provision are avoided.
• What access to technology does the target population have?
– Technology can be used for outreach, considering that marginalized groups often have limited access to technology.
214 | Wo RKING Tod Ay fo R A B ETTER To M o RR o W IN E T h I o PIA
PHASE 1
PHASE 2
Intake and registration
General concerns:
• Can application forms be accessed at different locations and in various ways, including through mobile devices?
• Are application forms easy to complete?
– forms collect only basic information.
– forms provide precoded answer options (yes or no check boxes) as much as possible.
– forms are provided in local languages.
Private sector engagement:
• Are employer intake and registration simple?
– only basic information is collected.
• does the intake process encourage applications from micro and small informal businesses?
– Simplified procedures are prepared for informal firms.
Staff-related issues:
• Are sufficient staff (permanent or contracted) available to process large groups efficiently?
– Sufficient capacity is needed to organize central registration events, door-to-door campaigns, or temporary service desks.
• Are intake officers familiar with the intake and registration procedures?
PHASE 3
Assessment of needs and conditions
General concerns:
• What approach to applicant profiling is used?
– The combination of caseworker assessment and statistical profiling tools has been decided.
– Which skills to test and which testing tools to use, including with input from potential employers, have been determined.
– Testing tools are appropriate for candidates’ skills levels and cultural backgrounds.
– Testing tools screen out unfit applicants.
• Are applicants aware what to expect from testing?
– An intake and registration manual is available for staff.
– Permanent and contracted staff are trained.
• Are resources available to permit people with access barriers to register?
– Mobile teams are servicing remote areas.
– Staff are prepared to assist low-skilled applicants and marginalized groups.
Institutional arrangements, international practice, and technology use:
• Is existing infrastructure, such as an established public employment service network or one-stop services center, used for client intake?
• Is intake aligned with the application window of programs targeting similar population groups?
• Is technology used to complement limited in-person assistance?
– Instructional videos and technology-assisted support systems (for example, chatbots) can assist applicants with completing their application.
• Are existing links between beneficiary registries used during the registration process?
– Candidates are informed why they are tested, how the test works, and what the test will show.
Private sector engagement:
• does the assessment process for employers follow a balanced approach?
– The initial assessment of firms is simple and quick to complete.
– A two-step approach can help identify qualified employers.
Labor Market Delivery Systems for Ethiopia and Beyond | 215
continued
Phase 3,
– Existing information about potential employers (for example, business registry or labor inspections) is used.
– A simplified assessment procedure has been prepared for informal employers.
Staff-related issues:
• have staff been trained to use the assessment tools?
– An assessment manual has been prepared for caseworkers.
PHASE 4
– Pretesting ensures that caseworkers are familiar with test procedures and interpreting test results.
Institutional arrangements, international practice, and technology use:
Eligibility, enrollment, and placement decisions
General concerns:
• Are selection criteria transparent and appropriate to the program?
• have decisions been made about how to wait-list eligible candidates, how to communicate these decisions, and how the program will use the waitlist?
• has the program determined how to match trainees with firms?
– The implementing agency matches trainees with firms by candidates’ preferences and firms’ capacity to host trainees.
– firms select trainees from a pool of candidates who meet the initial criteria.
• have grievance redress mechanisms (GRMs) for applicants been implemented to contest decisions on eligibility, enrollment, or placement?
Private sector engagement:
• do employers provide necessary information on available apprenticeships, in-demand occupations, and job-specific skills to enable candidates to make informed decisions about enrollment?
Staff-related issues:
• have staff been trained on eligibility, enrollment, and matching procedures?
• have staff been trained on and are available to swiftly address complaints, grievances, and appeals?
Institutional arrangements, international practice, and technology use:
• Are technology-assisted systems used to ensure fair and transparent enrollment?
• Are applicants matched based on their training field preference?
216 | Wo RKING Tod Ay fo R A B ETTER To M o RR o W IN E T h I o PIA
• have tools and tests developed for other countries been adapted to fit the country and program’s contexts? continued
PHASE 5
Notification and onboarding
General concerns:
• Are application outcomes communicated quickly?
• have onboarding modalities been decided?
– In-person onboarding, printed or digital communications, or a combination of both are helpful.
• does onboarding prepare trainees for program participation?
– Adequate preparation of less-educated trainees may require in-person onboarding.
Private sector engagement:
• do employers attend onboarding to provide additional program information to trainees?
PHASE 6
Provision of labor programs
General concerns:
• has the level of cooperation between training providers and the commissioning agency been decided?
• have adequate quality standards for program delivery and their assessment been defined?
Private sector engagement:
• Are service providers and employers providing services as contracted? do contracts link payment to performance? do the contracts
– Balance provider performance and risk,
– Incentivize providers to include participants from disadvantaged groups, and
Staff-related issues:
• Are staff familiar with onboarding procedures to help trainees?
• Are sufficient staff available for onboarding?
Institutional arrangements, international practice, and technology use:
• Are in-person group information sessions offered over several days?
• do onboarding requirements test participants’ commitment to the program?
• Are training providers (employers or nongovernmental agencies) invited to attend onboarding?
– Agree on realistic but ambitious targets?
• Are the program’s benefits visible to employers and trainees throughout the program?
Staff-related issues:
• Are staff qualified to manage, regulate, monitor, and supervise external service providers?
– Adequate training is provided for local staff.
– A procedures manual has been prepared.
Institutional arrangements, international practice, and technology use:
• Are trainee complaints and grievances addressed quickly?
Labor Market Delivery Systems for Ethiopia and Beyond | 217
PHASE 7
Monitoring compliance with conditionalities
General concerns:
• Are conditionalities communicated clearly to trainees and employers, including the consequences of noncompliance?
• Is a comprehensive monitoring system in place that allows for
– Tracking trainees’ compliance and progress, – Verifying employers’ compliance with predefined standards of service provision, and – harnessing self-reporting options in ways that allow for cross-checking information between trainees and employers?
Private sector engagement:
• Are employers and worker organizations (including those inside the firm) integrated into the monitoring process?
PHASE
8
Staff-related issues:
• Are staff trained in monitoring conditionalities and escalating cases of noncompliance?
• has an operations manual been prepared?
Institutional arrangements, international practice, and technology use:
• Are technology-based monitoring systems in use?
• does the grievance redress system provide trainees with a voice and resolve issues quickly?
• Is the information obtained through the GRM used to improve service delivery?
Case outcomes and program performance indicators
General concerns:
• have appropriate performance indicators been determined?
– Activities, outputs, and outcomes are measured.
– Indicators refer to relevant outcomes for trainees and employers.
Private sector engagement:
• does the program cooperate with employers and training providers to obtain postprogram employment information?
Staff-related issues:
• Are staff trained to conduct exit interviews and implement activities to track graduates?
Institutional arrangements, international practice, and technology use:
• Is technology used to trace program graduates?
• Is the focus on a few indicators that are relevant?
• Are incentives provided to encourage graduates to report back?
218 | Wo RKING Tod Ay fo R A B ETTER To M o RR o W IN E T h I o PIA
ECO-AUDIT Environmental Benefits Statement
The World Bank Group is committed to reducing its environmental footprint. In support of this commitment, we leverage electronic publishing options and print-on-demand technology, which is located in regional hubs worldwide. Together, these initiatives enable print runs to be lowered and shipping distances decreased, resulting in reduced paper consumption, chemical use, greenhouse gas emissions, and waste.
We follow the recommended standards for paper use set by the Green Press Initiative. The majority of our books are printed on Forest Stewardship Council (FSC)–certified paper, with nearly all containing 50–100 percent recycled content. The recycled fiber in our book paper is either unbleached or bleached using totally chlorine-free (TCF), processed chlorine–free (PCF), or enhanced elemental chlorine–free (EECF) processes.
More information about the Bank’s environmental philosophy can be found at http://www.worldbank.org/corporateresponsibility.

Ethiopia has long prioritized creating more and better jobs as core to its sustainable and inclusive development. However, steady growth in the gross domestic product and gains in agricultural productivity in recent decades have not translated into better opportunities nor increased earnings for much of the population. The 2021 Labor Force Survey data reveal labor trends since 1999 and underscore these realities. Moreover, COVID-19 and other shocks have reinforced the disconnect between positive macroeconomic trends at a national level and stagnant incomes at the household level
Working Today for a Better Tomorrow in Ethiopia: Jobs for Poor and Vulnerable Households outlines how Ethiopia can leverage its social safety net programs to help poor and vulnerable workers earn more in today’s labor market. The government’s latest development planning policies focus on private sector growth and structural transformation to create more and better jobs. While these long-term reforms take hold, the jobs agenda also must include near-term measures to improve worker productivity in and connect people to jobs that already exist. Complementing cash transfers with capital, training, and other services can help workers earn more in their current work, diversify into new types of employment, or connect to available wage jobs. These investments can have an immediate impact for poor people in Ethiopia while also contributing to sustainable and inclusive development.
ISBN 978-1-4648-2020-5 SKU 212020
