Africa’s Resource Future
Harnessing Natural Resources for Economic Transformation during the Low-Carbon Transition
 Edited by James Cust and Albert Zeufack
AFRICA DEVELOPMENT FORUM

Edited by James Cust and Albert Zeufack
© 2023 International Bank for Reconstruction and Development / The World Bank
1818 H Street NW, Washington, DC 20433
Telephone: 202-473-1000; Internet: www.worldbank.org
Some rights reserved
1 2 3 4 26 25 24 23
This work is a product of the staff of The World Bank with external contributions. The findings, interpretations, and conclusions expressed in this work do not necessarily reflect the views of The World Bank, its Board of Executive Directors, or the governments they represent, or the Agence Française de Développement. The World Bank does not guarantee the accuracy, completeness, or currency of the data included in this work and does not assume responsibility for any errors, omissions, or discrepancies in the information, or liability with respect to the use of or failure to use the information, methods, processes, or conclusions set forth. The boundaries, colors, denominations, and other information shown on any map in this work do not imply any judgment on the part of The World Bank concerning the legal status of any territory or the endorsement or acceptance of such boundaries. Nothing herein shall constitute or be construed or considered to be a limitation upon or waiver of the privileges and immunities of The World Bank, all of which are specifically reserved.
Rights and Permissions
This work is available under the Creative Commons Attribution 3.0 IGO license (CC BY 3.0 IGO) http:// creativecommons.org/licenses/by/3.0/igo. Under the Creative Commons Attribution license, you are free to copy, distribute, transmit, and adapt this work, including for commercial purposes, under the following conditions:
Attribution—Please cite the work as follows: Cust, James, and Albert Zeufack, eds. 2023. Africa’s Resource Future: Harnessing Natural Resources for Economic Transformation during the Low-Carbon Transition. Africa Development Forum. Washington, DC: World Bank. doi:10.1596/978-1-4648-1743-4. License: Creative Commons
Attribution CC BY 3.0 IGO
Translations—If you create a translation of this work, please add the following disclaimer along with the attribution: This translation was not created by The World Bank and should not be considered an official World Bank translation. The World Bank shall not be liable for any content or error in this translation.
Adaptations—If you create an adaptation of this work, please add the following disclaimer along with the attribution: This is an adaptation of an original work by The World Bank. Views and opinions expressed in the adaptation are the sole responsibility of the author or authors of the adaptation and are not endorsed by The World Bank.
Third-party content—The World Bank does not necessarily own each component of the content contained within the work. The World Bank therefore does not warrant that the use of any third-party-owned individual component or part contained in the work will not infringe on the rights of those third parties. The risk of claims resulting from such infringement rests solely with you. If you wish to re-use a component of the work, it is your responsibility to determine whether permission is needed for that re-use and to obtain permission from the copyright owner. Examples of components can include, but are not limited to, tables, figures, or images.
All queries on rights and licenses should be addressed to World Bank Publications, The World Bank Group, 1818 H Street NW, Washington, DC 20433, USA; e-mail: pubrights@worldbank.org
ISBN (paper): 978-1-4648-1743-4
ISBN (electronic): 978-1-4648-1744-1
DOI: 10.1596/978-1-4648-1743-4
Cover photo: © Zbynek Burival / Unsplash.com (https://unsplash.com/photos/GrmwVnVSSdU). License: https:// unsplash.com/license. Used with the permission of Zbynek Burival / Unsplash.com. Further permission required for reuse.
Cover design: Ricardo Echecopar / Beyond SAC; original design by Bill Pragluski, Critical Stages, LLC.
Library of Congress Control Number: 2022919548
The Africa Development Forum Series was created in 2009 to focus on issues of significant relevance to Sub-Saharan Africa’s social and economic development. Its aim is both to record the state of the art on a specific topic and to contribute to ongoing local, regional, and global policy debates. It is designed specifically to provide practitioners, scholars, and students with the most up-to-date research results while highlighting the promise, challenges, and opportunities that exist on the continent.
The series is sponsored by Agence française de développement and the World Bank. The manuscripts chosen for publication represent the highest quality in each institution and have been selected for their relevance to the development agenda. Working together with a shared sense of mission and interdisciplinary purpose, the two institutions are committed to a common search for new insights and new ways of analyzing the development realities of the Sub-Saharan Africa region.
Agence française de développement
Thomas Mélonio, Executive Director, Research and Knowledge Directorate
Hélène Djoufelkit, Director, Head of Economic Assessment and Public Policy Department
Sophie Chauvin, Head, Publications Division
World Bank
Andrew L. Dabalen, Chief Economist, Africa Region
Cesar Calderon, Lead Economist, Africa Region
Chorching Goh, Lead Economist, Africa Region
MAURITANIA CABO VERDE
MALI
NIGER
CHAD
ERITREA SUDAN
GUINEA-BISSAU
SIERRA LEONE
SENEGAL LIBERIA
THE GAMBIA GHANA
BURKINA FASO
GUINEA CÔTE D’IVOIRE
BENIN
NIGERIA TOGO
EQUATORIAL GUINEA
SÃO TOMÉ AND PRÍNCIPE
IBRD 39088 | MARCH 2023
Source: World Bank.
CAMEROON
GABON
SOUTH SUDAN CENTRAL AFRICAN REPUBLIC
REP. OF CONGO
DEMOCRATIC REPUBLIC OF CONGO
ANGOLA
ETHIOPIA
UGANDA KENYA
BURUNDI RWANDA
TANZANIA
MALAWI
COMOROS
Mayotte (Fr.)
NAMIBIA
ZAMBIA
ZIMBABWE
BOTSWANA
SOMALIA
SEYCHELLES
MOZAMBIQUE MADAGASCAR
MAURITIUS
La Réunion (Fr.)
SOUTH AFRICA
ESWATINI
LESOTHO
2023
Africa’s Resource Future: Harnessing Natural Resources for Economic Transformation during the Low-Carbon Transition (2023), James Cust, Albert Zeufack (eds.)
2021
Social Contracts for Development: Bargaining, Contention, and Social Inclusion in Sub-Saharan Africa (2021), Mathieu Cloutier, Bernard Harborne, Deborah Isser, Indhira Santos, Michael Watts
*Industrialization in Sub-Saharan Africa: Seizing Opportunities in Global Value Chains (2021), L’industrialisation en Afrique subsaharienne : saisir les opportunités offertes par les chaînes de valeur mondiales (2022), Kaleb G. Abreha, Woubet Kassa, Emmanuel K. K. Lartey, Taye A. Mengistae, Solomon Owusu, Albert G. Zeufack
2020
*Les systèmes agroalimentaires en Afrique : repenser le rôle des marches (2020), Food Systems in Africa: Rethinking the Role of Markets (2021), Gaelle Balineau, Arthur Bauer, Martin Kessler, Nicole Madariaga
*The Future of Work in Africa: Harnessing the Potential of Digital Technologies for All (2020), L’avenir du travail en Afrique : exploiter le potentiel des technologies numériques pour un monde du travail plus inclusif (2021), Jieun Choi, Mark A. Dutz, Zainab Usman (eds.)
2019
All Hands on Deck: Reducing Stunting through Multisectoral Efforts in SubSaharan Africa (2019), Emmanuel Skoufias, Katja Vinha, Ryoko Sato
*The Skills Balancing Act in Sub-Saharan Africa: Investing in Skills for Productivity, Inclusivity, and Adaptability (2019), Le développement des compétences en Afrique subsaharienne, un exercice d’équilibre : investir dans les compétences pour la productivité, l’inclusion et l’adaptabilité (2020), Omar Arias, David K. Evans, Indhira Santos
*Electricity Access in Sub-Saharan Africa: Uptake, Reliability, and Complementary Factors for Economic Impact (2019), Accès à l’électricité en Afrique subsaharienne : adoption, fiabilité et facteurs complémentaires d’impact économique (2020), Moussa P. Blimpo, Malcolm Cosgrove-Davies
2018
*Facing Forward: Schooling for Learning in Africa (2018), Perspectives : l’école au service de l’apprentissage en Afrique (2019), Sajitha Bashir, Marlaine Lockheed, Elizabeth Ninan, Jee-Peng Tan
Realizing the Full Potential of Social Safety Nets in Africa (2018), Kathleen Beegle, Aline Coudouel, Emma Monsalve (eds.)
2017
*Mining in Africa: Are Local Communities Better Off? (2017), L’exploitation minière en Afrique : les communautés locales en tirent-elles parti ? (2020), Punam Chuhan-Pole, Andrew L. Dabalen, Bryan Christopher Land
*Reaping Richer Returns: Public Spending Priorities for African Agriculture Productivity Growth (2017), Obtenir de meilleurs résultats : priorités en matière de dépenses publiques pour les gains de productivité de l’agriculture africaine (2020), Aparajita Goyal, John Nash
2016
Confronting Drought in Africa’s Drylands: Opportunities for Enhancing Resilience (2016), Raffaello Cervigni, Michael Morris (eds.)
2015
*Africa’s Demographic Transition: Dividend or Disaster? (2015), La transition démographique de l’Afrique : dividende ou catastrophe ? (2016), David Canning, Sangeeta Raja, Abdo S. Yazbeck (eds.)
Highways to Success or Byways to Waste: Estimating the Economic Benefits of Roads in Africa (2015), Rubaba Ali, A. Federico Barra, Claudia Berg, Richard Damania, John Nash, Jason Russ
Enhancing the Climate Resilience of Africa’s Infrastructure: The Power and Water Sectors (2015), Raffaello Cervigni, Rikard Liden, James E. Neumann, Kenneth M. Strzepek (eds.)
The Challenge of Stability and Security in West Africa (2015), Alexandre Marc, Neelam Verjee, Stephen Mogaka
*Land Delivery Systems in West African Cities: The Example of Bamako, Mali (2015), Le système d’approvisionnement en terres dans les villes d’Afrique de l’Ouest : l’exemple de Bamako (2015), Alain Durand-Lasserve, Maÿlis DurandLasserve, Harris Selod
*Safety Nets in Africa: Effective Mechanisms to Reach the Poor and Most Vulnerable (2015), Les filets sociaux en Afrique : méthodes efficaces pour cibler les populations pauvres et vulnérables en Afrique subsaharienne (2015), Carlo del Ninno, Bradford Mills (eds.)
2014
Tourism in Africa: Harnessing Tourism for Growth and Improved Livelihoods (2014), Iain Christie, Eneida Fernandes, Hannah Messerli, Louise Twining-Ward
*Youth Employment in Sub-Saharan Africa (2014), L’emploi des jeunes en Afrique subsaharienne (2014), Deon Filmer, Louise Fox
2013
*Les marchés urbains du travail en Afrique subsaharienne (2013), Urban Labor Markets in Sub-Saharan Africa (2013), Philippe De Vreyer, François Roubaud (eds.)
Enterprising Women: Expanding Economic Opportunities in Africa (2013), Mary Hallward-Driemeier
Securing Africa’s Land for Shared Prosperity: A Program to Scale Up Reforms and Investments (2013), Frank F. K. Byamugisha
The Political Economy of Decentralization in Sub-Saharan Africa: A New Implementation Model (2013), Bernard Dafflon, Thierry Madiès (eds.)
2012
Empowering Women: Legal Rights and Economic Opportunities in Africa (2012), Mary Hallward-Driemeier, Tazeen Hasan
*Financing Africa’s Cities: The Imperative of Local Investment (2012), Financer les villes d’Afrique : l’enjeu de l’investissement local (2012), Thierry Paulais
*Structural Transformation and Rural Change Revisited: Challenges for Late Developing Countries in a Globalizing World (2012), Transformations rurales et développement : les défis du changement structurel dans un monde globalisé (2013), Bruno Losch, Sandrine Fréguin-Gresh, Eric Thomas White
*Light Manufacturing in Africa: Targeted Policies to Enhance Private Investment and Create Jobs (2012), L’industrie légère en Afrique : politiques ciblées pour susciter l’investissement privé et créer des emplois (2012), Hinh T. Dinh, Vincent Palmade, Vandana Chandra, Frances Cossar
*The Informal Sector in Francophone Africa: Firm Size, Productivity, and Institutions (2012), Les entreprises informelles de l’Afrique de l’ouest francophone : taille, productivité et institutions (2012), Nancy Benjamin, Ahmadou Aly Mbaye
2011
Contemporary Migration to South Africa: A Regional Development Issue (2011), Aurelia Segatti, Loren Landau (eds.)
Challenges for African Agriculture (2011), Jean-Claude Deveze (ed.)
*L’économie politique de la décentralisation dans quatre pays d’Afrique subsaharienne : Burkina Faso, Sénégal, Ghana et Kenya (2011), Bernard Dafflon, Thierry Madiès (eds.)
2010
Gender Disparities in Africa’s Labor Market (2010), Jorge Saba Arbache, Alexandre Kolev, Ewa Filipiak (eds.)
*Africa’s Infrastructure: A Time for Transformation (2010), Infrastructures africaines : une transformation impérative (2010), Vivien Foster, Cecilia BriceñoGarmendia (eds.)
Challenges for African Agriculture (2011), Jean-Claude Deveze (ed.)
*Available in French
All books in the Africa Development Forum series that were copublished by Agence française de développement and the World Bank are available for free at https://openknowledge.worldbank.org/handle/10986/2150
In this time of global upheaval and a rapidly changing climate, the economies of Sub-Saharan Africa stand to benefit from vast endowments in natural resources and the transition to a low-carbon economy. Global efforts to decarbonize economies are likely to create demand for 3 million tons of minerals and metals needed to deploy solar, wind, and geothermal energy by 2050. Many of these minerals are founds in abundance across Africa. Africa’s diverse metal and mineral deposits, such as cobalt, copper, lithium, manganese, and platinum, also play an important role in batteries and electronics. The World Bank has been a trusted partner for African countries embarking in the energy transition, supporting them with increased financing committed to renewable energy projects and timely advice on reconciling climate and development goals across economic sectors.
Africa has an opportunity to harness natural resource wealth to accelerate energy access and transition, drive economic transformation and jobs, and generate more fiscal revenues. But how should policy makers make good on this promise and avoid the pitfalls of previous natural resource booms and busts?
The question of good governance is central to Africa’s future. It’s the difference between resources captured today for immediate benefits and resources saved and invested to cushion against future crises; it’s the difference between aging energy infrastructure that fails to meet people’s needs and investing in new sources of energy to meet growing demand; and it’s the difference between wealth for the few and better prospects, living conditions, and resilience for the many.
Although many uncertainties remain, governments can adopt a proactive stance toward global decarbonization, automation, and regional integration by backing steps that will provide economic benefits under different scenarios. The Africa’s Resource Future report aims to lay out actionable policy recommendations in these and other areas.
For example, we know that renewable energy will be part of the energy mix required to meet growing energy demand on the continent along with other forms of energy, like natural gas. Investing in related skills and value chains is a sound choice as countries phase out more polluting fossil fuels to meet their climate commitments.
The African Continental Free Trade Area and greater regional trade and economic integration offer an unprecedented opportunity for developing the mineto-market value chain within the continent, as resource-driven development becomes more feasible with greater access to larger markets and the ability to pool resources, skills, and comparative advantages. Reforming policy measures that currently limit opportunities for regional trade and integration is critical to retain more of the value of natural resources on the African continent.
Finally, this report comes at a time when governments are facing a deteriorating macroeconomic environment rife with inflation and debt distress and struggling to accelerate energy access. Transparency and good governance in the energy and extractives sectors, including appropriate taxation, would go a long way to reverse the track record of past decades to ensure that African citizens reap more benefits from their countries’ underground wealth.
A just transition for Africa, one that places people and the planet at the center, will depend on harnessing the economic benefits of oil, gas, and mineral resources in a responsible manner while preparing the region’s economies for a low-carbon future. Economic transformation and diversification to support resilient economies is the best path toward achieving sustainable and inclusive development, but the contributions from Africa’s natural resources will remain important in the years to come.
Ousmane Diagana Regional Vice President for Western and Central AfricaThe World Bank
Washington, DC
Victoria Kwakwa Regional Vice President for Eastern and Southern AfricaThe World Bank
Washington, DC
This volume is part of the African Regional Studies Program, an initiative of the Africa Region Vice Presidency at the World Bank. This series of studies aims to combine high levels of analytical rigor and policy relevance, and to apply them to various topics important for the social and economic development of SubSaharan Africa. Quality control and oversight are provided by the Office of the Chief Economist of the Africa Region.
The report was edited by James Cust and Albert Zeufack. Its preparation and background research were led by Boubacar Bocoum and James Cust in collaboration with the Office of the Chief Economist of the Africa Region and the Energy and Extractives Global Practice. The report builds on the work of many team members and academics.
Contributors to the report comprise Mamadou Tanou Balde, Gracelin Baskaran, Boubacar Bocoum, Hannah Grupp, Pietro Guj, Pierre Mandon, Justice Mensah, Nneoma Nwogu, Alexis Rivera Ballesteros, Richard Schodde, and Zainab Usman.
The team is grateful for the technical inputs, background research, and expert guidance from Paul Collier, Shanta Devarajan, Clara Galeazzi, Marek Hanusch, Maty Konte, Arthur Mendes, David Mihalyi, Steven Penning, Sven Renner, Thomas Scurfield, Jevgenijs Steinbuks, Rick van der Ploeg, Pierre Louis Vezina, and Rose Camille Vincent.
The following peer reviewers and other experts provided valuable advice and feedback: Kevin Carey, Souleymane Coulibaly, David Mihalyi, Anders Pedersen, Grzegorz Peszko, and Sajjad Ali Shah. Abrah Desiree Brahima, Ken Omondi, and Rose Claire Pakabomba provided valuable assistance throughout the preparation and writing of this book. The team is also thankful for the funding support from the Extractives Global Programmatic Support (EGPS) MultiDonor Trust Fund and the Africa Chief Economist Office.
James Cust is a Senior Economist in the Office of the Chief Economist for the World Bank’s Africa Region. His work focuses on the macroeconomics of natural resources, climate change, and sustainable development. Previously, he led the World Bank’s Changing Wealth of Nations program. He also cofounded a network of African chief economic advisers to 40 African presidents as part of the Chief Economists of Government Initiative (AfricaCEOG.org). Cust’s work has been published in academic journals including the Journal of the European Economic Association, Energy Economics, Climate Policy, and others. His work has been covered in The Economist, Nature, Reuters, the International Monetary Fund’s Finance and Development, and other publications. He was the Director of Research at the Natural Resource Governance Institute; before that he cofounded the Natural Resource Charter. He holds a DPhil in economics from the University of Oxford and a BA in economics from the University of Cambridge.
Albert Zeufack is the World Bank’s Country Director for Angola, Burundi, the Democratic Republic of Congo, and São Tomé and Príncipe. Before that, he was the Chief Economist for the World Bank’s Africa Region (2016–22). Zeufack, a Cameroonian national, joined the World Bank in 1997 as a Young Professional and started his career as a research economist in the macroeconomics division of the research department. Since then, he has held several positions in the World Bank’s Africa, East Asia and Pacific, and Europe and Central Asia Regions. While on leave from the World Bank (2008–12), he served as Director of Research and Investment Strategy / Chief Economist for Khazanah Nasional Berhad, a Malaysian Sovereign Wealth Fund. Zeufack holds a PhD in economics from Centre d’Études et de Recherches sur le Développement International (CERDI, University of Clermont-Ferrand, France) and a master’s degree in economic analysis and policy from the University of Yaoundé (Cameroon).
Mamadou Tanou Balde, Economist Consultant, World Bank
Gracelin Baskaran, Economist Consultant, World Bank
Boubacar Bocoum, Lead Mining Specialist, World Bank
Hannah Grupp, Program Coordinator, World Bank
Pietro Guj, Professor, University of Western Australia
Pierre Mandon, Economist, World Bank
Justice Mensah, Economist, World Bank
Nneoma Nwogu, Senior Counsel, World Bank
Alexis Rivera Ballesteros, Economist Consultant, World Bank
Richard Schodde, Managing Director, MinEx Consulting
Zainab Usman, Senior Fellow and Director, Africa Program, Carnegie Endowment for International Peace
A just transition for Africa will depend on successfully harnessing the economic benefits from oil, gas, and mineral resources while also preparing for a lowcarbon future. Given the extent of natural resource abundance, this wealth can play a central role in economic transformation for Africa’s economic future.
Resource revenues remain a key source of government financing, and in the majority of Sub-Saharan African countries resources dominate the economy. In addition, two decades of major petroleum and mineral discoveries mean that African economies will be utilizing resource wealth for years to come. However, several key megatrends will shape the coming decades for these resource-rich countries and their ability to benefit from commodity exports.
Managing the low-carbon transition. Over time, global decarbonization may lead to significant reductions in demand for Africa’s oil, gas, and coal resources. There may be a marked increase in demand for minerals required for the clean energy transition, such as lithium, cobalt, copper, platinum, manganese, and more, all found across Africa.
Mechanization and the digital transformation. Increasingly widespread automation and digitalization, both in the extractive sector and across the value chain, pose challenges and opportunities for job creation and value addition. Although this automation and digitalization will likely lead to productivity gains, it could also lead to rising capital intensity and lower job creation.
Mitigation of environmental degradation. As new exploration for extractives continues, forested regions may come under additional pressure from economic activity. A low-carbon transition away from fossil fuels may dampen Dutch disease effects in petroleum-exporting forested countries, increasing pressure on the forest from expanding traded sectors such as commercial agriculture.
Managing broader structural challenges. Structural challenges are an inherent part of extraction, and managing them is essential, especially addressing
depletion and obsolescence risks and mitigating human capital distortions, as well as adapting to and minimizing Dutch disease. Given the economic scale of natural resources, they can be a central factor in determining countries’ growth and poverty alleviation success. A central policy issue, therefore, is countries’ ability to manage the complications posed by extractives, particularly as they affect productivity and competitiveness in nonextractive sectors of the economy, which can limit options for economic diversification.
Estimates suggest that 80 percent of proven fossil fuel reserves must remain under the ground to meet Paris Agreement targets (Bos and Gupta 2019). However, the transition from fossil fuels to clean energy is likely to create demand for 3 billion tons of minerals and metals needed to deploy solar, wind, and geothermal energy by 2050. Lithium, cobalt, and vanadium are critical for energy storage, and copper, indium, selenium, and neodymium are essential for manufacturing wind and solar power generators.
Africa’s natural resource wealth remains critical to its economic recovery. About a third of Africa’s stock of wealth is held in natural capital, including nonrenewable petroleum and mineral deposits (World Bank 2021). Furthermore, resource rents are estimated to account for 9 percent of resource-rich Africa’s GDP (World Bank 2021). These endowments place Africa in an excellent position to benefit from the clean energy transition, given that resources such as cobalt, manganese, graphite, and lithium are central to new energy technologies. However, the outcomes will depend on effective policy choices and the ability to attract new investment.
Although resource-rich countries in Sub-Saharan Africa outpaced their nonresource-rich African counterparts in average growth per capita during the most recent boom (2004–14), when commodity prices fell, growth collapsed. The non-resource-rich counterparts, in contrast, were able to sustain their growth in the years following the boom.
Despite the increase in revenue and growth that resulted from the boom, it failed to translate into corresponding levels of poverty reduction. Extreme poverty is increasingly concentrated among Sub-Saharan African countries rich in resources. By 2030, more than 80 percent of the world’s poor are predicted to live in Sub-Saharan Africa, and almost 75 percent of the poor in Sub-Saharan Africa will live in resource-rich countries (Cust, Rivera-Ballesteros, and Zeufack 2022). A staggering 62 percent of the world’s poor are projected to be found in Sub-Saharan African resource-rich economies, up from 13 percent in 2000.
The low carbon-transition has begun. Countries such as the Democratic Republic of Congo, South Africa, and Zambia are already key players, being major producers of copper, platinum, and cobalt, respectively.
Four categories of technologies play a crucial role in the digital transformation of mining and metals: automation, robotics, and operational hardware; a digitally enabled workforce; integrated enterprise, platforms, and ecosystems; and next-generation analytics and decision support.
African countries’ per capita contribution to global climate change remains the smallest of any region. Urgent domestic economic and energy needs also indicate that fossil fuel production and consumption may continue to play a critical role. In particular, natural gas can be a source of export earnings and also a transition fuel deployed alongside renewable energy technologies. However, African governments can leverage global decarbonization to accelerate diversification, building resilience to external shocks and anticipating the decline in fossil fuel markets.
Harnessing value from Africa’s subsoil assets should not come at the expense of the vast renewable natural capital, such as cropland, forests, water resources, and biodiverse ecosystems. However, the depletion of natural resources increased by about 150 percent during the boom. Total forest area fell by 2 percent, declining from an area of about 6.9 million square kilometers in 2004 to about 6.5 million square kilometers in 2014 (World Bank, World Development Indicators 2022).
A just transition for Africa will depend on the countries’ harnessing the economic benefits from oil, gas, and mineral resources while also preparing for a low-carbon future.
Bos, K., and J. Gupta. 2019. “Stranded Assets and Stranded Resources: Implications for Climate Change Mitigation and Global Sustainable Development.” Energy Research & Social Science 56: 101215.
Cust, J., A. Rivera-Ballesteros, and A. Zeufack. 2022. “The Dog That Didn’t Bark: The Missed Opportunity of Africa’s Resource Boom.” Working Paper 1012, World Bank, Washington, DC.
World Bank. 2021. The Changing Wealth of Nations: Managing Assets for the Future Washington, DC: World Bank.
Minerals, oil, and gas account for a third or more of exports from most countries in Sub-Saharan Africa, and can reach similar shares of government revenues. The majority of countries in Sub-Saharan Africa can be categorized as resource rich, with more on the path to reaching this status given two decades of major new discoveries.
Sub-Saharan Africa has large reserves of resources such as oil, gas, and minerals, but has struggled to convert this wealth into sustainable prosperity. During the last commodity price boom, which lasted from 2004 to 2014, economic growth accelerated to record highs in the region’s resource-rich countries. But this prosperity proved to be precarious and dependent on high commodity prices, and few African countries shifted away from being resource-driven economies during this period. Since the decline in commodity prices in 2014, resource-rich Sub-Saharan Africa has grown more slowly than the region’s average growth rate, which is consistent with the “resource curse” hypothesis.
The previous boom and bust in commodity prices in Sub-Saharan Africa resulted in missed opportunities for the region’s resource-rich countries to convert their resource revenues into sustainable, diversified prosperity. This has led to slower economic growth and disappointing progress on poverty reduction. By 2030, it is projected that more than 80 percent of the world’s poor will be in the Africa region, and almost 75 percent of the world’s poor will live in resource-rich countries. As a result, global poverty eradication is becoming disproportionately a challenge faced mostly by resource-rich countries in SubSaharan Africa.
Africa’s natural resource wealth nonetheless harbors significant untapped economic potential. About one-third of the total stock of wealth in Sub-Saharan Africa is held in various forms of natural capital, including nonrenewable petroleum and mineral deposits (World Bank 2021). Sub-Saharan Africa has seen
more major petroleum discoveries since 2000 than any other region of the world, accounting for 50 percent of all giant discoveries in the 2010s (Cust, Rivera-Ballesteros, and Mihalyi 2021). Nevertheless, many mining and petroleum projects remain undeveloped. Buoyant commodity prices, if sustained, could be a major opportunity for new projects and thus for new sources of government revenues.
Harnessing natural resources to drive economic growth is critical to Africa’s future. Subsoil assets such as metals, minerals, oil, and gas remain important sources of government revenue, export earnings, and economic development potential in most African countries. Resource deposits could last decades, with new discoveries happening every year. Resource revenues continue to be a major source of government financing, and in most of Sub-Saharan Africa, resources make up a significant portion of the economy. To better mobilize these revenues for Africa’s economic transformation and achieve sustained growth, there are a series of policy choices that countries in the region should be considering for implementation (see box ES.1).
Capture the full value of resource rents, subject to fiscal terms that attract investment and are robust to changing conditions. World Bank estimates put the rental value at 2.6 times the level of government revenues, on average, with wider variations in specific countries. This implies that citizens are missing out on significant untapped revenues consistent with the same levels of investment, resulting in a substantial subsidy to production. This failure to fully capture rents encourages more fossil fuel production, and therefore more emissions, than would otherwise occur. Mining also results in environmental and social externalities not always fully borne by producers. Better taxation of extractives therefore offers a “double dividend,” for both people and the planet. Much more could therefore be done to invest in fiscal administration and to capture a greater share of resource rents. The international community could also play a supporting role to governments in the region as part of their efforts to mitigate climate change as well as improve development outcomes.
Manage structural challenges and prepare for the next boom-bust cycle. Policy makers in resource-rich countries may have more success working toward asset diversification rather than export diversification. Asset portfolio diversification is an important step toward sustained growth and is more feasible for resource-rich countries to achieve than traditional export diversification because of pressure from Dutch disease (Cust and Rivera-Ballesteros 2021a). The Changing Wealth of Nations 2021 report (World Bank 2021) suggests that targeting asset portfolio diversification—investing in
Box ES.1
the expansion of human and physical capital—instead of export diversification may be a successful policy for sustainable economic growth. This recommendation builds on earlier work (Gill et al. 2014; Peszko et al. 2020) exploring the benefits of portfolio diversification. However, to achieve asset diversification, countries must successfully transform the proceeds from resource extraction into other kinds of productive assets.
Beware the presource curse. Countries need to be mindful of policies that are consistent with managing expectations and ensuring fiscal sustainability, tempering the pressure to borrow and spend ahead of revenues. Discoveries can leave countries exposed if they are not prepared for declining prices. This is especially true where global decarbonization may imply both declining fossil fuel prices in the future and higher variation of natural resource prices due to mismatched supply and demand. Debt distress and sharp resource-induced recessions can cause more economic reversal than the positive value of the boom.
Improve the sustainability of the economy using revenues from the resource sector. To move from negative to positive adjusted net savings, governments need to invest in human capital, including education and health; produced capital, particularly infrastructure; and natural capital such as forests, cropland, and nature-based tourism. Revenues generated from the mining and petroleum sectors can be used to finance these forms of capital.
Support the transition to automation and mechanization. Given the expected decline in mining jobs resulting from mechanization, identifying new ways to increase employment opportunities is critical. The demographic dividend will translate into a sharp increase in the size of the workforce, and harnessing this workforce within the mining sector will require strengthening the foundation of basic education. Creating and implementing skills-development programs aligned with both mechanization and diversified economic activities to absorb the decline in labor demand resulting from mechanization is important. Although mechanization results in substantially higher productivity and revenue, it has a strong impact on local labor dynamics. Governments need to improve educational outcomes for communities around mines and develop a strong foundation in math and the sciences to ensure students are better prepared for a technology-intensive world.
Reconsider plans to implement or increase tariffs related to extractives regional value chains. Under the African Continental Free Trade Area, members must phase out 90 percent of tariff lines over the next 5–10 years, while another 7 percent deemed to be sensitive will get some additional time. As a first point of implementation, this means that no new tariffs should be erected. Countries can go further and seek to minimize new tariffs and reduce existing ones relating to promoting the development of extractives-linked value chains at the regional level across Africa. Unfortunately, much extractive sector policy today is formulated in national rather than regional terms.
Undertake regional harmonization of mining taxes and royalties. Tax harmonization has three components: an equalization of tax rates, a common definition of national tax bases, and uniform application of agreed-on rules (Mansour and Rota-Graziosi 2013). The lack of harmonized tax policy can undermine regional integration, even with the establishment of a customs union, a common market, and a monetary union (IMF 2015). Harmonized tax rates remove tax distortions and prevent competition for capital. Tax competition can foment a race to the bottom, which does not benefit any country given the reduction in tax revenue. Harmonizing tariffs and royalties requires rigid implementation, including coordination and surveillance. A powerful first step would be the creation of a common floor rate.
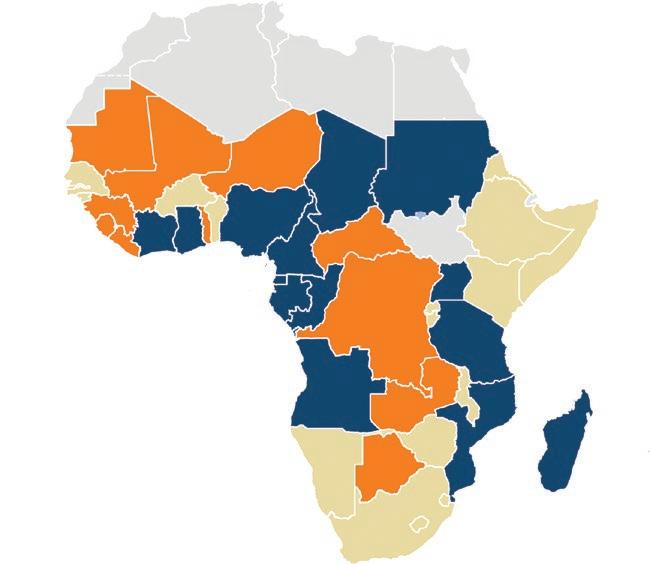
Sub-Saharan Africa has experienced increasing, not declining, resource abundance. Today there are markedly more resource-rich countries in SubSaharan Africa than there were at the turn of the twenty-first century, and the number is trending even higher because of new discoveries every year. By one definition (IMF 2012), the number of resource-rich countries rose from 18 out of 48 before the boom to 26 out of 48 countries by the end of the boom.
Map ES.1 shows the countries categorized as resource rich—a majority of Sub-Saharan Africa countries. This trend was caused by a combination of new discoveries, new production, and rising resource prices that pushed up levels of resource abundance and resource dependence and pulled more countries into this resource-rich grouping. Multiple discoveries in the past four decades have more than doubled the existing oil and gas reserves in the region. In the opposite direction, limited success in diversifying their economies away from resource dependence resulted in few countries exiting this grouping.
Climate change will shift the resource paradigm. Estimates suggest that 80 percent of proven fossil fuel reserves must remain under the ground to meet carbon-reduction targets (Bos and Gupta 2019). The transition from fossil fuels to clean energy is likely to create demand for 3 billion tons of minerals and metals needed to deploy solar, wind, and geothermal energy by 2050 (World Bank 2020a). This low-carbon energy transition will increase demand for many of the resources found in abundance across the region. Lithium, cobalt, and vanadium, for example, are critical for energy storage, and copper, indium, selenium, and neodymium are essential for the production of wind and solar power generators.
Nonetheless, significant untapped potential remains. Africa’s natural resource wealth remains an important part of its economic recovery given its
Fossil fuel rich
Mineral rich
Non-resource rich
North Africa and South Sudan
Source: Based on IMF (2012).
Note: Resource-rich countries are defined in IMF (2012) as low-income, lower-middle-income, or upper-middleincome countries that had either natural resource revenue or exports equating to at least 20 percent of total fiscal revenue or exports, respectively, over the period 2006–10, including countries with identified reserves but where production has not begun or has not reached significant levels. Countries where the main type of natural resource is oil or gas are in blue. Countries where the main type of natural resource is minerals and metals are in orange. South Sudan is not included in the IMF (2012) resource-rich country classification.
deep reserves and untapped investment potential. About one-third of SubSaharan Africa’s stock of wealth is held in various forms of natural capital, including nonrenewable petroleum and mineral deposits, which reached more than US$5 trillion during the boom years (World Bank 2021). Furthermore, resource rents are estimated to account for 9 percent of resource-rich SubSaharan Africa’s GDP (World Bank 2021). However, this figure far exceeds revenues captured by governments, with rents on average 2.6 times higher than revenues. This finding implies that countries may be failing to capture their full share of rents.
Although still relatively underexplored, the African continent already hosts a large proportion of the world’s mineral resources. These endowments place Africa at the center of the clean energy transition, given that resources such as cobalt, manganese, graphite, and lithium are central to clean energy technology.
The legacy from Africa’s commodity price boom and bust was one of missed opportunity. Countries squandered the opportunity available during the boom years, and therefore were poorly prepared for the drop in commodity prices. Many had failed to save and invest a sufficient proportion of resource revenues to grow national wealth via the accumulation of offsetting assets during the boom. As a consequence, the bust period saw collapsing growth and a reversal of economic gains made during the boom. Several resource-rich countries even entered debt crises after 2014. During this bust period (2015–20), there was also a more general pattern of resource-rich countries experiencing slumps in GDP growth, with rates falling below those of the rest of Africa (figure ES.1).
Poverty concentration in resource-rich Sub-Saharan Africa has substantially increased, a trend likely to continue; meanwhile, inequality remains persistent. Despite the increase in revenue that resulted from the boom, extreme poverty is increasingly concentrated among resource-rich Sub-Saharan African countries. Because of the backsliding since the fall in commodity prices beginning in 2015, poverty has been rising again in resource-rich countries. By 2030, more than 80 percent of the world’s poor are forecast to live in the Sub-Saharan
African region, and almost 75 percent of the poor in Sub-Saharan Africa will be located in resource-rich countries (Cust, Rivera-Ballesteros, and Zeufack 2022). In absolute terms, by 2030 the poverty headcount in resource-rich Africa is projected to rise to about 379 million, whereas the count in non-resourcerich Africa is set to fall to less than 120 million. Taken together, a staggering 62 percent of the world’s poor are projected to be found in Sub-Saharan African resource-rich economies, up from 13 percent in 2000. In comparison, by 2030, only 20 percent will be in non-resource-rich African countries (Cust, RiveraBallesteros, and Zeufack 2022).
There has been a failure to facilitate economic diversification. Headline economic performance during the boom was strong but proved unsustainable. This result reflects the overall dominance of the resource sector as a driver of growth, but also implies a failure to translate the boom into broader-based economic prosperity. The starkest evidence for an unsustainable and narrow economic boom was seen in the slump in growth rates following the fall in commodity prices. In the postboom period, annual GDP per capita growth in resource-rich countries was, on average, 2.5 percentage points lower than during the boom, and 1.5 percentage points lower than in non-resource-rich countries in the region (Cust, Rivera-Ballesteros, and Zeufack 2022). Many countries “consumed” the boom.
Unlocking the mining value chain’s economic potential from regional integration and the African Continental Free Trade Area (AfCFTA) is a huge opportunity. The AfCFTA brings together 54 African countries with a total population of more than 1 billion people and a combined GDP of more than US$3.4 trillion (World Bank 2020b). If successfully implemented, it will enable countries to deepen their linkages to regional and global value chains. The AfCFTA established the world’s largest free trade zone and has the potential to unlock an estimated US$3.2 trillion in intra-Africa trade. The AfCFTA offers an unprecedented opportunity to develop the mine-to-market value chain within the continent. Although many countries have prioritized local beneficiation, few have the capacity to wholly undertake it domestically. If implemented effectively, the AfCFTA would allow various countries to specialize in select parts of the value chain, and parts of the value chain could move between participating countries free of tariffs.
Tariff barriers in the extractive sector impeded implementation of the AfCFTA. As countries seek to increase their benefits from the mining sector amid mounting fiscal pressure and high levels of unemployment, many have turned to mineral-based industrialization strategies that include an increase in tariffs or that are at odds with a single-market approach.
Nontariff barriers are adversely affecting the competitiveness of regional mining value chains. Nontariff barriers (NTBs) remain a key roadblock to
actualizing the benefits of the AfCFTA. NTBs are restrictive regulations and procedures, other than tariffs, that increase the difficulty and cost of importing and exporting products. Research by UNCTAD shows that NTBs are at least three times as restrictive as standard customs duties and suggests that African countries would increase GDP by US$20 billion by tackling these NTBs at a continental level. Although article 4 of the AfCFTA Agreement states that “The State Parties shall progressively eliminate tariffs and non-tariff barriers to trade in goods,” research published by Fitch Ratings in 2021 suggests that the removal of NTBs under the AfCFTA is likely to lag behind the agreement’s ambitions, limiting its impact. Transportation and logistics costs are disproportionately high compared with those in other developing countries. According to the UNCTAD (1999) report, in 31 out of 43 Sub-Saharan Africa countries, freight costs on imports are 50 percent higher than the average for developing countries. Likewise, improving access to, and the cost of, electricity infrastructure can strengthen linkage development. Affordable and reliable energy is critical for developing a comparative advantage in manufacturing inputs or processing ores.
Africa’s resource future depends on navigating key megatrends, including the low-carbon transition. Although fully phasing out global oil, gas, and coal markets is likely to take decades, the transition period poses significant, but uncertain, risks for fossil fuel exporters in Africa. On the other hand, demand for metals and minerals could rise to supply the low-carbon economy. For those countries rich in certain metals and minerals, the prospects may be rosier (IEA 2021).
The demand for fossil fuels is expected to significantly decline over the coming decades. Depending on the pace of technological and policy changes, this decline could put permanent downward pressure on fossil fuel prices and threaten African countries’ ability to benefit from their carbon-based resource wealth; they run the risk of becoming stranded nations (Cust, Manley, and Cecchinato 2017). However, price signals from the oil and gas market still support development of many new assets. For the governments and citizens of Africa, the imperative is to be prepared for a range of futures, assuming both more drastic climate action and the curbing of fossil fuel demand in keeping with net-zero commitments called for by the Paris Agreement, but also a more gradual phasing out of oil consumption at the global level. Although little can be done to reduce the “belowground” risk contained in undeveloped and unextracted fossil fuels, many policy choices can increase or decrease the “aboveground” risk exposure. Examples explored in this report include how much state capital is to be invested in nationally owned fossil fuel companies, fossil fuel–linked jobs and industries, or sovereign wealth funds holding fossil fuel company stocks.
The medium- to long-term outlook for mineral exploration and mining on the African continent appears positive. Renewed foreign direct investment
in mineral exploration and development is likely to be boosted by the projected significant growth in demand for minerals from energy technology (World Bank 2020a), fueled by the metal-intensive transition to green energy. Indeed, the mineral demand projections under a 1.5- to 2-degree Celsius temperature constraint scenario represent highly significant increments above an alreadysubstantial projected increase in demand due to continuing growth in world population and its migration to urban areas, seeking ever-increasing living and environmental standards.
Mechanization and digitalization will have profound impacts on productivity and labor. The speed of digital technology adoption in the mining sector is accelerating. Four categories of technologies will play a crucial role in the digital transformation of mining and metals: automation, robotics, and operational hardware; a digitally enabled workforce; integrated enterprise, platforms, and ecosystems; and next-generation analytics and decision support. Firms are choosing to mechanize to maintain profitability amid supply and demand shocks (Baskaran 2021). Mechanization improves cost-competitiveness by increasing productivity, but also reduces jobs. Levels of automation in the region vary. For example, in Southern Africa, Botswana and South Africa have a higher degree of mechanization, whereas Zambia and Zimbabwe still largely rely on labor-intensive mines.
Environmental degradation is accelerating and could get worse. The depletion of natural resources in Sub-Saharan Africa increased by approximately 150 percent during the boom, and in the region’s resource-rich countries, depletion of natural resources increased by more than 190 percent. Total forest area fell by 2 percent, declining from an area of about 6.9 million square kilometers in 2004 to 6.5 million square kilometers in 2014. Nonetheless, Sub-Saharan Africa countries’ per capita contribution to global climate change remains the smallest of any region. African governments can take steps to leverage global decarbonization to accelerate the diversification of their economies, building resilience to external shocks, and anticipating the eventual decline in fossil fuel markets.
The link between resource extraction and forest loss is more complex than clearance that can occur around extraction sites. New research suggests that the amount of resource exports, and consequently the degree of Dutch disease a country experiences, can affect the amount of deforestation. Increased deforestation is driven by the impact on relative prices of resources and agricultural goods in countries where agricultural expansion may encroach on the forest. This mechanism, dubbed “Amazonian disease” by Cust, Harding, and RiveraBallesteros (forthcoming) because it was first measured in Brazil, suggests that falling oil exports or falling oil prices can increase the competitiveness of agriculture in the same country and thus increase the amount of forest loss, as seen, for example, in the period following falling oil prices beginning in 2015. This implies that global decarbonization could weaken the forces of Dutch disease
in oil-exporting countries, and because many countries in Africa are abundant in forests, forest clearance may be accelerated via improving agricultural competitiveness. Given the significant overlap between oil-exporting countries and tropical forests across Sub-Saharan Africa, this could have major unintended consequences as the region decarbonizes without carefully configured policy interventions.
Managing structural challenges will require new policy approaches. The future of African economic transformation depends on the ability to increase productivity and generate jobs and income, including in export-oriented sectors beyond commodity exports. However, achieving these increases under the condition of resource richness has proved to be challenging. There are three primary human capital distortions in resource-rich countries. First, the resource sector reallocates human capital away from some high-productivity sectors. Second, the distribution of human capital between men and women is more unequal in these nonrenewable-resource-rich countries compared with other countries. Third, human capital is skewed toward the public sector in resourcerich countries. These characteristics may contribute to, and be associated with, lower overall worker productivity arising from resource dependence.
Baskaran, G. 2021. “Firms’ Approach to Mitigating Risks in the Platinum Group Metals Sector.” Mineral Economics 34 (3): 385–98.
Bos, K., and J. Gupta. 2019. “Stranded Assets and Stranded Resources: Implications for Climate Change Mitigation and Global Sustainable Development.” Energy Research & Social Science 56: 101215.
Cust, J., T. Harding, and A. Rivera-Ballesteros. Forthcoming. “Tropical Deforestation and Terms of Trade Shocks.” World Bank, Washington, DC.
Cust, J., D. Manley, and G. Cecchinato. 2017. “Unburnable Wealth of Nations.” Finance and Development 54 (1). https://www.imf.org/external/pubs/ft/fandd/2017/03/cust.htm
Cust, J., and A. Rivera-Ballesteros. 2021a. “The Nonrenewable Wealth of Nations.” In Changing Wealth of Nations 2021: Managing Assets for the Future, 193–223. Washington, DC: World Bank.
Cust, J., A. Rivera-Ballesteros, and D. Mihalyi. 2021. “The Economic Effects of Giant Oil and Gas Discoveries.” In Giant Fields of the Decade: 2010–2020; AAPG Memoir 125. American Association of Petroleum Geologists, 21–35.
Cust, J., A. Rivera-Ballesteros, and A. Zeufack. 2022. “The Dog That Didn’t Bark: The Missed Opportunity of Africa’s Resource Boom.” Working Paper 1012, World Bank, Washington, DC.
Fitch Ratings. 2021. “African FTA Growth Impact Too Small to Affect Ratings.” Fitch Ratings, January 7, 2021. https://www.fitchratings.com/research/sovereigns/african -fta-growth-impact-too-small-to-affect-ratings-07-01-2021
Gill, I. S., I. Izvorski, W. van Eeghen, and D. De Rosa. 2014. Diversified Development: Making the Most of Natural Resources in Eurasia. Washington, DC: World Bank.
IEA (International Energy Agency). 2021. “The Role of Critical Minerals in Clean Energy Transitions.” World Energy Outlook Special Report, IEA, Paris. https://www .iea.org/reports/the-role-of-critical-minerals-in-clean-energy-transitions.
IMF (International Monetary Fund). 2012. “Macroeconomic Policy Frameworks for Resource-Rich Developing Countries.” Policy Paper, International Monetary Fund, Washington, DC. https://bit.ly/2txKGzB
IMF (International Monetary Fund). 2015. “Options for Low-Income Countries’ Effective and Efficient Use of Tax Incentives for Investment. Report to the G20 Development Working Group.” IMF, Washington, DC.
Mansour, M., and G. Rota-Graziosi. 2013. “Tax Coordination, Tax Competition, and Revenue Mobilization in the West African Economic and Monetary Union.” Working Paper 13/163, International Monetary Fund, Washington, DC.
Peszko, G., D. van der Mensbrugghe, A. Golub, J. Ward, C. Marijs, A. Schopp, J. Rogers, and A. Midgley. 2020. Diversification and Cooperation in a Decarbonizing World: Climate Strategies for Fossil Fuel–Dependent Countries. Washington, DC: World Bank.
UNCTAD (United Nations Conference on Trade and Development). 1999. “Investing in Transport Is an Investment in Africa’s Future.” Press Release, October 20, 1999. https:// unctad.org/press-material/investing-transport-investment-africas-future
World Bank. 2020a. Minerals for Climate Action: The Mineral Intensity of the Clean Energy Transition. Washington, DC: World Bank Group.
World Bank. 2020b. The African Continental Free Trade Area. Economic and Distribution Effects. Washington, DC: World Bank Group.
World Bank. 2021. The Changing Wealth of Nations: Managing Assets for the Future. Washington, DC: World Bank.
AfCFTA African Continental Free Trade Area
AIF ASEAN Infrastructure Fund
AMLA African Mining Legislation Atlas
ASEAN Association of Southeast Asian Nations
DT digital transformation
EITI Extractive Industries Transparency Initiative
EV electric vehicle
GDP gross domestic product
ILO International Labour Organization
IMF International Monetary Fund
LCP local content policy
LDCs least-developed countries
NTB nontariff barrier
OECD Organisation for Economic Co-operation and Development
RECs regional economic communities
SADC Southern African Development Community
SMEs small and medium enterprises
SOE state-owned enterprise
UNCTAD United Nations Conference on Trade and Development
WTO World Trade Organization
All dollar amounts are US dollars unless otherwise indicated.
Africa is blessed with significant wealth in natural resources. The continent is home to an abundance of resources, including diamonds, gold, oil, natural gas, uranium, platinum, copper, cobalt, iron, bauxite, and silver, among others. Minerals, oil, and gas account for a third or more of exports from most countries in Sub-Saharan Africa and can reach similar shares of government revenues. The majority of countries in Sub-Saharan Africa (26 out of the 48 countries in the region defined by the World Bank) are now categorized as resource rich according to the International Monetary Fund definition (IMF 2012), with more on the path to reaching this status given recent discoveries.
Despite large and growing reserves, converting subsoil wealth into sustainable prosperity has met with limited success. During the last commodity price boom, lasting from about 2004 to 2014, resource-rich countries saw economic growth accelerate, rising by an average of 1 percentage point compared with earlier years. This was, however, short-lived, with growth rates slowing with falling commodity prices from 2015—on average, 2.5 percentage points lower than during the boom. The boom years were a golden decade of rising revenues and new investments, but this prosperity proved precarious and dependent on high commodity prices. Few African countries shifted away from resource-driven economies during this period. Since the decline in commodity prices in 2014, resource-rich Africa has grown more slowly than the region’s average growth rate, a finding consistent with the “resource curse” hypothesis.
The legacy of the previous boom and bust was one of missed opportunity, where significant resource revenues were generally not converted into sustainable, diversified prosperity. This poor growth record is matched by disappointing
progress on poverty reduction. By 2030, more than 80 percent of the world’s poor will be found in the Africa region, and almost 75 percent of the world’s poor will be located in resource-rich countries. Taken together, 62 percent of the world’s poor will be found in Sub-Saharan African resource-rich countries. Poverty eradication is therefore becoming a disproportionately resource-rich country and Africa region problem.
Sub-Saharan Africa’s natural resource wealth nonetheless holds significant untapped economic potential. About one third of Sub-Saharan Africa’s total stock of wealth is held in various forms of natural capital, including nonrenewable petroleum and mineral deposits (World Bank 2021). In petroleum, Sub-Saharan Africa has seen more major discoveries since 2000 than any other region of the world, accounting for 50 percent of all giant discoveries in the 2010s. Before the boom period there were 14 petroleumproducing countries (7 major and 7 minor producers). After the boom period, the number of petroleum producers increased to 22 (10 major and 12 minor producers).
Nevertheless, many mining and petroleum projects remain undeveloped. Some languish after years of investment delays and complications, while many more deposits have yet to see firm investment commitments. Buoyant commodity prices, if sustained, could be a major opportunity for new projects and thus for new sources of government revenues.
Harnessing natural resource wealth to drive economic transformation is central to Africa’s economic future. Subsoil assets such as metals, minerals, oil, and gas remain key sources of government revenues, export earnings, and development potential across the majority of countries in the Africa region (AfDB 2018). Resource revenues remain a key source of government financing, and in the majority of Sub-Saharan African countries resources dominate large shares of the economy. Between 2004 and 2014, natural resource revenues accounted for about 26 percent of total government revenues in Africa and 30 percent of government revenues in resource-rich countries in Africa (UNU-WIDER 2022).
The extractive sector is well placed to support the economic recovery phase that the Africa region now faces. COVID-19 (coronavirus) and the associated debt challenges in many African countries highlighted the need to mobilize increased domestic revenues. To achieve national development goals, as well as Agenda 2030,1 it will be essential for resource-rich countries to find ways to avoid the pitfalls of the last boom-and-bust cycle, and to effectively harness resources for sustainable and inclusive development.
Several key megatrends will shape the coming decades and resource-rich countries’ ability to benefit from commodity exports. This period will require resilience, not just to commodity price cycles, but to other external shocks and structural changes.
Managing the low-carbon transition. Over time, global decarbonization may lead to significant declines in demand for Africa’s oil, gas, and coal resources. The timing and scale remain uncertain, however. Meanwhile, there may be a marked increase in the demand for minerals required for the clean energy transition, such as lithium, cobalt, copper, platinum, and manganese, many of which are found in abundance across Africa.
A just transition for Africa will depend on the countries’ harnessing the economic benefits from oil, gas, and mineral resources while also preparing their economies for a postpetroleum future. Economic transformation and diversification, alongside significant progress on poverty alleviation, is the best path to achieving this development vision.
Mechanization and the digital transformation. Increasingly widespread automation and digitalization, both in the extractive sector and throughout parts of the value chain, pose new challenges but also opportunities for job creation and value addition. Although this automation and digitalization will likely lead to productivity gains, it could also lead to rising capital intensity and lower job creation. Countries may need to reconsider how best to derive benefits from the sector, particularly in the context of high population growth.
Mitigation of environmental degradation, which has run rampant amid accelerating deforestation. As new exploration for extractives continues, forested regions may come under additional pressure from economic activity. Furthermore, a low-carbon transition away from fossil fuels may dampen Dutch disease effects in petroleum-exporting forested countries, increasing pressure on the forest from expanding traded sectors such as commercial agriculture. Managing broader structural challenges that are an inherent part of extraction, notably addressing depletion and obsolescence risks, mitigating human capital distortions, and minimizing Dutch disease. Resource-rich countries are becoming increasingly numerous in the region, and this trend will continue at least in the short term. Thus, core poverty-alleviation and growth challenges will center on countries’ ability to manage the complications posed by extractives, particularly as they affect productivity and growth in nonextractive sectors of the economy. This is a hurdle for the majority of countries in Sub-Saharan Africa.
Four main policy messages emerge from the findings in this report. Governments must grapple with these challenges, drawing insights from both the successes and failures of resource-rich countries around the world.
First, harness the full value of resources for development. This means taxing the sector effectively to capture a greater share of rents without deterring sufficient investment. It also implies investing these revenues into the economy to accumulate productive capital in the form of infrastructure, an educated workforce, and a healthy, productive environment including land, water, and forests. Doing so will help ensure that growth rates are robust and will help countries avoid the resource curse. Capturing a greater share of resource rents also implies
reducing any implicit subsidy to production and thereby lowering global emissions. This is particularly important when taxing fossil fuels: capturing more revenues for government ensures a double dividend for both development and the climate.
Second, manage expectations to ensure fiscal sustainability. Avoiding the presource curse, where countries can find themselves in debt distress or facing low growth even before production of resources begins, means tempering the pressure to borrow and spend ahead of revenues. Discoveries have been found to unleash powerful forces that can shape policy but leave countries exposed if they are not prepared for declining prices. This risk is especially true where global decarbonization may imply both declining fossil fuel prices in the future and higher variation in all kinds of natural resource prices because of mismatched supply and demand.
Third, embrace megatrends such as regional integration, the low-carbon transition, and mechanization and digitalization in the resource sector, as opportunities to break with the past. These megatrends explored in this report offer new horizons for Africa’s resource-rich economies. How the next two decades evolve will largely be a function of whether policy makers are able to navigate these trends effectively, while learning the lessons of the past. New trends mean new winners and new losers. They therefore put a premium on policy decisions that can find new ways to leverage resource wealth. This includes embracing regional integration to eliminate tariff and nontariff barriers in favor of building new regional value chains and country specialization, rather than doubling down on nationally defined local content and beneficiation. It also includes making the investment environment more responsive to ensure countries can capture market share for metals, minerals, and even fossil fuels such as natural gas, that may experience more demand during the low-carbon transition. It may also mean leveraging gradual mechanization and automation of the resource sector to improve productivity, while investing in a skilled and educated workforce that is not dependent on some of the lower-skilled jobs that may be displaced. Change brings challenge, but there is reason to be optimistic that many of these trends can work in favor of Africa’s resource-rich economies.
Fourth, navigate a development path consistent with the pressures of Dutch disease. This means that conventional export-led diversification may prove challenging while resources make up a major share of the economy. Instead, countries should seek to invest in assets rather than in traded sectors. Wealth accounting can help guide these choices. This strategy calls for investing in assets that can be useful to many sectors of the economy—such as power, transport, educated workers, and a sustainable environment. Dutch disease also implies that forests may be protected as long as resource exports remain high. Accelerating global decarbonization may therefore endanger tropical forests in Sub-Saharan Africa as declining fossil fuel demand weakens Dutch disease, and the agriculture sector
may become increasingly competitive. Policy makers in Africa should be mindful of, and prepare to mitigate, the so-called Amazonian disease, in which declining export value of petroleum may lead to more deforestation (Cust, Harding, and Rivera-Ballesteros, forthcoming). This implies that the global low-carbon transition may have unanticipated consequences and challenges.
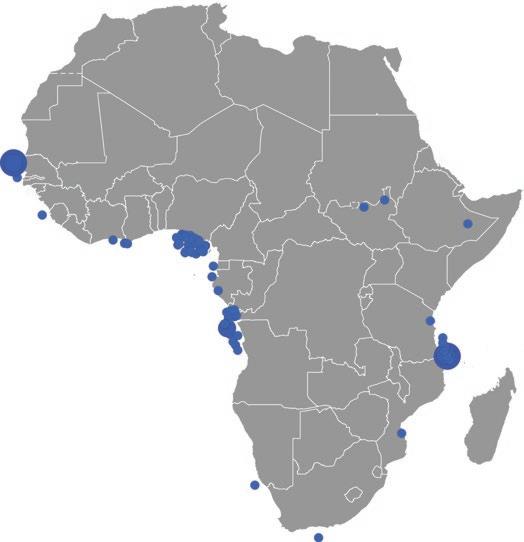
Today there are markedly more resource-rich countries in Sub-Saharan Africa than there were at the turn of the twenty-first century, and the number is trending even higher because of new discoveries every year. By one definition (IMF 2012), the number of resource-rich countries rose from 18 out of 48 before the boom to 26 out of 48 countries during and after the boom. Map O.1 shows the countries categorized as resource rich, which is a majority of Sub-Saharan African countries.2 This trend was caused by a combination of new discoveries, new production, and rising resource prices pushing up levels of resource abundance. Figure O.1 illustrates how multiple discoveries in the past four decades have more than doubled the existing oil and gas reserves in the region. (Most giant oil and gas fields have been discovered offshore, while metal and mineral deposits have been discovered throughout the continent; see map O.2 for oil and gas and map O.3 for metals and minerals.) In the opposite direction, limited success in diversifying their economies away from resource dependence resulted in few countries exiting this grouping. If the same IMF condition is applied to regions using aggregated values, Sub-Saharan Africa and the Middle East and North Africa would be considered the world’s two resource-rich regions (figure O.2).
A high level of resource abundance often translates into significant revenues for government to manage. Governments are designated as the custodians of subsoil wealth on behalf of citizens, and therefore a significant portion of the proceeds from resource extraction must accrue to government on this basis. Some countries in Sub-Saharan Africa have received as much as 80 percent of their revenues from natural resource extraction. The regional average is one of the highest in the world, reaching almost 30 percent of government revenues from resources during the 2004–14 commodity price boom. Resources also constitute a significant share of exports in Sub-Saharan Africa, exceeding 50 percent of export value during the last boom (figure O.2). In both cases the region ranks second in the world behind the Middle East and North Africa.
As the world moves away from fossil fuels, abiding by the commitments it made under the Paris Agreement, the subsoil wealth of African economies may be
Map O.1 Resource-Rich Countries in Sub-Saharan Africa during the Commodity Price Boom
Fossil fuel rich
Mineral rich
Non-resource rich
North Africa and South Sudan
Source: Based on IMF 2012.
Note: Resource-rich countries are defined in IMF (2012) as low-income, lower-middle-income, or upper-middleincome countries that had either natural resource revenue or exports equating to at least 20 percent of total fiscal revenue or exports, respectively, over the period 2006–10, including countries with identified reserves but where production has not begun or has not reached significant levels. Countries where the main type of natural resource is oil or gas are in blue. Countries where the main type of natural resource is minerals and metals are in orange. South Sudan is not included in the IMF (2012) resource-rich country classification.
at risk. Estimates suggest that 80 percent of proven fossil fuel reserves must remain under the ground to meet targets (Bos and Gupta 2019). On the other hand, the transition from fossil fuels to clean energy is likely to create demand for 3 billion tons of minerals and metals needed to deploy solar, wind, and geothermal energy by 2050 (World Bank 2020a). This low-carbon energy transition will increase demand for many of the resources found in abundance across the region. Lithium, cobalt, and vanadium, for example, are critical for energy storage, and copper, indium, selenium, and neodymium are essential for the production of wind and solar power generators.
On a promising note, research on trade elasticity shows that Sub-Saharan African hydrocarbon producers face lower demand import elasticity compared
with the rest of the world, which implies that hydrocarbons have the potential to remain an important source of export revenues over the short to medium term. However, because global oil and gas demand may begin to decline permanently as the global energy transition progresses, Sub-Saharan
producing countries will need to adapt to new market conditions and anticipate the challenges ahead. For the moment, however, they still have some time
manage an orderly transition away from fossil fuels and use revenues to
economic diversification.
On the other hand, the same evidence points to limited historical supply elasticity among African minerals producers, implying that African economies
500–2,500 MMBOE (giant)
2,500–4,999 MMBOE (giant)
5,000–25,000 MMBOE (supergiant)
25,000–49,999 MMBOE (supergiant)
≥50,000 MMBOE (megagiant)
Source: Based on Cust, Rivera-Ballesteros, and Mihalyi 2021. Note: MMBOE = million barrels of oil equivalent, a unit used to measure the size of an oil or gas deposit discovery. The locations of the discovered fields are approximated; therefore, the location accuracy may vary and could be greater than one degree.
may need to improve the investment responsiveness and enabling environment to capture the maximum upside from increasing demand for metals and minerals. Failure to do so runs the risk that other regions will capture market share and new investments.
Africa’s natural resource wealth remains an important part of its economic recovery given its deep reserves and untapped investment potential. Approximately one-third of Africa’s stock of wealth is held in various forms of natural capital, including nonrenewable petroleum and mineral deposits (World Bank 2021). Furthermore, resource rents are estimated to account for 9 percent of resource-rich Africa’s GDP (World Bank 2021). However, this figure exceeds
Bauxite
Cobalt
Copper
Gold
Graphite
Iron
Lithium
Nickel
PGE


Uranium
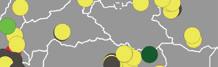


Zinc
Zircon


captured government revenues by 2.6 times, implying that countries may be failing to capture their full share of rents.3
Although still relatively underexplored, the African continent already hosts a large proportion of the world’s mineral resources. These minerals include, besides precious platinum group elements (59 percent of total world resources) and diamonds (48 percent), a dominant position in ferroalloy metals such as cobalt (75 percent), manganese (68 percent), graphite (59 percent), and undeveloped resources of lithium (Guj et al., forthcoming). These endowments place Africa at the center of the clean energy transition, given that resources such as cobalt, manganese, graphite, and lithium are central to clean energy technology.
Current production levels still lag in a number of African countries, despite their having some of the world’s largest resource endowments. For example, graphite, which is one of the most important components of lithium batteries, is relatively underexploited in several Sub-Saharan African countries,


a. Fossil fuel and metals and minerals as a share of total merchandise exports, 2004–14
Source: Cust, Rivera-Ballesteros, and Zeufack 2022.
Note: Panel a shows the 2004–14 average of fossil fuels, metals, and minerals exports as a share of each region’s total merchandise exports. Panel b shows the 2004–14 average of natural resource revenues as a share of total government revenues. This share is calculated as the 2004–14 average of the sum of natural resource revenues of all countries with nonmissing data for each region, divided by the region’s sum of total government revenues (resource plus nonresource revenues). The dashed blue line in each panel denotes the International Monetary Fund criteria for resource richness (natural resource revenue or exports at least 20 percent of total fiscal revenue or exports, respectively) applied to the boom period.
particularly Tanzania. Despite having the fifth-largest reserves in the world, Tanzania was ranked twenty-first in global graphite production in 2018. In comparison, India (with half of Tanzania’s reserves) and Norway (with 30 times smaller reserves) are ranked sixth and eighth in production, respectively.
The region’s abundant mineral deposits also offer significant exploration opportunities. Sub-Saharan African countries are still relatively unexplored compared with other regions of the world (McKinsey 2013). In 2017, the total number of active mineral exploration sites in Africa was estimated at 282, approximately half the number of sites as in Australia and Canada, despite the region having more than triple the surface area.
A driving factor behind the disproportionately low number of active mines is the level of exploration expenditures in Sub-Saharan Africa. Despite being the most profitable region in exploration terms, with the value of discoveries as a ratio of exploration costs of about 0.8, Sub-Saharan African countries’ mining exploration spending between 2007 and 2016 was lower than that in any other region (Schodde 2017). Sub-Saharan Africa’s ratio of 0.8 is significantly higher than Australia’s (0.5), Canada’s (0.6), or Latin America’s (0.3). Although Africa has rich endowments, between 2009 and 2018, it only attracted 14 percent of the world’s total exploration expenditure (US$10 billion of US$140 billion spent in the world).
Globally, exploration expenditures declined substantially after the last commodity boom. Exploration expenditure declined by 58 percent, from US$34.9 billion in 2012 to US$11.2 billion in 2016 (Schodde 2019). This decline largely resulted from heightened uncertainty within the commodities sector. The outlook for exploration investment in the medium term is more positive, given that commodity prices have increased significantly because of new infrastructure programs in countries such as China and the United States coupled with momentum from the clean energy transition.
Oil has accounted for more than 30 percent of total wealth in Sub-Saharan African resource-rich countries, including Chad, the Republic of Congo, and Gabon; however, this is still significantly less than in some resource-rich comparators outside Africa, where average oil wealth can exceed 50 percent (World Bank 2021). There are both major producers, defined as those that produce an average of more than 100,000 barrels per day, and minor producers, those that average less than 100,000 barrels per day of production. Before the boom period there were 14 petroleum-producing countries (7 major and 7 minor producers) in Africa. After the boom period, the number of petroleum producers increased to 22 (10 major and 12 minor producers). Figure O.3 shows that during the 2004–14 commodity boom the largest share of giant petroleum discoveries was concentrated in Sub-Saharan Africa, which led to an increase in petroleum production in the region.
Major new discoveries of oil and gas have the potential to transform many Sub-Saharan African economies; however, not all discoveries move quickly into production. Research points to three challenges countries have faced (Mihalyi and Scurfield 2021). First, discoveries did not always proceed to generate production and national wealth. So far, only 8 out of 12 countries that found large oil and gas deposits have had finds that have proved to be commercially viable. The initial finds in the other four countries—Guinea-Bissau, Liberia, São Tomé and Príncipe, and Sierra Leone—turned out to be dry wells or of low value and were abandoned. Second, the time from discovery to effective production and exploitation has been longer than expected. The initial forecast of the discoveryto-exploitation process was estimated to be 6.2 years for the 12 Sub-Saharan African countries, reevaluated to 11 years, on average. For example, oil fields (Block 1, Block 2, and Block 3) in Uganda are now projected to be exploited between 15 and 17 years after discovery, a significant increase over the 3 to 5 years in initial forecasts. Third, there is a major shortcoming in mobilization of forecasted revenue. In the 3 Sub-Saharan African countries that reached production, receipts collected were 63 percent lower than initially projected.
Policy makers have significant new opportunities to harness the untapped resource potential in Africa. By supporting clear and consistent approaches to sector policies, they can promote new investment to capture upside potential from new discoveries and exploration.
First, capture the full value of resource rents, subject to fiscal terms that attract investment and are robust to changing conditions. World Bank estimates put the rental value at 2.6 times the level of government revenues, on average, with wider variations in specific countries. This implies not only that citizens are missing out on significant untapped revenues consistent with the same levels of investment, but also that a significant subsidy is provided to production. This is bad for both countries and, in the case of subsidizing petroleum extraction, the climate. Capturing the full value of fossil fuel extraction will move closer toward imposing the true social cost of petroleum extraction, thus helping reduce global emissions.
In practice some combination of royalties and taxes on profits, or equivalent nontax instruments, can be used to ensure maximum and efficient rent capture for the government and its citizens. Countries should avoid and minimize tax incentives and design fiscal terms that can feasibly be administered and monitored, avoiding unnecessary complexity. Making fiscal terms robust to changing conditions, such as price cycles, also reduces the need, and pressure, to revise them frequently in response to external factors.
Second, set clear and consistent fiscal and social agreements in law, rather than negotiating them contract by contract, to help create policy stability, thereby promoting investment. For example, in 2020, 72 percent of mining firms surveyed through the Fraser Institute stated that uncertainty regarding the administration, interpretation, and enforcement of existing regulations was a mild deterrent, strong deterrent, or a reason that they would not pursue investment in South Africa (Yunis and Aliakbari 2020).
Third, develop policies that help ensure firms internalize their social and sustainability costs from exploration to mine and well closure. A primary reason that governments develop policies that can be perceived as punishing resource companies is because of the substantial negative externalities resource firms generate, historically and at present, including pollution, health consequences for workers and communities, infrastructure damage, and irreversible land damage. These costs should ideally be covered by the firms that profit from resource exploration. However, these costs should be built into legislation and the agreements that firms and governments enter into so that there is also policy clarity and stability, as discussed in the previous recommendation.
Fourth, strengthen the governance and transparency of the sector. Various governance frameworks have been developed that provide useful benchmarks for policy makers to measure themselves against. Adoption of frameworks such
as the Natural Resource Charter and the Extractive Industries Transparency Initiative (EITI) can help countries enhance disclosure and policy practices. The EITI standard requires information along the extractive value chain, including extraction, rent transfer, and how it benefits the public. Widespread adoption of the EITI, as well as accompanying standards such as routine contract disclosure, can reduce information asymmetry and help develop a mechanism to promote trust and collaboration. Other norms can be pursued that promote competition and transparency, such as budget transparency, debt transparency, competitive license allocation processes, open procurement, and reforms to the governance of national resource companies.
The experiences of different economies during Africa’s last commodity price boom-and-bust cycle can yield insights relevant to today’s policy makers. Rising commodity prices once again put Africa’s resource wealth at the center of economic decisions, and how these choices are made will determine the outcomes for a generation of Africans.
The previous commodity price boom from 2004 to 2014 was a huge economic opportunity for African countries abundant in oil, gas, and minerals. During this period, government revenues swelled and economic growth also rose considerably. Resource-rich countries saw, on average, economic growth during the boom years that was almost 1 percentage point higher than before the boom, driven by resource exports and increased government revenues (figure O.4). However, even during these bountiful times, economic development was largely confined to the resource sector. Once GDP growth contribution from the expanding resource sector is subtracted, overall economic performance was not significantly higher than in the rest of Africa.
The legacy of the boom was that countries squandered the opportunity, and therefore were poorly prepared for the drop in commodity prices. Many had failed to save and invest a sufficient proportion of resource revenues to grow national wealth via the accumulation of offsetting assets during the boom. As a consequence, the bust period saw collapsing growth and a reversal of economic gains made during the boom. Several resource-rich countries even entered debt crises after 2014. During this bust period (2015–20) there was also a more general pattern of resource-rich countries experiencing slumps in GDP growth, with rates falling below those of the rest of Africa (figure O.4).
The boom itself created a set of major public policy challenges. First, high prices meant significant revenues would accrue to government, which, in turn, implied that “big government” in some form was hard to avoid.
Government, as the constitutionally designated resource owners, had to attempt to capture the full value of resources on behalf of citizens while also efficiently managing state-owned resource companies and production shares. Second, government had to maximize these revenues from the sector in a way that was also consistent with inward investment into the sector, for example, to take advantage of the geologic potential and new discoveries being made. Third, they had to ensure those revenues were put to good use, fulfilling urgent development needs and longer-term investment goals for sustaining prosperity. Finally, they needed to ensure the economy was protected from the harmful effects of resource dependence, ranging across hazards such as Dutch disease (Corden and Neary 1982), price and revenue volatility, corruption, conflict, and profligacy.4
Chapter 2 finds that there was a broad failure to translate the boom into broader-based economic prosperity via investment in other parts of the economy. The starkest evidence for an unsustainable and narrow economic boom was seen in the slump in growth rates following the fall in commodity prices. In the postboom period, annual GDP per capita growth in resource-rich countries was, on average, 2.5 percentage points lower than during the boom, and 1.5 percentage points lower than in non-resource-rich countries in the region (Cust, Rivera-Ballesteros, and Zeufack 2022).
Despite the disappointments of the previous boom, making use of resource wealth effectively remains central to the development trajectories of most
of Africa. The rise in revenues and growth was sizable during the boom, and harnessing these revenues effectively can determine whether nonresource growth increases, and whether poverty levels fall. With commodity prices now rising, the economic fate of resource-rich countries may once again depend on how governments respond to this opportunity.
Although resource-rich countries in Sub-Saharan Africa outpaced their nonresource-rich Sub-Saharan African counterparts in average growth per capita during the boom, it was the non-resource-rich counterparts that sustained modestly positive growth in the years following the boom. Almost by definition, an increase in demand and prices for a country’s commodities will lead to a surge in resource sector GDP. During the boom, resource-rich countries in SubSaharan Africa also experienced some growth beyond the extractive industry, owing partially to development in backward and forward linkages, including construction, transport and logistics, and services. In fact, nonresource GDP growth rates exceeded 3 percent per year during the boom, but this rate was not significantly higher than the levels in non-resource-rich Africa.
However, a crucial question for countries trying to avoid the so-called resource curse is whether they can sustain higher rates of growth across the cycle in commodity prices. In other words, can they enable the nonresource economy to achieve a higher growth path, sustaining it into the bust and beyond. Research for this report shows that resource-rich countries have performed suboptimally. Although resource-rich countries grew modestly faster than the rest of the region during the boom, growth following the boom was far lower. Further, the slump was not limited to the resource sector; nonresource sector GDP growth slumped concurrently. This outcome could be partially due to the overdependence of other sectors on the resource sector, implying that a strategy based on economic linkages alone may expose the country to additional risk, as opposed to a strategy that promotes economic diversification.
This picture of economic concentration and dependence on natural resources is clearly found in wealth accounts as well. Higher commodity prices during the boom increased rents and raised the overall level of wealth across human capital, natural capital, and produced capital. The Changing Wealth of Nations report (World Bank 2021) finds additional evidence that resource-rich African countries did not use this boost in natural wealth to invest in other assets during the boom. Therefore, wealth plummeted when the boom ended. Wealth per capita, which was declining before the boom in many resource-rich African countries, had an outstanding annual growth rate during the boom—but fell back to negative growth when the boom ended. In comparison, on average, non-resource-rich African countries started and followed similar wealth growth rates before and during the boom, but were spared declining wealth as a result of less resource
dependence and more diversified economies. Declining wealth per capita in some resource-rich African countries points to a fundamentally unsustainable economic trajectory, where eventually GDP will be affected by a depleting asset base unless countries can raise the rate of investment into their economies.
Despite the increase in revenue that resulted from the boom, extreme poverty is increasingly concentrated among resource-rich Sub-Saharan African countries (figure O.5). As a result of the backsliding since the fall in commodity prices beginning in 2015 and the COVID-19 pandemic, poverty has been rising again in resource-rich countries. By 2030, more than 80 percent of the world’s poor are forecasted to live in the Sub-Saharan Africa region, and almost 75 percent of the poor in Sub-Saharan Africa will be located in resource-rich countries (Cust, Rivera-Ballesteros, and Zeufack 2022).5 In absolute terms, by 2030 the poverty headcount in resource-rich Africa is projected to rise to about 379 million, while the count in non-resource-rich Africa is set to fall to below 120 million (figure O.6). Taken together, a staggering 62 percent of the world’s poor are projected to be found in Sub-Saharan African resource-rich
Source: Calculations based on data from Lakner et al. (2021) and other staff estimates.
Note: The projected poverty headcount at US$1.90 a day reflects the impact of COVID-19 (coronavirus). The figure uses 2011 international prices. Data after 2020 corresponds to projected estimates. RR = resource rich; SSA = Sub-Saharan Africa.
Source: Cust, Rivera-Ballesteros, and Zeufack 2022. Note: The figure shows the number of people living on less than US$1.90 a day. Projected data start after 2020, and missing historical poverty data were filled using linear interpolation with the available data. RR = resource rich; SSA = Sub-Saharan Africa.
economies, up from 13 percent in 2000. In comparison, by 2030, only 20 percent will be in non-resource-rich African countries (Cust, Rivera-Ballesteros, and Zeufack 2022). Although numerically there remain significant numbers of people living in extreme poverty outside Sub-Saharan Africa, eradicating extreme poverty globally cannot be achieved without major progress within the region, and particularly within resource-rich countries such as the Democratic Republic of Congo and Nigeria.
Inequality also remains pervasive in resource-rich countries. Even the government revenue bonanza from the commodity price boom was not sufficient to reduce inequality in almost half of resource-rich Africa. In fact, most resource-rich countries for which Gini data are available (10 out of 18), including Mozambique, Tanzania, and Zambia, saw worsening inequality by 2014 compared with 2003, measured by an increase in their Gini coefficients. Mechanization can contribute to this worsening inequality, as the returns on the increasingly capital-intensive process accrue to capital rather than to labor. However, some resource-rich countries did manage to improve equality, including Botswana and Uganda (figure O.7). For instance, from its independence to the boom period, Botswana succeeded in converting its natural resource rents for use in enrolling the population 25 years old and older in secondary schooling. These successful public policies to convert resource endowments
Source: Based on World Bank Poverty and Inequality Platform data (https://pip.worldbank.org/home). Note: The figure presents the Gini index in 2014 or the closest year with reported value minus the Gini index in 2004 or closest year with reported value. Orange bars correspond to fossil-fuel-rich countries, and red bars correspond to mineral-rich countries according to IMF (2012). A decrease in the Gini coefficient indicates an improvement in the income equality of a country’s population. RR = resource rich; SSA = Sub-Saharan Africa.
into human capital may partly explain the positive dynamics in poverty and inequality alleviation during the boom period. The failure to reduce inequality was similar to non-resource-rich economies that did not enjoy the same surge in growth and revenues during this period.
Headline economic performance during the boom was strong but proved unsustainable. This result reflects the overall dominance of the resource sector as a driver of growth, but also implies a failure to translate the boom into broader-based economic prosperity. The starkest evidence for an unsustainable and narrow economic boom was seen in the slump in growth rates following the fall in commodity prices. In the postboom period, annual GDP per capita growth in resource-rich countries was, on average, 2.5 percentage points lower than during the boom, and 1.5 percentage points lower than in non-resource-rich countries in the region (Cust, Rivera-Ballesteros, and Zeufack 2022).
Policy makers sought to capitalize on the boom to translate investment and revenues into broader economic transformation, including boosting the growth of manufacturing exports and other nonresource sectors of the economy. This economic diversification agenda, with a focus on export diversification, was a popular economic objective during this period. However, there was little change in the overall sectoral composition of exports of resource-rich economies beyond a boost in the resource sector and a squeezing of agricultural exports.
Evidence shows that 11 of 23 resource-rich countries in Sub-Saharan Africa saw increasing economic concentration.6 Countries such as Chad, the Democratic Republic of Congo, and Zambia saw higher ratios of resource GDP to nonresource GDP by the end of the boom. In contrast, Botswana, Nigeria, and 10 other resource-rich countries managed to reduce economic concentration. For example, in Botswana, manufacturing’s contribution to GDP increased from 6 percent in 2004 to 8 percent in 2014.
A key tenet driving economic sustainability from resource wealth is to use the opportunity created by a boom to promote a more diversified economy. Although many countries actively pursued diversification strategies during their respective resource booms, the record of success is poor. The majority of resource-rich Sub-Saharan African countries (14 of 24 included in the export diversification index) saw increased export concentration (Cust, RiveraBallesteros, and Zeufack 2022). For example, Chad and Sudan saw increased export concentration, while Tanzania and Uganda were able to diversify exports. This rising export concentration in the resource sector is not unique to Africa. First modeled by Corden and Neary (1982), the phenomenon has become popularized as the Dutch disease.
The process of resource extraction has a first-order effect of reducing a country’s overall wealth by depleting the stock of nonrenewable, finite natural capital. However, countries may use the proceeds from this depletion to accumulate other forms of capital, such as building physical infrastructure, or investing in human capital via improvements in education and the health care of citizens. Meanwhile, the stock of natural capital can also increase because of rising prices applied to the remaining resource base, or new discoveries, some occurring as part of the discovery-by-extracting process.
During the boom decade, the total wealth stocks in resource-rich countries in Africa generally increased; that is, including price effects, the total value of a nation’s stock of human wealth, productive capital, and natural assets rose. The total wealth stocks during this period rose by an average of US$4,000 per person for Sub-Saharan Africa. Countries such as Botswana and Namibia
added more than US$20,000 per person to their total national wealth during this period (Cust, Rivera-Ballesteros, and Zeufack 2022). Still, additional wealth per capita does not necessarily translate into improved inequality; despite its national wealth gains, Namibia’s income inequality remains the second worst in the world.
One of the key determinants of sustainable natural resource management is the accumulation of assets to replace a depleting asset. Known as Hartwick’s rule (Hartwick 1977), this principle states that economic sustainability rests on replacing a nonrenewable natural asset with an alternative productive asset to offset depletion. This alternative asset can take the form of physical capital, financial capital, or human capital.
A useful metric with which to evaluate how well a country is accumulating these offsetting assets is the rate of adjusted net savings, calculated and published by the World Bank. Resource-rich countries face the risk of negative rates of adjusted net savings given the high levels of asset depletion associated with resource extraction. The implied rate of capital accumulation rises with the rate and value of the depleting asset; put another way, these countries need to save and invest proportionately more because their revenues are coming from asset depletion.
Unfortunately, during the boom the relationship between resource wealth, measured as rents as a share in GDP, and the rate of adjusted net savings failed to be positive, and in some cases was negative, particularly among fossil-fuel-rich countries. This is shown in figure O.8. In Africa, many countries with the most depletion (proxied by rents) saw low and negative rates of net saving, meaning they were running down the overall stock of assets in the country, and instead consuming a large share of this value. Such a pattern means countries brought forward consumption at the expense of future GDP, effectively reducing the available assets for future generations.
Analysis in World Bank (2019) shows that the largest reasons for negative adjusted net savings in the Southern Africa region is not depletion but depreciation. As mining becomes more capital-intensive, it absorbs a large part of national savings for investment to offset depreciation. And the more capital that is invested, the more assets are depreciated and the more savings are needed for investment to maintain the assets. However, that higher level of investment had not been forthcoming. Instead, many countries consumed the boom.
Investments in human and physical capital can improve adjusted net savings and reduce both poverty and inequality amid mechanization. Mining has become an increasingly capital-intensive process, and thus, the majority of returns accrue to capital. Investments in human capital, particularly education and skills, and physical capital, particularly infrastructure, can create an enabling environment for more diversified industries and create a more productive and healthier workforce.
The boom gave resource-rich countries the opportunity to mobilize economic resources to build better institutions that could secure revenue savings to protect them from price shocks given commodity market volatility. However, evidence shows that those countries missed this opportunity and instead, some indicators of institutional quality tumbled. A comparison of Worldwide Governance Indicator dimensions between resource-rich and non-resource-rich African countries shows that, on average, the latter performed much better than their resource-rich peers. The data show that perceptions of voice and accountability and rule of law declined during and after the boom in resource-rich countries. Meanwhile, the other four dimensions (control of corruption, government effectiveness, regulatory quality, and political stability) made limited progress in resource-rich African countries compared with non-resource-rich ones (figure O.9). The largest difference between the two groups resides in the perception of control of corruption.
Within resource-rich countries some countries performed worse than others. In some mineral-rich countries, including the Central African Republic,
where minerals have exacerbated rent-seeking behaviors, the six governance dimensions dropped. At the same time, there are mineral- and oil-rich countries that have slightly improved their good governance measures. For example, although starting from a low base, Angola, Liberia, and Sierra Leone have lifted their six dimensions since the end of the boom, led by better political stability and absence of violence, and improved voice and accountability. On the other hand, countries such as Botswana and Ghana have consistently performed well.
The “presource curse” hypothesis, first documented in Africa during the recent resource boom, highlights the risks faced by countries with recent major resource discoveries (Cust and Mihalyi 2017). This research finds that some countries with major discoveries have experienced “expectations booms” followed by growth disappointments. Figure O.10 illustrates that growth in countries with weaker institutions had worse outcomes compared with IMF growth forecasts after a giant hydrocarbon discovery. Meanwhile, access to Eurobond markets for many Sub-Saharan African countries has created new opportunities to issue sovereign debt at commercial rates and leverage resource wealth to do so.
Source: Cust and Mihalyi 2017. Note: IMF = International Monetary Fund.
commodity price uncertainty as well as project delays, such borrowing can increase the risk of debt unsustainability (Ruzzante and Sobrinho 2022), particularly if investment is not efficiently allocated to boost growth.
The hypothesis of overoptimistic expectations for citizens has been tested for hydrocarbon discoveries in 35 Sub-Saharan African countries between 2002 and 2015. Using Afrobarometer data surveys, Cust and Mensah (2020) use a difference-in-differences strategy and provide evidence of a 1- to 12-month postdiscovery overoptimism by citizens regarding macroeconomic conditions and improvements to standards of living (figure O.11), especially when the degree of democratization is low, suggesting that enhanced political institutions and better administration could help manage expectations. More precisely, Mihalyi and Scurfield (2021) examine what actions governments might take to reduce the risk of delay and failure, helping governments to live up to citizen expectations. They indicate that (a) reforms to licensing and company selection processes for
Source: Cust and Mensah 2020.
Note: Each point estimate shows the effect of discoveries on expectations (regarding economic conditions or living standards) estimated separately for the respective time window on the horizontal axis, where expectations equal 1 when survey respondents expect at least better economic or living conditions, and 0 otherwise. Vertical bars depict 95 percent confidence intervals.
extracting resources could help improve development prospects of discoveries, (b) reforms to regulatory norms and negotiation processes could help reduce delays to operationalization, and (c) reforms to tax mobilization and incentives related to discoveries might be key to ensuring fiscal sustainability and statefinancing capacity in a resource-rich context.
The past commodity boom together with unfulfilled expectations has heightened pressures around resource nationalism and protectionist policies. Some countries have experienced political pressure for contract renegotiation or the ratcheting up of fiscal terms. Others have experienced delayed and halted projects, creating uncertainty about when or if production will begin. Evidence from the 2004–14 boom shows that some countries may have missed the opportunity to convert their resource wealth into productive assets, while others failed to use the proceeds well.
Although the bust phase following a period of higher sustained commodity prices has obvious downsides for resource-rich countries, even the boom period can introduce serious macroeconomic risks into the economy if not managed carefully. For example, during a boom, government and private sector economic choices can be distorted, leading to misallocation or worse. Examples of distortions include the effect of Dutch disease, where resource exports can cause a contraction of traded sectors such as manufacturing. Booms can also lead to an increase in government revenues, resulting in spending that might crowd out the private sector, or distort the labor market, such as through increased salaries for government officials (Cust and Balde, forthcoming; Devarajan et al. 2013). This report finds that Dutch disease (Corden and Neary 1982) can also impact the forest by crowding out agriculture, and human capital by tilting spending to resource and government sectors. This carries additional risks for resource exporters.
New research suggests that in resource-rich countries, optimal fiscal policy depends on the exchange rate regime, where an optimal fiscal policy would be procyclical if the country has a floating exchange rate. Mendes and Pennings (2020) suggest that, contrary to the standard policy advice of saving during price windfalls and spending during price busts, the optimal fiscal policy will depend on whether a country has a floating or fixed exchange rate regime.
However, resource exuberance can also drive increased borrowing and spending that can lead to growth disappointments and, in some cases, macrofiscal crises (the presource curse, discussed earlier). Commodity cycles can also drive unsustainable procyclical fiscal policy, which can create challenges due to increasing macroeconomic volatility, depress investment in real and human capital, hamper growth, and harm the poor (Manasse 2006; Serven 1998; World Bank 2001). In extreme cases, procyclicality can encourage additional government borrowing and indebtedness during the boom-bust cycle. Some governments borrow during the boom, on top of the increased resource revenues they
are receiving. Also, countries may choose to collateralize debt against their resources, either in the form of guaranteed future revenue streams or in-kind deals in which the creditor is repaid in barrels of oil or tons of minerals. This type of activity led to a rise in public debt in resource-rich countries, especially in oil-rich countries, when the commodity boom ended (figure O.12).
During the 2004–14 boom period, governments saw large increases in their fiscal space, derived in part from the receipts from resource taxation. For example, at least eight Sub-Saharan African countries obtained revenues from natural resources equating to, on average, more than 10 percent of their GDP during the boom—a significant fraction by both regional and global standards (Cust, Rivera-Ballesteros, and Zeufack 2022). Many chose to use this time to undertake significant expansions of public service provision, such as educational enrollment, as well as increased infrastructure investment. For example, according to the IMF’s Investment and Capital Stock Dataset, public investment in physical assets, including economic infrastructure, such as roads and airports, and social infrastructure, such as hospitals and schools, rose from roughly an average of US$200 per capita during the preboom period (1998–2003), to an average of more than US$435 per capita during the boom, and US$270 after the boom in resource-rich countries in Africa.
Similarly, annual spending on health services rose from 4.6 percent of GDP to 4.9 percent, on average, and expenditure on education rose from an average of 2.8 percent of GDP before the boom to 3.5 percent of GDP after the boom (Cust, Rivera-Ballesteros, and Zeufack 2022).
Rising debt and record-high commodity prices are tempting many developing countries to pledge their natural resources to secure the financing they so urgently need. However, evidence on resource-backed loans calls for caution and points to hidden risks (Rivetti 2021). Research recently analyzed a sample of 30 resource-backed loans extended to central governments and state-owned enterprises (SOEs) in Sub-Saharan Africa from 2004 to 2018—totaling US$46.5 billion, or nearly a tenth of the continent’s new borrowing during this period. Despite the size of the loans, little information was available on their terms (Mihalyi et al. 2022).
Resource-backed loans are not necessarily cheaper than unsecured loans. Chad, for example, restructured its loan with Glencore in 2015, but was still paying an all-in cost of more than 8 percent on its fully collateralized loan before restructuring it again in 2018. First, the borrower taking on a resourcebacked loan usually has limited market access or limited funding sources. Second, given the complexity of these transactions, borrowers may not fully understand the implications of contract terms when negotiating them. These risks are compounded by the lack of transparency and government accountability.
The region is facing severe debt risks. The largest SOEs are often in the resource sector and carry debt of macroeconomic significance in several countries in the region. Many oil sector SOEs are looking to grow their upstream activities via state resources, generally in the form of additional borrowing. However, these are risky bets in light of the energy transition megatrend and uncertainty about future demand for fossil fuels. Many governments are also looking to borrow for petroleum processing, storage, transportation, and marketing and local value addition in mining. Unfortunately, much of the SOE debt, like resource-backed sovereign lending, is opaque and likely on cost terms. There is, however, some progress toward a culture of greater debt transparency in Sub-Saharan Africa and globally.
The policy toolkit for managing natural resource wealth must account for lessons from recent country experience, as well as be equipped to face emerging megatrends. The resource sector still holds great potential. New discoveries, promising geology, and positive demand projections for minerals and metals all point to a key role for resources in the next two decades. However, the legacy of the previous boom and bust suggests that countries need to focus more heavily
on sustainable use and transformation of resource wealth to ensure this opportunity is not squandered.
Beware the presource curse. Countries need to be mindful of policies that are consistent with managing expectations and ensuring fiscal sustainability. Avoiding the presource curse, where countries can find themselves in debt distress or facing low growth even before production of resources begins, means tempering the pressure to borrow and spend ahead of revenues. Discoveries have been found to unleash powerful forces that can shape policy but leave countries exposed if they are not prepared for declining prices. This is especially true where global decarbonization may imply both declining fossil fuel prices in the future and higher variation in all kinds of natural resource prices because of mismatched supply and demand. Getting it wrong carries a heavy price, where debt distress and sharp resource-induced recessions can cause more economic reversal than the positive value of the boom.
Improve the economic sustainability of the economy using revenues from the resource sector. To move from negative to positive adjusted net savings, governments need to invest in human capital, including education and health; produced capital, particularly infrastructure; and natural capital such as forests, cropland, and nature-based tourism. Revenues generated from the mining and petroleum sectors can be used to finance these forms of capital.
Shift policy considerations from exploitation to asset stewardship. Sustainable use of natural resources requires that overall national wealth rise, including stocks of natural capital, to safeguard the prosperity of future generations as well as the environment. A positive adjusted net savings is one step toward this goal, but mitigating the harmful impact of resource extraction on the environment and agriculture will also help ensure that overall levels of natural capital are rising, not falling, in resource-rich African countries. Furthermore, a shift to accounting for revenues from depleting natural assets as an asset rather than an income stream can help ensure they are invested in the future, not earmarked for recurrent consumption. Managing resource wealth for the future will require new consideration of the sustainability of public finances and economic growth. Wealth accounting provides means for policy makers to look beyond GDP, and to consider the wealth portfolio, asset diversification, and sustainable development driven by resource wealth.
Increase disclosure of resource-backed loans to improve value for money and protect countries. It is imperative that the details of resource-backed loans be made public. Some governments have begun to take important steps in that direction (Maslen and Aslan 2022). The Democratic Republic of Congo, for example, has published contracts involving resource-backed loans between its state-owned mining companies and a consortium of Chinese companies and with a large commodity trader. To encourage more progress, countries should put in place legal requirements for disclosure of loan contracts.
The African Continental Free Trade Area (AfCFTA) brings together 54 African countries with a total population of more than 1 billion people and a combined GDP of more than US$3.4 trillion (World Bank 2020b). If successfully implemented, it will enable countries to deepen their linkages to regional and global value chains.
The rise of regional and global value chains, in which the production process is disaggregated into specialized components, has opened a window of opportunity for developing countries to join the global market even where their contribution is only via individual parts of the production process. This division of labor allows countries to engage in specialized tasks within the value chain without having to cost-competitively produce the entire value chain. Free trade agreements are crucial to making regional and global value chains profitable because they allow the various production components to come together without added tariffs along the way. Regional clustering and specialization can further unlock economies of scale by pooling resources, skills, and expertise beyond often-small national markets. Currently, only 16 percent of international trade by African countries is traded between African countries. The AfCFTA established the world’s largest free trade zone and has the potential to unlock an estimated US$3.2 trillion in intra-Africa trade. On January 1, 2021, the AfCFTA became operational.
The AfCFTA offers an unprecedented opportunity to develop the mine-tomarket value chain within the continent. The mining sector is well-positioned to have a demonstration effect. The AfCFTA unlocks the potential to promote mineral value addition and beneficiation on the continent, which increases sectoral productivity and the overall value of exports. The value chain—from the manufacturing of intermediate inputs such as machinery (backward linkages), to the actual extraction of minerals, through to the processing phase (forward linkages)—can rarely be accomplished by a single country because of skills, infrastructure, and capital constraints, among others. Although many countries have prioritized local beneficiation, few have the capacity to wholly undertake it domestically. If implemented effectively, the AfCFTA would allow various countries within the continent to specialize in a select part of the value chain and move them free of tariffs between participating countries, enabling the entire value chain to come together competitively within Africa.
However, many of the policy measures in the extractive sector limit opportunities for regional trade and integration. Progress on the AfCFTA and a
move toward greater regional trade will require governments to be proactive in bringing resource sector restrictions in line with regional approaches. Examples include widespread adoption of local content policies (LCPs) and export restrictions that favor the domestic market over the African Union market. Similarly, tariff and nontariff barriers make it hard for regional clusters to develop and break into global value chains.
Chapter 3 of the report identifies key tariff, nontariff, and policy barriers that are undermining the development of Africa’s comparative advantage. It brings together data, a review of recent legislation, and national and firm-level case studies to provide an understanding of the depth of these barriers and how they are inhibiting linkage development, which hampers job creation, exportled growth, and increased participation in global value chains. It also provides a prioritized list of short- and long-term recommendations to mitigate barriers to stimulate intracontinental value chain development.
As countries seek to increase their benefits from the mining sector amid mounting fiscal pressure and high levels of unemployment, many have turned to mineral-based industrialization strategies that include an increase in tariffs or that are at odds with a single-market approach. The AfCFTA’s Schedule of Tariff Concessions includes the following:
• Elimination of tariffs on 90 percent of goods over a 5-year period, starting in 2020 (10 years for least developed countries, or LDCs).
• An additional 7 percent of tariff lines are deemed “sensitive.” Tariffs on these goods will be eliminated over a 10-year period (13 years for LDCs).
• The remaining 3 percent of tariff lines can be excluded from liberalization, but the value of these goods cannot exceed 10 percent of total intra-Africa imports.
Hesitancy in reducing tariffs can often be due to fears of loss of domestic revenue but may overlook the upside benefits. An analysis by the United Nations Conference on Trade and Development (UNCTAD) using the Global Trade Analysis Project computable general equilibrium model shows that if all tariffs are fully eliminated in the AfCFTA, the tariff revenue loss will amount to US$4.1 billion, equivalent to 9.1 percent of current revenue. But the upside is substantial. Long-term simulations show significant welfare gains of US$16.1 billion (after deducting the US$4.1 billion in tariff revenue losses); GDP is expected to grow by 0.97 percent; and total employment will increase by 1.2 percent. Intra-Africa trade is forecasted to grow by 33 percent, and the continent’s total trade deficit would be cut by half. Employment in the mining
sector would remain stagnant because production is capital-intensive, and additional production will not affect employment levels. But employment in every other sector of the economy is forecast to grow, with manufacturing experiencing the largest amount of growth (figure O.13). This expected growth of employment in manufacturing is aligned with the AfCFTA’s goal of structural transformation and industrialization (Saygili, Peters, and Knebe 2018). The growth of some sectors, such as machinery, mineral products, petroleum and coal, and metals, is reflective of the development of backward and forward linkages with the mining sector.
Regional harmonization efforts have been undermined by national policies. Burkina Faso, Côte d’Ivoire, Guinea, and Mali provide one example. Although export levies were harmonized at 3 percent among the four countries, implementation has not been even. On paper, there is no reason for exporters to choose a shipping base on the basis of a more advantageous tax jurisdiction, given that they all should be the same. However, Mali’s system has left a large loophole: the 3 percent is only applied to the first 50 kilograms of gold per month (Martin and Helbig de Balzac 2017); after that, the remaining weight is exported tax free. Thus, a significant amount of gold originating in each of these countries is being exported via Mali. The attempt at regional harmonization has given way to increased challenges and tension between countries, as well as a heightened risk of smuggling (Martin and Helbig de Balzac 2017).
Nontariff barriers (NTBs) remain a key roadblock to actualizing the benefits of the AfCFTA. NTBs are restrictive regulations and procedures, other than tariffs, that increase the difficulty and cost of importing and exporting products. Research by UNCTAD shows that NTBs are at least three times as restrictive as standard customs duties and suggests that African countries would increase GDP by US$20 billion by tackling these NTBs at a continental level. Although article 4 of the AfCFTA Agreement states that “The State Parties shall progressively eliminate tariffs and non-tariff barriers to trade in goods,” research published by Fitch Ratings in 2021 suggests that the removal of NTBs under the AfCFTA is likely to lag behind the agreement’s ambitions, limiting its impact. It notes, “The impact of the East African Community customs union, for example, has been limited by a lack of integration and removal of non-tariff barriers, despite its 15-year history” (Fitch Ratings 2021).
Transport and energy deficiencies are key NTBs that inhibit resource-based industrialization. To capture the magnitude of these challenges, consider that shipping a container from China to Beira, Mozambique, costs US$2,000, but transporting that same container from Beira to Malawi, a distance of 500 kilometers inland, costs US$5,000. Access to electricity remains scarce and unreliable, making the cost of doing business high. In Malawi, where the container has gone, 61 percent of households are not connected to an electric grid.
Transportation and logistics costs in Sub-Saharan African countries are disproportionately high compared with other developing countries, and undermine intraregional trade. Africa’s landmass is larger than the sum of China, Europe, India, and the continental United States, but its 82,000-kilometer rail network is marginally larger than the sum of France and Germany’s. Much of its rail infrastructure has been poorly maintained and 16 percent is entirely nonoperational. In 2016, Africa’s share in global ton-kilometers of rail freight was just 2 percent. Ports are unable to meet demand; on average, cargo waits nearly three weeks in Sub-Saharan Africa, which is more than in Asia, Europe, and Latin America, where it can take less than a week. Handling costs are 50 percent higher than in other parts of the world. The majority (80–90 percent) of freight is transported by road, but road density is one of the lowest in the world, at 27 kilometers of road per 10,000 people. Just 28 percent of the continent’s 2.8 million kilometers of road are paved. An analysis conducted by the IMF in 2019 shows that bringing the quality of Sub-Saharan Africa’s infrastructure up to the global average would increase continental trade by 7 percent (IMF 2019). Transportation costs have not improved significantly over time. Between 2005 and 2014, the difference between transport costs in Africa and other regions has increased, reaching twice as much as in developed economies.
High transport and logistics costs result from a range of factors, including poorly developed and undermaintained physical infrastructure, lack of regional and international transport connectivity, inefficient logistics services, mutual distrust among operators, cartels of transport providers, freight-sharing schemes, and poor access to shipping services. There is also a particularly extreme lack of infrastructure in Central Africa, which, by extension, is a key barrier to connectivity between North, East, West, and Southern Africa.
Landlocked countries face a particularly large disadvantage. According to the latest EITI reporting (2020), the extractive sector accounts for 77 percent of exports in Zambia. However, over time, the cost profile of the average Zambian mine has worsened because of aging mines, high transport costs, and new taxes, leading to a loss of profitability. Transport costs have added 40 percent to the cost of the product because accessing ports—including Beira, Dar es Salaam, Durban, Lobito, and Walvis Bay—is challenging. Further exacerbating infrastructure challenges, landlocked countries are also burdened by fuel price increases.
Mining, as an energy-intensive sector, requires 24-hour, steady, baseload power. The mining sector is the biggest user of energy in most countries. For example, in South Africa, the mining sector consumes approximately 30 percent of the country’s annual power generation for both mining and smelting activities. For health and safety, access, and production reasons, mines must have guaranteed access to power.
The mining sector is often reliant on state-owned utility companies and may face poor-quality generation, transmission, and distribution infrastructure (Cudennec and Kiwelu 2021). Sub-Saharan Africa’s Doing Business score for getting electricity7 is the lowest in the world—50.4 on a 100-point scale, compared with 85.9 in Organisation for Economic Co-operation and Development (OECD) high-income countries, 75.1 in East Asia and Pacific, and 71.7 in Latin America and the Caribbean. The cost of electricity in Africa is the highest of any region in the world—more than 3.5 times as much as the next highest, South Asia; more than five times higher than in East Asia and Pacific; and more than 7 times higher than in Latin America and in the Middle East and North Africa.
Improving access to, and the cost of, electricity infrastructure can strengthen linkage development. Affordable and reliable energy is critical for developing a comparative advantage in manufacturing inputs or processing ores. Power outages can lead to equipment damage, production downtimes, and processing delays and make it difficult to meet deadlines required by export customers. Steep increases in energy costs can have a considerable impact on the ability of mines to remain open.
Many Sub-Saharan African countries have implemented policies, such as export bans and local content targets, to support broader socioeconomic goals. These policies seek to increase domestic value addition, create jobs, generate revenue for the government, or facilitate diversified growth. Though these policies are well-intended, experience continentally and globally suggests that they have often failed to deliver on their goals. These policies can also undermine the development of competitive regional value chains. This summary explores the use of export restrictions, LCPs, local employment restrictions, tariffs, and NTBs and discusses how they are affecting the implementation of the AfCFTA. Mitigating policy impediments can help strengthen the implementation of a regional approach that brings together comparative advantages and increases continental value addition.
Since 2009, the number and extent of export restrictions on raw commodities in Sub-Saharan Africa has increased. The OECD global database includes 79 countries that export raw minerals and metals. All but one of the 19 SubSaharan African countries included in the database had some type of restriction on exporting raw minerals and metals in 2020. Map O.4 shows the types of export restrictions by country. All of these countries used multiple export restrictions, but when looking at the most restrictive measure, eight had export bans, eight charged export taxes, and two had nonautomatic licensing. Over time, a number of countries have implemented stricter export restrictions. In aggregate, the number of countries imposing export restrictions on raw minerals and metals in Sub-Saharan Africa varied between 17 and 19 since 2009, but there was a deepening in the severity of the restrictions. In 2009, 26.3 percent of countries used export bans compared with 42.1 percent in 2020.
Sub-Saharan African countries have often used primary commodity export bans to support domestic economic development goals. Although many SubSaharan African countries have significant mineral and metal deposits, processing capacity remains limited because of insufficient infrastructure, skills shortages, and a lack of adequate financial, technical, and human capital. Nevertheless, countries have used export restrictions to stimulate the development of forward linkages and increase domestic value addition.
LCPs are designed to enable countries to maximize domestic benefits from foreign direct investment by expanding local participation. As mining becomes increasingly capital-intensive, larger returns tend to accrue to capital. Given the constraints many Sub-Saharan African countries face, mining largely relies on foreign capital and foreign skills, which means that much of the income
Source: Based on Trade in Raw Materials Database, OECD 2020.
Note: Color coding is indicative of severity of restriction and not of the number of restrictions. Countries in gray have no data.
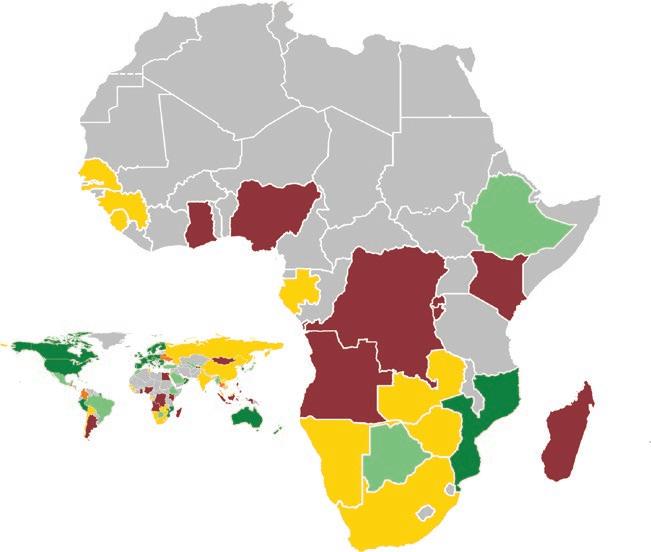
generated will accrue to foreigners rather than to the country owning the natural resources. Thus, policy makers view LCPs as an important avenue for widening the distribution of benefits generated by the mining sector.
The objective of local direct employment policies is to increase the quantity and quality of local employment in mining operations. If successful, they can create new local jobs, grow and develop the skills of the national workforce, and advance efforts to improve gender equality and social inclusion. One of the key challenges to achieving successful outcomes is a shortage of skilled labor. To address this issue, many countries have implemented training requirements for mining companies to increase the supply of skilled labor. There are two types of local employment policies.
• Regulatory approaches, which typically result in prescriptive, “stick”-based policies, are generally mandatory and rely on strong compliance mechanisms and include the following:
❍ Mandated local employment percentages, often different for different types of jobs
❍ Requirements to conduct training of locals or support training facilities
❍ Required succession, or localization, plans
❍ Visa restrictions on foreign workers
❍ Mandated employment of indigenous people, women, or disadvantaged groups
• Facilitative approaches, which typically result in incentives-based “carrot” policies, offer support and incentives for the development and employment of local workers and include the following:
❍ Preferences in the awarding of mining contracts
❍ Nonbinding requirements to hire locals (for example, “to the extent possible”)
The African Mining Legislation Atlas (AMLA) is a platform that aims to promote transparency, accessibility, and comparison of Africa’s mining laws; facilitate the preparation, revision, and implementation of mining laws; provide a living database that will catalyze research and policy debates on legal and regulatory issues; and promote the development of local legal expertise and mining laws. It can help to assess policies relating to (a) employment and training and (b) procurement of local goods and services.
A small handful of countries have no LCP focusing on employment and training, but the majority have between 1 and 4. There are some clear outliers: Gabon has 7, Chad has 8, Kenya and Tanzania have 9 each, and Zambia tops the list with 12. There is a wide array of employment and training LCPs. Some countries have more investor-friendly approaches, while others heavily favor domestic workers.
When it comes to local procurement, the vast majority of countries have very facilitative approaches, generally suggesting that local goods and services be procured if available. Only a few countries have more than two LCPs relating to local procurement. Similar to the employment and training category of LCPs, Kenya with 7, Tanzania with 7, and Zambia with 10 had the most, and five countries had explicit quotas.
Identify new ways to harness employment against the backdrop of mechanization. Governments need to step in to improve educational outcomes for communities around mines and develop a strong foundation in math and the sciences to ensure students are better prepared for a technology-intensive world. Mining firms could provide apprenticeships to students to train them for high-skill jobs that the mining sector requires in the context of the fourth industrial revolution.
Foster skills development programs for diversified economic activities and to develop local suppliers. A suitably skilled workforce needs to be developed for other industries that absorb high amounts of low-skilled labor, and local suppliers need to be trained to enhance a domestic mining technology and service market.
Short term: Reconsider plans to implement or increase tariffs. Under the AfCFTA, members must phase out 90 percent of tariff lines over the next 5–10 years, while another 7 percent, deemed to be sensitive, will get some additional time. Three percent will be allowed to be placed on an exclusion list. More than 80 percent of countries have already submitted their tariff reduction schedules. As a first point of implementation, this means that no new tariffs should be erected.
Medium term: Undertake regional harmonization of mining taxes and royalties. Tax harmonization has three components: an equalization of tax rates, a common definition of national tax bases, and uniform application of agreed-on rules (Mansour and Rota-Graziosi 2013). The lack of a harmonized tax policy can undermine regional integration, even with the establishment of a customs union, a common market, and a monetary union (IMF 2015). Harmonized tax rates remove tax distortions and prevent competition for capital. Tax competition can foment a race to the bottom, which does not benefit any country given the reduction in tax revenue. Harmonizing tariffs and royalties requires rigid implementation, including coordination and surveillance. A powerful first step would be the creation of a common floor rate.
Implementation of harmonized tariffs and regulations requires data and strong institutions that have coordination and enforcement capabilities. Establishing and regularly updating an online tax database that provides comprehensive data on national tax structures can be useful for understanding disparities. It would also offer a source of accountability because it publicly identifies countries that are deviating from regional efforts. This database should be complemented by financing and building the capacity of a regional institution that can provide training to national governments, coordinate forums and meetings to ensure continued dialogue, and enforce harmonization policies.
Challenges exist with such regional institutions. For example, the West African Economic and Monetary Union had not provided its regional institution with the requisite resources to effectively carry out surveillance (IMF 2016).
Short term: Undertake a mapping of key regional trade patterns to identify areas for strengthening infrastructure, including road, rail, and port. A mapping can identify infrastructure that has the highest potential for unlocking regional trade. Namibia has the potential to be a gateway for the AfCFTA, opening trade over land from Southern Africa to the rest of the continent, while also having a port that enables access to the EU and US markets. Though the World Economic Forum has called Namibia’s roads the best in Africa, most bulk commodities move by rail. More than 50 percent of the railway lines that state-owned railway company TransNamib currently operate on do not meet the minimum Southern African Development Community (SADC)–stipulated standard of 18.5 tons per axle load. TransNamib’s revenue generated from bulk commodities equates to about 93 percent of its revenue, which includes revenue from transporting Zambia’s commodities. TransNamib has a demonstrated interest in moving bulk commodities by rail between Angola, Botswana, Zambia, and Zimbabwe.
Create a policy landscape that is amenable to private renewable energy generation, and enable firms to export to meet regional needs. In 2021, the South African government announced that businesses would be allowed to generate power of up to 100 megawatts each without a license, a significant increase from the 1-megawatt limit. Mining firms could also buy electricity from other companies that produce a surplus. South African mining companies now have 3,900 megawatts of renewable energy projects in the pipeline. To put this into perspective, 100 megawatts could power two large mines in South Africa. This move drastically alleviates pressure on Eskom, the country’s state-owned electricity utility, while ensuring that energy is no longer a bottleneck for the mining sector. In the longer term, creating a policy environment that lets mining firms export renewable energy to other countries can alleviate regional constraints.
Medium term: Work toward mitigating policies that increase transport and logistics costs. Road transportation costs are high because restrictions arising from cabotage policies and the Third Country Rule forbid backhaul cargo in some countries. Cabotage is defined as the transportation of goods or passengers between two places within the same country by a transport operator from another country. The SADC Infrastructure Directorate has been discussing gradually eliminating the Third Country Rule, as recommended in the SADC Protocol on Transport, Communications and Meteorology, Article 5.3.
Establish a coordinated approach to planning and financing regional infrastructure. An example is the ASEAN Infrastructure Fund (AIF), which is
a dedicated fund established by the 10 member states of the Association of Southeast Asian Nations (ASEAN) and the Asian Development Bank (ADB) to address the ASEAN region’s infrastructure development needs by mobilizing regional savings, including foreign exchange reserves. The AIF is an integral part of ASEAN’s efforts to strengthen regional connectivity, and all projects are cofinanced by the AIF and the ADB.
Export restrictions—Short-term opportunities: Shift away from export restrictions; consider politically feasible alternatives or transitional arrangements, such as progressively tiered export restrictions. Although Mali did not fully implement the harmonized mining tax code of the four West African countries, it does use a tiered system to bring it into closer alignment: the 3 percent export tax is only applied to the first 50 kilograms of gold per month; after that, the remaining weight is exported tax free. A tiered system of export restrictions, which can include taxes and bans, in which a base amount is restriction free, and then progressively increases, can alleviate the bottleneck for intraregional trade. Over time, the threshold for the tiers could increase (or decrease in the opposite case), moving toward a fully free trade area that is not inhibited by export policy constraints. However, any deviation from a uniform approach should take into account the complexities of monitoring and enforcement, as well as inadvertent incentives for cross-border leakages.
Shifting from a national approach to local equity participation to a regional approach: Develop a regulatory framework for (sub)regional equity. Currently, countries have policies that require local equity. For example, Kenya’s new Mining Act makes the granting of every mining license conditional on local equity of at least 35 percent in respect of mineral rights, and in Namibia, all applications for a mining license must have 15 percent local owners. In countries where capital is limited, these local ownership policies can serve as a deterrent to investment. Expanding local equity to a regional level can facilitate the emergence of medium-size regional mining firms that have the capital to invest and sufficient interest in investing in various African jurisdictions. A regional equity requirement would also enable these African firms to benefit from skills and technology transfer from large multinationals, such as Rio Tinto, Glencore, BHP, and Anglo American. This regional equity may best be achieved first at the level of the subregion, via regional economic communities. Rapid implementation of the AfCFTA may facilitate technology transfer at the African Union level.
Local equity typically requires a developed regional capital market. Such an equity market implies freer and regionalized movement of capital and the provision of investment services within a region. It also means that investors can invest or raise capital in other countries, as well as from domestic markets, with confidence that they will engage with similar regulations, information, trading systems, settlement systems, accounting standards, and governance standards
throughout the region (Khatiwada 2014). As a first action, strengthening the presence of regional financial institutions is critical and may even be needed before consideration of local equity participation.
Financial infrastructure is key for an effective regional capital market. Such infrastructure includes the development of links between national clearing and payment systems, the establishment of regional credit agencies, and benchmarks to enhance the liquidity of capital markets. Additionally, the 2008 global financial crisis showed that financial distress has a higher chance of being transmitted to other countries in areas that are financially integrated. This transmission can be managed with a strong framework for prudential regulation and strong supervision capabilities to ensure that risks stemming from financial integration are monitored and managed.
Export restrictions—Medium-term: Replace national export restrictions with regional restrictions. Stringent national export restrictions in Africa can make all countries involved worse off. Not only do they adversely affect domestic mining production, as described in chapter 3, where production in a Tanzanian gold mine fell to just 13 percent of preban levels, the restrictions also affect other sectors, including transportation and logistics, services, and construction. Export restrictions have direct adverse effects on other countries within the region. Zambia’s imposition of import and export taxes also affected the Democratic Republic of Congo, which exported copper to Zambia for processing, and made Zambian processing of Democratic Republic of Congo commodities largely commercially unviable. In the medium term, countries may be able to better utilize regional or continental export restrictions, meaning that restrictions are not imposed on exports to other countries within the regional economic community or African Union region, but are in effect on exports moved out of the region, consistent with the goals of the AfCFTA.
Replace LCPs with regional content policies. Many African countries have skills shortages and limited capacity to produce or access key inputs when working at a national level. Regional content policies can reduce the burden of ongoing constraints by enabling countries to access a larger pool of skilled labor and requisite inputs. Firms operating in the region can implement training programs and capacity-building for micro, small, and medium enterprises in parallel with regional sourcing.
Although fully phasing out global oil, gas, and coal markets is likely to take decades, the transition period poses significant, but uncertain, risks for fossil
fuel exporters in Africa. Those countries rich in carbon-based resources such as oil, gas, and coal face the looming prospect of the decarbonizing global economy, associated with falling demand for their resource exports. On the other hand, demand for metals and minerals could rise to supply the low-carbon economy. For those countries rich in certain metals and minerals, the prospects may be rosier (IEA 2021b). Countries such as the Democratic Republic of Congo, South Africa, and Zambia are already key players in the low-carbon transition, being major producers of copper, platinum, and cobalt, respectively. As demand continues to rise for a range of metals and minerals, new opportunities to expand production are emerging. Likewise, petroleum, particularly natural gas, may still have years of robust demand as richer nations seek ways to fully decarbonize. Gas may also play an important role in meeting the growing domestic energy needs of the African continent.
Fossil fuel exporters face the bulk of the risks. African countries rich in carbon-based resources such as oil, gas, and coal face the looming prospect of the decarbonizing global economy and the challenges of a just transition. Because of changing policies, consumer behavior, and technology trends, the demand for fossil fuels is expected to significantly decline over the next 10 to 30 years (figure O.14). Depending on supply trends, this decline could put permanent downward pressure on fossil fuel prices and threaten African countries’ ability to benefit from their carbon-based resource wealth; they run the risk of becoming stranded nations (Cust, Manley, and Cecchinato 2017).
Although the transition away from fossil fuels is widely anticipated, it is not yet clear how, or how quickly, such an outcome might occur. At their current trajectories, carbon-mitigation commitments made on a country-by-country basis under the Paris climate agreement would fall short of the 2-degree Celsius goal. Meanwhile, significant cost reductions in alternative energy technologies— such as solar and wind power—have begun to undercut the costs of generating power from oil, gas, and coal, thus leading to potential reductions in fossil fuel consumption at a global scale.
However, price signals from the oil and gas market still support development in Sub-Saharan Africa of many new assets. Despite lofty rhetoric from oil-importing countries, insufficient action to impose domestic carbon taxes or otherwise curb fossil fuel demand has been seen. For the citizens of Africa, the imperative is to be prepared for a range of futures, assuming both more drastic climate action and the curbing of fossil fuel demand, but also a more gradual phasing out of oil consumption at the global level. Policy choices today matter since they have a long horizon of impact, such as contract design for a 30-year mine or oil field. As such, policies can be configured to be robust to a range of futures and help optimize the development path given this uncertainty.
Carbon-rich nations are highly exposed to carbon risk. Like the private sector concern with “stranded assets,” countries could be left with undeveloped fossil fuel reserves, creating the risk of “stranded nations” (Cust, Manley, and Cecchinato 2017). There are self-interested reasons for governments to take these risks seriously. While little can be done to reduce the belowground risk contained in undeveloped and unextracted fossil fuels, many policy choices can increase or decrease the aboveground risk exposure. Examples explored in this report include how much state capital should be invested in nationally owned fossil fuel companies or sovereign wealth funds holding fossil fuel company stocks. Similarly, resource-rich countries often use resource revenues to invest in fuel subsidies or to build local technical skills in the petroleum sector. However, looking ahead, such policies may be increasingly suboptimal if they lock the economy into a carbon-intensive path.
Much more could also be done to invest in fiscal administration to capture a greater share of resource rents. Here the international community could play a supporting role to governments in the region. Failure to tax the petroleum sector fully serves as a form of production subsidy in addition to generating fewer government revenues. It is therefore against the interests of governments, citizens, and the global community alike.
Unlike fossil fuel resources, the demand for Africa’s minerals and metals is likely to be much more robust in future decades, and may even expand rapidly. In spite of the challenges, the medium- to long-term outlook for mineral exploration and mining on the African continent is positive. Renewed foreign direct investment in mineral exploration and development is likely to be boosted by the projected significant growth in demand for minerals for energy technology
(World Bank 2020b), fueled by the metal-intensive transition to green energy following the zero emissions by 2050 pledge by a majority of countries at the Glasgow Climate Change Conference in 2021. Indeed, the mineral demand projections under a 1.5- to 2-degree Celsius temperature constraint scenario represent highly significant increments above an already substantial projected increase in demand due to continuing growth in world population and its migration to urban areas, seeking ever-increasing living and environmental standards.
This favorable outlook for Africa’s mineral export opportunities attributable to the energy transition is well-evidenced. Research by Galeazzi, Steinbuks, and Cust (2020) also concludes that export of hydrocarbons may decline less rapidly than some predict during the transition and has the potential to remain a significant source of revenues over the short to medium term. Nonetheless, the study also concludes that the ability of African economies to benefit from rising demand for certain metals and minerals depends on the responsiveness of investment, and other regions may be able to expand supply more rapidly, dampening upward price effects and limiting the expansion of any African share of world supply. For example, the demand for and rising prices of cobalt could trigger Sub-Saharan Africa’s export value of this mineral, which by 2029 could exceed five times its current export value (figure O.15).
The speed of digital technology adoption in the mining sector is accelerating. Four categories of technologies will play a crucial role in the digital transformation of mining and metals: automation, robotics, and operational hardware; a digitally enabled workforce; integrated enterprise, platforms, and ecosystems; and next-generation analytics and decision support. Firms are choosing to mechanize to maintain profitability amid supply and demand shocks (Baskaran 2021). Mechanization improves cost-competitiveness by increasing productivity (see figure O.16), but also reduces jobs. Levels of automation in the region vary. For example, in Southern Africa, Botswana and South Africa have a higher degree of mechanization, whereas Zambia and Zimbabwe still largely rely on labor-intensive mines.
Natural resource abundance, relative to the size of the economies, makes the mining, oil, and gas sectors a key contributor to foreign investment, export earnings, and government revenues. Historically, however, the mining sector’s contribution to employment creation has been small, and mechanization will squeeze it further. But expanding mechanization has contributed to a sharp increase in the number of women in the mining industry. In South Africa, 11,400 women were employed in the industry in 2002. By 2015, this number had increased to 53,000, and by 2019, to 56,691. This increase represents a
397 percent jump between 2002 and 2018. In comparison, during the same period, national female labor force participation increased from 42.4 percent to 44.9 percent, an increase of 2.5 percentage points. 8 In South Africa, women now account for 12 percent of the mining workforce; although a large improvement, this figure is still less than the global average of 17 percent. There are still laborintensive underground platinum and gold mines in South Africa, which tend to have lower percentages of female employees.
During the boom years, carbon emissions soared and natural resource depletion increased significantly. Total carbon emissions in Sub-Saharan Africa at the end of the boom increased by 32 percent over the level in the preboom period, but emissions in the region’s resource-rich countries increased by 46 percent by the end of the boom, increasing from 172 million to 252 million tons of carbon dioxide. Depletion of natural resources increased dramatically. The depletion of natural resources in Sub-Saharan Africa increased by approximately 150 percent during the boom, and in the region’s resource-rich countries, depletion of natural resources increased on average by more that 190 percent. Total forest area also decreased by 2 percent, declining from an average forest cover of 6.9 million square kilometers in 2004 to 6.5 million square kilometers in 2014. Nonetheless, Sub-Saharan African countries’ per capita contribution to global climate change remains the smallest of any region. Urgent domestic economic and energy needs also indicate that fossil fuel production and
consumption will have an important role in the coming years. However, African governments can take steps to leverage global decarbonization to accelerate the diversification of their economies, building resilience to external shocks, and anticipating the eventual decline in fossil fuel markets.
Other environmental challenges also present unique policy problems that governments may need new approaches to tackle.
Mining and petroleum projects can result in significant forest clearance or have spillovers that cause further forest loss. Cust et al. (forthcoming), for example, document the impact of mining in forested areas. Factors that seem to influence the scale of forest loss around resource extraction sites include the type of commodity and the form of extraction; for example, open-pit mines cause more clearance than shaft mining. Furthermore, road building in forested areas can account for much more subsequent forest loss than the project itself because it opens up access to new areas for farmers and loggers.
The link between resource extraction and forest loss is more complex than just the clearance that can occur around extraction sites. New research (Cust, Harding, and Rivera-Ballesteros, forthcoming) suggests that the amount of resource exports and consequently the degree of Dutch disease a country experiences can affect the amount of deforestation. Increased deforestation is driven by the impact on relative prices of resources and agricultural goods in countries where agricultural expansion may encroach on the forest. This mechanism, dubbed “Amazonian disease” by Cust, Harding, and Rivera-Ballesteros (forthcoming) because it was first measured in Brazil, suggests that falling oil exports or falling oil prices can increase the competitiveness of agriculture in the same country and thus increase the amount of forest loss, as seen, for example, in the period following falling oil prices beginning in 2015.
For a country such as Brazil, where agriculture often encroaches on the forest, an agricultural boom is associated with an uptick in deforestation. Meanwhile, as a major oil exporter, oil exports push up the real exchange rate, making agriculture less competitive than it would be otherwise when oil prices are low. Therefore, agricultural booms induced by falling oil prices or falling oil exports drive more deforestation unless policy intervenes.
The Amazonian disease has implications for African economies. First, major oil-exporting countries that also have abundant forests, such as Angola, Cameroon, and the Republic of Congo, currently may have less competitive agricultural sectors because of high oil exports than they might enjoy otherwise. As the world decarbonizes, demand and prices for fossil fuels such as oil are likely to decline over time. As oil exports decline in these countries, agricultural competitiveness is likely to rise. A boom in the agricultural sector in these countries could therefore drive a boom in deforestation unless policy is able to protect the forest. Put differently, the low-carbon transition could lessen Dutch disease in these countries, to be replaced instead by Amazonian disease. Instead
of the manufacturing sector losing out as with Dutch disease, it could instead be tropical forests that fall victim, as observed in Brazil.
Additionally, deforestation and destruction of biodiversity can adversely affect other economic sectors, notably tourism. Biodiversity is a driver of tourism: areas such as tropical forests and natural parks are reliant on preservation of natural capital to attract visitors.
Artisanal and small-scale mining also has a significant environmental footprint that is hard for policy makers to manage. Pollution of water and land degradation can have severe consequences for nearby agriculture and communities close to mining sites. The predominantly informal nature of artisanal and small-scale mining also makes it hard to encourage, monitor, or enforce basic environmental safeguards. Governments should therefore find ways to improve levels of formalization that are consistent with raising environmental standards, but also supporting the livelihoods of miners and their dependents.
The future of African economic transformation depends on the ability to increase productivity and generate jobs and income, including in exportoriented sectors beyond commodity exports. However, achieving these increases under the condition of resource richness has proved to be challenging.
According to Ross (2019), out of 50 oil exporters examined for success in export diversification since 1998, only 8 had greater export diversification at the end of the period. Further, Ross (2019) finds evidence that 4 of the 8 successful countries had achieved this either because of resource depletion or economic sanctions placed on them from outside. This is a very daunting historic record for those African resource-exporting countries seeking to promote export diversification prior to resource exhaustion.
This challenge to diversifying the economy stems from a phenomenon known as Dutch disease, which can crowd out manufacturing sector growth, the agriculture sector, and also distort human capital accumulation, away from productive jobs and into the government sector.
There are three primary human capital distortions in resource-rich countries. First, the resource sector reallocates human capital away from some highproductivity sectors. Second, the distribution of human capital between men and women is more unequal in these nonrenewable-resource-rich countries compared with other countries. Third, human capital is skewed toward the public sector in resource-rich countries. These characteristics may contribute to, and be associated with, lower overall worker productivity arising from resource dependence.
Gender disparities are prevalent. Cust and Mandon (2021) find that resource-rich countries have a human capital distribution skewed toward men, including in Sub-Saharan Africa. Figure O.17 shows the distribution of human capital between males and females in emerging market resource-rich and nonresource-rich countries. The distribution is particularly unequal in Sub-Saharan Africa, where resource-rich countries have one of the worst male-female human capital imbalances. While female human capital averages 42 percent of total human capital in non-resource-rich Sub-Saharan Africa, the share declines to 28 percent in the resource-rich group.
Asset diversification is a strategy that fossil fuel–dependent countries can pursue to manage the risks of the low-carbon transition. Peszko et al. (2020) find that decarbonization policies initiated by fuel importers can unleash macroeconomic forces that encourage traditional export diversification of fuel exporters, by which they reduce reliance on export revenues from fossil fuel commodities and diversify into downstream, emission-intensive fossil fuel value chains. Such diversification represents a comfort zone for fossil fuel exporters, but it increases their exposure to multiple channels of low-carbon transition impacts, such as
border carbon adjustments, disruptive technologies, and shifts in the preferences of consumers and investors. Asset diversification can be a long-term, sustainable alternative, but it is a challenging proposition because it requires discovery of new sources of comparative advantage and accumulation of unfamiliar produced assets and human capital, including new skills and capabilities.
Given the expected decline in mining jobs resulting from mechanization, identifying new ways to increase employment opportunities is critical. The demographic dividend will translate into a sharp increase in the size of the workforce, and harnessing this workforce in and out of the mining sector will require strengthening the foundation of basic education.
Developing and implementing skills-development programs aligned with both mechanization and diversified economic activities to absorb the decline in labor demand resulting from mechanization is important. Although mechanization results in substantially higher productivity and revenue, it has a strong impact on local labor dynamics. In particular, it changes the type of labor demanded from low-skilled to high-skilled and leads to an overall decline in the amount of labor demanded. The shift to mechanization has required the development of a suitably skilled workforce for other industries and jobs that are positioned to absorb high amounts of low-skilled labor. The increased tax revenue resulting from higher mining productivity can be used to finance skillsdevelopment programs.
Mechanization also requires providing training to develop local suppliers. The majority of mechanized machinery used in Africa is imported from overseas, as is the labor to operate and repair the machinery. Therefore, providing local suppliers and servicers with the necessary training to take over these tasks is key to making domestic mining technology and service firms competitive with international counterparts. Given the skills shortage facing many mining communities, this local supply will require capacity-building in the areas of technical and business development. It will also need increased access to finance to support the development of linkages while widening the beneficiary base of the mining sector. Existing LCPs largely focus on direct employment quotas but less on skills development for the creation of indirect employment in linkage sectors. Shifting the focus of LCPs to the latter would help grow both the mining multiplier effect and productive linkages.
The underlying question when studying Dutch disease is how an appreciation of the real exchange rate from resource revenues might be managed and mitigated by the government. The conventional permanent income hypothesis is that a sustained increase in consumption can be supported by interest on accumulated foreign assets through foreign exchange reserves or a sovereign wealth
fund, as recommended by the IMF (2012) or the more restrictive formulation of this approach called the bird-in-hand strategy (Barnett and Ossowski 2003). However, as analyzed by van der Ploeg and Venables (2011), these approaches are not optimal for all resource-rich countries. This is especially the case for lower-income resource-rich countries, which are generally capital-scarce, and the return on domestic capital may be higher than that on foreign-invested capital. According to van der Ploeg and Venables (2011), capital scarcity implies a low capital-to-labor ratio, little public infrastructure, low wages and income, and a high domestic interest rate. In capital-scarce resource-rich countries, a temporary influx of foreign exchange, consecutive to a commodity price boom, a massive resource discovery, or increasing resource production, should typically be spent and invested domestically, not spent to accumulate foreign assets. Countries should pursue policies that enable their capacity to invest domestically, that is, invest in investing. This investment policy allows for incremental increases in consumption for present generations as well as the use of savings for a combination of foreign debt reduction and the accumulation of domestic capital. First, the IMF (2012) policy paper argues that consumption should be skewed toward the present generation because of the relative poverty of the present generation compared with those in the far future. Second, savings should take the form of domestic capital accumulation to compensate for relative capital scarcity. This use of public spending is expected to boost private investment and accelerate growth of the nonresource sectors through (a) improving public infrastructure and the provision of public services such as electricity or the internet (domestic public investment), (b) lowering interest rates (foreign debt reduction), and (c) a process of “investing in investing.” This is where capital-scarce resource-rich countries can use public investment and related policies strategically to raise the overall absorptive capacity of the economy by flattening supply curves, and thus mitigate Dutch disease effects on the nontraded sectors.
Policy makers in resource-rich countries may have more success working toward asset diversification rather than export diversification. Asset portfolio diversification is an important step toward sustained growth and is more feasible for resource-rich countries to achieve than traditional export diversification because of pressure from Dutch disease (Cust and Rivera-Ballesteros 2021a). The Changing Wealth of Nations 2021 report (World Bank 2021) suggests that targeting asset portfolio diversification—investing in the expansion of human and physical capital—instead of export diversification may be a successful policy for sustainable economic growth. This recommendation builds on earlier work (Gill et al. 2014; Peszko et al. 2020) exploring the benefits of portfolio diversification.
However, to achieve asset diversification, countries must successfully transform the proceeds from resource extraction into other kinds of productive assets. A successful policy for sustainable economic growth might target asset portfolio diversification over export diversification by reducing the share of natural capital in total wealth (Cust and Rivera-Ballesteros 2021b). This does not mean a decline in the dollar value of natural capital per capita; instead, it emphasizes increased investments in the expansion of human capital and other productive assets. Such investments can be financed from the proceeds of prudent resource management. Lederman and Maloney (2012, 13) argue that countries should focus not on growth- or diversification-promoting sectors but on policies that “raise the overall ability of a country to increase productivity and quality, and to move to more sophisticated tasks.”
1. Agenda 2030, or the 2030 Agenda for Sustainable Development, is a universal call to action to end poverty. It sets 17 goals, including protecting the environment and improving lives, to be achieved by 2030.
2. This report focuses on the World Bank Africa region, which is predominantly SubSaharan Africa, comprising 48 countries in total (https://data.worldbank.org/region /sub-saharan-africa). This group of countries is referred to as Sub-Saharan Africa throughout. The report follows the IMF definition of resource richness to distinguish between the groups of countries for analysis (IMF 2012) and to chart changing patterns of resource dependency. The IMF considers a country resource rich primarily if the resource share of exports or government revenues exceeds 20 percent.
3. Calculations based on World Bank and the ICTD/UNU-WIDER Government Revenue Dataset 2019, considering only Sub-Saharan African countries with nonmissing data.
4. These various challenges faced by government are described in documents such as the Natural Resource Charter, which highlights the various public policy choices that must be made along the decision chain, from exploration for resources through how to invest revenues from resources for sustainable and diversified development (Cust and Manley 2018).
5. According to World Bank staff estimates and Lakner et al. (2021), by 2030 there will be about 616 million poor in the world, 500 million poor in Africa (81 percent), 448 million in resource-rich countries (73 percent), and 379 million of them will be living in Sub-Saharan Africa (62 percent of the world’s poor or 85 percent of poor people living in resource-rich countries).
6. In countries with sectoral GDP data (Cust, Rivera-Ballesteros, and Zeufack 2022).
7. The getting electricity indicators measure the procedures, time, and cost required for a business to obtain a permanent electricity connection for a newly constructed warehouse. Additionally, the reliability of supply and transparency of
tariffs index measures supply reliability, transparency of tariffs, and the price of electricity.
8. According to World Bank data based on the International Labour Organization, ILOSTAT database ( https://data.worldbank.org/indicator/SL.TLF.TOTL.FE .ZS?locations=).
AfDB (African Development Bank). 2018. African Economic Outlook 2018. Abidjan, Côte d’Ivoire: AfDB.
Barnett, S. A., and R. Ossowski. 2003. “What Goes Up…” Finance and Development 40 (1).
Baskaran, G. 2021. “Firms’ Approach to Mitigating Risks in the Platinum Group Metals Sector.” Mineral Economics 34 (3): 385–98.
Bos, K., and J. Gupta. 2019. “Stranded Assets and Stranded Resources: Implications for Climate Change Mitigation and Global Sustainable Development.” Energy Research and Social Science 56: 101215.
Calderon, C., and A. Zeufack. 2020. “Borrow with Sorrow? The Changing Risk Profile of Sub-Saharan Africa’s Debt.” Policy Research Working Paper 9137, World Bank, Washington, DC.
Corden, W. M., and J. P. Neary. 1982. “Booming Sector and De-industrialisation in a Small Open Economy.” Economic Journal 92 (368): 825–48.
Cudennec, S., and L. Kiwelu. 2021. “Powering Mining in Africa—The Rise of the MiniGrid and Captive Model.” Norton Rose Fulbright, April 26, 2021. https://www nortonrosefulbright.com/en/inside-africa/blog/2021/04/powering-mining-in-africa -the-rise-of-the-mini-grid-and-captive-model.
Cust, J., and T. Balde. Forthcoming. “Windfalls and Labor Dynamics in Sub-Saharan Africa.” World Bank, Washington, DC.
Cust, J., T. Harding, H. Krings, and A. Rivera-Ballesteros. Forthcoming. “Public Governance versus Corporate Governance: Evidence from Oil Drilling in Forests.” World Bank, Washington, DC.
Cust, J., T. Harding, and A. Rivera-Ballesteros. Forthcoming. “Tropical Deforestation and Terms of Trade Shocks.” World Bank, Washington, DC.
Cust, J., and P. Mandon. 2021. “Nonrenewable Natural Capital and Human Capital Distortions: Impact on Accumulation, Gender, and the Public Sector.” In The Changing Wealth of Nations 2021: Managing Assets for the Future, 311–41. Washington, DC: World Bank.
Cust, J., and D. Manley. 2018. The Carbon Wealth of Nations: From Rents to Risks. Washington, DC: World Bank Group. https://elibrary.worldbank.org/doi /full /10.1596/978-1-4648-1046-6_ch5.
Cust, J., D. Manley, and G. Cecchinato. 2017. “Unburnable Wealth of Nations.” Finance and Development 54 (1).
Cust, J., and J. T. Mensah. 2020. “Natural Resource Discoveries, Citizen Expectations and Household Decisions.” Policy Research Working Paper 9372, World Bank, Washington, DC.
Cust, J., and D. Mihalyi. 2017. “Evidence for a Presource Curse? Oil Discoveries, Elevated Expectations, and Growth Disappointments.” Policy Research Working Paper 8140, World Bank, Washington, DC.
Cust, J., and A. Rivera-Ballesteros. 2021a. “The Nonrenewable Wealth of Nations.” In The Changing Wealth of Nations 2021: Managing Assets for the Future, 193–223. Washington, DC: World Bank.
Cust, J., and A. Rivera-Ballesteros. 2021b. “Wealth Accounting, Diversification, and Macrofiscal Management.” In The Changing Wealth of Nations 2021: Managing Assets for the Future, 271–310. Washington, DC: World Bank.
Cust, J., A. Rivera-Ballesteros, and D. Mihalyi. 2021. “Giant Oil and Gas Field Discoveries 2018.” https://doi.org/10.7910/DVN/MEH5CS, Harvard Dataverse.
Cust, J., A. Rivera-Ballesteros, and A. Zeufack. 2022. “The Dog That Didn’t Bark: The Missed Opportunity of Africa’s Resource Boom.” Working Paper 1012, World Bank, Washington, DC.
Devarajan, S., M. M. Giugale, H. Ehrhart, T. M. Le, and H. Nguyen. 2013. “The Case for Direct Transfers of Resource Revenues in Africa.” Working Paper 333, Center for Global Development, Washington, DC.
EITI (Extractive Industries Transparency Initiative). 2020. “Zambia Extractive Industries Transparency Initiative. Zambia EITI Report 2019.” BDO Tunisia Consulting in Association with BDO Zambia, Tunis. https://eiti.org/sites/default/files/attachments /zeiti_report_2019.pdf.
Fitch Ratings. 2021. “African FTA Growth Impact Too Small to Affect Ratings.” Fitch Ratings, January 7, 2021. https://www.fitchratings.com/research/sovereigns/african -fta-growth-impact-too-small-to-affect-ratings-07-01-2021
Galeazzi, C., J. Steinbuks, and J. Cust. 2020. “Africa’s Resource Export Opportunities and the Global Energy Transition.” LiveWire, World Bank, Washington, DC.
Gill, I. S., I. Izvorski, W. van Eeghen, and D. De Rosa. 2014. Diversified Development: Making the Most of Natural Resources in Eurasia. Washington, DC: World Bank.
Guj, P., R. Schodde, B. Boucoum, and J. Cust. Forthcoming. “Mineral Resources of Africa.” World Bank, Washington, DC.
Hartwick, J. M. 1977. “International Equity and the Investing of Rents from Exhaustible Resources.” American Economic Review 67 (5): 972–74.
IEA (International Energy Agency). 2021a. “Fossil Fuel Use by Scenario, 2020, 2030 and 2050.” In World Energy Outlook 2021. Paris:IEA. https://www.iea.org/data-and -statistics/charts/fossil-fuel-use-by-scenario-2020-2030-and-2050.
IEA (International Energy Agency). 2021b. “The Role of Critical Minerals in Clean Energy Transitions.” World Energy Outlook Special Report, IEA, Paris. https://www .iea.org/reports/the-role-of-critical-minerals-in-clean-energy-transitions.
IMF (International Monetary Fund). 2012. “Macroeconomic Policy Frameworks for Resource-Rich Developing Countries.” Policy Paper, IMF, Washington, DC. https:// bit.ly/2txKGzB.
IMF (International Monetary Fund). 2015. “Options for Low-Income Countries’ Effective and Efficient Use of Tax Incentives for Investment. Report to the G20 Development Working Group.” IMF, Washington, DC.
IMF (International Monetary Fund). 2016. “West African Economic and Monetary Union. Common Policies of Member Countries—Press Release; Staff Report; and Statement by the Executive Director for the West African Economic and Monetary Union.” Country Report 16/96, IMF, Washington, DC.
IMF (International Monetary Fund). 2019. Sub-Saharan Africa Regional Economic Outlook: Recovery Amid Elevated Uncertainty. Washington, DC: IMF. https://www.imf .org/en/Publications/REO/SSA/Issues/2019/04/01/sreo0419.
Kaufmann, D., A. Kraay, and M. Mastruzzi. 2010. “The Worldwide Governance Indicators: Methodology and Analytical Issues.” Policy Research Working Paper 5430, World Bank, Washington, DC.
Khatiwada, Y. R. 2014. “Development of Regional Capital Markets in Asia: Issues and Challenges.” Bank of Nepal, presentation at the 50th SEACEN Governors’ Conference, Port Moresby, Papua New Guinea, November 2014. https://www.nrb.org.np/contents /uploads/2019/12/Governors_Speeches-Development_of_Regional_Capital Markets_in-Asia_-_Issues_and_Challenges.pdf.
Lakner, C., D. G. Mahler, N. Yonzan, R. A. Castaneda Aguilar, and H. Wu. 2021. “Updated Estimates of the Impact of COVID-19 on Global Poverty: Turning the Corner on the Pandemic in 2021?” World Bank Blogs. https://blogs.worldbank.org/opendata /updated-estimates-impact-covid-19-global-poverty-turning-corner-pandemic-2021.
Lederman, D., and W. Maloney. 2012. Does What You Export Matter? In Search of Empirical Guidance for Industrial Policies. Washington, DC: World Bank.
Manasse, P. 2006. “Procyclical Fiscal Policy: Shocks, Rules, and Institutions—A View from MARS.” Working Paper 06/27, International Monetary Fund, Washington, DC.
Mansour, M., and G. Rota-Graziosi. 2013. “Tax Coordination, Tax Competition, and Revenue Mobilization in the West African Economic and Monetary Union.” Working Paper 13/163, International Monetary Fund, Washington, DC.
Martin, A., and H. Helbig de Balzac. 2017. “The West African El Dorado: Mapping the Illicit Trade of Gold in Côte d’Ivoire, Mali and Burkina Faso.” Partnership Africa Canada, Ottawa. https://www.africaportal.org/publications/the-west-african-el-dorado -mapping-the-illicit-trade-of-gold-in-c%C3%B4te-divoire-mali-and-burkina-faso/.
Maslen, S., and C. Aslan. 2022. “Enhancing Debt Transparency by Strengthening Public Debt Transaction Disclosure Practices.” EFI Insight, World Bank, Washington, DC.
McKinsey. 2013. “Reverse the Curse: Maximizing the Potential of Resource-Driven Economies.” McKinsey Global Institute.
Mendes, A., and S. Pennings. 2020. “One Rule Fits All? Heterogeneous Fiscal Rules for Commodity Exporters When Price Shocks Can Be Persistent: Theory and Evidence.” Policy Research Working Paper 9400, World Bank, Washington, DC.
Mihalyi, D., J. Hwang, D. Rivetti, and J. Cust. 2022. “Resource-Backed Loans in Sub-Saharan Africa.” Policy Research Working Paper 9923, World Bank, Washington, DC.
Mihalyi, D., and T. Scurfield. 2021. “How Africa’s Prospective Petroleum Producers Fell Victim to the Presource Curse.” The Extractive Industries and Society 8 (1): 220–32. OECD (Organisation for Economic Co-operation and Development). 2020. Trade in Raw Materials Database. https://www.oecd.org/trade/topics/trade-in-raw-materials/
Peszko, G., D. van der Mensbrugghe, A. Golub, J. Ward, C. Marijs, A. Schopp, J. Rogers, and A. Midgley. 2020. Diversification and Cooperation in a Decarbonizing World: Climate Strategies for Fossil Fuel–Dependent Countries. Washington, DC: World Bank.
Rivetti, D. 2021. Debt Transparency in Developing Economies. Washington, DC: World Bank.
Ross, M. L. 2019. “What Do We Know about Economic Diversification in Oil Producing Countries?” Unpublished, UCLA and Oxford University.
Ruzzante, M., and N. Sobrinho. 2022. “The ‘Fiscal Presource Curse’: Giant Discoveries and Debt Sustainability.” International Monetary Fund, Washington, DC.
Saygili, M., R. Peters, and C. Knebe. 2018. “African Continental Free Trade Area: Challenges and Opportunities of Tariff Reductions.” UNCTAD Research Paper 15, Division on International Trade and Commodities, United Nations Conference on Trade and Development, Geneva. https://unctad.org/system/files/official-document /ser-rp-2017d15_en.pdf
Schodde, R. 2017. “Recent Trends and Outlook for Global Exploration.” Presentation at PDAC 2017, Toronto, March 6. https://minexconsulting.com/wp-content/uploads /2019/04/Exploration-Trends-and-Outlook-PDAC-Presentation_compressed.pdf.
Schodde, R. 2019. “Trends in Exploration.” Presentation at the IMARC Conference, Melbourne, October 30. Minex Consulting. http://minexconsulting.com/trends -in-exploration/
Servén, L. 1998. “Macroeconomic Uncertainty and Private Investment in Developing Countries: An Empirical Investigation.” Economics Letters 41 (2): 207–10
S&P Global Market Intelligence platform. Accessed November 2020. https://www .spglobal.com/marketintelligence/en/
UNCTAD (United Nations Conference on Trade and Development). n.d. “AfCFTA Support Programme to Eliminate Non-Tariff Barriers, Increase Regulatory Transparency and Promote Industrial Diversification.” UNCTAD. https://unctad.org /project/afcfta-support-programme-eliminate-non-tariff-barriers-increase-regulatory -transparency-and.
UNCTAD (United Nations Conference on Trade and Development). 1999. “Investing in Transport Is an Investment in Africa’s Future.” Press Release, October 20, 1999. https:// unctad.org/press-material/investing-transport-investment-africas-future.
UNEP (United Nations Environment Programme). 2017. “Tourism Can Help Sustain Biodiversity.” Accessed June 14, 2022. https://www.unep.org/news-and-stories/story /tourism-can-help-sustain-biodiversity.
UNU-WIDER. 2022. UNU-WIDER Government Revenue Dataset. Version 2022. https://doi.org/10.35188/UNU-WIDER/GRD-2022.
van der Ploeg, F., and A. J. Venables. 2011. “Harnessing Windfall Revenues: Optimal Policies for Resource‐Rich Developing Economies.” Economic Journal 121 (551): 1–30.
World Bank. 2001. World Development Report 2000/2001: Attacking Poverty. Washington, DC: World Bank. https://openknowledge.worldbank.org/handle/10986/11856
World Bank. 2019. “Digging beneath the Surface: An Exploration of the Net Benefits of Mining in Southern Africa.” World Bank, Washington, DC. https://openknowledge .worldbank.org/bitstream/handle/10986/32107/Digging-Beneath-the-Surface-An -Exploration-of-the-Net-Benefits-of-Mining-in-Southern-Africa.pdf?sequence=1
World Bank. 2020a. “Minerals for Climate Action: The Mineral Intensity of the Clean Energy Transition.” Washington, DC: World Bank.
World Bank. 2020b. The African Continental Free Trade Area: Economic and Distribution Effects. Washington, DC: World Bank.
World Bank. 2021. The Changing Wealth of Nations 2021: Managing Assets for the Future. Washington, DC: World Bank.
World Bank Group. Poverty and Inequality Platform. Accessed November 2020. https:// pip.worldbank.org/home
Yunis, J., and E. Aliakbari. 2020. “Fraser Institute Annual Survey of Mining Companies 2020.” Fraser Institute, Vancouver. https://www.fraserinstitute.org/sites/default/files /annual-survey-of-mining-companies-2020.pdf.
Introduction
Africa is blessed with significant natural resource wealth, spanning diamonds, gold, oil, natural gas, uranium, platinum, copper, cobalt, iron, bauxite, and silver, among others. In 2019, minerals and fossil fuels accounted for more than a third of all exports from at least 60 percent of African countries (Signé 2021). The majority of countries in Sub-Saharan Africa (26 out of 48) are now categorized as resource rich according to the International Monetary Fund definition (IMF 2012). This trend continues as a result of major new discoveries in recent years, with even more countries on the path to attaining resource-rich status.
Despite these large and growing reserves, success in converting subsoil wealth into above-ground sustainable prosperity and poverty reduction has so far been limited. For example, since the decline in commodity prices in 2014, resource-rich Sub-Saharan African countries have grown more slowly than the region’s average. In addition to slow growth, these same countries have performed worse in poverty alleviation. According to World Bank estimates, by 2030, more than 80 percent of the world’s poor will be found in Sub-Saharan Africa, and almost 75 percent of the world’s poor will be located in resourcerich countries (Cust, Rivera-Ballesteros, and Zeufack 2022).
Taken together, this implies a staggering 62 percent of the world’s poor could be found in Sub-Saharan Africa’s resource-rich economies by 2030 based on current trends. Poverty eradication is therefore becoming a disproportionately resource-rich country and Sub-Saharan African challenge. 1 And because the management of natural resources plays such an outsized role in the performance of these economies, poverty eradication therefore relies crucially on governments harnessing the resource base effectively and avoiding the macroeconomic harm it can otherwise cause.
Exploiting natural resource wealth to drive economic transformation is central to Africa’s economic future.2 Subsoil assets such as metals, minerals, oil, and gas remain key sources of government revenues, export earnings, and development potential across the majority of countries in Africa (AfDB 2018). The post-2014 slowdown in commodity prices, however, has squeezed the sector and placed governments and the private sector under increased pressure, highlighting the need for diversification (Christensen 2016). As the continent emerged from a long commodity price boom during the 2004–14 period, Sub-Saharan African countries found it difficult to shift away from resource dependence. Leveraging resources for economic transformation will require new approaches to confront long-standing political economy pitfalls.
The legacy of the boom and bust was one of missed opportunity, where significant resource revenues were generally not successfully converted into sustainable, diversified prosperity. Since the decline in commodity prices in 2014, resource-rich Africa has grown more slowly than the region’s average growth rate. While the boom years saw a golden decade of rising revenues and economic growth, the prosperity proved to be short-lived and precariously dependent on high commodity prices.
The extractive sector is well placed to support the economic recovery phase that the Africa region now faces. COVID-19 (coronavirus) and the associated debt challenges in many African countries highlighted the need for increased domestic revenue mobilization. Many look to the extractive industries as a source of potential economic opportunity; however, the historical record has been disappointing. Rising Asian demand for commodities has deepened investment in, and hence reliance on, natural resources. Despite decarbonization and depletion, the amount of natural resource wealth available for development continues to increase, providing a potential engine for structural transformation.
Africa holds huge untapped and unrealized mineral and petroleum resource potential and remains relatively underexplored by global benchmarks. The continent also boasts a diverse basket of commodities. Therefore, there is an expectation that, under the right circumstances, significant untapped geologic potential remains across the region.
However, the mining sector’s contribution to employment has been declining amid mechanization; thus, new approaches and policies may be required to ensure a more equitable distribution of benefits from extractive industries to other parts of the economy.
Although decarbonization of the global economy has begun, demand for fossil fuels remains high, and geopolitical events create new opportunities for the export of African oil and gas. Taken alongside two decades of major petroleum
discoveries in Africa and several new producer countries entering the market, the role fossil fuels play in the economies of Sub-Saharan Africa has never been more significant. The challenge is how to harness this wealth amid uncertainty about the future and the potentially significant downside risk of a declining, rather than expanding, petroleum market in the decades to come.
In contrast, the demand forecasts for a range of Africa’s metals and minerals predict significant growth. Deposits of cobalt, lithium, manganese, and other metals will play a critical role in the low-carbon transition. Meanwhile, Africa’s significant domestic energy needs in the decades to come imply an important role for natural gas, even while the global economy decarbonizes.
Taken together, subsoil assets ranging across metals, minerals, oil, and gas are likely to remain key sources of government revenues, export earnings, and development potential across the majority of countries in Sub-Saharan Africa in the years to come. Indeed, the past two decades have been characterized by rising levels of resource dependence, despite the finite, depleting nature of these resources. Even with the decarbonization of the global economy that is beginning to occur, the extent to which global demand for petroleum is entrenched implies that African policy makers should proceed with caution but that they have an opportunity to react proactively to this megatrend.
Tapping into Africa’s resource future and its significant economic potential is in the hands of policy makers. Meanwhile, managing risks on the horizon and building economic resilience to the range of possible futures can also be part of today’s policy choices.
During the resource boom, the number of resource-rich countries and the overall degree of resource richness for the whole Sub-Saharan Africa region increased markedly. According to the IMF, a country is resource rich if it derives either 20 percent of exports or 20 percent of government revenues from natural resources. By this definition, the number of resource-rich countries in the region rose from 18 before the boom to 26 during and after the boom, representing a majority of Sub-Saharan Africa’s 48 countries (IMF 2012).3 New discoveries, high prices, and more production caused this trend, increasing the levels of resource dependence and pulling more countries into this grouping. The IMF list in 2012 included five newly resource-rich countries and several that were prospectively resource rich due to major discoveries (see map 1.1).
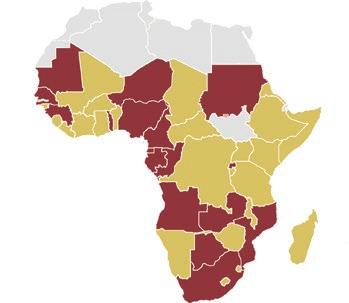
a. The Preboom (1998–2003); 18 total
b. IMF definition (2006–10); 26 total
Sources: Calculated using data from the International Monetary Fund (IMF), the UNU-WIDER Government Revenue Dataset (UNU-WIDER), the World Trade Organization (WTO), and the World Bank.
Note: Panel a: Resource-rich countries for the preboom period using the IMF criteria, where resource rich is defined as those countries that, on average, obtained at least 20 percent of total exports from oil and mining exports (WTO), or at least 20 percent of total fiscal revenues from natural resources (UNU-WIDER) during 1998–2003. Panel b: Resource-rich countries for the boom period defined by the IMF using the criteria of being a low-income country, a lower-middle-income country, or an upper-middle-income country, and having either natural resource revenues or exports accounting for at least 20 percent of total fiscal revenues or exports, respectively, over 2006–10 (average), including countries with identified reserves where production has not begun or has not reached significant levels (Central African Republic, Ghana, Madagascar, Mozambique, São Tomé and Príncipe, Sierra Leone, Tanzania, Togo, and Uganda). South Sudan is excluded because it did not gain its independence until 2011.
African countries account for a large number of resource-rich countries globally. Measuring rents as a percentage of GDP offers an indication of the overall economic importance of natural resources, and is an indication of potential revenues available for taxation for a given resource-rich country. When assessed in this way, many African countries are some of the most resource-rich countries in the world—with a large concentration among oil and gas–producing countries (figure 1.1).
The degree of resource richness observed in the Africa region compared with other regions can also be examined. By using the same threshold criteria applied at the country level (20 percent of exports or 20 percent of government revenues from resources), figures 1.2 and 1.3 show that two world regions can be considered resource rich based on the IMF 20 percent threshold classification: the Middle East and North Africa region notably dominates this category,
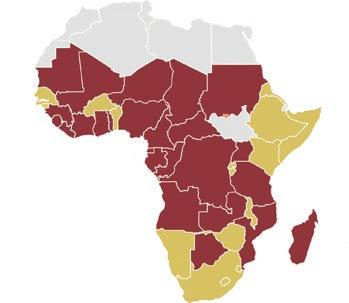
Source: Calculations based on World Bank data and Changing Wealth of Nations 2021 data.
Note: The figure shows countries for which natural resource rents exceed 10 percent of GDP. Fossil fuel–rich SubSaharan African countries (in yellow) are those defined as resource rich by the International Monetary Fund (IMF 2012); oil is their main nonrenewable natural resource. Mauritania and Zambia (in red) are resource-rich SubSaharan African countries for which minerals are the main type of nonrenewable natural resource in this figure
A total of 20 countries in the world saw average resource rents that exceeded 20 percent of GDP. Timor-Leste is not shown, but its share of natural resource rents exceeded 100 percent of its GDP. SSA = Sub-Saharan Africa.
Source: Cust, Rivera-Ballesteros, and Zeufack 2022.
Note: The figure shows the 2004–14 average of fossil fuels, metals, and minerals exports as a share of each region’s total merchandise exports. The dashed blue line denotes the International Monetary Fund criteria for resource richness (natural resource revenue or exports at least 20 percent of total fiscal revenue or exports, respectively) applied to the boom period.
Source: Cust, Rivera-Ballesteros, and Zeufack 2022.
Note: The figure shows the 2004–14 average of natural resource revenues as a share of total government revenues. This share is calculated as the 2004–14 average of the sum of natural resource revenues of all countries with nonmissing data in each region, divided by the region’s sum of total government revenues (resource plus nonresource revenues). The dashed blue line denotes the International Monetary Fund criteria for resource richness (natural resource revenue or exports at least 20 percent of total fiscal revenue or exports, respectively) applied to the boom period.
with almost 70 percent of total export value derived from natural resources— mostly petroleum—and more than 50 percent of government revenues. The Sub-Saharan Africa region also exceeds the 20 percent threshold for resource richness during this period but with a larger mineral component, exceeding 50 percent of export value and almost 30 percent of government revenues. Furthermore, in both of these regions, natural resource revenues in some individual countries surpassed 80 percent of total government revenues during the boom years.
Sub-Saharan Africa’s natural resource wealth, with the region’s deep reserves and untapped investment potential, can and should play an important role in its economic recovery. Approximately one-third of Sub-Saharan Africa’s stock of wealth in 2018 was held in various forms of natural capital, including nonrenewable petroleum and mineral deposits (World Bank 2021). Between 2004 and 2014, natural resource revenues averaged 29.6 percent of total government revenues in Sub-Saharan Africa and 36 percent of government revenues
in Sub-Saharan African resource-rich countries, based on UNU-WIDER data (2022).
However, revenues are falling short of capturing the economic potential of natural resources. Estimated rents from natural resources, which are the difference between the cost of extraction and the typical price of their sale (Cust and Rivera-Ballesteros 2021), are consistently far higher than the level of revenues collected by governments. Estimated annual resource rents in Sub-Saharan Africa account for the equivalent of 9 percent of resource-rich Africa’s GDP (World Bank 2021), but about 260 percent of their natural resource revenues, implying that a significant gap remains between the rents generated by resource extraction and the amount captured by governments as revenue.4
Leveraging these riches for sustainable development has never been more important, and governments must ensure these sectors remain productive and resilient. If governments across resource-rich Africa could capture just 10 percent of untapped rents, resource-rich Africa’s revenues would increase by US$2.4 billion per year.5 However, to close this gap, governments must find ways to more effectively tax the sector, including a move away from fiscal expenditures, especially for fossil fuels. Contract transparency, competitive bidding processes, and risk-based auditing are all tools governments can usefully deploy. Global efforts toward minimum taxation agreements can also serve to ensure countries capture a greater share of rents.
Sub-Saharan Africa remains a heavily resource-driven regional economy drawing on its significant endowments of petroleum, minerals, and metals. The minerals sector is a major and growing component of the economic output and exports of many Sub-Saharan African nations, accounting for 10 percent of Sub-Saharan Africa’s overall economic output and 50 percent of exports excluding petroleum products (Albertin, Devlin, and Yontcheva 2021).
Although it is underexplored, the Sub-Saharan African region already hosts a large proportion of the world’s mineral resources, placing Sub-Saharan Africa at the potential center of the clean energy transition. These resources include, besides precious platinum group elements (59 percent of total world resources) and diamonds (48 percent), a dominant position in ferroalloy metals such as cobalt (75 percent) and manganese (68 percent) (Guj et al., forthcoming). Some of these metals, such as cobalt, manganese, graphite, and lithium, are important inputs for clean energy technology. Some countries are particularly wellendowed: two-thirds of the world’s cobalt is mined in the Democratic Republic of Congo; Rwanda accounts for a third of tantalum mining; and South Africa has the world’s largest reserves of platinum, palladium, and manganese. The continent is also home to resources with rapidly growing global demand. Specifically, lithium is a critical input for the electric vehicle (EV) battery
industry, and countries including the Democratic Republic of Congo, Ghana, Mali, Namibia, and Zimbabwe have reserves (see Guj et al., forthcoming). The continent also hosts the world’s largest resources of phosphate rock (67 percent) and bauxite (59 percent), as well as important deposits of iron ore, heavy mineral sands, salt, and potash, and energy minerals such as coal and uranium. Map 1.2 shows the distribution of main minerals on the African continent.
Current production levels still lag in a number of Sub-Saharan African countries, despite their having some of the world’s largest resource endowments. The picture is similar for petroleum wealth. For example, graphite, which is one of the most important components of lithium batteries, is relatively underexploited in several Sub-Saharan African countries, particularly Tanzania. In 2018, despite having the fifth-largest reserves in the world, Tanzania is ranked 21st in global graphite production. In comparison, India (with half of Tanzania’s reserves) and Norway (with 30 times smaller reserves) are ranked 6th and 8th in production, respectively.
Bauxite
Cobalt
Copper
Gold
Graphite
Iron
Lithium
Nickel
PGE
Uranium
Zinc
Zircon
Another way to measure this discrepancy is to compare the gap between reserves and actual economic value from resources across different regions. The economic contribution from natural resources can be measured by using wealth accounting, as developed and published by the World Bank’s Changing Wealth of Nations program (World Bank 2021).
Although Sub-Saharan Africa has abundant natural resources—including minerals, metals, oil, natural gas, land, and forestry—its absolute level of resource wealth is one of the lowest among the world’s developing regions (figure 1.4). Measured in dollar terms using wealth accounting, Sub-Saharan Africa’s resource wealth is lagging both in aggregate and per capita levels, owing largely to less exploration and development in previous decades. Sub-Saharan Africa’s natural wealth could rise substantially in a generation if exploration and development of mining projects expand to levels seen in other regions. Evidence suggests that such a process may be under way (Arezki, van der Ploeg, and Toscani 2019), but that such investment decisions are influenced by institutional quality (Cust and Harding 2020).
The natural resource sector has untapped potential to make larger contributions to economic activity, primarily via revenue generation, but much of the resource wealth likely remains undiscovered. Sub-Saharan African countries are still relatively unexplored compared with other regions of the world (McKinsey 2013).
Underexploration is seen in the fact that the region’s resource wealth in per capita terms lags behind that of other regions, as just discussed and shown in figure 1.4. It can also be seen in the number of mine sites compared with other regions. Figure 1.5 shows the number of active mineral exploration sites worldwide by region. In 2017, African countries’ total number of active mineral exploration sites was estimated at 282, or about half of the number of sites in Australia or Canada, despite having more than triple the surface area.
A driving factor behind the disproportionately low number of active mines is the level of exploration expenditures in Sub-Saharan Africa. Despite being a highly profitable discovery region, where the estimated value of mineral discoveries exceeded exploration spending between 2005 and 2014, the amount of money spent on mineral exploration was relatively lower than in other places. Figure 1.6 shows that the expenditure on mineral exploration in Africa was lower than the estimated exploration spending in places where discoveries have accumulated less value, such as Latin America and Canada. The exploration-spending-to-discovery value in Sub-Saharan Africa is also higher than in other mineral-rich places, including Australia and the United States. Although Sub-Saharan Africa has rich endowments, between 2007 and 2016, it only attracted 14 percent of the world’s total exploration expenditure (US$20 billion). Such results are not surprising if investors attach greater perceived risk to operating in such jurisdictions. It is likely that the institutional environment influences investment location, as has been found for petroleum exploration decisions (Cust and Harding 2020).
Globally, exploration expenditures declined substantially after the last commodity boom. As figure 1.7 shows, exploration expenditure declined by 68 percent, from US$34.9 billion in 2012 to US$11.2 billion in 2016 (Schodde 2019). This decline was largely due to heightened uncertainty within the commodities sector as prices returned to more moderate levels. The outlook for exploration investment in the medium term is more positive because commodity prices have increased significantly as a result of new infrastructure programs in countries such as China the United States and coupled with momentum from the clean energy transition.
There are four tiers of mineral deposits. Tier 1 deposits are large, long-life, and low-cost deposits. Tier 2 deposits are significant deposits, but not quite as large, long life, or profitable as tier 1 deposits (they only meet some of the tier 1 criteria). Tier 3 deposits are small or marginal deposits. Tier 4 are uneconomic deposits and are unlikely to be developed. Most deposits found in Africa are tier 3 deposits. They can be profitable, but only meet one of the criteria for tier 1 deposits.6 Deposits can also be classified into four size categories: giant, major, moderate, and minor. These categories depend on the amount and type of contained minerals. For example, giant deposits of gold
contain more than 6 million ounces of this metal, and giant nickel deposits hold more than 1 metric ton of this resource (see Guj et al. [forthcoming] for the size categories’ threshold for different types of metals and minerals). Most deposits that are categorized as tier 1, 2, and 3 are considered major or giant in size, while tier 4 deposits correspond mostly to minor and moderately sized deposits. However, moderately sized deposits can qualify for the tier 1, 2, or 3 categories if they are considered valuable because of their sufficiently high grade.
Although Southern Africa has the highest total value of undeveloped resources, West Africa has the vast majority of tier 1 value (see figure 1.8 and table 1.1). In West Africa, 34.4 percent of gross mine-site value is in tier 1 deposits, compared with 0.2 percent in S outhern Africa and 0 percent in North, East, and Central Africa. On the other hand, Southern Africa has more than twice the total value of the rest of the African continent combined.
The average size of newly discovered deposits is decreasing. Schodde (2019) estimates that over the decade 2009–18, 846 mineral discoveries of moderate size or larger were made in the world. However, within that size range, the proportion of moderate-size discoveries has increased from 48 percent to
Total
Source: Guj et al., forthcoming.
Note: Total mine value is the gross value of total resources, including by-products, of operating African mines. Primary mineral value is the primary mineral value share in the gross value of the corresponding mine.
Source: Guj et al., forthcoming.
Note: Tier 1 deposits are large, long-life, and low-cost deposits. Tier 2 deposits are significant deposits, but not quite as large, long life, or profitable as tier 1 deposits (they only meet some of the tier 1 criteria). Tier 3 deposits are small or marginal deposits. The “Others” column includes tier 4 and unclassified deposits.
61 percent, indicating that, on average, the size of deposits being discovered is decreasing. On the other hand, over the past century, the number of discoveries on the continent has increased markedly (figure 1.9).
Gold still remains a major focus for exploration. Globally, gold accounted for 34 percent of expenditures over the past decade and 40 percent of all discoveries made. Gold also accounted for 25 percent of all tier 1 and 2 discoveries, most of which were in developing countries (figure 1.10).
Smaller mining companies recently began playing a larger role in exploration (figure 1.11). Until the 1990s, large mining companies made most
Source: Guj et al., forthcoming.
Note: State-owned companies = mines owned and managed by the national government. Industrial companies = companies engaged in mineral production. Oil companies = companies with the main activity of oil and gas exploration and production. Prospectors = companies that identify potential sites for mining. Junior explorers = companies that have limited or no revenue streams to finance their exploration activities. Small producers = companies with annual sales revenues of less than US$50 million per year. Moderate producers = companies with annual sales revenues between US$50 million and US$500 million per year. Major producers = companies with annual sales revenues greater than US$500 million per year. Major—singles = companies that tend to be focused on only one or two commodities. Major—multiples = companies with a spread of mining operations and expertise across a broad range of three or more different commodities.
new discoveries. Junior explorers first entered the scene in the 1990s, but they have grown substantially over the period 2009–18, during which time they made 63 percent of all discoveries. Sub-Saharan African policy makers need to take this into account when developing mining regulations and fiscal regimes to ensure they do not provide disincentives for junior exploration companies.
Petroleum Remains Sub-Saharan Africa’s Most Valuable Asset Oil has accounted for more than 30 percent of total wealth in Sub-Saharan African resource-rich countries, including Chad, the Republic of Congo, and Gabon; however, this is still significantly less than in some resource-rich comparators outside Africa, where average oil wealth can exceed 50 percent (World Bank 2021). There are both major producers, which are defined as those that produce an average of more than 100 barrels per day, and minor producers, which are defined as those that average less than 100 barrels per day. Before the boom period there were 14 petroleum-producing countries (7 major and 7 minor producers). After the boom period, the number of petroleum producers increased to 22 (10 major and 12 minor producers) (map 1.3).

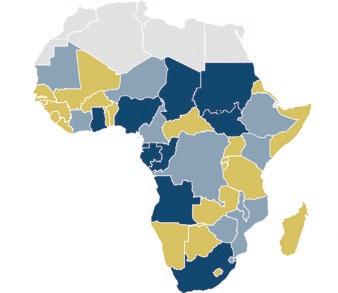
Figure 1.12 shows that during the 2004–14 commodity boom, the share of giant petroleum discoveries concentrated in Sub-Saharan Africa soared, which led to an increase in petroleum production in the region.
Mihalyi and Scurfield (2021) identify a growing number of Sub-Saharan African hydrocarbon-rich countries following the commodity price boom. Based on 12 Sub-Saharan African countries7 with significant hydrocarbon discoveries during the boom period (2004–14), they find three key disappointments related to these discoveries: (a) lack of commercial development, (b) longer-than-expected timeline from discovery to production, and (c) lower-than-expected revenue mobilization. One of the explanations for these disappointments is overoptimistic expectations, where forecasts—and associated policy decisions—overshoot the subsequent reality. In the worst case, discoveries can lead to low or reduced rates of economic growth, a phenomenon dubbed the “presource curse” (Cust and Mihalyi 2017).
First, some discoveries, despite initial euphoria, did not generate wealth. In the best scenario, only 8 of the 12 oil discoveries resulted in commercially
Source: Based on Cust, Rivera-Ballesteros, and Mihalyi 2021. Note: The share of giant discoveries by decade and region is calculated as the number of giant discoveries by region in each decade divided by the total number of giant fields discovered in that decade in the world. Geographic regions are as defined by the World Bank: EAP = East Asia and Pacific; ECA = Europe and Central Asia; LAC = Latin America and the Caribbean; MENA = Middle East and North Africa; SSA = Sub-Saharan Africa.
viable development (Mihalyi and Scurfield 2021). The initial finds in the other 4 countries—Guinea-Bissau, Liberia, São Tomé and Príncipe, and Sierra Leone— turned out to be dry wells or of low value and were abandoned. Announcements were also inflated. For instance, in São Tomé and Príncipe, the IMF in 2001 predicted oil production to start in 2006 despite no discovery having been confirmed. The discovery ended up being confirmed only in late 2006 by the company Chevron and its co-ventures. Although the company’s announcement indicated that it was too early to determine whether the discovery was commercially viable, it made reference to potential similarities with a large oil field in Nigeria. As a result, rumors emerged of at least 1 billion barrels being discovered. But these rumors were unsubstantiated, and it was later confirmed that the discovery was not commercially viable. No further discovery has happened since in either this or other blocks.8 Because of the disappointing exploration drilling results, all the major oil companies pulled out of the Joint Development Zone between São Tomé and Príncipe and Nigeria in 2012–13. In addition, the volume of discoveries in these countries since 2010, with the exception of Mozambique, has been disappointing, and the reserve-to-production ratio of all known reserves was less than expected. For instance, the ratio is about 50 years in Nigeria at the current production rate (and about 20 years for Angola, the other major oil producer in the region), whereas it is estimated to be more than 100 years in many of the major oil producers in the Middle East.
Second, the time from discovery to production and exploitation has been longer than expected. The initial forecast for the discovery-to-exploitation process for oil and gas was estimated to be 6.2 years for the 12 Sub-Saharan African countries studied by Mihalyi and Scurfield (2021), reevaluated to 11 years, on average, according to Mihalyi and Scurfield (2021). For instance, oil fields (Block 1, Block 2, and Block 3) in Uganda are now projected to be exploited between 15 and 17 years after discovery, a significant increase over the 3 to 5 years in initial forecasts. For gas fields (Block 1, Block 2, and Block 4) in Tanzania, Mihalyi and Scurfield (2021) estimate the discoveryto-exploitation process is between 15 and 17 years, up from 8 to 10 years in initial forecasts. Overall, 56 percent of the discovered hydrocarbon fields in Sub-Saharan Africa had not yet been exploited as of 2018, whereas only 33 percent of the discovered hydrocarbon fields for the rest of the world have not yet been exploited, according to Mihalyi (2020). Mihalyi (2020) reports survival models confirming that the process is longer in Sub-Saharan Africa than elsewhere for both oil and gas extraction, and even longer in the case of gas deposits compared with oil deposits. These results hold when controlling for the level of GDP, so cannot simply be explained by differences in income levels across countries and regions, echoing similar findings on the delays around mining projects (Khan et al. 2016).
Finally, revenue mobilization has underperformed. Revenues collected were 63 percent lower than those initially projected in the three countries that reached production—Ghana, Mauritania, and Niger. The Ghanaian case is particularly well documented in Mihalyi and Scurfield (2021). Following the massive Jubilee offshore oil find in 2007, in 2009 the IMF and the World Bank forecasted annual oil revenues to be at least US$1 billion from 2011 onward. Actually, from 2011 to 2017, annual oil revenues were only about US$0.6 billion according to Mihalyi and Scurfield (2021). The alleged factors behind these overoptimistic projections were a combination of overestimates of corporate income tax from exploitation and, more important, underestimates of cost recovery from additional new hydrocarbon production sites related to project ring-fencing provisions or lack thereof. Subsequent undershooting in revenues collected was also driven by falling oil prices. Many giant petroleum fields were discovered in Africa during the 2004–14 commodity boom (figure 1.13), creating a perception of a bonanza in resource-rich Africa; however, given the lead time to develop, few reached fruition before the end of the supercycle and declining world prices, further undermining the revenue contributions they could make.
Source: Based on Cust, Rivera-Ballesteros, and Mihalyi 2021. Note: The figure shows countries where real net present value from giant field discoveries exceeded 10 percent of constant GDP. EAP = East Asia and Pacific; ECA = Europe and Central Asia; LAC = Latin America and the Caribbean; MENA = Middle East and North Africa; SAR = South Asia; SSA = Sub-Saharan Africa.
The mining sector in Africa is relatively top-heavy, being dominated by large, often foreign-owned, mining companies that, in turn, often use international suppliers for key inputs. Other countries and regions have achieved success with smaller-scale, sometimes more domestically owned, mining and mining supply chain firms. A more balanced portfolio of large, medium, and small miners and firms in Africa could help the sector deliver wider shared benefits.
Unlocking the potential of small- to lower-medium-scale mining in SubSaharan Africa requires a strong regulatory environment, business support, and access to finance. South African small and medium enterprises (SMEs) benefit from a favorable investment climate. A large number of supplier and enterprise development programs have been implemented by large mining firms because of Mining Charter III’s9 provision that allows companies to offset up to 30 percent of their procurement budget against supplier and enterprise development. Though capacity of SMEs is being built, financing is still scarce. Commercial banks have limited risk appetite, particularly given the number of large mining firms with years of financial statements and established profitability. To integrate SMEs into mining supply chains, a complementary suite of measures is needed, including the development of junior African mining companies (box 1.1).
Fiscal instruments to capture a share of revenues should be bifurcated for SMEs and large mining companies. Royalties, for instance, can be made progressive, where the rate is tailored to the size of the deposit. Different categories of royalties for each category of mines can promote the development of small and medium mine projects. A review of 46 Sub-Saharan African countries’ mining laws indicates that, except for Tanzania, none of the mining policies or mining laws explicitly and separately specify the existence of, nor contain special provisions for, medium-scale mining activities. As a consequence, small to medium-size mines typically have the same fiscal regime as large-scale mines.
Beyond laws and policies, governments can support SME development by creating an enabling environment for a dynamic and competitive private sector capable of meeting the demands of mining companies by producing locally instead of importing goods. The recent experience in Zambia highlights the challenges associated with domestic firm preferences that can replace different suppliers with locals but still fail to increase linkages. Instead, the focus should be on value added and building durable capabilities. Companies willing to invest and accordingly increase the national value added need more than just privileged access to procurement contracts. For instance, a company willing to invest in mining machineries, or the dynamite industry, or the garment
Globally, the term “junior mining” refers specifically to prospecting companies engaged only in the early stages of mining development. But in South Africa, junior mining firms include midtier producers in addition to exploration companies. These firms are often supported by larger institutions. In Canada, junior mining companies are supported through the Prospectors & Developers Association of Canada. In South Africa, Minerals Council South Africa, the mining sector’s industry association, supports both junior and large firms.
Given high levels of information asymmetry, Minerals Council South Africa has established a Junior and Emerging Miners’ Desk to provide support and serve as a resource for small member companies within the association. The industry body provides support to junior mining firms that lack the capacity and resources to implement legislation and policies. The Junior and Emerging Miners’ Desk does not directly assist individual companies, but lobbies for junior mining firms at a policy level. For example, the Junior and Emerging Miners’ Leadership Forum successfully lobbied for concessions in the Mining Charter pertaining to smaller companies. Minerals Council South Africa also hosts breakfast seminars on topics such as mine community development, finance for junior miners, water management, and the Mining Charter and junior mining, and has set up a mentorship group to support junior and emerging miners.
Source: Minerals Council South Africa 2020.
industry will need to have a sufficient local skills base, infrastructure (energy, transport, and logistics), and access to a dynamic financial system to be competitive. In this case, government support can be more effective when addressing these broader bottlenecks.
Developing and implementing skills-development programs aligned with both mechanization and economic diversification to absorb the decline in labor demand resulting from mechanization can be an important pillar of any private sector support strategy. Although mechanization results in substantially higher productivity and revenue, it has a strong impact on local labor dynamics by raising the capital intensity of production. In particular, it can shift the type of labor demanded from low skilled to high skilled and lead to an overall decline in the amount of labor demanded. The transition to mechanization requires the development of a suitably skilled workforce for these new needs, as well as management of the flow of lower-skilled workers to other industries and jobs that are positioned to absorb high amounts of lower-skilled labor. The increased
tax revenue resulting from higher mining productivity can be used to finance skills-development programs, but proactive and nimble government support is also important.
Mechanization also requires capability development to ensure sufficient entry of local suppliers. Currently, nearly all of the mechanized machinery used in Sub-Saharan Africa is imported from overseas, as is the labor to operate and repair the machinery. Therefore, providing local suppliers and servicers with the necessary training is key to making domestic mining technology and service firms competitive with international counterparts. Given the skills shortage facing many mining communities, this upgrading will require capacity-building in the areas of technical and business development and increased access to finance to support the development of linkages while also widening the beneficiary base of the mining sector. Existing local content policies largely focus on direct employment quotas but less on skills development for the creation of indirect employment in linked sectors. Shifting the focus of local content policies to the latter would help grow the mining multiplier effect along with productive linkages. Additionally, investment and development of technical and vocational education and training in Africa can play an important role in providing the needed skilled jobs for the sector. Africa’s youthful population provides a significant opportunity for these next-generation skills to be home-grown and home-sourced from across the continent.
Policy recommendations to strengthen the governance of the mining sector can be broadly grouped into four areas: (a) strengthen the transparency and accountability of the sector, (b) honor existing fiscal and social agreements, (c) create policies that require firms to consistently cover all costs, and (d) strengthen revenue collection.
Improving transparency and accountability is critical for improving trust between mining companies and governments and for managing expectations between communities and firms. Historically, distrust has been rampant and has translated to abrupt policy changes and operational stoppages. For example, in 2017, the Tanzanian government accused London Stock Exchange–listed firm Acacia, the country’s largest gold mining company, of tax evasion, and handed the firm a US$190 billion tax bill—about four times the country’s GDP—for underreporting output and thus underpaying taxes, an allegation the company denied (World Bank 2019). Widespread adoption of the Extractive Industries Transparency Initiative (EITI), as well as accompanying standards such as routine contract disclosure, can reduce information asymmetry and help develop a mechanism to promote trust and collaboration between governments, firms, and civil society. The EITI standard requires information along the extractive value chain, including extraction, rent transfer, and how it benefits the public.
The EITI aims to reduce elite capture by shedding light on how licenses and contracts are allocated, who benefits from those operations, what the legal and fiscal arrangements in place are, how much is paid, how those revenues are allocated, and what extraction contributes to the economy, particularly for employment. Companies are increasingly stepping up their own practices, including making contracts public and open to scrutiny, along with more detailed project-level reporting on taxes paid and other social investments. High standards in environment, social, governance, and emissions reporting can also serve to improve channels of accountability.
Investors value policy stability, which includes consistent fiscal arrangements over time that are flexible to different price conditions. Policy and institutional stability can be central to keeping and attracting investments. For example, in 2020, 72 percent of mining firms surveyed by the Fraser Institute stated that uncertainty regarding the administration, interpretation, and enforcement of existing regulations was a mild deterrent, strong deterrent, or a reason that they would not pursue investment in South Africa (Yunis and Aliakbari 2020). This inclination follows years of relative policy change and uncertainty.
The Mining Charter was first developed in 2002 to help address the legacy of apartheid. It was amended in 2010 and revised again in 2017 and 2018. In 2019, the Minerals Council filed an application to take the third Mining Charter to judicial review, challenging several key provisions, including procurement and ownership. Under these provisions, companies that were previously compliant with the 26 percent ownership target in the past would remain compliant even if their Black Economic Empowerment (BEE) partners choose to exit the transaction. However, with the revised charter, these companies would lose their compliant status when they renew or transfer their mining rights, and would have to top up their BEE shareholding to the new minimum of 30 percent. This was contrary to a North Gauteng High Court ruling from April 2018, which stated that companies that met, but then fell below, the 26 percent target would not have to top up their BEE shareholding. The shift in policy created uncertainty among many existing firms and potential investors, largely because it was unexpected and would require substantial change on the part of firms.
Honoring existing fiscal agreements is also critical. There has been an increase in resource nationalism across Sub-Saharan Africa, which has translated to tax increases, increases in requirements for state equity, and local beneficiation requirements. When governments unilaterally amend or break existing fiscal agreements they have with mining firms, they signal that future investments or projects are high risk and vulnerable to abrupt changes. For example, despite being Sub-Saharan Africa’s second-largest copper producer, Zambia has struggled to keep existing investments and mobilize new investments,
compared with neighboring Democratic Republic of Congo. Although there are a number of reasons, one that could have a high impact is the unpredictable fiscal climate—in 2018, Zambia increased its royalty rates for the tenth time in 16 years, which created uncertainty for investors.
Developing and consistently enforcing policies that require firms to cover their social and sustainability costs from exploration to mine closure should be a central part of governance of the sector. A primary reason that governments develop policies that can be perceived as punishing mining companies is because of the substantial negative externalities mining firms generate, historically and at present, including pollution, health consequences for workers and communities, infrastructure damage, and irreversible land damage. These costs must be covered by the firms that profit from mining activities. However, these costs should be built into the agreements that firms and governments enter into so that there is also clarity and the potential for policy stability, as discussed in the previous recommendation.
And finally, governments should maximize revenue collection while being mindful of the hurdle rate, so that firms are adequately compensated for the risk associated with mining. Revenue from the mining sector is particularly low in some countries. For example, in 2017, South Africa’s mining and quarrying sector accounted for just 1.3 percent of total revenue collected by the country government, compared with the 7.3 percent t hat this sector contributed to GDP in that year, partially owing to tax incentives and provision payments.
Governments would benefit from adequate institutional arrangements for effective and efficient mining revenue collection, including improvements in data capacity. The ability to measure and monitor extractive sector activity can increase the governments’ ability to enforce existing fiscal requirements but also give them a wider range of taxation instrument options. The recommendation to join EITI to increase transparency and accountability, as well as to reduce information asymmetry, would enable governments to have accurate information with which to create adequate tax policies and use a combination of production taxes, royalties, and regulatory taxes to efficiently capture rents while ensuring firms are profitable. Furthermore, risk-based auditing can help maximize the impact of limited tax administration capacity.
For those countries rich in certain metals and minerals, the prospects may be rosier. Those with resources needed for low-carbon energy technologies or electronics could see increased demand in the future as the carbon transition accelerates. Such countries may have opportunities to benefit, but also must mitigate the resource curse in the face of strong demand for their exports.
High population growth and job creation pressures cause increased scrutiny of contributions by the extractive sector. As a capital-intensive but highly politically visible sector, the job creation contribution of mining is subject to intense debate and political pressure in many Sub-Saharan African countries. An examination of past performance in the region and beyond can bring more evidence and data to this passionate public discussion.
Automation and technological advancement are under way in the extractive sector. A looming question is to what extent automation and other technological innovations will affect investment prospects, new frontiers of exploration and extraction, or the labor intensity (and hence job creation potential) of the sector.
The carbon transition coincides with the need for a Sub-Saharan African energy transition. Supply shortages combined with low overall access and growing populations suggest the need for a step-change in the approach to electricity systems. An important question is how much Sub-Saharan Africa’s fossil fuel resources can and should contribute to this change versus embracing emerging technologies that may offer more decentralized and sustainable approaches to powering the continent.
The transition from fossil fuels to clean energy will create a demand for 3 billion tons of minerals and metals needed to deploy solar, wind, and geothermal energy by 2050. This energy transition will increase the demand for raw material inputs involved in clean energy technologies. The Sub-Saharan Africa region has significant mineral and petroleum deposits. Lithium, cobalt, and vanadium, for example, are critical for the deployment of energy storage, whereas copper, indium, selenium, and neodymium are essential for the production of wind and solar power generators. Some minerals, such as platinum group metals (platinum, palladium, and rhodium), are crucial for maintaining the current energy fleet based on the “legacy energy commodities,” for example, internal combustion engines. For some of these key energy transition resources, Sub-Saharan Africa is already a major supplier and exporter. Wind power and photovoltaic facilities, various battery systems, hydrogen storage, electric vehicles, and light-emitting diodes are just a few examples of mineral-intensive technologies (Wellmer et al. 2018). For example, an increasing market for EV lithium-ion batteries is accelerating a global demand surge for metals and minerals that are required to produce them (figure 1.14).
The projected rapid increase in production of EVs, and to a lesser extent of static energy storage, has attracted the focus of mining analysts and investors toward a range of minerals critical to their manufacture. A 2018 study by the McKinsey Center for Future Mobility estimates that global annual EV production will increase to 13 million to 18 million by 2025 and to 26 million to 36 million by 2030, with China accounting for 50–60 percent of output (McKinsey 2018). These figure s appear relatively optimistic,
particularly in light of the uncertain impact of COVID-19, which produced a plunge in EV sales of 60 percent in February 2020 compared with the same month in 2019 (IEA 2020b). In April 2020 sales rebounded to 80 percent of prepandemic levels, and the EV industry likely reverted to its trend along the lines of the IEA’s (2020b) medium- to long-term production estimates of almost 14 million EV units in 2025 and 25 million in 2030. These figure s are consistent with the IEA estimates that by 2030 there may be as many as 140 million EVs in circulation worldwide with existing government policies (which, however, will only represent 7 percent of total vehicles expected to be on the road by that time) (IEA 2020b).
The transition to clean energy will require the mining sector to reduce its own carbon footprint. Such transformation requires, among other things, stringent energy efficiency measures, a significant decrease in total primary energy demand for oil and natural gas, and a massive increase in global renewables capacity. Estimates suggest that 80 percent of proven fossil fuel reserves must remain underground to meet targets (Bos and Gupta 2019).
The mining sector is one of the primary consumers of coal and fuel, and reducing its reliance on these energy sources is critical for reducing the sector’s impact. For example, in Namibia, B2Gold, the country’s largest gold mining company, opened the Otjikoto solar plant in 2018, which is one of the world’s first fully autonomous hybrid plants, with 7 megawatts of solar capacity to reduce reliance on a 24-megawatt heavy fuel oil facility. Within the first year, Otjikoto Mine had reduced heavy fuel oil consumption by 2.1 million liters and
reduced overall fuel consumption by 17 percent. Importantly, the renewable energy solution created broader community benefits. B2Gold’s solar plant was part of its corporate social responsibility program; it will continue to provide power to local communities even after the mine shuts down. The Otjikoto solar plant was a triple win, improving economic returns, reducing environmental impacts, and providing sustainable energy to surrounding communities. Other countries could encourage similar initiatives to reduce the sector’s carbon footprint.
However, growth of the mineral sector to meet the needs of the clean energy transition will not translate to a proportional increase in direct jobs. The sector is capital-intensive, and is increasingly becoming more so, which leads to a demonstrated improvement in efficiency, but also to reduced labor intensity. In South Africa, Anglo American Platinum’s Mogalakwena open-pit mechanized mine employs 1,800 people. The mine runs four shifts a day, and 85,000 tons are extracted in one shift. At Impala, its conventional counterpart, 85,000 tons are extracted each month and 14,000 people are employed. The per person output is 11 times higher at the mechanized mine. Thus, identifying ways to create jobs in other parts of the supply chain, and elsewhere in a diversified economy, will be increasingly important.
Analysis of trade elasticities of the demand and supply of minerals and fossil fuels can help us understand how future changes in demand and supply might affect African economies. An examination of historical trade data can aid an evaluation of how African economies have performed relative to the rest of the world, allowing policy insights to be drawn on how governments might need to improve sector investments and responsiveness to capitalize on any potential mineral boom spurred by the low-carbon transition (see annex 1A at the end of this chapter).
The economies of many Sub-Saharan African countries rely heavily on the export of mineral commodities. Chemicals and allied industries (2 percent), base metals (8 percent), precious stones and metals (14 percent), and hydrocarbon mineral products (54 percent) together made up more than 75 percent of the current value of the region’s exports to the rest of the world between 1995 and 2018. They accounted for, on average, 25 percent of total Sub-Saharan African government revenues in 2014 (figure 1.15).
Along with other confounding factors, volatility in mineral prices can affect growth of Sub-Saharan African countries (Renner and Wellmer 2020; van der Ploeg and Poelhekke 2009). The COVID-19 crisis, for example, had a significant effect on mineral resource prices and exports. Average yearly forecasts of Brent oil prices in 2020 were revised downward from US$62.70 to US$39.00 per barrel,
Sources: Based on the UNU-WIDER Government Revenue Dataset, the International Monetary Fund, the International Centre for Tax and Development, and the Extractive Industries Transparency Initiative (February 2020 version).
Note: EAP = East Asia and Pacific; ECA = Europe and Central Asia; LAC = Latin America and the Caribbean; MENA = Middle East and North Africa; SAR = South Asia; SSA = Sub-Saharan Africa. Dotted lines correspond to region averages.
and of nickel prices from US$6.20 to US$5.70 per pound (S&P Global Market Intelligence 2020). Mining company operations have been interrupted by both isolated outbreaks and by government-mandated shutdowns in key exporting countries (Deloitte 2020). South Africa’s lockdown, for example, disrupted 75 percent of the global output of platinum, a key material in many clean energy technologies and emissions control devices, although the country later allowed mines to operate at 50 percent capacity (IEA 2020a). The Democratic Republic of Congo has experienced an even greater shock, with both a shutdown of the key Mutanda cobalt mine and demand reduction owing to COVID-19. Mining companies in Zambia, Sub-Saharan Africa’s second-largest copper producer, suffered a 30 percent drop in revenues when the COVID-19 pandemic hit the global economy (Reuters 2020).
Sub-Saharan African countries export mineral commodities to the world’s largest countries and trading blocs, including China, the European Economic Area, India, Japan, and the United States, which this report refers to as “main importers.” The export structure of these commodities has changed significantly over the past two decades, both in absolute terms and across trading partners (figure 1.16). This demand is likely to increase.
Although mineral products (including mineral fuels such as oil and gas, metal ores, and salts) remain the largest source of Sub-Saharan Africa’s exports and make up more than 54 percent of the region’s trade to other regions, their value has declined considerably in recent years (figure 1.16, panel a). Base metals make up a relatively smaller portion of exports from Sub-Saharan Africa, and have also seen a small decline (figure 1.16, panel b). There is positive momentum in exports of precious or semiprecious stones and precious metals (figure 1.16, panel c). These have grown every five years since 1995, and are more than twice as large as base metals and articles thereof today. Though relatively smaller, chemicals or allied industries have seen no periods of decline every five years since 1995 (figure 1.16, panel d). Finally, the export destinations of Sub-Saharan Africa’s mineral commodities have changed over time. While the European Economic Area is a consistently large importer of all Sub-Saharan African minerals, China has demonstrated a large and growing role in imports of mineral products and metals since 2009.
What is the outlook? Countries with significant mineral energy materials (MEM) reserves have an opportunity to expand their exports and capture the potential of the global energy transition and the recovery from COVID-19. The trade elasticity analysis suggests that the region’s MEM exporters will have to become more export responsive to take advantage of anticipated rising demand from the global energy transition.
The elasticity results also suggest that Sub-Saharan African hydrocarbon producers face relatively low demand import elasticity compared with the
a. Mineral products
b. Base metals and articles of base metal
1995–981999–20032004–082009–132014–18
1995–981999–20032004–082009–132014–18
1995–981999–20032004–082009–132014–18
Source: Galeazzi, Steinbuks, and Cust 2020.
1995–981999–20032004–082009–132014–18
Note: Mineral products (chapters 25–27) include ores, slag, and ash; mineral fuels (oil, gas), mineral oils, and products of their distillation; bituminous substances; mineral waxes; salt; sulfur; earths and stone; plastering materials, lime, and cement. Base metals and articles thereof (chapters 72–83) include iron and steel, copper, nickel, aluminum, lead, zinc, tin, etc.; cements and articles thereof. Precious or semiprecious stones and precious metals (chapter 71) include natural or cultured pearls, precious or semiprecious stones (diamond, etc.), precious metals (silver, gold, platinum, palladium, etc.), metals clad with precious metal, etc. Chemicals or allied industries (chapter 28) include inorganic chemicals; organic or inorganic compounds of precious metals, of rare-earth metals, of radioactive elements, or of isotopes. CHN = China; EUA = European Economic Area; IND = India; JPN = Japan; USA = United States.
rest of the world, which implies that the potential remains for hydrocarbons to continue to be a significant source of export revenues over the short to medium term. Because global oil and gas demand may begin to decline permanently as the global energy transition progresses, Sub-Saharan African hydrocarbon-producing countries will need to adapt to these new market conditions. For the moment, however, they still have some time to manage an orderly transition away from fossil fuels.
Sub-Saharan Africa is blessed with significant natural resource wealth. The number of countries counting themselves among the resource rich has been growing since the turn of the millennium. Now the majority of countries in Sub-Saharan Africa are categorized as resource rich, with even more on the path to reaching this status given recent major discoveries.
Despite these large reserves, the conversion of subsoil wealth into aboveground equitable prosperity has had limited success. Since the decline in commodity prices in 2014, resource-rich Sub-Saharan Africa has grown more slowly than the region’s average growth rate. Poverty is increasingly concentrated in resource-rich Sub-Saharan Africa. Meanwhile, the mining sector’s contribution to employment has been declining amid mechanization; therefore, new approaches and policies may be required to ensure a more equitable distribution of benefits from extractive industries to other parts of the economy.
According to World Bank estimates, in 2018, Sub-Saharan Africa’s stock of natural resource wealth reached US$3.9 trillion, from which US$1.1 trillion were held in petroleum and mineral deposits (World Bank 2021). This represents almost one-third of Africa’s total stock of wealth in natural resources. Considering its relatively underexplored mineral reserves and untapped investment potential, the region can potentially become an important part of the clean energy transition. Significant resources include precious platinum group elements (59 percent of total world resources) and diamonds (48 percent) and a dominant position in ferroalloy metals such as cobalt (75 percent) and manganese (68 percent) (Guj et al., forthcoming).
Sub-Saharan Africa has seen more major discoveries of petroleum since 2000 than any other region of the world, accounting for 50 percent of the world’s giant discoveries in the 2010s. Before the boom period, there were 14 petroleum-producing countries (7 major and 7 minor producers). After the boom period, the number of petroleum producers increased to 22 (10 major and 12 minor producers).
Harnessing natural resource wealth to drive economic transformation remains central to Sub-Saharan Africa’s economic future. The extractive sector is well placed to support the economic recovery phase that Sub-Saharan Africa now faces. Rising Asian demand for commodities has deepened investment in, and hence reliance on, natural resources. Despite decarbonization and depletion, the amount of natural resource wealth available for development continues to increase, providing a potential engine of structural transformation.
Tapping into this potential is in the hands of policy makers. Without appreciating the lessons of the booms and busts, as well as how emerging trends will shape the future, it will be hard for both the World Bank Group and policy makers to find adequate measures to promote sustainable growth in resource-rich Africa.
Governments must focus on developing s table policy environments that enable firms to have certainty and governments to collect revenue and protect communities, workers, and the environment from bearing the costs of mining.
First, strengthen the governance and transparency of the sector. Various governance frameworks have been developed that provide useful benchmarks for policy makers to measure themselves against. Adoption of frameworks such as the Natural Resource Charter and the Extractive Industries Transparency Initiative (EITI) can help countries enhance disclosure and policy practices. The EITI standard requires information along the extractive value chain, including extraction, rent transfer, and how it benefits the public. The EITI aims to reduce rent capture by looking at how licenses and contracts are allocated, who benefits from those operations, what legal and fiscal arrangements are in place, how much is paid, how those revenues are allocated, and what extraction contributes to the economy, particularly for employment. Widespread adoption of the EITI, as well as accompanying standards such as routine contract disclosure, can reduce information asymmetry and help in the development of a mechanism to promote trust and collaboration.
Companies are increasingly stepping up their own practices, including making contracts public and open to scrutiny, in addition to providing more detailed project-level reporting on taxes paid and other social investments. High standards in environment, social, governance, and emissions reporting can also serve to improve channels of accountability; however, they must be accompanied by strong regulation and enforcement by government, given the inherent limitations of voluntary measures by the private sector.
Second, clear and consistent fiscal and social agreements set in law, rather than negotiated on a contract-by-contract basis, can help create policy stability, thereby promoting investments. For example, in 2020, 72 percent of mining firms surveyed through the Fraser Institute stated that uncertainty regarding the administration, interpretation, and enforcement of existing regulations was a mild deterrent, strong deterrent, or a reason that they would not pursue investment in South Africa (Yunis and Aliakbari 2020).
Third, develop policies that help ensure that firms internalize their social and sustainability costs from exploration to mine closure. A primary reason that governments develop policies that can be perceived to be punishing mining companies is because of the substantial negative externalities mining firms generate, historically and at present, including pollution, health consequences for workers and communities, infrastructure damage, and irreversible land damage. These costs must be covered by the firms that profit from mineral activities. But, these costs should be built into legislation and the agreements that firms and governments enter into, so that there is also policy clarity and stability, as discussed in the previous recommendation.
Fourth, maximize revenue collection across both high- and low-price conditions, while being mindful of the hurdle rate, so that firms are adequately compensated for the risk associated with mining. In practice, some combination of royalties and taxes on profits can ensure rent capture for the government and its citizens. Countries should avoid and minimize tax incentives. Revenue from the mining sector is particularly low in some countries. For example, in 2017, South Africa’s mining and quarrying sector accounted for just 1.3 percent of total revenue collected, compared with the 7.3 percent of GDP the sector accounted for (World Bank 2019), partially owing to tax incentives and provision payments. Governments would benefit from adequate institutional arrangements for effective and efficient mining revenue collection.
Trade elasticities can provide further insight by showing the relative attractiveness of products or exporters in the world market. Low import demand elasticity (import demand strength) implies that importers’ consumption of mineral commodities is little changed if their prices increase or decline. High export supply elasticity (export supply strength) indicates that exporters can rapidly ramp up or down production if the commodity’s price increases or decreases. From the exporter’s perspective, low import demand elasticity and high export supply elasticity provide the best combination.
To analyze Sub-Saharan African export attractiveness for energy transition resources, import demand and export supply price elasticities for Sub-Saharan Africa relative to the rest of the world are calculated. Figure 1A.1 shows calculated elasticities for main importers and all commodities broken down into 97 Harmonized System (HS) chapters for the world as a whole. The size of the bubbles represents the size of trade for each product to the main importers. The energy transition resources are in shown in red. The figure shows, for example, that inorganic chemicals and compounds of precious metals have higher import demand strength than oil and gas because the import demand for these
Import demand advantage, export supply disadvantage
Oil and gas
Copper and articles thereof
Platinum group metals
Inorganic chemicals, compounds of precious metals, including REE
Import demand advantage, export supply advantage
Import demand elasticity
Import demand disadvantage, export supply disadvantage
Ores and concentrates, etc.
Salt; sulfur; graphite
Nickel and articles thereof
Import demand disadvantage, export supply advantage
Source: Galeazzi, Steinbuks, and Cust 2020 based on UN Comtrade version HS92; cleaned by CEPII published in BACI database. Elasticity calculations are based on modifications made by Broda and Weinstein (2006) and Soderbery (2015).
Note: In this figure, each bubble represents the difference between the elasticities calculated using [CES elasticities for all countries except SSA] – [the CES elasticities calculated using all countries].
The Y axis contains the difference for CES supply elasticity and the X axis contains the difference for CES demand elasticity.
A negative value in the y axis indicates that adding SSA increases the elasticity of supply [which is good].
A negative value in the x axis indicates that adding SSA decreases the elasticity of demand [which is good].
Nickel (HS chapter 75); copper (HS chapter 74); salt, sulfur, and graphite (HS chapter 25); platinum group metals (HS chapter 71); oil and gas (HS chapter 27); inorganic chemicals, including rare earth metals (HS chapter 28); ores and concentrates (HS chapter 26). HS = Harmonized System; REE = rare-earth elements; SSA = Sub-Saharan Africa.
commodities is less elastic. Their export supply is more elastic than that of oil and gas, also relatively beneficial for the exporter.
Figure 1A.1 plots the differences of import demand and export supply elasticities between all countries except Sub-Saharan Africa, and all countries. The size of the bubbles provides a gauge of the importance of exports from the SubSaharan African region. A negative value in the y-axis indicates that adding Sub-Saharan Africa to the sample increases the elasticity of supply, which is beneficial to exporters. A negative value along the x-axis indicates that adding Sub-Saharan Africa decreases the elasticity of demand, which is also beneficial to exporters.
Figure 1A.1 therefore suggests the following:
• Nickel, salt, sulfur, and graphite exports from the Sub-Saharan African region have relative export supply strength and relative import demand weakness, compared with the exports from the rest of the world.
• Platinum group metals, copper, and oil and gas exports from the SubSaharan African region have relative import demand strength and relative export supply weakness, compared with the exports from the rest of the world.
• Inorganic chemicals, including rare earth metals, have relative strength for both import demand and export supply.
• Ores and concentrates exports from the Sub-Saharan African region have relative weakness for both import demand and export supply.
These results indicate that there is substantial export potential for the SubSaharan African region to meet growing demand for some key new energy transition resources, such as selenium and other critical minerals. They also suggest that the Sub-Saharan African region’s exports of legacy energy resources such as oil and gas, and of platinum group metals as well as copper, are relatively more resilient to import price fluctuations. On the other hand, Sub-Saharan African exports of metal ores are less attractive as compared with the rest of the world.
To analyze the future potential of Sub-Saharan Africa’s largest energy mineral exports, trade elasticities are estimated for the following commodities: crude oil, cobalt, copper, and nickel (figure 1A.2). The three vertical sections of figure 1A.2 show the following:
• The importance of the Sub-Saharan African region in total trade for that commodity and the importance of the commodity in total Sub-Saharan African trade
• The price forecast for the commodity according to S&P Global Market Intelligence
• The export value forecast for the commodity, accounting separately for the price effect, based on the estimated elasticities
The COVID-19 (coronavirus) pandemic has had a significant effect on demand for and prices of crude oil, currently the main export commodity of the Sub-Saharan African region and about 30 percent of its total trade value in 2018 (panel a of figure 1A.2). COVID-19 led to a downward revision of 2020 prices from about 86 to 54 index points (2018 base year) in forecasts by S&P Global Market Intelligence (panel b of figure 1A.2). Prices are expected to range from about 54 to 91.5 index points between 2019 and 2028 and rejoin preCOVID-19 forecasts only in 2026. The price elasticity of demand effect in 2020 is not met by supply and other factors, and the market clears at about US$75 billion in current dollars (main importers, excluding India and the United States). Likely causes are a production curtailment by OPEC+10 and an overall decline in global demand, including demand for crude oil. The future growth of oil export revenues is thus expected to be modest in the coming decade.
a. Oil, % of total SSA trade (solid, right scale), % of total world trade of oil/gas (dashed)
b. Oil (Brent), price forecast, 2018 = 100
c. Crude oil, estimated SSA export value, price elasticity of demand effect (red) and other factors (yellow), US$
d. Cobalt ores (orange) and metal (green), % of total SSA trade (solid), % of to tal world trade in cobalt (dashed, right scale)
Crude Oil-Brent Crude Oil-Brent (Pre-COVID)
e. Cobalt, price forecast, 2018 = 100
f. Cobalt, ores (yellow); metal (red, right scale), price elasticity of demand effect (red) and other factors (yellow), US$
(continued next page)
g. Copper cathodes, % of total SSA trade (solid), % of total world trade of good (dashed, right scale)
h. Copper, price forecast, 2018 = 100
i. Copper cathodes, estimated SSA export value, price elasticity of demand effect (red), and other factors (yellow), US$
j. Unwrough nickel, % of total SSA trade (solid), % of total world trade of good (dashed, right scale)
k. Nickel, price forecast, 2018 = 100
l. Nickel, unwrought/not alloyed, estimated SSA export value, price elasticity of demand effect (red) and other factors (yellow), US$
Nickel, cash official Nickel, cash official (Pre-COVID) Market clearing value
Sources: Galeazzi Steinbuks, and Cust 2020, based on UN Comtrade version HS92; cleaned by CEPII published in BACI database (2020). Price forecasts from S&P Global Market Intelligence. Elasticity calculations based on modification by Broda and Weinstein (2006) and Soderbery (2015).
Note: Harmonized System codes: oil, 2709; cobalt ores, 2605; cobalt metal, 8105; copper cathodes, 7403; unwrought nickel, 7502. Selection between metals, ores/concentrates, and other alternatives of the same commodities based on availability of data and importance of trade for Sub-Saharan Africa. SSA = Sub-Saharan Africa.
Cobalt prices are expected to modestly recover after their collapse in 2019. Between 2019 and 2029, price forecasts range from about 45 to 65 index points (2018 base year) (panel e of figure 1A.2). The effect of price elasticity of demand (red in panel f of figure 1A.2) is expected to pale in comparison to other factors for Sub-Saharan African cobalt. New demand is likely to come from increased deployment of battery technology for energy storage in transport, power, and consumer electronics, creating opportunity for future export revenue growth for Sub-Saharan African cobalt exporters, particularly the Democratic Republic of Congo.
On the other hand, between 2019 and 2029, price forecasts for copper and nickel range from 91 to 130.5, and from 94 to 139 index points, respectively (2018 base year). The price elasticity of demand effect seems to contribute a larger portion of the market clearing value in copper compared with nickel, suggesting alternative demand and supply factors, affecting the growth of the Sub-Saharan African nickel market. This should benefit exports of major SubSaharan African exporters such as Côte d’Ivoire and Zimbabwe.
1. Impressive progress on poverty reduction in countries such as China and India means that poverty is becomingly increasingly concentrated in those countries that have stagnated or regressed on poverty alleviation in recent years. These countries are disproportionately resource-rich low-income countries, many of which are located in Sub-Saharan Africa. Combined with higher-than-average population growth rates, this makes the remaining poverty alleviation challenge significant.
2. This report focuses on the Africa region, defined by the World Bank as 48 Sub-Saharan African countries.
3. This report focuses on the World Bank Africa region, which is predominantly SubSaharan Africa, comprising 48 countries in total (https://data.worldbank.org/region /sub-saharan-africa). This group of countries is referred to as Sub-Saharan Africa throughout. The report follows the IMF definition of resource richness to distinguish between the groups of countries for analysis (IMF 2012) and to chart changing patterns of resource dependency.
4. Based on World Bank and the ICTD/UNU-WIDER Government Revenue Dataset 2019, only considering Sub-Saharan African countries with nonmissing data. For more discussion of resource rents and government take, see Cust and RiveraBallesteros (2021).
5. This number is calculated as 10 percent of resource-rich Africa’s average annual difference between natural resource rents (World Bank 2021) and natural resource revenues (UNU-WIDER), averaged over 2015–18. Resource-rich Africa includes countries listed in the IMF (2012) resource-rich definition, except for the Central African Republic, Côte d’Ivoire, Madagascar, Mozambique, Niger, Tanzania, and Togo, for which resource revenue data were missing.
6. Minex Consulting, “Tiers,” https://minexconsulting.com/definitions/tiers/.
7. The countries are Ghana, Guinea-Bissau, Kenya, Liberia, Mauritania, Mozambique, Niger, São Tomé and Príncipe, Senegal, Sierra Leone, Tanzania, and Uganda.
8. A “block” refers to a geographic area where a company is licensed for the exploration and production of oil or gas.
9. Mining Charter III, also known as the Broad-Based Socio-Economic Empowerment Charter for the Mining and Minerals Industry, is an initiative of the South African government published in 2018 that aims to facilitate the sustainable transformation, growth, and development of the mining industry. More details about this initiative are available at https://www.gov.za/sites/default/files/gcis_document/201809 /41934gon1002.pdf.
10. OPEC+ is a term used to refer to non-OPEC members that are among the world’s top oil producers, including Azerbaijan, Bahrain Darussalam, Brunei, Kazakhstan, Malaysia, Mexico, Oman, the Russian Federation, South Sudan, and Sudan.
AfDB (African Development Bank). 2018. African Economic Outlook 2018. Abidjan, Côte d’Ivoire: AfDB.
Albertin, G., D. Devlin, and B. Yontcheva. 2021. “Countering Tax Avoidance in SubSaharan Africa’s Mining Sector.” IMF Blog, November 5, 2021. https://www.imf.org /en/Blogs/Articles/2021/11/05/blog-countering-tax-avoidance-sub-saharan-africa -mining-sector
Arezki, R., F. van der Ploeg, and F. Toscani. 2019. “The Shifting Natural Wealth of Nations: The Role of Market Orientation.” Journal of Development Economics 138: 228–45.
Bos, K., and J. Gupta. 2019. “Stranded Assets and Stranded Resources: Implications for Climate Change Mitigation and Global Sustainable Development.” Energy Research and Social Science 56: 101215.
Broda, C., and D. E. Weinstein. 2006. “Globalization and the Gains from Variety.” Quarterly Journal of Economics 121 (2): 541–85.
Christensen, B. V. 2016. “Challenges of Low Commodity Prices for Africa.” BIS Paper No. 87, Monetary and Economic Department, Bank for International Settlements, Basel. https://www.bis.org/publ/bppdf/bispap87.pdf.
Cust, J., and T. Harding. 2020. “Institutions and the Location of Oil Exploration.” Journal of the European Economic Association 18 (3): 1321–50.
Cust, J. F., and D. Mihalyi. 2017. “Evidence for a Presource Curse? Oil Discoveries, Elevated Expectations, and Growth Disappointments.” Policy Research Working Paper 8140, World Bank, Washington, DC.
Cust, J., and A. Rivera-Ballesteros. 2021. “The Nonrenewable Wealth of Nations.” In The Changing Wealth of Nations 2021: Managing Assets for the Future, 193–223. Washington, DC: World Bank.
Cust, J., A. Rivera-Ballesteros, and D. Mihalyi. 2021. “Giant Oil and Gas Field Discoveries 2018.” https://doi.org/10.7910/DVN/MEH5CS, Harvard Dataverse.
Cust, J., A. Rivera-Ballesteros, and A. Zeufack. 2022. “The Dog That Didn’t Bark: The Missed Opportunity of Africa’s Resource Boom.” Working Paper 1012, World Bank, Washington, DC.
Deloitte. 2020. “Understanding COVID-19’s Impact on the Mining and Metals Sector: Guidance for Mining and Metals Executives.” https://www2.deloitte.com/global/en /pages/about-deloitte/articles/covid-19/understanding-covid-19-s-impact-on-the -mining---metals-sector---.html.
EIA (U.S. Energy Information Administration). 2022. “Annual Petroleum and Other Liquids Production.” Accessed July 2022. https://www.eia.gov/international/data/world.
Galeazzi, C., J. Steinbuks, and J. Cust. 2020. “Africa’s Resource Export Opportunities and the Global Energy Transition.” Live Wire 2020/111, World Bank, Washington, DC. https://openknowledge.worldbank.org/handle/10986/34946
Gaulier, G., and S. Zignago. 2010. “BACI: International Trade Database at the ProductLevel: The 1994-2007 Version.” CEPII Working Paper 2010-23. 2020 Update. Centre d’Études Prospectives et d’Informations Internationales (CEPII), Paris.
Guj, P., R. Schodde, B. Boucoum, and J. Cust. Forthcoming. “Mineral Resources of Africa.” World Bank, Washington, DC.
Hund, K., D. La Porta, T. P. Fabregas, T. Laing, and J. Drexhage. 2020. Minerals for Climate Action: The Mineral Intensity of the Clean Energy Transition. Washington, DC: World Bank.
IEA (International Energy Agency). 2020a. “Clean Energy Progress after the Covid-19 Crisis Will Need Reliable Supplies of Critical Minerals.” IEA, Paris. https://www.iea.org /articles/clean-energy-progress-after-the-covid-19-crisis-will-need-reliable-supplies-of -critical-minerals
IEA (International Energy Agency). 2020b. Global EV Outlook 2020: Entering the Decade of Electric Drive? Paris: IEA. https://iea.blob.core.windows.net/assets/af46e012-18c2 -44d6-becd-bad21fa844fd/Global_EV_Outlook_2020.pdf.
IMF (International Monetary Fund). 2012. “Macroeconomic Policy Frameworks for Resource-Rich Developing Countries.” Policy Paper, International Monetary Fund, Washington, DC. https://bit.ly/2txKGzB
Khan, T. S., T. T. T. Nguyen, R. Schodde, and F. Ohnsorge. 2016. “From Commodity Discovery to Production.” Policy Research Working Paper 7823, World Bank, Washington, DC.
McKinsey. 2013. “Reverse the Curse: Maximizing the Potential of Resource-Driven Economies.” McKinsey Global Institute.
McKinsey. 2018. “Lithium and Cobalt—A Tale of Two Commodities.” https://www .mckinsey.com/~/media/mckinsey/industries/metals%20and%20mining/our%20 insights/lithium%20and%20cobalt%20a%20tale%20of%20two%20commodities /lithium-and-cobalt-a-tale-of-two-commodities.ashx .
Mihalyi, D. 2020. “The Long Road to First Oil.” MPRA Paper 103725. University Library of Munich, Germany.
Mihalyi, D., and T. Scurfield. 2021. “How Africa’s Prospective Petroleum Producers Fell Victim to the Presource Curse.” The Extractive Industries and Society 8 (1): 220–32.
Minerals Council South Africa. 2020. “Junior and Emerging Miners’ Desk Fact Sheet.”
Accessed June 14, 2022. https://www.mineralscouncil.org.za/work/supporting-junior -and-emerging-miners.
Renner, S., and F. W. Wellmer. 2020. “Volatility Drivers on the Metal Market and Exposure of Producing Countries.” Mineral Economics 33 (3): 311–40.
Reuters. 2020. “Zambia Mining Revenues Drop 30% due to COVID-19, Chamber of Mines Says.” June 18, 2020.
S&P Global Market Intelligence. 2020. S&P Global Market Intelligence platform. Accessed November 2020. https://www.spglobal.com/marketintelligence/en/.
Schodde, R. 2017. “Recent Trends and Outlook for Global Exploration.” Presentation at PDAC 2017, Toronto, March 6, 2017. https://minexconsulting.com/wp-content /uploads/2019/04/Exploration-Trends-and-Outlook-PDAC-Presentation_compressed .pdf.
Schodde, R. 2019. “Trends in Exploration.” Presentation at the International Mining and Resources Conference (IMARC), Melbourne, October 30, 2019. Minex Consulting. http://minexconsulting.com/trends-in-exploration/.
Signé, L. 2021. “Digitalizing Africa’s Mines.” Africa in Focus, The Brookings Institution. Accessed June 14, 2022. https://www.brookings.edu/blog/africa-in-focus/2021/12/03 /digitalizing-africas-mines/.
Soderbery, A. 2015. “Estimating Import Supply and Demand Elasticities: Analysis and Implications.” Journal of International Economics 96 (1): 1–17.
UNU-WIDER (United Nations University–World Institute for Development Economic Research). 2022. Government Revenue Dataset, Version 2022. UNU-WIDER, Helsinki. Accessed June 2022. https://doi.org/10.35188/UNU-WIDER/GRD-2022.
van der Ploeg, F., and S. Poelhekke. 2009. “Volatility and the Natural Resource Curse.” Oxford Economic Papers 61 (4): 727–60.
Wellmer, F. W., J. E. Tilton, P. C. Crowson, J. H. DeYoung, Jr., R. G. Eggert, M. Ericsson, J. I. Guzmán, et al. 2018. “Public Policy and Future Mineral Supplies.” Resources Policy 57: 55–60.
World Bank. 2019. “Digging Beneath the Surface: An Exploration of the Net Benefits of Mining in Southern Africa.” World Bank, Washington, DC. https://openknowledge .worldbank.org/bitstream/handle/10986/32107/Digging-Beneath-the-Surface-An -Exploration-of-the-Net-Benefits-of-Mining-in-Southern-Africa.pdf?sequence=1.
World Bank. 2021. The Changing Wealth of Nations 2021: Managing Assets for the Future Washington, DC: World Bank.
Yunis, J., and E. Aliakbari. 2020. “Fraser Institute Annual Survey of Mining Companies 2020.” Fraser Institute, Vancouver. https://www.fraserinstitute.org/sites/default/files /annual-survey-of-mining-companies-2020.pdf.
Introduction
The commodity price boom from 2004 to 2014 was a huge economic opportunity for African countries with an abundance of oil, gas, and minerals. During this period, resource-rich African countries’ government revenues from resources grew by an average of US$1.1 billion compared with the preboom years (1998–2003); meanwhile, these countries’ economic growth increased by almost 1 percentage point. However, even during these bountiful times, economic development was narrowly confined, with much of the value addition in the resource sector. Once the expanding resource sector’s contribution to GDP growth is subtracted, overall economic performance was not significantly higher than in the rest of Africa.
One legacy of the boom was that because higher growth rates were not translated into broader sustainable development, countries found themselves poorly prepared for the subsequent drop in commodity prices. Many had failed to save and invest a sufficient proportion of resource revenues or to convert the higher resource rents into government receipts to grow national wealth via the accumulation of offsetting assets during the boom. For example, figure 2.1 shows the quick drop in government revenues from natural resources and natural resource rents’ share of GDP in selected large resource-rich Sub-Saharan African countries from 2014 onward. As a consequence, the “bust” period undermined the economic gains made during the boom. Several resource-rich countries entered debt crises after 2014. This postboom (or bust) period (2015–18) has also resulted in a more general pattern of resource-rich countries experiencing slumps in GDP growth and nonresource sector GDP growth, with rates of both falling below those of the rest of Africa.
This chapter examines the effects of the commodity price boom, running from about 2004 to 2014, and what it meant for the economies of Sub-Saharan Africa.
% of GDP % of GDP
35
30
25
20
15
a. Government revenues 5
from natural 10
40 1990 1992 1994 1996 1998 2000 2002 2004 2006 2008 2010 2012 2014 2016 2018 2020
50
40
30
20
10
0
b. Natural resource rents Congo, Rep. Equatorial Guinea Angola Gabon Nigeria
60 1990 1992 1994 1996 1998 2000 2002 2004 2006 2008 2010 2012 2014 2016 2018 2020
Sources: Panel a: Based on data from UNU-WIDER 2022. Panel b: Based on data from World Bank Open Data portal (https://data.worldbank.org/indicator/NY.GDP.TOTL.RT.ZS).
It considers how this period marked a change from the preboom years, and also the state of resource-rich economies once commodity prices fell after 2015. The chapter examines the record of resource-rich countries in harnessing the opportunity presented by the boom and considers how their economic performance compares with their non-resource-rich neighbors in the region.
The chapter, perhaps unsurprisingly, finds that there has been a broad failure to translate the boom into more broadly based economic prosperity via investment in other parts of the economy. The starkest evidence for an unsustainable and narrow economic boom was seen in the slump in growth rates following the fall in commodity prices. In the postboom period, annual GDP per capita growth in resource-rich countries was, on average, 2.5 percentage points lower than during the boom, and 1.5 percentage points lower than that of non-resource-rich countries in the region.
The boom in and of itself created a set of major public policy challenges. First, high prices meant significant revenues would accrue to government, which, in turn, implied that “big government” in some form was hard to avoid, leading to bloated public sector wage bills. Government, as the constitutionally designated resource owners, had to attempt to capture the full value of resources on behalf of citizens while also efficiently managing state-owned resource companies and production shares. Second, governments had to maximize these revenues from the sector in a way that was also consistent with inward investment into the sector, for example, to take advantage of the geologic potential and new discoveries being made. Third, governments had to ensure those revenues were put to good use—fulfilling urgent development needs and longer-term investment goals for sustaining prosperity. Finally, governments needed to ensure the economy was protected from the harmful effects of resource dependence, ranging from Dutch disease (Corden and Neary 1982) to price and revenue volatility, corruption, conflict, and profligacy.1
The legacy of the boom and bust was one of missed opportunity and a failure to convert resource wealth into sustainable, diversified prosperity. During this period, countries were left with little to show for the surge in revenues and investment. Fiscal deficits and rising indebtedness have endangered gains made toward poverty reduction and economic growth during the boom years. With regard to overall economic performance and poverty reduction, resource-rich countries have slipped further behind non-resource-rich countries. This trend is repeated across Sub-Saharan Africa. This chapter offers five key insights and outcomes from the resource boom.
• First, economic growth collapsed once commodities fell. Although resourcerich countries in Sub-Saharan Africa outpaced their non-resource-rich Sub-Saharan African counterparts in average growth per capita during the boom, it was the non-resource-rich countries that sustained modestly positive growth in 2015 and 2016.
• Second, poverty has drastically increased in resource-rich Sub-Saharan African countries—a trend likely to continue. In 2000, 13 percent of the world’s poor lived in resource-rich Sub-Saharan African countries. Despite rich endowments of resources and a commodity boom, extreme poverty is increasingly concentrated among resource-rich Sub-Saharan Africa. Forecasts suggest that by 2030, 62 percent of the world’s poor will live in these countries.
• Third, inequality remains pervasive and prevalent in resource-rich countries. Half of all resource-rich countries in the region experienced worsening inequality from the start to the end of the boom. Mechanization contributed to this trend—the returns on the increasingly capital-intensive process accrue to capital rather than to labor.
• Fourth, there has been a failure to diversify. Though policy makers sought to capitalize on the boom to translate investment and revenues into broader economic transformation, economic, export, and asset concentration has remained largely within the extractive sector, indicating limited diversification.
• Fifth, institutions play an important role in both governance of resources and support of fiscal stability. Institutions play an important role in reducing corruption, managing expectations, implementing countercyclical fiscal policies to prevent overborrowing, and creating an environment with a more equitable distribution of benefits generated by the sector.
Although resource-rich countries in Sub-Saharan Africa outpaced their nonresource-rich Sub-Saharan Africa counterparts in average growth per capita during the boom, it was the non-resource-rich countries that sustained modestly positive growth in the postboom years. During the boom, resource-rich countries in Sub-Saharan Africa experienced strong growth beyond the extractive industry, owing partially to some development in backward and forward links, including construction, transport and logistics, and services. In fact, nonresource GDP growth rates exceeded 3 percent per year during the boom (figure 2.2).
Despite strong growth during the boom (Warner 2015), GDP growth during a resource boom is neither evidence of productivity gains in the wider economy, nor evidence that any such economic expansion can be sustained beyond the period of high prices or depletion. Almost by definition, an increase in demand and prices for a country’s commodities will lead to a surge in resource sector GDP. But the sustainability question is whether the boom can set the nonresource economy on a higher growth path, outliving the
boom period. Figure 2.2 suggests that resource-rich countries have performed suboptimally. Although resource-rich countries grew modestly faster than the rest of the region during the boom, growth following the boom was far lower. Further, the slump was not limited to the resource sector, given that nonresource sector GDP growth slumped concurrently. This outcome could partially be due to the many sectors that boom with the mining industry, including logistics, construction, services, and others. Warner (2015) notes that while Gulf states were able to use resource revenues to finance migration-facilitated economic expansion, Sub-Saharan African countries struggled to do so. In his assessment of 18 countries, five were from Sub-Saharan Africa—Chad,
Equatorial Guinea, Mauritania, Mozambique, and Zambia—and in all cases, there was no statistically significant difference in growth during the boom period compared with the counterfactual nonboom period.
Higher commodity prices that occurred during the boom increased rents and raised the overall level of wealth across human capital, natural capital, and produced capital. The Changing Wealth of Nations report (World Bank 2021) finds evidence that resource-rich African countries did not use this additional boost in wealth to invest in other assets during the boom. Therefore, both wealth and prices plummeted when the boom ended. As figure 2.3 shows, wealth per capita, which was declining before the boom in resource-rich Sub-Saharan African countries, had an outstanding annual growth rate during the boom, but fell back to a negative rate when the boom ended. In comparison, on average, non-resourcerich Sub-Saharan African countries started and followed similar wealth growth rates before and during the boom, but were spared from declining wealth because they were less resource-dependent and had more diversified economies.
Despite the increase in revenue that resulted from the boom, extreme poverty is increasingly concentrated in resource-rich Sub-Saharan Africa. By 2030,
80 percent of the world’s poor are forecasted to live in Sub-Saharan Africa, and resource-rich Africa will be home to about 62 percent of the world’s poor, compared to 13 percent in 2000 (figure 2.4) (Cust, Rivera-Ballesteros, and Zeufack 2022).2
In absolute terms, by 2030 the poverty headcount is projected to rise to about 379 million, whereas the count in non-resource-rich Africa is set to fall below 120 million (figure 2.5). By 2030, 62 percent of the world’s poor are projected to be found in Sub-Saharan African resource-rich countries, compared to 20 percent in non-resource-rich nations of this region. The overall trend in resourcerich African countries was an increasing poverty headcount during the boom, indicated by the solid orange line in figure 2.5, from about 280 million in 2003 to more than 310 million living in extreme poverty as of 2019.
Though the commodity price boom resulted in large inflows to African economies via resource companies’ exports and government revenues from production shares, royalties, and other resource sector taxes, these inflows have not meaningfully reduced poverty and inequality. Furthermore, the impact of climate change on income and real consumption could push even more African people into poverty (Jafino et al. 2020). Poverty eradication is therefore becoming a disproportionately resource-rich-country and Africa region problem.
Source: Cust, Rivera-Ballesteros, and Zeufack 2022. Note: The figure shows the number of people living on less than US$1.90 a day. Projected data start after 2020, and missing historical poverty data were filled using linear interpolation with the available data. RR = resource rich; SSA = Sub-Saharan Africa.
Meanwhile non-resource-rich Africa saw a minor increase in the poverty headcount, from 110 million to more than 113 million over the same period, driven, in part, by a higher average (mean) poverty rate in resource-rich SubSaharan African countries that failed to converge with the poverty rates in non-resource-rich Sub-Saharan African countries. It was also driven by high population growth in these resource-rich countries; for example, according to data from the United Nations Population Division, the fertility rate during the boom in Nigeria was, on average, 5.9, and in the Democratic Republic of Congo it was 6.5, compared with 4.7 in Rwanda and 2.6 in South Africa. As a consequence, world poverty is increasingly concentrated in resource-rich SubSaharan Africa, which is expected to be home to more than 60 percent of the world’s poor in 2030 (figure 2.4).
From the start to the end of the boom, the poverty headcount increased in half of all resource-rich countries in Sub-Saharan Africa. Figure 2.6 shows the poverty headcount before and after the boom. Left of the 45-degree line indicates increased poverty headcount by the end of the boom compared with the period preceding the boom. Twelve of 24 resource-rich countries with poverty data available saw the poverty headcount increase, including Côte d’Ivoire, Madagascar, and Zambia. Several resource-rich countries, such as
Source: Based on World Bank’s PovcalNet.
Note: Countries where poverty increased appear above the 45-degree line. Poverty headcount at $1.90 a day (2011 PPP). Missing poverty data for 2003 and 2014 are replaced with the closest value from previous years. RR = resource rich; SSA = Sub-Saharan Africa.
Ghana, Tanzania, and Uganda, did manage to reduce poverty during the same period.3 Some poverty alleviation mechanisms included new social protection programs, such as cash transfers and pensions.
Poverty is likely to continue deepening as a result of the COVID-19 (coronavirus) pandemic and the effects of climate change. The economy in SubSaharan Africa is struggling to recover from the COVID-19-induced slowdown in global economic activity, continued supply chain disruptions, outbreaks of new coronavirus variants, high inflation, and growing risk resulting in high debt levels. This slow recovery has already had an impact on poverty in the region, adding more to the poverty headcount than in 2015 (figure 2.7). Economic growth was expected to decelerate in 2022 amid compounding shocks (Zeufack et al. 2022). Climate change will adversely affect agricultural productivity, which can, in turn, increase food prices, food insecurity, and the share of household expenditures dedicated to food consumption (Jafino et al. 2020). The poor are the least able to respond to these shocks. Social protection mechanisms to support the most vulnerable are critical to supporting poverty reduction. However, climate change may have a significant impact on global poverty incidence and increase the number of poor in the region. Jafino et al. (2020) have identified
Source: Calculations based on data from Lakner et al. 2021 and other staff estimates. Note: The projected poverty headcount at US$1.90 a day reflects the impact of COVID-19 (coronavirus). The figure uses 2011 international prices. Data after 2020 corresponds to projected estimates. RR = resource rich; SSA = Sub-Saharan Africa.
five climate change impact channels that can pull more people into poverty in the world, especially in Sub-Saharan Africa. The first impact is on agricultural productivity and prices, which can be more severe when a higher fraction of the population depends on and works in the agricultural sector. The second impact is associated with the extent of household expenditures dedicated to food consumption. The third impact relates to the exposure to and losses from natural disasters, such as cyclones, floods, or droughts. The fourth impact is linked to labor productivity for outdoor workers who may reduce their annual income as a result of extreme weather. The fifth impact of climate change centers on child stunting and diseases, including malaria and diarrhea. Resource-rich countries are vulnerable to climate change; thus, these impacts could raise current poverty rate forecasts.
Most alarmingly, by 2030, current projections suggest that, even after adjusting all countries for the impacts of COVID-19, 80 percent of the world’s poor will reside in Sub-Saharan Africa, and 75 percent of the world’s poor will be found in resource-rich countries. Taken together, 62 percent of the extreme poor could be concentrated in resource-rich Sub-Saharan Africa, up from only 13 percent in 2000 (Cust, Rivera-Ballesteros, and Zeufack 2022).
As with poverty, half of countries saw persistent or worsening income inequality from the start to the end of the boom. Most resource-rich countries for which Gini data are available (10 out of 18), including Mozambique, Tanzania, and Zambia, saw worsening inequality by 2014 compared with 2003, measured by an increase in their Gini coefficient. Figure 2.8 compares preboom (2003) inequality with inequality at the end of the boom (2014), with countries lying left of the 45-degree line having worsened their Gini coefficient during the boom. However, some resource-rich countries did manage to lessen inequality, including Botswana and Uganda. For instance, from its independence to the boom period, Botswana succeeded in converting its natural resource rents for use in enrolling the population 25 years old and older in secondary schooling. These successful public policies to convert resource endowments into human capital in Botswana and Uganda may partly explain the positive dynamics in poverty and inequality alleviation during the boom period.
2003
Source: Calculations based on World Bank and the Chartbook of Economic Inequality https://www .chartbookofeconomicinequality.com/
Note: Inequality increased in countries above the 45-degree line. Missing Gini coefficient values in 2003 and 2014 are replaced with the closest value from previous years. RR = resource rich; SSA = Sub-Saharan Africa.
Source: Based on World Bank Poverty and Inequality Platform data (https://pip.worldbank.org/home).
Note: The figure presents the Gini index in 2014 or the closest year with reported value minus the Gini index in 2004 or closest year with reported value. Orange bars correspond to fossil-fuel-rich countries, and red bars correspond to mineral-rich countries according to IMF (2012). A decrease in the Gini coefficient indicates an improvement in the income equality of a country’s population. RR = resource rich; SSA = Sub-Saharan Africa.
Some mineral-rich countries, such as Guinea and Mauritania, saw a large decline in inequality during these boom years, whereas other large oil producers, such as Cameroon and Chad, saw rising income inequality (figure 2.9).
Headline economic performance during the boom was strong but proved unsustainable. Resource-rich countries saw economic growth rise during the boom years, driven by resource exports and increased government revenues. However, economic growth, once the expanding resource sector is subtracted, was not significantly higher than in the rest of Africa. This situation reflects the overall dominance of the resource sector as a driver of growth, but also implies a failure to translate the boom into broader-based economic prosperity. The starkest evidence for an unsustainable and narrow economic boom was seen in the slump in growth rates following the fall in commodity prices. In the postboom period, annual GDP per capita growth in resource-rich countries was,
on average, 2.5 percentage points lower than during the boom, and 1.5 percentage points lower than in non-resource-rich countries in the region.
Policy makers sought to capitalize on the boom to translate investment and revenues into broader economic transformation. This objective was demonstrated by local content policies and export restrictions to increase domestic value added, undertaken to develop linkages. It also included the opportunity to boost the growth of manufacturing exports and other nonresource sectors of the economy. This economic diversification, with an emphasis on export diversification, was a popular economic objective during this period. However, there was little change in the overall sectoral composition of exports of resource-rich economies beyond a boost in the resource sector and a squeezing of agricultural exports (figure 2.10).
Evidence shows that 11 of 23 resource-rich countries in Sub-Saharan Africa saw increasing economic concentration.4 Figure 2.11 shows how each country fared: those lying to the left of the 45-degree line saw a higher ratio of resource to nonresource GDP after the boom, meaning economic concentration in resources increased by the end of the boom. Countries such as Chad,
Source: Estimates through the World Integrated Trade Solution platform from the Comtrade database maintained by the United Nations Statistics Division. Note: The figure shows sectoral export shares of total merchandise export value in Sub-Saharan African resource-rich countries; preboom (1998–2003), boom (2004–14), and postboom (2015–18) period averages.
Figure 2.11 Ratio of Resource GDP to Nonresource GDP in Sub-Saharan African Countries, 1998–2003 versus 2014–18 Averages
Resource GDP to nonresource GDP ratio, 1998–2003 average SSA non-RR SSA RR
Source: Cust, Rivera-Ballesteros, and Zeufack 2022. Note: Resource GDP corresponds to the GDP attributable to mining activities, including mining of metals and minerals and extraction of crude petroleum and gas. Countries above the 45-degree line increased their resource GDP more than their nonresource GDP after the boom. Botswana, Republic of Congo, Equatorial Guinea, and Gabon are not shown. Their ratios in 1998–2003 were 0.7, 0.4, 1.1, and 3.3, respectively. Their ratios in 2014–18 were 0.2, 0.4, and 0.6, respectively. RR = resource rich; SSA = Sub-Saharan Africa.
the Democratic Republic of Congo, and Zambia were in this category. In contrast, Botswana, Nigeria, and 10 other resource-rich countries managed to reduce economic concentration. For example, in Botswana, manufacturing’s contribution to GDP increased from 6 percent in 2004 to 8 percent in 2014.
A key tenet of best practice advice to resource-rich countries is to use the opportunity created by a boom to promote a more diversified economy. Doing so can reduce exposure to price volatility and price risk, while also moving the economy up the value chain to higher value added and shift the economy into labor-intensive export manufacturing and other nonresource sectors. Diversification is a protection against depletion of the resource base, and in
the case of hydrocarbons, it may be insurance against a future global shift away from fossil fuel consumption driven by alternative energy technologies and taxation of carbon emissions (Cust, Manley, and Cecchinato 2017).
Although many countries have actively pursued diversification strategies during their resource booms, the record of success is poor. For many oil-rich countries, including in Africa, the boom was associated with increases in export concentration. However, some regions saw some success, notably Latin American and Southeast Asian countries, according to Ross (2017). Ross finds evidence that for four of the eight successful cases in which oil-rich economies successfully diversified during periods of high oil prices, the countries were reaching resource depletion, or economic sanctions were being placed from outside.
The majority of resource-rich Africa reporting an export diversification index saw increased export concentration (14 of 24 were left of the 45-degree line). Figure 2.12 illustrates the export diversification performance of African economies. Those lying to the right of the 45-degree line increased their measure of export diversification late into the boom (2006–10) compared with the
Export diversification index, 1998–2003 average
Source: Cust, Rivera-Ballesteros, and Zeufack 2022.
Note: A lower index value means higher diversification; 2010 is the most recent year with data available. RR = resource rich; SSA = Sub-Saharan Africa.
preboom period (1998–2003). For example, Chad and Sudan saw increased export concentration, while Tanzania and Uganda were able to diversify exports. This rising export concentration in the resource sector is not unique to Africa. First modeled by Corden and Neary (1982), this phenomenon has become popularized as the Dutch disease. Harding and Venables (2016) find that for each additional dollar of resource revenues, countries tend to see a decrease in nonresource exports of US$0.75.
The process of resource extraction has a first-order effect of reducing a country’s overall wealth by depleting the stock of nonrenewable, finite natural capital. However, countries may use the proceeds from this depletion to accumulate other forms of capital, such as by building physical infrastructure or investing in human capital via improvements in education and the health care of citizens. Meanwhile, the stock of natural capital can also increase as a result of rising prices applied to the remaining resource base, or new discoveries, some occurring as part of the discovery-by-extracting process.
During the boom decade, the total wealth stocks in resource-rich countries in Africa generally increased. Thus, including price effects, the total value of a nation’s stock of human wealth, productive capital, and natural assets, rose.
Figure
The total wealth stocks during this period rose by an average of US$4,190 per person for Sub-Saharan Africa. Outliers in this process included countries such as Gabon, which, because of a combination of high oil depletion and high population growth, saw per capita wealth fall during the period from 2004 to 2014. Countries such as Botswana and Namibia added more than US$20,000 per person to their total national wealth during this period. Still, additional wealth per capita does not necessarily translate to improved equality: despite its national wealth gains, Namibia’s income inequality remains the second highest in the world.
One of the key principles of prudent natural resource management is the accumulation of assets to replace a depleting asset. Known as Hartwick’s rule (Hartwick 1977), this principle states that economic sustainability rests on replacing a nonrenewable natural asset with an alternative productive asset to offset depletion. This replacement can take the form of physical capital, financial capital, or human capital.
A useful metric with which to evaluate how well a country is accumulating these offsetting assets is the rate of adjusted net savings, calculated and published by the World Bank. Resource-rich countries face the risk of negative rates of adjusted net savings, given the high levels of asset depletion associated with resource extraction. The implied rate of capital accumulation rises with the rate and value of the depleting asset; put another way, these countries need to save and invest proportionately more because their revenues are coming from asset depletion. Unfortunately, during the boom the relationship between resource wealth, measured as rents’ share in GDP, has been negatively associated with countries’ rates of adjusted net savings, as shown in figure 2.14. In Africa, many countries with the highest depletion (proxied by rents) have seen low and negative rates of net saving, meaning they are running down the overall stock of assets in the country, and instead are consuming a large share of this value. This pattern means countries are bringing forward consumption at the expense of future GDP, effectively reducing the available assets for future generations.
Analysis by the World Bank (2019) shows that the largest reasons for negative adjusted net savings in the Southern Africa region is not depletion, but depreciation. As mining becomes more capital-intensive, it absorbs a large part of national savings for investment to offset depreciation. And the more capital that is invested, the more assets are depreciated and the more savings are needed for investment to maintain the assets. Venables (2016) documents this phenomenon.
Investments in human and physical capital can improve adjusted net savings and reduce both poverty and inequality amid mechanization. Mining has become an increasingly capital-intensive process, and thus, the majority of returns accrue to capital. Investments in human capital, particularly
Note:
education and skills, and physical capital, particularly infrastructure, can create an enabling environment for more diversified industries and create a more productive and healthy workforce.
According to the 2021 Changing Wealth of Nations report data (World Bank 2021), in 2004, 10 countries in Sub-Saharan Africa held most of their wealth in natural assets versus human or productive assets or net foreign assets. Surprisingly, by 2014, natural capital was still the most abundant asset in the same number of countries. Only Ghana reduced its natural capital share of total wealth below its human capital share, while the share increased in Niger. A large part of this occurred because countries replaced their depleting reserves with new discoveries; in addition, if prices rise sufficiently, the value of those depleting reserves also rises even as their stock might decrease, reflected in increased natural capital wealth. When focusing exclusively on nonrenewable natural assets, seven countries still held the majority (more than 50 percent) of their total wealth in assets including oil, natural gas, coal, or metals and minerals. By 2014, total wealth in seven of these countries was still concentrated in nonrenewable natural resources (table 2.1). These countries were Central
Source: Based on World Bank 2021.
Note: Natural, produced, and human capital values are in thousands of constant 2018 US dollars.
African Republic, Chad, the Democratic Republic of Congo, Gabon, Guinea, Liberia, and Mali. According to the Commission on Growth and Development (2008, 34), “Strong enduring growth requires high rates of investment… If the sustained, high-growth cases are any guide, it appears that overall investment rates of 25 percent of GDP or above are needed, counting both public and private expenditures.”
The resource boom did not translate into a significant shift in the asset portfolio composition of resource-rich countries. On average, the value of total wealth per person available in both resource-rich and non-resource-rich countries increased compared with the start of the boom. However, the asset composition proportions did not change considerably. Despite the rising value of nonrenewable natural assets in resource-rich countries, the value of natural capital available per person grew by less than 2 percent and continued to be the second-largest source of wealth. The growth of natural capital per person in non-resource-rich countries was also limited and remained around 20 percent of total wealth (see table 2.1 and figure 2.15).
Policy makers in resource-rich countries may have more success working toward asset diversification rather than export diversification . Asset portfolio diversification is an important step toward sustained growth and is more feasible for resource-rich countries to achieve than traditional export diversification because of pressure from Dutch disease (Cust and Rivera-Ballesteros 2021). The Changing Wealth of Nations 2021 report (World Bank 2021) suggests that targeting asset portfolio diversification, by investing in the expansion of human and physical capital, may be a more successful policy than export diversification for sustainable economic growth. This recommendation
builds on earlier work exploring the benefits of portfolio diversification, including Diversification and Cooperation Strategies in a Decarbonizing World (Peszko, van der Mensbrugghe, and Golub 2020), “Economic Diversification for a Sustainable and Resilient GCC” (Ollero et al. 2019), and Diversified Development (Gill et al. 2014).
The boom could have brought the opportunity for resource-rich countries to mobilize economic resources to build better institutions that could secure revenue savings to protect them from price shocks given the commodity market volatility. However, evidence shows that resource-rich countries missed this opportunity and instead some indicators of institutional quality tumbled. A comparison of Worldwide Governance Indicator dimensions between resource-rich and nonresource-rich African countries shows that, on average, the latter performed much better than their resource-rich peers. The data show that the perceptions of voice and accountability and rule of law declined during and after the boom in resource-rich countries. Meanwhile, the other four dimensions (control of corruption, government effectiveness, regulatory environment, and political stability) improved only slightly in resource-rich Africa compared with non-resource-rich Africa (figure 2.16). The largest difference between the two groups is in the perception of control of corruption, consistent with Konte and Vincent’s (2020) findings.
Within the resource-rich group, some countries performed worse than others. In some mineral-rich countries, including the Central African Republic and Mali, where gold or diamonds may have triggered rent-seeking behaviors, at least five governance dimensions dropped. At the same time, there are mineraland oil-rich countries that have slightly improved their good governance perceptions. For example, although starting from a low base, Angola, Liberia, and Sierra Leone have lifted all six dimensions since the end of the boom, led by better political stability and absence of violence, and improved voice and accountability. On the other hand, countries such as Botswana and Ghana have performed well consistently (figure 2.17).
Effective corruption, measured by the incidence of bribe payment at the local level and the sentiment of distrust in local government councilors, amplifies the negative effects of geographic closeness to an active mine. Mehlum, Moene, and Torvik (2006) find that in countries with abundant natural resources, grabberfriendly institutions5 push aggregate income down, while producer-friendly institutions raise income. Boschini, Pettersson, and Roine (2003) find that governance problems, such as rent-seeking and conflicts, can be countered by good institutional quality. Evidence suggests, however, that resource rents can gradually erode checks and balances (Collier and Hoeffler 2009), jeopardizing government savings and investment quality. Therefore, Arezki and Brückner (2011) conclude that resource-rich countries with stronger economic and political institutions have, on average, better macroeconomic performance. For example, fiscal policies in countries with weaker institutions tend to be more procyclical, which can complicate fiscal planning in the face of price volatility and the exhaustibility of natural resources (IMF 2012).
Based on data from
Angola
Botswana
Cameroon
Central African Republic
Chad
Congo, Dem. Rep.
Congo, Rep.
Côte d’Ivoire
Equatorial Guinea
Gabon
Ghana
Guinea
Liberia
Madagascar
Mali
Mauritania
Mozambi que
Niger
Nigeria
São Tomé and Príncipe
Sierra Leone
Sudan
Tanzania
Togo
Uganda
Zambia
Change in rating, 1998–2003 to 2015–18
Voice and accountability
Government effectiveness
Rule of law
Control of corruption
Regulatory quality
Political stability and absence of violence
The “presource curse” hypothesis, first developed by Cust and Mihalyi (2017), points to the risks faced by countries with recent major resource discoveries. The research finds that some countries with major discoveries have experienced “expectations booms” followed by growth disappointments.
Meanwhile, access to Eurobond markets for many Sub-Saharan African countries has created new opportunities to issue sovereign debt at commercial rates and leverage resource wealth to do so. Combined with commodity price uncertainty, such debt can increase the risk of debt unsustainability, particularly if investment is not efficiently allocated on high-return projects. Overoptimistic expectations about future growth rates, revenue flows, or the speed of project development can exacerbate risk-taking behavior, particularly when overoptimism is shared among citizens, governments, international financial institutions, sovereign credit risk rating agencies, and market participants.
On top of this, the squandering of the past commodity boom has heightened pressures to move toward so-called resource nationalism and protectionist policies. Some countries have sought contract renegotiation or the regular revising of fiscal terms. Others have been plagued by delayed and halted projects, creating uncertainty about when and if production will begin. This has further fueled the perception of the resource sector underdelivering on the expected economic gains some had forecast.
The presource curse phenomena was first documented using analysis of the impact from giant oil and gas discoveries around the world between 1988 and 2010. This period saw discoveries in 46 countries that led to an average underperformance of economic growth relative to forecast growth based on the impact of these discoveries. This effect was found to typically occur after the discovery, but before any extraction process had begun (Cust and Mihalyi 2017). This underperformance was measured as the combined impact of overoptimistic growth forecasts made by international actors (primarily the International Monetary Fund [IMF] in its World Economic Outlook series) and subsequent undershooting of the realized GDP growth rate. Overoptimistic forecasts of growth can drive elevated expectations from governments following discoveries, leading to various suboptimal behaviors ( figure 2.18). These suboptimal government behaviors can include risky borrowing (Mihalyi 2016), which is harmful to debt sustainability, or even arms imports, which can also be detrimental to fiscal sustainability (Vezina 2020). A stark example of this is Mozambique after 2009. Vezina (2020) explains that after the discovery of giant natural gas fields off the coast of Mozambique between 2009 and 2011, the country experienced rapid growth and a foreign investment boom, which translated into unprecedented borrowing used to illegally purchase military ships. Soon the country entered a fiscal crisis because revenues did not materialize on the scale and timetable originally expected.
The hypothesis of overoptimistic expectations on the part of citizens is tested by Cust and Mensah (2020) on hydrocarbon discoveries in 35 SubSaharan African countries between 2002 and 2015, using Afrobarometer
data surveys. They find that this overoptimism and overexpectations of citizens appear to be much less pronounced in countries with higher democratization scores.
Cust and Mensah (2020) use a difference-in-differences strategy to provide evidence of a 1- to 12-month postdiscovery overoptimism about macroeconomic conditions and improvements in standards of living (figure 2.19), especially when the degree of democratization is low, suggesting that enhanced political institutions and better administration could help manage and moderate the risk for inflated expectations that fail to be matched by subsequent performance. Similarly, they can help improve the likelihood that discoveries translate into timely economic benefits for the country.
More precisely, Mihalyi and Scurfield (2021) indicate that (a) reforms to licensing and company selection to extract resources could help improve the prospects that discoveries will be developed, (b) reforms to regulatory norms and negotiation processes could help reduce delays in operationalization, and (c) reforms to tax mobilization and incentives related to discoveries might be key to ensuring fiscal sustainability and state-financing capacity in a resourcerich context.
Source: Cust and Mensah 2020.
Note: Each point estimate shows the effect of discoveries on expectations (for economic conditions or living standards) estimated separately for the respective time window on the horizontal axis, where expectations equal 1 when survey respondents expect at least better economic or living conditions and 0 otherwise. Vertical bars depict 95 percent confidence intervals.
Evidence shows an increase in both public investment and public and private consumption for several years following a discovery. For example, Ruzzante and Sobrinho (2022) document a “fiscal presource curse.” They find natural resources can jeopardize fiscal sustainability even before the first drop of oil is pumped. Specifically, they find that giant discoveries, mostly of oil and gas, lead to permanently higher government debt and, eventually, debt distress episodes, specifically in countries with weaker political institutions and governance. This evidence suggests that the curse can be mitigated and even prevented by pursuing prudent fiscal policies and borrowing strategies, strengthening fiscal governance, and implementing transparent and robust fiscal frameworks for resource management.
Research shows that giant oil discoveries have a positive impact on fertility decisions, while subgiant discoveries do not affect fertility decisions. Cust and Mensah (2020) show that finding a giant oil discovery is associated with a 1.6 percentage point increase in the probability of a woman giving birth within one year after the discovery, a statistically and economically significant effect. Relative to the sample mean, the effects correspond to an 8 percent increase in childbirth. This provides evidence of a short-run baby boom after giant discoveries, which could be brought on by an increase in citizen expectations of better economic and welfare conditions from the resource extraction. They find evidence of impatience among citizens within two to three years after discoveries, before exploitation even begins. Institutional quality, however, plays a key role in managing expectations. Thus, building strong institutions is crucial to managing citizen expectations about the windfalls from resource exploitation.
Evidence shows that perceptions of governance are affected by proximity to the mine. Konte and Vincent (2020) find that geographic closeness to a mine affects individuals’ expectations of their future living standards. The results from the baseline suggest that residents living within a 50-kilometer radius of an active mine are less likely to approve of government performance in improving living standards (−1.8 percent), water and sanitation (−2.3 percent), job creation (−2.9 percent), health services (−1.8 percent), and public services delivery (−1.9 percent). In addition, they are also less likely to be optimistic about their future living standards (−4.2 percent). While the results are more muted for proximity to an inactive mine, Konte and Vincent (2020) point to the dissatisfaction of nearby residents with the government’s handling of water and sanitation (−1.1 percent) and a decrease in optimism about the future (−2.6 percent). Compared with nonactive mines, active mining reduces the probability of approving of the government’s performance with regard to improving living standards by 2.3 percentage points, on job creation by 2.7 percentage points, on health services by 1.2 percentage points, and on public services as a whole by 1.8 percentage points. In addition, the active status of a nearby mine also decreases optimism about the future by 1.6 percentage points.
Although the bust phase, following a period of higher sustained commodity prices, has obvious downsides for resource-rich countries, even the boom period can introduce serious macroeconomic risks into the economy if not managed carefully. For example, during a boom, government and private sector
economic choices can be distorted, leading to misallocation or worse. Examples of distortions include the effect of the Dutch disease, where resource exports can cause a contraction in the traded sectors, such as manufacturing. Booms can also lead to an increase in government revenues, resulting in spending that might crowd out the private sector or distort the labor market, such as through increased salaries to government officials (Balde 2020; Devarajan et al. 2013). Resource exuberance can also drive increased borrowing and spending that can lead to growth disappointments and, in some cases, macro-fiscal crises.
Commodity cycles can also drive procyclical fiscal policy, which can create challenges due to increasing macroeconomic volatility, depress investment in real and human capital, hamper growth, and harm the poor (Manasse 2006; Servén 1998; World Bank 2001). In extreme cases, procyclicality can encourage additional government borrowing and indebtedness during the boom-bust cycle. Some governments borrow during the boom, on top of the windfall revenues they are receiving. Also, countries may choose to collateralize debt against their resources, either in the form of guarantees of future revenue streams or in-kind deals in which the creditor is repaid in barrels of oil or tons of minerals.
Evidence suggests that in resource-rich countries, optimal fiscal policy depends on the exchange rate regime, where an optimal fiscal policy would be procyclical if the country has a floating exchange rate. Mendes and Pennings (2020) suggest that, contrary to the standard policy advice of saving during price windfalls and spending during price busts, the optimal fiscal policy will depend on whether a country has a floating or fixed exchange rate regime. They argue that countries with fixed exchange rates should follow countercyclical fiscal rules to smooth the business cycle. Countries with floating exchange rates, however, should spend more according to the permanent income hypothesis, given that commodity price shocks are highly persistent. However, the previous boom demonstrated the importance that such spending should be invested in sustainable assets, consistent with Hartwick’s rule, but also that countries should not face fiscal overextension when commodity prices fall.
During the 2004–14 boom period, governments enjoyed large increases in their fiscal space, derived in part from the receipts from resource taxation, alongside debt relief for some countries after 2000. For example, at least eight Sub-Saharan African countries obtained revenues from natural resources representing, on average, more than 10 percent of their GDP during the boom, a significant fraction by both regional and global standards. Many chose to use this time to undertake significant expansions of public service provision, such as educational enrollment, as well as increased infrastructure investment. For example, according to the IMF’s Investment and Capital Stock Dataset, public investment in physical assets, including economic infrastructure such as roads and airports and social infrastructure such as hospitals and schools, rose from an average of roughly US$200 per capita during the preboom period
(1998–2003) to more than US$435 per capita during the boom, and US$270 after the boom period in resource-rich countries in Africa (Cust, RiveraBallesteros, and Zeufack 2022). Similarly, annual spending on health services rose from 4.6 percent of GDP to 4.9 percent, on average, and expenditure on education rose from an average of 2.8 percent of GDP before the boom to 3.5 percent of GDP after the boom.
Calderon and Zeufack (2020) highlight that public debt for Sub-Saharan Africa in general and Sub-Saharan African resource-rich countries in particular was, in 2018, still below the preforgiveness period, although some countries borrowed significant amounts during the boom period (2004–14) and were subsequently overexposed to risks of public debt crises that can undermine structural transformation (figure 2.20).
More significantly, Calderon and Zeufack (2020) provide evidence that the risk profile of public debt has significantly increased since 2012 for Sub-Saharan Africa in general and Sub-Saharan African resource-rich countries in particular, as the share of concessional public debt has been declining while the share of Eurobonds owed to private creditors and non–Paris Club bilateral creditors has been rising. The higher risks of debt profiles is a particular problem for all the Sub-Saharan African resource-rich countries that engaged in resource-backed loans, that is, ex ante collateralization.
Rising debt and record-high commodity prices are tempting many developing countries to pledge their natural resources to secure the financing they so urgently need. However, new evidence on resource-backed loans calls for caution and points to hidden risks (Rivetti 2021).
Such loans are not inherently bad; under specific circumstances, they can be beneficial to poor countries with a wealth of natural resources. But they require a careful cost-risk and debt-sustainability analysis—and transparency about their contractual terms. That seldom occurs. As a result, resource-backed loans have been more likely to exacerbate debt vulnerabilities than to ease them; see, for example, Mihalyi, Adam, and Hwang (2020).
Mihalyi et al. (2022) analyze a sample of 30 resource-backed loans extended to central governments and state-owned enterprises (SOEs) in Sub-Saharan Africa from 2004 to 2018—totaling $46.5 billion, or nearly a tenth of the continent’s new borrowing during this period. Despite the size of the loans, little information was available on their terms (Mihalyi et al. 2022).
There are several reasons for this lack of data. First, countries that rely on such borrowing methods usually have weaker debt-reporting practices. Second, such loans are often contracted by SOEs or special-purpose vehicles that either do not publish audited financial statements or do not provide the data to the national debt office. Third, contracts often include stringent confidentiality clauses (Estevão 2022).
Resource-backed loans are not necessarily cheaper than unsecured loans. Chad, for example, restructured its loan with Glencore in 2015, but was still paying an all-in cost of more than 8 percent on its fully collateralized loan before restructuring it again in 2018 (Payne 2018). First, the borrower taking on a resource-backed loan usually has limited market access or limited funding sources. Second, given the complexity of these transactions, borrowers may not fully understand the implications of contract terms when negotiating them. These risks are compounded by the lack of transparency and government accountability.
Several African country cases underscore these challenges. South Sudan is paying the price for a poorly designed oil-backed loan it took on when its production capacity was still strong (Reuters 2022). Chad is struggling to restructure its debt—because the commercial lenders behind its oil-backed loans have little incentive to cut the government any slack (Savage and Prentice 2022). Zimbabwe recently entered into discussions with a commodity trader to hand over revenues from its lucrative gold and nickel mines to pay off its debts to the company (Njini and Sguazzin 2022).
Resource-backed loans involve large government borrowing—usually for infrastructure—and are collateralized by future income streams from
countries’ natural resource wealth. Such loans are often opaque; little is disclosed about their contractual terms, which means public accountability can be hard to ensure. Such loans are not new—they go back at least a century. But they became widely used across resource-rich developing countries during the commodity boom of the early 2000s. In Sub-Saharan Africa, for example, such loans represented nearly 10 percent of total new borrowing between 2004 and 2018.
Increased deal disclosure will improve value for money and protect countries. It is imperative that the details of these loans be made public. Some governments have begun to take important steps in that direction (Maslen and Aslan 2022). The Democratic Republic of Congo, for example, has published contracts involving resource-backed loans between its state-owned mining companies and a consortium of Chinese companies and with a large commodity trader. To encourage more progress, countries should put in place legal requirements for disclosure of loan contracts.
Alternative resource-leveraged instruments are also being explored, such as the proposed securitization of Ghana’s gold royalties. Although the proposal design is under development and has met with some controversy because of the speed of its passage through parliament, such financial innovations may yet open up new—as well as potentially more transparent and competitive—means of mobilizing new financing streams. For now, however, developing economies with rising revenue needs should remain wary of resource-backed loans and carefully consider the risk-reward calculus.
The conclusions of this chapter are stark. The 2004–14 commodity boom offered a huge opportunity for resource-rich Sub-Saharan African countries to outperform their non-resource-rich neighbors. However, the boom instead created a series of vulnerabilities in resource-rich countries that now depict a bitter legacy of a golden era. At the beginning, the boom created high expectations of growth in resource-rich countries, which induced them to engage in risky behaviors, generating phenomena such as the presource curse. During the boom, higher rents and attractive windfalls were not sufficiently channeled into diversifying the economy or into efforts to reduce poverty and inequality. Instead, poverty and inequality increased in many resource-rich countries during the boom. Additionally, the dependence on these resources introduced these countries to serious macroeconomic risks.
Resource-rich countries failed to take the opportunity to diversify their economies and use these additional revenues to invest in other assets or to better prepare for becoming more resilient. At the end of the boom,
resource-rich countries ended up with unsustainable growth paths and with greater vulnerability to commodity price shocks. The boom also did not help resource-rich African countries alleviate poverty; in fact, these countries are expected to house the largest share of poor in the world and with persistent inequality. The legacy of the boom has shown the critical role of policy choices and institutions in determining whether resourcerich African countries harnessed this bonanza. The outcomes from the next boom remain for African governments and the people of resourcerich Africa to shape.
1. These various challenges faced by governments are described in documents such as the Natural Resource Charter, which highlights the various public policy choices that must be made along the decision chain, from exploration for resources to how to invest revenues from resources for sustainable and diversified development (NRGI 2014).
2. Based on projections from Lakner et al. (2021), by 2030 there will be about 616 million poor in the world, 500 million poor in Africa (80 percent), 448 million in resource-rich countries (75 percent), and 379 million of them will be living in SubSaharan Africa (62 percent of the world’s poor, or 85 percent of poor people living in resource-rich countries).
3. Poverty projection estimates included in this report are based on the poverty projection methodology designed and published by Lakner et al. (2021), which incorporates the impact of COVID-19 on global poverty. These projections are based on the growth forecasts from the June 2021 version of Global Economic Prospects and take the Sustainable Development Goals’ definition of extreme poverty, which groups people living below the poverty line of US$1.90 a day, measured in 2011 purchasing power parity prices.
4. There were 23 countries with sectoral GDP data.
5. Grabber-friendly institutions’ typical features include weak rule of law, high risk of expropriation, malfunctioning bureaucracy, and corruption. Grabber-friendly institutions incentivize competition between rent-seeking and production, contrasting with producer-friendly institutions, where rent-seeking and production are complimentary activities (Mehlum, Moene, and Torvik 2006).
Arezki, R., and M. Brückner. 2011. “Oil Rents, Corruption, and State Stability: Evidence from Panel Data Regressions.” European Economic Review 55 (7): 955–63.
Balde, M. T. 2020. “A Brief History of Time: Taxation and Mineral Production in Developing Countries.” Resources Policy 68: 101687.
Boschini, A., J. Pettersson, and J. Roine. 2013. “The Resource Curse and Its Potential Reversal.” World Development 43: 19–41.
Calderon, C., and A. Zeufack. 2020. “Borrow with Sorrow? The Changing Risk Profile of Sub-Saharan Africa’s Debt.” Policy Research Working Paper 9137, World Bank, Washington, DC.
Collier, P., and A. Hoeffler. 2009. “Testing the Neocon Agenda: Democracy in ResourceRich Societies.” European Economic Review 53 (3): 293–308.
Commission on Growth and Development. 2008. The Growth Report: Strategies for Sustained Growth and Inclusive Development. Washington, DC: World Bank.
Corden, W. M., and J. P. Neary. 1982. “Booming Sector and De-industrialisation in a Small Open Economy.” Economic Journal 92 (368): 825–48.
Cust, J., D. Manley, and G. Cecchinato. 2017. “Unburnable Wealth of Nations.” Finance and Development 54 (1).
Cust, J., and J. T. Mensah. 2020. “Natural Resource Discoveries, Citizen Expectations and Household Decisions.” Policy Research Working Paper 9372, World Bank, Washington, DC.
Cust, J., and D. Mihalyi. 2017. “Evidence for a Presource Curse? Oil Discoveries, Elevated Expectations, and Growth Disappointments.” Policy Research Working Paper 8140, World Bank, Washington, DC.
Cust, J., and A. Rivera-Ballesteros. 2021. “The Nonrenewable Wealth of Nations.” In The Changing Wealth of Nations 2021: Managing Assets for the Future, 193–223. Washington, DC: World Bank.
Cust, J., A. Rivera-Ballesteros, and A. Zeufack. 2022. “The Dog That Didn’t Bark: The Missed Opportunity of Africa’s Resource Boom.” Policy Research Working Paper 10120, World Bank, Washington, DC.
Devarajan, S., M. M. Giugale, H. Ehrhart, T. M. Le, and H. Nguyen. 2013. “The Case for Direct Transfers of Resource Revenues in Africa.” Working Paper 333, Center for Global Development, Washington, DC.
Estevão, M. 2022. “Tracking Government Debt Is Hard. Banishing Secrecy Clauses Would Make It Far Easier.” World Bank Blogs, May 18, 2022. https://blogs.worldbank .org /voices / trackin g-government-debt-hard-banishing-secrecy-clauses-would - make-it-far-easier
Gill, I. S., I. Izvorski, W. van Eeghen, and D. De Rosa. 2014. Diversified Development: Making the Most of Natural Resources in Eurasia. Washington, DC: World Bank.
Harding, T., and A. J. Venables. 2016. “The Implications of Natural Resource Exports for Nonresource Trade.” IMF Economic Review 64 (2): 268–302.
Hartwick, J. M. 1977. “International Equity and the Investing of Rents from Exhaustible Resources.” American Economic Review 67 (5): 972–74.
IMF (International Monetary Fund). 2012. “Macroeconomic Policy Frameworks for Resource Rich Developing Countries.” Policy Paper, IMF, Washington, DC. https://www.imf.org/en /Publications/Policy-Papers/Issues/2016/12/31/Macroeconomic-Policy-Frameworks-for -Resource-Rich-Developing-Countries-PP4698
Jafino, B. A., B. Walsh, J. Rozenberg, and S. Hallegatte. 2020. “Revised Estimates of the Impact of Climate Change on Extreme Poverty by 2030.” Policy Research Working Paper 9417, World Bank, Washington, DC.
Kaufmann, D., A. Kraay, and M. Mastruzzi. 2010. “The Worldwide Governance Indicators: Methodology and Analytical Issues.” Policy Research Working Paper 5430, World Bank, Washington, DC.
Konte, M., and R. C. Vincent. 2020. “Mining and the Quality of Public Services: The Role of Local Governance and Decentralization.” World Development 140: 105350.
Lakner, C., D. G. Mahler, N. Yonzan, R. A. Castaneda Aguilar, and H. Wu. 2021. “Updated Estimates of the Impact of COVID-19 on Global Poverty: Turning the Corner on the Pandemic in 2021?” World Bank Blogs. https://blogs.worldbank.org/opendata/updated -estimates-impact-covid-19-global-poverty-turning-corner-pandemic-2021
Manasse, P. 2006. “Procyclical Fiscal Policy: Shocks, Rules, and Institutions—A View From MARS.” Working Paper 06/27, International Monetary Fund, Washington, DC.
Maslen, S., and C. Aslan. 2022. “Enhancing Debt Transparency by Strengthening Public Debt Transaction Disclosure Practices.” EFI Insight, World Bank, Washington, DC.
Mehlum, H., K. Moene, and R. Torvik. 2006. “Institutions and the Resource Curse.” Economic Journal 116 (508): 1–20.
Mendes, A., and S. Pennings. 2020. “One Rule Fits All? Heterogeneous Fiscal Rules for Commodity Exporters When Price Shocks Can Be Persistent: Theory and Evidence.” Policy Research Working Paper 9400, World Bank, Washington, DC.
Mihalyi, D. 2016. “Debt Sustainability Challenges in Resource-Rich Developing Countries.” NRGI Blog, November 18, 2016. https://resourcegovernance.org/blog/debt -sustainability-challenges-resource-rich-developing-countries
Mihalyi, D., A. Adam, and J. Hwang. 2020. “Resource-Backed Loans: Pitfalls and Potential.” NRGI (Natural Resource Governance Institute), New York. https:// resourcegovernance.org/sites/default/files/documents/resource-backed-loans-pitfalls -and-potential.pdf.
Mihalyi, D., J. Hwang, D. Rivetti, and J. Cust. 2022. “Resource-Backed Loans in SubSaharan Africa.” Policy Research Working Paper 9923, World Bank, Washington, DC.
Mihalyi, D., and T. Scurfield. 2021. “How Africa’s Prospective Petroleum Producers Fell Victim to the Presource Curse.” The Extractive Industries and Society 8 (1): 220–32.
Njini, F., and A. Sguazzin. 2022. “Trafigura Seeks Control of Zimbabwe’s Metals for Unpaid Debts.” Bloomberg, April 29, 2022. https://www.bloomberg.com/news /articles/2022-04-29/trafigura-seeks-control-of-zimbabwe-s-metals-for-unpaid-debts. NRGI (Natural Resource Governance Institute). 2014. “Natural Resource Charter.” NRGI, New York. https://Resourcegovernance.Org/Analysis-Tools/Publications /Natural-Resource-Charter-2nd-Ed.
Ollero, A. M., S. S. Hussain, S. Varma, G. Peszko, and H. M. F. Al-Naber. 2019. “Economic Diversification for a Sustainable and Resilient GCC.” Gulf Economic Update No. 5, World Bank, Washington, DC. http://documents.worldbank.org/curated /en/886531574883246643/Economic-Diversification-for-a-Sustainable-and-Resilient -GCC
Payne, J. 2018. “Glencore, Banks and Chad Reach Deal on $1 Bln-plus Oil-Backed Loan.” Reuters, February 21, 2018. https://www.reuters.com/article/us-glencore-chad/glencore -banks-and-chad-reach-deal-on-1-bln-plus-oil-backed-loan-idUSKCN1G52B9.
Peszko, G., D. van der Mensbrugghe, and A. Golub. 2020. Diversification and Cooperation Strategies in a Decarbonizing World. Washington, DC: World Bank.
Reuters. 2022. “Oil-Backed Loans Swallowing S. Sudan Government’s Salaries—Finance Minister.” Reuters, May 5, 2022. https://www.reuters.com/article/southsudan-oil -idUSL3N2WX31K
Rivetti, D. 2021. Debt Transparency in Developing Economies. Washington, DC: World Bank.
Ross, M. L. 2017. “What Do We Know about Economic Diversification in Oil Producing Countries?” Unpublished, UCLA and Oxford University.
Ruzzante, M., and N. Sobrinho. 2022. “The ‘Fiscal Presource Curse’: Giant Discoveries and Debt Sustainability.” International Monetary Fund, Washington, DC.
Savage, R., and A. Prentice. 2022. “Debt Deal Delays Blocking Funding for Chad—IMF Africa Director.” Financial Post , May 26, 2022. https://financialpost.com /pmn /business-pmn/debt-deal-delays-blocking-funding-for-chad-imf-africa-director
Servén, L. 1998. “Macroeconomic Uncertainty and Private Investment in Developing Countries: An Empirical Investigation.” Economics Letters 41 (2): 207–10
UNU-WIDER (United Nations University–World Institute for Development Economic Research). 2022. Government Revenue Dataset, Version 2022. UNU-WIDER, Helsinki. Accessed June 2022. https://doi.org/10.35188/UNU-WIDER/GRD-2022.
Venables, A. J. 2016. “Using Natural Resources for Development: Why Has It Proven So Difficult?” Journal of Economic Perspectives 30 (1): 161–84.
Vezina, P.-L. 2020. “The Oil Nouveau-Riche and Arms Imports.” Policy Research Working Paper 9374, World Bank, Washington, DC.
Warner, M. A. M. 2015. “Natural Resource Booms in the Modern Era: Is the Curse Still Alive?” Working Paper 15/237, International Monetary Fund, Washington, DC.
World Bank. 2001. World Development Report 2000/2001: Attacking Poverty. Washington, DC: World Bank.
World Bank. 2019. Digging Beneath the Surface: An Exploration of the Net Benefits of Mining in Southern Africa. Washington, DC: World Bank. https://openknowledge .worldbank.org/bitstream/handle/10986/32107/Digging-Beneath-the-Surface-An -Exploration-of-the-Net-Benefits-of-Mining-in-Southern-Africa.pdf?sequence=1.
World Bank. 2021. The Changing Wealth of Nations 2021: Managing Assets for the Future. Washington, DC: World Bank Group.
Zeufack, A. G., C. Calderon, A. Kabundi, M. Kubota, V. Korman, D. Raju, K. G. Abreha, W. Kassa, and S. Owusu. 2022. Africa’s Pulse, No. 25, April 2022. Washington, DC: World Bank.
The African Continental Free Trade Area (AfCFTA) brings together 54 African countries with a total population of more than 1 billion people and a combined gross domestic product (GDP) of more than US$3.4 trillion (World Bank 2020a). If successfully implemented, it will enable countries to deepen their linkages to regional and global value chains.
The rise of regional and global value chains, in which the production process is disaggregated into specialized components, has opened a window of opportunity for developing countries to join the global market. This division of labor allows countries to engage in specialized tasks within the value chain without having to cost-competitively produce the entire value chain. Free trade agreements are key to making regional and global value chains profitable because they allow the various production components to come together without added tariffs along the way. Currently, only 16 percent of international trade by African countries is traded within the region (WTO 2021), compared with 40.3 percent in North America and 61.7 percent in the European Union (UNCTAD 2019). The AfCFTA established the world’s largest free trade zone and has the potential to unlock an estimated US$3.2 trillion in intra-Africa trade (World Bank 2020a). For African countries to boost economic transformation and industrialization, regional integration and the promotion of trade linkages will play a critical role (Abreha et al. 2021; McMillan and Zeufack 2022).
The AfCFTA offers an unprecedented opportunity to develop the mineto-market value chain within the continent. On January 1, 2021, the AfCFTA became operational. The mining sector is well-positioned to have a demonstration effect. The AfCFTA unlocks the potential to promote mineral value addition
and beneficiation, which increases sectoral productivity and the overall value of exports, on the continent. The entire value chain—from the manufacturing of intermediate inputs such as machinery (backward linkages), to the actual extraction of minerals, through to the processing phase (forward linkages)— can rarely be provided by a single country because of skills, infrastructure, and capital constraints, among others. Although many countries have prioritized local beneficiation, few have the capacity to wholly undertake it domestically. If implemented effectively, the AfCFTA would allow various countries within the continent to specialize in a select part of the value chain and move the parts of the value chain between participating countries free of tariffs, enabling the entire value chain to come together competitively within Africa.
Timely implementation of the AfCFTA is critical to maximizing the regions’ gains from the clean energy transition. African countries are well-endowed with the metals required to manufacture battery storage. For example, Zimbabwe has one of the 10 largest reserves of lithium in the world, and other countries, such as Namibia, have started building lithium mines. South Africa is the world’s largest producer of manganese; the Democratic Republic of Congo is home to nearly 70 percent of the global supply of the cobalt used in lithium-ion batteries; and Madagascar, Mozambique, and Tanzania are among the 10 countries with the largest graphite deposits (IEA 2022). Currently, these resources are largely extracted and shipped overseas for processing or manufacturing of battery storage. By focusing on the development of a few manufacturing hubs within Africa, the region could benefit greatly from its rich supply of battery metals. This strategy requires a move away from each extracting country developing policies to manufacture domestically, which limits their competitiveness given the large factory operations in China, the European Union, and the United States. Instead, the focus should be on aggregating metals and manufacturing regionally, without duties and tariffs.
This chapter identifies key tariff, nontariff, and policy barriers that are limiting the development of Africa’s comparative advantage. The chapter brings together data, a review of recent legislation, and national and firm-level case studies to provide an understanding of the depth of these barriers and how they are inhibiting linkage development, which negatively affects job creation, export-led growth, and increased participation in global value chains. It then provides a prioritized list of short- and long-term recommendations to mitigate barriers to the stimulation of intracontinental value chain development.
The AfCFTA was established to bridge fragmentation and support equitable growth within the continent through four core objectives: (a) to create a single
continental market for goods and services, with free movement of business, persons, and investments, to accelerate the establishment of a continental customs union and an African customs union; (b) to expand intra-Africa trade through harmonization and coordination of trade liberalization and facilitation regimes and instruments across Africa; (c) to resolve the challenges of multiple and overlapping memberships and expedite regional and continental integration processes; and (d) to enhance competitiveness at the industry and enterprise levels by exploiting opportunities for scale production, continental market access, and better reallocation of resources (World Bank 2020a).
The AfCFTA can provide a platform for coordination between the many regional economic communities (RECs). The African Union currently recognizes eight RECs: the Arab Maghreb Union, the Common Market for Eastern and Southern Africa, the Community of Sahel–Saharan States, the East African Community, the Economic Community of Central African States, the Economic Community of West African States, the Intergovernmental Authority on Development, and the Southern African Development Community (SADC). The AfCFTA does not seek to replace RECs but rather to promote coordination among them to build a true free trade area. Without coordination, different levels of tariffs, trade facilitation requirements, and export restrictions can undermine the development of a strong value chain.
To build a cost-competitive continental value chain, as envisaged by the AfCFTA, reforms need to be undertaken in three areas: tariffs, nontariff barriers, and policy barriers that inhibit the implementation of the continental free trade area.
First, under the trade deal, tariffs on 90 percent of goods will be phased out in a 5-year time frame (10-year period for the least-developed countries, or LDCs). The remaining 10 percent would take additional time, starting in 2025, according to the AfCFTA secretariat (World Bank 2020a). Unfortunately, during the development of the AfCFTA, and even after it was signed in March 2018, a number of countries implemented tariffs, making regional value chain development cost prohibitive. Second, the cost of nontariff barriers, particularly transport and energy, is often higher than the cost of tariffs. For example, Atkin and Donaldson (2015) calculate that the cost of transporting goods could be up to five times higher (per unit distance) in some Sub-Saharan African countries than in the United States. Finally, policies have been put in place in various countries that directly inhibit regional value chain development, particularly export bans, local content policy, and foreign equity limitations.
Sub-Saharan Africa can become a global leader in mining value chains if countries come together to leverage the AfCFTA. As table 3.1 shows, the extractive sector already contributes at least 20 percent of export value in 30 SubSaharan African countries. This chapter identifies key tariff, nontariff, and policy barriers that are eroding the development of Africa’s comparative advantage.
Source: Based on World Bank World Integrated Trade Solution (WITS) data, 2019. Note: The product nomenclature used is Harmonized System 1988/92. Exports indicated are share of gross exports to the world, including re-exports, and valuation is free on board. Data not available for Chad, Equatorial Guinea, Liberia, Somalia, and South Sudan. Some countries have no available data for 2019. Data for Cameroon, Central African Republic, Sierra Leone, and Sudan correspond to 2018 values; Gabon to 2009 values; and Guinea-Bissau to 2006 values. — = not available.
As countries seek to increase their benefits from the mining sector amid mounting fiscal pressure and high levels of unemployment, many have turned to mineral-based industrialization strategies that include an increase in tariffs or are at odds with a single-market approach. The AfCFTA’s Schedule of Tariff Concessions includes the following (World Bank 2020a):
• Elimination of tariffs on 90 percent of goods over a five-year period, starting in 2020 (10 years for LDCs).
• An additional 7 percent of tariff lines are deemed “sensitive.” Tariffs on these goods will be eliminated over a 10-year period (13 years for LDCs).
• The remaining 3 percent of tariff lines can be excluded from liberalization, but the value of these goods cannot exceed 10 percent of total intra-Africa imports.
The hesitancy in reducing tariffs is often due to a perceived loss of domestic revenue. An analysis by the United Nations Conference on Trade and Development (UNCTAD) using the Global Trade Analysis Project computable general equilibrium model shows that if all tariffs are fully eliminated inside the AfCFTA, the tariff revenue loss will amount to US$4.1 billion, equivalent to 9.1 percent of current revenue (Saygili, Peters, and Knebe 2018). But the upside is substantial. Long-term simulations show significant welfare gains of US$16.1 billion (after deducting the US$4.1 billion in tariff revenue losses);
GDP is expected to grow by 0.97 percent; and total employment will increase by 1.2 percent. Intra-Africa trade is forecasted to grow by 33 percent, and the continent’s total trade deficit would be cut by half (Saygili, Peters, and Knebe 2018). The mining sector would remain limited because production is capital-intensive and additional production will not significantly affect employment levels. But employment in every other sector of the economy is forecasted to grow, with manufacturing experiencing the largest amount of growth (fi gure 3.1). This expected growth of employment in manufacturing is also aligned with the AfCFTA’s goal of structural transformation and industrialization (Saygili, Peters, and Knebe 2018). The growth of some sectors, such as machinery, mineral products, petroleum and coal, and metals, is reflective of the development of backward and forward linkages with the mining sector, rather than an expectation of significant job creation within the sector.
Even regional harmonization efforts can find themselves undermined by national policies. Burkina Faso, Côte d’Ivoire, Guinea, and Mali provide an example. Although export levies were harmonized at 3 percent among the four countries, implementation has not been even. On paper, there is no reason for exporters to choose a shipping base on the basis of a more advantageous tax jurisdiction, given that they all should be the same. However, Mali’s system has left a large loophole—the 3 percent is only applied to the first 50 kilograms of gold per month (Martin and Helbig de Balzac 2017); after that, the remaining
weight is exported tax free. Thus, a significant amount of gold originating in each of these countries is believed to be transported through Mali. Guinea responded by slashing all export duties, though Sierra Leone did not appreciate this action, given that it suspected that large amounts of gold were already being brought through Guinea to Mali. The attempt at regional harmonization has given way to increased challenges and tension between the countries, as well as a heightened risk of smuggling (Martin and Helbig de Balzac 2017).
Broadly, in the mining sector, countries are “speaking continentally” but “thinking nationally.” The remainder of this section examines a range of tariff policies that are likely to be at odds with the AfCFTA. Some have been long-standing, while others were implemented after the AfCFTA was discussed and signed.
Democratic Republic of Congo. The country has used an export ban on cobalt and copper concentrates intermittently to force companies to process the minerals domestically. The last ban was lifted in March 2019, but with a caveat that the government would review the need for an export ban every six months and would implement it if needed. In a letter to the National Federation of Enterprises, the Minister of Mines stated that the local beneficiation requirement was implemented to maximize domestic revenue from mine production. However, the National Federation of Enterprises has pointed to the country’s energy deficit as a major constraint to processing concentrates domestically. An export ban on copper concentrates has a significant impact on trade with Zambia, a major trading partner of the Democratic Republic of Congo (Hunter 2019).
Additionally, the Democratic Republic of Congo levies a 3 percent tax on gold exports, which has provided an incentive for illegal trade. Estimates suggest that 90 percent of the Democratic Republic of Congo’s gold production is illegally exported through neighboring Uganda and Rwanda (Economist 2019). Uganda taxed gold exports until 2014, when President Yoweri Museveni waived the export tax. This waiver led to a surge of investments. In 2014, Belgian investors poured US$15 million into African Gold Refinery after they were given assurance of tax exemptions for the import of raw gold and export of refined gold for a decade. Since then, the refinery has exported more than 30 tons of gold. A competing firm, Bullion Refinery, has also entered the market (Economist 2019).
Zambia. In early 2019, Zambia imposed a new 15 percent export duty on precious metals and a 5 percent import levy on copper and cobalt concentrates. A number of mining firms import copper and cobalt concentrates to increase the profitability of Zambian smelters. The import levy was designed to encourage firms to boost their domestic mining production and employ local people, rather than importing to meet smelting thresholds. Shortly thereafter, the Eurasian Resources Group opted to shut down its 55,000 tons per year Chambishi Copper Smelter in Zambia, as a result of the 5 percent import levy (Reuters 2020). The processing facility relied heavily on the import of copper
concentrate from neighboring Democratic Republic of Congo, including from Eurasian Resources Group’s Boss and Frontier Mines. About the same time, Vedanta Resources–owned Konkola Copper Mines stopped operations at its Nchanga Mine in Zambia, citing the 5 percent import duty on concentrate as the reason that smelting became commercially unviable. 1 The shutdown of these operations led to large-scale retrenchments and had a heavy impact on the stability of the sector. By 2020, Zambia announced that it had suspended its 15 percent export duty (except for diamonds), after its efforts to raise revenue resulted in a decline in production. In an interview, the mining minister said, “the industry was bleeding and production was falling” (Mfula 2019). More recent reforms under a new administration appear to be reversing these trends.
Namibia. The Export Levy Act 2 of 2016 was created to support the countr y’s efforts to deepen value chains and promote industrialization by encouraging local processing of raw materials. When the act was first implemented, levies for minerals, gas, and crude oil products ranged from 0.25 percent to 2 percent. In 2019, the export levy for dimension stones was increased to 15 percent (table 3.2). Although the Export Levy Act had been under development since 2012, it faced a high degree of resistance from Namibia’s Chamber of Mines, which argued that an export levy would discourage investments within
the sector. This is a clear example of a clash between deepening a domestic value chain by implementing export levies and deepening regional value chains by supporting free trade.
Sierra Leone. The country collects a tax on major exports, with the goal of encouraging both value addition and the development of local communities. There is a levy on both diamonds and gold, at 3 percent and 5 percent, respectively, although gold produced by artisanal miners is subject to a reduced levy of 3 percent. The value is assessed by the Precious Minerals Trading Directorate (WTO 2017). The export levies were initially set through a law created in 2009, and backed by the International Monetary Fund (IMF), to scale up government revenues in postwar Sierra Leone. However, it instead triggered a sharp reduction in official exports. In 2011, export levies were reduced from 6.5 percent to 3 percent for artisanal-mined diamonds, and from 5 percent to 3 percent for artisanal mined gold in 2012, to discourage smuggling and strengthen exports (Akam 2012).
South Africa. The Diamond Export Levy Act No. 15 of 2007 and the Diamond Export Levy (Administration) Act No. 14 of 2007 imposed an export levy on unpolished diamonds.2 The export duty is 5 percent of the total diamond value. The goal of the legislation is to spur the development of the domestic economy by encouraging the local diamond industry to process diamonds, including cutting and polishing, locally, thereby training people and creating jobs. The export levy discourages the sending of unpolished diamonds to neighboring Botswana, which has the existing capacity and capabilities to process diamonds.
Nontariff barriers (NTBs) remain a roadblock to actualizing the benefits of the AfCFTA. NTBs are restrictive regulations and procedures, other than tariffs, that increase the difficulty and cost of importing and exporting products.
Research by UNCTAD shows that NTBs are at least three times as restrictive as standard customs duties and suggests that African countries would increase GDP by US$20 billion by tackling these NTBs at a continental level (UNCTAD, n.d.). Although article 4 of the AfCFTA Agreement states that “The State Parties shall progressively eliminate tariffs and non-tariff barriers to trade in goods,” research published by Fitch Ratings in 2021 suggests that the removal of NTBs under the AfCFTA is likely to lag behind the agreement’s ambitions, limiting its impact. It notes, “The impact of the East African Community customs union, for example, has been limited by a lack of integration and removal of non-tariff barriers, despite its 15-year history” (Fitch Ratings 2021).
Improving nontariff barriers, particularly around logistics, is a core part implementing the AfCFTA. Five annexes focus on various dimensions of trade and logistics: Annex 3 focuses on Customs Cooperation and Mutual Administrative Assistance; Annex 4 on Trade Facilitation; Annex 5 on Nontariff Barriers; Annex 6 on Technical Barriers to Trade; and Annex 8 on Transit. The region has significant scope to improve logistics capabilities, given their poor performance thus far. The World Bank’s Logistics Performance Index (LPI) assesses the efficiency of customs and border management clearance systems, quality of trade and transport infrastructure, ease of arranging shipments, quality of logistics services, ability to track and trace consignments, and frequency with which shipments reached consignees on time. When looking at the LPI of African countries, just five scored above a 2.75 (out of 5): South Africa, Cote d’Ivoire, Rwanda, Kenya, and Benin. The average for the region was 2.35—the second lowest in the world after South Asia, which scored 2.3.
Transport and energy deficiencies are NTBs that inhibit resource-based industrialization. To capture the magnitude of these challenges, consider that the cost of shipping a container from China to Beira, Mozambique, is US$2,000, but transporting that same container from Beira to Malawi, a distance of 500 kilometers inland, costs US$5,000. Access to electricity remains scarce and unreliable, making the cost of doing business high. In Malawi, where the container has gone, 61 percent of households are not connected to an electric grid (Economist 2022).
Transportation and logistics costs in Sub-Saharan African countries are disproportionately high compared with other developing countries, and undermine intraregional trade. Africa’s landmass is larger than the sum of China, Europe, India, and the continental United States, but its 82,000-kilometer rail network is marginally larger than the sum of France and Germany’s. Much of its rail infrastructure has been poorly maintained and 16 percent is entirely nonoperational. In 2016, Africa’s share in global ton-kilometers of rail freight was just 2 percent. Ports are unable to meet demand; on average, cargo waits nearly three weeks in Sub-Saharan Africa, which is more than in Asia, Europe, and
Latin America, where it can take less than a week. Handling costs are 50 percent higher than in other parts of the world. The majority (80–90 percent) of freight is transported by road, but road density is one of the lowest in the world, at 27 kilometers of road per 10,000 people. Just 28 percent of the continent’s 2.8 million kilometers of road are paved. An analysis conducted by the IMF in 2019 shows that bringing the quality of Sub-Saharan Africa’s infrastructure up to the global average would increase continental trade by 7 percent (IMF 2019). Transportation costs have not improved significantly over time. Between 2005 and 2014, the difference between transport costs in Africa and other regions has increased, reaching twice as much as in developed economies (figure 3.2).
Central and West Africa not only have among the highest transport and logistics costs in the world, but they also have the lowest international scores on the perception of logistics services based on efficiency of customs clearance processes, quality of trade- and transport-related infrastructure, ease of arranging competitively priced shipments, quality of logistics services, ability to track and trace consignments, and frequency with which shipments reach the consignee within the scheduled time. These low scores indicate that there are deficiencies in both soft and hard infrastructure. The average cost to transport a container within Central and West Africa is US$2.43 per kilometer, which is 1.5 and 2.2 times the freight rates in South Africa and the United States, respectively. For landlocked economies such as Zambia (box 3.1), transport costs account for an
According to the Extractive Industries Transparency Initiative (EITI 2020), the extractive sector accounted for 77 percent of exports in Zambia in 2019. However, over time, the profitability of the average Zambian mine has declined because of aging mines, high transport costs, and new taxes.
High infrastructure costs have reduced Zambia’s competitiveness in mining. Transport costs have added 40 percent to the cost of the product because accessing ports, including Beira, Dar es Salaam, Durban, Lobito, and Walvis Bay, is costly. For example, when going overland to the port at Walvis Bay, Namibia, more than 50 percent of the railway lines that state-owned railway company TransNamib currently operate do not meet the minimum Southern African Development Community (SADC) stipulated standard of 18.5 tons per axle load.a This has forced trains to operate at reduced speeds and has led to delays and backlogs. These inefficiencies have a significant impact on the extractive sector, given that minerals and fuel account for 41.9 percent of tonnage transported (TransNamib 2021).
Border delays also disproportionately affect landlocked countries. In the space of five months in 2021, economies in Southern African lost US$330 million because of delays at borders between SADC countries. SADC issued a statement noting that business losses included 16.4 million hours in delays. SADC member states have called for the establishment of a Corridor Management Institution that would manage the North-South Corridor, a network of road and rail routes that connect the South African port of Durban via Johannesburg into Botswana or Zimbabwe, leading to Zambia, the Democratic Republic of Congo, and Malawi.
a. TransNamib (https://www.transnamib.com.na/).
average of 45 percent of import value and 35 percent of export value, which is much higher than the global averages of 5.4 percent (of imports) and 8.8 percent (of exports) (Viljoen, n.d.).
High transport and logistics costs result from a range of factors, including poorly developed and undermaintained physical infrastructure, lack of regional and international transport connectivity, inefficient logistics services, mutual distrust among operators, cartels of transport providers, freight-sharing schemes, and poor access to shipping services. There is also a particularly extreme lack of infrastructure in Central Africa, which, by extension, is a key barrier to connectivity between North, East, West, and Southern Africa.
Mining is an energy-intensive sector that requires 24-hour, steady, baseload power. The mining sector is the biggest user of energy in most extractive countries.
For example, in South Africa, the mining sector consumes approximately 30 percent of the country’s annual power stocks, for both mining and smelting activities. For health and safety, access, and production reasons, mines must have guaranteed power. Although other sectors, such as services or trade, can function on backup power, this is not tenable for energy-critical operations such as in mining.
The mining sector is often reliant on state-owned utility companies and may face lower-quality generation, transmission, and distribution infrastructure (Cudennec and Kiwelu 2021), leading to poor access to electricity in most Sub-Saharan African countries. As table 3.3 shows, Sub-Saharan Africa’s score for getting electricity3 is the lowest in the world—50.4 on a 100-point scale, compared with 85.9 in Organisation for Economic Co-operation and Development (OECD) high-income countries, 75.1 in East Asia and Pacific, and 71.7 in Latin America and the Caribbean. The cost of electricity is the highest of any region in the world, more than 3.5 times as high as the next highest, South Asia; more than 5 times higher than in East Asia and Pacific; and more than 7 times higher than in Latin America and in the Middle East and North Africa. However, some countries have begun to deregulate state-owned enterprises to improve access to the grid; see box 3.2.
Improving access to, and the cost of, electricity infrastructure can strengthen linkage development. Affordable and reliable energy is critical for developing a comparative advantage in manufacturing inputs or processing ores. Power outages can lead to equipment damage, production downtimes, and processing delays and make it difficult to meet deadlines for export customers. Steep increases in energy costs can have a considerable impact on the ability of mines to remain open.
Deregulating state-owned energy sectors can help the mining sector generate its own energy and reduce its reliance on grids with shortages and disruptions. In South Africa, Eskom, the state-owned energy producer, began implementing rolling blackouts in 2007 to offset energy shortages. These outages, coupled with steep tariff increases, became a liability to mining companies. In 2019, Minerals Council South Africa, the sector’s industry association, noted that the above-inflation increases to electricity prices would accelerate job losses at energy-intensive mines. Specifically, the association noted that the country’s gold and platinum mines would shed approximately 90,000 jobs over three years because of above-inflation electricity price increases by Eskom.
Recognizing the limitations of the state-owned provider, in 2021, the president of South Africa announced that private investors would be allowed to build their own power plants with up to 100 megawatts of generating capacity without requiring a license. In 2022, Anglo American reached an agreement with EDF Renewables, a global leader in renewable energy, to develop a regional renewable energy ecosystem in South Africa. The system is projected to provide 100 percent of Anglo American’s operational electricity requirements in South Africa by 2030. Anglo American said the partnership is expected to bring a host of benefits to South Africa and the region, including the implementation of three to five gigawatts of renewable electricity (solar and wind) and storage over the next decade. Anglo American has already secured 100 percent renewable electricity supply for all its operations in South Africa, which will translate to 56 percent of their global grid supply being generated by renewable energy by 2023.a
a. “Anglo American Partners with EDF Renewables to Secure 100% Renewable Energy Supply for South Africa Operations” (https://www.angloamerican.com/media/press-releases/2022/18-03-2022).
Given unreliable and expensive access to electricity, mining companies in a number of Sub-Saharan African countries have opted to build their own energy infrastructure. Between 2000 and 2015, mining houses in Africa spent approximately US$15.3 billion on their own electricity investment and operating costs and have installed 1,590 megawatts of generating capacity (Banerjee et al. 2015). For example, in 2019, Gem Diamonds invested about US$13.5 million in an infrastructure project to bring electrification to Letseng Mine and surrounding communities in Lesotho, thus reducing the need for diesel generators, which was a substantial cost given transport costs to get to the mountain kingdom. But in countries with less profitable endowments (Lesotho is home to some of the world’s most valuable diamonds), governments need to step in to finance infrastructure and then recoup those costs through taxes. Some companies
have also opted to take the renewable energy route. For example, as discussed in chapter 1, in Namibia, the country’s biggest gold producer, B2Gold, built a 7-megawatt hybrid solar power plant that is the world’s first large-scale, threeway (solar, heavy fuel oil, and electric) power provider.
Many Sub-Saharan African countries have implemented policies to support broader socioeconomic goals. These policies can seek to increase domestic value addition, create jobs, generate revenue for the government, or facilitate diversified growth. Though these policies are well-intended, experience continentally and globally suggests that they have a high propensity to backfire. Importantly, these policies can undermine the development of competitive regional value chains. This section explores the use of export restrictions and local content policies and assesses how they are affecting the implementation of the AfCFTA. The mitigation of policy impediments can help strengthen the implementation of a regional approach that brings together comparative advantages and increases continental value addition.
Since 2009, the severity of export restrictions on raw commodities in SubSaharan Africa has increased. The OECD global database includes 79 countries that export raw minerals and metals. Of the 19 Sub-Saharan African countries included in the database, all but one had some type of restriction on exporting raw minerals and metals in 2020 (OECD 2020). All of these countries used multiple export restrictions, but when looking at the most restrictive measure, eight had export bans, eight charged export taxes, and two had nonautomatic licensing (table 3.4). Over time, a number of countries have implemented stricter export restrictions. For example, in 2009, the most restrictive export measure in Angola, Madagascar, Sierra Leone, and Zimbabwe was the use nonautomatic licensing. By 2020, Sierra Leone and Zimbabwe had imposed export taxes, and Angola and Madagascar imposed export bans. Senegal, which had no restrictions in 2009, had implemented an export tax by 2021. In aggregate, while the number of countries imposing export restrictions on raw minerals and metals in Sub-Saharan Africa varied between 17 and 19 since 2009, the severity of the restrictions deepened. In 2009, 26.3 percent of countries used an export ban compared with 42.1 percent in 2020 (table 3.5). Map 3.1 shows the type of restrictions in Africa and other countries in the world.
Country
Most restrictive export measure
Mozambique no restrictions
Botswana nonautomatic licensing
Ethiopia nonautomatic licensing
Gabon export tax
Guinea export tax
Namibia export tax
Senegal export tax
Sierra Leone export tax
South Africa export tax
Zambia export tax
Zimbabwe export tax
Angola export ban
Burundi export ban
Congo, Dem. Rep. export ban
Ghana export ban
Kenya export ban
Madagascar export ban
Nigeria export ban
Rwanda export ban
Source: Based on Trade in Raw Materials Database, OECD 2020.
Source: Based on Trade in Raw Materials Database, OECD 2020; based on countries listed in table 3.4.
Sub-Saharan African countries have often used primary commodity export bans to support domestic economic development goals. Although many Sub-Saharan African countries have significant mineral and metal deposits, processing capacity remains limited because of insufficient infrastructure, a skills shortage, and a lack of adequate financial, technical, and
Source: Based on Trade in Raw Materials Database, OECD 2020.
Note: Color coding is indicative of severity of restriction and not of the number of restrictions. Countries in gray have no data.
human capital. Nevertheless, countries have used export restrictions to stimulate the development of forward linkages and increase domestic value addition. This section uses examples from the Democratic Republic of Congo, Guinea, Tanzania, and Zimbabwe to show that export bans can have the opposite effect: they can be a deterrent to investment, and hard-earned wins can be lost.
In 2013, the Democratic Republic of Congo, the world’s biggest cobalt producer and Africa’s largest copper producer, banned exports of copper and cobalt concentrates to encourage miners to process and refine the ore domestically. Unfortunately, smelting capacity remains limited because of
infrastructure shortages. Haut-Katanga Governor Jacques Kyabula Katwe noted, “There is still the issue of an electricity deficit, which prevents mining companies from building processing facilities.”4 Rather than eliminating the ban, the government repeatedly issued waivers. In 2020, the Democratic Republic of Congo indefinitely waived the export ban on cobalt hydroxides and carbonates, Alphamin’s tin concentrates, and concentrates of tin, tungsten, and tantalum.
In 2017, Guinea’s mining exports grew at an unprecedented 79 percent compared with annual growth rates of less than 50 percent between 2010 and 2014. This growth was driven by higher bauxite production derived from a reduction of bauxite production in Indonesia—Guinea’s bauxite competitor—resulting from regulatory changes in this Southeast Asian country’s laws requiring local production linkages.
In 2017, Tanzania announced a ban on exports of unprocessed gold, silver, copper, and nickel concentrates and ores. Unfortunately, the development of forward linkages was inhibited by the country’s lack of capacity to process raw mineral output profitably. A 2012 feasibility study showed that, based on volume, local processing was not feasible because an insufficient amount of gold was produced. In 2017, the Tanzania Chamber of Minerals and Energy recommended that the government temporarily suspend the ban while assessing the viability of in-country refining, smelting, and processing operations.5 Gold production dropped precipitously because of the ban (figure 3.3).
An analysis by Fitch Ratings predicts that Tanzania’s gold mine production will see an average annual growth rate of 1.5 percent during 2021–30 compared with 1.9 percent over the decade 2011–20 as the country’s mining regulations become stricter. From 2022 onward, gold production growth in
Tanzania will gradually slow as a result of increasing government control over natural resources in the country and continuing stringent mining policies (Fitch Solutions 2021).
In 2021, Zimbabwe’s cabinet approved an immediate ban on all exports of unprocessed chrome ore to support the attainment of an envisioned US$12 billion industry by 2023. The government stated that the ban on raw chrome ore exports would promote the domestic value chain. The ban was envisioned to capacitate current smelters and maximize domestic value added from the country’s abundant resources, as highlighted in the National Development Strategy 1.
Local content policies (LCPs) are designed to enable countries to maximize domestic benefits from foreign direct investment by expanding local participation. As mining becomes increasingly capital-intensive, larger returns tend to accrue to capital. Given the constraints many Sub-Saharan African countries face, mining largely relies on foreign capital and foreign skills, which means that much of the income generated will accrue to foreigners rather than to the country owning the natural resources. Thus, policy makers view LCPs as an important avenue for widening the distribution of benefits generated by the mining sector. There are four components of LCPs: (a) participation by nationals in employment and management (localization); (b) local sourcing of raw materials or value-added components, often referred to as local procurement;
(c) geographic definition of a “local” firm (local, regional, or national); and
(d) distinction in size of enterprise (micro, small, medium, or large enterprises). LCP requirements are incorporated into contractual agreements between governments and foreign companies or are legislated (Ba and Jacquet 2022). This section largely focuses on employment and procurement in the extractive sector; however, there is significant ambition and opportunity for domestic value addition and job creation in the sustainable energy sector, as captured by the Kigali Communique of 2022.6
The objective of these policies is to increase the quantity and quality of local employment by mining operations. If successfully implemented, the policies can create new local jobs, grow and develop the skills of the national workforce, and advance efforts toward gender equality and social inclusion. One of the key challenges to achieving successful outcomes is a shortage of skilled labor. To address this shortage, many countries have implemented mining companies’ training requirements to increase the supply of skilled labor. There are two types of local employment policies:
• Regulatory approaches, which typically result in prescriptive, “stick”-based policies, are generally mandatory and rely on strong compliance mechanisms. These include the following:
❍ Mandated local employment percentages, often different for different types of jobs
❍ Requirements to conduct training of locals or support training facilities
❍ Required succession, or localization, plans
❍ Visa restrictions on foreign workers
❍ Mandated employment of indigenous people, women, or disadvantaged groups
• Facilitative approaches, which typically result in incentive-based, “carrot” policies, offer support and incentives for the development and employment of local workers. These include the following:
❍ Preferences in the awarding of mining contracts
❍ Nonbinding requirements to hire locals (for example, “to the extent possible”)
The African Mining Legislation Atlas (AMLA) is a platform that aims to promote transparency, accessibility, and comparison of Africa’s mining laws, thereby facilitating the preparation, revision, and implementation of mining laws; providing a living database that will catalyze research and policy debates on legal and regulatory issues; and promoting the development of local legal expertise and mining laws. It can help in the assessment of policies relating to (a) employment and training and (b) procurement of local goods and services. There is substantial heterogeneity in the types of policies; some are regulatory with strict quotas (discussed later on in this section), whereas others are facilitative and can be read as suggestions. A small handful of countries have no LCP focusing on employment and training, but the majority have between 1 and 4. There are some clear outliers: Gabon has 7, Chad has 8, Kenya and Tanzania have 9, and Zambia tops the list with 12. A list of employment and training LCPs can be found in table 3.6. Beyond the regulatory measures included in AMLA, there are additional localization policies that this section touches on.
Even though all of these policies fall within the employment dimension of LCPs, they range across a wide spectrum. Some countries have a more investorfriendly approach, whereas others heavily favor domestic workers.
Mali (Title VIII, Chapter 1, Article 139) is investor friendly. “Holders of mining titles and their subcontractors may engage for their activities in Mali the
Country Number of policies Type of policies
Angola 1 local hiring and training
Benin 1 local hiring training and promotion program for locals
Facilitate technology transfer to benefit local firms and people
Botswana 1 local hiring training program
Burkina Faso 1 compliance with local labor law training program to phase out expatriate staff
Progressive quotas for training, employment, and promotion programs for local personnel approval of nonnational worker contracts
Burundi 2 hiring national staff, if equally qualified Cabo Verde 0 n.a.
Cameroon 4 Mechanisms for transfer of technology and skills to locals training and recruitment plan to increase local hires improving working conditions Development of a program for building local capacity of local MSMes
Upgrading the capacity of local companies in linkage sectors (that is, construction of mines)
Central African Republic 2 training and recruitment program of nationals
90% of the jobs that do not require a particular qualification are reserved for cameroonians.
90% of the jobs that do not require any particular qualification are reserved for nationals; the remaining 10% must be reserved for subregionals and regionals residing in the territory. Comoros 0
Chad 8 employment, technical training, and promotion of nationals technology transfer compliance with local labor law approval of nonnational worker contracts
(continued next page)
Type of policies
Congo, Dem. Rep. 2 Finance training abroad for national staff
hiring national staff, if equally qualified
Congo, Rep. 2 hiring national staff, if equally qualified
provide ongoing training for local staff
A fixed share of overall mining costs is to be used to build national expertise in the control of prospecting, research, and industrial safe work
Côte d’Ivoire 5 implement a training plan for national mSmes
priority hiring for nationals
Finance capacity-building efforts by mining Administration
Train national engineers and geologists
Djibouti 1 welcome university students and apprentices for internship and training opportunities
Equatorial Guinea 1 give preference to national workers and local goods, services, and equipment
Eritrea 1 local hiring
Training program for employees
Eswatini 4 Training program for employees and locals provide funding for education of employees
A reconnaissance license must come with a proposal to improve employment and training of nationals
Ethiopia 1 ensure employees have adequate training for mining operations
Quotas
(continued next page)
Gabon 7 hiring national staff, if equally qualified promotion of local small and medium enterprises establish annual training program for staff offer internships to nationals establish progressive plan for skills transfer
contribute to training fund for staff at the national mining administration
Quotas
Gambia, The 0 n.a. n.a.
Ghana 3 establishment of a training program to phase out expatriate staff
local hiring
Guinea 2 local hiring Title iv, chapter 1, Article 108 sets a strict minimum quota of guinean employees per development. in year 1, 33% of executives, 50% of management, 66% of skilled, and 100% of unskilled workers must be guinean. while all unskilled workers must be guinean across the life of the project, minimum quotas increase rapidly for remaining categories. by year five, 50% of executives and 80% of management and skilled workers must be guinean, and by year 11, 90% of executives and 100% of management and skilled workers must be guinean.
Guinea-Bissau 2 establishment of a training plan to phase out expatriate staff preference for hiring local staff, if equally qualified
Kenya 9 cabinet makes regulations on replacement of expatriates and number of years expatriates shall serve
Develop linkages with universities to train nationals local hiring and training
(continued next page)
(continued next page)
Table 3.6 (continued)
Country Number of policies
Type of policies Quotas
Senegal 1 hiring national staff, if equally qualified training and promotion program for national staff
Seychelles 0 n.a. n.a.
Sierra Leone 2 local hiring training program for local staff
Submit annual report with national/expatriate staff composition and status of training programs
a holder of a mineral right shall not import unskilled labor for the carrying out of any of its operations undertaken under the mineral right.
Somalia 0 n.a. n.a.
South Africa
2 local content policy dimensions within Mining charter iii include local ownership, human resource development, and employment equity
South Sudan 1 local hiring training program
Submit annual employment and training report give preference to national contractors if comparable to nonnationals
Sudan 1 Follow-up to the controls of employment, training, the insurance of sites and equipment and employees, with safety procedures against risks
Tanzania 9 hiring and training program for nationals
Submission of a succession plan for expatriates
Togo 1 training program
Submit training and periodic retraining programs
Mining charter iii has the following employment equity targets: board level (50% black, of which 20% black female); executive management (50% black, of which 20% black female); senior management (60% black, of which 25% black female); middle management (60% black, of which 25% black female); junior management (70% black, of which 30% black female); core and critical skills (60% black); and employees with disabilities (1.5% of total workforce).
a Mining license title holder shall not import unskilled labor for the carrying out of any of its Mining operations undertaken under the license.
(continued next page)
Uganda 6 no mining license will be granted without adequate proposal for hiring and training nationals
implementation of these programs
Zambia 12 hiring and training of nationals
Zimbabwe 3 Training program for nationals
Source: Based on AMLA (2022) database.
Note: MSMEs = micro, small, and medium enterprises; — = not available; n.a. = not applicable.
expatriate staff necessary for the effective conduct and success of their activities. The State will facilitate the acquisition of the administrative documents necessary for the entry and stay of this expatriate staff in accordance with the legislation in force.”
The Central African Republic (Title II, Section 5, Article 52) gives the investor more flexibility. “The Investor’s right to recruit or dismiss the local and expatriate personnel necessary for the efficient conduct of mining operations, and its commitment to train local personnel with a view to gradually replacing qualified expatriate personnel with local staff having acquired the same skills and experience on the job, in accordance with the legal provisions on employment…”
Guinea-Bissau (Chapter VIII, Article 58) takes a similar approach to the Central African Republic. “The holder of mining rights is free to employ the people he deems necessary or useful for his activity. Without prejudice to the provisions of the previous number, the holder, in equal circumstances, would give preference in employment to national citizens.”
On the other hand, Guinea has a very strict set of quotas (Title IV, Chapter 1, Article 108). The minimum quota of Guinean employees per development phase of the project or per period of operation of the company is defined in table 3.7.
The Guinean Mining Code also sets rules for top executives in the mining industry. The deputy general manager holding the mining exploitation title or quarry exploitation authorization must be Guinean beginning with the first year of commercial production. After the first five years of commercial production, the general manager of the operating company must also be Guinean. The holder of the mining title must first recruit Guinean executives and is required to prioritize hiring residents of surrounding local communities for jobs not requiring specialized qualifications. If these quotas and rules are not met, the title holder could be subject to a financial penalty.
Source: Guinea’s Mining Code of 2011 (https://guilaw.com/code-minier/).
A number of other countries use strict quotas for specific categories of workers.
• Cameroon. For jobs that do not require a particular qualification, 90 percent of the jobs are reserved for Cameroonians.
• Chad. For jobs that do not require any particular qualification, 90 percent of the jobs are reserved for nationals, and the remaining 10 percent must be reserved for subregionals and regionals residing in the territory.
• Liberia. No operator, its contractors, or subcontractors under the Mining Law of 2000 shall employ foreign unskilled labor.
• Sierra Leone. A holder of a mineral right shall not import unskilled labor for the carrying out of any of its operations undertaken under the mineral right.
• South Sudan. A Mining License Title Holder shall not import unskilled labor for the carrying out of any of its Mining Operations undertaken under the License.
Some policies are not captured within these laws. One such example is South Africa’s Broad-Based Black Socio-Economic Empowerment Charter for the South African Mining and Minerals Industry, also known as the Mining Charter. It was first developed in 2002, amended in 2010, and revised again in 2017 and 2018. Under the rubric of transformation, the charter aims to undo the legacy of apartheid, making mining more representative of South African demographics (table 3.8). The moving targets, shifted by each iteration of the Mining Charter, have created widespread policy uncertainty (table 3.8). In 2021, South Africa ranked 75th out of 84 mining jurisdictions for attractiveness to mining investment in the Fraser Institute’s Annual Survey of Mining Companies (Yunis and Elmira 2021). Regulatory uncertainty is a key contributing factor.
Governments implement LCPs to increase the participation of domestic firms in the mining supply chain. Broadly, there are three primary reasons countries adopt local procurement policies. First is fiscal and political pressure to
respond to the lack of structural transformation during commodity booms. As discussed earlier in this report, most countries have failed to diversify their economies during commodity booms. Thus, when the downturn occurs, governments opt to deepen industrial linkages between the extractive industry and other sectors. The development of linkage sectors also increases tax revenue. Governments also implement LCPs to stimulate upskilling and job creation. Mining in and of itself is not a labor-intensive sector. Thus, governments often use local procurement to stimulate the development of labor-intensive linkage sectors, such as manufacturing, services, logistics, and construction. Third is community development. Extractive activities often operate in rural or peri-urban areas rather than in urban hubs. Thus, mandating local procurement can help stimulate economic activity where little exists. Local procurement is an additional tool that can be used to leverage economic development, beyond direct jobs within the sector, royalties, and corporate social responsibility. When it comes to local procurement, the vast majority of countries have
very facilitative approaches, generally suggesting that local goods and services should be procured if available. Only a few countries had more than two LCPs relating to local procurement. Similar to the employment and training LCP category, Kenya (7), Tanzania (7), and Zambia (10) had the most, and five countries had explicit quotas. The full list of local procurement LCPs can be found in table 3.9.
Although LCPs are designed to create a more equitable distribution of mining-generated benefits, they can have unintended consequences. Hilson and Ovadia (2020) note that a blanket application of local content requirements can contribute to deepening within-country inequality because benefits will accrue to those who have capital, rather than more equitably distributing benefits. As table 3.10 shows, optimal outcomes of national LCPs are inhibited by skills shortages, tax exemptions for imports, and weak monitoring. Applying LCPs at a continental level would enable countries to become more competitive because they could draw from a larger pool of capital and skills, implement a
Angola
1 As long as prices are no more than 10% higher than national materials and delivery times do not exceed eight working days, the holders of mining rights must give preference to the use of materials, services, and national products whose quality is compatible with the economy, safety, and efficiency of mining operations.
Benin
1 Any foreign subcontractor who provides, for a period of more than six months, services on behalf of the holders of mining titles, is required to create a company in accordance with the regulations in force.
2 The minimum share of activities of Smes and Smis owned or controlled by gabonese, particularly in construction, supply, transport of personnel, and supply of goods and services, will be set by regulation. it cannot be lower than the following thresholds:
5% for research
5% for development
5% for operation, between the 5th and 10th years of operation
7% for operation, between the 10th and 15th years of operation
10% for operation, between the 15th and 20th years of operation
15% for operation beyond the 25th year of operation
1 minimum share of Smes, Smis, and companies owned or controlled by guineans in the supply of goods and services to mining companies: years 1–5: 15% years 6–10: 25%
1 mining charter iii sets out the following requirements (hogan lovells 2018):
in the case of mining goods, a minimum of 70% of total mining goods procurement spending (including nondiscretionary expenditure) must be on South African manufactured goods. “South African manufactured goods” is defined to mean goods with a minimum of 60% local content during the assembly or manufacturing of the product in South Africa. The 70% of total mining goods procurement spending must be allocated as follows:
• 21% to be spent on South African manufactured goods produced by a historically disadvantaged persons–owned and controlled company,
• 5% to be spent on South African manufactured goods produced by a woman- or youth-owned and controlled company,
• 44% to be spent on South African manufactured goods produced by a black economic empowerment–compliant company (which is defined to mean a company with a minimum broad-based black economic empowerment level 4 status in terms of the Department of Trade and i ndustries b road- b ased b lack e conomic empowerment codes of good practice, and minimum 25% plus one vote ownership by historically disadvantaged persons).
in relation to services, a minimum of 80% of the total spending on services (including nondiscretionary expenditure) must be sourced from South Africa–based companies. The 80% total spending on services must be allocated as follows:
• 50% must be spent on services supplied by historically disadvantaged persons–owned and controlled companies,
• 15% must be spent on services supplied by women-owned and controlled companies,
• 5% must be spent on services supplied by youth, and
• 10% must be spent on services supplied by black economic empowerment–compliant companies.
Liberia mine Development Agreements and investment provisions between mining companies and the liberian government usually require that companies and their main contractors give priority to goods and resources made in liberia and services provided by liberians residing in liberia or liberian suppliers (defined as firms in which liberians residing in liberia receive 60% of the profits) if those products and services are competitive in cost, quality, delivery, service, and so on; the mine Development Agreements and provisions also require that liberian content constitute 60% of firms’ production processes, and that all unskilled positions be filled by liberians.
Firms are required to present plans showing how they will meet the quotas for liberian workers in skilled positions. To facilitate the hiring of liberians in skilled, managerial, and technical positions, firms are required to provide training opportunities both in-country and abroad as well as scholarships to enable advanced education overseas.
mining firms are not meeting local employment requirements as a result of weak compliance mechanisms.
under the revenue code, oil, gas, and mining companies enjoy duty-free imports on the following: intermediate goods, “plant and equipment,” and unprocessed materials. The tax exemption benefits foreign firms.
Sierra Leone
The 2012 local content policy has the following requirements:
• in employment, operators and contractors are expected to give priority to Sierra leoneans (who have the required skills and training) over foreigners, fill all unskilled and junior positions with Sierra leoneans, and managerial and intermediate positions are expected to be filled by Sierra leoneans at the following percentages: 20% and 50%, respectively (which increases to 60% and 80%, respectively, after five years of operation).
• in the event that there are no Sierra leoneans with the required qualifications, firms must present training and succession plans for replacing foreigners with Sierra leoneans.
• with regard to procurement, priority should be given to goods and materials produced in Sierra leone if they meet international standards, service providers located in the country and owned by citizens of Sierra leone, and bids with the highest local content (at least 5% more than the closest competitor) if the tenders are within 5% in terms of price. Sierra leonean companies (defined as those registered in Sierra leone and with a minimum of 50% equity participation by Sierra leoneans) should receive preferential treatment to fulfill contracts, provided they are within 10% of the lowest bid price.
• To promote technology transfer and know-how, operators and contractors should facilitate joint ventures and partnerships between Sierra leonean firms and foreign firms. moreover, before the application for (or before receiving) any investment incentives, firms must present a local content plan outlining how their production and other processes will use and strengthen Sierra leonean content (goods and services) and how they will develop programs to facilitate joint ventures between domestic and foreign companies (local content Agency, Sierra leone 2012).
procurement is largely occurring in noncore services (particularly insurance, audit, and legal services, which tend to be less technical) and to a much lesser extent in core services (environmental assessment, mine drilling, and project and technical management).
Tax exemptions on imported goods (from which large firms benefit) do not extend to local suppliers, which puts the latter at a cost disadvantage. As a result, it is more cost-effective for major firms to import goods themselves than to procure the goods from local suppliers.
when comparing the procurement capability of local small and medium enterprises and international firms, local firms faced significant constraints and lagged behind international counterparts because of lack of capital, a limited range of goods and services, and a more informal style of business dealings. (continued next page)
Sierra Leone
• Finally, the local content committee was created with the goal of collecting data, monitoring policy implementation, evaluating local content plans, and educating Sierra leoneans about available opportunities.
The Sierra leone local content Agency Act, which was adopted in march 2016 by the government of Sierra leone (warner 2016), has incorporated most of the elements of the 2012 local content policy; however, the act has gone a step further by establishing penalties and mandating local content reporting to discourage noncompliance. The penalties include fines, imprisonment, revocation of investment incentives (such as tax exemptions), and cancellation of projects.
Ghana The 2012 minerals and mining regulation li 2173, which resulted from the collaboration between the minerals commission, the international Finance corporation, and mining firms, set the stage for local content regulation in mining and clarified and strengthened Act 703. local content policies focus on three areas:
• Local hiring requirements coupled with training requirements. All unskilled and clerical positions must be filled by ghanaians, and no more than 10% of senior staff may be foreign in the first three years, and no more than 6% after three years. Also, firms interested in obtaining licensing and mineral rights for exploration must submit a proposal indicating how they intend to train and hire the local workforce, which they must renew on a quinquennial basis.
• Procurement of goods and services produced locally preference must be given to materials and products produced in ghana, service agencies sited in ghana and owned by nationals (regardless of capital ownership and local equity by ghanaians), or firms registered in ghana. During the assessment of procurement bids for products or services, those that contain the highest level of ghanaian content for jobs (including management) and ownership must be chosen as long as they are no more than 2% higher in price than the lowest tender.
• Firms are required to submit a five-year plan detailing how local goods will be used; the plan is to be revised annually. Firms must report compliance levels yearly. Additionally, a monitoring and enforcement mechanism was put in place to ensure compliance with procurement of goods and localization goals. Firms that are noncompliant with the above measures face monetary penalties as high as uS$10,000 per day as well as the full payment of import duties.
Source: Based on government local policy laws.
For employment, the largest share of Sierra leoneans is in juniorlevel positions (57.4%), whereas the shares of Sierra leoneans in mid- and senior-level positions are 23.4% and 11.7%, respectively.
weak coordination with domestic education institutions results in a lack of input about curriculum development and course content from probable employers.
before 2012, local content was not clearly defined. Act 703 of the 2006 minerals and mining law, which aimed to encourage localization (particularly as it relates to mine workers) and create linkages whereby mining companies give preferential treatment to goods made in ghana and domestic service providers, was vague and open to different interpretations. Although local procurement increased to 20% (excluding fuel and power) of total spending by mining companies as of 2008, value addition in the country may not have increased, and local suppliers could be merely local offices of multinational corporations that have no linkages with the local economy. A shift from buying inputs from domestic firms to supporting domestic manufacturing is key.
harmonized tax code so foreign firms are not in an advantageous position in some countries, and strengthen monitoring by centralizing compliance.
State and local equity requirements are often used to widen the distribution of mining benefits. Governments use state equity to capture revenue streams from profitable projects and to have a seat at the decision-making table over future projects. A benefit of state equity is that it enables firms and governments to overcome information asymmetry because both parties are represented on the board. On the other hand, the state can have a conflict of interest if it is playing the roles of both equity stakeholder and regulator. One way to circumvent this conflict is to allocate regulatory and operational functions to two separate entities.
Local equity participation is used to keep some of the capital income within the country. Given that most mining companies have foreign shareholders, a majority of capital income likely leaves the country. To improve the domestic distribution of benefits, some countries have adopted local ownership requirements. For example, in Kenya, the Mining (Local Equity Participation) Regulations, 2012, issued under the previous mining act, make 35 percent local equity participation a prerequisite to granting a mining license. Additionally, the Mining Act of 2016 has a provision that enables the cabinet secretary to set limits on capital expenditure. A mining license holder whose planned capital expenditure exceeds the prescribed amount is required to list a minimum of 20 percent of its equity on the local stock exchange within three years of commencement of production. The mining license holder can, however, write to the cabinet secretary to execute an equitable alternative mechanism that will enable the company to meet this requirement. Similarly, in Namibia, effective April 2021, all applications for a mining license must have 15 percent local ownership,
Leverage Africa’s eight regional economic communities for a graduated approach to AfCFTA implementation. There was concern that the AfCFTA could make RECs redundant. However, it is likely to be the opposite—the AfCFTA can leverage the eight existing RECs and support a tiered approach to implementation. In the first instance, tariff, nontariff, and export policies within RECs could be harmonized. For example, new research shows that the Economic Community of West African States region can finance its infrastructure deficit by eliminating unnecessary fiscal incentives in member countries through a
harmonized framework by economic sector. Doing this can be complicated, given that some countries, such as Tanzania and the Democratic Republic of Congo, have multiple REC memberships. Once these policies are harmonized at the REC level, undertaking it over time at a continental level is the next step. This effort can massively reduce costs. An extended World Bank team working in Southern Africa found that one of the largest added costs for exports from Botswana and Zambia to Kenya was the change in truck drivers as goods transferred from the SADC zone to the East African Community zone. This is where harmonization between RECs could reduce costs, stimulate trade, and enable more regional value chain development. Ultimately, the RECs are an asset, given that they provide eight groups to harmonize rather than 55 individual countries to harmonize.
Reconsider plans to implement or increase tariffs. Under the AfCFTA, members must phase out 90 percent of tariff lines over the next 5–10 years, while another 7 percent, deemed to be sensitive, will get some additional time. Three percent will be allowed to be placed on an exclusion list. Already, more than 80 percent of countries have submitted their tariff reduction schedules. As a first point of implementation, this means that no new tariffs should be erected.
Undertake regional harmonization of mining taxes and royalties. Tax harmonization has three components: an equalization of tax rates, a common definition of national tax bases, and a uniform application of agreed-on rules (Mansour and Rota-Graziosi 2013). The lack of a harmonized tax policy can undermine regional integration, even with the establishment of a customs union, a common market, and a monetary union (IMF 2015). Harmonized tax rates remove tax distortions and mitigate competition among peer countries over attracting foreign capital by reducing taxes to be the most attractive for investments. This competition can cause a fiscal race to the bottom, which does not benefit any country given the overall reduction in tax revenue.
Implementation of harmonized tariffs and regulations requires data and strong institutions that have surveillance, coordination, and enforcement capabilities. As a first step toward implementation, establishing and regularly updating an online tax database that provides comprehensive data on national tax structures is key to understanding disparities. It would also offer a source of accountability because it publicly identifies countries that are in contempt of regional efforts. This database
should be complemented by financing and building the capacity of a regional institution that can provide training to national governments, coordinate forums and meetings to ensure continued dialogue, and enforce harmonization policies. Challenges exist with such regional institutions. For example, the West African Economic and Monetary Union has not provided its regional institution with the requisite resources to effectively carry out surveillance (IMF 2016).
Undertake a mapping of key regional trade patterns to identify areas for strengthening infrastructure, including road, rail, and port. A mapping can identify infrastructure that has the highest potential for unlocking regional trade. The case of Namibia was provided earlier in this chapter. Namibia has the potential to be a gateway for the AfCFTA, opening trade over land from Southern Africa to the rest of the continent, while also having a port that enables access to the US and EU markets. Though the World Economic Forum has called Namibia’s roads the best in Africa, most bulk commodities move by rail. More than 50 percent of the railway lines that state-owned railway company TransNamib currently operate on do not meet the minimum SADC stipulated standard of 18.5 tons per axle load. TransNamib’s revenue generated from bulk commodities equates to about 93 percent of its revenue, which includes revenue from transporting Zambia’s commodities. TransNamib has a demonstrated interest in moving bulk commodities by rail between Angola, Botswana, Zambia, and Zimbabwe. Create a policy landscape that is amenable to private renewable energy generation, and enable firms to export to meet regional needs. In 2021, the South African government announced that businesses would be allowed to generate power of up to 100 megawatts each without a license, a significant increase from the previous 1-megawatt limit. Mining firms could also buy electricity from other companies that produce a surplus. South African mining companies now have 3,900 megawatts of renewable energy projects in the pipeline. To put this into perspective, 100 megawatts could power two large mines in South Africa. This move drastically alleviates pressure on Eskom, the country’s state-owned electricity utility, while ensuring that energy is no longer a bottleneck for the mining sector. In the longer term, creating a policy environment that lets mining firms export renewable energy to other countries could alleviate regional constraints. Currently, South Africa exports Eskom’s electricity to a number of SADC countries, but these countries are also subject to rolling power outages and other resulting energy challenges. Enabling the private sector to export renewable energy can reduce regional energy constraints. For example, Anglo
American has already secured 100 percent renewable electricity supply for all its operations in South Africa, resulting in 56 percent of its global grid supply expected to be sourced from renewables by 2023.
Eliminate policies that increase transport and logistics costs. Road transportation costs are high because restrictions arising from cabotage policies and the Third Country Rule forbid backhaul cargo in some countries. Cabotage is defined as the transportation of goods (or passengers) between two places within the same country by a transport operator from another country. The SADC Infrastructure Directorate has been discussing gradually eliminating the Third Country Rule, as recommended in the SADC Protocol on Transport, Communications and Meteorology, Article 5.3.
Establish a coordinated approach to planning and financing regional infrastructure. An example is the ASEAN Infrastructure Fund (AIF), which is a dedicated fund established by the 10 member states of the Association of Southeast Asian Nations (ASEAN) and the Asian Development Bank (ADB) to address the ASEAN region’s infrastructure development needs by mobilizing regional savings, including foreign exchange reserves. The AIF is an integral part of ASEAN’s efforts to strengthen regional connectivity, and all projects are cofinanced by the AIF and the ADB. To support the climate transition, the ASEAN Catalytic Green Finance Facility leverages the AIF’s existing resources to bridge the viability gap for green infrastructure projects and attract private capital into these projects. The fund provides financing to sovereign or sovereign-guaranteed projects in the ASEAN region. For projects to be financed under the facility, the project must have (a) financial sustainability indicators (based upon typical project finance targets, such as the debt service coverage ratio and others), (b) clear environmental goals and targets, and (c) a road map for attracting private capital investments. Concessional funds from other development partners and donors are mobilized to support the facility’s efforts to create a larger pool of funds to deploy, while also reducing the cost of blended funds available for green infrastructure projects.
Shift away from export restrictions; consider tiered export restrictions. Although Mali did not properly implement the harmonized mining tax code of the four West African countries, it does use a tiered system: the 3 percent export tax is only applied to the first 50 kilograms of gold per month; after that, the
remaining weight is exported tax-free. A tiered system of export restrictions, which can include taxes and bans, in which a base amount is restriction-free, and then progressively increases, can alleviate the bottleneck for intraregional trade. Over time, the threshold for the tiers should increase, moving toward a true free trade area that is not inhibited by export policy constraints.
Develop a regulatory framework for regional equity. Currently, countries have policies that require local equity. For example, Kenya’s new Mining Act makes the granting of every mining license conditional on local equity of at least 35 percent in respect of mineral rights, and in Namibia, all applications for a mining license must have 15 percent local owners. In countries where capital is limited, these local ownership policies can serve as a deterrent to investment. Expanding local equity to a regional level can facilitate the emergence of medium-size regional mining firms that have the capital to invest and sufficient interest in investing in various African jurisdictions. A regional equity requirement would also enable these African firms to benefit from skills and technology transfer from large multinationals, such as Rio Tinto, Glencore, BHP, and Anglo American.
Local equity requires a regional capital market. A local equity market means that there are no barriers to the movement of capital and the provision of investment services within a region. It also means that investors can invest or raise capital in other countries, as well as from domestic markets, with confidence that they will engage with similar regulations, information, trading systems, settlement systems, accounting standards, and governance standards throughout the region (Khatiwada 2014). As a first action, strengthening the presence of regional financial institutions is critical.
Financial infrastructure is key for an effective regional capital market. Such infrastructure includes the development of links between national clearing and payment systems, the establishment of regional credit agencies, and benchmarks to enhance the liquidity of capital markets. Additionally, the 2008 global financial crisis showed that financial distress has a higher chance of being transmitted to other countries in areas that are financially integrated. This transmission can be managed with a strong framework for prudential regulation and strong supervision capabilities to ensure that risks stemming from financial integration are monitored and managed.
Consider implementing regional export restrictions instead of national ones. National export bans in Africa may make all countries involved worse off. Not only can such bans adversely affect domestic mining production, as was the case in Tanzania, highlighted earlier in this chapter, where production fell to just 13 percent of preban levels, but it also affects other sectors, including
transportation and logistics, services, and construction. Export restrictions have direct adverse effects on other countries within the region. Zambia’s imposition of import and export taxes also affected the Democratic Republic of Congo, which exported copper to Zambia for processing and made Zambian processing of Democratic Republic of Congo commodities largely commercially unviable. In the medium term, countries can use regional export restrictions, such that restrictions are not imposed on exports to other countries within the region, but are imposed on exports out of the region.
Augment or replace local content policies with regional and continental content policies. Many African countries have skills shortages and limited capacity to produce or access key inputs when working at a national level. Regional content policies can reduce the burden of ongoing constraints by enabling countries to access a larger pool of skilled labor and requisite inputs. Firms operating in the region can implement training programs and capacity-building for micro, small, and medium enterprises in parallel to regional sourcing. Table 3.11 provides a summary of the prioritized recommendations in the short and medium terms.
Possible areas
Tariffs
Terminate any plans to implement or increase tariffs.
Nontariff
infrastructure undertake a mapping of key trade patterns to identify priority areas for strengthening infrastructure (road, rail, port).
create a policy landscape that is amenable to private renewable energy generation and enable firms to export energy to meet regional needs.
export restrictions Shift away from export restrictions; consider tiered export restrictions.
local content policies replace national local content requirements with regional or continental requirements.
Source: World Bank.
Medium
undertake regional harmonization of mining taxes and royalties. Strengthen availability of and access to public tax data. enable a regional institution to coordinate and enforce harmonization policies.
eliminate policies that increase transport and logistics costs.
establish a coordinated approach to planning and financing regional infrastructure.
replace national restrictions with regional restrictions.
Develop a regulatory framework for regional equity.
1. “Zambia Vedanta Unit Halts Operations at Underground Mine on Tax Concerns,” Reuters, January 5, 2019 ( https://www.reuters.com/article/ozabs-us-zambia -mining-idAFKCN1OZ0A8-OZABS).
2. Diamond Export Levy Act 2007 (http://www.sadpmr.co.za/upload/Diamond _Export_Levy_Act,2007.pdf ).
3. The Getting Electricity indicators measure the procedures, time, and cost required for a business to obtain a permanent electricity connection for a newly constructed warehouse. Additionally, the Reliability of Supply and Transparency of Tariffs index measures supply reliability, transparency of tariffs, and the price of electricity.
4. “UPDATE 2-Congo allows copper and cobalt exports for miners with waivers” (https://www.reuters.com/article/congo-copper-idAFL2N2NF1OK).
5. Mining Weekly, March 3, 2017, “Tanzania Bans Metals, Minerals Exports in Bid to Increase Domestic Beneficiation” (https://www.miningweekly.com/article/tanzania -bans-metals-minerals-exports-in-bid-to-increase-domestic-beneficiation -2017-03-03).
6. “Ensuring a Just and Equitable Energy Transition in Africa: Seven Transformative Actions for SDG7,” Kigali Communique (https://www.mininfra.gov.rw/index.php? eID=dumpFile&t=f&f=44024&token=c9d8a3e4e9ad4d22aa3c3b883055c94267 60c584).
Abreha, K. G., W. Kassa, E. K. K. Lartey, T. A. Mengistae, S. Owusu, and A. G. Zeufack. 2021. Industrialization in Africa: Seizing Opportunities in Global Value Chains . Washington, DC: World Bank Group.
Akam, S. 2012. “S. Leone Plans Gold Tax Cut to Curb Smuggling.” Reuters, August 13, 2012. https://www.reuters.com/article/sierraleone-gold-tax-idUSL6E8JDAKX20120813. AMLA (African Mining Legislation Atlas). Database. Accessed July 2022. https://www .a-mla.org/en.
Atkin, D., and D. Donaldson. 2015. “Who’s Getting Globalized? The Size and Implications of Intra-National Trade Costs.” Working Paper 21439, National Bureau of Economic Research, Cambridge, MA.
Ba, D. G., and J. B. Jacquet. 2022. “Local Content Policies in West Africa’s Mining Sector: Assessment and Roadmap to Success.” The Extractive Industries and Society 9: 101030. https://www.sciencedirect.com/science/article/pii/S2214790X21002070
Banerjee, S. G., Z. Romo, G. McMahon, P. Toledano, P. Robinson, and I. Pérez Arroyo. 2015. The Power of the Mine: A Transformative Opportunity for Sub-Saharan Africa. Directions in Development. Washington, DC: World Bank.
Barrick Gold Corporation. 2021. “Annual Report 2021. Building Our Future.” https:// www.annualreports.com/HostedData/AnnualReports/PDF/TSX_ABX_2021.pdf.
Cudennec, S., and L. Kiwelu. 2021. “Powering Mining in Africa—The Rise of the MiniGrid and Captive Model.” Norton Rose Fulbright, April 26, 2021. https://www .nortonrosefulbright.com/en/inside-africa/blog/2021/04/powering-mining-in-africa -the-rise-of-the-mini-grid-and-captive-model.
Economist. 2019. “How Can Uganda Export So Much More Gold Than It Mines?” Economist, May 23, 2019. https://www.economist.com/middle-east-and -africa/2019/05/23/how-can-uganda-export-so-much-more-gold-than-it-mines.
Economist. 2022. “Why It Costs So Much to Move Goods around Africa.” Economist, May 26, 2022. https://www.economist.com/middle-east-and-africa/2022/03/26/why -it-costs-so-much-to-move-goods-around-africa.
EITI (Extractive Industries Transparency Initiative). 2020. “Zambia Extractive Industries Transparency Initiative. Zambia EITI Report 2019.” BDO Tunisia Consulting in Association with BDO Zambia, Tunis. https://eiti.org/sites/default/files/attachments /zeiti_report_2019.pdf.
Fitch Ratings. 2021. “African FTA Growth Impact Too Small to Affect Ratings.” Fitch Ratings, January 7, 2021. https://www.fitchratings.com/research/sovereigns/african -fta-growth-impact-too-small-to-affect-ratings-07-01-2021.
Fitch Solutions. 2021. “Tanzania Gold Production to Gradually Slow as Mining Policy Remains Stringent.” Fitch Solutions, July 27, 2021. https://www.fitchsolutions.com /commodities/tanzania-gold-production-gradually-slow-mining-policy-remains -stringent-27-07-2021.
Hilson, A.E. and J. S. Ovadia. 2020. “Local Content in Developing and Middle-Income Countries: Towards a More Holistic Strategy.” The Extractive Industries and Society, 7 (2): 253–62.
Hogan Lovells. “Mining Charter 2018.” Hogan Lovells Publications, October 1, 2018.
Hunter, A. 2019. “DRC U-turns on Cobalt, Copper Concentrate Export Ban; Says Could Reimpose.” Fastmarkets, March 21, 2019. https://www.metalbulletin .com/Article/3865124/DRC-U-turns-on-cobalt-copper-concentrate-export-ban-says -could-reimpose.html.
IEA (International Energy Agency). 2022. “Global Supply Chains of EV Batteries.” IEA, Paris. https://www.iea.org/reports/global-supply-chains-of-ev-batteries.
IMF (International Monetary Fund). 2015. “Options for Low-Income Countries’ Effective and Efficient Use of Tax Incentives for Investment. Report to the G20 Development Working Group.” IMF, Washington, DC.
IMF (International Monetary Fund). 2016. “West African Economic and Monetary Union. Common Policies of Member Countries—Press Release; Staff Report; and Statement by the Executive Director for the West African Economic and Monetary Union.” Country Report 16/96, IMF, Washington, DC.
IMF (International Monetary Fund). 2019. Sub-Saharan Africa Regional Economic Outlook: Recovery Amid Elevated Uncertainty. Washington, DC: IMF. https://www.imf .org/en/Publications/REO/SSA/Issues/2019/04/01/sreo0419.
IMF (International Monetary Fund). 2021. “Guinea: 2021 Article IV Consultation—Press Release; Staff Report; and Statement by the Executive Director for Guinea.” Country Report 2021/146, IMF, Washington, DC.
Khatiwada, Y. R. 2014. “Development of Regional Capital Markets in Asia: Issues and Challenges.” Bank of Nepal, presentation at the 50th SEACEN Governors’ Conference, Port Moresby, Papua New Guinea, November 2014. https://www.nrb.org.np/contents /uploads/2019/12/Governors_Speeches-Development_of_Regional_Capital _Markets_in-Asia_-_Issues_and_Challenges.pdf.
KPMG. 2019. “Expanding the Tax Base.” KPMG Advisory Services (Namibia). https:// assets.kpmg/content/dam/kpmg/na/pdf/2019/2019-namibia-tax-card.pdf.
Local Content Agency, Sierra Leone. 2012. “Sierra Leone Local Content Policy.” https:// www.localcontent.gov.sl/local-content-policy/.
Mansour, M., and G. Rota-Graziosi. 2013. “Tax Coordination, Tax Competition, and Revenue Mobilization in the West African Economic and Monetary Union.” IMF Working Paper WP/13/163, International Monetary Fund, Washington, DC.
Martin, A., and H. Helbig de Balzac. 2017. “The West African El Dorado: Mapping the Illicit Trade of Gold in Côte d’Ivoire, Mali and Burkina Faso.” Partnership Africa Canada, Ottawa. https://www.africaportal.org/publications/the-west -african -el-dorado-mapping-the-illicit-trade-of-gold-in-c%C3%B4te-divoire-mali-and -burkina-faso/
McMillan, M., and A. Zeufack. 2022. “Labor Productivity Growth and Industrialization in Africa.” Journal of Economic Perspectives 36 (1): 3–32.
Mfula, C. 2019. “Zambia Suspends 15% Export Duty on Gemstones: Minister.” Reuters, December 19, 2019. https://www.reuters.com/article/us-zambia-mining -idUSKBN1YN0LE.
OECD (Organisation for Economic Co-operation and Development). 2020. Trade in Raw Materials Database. https://www.oecd.org/trade/topics/trade-in-raw-materials/.
PricewaterhouseCoopers. 2017. “Tax First Alert Export Levy Act—Effective 1 June 2017.” PricewaterhouseCoopers, June 1, 2017. https://www.pwc.com/na/en/assets /pdf/tax-first-newsletter-alert-export-levy-procedures-2017.pdf
Reuters. 2020. “ERG Suspends Zambia Refinery on Shortage of Cobalt, Copper Concentrates.” Reuters, January 23, 2020. https://www.reuters.com/article/us-erg -zambia/erg-suspends-zambia-refinery-on-shortage-of-cobalt-copper-concentrates -idUSKBN1ZM21R
Saygili, M., R. Peters, and C. Knebe. 2018. “African Continental Free Trade Area: Challenges and Opportunities of Tariff Reductions.” UNCTAD Research Paper 15, Division on International Trade and Commodities, United Nations Conference on Trade and Development, Geneva. https://unctad.org/system/files/official-document /ser-rp-2017d15_en.pdf.
TransNamib. 2021. “Integrated Annual Report 2019–20.” https://www.transnamib.com .na/wp-content/uploads/2021/07/Annual-Report-201920.pdf.
UNCTAD (United Nations Conference on Trade and Development). n.d. “AfCFTA Support Programme to Eliminate Non-Tariff Barriers, Increase Regulatory Transparency and Promote Industrial Diversification.” UNCTAD. https://unctad.org/project/afcfta-support -programme-eliminate-non-tariff-barriers-increase-regulatory-transparency-and.
UNCTAD (United Nations Conference on Trade and Development). 1999. “Investing in Transport Is an Investment in Africa’s Future.” Press Release, October 20, 1999. https:// unctad.org/press-material/investing-transport-investment-africas-future
UNCTAD (United Nations Conference on Trade and Development). 2015. Review of Maritime Transport 2015. Geneva: United Nations. https://unctad.org/system/files /official-document/rmt2015_en.pdf.
UNCTAD (United Nations Conference on Trade and Development). 2019. “Key Statistics and Trends in Regional Trade in Africa.” Developing Countries in International Trade Studies Series. UNCTAD, Geneva. https://digitallibrary.un.org /record/3813156?ln=en.
Viljoen, W. n.d. “Transportation Costs and Efficiency in West and Central Africa.” Tralac. https://www.tralac.org/discussions/article/9364-transportation-costs-and -efficiency-in-west-and-central-africa.html.
Warner, M. 2016. “Not All Local Content Rules Are the Same. Local Content Regulation as a Differentiator for Inward Investment in Africa: The Case of Sierra Leone.” Local Content Solutions, Oxfordshire, UK. https://www.dai.com/uploads/tanzania-reading .pdf.
World Bank. 2019. Digging Beneath the Surface: An Exploration of the Net Benefits of Mining in Southern Africa. Washington, DC: World Bank Group.
World Bank. 2020a. The African Continental Free Trade Area: Economic and Distribution Effects. Washington, DC: World Bank Group.
World Bank. 2020b. Doing Business Report 2020. Washington, DC: World Bank. https:// archive.doingbusiness.org/en/doingbusiness
WTO (World Trade Organization). 2017. “Trade Policy Review, Sierra Leone.” Document WT/TPR/G/303/Rev.1, WTO, Geneva. https://www.wto.org/english/tratop_e/tpr _e/s303_e.pdf.
WTO (World Trade Organization). 2021. World Trade Report 2021: Economic Resilience and Trade. Geneva: WTO. https://www.wto.org/english/res_e/booksp_e/wtr21_e/00 _wtr21_e.pdf.
Yunis, J., and E. Aliakbari. 2021. “Fraser Institute Annual Survey of Mining Companies 2021.” Fraser Institute, Vancouver. https://www.fraserinstitute.org/sites/default/files /annual-survey-of-mining-companies-2021.pdf
Introduction
Rising commodity prices, geopolitical instability, and new sources of demand for metals and minerals all point to the continued importance of managing natural resources across Sub-Saharan Africa as a core development challenge. Given the scale of the untapped—and in many cases unexplored—metals, minerals, and fossil fuels across Africa, the economic future of the countries remains tied to how they manage their resource base.1
Africa faces several emerging global megatrends, such as the shift away from carbon-intensive energy sources. Although potentially a challenge to carbonrich countries if demand begins to decline, market conditions do not yet reflect global decarbonization. On the other hand, rising demand for low-carbon energy technologies and advanced electronics may boost demand for many of Africa’s metal resources; however, alternative sources of these metals may also be found and developed. Meanwhile, although automation and digitalization have improved productivity, these processes are still being phased in and will continue to be rolled out over coming years. And finally, structural forces from resource wealth may make certain development pathways more accessible than others; for example, asset diversification can be challenging when a country is faced with Dutch disease, while new value addition opportunities may open up.
As a consequence of these anticipated megatrends, African policy makers can plan for the future, and need not be reactive to it. Because several possible futures exist, this chapter explores how policy today can prepare for a range of outcomes tomorrow.
This chapter focuses on four key megatrends that will affect resource-rich countries across the region in the coming years. The chapter considers each in turn and how policy makers might best approach these challenges to ensure Africa’s resource wealth can continue to be a driver of economic development and job creation while building resilience against risks on the horizon.
The first megatrend is managing the low-carbon transition, which, over time, will lead to declining demand for oil, gas, and coal, while resulting in an increase in demand for minerals required for the clean energy transition, such as lithium, cobalt, copper, platinum, and manganese.
The second megatrend is a future in which automation and digitalization are increasingly widespread, both in the extractive sector and throughout parts of the value chain. Though this trend will lead to productivity gains, it will also lead to labor losses, and countries will need to reconsider how to draw benefits from the sector, particularly in the context of high population growth.
The third megatrend is mitigating environmental degradation, which has run rampant amid accelerating deforestation.
The final megatrend is management of the broader structural challenges that are an inherent part of extraction, notably addressing depletion and obsolescence risks, mitigating human capital distortions, and minimizing Dutch disease.
The critical policy question for resource-rich African economies is how to benefit from the value under the ground while adapting to changing times and changing circumstances. This chapter explores these questions and offers some insights into how African resource-rich economies might best position themselves to both be prepared for, and to maximally benefit from, this new commodity era.
The low-carbon transition has already begun. Although fully phasing out the oil, gas, and coal markets is likely to take decades, the transition period poses significant, but uncertain, risks for fossil fuel exporters. Countries rich in carbon-based resources such as oil, gas, and coal face the looming prospect of the decarbonizing global economy, with its associated declining demand for their resource exports. On the other hand, demand for metals and minerals could rise to supply the low-carbon economy. For those countries rich in certain metals and minerals, the prospects may be rosier (IEA 2021b). Countries such as the Democratic Republic of Congo, South Africa, and Zambia are already key players in the low-carbon transition, being major producers of copper, platinum, and cobalt, respectively. As demand continues to rise for a range of metals and minerals, new opportunities to expand production are emerging.
Fossil fuel exporters face the bulk of the uncertainty. Because of changing policies, consumer behavior, and technology trends, under the optimistic net zero scenario,2 the demand for fossil fuels could be expected to decline significantly over the next 10 to 20 years (figure 4.1) (IEA 2021a; McKinsey 2022). Other scenarios point to
less drastic demand cuts. Depending on technological, policy, and supply trends, a permanent decline in demand for fossil fuels could put significant downward pressure on fossil fuel prices and threaten African countries’ ability to benefit from their carbon-based resource wealth, that is, they risk becoming “stranded nations” (Manley, Cust, and Cecchinato 2018).
Although the transition away from fossil fuels is widely anticipated, it is not yet clear how, or how quickly, such an outcome might occur. At their current trajectories, carbon-mitigation commitments made on a country-by-country basis under the Paris climate agreement would fall short of the 2-degree Celsius goal. Meanwhile, significant cost reductions in alternative energy technologies—such as solar and wind power—have begun to undercut the costs of generating power from oil, gas, and coal, thus leading to potential reductions in fossil fuel consumption at a global scale.
This transition poses downside risks to Sub-Saharan African countries, which have seen significant new fossil fuel discoveries, mostly in oil and gas, as well as other reserve additions, in recent years. Although the cost of extraction varies widely by country and geology, there is little prospect of countries unilaterally leaving these resources under the ground, particularly amid shortages resulting from the Russia-Ukraine War. Indeed, without strong market or policy signals from the rest of the world—which have thus far been absent—the likelihood is that many of these resources will be developed in the coming years. Natural gas in particular shows promise as both a source of export earnings and an option to support domestic energy access goals. Natural gas is likely to be an
Source: Based on IEA 2021a.
Note: The stated policies scenario reflects current policy settings based on a sector-by-sector assessment and announced by governments. The announced pledges scenario assumes all climate commitments made by governments will be met in full and on time. The net zero scenario is based on the assumption that the global energy sector will achieve net zero CO2 emissions by 2050.
important transition fuel used alongside renewable energy technologies as their deployment is scaled up.
The prospects of the global carbon transition may have large future consequences for countries that decide to develop their oil, gas, and coal resources, especially those resources with long depletion horizons, or for new producer countries. Indeed, in the scenario that suggests that 80 percent of known fossil fuel reserves would remain undeveloped, the implications of the stranding of reserves in Sub-Saharan Africa would be significant. And this number does not consider those resources recently discovered or yet to be found.
Price signals from the oil and gas market still support development of many new assets in Sub-Saharan Africa. Despite lofty rhetoric from oil-importing countries, little action to impose domestic carbon taxes or otherwise curb fossil fuel demand has been taken. For the citizens of Africa, the imperative is to be prepared for a range of futures, assuming both more drastic climate action and the curbing of fossil fuel demand, but also a more gradual phasing out of oil consumption at the global level. Policy choices today matter because they have a long time horizon of impact, such as contract design for a 30-year mine or oil field. As such, policies can be configured to be robust to a range of futures and help optimize the development path given this uncertainty.
Carbon-rich nations are highly exposed to carbon risk. Similar to the private sector concern about “stranded assets,” countries could be left with undeveloped fossil fuel reserves, creating the risk of “stranded nations” (Cust, Manley, and Cecchinato 2017).
The first challenge is that carbon wealth could decline in value as the world decarbonizes, putting severe strains on carbon-rich countries’ finances (Malova and van der Ploeg 2017). This potential decline in value makes a number of countries highly vulnerable, particularly in the Middle East and North Africa, but also in many countries of Sub-Saharan Africa (figure 4.2). Additionally, carbon-rich nations in Africa cannot easily monetize their carbon wealth. Carbon-rich nations hold a lot of their wealth in the form of fossil fuels, but to benefit people, this wealth needs to be extracted and sold. However, getting resources out of the ground is costly. These countries may find themselves facing a race to exit the fossil fuel market just as producers speed up extraction while prices decline.
Of the 146 countries in the Changing Wealth of Nations 2021 (World Bank 2021) wealth database, 23 countries have at least 5 percent of their wealth in fossil fuels. The data show that the risk of a permanent drop in fossil fuel demand is worrisome for both poverty and geopolitical reasons. First, most of these countries are classified as low or middle income, and their governments derive more than half their revenues from oil, gas, coal, and other minerals.
Poverty alleviation in many of these countries remains a priority; therefore, the risk of a drop in the value of fossil fuel assets has important development implications. Second, five of these 23 countries are in Sub-Saharan Africa (Chad, Republic of Congo, Gabon, Mozambique, and Nigeria). Although extraction costs are relatively low in this region, the potential loss in government revenues would be significant, which would have heavy economic consequences given the high levels of overindebtedness within the region.
Asset diversification is a strategy that fossil fuel–dependent countries can pursue to manage the risks of a low-carbon transition. Peszko et al. (2020) find that decarbonization policies initiated by fuel importers can unleash macroeconomic forces that encourage traditional export diversification of fuel exporters, by which they reduce reliance on export revenues from fossil fuel commodities and diversify into downstream, emission-intensive fossil fuel value chains. Such diversification offers a comfort zone for fossil fuel exporters, but it increases their exposure to multiple channels of low-carbon transition impacts, such as border carbon adjustments, disruptive technologies, and shifts in the preferences of consumers and investors. Asset diversification can be a long-term, sustainable alternative, but it is a challenging proposition because it requires discovery of new sources of comparative advantage and accumulation of unfamiliar produced assets and human capital, including new skills and capabilities.
Unlike investors in an oil company who can merely sell their stock, countries cannot easily and quickly monetize their carbon wealth. For example, under current rates of production, oil-rich developing countries will take, on average, 14.8 years to deplete their oil reserves (Cust and Rivera-Ballesteros 2021b). Increasing depletion rates is difficult. One way to increase depletion
rates is for governments to directly change the production rates of existing wells, fields, or mines. If these projects are run by state-owned enterprises, governments can directly alter the pace of operations. If operated by private companies, governments can regulate the rate of production or establish incentives to change the rate of production. But in both cases, these measures can reduce profits, and governments are constrained by the need to ensure projects remain commercially viable. A second way to increase depletion rates is for governments to change the rate at which they license new fields for exploration and development. However, developing new fields also requires new investment, and with the risk of prices declining over the lifetime of these new projects, the costs of capital may rise.
Carbon-rich nations’ policies may increase carbon risk exposure. In seeking to develop and capture the benefits of fossil fuel industries, countries may increase their exposure to carbon risk. Carbon risk exposure is not limited to fossil fuel assets. Many countries choose to develop these resources in ways that may increase their overall risk exposure. These policies include investing in nationally owned resource companies, having sovereign wealth funds hold equities linked to the price of fossil fuels, and investing human capital and public money in developing skills, businesses, and infrastructure tied to the fortunes of the oil, gas, and coal mining sectors.
One question that carbon-rich countries are debating is whether they should be expanding refining capacity. In 2020, Angola exported crude oil worth US$17.7 billion, making it the 13th largest oil exporter globally. It exported US$12.1 billion to China, US$1.2 billion to India, and US$1.1 billion to Thailand. Crude petroleum and petroleum gas are Nigeria’s top exports, accounting for 84 percent of total exports at US$30 billion and US$5.9 billion, respectively. Both countries then import refined petroleum. Refining capacity remains a continental challenge.
Though countries have developed downstream industries to complement resource extraction and export, these linkage sectors are also at risk. Examples include refining, processing, power generation, and industrial uses of fossil fuels. Such investment can lock countries into more carbon-intensive production and exports, which may be at risk of border taxes and tariffs.
Unlike fossil fuel resources, the demand for Africa’s minerals and metals is likely to be much more robust in future decades, and may even expand rapidly. In spite of the challenges, the medium- to long-term outlook for mineral exploration and mining on the African continent is positive. Renewed foreign direct investment in mineral exploration and development is likely to be boosted by the projected significant growth in demand for minerals for clean energy
technology3 (World Bank 2020b), fueled by the metal-intensive transition to green energy following the zero emissions by 2050 pledge made by a majority of countries at the Glasgow Climate Change Conference in 2021. Indeed, the mineral demand projections under a 1.5- to 2-degree Celsius temperature constraint scenario are highly significant increments above an already substantial projected increase in demand due to continuing growth in world population and its migration to urban areas, seeking ever-increasing living and environmental standards.
Although realistic estimates of the increase in demand for minerals under different scenarios can be made within reasonable bands of confidence, there is a great degree of uncertainty as to the sources of the metal supply to satisfy it. Over the next three decades, many currently operating mines will be exhausted and, recycling and substitution notwithstanding, new ones will need to be discovered and developed against a background of increasing exploration maturity in most traditional mining jurisdictions. The quality of these minerals also varies widely, adding uncertainty about their adequacy for renewable energy purposes.
The industry’s focus and investment may have to shift once again to Africa, given its untapped potential, to secure dwindling supplies. This focus will likely force industry and governments to consider each other’s needs and expectations in a new light and negotiate more balanced and implementable compromises to bring about the necessary mine developments.
This favorable outlook for Africa’s mineral export opportunities attributable to the energy transition is well evidenced. Research by Galeazzi, Steinbuks, and Cust (2020) concludes that the ability of African economies to benefit from rising demand for certain metals and minerals depends on the responsiveness of investment, and other regions may be able to expand supply more rapidly, dampening upward price effects and limiting the expansion of any African share of world supply.
Firms are choosing to mechanize to maintain profitability amid supply and demand shocks. For example, labor is the biggest cost driver in the South African mining industry. Mechanization improves cost-competitiveness but reduces jobs. Levels of automation in the region vary. For example, in Southern Africa, Botswana and South Africa have a higher degree of mechanization, whereas Zambia and Zimbabwe still largely rely on labor-intensive mines.
As with other sectors, this adoption of digital technologies in mining and metals can increase productivity and lead to efficiency gains, growth, and rising
profits. However, more of the value and gains could accrue to the industry than to wider society. According to estimates (WEF and Accenture 2017), digital transformation in mining and metals has the potential to create approximately three times as much value (US$321 billion) for the industry as for wider society (US$106 billion).
One of the earliest empirical analyses of potential efficiency gains from automation is a case study of Australia. Bellamy and Pravica (2011) examine the implications of introducing driverless haul trucks in a typical large remote Australian open-pit mine. They find that such automation will save employee and associated costs, increase operational productive hours, and ultimately reduce mine site workforce numbers. The paper further notes that although there will be fewer jobs per mine, with reduced costs and higher productivity, some previously uneconomic mines may again be profitable.
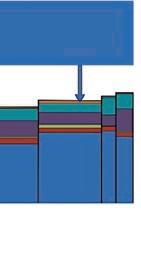
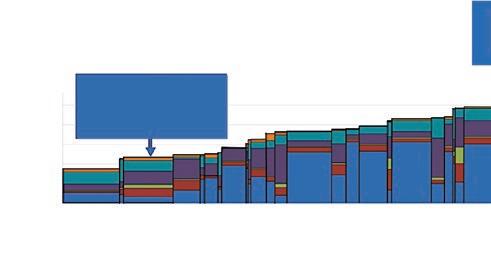
Within the continent, South Africa’s platinum group metals sector is an example of a mining subsector that has increasingly mechanized, drastically improving profitability. At the Anglo American Platinum Mogalakwena openpit mechanized mine, four shifts run each day, and 85,000 tons are extracted in one shift. Labor amounts to US$69.57 per ounce, with total production costs totaling US$500 per ounce (figure 4.3). In contrast, at Impala, the firm’s conventional mine, just 85,000 tons are extracted each month, and labor costs US$734.59 per ounce, with total production costs amounting to US$900 per ounce (Baskaran 2021). As figure 4.4 shows, between 2016 and 2020, platinum prices were often less than US$900 per ounce, indicating that many conventional mines were not running profitable operations.
Note:
Mechanization is also shifting the type of labor required, from low-skilled to high-skilled. For example, engineers who can run automated equipment to blast the rock have replaced lower-skilled rock blasters, significantly increasing productivity. At Mogalakwena, per worker output was 11 times higher than that at Impala, the conventional mine. The shift to mechanization has also led to mines becoming more economically detached from surrounding communities. Impala employs more than 14,000 people who live proximate to the mine, whereas Mogalakwena employs just 1,800. Because high-skilled labor is required and local communities tend to be limited by skills shortages, it has become commonplace for capital-intensive mines to bring in engineers from other parts of the country or who are expatriates. High-skilled mining jobs account for a significant share of jobs on South Africa’s critical skills list, which fast-tracks visa applications for foreigners.
A positive benefit of mechanization is the increased inclusion of women. Historically, women have faced many challenges with entering the mining industry. In 1935, the International Labour Organization (ILO) adopted Convention 54, which prohibited the employment of women in underground mining work. However, over time, many countries that initially ratified the
convention denounced it, including Canada (1978), Australia (1988), South Africa (1996), and Chile (1997). In 1995, the ILO passed Convention 176, Safety and Health in Mines, which covers the rights of all workers.4
The industry has not been safe for or friendly to women, particularly deep underground mining. Historically, South Africa has had some of the world’s deepest and least mechanized mines, relying on labor-intensive and dangerous mining methods. Platinum and gold mines have logged thousands of fatalities in the past three decades. Women have faced additional constraints, particularly because underground mines are dangerous and require high levels of physical strength and stamina, and personal protective equipment and tools are not designed for women. Table 4.1 presents some actions that the mining industry has implemented to reduce these constraints for women.
Mine mechanization has offered a number of social and economic benefits. These benefits include a safer working environment, increased productivity and profitability, and a more attractive working environment
Risk factor Consequences
Actions by the mining industry poorly lit tunnels and work areas, toilets that are often peripherally located in dim areas, and the small number of women working underground.
in South Africa, a number of incidents have been recorded where women have been raped or murdered by male colleagues. women have reported frequent incidents of physical and verbal abuse, requests to trade sexual favors for employment or promotions, and other forms of harassment.
Tasks like rock drilling can impose additional danger on women because they are required to hoist a heavy rock drill for long periods, and misuse can result in fatalities. Additionally, when toilets are located in the periphery, women may not drink water while working, which can result in dehydration and additional difficulty in completing tasks.
The shift to mechanization has reduced the need for physical strength and stamina. The mechanized mining industry requires fine motor skills, dexterity, and problem solving.
mines have made changes to improve safety for women who are working underground, including improving lighting in working and traveling areas; providing safe toilet, shower, and changing facilities; and adopting buddy systems to ensure that women do not have to move around dim or quiet areas alone. women generally do not have the same physical strength as their male counterparts. in physical work capacity testing, women entering the mining industry have been shown to be less physically active, and have had difficulty with the fitness and heat-tolerance required for underground jobs.
historically, women working underground have had to use personal protective equipment, boots, overalls, and tools that were designed and manufactured for men.
equipment is unlikely to fit correctly, cannot be adjusted easily, or requires a full undressing to use the toilet. Additionally, tools may be designed for bigger hands and strength levels. All of these factors put women at risk for injuries and fatalities.
Source: Minerals Council South Africa 2020.
mining companies and industry associations have put time and effort into identifying changes required for equipment to be female-friendly, including changes to cut and sizing of overalls; size and fit of goggles, helmets, and earplugs; and the sizing of boots and gloves.
for women. Also, with increasing mechanization of mines, physical strength may be less relevant than fine motor skills or dexterity, where women could perform better than men (Minerals Council South Africa 2020). At Anglo American’s Mogalakwena open-pit mechanized mine, roughly half of the machine operators are women.
Expanding mechanization has contributed to a sharp increase in the number of women in the mining industry. In South Africa, 11,400 women were employed in the industry in 2002. By 2015, this number had increased to 53,000, and by 2019, to 56,691, a 397 percent increase between 2002 and 2019. In comparison, during the same period, national female labor force participation increased from 42.4 percent to 44.9 percent, an increase of 2.5 percentage points (Minerals Council South Africa 2020). In South Africa, women now account for 12 percent of the mining workforce; although a large improvement, this figure is still below the global average of 17 percent. There are still laborintensive underground platinum and gold mines in South Africa, which tend to have lower shares of female employees (table 4.2).
Globally, policy makers are scrambling to prepare the workforce for the fourth industrial revolution. Though Africa’s shift toward mine mechanization is reflective of the third and fourth industrial revolutions, the industry is also developing digitally enabled mines that turn dangerous, labor-intensive extraction into safer, remotely monitored, autonomous operations. The 2017 World Economic Forum and Accenture White Paper on the mining and metals industry finds that the digital transformation could result in improvements in safety that could save about 1,000 lives and avoid 44,000 injuries, or a 10 percent decrease in lives lost and a 20 percent decrease in injuries between 2020 and
2030 (WEF and Accenture 2017). An in-depth assessment in a specialist magazine notes that since implementing autonomous technologies in several of its African mines, Randgold Resources (which merged with Barrick Gold Corporation in January 2019) saw a 29 percent quarter-over-quarter injury rate improvement (Creamer 2017). Randgold-Barrick’s Kibali mine is automated to the extent that remote operators function underground from safe, air-conditioned cubicles, managing the loaders on the open slopes of the underground operation that descends close to 800 meters below the surface into a massive orebody.
The speed of digital technology adoption in the mining sector is now converging with that of other industries, with societywide implications. According to an analysis by WEF and Accenture (2017), four categories of technologies will play a crucial role in the digital transformation of mining and metals in the decade to 2025: automation, robotics, and operational hardware; a digitally enabled workforce; integrated enterprise, platforms, and ecosystems; and nextgeneration analytics and decision support. The initiatives that create the largest impact on the industry are integrated platforms, connected workers, and remote operations centers, which are collectively accountable for more than 60 percent of the value at stake. Another report suggests that increased productivity and safety, combined with decreased expenses, may cause the mining automation market to grow 6.3 percent annually, reaching US$4.2 billion by 2027 (Markets and Markets 2022).
Historically, the mining sector’s contribution to employment creation has been small relative to other key sectors of the economy. Natural resource abundance, relative to the size of the economies, can make the mining, oil, and gas sectors a key contributor to GDP, foreign investments, export earnings, and government revenues. But estimates suggest that the resource sector contributes very modestly to overall employment, even in mineral-dependent economies (figure 4.5) due to its capital intensity.
Figure 4.6 shows the resource sector’s contribution to total employment between 2004 and 2014 in Sub-Saharan African countries. On average, the share of employment in the extractive sector does not exceed 2.5 percent. Burkina Faso is an exception; its share of employment in the extractive sector was about 11 percent. The share of employment in this sector in other Sub-Saharan miningrich countries ranged from 0.62 percent (Guinea) to about 5 percent (Democratic Republic of Congo). The share of employment in this sector in other Sub-Saharan African mining-rich countries ranged from 0.6 percent (Guinea) to about 5 percent (Democratic Republic of Congo). By comparison, the contribution to total export earnings from mining in these countries was 80 percent (Guinea) and 59 percent (Democratic Republic of Congo) over the same period. The average share of employment in this sector is even lower in some petroleum-rich
Source: Cust and Balde, forthcoming.
Note: Preboom = 1998–2003; boom = 2004–14; postboom = 2015–18.
Resource exports (left scale) Sectoral employment (right scale)
Sources: Based on ILO 2021 and UNCTAD 2021 data.
Note: The figure shows the average share of natural resources in total exports between 2004 and 2014 and the share of employment in the resource sector in Sub-Saharan African resource-rich countries.
economies such as Chad, and Cote d’Ivoire. As shown in figure 4.5, the average falls to 1.2 percent when the sample is limited to oil-rich economies only. This contrasts with export earnings as a share of total exports that, on average, range between 80 percent and 96 percent of total exports over the same period. On the whole, however, the share of employment within the mining sector is higher in Sub-Saharan African countries than in other regions (figure 4.7).
For African countries, the labor implications of the digital transformation of the minerals and metals sector may be significant, yet existing analyses and evidence are even more sparse. There are three key papers in this area. Oshokoya and Tetteh (2018) examine the extent to which mining engineering programs in select countries across Southern, North, West, and East Africa (South Africa, Namibia, Morocco, Ghana and Tanzania) are prepared for the mine of the future. The analysis is conducted over operating practices and technology, talent and leadership, partnership with key stakeholders, and governance. Oshokoya and Tetteh (2018) find that mining engineering education in these African countries, when benchmarked against Australian and Canadian universities, needs improvement to catch up with and meet the needs of the mine of the future.
The potential for automated technology to cause job losses is also a fear. Kansake et al. (2019) assess the preparedness of mine stakeholders for the adoption of autonomous mining systems in the surface mining industry in Ghana.
Results from their survey show that although respondents generally had knowledge of autonomous mining systems, they expressed unwillingness to accept them into Ghanaian mines because of a fear of increased unemployment. Socioeconomic factors may contribute to this fear. Baskaran (2020) deployed a survey to mine workers in South Africa’s platinum group metals sector. The survey asked workers whether they felt increasing technology and automation increased their chance of job losses. Although 55 percent of workers said yes, there was a sharp difference between workers of different ages and races. Though there was roughly an equal distribution of black and white workers surveyed, 63 percent of black workers felt at risk, compared with 36 percent of white workers. The disparity was largest with the 40–49 age category, in which 80 percent of black workers felt vulnerable, compared with just 15 percent of white workers. This vulnerability may be partially rooted in the fact that black workers in the semiskilled range are generally less senior, given the legacy of apartheid-era policies (Baskaran 2020).
As time progresses, mining’s contribution to employment will decline as a result of more capital-intensive, mechanized operations. As figure 4.8 shows, the output of a fully mechanized platinum group metals mine is 11 times higher than its conventional, labor-intensive counterpart. Anglo American has sold off nearly all of its conventional mining assets to focus on highly productive mechanized ones. This move reflects a larger sectoral global trend. Thus, though there is ample scope to open new mines, they will not lead to a proportional increase in employment in the sector (Baskaran 2020).
In many countries, the number of people engaged in artisanal and mostly informal mining is three to six times higher than in formal direct jobs in the sector (figure 4.9). The sector constitutes a smaller share of national employment than agriculture, for instance. Employment in the sector has been stable, with notable exceptions. In countries such as Burkina Faso and Mali, it has increased because of recent foreign direct investment flows and relatively new large-scale gold mining activity. Only South Africa has experienced a steady decline in absolute employment, with a net loss of 22,622 jobs across all mining types between 2015 and 2019 (Statistics South Africa 2019), and it is one of the countries where large-scale digital transformation (DT) adoption could further disrupt employment (see box 4.1).
Though direct formal employment potential within the mining sector is limited, there are two areas with potential for large-scale employment generation: linkage sectors (backward, forward, and horizontal) and use of mining revenues to finance infrastructure and create an enabling environment for other labor-intensive sectors, such as agriculture, agri-processing, and information and communication technologies.
The nonrenewables resource sector is one of the main “old sectors” in many SubSaharan African countries set to be disrupted by digital transformation (DT) adoption, with implications for formal and informal jobs. Of Sub-Saharan Africa’s 48 economies, 19 can be considered rich in mineral resources, defined by the International Monetary Fund as having mineral rents accounting for at least 25 percent of their exports (Lundgren, Thomas, and York 2013). Globally, it is estimated that robotic technologies in driverless vehicles, sensor-based sorting of minerals, and data analytics will reach their peak deployment in the mining sector by 2030 (World Bank 2020a). In the global mining industry, there will be a potential loss of 330,000 jobs, or nearly 5 percent of the workforce, due to DT adoption, with implications for Africa’s mineral-rich countries. Although there is a strong focus on the risk of job losses to automation, there could be improvements in safety that could result in a 10 percent decrease in lives lost and a 20 percent decrease in injuries by 2030 (WEF and Accenture 2017). In Sub-Saharan Africa, the mining sector contributes a small share of aggregate national employment despite accounting for between 25 percent and 86 percent of exports in 19 mineral-rich economies, and 60 percent to 90 percent of foreign direct investment in many countries (figure B4.1.1).
b. Contribution of mining sector to national employment, period averages
Source: Usman et al., forthcoming.
There is ongoing debate in the academic and policy literature about the impact of DT on work in the mining sector. The evidence so far is sketchy and presents a mixed portrait, both promising to create a win-win situation for companies, communities, and governments and threatening to exacerbate the tension between productivity enhancement and equity concerns. Some of the questions being raised include the following: Could DT adoption result in massive labor displacement, especially at the lower end of occupational profiles and routine tasks (figure B4.1.2)? Could it eliminate hazardous occupational profiles in underground mines, for example? Could it create new occupational profiles that are more inclusive of women, the elderly, and other marginalized groups? Could DT enhance the productivity of artisanal miners, formalize their activities, and promote small and medium enterprise development in the sector through miniaturization of equipment? Could DT enable the achievement of national development objectives in the sector beyond employment through tax policy and enforcement, and stronger special prospecting licensea interventions for mining communities? These are important policy debates for stakeholders in the mining sector, including governments, industry, and mining communities where employment in the sector is often the only major source of income.
Given the expected decline in mining jobs resulting from mechanization, identifying new ways to harness employment is critical. The demographic dividend will translate to a sharp increase in the size of the workforce, and harnessing this workforce growth in and out of the mining sector will require strengthening a foundation of basic education. The recommendation consists of two steps. First, governments need to step in to improve educational outcomes for communities around mines. Math pass rates at schools in areas around some mines in South Africa averaged less than 5 percent in 2018 (Baskaran 2020). A strong foundation of math and sciences is key to ensuring that students will be able to survive in a technology-intensive world (Baskaran 2019). Second, mining firms should build on this strong math and science foundation to provide bursaries and apprenticeships to students to train them for the high-skilled jobs that the mining sector requires in the context of mechanization and the fourth industrial revolution.
Developing and implementing skills-development programs aligned with both mechanization and diversified economic activities to absorb the decline in labor demand resulting from mechanization is important.
Moving into the era of digital transformation, the global mining industry is coming to terms with how to manage the transition to automation and other disruptive technologies. For African countries, a central question is whether the existing legal frameworks allow for leveraging these technologies to meet the explicitly articulated and implied labor-related objectives for the sector. Since the articulation of the Africa Mining Vision in 2009 (African Union 2009) and within the framework of the “shared-value paradigm”5 in mineral development, several countries have reformed laws that were enacted in the 1990s and early 2000s. 6 About 45 percent of African countries have revised their mining laws in ways that have gone beyond fiscal changes to incorporate provisions that are grounded in shared-value principles.7 In resource-rich countries, the pace of primary legislative reform has proved to be more significant. Substantively, these post–Africa Mining Vision laws include general provisions on local employment of citizens as well as procurement of local goods, which directly affects employment. Other provisions that have an impact on employment include (a) training citizens, with the objective of replacing expatriate labor or ensuring career mobility, hiring within a gender equity–based framework, and collaborating with universities to facilitate knowledge transfer; (b) obligations of the state or one of its Mining Development Agreements to establish training institutions for the mining industry, facilitate development of affected communities, and monitor the hiring practices of mining companies; and (c) creation, or in some cases enhancement, of a regulatory framework for artisanal mining or quarrying of locally procured materials.8
Broadly, government policies are not aligned with automation. Nwogu (2019) finds that although substantive legislative reform in Africa has been aimed at maximizing the benefits of mineral development, especially through
local content, automated systems are likely to have a negative impact on the expected benefits of this reform as related to local employment, potentially rendering ineffective this element of the reform. Consequently, governments should begin to acquire evidence to prepare for the revision or enactment of new mining laws that are fully cognizant of the impact of automation.
Despite limited direct jobs contributions, resource exports are found to have a larger job multiplier than other sectors of the economy, particularly in SubSaharan Africa. For example, the number of jobs added in the economy for each job in the mining sector is approximately 28 in Ghana; about 7 jobs are created in Chile, 5 in the United States, and 2.5 in Scotland (table 4.3).
Sector or industry
Agriculture
Mining
Total number of jobs in the economy for each direct job in a sector
• 1.2 (chile)
• 2 (united States and Scotland)
• 3 (Tanzania)
• 2.5 (Scotland)
• 5 (United States)
• 7 (Chile)
• 28 (Ghana)
Financial services
Oil and gas
hotels
retail
• 14.9 (indonesia)
• 19 (ghana)
• 7.5 (United States)
• 13.4 (Scotland)
• 24 (Ghana)
• 1.24 (Scotland)
• 2.66 (Tanzania)
• 1.27 (chile)
• 1.31 (Scotland)
• 1.89 (united States)
cement
• 2.47 (Scotland)
• 4.45 (united States)
Sources: Cooper 2019; IFC 2013, 2018; staff calculations.
Note: The table shows the number of direct, indirect, and induced jobs for every direct job. The higher-thanexpected job linkages in Ghana, for example, in Newmont Ghana’s Ahafo Mine, is, in part, due to the suppliers’ development program that has helped strengthen the community development program and supply-chain linkages. The number of suppliers increased by 5.7 times between 2007 (beginning of the program) and 2010. Accordingly, local purchasing under the program increased from US$1.7 million (with 25 suppliers) to US$9 million (with 143 suppliers) in 2010 (Kim, van Moorsel, and Kapstein 2013). In 2011, 4,500 jobs were supported by the mining company’s direct suppliers and suppliers’ suppliers.
Natural capital is a vital part of Sub-Saharan Africa’s total wealth. Sub-Saharan Africa has an estimated 20 percent of its total wealth in natural capital, including subsoil assets such as oil, gas, and minerals, as well as renewable natural capital. This renewable natural capital—comprising croplands, forests, mangroves, protected areas, and fisheries—accounts for about 15 percent of its total wealth. However, renewable capital per capita has been declining since 1995. Meanwhile, nonrenewable capital per capita, which made up about 5 percent of total wealth in 2018, rose significantly during the commodity price boom before declining sharply after 2014, largely driven by falling international commodity prices.
Figure 4.10 compares Sub-Saharan Africa’s renewable and nonrenewable natural capital by year showing the drop in renewable natural capital and the peak
in nonrenewable natural capital during the commodity boom. These figures suggest that countries in this region need to protect their renewable natural capital against depletion and degradation, while avoiding overdependence on nonrenewable natural capital because of its value volatility. The World Bank’s analysis in The Changing Wealth of Nations (World Bank 2021) finds that renewable natural capital increases with income, suggesting successful economies grow not at the expense of the natural environment but by protecting it.
Sub-Saharan Africa has an estimated US$2.9 trillion in renewable natural capital (figure 4.11), which increased in value by 6 percent between 1995 and 2018 but fell in per capita terms. Between 1995 and 2018, the value of each natural capital component changed in different directions and magnitudes. In aggregate, wealth in fisheries (75 percent), land (50 percent), and forests (36 percent) declined the most per capita. Wealth in protected areas increased 72 percent, up to US$282 billion, but in per capita terms it declined 7 percent.
We find that nonrenewable wealth forms an inverted-U shape, similar to the environmental Kuznets curve (Stern, Common, and Barbier 1996). This means that while the poorest countries in the world may be relatively resource poor, resources often form a rising share of wealth at lower income levels. Richer, advanced economies see a higher but declining share of their wealth in subsoil assets such as oil, gas, and minerals (Cust and Rivera-Ballesteros 2021a). This has important implications for development policy because it implies that managing that rising share of nonrenewable assets in total wealth is, on average, a significant part of the pathway toward higher income status.
On average, countries with higher levels of income have a smaller share of natural capital in total wealth. Also on average, lower-income countries have a larger proportion of natural capital than any other asset. Since 2000, the average share of natural capital in total wealth has been at least two times larger in low-income countries than in high-income countries. Meanwhile, the average share of human capital in total wealth in high-income countries is now almost twice the share in low-income countries.
Economic development has been associated with declining shares of natural capital relative to other categories of wealth. Low-income countries have asset portfolios that are highly concentrated in natural capital. In some Sub-Saharan African countries this capital can exceed half the country’s total wealth, as in the Central African Republic and Guinea. Countries with higher GDP growth over the past two decades saw a faster decline in the share of natural capital as other wealth accumulated. For example, Malaysia reduced its proportion of natural capital from one-fourth in 1995 to one-tenth of its total wealth in 2018, while its economy grew, on average, more than 5 percent each year. For richer countries
Based on the Changing Wealth of Nations 2021 (World Bank 2021) data.
the absolute value (and value per capita) of natural capital tends to rise with the level of national income, even while its share in total wealth declines.
During the boom years, carbon emissions soared and natural resource depletion increased significantly. While total carbon emissions in Sub-Saharan Africa by the end of the boom had increased by 32 percent compared with the level in the preboom period, the emissions in the region’s resource-rich countries increased by 46 percent by the end of the boom, going from a total of 172 million to 252 million tons of carbon dioxide. Depletion of natural resources also increased dramatically. The depletion of natural resources in Sub-Saharan Africa increased by approximately 150 percent during the boom, but in the region’s resource-rich countries, depletion of natural resources increased on average by more than 190 percent. Total forest area also decreased by 2 percent, going from an average forest cover of 6.9 million square kilometers in 2004 to 6.5 million square kilometers in 2014. Map 4.1 shows the areas that suffered tree cover loss during the boom years.
Tree cover loss is not always a result of expanding timber or agricultural production. Mining and petroleum projects can result in significant forest clearance or have spillovers that cause further forest loss. Cust et al. (forthcoming), for example, document the impact of mining in forested areas. Factors that seem to influence the scale of forest loss around resource extraction sites include the type of commodity and the form of extraction; for example, open-pit mines cause more clearance than shaft mining. Furthermore, road building in forested areas can account for much more subsequent forest loss than the project itself because it opens up access to new areas for farmers and loggers.
The link between resource extraction and forest loss is more complex than just the clearance that can occur around extraction sites. New research (Cust, Harding, and Rivera-Ballesteros, forthcoming) suggests that the amount of resource exports, and consequently the degree of Dutch disease a country experiences, can affect the amount of deforestation. Increased deforestation is driven by the impact on relative prices of resources and agricultural goods in countries where agricultural expansion may encroach on the forest. This mechanism, dubbed “Amazonian disease” by Cust, Harding, and RiveraBallesteros (forthcoming) because it was first measured in Brazil, suggests that falling oil exports or falling oil prices can increase the competitiveness of agriculture in the same country and thus increase the amount of forest loss, as seen, for example, in the period following falling oil prices beginning in 2015.
For a country such as Brazil, where agriculture often encroaches on the forest, an agricultural boom is associated with an uptick in deforestation. Meanwhile, as a major oil exporter, oil exports push up the real exchange rate, making agriculture less competitive than it would be otherwise when oil prices are low. Therefore, agricultural booms induced by falling oil prices or falling oil exports drive more deforestation unless policy intervenes.
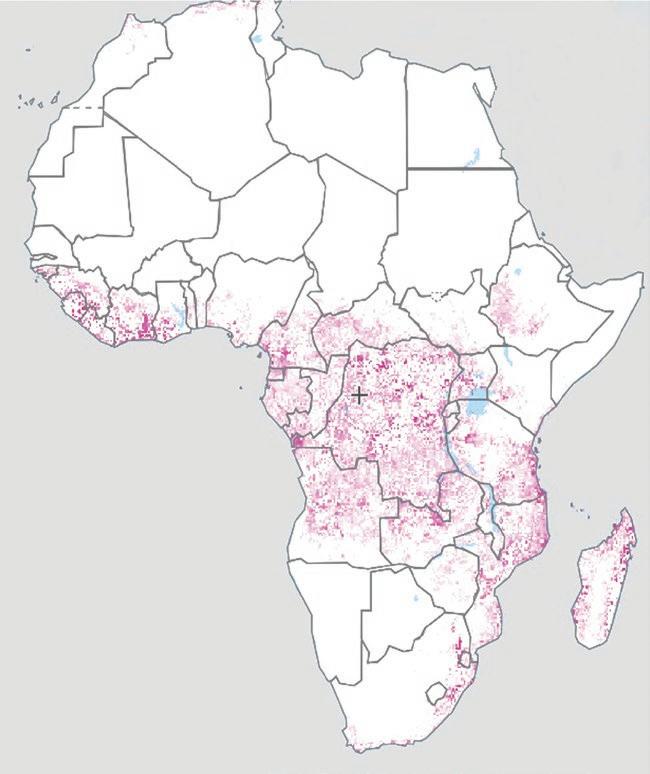
The Amazonian disease has implications for African economies. First, major oil-exporting countries that also have abundant forests, such as Angola, Cameroon, and the Republic of Congo, currently may have less competitive agricultural sectors because of high oil exports than they might enjoy otherwise. As the world decarbonizes, demand and prices for fossil fuels such as oil are likely to decline over time. As oil exports decline in these countries, agricultural competitiveness is likely to rise. A boom in the agricultural sector in these countries could therefore drive a boom in deforestation unless policy is able to protect the forest. Put differently, the low-carbon transition could lessen Dutch disease in these countries, to be replaced instead by Amazonian disease. Instead of the manufacturing sector losing out as with Dutch disease, it could instead be tropical forests that fall victim, as observed in Brazil.
Additionally, deforestation and destruction of biodiversity can adversely affect other economic sectors, notably tourism. Biodiversity is a driver of tourism—areas such as tropical forests and natural parks are reliant on preservation of natural capital to attract visitors. One such example is provided by the Democratic Republic of Congo, Rwanda, and Uganda, which are home to mountain gorillas and endangered species. In the 1970s and 1980s, large tracts of land in these countries were destroyed. But in the 1990s, the three countries signed an agreement on “transboundary gorillas.” The agreement focuses on respecting the natural habitat of mountain gorillas and makes conservation and tourism a transboundary collaboration. This agreement has led to mountain gorillas being the only ape subspecies to experience population growth. In 2015, the Rwandan national park management authority earned more than US$15 million from gorilla tracking permits, and total tourism income from associated services was estimated to be more than US$300 million. Some 10 percent of national park tourism income goes back to local communities, further encouraging the protection of biodiversity (UNEP 2017). Tourism also has a labor multiplier of approximately 1.5, signaling its ability to generate much-needed jobs.
The future of African economic transformation depends on the ability to increase productivity and generate jobs and income, including in export-oriented sectors beyond commodity exports. However, achieving these increases under the condition of resource-richness has proved to be challenging.
According to Ross (2019), out of 50 oil exporters examined for success in export diversification since 1998, only 8 had greater export diversification at the
end of the period. Further, Ross (2019) finds evidence that 4 of the 8 successful countries had achieved this either because of resource depletion or economic sanctions placed on them from outside. This is a very daunting historic record for those African resource-exporting countries seeking to promote export diversification prior to resource exhaustion.
As seen in chapter 2, the majority of resource-rich African countries reporting an export diversification index (14 of 24) saw increased export concentration.
Figure 4.12 illustrates the export-diversification performance of African economies. Those countries lying to the right of the 45-degree line increased their measure of export diversification late into the boom (2006–10) compared with the preboom period (1998–2003). For example, export concentration increased in Chad and Sudan, while Tanzania and Uganda experienced diversification.
This rising export concentration in the resource sector is not unique to Africa. First modeled by Corden and Neary (1982), this phenomenon has become popularized as the Dutch disease. Harding and Venables (2016) find
Source: Cust, Rivera-Ballesteros, and Zeufack 2022.
Note: A lower index value means higher diversification; 2010 is the most recent year with data available. rr = resource rich; SSA = Sub-Saharan Africa.
that for each additional dollar of resource revenues, countries tend to see a decrease in nonresource exports of US$0.75. Countries thus find it incredibly challenging to achieve export diversification goals alongside significant resource exports.
The underlying question when studying Dutch disease is how an appreciation of the real exchange rate from resource revenues might be managed and mitigated by the government. The conventional permanent income hypothesis is that a sustained increase in consumption can be supported by interest on accumulated foreign assets through foreign exchange reserves or a sovereign wealth fund, as recommended by the International Monetary Fund (IMF 2012) or the more restrictive formulation of this approach called the bird-in-hand strategy (Barnett and Ossowski 2003). However, as analyzed by van der Ploeg and Venables (2011), these approaches are not optimal for all resource-rich countries and especially for lower-income resource-rich countries, which are generally capital-scarce, and the return on domestic capital may be higher than that on foreign-invested capital. According to van der Ploeg and Venables (2011), capital scarcity implies a low capital-to-labor ratio, little public infrastructure, low wages and income, and a high domestic interest rate. In capital-scarce resource-rich countries, a temporary influx of foreign exchange, consecutive to a commodity price boom, a massive resource discovery, or increasing resource production, should typically be spent and invested domestically, not spent to accumulate foreign assets.
Countries should pursue policies that enable their capacity to invest domestically, that is, invest in investing. This investment policy allows for incremental increases in consumption for present generations as well as the use of savings for a combination of foreign debt reduction and the accumulation of domestic capital. First, the IMF (2012) policy paper argues that consumption should be skewed toward the present generation because of the relative poverty of the present generation compared with those in the far future. Second, savings should take the form of domestic capital accumulation to compensate for relative capital scarcity. This use of public spending is expected to boost private investment and accelerate growth of the nonresource sectors through (a) improving public infrastructure and the provision of public services such as electricity or the internet (domestic public investment), (b) lowering interest rates (foreign debt reduction), and (c) a process of “investing in investing.”
This is where capital-scarce resource-rich countries can use public investment and related policies strategically to raise the overall absorptive capacity of the economy by flattening supply curves, and thus mitigate Dutch disease effects on the nontraded sectors.
Policy makers in resource-rich countries may have more success working toward asset diversification rather than export diversification. Asset portfolio diversification, explored in chapter 2, is an important step toward sustained growth and is more feasible for resource-rich countries to achieve than traditional export diversification because of pressure from Dutch disease (Cust and RiveraBallesteros 2021a). However, to achieve a more diversified asset, countries must successfully transform the proceeds from resource extraction to other kinds of productive assets.
A successful policy for sustainable economic growth might target asset portfolio diversification instead of export diversification by reducing the share of natural capital in total wealth (Cust and Rivera-Ballesteros 2021b). This does not mean a decline in the dollar value of natural capital per capita; instead, it emphasizes increased investments in the expansion of human capital and other productive assets. Such investments can be financed from the proceeds of prudent resource management. Lederman and Maloney (2012, 13) argue that countries should focus not on growth- or diversification-promoting sectors but on policies that “raise the overall ability of a country to increase productivity and quality, and to move to more sophisticated tasks.” Achieving this goal requires resource-rich countries to save and invest a high share of resource revenues. This can be measured by reference to the World Bank’s measure of adjusted net savings.
Unfortunately, during the boom the relationship between resource wealth, measured as rents’ share in GDP, has been negatively associated with countries’ rates of adjusted net savings, as shown in figure 4.13. In Africa, many countries with the highest depletion (proxied by rents) have seen low and negative rates of net saving, meaning they are running down the overall stock of assets in the country, and instead consuming a large share of this value. This pattern means countries are bringing forward consumption at the expense of future GDP, effectively reducing the available assets for future generations.
The future prospects for the resource sector in Africa are also threatened by challenges other regions have faced in the form of resource exhaustion from depletion or from resource obsolescence. In both cases, the value to the country of a particular subsoil asset can fall as export earnings decline and the value added in the economy ceases. Resource depletion originates internally so may be easier to predict, whereas obsolescence is usually driven by external technological innovations or new scientific breakthroughs. Nonetheless, the economic policy challenges are comparable. Governments facing these risks must prepare their economies in advance to cushion the blow from the future loss of export earnings and jobs (see annex 4A for Chile’s experience). The lessons from the 2004–14 boom and
end-of-boom period can help guide resource-rich countries in how to plan for a postextractive future (Cust, Rivera-Ballesteros, and Zeufack 2022).
Resources skew employment toward the public sector and the resource sector. Cust and Balde (forthcoming) find that natural resource exports have, contrary to the conventional view, positive and significant effects on the share of manufacturing employment and nonagricultural employment in sectors such as services, construction, and mining. Their findings show that resource windfalls have a positive and significant incidence on the employment share of the public sector in total employment. And their estimations suggest that when the public sector is considered in the narrowest sense—in other words, public adminis
tration, defense, and social security—no significant effects of natural resource exports are found. Focusing on the same sector, they provide evidence that natural resource exports positively affect public wage bills. Additionally, they find that following a resource boom, the government tends to increase public wage bills significantly compared with increasing public employment. This result echoes earlier work by Stefanski (2015), who documents this public sector bias linked to resource abundance. An outsized public sector can also crowd
out private sector activity, much like a booming resource sector in the classic Dutch disease model. Public sector workers may also be of lower productivity or generate fewer improvements in factor productivity than the private sector, which may act as a drag on economic growth over time, further contributing to any potential resource curse effect.
Cust and Mandon (2021) identify three main ways human capital differs between resource-rich and non-resource-rich countries: (a) the resource sector reallocates human capital away from some high-productivity sectors because of Dutch disease (aligned with Cust and Mandon [2021]), (b) the distribution of human capital between men and women is more unequal in these (nonrenewable) resource-rich countries compared with other countries, and (c) human capital is skewed toward the public sector more in resource-rich countries. These characteristics may contribute to, and be associated with, lower overall worker productivity, and therefore lower human capital per capita (figure 4.14) arising from resource dependence.
Oil production has been shown to reduce the size of the female labor force, as evidenced by Ross (2008), who also shows that this reduction leads to a decline in women’s political influence. This situation can have an impact on gender imbalance and enable more patriarchal norms and institutions. In addition, oil production in countries with poor governance can drive a higher demand for
law or business jobs rather than engineering-related jobs because the former might have better access to rents (Ebeke, Omgba, and Laajaj 2015). This labor specialization might have long-term effects on productivity and the generation of future jobs.
On average, a male bias in human capital wealth is found for resource-rich Africa. Cust and Mandon (2021) find that resource-rich countries have a more unequal human capital distribution between men and women. Figure 4.15 highlights that the distribution of human capital between males and females is generally relatively more equal (closer to 50 percent) for non-resource-rich countries compared with resource-rich countries among emerging market and developing economies. For example, in 2018, 58 percent of human capital was concentrated among males and 42 percent among females in non-resourcerich countries in Sub-Saharan Africa, on average. In contrast, in resource-rich countries 72 percent of human capital was concentrated among males and only 28 percent among females, on average. Sub-Saharan Africa also has one of the worst gender imbalances in resource-rich countries. For Sub-Saharan Africa, the gender distortion was measured to be the most extreme between resourcerich and non-resource-rich countries. Among resource-rich countries, women accounted for only about 28 percent of human capital wealth, while in other Sub-Saharan African countries the share was greater than 40 percent.
The future of African economic transformation depends on countries’ ability to increase productivity and generate jobs and income in export-oriented sectors beyond commodity exports. However, doing so under the conditions of resource richness has proved to be challenging.
This chapter considers four key megatrends that are likely to affect resourcerich countries’ ability to maximize the development impact of resource wealth. First, the low-carbon transition must be carefully considered in policy choices made today. Although the pathways remain uncertain, they have large implications for resource-driven development and what market demand for commodities may look like in the coming years. The good news is that there are various ways countries can mitigate the carbon risks they face from the low-carbon transition. Avoiding overinvestment in carbon-linked assets while promoting a diversified, less resource-dependent economy can both reduce risk and promote resilience.
The second important megatrend relates to mechanization, digitalization, and even artificial intelligence. This so-called fourth industrial revolution has the potential to accelerate productivity gains in African economies. However, it is likely to make the resource sector increasingly technology- and capitalintensive, further reducing the prospects for significant new job creation in these sectors. Instead they hold the possibility for higher-skilled, higher-quality jobs, if the education and training systems can prepare the next generation accordingly.
The third important trend considered is related to environmental degradation. Too often resource extraction is linked to harm to the natural environment. However, this need not be the case. Environmental regulations and enforcement can reduce the negative environmental footprints, while a better understanding of the structural linkages between the resource sector, the forest, and the rest of the economy can help guide forest-smart policies. One such example is managing the so-called Amazonian disease, whereby falling oil prices or falling oil extraction in the future may endanger Africa’s tropical forests in much the same way the commodity price collapse in 2015 has endangered the Brazilian Amazon.
The fourth megatrend identifies the structural challenges associated with resource abundance. The successful economic transformation of resource-rich African economies will in part depend on policy makers’ ability to overcome the distortionary impacts of Dutch disease. As emphasized in chapter 2, improving institutional quality may be an important pathway to facilitating greater economic diversification. However, additional actions by government may be required to mitigate the risks of Dutch disease during the period of resource dependence.
Nitrate, the principal component of crop fertilizer and explosives, became a highly demanded commodity in the late nineteenth century as farmers across the world struggled to meet the needs of a rapidly growing world population and governments scaled up their defense production. Discovered in large quantities in the Atacama Desert, Chile gained control over nitrate deposits in 1883 and thereby acquired the world monopoly on the supply of natural nitrates. Chile’s economy grew 900 percent between 1879 and 1902 (Crow 1992). Exports expanded 12-fold between 1880 and 1913 (Mamalakis 1971). The government thrived on new revenues derived from an export tax on nitrate, which was as high as 30–70 percent of the local nitrate price (Brown 1963). Public debt, specifically foreign debt, increased rapidly as windfall prosperity allowed the government to issue bonds, further increasing the Chilean governments’ dependency on nitrate production. Chilean participation in the world market for nitrate reached 90 percent in the mid-1880s (Lüders and Wagner 2003), and nitrate became Chile’s main source of government revenues and exports with 70–80 percent of total annual government revenues and 60 percent of total exports, respectively (McConnell 1935).
However, Chile’s nitrate age would only last for as long as Chile could keep its world monopoly over nitrate production. In 1909, Fritz Haber and Carl Bosch discovered the process for combining atmospheric nitrogen with hydrogen to produce ammonia, a highly usable form of nitrogen that could be synthesized; popularly, this became known as the Haber-Bosch process. This event marked the beginning of the end of Chile’s nitrate age. A century after its invention, the air-fixation process is still applied all over the world and produces more than 500 million tons of artificial fertilizer per year (Montoya et al. 2015). This breakthrough invention transformed world food production and led to an unprecedented increase of world population.
By the time of the Great Depression, Chile’s nitrate market participation had fallen to 20 percent (Lüders and Wagner 2003), representing a decline of about 80 percentage points compared with its peak in the early 1880s . By 1953, world production of nitrates, including manufactured nitrogen compounds, was dominated by the United States, the United Kingdom, and Japan. Chile’s market share had fallen to 7 percent (figure 4A.1).
The Chilean economy at the time, highly open to the world economy and lacking stable domestic institutions, suffered extremely from these external shocks and the Great Depression, leading to the deepest recorded GDP loss in the world between 1930 and 1932 (Schmidt-Hebbel 2006). To avoid mass
unemployment9 and keep the industry alive, the Chilean government issued fiscal bills to nitrogen mining companies, which helped production pick up after the Great Depression (figure 4A.2) but also resulted in a series of annual deficits in government finances. With an increasing number of countries producing and exporting manufactured nitrogen compounds, including Germany and the United Kingdom, and at a later stage France, Japan, and the United States, the production and consumption of synthetic nitrates far outstripped the Chilean product (McConnell 1935).
Following the nitrate crisis, Chile adopted an import-substitution strategy based on government-led industrialization. Starting in the mid-1930s and increasingly until the mid-1970s, successive governments strengthened their role in resource allocation and property, broadened market interventions, expanded social policies and government transfers, and engaged in largely destabilizing macroeconomic policies. After a short period of high growth that characterized the post-Depression recovery, average per capita growth reached just 1.4 percent between 1938 and 1973. The government-led development strategy peaked during 1970–73 when government intervention, economic mismanagement, and sociopolitical conflict were reflected in large uncertainty and stagnating growth (Schmidt-Hebbel 2006).
Looking at Chile’s long-term per capita GDP growth rates from 1800 to 2017 (figures 4A.3 and 4A.4), the nitrate crisis is only associated with a relatively small slump compared with the unprecedented levels of economic growth that succeeded the Great Depression and that Chile has enjoyed since the 1990s (IMF 2000).
A crucial factor in Chile’s development during the second half of the twentieth century was its copper industry. However, despite the great abundance of copper and the highest copper prices of the postwar period between the 1960s and the early 2000s, its importance has diminished because of the diversification of the Chilean economy: Since the 1960s, copper-related products have accounted for more than 50 percent of Chile’s total exports value; however, other products, including salmon and wine, have experienced annual trade growth rates of more than 8 percent, especially between 1990 and 2007 (Lebdioui 2019).
Chile learned from its past and has successfully navigated the potential pitfalls of natural resource wealth with copper. After the nitrogen crisis, Chile diversified its economy; built strong institutions, including fiscal discipline and
protected property rights; invested in an educated labor force; and promoted an open-market economy. According to the Worldwide Governance Indicators, since 1995 Chile has ranked in the top 20th percentile for control of corruption, rule of law, and regulatory quality measures (Kaufmann, Kraay, and Mastruzzi 2010). Chile has also benefited from a high degree of transparency: information on both operations and revenues are published regularly by the finance ministry, along with comprehensive reviews of royalties, taxes, mining export values, and production volumes. Despite being the world’s largest copper producer, with reserves exceeding 20 percent of the world’s total (USGS 2022), Chile has been able to achieve sustained growth and avoid resource dependence to some degree.
1. In addition to being still relatively underexplored, Africa’s discovered natural resources are still to be developed. A significant proportion of the region’s mines are undeveloped; only 518 (or 30 percent) are currently operating out of the 1,747 significant mines discovered. The value of these undeveloped mines is about US$12 trillion, 68 percent of which is in mines located in Southern Africa, 13 percent in West Africa, and 8 percent in East Africa (Guj et al., forthcoming).
2. The net zero scenario refers to the pathway where global carbon dioxide emissions are cut down as close to zero as possible through stringent climate policies that will limit global warming to 1.5 degrees Celsius.
3. These include aluminum, cobalt, copper, graphite, lead, lithium, manganese, nickel, and zinc.
4. C176 Safety and Health in Mines Convention, 1995 (No. 176) (https://www.ilo.org /dyn/normlex/en/f?p=NORMLEXPUB:12100:0::NO::P12100_INSTRUMENT _ID:312321).
5. The shared-value paradigm claims that companies can bring value not only to themselves but also to the communities where they operate by providing government revenues, local employment, downstream uses of natural resources, and local procurement of goods and services (Cosbey et al. 2016).
6. According to World Bank data based on the International Labour Organization, ILOSTAT database ( https://data.worldbank.org/indicator/SL.TLF.TOTL.FE .ZS?locations=ZA).
7. The African Union member states that as of 2016 were at some stage of implementation of the Africa Mining Vision framework are listed at https://www-cdn.oxfam .org/s3fs-public/bp-africa-mining-vision-090317-en.pdf.
8. Based on the principles of the Africa Mining Vision Compact with private sector leaders (African Union and United Nations 2017).
9. Labor mobility was low as nitrate pampas were located in a desert district in northern Chile (McConnell 1935).
African Union. 2009. “Africa Mining Vision.” African Union, Addis Ababa. https:// au.int/en/ti/amv/about
African Union and United Nations. 2017. “African Mining Vision: Looking beyond the Vision: An AMV Compact with Private Sector Leaders.” United Nations Economic Commission for Africa. Special Initiatives Division. African Minerals Development Centre; African Union Commission, Addis Ababa. https://hdl.handle .net/10855/23876.
Barnett, S. A., and R. Ossowski. 2003. “What Goes Up…” Finance and Development 40 (1).
Baskaran, G. 2019. “State Must Take Up the Burden of Protecting Lost Mining Jobs.” BusinessDay, October 14, 2019.
Baskaran, G. 2020. “Essays on the Economic and Financial Challenges Facing South Africa’s Commodity Sector.” Doctoral thesis, University of Cambridge. https://doi .org/10.17863/CAM.74474
Baskaran, G. 2021. “Firms’ Approach to Mitigating Risks in the Platinum Group Metals Sector.” Mineral Economics 34 (3): 385–98.
Bellamy, D., and L. Pravica. 2011. “Assessing the Impact of Driverless Haul Trucks in Australian Surface Mining.” Resources Policy 36 (2): 149–58.
BGS (British Geological Survey). n.d. World Mineral Statistics of the British Empire and Foreign Countries. World Mineral Statistics Archive. https://www2.bgs.ac.uk /mineralsuk/statistics/worldArchive.html.
Brown, J. R. 1963. “Nitrate Crises, Combinations and the Chilean Government in the Nitrate Age.” Hispanic American Historical Review 43 (2): 230–46.
Cooper, R. 2019. “Fossils Fuels and Job Creation in Africa.” K4D Helpdesk Report 697, Institute of Development Studies, Brighton, UK.
Corden, W. M., and J. P. Neary. 1982. “Booming Sector and De-industrialisation in a Small Open Economy.” Economic Journal 92 (368): 825–48.
Cosbey, A., H. Mann, N. Maennling, P. Toledano, J. Geipel, and M. D. Brauch. 2016. Mining a Mirage? Reassessing the Shared-Value Paradigm in Light of the Technological Advances in the Mining Sector. Winnipeg: International Institute for Sustainable Development.
Creamer, M. 2017. “Kibali Africa’s Most Mechanised Gold Mine—Randgold.” Mining Weekly, November 2, 2017. https://www.miningweekly.com/article/kibali-africas -most-mechanised-mine-randgold-2017-11-02/rep_id:3650
Crow, J. A. 1992. The Epic of Latin America. 4th edition. Berkeley: University of California Press.
Cust, J., and T. Balde. Forthcoming. “Windfalls and Labor Dynamics in Sub-Saharan Africa.” World Bank, Washington, DC.
Cust, J., T. Harding, H. Krings, and A. Rivera-Ballesteros. Forthcoming. “Public Governance versus Corporate Governance: Evidence from Oil Drilling in Forests.” World Bank, Washington, DC.
Cust, J., T. Harding, and A. Rivera-Ballesteros. Forthcoming. “Tropical Deforestation and Terms of Trade Shocks.” World Bank, Washington, DC.
Cust, J., and P. Mandon. 2021. “Nonrenewable Natural Capital and Human Capital Distortions: Impact on Accumulation, Gender, and the Public Sector.” In The Changing Wealth of Nations 2021: Managing Assets for the Future, 311–41. Washington, DC: World Bank.
Cust, J., D. Manley, and G. Cecchinato. 2017. “Unburnable Wealth of Nations.” Finance and Development 54 (1).
Cust, J., and A. Rivera-Ballesteros. 2021a. “The Nonrenewable Wealth of Nations.” In The Changing Wealth of Nations 2021: Managing Assets for the Future, 193–223. Washington, DC: World Bank.
Cust, J., and A. Rivera-Ballesteros. 2021b. “Wealth Accounting, Diversification, and Macrofiscal Management.” In The Changing Wealth of Nations 2021: Managing Assets for the Future, 271–310. Washington, DC: World Bank.
Cust, J., A. Rivera-Ballesteros, and A. Zeufack. 2022. “The Dog That Didn’t Bark: The Missed Opportunity of Africa’s Resource Boom.” Policy Research Working Paper 10120, World Bank, Washington, DC.
Ebeke, C., L. D. Omgba, and R. Laajaj. 2015. “Oil, Governance and the (Mis)allocation of Talent in Developing Countries.” Journal of Development Economics 114: 126–41.
Galeazzi, C., J. Steinbuks, and J. Cust. 2020. “Africa’s Resource Export Opportunities and the Global Energy Transition.” LiveWire, World Bank, Washington, DC.
Global Forest Watch. 2022. Global Forest Watch Forest Change. https://globalforestwatch .org/map/
Guj, P., R. Schodde, B. Boucoum, and J. Cust. Forthcoming. “Mineral Resources of Africa.” World Bank, Washington, DC.
Hansen, M. C., P. V. Potapov, R. Moore, M. Hancher, S. A. Turubanova, A. Tyukavina, D. Thau, S. V. Stehman, S. J. Goetz, T. R. Loveland, A. Kommareddy, A. Egorov, L. Chini, C. O. Justice, and J. R. G. Townshend. 2013. “High-Resolution Global Maps of 21st-Century Forest Cover Change.” Science 342 (15 November): 850–53. Data available on-line: http://earthenginepartners.appspot.com/science-2013-global-forest Accessed through Global Forest Watch on 26/12/2022. www.globalforestwatch.org.
Harding, T., and A. J. Venables. 2016. “The Implications of Natural Resource Exports for Nonresource Trade.” IMF Economic Review 64 (2): 268–302.
IEA (International Energy Agency). 2021a. “Fossil Fuel Use by Scenario, 2020, 2030 and 2050.” In World Energy Outlook 2021. Paris: IEA. https://www.iea.org/data-and -statistics/charts/fossil-fuel-use-by-scenario-2020-2030-and-2050.
IEA (International Energy Agency). 2021b. “The Role of Critical Minerals in Clean Energy Transitions.” World Energy Outlook Special Report, IEA, Paris. https://www .iea.org/reports/the-role-of-critical-minerals-in-clean-energy-transitions
IFC (International Finance Corporation). 2013. Assessing Private Sector Contributions to Job Creation and Poverty Reduction. Washington, DC: IFC.
IFC (International Finance Corporation). 2018. Estimating the Effects of the Development of the Oil and Gas Sector on Growth and Jobs in Ghana (2015–30): A Modelling and
Value Chain Analysis. Washington, DC: IFC. https://commdev.org/wp-content /uploads/pdf/publications/Estimating-OG-Effects-Ghana-Rev.-7-06-17-2018.pdf
ILO (International Labour Organization). 2021. ILOSTAT. https://ilostat.ilo.org/data/
IMF (International Monetary Fund). 2000. “Chile in the 1990s: Embracing Development Opportunities.” Finance and Development 37 (1). https://www.imf.org/external/pubs /ft/fandd/2000/03/aninat.htm.
IMF (International Monetary Fund). 2012. “Macroeconomic Policy Frameworks for Resource-Rich Developing Countries.” Policy paper, IMF, Washington, DC. https:// www.imf.org/external/np/pp/eng/2012/082412.pdf
Kansake, B. A., F. A. Kaba, N. K. Dumakor-Dupey, and C. K. Arthur. 2019. “The Future of Mining in Ghana: Are Stakeholders Prepared for the Adoption of Autonomous Mining Systems?” Resources Policy 63: 101411.
Kaufmann, D., A. Kraay, and M. Mastruzzi. 2010. “The Worldwide Governance Indicators: Methodology and Analytical Indicators.” Policy Research Working Paper 5430, World Bank, Washington, DC. https://info.worldbank.org/governance/wgi /Home/Reports.
Kim, R., T. van Moorsel, and E. B. Kapstein. 2013. “The National and Regional SocioEconomic Impact of Newmont Ghana’s Ahafo Mine.” Steward Redqueen, Amsterdam. https://s24.q4cdn.com/382246808/files/doc_downloads/operations_projects/africa /quick_links/Socio-economic-impact-of-Ahafo-Operations.pdf.
Lebdioui, A. 2019. “Chile’s Export Diversification since 1960: A Free Market Miracle or Mirage?” Development and Change 50 (6): 1624–63.
Lederman, D., and W. Maloney. 2012. Does What You Export Matter? In Search of Empirical Guidance for Industrial Policies. Washington, DC: World Bank.
Lüders, R., and G. Wagner. 2003. “Export, Tariff, Welfare and Public Finance: Nitrates from 1880 to 1930.” Documentos de Trabajo 241, Instituto de Economia, Pontificia Universidad Católica de Chile.
Lundgren, C. J., M. A. H. Thomas, and M. R. C. York. 2013. Boom, Bust or Prosperity? Managing Sub-Saharan Africa’s Natural Resource Wealth . Washington, DC: International Monetary Fund.
Maddison Project Database. 2020 Release. https://www.rug.nl/ggdc/historicaldevelopment /maddison/releases/maddison-project-database-2020?lang=en.
Malova, A., and F. van der Ploeg. 2017. “Consequences of Lower Oil Prices and Stranded Assets for Russia’s Sustainable Fiscal Stance.” Energy Policy 105: 27–40.
Mamalakis, M. 1971. “The Role of Government in the Resource Transfer and Resource Allocation Processes: The Chilean Nitrate Sector, 1880–1930.” In Government and Economic Development, edited by G. Ranis, 181–215. New Haven, CT: Yale University Press.
Manley, D., J. F. Cust, and G. Cecchinato. 2018. “Stranded Nations? The Climate Policy Implications for Fossil Fuel–Rich Developing Countries.” OxCarre Policy Paper 34, Oxford Centre for the Analysis of Resource Rich Economies, Oxford, UK.
Markets and Markets. 2022. “Mining Automation Forecast to 2027 Report.” https://www .marketsandmarkets.com/Market-Reports/mining-automation-market-257609431.html.
McConnell, D. 1935. “The Chilean Nitrate Industry.” Journal of Political Economy 43: 506. McKinsey. 2022. “Global Energy Perspective 2022.” McKinsey and Company. https://www .mckinsey.com/industries/oil-and-gas/our-insights/global-energy-perspective-2022. Minerals Council South Africa. 2020. “Women in Mining in South Africa.” https://www .mineralscouncil.org.za/special-features/1064-women-in-mining-in-south-africa Minerals Council South Africa. 2021. “Junior and Emerging Miners’ Desk Fact Sheet.” Accessed June 14, 2022. https://www.mineralscouncil.org.za/work/supporting-junior -and-emerging-miners
Montoya, J. H., C. Tsai, A. Vojvodic, and J. K. Nørskov. 2015. “The Challenge of Electrochemical Ammonia Synthesis: A New Perspective on the Role of Nitrogen Scaling Relations.” ChemSusChem 8 (13): 2180–86.
Nwogu, N. V. 2019. “Mining at the Crossroads of Law and Development: A Comparative Review of Labor-Related Local Content Provisions in Africa’s Mining Laws through the Prism of Automation.” Washington International Law Journal 28: 137.
Oshokoya, P. O., and M. N. M. Tetteh. 2018. “Mine-of-the-Future: How Is Africa
Prepared from a Mineral and Mining Engineering Education Perspective?” Resources Policy 56: 125–33.
Peszko, G., D. van der Mensbrugghe, A. Golub, J. Ward, C. Marijs, A. Schopp, J. Rogers, and A. Midgley. 2020. Diversification and Cooperation in a Decarbonizing World: Climate Strategies for Fossil Fuel–Dependent Countries. Washington, DC: World Bank.
Ross, M. L. 2008. “Oil, Islam, and Women.” American Political Science Review 102 (1): 107–23.
Ross, M. L. 2019. “What Do We Know about Export Diversification in Oil-Producing Countries?” The Extractive Industries and Society 6 (3): 792–806.
Schmidt-Hebbel, K. 2006. “Chile’s Economic Growth.” Cuadernos de Economía 43 (127): 5–48.
Statistics South Africa. 2019. “Four Facts about the Mining Industry.” https://www .statssa.gov.za/?p=14682.
Stefanski, R. 2015. “Government Size, Misallocation and the Resource Curse.” In Commodity Prices and Macroeconomic Policy, edited by R. Caputo and R. Chang, 197–244. Santiago: Central Bank of Chile.
Stern, D. I., M. S. Common, and E. B. Barbier. 1996. “Economic Growth and Environmental Degradation: The Environmental Kuznets Curve and Sustainable Development.” World Development 24 (7): 1151–60.
UNCTAD (United Nations Conference on Trade and Development). 2021. UNCTADSTAT. https://unctadstat.unctad.org/EN/
UNEP (United Nations Environment Programme). 2017. “Tourism Can Help Sustain Biodiversity.” Accessed June 14, 2022. https://www.unep.org/news-and-stories/story /tourism-can-help-sustain-biodiversity
USGS (US Geological Survey). 2022. “Copper Statistics and Information.” https://www .usgs.gov/centers/national-minerals-information-center/copper-statistics-and -information.
Usman, Z., N. Oppong, N. Nwogu, and A. Henry. Forthcoming. “Digital Technologies and the Future of Work in Africa’s Mining Sector.”
van der Ploeg, F., and A. J. Venables. 2011. “Harnessing Windfall Revenues: Optimal Policies for Resource‐Rich Developing Economies.” Economic Journal 121 (551): 1–30.
Venables, A. J. 2016. “Using Natural Resources for Development: Why Has It Proven So Difficult?” Journal of Economic Perspectives 30 (1): 161–84.
WEF (World Economic Forum) and Accenture. 2017. “Digital Transformation Initiative Mining and Metals Industry.” White Paper. https://web.archive.org/web/20220320010909 /https://reports.weforum.org/digital-transformation/wp-content/blogs.dir/94/mp/files /pages/files/wef-dti-mining-and-metals-white-paper.pdf.
World Bank. 2019. “Digging Beneath the Surface: An Exploration of the Net Benefits of Mining in Southern Africa.” World Bank, Washington, DC. https://openknowledge .worldbank.org/bitstream/handle/10986/32107/Digging-Beneath-the-Surface -AnExploration-of-the-Net-Benefits-of-Mining-in-Southern-Africa.pdf?sequence=1.
World Bank. 2020a. The Future of Work in Africa: Harnessing the Potential of Digital Technologies for All. Washington, DC: World Bank.
World Bank. 2020b. Minerals for Climate Action: The Mineral Intensity of the Clean Energy Transition. Washington, DC: World Bank.
World Bank. 2021. The Changing Wealth of Nations 2021: Managing Assets for the Future Washington, DC: World Bank.
The World Bank Group is committed to reducing its environmental footprint. In support of this commitment, we leverage electronic publishing options and printon-demand technology, which is located in regional hubs worldwide. Together, these initiatives enable print runs to be lowered and shipping distances decreased, resulting in reduced paper consumption, chemical use, greenhouse gas emissions, and waste.

We follow the recommended standards for paper use set by the Green Press Initiative. The majority of our books are printed on Forest Stewardship Council (FSC)–certified paper, with nearly all containing 50–100 percent recycled content. The recycled fiber in our book paper is either unbleached or bleached using totally chlorine-free (TCF), processed chlorine–free (PCF), or enhanced elemental chlorine–free (EECF) processes.
More information about the Bank’s environmental philosophy can be found at http://www.worldbank.org/corporateresponsibility
This book examines the role for natural resource wealth in driving Africa’s economic transformation and the implications of the low-carbon transition for resource-rich economies. Resource wealth remains central to most Sub-Saharan African economies, and significant untapped potential is in the ground. Subsoil assets—such as metals, minerals, oil, and gas—are key sources of government revenues, export earnings, and development potential in most countries in the Africa region. Despite large reserves, success in converting subsoil wealth into aboveground sustainable prosperity has been limited. Since the decline in commodity prices in 2014, resource-rich Africa has grown more slowly than the region’s average growth rate. Finding ways to more effectively harness natural resource wealth to drive economic transformation will be central to Africa’s economic future.
As the world moves away from fossil fuels in alignment with commitments under the Paris Agreement, Africa’s resource-rich countries face new risks and opportunities. Recent estimates suggest that 80 percent of the world’s proven fossil fuel reserves must remain underground to meet the Paris targets, and much of these stranded reserves may be in Africa. This issue of stranded assets and, relatedly, “stranded nations,” has major implications for the many African economies that are dependent on petroleum extraction and export. On the other hand, the energy transition will increase demand for raw material inputs involved in clean energy technologies. The transition from fossil fuels to clean energy may create demand by 2050 for 3 billion tons of minerals and metals that are needed to deploy solar, wind, and geothermal energy. How can African economies tap into these opportunities while managing the downside risk to their fossil fuel wealth? Africa’s Resource Future explores these themes and offers policy makers insights to help them navigate the coming years of uncertainty.
ISBN 978-1-4648-1743-4
SKU 211743