A Unified Approach to Measuring Poverty and Inequality
Figure 3.8: Standardized General Mean Curves of Georgia, 2003 and 2006 3.0
Total
Generalized mean
2.4
1.8
1.2
0.6
0 –5
–4
–3
–2
–1
0 Alpha
2003
1
2
3
4
5
2006
Source: Based on ADePT Poverty and Inequality modules using Integrated Household Survey of Georgia 2003 and 2006.
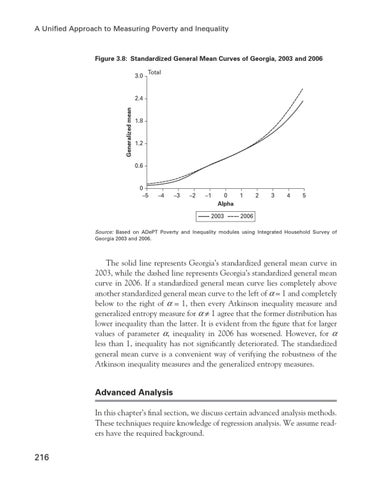
The solid line represents Georgia’s standardized general mean curve in 2003, while the dashed line represents Georgia’s standardized general mean curve in 2006. If a standardized general mean curve lies completely above another standardized general mean curve to the left of a = 1 and completely below to the right of a = 1, then every Atkinson inequality measure and generalized entropy measure for a ≠ 1 agree that the former distribution has lower inequality than the latter. It is evident from the figure that for larger values of parameter a, inequality in 2006 has worsened. However, for a less than 1, inequality has not significantly deteriorated. The standardized general mean curve is a convenient way of verifying the robustness of the Atkinson inequality measures and the generalized entropy measures.
Advanced Analysis In this chapter’s final section, we discuss certain advanced analysis methods. These techniques require knowledge of regression analysis. We assume readers have the required background.
216