
KITUI URBAN ECONOMIC PLAN January 2020


The development of Kitui’s Urban Economic Plan (UEP) has been made possible by funding from the UK government through UKaid’s Sustainable Urban Economic Development Programme (SUED) that is managed by Coffey, A Tetra Tech Company (“Coffey”). This report was developed by Atkins.
&ABBREVIATIONSACRONYMS CBD Central Business District CBO Community-based organisation CGoK Central Government of Kenya CIDP County Integrated Development Plan DFID Department for International Development FGDs Focus Group Discussions GBV Gender Based Violence GCP Gross County Product GDP Gross Domestic Product GVA Gross Value Added ISUDP Integrated Strategic Urban Development Plan KeBS Kenya Bureau of Standards KeNHA Kenya National Highways Authority KIHBS Kenya Integrated Household Budget Survey KII Key Informant Interview KOM Kick off Meeting KITWASCO Kitui Water and Sanitation Company KIMWASCO Mwingi Water and Sanitation Company KNBS Kenya National Bureau of Statistics KURA Kenya Urban Roads Authority MSW Municipal Solid Waste NER Net Enrolment Rate NGOs Non-Government Organisations NMT Non-motorised transport NSP National Spatial Plan PWD People Living with Disabilities PVs Photovoltaics SIG Special Interest Group SWOT Strengths, weaknesses, opportunities, and threats SUED Sustainable Urban Economic Development UN United Nations UEP Urban Economic Plan WSP Water Service Provider WASREB Water Services Regulatory Board
CONTENTS 1 Introduction 6 1.1. Background 6 1.2. Purpose of the plan 6 1.3. Approach 6 1.4. Key principles 9 1.5. Structure of this report 10 Executive Summary 2 2 Kitui Urban Diagnostics 12 2.1. Study area 12 2.2. Economic planning context 13 2.3. State of Kitui 15 2.4. Key challenges / risks 21 2.5. Key opportunities and drivers for growth 21 3 Economic Development Plan 24 3.1. Economic Visioning 24 3.2. Economic sector action plans 25 3.3. Kitui UEP 31 3.4. Development Framework 33 Focus Area 1: Town Centre 35 Focus Area 2: Industrial Cluster 47 Focus Area 3: Kalundu River Park 55 Wider Area Sectoral Proposals 65 3.5. Value Chain Projects 71 4 Implementation Plan 86 4.1. Partners & Institutional Structures 86 4.2. Implementation costs and potential funding sources 86 4.3. Recommendations for Capacity Building 94 4.4. Next Steps 96

› Create an attractive and vibrant business environment › Develop an enabling and responsive Municipal organisation › Promote opportunities for all members of the community
› Optimise and protect the use of Kitui’s abundant agricultural natural resources Action Plans have been developed for each of the key sectors, across: › Skills, training and technology provision › Marketing information and access
› Ensure resilient and resource efficient urban and economic growth
The Social Inclusion Study was a key part of the diagnostic, providing recommendations for meeting the aims of the SUED programme - to advance inclusion of PWDs, women and youth - as well as other identified groups who are currently excluded. The prioritised projects will embed recommendations for overcoming communication, physical, attitudinal and organisational barriers to inclusion.
The purpose of the plan is therefore to:
Section 2 of this document sets out the Diagnostic Assessment of Kitui, where the social, economic, infrastructure and environmental baseline has provided an understanding of the barriers and drivers to sustainable economic growth. Kitui has a high reliance on agriculture, though this is a low productivity sector with limited value addition and sectoral linkages. There is a general lack of skill availability and transfer of knowledge between people, businesses and sectors. It will be important to develop sectoral linkages and supply chains across the economic sectors and enable better market access, information and expertise.
› Supply chain linkages › Product quality certification › Finance and support for small business
The diagnostic identified three Key Sectors that Kitui should prioritise for infrastructure development and Value Chain opportunities, as: › Agriculture including Apiculture › Industry including Construction Materials › Trade and Commerce
EXECUTIVE SUMMARY
The Urban Economic Plan (UEP) is an advisory document that builds on existing work and priorities identified under the County Investment Development Plan (CIDP), the Integrated Strategic Urban Development Plan (ISUDP), the Capital Investment Plan (CIP), as well as aligning and complementing work done by other donors and organisations. In doing so, it will provide a focused urban and economic development strategy for the Municipal Board and Departments to deliver balanced and sustainable growth for Kitui.
EXECUTIVE SUMMARY 2
Critical for the development of the economy, through these key sectors, will be the improvement of the infrastructure particularly in areas affecting production such as irrigation for agriculture, energy for industry and transport access between suppliers and markets. There is unreliable water supply to support both population growth and production, whilst irrigated land is limited and not always used for high value crops. There is poor waste management and drainage around the town. The cost of electricity is high and unreliable, where the use of more sustainable and efficient energy sources, including solar and bio fuels, can drive industrial opportunities and support population Environmentalgrowth.and climate change threats exist, which will increase pressure on ecosystems, potentially worsen water scarcity and raise environmental degradation risks for soil, rivers, water supply, air quality and forested land. Furthermore, increased drought and flooding frequency may greatly impact agricultural yields and town production Addressingprocesses. these challenges can enable the town to establish itself as an effective multifunctioning centre, and lay foundations for sustainable economic growth.
› provide an inclusive urban and economic growth strategy that can guide future development towards increasing prosperity in Kitui; › prioritise economic activities and climate resilient infrastructure that can maximise benefits and support the development of a sustainable economic future of Kitui; › bring together stakeholders on deciding the economic future and growth trajectory of Kitui and implementing it; and › identify and prepare value chain projects that can be considered further in terms of their feasibility and bankability before SUED seed financing is committed. Stakeholders’ interests and insights have been considered throughout the development of the Kitui UEP.
Section 3 presents the Urban Economic Development Plan. This is driven by the economic vision that has been developed for Kitui: “Kitui will develop into a business innovation hub for the County as well as a supplier of premium honey and other quality products to the World”. This vision is underlined with objectives to:
Infrastructure developments Natural resource protection Effective land use management
The report then provides a programming and sequencing of the various projects along with high level cost estimations and suggestions on the sources of funding to finance them.
The proposed projects have been assessed against climate vulnerability and a number of adaptation measures have been identified to ensure resilience.
Furthermore, a range of wider area infrastructure projects and investments have been proposed which respond to the climate risks and environmental management required to support Kitui’s extensive agricultural base.
› Collaborations and partnerships
› An ecosystem (or cluster) of food processing activities starting with honey processing expanding into other products such as tamarind, mango and others in later stages.
Section 4 sets out further considerations for implementation across: partners and institutional structures; funding; capacity building; social inclusion; and climate change resilience. Following the completion of the UEP, during the next phase of the SUED programme, the identified value chain and climate resilient infrastructure projects will be developed further by: › Capacity building specialists to enhance municipal and local capacity to implement the projects and ensure revenue generation › Investment climate and attraction firms and experts to address policy and regulatory constraints; and to develop feasibility studies, business cases and investment promotion strategies for the projects Food processing, starting with honey Improved returns for bee keepers and stable prices for honey and related Directproductsemployment of 50 FTE in the first phase with high potential for employing SIGs, PWDs and other target groups By 2025 KSh 570 million of honey, wax, equipment could be purchased locally Wider value chain benefits with the supply of packaging materials, equipment and related premium price products. Estimated investment of KSh 230 - 280 million Building construction materials Supplying low-cost building materials to support the construction of affordable Reducinghomes construction’s carbon footprint and subsequent impact on local resources, place and production Direct employment of 72 FTE in the first phase with good provision especially for youth Trainingemploymentforanewgeneration of builders and establishing a low-skill construction system suppliers and routes. Estimated investment of KSh 90 - 120 million
3 KITUI URBAN ECONOMIC PLAN ›
›
These VC opportunities are presented in the Appendix with detail on: their key activities and supply chain, the capacity and competitiveness factors, the investment requirements and financials, potential partners, the infrastructure and land requirements, and overall impacts. In summary, the two VCs offer the following benefits for Kitui:
›
The three areas have been identified to create focused and concentrated infrastructure development investment and economic growth opportunities which are founded on the key economic sectors and infrastructure needs that have been identified through the diagnostic process. This will optimise climate resilient infrastructure investment and utilisation, enhance social cohesion and job opportunities, and unlock potential privately funded investments.
These Sector Action Plans will complement and provide an enabling environment for the shortlisted Value Chain (VC) opportunities. Six potential VC projects were identified in the assessment and in consultation with local stakeholders, by performing most strongly against the project’s evaluation criteria and Kitui’s established priority criteria - job creation, revenue generation and inclusion. All of these opportunities would be suitable for development in Kitui, however, two particular VC opportunities have been selected to maximise benefits and provide potential ‘quick wins’ for the programme:
Section 3 also presents the Development Framework, organised around three key focus areas -town centre, blue-green corridor and industrial cluster. A set of projects have been identified across urban design, power, transport, waste management and water management.
› Building construction materials - with a focus on brick making, roofing and affordable housing materials
EXECUTIVE SUMMARY 4 Figure 1 - Overall Development Framework plan showing the three focus areas and individual sector proposals


The preparation of the UEP comprised four main phases:
› Phase 3 - The UEP Technical Briefing Paper identified, assessed and prioritised economic growth opportunities and infrastructure needs and their respective requirements.
1. INTRODUCTION
INTRODUCTION 6
Combining local knowledge and international expertise, the Kitui Urban Economic Plan:
1.3. Approach The approach and methodology have been developed in response to the DFID terms of reference and in consultation with the SUED Team and DFID and has been tailored to consider local conditions in Kitui. The aim was to allow a collaborative approach between different stakeholders and the consultant team to assess Kitui’s economy in a systematic way, develop an agreed economic vision and prioritise actions that will have maximum impact and are ready to attract donor co-financing.
1.2. Purpose of the plan
› Phase 2 - The Diagnostics Phase was developed to provide a comprehensive and wide-ranging assessment of Kitui’s economy, demographics, infrastructure, environment and climate change risk profile against a local, national and international context.
In doing so, it will provide a focused infrastructure development and economic strategy for the Municipal Board and Municipal Departments to enable them to deliver sustainable urban and economic development within the municipality.
› Phase 4 - Development of the Final UEP which sets out in detail economic opportunities and actions and prioritises climate resilient infrastructure projects for implementation. It should be noted that this report is founded on the culmination of the preceding studies and phases which are all appendices to this report. Provides an inclusive economic strategy that can guide future development towards increasing prosperity in Kitui; Prioritises economic activities and climate resilient infrastructure that can maximise benefits and support the development of a sustainable economic future of Kitui and introduce international best practice and innovation; Brings together stakeholders on deciding the economic future of Kitui and implementing it; and Identifies and prepares value chain projects that can be considered further in terms of their feasibility and bankability before SUED seed financing is committed.
1.1. Background WS Atkins International Limited was commissioned to develop the Urban Economic Plan for Kitui as part of the UK’s Department for International Development Sustainable Urban Economic Development Programme (SUED). The aim of the programme is to support urban and market driven growth in emerging towns and cities in Kenya. Supporting these smaller centres provides an environment to create economic opportunities and job creation in a way that balances growth across the country, develops economic sectors that can contribute towards increasing the national output and provide an incentive for minimising uncontrolled migration. In order to enable the above, the programme will identify climate resilient infrastructure development that responds to the town’s urbanisation pressures and needs.
The UEP is an advisory document that builds on existing work and priorities identified under the County Integrated Development Plan (CIDP), the Integrated Strategic Urban Development Plan (ISUDP and the the Capital Investment Plan (CIP), as well as aligning and complementing work done by other donors and development agencies.
› Phase 1 - Inception Phase which focused on the Kick off Meeting. The aim was to present the approach of the UEP and capture key opportunities and challenges affecting urban development and economic growth in Kitui as defined by local stakeholders.
7 KITUI URBAN ECONOMIC PLAN Figure 2 - UEP Development Phases Inception Phase Gather throughcommentsinitialstakeholderengagement-KOM Economic International/DemographicandPolicyFrameworkNationaltrends UEP Technical Briefing Phase UEP PhaseDiagnostics Phase Identification of short listed VC opportunities and climate resilient infrastructure Consultation with Municipal Board, Municipality & County officers, Businesses, Special Interest Groups Analysis of Strengths,OpportunitiesWeaknesses,andThreatsofkeyeconomicsectors TransportationInfrastructureandprovisionEnvironmental&Climatechangeriskprofile theSettingprinciplesforthedevelopmentoftheUEP Setting Vision & key sectoreconomicactions Evaluating prioritisingandVCopportunities ClimateDevelopmentFramework&resilientinfrastructure resilientshortlistedrequirementsAssessing&impactofVCopportunitiesEvaluatingclimategreeninfrastructureopportunities opportunitiesValueprojects:Anchorchain
The Kitui UEP has been developed utilising primary and secondary research and analysis, ranging from local and national strategies and international studies to statistical analyses, focus discussions with stakeholders and surveys. A key component has been consultation with local stakeholders. Stakeholder Engagement The purpose of stakeholder engagement was to ensure that stakeholders’ interests are taken into consideration throughout the development of and reflected in the Kitui Urban Economic Plan. More specifically, the aims were:
› To ensure that the development of the Urban Economic Plan is inclusive and is undertaken in a manner that fits with Kitui’s business and community culture,
INTRODUCTION 8
Policy and Legal Framework Whilst the Urban Economic Plan (UEP) is a non-statutory document that is purposed to provide advisory services to the Kitui Municipality, it takes cognisance of the existing policy and legal framework. It builds on policies such as Vision 2030 and South Eastern Kenya Economic Block (SEKEB) which seek to promote economic sectors with the potential to unlock the economic growth of the Kitui County and Municipality. Further, it enhances the aspirations captured in the National Spatial Plan (NSP), Integrated Strategic Urban Development Plan (ISUDP), County Investment Development Plan (CIDP), and Capital Investment Plan (CIP). The UEP process substantially adopted the spirit of consultation as provided for in the County Physical and Land Use Development Plan as well as Local Physical and Land Use Development Plan. The rationale of the adopted context-based approach is to ensure that the UEP builds on the existing strengths to provide a focused and robust plan that will promote the sustainable urban and economic growth of Kitui Municipality.
› To understand better the interests of specific groups and how the Urban Economic Plan can benefit them, and
Figure 3 - UEP Statutory Context FrameworkPolicyUEP › Vision 2030 FrameworkLegal › Physical and Land Use Act, 2009 › Urban Areas and Cities Act, 2012 › The Land Act, 2012 SpatialPlans › NSP › CIDP › ISUDP › CIP
› To ensure that all stakeholders are clear on the purpose, scope, recommendations and outcomes of the Urban Economic Plan as well as meeting key stakeholder’s aspirations and gain buy-in from them,
Business consultation was undertaken to understand how Kitui’s businesses operate and their views on future growth opportunities and constraints. This consultation, through a detailed questionnaire, covered a range of respondents, including business and community groups that covered numerous enterprises, across Kitui’s main sectors.
› To provide a regular flow of information to and from key stakeholders A critical process in developing the UEP report has been stakeholder engagement including: › Stakeholder workshops; › Formal social consultations; and › Business consultations Three separate workshops were undertaken, including the Kick off Meeting (KOM), to gather feedback from stakeholders throughout the project. The first workshop (KOM) presented the project and process and collated information from over 80 stakeholders in terms of key characteristics, strengths and challenges within Kitui (captured within the Kitui Inception Report). Stakeholders included Municipal Board, Municipality and County officers, private sector, civil society groups and non-government organisations and representatives from Special Interest Groups. The second workshop focused on gathering feedback from the Kitui Municipal Head of Departments on the findings of the diagnostics evaluation, including sectoral SWOTs and identification of emerging economic opportunities. The feedback is in the Diagnostic Report and the UEP Technical Briefing Paper Report appended to this document. The third workshop focused on presenting and reaching consensus with stakeholders on economic opportunities that help leverage investment and support sustainable development in TheKitui.social inclusion study involved primary research, covering interviews with key project informants and five focus group discussions, which together resulted in the identification of socially excluded groups and the development of recommendations.
9 KITUI URBAN ECONOMIC PLAN
In addition to these principles, it is critical to ensure the UEP develops the competitiveness of the Municipality to promote and sustain economic growth.
Resource efficient: The projects will need to be resource efficient promoting minimisation of waste (or zero waste where possible) and optimising the use of water and energy. Sustainable: The UEP promotes green infrastructure and minimisation of environmental impacts. Resilient Resource Efficient Socially Inclusive Sustainable Resilient Shifts in the economy Adaptive infrastructure to climate change Smart Solutions Resource Efficient › Circular economy and zero waste › Water and energy management › Rural - urban linkages
›
›
›
›
Resilience: The prioritised projects will have to be resilient against shifts in the economy both for domestic and international markets as applicable to remain competitive. They will also need to be adaptive to potential climate change impacts, while ensuring technological advancement can be introduced where possible.
›
While these principles are closely linked and overlap in their definition, each one of them emphasizes a different aspect that is not fully captured by the others. Thus, it is important that all four principles are embedded in the UEP and its implementation.
Socially Inclusive Socio-economic trends Vulnerable groups Immigration/migration Sustainable › Low carbon development Green energy › Green infrastructure 1.4. Key principles It is important that the development of the UEP and evaluation of proposed projects are grounded on key principles that support the Programme’s aim to create market driven growth and build infrastructure resilience. The SUED Team has defined these principles as:
›
›
Socially inclusive: The UEP will need to be socially inclusive through a thorough understanding of who lives and works in Kitui and how all groups, including women, people living with disabilities and youth, can be engaged moving forward.
› Appendix D - Climate Vulnerability Assessment
1.5. Structure of this report Following this introduction, the report is structured as follows:
Utilise existing resources and comparative advantages; Successful cities should make the most of the assets and resources they already have, rather than trying to attract new types of industries that are not necessarily adapted. There is not a silver-bullet policy to improve competitiveness. Improve institutions and regulations; Poor institutions and high levels of corruption are likely to hinder private sector investment and development as these factors create uncertainty about public services delivery, efficiency and costs.
The purpose of the report is to assess the current position of the economy and state of infrastructure, alongside the regional, national and international context, before the consideration of emerging economic growth opportunities and infrastructure needs.
› Section 3 set outs the Urban Economic Development Plan, which is underlined by Kitui’s economic vision. Each of the three key sectors is presented with a summary of its SWOT analysis and a Sector Action Plan. The identified Value Chain projects are then set out in detail.
› Appendix A - Kitui Diagnostic Report
Section 3 outlines the Development Framework and supporting climate resilient infrastructure projects that have been identified for enabling urban and economic growth within Kitui.
› Appendix B - UEP Technical Briefing Paper Provides a Briefing Paper that captures the process followed from identification to assessment of growth opportunities for Kitui and provides recommendations on those with the greatest potential to maximise benefits and be developed further. The contents of this report will form the backbone of the Kitui UEP.
› Section 4 presents a range of implementation considerations to support the next stages of the SUED Programme.
Has been undertaken to outline the climate vulnerability context for the selected infrastructure projects to be developed in Kitui. The Climate Vulnerability Assessment will complement associated pre-feasibility and feasibility study assessments.
› Appendix C - Kitui Social Inclusion Study This study was a key part of the diagnostic process and engaged with special interest groups through interviews and focus group discussions. The study identified the groups that are excluded in socio-economic activities in Kitui and explored how and why they are excluded. The Study made a series of recommendations for the SUED programme to ensure inclusion and to address the multiple barriers (communication, physical, attitudinal and organisational) that these groups face.
› Section 2 provides a summary of key findings from the Kitui Diagnostics Report which forms the basis for the development of the Kitui UEP. Summaries of the demographic and economic profiles and the infrastructure and environmental assessments are presented. The section details the key challenges and drivers for growth, identifying Kitui’s key sectors.
INTRODUCTION 10
Develop a coordinated and comprehensive growth strategy; Achieving competitiveness requires improvements on a range of very different aspects, and there is a risk that decisions are taken individually with little considerations for how they interact. Instead, decisions should be coordinated around overarching goals (e.g., transport strategy should reflect and respond to strategies relating to poverty, skills and employment) and they should also be comprehensive (e.g., sectoral strategies should examine and target every step of the supply chain, not just the sector itself).
The report is supported by a series of appendices, in which:
Focus on the basics; › Health › Basic education
› ResearchInfrastructurefromthe World Bank shows that statistically, for cities with low levels of industrialisation and productivity, good institutions, social infrastructure (such as education and health) and basic physical infrastructures are the key determinants for success.

1 Government of Makueni County (2017) Makueni County Integrated Development Plan 2018-2022 105Machakoskm Kitui KonzaMakueniTechno City Agriculture is the engine that drives the economies of the SEKEB, and is the single largest employer across all the counties
The geographical focus of this report is Kitui Municipality and where applicable Kitui County Manufacturing & Mining 350kmMombasa 130Nairobikm
Thisbenefits.section
KITUI URBAN DIAGNOSTICS 12
› The environmental and climate risks
› Kitui’s socio-economic profile, with urban and economic conditions and trends
2.1. Study area The geographical focus of the Diagnostic Report is Kitui Municipality and where applicable Kitui County. Kitui is located on a low, flat plateau and is relatively close to Nairobi (130km to the west) and Machakos (105 km to the West) and is 350km north west of Mombasa. The county forms part of the South Eastern Kenya Economic Bloc (SEKEB) comprising three counties - Kitui, Machakos and Makueni. Agriculture is the engine that drives the economies of the SEKEB, and is the single largest employer across all the counties, however the sector is yet to reach its optimal productivity predominantly due to reliance on inappropriate technology and over reliance on rain-fed agriculture. While the economies of the bloc rely heavily on the agricultural sector, Machakos also has various manufacturing and mining industries which act as a key driver to the economy and Makueni will be primary host to Konza Techno City - the KSh 39 billion Technopolis for which phase 1 of infrastructure began at the end of 2018 1. The Technopolis is forecasted to boost trade within the county and encourage investors to establish industries nearby.
Study Area
2. KITUI URBAN DIAGNOSTICS Before any proposed interventions are developed it is important to understand the local development context and potential barriers. This has been undertaken with the UEP diagnostic process, as presented in Appendix A. This was a critical process to establish a foundation for identifying solutions that can deliver economic, social and environmental provides a summary of the diagnostic report’s assessment of:
› The state of Kitui’s existing infrastructure
13 KITUI URBAN ECONOMIC PLAN
International trends
National Polices and Strategies
Urban Areas and Cities Act (2011) Physical Planning Act No. 6 of 1996 (revised 2012) Kenya Vision 2030 National Spatial Plan (NSP) Kenya Green Growth Strategy
Introduce sustainable mining techniques Ensure the protection and conservation of the environment
The diagnostic process set the basis and context for the development of the UEP. The Kitui Diagnostic Report covers the key international and national trends, which are likely to influence Kitui’s growth trajectory, and the policy framework from national strategies through to Kitui’s own priorities and ambitions.
The Kitui UEP aspires to build on andenhance the work already done
Economic planning context
Urbanisation trends Depletion of resources Climate change Impacts of the 4th Industrial Revolution
Kenya Constitution 2010 (Chapters 5 & 12) County Governments Act No. 17 of 2012 (revised 2017)
Kitui County is part of the South Eastern Kenya Economic Bloc (SEKEB) alongside Machakos and Makueni. Agriculture is the engine that drives the economies of the SEKEB and is the single largest employer across all the counties.
Develop as an administrative center with multifunctional activites
Enhance and create small and medium scale industries, trade centre and storage facilities Preserve and develop agricultural land
Local Plans Kitui CIDP 2018-2022 ISUDP 2014 -2034
The Kitui UEP aspires to build on and enhance the work already done 2.2. Economic planning context
Kitui Municipal Charter (2018) Kitui Town Development Plan (dated 1996) Kitui Priorities
Existing Residential Areas: Low Density
Kitui
Existing Residential Areas: Medium Density
Existing Leisure and Natural Facilities Existing Transport Hubs Existing Government Facilities Existing Utilities Existing Industrial Sites Existing Commercial / Trading Centres
ExistingAirstripCarriageway (A9)
Existing Routes (Major and Minor)
LivestockDumpsiteMarket
A9 A9 KalawaRoadMbusyani Road KwaNgendu JikaRoad Sewage TreatmentKenyaPlantWater InstituteKitui District Hospital Kitui High School Kitui Stadium Kitui Town Hall Kitui Main Bus Terminal
Existing Conservancies Existing Recreational Areas Existing Markets Existing Healthcare Facilities Existing Educational Facilities Existing Community Facilities Kitui CBD Kitui CBD Kitui
Kenya Figure 4 - Kitui Context Plan
Dam and Eco Park KEFRI Forestry Commission
Airstrip
Kalundu
Existing Residential Areas: High Density
43%KituiMunicipality
MunicipalityKitui155,800populationin2009, at 15% of the county 232,000KituiMunicipalityestimatedtohaveinhabitantsin2020, a 20% share of the county population of 1.1 million 383,000KituiMunicipalityestimatedtohaveinhabitantsby 2035 Population Growth
Ofcountiesworking age residents with secondary education attainment Kitui25%County Kitui37%Municipality
3 Projections for Kitui to 2020 and 2035, and national and county to 2020 4 KNBS Census data (2009), 2009 population data from the Census
Nationally Kitui County
43%KituiMunicipality
2.3. State of Kitui Kitui town has experienced uncontrolled growth along main roads and urban sprawl which has resulted in the loss of rural land, poor configuration of uses, inadequate accessibility and lagging infrastructure. This threatens the economic growth, productivity and public health of Kitui.
EducationSecondary2.4% 1.2%
15 KITUI URBAN ECONOMIC PLAN
High levels of poverty
383,000KituiMunicipalityestimatedtohaveinhabitantsby 2035 Population Growth
Kitui3.5%Municipality
2 Kitui ISUDP (2014)
5 Kitui ISUDP (2014) As presented in Kitui Diagnostic Report, Atkins, 2019; as based on: KNBS 2009 Census, Kitui ISUDP (2014), Kitui CIDP (2017), KNBS, Exploring Kenya’s Inequalities (2014)
Demographic Profile
The county has a relatively large population, though the population is distributed across the land area where Kitui municipality represents an approximate 15% share with 155,800 people2 at the last Census. However, this share is expected to increase. Kitui Municipality is a mix of urban, peri-urban and rural population, where the town is a medium-sized urban settlement. There are some very high density areas in the town, with up to 4,300 persons per km2. Kitui municipality’s population is growing at a much faster pace (3.5% per annum) than the county (1.2%) and Kenya as a whole (2.4%).3 This reflects the pattern of increasing urbanisation in the county, where Kitui municipality has a high share of working age population (43%). There are educational disparities across Kitui County, whilst the Municipality aligns with the national level in urban areas for secondary education attainment.4 It is estimated that the municipality population will reach 231,000 in 2020 and 383,000 by 2035.5
30%County
MunicipalityKitui155,800populationin2009, at 15% of the county 232,000KituiMunicipalityestimatedtohaveinhabitantsin2020, a 20% share of the county population of 1.1 million
Kitui3.5%Municipality
High levels of poverty Inhabitants of Kitiu spend 1.5 times less than the average in Kenya. This ranks the County 37/47
Working Age
Ofcountiesworking age residents with secondary education attainment Kitui25%County Kitui37%Municipality
inbelowpeople590,00050%KituiTownshipwerelivingthepovertylinethecountyNationally23% For37%national urban areas
30%County
EducationSecondary2.4% 1.2%
Nationally Kitui County
inbelowpeople590,00050%KituiTownshipwerelivingthepovertylinethecountyNationally23% For37%national urban areas
Inhabitants of Kitiu spend 1.5 times less than the average in Kenya. This ranks the County 37/47
Working Age
A key part of the UEP diagnostic process was the Kitui Social Inclusion Study (Appendix C). This study engaged with special interest groups (SIGs) through interviews and focus group
4. Organisational barriers - the Programme’s Capacity Building wing shall design knowledge and skills development plans that benefit all the SIGs.
Leaving no one behind is a central theme that underlines both the 17 UN Sustainable Development Goals adopted in 2015 and Kitui County’s aim of transforming Kitui for Inclusive and Sustainable Development.
On average the inhabitants of Kitui County spent KSh 4,362 per month.6 This is 1.5 times less than the average Kenyan inhabitant (KSh 6,620). In only 10 counties (out of 47) were people spending less per month. In comparison, individual expenditure in Nairobi was 3 times higher at KSh 13,954 per month. Around 60% of the county population was living below the poverty line in Kitui in 2009, the county had the 10th highest share of residents in poverty.7 3.5% of the poorest inhabitants were living in Kitui.
2. Physical barriers - the Programme’s infrastructure must enhance access and use of physical activities by PWDs.
Thediscussions.studyfound that the groups regularly excluded in socio-economic activities in Kitui are: 0 8642,000,000,000,000 11110,0002,0004,0006,000 irobiNa baMomsa biKamu iKsumu Lamu kNauru khaMacos iNyer adijKao iiKrnyaga GiUasnishu ihiVga iiMgor bEmu Murang’a hiKerco ndaruNyaa ihiNkharaTat Siaya Meru liIsoo Bungoma iNTranszoa fiiliK BHomaay TiTataaveta iiiKs iandN iikiLapa kKaamega Garissa iNyamra kNaro iBarngo kMlEgeyoarawet Bomet iiKtu ikMauen iBusa lKwae iRTanaver Samburu kPWestoot iabMarst anderMa kTurana jiWar Monthly spend per capita Kenya average Social Inclusion
7 Source: KNBS, 2016.
The SUED Programme’s focus in terms of inclusion is PWDs, women and youth. Leaving no one behind is a central theme that underlines both the 17 UN Sustainable Development Goals adopted in 2015 and Kitui County’s aim of transforming Kitui for Inclusive and Sustainable Development. As such the UEP’s proposed interventions need to be PWDs, gender and age-responsive.
The Kitui Social Inclusion Study explored how and why these groups are excluded and made recommendations for their inclusion in the SUED Programme.
These recommendations are summarised as:
Social Inclusion in Kitui
Figure
3. Attitudinal barriers - the Programme to act as a role model in inclusion, and train staff on matters of inclusion.
Source: KNBS, Socio Economic Atlas of Kenya (2016) 5 - Monthly spend per capita (in KSh)
Note that the data has been calculated by combining census data from 2009, and a household survey from 2005. The results are expressed in 2013 prices.
1. Comunication barriers - the Programme to ensure all SIGs are included in subsequent workshops.
5. For the value chain projects for Kitui Municipality, a monitoring and evaluation framework should be implemented to measure inclusion progress throughout the Programme.
PWDs – They are discriminated against in employment and in transport infrastructure and buildings People Living with HIV/AIDs –Those who have openly expressed their status are discriminated against and face stigma in the community. Albinos – They are viewed as a ‘small, different’ group of people, who are never involved in decision making
6 Source: Kenya National Statistics Bureau of Statistics (KNBS), Socio Economic Atlas of Kenya, Second Edition (Nairobi: KNBS, 2016).
KITUI URBAN DIAGNOSTICS 16
17 KITUI URBAN ECONOMIC PLAN Economic Profile
Nyandanrua MarakwetoElgey Nairobi Mombasa Nakuru Lamu Kiambu Nyeri Machakos Embu Bomet NithiTharaka Kisumu Kirinyaga Marok Muranga Laikipia Busia Meru Nyamira Kericho TavetaTaita Uasin-Gishu Baringo Nandi Kajiado Kisii NzoiaTrans RiverTana Marsabit Makueni Dwale Isiolo BayHoma Bungoma Kakamega Siaya Vihiga Kitui Samburu Garissa Migori Kilifi Sajir Turkana PokotWest Mandera
Economic Profile small economy
GCP per capita (2017) Kenya average
Economic Profile small economy
Kirinyaga Marok Muranga Laikipia Busia Meru Nyamira Kericho TavetaTaita Uasin-Gishu Baringo Nandi Kajiado Kisii NzoiaTrans RiverTana Marsabit Makueni Dwale Isiolo BayHoma Bungoma Kakamega Siaya Vihiga Kitui Samburu Garissa Migori Kilifi Sajir Turkana PokotWest Mandera 100,000150,000200,000250,000300,000350,000400,00050,0000 Gross county product per capita, 2017 (in KSh) GCP per capita (2017) Kenya average Source: KNBS, Gross County Product (2019) 8 KNBS Gross County Product (2019), 2017 data Further, Kitui County is one of the smallest counties in terms of GCP per capita, at 39th out of 47 counties and half the national average. Mandera Wajir Isiolo Tharaka-NithiMeru GarissaLamu Kilifi Narok HomaMigoriBungomaNyamiraKerichoUasinGishuBaySiayaBusiaTransNzoiaVihigaKisumuKakamegaNandiKisiiBomet NyeriNakuru Nyandarua KirinyagaEmbuMakueniMachakosKajiadoKiambuMuang a Taita Taveta KwaleTana River MarsabitWestTurkanaPokotElgeyo-Marakwet Samburu Laikipia Baringo Kitui GCP change (%) 2013-17 < 1010to 20 20 to 30 30 to 40 > 40 Nairobi Mombasa 12% 25% The county has had the second slowest GCP growth rate between 2013 and 2017 at over the period, whilst Kenya grew at Figure 7 - GCP growth per annum by county, 2013-2017 Source: KNBS, Gross County Product (2019) Figure 6 - Gross county product per capita, 2017 (in KSh)
Nyandanrua MarakwetoElgey Nairobi Mombasa Nakuru Lamu Kiambu Nyeri Machakos Embu Bomet NithiTharaka Kisumu
100,000150,000200,000250,000300,000350,000400,00050,0000
Despite its recent population growth, Kitui County is a as the 26th largest county in Gross County Product (GCP) at Ksh 101 billion.8
Gross county product per capita, 2017 (in KSh)
Despite its recent population growth, Kitui County is a as the 26th largest county in Gross County Product (GCP) at Ksh 101 billion.8
11 KNBS, Exploring Kenya’s Inequalities (2014) State of Businesses in Kitui
One of the key questions was around constraints to growth, whilst most reported an aspiration to expand the following were seen as SEKEB, South Eastern Kenya Economic Bloc Concept Paper (2017)
10 As before - KNBS, Gross County Product (2019)
Source: KNBS, Gross County Product (2019)
Source:
Inequalities (2014) 24% 21% 25% 39% 13% 13% 12% 22% 32% 27% 26% 9% 9% 14% 10% 6% 13% 15% 16% 11% 8% 8% 9% 11% 0% 10% 20% 30% 40% 50% 60% 70% 80% 90% 100% Kenya Kitui County Kitui Municipality* Kitui Township Work for pay Fami y Business Family Agr cu tural Holding Intern/Volunteer Retired/Homemaker Ful t me student Incapacitated No work Poor infrastructureurban Small marketlocalscale Limited access to markets Lack of finance Figure 8 - Employment status, 2009
KITUI URBAN DIAGNOSTICS 18
The
Technical services include ICT, finance, real estate, professional & scientific activities.
Exploring
barriers: EconomicstructureofKitui,2017 servicesPublic21% Retail, hospitality and other 7%services Agriculture41%Mining and utilities Manufacturing2%<1%Constructionandlogistics10%Technicalservices19% 9
Most of Kitui’s economy relies on agriculture with more than 40% of its GCP and a far greater share of its livelihoods (75% of the municipality and 87% of the county) depending upon it.9 However, it is currently a low value sector with the county providing only 1.5% of total national agricultural output. The town’s economy is largely composed of public services, reflecting the town’s important role for the county as an administrative and economic centre, whilst manufacturing is an undeveloped sector and represents less than 1% of the total county output.10
As part of the diagnostic process, businesses based in Kitui town were consulted with. This covered 16 respondents including business and community groups that represented nearly 2,000 workers.
Kitui County overall shows a relatively similar picture of the labour force to the national economy, with very similar shares of the population in and out of work. municipality and township have greater shares working for pay, however also higher shares out of work.11 KNBS, Kenya’s
There is significant potential for renewable energy generation from solar.
WalkingTransportationandbodabodas are the main modes of transport in Kitui town.
Sanitation Solid Waste
use motorcycle boda-bodas reflecting the demand for end to end services that is not currently met by public transport services of the population walk
Infrastructure Provision
19 KITUI URBAN ECONOMIC PLAN
7,000 - 10,50032%
If utilised, this will reduce the reliance on hydropower and reduce carbon emissions by offsetting generation from fossil fuels.
The plan also estimates that a further 500,000 hectares could be irrigated if the Tana and Athi river basins were developed.
20%70%
*JMP 2017 - https://washdata.org/data/household#!/table?geo0=country&geo1=KEN
IrrigationWater Power Drainage
In Kitui of the population have access to water within a 30-minute return trip on foot of the population have access to at least a basic water supply* Nationally 58.9% 42% ofOnlythe urban population have a connection to the public water supply
1,850 hectares of land are irrigated 9,245 hectares Kitui county currently has the potential to expand irrigation to an additional 56.8% of households in Kitui have access to improved sanitation services 10-15% of the waste is recyclable (paper, card, plastic, metals and glass) equating to around is the national average65.3%
Dumping of waste in open areas occurs frequently. tonnes currently for Kitui town increasing to around 12,500 - 18,750 tonnes in 2035
There are plans to rehabilitate the drainage systems within Kitui. The town largely relies on pit latrines and septic tanks for disposal of wastewater/sewage.
The geology and soils of Kitui provide a rich base for resources such as sand, clay, limestone, iron ore, copper and other commercially exploitable minerals. The most exploited resource in the county is sand, which is mainly harvested from rivers.
The climate of Kitui County is hot and dry with unreliable rainfall. The climate falls under two climatic zones i.e. arid and semi-arid with most of the county being classified as arid.
KITUI URBAN DIAGNOSTICS 20
The lack of regulation of the sand harvesting industry has resulted in usethreatsdegradationenvironmentalofrivercatchments,onecosystems,andwaterconflicts
Water scarcity is an issue in Kitui County, due to low rainfall and recurring droughts Kitui County experiences land degradation challenges (driven by cropping and overgrazing), loss of forest cover, pressures on conservation areas and the extraction of natural resources.
Environment and climate change risk profile
The forests are sources of products such as poles, timber, fuelwood, wood posts, charcoal, herbal products, wood for carvings, animal fodder and honey. The agricultural activities, while sustaining livelihoods in the county, have also had the greatest toll on the land due to its susceptibility to erosion, compaction, and denudation.
The dryland hilltops in Kitui are species-rich ecosystems that harbour diverse and unique biodiversity owing to cooler temperatures and higher precipitation relative to the surrounding savannahs.
The Semi-arid farming zone has good potential for agricultural development and is currently either cultivated or under woodlands.
Theimprovements.costofelectricity is high and there is poor rural access. This can be overcome with the use of more sustainable and efficient energy sources, including solar and bio fuels, to drive industrial opportunities and support population growth. Transport provision is hampered with poor conditions of the road network, increasing journey time and limiting scope for processing and exports; whilst unreliable bus routes, limited non-motorised facilities and a lack of parking inhibit the town being an effective multi-functioning centre. There will be a need to employ sustainable and efficient practices utilising local resources as the economy diversifies and grows. Appropriate economic opportunities should be promoted, and the supporting infrastructure put in place, which minimise the exposure to climate change risks.
The county’s eastern and central areas are low lying and vulnerable to flooding during heavy rains, resulting in impassable earth roads, disease outbreak and soil erosion. These effects pose significant risks to Kitui’s infrastructure, for example changes in rainfall patterns impact hydropower generation.
2.4. Key challenges/risks In order to achieve sustainable growth, there are a number of key challenges for Kitui to overcome. There is a general lack of skill availability and transfer of knowledge (both traditional and new technology) between people, businesses and sectors.
A SWOT analysis was undertaken for these sectors, based on the detailed analysis and consultations of the diagnostic process. This considered the strengths and weaknesses of the sectors’ existing activity and economic linkages, as well as the future opportunities and threats that will need to be addressed. This process set a baseline for developing Sector Action Plans, to drive economic growth in Kitui and support the identified Value Chain opportunities. The following section provides summaries of the SWOTs and details the Sector Action Plans.
Agriculture ConstructionIndustryApicultureincludingincludingmaterials Trade and Commerce
Climate change effects Kitui County has been hard hit by the effects of climate change. This is due to the county’s reliance on agro-pastoralism, and encroachment of agricultural activities on otherwise fragile environments. The most visible effects of climate change include more frequent and prolonged drought, shorter and unpredictable rainfall seasons, dry river beds, massive crop failure, increased temperatures, increased pest and disease incidences, and increased poverty.
2.5. Key opportunities and drivers for growth Kitui is a vibrant town that services the county and benefits from its strategic location and abundance of natural resources, all of which form a solid basis for developing the economy. The Kitui Diagnostics Report identified three key sectors for further assessment, as the sectors with the most potential for Value Chain opportunities.
Understanding sectoral linkages and improving access to supply chains will be an important factor for growth alongside improvements in market access, information and expertise.
Critical for the development of the economy will be the improvement of the infrastructure within Kitui as well as outside the town, particularly in areas affecting production. There is unreliable water supply to support both population growth and production crops, whilst irrigated land is limited and not always used for high value crops. There is increasing pressure on ecosystems from unsustainable practices, where pollution and degradation from existing activities are evidenced - soil, rivers, water supply, air quality, deforestation - although there are small
Climate change adaptation is an essential consideration in the planning, design and operation of Kitui’s infrastructure.
21 KITUI URBAN ECONOMIC PLAN


Objectives Vision Objectives& Economic Sector Action Plan & Value Chain Project Opportunities Development Framework & Priority Infrastructure Projects
The model for development for Kitui is founded on the UEP principles set out in Section 1 and in collaboration with Kitui stakeholders. It aims to strengthen Kitui’s economic position based on its competitive and comparative advantages and taking a citizen centred approach to green growth and sustainable investment. The Kitui Urban Economic Plan sets out an economic Vision and economic action plan which will support the Municipal Board and the Municipality deliver a more cohesive, holistic and sustainable economic future for AKitui.number of potential value chain projects have been identified which can act as anchor projects while a development framework prioritises key climate resilient infrastructure projects that will be required to support economic growth.
ECONOMIC DEVELOPMENT PLAN 24
3. ECONOMIC DEVELOPMENT PLAN
To promote diverse economic development within an attractive investment business environment, Kitui must focus on its key economic sectors and competitive advantages that can support growth within the Municipality, and throughout the county, and facilitate both sustainable growth and the adoption of latest best Aspractices.aresult the Economic Vision for Kitui is as follows: “Kitui will develop into a business innovation hub for the County as well as a supplier of premium honey and other quality products to the World”. The Vision is supported by a series of objectives to be adopted by the Municipality which will provide direction and clarity in its decision making and future activities. These are: Ensure resilient and resource efficient urban and economic Creategrowth an attractive and vibrant business environment Develop an enabling and responsive Municipal organisation Promote opportunities for all members of the community Optimise and protect the use of Kitui’s abundant agricultural natural resources
3.1. Economic Visioning
Inability to meet increasing energy demands, with an underutilisation of non-hydro renewable energy sources.
Some good social inclusion and county engagement, such as women’s producer groups.
Poor marketing and market information, with lacking supply chain infrastructure.
Traditional apiculture techniques reduce quality and quantity of produce.
Increasing water scarcity and water contamination risks due to land degradation, lacking regulations and poor waste management.
3.2. Economic Sector Action Plans
Negative attitudes towards PWDs in this sector, cultural values can constrain women’s roles.
Some high value crops such as mangoes (Kitui is a leading producer), cereals, sisal and cotton. Close to Nairobi for markets and processing facilities, with a strategic location in SEKEB. Historic apiculture activity and knowledge - small scale and traditional methods used. There is some fishing activity with recent growth, and a conducive environment.
Lack of private land ownership impacts land use and advanced methods practice. Risk of poor resource and new technology Themanagement.lackoftown space and effective planning constrains market development for produce.
Having identified the three key sectors for further assessment (see page 21) the Economic Development Plan has formulated the following Action Plans for each sector. These are premised on the SWOT analysis that was part of the Diagnostics Reporting stage (Appendix A). Summaries of the SWOTs are presented below for each sector (with strengths, weaknesses and challenges), whilst the Value Chain opportunities are presented in Section 3.3. Agriculture including Apiculture Agriculture is a sector of fundamental importance to Kenya’s economy. It accounts for approximately 25% of annual GDP with a further 25% through the supply chain and related spending. Agriculture represents 65% of Kenya’s exports and accounts for 70% of informal employment in rural areas.12 As such, developing the sector has been identified as a central component of the country’s growth strategy, as clearly reflected in Vision 2030. Specific policies being targeted include improving the branding of Kenyan agricultural products to increase their value in global markets and improving the management of land registries for land use to help increase productivity. Kitui is a rural county, with a higher than average share of residents deriving their livelihood from agriculture and its semi-arid farming zones provide a strong basis for agricultural development. However only 10% of the county’s arable land is available for production.
Strengths Weaknesses Challenges to address
Growing population to put more pressure on ecosystem with unsustainable practices. Climate change to further impact the incidence of drought and flooding. Further land degradation from over-cropping and overgrazing, and deforestation - reducing land productivity.
Less than 10% of potential irrigated land has infrastructure in place - mainly used for low-value crops.
25 KITUI URBAN ECONOMIC PLAN
Poor storage and processing facilities - with limited sector and industry linkages.
Low skill levels for technology use and best practice leadership.
Limited access to electricity in rural areas, with high costs and a reliance on local hydroelectric power.
Continued urban migration, leaving a lower working age population and skills base.
Many of the crops are seasonal and this limits annual output.Other crops include green cowpeas,pigeongrams,peas,maize.
12
SWOT Analysis Summary for Agriculture, including Apiculture
Agricultural sector development strategy
Limited added value with a lack of modern technology knowledge, reducing quality.
› Support certification:productObtaining product certifications can help differentiate crops in the market-place, and justify selling them at a premium.
ECONOMIC DEVELOPMENT PLAN 26
› Improve access to agriculture training: NAFIS (national farmers information service) is a government service that provides ad-hoc support to farmers.
› Introduce processing:particularlymechanisationmorepractices,inagroit enables time and physical efficiencies, can help grow the quantity and quality of products, while reducing losses. Mechanisation can happen at the production stage (tractors, technologies)irrigationand at processing stage (grinders, juicers, dryers to product byproducts, for instance mango juices).
› Promote financial support for small businesses: Access to finance is particularly difficult for farmers wishing to expand to more mechanised activities. The high seasonality of the industry, risks related to weather conditions and the lack of secured property rights makes production highly reliant on external factors and therefore risky to finance. The World Bank is working through its AgriFin programme to provide technical assistance to the financial sector in Africa, helping to develop products that are specific to the agribusiness and are better at assessing risks and opportunities. Specific financial products are also made available for vulnerable groups, such as governmentbacked Uweto Fund for women, youth and people with disabilities. The World Bank, Growing Africa: unlocking the potential of Agribusiness (Washington: the World Bank, 2013)
› Develop and strengthen local informal markets: it is crucial to develop platforms for farmers to sell their products locally.
Improve road accessibility: in particular, connecting to the “extra mile” - between fields and the main town or market - can be particularly challenging and costly. In Nyeri County, the cost of transporting onions over the first two kilometres accounts for 10 to 20 per cent of the income that farmers derive from selling their onions, meaning good accessibility from the fields to main corridors is essential.
Skills & Technology Marketing Finance
› Partner with key organisation for best practices and access to technology: The Centre for Agriculture and Bioscience International (CABI) in Kenya has thetoApiculture(KALRO)ResearchAgriculturequalitybiologicalandprotectingdevelopedsuccessfullymethodsofcropsfrompestsdiseases,effectivecontrolsandseeimprovement.KenyaandLivestockOrganisationhasopenedanResearchInstitutesupportthesectoracrosscountry.
Actions for Apiculture Bank
It is estimated that 1,850 hectares of land is currently irrigated, but the county has the potential to expand irrigation to an additional 9,245 hectares. Research also shows scope for improving water productivity through practices including water harvesting, supplemental irrigation, deficit irrigation, precision conservationtechniques,irrigationandsoil-waterpractices.
program to introduce modern beehives across the County, including training in how to use them › Expand the number of beekeepers and beehives across the County › Expand the number of honey extraction sites across the County › Increase understanding of hygiene and quality control issues through extension agriculture officers › Develop centralised honey processing and service centre
FAO. 2011.Sustainable Land Management in Practice. Rome: TerrAfrica Techniques to reduce soil erosion and degradation should be explored. Land diversification techniques, such as crop rotation (cultivating different crops throughout seasons) and intercropping (cultivating several crops simultaneously) could be explored as they tend to have positive impacts on erosion, biodiversity and water retention. Other practices, such as croplivestock integration and agroforestry can help reducing the use of pesticides and fertilisers.
› Consolidate the value chain by encouraging packaging and labelling practices: post-production practices are less developed in Kitui, but they could help generate more value from products. Local honey is currently sold in plastic containers and often lacks labelling, but a better packaging and presentation will be required for exports to larger national markets. (Refer to Value chain projects and Development Framework further below)
The World Bank, Growing Africa: unlocking the potential of Agribusiness (Washington: the World Bank, 2013) Kitui is vulnerable to the loss of forest-covered land, which puts at risk the development of apiculture activities - identified as a key activity for agricultural growth. Developing practices such as agro-forestry can give more economic value to forest land and limit detrimental human activities over it.
› Continue the World
Actions for Agricultural Development
BuildInfrastructureefficient storage facilities: this has been recognised as an important investment for farmers in Kitui county, and efforts must be pursued to provide adequate facilities.
Malabo Montpellier Panel, Mechanized: transforming Africa’s Agriculture Value Chains (Dakar: Malabo Montpellier Panel, 2018)
Improve Water Management Prevent Soil Degradation Protect Forest Coverage
› Promote non-financial support for small businesses: With regards to non-financial support, such as business and marketing training, organisations such as the Kenya Association of Manufacturers (KAM) provide training and courses to help small businesses develop their business strategy.
27 KITUI URBAN ECONOMIC PLAN
The recent acquisition of a stone crusher provides a good opportunity for Kitui to develop interlocking blocks, to support high demand for affordable housing and construction in general.
Construction materials and block making
Strengths Weaknesses Challenges to address
Further pollution of soils and water resources from poor management of Insufficientwastes. regulation resulting in environmental degradation of river catchments, and water use. Climate change to exacerbate water supply issues.
Lack of railway line and good airport/port access.
Growing congestion on local road network from B7 development. Lack of parking capacity.
SWOT Analysis Summary for Industry, including Construction Materials
Unreliable water supply for the industry and larger scale
Lack of spare capacity at substations constrains rapid industrialisation.
Poor marketing and supply chain infrastructure, limited engagement and training in construction activity.
Availability of materials: stone and quarry dust, clay, limestone, iron ore, coal. Skills in stone cutting and block making.
Limited access to and management of better machinery. Lack of skills and local training in new methods.
High demand for construction sector both within the county and also nationally. There is interest from youth groups in terms of employment. Presence of a clothing factory with a developing workforce.
Manufacturing has been identified as a key driver of economic growth in the Kenyan government’s development strategy.
The sector contributes to around 10% of GDP and the government aspires to increase that share to 15% of GDP by 2022. Food production is the largest contributor to manufacturing-led economic output. The industrial sector is limited in Kituiwith manufacturing accounting for less than 1% of the county’s GCP. There are two main subsectors considered within the UEP: › Agro-processing ›
Unsustainable methods e.g. clay blasting, with large volumes of waste and poor waste management. Limited access to affordable energy. Little understanding of electricity generation and biofuel and renewable sources.
The exclusion of certain social groups would limit the sector’s inclusive economic growth.
Industry, including Construction Materials
Poorproduction.roads conditions and only one connection to national trunk road (A9).
treated.moreinpollutionpurposesbeneficialproximityGeographicalcanalsobeforenvironmental-wasteandareconcentratedonelocationandcanbeeasilymanagedand
› Ensure the County mortgage program supports the use of these new materials
ECONOMIC DEVELOPMENT PLAN 28
› Provide vocational training to new workers:manufacturing
Skills Finance
When in comes to training for factory workers, the best type of skills development policy for the is through onsite training, instead of managementfactoryproposeofashours.workasmoretargeteddeliverOnsiteinstitution-basedtraditional,learning.trainingallowstomorerelevantandtraining,andisalsoconvenientforworkersithappenswheretheyandduringworkingInstitutionssuchtheKenyaAssociationManufacturers(KAM)trainingforworkersandmiddlealike.
› Encourage long-term education in technology: the county is looking at upgrading Mulango Polytechnic to middle level tertiary education.
Actions for Building Materials
› Support small companies’ access to finance and business support: While a range of financial products are available for small and medium size companies through traditional banks, Kenya Industrial Estates Ltd is dedicated to finance micro, small and medium industrial companies and support Itindustrialisation.ruralprovidesfunding as well as incubation services to support entrepreneurs.
Actions for the Development of the Industry Sector
Plan for Industrial Activity (Refer to Specific Section in Development Framework)
› Include training in use of new materials such as interlocking blocks at vocational training colleges
› Prioritise use of the blocks and other new low-cost materials in Town and County developments of schools, clinics, houses, etc
› As the industrial sector is currently very limited, there is an opportunity to develop new industrial projects in the same geographical location. Manufacturing and processing industries often have the same type of spatial requirementlarge floorspace, good accessibility for deliveries, strategic location near road networks, relative distance to residential areas - making it cost-efficient in a public investment point of view to create an industrial cluster. Infrastructure provision (water, energy) can be more efficient.


Redevelopment of the B7 road could bring congestion through the Furthertown. encroachment and pollution impacting the rivers and riparian corridors.
Large parts of the road network are in poor condition, lack non-motorised provision.
Rapid population growth, with unplanned expansion of the town to impact its appeal (e.g. waste, congestion).
Poor waste management of households and businessesimpacts the appeal of the town.
29 KITUI URBAN ECONOMIC PLAN
Limited access to affordable energy, with high cost electricity, and power interruptions.
Kitui town is the only significant agglomeration within a large, highly populated (1.1 million inhabitants), and mostly rural county. This makes it a key regional market place whose role is likely to grow over the next decades. It is important that steps must be taken to manage this projected growth and ensure the town continues playing its role as a place of trade and commerce efficiently. Several issues have been highlighted including poor traffic circulation, a lack of parking spaces, lack of pedestrian facilities, and a need to increase the number of recreational zones and ornamental space.
SWOT Analysis Summary for Trade and Commerce
Little cultural or tourism offer, with no classified tourist hotels in the Limitedtown.locally made products that can promote further trade activity with other counties and nationally.
Some of those elements can be critical to trade activities - in particular those that relate to human mobility and transport.
Strengths Weaknesses Challenges to address
Trade and Commerce
Climate change to exacerbate water supply issues. Lack of local affordability of products will undermine sector contribution to sustainable economic development. Kitui town is main administrative centre for the county, with 3 local markets for trade.
While Kitui town already has several locations for trade, including three markets, more are needed given the growing local importance of the town. The county identifies that 22 new informal markets will be needed as the town centre is increasingly becoming heavily congested and served by an undersized bus park.
Lack of security and safety due to limited lighting around the town and market areas. Limited skills to expand the sector’s value and take up service jobs.
Vibrant urban core with a mix of commercial and residential uses, which can be enhanced. Different groups are involved in local crafts production, Kitui Taka Youth Group and Kyanika Women's group.
ECONOMIC DEVELOPMENT PLAN 30
Living Cities, 14 smart ways to create public space: real examples from sub-Saharan Africa (Stockholm: Living Cities, 2018)
› Engage with local stakeholders: planning processes require full involvement from local business community
Actions for the Development of Trade and Commerce Sector
› Improve placemaking in Kitui town centre: placemaking includes all policies that aim to “understand, design and program public spaces by putting people and communities ahead of efficiency and aesthetics”. This aims to make urban areas more accessible and empower citizens. Providing spaces for trading and social gathering – for instance a pedestrian square - would help support trade in a town that lacks pedestrian areas like Kitui. Providing recreational zones like parks and playgrounds, while not directly supporting trade, could still make the town more liveable and attractive to consumers.
› Improve business registry: the national government is in charge of maintaining track of businesses, and has facilitated business registration through an online process.
Land Use & Infrastructure (Refer to Specific Section in Development Framework) Marketing
› Provide space for logistics: logistic space, including parking space for lorries, has been identified as missing in the town. If trade is to become a growing sector in the town, logistics infrastructure will have to be further developed - taking into consideration the location of main markets, industrial clusters and residential areas.
› Strengthen public transport infrastructure and operations: increasing the capacity of the bus park - or opening a new bus parkwill reduce city centre congestions and make accessibility to the town centre easier and more reliable, with spinoff effects on trade and access to public services.
› Develop business support training and enable access to finance including targeted training for vulnerable groups: a number of financial and non-financial services are available.


Activities that could transfer Target activities Trends: Planning policies - ISUDP, CIDP Municipality specific opportunities
• Economic • Technology • Environment ActivitiesPotential SWOT
31 KITUI URBAN ECONOMIC PLAN
EvaluationOpportunitiescriteria:Municipality
Short list Opportunitiesof
The overall approach to identifying the long list of potential value chain projects for Kitui has been to first develop an extensive list of potential economic opportunities, and then assess these in terms of the economic potential and constraints within the Municipality and in relation to the wider national and regional economic context. The approach is outlined in Figure 9 left while Volume B of the appendices provides a detailed account of the process used to identify and prioritise opportunities including an assessment of those value chain opportunities that can maximise benefits for Kitui.
3.3. Kitui UEP Critical to the successful delivery of the SUED programme is the identification of potential value chain and climate resilient infrastructure projects that can promote economic growth in Kitui, support sustainable urbanisation and attract funding including seed financing. This section provides a summary of value chain projects that have been identified and assessed against a set list of criteria. These are considered as having the most potential within Kitui to act as anchor projects for the development of Kitui’s key economic sectors.
Figure 9 - Identifying VC Opportunities: overall approach Long list of Potential Value Chain
Broader economic opportunities
Government policies - Four Pillars... Economic activities VC Studies - Government, NGOs... Natural resources Exports - potential to grow Market base Imports - potential substitution Infrastructure New products/services Manpower and skills
The primary activity will be the production of interlocking construction blocks (Hydraform blocks or similar) by combining stone crusher waste materials (dust, grit) with other materials (sand, earth, clay), a binding agent (cement) and water. The stone crusher waste will be sourced from the Council’s stone crusher at a quarry around 50 km from Kitui Town. The blocks have many advantages: they use less cement than standard blocks (less than 5%), have a lower energy footprint than traditional clay bricks, are low cost, and can be used/installed with little training. The second phase of the project will be to provide other low-cost construction products, with the initial targets being earthen floors and modular roofing panels. Food processing centre with first phase focussing on tamarind
ECONOMIC DEVELOPMENT PLAN 32
This value chain opportunity centres on the sorting and consolidating of separate municipal solid waste streams (MSW) into commercially valuable volumes, rather than Thelandfill.main waste stream is organic material which can either be composted and used as a soil improver/fertiliser or used to produce biogas and a soil improver. The other key streams, plastics, metals, cardboard and glass, each have significant market value in Mombasa or Nairobi when sorted.
There are around 400,000 head of cattle in Kitui County and nearly 1 million shoats (goats and sheep), but no commercial-scale Thisabattoir.project is for an abattoir that would utilise the resources in the County as well as livestock that is transported from the Tana River area to Nairobi. The abattoir would supply meat and meat products to both the local and Nairobi / Mombasa markets.
Tannery: hides from abattoir and other sources in county The opportunity is to take hides from the abattoir and elsewhere in Kitui and tan them, increasing their value substantially and providing a raw material to the leather industry. Currently, a substantial proportion of Kenya’s hide production is exported in the semi-processed wet blue stage, rather than finished leather.
The waste products from the tannery could be processed alongside the wastes from the abattoir (in the bio-digestor), reducing investment costs and increasing the production of biogas and bio-fertilisers.
Once these streams have been sorted and processed there is then little that needs to be sent to landfill.
The proposed tannery would be based on the use of enzymes (for de-hairing) and natural tannins, which will reduce the environmental impact substantially. The resulting leather could then be marketed as a “green” product, with potential for a significant price premium.
Six potential projects were identified as part of the assessment and in consultation with local stakeholders: Honey and associated products: processing and marketing
Building materials: interlocking blocks, roof panel and floors
While all the above projects have potential to contribute to economic growth, their successful implementation will be influenced by a number of factors including regional provision and competition, reliance on prerequisite investment and Followinginfrastructure.further assessment and consultation with stakeholders the opportunities set out below have the most potential to work as anchor projects for sustainable economic development and growth and form part of the development framework for Kitui presented in the next
Municipal solid waste separation and processing
› Building construction materials - with a focus on brick making, roofing and affordable housing materials (GoK Big 4 pillar) Section 3.5 of this report provides a more detailed scope for these facilities.
The MSW facility would comprise a delivery area, conveyor for hand separation of materials, compacting and storage, and composting windrows for the organic waste. Abattoir and meat processing
›section:Anecosystem (or cluster) of foodprocessing activities starting with honey processing expanding into other products such as tamarind, mango and others in later stages.
There is potential for several food processing activities in Kitui, including producing mango juice and dried fruit, and processing tamarind, aloes and gum Arabic. There are many synergies in the processing of these products, with some common machinery, storage, marketing and manpower skills. This project covers the establishment of a multi-purpose food processing centre in Kitui with initial focus processing tamarind. This project would buy in supplies of dried tamarind for producing tamarind juice, jams, pickles, concentrated slabs (deseeded) and cleaned seeds. Further stages of value-added processing could be added as the project develops (powdered pulp, roasted kernels, seed testa, tamarind oil, etc.).
The bulk of the tanning industry worldwide is based on chemical (chrome) tanning, which poses serious challenges for waste water handling and potential pollution.
The value of local honey production can be raised through improved extraction, processing, bottling, branding and marketing. Beekeepers can then realise higher prices. In addition, acting as a buyer and packer of other products will support an expansion in production and raise value added in the sector. This VC opportunity is for a facility to process honey and related activities.
Development Framework
Figure 10 - Kitui Urban Framework
The three main zones being:
› Town Centre / CBD: Trade and Commerce › Industrial Cluster: Industrial / Manufacturing Diversity › Kalundu River and Dam: Public / Social Amenity
Based on the diagnostics of Kitui’s socio economic conditions, the town’s urban typology, character and infrastructure provision, as well as the economic sector priorities that have been set out, this section brings together proposals that will support economic growth, optimise the impact of infrastructure development and tackle the most pressing needs of the town in order to respond to the pressures of urban growth whilst building climate resilience and sustainability. These proposals have been sequenced based on optimising their individual and collective impacts whilst aiming to minimise costs. Whilst each proposal may, in itself, be implemented as a standalone project it is only through their effective linking and sequencing that they will create the highest impacts on future private and public investment potential.
The urban planning and infrastructure proposals therefore aim to support and unlock the potential within these specific key focus areas and by doing so provide a foundation for future urban and economic development across the remainder of the town. The Development Framework proposals are therefore organised around these three key focus areas: › Town Centre › Industrial Cluster › Blue-Green Corridor
33 KITUI URBAN ECONOMIC PLAN
3.4.
Following a review of the ISUDP, meetings with local stakeholders and a series of site visits the potential growth areas of the town have been identified. As can be seen from the map in Figure 10 there are residential expansion zones anchored around the town centre core and civic district. A series of activity clusters have also been identified to the west and north of the town. This information has formed the basis of our Development Framework proposals and allowed the proposals to focus on the critical core area and potential expansion zones. Figure 11 provides a spatial interpretation of the preferred location of the main economic sectors that have been identified through the diagnostics process.
The proposed projects located within each Focus Area have been considered in terms of their sequencing, programming and implementation. This has been premised on identifying some potential ‘quick wins’ which will enable short term infrastructure and economic benefits to the town. Furthermore, high level initial cost estimates have been done for the projects and these have been assessed in terms of the likely funding sources required, these being public funding, public/private funding and private investment funding. Certain projects within the public funding orbit are proposed due to their catalytic effect of unlocking potential private investment opportunities, for example the public square and pedestrianisation with the CBD, or the phase 1 infrastructure in the industrial cluster. These are described at the end of this section.
Figure 11 - Economic Sector Activity Zones

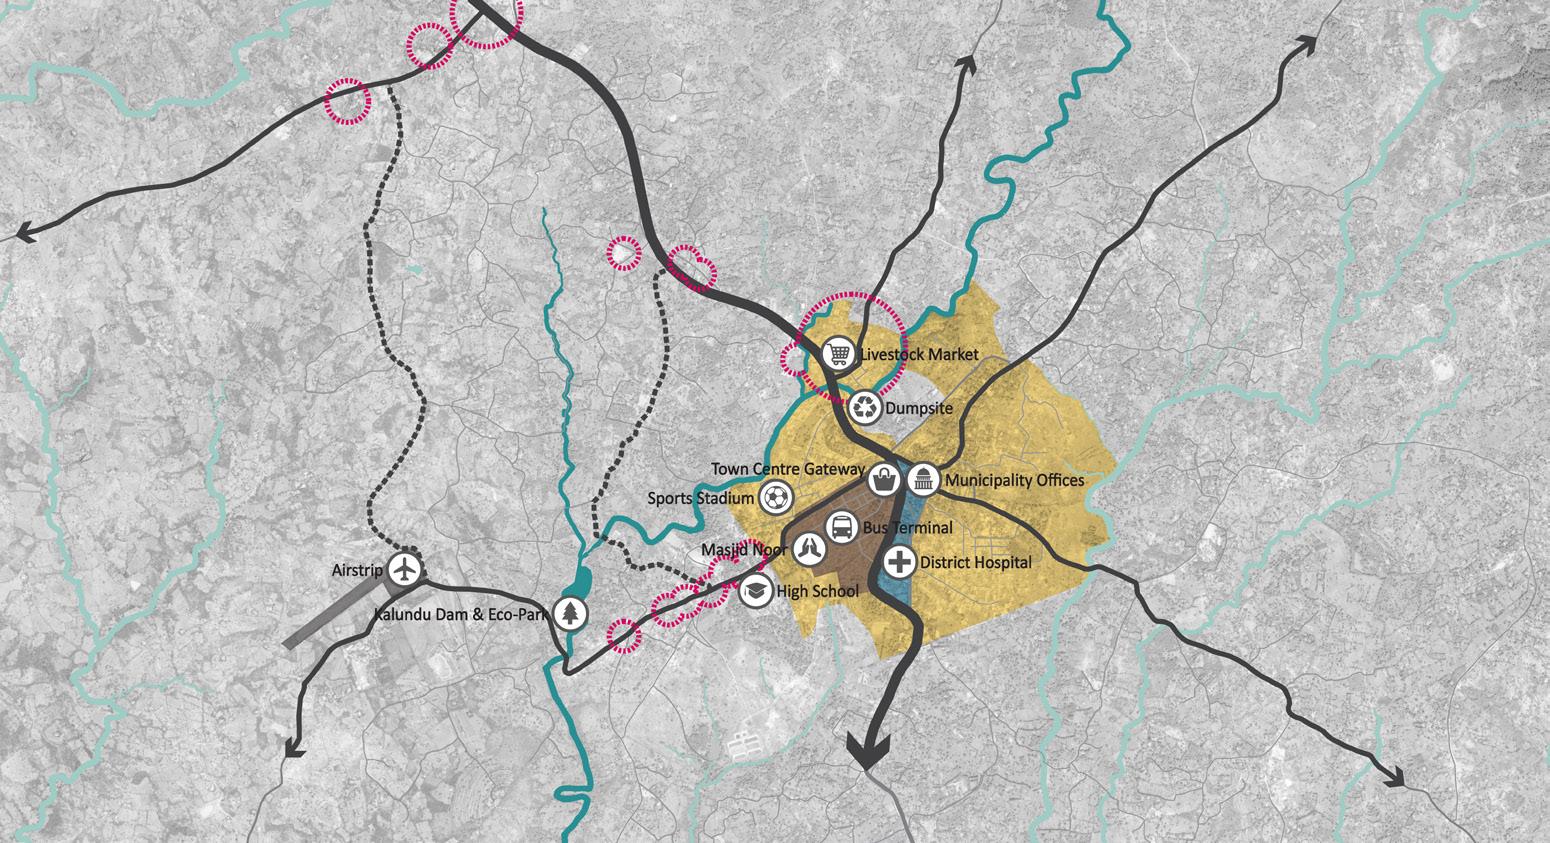

ECONOMIC DEVELOPMENT PLAN 34 Figure 12 - Overall Development Framework plan showing the three focus areas and individual sector proposals
FOCUS AREA 1:
Figure 13 - Development Framework plan showing Focus Area 1 - Town Centre and individual proposals under that focus area
35 KITUI URBAN ECONOMIC PLAN
Introduction The perception of a city is mostly given by the images that visitors and residents alike retain when using and visiting it. The arrival experience, the ease of movement and security, cleanliness, quality, space of the public realm and good quality architecture are all elements concurring to deliver a good urban environment that stimulates repeat visits and creates a good “economic milieu” for investment and business. Urbanism projects are multidisciplinary and integrate a wide range of diverse inputs into a strong, coordinated vision that underpins development. The following proposals aim at enhancing the urban environment and being catalysers for development and economic growth. Green links and SUDs Kitui Town centre is a dense built up area with very limited green infrastructure and public open space. The above are exacerbated by increased rainfall rate expected for the area and the sloping local topography. Sustainable Urban Drainage Systems (SUDs) are an effective solution to mitigate multiple issues including increased rainfall, flash floods, improvement of local micro-climate and enhancement of streetscape. All of these contribute to both improved urban quality and reduced pressure on existing or planned infrastructure. SUDs have been proposed in certain areas identified on the plan opposite.
TOWN CENTRE

1. Relocated bus terminal - this will unlock the economic potential of the CBD which is currently constrained by traffic congestion emanating from the bus and taxi traffic which moves through the centre to access the existing terminal. Relocation will not only reduce congestion and improve the amenity of the area it will also create an opportunity to develop a central town square. Two sites have been suggested for the new bus terminal and these will need to be further investigated, however it is important that it remains on the fringes of the CBD in order to promote pedestrian access in to the town centre.
4. Pedestrianised main street - the development of the public square and the gateway improvements can be linked via the proposed pedestrianisation of the main street. This also allows for the upgrading and redevelopment of the many lanes and service corridors within the CBD which can great potential for more market stalls and selling areas whilst enhancing user/visitor experience to the CBD.
Figure 14 - Detailed development plan showing proposals in Focus Area 1 and how they link with each other
3. Gateway improvements - the relocation of the bus terminal will reduce traffic congestion and allow the development of the new gateway entrance into the CBD.
2. Public square - following relocation of the bus terminal the proposed central town square will create significant economic development and renewal opportunities with enhanced commercial spaces and buildings, as well as promote public activities and events to attract more foot fall into the CBD.
5Minutes setuniM01 N Improved link to sports stadium and river New Public Square New Shared Surface Improved pedestrian access to mosque Gateway Developed Bus Sta�on relocated along main route Enhanced Retail Frontage Developed Laneway Links Improved pedestrian links 1 1 7 7 6 6 6 6 6 6 2 4 3 6 5 5 5
ECONOMIC DEVELOPMENT PLAN 36
6. Street lighting - all road and public realm improvements should be further enhanced through appropriate integrated solar street lighting which will provide greater amenity and safety for business owners, users and visitors to the CBD.
5. Green links with SUDs - it is proposed that many of the roads and lanes to be upgraded within the CBD will provide safer pedestrian footpaths and shop entrances whilst integrating sustainable urban drainage infrastructure to manage storm events by directing water flows in a managed way into the Kalundu River basin.
Focus Area 1: Sequencing The projects identified have been numbered based on their preferred sequencing. In order to maximise the impacts of these projects in uplifting and the CBD and improving business and trading conditions for both commercial operators and their customers it is important that they are linked and developed sequentially. For example, the relocation of the bus terminal will unlock the creation of a central public plaza which should be connected to the CBD’s Gateway through the pedestrian improvements along the main street and lanes to create a functional environment for businesses and visitors.
7. Boda boda sites - have been identified to provide gathering places and access for users in the most appropriate spaces that align with the proposed road and public realm improvements.


Proposed sites for relocated bus terminal: New Bus Terminus (TOD) 1 Kitui’s bus station is a vital point of access for people visiting and operating businesses across the region. As a centrepoint of activity, it also offers business opportunities to the most marginalised citizens in town and as a result it inhabits a high centration of people. To accommodate their needs the space has rapidly expanded however the provision for retail space has been built to a low-quality and is missing access to basic amenities. Such expansion means that the bus stations infrastructure and operation is compromised by a lack of planning and management with the safety of pedestrians a specific concern. As a centre for growth the number of buses accessing the station will continue to grow and consequently the existing congestion and pollution will intensify alongside an increased likelihood that informal businesses will continue to expand and pedestrian safety becoming more severe.
›
37 KITUI URBAN ECONOMIC TRANSPORTATIONPLAN
› Opportunity to provide modern amenities and accommodate future growth › Opportunity to provide more asoperationsefficientsuchaccessandsafety › Potential to become a sub-centre for local businesses › Will relieve congestion and pollution in the town centre › Will add value to land adjacent to the new terminal › Kitui County in coordination with the ›stakeholderandbusinesslocalMunicipality,landowners,operatorscommunitygroupsPublicparticipation
Challenges Data Gaps Time Frame PhasingProject Priority &OperationsMaintenance
As part of a wider scheme to introduce a new civic square, it is proposed that the bus station is relocated to an alternative site. Two were identified as suitable, one on KibweziKitui Rd and second on Mbusyani Rd as illustrated below. The preferred site sees the Kibwezi-Kitui Rd site (owned by the municipality) becoming a Transit Oriented Development (mixed-use transport HUB). This scenario presents an opportunity to develop a new bus station that can accommodate future growth whilst providing modern-day amenities for businesses and people utilising public transit. Furthermore, there is potential to including real estate components other than operational and public realm. The new bus location will enable planning for more efficient operations such as dedicated pedestrian footpaths and crossings, a feeder service for minibuses to link the bus terminal with rest of the urban areas and routes for larger buses which can avoid travelling through the town centre. Subject to a detailed feasibility study, the new HUB could include amenities such as a business complex, Sacco offices, a new public square and a satellite car parking (at grade or multi-storey). Such a project has the potential to be a catalyst for a new localised business centre in Kitui within walking distance to the CBD and relieve pressure on the existing town centre.
› Will cause disruption to public transit › Relocation of bus station will need further consultation › Installation likely to interrupt traffic flows › Funding › studyPre-feasibility › Site requiredsurvey › consultationPublic › Medium to long term › Single Phase › Urban EconomicsupportingProposalsDevelopmentGrowth Establish a managementstationcompany
Estimated cost Impacts Delivery mechanisms Potential funding › Masterplan to be developed for new bus station forgrowthresilienceoperations,proposedoutliningtoandspacebusinesses
› To be coordinated with plannerstransport › Clearing the existing 44terminal:busKShmillion › Capex 330terminal:adevelopingofnewbusKShmillion › Annual Opex of the 235.2terminal:busKShmillion
› Kitui County or a mixed infrastructurePublicandbetweenentityPublicPrivatewherebodyfundsand RE is built and operated by private › completion:Following revenue from additional Boda Boda parking, retail, increased land value of surroundingbuildings the station
Sub-components
ECONOMIC DEVELOPMENT PLAN 38
-
The existing the bus terminal at Ubungo is at the heart of Dar es Salaam. The terminal will be moved to the new terminal at Mbezi. The construction of the upcountry modern bus terminal at Mbezi began in 2019. The preparation of the project took long time due to the various government procedures including land acquisition and compensation. The new terminal is expected to accommodate the inter-city bus services which are currently travel through the city centre. The cost of the project is estimated to be US$22million (KSh 2.3billion).
Case UbungoStudy:Bus Terminal Dar es Salaam, Tanzania
Source: Construction Review Online Case Studies: Lublin Bus Station, Poland Environmentally friendly, tackles air-pollution, public realm, proposed Tilburg Central Bus Station, Netherlands Self-sufficient, energy production, completed Plans showing option sites for relocation of bus station


Estimated cost Impacts Delivery mechanisms Potential funding › Masterplan to be developed for the square proposedoptionsinexistingsolutionsoutliningtoproblemstheareaandforactivities
The town centre of Kitui operates as a hub for local businesses with people visiting from the across the region. As such, access to the town has shaped the urban fabric with priority given to private vehicles and public transit (namely buses) with high density clusters of buildings confined to the roadside. The concentration of roads and buildings has created an environment dominated by hard surfaces and consequently is increasingly at risk from flash flooding. Alongside high levels of congestion and pollution the centre of Kitui presents itself as growing town which needs spaces to breath and refine its image an attractive business hub. As such there is a strong case to develop access to public realm which can address these current problems. The proposal includes the development of a new civic square to replace the current location of the bus station. Located in the town centre such a space presents an opportunity to change the image of Kitui by operating as a meeting point and a place for year-round activities such as seasonal markets, hosting events and cultural celebrations. The space is also large enough to accommodate green areas for aesthetic appeal and for practical applications such as drainage (ie.: rain gardens). Whilst the proposal, initially, may be perceived as controversial, the expected benefits such as improvement to the urban fabric, reduction of pollution and congestion in the CBD will contribute to the long-term economic success, health and well-being of Kitui citizens. As a centre for growth a new civic square with year-round activities will attract more visitors and has the potential to be a catalyst for urban regeneration in the surrounding area adding further value to businesses operating in the town.
› KSh 550,000 - feasibility / high transformationstreetscapeadesignconceptlevelfortypical › buildings)(excludingKShCAPEX130m
Challenges Data Gaps Time Frame PhasingProject Priority &OperationsMaintenance
Sub-components
›
›
›
› Integration of SUDs, waterreducegardenssurfacespermeableandrainwillsurfacerun-off › Street trees and planting to support appealandimplementationSUDsaddaesthetic
› Enhanced image of the street will attract more businesses › Larger footpaths and crossings will encourage more pedestrians › Higher revenue from increased footfall › Versatility of space offers opportunities for regular and seasonal activities encouraging more people to visit › Safer environment for pedestrians by limiting vehicular access › Green links will promote a healthier environment › Improved drainage for surface water run-off Typically, Public funded project › Potentially: In partnership with local Districts)Improvement(Businessbusiness › Local, localcontributionIFIsCounty,Authority,Government,withsomefrombusinesses › completion:Following revenue from additional Boda Boda parking, retail stalls, events taking place in the square, increased land value of surroundingbuildings the plaza
›
URBAN DESIGN
39 KITUI URBAN ECONOMIC PLAN
› Will cause disruption publicto transit › Relocation of bus station will need further consultation Installation likely to interrupt traffic flows › Funding › studyPre-feasibility › Site requiredsurvey Medium to long term › Single developmentphase Urban EconomicsupportingProposalsDevelopmentGrowth As a public square, this is managed by Local Municipality
Public square to replace relocated bus terminal: New Civic Square 2
›
Precedent images
ECONOMIC DEVELOPMENT PLAN 40
as
proposed
Illustrative models showing existing aerial view of the bus station and civic square


41 KITUI URBAN ECONOMIC PLAN Case Studies: Grote Markt - Vilvoorde, Belgium Market square, underground car park, completed Centenary Square - Parramatta, Australia Year-round activities, events space, urban regeneration, completed Jeevanjee Garden & Dandora Streetscape - Nairobi, Kenya Increase in land value, higher local revenue regeneration, completed Stroget - Copenhagen, Denmark Pedestrianisation of the city centre (by Jan Gehl), completed

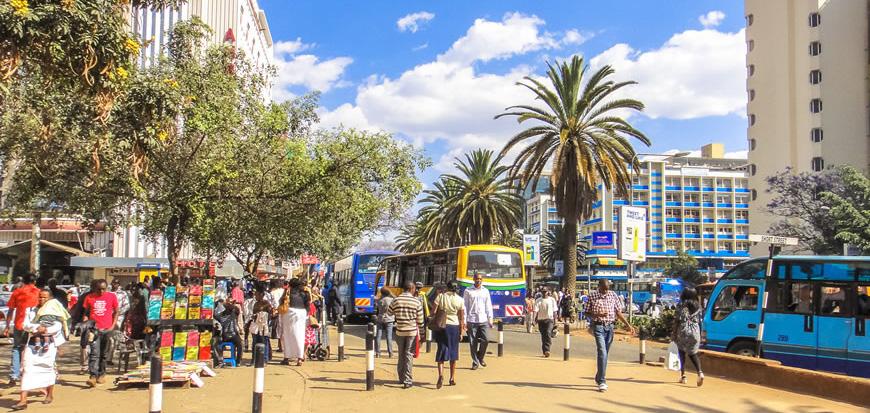


Sub-components Estimated cost Impacts Delivery mechanisms Potential funding › Masterplan to be developed for the gateway outlining high and lowcost options and providing solutions to problemsexistingin the area › KSh 450,000Gateway;studyfeasibilityfor › (inc.KShCAPEX190mbuildings) › Enhances the local economy with modern amenities › Provides a positive image of the town › Opportunity to enhance green links and pedestrian access › Adds value to the sense of place › Opportunity for the Municipality to source funds through the World Bank KUSP programme › Private investment into new buildings and facilities such as retail, entertainmentF&B, › Private investment › PR & Utilities by LPA › ›completion:FollowingRevenuefromadditionalBodaBodaparking › Revenue from provision of services, business licencing › Revenue from leasing / rentals Challenges Data Gaps Time Frame PhasingProject Priority &OperationsMaintenance › Existing buildings and public realm will need to be altered › Installation likely to interrupt traffic flows › Funding › Pre-feasibility and feasibility studies › Site requiredsurvey › Medium to long term › Single Phase › Urban EconomicsupportingProposalsDevelopmentGrowth › Private areas by operator / leaseholder › Public areas by (ie.Municipalitycleaning, etc) Case Studies: Box Park - London, UK Retail units, modular, low-cost, completed Moyo Urban Farm - Cape Town, South Africa Sustainable urban farming, major tourist destination, completed
Kitui is a thriving commercial and business centre in Kenya but the immediate impression on arrival in the Central Business District (CBD) is of vibrant community suffering from generalised decay and poverty. The triangular plot to the east of the CBD greets visitors with poor and unorganised tin sheds hosting food stalls, restaurants, disorderly boda boda parking and unmanaged shops servicing. No public realm exists. Across the road surrounding the triangle hawkers unsafely occupy spaces necessary for sidewalks. The proposal will rehabilitate the node by infusing new vitality and dynamism underpinned by clean and well organised shops, a new town square, buildings with potentially increased heights (by comparison to existing buildings) to accommodate a variety of uses including retail, small offices and start-up spaces. The project could use low cost modular building solutions (shipping containers, for example) to remain flexible for future evolution, quick execution and to ultimately contain the overall costs.
URBAN DESIGN Gateway Regeneration 3
ECONOMIC DEVELOPMENT PLAN 42


› Integration of SUDs will reduce surface water run-off › Adding street trees and planting to support appealandimplementationSUDsaddaesthetic
› Existing buildings and public realm may need to be removed › Installation likely to interrupt traffic flows
Reconfiguring an existing route with priority given to pedestrian use › Roadside parking to be replaced with marketdeliveriesactivitiesforSUDsfootpaths,expandedplanting,andspacesmulti-usesuchasandstalls
›
It is expected that this approach and outcome will expand to other streets and provide a benchmark for streetscape design in the local area. It is anticipated that by improving the public realm the revenues for local businesses will improve whilst providing a healthier and more vibrant environment for people.
Sub-components Estimated cost Impacts Delivery mechanisms Potential funding
The proposal aims to limit motor vehicle access and on-street parking on selected streets (minimised operations such as deliveries and emergency access only) and re-design the streetscape around people rather than cars. This can be initially introduced as a pilot scheme between the City Gate Centre and Masjid Noor. The street presents an opportunity to provide multiple uses across different days in the week such as s market day and a delivery day. The streets remodelling will also focus on addressing the resilience to climate change through increased greening such as trees and permeable surfaces to mitigate against surface water run-off and mitigate the Urban Heat Island effect. The proposal could furthermore revitalise the alleyways between the main strip frontages to accommodate a safer and more attractive urban fabric for businesses.
43 KITUI URBAN ECONOMIC PLAN
Challenges Data Gaps Time Frame PhasingProject Priority &OperationsMaintenance
› KSh 550,000 - feasibility / high transformationstreetscapeadesignconceptlevelfortypical › KShCAPEX25.5m
URBAN DESIGN
On the fringes of the CBD, toward the Kalundu river, select streets can also be upgraded to accommodate a more resilient type of design, namely incorporating Sustainable Urban Drainages (SUDs), raingardens, trees and more permeable surfaces. This will contribute to the well-being and attractiveness of the streets and encourage walking and make streets more vibrant.
4 Streets of the CBD tend to be dominated by motor vehicles and informal street stalls. Such arrangements create congestion and a poor-quality urban environment with a substantial risk to pedestrians (whom currently walk along the road) and a reduced revenue value from footfall. It is expected that Kitui will experience demographic growth and further urbanisation. As such additional pressure will fall on the existing infrastructure and public realm and without action streets are likely to become more congested with no space for business to grow and may ultimately result in a significant loss in real estate value.
Streetscape Improvement and Flexible Street Management (Pedestrianisation)
› Funding › Pre-feasibility and feasibility studies › Site requiredsurvey › Short to medium term › Initially test the idea as “pop-up” / temporary to gauge ›effect;Ifpositive,implement on a permanent basis › Urban EconomicsupportingProposalsDevelopmentGrowth › Temporary road closures, arrangements cleaning and general maintenance by Municipality Potential for additional revenue from stalls rents
› Enhanced image of the street will attract more businesses › Larger footpaths and crossings will encourage more pedestrians › Higher revenue from increased footfall › Versatility of space offers opportunities for regular and seasonal activities encouraging more people to visit › Safer environment for pedestrians by limiting vehicular access › Green links will promote a healthier environment › Improved drainage for surface water run-off › Typically Public funded projects › Potentially: In partnership with local business › Private Districts)Improvement(ie.:developmentfundingsectorforBusiness › Local, IFIsCounty,Authority,Government, › Private initiative of local businesses › ›completion:Followingrevenuefromadditionalretailstalls › Potential to set up a ImprovementBusiness District levy on owners and traders
ECONOMIC DEVELOPMENT PLAN 44 Scenario 1: Deliveries Scenario 2: Seasonal Event Illustrative models showing existing Streetscape Improvement and Flexible Street Management (Pedestrianisation) Proposed street sections


45 KITUI URBAN ECONOMIC PLAN High Street Laneways: Proposal (Before) High Street Laneways: Proposal (After) Case Studies: Las Marias - Pinto Salinas, Venezuela A small public square reclaimed from a potential dump site, completed Laneways - Melbourne, Australia Urban regeneration of alleyways, retail uses, completed


Case Study: Jinja is the main city in the district of Jinja, Uganda, with a population of 76,000 and a daily additional working population of 300,000. The Municipal Council has limited revenue generation from taxes and central government transfers, and ran up a significant debt with its electricity provider, so much so, that the provider cut off the street lights. Subsequently crime rates rose, and economic activity was limited to daylight hours. Jinja then became part of national level programmes designed to upgrade informal settlements and urban infrastructure and received over £0.5m to spend on improvement projects. Municipal decision makers indicated a preference for installing solar street lighting over conventional. So far 92 solar street lights have been installed, including 70 along a 2.5km stretch of main road through the town. The average cost per street light pole US$1,600 compared to US$2,350. This is a saving of roughly US$50,000. Additionally, operating costs are zero compared to traditional streetlights, as they do not consume electricity, and maintenance costs are low, comprising cleaning of the panel, routine checks and servicing of components. The outcome has been that the Municipal Government has drastically reduced its monthly bill, allowing it to reduce its debt and finance other projects, including further streetlighting14.
14 ibid
ECONOMIC DEVELOPMENT PLAN 46 POWER Solar LED street and park lighting 6 Categorisation: Town Betterment Linked to: Urban Lighting - Focus Area 1, Urban Design Projects, Park Lighting - Focus Area 3, Urban Design Project 4 Outcome › Improved provision of street lighting to urban areas and proposed park land area › Increased safety for residents and improved business activities in lit areas Sub-components Estimated cost Impacts Delivery mechanisms › Study to determine extent of proposed lighting system picks up all key areas (i.e. relocated bus station) and route proposals › Lighting design study to ensure suitable coverage of proposed areas › selectionEquipment › Development of procurement and deployment planimplementation/ › Maintenance plan › KShBenchmark:1,250per pole13, KSh 30-40k per km depending on spacing › UrbanActual:KSh 100-120k Park KSh 130-150k › maintenance):(eqpt,Fundinginstallation, › Part IFI, part public funded › Increased safety and security for all residents in newly lit areas › Allows street side businesses to stay open longer › Avoided lightingurbanassociatedemissionscarbonwithstreet › More grid power available for other uses › More activitiesotheravailablerevenueformunicipal › Partner with Kitui Municipality to coordinate activities (fully aligned with CIP - project POW2 xiii) › Partnering technologyappropriatetoequipmentwithspecialistsdeterminesolutions › Maintenancecapacity ofcontinuedprogrammebuildingtoensureoperationsystems Challenges Data Gaps Time Frame › Long-term operability of stand-alone systems (i.e. maintenance requirements) › Funding › No knowledge of current products on market workforceinstallation/maintenanceand › Short term 13 Africa and solar powered street lights, accessed 29th July https://www.engoplanet.com/single-post/2019/07/22/Africa-and-Solar-powered-Street-lights2019

5. Boda boda sites - these will also be provided along the corridor and at strategic points to provide alternative forms of transport for workers and suppliers accessing the industrial development.
2. Waste water treatment plant - a package plant will be introduced to support the Phase 1 development and which can be extended to accommodate future phases of development. This will form part of the overall eco-industrial park strategy through treating and recycling of waste water and water re-use.
Introduction Industrial development is an important driver of economic growth, however, if poorly planned industrial areas can use a great deal of natural resources and severely impact the environment, workers and people living near-by. By creating a sustainable industrial zone in Kitui emissions will be lowered and resources managed more efficiently (e.g. with shared facilities) to create a healthier working environment, lower costs and increase business competitiveness.
1. Phase 1 infrastructure - the overall industrial cluster development will create up to 2.75 ha of industrial plots with additional areas for circulation, utilities, green space and a water treatment plant, along with potential future development areas. The development will be phased and for Phase 1, as indicated on the plan, an initial access road providing frontage to a range of plots will be developed with supporting utilities of water, power, sanitation and storm water management. This will enable at a significantly reduced cost the development of the first agroprocessing plants which are considered to be a honey processing plant, for example.
Figure 15 - Proposed Light Industrial Cluster location
FOCUS AREA 2: CLUSTERINDUSTRIAL
47 KITUI URBAN ECONOMIC PLAN
Focus Area 2: Industrial Cluster - Sequencing The projects identified have been numbered based on their preferred sequencing as follows:
3. Existing road upgrade - the location of the industrial cluster along the B62 and near to the A9 already positions it for good regional access to markets. However in order to improve the accessibility of the development to Kitui and its residents / employees it id proposed to upgrade the roak link between the B62 and Mbusyani Road thereby providing an alternative route to the A9. This upgraded corridor will also enhance potential activity along it and provide bus and transport routes between the communities.
The proposed site has been selected based on land availability and designation within the ISUDP, proximity to Kitui and access to main regional and national centres.
4. Location of new bus stops - these are to be strategically located along the new upgraded road corridor as well collection points such as the industrial cluster, the airstrip and adjacent to communities along the road.

ECONOMIC DEVELOPMENT PLAN 48 Figure 16 - Development Framework plan showing Focus Area 3 - Industrial Cluster and individual proposals within that focus area

49 KITUI URBAN ECONOMIC PLAN Figure 17 - Conceptualised Industrial Cluster Industrial Cluster: Phase 1 New Roads 371m Honey Processing Centre 750 sqm each (3 No. Units) Water Treatment Plant 1,400 sqm Industrial Units: Type 1 750 sqm each (3 No. Units) Industrial Units: Type 2 1,000 sqm each (3 No. Units)


ECONOMIC DEVELOPMENT PLAN 50
Sub-components Estimated cost Impacts Delivery mechanisms Potential funding › Masterplan to be developed for the Focus area 2Industrial Cluster › On site internal roads and SUDssanitation,(water,infrastructurenetworkpower,ICT, › Blue & InfrastructureGreen › KSh 220m for Phase 1 › KSh 290m for future phase › Enhances the local economy with modern manufacture, and mixeduse amenities › Opportunity for immediate investment and development › Opportunity to enhance an isolated community › Private investor › Design DBOMOperateBuildMaintain › Public authoritiesservice › Public / investmentPrivate › Infrastructure supply up to the precinct boundary by County / Municipality Challenges Data Gaps Time Frame PhasingProject Priority &OperationsMaintenance › Land ownership › Partially topography › Market study › Pre-feasibility and feasibility studies › Site requiredsurvey › Short to medium term › Multi-phase › EconomicsupportingProposalsDevelopmentEconomicGrowth › Private operator / leaseholder Precedent images
Economic development is a fundamental component for the SUED proposals. The vision for the territorial development for Kitui indicates a cluster approach throughout the county, certain nodes are developed as mixed-use neighbourhoods supporting local economic activities. Focus area 2 proposal builds on this inherent spatial development concept and expands on an already earmarked industrial zone in the Mulutu locality. The proposal capitalises on the site features such as high-level accessibility of the site (which lies along the B62 and the road linking to the airport) availability of infrastructure and land. The proposal compliments existing residences and small business and seeks to create a small community where already infrastructure, schools and population is localised. The industrial precinct spreads across a 17ha site area and is split in 8 discreet development blocks with flexibility to accommodate larger or smaller properties and adapt to market demand. The precinct will benefit from opportunity of direct access from both the Machakos-Kitui Rd and the airport link road. The industrial zone will benefit from a primary frontage along this corridor which will allow for smaller scale retail/office/light industry units to be in that zone and further contribute to business vibrancy in Mulutu. Further amenities included are the green and blue infrastructure which are fundamental industrial cluster. These will contribute to create a desirable and attractive business and working environment, further attract investors and ensure natural site features are integrated in the development plans.
INDUSTRIAL PARK Phase 1
Infrastructure Development 1
As part of Phase 1, a loop road (see Phase 1 diagram) and a water treatment plant for industrial effluents will add to the immediate and inherent attractiveness of the site for businesses to locate here.


WATER MANAGEMENT
51 KITUI URBAN ECONOMIC PLAN
Source: http://eipvn.org/ Eco-industrial Park, Vietnam
Wastewater treatment plant on industrial site 2 Industrial development is an important driver of economic growth, however, if poorly planned industrial areas can use a great deal of natural resources, have a high impact on the environment, workers and the people living near-by. By creating a sustainable industrial zone in Kitui emissions will be lowered and resources managed more efficiently, creating an overall healthier working environment, lowering costs and increasing the competitiveness of the businesses. In a sustainable industrial zone, careful planning means businesses can make cost efficiencies through shared facilities such as water and wastewater. These type of resource efficiencies also reduce the impact on the environment. In Kitui, public water supply is not reliable and of sufficient quantity and quality to meet the needs of new industry, particularly food processing, which requires drinking water quality water for cleaning to prevent contamination. Boreholes in the Kitui areas are shown to yield between 1.83.5m3 /hr and should be able to supply the requirements of a cluster of food processing units but additional treatment with chlorination would be needed as a minimum. Water quality must be monitored closely to ensure quality is maintained. By sharing water quality and treatment facilities companies can make efficiencies and save resources. Wastewater will come from different processing plants to a central treatment centre. The wastewater conveyance system should be designed to be gravity fed where possible to reduce pumping costs and save energy. The right package plant for effluent treatment needs to be selected based on the discharges from all the plants in the cluster. This can be difficult to negotiate if some industries on the site have high effluent loads and need more expensive treatment. However, effluents can be diluted and mixed from different processes to reduce the treatment needed. The effluent treatment plant can be run as a business in itself, charging users in the industrial cluster. The cluster should have storage for treated wastewater so that this can be recycle/reuse in process plants where possible or used for irrigation of green spaces on the site or irrigation of crops grown in the local vicinity.

ECONOMIC DEVELOPMENT PLAN 52 Sub-components Estimated cost Impacts Delivery mechanisms › businessesrequirementsresourceUnderstandingof › Develop includingmanagementandsupply,integratedanwaterwastewaterstormwaterplanreuse › Design constructionand of water systems › Dependant on number and types of business in the industrial zone › See below for intial estimates › Lower costs for businesses › impactenvironmentalReduced › Improved workers’ health and safety › Better access to technologies and finance › Involving Government / banks / international donor and private investors for funding › Partnering with business owners and planners › Partnering with water treatment (clean and waste operatorscompanieswater)and Estimated cost KSh Assuming 355m3/day wastewater treatment plant 1 Preliminaries mobilisation, permits and approvals, EIA etc 4,000,000.00 2 Supply test and commission a 355m3 WWTP 25,000,000.00 3 Minor Civil Works Costs within WWTP plant vicinity excluding any demolitions or excavations in hard rock and assuming electric power interface on site 15,000,000.00 4 Estimated Total Cost 44,000,000.00 Challenges Data Gaps Time Frame › Integrated planning and phasing between businesses › High investment costs › Water and requirementwastewaterofbusiness in zone › Water resources availability › Potential funds availability › Market availability › Medium to long term Khanh Phu Industrial Zone, Nimh Binh. Source: http://eipvn.org/khanh-phu-industrial-zone/ Case Study: In the past 10 years, Vietnam has experienced rapid economic growth driven mainly by the processing and manufacturing sectors. The government created industrial zones (IZs), which account for 40% of the national industrial output and 49% of the total export value of the country. However, industrial activities have also caused negative impacts on the environment and on human health. In-efficient management of resources has increased greenhouse gas (GHG) emissions and has caused water and soil pollution. To try to remedy this, a project has been undertaken to transform existing IZs into eco-industrial parks (EIP), in which companies cooperate with each other and with the local community to reduce environmental impacts and production costs. In addition, clean and low-carbon technologies and practices will be demonstrated within the industries to minimize GHG emissions, the release of persistent organic pollutants (POPs) and land-based water pollution. The project worked with 72 companies in five pilot industrial parks to adopt resource efficient and cleaner production (RECP) practises and technologies. These looked at opportunities to optimise inputs of raw material, energy, water as well as common chemical safety and waste management systems. 547 RECP options were identified and it is estimated that they saved 19,274 MWh/ year of electricity, 142 TJ/year of fossil fuels, reduced 30.2 Kt / CO2 eq/year, 606,816m3 water/year and 4,225t/year of raw chemicals. Estimated Wastewater Treatment Costs
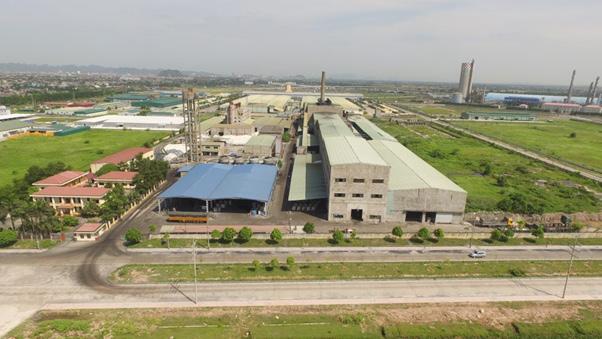
A9 A9 Road Upgrade B62 Kitui Town Katyetoka N Figure 18 - Plan showing extent of road upgrade Sub-components Estimated cost Impacts Delivery mechanisms Potential funding › Upgrading 4km earth road to bitumen road › Bring the road under national road classification › Drainage facility › Covered drainage to create footways › Two improvementjunctions › Capex 440milliontheupgradingofroadKSh › Annual Opex of 100millionroadtheKSh › CAPEX of the drainage KSh 60million › Easy all-weather access to the industry › Better and safe facilitiespedestrian › Easy access to Nairobi and Kitui town › Improved land value along the road › Kenya Urban Roads jurisdictionunder(KURA)Authorityasroadfallsagency’s › 2015AssetProcurementandRegulationsProcurementoutlinedprocedureprocurementStandardasinPublic2013ThePublicandDisposalAct, › Public fundingpotentially from National government or partnersdevelopmentinternational › Potential for thethecontributionssomefromdevelopersofindustrialcluster Challenges Data Gaps Time Frame PhasingProject Priority &OperationsMaintenance › May require some land acquisition › Would increase noise and air pollution due to motorisedincreasedvehicles › Funding › Pre-feasibility and feasibility studies › Impact of road traffic due to this new road › Immediate term › Essential infrastructureenabling
53 KITUI URBAN ECONOMIC TRANSPORTATIONPLAN
Existing road upgrade: Upgrading the road that connects Machakos-Kitui road (B62) with Mbusyani road from earth to bitumen road 3
The proposal for the food processing industry is to locate the facility along the road that connects Machakos-Kitui road and Mbusyani road. The road is currently unpaved that carries limited local traffic. The proposal is to upgrade this road to a bitumen road with appropriate drainage facilities. The Food processing industry will have direct access to this new road, which will allow traffic to travel Kitui Town as well as allow easy access to the B62 towards Nairobi.
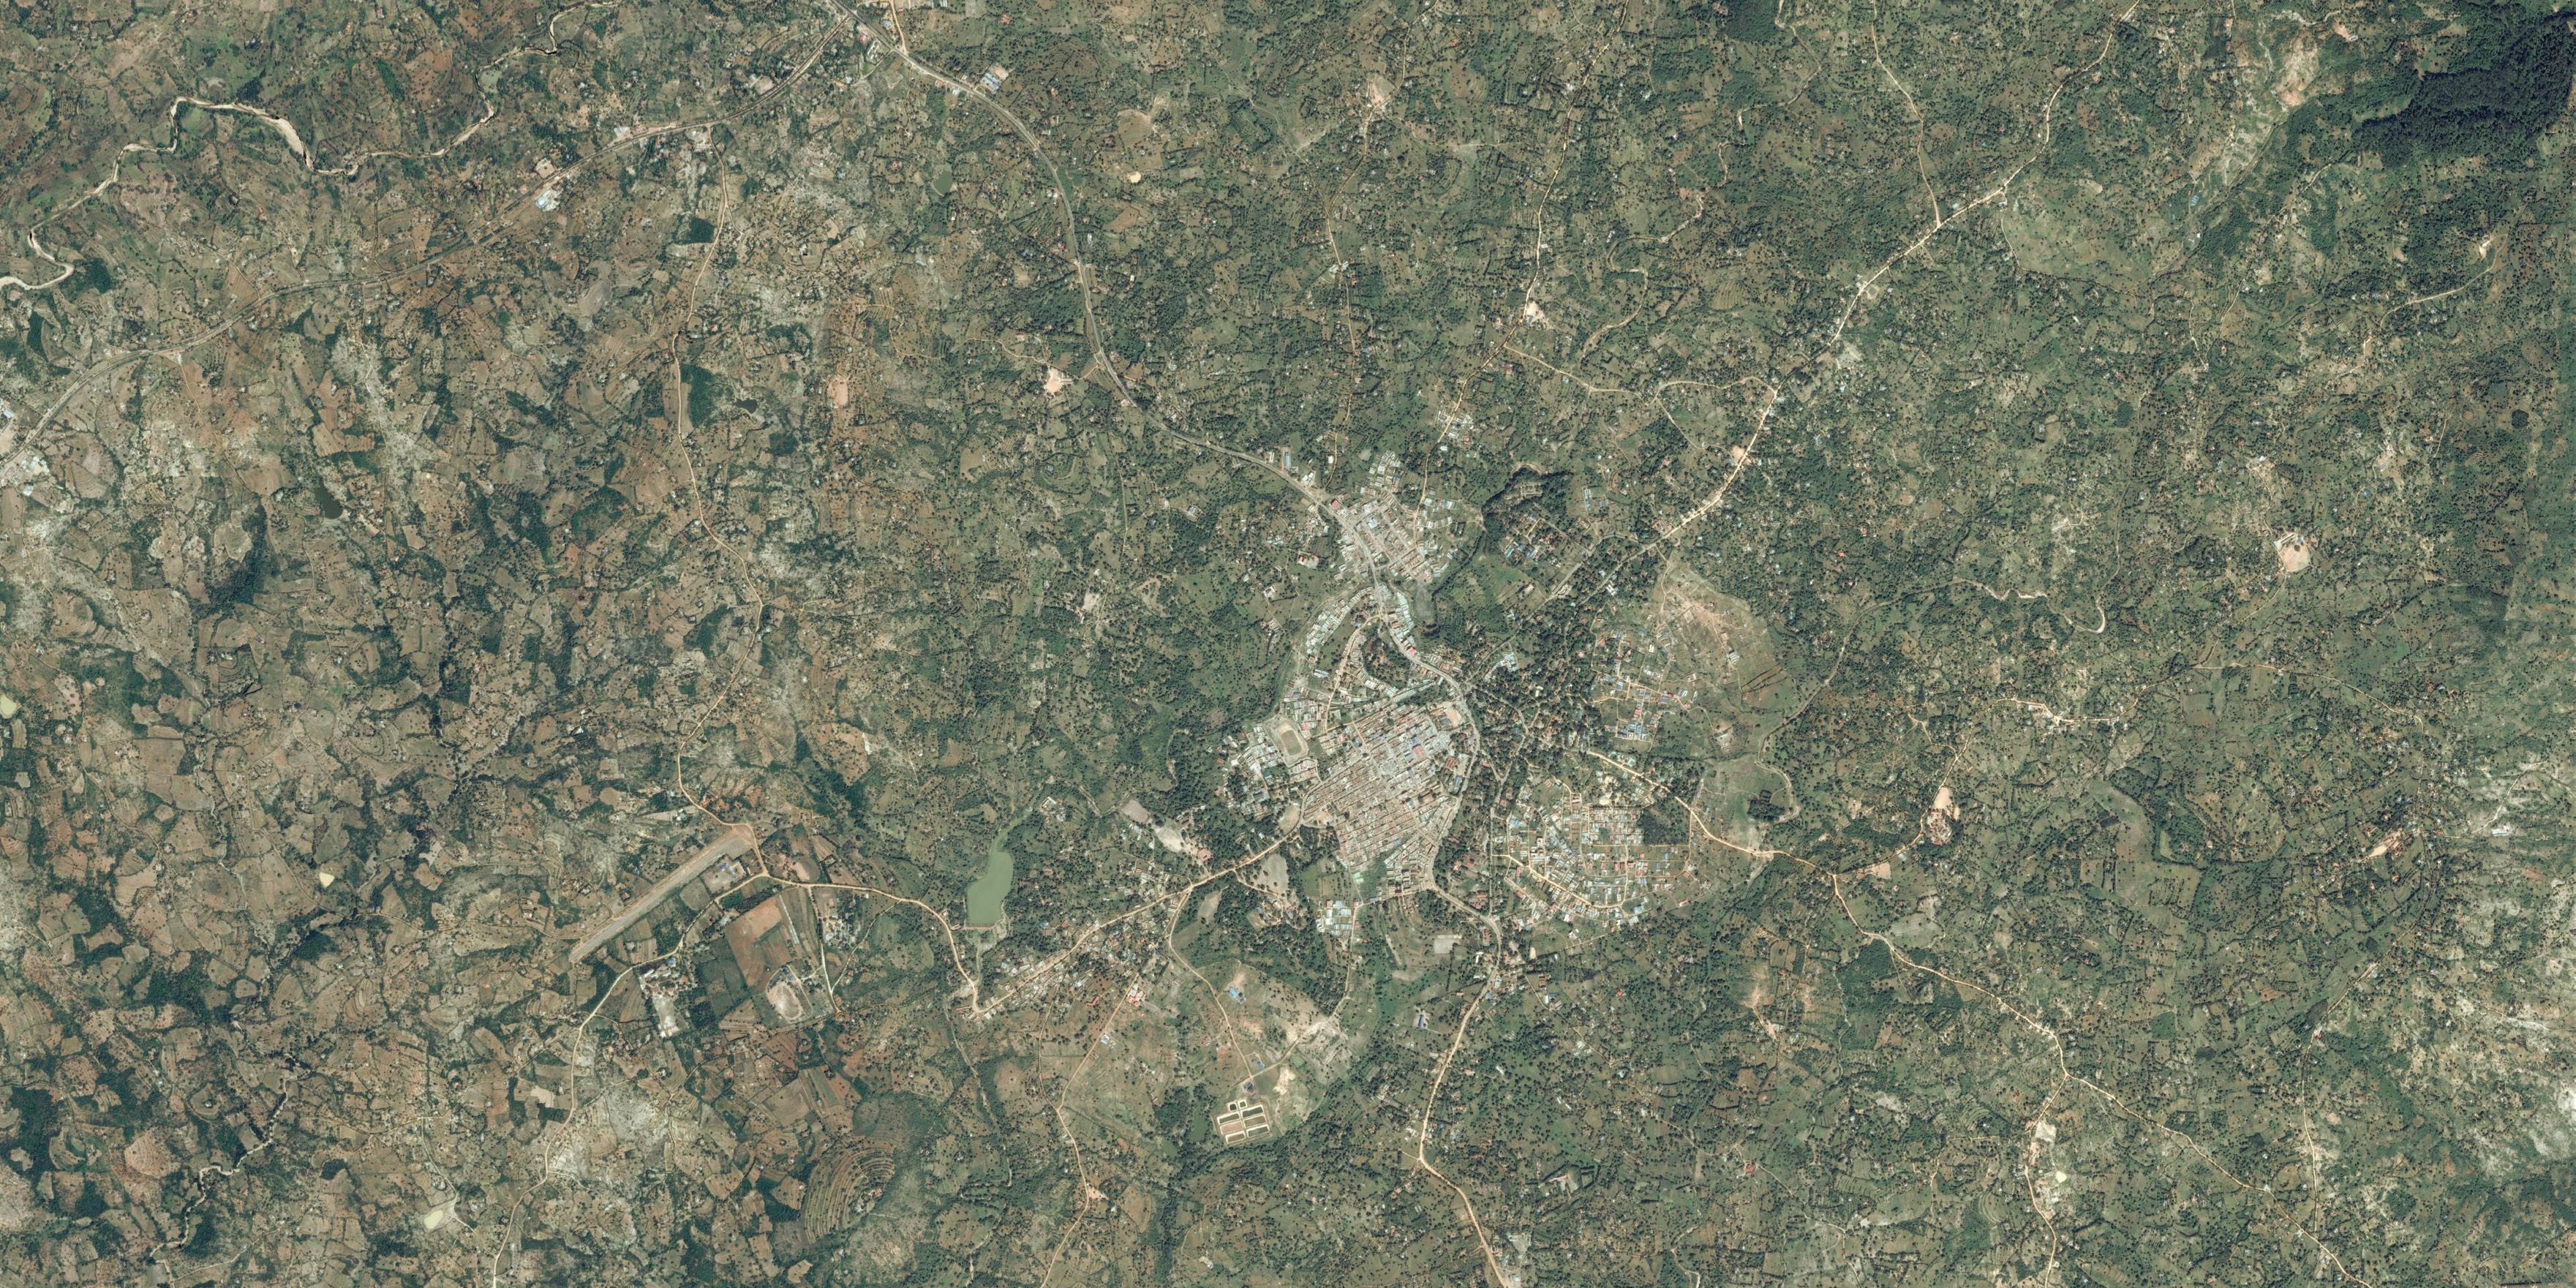


Figure 19 -
shelterBoda-bodaTwo bus stops - one in directioneach
4
Sub-components Estimated cost Impacts Delivery mechanisms Potential funding › Six sheltered bus stops (as shown in the figure) › Boda-boda shelter › Capex of six KShbusshelteredstops6million › Capex of KShshelterBoda-bodaone3million › Annual Opex of the bus stops millionKShboda-shelterand3.6 › Better access to the facility by bus › Improved bus facilities along the new corridor › Better access by Boda-boda services › Improved land value along the road › Kitui 2015AssetProcurementandRegulationsProcurementoutlinedprocedureprocurementtheCouncilCountyfollowingstandardasinPublic2013ThePublicandDisposalAct, › Public orpartnersdevelopmentCountypotentiallyfundingfromfunds,(KUSP)combination › Some revenue can be maintenancecontributestops.rightssellingthroughgeneratedleasingorofadvertisingatbusThatwouldtowards Challenges
Priority &OperationsMaintenance › May require some land acquisition › Would increase noise and air pollution due to motorisedincreasedvehicles › Funding › Attract bus / matatu services on the new upgraded road › Pre-feasibility and feasibility studies › Bus rationalisationroute › Medium-term › It is good to provide designated bus stop. Not all three locations are immediately.needed They can be phased in line with the growth of the demand.
TRANSPORTATION
N
Time Frame
ECONOMIC DEVELOPMENT PLAN 54 A9 A9 Kitui Town Katyetoka
Improvement to public transport facilities along the proposed upgraded road
The proposal for the food processing industry is to locate the facility along the road that connects Machakos-Kitui road and Mbusyani road. The proposal is to upgrade the earth road to a bitumen standard. This proposal is to better public transport facilities along the upgraded road. A good public transport connection is very important for the food processing facility for both the employees and the local farmers. While the processing unit will have a dedicated collection vehicle, which would travel to a designated place in Kitu, i.e., local market, to collect the produce, farmers and beekeepers are also expected to travel to the facility to deliver their produce. Plan showing proposed locations of bus stops and Boda-Boda shelters on the upgraded road Data Gaps PhasingProject
Introduction The Kalundu River is an important physical feature in Kitui. The stream is seasonal and it runs parallel to the town centre, nearly mirroring the linear development of Kitui’s urban fabric. It links strategically located areas, including the Dam to the West and the dump site closer to the town centre. This small valley is already being used for leisure purposes but suffers from pollution, probably caused by discharge in its waters of both local sewage and from effluents of the dump site upstream. The proposal introduces the idea of the “Kalandu Linear Park” which primes in preservation of water quality and the sensible introduction of pedestrian and cycle links alternated to public spaces of different nature and scale.This newly established blue-green infrastructure corridor will enable Kitui to address priority issues such as the climate crisis and environmental hazards (especially water pollution). The new Kalandu Linear Park resolves social and environmental problems relating to water resources management, sanitation, solid waste management, and conservation of natural ecosystems while developing an attractive place for recreational purposes. The proposed “Kalandu Linear Park” concept demonstrates how a strong vision can address a series of complex and interconnected challenges.
Figure 20 - Development Framework plan showing Focus Area 3 - Blue-Green Corridor and individual proposals under that focus area
As existing photos along the Kalundu River
KALUNDU RIVER PARK
55 KITUI URBAN ECONOMIC PLAN
FOCUS AREA 3:


Focus Area 3: Sequencing
1. Remediation of existing land fillthe current uncontrolled dumping on the Kalundu River dump site is a major environmental and health hazard that needs to be rectified. It is therefore proposed to halt dumping and remove the residual waste by haulage to the new County landfill site. This will be the first step in removing a significant environmental impact on the river thereby supporting its future recreative use.
A new sewage treatment plant has been constructed and an integrated plan and role out of infrastructure needs to be implemented to improve the water quality in the dam and river.
ECONOMIC DEVELOPMENT PLAN 56
3. Improvement to sewage and sanitation network - along with the impacts of the dump site, the uncontrolled flow of waste water and effluent into the Kalundu River basin also needs to be stemmed.
Example images of interventions that can be adopted along the river corridor
The projects identified have been numbered based on their preferred sequencing. Before the river area can be utilised for public recreative purposes, and as a blue-green corridor, it will be critical to remove the current main sources of pollution and degradation that impact the water quality and surrounding riparian environment. Thus the sequencing of the projects is proposed as follows:
4. Linear Park infrastructure - subsequent to the above initiatives the Kalundu River corridor can be opened up for public realm improvements and park facilities. This will link the town centre and eastern parts of the town with the Kalundu Dam and provide a valuable social amenity to the town, its residents and visitors.
2. Sorting and recycling facility - following remediation of the dump site there will be an opportunity to introduce recycling and treatment infrastructure on to the site. This will provide the organised and managed collection of solid waste and its recycling before onward shipping to other centres or the County land fill site. This initiative will include developing an operational structure for waste management in Kitui along with integrating the role of the informal sector in waste collection and management.
5. Solar street lighting - this will be integrated and installed with other amenities along the park corridor to enhance the overall safety of the public realm and encourage usage throughout the day and night.


57 KITUI URBAN ECONOMIC PLAN Mee�ng Point Park (Natural & Formal) Sports Field Water Sports Sor�ng & Recycling Facility Sports Stadium Kalundu Dam & Eco-Park N Figure 21 - Detail development plan showing proposals in Focus Area 3 along the River Kalundu


The Maldives is currently mitigating dumping of its waste by improving waste collection systems and constructing new engineered disposal sites that can serve a number of islands (World Bank 2017a).
ECONOMIC DEVELOPMENT PLAN 58 WASTE MANAGEMENT Remediation of existing landfill 1 Remediation of the existing dumpsite at Kalundu River. Removal of existing residual waste from the open dump site and haulage/ disposal to the new landfill site proposed for Kitui ›County.Determine level of investment and secure funding (IFI, grant, PPP or direct by government) › Appoint private contractors to remediate and clean the site › Engage with informal sector and CBOs › Provide area/ site for receiving waste still being produced by Kitui Town Construct concrete slab on remediated land to provide sufficient area for development of MRF and IVC and waste reception. Sub-components Estimated cost Impacts Delivery mechanisms › newmaterialofandExcavationhaulagedumpedtolandfill › arearemediatedslabofConstructionconcreteon › KShCapex220m › FinanceIFIFunding:/Donor › KShCapex100m › Improved ground and water quality around the River Kalundu › Reduces methane production in the landfill › Improves local air quality › Provides employment › Removal of ~25,000m3 of dumped waste (estimate assuming a 5,000m2 dumpsite area and 5m deep waste deposit) › Reduced ground and water pollution around Kalundu › Provides area for formalised recycling and waste composting to take place › Creating employment › Compliments CIP projects SWM 6 › Opportunity privatecollaborationforwithsector › Opportunity privatecollaborationforwithsector Challenges Data Gaps Time Frame › Kitui has waste being dumped on the road, uncontrolled fires and pollution of surrounding water bodies › No formal means of treating and disposing of waste › Need to be mindful of employment and social impacts on informal sector that live and work on the existing dumpsite › Obtain funding for remediation infrastructure › Obtain funding for construction of new concrete slab › Construction of new landfill required to receive remediated waste › Remediation of existing dumpsite: Short-term › Construction of concrete slab: Short-term Case RemediationStudy: of open dumpsites in South Asia (What a Waste 2.0, World Bank Group, 2018) Open dumping is common in South Asia with most open dumpsites lacking any form of leachate collection and treatment, landfill gas collection and many also lack any form of liner. However, the remediation of existing dumpsites and the construction of new engineered landfills is underway with the newer official and well operated landfills generally being privately operated.

› Formalises
› Determine level of investment and secure funding (IFI, grant, PPP or direct by government) Engage with informal sector and CBOs (existing Kalundu dumpsite pickers, Kitui Taka Youth Group, etc)
Challenges Data Gaps Time Frame › Kitui has waste being dumped on the road, uncontrolled fires and pollution of surrounding water bodies › No formal means of treating and disposing of waste. › Limited formal collection mechanisms › Secure markets for recyclates and land / area for the treatment facilities Obtain funding for treatment infrastructures › Formalise collection process so that waste is sorted and transported to the appropriate facility Material Recovery Facility (MRF): Short / medium-term › In-vessel composting Facility: Short/medium-term Case CEMPRE,Study:Brazil - www.cempre.org.br
2
›
›
›
In Brazil, 800,000 waste pickers collect and sort 18% of the recycled waste in the country. In 1992, a group of companies created the Compromissa Empresarial para Reciclagem (CEMPRE) translated to Brazilian Recycling Commitment, which is a non-profit organisation funded by consumer goods corporations, who have partnered to promote recycling and provide safe conditions for waste pickers in Brazil.
›
›
Sub-components costEstimated(range) Impacts (benefits) Delivery mechanisms › FacilityRecoveryMaterial(MRF) › KShCapex70m › FinanceDonorIFIFunding:/ › Improve
›
›
›
›
›
›
›
CEMPRE trains waste pickers, also known as ‘catadores’, through pictures and videos on how to build a business in waste picking and recycling while following health and safety guidelines. The organisation also removes the middle man from the selling transaction in order to allow waste pickers to deal directly with reprocessors and brokers and keep the entire value of the material they collect and sell.
›
Development of composting facility for managing organic waste Develop mechanism for implementing source segregation of organic waste (through waste collection and simple MRF) Develop mechanism for developing invessel composting facility (PPP, funding, grants or direct by government) and identify opportunities / impacts of CDM Develop the facility and secure / ensure end-markets are available - for recyclate and for compost on agricultural land Develop mechanisms for payment / fees between collectors, municipality, pickers and recyclate sales. community waste awareness Provides an increased level of service and engages community and private sector the sorting process informal waste pickers Secures markets to sell the recovered outputs Provide a safe and regulated environment for waste sorting Recover and sell recyclable material (e.g. plastics, paper, glass, metals) and receive revenue from sales Opportunity for private or public sector to collaborate with informal sector Would enable wide spread source segregation to be implemented across the town Collaboration with recycling facilities to secure markets: locally in Kitui - paper/ card and possibly plastics; nationally in Nairobi or Mombasa - metals and plastics Reduced wild dumping of waste and improved sanitation Can produce usable fertilizer for agriculture Reduces methane production in the landfill Diverts organic waste from landfill Improves local air quality › Opportunity for private or public sector to collaborate with informal sector › Would enable wide spread source segregation to be implemented Collaboration with farmers to secure local end markets
› Employs
Solid waste infrastructureofimprovementsinfrastructure-developmentrecyclingandtreatment
›
›
› facilitycompostingIn-vessel › KShCapex50m › FinanceDonorIFIFunding:/ ›
59 KITUI URBAN ECONOMIC PLAN WASTE MANAGEMENT
›
›
Developing basic recycling infrastructure. Construction of a simple material recycling facility (MRF) at the landfill to enable informal sector to recycle safely and increase waste awareness and education.

WATER MANAGEMENT
KalunduCBD
Improvements to the sanitation system in Kitui are needed to improve to water quality in the dam and river and improve health through reduced diarrhoeal disease. To make a sustainable impact an integrated plan is needed combining sanitation, water management, drainage and solid waste. If one intervention is undertaken in isolation it is unlikely to have a significant effect on the environmental health of the dam and rivers in Kitui.
Improvement to sewage and sanitation network 3
ECONOMIC DEVELOPMENT PLAN 60
A new sewage treatment works has been constructed to serve Kitui. A sewer network has been designed and the municipality are in the process of developing it. However, this is a costly and slow process and the cost of connecting to the sewer system is often prohibitive for low income households.
Lack of adequate sanitation and drainage is causing environmental degradation and health risks to populations. Pit latrines are sited close to wells resulting in contamination of groundwater and sewerage and waste water are sometimes dumped directly in the rivers and streams or storm water washes pollution into watercourses (Figure 22).
MjiniMosquitoKunda
- Kindu Majengo DamKalundu DumpKalundusite Figure 22 - Environmental degradation hotspots
Figure 23 - New sewage treatment works KituiCBD Mjini MosquitoKalundu Majengo KundaKindu 0 0.5 1km0.25 0 75 N Key Pump Station Sewer Lines Sewer Treatment Works Man SettlementHole Boundaries PublicRoadsRiverDam Toilet
61 KITUI URBAN ECONOMIC PLAN
A gradual sewering approach would enable sewers to be constructed when funds are available, with priority should be given to areas where residents can afford to connect and public toilets, but also make provision for improving cheaper on-site sanitation options and to develop public services or small businesses to provide emptying for septic tanks and pit latrines (honeysuckers or manual emptying). This could include holding tanks for discharge of faecal sludge into the sewer, reducing the distance that on-site sanitation emptying services need to travel to discharge their load. In lower income areas simplified sewers should also be considered to lower the cost of construction and connection. These are small diameter, shallower sewers with less Weslope.understand that the main sewer lines are under construction, as shown in Figure 23 but there is still a need to develop the last mile sewers and connect customers. This are essential to enable the water company to collect customer. In Kenya the Water Services Trust Fund are promoting last mile infrastructure development and strengthening the capacities of utilities for of utilities for sustainable operation of infrastructure in urban low-income areas
Impacts (benefits): Improvements to water quality, Improvements to local environment, Decrease in disease and improved well-being and improvements to surface and ground water quality
- Kibera, Kenya In some areas sewerage may be financially sustainable in the medium term and gradual sewering can help to move from on-site sanitation systems to sewered systems. In Kiberia, sanitation was very bad, most toilets were share pit latries and sludge was dumped in local watercourses. The sewerage connection cost is often a barrier to households ability to connect to the network so the gradual approach was taken connecting public and some communal toilets / pay per use toilets first. New public toilets were then constructed that were able to receive sludge from septic tanks and pit latrines. In parallel independent business were developed or improved to provide pit emptying and transportation services for faecal sludge. The programme then gradually extended to other communal toilets and individual household toilets. The scheme connected 20 communal toilets in the first year and after 2 years 18 were functioning well. However, there was instances of landlords imposing high charges or restricting access to the facilities. At the end of the third year 60 landlords (with communal toilets) had connected and another 130 had expressed interest to do so.
Estimated cost Impacts Delivery mechanisms
Sub-components
A town sanitation plan and integrated urban water management KSh 155,000,000 n/a A consultant with the water services board, KITWASCO, municipality and consultation with residents and community groups
Operational costs include maintenance of the exhauster trucks and payment of staff. These costs should be covered by the customer septic tank of pit latrine de-sludging fee. KITWASCO with the municipality and the local communities. Potential to involve NGOs such as WSUP who have experience in developing theses service in Kenya. Upscaling Basic Sanitation for the Urban Poor (UBSUP) is an initiative that is run by the WSTF and focuses in funding and support to develop improvements for plot level sanitation. The tool kit: theprovideshttps://waterfund.go.ke/safisan/detailsofhowtodevelopprojectandapplyforfunding.
KSh 550 million Opex covers costs for operation of the pumping stations and the wastewater treatment plant and general maintenance. This should be covered by the customer sewerage charge but an economic model is need to see if this is feasible. KITWASCO with possible funding from the Water Services Trust Fund (WSTF)
upgradessewerageforlast
Priority mile connections
ECONOMIC DEVELOPMENT PLAN 62
› Cost of connections to the sewerage system - is it affordable? › Cost of pumped sewerage system - are operational costs financial sustainable? › Sanitation and drainage plan including willingness to pay survey › Immediate to medium term
arrangements.sludgesupportingopportunitieson-site-sanitationsafeandfaecalmanagement
Provision of four toilets / ablution blocks (with sewer connections or septic tanks) in public places and capacity building of private operators. KSh donorthetocostLand4,500,000andcapitalwouldneedbeprovidedbymunicipality/funded Operational costs include for cleaning, toilet paper, soap, water supply, and repairs. Operational costs could be covered through as pay-per-use system (~10 kSh in Malindi) and run as a small business. The municipality would need to pay for and own the infrastructure and would lease it to a SME who would operate the facility and collect the revenue from use.
Source: WSUP Practice note 15, March PN015-ENGLISH-Gradual-Sewering.pdfhttps://www.wsup.com/content/uploads/2017/08/2014,
Challenges Data Gaps Frame
Time
Development and promotion of 2 exhauster trucks: KSh 20 funding.orbewouldandCapitalKShAwarenessKShbusinesses:sludgeTrainingmillionoftrucking3millionraising:2.4millionInvestmenttrainingneedtothroughdonormunicipality
Pit emptier services discharging was te into a holding tank the public toilets for discharge into the sewer system.
Case GradualStudy:Sewering
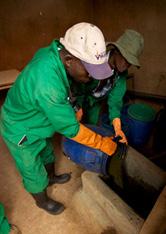
›
63 KITUI URBAN ECONOMIC PLAN
Development of linear park along Kalundu River 4
Estimated cost Impacts Delivery mechanisms Potential funding › Overall strategy to be routesofoutliningdevelopedlocationactivitiesand Implantation of trees and plants where required to enhance the sense of place › To be coordinated waste and andaddressmanagementwatertosanitationwaterquality
›
› Opportunity to encourage outdoor activities and link existing recreational nodes › healthierPromotesliving for residents and visitors
URBAN DESIGN
The Kalundu river which runs through Kitui has the potential to be an attractive part of the town offering areas for leisure and recreational activities. However, it is currently polluted due to presence of waste and a lack of sanitation along the river neighbourhoods, As such, these activities are currently limited. The proposals primary aim is to develop a linear park which will connect adjacent nodes and revitalise the river. These include the transformation of the dumping site upstream and remediation of its land to transform it into an Ecological Island (ref.: to Waste Management proposal 1 for details), installation of sanitation in the neighbourhoods immediately adjacent the river and the construction of cycling and walking routes linked with stop-over points featuring leisure facilities such as BBQ and pic-nic spots, sport zones and play areas. Regenerating the river presents an opportunity to connect key recreational and educational nodes such as the Ecological Island upstream (former dumping ground), Kitui Sports Stadium, Kalundu Dam and the Eco Park thus forming a coherent link that will encourage people to play, walk, relax, enjoy nature and engage in sporting activities. It is essential that water quality is re-instated and such essential action will spur several opportunities, including opening the use of the dam for water sports and enrich the valley with leisure and social opportunities. Given its proximity to the town centre the linear park offers a place to escape from the pressures of urban life and promote a healthier environment for the residents of Kitui.
›
›
Sub-components
› KSh million185 › For feasibility and studydesignconcept › KShCapex720m
› Can be implemented in stages as more funding becomes available Opportunities for community participation such as tree planting Public projectsfunded › Local, IFIsCounty,Authority,Government, › completion:Following revenue from linearsurroundingvalueincreasedpop-upBodaadditionalBodaparking,stalls,landofbuildingsthepark
Challenges Data Gaps Time Frame PhasingProject Priority &OperationsMaintenance › Sanitation and waste dumping are likely to require further education and participationcommunity › Installation around the river will require careful planning and management to retain river flows and avoid flooding › Funding › studyPre-feasibility › Site requiredsurvey › Seasonal water flows floodingand › Short to Medium term › Three phases: 1. Water clean-up 2. preparationEmbankments 3. Installation of leisure facilities and infrastructure › Urban EconomicsupportingProposalsDevelopmentGrowth Kitui MunicipalityCounty and Water and Sewerage authority
enhancementsCaseStudies:
ECONOMIC DEVELOPMENT PLAN 64 Perreux River Banks - Paris, France Vegetal engineering, community participation, regeneration, completed Jurong Lake Gardens - Singapore Eco-driven, community participation, regeneration, completed Illustrative models showing as existing aerial view of a section of Kalundu River and proposed


Most of these wider area sectoral proposals are aimed at increasing agricultural productivity and climate resilience as well as bringing wider economic opportunities to marginalised communities across the municipal area.
Proposed sites for bus sta�on reloca�on
N
Area considered for wastewater treatment plant
Figure 24 - Plan showing wider area proposals spread across the entire region
Irriga�on Formaliseefficiencywastecollec�on and segrega�on Solar irriga�on and boreholes Rural mini-grid
WIDER PROPOSALSSECTORALAREA
65 KITUI URBAN ECONOMIC PLAN
WIDER AREA PROPOSALS
Introduction The previous sections have considered and proposed climate resilient infrastructure projects which either directly support the proposed value chain opportunities, or further enable the town to respond to immediate needs with regards improvements in traffic and pedestrian circulation, public realm, solid waste management and extensions to the sewage and sanitation network. This section outlines other proposed infrastructure projects which will assist with issues which are located in the wider hinterland of the town and will promote climate resilient approaches to the introduction of power, irrigation, water and the development of a recycling and waste treatment stream to service the town and it’s wider communities.

ECONOMIC DEVELOPMENT PLAN 66 POWER Rural mini-grid Categorisation: UDP supporting economic growth Linked to: n/a (stand-alone) Outcome › Provision of electricity to remote rural locations currently not served by the national grid › Improved life for residents due to improved ability to undertake more advanced economic activity, and improved safety Sub-components Estimated cost Impacts Delivery mechanisms › Detailed study of target communities to determine current / potential demand and ability to pay › Financial modelling › Community / stakeholder engagement plan › Selection of proposed project site › Initial technical design, economic, social and environmental analysis › Development of procurement and deployment implementation/ plan › Operation plan (including revenue maintenancecollection,etc.) › connection1,400US$800Benchmark:-per › connection)US$1,200cost(atperconnectionsaveraging3totalUS$180,000Approx.Actual:basedonmini-grids50minigridsaverageofper › Funding: operator(s)developer(s)mini-gridindependentFromplant/ › Improved quality of life › Improved conditionsstudy › Improved health and safety › Increase in business activities › Coordination with Kitui County Government, Rural Electrification & Renewable Energy Corporation, and other AccessKenyapartiesinterestedincludingOff-gridSolarProject(KOSAP) › Partnering with local / regional equipment specialists such as Powerhive to determine appropriate technology solutions › Maintenancecapacity operationensureprogrammebuildingtocontinuedofsystems › Maintenanceresponsibility of plant developer(s) / operator(s) Challenges Data Gaps Time Frame › Perceived high cost of electricity from minigrids › Regulatory issues around minigrids implementation › Detailed information on underserved communities in Kitui County › Short to mid-term Case Study: Devergy is an energy services company that provides minigrids solutions to low income people in rural villages. In Mbeya, in western Tanzania, they installed an adaptive direct current solar PV minigrids to serve around 60 households. Customers can pre-pay for affordable energy services in daily, weekly or monthly package at local stored, or via mobile money services such as DevergyM-Pesa.covers the installation costs except for a small connection fee of between US$6 (KSh 620) and 12, which covers wiring, metering and two bulbs. Customers can also purchase a range of energy efficient DC appliances, including LED lights, TVs, refrigerators and fans. In comparison a traditional grid connection could cost around US$250 (KSh 26,000). Devergy has initially relied upon financial assistance from USAid and other investors, Unlike traditional government minigrids projects, this one is market driven with key innovations around the scalable technology, payment system and operating model. Additionally Devergy maintains a long-term commitment to the village, so they are available to ensure system operation and reliability are maintained. Devergy’s work has demonstrated that minigrids can be both profitable for the operator and affordable for the customer16
16 Adaptive solar PV minigrids in Tanzania, accessed 30th July https://www.usaid.gov/energy/mini-grids/case-studies/tanzania-smart-solar/2019

Case Study: Grid Alternatives International Program has been helping farmers in Nicaragua with sustainable irrigation solutions for the last five years. One such solution helped the Valle family of Matagalpa. They grew squash, passion fruit and tomatoes on two acres of land to sell at the local market but had trouble making a profit due to high irrigation costs. The monthly electricity bill to run their pump was US$33, but their income was only US$103. Also, the supply quality was poor, meaning they could only irrigate on three days per week instead of every day. Other expenditure reduced their earnings to US$25 a month. Working with Grid Alternatives and local company Suni Solar, they installed a solar irrigation system. The total cost was US$10,000, but Valle family was only asked to pay US$2,000 which they financed via UNAG, their national agricultural organisation. Two solar panels power a pump that abstracts water from a nearby river into a cement tank and to a gravity fed pole mount system that drips onto the plants. With adequate water supply to the plants, they can now irrigate other crops, including onions, pipian and pasturage, and also raise tilapia. Their monthly electricity bill is now US$3, and their monthly earnings have now increased to US$54618.
67 KITUI URBAN ECONOMIC PLAN POWER Solar irrigation and boreholes Categorisation: UDP supporting economic growth Linked to: Wider Area Proposal, Water Management, Sustainable Irrigation Outcome › Improved provision and ability to irrigate crops and provide drinking water to livestock in rural areas currently not served by the electricity grid or by the domestic water supply system › Reduced carbon emissions through replacement of diesel generators Sub-components Estimated cost (range) Impacts (benefits) Delivery mechanisms › Mapping of ownership of all agricultural and livestock holdings and current status of their irrigation facilities › Review of abstraction volumes from each borehole › Establishment of needs for solar irrigation and borehole systems › Preparation of design brief for boreholes / irrigation systems › Development of procurement and deployment plan › Maintenance plan › systemUS$3,000Benchmark:per17 › Actual: US$90,000 based on max 30 systems › Funding installation):(eqpt,IFI / donor finance › Lower costs for farmers where current system is on grid › irrigationnoforserviceConsistentprovisionfarmerswithpowered › Reduced farmingassociatedemissionscarbonwithsector › Partner with regional / county government to activitiescoordinate › Partnering with local equipment specialists to solutionsdetermine › Maintenancecapacity ofcontinuedprogrammebuildingtoensureoperationsystems › Maintenanceresponsibility of individual farmers Challenges Data Gaps Time Frame › Effort needed to obtain comprehensive data on current situation › Funding › No knowledge of current situation › Short to mid-term 17 FAO The benefits and risks of solar-powered irrigation - a global overview (2018) 18 Solar Drip Irrigation Case Study - The Valle Family, accessed 29th July https://gridalternatives.org/sites/default/files/International%20Valle%20irrigation%20case%20study.pdf2019

water › theincomeandfoodIncreasedsecuritysurplusforfarmers › losseseconomicReducedfor the farmers › Lower
› Preparation
and
Agriculture is a key sector in Kitui, particularly in rural areas where it is estimated to contribute to around 87% of income. Reliance on agriculture make the population vulerable to water scarcity. Water and infrastructure for irrigation can help populations to become more resilient to changes in weather, it can increase land productivity abd enable the population to grow a more diverse and valuable crops.
companies for continuous O&M support › Maintenance /
› provisionpowerConsistent › sectorwithassociatedemissionscarbonReducedfarming › Involving Government / banks / international donor for funding › Partnering with
Sustainable Irrigation
› Mapping
for
› Review
›
WATER MANAGEMENT
› Procurement implementationand › Preparation of
Sub-components
The sustainable irrigation helps to build resilience to droughts, floods, climate change, competition and pollution. Sustainability can be achieved through technical and nontechnical solutions. Technical solution includes selection of right crops and varieties, applying water saving technologies such as drip and sprinkler, greenhouse, hydroponics and automation. Non-technical solutions play equally important role supporting the long-term operation and maintenance of technical solutions. Thus, sustainability must be ensured by appropriate institutional strengthening and capacity building.
10% of the capex cost › productionIncreased or profit per unit
› Drip
for profitable sales › Partnering
ECONOMIC DEVELOPMENT PLAN 68
programme to ensure continued system operation Challenges Data Gaps Time Frame › Data availability on the current situation › Irrigation is a costly affair and so the fund needs are too high › Data on agricultural area › Water resources availability › Market availability › Potential funds availability › Market availability › Medium term
Estimated cost opexEstimatedcost (benefits)Impacts Delivery and funding mechanisms of all householdholdingsagriculturalincludinggardens of water resources, crop marketpracticesagriculturalvarieties,and Planning of suitable agriculture and systemirrigation of feasibility study and design of project operationlong-term implementationbuildingplan,maintenanceandcapacityand irrigation: systemUSDApproximatelyirrigation:2,500per of costs gridcurrentlyfarmersonsupply markets with drip sprinkler capacity building
Sustainable irrigation practices provide a long-term solution for the management of spatially and temporally changing and increasing scarce water resources. Sustainable irrigation practises can be applied to all irrigation related activities to improve food security and achieve higher economical return while limiting the impact the environment.
› perUSDApproximately6-7,000ha › Solar

The system can be expanded to an additional 0.1 ha for KSh 5,000.
Adopted from Malabo Montpellier Panel Report: ‘Water Wise: Smart irrigation strategies for Africa’
69 KITUI URBAN ECONOMIC PLAN
The US company SunCulture, based in Nairobi, has been selling solar irrigation kits to Kenyan smallholder farmers since 2013. The SunCulture AgroSolar irrigation system combines the energy efficiency of solar power with the effectiveness of drip irrigation. Solar panels provide the pump’s electricity without the need for batteries or inverters. Water is pumped into a raised water storage tank during the day. During the evening, the irrigation takes place and a valve on the water tank is opened; using gravity, water flows down through a filtration system onto the crop root zones via the irrigation tape. The kit costs KSh 260,000, including the solar pumping system, drip irrigation equipment for 0.4 ha, and training on how to operate the system. According to experience, farmers can increase their yields by up to 300 percent and save over KSh 1million per year compared to using petrol or furrow systems.
Grid Alternatives Solar Drip Irrigation Case Study
- The Valle Family Grid Alternatives International Program has been helping farmers in Nicaragua with sustainable irrigation solutions for the last five years. One such solution helped the Valle family of Matagalpa. They grew squash, passion fruit and tomatoes on two acres of land to sell at the local market but had trouble making a profit due to high irrigation costs. The monthly electricity bill to run their pump was US$33, but their income was only US$103. Also, the supply quality was poor, meaning they could only irrigate on three days instead of every day. Other expenditure reduced their earnings to US$25 a month. Working with Grid Alternatives and local company Suni Solar, they installed a solar irrigation system. The total cost was US$10,000, but Valle family was only asked to pay US$2,000 which they financed via UNAG, their national agricultural organisation. Two solar panels power a pump that abstracts water from a nearby river into a cement tank and to a gravity fed pole mount system that drips onto the plants. With adequate water supply to the plants, they can now irrigate other crops, including onions, pipian and pasturage, and also raise tilapia. Their monthly electricity bill is now US$3, and their monthly earnings have now increased to US$546
Case AdoptedStudy:from
Source: Solar Drip Irrigation Case StudyThe Valle Family, accessed 29th July %20Valle%20irrigation%20case%20study.pdfhttps://gridalternatives.org/sites/default/files/International2019
Case AdoptedStudy:from Malabo Montpellier Panel Report on Water-wise: Smart irrigation strategies for Africa Drip irrigation can improve agricultural yield by up to 100% over conventional irrigation system using 50% less irrigation water. An example from Ghana showed income growth of over 100 percent resulting from use of drip irrigation on onion fields. Since 1996, the Kenya Agricultural and Livestock Research Organisation (KALRO) has promoted gravity-fed drip irrigation systems to farmers who were previously watering their crops by hand. Depending on the crop, farmers reported additional income of between KSh 600 - 750,000 with a single bucket kit per person. In 2016, Kenya’s Meru University of Science and Technology developed a “sensor-based automatic irrigation system” app that monitors the need for water in fields and controls irrigation equipment. The app makes use of sensors placed in a field to determine the soil’s moisture. If it is too dry, a control unit uses solar panels to open the valve of a water tank and closes it again when the soil is damp enough. The upfront costs are high - KSh 50,000 per 0.1 ha for a combined app and irrigation system, including solar panels and two drip irrigation lines.
ECONOMIC DEVELOPMENT PLAN 70
is
-
as litter › No formal
in place › Lack of
15
in place for collecting and sorting waste by informal
WASTE
on the
to facilitate town-wide waste collection and segregation. Sub-components Estimated cost Impacts Delivery mechanisms › Formalising the Informal ServicesCollectionWaste › KSh 5-10m › KSh 5m to develop collectionwastesmartimplementandappfortown-wide › Funding: IFI / Donor Finance › Reduced wild dumping of waste and improved sanitation › Provides an increased level of service and engages community and private sector › Improves sanitation and flood and surface water management ability › Formal employment for waste pickers with adequate wages and health and safety training › Involvement of waste picker organisations to provide support and supervision › Better working conditions for waste sorters › More efficient segregation of recyclables › Higher quality materials which can be sold to recycling brokers › Improved understanding of waste collection and collection days, etc › Introduction of Private collectionintoPartnershipPublic(PPP)wasteeffort › Support from NGOs, Youth(e.g.wastegroups,communitypickersKituiTakaGroup) › Employment and training by CBOsprivateMunicipalityKituiorentity/ › Funding for PPE, collection carts, training and wages for the CBOs, etc › responsibilityMaintenance of Municipal Government Challenges Data Gaps Time Frame › Non-biodegradable
Solid waste infrastructure improvements formalise waste collection and segregation integrating the role of the informal sector into Kitui Town’s waste management system. Introducing source segregation in households and commercial establishments. Encouraging Community Based Organisations (such as the Kitui Taka Youth Group) to operational partnerships with private or public waste collectors. app system waste left streets recycling health safety systems sector pickers) Case DevelopingStudy: an Integrated Waste Management System15 - Kampala, Uganda In Kampala, Uganda, the development of an integrated waste system was prompted by the lack of formalisation in the waste sector. Much of the waste was disposed informally by dumping, burning or burying. Only 55% of the city’s solid waste was officially collected and transported to the city’s landfill by the Kampala Capital City Authority (KCCA). Several standalone Community Based Organisations (CBO) existed offering financial incentives to informal settlements for the collection of recyclable materials, however, the KCCA were not aware of many of these Theorganisations.KCCAdeveloped a new Kampala City Integrated Waste Management System to improve the collection, transportation and treatment of the city’s waste and incorporate the informal sector (predominately the landfill pickers and CBOs) as part of an integrated approach across the waste management value chain. As a result of the Integrated Waste Management System, a strategy was developed to identify, inform and consult stakeholders; clear objectives and measurable targets for education and knowledge sharing were created; activities were undertaken to educate waste pickers; a new contract was developed to ensure that new landfill operators would formally integrate registered waste pickers; and CBOs were encouraged to form partnerships with the KCCA in order make the System more integrated. Waste Pickers Alliance, Uganda
/ text message
MANAGEMENT
Formalising and
form
and
(waste
› Not all residents have smart phones › Provide adequate training and support systems › Convert infrastructureexisting › Launch public awareness campaign › /Short-termOngoing
› Identifying roles in waste management › Maintain dialogue and interaction › Maintaining employment Develop and implement a smart
Projects
This VC project is a facility for processing, packaging, marketing and selling honey and related products.
› Support move to modern beekeeping Support improvement in bee stock
Project: Honey and associated products
Development of the honey and bee products value chain has been highlighted as a priority at both the local and national ›level:Big Four Agenda: prioritises enhancing manufacturing which includes all areas of agroprocessing, including apiculture › Kitui CIDP 2018-2022: includes programs for the development of the honey value chain, with plans to expand production, promote the switch to modern hives and establish processing facilities
› Vision 2030 Strategic Plan: Ministry of Agriculture, Livestock and Fisheries: supports enhanced value addition for agricultural products, including honey Sector supply chain Beekeeping in Kitui is an established activity with over 132,000 hives across the County and production of around 1,140 tons of honey in 2018. Some 90% of beehives are traditional log hives, which limits yields and prohibits the production of some non-honey products. Beekeepers generally have between 5 and 50 hives, and most use traditional extraction methods (crushing and sieving), which reduces quality. Some honey is extracted in centrifuges and bottled by small-scale processors (there are two in Kitui Town), but most is bottled by the beekeepers. The bulk of production is sold directly to consumers, while some goes through small-scale retailers (see Figure 25). Part-processed wax is mainly sold to traders for export, and there is almost no commercial production of the high-value products such as royal jelly, propolis or pollen. Kitui Town is a centre for some processing and bottling of honey and supply of equipment, with some hives, smokers and beekeeping tools made locally.
3.5. Proposed Value Chain
The key outcomes include: › Improved returns for beekeepers › Provide stable price and offtake for honey and other products - supporting investment › Supply full range of beekeeping equipment › Purchase equipment from local manufacturers - stabilising their incomes
›
› Hygienic processing of wax - improving biosecurity
71 KITUI URBAN ECONOMIC PLAN
› Direct employment of 50 FTE in the first phase with high potential for employing SIGs, PWDs and other target groups
› Support for a network of over 3,000 beekeepers by 2025, through stable purchase prices and offtake › Linking with the World Bank’s National Agricultural and Rural Inclusive Growth Project which has a training programme for bee keepers
Base assessment Kitui is known in Kenya for its honey, but the local value added is limited, the quality can be variable, and there is little production of other high-value bee-related Toproducts.realise the substantial potential value added from apiculture, this value chain project is for the development of a facility in Kitui for extraction, processing, bottling, branding and marketing of honey and related products, and supporting activities.
Table 1 - Production outlook
25 - Existing
PropolisHoneyWaxRoyalJellyPollen
ProcessorsTraders
Expected
Figure supply chain
The price differentials are then sufficient to cover transport costs and a margin.
Competitiveness The facility would sell packaged honey to the local market (in plastic bottles - in line with current preferences), as well as to Europe and North America (in glass jars).
The main competition in the region will be from Tanzania, where the export price for bulk, unbranded honey is just under KSh 200 per kg. While this is significantly below average farmgate prices in Kitui, this is for basic bulk product. The Kitui facility would provide branded, packaged honey that is subject to quality controls and with a known provenance. This would then target the medium to high-end segment of the international markets.
Log Modern Total Log Modern Total Hives: No. 120,000 12,000 132,000 60,000 200,000 260,000 Honey: t/y 960 180 1,140 480 4,000 4,480 Wax: t/y 96 10 106 48 253 301
The planned expansion in the number of hives and switch from log to modern hives is expected to support a rise in total marketed honey in the County to 4,480 tons by 2025 (see Table 1). Much of this growth in production would be targeted by the new processing facility.
ECONOMIC DEVELOPMENT PLAN 72 Processors Beekeepers
A key factor supporting the competitiveness of the honey supplies in both the local and international markets will be the focus on quality. The facility’s extension workers will engage with beekeepers to ensure quality control from hive to bottle and to support this, quality mark approvals will be sought from a range of organisations including Kenya Bureau of Standards (KeBS), Fairtrade, Organic products associations, True Source Certified, etc. This will ensure that the facility’s products are not competing in the bulk market, where adulteration is a significant issue. The World Bank bee keepers training programme will also underscore the production of higher quality honey and good apicultural practices. For beeswax, the bulk of production will be mainly for export. Beeswax can be viewed as a commodity, with a single price (if impurity standards are met). Unprocessed wax can be purchased in Kitui for under KSh 400 per kg, and export prices from regional markets to Europe are around KSh 750 per kg, which leaves sufficient margin for processing. For the higher value products (royal jelly, pollen and propolis), competitivity centres on two factors: › Labour costs: the collection, processing and packaging are all relatively labourintensive, and local labour costs are competitive with key international suppliers › Quality: as with honey, good Quality Control and Quality Assurance is essential to obtaining premium prices, and control of standard will be built into the project Current - 2018 by 2025
Processors National Market Export Markets
Honey production in Kitui can compete with other regions of Kenya as the cost base (labour, machinery, etc.) is similar and the production volumes support commercialscale processing and packaging. Internationally, honey from Kitui can also be competitive. The average farmgate price of honey in the County is around KSh 300 per kg, compared with wholesale prices (bulk, unbranded) in the USA of KSh 500 (US$ 5) and the UK of KSh 520 (£4) per kg, and retail prices up to twice these levels.
LocalLocalConsumersConsumersRetailers
› Supply of a full range of beekeeping equipment - acting as an outlet for local manufacturers of beehives and other products where possible Central to the project will be the development of a quality brand for Kitui honey and bee products. To this end, support workers will be employed to work with beekeepers in order to: Ensure that best practice is followed › Monitor provenance of the products
Figure 26 - Future supply chain Processors Beekeepers
› Purchase of other apiculture products (royal jelly, propolis, pollen)
›
› Provide information and training for beekeepers, with a focus on the more technical products (royal jelly, propolis, bee venom and pollen) To support the brand, quality mark approvals will be sought from KeBS, Fairtrade, Organic products associations etc.
›
› Extraction of honey Purchase of liquid honey from beekeepers Honey processing (filtering) › Honey bottling, labelling, packaging, etc.
This Value Chain (VC) opportunity is for a facility to process, package and market honey and other beekeeping related products from across the County (see Figure 26). The facility would sell to local and export markets, with the key activities including:
PropolisHoneyWaxRoyalJelly
KituiProcessingHoneyCentre Pollen Processors National Market Export Markets Processors Traders Local Consumers LocalRetailersConsumers
›
73 KITUI URBAN ECONOMIC PLAN
›
Key activities
› Processing and packaging of other products Marketing and sales of honey and other products, including exports
Operating costs
›
›
The key processing capacity will centre on honey and wax. Target capacity for the facility will initially be for around 500 tonnes of honey and 60 tonnes of wax per year, rising to 1,000 tonnes of honey and 75 tonnes of wax as the sector grows. These volumes represent just over 10% of the expected honey production in the County by 2025 and 20% of wax production. Identification of the machinery and equipment for the facility aims at striking the right balance between automation and employment impact. Key equipment will radial extractors for use in the facility Small extractors for harvesting at apiaries Bottle filler Settling and warming tanks Pumps for moving honey between tanks (warming to filling) Sump with heater for wax extraction
Costs The key cost assumptions are: Manpower: › Head count of 50 in total › Monthly salaries of KSh 12,500 to KSh 20,000 depending on skills
ECONOMIC DEVELOPMENT PLAN 74
Indicative costs and revenues Investment Total investment required is estimated at KSh 230 to KSh 280 million. Around one quarter of this will be for the buildings, machinery and equipment, 10% for marketing and training, and the remainder is for working capital, calculated at 3 months of opex.
›include:Large
›
440 Utilities 13 Manpower 12 Packaging 41 Other Products 2 Wax 26 Honey 500 540520500480460millionKSh 620600580560 0 Other Products 4 Wax 51 Honey - export 167 Honey - local 560 500400300200100millionKSh 900800700600
Figure 27 - Operating Costs 2025 Figure 28 - Revenues 2025Capacity
Total operating costs are expected to approach KSh 600 million by 2025 (see Figure 27). Over 80% of these costs will be the purchase of honey.
The value added margin for honey (sales price less raw honey purchase and packaging) ranges from KSh 157 per kg for local sales to KSh 246 per kg for exports, while for wax the margin is estimated at KSh 333 per kg (see Table 2).
› Additional employment costs of 25% of salary Raw materials: › Honey cost of KSh 500 per kg › Wax cost of KSh 350 per kg › Jars costed at KSh 40 per 0.5 kg jar › Bottles costed at KSh 19 per 0.5 kg container
›
Value added
›
› All the above are costed at current market prices for quality product Other opex: › Covers utilities, vehicle maintenance, marketing, etc Revenues Annual revenues are estimated to reach KSh 782 million by 2025 (see Figure 28). It is projected that 72% of revenues will be from local sales of honey, with the remainder coming from export sales of honey (21%), wax and other products.
The two key enabling factors for this VC project are: ›
Honey All
KituiMarketingExportandSalesHoneyProcessingCentreCard0.4Glass:mnunitspackagingPlasticbottles:1.6mnunitsOtherpacks:0.1mnunits National Markets Other Countries Export RegionalMarketsMarketsLocalMarkets BrandingMonofloralFairtrade Organic
Stable prices and offtake Quality control
RoyalHoneyPollenJellyPropolis
The VC project will target the premium honey market, where prices are dependent on four factors (Figure 30). The honey and other products will be predominantly monofloral (acacia) and organic. A marketing partner will be required to develop a strong brand while a technical partner will support the certification (FairTrade, KeBS, etc.), as well as Quality Control and Quality Assurance procedures and training. Products
75 KITUI URBAN ECONOMIC PLAN Table 2 - Value added for wax and honey (KSh per kg) Figure 29 - Wider value chain impact Figure 30 - Factors supporting premium price realisation Honey - Local Sales Honey - Exports Wax - Exports Purchase price 500 500 350 Packaging 43 87 Value added 157 246 333 Sales price 700 833 683 Recommendations for enabling business environment and/or other catalysts
To support development of the apiculture sector, the facility will offer stable prices and volume offtake for honey, wax and other products. This will support investment by beekeepers in hives and devices for production of other products (e.g. production cups and extractors for royal Thejelly).VC project will focus on quality control at all stages of production from bee to bottle. This will enable beekeepers and the VC project to realise premium prices for their products and support the development of stable market outlets in the long-term. Impact The facility would have a significant impact on the local economy. Aside from the direct employment of 50 people, by 2025 some KSh 570 million of honey, wax, equipment, etc. would be purchased locally. Once the brand and export market linkages have been established, there is potential to expand operations to include sales of products from other counties (see Figure 29).
›
Premium-price products
This technical support could be provided by the export market partner. Inclusion issues
Simple appropriate devices will also be provided to support beekeepers with disabilities. This could include tilting stands for hives, frame grips and holders.
The target markets for these products are Europe and North America, and to a lesser extent the Middle East and Asia.
› Woodland Honey: make beehives and buy in honey for processing and bottling alongside their own Local distribution partner
In addition, they are needed to access the tourist market, getting export-quality products into tourism retail outlets at airports, resorts, etc. Export-marketing partners
A local distribution partner will support sales across the country, especially in the key markets of Nairobi and Mombasa.
Potential partners
› Export-marketing partner
› Technical partner
› USA - Queen of America and HoneyTree Technical partner
While both operate on a relatively small scale, they are well established and have links with beekeepers across the County, and a good understanding of the issues facing beekeepers in Kitui:
› Local distribution partner
The processing facility should be designed for full disability access with ramps, swing doors, low-level switches, open worktops allowing wheelchair access, etc.
A technical partner will be needed to help ensure quality control and support the training of beekeepers in the production of propolis, royal jelly and pollen. In particular, the technical partner will be critical in ensuring that products get the necessary certification to support access to premium price market segment.
Existing operators
The VC project would benefit from a number of partners: › Existing operators
› Royal Beekeepers: make beehives, process honey and provide training and supplies. They are now looking at expanding into other products (propolis, royal jelly)
As a commodity product, exporting wax is relatively easy and will not require a partner. However, exports of honey and other products will require good branding and access to existing supply networks.
ECONOMIC DEVELOPMENT PLAN 76
› UK - Rowse Honey and Dandy Lions
There are two operators in Kitui Town that could form the basis of the VC projects.
The VC project will work with one or more of the established honey distributors in Europe and/or North America. Leading distributors include:


This can be seen as a green scheme with environmental benefits outweighing the impacts. No significant environmental impacts have been identified:
Honey production is less vulnerable to periods of low rainfall than crop production, but yield will still go up and down with rainfall. To ensure that farmers are equipped to be as resilient as possible to periods of drought they will need to be trained to extract the higher end products too - propolis, Queen Jelly, bee pollen and Thisbeeswax.project has the potential to benefit the environment through the education of bee keepers who will be encouraged to prevent future deforestation and nurture the existing environment which will directly and positively affect their yields. This could be expanded to include education and awareness within local schools and educational establishments. The production of honey and apiculture products has a low impact on the environment through low water and electrical consumption and no chemical discharges to air, water or land.
Transport Infrastructure
access will be critical for both employees and beekeepers bringing their produce to local markets or at the industrial processing area. While the Matatu fares are quite stable on most routes, they can fluctuate between peak and off-peak times and can also become unpredictable depending on weather, the presence of a traffic police crackdown, or the severity of traffic. As a result, users have to pay a fare that the drivers ask for on a particular day, which may result in a variable selling price of raw honey by the beekeepers. A thriving honey processing industry has the potential to attract beekeepers outside of the Kitui Town, possibly traveling from wider Kitui County. Mbitini and Matinyani are the key areas served by the public transport services from Kalundu terminal. A better bus service from Kalundu to external trading centres will help the honey industry in Kitui. The route and bus stops need to be aligned with the local market place in a way that pedestrians have easy access from bus stops to the market place without creating major conflict with the other traffic. In addition to public transport, there will be a need for improving the non-motorised transport network and facilities. This is detailed further in the Diagnostic Report in Appendix A. Energy Infrastructure General power and lighting demand for 800m2 of building and process load could be in the region of 80-100kW range depending on the type and efficiency of equipment installed. In urban centres the grid is more extensive and mainly reliable. The facility will be located reasonably close to the existing Kitui 33/11kV substation, so it is likely there will be a suitable 11kV grid supply nearby. The demand is fairly low, and there should be enough spare capacity in the substation once the proposed capacity upgrade identified in the Diagnostic Report is completed. The facility will have a dedicated 11/0.4kV Solartransformer.PVshould be installed but would be limited to the roof of the building. An appropriate system would generate about 20kW. This output will be reduced during cloud cover and at night, therefore the grid supply will still cover the peak demand however PV will offset a lot of the cost of grid electricity. 40kWh of battery storage should be considered, to help with any power cuts. As the honey making process has very limited waste output waste to
The honey industry is expected to serve local (Kitui Town), regional (Kitui County), national and international markets. Hence the industry will need to be well connected with the national road network, airports, and seaports. The processing unit is expected to generate around 370 to 450 trips of small 3.5 tonnes (Gross Weight Vehicle) per year. It is equivalent to an average of about 2 trips per day over 255 working days. There would be some seasonal variations in the trip making due to the harvesting period of honey. Both Kibwezi-Kitui (A9) road and MachakosKitui (B62) road will be the critical corridors for this industry for transporting materials and packaged products in and out of the industrial complex. Given the number of trips to be generated by this industry, no significant impact in addition to the existing traffic condition is expected on these two roads. For the international market, these two corridors will provide a valuable connection to international airports in Nairobi and Mombasa, and the seaport in PublicMombasa.transport
77 KITUI URBAN ECONOMIC PLAN
There is a need to ensure that the business is resilient to climate change and can ride out periods of low honey production during drought. This can be achieved through training beekeepers to harvest other products (propolis, pollen, venom, etc.)
There is some potential to share resources with other agroprocessing activities (e.g. tamarind processing), and as such location within a multi-activity processing zone would be of benefit.
› Water use is low c.1-2m3 per day › Wastewater is suitable for disposal in the sewage network › Solid waste generation is low (<10kg / week) and suitable for composting
The facility needs a site of around 1,200m2 Of this around 800m2 of light-industrial style buildings would be required to house the processing, packing and storage areas, with 400m2 needed for deliveries and dispatch. Good road access is required for deliveries and dispatch of honey and other products, as well as personnel. A consumer-facing outlet for sales would be beneficial (depending on location), though this is not essential, and a separate retail outlet could be established inside the Town’s central area.
Location specific analysis
Infrastructure assessment Environmental Impact
ECONOMIC DEVELOPMENT PLAN 78
energy is not a viable proposition. High efficiency motors and drives should be installed throughout to ensure the demand is at the lower end of projections.
Water and Wastewater Infrastructure
The Practice Manual for Water Services (KWDM) in Kenya, 2005 recommend an allowance of 20,000 l/ha/day for general industrial units. The honey processing plant is estimated to be around 1,200m3 so the water requirement will be 2.2m3/ day. This includes process water and water and sanitation for the employees. It is assumed that this will be available from the public water supply. 1-2 days storage is recommended to allow for intermittent supply from the water company. Water quality of water used in the processing should be of drinking water standard and should be monitored. Additional water treatment (Chlorine dosing) may be needed if the quality is not reliable. Waste washing water will contain traces of sugar and wax but should meet Kenyan standards for discharge in to the sewerage system. If solids are contained a primary filter will be needed. There is scope for reusing the grey water and washing water to flush toilets reducing the employee water demand by 50%. Solid Waste Management Honey production generates both process specific wastes (such as dead bees, pupae, waste waxes from filtration etc.) and also general municipal type wastes from offices and welfare blocks and from the bottling and packaging process. Assuming a workforce of 40 employees working a seven day week and an average of 0.25kg of general waste per person per day, around 70kg of general MSW type waste will be generated weekly. In addition, it is estimated that around 10kg of process specific wastes will be generated per week. Some sporadic wastes resulting from the ongoing maintenance and development of honey production infrastructure such as wood, wire, steel, etc may be generated. Much of the wastes likely to be generated by honey production has potential to be recycled and existing markets exist for a wide variety of materials - plastic, metals, cardboard, paper and glass. The forecast impact on the existing and proposed landfill provision is considered to be low and could support future recycling and reuse.


› Introduction of a low-skill construction system
› Development of a County-level mortgage scheme Sector supply chain Production of durable building materials in Kitui County is largely limited to:
› Quarried stone: this is small-scale, labour-intensive, and often takes place at unregulated quarries. Prices are relatively high and quality is variable.
The development of affordable housing and supply of supporting materials is a goal of both local and national policy. Under the Big Four Agenda, the provision of affordable housing is one of the Government’s top objectives, with a national target of developing at least 500,000 affordable new houses for Kenyans by 2022. At the County level, the Kitui CIDP 20182022, includes: › Goals for working with national government to implement housing development › Targets for affordable housing construction in Kitui and Mwingi Towns
› Modular roofing panels from recyclate
› Baked clay bricks: dominated by smallscale production using charcoal Clay bricks are a leading construction material in the County, but demands for charcoal is leading to overexploitation of forests, and the CIDP has identified the development of interlocking bricks and other alternative materials as a priority. Other construction materials are generally trucked into the County:
› Cement is trucked in from the Athi River cement works located to the southeast of Nairobi Competitiveness
All three of the proposed building materials to be produced under this project compete well on prices with alternative materials. Blocks Compressed blocks are low cost to produce and install. The cement component is 5% or less, and there is no need for mortar between the blocks.
› Earthen floors
› Supply of low-cost building materials to support the construction of affordable homes › Reduction in the carbon footprint of construction › Reduction in local production of baked bricks and related charcoal burning
The need for affordable housing, and low-cost building materials, is a common issue across Kenya. In Kitui County there is a shortage of durable, low-cost building materials: currently over 23% of houses have mud and bamboo walls, nearly 60% have unsealed earth floors and over 90% have corrugated iron sheet roofing.
As a result, the blocks compete well on price with alternatives (see Table 3). The blocks are around 25% cheaper than clay bricks, without the environmental Theyissues.can also compete with low-cost sources of quarry stone, and well as concrete blocks.
The primary activity of this VC project will be the production of low-cost interlocking construction blocks (Hydraform blocks or similar) from combining stone crusher waste with other materials. The crusher waste will be sourced from the Council’s stone crusher at a quarry some 50 km from Kitui Town. The second phase of the project will be to provide other low-cost construction products, with the initial targets being:
› Corrugated roofing materials sourced from Nairobi or Mombasa
Project 2: Low-cost building materials focussing on interlocking blocks
› Use of PPP to provide affordable housing
› Training for a new generation of builders Base assessment
The benefits of the project include:
79 KITUI URBAN ECONOMIC PLAN

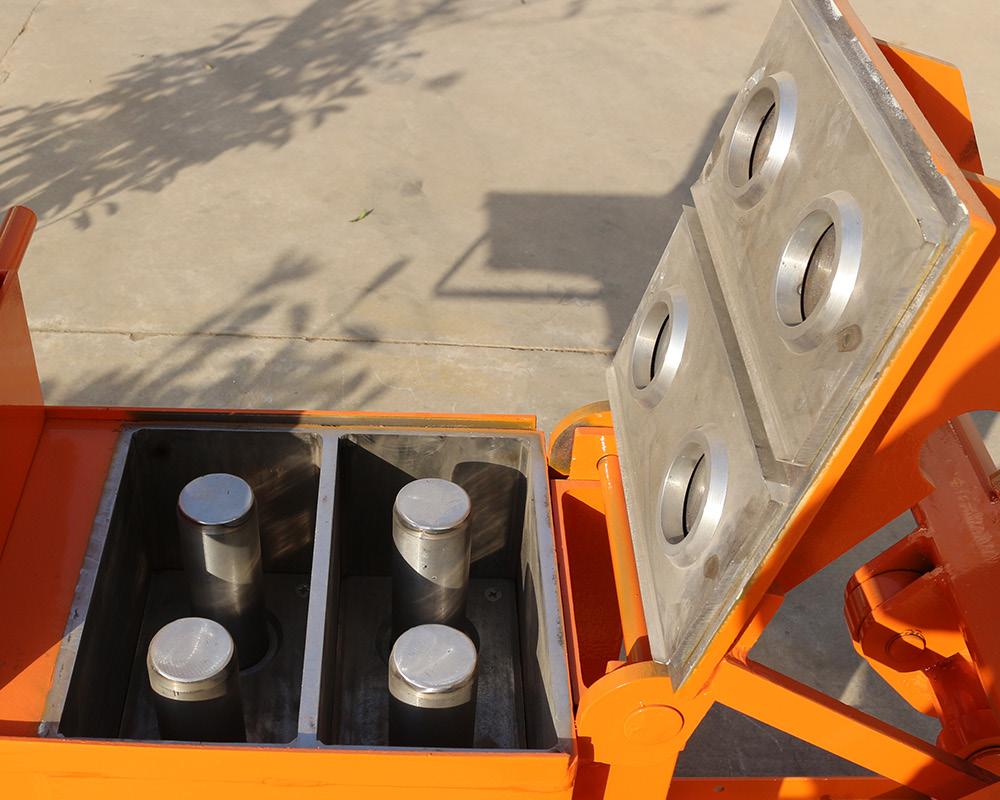

The interlocking blocks are made by combining stone crusher waste materials (dust, grit) with other materials (sand, earth, clay), a binding agent (cement) and water. The mix is poured into a mould, compressed, and then finished blocks are stored for two weeks while they “cure” and reach maximum strength.
Theresistant.panels, which last over 10 years, are interlocking and easy to install and replace. They offer better sound and heat insulation than corrugated roofing. This is a technology that has been developed and used successfully by ModRoof. Earthen floors
Thickness: mm Nairobi Coastal Western Northern Quarry stone 200 1,721 1,900 2,100 2,160 Solid concrete block 200 2,046 2,177 2,267 2,584 Hollow concrete block 200 1,850 1,950 1,900 Hollow concrete block 250 1,900 2,100 2,100 Clay brick (230 x 75 x 115) 230 2,000 2,150 2,000 2,000 Compressed blocks 220 1,520 1,520 1,520 1,520
Note: Compressed blocks cost estimate is based on 38 blocks per m2 and a price of KSh 40 per block
The cost of installing a compacted earth sealed floor has been estimated by Earth Enable at the equivalent of KSh 80,000 for a 25m2 floor. This competes with a cost of over KSh12,000 just for raw materials for a concrete floor. Roof panels The cost of the roof panels is expected to be around KSh 500 to KSh 750 per square metre. This places it mid-range in terms of price when compared traditional corrugated sheets which range in price from KSh 330 per m2 (e.g. 32g aluminium zinc coated steel) to KSh 1,276 per m2 (composite roof-tile styled panels).
› Fine earth mix: usually a mix of sieved fine sand and clay › Oil sealant: the oil layer permeates the fine earth mix, forming a waterproof resin-like layer on top. Locally available oils could be used Earthen floors cost around 30% of alternative cement-concrete floors and can be readily repaired (unlike concrete). The earthen floors would be installed directly in situ, with equipment and materials being stored at the VC site. Capacity The capacity for the construction materials operations is based on a target of 500 housing units per year (with an average floor area of 50m2 per house). This capacity takes account of the demand for housing in the County and the scale required to achieve good production economies.
Taking into account the better sound and temperature insulation properties of the Modroof type of panels, they should be competitive with existing materials.
Key activities
Flooring
Housing needs in the County are
›substantial:Housing demand growth: estimated at 1,500 units per year
KSh / m2 by Region
There are many providers of compressed blockmaking machines, with the leading ones (such as Hydraform of South Africa) providing a range of moulds and advice on the best mix given the available grit, sands and local soils. Roofing panels The roofing panels are manufactured from waste packaging and agriculture waste. The core comprises a compressed block of organic fibre (e.g. cardboard, coir, straw), which is wrapped in a layer of mixed recycled plastic to maintain structural integrity and make the panel water
› Roof panels: 32,000m2 per year
There are several earthen flooring systems designed for low-cost housing. A leading technology by Earth Enable comprises three layers: › Laterite: this base layer is flattened and compacted. Laterite soils are widely available in Kitui County
› Earthen floors: 25,000m2 per year
Table 3 - Cost comparisons (units)
› Housing backlog: estimated at over 20,000 units
With a target of 500 housing units per year, and assuming 225 operating days per year, which takes into account weekends, holiday and downtime, the capacities would then be:
This VC opportunity is a low-cost building materials production facility that would combine three products: › Interlocking compressed construction blocks › Modular roofing panels › Earthen flooring Interlocking compressed construction blocks
› Construction blocks: 10,000 blocks per day
ECONOMIC DEVELOPMENT PLAN 80
The technology for producing compressed earth blocks, and interlocking blocks, has been around in Kenya for decades, but the take-up has been slow, and equipment has been left idle. Reasons for failure include poor quality blocks, and a lack of training in making and using blocks. This VC project has been developed to avoid the pitfalls of the past. Specifically, the project will include: › Strong marketing and sales, with technical support for customers
› Examples of building on site › Trained workforce making blocks throughout the year
Total investment required for the blockmaking is estimated at KSh 90 to KSh 120 million. Of this around 60% would be for the equipment and machinery, and 20% for working capital. Operating costs Total operating costs are expected to approach KSh 37 million by 2025 (see Figure 31), just over one third of which would be manpower costs and 18% raw materials. Figure 31 - Operating Costs 2025 0 Other 18.3 Raw materials 4.7 Manpower 14.0 25.020.015.010.05.0millionKSh 40.035.030.0
› Consistent supply of raw materials, with a consistent mix for the blocks
› Pricing of blocks at a significant discount to alternative materials
The project will also benefit from the support of the Municipality and County administrations. Figure 32 - Value Added and Margin 0 Margin 23.6 Other costs 8.1 Manpower 2.1 Raw materials 6.2 25.020.015.010.05.0blockperKSh 45.040.035.030.0
The cash cost for the blocks is estimated at around KSh 16.4 per block (see Figure 32). A sales price of KSh 40 then provides a substantial operating margin to cover initial capital costs and replacement.
Value added
Phase 1 block production Investment
81 KITUI URBAN ECONOMIC PLAN Indicative costs and revenues:
The key cost assumptions are: Manpower: › Head count of 72 in total › Monthly salaries of KSh 12,500 to KSh 20,000 depending on skills › Additional employment costs of 25% of salary Raw materials: › Provision of KSh 1.6 million for cement and KSh 3 million per year for other materials (allowing sand/clay etc. to be trucked in if needed) Other opex: › Covers utilities, fuel, vehicle maintenance, marketing, etc Revenues
The blocks would be priced at a discount to alternative concrete blocks. The target sales price would then be KSh 40 per block (sufficient to cover all capex costs) which compares favourably with the price for standard concrete blocks of KSh 50 per block. With this price the total revenues would be around KSh 90 million per year.
Recommendations for enabling business environment and / or other catalysts
ECONOMIC DEVELOPMENT PLAN 82
Figure 33 -
ContractorsIndividualbuilders Roof Panels Buildingsuppliersmaterial Earthen Floors Installation teams SalesSales Satellite block fabrication Blocks Blocks Blocks
Impact The facility would have a significant impact on the supply of low-cost, durable materials for affordable housing. Blocks and roof panels would be sold to building material suppliers, contractors and individual builders across the County, while floor installation teams would work at construction sites (see Figure 33). Once the construction block production is well established, teams would be trained and sent out to set up blockmaking sites at other locations. These could either be permanent sites or located at construction project sites. Potential partners The VC project would benefit from partnering with the technology provider and local administration. The equipment supplier would also be the technology partner. Companies such as Hydraform provide training and advice on the optimal mix of materials, curing times, Theetc. Municipality and County Government should be considered as potential partners. Aside from owning the quarry and supply of raw materials, they can also be pivotal in promoting the use of the blocks in some construction projects.
ConstructionLinkagesBlocks
Alternatively, a 25 seater matatu would create around maximum 10 trips in a day for the employees. It may not create a major incentive for the operators to run a regular service to the facility. As an alternative, the industry can provide a shuttle service for the employees from the town centre. Due to its location at the outskirts of the town, the end-to-end pedestrian volume to the facility will not be as high as the average of the town. Staff may, however, alight from public transport to the nearest location and then walk to the facility. Therefore, it is essential that access to the site needs to be pedestrian-friendly. In general, the VC opportunity requires the following access: › Good public transport connection for the employees or provide shuttle service if the location does not have a public transport connection › Good non-motorised transport connection for the employees
The production of low cost building materials will have limited impact on climate change in terms of carbon output which would principally be from vehicle and machinery emissions. Earthen floors are a good low carbon option compared to concrete floors. Although the supply of raw materials are likely to be resilient to the effects of climate change the production of the building blocks will rely on a steady supply of water. Through the recycling of grey water and the inclusion of other products which are less water hungry (roofing panels and earthen floors) the project has the potential to build in resilience to water shortages.
Location specific analysis
The production of the roofing panels would need around 2,200m2 while the site for storing raw materials and equipment for the floor installation operations would be around Locating800m2.atthe quarry provides the good heavy vehicle access needed to bring in additional raw materials and dispatch products.
The building material industry is expected to serve mainly local (Kitui Town) and regional (Kitui County) markets. The final product of the facility will be around 10,000 blocks (10cubic metre) per day or 15-20 tonnes a day. It would mean two to four trips a day by a 20 tonne (GWV) truck. Some of the trucks could be used for both delivering raw materials as well as transporting the final product.
The total area required for the VC projects is estimated at 7,700m2. Block production needs an area of around 4,700m2, over half of which would be required for postproduction storage of blocks for the two weeks they need to cure.
Infrastructure assessment Environmental impact
The ideal production site is out at the quarry where the main raw material for the block production is located and the area is suitable for an industrial operation.
83 KITUI URBAN ECONOMIC PLAN
Pickup vans can serve the local market while the regional markets will need a good connection to both Kibwezi-Kitui (A9) road and Machakos-Kitui (B62) for heavy trucks.
While the number of trips is not very high, it is preferable that the heavy goods vehicles do not travel through the town centre.
Currently, there is no paved road connection to the B62 from the western part of the town. The convenient access is through the A9. However, that connection will require heavy vehicles to pass through the town centre using Mbusyani Road. Given the location of the industry is expected to be approximately 50km from the town, access for the employees will potentially rely on boda-bodas.
› The access road to the facility needs to accommodate 20 tonne trucks › The facility will be close to a quarry to reduce trips for raw materials › Road safety considerations will be needed due to the presence of heavy trucks Energy Infrastructure General power and lighting demand for 800m2 of building and process load could be in the region of 250-300kW depending on the type and efficiency of equipment installed. This facility will be located in a rural location near to the quarry, which is some way from Kitui Town. In rural areas access to electricity is very poor, and where it is available it is unreliable. The area where the quarry is located does not have a grid supply. The quarry may be closer to the 132/33kV substation, so the service could come from there, but this would need to be confirmed by a detailed survey. The most viable renewable energy option would be solar PV. For PV limited to the roof, assuming 1,000m2 of panels, would generate about 175kW. If a suitable land area could be found external to the site, energy needs for the whole development could be generated. This is in effect a minigrid. If the installed capacity of the solar PV installation reached 500kW, it would qualify for feed-in-tariffs at US$0.20 for off-grid, and there is potential spare capacity that could provide power to surrounding underserved communities. This would need to be confirmed by survey to determine if the actual demand would be suited to a minigrid of this scale.
The use of recycled raw materials (crusher waste, waste packaging and agriculture waste) is of benefit reducing dependence on non-renewable resources. By diverting reliance on baked clay bricks (which are fired using wood and charcoal) as the primary building material this project should help slow deforestation in the area. There will be a low impact on the environment in terms of discharges to water or land, however, there will be dust emissions and noise. These could be mitigated through careful selection of the site away from residential or agricultural receptors. Transport Infrastructure
› Block mixing: 600m3 per year (based on 1:2 water to cement ratio and a 5% cement content)
ECONOMIC DEVELOPMENT PLAN 84
› Curing: 200m3 per year (rough estimate and weather dependent)
The facility would need an alternative supply to back-up output from the solar panels. A grid connection may be too expensive, therefore oil-fired generators are an option, however energy storage, such as a battery facility would be considered a better option to reduce costs and carbon Theemissions.block making process has very limited waste output, therefore waste to energy is not a viable proposition for this option. High efficiency motors and drives should be installed throughout to ensure the demand is at the lower end of projections.
The water requirements for the block mixing and curing (dampening the blocks) is estimated to be 3.5m3/day (based on 220 working days per years)
Water and wastewater infrastructure
There is no recommended design water consumption rate for brick making in The Practice Manual for Water Services (KWDM) in Kenya, 2005. The value of 50l per employee per day is given for a livestock unit and this has been used as an estimation as both are active manual work. This gives an employee water requirement of 6.6m3/day for 132 staff members and a total requirement of around 10m3/day. The site of the quarry is outside the public water supply for Kitui so would need to be supplied from a private borehole. Recent boreholes in the Kitui region yield between 1.8-3.5m3/hr, therefore one borehole would provide adequate water. 1 - 2 days of storage is recommended incase of disruption. Water for brickmaking and toilets can be used untreated but drinking water will need to be tested for quality issues and chlorinated as a minimum. Waste grey water from handwashing and cooking etc. could be reused for flushing toilets or for brickmaking. Pour flush toilets with a septic-tanks are likely to be the most suitable sanitation for the employees. Solid waste management Likely waste to be generated will result from the solids in the wash water from block batching and from reject blocks. Quantities of waste are likely to be relatively small and the proposed processes are likely to be able to reuse recovered aggregates and dust in the process as well as utilise recycled plastics in roofing products. Municipal type wastes will also be generated by the welfare, office and packaging areas of the process. It is estimated that around 7 tonnes of municipal type waste may be generated per year by the anticipated 132 employees assuming 0.25kg per person per day and assuming 220 workdays per year. However, much of this waste will be packaging wastes and will be readily recyclable in existing local markets (e.g. wood, plastic and metals).


› Integrated approach: there is inherent disconnect between spatial planning, economic planning, infrastructure plans and investment planning decisions which creates risks for high impact development and is exacerbated by ‘silo’ thinking and lack of capacity at the local level. Better vertical and horizontal governance will ensure that all issues are considered, and appropriate decisions are taken. Establishment of working groups or zonal authority could facilitate integrative thinking and improved coordination as well as providing a platform for stakeholder engagement within the process. The following sections discuss some of the relevant considerations in further detail.
4.
The strength of urban governance is one of the biggest issues affecting the ability of cities to respond to major economic and environmental challenges. There are two different aspects of multi-level governance:
Vertical recommendationsgovernance Kitui Municipality and the various departments of the municipality maintain good relations with the county government and various, frictionless communication channels exist vertically. Nonetheless, the municipality should implement a plan of regular communication (eg. periodic meetings and/or reporting) to keep the county government appraised of progress and developments on SUED projects and to ensure that efforts are coordinated across the county. Failure to put such structures and processes in place will cause significant delays in project formulation and implementation along with direct impacts on the future role out of supporting climate resilient infrastructure and their associated costs.
› A mapping exercise should also be undertaken to identify the existing relationships and partnerships that exist at both a municipality and county level. Existing relationships with multilateral institutions, bilateral institutions, NGOs and think tanks can all be leveraged to support SUED projects. The mapping exercise will also be conducive to building greater coordination between the existing partnerships as well as identification of opportunities for partnerships with new and emerging entitie 4.2. Implementation costs and potential funding sources
IMPLEMENTATION PLAN
A number of other factors also impact on the ability of cities to respond to risks and development needs. These include the skills available in the workforce and within the municipal authorities, an effective and transparent governance structure, issues shaped by national and regional economic policies and dynamics, as well as access to global financial markets and the global governance of environmental issues. It will be critical to identify potential risks to implementation and how positive impact can be maximised. This will need to be a continuous process reviewing identified delivery risks starting from planning to implementation stages. The proposed Kitui UEP and projects within the Development Framework have considered the existing economic and urban context including institutional and financial capacity of the county and municipality. Key mitigation measures that will ensure successful implementation include:
4.1. Partners & Institutional Structures
Horizontal recommendationsgovernance
The investment experts as part of the SUED programme will develop feasibility studies for the projects which will include estimated capital expenditure and operating expenditure requirements.
IMPLEMENTATION PLAN 86
› Thematic project teams and working groups: Kitui Municipality should establish working groups & project teams drawn from representatives from government and community stakeholders to develop particular actions and projects and track implementation. These working groups and project teams would then report back to Kitui Municipality on a quarterly basis
1. Vertical governance which refers to the strength of coordination across multiple levels of government at national, regional and city levels, and 2. Horizontal governance referring to the coordination of activities across different sectors of society from local governments to the private sector, civil society and grassroots organisations
› Involvement of stakeholders in steering committees & working groups: The Kitui Municipal Board should involve a broad range of stakeholders throughout the lifecycle of any SUED value chain and infrastructure project
› Sequencing: it is very important to initiate infrastructure development carefully and strategically to lead and signal the optimum development direction for Kitui such as designation of industrial cluster or redevelopment of the CBD area.
Effective urban and economic planning by strong, empowered city governments is critical to the success of cities in responding to current and future challenges given city governments’ central role in the coordination of actors that shape urban development and economic growth. Planning plays a critical role in directing and controlling land use, urban form, infrastructure and service delivery.
Focus Area 1: Town Centre Funding KSh Notes on costings
Key points: › Approximately 50% of the proposed projects could attract private investment
1 Transit Hub Bus Terminal: Option 1 Public InitiativePrivate 330,595,505 Bus Terminal: Partially open-plan structure housing retail units,seating, amenities such bathrooms, lighting, digital display information; wayfinding. Structure roof to be cladded PV solar panels
Boda Boda Terminal: Enclosed structure with shade canopy; to house core amentieis such as bathroom, seated space, storage, electric charge points (for future use). Structure roof to be cladded with PV solar panels
Public Realm Components: Off-shelf seating, bollards, street trees, lighting, permeable surfaces; litter/ recycling bins
1 Transit Hub Bus Terminal: Option 2 Terminal and Multi-Storey Car Park
› Proposed infrastructure projects include 30% uplift to account for planning, design, engineering costs and inflation
Boda Boda Terminal: Enclosed structure with shade canopy; to house core amentieis such as bathroom, seated space, storage, electric charge points (for future use). Structure roof to be cladded with PV solar panels
Public InitiativePrivate 674,532,800 Bus Terminal: Partially open-plan structure housing retail units,seating, amenities such bathrooms, lighting, digital display information; wayfinding. Structure roof to be cladded PV solar panels
The following tables provide a summary of high level cost estimates for the identified projects including indication of type of funding that would be required for implementation.
87 KITUI URBAN ECONOMIC PLAN
› Potential costs for adaptation measures are excluded. This can range from 0%-20% (0% where a defined projects is targeting climate change impacts such as SUDS)
Public Realm Components: Off-shelf seating, bollards, street trees, lighting, permeable surfaces; litter/ recycling Multi-StoreybinsCar Park for 250+ cars. Roof to be cladded with PV solar panels It will likely be necessary to blend and combine a range of different sources of financial and non-financial support to meet the projects’ expenditure requirements. Careful consideration will have to be given to the differing eligibility criteria of the various sources in order to successfully structure blended finance arrangements.
Urban Regeneration Plaza Square Public InitiativePrivate 128,746,475 Public Realm Components: Intergated seating, bollards, street trees, lighting, water feature, permeable surfaces; litter/recycling bins Regeneration Town Centre Gateway Development Public InitiativePrivate 192,410,075
4 Streetscape
5 Streetscape Design Green Links: Development of existing Infrastructure
3 Urban
5 Streetscape Design Green Links: Regeneration of Laneways Public
Main
Renewal
Public Realm Surface Ratio: 70/30 (paving/planting)
Boda Boda Terminal: Canopy Structure with core amentieis such as bathroom, seated space, storage, electric charge points (for future use)
Public Realm Components: Off-shelf seating, bollards, street trees, lighting, permeable surfaces, litter/ recycling bins Shared Through-Route (drop-off, deliveries): Permeable Surface, SUDs Design Street Public Funded 25,368,078 (W) 3m footpath, (W)2.5m roadside parking; permeable surfaces, street trees every 6m. (L) 6m x (W) 3m plant beds every 20m, street lighting, SUDs Public Funded 298,618,317 (W) 3m footpath, street trees every 6m, permeable surfaces, street lighting, SUDs Funded 61,801,415 Permeable surfaces, drainage channels, street lighting, SUDs Total 1,712,072,665
Building Height: 2-3 Stories; Mixed-Use. Roof to be cladded with PV solar panels
IMPLEMENTATION PLAN 88 Focus Area 1: Town Centre Funding KSh Notes on costings 2
89 KITUI URBAN ECONOMIC PLAN Focus Area 2: Industrial Cluster Funding KSh Notes on costings 1 Industrial Cluster Industrial Development - Phase 1 379,058,550 Industrial Buildings; Water Treatment Plant; Infrastructure (such as roads and utilities); Space for future growth; Green Space; SUDs; Trees/PlantingPhase 1 roads as per the drawing = 145m long Public Funded Water & Sanitation GreenPower Space Water Treatment Plant Package 1 FundedPrivately 2 Industrial Cluster Future Development 290,435,600 As above Roads, paving, SW Water & Sanitation Public Funded GreenPower Space Water Treatment Plant Package 2 FundedPrivately 3 Food Processing Honey Processing Facility FundedPrivately 280,000,000 Buildings and equipment, 10% for marketing and training and working capital, calculated at 3 months of opex Total 949,494,150
4&5
4&5
IMPLEMENTATION PLAN 90 Focus Area 3: Kalundu River Park Funding KSh Notes on costings
4&5 Public Realm Design Riverside Activity 3: Sports Field (x1) Public InitiativePrivate 207,430,000 Public Realm Components: Off-shelf seating, lighting, permeable surfaces; football accessories such as goal posts and nets
Design
3 Sanitation
1 Solid
4&5 Public Realm Design Riverside Activity 2: Meeting Points (x4) Public Funded 3,315,000 Public Realm Components: Off-shelf seating, bollards, street trees, lighting, permeable surfaces, shade canopies
4&5 Public Realm Riverside Activity 4: Water Sports Area (x1) Public InitiativePrivate 372,254,100 Sport Building: 1 Storey. Enclosed structure to house ameneities such as changing rooms, sport storage, restaurant/cafe. Secure compound. Roof to be cladded with PV solar panels
Waterside Dock Components: (L) 25 x (W) 5m t-shape structure over water; lighting Public Realm Components: (W) 9m Shared-use for transportation of equipment; permeable surfaces; lighting; street trees; off-shelf seating; perimeter fencing Car Parking: Single level, 100+ spaces, lighting, permeable surfaces Total 3,026,336,300
2 Solid
Ecological Recovery Riverside Regeneration Public Funded 1,079,000 Waste & debris removal and general cleaning Waste Landfill Remediation Public Funded 318,500,000 Excavation & haulage of waste material, construction of remediated area for recycling Waste Sorting recycling facility Public InitiativePrivate 117,000,000 Solid waste recovery facility (MRF) Town centre Sanitation network upgrade Public Funded 1,500,000,000 Upgrading of the sanitation system through an integrated plan combining sanitation, water management and drainage. Last mile connections to the sewage treatment works Public Realm Design Riverside Walk Public Funded 490,183,200 Shared-use paved route; permeable surface; (W) 3m (with (W) 2m for pedestrians and (W) 1m for cyclists), street lighting Public Realm Design Riverside Activity 1: Parks (x6) Public Funded 16,575,000 Public Realm Components: Seating, street trees, lighting, permeable surfaces; children’s play equipment
91 KITUI URBAN ECONOMIC PLAN Out of Town Location (Quarry) Funding KSh Notes on costings 1 Low cost buildings materials Facility focusing on Interlocking blocks FundedPrivately 120,000,000 60% of CAPEX on building and equipment and 20% on working capital Project Costs Sub-Components Funding Rural mini-grid CAPEX estimateKSh 145,000 per connection › Detailed study of target communities to determine current / potential demand and ability to pay › Financial modelling › Community/stakeholder engagement plan › Selection of proposed project site › Initial technical design, economic, social and environmental analysis › Development of procurement and deployment/implementation plan › Operation plan (including revenue collection, maintenance etc) Public Private Initiative Solar irrigation and boreholes CAPEX estimateKSh 250,000 per system › Mapping of ownership of all agricultural and livestock holdings and current status of their irrigation facilities › Review of abstraction volumes from each borehole › Establishment of needs for solar irrigation and borehole system › Development of procurement and deployment plan › Maintenance plan Public Private Initiative Sustainable irrigation Mapping KShirrigation:750,000holdingsagriculturalof-KShDrip720,000per ha › Mapping of all agricultural holdings including household gardens › Review of water resources, crop varieties, agriculture practices and market › Planning of sustainable agriculture and irrigation system › Preparation of feasibility study and design of project › Procurement and implementation › Preparation of long-term operation and Maintenance plan, capacity building and implementation Public Private Initiative Wider Area Infrastructure Proposals
IMPLEMENTATION PLAN 92 Project Costs Sub-Components Funding Formalising the waste collection and management system Opex - KSh 10m per annum › Identifying roles in waste collection and management › Provision of training within the informal sector › Developing a community based awareness and home waste segregation approach › Development of an App to manage waste collection and recycling Public Private Initiative Road Upgrade - B62 to Mbusyani Road CAPEX estimateKSh 500,000,000 CAPEX estimate - KSh 500,000,001 Public Funded
› Include a statement of purpose or intent to address or improve climate resilience in order to differentiate between adaptation to current and future climate change and good development; › Set out a context of climate vulnerability (climate data, exposure and sensitivity), considering both the impacts from climate change as well as climate variability related risks; › Link project activities to the context of climate vulnerability (e.g., socio-economic conditions and geographical location), reflecting only direct contributions to climate
Private sector finance for a range of sectors is available in East Africa from both local and international sources. Existing investors in the region include impact investors, venture capitalists and private equity funds who are able to provide relevant instruments for the value chain projects such as equity, quasi-equity (mezzanine finance) or concessionary debt. Access to private finance will be contingent on the concrete demonstration of viable business models and strong governance structures.Projects will also benefit by blending in non-financial support in the form of social capital, such as volunteer efforts from the community. Actions to build social capital include mobilising community organisations and volunteers to be involved with the development and implementation of projects. The most successful mobilisation of human and social capital resources occurs for projects where there is a demonstrated, direct and visible relationship between the project and the future benefits for community and volunteer stakeholders. Examples of projects could include raising awareness campaigns for more efficient use of water and solid waste collection and management. Mobilising the scale of resources to address the identified climate change adaptation measures to be implemented and ensure that the selected value chain and infrastructure projects are climate resilient, the counties need to consider the full spectrum of potential funding sources available. Presented below is a snapshot of the available climate change funds that cover climate adaptation and mitigation including the country Focal Points for these. The identified value chain and infrastructure projects could potentially apply to these funds for access to resources for implementing climate adaptation and mitigation activities. It is important to note the following:
Potential sources of funding
Existing guidance presents the following principles that need to be generally adhered to. The project activity must:
Potentialresilience.global funds include: › Green Climate Fund (GCF): The GCF seeks to promote a paradigm shift to low-emission and climate-resilient development, taking into account the needs of nations that are particularly vulnerable to climate change impacts including Africa and Small Island Developing States (SIDs). The GCF aims to deliver equal amounts of funding to mitigation and adaptation and its activities are aligned with the priorities of developing countries through the principle of country ownership. The financial instrument / delivery mechanism for the GCF is grants, loans, equity or guarantees.
The National Treasury is the Kenyan National Designated Authority (NDA) for the GCF and the National Environment Management Authority of Kenya (NEMA) is a direct access Accredited Entity (AE) . In 2017, the National Treasury developed the Kenya National Green Climate Fund (GCF) Strategy which has a vision to increase financial flow from the GCF for a climateresilient society and low-carbon economy.
› Furthermore, it is vital to realise that especially for adaptation, each project activity is location and context specific.
Grant funding can help improve the financial viability of projects which have significant, upfront capital expenditures, improving the overall investment appeal of a project and attracting additional private investment as a result. The proportion of grant finance of the total project finance amount should be carefully justified, as simply seeking a maximised grant finance proportion can seed doubts in the private sector about the long-term financial sustainability of the project. Grant funding is also available to less, commercially viable projects with significant socio-economic or environmental benefits, particularly relating to climate change and resilience. They may also be focused on certain activities such as technical assistance in project preparation or capacity development. Philanthropic and NGO grant funding could also be leveraged through initiatives such as businesses dedicating 1% of profits to corporate social responsibility (CSR) initiatives. Examples of projects could include include tree planting, provision of or access to recreational facilities.
93 KITUI URBAN ECONOMIC PLAN
A comprehensive grasp of funding criteria as well as the different financial mechanisms and the extent to which they can be combined is important.
› Some of the value chain and infrastructure projects are climate action projects in themselves i.e. they directly address and contribute to climate mitigation and/or adaptation (e.g. solar powered street lighting and sustainable urban drainage systems respectively), while all of these projects could have specific activities introduced in their design and implementation to help address identified climate risks, and these would be the basis on which an application would be made to the relevant fund. › To gain access to these funds, investments will need to demonstrate a significant contribution to climate action. Successfully accessing resources from these funds depends on a good understanding of the funder’s perspective and procedures.
› NEMA is the is the National Implementing Entity (NIE) for Adaptation Fund in Kenya.
› The Least Developed Countries Fund (LDCF): The LDCF was established to meet the adaptation needs of least developed countries (LDCs). Specifically, the LDCF has financed the preparation and implementation of National Adaptation Programs of Action (NAPAs) to identify priority adaptation actions for a country, based on existing information.
› The municipality could also benefit from general commercial development capacity building. The training does not need to be sector specific, and should cover: › Engaging with business › Developing business linkages › Developing commercial prospectus › Building and testing business cases
The Strategy identifies County governments as critical co-financiers who can take the role of Executing Entities and/or Implementing Entities of climateresilient and low-carbon initiatives.
The Strategy provides a roadmap for stakeholders in harnessing resources from the GCF.
IMPLEMENTATION PLAN 94
› The Global Environment Facility (GEF) administers the LDCF and Operational Focal Points (OFPs) are responsible for coordination in country.
Initiatives are based on country needs, views and priorities. The financial instrument / delivery mechanism used by the Adaptation Fund is grants.
› The Ministry of Environment and Forestry is Kenya’s GEF Operational Focal Point. › The Special Climate Change Fund (SCCF): The SCCF was established to address the specific needs of developing countries under the UNFCCC with respect to covering incremental costs of interventions to address climate change relative to a development baseline. Adaptation to climate change is the top priority of the SCCF. 4.3. Recommendations for Capacity Building
The financial instrument / delivery mechanism used by the LDCF is grants.
› As the SUED value chain and climate resilient infrastructure projects involve diverse stakeholder backgrounds and representations, strong governance and strong institutions will be required to effectively manage all stakeholders. Technical assistance and capacity building to support governance and institutional strengthening is thus also recommended › In order to progress the SUED value chain and climate resilient infrastructure projects, additional investment will need to be secured from a range of public and private sources. Currently, the investment sourcing and investment coordination capacities of the municipality is limited. Some amount of capacity building efforts should focus on this issue
Existing municipality staff could be trained to work in this office and the office would function as a “horizontal” capability, providing specialised project management assistance to projects across all sectors. There are potential capacity building synergies to be realised in conjunction with the World Bank’s Kenya Urban Support Programme (KUSP) which is also considering related capacity building activities
› The two value chains of agro-processing and construction, it would be beneficial for the municipality or county to develop some vocational training focused on: › Food processing: standard food hygiene course and wider product handling, packaging and processing courses. The honey processing facility could be set up to be used as a training site as well › Construction: basic training in building techniques with a focus on using interlocking construction blocks. The block making facility could be used as a training site. Training could be expanded to cover multiple products, as well as general house and building construction
The Municipal managers and other municipality staff will be responsible for the overall management and delivery of the SUED value chain and infrastructure projects. Ensuring that these staff have sufficient capacity and skills will thus be of critical importance to the success of the SUED project. The following recommendations have been made based on interactions with municipality staff to date. › Municipal managers could benefit from capacity building on project management and delivery of large projects (as relevant to the UEP) and the community engagement required › Aside from capacity building of the municipal managers, developing a consolidated project preparation, delivery and monitoring office within the municipality would be beneficial.
› The Adaptation Fund: The AF finances projects and programmes that help vulnerable communities in developing countries adapt to climate change.
As a result,the climate change technical skills and performance of the municipality needs to be coordinated, enhanced and delivered through the municipality’s Department of Environment which currently mostly focuses on waste management issues.
The climate change skills and performance of Kitui County staff both individually and collectively need to be enhanced to ensure the delivery of the county climate change policy and that climate change is effectively embedded into county and municipal development processes and plans, while at the same time providing support for the interdependent functions necessary for efficient implementation. The availability of sufficient, well equipped and motivated personnel is important for translating the climate change adaptation objectives of the county climate policy into action. A sufficient headcount of qualified staff for the task at hand will help ensure those appointed are not thinly spread across too many issues. Kitui municipality, as the major urban centre within Kitui County needs to support the County’s Climate Change Policy (2018) which itself responds to the National Adaptation Plan (NAP2015-2023) as well as other national policies and strategies.
Recommendations for Social Inclusion
20 http://www.oecd.org/env/cc/21018790.pdf
› Steering Committee › Interim Technical Committees › Ward Planning Committees (in ten selected Wards)
21 https://wriorg.s3.amazonaws.com/s3fs-public/pdf/ready_or_not.pdf
Activities and capabilities to build the capacity of key staff and actors across Kitui County will underpin its climate resilience objectives. The activities will be centred around the core functions of institutions including authorising, resourcing and delivering climate action19; while the capabilities will be centred around climate-specific capacity needs (human resources and skills, policy integration and participation) and climate-relevant capacity needs (across sectors, policy and market instruments, political economy) within the local context of the county20.
› County Climate Change Fund
Developing Kitui into a sustainable municipality will require urban economic planners and social inclusion experts to make decisions that promote nondiscrimination. In Kitui, this will involve inclusion of vulnerable groups strategically categorised as PWDs, youth and women; but specifically identified as PLWHAs, PWDs and People Living with Albinism. To fully harness the potential of sustainable urban development in Kitui, social inclusion will be a basic prerequisite that will be achieved by:
A key prerequisite of the SUED Programme is the implementation of climate resilient infrastructure. Thus the ability of the municipality to respond to this challenge needs to supported through building appropriate capacity. In 2018 Kitui County drafted its climate change policy as a specific response to the existing national climate change policies, strategies and plans. The draft county climate policy aims to enhance the adaptive capacity of its population and ecosystems to the impacts of climate change, achieve a structured efficient and effective information management and dissemination systems, enhance county-level climate finance mobilisation capacity and create a robust mechanism for collaboration between Theactors.Kitui County Department of Environment and Natural Resources has the mandate to promote climate adaptation and enhance mitigation among the county residents. To support the department, the following fund and committees were set up:
2. Commitment to ensure that for all emerging capacity building and/or employment opportunities available, employment opportunities available, are given equal and fair opportunity access to be engaged in training and employment respectively; 3. Commitment to facilitate access for PWDs on an equal basis with others to basic physical and social infrastructure without any form of discrimination; 4. Commitment to develop safe, accessible, green infrastructure projects that promote people living safely together, and social inclusion 5. Commitment to build the social inclusion capacity of all the UEP players in Kitui so that non-discrimination becomes embedded in the related discussions and planning Climate Change Capacity and Resilience
1. Commitment to promote age, gender and PWDs with responsive planning and implementation by enabling full and meaningful participation of PWDs, PLWHAs and albinos in implementation of the VC and other infrastructure projects;
22 The pilot applications of the framework in Bolivia, Ireland, and Nepal suggest that the NAC framework is useful across a range of countries and that it can be tailored to specific country contexts
95 KITUI URBAN ECONOMIC PLAN
It is recognised that a gradual and phased approach over time will be required to bridge the gap (through investments and action) from the existing capacity to the required level. To support this process, Kitui County could apply the National Adaptive
19 https://www.cpgd2019.org/wp-content/uploads/2019/03/Learning-Paper-Strengthening-Institutional-Capacity.pdf
Adaptive Capacity This will complement the identification of climate change adaptation measures and the assessment of their costs and benefits.
IMPLEMENTATION PLAN 96 Capacity (NAC) Framework21 at its county Thelevel22.NAC framework provides a practical approach for understanding the institutional aspects of adaptive capacity. It enables its users to systematically assess institutional strengths and weaknesses that may help or hinder adaptation. Adaptation plans can then be better designed to make the greatest use of strengths and remedy weaknesses. The NAC framework evaluates the performance of institutions against five key functions critical to adaptation: assessment, prioritization, coordination, information management, and climate risk management. The NAC treats performance of these functions as an indication of a country’s overall adaptive capacity.
4.4. Next Steps Following the completion of the UEP, during the next phase of the SUED Programme the identified value chain and climate resilient infrastructure projects will be developed further forward by: Capacity building specialists to help: › enhance municipal and local capacity to implement the identified projects, and › enable revenue generation to ensure financial sustainability beyond the programme Investment experts to help: › develop feasibility studies and business cases for specific projects to establish their bankability, and › develop investment promotion strategies to draw in investment (including seed financing through the programme) Investment climate advisers: › will help remove or amend policy and regulatory constraints to private sector led urban development and growth

