WINTER
• A novel approach to tailor Sauvignon Blanc styles
• Towards net zero in the winery

• Impact of long-term vineyard floor management on soil health and plant communities
• Is there a meaningful role for luxury in wine?
• Tasting: $50+ Pinot Noir
WINTER 2023 • VOLUME 38 NUMBER 3

INDUSTRY ASSOCIATION COLUMNS
8 AGW (Lee McLean): Investing in India now will deliver dividends for Australian wine in the future

11 ASVO (Andy Clarke): Viticulture seminars kick off in July

WINEMAKING
13 A novel approach to tailor Sauvignon Blanc styles
19 Decompacting waves: an overview of a ‘soft’ maceration technique for improving extraction and wine quality
22 TOWARDS NET ZERO: Towards net zero in the winery
27 Spinning cone column distillation of smoke-affected juice
Trends in the composition of Australian wine 1990-2021 Part 3: free, total and bound sulfur dioxide concentrations, and the ratio of free to total SO2 concentrations
AWRI REPORT: An artist in residence at the AWRI: exploring synaesthesia and visual harmony with red wine


VITICULTURE
46 Impact of long-term vineyard floor management on soil health indicators and plant communities

56 Incidence of spring frost under climate change: injury and recovery options in a Barbera vineyard
61 A few words on grapevine winter buds and pruning with respect to sap flow
65 TOWARDS NET ZERIO: The carbon economy and vineyards – Part 2: Preparing for and participating in the new carbon economy
67 ALTERNATIVE VARIETIES: Trousseau
BUSINESS & MARKETING
71 Is there a meaningful role for luxury in wine?
73 Update on the market for Australian wine in Southeast Asia
75 Global wine consumption drops to nine-year low as exports hit record value
TASTING
78 $50+ Australian and New Zealand Pinot Noir
CONTENTS a) 22 40 56 69
b)
c)
b)
c) a) b) c)
Established 1985
Published quarterly
PUBLISHER: Hartley Higgins
GENERAL MANAGER: Robyn Haworth

EDITOR: Sonya Logan
Pvh (08) 8369 9502 Fax (08) 8369 9501
Email: s.logan@winetitles.com.au
EDITORIAL ADVISORY PANEL:
Gary Baldwin, Peter Dry, Mark Krstic, Armando Corsi, Markus Herderich
CONTRIBUTING WRITERS:
Eleanor Bilogrevic
Dimitra Capone
Timothy Cavagnaro
Andy Clarke
Justin Cohen
Cassandra Collins
Angelica Crabb
Roberta De Bei
Alain Deloire
Filippo Del
Zozzo
Michael Downer
Carole Dumont
Tommaso Frioni
Peter Godden
Massimo Giudici
Markus Herderich
Tony Hoare
Madison James
David Jeffery
Adam Keath
Merek Kesser
Mark Krstic
Hamish Laurie
Kate Laurie
Desireé Likos
Lee McLean
Fabio Mencarelli
Damian
Espinase
Nandorfy
Wes Pearson
ADVERTISING SALES:
Ph (08) 8369 9514
Andrew Everett
Email: A.Everett@winetitles.com.au
DESIGN AND PRODUCTION:
Tim Coleman
CREATIVE SERVICES:
Tim Coleman
SUBSCRIPTIONS:
One-year subscription (4 issues)
Australia $58.50 (AUD)
Two-year subscription (8 issues)
Australia $110.00 (AUD)
To subscribe and for overseas prices, visit: www.winetitles.com.au
Published by Winetitles Media
ABN 85 085 551 980
ADDRESS:
630 Regency Road, Broadview, South Australia 5083
TELEPHONE: Ph (08) 8369 9500
EMAIL: General info@winetitles.com.au
Editorial s.logan@winetitles.com.au
Subscriptions subs@winetitles.com.au
Sonya Logan, Editor
Coal was first. Then it was timber. Barley is expected to be next. It would seem that the lifting of China’s trade sanctions on Australia’s remaining exports — wine and lobster — might be a matter of months away, possibly by the end of the year according to several expectations.
Anne Pellegrino
Alan PetersOswald
Stefano Poni
Carolyn Puglisi
Renata Ristic
Suzy Rogiers
Aurélie Roland
Jamie Saint
Xingchen Wang
Eric Wilkes
Kerry Wilkinson
Leigh Francis
Elizabeth Willing
While the prospect of Australian wine exports to China resuming will be music to the ears of the industry, the fact remains that the market is not what it was when we took it by storm, becoming our most valuable export destination in 2016.
As the OIV’s latest annual State of the World Vine and Wine Sector report reveals (the highlights of which I’ve summarised in an article starting on page 75 in this issue), China’s wine consumption in 2022 fell 16% compared with the previous year – indeed, consumption in the country has dropped an average of 2 million hectolitres per year since 2018. Consequently, China has been importing less wine. Again, according to the OIV’s report, China’s wine imports fell 21% by volume in 2022 compared with 2021; specifically, the amount of bottled wine imported by the country fell 24%.
Nonetheless, the opportunity to win back some ground in China from the likes of France, Italy, Spain and Chile who have filled the void left by our absence cannot be underestimated. Perhaps the news we’ve been waiting for will have broken by the next issue of the Journal….
While China’s anti-dumping duties on Australian bottled wine have all but halted our trade with the nation, exporters have increased
their focus on other markets, including those in Southeast Asia. In 2022, shipments to the region grew 16 per cent in value and 56% in volume to 27 million litres. Angelica Crabb from Wine Australia provides an update on this market for Australian wine on page 73.
Our Towards Net Zero series of articles continues in this issue, beginning with Part 2 of Tony Hoare’s article in which he explores what can be done in the vineyard to limit carbon emissions (page 65). At the other end of the production spectrum, Adam Keath, from Wine Network Consulting, discusses the options available to wineries to reduce their carbon outputs (page 22).
For this issue’s focus on Grape & Juice Handling, researchers from The University of Adelaide look at the effect of the novel crushing technique known as ‘accentuated cut edges’ (ACE), usually used in red wine production, on the release of varietal thiols and their precursors during Sauvignon Blanc wine production (page 13), while an Italian professor from the University of Pisa shares his views on Air-Mixing MI, a relatively new innovation that creates disruptive waves inside tanks to manage caps (page 19).
Back in Viticulture, in another contribution to this issue from The University of Adelaide, researchers reveal the findings of their study into the effect of lower impact floor management strategies on ruderal weed species and soil health indicators compared with tillage and herbicides (page 46).
And be sure to catch the results of our $50+ Pinot Noir tasting on page 81.
Advertising A.Everett@winetitles.com.au
WEBSITE: www.winetitles.com.au
Printed by Lane Print, Adelaide, South Australia. ISSN 1838-6547
Printed on FSC Certified Paper, manufactured under the Environmental Management System ISO 14001, using vegetable-based inks from renewable resources.
Conditions
The opinions expressed in Wine & Viticulture Journal are not necessarily the opinions of or endorsed by the editor or publisher unless otherwise stated. All articles submitted for publication become the property of the publisher.
All material in Wine & Viticulture Journal is copyright © Winetitles Media. All rights reserved.No part may be reproduced or copied in any form or by any means (graphic, electronic, or mechanical including information and retrieval systems) without written permission of the publisher. While every effort has been made to ensure the accuracy of information, the publisher will not accept responsibility for errors or omissions, or for any consequences arising from reliance on information published.
E @winetitlesmedia
D @winetitles
REGULAR FEATURES
Q @winetitlesmedia
C linkedin.com/company/winetitles-pty-ltd
NEWS 6 AUSTRALIAN GRAPE & WINE 8 ASVO 11 AWRI REPORT 40 ALTERNATIVE VARIETIES 69 VARIETAL REPORT 78 PRODUCTS & SERVICES 89
LOOKING TO DIVERSIFY, REPLANT OR UPDATE YOUR VINEYARD


With over 30 years experience propagating, grape growing and winemaking with Chalmers collection of over 90 different clones and varieties, mostly of italian origin, Chalmers can offer first hand unique insights and absolute premium quality vines for the next exciting phase of your business. Chalmers can also offer a wide range of public varieties and clones subject to availability.
Diversifying your plantings can help future proof your vineyard. By selecting the right grape variety and rootstock combination for your site, together with the use of smart viticulture you can reduce your inputs and increase grape and wine quality.

PLANTINGS?
Lagrein
•
•
Moscato
•
•
Nero d’Avola • Nosiola • Pecorino • Picolit Piedirosso • Pinot Bianco •
Pinot Nero •
•
Refosco Dal Peduncolo Rosso • Ribolla Gialla Sagrantino • Sangiovese • Schioppettino Teroldego • Uva di Troia Verdicchio • Vermentino For all enquiries and for further information email nursery@chalmers.com.au Phone Jill on 0499 184 542 or visit CHALMERS.COM.AU 2023 ORDERS NOW OPEN ONLINE
Aglianico • Ansonica • Arneis • Barbera Colorino • Dolcetto • Falanghina Fiano • Garganega • Grechetto • Greco
• Lambrusco Salamino Lambrusco Maestri • Malbec • Malvasia Istriana Mammolo
Marzemino
Merlot• Montepulciano
Giallo
Nebbiolo
Negroamaro
Pinot Grigio
Pinotage
Glera (Prosecco)
WINE EXPORTS AUSTRALIA-UK FREE TRADE AGREEMENT NOW IN FORCE
The coming into force of the Australia-United Kingdom Free Trade Agreement (A-UKFTA) on 31 May 2023 has been welcomed by Australian Grape & Wine (AGW).
“The UK is Australia’s second largest export market by value at $359 million, and our largest by volume with 208 million litres of wine exported to the UK to March 2023,” said AGW CEO Lee McLean.
“For wine, the agreement will see the elimination of import tariffs on entry into force. This creates a level playing field for Australia’s wine exports with our major competitors from Continental Europe. We estimate the tariff elimination represents a saving of approximately AUD $50 million per year for the Australian wine sector, although a decline in exports in recent months in line with changing market conditions in the UK may reduce this figure.
“Free Trade Agreements (FTAs) are a major contributor to improving export market access and removing barriers to trade. These are now more important than ever with the Australian grape and wine sector’s continued prioritised efforts to grow and diversify our export markets,” McLean said.
TOUGH CONDITIONS PERSIST FOR AUSTRALIAN WINE EXPORTS
Strong growth in emerging markets in Southeast Asia for Australian wine exports during the 12 months ending March 2023 has been unable to offset declining value to traditional markets where tough conditions continue, Wine Australia’s latest export report has revealed.
Australian wine exports overall declined by 7 per cent in value to $1.90 billion and 1% in volume to 620 million litres (69 million 9-litre case equivalents) in the year to 31 March 2023. This is 18% below the 10-year average value of $2.30 billion and 16% below the 10year average volume of 736 million litres.
Wine Australia manager, market insights, Peter Bailey said the year-on-year decline in value was largely driven by a decrease in exports to the United Kingdom (UK).
“The UK is still experiencing the decline that we’ve previously reported, which is the result of elevated shipments over the past two years due to pre-Brexit demand and
COVID-19 induced changes in consumer preferences,” Bailey said.
“In comparison to value, total shipment volume was relatively stable — with the large decline to the UK being outweighed by volume growth to the United States (US) and Canada, particularly in unpackaged wine, as global shipping conditions continue to improve.
“A positive in the report is that Australia’s diversification into emerging markets is starting to bear fruit, which is beneficial for longer-term stability and growth. Southeast Asia grew strongly at both the commercial and premium ends of the price spectrum, and to key emerging markets including Thailand, Malaysia, Indonesia, Vietnam and Philippines.
“In traditional markets for Australian wine, the decline in the demand for wine is being felt the most in lower price segments while premium wine is still finding growth, as consumers purchase wine less frequently but are choosing to spend more on each wine product they purchase,” Bailey continued.
“This change disproportionally affects Australia, as a large share of exports to traditional markets such as the UK and US are currently in lower priced products, and this therefore impacts export performance. It’s a tough export environment for Australian wine.”
RESEARCH & DEVELOPMENT
NEW TECHNOLOGY REMOVES UNDESIRABLE AROMAS
A new ‘smart surface’ has been shown to successfully remove unwanted sulfur aromas from wine, opening up new opportunities for Australian winemakers.
Developed by scientists from the Australian Wine Research Institute (AWRI) and Flinders University, with funding from Wine Australia and in-kind support from Flinders University, the technology is based on applying a thin plasma polymer coating to a surface and then immobilising nanoparticles on that surface, which then bind strongly to sulfur compounds in wine.
Trials of the new surface removed up to 45% of free hydrogen sulfide from wine and the treatment was also effective at removing more complex sulfur compounds, such as methanethiol.
“A key benefit of the new approach is that it is easily deployable and retrievable. Essentially there’s a one-step process where the smart surface is added directly to the wine
and then removed after a certain time period,” said Mierczynska-Vasilev, AWRI principal research scientist.
Since the nanoengineered surfaces developed are independent of the substrate material, there is also potential for them to be applied to various relevant wine equipment such as filtration devices, aerators, decanters, packaging materials or closures.
The new smart surface has been shown to outperform the traditional winemaking treatment of copper sulfate addition commonly used to avoid unwanted volatile sulfur compounds. In addition, unlike copper sulfate, it does not cause any negative effects on flavour.
The next steps in the development of the smart surfaces for deployment in the wine sector are currently being explored.
CONTAINER DEPOSIT SCHEMES
QUEENSLAND TO ADD WINE BOTTLES TO CONTAINER DEPOSIT SCHEME
The announcement by the Queensland Government that the state’s container deposit scheme will be expanded to include glass wine and spirit bottles from 1 November this year has been condemned by Australian Grape & Wine (AGW).
The government’s plan will do nothing to increase glass recycling but slug Australia’s winemakers $20 million a year, rising to $100 million if other states follow suit, said AGW’s CEO Lee McLean.
“Make no mistake, Queenslanders will pay more for wine…,” he said. “This will not lead to a discernable increase in recycling, and it will not lead to a more circular economy. What it will lead to is an increase in the cost of wine at every pub, club, restaurant and bottle shop in Queensland and an increase in carbon emissions.
“This is a bad outcome that could not come at a worse time for our industry. Australia’s grapegrowers and winemakers are doing it tough. In recent years we have faced challenges of fires, smoke, hail, frost, poor fruit set, COVID-19 and the loss of our biggest export market. What we need from the government is support, not another kick in the guts.
“This government has engaged in a sham consultation with a pre-determined outcome. They do not understand business and they have no idea of the administrative burden of
6 www.winetitles.com.au WINE & VITICULTURE JOURNAL WINTER 2023 V38N3 NEWS
implementing such a change at such short notice. They do not appreciate the impacts this will have on not just Queensland businesses, but businesses across the country.”
McLean called on the Queensland Government to release a comprehensive cost benefit analysis that will demonstrate what the policy will cost and whether it will lead to a meaningful increase in glass recycling.
WINEGRAPE VARIETES
PROSECCO CONFIRMED AS THE NAME OF A GRAPE VARIETY
Prosecco is the name of a grape variety and should continue to be accepted as such, a research report prepared at the request of Australian Grape and Wine (AGW) has concluded.
The report is the culmination of five years of research conducted by Professor of Law Mark Davison and the Faculty of Law at Monash University and the Macquarie Law School, Macquarie University.
It follows renewed requests by the European Union to protect Prosecco as a wine Geographical Indication (GI) through its negotiations with Australia for amendments to the Australia-European Community Agreement on Trade in Wine and a Free Trade Agreement.
Mark Davison said: “The evidence speaks for itself, Prosecco has been recognised as the name of a grape for centuries, but not as a geographical indication (GI). Protecting the
term as a geographical indication is a cynical attempt to avoid competition from Australian wine producers.”
Lee McLean, CEO of AGW, said: “The risks of banning the ability of our industry to use well-established grape variety names are significant and have the potential to cause widespread damage to our sector and the regional communities it underpins.”
He said Australian Prosecco has grown to over $200 million dollars in value, with regions like Victoria’s King Valley investing millions in vineyards, production facilities and associated tourism infrastructure. To lose the right to use Prosecco now, when the sector is under significant economic pressure, would be devastating to these regions and their communities, he added. It would also leave Australian grape and wine businesses wondering which grape varieties will be targeted next by the EU.
The Australian Government conducted a public objections process on the EU’s wine GIs, including Prosecco, which began on 24 March 2023 and finished on 21 April. The Government is now considering the submissions it received and will use them to help inform its negotiations on the protection of the EU’s wine GIs under the AustraliaEuropean Community Agreement on Trade in Wine.
The research report can be found here: https://www.agw.org.au/wp-content/ uploads/2023/04/Prosecco-Report-Final-16August-2022.pdf
INDUSTRY EVENTS
ASVO ANNUAL VITICULTURE SEMINAR TO BE SPLIT OVER TWO HALF DAYS


The annual Viticulture Seminar run by the Australian Society of Viticulture & Oenology will this year be spread over two separate Friday afternoons the first in July and the second in August — and cover two distinct topics: ‘Maintaining Established Vineyards’ and ‘Establishing New Vineyards’.
Previously run over a single day, the seminar will be held from 12.00-4.00pm on 21 July and 4 August, 2023.

The first session on ‘Maintaining Established Vineyards’ will cover topics such as comparing vine age performance; vine age and economic viability; replacing old irrigation; pruning for longevity; field grafting and changing height/canopy structure.
The second session on ‘Establishing New Vineyards’ will address quarantine for imported cuttings; clones and alternate varieties; vineyard and irrigation design; as well as pest control, nutrition and weed management for young vines.

The 2023 ASVO Viticulture Seminar will be held at regional hubs to allow attendees to network and discuss the topics with their peers or watch online if they cannot attend a regional location.
Register for the ASVO 2023 Viticulture Seminar here: https://www.asvo.com.au/ events/2023-half-day-viticulture-seminars WVJ
MEET THE FISCHER FLEX1 FLEX2 WEEDING SYSTEM & NEW FISCHER TORNADO Fischer FKT-420 RSO CANE RAKE sales@fischeraustralis.com.au FITS 12 UNIQUE UNDERVINE MANAGEMENT DEVICES V38N3 WINE & VITICULTURE JOURNAL WINTER 2023 www.winetitles.com.au 7 NEWS
Investing in India now will deliver dividends for Australian wine in the future
 By Lee McLean, Chief Executive Officer, Australian Grape & Wine

Prime Minister Anthony Albanese’s visit to India in March 2023 was a remarkable demonstration of the growth in Australia’s bilateral relationship with India. It was loud, colourful and celebratory, and those who saw the PM and his Indian counterpart, Narendra Modi, being drawn around the oval in a golden chariot at the fourth cricket Test in Ahmedabad must have sensed the relationship had reached a historic high point.
I agree — but it hasn’t always been this way. We should be mindful of history as we seek to capitalise on this seemingly brighter future. As the late Australian foreign policy analyst, Allan Gyngell AO, used to regularly point out, “every Australian Government ‘discovers’ India at some point in its time in office”, with the implicit message being that when the discoverer dug a little deeper, enthusiasm waned upon realising the challenges of the market and entrenched protectionist politics.
So what has changed and what needs to change?
In defence of those governments of the past, when you look at the data, one can understand how such discoveries are made. India’s growth and demographic trajectory, democratic political system and cultural links to Australia made it attractive to Australian leaders. And it’s more attractive than ever today. India now has the world’s largest population and the fifth largest economy in nominal terms, and its youthful population, growing middle class, democratic underpinnings and entrepreneurial, techdriven business cohort has the World Economic Forum projecting India to become the world’s second-largest economy by 2050. However, despite these discoveries, the history of the Australia-India bilateral relationship has until now been plagued by relatively superficial engagement. For many Australians, our understanding of the
relationship was limited to the ‘three Cs’ of cricket, curry and the Commonwealth. But things are changing and changing fast, and Australia’s wine sector needs to invest now to reap what may be substantial rewards in the years ahead. Put simply, we need to become more sophisticated and coordinated in our approach and take immediate actions with a long-term view on returns to the industry.
WHAT IS THE OPPORTUNITY FOR AUSTRALIAN WINE?
While India’s religious and cultural sensitivities mean the market is far from homogenous in its acceptance of alcohol, for the most part alcohol is a well-understood and accepted part of society in India. The Indian market is currently dominated by whiskey and beer, but as the middle class emerges more people are shifting away from hard spirits to wine, which is seen as a more stylish and sophisticated choice, particularly for women.
8 www.winetitles.com.au WINE & VITICULTURE JOURNAL WINTER 2023 V38N3 AUSTRALIAN GRAPE & WINE
In terms of the growth opportunity, with 19 million people reaching legal drinking age every year in the world’s fastest-growing economy, on the surface it would appear there is an unparallel opportunity for Australian wine in India. Of course, the story is not so simple (as you will read below), but the demographic and economic momentum will drive substantial opportunities for all wine producer nations in the years ahead.
We’re already doing well in the market, albeit off a low base, with Australian wines making up 40 per cent of all imported volumes — well ahead of the nearest competitors Italy (14%), France (12%) and Chile (11%), according to Wine Australia and IWSR data1 However, like Australia, the Indian wine market is dominated by local production which accounts for between 65-75% of the total market share. This trend away from beer and spirits replicates what we have seen in several other maturing alcohol markets as people seek beverages they perceive as both classier than traditional beer and spirit offerings, and drinks of moderation. For example, in China two decades ago, beer and baijiu dominated the local alcohol market, but wine quickly gained traction as the middle class learned more about the product and how it could be a part of a sophisticated lifestyle.
But there is significant opportunity for further growth in India’s wine market, and Australia is better placed than most to capture this opportunity. The signing of the Australia-India Economic Cooperation and Trade Agreement (ECTA) last year is a positive step for the trading relationship. While it is not perfect (e.g. ECTA limits phased tariff reductions on wines above US$5 CIF), it is a big step in the right direction, and the fact that Australia and India were able to secure an interim agreement on agricultural products is quite extraordinary in itself. Only a few years ago, any agreement that included agriculture would have been viewed as impossible given India’s reputation as one of the world’s most protectionist nations with regard to farmers and agricultural products. In addition to the tariff reductions, ECTA also commits to formalised dialogue between Australia and India on wine related issues, and carries a ‘Most Favoured Nation’ provision, which means Australia will receive equal conditions to any other nation that is
1https://www.wineaustralia.com/news/media-releases/ welcoming-benefits-for-australian-wine-in-the-ai-ecta
able to secure a better deal on wine imports in the future.
WHAT ARE THE BARRIERS TO SUCCESS?
While ECTA brings some tariff relief to producers considering the India market, the reality is that for many exporters there is still a 150% tariff applied upon entry to the market. This is a major barrier to entry into the market, and to investment in India’s industry.
Secondly, across India’s 28 states and eight Union Territories there is often high additional financial imposts in the form of state taxes and charges, and significant regulatory divergence between different states, including in the form of states like Bihar which are prohibitionist. For any business contemplating the India market, my advice to you is make sure you do your homework and find the right local partners before entering the market.
Thirdly, India’s infrastructure and transportation arrangements for wine are patchy at best and this needs to be considered in any export and distribution strategy. Expectations of temperature-controlled storage and seamless logistics must be tempered.
Finally, while Australian Grape & Wine has made good inroads into its relationship with the Indian wine sector, across India’s agriculture sector by and large protectionist tendencies remain. The farmer lobby is incredibly powerful in India and our ability to make progress on agricultural trade in the broadest sense will be dependent on our ability to show Indian producers that our entry into the market will not be to their detriment.
WHAT ARE WE DOING ABOUT IT?
Australian Grape & Wine is engaging in a range of activities to build and strengthen our relationship with India’s grapegrowers and winemakers. Support from the Australian Government’s Agribusiness Expansion Initiative and collaboration with Wine Australia, Austrade, the Department of Agriculture, Fisheries and Forestry, DFAT and wine companies is allowing us to bring Indian industry representatives to Australia and for Australia to make reciprocal visits. The aim of such engagement is to take a collaborative approach with Indian industry in which we work together to identify common problems and opportunities in the market, and work together to solve them. The India-Australia Wine Regulatory Forum, scheduled for early June 2023, is a great example of how we can
bring the right decision makers into the room with our Indian colleagues.
The second aspect of our engagement is to work with India to better understand the market place, and where Indian and Australian wines fit into it. We’re sharing consumer insights, seeking to understand the perspectives of Indian businesses and working to ensure we all have a clear picture of where wines from Australia and India sit in the Indian market. If we get this right, we can grow the market together, for the benefit of all.
Finally, the Australian and Indian Governments are now working to secure a final, more comprehensive free trade agreement, which would supersede the ECTA. We believe there is a real appetite to improve the outcomes achieved in ECTA in such a way that helps improve conditions for Australian exporters while growing the market for wine in India as a whole. The relationships we are forging with India’s grape and wine producers and the technical and capacity building work we are driving will be critical to helping achieve this.
V38N3 WINE & VITICULTURE JOURNAL WINTER 2023 www.winetitles.com.au 9 AUSTRALIAN GRAPE & WINE
“…things are changing and changing fast, and Australia’s wine sector needs to invest now to reap what may be substantial rewards in the years ahead.
WVJ
“…there is significant opportunity for further growth in India’s wine market, and Australia is better placed than most to capture this opportunity.”
2023 Wine Packaging Forum, Expo & Design Awards Supplement in Grapegrower & Winemaker
JULY 2023
An unmissable line-up of expert industry speakers share their knowledge and experience in the published Supplement in Grapegrower & Winemaker June issue and PACKWINE website
Source trusted industry suppliers to find out how they can help to improve your productivity and business growth


Discover new tech and sustainable product options Meet the innovative local suppliers who support your industry
View the entire field of striking entries that capture the Australian and New Zealand wine industry at its creative best. Find out which packaging designs are among the year’s best by visiting the Design Awards presentation.

NEWS AUSTRALIAN GRAPE & WINE
Presented by
Award Sponsor
in association with
Viticulture seminars kick off in July
By Andy Clarke, President, Australian Society of Viticulture & Oenology

With vintage over and preparations under way for managing vineyards through the winter months ahead, we can look forward to the ASVO’s planned events for the second half of the year.
VITICULTURE SEMINARS
On 21 July, the first of our viticulture seminars for 2023 will be held covering longterm vine health, productivity and economic viability of vineyards, comparing vine age performance, vine age and economic viability, old irrigation infrastructure and replacements. The second viticulture seminar will focus on establishing new vineyards and will take place on 4 August.
As always, these events will be a mix of science supported by real case studies from local and international speakers.
Based on feedback, to reduce the disruption to the working week we have split our viticulture seminars into two halfday seminars. Both seminars are planned for Friday afternoons to enable growers to connect over lunch, learn from interactive sessions and finish the day with a drink and networking.
2023
ASVO BOARD NOMINATIONS
We invite all ASVO members to consider nominating to our board of directors. Serving on a board can be personally and professionally rewarding. It can enhance your career development by providing a different perspective on what it takes to deliver value
to members, raise resources and ensure accountability.
If you are truly passionate about the wine industry, it’s a great way to give back and support the professional society that supports the Australian wine industry.
Nominations for general director positions open from 1 July 2023. Directors serve for a period of two years, contributing to the strategic direction, legal and financial accountabilities, and oversight of our society. Nominations close on 27 August 2023. Visit the ASVO website for more information www.asvo.com.au.
2023
ASVO FELLOW NOMINATIONS
Each year the ASVO board has the opportunity to invite one of its members to become a Fellow of the society. It is an exciting and humbling part of our role to reflect on the history of both the society and the Australian wine industry and, in doing so, acknowledge those whose significant contributions have had an enduring impact.
ASVO Fellows have a valued role within the society. Their contribution to ASVO activities is tireless. In the past year, our Fellows judged presentations at the Australian Wine Industry Technical Conference, they served on the selection committees for the ASVO Awards, edited seminar proceedings and reviewed our constitution, while Terry Lee has continued to lend his expertise in the role of editor of the Australian Journal of Grape and Wine Research
If you know an ASVO member who has made a particularly outstanding and meritorious contribution to the grape and wine industry and who is worthy of recognition for their exemplary contribution to the society, please nominate them for invitation as an ASVO Fellow.
The eligibility criteria and additional information can be downloaded from the ASVO website: www.asvo.com.au
Nominations for consideration in 2023 close on 31 July 2023. Please refer to the eligibility criteria when preparing your nomination. Nominations can be submitted throughout the year, online through the ASVO website: www.asvo.com.au/nominationfellow-society
2023 AWARDS FOR EXCELLENCE
The ASVO has proudly presented the Awards for Excellence for more than 10 years. This year the event will be held in person at the National Wine Centre in Adelaide on Wednesday 8 November. Winners of the ASVO Wine Science and Technology Award, in addition to the ASVO Viticulturist and Winemaker of the Year, will be announced. We will also acknowledge the Viticulture and Oenology Papers of the Year and the Dr Peter May Award for the most cited paper from the Australian Journal of Grape and Wine Research
V38N3 WINE & VITICULTURE JOURNAL WINTER 2023 www.winetitles.com.au 11 ASVO
AU & NZ’s MOST COMPREHENSIVE WINE INDUSTRY COVERAGE BUY • SELL • NEW • USED ENGAGE I SUBSCRIBE I FOLLOW I CONNECT Find us here: EQDC WVJ

THE AUSTRALIAN AND NEW ZEALAND WINE INDUSTRY DIRECTORY Directory for winery profiles, locate vineyards and consultants in your area, or identify potential new customers. Buyers’ Guide makes it easy to find the suppliers and service providers to assist your Directory provides the most current growers, wine and grape industry professionals, products and services across Australia and New Zealand at your fingertips. Over 500 pages of essential information and data for the wine industry and its suppliers End of Financial Available — both print and online winetitles.com.au | +618 8369 9500 Order Now! *Limited time only Sale ends 30 June 2023 OFF* 15% Use code EOFY23 at the checkout
A novel approach to tailor Sauvignon Blanc styles
By Xingchen Wang1, Dimitra L. Capone1, Aurélie Roland2, and David W. Jeffery1
The novel crushing technique known as ‘accentuated cut edges’ (ACE), typically used to make red wine, was tested for its effect on the release of varietal thiols and their precursors during Sauvignon Blanc wine production.
INTRODUCTION
This article originated from Xingchen Wang’s PhD project entitled ‘Varietal thiols and precursors: biogenesis, reactivity, and impact of winemaking practices’, which was completed in 2022 at The University of Adelaide. Two scientific papers from the PhD were published under the research scope of ‘Impact of winemaking practices’. Forming the basis for this article, one of those papers reported on the impact of a novel grape crushing technique typically used for red winemaking, along with the influence of yeast strain and malolactic fermentation on the release of varietal thiols and their precursors during Sauvignon Blanc wine production (Wang et al. 2023).
According to the Wine Australia National Vintage Report 2022, more than 90,000 tonnes of Sauvignon Blanc were crushed with an approximate value of more than A$73 million, making it the second largest crushed white grape variety in Australia. The typical sensory attributes of Sauvignon Blanc wine are described as ‘green, herbaceous’, ‘tropical fruit’, ‘grapefruit’, ‘passionfruit’, and
‘blackcurrant’ (Marais 1994), with the ‘fruity’ aroma notes primarily being attributed to a group of sulfur-containing volatiles, namely varietal thiols (Roland, Schneider, Razungles et al. 2011). These thiol molecules are the reason we are interested in Sauvignon Blanc, as we aim to improve understanding of the effect of grapegrowing and winemaking practices for this important white variety in Australia.
Varietal thiols discovered in wine predominantly include 3-sulfanylhexan-1-ol (3-SH), 3-sulfanylhexyl acetate (3-SHA), and 4-methyl-4-sulfanylpentan-2-one (4-MSP) (Darriet et al. 1995, Tominaga et al. 1996, Tominaga et al. 1998). These thiols are notable for their extremely low odour detection thresholds, determined in hydroalcoholic solution to be 60ng/L for 3-SH, 4.2ng/L for 3-SHA, and 0.8ng/L for 4-MSP (Tominaga et al. 1998). These compounds were revealed to play key roles in characterising wine sensory profiles (Benkwitz et al. 2012) – in other words, they are character impact odorants. Intriguingly, they are not initially present to any significant extent in grapes or at the beginning
IN BRIEF
■ Accentuated cut edges (ACE) grape crushing technique was evaluated in the production of Sauvignon Blanc wine and compared to conventional crushing.
■ ACE was found to significantly increase the concentrations of varietal thiols compared with the conventional grape crushing treatment.
■ Two yeast strains were studied for their capacity to release varietal thiols, with one producing more 3-SH and 3-SHA, but less 4-MSP than the other.
■ Impact of malolactic fermentation in Sauvignon Blanc production was studied, showing that the concentrations of 3-SH and 4-MSP were substantially increased, whereas 3-SHA decreased.
■ Sensory analysis on the studied wines showed that yeast strain and malolactic fermentation had more impact on sensory profiles than the grape crushing method.

V38N3 WINE & VITICULTURE JOURNAL WINTER 2023 www.winetitles.com.au 13 GRAPE & JUICE HANDLING WINEMAKING
1School of Agriculture, Food and Wine, and Waite Research Institute, The University of Adelaide, PMB 1, Glen Osmond, 5064, South Australia
of winemaking, but exist as non-volatile precursors mainly conjugated to l-glutathione or l-cysteine that are predominantly found in grape skin (Peyrot des Gachons et al. 2002, Roland, Schneider, Charrier et al. 2011). The precursors, which include dipeptide and aldehyde variants, are formed and interconverted during the grapegrowing season or harvesting and crushing stage and are enzymatically released as their odouractive varietal thiol forms during alcoholic fermentation (Cerreti et al. 2015, Grant-Preece et al. 2010).
A series of factors, ranging from wine region, grape variety and vineyard management to winemaking practices and ageing, have been investigated to gain better comprehension and manipulation of the production of varietal thiols and their precursors (Roland, Schneider, Razungles et al. 2011). Considering their localisation in skins, one option is to enhance the extraction of thiol precursors from grape skin into grape juice before fermentation. For instance, thiol precursors in grape juice obtained from frozen berries (−20°C for a month) and varietal thiols in the resultant wine were significantly increased compared with those from fresh grapes (Chen et al. 2019). Other investigations have considered the effects on precursors of machine harvesting, fruit transportation and cold storage in picking bins (Jeffery 2016).
Other than the winemaking practices that have been studied, a novel grape crushing technique, prototypically known as ‘accentuated cut edges’ (ACE), attracted our attention given the improved extraction of grape skin contents into red grape must. Applied in the production of Tasmania Pinot Noir and McLaren Vale Shiraz wines, ACE was found to increase the extraction rate and amount of red colour, tannin and nonbleachable pigments in Pinot Noir wine, and tannin and total phenolics in Shiraz wine (Kang et al. 2020, Sparrow et al. 2016). Therefore, it was hypothesised that the novel application of ACE in the production of Sauvignon Blanc wine could potentially increase the concentrations of thiol precursors in grape juice as well as varietal thiols in the resultant wine. Meanwhile, the impact of thiolreleasing commercial yeast strains as well as malolactic fermentation on the release of varietal thiols in Sauvignon Blanc were also studied.
MATERIALS AND METHODS
Sauvignon Blanc grapes were mechanically harvested in 2021 from a vineyard at the southern end of the Adelaide Hills Geographical Indication. The grapes were destemmed and crushed conventionally at a commercial winery, with half being reserved (control) and the other half processed through a Della Toffola Maceration Accelerator (ACE treatment). After transferring the treatments to The University of Adelaide and cold macerating for 21 hours at 5°C, the musts were pressed and the juice was settled overnight and racked. Juices were inoculated for alcoholic fermentation (VIN13 or Sauvy), yielding four treatments: Control_VIN13, Control_Sauvy, ACE_VIN13, and ACE_Sauvy. Malolactic fermentation was undertaken for half of the above-mentioned treatments by inoculating with Oenococcus oeni 48 hours after yeast inoculation, giving another four treatments: Control_VIN13_MLF, Control_Sauvy_MLF, ACE_VIN13_MLF, and ACE_SauvyMLF. Triplicate fermentations (3.2 litres of juice per fermenter) were performed at 16-18°C until sugar dryness or until malic acid was undetectable for malolactic fermentation treatments, after which the wines were settled overnight at 4°C, racked into two-litre flagons, and SO2 and titratable acidity (TA) were adjusted. Wines were stabilised at 4°C for three weeks, bottled into 375mL screwcap bottles, and stored at 16°C for four months. Volatile compounds and the sensory profiles of the wine samples were analysed with a full description of the winemaking and analysis to be found in Wang et al. (2023).
Table 1. Basic composition of
Parameter
RESULTS
The total soluble solids (TSS), pH, TA (as tartaric acid), and yeast assimilable nitrogen (YAN) in Sauvignon Blanc juice obtained from conventional crushing were 21.0°Brix, 3.4, 4.1g/L and 175mg/L, and in juice from ACE processing were 21.9°Brix, 3.4, 4.6g/L and 182mg/L, respectively. The basic parameters measured for the resultant wines included pH, TA, alcohol, total and free SO2, residual sugar and organic acids (Table 1). Although each result was statistically significant according to the treatment, there were only minor differences for most parameters from a practical perspective, with the exception that free SO2 in the ACE treated wines (8-18mg/L) was lower than that in the control wines (2027mg/L). The difference in free SO2 between treatments may be induced by the reaction with phenolic oxidation products that were likely more abundant in the ACE treatments due to the higher extraction of phenolics (data not shown – Wang et al. (2023)). The absence of malic acid in all MLF treatments indicated the completion of malolactic fermentation.
To examine the hypothesis that ACE could increase the concentrations of thiol precursors compared with conventional crushing, precursors to 3-SH, namely, 3-S-glutathionylhexan-1-ol (GSH-3-SH) and 3-S-cysteinylhexan-1-ol (Cys-3-SH), were monitored during the 21 hours of cold maceration stage.
Figure 1 (see page 15) illustrates that ACE significantly increased the concentration and the extraction rate of thiol precursors compared
different
yeast strain (VIN 13 or Sauvy), and malolactic fermentation.*
Treatments
* Control: conventionally crushed grape; ACE: accentuated cut edges crushed grape; MLF: treatments with malolactic fermentation.
14 www.winetitles.com.au WINE & VITICULTURE JOURNAL WINTER 2023 V38N3 WINEMAKING GRAPE & JUICE HANDLING
Sauvignon Blanc wines from
treatments involving accentuated cut edges,
Control_ VIN13 Control_ Sauvy ACE_ VIN13 ACE_ Sauvy Control_ VIN13_ MLF Control_ Sauvy_ MLF ACE_ VIN13_ MLF ACE_ Sauvy_ MLF pH 3.32 3.29 3.44 3.40 3.31 3.32 3.36 3.34 Titratable acidity (g/L) 6.2 6.3 6.9 6.8 6.5 6.4 7.1 6.7 Alcohol % v/v 13.1 12.9 13.0 12.8 12.6 12.4 12.5 12.1 Total SO2 (mg/L) 80.5 75.2 89.3 73.3 79.2 67.7 84.8 71.7 Free SO2 (mg/L) 23.5 19.6 8.3 8.3 26.7 26.9 18.1 9.9 Glycerol (g/L) 7.6 8.5 7.5 8.8 7.1 7.7 7.0 7.9 Malic acid (g/L) 2.1 1.3 2.2 1.5 0.0 0.0 0.0 0.0 Tartaric acid (g/L) 2.8 3.6 2.2 3.0 3.2 3.4 2.6 2.8 Citric acid (g/L) 0.2 0.2 0.3 0.3 0.2 0.1 0.2 0.1 Lactic acid (g/L) 0.1 0.1 0.1 0.0 3.3 3.0 3.7 3.1 Acetic acid (g/L) 0.4 0.4 0.5 0.4 0.5 0.5 0.6 0.7
Figure 1. Evolution of (A) GSH-3-SH (nmol/L) and (B) Cys-3-SH (nmol/L) in Sauvignon Blanc juice of different treatments during cold maceration, and at yeast inoculation. Dark blue curves in A and B show analytes from ACE treatment and light blue curves show analytes from control grape crushing treatment, with error bars representing standard deviation (n = 2 from duplicate measurement of grape juice from each crushing method). Significant differences between treatments for a single time point are indicated with *, p < 0.05 and **, p < 0.01, and within a treatment for different time points are indicated with different lower case letters.
with the control. Specifically, both precursors at time zero hours were not significantly different between the treatments, with 770nmol/L for GSH3-SH (Figure 1A) and 30-40nmol/L for Cys-3-SH (Figure 1B). However, their concentrations in juice from ACE treatment (ACE_juice) increased significantly after three hours of maceration and reached a peak after nine hours, yielding 1262nmol/L for GSH-3-SH (Figure 1A) and 61nmol/L for Cys-3-SH (Figure 1B). Comparatively, both precursors in the juice obtained from conventional crushing (Control_juice) started with a decline in concentration until nine hours of maceration, followed by a moderate incline to 938nmol/L for GSH-3-SH (Figure 1A) and 31nmol/L for Cys3-SH (Figure 1B) at 21 hours. Although both precursors in control juice increased moderately after pressing and before yeast inoculation, the concentrations of GSH-3-SH and Cys-3-SH were still lower than that of the ACE treatments by 20% and 33%, respectively.
Varietal thiols were quantified at the wine bottling stage to evaluate the potential influence of the three studied factors, namely, grape crushing method, yeast strain and malolactic fermentation, on their release from the precursors. 3-SH, 3-SHA and 4-MSP were determined to range from 8.2-12.8nmol/L (Figure 2A), 0.11-0.25nmol/L (Figure 2B), and 0.59-1.4nmol/L (Figure 2C), respectively, with the values being significantly higher than their respective odour detection thresholds. Statistical analysis of data revealed that the factors (grape crushing method, yeast strain and malolactic fermentation) had interaction effects on the concentrations of all varietal thiols that were measured. Notably, ACE and MLF significantly increased the concentration of 3-SH by 40% and 14% compared with the control and no MLF treatments, respectively. Compared with Sauvy, the yeast strain VIN13 had significantly higher concentrations of 3-SH in the treatments for conventionally crushed grapes (27% higher) or without malolactic fermentation (17% higher). With respect to 3-SHA, statistical analysis revealed that ACE and yeast strain VIN13 significantly increased its concentration by 43% and 42%, respectively, compared with Control and Sauvy yeast.
Malolactic fermentation generally induced a minor decrease of 7% in the concentration of 3-SHA compared with the treatments without MLF. The analysis of 4-MSP in the wines showed that ACE, Sauvy and MLF could each increase the concentration by 21%, 75% and 16%, respectively, compared with Control, VIN13 and no MLF treatments.
A sensory panel comprising regular wine consumers was recruited to evaluate aroma, flavour and mouthfeel of all treatments. The significantly different aroma and flavour attributes are illustrated in Figure 3A and 3B,
The clear choice for fining wine

Spring’ FinerTM
Spring’Finer™ is a source of yeast proteins that are remarkably effective for wine clarification and stabilization enhancement. It removes astringent and bitter tannins while preserving wine structure. And because it doesn’t use animal protein like most fining agents, it’s also allergen-free.

V38N3 WINE & VITICULTURE JOURNAL WINTER 2023 www.winetitles.com.au 15
05101520 0 500 1000 1500 2000 50 Maceration duration (h) GSH-3-SH (3-SH equiv. nmol/L) ACE_juice Control_juice (A) Yeast inoculation ** ** ** * * c ab b b ab a b c c c a a 0510152025 0 20 40 60 80 100 50 Maceration duration (h) Cys-3-SH (3-SH equiv. nmol/L) ACE_juice Control_juice (B) Yeast inoculation ** * ** * a c bc abc ab a ab ab bc ab c abc
Figure 2. Concentrations (nmol/L) of (A) 3-SH, (B) 3-SHA, and (C) 4-MSP in Sauvignon Blanc wines at bottling. Dark blue bars in A, B, and C represent analytes from ACE treatment and light blue bars show analytes from control grape crushing treatment, with error bars representing standard deviation (n = 6 from duplicate measurement of three biological replicates). The odour detection threshold (ODT) indicated for each compound is the literature value determined in aqueous ethanol solution.
respectively. It was evident that wines with malolactic fermentation were ranked higher in savoury attributes, including ‘sulfidic’ (aroma and flavour), ‘bacon’ and ‘mineral’, but were less abundant in the remaining attributes that characterised the other wines in terms of ‘tropical fruits’, ’melon’ and ‘floral’ odours (Figure 3A) and flavour notes of ‘tropical fruits’, ‘floral’, ‘stone fruit’ and ‘honey’ (Figure 3B). The impact of yeast strain on aroma and flavour profiles was less evident, although Sauvy yeast seemed to impart more abundant ‘melon’ aroma (Figure 3A), ‘tropical fruits’, ‘floral’, ‘confectionery’, ‘stone fruit’ and ‘honey’ flavours (Figure 3B).
Figure 3. Sensory profiles showing significantly different (A) aroma attributes and (B) flavour attributes of Sauvignon Blanc wines from different treatments (± ACE, VIN13 or Sauvy, ± MLF). Solid lines represent wines without malolactic fermentation and dashed lines represent wines that underwent malolactic fermentation. *, **, *** indicate significant differences at p < 0.1, p < 0.05, and p < 0.01, respectively.
Australian Designed Centrifuge

Separator Technology Solutions (STS), formed in 2005, are based in Melbourne with subsidiaries in France, USA, South Africa and Chile. We manufacture a varied range of Centrifuges – from “skid mounted” 5kl/hr models to 75kl/hr polishers to suit all your processing needs and boast the highest yielding potential of winery separators in the marketplace.


Some notable advancements in technology include:
• Upgrades for existing STS Series 20-25% flow rate increase
• ISOBARIC for charmat
• CPCS for Juice Float Lees - Finally, a solution offering high flow rates + suitable clarity + high concentration of the bourbes / solids. Parts and service for STS and “OEM” centrifuges - Genuine, OEM and Compatible, with considerable savings!
Please contact us for more information.
Ragan Wood General Manager

M: 0437 919 650
E: ragan.wood@sts200.com
Andrea Birrell

After Sales Service/Spare Parts
M: 0429 415 150
E: andrea.birrell@sts200.com
03 8560 6928
Grape crushing method showed minor influences on both the aroma and flavour profiles compared with yeast strain and malolactic fermentation. In the treatments without malolactic fermentation, Control_Sauvy was more abundant in ‘floral’ (aroma), ‘tropical fruits’, ‘stone fruits’ and ‘honey’ (flavour) characteristics than ACE_Sauvy treatment, and Control_VIN13 was more intense in ‘honey’ (aroma and flavour) note than ACE_VIN13. In the malolactic fermentation treatments, Control_Sauvy_MLF was more expressive of ‘grapefruit’ and ‘sulfidic’ but less abundant in
Get in touch +61
sts-la.com
16 www.winetitles.com.au WINE & VITICULTURE JOURNAL WINTER 2023 V38N3
WINEMAKING GRAPE & JUICE HANDLING 0.0 1.0 2.0 3.0 4.0 5.0 A_Tropical fruits** A_Grapefruit * A_Melon** A_Floral* A_Honey** A_Sulfidic*** A_Bacon* Control_VIN13 Control_Sauvy ACE_VIN13 ACE_Sauvy Control_VIN13_MLF Control_Sauvy_MLF ACE_VIN13_MLF ACE_Sauvy_MLF (A) 0.0 1.0 2.0 3.0 4.0 5.0 F_Tropical fruits*** F_Citrus** F_Floral* F_Confectionery* F_Stone fruits*** F_Honey*** F_Sulfidic*** F_Mineral* Control_VIN13 Control_Sauvy ACE_VIN13 ACE_Sauvy Control_VIN13_MLF Control_Sauvy_MLF ACE_VIN13_MLF ACE_Sauvy_MLF (B)
VIN13 Sauvy VIN13 Sauvy 5 10 15 20 ACE Control (A) MLF Yeast strain ODT MLF 3-SH (nmol/L) VIN13 Sauvy VIN13 Sauvy 0 0 0 1 0 2 0 3 ACE Control (B) MLF Yeast strain ODT 3-SHA (nmol/L) MLF VIN13 Sauvy VIN13 Sauvy 0 5 1 0 1 5 2 0 ACE Control MLF ODT (C) 4-MSP (nmol/L) MLF Yeast strain VIN13 Sauvy VIN13 Sauvy 5 10 MLF Yeast strain ODT MLF VIN13 Sauvy VIN13 Sauvy 0 0 0 1 MLF Yeast strain ODT MLF VIN13 Sauvy VIN13 Sauvy 0 5 1 0 1 5 2 0 ACE Control MLF ODT (C) 4-MSP (nmol/L) MLF Yeast strain VIN13 Sauvy VIN13 Sauvy 5 10 15 20 ACE Contro (A) MLF Yeast strain ODT MLF 3-SH (nmol/L) VIN13 Sauvy VIN13 Sauvy 0 0 0 1 0 2 0 3 ACE Control (B) MLF Yeast strain ODT 3-SHA (nmol/L) MLF VIN13 Sauvy VIN13 Sauvy 0 5 1 0 1 5 2 0 ACE Contro MLF ODT (C) 4-MSP (nmol/L) MLF Yeast strain
PERA MEMBRANE PRESS


SMART PRESS
• Qualitative and protected juice
- Juice and grapes inerted with INGAS system
-Injection of proteins, enzymes or antioxidants with ENOXY+ system
• Easy to use
Intuitive and ergonomic touch screen PLC
• Easy to clean
Pierced open cage or draining grids on closed cage
• Higher performances
Smart management of the press: filling, pressing and emptying

• Connected Press
Press real-time data capture on your smartphone
• Adapted range to suit all winemakers expectations:
- open cage : 40 to 150 hl
- closed cage : 20 to 600 hl
Pellenc Australia (SA)
14 Opala Street Regency Park SA 5010 08 8244 7700
admin.sa@pellenc.com.au
Pellenc Australia (VIC)
1B Randor Street Campbellfield VIC 3061 03 8580 7444
admin.vic@pellenc.com.au

Nicholls Machinery (WA) 31/33 Bunbury Street Busselton WA 6280 08 9752 1466
admin@nichollsmachinery.com.au
Closed cage SPC : 20 to 600 hl
Open cage SPO : 40 to 150 hl
‘honey’ aroma notes than the ACE_Sauvy_MLF treatment, and ACE_VIN13_MLF was more abundant in ‘mineral’ flavour than the Control_ VIN13_MLF treatment.
CONCLUSION
Novel application of the ACE technique to Sauvignon Blanc wine production significantly increased the extraction rate and concentration (potentially including in-situ formation) of thiol precursors during cold maceration, which is relevant in terms of affecting the concentrations of varietal thiols in the subsequent wines. Indeed, analysis of varietal thiols in the experimental wines indicated that ACE had substantially increased the concentrations of 3-SH, 3-SHA and 4-MSP by 40%, 43%, and 21%, respectively. However, such increments were not equally reflected in the enhancement of aroma and flavour profiles of the wines (which were already seen as tropical and fruity), where only ‘honey’ and ‘mineral’ flavour notes were more abundant in ACE than control. The treatments produced with yeast strain VIN13 had higher concentrations of 3-SH and 3-SHA by 17-27% and 42%, respectively, but a lower concentration of 4-MSP by 75% compared with yeast strain Sauvy (verifying its ability to produce this varietal thiol in particular).
Sensory analysis showed that the yeast strain Sauvy enhanced ‘melon’ (aroma), ‘tropical fruits’, ‘floral’, ‘confectionery’, ‘stone fruit’ and ‘honey’ (flavour) attributes more than VIN13. Although MLF is not typically used in Sauvignon Blanc wine production, it was applied in this study to evaluate its impact on the release of varietal thiols. The results revealed that MLF increased concentrations of 3-SH and 4-MSP by 14% and 16%, respectively, but decreased 3-SHA by 7%. These were modest changes, but a general sensory impact of MLF was evident, with several savoury attributes being significantly enhanced, such as ‘sulfidic’, ‘mineral’ and ‘bacon’, in conjunction with decreased ‘fruity’ and ‘floral’ attributes. Overall, the ACE technique has shown its potential in white wine production, particularly in tailoring Sauvignon Blanc wine styles in combination with other winemaking treatments.
ACKNOWLEDGEMENTS
We thank Duncan Lloyd (Coriole Vineyards) for the donation and processing of Sauvignon Blanc grapes as well as participation in an informal tasting panel. Eveline Bartowsky (Lallemand) is acknowledged for the donation of Sauvy yeast.
Sue Maffei (CSIRO) is thanked for helping with the analysis of thiols. We acknowledge University of Adelaide colleagues including Claire Armstrong for the help with the sensory study, Susan Bastian and Pietro Previtali for participation in an informal tasting panel, Nick van Holst for the assistance with organic acids analysis, and Renata Ristic for valuable winemaking advice. We appreciate the efforts of the sensory panellists who assessed the wines. Xingchen Wang is a recipient of the joint scholarship of The University of Adelaide and China Scholarship Council (201806300044) and is supported by a Wine Australia Supplementary Scholarship (WA Ph1803). The Australian Research Council Training Centre for Innovative Wine Production (www.ARCwinecentre.org.au; project number IC170100008) is funded by the Australian Government with additional support from Wine Australia, Waite Research Institute and industry partners. The University of Adelaide is a member of the Wine Innovation Cluster.
REFERENCES
Benkwitz, F.; Nicolau, L.; Lund, C.; Beresford, M.; Wohlers, M. and Kilmartin, P.A. (2012) Evaluation of key odorants in Sauvignon Blanc wines using three different methodologies. Journal of Agricultural and Food Chemistry 60(25):6293-6302. https://doi. org/10.1021/jf300914n
Cerreti, M.; Esti, M.; Benucci, I.; Liburdi, K.; de Simone, C. and Ferranti, P. (2015) Evolution of S-cysteinylated and S-glutathionylated thiol precursors during grape ripening of Vitis vinifera L. cvs Grechetto, Malvasia del Lazio and Sauvignon blanc. Australian Journal of Grape and Wine Research 21(3):411-416. https://doi.org/10.1111/ ajgw.12152
Chen, L.; Capone, D.L.; Nicholson, E.L. and Jeffery, D.W. (2019) Investigation of intraregional variation, grape amino acids, and pre-fermentation freezing on varietal thiols and their precursors for Vitis vinifera Sauvignon Blanc. Food Chemistry, 295:637-645. https://doi.org/10.1016/j. foodchem.2019.05.126
Darriet, P.; Tominaga, T.; Lavigne, V.; Boidron, J.-N. and Dubourdieu, D. (1995) Identification of a powerful aromatic component of Vitis vinifera L. var. Sauvignon wines: 4-Mercapto-4-methylpentan-2one. Flavour and Fragrance Journal 10(6):385-392. https://doi.org/10.1002/ffj.2730100610
Grant-Preece, P.A.; Pardon, K.H.; Capone, D.L.; Cordente, A.G.; Sefton, M.A.; Jeffery, D.W. and Elsey, G.M. (2010) Synthesis of wine thiol conjugates and labelled analogues: Fermentation of the glutathione conjugate of 3-mercaptohexan-1-ol yields the corresponding cysteine conjugate and free thiol. Journal of Agricultural and Food Chemistry
58(3):1383-1389. https://doi.org/10.1021/jf9037198
Jeffery, D.W. (2016) Spotlight on varietal thiols and precursors in grapes and wines. Australian Journal of Chemistry, 69:1323-1330. https://doi. org/10.1071/CH16296
Kang, W.; Bindon, K.A.; Wang, X.; Muhlack, R.A.; Smith, P.A.; Niimi, J. and Bastian, S.E.P. (2020) Chemical and sensory impacts of accentuated cut edges (ACE) grape must polyphenol extraction technique on Shiraz wines. Foods 9(8):1027. https:// doi.org/10.3390/foods9081027
Marais, J. (1994) Sauvignon Blanc cultivar aroma - A review. South African Journal of Enology and Viticulture, 15(2):41-45.
Peyrot des Gachons, C.; Tominaga, T. and Dubourdieu, D. (2002) Localisation of S-cysteine conjugates in the berry: effect of skin contact on aromatic potential of Vitis vinifera L. cv. Sauvignon Blanc must. American Journal of Enology and Viticulture 53(2):144-146. https://doi.org/10.5344/ ajev.2002.53.2.144
Roland, A.; Schneider, R.; Charrier, F.; Cavelier, F.; Rossignol, M. and Razungles, A. (2011) Distribution of varietal thiol precursors in the skin and the pulp of Melon B. and Sauvignon Blanc grapes. Food Chemistry 125(1):139-144. https://doi. org/10.1016/j.foodchem.2010.08.050
Roland, A.; Schneider, R.; Razungles, A. and Cavelier, F. (2011) Varietal thiols in wine: Discovery, analysis and applications. Chemical Reviews 111(11): 7355-7376. https://doi.org/10.1021/cr100205b
Sparrow, A.M.; Holt, H.E.; Pearson, W.; Dambergs, R.G. and Close, D.C. (2016) Accentuated cut edges (ACE): Effects of skin fragmentation on the composition and sensory attributes of Pinot Noir wines. American Journal of Enology and Viticulture 67(2):169-178. https://doi.org/10.5344/ ajev.2015.15094
Tominaga, T.; Darriet, P. and Dubourdieu, D. (1996) Identification of 3-mercaptohexyl acetate in Sauvignon wine, a powerful aromatic compound exhibiting box-tree odour. Vitis 35(4):207-210. https:// doi.org/10.5073/vitis.1996.35.207-210
Tominaga, T.; Furrer, A.; Henry, R. and Dubourdieu, D. (1998) Identification of new volatile thiols in the aroma of Vitis vinifera L. var. Sauvignon Blanc wines. Flavour and Fragrance Journal 13(3):159-162. https://doi.org/10.1002/(SICI)10991026(199805/06)13:3<159::AID-FFJ709>3.0.CO;2-7
Tominaga, T.; Murat, M.-L. and Dubourdieu, D. (1998) Development of a method for analysing the volatile thiols involved in the characteristic aroma of wines made from Vitis vinifera L. cv. Sauvignon Blanc. Journal of Agricultural and Food Chemistry 46(3):1044-1048. https://doi.org/10.1021/jf970782o
Wang, X.; Capone, D. L.; Roland, A. and Jeffery, D.W. (2023) Impact of accentuated cut edges, yeast strain, and malolactic fermentation on chemical and sensory profiles of Sauvignon Blanc wine. Food Chemistry 400:134051. https://doi.org/10.1016/j. foodchem.2022.134051
18 www.winetitles.com.au WINE & VITICULTURE JOURNAL WINTER 2023 V38N3
WINEMAKING GRAPE & JUICE HANDLING WVJ
Decompacting waves: an overview of a ‘soft’ maceration technique for improving extraction and wine quality
By Fabio Mencarelli, Department of Agricultural, Food and Agro-Environmental Sciences, University of Pisa, Italy

A professor at the University of Pisa in Italy, Fabio shares his thoughts on a relatively new innovation that creates disruptive waves inside tanks to manage caps.
Maceration is one of the most used terms in winemaking. The extraction of enochemical compounds from grapes is not economically sustainable as it requires a lot of energy, especially when horizontal fermentation tanks are used, and is very invasive and leads to the formation of a lot of lees. The most extraction that can be achieved is 70%, depending on the variety and the maturity stage of the grape. After this, recovery of wine from lees is necessary, requiring the need for filtration which further increases electricity consumption. The equilibrium between the quality of extraction and electricity consumption is very hard to achieve because:
• we do not know the maturity of cells in the vineyard (lab analyses can be carried out but these can be time-consuming and therefore cost money), thus we estimate
• we do not know what and how to selectively extract for the desired wine product
• our biochemical knowledge of winemaking is scarce, especially in relation to several environment parameters
• we use an average of grape maturity at harvest for vinification and wine fining purposes (unless the vineyard is small and perfectly homogenous).
Below are some examples of operations with unexpected or unknown outcomes:
USE OF ENZYMES IN MACERATION PREFERMENTATION
Most of the time pectolytic enzymes are used at low temperature (4-6°C), therefore only 10-20% of them work because the
optimal temperature for their activity is between 20°C and 25°C. If you achieve a good result, it is not due to the enzyme but the temperature. To compare maceration with and without enzymes, the enzyme concentrations, size of the vats and the temperature inside both vats must be the same. This is almost impossible, thus you could be throwing away money in using those enzymes.
USE OF MECHANICAL EXTRACTOR
Whatever the system used to manage the cap, extraction depends on the temperature; as mentioned above, grape and yeast-derived enzymes require specific temperatures to work, thus the stratification of temperature is partially solved through mechanical movement of the cap, especially with high vertical
fermentation tanks with a thick cap, but the electricity requirement is very high. Energy consumption is also high for pumping over and delestage which guarantee a high yet momentary mixing rate.
CARBONIC MACERATION
Carbonic maceration is well-known in the wine sector but is rarely done accurately, resulting in liquid being exposed to CO2 instead of just grape bunches. The metabolic effect of carbonic maceration is intriguing but it is also energy consuming due to the use of carbon dioxide in the form of dry ice, unless CO2 captured from fermentation is used. Nitrogen has been used instead of carbon dioxide with surprising aromatic results because the metabolism of grapes responds

V38N3 WINE & VITICULTURE JOURNAL WINTER 2023 www.winetitles.com.au 19 GRAPE & JUICE HANDLING WINEMAKING
differently to nitrogen. A nitrogen generator can be used to easily saturate the ambient air or, if used successively to create an atmosphere rich in nitrogen and CO2
USE OF AIRFLOW TO HOMOGENISE THE MASS
These systems are less invasive and less energy-consuming than mechanical extractors, and they do not require pumping over. Moreover, they are automated and thus less labor intensive. They are very useful in homogenising the temperature in a vat.
One system uses big air bubbles which are blown from the bottom of the vat into the must, creating a boiling-type movement. The problem with big bubbles is that they could have preferential routes depending on the thickness of the cap. As the rate of bubbling increases, more extraction is obtained and more energy is required, leading to the formation of more lees.
Another system uses decompacting waves created by sequential modulated air jets (via a very small injection of air) placed around the circumference of a vat in the lower part of the tank. This technique will be the focus of the remainder of this article.
DECOMPACTING WAVES
The innovative decompacting wave technique utilises a modulated injection system developed and patented by Parsec based in Italy and is called Air-Mixing MI®
It uses resonance wave theory to avoid cap formation during fermentation. As I mentioned earlier, the purpose of maceration is to extract the elements of enochemical interest from the cap to the liquid.
The physical processes that drive extraction are:
• the rupture of the cells of the berry
• infusion
• leaching.
The factors that facilitate these processes are:
• grape variety
• maturation stage
• in-vineyard environmental factors that influence the structure of the berry
• post-harvest interventions
• mechanical or physical interventions in the cellar
• voluntary or involuntary additions (pectolytic enzymes, yeasts, bacteria, fungi, sulfur dioxide)
• fermentation process (pH, ethanol, temperature, actions on the cap)
• operator preparation.
Infusion and leaching in maceration
Infusion ensures the enrichment of the interstitial juice while leaching takes the interstitial juice rich in enochemicals and enriches the free juice, causing a concentration gap. The extraction of phenolic compounds therefore takes place via infusion while distribution of the cap exploits leaching (Figure 1).
The resonance phenomenon occurs when the frequency caused by the oscillators coincides with the oscillation frequency of the material and the cap begins to disintegrate. Therefore, when the frequency of the wave caused by Air-Mixing MI coincides with the oscillation frequency of the solid material in the cap, movements in all directions occur, and the cap begins to disintegrate. The thicker the cap for the same diameter, the greater the effect of the resonance (solid and liquid volume movement). The thinner it is, the faster the resonance point will be reached (rapid mass homogenisation).
When we blow with a straw in a liquid in a glass, as in Figure 2, the bubbles move the liquid and after a while the liquid is blown out of the glass; we have reached the resonance peak of the liquid.
What is the difference between breaking the cap with air bubbles and preventing the formation of the cap using resonance?
Air bubbles, however small, act by creating a pressure on the solid material. The pressure depends on the force with which the bubbles impact the solid material; for a pressure to act it needs a surface that offers resistance. The stiffer the cap, the greater the pressure exerted by the bubbles. The assumption is that the bubbles seek a preferential route where the surface exerts less pressure. Therefore, there is inhomogeneity in the fracturing of the cap with ever wider movements of masses and preferential channels.
The decompacting wave, on the other hand, is formed as a result of the pressure exerted by the air which, due to being pulsed at a certain frequency and wavelength, causes a particular wave propagation speed, putting the liquid mass into resonance which starts to move the solids.
20 www.winetitles.com.au WINE & VITICULTURE JOURNAL WINTER 2023 V38N3 WINEMAKING GRAPE & JUICE HANDLING
dissolution diffusion gravity
infusion phase
Juice movement leaching
juice
juice
Resonance Frequency Amplitude
Figure 1.
Juice Movement
Figure 2.
The continuous movement of the liquid facilitates leaching and therefore also the diffusion from the cap, continuously creating an internal-external concentration gap. Thus, the juice phase decreases and enochemicals are dispersed into the liquid. The continuous formation of concentration gradients favour diffusion which prevents the formation of thermal pockets, thus avoiding inhomogeneity in the extraction process in the distribution of volatile compounds, the activity of the microorganisms and, initially, the activity of the wall enzymes.
Moreover, the non-invasiveness of the process prevents the extraction of unwelcome compounds such as proanthocyanidins (PA) from grape seeds if they are not perfectly aged (dry). In the case of musts rich in sugars, such as those from dried grapes in which glyceropyruvic fermentation (GPF) is particularly active initially and can cause considerable formation of acetic acid, the uniform distribution of air and temperature allows the yeasts to move more rapidly from GPF to alcoholic fermentation.
Finally, Air-Mixing MI provokes a slight overpressure in the mass and, therefore, the
release of volatile compounds that concentrate in the head space and then resolubilise back into the liquid (exploiting Henry’s law).
Special care is needed when choosing the modulated pulse frequency and inactivity periods and depends on:
• grape variety and ripeness, meaning the knowledge of the operator is essential

• size and shape of the wine vessel.
Some advice on using Air-Mixing MI:
• continuous movement can create lees on the surface that are too fine, which needs to be managed (racking immediately when fermentation has completed)

• excess wave frequency can cause disintegration of the cap but not extraction because the dissolution of substances depends on their level of cellular binding, especially when it comes to phenolic compounds
• excess wave frequency on grapes with many seeds that are not aged can cause strong leaching and therefore extraction
CONCLUSIONS
• Grape maceration is a multifaceted and
fascinating subject that is influenced by numerous factors. Regardless of the system used, we can never be entirely certain that we will achieve the desired outcome; it cannot be precisely modelled. All we can do is:
• understand the characteristics of grapes through analysis
• utilise systems to best understand each individual step of the process.
• hope for a bit of luck.
The utilisation of disgregating waves by AirMixing MI is simultaneously simple and complex. This technique is highly beneficial for high tanks with thick caps as it prevents the formation of a hard and compact layer. However, it is equally worthwhile for smaller tanks as it ensures excellent extraction. To achieve optimal results, winemakers should customise the implementation of AirMixing MI based on the following factors:

• grape features (phenolic and cellular maturity, seed maturity)
• tank shape and size
• level of extraction required
• speed of fermentation required.
www.fineweld.com.au MANUFACTURERS OF QUALITY EQUIPMENT FOR THE WINE INDUSTRY • Slot and Grated Drains • Storage and Settling Vats • Variable Capacity • Transportable Tanks • Grape Receival Bins • Conveyor Systems • Installations • Valves • Manways • Fittings • Stainless Steel Wine Barrels • Winery Design and Layouts • Winery 3D Modelling • Gantry – Stairs and Platforms • Drafting and Design • Installation Ph: 03 9775 0339 Fax 03 9775 0338 Email: info@fineweld.com.au 17
V38N3 WINE & VITICULTURE JOURNAL WINTER 2023 www.winetitles.com.au 21 GRAPE & JUICE HANDLING WINEMAKING
Tova Drive Carrum Downs Victoria 3201
WVJ
Towards net zero in the winery
By Adam Keath, Consultant, Wine Network Consulting, Victoria

In this third article in our ‘Towards Net Zero’ series, Adam outlines the current options available to wineries to reduce their carbon outputs as the Australian wine industry endeavours to achieve its target of zero emissions by 2050.
Whilst the Australian wine industry is not a huge contributor to the country’s carbon emissions, it is not insignificant. Of Australia’s roughly 500 million tonnes of CO2e, our industry, including all its related supply chain including bottles and transport, contributes roughly two million tonnes. While that’s equivalent to around just 0.4% of our country’s emissions, it could also be smaller, and as our overall emissions decrease across the board we must ensure that we follow suit to keep our green-ish image intact.
Scope 1 and 2 emissions in the winery can be considerable due to refrigeration and other energy-intensive tasks in production, but it is the Scope 3 emissions that add up quickly when we look into the effects of transporting

grapes, wine and heavy dry goods like glass to and from wineries.
The push to reach net zero carbon emissions is gaining momentum. What was for a long time something considered the responsibility of governments is now seen as the responsibility of individual industries and businesses. Whilst consumers continue to want services and products that they have always enjoyed, there is now an expectation that those products are made in a sustainable way. Wine Intelligence recently reported that 65% of Australian wine drinkers prefer sustainably made wines¹. This is just one statistic that highlights the growing opportunities for businesses to change their
practices and fit the market. Consumer expectations are high and authentic results are desired; any suggestion of ‘greenwashing’ can have the opposite effect and negatively impact business.
This is the third article in the ‘Towards Net Zero’ series, looking at ways to reduce carbon emissions within the Australian wine industry. Achieving this in the winery is essentially a three-step process:
1. Understand your inputs completely. Where are the carbon-intensive parts of your business?
2. Understand what can be done to minimise these emissions and costs.
3. Understand what can be done with the remaining emissions — supplement with green energy or offset with other activities? 1IWSR Wine Intelligence SOLA 2023
22 www.winetitles.com.au WINE & VITICULTURE JOURNAL
2023 V38N3 WINEMAKING
NET ZERO
WINTER
TOWARDS
Recognising the common areas of high emissions in a winery and understanding what can be achieved through some simple and smart management of services is key to making practical and realistic changes. Further to this is then looking at the latest in carbon sequestration and how businesses can supplement their remaining carbon footprint with green energy and offsets that are auditable and have real outcomes.
The Greenhouse Gas Protocol (GHG Protocol) identifies three scopes of carbon reporting:
• Scope One – direct emissions from source, owned and controlled by a company
• Scope Two – indirect emissions from purchased electricity, steam, heat and cooling
• Scope Three – all other emissions associated with a company’s activities
It is important to identify key areas within the business that will have the largest impact, but it is worthwhile noting that it is the sum of all parts that makes the biggest difference. If the business is not committed to the measurement and control of all three parts of the [Greenhouse Gas Protocol], not just Scope One and Two, then gains made in the vineyard and winery will not significantly change your overall footprint.


Scope 1 and 2 are the easiest to measure and therefore the easiest to control and report on. They cover emissions released from owned and controlled assets, such as fuel used in company tractors, forklifts and cars, gas burnt in boilers and fugitive emissions like refrigerant leaks and spills. Scope 2 covers indirect emissions from purchased electricity. It is Scope Three, however, that gets more complicated and can be difficult to calculate and understand. Transport emissions, both upstream and down, can be influenced heavily by decisions made in the winery and, to a greater extent, the marketing and sales departments.
Product packaging and transport can have a significant impact on your carbon footprint depending on the weight of the glass bottles, where they are produced and the delivery methods used, for both goods receival and outgoing products. Changes at this stage of operations can have a larger effect than by trying to make reductions in other areas, for instance, limiting tractor passes in the vineyard. For example, according to the carboncare.org emissions calculator, transporting a full glass 2.5kg bottle of wine via air freight from Melbourne to London (17,000km) will contribute 32kg of CO2 emissions to your footprint, whereas a full eco lightweight design bottle (1.2kg) sent via boat will only contribute 0.2kg of CO2 emissions. The average density of Australian vine rows is 3.17km/ha, so a tractor traveling at 7.5km/hr will produce, on average, 3.8kg CO2 emissions per hectare per pass. This divided over the potential 9000 bottles produced from that hectare is negligible (0.4 grams) when compared to that of transporting heavy glass by plane.

Find out about the range of custom and stock muselets, hoods, capsules and crowns. Market your brand with a twist, tear, cap or crown. Call (03) 9555 5500 or email info@grapeworks.com.au grapeworks.com.au V38N3 WINE & VITICULTURE JOURNAL WINTER 2023 www.winetitles.com.au 23
It is important to identify key areas within the business that will have the largest impact, but it is worthwhile noting that it is the sum of all parts that makes the biggest difference. If the business is not committed to the measurement and control of all three parts of the GHP Protocol, not just Scope One and Two, then gains made in the vineyard and winery will not significantly change your overall footprint.
Management expert Peter Drucker once said, “what gets measured, gets managed” and nothing could be more accurate when trying to reduce your carbon emissions. This is particularly relevant when undertaking the first step towards this goal, understanding your business’ current state and determining a benchmark to measure against in the future. There are many tools and services available to help measure your emissions, but it is important to compare like with like by ensuring that the model you use includes the same scope of emissions, allowing for direct and accurate comparison. For this reason, we actively support the use of a single industry-wide program — Sustainable Winegrowing Australia (SWA). Collectively managed by Australian Grape and Wine, Wine Australia and the Australia Wine Research Institute (AWRI), the program is designed to help create a socially, environmentally and economically resilient business and gain nationally-recognised certification. SWA provides a platform for its members to record all their inputs, including energy, water and transport, enabling wineries to track and report on their Scope One and Two emissions. The ongoing benefit of the program is that as more
wineries join and gain accreditation, the more accurate and useful the benchmarking tools become.
Knowing how you compare in various areas to other wineries allows you to understand where to focus your attention first in order to make the most significant gains. Whilst the initial phase has been about getting the industry onboard — a task that seems to be progressing well with a 48% increase in members in 2022 — the program, after three years of operation, now covers 804 vineyards, representing 37% of Australia’s total vineyard area, and 113 wineries, representing 41% of Australia’s wine production.
All members are required to input data on their energy and waste, allowing SWA to determine and report not only on all Scope One and Two emissions, but also some Scope Three emissions. The program also acts as a survey to determine, in a less quantitative manner, what the industry is interested in and focusing on. From current member data, SWA has identified that 79% of participating vineyards are taking active measures and are prioritising energy-efficient practices in the vineyard. It also shows that 85% of wineries have prioritised energy efficiency for new plant and equipment. These insights are important in helping to promote and highlight the positive changes that are happening within the wine industry.
Whilst membership is based on selfreporting, to become a certified member and display the SWA trust mark on their products and marketing materials, wineries, vineyards and wine businesses are required
to undertake an independent audit against the Australian Wine Industry Standard of Sustainable Practice. The involvement of companies such as Treasury, Pernod Ricard Winemakers and Yalumba indicate that there is value in participating in the program, both ethically and commercially.
The AWRI’s manager of sustainability and viticulture, Mardi Longbottom, confirmed this strategy: “A critical first step is to measure and calculate your emissions to understand your own site’s emissions profile You can then target where your emissions can be decreased and track your progress”
It may look simple but once understood, a plan can be made to minimise each of the inputs.
Electricity is by far the largest contributor to a winery’s emissions, as shown in Figure 1, and though an easy option would be to supplement with green energy from the grid, there is an opportunity to look into what this number comprises and what can be done to reduce it.
The largest contributor to this number in most Australian wineries is refrigeration. It is commonly reported that up to 70% of a winery’s energy use will be from refrigeration.

Winery software system VinWizard uses specific inbuilt features that can be used to help reduce wineries’ energy uses. Kelly Graves, the CEO of Wine Technology Incorporated, which owns VinWizard, explained the benefits of using this kind of technology.
“Having previously worked for one of the world’s largest wine producers in a role which focused on cost savings and margin expansion through the use of better technology, I can confidently say that few
Source: Hirlam, K.; Longbottom, M.; Wilkes, E. and Krstic, M. (2023) Understanding the greenhouse gas emissions of Australian wine production. Wine & Viticulture Journal 38(2):34-36.
24 www.winetitles.com.au WINE & VITICULTURE JOURNAL WINTER 2023 V38N3 WINEMAKING TOWARDS NET ZERO
Figure 1. Sources of greenhouse gas emissions in Australian wineries.
CO2
automation platforms take direct aim at reducing energy consumption like VinWizard has,” she said.
“When evaluating the merits of automating areas of wine production, my belief is there should always be a demonstrable, beneficial financial impact for the winery. The most discrete and easily confirmed means of cost savings arises from reducing the amount of energy consumed. Every winery has a line item on their P&L for utilities; when we can point to that specific line item and show that it decreases, it’s a win for both VinWizard and the winery.”
Graves identified four key features of the software that help drive a reduction in energy and emissions:

LOAD SCHEDULING
This can take many forms, but the major gains come from shifting the bulk of chilling from day to night. As refrigeration plants are essentially just transferring heat from one place to another, that transfer happens more efficiently at night when ambient temperatures are lower. The main idea is to

manipulate the situation so that the call for cooling is moved to a time when the plant can operate at its most efficient. By allowing a tank of wine to be chilled by an additional one to two degrees at night time, so that it requires no cooling during the day, will result in less energy being used. It also has the added benefit of consuming power during the off-peak period, which is the cheapest time of the day.
It means that the chiller operates for less hours of the day, but in a more efficient way. Whilst this will not always work in every situation, for example, during vintage with ferments, having the ability and logic to identify those tanks that can be treated like this can make a significant difference. It allows additional cooling capacity during the day to manage additional incoming fruit chilling, managing more fruit with less capacity. It has been demonstrated that a 25-35% reduction in power use can be accomplished with this strategy.
AUTOMATIC ADJUSTMENT
Automatically adjusting coolant setpoints is another way VinWizard can save energy. With
the ability to talk to the refrigeration plant, you can set up the program to change the cooling setpoint of the secondary refrigerant, based on the setpoints within the winery. Outside of vintage, if you are trying to maintain tanks at 10˚C, you don’t need the glycol to be at -6˚C or -8˚C.
Many wineries manage this manually by changing the setpoints based on what is happening in the winery, but this normally happens in blocks of time and doesn’t take full advantage of the savings available. The cost increases can be around 2.5% for every degree colder the coolant is maintained at, so in the example above if your glycol temp was at 4˚C instead of -6˚C the net saving could be as high as 25%.
PULSE COOLING
The principle of this process, which has been trialled and tested at the University of California, Davis, by Roger Boulton, is to fill the jacket with cold glycol and stop the flow to allow the heat transfer from the juice. When the glycol is close to the juice temperature, the jacket is filled with glycol again and so on while
eter Steer - 0423 318 555 | Neville Fielke - 0407 993 387 *versatility enhances traditional barrel programs, avoids barrel variation, 3X lower cost, 5X lower carbon per Ltr, 25yr life, pre-set OTR choice Wine excellence that doesn't cost the earth Be Barrel-Smart. Elevate barrel performance* Proven, long life, large barrels - masters control & consistency for ageing success Affordable new top barrel oak every vintage - suits a variety of price points & styles Synergises oxygen & oak - performs like new top-end French barrels annually Barrels that nurture nature & save water - reduces the winery carbon footprint Increases quality, lowers cost - more flexibility & control for barrel-smart winemakers elevagebarrels.com © 2023 V38N3 WINE & VITICULTURE JOURNAL WINTER 2023 www.winetitles.com.au 25
TOWARDS NET ZERO WINEMAKING
the juice is above setpoint. The benefits to the wine and the power savings potential include, but are not limited to, the following:
• no ice build-up on the inside or outside of the tank so heat transfer is more efficient
• the return glycol is warmer than normal and will be returned to the chiller in bursts, so the chiller works more efficiently to bring it back down to temperature
• the glycol is stationary when it does its work, which is more efficient than having a constant flow

• the fluctuations in temperature cause convection in the tank, which helps mix the product (less expensive than installing agitators)
• the glycol does not need to be as cold as the heat transfer is more efficient.
PUMP CONTROL
Running brine circulation pumps at full power, 24 hours a day, is simply a waste of energy. Running variable speed drives (VSD) and even controlling VSD setpoints based on load, can significantly reduce the power needed for this function.
FURTHER REDUCTIONS
Other energy-intensive tasks in the winery include wastewater management, aerating ponds or reactors with blowers at full speed, with no feedback loop to dissolved oxygen, which all result in a large amount of wasted energy. Like refrigeration, any energyintensive task that can be monitored and regulated will result in large cost savings and aid in reaching your targets.
With some careful investment, a winery can reduce their power consumption by up to 50%, significantly decrease their carbon footprint and achieve a more sustainable business with reduced operating costs.
Another area identified in Figure 1 that can have a significant impact on emissions is CO2 This refers to CO2 purchased and used in the process of making wine. What is not identified on any carbon footprint calculation is the CO2 emitted by a winery during fermentation as it is considered offset by the growing of grapes (cyclic). This is technically the largest direct CO2 emission from wineries, with every tonne of fermented grapes releasing around 100kg of CO2, the equivalent of around 50,000 litres. If you were able to capture and reuse or export this CO2, a positive credit could be applied to a winery’s carbon footprint.
Simon Nordestgaard, principal engineer at Affinity Labs, is a keen observer of this space and when speaking with him, he pointed out that the capture and reuse of CO2 is much more common in the brewing industry as ferments are conducted all year round. That being said, the conversation in the wine industry is gaining traction, with more support and attention being directed towards this area. Nordestgaard noted that the upcoming Winery Engineering Association conference (WINE ENG 2023, 26-27 July, Barossa Valley) will have three speakers discussing this topic.
Jean-Philippe Ricard, from CO2 Winery in France, will share his experience of working with wineries to capture and reuse CO2; Laurent Fargeton, from Vivelys, will talk about its Scalya’UP system that uses captured CO2 to mix ferments; and Frank McCormack, from Coopers, will discuss his experiences with CO2 reuse systems in breweries.
CO2 Winery offers a suite of different solutions for reusing CO2 It has systems at two wineries in Bordeaux — Chateau Montrose and Smith Haute Lafite that capture the CO2 from ferments and convert it into potassium or sodium bicarbonate for sale. At other wineries they are compressing CO2 for later use, adding it to water to reduce the volume required for rinsing, using it for tank agitation or to slightly reduce alcohol levels.
Removing the need to purchase bulk CO2 for inerting purposes in a winery can remove 5-10% of CO2 emissions reported at the winery. The difficulty of this process is managing the storage of something that is only generated at one time of the year.
Once a winery has reduced its inputs, it can then look into how the remaining CO2 emissions can be removed through the use of green energy. Whether this is generated on site or purchased through agreements with others, it is an option that requires further consideration.
The main objective to keep in mind when planning to reduce carbon emissions is to focus on what is manageable and achievable. It is important to investigate and consider all areas of the business, not just what is visible in the winery. Being aware of the impact of things such as packaging, mode of transport and even the impact of international promotional travel, can affect your footprint and ability to reach your targets.
Focusing on one area alone, like power consumption and its source, whilst still
beneficial and worthwhile, is not going to enable you to achieve net zero in the winery. Consumer behaviour is now heavily influenced by a business’s ethical and environmental standards, but it is unwise to promote these practices if they are not consistent across all areas of the business.

Using resources like SWA and integrated systems in the winery that allow you to measure and adjust as you go are incredibly useful tools that are both easily accessible and user-friendly. It also shows where the Australian wine industry is heading and the commitment to working together to achieve a more sustainable and environmentallyresponsible industry.
It can seem overwhelming to many businesses to begin the process of assessing and implementing changes to reduce their carbon footprint, but with the right tools and support it is absolutely achievable and will improve the business long-term. The most important part is to start somewhere. Any changes that improve sustainability and reduce your carbon footprint are positive changes.
26 www.winetitles.com.au WINE & VITICULTURE JOURNAL WINTER 2023 V38N3
WINEMAKING TOWARDS NET ZERO WVJ
Simon Nordestgaard, principal engineer at Affinity Labs.
Manager of sustainability and viticulture at the Australian Wine Research Institute, Mardi Longbottom.
Spinning cone column distillation of smoke-affected juice and wine
By Carolyn Puglisi1, Renata Ristic1, Jamie Saint2 and Kerry Wilkinson1
Australian researchers investigated the potential of spinning cone column distillation as a remediation strategy for smoke-affected grape juice and wine.
INTRODUCTION
Spinning cone column distillation is a separation process used in the production of no and low alcohol (NOLO) wines. Steam is applied (under vacuum) to achieve dealcoholisation at low operating temperatures (typically <40°C), and volatile compounds (including ethanol) are ‘stripped’ into the steam and then recovered by condensing the vapour that flows from the top of the column, while dealcoholised wine is collected at the base of the column (Figure 1). This study investigated the partitioning of smoke taint marker compounds (i.e., volatile phenols and their glycosides) during spinning cone column distillation of smoke-affected grape juice and wine (Puglisi et al 2022) to evaluate its potential as a strategy for the remediation of smoke taint.
METHODS
Two smoke-affected wines – a Shiraz Sangiovese and a Petit Verdot Sangiovese, made from grapes harvested from New South Wales vineyards that were exposed to smoke during the 2019-20 growing season – were treated by Australian Vintage Limited using an industrial-scale spinning cone column distillation system. Briefly, wines (8000L) were fed into the top of the column under vacuum, with steam fed into the base of the column. The vapour from the top of the column (a mix of steam and volatiles stripped from the wine) was passed through a condensing system and collected as ‘condensate’ while ‘stripped’ (dealcoholised; ~29% strip rate) wine was collected from the base of the column. The concentrations of free and glycosylated volatile phenols were measured as chemical markers of smoke taint in wine and condensate samples using gas chromatography-mass spectrometry and liquid chromatography-mass spectrometry (Hayasaka et al 2010, 2013), while the sensory profiles of wines were determined using the Rate-All-That-Apply method (Ares et al 2014).
In a separate trial, a smoke-affected juice – made from Pinot Grigio, Tempranillo and Pinot Noir grapes harvested from vineyards in the Adelaide Hills that were also exposed to smoke during the 2019-20 growing season –was also treated by Australian Vintage Limited. The juice was first clarified using crossflow filtration before being heated at 90°C for four hours. Upon cooling, it was then subjected to spinning cone column distillation (~25% strip rate). The resulting condensate was treated via an inline anion/cation exchange process to remove volatile phenols, before being blended with juice concentrate, and the reconstituted
IN BRIEF
■ Spinning cone column distillation of wine concentrated volatile phenols and their glycoconjugates such that the sensory perception of smoke taint was enhanced in ‘stripped’ (dealcoholised) wine.
■ Spinning cone column distillation of juice gave condensate with significantly increased volatile phenols, the majority of which were then removed by passing the condensate through an ion exchange column.

■ Fermentation of reconstituted juice gave wine with lower volatile phenol levels than the initial juice, except for syringol, which was released via hydrolysis of glycoconjugate precursors during both spinning cone column distillation and fermentation.
juice fermented to produce red wine. Juice, condensate, reconstituted juice and wine samples were collected for analysis of smoke taint marker compounds.
OUTCOMES FROM SPINNING CONE COLUMN DISTILLATION OF SMOKEAFFECTED WINE
As was expected, spinning cone column distillation of smoke-affected wines resulted in their dealcoholisation, with initial alcohol concentrations of 15.1% and 14.2% alcohol by volume (abv), decreasing to <0.3% abv in stripped wines (Table 1, page 26). Small changes in residual sugar (≤0.2 g/L), pH (≤0.2) and volatile acidity (≤0.12g/L) were observed but were not expected to meaningfully affect wine sensory properties. However, the
V38N3 WINE & VITICULTURE JOURNAL WINTER 2023 www.winetitles.com.au 27 SMOKE TAINT WINEMAKING
1Department of Wine Science, The University of Adelaide, Urrbrae, South Australia 2Australian Vintage Limited, Balmain, New South Wales, Australia
Figure 1. Schematic of a spinning cone column distillation system.
concentration of organic acids and phenolic compounds (including anthocyanins) resulted in 30-40% increases in titratable acidity, wine colour and total phenolics (Table 1), reflecting the ~29% stripping rate (i.e., the removal of ~29% of the initial wine volume), and these changes were anticipated to have sensory consequences.
Relatively small changes in volatile phenol concentrations (i.e., ± ≤5µg/L) were observed between untreated and stripped wines because of spinning cone column distillation (Table 2). Guaiacol and cresols (but not syringol) were detected in condensates, however, their concentrations indicated only partial extraction from wine, i.e., volatile phenols were largely retained (and concentrated) in stripped wine. Variation in the volatility and vapour pressure of the different volatile phenols explains why guaiacol and cresols were removed to some extent, but not syringol. Of the volatile phenol glycoconjugates that were measured, none were detected in condensates (Table 2). Instead, these non-volatile marker compounds were concentrated in stripped wines, due to water and ethanol being removed.
There were clear differences in the sensory profiles of untreated and stripped wines (Figure 2, page 29). Whereas untreated wines exhibited moderate fruit aromas and flavours and very little smoke character, the intensity of fruit expression diminished and the perception of smoke and cold ash aromas, smoky and burnt rubber flavours, and ashy aftertaste increased for stripped wines. The loss of fruit
expression reflects the extraction of desirable aroma volatile compounds, alongside ethanol removal, while the perceived intensification of smoke taint reflects both the loss of fruit character, and the concentration of free and glycosylated volatile phenols. Spinning cone column distillation also impacted taste and mouthfeel attributes (Figure 2): intensity ratings for acidity and saltiness increased markedly (due to the aforementioned concentration of organic acids, and salts), while the perception of hotness decreased (due to the removal of ethanol).
Results from the wine remediation trial suggest that in isolation, spinning cone column distillation is not capable of mitigating the chemical and sensory consequences of grapevine exposure to smoke; instead, the process exacerbates the perception of smoke taint. However, used in combination with other treatments, e.g., the addition of adsorbents like activated carbon, it could enable selective treatment of wine fractions enriched with smoke taint compounds, rather than whole wine, to mitigate any removal of desirable wine constitutes (e.g., anthocyanins that contribute red wine colour and/or volatiles that contribute varietal aromas and flavours).
OUTCOMES FROM SPINNING CONE COLUMN DISTILLATION OF SMOKEAFFECTED JUICE
Volatile phenols were detected in the smoke-affected juice in both free and glycosylated forms (Table 3, page 28), however, significantly elevated volatile
phenol concentrations were observed in the condensate obtained after heating and spinning cone column distillation of the juice. In the case of guaiacol and cresols, this can be attributed directly to extraction because concentration changes reflect the 25% stripping rate (i.e., the removal of ~25% of the initial juice volume). In the case of syringol, which was not detected in untreated juice, extraction must have occurred after (partial) hydrolysis of syringol glycoconjugates; the observed decrease in syringol gentiobioside concentrations for juice vs. reconstituted juice (i.e., from 85 to 62µg/L, respectively, Table 3) provides evidence that hydrolysis occurred to some extent. Interestingly, whereas volatile phenols were not readily extracted during spinning cone column distillation of wine (Table 2), they were during spinning cone column distillation of juice. This likely reflects differences in liquid-vapour partitioning that can be attributed to the presence of sugars; i.e., a ‘salting-out’ effect, as reported previously for mango juice (Pan et al 2021).
Importantly, ion exchange column treatment of the condensate achieved almost complete removal of volatile phenols; only 1µg/L guaiacol remained in the condensate after the anion/cation exchange process (Table 3). Following juice reconstitution, 1–2µg/L of guaiacol and cresols were detected, together with 22µg/L of syringol. Again, the presence of syringol likely reflects hydrolysis of syringol gentiobioside (and/or other precursor forms of syringol) during heating and/or spinning cone column distillation, but retention in
Table 2. Concentration of volatile phenols and their glycoconjugates (µg/L) in smoke-tainted Shiraz Sangiovese (ShS) and Petit Verdot Sangiovese (PVS) wines, and their condensates and stripped (dealcoholised) wines.
phenol rutinoside; CrR = cresol rutinoside; SyrGB = syringol gentiobioside; 4MSGB = 4-methylsyringol gentiobioside
28 www.winetitles.com.au WINE & VITICULTURE JOURNAL WINTER 2023 V38N3 WINEMAKING SMOKE TAINT
Alcohol (% abv) Residual Sugar (g/L) pH Titratable Acidity (g/L) Volatile Acidity (g/L) Wine Colour (au) Wine Hue Phenolics (au) ShS Untreated wine 15.1 1.4 3.7 6.3 0.53 6.5 0.87 48 Stripped wine 0.3 1.4 3.5 8.5 0.48 9.2 0.87 65 PVS Untreated wine 14.2 0.7 3.7 5.7 0.36 4.2 0.96 32 Stripped wine 0.3 0.8 3.5 7.3 0.48 5.9 0.95 43
Table 1. Basic chemistry of smoke-tainted Shiraz Sangiovese (ShS) and Petit Verdot Sangiovese (PVS) wines, and their stripped (dealcoholised) wines.
Guaiacol Cresols Syringol GuR 4MGR PhR CrR SyrGB 4MSGB ShS Untreated wine 49 29 13 41 37 26 27 112 7 Condensate 80 25 nd nd nd nd nd nd nd Stripped wine 46 29 18 55 51 35 38 152 11 PVS Untreated wine 55 29 15 39 33 20 26 94 6 Condensate 65 20 nd nd nd nd nd nd nd Stripped wine 50 30 17 61 51 32 38 138 8 Glycosides measured as syringol gentiobioside equivalents; nd =
detected.
=
not
GuR = guaiacol rutinoside; 4MGR = 4-methylguaiacol rutinoside; PhR
50 %* energy saving with progressive temperature control

*individual results may vary
// Discover why winemakers prefer to partner with us >

On/Off ELEMENT angle seat valve provides integration of automation modules, electrical/ optical position feedback and pneumatic control units

in smoke-tainted red grape juice, condensates (before and after ion exchange column treatment), reconstituted juice and wine.
Glycosides measured as syringol gentiobioside equivalents; nd = not detected; – = not measured; IEX = ion exchange; GuR = guaiacol rutinoside; 4MGR = 4-methylguaiacol rutinoside; PhR = phenol rutinoside; CrR = cresol rutinoside; SyrGB = syringol gentiobioside; 4MSGB = 4-methylsyringol gentiobioside.
juice concentrate, rather than extraction into condensate. Volatile phenol glycoconjugates were similarly retained in juice concentrate and were thus not detected in condensates. Except for syringol gentiobioside (which underwent partial hydrolysis), volatile phenol glycoconjugate concentrations were comparable for juice versus reconstituted juice. The increase in volatile phenol concentrations during fermentation of reconstituted juice suggests some metabolism of glycosylated volatile phenols occurred during winemaking; unfortunately, glycoconjugate data was not available for
the resulting wine. Nevertheless, results from the juice remediation trial demonstrate the successful removal of volatile phenols associated with smoke taint, and whilst further research is required to confirm this achieves a favourable sensory outcome, these preliminary findings are promising.

CONCLUSIONS
Compositional analysis of samples collected before and after spinning cone column distillation of smoke-affected juice and wine demonstrated differences in the partitioning of volatile phenols associated
with smoke taint, as well as the relative stability of their non-volatile glycoconjugates. This provides insight into how spinning cone column distillation might be used, in combination with adsorbents such as activated carbon, to selectively remove smoke taint compounds from: dealcoholised wine, before re-addition of the volatile fraction (captured as condensate) to restore aroma and flavour; or condensate, before juice reconstitution and fermentation. Used in combination with adsorbents, spinning cone column distillation looks to be a promising remediation strategy.
GENTLE DEALCOHOLISATION WITH THE SPINNING CONE COLUMN
Operating Temperature: 30-45°C | Column Residence Time: 30 sec

ALCOHOL, MAXIMUM FLAVOUR!
JULY
NURIOOTPA flavourtech.com 30 www.winetitles.com.au WINE & VITICULTURE JOURNAL WINTER 2023 V38N3 WINEMAKING SMOKE TAINT
ZERO
VISIT US AT WINEENG2023 26-27
IN
Guaiacol Cresols Syringol GuR 4MGR PhR CrR SyrGB 4MSGB Juice 10 6 nd 19 27 10 23 85 11 Condensate (pre-IEX) 42 23 5 nd nd nd nd nd nd Condensate (post-IEX) 1 nd nd nd nd nd nd nd nd Reconstituted juice 2 1 22 20 28 11 24 62 10 Wine 4 3 30 – – – – – –
Table 3. Concentration of volatile phenols and their glycoconjugates (µg/L)
ACKNOWLEDGEMENTS
The authors thank the industry partners who supported this research by providing access to smoke-affected juice and wine, the Australian Wine Research Institute’s Commercial Services Laboratory for chemical analysis, and the sensory panellists who evaluated wines. This research was funded by the Department of Primary Industries and Regions South Australia, via the South Australian Wine Industry Development fund.
REFERENCES
Ares, G.; Bruzzone, F.; Vidal, L.; Cadena, R.S.; Giménez, A.; Pineau, B.; Hunter, D.C.; Paisley, A.G. and Jaeger, S.R. (2014) Evaluation of a rating-based variant of check-all-that-apply questions: Rate-all-that-apply (RATA). Food Quality and Preference 36:87–95.


Hayasaka, Y.; Baldock, G.A.; Parker, M.; Pardon, K.H.; Black, C.A.; Herderich, M.J. and Jeffery, D.W. (2010) Glycosylation of smoke-derived volatile phenols in grapes as a consequence of grapevine exposure to bushfire smoke. Journal of Agricultural and Food Chemistry 58:10989–10998.
Hayasaka, Y.; Parker, M.; Baldock, G.A.; Pardon, K.H.; Black, C.A.; Jeffery, D.W. and Herderich, M.J. (2013) Assessing the impact of smoke exposure in grapes: Development and validation of an HPLC-MS/MS method for the quantitative analysis of smoke-derived phenolic glycosides in grapes and wine. Journal of Agricultural and Food Chemistry 61:25–33.
Pan, X.; Wu, J.; Zhang, W.; Liu, J.; Yang, Xu.; Liao, X.; Hu, X. and Lao, F. (2021) Effects of sugar matrices on the release of key aroma compounds in fresh and high hydrostatic pressure processed Tainong mango juices. Food Chemistry 338:128117.
Puglisi, C.; Ristic, R.; Saint, J. and Wilkinson, K. (2022) Evaluation of spinning cone column distillation as a strategy for remediation of smoke taint in juice and wine. Molecules 27:8096.
The most convenient wine analysis tool available.
As world leaders in biosensor technology, our reputation is built on precision.
That’s why you can trust the Sentia™ hand-held wine analyzer to reliably measure:

• acetic acid (NEW)
• titratable acidity (NEW)
• fructose and glucose
• free SO2
• malic acid
Test results in minutes, wherever and whenever you need them.
Protective case, lanyard and stylus optional extras.
For more information, call 03 9555 5500 or sentia@grapeworks.com.au

WVJ V38N3 WINE & VITICULTURE JOURNAL WINTER 2023 www.winetitles.com.au 31
NEW Tests AVAILABLE NOW
(a) (b)
Figure 2. Sensory profiles of smoke-tainted (a) Shiraz Sangiovese (ShS) and (b) Petit Verdot Sangiovese (PVS) wines, and their stripped (dealcoholised) wines. A = aroma, F = flavour, AT = aftertaste.
Trends in the composition of Australian wine 1990-2021
Part three: free, total and bound sulfur dioxide concentrations, and the ratio of free to total SO2 concentrations
By Peter Godden1 and Eric Wilkes2*
This article is the third in a three-part series presenting data on the composition of Australian wine. The first part (published in the Summer 2023 issue) provided an introduction to the data and discussed titratable acidity and pH while the second (published in the Autumn 2023 issue) covered alcohol and glucose and fructose. This third and final part discusses free, total and bound SO2 as well as the ratio of free to total SO2.

DATA PRESENTATION
The data are presented in two formats, interval plots and box plots, with the plots for white and rosé wines shown in green and the plots for red wines shown in red. The interval plots show the mean of the data for each year. In the box plots, the centre horizontal line marks the median of the data for each year. More details about the data presentation can be found in Godden and Wilkes (2023a).
RESULTS AND DISCUSSION
The plots presented here summarise the analytical results recorded in the database when they were generated in mid-2022. For each compositional variable, plots are presented for white and rosé wines combined, and for red wines. Data for rosé wines were first included in this series by Godden et al (2015) from the 2004 vintage onwards
In this article the approach taken to measures of SO2 follows that taken by
Godden et al. (2015). While the measures of several of the other analytes discussed in this three-part series may change over time in bottled wine, those changes are generally so minor that overall trends are not altered. However, that is not the case with SO2, and consequently data has been restricted to that which was analysed within one year of the vintage year for white and rosé wines, and within two years for red wines. While this approach has reduced the number of data
32 www.winetitles.com.au WINE & VITICULTURE JOURNAL WINTER 2023 V38N3 WINEMAKING WINE COMPOSITION
1Arrivo Wine, PO Box 151, Aldgate, South Australia 5154
2The Australian Wine Research Institute, PO Box 197, Glen Osmond, South Australia 5064
IN BRIEF
■ Since 2015, concentrations of free SO2 have stabilised in narrow bands of between 27.1mg/L and 28.8mg/L for white and rosé wines, and 24.5mg/L and 25.0mg/L for red wines.
■ The means of total SO2 concentrations have shown steady declines: for white and rosé wines, from a peak of 129.5mg/L in 2012 to 108.4mg/L in 2021; for reds, from a peak of 86.7mg/L in 2011 to 61.6mg/L in 2021.
■ The mean concentrations of bound SO2 peaked at 101.4mg/L for white and rosé wines in 2010, and at 62.1mg/L for red wines in 2009. In 2021, bound SO2 concentrations for white/rosé wines and red wines fell to 80.3mg/L and 36.6mg/L, respectively.
■ In 2021, the mean ratio of free-tototal SO2 increased to 0.28 for white and rosé wines, and to 0.45 for red wines.
■ While the data indicates excellent SO2 management by Australian winemakers, the actual free and total SO2 concentrations at bottling have probably reduced to a point close to the minimum concentrations recommended by the AWRI.
points available for the four SO2 measures discussed, it has also reduced the impacts of variability in the data arising from differing time intervals between bottling and the time of analysis. Consequently, the current approach is considered to provide a clearer indication of SO2 conentrations at the time of packaging and enables more valid comparisons between vintages than the approach taken prior to 2015. However, caution should therefore be exercised when comparing the SO2, data published here and in Godden et al (2015) to that in the publications prior to 2015.
SO2 is the most common wine additive because of its combined antimicrobial and antioxidant properties. As previously stated, compared with the other compositional
variables reviewed, SO2 concentrations are the most prone to change over time in bottle due to the compound’s sacrificial role in countering oxidation.
Under the Australia New Zealand Food Standards Code, section 4.5.1 Wine Product Requirements, the maximum concentration of SO2 permitted in wines for sale in Australia is 250mg/L for wines containing up to 35g/L of sugar and 300mg/L for wines containing more than 35g/L of sugar.
For all four of the measures of SO2 discussed here, for both white/rosé wine and red wines, the plots present an extremely positive picture regarding the manner in which Australian winemakers are managing SO2
Since the 2015 publication the concentrations of free SO2 have stabilised in narrow bands of between 27.1mg/L and 28.8mg/L for white and rosé wines, and 24.5mg/L and 25.0mg/L for red wines (Figures 1a and 2a, page 34). The distributions of mean free SO2 concentrations (Figures 1b and 2b) show reductions in the number of outliers at the upper end of the distributions, and a slight expansion in the proportion of wines represented by the second and third quartiles (the box), particularly for red wines (Figure 2b). Interestingly, a substantial number of outliers at the lowest end of the distribution are also evident. These are wines with negligible free and total SO2 and are more evident on some of the other SO2 plots discussed
V38N3 WINE & VITICULTURE JOURNAL WINTER 2023 www.winetitles.com.au 33 WINE COMPOSITION WINEMAKING
10 20 30 1990 2000 2010 2020 Vintage F r e e S O 2 ( m g L ) 0 20 40 60 80 1990 2000 2010 2020 Vintage F r e e S O 2 ( m g L )
Figure 1a. Mean free SO2 concentration in white and rosé wines 1990-2021 (rosé wines included from 2004 vintage onwards).
Figure 1b. Median (horizontal line) and distribution of free SO2 concentrations in white and rosé wines 1990-2021 (rosé wines included from 2004 vintage onwards).
below. They are thought to represent the trend pursued by some winemakers of low intervention winemaking, sometimes referred to as making ‘natural’ wines.
The means of the total SO2 concentrations are presented in Figure 3a for white and rosé wines, and 4a for red wines. Both show steady declines in total SO2; for white and rosé wines from a peak of 129.5mg/L in 2012 to 108.4mg/L in 2021, and for red wines from a peak of 86.7mg/L in 2011, to 61.6mg/L in 2021.
The distributions of total SO2 (Figures 3b and 4b) graphically illustrate the lowintervention wine cohort as outliers at the bottom of the distributions. Otherwise, some differences in the distributions are evident between white/rosé wines (Figure 3b) and red wines (Figure 4b). White and rosé wines show a widening of the distributions from 2012 onwards, especially for the first and
fourth quartiles (i.e. the whiskers above and below the box), while the box representing the second and third quartiles has also expanded somewhat, as was seen with the distributions of free SO2 However, red wines do not illustrate the same widening of the distributions but rather a general downward shift in the entire distribution from 2016 onwards, with a reduction in the number of outliers at the upper end of the distribution from 2019 onwards.
The mean concentrations of bound SO2 peaked at 101.4mg/L for white and rosé wines in 2010, and at 62.1mg/L for red wines in 2009. Godden et al. (2015) noted that declines in this measure appeared to have become established since those vintages, which is confirmed by the more recent data. The means of bound SO2 for white/rosé wines and red wines have fallen to 80.3mg/L and 36.6mg/L, respectively, in 2021.
The distribution of mean bound SO2 concentrations in white and rosé wines (Figure 5b) once again illustrates the recent cohort of low-intervention wines, which have negligible bound SO2, and as with total SO2, there is a widening of the distribution from 2012 onwards. Red wines, however, do not demonstrate the low-intervention cohort for bound SO2 (Figure 6b, page 34), but do show the same narrowing of the distributions seen with total SO2 in red wines, particularly with the first, and to a lesser extent with the second and third quartiles, but not with the fourth.
The ratio of free-to-total SO2 provides some indication of a wine’s history of microbial stability and/or oxygen exposure. Both of those factors lead to a loss of SO2 in the free form, with a greater proportion of SO2 becoming bound to other compounds in the wine, thereby reducing its anti-microbial and antioxidant
34 www.winetitles.com.au WINE & VITICULTURE JOURNAL WINTER 2023 V38N3 WINEMAKING WINE COMPOSITION
0 10 20 30 1990 2000 2010 2020 Vintage F r e e S O 2 ( m g L ) 60 80 100 120 140 1990 2000 2010 2020 Vintage T o t a S O 2 ( m g L ) 0 25 50 75 100 1990 2000 2010 2020 Vintage F r e e S O 2 ( m g L ) 0 100 200 300 1990 2000 2010 2020 Vintage T o t a S O 2 ( m g L )
Figure 2a. Mean free SO2 concentration in red wines 1990-2021.
Figure 3a. Mean total SO2 concentration in white and rosé wines 19902021 (rosé wines included from 2004 vintage onwards).
Figure 2b. Median (horizontal line) and distribution of free SO2 concentrations in red wines 1990-2021.
Figure 3b. Median (horizontal line) and distribution of total SO2 concentrations in white and rosé wines 1990-2021 (rosé wines included from 2004 vintage onwards).
properties. Strategies to increase the ratio of free-to-total SO2 and how to use it in routine quality control and troubleshooting were advocated in AWRI workshops presented in many wine regions around Australia from 2001 onwards, and by Robinson and Godden (2003). It is therefore pleasing to note that the mean ratio of free-to-total SO2 continued to increase to 0.28 in 2021 for white and rosé wines, and to 0.45 in 2021 for red wines (Figures 7a, page 35, and 8a, page 36). However, it should be noted that based on data published in 2015, the ratio of free to total SO2 in red wines for the two most recent vintages are the compositional variables most likely to change over time as more data points for those vintages are added from the analysis of older wines. Nonetheless, the mean 2020 and 2021 ratios of 0.40 and 0.45, respectively, were accurate when the plots were generated, and are testament to
excellent SO2 management, enhancing the long-term stability of those wines in overseas markets.
The distributions of free-to-total SO2 ratios (Figures 7b, page 35, and 8b, page 36) both highlight the low-intervention cohort; that is, wines that have negligible free and total SO2, and, hence, a high ratio of free-to-total SO2 of ~1.0. However, while the number of outliers at that level is visually striking on the plots, they represent a very small proportion of the overall data set and are not present in sufficient numbers to influence the overall trends.
Otherwise, the plots for the distribution of free-to-total SO2 ratios for white/rosé wines and for red wines are more similar than for the other SO2 measures, both demonstrating a general upward shift in the entire distributions since the 2015 publications, with that upward shift most evident in red wines (Figure 8b).
The strong upward trend in the ratio of freeto-total SO2 in red wines indicates that, as with white and rosé wines, Australian winemakers are successfully employing strategies to make their SO2 additions more effective. A contributing factor might be the widespread uptake of crossflow filtration in recent years. Many substances that might cause increased turbidity in wines can bind SO2 (Robinson and Godden 2003), so the ability to achieve lower turbidity earlier in a wine’s life might indirectly lead to less SO2 becoming bound, and a consequent increase in the ratio of free-to-total SO2
As stated above, while the data presented here indicate excellent SO2 management by Australian winemakers, it should also be noted that the actual free and total SO2 concentrations at bottling have, in all probability, reduced to a point close to the
V38N3 WINE & VITICULTURE JOURNAL WINTER 2023 www.winetitles.com.au 35
WINE COMPOSITION WINEMAKING 25 50 75 1990 2000 2010 2020 Vintage T o t a S O 2 ( m g L ) 60 80 100 120 1990 2000 2010 2020 Vintage B o u n d S O 2 ( m g L ) 0 100 200 300 1990 2000 2010 2020 Vintage T o t a S O 2 ( m g L ) 0 50 100 150 200 250 1990 2000 2010 2020 Vintage B o u n d S O 2 ( m g L )
Figure 4a. Mean concentration of total SO2 in red wines 1990-2021.
Figure 5a. Mean bound SO2 concentration in white and rosé wines 1990-2021 (rosé wines included from 2004 vintage onwards).
Figure 4b. Median (horizontal line) and distribution of total SO2 concentrations in red wines 1990-2021.
Figure 5b. Median (horizontal line) and distribution of bound SO2 concentrations in white and rosé wines 1990-2021 (rosé wines included from 2004 vintage onwards).
minimum concentrations recommended by the AWRI. Cowey and Coulter (2021) state that for white wines, free SO2 at bottling should be 35-40mg/L for a two-year shelf life and 40-45mg/L for a five-year shelf life. For red wines, total SO2 at bottling of 65-70mg/L is recommended for a two-year shelf life, 85-95mg/L for a three-year shelf life, and 95-105mg/L for a five-year shelf life. Therefore, that free SO2 concentrations for white/rosé wines and for red wines seem to have stabilised at approximately 28mg/L and 25mg/L, respectively, might be seen as positive. However, further reductions in total SO2 concentrations from the current 108mg/L for white and rosé wines, and 62mg/L for red wines, might be counterproductive and
have the effect of reducing the shelf life of Australian wines in international markets.
CONCLUDING COMMENTS
The compositional data reviewed in this three-part series provides an overview of common analytical parameters of Australian wines being consumed internationally, with the extent and rate of change in composition being reflected. To the extent that market tastes over time are reflected, extrapolation may provide insights into future market demands, with potential economic benefit for wine producers who use the data to set objective specifications for future grape and wine production. The data might also be used by wine producers to benchmark the
composition of their own wines for several key compositional variables against the overall trends for exported wines.
During the 38-year period for which data has been reviewed by publications in this series, the Australian wine industry has undergone huge development and change, with the geographic range of viticulture, the area under vine, and the range of grape varieties being grown all increasing markedly. The technology available to winemakers also continues to increase, allowing winemakers to explore novel wine style and winemaking philosophies, resulting in greater diversity for consumers. Consumer preferences for wine types and styles also constantly evolve, or shift to new wine types altogether,
36 www.winetitles.com.au WINE & VITICULTURE JOURNAL WINTER 2023 V38N3
WINEMAKING WINE COMPOSITION 20 40 60 1990 2000 2010 2020 Vintage T o t a l S O 2 ( m g L ) 0 100 200 300 1990 2000 2010 2020 Vintage T o t a S O 2 ( m g L )
Figure 6a. Mean bound SO2 concentration in red wines 1990-2021.
Figure 6b. Median (horizontal line) and distribution of bound SO2 concentrations in red wines 1990-2021.
such as low-alcohol wines, the increasing numbers of rosé wines, and the recent rise in low-intervention wines. These trends are well reflected in the profile of wines being submitted to Affinity Labs and, consequently, in the data presented here.
In general, the trends captured present an insight into both the tastes of the market and Australian winemakers, because none should be considered solely market or production driven. In all probability, both the market and wine producers have a role in setting trends, but what does seem clear, as also noted in previous publications, is that once an upward or downward trend is evident, a large number of wine producers tend to follow it, sometimes resulting in the trend accelerating over time.
The last 10 years has also been a time of increasingly rapid climate change, in some vintages resulting in earlier harvest of grapes with sugar concentrations that are often higher than ideal, and the phenomenon of compressed vintages has also become a regular occurrence, where many grape varieties are ready for harvest at the same time. In compressed vintages, harvesting and winery processing capacity quickly reach their limit, resulting in grapes remaining in the vineyard for longer, with consequent additional sugar accumulation. Notwithstanding, data presented in this series of articles demonstrate downward trends in alcohol concentrations in white/rosé and red wines. This is likely driven, in part, by market preference as well as by the most notable
change in winemaking regulation since the last publication in 2015 — the allowable addition of water to must to a sugar concentration of no less than 13.5 degrees Baumé.
It is likely that improved and more widely available winemaking technology also favours some of the identified trends, for instance, recent years have seen widespread uptake of crossflow filtration. This technology allows winemakers greater confidence that residual sugar and higher pH will not lead to later stability problems in bottled wine. Crossflow filtration also allows lower wine turbidity to be achieved at an earlier stage in the winemaking process, which probably contributes to the observed increases in free SO2 and the ratio of free-to-total SO2.
V38N3 WINE & VITICULTURE JOURNAL WINTER 2023 www.winetitles.com.au 37
WINE COMPOSITION WINEMAKING 0.0 0.1 0.2 0.3 0.4 1990 2000 2010 2020 Vintage F r e e T o t a S O 2 r a t i o 0.00 0.25 0.50 0.75 1.00 1990 2000 2010 2020 Vintage F r e e T o t a l S O 2 r a t i o
Figure 7a. Mean ratios of free to total SO2 in white and rosé wines 1990-2021 (rosé wines included from 2004 vintage onwards).
Figure 7b. Median (horizontal line) and distribution of ratios of free to total SO2 in white and rosé wines 1990-2021 (rosé wines included from 2004 vintage onwards).
Regardless of how the data presented in this series are used, the charts provide a graphic historical record of the composition of Australian wine for a 38-year period of extraordinary growth and technological change in the Australian wine industry and the evolution of Australia’s wine offering over that period.
ACKNOWLEDGEMENTS
This work was supported by Wine Australia, with levies from Australia’s grapegrowers and winemakers and matching funds from the Australian Government. The AWRI is a member of the Wine Innovation Cluster in Adelaide, South Australia.
The authors thank Affinity Labs for access
to the database and for extracting the raw data, Anne Lord and Rosanne Dunne for help with literature searches, and Geoff Cowey for supplying reference material and for discussion of the data. Ella Robinson is thanked for editorial assistance.
REFERENCES
AWRI (2004) Australian Wine Research Institute Annual Report: 37-38. Available from: https://www. awri.com.au/about_the_awri/annual-reports/
Cowey, G. and Coulter, A. (2021) Ask the AWRI: How much sulfur dioxide (SO2) is needed at bottling? Aust. N.Z. Grapegower Winemaker 687:76-77.
Godden, P.W. (2000) Persistent wine instability issues. Aust. N.Z. Grapegrower Winemaker 443:1014.
Godden, P.W. and Gishen, M. (2005) Trends in the composition of Australian wine 1984-2004. Blair,
R.; Francis, M.; Pretorius, I. (eds.) AWRI: advances in wine science: commemorating 50 years of The Australian Wine Research Institute. Glen Osmond, SA: The Australian Wine Research Institute: 115-139.
Godden, P.W. and Muhlack, R. (2010) Trends in the composition of Australian wine 1984-2008, Aust. N.Z. Grapegrower Winemaker 558:47-61.
Godden, P.W.; Wilkes, E. and Johnson, D. (2015) Trends in the composition of Australian wine 19842014. Aust. J. Grape Wine Res. 21(S1):741-753.
Godden, P.W. and Wilkes, E. (2023a) Trends in the composition of Australian wine 1990-2021. Part one: Introduction, titratable acidity (TA) and pH. Wine Vitic. J. 38(1):20-24.
Godden, P.W. and Wilkes, E. (2023b) Trends in the composition of Australian wine 1990-2021. Part two: alcohol and glucose plus fructose. Wine Vitic. J. 38(2):30-33.
Robinson, E. and Godden, P. (2003) Revisiting sulfur dioxide use. AWRI Tech. Rev 145.
WVJ 38 www.winetitles.com.au WINE & VITICULTURE JOURNAL WINTER 2023 V38N3
WINEMAKING WINE COMPOSITION 0.2 0.3 0.4 0.5 1990 2000 2010 2020 Vintage F r e e T o t a l S O 2 r a t i o 0.00 0.25 0.50 0.75 1.00 1990 2000 2010 2020 Vintage F r e e T o t a l S O 2 r a t o
Figure 8a. Mean ratios of free to total SO2 in red wines 1990-2021.
Figure 8b. Median (horizontal line) and distribution of ratios of free to total SO2 in red wines 1990-2021.

Scan here to see more information about Sumitomo products www.sumitomo-chem.com.au ® Registered trademarks. ™ Trademark. DiPel BIOLOGICAL INSECTICIDE ® H E R B I C I D E
By Leigh Francis, Elizabeth Willing, Desireé Likos, Eleanor Bilogrevic,
In 2019 the Australian Wine Research Institute hosted Elizabeth Willing as an artist-in-residence as part of an Australian Network for Art and Technology (ANAT) funded program, which aims to bring art and science together in a mutually beneficial collaboration. This article describes some of the work Elizabeth conducted at the boundaries between art and sensory science during her time at the AWRI.
DEVELOPING VISUAL IMAGES TO REPRESENT WINE FLAVOUR


Can a practising artist bring benefits and new insights to wine research? Can the work of the artist be positively influenced by time spent working with professional scientists? In 2019 the AWRI hosted an artist-in-residence for the first time as part of an Australian Network for Art and Technology (ANAT) funded program, which aims to bring art and science together in a mutually beneficial collaboration. The intention is that both parties will benefit, and that the artist will contribute seriously to research and not just be an observer. The residency was supported by both ANAT and the AWRI.
An application process was coordinated by ANAT, and AWRI staff were involved in the selection of the successful artist. Ten strong applications from artists around Australia were received. The successful artist, Brisbanebased Elizabeth Willing, was interested in exploring ‘cross-modal’ synaesthetic harmony between wine sensory properties and visual forms such as colours or shapes.
Elizabeth has a background in using food and beverages in her art practice.
She has a Masters of Fine Art and a Fine Arts degree from Queensland University of Technology. She has undertaken a residency in Helsinki, exhibitions and work in New York, London, Berlin, Denmark, Basel, Melbourne and Brisbane, and is represented by the prestigious Tolarno Galleries in Melbourne. Her residency initially involved discussions with AWRI researchers from a wide range of backgrounds to look for areas that might spark both scientific benefit and creative outcomes in Elizabeth’s practice, bringing the
two worlds of art and oenology together. She wrote a fascinating blog during her time at the AWRI (https://willing2019.blog.anat.org.au/) where she touched on areas as diverse as the names and origin of yeast and bacteria; cell division; seeds and flowers; the lack of ‘hospitality’ of wine in barrel to potentially harmful microorganisms; and beneficial insects in the vineyard, amongst many others. Given her interest in wine flavour, it was logical that she spent most time working with AWRI sensory scientists for the residency. During her stay, Elizabeth worked very much hands-on in helping to set up different types of sensory tests, and was involved in regular sensory panel projects.
The main area that Elizabeth and the sensory team were interested in looking into was the translation of wine flavour into the sense of sight through a visual image. Crossmodal interactions between the senses are generally important influences on perception and tasting experience in foods or drinks, with aspects such as the weight of a bottle, plate or utensil, or the colour of a food having large psychological effects on how flavour is comprehended. Synaesthesia is the condition
40 www.winetitles.com.au WINE & VITICULTURE JOURNAL WINTER 2023 V38N3 AWRI REPORT
An artist in residence at the AWRI: exploring synaesthesia and visual harmony with red wine flavour
Mark Krstic
“Synaesthesia is the condition of blending of the senses, where one sense, such as sound, can generate in some individuals the perception of another sense, such as colour.
Damian Espinase Nandorfy, Wes Pearson, Markus Herderich and Mark Krstic, PO Box 197, Glen Osmond, South Australia 5064
Foldable stillages for wooden barrels


ARMT18/1
Pallet for wooden barrels
A foldable steel pallet with a load capacity of 750 kg. Stacks into a 5-level rack with a height of 5m .

In the ARMT18/1 variant, the barrels rest on rollers. This allows you to conveniently rotate the barrels in order to, for example, wash them inside. Powder coating to any RAL color.
• Capacity: 2 barrels 225Lt or 300Lt

• Weight: 54 kg
• Outside dimensions: 1.8 x 0.8 x 1.0m
• Stacks into a 5-level rack with a height of 5m
• Folding design for optimised transport and intralogistics flexibility.
Quoted and shipped directly from the manufacturer!

ARCOM Sp. z o.o. ul. Brzeska 3, 32-765 Rzezawa, Poland arcom.net.pl email: info@arcom.net.pl
Acidity
Canberra
Red Fruit
of blending of the senses, where one sense, such as sound, can generate in some individuals the perception of another sense, such as colour. There is increasing evidence that this phenomenon is more widespread than previously thought, with many variations. Synaesthesia is known to occur in taste and smell (University of Sussex 2022).
It was decided to work with Shiraz wines and investigate whether there can be firm associations of red wine flavour properties with visual elements. From an industry point of view, the work has potential practical benefit for wine packaging and marketing, with ‘sensory branding’ having been used in recent years by food and beverage companies to harmonise the overall product experience with a product’s sensory properties.
CONFIRMING THE AROMA AND FLAVOUR PROPERTIES OF THE WINES STUDIED
A set of six commercially-produced Shiraz wines sourced from Canberra, Yarra Valley, McLaren Vale, Barossa Valley and Coonawarra were used in the project, with one Shiraz-Grenache blend. The wines were selected as representing a wide range of styles, and several of the wines had been recently included in a multi-region terroir study. The wines were not selected as necessarily being representative of their regions, with the selection criteria only involving the inclusion of wines with diverse sensory characteristics.
The wines were first characterised using the conventional quantitative descriptive analysis sensory method. A trained panel determined the intensity of defined attributes, with the results shown in the form of a Principal Component Analysis plot (Figure 1).
In Figure 1 those attributes situated close to a particular wine were rated highly in that wine.
YarraValley
Vegetal
Reductive/Drain
McLaren Vale
Astringency
Floral
Blackcurrant
PC 1 (62.2 %)
Woody
Vanilla/Chocolate
Fruit Aftertaste
Sweetness
Viscosity
Barossa Valley
The Yarra Valley wine was rated notably highly in vegetal (green) aroma, while the McLaren Vale Shiraz was also relatively high in vegetal but had a low level reductive aroma as well, while having high viscosity, sweetness and fruit aftertaste. The Barossa Valley wine was viscous, jammy, hot, oaky and slightly sweet, while the Coonawarra wine showed more blackcurrant and floral notes, with some red fruit. The Canberra wine was less viscous, more acidic, and was rated relatively highly in red fruit. The McLaren Vale Shiraz-Grenache blend was intermediate in most attributes, with stronger red fruit and floral aroma. Overall, the six wines were quite distinct and were good candidates for a visual association test.
CAN RED WINE FLAVOUR DIFFERENCES BE TRANSLATED TO VISUAL IMAGES?
Several sorting-type tasks were conducted with the six Shiraz wines to assess associations of wine flavour with colours and shapes. The wines were tasted in black glasses, with 62 assessors asked to taste a wine and place it on a colour grid surface (Figure 2a), and separately on a line with different degrees of angularity/smoothness (Figure 2b). The assessors were AWRI staff, with widely differing wine sensory experience, most of whom were not trained sensory panellists.
While all wines in the study were Shiraz (with one Shiraz/Grenache blend), the
Heat
Jammy/Cooked Fruit
colours that the panel associated with the wines when tasted in black glasses were surprisingly distinct. Figure 3 shows that the Canberra District wine, which was relatively acidic, was associated with red colours, while the vegetal/stalky Yarra Valley wine was mapped in the green part of the grid. The high dark-fruit-flavoured McLaren Vale wine was associated with deeper blue/purple colours, and the Shiraz-Grenache blend with floral and red fruit characters was related to yellow shades. There were notable statistically significant differences among the wines, as assessed by 95% confidence ellipses.
Regarding the scale used for associations with smooth, curving shapes versus angular, spiky shapes, the Coonawarra and Barossa wines with higher astringency (drying, tannic) were indicated as more spiky, while the softer, slightly sweeter wines were associated with the more curved part of the scale.
42 www.winetitles.com.au WINE & VITICULTURE JOURNAL WINTER 2023 V38N3 AWRI REPORT
“It was decided to work with Shiraz wines and investigate whether there can be firm associations of red wine flavour properties with visual elements. From an industry point of view, the work has potential practical benefit for wine packaging and marketing…”
“While all wines in the study were Shiraz (with one Shiraz/Grenache blend), the colours that the panel associated with the wines when tasted in black glasses were surprisingly distinct.”
McLaren Vale ShirazGrenache Coonawarra
PC2 (20.2%)
Figure 1. Overview of the sensory properties of the six Shiraz wines studied based one results from a trained sensory descriptive analysis panel. Each wine is represented by a blue dot.
differences in colours and shapes chosen by individuals. She also interpreted the results with the help of a smaller panel who were asked to ‘draw wine flavour’ using colours within a circular area with subsequent discussion of how they felt about the tasks. After a period of work in her studio, Elizabeth developed artworks for each of the wines that took into account all the information gathered, as well as her own art practice, insight and training. Elizabeth notes that she was frustrated by the data being condensed down to a single point on a graph, whereas the artworks provided a space to acknowledge a range of clustered responses. The six wines were represented as circular images with different shadings and tones painted by Elizabeth in watercolour and pencil. Aromas were featured as background colours while taste formed the foreground details. Figure 4 (page 44) shows the images for three of the wines. The six watercolours were acquired by the AWRI and are now displayed in the AWRI boardroom.
DOES A COMPLEMENTARY IMAGE INCREASE ENJOYMENT OF A WINE?


As a final step in Elizabeth’s residency the effect of the images on the wine consumption experience was evaluated using a preference study (n=38 assessors). This relatively small
enjoyment pleasure.
were tasted blind under three conditions: in a white sensory booth, a booth decorated with the yellow/light red graphic that was developed by Elizabeth to match the McLaren Vale Shiraz-Grenache wine (Figure 4b), and a booth with a purple/pink/light red graphic matching the Coonawarra wine (Figure 4c). The order of the different environments that
the panellists tasted in was randomised across the assessors, with a single set of the three wines assessed per tasting session.
The results suggest that the graphics affected preference for only one of the wines, the McLaren Vale Shiraz, with the results shown in Figure 5 (page 44). There was evidence (P=0.05) that the yellowdominated artwork that was developed to match the Shiraz-Grenache wine resulted in a lower liking response for the McLaren Vale Shiraz compared to the same wine tasted in the booth decorated with the more purple/pink/light red artwork that matched the Coonawarra Shiraz. It should be noted that this was a small study, completed right at the end of Elizabeth’s residency when time was limited, and further work is required to confirm the validity of these results. If confirmed, the results provide the possibility of options for differentially increasing enjoyment through
V38N3 WINE & VITICULTURE JOURNAL WINTER 2023 www.winetitles.com.au 43 AWRI REPORT
“…the Coonawarra and Barossa wines with higher astringency (drying, tannic) were indicated as more spiky, while the softer, slightly sweeter wines were associated with the more curved part of the scale.”
McLaren Vale High dark fruit, sl. sweet
Coonawarra Blackcurrant, astringent
Yarra Valley Vegetal Canberra Acid, lighter style
Barossa Valley Jammy, cooked fruit
McLaren Vale ShirazGrenache Floral, confection, red fruit
Figure 3. A representation of the colours associated with the flavour of six young commercially produced Shiraz wines (including one blend) by a group of 62 individuals, tasting the wines in black glasses. The set of descriptors associated with each wine are taken from the sensory descriptive analysis study.
a) Please taste the wine and think about what colour best represents the flavour of the sample. Closing your eyes while tasting might help distinguish and clarify your decision. Drag and drop the pin onto the colour grid as closely as possible to your colour association.
a) Please taste the wine and think about what colour best represents the flavour of the sample. Closing your eyes while tasting might help distinguish and clarify your decision.
b) Please taste the wine and place the pin along the line at the point where you think the flavour of the sample is best represented.
visual elements for in-store tastings or cellar door settings, or ‘experience’ type events. In this case, for the selected McLaren Vale Shiraz wine, yellow/pale red visual cues might be avoided in favour of bolder colours in packaging or promotion materials.

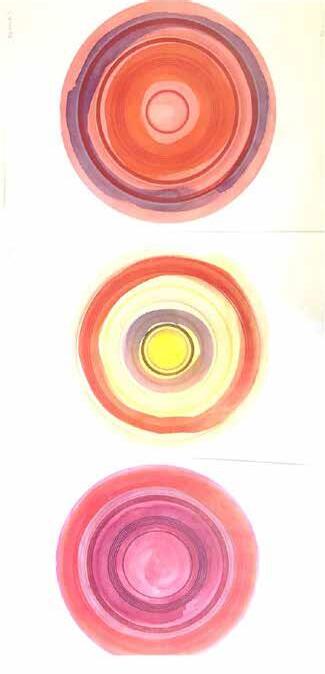
CONCLUSION
From a practical viewpoint, the associations of flavour and wine style with visual elements could be used by producers to align packaging and marketing cues to match or complement wine sensory perception, with a view to enhancing the tasting experience. Conversely, careful wine selections may, in turn, further elevate the experience of art. This goes further than relatively simple ‘sensory branding’ approaches, such as where pink rosé-style wines might be marketed with pink visual elements on a label or promotional
material. Given the strong influence the visual sense has on other senses it is logical that images in labels or packaging that are closely related to or harmonious with specific wine aroma and flavour profiles could increase enjoyment and potentially increase the likelihood of consumers repeat purchasing. Further work would be needed to confirm the practical significance of this work, and expanding to other wine styles and varieties would be fascinating.
After her residency, Elizabeth worked with the well-regarded East Brisbane restaurant ‘The Wolfe’ in a year-long chef collaboration where the Shiraz circle paintings were turned into napkins, and the actual wines were on an Artist Degustation menu. Unfortunately, due to the COVID-19 pandemic, the collaboration was cut short. Elizabeth may develop a larger exhibition stemming from her experiences at
the AWRI. While COVID restrictions affected any further developments, artist in residence visitors through ANAT may be supported in the future.


Overall, even though the project was a small component in the overall AWRI sensory research program, it was intriguing to work with an artist with a very different approach to the senses than the highly analytical one practised in our industry. The demonstration of the quite strong associations of the visual sense with wine flavour was unexpected, and it would be fascinating to pursue these links further.
REFERENCES
University of Sussex (2022) Synaesthesia research – FAQ. Available from: https://www.sussex. ac.uk/synaesthesia/faq#howcommon
Willing, E. (2019) Blog about AWRI residency. Available from: https://willing2019.blog.anat.org.au/
WVJ 44 www.winetitles.com.au WINE & VITICULTURE JOURNAL WINTER 2023 V38N3
a) b) a) b) c) a) b) c) 1 2 3 4 5 6 7
White sensory booth
Purple/red/pink graphic
Mean Liking score
Yellow/Light red graphic
Figure 5. Liking scores for the same McLaren Vale Shiraz wine tasted by 38 assessors under three randomised conditions: in a plain white tasting booth or in a booth decorated with two different artworks developed by Elizabeth Willing (shown in Figure 3).
The power of smart irrigation systems in Australian vineyards

Grapegrowing in Australia can be challenging, especially when it comes to frost risk and water management. That’s why having an efficient irrigation system has become essential for vineyard managers and viticulturists.
THE IMPORTANCE OF SOIL MOISTURE MONITORING
Water is a crucial factor in grape production. Choosing the right irrigation system can greatly affect the quality and yield of your grape crop. One of the main challenges of irrigation management is under or overwatering. This can be exacerbated by evaporation and runoff, making accurate soil moisture monitoring even more essential. By using the Milesight EM500 Soil Moisture Sensor, you can accurately monitor the amount of water available to your vines as well as the temperature and electrical conductivity of the soil. This allows you to make informed decisions about when and how much to irrigate to ensure optimal growing conditions for your vines.
THE BENEFITS OF LORAWAN TECHNOLOGY


The Milesight EM500 Soil Moisture Sensor uses LoRaWAN technology to transmit data through their gateway and to the IoT Cloud platform. This technology ensures that sensor data is transmitted accurately and in real-time to enable timely decision-making. By using this technology, you can quickly identify potential issues and take immediate action to avoid negative impacts on your grape crop.
SOLENOID CONTROL VALVE FOR EFFECTIVE WATER MANAGEMENT

With real-time data from smart monitoring sensors, vineyard managers and viticulturists can now take immediate action to activate irrigation systems to prevent frost or improve the water supply for healthy vine growth. Milesight’s Solenoid Control Valves provide a cost-efficient, accurate way to regulate water flow. They are self-sufficient and require no extra power or bulky battery setups so that you can enjoy the convenience of an immediate on/off switch for your irrigation system with absolute precision.
REMOTE MANAGEMENT AND MONITORING


Managing a vineyard can be time-consuming and demanding but with a Milesight Smart Agriculture Solution, you can remotely monitor and manage your irrigation system from anywhere. By using the IoT Cloud platform, you can receive notifications about soil conditions, set thresholds and control your solenoid valve without the need for manual intervention. This provides you with valuable insights into your vineyard’s growing conditions and can lead to improved crop yields.
THE FUTURE OF SMART IRRIGATION IN AUSTRALIAN VINEYARDS
As the climate changes and environmental conditions become more challenging, smart irrigation systems will become an increasingly critical tool for Australian vineyards. With advanced sensor technologies and innovative solenoid valve control systems, vineyard managers and viticulturists can look forward to increased water efficiency, labour cost savings, and improved vine health.
The future of smart irrigation in Australian vineyards is bright, and with proper planning and implementation, you can reap the benefits for years to come.
Test the concept today with our Milesight Agricultural Monitoring Starter Kit. With this starter kit, you can quickly and easily collect data on soil temperature and moisture levels, light intensity, and more. Scan the QR code to find out more or contact one of our specialists on 1300 768 887 to build your own kit today!

(ADVERTISEMENT)
www.onetemp.com.au sales@onetemp.com.au V38N3 WINE & VITICULTURE JOURNAL WINTER 2023 www.winetitles.com.au 45
OneTemp
Impact of long-term vineyard floor management on soil health indicators and plant communities
By Merek Kesser, Timothy Cavagnaro, Roberta De Bei and Cassandra Collins, The University of Adelaide, School of Agriculture, Food & Wine, Waite Research Institute, PMB 1, Glen Osmond, 5064 South Australia
A study carried out in vineyards in the Barossa Valley, Eden Valley and McLaren Vale has suggested that lower impact floor management strategies, such as slashing and grazing, may reduce ruderal weed species and benefit various soil health indicators in the long-term compared with tillage and herbicides.
INTRODUCTION
Vineyard floor management practices have traditionally included the use of herbicides and tillage in both the mid- and under-vine rows throughout warm, dry viticultural regions, such as South Australia, to limit competition for water and nutrients (Abad et al. 2021, Garcia et al. 2018, Guerra and Steenwerth 2012). Although these practices are effective in controlling unwanted vineyard plants or weeds, there can be long-term environmental consequences associated with their use, namely, both practices reduce the duration of living plants in soil which can give rise to exposed, bare earth areas that are located predominantly in vineyard under-vine rows.
Due to a lack of both above-ground plant coverage and below-ground intact roots, these areas of bare earth are more likely to lose soil and nutrients due to erosion (RuizColmenero et al. 2013), not to mention the reduced capacity of soil biology to facilitate natural soil processes (Steenwerth and Belina 2008). Furthermore, chemical herbicides have been discovered to persist in freshwater ways, in grapevines and in grapes (Ying and Williams 2000, Zaller et al. 2018). Overall, the reduction of plant growth in vineyard floors not only reduces plant species diversity but also reduces biodiversity at many trophic levels (Bruggisser et al. 2010, Winter et al. 2018).
For these reasons, alternative vineyard floor management methods with lower degrees of intensities that increase the percentage of vineyard floor covered by living plants have thus been of particular interest to vineyard managers across South Australia and in other viticultural regions with similar Mediterranean climates. There is evidence from other viticultural regions, such as the Western Cape in South Africa, to suggest that minimal vegetation management may indeed support
IN BRIEF
■ Differences in soil health and plant communities were assessed during the 2020-21 growing season across 24 vineyard sites that were grouped according to the intensity of their floor management (Low, Medium, High); they were compared alongside four unmanaged native sites.
less competitive plant species which, in turn, reduces the required interventions in the long run, whilst simultaneously enhancing floor plant coverage and biodiversity (MacLaren et al. 2019).
It is relatively unknown how different vineyard floor management practices comparatively impact environmental health indicators over a large viticultural landscape in Australia, therefore this study sought to investigate vineyard floor management intensity in three Geographical Indications (GIs) in South Australia — the Barossa Valley, Eden Valley, and McLaren Vale. Twenty-four commercial vineyards — grouped into High, Medium, and Low floor management intensities and four adjacent native unmanaged areas across these GIs were assessed quarterly in separate midand under-vine row investigations during the 2020-21 growing season for plant community dynamics in addition to a suite of soil health indicators.
METHODS Vineyards and native sites
During the 2020-21 growing season, soil health measures and plant surveys were conducted quarterly during the seasons (winter, spring, summer, autumn) at 24 commercial vineyards and four adjacent native unmanaged sites in the Barossa Valley, Eden Valley and McLaren Vale regions as shown in Table 1 (see page 46). At every vineyard, samples were collected from three equidistant sampling areas of three panels in length each across a diagonal transect in both the mid-row and under-vine row areas. At all vineyards, consistent floor management practices had been applied for at least the previous three growing seasons.
Based on these floor management practices, the vineyard sites were grouped
■ Soil health and plant species were most different between the under-vine areas of vineyards whereas measurements in the midrows were more similar across the intensity groups.
■ Low vineyard floor management intensity encouraged plant species in the Poaceae (grass) and Fabaceae (legumes) family compared to higher frequencies of Asteraceae (thistles) and Polygonaceae (wireweed) plants occurring in the under-vine rows of the Medium and High groups.
■ High and Medium floor management intensities resulted in slower soil water infiltration, drier soils, less soil total nitrogen and ammonium-N, and tended to reduce soil organic carbon in the undervine rows.
into Low, Medium, and High management intensity groups. There were nine sites in the High group, which managed the undervine row by two to four passes of herbicides and/or tillage and the mid-row by cover crops or spontaneous vegetation with tillage and/or slashing. In the Medium group, there were eight sites and these managed the under-vine row by one pass with herbicides and/or tillage and the mid-row by slashing and/or animal grazing. The Low management group consisted of seven vineyard sites, which only used slashing and/or animal grazing to manage both the under-vine and mid-rows (Table 1, see page 48).
46 www.winetitles.com.au WINE & VITICULTURE JOURNAL WINTER 2023 V38N3 VITICULTURE VINEYARD FLOOR MANAGEMENT
The management ideologies of the vineyard sites were reported by the vineyard managers and were categorised into the following groups: Regenerative, Conventional, Low-input and Organic. There were two native sites in McLaren Vale, one in Eden Valley, and one in the Barossa Valley where samples were collected across three sampling areas in a diagonal transect across the site, all of which had not undergone any management practices in the past 20 years (Table 1).
Plant surveys and soil samples
At each sampling campaign, a plant coverage and diversity survey were conducted in 18 replicates at each site: three surveys per sampling zone in the mid-row and under-vine row areas using a 1m2 frame (Guzmán et al. 2019). Plant species were identified and their percent ground coverage was recorded, in addition to ground coverage by litter (organic surface material) and bare earth.
An above-ground plant biomass sample was also collected at each replicate. In addition to the plant samples, composite soil samples were collected to measure nitrate-N, ammonium-N and gravimetric water content seasonally.
Attention was made to avoid rainfall events when sampling between sites during the same seasonal campaign. During the spring 2020 campaign, dry bulk density and in situ water infiltration were measured (USDA NRCS 1999, Porzig et al. 2018), while a comprehensive soil physiochemical analysis was conducted at every site during autumn 2021 by Eurofins Australian Precision Agriculture Laboratory (Adelaide, South Australia) following protocols of Rayment and Lyons (2011).
Data analysis


The soil and plant measurements made at each site were aggregated into groups based on the specific management intensity of the site, and subsequently non-parametric KruskalWallis tests were performed to compare differences between groups, while principal component analyses (PCAs) were conducted to assess for relationships between the measured soil and plant variables. All statistical tests and figures were made using R (version 4.1.2, R Core Team 2021).
RESULTS AND DISCUSSION
It was demonstrated by this study across three viticultural landscapes in South Australia

that the under-vine area of vineyards was more impacted by different floor management intensities than the mid-rows, as this is the area where most management practices are carried out. At the sites that were investigated, midrows were managed relatively similarly across all three management intensity groups and the primary differences in outcomes were related to plant floor coverage and the plant species that were identified.
When aggregated throughout the entire growing season, there were no differences between plant biomass in the mid-row areas between the management intensity groups, however there was a trend of higher plant species richness (p-value = 0.083) and increased plant coverage in this area as management intensity decreased (Table 2, see page 48). These findings were very similar to other vineyard landscape studies in Europe which reported higher plant diversity and coverage under management that was lower or less frequent in intensity (Guzman et al. 2019, Hall et al. 2020).
In all vineyard mid-rows, plants in the Poaceae (grass) family dominated throughout the year, particularly in the Low and Native groups with ranges from 41.9% to 52.6% of
Soil Improve Your with and Build Vine Resilience For over 12 years CropBioLife has helped create: • Increased Soil Biology
Increased Soil Carbon
Nutrient Rich Fruit
Improved Vine Health
Increased Yield GROW WITH US WWW.CROPBIOLIFE.COM V38N3 WINE & VITICULTURE JOURNAL WINTER 2023 www.winetitles.com.au 47 VINEYARD FLOOR MANAGEMENT VITICULTURE
•
•
•
•
VITICULTURE VINEYARD FLOOR MANAGEMENT
Table
aAustralian Geographical Indication (GI): BV: Barossa Valley, EV: Eden Valley, and MV: McLaren Vale.
bAustralian Soil Classification as determined by MIR spectroscopy.
cTime that specified vineyard management has been implemented in years (yrs).
dPredominant type of mid-row vegetation: CC: annually sown cover crop, CC alt. SS: rows with annual alternating sown cover crop and spontaneous sward, Mix SS + CC: spontaneous sward with a mix of cover crop species direct drilled, and SS: spontaneous sward.
eMid-row vegetation (veg.) management (mgt.): S: slash and T: tillage.
fPasses of vegetation management indicated for the mid-row or under-vine row vegetation management in order of listed practice.
gPredominant type of under-vine row: BE: bare earth and SS: spontaneous sward.
hUnder-vine row vegetation (veg.) management (mgt.): Herbicide: H, S: slash, and T: tillage.
iFloor management intensity group: High: mid-row cover crops or spontaneous sward with a bare earth under-vine row managed with 2 or more passes of herbicides, Medium: mid-row cover crops or spontaneous sward with bare earth or spontaneous sward under-vine row managed with either 1 pass of herbicides or 1-3 passes of tillage, Low: mid-row spontaneous sward or cover crops alternating with spontaneous sward with a spontaneous under-vine row without management or managed by slashing, and Native: native area adjacent to a vineyard that has not received management intervention for at least the last 20 years. jManagement ideology group: summarised based on growers’ descriptions of management practices.
floor area coverage in the Low group, and from 50.1% to 78.0% in the Native group (Figure 1, see page 51), similar to mid-rows in a South African vineyard landscape study (MacLaren et al 2019). The quarterly sampling times revealed that the plant species themselves shifted throughout the growing season (Fried et al 2019) and, particularly in winter, there was a distinctive community dynamic because of a high presence of soursob (Oxalis pescaprae L.) in the Oxalidaceae family in all sites, which contributed between 17.1% in the Low intensity group to 30.4% of floor coverage in the Medium intensity group. Plants in the Fabaceae (legumes) family had the highest degrees of coverage at sites in the Medium and Low groups during spring 2020, where they
constituted 16.2% and 19.9% of floor coverage, respectively. Asteraceae family plants (thistles) were most predominant in the Medium intensity group, ranging from 6.4% to 17.1% coverage, while they made up the lowest percent coverage in the Low and Native groups, where they peaked in spring 2020 at 3.3% and 4.6% coverage, respectively (Figure 1).
Throughout the entire 2020-21 growing season for the under-vine areas of the vineyards, plant species richness and plant biomass were both significantly greater in the Medium, Low and Native groups compared to the High intensity group. Species richness ranged from 7.67 species identified per sampling campaign in the Native sites to 8.07 species in the Low group and 8.47 in the
Medium, whereas there were 5.25 species on average in the High group (Table 2, see page 50). Plant biomass was between three and four times greater in the Low, Medium and Native groups (2.55, 2.02, and 2.19 t·ha-1) than in the High (0.61 t·ha-1) group, and living plants contributed to 72.6% more floor coverage in the Low sites compared to the High sites (Table 2).
Plants in the Asteraceae (thistles) family were most prevalent at sites in the High and Medium groups during winter 2020, when they made up 5.6% floor coverage for the High group and 10.5% for the Medium group, while in the Low and Native groups they contributed 3.8% and 2.8% coverage, respectively (Figure 1). This finding aligns well with other
48 www.winetitles.com.au WINE & VITICULTURE JOURNAL WINTER 2023 V38N3
Site ID GIa Year of vine planting Elevation (m) Soil textureb Time (yrs.)c Type of mid-rowd Mid-row practicese Mid-row passesf 1 EV 1998 395 Loamy sand 5 SS S 2 2 BV 1992 290 Loam 30 CC S + T 2 + 1 3 MV 1999 55 Silty clay loam 15 SS S 3 4 BV 1995 280 Loam 15 CC S + T 3 + 1 5 EV 1997 390 Loamy sand 23 SS S 3 6 EV 1990 350 Loamy sand 30 CC alt. SS S + T 1 + 0.5 7 MV 1999 60 Loam 22 CC alt. SS S + T 1 + 0.5 8 MV 1973 190 Loamy sand 15 CC S + T 3 + 1 9 MV 1998 110 Silty loam 15 CC S + T 3 + 1 10 EV 1998 430 Loamy sand 24 SS S 2 11 BV 2010 310 Loamy sand 15-20 CC S + T 1 + 2 12 BV late 1960’s 285 Sand 6 SS S + T 2 + 1 13 MV 2001 75 Loamy sand 12 CC alt. SS S + T 3 + 0.5 14 MV 1996 80 Loamy sand 10 SS S 2 15 MV 1971 70 Loamy sand 14 SS S 2 16 MV 2004 140 Loamy sand 6 CC S + T 1 + 1 17 MV 2016 82 Silty loam 4 Mix SS + CC S 2 18 BV 2009 285 Loam 3 SS S 3 19 EV 1998 395 Loamy sand 5 SS S 2 20 MV 1999 90 Silty loam 14 SS S 5 21 MV 1998 175 Silty loam 10 SS S 2 22 MV 1996 110 Loam 20 SS S 2 23 MV 1993 110 Loamy sand 8 SS S 2 24 MV early 2000’s 100 Silty loam 6 CC alt. SS S + T 2 + 0.5 25 EV - 385 Loamy sand 80 NV -26 BV - 280 Loam 50 NV -27 MV - 180 Silty loam > 20 NV -28 MV - 70 Loamy sand 20 NV - -
1. Characteristics of the vineyard sites and their floor management practices.
Type of under-vine rowg Under-vine practicesh Under-vine passesf Months of grazing animals Management intensity groupi Management ideologyj

vineyard floor investigations that showed higher levels of disturbance from tillage and/ or herbicides increase the prevalence of ruderal plant species, or those that are highly competitive due to functional traits of being


fast growing and with high specific leaf area (Kazakou et al 2016, Guerra et al 2021). Overtime, these characteristics have allowed ruderal plant species to survive these higher levels of disturbance, thus they out-compete
slower growing, perennial species that were more prevalent in the Low and Native groups (Grime 1977). Evidence from the present study supports this as perennial plant species in the Fabaceae family (legumes) were most
AU 1800 359 559 biostart.com.au or NZ 0800 116 229 www.biostart.co.nz Lift Vineyard Performance* with Biostart’s biological programme. *2022Accoladewinetrialshowedbetternutrientuptake, consistencyinyieldsandbetterwineflavour. Apply Mycorrcin in spring at budbreak to activate the soil microbiology that increases nutrient uptake by the vine. Apply Foliacin to activate the foliar biology to boost foliar health and lift photosynthesis. Apply Digester to rapidly recycle prunings back into nutrients and organic matter and reduce disease overwintering. V38N3 WINE & VITICULTURE JOURNAL WINTER 2023 www.winetitles.com.au 49 VINEYARD FLOOR MANAGEMENT VITICULTURE
BE H 4 1 High Regenerative BE H 2 1 High Conventional BE H 4 - High Conventional BE H 2 - High Conventional BE H 2 - High Conventional BE H 2 - High Conventional BE H 3 - High Conventional BE H 3 - High Conventional BE H 2 - High Low-input BE H 1 3.5 Medium Low-input BE T 3 - Medium Organic SS S + T 1 + 4 - Medium Regenerative SS T 3 4 Medium Organic SS H 1 3.5 Medium Low-input BE H 1 - Medium Low-input SS T 1 3 Medium Organic SS T 1 0.5 Medium Regenerative SS - - - Low Organic SS - - 1 Low Regenerative SS S 2 - Low Low-input SS S 1 1.5 Low Organic SS - - - Low Organic SS - - - Low Low-input SS - - - Low Organic - - - - Native- - - - Native- - - - Native- - - - Native -
prevalent in the Low (10.2%), Medium (7.1%), and Native (6.7%) groups compared to the High group (1.1%).
Finally, the Low and Native groups had the highest coverage by perennial species in the Poaceae (grass) family which were both highest in autumn 2021 at 57.4% and 69.6% coverage, respectively (Figure 1). Thus, as was concluded by similar vineyard floor plant studies also in Mediterranean conditions, we can suggest that the best way to reduce the prominence of noxious, competitive plant species is to use less-intensive management methods, in particular slashing (Guerra et al 2021, MacLaren et al 2019, Nascimbene et al 2013).
Soil measures in the under-vine rows were also different between the management intensity groups, likely directly related to the high variation detected in living plant coverage, biomass and plant species. There was a notable trend (p-value = 0.0981) of soil gravimetric water content being greatest in the under-vine rows of the Low intensity group, a 28.3% increase compared to the High group and 40.1% greater than the Medium group. These results suggest that throughout the course of an entire growing season, maintaining plant coverage of 95% or higher in the under-vine areas can have a positive
impact on reducing water loss by evaporation from the soil surface. However, this is not always the case in dry climates when activelygrowing vineyard floor plants can take up more water than what is lost from evaporation from bare soil (Celette et al 2009).
Another likely explanation for the significantly improved soil water infiltration rates that were measured in the under-vine areas of the Low management intensity group by more than six times compared to the High group and more than two times compared to the Medium group, is the possibility that the permanent plant root systems improved continuous soil porosity (García-Diaz et al 2018). Another likely reason that there was higher soil gravimetric water content and improved water infiltration in the Low management intensity group is due to the measures of soil organic carbon in these soils (Steenweth and Belina 2008), which the Low group was 59% higher compared to the High group and 53% higher than the Medium group, although it should be noted that soil organic carbon was not significantly different between the intensity groups at a level of p < 0.05 due to the large range at different sites and soil types (Figure 2, see page 52).
Soil total nitrogen was significantly greater in the under-vine areas of the Low intensity
sites by 47% compared to the High group, 59% compared to the Medium group, and 12% compared to the Native group (Table 2); which could be related to the higher coverage by nitrogen-fixing Fabaceae plant species in the winter and spring seasons (El Sabagh et al. 2020), which was also discovered when white clover was used as an under-vine cover crop in the eastern United States (Karl et al 2016). Soil ammonium-N, which is an inorganic form of nitrogen and a by-product of soil microorganisms breaking down organic compounds, was two times greater in the Low intensity group than the High group and also significantly greater than the Medium group. This signifies the relevance of living plants, particularly those in the Fabaceae family, in the under-vine row to maintain the natural functionality of the soil system (Garland et al 2021).
Other soil health indicators, such as bulk density and phosphorus levels, were not dependent on management intensity and were very variable between sites in each group, demonstrating the significant role being played by environmental site factors such as soil type, amongst others (Figure 2).
PCAs were made to assess the interactions between the many plant and soil variables that were measured across the different
50 www.winetitles.com.au WINE & VITICULTURE JOURNAL WINTER 2023 V38N3 VITICULTURE VINEYARD FLOOR MANAGEMENT
Mid-row plant measurements High Medium Low Native p-value Sig. Plant species richness 6.86 ± 0.42 8.66 ± 0.55 7.96 ± 0.49 7.67 ± 0.82 0.083 ° Plant biomass (t·ha-1) 1.70 ± 0.19 2.02 ± 0.18 1.80 ± 0.16 2.19 ± 0.22 0.384 Plant cover (%) 80.03 ± 4.50 b 82.21 ± 4.51 b 94.47 ±2.02 a 97.36 ± 1.60 a 0.001 ** Living plants (% of total plants) 60.81 ± 6.21 55.41 ± 6.97 60.43 ±7.19 59.26 ± 9.21 0.936 Mid-row soil measurements Soil gravimetric water (%) 17.00 ± 1.68 13.74 ± 1.98 19.40 ± 2.37 14.5 ± 3.54 0.182 Soil total nitrogen (%) 0.21 ± 0.01 bc 0.19 ± 0.01 c 0.28 ± 0.02 a 0.25 ± 0.03 abc 0.003 ** Soil nitrate-N (mg·kg-1) 5.02 ± 1.06 4.90 ± 1.74 4.82 ±1.44 3.01 ± 0.94 0.506 Soil ammonium-N (mg·kg-1) 1.96 ± 0.35 2.26 ± 0.73 2.72 ± 0.46 3.09 ± 0.65 0.141
Plant species richness 5.25 ± 0.50 b 8.47 ± 0.59 a 8.07 ± 0.49 a 7.67 ± 0.82 a 0.0003 ** Plant biomass (t·ha-1) 0.61 ± 0.14 b 2.02 ± 0.27 a 2.55 ± 0.22 a 2.19 ± 0.22 a < 0.001 *** Plant cover (%) 44.62 ± 3.93 c 70.51 ± 4.59 b 95.90 ± 1.24 a 97.36 ± 1.60 a < 0.001 *** Living plants (% of total plants) 36.11 ± 5.94 b 49.88 ± 7.23 ab 62.34 ± 5.13 a 59.26 ± 9.21 ab 0.0377 * Under-vine soil measurements Soil gravimetric water (%) 15.94 ± 1.48 14.60 ± 1.99 20.45 ± 2.05 14.5 ± 3.54 0.0981 ° Soil total nitrogen (%) 0.23 ± 0.02 b 0.20 ± 0.01 b 0.31 ± 0.03 a 0.25 ± 0.03 ab 0.0213 * Soil nitrate-N (mg·kg-1) 7.25 ± 1.47 5.59 ± 1.29 4.43 ± 0.98 3.01 ± 0.94 0.1303 Soil ammonium-N (mg·kg-1) 1.36 ± 0.27 b 1.65 ± 0.39 b 2.75 ± 0.49 a 3.09 ± 0.65 a 0.0099 ** Average group measures are compared with a Kruskal-Wallis non-parametric test. Differences between groups are indicated by lower-case letters and significance (Sig.) is indicated by *** (p < 0.001), ** (p < 0.01), * (p < 0.05), and ° (p < 0.1).
Table 2. Summary of annual average ± standard error of mid-row and under-vine plant and soil measurements from the three management intensity groups of High, Medium, and Low, shown alongside the Native sites.
Under-vine plant measurements
Figure 1. Plant family or cover percent coverage measured quarterly during the 2020 -2021 growing season in winter 2020, spring 2020, summer 2020, and autumn 2021 in the (A) mid -rows and (B) under -vine rows from the three management intensity groups of High, Medium, a nd Low, shown alongside the Native sites.
Figure 1. Plant family or cover percent coverage measured quarterly during the 2020-2021 growing season in winter 2020, spring 2020, summer 2020, and autumn 2021 in the (A) mid-rows and (B) under-vine rows from the three management intensity groups of High, Medium, and Low, shown alongside the Native sites.
Plant family percent ground cover was collated by assessing percent ground cover by individual plant species and grouping plants in their designated taxonomic families. The coverage lent by each taxonomic family i s expressed as a percentage of the total surveyed floor coverage in all sites within the management intensity group, thus ground cover of bare soil and litter are also depicted here. For each quarterly sampling time (winter, spring, summer, and autumn), n = 9 at every site.
Plant family percent ground cover was collated by assessing percent ground cover by individual plant species and grouping plants in their designated taxonomic families. The coverage lent by each taxonomic family is expressed as a percentage of the total surveyed floor coverage in all sites within the management intensity group, thus ground cover of bare soil and litter are also depicted here. For each quarterly sampling time (winter, spring, summer, and autumn), n = 9 at every site.
vineyard sites. In Figure 3 (see page 54), the measurements made in the undervine row areas depict that there was more differentiation between sites when they were grouped according to management intensity rather than management ideology or GIs. Specifically, the Low and High management intensity groups were relatively distinct from each other, while the sites in the Medium group shared characteristics of both groups (Figure 3A). Furthermore, the Low management sites tended to have higher plant biomass and species richness, faster soil water infiltration and higher silt content in addition to increased soil organic carbon, total soil nitrogen, soil
ammonium-N, soil electrical conductivity and soil phosphorus than the High management intensity group.
The High group, on the other hand, was more defined by having soils with higher bulk densities, penetration resistance, pH, soil nitrate-N and greater sand content, as were sites with higher elevations that had been farmed in the same way for a longer duration of time (Figure 3). This indicates that the intensity of practices with which the under-vine row is managed to achieve varying degrees of plant coverage, combined with site characteristics, play bigger roles in determining soil and plant measures than do management ideologies
alone (Figure 3), supporting findings by Bruggisser et al (2010), MacLaren et al (2019) and Garland et al (2021).

FUTURE WORK
This study was very explorative and investigative by nature, thus it was very much a starting point to begin to understand how vineyard floor management systems impact a variety of environmental health indicators, and here we focussed on soil and plant dynamics over one growing season only. Our findings underline how management intensity, particularly in the under-vine area, is negatively associated with floor plant coverage, thus the higher the intensity, the lower the plant coverage — and this is the factor that seems to be most correlated with other soil and plant diversity measures.

Higher management intensity also seemed to be driving slower water infiltration, drier soils, less soil organic carbon and less soil total nitrogen and ammonium-N, to name a few. Plant species were also selected for differently depending on management intensity, with ruderal plants in the Asteraceae and Polygonaceae families being specifically more common in vineyards with higher levels of management intensity. Future work on this topic would therefore be instrumental at untangling the suite of relevant factors in South Australia, such as environmental characteristics, soil types, irrigation and nutrition regimes and pest control strategies, that play instrumental roles in these soil and plant outcomes following promising indications of using under-vine plants to improve grapevine-environment relations in the eastern United States (Vanden Heuvel and Centinari 2021).
REFERENCES
Abad, J.; Hermoso de Mendoza, I.; Marin, D.; Orcaray, L. and Santesteban, L.G. (2021) Cover crops in viticulture. A systematic review (1): Implications on soil characteristics and biodiversity in vineyard. OENO One 55(1):295-312. https://doi. org/10.20870/oneo-one.2021.55.1.3599
Bruggisser, O.T.; Schmidt-Entling, M.H. and Bacher, S. (2010) Effects of vineyard management on biodiversity at three trophic levels. Biological Conservation 143:1521-1528. https://doi. org/10.1016/j.biocon.2010.03.034
Celette, F.; Findeling, A. and Gary, C. (2009)
Competition for nitrogen in an unfertilized intercropping system: The case of an association of grapevine and grass cover in a Mediterranean climate. European Journal of Agronomy 30(1):41-51. https://doi.org/10.1016/j.eja.2008.07.003
V38N3 WINE & VITICULTURE JOURNAL WINTER 2023 www.winetitles.com.au 51 VINEYARD FLOOR MANAGEMENT VITICULTURE
Figure 2. Boxplots showing the median and ranges of four soil measurements: water infiltration measured in autumn 2021 (WI Autumn), dry bulk density, Colwell phosphorus, and total organic carbon (OC) quarterly during the 2020 -2021 growing season in winter 2020, spring 2020, summer 2020, and autumn 2021 in the (A) midrows and (B) under -vine rows from the three management intensity groups of High, Medium, and Low, shown alongside the Native sites.
Figure 2. Boxplots showing the median and ranges of four soil measurements: water infiltration measured in autumn 2021 (WI Autumn), dry bulk density, Colwell phosphorus, and total organic carbon (OC) quarterly during the 2020-2021 growing season in winter 2020, spring 2020, summer 2020, and autumn 2021 in the (A) mid-rows and (B) under-vine rows from the three management intensity groups of High, Medium, and Low, shown alongside the Native sites.

Differences between the groups were assessed with a Kruskal-Wallis non-parametric test and differences between groups are indicated by * (p < 0.05) and ** (p < 0.01)
Differences between the groups were assessed with a Kruskal-Wallis non-parametric test and differences between groups are indicated by * (p < 0.05) and ** (p < 0.01).
El Sabagh, A; Hossain, A.; Sohidul Islam, M.; Fahad, S.; Ratnasekera, D.; Swaroop Meena, R.; Wasaya, A.; Ahmad Yasir, T.; Ikram, M.; Mubeen, M.; Fatima, M.; Nasim, W.; Çığ, A.; Çığ, F.; Erman M. and Hasanuzzaman, M. (2020) ‘Nitrogen fixation of legumes under the family Fabaceae: Adverse effect of abiotic stresses and mitigation strategies’. In: The Plant Family Fabaceae. Eds. M. Hasanuzzaman, S. Araújo and S. Gill, Springer: Singapore. https://doi. org/10.1007/978-981-15-4752-2_4
Fried, G.; Cordeau, S.; Metay, A. and Kazakou, E. (2019) Relative importance of environmental factors and farming practices in shaping weed communities structure and composition in French vineyards. Agriculture, Ecosystems and Environment 275:1-13. https://doi.org/10.1016/j.agee.2019.01.006
Garcia, L.; Celette, F.; Gary, C.; Ripoche, A.; Valdés-Gómez, H. and Metay, A. (2018) Management of service crops for the provision of ecosystem services in vineyards: A review. Agriculture, Ecosystems and Environment 251:158170. https://doi.org/10.1016/j.agee.2017.09.030
García-Díaz, A.; José Marqués, M.; Sastre, B. and Bienes, R. (2018) Labile and stable soil organic carbon and physical improvements using groundcovers in vineyards from central Spain. Science of the Total Environment 621:387-397. https://doi.org/10.1016/j.scitotenv.2017.11.240
Garland, G.; Edlinger, A.; Banerjee, S.; Degrune, F.; García-Palacios, P.; Pescador, D.S.; Herzog, C.; Romdhane, S.; Saghai, A.; Spor, A.; Wagg, C.; Hallin, S.; Maestre, F.T.; Philippot, L.; Rillig, M.C. and van der Heijden, M.G.A. (2021) Crop cover is more important than rotational diversity for soil multifunctionality and cereal yields in European cropping systems. Nature Food 2:28-37. https://doi. org/10.1038/s43016-020-00210-8
Grime, J.P. (1977) Evidence for the existence of three primary strategies in plants and its relevance to ecological and evolutionary theory. American Naturalist 111(982):1169-1194. http://www.jstor.org/ stable/2460262
Guerra, B. and Steenwerth, K. (2012) Influence of floor management technique on grapevine growth, disease pressure, and juice and wine composition: A review. American Journal of Enology and Viticulture 63(2):149-164. https://doi. org/10.5344/ajev.2011.10001
Guerra, J.G.; Cabello, F.; Fernández-Quintanilla, C. and Dorado, J. (2021) A trait-based approach in a Mediterranean vineyard: Effects of agricultural management on the functional structure of plant communities. Agriculture, Ecosystems and Environment 316(107465):1-15. https://doi. org/10.1016/j.agee.2021.107465
Guzmán, G.; Cabezas, J.M.; Sánchez-Cuesta, R.; Lora, Á.; Bauer, T.; Strauss, P.; Winter, S.; Zaller, J.G. and Gómez, J.A. (2019) A field evaluation of the impact of temporary cover crops on soil properties and vegetation communities in southern Spain vineyards. Agriculture, Ecosystems and Environment 272:135-145. https://doi.org/10.1016/j. agee.2018.11.010
Hall, R.M.; Penke, N.; Kriechbaum, M.; Kratschmer, S.; Jung, V.; Chollet, S.; Guernion, M.; Nicolai, A.; Burel, F.; Fertil, A.; Lora, Á.; SánchezCuesta, R.; Guzmán, G.; Gómez, J.; Popescu, D.; Hoble, A.; Bunea, C.I.; Zaller, J.G. and Winter, S. (2020) Vegetation management intensity and landscape diversity alter plant species richness, functional traits and community composition across European vineyards. Agricultural Systems 177(102706):1-14. https://doi.org/10.1016/j. agsy.2019.102706
Karl, A.D.; Merwin, I.A.; Brown, M.G.; Hervieux, R.A. and Vanden Heuvel, J.E. (2016) Undervine management impacts soil properties and leachate composition in a New York state vineyard. Journal of the American Society for Horticultural Science 51(7):941-949. https://doi.org/10.21273/ HORTSCI.51.7.941
Kazakou, E.; Fried, G.; Richarte, J.; Gimenez, O.; Violle, C. and Metay, A. (2016) A plant traitbased response-and-effect framework to assess vineyard inter-row soil management. Botany Letters 163:373-388. https://doi.org/10.1080/23818107.20 16.1232205


MacLaren, C.; Bennett, J. and Dehnen-Schmutz, K. (2019) Management practices influence the competitive potential of weed communities and their value to biodiversity in South African vineyards. Weed Research 59:93-106. https://doi.org/10.1111/ wre.12347
Nascimbene, J.; Marini, L.; Ivan, D. and Zottini, M. (2013) Management intensity and topography determined plant diversity in vineyards. PLoS One 8:1-7. https://doi.org/10.1371/journal.pone.0076167
Porzig, E.L.; Seavy, N.E.; Owens, B.E. and Gardali, T. (2018) Field evaluation of a simple infiltration test and its relationship with bulk density and soil organic carbon in California rangelands. Journal of Soil and Water Conservation 73(2):200206. http://doi:10.2489/jswc.73.2.200
Rayment, G.E. and Lyons, D.J. (2011) Soil Chemical Methods - Australasia, Soil Use and Management. CSIRO Publishing, Collinswood, Victoria.
Ruiz-Colmenero, M.; Bienes, R.; Eldridge, D.J. and Marques, M.J. (2013) Vegetation cover reduces erosion and enhances soil organic carbon in a vineyard in the central Spain. Catena 104:153-160. https://doi.org/10.1016/j.catena.2012.11.007
52 www.winetitles.com.au WINE & VITICULTURE JOURNAL WINTER 2023 V38N3 VITICULTURE VINEYARD FLOOR MANAGEMENT
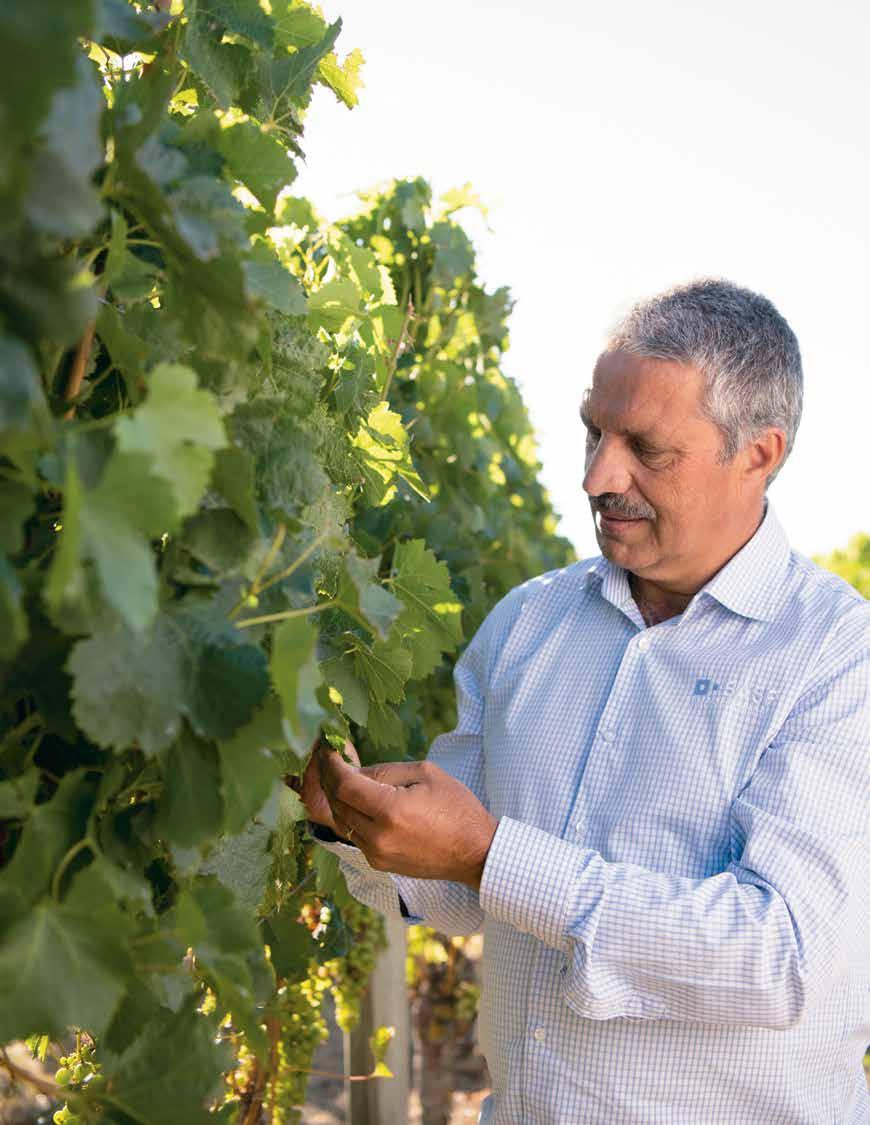


Talk to your local reseller or visit crop-solutions.basf.com.au Vineyard solutions for your best season yet ALWAYS READ AND FOLLOW LABEL DIRECTIONS © Copyright BASF 2023 ® Registered trademark of BASF. 213781 0523
Figure 3. Principal component analyses (PCA’s) of soil and plant measurements collected from the vineyard under-vine rows during the 2020-2021 growing season. Sites are grouped differently in each PCA: (A) management intensity of High, Medium, and Low; (B) management ideologies of Regenerative, Conventional, Low-input, and Organic; and (C) Geographical Indications (GI’s) of Eden Valley, Barossa Valley, and McLaren Vale. (D) is a PCA bi-plot of the contribution (contrib.) or each of the measurements.
Figure 3. Principal component analyses (PCA’s) of soil and plant measurements collected from the vineyard under-vine rows during the 2020-2021 growing season. Sites are grouped differently in each PCA: (A) management intensity of High, Medium, and Low; (B) managemen t ideologies of Regenerative, Conventional, Low-input, and Organic; and (C) Geographical Indications (GI’s) of Eden Valley, Barossa Valley, and McLaren Vale. (D) is a PCA bi-plot of the contribution (contrib.) or each of the measurements.

Confidence ellipses at the 90% level are shown for each of the grouping variables. Measurements included are: soil % sand (Sand), soil % clay (Clay), soil % silt (Silt), soil dry bulk density (BD), soil pH water (pH), soil penetration resistance (PR), soil nitrate-N (NO3), soil ammonium-N (NH4), soil cation exchange capacity (CEC), soil Colwell phosphorus (P), soil calcium carbonate (CaCO3), soil total organic carbon (TOC), soil total nitrogen (TN), soil water infiltration rate (WI), site elevation (Elev), irrigation water sodium in ppm (Nappm), total number of plant species (Plants), average plant biomass (BM), and total number of years of management implementation (Years).
Steenwerth, K. and Belina, K.M. (2008)
Cover crops enhance soil organic matter, carbon dynamics and microbiological function in a vineyard agroecosystem. Applied Soil Ecology 40:359-369. https://doi.org/10.1016/j.apsoil.2008.06.006
Confidence ellipses at the 90% level are shown for each of the grouping variables. Measurements included are: soil % sand (Sand), soil % clay (Clay), soil % silt (Silt), soil dry bulk density (BD), soil pH water (pH), soil penetration resistance ( PR), soil nitrate-N (NO3), soil ammonium-N (NH4), soil cation exchange capacity (CEC), soil Colwell phosphorus (P), soil calcium carbonate (CaCO3), soil total organic carbon (TOC), soil total nitrogen (TN), soil water infiltration rate (WI), site elevati on (Elev), irrigation water sodium in ppm (Nappm), total number of plant species (Plants), average plant biomass (BM), and total number of years of management implementation (Years).
USDA NRCS (United States Department of Agriculture, Natural Resources Conservation Service). (1999) Soil Quality Test Kit Guide. Washington, DC: USDA Natural Resources Conservation Service. http:// www.nrcs.usda.gov/Internet/FSE_DOCUMENTS/ stelprdb1044790.pdf
Vanden Heuvel, J. and Centinari, M. (2021) Under-vine vegetation mitigates the impacts of excessive precipitation in vineyards. Frontiers in Plant Science 12:1-14. https://doi.org/10.3389/ fpls.2021.713135
Winter, S.; Bauer, T.; Strauss, P.; Kratschmer, S.; Paredes, D.; Popescu, D.; Landa, B.; Guzmán, G.; Gómez, J.A.; Guernion, M.; Zaller, J.G. and Batáry, P. (2018) Effects of vegetation management intensity on biodiversity and ecosystem services in vineyards: A meta-analysis. Journal of Applied Ecology 55:2484-2495. https://doi.org/10.1111/13652664.13124
Ying, G.G. and Williams, B. (2000) Dissipation of herbicides in soil and grapes in a South Australian vineyard. Agriculture, Ecosystems and Environment 78:283-289.
Zaller, J.G.; Cantelmo, C.; Dos Santos, G.; Muther, S.; Gruber, E.; Pallua, P.; Mandl, K.; Friedrich, B.; Hofstetter, I.; Schmuckenschlager, B. and Faber, F.
(2018) Herbicides in vineyards reduce grapevine root mycorrhization and alter soil microorganisms and the nutrient composition in grapevine roots, leaves, xylem sap and grape juice. Environmental Science and Pollution Research 25:23215-23226. https://doi. org/10.1007/s11356-018-2422-3
This article was adapted from: Kesser, M.M.; Cavagnaro, T.R.; De Bei, R. and Collins, C. (2023) Vineyard floor management intensity impacts soil health indicators and plant diversity across South Australian viticultural landscapes. ONEO One, Special Issue for GiESCO 2023. DOI: 10.20870/oenoone.2023.57.2.7432
WVJ 54 www.winetitles.com.au WINE & VITICULTURE JOURNAL WINTER 2023 V38N3 VITICULTURE VINEYARD FLOOR MANAGEMENT


Ian Mason Call us now 1800 797 629 or +61 448 111 384 E info@aussiefrostfans.com.au or visit aussiefrostfans.com.au Take the guesswork out of fighting frost with our FrostBoss® advanced wind solution. • De signed by an ex-America’s Cup Research Engineer • Blows warmer air across the crop to stop frost settling • Low noise, no ’chop-chop’ sound • Excellent coverage • Fuel efficient • Auto start and stop to preset temperatures • Compatible with FrostSmart® real-time monitoring • Ongoing support The quiet frost fan. Stops frost damage.
Incidence of spring frost under climate change: injury and recovery options in a Barbera vineyard
By Filippo Del Zozzo¹, Stefano Poni² and Tommaso Frioni³
The effect of a spring frost that occurred in 2021 in northern Italy was studied in a cv. Barbera vineyard and data were compared to those derived from the previous season (2020), when no frost damage occurred. Due to rising temperatures, the advancement of budburst widens the period that exposes developing shoots to spring frost injuries. In vineyards, damage can vary considerably according to frost severity and duration, as well as the stage of shoot development. Thus, a careful assessment of the frost consequences should be carried out in order to make the best decisions either to manage the eventual residual crop or to ensure next season’s full cropping.
INTRODUCTION
Under the current climate change scenario, the expected rising temperatures are causing budburst to occur earlier which, in turn, can increase the severity of spring frost damage (Poni et al 2022). A late spring frost is a significant threat to grapevines and is capable of destroying a full crop, especially when it occurs at the green tip stage and beyond, i.e. when tissue water content has almost reached 75-80% (Fuller et al 1999).
Frost damage to developing shoots affects both yield and grape quality of the current season and, potentially, the following year. The damage severity depends on the cold tolerance of the cultivar, type of frost event and exposure and slope, ranging from total, partial to low injury. As a result, the consequences of frost are anything but predictable with the effect varying within a vineyard and even within the same vine, along the cane or cordon (Frioni et al 2017, Grant et al 2015) (Figure 1). Therefore, objective damage estimation can help growers manage a vineyard according to the mortality of the developing shoot and the following response of the vine.
Grapevine dormant buds contains three meristems: one primary bud primordium and two secondary primordia positioned laterally in relation to the primary. The secondary buds are not usually able to burst unless the
IN BRIEF
■ Budburst was significantly anticipated due to high winter temperatures.
■ A post-budburst sudden decrease of temperatures to -3°C damaged 75% of developing primary shoots.
correlative inhibition derived from the primary shoot ceases (Keller 2010, Lavee et al 1998). If a spring frost kills primary shoots, hitherto inhibited secondary buds can develop new shoots that allow a quick canopy recovery. However, they are known to be less fruitful than the primary bud, with fruitfulness varying from one cultivar to another (Sanchez et al 2005).
This article shows the impact of the 2021 spring frost that killed 75% of developing primary shoots in a cv. Barbera vineyard in northern Italy compared with the previous year when no spring frost occurred, and discusses the role that secondary shoots and suckers might play in canopy and yield recovery (Del Zozzo et al 2022).
BUDBURST AND SPRING FROST OCCURRENCE
In 2021, budburst occurred on 31 March 2021, 13 days earlier than 2020. Over the following days, temperatures dropped below 0°C with a minimum of -3°C reached on 9 April. At that time, some nodes along canes had two to three unfolded leaves, while others were still at the swollen stage. Due to this growth heterogeneity, the impact of the frost was variable along canes. However, a damage assessment revealed 75% mortality in the total developing primary shoots (PS), with only
■ Frost recovery depended on the number of survived primary shoots and suckers developed from latent buds, according to the respective fruitfulness.
■ Shoots from secondary buds were unable to assure yield recovery due to their low fruitfulness.
four surviving out of the 16 nodes retained at pruning time.
VEGETATIVE RECOVERY AFTER THE FROST
Grapevine growth reaction was quick, and 10 days after the spring frost, in addition to the survived PS, shoots from secondary buds (SSB) burst (Figure 2) as well as suckers (SK) originating from latent buds located on the head of the vine trunk. At flowering, the canopy was formed by four PS, six SSB and seven SK, on average (Table 1, see page 59). Vine reaction to frost damage was proportional to the number of damaged PS (Figure 3, see page 58).
YIELD AND SHOOT FRUITFULNESS
The spring frost significantly reduced vine yield to 2.65kg compared to 6.67kg the previous season in the absence of any damage (Table 1). Yield per vine composition
56 www.winetitles.com.au WINE & VITICULTURE JOURNAL WINTER 2023 V38N3 VITICULTURE FROST CONTROL
¹PhD student, Department of Sciences of Sustainable Crop Production, Universita Cattolica del Sacro Cuore, Piacenza, Italy
²Professor of Viticulture, Faculty of Agriculture, Food and Environmental Sciences, Department of Sustainable Crop Production, Universita Cattolica del Sacro Cuore, Piacenza, Italy ³Faculty of Agricultural, Food and Environmental Sciences, Department of Sustainable Vegetable Production Sciences
was 0.98kg from PS, 1.56kg from SK and only 0.51kg from SSB, thus reflecting lower fruitfulness of SSB and SK compared to PS. PS fertility (inflorescences/shoot) was 1.4, whereas SSB had 0.4 and SK 0.8. In addition, bunch weight and compactness from SSB were significantly lower than from PS and SK (Figure 4, see page 58). SSB were not able to compensate for yield losses from bunches carried by PS due to fewer and lighter bunches. At harvest, the number of PS that survived the frost event was directly correlated to total vine yield (Figure 5, see page 58). In our case study, yield primarily relied on the number of survived PS and the number and fruitfulness of SK developed after the spring frost.
VINE BALANCE AND HARVEST GRAPE COMPOSITION
The significant yield/vine reduction was coupled with an unchanged total leaf area and, consequently, the leaf-area-to-yield ratio was

SnapMax Vineguards
The mini greenhouse for vines!
• Pre-assembled and ready to use, NO tools required.
• UV stable long life durable polyethylene, reusable and recyclable at end of life.
• Does NOT split or pop open.
• Translucent for vine inspection.


• Life expectancy 5 years.
• Trains vine straight to the cordon wire.
• For a perfect fit every time, all SnapMax have extra length for ground-wire variation.
For further information call, 03 9555 5500 or email info@globalgreen.com.au
globalgreen.com.au

GENUINE SnapMax
V38N3 WINE & VITICULTURE JOURNAL WINTER 2023 www.winetitles.com.au 57
Figure 1. Shoots on a cane affected by the spring frost. Frost damage varied along the cane. While some shoots were completely desiccated, others survived since their frost tolerance was higher at the time the spring frost occurred due to their different phenological stage.
Figure 2. This developing primary shoot was completely desiccated by the spring frost. Next to the injured shoot, a secondary bud can be seen bursting after the inhibition from the primary shoot ceased.
TheViniClipSystem
Specially developed for the viticulture industry

• Clips are moulded from UV stabilized polyethylene plastic
• Screws are protected by a durable coating
• Available in single or double ended clips
• By design the load is carried by the screw rather than the clip
• Screw pull out loads far exceed those of nails and staples
• Screws can be driven into softer timbers without pre-drilling

• Posts are not subjected to hammer shock when screw driving


• Clips available with nail fixing if preferred (nail gun best results).
AUTOMATIC FLUSHER VALVE FOR DRIP LINE IRRIGATION SYSTEMS
Available in four sizes to fit hose ID 1/2” 13mm, 9/16” 15mm, 5/8” 16-17mm and 3/4” 19mm.
plasticpreciseproducts.com.au
PLASTIC PRECISE PRODUCTS
largely affected. Indeed, in the previous year in the absence of spring frost, the vines had a 0.7m2/kg leaf-area-to-yield ratio, while in 2021 the leaf-area-to-yield ratio (averaged over the three shoot types) rose to 1.45m2/kg which is higher than the presumably optimal range of 0.8-1.2m2/kg (Kliewer et al 2005). This contributed to an excessive final grape sugar concentration (Table 1). At harvest, carried out in both years as soon as grapes had a titratable acidity of <10g/L, the TSS concentration was 27.8°Brix compared with 23.3°Brix in the previous year in absence of frost. Figure 6 also shows that the grapes’ TSS concentration at harvest was inversely correlated to the number of PS avoiding fatal injuries. In addition, in both PS and SK bunches, the soluble solids concentration was correlated with the leaf-area-to-yield ratio (Figure 7 and 8, respectively, see page 60).


SPRING FROST MANAGEMENT: BEFORE AND AFTER
Yield was dependent on the number of PS that survived the spring frost and, eventually, the number and fruitfulness of developed SK. SSB were not reliable for yield recovery after the spring frost event, since their fruitfulness was negligible (Del Zozzo et al 2022). Strategies of direct protection are characterised by keeping the temperature near the vegetative organs above 0°C. Passive strategies aim to skip frost events using vine phenology to delay budburst (Poni et al 2022). Therefore, the desirable actions for protecting crops are mainly preventive, avoiding fatal injuries to PS.

T ppp@tpg.com.au e
61 2 9482 5663
Unit 3A/ 3 Leighton Place, Hornsby NSW 2077
Nail Clip
Water exits here
MADE
Screw Clip
AUSTRALIAN
58 www.winetitles.com.au WINE & VITICULTURE JOURNAL WINTER 2023 V38N3 VITICULTURE FROST CONTROL
Figure 3. The proportional development of shoots from secondary buds and suckers compared to the rate of primary shoots killed by the spring frost. y = 0.8913x + 2.3333; R² = 0.6307.
Figure 4. Bunches carried by a primary shoot (a), suckers (b) and a shoot from secondary bud (c) in 2021, after the spring frost occurred.
Figure 5. The correlation between the number of survived primary shoots after the spring frost and yield. y = 0.3789x + 0.8468; R² = 0.6614.
Figure 6. The correlation between the number of survived primary shoots after the spring frost and total soluble solids. y = -0.693x + 31.494; R² = 0.5486.
However, if a grower is unprepared for a spring frost and nothing preventive can be done, it is useful to carry out a representative damage assessment which should guide the following actions. The number of survived PS is pivotal to the estimation of the final crop yield and the decision to pursue the final harvest or not - even though a smaller amount - can be taken immediately after the frost event. In the event an adequate number of PS survive a spring frost, a reduced but economically viable harvest can be achieved. Our study suggests that action should be directed at restoring a ratio between the photosynthetic area and the crop to within the range proposed by Kliewer et al (2005). Specifically, a calibrated selective shoot thinning performed early in the season when inflorescences are visible could influence the leaf-area-to-yield ratio in favour of the yield. In the scenario of a spring frost with high damage, harvest is not an economically viable option. Indeed, the costs of vineyard management and grape picking would outweigh the potential yield obtainable. Therefore, activities should only focus on vineyard maintenance with regard to the following year’s crop. Under such conditions, shoot thinning should be specifically carried out based on the renewal of productive units, taking into account the total number of shoots and their position within the vine.
FUTURE PERSPECTIVES
This study outlined the importance of prevention against spring frost damage at

Table
‡*** means are significantly different with p < 0.001. ns = no significant differences.
¶Different letters mean significant differences with p < 0.05 (Student-Newman-Keuls test, n=12).
TSS = Total Soluble Solids, TA = Titratable Acidity.
the expense of PS, since the PS fruitfulness is not replaceable. The implementation of passive methods aimed at delaying the phenology of a grapevine can result in skipping a spring frost event, taking advantage of the much higher frost tolerance of dormant buds (Poni et al 2022). Given the current warming climate, it is likely that grapevine phenology will take place earlier in the coming decades, increasing the risk of spring frost occurrence. However, after the most vulnerable location in a vineyard has been identified, a site-specific approach
can be implemented, considering both pre- and post- spring frost strategies of protection. Finally, this study highlights that, depending on the mortality of PS caused by a spring frost, it is still possible to achieve an economically viable harvest.
REFERENCES
Poni, S.; Sabbatini, P. and Palliotti, A. (2022) Facing spring frost damage in grapevine: recent developments and the role of delayed winter pruning–a review. American Journal of Enology and Viticulture 73(4): 211-226.
CORDLESS ELECTRIC PRUNING AND TYING TOOLS


STARK L — 37mm cutting capacity, powerful 21.6v Lithium-Ion battery power, pole mountable, available with 2 or 3 batteries as required.
STARK M — 32mm cutting capacity, 14.4v Lithium-Ion battery power, quick cutting capacity, available with 2 or 3 batteries.

T-FOX — 10cm cutting capacity, 24v Lithium-Ion battery power, weighs only 1.3kg, ¼” chain for clean cuts and built in automatic oiler.
For more information and the nearest stockist in your area, contact us on P: 08 8351 8611

NEXI TYING —
2 x 14.4v Lithium-Ion batteries with 10,000 ties per battery, up to 25mm tie, various spools of tie wire available to suit your needs.
Road, Keswick, SA 5035
V38N3 WINE & VITICULTURE JOURNAL WINTER 2023 www.winetitles.com.au 59
FROST CONTROL VITICULTURE
THE INNOVATIVE & QUALITY RANGE FROM
1 Marlow
E: info@eclipseenterprises.com.au W: www.eclipseenterprises.com.au
2021 Mean/total vine PS SS SK Sig.‡ 2020 2021 Sig.‡ Shoots/vine (n) 4 b¶ 6 a 7 a *** 16 17 ns Leaf area (m2/vine) 1.51 a 0.52 b 1.93 a *** 4.69 3.96 ns Yield (kg/vine) 0.98 b 0.51 c 1.56 a *** 6.67 2.65 *** Bunches/vine (n) 6 a 4 b 7 a *** 29 17 *** Leaf area/Yield (m2/kg) 1.60 1.18 1.39 ns 0.70 1.45 *** Shoot fruitfulness (inf./ shoot) 1.4 a 0.4 c 0.8 b *** 1.8 0.8 *** Bunch weight (g) 178 a 121 b 208 a *** 228 166 *** TSS (°Brix) 28.4 26.9 28.1 ns 23.3 27.8 *** TA (g/L) 10.05 9.72 10.61 ns 9.37 10.12 ns TSS/TA ratio 2.82 2.77 2.65 ns 2.49 2.75 *** Total anthocyanins (mg/g) 1.67 1.75 1.66 ns 1.02 1.72 *** Total polyphenols (mg/g) 2.86 3.00 2.87 ns 1.91 2.92 ***
1. Canopy composition, shoot fruitfulness, yield and grape composition after a late spring frost occurred in 2021, with respect to the previous year.
leaf area to yield ratio and total soluble solids of


shoots. y = 3.9504x + 22.833; R² = 0.8397.
Fuller, M.P. and Telli, G. (1999) An investigation of the frost hardiness of grapevine (Vitis vinifera) during bud break Annals of Applied Biology 135(3):589-595.
Keller, M. (2010) The Science of Grapevines: Anatomy and Physiology, 1st edition, Elsevier Academic Press, Burlington, MA, United States of America.
Lavee, S. and May, P. (1997) Dormancy of grapevine buds - facts and speculation. Australian Journal of Grape and Wine Research 3:31-46.
Sanchez, L.A. and Dokoozlian, N.K. (2005) Bud microclimate and fruitfulness in Vitis vinifera L, American Journal of Enology and Viticulture 56:319-329.
Frioni, T.; Green, A.; Emling, J.E.; Zhuang, S.; Palliotti, A.; Sivilotti, P.; Falchi, R.
Global Irrigation
3.8675x2 - 5.439x + 28.155; R² = 0.7977.
quality of Vitis interspecific hybrid Marquette Scientia Horticulturae 219:302-309.
Grant, T.N. and Dami, I.E. (2015) Physiological and biochemical seasonal changes in Vitis genotypes with contrasting freezing tolerance American Journal of Enology and Viticulture 66(2):195-203.
Del Zozzo, F.; Canavera, G.; Pagani, S.; Gatti, M.; Poni, S. and Frioni, T. (2022). Post-Spring Frost Canopy Recovery, Vine Balance, and Fruit Composition in cv. Barbera Grapevines. Australian Journal of Grape and Wine Research, doi: https://doi.org/10.1155/2022/6596021
Kliewer, W. M. and Dokoozlian, N. K. (2005) Leaf area/crop weight ratios of grapevines: influence on fruit composition and wine quality American Journal of
Simple, Smart Irrigation Management
• Automating vineyards for over 21 years

• Saves time, money and water
• Remote control from your smart phone or device
• Helps to prevent frost damage, heat stress and disease
"Angove Family Winemakers are proud and privileged to have had a long and successful relationship with WiSA"
Angove Family Winemaker
"With our WiSA system every aspect is integrated to ensure maximum efficiency"

Andrew Peace Wines
Serving customer in vitaculture:
• Andrew Peace Wines
• Angove Family Winemakers
• Brown Brothers
• Coriole Vineyards
• Dayleswood Wines
• Jaengenya Wines
• Kendal Jackson Wines- USA
• Nyah Vineyards
• Otuwehero Estates- NZ
• Rymill Coonawarra
SERVICING THE WINE INDUSTRY FOR 25 YEARS. www.irrigatewisa.com.au
• Snobs Creek Estate Wines
• Yarra Valley Vineyards
60 www.winetitles.com.au WINE & VITICULTURE JOURNAL WINTER 2023 V38N3
VITICULTURE FROST CONTROL
Figure 7. The correlation between vine balance expressed as
primary
Figure 8. The correlation between vine balance expressed as the leaf area to yield ratio and total soluble solids of suckers. y = -0.2525x3 +
A few words on grapevine winter buds and pruning with respect to sap flow
By Alain Deloire1, Carole Dumont2, Massimo Giudici2, Suzy Rogiers3 and Anne Pellegrino1
One objective of pruning is to manage yield per vine which is achieved by regulating the number of latent buds. For many years growers and wineries have been interested in what is currently called gentle pruning, precision pruning or pruning with respect to sap flow. But what is behind these concepts?
This article aims to summarise some of the principles behind what is called ‘gentle pruning’. We will detail a) the pruning methods that limit or minimise pruning wound size/surface area on grapevine arms and spurs and b) pruning that allows for a morphology that is conducive to continuous sap flow versus the ‘hydraulic isolation’ of regions within the vine. But first a few words on grapevine dormancy and latent bud organisation.

A FEW WORDS ON GRAPEVINE DORMANCY
Grapevine dormancy is an important phenological period comprising both endodormancy and codormancy. Endodormancy is the inhibition of growth originating from the latent bud meristem. It is brought about by internal factors within the plant that prevent the breakage of dormancy even if external factors are optimal for growth.
Aside from hormonal regulation, endodormancy is triggered by shorter days and cooler temperatures. Winter chilling is then necessary to overcome endodormancy. Although the effect of chilling temperature on dormancy release needs further research at the molecular level, a 200-hour period (eight days) with a mean daily temperature ≤ +8°C has proven to be effectual at permitting buds to break within a reasonable duration and to an acceptable level.
When endodormancy has been overcome, grapevine varieties are physiologically ready for bud break, however conditions that lead to ecodormancy must now also be surpassed. Vines can exist within an ecodormant state if environmental factors that support root activity and bud growth are not optimal. The main environmental factors permitting budbreak include warm temperature (air and soil; > +15 °C) and soil water refilling1
A FEW WORDS ON THE LATENT BUDS IN GRAPEVINES
The latent bud is a compound of vegetative miniaturised axils protected by scales2 The principal axil of this compound is called the latent primary axil, which will develop into the future primary shoot (year n+1). Budbreak of the latent buds at each node of the primary shoot (year n) is first inhibited by a hormonal release from the primary shoot and a prompt bud which forms the shoots called laterals. This nascent structure in the latent bud differs more than two to four months to the simultaneous growth of the bearer shoot before entering into endodormancy (around August in the Northern Hemisphere). Its phyllotaxic plane is perpendicular
to that of the prompt bud and, consequently, the new developed shoot (year n+1) will grow in a parallel plan to that of the bearer shoot/cane.
The meristem which initiated the primordia of leaves and inflorescences in latent buds (year n) pursues its development after budbreak (year n+1).
The developing shoot is named the proleptic axil. The potential fertility is represented in the number of initial inflorescences developed on the primary shoot (on average, 1 to 3 primordia of inflorescences per latent bud) which will form future grapes. This fertility depends on the cultivar, rootstocks and on the climate (mainly temperature, light and water) and the trophic conditions of the year in which the bud is formed.
The main bud primordium of the latent bud, which is a complex of three bud primordia, bears 70-80% of the potential yield.
V38N3 WINE & VITICULTURE JOURNAL WINTER 2023 www.winetitles.com.au 61 PRUNING
VITICULTURE
1University of Montpellier (L’institut Agro), France 2Simonit & Sirch, Italy 3New South Wales Department of Primary Industries, Australia
WHILE PRUNING, SOME BASIC PRINCIPLES NEED TO BE CONSIDERED FOR GRAPEVINE SUSTAINABILITY


Gentle pruning was known and practised in French vineyards as early as the early 20th century (as published by Lafon R. 19213). Strangely, these practices were forgotten for decades but have been reintroduced and practised worldwide in vineyards for the past 20 years. The following information about gentle pruning is a synthesis of books, published research articles and the personal experience of the authors.
Pruning is a traumatic cultural practice for vines irrespective of the pruning method (hand or mechanical pruning). With this in mind, it is important to distinguish two founding principles of pruning that are not always dependant on each other: i) to reduce the size of pruning wounds; ii) to respect the hydraulic flow between the vine organs (trunks, arms, spurs).
The following is a few rules of gentle pruning:
1. As published by Lafon, R. (1921) it is crucial to respect the sap flows by positioning the pruning wounds, when possible, on the same side of the arms and spurs (Figure 1).
2. In the case of cane/Guyot pruning4, 5 , avoid the formation of a willow head.
3. To prevent the creation of dead zones (desiccated cones) within the perennial
in
62 www.winetitles.com.au WINE & VITICULTURE JOURNAL WINTER 2023 V38N3
VITICULTURE PRUNING
organs (trunk, arms, spurs), avoid cuts
close proximity to the wood (Figures 2, 3).
Figure 1. Example of pruning wounds which have been positioned over years on the same side of the arms and the associated spurs (yellow arrows). This promotes the anatomical isolation of the pruned organs while maintaining the hydraulic integration across the plant.
Figure 2. Example of proper spur (cordon) pruning respecting the sap flow of the arm and the spurs: (A) Applying gentle pruning will lead to an increase in the size of spurs year after year; (B) Gentle pruning does not induce necrotic tissue formation in the arm and spurs.
Figure 3. Example of inappropriate spur pruning on a cordon that has resulted in tissue necrosis of the arm and the spurs, interrupting the conduit for sap flow: (C) Necrotic/dead spurs on a cordon due to inappropriate/bad pruning; (D) Inappropriate pruning has induced wood/tissue necrosis at the spur and arm levels, impacting sap flow and vine sustainability.
Figure 4. (A, B) Examples of inappropriate pruning cuts which have been made too close to the adjoining wood (conducting tissues) (orange arrows); (C) A portion of internode should be left while pruning (the length should be 1.5 or 2 times the diameter of the pruned organ; yellow arrows).
4. In wood older than one year, a portion of wood should be left while pruning. The length should be 1.5 or 2 times the diameter of the pruned organ, as presented in Figure 46
5. A consequence of leaving a portion of the wood, however, could be the development of basal buds that will require some extra work by cleaning/removing these growing shoots in spring.

6. The role of the diaphragm (Figure 5) of the cane is to protect the node and the associated latent bud from necrosis or bioaggressor infection as a result of pruning. It acts by isolating the pith between successive internodes7
7. To protect the latent bud from damage due to pruning wounds located above it, it is recommended to leave a section of internode (at least 2cm) above the chosen latent bud which bears the future crop (Figure 6, see page 64). In certain wine regions (Champagne, Charentes, Argentina, Atlantic Coast, etc), the length of the necrosis can be more extensive and is also dependent on the variety. For these situations, one solution is to retain the full internode above the latent bud.
8. Irrespective of the training system it is crucial to allow for the continuous development of living wood (which means avoiding the formation of dead wood) which will lead to an increase in the diameter of the arms and the spurs (Figure 2).
The general aims of gentle pruning respecting the sap flow are:

• to avoid the gradual yearly build-up of necrotic-dead wood/tissues
• to maintain the vascular system (xylemphloem) operational.
WHY APPLY GENTLE PRUNING?
Avoiding tissue necrosis due to pruning wounds, and therefore respecting the vine’s hydraulic integration8, will improve vine and vineyard sustainability and will help:
• achieve more homogeneous budbreak and primary shoot development, and therefore homogeneous vines,
V38N3 WINE & VITICULTURE JOURNAL WINTER 2023 www.winetitles.com.au 63
PRUNING VITICULTURE
Figure 5. The diaphragm is located at the node level and is present in a one-year cane (a) and three-year stem (b). Photo (a) is showing starch coloured in violet by the Lugol and located in the parenchyma cells of the xylem II.
considering that proper sap flow pathways are needed for shoot development
• achieve a better fruit zone microclimate (depending on the vegetative expression/ vigour of the vines) by increasing the height of the spurs over years on a cordon.
• avoid the spread of wood diseases (Esca, Botryosphaeria dieback, etc), another goal of gentle pruning (taille ‘non mutilante’)9

REFERENCES
1Pellegrino A.; Rogiers S. and Deloire A. (2020) Grapevine latent bud dormancy and shoot development, IVES Technical Reviews. DOI: https:// ivestechnicalreviews.eu/article/view/3420
2Torregrosa L.; Carbonneau A. and Kelner J.J. (2021) The shoot system architecture of Vitis vinifera ssp. Sativa, Scientia Horticulturae 288. DOI: https:// doi.org/10.1016/j.scienta.2021.110404
3Lafon, R. (1921) Modification à apporter à la taille de la vigne dans les Charentes, Taille GuyotPoussart mixte et double, Arts & Arts Editions, Bordeaux (réimpression en 2021 de l’édition originale de 1921, éditée à Montpellier).
4Simonit, M. (2015) Guide de la taille Guyot, Editions France Agricole.
5Sicavac (2015) Manuel des pratiques viticoles contre les maladies du bois, BIVC, Sicavac CentreLoire, Imprimerie Paquereau, ISBN 978-2-37006000-6.
6Cholet, C.; Martignon, T.; Giudici, M.; Simonit, M. and Geny, L. (2017) Vigne: pourquoi tailler moins ras aide à freiner l’esca. Phytoma hal-01603357.
7Faúndez-López, P.; Gutiérrez-Gamboa, G. and Moreno-Simunovic, Y. (2021) The role of diaphragm
Figure 6. The wound created while pruning a winter cane (a) will lead to the necrosis of the conducting tissues just below the wound. The length of the necrotic region does not exceed 0.5 to 1cm under certain climatic conditions; (b, c) the dead tissues (brown zone) in comparison with the living conducting tissues (xylem, phloem) around 10 weeks after pruning (Shiraz).
as a natural resistance to the necrosis produced by pruning cuts, IVES Technical Reviews. DOI: https:// doi.org/10.20870/IVES-TR.2021.4817
8McElrone, A.J.; Manuck, C.M.; Brodersen, C.R.; Patakas, A.; Pearsall, K.R. and Williams L.E. (2021) Functional hydraulic sectoring in grapevines as evidenced by sap flow, dye infusion, leaf removal and micro-computed tomography, AoB PLANTS 13(2), April 2021, plab003. DOI: https://doi.org/10.1093/ aobpla/plab003
9Lecomte, P.; Diarra, B.; Boisseau, M.; Weingartner, S. and Rey, P. (2021) Preventing ESCA in Vitis vinifera by proscribing vine training systems or mutilating pruning methods, IVES Technical Reviews. DOI: https://ivestechnicalreviews.eu/article/view/4734

This article was first published online by IVES Technical Reviews, DOI: https://doi. org/10.20870/IVES-TR.2022.5512

WVJ 64 www.winetitles.com.au WINE & VITICULTURE JOURNAL WINTER 2023 V38N3
VITICULTURE PRUNING
Essential Reading for wine industry professionals. www.winetitles.com.au/wvj Subscribe today!
The carbon economy and vineyards – Part 2 Preparing for and participating in the new carbon economy
By Tony Hoare
Following his summary of what we currently know about the wine industry’s carbon footprint, published in the Autumn 2023 issue of the Journal, Tony explores what can be done in the vineyard to limit carbon emissions.
Now that the green house gas (GHG) emission reduction targets have been set and the countdown to meet those targets has begun, how do winegrape growers fit into this new carbon economy?

There seems to be a lot to unpack around this topic. This will undoubtedly create more work for growers and require their careful consideration about how to act to decarbonise and reduce other GHG emissions or, alternatively, increase carbon sequestration in their businesses to either become carbon neutral or a seller in the carbon credits market. Understanding the overall processes and where you fit in as a business is important to ensure that the most appropriate pathway into the carbon economy is chosen to deliver the best outcomes for your business.
The diverse range of winegrape growing enterprises in Australia means that there will be different motivation and means for addressing GHG emissions. As winegrape growers there are two pathways to take at present in the carbon economy. The first is becoming carbon neutral by reducing GHG emissions through changing current practices as well as supplementing any shortfalls towards carbon neutral by purchasing carbon credits, also known as ‘offsets’. Carbon neutrality will become mandatory for winegrape growers in Australia by 2050 as the wine market falls into line with international export markets as well as various government, industry and social expectations and regulations and timeframes for GHG emission reductions.
GETTING STARTED TO REDUCE GHG EMISSIONS IN VINEYARDS
With the target of zero carbon emissions by 2050, there is a relatively long lead time for Australian winegrape growers to achieve GHG emissions reduction targets compliancy. Wine Australia is currently developing an emissions
reduction roadmap for the grape and wine sector. In the meantime, there are plenty of resources to begin the process of auditing your carbon footprint and beginning positive action to reduce GHG emissions in your vineyard business.
A valuable publication has recently been released specifically for viticulture by Integrity Ag and Environment. ‘A Guide to Carbon Footprint Assessment for South Australian Viticulture Production Systems’ is viticulturespecific guide and a great reference for winegrape growers starting to look at GHG emissions and the carbon economy. Australian Grape and Wine, together with South Australian Wine Industry Association (SAWIA), also released a great guide in 2010 which is still relevant today: ‘A Guide to Greenhouse Gas Reduction for South Australian Grapegrowers & Winemakers’. A useful resource for performing your own carbon accounting benchmarking exercise and establishing your baseline carbon footprint is the Australian Wine Industry Carbon Calculator. Calculating your carbon footprint allows identification of Scope 1, 2 and 3 emissions and identification of the ‘hotspots’ of high GHG emissions. Strategies can then be considered to reduce those areas of your business responsible for causing the majority of emissions. Beginning to decarbonise your vineyard in preparation for certification can start at any time and deliver reduced GHG emissions as well as improvements to productivity and improvements in sustainability credentials.
The two ways to achieving carbon neutrality are either to decarbonise aspects of the business or, if this is not possible or practical, to purchase offset carbon credits. Keep in mind that the best emission is the one that doesn’t occur and purchasing carbon credits is seen by some as giving GHG polluters a licence to pollute. The practice of ‘greenwashing’,
whereby a business makes false or misleading environmental claims, is under the microscope at present from not only consumers but authorities protecting consumer interests, such as the ACCC. Wine Australia also has guidelines around making carbon neutral claims and ensuring that those claims are validated and legitimate. Ideally, the best way to carbon neutrality is to reduce carbon and other GHG emisisons by baselining GHG emission levels and understanding where the areas of pollution are occurring.
According to the recent publication ‘A Guide to Carbon Footprint Assessment for South Australian Viticulture Production Systems’, which is based on the outcomes and feedback from a study conducted for South Australia’s Department of Primary Industries and Regions (PIRSA) and a series of pilot carbon accounting workshops run in early 2022 throughout the state in conjunction with Ag Excellence Alliance:
“Reducing emissions in Australian grapegrowing operations should typically focus on optimising inputs, primarily electricity use, fuel use, water use, and purchased inputs (such as nitrogen fertilisers, herbicides, and pesticides) relative to yield developing options to use less emission-intensive input”.
The reduction of GHG emissions in vineyards can begin by focussing on some key areas. The use of nitrogenous fertilisers is a significant contributor to GHG emissions in vineyards. Nitrous oxide (N2O) is the byproduct of nitrogenous fertilisers, animal excreta, legumes and soil cultivation and has 310 times the global warming potential of carbon dioxide. Improving the efficient use of nitrogen fertilisers, minimising soil cultivation and improving soil fertility, drainage and overall structure through increasing soil organic matter (carbon) are all positive steps towards reducing this potent GHG emission. Reducing nitrous oxide emissions from agriculture is the focus
V38N3 WINE & VITICULTURE JOURNAL WINTER 2023 www.winetitles.com.au 65 TOWARDS NET ZERO
VITICULTURE
of a current study at the Primary Industries Climate Challenge Centre based at the University of Melbourne (piccc.org.au). A trial is currently under way in the Quelltaler Estate vineyards in the Clare Valley, South Australia, examining the potential of plasma technology to extract nitrogen from the atmosphere to be stored in water and used for agricultural production. The low energy consumption and high output production rate, which is scalable, has the potential to provide ‘green nitrogen’ for agriculture in the future.
Fuel for vehicles is the major source of GHG emissions in vineyards. Although all on-farm vehicles contribute, tractors are the major GHG emissions polluter in vineyards. Most growers already keep tractor use to a minimum so the risk in making further reductions is that the vineyard may suffer in the short term through jeopardising a crop and in the long term through taking shortcuts in vineyard operations, such as weed management. A good place to start looking at GHG emissions and tractor use is to keep track of the hours and mileage for various operations and consider alternative practices. Weed control is a good example of where reductions in tractor operations can be achieved through practices such adopting undervine mulch, the use of an ATV for herbicide application instead of a tractor
or the use of sensor technology such as the WeedSeeker, a selective weed spray device which allows an increase in tractor speed during spraying and a reduction in herbicide volume.
The other major seasonal tractor operation in vineyards is canopy spraying for fungal and insect pathogens. For most growers the number of spray passes will depend on seasonal disease pressure influenced by climate conditions. Reducing the amount of spray passes and diesel tractor use is a risk
and reward scenario. To have the confidence to remove a spray or increase spray intervals a grower must weigh up the cost savings of chemical, fuel, labour and GHG emissions versus the risk to the vineyard of reduced yield or fruit quality from disease. The new era of electric tractors is fast approaching to ‘fix’ the GHG emissions from diesel tractors however, until electric tractors become more within reach, other strategies to reduce spray passes could be considered. Ensuring spray efficiency and efficacy are maximised through spray coverage and chemical dosage is the best place to start by ensuring correct sprayer operation. Attending a regional spray application workshop or engaging the services of an expert, such as Don Thorp at Hortspray, might allow a reduction in spray frequencies and reduced GHG emissions without increased risk to crop loss.
Field Emissions (Scope 1)
Electricity (Scope 2)

On-Farm Fuel Usage (Scope 3)
Water Pumping (Scope 1, 2 or 3)*

Pre-Farm Emissions (Scope 3)
Source: A Guide to Carbon Footprint Assessment for South Australian Viticulture Production Systems

*Water pumping could be Scope 1, 2 or 3 depending on where and how the power generation for pumping occurs (e.g. Scope 1 for on-farm diesel pumps, Scope 2 for on-farm electric-powered pumps, or Scope 3 for water supplied to the farm under pressure through infrastructure such as a central irrigation system).
One other significant source of GHG emissions in vineyards is the use of electricity to pump water in irrigated vineyards. Emissions from pump use can be offset in a number of ways. If it is not viable to add photovoltaic (PV) power to harvest solar energy for pumping then it may be possible to purchase ‘green energy’ from a supplier. Maximising water use efficiency also maximises electricity use in pumping. To maximise water use efficiency to reduce electricity usage an important starting point is the pump itself. Is your pump fit for purpose and operating at maximum efficiency? An audit of your irrigation system performance will allow you to assess your system efficiency. Check both ends of the system by evaluating emitter uniformity which is as simple as timing output with a bucket placed either under a dripper, or the midrow of a vineyard if you have overhead sprinklers. Good hydraulics are essential for maximising pump efficiency and vice-versa. A good place to start is your local irrigation experts. Or, an independent pump efficiency
66 www.winetitles.com.au WINE & VITICULTURE JOURNAL WINTER 2023 V38N3
VITICULTURE TOWARDS NET ZERO
David Zadow uses 100% solar energy for his vineyard irrigation pumping costs at Blanchetown, South Australia.
Emissions profile of an example grapegrowing operation at a PIRSA research station at Loxton, South Australia.
Green ammonia production trial in the Clare Valley, South Australia.
57% 9% 12% 20% 2%
Production of aqueous ammonia (NH4) using PlasmaLeap’s plasma device to extract nitrogen from air into water.
expert can provide assessment of your pumps’ efficiency or run courses to train you or your staff how to do it yourself. Rob Wellke is an Australian-based international expert who offers courses in hydraulic and pump performance assessment and optimisation (www.talle.biz).

CARBON NEUTRAL CERTIFICATION
Once zero GHG emissions status has been achieved and is sustainable into the future, then an official certification can be sought through the Climate Active program (climateactive. org.au/be-climate-active/certification). To be certified carbon neutral, a business must not produce any excess GHG emissions and show this to be the case on an ongoing basis. Once certification has been achieved, if there are excess carbon credits generated by the business then consideration maybe made to sell those carbon credits through the Clean Energy Regulator, the independent statutory authority responsible for administering legislation aimed at reducing Australia’s carbon emissions and increase the use of clean energy (cleanenergyregulator.gov.au)
PLAYING THE MARKET — AUSTRALIAN CARBON CREDITS (ACCUS)
The Australian government has allocated funds for an emissions reduction fund which in the future will allow the trading of Australian Carbon Credits (ACCUs) which have been certified under the Clean Energy Regulator’s standards. This will allow carbon neutral businesses to on sell surplus ACCUs to industries that do not have the ability to decarbonise their businesses and have to purchase carbon credits to offset emissions to become carbon neutral. To generate ACCUs that are certified for trading is not a straightforward or easy process at present.
Forty years of increasing carbon dioxide levels in the atmosphere measured at the Kennaook/ Cape Grim Baseline Air Pollution Station, Tasmania. Source: https://www.csiro.au/greenhousegases


Winegrape growers might assume that because they have land and vegetation in their vineyards that they will automatically have ACCUs which they can turn into cash. The prospect of making passive income from sequestering carbon and selling the credits is obviously appealing to vineyard landholders however, it is not a simple or inexpensive process. Firstly, the landholder must be certified carbon neutral under the Climate Active program guidelines. Only then can surplus carbon credits be traded. Landholders must also demonstrate that any carbon credits they generate are from a change in land use which for many farmers might not work and be counterproductive to their current agricultural production. Whilst the scheme doesn’t allow for existing permanent crops such as grapevines to be considered as ACCU generators in the scheme, it does allow for the midrow, headlands and land surrounding vineyards to be used to generate ACCUs.
A response to this aspect of the carbon economy has been the emergence of carbon ‘trading’ companies, also known as ‘aggregators’ or ‘project developers’. These companies facilitate the sale of your excess carbon credits (additionality) to the carbon economy where others purchase them to offset their own emissions in exchange for a commission of between 20-30%. It is a case of buyer beware when entering this carbon economy as project developers have various inclusions and exclusions as part of their commission. Keep in mind that carbon stability for offset ACCUs sold need to be audited regularly with associated costs of randomised soil sampling and laboratory analysis usually borne by the landholder which is not a cheap exercise. Aerial imagery has been touted as a quick fix for auditing soil and vegetation carbon levels from the air however, this is yet to be realised in practice and is still being developed. The biggest single consideration to becoming a
vinpost.com.au Contact Mat: 0439 869 499 or mat@vinpost.com.au Find us on Instagram and Facebook Five times faster than replacing the post! FIX broken timber posts k Stronger Faster Safer Proudly supporting the Australian Wine industry V38N3 WINE & VITICULTURE JOURNAL WINTER 2023 www.winetitles.com.au 67
TOWARDS NET ZERO VITICULTURE
trader in the ACCU market is that the land and vegetation used has to be committed to carbon credit generation for more than 25 years with testing required every three to five years.
The acclaimed environmental scientist, author and explorer Tim Jarvis, through his Forktree project, is trialling methods on a property in the Fleurieu Peninsula, South Australia, for quantifying carbon stored in soil and vegetation (www.theforktreeproject.com). It is hoped that the project will allow small to medium sized landholders to calculate more easily carbon sequestration rates and improve biodiversity at the same time.
For further information and the process and eligibility of a proposed ACCU project visit: https://www.cleanenergyregulator.gov.au/ ERF/About-the-Emissions-Reduction-Fund/ emissions-reduction-fund-schematic.
AUTHOR’S NOTE
This is not my first attempt to write about this topic. Fifteen years ago I wrote a piece for Australian Viticulture (since incorporated into the Wine & Viticulture Journal) titled ‘Carbon neutral viticulture the inconvenient truth’. I even went as far as establishing a certified carbon neutral vineyard and used it as a case study. I remember there was a real buzz around that time, especially after the release of the documentary ‘An Inconvenient Truth’, presented by former US Vice President Al Gore. Then, all of a sudden, the momentum was lost and a hiatus set in for the next 15 years. Thankfully, it seems we are back where we started, only this time there is government support, new technology, a new generation at the helm and, finally, it seems, a greater social will to have a real crack at reducing GHG emissions.
Step 1 – Enter and maintain a licence agreement
Entering into a licence agreement confirms your commitment to achieving carbon neutrality and ensures you are aware of your obligations for certification. A licence agreement lasts for two years; however, you will have the opportunity to re-commit to a new agreement every year.
Step 2 – Calculate your emissions
Calculating emissions ensures you are taking responsibility for all emissions produced from a certified activity. Emissions can come from many sources, including electricity use, transport fuels, waste and business travel. Emissions from all relevant sources are added up to give the total emissions in a carbon account. A base year is set to allow for emission comparisons over time.
Step 3 – Develop and implement an emission reduction strategy
A key component of certification is to make emission reductions ahead of offsetting. An emission reduction strategy identifies the activities you plan to undertake to reduce your emissions over a defined period. This often includes changes to your business operations such as reducing electricity or purchasing it from renewable sources, limiting or avoiding travel, and using certified carbon neutral products and services. You will need to report publicly on your emissions each year and identify where reduction activities have contributed to lower emissions.
Step
4 – Purchase offsets
Offsets are purchased to compensate for emissions that cannot be reduced or avoided. To ensure all offsets used under Climate Active are genuine abatement, only offsets that have met strict integrity criteria are allowed.
Step 5 – Arrange
independent validation
Independent validation helps provide assurance that a carbon neutral claim is credible. Independent validations vary depending on the certification type and size of your total emissions. It may include arranging a source data audit when you apply and periodic technical assessments of your carbon neutral claim.
Step 6 – Publish a public
statement
A public disclosure statement allows interested parties to interrogate your carbon neutral claim. It ensures transparency and helps builds trust and public confidence in the claim. A statement is required every year for ongoing certifications.
Six steps to certification.
Source: Climate Active Guide © Commonwealth of Australia (Department of the Environment and Energy) 2019.
REFERENCES
Hoare, T. (2008) Carbon neutral viticulture – the inconvenient truth. Australian Viticulture 12(2):39-42.
RESOURCES REFERRED TO IN THIS ARTICLE
A Guide to Carbon Footprint Assessment for South Australian Viticulture Production Systems
https://agex.org.au/wp-content/ uploads/2022/08/1327-Viticulture-producer-guideFINAL_July22.pdf
A Guide to Greenhouse Gas Reduction for South Australian Grapegrowers & Winemakers
https://agw.org.au/assets/environment-biosecurity/ Greenhouse-Gas-Reduction-Guide-Nov-2010.pdf
Carbon Neutral Claims (Wine Australia)
https://www.wineaustralia.com/getmedia/78afcedea124-4ec8-ac88-89bccb7ad61d/WA_Factsheet_ CarbonNeutralClaims_May-2021-pdf.pdf
Climate Active Guide
https://www.climateactive.org.au/sites/default/ files/2022-07/climate-active-guide.pdf
Australian Wine Carbon Calculator
https://www.awri.com.au/industry_support/ sustainable-winegrowing-australia/carbon-calculator/
Greenwashing by Businesses in Australia: Findings of the ACCC’s Internet Sweep of Environmental Claims
https://www.accc.gov.au/system/files/ Greenwashing%20by%20businesses%20in%20 Australia.pdf
ACKNOWLEDGEMENTS
Thank you to Edward Scott, from Soil and Land Co. (soilandland.com.au/in-touch-withyour-soil.html#/) for his time and explanations of the complexities of the carbon economy for this article.
68 www.winetitles.com.au WINE & VITICULTURE JOURNAL WINTER 2023 V38N3
VITICULTURE TOWARDS NET ZERO Climate Active Guide 6 Climate Active certification 16
WVJ
The tempting taste of Trousseau
By Sonya Logan
Smallfry Wines is a partnership in business and life between Suzi Hilder and Wayne Ahrens. Viticulturists bitten by the winemaking bug, the couple acquired a farm in the Barossa Valley which contained an assortment of unidentified varieties including, as they would eventually learn, Trousseau.
When partners in business and life
Wayne Ahrens and Suzi Hilder, of small batch producer Smallfry Wines, purchased a farm in Vine Vale, east of the Barossa Valley township of Tanunda, in 2007 they became the custodians of a vineyard that boasted some of the oldest vines in the region. As well as some usual suspects — Grenache, Shiraz, Semillon and Riesling among them — the vineyard contained a “murky hodgepodge” of unidentified vines, as Ahrens describes them.
“I asked Ken, the vendor, what they were and he told me Pinot Noir but I was unsure,” Ahrens recalls. Around 2012, Suzi attended an ampelographers workshop. Ahrens took the opportunity to take samples of the vines along to the workshop where he was informed they were Trousseau — a variety he admits he’d not heard of.
The Trousseau vines in question number little more than 20 vines and are dotted throughout plantings of predominately Grenache and a smattering of Pedro Ximenez, Cinsault and Mataro.
“My theory is that this was a bundle of cuttings that someone picked up from Spain after being told they were Garnacha and were then planted into our Vine Vale dirt,” Ahrens surmises.
Remarking that the Trousseau vines have “butts a foot thick”, Ahrens says cuttings were propagated from these original plantings and used to establish an additional acre “for interest” in 2014.
“We have tended to put the Trousseau on the better sites within the vineyard,” Ahrens says. “We are on Soldized Solondnetz soils which I think does help this variety express in our climate. Budburst is early so we decided to put them on a higher trellis as we are a bit frost sensitive.
“In order for something to be viable on our farm it needs to be resilient. We use a simple foliage catch wire and cordon pruning. There will be no foolish bunch/shoot thinning on our farm.
“We have established a cordon for our young vines and, looking at the old vines, they seem to enjoy the establishment of structure. I am not sure how they would go on cane pruning. In our climate a foliage catch wire is very helpful.”
Asked if the vines were particularly thirsty compared with the other varieties in the vineyard, Ahrens responds saying, “This is an interesting point”.
“Given it is what I would class a continental variety, I think it fits into a similar category as Riesling. Whilst it doesn’t mind a drink (like most of us!) it can do without as well. I don’t see it requiring a higher water regime than we would apply elsewhere. I do think as mangers we need to be aware of the timing of a particular variety’s cycle. As an early variety I include it at the beginning of an irrigation cycle and am aware that a little drink ahead of veraison is going to be ahead of the other varieties on our property.”
He says the variety, or at least his clone of Trousseau, is quite resilient to disease and climatic variations in general.
“They seem quite resilient to fungal disease. In a year when we have had downy mildew pressure in particular they have stood up better than Grenache, for example,” Ahrens notes.
He says yields are “on the low side with small bunches sparsely located”. “Think Pinot not Shiraz,” he elaborates.
At the time Wayne and Suzi discovered they were growing Trousseau they were making an Iberian blend so decided to add the fruit from the old vines to that wine having previously included it in a fortified.

“I was trying to create a little Iberia as I have an affinity for Spain and Portugal having lived in Catalunya during my not entirely misspent youth,” Ahrens explains. “By the time the new vines came into production our outlook had changed and Suzi suggested we do something a bit more ‘Basket Rangey’, so I decided to incorporate carbonic maceration into the mix and a star was born.
“You want to talk about when you get it right, everyone gets it? This was that wine. Right from the start we knew this was something worth pursuing. It helped that at the time of our first release Anton Von Klopper [Lucy M. Wines, Basket Range] had a Trousseau and Joe Holyman [Stoney Rise,
V38N3 WINE & VITICULTURE JOURNAL WINTER 2023 www.winetitles.com.au 69 ALTERNATIVE VARIETIES VITICULTURE
Smallfry Barossa Pimpernel Trousseau
Tasmania] also released his first Trousseau. It felt like something was really happening.”
Ahrens says he harvests Trousseau “as soon as any green tannin backs off”.
“I love the strawberry fruit spectrum that we get from this variety and for me the picking window is a matter of a day or two at most,” he explains.
Fruit is hand harvested and then undergoes carbonic maceration for eight to 10 days. After the fruit is crushed and destemmed, open fermentation takes place over three to five days. The juice is then drained and lightly pressed before finishing ferment in tank. It is bottled under crown seal with 20ppm SO2
Ahrens says there are no plans to extend Smallfry’s Trousseau plantings as he doesn’t believe it’s a variety that is ideally suited to the Barossa Valley’s climate.
“It is an interesting variety for us. It works as it gives us something to do early in the season. Intuitively, though, we shouldn’t be planting this variety in the Barossa; we should be down in the Tamar with Joe Holyman, but
Trousseau
BACKGROUND
The preferred international synonym for this variety is Trousseau (true-so) because DNA evidence suggests an origin in north-east France. Interestingly, both Chenin Blanc and Sauvignon Blanc are siblings of Trousseau; and Savagnin is a likely parent.
The first mention of Trousseau was in Jura (north-east France) in the 18th century as Troussot. It appears to have been taken to the Iberian Peninsula long ago because it has been grown in both Portugal and Spain for at least 200 years. Trousseau has many synonyms including Bastardo and variants (Portugal), Carnaz and Godello Tinto (Galicia Spain), Maria Ordona and variants (Spain) and Maturana Tinta (Rioja, Spain).
The global area planted in 2010 was 3431ha with at least 90% in Portugal, where it is mainly grown in the Douro (as a port variety). In the Jura, where it is a very minor variety today, it is authorised for both Arbois and Cotes du Jura appellations for rosé and red wines. In Australia, Trousseau has had an interesting history. It is likely that it was imported in the 19th century, together
as a contrarian I see its value. Treated with respect and understanding this varietal has a place in our mix.
“I think that we have a lot to learn about how to manage this variety. We are looking
to produce a fruit forward style from largely young vines but I do believe there is potential to produce a wine with much more gravitas with tweaking and vine age,” Ahrens says.
with other varieties from Portugal, and was subsequently grown under various names in SA, NSW and Victoria.
When Pierre Truel, the noted French ampelographer, was invited to Australia in 1976 by the CSIRO, he identified old so-called ‘Cabernet Gros’ and ‘Touriga’ vines in mixed plantings in SA and NSW, respectively, as Trousseau. In SA, Francois de Castella (in his report to the Phylloxera Board in 1941-42) stated that ‘Cabernet Gros’ was not a type of Cabernet (as did Boehm and Tulloch 1967).
Until recently, the total area in Australia has been small — there were 26ha in SA in 1999 (Kerridge and Antcliff 1999). Currently, there are at least 10 wine producers in Australia (mainly in SA and WA) with wines labelled as either Bastardo, Trousseau or Maturana Tinta.
VITICULTURE
Budburst and maturity are early. Vigour is moderate with a sprawling growth habit. Bunches are small and well-filled with small berries Yield can be low to moderate. It is more susceptible to fungal diseases than average, particularly Botrytis bunch rot.
Bunches are also prone to sunburn and, as for Shiraz, berries shrivel when ripe.
WINE
Due to a lack of colour, Trousseau is most suited to rosés and light reds if not blended with other varieties. Nevertheless, wines can have fresh acidity and intense fruit with notes of raspberry, spice, and orange peel.
REFERENCES
Boehm, E.W. and Tulloch, H.W. (1967) Grape varieties of South Australia. Adelaide, SA: Department of Agriculture: 95p.
De Castella, F. (1942) The grapes of South Australia: a survey of the viticultural industry, 1941-1942: Francois De Castella’s reports to the Phylloxera Board. Adelaide: Mail Newspapers Ltd: 59p.
Kerridge, G. and Antcliff, A. (1999) Wine grape varieties. Collingwood, Vic.: CSIRO Publishing: 205p.
For further information on this and other emerging varieties, contact Marcel Essling at the AWRI (marcel.essling@awri.com.au or 08 8313 6600) to arrange the presentation of the Alternative Varieties Research to Practice program in your region.
70 www.winetitles.com.au WINE & VITICULTURE JOURNAL WINTER 2023 V38N3 VITICULTURE ALTERNATIVE VARIETIES
WVJ
Partners in business and life, Smallfry Wines’ Suzi Hilder and Wayne Ahrens.
Is there a meaningful role for luxury in wine?
 By Justin Cohen, Senior Marketing Scientist, Ehrenberg-Bass Institute for Marketing Science, University of South Australia

The opening session of the Pinot Noir Celebration Australia, held in the Mornington Peninsula in February, had the somewhat ambiguous title, ‘Challenging our philosophy’. Advertised as “an intellectual exploration of wine”, the discussion focussed on the concept of luxury and its application to wine. Picking up on this thread, Justin canvasses what it means to be a luxury brand and, more importantly, how to attract sales in this category.
The 10th Pinot Celebration Australia was held in the Mornington Peninsula this past February. The event stimulated discussion among wine scribes about the philosophy of luxury and how this relates to the wine category (Allen 2023, Hooke 2023, Woodward 2023).
To gather further insight into this topic, I conducted interviews with Olivia Barrie, CEO of Mornington Peninsula Vignerons Association; Chad Elson, CEO of Gibson Wines, based in the Barossa Valley, who in his previous role as general manager of international sales and brand at Seppeltsfield conducted a considerable amount of research into the meaning of luxury; and Justin Lane, a domestic wine buyer at Langton’s. The purpose of this article is to discuss the context of luxury in the Australian wine category and address how to create demand for fine wine brands.
DEFINING LUXURY
Chad Elson reflected that luxury brands are defined by price, quality, history, pedigree and authenticity. Focusing specifically on the role of quality in luxury, Justin Lane said, “The devil is in the detail. There is no marketing fluff or sugar coating around perceived quality. It either is or it isn’t. At the luxury level it becomes more objective than subjective.” Commenting on achieving a luxury designation, Elson added, “Luxury can’t be claimed. It needs to be earned. As a producer, we can have a thought on what it means, but the final verdict is in the hands of a consumer.”
Olivia Barrie acknowledged that there is a lot of discomfort around the word ‘luxury’ in the wine industry. Elson said, “If you think about people investing in luxury as a form of status,
Grange is an example of that. A lot of people buy it as a form of conspicuous consumption”. He elaborated, “Luxury has its role in the wine industry, but the majority of wine drinkers don’t wake up and say they want a luxury wine today and let me go and find one.” He also pointed out that there is a distinction between people seeking out a luxury good versus a collectible. Luxury is more status-driven, he said, whereas a collectible is more of a personal investment that the buyer believes will accrue value over time.
DOES RESTRICTED AVAILABILITY IN THE LUXURY DEBATE MATTER?
Romaniuk and Sharp (2016) challenged the commonly-held belief that a higher market penetration of a brand would lead to a reduction in desirability, which has been a key tenet of the luxury sector. Romaniuk and Sharp (2016) used multiple sets of data from multiple categories, including Champagne, in multiple markets and investigated the relationship between awareness, ownership and desirability. Their research discredited the belief that having higher penetration decreases demand. Another study on alcohol brands, reported by Romaniuk and Sharp (2016), showed that perceptions of restricted availability do not correlate with perceptions of luxury which should further alleviate concerns about wide distribution.
The issue of restricted availability for luxury wine, however, is perhaps more a practical debate than just an ideological one. Reflecting on the Mornington Peninsula wine region, Barrie said, “We don’t want to become the Monaco of Melbourne”. However, producing a premium varietal with limited supply means debate must be had about who their customer
base should be from a strategic perspective. Barrie said: “We are an hour out of Melbourne. We are a little region with a lot of tourist traffic. We can’t accommodate lots of people and we want high value spenders. Don’t talk to everyone. Find your people and talk to your people.”
Using the language of the Ehrenberg-Bass Institute, we would advocate sophisticated mass marketing (Sharp 2010). It is important to understand that people buy from repertoires so brands shouldn’t be too narrow in their focus on wine fanatics as they are not the only high value spenders in the market. Furthermore, due to their high involvement in the category, these buyers will have a larger repertoire and competitive set to choose from. This is further supported in the context of fine wine by Sharp et al (2011) using Australian wine retail data from Cohen (2010) showing that there is limited evidence of niche behaviour when investigating grape variety, region or price tier. According to Chad Elson: “You find luxury buyers across all life stages if your product resonates with them. There are not certain demographics that exclude buyers in the luxury space.” Penetration is still the route to sustainable growth (Sharp 2010).
IT’S A JOURNEY TO INCREASE SPEND
Justin Lane spoke about the risk for emerging fine wine producers in setting higher price points too quickly. If this increment is too great a divide, it can result in not bringing their customers along with them. Elson added, “It is fanciful to think you can formulate a luxury product, bring it to market and hold the correct perception of luxury without persistence of strategy over a long period of time.” Lane remarked that to maintain and build a higher
V38N3 WINE & VITICULTURE JOURNAL WINTER 2023 www.winetitles.com.au 71 LUXURY WINE SALES BUSINESS & MARKETING
spend you must work to build reach so that demand outstrips supply.
It is also imperative that brands find alignment within their region. Lane acknowledged that there is a movement of producers who are trying to push into the luxury market but are being undermined by volume levels at a lower price point. Lane lamented: “How does a brand avoid deep discounting and hold price, let alone elevate price, in this turbulent market? It is hard to be luxury and have a deep discount component in your business under the same umbrella.”
ON-PREMISE IS AN OPPORTUNITY
Lane observed that many prospective fine wines are getting their start by building demand in on-premise and getting on the right wine lists. By way of example, Barrie commented on the success Mornington Peninsula has had with on-premise. This is further supported by Woodward (2023) who reported on Wine Business Solutions data that indicated that Pinot Noir accounts for 18.5% of restaurant sales compared to its 5% share of plantings in Australia. The emerging opportunity in wine-by-the-glass programs was further explained by Lane: “There was a time when 15 bucks a glass was the limit, but now the prevalence of Coravin has helped break that ceiling and get beyond 20 bucks a glass.” He added wine brands need a strategy to harness these wine experiences on-premise and lead consumers to engage further with the brands and make purchases through other sales channels.
AUTHENTIC STORYTELLING IS KEY
Elson said the wine industry is very good at talking about technical aspects, but there is an incorrect view that this is the only reason buyers will invest in higher price wines. “We should be working harder at the development of the stories behind the wine in the bottle,” he said. “People spend money for emotive reasons and the story and the myth that sits in the wine. Where the rubber hits the road is where a customer walks into a cellar door environment and they engage with a hospitality worker and not a winemaker,” he commented, adding that brands need to invest in training and consider how storytelling translates in that environment. His view is that this will lead to consumers being willing to pay higher price points.
ASSOCIATING WITH HIGHER SPENDING OCCASIONS IS CRITICAL
Building associations between your variety, region and brand and higher spending purchase and consumption occasions will help achieve a higher spend. Romaniuk and Sharp’s (2016) principles of prioritising category entry points (CEPs) and building mental availability can help. I have previously published articles in this journal (2021, 2022) that are useful for review. Building the association between wine and food is one such opportunity to develop higher spend on wine, according to Elson. He used Napa as an example of a region that has used this strategy to build value into its regional brand. Research needs to be done to uncover and help brands prioritise CEPs that will lead to higher spending occasions both within the competitive context of the wine category, but even more broadly in categories beyond wine that appeal to buyers’ discretionary incomes and hedonic needs. It is important that brands understand the important role that memory plays and that getting recalled in these key higher spending occasions is more important than communicating that premium, fine or luxury position.
LUXURY ISN’T A STRATEGY FOR EVERYONE
The debate about luxury and what it means for the wine industry plays an important role in helping brands focus their attention on where they currently sit and where they want to be. The production side of a wine brand plays a critical role in the quality of wine. However, as Barrie commented, the consumer must always be kept in the middle of all decisions. She said marketers are necessary to make sure strategy is scalable. Elson cautioned: “There is something naturally sexy about the luxury category. However, wine businesses can be incredibly successful not in that space. Be careful about being particular about what chapter of the industry you want to be in because luxury is not the be all and end all for everyone.”
REFERENCES
Allen, M. (2023) How authentic is your (expensive) Pinot Noir? Australian Financial Review, 23 February, https://www.afr.com/life-and-luxury/ food-and-wine/how-authentic-is-your-expensivepinot-noir-20230215-p5ckth


Cohen, J. (2010) Descriptive Patterns in Wine Buying, doctoral thesis conferred by the University of South Australia.
Cohen, J. (2021) Avoid marketing pitfalls so you can invest in sustainable growth. Wine & Viticulture Journal 36(1):73-74.
Cohen, J. (2022) How wine brands can effectively use social media. Wine & Viticulture Journal 37(1):8384.
Hooke, H. (2023) Luxury and wine explored. The Real Review, 14 March, https://www.therealreview. com/2023/03/14/luxury-and-wine-explored/ Romaniuk, J. and Sharp, B. (2016) How brands grow: Part 2. Melbourne, Oxford University Press. Sharp, B. (2010) How brands grow. Melbourne, Oxford University Press.
Sharp, B.; Lockshin, L. and Cohen, J. (2011) How do fine wine brands grow? 6th Academy of Wine Business Research Conference, Bordeaux, France. Woodward, G. (2023) Australia should celebrate its Pinot Noirs more. The Buyer, 5 April, https://www. the-buyer.net/insight/guy-woodward-on-australianpinot-noir/
72 www.winetitles.com.au WINE & VITICULTURE JOURNAL WINTER 2023 V38N3
BUSINESS & MARKETING LUXURY WINE SALES
Justin Lane
Chad Elson
WVJ
Olivia Barrie
Update on the market for Australian wine in Southeast Asia
By Angelica Crabb, Senior Analyst, Wine Australia

Southeast Asia has become an important region for the Australian wine sector. In 2022, Australian wine exports to Southeast Asia grew by 16 per cent in value to $305 million and 56% in volume to 27 million litres.
The region is a diverse group of markets, home to more than 686 million people, about 8.6% of the world’s population. Indonesia and the Philippines are the most populous, followed by Vietnam, Thailand, Myanmar and Malaysia. As a whole, these markets represent a significant opportunity for Australian wine due to their population size and economic growth.
Singapore is the only market classified by the International Monetary Fund as an “advanced economy” in Southeast Asia, while the rest are classified as “emerging”. Although the emerging markets currently have lower GDP per capita levels, their wealth is expected to grow at stronger rates than developed economies over the next few years.

As a whole, Southeast Asian markets represented 6.7 million nine-litre cases of wine
sold in 2021, valued at US$1.4 billion in retail value. This ranks the group roughly around 43rd in global wine markets by volume but ranked 25th by value. Driving this result is the high average value of wine sold in these markets – an average of US$17.88 per bottle overall compared to US$9.46 in the United States, US$11.67 in the United Kingdom and US$9.10 in Australia. However, this high average value is partially driven by high taxes on wine in some of the Southeast Asian markets.
Wine consumption fell for these markets as a group during 2020 as a result of the COVID-19 pandemic restricting tourism. There was a small recovery in 2021, growing by 1% in volume and 5% in value. Looking at projected growth to 2026, IWSR is forecasting 7% growth in volume and value on average per annum. Driving this growth are rising incomes, the return of tourists and a growing appetite for good quality alcohol.
In the year ended December 2022, exports of Australin wine to Southeast Asia increased by 16% in value to $305 million and 56%
in volume to 27 million litres — a record level. There are 461 exporters shipping to the region, a 7% increase compared to the previous year. As a group, Southeast Asia is worth more in value than the Canadian market for Australian wine exports, but less than the United Kingdom.
Exports to all key Southeast Asian destinations increased in value, with the exception of Singapore. The main drivers behind this growth were Thailand (up 118% to $62 million) and Malaysia (up 78% to $61 million). A decline in the value of exports to Singapore, down 20% to $132 million, offset some of these gains. Singapore remains the number one destination in Southeast Asia for Australian wine exports but as a trading hub some of the wine is on-shipped to other Asian markets.
For the whole wine category, the largest wine market in the region by value (and second only to the Philippines by volume) is Singapore. While the wine market in Singapore is fairly well developed compared to other destinations in the region, Singaporeans
V38N3 WINE & VITICULTURE JOURNAL WINTER 2023 www.winetitles.com.au 73 EXPORTS BUSINESS & MARKETING
Singapore remains the number one destination in Southeast Asia for Australian wine exports but as a trading hub some of the wine is on-shipped to other Asian markets.
only drink 2.6 litres of wine per adult per annum. IWSR has forecasted that Singapore will experience growth by both volume and value during 2021-26, growing by just over 200,000 cases worth US$80 million, or 3% on average per annum.
Australia is well placed to take advantage of this growth being ranked number one in volume and value of wine sales in 2021, with French, Chilean and Italian wines trailing after. And perceptions of Australian wine are improving among wine consumers in Singapore. The perceived quality of Australian wine has been on a steady increase from 2016 to 2022, now scored 7.85 out of 10. While being associated with a wide variety of wines, as well as being food friendly, have always ranked highly by Australian wine drinkers in Singapore, attributes like expensive/fine, sustainable and innovative are slowly growing as well. While it has only been measured for two years, the authenticity of Australian wines is ranked highly at 89% of consumers agreeing with the association. In fact, Australian wine’s associations with authenticity and sustainability in Singapore is on the same level as Australian wine consumers back home in the domestic market.
Singapore is a major trading hub in Southeast Asia, and as such some of the wine it imports gets re-exported to other markets in the region. For instance, in 2021 it recorded wine imports of more than 32 million litres, while only 12.4 million litres were consumed in market. While Australian wine ranks first in consumption, French wine is the number one imported source. It appears that most of the French wine is re-exported to markets including Japan, Hong Kong and even Australia. A share of Australian wine is also re-exported to destinations such as Malaysia, Indonesia and Thailand.
Thailand is an emerging wine market, where consumption is driven by tourists. During the COVID-19 pandemic inbound
tourism suffered and wine consumption along with it. The volume of wine sold in Thailand fell by 23% in 2020 to 1 million cases, and recovered slightly to 1.2 million cases in 2021. IWSR forecasts a return to the 2019 level of wine consumption by 2024. This is similar to OECD’s forecasts for the recovery of the tourism sector in Thailand.
Australia is the number one country of origin by volume and value of wine sales in Thailand, ahead of Chile, Italy and France. In 2022, Australian wine exports to Thailand increased by 118% in value to $62 million and 129% in volume to 7 million litres. This translated to a rise in the value ranking of Thailand as a destination market from number 15 in 2021 to number 7 in 2022 its first appearance in the top ten.
Unlike Singapore and Thailand, the Vietnamese wine market has a significant domestic category which, in 2021, had a 26% volume share of wine sales. Australia ranks fifth in volume after domestic, Chilean, French and Italian wines. Australian wine is forecasted

to grow by 9% per annum out to 2026, slightly faster than the total market (8% growth) and overtaking Italy in volume by 2023. In 2022, Australian wine exports to Vietnam grew by 103% in value to $11 million and 222% in volume to 2.1 million litres. The number of exporters shipping to Vietnam also grew — up 60% to 101 companies.

As with other markets in the region, wine consumption is heavily reliant on tourism and faced setbacks during the COVID-19 pandemic. Beer is also a major competitor, controlling 99% of the alcohol market in Vietnam. Wine (especially imported) is seen as a luxury product typically reserved for special occasions or corporate gifts. Because wine is an emerging category in Vietnam, consumers often use attributes such as price for an indication of product quality, especially for those on lower incomes. While per capita consumption is less than a litre per year, population and economic growth make Vietnam an attractive emerging market in the years to come.

74 www.winetitles.com.au WINE & VITICULTURE JOURNAL WINTER 2023 V38N3 BUSINESS & MARKETING EXPORTS
Figure 1: Wine consumption in Southeast Asia
WVJ Broadcast on Daily Wine News, social media and more!
LIST WITH US ONLINE
Figure 1. Wine consumption in Southeast Asia.
Adding to your staff?
Global wine consumption drops to nine-year low as exports hit record value
By Sonya Logan
In April this year the International Organisation of Vine & Wine (OIV) released its annual State of the World Vine and Wine Sector report for 2022. The following is some of the highlights from that report.
The world consumed an estimated 2 million hectolitres less wine in 2022 than it did in 2021, continuing the downward trend that began in 2018, according to the latest State of the World Vine and Wine Sector report compiled by the International Organisation of Vine & Wine (OIV).
The decline in consumption to an estimated 232 million hectolitres (mhl) is the lowest level since 2002 (227mhl).

Since 2017, global wine consumption has decreased at a regular rate, the OIV’s report notes.
3. W Wine consumption
“This negative trend can be mainly attributed to the decline in China’s consumption, which has lost on average 2mhl per year since 2018. This downward trend was accentuated in 2020 by the COVID-19 pandemic, which brought a depressing effect on many large wine markets. Consumption was hit by lockdown measures, the disruption of the HoReCa [hotels, restaurants, and catering] channel, and an overall lack of tourism,” the OIV report continues.
the war in Ukraine and the associated energy crisis, together with the global supply chain disruptions, led to a spike in costs in production and distribution. This resulted in significant increases in wine prices, the OIV report states.
EU markets consumed the most wine in 2022 (111mhl), accounting for 48% of the world’s consumption. France was the highest consuming country in the EU at 25.3mhl followed by Italy with an estimated 23.0mhl.
In 2022, consumption in the UK the fifth largest wine consuming country in the world behind the US, France, Italy and Germany — is estimated to be 12.8mhl, a decline of 2% on 2021.
IN BRIEF
■ It is estimated the world produced 258 million hectolitres of wine in 2022, a 1% decrease compared with 2021.
■ World wine consumption in 2022 is estimated to be 232 million hectolitres, a drop of 2 million hectolitres compared to 2021.
World wine consumption in 2022 is estimated at 232 mhl, marking a decrease of 2 mhl (-1%)
The removal of restrictions on the movement of people and goods, the reopening of the HoReCa channel and the return of social gatherings and celebrations in 2021 contributed to an increase in consumption that year in most countries around the world. However, in 2022
The US consumed an estimated 34.0mhl of wine in 2022, an increase of almost 3% on the previous year, while China consumed 16% less wine in 2022 compared to 2021, down to 8.8mhl. The OIV’s report notes that the decline in China was due to an overall drop in internal demand, which had also made a significant contribution to the fall in global consumption.
compared to 2021
■ An overall lower volume of wine was exported around the world in 2022 at a much higher average price, resulting in global wine exports reaching a record estimated €37.6 billion.
GLOBAL WINE EXPORTS
In South Africa, consumption rose to the highest level ever recorded to an estimated 4.6mhl, a rise of 16% compared to 2021.
Starting in 2018, global wine consumption has decreased at a regular rate. This negative trend can be mainly attributed to the decline in China’s consumption, which has lost on average 2 mhl per year since 2018. This downward trend was accentuated in 2020 by the Covid19 pandemic, which brought a depressing effect on many large wine markets. Consumption was hit by lockdown measures, the disruption of the HoReCa channel, and an overall lack of tourism. In 2021, the uplifting of restrictions pertaining to movement of people and goods, reopening of HoReCa channel and the revival of social gatherings and celebrations have, as anticipated, contributed to an increase in consumption in most countries around the world. In 2022, however, the war in Ukraine and the associated energy crisis, together with the global supply chain disruptions, lead to a spike in costs in production and distribution This resulted in significant increases in wine prices for the consumers. In such a context, wine consumption behaviours at country level have been quite heterogenous across geographical regions.
Australia’s wine consumption was down for the second year in a row to 5.5mhl, 3% less than 2021 and 2% below the average of the previous five years.
The OIV report states that wine exports in 2022 were severely impacted by the war in Ukraine and the energy crisis which “generated a strong inflationary pressure on all major economies”.
“At the same time, the year 2022 was marked by global supply chain disruptions that led to significant slowdown of sea freight,” says the report. This combination of events, it continues, resulted in an overall lower volume
Trends in the main wine consuming countries
V38N3 WINE & VITICULTURE JOURNAL WINTER 2023 www.winetitles.com.au 75
GLOBAL SNAPSHOT BUSINESS & MARKETING
Fig 5 Evolution of world wine consumption
Figure 1. Evolution of world wine consumption. Source: OIV State of the World Vine and Wine Sector in 2022 report.
of wine exported around the world at a much higher average price, with these exports valued at an estimated €37.6 billion the highest figure ever recorded.
In terms of value, France confirmed its position as the biggest exporter of wine at €12.3 billion, up €1.2 billion on 2021, representing almost one third of the global export value.
Italy was the world’s largest exporter of wine by volume in 2022 with 21.9mhl, accounting for 20% of global exports. The amount of wine exported by most countries in 2022 declined compared with the previous year, the largest contributors being Spain (-2.4mhl), Argentina (-0.7mhl), France (-0.7mhl), the US (-0.5mhl), and South Africa (-0.4mhl). Among the top exporting countries, only Australia and Canada did not record a decline on the volumes they exported it 2021.
Fig 6 Wine consumption in major countries
World trade value
WINE PRODUCTION
World wine production from the 2022 harvest in both the Southern and Northern Hemispheres, excluding juices and musts, is estimated at 258mhl, down 1% (3mhl) on the previous year. The OIV report attributes this figure to the higher-than-expected harvest in Europe and the US and an
Figureinitalics:OIVestimates
Sources:
Sources:OIV,FAO,NationalStatiosticalOffices,SpecialisedPress
Notwithstanding the decrease in volume, 2 2022 g global wine export value i is at a record-high 37.6 bn EUR, 9% higher than 2021. This is the consequence of a sharp rise in average export prices in all major wine exporting countries. In terms of value, France confirms its position as the first world exporter in 2022, with wine exports worth 12.3 bn EUR, accounting for almost one third of global exports value. The countries that contributed the most to this significant rise in value at world level are France (+1.2 bn EUR / 2021), Italy (+717 m EUR / 2021), Chile (+154 m EUR / 2021) and the USA (+148 m EUR / 2021).

average production level in the Southern Hemisphere.
The EU produced an estimated 161.1mhl of wine in 2022 in line with its average for the last five years. At the beginning of the season, there was widespread concern that yields would be lower due to extreme heat and a lack of rainfall in many areas. However,
an absence of major grape diseases and late summer rains made up for it, resulting in higher-than-expected yields in several regions and countries.
Italy, France and Spain together accounted for 51% of the world’s wine production in 2022. Italy’s production remained relatively stable at 49.8mhl, down 1% compared to 2021 and
76 www.winetitles.com.au WINE & VITICULTURE JOURNAL WINTER 2023 V38N3
BUSINESS & MARKETING GLOBAL SNAPSHOT
8 mhl 2 0 1 8 2 0 1 9 2 0 2 0 2 0 2 1 2 0 2 2 2 2 / 2 1 2 0 2 2 P r o v P r e l % V a r % w o r l d USA 33.7 34.3 32.9 33.1 34.0 2.8% 15% France 26.0 24.7 23.2 24.9 25.3 1.5% 11% Italy 22.422.6 24.224.2 23.0 -5.0% 10% Germany 20.0 19 .819.819.9 19.4 -2.5% 8% UK 12.9 13.013.2 13.1 12.8 -2.2% 6% Russia 9.9 10.010.310.510.8 3.3% 5% Spain 10.710 .2 9.2 10.310.3 -0.1% 4% China 17.6 15.0 12.4 10.5 8.8 -16.0% 4% Argentina 8.48.9 9.4 8.48.3 -1.3% 4% Portugal 5.15.4 4.4 5.3 6.0 14.3% 3% Australia5.35.8 6.0 5.7 5.5 -3.2%2% South Africa 4.2 3.93.13.9 4.6 15.8% 2% Canada 4.94.74.44.24.2 -0.4% 2% Romania 3.9 2.22.6 3.73.7 -0.2%2% Netherlands 3.63.53.73.73.6 -3.4% 2% Brazil 3.33.6 4.14.1 3.6 -12.9%2% Japan 3.53.53.53.33.4 1.7% 1% Switzerland 2.42.62.52.6 2.6 2.6% 1% Austria 2.42.32.32.42.4 -0.4% 1% Czech Republic 2.02.22.12.22.2 0.3% 1% Belgium 2.72.72.72.42.0 -14.5% 1% Sweden 2.12.02.12.12.0 -5.9% 1% Other countries 34.2 33.833.533.633.1 -1.4%14% W o r l d t o t a l 2 4 1 2 3 7 2 3 1 2 3 4 2 3 2 - 1 0 % 1 0 0 %
Table 1. Wine consumption in major countries.
World trade by product type B ttl d i ( 2 lit ) represents 53% of trade volumes globally in 2022, a share in line with that recorded in the last 10 years. In
Fig 9 Evolution of international trade of wine by value
Figure 2. Evolution of international trade of wine by value. Source: OIV State of the World Vine and Wine Sector in 2022 report.
In terms of value, France confirmed its position as the biggest exporter of wine at €12.3 billion, up €1.2 billion on 2021, representing almost one third of the global export value.
Figure in italics: OIV estimates
OIV, FAO, National Statiostical Offices, Specialised Press
Fig 4 Wine production (juices and musts excluded) in major countries 5
*Countries with a wine production equal to or above 1mhl in 2022
Figure in italic: OIV estimate
Sources:OIV,ECDGAGRI,FAO,NationalStatisticalOffices,SpecialisedPress
Sources: OIV, EC DG AGRI, FAO, National Statistical Offices, Specialised Press
up 2% on its average production for the last five years. Production in France rose 21% on 2021 to 45.6mhl, representing 7% more than its average for the past five years. In spite of drought and limited access to water in many regions, Spain’s 2022 wine production level climbed 1% to 35.7mhl, although this was 5% below its average production from the last five years.
Among the other major EU countries, Germany was the only country that recorded a rise in wine production in 2022, up 6% to 8.9mhl.
Greece recorded one of its lowest levels of wine production in decades, noted the OIV, falling 14% to 2.1mhl.
Wine production in China was estimated to reach 4.2mhl, 29% less than in 2021 and in line with declining production levels over the last decade.
Frost damage, drought-like conditions in summer and a consequent lack of water supply in certain wine regions are said to be behind a 7% drop in wine production in the US in 2022 compared with the previous year. Producing an estimated 22.4mhl, this was 9% lower than the US’s last five-year average.
The majority of South America’s wineproducing countries recorded a fall in production compared with 2021. The continent’s larger producer, Chile, made 12.4mhl of wine, 7% less than in 2021 but 7% above its average for the last five years.
Australia produced 12.7mhl of wine in 2022, 14% less than in 2021. New Zealand produced 3.8mhl in 2022, up 44% on the previous year. In 2021, New Zealand was the only major Southern Hemisphere country to record a below-average winegrape harvest. Its 2022 wine production was a record high.
WORLD TRADE BY PRODUCT TYPE
Bottled wine (<2 litres) represented 53% of the trade volumes globally in 2022, a share in line with that recorded over the last 10 years. This category constituted 68% of the total value of wines exported throughout the world in the same year. Overall, bottled wine exports fell 4% in volume but rose 7% in value compared to 2021.
Sparkling wine was the only category that recorded an increase both in terms of volume and value in 2022. Representing 11% of global exports by volume and 23% in value, sparkling wine increased 5% in volume and 18% in value in 2022 compared to the previous year. The top exporters of sparkling wine were France, Italy and Spain whose sparkling wine exports represented 17%, 24% and 8% of the total export volumes, respectively, and 38%, 28% and 17% of their total wine export values, respectively.
V38N3 WINE & VITICULTURE JOURNAL WINTER 2023 www.winetitles.com.au 77
GLOBAL SNAPSHOT BUSINESS & MARKETING
7
mhl 2 0 1 8 2 0 1 9 2 0 2 0 2 0 2 1 2 0 2 2 2 2 / 2 1 2 0 2 2 P r o v P r e l % V a r % w o r l d Italy 54.8 47.5 49.1 50.2 49.8 -1% 19.3% France 49.2 42.2 46.7 37.6 45.6 21% 17.7% Spain 44.9 33.7 40.9 35.5 35.7 1% 13.8% USA 26.1 25.6 22.8 24.1 22.4 -7% 8.7% Australia 12.7 12.0 10.9 14.8 12.7 -14% 4.9% Chile 12.9 11.9 10.3 13.4 12.4 -7% 4.8% Argentina 14.5 13.0 10.8 12.5 11.5 -8% 4.4% South Africa 9.5 9.7 10.4 10.8 10.2 -6% 3.9% Germany 10.3 8.2 8.4 8.4 8.9 6% 3.5% Portugal 6.1 6.5 6.4 7.4 6.8 -8% 2.6% Russia 4.3 4.6 4.4 4.5 4.7 4% 1.8% China 9.3 7.8 6.6 5.9 4.2 -29% 1.6% Romania 5.1 3.8 4.0 4.8 3.9 -19% 1.5% New Zealand 3.0 3.0 3.3 2.7 3.8 44% 1.5% Brazil 3.1 2.2 2.3 2.9 3.2 9% 1.2% Hungary 3.7 2.7 2.9 3.1 2.9 -6% 1.1% Austria 2.8 2.5 2.4 2.5 2.3 -5% 0.9% Georgia 1.7 1.8 1.8 2.1 2.1 2% 0.8% Greece 2.2 2.4 2.3 2.5 2.1 -14% 0.8% Moldova 1.9 1.5 0.9 1.4 1.4 -2% 0.5% Switzerland 1.1 1.0 0.8 0.6 1.0 63% 0.4% Other countries 15.3 14.4 14.0 13.4 10.6 -21% 4.1% W o r l d t o t a l 2 9 4 2 5 8 2 6 2 2 6 1 2 5 8 - 1 % 1 0 0 %
5 Countries with a wine production equal to or above 1 mhl in 2022.
Figureinitalic:OIVestimate
Table 2. Wine production (juices and musts excluded) in major countries*.
WVJ
Crafting exquisite Pinot Noir at $50+

After tasting Australian and New Zealand Pinot Noirs with recommended retail prices of $30-$50 for the Summer 2023 issue of the Journal, we turned our attention to their $50+ counterparts for this issue. Readers will recall that one of the top wines of our $30-$50 tasting was the 2021 Pipers Brook Estate Pinot Noir. Given its recommended retail price of $50 a bottle, it was also entered in our $50+ tasting where it again was judged to be among the top four wines. As Pipers Brook provided details on the making of that wine as part of our Summer issue’s tasting, we approached the makers behind the other three top wines of the tasting — Murdoch Hill, Deviation Road and New Zealand’s Nanny Goat Vineyard — to do the same for their top drops. See page 81 for the results of the tasting.
MURDOCH HILL 2022 PHAETON PINOT NOIR (RRP$55.00/BOTTLE)
WINEMAKING
All fruit is hand harvested with partial whole bunch inclusion; this wine sees an average of 20% whole bunch. Fermentation is spontaneous with pumpovers carried out twice daily for a gentle extraction. Time on skins ranges from 14-21 days. Maturation takes place in a mix of barrique, puncheons and demi-muid barrels for nine months with 25% new. The wine is bottled without any fining or filtration.
With the past few years seeing much cooler, wetter conditions, whole bunch use has definitely been pulled back, with longer time on skins taking place where possible.
VITICULTURE

The fruit for the 2022 Phaeton Pinot Noir was half sourced from our Lenswood vineyard while the other half was from growers in the Piccadilly Valley. These are two distinct subregions of the Adelaide Hills: both feature an elevation of more than 500m and experience high rainfall.
Our Lenswood vineyard has four blocks of Pinot Noir including three comprising 33-year-old D5V12 Pinot Noir on own roots while the latest planting in 2000 is of 114 and 115. All blocks were established with 2.4m x 1.8m spacings and are trained to a VSP trellis system. Detailed shoot thinning and
bunch thinning is carried out when required. Given the high rainfall, minimal irrigation is needed.
2022 was the first season that this vineyard was under our management. It was previously managed according to conventional practices but we are now adopting an organic approach going forward. The vines are cane-pruned with two canes retained per vine.
The Piccadilly Valley vineyards that provided the fruit for the 2022 Phaeton Pinot Noir predominantly comprise clones 114 and 115. All are mature vines planted in the late 1990s and early 2000s.
MARKETING
The Phaeton Pinot Noir is part of our carriage collection. These wines are named after horse-drawn carriages. My grandfather, Tom Downer, was a collector of these and even featured in the movie Picnic at Hanging Rock. Even today we have a small collection of these in the barn.
All our wines are largely sold domestically with 20% exported. This wine was selected for Korean Air inflight business class giving some brilliant international exposure. We sell largely to on-premise venues which account for 70% of our sales.
78 www.winetitles.com.au WINE & VITICULTURE JOURNAL WINTER 2023 V38N3 VARIETAL REPORT
MICHAEL DOWNER WINEMAKER MURDOCH HILL ADELAIDE HILLS SOUTH AUSTRALIA
Murdoch Hill’s Lenswood vineyard in the Adelaide Hills.
VITICULTURE
This wine is produced from estate-grown fruit, grown on a warmer western slope at 350m altitude. The rows run east-west, preventing sunburn from late afternoon sun. We have been restoring organic matter to build up the topsoil as it is very shallow in this site. The topsoil lies over layers of acidic clay and broken shale.
The site was planted in 2007 on own roots and comprises multiple clones, specifically MV6, 777, 667, 114 and Martini 18. Trained to a VSP trellis system, there is 2.5m between rows and 1.5m between vines. Shoot and bunch thinning is carried out every year to remove a secondary crop or short shoot bunches.
Irrigation is given as needed only, depending on the season, sourced from a dam on the property.
Undervine composting has been an ongoing project over the years to improve organic matter. We are currently applying Bounce Back, an organic blend from Neutrog which is working well. Inter-row clover/grass cover crops are seeded to improve soil structure and prevent erosion. Annual blading undervine has been utilised during the past few years to minimise herbicide use.
The site is hand pruned, with spur pruning used for three consecutive years, then the cordon rejuvenated with a new cane in the fourth year (with approximately 16 buds). Disease management is very much dependant on the season. We aim for minimal sprays, however if required we will react in the wetter seasons to prevent development of powdery, downy and botrytis.
The vines crop at 2kg/vine with an average bunch weight of 80-90g.
We are looking to produce fruit that has uniform ripening across the bunches. This ensures the balance comes from every berry, rather than an average of over and underripe bunches. The site delivers riper flavours with good colour and lignified stalks before harvest.
WINEMAKING
Every clone is handpicked and fermented separately, with different treatments
carried out according to the clone. MV6 is destemmed and berry sorted using a Bucher mechanical sorter, while the M18 and 667 undergo whole cluster fermentation, are then sealed for a week before being opened and foot trodden to finish the ferment aerobically. 777 is also destemmed and berry sorted and a small proportion of whole bunches put back on top. This approach to each clone has been worked out over the past few years from many trials to best handle what they give.
All are inoculated and spend roughly two to three weeks on skins before being basket pressed to barrel. Each clone is aged in oak in individual parcels until blending after about 10 months; 30% new French oak is used
and a mix of hogsheads and puncheons. The wine is aged in bottle for five months before release.
MARKETING
Our still Pinot Noir is a premium wine in our range. Production is small (10 barrels for this vintage) and we sell it direct to customers via our tasting room and website, plus limited distribution Australia-wide to on-premise and independent fine wine retailers.
Our still wine labels have been largely untouched since they were first designed back in 2010. They promote our sense of place in the Adelaide Hills which we are passionate promoters of!

V38N3 WINE & VITICULTURE JOURNAL WINTER 2023 www.winetitles.com.au 79 VARIETAL REPORT
DEVIATION ROAD 2021 PINOT NOIR (RRP$55.00/BOTTLE)
HAMISH LAURIE OWNER/MANAGING DIRECTOR KATE LAURIE OWNER/WINEMAKER DEVIATION ROAD,LONGWOOD ADELAIDE HILLS
Kate & Hamish Laurie with Aggie the Vizsla
VITICULTURE
The 2019-20 growing season was a challenge in many respects — unusually high rainfall during flowering and at other key times resulted in low yields (40% decrease on average) and gave us some disease headaches (powdery mildew and botrytis) that we would not ordinarily encounter in Central Otago. Ordinarily achievable target yields of 6-6.5 tonnes/hectare were, in some cases, reduced to 2t/ha, the upside being that in most cases bunches were loose and berries were small and intensely flavoured.
The fruit for our 2020 Super Nanny Pinot Noir was sourced from four vineyards: 33% from our organically-farmed home vineyard in Queensberry alongside three conventionallyfarmed grower blocks in Pisa (34%), Gibbston (28%) and Bannockburn (5%).
Our home vineyard in Queensberry, located approximately halfway between Cromwell and Wanaka on the south-western side of the Clutha River, was planted in 2001, predominantly to Pinot Noir (clones 5, 113, 115, 667, 777 and Abel) with a vine density of 3787 vines/ha (2.2m row x 1.2m vine spacing). The vineyard gained organic certification with Biogro in 2019 after a three-year conversion period.
At an elevation ranging between 270m and 290m above sea level, our vines are planted over three relatively flat terraces of deep, freedraining, glacial moraine and alluvial gravels, overlaid with a shallow top layer of fine windblown silt loess.
Pruning is a mix of cane and spur pruning on a VSP trellising system, with shoot thinning, leaf plucking and other canopy management inputs being carried out by hand.
Under vine management is a hugely important aspect of growing organically and continues to be a work in progress — we are currently seeing good results with our Bahr Roller Hacke Finger & Weeder system but are refining processes each season as we learn.
Our grower vineyards are all conventionally farmed, contributing parcels of clones 667, 777, 5, Abel and 10/5 from vines ranging from 15-20 years of age and planting densities of 2500 vines/ha to 3200 vines/ha. As with our own vineyard, pruning is a mix of cane and spur and training to a VSP trellising system.
Soils range from clay base with roughly sorted angular schist and alluvial/colluvial material (Bannockburn, 350m above sea
level), wind-blown loess and decomposing schist (Gibbston, 375m above sea level) and free-draining colluvial soils and silt loess (Pisa, 290m above sea level).
WINEMAKING
Components for our Super Nanny Pinot Noir are selected based purely on the way they present in the vineyard in the lead up to harvest. There are always a handful of parcels that have an elevated intensity to them, whether that be their flavour profile, structure or colour that elevates their status well before they are picked. The origin vineyards, blocks and clones that raise their hands for selection will vary from season to season — Super Nanny is a snapshot of the best each vintage produces.
Not unlike our other Pinot Noir SKUs, these parcels are hand harvested into 500kg picking bins with careful attention to fruit quality at the picking bin to remove diseased, under ripe and bird-pecked fruit as our first step towards ensuring only the best quality fruit reaches the winery.
At the winery, the fruit is sent across a Scharfenberger vibrating sorting table for a second round of quality control before passing through a Pellenc Selectiv’ Process destemmer which does a fantastic job of retaining a high proportion of whole berries — a significant change in our processing set-up since the 2019 vintage. Moving away from the use of a far less gentle destemmer/must pump set-up, allowing for the retention of more whole berries and reducing the maceration of skins and seeds has certainly had positive effects on the aromatics and structure of this wine.
After destemming, the processed fruit is tipped by forklift into 4.2-tonne open flowerpot fermenters, some of which contain up to 66%
whole bunches depending on the vineyard source and stem ripeness. Additions to the must are kept to a minimum, in line with my philosophy of less is more, while fermentation is carried out via native yeast after a brief soak at ambient cellar temperature since temperature control isn’t possible with the flowerpot fermenters. Ferments are hand plunged initially only once daily, increasing to twice daily at the peak of ferment and are treated with ‘pulse air’ to aerate the ferment and break up the cap should the ferment become reductive.
Post-ferment maceration duration ultimately comes down to how long each parcel takes for the tannins to come together and soften to a point where the wine has a nice balance — often this is somewhere between 28 and 32 days.

Once pressed, the wine is settled for 24 hours before racking to 225L French oak barrels for 13 months maturation. In the case of the 2020 vintage, 25% of the oak was new, with the balance ranging from second fill to fourth fill.
Bottled without fining or filtration, we mature the Super Nanny for 12 months before release for sale.
MARKETING
2012 marked the release of the first ever Super Nanny Pinot Noir and from there, we have remained steadfast in our commitment to producing a Pinot Noir under the label that encapsulates the very best of the fruit we source each year across our vineyards.
Our philosophy to pursue magic, or the perfect Pinot, ties perfectly with our goal to have this special wine listed in the best bars and restaurants in Australia, New Zealand and other key export markets.
At our cellar door, Super Nanny, alongside our three other Pinot Noirs, enables us to tell a story to the consumer: showcasing a sense of place, vintage variation, winemaking and terrior. Super Nanny’s striking and somewhat demonic label featuring the single goat head has created a cult following; we will never mess with label perfection!
80 www.winetitles.com.au WINE & VITICULTURE JOURNAL WINTER 2023 V38N3 VARIETAL REPORT
MADISON JAMES BRAND MANAGER ALAN PETERS-OSWALD WINEMAKER NANNY GOAT VINEYARD CENTRAL OTAGO, NEW ZEALAND
NANNY GOAT VINEYARD 2020 SUPER NANNY PINOT NOIR (RRP$75.00/BOTTLE)
Alan Peters-Oswald
$50+ Pinot Noir tasting highlights less is more
By Sonya Logan
Following our recent taste-off between Australian and New Zealand Pinot Noirs with recommended retail prices of between $30-$50, for this issue we blindtasted Pinots retailing for $50 and above.
While our tasting panels are usually made up of winemakers, given the timing of this tasting in the middle of the 2023 vintage, we invited three sommeliers to offer their opinions on the 30 wines in the line-up. They were Marcell Kustos, Patrick White and James Boden.
Kustos completed a PhD at The University of Adelaide which focused on food, wine and emotional pairings. He subsequently became head sommelier at Penfold’s Magill Estate before joining Restaurant Botanic as beverage director in 2021. He recently established his own consulting business, Wine Concepts and Concierge, which aims to help wineries deliver memorable wine experiences. Since 2018, Marcell has also produced small-batch wines under LUDO Wines.
White is a career sommelier of more than 20 years, having developed his professional skills working in Sydney where he was group sommelier for the Fink Restaurant Group. He is currently cellar master and sommelier for the Adelaide Club and has been a judge at the Royal Sydney, Royal Adelaide, Margaret River, Limestone Coast and Alternative Varieties Wine Shows.
Boden is currently the senior wine buyer with the wine subscription service Good Pair Days after working as a sommelier for the past 10 years in both South Australia and Western Australia. He spent more than four years as the head sommelier at the National Wine Centre of Australia in Adelaide where he curated comprehensive lists of Australian wines.
Like our RRP$30-50 Pinot Noir tasting, our RRP$50+ Pinot Noir tasting was open to New Zealand wineries. However, just one NZ winery entered, with the remainder of the wines hailing predominantly from the Adelaide Hills and Tasmania with regions such as Orange, Great Southern, Mornington Peninsula, Macedon Ranges, Geelong and Southern New South Wales making up the balance.
Most of the wines were from either the 2022 or 2021 vintages. The recommended retail prices across all the wines in the tasting ranged from $50-$90 a bottle.
Reflecting on their assessments of the wines after their identities were revealed, the tasting panellists conceded they had a leaning towards the Adelaide Hills entries.
“I think there has been a bit of a bias towards the Adelaide Hills wines from the three of us,” Boden said. “The Tassie wines probably didn’t come up as well as they would have if we were just looking at Tassie Pinots.”
“We might have a cellar palate for Adelaide Hills wines,” agreed Kustos.
The panellists also concurred that some of the producers behind the wines had pushed the envelope with respect to their use of whole bunches and oak.
“It’s interesting to see the influence of whole bunch in a few of these,” said Boden. “That stemmy approach that a few have headed down sticks out a little bit, especially in the younger wines. A few have gone down the heavily oaked path which stuck out a little bit as well.
“The adage where less is more…in a lot of these wines there’s been too much play for the sake of it and it has stuck out a bit.”
“The wines that were ranked highly across the three of us were from producers with good experience who had well-managed vineyards and handled their wine sensitively — that was

the take-out for me from this tasting,” said White. “They weren’t heavy handed and they clearly had good vineyards that they were drawing off.
“I liked seeing the bracket of 2022s together as they were widely divergent in styles,” White continued. “Some were quite pale and light-on while some were quite full throttled and ripe and received a fair bit of treatment. In the main there was good freshness. Some veered towards being heavy handed but broadly there was good varietal definition in the 2022s.
“The 2021s were a bit more settled and there were a handful in there which I thought were excellent,” White observed.
Of the 2022 wines, Kustos said: “There were some good examples in the 2022s but the majority of them needed a bit more time. Others looked a bit more advanced and developed for 2022s. I also questioned the whole bunch component — some had a very bleached colour while others were quite stalky which distracted from the fruit underneath.”
Echoing White’s comments, Kustos said the 2021 wines were “more settled”, noting that the use of oak in some of them was more than the fruit could handle.
The panellists’ top wines of the tasting were Murdoch Hill’s 2022 Phaeton Pinot Noir, Deviation Road’s 2021 Pinot Noir, Pipers Brook Estate’s 2021 Pinot Noir and Nanny Goat Vineyard’s 2020 Super Nanny Pinot Noir.
V38N3 WINE & VITICULTURE JOURNAL WINTER 2023 www.winetitles.com.au 81 TASTING NOTES
The panellists for our $50+ Pinot Noir tasting were (from left) Patrick White, James Boden and Marcel Kustos.
MURDOCH HILL 2022
PHAETON PINOT NOIR


Adelaide Hills, South Australia
12.5%v/v
RRP$53.00/bottle
Best of tasting: Clear colour of ruby with a bright rim. Attractive bright fruits on the nose, including strawberry, cherry, cranberry and rose hip, as well as subtle vanilla, chai and toasty oak notes and rich, complexing, savoury characters in the background; savoury stalk spice also evident. Fresh, vibrant and silky palate of fresh red fruits where a whole bunch element adds to the savoury tannins to balance the fruity style. Lingering flavours. “Delicious!” wrote one taster. “Nice firm oak with good quality fruit pulling it through,” noted another taster, who thought the oak, spice and structure of the palate were overt, with the fruit playing second fiddle.
DEVIATION ROAD 2021
PINOT NOIR
Adelaide Hills, South Australia
13.0%v/v
RRP$55.00/bottle
Best of tasting: Pale ruby in colour with some haze, perhaps suggesting it is unfined. Hint of aldehyde initially on the attractive and harmonious nose; some vegetal funk and earthiness apparent along with some red fruit, including cranberries, brambles and nuttiness and a hint of cacao. Palate has a creamy structure, nice tannin and mouthfeel. Nice edginess matched by the fruit. One taster described the palate as being “fairly raw and unfiltered”. Another noted: “Savoury style in which heat and chalky tannins work well. Would love to see more fruit and acidity for balance though.” “Not too polished a bit of a diamond in the rough,” concluded one taster.
PINOT NOIR
Central Otago, New Zealand
13.5%v/v
RRP$75.00/bottle
Best of tasting: Full ruby in colour with a bright rim; not quite clear. Bunchy spice lifts the aromas which include pea pods, dark cherry, plum, blood orange, rhubuarb, red currant, cherry vanilla, earth, cured meats, white button mushroom and savoury oak spice; some vegetal top notes. Tight and bright palate which builds. Concentrated flavours and firm structure. Creamy texture of vanilla and malt. Nice fruit and attractive earthy notes The tannins are powdery and nearly seamless, only show themselves after multiple sips. Savoury amaro-like finish. Has plenty of years in the bottle. “Well made and sure to please,” concluded one taster.
PIPERS BROOK ESTATE
2021 PINOT NOIR
Pipers River, Tasmania
13.5%v/v
RRP$50.00/bottle
Best of tasting: Clear and bright colour of medium to full ruby. Creamy, meaty and brothy nose featuring notes of cherry, blossom and spices; one taster noted “bunchy barrel funk reduction”. Fresh palate has a creamy texture and good fruit weight, with ripe but bright fruit coming through, including cherry and strawberry. Lots of details. Nice complete tannins. Lingering flavours. “Overall, a well-made and classic style,” noted one taster. Another taster thought the wine was a touch confected.

82 www.winetitles.com.au WINE & VITICULTURE JOURNAL WINTER 2023 V38N3 TASTING NOTES
NANNY GOAT VINEYARD
2020 SUPER NANNY
ARC WINES
2022 RADFORDS
PINOT NOIR
Gippsland, Victoria
11.0%v/v
RRP$60.00/bottle
Clear, pale ruby in colour with a bright rim. Aromas of confected strawberry, cherry, cherry blossom, red apple skin, cranberry, stalky spice, fresh meat and blood orange; evidence of some bunchy reduction and some vegetal characters and char in the background. Fresh and tart palate follows the nose in its bright red fruit characters; crunchy acidity; low, slightly green tannins. “Fun, drink-now style,” noted one taster, adding that it could be enjoyed chilled. “Friendly Pinot Noir with plenty of fruit and touch of interest, noted another taster.
BARRISTERS BLOCK
2022 BEAU PINOT NOIR


Adelaide Hills, South Australia
13.5%v/v
RRP$52.00/bottle
Deep, dark cherry red in colour. Rich, ripe, dark fruits on the nose along with confected cherry and chocolate notes and a slight green herbal edge; plenty of spice and moderate tannins. More complexity on the palate which features darker fruits, plenty of spice and moderate tannin. Lots of savoury oak at play with the red fruit characters.
“Straightforward but a bit short,” noted one taster. “A bit tired,” noted another.
“The structure and power in this wine is plain as day,” described yet another.


MAYFIELD 2022
‘WILLIAM’ PINOT NOIR
Orange, New South Wales
14.0%v/v
RRP$65.00/bottle
Pale red with a slight orange hue. Amaro and light strawberry characters on the subtle nose and some vegetal notes. Mouth has a firm tannin structure and a good balance between fruit and oak but is a bit simple; nice creamy mid palate. Slightly short. “Lacks some stuffing,” noted one taster. “At the lighter, savoury end of Pinot but stylistically it has its appeal,” noted one taster.
APOLLO PINOT NOIR


Adelaide Hills, South Australia
12.5%v/v
RRP$90.00/bottle
Dry ruby in colour with a bright rim. Nose of beef broth, dark fruits, including plum and dark cherry, and some smoke, char and toasty oak; green herbs at the edges; reduction evident. Youthful and tight palate has a solid structure but is still elegantly ‘Pinotesque’, “some would say Burgundian”, described one taster. Flavours of bright, ripe cherry, Cherry Ripe, forest floor and earthy notes with plenty of baking spice. “Oaky – maybe dominant at the moment,” concluded one taster. “Has some interesting details but rather tight and short at the moment,” noted another, adding that he could see the wine becoming “something quite interesting”.
Adelaide Hills, South Australia
13.0%v/v
RRP$50.00/bottle
Deep ruby in colour with dull edges. Stewed cherries, strawberries, blood orange and subtle plum on the nose with red apple spice. One taster found the nose was porty but said this dissipated with time in the glass but still found it developed for a 2022. Reasonably fresh on the palate in spite of the heat from ripeness. Nice red fruit at play, including strawberries and cherries, together with satsuma plum and spice. Moderate tannin and high acidity. “A solid wine with the right balance of oak and fruit – a more cooked style,” concluded one taster.
Perfected
Our techical expertise, innovation and attention to detail are what sets us apart. With our state of the art facilities your creative options are endless.
closures of excellence
V38N3 WINE &
WINTER 2023 www.winetitles.com.au 83 TASTING NOTES
VITICULTURE JOURNAL
NOVA VITA 2022 FIREBIRD ‘QUARTZ BLOCK’ PINOT NOIR
MURDOCH HILL 2022
HEIRLOOM
VINEYARDS 2022
ALCAZAR CASTLE ADELAIDE HILLS
PINOT NOIR
Adelaide Hills, South Australia
13.3%v/v
RRP$80.00/bottle

Deep and dark colour of ruby with purple lights — deepest and darkest of the 2022 vintage bracket. Nose has good lift and is fresh but is somewhat stemmy, featuring notes of ripe dark fruits, cineol/eucalypt, green herbs, cola spice, smoke, some confection and some bruised fruit; slight bunchy spice. Powerful palate with lovely silkiness and suppleness; black plum and blackberry notes apparent. “A ripe, warmer and full expression of Pinot and is probably more reminiscent of a dry red,” concluded one taster. “Too green — under ripe,” noted another.
PIKE AND JOYCE 2022 WJJ
PINOT NOIR
Clare Valley, South Australia
Fruit: Adelaide Hills, South Australia
13.5%v/v
RRP$65.00/bottle
Clear and youthful colour of deep, dark ruby with a bright rim. Aromas of red cherry, black cherry, red apple skin, slightly cooked fruit and blood. Nose a bit subdued but is clean and harmonious. Bold and mouthfilling palate with notes of blood plum and black cherry and spice. Silky middle palate. Fresh, tapering acidity to finish. “Fruit-focused, seemingly free of excessive bunch and oak characters; fresh and vibrant with purity and deliciousness in every aspect; balanced and refined” concluded one taster. “Pretty complete all the required aspects for a good Pinot Noir but not super interesting,” said another.
2022 GLAZIERS BAY
PINOT NOIR
Tasmania
13.5%v/v
RRP$55.00/bottle

Slightly dull colour of medium ruby with red highlights. Nose is simple and clean with slightly candied red fruits, including apple, and charred woodsy spices. Sweet red fruits on the palate, including red apple and cherry, and a touch of spice. One taster thought that palate was slightly soapy palate but liked its concentration. Moderately high acidity. Low tannins. “Attractive and harmonious but a bit simple,” concluded one taster. “OK example –competent but no frills,” concluded another.
Trusted
WINES 2022
PERFECTUS
PINOT NOIR
Adelaide Hills, South Australia
13.5%v/v
RRP$50.00/bottle
Dark ruby red in colour with a red rim. Nose is somewhat herbaceous with some funk and char apparent; some eucalypt leaf and cola spice shadowing the predominantly dark fruits. Palate is salty and savoury. Dark fruit characters in the background. One taster thought the palate lacked structure due to the low acidity. Another said it was supple and rich, noting the acidity was in balance.
2022 ICON 1777
PINOT NOIR


Adelaide Hills, South Australia
13.5%v/v
RRP$60.00/bottle
Pale ruby in colour which is clear and bright. Creamy nose of cherry cola, wild strawberries and black cherries along with cineol, molasses and honey. Lovely balance of fruit, oak and spice on the palate; predominantly red fruits evident with some cherry cola. Taut acidity. Moderate tannins. “Fine-boned and pretty,” concluded one taster.
closures of excellence
Trusted by Australia’s finest wine producers to provide unique closures of distinction. Our complete in-house manufacturing facility ensures your peace of mind at every step.
84 www.winetitles.com.au WINE & VITICULTURE JOURNAL WINTER 2023 V38N3 TASTING NOTES
RIVULET WINES
SIMON TOLLEY
TOMICH WINES
Great Southern, Western Australia
13.5%v/v
RRP$50.00/bottle
Dark ruby in colour with purple highlights and a clear and bright rim.
Vibrant, high-toned red fruits on the simple, fresh and confected nose, including raspberry and red cherry. Palate is better than the nose promised with herbal and complexing characters along with crunchier red fruits, including cherries, spice, vanilla oak and amaro.
Creamy texture. “A more robust Pinot Noir but with good balance,” concluded one taster.
2022 CLONAL SELECTION 114
PINOT NOIR
13.5%v/v
RRP$50.00/bottle

Bright colour of deep, dark ruby. Nose is clean, fresh, subtle and harmonious with notes of ripe strawberries, raspberries, cranberries, red cherries, grilled blood orange, choc mint, sage and a touch of baking spice. One taster thought nose hinted at a stuck ferment, noting a pickle character. An energetic palate with layers of red berries, brambly fruit characters and nice spice along with savoury, meaty elements that add complexity. Somewhat angular and tight. Understated oak. Lovely silky mid-palate and a long acid line. One taster wondered if too much acid correction had been carried out. “Quite a delicious drink,” noted one taster.
“Modern, friendly Pinot for a consumer trying the variety for the first time,” added another.
DEXTER 2021
MORNINGTON
PENINSULA
PINOT NOIR
Mornington Peninsula, Victoria
13.5%v/v
RRP$60.00/bottle
Bright and clear colour of medium ruby with a red rim. Nose of red fruits, dark cherry and plum with a touch of amaro, florals and citrus zest; smoke and char in the background and some VA coming into play. Palate is high-toned, tight, lean and quite fine-boned but is attractive and has good persistence; taut cranberry and Campari characters. Nice tannin that is firm and playing its cards close to its chest. “A polarising wine that would have its fans,” concluded one taster.
HANGING ROCK
WINERY 2021 ‘JIM
JIM’ PINOT NOIR
Macedon Ranges, Victoria 13.5%v/v RRP$60.00/bottle


Dull ruby in colour with a copper hue. Minty and stemmy notes combined with plenty of green herbs, stewed rhubarb, earthy and vegetal aromas; some wood smoke evident too. Sweet and savoury spices, dark cherry, Satsuma plum and cranberry on the palate which has good ripeness, weight, and length; use of good quality oak evident. “A classic Aussie Pinot Noir,” concluded one taster.
McLaren Vale, South Australia
Fruit: Tasmania
13.5%v/v
RRP$60.00/bottle
Slightly dull colour of dark ruby with a red rim. Palate is rather closed; some reduction evident; dark fruits in the background along with oaky and toasty characters. Palate is slippery, ripe, forward and oak-dominant with the fruit hiding behind it; sweet and sour characters along with blood, molasses and tomato leaf flavours.
closures of excellence
United V38N3 WINE & VITICULTURE JOURNAL WINTER 2023 www.winetitles.com.au 85 TASTING NOTES
With our end-to-end, state of the art in-house manufacturing and production facility, Interpack can efficiently unite all your closure requirements under one roof.
MAXWELL 2021 SMALL BATCH EXCLUSIVE PINOT NOIR
WIGNALLS 2022 SINGLE VINEYARD PINOT NOIR
PIKE AND JOYCE
NANNY GOAT VINEYARD
2021 SINGLE VINEYARD
‘QUEENSBERRY’
PINOT NOIR
Central Otago, New Zealand
14.0%v/v
RRP$57.00/bottle
Deep ruby in colour – the deepest of the ’21 vintage bracket. Powerful and attractive nose of dark plum, mulberry, orange rind, clove, baking spice, oak, vanilla and a touch of green herbs. Plum skin, red berries, blood orange and char on the dark, dense and warm palate. Plenty of grainy oak at play and oak tannin. Nice pucker on the finish. “Quite Shirazy,” noted one taster. “A big Pinot with plenty of quality oak,” concluded another.
SMALL ISLAND WINES
2021 HOYLE’S CUT ‘A BIT
SPECIAL’ PINOT NOIR
Tasmania
13.5%v/v
RRP$90.00/bottle
Deep ruby in colour with a bright rim. Hit of bunch/stem notes on the nose. Methoxypyrazine, blood plum and Ribena characters also apparent along with some oak spice and char. Strong stem character also evident on the palate which has a touch of red fruits, including blood plum, and lacks some texture. Fresh acid with some puckering. Green tannins. Good length. “Perceptibly early picked,” noted one taster. “Too wholebunchy,” concluded another taster, while another quite liked the whole-bunch component as it gave the wine freshness and lift.
Refined
At Interpack, our state of the art in-house manufacturing facility combined with our expert craftsmen, produce innovative solutions for all your closures. From exquisite muselets through to crown seals, beverage and wine closures.

Tasmania 13.5%v/v RRP$50.00/bottle
Deep ruby in colour with a bright rim. Ripe fruit on the nose which shows evidence of oxidation and sulfite. “A bit pongy,” noted one taster. Simple, candied fruits on the palate which is fruit-driven and brooding. Nice savoury notes once it opens up.
SMALL ISLAND WINES
2021 MV6 ‘A BIT SPECIAL’ PINOT NOIR
Tasmania 13.5%v/v RRP$90.00/bottle


Deep ruby in colour with a bright rim. Medicinal and herbal tones on the nose which is ‘bunchy’; hint of blueberry, spice, methoxypyrazine and spritz. Very fresh on the palate which seems to come from an early pick, resulting in some less desirable features, such as green flavours, bunchy tannins and harsh acidity. Palate is big, full and plump with savoury edges and fruit weight. “A modern, whole bunch style,” noted one taster. “Bit broad,” noted another.
closures of excellence
86 www.winetitles.com.au WINE & VITICULTURE JOURNAL WINTER 2023 V38N3 TASTING NOTES
RIVULET WINES 2021 BURNSIDE PINOT NOIR
STEFANO LUBIANA
ESTATE 2021 ‘DERWENT
VALLEY ESTATE’
PINOT NOIR
Tasmania
13.0%v/v RRP$70.00/bottle
Moderate to deep ruby red in colour. Touch of spice, creamy vanillin, cherries, bruised strawberries and red apple skin on the nose. One taster detected an aldehyde note. More to like on the palate which is structured yet subtle. Oak is dominant but has nice layers behind it. Mouthfilling tannins. “Overall, lacks character,” noted one taster. “Very much on the tannic end and needing time but a keeper,” concluded another. “A fresher and more taught expression of Pinot,” said yet another.
TETAZ PINOT NOIR

Geelong, Victoria
13.8%v/v RRP$80.00/bottle


Clear and bright colour of medium ruby with a slightly developed hue. Slight aldehyde note on the fragrant and floral nose which has characters of fresh strawberries, cherries, grilled cherries, plums, oak and baking spice, creamy vanillin, cardamon and lavender. Palate is medium bodied, soft, sweet, savoury, full and forward. The charred oak elements work well to balance the sweet fruits. Touch of white pepper brings further interest. Light on its feet with oak adding weight. Lots of details and finesse. “Attractive now but possibly advanced for its age,” noted one taster.
2020 PINOT NOIR
Tasmania
13.5%v/v RRP$70.00/bottle
Clear and bright colour of medium ruby. Notes of cherry blossom and red and black cherries on the nose as well as some bunchy reduction and a touch of development. Cherry and orange rind on the supple palate combined with savoury oak spice, savoury tannins, earth and char characters and mouth-watering acidity; one taster thought the acid stuck out, concluding the wine was nice but the acid was not in check.
“An amaro finish,” described another taster. “Find the warmth distracting from the otherwise stylish elements,” concluded yet another taster.
PINOT NOIR
Southern Tablelands, New South Wales
13.8%v/v
RRP$50.00/bottle
Clear medium ruby in colour which is showing some development on the rim. Attractive, developing nose of strawberry compote, red cherries, wild strawberries, earth, mushrooms, some rust and blood combined with sweet oak spice and fennel seed. One taster noted an aldehyde character. Soft, silky, tightly structured and impressive palate which has sweet fruit, touch of under-ripe cherry, plenty of earthy characters and spice, lingering oak and evolved tannin. Moderate acidity. “Quite forward – at or near peak,” concluded one taster. “A nicely integrated, older style,” noted another.
V38N3 WINE & VITICULTURE JOURNAL WINTER 2023 www.winetitles.com.au 87 TASTING NOTES
BELLBRAE ESTATE 2020
FREYCINET VINEYARD
HATHERLEIGH 2019
BATCH
McLaren Vale, South Australia
Fruit: Tasmania
13.5%v/v
RRP$60.00/bottle
Clear pale ruby in colour which shows some development. Light and delicate nose featuring bright fruit, including strawberries and cherries; touch of aldehyde and pickle combined with white pepper and dried dill. Fruit is starting to fade on the light to mediumbodied and savoury palate but has energetic acidity reminiscent of a blood orange; forest floor character also evident. Subtle tannin. “A bit simple and quite advanced,” noted one taster. “Not complex but well integrated and plenty of charm,” noted another.
Tasmania 13.8%v/v
RRP$60.00/bottle

Deep ruby in colour with a brick rim. Plenty of earthy and mushroom tones on the nose which is porty and sweet. Big dry red palate which lacks varietal definition; earthy and savoury notes apparent. Sweet tannins. “Still showing life but the back end of life,” described one taster of the palate, concluding the wine overall was “dusty and faded; past its best”.
Tasmania 13.2%v/v

RRP$90.00/bottle
Advanced colour of medium ruby with brick tinges developing throughout. Savoury and secondary aromas on the nose; characters include dried spices, mushrooms, earth, herb, kumquat, maraschino cherry, cough syrup and dried cranberry. Fruit is on the way out with just a touch of strawberry evident. Despite this, the rest of the palate is in a good nick. Lots of earthy, spice and mushroom notes along with some amaro and cola.

88 www.winetitles.com.au WINE & VITICULTURE JOURNAL WINTER 2023 V38N3 TASTING NOTES
GREY SANDS 2012 PINOT NOIR
MAXWELL WINES 2019 SMALL
EXCLUSIVE PINOT NOIR
GREY SANDS 2015 PINOT NOIR
Flavonoids: Why CropBioLife is a powerful tool for regenerative agriculture

Flavonoids, naturally-occurring plant compounds, significantly enhance the nutrient exchange processes to support regenerative agriculture practices in viticulture. These flavonoids positively influence plant metabolism, root exudation and overall plant health.
When CropBioLife is applied to vines through foliar applications, it works to improve metabolism which results in enhanced photosynthesis. The flow-on effect is improved root exudation that shapes the microbial communities under the vines. Therefore, plants experience boosted plant vigour, increased fruitset, improved ripening and enhanced grape flavour development. This translates to higher yields, superior grape quality, increased profits for growers and an elevated tasting experience for wine enthusiasts.
MOVING TOWARDS NET ZERO

The wine industry can significantly contribute to global net zero carbon emission goals by adopting regenerative agriculture practices. Prioritising plant health, nutrition and flavour through practices such as using organic products with activated flavonoids, like CropBioLife, enables vineyards to reduce carbon emissions, sequester soil carbon, promote biodiversity and enhance operational sustainability.


CropBioLife amplifies the root exudation process, vital for carbon sequestration. As plants photosynthesise, they capture atmospheric carbon dioxide, converting it into carbohydrates. A portion of these carbohydrates is released into the soil through root exudation, stimulating soil microorganism growth and facilitating organic matter breakdown and incorporation. This leads to stable soil carbon formation, effectively sequestering atmospheric CO2
Regenerative agriculture practices, including cover cropping, reduced tillage and organic amendments, further improve soil structure and encourage the growth of beneficial soil organisms, enhancing carbon sequestration. These practices also contribute to better water retention and erosion control, reducing vineyards’ vulnerability to climate change impacts.
For further information visit www.cropbiolife.com
V38N3 WINE & VITICULTURE JOURNAL WINTER 2023 www.winetitles.com.au 89 PRODUCTS & SERVICES
Wherever you go, we’re with you! Wine Industry news at your fingertips— delivered to your inbox daily* Subscribe FREE winetitles.com.au/news
Small-scale production of NOLO wine
Flavourtech, a pioneer in dealcoholisation technologies, developed its first spinning cone column (SCC) for the wine industry almost 40 years ago. Since then, it has been the preferred choice for alcohol adjustment of high-quality wines as well as the production of low-alcohol products.
With the boom in zero-alcohol wine, Flavourtech has developed a small-scale SCC with a throughput of only 25-120L/hr, instead of the thousands of litres required for commercially-sized SCCs. This new model, known as the SCC100, has been designed for use in R&D departments or small production runs. It is therefore perfect for smaller wineries entering the zero-alcohol market and is quickly assembled, operated and maintained by the user.

Flavourtech recently installed a SCC100 at the Australian Wine Research Institute’s no and low alcohol research facility at the University of Adelaide’s Waite Campus which was officially launched in early April. The new facility allows producers to trial and refine NOLO wine products using smaller volumes.
The unique design of Flavourtech’s SCC ensures that wine is only exposed to low operating temperatures (<40oC) over extremely short residence times (25 seconds). The result is higher quality NOLO products with the full varietal flavour of the original wine intact.
For further information email sales@flavourtech.com or phone (02) 6969 1111.
Smart Graph: a support tool for optimal pressing
The smooth management of a qualitative pressing is governed by many interdependent factors. Knowing how the pressing cycle works by representing it in the form of a curve is essential for guiding the choices that winemakers will make as they manage the pressing process.
Smart Graph, by Pellenc, is a software that makes it possible to see information about the grape-pressing process in the form of a curve. The data provided include the pressure applied by the membrane, the quantity of juice extracted, the total juice flow as a function of time and the axial inlet pressure.
Smart Graph is a decision-support tool allowing winemakers to better understand
pressing operations (filling, draining, pressing, etc.), enabling them to optimise pressing cycles. It makes it possible to carry out a diagnosis of the wine press in real time on the display screen of the press, on a remote laptop or on a mobile phone.
Achieving the best pressing outcomes directly impacts wine quality (lees content, rapid juice extraction = limited oxidation). Optimising the management of the various stages of the pressing process allows, in many cases, to reduce the cycle time.
Thanks to Smart Graph, winemakers can now closely follow every stage of their pressing cycles. They can analyse pressings every day and adapt day-to-day programs according to the grape varieties processed.
The end-of-season analysis also makes it possible to confidently prepare for the next season.
For further information visit www.pellenc.com/en-au

90 www.winetitles.com.au WINE & VITICULTURE JOURNAL WINTER 2023 V38N3 PRODUCTS & SERVICES


REX SERIES Up to ll2hp, 4.41tr Perkins VINEYARD/ORCHARD SPECIALIST 4 - SERIES Up to 107hp, 3.6 Deutz VINEYARD SPECIALIST GEPPS CROSS 08 8139 7222 www.landinicentral.com.au SUMMERTOWN 08 8390 3017 NARACOORTE 08 8762 0123 admin@landinicentral.com.au
4 - SERIES Up to 107hp, 3.6 Deutz VINEYARD SPECIALIST
ORCHARD & VINEYARD MAINTENANCE
REX SERIES Up to 112hp, 4.4L Perkins VINEYARD
/ ORCHARD SPECIALIST

