CREATING VALUE. DELIVERING RESULTS.


ONEOK ANNUAL REPORT 2022

We deliver energy products and services vital to an advancing world.
We commit to a zero-incident culture for the well-being of our employees, contractors and communities and to operate in an environmentally responsible manner.
We act with honesty, integrity and adherence to the highest standards of personal and professional conduct.
We respect the uniqueness and worth of each employee, and believe that a diverse, inclusive workforce is essential for a sense of belonging, engagement and performance.
We hold ourselves and others accountable to a standard of excellence through continuous improvement and teamwork.
We invest our time, effort and resources to serve each other, our customers and communities.
We seek to develop creative solutions by leveraging collaboration through ingenuity and technology.
ONEOK, Inc. (pronounced ONE-OAK) (NYSE: OKE) is a leading midstream service provider and owner of one of the nation's premier natural gas liquids (NGL) systems, connecting NGL supply in the Rocky Mountain, Mid-Continent and Permian regions with key market centers and an extensive network of natural gas gathering, processing, storage and transportation assets. ONEOK is a FORTUNE 500 company and is included in the S&P 500.
To create exceptional value for our stakeholders by providing solutions for a transforming energy future.
For ONEOK, 2022 was a year of strong results thanks to the dedication of our employees and resiliency of our assets, which delivered another year of consecutive earnings growth for our shareholders. Our strong return on invested capital (ROIC) is a source of pride for ONEOK and is a key metric for evaluating our management team’s performance annually. Our nearly 15% ROIC in 2022 highlights the scrutiny we place on investments, the efficiency of our capital and the high quality of our project’s earnings.
Net income increased 15% in 2022, compared with 2021, and adjusted earnings before interest, taxes, depreciation and amortization (EBITDA) increased for the 9th consecutive year. These higher 2022 results were driven primarily by increased producer activity, higher realized commodity prices, higher average fee rates and higher natural gas storage and transportation services. Volumes through many of our vast networks of pipelines and facilities grew to record levels.
This past year also marked yet another year of successfully navigating challenges from weather-related events in the Williston Basin and an incident at our Medford fractionation facility. We are grateful that the Medford incident did not result in any employee injuries and our team showed tremendous professionalism and resiliency in successfully managing this situation with minimal business interruption.

Just as important to our business performance, ONEOK also marked our best recorded safety year in company history, related to minor and serious injuries. Safety is one of our Core Values and is demonstrated by achieving this record-setting year. While we are proud of the Environment, Safety and Health (ESH) culture we have built at ONEOK, we know safety performance requires constant vigilance and work to help ensure we continue to deliver in this essential area.
We continue to invest in our core businesses. Construction of our Demicks Lake III natural gas processing facility in the Williston Basin was completed in the first quarter 2023. With this newest facility, ONEOK has nearly 2 billion cubic feet of natural gas processing capacity to support producer activity in the region while continuing our commitment to help customers reduce natural gas flaring.
The MB-5 Natural Gas Liquids (NGL) fractionator in Month Belvieu, Texas, remains on schedule to be completed early in the second quarter 2023. MB-5 will accommodate the incremental growth in NGL volumes from across our operations, including the Rocky Mountain and Mid-Continent regions and Permian Basin.

With the Medford facility insurance claim resolved in January 2023, ONEOK announced plans to construct a new 125,000-barrel per day (bpd) NGL fractionator at our Mont Belvieu, Texas, facility called MB-6, which will better align with NGL market demand in the Gulf Coast. Construction on MB-6 is expected to be completed in the first quarter of 2025.
In December 2022, we announced that the Saguaro Connector Pipeline subsidiary has filed a Presidential Permit application with the Federal Energy Regulatory Commission (FERC) to construct and operate facilities for the exportation of natural gas at a new international border-crossing at the U.S. and Mexico border in Hudspeth County, Texas. The proposed crossing facilities would connect to the potential 155-mile, 48-inch-diameter natural gas Saguaro Connector Pipeline originating at the Waha Hub in Pecos County, Texas. The ultimate design capacity of the potential pipeline would be approximately 2.8 billion cubic feet per day. Final investment decision on the crossing facilities and the potential pipeline is expected by mid-2023.
Returning value to our investors, ONEOK maintained the quarterly dividend in 2022 and increased it by 2% in January 2023. This increase underlines our commitment and confidence to create exceptional value for our stakeholders.
Energy and energy transformation continue to be front and center on the global stage. At ONEOK, we are well-positioned to continue to be a part of the current energy mix as well as becoming a significant part of the global energy transformation to deliver results that are vital to an advancing world.
Thank you to our employees for their steadfast dedication to excellence. And to our investors, your trust in our company and employees is the thread that connects your investment to ONEOK's future.
Julie H. Edwards Board Chair Pierce H. Norton II President and Chief Executive Officer March 8, 2023

Natural Gas Gathering Pipelines
Natural Gas Processing Plants
NGL Pipelines
NGL Fractionators
Partial Interest
Natural Gas Pipelines
Natural Gas Storage
Growth Projects Basins
WILLISTON BASIN
POWDER RIVER BASIN
DENVERJULESBURG BASIN
PERMIAN BASIN


☒ ANNUAL REPORT PURSUANT TO SECTION 13 OR 15(d) OF THE SECURITIES EXCHANGE ACT OF 1934
For the fiscal year ended December 31, 2022. OR
☐ TRANSITION REPORT PURSUANT TO SECTION 13 OR 15(d) OF THE SECURITIES EXCHANGE ACT OF 1934
For the transition period from __________ to __________.
Commission file number 001-13643

(Exactnameofregistrantasspecifiedinitscharter) Oklahoma 73-1520922
(State or other jurisdiction of incorporation or organization)
(I.R.S. Employer Identification No.)
100 West Fifth Street,Tulsa,OK 74103
(Address of principal executive offices)
(Zip Code)
Registrant’s telephone number, including area code (918) 588-7000
Securities registered pursuant to Section 12(b) of the Act:
Title of each class Trading Symbol(s)Name of each exchange on which registered Common stock, par value of $0.01 OKE New York Stock Exchange
Securities registered pursuant to Section 12(g) of the Act: None
Indicatebycheckmarkiftheregistrantisawell-knownseasonedissuer,asdefinedinRule405oftheSecuritiesAct. Yes ☒ No ☐
IndicatebycheckmarkiftheregistrantisnotrequiredtofilereportspursuanttoSection13orSection15(d)oftheAct. Yes ☐ No ☒
Indicatebycheckmarkwhethertheregistrant(1)hasfiledallreportsrequiredtobefiledbySection13or15(d)oftheSecuritiesExchangeAct of1934duringthepreceding12months(orforsuchshorterperiodthattheregistrantwasrequiredtofilesuchreports),and(2)hasbeensubject tosuchfilingrequirementsforthepast90days. Yes ☒ No ☐
IndicatebycheckmarkwhethertheregistranthassubmittedelectronicallyeveryInteractiveDataFilerequiredtobesubmittedpursuanttoRule 405ofRegulationS-T(§232.405ofthischapter)duringthepreceding12months(orforsuchshorterperiodthattheregistrantwasrequiredto submitsuchfiles). Yes ☒ No ☐
Indicatebycheckmarkwhethertheregistrantisalargeacceleratedfiler,anacceleratedfiler,anon-acceleratedfiler,smallerreportingcompany oranemerginggrowthcompany. Seethedefinitionsof“largeacceleratedfiler,”“acceleratedfiler,”“smallerreportingcompany”and “emerginggrowthcompany”inRule12b-2oftheExchangeAct.
Largeacceleratedfiler ☒ Acceleratedfiler ☐ Non-acceleratedfiler ☐ Smallerreportingcompany ☐ Emerginggrowthcompany ☐
Ifanemerginggrowthcompany,indicatebycheckmarkiftheregistranthaselectednottousetheextendedtransitionperiodforcomplyingwith anyneworrevisedfinancialaccountingstandardsprovidedpursuanttoSection13(a)oftheExchangeAct. ☐
Indicatebycheckmarkwhethertheregistranthasfiledareportonandattestationtoitsmanagement’sassessmentoftheeffectivenessofits internalcontroloverfinancialreportingunderSection404(b)oftheSarbanes-OxleyAct(15U.S.C.7262(b))bytheregisteredpublicaccounting firmthatpreparedorissueditsauditreport. ☒
IfsecuritiesareregisteredpursuanttoSection12(b)oftheAct,indicatebycheckmarkwhetherthefinancialstatementsoftheregistrant includedinthefilingreflectthecorrectionofanerrortopreviouslyissuedfinancialstatements. ☐
Indicatebycheckmarkwhetheranyofthoseerrorcorrectionsarerestatementsthatrequiredarecoveryanalysisofincentive-based compensationreceivedbyanyoftheregistrant’sexecutiveofficersduringtherelevantrecoveryperiodpursuantto§240.10D-1(b). ☐
Indicatebycheckmarkwhethertheregistrantisashellcompany(asdefinedinRule12b-2oftheAct). Yes ☐ No ☒
Aggregatemarketvalueofregistrant’scommonstockheldbynon-affiliatesbasedontheclosingtradepriceonJune30,2022,was$24.5billion OnFebruary21,2023,theCompanyhad447,220,972sharesofcommonstockoutstanding.
DOCUMENTSINCORPORATEDBYREFERENCE:
PortionsofthedefinitiveproxystatementtobedeliveredtoshareholdersinconnectionwiththeAnnualMeetingofShareholderstobeheldMay 24,2023,areincorporatedbyreferenceinPartIII.
The abbreviations, acronyms and industry terminology used in this Annual Report are defined as follows:
$1.5 Billion Term Loan Agreement
$2.5 Billion Credit Agreement
AFUDC
Annual Report
The senior unsecured delayed-draw three-year $1.5 billion term loan agreement dated November 19, 2018
ONEOK’s $2.5 billion revolving credit agreement, as amended and restated
Allowance for funds used during construction
Annual Report on Form 10-K for the year ended December 31, 2022
ASU Accounting Standards Update
Bbl
BBtu/d
Barrels, 1 barrel is equivalent to 42 United States gallons
Billion British thermal units per day
Bcf Billion cubic feet
Bcf/d Billion cubic feet per day
Btu British thermal unit
CFTC
Clean Air Act
Clean Water Act
United States Commodity Futures Trading Commission
Federal Clean Air Act, as amended
Federal Water Pollution Control Act Amendments of 1972, as amended
COVID-19 Coronavirus disease 2019, including variants thereof
DJ Denver-Julesburg
DOT
EBITDA
United States Department of Transportation
Earnings before interest expense, income taxes, depreciation and amortization
EPA United States Environmental Protection Agency
EPS
Earnings per share of common stock
ESG Environmental, social and governance Exchange Act
Securities Exchange Act of 1934, as amended
FERC Federal Energy Regulatory Commission
Fitch Fitch Ratings, Inc.
GAAP Accounting principles generally accepted in the United States of America
Guardian Guardian Pipeline, L.L.C., a wholly owned subsidiary of ONEOK, Inc.
Guardian Term Loan AgreementGuardian’s senior unsecured three-year $120 million term loan agreement dated June 24, 2022
GHG
Homeland Security
ICE
Inflation Reduction Act
Intermediate Partnership
KCC
LIBOR
Greenhouse gas
United States Department of Homeland Security
Intercontinental Exchange
Inflation Reduction Act of 2022
ONEOK Partners Intermediate Limited Partnership, a wholly owned subsidiary of ONEOK Partners, L.P.
Kansas Corporation Commission
London Interbank Offered Rate
MBbl/d Thousand barrels per day
MDth/d
Thousand dekatherms per day
MMBbl Million barrels
MMBbl/d Million barrels per day
MMBtu Million British thermal units
MMcf/d Million cubic feet per day
Moody’s Moody’s Investors Service, Inc.
Natural Gas Act
Natural Gas Policy Act
NGL(s)
Northern Border
Natural Gas Act of 1938, as amended
Natural Gas Policy Act of 1978, as amended
Natural gas liquid(s)
Northern Border Pipeline Company, a 50% owned joint venture
NYMEX New York Mercantile Exchange
NYSE New York Stock Exchange
OCC
ONEOK
Oklahoma Corporation Commission
ONEOK, Inc.
ONEOK Partners
ONEOK Partners, L.P., a wholly owned subsidiary of ONEOK, Inc.
OPIS Oil Price Information Service
Overland Pass
PHMSA
Overland Pass Pipeline Company, LLC, a 50% owned joint venture
United States Department of Transportation Pipeline and Hazardous Materials Safety Administration
POP Percent of Proceeds
Purity NGLs
Quarterly Report(s)
Roadrunner
RRC
S&P
SCOOP
Marketable natural gas liquid purity products, such as ethane, ethane/propane mix, propane, iso-butane, normal butane and natural gasoline
Quarterly Report(s) on Form 10-Q
Roadrunner Gas Transmission, LLC, a 50% owned joint venture
Railroad Commission of Texas
S&P Global Ratings
South Central Oklahoma Oil Province, an area in the Anadarko Basin in Oklahoma
SEC Securities and Exchange Commission
Securities Act
Series E Preferred Stock
SOFR
STACK
Term SOFR
Viking
WTI
XBRL
Securities Act of 1933, as amended
Series E Non-Voting, Perpetual Preferred Stock, par value $0.01 per share
Secured Overnight Financing Rate
Sooner Trend Anadarko Canadian Kingfisher, an area in the Anadarko Basin in Oklahoma
The forward-looking term rate based on SOFR
Viking Gas Transmission Company, a wholly owned subsidiary of ONEOK, Inc.
West Texas Intermediate
eXtensible Business Reporting Language
The statements in this Annual Report that are not historical information, including statements concerning plans and objectives of management for future operations, economic performance or related assumptions, are forward-looking statements. Forward-looking statements may include words such as “anticipate,” “believe,” “continue,” “could,” “estimate,” “expect,” “forecast,” “goal,” “guidance,” “intend,” “may,” “might,” “outlook,” “plan,” “potential,” “project,” “scheduled,” “should,” “target,” “will,” “would” and other words and terms of similar meaning. Although we believe that our expectations regarding future events are based on reasonable assumptions, we can give no assurance that such expectations or assumptions will be achieved. Important factors that could cause actual results to differ materially from those in the forward-looking statements are described under Part I, Item 1A, Risk Factors, and Part II, Item 7, Management’s Discussion and Analysis of Financial Condition and Results of Operations and “Forward-Looking Statements,” in this Annual Report.
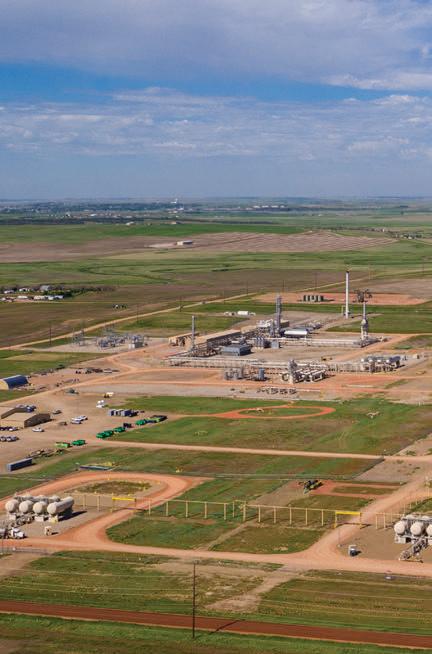
We are incorporated under the laws of the state of Oklahoma, and our common stock is listed on the NYSE under the trading symbol “OKE.” We are a leading midstream service provider and own one of the nation’s premier NGL systems, connecting NGL supply in the Rocky Mountain, Permian and Mid-Continent regions with key market centers and own an extensive network of gathering, processing, fractionation, transportation and storage assets. We apply our core capabilities of gathering, processing, fractionating, transporting, storing and marketing natural gas and NGLs through vertical integration across the midstream value chain to provide our customers with premium services while generating consistent and sustainable earnings growth.
NaturalGasLiquids
NaturalGasPipelines
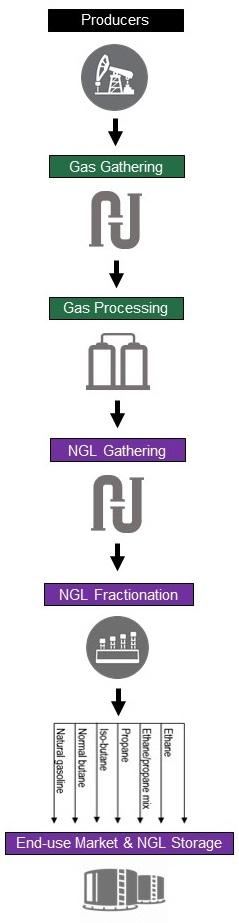
Rawnaturalgasistypicallygatheredatthe wellhead,compressedandtransportedthrough pipelinestoourprocessingfacilities. Mostraw naturalgasproducedatthewellheadalso containsamixtureofNGLcomponents, includingethane,propane,iso-butane,normal butaneandnaturalgasoline.
Gatheredwellheadnaturalgasisdirectedtoour processingplantstoremoveNGLs,resultingin residuenaturalgas(primarilymethane).
Midstream Value Chain
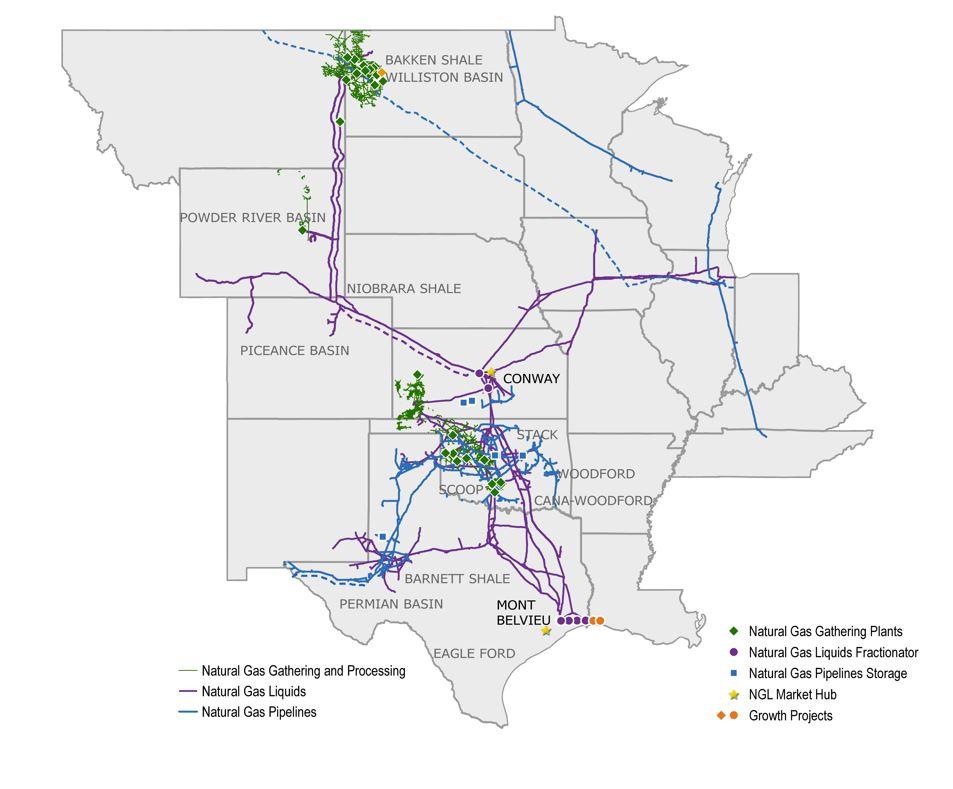
Weareconnectedtosupplyinnaturalgasand NGLproducingbasinsandhavesignificant basindiversification,includingtheWilliston, Permian,PowderRiverandDJBasins,andthe SCOOPandSTACKareas. InourNaturalGas GatheringandProcessingsegment,wehave morethan3milliondedicatedacresinthe WillistonBasinandapproximately300,000 dedicatedacresintheSCOOPandSTACK areas. InourNaturalGasLiquidssegment,we arethelargestNGLtakeawayproviderinthe WillistonandPowderRiverBasins;Oklahoma, includingtheSCOOPandSTACKareas; Kansas;andtheTexasPanhandle. Wealsohave asignificantpresenceinthePermianBasin.
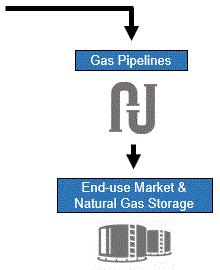
Onceprocessed,residuenaturalgasis recompressedanddeliveredtointrastateand interstatenaturalgaspipelinesprimarilyinour NaturalGasPipelinessegment.
NGLsextractedatnaturalgasprocessingplants, boththird-partyandourown,arethengathered byourNGLgatheringpipelines.
GatheredNGLsaredirectedtoourdownstream fractionatorsintheMid-Continentregionand MontBelvieu,Texas,tobeseparatedintopurity products.
Residuenaturalgasistransportedtostorage facilitiesandendusers,suchaslargeindustrial customers,naturalgasandelectricutilities servingcommercialandresidentialconsumers, andcanultimatelyreachinternationalmarkets throughliquefiednaturalgasexportsandcrossborderpipelines.
Purityproductsarestoredordistributedtoour customers,suchaspetrochemicalcompanies, propanedistributors,heatingfuelusers,ethanol producers,refineriesandexporters.
Business Update and Market Conditions - We experienced earnings growth in 2022, compared with 2021, due primarily to increased producer activity across our operations, higher realized commodity prices, net of hedging, and higher average fee rates. In 2023, we expect to benefit from higher volumes, our completed Demicks Lake III natural gas processing plant and the expected completion of our MB-5 NGL fractionator, highlighting our extensive and integrated assets that are located in some of the most productive shale basins in the United States. Although the energy industry has experienced many commodity cycles, we have positioned ourselves to reduce exposure to direct commodity price volatility. Each of our three segments are primarily fee-based, and our consolidated earnings were approximately 90% fee-based in 2022. While our Natural Gas Gathering and Processing segment’s earnings are primarily fee-based, we have direct commodity price exposure related primarily to our fee with POP contracts, and we have hedged approximately 70% of our forecasted equity volumes for 2023. In addition, our Natural Gas Gathering and Processing and Natural Gas Liquids segments are exposed to volumetric risk as a result of drilling and well completion activity, severe weather disruptions, operational outages, global crude oil, NGL and natural gas demand, changes in gas-to-oil ratios and normal volumetric well declines. Our Natural Gas Pipelines segment is not exposed to significant volumetric risk due to nearly all of our capacity being subscribed under long-term, firm fee-based contracts.
Medford Incident - On July 9, 2022, a fire occurred at our 210 MBbl/d Medford, Oklahoma, NGL fractionation facility. All personnel were safe and accounted for with temporary evacuations of local residents taken as a precautionary measure. On January 9, 2023, we reached an agreement with our insurers to settle all claims for physical damage and business interruption related to the Medford incident. Under the terms of the settlement agreement, we agreed to resolve the claims for total insurance payments of $930 million, $100 million of which was received in 2022. The remaining $830 million was received in the first quarter 2023. The proceeds serve as settlement for property damage, business interruption claims to the date of the settlement and as payment in lieu of future business interruption insurance claims. Subsequent to settling the insurance claims, we announced plans to construct MB-6, a new 125 MBbl/d NGL fractionator in Mont Belvieu, Texas.
See Part II, Item 7, Recent Developments, in this Annual Report for more information on the Medford incident.
Geopolitical events and supply chain - Geopolitical events have disrupted global supply chains and caused volatile commodity prices for natural gas, NGLs and crude oil. The United States has banned the import of oil and other energy commodities from Russia, and European countries have taken steps to reduce imports of Russian oil and natural gas. In addition, a continued Gulf Coast liquified natural gas facility outage has further disrupted the overseas and domestic natural gas markets. These events have highlighted the importance of a strong national energy supply and infrastructure supporting the United States economy and national security. We operate an integrated, reliable, resilient and diversified network of NGL and natural gas gathering, processing, fractionation, transportation and storage assets connecting supply in the Rocky Mountain, Mid-Continent, Permian and Gulf Coast regions with key market centers. We believe our assets are well positioned to provide midstream services to producers and end-use markets as they respond to domestic and international demand.
Inflation - Inflation in the United States increased significantly in late 2021 and 2022. This rise in inflation generally resulted in higher costs in 2022. However, many of our NGL and natural gas processing contracts include fee escalators or fuel recovery mechanisms that fully offset the increase in costs in 2022. While we expect inflation to remain elevated, we do not expect a material impact on our results of operations as a result of these contract escalators.
Winter weather - In the second and fourth quarters of 2022, we experienced winter weather events in the Rocky Mountain region that brought disruptions to our operations. Our employees in the region were prepared and made the necessary operational adjustments to maintain the safety of our employees, their families and our assets. Region-wide power outages in the second quarter and blizzard conditions in both quarters negatively impacted the gathered and processed volumes in our Natural Gas Gathering and Processing segment, and NGL volumes, including volumes from third parties, delivered to and transported by our Natural Gas Liquids segment.
See Part II, Item 7A, Quantitative and Qualitative Disclosures About Market Risk, in this Annual Report for more information on our exposure to market risk.
Sustainability and Social Responsibility - In 2023, we qualified for inclusion in the S&P Global Sustainability Yearbook for the third year in a row. In 2022, we received an MSCI ESG Rating of AAA and received a perfect score of 100 in the Human Rights Campaign Corporate Equality Index. Additionally, in 2022, our ESG Risk Rating was in the lowest-risk quintile of the Sustainalytics’ refiners and pipelines industry, indicating that our ESG risk management is in the top 20% of our industry.
In September 2021, we announced a companywide absolute GHG emissions reduction target of 2.2 million metric tons of carbon dioxide equivalents from our combined Scope 1 and Scope 2 GHG emissions by 2030. The target represents a 30%
reduction in combined operational Scope 1 and location-based Scope 2 GHG emissions attributable to ONEOK assets as of December 31, 2019. We have achieved reductions totaling approximately 0.5 million metric tons of the targeted 2.2 million metric tons of carbon dioxide equivalents, primarily as a result of methane emissions mitigation, system optimizations, electrification of certain natural gas compression equipment and lower carbon-based electricity in states in which we operate. We continue to look for ways to reduce our GHG emissions and utilize more efficient technologies. We are evaluating the development of renewable energy and low-carbon projects, including opportunities that may complement our extensive midstream assets and expertise.
For more information on our GHG emissions, see “GHG emissions” in the “Regulatory, Environmental and Safety Matters” section.
Capital Ventures Opportunity - In 2022, we formed a capital ventures team focused on pursuing investments in early-stage energy technology companies. During the third quarter 2022, we reached an agreement between us, several other Oklahoma energy companies and organizations and an established energy-focused venture capital firm to commit funds of up to $50 million, collectively, toward a new venture capital fund. We also intend to make direct equity investments in early-stage energy technology companies that help to improve our operations and are aligned with energy transformation. We completed our first direct equity energy investment during the fourth quarter 2022 in a hyperspectral satellite company that is expected to increase our and the industry’s asset monitoring capabilities.
Natural Gas - In our Natural Gas Gathering and Processing segment, we benefited from increased volumes, higher realized commodity prices, net of hedging, and higher average fee rates in 2022, compared with 2021, due primarily to increased producer activity in the Rocky Mountain and Mid-Continent regions, offset partially by the impact of winter weather in the Rocky Mountain region in 2022. We expect additional earnings benefit in 2023 due to the completion of our 200 MMcf/d Demicks Lake III natural gas processing plant in the first quarter, which increased our total processing capacity to approximately 1.9 Bcf/d in the Williston Basin.
In our Natural Gas Pipelines segment, continued demand from local distribution companies, electric-generation facilities and large industrial companies resulted in low-cost expansions that position us well to provide additional services to our customers. In April 2022, we completed a 1.1 Bcf expansion of our Texas natural gas storage facilities’ capacities, and the expansion is fully subscribed through 2032. We are currently expanding the injection capabilities of our Oklahoma natural gas storage facilities which will allow us to utilize and subscribe an additional 4 Bcf of our existing storage capacity, with expected completion in the second quarter 2023. We have subscribed 100% of the incremental 4 Bcf of storage capacity through 2027 and 90% through 2029. In addition, we have begun the electrification of certain compression assets for Viking to improve the reliability of our operations while lowering our Scope 1 emissions from this equipment. This project is expected to cost approximately $95 million and be completed in the third quarter 2023. Viking will seek to recover its investment in the project through a proposed change in rates expected to be filed in third quarter 2023.
NGLs - In our Natural Gas Liquids segment, we benefited from increased volumes and higher average fee rates in 2022, compared with 2021, from increased production in the Rocky Mountain region and the Permian Basin, offset partially by higher costs. In addition, we expect to benefit from the completion of our 125 MBbl/d MB-5 fractionator in Mont Belvieu, Texas, in the second quarter 2023.
See Part II, Item 7, Management’s Discussion and Analysis of Financial Condition and Results of Operations, in this Annual Report for more information on our growth projects, results of operations, liquidity and capital resources.
Our mission is to deliver energy products and services vital to an advancing world. Our vision is to create exceptional value for our stakeholders by providing solutions for a transforming energy future. Our business strategy is focused on:
•Zero incidents - we commit to developing processes to drive a zero-incident culture for the well-being of our employees, contractors and communities. Safety and environmental responsibility continue to be primary areas of focus for us, and our emphasis on safety has produced improving trends in the key indicators we track.
•Highly engaged workforce - we strive to be an employer of choice and continue to focus on attracting, selecting and retaining talent, advancing an inclusive, diverse and engaged culture and developing individuals and leaders.
•Sustainable business model - we aim to maintain prudent financial strength and flexibility while operating a safe, reliable and resilient asset base. We seek to maintain investment-grade credit ratings and a strong balance sheet. We believe our internally generated cash flows will allow us to fund capital-growth projects in our existing operating regions and to provide value-added products and services that contribute to long-term growth, profitability and
business diversification. We continue to actively research opportunities that will complement our extensive midstream assets and expertise, strengthening the role we expect to play in the transformation to a lower-carbon economy.
•Maximizing total shareholder return - we plan to grow earnings and sustain our dividend by efficiently allocating capital to investments that produce returns above our cost of capital. Producing consistent and strong returns on invested capital will allow us to not only reward our shareholders but also provide the means and opportunity to serve our additional stakeholders, including employees, communities and the environment.
We report operations in the following business segments:
•Natural Gas Gathering and Processing;
•Natural Gas Liquids; and
•Natural Gas Pipelines.
Overview - Our Natural Gas Gathering and Processing segment provides midstream services to producers in North Dakota, Montana, Wyoming, Kansas and Oklahoma.
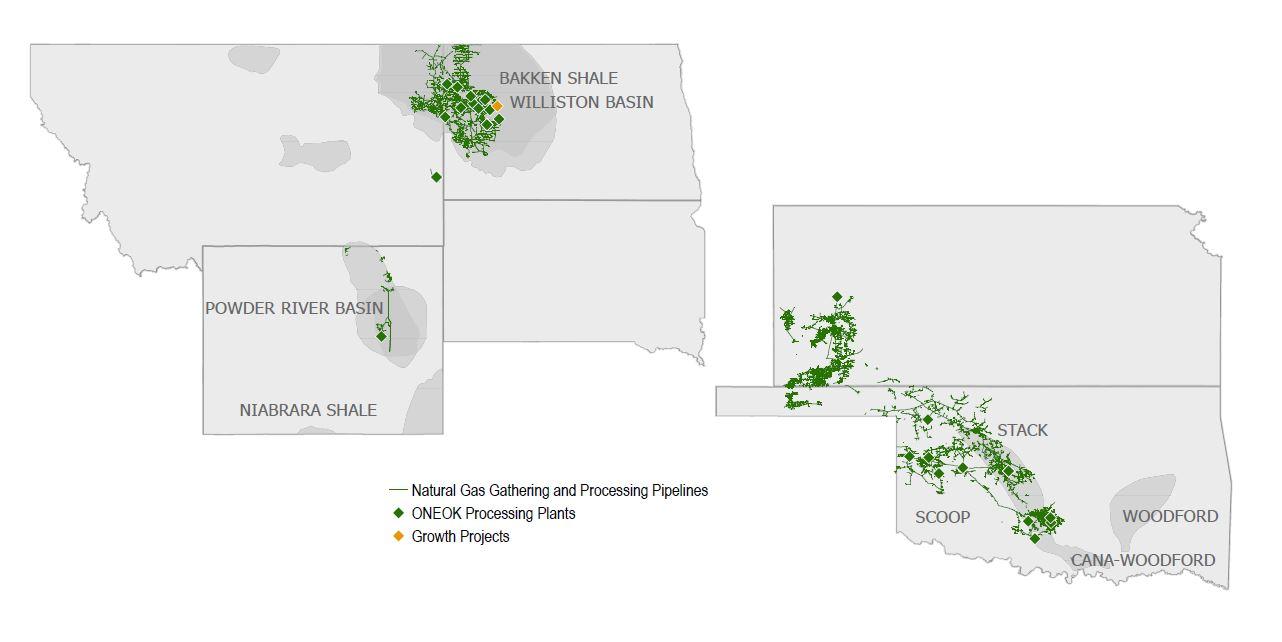
Rocky Mountain region - The Williston Basin is located in portions of North Dakota and Montana and includes the oilproducing, NGL-rich Bakken Shale and Three Forks formations.
The Powder River Basin is primarily located in Wyoming, which includes the NGL-rich Niobrara Shale and Frontier and Turner formations where we provide gathering and processing services to customers in the eastern portion of the state.
Mid-Continent region - The Mid-Continent region includes the oil-producing, NGL-rich SCOOP and STACK areas including the Cana-Woodford Shale, Woodford Shale, Springer Shale, Meramec, Granite Wash and Mississippian Lime formations of Oklahoma and the Hugoton Basin in Kansas.
Property - Our Natural Gas Gathering and Processing segment includes the following assets:
•17,200 miles of natural gas gathering pipelines;
•14 natural gas processing plants with 1.9 Bcf/d of processing capacity in the Rocky Mountain region, and nine natural gas processing plants with 0.9 Bcf/d of processing capacity in the Mid-Continent region, and up to 150 MMcf/d of processing capacity in the Mid-Continent region through a long-term processing services agreement with an unaffiliated third party; and
•14 MBbl/d of NGL fractionation capacity and 26 MBbl/d of de-ethanizer capacity at various natural gas processing plants.
We recently completed the construction of our 200 MMcf/d Demicks Lake III natural gas processing plant in the Williston Basin, which is included in the assets listed above.
See “Recent Developments” in Part II, Item 7, Management’s Discussion and Analysis of Financial Condition and Results of Operations, in this Annual Report for more information on our growth projects.
Sources of Earnings - Earnings for this segment are derived primarily from the following types of service contracts:
•Fee with POP contracts with no producer take-in-kind rights - We purchase raw natural gas and charge contractual fees for providing midstream services, which include gathering, treating, compressing and processing the producer’s natural gas. After performing these services, we sell the commodities and remit a portion of the commodity sales
proceeds to the producer less our contractual fees. This type of contract represented 73% of supply volumes in this segment for 2022 and 2021.
•Fee with POP contracts with producer take-in-kind rights - We purchase a portion of the raw natural gas stream, charge fees for providing the midstream services listed above, return primarily the residue natural gas to the producer, sell the remaining commodities and remit a portion of the commodity sales proceeds to the producer less our contractual fees. This type of contract represented 20% of supply volumes in this segment for 2022 and 2021.
•Fee-only - Under this type of contract, we charge a fee for the midstream services we provide, based on volumes gathered, processed, treated and/or compressed. Our fee-only contracts represented 7% of supply volumes in this segment for 2022 and 2021.
For commodity sales, we contract to deliver residue natural gas, condensate and/or unfractionated NGLs to downstream customers at a specified delivery point. Our sales of NGLs are primarily to our affiliate in the Natural Gas Liquids segment.
Utilization - The utilization rates for our natural gas processing plants were 70% and 69% for 2022 and 2021, respectively, due primarily to increased producer activity in the Rocky Mountain region and the SCOOP and STACK areas of Oklahoma. Our 2022 utilization rates were also impacted by winter weather in the Rocky Mountain region in the second and fourth quarters of 2022 and the full year impact of the capacity made available by the Bear Creek plant expansion, which was placed in-service in the fourth quarter 2021. We calculate utilization rates using a weighted-average approach, adjusting for the dates that assets were placed in or removed from service.
Unconsolidated Affiliates - Our unconsolidated affiliates in this segment are not material.
See Note N of the Notes to Consolidated Financial Statements in this Annual Report for additional discussion of our unconsolidated affiliates.
Government Regulation - The FERC traditionally has maintained that a natural gas processing plant is not a facility for the transportation or sale of natural gas in interstate commerce and, therefore, is not subject to jurisdiction under the Natural Gas Act. Although the FERC has made no specific declaration as to the jurisdictional status of our natural gas processing operations or facilities, our natural gas processing plants are primarily involved in extracting NGLs and, therefore, are exempt from FERC jurisdiction. The Natural Gas Act also exempts natural gas gathering facilities from the jurisdiction of the FERC. We believe our natural gas gathering facilities, upstream of our natural gas processing plants, meet the criteria used by the FERC for non-jurisdictional natural gas gathering facility status. Interstate transmission facilities remain subject to FERC jurisdiction. The FERC has historically distinguished between these two types of facilities, either interstate or intrastate, on a fact-specific basis. We transport residue natural gas from certain of our natural gas processing plants to interstate pipelines in accordance with Section 311(a) of the Natural Gas Policy Act. Oklahoma, Kansas, Wyoming, Montana and North Dakota also have statutes regulating, to varying degrees, the gathering of natural gas in those states. In each state, regulation is applied on a case-by-case basis if a complaint is filed against the gatherer with the appropriate state regulatory agency.
See further discussion in the “Regulatory, Environmental and Safety Matters” section.
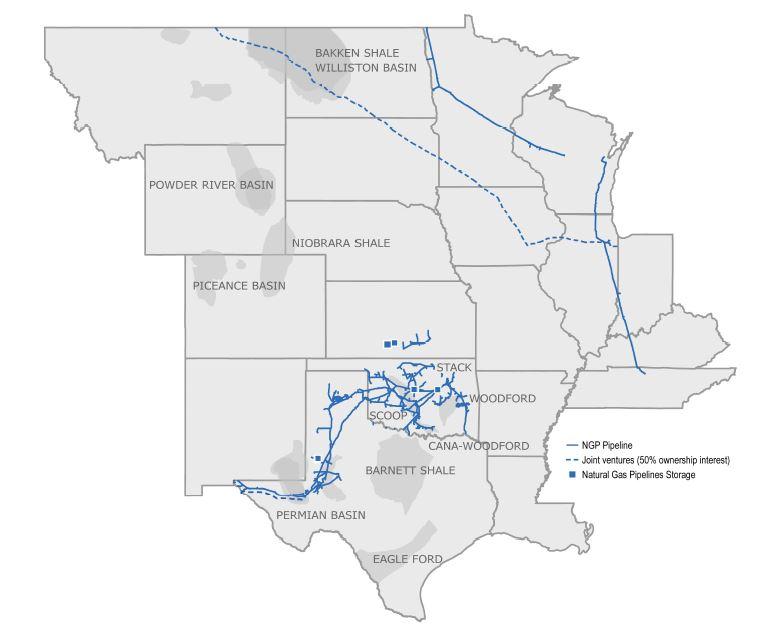
Overview - Our Natural Gas Liquids segment owns and operates facilities that gather, fractionate, treat and distribute NGLs and store purity NGLs, primarily in Oklahoma, Kansas, Texas, New Mexico and the Rocky Mountain region, which includes the Williston, Powder River and DJ Basins. We provide midstream services to producers of NGLs and deliver those products to the two primary market centers: one in the Mid-Continent in Conway, Kansas, and the other in the Gulf Coast in Mont Belvieu, Texas. We own or have an ownership interest in FERC-regulated NGL gathering and distribution pipelines in Oklahoma, Kansas, Texas, New Mexico, Montana, North Dakota, Wyoming and Colorado, and terminal and storage facilities in Kansas, Nebraska, Iowa and Illinois. We have a 50% ownership interest in Overland Pass, which operates an interstate NGL pipeline originating in Wyoming and Colorado and terminating in Kansas. The majority of the pipeline-connected natural gas processing plants in the Williston Basin, Oklahoma, Kansas and the Texas Panhandle are connected to our NGL gathering systems. We lease rail cars and own and operate truck- and rail-loading and -unloading facilities connected to our NGL fractionation, storage and pipeline assets. We also own FERC-regulated NGL distribution pipelines in Kansas, Nebraska, Iowa, Illinois and Indiana that connect our Mid-Continent assets with Midwest markets, including Chicago, Illinois. A portion of our ONEOK North System transports refined petroleum products, including unleaded gasoline and diesel, from Kansas to Iowa.
Property - Our Natural Gas Liquids segment includes the following assets:
•9,140 miles of gathering pipelines with operating capacity of 1,790 MBbl/d, including 6,350 miles of FERC-regulated pipelines with operating capacity of 1,490 MBbl/d;
•4,350 miles of distribution pipelines with operating capacity of 1,150 MBbl/d, including 4,180 miles of FERCregulated pipelines with operating capacity of 1,080 MBbl/d;

•seven NGL fractionators with combined operating capacity of 710 MBbl/d (includes interests in our proportional share of operating capacity), including 310 MBbl/d in the Mid-Continent region and 400 MBbl/d in the Gulf Coast region;
•one isomerization unit with operating capacity of 10 MBbl/d;
•one ethane/propane splitter with operating capacity of 40 MBbl/d;
•six NGL storage facilities with operating storage capacity of 30 MMBbl; and
•eight purity NGLs terminals.
In addition, we lease 10 MMBbl of annual pipeline capacity near our ONEOK North System and have access to 5 MMBbl of combined NGL storage capacity at facilities in Kansas and Texas and 60 MBbl/d of NGL fractionation capacity in the Gulf Coast through service agreements.
We are in the process of constructing our 125 MBbl/d MB-5 and MB-6 NGL fractionators in Mont Belvieu, Texas. The additional capacity from these projects is excluded from the assets listed above. As a result of the Medford incident, our 210 MBbl/d NGL fractionator in Medford, Oklahoma, is no longer operational and is excluded from the assets listed above.
See “Recent Developments” in Part II, Item 7, Management’s Discussion and Analysis of Financial Condition and Results of Operations, in this Annual Report for more information on our growth projects.
Sources of Earnings - Earnings for our Natural Gas Liquids segment are derived primarily from commodity sales and purchases and fee-based services. We purchase NGLs and condensate from third parties, as well as from our Natural Gas Gathering and Processing segment. Our business activities are categorized as follows:
•Exchange services - We utilize our assets to gather, transport, treat and fractionate unfractionated NGLs, thereby converting them into marketable purity NGLs delivered to a market center or customer-designated location. Some of these exchange volumes are under contracts with minimum volume commitments that provide a minimum level of revenues regardless of volumetric throughput. Our exchange services activities are primarily fee-based and include some rate-regulated tariffs; however, we also capture certain product price differentials through the fractionation process.
•Transportation and storage services - We transport purity NGLs and refined petroleum products, primarily under FERC-regulated tariffs. Tariffs specify the maximum rates we may charge our customers and the general terms and conditions for transportation service on our pipelines. Our storage activities consist primarily of fee-based NGL storage services at our Mid-Continent and Gulf Coast storage facilities.
•Optimization and marketing - We utilize our assets, contract portfolio and market knowledge to capture location, product and seasonal price differentials through the purchase and sale of unfractionated NGLs and purity NGLs. We primarily transport purity NGLs between Conway, Kansas, and Mont Belvieu, Texas, to capture the location price differentials between the two market centers. Our marketing activities also include utilizing our NGL storage facilities to capture seasonal price differentials and serving truck and rail markets. Our isomerization activities capture the price differential when normal butane is converted into the more valuable iso-butane at our isomerization unit in Conway, Kansas.
In the majority of our exchange services contracts, we purchase the unfractionated NGLs at the tailgate of the processing plant and deduct contractual fees related to the transportation and fractionation services we must perform before we can sell them as purity NGLs. To the extent we hold unfractionated NGLs in inventory, the related contractual fees are not recognized until the unfractionated inventory is fractionated and sold.
Utilization - Increased volumes and decreased capacity, related to capacity constraints after the Medford incident, drove higher utilization rates at our NGL fractionators. The utilization rates for 2022 and 2021, respectively, were as follows:
•our NGL gathering pipelines were 62% and 61%;
•our NGL distribution pipelines were 49% and 51%; and
•our NGL fractionators were 97% and 91%.
We calculate utilization rates using a weighted-average approach, adjusting for the dates that assets were placed in or removed from service. Our fractionation utilization rate reflects approximate proportional capacity associated with our ownership interests.
Unconsolidated Affiliates - We have a 50% ownership interest in Overland Pass, which operates an interstate NGL pipeline system extending 760 miles, originating in Wyoming and Colorado and terminating in Kansas. Our other unconsolidated affiliates in this segment are not material.
See Note N of the Notes to Consolidated Financial Statements in this Annual Report for additional discussion of unconsolidated affiliates.
Government Regulation - The operations and revenues of our NGL pipelines are regulated by various state and federal government agencies. Our interstate NGL pipelines are regulated under the Interstate Commerce Act, which gives the FERC jurisdiction to regulate the terms and conditions of service, rates, including depreciation and amortization policies, and initiation of service. In Oklahoma, Kansas and Texas, certain aspects of our intrastate NGL pipelines that provide common carrier service are subject to the jurisdiction of the OCC, KCC and RRC, respectively.
See further discussion in the “Regulatory, Environmental and Safety Matters” section.
Overview - In our Natural Gas Pipelines segment, our assets are connected to key supply areas and demand centers, including export markets in Mexico via Roadrunner and supply areas in Canada and the United States via our interstate and intrastate
natural gas pipelines and Northern Border, which enables us to provide essential natural gas transportation and storage services. Continued demand from local distribution companies, electric-generation facilities and large industrial companies resulted in low-cost expansions that position us well to provide additional services to our customers when needed.
Intrastate Pipelines and Storage - Our intrastate natural gas pipeline and storage assets are located in Oklahoma, Texas and Kansas. Our intrastate pipeline and storage companies include:
•ONEOK Gas Transportation, which transports natural gas throughout the state of Oklahoma and has access to the major natural gas production areas in the Mid-Continent region, which include the SCOOP and STACK areas and the Cana-Woodford Shale, Woodford Shale, Springer Shale, Meramec, Granite Wash and Mississippian Lime formations. ONEOK Gas Transportation is connected to our ONEOK Gas Storage storage fields in Oklahoma, which provide 46 Bcf of working gas storage capacity; and
•ONEOK WesTex Transmission, which transports natural gas throughout the western portion of the state of Texas, including the Waha area where other pipelines may be accessed for transportation to western markets, exports to Mexico, several markets to the southeast along the Gulf Coast, including the Houston Ship Channel, and the MidContinent market to the north. It has access to major natural gas producing formations in the Texas Panhandle, including the Granite Wash formation and Delaware and Midland Basins in the Permian Basin. ONEOK WesTex Transmission is connected to our ONEOK Texas Gas Storage storage fields, which provide 5 Bcf of working gas storage capacity.
Interstate Pipelines - Our interstate pipelines are regulated by the FERC and are located in North Dakota, Minnesota, Wisconsin, Illinois, Indiana, Kentucky, Tennessee, Oklahoma, Texas and New Mexico. Our interstate pipeline companies include:
•Guardian, which interconnects with several pipelines at the Chicago Hub near Joliet, Illinois, and with local natural gas distribution and electric generation companies in Wisconsin;
•Midwestern Gas Transmission, which is a bidirectional system that interconnects with Tennessee Gas Transmission Company’s pipeline near Portland, Tennessee, and with multiple interstate pipelines that have access to both the Utica Shale and the Marcellus Shale, and multiple interstate pipelines at the Chicago Hub near Joliet, Illinois;
•Viking, which is a bidirectional system that interconnects with a TC Energy Corporation pipeline at the United States border near Emerson, Canada, and ANR Pipeline Company near Marshfield, Wisconsin; and
•OkTex Pipeline, which has interconnections with several pipelines in Oklahoma, Texas and New Mexico.
Property - Our Natural Gas Pipelines segment includes the following assets:
•5,100 miles of state-regulated intrastate transmission pipelines with transportation capacity of 4.4 Bcf/d;
•1,500 miles of FERC-regulated interstate natural gas pipelines with 3.5 Bcf/d of transportation capacity; and
•six underground natural gas storage facilities with 53.3 Bcf of total active working natural gas storage capacity.
Our storage includes two underground natural gas storage facilities in Oklahoma, two underground natural gas storage facilities in Kansas and two underground natural gas storage facilities in Texas. We are in the process of expanding the injection capabilities of our Oklahoma natural gas storage facilities which will allow us to utilize and subscribe an additional 4 Bcf of our existing storage capacity.
We are also exploring reactivating previously idled storage facilities in Oklahoma and Texas, which are not included in the capacity above.
Sources of Earnings - Earnings in this segment are derived primarily from transportation and storage services.
Our transportation earnings are primarily fee-based from the following types of services:
•Firm service - Customers reserve a fixed quantity of pipeline capacity for a specified period of time, which obligates the customer to pay regardless of usage. Under this type of contract, the customer pays a monthly fixed fee and incremental fees, known as commodity charges, which are based on the actual volumes of natural gas they transport or store. Under the firm service contract, the customer generally is guaranteed access to the capacity they reserve.
•Interruptible service - Under interruptible service transportation agreements, the customer may utilize available capacity after firm service requests are satisfied. The customer is not guaranteed use of our pipelines unless excess capacity is available.
Our regulated natural gas transportation services contracts are based upon rates stated in the respective tariffs, which have generally been established through shipper specific negotiation, discounts and negotiated settlements. The rates are filed with FERC or the appropriate state jurisdictional agencies. In addition, customers typically are assessed fees, such as a commodity charge, and we may retain a percentage of natural gas in-kind for our compression services.
Our storage earnings are primarily fee-based from the following types of services:
•Firm service - Customers reserve a specific quantity of storage capacity, including injection and withdrawal rights, and generally pay fixed fees based on the quantity of capacity reserved plus an injection and withdrawal fee. Firm storage contracts typically have terms longer than one year.
•Park-and-loan service - An interruptible storage service offered to customers providing the ability to park (inject) or loan (withdraw) natural gas into or out of our storage, typically for monthly or seasonal terms. Customers reserve the right to park or loan natural gas based on a specified quantity, including injection and withdrawal rights when capacity is available.
Utilization - Our natural gas pipelines were 94% and 95% subscribed in 2022 and 2021, respectively, and our natural gas storage facilities were 77% and 70% subscribed in 2022 and 2021, respectively.
Unconsolidated Affiliates - Our Natural Gas Pipelines segment includes the following unconsolidated affiliates:
•50% ownership interest in Northern Border, which owns a FERC-regulated interstate pipeline that transports natural gas from the Montana-Saskatchewan border near Port of Morgan, Montana, and the Williston Basin in North Dakota to a terminus near North Hayden, Indiana.
•50% ownership interest in Roadrunner, a bidirectional pipeline, which has the capacity to transport 570 MMcf/d of natural gas from the Permian Basin in West Texas to the Mexican border near El Paso, Texas, and has capacity to transport approximately 1.0 Bcf/d of natural gas from the Delaware Basin to the Waha area. We are the operator of Roadrunner.
See Note N of the Notes to Consolidated Financial Statements in this Annual Report for additional discussion of unconsolidated affiliates.
Government Regulation - Interstate - Our interstate natural gas pipelines are regulated under the Natural Gas Act, which gives the FERC jurisdiction to regulate virtually all aspects of this business, such as transportation of natural gas, rates and charges for services, construction of new facilities, depreciation and amortization policies, acquisition and disposition of facilities and the initiation and discontinuation of services.
Intrastate - Our intrastate natural gas pipelines in Oklahoma, Kansas and Texas are regulated by the OCC, KCC and RRC, respectively, and by the FERC under the Natural Gas Policy Act for certain services where we deliver natural gas into FERC regulated natural gas pipelines. While we have flexibility in establishing natural gas transportation rates with customers, there is a maximum rate that we can charge our customers in Oklahoma and Kansas and for the services regulated by the FERC. In Texas and Kansas, natural gas storage may be regulated by the state and by the FERC for certain types of services. In Oklahoma, natural gas storage operations are not subject to rate regulation by the state, and we have market-based rate authority from the FERC for certain types of services.
See further discussion in the “Regulatory, Environmental and Safety Matters” section.
Supply and Demand - Supply for each of our segments depends on crude oil and natural gas drilling and production activities, which are driven by the strength of the economy and impacts of geopolitical events; natural gas, crude oil and NGL prices; the demand for each of these products from end users; the decline rate of existing production; producer access to capital and investment in the industry; or producer firm commitments to transportation pipelines.
Demand for gathering and processing services is dependent on natural gas production by producers in the regions in which we operate. Demand for NGLs and the ability of natural gas processors to successfully and economically sustain their operations affect the volume of unfractionated NGLs produced by natural gas processing plants, thereby affecting the demand for NGL gathering, transportation and fractionation services. Natural gas and purity NGLs are affected by the demand associated with the various industries that utilize the commodities, such as butanes and natural gasoline used by the refining industry as blending stocks for motor fuel, denaturant for ethanol and diluents for crude oil. Ethane, propane, butanes and natural gasoline are also used by the petrochemical industry to produce chemical components, used for a range of products that improve our daily lives and promote economic growth, including health care products, recyclable food packaging, clothing, technology, building materials, industrial, manufacturing and energy infrastructure, lightweight vehicle components and batteries. Propane is also used to heat homes and businesses. Demand for natural gas and NGLs is also impacted by global macroeconomic factors.
Commodity Prices - Our earnings are primarily fee-based in all three of our segments, however in our Natural Gas Gathering and Processing segment, we are exposed to commodity price risk as a result of retaining a portion of the commodity sales proceeds associated with our fee with POP contracts. We have hedged approximately 70% of our forecasted equity volumes for 2023. Under certain fee with POP contracts, our contractual fees and POP percentage may increase or decrease if production volumes, delivery pressures or commodity prices change relative to specified thresholds. In our Natural Gas Liquids segment, we are exposed to commodity price risk associated with changes in the price of NGLs; the location differential between the Mid-Continent, Chicago, Illinois, and Gulf Coast regions; and the relative price differential between natural gas, NGLs and individual purity NGLs, which affect our NGL purchases and sales, our exchange services, transportation and storage services, and optimization and marketing financial results. NGL storage revenue may be affected by price volatility and forward pricing of NGL physical contracts versus the current price of NGLs on the spot market. In our Natural Gas Pipelines segment, we are exposed to minimal commodity price risk associated with (i) changes in the price of natural gas, which impact our fuel costs and retained fuel in-kind received for our compression services; and (ii) the differential between forward pricing of natural gas physical contracts and the price of natural gas on the spot market, which may affect our customer demand for our natural gas storage services.
See additional discussion regarding our commodity price risk and related hedging activities under “Commodity Price Risk” in Part II, Item 7A, Quantitative and Qualitative Disclosures about Market Risk, in this Annual Report.
Seasonality - Cold temperatures usually increase demand for natural gas and certain purity NGLs, such as propane, a heating fuel for homes and businesses. Warm temperatures usually increase demand for natural gas used in gas-fired electric generation for residential and commercial cooling, as well as agriculture-related equipment like irrigation pumps and crop dryers. Demand for butanes and natural gasoline, which are primarily used by the refining industry as blending stocks for motor fuel, denaturant for ethanol and diluents for crude oil, are also subject to some variability during seasonal periods when certain government restrictions on motor fuel blending products change. During periods of peak demand for a certain commodity, prices for that product typically increase.
Extreme weather conditions, seasonal temperature changes and the impact of temperature and humidity on the mechanical abilities of our equipment impact the volumes of natural gas gathered and processed, and NGL volumes gathered, transported and fractionated. Power interruptions and inaccessible well sites as a result of severe storms or freeze-offs, a phenomenon
where water vapor from the well bore freezes at the wellhead or within the natural gas gathering system, may cause a temporary interruption in the flow of natural gas and NGLs.
In our Natural Gas Pipelines segment, natural gas storage is necessary to balance the relatively steady natural gas supply with the seasonal demand of our local natural gas distribution and electric-generation customers as a result of the demand from their residential and commercial customers.
Competition - We compete for natural gas and NGL supply with other midstream companies, major integrated oil companies and independent exploration and production companies that have gathering and processing assets, fractionators, intrastate and interstate pipelines and storage facilities. The factors that typically affect our ability to compete for natural gas and NGL supply are:
•quality of services provided;
•producer drilling activity;
•proceeds remitted and/or fees charged under our contracts;
•proximity of our assets to natural gas and NGL supply areas and markets;
•proximity of our assets to alternative energy production;
•location of our assets relative to those of our competitors;
•efficiency and reliability of our operations;
•receipt and delivery capabilities for natural gas and NGLs that exist in each pipeline system, plant, fractionator and storage location;
•the petrochemical industry’s level of capacity utilization and feedstock requirements;
•current and forward natural gas and NGL prices; and
•cost of and access to capital.
We have remained competitive by making capital investments to access and connect new supplies with end-user demand; increasing gathering, processing, fractionation and pipeline capacity; increasing storage, withdrawal and injection capabilities; and improving operating efficiency so that we compete effectively. Our and our competitors’ infrastructure projects may affect commodity prices and could displace supply volumes from the Mid-Continent and Rocky Mountain regions and the Permian Basin where our assets are located. We believe our assets are located strategically, connecting diverse supply areas to market centers.
Customers - Our Natural Gas Gathering and Processing and Natural Gas Liquids segments derive services revenue from major and independent crude oil and natural gas producers. Our Natural Gas Liquids segment’s customers also include other NGL and natural gas gathering and processing companies. Our downstream commodity sales customers are primarily petrochemical, refining and marketing companies, utilities, large industrial companies, natural gasoline distributors, propane distributors and municipalities. Our Natural Gas Pipeline segment’s assets primarily serve local natural gas distribution companies, electricgeneration facilities, large industrial companies, municipalities, producers, processors and marketing companies. Our utility customers generally require our services regardless of commodity prices. See discussion regarding our customer credit risk under “Counterparty Credit Risk” in Part II, Item 7A, Quantitative and Qualitative Disclosures about Market Risk, in this Annual Report.
Through ONEOK Leasing Company, L.L.C. and ONEOK Parking Company, L.L.C., we own a 17-story office building (ONEOK Plaza) and a parking garage in downtown Tulsa, Oklahoma, where our headquarters are located. ONEOK Leasing Company, L.L.C. leases excess office space, if any, to others and operates our headquarters office building. ONEOK Parking Company, L.L.C. owns and operates a parking garage adjacent to our headquarters. We have a wholly-owned captive insurance company, which was formed in 2022.
We are subject to a variety of historical preservation and environmental laws and/or regulations that affect many aspects of our present and future operations. Regulated activities include, but are not limited to, those involving air emissions, storm water and wastewater discharges, handling and disposal of solid and hazardous wastes, wetland and waterway preservation, wildlife conservation, cultural resource protection, hazardous materials transportation, and pipeline and facility construction. These laws and regulations require us to obtain and/or comply with a wide variety of environmental clearances, registrations, licenses, permits and other approvals. Failure to comply with these laws, regulations, licenses and permits may expose us to fines, penalties, reputational harm and/or interruptions in our operations that could be material to our results of operations or financial
condition. In addition, emissions controls and/or other regulatory or permitting mandates under the Clean Air Act and other similar federal and state laws could require unexpected capital expenditures at our facilities. We cannot assure that existing environmental statutes and regulations will not be revised or that new regulations will not be adopted or become applicable to us. We also cannot assure that existing permits will not be revised or cancelled, potentially impacting facility construction activities or ongoing operations.
Air and Water Emissions - The Clean Air Act, the Clean Water Act and analogous state laws and/or regulations impose restrictions and controls regarding the discharge of pollutants into the air and water in the United States. Under the Clean Air Act, a federal operating permit is required for sources of significant air emissions. We may be required to incur certain capital expenditures for air pollution-control equipment in connection with obtaining or maintaining permits and approvals for sources of air emissions. The Clean Water Act imposes substantial potential liability for pollutants discharged into waters of the United States and requires remediation of waters affected by such discharge.
GHG Emissions - 2021 estimated GHG emissions were 3.8 million metric tons of carbon dioxide equivalents of Scope 1 emissions and 2.7 million metric tons of carbon dioxide equivalents of Scope 2 emissions. Scope 1 emissions originate from the combustion of fuel in our equipment, such as compressor engines and heaters, as well as fugitive methane emissions. Scope 2 emissions are generated from purchased power sources.
In September 2021, we announced a companywide absolute GHG emissions reduction target of 2.2 million metric tons of carbon dioxide equivalents from our combined Scope 1 and Scope 2 GHG emissions by 2030. The target represents a 30% reduction in combined operational Scope 1 and location-based Scope 2 GHG emissions attributable to ONEOK assets as of December 31, 2019. We have achieved reductions totaling approximately 0.5 million metric tons of the targeted 2.2 million metric tons of carbon dioxide equivalents, primarily as a result of methane emissions mitigation, system optimizations, electrification of certain natural gas compression equipment and lower carbon-based electricity in states in which we operate. GHG emission reductions as reported may be modified, updated, changed or supplemented based on available information. For the years ended December 31, 2022, 2021 and 2020, we did not have any dedicated capital expenditures specifically for climate-related projects, nor did we purchase or sell carbon credits or offsets. Progress to date on our goal has been accomplished through routine capital-growth projects and asset optimizations that were primarily performed for operational improvements that inherently improved our emissions profile. We continue to anticipate several potential pathways toward achieving our emissions reduction target. In 2023, we anticipate reduction in our emissions to be primarily a result of improved methane management practices and system optimization that will not require material capital expenditures. We do not anticipate purchasing or selling carbon credits or offsets in 2023. Although we have begun the electrification of certain compression assets for Viking to improve the reliability of our operations, which will reduce our Scope 1 emissions, we do expect an increase in our Scope 2 emissions as a result of this project, but anticipate an overall net reduction of GHG emissions on this project to be included in our pathway to achieve our target.
We participated in the EPA’s Natural Gas STAR Program for more than 20 years and are now a legacy natural gas partner as the program ended in late 2022. We currently participate in Our Nation’s Energy (ONE) Future Coalition to voluntarily report methane emission reductions and to calculate our methane intensity. We continue to focus on maintaining low methane gas release rates through expanded implementation of improved practices to limit the release of natural gas during pipeline and facility maintenance and operations.
PHMSA - The PHMSA has submitted to the Federal Register an advisory bulletin underscoring to pipeline and pipeline facility operators requirements to minimize methane emissions in the Protecting our Infrastructure of Pipelines and Enhancing Safety (PIPES) Act of 2020. The PIPES Act directs pipeline operators to update their inspection and maintenance plans to address the elimination of hazardous leaks and to minimize natural gas releases from pipeline facilities. The updated plans must also address the replacement or remediation at facilities that historically have been known to experience leaks. We have completed and continue to update our pipeline maintenance procedures to identify and reduce methane leaks.
EPA - The EPA’s Mandatory Greenhouse Gas Reporting Rule requires annual GHG emissions reporting from our affected facilities and the carbon dioxide emission equivalents for all NGLs produced by us as if all of these products were combusted, even if they are used otherwise. The additional cost to gather and report this emission data did not have, and we do not expect it to have, a material impact on our results of operations, financial position or cash flows.
Recently, the EPA has updated the New Source Performance Standards Subpart OOOOb regulations to further reduce methane emissions, which includes increased monitoring frequency and more stringent repair requirements for new and modified oil and gas facilities. In addition, the EPA is proposing new nationwide emission guidelines for states to limit methane emissions from existing oil and gas facilities. Generally, EPA rule-makings require expenditures for updated emissions controls, monitoring
and recordkeeping requirements at affected facilities. At this time, we do not anticipate a material impact to our planned capital, operations and maintenance costs resulting from compliance with the current or pending regulations and proposed EPA actions. However, the EPA may issue additional regulations, responses, amendments and/or policy guidance, which could alter our present expectations.
In June 2022, the U.S. Supreme Court issued a decision in West Virginia v. EPA, which did not preclude but instead limited the EPA’s ability to regulate GHG emissions absent clear congressional authorization. The Court determined that the EPA’s emission reduction measures requiring an industry wide shift in electricity production from coal and natural gas-fired power plants to renewable power sources required specific congressional authorization which had not been given under the Clean Air Act.
Federal Regulation - In August 2022, the Inflation Reduction Act was signed into law. The Inflation Reduction Act includes tax credits and other incentives intended to combat climate change by advancing decarbonization and promoting increased investment in renewable and low carbon intensity energy. In addition, the Inflation Reduction Act also imposes a waste emissions charge for methane emissions from specific types of facilities that are required to report their GHG emissions to the EPA and a sector specific methane intensity rate. We will continue to monitor clarification of the regulation, and based on current estimates, we do not believe waste emission charges will have a material impact on our results of operations, financial position or cash flows.
We believe it is likely that continued future governmental legislation and/or regulation may require us to limit GHG emissions associated with our operations, pay additional fees associated with our GHG emissions or purchase allowances for such emissions. However, we cannot predict precisely what form these future regulations will take, the stringency of the regulations, when they will become effective or the impact on our capital expenditures, competitive position and results of operations. In addition to activities on the federal level, state and regional initiatives could also lead to the regulation of GHG emissions sooner than or independent of federal regulation. These regulations could be more stringent than any federal legislation that may be adopted. We monitor all relevant legislation and regulatory initiatives to assess the potential impact on our operations and otherwise take steps to limit GHG emissions from our facilities, including methane.
For additional information regarding the potential impact of laws and regulations on our operations see Item 1A “Risk Factors.”
Pipeline and Facility Safety - We are subject to PHMSA safety regulations, including pipeline asset integrity-management regulations. The Pipeline Safety Improvement Act of 2002 requires pipeline companies operating high-pressure pipelines to perform integrity assessments on pipeline segments that pass through densely populated areas or near specifically designated high-consequence areas (HCAs). The Pipeline Safety, Regulatory Certainty and Job Creation Act of 2011 (the 2011 Pipeline Safety Act) increased maximum penalties for violating federal pipeline safety regulations, directs the DOT and Secretary of Transportation to conduct further review or studies on issues that may or may not be material to us and may result in the imposition of more stringent regulations.
In 2015, PHMSA issued notices of proposed rule-making for hazardous liquid pipeline safety regulations, natural gas transmission and gathering lines and underground natural gas storage facilities. For natural gas and natural gas gathering pipelines, the new proposed regulations became known as “the Mega Rule.” Due to the large number of rules being considered, PHMSA partitioned the new rule-making into three sections. The first section of rules was finalized and published in 2019 in the Federal Register and became effective in July 2020. These final rules mostly address congressional mandates due to former pipeline safety reauthorizations and established criteria for verifying current operating pressures. The second section of the PHMSA Gas Mega Rule, which was published in August 2022 and will be effective in May 2023, focuses on natural gas transmission pipelines and includes enhancements to management requirements for risk and integrity assessments, guidance for corrosion and mitigation timelines, pipeline inspections following extreme weather events and repair requirements for HCAs and non-HCAs. The third section of the Mega Rule established new regulations for certain gas gathering lines, which were formerly unregulated, and was published in November 2021 and became effective in May 2022.
Coupled together, these new sections of the Mega Rule provide increased requirements for operating and maintenance, integrity management, public awareness and civil/criminal penalties; however, we do not anticipate a material impact to our planned capital or operations and maintenance costs resulting from compliance with the newly published regulations.
In 2020, legislation was passed to reauthorize PHMSA through 2024. Certain requirements for operations and maintenance, integrity management, leak detection and public awareness will be subject to future rule-making as a result. The potential capital and operating expenditures related to the new regulations are not fully known, but we do not anticipate a material impact to our planned capital or operations and maintenance costs resulting from compliance with the new regulations.
On July 9, 2022, a fire occurred at our 210 MBbl/d Medford, Oklahoma, natural gas liquids fractionation facility. All personnel were safe and accounted for with temporary evacuations of local residents taken as a precautionary measure. As a result of the incident, the United States Chemical Safety and Hazard Investigation Board (CSB) requested information including the incident investigation report and causal factors of the incident, which we submitted to the CSB.
Pipeline Security - Homeland Security’s Transportation Security Administration (TSA) and the DOT have completed a review and inspection of our “critical facilities” and identified no material security issues. Also, the TSA has released new pipeline security guidelines that include broader definitions for the determination of pipeline “critical facilities.” We have reviewed our pipeline facilities according to the new guidelines and met the timelines associated with TSA reporting. The cost of compliance did not have a material impact on our operations, financial position or cash flows.
The TSA issued two security directives in 2021 in response to ongoing cybersecurity threats to the pipeline industry. The first security directive, version “A,” was issued in May 2021 and requires critical pipeline owners and operators to (1) report confirmed and potential cybersecurity incidents to the Cybersecurity and Infrastructure Security Agency (CISA); (2) designate a cybersecurity coordinator to be available 24 hours a day, seven days a week; (3) review current practices; and (4) identify any gaps and related remediation measures to address cyber-related risks and report the results to TSA and CISA within 30 days. The second security directive, version “B,” was issued in July 2021 and requires owners and operators of TSA-designated critical pipelines to implement specific mitigation measures to protect against ransomware and other known threats to information technology and operational technology systems, develop and implement a cybersecurity contingency and recovery plan, and conduct a cybersecurity architecture design review. Version “B” was replaced with version “C” in July 2022. This version requires critical pipeline owners and operators to create a Cybersecurity Implementation Plan for approval and audit by the TSA. Our Cybersecurity Implementation Plan was approved in December 2022. While compliance with the security directives is utilizing significant internal and external resources, we do not expect it to have a material impact on our results of operations, financial position or cash flows.
The long-term sustainability of our business is dependent on our continued ability to maintain a highly engaged workforce. To accomplish this, our business strategy includes attracting, selecting and retaining talent, advancing an inclusive, diverse and engaged culture and developing individuals and leaders.
In 2021, we conducted our first annual employee engagement survey using Gallup Inc.’s Q12 methodology. All leaders were asked to review their results with their teams and create an action plan specific to enhancing their employees’ engagement in 2022. In 2022, the annual employee engagement participation rate increased to 90% compared with 80% in 2021. The overall engagement mean went from under the 40th percentile to above the 50th percentile. We showed improvement on all survey questions. The ratio of engaged employees to actively disengaged more than doubled. All leaders have been asked to discuss the 2022 survey results with their teams and create an engagement action plan for 2023. Training and support resources are also available through our learning management system, the Gallup Engagement Portal and dedicated individuals within our human resources department.
As of December 31, 2022, we had 2,966 employees. Listed below is a summary of our human capital resources, measures and objectives that are collectively important to our success as an organization.
Values - Our success relies on the skills, experience and dedication of our employees. We are committed to cultivating an inclusive and dynamic work environment where talented people can find opportunities to succeed, grow and contribute to the success of the company. Our employees work each day to provide safe and reliable services to a wide range of customers in the states where we operate. Our core values, listed below, guide the way in which our employees conduct our business and operations.
•Safety & Environmental: we commit to a zero-incident culture for the well-being of our employees, contractors and communities and to operate in an environmentally responsible manner.
•Ethics: we act with honesty, integrity and adherence to the highest standards of personal and professional conduct.
•Diversity & Inclusion: we respect the uniqueness and worth of each employee, and believe that a diverse, inclusive workforce is essential for a sense of belonging, engagement and performance.
•Excellence: we hold ourselves and others accountable to a standard of excellence through continuous improvement and teamwork.
•Service: we invest our time, effort and resources to serve each other, our customers and communities.
•Innovation: we seek to develop creative solutions by leveraging collaboration through ingenuity and technology.
Diversity and Inclusion - Our diversity and inclusion (D&I) strategy is a cross-functional effort that draws upon contributions from employees at all levels of the organization and is focused on enhancing the workplace to attract and retain talent. The strategy is guided by a D&I Council composed of a diverse group of employees who represent different demographics, work locations, points of view, roles and levels of seniority. We also have a team within our human resources department that is wholly dedicated to supporting our D&I efforts.
In 2022, we provided funding and support for five legacy employee-led business resource groups (BRGs): a Black/African American Resource Group (BAARG); an Indigenous/Native American Resource Group (INRG); a Latinx/Hispanic American Resource Group (LXHA); a Veterans Resource Group; and a Women’s Resource Group. In addition, a new LGBTQ+ (Lesbian, Gay, Bisexual, Transgender, Queer and others) BRG was added in 2022. Each BRG’s purpose is to promote the attraction, development, motivation and retention of members of traditionally underrepresented groups in our industry and workplace in an effort to drive positive business outcomes. A key factor in the success of our BRGs is the active participation by officer-level executive sponsors and allies from outside the BRG’s underrepresented populations. All employees are invited to become a supporter of one or more of our BRGs.
In early 2023, we introduced a Racial Inclusion Collective Resource Group that combines our legacy race- and ethnicityfocused BRGs, along with new resources and support for our Asian-American and Pacific Islander employees and allies, into a single organization to facilitate collaboration on topics relevant to all groups while reserving opportunities for more identityfocused programming where appropriate.
We embed D&I concepts into our core leadership development curriculum and sponsor a number of internal programs intended to promote D&I. In addition, we seek to give back to the communities where we operate by partnering on initiatives to support underrepresented community members and local charitable organizations.
Employee Safety - The safety of our employees is critical to our operations and success. By promoting the safety of our employees and monitoring the integrity of our assets, we are investing in the long-term sustainability of our businesses. We continuously assess the risks our employees face in their jobs, and we work to mitigate those risks through training, appropriate engineering controls, work procedures and other preventive safety programs. Reducing incidents and improving our personal safety incident rates are important, but we are not focused only on statistics. Low personal safety incident rates alone cannot prevent a large-scale incident, which is why we continue to focus on enhancing our Environmental, Safety and Health management systems and process safety programs, such as key risk/key control identification and knowledge sharing. We endeavor to operate our assets safely, reliably and in an environmentally responsible manner. We maintain mature and robust programs that guide trained staff in the completion of these activities, and we continue to enhance and improve these programs and our internal capabilities. We successfully implemented our return to office plan in early 2022, and we have continued to take safety precautions for our employees who work in the field or report to a ONEOK facility.
Health and Welfare - We provide a variety of benefits to help promote the health and welfare of our employees and their families. These benefits include medical, dental and vision plans, virtual health visits and engagement of third-party service providers to offer company on-site and near-site clinics in several of our operating areas. Eligible employees also have access, at no charge, to an employee assistance program, a medical second opinion service and a health care concierge service to assist with finding in-network providers and billing resolution. We offer full pay for maternity, paternity or adoption leave of up to 240 hours per qualifying event. We also provide up to $10,000 for reasonable and necessary expenses of a qualifying adoption and/or surrogacy. Additional benefits provided for the welfare of our employees include, among others, life insurance and long-term disability plans, health and dependent care flexible spending accounts, fertility benefits, disease prevention and management programs and full pay while on bereavement, military or personal and family care leave.
We also provide the opportunity for our employees to help fellow employees through the ONE Trust Fund by contributing donated vacation hours or monetary donations. The ONE Trust Fund is a nonprofit, charitable organization run entirely by employee volunteers, that serves our employees in times of personal crises due to natural disasters, medical emergencies or other hardships.
Personal and Professional Development - We provide various options to assist with career growth and development. For employees just entering the workforce who desire to advance their career and continue to learn or for the professional who is interested in developing their skills, we provide education and training in a variety of areas, including leadership, functional and industry-specific topics, professional development and skill-building opportunities. Our organizational development and D&I teams provide live in-person and virtual classroom training, computer-based self-study and one-on-one coaching that is available to all employees.
We value education and assist eligible employees with the expense of furthering their education in job-related fields, including up to $5,000 per year in qualifying tuition expenses. We also may reimburse employees for certain job-related professional certification examination fees.
Recruiting - We make it a priority to attract, select, develop, motivate, challenge and retain the talent necessary to support our key business strategies. We use targeted recruitment events, maintain strong relationships with area technical schools, colleges and universities, and we offer compensation benefits and career opportunities that are designed to position us as an employer of choice. D&I continues to be a priority in recruiting, and we deploy sourcing strategies designed to access talent from groups that are historically underrepresented in our industry and workplace.
Retirement - We maintain a 401(k) Plan for our employees and match 100% of employee contributions up to 6% of eligible compensation each payroll period, subject to applicable tax limits. We also have a defined benefit pension plan covering certain employees and former employees, which closed to new participants in 2005. Employees that do not participate in our defined benefit pension plan are eligible to receive quarterly and annual profit-sharing contributions under our 401(k) Plan. As of December 31, 2022, 95% of eligible employees were contributing to our 401(k) Plan. For additional information about our retirement benefits, see Note L of the Notes to Consolidated Financial Statements in this Annual Report.
All executive officers are elected annually by our Board of Directors. Our executive officers listed below include the officers who have been designated by our Board of Directors as our Section 16 executive officers.
Vice President, Natural Gas Pipelines, ONEOK Senior Vice President, Natural Gas Pipelines 2018 to 2022Senior Vice President, Natural Gas, ONEOK 2017 to 2018Senior Vice President, Natural Gas Gathering & Processing, ONEOK
Stephen B. Allen
to presentSenior Vice President, General Counsel and Assistant Secretary, ONEOK Senior Vice President, General Counsel and Assistant Secretary, ONEOK
Mary M. Spears
to presentSenior Vice President and Chief Accounting Officer, Finance and Tax, ONEOK
Vice President and Chief Accounting Officer, Finance and Tax 2019 to 2021Vice President and Chief Accounting Officer, ONEOK
Scott D. Schingen
2015 to 2019Director, SEC Reporting, ONEOK
No family relationships exist between any of the executive officers, nor is there any arrangement or understanding between any executive officer and any other person pursuant to which the officer was selected.
We make available, free of charge, on our website (www.oneok.com) copies of our Annual Reports, Quarterly Reports, Current Reports on Form 8-K, amendments to those reports filed or furnished to the SEC pursuant to Section 13(a) or 15(d) of the Exchange Act and reports of holdings of our securities filed by our officers and directors under Section 16 of the Exchange Act as soon as reasonably practicable after filing such material electronically or otherwise furnishing it to the SEC. Copies of our Code of Business Conduct and Ethics, Corporate Governance Guidelines, Director Independence Guidelines, Corporate Sustainability Report and the written charters of our Board Committees also are available on our website, and we will provide copies of these documents upon request.
In addition to our filings with the SEC and materials posted on our website, we also use social media platforms as additional channels of distribution to reach public investors. Information contained on our website, posted on our social media accounts, and any corresponding applications, are not incorporated by reference into this report.
Our investors should consider the following risks that could affect us and our business. Although we have tried to identify key factors, our investors need to be aware that other risks may prove to be important in the future. New risks may emerge at any time, and we cannot predict such risks or estimate the extent to which they may affect our financial performance. Investors should consider carefully the following discussion of risks and the other information included or incorporated by reference in this Annual Report, including “Forward-Looking Statements,” which are included in Part II, Item 7, Management’s Discussion and Analysis of Financial Condition and Results of Operations.
If the level of drilling in the regions in which we operate declines substantially near our assets, our volumes and revenues could decline.
Our gathering and transportation pipeline systems are dependent upon production from natural gas and crude oil wells, which naturally declines over time. As a result, our cash flows associated with these wells may also decline over time. In order to maintain or increase throughput levels on our gathering and transportation pipeline systems and the asset utilization rates at our processing and fractionation facilities, we must continually obtain new supplies. Our ability to maintain or expand our businesses depends largely on the level of drilling and production by third parties in the regions in which we operate. Our natural gas and NGL supply volumes may be impacted if producers curtail or redirect drilling and production activities. Drilling and production are impacted by factors beyond our control, including:
•demand and prices for natural gas, NGLs and crude oil;
•producers’ access to capital;
•producers’ finding and development costs of reserves;
•producers’ ability to secure drilling and completion crews and equipment;
•producers’ desire and ability to obtain necessary permits, drilling rights and surface access in a timely manner and on reasonable terms;
•crude oil and associated natural gas field characteristics and production performance; and
•capacity constraints and/or shut downs on the pipelines that transport crude oil, natural gas and NGLs from producing areas and our facilities.
Commodity prices are subject to significant volatility. Drilling and production activity levels may vary across our geographic areas; however, a prolonged period of low commodity prices may reduce drilling and production activities across all areas. If we are not able to obtain new supplies to replace the natural decline in volumes from existing production or reductions in volumes because of competition, including increased competition due to industry consolidation, throughput on our gathering and transportation pipeline systems and the utilization rates of our processing and fractionation facilities would decline, which could affect adversely our business, results of operations, financial position and cash flows.
In addition to impacts from the COVID-19 pandemic, uncertainty or adverse changes in economic conditions worldwide, in the United States, or in the economic regions in which we operate, could negatively affect the crude oil and natural gas markets, resulting in reduced demand and increased price competition for our services and products, or otherwise affect adversely our business, results of operations, financial position and cash flows. Volatility in commodity prices may have an impact on many
of our suppliers and customers, which, in turn, could have a negative impact on their ability to meet their obligations to us. Periods of severe volatility in equity and credit markets may disrupt our access to such markets, make it difficult to obtain financing necessary to expand facilities or acquire assets, increase financing costs and result in the imposition of restrictive financial covenants. Also, economic conditions in the wake of the pandemic have included increasing inflation. Inflationary pressures have resulted in, and may continue to result in, additional increases to the cost of our materials, services and personnel, which could increase our capital expenditures and operating costs. Sustained levels of high inflation have caused the Federal Reserve System and other central banks to increase interest rates, which may cause the cost of capital to increase and depress economic growth, either of which, or the combination of both, could affect adversely our business, results of operations, financial position and cash flows.
The volatility of natural gas, crude oil and NGL prices could affect adversely our earnings and cash flows.
Lower commodity prices could reduce crude oil, natural gas and NGL production, which could decrease the demand for our services. Additionally, a significant portion of our revenues are derived from the sale of commodities that are received in conjunction with natural gas gathering and processing services, the transportation and storage of natural gas, and from the purchase and sale of NGLs and purity NGLs. As commodity prices decline, we could be paid less for our commodities thereby reducing our cash flows. Historically, commodity prices have been volatile and can change quickly. For example, in March 2020, unsuccessful negotiations between the Organization of the Petroleum Exporting Countries (OPEC) and Russia regarding crude oil production cuts resulted in a price war between Saudi Arabia and Russia. As a result, the global supply of crude oil significantly exceeded demand and led to a collapse in crude oil prices. It is likely that commodity prices will continue to be volatile in the future.
The prices we receive for our commodities are subject to wide fluctuations in response to a variety of factors beyond our control, including, but not limited to, the following:
•overall domestic and global economic conditions and uncertainty;
•changes in the supply of, and demand for, domestic and foreign energy, even if relatively minor;
•market uncertainty;
•the occurrence of wars and other geopolitical conditions impacting supply and demand for natural gas, NGLs and crude oil;
•production decisions by other countries, and the failure of countries to abide by recent agreements relating to production decisions;
•the availability and cost of third-party transportation, natural gas processing and fractionation capacity;
•the level of consumer product demand and storage inventory levels;
•ethane rejection;
•weather conditions;
•domestic and foreign governmental regulations and taxes;
•the price and availability of alternative fuels;
•speculation in the commodity futures markets;
•the effects of imports and exports on the price of natural gas, crude oil, NGL and liquefied natural gas;
•the effect of worldwide energy-conservation measures;
•the impact of new supplies, new pipelines, processing and fractionation facilities on location price differentials; and
•technology and improved efficiency impacting supply and demand for natural gas, NGLs and crude oil.
These external factors and the volatile nature of the energy markets make it difficult to reliably estimate future prices of commodities and the impact commodity price fluctuations have on our customers and their need for our services, which could affect adversely our business, results of operations, financial position and cash flows.
There are increasing expectations that companies across all industries address ESG issues, including climate change. Changes in regulatory policies, public sentiment or widespread adoption of technologies that aim to address climate change through reducing GHG emissions may result in a reduction in the demand for hydrocarbon products, restrictions on their use or increased use of alternative energy sources. These changes could reduce the demand for our services, impacting our business, results of operations, financial position and cash flows.
In addition, increasing attention to climate change has resulted in an increased likelihood of governmental investigations, regulation, shareholder activism and private litigation, which could increase our costs or otherwise affect adversely our business. For example, the SEC has announced its plans to propose new climate change disclosure requirements. While the
form those requirements may take are not final, we may face increased costs associated with complying with any new climate disclosure rules.
Certain investors are increasingly focused on ESG issues, including climate change. Further, organizations that provide information to investors on corporate governance and related matters have also increased their focus on ESG issues and have developed ratings processes for evaluating companies on various ESG initiatives. Unfavorable ESG ratings may lead to increased negative investor sentiment toward us or midstream companies in general. Due to climate change concerns, some investors may choose to either not invest, or to reduce their investment, in companies that explore for, produce, process, transport or sell products derived from hydrocarbons. If this negative investor sentiment increases, we may see reduced demand for our securities, which could impact our liquidity or the value of our securities. Additionally, certain large institutional lenders have announced their own policies to meet publicly announced climate commitments, which often involve commitments to shift lending activities in the energy sector to meet GHG emissions goals. As a result, certain institutional lenders may impose additional requirements on us, or decide not to lend to us, based on ESG concerns, which could adversely affect our access to capital on reasonable terms or at all and, as a result, our financial condition. To the extent financial markets view climate change and emissions of GHGs as a financial risk, this could also negatively affect our ability to access capital or cause us to receive less favorable terms and conditions in future financings.
In September 2021, we announced a companywide absolute GHG emissions reduction target of 2.2 million metric tons of carbon dioxide equivalents from our combined Scope 1 and Scope 2 emissions by 2030. The target represents a 30% reduction in combined operational Scope 1 and location-based Scope 2 GHG emissions attributable to ONEOK assets as of December 31. To the extent that the potential pathways we have identified to achieve this emissions reduction target are not available to us, or to the extent we otherwise are unable to make progress toward other ESG-related targets we may establish, we may face additional costs to meet these targets, or we may fail to meet them, which could negatively impact our business and reputation.
The threat of global climate change may create physical and financial risks to our business. Some of our customers’ energy needs vary with weather conditions, primarily temperature. For residential customers, heating and cooling represent their largest energy use. To the extent weather conditions may be affected by climate change, customers’ energy use could increase or decrease depending on the duration and magnitude of any changes. Increased energy use due to weather changes may require us to invest in more pipelines and other infrastructure to serve increased demand. A decrease in energy use due to weather changes may affect our financial condition, through decreased revenues. Extreme weather conditions in general require more system backup, adding to costs, and can contribute to increased system stresses, including damage to our assets or service interruptions. Weather conditions outside of our operating territory could also have an impact on our revenues. Severe weather impacts our operating territories primarily through hurricanes, thunderstorms, tornados, floods, freezing temperatures and snow or ice storms. To the extent the severity or frequency of extreme weather events increases, this could increase our cost of providing services, including the cost of insurance, and decrease the availability of certain insurance coverages. We may not be able to pass on the higher costs to our customers or recover all costs related to mitigating these physical risks.
Our operations are subject to operational hazards and unforeseen interruptions, which could affect adversely our business and for which we may not be adequately insured.
Our operations are subject to all the risks and hazards typically associated with the operation of natural gas and NGL gathering, transportation and distribution pipelines, storage facilities and processing and fractionation facilities, which include, but are not limited to, leaks, pipeline ruptures, damage by third parties, the breakdown or failure of equipment or processes and the performance of facilities below expected levels of capacity and efficiency. For example, on July 9, 2022, a fire occurred at our 210 MBbl/d Medford, Oklahoma, natural gas liquids fractionation facility. Other operational hazards and unforeseen interruptions include adverse weather conditions (including extreme cold weather), infectious disease including a pandemic, cybersecurity attacks, geopolitical reactions, accidents, explosions, fires, the collision of equipment with our pipeline facilities (for example, this may occur if a third party were to perform excavation or construction work near our facilities) and catastrophic events such as tornados, hurricanes, earthquakes, floods and other similar events beyond our control. Similar operational hazards and unforeseen interruptions may also impact our producers or suppliers; for example, extreme cold weather can result in supply reductions from producer wellhead freeze-offs, as well as power curtailments or outages. Further, the United States government warned that energy assets, specifically the nation’s pipeline infrastructure, may be targets of terrorist attacks. An act of terrorism could target our facilities, those of our suppliers or customers or those of other pipelines. A casualty occurrence may result in injury or loss of life, extensive property damage or environmental damage. The occurrence of operational hazards and unforeseen interruptions could affect adversely our business results of operations, financial position and cash flows.
Premiums and deductibles for certain insurance policies can increase substantially, and, in some instances, certain insurance may become unavailable or available only for reduced amounts of coverage. Consequently, we may not be able to renew existing insurance policies or purchase other desirable insurance on commercially reasonable terms, if at all. Insurance proceeds may not be adequate to cover all liabilities or incurred costs and losses or lost earnings. Further, we are not fully insured against all risks inherent to our business. If we were to incur a significant liability for which we were not fully insured, it could affect adversely our business, results of operations, financial position and cash flows. Further, the proceeds of any such insurance may not be paid in a timely manner.
Continued development of supply sources outside of our operating regions could impact demand for our services.
Production areas outside of our operating regions may compete with natural gas and NGL supply originating in production areas connected to our systems, which may cause natural gas and NGLs in supply areas connected to our systems to be diverted to markets other than our traditional market areas and may affect capacity utilization adversely on our pipeline systems and our ability to renew or replace existing contracts. In our Natural Gas Gathering and Processing segment, the development of reserves could move drilling rigs from our current service areas to other areas, which may reduce demand for our services. In our Natural Gas Pipelines segment, the displacement of natural gas originating in supply areas connected to our pipeline systems by supply sources that are closer to the end-use markets could reduce demand for our services. Either of these possibilities could result in lower revenues, which could affect adversely our business, results of operations, financial position and cash flows.
We do not hedge fully against commodity price risk or interest rate risk, including commodity price changes, seasonal price differentials, product price differentials or location price differentials. This could result in decreased revenues, increased costs and lower margins, affecting adversely our results of operations.
Certain of our businesses are exposed to market risk and the impact of market fluctuations in natural gas, NGLs and crude oil prices. Market risk refers to the risk of loss of future cash flows and earnings arising from adverse changes in commodity prices. Our primary commodity price exposures arise from:
•the value of the commodities sold under fee with POP contracts of which we retain a portion of the sales proceeds;
•the price differentials between the individual purity NGLs with respect to our NGL transportation and fractionation agreements;
•the location price differentials in the price of natural gas and NGLs;
•the seasonal price differentials in natural gas and NGLs related to our storage operations;
•the price risk related to electric costs to operate our facilities; and
•the fuel costs and the value of the retained fuel in-kind in our natural gas pipelines and storage operations.
To manage the risk from market price fluctuations in natural gas, NGLs, crude oil and electricity prices, we may use derivative instruments such as swaps, futures, forwards and options. However, we do not hedge fully against commodity price changes, and we therefore retain some exposure to market risk. Further, hedging instruments that are used to reduce our exposure to interest-rate fluctuations could expose us to risk of financial loss where we may contract for fixed-rate swap instruments to hedge variable-rate instruments and the fixed rate exceeds the variable rate. Finally, hedging arrangements for forecasted sales and purchases are used to reduce our exposure to commodity price fluctuations and may limit the benefit we would otherwise receive if market prices for natural gas, crude oil and NGLs differ from the stated price in the hedge instrument for these commodities.
A breach of information security, including a cybersecurity attack, or failure of one or more key information technology or operational systems, or those of third parties, may affect adversely our operations, financial results or reputation.
Our businesses are dependent upon our operational systems to process a large amount of data and complex transactions. The various uses of these information technology systems, networks and services include, but are not limited to:
•controlling our plants and pipelines with industrial control systems including Supervisory Control and Data Acquisition;
•collecting and storing customer, employee, investor and other stakeholder information and data;
•processing transactions;
•summarizing and reporting results of operations;
•hosting, processing and sharing confidential and proprietary research, business plans and financial information;
•complying with regulatory, legal, financial or tax requirements;
•providing data security; and
•other processes necessary to manage our business.
If any of our systems are damaged, fail to function properly or otherwise become unavailable, we may incur substantial costs to repair or replace them and may experience loss or corruption of critical data and interruptions or delays in our ability to perform critical functions, which could affect adversely our business and results of operations. Our financial results could also be affected adversely if our operational systems fail as a result of an inadvertent error or by deliberate tampering with or manipulation of our operational systems. In addition, dependence upon automated systems may further increase the risk that operational system flaws or employee or third-party tampering or manipulation of those systems will result in losses that are difficult to detect.
Due to increased technology advances and an increase in remote work arrangements, we have become more reliant on technology to help increase efficiency in our businesses. We use software to help manage and operate our businesses, and this may subject us to increased risks. According to experts, there has been a rise in the number and sophistication of cyberattacks on companies’ network and information systems by both state-sponsored and criminal organizations and, as a result, the risks associated with such an event continue to increase. A significant failure, compromise, breach or interruption in our systems, or those of our vendors, could result in a disruption of our operations, physical or environmental damages, customer dissatisfaction, damage to our reputation and a loss of customers or revenues. If any such failure, interruption or similar event results in the improper disclosure of information maintained in our information systems and networks or those of our vendors, including personnel, customer and vendor information, we could also be subject to liability under relevant contractual obligations and laws and regulations protecting personal data and privacy. Efforts by us and our vendors to develop, implement and maintain security measures may not be successful in anticipating, detecting or preventing these events from occurring, due in part to attackers’ ever-changing methods and efforts to conceal their activities, and any network and information systemsrelated events could require us to expend significant resources to identify, assess and remedy such events. Cybersecurity, physical security and the continued development and enhancement of our controls, processes and practices designed to protect our enterprise, information systems and data from attack, damage or unauthorized access and to identify and appropriately report cyberattacks, remain a priority for us. Although we believe that we have robust information security procedures and other safeguards in place, including sufficient insurance, as cyberthreats continue to evolve, we may be required to expend additional resources to continue to enhance our information security measures and/or to investigate and remediate information security vulnerabilities.
Cyberattacks against us or others in our industry could result in additional regulations or cumbersome contractual obligations. Current efforts by the federal government, such as the Improving Critical Infrastructure Cybersecurity executive order, and the TSA security directives issued in May and July 2021, and July 2022, have utilized significant internal and external resources, and any potential future statutes, regulations or orders could lead to further increased regulatory compliance costs, insurance coverage costs or capital expenditures. We cannot predict the potential impact to our business resulting from additional regulations.
Growing our business by constructing new pipelines and facilities or making modifications to our existing facilities subjects us to construction risk and supply risks, should adequate natural gas or NGL supply be unavailable upon completion of the facilities.
To expand our business, we regularly construct new and modify or expand existing pipelines and gathering, processing, storage and fractionation facilities. The construction and modification of these facilities may involve the following risks:
•projects may require significant capital expenditures, which may exceed our estimates, and involve numerous regulatory, environmental, political, legal and weather-related uncertainties;
•projects may increase demand for labor, materials (which may be even more difficult to obtain due to supply chain constraints) and rights of way, which may, in turn, affect our costs and schedule;
•we may be unable to obtain new rights of way or permits to connect our systems to supply or downstream markets;
•if we undertake these projects, we may not be able to complete them on schedule or at the budgeted cost;
•our revenues may not increase immediately upon the expenditure of funds on a particular project. For instance, if we build a new pipeline, the construction will occur over an extended period of time, and we will not receive any material increases in revenues until after completion of the project;
•we may construct facilities to capture anticipated future growth in production or downstream demand in which anticipated growth does not materialize;
•opposition from environmental and social groups, landowners, tribal groups, local groups and other advocates could result in organized protests, attempts to block or sabotage our construction activities or operations, intervention in regulatory or administrative proceedings involving our assets, or lawsuits or other actions designed to prevent, disrupt or delay the construction or operation of our assets;
•we may be required to rely on third parties downstream of our facilities to have available capacity for our delivered natural gas or NGLs, which may not be operational; and •inflationary pressure could increase our costs for construction materials or labor.
As a result, new facilities may not be able to attract enough natural gas or NGLs to achieve our expected investment return, which could affect adversely our business, results of operations, financial position and cash flows.
Estimates of hydrocarbon reserves may be inaccurate, which could result in lower than anticipated volumes.
We may not be able to accurately estimate hydrocarbon reserves and production volumes expected to be delivered to us for a variety of reasons, including the unavailability of sufficiently detailed information and unanticipated changes in producers’ expected drilling schedules. Accordingly, we may not have accurate estimates of total reserves committed to our assets, the anticipated life of such reserves or the expected volumes to be produced from those reserves. In such event, if we are unable to secure additional sources, then the volumes that we gather, process, fractionate and transport in the future could be less than anticipated. A decline in such volumes could affect adversely our business, results of operations, financial position and cash flows.
We do not own all of the land on which our pipelines and facilities are located, and we lease certain facilities and equipment, which could disrupt our operations.
We do not own all of the land on which certain of our pipelines and facilities are located, and we are, therefore, subject to the risk of increased costs to maintain necessary land use. We obtain the rights to construct and operate certain of our pipelines and related facilities on land owned by third parties and governmental agencies for a specific period of time. Our loss of these rights, through our inability to renew right-of-way contracts on acceptable terms or increased costs to renew such rights, could affect adversely our business, results of operations, financial position and cash flows.
Measurement adjustments on our pipeline system may be impacted materially by changes in estimation, type of commodity and other factors.
Natural gas and NGL measurement adjustments occur as part of the normal operating conditions associated with our assets. The quantification and resolution of measurement adjustments are complicated by several factors including: (i) the significant quantities (i.e., thousands) of measurement equipment that we use across our natural gas and NGL systems, primarily around our gathering and processing assets; (ii) varying qualities of natural gas in the streams gathered and processed through our systems and the mixed nature of NGLs gathered and fractionated; and (iii) variances in measurement that are inherent in metering technologies and standards. Each of these factors may contribute to measurement adjustments that may occur on our systems, which could affect adversely our business, results of operations, financial position and cash flows.
In the competition for supply, we may have significant levels of excess capacity on our natural gas and NGL pipelines, processing, fractionation and storage assets.
Our natural gas and NGL pipelines, processing, fractionation and storage assets compete with other pipelines, processing, fractionation and storage assets for natural gas and NGL supply delivered to the markets we serve. As a result of competition, we may have significant levels of uncontracted or discounted capacity on our assets, which could affect adversely our business, results of operations, financial position and cash flows.
Many of our assets have been in service for several decades.
Many of our assets are designed as long-lived assets. Over time the age of these assets could result in increased maintenance or remediation expenditures and an increased risk of product releases and associated costs and liabilities. Any significant increase in these expenditures, costs or liabilities could affect adversely our business, results of operations, financial position and cash flows.
Our operating cash flows are derived partially from cash distributions we receive from our unconsolidated affiliates.
Our operating cash flows are derived partially from cash distributions we receive from our unconsolidated affiliates, as discussed in Note N of the Notes to Consolidated Financial Statements in this Annual Report. The amount of cash that our unconsolidated affiliates can distribute principally depends upon the amount of cash flows these affiliates generate from their respective operations, which may fluctuate from quarter to quarter. We may be unable to unilaterally determine the cash
distribution policies of our unconsolidated affiliates. This may contribute to us not having sufficient available cash each quarter to continue paying dividends at the current levels.
We may be unable to cause our joint ventures to take or not to take certain actions unless some or all of our jointventure participants agree.
We participate in several joint ventures. Due to the nature of some of these arrangements, each participant in these joint ventures has made substantial investments in the joint venture and, accordingly, has required that the relevant charter documents contain certain features designed to provide each participant with the opportunity to participate in the management of the joint venture and to protect its investment, as well as any other assets that may be substantially dependent on or otherwise affected by the activities of that joint venture. These participation and protective features customarily include a corporate governance structure that requires at least a majority-in-interest vote to authorize many basic activities and requires a greater voting interest (sometimes up to 100%) to authorize more significant activities. Examples of these more significant activities are large expenditures or contractual commitments, the construction or acquisition of assets, borrowing money or otherwise raising capital, transactions with affiliates of a joint-venture participant, litigation and transactions not in the ordinary course of business, among others. Thus, without the concurrence of joint-venture participants with enough voting interests, we may be unable to cause any of our joint ventures to take or not to take certain actions, even though those actions may be in the best interest of us or the particular joint venture.
Moreover, subject to contractual restrictions, any joint-venture owner generally may sell, transfer or otherwise modify its ownership interest in a joint venture, whether in a transaction involving third parties or the other joint-venture owners. Any such transaction could result in us being required to partner with different or additional parties who may have business interests different from ours.
We do not operate all of our joint-venture assets nor do we employ directly all of the persons responsible for providing administrative, operating and management services. This reliance on others to operate joint-venture assets and to provide other services could affect adversely our business and results of operations.
We rely on others to provide administrative, operating and management services for certain of our joint-venture assets. We have a limited ability to control the operations and the associated costs of such operations. The success of these operations depends on a number of factors that are outside our control, including the competence and financial resources of the operator or an outsourced service provider. We may have to contract elsewhere for outsourced services, which may cost more than we are currently paying. In addition, we may not be able to obtain the same level or kind of service or retain or receive the services in a timely manner, which may impact our ability to perform under our contracts and affect adversely our business and results of operations.
The COVID-19 pandemic has affected adversely, and could further affect adversely, our results of operations.
The COVID-19 pandemic led to global and regional economic disruption, volatility in the financial markets and a weakened commodity price environment. The outbreak and government measures taken in response, including extended quarantines, closures and reduced operations of businesses, had a significant adverse impact, both direct and indirect, on our business and the economy.
Uncertainty remains regarding the duration of global impacts due to COVID-19. This uncertainty, and the occurrence of these events and measures taken in response, could further affect adversely our results of operations by, among other things, reducing demand for the services we provide, impacting our supply chains and the availability and efficiency of our workforce, including our executive officers, creating operational challenges and impacting our ability to access capital markets. Additionally, in the wake of the COVID-19 pandemic, inflationary pressures have increased in the U.S. and globally. The degree to which the pandemic further impacts our business and results of operations will depend on future developments beyond our control, including the success of vaccination efforts and the effectiveness of such vaccines against future mutations of the COVID-19 virus, how quickly and to what extent economic and operating conditions resume to pre-COVID-19 levels, and the severity and duration of reduced global and regional economic activity resulting from the pandemic.
Increased regulation of exploration and production activities, including hydraulic fracturing, well setbacks and disposal of wastewater, could result in reductions or delays in drilling and completing new crude oil and natural gas wells.
The crude oil and natural gas industry is relying increasingly on supplies from nonconventional sources, such as shale and tight sands. Natural gas extracted from these sources frequently requires hydraulic fracturing, which involves the pressurized injection of water, sand and chemicals into a geologic formation to stimulate crude oil and natural gas production. Legislation or regulations placing restrictions on exploration and production activities, including hydraulic fracturing and disposal of wastewater, could result in operational delays, increased operating costs and additional regulatory burdens on exploration and production operators. Any of these factors could reduce their production of unprocessed natural gas and, in turn, affect adversely our revenues and results of operations by decreasing the volumes of natural gas and NGLs gathered, treated, processed, fractionated and transported on our or our joint ventures’ assets.
The energy industry historically has been subject to heavy state and federal regulation that extends to many aspects of our businesses and operations, including:
•change to federal, state and local taxation;
•regulatory approval and review of certain of our rates, operating terms and conditions of service;
•the types of services we may offer our counterparties;
•construction and operation of new facilities;
•the integrity, safety and security of facilities and operations;
•acquisition, extension or abandonment of services or facilities;
•reporting and information posting requirements;
•maintenance of accounts and records; and
•relationships with affiliate companies involved in all aspects of the natural gas and energy businesses.
Compliance with these requirements can be costly and burdensome. Future changes to laws, regulations and policies in these areas may impair our ability to compete for business or to recover costs and may increase the cost and burden of our operations. We cannot guarantee that state or federal regulators will not challenge our safety practices or will authorize any projects or acquisitions that we may propose in the future. Moreover, there can be no guarantee that, if granted, any such authorizations will be made in a timely manner or will be free from potentially burdensome conditions.
Under the Natural Gas Act, which is applicable to our interstate natural gas pipelines, and the Interstate Commerce Act, which is applicable to our interstate NGL pipelines, our interstate transportation rates are regulated by the FERC and many changes to our pipeline tariffs must be approved in a regulatory proceeding. Additionally, shippers, the FERC and/or state regulatory agencies may investigate our tariff rates which could result in, among other things, our being ordered to reduce rates or make refunds to shippers.
Failure to comply with all applicable state or federal statutes, rules and regulations and orders could bring substantial penalties and fines.
We may face significant costs to comply with the regulation of GHG emissions.
GHG emissions in the midstream industry originate primarily from combustion engine exhaust, heater exhaust and fugitive methane gas emissions. International, federal, regional and/or state legislative and/or regulatory initiatives may attempt to control or limit GHG emissions, including initiatives directed at issues associated with climate change. Various federal and state legislative proposals have been introduced to regulate the emission of GHGs, particularly carbon dioxide and methane, and the United States Supreme Court has ruled that carbon dioxide is a pollutant subject to regulation by the EPA. In addition, there have been international efforts seeking legally binding reductions in emissions of GHGs.
We believe it is likely that future governmental legislation and/or regulation on the federal, state and regional levels, may further require us to limit GHG emissions associated with our operations, pay additional fees associated with our GHG emissions or purchase allowances for such emissions. For example, the Inflation Reduction Act will require the payment of “Methane Fees” for specific facilities that exceed GHG emission and/or methane intensity thresholds beginning in 2024. This and other legislative and/or regulatory initiatives could make some of our activities uneconomic to maintain or operate. However, we cannot predict precisely what form these future legislative and/or regulatory initiatives will take, the stringency of
such initiatives, when they will become effective or the impact on our capital expenditures, competitive position and results of operations. Further, we may not be able to pass on the higher costs to our customers or recover all costs related to complying with GHG legislative and/or regulatory requirements. Our future results of operations, financial position or cash flows could be affected adversely if such costs are not recovered or otherwise passed on to our customers.
Our operations are subject to federal and state laws and regulations relating to the protection of the environment, which may expose us to significant costs and liabilities. Increased litigation and activism challenging oil and gas development as well as changes to and/or increased penalties from the enforcement of laws, regulations and policies could impact adversely our business.
The risk of incurring substantial environmental costs and liabilities is inherent in our business. Our operations are subject to extensive federal, state and local laws and regulations relating to the protection of the environment. Examples of these laws include:
•the Clean Air Act and analogous state laws that impose obligations related to air emissions;
•the Clean Water Act and analogous state laws that impose requirements related to activities in and around certain state and federal waters, including requirements related to discharge of wastewater from our facilities into state and federal waters;
•the Comprehensive Environmental Response, Compensation and Liability Act (CERCLA) and analogous state laws that regulate the cleanup of hazardous substances that may have been released at properties currently or previously owned or operated by us or locations to which we have sent waste for disposal;
•the Endangered Species Act and analogous state laws that impose obligations related to protection of threatened and endangered species; and
•the Resource Conservation and Recovery Act (RCRA) and analogous state laws that impose requirements for the handling and discharge of solid and hazardous waste from our facilities.
Various federal and state governmental authorities, including the EPA, have the power to enforce compliance with these laws and regulations and the permits issued under them. Violators are subject to administrative, civil and criminal penalties, including civil fines, injunctions or both. Joint and several, strict liability may be incurred without regard to fault under the CERCLA, RCRA and analogous state laws for the remediation of contaminated areas.
There is an inherent risk of incurring environmental costs and liabilities in our business due to our handling of the products we gather, transport, process and store, air emissions related to our operations, past industry operations and waste disposal practices, some of which may be material. Private parties, including the owners of properties through which our pipeline systems pass, may have the right to pursue legal actions to enforce compliance as well as to seek damages for noncompliance with environmental laws and regulations or for personal injury or property damage arising from our operations. Some sites we operate are located near current or former third-party hydrocarbon storage and processing operations, and there is a risk that contamination has migrated from those sites to ours. In addition, increasingly strict laws, regulations and enforcement policies could increase significantly our compliance costs, penalties and other cost associated with any alleged noncompliance, and the cost of any remediation that may become necessary; some of these costs could be material and could adversely affect our business, results of operation, financial position and cash flows. Our insurance may not cover all of these environmental risks, and there are also limits on coverage. Additional information is included under Item 1, Business, under “Regulatory, Environmental and Safety Matters” and in Note O of the Notes to Consolidated Financial Statements in this Annual Report.
Increased litigation and activism challenging oil and gas development as well as changes to and/or more aggressive enforcement of laws, regulations and policies could impact our business. These actions could, among other things, impact our customers’ activities, our existing permits, our ability to obtain permits for new development projects and public perception of our company, which could affect adversely our business, results of operations, financial position or cash flows.
Changes in interest rates could affect adversely our business.
We use both fixed and variable rate debt, and we are exposed to market risk due to the floating interest rates on our short-term borrowings. Our results of operations, financial position and cash flows could be affected adversely by significant fluctuations in interest rates.
Any reduction in our credit ratings could affect adversely our business, results of operations, financial position and cash flows.
Our long-term debt has been assigned an investment-grade credit rating of “Baa3” by Moody’s and “BBB” by both S&P and Fitch. Our commercial paper program has been assigned an investment-grade credit rating of Prime-3, A-2 and F2 by Moody’s, S&P and Fitch, respectively. We cannot provide assurance that any of our current ratings will remain in effect for any given period of time or that a rating will not be lowered or withdrawn entirely by these credit rating agencies. If these agencies were to downgrade our long-term debt or our commercial paper rating, particularly below investment grade, our borrowing costs could increase, which would affect adversely our financial results, and our potential pool of investors and funding sources could decrease. Ratings from these agencies are not recommendations to buy, sell or hold our securities. Each rating should be evaluated independently of any other rating.
Our indebtedness and guarantee obligations could impair our financial condition and our ability to fulfill our obligations.
As of December 31, 2022, we had total indebtedness of $13.6 billion. Our indebtedness and guarantee obligations could have significant consequences. For example, they could:
•make it more difficult for us to satisfy our obligations with respect to senior notes and other indebtedness due to the increased debt-service obligations, which could, in turn, result in an event of default on such other indebtedness or the senior notes;
•impair our ability to obtain additional financing in the future for working capital, capital expenditures, acquisitions or general business purposes;
•diminish our ability to withstand a downturn in our business or the economy;
•require us to dedicate a substantial portion of our cash flows from operations to debt-service payments, reducing the availability of cash for working capital, capital expenditures, acquisitions, dividends or general corporate purposes;
•limit our flexibility in planning for, or reacting to, changes in our business and the industry in which we operate; and
•place us at a competitive disadvantage compared with our competitors that have proportionately less debt and fewer guarantee obligations.
We are not prohibited under the indentures governing the senior notes from incurring additional indebtedness, but our debt agreements do subject us to certain operational limitations summarized in the next paragraph. If we incur significant additional indebtedness, it could worsen the negative consequences mentioned above and could affect adversely our ability to repay our other indebtedness.
Our $2.5 Billion Credit Agreement contains provisions that restrict our ability to finance future operations or capital needs or to expand or pursue our business activities. For example, our $2.5 Billion Credit Agreement contains provisions that, among other things, limit our ability to make material changes to the nature of our business, merge, consolidate or dispose of all or substantially all of our assets, grant liens and security interests on our assets, engage in transactions with affiliates or make restricted payments, including dividends. It also requires us to maintain certain financial ratios, which limit the amount of additional indebtedness we can incur, as described in the “Liquidity and Capital Resources” section of Part II, Item 7, Management’s Discussion and Analysis of Financial Condition and Results of Operations, in this Annual Report. These restrictions could result in higher costs of borrowing and impair our ability to generate additional cash. Future financing agreements we may enter into may contain similar or more restrictive covenants.
If we are unable to meet our debt-service obligations or comply with financial covenants, we could be forced to restructure or refinance our indebtedness, seek additional equity capital or sell assets. We may be unable to obtain financing or sell assets on satisfactory terms, or at all.
The indentures governing certain of our and ONEOK Partners’ senior notes include an event of default upon the acceleration of other indebtedness of $15 million or more for certain of our senior notes or $100 million or more for certain of our and ONEOK Partners’ senior notes. Such events of default would entitle the trustee or the holders of 25% in aggregate principal amount of our and ONEOK Partners’ outstanding senior notes to declare those senior notes immediately due and payable in full. We may not have sufficient cash on hand to repurchase and repay any accelerated senior notes, which may cause us to borrow money under our credit facility or seek alternative financing sources to finance the repurchases and repayment. We could also face
difficulties accessing capital or our borrowing costs could increase, impacting our ability to obtain financing for acquisitions or capital expenditures, to refinance indebtedness and to fulfill our debt obligations.
The right to receive payments on our outstanding debt securities and subsidiary guarantees is unsecured and will be effectively subordinated to any future secured indebtedness as well as to any existing and future indebtedness of our subsidiaries that do not guarantee the senior notes.
Although ONEOK Partners and the Intermediate Partnership have guaranteed our debt securities, the guarantees are subject to release under certain circumstances, and we have subsidiaries that are not guarantors. In those cases, the debt securities effectively are subordinated to the claims of all creditors, including trade creditors and tort claimants, of our subsidiaries that are not guarantors. In the event of the insolvency, bankruptcy, liquidation, reorganization, dissolution or winding up of the business of a subsidiary that is not a guarantor, creditors of that subsidiary would generally have the right to be paid in full before any distribution is made to us or the holders of the debt securities.
A court may use fraudulent conveyance considerations to avoid or subordinate the cross guarantees of our and ONEOK Partners’ indebtedness.
ONEOK, ONEOK Partners and the Intermediate Partnership have cross guarantees in place for our and ONEOK Partners’ indebtedness. A court may use fraudulent conveyance laws to subordinate or avoid the cross guarantees of certain of our and ONEOK Partners’ indebtedness. It is also possible that under certain circumstances, a court could avoid or subordinate the guarantor’s guarantee of our and ONEOK Partners’ indebtedness in favor of the guarantor’s other debts or liabilities to the extent that the court determined either of the following were true at the time the guarantor issued the guarantee:
•the guarantor incurred the guarantee with the intent to hinder, delay or defraud any of its present or future creditors or the guarantor contemplated insolvency with a design to favor one or more creditors to the total or partial exclusion of others; or
•the guarantor did not receive fair consideration or reasonable equivalent value for issuing the guarantee and, at the time it issued the guarantee, the guarantor:
– was insolvent or rendered insolvent by reason of the issuance of the guarantee;
– was engaged or about to engage in a business or transaction for which its remaining assets constituted unreasonably small capital; or
– intended to incur, or believed that it would incur, debts beyond its ability to pay such debts as they matured.
The measure of insolvency for purposes of the foregoing will vary depending upon the law of the relevant jurisdiction. Generally, however, an entity would be considered insolvent for purposes of the foregoing if:
•the sum of its debts, including contingent liabilities, were greater than the fair saleable value of all of its assets at a fair valuation;
•the present fair saleable value of its assets was less than the amount that would be required to pay its probable liability on its existing debts, including contingent liabilities, as they become absolute and mature; or
•it
Among other things, a legal challenge of the cross guarantees of our and ONEOK Partners’ indebtedness on fraudulent conveyance grounds may focus on the benefits, if any, realized by the guarantor as a result of our and ONEOK Partners’ issuance of such debt. To the extent the guarantor’s guarantee of our and ONEOK Partners’ indebtedness is avoided as a result of fraudulent conveyance or held unenforceable for any other reason, the holders of such debt would cease to have any claim in respect of the guarantee.
Mergers and acquisitions that appear to be accretive may nevertheless reduce our cash from operations on a per-share basis.
Any merger or acquisition involves potential risks that may include, among other things:
•inaccurate assumptions about volumes, revenues and costs, including potential synergies;
•an inability to integrate successfully the businesses we acquire;
•decrease in our liquidity as a result of our using a significant portion of our available cash or borrowing capacity to finance the acquisition;
•a significant increase in our interest expense and/or financial leverage if we incur additional debt to finance the acquisition;
•the assumption of unknown liabilities for which we are not indemnified, our indemnity is inadequate or our insurance policies may exclude from coverage;
•an inability to hire, train or retain qualified personnel to manage and operate the acquired business and assets;
•limitations on rights to indemnity from the seller;
•inaccurate assumptions about the overall costs of equity or debt;
•the diversion of management’s and employees’ attention from other business concerns;
•unforeseen difficulties operating in new product areas or new geographic areas;
•increased regulatory burdens;
•customer or key employee losses at an acquired business; and
•increased regulatory requirements.
If we consummate any future mergers or acquisitions, our capitalization and results of operations may change significantly, and investors will not have the opportunity to evaluate the economic, financial and other relevant information that we will consider in determining the application of our resources to future acquisitions.
We may not have sufficient cash each quarter to pay dividends or maintain current or expected levels of dividends. The actual amount of cash we pay in the form of dividends may fluctuate from quarter to quarter and will depend on various factors, some of which are beyond our control, including our working capital needs, our ability to borrow, the restrictions contained in our indentures and credit facility, our debt-service requirements and the cost of acquisitions, if any. A failure either to pay dividends or to pay dividends at expected levels could result in a loss of investor confidence, reputational damage and a decrease in the value of our stock price.
We are exposed to the credit risk of our customers or counterparties, and our credit-risk management may not be adequate to protect against such risk.
We are subject to the risk of loss resulting from nonpayment and/or nonperformance by our customers and counterparties. Our customers or counterparties may experience rapid deterioration of their financial condition as a result of changing market conditions, commodity prices or financial difficulties that could impact their creditworthiness or ability to pay us for our services. We assess the creditworthiness of our customers and counterparties and obtain collateral or contractual terms as we deem appropriate. We cannot, however, predict to what extent our business may be impacted by deteriorating market or financial conditions, including possible declines in our customers’ and counterparties’ creditworthiness. Our customers and counterparties may not perform or adhere to our existing or future contractual arrangements. To the extent our customers and counterparties are in financial distress or commence bankruptcy proceedings, contracts with them may be subject to renegotiation or rejection under applicable provisions of the United States Bankruptcy Code. If our risk-management policies and procedures fail to assess adequately the creditworthiness of existing or future customers and counterparties, any material nonpayment or nonperformance by our customers and counterparties due to inability or unwillingness to perform or adhere to contractual arrangements could affect adversely our business, results of operations, financial position and cash flows.
We are connected to market areas located in the Mid-Continent, Rocky Mountain, Permian Basin, Midwest markets, including Chicago, Illinois, and Gulf Coast regions of the U.S. Our counterparties are primarily major integrated and independent exploration and production, pipeline, marketing and petrochemical companies and natural gas and electric utilities. Therefore, our counterparties may be similarly affected by changes in economic, regulatory or other factors that may affect our overall credit risk.
Our operations require skilled and experienced workers with proficiency in multiple tasks. In recent years, a shortage of workers trained in various skills associated with the midstream energy business has, at times, caused us to conduct certain operations without full staff, thus hiring outside resources, which may decrease productivity and increase costs. This shortage of trained workers is the result of experienced workers reaching retirement age and increased competition for workers in certain areas, combined with the challenges of attracting new, qualified workers to the midstream energy industry. This shortage of skilled labor could continue over an extended period. If the shortage of experienced labor continues or worsens, it could affect adversely our labor productivity and costs and our ability to expand operations in the event there is an increase in the demand for our services and products, which could affect adversely our business, results of operations, financial position and cash flows.
Our employees or directors may engage in misconduct or other improper activities, including noncompliance with regulatory standards and requirements.
As with all companies, we are exposed to the risk of employee fraud or other misconduct. Our Board of Directors has adopted a code of business conduct and ethics that applies to our directors, officers (including our principal executive and financial officers, principal accounting officer, controllers and other persons performing similar functions) and all other employees. We require all directors, officers and employees to adhere to our code of business conduct and ethics in addressing the legal and ethical issues encountered in conducting their work for our company. Our code of business conduct and ethics requires, among other things, that our directors, officers and employees avoid conflicts of interest, comply with all applicable laws and other legal requirements, conduct business in an honest and ethical manner and otherwise act with integrity and in our company’s best interest. All directors, officers and employees are required to report any conduct that they believe to be an actual or apparent violation of our code of business conduct and ethics. However, it is not always possible to identify and deter misconduct, and the precautions we take to detect and prevent this activity may not be effective in controlling unknown or unmanaged risks or losses or in protecting us from governmental investigations or other actions or lawsuits stemming from a failure to comply with such laws or regulations. If any such actions are instituted against us, and we are not successful in defending ourselves or asserting our rights, those actions could affect adversely our reputation, business, results of operations, financial position and cash flows.
An impairment of goodwill, long-lived assets, including intangible assets, and equity-method investments could reduce our earnings.
Goodwill is recorded when the purchase price of a business exceeds the fair market value of the tangible and separately measurable intangible net assets. GAAP requires us to test goodwill for impairment on an annual basis or when events or circumstances occur indicating that goodwill might be impaired. Long-lived assets, including intangible assets with finite useful lives, are reviewed for impairment whenever events or changes in circumstances indicate that the carrying amount may not be recoverable. For the investments we account for under the equity method, the impairment test considers whether the fair value of the equity investment as a whole, not the underlying net assets, has declined and whether that decline is other than temporary. For example, if a low commodity price environment persisted for a prolonged period, it could result in lower volumes delivered to our systems and impairments of our assets or equity-method investments. If we determine that an impairment is indicated, we would be required to take an immediate noncash charge to earnings with a correlative effect on equity and balance sheet leverage as measured by consolidated debt to total capitalization.
For further discussion of impairments of goodwill, long-lived assets and equity-method investments, see Notes A, E, F, and N, respectively, of the Notes to Consolidated Financial Statements in this Annual Report.
The cost of providing pension and postretirement health care benefits to eligible employees and qualified retirees is subject to changes in pension fund values and changing demographics and may increase.
We have a defined benefit pension plan for certain employees and former employees, which closed to new participants in 2005, and postretirement welfare plans that provide postretirement medical and life insurance benefits to certain employees hired prior to 2017 who retire with at least five years of full-time service. The cost of providing these benefits to eligible current and former employees is subject to changes in the market value of our pension and postretirement benefit plan assets, changing demographics, including longer life expectancy of plan participants and their beneficiaries and changes in health care costs. For further discussion of our defined benefit pension plan and postretirement welfare plans, see Note L of the Notes to Consolidated Financial Statements in this Annual Report.
Any sustained declines in equity markets and reductions in bond yields may affect adversely the value of our pension and postretirement benefit plan assets. In these circumstances, additional cash contributions to our pension plans may be required, which could affect adversely our business, financial condition and cash flows.
If we fail to maintain an effective system of internal controls, we may not be able to report accurately our financial results or prevent fraud. As a result, current and potential holders of our equity and debt securities could lose confidence in our financial reporting.
Effective internal controls are necessary for us to provide reliable financial reports, prevent fraud and operate successfully as a public company. We cannot be certain that our efforts to maintain our internal controls will be successful, that we will be able to maintain adequate controls over our financial processes and reporting in the future or that we will be able to continue to comply with our obligations under Section 404 of the Sarbanes-Oxley Act of 2002. Any failure to maintain effective internal
controls, or difficulties encountered in implementing or improving our internal controls, could harm our operating results or cause us to fail to meet our reporting obligations. Ineffective internal controls could also cause investors to lose confidence in our reported financial information, which would likely have a negative effect on the trading price of our equity, our access to capital markets and the cost of capital.
Not applicable.
A description of our properties is included in Item 1, Business.
Information about our legal proceedings is included in Note O of the Notes to Consolidated Financial Statements in this Annual Report.
Not applicable.
Our common stock is listed on the NYSE under the trading symbol “OKE.” The corporate name ONEOK is used in stock listings.
At February 21, 2023, there were 13,064 holders of record of our 447,220,972 outstanding shares of common stock.
For information regarding our Employee Stock Award Program and other equity compensation plans, see Note K of the Notes to Consolidated Financial Statements and “Equity Compensation Plan Information” included in Part III, Item 12, Security Ownership of Certain Beneficial Owners and Management and Related Stockholder Matters, in this Annual Report.
The following performance graph compares the performance of our common stock with the S&P 500 Index, the Alerian Midstream Energy Select Index and a ONEOK Peer Group during the period beginning on December 31, 2017, and ending on December 31, 2022.
Value of a $100 Investment, Assuming Reinvestment of Distributions/Dividends, at December 31, 2017, and at the End of Every Year Through December 31, 2022.
(a)-ThecurrentONEOKPeerGroupiscomposedofthefollowingcompanies:DCPMidstream,LP;EnergyTransferLP;EnLink Midstream,LLC;EnterpriseProductsPartnersL.P.;KinderMorgan,Inc.;MagellanMidstreamPartners,L.P.;MPLXLP;NuStarEnergy L.P.;PlainsAllAmericanPipeline,L.P.;TargaResourcesCorp.;WesternMidstreamPartners,LP;andTheWilliamsCompanies,Inc.
(b)-TheAlerianMidstreamEnergySelectIndexmeasuresthecompositeperformanceofapproximately29NorthAmericanenergy infrastructurecompanieswhoareengagedinmidstreamactivitiesinvolvingenergycommodities.
ITEM 6. [RESERVED]
The following discussion and analysis should be read in conjunction with Part I, Item 1, Business, our audited Consolidated Financial Statements and the Notes to Consolidated Financial Statements in this Annual Report.
Please refer to the “Financial Results and Operating Information” and “Liquidity and Capital Resources” sections of Management’s Discussion and Analysis of Financial Condition and Results of Operations in this Annual Report for additional information.
Market Conditions - We experienced earnings growth in 2022, compared with 2021, due primarily to increased producer activity across our operations, higher realized commodity prices, net of hedging and higher average fee rates. In 2023, we expect to benefit from higher volumes, our completed Demicks Lake III natural gas processing plant and the expected completion of our MB-5 NGL fractionator, highlighting our extensive and integrated assets that are located in some of the most productive shale basins in the United States.
Medford Incident - On July 9, 2022, a fire occurred at our 210 MBbl/d Medford, Oklahoma, natural gas liquids fractionation facility. All personnel were safe and accounted for with temporary evacuations of local residents taken as a precautionary measure.
Net income for the year ended December 31, 2022, includes the unfavorable impact of our $5 million property deductible and approximately $30 million of losses incurred associated with the 45-day waiting period for business interruption coverage. Beginning in August 2022, we developed claims related to the Medford incident and recorded accruals for expected insurance recoveries. The table below sets forth our 2022 insurance accruals associated with the Medford incident:
(a)-Wereceiveda$100millionpaymentinthefourthquarter2022,leavingareceivablebalanceatDecember31,2022,of$50.7million.
Our business interruption insurance includes coverage for (i) incurred costs and losses that are either unavoidable or incurred to mitigate or reduce losses and (ii) lost earnings. Our business interruption insurance accruals in the table above primarily represent third-party fractionation costs and fully offset the actual losses incurred in 2022, subsequent to the 45-day waiting period.
We assessed the property damage to our facility and wrote off assets totaling $45.6 million, which represents the carrying value associated with certain damaged Medford facility property. These noncash property losses are fully offset by insurance recoveries noted in the table above. We expect to continue to operate NGL pipeline assets in Medford along with existing offices for regional operations. In addition, we are preserving certain Medford assets for future potential NGL facilities that could be constructed in Medford to enhance our NGL business as the market evolves. For additional information on the Medford incident, see Note B of the Notes to Consolidated Financial Statements in this Annual Report.
Subsequent Event - On January 9, 2023, we reached an agreement with our insurers to settle all claims for physical damage and business interruption related to the Medford incident. Under the terms of the settlement agreement, we agreed to resolve the claims for total insurance payments of $930 million, $100 million of which was received in 2022. The remaining $830 million was received in the first quarter 2023. The proceeds serve as settlement for property damage, business interruption claims to the date of settlement and as payment in lieu of future business interruption insurance claims.
In the first quarter 2023, we applied the $830 million received to our outstanding insurance receivable at December 31, 2022, of $50.7 million, and recorded a gain in operating income for the remaining $779.3 million. We expect our cash from operations in the remainder of 2023 and in 2024 to be impacted by incurred costs and losses resulting from the Medford incident for which we will no longer receive business interruption proceeds.
Due to market demand and a more favorable completion schedule, we announced plans to construct a new 125 MBbl/d MB-6 NGL fractionator in Mont Belvieu, Texas, instead of rebuilding our Medford NGL fractionator at this time. The MB-6 fractionator will have the capability to produce purity ethane instead of the ethane/propane mix previously produced at the Medford facility. The 125 MBbl/d capacity of the MB-6 fractionator is expected to be economically equivalent to the capacity lost at Medford. In addition, our 125 MBbl/d MB-5 NGL fractionator remains on schedule to be completed early in the second quarter of 2023, which is expected to reduce the need for third-party fractionation while the new MB-6 fractionator is being constructed. Until these projects are completed, we expect to continue to provide midstream services through existing arrangements with industry peers, along with our integrated NGL pipeline system between the Mid-Continent and Gulf Coast regions and our fractionation and storage assets.
Ethane Production - Price differentials between ethane and natural gas can cause natural gas processors to extract ethane or leave it in the natural gas stream, known as ethane rejection. As a result of these ethane economics, ethane volumes on our system can fluctuate. In the second half of 2022, ethane prices decreased relative to natural gas prices, as overall demand decreased, and were further impacted by lower petrochemical plant utilization, both planned and unplanned. This resulted in higher ethane rejection across most basins where we operate, with the largest impact in the Mid-Continent region, compared with the first half of 2022. As utilization increases and demand for feedstock returns, we expect improvement in ethane economics; however, price fluctuations are expected to continue.
Ethane volumes under long-term contracts delivered to our NGL system increased approximately 20 MBbl/d to an average of 450 MBbl/d in 2022, compared with 430 MBbl/d in 2021, due primarily to changes in ethane extraction economics. We estimate that there are more than 225 MBbl/d of discretionary ethane, consisting of more than 125 MBbl/d in the Rocky Mountain region and approximately 100 MBbl/d in the Mid-Continent region, that can be recovered and transported on our system.
Growth Projects - We operate an integrated, reliable and diversified network of NGL and natural gas gathering, processing, fractionation, transportation and storage assets connecting supply in the Rocky Mountain, Mid-Continent and Permian regions with key market centers. Our primary capital-growth projects are outlined in the table below:
(a)-Excludescapitalizedinterest/AFUDC.
Debt Issuances and Repayments - In November 2022, we completed an underwritten public offering of $750 million, 6.1% senior unsecured notes due 2032. The net proceeds, after deducting underwriting discounts, commissions and offering expenses, were $742 million. The proceeds were used primarily to repay all outstanding amounts under our commercial paper program. The remainder was used for general corporate purposes.
In July 2022, we redeemed the remaining $895.8 million of our 3.375% senior notes due October 2022 at 100% of the principal amount, plus accrued and unpaid interest, with cash on hand and short-term borrowings.
Subsequent event - We elected to redeem our $425 million, 5.0% senior notes due September 2023, with a redemption effective date in late February 2023. We expect the redemption price to equal 100% of the principal amount of the notes, plus accrued and unpaid interest, which we will pay with cash on hand.
Dividends - During 2022, we paid common stock dividends totaling $3.74 per share, which is consistent with the prior year. In February 2023, we paid a quarterly common stock dividend of $0.955 per share ($3.82 per share on an annualized basis), an increase of 2% compared with the same quarter in the prior year. Our dividend growth is primarily due to the increase in cash flows resulting from the growth of our operations.
Management uses a variety of financial and operating metrics to analyze our performance. Our consolidated financial metrics include: (1) operating income; (2) net income; (3) diluted EPS; and (4) adjusted EBITDA. We evaluate segment operating results using adjusted EBITDA and our operating metrics, which include various volume and rate statistics that are relevant for the respective segment. These operating metrics allow investors to analyze the various components of segment financial results in terms of volumes and rate/price. Management uses these metrics to analyze historical segment financial results and as the key inputs for forecasting and budgeting segment financial results. For additional information on our operating metrics, see the respective segment subsections of this “Financial Results and Operating Information” section.
Non-GAAP Financial Measures - Adjusted EBITDA is a non-GAAP measure of our financial performance. Adjusted EBITDA is defined as net income adjusted for interest expense, depreciation and amortization, noncash impairment charges, income taxes, allowance for equity funds used during construction, noncash compensation expense and certain other noncash items. We believe this non-GAAP financial measure is useful to investors because it and similar measures are used by many companies in our industry as a measurement of financial performance and is commonly employed by financial analysts and others to evaluate our financial performance and to compare financial performance among companies in our industry. Adjusted EBITDA should not be considered an alternative to net income, EPS or any other measure of financial performance presented in accordance with GAAP. Additionally, this calculation may not be comparable with similarly titled measures of other companies.
Selected Financial Results - The following table sets forth certain selected financial results for the periods indicated:
Changes in commodity prices and sales volumes affect both revenues and cost of sales and fuel in our Consolidated Statements of Income and, therefore, the impact is largely offset between these line items, except where noted.
Operating income for the year ended December 31, 2022, includes $96.1 million of business interruption insurance recoveries, which are included in the other operating (income) expense, net line item above, and an approximately $30 million unfavorable impact from the 45-day business interruption coverage waiting period related to the Medford incident in our Natural Gas Liquids segment.
2022 vs. 2021 - Operating income increased $211.1 million primarily as a result of the following:
•Natural Gas Gathering and Processing - an increase of $127.7 million due primarily to higher realized commodity prices, net of hedging, and higher average fee rates and $53.8 million from higher volumes in the Rocky Mountain and Mid-Continent regions; and
•Natural Gas Liquids - an increase of $102.8 million in exchange services related primarily to higher average fee rates and higher volumes in the Rocky Mountain region and Permian Basin, offset partially by higher fuel and power costs and third-party fractionation costs; an increase of $46.2 million due to the unfavorable impact of Winter Storm Uri in the first quarter 2021 and $18.2 million in higher optimization and marketing earnings; offset by
•Natural Gas Pipelines - a decrease of $134.7 million due to the favorable impact of Winter Storm Uri in the first quarter 2021, offset partially by increases of $92.1 million due primarily to higher storage and transportation services, higher average earnings on natural gas sales and higher pricing on compression services; and
• Consolidated Operating Costs - an increase of $82.7 million due primarily to higher outside services, materials and supplies expense and property taxes, related primarily to the growth of our operations.
Net income and diluted EPS increased due primarily to the items discussed above, lower interest expense related to increased capitalized interest and lower debt balances and higher equity in net earnings from investments. These increases were offset partially by higher income taxes and losses related to the mark-to-market of investments associated with certain benefit plan investments.
Capital expenditures increased due primarily to our capital-growth projects, including the construction of our Demicks Lake III natural gas processing plant, our MB-5 fractionator and the Viking compression project.
Additional information regarding our financial results and operating information is provided in the following discussion for each of our segments.
Selected Financial Results and Operating Information for the Year Ended December 31, 2021 vs. 2020 - The consolidated and segment financial results and operating information for the year ended December 31, 2021, compared with the year ended December 31, 2020, are included in Part II, Item 7, Management’s Discussion and Analysis of Financial Condition and Results of Operations of our 2021 Annual Report on Form 10-K, which is available via the SEC’s website at www.sec.gov and our website at www.oneok.com.
Growth Projects - Our Natural Gas Gathering and Processing segment has invested in growth projects in NGL-rich areas in the Williston Basin. See “Growth Projects” in the “Recent Developments” section for discussion of our capital-growth projects.
For a discussion of our capital expenditure financing, see “Capital Expenditures” in the “Liquidity and Capital Resources” section.
Selected Financial Results and Operating Information - The following tables set forth certain selected financial results and operating information for our Natural Gas Gathering and Processing segment for the periods indicated:
Changes in commodity prices and sales volumes affect both revenue and cost of sales and fuel, and, therefore, the impact is largely offset between these line items.
2022 vs. 2021 - Adjusted EBITDA increased $147.5 million, primarily as a result of the following:
• an increase of $127.7 million due primarily to higher realized commodity prices, net of hedging, and average fee rates; and
• an increase of $53.8 million from higher volumes due primarily to increased producer activity in the Rocky Mountain and Mid-Continent regions, offset partially by the impact of winter weather in the Rocky Mountain region in the second and fourth quarters of 2022; offset by
• an increase of $35.2 million in operating costs due primarily to higher materials and supplies expense due primarily to the growth of our operations and higher outside services.
Capital expenditures increased due primarily to growth projects, including our Demicks Lake III project.
(a)-Includesvolumesforconsolidatedentitiesonly.
(b)-Includesvolumesweprocessedatcompany-ownedandthird-partyfacilities.
2022 vs. 2021 - Our natural gas gathered and natural gas processed volumes increased due primarily to increased producer activity in the Rocky Mountain and Mid-Continent regions, offset partially by the unfavorable impact of winter weather in the Rocky Mountain region in the second and fourth quarters of 2022.
Our average fee rate increased due primarily to increased contribution of volumes on higher fee contracts in the Williston Basin and inflation-based escalators in our contracts. Also, for certain fee with POP contracts, our contractual fees increased due to production volumes, delivery pressures, or commodity prices relative to specified contractual thresholds.
Commodity Price Risk - See discussion regarding our commodity price risk under “Commodity Price Risk” in Item 7A, Quantitative and Qualitative Disclosures about Market Risk.
Growth Projects - Our Natural Gas Liquids segment invests in projects to transport, fractionate, store and deliver to market centers NGL supply from shale and other resource development areas. Our growth strategy is focused around connecting
diversified supply basins from the Rocky Mountain region through the Mid-Continent region and the Permian Basin with purity NGLs demand from the petrochemical and refining industries and NGL export demand in the Gulf Coast. See “Growth Projects” in the “Recent Developments” section for discussion of our capital-growth projects.
In 2022, we connected one third-party natural gas processing plant in the Permian Basin and one raw feed truck terminal in the Mid-Continent region to our NGL system. In addition, one third-party natural gas processing plant in the Permian Basin connected to our system was expanded.
For a discussion of our capital expenditure financing, see “Capital Expenditures” in the “Liquidity and Capital Resources” section.
Selected Financial Results and Operating Information - The following tables set forth certain selected financial results and operating information for our Natural Gas Liquids segment for the periods indicated:
SeereconciliationofnetincometoadjustedEBITDAinthe“Non-GAAPMeasures”section.
Changes in commodity prices and sales volumes affect both revenues and cost of sales and fuel, and, therefore, the impact is largely offset between these line items.
Adjusted EBITDA for the year ended December 31, 2022, includes $96.1 million of business interruption insurance recoveries, which are included in the other line item above, and an approximately $30 million unfavorable impact from the 45-day business interruption coverage waiting period related to the Medford incident.
2022 vs. 2021 - Adjusted EBITDA increased $131.6 million primarily as a result of the following:
•an increase of $102.8 million in exchange services (excluding the impact of Winter Storm Uri discussed below) due primarily to:
◦$186.3 million in higher average fee rates, primarily as a result of inflation-based and fuel cost escalators in our contracts,
◦$50.1 million in higher volumes primarily in the Rocky Mountain region and Permian Basin, offset partially by lower volumes in the Mid-Continent region, offset by
◦$129.9 million in higher costs, primarily fuel and power costs and third-party fractionation costs. A portion of the third-party fractionation costs relate to the 45-day Medford incident business interruption coverage waiting period, and
◦$12.9 million related to recognition of proceeds previously considered a gain contingency in 2021; and
• an increase of $46.2 million in exchange services due to the unfavorable impact of Winter Storm Uri in the first quarter 2021;
•an increase of $18.2 million in optimization and marketing due primarily to wider location and commodity price differentials, offset partially by nonrecurring activities in the first quarter 2021 during Winter Storm Uri; and
•an increase of $13.6 million in equity in net earnings from investments due primarily to higher volumes delivered to the Overland Pass pipeline; offset by
•an increase of $48.8 million in operating costs due primarily to higher property taxes associated with our completed capital-growth projects and higher outside services.
Capital expenditures increased due primarily to capital-growth projects, including our MB-5 fractionator.
(a)-Representsphysicalrawfeedvolumesforwhichweprovidetransportationand/orfractionationservices.
We generally expect ethane volumes to increase or decrease with corresponding increases or decreases in overall NGL production. However, ethane volumes may experience growth or decline greater than corresponding growth or decline in overall NGL production due to ethane economics causing producers to extract or reject ethane.
2022 vs. 2021 - Volumes increased due primarily to increased NGL production in the Rocky Mountain region and Permian Basin, and higher ethane volumes from incentivized ethane recovery in the Rocky Mountain region, offset partially by decreased ethane recovery in the Mid-Continent region due to ethane economics. Volumes also benefited from the unfavorable impact of Winter Storm Uri in the first quarter 2021, offset partially by the impact of winter weather in the Rocky Mountain region in the second and fourth quarters of 2022.
Growth Projects - Our Natural Gas Pipelines segment invests in projects that provide transportation and storage services to end users. In December 2022, our Saguaro Connector Pipeline L.L.C. subsidiary filed a Presidential Permit application with the FERC to construct and operate new international border-crossing facilities at the U.S. and Mexico border. The proposed border facilities would connect upstream with a potential intrastate pipeline, the Saguaro Connector Pipeline, which would be owned and operated by ONEOK. Additionally, the proposed border facilities would connect at the international boundary with a new pipeline under development in Mexico for delivery to a liquefied natural gas export facility on the west coast of Mexico. The final investment decision on the pipeline is expected by mid-2023.
See “Growth Projects” in the “Recent Developments” section for discussion of our capital-growth projects.
For a discussion of our capital expenditure financing, see “Capital Expenditures” in the “Liquidity and Capital Resources” section.
Selected Financial Results and Operating Information - The following tables set forth certain selected financial results and operating information for our Natural Gas Pipelines segment for the periods indicated:
2022 vs. 2021 - Adjusted EBITDA decreased $39.4 million primarily as a result of the following:
•a decrease of $134.7 million due to the favorable impact of Winter Storm Uri in the first quarter 2021 on natural gas sales of volumes previously held in inventory, interruptible transportation revenue and park and loan revenue; and
•an increase of $12.0 million in operating expenses due primarily to higher outside services, offset by
• an increase of $51.5 million in storage services due primarily to higher storage rates on renegotiated contracts;
•an increase of $23.1 million in transportation services due primarily to higher interruptible revenue, excluding the impact of Winter Storm Uri in the first quarter 2021 noted above, and higher firm transportation revenue;
• an increase of $17.5 million due primarily to higher average earnings on natural gas sales of volumes previously held in inventory, excluding the impact of Winter Storm Uri in the first quarter 2021 noted above, and higher pricing on compression services; and
•an increase of $10.4 million from higher equity in net earnings from investments due primarily to increased volumes on Northern Border and higher firm transportation rates on Roadrunner.
Capital expenditures increased in 2022 due primarily to capital-growth projects, including the Viking compression project.
(a)-Includesvolumesforconsolidatedentitiesonly.
In April 2022, the FERC initiated a review of Guardian’s rates pursuant to Section 5 of the Natural Gas Act. In August 2022, Guardian reached a settlement in principle with the participants in the Section 5 rate case. The FERC approved the settlement in February 2023, which will result in a future reduction of rates. We do not expect the reduced rates to have a material impact on our results of operations.
The following table sets forth a reconciliation of net income, the nearest comparable GAAP financial performance measure, to adjusted EBITDA for the periods indicated:
ReconciliationofsegmentadjustedEBITDAtoadjustedEBITDA
(a)-YearsendedDecember31,2022,2021and2020,includesalossof$18.8million,andbenefitsof$10.4millionand$19.8million, respectively,relatedtothemark-to-marketofinvestmentsassociatedwithcertainbenefitplaninvestments.
(b)-YearendedDecember31,2020,includescorporatenetgainsof$22.3milliononextinguishmentofdebtrelatedtoopenmarket repurchases.
See Note O of the Notes to Consolidated Financial Statements in this Annual Report for a discussion of regulatory and environmental matters.
Other Legal Proceedings - We are a party to various legal proceedings that have arisen in the normal course of our operations. While the results of these proceedings cannot be predicted with certainty, we believe the reasonably possible losses from such
proceedings, individually and in the aggregate, are not material. Additionally, we believe the probable final outcome of such proceedings will not have a material adverse effect on our consolidated results of operations, financial position or cash flows.
General - Our primary sources of cash inflows are operating cash flows, proceeds from our commercial paper program and our $2.5 Billion Credit Agreement, debt issuances and the issuance of common stock for our liquidity and capital resources requirements.
On January 9, 2023, we reached an agreement with our insurers to settle all claims for physical damage and business interruption related to the Medford incident. Under the terms of the settlement agreement, we agreed to resolve the claims for total insurance payments of $930 million, $100 million of which was received in 2022. The remaining $830 million was received in the first quarter 2023. The proceeds serve as settlement for property damage, business interruption claims to the date of settlement and as payment in lieu of future business interruption insurance claims. We expect our cash from operations in the remainder of 2023 and in 2024 to be impacted by incurred costs and losses resulting from the Medford incident for which we will no longer receive business interruption proceeds.
We expect our sources of cash inflows to provide sufficient resources to finance our operations, quarterly cash dividends, capital expenditures and maturities of long-term debt. We believe we have sufficient liquidity due to our $2.5 Billion Credit Agreement, which expires in June 2027, and access to $1.0 billion available through our “at-the-market” equity program. As of the date of this report, no shares have been sold through our “at-the-market” equity program.
We may manage interest-rate risk through the use of fixed-rate debt, floating-rate debt and interest-rate swaps. For additional information on our interest-rate swaps, see Note D of the Notes to Consolidated Financial Statements in this Annual Report.
Guarantees and Cash Management - We and ONEOK Partners are issuers of certain public debt securities. We guarantee certain indebtedness of ONEOK Partners, and ONEOK Partners and the Intermediate Partnership guarantee certain of our indebtedness. The guarantees in place for our and ONEOK Partners’ indebtedness are full, irrevocable, unconditional and absolute joint and several guarantees to the holders of each series of outstanding securities. Liabilities under the guarantees rank equally in right of payment with all existing and future senior unsecured indebtedness. As ONEOK Partners and the Intermediate Partnership are consolidated subsidiaries of ONEOK, separate financial statements for the guarantors are not required, as long as the alternative disclosure required by Rule 13-01 is provided, which includes narrative disclosure and summarized financial information. The Intermediate Partnership holds all of ONEOK Partners’ interests and equity in its subsidiaries, which are nonguarantors, and substantially all the assets and operations reside with nonguarantor operating subsidiaries. Therefore, as allowed under Rule 13-01, we have excluded the summarized financial information for each issuer and guarantor as the combined financial information of the subsidiary issuer and parent guarantor, excluding our ownership of all the interests in ONEOK Partners, reflect no material assets, liabilities or results of operations, apart from the guaranteed indebtedness. For additional information on our and ONEOK Partners’ indebtedness, see Note G of the Notes to Consolidated Financial Statements in this Annual Report.
We use a centralized cash management program that concentrates the cash assets of our nonguarantor operating subsidiaries in joint accounts for the purposes of providing financial flexibility and lowering the cost of borrowing, transaction costs and bank fees. Our centralized cash management program provides that funds in excess of the daily needs of our operating subsidiaries are concentrated, consolidated or otherwise made available for use by other entities within our consolidated group. Our operating subsidiaries participate in this program to the extent they are permitted pursuant to FERC regulations or their operating agreements. Under the cash management program, depending on whether a participating subsidiary has short-term cash surpluses or cash requirements, we provide cash to the subsidiary or the subsidiary provides cash to us.
Short-term Liquidity - Our principal sources of short-term liquidity consist of cash generated from operating activities, distributions received from our equity-method investments, proceeds from our commercial paper program and our $2.5 Billion Credit Agreement.
We had working capital (defined as current assets less current liabilities) deficits of $503.9 million and $810.2 million as of December 31, 2022, and December 31, 2021, respectively. Although working capital is influenced by several factors, including, among other things: (i) the timing of (a) debt and equity issuances, (b) the funding of capital expenditures, (c) scheduled debt repayments, and (d) accounts receivable and payable; and (ii) the volume and cost of inventory and commodity imbalances, our working capital deficits at December 31, 2022 and 2021, were driven primarily by current maturities of long-term debt. We may have working capital deficits in future periods as we continue to repay long-term debt. We do not expect this working capital deficit to have an adverse impact to our cash flows or operations.
At December 31, 2022, we had no borrowings under our $2.5 Billion Credit Agreement and $220.2 million of cash and cash equivalents.
In June 2022, we amended and restated our $2.5 Billion Credit Agreement, which matures in June 2027. As of December 31, 2022, we are in compliance with all covenants of our $2.5 Billion Credit Agreement.
For additional information on our $2.5 Billion Credit Agreement, see Note G of the Notes to Consolidated Financial Statements in this Annual Report.
Long-term Financing - In addition to our principal sources of short-term liquidity discussed above, we expect to fund our longer-term financing requirements by issuing long-term notes. Other options to obtain financing include, but are not limited to, issuing common stock, loans from financial institutions, issuance of convertible debt securities or preferred equity securities, asset securitization and the sale and lease-back of facilities.
Debt Issuances - In November 2022, we completed an underwritten public offering of $750 million, 6.1% senior unsecured notes due 2032. The net proceeds, after deducting underwriting discounts, commissions and offering expenses, were $742 million. The proceeds were used primarily to repay all outstanding amounts under our commercial paper program. The remainder was used for general corporate purposes.
In June 2022, Guardian entered into a $120 million unsecured term loan agreement. During the second quarter 2022, Guardian drew the full $120 million available under the agreement and used the proceeds to repay intercompany debt with ONEOK.
Debt Repayments - In July 2022, we redeemed the remaining $895.8 million of our 3.375% senior notes due October 2022 at 100% of the principal amount, plus accrued and unpaid interest, with cash on hand and short-term borrowings.
Subsequent event - We elected to redeem our $425 million, 5.0% senior notes due September 2023, with a redemption effective date in late February 2023. We expect the redemption price to equal 100% of the principal amount of the notes, plus accrued and unpaid interest, which we will pay with cash on hand.
Material Commitments - We have material cash commitments related to our capital expenditures, senior notes and corresponding interest payments, which we expect to fund through our sources of cash inflows discussed above. Our senior notes and interest payments are discussed in Note G of the Notes to Consolidated Financial Statements in this Annual Report. We also have cash commitments related to transportation, storage and other commercial contracts, as well as our financial and physical derivative obligations, which we expect to fund with cash from operations.
Capital Expenditures - We classify expenditures that are expected to generate additional revenue, return on investment or significant operating or environmental efficiencies as growth capital expenditures. Maintenance capital expenditures are those capital expenditures required to maintain our existing assets and operations and do not generate additional revenues. Maintenance capital expenditures are made to replace partially or fully depreciated assets, to maintain the existing operating capacity of our assets and to extend their useful lives. Our capital expenditures are financed typically through operating cash flows and short- and long-term debt.
The following table sets forth our growth and maintenance capital expenditures, excluding AFUDC, for the periods indicated:
Capital expenditures increased in 2022, compared with 2021, due primarily to our capital-growth projects, including the construction of our Demicks Lake III natural gas processing plant, our MB-5 fractionator and the Viking compression project. See discussion of our announced capital-growth projects in the “Recent Developments” section.
We expect total capital expenditures, excluding AFUDC and capitalized interest, of $1.3-$1.5 billion in 2023.
Credit Ratings - Our long-term debt credit ratings as of February 21, 2023, are shown in the table below:
Our credit ratings, which are investment grade, may be affected by our leverage, liquidity, credit profile or potential transactions. The most common criteria for assessment of our credit ratings are the debt-to-EBITDA ratio, interest coverage, business risk profile and liquidity. If our credit ratings were downgraded, our cost to borrow funds under our $2.5 Billion Credit Agreement could increase and a potential loss of access to the commercial paper market could occur. In the event that we are unable to borrow funds under our commercial paper program and there has not been a material adverse change in our business, we would continue to have access to our $2.5 Billion Credit Agreement, which expires in 2027. An adverse credit rating change alone is not a default under our $2.5 Billion Credit Agreement.
In the normal course of business, our counterparties provide us with secured and unsecured credit. In the event of a downgrade in our credit ratings or a significant change in our counterparties’ evaluation of our creditworthiness, we could be required to provide additional collateral in the form of cash, letters of credit or other negotiable instruments as a condition of continuing to conduct business with such counterparties. We may be required to fund margin requirements with our counterparties with cash, letters of credit or other negotiable instruments.
Dividends - Holders of our common stock share equally in any common stock dividends declared by our Board of Directors, subject to the rights of the holders of outstanding preferred stock. In 2022, we paid common stock dividends of $3.74 per share, which is consistent with prior year. In February 2023, we paid a quarterly common stock dividend of $0.955 per share ($3.82 per share on an annualized basis), an increase of 2% compared with the same quarter in the prior year.
Our Series E Preferred Stock pays quarterly dividends on each share of Series E Preferred Stock, when, as and if declared by our Board of Directors, at a rate of 5.5% per year. In 2022, we paid dividends of $1.1 million for the Series E Preferred Stock. In February 2023, we paid quarterly dividends totaling $0.3 million for the Series E Preferred Stock.
For the year ended December 31, 2022, our cash flows from operations exceeded dividends paid by $1.2 billion. We expect our cash flows from operations to continue to sufficiently fund our cash dividends. To the extent operating cash flows are not sufficient to fund our dividends, we may utilize cash on hand from other sources of short- and long-term liquidity to fund a portion of our dividends.
We use the indirect method to prepare our Consolidated Statements of Cash Flows. Under this method, we reconcile net income to cash flows provided by operating activities by adjusting net income for those items that affect net income but do not result in actual cash receipts or payments during the period and for operating cash items that do not impact net income. These reconciling items can include depreciation and amortization, impairment charges, allowance for equity funds used during construction, gain or loss on sale of assets, deferred income taxes, net undistributed earnings from equity-method investments, share-based compensation expense, other amounts and changes in our assets and liabilities not classified as investing or financing activities.
The following table sets forth the changes in cash flows by operating, investing and financing activities for the periods indicated:
Operating Cash Flows - Operating cash flows are affected by earnings from our business activities and changes in our operating assets and liabilities. Changes in commodity prices and demand for our services or products, whether because of general economic conditions, changes in supply, changes in demand for the end products that are made with our products or increased competition from other service providers, could affect our earnings and operating cash flows. Our operating cash flows can also be impacted by changes in our NGLs and natural gas inventory balances, which are driven primarily by commodity prices, supply, demand and the operation of our assets.
2022 vs. 2021 - Cash flows from operating activities, before changes in operating assets and liabilities, increased $214.5 million due primarily to higher net income resulting from higher realized commodity prices, net of hedging, and higher average fee rates in our Natural Gas Gathering and Processing segment and higher exchange services in our Natural Gas Liquids segment. These increases were offset partially by the impact of Winter Storm Uri in our Natural Gas Pipelines segment in the first quarter 2021, as discussed in “Financial Results and Operating Information.”
The changes in operating assets and liabilities increased operating cash flows $3.4 million for the year ended December 31, 2022, compared with a decrease of $141.8 million for the same period in 2021. The change is due primarily to changes in risk management assets and liabilities, which include the gains associated with the settlements of forward-starting interest rate swaps in 2022 and changes in the fair value of risk-management assets and liabilities; accounts receivable resulting from the timing of receipt of cash from customers and NGLs and natural gas in inventory, both of which vary from period to period and with changes in commodity prices; offset partially by changes in accounts payable, which also vary from period to period with changes in commodity prices, and from the timing of payments to vendors, suppliers and other third parties and changes in other assets and liabilities.
2022 vs. 2021 - Cash used in investing activities increased $474.0 million due primarily to capital expenditures related to our capital-growth projects.
2022 vs. 2021 - Cash used in financing activities decreased $566.2 million due primarily to the issuance of long-term debt in 2022.
Cash Flow Analysis for the Year Ended December 31, 2021 vs. 2020 - The cash flow analysis for the year ended December 31, 2021, compared with the year ended December 31, 2020, is included in Part II, Item 7, Management’s Discussion and Analysis of Financial Condition and Results of Operations of our 2021 Annual Report on Form 10-K, which is available via the SEC’s website at www.sec.gov and our website at www.oneok.com.
Information about the impact of new accounting standards is included in Note A of the Notes to Consolidated Financial Statements in this Annual Report.
The preparation of our Consolidated Financial Statements and related disclosures in accordance with GAAP requires us to make estimates and assumptions with respect to values or conditions that cannot be known with certainty that affect the reported amounts of assets and liabilities, and the disclosure of contingent assets and liabilities at the date of the Consolidated Financial Statements. These estimates and assumptions also affect the reported amounts of revenue and expenses during the reporting period. Although we believe these estimates and assumptions are reasonable, actual results could differ from our estimates.
The following is a summary of our most critical accounting policies and estimates, which are defined as those estimates and policies most important to the portrayal of our financial condition and results of operations and requiring management’s most difficult, subjective or complex judgment, particularly because of the need to make estimates concerning the impact of inherently uncertain matters. We have discussed the development and selection of our estimates and critical accounting policies with the Audit Committee of our Board of Directors. See Note A of the Notes to Consolidated Financial Statements in this Annual Report for the description of our accounting policies and additional information about our critical accounting policies and estimates.
Derivatives and Risk-management Activities - We utilize derivatives to reduce our market-risk exposure to commodity price and interest-rate fluctuations and to achieve more predictable cash flows. The accounting for changes in the fair value of a derivative instrument depends on whether it qualifies and has been designated as part of a hedging relationship. When possible, we implement effective hedging strategies using derivative financial instruments that qualify as hedges for accounting purposes. We have not used derivative instruments for trading purposes. For a derivative designated as a cash flow hedge, the gain or loss from a change in fair value of the derivative instrument is deferred in accumulated other comprehensive loss until the forecasted transaction affects earnings, at which time the fair value of the derivative instrument is reclassified into earnings.
We assess hedging relationships at the inception of the hedge and on an ongoing basis to determine whether the hedging relationship is, and is expected to remain, highly effective. We do not believe that changes in our fair value estimates of our derivative instruments have a material impact on our results of operations, as the majority of our derivatives are accounted for as effective cash flow hedges. However, if a derivative instrument is ineligible for cash flow hedge accounting or if we fail to appropriately designate it as a cash flow hedge, changes in fair value of the derivative instrument would be recorded currently in earnings. Additionally, if a cash flow hedge ceases to qualify for hedge accounting treatment because it is no longer probable that the forecasted transaction will occur, the change in fair value of the derivative instrument would be recognized in earnings. For more information on commodity price sensitivity and a discussion of the market risk of pricing changes, see Item 7A, Quantitative and Qualitative Disclosures about Market Risk.
See Notes A, C and D of the Notes to Consolidated Financial Statements in this Annual Report for additional discussion of fair value measurements and derivatives and risk-management activities.
Impairment of Goodwill and Long-Lived Assets, Including Intangible Assets - We assess our goodwill for impairment at least annually as of July 1, unless events or changes in circumstances indicate an impairment may have occurred before that time. As part of our goodwill impairment test, we may first assess qualitative factors (including macroeconomic conditions, industry and market considerations, cost factors and overall financial performance) to determine whether it is more likely than not that the fair value of each of our reporting units is less than its carrying amount. If further testing is necessary or a quantitative test is elected, we perform a Step 1 analysis for goodwill impairment.
In a Step 1 analysis, an assessment is made by comparing the fair value of a reporting unit with its carrying amount, including goodwill. If the carrying value of a reporting unit exceeds its fair value, an impairment loss is recognized in an amount equal to that excess, limited to the total amount of goodwill allocated to that reporting unit.
We assess our long-lived assets, including intangible assets, for impairment whenever events or changes in circumstances indicate that an asset’s carrying amount may not be recoverable. An impairment is indicated if the carrying amount of a longlived asset exceeds the sum of the undiscounted future cash flows expected to result from the use and eventual disposition of the asset. If an impairment is indicated, we record an impairment loss equal to the difference between the carrying value and the fair value of the long-lived asset.
Our impairment tests require the use of assumptions and estimates, such as industry economic factors and the profitability of future business strategies. To estimate undiscounted future cash flows of long-lived assets, we may apply a probabilityweighted approach that incorporates different assumptions and potential outcomes related to the underlying long-lived assets. The evaluation is performed at the lowest level for which separately identifiable cash flows exist. To estimate the fair value of
these assets, we use two generally accepted valuation approaches, an income approach and a market approach. Under the income approach, our discounted cash flow analysis includes the following inputs that are not readily available: a discount rate reflective of industry cost of capital, our estimated contract rates, volumes, operating margins, operating and maintenance costs and capital expenditures. Under the market approach, our inputs include EBITDA multiples, which are estimated from recent peer acquisition transactions, and forecasted EBITDA, which incorporates inputs similar to those used under the income approach. If actual results are not consistent with our assumptions and estimates or our assumptions and estimates change due to new information, we may be exposed to future impairment charges.
See Notes A, E and F of the Notes to Consolidated Financial Statements in this Annual Report for additional discussion of goodwill, long-lived assets and investments in unconsolidated affiliates.
Depreciation Methods and Estimated Useful Lives of Property, Plant and Equipment - Our property, plant and equipment are depreciated using the straight-line method that incorporates management assumptions regarding useful economic lives and residual values. As we place additional assets in service, our estimates related to depreciation expense have become more significant and changes in estimated useful lives of our assets could have a material effect on our results of operations. At the time we place our assets in service, we believe such assumptions are reasonable; however, circumstances may develop that would cause us to change these assumptions, which would change our depreciation expense prospectively. Examples of such circumstances include changes in (i) competition, (ii) laws and regulations that limit the estimated economic life of an asset, (iii) technology that render an asset obsolete, (iv) expected salvage values, (v) results of rate cases or rate settlements on regulated assets and (vi) forecasts of the remaining economic life for the resource basins where our assets are located, if any. For the fiscal years presented in this Form 10-K, no changes were made to the determinations of useful lives that would have a material effect on the timing of depreciation expense in future periods.
See Note E of the Notes to Consolidated Financial Statements in this Annual Report for additional discussion of property, plant and equipment.
Some of the statements contained and incorporated in this Annual Report are forward-looking statements as defined under federal securities laws. The forward-looking statements relate to our anticipated financial performance (including projected operating income, net income, capital expenditures, cash flows and projected levels of dividends), liquidity, management’s plans and objectives for our future capital-growth projects and other future operations (including plans to construct additional natural gas and NGL pipelines, processing and fractionation facilities and related cost estimates), our business prospects, the outcome of regulatory and legal proceedings, market conditions and other matters. We make these forward-looking statements in reliance on the safe harbor protections provided under federal securities legislation and other applicable laws. The following discussion is intended to identify important factors that could cause future outcomes to differ materially from those set forth in the forward-looking statements.
Forward-looking statements and other statements in this Annual Report regarding our environmental, social and other sustainability targets, plans and goals are not an indication that these statements are required to be disclosed in our filings with the SEC, or that we will continue to make similar statements in the same extent or manner in future filings. In addition, historical, current and forward-looking environmental, social and sustainability-related statements may be based on standards and processes for measuring progress that are still developing and that continue to evolve, and assumptions that are subject to change in the future.
Forward-looking statements include the items identified in the preceding paragraph, the information concerning possible or assumed future results of our operations and other statements contained or incorporated in this Annual Report identified by words such as “anticipate,” “believe,” “continue,” “could,” “estimate,” “expect,” “forecast,” “goal,” “guidance,” “intend,” “may,” “might,” “outlook,” “plan,” “potential,” “project,” “scheduled,” “should,” “target,” “will,” “would,” and other words and terms of similar meaning.
One should not place undue reliance on forward-looking statements. Known and unknown risks, uncertainties and other factors may cause our actual results, performance or achievements to be materially different from any future results, performance or achievements expressed or implied by forward-looking statements. Those factors may affect our operations, markets, products, services and prices. In addition to any assumptions and other factors referred to specifically in connection with the forwardlooking statements, factors that could cause our actual results to differ materially from those contemplated in any forwardlooking statement include, among others, the following:
•the impact of inflationary pressures, including increased interest rates, which may increase our capital expenditures and operating costs, raise the cost of capital or depress economic growth;
•the impact on drilling and production by factors beyond our control, including the demand for natural gas, NGLs and crude oil; producers’ desire and ability to drill and obtain necessary permits; regulatory compliance; reserve performance; and capacity constraints and/or shut downs on the pipelines that transport crude oil, natural gas and NGLs from producing areas and our facilities;
•risks associated with adequate supply to our gathering, processing, fractionation and pipeline facilities, including production declines that outpace new drilling, the shutting-in of production by producers, actions taken by federal, state or local governments to require producers to prorate or to cut their production levels as a way to address any excess market supply situations or extended periods of ethane rejection;
•demand for our services and products in the proximity of our facilities;
•economic climate and growth in the geographic areas in which we operate;
•the risk of a slowdown in growth or decline in the United States or international economies, including liquidity risks in United States or foreign credit markets;
•the possibility of future terrorist attacks or the possibility or occurrence of an outbreak of, or changes in, hostilities or changes in the political conditions throughout the world, including the current conflict in Ukraine and the surrounding region;
•performance of contractual obligations by our customers, service providers, contractors and shippers;
•the effects of changes in governmental policies and regulatory actions, including changes with respect to income and other taxes, pipeline safety, environmental compliance, cybersecurity, climate change initiatives, emissions credits, carbon offsets, carbon pricing, production limits and authorized rates of recovery of natural gas and natural gas transportation costs;
•changes in demand for the use of natural gas, NGLs and crude oil because of the development of new technologies or other market conditions caused by concerns about climate change;
• the impact of the transformation to a lower-carbon economy, including the timing and extent of the transformation, as well as the expected role of different energy sources, including natural gas, NGLs and crude oil, in such a transformation;
• the pace of technological advancements and industry innovation, including those focused on reducing GHG emissions and advancing other climate-related initiatives, and our ability to take advantage of those innovations and developments;
• the effectiveness of our risk-management function, including mitigating cyber- and climate-related risks;
• our ability to identify and execute opportunities, and the economic viability of those opportunities, including those relating to renewable natural gas, carbon capture, use and storage, other renewable energy sources such as solar and wind and alternative low carbon fuel sources such as hydrogen;
• the ability of our existing assets and our ability to apply and continue to develop our expertise to support the growth of, and transformation to, various renewable and alternative energy opportunities, including through the positioning and optimization of our assets;
• our ability to efficiently reduce our GHG emissions (both Scope 1 and 2 emissions), including through the use of lower carbon power alternatives, management practices and system optimizations;
• the necessity to focus on maintaining and enhancing our existing assets while reducing our Scope 1 and 2 GHG emissions;
•the effects of weather and other natural phenomena and the effects of climate change (including physical and transformation-related effects) on our operations, demand for our services and commodity prices;
•acts of nature, sabotage, terrorism or other similar acts that cause damage to our facilities or our suppliers’, customers’ or shippers’ facilities;
•the inability of insurance proceeds to cover all liabilities or incurred costs and losses, or lost earnings, resulting from a loss;
•delays in receiving insurance proceeds from covered losses;
•the risk of increased costs for insurance premiums;
•increased costs associated with insurance coverage, security or other items as a consequence of terrorist attacks;
•the timing and extent of changes in energy commodity prices, including changes due to production decisions by other countries, such as the failure of countries to abide by agreements to reduce production volumes;
•competition from other United States and foreign energy suppliers and transporters, as well as alternative forms of energy, including, but not limited to, solar power, wind power, geothermal energy and biofuels such as ethanol and biodiesel;
•the ability to market pipeline capacity on favorable terms, including the effects of:
– future demand for and prices of natural gas, NGLs and crude oil;
– competitive conditions in the overall energy market;
– availability of supplies of United States natural gas and crude oil; and
– availability of additional storage capacity;
•the efficiency of our plants in processing natural gas and extracting and fractionating NGLs;
•the composition and quality of the natural gas and NGLs we gather and process in our plants and transport on our pipelines;
•risks of marketing, trading and hedging activities, including the risks of changes in commodity prices or the financial condition of our counterparties;
•our ability to control operating costs and make cost-saving changes;
•the risks inherent in the use of information systems in our respective businesses and those of our counterparties and service providers, including cyber-attacks, which, according to experts, have increased in volume and sophistication since the beginning of the COVID-19 pandemic; implementation of new software and hardware; and the impact on the timeliness of information for financial reporting;
•the timely receipt of approval by applicable governmental entities for construction and operation of our pipeline and other projects and required regulatory clearances;
•the ability to recover operating costs and amounts equivalent to income taxes, costs of property, plant and equipment and regulatory assets in our state and FERC-regulated rates;
•the results of governmental actions, administrative proceedings and litigation, regulatory actions, executive orders, rule changes and receipt of expected clearances involving any local, state or federal regulatory body, including the FERC, the National Transportation Safety Board, Homeland Security, the PHMSA, the EPA and the CFTC;
•the mechanical integrity of facilities and pipelines operated;
•the capital-intensive nature of our businesses;
•the impact of unforeseen changes in interest rates, debt and equity markets, inflation rates, economic recession and other external factors over which we have no control, including the effect on pension and postretirement expense and funding resulting from changes in equity and bond market returns;
•actions by rating agencies concerning our credit;
•our indebtedness and guarantee obligations could cause adverse consequences, including making us vulnerable to general adverse economic and industry conditions, limiting our ability to borrow additional funds and placing us at competitive disadvantages compared with our competitors that have less debt;
•our ability to access capital at competitive rates or on terms acceptable to us;
•our ability to acquire all necessary permits, consents or other approvals in a timely manner, to promptly obtain all necessary materials and supplies required for construction, and to construct gathering, processing, fractionation, transportation and storage facilities without labor or contractor problems;
•our ability to control construction costs and completion schedules of our pipelines and other projects;
•difficulties or delays experienced by trucks, railroads or pipelines in delivering products to or from our terminals or pipelines;
•the uncertainty of estimates, including accruals and costs of environmental remediation;
•the impact of uncontracted capacity in our assets being greater or less than expected;
•the impact of potential impairment charges;
•the profitability of assets or businesses acquired or constructed by us;
•the risks associated with pending or possible acquisitions and dispositions, including our ability to finance or integrate any such acquisitions and any regulatory delay or conditions imposed by regulatory bodies in connection with any such acquisitions and dispositions;
•the risk that material weaknesses or significant deficiencies in our internal controls over financial reporting could emerge or that minor problems could become significant;
•the impact and outcome of pending and future litigation;
•the impact of recently issued and future accounting updates and other changes in accounting policies;
•the risk factors listed in the reports we have filed, which are incorporated by reference, and may file with the SEC; and
•the length, severity and reemergence of a pandemic or other health crisis, such as the COVID-19 pandemic and the measures taken to address it, which may (as with COVID-19) precipitate or exacerbate one or more of the factors herein, reduce the demand for natural gas, NGLs and crude oil and significantly disrupt or prevent us and our customers and counterparties from operating in the ordinary course of business for an extended period and increase the cost of operating our business.
These factors are not necessarily all of the important factors that could cause actual results to differ materially from those expressed in any of our forward-looking statements. Other factors could also affect adversely our future results. These and other risks are described in greater detail in Part I, Item 1A, Risk Factors, in this Annual Report and in our other filings that we make with the SEC, which are available via the SEC’s website at www.sec.gov and our website at www.oneok.com. All forward-looking statements attributable to us or persons acting on our behalf are expressly qualified in their entirety by these factors. Any such forward-looking statement speaks only as of the date on which such statement is made, and other than as required under securities laws, we undertake no obligation to update publicly any forward-looking statement whether as a result of new information, subsequent events or change in circumstances, expectations or otherwise.
Our exposure to market risk discussed below includes forward-looking statements and represents an estimate of possible changes in future earnings that could occur assuming hypothetical future movements in interest rates or commodity prices. Our views on market risk are not necessarily indicative of actual results that may occur and do not represent the maximum possible gains and losses that may occur since actual gains and losses will differ from those estimated based on actual fluctuations in interest rates or commodity prices and the timing of transactions.
We are exposed to market risk due to commodity price and interest-rate volatility. Market risk is the risk of loss arising from adverse changes in market rates and prices. We may use financial instruments, including forward sales, swaps, options and futures, to manage the risks of certain identifiable or anticipated transactions and achieve more predictable cash flows. Our risk-management function follows policies and procedures established by our Risk Oversight and Strategy Committee to monitor our natural gas, condensate and NGL marketing activities and interest rates to ensure our hedging activities mitigate market risks and comply with approved thresholds or limits. We do not use financial instruments for trading purposes.
We utilize a sensitivity analysis model to assess the risk associated with our derivative portfolio. The sensitivity analysis measures the potential change in fair value of our derivative instruments based upon a hypothetical 10% movement in the underlying commodity prices or interest rates. In addition to these variables, the fair value of our derivative portfolio is influenced by fluctuations in the notional amounts of the instruments and the discount rates used to determine the present values. Because we enter into these derivative instruments for the purpose of mitigating the risks that accompany certain of our business activities, as described below, the change in the market value of our derivative portfolio would typically be offset largely by a corresponding gain or loss on the hedged item.
See Note A of the Notes to Consolidated Financial Statements in this Annual Report for discussion on our accounting policies for our derivative instruments and the impact on our Consolidated Financial Statements.
As part of our hedging strategy, we use commodity derivative financial instruments and physical-forward contracts described in Note D of the Notes to Consolidated Financial Statements in this Annual Report to reduce the impact of near-term price fluctuations of natural gas, NGLs and condensate.
Although our businesses are primarily fee-based, in our Natural Gas Gathering and Processing segment, we are exposed to commodity price risk as a result of retaining a portion of the commodity sales proceeds associated with our fee with POP contracts. Under certain fee with POP contracts, our contractual fees and POP percentage may increase or decrease if production volumes, delivery pressures or commodity prices change relative to specified thresholds. We are exposed to basis risk between the various production and market locations where we buy and sell commodities.
The following table presents the effect a hypothetical 10% change in the underlying commodity prices would have on the estimated fair value of our commodity derivative instruments as of the dates indicated:
Our sensitivity analysis represents an estimate of the reasonably possible gains and losses that would be recognized on our commodity derivative contracts assuming hypothetical movements in future market prices and is not necessarily indicative of
actual results that may occur. Actual gains and losses may differ from estimates due to actual fluctuations in market prices, as well as changes in our commodity derivative portfolio during the year.
The following tables set forth hedging information for our Natural Gas Gathering and Processing segment’s forecasted equity volumes for the period indicated:
Our Natural Gas Gathering and Processing segment’s commodity price sensitivity is estimated as a hypothetical change in the price of NGLs, crude oil and natural gas at December 31, 2022. Condensate sales are typically based on the price of crude oil. Assuming normal operating conditions, we estimate the following for our forecasted equity volumes:
•a $0.01 per gallon change in the composite price of NGLs, excluding ethane, would change adjusted EBITDA for the years ending December 31, 2023 and 2024, by $2.5 million and $2.6 million, respectively;
•a $1.00 per barrel change in the price of crude oil would change adjusted EBITDA for the years ending December 31, 2023 and 2024, by $0.9 million and $1.0 million, respectively; and
•a $0.10 per MMBtu change in the price of residue natural gas would change adjusted EBITDA for the years ending December 31, 2023 and 2024, by $4.8 million and $5.2 million, respectively.
These estimates do not include any effects of hedging or effects on demand for our services or natural gas processing plant operations that might be caused by, or arise in conjunction with, commodity price fluctuations. For example, a change in the gross processing spread may cause a change in the amount of ethane extracted from the natural gas stream, impacting gathering and processing financial results for certain contracts.
We are exposed to interest-rate risk through borrowings under our $2.5 Billion Credit Agreement, commercial paper program and long-term debt issuances. Future increases in commercial paper rates or bond rates could expose us to increased interest costs on future borrowings. We may manage interest-rate risk through the use of fixed-rate debt, floating-rate debt and interestrate swaps. Interest-rate swaps are agreements to exchange interest payments at some future point based on specified notional amounts.
In 2022, we settled $750 million of our forward-starting interest-rate swaps related to our underwritten public offering of $750 million senior unsecured notes, resulting in a gain of $28.1 million, which is included in accumulated other comprehensive loss and amortized into interest expense over the term of the related debt. In December 2022, we terminated the remaining $375 million of our forward-starting interest swaps that had mandatory termination dates of December 31, 2022. We simultaneously entered into forward-starting interest-rate swaps with the same notional amounts at current market rates to hedge the variability of interest payments on a portion of our forecasted debt issuances that may result from changes in the benchmark interest rate before the debt is issued.
At December 31, 2022, and December 31, 2021, we had forward-starting interest-rate swaps with notional amounts totaling $0.4 billion and $1.1 billion, respectively, to hedge the variability of interest payments on a portion of our forecasted debt issuances. All of our interest-rate swaps are designated as cash flow hedges. At December 31, 2022 and 2021, we had derivative assets of $10.9 million and derivative liabilities of $145.5 million, respectively, related to these interest-rate swaps.
The following table presents the effect of a 10% hypothetical change in interest rates on the estimated fair value of our interestrate derivative instruments as of the dates indicated:
Our sensitivity analysis represents an estimate of the reasonably possible gains and losses that would be recognized on our interest-rate derivative contracts assuming hypothetical movements in future interest rates and is not necessarily indicative of actual results that may occur. Actual gains and losses may differ from estimates due to actual fluctuations in interest rates, as well as changes in our interest-rate derivative portfolio during the year.
See Note D of the Notes to Consolidated Financial Statements in this Annual Report for more information on our hedging activities.
We assess the creditworthiness of our counterparties on an ongoing basis and require security, including prepayments and other forms of collateral, when appropriate. Certain of our counterparties may be impacted by a relatively low commodity price environment and could experience financial problems, which could result in nonpayment and/or nonperformance, which could impact adversely our results of operations.
Natural Gas Gathering and Processing - Our Natural Gas Gathering and Processing segment derives services revenue primarily from major and independent crude oil and natural gas producers, which include both large integrated and independent exploration and production companies. In this segment, our downstream commodity sales customers are primarily utilities, large industrial companies, marketing companies and our NGL affiliate. We are not typically exposed to material credit risk with producers under fee with POP contracts as we sell the commodities and remit a portion of the sales proceeds back to the producer less our contractual fees. In 2022 and 2021, approximately 95% and 90%, respectively, of the downstream commodity sales in our Natural Gas Gathering and Processing segment were made to customers rated investment-grade by S&P, approved through comparable internal counterparty analysis, or were secured by letters of credit or other collateral.
Natural Gas Liquids - Our Natural Gas Liquids segment’s counterparties are primarily NGL and natural gas gathering and processing companies; major and independent crude oil and natural gas production companies; utilities; large industrial companies; natural gasoline distributors; propane distributors; municipalities; and petrochemical, refining and marketing companies. We charge fees to NGL and natural gas gathering and processing counterparties and NGL pipeline transportation customers. We are not typically exposed to material credit risk on the majority of our exchange services fees, as we purchase NGLs from our gathering and processing counterparties and deduct our fee from the amounts we remit. We also earn sales revenue on the downstream sales of purity NGLs. In 2022 and 2021, approximately 85% and 70%, respectively, of this segment’s commodity sales were made to customers rated investment-grade by S&P, approved through comparable internal counterparty analysis, or were secured by letters of credit or other collateral. In addition, the majority of our Natural Gas Liquids segment’s pipeline tariffs provide us the ability to require security from shippers.
Natural Gas Pipelines - Our Natural Gas Pipelines segment’s customers are primarily local natural gas distribution companies, electric-generation facilities, large industrial companies, municipalities, producers, processors and marketing companies. In 2022 and 2021, approximately 90% and 85%, respectively, of our revenues in this segment were from customers rated investment-grade by S&P, approved through comparable internal counterparty analysis, or were secured by letters of credit or other collateral. In addition, the majority of our Natural Gas Pipelines segment’s pipeline tariffs provide us the ability to require security from shippers.
We have audited the accompanying consolidated balance sheets of ONEOK, Inc. and its subsidiaries (the “Company”) as of December 31, 2022 and 2021, and the related consolidated statements of income, of comprehensive income, of changes in equity and of cash flows for each of the three years in the period ended December 31, 2022, including the related notes (collectively referred to as the “consolidated financial statements”). We also have audited the Company's internal control over financial reporting as of December 31, 2022, based on criteria established in Internal Control - Integrated Framework (2013) issued by the Committee of Sponsoring Organizations of the Treadway Commission (COSO).
In our opinion, the consolidated financial statements referred to above present fairly, in all material respects, the financial position of the Company as of December 31, 2022 and 2021, and the results of its operations and its cash flows for each of the three years in the period ended December 31, 2022, in conformity with accounting principles generally accepted in the United States of America. Also in our opinion, the Company maintained, in all material respects, effective internal control over financial reporting as of December 31, 2022, based on criteria established in Internal Control - Integrated Framework (2013) issued by the COSO.
The Company's management is responsible for these consolidated financial statements, for maintaining effective internal control over financial reporting, and for its assessment of the effectiveness of internal control over financial reporting, included in Management's Report on Internal Control Over Financial Reporting appearing under Item 9A. Our responsibility is to express opinions on the Company’s consolidated financial statements and on the Company's internal control over financial reporting based on our audits. We are a public accounting firm registered with the Public Company Accounting Oversight Board (United States) (PCAOB) and are required to be independent with respect to the Company in accordance with the U.S. federal securities laws and the applicable rules and regulations of the Securities and Exchange Commission and the PCAOB.
We conducted our audits in accordance with the standards of the PCAOB. Those standards require that we plan and perform the audits to obtain reasonable assurance about whether the consolidated financial statements are free of material misstatement, whether due to error or fraud, and whether effective internal control over financial reporting was maintained in all material respects.
Our audits of the consolidated financial statements included performing procedures to assess the risks of material misstatement of the consolidated financial statements, whether due to error or fraud, and performing procedures that respond to those risks. Such procedures included examining, on a test basis, evidence regarding the amounts and disclosures in the consolidated financial statements. Our audits also included evaluating the accounting principles used and significant estimates made by management, as well as evaluating the overall presentation of the consolidated financial statements. Our audit of internal control over financial reporting included obtaining an understanding of internal control over financial reporting, assessing the risk that a material weakness exists, and testing and evaluating the design and operating effectiveness of internal control based on the assessed risk. Our audits also included performing such other procedures as we considered necessary in the circumstances. We believe that our audits provide a reasonable basis for our opinions.
A company’s internal control over financial reporting is a process designed to provide reasonable assurance regarding the reliability of financial reporting and the preparation of financial statements for external purposes in accordance with generally accepted accounting principles. A company’s internal control over financial reporting includes those policies and procedures that (i) pertain to the maintenance of records that, in reasonable detail, accurately and fairly reflect the transactions and dispositions of the assets of the company; (ii) provide reasonable assurance that transactions are recorded as necessary to permit preparation of financial statements in accordance with generally accepted accounting principles, and that receipts and expenditures of the company are being made only in accordance with authorizations of management and directors of the company; and (iii) provide reasonable assurance regarding prevention or timely detection of unauthorized acquisition, use, or disposition of the company’s assets that could have a material effect on the financial statements.
Because of its inherent limitations, internal control over financial reporting may not prevent or detect misstatements. Also, projections of any evaluation of effectiveness to future periods are subject to the risk that controls may become inadequate because of changes in conditions, or that the degree of compliance with the policies or procedures may deteriorate.
The critical audit matter communicated below is a matter arising from the current period audit of the consolidated financial statements that was communicated or required to be communicated to the audit committee and that (i) relates to accounts or disclosures that are material to the consolidated financial statements and (ii) involved our especially challenging, subjective, or complex judgments. The communication of critical audit matters does not alter in any way our opinion on the consolidated financial statements, taken as a whole, and we are not, by communicating the critical audit matter below, providing a separate opinion on the critical audit matter or on the accounts or disclosures to which it relates.
As described in Note B to the consolidated financial statements, on July 9, 2022, a fire occurred at the Company’s 210 MBbl/d Medford, Oklahoma, natural gas liquids fractionation facility. The Company has property damage and business interruption coverage against which they developed claims related to the Medford incident and recorded accruals for the expected insurance recoveries. Management records recoveries for incurred costs and lost earnings related to its business interruption coverage for the amount probable of recovery, not to exceed the actual losses incurred, and for lost earnings that have been realized and are no longer considered a gain contingency. Management assessed property damage to the facility and incurred costs and lost earnings related to business interruption, as well as timing of recognition under applicable insurance recovery guidance, and recorded accruals of $150.7 million for the year ended December 31, 2022, which was comprised of property damage of $45.6 million, with a corresponding write off of assets due to property damage of the facility; $9 million related to incurred costs in excess of the deductible that were probable of recovery, with an offset to the operating and maintenance line item; and $96.1 million primarily related to third-party fractionation costs incurred subsequent to the 45-day business interruption waiting period, with an offset to other operating (income) expense. The Company received a $100 million unallocated payment from the insurers in the fourth quarter of 2022, and had recorded an outstanding insurance receivable of $50.7 million as of December 31, 2022.
The principal considerations for our determination that performing procedures relating to the accounting for the Medford incident is a critical audit matter are (i) the significant judgment by management when assessing the application of accounting guidance for business interruption and the resulting recognition of incurred costs and lost earnings; (ii) a high degree of auditor judgment, subjectivity, and effort in performing procedures and evaluating management’s assessment of the application of accounting guidance for business interruption and the resulting recognition of incurred costs and lost earnings.
Addressing the matter involved performing procedures and evaluating audit evidence in connection with forming our overall opinion on the consolidated financial statements. These procedures included testing the effectiveness of controls relating to the application of accounting guidance for business interruption and recognition of the incurred costs and lost earnings. These procedures also included, among others, (i) reading the related customer contracts to assess lost earnings; (ii) evaluating management’s assessment of the incurred costs and lost earnings, including their assessment of the application of the appropriate accounting guidance for business interruption; (iii) testing the incurred costs, lost earnings, and related recovery, which included testing the appropriate presentation within the financial statements; and (iv) tracing the insurance payments received to the Company’s general ledger.
/s/ PricewaterhouseCoopers LLP
Tulsa, Oklahoma
February 28, 2023
We have served as the Company’s auditor since 2007.
Equity(NoteH)
ONEOKshareholders’equity:
Preferredstock,$0.01parvalue: authorizedandissued20,000sharesatDecember31,2022,andatDecember31,2021 — —
Commonstock,$0.01parvalue: authorized1,200,000,000shares;issued474,916,234sharesandoutstanding 447,157,771sharesatDecember31,2022;issued474,916,234sharesandoutstanding446,138,177
SeeaccompanyingNotestoConsolidatedFinancialStatements.
Organization and Nature of Operations - We are a corporation incorporated under the laws of the state of Oklahoma.
Our Natural Gas Gathering and Processing segment provides midstream services to producers in North Dakota, Montana, Wyoming, Kansas and Oklahoma. Raw natural gas is typically gathered at the wellhead, compressed and transported through pipelines to our processing facilities. Processed natural gas, usually referred to as residue natural gas, is then recompressed and delivered to natural gas pipelines, storage facilities and end users. The NGLs separated from the raw natural gas are sold and delivered through NGL pipelines to fractionation facilities for further processing.
Our Natural Gas Liquids segment owns and operates facilities that gather, fractionate, treat and distribute NGLs and store purity NGLs, primarily in Oklahoma, Kansas, Texas, New Mexico and the Rocky Mountain region, which includes the Williston, Powder River and DJ Basins. We provide midstream services to producers of NGLs and deliver those products to the two primary market centers, one in the Mid-Continent in Conway, Kansas, and the other in the Gulf Coast in Mont Belvieu, Texas. We own or have an ownership interest in FERC-regulated NGL gathering and distribution pipelines in Oklahoma, Kansas, Texas, New Mexico, Montana, North Dakota, Wyoming and Colorado, and terminal and storage facilities in Kansas, Nebraska, Iowa and Illinois. We have a 50% ownership interest in Overland Pass, which operates an interstate NGL pipeline originating in Wyoming and Colorado and terminating in Kansas. The majority of the pipeline-connected natural gas processing plants in the Williston Basin, Oklahoma, Kansas and the Texas Panhandle are connected to our NGL gathering systems. We lease rail cars and own and operate truck- and rail-loading and -unloading facilities connected to our NGL fractionation, storage and pipeline assets. We also own FERC-regulated NGL distribution pipelines in Kansas, Missouri, Nebraska, Iowa, Illinois and Indiana that connect our Mid-Continent assets with Midwest markets, including Chicago, Illinois. A portion of our ONEOK North System transports refined petroleum products, including unleaded gasoline and diesel, from Kansas to Iowa.
Our Natural Gas Pipelines segment, through its wholly owned assets primarily in Oklahoma, Texas and the upper Midwest, provides transportation and storage services to end users, such as natural gas distribution and electric-generation companies that require natural gas to operate their businesses regardless of location price differentials. We have 50% ownership interests in Northern Border and Roadrunner, which provide transportation services to various end users. Our assets are connected to key supply areas and demand centers, including supply areas in Canada and the United States via our intrastate and interstate natural gas pipelines and Northern Border, and export markets in Mexico via Roadrunner which enable us to provide essential natural gas transportation and storage services.
Consolidation - Our Consolidated Financial Statements include our accounts and the accounts of our subsidiaries over which we have control or are the primary beneficiary. All intercompany balances and transactions have been eliminated in consolidation.
Investments in unconsolidated affiliates are accounted for using the equity method if we have the ability to exercise significant influence over operating and financial policies of our investee. Under this method, an investment is carried at its acquisition cost and adjusted each period for contributions made, distributions received and our share of the investee’s comprehensive income. For the investments we account for under the equity method, the premium or excess cost over the fair value of the underlying net assets is referred to as equity-method goodwill. Impairment of equity investments is recorded when the impairments are other than temporary. These amounts are recorded as investments in unconsolidated affiliates on our accompanying Consolidated Balance Sheets. See Note N for disclosures of our unconsolidated affiliates.
Distributions paid to us from our unconsolidated affiliates are classified as operating activities on our Consolidated Statements of Cash Flows until the cumulative distributions exceed our proportionate share of income from the unconsolidated affiliate since the date of our initial investment. The amount of cumulative distributions paid to us that exceeds our cumulative proportionate share of income in each period represents a return of investment and is classified as an investing activity on our Consolidated Statements of Cash Flows.
Use of Estimates - The preparation of our Consolidated Financial Statements and related disclosures in accordance with GAAP requires us to make estimates and assumptions with respect to values or conditions that cannot be known with certainty that affect the reported amounts on our Consolidated Financial Statements. Items that may be estimated include, but are not limited to, the economic useful life of assets, fair value of assets, liabilities and equity-method investments, obligations under employee benefit plans, allowance for credit losses, expenses for services received but for which no invoice has been received, provision for income taxes, including any deferred tax valuation allowances, the results of litigation and various other recorded or
disclosed amounts. In addition, a portion of our revenues and cost of sales and fuel are recorded based on current month prices and estimated volumes. The estimates are reversed in the following month when we record actual volumes.
We evaluate our estimates on an ongoing basis using historical experience, consultation with experts and other methods we consider reasonable based on the particular circumstances. Nevertheless, actual results may differ significantly from the estimates. Any effects on our financial position or results of operations from revisions to these estimates are recorded in the period when the facts that give rise to the revision become known.
Fair Value Measurements - For our fair value measurements, we utilize market prices, third-party pricing services, present value methods and standard option valuation models to determine the price we would receive from the sale of an asset or the transfer of a liability in an orderly transaction at the measurement date. We measure the fair value of a group of financial assets and liabilities consistent with how a market participant would price the net risk exposure at the measurement date.
Most of the contracts in our derivative portfolio are executed in liquid markets where price transparency exists. Our financial commodity derivatives are generally settled through a NYMEX or ICE clearing broker account with daily margin requirements. We validate our valuation inputs with third-party information and settlement prices from other sources, where available.
We compute the fair value of our derivative portfolio by discounting the projected future cash flows from our derivative assets and liabilities to present value using interest-rate yields to calculate present-value discount factors derived from the implied forward SOFR yield curve. The fair value of our forward-starting interest-rate swaps is determined using financial models that incorporate the implied forward SOFR yield curve for the same period as the future interest-rate swap settlements. We consider current market data in evaluating counterparties’, as well as our own, nonperformance risk, net of collateral, by using counterparty-specific bond yields. Although we use our best estimates to determine the fair value of the derivative contracts we have executed, the ultimate market prices realized could differ materially from our estimates.
Fair Value Hierarchy - At each balance sheet date, we utilize a fair value hierarchy to classify fair value amounts recognized or disclosed in our financial statements based on the observability of inputs used to estimate such fair value. The levels of the hierarchy are described below:
•Level 1 - fair value measurements are based on unadjusted quoted prices for identical securities in active markets. These balances are composed predominantly of exchange-traded derivative contracts for natural gas and crude oil.
•Level 2 - fair value measurements are based on significant observable pricing inputs, including quoted prices for similar assets and liabilities in active markets and inputs from third-party pricing services supported with corroborative evidence. These balances are composed of exchange cleared and over-the-counter derivatives to hedge natural gas basis and NGL price risk and over-the-counter interest-rate derivatives.
•Level 3 - fair value measurements are based on inputs that may include one or more unobservable inputs.
Determining the appropriate classification of our fair value measurements within the fair value hierarchy requires management’s judgment regarding the degree to which market data is observable or corroborated by observable market data. We categorize derivatives based on the lowest level input that is significant to the fair value measurement in its entirety.
See Note C for our fair value measurements disclosures.
Cash and Cash Equivalents - Cash equivalents consist of highly liquid investments, which are readily convertible into cash and have original maturities of three months or less.
Revenue Recognition - Revenues are recognized when control of the promised goods or services is transferred to our customers in an amount that reflects the consideration we expect to be entitled to receive in exchange for those goods or services. Our payment terms vary by customer and contract type, including requiring payment before products or services are delivered to certain customers. However, the term between customer prepayments, completion of our performance obligations, invoicing and receipt of payment due is not significant.
Performance Obligations and Revenue Sources - Revenue sources are disaggregated in Note R and are derived from commodity sales and services revenues, as described below:
Commodity Sales (all segments) - We contract to deliver residue natural gas, condensate, unfractionated NGLs and/or purity NGLs to customers at a specified delivery point. Our sales agreements may be daily or longer-term contracts for a specified volume. We consider the sale and delivery of each unit of a commodity an individual performance obligation as the customer is expected to control, accept and benefit from each unit individually. We record revenue when the commodity is delivered to the
customer as this represents the point in time when control of the product is transferred to the customer. Revenue is recorded based on the contracted selling price, which is generally index-based and settled monthly. Occasionally, we sell unfractionated NGLs to customers at an index-based price less third-party fractionation costs. These costs are included as a reduction to commodity sales revenue. The third-party fractionation costs we incurred associated with the Medford incident (Note B) were primarily under this type of agreement.
Gathering only contracts (Natural Gas Gathering and Processing segment) - Under this type of contract, we charge fees for providing midstream services, which include gathering and treating our customer’s natural gas. Our performance obligation begins with delivery of raw natural gas to our system. This service is treated as one performance obligation that is satisfied over time. We use the output method based on delivery of product to our system as the measure of progress, as our services are performed simultaneously.
Fee with POP contracts with producer take-in-kind rights (Natural Gas Gathering and Processing segment) - Under this type of contract, we do not control the stream of unprocessed natural gas that we receive at the wellhead due to the producer’s takein-kind rights. We purchase a portion of the raw natural gas stream, charge fees for providing midstream services, which include gathering, treating, compressing and processing our customer’s natural gas. After performing these services, we return primarily the residue natural gas to the producer, sell the remaining commodities and remit a portion of the commodity sales proceeds to the producer less our contractual fees. Our performance obligation begins with delivery of raw natural gas to our system. This service is treated as one performance obligation that is satisfied over time. We use the output method based on delivery of product to our system as the measure of progress, as our services are performed simultaneously.
Transportation and exchange contracts (Natural Gas Liquids segment) - Under this type of contract, we charge fees for providing midstream services, which may include a bundled combination of gathering, transporting and/or fractionation of our customer’s NGLs. Our performance obligation begins with delivery of unfractionated NGLs or purity NGLs to our system. These services represent a series of distinct services that are treated as one performance obligation that is satisfied over time. We use the output method based on delivery of product to our system as the measure of progress, as our services are performed simultaneously. For transportation services under a tariff on our NGL transportation pipelines, fees are recorded upon redelivery to our customer at the completion of the transportation services.
Storage contracts (Natural Gas Liquids and Natural Gas Pipelines segments) - We reserve a stated storage capacity and inject/ withdraw/store commodities for our customer. The capacity reservation and injection/withdrawal/storage services are considered a bundled service, as we integrate them into one stand-ready obligation provided on a daily basis over the life of the agreement and satisfied over time. Fixed capacity reservation fees are allocated and evenly recognized in revenue. Capacity reservation fees that vary based on a stated or implied economic index and correspond with the costs to provide our services are recognized in revenue as invoiced to our customers. For contracts that do not include a capacity reservation, transportation, injection and withdrawal fees are recognized in revenue as those services are provided and are dependent on the volume transported, injected or withdrawn by our customer, which is at our customer’s discretion. We use the output method based on the passage of time to measure satisfaction of the performance obligation associated with our daily stand-ready services.
Firm service transportation contracts (Natural Gas Pipelines segment) - We reserve a stated transportation capacity and transport commodities for our customer. The capacity reservation and transportation services are considered a bundled service, as we integrate them into one stand-ready obligation provided on a daily basis over the life of the agreement and satisfied over time. Fixed capacity reservation fees are allocated and evenly recognized in revenue. Capacity reservation fees that vary based on a stated or implied economic index and correspond with the costs to provide our services are recognized in revenue based on a daily effective fee rate. If the capacity reservation fees vary solely as a contract feature, contract assets or liabilities are recorded for the difference between the amount recorded in revenue and the amount billed to the customer. Transportation fees are recognized in revenue as those services are provided and are dependent on the volume transported by our customer, which is at our customer’s discretion. We use the output method based on the passage of time to measure satisfaction of the performance obligation associated with our daily stand-ready services.
Interruptible transportation contracts (Natural Gas Pipelines segment) - We agree to transport natural gas on our pipelines between the customer’s specified nominated-receipt and delivery points if capacity is available after satisfying firm transportation service obligations. The transaction price is based on the transportation fees times the volumes transported. We use the output method based on delivery of product to the customer to measure satisfaction of the performance obligation. The total consideration for delivered volumes is recorded in revenue at the time of delivery, when the customer obtains control.
Many of the contract types described above contain additional fees or charges payable by customers for nonperformance (e.g., minimum volume commitments or product specifications), which are considered to be variable consideration. These fees and charges are not recorded until it is probable that a significant reversal of the associated revenue will not occur.
Contract Assets and Contract Liabilities - Contract assets and contract liabilities are recorded when the amount of revenue recognized from a contract with a customer differs from the amount billed to the customer and recorded in accounts receivable. Our contract asset balances at the beginning and end of the period primarily relate to our firm service transportation contracts with tiered rates. Our contract liabilities primarily represent deferred revenue on NGL storage contracts for which revenue is recognized over a one-year term, and deferred revenue on contributions in aid of construction received from customers for which revenue is recognized over the contract periods, which range from 5 to 10 years.
Cost of Sales and Fuel - Cost of sales and fuel primarily includes (i) the cost of purchased commodities, including NGLs, natural gas and condensate, (ii) fees incurred for third-party transportation, fractionation and storage of commodities, (iii) fuel and power costs incurred to operate our own facilities that gather, process, transport and store commodities, and (iv) an offset from the contractual fees deducted from the cost of purchased commodities under the contract types below:
Fee with POP contracts with no producer take-in-kind rights (Natural Gas Gathering and Processing segment) - We purchase raw natural gas and charge contractual fees for providing midstream services, which include gathering, treating, compressing and processing the producer’s natural gas. After performing these services, we sell the commodities and return a portion of the commodity sales proceeds to the producer less our contractual fees.
Purchase with fee (Natural Gas Liquids segment) - Under this type of contract, we purchase raw, unfractionated NGLs at an index price and charge fees for providing midstream services, which may include a bundled combination of gathering, transporting and/or fractionation.
Operations and Maintenance - Operations and maintenance primarily includes (i) payroll and benefit costs, (ii) third-party costs for operations, maintenance and integrity management, regulatory compliance and environmental and safety, and (iii) other business-related service costs.
Accounts Receivable - Accounts receivable represent valid claims against nonaffiliated customers for products sold or services rendered. We present accounts receivable net of an allowance for credit losses to reflect the net amount expected to be collected. We assess the creditworthiness of our counterparties on an ongoing basis and require security, including prepayments and other forms of collateral, when appropriate. Outstanding customer receivables are reviewed regularly for possible nonpayment indicators, and allowances for credit losses are recorded based upon management’s estimate of collectability, current conditions and supportable forecasts at each balance sheet date. At December 31, 2022, our allowance for credit losses was not material.
Inventory - The values of current NGLs and natural gas in storage are determined using the lower of weighted-average cost or net realizable value. Noncurrent NGLs and natural gas are classified as property and valued at cost. Materials and supplies are valued at average cost. Certain large equipment inventory, which will ultimately be included in property, plant and equipment when utilized, is included in other assets in our Consolidated Balance Sheets and is valued at weighted-average cost.
Commodity Imbalances - Commodity imbalances represent amounts payable or receivable for NGL exchange contracts and natural gas pipeline imbalances and are valued at market prices. Under the majority of our NGL exchange agreements, we physically receive volumes of unfractionated NGLs, including the risk of loss and legal title to such volumes, from the exchange counterparty. In turn, we deliver purity NGLs back to the customer and charge them gathering, transportation and fractionation fees. To the extent that the volumes we receive under such agreements differ from those we deliver, we record a net exchange receivable or payable position with the counterparties. These net exchange receivables and payables are generally settled with movements of purity NGLs rather than with cash. Natural gas pipeline imbalances are settled in cash or in-kind, subject to the terms of the pipelines’ tariffs or by agreement.
Derivatives and Risk Management - We utilize derivatives to reduce our market-risk exposure to commodity price and interest-rate fluctuations and to achieve more predictable cash flows. We record all derivative instruments at fair value, with the exception of normal purchases and normal sales transactions that are expected to result in physical delivery. Commodity price and interest-rate volatility may have a significant impact on the fair value of derivative instruments as of a given date. The accounting for changes in the fair value of a derivative instrument depends on whether it has been designated and qualifies as part of a hedging relationship and, if so, the reason for holding it. The table below summarizes the various ways in which we account for our derivative instruments and the impact on our Consolidated Financial Statements:
RecognitionandMeasurement
AccountingTreatment
Normalpurchasesand normalsales
Mark-to-market
Cashflowhedge
BalanceSheet
-Fairvaluenotrecorded
-Recordedatfairvalue
-Thegainorlossonthe derivativeinstrumentisreportedinitiallyasa componentofaccumulatedother comprehensiveincome(loss)
IncomeStatement
-Changeinfairvaluenotrecognizedinearnings
-Changeinfairvaluerecognizedinearnings
-Thegainorlossonthederivativeinstrumentis reclassifiedoutofaccumulatedother comprehensiveincome(loss)intoearningswhen theforecastedtransactionaffectsearnings
Fairvaluehedge
-Recordedatfairvalue
-Changeinfairvalueofthehedgeditemis recordedasanadjustmenttobookvalue
-Thegainorlossonthederivativeinstrumentis recognizedinearnings
-Changeinfairvalueofthehedgeditemis recognizedinearnings
To reduce our exposure to fluctuations in natural gas, NGLs and condensate prices, we periodically enter into futures, forward purchases and sales, options or swap transactions in order to hedge anticipated purchases and sales of natural gas, NGLs and condensate. Interest-rate swaps are used from time to time to manage interest-rate risk. Under certain conditions, we designate our derivative instruments as a hedge of exposure to changes in fair values or cash flows. We formally document all relationships between hedging instruments and hedged items, as well as risk-management objectives and strategies for undertaking various hedge transactions, and methods for assessing and testing correlation and hedge effectiveness. We specifically identify the forecasted transaction that has been designated as the hedged item in a cash flow hedge relationship. We assess hedging relationships at the inception of the hedge and on an ongoing basis to determine whether the hedging relationship is, and is expected to remain, highly effective. We also document our normal purchases and normal sales transactions that we expect to result in physical delivery and that we elect to exempt from derivative accounting treatment.
The realized revenues and purchase costs of our derivative instruments not considered held for trading purposes and derivatives that qualify as normal purchases or normal sales that are expected to result in physical delivery are reported on a gross basis.
Cash flows from futures, forwards, options and swaps that are accounted for as hedges are included in the same category as the cash flows from the related hedged items in our Consolidated Statements of Cash Flows.
See Notes C and D for disclosures of our fair value measurements and risk-management and hedging activities, respectively.
Property, Plant and Equipment - Our properties are stated at cost, including AFUDC and capitalized interest. In some cases, the cost of regulated property retired or sold, plus removal costs, less salvage, is charged to accumulated depreciation. Gains and losses from sales or transfers of nonregulated properties or an entire operating unit or system of our regulated properties are recognized in income. Maintenance and repairs are charged directly to expense.
The interest portion of AFUDC and capitalized interest represent the cost of borrowed funds used to finance construction activities for regulated and nonregulated projects, respectively. We capitalize interest costs during the construction or upgrade of qualifying assets. These costs are recorded as a reduction to interest expense. The equity portion of AFUDC represents the capitalization of the estimated average cost of equity used during the construction of major projects and is recorded in the cost of our regulated properties and as a credit to the allowance for equity funds used during construction.
Our properties are depreciated using the straight-line method over their estimated useful lives. Generally, we apply depreciation rates to functional groups of property having similar economic lives. We periodically conduct depreciation studies to assess the economic lives of our assets. For our regulated assets, these depreciation studies are completed as a part of our rate proceedings or tariff filings, and the changes in economic lives, if applicable, are implemented prospectively when the new rates are approved. For our nonregulated assets, if it is determined that the estimated economic life changes, the changes are made prospectively. Changes in the estimated economic lives of our property, plant and equipment could have a material effect on our financial position or results of operations.
Property, plant and equipment on our Consolidated Balance Sheets includes construction work in process for capital projects that have not yet been placed in service and therefore are not being depreciated. Assets are transferred out of construction work in process when they are substantially complete and ready for their intended use.
See Note E for our property, plant and equipment disclosures.
Impairment of Goodwill and Long-Lived Assets, Including Intangible Assets - We assess our goodwill for impairment at least annually as of July 1, unless events or changes in circumstances indicate an impairment may have occurred before that time. Our qualitative goodwill impairment analysis performed as of July 1, 2022, did not result in an impairment charge nor did our analysis reflect any reporting units at risk, and subsequent to that date, no event has occurred indicating that the implied fair value of our reporting units with goodwill are less than the carrying value of their net assets.
Goodwill - As part of our goodwill impairment test, we assess qualitative factors (including macroeconomic conditions, industry and market considerations, cost factors and overall financial performance) to determine whether it was more likely than not that the fair value of our reporting units with goodwill are less than their carrying amount. If further testing is necessary or a quantitative test is elected, we perform a Step 1 analysis. In a Step 1 analysis, an assessment is made by comparing the fair value of a reporting unit with its carrying amount, including goodwill. If the carrying value of a reporting unit exceeds its fair value, an impairment loss is recognized in an amount equal to that excess, limited to the total amount of goodwill allocated to that reporting unit.
To estimate the fair value of our reporting units, we use two generally accepted valuation approaches, an income approach and a market approach, using assumptions consistent with a market participant’s perspective. Under the income approach, we use anticipated cash flows over a period of years plus a terminal value and discount these amounts to their present value using appropriate discount rates. The forecasted cash flows are based on probability weighted-average possible future cash flows for a reporting unit over a period of years. Under the market approach, we apply EBITDA multiples to forecasted EBITDA. The multiples used are consistent with recent market transactions.
Long-lived assets - We assess our long-lived assets for impairment whenever events or changes in circumstances indicate that an asset’s carrying amount may not be recoverable. An impairment is indicated if the carrying amount of a long-lived asset exceeds the sum of the undiscounted future cash flows expected to result from the use and eventual disposition of the asset. If an impairment is indicated, we record an impairment loss equal to the difference between the carrying value and the fair value of the long-lived asset.
Investments in unconsolidated affiliates - The impairment test for equity-method investments considers whether the fair value of the equity investment as a whole, not the underlying net assets, has declined and whether that decline is other than temporary. Therefore, we periodically evaluate the amount at which we carry our equity-method investments to determine whether current events or circumstances warrant adjustments to our carrying values.
See Notes E, F and N for our disclosures and related impairment charges related to long-lived assets, goodwill and intangible assets and investments in unconsolidated affiliates, respectively.
Regulation - Depending on the specific service provided, our natural gas transmission pipelines, NGL pipelines and certain natural gas storage facilities are subject to rate regulation and/or accounting requirements by one or more of the FERC, OCC, KCC and RRC. Accordingly, portions of our Natural Gas Liquids and Natural Gas Pipelines segments follow the accounting and reporting guidance for regulated operations as defined pursuant to Financial Accounting Standards Board’s (FASB) Accounting Standards Codification 980, Regulated Operations. In our Notes to Consolidated Financial Statements, we also state separately certain amounts for regulated operations where they are defined by the SEC. In Notes E and R we have made certain reclassifications to prior year amounts to conform to current year presentation. During the rate-making process for certain of our assets, regulatory authorities set the framework for what we can charge customers for our services and establish the manner that our costs are accounted for, including allowing us to defer recognition of certain costs and permitting recovery of the amounts through rates over time as opposed to expensing such costs as incurred. Certain examples of types of regulatory guidance include costs for fuel and losses, acquisition costs, contributions in aid of construction, charges for depreciation, and gains or losses on disposition of assets. This allows us to stabilize rates over time rather than passing such costs on to the customer for immediate recovery. Actions by regulatory authorities could have an effect on the amounts we may charge our customers. Any difference in the amount recoverable and the amount deferred is recorded as income or expense at the time of the regulatory action. A write-off of regulatory assets and costs not recovered may be required if all or a portion of the regulated operations have rates that are no longer (i) established by independent, third-party regulators and (ii) set at levels that will recover our costs when considering the demand and competition for our services.
Retirement and Other Postretirement Employee Benefits - We have defined benefit retirement plans covering certain employees and former employees. We sponsor welfare plans that provide postretirement medical and life insurance benefits to certain employees hired prior to 2017 who retire with at least five years of service. The expense and liability related to these plans is calculated using statistical and other factors that attempt to anticipate future events. These factors include assumptions about the discount rate, expected return on plan assets, rate of future compensation increases, mortality and employment length. In determining the projected benefit obligations and costs, assumptions can change from period to period and may result in changes in the costs and liabilities we recognize.
See Note L for our retirement and other postretirement employee benefits disclosures.
Income Taxes - Deferred income taxes are provided for the difference between the financial statement and income tax basis of assets and liabilities and carryforward items based on income tax laws and rates existing at the time the temporary differences are expected to reverse. Generally, the effect of a change in tax rates on deferred tax assets and liabilities is recognized in income in the period that includes the enactment date of the rate change.
We utilize a more-likely-than-not recognition threshold and measurement attribute for the financial statement recognition and measurement of a tax position that is taken or expected to be taken in a tax return. We reflect penalties and interest as part of income tax expense as they become applicable for tax provisions that do not meet the more-likely-than-not recognition threshold and measurement attribute. For all periods presented, we had no uncertain tax positions that required the establishment of a material reserve.
We utilize the “with-and-without” approach for intra-period tax allocation for purposes of allocating total tax expense (or benefit) for the year among the various financial statement components.
We file numerous consolidated and separate income tax returns with federal tax authorities of the United States along with the tax authorities of several states. We are not under any United States federal audits or statute waivers at this time.
See Note M for our income taxes disclosures.
Asset Retirement Obligations - Asset retirement obligations represent legal obligations associated with the retirement of longlived assets that result from the acquisition, construction, development and/or normal use of the asset. Certain of our natural gas gathering and processing, NGL and natural gas pipeline facilities are subject to agreements or regulations that give rise to our asset retirement obligations for removal or other disposition costs associated with retiring the assets in place upon the discontinued use of the assets. We recognize the fair value of a liability for an asset retirement obligation in the period when it is incurred if a reasonable estimate of the fair value can be made. We are not able to estimate reasonably the fair value of the asset retirement obligations for portions of our assets, primarily certain pipeline assets, because the settlement dates are indeterminable given our expected continued use of the assets with proper maintenance. We expect our pipeline assets, for which we are unable to estimate reasonably the fair value of the asset retirement obligation, will continue in operation as long as supply and demand for natural gas and NGLs exist. Based on the widespread use of natural gas for heating and cooking activities for residential users and electric-power generation for commercial users, as well as use of NGLs by the petrochemical industry, we expect supply and demand to exist for the foreseeable future.
For our assets that we are able to make an estimate, the fair value of the liability is added to the carrying amount of the associated asset, and this additional carrying amount is depreciated over the life of the asset. The liability is accreted at the end of each period through charges to operating expense. If the obligation is settled for an amount other than the carrying amount of the liability, we will recognize a gain or loss on settlement. The depreciation and accretion expense are immaterial to our Consolidated Financial Statements.
Contingencies - Our accounting for contingencies covers a variety of business activities, including contingencies for legal and environmental exposures. We accrue these contingencies when our assessments indicate that it is probable that a liability has been incurred or an asset will not be recovered and an amount can be estimated reasonably. We expense legal fees as incurred and base our legal liability estimates on currently available facts and our estimates of the ultimate outcome or resolution. Accruals for estimated losses from environmental remediation obligations generally are recognized no later than completion of a remediation feasibility study. Recoveries of environmental remediation costs from other parties are recorded as assets when their receipt is deemed probable. Our expenditures for environmental evaluation, mitigation, remediation and compliance to date have not been significant in relation to our financial position or results of operations, and our expenditures related to environmental matters had no significant effect on earnings or cash flows during 2022, 2021 and 2020. Actual results may differ from our estimates resulting in an impact, positive or negative, on earnings.
Share-Based Payments - We expense the fair value of share-based payments net of estimated forfeitures. We estimate forfeiture rates based on historical forfeitures under our share-based payment plans.
See Note K for our share-based payments disclosures.
Earnings per Common Share - Basic EPS is calculated based on the daily weighted-average number of shares of common stock outstanding during the period, vested restricted and performance units that have been deferred and share awards deferred under the compensation plan for non-employee directors. Diluted EPS is calculated based on the daily weighted-average number of shares of common stock outstanding during the period plus potentially dilutive components. The dilutive components are calculated based on the dilutive effect for each quarter. For fiscal-year periods, the dilutive components for each quarter are averaged to arrive at the fiscal year-to-date dilutive component.
See Note J for our EPS disclosures.
Segment Reporting - Our chief operating decision-maker reviews the financial performance of each of our three segments, as well as our financial performance as a whole, on a regular basis. Adjusted EBITDA by segment is utilized in this evaluation. We believe this financial measure is useful because it and similar measures are used by many companies in our industry as a measurement of financial performance and are commonly employed by financial analysts and others to evaluate our financial performance and to compare financial performance among companies in our industry. Adjusted EBITDA for each segment is defined as net income adjusted for interest expense, depreciation and amortization, noncash impairment charges, income taxes, allowance for equity funds used during construction, noncash compensation expense, and other noncash items. This calculation may not be comparable with similarly titled measures of other companies.
Recently Issued Accounting Standards Update - Changes to GAAP are established by the FASB in the form of ASUs to the FASB Accounting Standards Codification. We consider the applicability and impact of all ASUs. ASUs not discussed herein were assessed and determined to be either not applicable or clarifications of ASUs previously issued. There have been no new accounting pronouncements that have become effective or have been issued that are of significance or potential significance to us.
On July 9, 2022, a fire occurred at our 210 MBbl/d Medford, Oklahoma, natural gas liquids fractionation facility. All personnel were safe and accounted for with temporary evacuations of local residents taken as a precautionary measure. Subject to the terms and conditions of our insurance policies and any applicable sub-limits, we have property damage and business interruption coverage with a combined per occurrence limit of $2 billion and deductibles of $5 million per occurrence for property damage and a 45-day waiting period per occurrence for business interruption coverage. Beginning in August 2022, we developed claims related to the Medford incident and recorded accruals for the expected insurance recoveries. We assessed incurred costs and lost earnings related to business interruption and property damage to our facility, as well as timing of recognition under applicable insurance recovery guidance, and recorded accruals of $150.7 million in 2022. We received a $100 million unallocated payment from our insurers in the fourth quarter 2022.
We assessed the property damage to our facility and wrote off assets totaling $45.6 million for the year ended December 31, 2022, which represents the value associated with certain damaged Medford facility property. We recorded an insurance receivable that was probable of recovery and fully offsets our noncash property losses, resulting in no impact to our Consolidated Statement of Income. We expect to continue to operate NGL pipeline assets in Medford along with existing offices for regional operations. In addition, we are preserving certain Medford assets for future potential NGL facilities that could be constructed in Medford to enhance our NGL business as the market evolves. Our property insurance policy also includes coverage for expenses incurred in response to the Medford incident. For the year ended December 31, 2022, we recorded accruals of $9 million related to the incurred costs in excess of our $5 million deductible that were probable of recovery, with an offset to the operations and maintenance line item in our Consolidated Statement of Income.
Our business interruption insurance provides coverage including, but not limited to (i) incurred costs and losses that are either unavoidable or incurred to mitigate or reduce losses and (ii) lost earnings. We record recoveries for incurred costs and losses related to our business interruption coverage for the amount probable of recovery, not to exceed the actual losses incurred and
for lost earnings that have been realized and are no longer considered a gain contingency. For the year ended December 31, 2022, we recorded accruals of $96.1 million, related primarily to third-party fractionation costs incurred subsequent to the 45day business interruption waiting period. Accruals for business interruption insurance proceeds are recorded to other operating (income) expense, net in our Consolidated Statement of Income.
Subsequent Event - On January 9, 2023, we reached an agreement with our insurers to settle all claims for physical damage and business interruption related to the Medford incident. Under the terms of the settlement agreement, we agreed to resolve the claims for total insurance payments of $930 million, $100 million of which was received in 2022. The remaining $830 million was received in January and February 2023. The proceeds serve as settlement for property damage, business interruption claims to the date of the settlement and as payment in lieu of future business interruption insurance claims.
In the first quarter 2023, we applied the $830 million received to our outstanding insurance receivable at December 31, 2022 of $50.7 million, and recorded an operational gain for the remaining $779.3 million.
Recurring Fair Value Measurements - The following tables set forth our recurring fair value measurements as of the dates indicated:
(a)-DerivativeassetsandliabilitiesarepresentedinourConsolidatedBalanceSheetonanetbasis. Wenetderivativeassetsandliabilities whenalegallyenforceablemaster-nettingarrangementexistsbetweenthecounterpartytoaderivativecontractandus. AtDecember31, 2022,weheldnocashandposted$8.9millionofcashwithvariouscounterparties,whichisincludedinothercurrentassetsinour ConsolidatedBalanceSheets.
(a)-DerivativeassetsandliabilitiesarepresentedinourConsolidatedBalanceSheetonanetbasis. Wenetderivativeassetsandliabilities whenalegallyenforceablemaster-nettingarrangementexistsbetweenthecounterpartytoaderivativecontractandus. AtDecember31, 2021,weheldnocashandposted$157.0millionofcashwithvariouscounterparties,including$99.6millionofcashcollateralthatis offsettingderivativenetliabilitypositionsundermaster-nettingarrangementsinthetableabove. Theremaining$57.4millionofcash collateralinexcessofderivativenetliabilitypositionsisincludedinothercurrentassetsinourConsolidatedBalanceSheet.
The following table sets forth a reconciliation of our Level 3 fair value measurements for the periods indicated:
(a)-Includedincommoditysalesrevenues/costofsalesandfuelinourConsolidatedStatementsofIncome.
(b)-IncludedinchangeinfairvalueofderivativesinourConsolidatedStatementsofComprehensiveIncome.
During the years ended December 31, 2022 and 2021, transfers out of Level 3 related to commodity derivatives associated with certain locations for both NGL and natural gas basis swaps were principally due to improved transparency of market prices as a result of the volume and frequency of transactions in these markets. We consider the valuation of these commodity derivatives transacted through a clearing broker and valued with an unadjusted published price from an exchange as a Level 2 valuation.
Other Financial Instruments - The approximate fair value of cash and cash equivalents, accounts receivable, accounts payable and short-term borrowings is equal to book value due to the short-term nature of these items. Our cash and cash equivalents are composed of bank and money market accounts and are classified as Level 1. Our short-term borrowings are classified as Level 2 since the estimated fair value of the short-term borrowings can be determined using information available in the commercial paper market. We have investments associated with our supplemental executive retirement plan and nonqualified deferred compensation plan that are carried at fair value and primarily are composed of exchange-traded mutual funds classified as Level 1.
The estimated fair value of our consolidated long-term debt, including current maturities, was $12.7 billion and $15.6 billion at December 31, 2022 and 2021, respectively. The book value of our consolidated long-term debt, including current maturities, was $13.6 billion at December 31, 2022 and 2021. The estimated fair value of the aggregate senior notes outstanding was determined using quoted market prices for similar issues with similar terms and maturities. The estimated fair value of our consolidated long-term debt is classified as Level 2.
Risk-management Activities - We are sensitive to changes in natural gas, crude oil and NGL prices, principally as a result of contractual terms under which these commodities are processed, purchased and sold. We are also subject to the risk of interestrate fluctuation in the normal course of business. We use physical-forward purchases and sales and financial derivatives to secure a certain price for a portion of our natural gas, condensate and purity NGLs; to reduce our exposure to commodity price and interest-rate fluctuations; and to achieve more predictable cash flows. We follow established policies and procedures to assess risk and approve, monitor and report our risk-management activities. We have not used these instruments for trading purposes.
Commodity price risk - Commodity price risk refers to the risk of loss in cash flows and future earnings arising from adverse changes in the price of natural gas, NGLs and condensate. We may use the following commodity derivative instruments to reduce the near-term commodity price risk associated with a portion of the forecasted sales of these commodities:
•Futures contracts - Standardized contracts to purchase or sell natural gas and crude oil for future delivery or settlement under the provisions of exchange regulations;
•Forward contracts - Nonstandardized commitments between two parties to purchase or sell natural gas, crude oil or NGLs for future physical delivery. These contracts are typically nontransferable and can only be canceled with the consent of both parties;
•Swaps - Exchange of one or more payments based on the value of one or more commodities. These instruments transfer the financial risk associated with a future change in value between the counterparties of the transaction, without also conveying ownership interest in the asset or liability;
•Options - Contractual agreements that give the holder the right, but not the obligation, to buy or sell a fixed quantity of a commodity at a fixed price within a specified period of time. Options may either be standardized and exchangetraded or customized and nonexchange-traded; and
•Collar - Combination of a purchased put option and a sold call option, which places a floor and ceiling price for commodity sales being hedged.
We may also use other instruments to mitigate commodity price risk.
In our Natural Gas Gathering and Processing segment, we are exposed to commodity price risk as a result of retaining a portion of the commodity sales proceeds associated with our fee with POP contracts. Under certain fee with POP contracts, our fees and POP percentage may increase or decrease if production volumes, delivery pressures or commodity prices change relative to specified thresholds. We also are exposed to basis risk between the various production and market locations where we buy and sell commodities. As part of our hedging strategy, we use the previously described commodity derivative financial instruments and physical-forward contracts to reduce the impact of price fluctuations related to natural gas, NGLs and condensate.
In our Natural Gas Liquids segment, we are primarily exposed to commodity price risk resulting from the relative values of the various purity NGLs to each other, the value of NGLs in storage and the relative value of NGLs to natural gas. We are also exposed to location price differential risk as a result of the relative value of NGL purchases at one location and sales at another location, primarily related to our optimization and marketing business. As part of our hedging strategy, we utilize physicalforward contracts and commodity derivative financial instruments to reduce the impact of price fluctuations related to NGLs.
In our Natural Gas Pipelines segment, we are primarily exposed to commodity price risk on our intrastate pipelines because they consume natural gas in operations and retain natural gas from our customers for operations or as part of our fee for compression services provided. When the amount consumed in operations differs from the amount provided by our customers, our pipelines must buy or sell natural gas, or store or use natural gas inventory, which can expose this segment to commodity price risk depending on the regulatory treatment for this activity. To the extent that commodity price risk in our Natural Gas Pipelines segment is not mitigated by fuel cost-recovery mechanisms, we may use physical-forward sales or purchases to reduce the impact of natural gas price fluctuations. At December 31, 2022 and 2021, there were no financial derivative instruments with respect to our natural gas pipeline operations.
Interest-rate risk - We may manage interest-rate risk through the use of fixed-rate debt, floating-rate debt and interest-rate swaps. Interest-rate swaps are agreements to exchange interest payments at some future point based on specified notional amounts. In 2022, we settled $750 million of our forward-starting interest-rate swaps related to our underwritten public offering of $750 million senior unsecured notes resulting in a gain of $28.1 million, which is included in accumulated other comprehensive loss and amortized into interest expense over the term of the related debt. In December 2022, we terminated the remaining $375 million of our forward-starting interest swaps that had mandatory termination dates of December 31, 2022. We simultaneously entered into forward-starting interest rate swaps with the same notional amounts at current market rates to hedge the variability of interest payments on a portion of our forecasted debt issuances that may result from changes in the benchmark interest rate before the debt is issued.
At December 31, 2022, and December 31, 2021, we had forward-starting interest-rate swaps with notional amounts totaling $0.4 billion and $1.1 billion, respectively, to hedge the variability of interest payments on a portion of our forecasted debt issuances. All of our interest-rate swaps are designated as cash flow hedges.
Fair Values of Derivative Instruments - See Note A for a discussion of the inputs associated with our fair value measurements. The following table sets forth the fair values of our derivative instruments presented on a gross basis as of the dates indicated:
(a)-DerivativeassetsandliabilitiesarepresentedinourConsolidatedBalanceSheetsonanetbasiswhenalegallyenforceablemasternettingarrangementexistsbetweenthecounterpartytoaderivativecontractandus.
(b)-AtDecember31,2021,ourderivativenetliabilitypositionsundermaster-nettingarrangementsforfinancialcontractswerefullyoffset bycashcollateralof$99.6million.
Notional Quantities for Derivative Instruments - The following table sets forth the notional quantities for derivative instruments held for the periods indicated:
Derivativesdesignatedashedginginstruments:
Derivativesnotdesignatedashedginginstruments:
Cash Flow Hedges - The following table sets forth the unrealized change in fair value of cash flow hedges in other comprehensive income (loss) for the periods indicated:
The following table sets forth the effect of cash flow hedges on net income for the periods indicated:
comprehensivelossintonetincomeonderivatives
(a)-TheyearendedDecember31,2020,includesalossof$48.3milliononthesettlementof$1.3billionofinterest-rateswapsusedtohedge ourLIBOR-basedinterestpayments.
Credit Risk - We monitor the creditworthiness of our counterparties and compliance with policies and limits established by our Risk Oversight and Strategy Committee. We maintain credit policies with regard to our counterparties that we believe minimize overall credit risk. These policies include an evaluation of potential counterparties’ financial condition (including credit ratings, bond yields and credit default swap rates), collateral requirements under certain circumstances and the use of standardized master-netting agreements that allow us to net the positive and negative exposures associated with a single counterparty. We use internally developed credit ratings for counterparties that do not have a credit rating.
Our financial commodity derivatives are generally settled through a NYMEX or ICE clearing broker account with daily margin requirements. However, we may enter into financial derivative instruments that contain provisions that require us to maintain an investment-grade credit rating from S&P, Fitch and/or Moody’s. If our credit ratings on our senior unsecured long-term debt were to decline below investment grade, the counterparties to the derivative instruments could request collateralization on derivative instruments in net liability positions. There were no financial derivative instruments with contingent features related to credit risk at December 31, 2022.
The counterparties to our derivative contracts typically consist of major energy companies, financial institutions and commercial and industrial end users. This concentration of counterparties may affect our overall exposure to credit risk, either positively or negatively, in that the counterparties may be affected similarly by changes in economic, regulatory or other conditions. Based on our policies, exposures, credit and other reserves, we do not anticipate a material adverse effect on our financial position or results of operations as a result of counterparty nonperformance.
At December 31, 2022, the credit exposure from our derivative assets is with investment-grade companies in the financial services sector.
The following table sets forth our property, plant and equipment by property type, as of the dates indicated:
The average depreciation rates for our regulated property are set forth, by segment, in the following table for the periods indicated:
We incurred costs for construction work in process that had not been paid at December 31, 2022, 2021 and 2020, of $171.1 million, $130.5 million and $151.7 million, respectively. Such amounts are not included in capital expenditures (less AFUDC) on the Consolidated Statements of Cash Flows.
Medford Assets - In connection with the Medford incident, we assessed the property damage to our facility and wrote off assets totaling $45.6 million, which represents the carrying value associated with certain damaged Medford facility property. These noncash property losses are fully offset by insurance recoveries.
Impairment Charges - In 2020, we evaluated our Natural Gas Gathering and Processing segment asset groups and determined that the carrying value of certain long-lived asset groups in the Powder River Basin, western Oklahoma and Kansas were not recoverable and exceeded their estimated fair value. As a result, we recorded noncash impairment charges of $362.3 million, which includes a natural gas processing plant and infrastructure in the Powder River Basin and its related supply contracts and natural gas processing plants and infrastructure in western Oklahoma and Kansas. In our Natural Gas Liquids segment, we recorded noncash impairment charges of $71.6 million related primarily to certain inactive assets, as our expectation for future use of the assets changed. These charges are included within impairment charges in our Consolidated Statement of Income for the year ended December 31, 2020.
Goodwill - The following table sets forth our goodwill, by segment, as of the dates indicated:
Impairment Charges - In 2020, we experienced a significant decline in our share price and market capitalization as the energy industry experienced historic events that led to a simultaneous demand and supply disruption. Due to the impact of these events, we tested our goodwill for impairment and concluded that the carrying value of the Natural Gas Gathering and Processing reporting unit exceeded its estimated fair value, resulting in a noncash impairment charge of $153.4 million, which is included within impairment charges in our Consolidated Statement of Income for the year ended December 31, 2020. We have no remaining goodwill in our Natural Gas Gathering and Processing segment.
Intangible Assets - Our intangible assets relate primarily to contracts acquired through acquisitions in our Natural Gas Liquids segment, which are being amortized over periods of 15 to 40 years. Amortization expense for intangible assets was $10.4 million in 2022, $10.4 million in 2021, and $10.8 million in 2020, and the amortization expense for each of the next five years is estimated to be $10.4 million. The following table reflects the gross carrying amount and accumulated amortization of intangible assets as of the dates presented:
Impairment Charges - In 2020 in our Natural Gas Gathering and Processing segment, we recorded noncash impairment charges to intangible assets of $19.9 million related to supply contracts associated with our natural gas processing plant in the Powder River Basin, which was also impaired. These charges are included within impairment charges in our Consolidated Statement of Income for the year ended December 31, 2020.
The following table sets forth our consolidated debt for as of the dates indicated:
$2.5 Billion Credit Agreement - In June 2022, we amended and restated our $2.5 Billion Credit Agreement, extending its maturity to June 2027. Our $2.5 Billion Credit Agreement is a revolving credit facility and contains certain customary conditions for borrowing, as well as customary financial, affirmative and negative covenants. Among other things, beginning in June 2022, these covenants include maintaining a ratio of consolidated net indebtedness to adjusted EBITDA (EBITDA, as defined in our $2.5 Billion Credit Agreement, adjusted for all noncash charges and increased for projected EBITDA from certain lender-approved capital expansion projects) of no more than 5.0 to 1 at December 31, 2022.
The $2.5 Billion Credit Agreement includes a $100 million sublimit for the issuance of standby letters of credit and a $200 million sublimit for swingline loans. Under the terms of the $2.5 Billion Credit Agreement, we may request up to an aggregate $1.0 billion increase in the size of the facility, upon satisfaction of customary conditions, including receipt of commitments from new lenders or increased commitments from existing lenders. The $2.5 Billion Credit Agreement contains provisions for an applicable margin rate and an annual facility fee, both of which adjust with changes in our credit ratings. Borrowings, if any, will accrue at Term SOFR plus an applicable margin based on our credit ratings at the time of determination plus an adjustment of 10 basis points. Under our current credit ratings, the applicable margin on any borrowings
would be 110 basis points. We are required to pay an annual facility fee equal to the daily amount of aggregate commitments under the $2.5 Billion Credit Agreement times an applicable rate based on our credit rating at the time of determination. Under our current credit ratings, the applicable rate is 15 basis points. We have the option to request two one-year maturity extensions, subject to lender approvals. The $2.5 Billion Credit Agreement also contains various customary events of default, the occurrence of which could result in a termination of the lenders’ commitments and the acceleration of all of our obligations thereunder. As of December 31, 2022, our ratio of consolidated net indebtedness to adjusted EBITDA was 3.7 to 1, and we were in compliance with all covenants under our $2.5 Billion Credit Agreement.
At December 31, 2022 and 2021, we had letters of credit issued totaling $7.9 million and $7.7 million, respectively, and no borrowings outstanding under our $2.5 Billion Credit Agreement.
Guardian Term Loan Agreement - In June 2022, Guardian entered into a $120 million unsecured term loan agreement. The Guardian Term Loan Agreement matures in June 2025, and bears interest at Term SOFR plus an applicable margin based on Guardian’s credit rating at the time of determination plus an adjustment of 10 basis points. Under Guardian’s current credit ratings, the applicable margin is 112.5 basis points. The Guardian Term Loan Agreement allows prepayment of all or any portion outstanding without penalty or premium. During the second quarter 2022, Guardian drew the full $120 million available under the agreement and used the proceeds to repay intercompany debt with ONEOK. As of December 31, 2022, Guardian was in compliance with all covenants under the Guardian Term Loan Agreement.
Senior Unsecured Obligations - All notes are senior unsecured obligations, ranking equally in right of payment with all of our existing and future unsecured senior indebtedness, and are structurally subordinate to any of the existing and future debt and other liabilities of any non guarantor subsidiaries.
Issuances - In November 2022, we completed an underwritten public offering of $750 million, 6.1% senior unsecured notes due 2032. The net proceeds, after deducting underwriting discounts, commissions and offering expenses, were $742 million. The proceeds were used primarily to repay all outstanding amounts under our commercial paper program. The remainder was used for general corporate purposes.
In May 2020, we completed an underwritten public offering of $1.5 billion senior unsecured notes consisting of $600 million, 5.85% senior notes due 2026; $600 million, 6.35% senior notes due 2031; and $300 million, 7.15% senior notes due 2051. The net proceeds, after deducting underwriting discounts, commissions and offering expenses, were $1.48 billion. A portion of the proceeds was used to repay the outstanding borrowings under our $1.5 Billion Term Loan Agreement. The remainder was used for general corporate purposes.
In March 2020, we completed an underwritten public offering of $1.75 billion senior unsecured notes consisting of $400 million, 2.2% senior notes due 2025; $850 million, 3.1% senior notes due 2030; and $500 million, 4.5% senior notes due 2050. The net proceeds, after deducting underwriting discounts, commissions and offering expenses, were $1.73 billion. A portion of the proceeds was used to pay all outstanding amounts under our commercial paper program. The remainder was used for general corporate purposes, which included repayment of other existing indebtedness and funding capital expenditures.
Repayments - In July 2022, we redeemed the remaining $895.8 million of our 3.375% senior notes due October 2022 at 100% of the principal amount, plus accrued and unpaid interest, with cash on hand and short-term borrowings.
In November 2021, we redeemed the remaining $536.1 million of our $700 million, 4.25% senior notes due February 2022 at 100% of the principal amount, plus accrued and unpaid interest, with cash on hand and short-term borrowings.
In June 2021, we repaid the remaining $11.7 million of Guardian’s senior notes due December 2022 with cash on hand.
In 2021, we repurchased in the open market outstanding principal of certain of our senior notes in the amount of $55.2 million for an aggregate repurchase price of $54.6 million with cash on hand.
In May 2020, we repaid the remaining $1.25 billion of our $1.5 Billion Term Loan Agreement with cash on hand from our May 2020 public offering of $1.5 billion senior unsecured notes.
In 2020, we repurchased in the open market outstanding principal of certain of our senior notes in the amount of $224.4 million for an aggregate repurchase price of $199.6 million with cash on hand. In connection with these open market repurchases, we recognized $22.3 million of net gains on extinguishment of debt, which is included in other income (expense), net in our Consolidated Statement of Income for the year ended December 31, 2020.
Subsequent event - We elected to redeem our $425 million, 5.0% senior notes due September 2023, with a redemption effective date in late February 2023. We expect the redemption price to equal 100% of the principal amount of the notes, plus accrued and unpaid interest, which we will pay with cash on hand.
The aggregate maturities of long-term debt outstanding and interest payments on debt as of December 31, 2022, for the years 2023 through 2027 are shown below:
Compliance with Debt Covenants - As of December 31, 2022, we were in compliance with the covenants contained in our various debt agreements.
Other - We amortize premiums, discounts and expenses incurred in connection with the issuance of long-term debt consistent with the terms of the respective debt instrument.
Debt Guarantees - ONEOK, ONEOK Partners and the Intermediate Partnership have cross guarantees in place for our and ONEOK Partners’ indebtedness. The Guardian Term Loan Agreement is not guaranteed by ONEOK, ONEOK Partners or the Intermediate Partnership.
Series A and B Convertible Preferred Stock - There are no shares of Series A or Series B Preferred Stock currently issued or outstanding.
Equity Issuances - In July 2020, we established an “at-the-market” equity program for the offer and sale from time to time of our common stock up to an aggregate offering price of $1.0 billion. The program allows us to offer and sell common stock at prices we deem appropriate through a sales agent, in forward sales transactions through a forward seller or directly to one or more of the program’s managers acting as principals. Sales of our common stock may be made by means of ordinary brokers’ transactions on the NYSE, in block transactions or as otherwise agreed to between us and the sales agent. We are under no obligation to offer and sell common stock under the program. No shares have been sold through our “at-the-market” program as of the date of this report.
In June 2020, we completed an underwritten public offering of 29.9 million shares of our common stock at a public offering price of $32.00 per share, generating net proceeds, after deducting underwriting discounts, commissions and offering expenses, of $937.0 million. The proceeds were used for general corporate purposes, including repayment of existing indebtedness and funding capital expenditures.
Dividends - Holders of our common stock share equally in any dividend declared by our Board of Directors, subject to the rights of the holders of outstanding Series E Preferred Stock. Dividends paid totaled $1.7 billion, $1.7 billion and $1.6 billion for 2022, 2021 and 2020, respectively. The following table sets forth the quarterly dividends per share paid on our common stock in the periods indicated:
Additionally, in February 2023, we paid a quarterly common stock dividend of $0.955 per share ($3.82 per share on an annualized basis), which was paid to shareholders of record as of January 30, 2023.
The Series E Preferred Stock pays quarterly dividends on each share of Series E Preferred Stock, when, as and if declared by our Board of Directors, at a rate of 5.5% per year. We paid dividends for the Series E Preferred Stock of $1.1 million in 2022, 2021 and 2020. We paid quarterly dividends totaling $0.3 million for the Series E Preferred Stock in February 2023.
The following table sets forth the balance in accumulated other comprehensive loss for the periods indicated:
(a)-Allamountsarepresentednetoftax.
(b)-Includesamountsrelatedtosupplementalexecutiveretirementplan.
(c)-SeeNote D fordetailsofamountsreclassifiedtonetincomeforrisk-managementassets/liabilities.
The following table sets forth information about the balance of accumulated other comprehensive loss at December 31, 2022, representing unrealized gains (losses) related to risk-management assets and liabilities, net of tax:
(a)-Allamountsarepresentednetoftax.
(b)-BasedoncommoditypricesonDecember31,2022,weexpectnetgainsof$28.7million,netoftax,willbereclassifiedintoearnings duringthenext12months.
(c)-Weexpectnetlossesof$18.0million,netoftax,willbereclassifiedintoearningsduringthenext12months.
(d)-IncludestheinterestrateswapsterminatedinDecember2022. SeeNoteDformoredetails.
The remaining amounts in accumulated other comprehensive loss relate primarily to our retirement and other postretirement benefit plan obligations, which are expected to be amortized over the average remaining service period of employees participating in these plans.
The following tables set forth the computation of basic and diluted EPS for the periods indicated:
Our Equity Incentive Plan (EIP) provides for the granting of stock-based compensation, including restricted stock unit awards and performance unit awards, to eligible employees and the granting of stock awards to non-employee directors. We have reserved 8.5 million shares of common stock for issuance under the EIP and at December 31, 2022, we had 4.6 million shares available for issuance under the plan. This calculation of available shares reflects shares issued and estimated shares expected to be issued upon vesting of outstanding awards granted under the EIP, excluding estimated forfeitures expected to be returned to the plan.
Restricted Stock Units - We have granted restricted stock units to key employees that vest at the end of a designated period, typically three years, and entitle the grantee to receive shares of our common stock. Restricted stock unit awards are measured at fair value as if they were vested and issued on the grant date and adjusted for estimated forfeitures. Restricted stock unit awards accrue dividend equivalents in the form of additional restricted stock units prior to vesting. Compensation expense is recognized on a straight-line basis over the vesting period of the award.
Performance Unit Awards - We have granted performance unit awards to key employees that vest at the end of a three-year period. Upon vesting, a holder of outstanding performance units is entitled to receive a number of shares of our common stock equal to a percentage (0% to 200%) of the performance units granted, based on our total shareholder return over the vesting period, compared with the total shareholder return of a peer group of other energy companies over the same period. Performance unit awards are measured at fair value on the grant date based on a Monte Carlo model and adjusted for estimated forfeitures. Performance unit awards accrue dividend equivalents in the form of additional performance units prior to vesting. Compensation expense is recognized on a straight-line basis over the vesting period of the award.
The EIP provides for the granting of nonstatutory stock options and stock bonus awards to non-employee directors, including performance unit awards and restricted stock unit awards. Under the EIP, awards may be granted by the Executive Compensation Committee at any time, until grants have been made for all shares authorized under the EIP. The maximum number of shares of common stock and cash-based awards that can be issued to a participant under the EIP during any year is limited to $0.8 million in value as of the grant date. No performance unit awards or restricted stock unit awards have been made to non-employee directors, and there are no options outstanding.
For all awards outstanding, we used a 3% forfeiture rate based on historical forfeitures under our share-based payment plans. We currently use treasury stock to satisfy our share-based payment obligations.
Compensation expense for our share-based payment plans was $52.8 million, $54.1 million and $29.4 million during 2022, 2021 and 2020, respectively, before related tax benefits of $13.5 million, $14.4 million and $14.1 million, respectively.
As of December 31, 2022, we had $20.7 million of total unrecognized compensation cost related to our nonvested restricted stock unit awards, which is expected to be recognized over a weighted-average period of 1.7 years. The following tables set forth activity and various statistics for our restricted stock unit awards:
As of December 31, 2022, we had $33.7 million of total unrecognized compensation cost related to the nonvested performance unit awards, which is expected to be recognized over a weighted-average period of 1.7 years. The following tables set forth activity and various statistics related to the performance unit awards and the assumptions used in the valuations at the respective grant dates:
We have reserved a total of 11.6 million shares of common stock for issuance under our Employee Stock Purchase Plan (the ESPP). Subject to certain exclusions, all employees are eligible to participate in the ESPP. Employees can choose to have up to 10% of their base pay withheld from each paycheck during the offering period to purchase our common stock, subject to terms and limitations of the plan. The purchase price of the stock is 85% of the lower of its grant date or exercise date market price. Approximately 68%, 69% and 68% of employees participated in the plan in 2022, 2021 and 2020, respectively. Under the plan, we sold 235,583 shares at a weighted average of $47.21 per share in 2022, 277,012 shares at a weighted average of $38.98 per share in 2021 and 359,977 shares at a weighted average of $27.78 per share in 2020.
Under our Employee Stock Award Program, we issue, for no monetary consideration, to all eligible employees one share of our common stock when the per-share closing price of our common stock on the NYSE is at or above each one-dollar increment above its previous high closing price. The total number of shares of our common stock available for issuance under this program is 900,000. Shares issued to employees under this program during 2020 totaled 2,871. Compensation expense related to the Employee Stock Award Program was $0.2 million for 2020. No shares were issued to employees under this program in 2022 or 2021. As of the date of this report, the next award will be issued when our common stock closes at or above $78.
Our Deferred Compensation Plan for Non-Employee Directors provides our non-employee directors the option to defer all or a portion of their compensation for their service on our Board of Directors. Under the plan, directors may elect either a cash deferral option or a phantom stock option. Under the cash deferral option, directors may elect to defer the receipt of all or a portion of their annual retainer fees, which will be credited with interest during the deferral period. Under the phantom stock option, directors may defer all or a portion of their annual retainer fees and receive such fees on a deferred basis in the form of shares of common stock under our EIP, which earn the equivalent of dividends declared on our common stock. Shares are distributed to non-employee directors at the fair market value of our common stock at the date of distribution.
Retirement and Other Postretirement Benefit Plans
Retirement Plans - We have a defined benefit pension plan covering certain employees and former employees, which closed to new participants in 2005. In addition, we have a supplemental executive retirement plan for the benefit of certain officers who participate in our defined benefit pension plan. Our supplemental executive retirement plan is closed to new participants. We fund our defined benefit pension plan at a level needed to maintain or exceed the minimum funding levels required by the Employee Retirement Income Security Act of 1974, as amended.
All employees are eligible to make salary deferrals and receive company matching contributions under our 401(k) Plan, and employees that do not participate in our defined benefit pension plan are also eligible to receive quarterly and annual profitsharing contributions under our 401(k) Plan.
Other Postretirement Benefit Plans - We sponsor health and welfare plans that provide postretirement medical and life insurance benefits to employees hired prior to 2017 who retire with at least five years of full-time consecutive service. The postretirement medical plan for pre-Medicare participants is contributory, with retiree contributions adjusted periodically, and contains other cost-sharing features such as deductibles and coinsurance. The postretirement medical plan for Medicareeligible participants is an account-based plan under which participants may elect to purchase private insurance policies under a private exchange and/or seek reimbursement of other eligible medical expenses.
Obligations and Funded Status - The following table sets forth our retirement and other postretirement benefit plans benefit obligations and fair value of plan assets for the periods indicated:
(a)-ThebenefitobligationforRetirementBenefitsatDecember31,2022and2021,includethesupplementalexecutiveretirementplan obligation.
(b)-FairvalueofplanassetsforRetirementBenefitsexcludetheassetsofoursupplementalexecutiveretirementplan,whichtotaled $91.8millionand$111.2millionatDecember31,2022and2021,respectively,andareincludedinotherassetsontheConsolidatedBalance Sheets. Theseassetsaremaintainedinarabbitrustandarenottreatedasassetsofthesupplementalexecutiveretirementplan.
The accumulated benefit obligation for our retirement plans was $408.6 million and $541.8 million at December 31, 2022 and 2021, respectively.
The actuarial gains impacting our benefit obligations for our retirement and other postretirement benefit plans are due primarily to changes in the discount rate assumptions discussed in the “Actuarial Assumptions” section below.
Components of Net Periodic Benefit Cost - The following table sets forth the components of net periodic benefit cost for our retirement and other postretirement benefit plans for the periods indicated:
Other Comprehensive Income (Loss) - The following table sets forth the amounts recognized in other comprehensive income (loss) related to our retirement and other postretirement benefits for the periods indicated:
The table below sets forth the amounts in accumulated other comprehensive loss that had not yet been recognized as components of net periodic benefit expense for the periods indicated:
Actuarial Assumptions - The following table sets forth the weighted-average assumptions used to determine benefit obligations for retirement and other postretirement benefits for the periods indicated:
The following table sets forth the weighted-average assumptions used to determine net periodic benefit costs for the periods indicated:
We determine our overall expected long-term rate of return on plan assets based on our review of historical returns and economic growth models.
We determine our discount rates annually utilizing portfolios of high-quality bonds matched to the estimated benefit cash flows of our retirement and other postretirement benefit plans. Bonds selected to be included in the portfolios are only those rated by S&P or Moody’s as an AA or Aa2 rating or better and exclude callable bonds, bonds with less than a minimum issue size, yield outliers and other filtering criteria to remove unsuitable bonds.
Health Care Cost Trend Rates - The following table sets forth the assumed health care cost-trend rates for the periods indicated:
Plan Assets - Our investment strategy is to invest plan assets in accordance with sound investment practices that emphasize long-term fundamentals. The goal of this strategy is to maximize investment returns while managing risk in order to meet the plan’s current and projected financial obligations. The investment allocation for our other postretirement benefit plans is to target a diversified mix of approximately 30% fixed income and 70% equity securities. The investment allocation for our defined benefit pension plan follows a glide path approach of liability-driven investing that shifts a higher portfolio weighting to fixed income as the plan’s funded status increases. The purpose of liability-driven investing is to structure the asset portfolio to more closely resemble the pension liability and thereby more effectively hedge against changes in the liability. The plan’s current investments include a diverse blend of various domestic and international equities, investments in various classes of debt securities, real estate and hedge funds. The target allocation for the assets of our retirement plan as of December 31, 2022, is as follows:
As part of our risk management for the plans, minimums and maximums have been set for each of the asset classes listed above.
The following tables set forth the plan assets by fair value category as of the measurement date for our defined benefit pension and other postretirement benefit plans:
(a)-Thiscategoryrepresentssecuritiesoftherespectivemarketsectorfromdiverseindustries.
(b)-Thiscategoryrepresentsbondsfromdiverseindustries.
(c)-Thiscategoryrepresentsalternativeinvestmentsinlimitedpartnerships,whichcanberedeemedwitha30-daynoticewithnofurther restrictions. Therearenounfundedcapitalcommitments. Theselimitedpartnershipsinvestthroughmulti-strategyprogramsinbroadly diversifiedportfoliosofprivateinvestmentfunds,hedgefundsand/orseparateaccountstoseekequity-likereturnswithlowmarket correlation,reducedvolatilityandlimitedrisk.
(d)-Planassetinvestmentsmeasuredatfairvalueusingthenetassetvaluepershare.
(a)-Thiscategoryrepresentssecuritiesoftherespectivemarketsectorfromdiverseindustries.
(a)-Thiscategoryrepresentssecuritiesoftherespectivemarketsectorfromdiverseindustries.
Contributions - During 2022, we made no contributions to our defined benefit pension and other postretirement benefit plans. Our defined benefit pension plan has a minimum required contribution of approximately $7 million in 2023. We expect that any contributions to our defined benefit pension plan in 2023 will be satisfied entirely through a non-cash offset against our prefunding account balance. We do not expect to make any contributions to our other postretirement benefit plans in 2023.
Pension and Other Postretirement Benefit Payments - Benefit payments for our defined benefit pension and other postretirement benefit plans for the period ending December 31, 2022, were $19.8 million and $4.5 million, respectively. The following table sets forth the defined benefit pension and other postretirement benefits payments expected to be paid in 2023 through 2032:
The expected benefits to be paid are based on the same assumptions used to measure our benefit obligation at December 31, 2022, and include estimated future employee service.
401(k) Plan - We have a 401(k) Plan covering all employees, and employee contributions are discretionary. We match 100% of employee 401(k) Plan contributions up to 6% of each participant’s eligible compensation each payroll period, subject to certain limits. We also make profit-sharing contributions under our 401(k) Plan for employees who do not participate in our defined benefit pension plan. We generally make a quarterly profit-sharing contribution equal to 1% of each profit-sharing participant’s eligible compensation during the quarter and an annual discretionary profit-sharing contribution equal to a percentage of each profit-sharing participant’s eligible compensation. Our contributions made to the plan, including profitsharing contributions, were $34.7 million, $32.7 million and $27.1 million in 2022, 2021 and 2020, respectively.
Nonqualified Deferred Compensation Plan - The 2020 Nonqualified Deferred Compensation Plan and its predecessor nonqualified deferred compensation plans (collectively, the NQDC Plan) provide a select group of management and highly compensated employees, as approved by our Chief Executive Officer, with the option to defer portions of their compensation and receive notional employer contributions that generally are not available due to limitations on employer and employee contributions to qualified defined contribution plans under federal tax laws. We have investments included in other assets on the Consolidated Balance Sheets related to the NQDC Plan, which totaled $22.9 million and $36.1 million at December 31, 2022 and 2021, respectively. These investments are maintained in a rabbi trust. Our contributions to the plan were not material in 2022, 2021 or 2020.
The following table sets forth our provision for income taxes for the periods indicated:
The following table is a reconciliation of our income tax provision for the periods indicated:
(a)TheyearendedDecember31,2021,includes$19.4millionimpactfrompreviouslyrecognizedgainsoncertainbenefitplaninvestments.
The following table sets forth the tax effects of temporary differences that gave rise to significant portions of the deferred tax assets and liabilities for the periods indicated:
(a)TheyearendedDecember31,2022,includesanindefinite-livedinterestlimitationcarryforwardof$24.7million.
(b)Dueprimarilytoexcessoftaxoverbookdepreciation.
In August 2022, the U.S. government enacted the Inflation Reduction Act into law. The Inflation Reduction Act includes a new corporate alternative minimum tax (CAMT) of 15% on the adjusted financial statement income (AFSI) of corporations with average AFSI exceeding $1.0 billion over a three-year period. The CAMT is effective for tax years beginning after December 31, 2022. We expect the CAMT to have an impact on our cash taxes beginning with the 2024 tax year. When we become subject to the CAMT and our CAMT liability is greater than our regular U.S. federal income tax liability for any particular year, the CAMT liability would effectively accelerate our future U.S. federal income tax obligations but provide an offsetting credit against our regular U.S. federal income tax liability for future years. As a result, we expect that any impact is limited to timing differences in future tax years.
As of December 31, 2022, we have federal net operating loss carryforwards of $5.3 billion, the majority of which have an indefinite carryforward period. We expect to generate taxable income and utilize these net operating loss carryforwards in future periods. We also have loss and credit carryovers in multiple states, $2.7 billion of which have an indefinite carryforward period and $1.7 billion of which will expire between 2024 and 2039. We have deferred tax assets related to federal and state net operating loss and credit carryforwards of $1.3 billion and $1.6 billion in 2022 and 2021, respectively. We believe that it is more likely than not that the tax benefits of certain state carryforwards will not be utilized; therefore, we recorded a valuation allowance, which was reduced by $1.4 million in 2022, and increased by $6.4 million and $20.9 million in 2021 and 2020, respectively, through net income
Investments in Unconsolidated Affiliates - The following table sets forth our investments in unconsolidated affiliates as of the dates indicated:
(a)-Equity-methodgoodwill(NoteA)was$16.5millionatDecember31,2022and2021.
Equity in Net Earnings from Investments and Impairments - The following table sets forth our equity in net earnings from investments for the periods indicated:
Impairment Charges - In 2020, we incurred a noncash impairment charge of $30.5 million related to our 10.2% investment in Venice Energy Services Company in our Natural Gas Gathering and Processing segment, which includes $22.3 million related to equity-method goodwill, and a $7.2 million noncash impairment charge related to our 50% investment in Chisholm Pipeline Company in our Natural Gas Liquids segment. These impairment charges are included within impairment of equity investments in our Consolidated Statement of Income for the year ended December 31, 2020.
We incurred expenses in transactions with unconsolidated affiliates of $82.8 million, $62.8 million and $135.4 million for 2022, 2021 and 2020, respectively, primarily related to Overland Pass and Northern Border. Revenue earned and accounts receivable from, and accounts payable to, our equity-method investees were not material.
Northern Border - The Northern Border partnership agreement provides that distributions to Northern Border’s partners are to be made on a pro rata basis according to each partner’s ownership percentage interest. The Northern Border Management Committee determines the amount and timing of such distributions. Any changes to, or suspension of, the cash distribution policy of Northern Border requires the unanimous approval of the Northern Border Management Committee. Cash distributions are equal to 100% of distributable cash flow as determined from Northern Border’s financial statements based upon EBITDA less interest expense and maintenance capital expenditures. Loans or other advances from Northern Border to its partners or affiliates are prohibited under its credit agreement. In all periods presented, we made no contributions to Northern Border.
Roadrunner - The Roadrunner agreement provides that distributions to members are made on a pro rata basis according to each member’s ownership interest. As the operator, we have been delegated the authority to determine such distributions in accordance with, and on the frequency set forth in, the Roadrunner agreement. Cash distributions are equal to 100% of available cash, as defined in the limited liability company agreement. In 2022, 2021 and 2020, our contributions to Roadrunner were not material.
We have an operating agreement with Roadrunner that provides for reimbursement or payment to us for management services and certain operating costs. Reimbursements and payments from Roadrunner included in operating income in our Consolidated Statements of Income for all periods presented were not material.
Overland Pass - The Overland Pass agreement provides that distributions to Overland Pass’s members are to be made on a pro rata basis according to each member’s ownership percentage interest. The Overland Pass Management Committee determines the amount and timing of such distributions. Any changes to, or suspension of, the cash distributions from Overland Pass requires the unanimous approval of the Overland Pass Management Committee. Cash distributions are equal to 100% of available cash as defined in the limited liability company agreement. In all periods presented, our contributions to Overland Pass were not material.
Commitments - Firm transportation and storage contracts are fixed-price contracts that provide us with firm transportation and storage capacity. The following table sets forth our firm transportation and storage contract payments for the periods indicated:
Environmental Matters and Pipeline Safety - The operation of pipelines, plants and other facilities for the gathering, processing, fractionation, transportation and storage of natural gas, NGLs, condensate and other products is subject to numerous and complex laws and regulations pertaining to health, safety and the environment. As an owner and/or operator of these facilities, we must comply with laws and regulations that relate to air and water quality, hazardous and solid waste management and disposal, cultural resource protection and other environmental and safety matters. The cost of planning, designing, constructing and operating pipelines, plants and other facilities must incorporate compliance with these laws, regulations and safety standards. Failure to comply with these laws and regulations may trigger a variety of administrative, civil and potentially criminal enforcement measures, including citizen suits, which can include the assessment of monetary penalties, the imposition of remedial requirements and the issuance of injunctions or restrictions on operation or construction. Management does not believe that, based on currently known information, a material risk of noncompliance with these laws and regulations exists that will affect adversely our consolidated results of operations, financial condition or cash flows.
Legal Proceedings - We are a party to various legal proceedings that have arisen in the normal course of our operations. While the results of these proceedings cannot be predicted with certainty, we believe the reasonably possible losses from such proceedings, individually and in the aggregate, are not material. Additionally, we believe the probable final outcome of such proceedings will not have a material adverse effect on our consolidated results of operations, financial position or cash flows.
We lease certain buildings, warehouses, office space, pipeline capacity, land and equipment, including pipeline equipment, rail cars and information technology equipment. Our lease payments are generally straight-line and the exercise of lease renewal options, which vary in term, is at our sole discretion. We include renewal periods in a lease term if we are reasonably certain to exercise available renewal options. We apply the short-term policy election, which allows us to exclude from recognition leases with an initial term of 12 months or less. Our lease agreements do not include any residual value guarantees or material restrictive covenants.
Through ONEOK Leasing Company, L.L.C. and ONEOK Parking Company, L.L.C., we own an office building and a parking garage and lease excess space in these facilities to affiliates and others. Our consolidated lease income is not material.
The following table sets forth information about our lease assets and liabilities included in our Consolidated Balance Sheet as of the dates indicated:
The following table sets forth information about our leases for the periods indicated:
(a)-Ourweighted-averagediscountratesrepresenttherateimplicitintheleaseorourincrementalborrowingrateforatermequaltothe remainingtermofthelease.
The following table sets forth the maturity of our lease liabilities as of December 31, 2022:
Our lease costs and supplemental cash flow information related to our leases for the periods ended December 31, 2022 and 2021 are not material.
Contract Assets and Contract Liabilities - Our contract asset balances at the beginning and end of the years ended December 31, 2022 and 2021, primarily relate to our firm service transportation contracts with tiered rates, which are not material. The following table sets forth the balances in contract liabilities for the periods indicated:
(a)-Contractliabilitiesof$35.3millionand$16.2millionareincludedinothercurrentliabilitiesandotherdeferredcredits,respectively,in ourConsolidatedBalanceSheet.
(b)-Contractliabilitiesof$23.3millionand$29.1millionareincludedinothercurrentliabilitiesandotherdeferredcredits,respectively,in ourConsolidatedBalanceSheet.
Receivables from Customers and Revenue Disaggregation - Substantially all of the balances in accounts receivable on our Consolidated Balance Sheets at December 31, 2022 and 2021, relate to customer receivables. Revenues sources are disaggregated in Note R.
Transaction Price Allocated to Unsatisfied Performance Obligations - We do not disclose the value of unsatisfied performance obligations for (i) contracts with an original expected length of one year or less and (ii) variable consideration on contracts for which we recognize revenue at the amount to which we have the right to invoice for services performed.
The following table presents aggregate value allocated to unsatisfied performance obligations as of December 31, 2022, and the amounts we expect to recognize in revenue in future periods, related primarily to firm transportation and storage contracts with remaining contract terms ranging from one month to 22 years:
The table above excludes variable consideration allocated entirely to wholly unsatisfied performance obligations, wholly unsatisfied promises to transfer distinct goods or services that are part of a single performance obligation and consideration we determine to be fully constrained. Information on the nature of the variable consideration excluded and the nature of the performance obligations to which the variable consideration relates can be found in the description of the major contract types discussed in Note A. The amounts we determined to be fully constrained relate to future sales obligations under long-term sales contracts where the transaction price is not known and minimum volume agreements, which we consider to be fully constrained until invoiced.
Segment Descriptions - Our operations are divided into three reportable business segments, as follows:
•our Natural Gas Gathering and Processing segment gathers, treats and processes natural gas;
•our Natural Gas Liquids segment gathers, treats, fractionates and transports NGLs and stores, markets and distributes purity NGLs; and
•our Natural Gas Pipelines segment transports and stores natural gas via regulated intrastate and interstate natural gas transmission pipelines and natural gas storage facilities.
Other and eliminations consist of corporate costs, the operating and leasing activities of our headquarters building and related parking facility, the activity of our wholly-owned captive insurance company, which began in 2022, and eliminations necessary to reconcile our reportable segments to our Consolidated Financial Statements.
For the year ended December 31, 2022, we had no single customer from which we received 10% or more of our consolidated revenues. For the year ended December 31, 2021, revenues from one customer in our Natural Gas Liquids segment represented approximately 11.6% of our consolidated revenues. For the year ended December 31, 2020, we had no single customer from which we received 10% or more of our consolidated revenues.
Operating Segment Information - The following tables set forth certain selected financial information for our operating segments for the periods indicated:
(a)-OurNaturalGasLiquidssegmenthasregulatedandnonregulatedoperations. OurNaturalGasLiquidssegment’sregulatedoperations hadrevenuesof$2.5billion,ofwhich$2.3billionrelatedtorevenueswithinthesegment,costofsalesandfuelof$686.9millionand operatingcostsof$333.7million.
(b)-OurNaturalGasPipelinessegmenthasregulatedandnonregulatedoperations. OurNaturalGasPipelinessegment’sregulated operationshadrevenuesof$438.2million,costofsalesandfuelof$48.9millionandoperatingcostsof$154.4million.
(c)Intersegmentrevenuesareprimarilycommoditysales,whicharebasedonthecontractedsellingpricethatisgenerallyindex-basedand settledmonthly,andfortheNaturalGasGatheringandProcessingsegmenttotaled$3.7billion. IntersegmentrevenuesfortheNaturalGas LiquidsandNaturalGasPipelinessegmentswerenotmaterial.
(a)-OurNaturalGasLiquidssegmenthasregulatedandnonregulatedoperations. OurNaturalGasLiquidssegment’sregulatedoperations hadrevenuesof$2.4billion,ofwhich$2.2billionrelatedtorevenueswithinthesegment,costofsalesandfuelof$607.5millionand operatingcostsof$308.5million.
(b)-OurNaturalGasPipelinessegmenthasregulatedandnonregulatedoperations. OurNaturalGasPipelinessegment’sregulated operationshadrevenuesof$521.3million,costofsalesandfuelof$28.5millionandoperatingcostsof$147.5million.
(c)-Intersegmentrevenuesareprimarilycommoditysales,whicharebasedonthecontractedsellingpricethatisgenerallyindex-basedand settledmonthly,andfortheNaturalGasGatheringandProcessingsegmenttotaled$2.9billion. IntersegmentrevenuesfortheNaturalGas LiquidsandNaturalGasPipelinessegmentswerenotmaterial.
commoditycontracts.
(a)-OurNaturalGasLiquidssegmenthasregulatedandnonregulatedoperations. OurNaturalGasLiquidssegment’sregulatedoperations hadrevenuesof$2.0billion,ofwhich$1.8billionrelatedtorevenueswithinthesegment,costofsalesandfuelof$520.6millionand operatingcostsof$225.8million.
(b)-OurNaturalGasPipelinessegmenthasregulatedandnonregulatedoperations. OurNaturalGasPipelinessegment’sregulated operationshadrevenuesof$410.8million,costofsalesandfuelof$35.4millionandoperatingcostsof$121.9million.
(c)-Intersegmentrevenuesareprimarilycommoditysales,whicharebasedonthecontractedsellingprice,whichisgenerallyindex-based andsettledmonthly,andfortheNaturalGasGatheringandProcessingsegmenttotaled$865.6million. IntersegmentrevenuesfortheNatural GasLiquidsandNaturalGasPipelinessegmentswerenotmaterial.
(a)-NoncustomerrevenuefortheyearendedDecember31,2020,totaled$65.8millionrelatedprimarilytogainsfromderivativeson commoditycontracts.
(a)-TheyearendedDecember31,2020,includescorporatenetgainsof$22.3milliononextinguishmentofdebtrelatedtoopenmarket repurchases.
None.
Our Chief Executive Officer (Principal Executive Officer) and Chief Financial Officer (Principal Financial Officer) have concluded that our disclosure controls and procedures were effective as of the end of the period covered by this report based on the evaluation of the controls and procedures required by Rules 13a-15(b) and 15d-15(b) of the Exchange Act.
Our management is responsible for establishing and maintaining adequate internal control over financial reporting, as such term is defined in Exchange Act Rule 13a-15(f). Under the supervision and with the participation of our management, including our Principal Executive Officer and Principal Financial Officer, we evaluated the effectiveness of our internal control over financial reporting based on the framework in Internal Control-Integrated Framework (2013) issued by the Committee of Sponsoring Organizations of the Treadway Commission. Because of inherent limitations, internal control over financial reporting may not prevent or detect misstatements. Also, projections of any evaluation of effectiveness to future periods are subject to the risk that controls may become inadequate because of changes in conditions, or that the degree of compliance with the policies or procedures may deteriorate. Based on our evaluation under that framework, our management concluded that our internal control over financial reporting was effective as of December 31, 2022.
The effectiveness of our internal control over financial reporting as of December 31, 2022, has been audited by PricewaterhouseCoopers LLP, an independent registered public accounting firm, as stated in their report which is included herein (Item 8).
There have been no changes in our internal control over financial reporting during the quarter ended December 31, 2022, that have materially affected, or are reasonably likely to materially affect, our internal control over financial reporting.
ITEM 9B. OTHER INFORMATION
Not applicable.
ITEM 9C. DISCLOSURE REGARDING FOREIGN JURISDICTIONS THAT PREVENT INSPECTIONS
Not applicable.
Information concerning our directors is set forth in our 2023 definitive Proxy Statement and is incorporated herein by this reference.
Executive Officers of the Registrant
Information concerning our executive officers is included in Part I, Item 1, Business, of this Annual Report.
Information on compliance with Section 16(a) of the Exchange Act is set forth in our 2023 definitive Proxy Statement and is incorporated herein by this reference.
Code of Ethics
Information concerning the code of ethics, or code of business conduct, is set forth in our 2023 definitive Proxy Statement and is incorporated herein by this reference.
Nominating Committee Procedures
Information concerning the Nominating Committee procedures is set forth in our 2023 definitive Proxy Statement and is incorporated herein by this reference.
Audit Committee
Information concerning the Audit Committee is set forth in our 2023 definitive Proxy Statement and is incorporated herein by this reference.
Audit Committee Financial Experts
Information concerning the Audit Committee Financial Experts is set forth in our 2023 definitive Proxy Statement and is incorporated herein by this reference.
Information on executive compensation is set forth in our 2023 definitive Proxy Statement and is incorporated herein by this reference.
Security Ownership of Certain Beneficial Owners
Information concerning the ownership of certain beneficial owners is set forth in our 2023 definitive Proxy Statement and is incorporated herein by this reference.
Security Ownership of Management
Information on security ownership of directors and officers is set forth in our 2023 definitive Proxy Statement and is incorporated herein by this reference.
The following table sets forth certain information concerning our equity compensation plans as of December 31, 2022:
(1)-IncludessharesgrantedunderourEmployeeStockPurchasePlan,EmployeeStockAwardProgramandrestrictedstockincentiveunit awardsandperformanceunitawardsgrantedunderourformerLong-TermIncentivePlan,ourformerEquityCompensationPlanandour EquityIncentivePlan. Forabriefdescriptionofthematerialfeaturesoftheseplans,seeNote K oftheNotestoConsolidatedFinancial StatementsinthisAnnualReport. Column(c)includes459,886,130,204and4,521,154sharesavailableforfutureissuanceunderour EmployeeStockPurchasePlan,EmployeeStockAwardProgramandEquityIncentivePlan,respectively.
(2)-IncludesourNQDCPlan,DeferredCompensationPlanforNon-EmployeeDirectorsandourformerStockCompensationPlanforNonEmployeeDirectors. Forabriefdescriptionofthematerialfeaturesoftheseplans,seeNotes K and L oftheNotestoConsolidated FinancialStatementsinthisAnnualReport.
(3)-Thereisnoexercisepriceassociatedwithrestrictivestockincentiveunitawardsandperformanceunitawards. Compensationdeferred intoourcommonstockunderourDeferredCompensationPlanforNon-EmployeeDirectorsisdistributedtoparticipantsatfairmarket valueonthedateofdistribution. Thepriceusedfortheseplanstocalculatetheweighted-averageexercisepriceinthetableis$65.70, whichrepresentsthe2022year-endclosingpriceofourcommonstockontheNYSE.
Information on certain relationships and related transactions and director independence is set forth in our 2023 definitive Proxy Statement and is incorporated herein by this reference.
Information concerning the principal accountant’s fees and services is set forth in our 2023 definitive Proxy Statement and is incorporated herein by this reference.
All schedules have been omitted because of the absence of conditions under which they are required. (3)
3.1Amended and Restated Certificate of Incorporation of ONEOK, Inc., dated July 3, 2017, as amended (incorporated by reference from Exhibit 3.2 to ONEOK, Inc.’s Quarterly Report on Form 10-Q for the quarter ended September 30, 2017, filed November 1, 2017 (File No. 1-13643)).
3.2Amended and Restated By-laws of ONEOK, Inc. (incorporated by reference from Exhibit 3.1 to ONEOK Inc.’s Current Report on Form 8-K filed February 24, 2023 (File No. 1-13643)).
4 Certificate of Designation for Convertible Preferred Stock of WAI, Inc. (now ONEOK, Inc.) filed November 21, 2008 (incorporated by reference from Exhibit 3.1 to ONEOK, Inc.’s Quarterly Report on Form 10-Q for the quarter ended June 30, 2012, filed August 1, 2012 (File No. 1-13643)).
4.1Certificate of Designation for Series C Participating Preferred Stock of ONEOK, Inc. filed November 21, 2008 (incorporated by reference from Exhibit No. 3.1 to ONEOK, Inc.’s Quarterly Report on Form 10-Q for the quarter ended June 30, 2012, filed August 1, 2012 (File No. 1-13643)).
4.2Fifth Supplemental Indenture, dated as of June 30, 2017, by and among ONEOK, Inc., ONEOK Partners, L.P., ONEOK Partners Intermediate Limited Partnership and The Bank of New York Mellon Trust, as trustee (incorporated by reference from Exhibit 4.1 to ONEOK Inc.’s Current Report on Form 8-K filed July 3, 2017 (File No. 1-13643)).
4.3Form of Common Stock Certificate (incorporated by reference from Exhibit 1 to ONEOK, Inc.’s Registration Statement on Form 8-A filed November 21, 1997 (File No. 1-13643)).
4.4Indenture dated December 28, 2001, between ONEOK, Inc. and SunTrust Bank, as trustee (incorporated by reference from Exhibit 4.1 to Amendment No. 1 to ONEOK, Inc.’s Registration Statement on Form S-3 filed December 28, 2001 (File No. 333-65392)).
4.5Second Supplemental Indenture dated September 25, 1998, between ONEOK, Inc. and Chase Bank of Texas, as trustee, with respect to the 6.875% Debentures due 2028 (incorporated by reference from Exhibit 5(b) to ONEOK, Inc.’s Current Report on Form 8-K/A filed October 2, 1998 (File No. 1-13643)).
4.6Third Supplemental Indenture, dated as of June 30, 2017, by and among ONEOK, Inc., ONEOK Partners, L.P., ONEOK Partners Intermediate Limited Partnership and U.S. Bank National Association, as trustee (incorporated by reference from Exhibit 4.2 to ONEOK Inc.’s Current Report on Form 8-K filed July 3, 2017 (File No. 1-13643)).
4.7 Thirteenth Supplemental Indenture, dated March 20, 2015, among ONEOK Partners, L.P., ONEOK Partners Intermediate Limited Partnership and Wells Fargo Bank, N.A., as trustee, with respect to the 3.80% Senior Notes due 2020 (incorporated by reference to Exhibit 4.2 to ONEOK Partners, L.P.’s Current Report on Form 8-K filed on March 20, 2015 (File No. 1-12202)).
4.8Fourteenth Supplemental Indenture, dated March 20, 2015, among ONEOK Partners, L.P., ONEOK Partners Intermediate Limited Partnership and Wells Fargo Bank, N.A., as trustee, with respect to the 4.90% Senior Notes due 2025 (incorporated by reference to Exhibit 4.3 to ONEOK Partners, L.P.’s Current Report on Form 8-K filed on March 20, 2015 (File No. 1-12202)).
4.9Fourth Supplemental Indenture, dated as of July 13, 2017, by and among ONEOK, Inc., ONEOK Partners, L.P., ONEOK Partners Intermediate Limited Partnership and U.S. Bank National Association, as trustee, with respect to the 4.00% Senior Notes due 2027 (incorporated by reference from Exhibit 4.1 to ONEOK Inc.’s Current Report on Form 8-K filed July 13, 2017 (File No. 1-13643)).
4.10Fifth Supplemental Indenture, dated as of July 13, 2017, by and among ONEOK, Inc., ONEOK Partners, L.P., ONEOK Partners Intermediate Limited Partnership and U.S. Bank National Association, as trustee, with respect to the 4.95% Senior Notes due 2047 (incorporated by reference from Exhibit 4.2 to ONEOK Inc.’s Current Report on Form 8-K filed July 13, 2017 (File No. 1-13643)).
4.11Fifteenth Supplemental Indenture, dated as of June 30, 2017, by and among ONEOK Partners, L.P., ONEOK, Inc., ONEOK Partners Intermediate Limited Partnership and Wells Fargo Bank, N.A., as trustee (incorporated by reference from Exhibit 4.1 to ONEOK, Partners, L.P.’s Current Report on Form 8-K filed July 3, 2017 (File No. 1-12202)).
4.12Certificate of Designation, Preferences and Rights of Series E Non-Voting Perpetual Preferred Stock of ONEOK, Inc. filed April 20, 2017 (incorporated by reference from Exhibit No. 3.1 to ONEOK, Inc.’s Current Report on Form 8-K filed April 20, 2017 (File No. 1-13643)).
4.13Third Supplemental Indenture, dated June 17, 2005, between ONEOK, Inc. and SunTrust Bank, as trustee, with respect to the 6.00% Senior Notes due 2035 (incorporated by reference from Exhibit 4.3 to ONEOK, Inc.’s Current Report on Form 8-K filed June 17, 2005 (File No. 1-13643)).
4.14Eleventh Supplemental Indenture, dated September 12, 2013, among ONEOK Partners, L.P., ONEOK Partners Intermediate Limited Partnership and Wells Fargo Bank, N.A., as trustee, with respect to the 5.000% Senior Notes due 2023 (incorporated by reference to Exhibit 4.3 to ONEOK Partners, L.P.’s Current Report on Form 8-K filed September 12, 2013 (File No. 1-12202)).
4.15Twelfth Supplemental Indenture, dated September 12, 2013, among ONEOK Partners, L.P., ONEOK Partners Intermediate Limited Partnership and Wells Fargo Bank, N.A., as trustee, with respect to the 6.200% Senior Notes due 2043 (incorporated by reference to Exhibit 4.4 to ONEOK Partners, L.P.’s Current Report on Form 8-K filed September 12, 2013 (File No. 1-12202)).
4.16Indenture, dated September 25, 2006, between ONEOK Partners, L.P. and Wells Fargo Bank, N.A., as trustee (incorporated by reference to Exhibit 4.1 to ONEOK Partners, L.P.’s Current Report on Form 8-K filed September 26, 2006 (File No. 1-12202)).
4.17Third Supplemental Indenture, dated September 25, 2006, among ONEOK Partners, L.P., ONEOK Partners Intermediate Limited Partnership and Wells Fargo Bank, N.A., as trustee, with respect to the 6.65% Senior Notes due 2036 (incorporated by reference to Exhibit 4.4 to ONEOK Partners, L.P.’s Current Report on Form 8-K filed September 26, 2006 (File No. 1-12202)).
4.18Fourth Supplemental Indenture, dated September 28, 2007, among ONEOK Partners, L.P., ONEOK Partners Intermediate Limited Partnership and Wells Fargo Bank, N.A., as trustee, with respect to the 6.85% Senior Notes due 2037 (incorporated by reference to Exhibit 4.2 to ONEOK Partners, L.P.’s Current Report on Form 8-K filed September 28, 2007 (File No. 1-12202)).
4.19Ninth Supplemental Indenture, dated September 13, 2012, among ONEOK Partners, L.P., ONEOK Partners Intermediate Limited Partnership and Wells Fargo Bank, N.A., as trustee, with respect to the 3.375% Senior Notes due 2022 (incorporated by reference from Exhibit 4.3 to ONEOK Partners, L.P.’s Current Report on Form 8-K filed September 13, 2012 (File No. 1-12202)).
4.20Seventh Supplemental Indenture, dated January 26, 2011, among ONEOK Partners, L.P., ONEOK Partners Intermediate Limited Partnership and Wells Fargo Bank, N.A., as trustee, with respect to the 6.125% Senior Notes due 2041 (incorporated by reference from Exhibit 4.3 to ONEOK Partners, L.P.’s Current Report on Form 8-K filed January 26, 2011 (File No. 1-12202)).
4.21Indenture, dated January 26, 2012, among ONEOK, Inc. and U.S. Bank National Association, as trustee (incorporated by reference to Exhibit 4.1 to ONEOK, Inc.’s Current Report on Form 8-K filed January 26, 2012 (File No. 1-13643)).
4.22First Supplemental Indenture, dated January 26, 2012, among ONEOK, Inc. and U.S. Bank National Association, as trustee, with respect to the 4.25% Senior Notes due 2022 (incorporated by reference to Exhibit 4.2 to ONEOK, Inc.’s Current Report on Form 8-K filed January 26, 2012 (File No. 1-13643)).
4.23Second Supplemental Indenture, dated August 21, 2015, between ONEOK, Inc. and U.S. Bank National Association, as trustee, with respect to the 7.50% Notes due 2023 (incorporated by reference to Exhibit 4.1 to ONEOK, Inc.’s Current Report on Form 8-K filed August 21, 2015 (File No. 1-13643)).
4.24Fourth Supplemental Indenture, dated as of June 30, 2017, by and among ONEOK, Inc., ONEOK Partners, L.P., ONEOK Partners Intermediate Limited Partnership and U.S. Bank National Association, as trustee, with respect to the 6.00% Senior Notes due 2035 (incorporated by reference from Exhibit 4.3 to ONEOK Inc.’s Current Report on Form 8-K filed July 3, 2017 (File No. 1-13643)).
4.25 Sixth Supplemental Indenture, dated as of July 2, 2018, among ONEOK, Inc., ONEOK Partners, L.P., ONEOK Partners Intermediate Limited Partnership and U.S. Bank National Association, as trustee, with respect to the 4.55% Senior Notes due 2028 (incorporated by reference from Exhibit No. 4.1 to ONEOK, Inc.’s Current Report on Form 8-K filed July 2, 2018 (File No. 1-13643)).
4.26 Seventh Supplemental Indenture, dated as of July 2, 2018, among ONEOK, Inc., ONEOK Partners, L.P., ONEOK Partners Intermediate Limited Partnership and U.S. Bank National Association, as trustee, with respect to the 5.20% Senior Notes due 2048 (incorporated by reference from Exhibit No. 4.2 to ONEOK, Inc.’s Current Report on Form 8-K filed July 2, 2018 (File No. 1-13643)).
4.27 Eighth Supplemental Indenture, dated as of March 13, 2019, among ONEOK, Inc., ONEOK Partners, L.P., ONEOK Partners Intermediate Limited Partnership and U.S. Bank National Association, as trustee, with respect to the 4.35% Senior Notes due 2029 (incorporated by reference from Exhibit No. 4.2 to ONEOK, Inc.’s Current Report on Form 8-K filed March 13, 2019 (File No. 1-13643)).
4.28Ninth Supplemental Indenture, dated as of March 13, 2019, among ONEOK, Inc., ONEOK Partners, L.P., ONEOK Partners Intermediate Limited Partnership and U.S. Bank National Association, as trustee, with respect to the 5.20% Senior Notes due 2048 (incorporated by reference from Exhibit No. 4.3 to ONEOK, Inc.’s Current Report on Form 8-K filed March 13, 2019 (File No. 1-13643)).
4.29Tenth Supplemental Indenture, dated as of August 15, 2019, among ONEOK, Inc., ONEOK Partners, L.P., ONEOK Partners Intermediate Limited Partnership and U.S. Bank National Association, as trustee, with respect to the 2.75% Senior Notes due 2024 (incorporated by reference from Exhibit No. 4.1 to ONEOK, Inc.’s Current Report on Form 8-K filed August 15, 2019 (File No. 1-13643)).
4.30Eleventh Supplemental Indenture, dated as of August 15, 2019, among ONEOK, Inc., ONEOK Partners, L.P., ONEOK Partners Intermediate Limited Partnership and U.S. Bank National Association, as trustee, with respect to the 3.40% Senior Notes due 2029 (incorporated by reference from Exhibit No. 4.2 to ONEOK, Inc.’s Current Report on Form 8-K filed August 15, 2019 (File No. 1-13643)).
4.31Twelfth Supplemental Indenture, dated as of August 15, 2019, among ONEOK, Inc., ONEOK Partners, L.P., ONEOK Partners Intermediate Limited Partnership and U.S. Bank National Association, as trustee, with respect to the 4.45% Senior Notes due 2049 (incorporated by reference from Exhibit No. 4.3 to ONEOK, Inc.’s Current Report on Form 8-K filed August 15, 2019 (File No. 1-13643)).
4.32Thirteenth Supplemental Indenture, dated as of March 10, 2020, among ONEOK, Inc., ONEOK Partners, L.P., ONEOK Partners Intermediate Limited Partnership and U.S. Bank National Association, as trustee, with respect to the 2.200% Senior Notes due 2025 (incorporated by reference from Exhibit No. 4.1 to ONEOK, Inc.’s Current Report on Form 8-K filed March 10, 2020 (File No. 1-13643)).
4.33Fourteenth Supplemental Indenture, dated as of March 10, 2020, among ONEOK, Inc., ONEOK Partners, L.P., ONEOK Partners Intermediate Limited Partnership and U.S. Bank National Association, as trustee, with respect to the 3.100% Senior Notes due 2030 (incorporated by reference from Exhibit No. 4.2 to ONEOK, Inc.’s Current Report on Form 8-K filed March 10, 2020 (File No. 1-13643)).
4.34Fifteenth Indenture, dated as of March 10, 2020, among ONEOK, Inc., ONEOK Partners, L.P., ONEOK Partners Intermediate Limited Partnership and U.S. Bank National Association, as trustee, with respect to the 4.500% Senior Notes due 2050 (incorporated by reference from Exhibit No. 4.3 to ONEOK, Inc.’s Current Report on Form 8-K filed March 20, 2020 (File No. 1-13643)).
4.35Sixteenth Supplemental Indenture, dated as of May 7, 2020, among ONEOK, Inc., ONEOK Partners, L.P., ONEOK Partners Intermediate Limited Partnership and U.S. Bank National Association, as trustee, with respect to the 5.850% Senior Notes due 2026 (incorporated by reference from Exhibit No. 4.1 to ONEOK, Inc.’s Current Report on Form 8-K filed May 7, 2020 (File No. 1-13643)).
4.36Seventeenth Supplemental Indenture, dated as of May 7, 2020, among ONEOK, Inc., ONEOK Partners, L.P., ONEOK Partners Intermediate Limited Partnership and U.S. Bank National Association, as trustee, with respect to the 6.350% Senior Notes due 2031 (incorporated by reference from Exhibit No. 4.2 to ONEOK, Inc.’s Current Report on Form 8-K filed May 7, 2020 (File No. 1-13643)).
4.37Eighteenth Supplemental Indenture, dated as of May 7, 2020, among ONEOK, Inc., ONEOK Partners, L.P., ONEOK Partners Intermediate Limited Partnership and U.S. Bank National Association, as trustee, with respect to the 7.150% Senior Notes due 2051 (incorporated by reference from Exhibit No. 4.3 to ONEOK, Inc.’s Current Report on Form 8-K filed May 7, 2020 (File No. 1-13643)).
4.38Nineteenth Supplemental Indenture, dated as of November 18, 2022, among ONEOK, Inc., ONEOK Partners, L.P., ONEOK Partners Intermediate Limited Partnership and U.S. Bank Trust Company, National Association (successor in interest to U.S. Bank National Association), as trustee, with respect to the 6.100% Senior Notes due 2032 (incorporated by reference from Exhibit No. 4.1 to ONEOK, Inc.’s Current Report on Form 8-K filed November 18, 2022 (File No. 1-13643)).
4.39Description of securities (incorporated by reference from Exhibit 4.43 to ONEOK, Inc.'s Annual Report on Form 10-K for the fiscal year ended December 31, 2020, filed February 23, 2021 (File No. 1-13643)).
10ONEOK, Inc. Long-Term Incentive Plan (incorporated by reference from Exhibit 10(a) to ONEOK, Inc.’s Annual Report on Form 10-K for the fiscal year ended December 31, 2001, filed March 14, 2002 (File No. 1-13643)).
10.1ONEOK, Inc. Stock Compensation Plan for Non-Employee Directors (incorporated by reference from Exhibit 99 to ONEOK, Inc.’s Registration Statement on Form S-8 filed January 25, 2001 (File No. 333-54274)).
10.2ONEOK, Inc. Supplemental Executive Retirement Plan terminated and frozen December 31, 2004 (incorporated by reference from Exhibit 10.1 to ONEOK, Inc.’s Current Report on Form 8-K filed December 20, 2004 (File No. 1-13643)).
10.3ONEOK, Inc. 2005 Supplemental Executive Retirement Plan, as amended and restated, dated December 18, 2008 (incorporated by reference from Exhibit 10.3 to ONEOK, Inc.’s Annual Report on Form 10-K for the fiscal year ended December 31, 2008, filed February 25, 2009 (File No. 1-13643)).
10.4Credit Agreement, dated as of April 18, 2017, among ONEOK, Inc., Citibank, N.A., as administrative agent, a swingline lender, a letter of credit issuer and a lender, and the other lenders, swingline lenders and letter of credit issuers parties thereto (incorporated by reference from Exhibit 10.1 to ONEOK, Inc.’s Current Report on Form 8-K filed April 19, 2017 (File No. 1-13643)).
10.5Form of Indemnification Agreement between ONEOK, Inc. and ONEOK, Inc. officers and directors, as amended (incorporated by reference from Exhibit 10.5 to ONEOK, Inc.’s Annual Report on Form 10-K for the fiscal year ended December 31, 2014, filed February 25, 2015 (File No. 1-13643)).
10.6Amended and Restated ONEOK, Inc. Annual Officer Incentive Plan (incorporated by reference from Exhibit 10.1 to ONEOK, Inc.’s Current Report on Form 8-K filed May 27, 2009 (File No. 1-13643)).
10.7ONEOK, Inc. Employee Nonqualified Deferred Compensation Plan, as amended and restated December 16, 2004 (incorporated by reference from Exhibit 10.3 to ONEOK, Inc.’s Current Report on Form 8-K filed December 20, 2004 (File No. 1-13643)).
10.8ONEOK, Inc. 2005 Nonqualified Deferred Compensation Plan, as amended and restated, dated December 18, 2008 (incorporated by reference from Exhibit 10.8 to ONEOK, Inc.’s Annual Report on Form 10-K for the fiscal year ended December 31, 2008, filed February 25, 2009 (File No. 1-13643)).
10.9ONEOK, Inc. Deferred Compensation Plan for Non-Employee Directors, as amended and restated, dated December 18, 2008 (incorporated by reference from Exhibit 10.9 to ONEOK, Inc.’s Annual Report on Form 10-K for the fiscal year ended December 31, 2008, filed February 25, 2009 (File No. 1-13643)).
10.10Guaranty Agreement, dated as of June 30, 2017, by and between ONEOK Partners, L.P. and ONEOK Partners Intermediate Limited Partnership, in favor of Citibank, N.A., as administrative agent, under the Credit Agreement, dated as of April 18, 2017, by and among ONEOK, Inc., Citibank, N.A. and the other lenders parties thereto (incorporated by reference from Exhibit 10.1 to ONEOK, Inc.’s Current Report on Form 8-K filed July 3, 2017 (File No. 1-13643)).
10.11Extension Agreement, dated as of June 18, 2018, among ONEOK, Inc., Citibank, N.A., as administrative agent, a swingline lender, a letter of credit issuer and a lender, and the other lenders, swingline lenders and letter of credit issuers parties thereto (incorporated by reference from Exhibit No. 10.1 to ONEOK, Inc.’s Current Report on Form 8-K filed June 18, 2018 (File No. 1-13643)).
10.12First Amendment and Extension Agreement, dated as of May 24, 2019, among ONEOK, Inc., Citibank, N.A., as administrative agent, a swingline lender, a letter of credit issuer and a lender, and the other lenders, swingline lenders and letter of credit issuers parties thereto (incorporated by reference from Exhibit No. 10.1 to ONEOK, Inc.’s Current Report on Form 8-K filed May 29, 2019 (File No. 1-13643)).
10.13Amended and Restated Limited Liability Company Agreement of Overland Pass Pipeline Company LLC entered into between ONEOK Overland Pass Holdings, L.L.C. and Williams Field Services Company, LLC dated May 31, 2006 (incorporated by reference to Exhibit 10.6 to ONEOK Partners, L.P.’s Quarterly Report on Form 10-Q for the quarter ended June 30, 2006, filed August 4, 2006 (File No. 1-12202)).
10.14Form of ONEOK, Inc. Officer Change in Control Severance Plan (incorporated by reference from Exhibit 10.1 to ONEOK, Inc.’s Current Report on Form 8-K filed July 22, 2011 (File No. 1-13643)).
10.15Form of 2023 Restricted Unit Stock Award Agreement dated February 22, 2023.
10.16Form of 2023 Performance Unit Award Agreement dated February 22, 2023.
10.17Form of 2022 Restricted Unit Award Agreement (incorporated by reference from Exhibit 10.17 to ONEOK, Inc.’s Annual Report on Form 10-K, filed March 1, 2022 (File No. 1-13643)).
10.18Form of 2022 Performance Unit Award Agreement (incorporated by reference from Exhibit 10.18 to ONEOK, Inc.’s Annual Report on Form 10-K, filed March 1, 2022 (File No. 1-13643)).
10.19Term Loan Agreement, dated as of November 19, 2018, among ONEOK, Inc., Mizuho Bank, Ltd., as administrative agent and a lender, and the other lenders parties thereto (incorporated by reference from Exhibit No. 10.1 to ONEOK, Inc.’s Current Report on Form 8-K filed November 21, 2018 (File No. 1-13643)).
10.20Guaranty Agreement, dated as of November 19, 2018, by ONEOK Partners Intermediate Limited Partnership and ONEOK Partners, L.P. in favor of Mizuho Bank, Ltd., as administrative agent, under the above-referenced Term Loan Agreement (incorporated by reference from Exhibit No. 10.2 to ONEOK, Inc.’s Current Report on Form 8-K filed November 21, 2018 (File No. 1-13643)).
10.21ONEOK, Inc. Equity Incentive Plan (incorporated by reference to Appendix A to ONEOK, Inc.’s definitive proxy statement on Schedule 14A filed on April 5, 2018 (File No. 1-13643)).
10.22ONEOK, Inc. Profit Sharing Plan, dated January 1, 2005 (incorporated by reference from Exhibit 99 to ONEOK, Inc.’s Registration Statement on Form S-8 filed December 30, 2004 (File No. 333-121769)).
10.23ONEOK, Inc. Equity Compensation Plan, as amended and restated, dated December 18, 2008 (incorporated by reference from Exhibit 10.44 to ONEOK, Inc.’s Annual Report on Form 10-K for the fiscal year ended December 31, 2008, filed February 25, 2009 (File No. 1-13643)).
10.24Equity Distribution Agreement, dated July 23, 2020, among ONEOK, Inc., and Credit Suisse Securities (USA) LLC, BofA Securities, Inc., Goldman Sachs & Co. LLC, Mizuho Securities USA LLC, Morgan Stanley & Co. LLC, RBC Capital Markets, LLC, Scotia Capital (USA) Inc., SMBC Nikko Securities America, Inc., SunTrust Robinson Humphrey, Inc. and TD Securities (USA) LLC as sales agents, principals and/or forward sellers, and Credit Suisse Capital LLC, Bank of America, N.A., Goldman Sachs & Co. LLC, Mizuho Markets Americas LLC, Morgan Stanley & Co. LLC, Royal Bank of Canada, The Bank of Nova Scotia and The Toronto-Dominion Bank as forward purchasers (incorporated by reference from Exhibit 1.1 to ONEOK, Inc.’s Current Report on Form 8-K with a filing date of July 24, 2020 (File No. 1-13643)).
10.25Form of Master Forward Confirmation (incorporated by reference from Exhibit 1.2 to ONEOK Inc.’s Current Report on Form 8-K with a filing date of July 24, 2020 (File No. 1-13643)).
10.26Second Amendment to Credit Agreement, dated as of June 26, 2020, among ONEOK, Inc., Citibank, N.A., as administrative agent, a swingline lender, a letter of credit issuer and a lender, and the other lenders, swingline lenders and letter of credit issuers parties thereto (incorporated by reference from Exhibit 10.1 to ONEOK, Inc.’s Current Report on Form 8-K, filed June 30, 2020 (File No. 1-13643)).
10.27Form of 2019 Restricted Unit Award Agreement, dated February 20, 2019 (incorporated by reference to Exhibit 10.54 to ONEOK, Inc.’s Annual Report on Form 10-K for the fiscal year ended December 31, 2018, filed February 26, 2019 (File No. 1-13643)).
10.28Form of 2019 Performance Unit Award Agreement, dated February 20, 2019 (incorporated by reference to Exhibit 10.55 to ONEOK, Inc.’s Annual Report on Form 10-K for the fiscal year ended December 31, 2018, filed February 26, 2019 (File No. 1-13643)).
10.29Form of 2021 Restricted Unit Award Agreement (incorporated by reference from Exhibit 10.33 to ONEOK, Inc.'s Annual Report on Form 10-K for the fiscal year ended December 31, 2020, filed February 23, 2021 (File No. 1-13643)).
10.30Form of 2021 Performance Unit Award Agreement (incorporated by reference from Exhibit 10.34 to ONEOK, Inc's Annual Report on Form 10-K for the fiscal year ended December 31, 2020, filed February 23, 2021 (File No. 1-13643)).
10.31Form of 2020 Restricted Unit Award Agreement (incorporated by reference to Exhibit 10.35 to ONEOK, Inc.’s Annual Report on Form 10-K for the fiscal year ended December 31, 2019, filed February 25, 2020 (File No. 1-13643)).
10.32Form of 2020 Performance Unit Award Agreement (incorporated by reference to Exhibit 10.36 to ONEOK, Inc.’s Annual Report on Form 10-K for the fiscal year ended December 31, 2019, filed February 25, 2020 (File No. 1-13643)).
10.33ONEOK, Inc. Employee Stock Purchase Plan as amended and restated effective May 23, 2012 (incorporated by reference to Exhibit 10.2 to ONEOK, Inc.’s Quarterly Report on Form 10-Q for the quarter ended June 30, 2012, filed August 1, 2012 (File No. 1-13643)).
10.34Form of First Amendment to 2019 Performance Unit Award Agreement (incorporated by reference to Exhibit 10.38 to ONEOK, Inc.’s Annual Report on Form 10-K for the fiscal year ended December 31, 2019, filed February 25, 2020 (File No. 1-13643)).
10.35ONEOK, Inc. 2020 Nonqualified Deferred Compensation Plan dated July 24, 2019, and effective as of January 1, 2020 (incorporated by reference from Exhibit 10.40 to ONEOK, Inc.’s Annual Report on Form 10-K for the fiscal year ended December 31, 2020, filed February 23, 2021 (File No. 1-13643)).
10.36Form of ONEOK, Inc. Equity Incentive Plan Restricted Unit Award Agreement (Make-Whole Award) between ONEOK, Inc. and Pierce H. Norton II (incorporated by reference to Exhibit 10.1 to ONEOK, Inc.’s Quarterly Report on Form 10-Q for the quarter ended June 30, 2021, filed August 4, 2021 (File No. 1-13643)).
10.37Form of ONEOK, Inc. Equity Incentive Plan Restricted Unit Award Agreement (Make-Whole Award) (incorporated by reference to Exhibit 10.1 to ONEOK, Inc.’s Quarterly Report on Form 10-Q for the quarter ended September 30, 2022, filed November 2, 2022 (File No. 1-13643)).
10.38Restricted Unit Award Agreement between ONEOK, Inc. and Pamela Amburgy (incorporated by reference to Exhibit 10.2 to ONEOK, Inc.’s Quarterly Report on Form 10-Q for the quarter ended September 30, 2022, filed November 2, 2022 (File No. 1-13643)).
10.39Restricted Unit Award Agreement between ONEOK, Inc. and Janet Hogan (incorporated by reference to Exhibit 10.3 to ONEOK, Inc.’s Quarterly Report on Form 10-Q for the quarter ended September 30, 2022, filed November 2, 2022 (File No. 1-13643)).
10.40Restricted Unit Award Agreement between ONEOK, Inc. and Darren Wallis (incorporated by reference to Exhibit 10.4 to ONEOK, Inc.’s Quarterly Report on Form 10-Q for the quarter ended September 30, 2022, filed November 2, 2022 (File No. 1-13643)).
10.41Amended and Restated Credit Agreement, dated June 10, 2022, by and among ONEOK, Inc., as borrower, Citibank, N.A., as administrative agent, a swing line lender, a letter of credit issuer and a lender, and the other lenders, swing line lenders and letter of credit issuers parties thereto (incorporated by reference from Exhibit 10.1 to ONEOK, Inc.’s Current Report on Form 8-K, filed June 13, 2022 (File No. 1-13643)).
10.42Amended and Restated Guaranty Agreement, dated June 10, 2022, by and between ONEOK Partners, L.P. and ONEOK Partners Intermediate Limited Partnership, in favor of Citibank, N.A. (incorporated by reference from Exhibit 10.2 to ONEOK, Inc.’s Current Report on Form 8-K, filed June 13, 2022 (File No. 1-13643)).
10.43Sworn Statement in Proof of Loss and Full and Final Settlement, Release, and Indemnity Agreement, dated January 9, 2023, among ONEOK, Inc., Bison Prairie Assurance, L.L.C., certain North American, British, and/or Continental European insurers who are parties thereto and certain North American, British, and/or Continental European reinsurers who are parties thereto (incorporated by reference from Exhibit 10.1 to ONEOK, Inc.’s Current Report on Form 8-K, filed January 10, 2023 (File No. 1-13643)).
21Required information concerning the registrant’s subsidiaries.
22.1List of subsidiary guarantors and issuers of guaranteed securities.
23Consent of Independent Registered Public Accounting Firm - PricewaterhouseCoopers LLP.
31.1Certification of Pierce H. Norton II pursuant to Section 302 of the Sarbanes-Oxley Act of 2002.
31.2Certification of Walter S. Hulse III pursuant to Section 302 of the Sarbanes-Oxley Act of 2002.
32.1Certification of Pierce H. Norton II pursuant to 18 U.S.C. Section 1350 as adopted pursuant to Section 906 of the Sarbanes-Oxley Act of 2002 (furnished only pursuant to Rule 13a-14(b)).
32.2Certification of Walter S. Hulse III pursuant to 18 U.S.C. Section 1350 as adopted pursuant to Section 906 of the Sarbanes-Oxley Act of 2002 (furnished only pursuant to Rule 13a-14(b)).
101.INSInline XBRL Instance Document - the instance document does not appear in the Interactive Data File because its XBRL tags are embedded within the Inline XBRL document.
101.SCHInline XBRL Taxonomy Extension Schema Document.
101.CALInline XBRL Taxonomy Calculation Linkbase Document.
101.DEFInline XBRL Taxonomy Extension Definitions Document.
101.LABInline XBRL Taxonomy Label Linkbase Document.
101.PREInline XBRL Taxonomy Presentation Linkbase Document.
104Cover Page Interactive Data File (formatted in Inline XBRL and contained in Exhibit 101).
Attached as Exhibit 101 to this Annual Report are the following Inline XBRL-related documents: (i) Document and Entity Information; (ii) Consolidated Statements of Income for the years ended December 31, 2022, 2021 and 2020; (iii) Consolidated Statements of Comprehensive Income for the years ended December 31, 2022, 2021 and 2020; (iv) Consolidated Balance Sheets at December 31, 2022 and 2021; (v) Consolidated Statements of Cash Flows for the years ended December 31, 2022, 2021 and 2020; (vi) Consolidated Statements of Changes in Equity for the years ended December 31, 2022, 2021 and 2020; and (vii) Notes to Consolidated Financial Statements.
None.
Pursuant to the requirements of Section 13 or 15(d) of the Exchange Act, the registrant has duly caused this report to be signed on its behalf by the undersigned, thereunto duly authorized.
Date: February 28, 2023
By:/s/ Walter S. Hulse III
Walter S. Hulse III
Chief Financial Officer, Treasurer and Executive Vice President, Investor Relations and Corporate Development
(Principal Financial Officer)
Pursuant to the requirements of the Exchange Act, this report has been signed below by the following persons on behalf of the registrant and in the capacities indicated on this 28th day of February 2023.
/s/ Julie H. Edwards
/s/ Pierce H. Norton II
Julie H. Edwards Pierce H. Norton II Board Chair President, Chief Executive Officer and Director
/s/ Walter S. Hulse III
Walter S. Hulse III
/s/ Mary M. Spears
Mary M. Spears
Chief Financial Officer, Treasurer and Senior Vice President and Chief Executive Vice President, Investor Accounting Officer, Finance and Relations and Corporate Development Tax
/s/ Brian L. Derksen
/s/ Pattye L. Moore
Pattye L. Moore Director Director
Brian L. Derksen
/s/ Mark W. Helderman
/s/ Eduardo A. Rodriguez
Eduardo A. Rodriguez Director Director
Mark W. Helderman
/s/ Randall J. Larson
/s/ Gerald B. Smith
Gerald B. Smith Director Director
Randall J. Larson
/s/ Steven J. Malcolm
Steven J. Malcolm Director
/s/ Jim W. Mogg
Jim W. Mogg Director
Brian L. Derksen, 71
Positions and ages as of February 25, 2023
Retired Global Deputy Chief Executive Officer, Deloitte Touche Tohmatsu Limited
Dallas, Texas
Julie H. Edwards, 64
Board Chair, ONEOK, Inc.
Former Chief Financial Officer, Frontier Oil Corporation and Southern Union Company
Houston, Texas
Mark W. Helderman, 64
Retired Managing Director and Co-Portfolio Manager, Sasco Capital Inc. Westlake, Ohio
Randall J. Larson, 65
Retired Chief Executive Officer, TransMontaigne Partners L.P. Tucson, Arizona
Steven J. Malcolm, 74
Retired Chairman, President and Chief Executive Officer, The Williams Companies, Inc. Tulsa, Oklahoma
Jim W. Mogg, 74
Retired Chairman, DCP Midstream GP, L.L.C. Hydro, Oklahoma
Pattye L. Moore, 65
Former Board Chair, Red Robin Gourmet Burgers; Former Board Chair and President, Sonic Corp. Broken Arrow, Oklahoma
Pierce H. Norton II, 63 President and Chief Executive Officer, ONEOK, Inc. Tulsa, Oklahoma
Eduardo A. Rodriguez, 67 President, Strategic Communications Consulting Group El Paso, Texas
Gerald B. Smith, 72
Founder, Chairman and Chief Executive Officer, Smith Graham & Company Investment Advisors Houston, Texas
ONEOK, INC. OFFICERS Positions and ages as of February 25, 2023
Pierce H. Norton II, 63
President and Chief Executive Officer
Walter S. Hulse III, 59
Chief Financial Officer, Treasurer and Executive Vice President, Investor Relations and Corporate Development
Kevin L. Burdick, 58
Executive Vice President and Chief Commercial Officer
Stephen B. Allen, 49
Senior Vice President, General Counsel and Assistant Corporate Secretary
Janet L. Hogan, 58
Senior Vice President, Chief Human Resources Officer
ANNUAL MEETING
The 2023 annual meeting of shareholders will be held Wednesday, May 24, 2023, at 9 a.m. Central Daylight Time as a virtual meeting only. In order to virtually attend the annual meeting, shareholders must register online at www.proxydocs.com/oke
AUDITORS
PricewaterhouseCoopers LLP
Two Warren Place
6120 South Yale Avenue, Suite 1850
Tulsa, OK 74136
DIRECT STOCK PURCHASE AND DIVIDEND REINVESTMENT PLAN
ONEOK's Direct Stock Purchase and Dividend Reinvestment Plan provides investors the opportunity to purchase shares of common stock without payment of any brokerage fees or service charges and to reinvest dividends automatically.
TRANSFER AGENT, REGISTRAR AND DIVIDEND DISBURSING AGENT
EQ Shareowner Services
P.O. Box 64854
St. Paul, MN 55164-0854
866-235-0232
ww w.shareowneronline.com
CREDIT RATINGS OKE
S&P Global Ratings BB B (stable)
Fitch Ratings, Inc. BB B (stable)
Moody’s Investors Service Ba a3 (positive)
Scott D. Schingen, 49 Senior Vice President, Operations
Sheridan C. Swords, 53
Senior Vice President, Natural Gas Liquids and Natural Gas Gathering and Processing
Charles M. Kelley, 64 Senior Vice President, Natural Gas Pipelines
Mary M. Spears, 43
Senior Vice President, Chief Accounting Officer, Finance and Tax
Pat Cipolla, 57
Vice President, Associate General Counsel - Compliance & Ethics and Corporate Secretary
INVESTOR RELATIONS
oneokinvestorrelations@oneok.com
877-208-7318
CORPORATE WEBSITE
www.oneok.com
FORWARD-LOOKING STATEMENTS
The statements in this annual report that are not historical information, including statements concerning plans and objectives of management for future operations, economic performance or related assumptions, are forward-looking statements. Forward-looking statements may include words such as “anticipate,” “believe,” “continue,” “could,” “estimate,” “expect,” “forecast,” “goal,” “target,” “guidance,” “intend,” “may,” “might,” “outlook,” “plan,” “potential,” “project,” “scheduled,” “should,” “will,” “would” and other words and terms of similar meaning. Although we believe that our expectations regarding future events are based on reasonable assumptions, we can give no assurance that such expectations or assumptions will be achieved. Important factors that could cause actual results to differ materially from those in the forward-looking statements are described under Part I, Item 1A, Risk Factors and Part II, Item 7, Management’s Discussion and Analysis of Financial Condition and Results of Operations and “Forward-Looking Statements” in the ONEOK, Inc. Annual Report on Form 10-K for the year ended Dec. 31, 2022, included in this annual report.