haematologica

VOL. 108 JULY 2023 Journal of the Ferrata Storti Foundation ISSN 0390 - 6078 haematologica.org
J/"#,-#%3,0%&'()*#5*-K%*-%%
4'+5%+*$/1%6,'0-")%
78&"+$%!"+$,0%9:9;<%;;=:>%%% %?*$/@+,0/%9:9;<%;;=A%%%
!"#$%0/B*/C%&0,+/##%
@'(8*##*,-%→%;#$%1/+*#*,-<%;D%1"E#%

!"#$%&'()*+"$*,-%

."&/0#%*##'/1%2'#$%"3$/0%"++/&$"-+/
F,C%&'()*+"$*,-%+,#$%

G5/%&'()*#5/0%*#%"%-,-H&0,3*$% %!,'-1"$*,-%$5"$%I//&#%$5/%% %+,#$%3,0%"'$5,0#%"#%),C%"#%&,##*()/%
6,'0-")%,3%$5/%!/00"$"H%@$,0$*%!,'-1"$*,-%
h aematologica
haematologica
Editor-in-Chief
Jacob M. Rowe (Jerusalem)
Deputy Editors
Carlo Balduini (Pavia), Jerry Radich (Seattle)
Associate Editors
Shai Izraeli (Tel Aviv), Steve Lane (Brisbane), Pier Mannuccio Mannucci (Milan), Pavan Reddy (Houston), David C. Rees (London), Paul G. Richardson (Boston), Francesco Rodeghiero (Vicenza), Gilles Salles (New York), Kerry Savage (Vancouver), Aaron Schimmer (Toronto), Richard F. Schlenk (Heidelberg), Sonali Smith (Chicago)
Statistical Consultant
Catherine Klersy (Pavia)
Editorial Board
Walter Ageno (Varese), Sarit Assouline (Montreal), Andrea Bacigalupo (Roma), Taman Bakchoul (Tübingen), Pablo Bartolucci (Créteil), Katherine Borden (Montreal), Marco Cattaneo (Milan), Corey Cutler (Boston), Kate Cwynarski (London), Ahmet Dogan (New York), Mary Eapen (Milwaukee), Francesca Gay (Torino), Ajay Gopal (Seattle), Alex Herrera (Duarte), Martin Kaiser (London), Marina Konopleva (Houston), Johanna A. Kremer Hovinga (Bern), Nicolaus Kröger (Hamburg), Austin Kulasekararaj (London), Shaji Kumar (Rochester), Ann LaCasce (Boston), Anthony R. Mato (New York), Matthew J. Mauer (Rochester) Neha Mehta-Shah (St. Louis), Moshe Mittelman (Tel Aviv), Alison Moskowitz (New York), Yishai Ofran (Haifa), Farhad Ravandi (Houston), John W. Semple (Lund), Liran Shlush (Toronto), Sarah K. Tasian (Philadelphia), Pieter van Vlieberghe (Ghent), Ofir Wolach (Haifa), Loic Ysebaert (Toulouse)
Managing Director
Antonio Majocchi (Pavia)
Editorial Office
Lorella Ripari (Office & Peer Review Manager), Simona Giri (Production & Marketing Manager), Paola Cariati (Graphic Designer), Giulia Carlini (Graphic Designer), Debora Moscatelli (Graphic Designer), Igor Poletti (Graphic Designer), Marta Fossati (Peer Review), Diana Serena Ravera (Peer Review), Laura Sterza (Account Administrator)
Assistant Editors
Britta Dost (English Editor), Rachel Stenner (English Editor), Anne Freckleton (English Editor), Rosangela Invernizzi (Scientific Consultant), Marianna Rossi (Scientific Consultant), Massimo Senna (Information Technology), Luk Cox (Graphic Artist)
Haematologica | 108 - July 2023
Brief information on Haematologica
Haematologica (print edition, pISSN 0390-6078, eISSN 1592-8721) publishes peer-reviewed papers on all areas of experimental and clinical hematology. The journal is owned by a non-profit organization, the Ferrata Storti Foundation, and serves the scientific community following the recommendations of the World Association of Medical Editors (www.wame.org) and the International Committee of Medical Journal Editors (www.icmje.org).
Haematologica publishes Editorials, Original articles, Review articles, Perspective articles, Editorials, Guideline articles, Letters to the Editor, Case reports & Case series and Comments. Manuscripts should be prepared according to our guidelines (www.haematologica.org/information-for-authors), and the Uniform Requirements for Manuscripts Submitted to Biomedical Journals, prepared by the International Committee of Medical Journal Editors (www.icmje.org).
Manuscripts should be submitted online at http://www.haematologica.org/.
Conflict of interests. According to the International Committee of Medical Journal Editors (http://www.icmje.org/#conflicts), “Public trust in the peer review process and the credibility of published articles depend in part on how well conflict of interest is handled during writing, peer review, and editorial decision making”. The ad hoc journal’s policy is reported in detail at www.haematologica.org/content/policies.
Transfer of Copyright and Permission to Reproduce Parts of Published Papers. Authors will grant copyright of their articles to the Ferrata Storti Foundation. No formal permission will be required to reproduce parts (tables or illustrations) of published papers, provided the source is quoted appropriately and reproduction has no commercial intent. Reproductions with commercial intent will require written permission and payment of royalties.
Subscription. Detailed information about subscriptions is available at www.haematologica.org. Haematologica is an open access journal and access to the online journal is free. For subscriptions to the printed issue of the journal, please contact: Haematologica Office, via Giuseppe Belli 4, 27100 Pavia, Italy (phone +39.0382.27129, fax +39.0382.394705, E-mail: info@haematologica.org).
Rates of the printed edition for the year 2022 are as following:
Institutional: Euro 700
Personal: Euro 170
Advertisements. Contact the Advertising Manager, Haematologica Office, via Giuseppe Belli 4, 27100 Pavia, Italy (phone +39.0382.27129, fax +39.0382.394705, e-mail: marketing@haematologica.org).
Disclaimer. Whilst every effort is made by the publishers and the editorial board to see that no inaccurate or misleading data, opinion or statement appears in this journal, they wish to make it clear that the data and opinions appearing in the articles or advertisements herein are the responsibility of the contributor or advisor concerned. Accordingly, the publisher, the editorial board and their respective employees, officers and agents accept no liability whatsoever for the consequences of any inaccurate or misleading data, opinion or statement. Whilst all due care is taken to ensure that drug doses and other quantities are presented accurately, readers are advised that new methods and techniques involving drug usage, and described within this journal, should only be followed in conjunction with the drug manufacturer’s own published literature.
Direttore responsabile: Prof. Carlo Balduini; Autorizzazione del Tribunale di Pavia n. 63 del 5 marzo 1955. Printing: Press Up, zona Via Cassia Km 36, 300 Zona Ind.le Settevene - 01036 Nepi (VT)

Associated with USPI, Unione Stampa Periodica Italiana. Premiato per l’alto valore culturale dal Ministero dei Beni Culturali ed Ambientali
Haematologica | 108 - July 2023
Table of Contents
Volume 108, Issue 7: July 2023
About the Cover
Image taken from the Editorial by Maria Sjöstrand and Michel Sadelain in this issue.
Landmark Paper in Hematology
1713 TCF3::HLF acute lymphoblastic leukemia: still challenging to cure thirty years later
Sarah K. Tasian
https://doi.org/10.3324/haematol.2023.283148
Editorials
1715 Venetoclax response prediction in acute myeloid leukemia: are we Finnish-ed with uncertainty? Brett Stevens and Daniel A. Pollyea
https://doi.org/10.3324/haematol.2022.282440
1718
Second chances – better than none
Jane Liesveld
https://doi.org/10.3324/haematol.2022.282441
1721
Driving CARs to new places: locally produced BCMA CAR T cells to treat multiple myeloma
Maria Sjöstrand and Michel Sadelain
https://doi.org/10.3324/haematol.2022.282053
1724 Terrific cells for SARS-CoV-2
Stephen Gottschalk
https://doi.org/10.3324/haematol.2022.282273
1726 Adipocytes in their (CD)40s
Adeline Bertola et al.
https://doi.org/10.3324/haematol.2022.282475
1729
From cell surface to nucleus: CCRL2 regulates response to hypomethylating agents in myelodysplastic syndromes
Caner Saygin
https://doi.org/10.3324/haematol.2022.282477
1731
Fetal microchimerism and beyond: a new player in regenerative medicine
Panicos Shangaris and Sara El Hoss
https://doi.org/10.3324/haematol.2022.282244
Review Articles
1734 The relative importance of platelet integrins in hemostasis, thrombosis and beyond
Emily Janus-Bell and Pierre H. Mangin
https://doi.org/10.3324/haematol.2022.282136
Haematologica | 108 - July 2023 I
Articles
1748 How we manage cardiovascular disease in patients with hemophilia
Massimo Franchini, Daniele Focosi and Pier Mannuccio Mannucci
https://doi.org/10.3324/haematol.2022.282407
1758 Acute Lymphoblastic Leukemia
General condition and comorbidity of long-term survivors of adult acute lymphoblastic leukemia
Nicola Gökbuget et al.
https://doi.org/10.3324/haematol.2022.281820
1768 Acute Myeloid Leukemia
Ex vivo venetoclax sensitivity testing predicts treatment response in acute myeloid leukemia
Heikki Kuusanmäki et al.
https://doi.org/10.3324/haematol.2022.281692
1782 Acute Myeloid Leukemia
Second hematopoietic stem cell transplantation as salvage therapy for relapsed acute myeloid leukemia/myelodysplastic syndromes after a first transplantation
Yaara Yerushalmi et al.
https://doi.org/10.3324/haematol.2022.281877
1793 Acute Myeloid Leukemia
Results from a phase I/II trial of cusatuzumab combined with azacitidine in patients with newly diagnosed acute myeloid leukemia who are ineligible for intensive chemotherapy
Thomas Pabst et al.
https://doi.org/10.3324/haematol.2022.281563
1803 Bone Marrow Transplantation
Transcriptome analysis in acute gastrointestinal graft-versus host disease reveals a unique signature in children and shared biology with pediatric inflammatory bowel disease
Pooja Khandelwal et al.
https://doi.org/10.3324/haematol.2022.282035
1817 Bone Marrow Transplantation
Clonal hematopoiesis in the donor does not adversely affect long-term outcomes following allogeneic hematopoietic stem cell transplantation: result from a 13-year follow-up
Kyoung Ha Kim et al.
https://doi.org/10.3324/haematol.2022.281806
1827 Cell Therapy & Immunotherapy
Development and manufacture of novel locally produced anti-BCMA CAR T cells for the treatment of relapsed/refractory multiple myeloma: results from a phase I clinical trial
Nathalie Asherie et al.
https://doi.org/10.3324/haematol.2022.281628
1840 Cell Therapy & Immunotherapy
Allogeneic, off-the-shelf, SARS-CoV-2-specific T cells (ALVR109) for the treatment of COVID-19 in high-risk patients
Spyridoula Vasileiou et al.
https://doi.org/10.3324/haematol.2022.281946
1851 Chronic Lymphocytic Leukemia
Sialylation regulates migration in chronic lymphocytic leukemia
Alessandro Natoni et al.
https://doi.org/10.3324/haematol.2022.281999
1861 Coagulation & its Disorders
Plasminogen activator-coated nanobubbles targeting cell-bound b2-glycoprotein I as a novel thrombusspecific thrombolytic strategy
Paolo Macor et al.
https://doi.org/10.3324/haematol.2022.281505
Haematologica | 108 - July 2023
II
1873 Hematopoiesis
Adipocytes control hematopoiesis and inflammation through CD40 signaling
Myrthe E. Reiche et al.
https://doi.org/10.3324/haematol.2022.281482
1886 Myelodysplastic Syndromes
CCRL2 affects the sensitivity of myelodysplastic syndrome and secondary acute myeloid leukemia cells to azacitidine
Theodoros Karantanos et al.
https://doi.org/10.3324/haematol.2022.281444
1900 Myeloproliferative Disorders
Association between the choice of the conditioning regimen and outcomes of allogeneic hematopoietic cell transplantation for myelofibrosis
Guru Subramanian Guru Murthy et al.
https://doi.org/10.3324/haematol.2022.281958
1909 Platelet Biology & its Disorders
Exome sequencing in 116 patients with inherited thrombocytopenia that remained of unknown origin after systematic phenotype-driven diagnostic workup
Caterina Marconi et al.
https://doi.org/10.3324/haematol.2022.280993
1920 Red Cell Biology & its Disorders
Contribution of fetal microchimeric cells to maternal wound healing in sickle cell ulcers
Mansour Alkobtawi et al.
https://doi.org/10.3324/haematol.2022.281140
Letters
1934 Longitudinal analysis of the evolution of cellular immunity to SARS-CoV-2 induced by infection and vaccination
Spyridoula Vasileiou et al.
https://doi.org/10.3324/haematol.2022.281947
1940 Kaposi sarcoma herpesvirus viral load as a biomarker for leptomeningeal involvement by primary effusion lymphoma
Kathryn Lurain et al.
https://doi.org/10.3324/haematol.2022.281472
1945 A novel colony stimulating factor 3 receptor activating mutation identified in a patient with chronic neutrophilic leukemia
Breanna N. Maniaci et al.
https://doi.org/10.3324/haematol.2022.281828
1951 Clonal dynamics using droplet digital polymerase chain reaction in peripheral blood predicts treatment responses in myelodysplastic syndrome
Johanna Illman et al.
https://doi.org/10.3324/haematol.2022.281595
1957 Covid-19 vaccination in patients with immune-mediated thrombotic thrombocytopenic purpura: a single-referral center experience
Silvia Maria Trisolini et al.
https://doi.org/10.3324/haematol.2022.282311
1960 Long-term treatment with pacritinib on a compassionate use basis in patients with advanced myelofibrosis
Claire Harrison et al.
https://doi.org/10.3324/haematol.2022.282089
Haematologica | 108 - July 2023 III
Case Reports
1965 Radical surgery and venetoclax plus azacitidine in an octogenarian with acute myeloid leukemia
Florian Ramdohr et al.
https://doi.org/10.3324/haematol.2022.282282
1968 Omalizumab alleviates pruritus in myeloproliferative neoplasms
Anna Ravn Landtblom et al.
https://doi.org/10.3324/haematol.2022.281639
Haematologica | 108 - July 2023 IV
TCF3::HLF acute lymphoblastic leukemia: still challenging to cure thirty years later
 Sarah K. Tasian
Children’s Hospital of Philadelphia, PA, USA
E-mail: tasians@chop.edu
https://doi.org/10.3324/haematol.2023.283148
©2023 Ferrata Storti Foundation
Published under a CC BY-NC license
TITLE Two types of genomic rearrangements create alternative E2A-HLF fusion proteins in t(17;19)-ALL.
AUTHORS Hunger SP, Devaraj PE, Foroni L, Secker-Walker LM, Cleary ML.
JOURNAL Blood. 1994;83(10):2970-2977. PMID: 8065331.

While the majority of children, adolescents, and young adults with B-cell acute lymphoblastic leukemia (B-ALL) can be cured by risk-adapted multi-agent chemotherapy regimens optimized during the past 50 years, long-term
survival has remained elusive for pediatric patients with the rare (<1% of cases), but to date universally-fatal, t(17;19) subtype harboring TCF3::HLF (formerly E2A-HLF) fusions first identified and reported in 1991.1 A landmark
Figure 1. Two genomic rearrangements within t(17;19)(q22;p13) acute lymphoblastic leukemia induce unique clinical phenotypes. Type I rearrangements (upper panel) involving E2A (now TCF3) exon 13 and HLF exon 4 are associated with disseminated intravascular coagulation. Type II rearrangements (lower panel) involving E2A exon 12 and HLF exon 4 are associated with hypercalcemia. The uncommon TCF3::HLF B-ALL subtype occurs almost exclusively in pediatric patients, most commonly in adolescence. (Figure adapted with permission from Hunger et al. Blood 1994).2

Haematologica | 108 June 2023 1713 LANDMARK PAPER IN HEMATOLOGY S.K. Tasian
study by Dr Stephen Hunger and colleagues in 19942 cloned and further defined the two major TCF3::HLF fusion breakpoints that are now known to be associated with highly characteristic clinical presentations in patients with this deadly form of B-ALL (Figure 1). Type 1 rearrangements result in translocation between exon 13 of TCF3 and exon 4 of HLF and are associated with a severe disseminated intravascular coagulation phenotype. Type 2 rearrangements result in translocation between exon 12 of TCF3 and exon 4 of HLF and induce a severe hypercalcemia phenotype. The precise mechanisms of these phenomena remain incompletely elucidated. Such clinical manifestations are extremely unusual in other B-ALL subtypes and provide important early clues regarding potentially worrisome leukemia-associated genetic alterations to be detected via cytomolecular assays. Regardless of the specific t(17;19) breakpoints and distinctive clinical phenotypes, patients with TCF3::HLF B-ALL have poor initial responses to chemotherapy and/or experience early relapses (usually within two years of diagnosis) that have been unsalvageable to date with intensive chemotherapy and allogeneic hematopoietic stem cell transplantation (HSCT) in first remission.
Chemoresistance in TCF3::HLF B-ALL has been attributed in part to upregulation of P-glycoprotein expression and ABC multi-drug resistance transport proteins and to upregulation of RAS, BCL-2, and other pro-survival pathways. Recent preclinical studies based upon gene expression
References
1. Raimondi SC, Privitera E, Williams DL, et al. New recurring chromosomal translocations in childhood acute lymphoblastic leukemia. Blood. 1991;77(9):2016-2022.
2. Hunger SP, Devaraj PE, Foroni L, Secker-Walker LM, Cleary ML. Two types of genomic rearrangements create alternative E2AHLF fusion proteins in t(17;19)-ALL. Blood. 1994;83(10):2970-2977.
3. Fischer U, Forster M, Rinaldi A, et al. Genomics and drug profiling of fatal TCF3-HLF-positive acute lymphoblastic
characterization and biochemical high-throughput drug screening of primary TCF3::HLF ALL specimens have identified potential Achilles’s heels for targeted therapies, including MEK inhibition (also germane given frequent KRAS or NRAS co-mutations), BH3 family protein inhibition with navitoclax and/or venetoclax, SRC family kinase inhibition with dasatinib, and Aurora kinase inhibition with alisertib.3 However, such precision medicine approaches have not been widely evaluated in the clinic given the relative rarity of patients with TCF3::HLF B-ALL.
As in other relapsed/refractory B-ALL subtypes, there is tremendous interest in learning if paradigm-shifting CD19targeted or CD22-targeted antibody-based or cellular immunotherapies will ultimately be able to declare victory over the TCF3::HLF B-ALL villain. Encouragingly, recent case series have reported successful remission induction in a small number of patients with relapsed/refractory TCF3::HLF B-ALL treated with blinatumomab-to-HSCT or CD19 chimeric antigen receptor T cells,4,5 although most children have experienced subsequent relapse with longer follow-up. Further studies are necessary to determine if these promising immunotherapeutic approaches are truly high-risk genetics-agnostic and can be further optimized for long-term cure of the unique, and quite deadly, TCF3::HLF B-ALL subtype.
Disclosure
No conflicts of interest to disclose.
leukemia identifies recurrent mutation patterns and therapeutic options. Nat Genet. 2015;47(9):1020-1029.
4. Mouttet B, Vinti L, Ancliff P, et al. Durable remissions in TCF3HLF positive acute lymphoblastic leukemia with blinatumomab and stem cell transplantation. Haematologica. 2019;104(6):e244-e247.
5. Leahy AB, Devine KJ, Li Y, et al. Impact of high-risk cytogenetics on outcomes for children and young adults receiving CD19directed CAR T-cell therapy. Blood. 2022;139(14):2173-2185.
Haematologica | 108 July 2023 1714 LANDMARK PAPER IN HEMATOLOGY S.K. Tasian
Venetoclax response prediction in acute myeloid leukemia: are we Finnish-ed with uncertainty?
Brett Stevens and Daniel A. Pollyea University of Colorado School of Medicine, Division of Hematology, Aurora, CO, USA
Correspondence: D.A. Pollyea
daniel.pollyea@ucdenver.edu
Received: January 20, 2023.
Accepted: February 7, 2023.
Early view: February 16, 2023.
https://doi.org/10.3324/haematol.2022.282440
©2023 Ferrata Storti Foundation
Published under a CC BY-NC license
Venetoclax-based regimens for newly diagnosed patients with acute myeloid leukemia (AML) who are not suitable candidates for intensive induction chemotherapy have had rapid and widespread uptake. There are at least two reasons for this: (i) there was previously no consensus on or enthusiasm for a standard-of-care therapy in this population, and (ii) outcomes from the venetoclax treatment arms were regarded as clinically impactful.1,2 As we settle in to the post-venetoclax AML era, one thing is clear: those of us who work in the AML field are greedy. We have quickly become accustomed to a well-tolerated therapy with the potential for rapid and deep remissions, and we are done with marveling at response rates in the 60-70% range. Attention has turned to the 30-40% who do not respond to this regimen. We look forward to a future in which we develop interventions to augment or replace venetoclax-based regimens, but to reach this promised land, we must be able to reliably recognize, a priori, those patients least likely to respond. Once upon a time, when intensive induction chemotherapy was the only reasonable intervention for a patient with newly diagnosed AML, rules were written regarding who was and who was not likely to respond to these regimens. After decades of experience using induction chemotherapy, those rules were codified into prognostic systems that judgmentally labeled AML: the hoped-for “favorable” strain, the much-feared “adverse” flavor, and the murky “intermediate” group. Of course, these characteristics were never inherent to AML, but were instead a reflection of response to a particular treatment. In a world with one treatment, however, this subtlety was lost, and these categories came to define the disease subtypes themselves, not describe their response to induction chemotherapy. When another effective treatment arrived, this one with a wholly different mechanism, we had to be reminded that the traditional labels, defined by response to intensive chemotherapy, could not be extrapolated without rigorous study and testing. Indeed, as we have gained experience with venetoclax, we have learned that
some traditional risk factors, such as adverse cytogenetic profiles, do not carry adverse implications.3 Others, such as TP53 mutations, still do,3 and still others that had previously been prognostically neutral, such as IDH mutations, are associated with better responses.4 But we cannot limit our analyses to traditional risk factors; biases such as biases such as these, when attempting to uncover predictors for a novel therapy, have the potential to prevent the discovery of new and important factors that may not involve chromosomal abnormalities or gene mutations.
In this issue of Haematologica, Kuusanmaki et al. and the Finnish group make further progress in advancing the field of venetoclax response prediction in AML.5 They have been leaders in this movement; 3 years ago, in this Journal, this team made the novel observation that venetoclax response might vary by the degree of maturation of AML, with more primitive disease having higher sensitivity and more mature forms having greater resistance.6 This unexpected observation of stage of differentiation as a predictive marker has since been validated, by our group and others, in retrospective studies of patients receiving treatment and with further mechanistic work.7,8
They have now made the logical next step: seeking to predict, prospectively, whether an individual patient might respond to venetoclax with ex vivo testing. The authors designed a pilot study for newly diagnosed or relapsed/refractory AML patients who at baseline had bone marrow or peripheral blood sampled, to which multiple measures of ex vivo sensitivity testing were applied using multiple culture conditions and measures of efficacy. All patients (N=39) then received a standard venetoclax+azacitidine regimen, regardless of their sensitivity testing results, which were not communicated to the clinicians treating the patients. Comparison of the predicted versus actual response yielded an encouraging positive predictive value of 88%, and the ex vivo test was able to predict a cohort with superior overall survival.5
The group showed that not accounting for heterogeneity
Haematologica | 108 July 2023 1715 EDITORIAL B. Stevens and D.A. Pollyea
inherent to this disease led to false predictions of resistance. Interestingly, ex vivo efficacy was affected by culture conditions, with the strongest correlations occurring with the use of conditioned media. Furthermore, measurement by flow cytometry had the highest correlation with in vivo efficacy.5 Ultimately, this method largely recapitulates previous preclinical and clinical findings regarding the heterogeneity of response in subsets of cells with some minor exceptions that are likely due to limited representation.
Previous groups have attempted similar measures of predicting drug sensitivity ex vivo to guide therapy.9,10 Importantly, these have largely concentrated on response to conventional chemotherapy agents. Furthermore, accounting for disease heterogeneity, and utilization of multiple media conditions in an iterative fashion, makes the report by Kuusanmaki et al. distinctive and particularly exciting.
The authors highlight many of hurdles to developing their assay as a fully-realized clinical test. These include logistical and quality issues around the samples, false predictions, inability to identify small subclones, and scalability issues for its use in multiple laboratories. Addressing these challenges will not be trivial, but this process will be crucial to bringing this type of assay to the clinic. The manuscript by Kuusanmaki et al. is an admirable first step to guiding venetoclax-based therapy prospectively by a response prediction assay that is rapid and accurate. Indeed, the authors report that they are currently using results of this assay to decide whether or not to administer venetoclax+azacitidine to relapsed/refractory AML patients in an ongoing follow-up study. If successful, one can envision a near-future clinical trial design landscape in which patients, after screening, are assigned to venetoclax with a single backbone therapy if they are predicted to respond well, a “triplet” if they might encounter resis-

Haematologica | 108 July 2023 1716 EDITORIAL B. Stevens and D.A. Pollyea
Figure 1. The current and hopeful future of treatment decision-making involving venetoclax in patients with acute myeloid leukemia. (A) Currently, venetoclax-based regimens are prescribed with no insight into the likelihood that the regimen will be effective, akin to a spin of the roulette wheel. (B) In the future, practitioners may have access to rapid and reliable ex vivo testing that can help them to recommend a conventional venetoclax-based therapy, a venetoclax "triple combination", or a nonvenetoclax-containing regimen.
tance that the third agent could overcome, or a non-venetoclax regimen if they are likely to be refractory (Figure 1). We eagerly anticipate the next phase of their study, and hope we can continue to rely on the Finnish to diminish uncertainty in predicting venetoclax responders in AML patients.
References
1. DiNardo CD, Jonas BA, Pullarkat V, et al. Azacitidine and venetoclax in previously untreated acute myeloid leukemia. N Engl J Med. 2020;383(7):617-629.
2. Wei AH, Montesinos P, Ivanov V, et al. Venetoclax plus LDAC for newly diagnosed AML ineligible for intensive chemotherapy: a phase 3 randomized placebo-controlled trial. Blood. 2020;135(24):2137-2145.
3. Pollyea DA, Pratz KW, Wei AH, et al. Outcomes in patients with poor-risk cytogenetics with or without TP53 mutations treated with venetoclax and azacitidine. Clin Cancer Res. 2022;28(24):5272-5279.
4. Pollyea DA, DiNardo CD, Arellano ML, et al. Impact of venetoclax and azacitidine in treatment-naive patients with acute myeloid leukemia and IDH1/2 mutations. Clin Cancer Res. 2022;28(13):2753-2761.
5. Kuusanmaki H, Kytola S, Vanttinen I, et al. Ex vivo venetoclax sensitivity testing predicts treatment response in acute myeloid leukemia. Haematologica. 2023;108(7):1768-1781.
Disclosures
DAP receives research funding from Abbvie and serves as a consultant for Abbvie and Genentech.
Contributions
BS and DAP wrote the manuscript.
6. Kuusanmaki H, Leppa AM, Polonen P, et al. Phenotype-based drug screening reveals association between venetoclax response and differentiation stage in acute myeloid leukemia. Haematologica. 2020;105(3):708-720.
7. Pei S, Pollyea DA, Gustafson A, et al. Monocytic subclones confer resistance to venetoclax-based therapy in patients with acute myeloid leukemia. Cancer Discov. 2020;10(4):536-551.
8. White BS, Khan SA, Mason MJ, et al. Bayesian multi-source regression and monocyte-associated gene expression predict BCL-2 inhibitor resistance in acute myeloid leukemia. NPJ Precis Oncol. 2021;5(1):71.
9. Frismantas V, Dobay MP, Rinaldi A, et al. Ex vivo drug response profiling detects recurrent sensitivity patterns in drug-resistant acute lymphoblastic leukemia. Blood. 2017;129(11):e26-e37.
10. Snijder B, Vladimer GI, Krall N, et al. Image-based ex-vivo drug screening for patients with aggressive haematological malignancies: interim results from a single-arm, open-label, pilot study. Lancet Haematol. 2017;4(12):e595-e606.
Haematologica | 108 July 2023 1717 EDITORIAL B. Stevens and D.A. Pollyea
Second chances – better than none
Jane Liesveld
In this issue of Haematologica, Yerushalmi and colleagues explore what happens to patients with acute myelogenous leukemia (AML) and myelodsyplastic syndromes (MDS) who relapse after a first allogeneic hematopoietic stem cell transplant (HSCT1) with the purpose of understanding the benefit of a second transplant (HSCT2) – the second chance.1 When HSCT is performed in AML and MDS, relapse still remains the most common cause of failure even though the treatment is administered with the intent to achieve long-term survival free of graft-versus-host disease (GvHD). Of the 407 patients included in this single-center, retrospective study, 62 had HSCT2 (15%) and 345 did not. The 5-year overall survival rates were 25% (95% confidence interval [95% CI]: 14-36%) and 7% (95% CI: 4-10%) in the transplant and non-transplant groups, respectively (Figure 1). These results mirror the overall 10-15% long-term survival rate often quoted after post-transplant relapse and the long-term survival rates reported after HSCT2 by other single centers,2,3 in cooperative groups,4 or through meta-analysis.5 In most of these studies, less than one third of patients reached HSCT2. In the study by Yerushalmi et al., 28% of patients died in the first 2 months after relapse and could not be considered for HSCT2. Non-relapse mortality in this series was 26%, similar to that in many other studies,2,3 and disease relapse was the main reason for lack of success after HSCT2.
The multivariable analysis conducted by Yerushalmi et al. demonstrated that female gender was the only factor associated with a better overall survival, whereas short remission after HSCT1, acute GvHD after HSCT1, HSCT2 from a haploidentical or matched unrelated donor, and relapse in earlier years of the study were associated with worse survival, suggesting that non-relapse mortality has improved with time. Why female recipients fare better in this situation is unclear and has not been noted in many other series. Others have found that chronic GvHD after the first transplant and a Hematopoietic Cell Transplant-specific Comorbidity Index of ≥2 are associated with inferior progression-free survival and overall survival after HSCT2.3 One of the important analyses in the paper by Yerushalmi et al. was a multivariable analysis of all relapsed patients, with HSCT2 entered as a time-dependent variable. This
Correspondence: J. Liesveld jane_liesveld@urmc.rochester.edu
Received: December 21, 2022.
Accepted: December 30, 2022.
Early view: January 5, 2023.
https://doi.org/10.3324/haematol.2022.282441
©2023 Ferrata Storti Foundation
Published under a CC BY-NC license
helped to eliminate some of the bias created by patients who progress or die early after relapse and never reach HSCT. In this analysis, female gender and having myeloablative conditioning during HSCT1 were associated with better outcomes, whereas relapse within 6 months after HSCT1, acute GvHD before relapse, relapse in earlier years, and not receiving a HSCT2 (P =0.01) were predictive of poorer overall survival. This may imply that those who are fit enough for ablative conditioning in HSCT1 will be more likely to meet performance status and co-morbidity criteria for HSCT2.
In almost all the series examining HSCT2 outcomes, the main cause of death is disease recurrence rather than GvHD or other non-relapse causes, and the majority of patients receive reduced intensity conditioning and most are in remission. Likewise, those who underwent HSCT2 in the study by Yerushalmi et al. tended to be younger than those who did not undergo HSCT2, but HSCT2 could be performed into the upper 70s, and median age at second transplant was 58 years. Most of the HSCT2 patients received GvHD prophylaxis with cyclosporine and methotrexate. Whether incorporation of post-transplant cyclophosphamide will influence the ability to perform second transplants favorably or unfavorably has not been examined, and most series reported to date have not included many patients undergoing haploidentical HSCT1. Most patients had HSCT1 when in first complete remission, but whether performed in first or subsequent remission did not influence outcomes after HSCT2. Minimal residual disease status was not available prior to either transplant.
In univariate analysis, survival in those with active disease at the time of HSCT2 was no different from those in complete remission. This was not significant in multivariable analysis, and in most series, disease status at the time of HSCT2
is predictive of overall survival.3
In some centers, about half of second transplants are accomplished using the same donor as that for the first transplant3 whereas in this series by Yerushalmi et al. only patients receiving grafts from different donors were considered to have undergone HSCT2. Most analyses have shown that whether the same or a different donor is used, overall survival is comparable.5-7 Non-T-cell-depleted haplo-identical transplants have been used for HSCT2,
Department of Medicine, James P. Wilmot Cancer Institute, University of Rochester, Rochester, NY, USA.
Haematologica | 108 July 2023 1718 EDITORIAL J. Liesveld
but non-relapse mortality was higher, and overall survival was not better.7
Current management in the post-HSCT relapse setting is limited to supportive care, withdrawal of immune suppression, chemotherapy, hypomethylating agents,8 targeted agents such as FLT3 or IDH2 inhibitors, donor leukocyte infusions, or HSCT2. More research is needed to find new effective therapies for post-HSCT relapse and to determine how available therapies can be best used. For example, can more effective bridging therapies that reduce disease burden pre-HSCT2 or more effective conditioning regimens for HSCT2 allow progress?9 Also, hypomethylating agents alone or in combination with venetoclax are being used more commonly with or without donor lymphocyte infusions in patients who relapse after HSCT1. It will be interesting to study in the future how these regimens impact bridging to and results of HSCT2.10
The study by Yerushalmi et al. has the limitations of a single-center, retrospective analysis. Patients who relapsed after haploidentical transplants or cord blood transplants were not included in this series, and those who received a second transplant from the same donor
Figure 1. Disposition of the 407 patients who relapsed after hematopoietic stem cell transplant in the study by Yerushalmi et al.1 AML: acute myelogenous leukemia; MDS: myelodysplastic syndrome; HSCT2: second hematopoietic stem cell transplant; OS: overall survival; GvHD: graft- versus-host disease; URD: unrelated donor.
(n=7) were not included in the HSCT2 group. Nevertheless, this work does add to our knowledge of what can be expected of second allografts and what variables are important to consider as decisions about treatment options are made with patients and families. While unlikely that a randomized study will ever be conducted to address postrelapse treatment options due to patients’ heterogeneity, patient and physician preferences, and other logistical barriers, the emphasis must be on relapse prevention, early detection of relapse through measurable residual disease evaluation, and continued development of more effective immune therapies and targeted therapies which could have an impact in a post-transplant relapse setting. Anti-relapse strategies in those undergoing HSCT2 are also needed. The series presented here shows us that, to date, second transplants offer the best chance for survival, but better tolerated and more effective second chances are needed.

Disclosures
JL has sat on advisory boards for Blueprint Sciences, BMS, Servier, Pharmacosmos and Daiichi Sanky o, and participated in a Data Safety Monitoring Board for Syros.
Haematologica | 108 July 2023 1719 EDITORIAL J. Liesveld
References
1. Yerushalmi Y, Shem-Tov N, Danylesko I, et al. Second hematopoietic stem cell transplantation as salvage therapy for relapsed acute myeloid leukemia/myelodysplastic syndromes after a first transplantation. Haematologica. 2023;108(7):1782-1792.
2. Zuanelli Brambilla C, Lobaugh SM, Ruiz JD, et al. Relapse after allogeneic stem cell transplantation of acute myelogenous leukemia and myelodysplastic syndrome and the importance of second cellular therapy. Transplant Cell Ther. 2021;27(9):771.
3. Yalniz FF, Saliba RM, Greenbaum U, et al. Outcomes of second allogeneic hematopoietic cell transplantation for patients with acute myeloid leukemia. Transplant Cell Ther. 2021;27(8):689-695.
4. Ruutu T, de Wreede LC, van Biezen A, et al. Second allogeneic transplantation for relapse of malignant disease: retrospective analysis of outcome and predictive factors by the EBMT. Bone Marrow Transplant. 2015;50(12):1542-1550.
5. Kharfan-Dabaja MA, Labopin M, Brissot E, Ket al. Second allogeneic haematopoietic cell transplantation using HLAmatched unrelated versus T-cell replete haploidentical donor and survival in relapsed acute myeloid leukaemia. Br J Haematol. 2021;193(3):592-601.
6. Christopeit M, Kuss O, Finke J, et al. Second allograft for hematologic relapse of acute leukemia after first allogeneic stem-cell transplantation from related and unrelated donors: the role of donor change. J Clin Oncol. 2013;31(26):3259-3271.
7. Shimoni A, Labopin M, Finke J, et al. Donor selection for a second allogeneic stem cell transplantation in AML patients relapsing after a first transplant: a study of the Acute Leukemia Working Party of EBMT. Blood Cancer J. 2019;9(12):88.
8. Yoshimoto G, Mori Y, Kato K, et al. Azacitidine for the treatment of patients with relapsed acute myeloid leukemia after allogeneic stem cell transplantation. Leuk Lymphoma. 2021;62(12):2939-2948.
9. Finke J, Schmoor C, Stelljes M, et al. Thiotepa-fludarabinetreosulfan conditioning for 2nd allogeneic HCT from an alternative unrelated donor for patients with AML: a prospective multicenter phase II trial. Bone Marrow Transplant. 2022;57(11):1664-1670.
10. Zhao P, Ni M, Ma D, et al. Venetoclax plus azacitidine and donor lymphocyte infusion in treating acute myeloid leukemia patients who relapse after allogeneic hematopoietic stem cell transplantation. Ann Hematol. 2022;101(1):119-130.
Haematologica | 108 July 2023 1720 EDITORIAL J. Liesveld
Driving CARs to new places: locally produced BCMA CAR T cells to treat multiple myeloma
Maria Sjöstrand and Michel Sadelain Center for Cell Engineering, Memorial Sloan Kettering Cancer Center, New York, NY, USA
Correspondence: M. Sadelain
m-sadelain@ski.mskcc.org
Received: January 27, 2023.
Accepted: February 7, 2023. Early view: February 16, 2023.
https://doi.org/10.3324/haematol.2022.282053
©2023 Ferrata Storti Foundation
Published under a CC BY-NC license
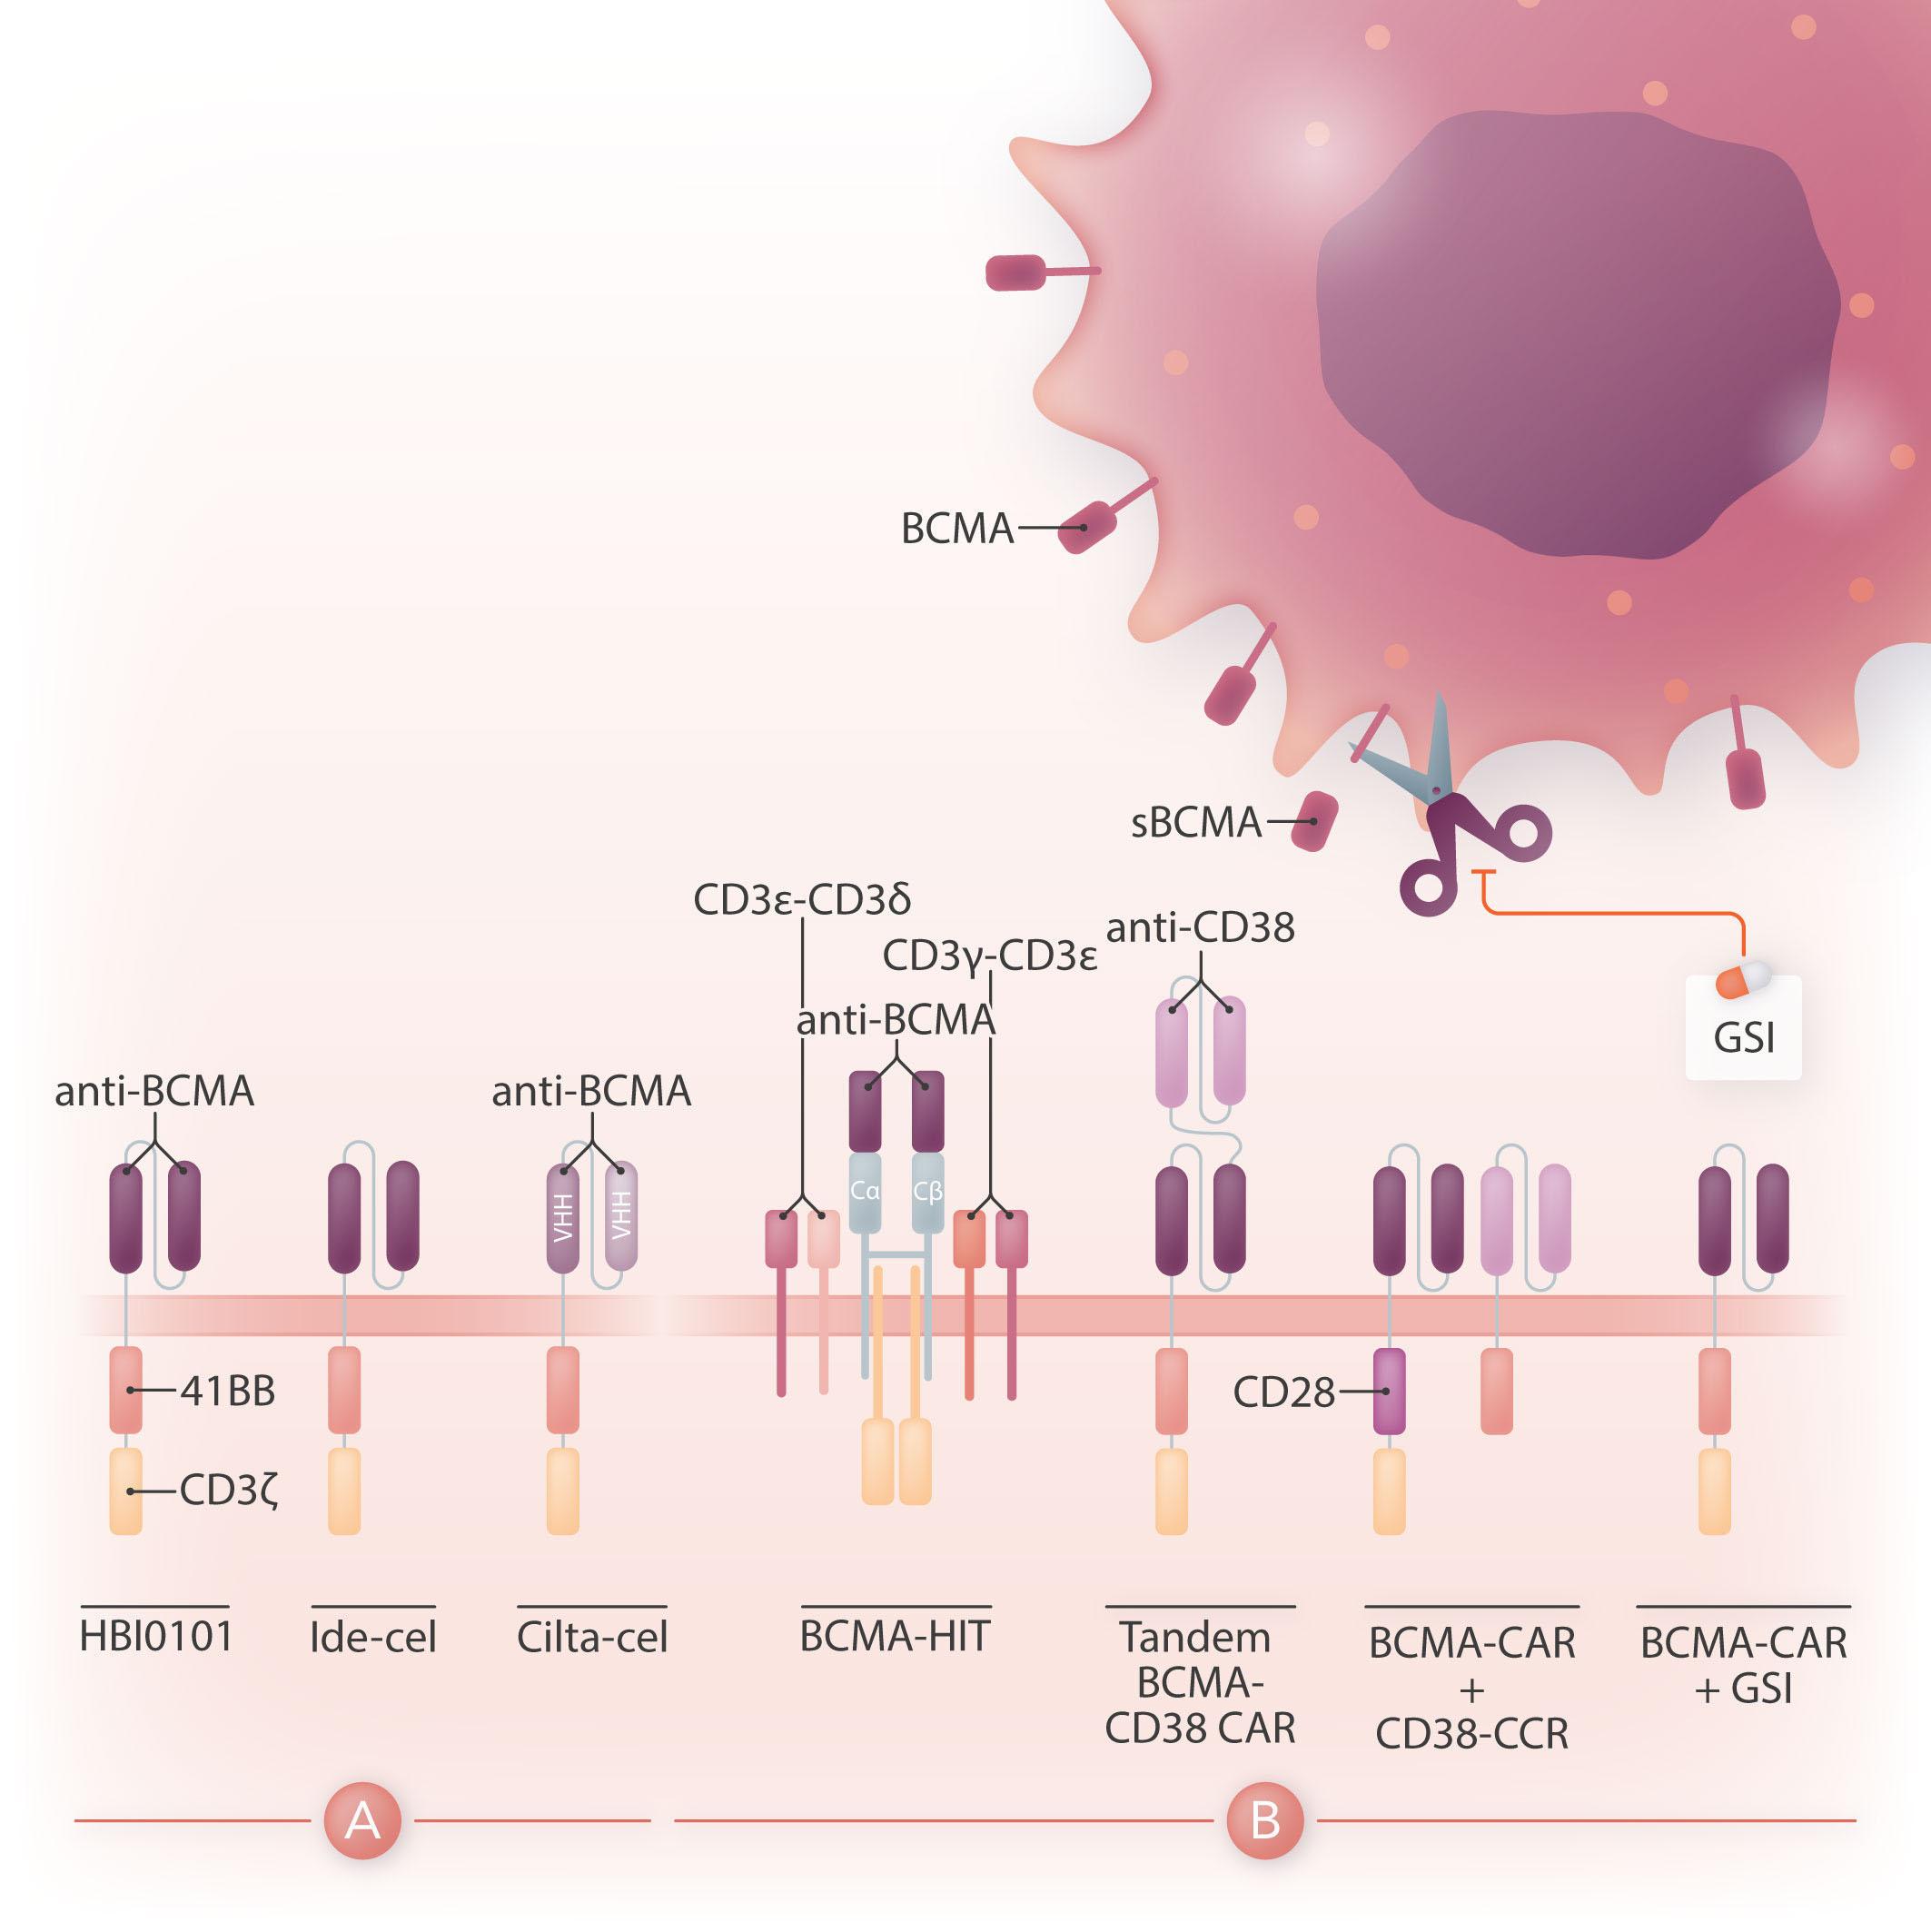
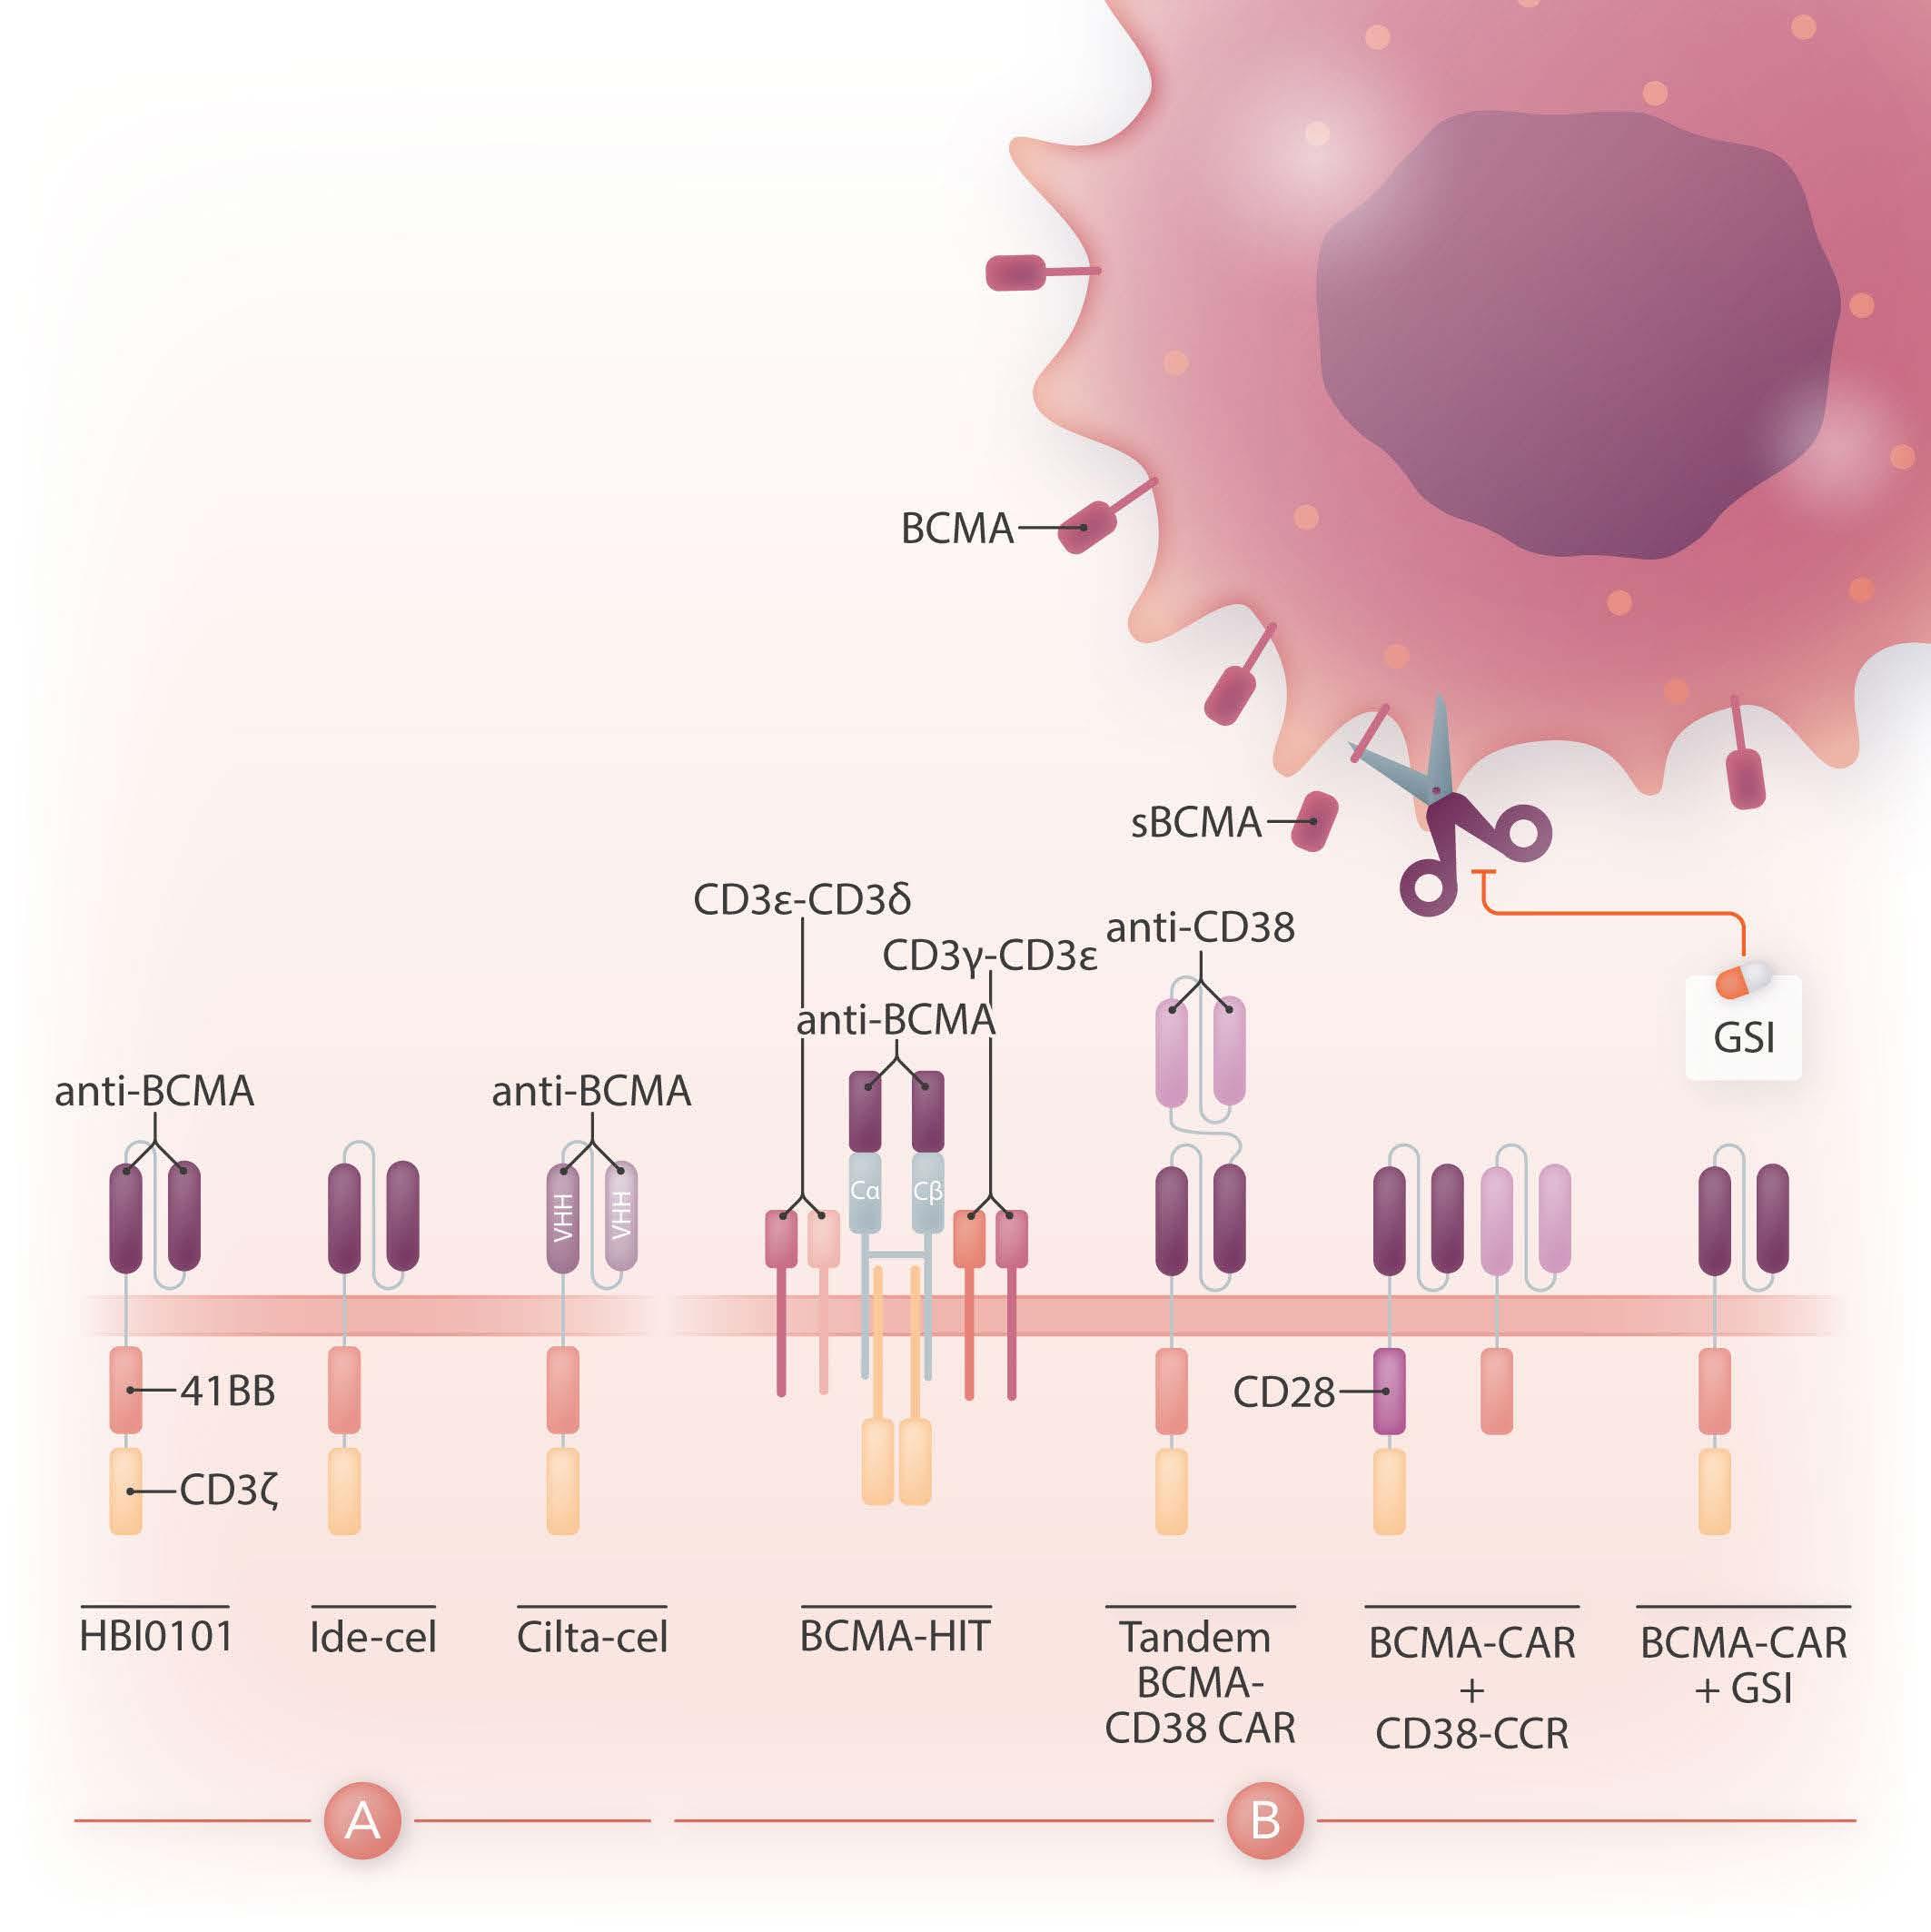
Chimeric antigen receptor (CAR) therapy is a novel immunotherapy that is based on the genetic targeting and reprogramming of immune cells to rapidly provide effective immunity. CAR are synthetic receptors for antigen that typically comprise an extracellular antigen-recognition domain (most often consisting of an scFv derived from an antibody specific for the targeted cell-surface molecule) and a dual-signaling intracellular domain that initiates Tcell activation and augments T-cell functions through costimulatory signals provided by CD28 or 4-1BB cytoplasmic domains.1 Various extracellular scaffold and transmembrane elements may be interposed between the antigen-binding and signaling moieties. The targeting of CD19, a cell surface molecule found in most leukemias and non-Hodgkin lymphomas, has established the formidable potency of CAR T-cell therapy in the clinic2 and paved the way for a vast spectrum of potential CAR therapies for other hematologic malignancies, solid tumors, and several pathologies beyond cancer.3 Six CAR therapies have so far been approved in the US, four of which target CD19 and two B-cell maturation antigen (BCMA), an antigen commonly found in multiple myeloma. BCMA binds to its ligands, BAFF (B-cell activating factor) and APRIL (a proliferation-inducing ligand), and promotes survival in plasma cells. BCMA is a favorable CAR target owing to its restricted expression in B cells and plasma cells, including malignant plasma cells. The two CAR therapies that are approved for the treatment of refractory/relapsed multiple myeloma, idecabtagene vicleucel (ide-cel) and ciltacabtagene autoleucel (cilta-cel), consist of autologous T cells that are lentivirally transduced to express a CAR binding to BCMA through an scFv or two llama VHH elements and signaling through 4-1BB and CD3ζ cytoplasmic domains (Figure 1A). The remarkable response rates following BCMA CAR treatment led to US Food and Drug Administration (FDA) approval of ide-cel in March 2021 and cilta-cel in February 2022.
Challenges remain, in particular in terms of efficacy and access to therapy. Although initial response rates are ex-
cellent, many patients will eventually relapse. Furthermore, since most CAR products require autologous manufacturing and are thus personalized for each patient, commercial production in centralized facilities is both expensive, and possible delays impact CAR T-cell availability. In this issue of Haematologica, Asherie and co-workers describe their findings in a phase I dose escalation clinical trial with a BCMA CAR T-cell product, HBI0101, developed in-house and locally manufactured for the first time in Israel.4 The CAR molecule itself comprises an scFv derived from the C11D5.3 anti-BCMA monoclonal antibody, the hinge and transmembrane domains of CD8α and arrayed 4-1BB and CD3ζ cytoplasmic domains. The CAR design is similar in concept to idecabtagene vicleucel (ide-cel) but differs in using a γ-retroviral vector for its transduction to patient T cells. The clinical team enrolled 20 patients with relapsed and/or refractory multiple myeloma. The study shows a good safety profi le (on the whole similar to other BCAM CAR T-cell phase I-II studies) and similar efficacy (albeit with shorter follow-up) to that initially reported with the later FDA-approved BCMA CAR T cells (75% overall response rate [ORR]; 85% ORR in the group given the highest CAR T-cell dose,4 compared with 85% in the phase I trial evaluating ide-cel5 and 97% in the phase 1b/II trial for cilta-cel6). The Jerusalem trial included nine patients who had relapsed after treatment with an anti-BCMA antibody, belantamab mafodotin, prior to receiving HBI0101, which the authors suggested may be associated with a less favorable response to CAR therapy, although there were no differences in BCMA levels or in the frequency of positive plasma cells compared to patients who had not been treated with belantamab mafodotin. The authors further suggest that CD56 expression in plasma cells may be a favorable prognostic biomarker as 70% of responders were positive for CD56 while non-responders were all CD56-negative. The Jerusalem trial is a small study with a median follow-up of 136 days, and fi ndings need to be substantiated in a larger cohort and with longer follow-up.
Haematologica | 108 July 2023 1721 EDITORIAL M. Sjöstrand and M. Sadelain
Figure 1. Design of HBI0101 and new CAR strategies to target B-cell maturation antigen-low multiple myeloma. (A). HBI0101 is a novel chimeric antigen receptor (CAR) that incorporates 4-1BB and CD3ζ signaling moieties, similar to both US Food and Drug Administration-approved B-cell maturation antigen (BCMA) CAR. Cilta-cel comprises two llama-based VHH regions that bind to two different epitopes of BCMA and thereby increase overall binding affinity. (B) To minimize BCMA-low escape, several new CAR designs have been proposed. These include, from left to right, the use of a BCMA HIT receptor, a tandem CAR engaging CD38 and BCMA, a BCMA CAR co-expressed with a CD38 CCR and the use of γ-secretase inhibitors to block the shedding of soluble BCMA. Ide-cel: idecabtagene vicleucel; cilta-cel: ciltacabtagene autoleucel; CCR: chimeric co-stimulatory receptor; VHH: variable domain on a heavy-chain; GSI: γ-secretase inhibitor; sBCMA: soluble BCMA; HIT: HLA (human leukocyte antigen)-independent Tcell receptor (TCR); Cα/β: constant regions of αβ-TCR.
What makes this study so remarkable is how two academic groups came together to construct a CAR, set up a Current Good Manufacturing Practice production facility, and completed a clinical trial in record time. The laboratory of Cyrille Cohen at Bar-Ilan University built a BCMA CAR vector while Polina Stepensky and her team established the facilities and procedures for local CAR T-cell manufacturing at the Hadassah Medical Center. Having hatched the project in 2018, they opened the trial in February 2021, and had infused 20 subjects by December 2021. This exploit will likely inspire others in the academic world who are tempted to part take in projects to advance CAR therapy and may not have thought it possible.
While there is a need to meet the increasing demand for CAR T-cell therapy and shorten the vein-to-vein delivery time, it is also essential to improve CAR T-cell designs for multiple myeloma since most of the patients treated with BCMA CAR will eventually relapse. One mechanism behind treatment failure is antigen-low relapse.7 It is noteworthy that all current BCMA CAR in the clinic are of the 4-1BB type, which several studies have shown to be less sensitive to low antigen density than CD28-based CAR.8 Other strategies are under evaluation to more effectively target BCMA (Figure 1B). One is to stabilize BCMA on the cell surface by blocking its cleavage using a γ-secretase inhibitor.9 Another is to increase the avidity of CAR T cells for BCMA-
Haematologica | 108 July 2023 1722 EDITORIAL M. Sjöstrand and M. Sadelain
positive cells by co-expressing along with the BCMA CAR a second scFv or chimeric co-stimulatory receptor binding to CD38.10 A bi-specific or tandem CAR engaging both BCMA and CD38 has also shown increased cytotoxicity against multiple myeloma cell lines.11 Finally, novel CAR designs co-opting the CD3 complex, such as the HIT receptor, also increase sensitivity to BCMA.12
All in all, BCMA targeted CAR T-cell therapy offers the prospect for improved outcome in heavily pre-treated patients with multiple myeloma. Increased accessibility to this therapy will benefit patients worldwide. Novel CAR
References
1. Sadelain M, Rivière I, Riddell S. Therapeutic T cell engineering. Nature. 2017;545(7655):423-431.
2. June CH, Sadelain M. Chimeric antigen receptor therapy. N Engl J Med. 2018;379(1):64-73.
3. Levin AG, Riviere I, Eshhar Z, Sadelain M. CAR T cells: building on the CD19 paradigm. Eur J Immunol. 2021;51(9):2151-2163.
4. Asherie N, Kfir-Erendeld S, Avni B, et al. Development and manufacture of novel locally produced anti-BCMA CAR T cells for the treatment of relapsed/refractory multiple myeloma: results from a phase I clinical trial l. Haematologica. 2023:108(7):1827-1839.
5. Raje N, Berdeja J, Lin Y, et al. Anti-BCMA CAR T-cell therapy bb2121 in relapsed or refractory multiple myeloma. N Engl J Med. 2019;380(18):1726-1737.
6. Berdeja JG, Madduri D, Usmani SZ, et al. Ciltacabtagene autoleucel, a B-cell maturation antigen-directed chimeric antigen receptor T-cell therapy in patients with relapsed or refractory multiple myeloma (CARTITUDE-1): a phase 1b/2 open-label study. Lancet. 2021;398(10297):314-324.
designs introduced into T cells and other immune cell types that avert late relapse have the potential to further improve the efficacy of this therapy and will shape the future of CAR therapy for multiple myeloma.
Disclosures
No conflicts of interests to declare pertaining to multiple myeloma.
Contributions
MSj and MSa contributed equally as co-authors.
7. Roex G, Timmers M, Wouters K, et al. Safety and clinical efficacy of BCMA CAR-T-cell therapy in multiple myeloma. J Hematol Oncol. 2020;13(1):164.
8. Hamieh M, Dobrin A, Cabriolu A, et al. CAR T cell trogocytosis and cooperative killing regulate tumour antigen escape. Nature. 2019;568(7750):112-116.
9. Pont MJ, Hill T, Cole GO, et al. γ-Secretase inhibition increases efficacy of BCMA-specific chimeric antigen receptor T cells in multiple myeloma. Blood. 2019;134(19):1585-1597.
10. Katsarou A, Sjostrand M, Naik J, et al. Combining a CAR and a chimeric costimulatory receptor enhances T cell sensitivity to low antigen density and promotes persistence. Sci Transl Med. 2021;13(623):eabh1962.
11. Mei H, Li C, Jiang H, et al. A bispecific CAR-T cell therapy targeting BCMA and CD38 in relapsed or refractory multiple myeloma. J Hematol Oncol. 2021;14(1):161.
12. Mansilla-Soto J, Eyquem J, Haubner S, et al. HLA-independent T cell receptors for targeting tumors with low antigen density. Nat Med. 2022;28(2):345-352.
Haematologica | 108 July 2023 1723 EDITORIAL M. Sjöstrand and M. Sadelain
Terrific cells for SARS-CoV-2
Stephen Gottschalk
Department of Bone Marrow Transplantation and Cellular Therapy, St. Jude Children’s Research Hospital, Memphis, TN, USA
Correspondence: S. Gottschalk stephen.gottschalk@stjude.org
Received: November 29, 2022.
Accepted: December 2, 2022.
Early view: December 7, 2022.
https://doi.org/10.3324/haematol.2022.282273
©2023 Ferrata Storti Foundation
Published under a CC BY-NC license
In this issue of Haematologica, Vasileiou and colleagues describe their elegant work on the development of an allogeneic, off-the-shelf, severe acute respiratory syndrome coronavirus 2 (SARS-CoV-2)-specific T-cell bank.1 While vaccines, monoclonal antibodies, and antivirals have had a significant impact on reducing the morbidity and mortality of coronavirus disease 2019 (COVID-19), caused by SARS-CoV-2 infection, there is a continued need to develop novel biotherapeutics. In this regard, numerous cell therapies are currently being developed for the prevention and treatment of SARS-CoV-2 infection, including virusspecific T cells (VST), and unmodified or genetically modified natural killer cells.2 In addition, clinical studies are currently exploring the utility of cell products, including regulatory T cells and mesenchymal stem cells, to modulate SARS-CoV-2-induced immune activation.2
In their study, Vasileiou and colleagues initially examined T-cell responses to four structural proteins (spike [S], membrane [M], envelope [E], nucleocapsid [N]) and 14 non-structural/accessory proteins (NSP/AP) of SARS-CoV2 in the peripheral blood of convalescent patients. In order to detect SARS-CoV-2-specific T-cell responses, they used pepmixes, which consisted of 15 amino acidlong peptides with an 11 amino acid overlap, spanning the entire amino acid sequence of the respective SARS-CoV2 proteins. T-cell responses to S, M, and N dominated, a finding that was consistent with other studies.3,4 T-cell responses to NSP/NP were generally low or undetectable; however, variable responses were observed against NSP/AP 4 and 7A. Based on these findings, the authors selected S, M, N, 4 and 7A for the generation of an allogeneic, off-the-shelf, SARS-CoV-2-specific T-cell bank.
SARS-CoV-2-specific T cells were generated with a wellestablished method using pepmixes in the presence of interleukin-4 and interleukin-7.5 The VST generated were enriched in CD4+ T cells, had a predominant central memory phenotype, and were polyclonal as judged by T-cell receptor vβ repertoire analysis. Predominance of CD4+ T cells in VST products has been observed for other viruses,5 and is most likely a reflection of the cytokine cocktail used.6 Functional analysis revealed that CD4+ T cells predominantly contributed to SARS-CoV-2 reactivity, and that these T cells were polyfunctional, recognizing
multiple viral antigens, which should reduce the risk of immune escape. Importantly, the generated SARS-CoV-2specific T cells recognized pepmixes encoding S proteins of SARS-CoV-2 variant strains, including alpha, beta, gamma, delta, epsilon and kappa. This is consistent with other studies, which had found that individuals who were vaccinated with a SARS-CoV-2 vaccine developed T-cell responses to variant strains.7
Vasileiou and colleagues infused four COVID-19 patients with off-the-shelf VST; the patients received standard care but were at high risk of progressing to having severe disease. VST infusions were well tolerated and only one patient developed cytokine release syndrome. VST could be detected in all infused patients, as determined by Tcell receptor deep sequencing analysis. COVID-19 infection resolved in three out of the four patients. While these results are encouraging, the clinical study was closed to accrual ‘due to trial's eligibility criteria and the low census of hospitalized COVID-19 patients meeting eligibility criteria’ as stated on the ClinicalTrials.gov webpage for this study.
The study is noteworthy for several reason. First, it highlights that existing technologies to generate VST can be readily adapted to new viral pathogens such as SARSCoV-2. Second, the SARS-CoV-2-specific T cells generated were polyclonal and able to recognize numerous SARSCoV-2 variants, which is a significant advantage over other biologics, including monoclonal antibodies. Finally, it is the first clinical study in which an allogeneic, off-the-shelf VST product was evaluated without prior evaluation in the donor-derived hematopoietic cell transplant setting. Where do cell therapies fit into our current treatment armamentarium for SARS-CoV-2 and its variants? The acute setting might be less than ideal as highlighted by the closure of this study. Given as prophylaxis to high-risk individuals might be a more attractive option, especially in the setting of iatrogenic immunosuppression, including after hematopoietic cell transplantation (HCT) or solid organ transplantation, since these cells can be genetically modified to be resistant to immunosuppressive agents such as calcineurin inhibitors.8 In addition, expressing other therapeutic molecules, including tumor-specific chimeric antigen receptors (CAR) might be an attractive approach to
Haematologica | 108 July 2023 1724 EDITORIAL S. Gottschalk
prevent relapse in the post-HCT setting. In particular, since potent vaccines are available to boost adoptively transferred CAR-expressing SARS-CoV-2-specific T cells in contrast to CAR-VST that recognize other viruses.9 Finally, SARS-CoV-2-specific T cells might be useful for treating symptoms associated with long COVID-19, in a way similar to the use of Epstein-Barr virus-specific T cells for chronic Epstein-Barr virus infections.10
In conclusion, the study by Vasileious et al. highlights the feasibility of generating an allogeneic, off-the-shelf, SARSCoV-2-specific T-cell bank with broad specificity against
References
1. Vasileiou S, Hill L, Kuvalekar M, et al. Allogeneic, off-the-shelf, SARS-CoV-2-specific T cells (ALVR109) for the treatment of COVID-19 in high-risk patients Haematologica. 2023;108(7):1840-1850.
2. Conway SR, Keller MD, Bollard CM. Cellular therapies for the treatment and prevention of SARS-CoV-2 infection. Blood. 2022;140(3):208-221.
3. Keller MD, Harris KM, Jensen-Wachspress MA, et al. SARS-CoV2-specific T cells are rapidly expanded for therapeutic use and target conserved regions of the membrane protein. Blood. 2020;136(25):2905-2917.
4. Bertoletti A, Le Bert N, Tan AT. SARS-CoV-2-specific T cells in the changing landscape of the COVID-19 pandemic. Immunity. 2022;55(10):1764-1778.
5. Tzannou I, Papadopoulou A, Naik S, et al. Off-the-shelf virusspecific T cells to treat BK virus, human herpesvirus 6, cytomegalovirus, Epstein-Barr virus, and adenovirus infections after allogeneic hematopoietic stem-cell transplantation. J Clin Oncol. 2017;35(31):3547-3557.
SARS-CoV-2 variants. The initial clinical safety and efficacy data of off-the-shelf VST were encouraging, paving the way for future studies.
Disclosures
SG has patent applications in the fields of cell and/or gene therapy for cancer, is a consultant for TESSA Therapeutics, is a member of the Data and Safety Monitoring Board of Immatics, and has received honoraria from Tidal, Catamaran Bio, Sanofi, and Novartis within the last 2 years. None of these relationships conflicts with the published work.
6. Durkee-Shock J, Lazarski CA, Jensen-Wachspress MA, et al. Transcriptomic analysis reveals optimal cytokine combinations for SARS-CoV-2-specific T cell therapy products. Mol Ther Methods Clin Dev. 2022;25:439-447.
7. Keeton R, Tincho MB, Ngomti A, et al. T cell responses to SARSCoV-2 spike cross-recognize omicron. Nature. 2022;603(7901):488-492.
8. Peter L, Wendering DJ, Schlickeiser S, et al. Tacrolimusresistant SARS-CoV-2-specific T cell products to prevent and treat severe COVID-19 in immunosuppressed patients. Mol Ther Methods Clin Dev. 2022;25:52-73.
9. Lapteva N, Gilbert M, Diaconu I, et al. T-cell receptor stimulation enhances the expansion and function of CD19 chimeric antigen receptor-expressing T cells. Clin Cancer Res. 2019;25(24):7340-7350.
10. Savoldo B, Huls MH, Liu Z, et al. Autologous Epstein-Barr virus (EBV)-specific cytotoxic T cells for the treatment of persistent active EBV infection. Blood. 2002;100(12):4059-4066.
Haematologica | 108 July 2023 1725 EDITORIAL S. Gottschalk
Adipocytes in their (CD)40s
Adeline Bertola,1 David Dombrowicz2 and Stoyan Ivanov1
Immune cells play a crucial role in cardiometabolic diseases (obesity, atherosclerosis, non-alcoholic steatohepatitis). Cells associated with the innate (macrophages, monocytes, neutrophils, NK cells) and adaptive (T and B lymphocytes) immune responses are involved in disease onset and progression. Optimal T- and B-cell activation requires the involvement of co-stimulatory molecules including the CD40-CD40L receptor-ligand pair.1 CD40L is detected on T cells, while CD40 is typically expressed on antigen-presenting cells such as dendritic cells, macrophages and B cells. Interestingly, CD40 expression was also observed on non-hematopoietic cells including fibroblasts, endothelial cells and epithelial cells. The functional significance of engaging the CD40-CD40L pathway in the development of cardiometabolic diseases has been documented.2-4 Indeed, previous work demonstrated that myeloid cell-specific CD40 deletion on a pro-atherogenic genetic background led to the development of smaller atherosclerotic plaque lesions.2 This was mainly due to the anti-inflammatory phenotype of CD40-deficient macrophages. Furthermore, besides antigen-presenting cells, adipocytes expressed functional MHC-II, suggesting a potential role in antigen presentation.5 However, the potential role of adipocytes in immune responses remains poorly characterized.
In an article published in this issue of Haematologica, Reiche and colleagues describe the impact of CD40 deletion in mature adipocytes on inflammation and metabolic diseases.6 The authors generated mice selectively lacking CD40 expression on mature adipocytes (AdipoQcre x CD40fl/fl mice) and observed decreased bone marrow hematopoietic stem cell numbers in adult and aged mice. Moreover, Bcell and T-cell homeostasis was altered, with decreased numbers of B cells and T cells displaying an activated proinflammatory phenotype. The presence of a large population of regulatory T cells (Treg) in visceral white adipose tissue has also been documented.7 Visceral adipose tissue Treg display a sex-specific phenotype and are enriched in male mice in comparison to age-matched females.8 Pioneering work defined a role for MHC-II, mainly expressed on CD11b+ and CD11c+ antigen-presenting cells, in Treg adipose tissue accumulation.9 The study by Reiche et al. dem-
Correspondence: S. Ivanov stoyan.ivanov@unice.fr
Received: January 13, 2023.
Accepted: January 25, 2023.
Early view: February 2, 2023.
https://doi.org/10.3324/haematol.2022.282475
©2023 Ferrata Storti Foundation
Published under a CC BY-NC license
onstrates that adipocyte CD40 expression is not involved in the generation and maintenance of visceral adipose tissue Treg. In a model of diet-induced obesity, adipocytespecific CD40 deletion led to improved glucose tolerance and weight gain possibly linked to increased fat oxidation. When AdipoQcre x CD40fl/fl mice were bred on a pro-atherogenic (ApoE-/-) background, CD40 pathway engagement on adipocytes had multiple impacts on atherosclerosis disease parameters, culminating in a protective phenotype as illustrated by decreased plaque area. Adipocyte CD40-deficient animals displayed increased myelopoiesis and lymphopoiesis, smaller atherosclerotic plaque area but, surprisingly, the necrotic area in the plaques was increased. Monocytes obtained from AdipoQcre x CD40fl/fl ApoE-/- mice had improved chemotaxis towards CCL2, suggesting potentially increased plaque recruitment.
Taken together these data suggest a major role of CD40 in both hematopoiesis and immune cell functions. However, precisely how cholesterol or lipid metabolism, altered in metabolic diseases, could affect CD40 signaling in adipocytes and its interaction with CD40L remains to be established. Likewise, Reiche et al. documented increased bone marrow adipocyte area in AdipoQcre x CD40fl/fl mice, but the molecular mechanisms underlying the role of CD40 in bone marrow-adipocyte interactions are yet to be identified. Furthermore, mechanisms linking adipocyte CD40 to monocyte migration or T-cell activation in adipose tissue, and whether these lead to the production of a specific set of cytokines, require further investigation. In both models of obesity and atherosclerosis, increased T-cell activation and plasma interferon-γ were observed in AdipoQcre x CD40fl/fl mice, in comparison to littermate control animals, suggesting a rather inhibitory role of adipocyte CD40 on Tcell activation. T cells play a major role during atherosclerosis development. While Th1 cell-derived interferon-γ and tumor necrosis factor-α are detrimental, Treg play a beneficial role through the production of interleukin-10.10 It was demonstrated that T-cell activation during atherosclerosis depends, at least partially, on the presentation of ApoBderived peptides by MHC-II. Whether adipocyte CD40 is required for optimal T-cell activation in this context remains to be defined. Haematologica
1Université Côte d’Azur, CNRS, LP2M, Nice and 2Université Lille, Inserm, CHU Lille, Institut Pasteur de Lille, U1011-EGID, Lille, France
| 108 July 2023 1726 EDITORIAL A. Bertola et al.
Figure 1. Effects of CD40 deficiency in adipocytes on hematopoiesis and cardiometabolic diseases Mice lacking CD40 in mature adipocytes had decreased bone marrow hematopoietic stem cells and altered B- and T-cell homeostasis with reduced B-cell counts and increased T-cell activation. These changes were associated with elevated bone marrow adiposity and plasma corticosterone levels. In a model of obesity induced by a high-fat diet, adipocyte-specific CD40 deficiency ameliorated weight gain and glucose tolerance, in line with increased fat oxidation. In an atherosclerosis-prone genetic mouse model, adipocytespecific CD40 deficiency enhanced hypercholesterolemia-induced myelopoiesis and lymphopoiesis, and resulted in smaller atherosclerotic plaques but larger necrotic cores. The more activated phenotype of T cells in adipocyte CD40-deficient mice may eventually aggravate cardiometabolic diseases. HFD: high-fat diet; HCD: high-cholesterol diet; IFN: interferon; TNF: tumor necrosis factor; IL: interleukin.

In mammals, three major adipocyte subsets have been identified: namely white, beige and brown adipocytes. White adipocytes are implicated in energy storage and mobilization upon nutrient deprivation, while brown and beige adipocytes are involved in non-shivering thermogenesis during cold exposure, a process heavily relying on their Ucp1 expression. In the study by Reiche et al., a pan-adipocyte CD40 deletion strategy was achieved. Whether CD40
References
1. Elgueta R, Benson MJ, de Vries VC, Wasiuk A, Guo Y, Noelle RJ. Molecular mechanism and function of CD40/CD40L engagement in the immune system. Immunol Rev. 2009;229(1):152-172.
plays a different role in different adipocyte subsets remains to be defined.
Disclosures
No conflicts of interest to disclose.
Acknowledgments
All authors wrote and edited the manuscript.
2. Bosmans LA, van Tiel CM, Aarts SABM, et al. Myeloid CD40 deficiency reduces atherosclerosis by impairing macrophages' transition into a pro-inflammatory state. Cardiovasc Res.
Haematologica | 108 July 2023 1727 EDITORIAL A. Bertola et al.
2022 May 19. doi:10.1093/cvr/cvac084. [Epub ahead of print]
3. Reiche ME, den Toom M, Willemsen L, et al. Deficiency of T cell CD40L has minor beneficial effects on obesity-induced metabolic dysfunction. BMJ Open Diabetes Res Care. 2019;7(1):e000829.
4. Aarts S, Reiche M, den Toom M, et al. Depletion of CD40 on CD11c(+) cells worsens the metabolic syndrome and ameliorates hepatic inflammation during NASH. Sci Rep. 2019;9(1):14702.
5. Deng T, Lyon CJ, Minze LJ, et al. Class II major histocompatibility complex plays an essential role in obesityinduced adipose inflammation. Cell Metab. 2013;17(3):411-422.
6. Reiche ME, Poels K, Bosmans LA, et al. Adipocytes control hematopoiesis and inflammation through CD40 signaling.
Haematologica. 2023;108(7):1873-1885.
7. Feuerer M, Herrero L, Cipolletta D, et al. Lean, but not obese, fat is enriched for a unique population of regulatory T cells that affect metabolic parameters. Nat Med. 2009;15(8):930-939.
8. Vasanthakumar A, Chisanga D, Blume J, et al. Sex-specific adipose tissue imprinting of regulatory T cells. Nature. 2020;579(7800):581-585.
9. Kolodin D, et al. Antigen- and cytokine-driven accumulation of regulatory T cells in visceral adipose tissue of lean mice. Cell Metab. 2015;21(4):543-557.
10. Wolf D, Ley K. Immunity and inflammation in atherosclerosis. Circ Res. 2019;124(2):315-327.
Haematologica | 108 July 2023 1728 EDITORIAL A. Bertola et al.
From cell surface to nucleus: CCRL2 regulates response to hypomethylating agents in myelodysplastic syndromes
Caner Saygin
Section of Hematology/Oncology, Department of Medicine, University of Chicago, Chicago, IL, USA
Correspondence: C. Saygin
caner.saygin@uchicagomedicine.org
Received: February 2, 2023.
Accepted: February 7, 2023.
Early view: February 16, 2023.
https://doi.org/10.3324/haematol.2022.282477
©2023 Ferrata Storti Foundation
Published under a CC BY-NC license
Myelodysplastic syndromes (MDS) are clonal stem cell disorders characterized by ineffective hematopoiesis with varying degrees of dysplasia and peripheral cytopenias.1 The treatment of MDS focuses on improving the cytopenias and alleviating transfusion requirements, while preventing progression to secondary acute myeloid leukemia (AML).2 Hypomethylating agents (HMA) are the standard of care for treatment of high-risk MDS, and several studies looking at combination therapies with newer agents failed to show survival benefit.3 Patients with high-risk MDS or secondary AML have a dismal prognosis, especially those in whom HMA fail. New therapies are urgently needed to improve outcomes for these patients.
In this issue of Haematologica, Karantanos et al. report the role of CCRL2 in driving resistance to HMA therapy in cell lines and mouse models of MDS and secondary AML.4 Previous work from the authors showed that the chemokine receptor CCRL2 was highly expressed in CD34+ stem/progenitor cells from patients with MDS and secondary AML.5 High CCRL2 expression was associated with poor survival in these patients, and the authors’ mechanistic studies revealed that JAK-STAT pathway activation was the downstream mediator of the effect of CCRL2. They also found that CCRL2high cells had increased expression of DNA methyltransferase 1 (DNMT1) when compared to their CCRL2low counterparts. Given the adverse prognosis associated with high CCRL2 levels, Karantanos et al. tested the hypothesis that CCRL2 might be a driver of HMA resistance in MDS and AML, and could also serve as a biomarker of response to HMA.
In an unbiased RNA-sequencing analysis comparing control versus CCRL2 knockdown (KD) TF-1 cells (a human erythroleukemia cell line), the authors observed downregulation of genes involved in polycomb repressive complex 2 (PRC2) (e.g., AEBP2, EED, and SUZ12), DNA methylation (e.g., DNMT), DNA damage repair and retinoblastoma pathways. They validated these results in the MDS-L cell line and the publicly available BloodSpot database, which includes data from 228 MDS cases. Given the association between CCRL2 expression and genes in-
volved in DNA methylation and histone modification, the authors investigated the efficacy of HMA therapy (i.e., azacitidine) in CCRL2 KD cells (Figure 1). When compared to the control cells, CCRL2 KD cells had decreased self-renewal capacity upon azacitidine treatment, as assessed using in vitro serial transplant experiments. CCRL2 KD enhanced the cytotoxicity of azacitidine therapy, and CCRL2 KD cells showed evidence of differentiation by surface immunophenotyping after azacitidine treatment. In contrast, CCRL2 overexpression decreased the clonogenicity inhibition effect of azacitidine, and increased resistance to HMA therapy. An in vivo model using the MDS-L cell line showed reduced tumor burden in CCRL2 KD mice treated with azacitidine compared to that in mice engrafted with CCRL2 wildtype cells and treated with azacitidine. The former had higher CD11b expression as well, which may suggest increased differentiation of malignant cells. Finally, in a cohort of 20 MDS patients, there was no correlation between CCRL2 expression and age, revised International Prognostic Scoring System score, cytogenetics and number of mutations. Interestingly, CCRL2 levels were higher in male patients, and in patients with MDS/myeloproliferative neoplasm overlap or SETBP1 mutations. Patients with high CCRL2 expression had lower rates of complete remission after HMA therapy.
This study provides several important points for reflection. First, the authors identified a high-risk subset of MDS patients with high CCRL2 expression, which might be a predictor of response to HMA therapy. They also provide critical preclinical data showing synergy between low CCRL2 levels and azacitidine treatment. This might be due to the impact of CCRL2 signaling on the expression of DNA methyltransferases and members of the PRC2 complex. As a seven transmembrane protein on the cell surface, CCRL2 may be targeted by antibody-based approaches (such as antibody-drug conjugates) or chimeric antigen receptor Tcell immunotherapy. The results of the study by Karantanos et al. do, therefore, have immediate clinical and translational applications.
While CCRL2 is being recognized as an important protein
Haematologica | 108 July 2023 1729 EDITORIAL C. Saygin
Figure 1. CCRL2high myelodysplastic syndrome cells are characterized by increased expression of DNA methyltransferase and polycomb repressive complex 2, resulting in decreased response to azacitidine therapy. MDS: myelodysplastic syndrome; DNMT: DNA methyltransferase; PRC2: polycomb repressive complex 2.

in myeloid neoplasms, several questions remain unanswered. What are the mechanisms by which CCRL2 regulates the expression of DNMT and PRC2 complex genes? Does CCRL2 interact with a ligand on MDS and AML cells? Can CCRL2-targeted therapies rescue HMA-refractory MDS cases? Recent studies have also shown the role of CCRL2 in augmenting anti-tumor T-cell immunity in solid tumors.6,7 It will, therefore, be interesting to investigate the role of CCRL2 in the MDS microenvironment, as
References
1. Saygin C, Godley LA. Genetics of myelodysplastic syndromes. Cancers (Basel). 2021;13(14):3380.
2. Brunner AM, Leitch HA, van de Loosdrecht AA, Bonadies N. Management of patients with lower-risk myelodysplastic syndromes. Blood Cancer J. 2022;12(12):166.
3. Sekeres MA. Improving clinical trials in higher-risk myelodysplastic syndromes. Best Pract Res Clin Haematol. 2022;35(4):101406.
4. Karantanos T, Teodorescu P, Arvanitis M, et al. CCRL2 affects the sensitivity of myelodysplastic syndrome and secondary acute myeloid leukemia cells to azacitidine. Haematologica. 2023;108(7):1886-1899.
well as its impact on therapies targeting innate immune checkpoints such as CD47.
Disclosures
No conflicts of interest to disclose.
Acknowledgments
I thank Luk Cox for his excellent contribution to the preparation of the illustration.
5. Karantanos T, Teodorescu P, Perkins B, et al. The role of the atypical chemokine receptor CCRL2 in myelodysplastic syndrome and secondary acute myeloid leukemia. Sci Adv. 2022;8(7):eabl8952.
6. Del Prete A, Sozio F, Schioppa T, et al. The atypical receptor CCRL2 is essential for lung cancer immune surveillance. Cancer Immunol Res. 2019;7(11):1775-1788.
7. Yin W, Li Y, Song Y, et al. CCRL2 promotes antitumor T-cell immunity via amplifying TLR4-mediated immunostimulatory macrophage activation. Proc Natl Acad Sci U S A. 2021;118(16):e2024171118.
Haematologica | 108 July 2023 1730 EDITORIAL C. Saygin
Fetal microchimerism and beyond: a new player in regenerative medicine
Panicos Shangaris1,2 and Sara El Hoss3
1Women and Children's Health, School of Life Course & Population Sciences; 2Peter Gorer Department of Immunobiology, School of Immunology and Microbial Sciences, Faculty of Life Sciences and Medicine and 3Red Cell Hematology Laboratory, Comprehensive Cancer Centre, School of Cancer & Pharmaceutical Sciences, King's College London, London, UK
Correspondence: P. Shangaris panicos.shangaris@kcl.ac.uk
Received: December 14, 2022.
Accepted: January 10, 2023.
Early view: January 26, 2023.
https://doi.org/10.3324/haematol.2022.282244
©2023 Ferrata Storti Foundation
Published under a CC BY-NC license
Fetal cells in the maternal circulation have been studied for the last 30 years.1 They have contributed to developing the non-invasive prenatal diagnosis of congenital disorders in an unborn fetus.2 In addition, we know that fetal cells, particularly stem cells, can be used in regenerative medicine, and their potential is enormous.3,4 For example, they can be used to treat a myocardial injury, engraft the haematopoietic system when injected in utero, and improve the clinical status in a rat model of necrotizing enterocolitis3 (Figure 1).
In their article, published in this issue of Haematologica; Alkobtawi et al.5 demonstrate that these cells are functional, in vivo, and contribute to healing ulcers in a disease setting, such as sickle cell disease (SCD). Fetal microchimeric cells (low levels of fetal cells in the maternal circulation) are potent contributors to maternal wound healing, even postnatally.5 These fetal cells can differentiate into leukocytes and endothelial cells, thus contributing to the healing of ulcers. This is not surprising since amniotic fluid stem cells can accelerate wound healing by enhancing re-epithelialization and reducing scarring.5 It has previously been shown, by some of the same authors, that ccl2/ccr2 signaling is responsible for the recruitment of fetal cells in maternal wound healing.6 Injections of Ccr2 enhance wound healing in pregnant or postpartum mice but not in virgins. This study showed that fetal microchimeric cells could be selectively recruited using Ccr2 injections into maternal injured tissue.6 The study is critical because it opens the doors for developing potential therapies using fetal stem cells, by in vivo recruitment, or postnatally since they can also be easily obtained at delivery by processing the placenta and placental membranes.7 They can also be stored in a biobank for future use (Figure 1). The study's findings can be expanded to other skin conditions, such as epidermolysis bullosa.5 In a clinical trial, infusion of allogeneic fetal cord mesenchymal stem cells was found to be safe and had transient clinical benefits in patients with epidermolysis bullosa.8 It would be interesting to see
if fetal cells contribute to the maternal haematopoietic niche and how they can affect ineffective erythropoiesis, a newly highlighted mechanism in SCD.9 Ineffective erythropoiesis in SCD is accompanied by apoptosis of differentiating erythroblasts between the polychromatic and orthochromatic stages.9 El Hoss et al. have demonstrated that fetal haemoglobin, produced by fetal haemoglobin-containing cells (F-cells), decreases ineffective erythropoiesis9 by playing an anti-apoptotic role in terminal erythroid differentiation. In the study by Alkobtawi et al., the authors demonstrated that fetal cells display features of hematopoietic progenitor cells by the high expression of genes associated with hematopoietic stem cells, such as Sca1 and Myc.5 Hence, a future study could assess whether there is any improvement in the levels of ineffective erythropoiesis in SCD patients who are pregnant or just had a baby. This potential therapeutic approach could be added to the various antisickling therapeutic strategies designed to improve bone marrow cellularity and erythropoiesis in SCD patients.9
Moreover, the study of Alkobtawi et al. emphasizes the crucial need for the biobanking of fetal stem cells and of cord blood stem cells10 (Figure 1). Some commercial biobanks offer isolation and storage of placental stem cells, but the latter are expensive and are yet to be widely used.7 Since the mother is tolerant to her semi-allogenic fetus, infusion of expanded fetal stem cells from her baby isolated at delivery should be tolerated with an even more remarkable healing effect.5 This could be the basis of a phase I clinical trial following the publication by Alkobtawi et al. Various ways of targeting the site of ulceration could be addressed. For example, direct injection of these cells around the ulcer or intravenously via a peripheral vein. Identifying ways of in-vivo expansion of fetal microchimeric cells, such as Ccr2 injections,6 by targeting their unique characteristics could be a potential approach to improve their therapeutic potential. It will also be interesting to study the potential of these cells, if they are infused as an allogeneic source of cells, to SCD patients
Haematologica | 108 July 2023 1731 EDITORIAL P. Shangaris and S. El Hoss
(cffDNA) used in non-invasive prenatal diagnosis results from the apoptotic disposal of AFSC or PAPC. Fetal stem cells could be harvested at birth and banked for potential therapeutic pathways. Figure adapted from Rosner et al.l0 and Antoniadou et al.7

with severe leg ulcers, having been HLA-matched first. In addition, fetal cells collected at birth could be used to treat the fathers of the infants, since they are also semiallogeneic to their offspring.
Fetal stem cells are superior to their adult counterparts because they have better pluripotency, greater proliferation capacity, lower senescence levels and longer telomeres. They can be used for the treatment of many diseases.4 These cells can easily be recruited in vivo by injecting Ccr2 at the site of interest and non-invasively collected at birth and biobanked.4,5 Further studies should explore the contribution of fetal microchimeric cells to the hematopoietic system in SCD, their effect on
ineffective erythropoiesis, how they can be recruited efficiently in vivo and their biobanking potential. By recruiting fetal cells already in the maternal circulation, the study by Alkobtawi et al. 5 gives hope for further expansion of the therapeutic options for the various comorbidities in SCD and improvement of the quality of life of SCD patients.
Disclosures
No conflicts of interest to disclose.
Contributions
PS and SEH drafted, edited and approved the manuscript.
Haematologica | 108 July 2023 1732 EDITORIAL P. Shangaris and S. El Hoss
Figure 1. Illustration of fetal microchimerism in the maternal circulation. Fetal cells in the maternal circulation might be a form of amniotic fluid stem cells (AFSC), which can give origin to pregnancy-associated progenitor cells (PAPC). These cells can engraft maternal tissues, which is the reason for the wound healing seen in the study by Alkobtawi et al.5 The cell-free fetal DNA
Funding
PS is supported by an NIHR Clinical Lectureship (CL-201817-002), an Academy of Medical Sciences Starter Grant for Clinical Lecturers (SGL023\1023) and grants from the Fetal
References
1. Holzgreve W, Garritsen HS, Ganshirt-Ahlert D. Fetal cells in the maternal circulation. J Reprod Med. 1992;37(5):410-418.
2. Twiss P, Hill M, Daley R, Chitty LS. Non-invasive prenatal testing for Down syndrome. Semin Fetal Neonatal Med. 2014;19(1):9-14.
3. Loukogeorgakis SP, de Coppi P. Stem cells from amniotic fluidpotential for regenerative medicine. Best Pract Res Clin Obstet Gynaecol. 2016;31:45-57.
4. de Coppi P, Bartsch G, Siddiqui MM, et al. Isolation of amniotic stem cell lines with potential for therapy. Nat Biotechnol. 2007;25(1):100-106.
5. Alkobtawi M, Sbeih M, Souaid K, et al. Contribution of fetal microchimeric cells to maternal wound healing in sickle cell ulcers. Haematologica. 2023;108(7):1920-1933.
6. Castela M, Nassar D, Sbeih M, Jachiet M, Wang Z, Aractingi S.
Medicine Foundation. SEH has receiv ed funding from the European Union's Horizon 2020 research and innovation programme under the Marie Sklodowska-Curie grant agreement number 101024970.
Ccl2/Ccr2 signalling recruits a distinct fetal microchimeric population that rescues delayed maternal wound healing. Nat Commun. 2017;8(1):15463.
7. Antoniadou E, David AL. Placental stem cells. Best Pract Res Clin Obstet Gynaecol. 2016;31:13-29.
8. Lee SE, Lee SJ, Kim SE, et al. Intravenous allogeneic umbilical cord blood–derived mesenchymal stem cell therapy in recessive dystrophic epidermolysis bullosa patients. JCI Insight. 2021;6(2):e143606.
9. El Hoss S, Cochet S, Godard A, et al. Fetal hemoglobin rescues ineffective erythropoiesis in sickle cell disease. Haematologica. 2020;106(10):2707-2719.
10. Rosner M, Hengstschläger M. Amniotic fluid stem cells and fetal cell microchimerism. Trends Mol Med. 2013;19(5):271-272.
Haematologica | 108 July 2023 1733 EDITORIAL P. Shangaris and S. El Hoss
The relative importance of platelet integrins in hemostasis, thrombosis and beyond
Emily Janus-Bell and Pierre H. Mangin
Université de Strasbourg, INSERM, EFS Grand-Est, BPPS UMR-S1255, FMTS, Strasbourg, France
Abstract
Correspondence: E. Janus-Bell emily.janus-bell@efs.sante.fr
Received: October 6, 2022.
Accepted: January 9, 2023.
Eary view: January 26, 2023.
https://doi.org/10.3324/haematol.2022.282136
©2023 Ferrata Storti Foundation
Published under a CC BY-NC license
Integrins are heterodimeric transmembrane receptors composed of α and β chains, with an N-terminal extracellular domain forming a globular head corresponding to the ligand binding site. Integrins regulate various cellular functions including adhesion, migration, proliferation, spreading and apoptosis. On platelets, integrins play a central role in adhesion and aggregation on subendothelial matrix proteins of the vascular wall, thereby ensuring hemostasis. Platelet integrins belong either to the β1 family (α2β1, α5β1 and α6β1) or to the β3 family (αIIbβ3 and αvβ3). On resting platelets, integrins can engage their ligands when the latter are immobilized but not in their soluble form. The effects of various agonists promote an inside-out signal in platelets, increasing the affinity of integrins for their ligands and conveying a modest signal reinforcing platelet activation, called outside-in signaling. This outside-in signal ensures platelet adhesion, shape change, granule secretion and aggregation. In this review, we examine the role of each platelet integrin in hemostatic plug formation, hemostasis and arterial thrombosis and also beyond these classical functions, notably in tumor metastasis and sepsis.
Blood platelets: their role in hemostasis, arterial thrombosis and beyond
Blood platelets are small, anucleate, discoid cells that are derived from cytoplasmic extensions of megakaryocytes into the bone marrow sinusoids.1 Platelets play a major role in hemostasis by arresting bleeding following vascular injury. They adhere, become activated and aggregate at the lesion site to form a hemostatic plug that reduces the bleeding, a process called primary hemostasis. A similar process can occur under pathological conditions, following rupture or injury of an evolved atherosclerotic plaque in a diseased artery. Platelets adhere, activate and aggregate on the exposed reactive plaque material. The resulting thrombus can cause vessel occlusion at the lesion site, or form emboli which can occlude a downstream vessel and lead to severe ischemic pathologies such as myocardial infarction, ischemic stroke and obstructive peripheral arterial disease.2 Platelets also maintain vascular integrity as evidenced by endothelial thinning and fenestration in the capillaries and post-capillary venules of thrombocytopenic rabbits.3 This was confirmed by the
leakage of blood fluids from vessels of thrombocytopenic mice.4 Furthermore, platelets prevent inflammatory bleeding as evidenced by local bleeding under inflammatory conditions in the skin, lungs, and brain of thrombocytopenic mice.5
The molecular mechanisms of platelet interactions with the vascular wall are well documented. Under high shear conditions, von Willebrand factor (vWF), present in the subendothelium and adsorbed from plasma onto adhesive proteins of the vessel wall, recruits platelets through its interaction with the glycoprotein (GP) Ib-IX-V complex. Stable adhesion of platelets is then ensured by the β1 integrin family, namely α2β1, α5β1 and α6β1, which interact with collagen, fibronectin and laminins, respectively. Integrin αIIbβ3 is also implicated in stable platelet adhesion, mostly through its interactions with vWF and subendothelial fibronectin. The capture of platelets facilitates the interaction of GPVI with collagen, inducing an intracellular signaling cascade leading to sustained platelet activation.6,7 The latter results in platelet shape change, filopodia formation and secretion of the contents of intracellular granules, including adenosine diphosphate (ADP) and adenosine triphosphate. Activated platelets also synthesize
Haematologica | 108 July 2023 1734 REVIEW ARTICLE
and liberate thromboxane A2 (TxA2). By interacting with their respective receptors, P2Y1 and P2Y12 for ADP, P2X1 for adenosine triphosphate and thromboxane and prostaglandin receptor for TxA2, these soluble agonists amplify the platelet activation, upregulating the affinity of αIIbβ3 for its main ligand, soluble fibrinogen. Fibrinogen forms bridges between adjacent platelets, ensuring platelet aggregation and formation of the hemostatic plug.8 Some activated platelets expose negatively charged phospholipids, phosphatidylserine, allowing the recruitment of coagulation factors, thrombin generation and the formation of an insoluble fibrin network which stabilizes the platelet plug.
Besides their role in hemostasis and thrombosis, platelets are also implicated in non-hemostatic functions. On the one hand, these functions can be physiological such as embryonic and fetal development with the involvement of C-type lectin-like receptor 2 (CLEC-2) in blood and lymphatic vessel separation,9 angiogenesis and tissue repair through their ability to release proangiogenic factors such as vascular endothelial growth factor and platelet-derived growth factor, and innate immunity through the expression of toll-like receptors 1-9 which recognize pathogens and induce secretion of antimicrobial factors.10 On the other hand, platelets are also involved in pathological processes. A role in tumor metastasis has been demonstrated by Gasic and collaborators since thrombocytopenia reduces the capacity of tumor cells to colonize the lungs after their intravenous injection, a process reversed by platelet transfusion.11 Conversely, thrombocytopenia increases septic mortality in patients.12 Platelets have also been proposed to contribute to rheumatoid arthritis13 and autoimmune diseases such as systemic lupus erythematosus.14
The structure and function of integrins
Integrins are a superfamily of heterodimeric transmembrane receptors resulting from the association of two glycoprotein chains, α and β. In man, various combinations of 18 α subunits and eight β subunits can form 24 different integrins.15 The N-terminal extracellular domain of the α subunit consists of the β propeller, thigh, and calf-1 and2 domains. A particularity exists for nine of the integrin α chains which present over the β propeller an αI-domain containing the ligand binding site,15 a metal ion-dependent adhesion site (MIDAS).16 The N-terminal extracellular domain of the β subunit is composed of the βI, hybrid, plexin-semaphorin-integrin, integrin epidermal growth factor-1 to 4 and β-tail domains. The βI domain contains three metal ions site: the MIDAS, the synergistic metal binding site, also known as ligand-associated metal binding site (LIMBS), and the adjacent to MIDAS (ADMIDAS).16
The N-terminal α subunit β propeller domain (for integrins that do not present αI-domains) and the β subunit βI domain, assemble to form a globular head corresponding to the ligand binding site.15 The transmembrane domain is composed of two parallel helices in close proximity, which need to be separated for the integrin to signal.17 Finally, the short C-terminal intracellular domains of both subunits interact non-covalently and are important for integrin signaling.
Agonist binding to platelet receptors promotes an intracellular signal, called inside-out signaling, which leads to a change in the conformation of the integrin extracellular domain, increasing the affinity for its ligands. Electron microscopy has enabled identification of three different integrin conformations:18 (i) in the resting state the ectodomain is closed and folded, forming an inverted V, and the integrin has a low affinity for extracellular ligands, the binding site being close to the membrane surface; (ii) in the intermediate state the ectodomain expands, but the globular head remains closed and the integrin has an intermediate affinity for its ligands; (iii) in the high affinity state the integrin is expanded and the globular head is open, exposing the ligand binding site (Figure 1). Besides their conformational changes following cell stimulation, integrins also cluster into oligomers to increase the avidity for their ligands.19
Integrins are receptors for soluble ligands, cell surface ligands and matrix proteins which mediate cell-cell and cell-extracellular matrix interactions. They regulate general functions such as cell adhesion, migration, proliferation, spreading and apoptosis and also participate in numerous pathophysiological processes such as hemostasis, thrombosis and immune responses.
The repertoire of platelet integrins
Two integrin families are expressed on platelets. Firstly, the β1 integrins α2β1, α5β1 and α6β1 which mainly ensure platelet adhesion on extracellular matrix proteins.20-22 Secondly, the β 3 integrins with α IIb β 3 implicated mostly in platelet aggregation and αvβ3 for which no major hemostatic function has been identified. The expression levels, ligands, expression on other cell types and general roles of these platelet integrins are summarized in Table 1.
The role of integrins in megakaryocyte biology and platelet generation
The role of integrins in the regulation of megakaryopoïesis was recently described in detail in a review by Katya Ravid’s group.23 Integrins, being major adhesion receptors, have been shown to contribute to the anchorage of megakaryo-
Haematologica | 108 July 2023 1735 REVIEW ARTICLE - Platelet integrins: hemostasis, thrombosis, and more E. Janus-Bell and P.H. Mangin
cytes to the extracellular matrix proteins of the bone marrow such as fibrinogen and fibronectin, notably through αIIbβ3 and α5β1, to regulate megakaryopoïesis.24,25 Most of the integrins expressed by megakaryocytes also regulate post-adhesion events such as spreading and migration, which is the case of α2β1 and αIIbβ3.26,27 While platelets are limited to the expression of six integrins, it has been pro-
posed that megakaryocytes express two additional ones, namely α3β1 and α4β1.28,29 Integrin α3β1 has been reported to mediate the interaction of megakaryocytes with a fibroblast matrix and reduced fibroblast proliferation, suggesting a potential contribution to myelofibrosis.29 The expression of α4β1 appears limited to the early stages of megakaryocyte maturation and could contribute to this process.28,30
Main ligand
Other ligands
Other localizations
General role (apart from on platelets)
Collagen (GFOGER sequence on type I collagen)
Complement protein complex C1q, laminins, netrin-4, perlecan
Epithelial cells, endothelial cells, fibroblasts
Cell adhesion and migration, angiogenesis
CD40L: cluster of differentiation 40
Fibronectin (RGD and PHSRN sequences)
Laminins
- TSP-1
Endothelial cells, fibroblasts, lymphocytes, monocytes, cancer cells
Cell adhesion, migration and differentiation
Endothelial cells, pericytes, eosinophils, neutrophils, cancer cells
Figure 1. Integrin conformations. (A) Integrin in the resting state, with a folded ectodomain and low affinity for its ligands. (B) Integrin in the intermediate state with an extended ectodomain and a closed globular head. It has an intermediate affinity for its ligands. (C) Integrin in the high affinity state for its ligands, with an extended ectodomain and opened globular head exposing the ligand binding site.
Fibrinogen (RGD and KQAGDV sequences)
vWF, fibronectin, vitronectin, fibrin, TSP-1, CD40L
None (platelet-specific)
Vitronectin
vWF, fibronectin, fibrinogen, osteopontin
Smooth muscle cells, endothelial cells, fibroblasts, neutrophils, osteoclasts, cancer cells
Cell differentiation, epithelium structureCell adhesion and migration, angiogenesis
ligand; OCS: open canalicular system; TSP-1: thrombospondin 1; vWF: von Willebrand factor.

α2 β1 α5 β1 α6 β1 αIIb β3 αv β3
platelet 3,000-5,000 α2
phism
humans 2,000-4,000 2,000-4,000
30,000
OCS and α
membranes ≈ 100
Copies per
chain polymor-
leads to variable expression levels in
80,000 on the cell surface and
on
granule
B
Table 1. Expression levels, ligands, expression on other cell types and general roles of platelet integrins.
Haematologica | 108 July 2023 1736 REVIEW ARTICLE - Platelet integrins: hemostasis, thrombosis, and more E. Janus-Bell and P.H. Mangin A C
With regard to platelet generation, it has been reported that only platelet-expressed integrins on megakaryocytes, αvβ3, αIIbβ3, α2β1, α5β1 and α6β1, contribute to a distinct degree to proplatelet extension or regulation.23,27,31-33 It should however be noted that α2-, α5- and α6-deficient mice have a normal platelet count, while α 3 knockouts have only a modest reduction, which does not suggest a key role of these integrins on their own in platelet production.34-36 In agreement, patients with Glanzmann thrombasthenia have a platelet count in the normal range, but patients with a gain-of-function mutation exhibit macrothrombocytopenia, suggesting a potential role of αIIbβ3 in the regulation of platelet count.37 In addition, it is possible that integrins compensate for each other, as they do for platelet function, and that multiple deficiencies in mice could highlight a more prominent role in platelet production.
The activation state of integrins and integrin signaling
Integrins constantly oscillate between a low and a high affinity state, and it is well accepted that on resting platelets, integrins are mainly present in a low affinity state. Activation of platelets through many different receptors generates inside-out signaling, resulting in upregulation of the affinity of integrins which change to a high affinity state and become able to bind adhesive proteins in their soluble form, which is best illustrated by αIIbβ3 becoming able to bind fibrinogen in solution. However, when ligands (vWF, fibrinogen, laminins, fibronectin, collagen…) are immobilized on a surface, integrins of resting platelets can engage and support recruitment of resting, unstimulated platelets.38,39 This has been demonstrated in numerous flow-based experiments in which whole blood perfused over immobilized adhesive proteins showed efficient platelet adhesion through either β1 or β3 integrins. It should however be underlined that integrins ensure platelet capture only under low or intermediate flow (<900 s-1), as above such a threshold, GPIb is essential.40 This is most likely explained by the fact that immobilized adhesive proteins present a different conformation from that in solution, exposing cryptic sites and increasing the affinity of integrins. This has been well described for vWF which is in a globular form in solution and unfolds even under low shear when immobilized on a surface.41 This observation also indicates that platelet integrins do not require efficient inside-out signals to engage immobilized ligands, suggesting that platelets contain a sufficient number of integrins in a ready-to-go state to ensure rapid adhesion. Nevertheless, this is not incompatible with the fact that platelet activation certainly increases the affinity of an elevated number of integrins for their ligands. In the fol-
lowing paragraphs, two distinct aspects of integrin signaling will be discussed, one called inside-out signaling which leads to integrin activation and is mediated by binding of agonists to platelet receptors, and the other conveyed by the integrin, which ensures platelet adhesion and induces outside-in signaling, reinforcing platelet shape change, granule secretion and aggregation.
Activation of platelet integrins (inside-out signaling)
The binding of agonists such as collagen, ADP, TxA2 and thrombin to their respective platelet receptors, GPVI, P2Y1 and P2Y12, thromboxane and prostaglandin receptor and protease-activated receptor, promotes integrin activation through inside-out signaling, which involves the activation of phospholipase C (PLC) β or γ pathways. PLC hydrolyzes phosphatidylinositol (4,5)-bisphosphate into diacylglycerol and inositol-1,4,5-triphosphate (IP3), thereby activating protein kinase C (PKC) and mobilizing intracellular calcium42 through IP3 receptor channels. The post-calcium events of inside-out signaling have been particularly welldescribed for αIIbβ3 activation. PKC and intracellular calcium, via calcium and diacylglycerol-regulated guanine nucleotide exchange factor I binding and activation, induce the conversion of Ras-related protein (Rap) 1b-GDP into Rap1b-GTP, the activated form.43 Activated Rap1b is then translocated to the plasma membrane and binds to talin, which interacts with the β 3 cytoplasmic tail to change the conformation of the integrin and induce its activation.44 This was demonstrated using mice with a β 3 L746A substitution selectively disrupting the interaction between β3 and talin and mice with a defect in talin-1; αIIbβ3 activation was reduced in these animals, resulting in defective platelet aggregation and an increased bleeding time.45,46 Kindlin-3 was also shown to participate in β3 integrin activation by enhancing the interaction between talin and the β3 subunit.47 Other proteins are involved in the last step of β3 integrin activation, such as integrinlinked kinase, which serves as an adaptor protein forming an integrin-linked kinase/PINCH/parvin complex linked to the β 3 tail,48 adhesion and degranulation promoting adapter protein and paxillin, which act as bridging molecules between talin and kindlin.49,50 Moreover, there are also negative regulators of the activation of platelet β3 integrin, such as Ras GTPase-activating protein 3 (Rasa3). On resting platelets, Rasa3 in close proximity to integrins in the plasma membrane has a negative regulatory effect. The mechanism by which activated phosphoinositide 3kinase (PI3K) impairs Rasa3 activity, thus inducing integrin activation, is still unknown51 (Figure 2). Regulators of Gprotein signaling (RGS) also act as negative regulators since platelets from Rgs10-/- and Rgs16-/- mice present increased integrin activation, as measured by flow cytometry.52,53 Other proteins, such as α-actinin54 and calcium and integrin-binding protein 1,55 would also be involved in
Haematologica | 108 July 2023 1737 REVIEW ARTICLE - Platelet integrins: hemostasis, thrombosis, and more E. Janus-Bell and P.H. Mangin
Figure 2. Mechanism of αIIb β3 inside-out signaling. On platelets, the collagen-GPVI interaction induces PLCγ2 activation while ADP-P2Y1, TxA2-TP and thrombin-PAR interactions induce PLCβ activation. Activated PLC then generates IP3 and DAG, which mobilize intracellular calcium and activate PKC, respectively, leading to CalDAG-GEFI activation. The ADP-P2Y12 interaction activates PI3K which inhibits Rasa3. Activated CalDAG-GEFI and inhibited Rasa3 induce Rap1b activation, which binds to talin, thereby enabling activation of integrin αIIbβ3 and a change in its conformation. Kindlin-3, by enhancing the interaction between talin and αIIbβ3, also participates in αIIbβ3 activation. ADP: adenosine diphosphate; ATP: adenosine triphosphate; CalDAG-GEFI: calcium and diacylglycerol-regulated guanine nucleotide exchange factor I; DAG: diacylglycerol; GPVI: glycoprotein VI; GTP: guanosine triphosphate; IP3: inositol-1,4,5-triphosphate; PAR: protease-activated receptor; PI3K: phosphoinositide 3-kinase; PKC: protein kinase C; PLC: phospholipase C; RAP1b: Ras-related protein 1b; Rasa3: Ras GTPase-activating protein 3; TP: thromboxane and prostaglandin receptor; TxA2: thromboxane A2.

this negative regulation through a competitive effect at the talin binding site.
The molecular mechanisms of β1 integrin activation are less well known. It has been proposed that the mechanism of activation of α2β1 might resemble that of αIIbβ3, with a rise in intracytoplasmic calcium levels and the involvement of talin and kindlin-3.47,56 It has been suggested that PI3K,57 actin polymerization and Rho GTPase58 may also be implicated. In contrast to αIIbβ3 and α2β1, in α5β1 inside-out signaling, kindlin-1 and -2 would have an inhibitory rather than an activating effect.59
Platelet outside-in signaling
Once ligands have bound to platelet β1 or β3 integrins, they induce a signaling cascade called outside-in signaling. For α2β1 and αIIbβ3, this outside-in signaling involves Src kinase
which is constitutively associated to the β subunit and phosphorylated on tyrosine 529 to maintain its inhibition.60 The integrin-ligand interaction induces protein-tyrosine phosphatase-1B recruitment, dephosphorylation of Src and subsequent Src activation.61 Activated Src recruits and phosphorylates spleen tyrosine kinase (Syk), which is then in an activated state.60 Activated Syk phosphorylates SLP76 and PLCγ2 to induce the formation of a signaling complex,6264 including PI3K in the case of αIIbβ3.65 Activated PLCγ2 then generates IP3 and diacylglycerol, leading to intracellular calcium mobilization and activation of PKC, respectively. Together, these events result in further integrin activation, platelet shape change and filopodia formation. With regard to platelet α6β1, only the implication of Syk and PLCγ2 has been described,66 while the outside-in signaling cascades of α5β1 and αvβ3 have not yet been studied (Figure 3).
Haematologica | 108 July 2023 1738 REVIEW ARTICLE - Platelet integrins: hemostasis, thrombosis, and more E. Janus-Bell and P.H. Mangin
Apart from the best known actors involved in outside-in signaling downstream of αIIbβ3, additional players have been proposed. The auto-phosphorylation of Fyn, another Src family kinase linked to the β 3 cytoplasmic tail, has been shown to promote the phosphorylation of two tyrosines of the β3 tail, Tyr747 and Tyr759,67 inducing: (i) the phosphorylation and activation of proline-rich tyrosine kinase 2 which stimulates PI3Kβ and activates the Akt pathway to regulate platelet adhesion and spreading;68 (ii) adaptor protein phosphorylation in the form of Dok2,69

Grb2 and Shc associated with β3,70 leading to activation of the mitogen-activated protein kinase pathway; and (iii) recruitment of myosin linked to the β3 cytoplasmic tail and interaction with the actin cytoskeleton which in turn regulates platelet morphological changes.71 Moreover, cSrc and G α 13 cluster with the β 3 tail, inducing Rho GTPase-activating protein, which inhibits a small GTPase from the Rho family called Ras homolog family member A, thereby causing platelet spreading. Cleavage of the link between Src and the β3 cytoplasmic tail by calpain then
Figure 3. Mechanisms of platelet integrin outside-in signaling. Binding of fibrinogen to αIIbβ3 induces c-Src activation followed by the recruitment of Syk, which phosphorylates SLP76 and PLCγ2, leading to the formation of a signaling complex. Activated PLCγ2 then generates IP3 and DAG, which mobilize intracellular calcium and activate PKC, respectively. Additional factors have been proposed to participate in the outside-in signaling of αIIbβ3 with the auto-phosphorylation of Fyn enabling the phosphorylation of tyrosines on β3, thereby inducing: (i) activation of Pyk2 and stimulation of PI3Kβ and Akt; (ii) Dok2, Grb2 and Shc phosphorylation leading to MAPK activation; (iii) recruitment of myosin linked to the β3 cytoplasmic tail and interaction with the actin cytoskeleton. Moreover, the clustering of c-Src and Gα13 induces RhoGAP activation, inhibiting RhoA. Altogether, these events promote further integrin activation, platelet shape change, granule content release and TxA2 synthesis as well as clot retraction. The α2β1-collagen interaction induces outside-in signaling through Src activation leading to recruitment of Syk, which phosphorylates SLP76 and PLCγ2. Similarly, the α6β1-laminin interaction induces outside-in signaling through Syk recruitment followed by PLCγ2 phosphorylation. PLCγ2 generates IP3 and DAG, which mobilize intracellular calcium and activate PKC, respectively. These outside-in signaling pathways lead to platelet shape change, integrin activation and filopodia formation. The outside-in signaling mechanisms of α5β1 and αvβ3 have not yet been studied. DAG: diacylglycerol; Dok2: docking protein 2; Grb2: growth factor receptor-bound protein 2; IP3: inositol-1,4,5-triphosphate; MAPK: mitogen-activated protein kinase; PI3K: phosphoinositide 3-kinase; PKC: protein kinase C; PLC: phospholipase C; Pyk2: proline-rich tyrosine kinase 2; RhoA: Ras homolog family member A; RhoGAP: Rho GTPase-activating protein; Syk: spleen tyrosine kinase; TxA2: thromboxane A2.
Haematologica | 108 July 2023 1739 REVIEW ARTICLE - Platelet integrins: hemostasis, thrombosis, and more E. Janus-Bell and P.H. Mangin
induces Ras homolog family member A activation and clot retraction.72 These pathways enhance α IIb β 3 activation and promote platelet shape change, granule content release and TxA2 synthesis as well as fibrin clot retraction (Figure 3). In addition, it has been suggested that αIIbβ3 could use FcγRIIA as a signaling partner. The interaction of α IIb β 3 with its ligand would induce intracellular phosphorylation of FcγRIIA and amplify the platelet activation signal.73,74 However, this concept was recently challenged by work from our group which did not identify a major functional role of Fc γ RIIA in the outside-in signaling of αIIbβ3.75
Role of GPVI in platelet activation on immobilized fibrinogen: impact on the importance of αIIb β3
outside-in signaling
We recently identified a major role of GPVI in platelet activation on fibrinogen, which is instrumental in platelet spreading, but not adhesion.76,77 This activation occurs via a direct interaction between GPVI and fibrinogen, while αIIbβ3 is required to support platelet adhesion. This finding indicates that GPVI mediates a signal following platelet adhesion to fibrinogen which is distinct from αIIbβ3 outside-in signaling and that the signaling measured upon platelet adhesion to fibrinogen cannot be exclusively related to outside-in signaling as reported so far. Importantly, only human but not murine GPVI is a functional receptor for fibrinogen,78 which explains a long unanswered question why resting mouse platelets deposited on immobilized fibrinogen do not spread. This was notably demonstrated by the observation that expression of human GPVI in mouse platelets led to a nice spreading on fibrinogen as human platelets do.77 We proposed that the GPVI-fibrinogen interaction is functionally important as it results in thrombus build-up. As a consequence, these observations indicate that the outside-in signaling of αIIbβ3, which has been assessed in a model consisting of depositing platelets on immobilized fibrinogen, has been overestimated and that some of the actors identified might not even be specific as they could belong to the GPVI signaling pathway. A re-investigation of αIIbβ3 outside-in signaling, in the absence of GPVI, appears required for a more thorough investigation of the signaling actors really involved downstream of platelet integrins and their physiological importance.
The role of integrins in the formation of a hemostatic plug
Integrins play a major role in platelet adhesion at the site of vascular injury. Under low shear flow (<900 s-1), integrins are sufficient to allow the capture of platelets on their immobilized ligands, while at higher shear (>900 s-1), the
GPIb-IX complex is required to recruit platelets to vWF immobilized on adhesive proteins, with integrins ensuring stable adhesion.40 In mice, the threshold shear rate needed for integrins to capture circulating platelets is much higher than in humans.40,79 Platelet integrins contribute to platelet activation through outside-in signaling, but the level of activation generated is very modest compared to that induced by soluble agonists.36,66,80 Concerning aggregation, α IIb β 3 is the major platelet integrin involved due to its ability to bind plasma fibrinogen, thereby enabling platelet-platelet interactions. α IIb β 3vWF bonds are also implicated in platelet aggregate formation; this was found to be important in the absence or presence of low levels of fibrinogen, notably in aggregates formed in blood from afibrinogenemia patients.81 However, vWF also supports platelet aggregation in the presence of fibrinogen since: (i) flowing platelets attach to vWF under a very wide range of wall shear rates, including low shears of 100 s-1;40 and (ii) vWF on activated platelets is central to enabling platelet attachment to thrombi, indicating the key role of GPIb-vWF bonds in platelet aggregation under normal conditions, i.e. in the presence of fibrinogen.82 Furthermore, under very high shear conditions, platelet aggregation depends strongly on vWF through its ability to unfold, bind platelets and form rolling aggregates.83 In addition to β3, platelet α5β1 could be implicated in thrombus formation in vitro on collagen. Indeed, perfusion of whole blood from mice genetically deficient in α5 in the platelet linage (PF4Cre-α5-/-) over collagen, a surface that does not activate α5β1, resulted in a reduced thrombus volume as compared to that following perfusion of whole blood from control mice.35 This suggests that α 5 β 1 contributes to thrombus formation through an interaction with plasma fibronectin. However, the same effect was not observed using human blood perfused over collagen in the presence of an anti-α5 blocking antibody.
The importance of platelet integrins in hemostasis
Despite their involvement in platelet adhesion and aggregation, platelet β1 integrins do not seem to play a crucial role in hemostasis since the only patient described to have an α2β1 defect was a female who displayed moderate hemorrhages limited to childhood, which disappeared after puberty.84 Furthermore, α6β1-deficient patients do not have a bleeding diathesis and no patients with α5β1 deficiency have been reported. These observations were confirmed in mice in which inactivation of α2,34,85 α535 or α6 genes36 did not modify the tail bleeding time. Moreover, mice deficient in all three β1 integrins in the platelet linage (PF4Cre-β1-/-) had a normal bleeding time,86 in agreement
Haematologica | 108 July 2023 1740 REVIEW ARTICLE - Platelet integrins: hemostasis, thrombosis, and more E. Janus-Bell and P.H. Mangin
with results obtained in our laboratory (Online Supplementary Figure S1A, B). Nevertheless, another mouse strain deficient in all three β1 integrins on hematopoietic cells did have an increased tail bleeding time,87 suggesting compensatory mechanisms between the different β1 integrins. The variation in bleeding time between these mouse strains is difficult to explain, but could arise from the different targeting approaches, i.e., a deficiency in the platelet linage versus all hematopoietic cells. Integrin α IIb β 3 is well known to play a critical role in hemostasis, as illustrated by a rare and severe hemorrhagic disease called Glanzmann thrombasthenia, which occurs when one subunit of the integrin is absent or nonfunctional. This disease is characterized by a reduction in the ability of platelets to adhere and spread on fibrinogen and to aggregate. Patients with Glanzmann thrombasthenia exhibit a marked hemorrhagic phenotype.88 Furthermore, mice with αIIb or β3 gene inactivation have a Glanzmann thrombasthenia phenotype with bleeding linked to surgery, an increased bleeding time and an absence of platelet aggregation and thrombus formation under flow conditions.89,90 In addition, an immunodeficiency syndrome called leukocyte adhesion deficiency (LAD)-III induces a Glanzmann thrombasthenia-like bleeding disorder due to a mutation of the kindlin-3 gene in hematopoietic cells: platelet surface expression of αIIbβ3 integrin is normal but the mutation causes a defect in β3 integrin activation, inducing a decrease in fibrinogen binding and platelet aggregation.91 Contrary to Glanzmann patients, platelets from LAD-III patients have an adhesion defect on immobilized collagen in perfusion assays since α2β1 integrin is unable to bind collagen due to the kindlin-3 mutation.92 In sharp contrast, integrin αvβ3 does not seem to play a major part in hemostasis. This is supported by the modest role of this integrin in platelet functions, but also because no mutation of αvβ3 has been reported to be responsible for a hemorrhagic condition in man.
The importance of platelet integrins in arterial thrombosis
In humans, the presence of an allele inducing enhanced expression of α2β1 has been described to be associated with an increased risk of myocardial infarction, diabetic retinopathy and stroke,93,94 potentially linked to increased platelet adhesion. Consistent with these clinical results, platelet β1 integrins were reported to play a role in experimental thrombosis, as PF4Cre-β1-/- mice showed reduced thrombosis in in vivo models based on a mechanical- or laser-induced lesion;36 however, such protection was not observed in an independent study relying on mechanical injury of the carotid artery, challenging the view of a key role of platelet β 1 integrins in arterial thrombosis.95 To
date, no study has compared the relative importance of individual integrins in experimental thrombosis. There is some controversy over the importance of α2β1 in experimental thrombosis because while some groups identified a role for this integrin in models relying on injuries induced by rose Bengal and ferric chloride,96,97 others did not observe any protection after a mechanical injury.95 In agreement with the study by Grüner and colleagues, our group also did not identify any obvious role after either injury of the carotid artery induced by ferric chloride (Online Supplementary Figure S2A, B) or deep laser injury of mesenteric arteries in α 2-deficient mice (Online Supplementary Figure S2C, D). We recently reported that α5β1 does not seem to play a major role in arterial thrombosis as PF4Cre-α5-/- mice did not display reduced thrombosis in three different in vivo models (ferric chloride injury of the carotid artery, mechanical lesion of the abdominal aorta and laser lesion of mesenteric arterioles).35 Concerning α6β1, our group observed that PF4Cre-α6-/- mice are protected against thrombosis in in vivo models using a mechanical or laser lesion.36 This protection reached the same level as in the PF4Cre-β1-/- mice mentioned above,36 suggesting that the platelet β1 integrin with greatest importance in arterial thrombosis is α6β1.
With regard to β3 integrins, the role of αvβ3 in thrombosis is poorly defined but would seem to be minor, since PF4Cre-αv-/- mice display a normal response in experimental models of thrombosis (Online Supplementary Figure S2E, F). In contrast, the other platelet β3 integrin, αIIbβ3, is undoubtedly the most crucial platelet integrin in arterial thrombosis, because of its ability to ensure platelet aggregation and thrombus growth and stability.89,90 Its importance in thrombosis is attested by the existence of a class of clinical antiplatelet agents targeting this integrin.
Integrins as antithrombotic targets
Integrin αIIbβ3 is a well-established antithrombotic target and three antiplatelet agents currently used in clinical practice target this receptor. Abciximab is a Fab fragment from a chimeric monoclonal antibody that interacts with the ligand-binding site of the β3 chain, but also with the KQAGDV sequence of the αIIb chain, which impairs ligand interaction with αIIbβ3 through a conformational effect.98 Eptifibatide is a cyclic heptapeptide containing the KGD sequence99 and tirofiban is a synthetic non-peptidic molecule derived from tyrosine, both obtained from snake venom disintegrins. They both interact with the binding pocket between the α IIb and β 3 chains, blocking fibrinogen and vWF binding.98 All three antiplatelet agents are administered intravenously in emergency situations such as myocardial infarction and percutaneous coronary interventions because they are highly antithrombotic. To ex-
Haematologica | 108 July 2023 1741 REVIEW ARTICLE - Platelet integrins: hemostasis, thrombosis, and more E. Janus-Bell and P.H. Mangin
pand the use of anti-αIIbβ3 molecules towards the prevention of cardiovascular disease, oral anti-αIIbβ3 preparations have been developed. However, unacceptable side effects were observed, notably increased hemorrhage and mortality, ending the clinical trials.100 This increased mortality was described to be linked to a paradoxical platelet activation by oral αIIbβ3 antagonists which bind to the receptor and promotes its activation.101 Current antiαIIbβ3 agents target this integrin in its resting and activated states, resulting in an enhanced risk of bleeding. To reduce this risk, it has been proposed that drugs targeting only activated αIIbβ3 could be used. Such agents would have the advantage of not targeting resting αIIbβ3, thereby avoiding their pre-activation, and would only block the activated pro-thrombotic form of integrins. The potential of such agents has been nicely described by the group of Karlheinz Peter, who showed that a single-chain anti-activated α IIb β 3 antibody, SCE5, impaired experimental thrombosis with a minimal effect on hemostasis.102 This type of agents currently includes variable fragments of blocking anti-activated α IIb β 3 antibodies,103 small molecules interfering with the metal ion-dependent adhesion site of β3104 and agents targeting the outside-in signaling of the integrin rather than the integrin itself.105 There are currently no antithrombotic agents targeting any of the other four platelet integrins. Since α v β 3 and α 5 β 1 do not play major roles in experimental arterial thrombosis35 (Online Supplementary Figure S2E, F), they are unlikely to be suitable targets for antithrombotic therapy. With regard to integrin α 2 β 1, a reduction in thrombus formation was reported,96,97 indicating that this receptor could represent a potential antithrombotic target. However, α 2 β 1 is not platelet-specific and blocking this receptor might have side effects. In addition, the observation of embolization in mice deficient in α 2 β 1 suggests that targeting this integrin could be harmful. 97 Finally, platelet α 6 β 1 plays an important part in experimental thrombosis but not in hemostasis as PF4Cre- α 6/- mice have a normal bleeding time.36 Hence α 6 β 1 might represent a new and safer antithrombotic target as compared to α IIb β 3. Nevertheless, since α 6 β 1 is not only expressed on platelets but also on endothelial cells106 and is implicated in epithelial anchoring,107 targeting this receptor could have side effects.
The importance of platelet integrins beyond hemostasis
Tumor metastasis
A role of platelets in tumor metastasis has been suggested since thrombocytosis is often observed in cancer patients.108 Some cancer cells, such as ovarian cancer cells, can express interleukin-6, thereby inducing the synthesis of a regulator
of platelet production, thrombopoietin, directly by the tumor cells or in the liver. Moreover, in rodent models of experimental metastasis, thrombocytopenia reduced the ability of tumor cells to colonize the lungs, which was restored by platelet transfusion.11 The involvement of platelet β1 integrins has been proposed since mice deficient in all platelet β1 integrins (PF4Cre-β1-/-) developed less lung metastasis than control animals in models of orthotopic metastasis or intravenous tumor cell injection.109 This effect seemed to be mostly due to platelet α6β1 as PF4Cre-α6-/- and PF4Creβ1-/- mice presented very similar results in both experimental models. A possible mechanism could depend on an interaction between platelet α6β1 and ADAM-9 on tumor cells,109 which would form a platelet shield around the cells, preventing the deleterious effects of high shear stress and helping the cells to escape immune surveillance.110 Platelet α2β1 integrin has been described to play a role in epithelialmesenchymal transition, a process stimulating the invasive properties of tumor cells.111 Interaction of α2β1 with MCF-7 breast cancer cells caused the cells to secrete transforming growth factor-β1,112 a cytokine known to promote epithelialmesenchymal transition. As far as concerns platelet β3 integrins, the use of αIIbβ3 inhibitors and transplantation of bone marrow from β3-deficient mice into irradiated wildtype mice have been reported to decrease experimental metastasis.113,114 αIIbβ3 could be implicated in the formation of a shield around tumor cells through platelet αIIbβ3-tumor cell αvβ3 interaction via a ligand (fibrinogen, vWF or thrombospondin) acting as a bridge between the two integrins,115 as in the α6β1-ADAM-9 interaction. However, the involvement of αIIbβ3 is controversial since in a mouse model of lung colonization, 10 days after inoculation, αIIb-deficient mice developed more metastasis than control animals.116
Sepsis
Platelets have also been described to play a role in sepsis, a life-threatening organ dysfunction caused by infection-induced dysregulation of the inflammatory response leading to a pro-inflammatory state. Thrombocytopenia is present in 20 to 60% of septic patients117 and negatively influences the prognosis.12 In line with the observation of a potential benefit of platelets in sepsis, it has been demonstrated that thrombocytopenia promotes the growth and dissemination of bacteria and increases systemic inflammation, tissue damage and mortality during experimental sepsis in mice.118 However, platelet α IIb β 3 would appear to have a deleterious effect under septic conditions, since anti-αIIbβ3 agents decrease the activation of coagulation, endothelial dysfunction and tissue injury characteristic of sepsis. Thus, eptifibatide has been shown to reduce mortality and improve clinical indicators in experimental mouse models of sepsis.119 Another antiα IIb β 3 molecule, AZ-1, decreased endothelial cell injury and mortality in a model of endotoxin shock in rabbits.120
Haematologica | 108 July 2023 1742 REVIEW ARTICLE - Platelet integrins: hemostasis, thrombosis, and more E. Janus-Bell and P.H.
Mangin
Role in platelet function
Platelet adhesion to collagen
Low platelet activation
Platelet adhesion to fibronectin
Low platelet activation
In vitro thrombus formation
Platelet adhesion to laminins
Low platelet activation
Platelet adhesion to vWF and fibronectin
Platelet aggregation through fibrinogen or vWF binding
Platelet adhesion to vitronectin, fibronectin, fibrinogen and fibrin
No crucial role No crucial role No crucial role Major role No crucial role
Role in hemostasis
1 patient with α2β1 deficiency described: moderate hemorrhages only during childhood
Platelet α2β1 genetically deficient mice: normal bleeding time
Role in experimental thrombosis
No patient described
Patients with α6β1 deficiency: no bleeding diathesis
αIIbβ3 deficiency or dysfunction: hemorrhagic disease (GT) No patient described
Role in arterial thrombosis
Platelet α5β1 genetically deficient mice: normal bleeding time
No major role in experimental thrombosis
Platelet α6β1 genetically deficient mice: normal bleeding time
Role in experimental thrombosis
Platelet αIIbβ3 genetically deficient mice: GT phenotype with increased bleeding time
Most important platelet integrin in arterial thrombosis
αIIbβ3 as an antithrombotic target: abciximab eptifibatide tirofiban
-
No major role in experimental thrombosis
-
Role beyond hemostasis
Potential role in cancer cell epithelial-mesenchymal transition
-
Proposed role in experimental model of lung metastasis
Finally, abciximab reduced sepsis-induced organ damage in a baboon model.121 No role in sepsis has been identified to date for platelet β 1 integrins. In brief, as yet there are not enough data to draw conclusions on a deleterious effect of platelet integrins in sepsis and further studies need to be carried out, including in genetically deficient mice.
Alongside their involvement in tumor metastasis and sepsis, platelets have been suggested to be implicated in rheumatoid arthritis and systemic lupus erythematosus,13,122 but no role of platelet integrins has yet been described in these diseases.
Conclusions
The main role of platelet integrins is to form a hemostatic plug by participating in: (i) platelet adhesion at the
Potential role in experimental metastasis and sepsis
-
vascular wall; (ii) platelet activation, even though the activation level stays low as compared to that induced in response to soluble agonists; and (iii) platelet aggregation, ensured by α IIb β 3, with a secondary role for α 5 β 1. Platelet α IIb β 3 plays a major role in hemostasis as evidenced by Glanzmann thrombasthenia, with platelet β 1 integrins also being implicated in this process. Concerning arterial thrombosis, as for hemostasis, the main platelet integrin implicated is α IIb β 3, with platelet β 1 integrins also playing a role, probably mostly through α 6 β 1. Besides these classical roles, platelet integrins have also been described to be implicated in non-hemostatic processes such as tumor metastasis and sepsis. The role of platelet integrins in hemostasis, arterial thrombosis and beyond are summarized in Table 2. Further studies are required to better comprehend the implication of platelet integrins and potentially improve the treatment of these diseases.
α2 β1 α5 β1 α6 β1 αIIb β3 αv β3
- - -
Table 2. Platelet integrins in platelet function, hemostasis, arterial thrombosis and beyond.
Haematologica | 108 July 2023 1743 REVIEW ARTICLE - Platelet integrins: hemostasis, thrombosis, and more E. Janus-Bell and P.H. Mangin
GT: Glanzmann thrombasthenia; vWF: von Willebrand factor.
Disclosures
No conflicts of interest to disclose.
Contributions
EJ-B and PHM both contributed substantially to the conception of the article, to the interpretation of the relevant literature and drafted the article.
References
1. Pease DC. An electron microscopic study of red bone marrow. Blood. 1956;11(6):501-526.
2. Jackson SP. Arterial thrombosis--insidious, unpredictable and deadly. Nat Med. 2011;17(11):1423-1436.
3. Kitchens CS, Weiss L. Ultrastructural changes of endothelium associated with thrombocytopenia. Blood. 1975;46(4):567-578.
4. Gupta S, Konradt C, Corken A, et al. Hemostasis vs. homeostasis: platelets are essential for preserving vascular barrier function in the absence of injury or inflammation. Proc Natl Acad Sci U S A. 2020;117(39):24316-24325.
5. Goerge T, Ho-Tin-Noe B, Carbo C, et al. Inflammation induces hemorrhage in thrombocytopenia. Blood. 2008;111(10):4958-4964.
6. Nieswandt B, Watson SP. Platelet-collagen interaction: is GPVI the central receptor? Blood. 2003;102(2):449-461.
7. Nieswandt B, Brakebusch C, Bergmeier W, et al. Glycoprotein VI but not alpha2beta1 integrin is essential for platelet interaction with collagen. EMBO J. 2001;20(9):2120-2130.
8. Versteeg HH, Heemskerk JWM, Levi M, Reitsma PH. New fundamentals in hemostasis. Physiol Rev. 2013;93(1):327-358.
9. Haining EJ, Lowe KL, Wichaiyo S, et al. Lymphatic blood filling in CLEC-2-deficient mouse models. Platelets. 2021;32(3):352-367.
10. Yeaman MR. Platelets: at the nexus of antimicrobial defence. Nat Rev Microbiol. 2014;12(6):426-437.
11. Gasic GJ, Gasic TB, Stewart CC. Antimetastatic effects associated with platelet reduction. Proc Natl Acad Sci U S A. 1968;61(1):46-52.
12. Claushuis TAM, van Vught LA, Scicluna BP, et al. Thrombocytopenia is associated with a dysregulated host response in critically ill sepsis patients. Blood. 2016;127(24):3062-3072.
13. Boilard E, Nigrovic PA, Larabee K, et al. Platelets amplify inflammation in arthritis via collagen-dependent microparticle production. Science. 2010;327(5965):580-583.
14. Joseph JE, Harrison P, Mackie IJ, Isenberg DA, Machin SJ. Increased circulating platelet-leucocyte complexes and platelet activation in patients with antiphospholipid syndrome, systemic lupus erythematosus and rheumatoid arthritis. Br J Haematol. 2001;115(2):451-459.
15. Barczyk M, Carracedo S, Gullberg D. Integrins. Cell Tissue Res. 2010;339(1):269-280.
16. Zhang K, Chen J. The regulation of integrin function by divalent cations. Cell Adhes Migr. 2012;6(1):20-29.
17. Hu P, Luo B-H. Integrin αIIbβ3 transmembrane domain separation mediates bi-directional signaling across the plasma membrane. PloS One. 2015;10(1):e0116208.
18. Takagi J, Petre BM, Walz T, Springer TA. Global conformational rearrangements in integrin extracellular domains in outside-in and inside-out signaling. Cell. 2002;110(5):599-511.
19. Carman CV, Springer TA. Integrin avidity regulation: are changes
Acknowledgments
The authors would like to thank Monique Freund and Catherine Ziessel for their help with thrombosis models.
Funding
This work was supported by INSERM, EFS and ARMESA (Association de Recherche et Dév eloppement en Médecine et Santé Publique).
in affinity and conformation underemphasized? Curr Opin Cell Biol. 2003;15(5):547-556.
20. Piotrowicz RS, Orchekowski RP, Nugent DJ, Yamada KY, Kunicki TJ. Glycoprotein Ic-IIa functions as an activation-independent fibronectin receptor on human platelets. J Cell Biol. 1988;106(4):1359-1364.
21. Sonnenberg A, Modderman PW, Hogervorst F. Laminin receptor on platelets is the integrin VLA-6. Nature. 1988;336(6198):487-489.
22. Staatz WD, Rajpara SM, Wayner EA, Carter WG, Santoro SA. The membrane glycoprotein Ia-IIa (VLA-2) complex mediates the Mg++-dependent adhesion of platelets to collagen. J Cell Biol. 1989;108(5):1917-1924.
23. Yang X, Chitalia SV, Matsuura S, Ravid K. Integrins and their role in megakaryocyte development and function. Exp Hematol. 2022;106:31-39.
24. Schick PK, Wojenski CM, He X, Walker J, Marcinkiewicz C, Niewiarowski S. Integrins involved in the adhesion of megakaryocytes to fibronectin and fibrinogen. Blood. 1998;92(8):2650-2656.
25. Pan R, Wang J, Nardi MA, Li Z. The inhibition effect of antiGPIIIa49-66 antibody on megakaryocyte differentiation. Thromb Haemost. 2011;106(3):484-490.
26. Matsuura S, Thompson CR, Ng SK, et al. Adhesion to fibronectin via α5β1 integrin supports expansion of the megakaryocyte lineage in primary myelofibrosis. Blood. 2020;135(25):2286-2291.
27. Leven RM. Differential regulation of integrin-mediated proplatelet formation and megakaryocyte spreading. J Cell Physiol. 1995;163(3):597-607.
28. Avraham H, Cowley S, Chi SY, Jiang S, Groopman JE. Characterization of adhesive interactions between human endothelial cells and megakaryocytes. J Clin Invest. 1993;91(6):2378-2384.
29. Schmitz B, Thiele J, Otto F, et al. Evidence for integrin receptor involvement in megakaryocyte-fibroblast interaction: a possible pathomechanism for the evolution of myelofibrosis. J Cell Physiol. 1998;176(3):445-455.
30. Mossuz P, Schweitzer A, Molla A, Berthier R. Expression and function of receptors for extracellular matrix molecules in the differentiation of human megakaryocytes in vitro. Br J Haematol. 1997;98(4):819-827.
31. Matsunaga T, Fukai F, Kameda T, et al. Potentiated activation of VLA-4 and VLA-5 accelerates proplatelet-like formation. Ann Hematol. 2012;91(10):1633-1643.
32. Larson MK, Watson SP. Regulation of proplatelet formation and platelet release by integrin alpha IIb beta3. Blood. 2006;108(5):1509-1514.
33. Mazharian A, Thomas SG, Dhanjal TS, Buckley CD, Watson SP. Critical role of Src-Syk-PLCγ2 signaling in megakaryocyte migration and thrombopoiesis. Blood. 2010;116(5):793-800.
Haematologica | 108 July 2023 1744 REVIEW ARTICLE - Platelet integrins: hemostasis, thrombosis, and more E. Janus-Bell and P.H. Mangin
34. Habart D, Cheli Y, Nugent DJ, Ruggeri ZM, Kunicki TJ. Conditional knockout of integrin α2β1 in murine megakaryocytes leads to reduced mean platelet volume. PloS One. 2013;8(1):e55094.
35. Janus-Bell E, Yakusheva A, Scandola C, et al. Characterization of the role of integrin α5β1 in platelet function, hemostasis, and experimental thrombosis. Thromb Haemost. 2022;122(5):767-776.
36. Schaff M, Tang C, Maurer E, et al. Integrin α6β1 is the main receptor for vascular laminins and plays a role in platelet adhesion, activation, and arterial thrombosis. Circulation. 2013;128(5):541-552.
37. Kashiwagi H, Kunishima S, Kiyomizu K, et al. Demonstration of novel gain-of-function mutations of αIIbβ3: association with macrothrombocytopenia and Glanzmann thrombasthenia-like phenotype. Mol Genet Genomic Med. 2013;1(2):77-86.
38. Savage B, Shattil SJ, Ruggeri ZM. Modulation of platelet function through adhesion receptors. A dual role for glycoprotein IIb-IIIa (integrin alpha IIb beta 3) mediated by fibrinogen and glycoprotein Ib-von Willebrand factor. J Biol Chem. 1992;267(16):11300-11306.
39. Santoro SA, Walsh JJ, Staatz WD, Baranski KJ. Distinct determinants on collagen support alpha 2 beta 1 integrinmediated platelet adhesion and platelet activation. Cell Regul. 1991;2(11):905-913.
40. Savage B, Saldívar E, Ruggeri ZM. Initiation of platelet adhesion by arrest onto fibrinogen or translocation on von Willebrand factor. Cell. 1996;84(2):289-297.
41. Siedlecki CA, Lestini BJ, Kottke-Marchant KK, Eppell SJ, Wilson DL, Marchant RE. Shear-dependent changes in the threedimensional structure of human von Willebrand factor. Blood. 1996;88(8):2939-2950.
42. Williams RL. Mammalian phosphoinositide-specific phospholipase C. Biochim Biophys Acta. 1999;1441(2-3):255-267.
43. Cifuni SM, Wagner DD, Bergmeier W. CalDAG-GEFI and protein kinase C represent alternative pathways leading to activation of integrin alphaIIbbeta3 in platelets. Blood. 2008;112(5):1696-1703.
44. Lagarrigue F, Paul DS, Gingras AR, et al. Talin-1 is the principal platelet Rap1 effector of integrin activation. Blood. 2020;136(10):1180-1190.
45. Nieswandt B, Moser M, Pleines I, et al. Loss of talin1 in platelets abrogates integrin activation, platelet aggregation, and thrombus formation in vitro and in vivo. J Exp Med. 2007;204(13):3113-3118.
46. Petrich BG, Fogelstrand P, Partridge AW, et al. The antithrombotic potential of selective blockade of talindependent integrin alpha IIb beta 3 (platelet GPIIb-IIIa) activation. J Clin Invest. 2007;117(8):2250-2259.
47. Moser M, Nieswandt B, Ussar S, Pozgajova M, Fässler R. Kindlin3 is essential for integrin activation and platelet aggregation. Nat Med. 2008;14(3):325-330.
48. Honda S, Shirotani-Ikejima H, Tadokoro S, et al. Integrin-linked kinase associated with integrin activation. Blood. 2009;113(21):5304-5313.
49. Kasirer-Friede A, Kang J, Kahner B, Ye F, Ginsberg MH, Shattil SJ. ADAP interactions with talin and kindlin promote platelet integrin αIIbβ3 activation and stable fibrinogen binding. Blood. 2014;123(20):3156-3165.
50. Gao J, Huang M, Lai J, et al. Kindlin supports platelet integrin αIIbβ3 activation by interacting with paxillin. J Cell Sci. 2017;130(21):3764-3775.
51. Battram AM, Durrant TN, Agbani EO, et al. The phosphatidylinositol 3,4,5-trisphosphate (PI(3,4,5)P3) binder Rasa3 regulates phosphoinositide 3-kinase (PI3K)-dependent integrin αIIbβ3 outside-in signaling. J Biol Chem.
2017;292(5):1691-1704.
52. Hensch NR, Karim ZA, Druey KM, Tansey MG, Khasawneh FT. RGS10 negatively regulates platelet activation and thrombogenesis. PloS One. 2016;11(11):e0165984.
53. Hernandez KR, Karim ZA, Qasim H, Druey KM, Alshbool FZ, Khasawneh FT. Regulator of G-protein signaling 16 is a negative modulator of platelet function and thrombosis. J Am Heart Assoc. 2019;8(5):e011273.
54. Tadokoro S, Nakazawa T, Kamae T, et al. A potential role for αactinin in inside-out αIIbβ3 signaling. Blood. 2011;117(1):250-258.
55. Yuan W, Leisner TM, McFadden AW, et al. CIB1 is an endogenous inhibitor of agonist-induced integrin alphaIIbbeta3 activation. J Cell Biol. 2006;172(2):169-175.
56. Petrich BG, Marchese P, Ruggeri ZM, et al. Talin is required for integrin-mediated platelet function in hemostasis and thrombosis. J Exp Med. 2007;204(13):3103-3111.
57. Jung SM, Moroi M. Platelet collagen receptor integrin alpha2beta1 activation involves differential participation of ADPreceptor subtypes P2Y1 and P2Y12 but not intracellular calcium change. Eur J Biochem. 2001;268(12):3513-3522.
58. Pula G, Poole AW. Critical roles for the actin cytoskeleton and cdc42 in regulating platelet integrin alpha2beta1. Platelets. 2008;19(3):199-210.
59. Harburger DS, Bouaouina M, Calderwood DA. Kindlin-1 and -2 directly bind the C-terminal region of beta integrin cytoplasmic tails and exert integrin-specific activation effects. J Biol Chem. 2009;284(17):11485-11497.
60. Obergfell A, Eto K, Mocsai A, et al. Coordinate interactions of Csk, Src, and Syk kinases with αIIbβ3 initiate integrin signaling to the cytoskeleton. J Cell Biol. 2002;157(2):265-275.
61. Arias-Salgado EG, Haj F, Dubois C, et al. PTP-1B is an essential positive regulator of platelet integrin signaling. J Cell Biol. 2005;170(5):837-845.
62. Inoue O, Suzuki-Inoue K, Dean WL, Frampton J, Watson SP. Integrin alpha2beta1 mediates outside-in regulation of platelet spreading on collagen through activation of Src kinases and PLCgamma2. J Cell Biol. 2003;160(5):769-780.
63. Obergfell A, Judd BA, del Pozo MA, Schwartz MA, Koretzky GA, Shattil SJ. The molecular adapter SLP-76 relays signals from platelet integrin alphaIIbbeta3 to the actin cytoskeleton. J Biol Chem. 2001;276(8):5916-5923.
64. Wonerow P, Pearce AC, Vaux DJ, Watson SP. A critical role for phospholipase Cgamma2 in alphaIIbbeta3-mediated platelet spreading. J Biol Chem. 2003;278(39):37520-37529.
65. Nesbitt WS, Kulkarni S, Giuliano S, et al. Distinct glycoprotein Ib/V/IX and integrin alpha IIbbeta 3-dependent calcium signals cooperatively regulate platelet adhesion under flow. J Biol Chem. 2002;277(4):2965-2972.
66. Inoue O, Suzuki-Inoue K, McCarty OJT, et al. Laminin stimulates spreading of platelets through integrin alpha6beta1-dependent activation of GPVI. Blood. 2006;107(4):1405-1412.
67. Watson SP, Auger JM, McCarty OJT, Pearce AC. GPVI and integrin alphaIIb beta3 signaling in platelets. J Thromb Haemost. 2005;3(8):1752-1762.
68. Cipolla L, Consonni A, Guidetti G, et al. The proline-rich tyrosine kinase Pyk2 regulates platelet integrin αIIbβ3 outside-in signaling. J Thromb Haemost. 2013;11(2):345-356.
69. Hughan SC, Watson SP. Differential regulation of adapter proteins Dok2 and Dok1 in platelets, leading to an association of Dok2 with integrin alphaIIbbeta3. J Thromb Haemost. 2007;5(2):387-394.
70. Law DA, Nannizzi-Alaimo L, Phillips DR. Outside-in integrin signal transduction. Alpha IIb beta 3-(GP IIb IIIa) tyrosine phosphorylation induced by platelet aggregation. J Biol Chem.
Haematologica | 108 July 2023 1745 REVIEW ARTICLE - Platelet integrins: hemostasis, thrombosis, and more E. Janus-Bell and P.H. Mangin
1996;271(18):10811-10815.
71. Jenkins AL, Nannizzi-Alaimo L, Silver D, et al. Tyrosine phosphorylation of the beta3 cytoplasmic domain mediates integrin-cytoskeletal interactions. J Biol Chem. 1998;273(22):13878-13885.
72. Gong H, Shen B, Flevaris P, et al. G protein subunit Galpha13 binds to integrin alphaIIbbeta3 and mediates integrin “outsidein” signaling. Science. 2010;327(5963):340-343.
73. Boylan B, Gao C, Rathore V, Gill JC, Newman DK, Newman PJ. Identification of FcgammaRIIa as the ITAM-bearing receptor mediating alphaIIbbeta3 outside-in integrin signaling in human platelets. Blood. 2008;112(7):2780-2786.
74. Zhi H, Rauova L, Hayes V, et al. Cooperative integrin/ITAM signaling in platelets enhances thrombus formation in vitro and in vivo. Blood. 2013;121(10):1858-1867.
75. Ahmed MU, Receveur N, Janus-Bell E, et al. Respective roles of glycoprotein VI and FcγRIIA in the regulation of αIIbβ3-mediated platelet activation to fibrinogen, thrombus buildup, and stability. Res Pract Thromb Haemost. 2021;5(5):e12551.
76. Ahmed MU, Kaneva V, Loyau S, et al. Pharmacological blockade of glycoprotein VI promotes thrombus disaggregation in the absence of thrombin. Arterioscler Thromb Vasc Biol. 2020;40(9):2127-2142.
77. Mangin PH, Onselaer M-B, Receveur N, et al. Immobilized fibrinogen activates human platelets through GPVI. Haematologica. 2018;103(9):1568-1576.
78. Janus-Bell E, Ahmed MU, Receveur N, et al. Differential role of glycoprotein VI in mouse and human thrombus progression and stability. Thromb Haemost. 2021;121(4):543-546.
79. Panteleev MA, Korin N, Reesink KD, et al. Wall shear rates in human and mouse arteries: Standardization of hemodynamics for in vitro blood flow assays: communication from the ISTH SSC Subcommittee on Biorheology. J Thromb Haemost. 2021;19(2):588-595.
80. Maurer E, Schaff M, Receveur N, et al. Fibrillar cellular fibronectin supports efficient platelet aggregation and procoagulant activity. Thromb Haemost. 2015;114(6):1175-1188.
81. De Marco L, Girolami A, Zimmerman TS, Ruggeri ZM. von Willebrand factor interaction with the glycoprotein IIb/IIa complex. Its role in platelet function as demonstrated in patients with congenital afibrinogenemia. J Clin Invest. 1986;77(4):1272-1277.
82. Kulkarni S, Dopheide SM, Yap CL, et al. A revised model of platelet aggregation. J Clin Invest. 2000;105(6):783-791.
83. Ruggeri ZM, Orje JN, Habermann R, Federici AB, Reininger AJ. Activation-independent platelet adhesion and aggregation under elevated shear stress. Blood. 2006;108(6):1903-1910.
84. Nieuwenhuis HK, Sakariassen KS, Houdijk WP, Nievelstein PF, Sixma JJ. Deficiency of platelet membrane glycoprotein Ia associated with a decreased platelet adhesion to subendothelium: a defect in platelet spreading. Blood. 1986;68(3):692-695.
85. Holtkötter O, Nieswandt B, Smyth N, et al. Integrin alpha 2deficient mice develop normally, are fertile, but display partially defective platelet interaction with collagen. J Biol Chem. 2002;277(13):10789-10794.
86. Nieswandt B, Brakebusch C, Bergmeier W, et al. Glycoprotein VI but not alpha2beta1 integrin is essential for platelet interaction with collagen. EMBO J. 2001;20(9):2120-2130.
87. Petzold T, Ruppert R, Pandey D, et al. β1 integrin-mediated signals are required for platelet granule secretion and hemostasis in mouse. Blood. 2013;122(15):2723-2731.
88. Solh T, Botsford A, Solh M. Glanzmann’s thrombasthenia: pathogenesis, diagnosis, and current and emerging treatment
options. J Blood Med. 2015;6:219-227.
89. Hodivala-Dilke KM, McHugh KP, Tsakiris DA, et al. Beta3integrin-deficient mice are a model for Glanzmann thrombasthenia showing placental defects and reduced survival. J Clin Invest. 1999;103(2):229-238.
90. Tronik-Le Roux D, Roullot V, Poujol C, Kortulewski T, Nurden P, Marguerie G. Thrombasthenic mice generated by replacement of the integrin alpha(IIb) gene: demonstration that transcriptional activation of this megakaryocytic locus precedes lineage commitment. Blood. 2000;96(4):1399-1408.
91. Wolach B, Gavrieli R, Wolach O, et al. Leucocyte adhesion deficiency-a multicentre national experience. Eur J Clin Invest. 2019;49(2):e13047.
92. van de Vijver E, De Cuyper IM, Gerrits AJ, et al. Defects in Glanzmann thrombasthenia and LAD-III (LAD-1/v) syndrome: the role of integrin β1 and β3 in platelet adhesion to collagen. Blood. 2012;119(2):583-586.
93. Matsubara Y, Murata M, Maruyama T, et al. Association between diabetic retinopathy and genetic variations in alpha2beta1 integrin, a platelet receptor for collagen. Blood. 2000;95(5):1560-1564.
94. Santoso S, Kunicki TJ, Kroll H, Haberbosch W, Gardemann A. Association of the platelet glycoprotein Ia C807T gene polymorphism with nonfatal myocardial infarction in younger patients. Blood. 1999;93(8):2449-2453.
95. Grüner S, Prostredna M, Schulte V, et al. Multiple integrin-ligand interactions synergize in shear-resistant platelet adhesion at sites of arterial injury in vivo. Blood. 2003;102(12):4021-4027.
96. He L, Pappan LK, Grenache DG, et al. The contributions of the alpha 2 beta 1 integrin to vascular thrombosis in vivo. Blood. 2003;102(10):3652-3657.
97. Kuijpers MJE, Pozgajova M, Cosemans JMEM, et al. Role of murine integrin alpha2beta1 in thrombus stabilization and embolization: contribution of thromboxane A2. Thromb Haemost. 2007;98(5):1072-1080.
98. Hashemzadeh M, Furukawa M, Goldsberry S, Movahed MR. Chemical structures and mode of action of intravenous glycoprotein IIb/IIIa receptor blockers: a review. Exp Clin Cardiol. 2008;13(4):192-197.
99. Phillips DR, Scarborough RM. Clinical pharmacology of eptifibatide. Am J Cardiol. 1997;80(4A):11B-20B.
100. Chew DP, Bhatt DL, Sapp S, Topol EJ. Increased mortality with oral platelet glycoprotein IIb/IIIa antagonists: a meta-analysis of phase III multicenter randomized trials. Circulation. 2001;103(2):201-206.
101. Bassler N, Loeffler C, Mangin P, et al. A mechanistic model for paradoxical platelet activation by ligand-mimetic alphaIIb beta3 (GPIIb/IIIa) antagonists. Arterioscler Thromb Vasc Biol. 2007;27(3):e9-15.
102. Schwarz M, Meade G, Stoll P, et al. Conformation-specific blockade of the integrin GPIIb/IIIa: a novel antiplatelet strategy that selectively targets activated platelets. Circ Res. 2006;99(1):25-33.
103. Ziegler M, Hohmann JD, Searle AK, et al. A single-chain antibody-CD39 fusion protein targeting activated platelets protects from cardiac ischaemia/reperfusion injury. Eur Heart J. 2018;39(2):111-116.
104. Li J, Vootukuri S, Shang Y, et al. RUC-4: a novel αIIbβ3 antagonist for prehospital therapy of myocardial infarction. Arterioscler Thromb Vasc Biol. 2014;34(10):2321-2329.
105. Huang J, Shi X, Xi W, Liu P, Long Z, Xi X. Evaluation of targeting c-Src by the RGT-containing peptide as a novel antithrombotic strategy. J Hematol Oncol. 2015;8:62.
106. Larrieu-Lahargue F, Welm AL, Thomas KR, Li DY. Netrin-4
Haematologica | 108 July 2023 1746 REVIEW ARTICLE - Platelet integrins: hemostasis, thrombosis, and more E. Janus-Bell and P.H. Mangin
activates endothelial integrin α6β1. Circ Res. 2011;109(7):770-774
107. Kadoya Y, Kadoya K, Durbeej M, Holmvall K, Sorokin L, Ekblom P. Antibodies against domain E3 of laminin-1 and integrin alpha 6 subunit perturb branching epithelial morphogenesis of submandibular gland, but by different modes. J Cell Biol. 1995;129(2):521-534.
108. Hufnagel DH, Cozzi GD, Crispens MA, Beeghly-Fadiel A. Platelets, thrombocytosis, and ovarian cancer prognosis: surveying the landscape of the literature. Int J Mol Sci. 2020;21(21):8169.
109. Mammadova-Bach E, Zigrino P, Brucker C, et al. Platelet integrin α6β1 controls lung metastasis through direct binding to cancer cell-derived ADAM9. JCI Insight. 2016;1(14):e88245.
110. Nieswandt B, Hafner M, Echtenacher B, Männel DN. Lysis of tumor cells by natural killer cells in mice is impeded by platelets. Cancer Res. 1999;59(6):1295-1300.
111. Labelle M, Begum S, Hynes RO. Direct signaling between platelets and cancer cells induces an epithelial-mesenchymallike transition and promotes metastasis. Cancer Cell. 2011;20(5):576-590.
112. Zuo X-X, Yang Y, Zhang Y, Zhang Z-G, Wang X-F, Shi Y-G. Platelets promote breast cancer cell MCF-7 metastasis by direct interaction: surface integrin α2β1-contacting-mediated activation of Wnt-β-catenin pathway. Cell Commun Signal. 2019;17(1):142.
113. Amirkhosravi A, Mousa SA, Amaya M, et al. Inhibition of tumor cell-induced platelet aggregation and lung metastasis by the oral GpIIb/IIIa antagonist XV454. Thromb Haemost. 2003;90(3):549-554.
114. Bakewell SJ, Nestor P, Prasad S, et al. Platelet and osteoclast beta3 integrins are critical for bone metastasis. Proc Natl Acad Sci U S A. 2003;100(24):14205-14210.
115. Dardik R, Kaufmann Y, Savion N, Rosenberg N, Shenkman B, Varon D. Platelets mediate tumor cell adhesion to the subendothelium under flow conditions: involvement of platelet GPIIb-IIIa and tumor cell alpha(v) integrins. Int J Cancer. 1997;70(2):201-207.
116. Echtler K, Konrad I, Lorenz M, et al. Platelet GPIIb supports initial pulmonary retention but inhibits subsequent proliferation of melanoma cells during hematogenic metastasis. PloS One. 2017;12(3):e0172788.
117. Greinacher A, Selleng K. Thrombocytopenia in the intensive care unit patient. Hematol Am Soc Hematol Educ Program. 2010;2010:135-143.
118. de Stoppelaar SF, van ’t Veer C, Claushuis TAM, Albersen BJA, Roelofs JJTH, van der Poll T. Thrombocytopenia impairs host defense in Gram-negative pneumonia-derived sepsis in mice. Blood. 2014;124(25):3781-3790.
119. Sharron M, Hoptay CE, Wiles AA, et al. Platelets induce apoptosis during sepsis in a contact-dependent manner that is inhibited by GPIIb/IIIa blockade. PloS One. 2012;7(7):e41549.
120. Pu Q, Wiel E, Corseaux D, et al. Beneficial effect of glycoprotein IIb/IIIa inhibitor (AZ-1) on endothelium in Escherichia coli endotoxin-induced shock. Crit Care Med. 2001;29(6):1181-1188.
121. Taylor FB, Coller BS, Chang AC, et al. 7E3 F(ab’)2, a monoclonal antibody to the platelet GPIIb/IIIa receptor, protects against microangiopathic hemolytic anemia and microvascular thrombotic renal failure in baboons treated with C4b binding protein and a sublethal infusion of Escherichia coli. Blood. 1997;89(11):4078-4084.
122. Duffau P, Seneschal J, Nicco C, et al. Platelet CD154 potentiates interferon-alpha secretion by plasmacytoid dendritic cells in systemic lupus erythematosus. Sci Transl Med. 2010;2(47):47ra63.
Haematologica | 108 July 2023 1747 REVIEW ARTICLE - Platelet integrins: hemostasis, thrombosis, and more E. Janus-Bell and P.H. Mangin
How we manage cardiovascular disease in patients with hemophilia
Massimo Franchini,1 Daniele Focosi2 and Pier Mannuccio Mannucci3
Abstract
Correspondence: M. Franchini massimo.franchini@asst-mantova.it
Received: November 11, 2022. Accepted: January 17, 2023. Early view: January 26, 2023.
https://doi.org/10.3324/haematol.2022.282407
©2023 Ferrata Storti Foundation
Published under a CC BY-NC license
With the striking advances in hemophilia care that have materialized particularly in the last two decades, an increasing number of persons with hemophilia (PWH) have achieved a quality of life and life expectancy very close to that of unaffected individuals. With aging, a growing number of PWH develop age-related co-morbidities, including cancer and cardiovascular disease. The latter (particularly coronary artery disease and atrial fibrillation) represent a new challenge for the hemophilia treatment centers because their management implies a delicate balance between the thrombotic risk and bleeding tendency, that is further enhanced by the concomitant use of antithrombotic agents. Because evidence from clinical trials is lacking, the management of PWH with cardiovascular diseases is mostly based on expert opinions, personal experiences, and the adaptation of the evidence stemming from studies on people without hemophilia. In this article, we focus on how to manage coronary artery disease and atrial fibrillation in patients with hemophilia.
Introduction
Hemophilia, the most common X-linked inherited disease which affects approximately 400,000 people worldwide, is characterized by reduced or unmeasurable levels of coagulation factor VIII (FVIII, hemophilia A) or factor IX (FIX, hemophilia B).1 The phenotypic severity and bleeding tendency are generally proportional to the degree of factor deficiency. Accordingly, patients with severe hemophilia (plasma factor levels <1%) suffer from recurrent hemorrhages into muscles and joints that, if untreated or inadequately treated, lead to an invalidating arthropathy.2 Since the early 1970s, the availability of coagulation factor concentrates (first plasma-derived and then recombinant) has dramatically improved the therapeutic approach to persons with hemophilia (PWH) by permitting home treatment and thus the early control or prevention of bleeding.3,4 Before this period, PWH had a very short life expectancy (20-30 years) and many died at a young age due to life-threatening bleeding episodes.5 Since the 1990s, the wider implementation of regular prophylaxis by hemophilia treatment centers (HTC) offering specialized and comprehensive care has fostered the clinical management of PWH, significantly contributing to improved
clinical outcomes. In the last decade, the availability of extended half-life recombinant FVIII and FIX products and the non-replacement product emicizumab administered subcutaneously has improved patient adherence to prophylaxis, further personalizing this therapeutic approach.5 Thus, with the availability of safe and effective treatments, both quality of life and life expectancy of PWH have progressively increased, approaching those of the general male population, at least in high-income countries. As a result, hematologists are now confronted with a growing population of older PWH who develop age-related diseases, including cardiovascular disease (CVD), malignancies, and renal diseases.6-10 In this article, based on our experience as well as on an analysis of the literature, we are focusing on the management of two frequent CVD: coronary artery disease (CAD) and non-valvular atrial fibrillation (AF).
Search methods
We reviewed the medical literature for fully published studies on the management of CVD in PWH. A literature search of the PubMed electronic database (through Med-
1Department of Transfusion Medicine and Hematology, Carlo Poma Hospital, Mantova; 2North-Western Tuscany Blood Bank, Pisa University Hospital, Pisa and 3Fondazione IRCCS Ca' Granda-Ospedale Maggiore Policlinico, Angelo Bianchi Bonomi Hemophilia and Thrombosis Center, Milan, Italy
Haematologica | 108 July 2023 1748 REVIEW ARTICLE
line) was carried out without temporal limits using English language as restriction. The Medical Subject Heading (MeSH) and keywords used were: “hemophilia”, “bleeding disorders”, “elderly patients”, “aging patients”, “co-morbidities”, “management”, “treatment”, “mortality”, “life expectancy”, “factor VIII”, “factor IX”, “cardiovascular disease”, “ischemic heart disease”, “coronary artery disease”, “cerebrovascular disease”, “atherosclerosis”, “arterial thrombosis”, “atrial fibrillation”, “antiplatelet agents”, “antithrombotic agents” and “anticoagulation”. We also screened the reference lists of the most relevant review articles for further studies not captured in our initial literature search. Figure 1 reports the results of our literature search.

Clinical case
In January 2016, a 76-year-old man with severe hemophilia A was admitted to the emergency department of the Mantova City Hospital for acute coronary syndrome. He
was on prophylactic replacement therapy with a plasmaderived FVIII concentrate (Haemoctin®, Biotest Pharma, Dreieich, Germany) administered on alternate days, suffered from chronic arthropathy, and had undergone total hip arthroplasty in 1993 and transurethral prostate resection in 2011, both surgeries being performed under hemostatic coverage with the FVIII concentrate. Chronic AF was one of his comorbidities, and this was handled with lowdose aspirin as the only antithrombotic prophylaxis. He had a family history positive for CVD and several additional cardiovascular risk factors, such as hypertension, obesity (body mass index 32) and dyslipidemia. After hospital admission, he underwent percutaneous coronary angiography (radial access) that showed a critical stenosis of the interventricular anterior and right coronary arteries. Two bare metal stents (BMS) were deployed under hemostatic coverage with Haemoctin® (4000 IU) with the goal of obtaining a peak FVIII level in plasma of at least 80% prior to the revascularization procedure. Before this, an intravenous bolus of 5000 IU unfractionated heparin (UFH) had also been administered, followed by a loading dose
Haematologica | 108 July 2023 1749 REVIEW ARTICLE - CVD management in hemophilia M. Franchini, et al.
Figure 1. Flow diagram of study selection.
of 325 mg aspirin and 600 mg clopidogrel. Dual antiplatelet therapy with aspirin 100 mg daily and clopidogrel 75 mg daily was also planned. The patient was discharged after three days with no bleeding complications, the planned antithrombotic regimen was prescribed together with continued prophylaxis with daily infusions of FVIII concentrate to keep trough plasma FVIII levels above 30%. One month after the revascularization procedure the patient was switched to low-dose aspirin (75 mg daily) and prophylactic FVIII was stopped. He was again admitted to the Emergency Department of the Mantova hospital for the onset of hematuria and large hematomas in the lower trunk and limbs, and prophylaxis with the same FVIII product (3000 UI) was restarted on alternate days to maintain trough plasma FVIII above 5%. The bleeding diathesis disappeared. The patient was also re-evaluated for chronic AF. Because anticoagulant prophylaxis was deemed contraindicated by his high bleeding risk due to the coagulation disorder plus antiplatelet therapy, in March 2021 he underwent surgery for left atrial appendage closure. The procedure was followed by 30 days of dual antiplatelet therapy (aspirin 100 mg daily and clopidogrel 75 mg/daily), which again required daily treatment with FVIII (target FVIII trough level: ≥30%). The patient is currently on low-dose aspirin (100 mg daily) and prophylactic therapy (Haemoctin® 3000 UI) on alternate days with no further bleeding at the 6-month follow-up.
The burden of cardiovascular disease in hemophilia
Although hemophilia has been postulated to protect against the development of CVD due to the underlying hypocoagulability, the precise incidence of cardiovascular diseases in PWH is not known.11-15 While a number of studies have documented that PWH have a lower mortality from CAD than the age-matched male population,16,17 more recent data indicate that prevalence of CAD in PWH increases with age. In a single-center study conducted between 1993 and 1998 in the USA, the age-specific prevalence of CAD ranged from 0.05% in PWH under the age of 30 years up to 15.2% in those aged 60 years or older.18 In addition, CAD-related mortality increased from 2% to 6% between 1972 and 2001, paralleling the growing life expectancy.19 Similarly, the standardized mortality ratio (SMR) for CAD during the period 2000-2007 was approximately two-fold higher than during the years 1990-1999 (0.55 vs. 0.25).20 An SMR of 3.0 for myocardial infarction, indicating an increased risk of death, was reported in a large study of PWH from the USA.21 Despite their natural anticoagulation state, that should in principle protect against thrombus formation, older PWH have a number of factors favoring the onset of CVD, including the use of
clotting factor concentrates, the presence of co-infections (i.e., HIV on antiretroviral therapy), and such other risk factors as hypertension, diabetes, overweight, poor physical activity, and chronic renal disease.22,23 Indeed, a retrospective study from Canada observed that risk factors for CVD (i.e., hypertension, smoking, obesity, diabetes mellitus, dyslipidemia, family history, and anti-retroviral therapy), as well as such cardiovascular events as acute coronary syndrome, cerebrovascular ischemic disease and AF were common in PWH.24 A retrospective study conducted in the USA found that among PWH the prevalence of CAD, stroke and myocardial infarction was around two-fold higher than in non-hemophilia males.25 Furthermore, a large retrospective USA study documented an increased prevalence of CVD in PWH compared with the general male population,26 and a report from Taiwan demonstrated that atherothrombotic cardiovascular events occurred at an earlier age, with chronic obstructive pulmonary disease, hypertension and hyperlipidemia as the main associated risk factors.27
All in all, evidence from the literature indicates that the prevalence of CVD in PWH is at least equal to that of their peers without hemophilia. This finding is consistent with another line of research on carotid and femoral artery intimal-medial thickness (a surrogate measure of atherosclerosis burden) which showed comparable values in PWH and the general population,28,29 indicating that hemophiliarelated hypocoagulability does not exclude atherogenesis.
Management of cardiovascular diseases
Evidence-based recommendations on how to handle CVD in PWH are lacking due to the absence of clinical trials. Thus, the few available guidelines are mostly based on those originally prepared for persons without hemophilia.30,31 There is general consensus that PWH must be managed like their age-related peers, provided replacement therapy is adapted to the degree of plasma factor deficiency and the added risk of bleeding carried by invasive cardiac procedures and use of antithrombotic drugs.8 The balance between bleeding and thrombosis is indeed particularly delicate in PWH, thereby representing a major challenge when these patients develop CVD.
Coronary artery disease
Both stable angina and acute coronary syndrome, the main types of CAD, can occur in PWH and need the same therapeutic approach as people without hemophilia.13,32 However, the management of CAD is challenging because standard treatment requires antiplatelet and anticoagulant drugs, such invasive procedures as percutaneous coronary intervention (PCI), the use of bare metal stents
Haematologica | 108 July 2023 1750 REVIEW ARTICLE - CVD management in hemophilia M. Franchini, et al.
(BMS), drug-eluting stents (DES) or even cardiac surgery with coronary artery bypass graft (CABG).33-35 Accordingly, particular attention must be paid to long-term antithrombotic treatments that expose PWH with CAD to a long-lasting increased risk of bleeding, as pointed out by the French registry.36
As far as the management of stable angina is concerned, long-term low-dose aspirin (≤ 100 mg/day) should be prescribed, but for PWH with severe disease, clotting factor prophylaxis should be given to prevent any worsening of the bleeding tendency.10 In particular, prophylaxis is mandatory in those PWH with a phenotype of 'heavy bleeder' or at high risk of bleeding owing to comorbidities (arterial hypertension, history of intracranial bleeding, gastrointestinal disease, liver disease or other conditions increasing the bleeding tendency).10
With the aim of standardizing therapeutic approaches, an institutional guideline for CAD in PWH has been developed in The Netherlands 30,31 offering suggestions largely extrapolated from the guidelines for Dutch patients without hemophilia. More recently, an international group tried to apply the guidelines of the European Society of Cardiology (ESC) for the management of acute coronary syndrome to PWH. 31 Thus, by harmonizing the indications from these guidelines with our own personal experience, we recommend that PCI should be performed as soon as possible and is to be preferred over thrombolysis among the revascularization procedures due to its reduced risk of bleeding compli-
cations (Figure 2). Thrombolysis should be considered only when PCI cannot be accessed.
Regarding the choice of the stent, BMS have been the preferred approach, because of the benefit of a shorter duration of combined antiplatelet treatment (usually one month).36,37 First-generation DES use has been reported in PWH, but these devices require more time to endothelize and dual antiplatelet therapy is required for longer.38 Thus, BMS and short-term combined antiplatelet treatment have been the main recommendations.30 However, second-generation DES have demonstrated a neat superiority over both BMS and early-generation DES in terms of efficacy and safety.39 In addition, with the latest available DES, one month of dual antiplatelet therapy is not inferior to a longer treatment period in patients at high risk of bleeding.40 Thus, we prefer to use second-generation DES and one month of dual antiplatelet therapy in PWH undergoing PCI. Regarding the access route for PCI, the radial artery is preferred to the femoral access owing to a lower risk of bleeding (local hematoma and anemia with transfusion requirement).41 In addition, the radial artery can be more easily compressed and does not carry the risk of the retroperitoneal bleeding associated with the femoral access.
The delicate balance between coagulation and anticoagulation in PWH with acute coronary syndrome deserves special attention. Regarding heparin anticoagulation, a single intravenous bolus of UFH should be started before PCI at the dosages reported in Figure 2. According to re-

Haematologica | 108 July 2023 1751 REVIEW ARTICLE - CVD management in hemophilia M. Franchini, et al.
Figure 2. Management of acute coronary syndrome in persons with hemophilia. PCI: percutaneous coronary intervention; DES: drug-eluting stents; IV: intravenous; UFH: unfractioned heparin; LMWH: low molecular weight heparin; ASA: acetylsalycilic acid.
cent guidelines for non-hemophilia patients, continuous UHF infusion following revascularization is no longer required. UFH is preferable to low molecular weight heparin (LMWH) because the anticoagulant effect can be easily measured by means of a simple point-of-care test (the activated clotting time), shorter half-life (1-2 vs. 4-5 hours), and availability of protamine sulfate as an antidote. Along with UFH, PWH are usually treated with dual antiplatelet therapy with aspirin and clopidogrel according to general guideline recommendations and evidence from published case series of PWH.30-32 We recommend a loading dose of 325 mg aspirin and 600 mg clopidogrel before PCI. Afterwards, PCI dual antiplatelet therapy is warranted to prevent stent thrombosis, but this is inevitably associated with an increased risk of bleeding related to the combination of the inherited coagulation defect with drug-induced platelet dysfunction. In the French registry that collected information on long-term antithrombotic treatments prescribed to PWH with CVD, bleeding was more frequent in patients treated with antiplatelet medications than in those without.36 Therefore, in order to minimize the risk of bleeding, we recommend dual antiplatelet therapy (aspirin 80-100 mg daily and clopidogrel 75 mg daily) for the shortest possible time, i.e., only during the 4 weeks following stent deployment. Long-term single therapy with low-dose aspirin 80-100 mg daily is recommended as secondary antiplatelet prophylaxis after PCI and stent deployment in PWH.42 Notwithstanding their higher efficacy than clopidogrel for reducing deaths and major cardiovascular events, prasugrel and ticagrelor should not be chosen for dual antiplatelet therapy due to the higher bleeding risk.43,44 There is very little experience in PWH with glycoprotein IIb/IIIa inhibitors, but their use is discouraged because they are associated with a particularly high risk of bleeding.32 Obviously, PWH with CAD can be treated as above with antithrombotic agents provided their coagulation defect is adequately corrected with factor replacement therapy. Accordingly, the dosage and intervals of factor administration should be planned and tailored in order to attain a given target plasma factor level. We recommend a trough factor level of no less than 30% for the treatment of acute coronary syndrome during the dual antiplatelet period. A higher peak factor level (≥80%) is warranted during the peri-procedural PCI period, whereas trough factor levels of approximately 5% are sufficient during long-term aspirin monotherapy (Figure 2). This target level can be attained by means of factor concentrate administration every other day, or even at more spaced out intervals when extended half-life concentrates are used. In patients with severe hemophilia, factor replacement prophylaxis is indicated for as long as an antithrombotic drug is prescribed. Finally, in the rare instances when thrombolysis is used, a more intensive factor replacement (trough 50% and peak ≥80%) should be provided.
A particularly challenging situation is the management of an acute coronary syndrome in PWH who developed alloantibodies that inactivate the coagulant activity of infused coagulation factors,45 i.e., up to 30% of cases with severe hemophilia A. There is very little information as to the best management strategy to adopt when inhibitor patients develop acute coronary syndrome. Because they fail to achieve a satisfactory hemostasis following regular replacement therapy, it is necessary to resort to plasmaderived (factor VIII inhibitor bypassing activity, FEIBA) or recombinant (activated factor VII, rFVIIa) products that contain activated coagulation factors able to bypass the inhibitor defect and thus ensure hemostasis.45 However, both bypassing agents are potentially thrombogenic and special attention should be paid to their use in PWH who have a hypercoagulable state at the time of acute coronary syndrome.
During PCI, we suggest administering rFVIIa on the day of the procedure at a dose of 90-100 mg/kg every 3-4 hours for 24 hours, followed by the same dose given daily during the next 4-week duration of antiplatelet therapy after stent deployment. When FEIBA is chosen as bypassing medication, we suggest a dosage of 80 U/kg every 12 hours for the first 24 hours, followed by the same daily dose during the next 4-week duration of antiplatelet therapy. During this period, the use of low-dose aspirin monotherapy instead of dual antiplatelet therapy is preferable due to the increased bleeding risk caused by the concomitant presence of two antiplatelet medications and the FVIII inhibitor.46
More uncertainty remains as to the management of CAD in the increasing number of FVIII inhibitor patients on prophylaxis with emicizumab (a long-acting bispecific monoclonal antibody that mimics the function of activated FVIII). Because PWH on emicizumab undergoing PCI cannot be monitored in the laboratory according to activated partial thromboplastin time (APTT)-based coagulation factor assays, bovine chromogenic assays should be used to monitor and tailor FVIII levels following concentrate infusion and heparin therapy.
Cardiac surgery is feasible in PWH provided replacement therapy is adequately planned in terms of dosage and duration in the frame of a multidisciplinary specialized team that offers close clinical and laboratory surveillance and follow-up. Fortunately, in recent years the progressive increase of PCI has substantially reduced the number of CABG in general, and also in PWH with CAD.47,48 Accordingly, indications for CABG are now limited to multi-vessel CAD or when the PCI revascularization approach is compromised.
Non-valvular atrial fibrillation
Atrial fibrillation is a leading cause of cardioembolic stroke and is a very common CVD in the aging population.49 Thus, the frequency of this arrythmia is continuously increasing in PWH, because they are not naturally protected from AF
Haematologica | 108 July 2023 1752 REVIEW ARTICLE - CVD management in hemophilia M. Franchini, et al.
nor from the ensuing thromboembolic complications. As for CAD, PWH should be treated in the same way as patients without hemophilia. Considering that there are no formal clinical trial data supporting recommendations for antithrombotic prophylaxis in PWH, their therapy should be personalized, balancing the risk of bleeding with that of thromboembolic complications.50 In the non-hemophilia population, there is a strong indication to use anticoagulation for stroke prevention if the CHA2DS2-VASc score with AF has a value of 1 or higher in men.51,52 Anticoagulation, which leads to a two-thirds reduction in the risk of cardioembolic stroke, may be carried out with vitamin K antagonists (VKA) or direct oral anticoagulants (DOAC), but the latter are generally preferable, particularly in patients at high risk of bleeding, due to a lower risk of cerebral hemorrhage.51 Scores have also been proposed to calculate the hemorrhagic risk in non-hemophilia patients who are candidates for oral anticoagulation; the HAS-BLED score is the most used.53 However, the applicability of both the thrombotic (CHA2DS2-VASc) and bleeding (HAS-BLED) risk scores is questionable in PWH because, owing to the impact of the inherited hypocoagulable state on both thrombotic and hemorrhagic risk evaluation, it is difficult to ascertain whether these tools originally developed and validated for the general population do, in fact, over-estimate (CHA2DS2-VASc) or under-estimate (HAS-BLED) the corresponding risk in PWH. In particular, although the French registry reported that bleeding episodes were more frequent in PWH with HAS-BLED scores higher than 3 than in those with scores of 3 or less,36 this tool is far from being standardized for use in congenital bleeders. Nevertheless, we and others suggest that oral anticoagulation should be considered for PWH with AF and a CHA2DS2VASc score of 2 or higher.35,46,54 When oral anticoagulation is implemented, we recommend DOAC instead of VKA due to the lower risk of cerebral hemorrhage.55,56 However, information on the safety of DOAC, as well as their efficacy and at which dosage, is not yet available in PWH with AF owing to the lack of adequately powered trials. In practice, we prefer to use DOAC at the lower recommended daily dosages, i.e., those for older patients and for those with renal impairment. We suggest daily doses of 220 mg for dabigatran, 15 mg for rivaroxaban, 5 mg for apixaban, and 30 mg for edoxaban.
According to guidelines and expert opinions,35,46 PWH with atrial fibrillation may be able to receive oral anticoagulation without changing their adopted therapeutic regimens when their endogenous factor levels are 20% or higher (Figure 3). According to patient experience, expert opinion and laboratory data, this cut-off value during oral anticoagulant therapy is considered to be safe enough.35 To minimize the risk of bleeding, the continuous prophylactic use of factor concentrate is warranted in patients with FVIII/FIX levels lower than 20%, even though this approach
is associated with the consumption of large amounts of concentrates and high costs. Perhaps it has been in response to these challenges that antiplatelet monotherapy has been proposed as a compromise in PWH at higher thrombotic (CHA2DS2-VASc score ≥2) and hemorrhagic (factor levels <20%) risk.57 However, because antiplatelet drugs are no longer recommended to reduce the risk of stroke in the general population with AF, and yet are associated with a significant increase in bleeding risk,51 we do not in any way support their use for PWH.
Patients with severe hemophilia (clotting factor level <1%) with AF are not usually treated with oral anticoagulation, in line with the observation that in these patients the naturally occurring, endogenous decrease in thrombin formation is similar to that of patients on the therapeutic International Normalized Ratio range during VKA therapy.58 Thus, considering the uncertainties of the bleeding risk in PWH with FVIII/FIX levels between 1% and 20%, strategies aimed at avoiding the need for long-term anticoagulant therapy should be strongly considered. Non-anticoagulant options for AF, such as cardioversion, catheter ablation and closure of the left atrial appendage, have been successfully used not only in non-hemophilia patients at high risk of bleeding (HAS-BLED > 3), but also in PWH (Table 1).17,59,60
Catheter ablation
Catheter ablation after pulmonary vein isolation using a femoral vein approach can be used to interrupt the abnormal electrical activity that sustains AF, and can recover and maintain the sinus cardiac rhythm. In patients at high risk of bleeding (HAS-BLED ≥3), catheter ablation has been shown to be as effective as oral anticoagulation in the prevention of long-term thromboembolic complications, but with a lower risk of bleeding.61 A successful singlecenter experience with catheter ablation in PWH was reported by van der Valk et al.; all patients obtained long-term sinus rhythm.59
Percutaneous left atrial appendage closure
Percutaneous left atrial appendage closure, non-inferior to oral anticoagulation in the prevention of thromboembolism and cardiac death,62 is another intervention used in PWH with AF in order to limit the duration of antithrombotic therapy and the risk of bleeding, particularly in those with more severe factor deficiency.63 The rationale for this approach lies in the fact that more than 90% of emboli originate in the left atrial appendage.64 However, in order to prevent device-related thrombosis, antithrombotic treatment is required at least until complete endothelization of the device surface has occurred, usually for at least 3 months.65 Factor concentrate prophylaxis is required during this antithrombotic treatment (Table 1). Although promising, experience with this technique in PWH is limited; a recent systematic literature review identified only 9 cases.66 In
Haematologica | 108 July 2023 1753 REVIEW ARTICLE - CVD management in hemophilia M. Franchini, et al.
these, there was some variability in the choice of the occluding device, severity of hemophilia, as well as type and duration of antithrombotic therapy.66 Different antithrombotic strategies in non-hemophilia AF cases at increased hemorrhagic risk have been proposed depending on their thrombotic risk profile, ranging from dual antiplatelet therapy for one month and antiplatelet monotherapy for two additional months in patients with CHA2DS2-VASc score of 4 or more, to up to three months of antiplatelet monotherapy in those with CHA2DS2-VASc score less than 4.67 In ad-
dition, data from a recent randomized trial suggest that low-dose DOAC may be an effective alternative to antiplatelet agents for post-procedural anticoagulation.68 Whatever the therapeutic regimen used, we suggest antiplatelet therapy for at least 3 months (the minimum period required for endothelization) following percutaneous left atrial appendage closure, together with adequate clotting factor prophylaxis (Table 1).

In summary, the CHA2DS2-VASc score and patient residual coagulation factor levels should first be taken into ac-
Procedure Management
Cardioversion
● AF ≤48 hours duration: no antithrombotic therapy.
● AF >48 hours duration: periprocedural (5 days) therapeutic doses of UFH and additional 4 weeks of OAC. CFC prophylaxis to maintain trough factor levels ≥80% during periprocedural period and ≥30% during the 4 weeks of OAC.
Catheter ablation
Periprocedural (2 days) therapeutic doses of UFH and additional 4-6 weeks of OAC. CFC prophylaxis to maintain trough factor levels >80% during periprocedural period and ≥30% during the 4-6-weeks of OAC.
Left atrial appendage closure
ASA and clopidogrel (preprocedural loading dose and postprocedural maintenance dose) for 1 month followed by ASA monotherapy (80-100 mg/day) for 2 months. Maintain peak factor plasma levels ≥80% during periprocedural (48 hours) period, trough factor plasma levels >30% during DAPT (1 month), and trough factor plasma levels ≥5% during ASA monotherapy (2 months).
AF: atrial fibrillation; OAC: oral anticoagulation; UFH: unfractionated heparin; DAPT: dual antiplatelet therapy; ASA: acetylsalicylic acid; CFC: coagulation factor concentrate.
Figure 3. Management of atrial fibrillation in persons with hemophilia.
Table 1. Management of atrial fibrillation in persons with hemophilia.
Haematologica | 108 July 2023 1754 REVIEW ARTICLE - CVD management in hemophilia M. Franchini, et al.
count when considering the indication for oral anticoagulation in PWH with AF, although several grey areas still persist.
Conclusions
The management of CVD in PWH is complex, requiring an accurate balance between coagulation and anticoagulation. Even though we have attempted here to provide indications on the management of two main CVD, it must be emphasized once more that the approaches suggested here and published in the literature are heterogeneous, making it difficult to provide solid guidelines. Despite these limitations, some general recommendations can be offered in the light of our experience as care providers in large hemophilia treatment centers. The cardiovascular management of PWH should be individualized in order to balance the bleeding risk with the antithrombotic protection, based on the cardiovascular risk profile and the severity of factor deficiency
References
1. Mannucci PM, Tuddenham EG. The hemophilias - from royal genes to gene therapy. N Engl J Med. 2001;344(23):1773-1779.
2. Franchini M, Mannucci PM. Hemophilia A in the third millennium. Blood Rev. 2013;27(4):179-184.
3. Franchini M, Mannucci PM. Past, present and future of hemophilia: a narrative review. Orphanet J Rare Dis. 2012;7:24.
4. Mannucci PM. Back to the future: a recent history of haemophilia treatment. Haemophilia. 2008;14(Suppl. 3):10-18.
5. Franchini M, Mannucci PM. The more recent history of hemophilia treatment. Semin Thromb Hemost. 2022;48(8):904-910.
6. Franchini M, Mannucci PM. Co-morbidities and quality of life in elderly persons with haemophilia. Br J Haematol. 2010;148(4):522-533.
7. Coppola A, Santoro C, Franchini M, et al. Emerging issues on comprehensive hemophilia care: preventing, identifying, and monitoring age-related comorbidities. Semin Thromb Hemost. 2013;39(7):794-802.
8. Mannucci PM, Schutgens RE, Santagostino E, MauserBunschoten EP. How I treat age-related morbidities in elderly persons with hemophilia. Blood. 2009;114(26):5256-5263.
9. Angelini D, Sood SL. Managing older patients with hemophilia. Hematology Am Soc Hematol Educ Program. 2015;2015:41-47.
10. Coppola A, Tagliaferri A, Franchini M. The management of cardiovascular diseases in patients with hemophilia. Semin Thromb Hemost. 2010;36(1):91-102.
11. Tuinenburg A, Mauser-Bunschoten EP, Verhaar MC, Biesma DH, Schutgens R. Cardiovascular disease in patients with hemophilia. J Thromb Haemost. 2008;7(2):247-254.
12. Schutgens RE, Voskuil M, Mauser-Bunschoten EP. Management of cardiovascular disease in aging persons with haemophilia. Hamostaseologie. 2017;37(3):196-201.
13. Canaro M, Goranova-Marinova V, Berntorp E. The ageing patient with hemophilia. Eur J Haematol. 2015;94(Suppl. 77):17-22.
14. Hermans C, de Moerloose P, Dolan G. Clinical management of
and/or bleeding phenotype. On the whole, however, clinical choices for PWH should be the same as those adopted for non-hemophilia patients, provided factor deficiencies are corrected by adequately tailored replacement therapy. The optimization of treatment efficacy and the mitigation of bleeding can only be reached through close co-operation between hematologists and other care providers from the specialized treatment centers in a multi-disciplinary approach (cardiologists, radiologists, surgeons) including all of those involved in the management of PWH with cardiovascular diseases.
Disclosures
PMM has received honoraria from Bayer, Kedrion, Roche and Werfen for lectures at educational symposia. MF and DF have no conflicts of interest to disclose.
Contributions
All the authors collaborated in writing and reading the manuscript.
older persons with haemophilia. Crit Rev Oncol Hematol. 2014;89(2):197-206.
15. Wang JD. Comorbidities of cardiovascular disease and cancer in hemophilia patients. Thromb J. 2016;14(Suppl. 1):34.
16. Rosendaal FR, Briet E, Stibbe J, et al. Haemophilia protects against ischemic heart disease: a study of risk factors. Br J Haematol. 1990;75(4):525-530.
17. Ferraris VA, Boral LI, Cohen AJ, Smyth SS, White GC 2nd. Consensus review of the treatment of cardiovascular disease in people with hemophilia A and B. Cardiol Rev. 2015;23(2):53-68.
18. Kulkarni R, Soucie JM, Evatt BL and the Hemophilia Surveillance System Project Investigators. Prevalence and risk factors for heart disease among males with hemophilia. Am J Hematol. 2005;79(1):36-42.
19. Plug I, Van der Bom JG, Peters M, et al. Mortality and causes of death in patients with hemophilia, 1992-2001: a prospective cohort study. J Thromb Haemost. 2006;4(3):510-516.
20. Tagliaferri A, Rivolta GF, Iorio A, et al.; Italian Association of Hemophilia Centers. Mortality and causes of death in Italian persons with haemophilia, 1990-2007. Haemophilia. 2010;16(3):437-446.
21. Soucie JM, Nuss R, Evatt B, et al. Mortality among males with hemophilia: relations with source of medical care. The Hemophilia Surveillance System Project Investigators. Blood. 2000;96(2):437-442.
22. Siboni SM, Mannucci PM, Gringeri A, et al. Health status and quality of life of elderly patients with severe hemophilia born before the advent of modern replacement therapy. J Thromb Hemost. 2009;7(5):780-786.
23. Kulkarni R, Soucie JM, Evatt B. Renal disease among males with hemophilia. Haemophilia. 2003;9(6):703-710.
24. Minuk L, Jackson S, Iorio A, et al. Cardiovascular disease (CVD) in Canadians with haemophilia: Age-Related CVD in Haemophilia Epidemiological Research (ARCHER study). Haemophilia. 2015;21(6):736-741.
Haematologica | 108 July 2023 1755 REVIEW ARTICLE - CVD management in hemophilia M. Franchini, et al.
25. Sharathkumar AA, Soucie JM, Trawinski B, Greist A, Shapiro AD. Prevalence and risk factors of cardiovascular disease (CVD) events among patients with haemophilia: experience of a single haemophilia treatment centre in the United States (US). Haemophilia. 2011;17(4):597-604.
26. Pocoski J, Ma A, Kessler CM, Boklage S, Humphries TJ. Cardiovascular comorbidities are increased in U.S. patients with haemophilia A: a retrospective database analysis. Haemophilia. 2014;20(4):472-478.
27. Wang JD, Chan WC, Fu YC, et al. Prevalence and risk factors of atherothrombotic events among 1054 hemophilia patients: a population-based analysis. Thromb Res. 2015;135(3):502-507.
28. Sartori MT, Bilora F, Zanon E, et al. Endothelial dysfunction in haemophilia patients. Haemophilia. 2008;14(5):1055-1062.
29. Biere-Rafi S, Tuinenburg A, Haak BW, et al. Factor VIII deficiency does not protect against atherosclerosis. J Thromb Haemost. 2012;10(1):30-37.
30. Schutgens RE, Tuinenburg A, Roosendaal G, Guyomi SH, MauserBunschoten EP. Treatment of ischaemic heart disease in haemophilia patients: an institutional guideline. Haemophilia. 2009;15(4):952-958.
31. Tuinenburg A, Damen SA, Ypma PF, Mauser-Bunschoten EP, Voskuil M, Schutgens RE. Cardiac catheterization and intervention in haemophilia patients: prospective evaluation of the 2009 institutional guideline. Haemophilia. 2013;19(3):370-377.
32. Staritz P, De Moerloose P, Schutgens R, et al. Applicability of the European Society of Cardiology guidelines on the management of acute coronary syndromes to people with hemophilia – an assessment by the ADVANCE Working Group. Haemophilia. 2013;19(6):833-840.
33. Konkle BA, Kessler C, Aledort L, et al. Emerging clinical concerns in the ageing haemophilia patient. Haemophilia. 2009;15(6):1197-1209.
34. Fogarty PF, Mancuso ME, Kasthuri R, et al.; Global Emerging Hemophilia Panel (GEHEP). Presentation and management of acute coronary syndromes among adult persons with haemophilia: results of an international, retrospective, 10-year survey. Haemophilia. 2015;21(5):589-597.
35. Shapiro S, Benson G, Evans G, Harrison C, Mangles S, Makris M. Cardiovascular disease in hereditary haemophilia: the challenges of longevity. Br J Haematol. 2022;197(4):397-406.
36. Guillet B, Cayla G, Lebreton A, et al. Long-term antithrombotic treatments prescribed for cardiovascular diseases in patients with hemophilia: results from the French Registry. Thromb Haemost. 2021;121(3):287-296.
37. Boehnel C, Rickli H, Graf L, Maeder MT. Coronary angiography with or without percutaneous coronary intervention in patients with hemophilia - systematic review. Catheter Cardiovasc Interv. 2018;92(1):1-15.
38. Iakovou I, Schmidt T, Bonizzoni E, et al. Incidence, prediction and outcome of thrombosis after successful implantation of drug-eluting stents. JAMA. 2005;4;293(17):2126-2130.
39. National Institute of Clinical Excellence (NICE). Acute coronary syndromes. National Institute of Clinical Excellence (NICE) Guideline NG185. Published 18 November 2020. https://www.nice.org.uk/guidance/ng185 Accessed October 5, 2022.
40. Valgimigli M, Frigoli E, Heg D, et al; MASTER DAPT Investigators. Dual antiplatelet therapy after PCI in patients at high bleeding risk. N Engl J Med. 2021;385(18):1643-1655.
41. Agostoni P, Biondi-Zoccai GG, de Benedictis ML, et al. Radial versus femoral approach for percutaneous coronary diagnostic and interventional procedures: systematic overview and meta-
analysis of randomized trials. J Am Coll Cardiol. 2004;44(2):349-356.
42. Mannucci PM, Mauser-Bunschoten EP. Cardiovascular disease in hemophilia patients: a contemporary issue. Haemophilia. 2010: 16(Suppl. 3):58-66.
43. Wallentin L, Becker RC, Budaj A, et al. Ticagrelor versus clopidogrel in patients with acute coronary syndromes. N Engl J Med. 2009;361(11):1045-1057.
44. Wiviott SD, Braunwald E, McCabe CH, et al; TRITON-TIMI 38 Investigators. Prasugrel versus clopidogrel in patients with acute coronary syndromes. N Engl J Med. 2007;357(20):2001-2015.
45. Franchini M, Mannucci PM. Inhibitors of propagation of coagulation (factors VIII, IX and XI): a review of current therapeutic practice. Br J Clin Pharmacol. 2011;72(4):553-562.
46. Mannucci PM. Management of antithrombotic therapy for acute coronary syndromes and atrial fibrillation in patients with hemophilia. Expert Opin Pharmacother. 2012;13(4):505-510.
47. Arora UK, Dhir M, Cintron G, Strom JA. Successful multi-vessel percutaneous coronary intervention with bivalirudin in a patient with severe hemophilia A: a case report and review of literature. J Invasive Cardiol. 2004;16(6):330-332.
48. Rossi M, Jayaram R, Sayeed R. Do patients with haemophilia undergoing cardiac surgery have good surgical outcomes? Interact Cardiovasc Thorac Surg. 2011;13(3):320-331.
49. Franchini M, Tagliaferri A, Mannucci PM. The management of hemophilia in elderly patients. Clin Interv Aging. 2007;2(3):361-368.
50. Schutgens RE, Klamroth R, Pabinger I, Dolan G; ADVANCE working group. Management of atrial fibrillation in people with haemophilia - a consensus view by the ADVANCE Working Group. Haemophilia. 2014;20(6):e417-e420.
51. Hindricks G, Potpara T, Dagres N, et al. 2020 ESC guidelines for the diagnosis and management of atrial fibrillation developed in collaboration with the European Association for Cardio-Thoracic Surgery (EACTS): the task force for the diagnosis and management of atrial fibrillation of the European Society of Cardiology (ESC) developed with the special contribution of the European heart rhythm association (EHRA) of the ESC. Eur Heart J. 2021;42(5):373-498.
52. Lip GY, Banerjee A, Boriani G, et al. Antithrombotic therapy for atrial fibrillation: CHEST guideline and expert panel report. Chest. 2018;154(5):1121-1201.
53. Pisters R, Lane DA, Nieuwlaat R, de Vos CB, Crijns HJ, Lip GY. A novel user-friendly score (HAS-BLED) to assess 1-year risk of major bleeding in patients with atrial fibrillation: the Euro Heart Survey. Chest. 2010;138(5):1093-1100.
54. Schutgens RE, Klamroth R, Pabinger I, Malerba M, Dolan G; ADVANCE working group. Atrial fibrillation in patients with haemophilia: a cross-sectional evaluation in Europe. Haemophilia. 2014;20(5):682-686.
55. Makam RCP, Hoaglin DC, McManus DD, et al. Efficacy and safety of direct oral anticoagulants approved for cardiovascular indications: systematic review and meta-analysis. PLoS One. 2018;13(5):e0197583.
56. Khan S, Krishnaswamy R, Malik BH, et al. Comparing safety and efficacy of dabigatran and factor Xa inhibitors for stroke prevention in hemophiliacs with non-valvular atrial fibrillation. J Atr Fibrillation. 2019;12(4):2157.
57. Schutgens RE, van der Heijden JF, Mauser-Bunschoten EP, Mannucci PM. New concepts for anticoagulant therapy in persons with hemophilia. Blood. 2016;128(20):2471-2474.
58. de Koning MLY, Fischer K, de Laat B, Huisman A, Ninivaggi M, Schutgens REG. Comparing thrombin generation in patients with hemophilia A and patients on vitamin K antagonists. J
Haematologica | 108 July 2023 1756 REVIEW ARTICLE - CVD management in hemophilia M. Franchini, et al.
Thromb Haemost. 2017;15(5):868-875.
59. van der Valk PR, Mauser-Bunschoten EP, van der Heijden JF, Schutgens REG. Catheter ablation for atrial fibrillation in patients with hemophilia or von Willebrand disease. TH Open. 2019;3(4):e335-e339.
60. Toselli M, Bosi D, Benatti G, Solinas E, Cattabiani MA, Vignali L. Left atrial appendage closure: a balanced management of the thromboembolic risk in patients with hemophilia and atrial fibrillation. J Thromb Thrombolysis. 2020;50(3):668-673.
61. Potpara TS, Larsen TB, Deharo JC, et al. Scientific Initiatives Committee of European Heart Rhythm Association (EHRA). Oral anticoagulant therapy for stroke prevention in patients with atrial fibrillation undergoing ablation: results from the First European Snapshot Survey on Procedural Routines for Atrial Fibrillation Ablation (ESS-PRAFA). Europace. 2015;17(6):986-993
62. Holmes DR, Reddy VY, Turi ZG, et al. PROTECT AF Investigators. Percutaneous closure of the left atrial appendage versus warfarin therapy for prevention of stroke in patients with atrial fibrillation: a randomised non-inferiority trial. Lancet. 2009;374(9689):534-542.
63. Dognin N, Salaun E, Champagne C, et al. Percutaneous left atrial appendage closure in patients with primary hemostasis disorders and atrial fibrillation. J Interv Card Electrophysiol. 2022;64(2):497-509.
64. Badescu MC, Badulescu OV, Butnariu LI, et al. Current therapeutic approach to atrial fibrillation in patients with congenital hemophilia. J Pers Med. 2022;12(4):519.
65. Schwartz RS, Holmes DR, Van Tassel RA, et al. Left atrial appendage obliteration: mechanisms of healing and intracardiac integration. JACC Cardiovasc Interv. 2010;3(8):870-877.
66. Lim MY, Abou-Ismail MY. Left atrial appendage occlusion for management of atrial fibrillation in persons with hemophilia. Thromb Res. 2021;206:9-13.
67. Patti G, Cavallari I. Antithrombotic approaches in patients undergoing left atrial appendage occlusion: current evidence and future perspectives. G Ital Cardiol (Rome). 2019;20(3 Suppl 1):23S-27S.
68. Duthoit G, Silvain J, Marijon E, et al. Reduced rivaroxaban dose versus dual antiplatelet therapy after left atrial appendage closure: ADRIFT a randomized pilot study. Circ Cardiovasc Interv. 2020;13(7):e008481.
Haematologica | 108 July 2023 1757 REVIEW ARTICLE - CVD management in hemophilia M. Franchini, et al.
General condition and comorbidity of long-term survivors of adult acute lymphoblastic leukemia
Nicola Gökbuget,1 Kristina Ihrig,1 Michael Stadler,2 Matthias Stelljes,3 Ahmet Elmaagacli,4 Michael Starck,5 Simon Raffel,6 Andrea Stoltefuss,7 Andreas Viardot,8 Karl-Anton Kreuzer,9 Daniela Heidenreich,10 Andrea Renzelmann,11 Ralph Wäsch,12 Max S. Topp,13 Barbara Ritter,14 Peter Reimer,15 Joachim Beck,16 Jörg Westermann,17 Knut Wendelin,18 Nael Alakel,19 Maher Hanoun,20 Hubert Serve1 and Dieter Hoelzer1
1Goethe University, University Hospital, Department of Medicine II, Hematology/Oncology, Frankfurt; 2Hannover Medical School, Department of Hematology, Hemostasis, Oncology, and Stem Cell Transplantation, Hannover; 3University of Muenster, Department of Medicine
A, Hematology, Oncology and Pneumology, Muenster; 4Asklepios Hospital Hamburg St. Georg, Hamburg; 5Munich Hospital Schwabing, München; 6University Hospital, Department of Internal Medicine V, Hematology, Oncology and Rheumatology, Heidelberg; 7Evangelisches
Krankenhaus Hamm, Hamm; 8University Hospital of Ulm, Department of Internal Medicine III, Ulm; 9University at Cologne, Department I of Internal Medicine, Köln; 10University Hospital Mannheim, Clinic for Hematology and Oncology, Mannheim; 11University Hospital for Internal Medicine, Oncology and Hematology, Oldenburg; 12University of Freiburg, University Medical Center, Department of Hematology, Oncology and Stem Cell Transplantation, Freiburg; 13University Hospital, Medical Clinic and Polyclinic II, Würzburg; 14Klinikum Kassel, Medical Clinic IV, Oncology, Hematology and Immunology, Kassel; 15Evang. Kliniken Essen-Mitte, Essen; 16University Medicine Mainz, Medical Clinic and Polyclinic III, Hematology, Oncology and Pneumonology, Mainz; 17Charite University Medicine Berlin, Campus Virchow-Klinikum, Berlin; 18Klinikum Nuernberg, Paracelsus Medizinische Privatuniversität, Nuernberg; 19University Hospital Dresden, Department I of Internal Medicine, Hematology and Oncology, Dresden and 20University Hospital, Department of Hematology and Stem Cell Transplantation, Essen, Germany
Abstract
Correspondence: N. Gökbuget goekbuget@em.uni-frankfurt.de
Received: August 8, 2022.
Accepted: February 2, 2023. Early view: February 9, 2023.
https://doi.org/10.3324/haematol.2022.281820

©2023 Ferrata Storti Foundation
Published under a CC BY-NC license
Cure rates in adult acute lymphoblastic leukemia (ALL) improved using pediatric-based chemotherapy and stem cell transplantation (SCT). However, limited data on the health condition of cured adults are available whereas pediatric data cannot be transferred. The GMALL analyzed the health status in survivors of adult ALL retrospectively. Physicians answered a questionnaire on general condition (Eastern Cooperative Oncology Group [ECOG] status) and comorbidity or syndrome occurrence observed after treatment. Five hundred and thirty-eight patients with a median age of 29 (range, 15-64) years at diagnosis were analyzed, median follow-up was 7 (range, 3-24) years. Thirty-one percent had received SCT. ECOG status was 0-1 in 94%, 34% had not developed significant comorbidities. Most frequent comorbidities involved the neurologic system (27%), endocrine system (20%), skin (18%), graft-versus-host-disease (15%), cardiac system (13%), fatigue (13%). SCT impacted ECOG status and comorbidity occurrence significantly. ECOG 0-1 was observed in 86% of SCT and 98% of non-SCT patients (P<0.0001); comorbidity was observed in 87% and 57% respectively (P<0.0001). Our analysis elucidates the spectrum of comorbidities in cured adult ALL patients, with higher risk for transplanted patients, providing stimulations for the design of adequate aftercare programs. Overall, a large proportion of non-SCT patients achieved unrestricted general condition. The data provide a reference for new patient-centered endpoints in future trials.
Introduction
Outcome of adult acute lymphoblastic leukemia (ALL) has considerably improved using pediatric-based therapies. Complete remission rates reach 90% and survival approaches 60-70% in younger adults.1,2 Intensive chemotherapy is the mainstay of therapy and patients suffer from acute and long-term toxicities. In addition,
more adult compared to pediatric patients display highrisk (HR) features and these patients are often candidates for allogeneic stem cell transplantation (SCT). 3 With improving survival, the incidence and type of comorbidities and late effects is highly relevant. A variety of systematic evaluations of survivors from pediatric neoplasia have been reported.4-7 Several specific syndromes were described such as disorders of the central
Haematologica | 108 July 2023 1758 ARTICLE - Acute Lymphoblastic Leukemia
nervous system (CNS), obesity, osteonecrosis, and secondary malignancies (reviewed in 8). Late effects of SCT include graft-versus-host disease (GvHD), cardiovascular, pulmonary, endocrine, or musculoskeletal disorders, and secondary malignancies (reviewed in 9). Observations in children can, however, not be easily transferred to adult ALL survivors since treatment approaches are different and biological reactions to chemotherapy or irradiation may be different in developing tissues. Overall, limited data are available with respect to the health condition in long-term survivors of adult ALL. Since 1981, the German Multicenter Study Group for Adult Acute Lymphoblastic Leukemia (GMALL) has completed seven consecutive prospective treatment trials for adults aged between 15 and 65 years. The major focus was riskadapted subgroup-specific therapy. In order to establish a systematic overview of the health status of long-term survivors i.e., cured ALL patients, the GMALL performed a retrospective study in survivors of six consecutive GMALL trials initiated between 1984 and 2003 (clinicaltrials gov. Identifier: NCT00198978, NCT00199004, NCT00199017, NCT00199069, NCT00199056 and NCT00198991). The aim was to describe the incidence of comorbidities and the potential correlation to patient and disease characteristics.
Methods
Patient characteristics
Patients enrolled in six consecutive GMALL studies for newly diagnosed ALL (age, 15-65 years) were eligible; patients younger than 18 years were only included until 2012. All protocols were based on intensive, pediatric-based chemotherapy according to a BFM backbone, including prophylactic CNS irradiation, intrathecal therapies and consolidation including high-dose (HD) methotrexate and cytarabine followed by maintenance therapy.10,11,12,13,14 Since trial 06/99 PEG-asparaginase replaced native E.coli Asparaginase in first-line therapy. Patients with HR features were candidates for SCT. Figure 1 shows a schematic overview whereas dosing is stated in the Online Supplementary Table S2. The studies were conducted in over 100 participating hospitals. All patients agreed to trial participation after informed consent. The trials were reviewed by Ethical Review Boards. Patients aged between 15 and 65 years were identified in the respective GMALL databases (02/84, 03/87, 04/89, 05/93, 06/99 and 07/03) if they were alive more than 5 years from their diagnosis. Several patients from recent trials 06/99 and 07/03 with shorter follow-up were accepted to gather information on outcomes of these intensified regimens.

Haematologica | 108 July 2023 1759 ARTICLE - Late effects in adult ALL survivors N. Gökbuget et al.
Figure 1. Schematic overview on GMALL trials 02/84 – 07/03. CNS-RAD: central nervous system irradiation 24 Gy; SR: standard risk; HR: high risk; T: T-cell acute lymphoblastic leukemia; VHR: very high risk (Ph/BCR-ABL positive); HDMTX: high-dose methotrexate; HDARAC: high-dose cytarabine; R: randomization; SCT: stem cell tranplantation.
Data collection
The questionnaire was sent to responsible physicians in participating hospitals and included information on surviving patients as identified in the GMALL database. Physicians were asked either to answer the questionnaire or to forward it to the respective practitioners responsible for aftercare. The questionnaires were to be answered in patients alive according to the last follow-up, only. Questions were related to any disease or syndrome documented in patient files after the end of ALL treatment. The questionnaire was divided into three parts. Part 1 addressed any comorbidity observed in one of eight organ systems (skin, lung, neurologic system, endocrine system, kidney/liver, cardiac system, gastrointestinal system, eyes). Part 2 was directed in addition to speci fic syndromes (e.g., fatigue, GvHD, secondary malignancies, infections, osteonecrosis, hyperthyroidism/ hypothyroidism). Part 3 addressed the general health condition, measured as ECOG performance status at last patient visit. In addition, a classification of severity according to CTCAE was requested. Details on the items of the questionnaire are given in the Online Supplementary Table S3.
Altogether, 55 specific comorbidities in nine categories or syndromes were addressed. In addition, physicians had the opportunity to add text comments. The completed questionnaires were sent to the GMALL study center and information was collected in a database. In case of erroneously documented symptoms in the category of GvHD in patients without prior allogeneic SCT, the comorbidities were allocated to the respective organ categories. In case of documentation by both hospital physician and general practitioners, data were combined, and potential discrepancies clarified.
Study endpoints
The study was designed to analyze frequencies and severity of comorbidities and syndromes. In order to analyze the potential impact of patient or treatment-related factors on these outcomes, two major endpoints were analyzed: (i) general comorbidity status defined as occurrence of at least one comorbidity in nine organ categories or specific syndromes versus occurrence of no comorbidity and (ii) ECOG status of 0-1 compared to 2-4. Furthermore, the correlation of these factors with distinct comorbidities or syndromes was described. Four relevant patient or disease related factors were defined: sex, age at ALL diagnosis (15-55 years vs. 56-65 years), history of any SCT versus no SCT and finally the study cohorts were grouped by overall (02/84-05/93 vs. 06/99-07/03).
Statistical analysis
Statistical analysis was performed by SAS proprietary software Release 9.4. Patient characteristics and incidences of comorbidities or syndromes were described by
calculating absolute frequencies, median and range in comparison of different patient and treatment characteristics. The impact of patient and treatment characteristics as predictive factors for outcome parameters was analyzed in univariate analysis (c2-test or bidirectional Fisher’s exact test) and multivariate analysis by logistic regression. For logistic regression, the effect of SCT, age in two groups (≤ or > 55 years), and sex was analyzed. As significance level for univariate and multivariate analysis α=5% was chosen.
Results
Study population and patient characteristics
Overall, 1,413 long-term survivors were identified in the databases of GMALL trials 02/84-07/03. Patients with a follow-up of less than 3 years at time point of data collection (n=12) were excluded. One hundred and twentytwo patients, mostly from trials 06/99 and 07/03 with a follow-up of 3-4 years (n=41) or 4-5 years (n=76) were included. Six hundred and ten completed questionnaires on 561 patients were collected. There was no difference in terms of major clinical characteristics between patients with available questionnaire and those without (Online Supplementary Table S1). Five hundred and eighty-four questionnaires from 538 patients were eligible (Table 1). This included 295 patients documented by physicians from hospitals, 197 patients documented by practitioners and 46 cases with responses from both sources. Data were collected from trials 02/84 (n=41), 03/87 (n=16), 04/89 (n=60), 05/93 (n=180), 06/99 (n=162), 07/03 (n=79). Median age at diagnosis was 29 (range, 15-64) years and did not vary between studies (Table 1). Fourty patients had experienced a relapse during their medical history. Fourtynine patients had Ph/BCR-ABL-positive ALL. At diagnosis 36% of the patients were younger than 25 years (n=191) and 5% older than 55 years (n=26). The median age at time of follow-up was 39 (range, 19-74) years.
The median follow-up was 7.5 (range, 3-24) years. Most patients (78%) were alive more than 5 years from diagnosis (n=416) including 35% with more than 10 years follow-up. Overall, 31% (n=168) of the patients had received SCT; of these 88% were allogeneic SCT (n=147) and 12% were autologous SCT (n=21). The proportion of patients with any SCT increased over time, from 14% in studies 02/84-04/89 to 21% in study 05/93 to 47% in studies 06/99-07/03 (Table 1). Seventy-three percent of the transplanted patients had a follow-up of 4 or more years after transplantation.
General condition
Five hundred and twenty-two patients were evaluable for their ECOG performance status. No restrictions (ECOG=0)
Haematologica | 108 July 2023 1760 ARTICLE - Late effects in adult ALL survivors N. Gökbuget et al.
were documented for 70% of the patients (n=367). Twenty-four % (n=125) of the patients had slight restrictions (ECOG 1). More relevant restrictions (ECOG 2-4) were present in 6% of the patients (n=30). Online Supplementary Table S4 gives the frequencies of ECOG status by age groups and trial generation.
Overall incidences of comorbidities and specific syndromes
For one third of survivors of ALL no comorbidities were reported. About 66% had developed some comorbidity (n=355). Comorbidities most frequently involved the neurological system (27%), the endocrine system (17% of male and 24% female patients) and skin including alopecia (18%) (Table 2). For 37 items, a grading according to CTCAE had been requested and 692 events had been classified. Overall, the median of severity grade according to CTCAE was 2 (range, 1-4). Higher severity grades 3 and 4 were documented in the neurologic system (n=62), in specific syndromes (n=59), in the cardiac system (n=26), in lung (n=28), and in eye impairment (n=21).
Incidences and characteristics of specific syndromes
GvHD: the most frequently documented specific syndrome was GvHD in 15% (n=79) overall (Table 2) and 47% of the
patients with SCT. GvHD was manifested by skin involvement (n=52), eye impairment/sicca syndrome (n=45), liver affection (n=25), intestine (n=12), or lung (n=10). Half of the patients with GvHD had only one organ involved, but in 30% and 19% two or more organs were involved, respectively. The median time from primary diagnosis to GvHD documentation was 3 (range, 0.2-8) years.
Osteonecrosis: osteonecrosis was documented in 8% (n=41). The incidence was 10% in female and 6% in male patients respectively (Table 3). The hip (n=18), shoulder (n=8) or both large joints (n=2) were involved. The severity was grade 1-2 in 18% of osteonecrosis cases (n=7), grade 3 in 48% (n=19), grade 4 in 35% (n=14), and unknown in 2% (n=1). The incidence was 9% in transplanted and 7% in non-transplanted patients (P>0.05). The median age was 24 (range, 15-72) years at diagnosis of ALL and 27 (range, 18-59) years at the event. The median time from ALL diagnosis to event was three (range, 0-13) years (Online Supplementary Table S5). The incidence of grade 3/4 cases in adolescent patients was 13% and 5% in adults, respectively (Online Supplementary Table S5).
Secondary malignancies: second malignancies were reported in 4% (n=21). The median age at primary diagnosis was 36 (range, 16-64) years and the median age at event was 46 (range, 22-72) years. The median time from diag-
Study Cohort
Chracteristics
Trials 02-04 Trial 05 Trials 06-07 Total Evaluable patients, N 117 180 241 538 From hospitals, N (%) 27 (23) 79 (44) 189 (78) 295 (55) From private practitioners, N (%) 79 (68) 77 (43) 41 (17) 197 (37) From both, N (%) 11 (9) 24 (13) 11 (5) 46 (8) Male, N (%) 65 (56) 111 (62) 151 (63) 327 (61) Female, N (%) 52 (44) 69 (38) 90 (37) 211 (39) Age in yrs at diagnosis, median 28 29 30 29 Age in yrs at diagnosis, range 15-60 15-64 15-64 15-64 ≤ 25 years, N (%) 44 (38) 66 (37) 81 (34) 191 (36) 26-55 years, N (%) 70 (60) 104 (58) 147 (61) 321 (60) > 55 years, N (%) 3 (2) 10 (5) 13(5) 26 (5) Age in yrs at evaluation, median 46 38 36 39 Age in yrs at evaluation, range 22-72 20-74 19-69 19-74 ≤ 25, N (%) 1 (1) 7 (4) 42 (17) 50 (10) > 25-55, N (%) 85 (73) 142 (76) 173 (72) 400 (74) > 55, N (%) 31 (26) 31 (17) 26 (11) 88 (16) Follow-up ≤ 7.5 yrs, N (%) 1 (1) 28 (16) 240 (99) 269 (50) Time since diagnosis, evaluation in yrs, median 16.5 9 5 7 Time since diagnosis, evaluation in yrs, range 3-24 4-14 3-8 3-24 Stem cell transplantation, N (%) 16 (14) 38 (21) 114 (47) 168 Chemotherapy alone, N (%) 101 (86) 142 (79) 127 (53) 370
yrs: years. Haematologica | 108 July 2023 1761 ARTICLE - Late effects in adult ALL survivors N. Gökbuget et al.
Table 1. Data collection, patient and treatment characteristics.
nosis of ALL to diagnosis of secondary malignancy was 11 (range, 2-23) years. The detected tumors were melanoma (n=4), basal cell carcinoma (n=4), hematological malignancies (n=4), breast cancer (n=2), prostate cancer (n=2), glioblastoma, small intestine cancer, cancers of stomach, and cervix, as well as sarcoma (each n=1). The incidence of secondary malignancy was similar in transplanted and non-transplanted patients ( Online Supplementary Table S6)
Fatigue was observed in 13% (n=71). Most patients developed minor grades (1-2) (n=63) whereas seven and one patient developed grade 3 or 4, respectively. The median age at diagnosis of ALL was 29 (range, 15-64) years and the median age at event was 35 (range, 18-67) years. The median time from primary diagnosis to fatigue event was 3.5 (range, 0,1-17 years). The incidence of fatigue was 19% in transplanted and 11% in non-transplanted patients (P>0.05). The incidence of grade 3/4 in adolescents was 1% versus 2% in adult patients (P>0.05) (Online Supplementary Table S5).
Other specific syndromes: infections in the past 12 months, mainly with respiratory involvement, were described in 12% of the patients. Hypothyroidism was seen in 5% of patients (n=26), hyperthyroidism in 1% (n=7).
Incidences and characteristics of comorbidities according to organ classes
Neurologic disorders: 27% of the patients developed neurologic disorders (Table 2). Seventy-one patients (13%) had mood alterations (grade 3 in n=15). Cognitive disturbances or memory alterations were documented in 7%. Polyneuropathy was documented in 7% (n=35; grade 3 in n=14) including peripheral sensory and/or motor neuropathy. In addition, sensory or motor/reflex impairment as distinct comorbidities were documented in further 28 patients (n=11 and n=17, respectively), accounting for a total incidence of peripheral nerve disorders of 12%. Leukoencephalopathy was documented in 16 patients (3%). Fourty-two percent of these patients had received a prior SCT.
Endocrine disorders: 20% of the patients developed some disorder in the endocrine system (n=105). The overall incidence was 24% for women and 17% for men. Infertility in females was adjusted for age and described in 17% of the female patients younger than 40 years at time of evaluation (n=18/104). Six percent of the female patients had osteoporosis (n=12). Four percent of the male patients had documented infertility (n=12) and additional eight patients had a pathological hormone status and/or erectile dysfunction, but without documentation of infertility. Diabetes was documented in 5% of female and 2% of male patients.
Skin disorders: 18% (n=97) of the patients developed skin impairment. Alopecia was the most common finding (10%) and 13 had documented skin GvHD in addition.
Ocular disorders: eye impairment was documented for 12% of the patients (n=65). The most frequent ocular comorbidity was cataract in 6% (n=30; grade 3 in n=16). Four percent had conjunctivitis and 3% had visual impairment. Sicca syndrome, documented as part of GvHD, was highly correlated with documentation of further eye impairment (P<0.0001).
Other organ categories: the incidences of diseases in other organ systems are summarized in Table 2. Patients developed cardiac diseases (13%), e.g., hypertension (9%); liver or kidney diseases (10%), e.g., liver failure (6%); lung diseases (8%), e.g., dyspnea (5%); or diseases of the gastrointestinal system (6%).
Predictive factors for long-term general condition and occurrence of comorbidities
General condition: 98% of patients without SCT compared to 86% of SCT patients had an ECOG status of 0-1 (P<0.0001). Ninety-five percent of the patients younger and 84% of those older than 55 years at time of diagnosis had no or minor restrictions of general condition (P=0.02). If younger patients (≤55 years) were subdivided at a cutoff of 25 years, the incidences of ECOG status 0-1 were 96% and 94%, respectively (P>0.05). No differences for ECOG status were evident regarding the trial cohorts, or
Incidences Comorbidity Evaluable per item N % N No comorbidity 355 66 538 Comorbidities according to organ classes Skin 97 18 538 Lung 41 8 538 Cardiac system 70 13 538 Gastrointestinal system 30 6 537 Neurologic system 147 27 538 Kidney/liver 56 10 538 Eyes 65 12 537 Endocrine system Women 50 24 211 Men 55 17 327 Specific syndromes Infection (in past 12 months) 64 12 533 Fatigue 71 13 533 GvHD 79 15 538 Osteonecrosis 41 8 538 Secondary malignancy 21 4 538 Hypothyreodism 26 5 537 Hyperthyreodism 7 1 538
Table 2. Overall incidences of comorbidities and specific syndromes.
Haematologica | 108 July 2023 1762 ARTICLE - Late effects in adult ALL survivors N. Gökbuget et al.
GvHD: graft-versus-host disease.
SCT vs . CT Sex Age at diagnosis Study Cohort SCT CT alone male female ≤ 55 years >55 years Trial 2-4 Trial 5-7 N % N % P uni (multi) N % N % P uni (multi) N % N % P uni (multi) N % N % P uni (multi) ECOG grade 0-1 142 86 350 98 <0.0001 (<0.00001) 297 94 195 95 ns 471 95 21 84 0.02 (0.02) 109 96 383 94 ns (ns) ≥ one comorbidity 146 87 209 57 <0.0001 (<0.0001) 204 62 151 72 0.03 (ns) 335 65 20 77 ns (ns) 83 71 272 65 ns (0.007) Skin 53 32 44 12 <0.0001 (<0.0001) 49 15 48 23 0.0222 (0.0283) 92 18 5 19 ns (ns) 17 15 80 19 ns (ns) Lung 30 18 11 3 <0.0001 (<0.0001) 29 9 12 6 ns (ns) 39 8 2 8 ns (ns) 5 4 36 9 ns (ns) Cardiac system 27 16 43 12 ns (0.03) 41 13 29 14 ns (ns) 63 12 7 27 0.03 (0.02) 24 21 46 11 0.006 (0.0012) GI system 15 9 15 4 0.02 (0.02) 22 7 8 4 ns (ns) 27 5 3 12 ns (ns) 5 4 25 6 ns (ns) Neurologic system 61 36 86 23 0.001 (0.002) 77 24 70 33 0.014 (0.02) 136 27 11 42 ns (ns) 36 31 111 26 ns (ns) Kidney/liver 39 23 17 5 <0.0001 (<0.0001) 33 10 23 11 ns (ns) 51 10 5 19 ns (ns) 8 7 48 11 ns (ns) Endocrine system (f) 26 38 24 17 0.0009 (0.0011)50 2447 23 3 33 ns (ns) 8 15 42 26 ns (ns) Endocrine system (m) 34 34 21 9 <0.0001 (<0.0001) 55 17-49 16 6 35 0.04 (0.0177) 8 12 47 18 ns (ns) Eye impairment 48 29 17 5 <0.0001 (<0.0001) 36 11 29 14 ns (ns) 59 12 6 23 ns (0.04) 10 9 55 13 ns (ns) Infection 34 20 30 8 <0.0001 (0.0001) 29 9 35 17 0.008 (0.01) 61 12 3 12 ns (ns) 13 11 51 12 ns (ns) Fatigue 32 19 39 11 0.006 40 12 31 15 ns 67 13 4 15 ns 11 9 60 14 ns (0.007) (ns) (ns) (ns) GvHD 79 47 0 0 <0.0001 (ns) 46 14 33 16 ns (ns) 75 15 4 15 ns (ns) 2 2 77 18 <0.0001 (0.0004) Osteonecrosis 15 9 26 7 ns (ns) 20 6 21 10 ns (ns) 41 8 0 0 ns (ns) 12 10 29 7 ns (ns) Secondary malignancies 6 4 15 4 ns (ns) 14 4 7 3 ns (ns) 18 4 3 12 0.04 (0.03) 10 9 11 3 0.003 (0.003) Hypothyroidism 10 6 16 4 ns (ns) 11 3 15 7 ns (ns) 26 5 0 0 ns (ns) 5 4 21 5 ns (ns) Hyperthyroidism 2 1 5 1 ns (ns) 4 2 3 1 ns (ns) 7 1 0 0 ns (ns) 2 2 5 1 ns (ns)
transplantation; CH: chemotherapy;
fi
>0.05; GI: gastrointestinal; GvHD: graftversus -host disease; P uni: P value for univariate analysis; multi: P value
Haematologica | 108 July 2023 1763 ARTICLE - Late effects in adult ALL survivors N. Gökbuget et al.
Table 3. Predictive factors for general condition and incidence of comorbidities.
SCT: stem cell
ns: not signi
cant
for multivariate analysis; f: female; m: male.
sex (Table 3). In a multivariate analysis the significant effect of SCT (P<0.001) and age ≤ or > 55 years (P=0.02) on ECOG status was confirmed.
Overall incidence of any comorbidity: the incidence of any comorbidity was 87% in patients with SCT compared to 57% in those without SCT (P<0.0001). Females showed a slightly higher incidence of any comorbidity (72% vs. 62%; P=0.03). Older patients had a higher incidence of comorbidities (77%) compared to younger patients (65%), but the difference was not significant (P=0.05). The significant impact of SCT was confirmed in a multivariate analysis. The trial cohort had a significant impact on the occurrence of comorbidities in the multivariate approach only (P<0.007) (Table 3).
Incidence of specific comorbidities: in univariate analysis, SCT had a significant impact on the incidence on nearly all comorbidities except for cardiac diseases; this was confirmed in multivariate analyses (Table 3). Sex had a significant effect only on neurologic disorders with incidences of 33% in females compared to 24% in males (P=0.01). Skin comorbidity was described more often in female patients (23% vs. 15%) (P=0.02). Age at diagnosis was correlated to cardiac disorders, which were described in 12% of the patients younger and 27% of the patients older than 55 years (P=0.03). Age was also correlated to the occurrence of endocrine disorders in male patients (16% vs 35%) (P=0.04) (Table 3).
Incidence of specific syndromes: patients with SCT had significantly higher incidences of GvHD (46% vs. 0%; P<0.0001), infections within the last 12 months (20% vs. 8%; P<0.0001), and fatigue (19% vs. 11%; P=0.007). No impact of SCT was seen for secondary malignancies, osteonecrosis, and hyper- or hypothyroidism (Table 3). Sex correlated with the incidence of infections (17% vs. 9% in females and males; P=0.008). Age had an impact on secondary malignancies (4% in younger and 12% in older patients; P=0.04). Trial cohort was correlated to occurrence of GvHD, which was observed in 18% of the recent compared to 2% in the historic trials (P<0.0001). Conversely, the incidence of secondary malignancies was higher in the historic trials (9%) compared to the recent ones (3%) (P=0.003). The described differences were also confirmed in multivariate analysis.
Further correlation of age at different cut-offs to ECOG status and incidence of comorbidities is reported in the Online Supplementary Table S7.
Discussion
Numerous studies have been conducted in long-term survivors of pediatric cancer including ALL (reviewed in 8). They reported a higher mortality, more chronic medical conditions, impaired general and mental health, functional
impairment, and poorer social parameters compared to healthy relatives and the general population.5 After treatment modifications, the number of late effects was lower in patients treated with contemporary regimens. However, ALL survivors still displayed an increased risk of chronic medical conditions compared to healthy siblings.7
The use of intensified pediatric-based chemotherapy contributed to improved outcome in younger adults. However, in many study groups for adult ALL up to 50% of patients are considered at high-risk for relapse with an indication for allogeneic SCT. Despite an increasing number of longterm survivors of adult ALL, little is known about the health status of cured patients.
To our knowledge, this report covers the largest number of adults with ALL analyzed with a systematic approach to describe the health condition of long-term survivors. Due to the infrastructure of the GMALL study group it was possible to identify physicians involved in aftercare and to collect the respective documentation. The data represent a comprehensive and structured summary of standard aftercare source data documentations. It might be a potential limitation of the study, that aftercare was split between hospitals and practitioners. Also, the comparison to patients’ self-assessment would be of interest. All patients had received pediatric-based chemotherapy; cranial irradiation and intrathecal therapy were part of all trials. Treatment intensity increased in subsequent trials. Particularly, more patients became candidates for SCT, mostly with total body irradiation as conditioning regimen. Given these facts, it is of interest that in total 94% of the patients had no (ECOG=0) or only slight restrictions (ECOG=1) in the general condition. Even in the more intensive recent trials the general condition of ALL survivors was generally good. Not surprisingly, older patients had a higher risk to develop restrictions of the ECOG, whereas this risk was low in patients with ALL diagnosis in young adulthood.
Two thirds of patients had developed a significant disease documented in aftercare at a median age of 39 years. The study does not allow comparison of disease incidence with the general population mainly due to the lack of incidence data from comparable general population cohorts. Altogether, the incidence of general comorbidities like cardiovascular diseases, gastrointestinal or lung diseases was rather moderate in the study population.
On the other hand, the incidence of certain comorbidities with probable relationship to previous ALL therapy was quite high such as cognitive and psychiatric disorders (27%). Childhood ALL survivors showed an increased risk for neurologic dysfunction compared to siblings.5 This was in the past mainly attributed to the effects of cranial irradiation15 or HD methotrexate.16 The developing brain may be more prone to damages induced by cranial radiotherapy but also adult ALL survivors often complain about dis-
Haematologica | 108 July 2023 1764 ARTICLE - Late effects in adult ALL survivors N. Gökbuget et al.
turbed concentration or memory. For “chemo-brain”, a physiological correlate is unknown.17 It is difficult to measure complaints in a reproducible and quantifiable way. Potential tests which are applicable with limited effort in general practice, as the DemTect test,18 may not be sensitive enough. More differentiated tests as those developed for pediatric ALL should therefore be used in adults as well.19 Since in our study most patients had received prophylactic cranial irradiation it remains open, whether the incidence of neurologic dysfunction would be lower with approaches without irradiation. The GMALL study group performed a randomization between cranial irradiation with intrathecal prophylaxis and intrathecal prophylaxis only. This trial will hopefully answer some of the open questions.
Similar considerations apply to fatigue, as observed in 13% of adult ALL survivors in our study. A relevant incidence of fatigue was also reported by others.20 The syndrome can present many years after therapy and may be associated with depression and reduced quality of life. So far, it seems that fatigue is only rarely diagnosed by physicians involved in aftercare.21 The prevention of fatigue and its detection by specific questionnaires should therefore be one focus of aftercare.
A significant number of patients had endocrine disorders, including infertility, osteoporosis, and diabetes mellitus. The detection of infertility raises methodological problems. It is known that patients can maintain fertility after chemotherapy,22 whereas infertility is observed in most SCT patients.23,24 In the absence of systematic testing, infertility is usually only detected in patients in childbearing age and with the desire to have children. According to a patient questionnaire, this is the case in less than 50% of the former ALL patients (NG, personal communication). Despite these limitations, from the patient's perspective, our data are still of interest, with 18% infertility documented in women and 12% infertility in men.
Avascular osteonecrosis is a clinically relevant problem particularly observed in younger adults.25-27 Risk factors are intensified treatment with steroids and these effects may be enhanced by asparaginase or HD methotrexate. It is difficult to compare incidences between trials since protocols, detection methods, and observation periods vary. In one pediatric study with postinduction dexamethasone or prednisone pulses the incidence of skeletal toxicity was 13%. It was higher (25% vs. 11%) in older children (>10 years vs. <10 years) treated with dexamethasone pulses.26,27 In contrast the UKALL/ECOG2993 study for adult ALL found an overall incidence of 4% osteonecrosis. The incidence was higher in younger (<20 years) versus older patients.28 In our analysis, overall, 8% of the patients developed osteonecrosis, mostly grade 3-4 and with a significantly higher incidence in younger patients. No incidence increase was observed in the more recent trial cohorts and
SCT had no significant impact. The incidence may be underestimated, since only long-term survivors were analyzed. Due to the potential longer latency period and the correlation with osteoporosis occurring at higher age, a close observation of this complication should be considered for future ALL trials.29
Survivors of pediatric ALL have an additional risk to develop cancer resulting e.g., from the cell damage induced by chemotherapy and/or irradiation.30 In our study, the risk of secondary malignancies was higher in older patients and with longer follow-up. Published data show a variety of solid tumors.31 For these malignancies a lifetime increase can be observed. Of interest, in our study only one secondary CNS tumor was observed, although most patients had received cranial irradiation per protocol. This is a significant difference compared to childhood ALL cohorts.32
The frequent second malignancies are hematologic neoplasias, which mostly occur within the first 5-10 years after end of chemotherapy.33 These malignancies (n=4) may be underestimated in our cohort, since only longterm survivors were analyzed whereas patients with secondary hematologic malignancies may already die early.31,32 Our observations underline that aftercare should have a specific focus on skin tumors and breast cancer. Assessment of the real incidence of secondary malignancies, would require a prospective trial addressing this question. Interestingly the experience of SCT apparently did not affect the risk of secondary malignancies.
Overall, SCT was the most prominent risk factor for restrictions of general condition as well as for specific comorbidities or syndromes. Specific late effects such as skin disorders correlated to GvHD, sicca syndrome, restrictive and obstructive pulmonary disorders and cataract have been described by others.34,35 Of note, many SCT patients in our cohort (47%) showed symptoms of GvHD and significantly more skin and eye disorders, neurologic symptoms or fatigue were observed. The extent of morbidity after SCT may even be underestimated since patients dying early are not included in this analysis. Overall, the study provided important insights in the spectrum of potential late effects of disease and treatment in cured ALL patients. It does not show the total treatment-related burden of morbidity and mortality. Nevertheless, these data are helpful to inform physicians in aftercare. Therefore, the GMALL study group developed a patient card with information summarizing the ALL treatment, information on time points of aftercare evaluations including recommended questionnaires and laboratory or physical examinations. Academic clinical trials are usually funded by public agencies and no funds are available for the long-term follow-up. This would be essential to improve patient care and to completely evaluate standard and new treatment approaches. The
Haematologica | 108 July 2023 1765 ARTICLE - Late effects in adult ALL survivors N. Gökbuget et al.
outcomes may change with more intensive chemotherapy regimens and/or optimized conditioning regimens or approaches to manage GvHD. In order to provide the full picture of treatment-related burden, for future studies a prospective, standardized set of follow-up tests and respective documentations would be desirable and part of long-term observation of clinical trial patients. To this end, our trial provides reference data for these patientcentered endpoints, which are of increasing importance also for the evaluation of new targeted therapy approaches in de novo ALL.
Disclosures
No conflicts of interest to disclose.
Contributions
NG designed the analysis. NG and KI performed the analysis. All authors recruited patients, conducted patient follow-up, and collected clinical data. The manuscript was
References
1. Hoelzer D, Bassan R, Dombret H, et al. Acute lymphoblastic leukaemia in adult patients: ESMO Clinical Practice Guidelines for diagnosis, treatment and follow-up. Ann Oncol. 2016;27(suppl 5):v69-v82.
2. Bassan R, Bourquin JP, DeAngelo DJ, Chiaretti S. New approaches to the management of adult acute lymphoblastic leukemia. J Clin Oncol. 2018 Sep 21. doi: 10.1200/JCO.2017.77.3648. [Epub ahead of print]
3. Giebel S, Boumendil A, Labopin M, et al. Trends in the use of hematopoietic stem cell transplantation for adults with acute lymphoblastic leukemia in Europe: a report from the Acute Leukemia Working Party of the European Society for Blood and Marrow Transplantation (EBMT). Ann Hematol. 2019;98(10):2389-2398.
4. Nottage KA, Ness KK, Li C, Srivastava D, Robison LL, Hudson MM. Metabolic syndrome and cardiovascular risk among longterm survivors of acute lymphoblastic leukaemia - From the St. Jude Lifetime Cohort. Br J Haematol. 2014;165(3):364-374.
5. Mody R, Li S, Dover DC, et al. Twenty-five-year follow-up among survivors of childhood acute lymphoblastic leukemia: a report from the Childhood Cancer Survivor Study. Blood. 2008;111(12):5515-5523.
6. Armstrong GT, Liu Q, Yasui Y, et al. Late mortality among 5-year survivors of childhood cancer: a summary from the Childhood Cancer Survivor Study. J Clin Oncol. 2009;27(14):2328-2338.
7. Essig S, Li Q, Chen Y, et al. Risk of late effects of treatment in children newly diagnosed with standard-risk acute lymphoblastic leukaemia: a report from the Childhood Cancer Survivor Study cohort. Lancet Oncol. 2014;15(8):841-851.
8. Silverman LB. Balancing cure and long-term risks in acute lymphoblastic leukemia. Hematology Am Soc Hematol Educ Program. 2014;2014(1):190-197.
9. Bhatia S. Caring for the long-term survivor after allogeneic stem cell transplantation. Hematology Am Soc Hematol Educ Program. 2014;2014(1):495-503.
10. Hoelzer D, Thiel E, Lîffler H, et al. Intensified therapy in acute lymphoblastic and acute undifferentiated leukemia in adults.
prepared by NG and KI and all authors participated in data interpretation and drafting of the manuscript and read, revised, and approved the final manuscript.
Acknowledgments
We thank the staff of over 80 involved hospitals and the private practitioners who completed the follow-up questionnaires and participated in this study.
Funding
This retrospective analysis was funded by the Jose Carreras Leukämie Stiftung (grant number: R 05/09 and R 07/33). The clinical trials were funded by Deutsche Krebshilfe and BMBF.
Data-sharing statement
All data generated or analyzed during this study are included in this published article (and its Online Supplementary Appendix).
Blood. 1984;64(1):38-47.
11. Hoelzer D, Thiel E, Lîffler H, et al. Prognostic factors in a multicenter study for treatment of acute lymphoblastic leukemia in adults. Blood. 1988;71(1):123-131.
12. Gökbuget N, Hoelzer D, Arnold R, et al. Treatment of adult ALL according to the protocols of the German Multicenter Study Group for Adult ALL (GMALL). Hematol Oncol Clin North Am. 2000;14(6):1307-1325.
13. Gökbuget N, Beck J, Brandt K, et al. Significant improvement of outcome in adolescents and young adults (AYAs) aged 15-35 years with acute lymphoblastic leukemia (ALL) with a pediatric derived adult ALL protocol; results of 1529 AYAs in 2 consecutive trials of the German Multicenter Study Group For Adult ALL (GMALL). Blood. 2013;122(21):839.
14. Gökbuget N, Baumann A, Beck J, et al. PEG-Asparaginase intensification in adult acute lymphoblastic leukemia (ALL): significant improvement of outcome with moderate increase of liver toxicity In the German Multicenter Study Group for Adult ALL (GMALL) Study 07/2003. Blood. 2010;116(21):494.
15. Armstrong GT, Reddick WE, Petersen RC, et al. Evaluation of memory impairment in aging adult survivors of childhood acute lymphoblastic leukemia treated with cranial radiotherapy. J Natl Cancer Inst. 2013;105(12):899-907.
16. Krull KR, Cheung YT, Liu W, et al. Chemotherapy pharmacodynamics and neuroimaging and neurocognitive outcomes in long-term survivors of childhood acute lymphoblastic leukemia. J Clin Oncol. 2016;34(22):2644-2653.
17. Raffa RB, Duong PV, Finney J, et al. Is 'chemo-fog'/'chemo-brain' caused by cancer chemotherapy? J Clin Pharm Ther. 2006;31(2):129-138.
18. Kalbe E, Kessler J, Calabrese P, et al. DemTect: a new, sensitive cognitive screening test to support the diagnosis of mild cognitive impairment and early dementia. Int J Geriatr Psychiatry. 2004;19(2):136-143.
19. Krull KR, Okcu MF, Potter B, et al. Screening for neurocognitive impairment in pediatric cancer long-term survivors. J Clin
Haematologica | 108 July 2023 1766 ARTICLE - Late effects in adult ALL survivors N. Gökbuget et al.
Oncol. 2008;26(25):4138-4143.
20. Meeske KA, Siegel SE, Globe DR, Mack WJ, Bernstein L. Prevalence and correlates of fatigue in long-term survivors of childhood leukemia. J Clin Oncol. 2005;23(24):5501-5510.
21. Wagner LI, Cella D. Fatigue and cancer: causes, prevalence and treatment approaches. Br J Cancer. 2004;91(5):822-828.
22. Kreuser ED, Hetzel WD, Heit W, et al. Reproductive and endocrine gonadal functions in adults following multidrug chemotherapy for acute lymphoblastic or undifferentiated leukemia. J Clin Oncol. 1988;6(4):588-595.
23. Brennan BM, Shalet SM. Endocrine late effects after bone marrow transplant. Br J Haematol. 2002;118(1):58-66.
24. Sanders JE, Hawley J, Levy W, et al. Pregnancies following highdose cyclophosphamide with or without high-dose busulfan or total-body-irradiation and bone marrow transplantation. Blood. 1996;87(7):3045-3052.
25. Kunstreich M, Kummer S, Laws HJ, Borkhardt A, Kuhlen M. Osteonecrosis in children with acute lymphoblastic leukemia. Haematologica. 2016;101(11):1295-1305.
26. Vrooman LM, Neuberg D, O'Brien J, Sallan SE, Silverman LB. Increased risk of skeletal toxicity and infection in children 10 years or older treated for acute lymphoblastic leukemia (ALL) with dexamethasone: results from the DFCI ALL Consortium. Blood. 2007;110(1):849.
27. te Winkel ML, Pieters R, Hop WC, et al. Prospective study on incidence, risk factors, and long-term outcome of osteonecrosis in pediatric acute lymphoblastic leukemia. J Clin Oncol. 2011;29(31):4143-4150.
28. Patel B, Richards SM, Rowe JM, Goldstone AH, Fielding AK. High
incidence of avascular necrosis in adolescents with acute lymphoblastic leukaemia: a UKALL XII analysis. Leukemia. 2008;22(2):308-312.
29. Kuhlen M, Kunstreich M, Gokbuget N. Osteonecrosis in adults with acute lymphoblastic leukemia: an unmet clinical need. Hemasphere. 2021;5(4):e544.
30. Klein G, Michaelis J, Spix C, et al. Second malignant neoplasms after treatment of childhood cancer. Eur J Cancer. 2003;39(6):808-817.
31. Tavernier E, Boiron JM, Huguet F, et al. Outcome of treatment after first relapse in adults with acute lymphoblastic leukemia initially treated by the LALA-94 trial. Leukemia. 2007;21(9):1907-1914.
32. Schmiegelow K, Levinsen MF, Attarbaschi A, et al. Second malignant neoplasms after treatment of childhood acute lymphoblastic leukemia. J Clin Oncol. 2013;31(19):2469-2476.
33. Pagano L, Annino L, Ferrari A, et al. Secondary haematological neoplasm after treatment of adult acute lymphoblastic leukemia: analysis of 1170 adult ALL patients enrolled in the GIMEMA trials. Gruppo Italiano Malattie Ematologiche Maligne dell'Adulto. Br J Haematol. 1998;100(4):669-676.
34. Bhatia S, Francisco L, Carter A, et al. Late mortality after allogeneic hematopoietic cell transplantation and functional status of long-term survivors: report from the Bone Marrow Transplant Survivor Study. Blood. 2007;110(10):3784-3792.
35. Chow EJ, Cushing-Haugen KL, Cheng GS, et al. Morbidity and mortality differences between hematopoietic cell transplantation survivors and other cancer survivors. J Clin Oncol. 2017;35(3):306-313.
Haematologica | 108 July 2023 1767 ARTICLE - Late effects in adult ALL survivors N. Gökbuget et al.
Ex vivo venetoclax sensitivity testing predicts treatment response in acute myeloid leukemia
Heikki Kuusanmäki,1,2,3 Sari Kytölä,4 Ida Vänttinen,1 Tanja Ruokoranta,1 Amanda Ranta,1 Jani Huuhtanen,5 Minna Suvela,1 Alun Parsons,1 Annasofia Holopainen,6 Anu Partanen,6 Milla E.L. Kuusisto,7,8 Sirpa Koskela,9 Riikka Räty,4 Maija Itälä-Remes,10 Imre Västrik,1 Olli Dufva,5 Sanna Siitonen,11 Kimmo Porkka,4,5 Krister Wennerberg,2 Caroline A. Heckman,1 Pia Ettala,10 Marja Pyörälä,6 Johanna Rimpiläinen,9 Timo Siitonen7 and Mika Kontro1,3,4
1Institute for Molecular Medicine Finland (FIMM), HiLIFE, University of Helsinki, Helsinki, Finland; 2Biotech Research & Innovation Centre (BRIC), University of Copenhagen, Copenhagen, Denmark; 3Foundation for the Finnish Cancer Institute, Helsinki, Finland; 4Department of Hematology, Helsinki University Hospital Comprehensive Cancer Center, Helsinki, Finland; 5Hematology Research Unit, University of Helsinki, Helsinki, Finland; 6Department of Medicine, Kuopio University Hospital, Kuopio, Finland; 7Department of Medicine, Oulu University Hospital, Oulu, Finland; 8Department of Hematology, University of Oulu, Oulu, Finland; 9Department of Internal Medicine, Tampere University Hospital, Tampere, Finland; 10Department of Clinical Hematology, Turku University Hospital, Turku, Finland and 11Department of Clinical Chemistry, University of Helsinki and Helsinki University Hospital, Helsinki, Finland
Abstract
Correspondence: M. Kontro mika.kontro@helsinki.fi
Received: June 30, 2022.
Accepted: November 28, 2022.
Early view: December 15, 2022.
https://doi.org/10.3324/haematol.2022.281692
©2023 Ferrata Storti Foundation
Published under a CC BY-NC license
The BCL-2 inhibitor venetoclax has revolutionized the treatment of acute myeloid leukemia (AML) in patients not benefiting from intensive chemotherapy. Nevertheless, treatment failure remains a challenge, and predictive markers are needed, particularly for relapsed or refractory AML. Ex vivo drug sensitivity testing may correlate with outcomes, but its prospective predictive value remains unexplored. Here we report the results of the first stage of the prospective phase II VenEx trial evaluating the utility and predictiveness of venetoclax sensitivity testing using different cell culture conditions and cell viability assays in patients receiving venetoclax-azacitidine. Participants with de novo AML ineligible for intensive chemotherapy, relapsed or refractory AML, or secondary AML were included. The primary endpoint was the treatment response in participants showing ex vivo sensitivity and the key secondary endpoints were the correlation of sensitivity with responses and survival. Venetoclax sensitivity testing was successful in 38/39 participants. Experimental conditions significantly influenced the predictive accuracy. Blast-specific venetoclax sensitivity measured in conditioned medium most accurately correlated with treatment outcomes; 88% of sensitive participants achieved a treatment response. The median survival was significantly longer for participants who were ex vivo-sensitive to venetoclax (14.6 months for venetoclax-sensitive patients vs. 3.5 for venetoclax-insensitive patients, P<0.001). This analysis illustrates the feasibility of integrating drug-response profiling into clinical practice and demonstrates excellent predictivity. This trial is registered with ClinicalTrials.gov identifier: NCT04267081
Introduction
A long-term goal in leukemia and cancer research has been the determination of responses to anti-cancer therapy in the laboratory prior to clinical treatment, in analogy to the success of antibiotic sensitivity testing in microbial disease.1 The development of targeted therapies and technological advances has highlighted the approach again in acute myeloid leukemia (AML), as genomic data are often neither actionable nor predictive.2 We and others, including the Beat AML program, have previously demonstrated that drug sensitivity profiling provides clinically actionable therapeutic insights for individual patients with AML.3,4
However, only a few prospective trials have analyzed the predictiveness of ex vivo drug sensitivity testing,5,6 and more data are needed to demonstrate its clinical utility.7 Sensitivity to drugs is currently tested using multiple techniques. This diversity highlights the importance of understanding how different parameters influence the results. In AML, bone marrow is often a heterogeneous mix of cells consisting of leukemic blasts and more mature leukemic and healthy cells. Thus, commonly used homogeneous cell viability assays cannot accurately measure blast-specific drug responses. To overcome this limitation, immunofluorescence microscopy and flow cytometry-based assays have been implemented to evaluate
Haematologica | 108 July 2023 1768 ARTICLE - Acute Myeloid Leukemia
responses at the single-cell level.8,9 We previously demonstrated that a flow cytometry-based assay can determine the venetoclax sensitivity of each cell population.10 Importantly, blast-specific results of drug sensitivity differ dramatically from the sensitivity of bulk samples. An as yet unexplored challenge is the effect of culture conditions on ex vivo responses and correlation with treatment outcomes. Our previous work showed that conditioned medium (CM) derived from HS-5 bone marrow stromal cells, which closely resembles the bone marrow microenvironment, improves cell viability and alters the results of ex vivo drug sensitivity testing.11
For AML, predicting treatment outcome is extremely relevant. New therapeutic options have emerged, but there is heterogeneity in responses, and difficulties in identifying patients who will benefit from these therapies.2 The B-cell lymphoma 2 (BCL-2) inhibitor venetoclax is an excellent illustration of this challenge. In patients ineligible for induction therapy, venetoclax combined with the hypomethylating agent azacitidine showed acceptable safety and favorable responses. In the Viale-A trial complete remission (CR) and complete remission with incomplete blood recovery (CRi) were observed in 66% of the participants and the median overall survival was 14.7 months.12 In a single-center trial of relapsed or refractory (R/R) patients, 40% achieved CR/CRi, with the median overall survival being 7.8 months.13 While certain genetic changes correlate with treatment outcomes (e.g., IDH2, NPM1, and TP53),14,15 not all patients harbor these alterations. Furthermore, based on existing data, mutations are unable to predict response to venetoclax-azacitidine precisely.16,17 Thus, novel approaches are needed to identify patients who will benefit, particularly in the R/R setting. Previous retrospective studies have shown that ex vivo sensitivity to venetoclax is associated with treatment responses in small cohorts of patients with AML,3 myelodysplastic syndromes,18 and B-cell acute lymphoblastic leukemia.19 In addition, BH3 profiling showed that combined MCL-1 and BCL-XL dependency correlated inversely with the achievement of CR in 19 AML patients treated with venetoclax and a hypomethylating agent.20 However, no prospective clinical trials have analyzed the ability of ex vivo drug sensitivity testing to predict outcomes following venetoclax treatment. Furthermore, a systematic evaluation of the effects of cell culture conditions and different drug testing platforms (e.g., bone marrow bulk analysis with luminescent cell viability assay or targeted flow cytometry) remains unexplored. These gaps in knowledge have also hindered the development of preclinical models. Therefore, we designed this prospective VenEx trial to evaluate the usability of ex vivo drug sensitivity testing in a clinical context and to evaluate the correlation of drug sensitivity test results with outcomes of venetoclax-azacitidine treatment in AML.
Methods
More detailed information of the methods and analyses is provided in the Online Supplementary Appendix.
Study design and participants
The VenEx trial is an ongoing, multicenter, two-stage, open-label, phase II trial evaluating the correlation of ex vivo sensitivity to venetoclax with clinical outcomes in chemotherapy-ineligible patients with de novo, secondary, or R/R AML treated with venetoclax and azacitidine. Ineligibility for standard induction therapy was defined by modified Ferrara criteria21 which include age (≥70 years); clinically relevant comorbidities, such as decreased left ventricular ejection fraction (<50%), chronic stable angina, or controlled congestive heart failure; and decreased lung diffusion capacity (≤65%) or forced expiratory volume in 1 second ≤65%. For relapsed patients with non-core binding factor AML, an age criterion of ≥55 years was allowed. For participants younger than 55 years, additional inclusion criteria included either a remission duration of less than 12 months or relapse after allogeneic stem cell transplantation. Ex vivo drug sensitivity testing was obligatory for all participants at screening. The main exclusion criteria were a blast count ≤10% in the bone marrow or peripheral blood, depending on which was used for ex vivo drug testing, and previous venetoclax therapy for myeloid malignancy.
The study is being conducted by the Finnish AML Group at five university hospitals in Finland. The Helsinki University Hospital District is the trial’s sponsor and the study is funded by independent institutions and foundations. The funders do not have any role in the study design, data collection, data analysis, data interpretation, or report writing. The study is being conducted in accordance with the Declaration of Helsinki and International Council for Harmonization on Good Clinical Practice guidelines. The study protocol, which was approved by an independent ethics committee and competent authority, is available in the Online Supplementary Material. All participants provided written informed consent before initiation of the study.
Screening procedures and venetoclax sensitivity analysis
At screening, all participants underwent bone marrow sampling. When the bone marrow could not be aspirated, peripheral blood with a blast count >10% was used for analyses. For drug sensitivity testing, 20 mL of bone marrow (n=37) or 30 mL of peripheral blood (n=2) were shipped from five trial sites to the central laboratory in EDTA tubes at room temperature. Mononuclear cells were isolated using Ficoll gradient centrifugation and plated in two different drug plates within 26 hours of
Haematologica | 108 July 2023 1769 ARTICLE - Ex vivo venetoclax sensitivity testing in AML H. Kuusanmäki et al.
sampling. The drug plates contained venetoclax, a venetoclax–azacitidine combination, and other BCL-2 family inhibitors across a 10,000-fold concentration range (Online Supplementary Table S1). After incubation with the drugs for 48 hours, cell viability was assessed in parallel using CellTiterGlo® (CTG) and flow cytometry. The trial outline is presented in Figure 1A. For the flow cytometry-based drug sensitivity assay, cells were plated in 96-well, conical-bottomed plates with 100,000 cells/well in 100 mL of the appropriate medium. Venetoclax sensitivity was measured in three different cell culture conditions: (i) RPMI + 10% fetal bovine serum, (ii) CM (medium derived from the HS-5 cell line), and (iii) StemSpan SFEM II + 20 ng/mL of FLT3L + stem cell factor + thrombopoietin (SPM) (Online Supplementary Table S2). Following incubation for 48 hours, cells were stained with an antibody mix containing CD45, CD34, CD117, CD14,
CD11b, CD64, and CD38, and then stained with markers of apoptosis (annexin V) and dead cells (7-aminoactinomycin D; 7-AAD). Flow cytometry data were acquired using an iQue Screener PLUS instrument (Sartorius, Germany), and ForeCyt software (Sartorius) was used to analyze the cells. The gating strategy is presented in Online Supplementary Figures S1 and S2. The number of remaining viable blasts in each well was counted and normalized to the number in control wells containing dimethylsulfoxide (DMSO) (Online Supplementary Figure S3 ). For the CTG-based drug sensitivity assay, cells were suspended in 25 mL of CM and plated in 384-well plates with 10,000 cells/well. After incubation for 48 hours, 25 mL of CTG were added to each well, and the intensity of the luminescence was measured using the PHERAstar FS plate reader (BMG LABTECH, Germany). Drug sensitivity scores (DSS) derived from the optimized area under the dose-response curve calculations22
Figure 1. Sample processing and trial outline. (A) Outline of sample processing and drug sensitivity testing. (B) Outline of study recruitment, including number of participants, reasons for screening failure, and number of participants eligible for ex vivo/in vivo correlation. BM: bone marrow; MNC: mononuclear cells; CTG: CellTiterGlo®; CM: conditioned medium; DSS: drug sensitivity score; FC: flow cytometry; AML: acute myeloid leukemia; sAML: secondary AML; R/R AML: relapsed and/or resistant AML; SCR: screening; C: cycle; AZA: azacitidine; CR: complete remission; CRi: CR with incomplete blood recovery; MLFS: morphological leukemia-free state.

Haematologica | 108 July 2023 1770 ARTICLE - Ex vivo venetoclax sensitivity testing in AML H. Kuusanmäki et al. A B
indicated the efficacy of both viability assays (Online Supplementary Figure S3). Quality control metrics and reproducibility of the assay are described in the Online Supplementary Methods and Online Supplementary Figure S4.
Treatment
During the first stage of the trial, all participants received the study treatment regardless of their venetoclax sensitivity testing results (n=39). The results were not communicated to the investigators. The study treatment consisted of 28-day cycles of azacitidine (75 mg/m2 on days 1-7) and venetoclax (400 mg daily for a maximum of 28 days). For responding participants, a cycle could be prolonged up to 42 days to enable blood count recovery. After a CR/CRi or a morphological leukemia-free state (MLFS) had been reached, the cycle of venetoclax administration was reduced to 21 days, and then, after three cycles, to 14 days in each cycle. Treatment response was assessed at day 29 of cycle 1, cycle 3, and cycle 6, and then every three cycles. For participants not in CR, CRi, or MLFS at day 29 of cycle 1, the bone marrow was also evaluated at day 29 of cycle 2. Those participants refractory to the study treatment after three cycles were taken off the trial.
Assessments and statistical analyses
The primary endpoint was the treatment response during the first three therapy cycles in participants who showed ex vivo sensitivity to venetoclax. The cutoff value for sensitivity was evaluated retrospectively after all trial participants had been evaluated for treatment response. The investigators assessed the response using criteria defined by the European LeukemiaNet for AML in 2017.23 The key secondary endpoint was the correlation of ex vivo drug sensitivity with overall survival and the overall response rate. Both recruiting cohorts and trial phases are analyzed separately. The Online Supplementary Appendix provides details on the statistical analyses.
Results
Enrollment and patients’ demographics
Between February 2020 and January 2021, 41 participants were recruited for the first part of the VenEx trial to evaluate the feasibility, predictiveness, and best cut-off value for drug sensitivity testing to venetoclax (Figure 1B). Screening failed in two participants, in one case because of uncontrolled infection and in the other because of a low bone marrow blast count (6%). Of the eligible participants, 16 had de novo AML, 15 had R/R AML and eight had secondary AML. All participants with secondary AML had an antecedent myelodysplastic syndrome or chronic mye-
lomonocytic leukemia previously treated with a hypomethylating agent, chemotherapy or both and were analyzed together with the R/R participants. The patients’ characteristics are presented in Table 1. Of participants with de novo AML, 75% (12/16) achieved CR/CRi, while 39% (9/23) of those with secondary or R/R AML did so. The overall response rate (CR, CRi or MLFS) was 88% (14/16) for de novo AML and 52% (12/23) for secondary or R/R AML (Online Supplementary Table S3).
Drug sensitivity testing was technically successful in 38/39 participants treated with venetoclax–azacitidine. In one participant, the leukemic blasts were not robustly identified using the flow cytometry assay because of low CD34+ and CD117+ cell counts (< 2%), which was likely the result of hemodilution. One participant died of pneumonia during cycle 1 on day 13. Thus, the in vivo/ex vivo correlation was evaluable in 37 participants (Figure 1B). The median cell viability of the bone marrow mononuclear cells was 90% after mononuclear cell separation and 75% after 48 hours of incubation in CM (Online Supplementary Figure S5A). A minor decrease in cell viability was observed after 48 hours of incubation in shipped samples processed the following morning when compared to samples processed on the same day (79% vs. 66%) (Online Supplementary Figure S5B, C). Importantly, decreased viability did not affect ex vivo venetoclax sensitivity (Online Supplementary Figure S5D, E). These results demonstrate that drug testing can be performed in a clinical context with a high success rate.
AML: acute myeloid leukemia; R/R AML: relapsed and/or resistant acute myeloid leukemia; ECOG PS: Eastern Cooperative Oncology Group performance status; alloHSCT: allogeneic hematopoietic stem cell transplantation; ITD: internal tandem duplication.
De novo AML Secondary or R/R AML N of patients 16 23 Age, years, median (range) 75.7 (66.5 - 84.6) 69.1 (41.9 - 79.1) Male sex, N (%) 12 (75) 12 (52) ECOG PS 0-1, N (%) 12 (75) 20 (87) ECOG PS 2-3, N (%) 4 (25) 3 (13) Previous alloHSCT, N (%) 0 (0) 9 (39) Normal karyotype, N (%) 6 (38) 13 (57) 5 or 5q deletion, N (%) 4 (25) 2 (9) 7 or 7q deletion, N (%) 2 (13) 3 (13) Complex karyotype, N (%) 3 (19) 2 (9) IDH1 and/or IDH2, N (%) 6 (38) 10 (43) FLT3 ITD, N (%) 1 (6) 4 (17) NPM1, N (%) 2 (13) 3 (13) TP53, N (%) 4 (25) 2 (9)
Table 1. Patients’ characteristics.
Haematologica | 108 July 2023 1771 ARTICLE - Ex vivo venetoclax sensitivity testing in AML H. Kuusanmäki et al.
Culture conditions and method of assessing sensitivity influence venetoclax responses
For drug sensitivity testing, 20 mL of bone marrow or 30 mL of peripheral blood were shipped to the central laboratory and ex vivo venetoclax sensitivity was assessed with different methods and culture conditions. DSS derived from the area under the dose-response curves indicated efficacy (Figure 1A, Online Supplementary Figure S3). Flow cytometry (blast-specific sensitivity) and CTG (bulk mononuclear cell sensitivity) assays were used to analyze ex vivo venetoclax sensitivity from the trial participants’ samples in CM. Bulk sensitivity assessed using CTG was significantly lower than the sensitivity determined by the blast-specific flow cytometry assay (median DSS: 4.8 vs. 23.9, respectively, P<0.0001) (Figure 2A). Flow cytometry showed that monocytic and granulocytic cells were resistant to venetoclax, causing decreased bulk sensitivity in the CTG assay (Figure 2B). Accordingly, most samples with blast counts of <50% were resistant to venetoclax in the CTG assay (median DSS: 0.9 vs. 13.4) (Figure 2C, Online Supplementary Figure S6). Thus, for the samples with low blast counts, CTG measurement provided a resistant phenotype, even though the blasts were sensitive to venetoclax when assessed by flow cytometry (Figure 2D). To gain insight into the influence of cell culture conditions, cells were cultured in three different media (RPMI, CM and SPM), and venetoclax sensitivity was assessed using flow cytometry. After 48 hours, cell viability in the DMSO control was similar to that in all types of media (70-76%) (Online Supplementary Figure S7A). The number of CD14+ cells increased in all types of media during the 48 hours of culture, whereas the number of CD34+ cells increased significantly only in the SFEM II medium supplemented with FLT3, stem cell factor and thrombopoietin (SPM) (Online Supplementary Figure S7B). In RPMI medium, the blasts were highly sensitive to venetoclax, whereas in CM, the efficacy of venetoclax was lower (median DSS: 27.6 vs. 23.9, P<0.0001) (Figure 2E). The sensitivity to venetoclax was drastically lower when cells were cultured in the SPM medium (median DSS: 6.8, P<0.0001) (Figure 2E). Median venetoclax dose-response curves for each assay are presented in Online Supplementary Figure S8. We explored further whether specific genotypic or phenotypic features of the blasts correlated with venetoclax sensitivity in different media. In all genotypic and phenotypic subgroups blasts exhibited the highest venetoclax sensitivity in RPMI medium, less sensitivity in CM and the lowest in SPM medium (Online Supplementary Figure S9A). In all three media, blasts with SRSF2 mutations showed increased ex vivo sensitivity to venetoclax compared to wildtype blasts. In contrast, blasts in samples in which the blast phenotype was defined as CD34+CD38– were more resistant to venetoclax (Online Supplementary Figure S9B, Online Supplementary Table S4). Together, these find-
ings demonstrate that the cell viability assays and cell culture conditions substantially affect the ex vivo efficacy of venetoclax, whereas the genotype or immunophenotype associated with ex vivo venetoclax responses remains similar across all types of media.
Blast-specific venetoclax sensitivity in conditioned medium provides best response prediction
After the first 39 participants had been evaluated for treatment response, we examined which assay and medium provided the best separation of venetoclax-azacitidine treatment outcomes as defined by cumulative overall response (CR/CRi/MLFS) versus resistant disease during the first three treatment cycles. The best separation of non-responding and responding participants occurred when blast-specific venetoclax sensitivity was measured using flow cytometry in CM (median DSS: 6.9 vs. 26.0, P<0.001) (Figure 2F). When the ex vivo/in vivo correlation was assessed using CTG, several participants who responded to treatment were resistant to venetoclax ex vivo (Figure 2F). Similarly, the cytokine-rich SPM medium yielded false-resistant phenotype predictions in blastspecific flow cytometry measurements. In contrast, the overall sensitivity was higher in RPMI medium, leading to increased ex vivo venetoclax sensitivity in samples from patients who failed to achieve a clinical response. Considering that patients received venetoclax-azacitidine, we also assessed the ex vivo efficacy of the combination by flow cytometry by adding 300 nM or 1,000 nM of azacitidine to the venetoclax-containing wells across the entire concentration range in CM. We observed that adding azacitidine increased the sensitivity of the blasts from the participants with in vivo-resistant AML. Importantly, ex vivo testing of the venetoclax-azacitidine combination led to decreased predictive accuracy (Figure 2F, Online Supplementary Figure S10A). We also evaluated whether the increased sensitivity was restricted to a particular phenotype or genotype but could not detect correlations (Online Supplementary Figure S10B). These results indicate that venetoclax sensitivity measured using a blast-specific flow cytometry assay and CM provides the best distinction between responding and non-responding patients. Using receiver operating characteristic (ROC) curve analysis, the greatest area under the ROC curve (AUROC = 0.82) was obtained for blast-specific venetoclax sensitivity in CM (Online Supplementary Table S5). Using a DSS threshold of 10.7, the test’s sensitivity was 92%, its specificity was 75%, and its positive predictive value (identification of patients as responders) was 88% (Figure 3A-C). In the R/R cohort, the test’s positive predictive value was 79%, and no false predictions of resistance were observed (Figure 3D-F). In de novo AML, all but one participant achieved treatment response, and thus, venetoclax sensitivity testing produced limited additional value for de novo participants (Figure 3G-I).
Haematologica | 108 July 2023 1772 ARTICLE - Ex vivo venetoclax sensitivity testing in AML H. Kuusanmäki et al.
Figure 2. Comparison of venetoclax sensitivity among different assays and cell culture media. (A) Venetoclax sensitivity of trial participants (n=37) assessed using CellTiterGlo® (CTG) and flow cytometry (FC) assays and expressed as measured by the drug sensitivity score. The line represents the median. The P value was calculated using a two-tailed Wilcoxon matched-pairs signedrank test. (B) FC scatter plot of a sample treated with dimethylsulfoxide (DMSO) control or 100 nM of venetoclax for 48 h. Blasts, lymphocytes, monocytic cells, and granulocytic cells are gated in the upper row plots using side scatter versus CD45, and in the lower row blasts are gated using CD34. Absolute numbers of viable cells present after treatment with 100 nM of venetoclax in each gate were normalized to the number of cells present in the wells containing the DMSO control. (C) Comparison of sensitivity to venetoclax between samples with blast counts <50% (n=19) and >50% (n=18), assessed using the CTG assay in conditioned medium. The line represents the median. The P value was calculated using the Mann-Whitney U test. (D) Sensitivity to venetoclax of samples with blast counts <50% (n=19), assessed using the CTG or FC assay. The line represents the median. The P value was calculated using a two-tailed Wilcoxon matched-pairs signed-rank test. (E) Blast-specific venetoclax sensitivity measured using FC in three different cell culture media. The line represents the median. The P value was calculated using a twotailed Wilcoxon matched-pairs signed-rank test. (F) The drug sensitivity scores for venetoclax determined using different assays and media and plotted for each participant (n=37). Participants were divided into responders (n=25) and non-responders (n=12). The line represents the median. The P value was calculated using a one-tailed Mann-Whitney U test. CM: conditioned medium; SSC: side scatter; Gran: granulocytes; Mon: monocytes; Lym: lymphocytes; DSS: drug sensitivity score; RD: refractory disease; PD: progressive disease; CR: complete remission; CRi: complete remission with incomplete blood recovery; MLFS: morphological leukemia-free state; AZA: azacitidine.

A B C D
Haematologica | 108 July 2023 1773 ARTICLE - Ex vivo venetoclax sensitivity testing in AML H. Kuusanmäki et al. F E
Figure 3. Determination of the predictive value of drug sensitivity testing in different cohorts of patients. (A) The sensitivity of each participant to venetoclax, determined using flow cytometry and conditioned medium and expressed as a drug sensitivity score (DSS). The participants are divided into responders and non-responders. The dashed line at DSS 10.7 represents the best cutoff value. The P value was calculated using a one-tailed Mann-Whitney U test. (B) Receiver operating characteristic (ROC) curve analysis of DSS and clinical response using the Wilson-Brown method. (C) Sensitivity, specificity, positive predictive value and negative predictive value of the test when using the cutoff value of DSS 10.7, illustrated in a confusion matrix. (D) DSS versus clinical response in relapsed/refractory (R/R) or secondary acute myeloid leukemia (sAML). The P value was calculated using a one-tailed Mann-Whitney U test. (E) ROC analysis of R/R or sAML. (F) Predictive value of the test in R/R or sAML. (G) DSS versus clinical response in de novo AML. The P value was calculated using a one-tailed Mann-Whitney U test. (H) ROC analysis of de novo AML. (I) Predictive value of the test in de novo AML. DSS: drug sensitivity score; FC: flow cytometry; CM: conditioned medium; RD: refractory disease; PD: progressive disease; CR: complete remission; CRi: complete remission with incomplete blood recovery; MLFS: morphological leukemia-free state.

A B C D E F G H I
Haematologica | 108 July 2023 1774 ARTICLE - Ex vivo venetoclax sensitivity testing in AML H. Kuusanmäki et al.
Of the de novo participants exhibiting ex vivo sensitivity (DSS >10.7), 92% (11/12) had a CR/CRi, whereas of participants with secondary or R/R AML, 57% (8/14) had a CR/CRi (Online Supplementary Table S3). The overall response rate (CR, CRi, or MLFS) for ex vivo drug-sensitive de novo AML was 100% (12/12), whereas it was 79% (11/14) for R/R or secondary AML.
Ex vivo venetoclax sensitivity predicts longer survival
At a median follow-up of 18.6 months, the median overall survival of patients with de novo AML was 17.4 months (95% CI: NR) whereas that for patients with secondary or R/R AML was 7.6 months (95% CI: 6.5-8.6 months) (Figure 4A, Online Supplementary Figure S11). These results are similar to those in previous reports.12,13 Notably, ex vivo venetoclax sensitivity (determined by flow cytometry in CM) also correlated with survival: the median overall survival for patients with DSS <10.7 (ex vivo-resistant) was 3.5 months (95% CI: 2.5-4.6 months), and that for patients with DSS >10.7 (ex vivo-sensitive) was 14.6 months (95% CI: 8.8-20.4 months, P<0.001) (Figure 4B). Moreover, greater sensitivity correlated with longer survival (r=0.518, P<0.001) (Online Supplementary Figure S12). The median progression-free survival for patients with de novo AML was 13.1 months (95% CI: 8.7-17.5 months) whereas that for patients with secondary or R/R AML was 3.3 months (95% CI: 2.5-4.2 months) (Figure 4C). The median progression-free survival for ex vivo-resistant patients was 2.4 months (95% CI: 2.2-2.6 months) and that for ex vivo-sensitive patients was 9.8 months (95% CI: 5.5-14.1 months) (Figure 4D). As reported earlier,15,24 in our cohort, patients harboring IDH2 or SRSF2 mutations had a high likelihood of responding (91% and 90%, respectively), whereas participants with PTPN11 (n=3) failed to respond to the treatment (Figure 5). Importantly, other genetic alterations did not clearly associate with treatment responses. In comparison, the use of drug sensitivity testing in this cohort showed that 88% of ex vivo-sensitive patients responded to the treatment.
Progenitor cell sensitivity associates with venetoclax response in monocytic acute myeloid leukemia
We and others have previously shown that monocytic AML samples (M4/M5 according to the French-American-British [FAB] classification) are resistant to venetoclax ex vivo. 10,25 Furthermore, Pei et al. found a correlation between FAB M5 phenotype and in vivo venetoclax resistance.16 In our trial, four participants had FAB M5 AML, and one had M4 AML. The patients’ characteristics and treatment responses are presented in Online Supplementary Table S6. Confirming the earlier ex vivo findings,10 monocytic samples were resistant to venetoclax when using the CTG assay on bulk bone marrow (Figure 6A). However, four of the five participants achieved remission. Intriguingly, we
observed that monocytic disease has distinctive cell population-specific response patterns. The blast cell fraction (defined by CD34 or CD117 positivity) exhibited venetoclax sensitivity in all cases that achieved a clinical response (Figure 6A, Online Supplementary Table S6). In contrast, the monocytic/granulocytic cell fraction was less sensitive in all samples (Online Supplementary Figure S13). Accordingly, the CD34+ cell fraction enriched from two samples that had a high number of monocytic/granulocytic cells exhibited increased venetoclax sensitivity in the CTG assay (Online Supplementary Figure S14).
To assess whether the gene expression signature could explain the distinct venetoclax responses, we performed single-cell RNA sequencing on two monocytic samples and one myelomonocytic sample. Monocytic cells expressing CD14 accounted for 25-50% of the leukemic cells in each sample and selectively expressed MCL1, BCL2A1, and S100A9/S100A9 but not BCL2 (Figure 6B, C). In contrast, CD34 progenitor cells showed increased BCL2 expression accompanied by low BCL2A1 and MCL1 expression, which may explain the observed sensitivity to venetoclax. Together, these findings suggest that the less mature progenitor cells of monocytic AML samples are sensitive to venetoclax ex vivo and progenitor cell sensitivity also correlates with clinical responses.
Discussion
This interim analysis illustrates the technical feasibility of integrating venetoclax drug response profiling into clinical practice for patients with AML. Furthermore, the study demonstrates that the correlation between in vivo and ex vivo responses is profoundly affected by the selected cell culture medium and the method of assaying viability. In the first stage of the trial, we determined the optimal cutoff value for venetoclax sensitivity retrospectively and observed the best in vivo/ex vivo correlation using CM coupled with a blast-specific flow cytometry assay.
We observed that response evaluation using bulk bone marrow was associated with false predictions of resistance. Our flow cytometry data demonstrated that different cell populations have distinct sensitivity to venetoclax, and thus, less sensitive cell populations - especially monocytic and granulocytic ones - blur the sensitivity of blasts. Earlier studies assessing bulk mononuclear cell drug sensitivity demonstrated that monocytic AML samples have reduced sensitivity to venetoclax.25,26 Accordingly, in a retrospective analysis of 100 patients with newly diagnosed AML, patients with FAB M5 AML were less likely to get a clinical response.16 In our cohort, four out of five participants with AML FAB subtypes M4 and M5 achieved remission. Blast-specific ex vivo venetoclax sensitivity was associated with treatment response in all par-
Haematologica | 108 July 2023 1775 ARTICLE - Ex vivo venetoclax sensitivity testing in AML H. Kuusanmäki et al.
ticipants, whereas all samples were resistant when bulk sample sensitivity was assessed using CTG. Interestingly, scRNA sequencing of three monocytic/myelomonocytic single-cell RNA samples showed that the expression of several genes associated with venetoclax resistance based on preclinical studies, such as BCL2A1 25 and S100A8/S100A9, 27 were observed mainly in mature mono-
cytes. In contrast, in primitive blasts, the expression of BCL2 was higher and the expression of MCL1 was lower. The distinct venetoclax sensitivity of monocytic cells and blasts was also reflected in individual participants whose monocytosis persisted after blast clearance (Online Supplementary Figure S15, Supplementary Table S6). Although our sample size is limited, our results highlight the impor-
Figure 4. Overall survival based on disease state and ex vivo sensitivity to venetoclax. (A) The median overall survival for de novo acute myeloid leukemia (AML) versus secondary AML (sAML) or relapsed/refractory AML (R/R AML) was 17.4 months (95% confidence interval [95% CI]: not reached) and 7.6 months (95% CI: 6.5-8.6), respectively. (B) The median overall survival for participants with a drug sensitivity score <10.7 (ex vivo-resistant) versus >10.7 (ex vivo-sensitive) was 3.5 months (95% CI: 2.54.6) and 14.6 months (95% CI: 8.8-20.4), respectively. Participants alive at the data cutoff day were censored. The median followup time was 18.6 months. (C) The median progression-free survival for de novo AML versus sAML or R/R AML was 13.1 months and 3.3 months, respectively. (D) The median progression-free survival for ex vivo drug-resistant versus ex vivo drug-sensitive patients was 9.8 versus 2.4 months, respectively. Progression-free survival was defined as the number of days from the date of the first dose to the date when the patient was deemed refractory or the earliest evidence of relapse or death. Ven Res: resistant to venetoclax; Ven Sen, sensitive to venetoclax.

A B C D Haematologica | 108 July 2023 1776 ARTICLE - Ex vivo venetoclax sensitivity testing in AML H. Kuusanmäki et al.
tance of assessing drug sensitivity and gene expression at the progenitor cell level, particularly in monocytic samples and samples with low blast counts.
The effect of the cell culture medium was critical when assessing blast-specific ex vivo responses. Sensitivity to venetoclax was significantly lower in the SPM medium supplemented with cytokines than in RPMI medium and CM. Some false predictions of resistance might be due to several cytokines (including FLT3L, stem cell factor, and thrombopoietin) and other supplements in the SPM medium, leading to the activation of kinase signaling pathways (including, for example, the JAK-STAT and RAS-ERK pathways) associated with venetoclax resistance.11,15,28 Thus, SPM medium may artificially “desensitize” cells ex vivo, which are in fact sensitive in vivo in the bone marrow compartment. In contrast, the overall sensitivity was higher in RPMI medium, leading to false predictions of
sensitivity. This might be due to the lack of cytokines and other factors in this medium, which may decrease the apoptotic threshold of the blasts compared to a more protective bone marrow environment in vivo. These findings suggest that CM can be used in venetoclax sensitivity testing for primary patients’ samples, based on the superior in vivo/ex vivo correlation. Importantly, most preclinical studies utilize an ex vivo venetoclax sensitivity assessment of cell lines and primary patients’ samples to study resistance mechanisms. Based on our findings, the mechanisms identified might be highly method-dependent; thus, methods capable of mimicking in vivo responses and assessing blast-specific responses might increase the relevance of these studies in the future.
Newly diagnosed AML patients harboring IDH1/IDH2 and NPM1 mutations have shown high response rates and favorable survival with venetoclax and hypomethylating
Figure 5. Genetic predictors of response. Treatment responses, drug testing predictions, previous treatment with a hypomethylating agent, prior allogeneic stem cell transplantation, disease state, French-American-British subtype and recurrent mutations at the time of the screening presented in an OncoPrint heatmap. Percentages correspond to the number of responders with a specific feature. CR: complete remission; CRi: complete remission with incomplete blood recovery; MLFS: morphological leukemia-free state; RD: resistant disease; Sen: sensitive; Res: resistant; HMA: hypomethylating agent; HSCT: allogeneic hematopoietic stem cell transplantation; Prev: previous; FAB: French-American-British; ITD: internal tandem duplication; TKD: tyrosine kinase domain; sAML/R/R: secondary or relapsed and/or resistant acute myeloid leukemia.

Haematologica | 108 July 2023 1777 ARTICLE - Ex vivo venetoclax sensitivity testing in AML H. Kuusanmäki et al.
Figure 6. Cell populations in monocytic acute myeloid leukemia samples have distinct drug response patterns and gene expression profiles. (A) Drug sensitivity score of five myelomonocytic/monocytic samples measured using CellTiterGlo® or flow cytometry assays in conditioned medium. Clinical responses (complete remission/complete remission with incomplete blood recovery/resistant disease) are annotated in the graph. The P value was calculated using a two-tailed Wilcoxon matched-pairs signed-rank test. (B) Uniform Manifold Approximation and Projection (UMAP) representation of monocytic and progenitor cells from three bone marrow samples profiled by single-cell RNA sequencing. The samples were taken from three patients with acute myeloid leukemia before venetoclax-azacitidine treatment. The bar plot on the right shows the proportion of cell phenotypes in each sample. (C) Expression of a set of canonical markers used to identify monocytic and progenitor cell populations. Expression of BCL2 family genes and genes associated with response to venetoclax based on preclinical studies. Dot size corresponds to the percentage of cells expressing a given gene in a given cluster, and dot color corresponds to the average expression of a given gene in a given cluster. Circled dots are differentially expressed in the cluster (Padj<0.05, Bonferroni corrected t test). The clusters are the same as shown in panel (B), and their distributions across patients are shown in the bar plot on the right. DSS: drug sensitivity score; AML: acute myeloid leukemia; CM: conditioned medium; CTG: CellTiterGlo®; sAML: secondary AML; CR: complete remission; CRi: complete remission with incomplete blood recovery; RD: resistant disease; FAB: French-American-British; HPSC: hematopoietic stem and progenitor cell; GMP: granulocyte-monocyte progenitor; Pro-mono: pro-monocyte; DC: dendritic cells; BCL2: BCL2 family gene; Venetoclax: genes associated with venetoclax resistance based on preclinical studies.

A B C
Haematologica | 108 July 2023 1778 ARTICLE - Ex vivo venetoclax sensitivity testing in AML H. Kuusanmäki et al.
agent therapy, whereas patients with RAS and TP53 mutations have worse outcomes.12,15,29 Similar observations have been made in R/R AML, but the data are more limited.13,14 Thus, venetoclax sensitivity testing may help to guide therapy for patients who lack the mutation associated with treatment response, particularly in the R/R setting. We observed that IDH2 and SRSRF2 mutations were accompanied by high treatment response rates (overall response rates, 91% and 90%, respectively). In our cohort, NPM1 mutation was not predictive of treatment response (overall response rate, 60%), whereas PTPN11 was associated with resistance. The small sample size and heterogeneous population of patients might have diminished the observed predictive values of the mutations, but significantly, drug testing was able to predict responses across the entire cohort of patients, with a positive predictive value of 88%. Importantly, ex vivo drug sensitivity testing could predict not only the treatment response, but also survival: the overall survival for ex vivo-drug-resistant participants was 3.5 months, whereas patients showing ex vivo drug sensitivity had an overall survival of 14.6 months (P<0.001).
Although drug testing provided promising results, some challenges exist. First, adequate quality controls, collection, and prompt delivery of fresh tumor material from sites require precise coordination of clinical units, laboratories, and logistics. Second, we observed two false predictions of resistance in de novo participants. While we observed that sensitivity to venetoclax predicted treatment response better than combinatory venetoclax-azacitidine sensitivity, it is probable that our short assay fails to capture azacitidine sensitivity and a possible apoptosis-priming effect adequately. Third, the assay cannot identify small, resistant subclones that might be selected, leading to rapid relapse. Another potential caveat is the fact that ex vivo sensitivity testing was conducted in a single laboratory. The forthcoming pan-Nordic LD-VenEx trial (Eudra-CT 2020-005461-14) will evaluate the feasibility of this approach in a multilaboratory setting. The second part of the trial is still underway. Reflecting the high response rates in the de novo participants, the second part of the trial includes all de novo patients in the study treatment, irrespective of venetoclax sensitivity. However, ex vivo venetoclax sensitivity is observationally tested. For R/R and secondary AML patients, venetoclax sensitivity testing is used for the selection of patients, and only participants exhibiting ex vivo sensitivity (DSS >10.7) receive study therapy.
In summary, although new AML therapy options have the potential to improve patients’ outcomes, the challenge remains to identify the factors predicting response and to target therapies to only those patients who could be expected to benefit from them. In the interim analysis of our
VenEx trial, we showed that ex vivo testing for venetoclax sensitivity was feasible in AML with a high success rate. In addition, our results provide essential data to be used in preclinical studies exploring venetoclax sensitivity and resistance. Nevertheless, novel prospective trials are needed to assess the usability of ex vivo drug sensitivity testing for other therapies as well as to repurpose anticancer agents to further personalize patients’ care.
Disclosures
HK reports research funding from AbbVie and personal fees from Faron outside the submitted work. APart reports personal fees from AbbVie, Astra Zeneca, Janssen-Cilag, Novartis, Sanofi, and Takeda outside the submitted work. KP reports personal fees from AbbVie, Astellas Pharma, BMS/Celgene, Incyte, Novartis, and Pfizer and research funding from AbbVie, BMS/Celgene, Incyte, Novartis, and Pfizer outside the submitted work. CAH reports research funding from Novartis, Orion Pharma, BMS/Celgene, Oncopeptides, and Kronos Bio Inc. and personal fees from Oncopeptides outside the submitted work. PE reports personal fees from Novartis, Pfizer, Amgen, and Sanofi outside the submitted work. MP reports personal fees from Pfizer, Novartis, and AbbVie outside the submitted work. JR reports personal fees from Astellas Pharma, AbbVie, Bristol-Myers Squibb, and Pfizer outside the submitted work. TS reports personal fees from Novartis, Bristol-Myers Squibb, Janssen-Cilag, AbbVie, and Takeda outside the submitted work. MK reports personal fees from Astellas Pharma, AbbVie, Bristol-Myers Squibb, Faron, Jazz Pharmaceuticals, Novartis and Pfizer and research funding from AbbVie outside the submitted work. The other authors have no disclosures to make.
Contributions
HK and MK conceived and designed the study, acquired funding for the study and supervised it. SKy, MK, and HK were responsible for project administration and coordination. PE, JR, TS, and MP were principal investigators and were responsible for administration, coordination, supervision and resource management at sites. PE, JR, TS, MP, MK, SKy, AH, APart, MELK, SKo, RR, and MIR recruited and cared for patients and collected data. HK, IV, TR, AR, MS, and APars were responsible for sample processing and investigations. IMV developed the database for drug sensitivity data. JH and OD conducted the formal analysis of RNA sequencing data. CAH, SS, KP, and KW provided administrative, technical and material support. HK, MK, SKy, IV, AR, and TR were responsible for methodology, data curation, formal analysis, and visualization. HK, SKy, IV, TR, and MK wrote the original v ersion of the manuscript. All authors contributed to reviewing and editing the manuscript and approved the final version.
Haematologica | 108 July 2023 1779 ARTICLE - Ex vivo venetoclax sensitivity testing in AML H. Kuusanmäki et al.
Acknowledgments
The authors would like to thank the patients, their families, and physicians for their participation in the trial. We especially want to express gratitude to VenEx study nurses and coordinators: Sari Nikkola, Päivi Pellikka, Carita Rantanen, Satu Määttä-Halonen, Kirsi Kvist-Mäkelä, Elina Ellilä, Jenni Raali, and Saara Vaalas. We acknowledge the personnel at the FIMM Single Cell Analytics Unit and FIMM High Throughput Biomedicine Unit, which are hosted by the University of Helsinki and supported by HiLIFE and Biocenter Finland, for their expert technical assistance.
Funding
This study received funding from the Finnish Medical Foun-
References
1. Hourigan CS, Karp JE. Personalized therapy for acute myeloid leukemia. Cancer Discov. 2013;3(12):1336-1338.
2. Estey E, Levine RL, Löwenberg B. Current challenges in clinical development of “targeted therapies”: the case of acute myeloid leukemia. Blood. 2015;125(16):2461-2466.
3. Malani D, Kumar A, Brück O, et al. Implementing a functional precision medicine tumor board for acute myeloid leukemia. Cancer Discov. 2022;12(2):388-401.
4. Tyner JW, Tognon CE, Bottomly D, et al. Functional genomic landscape of acute myeloid leukaemia. Nature. 2018;562(7728):526-531.
5. Kornauth C, Pemovska T, Vladimer GI, et al. Functional precision medicine provides clinical benefit in advanced aggressive hematologic cancers and identifies exceptional responders. Cancer Discov. 2022;12(2):372-387.
6. Martínez-Cuadrón D, Gil C, Serrano J, et al. A precision medicine test predicts clinical response after idarubicin and cytarabine induction therapy in AML patients. Leuk Res. 2019;76:1-10.
7. Letai A, Bhola P, Welm AL. Functional precision oncology: testing tumors with drugs to identify vulnerabilities and novel combinations. Cancer Cell. 2022;40(1):26-35.
8. Bennett TA, Montesinos P, Moscardo F, et al. Pharmacological profiles of acute myeloid leukemia treatments in patient samples by automated flow cytometry: a bridge to individualized medicine. Clin Lymphoma Myeloma Leuk. 2014;14(4):305-318.
9. Snijder B, Vladimer GI, Krall N, et al. Image-based ex-vivo drug screening for patients with aggressive haematological malignancies: interim results from a single-arm, open-label, pilot study. Lancet Haematol. 2017;4(12):e595-e606.
10. Kuusanmäki H, Leppä A-M, Pölönen P, et al. Phenotype-based drug screening reveals association between venetoclax response and differentiation stage in acute myeloid leukemia. Haematologica. 2020;105(3):708-720.
11. Karjalainen R, Pemovska T, Popa M, et al. JAK1/2 and BCL2 inhibitors synergize to counteract bone marrow stromal cellinduced protection of AML. Blood. 2017;130(6):789-802.
12. DiNardo CD, Jonas BA, Pullarkat V, et al. Azacitidine and venetoclax in previously untreated acute myeloid leukemia. N Engl J Med. 2020;383(7):617-629.
13. DiNardo CD, Maiti A, Rausch CR, et al. 10-day decitabine with venetoclax for newly diagnosed intensive chemotherapy ineligible, and relapsed or refractory acute myeloid leukaemia: a
dation, Cancer Foundation Finland, Helsinki University Hospital Comprehensive Cancer Center, Helsinki University, iCAN – Digital Precision Medicine and FiCAN South. HK and MK are supported by the Foundation for the Finnish Cancer Institute. SKy received support from the Finnish Medical Foundation.
Data-sharing statement
All data relevant to the study are included in the article or uploaded in the Online Supplementary Data. The datasets used and/or analyzed during the study are available from the Finnish AML Group upon reasonable request to the corresponding author. Initial requests should be directed to the principal investigator Mika Kontro (mika.kontro@helsinki.fi).
single-centre, phase 2 trial. Lancet Haematol. 2020;7(10):e724-e736.
14. Stahl M, Menghrajani K, Derkach A, et al. Clinical and molecular predictors of response and survival following venetoclax therapy in relapsed/refractory AML. Blood Adv. 2021;5(5):1552-1564.
15. DiNardo CD, Tiong IS, Quaglieri A, et al. Molecular patterns of response and treatment failure after frontline venetoclax combinations in older patients with AML. Blood. 2020;135(11):791-803.
16. Pei S, Pollyea DA, Gustafson A, et al. Monocytic subclones confer resistance to venetoclax-based therapy in patients with acute myeloid leukemia. Cancer Discov. 2020;10(4):536-551.
17. Cherry EM, Abbott D, Amaya M, et al. Venetoclax and azacitidine compared with induction chemotherapy for newly diagnosed patients with acute myeloid leukemia. Blood Adv. 2021;5(24):5565-5573.
18. Spinner MA, Aleshin A, Santaguida MT, et al. Ex vivo drug screening defines novel drug sensitivity patterns for informing personalized therapy in myeloid neoplasms. Blood Adv. 2020;4(12):2768-2778.
19. Seyfried F, Demir S, Hörl RL, et al. Prediction of venetoclax activity in precursor B-ALL by functional assessment of apoptosis signaling. Cell Death Dis. 2019;10(8):571.
20. Bhatt S, Pioso MS, Olesinski EA, et al. Reduced mitochondrial apoptotic priming drives resistance to BH3 mimetics in acute myeloid leukemia. Cancer Cell. 2020;38(6):872-890.
21. Ferrara F, Barosi G, Venditti A, et al. Consensus-based definition of unfitness to intensive and non-intensive chemotherapy in acute myeloid leukemia: a project of SIE, SIES and GITMO group on a new tool for therapy decision making. Leukemia. 2013;27(5):997-999.
22. Yadav B, Pemovska T, Szwajda A, et al. Quantitative scoring of differential drug sensitivity for individually optimized anticancer therapies. Sci Rep. 2014;4:5193.
23. Döhner H, Estey E, Grimwade D, et al. Diagnosis and management of AML in adults: 2017 ELN recommendations from an international expert panel. Blood. 2017;129(4):424-447.
24. Stahl M, Menghrajani K, Derkach A, et al. Clinical and molecular predictors of response and survival following venetoclax therapy in relapsed/refractory AML. Blood Adv. 2021;5(5):1552-1564.
25. Zhang H, Nakauchi Y, Köhnke T, et al. Integrated analysis of patient samples identifies biomarkers for venetoclax efficacy and combination strategies in acute myeloid leukemia. Nat
Haematologica | 108 July 2023 1780 ARTICLE - Ex vivo venetoclax sensitivity testing in AML H. Kuusanmäki et al.
Cancer. 2020;1(8):826-839.
26. Bisaillon R, Moison C, Thiollier C, et al. Genetic characterization of ABT-199 sensitivity in human AML. Leukemia. 2019;34(1):63-74.
27. Karjalainen R, Liu M, Kumar A, et al. Elevated expression of S100A8 and S100A9 correlates with resistance to the BCL-2 inhibitor venetoclax in AML. Leukemia. 2019;33(10):2548-2553.
28. Schumich A, Prchal-Murphy M, Maurer-Granofszky M, et al. Phospho-profiling linking biology and clinics in pediatric acute myeloid leukemia. HemaSphere. 2020;4(1):e312.
29. Pollyea DA, Pratz KW, Wei AH, et al. Outcomes in patients with poor-risk cytogenetics with or without TP53 mutations treated with venetoclax and azacitidine. Clin Cancer Res. 2022;28(24):5272-5279.
Haematologica | 108 July 2023 1781 ARTICLE - Ex vivo venetoclax sensitivity testing in AML H. Kuusanmäki et al.
Second hematopoietic stem cell transplantation as salvage therapy for relapsed acute myeloid leukemia/myelodysplastic syndromes after a first transplantation
Correspondence: A. Shimoni
avichai.shimoni@sheba.health.gov.il
Received: August 1, 2022.
Accepted: November 28, 2022.
Early view: December 7, 2022.
https://doi.org/10.3324/haematol.2022.281877
©2023 Ferrata Storti Foundation
Published under a CC BY-NC license
Abstract
Second allogeneic hematopoietic stem-cell transplantation (HSCT2) is a therapeutic option for patients with acute myeloid leukemia (AML)/myelodysplastic syndrome (MDS) relapsing after a first transplant (HSCT1). However, patients allocated to HSCT2 may be a selected group with better prognosis and the added efficacy of HSCT2 is not well established. We retrospectively analyzed 407 consecutive patients with relapsed AML/MDS after HSCT1. Sixty-two patients had HSCT2 (15%) and 345 did not. The 2-year cumulative incidence rates of non-relapse mortality and relapse after HSCT2 were 26% (95% confidence interval [95% CI]: 17-39%) and 50% (95% CI: 39-65%), respectively. The 5-year overall survival rates were 25% (95% CI: 14-36%) and 7% (95% CI: 4-10%) in the HSCT2 and no-HSCT2 groups, respectively. Multivariate analysis identified female gender (hazard ratio [HR]=0.31, P=0.001), short remission duration after HSCT1 (HR=2.31, P=0.05), acute graft-versus-host disease after HSCT1 (HR=2.27, P=0.035), HSCT2 from a haplo-identical donor (HR=13.4, P=0.001) or matched unrelated donor (HR=4.53, P=0.007) and relapse after HSCT1 in earlier years (HR=2.46, P=0.02) as factors predicting overall survival after HSCT2. Multivariate analysis of all patients including HSCT2 as a timedependent variable identified relapse within 6 months after HSCT1 (HR=2.32, P<0.001), acute graft-versus-host disease before relapse (HR=1.47, P=0.005), myeloablative conditioning in HSCT1 (HR=0.67, P=0.011), female gender (HR=0.71, P=0.007), relapse in earlier years (HR=1.33, P=0.031) and not having HSCT2 (HR=1.66, P=0.010) as predictive of overall survival after relapse. In conclusion, HSCT2 is associated with longer survival compared to non-transplant treatments and may be the preferred approach in a subset of patients with relapsed AML/MDS after HSCT1.
Introduction
Allogeneic hematopoietic stem cell transplantation (HSCT) is an effective treatment with a curative potential for patients with acute myeloid leukemia (AML) or myelodysplastic syndromes (MDS). The outcome of HSCT has improved markedly in the last decades due to a significant reduction in the rate of non-relapse mortality after stem cell transplants.1 However, relapsed disease remains the major cause of treatment failure.2 Marked changes have been introduced in modern HSCT over the past decades, including transplants in older patients, more common use
of unrelated donors as well as haplo-identical donors, and the use of peripheral blood stem cells as the source of stem cells. Novel conditioning regimens and regimens for the prevention of graft-versus-host disease (GvHD) have also been introduced. However, these changes did not change the rate of disease relapse substantially, and the prognosis for relapsed patients following HSCT remains dismal with a long-term survival rate of about 10-15%.3-5 There is no established standard-of-care therapy for patients relapsing after HSCT. The spectrum of management includes palliative care, withdrawal of immune-suppression therapy, low-dose or intensive chemotherapy,
Yaara Yerushalmi,1,2 Noga Shem-Tov,1,2 Ivetta Danylesko,1,2 Jonathan Canaani,1,2 Abraham Avigdor,1,2 Ronit Yerushalmi,1,2 Arnon Nagler1,2 and Avichai Shimoni1,2
1The Division of Hematology and Bone Marrow Transplantation, Chaim Sheba Medical Center, Tel-Hashomer and 2Tel-Aviv University and Sackler School of Medicine, Tel-Aviv, Israel
Haematologica | 108 July 2023 1782 ARTICLE - Acute Myeloid
Leukemia
targeted treatments, donor lymphocyte infusion, a second allogeneic transplantation (HSCT2), or a combination of these therapies.2-5 Prolonged survival can be achieved only by patients who have a second complete remission and are supported by a form of cellular therapy such as donor lymphocyte infusion or HSCT2.6,7 The role of HSCT2 in the treatment of relapsed AML or MDS patients still needs to be determined, including the indications and predictive factors for, and outcomes after, a second transplant in comparison with those for non-transplant treatments. Several studies have shown that the major predictive factors of outcome of HSCT2 are the duration of remission after the first HSCT and the status of disease at HSCT2.717 Age, gender, choice of stem cell donor and acute and/or chronic GvHD prior to and following HSCT2 have also been described as important predictive factors.2-17 The longterm survival after HSCT2 is estimated as 25-30%.2-17 However, patients addressed to HSCT2 may be a selected group with a better prognosis than those not given a second transplant. In addition, survival time between relapse and HSCT2 may bias in favor of HSCT2, as early deaths are not included in the analysis of HSCT2. In the current study we describe the outcomes of patients relapsing after a first allogeneic HSCT whether they did or did not have HSCT2. We consider HSCT2 as a time-dependent variable to reduce these biases.
Methods
Study design and data collection
This is a retrospective, single-center analysis. The study included adult patients with AML or MDS who relapsed after a first allogeneic HSCT from an HLA-matched sibling or unrelated donor between the years 2000-2018. Patients given a first HSCT from haplo-identical donors were not included, because of their small number during that period and to the different biology of relapse after haploidentical transplants. Patients were divided into two subgroups according to whether they did or did not have HSCT2. Only patients who underwent HSCT2 from a different donor were considered in the HSCT2 subgroup. All patients provided written informed consent authorizing the use of their personal information for research purposes and the study was approved by the institutional review board.
Conditioning regimens
The conditioning regimen was selected at the attending physicians’ discretion. Dose intensity was defined as myeloablative, reduced toxicity (intermediate intensity) or reduced intensity according to standard criteria.18,19 GvHD prophylaxis consisted of cyclosporine with short-term methotrexate or mycophenolate mofetil in most cases.
Antithymocyte globulin was allowed at the attending physicians’ discretion. No ex-vivo manipulation of cells was used.
Evaluation of outcomes
Active disease was defined as no complete remission (CR) or complete remission with incomplete count recovery (CRi) in AML and >5% marrow blasts in MDS. Disease relapse and transplant engraftment were defined according to standard hematologic criteria. In the analysis of outcomes after HSCT2, non-relapse mortality was defined as death of any cause in the absence of disease recurrence. Leukemia-free survival was defined as survival without relapse. Overall survival was calculated from the day of HSCT2 until death of any cause or the date of last followup. In the analysis of outcomes in the entire group of patients all outcomes were calculated from the day of relapse. Acute GvHD was graded and staged by the consensus criteria.20 Chronic GvHD was graded and staged according to National Institute of Health consensus criteria.21
Statistical analysis
This study had two parts. In the first part we analyzed the group of patients who underwent HSCT2. Overall survival and leukemia-free survival were analyzed by the KaplanMeier method.22 Non-relapse mortality, relapse, and acute and chronic GvHD were evaluated by cumulative incidence analysis considering competing risks.23 Univariate analysis of predictive factors was done by log-rank tests for overall survival and leukemia-free survival and by the Gray test for the other outcomes. Multivariate analysis was done using the Cox proportional-hazard method. In the second part of the study, we evaluated the role of HSCT2 in the entire group of patients who relapsed after their first HSCT. The primary endpoint of this part was overall survival after relapse. The two treatment groups (HSCT2 and no-HSCT2) were compared by the c2 method for qualitative variables, and the Mann-Whitney test for continuous parameters. Outcomes were analyzed by the same methodologies. Multivariate analyses were performed using Cox proportional hazards with stepwise backward selection including performing HSCT2 as a time-dependent variable. We also used a landmark analysis at 60 days after relapse and included only patients alive at the landmark. Statistical analyses were performed with SPSS 24.0 (SPSS Inc., Chicago, IL, USA) and R 3.4.1 software packages (Vienna, Austria; URL https://www.R-project.org/).
Results
Patients’ characteristics
The study included 407 patients with AML (n=338) and
Haematologica | 108 July 2023 1783 ARTICLE - Second HSCT for AML/MDS relapse Y. Yerushalmi et al.
MDS (n=69) who relapsed after a first allogeneic HSCT that was carried out during the years 2000-2018. The median year of relapse was 2012 (range, 2001-2021). The patients’ characteristics are outlined in Table 1. A total of 62 patients were given HSCT2. Among the other 345 patients, 98 patients had cellular therapy that was not considered HSCT2, including donor lymphocyte infusion (n=40), granulocyte colony-stimulating factor-mobilized donor lymphocyte infusion given after salvage chemotherapy (n=50) or a second transplant from the same donor (n=7). The patients’ median age was 56 years (range, 1878); 49 years (range, 18-76) in the HSCT2 group and 58 years (range, 18-78) in the no-HSCT2 group (P<0.001). Forty-two percent of patients were males in the HSCT2 group and 61% in the no-HSCT2 group (P=0.006). The con-
ditioning regimens for the first HSCT were myeloablative (n=153), reduced intensity (n=118) and reduced toxicity (n=136) with a higher rate of myeloablative conditioning and a lower rate of reduced intensity conditioning in those receiving HSCT2. The GvHD prophylaxis regimen at first HSCT was cyclosporine A/methotrexate in most patients. In the HSCT2 and no-HSCT2 groups, 44% and 37% of the patients, respectively, were in first complete remission/MDS with no blasts and 11% and 12% were in second complete remission. Data on measurable residual disease at the time of HSCT were not available as it was not routine practice to determine residual disease in AML at the beginning of the study. The median time from the first HSCT to first relapse was 4.5 months (range, 0.4-143.1 months). It was longer in the HSCT2 group (10.5 months
HSCT: hematopoietic stem cell transplantation; AML: acute myeloid leukemia; MDS: myelodysplastic syndrome; ELN: European Leukemia Network; CR1: first complete remission; CR2: second complete remission; MAC: myeloablative conditioning; RIC: reduced-intensity conditioning; RTC: reduced toxicity myeloablative conditioning; GvHD: graft-versus-host disease; CSA: cyclosporine A; MTX: methotrexate; F to M: female donor to male recipient.
Haematologica | 108 July 2023 1784 ARTICLE - Second HSCT for AML/MDS relapse Y. Yerushalmi et al. Second HSCT No second HSCT P value Number 62 345 Age, years, median (range) Age >55 years, N (%) 49 (18-76) 21 (34) 58 (18-78) 199 (58) <0.001 Male gender, N (%) 26 (42) 209 (61) 0.006 Diagnosis, N (%) AML MDS 47 (76) 15 (24) 291 (84) 54 (16) 0.09 ELN risk (AML only), N (%) Good Intermediate Poor Missing 7 (15) 17 (36) 16 (34) 7 (15) 28 (10) 119 (62) 107 (56) 37 (19) 0.29 Status at 1st HSCT, N (%) CR1/MDS no blasts CR2 Active disease 27 (44) 5 (11) 30 (48) 127 (37) 41 (12) 177 (51) 0.51 Conditioning for 1st HSCT, N (%) MAC RIC RTC 30 (48) 9 (15) 23 (37) 123 (36) 109 (32) 113 (33) 0.02 GvHD prophylaxis, N (%) CSA/MTX CSA/Cellcept 55 (89) 7 (11) 266 (77) 79 (23) 0.04 Source of stem cells, N (%) Peripheral blood stem cells Bone marrow 59 (95) 3 (5) 340 (99) 5 (1) 0.08 Donor for 1st HSCT, N (%) Sibling Matched unrelated 31 (50) 31 (50) 169 (49) 176 (51) 0.49 F to M, N (%) 10 (17) 69 (20) 0.51 Prior acute GvHD, N (%) 16 (26) 110 (32) 0.3 Prior chronic GvHD, N (%) 17 (27) 65 (19) 0.12 Time to 1st relapse, months, median (range) 1st relapse in <6 months, N (%) 10.5 (1.3-143) 19 (31) 3.8 (0.4-112) 224 (65) <0.001 Year of relapse, median (range) 2013 (2002-2021) 2012 (2001-2020) 0.02
Table 1. Patients’ characteristics.
[range, 1.3-143]) than in the no-HSCT2 group (3.8 months [range, 0.4-112]) (P<0.001). Of all relapses, 31% and 65% occurred within the first 6 months after the first HSCT in the HSCT2 and no-HSCT2 groups, respectively. A similar percent of patients had acute GvHD and/or chronic GvHD prior to relapse.
Characteristics of the second hematopoietic stem cell transplantation
The median time from relapse to HSCT2 was 4.5 months (range, 0.3-91). Eighteen patients (29%) underwent HSCT2 within 3 months of relapse. The median time from first to second HSCT was 23 months (range, 3.3-146). Seventeen patients (27%) underwent HSCT2 within less than 1 year of the first HSCT. At the time of HSCT2, 29 patients (47%) were in complete remission, and 33 patients (53%) had active disease. The donor for HSCT2 was a different donor in all second transplants; either a second HLA-matched sibling (n=13, 21%), a matched unrelated donor (n=39, 63%), or a haplo-identical donor (n=10, 16%). The conditioning regimen in the matched transplants included a sequential salvage and reduced intensity conditioning (FLAMSA-like) in six patients (treosulfan-based in 2 of these patients), fludarabine with 2 days of busulfan in seven patients, fludarabine with 4 days of busulfan in five patients, and fluradabinetreosulfan in 34 patients. Among the ten recipients of
haplo-identical transplants, five were given thiotepa/busulfan/fludarabine with post-transplant cyclophosphamide and five were given T-cell-depleted transplants. In all, conditioning intensity was determined as low intensity in 29 patients and intermediate intensity in 33 patients according to the redefined European Society for Blood and Marrow Transplantation (EBMT) criteria.
Outcome after a second hematopoietic stem cell transplantation
Fifty-seven of the 62 patients who were given HSCT2 following relapse engrafted at a median of 12 days (range, 9-32). Five patients died prior to engraftment. The median follow-up was 55 months (range, 8-188 months). The 100-day cumulative incidence of acute GvHD was 31% (95% confidence interval [95% CI]: 21-46%) and the 1-year cumulative incidence of chronic GvHD was 15% (95% CI: 8-27%). In all, at last follow-up, 17 patients were alive, and 45 patients had died. Sixteen patients died of non-relapse causes including GvHD (n=3), infection (n=4), and organ toxicity (n=9). The 2-year cumulative incidence of non-relapse mortality was 26% (95% CI: 17-39%) (Figure 1A). Forty-nine patients relapsed after HSCT2, with a 2-year cumulative incidence of relapse of 50% (95% CI: 39-65%) (Figure 1B). Four of these patients were alive after a second relapse, three of them in the long-term. The 2-year and 5-year overall survival rates were 38%

A C B Haematologica | 108 July 2023 1785 ARTICLE - Second HSCT for AML/MDS relapse Y. Yerushalmi et al.
Figure 1. Outcomes after second allogeneic hematopoietic stem cell transplantation. (A) Non-relapse mortality. (B) Relapse. (C) Overall survival. HSCT2: second hematopoietic stem cell transplantation.
HSCT: hematopoietic stem cell transplantation; AML: acute myeloid leukemia; MDS: myelodysplastic syndrome; ELN: European Leukemia Network; CR1: first complete remission; CR2: second complete remission; MAC: myeloablative conditioning; RIC: reduced-intensity conditioning; RTC: reduced toxicity myeloablative conditioning; GvHD: graft-versus-host disease; CSA: cyclosporine A; MTX: methotrexate; F to M: female donor to male recipient.
N Alive (N) 2-year OS, percent (95% CI) P value All patients 62 17 38 (26-50) Age <55 years >55 years 41 21 12 5 40 (25-55) 33 (13-54) 0.34 Gender Female Male 36 26 12 5 49 (33-66) 22 (5-40) 0.001 Diagnosis AML MDS 47 15 16 1 44 (29-58) 20 (0-40) 0.04 ELN risk (AML only) Good Intermediate Poor Missing 7 17 16 8 5 5 3 3 71 (38-100) 39 (16-69) 20 (0-39) 40 (19-61) 0.02 Status at 1st HSCT CR1/MDS no blasts CR2 Active disease 27 5 30 9 2 6 47 (28-66) 30 (0-77) 30 (14-46) 0.26 Conditioning 1st HSCT MAC RIC (low intensity) RTC (intermediate intensity) 30 9 23 12 3 2 52 (34-71) 33 (3-64) 22 (5-39) 0.11 GvHD prophylaxis CSA/MTX Other 55 7 17 0 43 (30-56) 0 (0-40) 0.09 Stem cell source Peripheral blood stem cells Bone marrow 59 3 16 1 38 (26-51) 33 (0-87) 0.76 Donor for 1st HSCT Sibling Matched unrelated 31 31 10 7 41 (23-59) 35 (18-52) 0.67 F to M Yes No 10 52 2 15 15 (0-40) 43 (29-56) 0.02 Prior acute GvHD Yes No 16 46 4 13 28 (5-51) 41 (27-55) 0.42 Prior chronic GvHD Yes No 17 45 6 11 43 (18-68) 36 (22-50) 0.40 Median year of relapse ≤ 2012 > 2012 27 35 5 12 26 (9-43) 48 (31-65) 0.15 Time from relapse to 2nd HSCT <3 months >3 months 18 44 5 12 36 (13-59) 36 (21-50) 0.68 Time from 1st to 2nd HSCT <1 year >1 year 17 45 4 13 23 (3-44) 43 (28-58) 0.05 Status at 2nd HSCT Active disease Complete remission 33 29 7 10 33 (17-49) 40 (22-59) 0.23 Donor for 2nd HSCT Sibling Matched unrelated Haplo-identical 13 39 10 6 10 1 42 (14-70) 25 (11-38) 10 (0-20+) 0.02 Conditioning for 2nd HSCT Low intensity Intermediate intensity 29 33 7 10 27 (23-58) 24 (9-40) 0.45 Treosulfan in 2nd HSCT Yes No 36 26 14 3 36 (20-53) 11 (0-24) 0.007
Table 2. Univariate analysis of factors predicting 2-year overall survival after second hematopoietic stem cell transplantation.
Haematologica | 108 July 2023 1786 ARTICLE - Second HSCT for AML/MDS relapse Y. Yerushalmi et al.
Figure 2. Overall survival after relapse. (A) Overall survival in 345 patients not given a second hematopoietic stem cell transplant (HSCT2) compared with overall survival after HSCT2 in 62 recipients (calculated from the day of the second transplant). (B) Landmark analysis at 60 days after relapse according to whether patients did or did not have a HSCT2.
(95% CI: 26-50%) and 25% (95% CI: 14-36%), respectively (Figure 1C). The 2-year and 5-year leukemia-free survival rates were 24% (95% CI: 13-34%) and 18% (95% CI: 829%), respectively. Seven patients were given maintenance treatment after HSCT2, including azacytidine (n=5) and sorafenib (n=2). Two of these patients are long-term survivors.
Factors predicting 2-year overall survival after second hematopoietic stem cell transplantation
Table 2 outlines the univariate analysis of factors predicting 2-year overall survival after HSCT2. A 2-year overall survival advantage was statistically significant for females compared to males (P=0.001), AML compared to MDS (P=0.04), favorable European LeukemiaNetwork (ELN24) risk (P=0.02), a prior remission duration from HSCT to first relapse that was longer than 6 months (P=0.05), and a matched sibling as a donor at HSCT2 (P=0.03) compared to an unrelated or haplo-identical donor. Interestingly, the survival of patients with active disease at HSCT2 was not statistically significantly different from that of patients in complete remission. However, six of the 33 patients with active disease at HSCT2 had not had therapy prior to HSCT. When these patients were excluded the 2-year overall survival was 14% (95% CI: 6-34) compared with 40% (95% CI: 22-59) in patients in complete remission (P=0.10). The use of treosulfan in the conditioning regimen was also associated with better outcome in the univariate analysis (P=0.002). Survival in more recent years has improved, but this difference has not reached statistical significance. Post-transplant maintenance therapy was given to a small group of patients so a meaningful evaluation of its role was not possible.
Table 3 outlines the multivariate analysis of factors predicting survival after a second HSCT. The analysis identified female gender as a factor predicting improved survival rate (HR=0.31, P=0.001). Short remission after first HSCT (HR=2.31, P=0.05), acute GvHD after first HSCT
HR: hazard ratio; 95% CI: 95% confidence interval; GvHD: graft-versus-host disease; HSCT: hematopoietic stem cell transplantation.
(HR=2.27, P=0.035) and HSCT2 from a haplo-identical donor (HR=13.04, P=0.001) or matched unrelated donor (HR=4.53, P=0.007) predicted lower survival rates. Earlier year of relapse after the first HSCT (in or before 2012) was associated with inferior survival (HR=2.46, P=0.012).
Outcome of patients who did not have a second hematopoietic stem cell transplant
A total of 345 patients did not have second HSCT following relapse. The median follow-up for patients alive was 57 months (range, 8-223). At the last follow-up, 31 patients were alive. The median survival was 3.3 months. Figure 2A shows the Kaplan-Meier survival curves from relapse. The 2-year and 5-year overall survival rates were 13% (95% CI: 9-16%) and 7% (95% CI: 4-10%), respectively. The 5-year overall survival of patients given cellular therapy other than HSCT2 from a different donor was 14% (95% CI: 7-21) compared to 25% (95% CI: 14-36) in the HSCT2 group (P=0.05). In the comparative group of patients who had HSCT2, the survival was calculated from the time of HSCT2 in order not to overestimate the advantage of survival from relapse to HSCT2.

HR (95% CI) P value Gender (female) 0.35 (0.15-0.66) 0.001 Short remission 2.31 (1.00-5.34) 0.050 Prior acute GvHD 2.27 (1.06-4.87) 0.035 Donor for 2nd HSCT Haplo-identical Matched unrelated 13.4 (3.52-51.3) 4.53 (1.52-13.5) 0.001 0.007 Year of relapse ≤ 2012 2.46 (1.22-4.96) 0.031
A B Haematologica | 108 July 2023 1787 ARTICLE - Second HSCT for AML/MDS relapse Y. Yerushalmi et al.
Table 3. Multivariate analysis of factors predicting survival after second hematopoietic stem cell transplantation.
Factors predicting 2-year overall survival after relapse following hematopoietic stem cell transplantation
We analyzed data from 407 consecutive patients who relapsed after a first HSCT. The median follow-up of patients alive after relapse was 60 months (range, 8-222). At last follow-up, 47 patients were alive. The 2-year overall survival rate for the entire group was 18% (95% CI: 1422). Univariate analysis of factors predicting 2-year overall survival after first relapse is presented in Table 4. Improved survival was seen in females (P=0.003), those with favorable ELN risk (P=0.008), patients in complete remission at HSCT (P=0.05), patients given myeloablative conditioning ( P =0.006), those given methotrexate as GvHD prophylaxis (P=0.001), not a female donor to male recipient combination at first HSCT (P=0.04) and relapse in more recent years (after 2012, P=0.002). A significant advantage in 2-year overall survival rate was seen in patients with relapse occurring more than 6 months after HSCT (P<0.001). To reduce the bias of time to HSCT2 we analyzed only patients having HSCT2 within 6 months of relapse and found that having HSCT2 was a highly significant predictive factor in this univariate analysis (P=0.0002).
For multivariate analysis we used a Cox proportional hazard model with HSCT2 entered as a time-dependent variant. Patients who did not have HSCT2 had an inferior survival (HR=1.66, P =0.010). Other factors predicting an inferior outcome were relapse within the first 6 months after HSCT (HR=2.32, P<0.001) and acute GvHD before relapse (HR=1.47, P=0.005). Relapse in earlier years (before 2012) was associated with inferior overall survival (HR=1.33, P=0.031). Myeloablative conditioning after first HSCT and female gender predicted improved outcome (Table 5). Since only 15% had HSCT2, the performance of HSCT2 was the only post-HSCT2 factor included (as a time-dependent factor), while subgroups of second transplant characteristics could not be analyzed in this group.
To further explore the role of HSCT2 we used a landmark analysis set at 60 days after relapse. At this landmark, 65 patients were in remission, 208 patients were alive with active disease, nine patients had already undergone HSCT2 due to relapse or graft failure, 112 patients had died, and four patients were lost to follow-up. A total of 33 patients who were alive at the 2-month landmark underwent HSCT2 within the following 4 months. The 2year and 5-year overall survival rates were 35% (95% CI: 18-51%) and 22% (95% CI: 8-32%), respectively. Among all other patients alive at the 2-month landmark, 2-year and 5-year overall survival rates were 23% (95% CI: 1829%) and 13% (95% CI: 8-18%), respectively (P=0.03) (Figure 2B). Of the latter, 24 patients underwent HSCT2 later in their disease course (>6 months).
Discussion
A second HSCT is a potentially curative treatment for patients with relapsed AML or MDS after a first transplant. The current single-center study shows that approximately 25% of HSCT2 recipients achieve long-term survival. A similar outcome has been found in several other retrospective studies6-17 and is better than expected with no additional cellular therapy.3,6,25 In the current study we analyzed the results of HSCT2 in the context of all relapsing AML or MDS patients with the intent to explore the independent effect of HSCT2. Despite our policy to offer a second transplant to patients relapsing after a first HSCT, only 15% of our patients did eventually undergo HSCT2. This group included patients who were younger and with a longer time to relapse, and as such with a better expected survival. The median time from relapse to HSCT2 was 4.5 months, while 28% of all patients had already died in the first 2 months after relapse and could not have been considered for HSCT2. After adjusting for these biases by multivariate analysis and by considering HSCT2 as a time-dependent variable, HSCT2 remained an independent positive prognostic factor for survival after relapse. In addition, we also performed a landmark analysis of patients alive 2 months after first relapse and treated with HSCT2 compared with other treatments and showed a similar survival advantage for HSCT2. These analyses are based on retrospective data and may not completely adjust for unknown considerations that led the attending physicians to select patients for HSCT2. A randomized study comparing HSCT2 to other treatments may be the only way to prove the advantage of the former but is unlikely to be performed because of the high probability of physicians’ reluctance to include patients in such a study with the possibility of deferring a curative approach. In the absence of such studies the current analysis supports an independent advantage of HSCT2.
The definition of a second HSCT is not well established. HSCT2 with a different donor from the one used for the first transplant can obviously be defined as a second transplant. However, when using the same donor, peripheral blood stem cells left from the original HSCT or recollected can be used to support non-myeloablative salvage chemotherapy, with no or minimal immune suppression. This can be defined as a second transplant or, more appropriately, as donor lymphocyte infusion (mobilized donor lymphocyte infusion) or a form of cellular therapy.26 To circumvent these differences in definition, we included in the subgroup of patients who underwent HSCT2 only those patients who received the second transplant from a different donor (another HLA-matched sibling, a matched unrelated donor, or a haplo-identical donor). The selection of a different donor is based on the assumption that this may provide a graft-versus-leukemia
Haematologica | 108 July 2023 1788 ARTICLE - Second HSCT for AML/MDS relapse Y. Yerushalmi et al.
Table 4. Univariate analysis of factors predicting 2-year overall survival after first relapse.
OS: overall survival; 95% CI: 95% confidence interval; AML: acute myeloid leukemia; MDS: myelodysplastic syndrome; ELN: European Leukemia Network; HSCT: hematopoietic stem cell transplantation; CR1: first complete remission; CR2: second complete remission; MAC: myeloablative conditioning; RIC: reduced intensity conditioning; RTC: reduced toxicity myeloablative conditioning; GvHD: graft-versus-host disease; CSA: cyclosporine A; MTX: methotrexate; F to M: female donor to male recipient.
N Alive (N) 2-year OS, percent (95% CI) P value All patients 407 47 18 (14-22) Age <55 years ≥55 years 187 220 27 20 22 (16-28) 15 (10-19) 0.06 Gender Female Male 172 235 25 22 25 (19-32) 13 (9-17) 0.003 Diagnosis AML MDS 338 69 37 10 18 (14-22) 20 (11-29) 0.22 ELN risk (AML only) Good Intermediate Poor Missing 35 136 123 44 10 16 5 6 29 (14-45) 20 (14-27) 12 (6-17) 0.008 Status at 1st HSCT CR1/MDS no blasts CR2 Active disease 154 46 207 18 8 21 21 (14-27) 26 (13-39) 15 (10-20) 0.05 Conditioning for 1st HSCT MAC RIC RTC 153 108 136 26 11 10 24 (17-31) 16 (9-22) 14 (8-20) 0.006 GvHD prophylaxis CSA/MTX Other 321 86 42 5 21 (17-26) 6 (1-12) 0.001 Stem cell source Peripheral blood stem cells Bone marrow 399 8 46 1 18 (14-22) 13 (0-35) 0.89 Donor for 1st HSCT Sibling Matched unrelated 200 207 23 24 17 (12-23) 19 (14-24) 0.34 F to M Yes No 79 328 5 42 20 (16-24) 11 (4-18) 0.04 Prior acute GvHD Yes No 126 281 11 36 13 (7-19) 21 (16-25) 0.13 Prior chronic GvHD Yes No 82 325 11 36 24 (15-33) 17 (13-20) 0.10 Time from HSCT to relapse <6 months >6 months 243 164 17 30 11 (8-16) 29 (22-36) < 0.001 2nd HSCT within 6 months of relapse Yes No 38 329 9 38 36 (20-51) 16 (13-20) 0.0002 Median year of relapse ≤ 2012 > 2012 213 192 17 30 14 (9-18) 23 (17-29) 0.0002
Haematologica | 108 July 2023 1789 ARTICLE - Second HSCT for AML/MDS relapse Y. Yerushalmi et al.
effect that was not induced by the first transplant or that may overcome resistance mechanisms against the first given immune system. However, there are no data to support HSCT2 from a different donor being more effective.2,8,10,11,13 Thus, our data may underestimate the advantage of HSCT2. In addition, other forms of cellular therapies, such as donor lymphocyte infusion or mobilized donor lymphocyte infusion can also be associated with long-term survival and there are currently no data to support HSCT2 over these other forms of cellular therapy.7,15 The other poor prognostic factors for survival after relapse identified by the multivariate analysis were short duration of prior remission and prior acute GvHD. Female patients and patients given myeloablative conditioning at the first HSCT had better outcomes. In line with most previous studies,6-10,25 our study showed that relapse within 6 months after the first HSCT was consistently associated with poor outcome, also among patients who were able to proceed with HSCT2. This reflects an aggressive biology of the underlying leukemia and, in our series, overrode the role of other prognostic factors such as cytogenetics and ELN classification. The results of all therapies in these patients are dismal and such patients are often offered palliative care alone. However, a small fraction of these patients (approximately 10%) did enjoy long survival and they should not be automatically deferred from an intensive treatment approach. The better outcome of patients given myeloablative conditioning is not consistent in all studies.15 Patients initially given myeloablative conditioning may be fitter for additional treatments even after relapse. In addition, the anti-leukemia effect following reduced intensity condition is more dependent on the graft-versus-leukemia effects.27 Patients relapsing after reduced intensity conditioning may, therefore, respond less to immune manipulations. This may also explain the worse prognosis of patients with acute GvHD before relapse. We previously reported better outcomes in female recipients.5 This was also seen in the current study but not in other large series. There is no definite biological explanation for this observation and it merits further study. The prognostic factors for poor survival in the group of patients who had a HSCT2 included male gender, short duration from first HSCT to relapse and prior acute GvHD. We also found that HSCT2 from a second unrelated donor and in particular from a haplo-identical donor was associated with inferior survival. An inferior outcome of HSCT from a second unrelated donor has been described in earlier reports.9 A recent EBMT report showed that haploidentical second transplants may be associated with lower survival due to increased non-relapse mortality.2 However, a subsequent EBMT report found no difference between outcomes following transplants from haploidentical or unrelated HSCT2 donors.28 The group of second haplo-identical transplants in the current study was
too small to enable definite conclusions. In addition, about half of the transplants were T-cell-depleted while the recent EBMT studies included patients conditioned with post-transplant cyclophosphamide, which may be much safer. Due to the small numbers and in order to create a less heterogeneous group, we did not include patients with a first HSCT from a haplo-identical donor in our study. In these patients a different haplo-identical donor is usually required for a second haplo-identical HSCT to overcome the possibility of leukemia immune escape by loss of the unshared haplotype.29 We did include HSCT2 from a haplo-identical donor as we wanted to explore all HSCT2 options and the potential role of the graftversus-leukemia effect from a mismatched donor transplant after failure of a matched donor transplant. In all, it seems there is no graft-versus-leukemia advantage from haplo-identical transplantation that could justify preferential switching to a haplo-identical donor in a second transplant.
The status of disease at HSCT2 has been shown in multiple studies to be an important predictive factor for outcome, with patients transplanted in remission having significantly better outcome. We did not find such an association in the current study possibly because of the small number of patients. However, some of the patients with active disease at HSCT2 had not been previously treated at the time of the HSCT2. When these patients were excluded the 2-year overall survival of this group was much lower at 14%, but still some were salvaged with HSCT2. We used treosulfan-based conditioning in the majority of HSCT2. Treosulfan has shown some advantages compared to other regimens in patients with active disease.30 In the current series, treosulfan was indeed associated with a survival advantage in the HSCT2 setting in the univariate analysis, but not in the multivariate analysis. Other studies have not shown an advantage for any conditioning regimen in HSCT2.2 It seems that a small subset of patients who do not achieve a stringent re-
HR (95% CI) P
No 2nd HSCT 1.66 (1.13-2.45) 0.010 Short remission 2.32 (1.75-3.06) < 0.001 Female gender 0.71 (0.54-0.91) 0.007 MAC for 1st HSCT 0.67 (0.49-0.91) 0.011 Prior acute GvHD 1.47 (1.11-1.93) 0.005 Year of relapse ≤ 2012 1.33 (1.03-1.74) 0.031
value
Table 5. Multivariate analysis of factors predicting survival after relapse.
Haematologica | 108 July 2023 1790 ARTICLE - Second HSCT for AML/MDS relapse Y. Yerushalmi et al.
HR: hazard ratio; 95% CI: 95% confidence interval; HSCT: hematopoietic stem cell transplantation; MAC: myeloablative conditioning; GvHD: graft-versus-host disease.
mission with salvage chemotherapy prior to HSCT2 can still benefit from a second transplant, but this subgroup should be defined better in larger studies. With modern transplantation techniques, non-relapse mortality after HSCT2 is relatively acceptable. The current study, in line with other studies, has shown that the outcomes following post-transplant relapse and HSCT have improved in recent years.4,7 However, the major obstacle to cure remains a very high incidence of relapse, with a 2-year cumulative incidence of 50% in the current series. The chances of prolonged survival after a post-HSCT2 relapse are very low.31 Novel maintenance therapies and immune therapies need to be explored in an attempt to improve the survival.
In conclusion, relapse of AML or MDS following HSCT is associated with a relatively poor outcome. A second HSCT
References
1. Gooley TA, Chien JW, Pergam SA, et al. Reduced mortality after allogeneic hematopoietic-cell transplantation. N Engl J Med. 2010;363(22):2091-2101.
2. Shimoni A, Labopin M, Finke J, et al. Donor selection for a second allogeneic stem cell transplantation on AML patients relapsing after a first transplant: a study of the Acute Leukemia Working Party of EBMT. Blood Cancer J. 2019;9(12):88.
3. Bejanyan N, Weisdorf DJ, Logan BR, et al. Survival of patients with acute myeloid leukemia relapsing after allogeneic hematopoietic cell transplantation: a Center for International Blood and Marrow Transplant Research study. Biol Blood Marrow Transplant. 2015;21(3):454-459.
4. Bazarbachi A, Schmid C, Labopin M, et al. Evaluation of trends and prognosis over time in patients with AML relapsing after allogeneic hematopoietic cell transplant reveals improved survival for young patients in recent years. Clin Cancer Res. 2020;26(24):6475-6482.
5. Shem-Tov N, Saraceni F, Danylesko I, et al. Isolated extramedullary relapse of acute leukemia after allogeneic stem cell transplantation: different kinetics and better prognosis than systemic relapse. Biol Blood Marrow Transplant. 2017;23(7):1087-1094.
6. Schmid, C, Labopin M, Nagler A, et al. Treatment, risk factors, and outcome of adults with relapsed AML after reduced intensity conditioning for allogeneic stem cell transplantation. Blood. 2012;119(6):1599-1606.
7. Zuanelli Brambilla C, Lobaugh SM, Ruiz JD, et al. Relapse after allogeneic stem cell transplantation of acute myelogenous leukemia and myelodysplastic syndrome and the importance of second cellular therapy. Transplant Cell Ther. 2021;27(9):771.
8. Eapen, M, Giralt SA, Horowitz MM, et al. Second transplant for acute and chronic leukemia relapsing after first HLA-identical sibling transplant. Bone Marrow Transplant. 2004;34(8):721-727.
9. Shaw BE, Mufti GJ, Mackinnon S, et al. Outcome of second allogeneic transplants using reduced-intensity conditioning following relapse of hematological malignancy after an initial allogeneic transplant. Bone Marrow Transplant. 2008;42(12):783-789.
10. Orti G, Sanz J, Bermudez A, et al. Outcome of second allogeneic hematopoietic cell transplantation after relapse of myeloid malignancies following allogeneic hematopoietic cell
can be curative in a subset of patients, in particular those with longer remission after the first HSCT.
Disclosures
No conflicts of interest to disclose.
Contributions
YY and AS designed the study, analyzed the data and wrote the manuscript. NS, ID, JC, AA, RY, AN, and AS collected patients’ data. YY and AS performed the statistical analysis. All authors revised the manuscript and approved the last version.
Data-sharing statement
The data are available from the corresponding author upon reasonable request.
transplantation: a retrospective cohort on behalf of the Grupo Español de Trasplante Hematopoyetico. Biol Blood Marrow Transplant. 2016;22(3):584-588.
11. Christopeit M, Kuss O, Finke J, et al. Second allograft for hematologic relapse of acute leukemia after first allogeneic stem-cell transplantation from related and unrelated donors: the role of donor change. J Clin Oncol. 2013;31(26):3259-3271.
12. Yaniv I, Krauss AC, Beohou E, et al. Second hematopoietic stem cell transplantation for post-transplantation relapsed acute leukemia in children: a retrospective EBMT-PDWP study. Biol Blood Marrow Transplant. 2018;24(8):1629-1642.
13. Ruutu T, de Wreede LC, van Biezen A, et al. Second allogeneic transplantation for relapse of malignant disease: retrospective analysis of outcome and predictive factors by the EBMT. Bone Marrow Transplant. 2015;50(12):1542-1550.
14. Michallet M, Tanguy ML, Socié G, et al. Second allogeneic haematopoietic stem cell transplantation in relapsed acute and chronic leukaemias for patients who underwent a first allogeneic bone marrow transplantation: a survey of the Société Française de Greffe de Moelle (SFGM). Br J Haematol. 2000;108(2):400-407.
15. Kharfan-Dabaja MA, Labopin M, Polge E, et al. Association of second allogeneic hematopoietic cell transplant vs donor lymphocyte infusion with overall survival in patients with acute myeloid leukemia relapse. JAMA Oncol. 2018;4(9):1245-1253.
16. Vrhovac R, Labopin M, Ciceri F, et al. Second reduced intensity conditioning allogeneic transplant as a rescue strategy for acute leukaemia patients who relapse after an initial RIC allogeneic transplantation: analysis of risk factors and treatment outcomes. Bone Marrow Transplant. 2016;51(2):186-193.
17. Kedmi M, Resnick IB, Dray L, et al. A retrospective review of the outcome after second or subsequent allogeneic transplantation. Biol Blood Marrow Transplant. 2009;15(4):483-489.
18. Bacigalupo A, Ballen K, Rizzo D, et al. Defining the intensity of conditioning regimens: working definitions. Biol Blood Marrow Transplant. 2009;15(12):1628-1633.
19. Spyridonidis A, Labopin M, Savani BN, et al. Redefining and measuring transplant conditioning intensity in current era: a study in acute myeloid leukemia patients. Bone Marrow Transplant. 2020;55(6):1114-1125.
20. Przepiorka D, Weisdorf D, Martin P, et al. 1994 Consensus
Haematologica | 108 July 2023 1791 ARTICLE - Second HSCT for AML/MDS relapse Y. Yerushalmi et al.
Conference on acute GVHD grading. Bone Marrow Transplant. 1995;15(6):825-828.
21. Jagasia MH, Greinix HT, Arora M, et al. National Institutes of Health Consensus Development Project on criteria for clinical trials in chronic graft-versus-host disease: I. The 2014 Diagnosis and Staging Working Group report. Biol Blood Marrow Transplant. 2015;21(3):389-401.
22. Kaplan EL, Meier P. Nonparametric estimation from incomplete observations. J Am Stat Assoc. 1958;53(282):457-481.
23. Gooley TA, Leisenring W, Crowley J, Storer BE. Estimation of failure probabilities in the presence of competing risks: new representations of old estimators. Stat Med. 1999;18(6):695-706.
24. Döhner H, Estey E, Grimwade D, et al. Diagnosis and management of AML in adults: 2017 ELN recommendations from an international expert panel. Blood. 2017;129(4):424-447.
25. Thanarajasingam G, Kim HT, Cutler C, et al. Outcome and prognostic factors for patients who relapse after allogeneic hematopoietic stem cell transplantation. Biol Blood Marrow Transplant. 2013;19(12):1713-1718.
26. Abbi KK, Zhu J, Ehmann WC, et al. G-CSF mobilized vs conventional donor lymphocytes for therapy of relapse or incomplete engraftment after allogeneic hematopoietic transplantation. Bone Marrow Transplant. 2013;48(3):357-362.
27. Baron F, Labopin M, Niederwieser D, et al. Impact of graftversus-host disease after reduced-intensity conditioning allogeneic stem cell transplantation for acute myeloid leukemia: a report from the Acute Leukemia Working Party of the European Group for Blood and Marrow Transplantation. Leukemia. 2012;26(12):2462-2468.
28. Kharfan-Dabaja MA, Labopin M, Bazarbachi A, et al. Comparing outcomes of a second allogeneic hematopoietic cell transplant using HLA-matched unrelated versus T-cell replete haploidentical donors in relapsed acute lymphoblastic leukemia: a study of the Acute Leukemia Working Party of EBMT. Bone Marrow Transplant. 2021;56(9):2194-2202.
29. Vago L, Perna SK, Zanussi M, et al. Loss of mismatched HLA in leukemia after stem-cell transplantation. N Engl J Med. 2009;361(5):478-488.
30. Shimoni A, Labopin M, Savani B, et al. Intravenous busulfan compared with treosulfan-based conditioning for allogeneic stem cell transplantation in acute myeloid leukemia: a study on behalf of the Acute Leukemia Working Party of European Society for Blood and Marrow Transplantation. Biol Blood Marrow Transplant. 2018;24(4):751-757.
31. Shimoni A. Relapse of acute leukemia after a second allogeneic stem-cell transplantation; is there any hope for cure? Bone Marrow Transplant. 2022;57(3):336-337.
Haematologica | 108 July 2023 1792 ARTICLE - Second HSCT for AML/MDS relapse Y. Yerushalmi et al.
Results from a phase I/II trial of cusatuzumab combined with azacitidine in patients with newly diagnosed acute myeloid leukemia who are ineligible
for intensive chemotherapy
Thomas Pabst,1 Norbert Vey,2 Lionel Adès,3 Ulrike Bacher,4 Mario Bargetzi,5 Samson Fung,6 Gianluca Gaidano,7 Domenica Gandini,8 Anna Hultberg,8 Amy Johnson,9 Xuewen Ma,9 Rouven Müller,10 Kerri Nottage,11 Cristina Papayannidis,12 Christian Recher,13 Carsten Riether,14 Priya Shah,15 Jeffrey Tryon,11° Liang Xiu11 and Adrian F. Ochsenbein14
1Department of Medical Oncology, University Hospital, Inselspital and University of Bern, Bern, Switzerland; 2Hématologie Clinique, Institut Paoli-Calmettes, Marseille, France; 3Hôpital Saint-Louis, Assistance Publique-Hôpitaux de Paris and Université Paris Cité, and Centre d’Investigation Clinique (INSERM CIC 1427), Paris, France; 4Department of Hematology and Central Hematology Laboratory, Inselspital, Bern University Hospital, University of Bern, Bern, Switzerland; 5Division of Hematology and Transfusion Medicine, Kantonsspital Aarau, Aarau, Switzerland; 6Fung Consulting Healthcare and Life Sciences, Eching, Germany; 7Division of Hematology, Department of Translational Medicine, University of Eastern Piedmont and Maggiore Hospital, Novara, Italy; 8argenx, Ghent, Belgium; 9Janssen Research & Development, Spring House, PA, USA; 10Department of Medical Oncology and Hematology, University Hospital Zurich, Zurich, Switzerland; 11Janssen Research & Development, Raritan, NJ, USA; 12IRCCS, Azienda Ospedaliero Universitaria di Bologna, Istituto di Ematologia “L e A Seràgnoli”, Bologna, Italy; 13Centre Hospitalier Universitaire de Toulouse, Institut Universitaire du Cancer de Toulouse Oncopole, Service d'Hématologie, Toulouse, France and Université Toulouse III Paul Sabatier, Toulouse, France; 14Department of Medical Oncology, Inselspital, Bern University Hospital, University of Bern, Bern, Switzerland and Department of BioMedical Research (DBMR), University of Bern, Bern, Switzerland and 15Janssen Research & Development, High Wycombe, Buckinghamshire, UK
°Retired.
Abstract
Correspondence: T. Pabst
Thomas.Pabst@insel.ch
Received: June 10, 2022.
Accepted: January 27, 2023.

Early view: February 9, 2023.
https://doi.org/10.3324/haematol.2022.281563
Published under a CC BY license
Cusatuzumab is a high-affinity, anti-CD70 monoclonal antibody under investigation in acute myeloid leukemia (AML). This two-part, open-label, multicenter, phase I/II trial evaluated cusatuzumab plus azacitidine in patients with newly diagnosed AML ineligible for intensive chemotherapy. Patients received a single dose of cusatuzumab at one of four dose levels (1, 3, 10, or 20 mg/kg) 14 days before starting combination therapy. In phase I dose escalation, cusatuzumab was then administered on days 3 and 17, in combination with azacitidine (75 mg/m2) on days 1-7, every 28 days. The primary objective in phase I was to determine the recommended phase II dose (RP2D) of cusatuzumab plus azacitidine. The primary objective in phase II was efficacy at the RP2D (selected as 10 mg/kg). Thirty-eight patients were enrolled: 12 in phase I (three per dose level; four with European LeukemiaNet 2017 adverse risk) and 26 in phase II (21 with adverse risk). An objective response (≥partial remission) was achieved by 19/38 patients (including 8/26 in phase II); 14/38 achieved complete remission. Eleven patients (37.9%) achieved an objective response among the 29 patients in phase I and phase II treated at the RP2D. At a median follow-up of 10.9 months, median duration of fi rst response was 4.5 months and median overall survival was 11.5 months. The most common treatment-emergent adverse events were infections (84.2%) and hematologic toxicities (78.9%). Seven patients (18.4%) reported infusion-related reactions, including two with grade 3 events. Thus, cusatuzumab/azacitidine appears generally well tolerated and shows preliminary effi cacy in this setting. Investigation of cusatuzumab combined with current standard-of-care therapy, comprising venetoclax and azacitidine, is ongoing.
Haematologica | 108 July 2023 1793 ARTICLE - Acute Myeloid Leukemia
Introduction
Intensive induction and consolidation chemotherapy with curative intent is recommended for patients with newly diagnosed acute myeloid leukemia (AML), provided they demonstrate adequate drug tolerance.1 For patients unsuitable for intensive chemotherapy, standard of care is evolving. Hypomethylating agents (HMA), such as azacitidine and decitabine, have been central to treatment for several years.1-4 However, since the start of this phase I/II trial, other agents have been studied in combination with HMA, and recent data have established venetoclax plus an HMA as a new standard of care in this setting.5 Despite this changing landscape, overall survival (OS) is <15 months with venetoclax/azacitidine, and even in the subgroup of responding patients, median duration of response is <18 months,5 indicating a need for more effective therapies. Acute myeloid leukemia is driven by leukemic stem cells (LSC) that have a key role in initiating and sustaining malignancy.6 LSC also have a capacity for self-renewal and their persistence is believed to be the primary cause of relapse in AML.7-9 Selective elimination of LSC, without affecting normal hematopoiesis, is challenging owing to the greater resistance of LSC to conventional chemotherapy compared with more differentiated AML blasts.10,11 CD70, a tumor necrosis factor receptor ligand, is a very promising target due to its consistent expression on LSC and AML blasts.12,13 In AML, the binding of CD70 to its receptor, CD27, on LSC and subsequent downstream signaling activates gene-expression profiles that promote LSC proliferation, reduce differentiation, and lead to release of soluble CD27 (sCD27).12,13 Serum sCD27 levels are increased in patients with newly diagnosed AML,12,13 and are a strong, independent negative predictor of cancer prognosis.12
Cusatuzumab (ARGX-110) is a high-affinity, anti-CD70 monoclonal antibody that blocks CD70/CD27 signaling, leading to inhibition of LSC proliferation, a reduction in leukemic blast cells, blockade of regulatory T-cell survival (preventing tumor immune escape), and restoration of normal myeloid differentiation.12-15 It also exerts direct Fc-mediated, effector functions via enhanced antibody-dependent cellular cytotoxicity (modified using POTELLIGENT® Technology), complement-dependent cytotoxicity, and antibody-dependent cellular phagocytosis, leading to apoptosis of leukemic cells and blasts.13,14
Treatment with HMA upregulates CD70 expression on LSC isolated from patients with newly diagnosed AML, and combined anti-CD70 and HMA treatment can synergistically decrease LSC to a greater extent than blocking CD70 alone.13 Hence, there is a rationale for studying cusatuzumab in combination with an HMA.
First-in-human studies have shown that single-agent cusatuzumab is well tolerated and is biologically active in patients with advanced solid tumors or hematologic
malignancies, including AML.16,17 Promising early responses and pharmacodynamic activity at all cusatuzumab doses were demonstrated in interim data from a two-part, phase I/II dose-escalation and expansion study undertaken to investigate the potential of cusatuzumab in combination with azacitidine for the treatment of newly diagnosed patients with AML who were not candidates for intensive chemotherapy.13 Treatment was also well tolerated without reaching a maximum tolerated dose. This work builds on the interim data from the same study, reporting results for the entire study population, including the phase II expansion.
Methods
Study design
This was an open-label, multicenter, non-randomized, dose-escalation (phase I) and expansion (phase II) study. Phase I employed a 3+3 design with dose increments based on a modified Fibonacci scheme. Phase I enrolled patients in four sequential dose cohorts (1, 3, 10, 20 mg/kg). In each cohort, patients received a single intravenous (IV) dose of cusatuzumab on day -14 followed by combination therapy, comprising IV cusatuzumab on days 3 and 17 plus azacitidine 75 mg/m2 subcutaneously or IV on days 1-7, every 28 days. To mitigate infusion-related reactions (IRR), all patients were premedicated with acetaminophen, an antihistamine, and an IV glucocorticoid prior to cusatuzumab infusion. The first patient in each cohort was monitored until cycle 1 day 7; if no dose-limiting toxicities (DLT) occurred (Online Supplementary Appendix), further patients were enrolled in the cohort. Subsequent cohorts were opened upon approval from the Data Safety Monitoring Board. Phase II patients received cusatuzumab at the recommended phase II dose (RP2D) from phase I plus azacitidine at the same dose/schedule as phase I. Patients were treated for as long as they derived clinical benefit or until disease progression, unacceptable toxicity, death, withdrawal, or loss to follow-up.
The study was carried out in accordance with the principles of the Declaration of Helsinki, Good Clinical Practice guidelines, and regulatory and country-specific requirements, and is registered with clinicaltrials.gov (NCT03030612). The protocol was approved by an independent ethics committee/review board. Patients gave written informed consent.
Eligibility
Adults (≥18 years) with newly diagnosed AML (defined by a blast count of ≥20%), unsuitable for intensive chemotherapy, were enrolled. Additional eligibility criteria included an expected life expectancy of ≥3 months and Eastern Cooperative Oncology Group (ECOG) performance status of 0-2. Patients with any prior chemotherapy/radiotherapy for AML
Haematologica | 108 July 2023 1794 ARTICLE - Phase I/II trial of cusatuzumab/azacitidine in AML T. Pabst et al.
(except hydroxyurea/hydroxycarbamide, which had to be discontinued prior to the first day of azacitidine administration) were excluded. Full eligibility criteria are listed in the Online Supplementary Appendix.
Endpoints and assessments
In phase I, the primary endpoint was incidence of DLT at each dose of cusatuzumab plus standard dose azacitidine (to inform RP2D). In phase II, the primary endpoint was overall response rate (ORR), defined as complete remission (CR) plus CR with incomplete recovery (CRi) plus morphologic leukemia-free state plus partial remission at cusatuzumab dose established in phase I plus standard dose azacitidine. Secondary endpoints in both parts included: treatment-emergent adverse events (TEAE); pharmacokinetics and immunogenicity of cusatuzumab in peripheral blood; minimal residual disease evaluation by multiparameter flow cytometry performed in one of two laboratories (see Online Supplementary Appendix); time to, level, and duration of response; OS; 30/60-day mortality; and transfusion independence. Pharmacodynamic markers were also assessed (see Online Supplementary Appendix). Response evaluation by investigators was based on established criteria (Online Supplementary Table S1). Safety and tolerability were assessed throughout; evaluations included TEAE (graded using National Cancer Institute-Common Terminology Criteria for Adverse Events; NCI-CTCAE, version 4.03), laboratory parameters, electrocardiogram, vital signs, physical examinations, and ECOG performance status (Online Supplementary Appendix).
Statistical analysis
Using Simon’s two-stage design with a target ORR of 50% versus 25%, 5% type 1 error, and 20% type 2 error, 24 patients were needed in phase II for 80% power. The null hypothesis was to be rejected if the ORR was >37.5% (>9/24 responses). Analyses of the primary endpoint were performed on the full analysis set (patients who received an infusion of any study drug), as well as a combination therapy analysis set (patients from phase I and phase II who received cusatuzumab at the RP2D and azacitidine). Statistical inference according to the Simon’s design was based on the full analysis set as well as the combination therapy analysis set. Time-to-event data were analyzed by KaplanMeier methods.
Results
Patients' cohorts, treatment and response
Between January 2017 and February 2019, 38 patients were enrolled at eight sites across Switzerland, France, and Italy, and treated in the phase I dose escalation (n=12) or phase II expansion (n=26). The dataset used for this analysis
includes extended follow-up for 12 phase I patients treated at the 1, 3, 10, and 20 mg/kg dose levels (three per cohort) and 26 phase II patients treated at the RP2D of 10 mg/kg. The data cut-off for this analysis was July 1, 2020.
Treatment was discontinued in 34 out of 38 patients (89.5%): 2/3 patients at 1 mg/kg, 3/3 at 3 mg/kg, 26/29 at 10 mg/kg, and 3/3 at 20 mg/kg. Reasons for treatment discontinuation were: progressive disease (n=17, 50%), adverse event (AE) (n=6, 17.6%), death (n=6, 17.6%), investigator decision (n=2, 5.9%), protocol deviation (n=1, 2.9%), withdrawal of consent (n=1, 2.9%), and other (n=1, 2.9%; patient wished to proceed to allogeneic transplant).
Recommended phase II dose
The 10 mg/kg dose level of cusatuzumab was selected as the RP2D based on a prespecified interim analysis of phase I data for the 1-10 mg/kg dose cohorts in April 2018. No DLT were observed in any of these dose cohorts and the maximum tolerated dose was not reached. At the time of the interim analysis, data for the DLT period were incomplete for two out of three patients in the phase I 20 mg/kg dose cohort. None of the three patients treated at 20 mg/kg went on to experience DLT.
Patients' baseline characteristics
Baseline demographics and disease characteristics are shown in Table 1. Across all patients, median age was 75 years (range, 59-90), 50% of patients were female, 7.9% had an ECOG performance status of 2, 34.2% had secondary AML, and 65.8% had adverse genetic risk per European LeukemiaNet (ELN) 2017 criteria3 (with risk categories assigned post hoc by an independent reviewer). Median time from diagnosis to treatment was 14.5 days (range, 3-139).
Efficacy
Response data are presented in Table 2 and Figure 1. An objective response was achieved by 19/38 patients in the full analysis set (both study phases combined), for an ORR of 50% (95% confidence interval [95%CI]: 33.4-66.6). All responding patients achieved CR or CRi (no partial remission or morphologic leukemia-free state): 14 (36.8%) with CR and five (13.2%) with CRi. In phase II, 8/26 patients responded to treatment at 10 mg/kg (ORR, 30.8%; 95%CI: 14.3-51.8), including five with CR (19.2%) and three with CRi (11.5%). A response of CR/CRi was achieved by 4/4 patients with favorable ELN risk status, 7/9 with intermediate status, and 8/25 with adverse status (Online Supplementary Table S2). Of the 19 patients with a best response of CR/CRi, six (31.6%) achieved minimal residual disease negativity.
Among patients in phase I and phase II receiving cusatuzumab 10 mg/kg, 11/29 (37.9%) achieved an objective response in the full analysis set. Two of these patients were classified as non-evaluable because they died in the
Haematologica | 108 July 2023 1795 ARTICLE - Phase I/II trial of cusatuzumab/azacitidine in AML T. Pabst et al.
AML: acute myeloid leukemia; ECOG: Eastern Cooperative Oncology Group; ELN: European LeukemiaNet.
CI: confidence interval; CR: complete remission; CRi: complete remission with incomplete recovery; MLFS: morphologic leukemia-free state; NE: not evaluable; ORR: overall response rate; PR: partial remission; SD: stable disease. aExcluding 2 patients who did not receive azacitidine and died before first post-treatment disease assessment. bOverall response includes patients with a response of CR, CRi, MLFS, or PR. c Treatment failure responses were categorized as SD.
interval after their first dose of cusatuzumab and did not receive either azacitidine nor their first post-treatment assessment on cycle 1 day 1; these deaths were unrelated to
cusatuzumab. Excluding these two patients resulted in the combination therapy analysis set and an objective response rate of 11/27 (40.7%). While the total number of patients in
Phase I Phase II Phase I+II Total (N=38) 1 mg/kg (N=3) 3 mg/kg (N=3) 10 mg/kg (N=3) 20 mg/kg (N=3) All doses (N=12) 10 mg/kg (N=26) 10 mg/kg (N=29) 10 mg/kg (N=27)a ORR,b N (%) [95%CI] 3 (100) [29.2-100] 2 (66.7) [9.4-99.2] 3 (100) [29.2-100] 3 (100) [29.2-100] 11 (91.7) [61.5-99.8] 8 (30.8) [14.3-51.8] 11 (37.9) [20.7-57.7] 11 (40.7) [22.4-61.2] 19 (50) [33.4-66.6] Response category, N (%) CR CRi MLFS PR SDc NE 2 (66.7) 1 (33.3) 0 0 0 0 2 (66.7) 0 0 0 1 (33.3) 0 2 (66.7) 1 (33.3) 0 0 0 0 3 (100) 0 0 0 0 0 9 (75) 2 (16.7) 0 0 1 (8.3) 0 5 (19.2) 3 (11.5) 0 0 16 (61.5) 2 (7.7) 7 (24.1) 4 (13.8) 0 0 16 (55.2) 2 (6.9) 7 (25.9) 4 (14.8) 0 0 16 (59.3) 0 14 (36.8) 5 (13.2) 0 0 17 (44.7) 2 (5.3)
Table 2. Best response to cusatuzumab plus azacitidine.
Characteristic Phase I Phase II Total (N=38) 1 mg/kg (N=3) 3 mg/kg (N=3) 10 mg/kg (N=3) 20 mg/kg (N=3) All doses (N=12) 10 mg/kg (N=26) Age in years, median (range) 77.0 (75-81) 71.0 (71-84) 74.0 (64-75) 76.0 (72-77) 75.0 (64-84) 75.5 (59-90) 75.0 (59-90) Sex, N (%) Female Male 1 (33.3) 2 (66.7) 2 (66.7) 1 (33.3) 1 (33.3) 2 (66.7) 1 (33.3) 2 (66.7) 5 (41.7) 7 (58.3) 14 (53.8) 12 (46.2) 19 (50) 19 (50) Race, N (%) White Not reported 3 (100) 0 3 (100) 0 3 (100) 0 3 (100) 0 12 (100) 0 19 (73.1) 7 (26.9) 31 (81.6) 7 (18.4) ECOG performance status, N (%) 0 1 2 1 (33.3) 2 (66.7) 0 3 (100) 0 0 0 3 (100) 0 0 3 (100) 0 4 (33.3) 8 (66.7) 0 9 (34.6) 14 (53.8) 3 (11.5) 13 (34.2) 22 (57.9) 3 (7.9) AML type, N (%) De novo Secondary 0 3 (100) 1 (33.3) 2 (66.7) 3 (100) 0 2 (66.7) 1 (33.3) 6 (50) 6 (50) 19 (73.1) 7 (26.9) 25 (65.8) 13 (34.2) Genetic risk category per ELN 2017 criteria, N (%) Favorable Intermediate Adverse 0 2 (66.7) 1 (33.3) 1 (33.3) 2 (66.7) 0 0 2 (66.7) 1 (33.3) 1 (33.3) 0 2 (66.7) 2 (16.7) 6 (50) 4 (33.3) 2 (7.7) 3 (11.5) 21 (80.8) 4 (10.5) 9 (23.7) 25 (65.8) Time from diagnosis to treatment, days, median (range) 28.0 (3-64) 29.0 (13-69) 8.0 (3-17) 30.0 (6-47) 22.5 (3-69) 13.5 (6-139) 14.5 (3-139) Haematologica | 108 July 2023 1796 ARTICLE - Phase I/II trial of cusatuzumab/azacitidine in AML T. Pabst et al.
Table 1. Patients' demographics and baseline characteristics.
these analyses deviates from the original Simon’s design of 24, ad hoc Simon’s criteria based on the same design parameters calls for rejecting the null hypothesis if ORR is ≥12/29 or ≥11/27. The null hypothesis is not rejected in the full analysis set but is rejected in the combination therapy analysis set.
For the full analysis set, at a median follow-up of 10.6 months (range, 0.3-38.2), median time to first response was 3.2 months (range, 0.5-12.4) and median duration of first response was 4.5 months (range, 0.02-33.7). Median OS was 11.5 months (95%CI: 7.3-17.1), with a 12-month OS rate of 49%.
Independence from red blood cell (RBC) and platelet (PLT) transfusion (defined as reaching ≥8 consecutive weeks without a transfusion from administration of the first dose of study drug) was observed in 24 patients (63.2%).
Twenty-four patients (63.2%) achieved RBC transfusion independence and 29 (76.3%) obtained PLT transfusion independence. Median duration of RBC/PLT independence was 13.0 months (range, 2.0-37.9).
Safety and tolerability
Median duration of study treatment was 5.8 months (range, 0-37.9) and a median of six cycles were administered (range, 1-40).
All 38 patients had ≥1 TEAE and all experienced a grade ≥3 TEAE (Table 3). The most common TEAE were febrile neutropenia and neutropenia (n=15 each, 39.5%), followed by anemia, thrombocytopenia, pneumonia, and pyrexia (n=14 each, 36.8%). After pneumonia, the next most frequent infectious TEAE were sepsis (n=11, 28.9%) and urinary tract infection (n=4, 10.5%). Thirty-two patients (84.2%) had a
responses and outcomes in patients with newly diagnosed acute myeloid leukemia treated with cusatuzumab plus azacitidine (total study population, N=38). Timing of death is not included. Adv: adverse; AE: adverse event; CR: complete remission; CRi: complete remission with incomplete recovery; EOS: end of study; EOT: end of treatment; Fav: favorable; ID: investigator decision; Int: intermediate; MLFS: morphologic leukemia-free state; MRD: minimal residual disease; NE: not evaluable; PD: progressive disease; PR: partial remission; SD: stable disease.
Figure 1.

Haematologica | 108 July 2023 1797 ARTICLE - Phase I/II trial of cusatuzumab/azacitidine in AML T. Pabst et al.
Swimmer plot illustrating
serious TEAE which led to hospitalization in all but one of these patients (Table 3). The most common serious TEAE were febrile neutropenia (n=13, 34.2%), sepsis (n=11, 28.9%), and pneumonia (n=10, 26.3%) (Online Supplementary Table S3). TEAE leading to discontinuation of any study agent were reported in eight patients (21.1%; n=6 at 10 mg/kg, and n=1 each at 3 and 20 mg/kg) and included anal abscess,
diverticulitis, pneumonia, general deterioration in physical health, multiple organ dysfunction syndrome, cardiac failure, hypopituitarism, enterocolitis, and hypertension (all n=1). There were 10 fatal TEAE (26.3%; eight at 10 mg/kg and two at 20 mg/kg); none were considered drug-related. TEAE leading to death were: multiple organ dysfunction syndrome (n=3), general deterioration in physical health
Gr: grade. a Treatment-emergent adverse events (TEAE) are defined as AE with onset or worsening on or after the date of the first dose of study treatment up to and including 30 days after date of last dose of study medication. b TEAE are listed in decreasing frequency of anygrade TEAE in the total study population (N=38). c Pneumonia includes the following preferred terms: pneumonia, bacterial pneumonia, and fungal pneumonia. dSepsis includes the following preferred terms: Enterobacter sepsis,
sepsis,
septic shock, and Staphylococcal bacteremia.
Patients with ≥1 TEAE,a N (%) Dose group Total (N=38) 1 mg/kg (N=3) 3 mg/kg (N=3) 10 mg/kg (N=29) 20 mg/kg (N=3) Any TEAE, N (%) Grade ≥3 Drug-related 3 (100) 3 (100) 3 (100) 3 (100) 3 (100) 3 (100) 29 (100) 29 (100) 27 (93.1) 3 (100) 3 (100) 3 (100) 38 (100) 38 (100) 36 (94.7) Serious TEAE, N (%) Grade ≥3 Leading to hospitalization 3 (100) 3 (100) 3 (100) 3 (100) 3 (100) 3 (100) 24 (82.8) 24 (82.8) 23 (79.3) 2 (66.7) 2 (66.7) 2 (66.7) 32 (84.2) 32 (84.2) 31 (81.6) TEAE leading to any study drug discontinuation, N (%) 0 1 (33.3) 6 (20.7) 1 (33.3) 8 (21.1) TEAE leading to death, N (%) Drug-related 0 0 0 0 8 (27.6) 0 2 (66.7) 0 10 (26.3) 0 Most common TEAE (≥15% of all patients),b N (%) All Gr ≥3 All Gr ≥3 All Gr ≥3 All Gr ≥3 All Gr ≥3 Febrile neutropenia 2 (66.7) 2 (66.7) 1 (33.3) 1 (33.3) 10 (34.5) 10 (34.5) 2 (66.7) 2 (66.7) 15 (39.5) 15 (39.5) Neutropenia 1 (33.3) 1 (33.3) 3 (100) 3 (100) 9 (31) 9 (31) 2 (66.7) 2 (66.7) 15 (39.5) 15 (39.5) Anemia 1 (33.3) 1 (33.3) 3 (100) 3 (100) 10 (34.5) 10 (34.5) 0 0 14 (36.8) 14 (36.8) Thrombocytopenia 2 (66.7) 2 (66.7) 3 (100) 3 (100) 7 (24.1) 7 (24.1) 2 (66.7) 1 (33.3) 14 (36.8) 13 (34.2) Pneumoniac 2 (66.7) 1 (33.3) 0 0 10 (34.5) 6 (20.7) 2 (66.7) 2 (66.7) 14 (36.8) 9 (23.7) Pyrexia 2 (66.7) 0 2 (66.7) 1 (33.3) 9 (31.0) 0 1 (33.3) 0 14 (36.8) 1 (2.6) Constipation 1 (33.3) 0 1 (33.3) 1 (33.3) 7 (24.1) 0 2 (66.7) 0 11 (28.9) 1 (2.6) Nausea 1 (33.3) 0 0 0 9 (31.0) 0 1 (33.3) 0 11 (28.9) 0 Sepsisd 0 0 0 0 10 (34.5) 10 (34.5) 1 (33.3) 1 (33.3) 11 (28.9) 11 (28.9) Vomiting 0 0 2 (66.7) 0 5 (17.2) 0 2 (66.7) 0 9 (23.7) 0 Leukopenia 2 (66.7) 2 (66.7) 2 (66.7) 1 (33.3) 2 (6.9) 2 (6.9) 1 (33.3) 0 7 (18.4) 5 (13.2) Diarrhea 0 0 0 0 4 (13.8) 0 3 (100) 1 (33.3) 7 (18.4) 1 (2.6) Chills 1 (33.3) 0 1 (33.3) 0 4 (13.8) 1 (3.4) 0 0 6 (15.8) 1 (2.6) Cough 1 (33.3) 0 2 (66.7) 0 3 (10.3) 0 0 0 6 (15.8) 0 Hypokalemia 0 0 1 (33.3) 1 (33.3) 5 (17.2) 0 0 0 6 (15.8) 1 (2.6)
Table 3. Summary of treatment-emergent adverse events following treatment with cusatuzumab plus azacitidine.
Escherichia
pseudomonal bacteremia,
Haematologica | 108 July 2023 1798 ARTICLE - Phase I/II trial of cusatuzumab/azacitidine in AML T. Pabst et al.
sepsis,
(n=2), and pneumonia, sepsis, acute coronary syndrome, large intestine perforation, and respiratory failure (n=1 each).
Seven patients (18.4%) reported IRR, of which chills (n=5, 13.2%) and pyrexia (n=2, 5.3%) were the most common. Two grade 3 IRR (5.3%; chills n=1 and hypertension n=1) were observed; the hypertension event led to treatment discontinuation. There were no IRR observed in the 20 mg/kg cohort.
Two deaths (5.3%; both due to an AE) occurred within 30 days. Four (10.5%) deaths occurred within 60 days of first treatment with cusatuzumab, all in the phase II 10 mg/kg cohort: three due to an AE (n=2 multiple organ dysfunction syndrome, n=1 pneumonia), one due to other reasons (assisted-suicide).
Pharmacokinetics and pharmacodynamics
In phase I, after IV administration of the monotherapy dose (on day -14) or second dose (on cycle 1 day 3, postazacitidine) of cusatuzumab, mean maximum serum concentration (Cmax) and mean area under the serum concentration-time curve from time 0 to 14 days (AUC14d) increased with increasing doses (Online Supplementary Table S4). Mean serum half-life (t1/2) ranged from 6.1 to 10.4 days across the four dose cohorts in phase I. There was no obvious change in dose-normalized parameters with increasing dose, suggesting exposure increased in an approximately dose-proportional manner over the dose range 1-20 mg/kg. In phase II, after IV administration of the 10 mg/kg monotherapy dose of cusatuzumab, mean C max was 195 mg/mL; AUC14d was 32,932 mg.h/mL, and t1/2 was 11.1 days. After administration of the second dose on cycle 1 day 3, mean Cmax was 233 m g/mL; AUC14d was 38,298 mg.h/mL, and t1/2 was 8.3 days. There was a lower median percentage bone marrow blast count from baseline (screening) to cycle 1 day 1, i.e., following the single monotherapy dose of cusatuzumab, and prior to the first dose of azacitidine and second dose of cusatuzumab (Online Supplementary Figure S1). Analysis of pharmacodynamic markers showed most patients exhibited the biggest decrease in sCD27 levels after the initial cusatuzumab monotherapy dose (Online Supplementary Figure S2). Finally, expression of CD70 on the blasts was confirmed by flow cytometry but could not be associated with clinical response (Online Supplementary Figure S3).
Immunogenicity
Among 36 cusatuzumab-treated patients with evaluable samples, 11 (30.6%) tested positive for antibodies to cusatuzumab post dose: 10/11 patients had antibodies first detected in cycle 1; one of 11 patients had antibodies first detected in cycle 3. One of four patients with a positive sample at baseline became positive for treatment-boosted antidrug antibodies. The small sample size means that no
conclusions as to how cusatuzumab concentration affects immunogenicity can be reached.
Discussion
This study assessed the feasibility of combining the antiCD70 monoclonal antibody, cusatuzumab, with standarddose azacitidine in patients with newly diagnosed AML who were ineligible to receive intensive chemotherapy due to advanced age, comorbidities, and/or a poor performance status. Building on the interim results of the phase I doseescalation period of this study,13 we found that half of the 38 patients (50%) treated with cusatuzumab/azacitidine achieved an objective response (CR or CRi). For the full analysis set of all patients who received the cusatuzumab 10 mg/kg treatment from phase I and phase II (n=29), the null hypothesis is not rejected; it is, however, rejected in the combination therapy analysis set (n=27) after excluding two patients who died before receiving combination therapy. It should be noted that after the data lock for this study, another patient who had been treated with cusatuzumab 10 mg/kg had a confirmed CRi, which would allow for the null hypothesis to be rejected for both the full analysis and combination therapy sets.
While these responses clearly demonstrate the clinical activity of the combination, response rates in the phase II part were lower than those reported in the initial phase I interim analysis, where high response rates were reported.13 The apparent discrepancy between the phase I interim data and final combined results may be explained, at least in part, by the small number of patients in the two phases of the study and by differences in baseline characteristics, particularly the prevalence of adverse genetic risk per ELN criteria (33.3% in phase I vs. 80.8% in phase II), with higher response rates among favorable- and intermediate-risk patients (11/13 for favorable/intermediate risk compared with 8/25 for adverse risk). Despite the lower than anticipated response rates, durable CR were observed in a number of patients at all dose levels, including at the 10 mg/kg dose of cusatuzumab selected for expansion, and almost twothirds of patients (63.2%) achieved transfusion independence, which is a strong prognostic factor in unfit patients with AML.18 Responses were also observed in each ELN 2017 genetic risk group (a good predictor of prognosis in newly diagnosed AML3,19), indicating the feasibility of the combination for all patients, including those with adverse risk profiles. Notably, the median OS of 11.5 months compares favorably with a recent real-world report for azacitidine alone (7.1 months),20 suggesting that the cusatuzumab/azacitidine combination is worthy of further study.
Cusatuzumab combined with azacitidine was generally well tolerated, with most TEAE consistent with those expected for an AML population undergoing treatment with azaciti-
Haematologica | 108 July 2023 1799 ARTICLE - Phase I/II trial of cusatuzumab/azacitidine in AML T. Pabst et al.
dine,4,21 and there was no obvious dose dependency for toxicities. The most common TEAE were infections and hematologic toxicities, which were generally manageable. IRR, a common side effect of many monoclonal antibodies used to treat hematologic malignancies,22-24 were the only notable addition to the AE profile. These reactions were usually mild or moderate in intensity and were generally managed successfully by interrupting the cusatuzumab infusion, providing specific treatment for the symptom manifested, and restarting the infusion at a reduced rate. Formation of antidrug antibodies have previously been shown to contribute to loss of efficacy;25 however, the clinical impact of the antidrug antibodies observed in this cohort remains uncertain since neutralizing assays were not performed. The pharmacodynamic data were consistent with previous assessments for cusatuzumab and support its mechanism of action to reduce AML blasts and decrease serum sCD27 levels.12-14,16 CD70 expression could be detected on baseline peripheral blood blasts but could not be identified as a predictor of response to cusatuzumab/azacitidine in patients with newly diagnosed AML as observed for other immune-related molecules.26,27 These data suggest that CD70 expression is not a limiting factor for the efficacy of cusatuzumab treatment. In addition, it has
been shown that HMA treatment upregulates CD70.13
The pharmacokinetic evaluations also supported other prior investigations16,17 and showed that cusatuzumab exposure increases in an approximately dose-proportional manner following treatment over the dosing interval 1-20 mg/kg. This approximate dose-proportional increase in systemic exposure, combined with the (limited) response and safety data seen at the 20 mg/kg dose level, provides a rationale for further investigating the higher dose of cusatuzumab. Though the cohort was small, all three patients treated at 20 mg/kg, including two with adverse genetic risk per ELN, achieved CR without evidence of disease progression after >1 year of therapy. There were also no indications of additional toxicity. As these data only became available after the RP2D of 10 mg/kg had been selected, the optimal dose of cusatuzumab for further study remains uncertain. Consequently, the ongoing randomized, phase II, CULMINATE trial is evaluating the efficacy and safety of the 10 and 20 mg/kg doses of cusatuzumab combined with azacitidine in a similar AML study population.28 The clinical potential of cusatuzumab is also being investigated in combination with the new standard of care, venetoclax, with or without azacitidine (clinicaltrials.gov NCT04150887). This latter trial is informed by preclinical data showing that cusatuzumab works synergistically with both azacitidine and venetoclax to eliminate primary human AML LSC.29 In conclusion, our findings suggest that the combination of cusatuzumab and azacitidine is generally well tolerated and may be efficacious in patients with previously untreated AML not eligible for intensive chemotherapy.
Studies are ongoing to establish the optimal dose level of cusatuzumab (10 vs. 20 mg/kg) plus azacitidine and assess the feasibility of combining cusatuzumab with venetoclax, with or without azacitidine.
Disclosures
LX is a Janssen employee. NV has received consulting fees from Janssen, and payment or honoraria from argenx. MB has received support for the present manuscript (study materials and patient fee) from Janssen. SF has received support for the present manuscript (consultancy fees, travel expenses) from argenx BV; consulting fees from BristolMyers Squibb GmbH & Co. KGaA, Molecular Partners AG (plus travel expenses), InhaTarget Therapeutics, Takeda Pharma AG, Polyphor Ltd., Synteract GmbH, Affimed GmbH (plus travel expenses), Incyte GmbH, IOME BIO SA (no payment), OM Pharma SA, Kiadis Pharma NV (plus travel expenses), ISA Pharma NV (plus travel expenses), Pharmalog GmbH, Novateur Inc., Nagel & Partners Ltd.; honoraria for lectures from BioM Biotech Cluster Development GmbH; support for attending meetings from argenx BV (travel expenses); patents: argenx BV (named inventor on several patents); participation on a Data Safety Monitoring Board or Advisory Board from RHEACELL GmbH – DSMB (Honorarium), selectION Therapeutics GmbH (no payment), Immutep Ltd – Ad Board (Honorarium, travel expenses), Simbec-Orion – Ad Board (no payment). GG has received grants or contracts from argenx (payment to institution), Janssen (payment to institution and personal fees). DG is an argenx employee; participation on a Data Safety Monitoring Board or Advisory Board for argenx; has stock or stock options with argenx. AH is an argenx employee; patents: argenx; stock or stock options: argenx. AJ has stock or stock options from Johnson & Johnson (employee), Vincerx Pharma (employee). XM is a Janssen employee. RM has received consulting fees from GlaxoSmithKline; payment or honoraria from AbbVie; support for attending meetings and/or travel expenses from Amgen, Janssen; participation on a Data Safety Monitoring Board or Advisory Board from Novartis, Takeda, Celgene/BMS, Janssen, AbbVie, Amgen, Sanofi, Sandoz, Jazz Pharmaceuticals. KN is a Janssen employee and stock holder. CP received payment or honoraria from Amgen, Novartis, Pfizer, AbbVie, Astellas, Janssen. CRe has received grants or contracts (payments to institution) from AbbVie, Amgen, Astellas, Celgene BMS, Jazz Pharmaceuticals, Agios, Daiichi-Sankyo, MaaT Pharma, Novartis; consulting fees: AbbVie, Amgen, Astellas, Celgene BMS, Jazz Pharmaceuticals, Agios, Daiichi-Sankyo, Incyte, MacroGenics, Janssen, Novartis, Otsuka, Takeda; payment or honoraria from AbbVie, Astellas, Celgene BMS , Jazz Pharmaceuticals, Daiichi-Sankyo; support for attending meetings and/or travel expenses: Incyte, Celgene BMS, Sanofi, Amgen, Novartis, Daiichi-Sankyo, Gilead; participation on a Data Safety Monitoring Board or Advisory Board from PEVOLAM trial
Haematologica | 108 July 2023 1800 ARTICLE - Phase I/II trial of cusatuzumab/azacitidine in AML T. Pabst et al.
(PETHEMA study group). CRi is listed as inventor on a patent held by the University of Bern on targeting CD70 for treatment in AML. PS is a Janssen R&D employee. JT has stock or stock options from JNJ Company 401K, JNJ Stock Option Plan. AFO has received support for the present manuscript (funding) from SAKK, Rising Tide, Gateway; grants or contracts from argenx (funding); royalties and licenses from argenx/Janssen; patent: Targeting CD70 in myeloid leukemia. TP, LA and UB have no conflicts of interest to disclose.
Contributions
TP and AO contributed to study and protocol design, conduct of the study, and interpretation of results. CRi and UB contributed to study and protocol design, and interpretation of results. MB, RM, NV, LA, CRe, CP and GG helped conduct the study. DG and AH contributed to study protocol and interpretation of results. SF provided consultancy services to argenx and contributed to interpretation of results. AJ, XM, KN, LX, JT and PS were involved in interpretation of results. All authors critically reviewed and revised the manuscript, and approved the final version for submission.
Acknowledgments
The authors would like to thank all patients and staff who participated in this study. The authors would like to express their sincere gratitude to Christina Guttke of Janssen Research & Development, Spring House, PA, USA, for her
References
1. Heuser M, Ofran Y, Boissel N, et al. Acute myeloid leukaemia in adult patients: ESMO Clinical Practice Guidelines for diagnosis, treatment and follow-up. Ann Oncol. 2020;31(6):697-712.
2. Sekeres MA, Guyatt G, Abel G, et al. American Society of Hematology 2020 guidelines for treating newly diagnosed acute myeloid leukemia in older adults. Blood Adv. 2020;4(15):3528-3549.
3. Döhner H, Estey E, Grimwade D, et al. Diagnosis and management of AML in adults: 2017 ELN recommendations from an international expert panel. Blood. 2017;129(4):424-447.
4. Dombret H, Seymour JF, Butrym A, et al. International phase 3 study of azacitidine vs conventional care regimens in older patients with newly diagnosed AML with >30% blasts. Blood. 2015;126(3):291-299.
5. DiNardo CD, Jonas BA, Pullarkat V, et al. Azacitidine and venetoclax in previously untreated acute myeloid leukemia. N Engl J Med. 2020;383(7):617-629.
6. Lapidot T, Sirard C, Vormoor J, et al. A cell initiating human acute myeloid leukaemia after transplantation into SCID mice. Nature. 1994;367(6464):645-648.
7. Hanekamp D, Cloos J, Schuurhuis GJ. Leukemic stem cells: identification and clinical application. Int J Hematol. 2017;105(5):549-557.
8. Bonnet D, Dick JE. Human acute myeloid leukemia is organized as a hierarchy that originates from a primitive hematopoietic cell. Nat Med. 1997;3(7):730-737.
9. Thomas D, Majeti R. Biology and relevance of human acute
valuable contribution to the biomarker data in this publication, and to Julie Jacobs of argenx, Ghent, Belgium, for her substantial contribution to the discussion and conclusions.
Funding
The trial was funded by Janssen Oncology, Pharmaceutical Companies of Johnson & Johnson, in collaboration with argenx. Medical writing support for the development of this manuscript was provided by Ranjana Whitlock of Ashfield MedComms, an Ashfield Health company, part of UDG Healthcare plc, and was funded by Janssen Oncology and argenx.
Data-sharing statement
Janssen has an agreement with the Yale Open Data Access (YODA) Project to serve as the independent review panel for evaluation of requests for clinical study reports and participant-level data from investigators and physicians for scientific research that will advance medical knowledge and public health. Data will be made available following publication and approval by YODA of any formal requests with a defined analysis plan. For more information on this process, or to make a request, please visit The Yoda Project site at http://yoda.yale.edu. The data-sharing policy of Janssen Pharmaceutical Companies of Johnson & Johnson is available at https://www.janssen.com/clinical-trials/transparency.
myeloid leukemia stem cells. Blood. 2017;129(12):1577-1585.
10. Craddock C, Quek L, Goardon N, et al. Azacitidine fails to eradicate leukemic stem/progenitor cell populations in patients with acute myeloid leukemia and myelodysplasia. Leukemia. 2013;27(5):1028-1036.
11. Zeng Z, Shi YX, Samudio IJ, et al. Targeting the leukemia microenvironment by CXCR4 inhibition overcomes resistance to kinase inhibitors and chemotherapy in AML. Blood. 2009;113(24):6215-6224.
12. Riether C, Schürch CM, Bührer ED, et al. CD70/CD27 signaling promotes blast stemness and is a viable therapeutic target in acute myeloid leukemia. J Exp Med. 2017;214(2):359-380.
13. Riether C, Pabst T, Höpner S, et al. Targeting CD70 with cusatuzumab eliminates acute myeloid leukemia stem cells in patients treated with hypomethylating agents. Nat Med. 2020;26(9):1459-1467.
14. Silence K, Dreier T, Moshir M, et al. ARGX-110, a highly potent antibody targeting CD70, eliminates tumors via both enhanced ADCC and immune checkpoint blockade. MAbs. 2014;6(2):523-532.
15. Claus C, Riether C, Schürch C, Matter MS, Hilmenyuk T, Ochsenbein AF. CD27 signaling increases the frequency of regulatory T cells and promotes tumor growth. Cancer Res. 2012;72(14):3664-3676.
16. Aftimos P, Rolfo C, Rottey S, et al. Phase I dose-escalation study of the anti-CD70 antibody ARGX-110 in advanced malignancies. Clin Cancer Res. 2017;23(21):6411-6420.
Haematologica | 108 July 2023 1801 ARTICLE - Phase I/II trial of cusatuzumab/azacitidine in AML T. Pabst et al.
17. De Meulenaere A, Vermassen T, Creytens D, et al. An openlabel, nonrandomized, phase Ib feasibility study of cusatuzumab in patients with nasopharyngeal carcinoma. Clin Transl Sci. 2021;14(6):2300-2313.
18. Gavillet M, Noetzli J, Blum S, Duchosal MA, Spertini O, Lambert JF. Transfusion independence and survival in patients with acute myeloid leukemia treated with 5-azacytidine. Haematologica. 2012;97(12):1929-1931.
19. Herold T, Rothenberg-Thurley M, Grunwald VV, et al. Validation and refinement of the revised 2017 European LeukemiaNet genetic risk stratification of acute myeloid leukemia. Leukemia. 2020;34(12):3161-3172.
20. Zeidan AM, Wang R, Wang X, et al. Clinical outcomes of older patients with AML receiving hypomethylating agents: a large population-based study in the United States. Blood Adv. 2020;4(10):2192-2201.
21. Fenaux P, Mufti GJ, Hellström-Lindberg E, et al. Azacitidine prolongs overall survival compared with conventional care regimens in elderly patients with low bone marrow blast count acute myeloid leukemia. J Clin Oncol. 2010;28(4):562-569.
22. Lenz HJ. Management and preparedness for infusion and hypersensitivity reactions. Oncologist. 2007;12(5):601-609.
23. Mateos MV, Cavo M, Blade J, et al. Overall survival with daratumumab, bortezomib, melphalan, and prednisone in newly diagnosed multiple myeloma (ALCYONE): a randomised, openlabel, phase 3 trial. Lancet. 2020;395(10218):132-141.
24. Marcus R, Davies A, Ando K, et al. Obinutuzumab for the firstline treatment of follicular lymphoma. N Engl J Med.
2017;377(14):1331-1344.
25. Mosch R, Guchelaar HJ. Immunogenicity of monoclonal antibodies and the potential use of HLA haplotypes to predict vulnerable patients. Front Immunol. 2022;13:885672.
26. Subklewe M, Stein A, Walter RB, et al. Preliminary results from a phase 1 first-in-human study of AMG 673, a novel half-life extended (HLE) anti-CD33/CD3 BiTE (bispecific T-cell engager) in patients with relapsed/refractory (R/R) acute myeloid leukemia (AML). Blood. 2019;134(Supplement_1):833.
27. Subklewe M, Stein A, Walter RB, et al. Updated results from a phase 1 first-in-human dose escalation study of AMG 673, a novel anti-CD33/CD3 BiTE® (bispecific T-cell engager) in patients with relapsed/refractory acute myeloid leukemia. EHA. 2020;EP548.
https://library.ehaweb.org/eha/2020/eha25th/294466/marion.su bklewe.updated.results.from.a.phase.1.first-inhuman.dose.escalation.html?f=menu%3D6%2Abrowseby%3D8% 2Asortby%3D2%2Amedia%3D3%2Ace_id%3D1766%2Aot_id%3D2 3221%2Amarker%3D757. Accessed 4 April 2022.
28. Trudel GC, Howes AJ, Jeste N, et al. CULMINATE: a phase II study of cusatuzumab + azacitidine in patients with newly diagnosed AML, ineligible for intensive chemotherapy. J Clin Oncol. 2020;38(15 suppl):TPS7565-TPS7565.
29. Riether C, Chiorazzo T, Johnson AJ, et al. The combination of the BCL-2 antagonist venetoclax with the CD70-targeting antibody cusatuzumab synergistically eliminates primary human leukemia stem cells. Blood. 2019;134(Supplement_1):3918.
Haematologica | 108 July 2023 1802 ARTICLE - Phase I/II trial of cusatuzumab/azacitidine in AML T. Pabst et al.
Transcriptome analysis in acute gastrointestinal graft-versus host disease reveals a unique signature in children and shared biology with pediatric inflammatory bowel disease
Correspondence: P. Khandelwal pooja.khandelwal@cchmc.org
Received: October 10, 2022.
Accepted: January 25, 2023.
1Division of Bone Marrow Transplant and Immune Deficiency, Cincinnati Children’s Hospital Medical Center, Cincinnati, OH, USA; 2Department of Pediatrics, University of Cincinnati College of Medicine, Cincinnati, OH, USA; 3Division of Gastroenterology, Cincinnati Children’s Hospital Medical Center, Cincinnati, OH, USA; 4Sheba Medical Center, Tel Hashomer, affiliated with the Tel Aviv University, Tel Aviv, Israel; 5Division of Biomedical Informatics, Cincinnati Children’s Hospital Medical Center, Cincinnati, OH, USA and 6Department of Pathology, Cincinnati Children’s Hospital Medical Center, Cincinnati, OH, USA
Abstract
Early view: February 2, 2023.
https://doi.org/10.3324/haematol.2022.282035
©2023 Ferrata Storti Foundation
Published under a CC BY-NC license
We performed transcriptomic analyses on freshly frozen (n=21) and paraffin-embedded (n=35) gastrointestinal (GI) biopsies from children with and without acute acute GI graft-versus-host disease (GvHD) to study differential gene expressions. We identified 164 significant genes, 141 upregulated and 23 downregulated, in acute GvHD from freshy frozen biopsies. CHI3L1 was the top differentially expressed gene in acute GvHD, involved in macrophage recruitment and bacterial adhesion. Mitochondrial genes were among the top downregulated genes. Immune deconvolution identified a macrophage cellular signature. Weighted gene co-expression network analysis showed enrichment of genes in the ERK1/2 cascade. Transcriptome data from 206 ulcerative colitis (UC) patients were included to uncover genes and pathways shared between GvHD and UC. Comparison with the UC transcriptome showed both shared and distinct pathways. Both UC and GvHD transcriptomes shared an innate antimicrobial signature and FCγ1RA/CD64 was upregulated in both acute GvHD (log-fold increase 1.7, P=0.001) and UC. Upregulation of the ERK1/2 cascade pathway was specific to GvHD. We performed additional experiments to confirm transcriptomics. Firstly, we examined phosphorylation of ERK (pERK) by immunohistochemistry on GI biopsies (acute GvHD n=10, no GvHD n=10). pERK staining was increased in acute GvHD biopsies compared to biopsies without acute GvHD (P=0.001). Secondly, plasma CD64, measured by enzyme-linked immunsorbant assay (n=85) was elevated in acute GI GvHD (P<0.001) compared with those without and was elevated in GVHD compared with inflammatory bowel disease (n=47) (P<0.001), confirming the upregulated expression seen in the transcriptome.
Introduction
A cute graft- versus-host disease (GvHD) is the greatest barrier to a successful hematopoietic stem cell transplant (HSCT), with mortality rates of up to 50% in advanced cases.1 Gastrointestinal (GI) GvHD is particularly challenging to treat and carries a higher mortality rate when compared to acute skin GvHD.2 Steroids are the mainstay of acute GvHD therapy, but treatment failure is frequent, and toxicities are common.3 Knowledge gaps in the pathophysiology of acute GvHD are main reasons for poor outcomes, especially in steroid-refractory acute GI GvHD.4 Several research studies have identified the need to study target organ (skin, intestine or liver) biology in humans at the time of GvHD to identify targetable pathways, but also
acknowledge logistic challenges of obtaining target organ tissue for research.5 As a result, most GvHD studies use blood biomarkers or animal models to construct the biology of acute GvHD, and these studies currently guide prophylaxis, classification, treatment, and prognosis. Studies of target organ biology in pediatric inflammatory bowel disease (IBD) may provide us with a template to further study pediatric acute GvHD. Transcriptome analyses of intestinal biopsies in pediatric ulcerative colitis (UC) have identified a reduction in epithelial mitochondrial genes and associated energy production pathways, a novel observation.6 Upregulated gene signatures in pediatric UC are enriched for integrin signaling (P<1.08x10⁻¹²) and the TNF pathway (P<9.9x10-93), aligning with current therapeutic approaches.6 Epithelial gene signatures in
Pooja Khandelwal,1,2 Dana T. Lounder,1,2 Allison Bartlett,1,2 Yael Haberman,2,3,4 Anil G. Jegga,2,5 Sudhir Ghandikota,2,5 Jane Koo,1,2 Nathan Luebbering,1,2 Daniel Leino,6 Sheyar Abdullah,1,2 Michaela Loveless,1,2 Phillip Minar,2,3 Kelly Lake,1,2 Bridget Litts,1,2 Rebekah Karns,2,3 Adam S. Nelson,1,2 Lee A. Denson2,3 and Stella M. Davies1,2
Haematologica | 108 July 2023 1803 ARTICLE - Bone Marrow Transplantation
Crohn’s disease identified upregulation of expression of the antimicrobial gene dual oxidase (DUOX2) along with decreased expression of lipoprotein APO1.7 The combination of DUOX2 upregulation and APO1 downregulation was associated with Proteobacteria and Firmicutes expansion, increased oxidative stress and increased severity of gut inflammation in pediatric Crohn’s disease.7 These findings are collectively directing individualized therapeutic approaches and driving further understanding of IBD in children.
Transcriptome analyses of peripheral blood mononuclear cells in non-human primates at the time of acute GvHD onset have identified aurora kinases as novel pathways which could be targeted to ameliorate manifestations of GvHD.8 Furthermore, a recent epithelial transcriptomic study of 22 adults with acute GI GvHD identified important associations and clues to mechanisms of disease but was limited by extraction of RNA from formalin-fixed paraffinembedded (FFPE) tissue, in which RNA is commonly degraded or chemically altered, raising the possibility that important findings could be overlooked.9 We performed a study of transcriptome analyses of intestinal biopsies collected and frozen at the time of clinical diagnosis of acute GI GvHD and compared these findings to patients who underwent endoscopy for routine clinical indications pre or post HSCT and did not have evidence of colitis or acute GI GvHD. We also compared these results to a previously established cohort of patients with UC in which transcriptomic data was performed on freshly frozen GI biopsies. Finally, we performed transcriptomic analyses on 35 allogeneic HSCT patients with (n=20) and without acute GI GvHD (n=15) using FFPE tissue to augment our small sample size of our prospective study and further to highlight similarities and differences in differential gene expression using different tissue sources.
Methods
Patient enrollment for prospective study
The Cincinnati Children’s Hospital Medical Center (CCHMC) Institutional Review Board approved this study. Patients were eligible if they were aged 2 years and older, pre- or post-allogeneic HSCT and were scheduled for a lower GI endoscopy at CCHMC for clinical indications such as diarrhea, hematochezia, and abdominal pain, or for routine screening. Additional details are described in the Online Supplementary Appendix. Clinical grading of acute GvHD was done using the modified Glucksberg criteria.10
Patient selection for formalin-fixed paraffin-embedded tissue RNA sequencing
Pediatric allogeneic HSCT patients with available FFPE biopsies were selected and separated into two cohorts: pa-
tients with acute GI GvHD at the time of biopsy (n=20) and patients without acute GI GvHD at the time of biopsy and at any time clinically (n=15). All patients had consented to our institutional tissue biorepository where clinical samples may be used for future unspecified research. Demographic information was collected retrospectively. Details of transcriptome analyses for both cohorts are described in the Online Supplementary Appendix
Weighted gene co-expression network analyses
A weighted gene co-expression network analyses (WGCNA) was performed to generate gene modules.11 Details are described in the Online Supplementary Appendix. Data from freshly frozen biopsies was used for these analyses.
Immune deconvolution
We performed a cell type deconvolution to estimate cell subset proportions using CIBERSORT, a versatile computational method, to provide an estimation of the abundances of member cell types in a mixed cell population using gene expression data.12 The statistical significance between cell populations in acute GI GvHD and no GvHD was determined by t-test. Data from freshly frozen biopsies was used for these analyses.
Immunohistochemistry for pERK
Samples of 20 separate and de-identified FFPE GI biopsies (acute GI GvHD n=10, post-HSCT biopsies without acute GI GvHD n=10) were stained for pERK. Additional details are described in the Online Supplementary Appendix.
Plasma CD64
Cryopreserved plasma samples from 85 HSCT recipients (acute GI GvHD n=30, no GvHD n=30, acute skin GvHD n=25) were obtained from our institutional biorepository where consecutive patients are consented for future research and compared with 47 children with IBD and 42 non-IBD controls. Details are described in the Online Supplementary Appendix.
Comparison with ulcerative colitis
We had access to data from 206 UC patients who underwent high-throughput RNA sequencing of intestinal biopsies prior to treatment, from the Predicting Response to Standardized Pediatric Colitis Therapy cohort, which originally included 428 UC patients from 29 pediatric gastroenterology centers in North America.7 Transcriptomic data from these 206 UC patients were included in our study for analyses to uncover genes and pathways shared between acute GI GvHD and IBD. Data from freshly frozen biopsies was used for these comparative analyses between acute GI GvHD and IBD as IBD biopsies were also freshly frozen. For this comparative cohort of pediatric UC,6 all samples were rectal biopsies.
Haematologica | 108 July 2023 1804 ARTICLE - RNAseq in acute GI GvHD P. Khandelwal et al.
Results
Twenty-one patients underwent endoscopy pre (n=5) or post BMT (n=16) for routine clinical indications and met study criteria between 2017-2019. The median age of patients was 13.5 years (range, 4.5-25 years). Patient demographics and details of GvHD including stage and additional organ involvement are described in the Online Supplementary Table S1. Each patient contributed a single
lower GI biopsy sample for RNA sequencing and no patient had multiple samples submitted for transcriptomics. In all but one patient, lower GI biopsies were obtained at diagnosis of acute GI GvHD, prior to treatment. In one patient, biopsy was obtained after treatment was initiated with ruxolitinib to follow disease response. Nine patients had clinical symptoms of acute GI GvHD, and the diagnosis was confirmed with biopsies reviewed by an experienced pathologist. Three of the nine patients had steroid-re-
Figure 1. Results of freshly frozen gastrointestinal biopsy analyses. (A) Study profile showing number of patients enrolled on the prospective study number of patients excluded from analyses and final number of patients included for RNA sequencing analyses. (B) Principal component analysis of 9 patients with gastrointestinal (GI) graft-versus-host disease (GvHD) and 8 patients without acute GI GVHD using 14,229 protein-coding genes that passed expression filtering. PCA PC1 value between groups were compared and were significantly different (t-test P=0.035). (C) Unsupervised hierarchical clustering analysis using the top upand downregulated genes in patients with acute GvHD compared to patients without GvHD from freshly frozen GI biopsies. (D) Immune deconvolution showing significant cell types in acute GI GvHD compared to patients without acute GvHD. *P<0.05.

A B D C
Haematologica | 108 July 2023 1805 ARTICLE - RNAseq in acute GI GvHD P. Khandelwal et al.
sponsive acute GI GvHD while the rest had steroid refractory acute GI GvHD. Eight patients did not have acute GI GvHD at the time of the intestinal biopsy or subsequently during their clinical course. Of these eight patients without acute GI GvHD, six patients did not have any abnormality on their biopsies, one patient had changes consistent with mild CMV infection and one patient‘s pretransplant biopsy had intestinal changes reflective of
brincidofovir treatment. All biopsy samples were obtained from the rectum except one patient who was subsequently excluded from our analyses (Figure 1A).
Four patients were excluded from analyses (Figure 1A). The final analyses included nine patients with acute GI GvHD and eight patients without acute GI GvHD.
Paraffin-embedded GI biopsies were available for 35 allogeneic HSCT patients who underwent endoscopy post HSCT
genes from freshly frozen gastrointestinal biopsies within the core acute gastroinstestinal graft-versus-host disease gene signature with false discovery rate-adjusted P value <0.05.13
Table 1.
Participates in tissue remodeling, Th2 response, M2 differentiation, bacterial adhesion/invasion, mediating AKT1 signaling and IL-8 production in colonic
factor
migration to sites of inflammation
Recognizes damage-associated molecular patterns of abnormal self and pathogen-associated molecular patterns of bacteria and fungi
Comparison of top upregulated genes of freshly frozen gastrointestinal (GI) biopsies from paraffin-embedded GI biopsies also shown. GvHD: graft-versus-host disease; IBD: inflammatory bowel disease; na: not analyzed; nd: not detected.
Haematologica | 108 July 2023 1806
Genes Adjusted P value (GvHD vs. no GvHD) Freshly obtained biopsies Log fold change Adjusted P value (GvHD vs. no GvHD) Paraffin-embedded biopsies Log fold change Function 1 CHI3L1 0.0001 4.5 2.10x10⁻¹² 3
2 AQP9 0.0005 4.3 0.0012 1.7 Water channel protein regulates permeability to water and other solutes; induced in sepsis 3 MTRNR2L8 0.02 3.9 0.1 0.7 Antiapoptotic factor 4 MMP3 0.003 3.7 1.49x10⁻⁵ 2 Metabolism of extracellular matrix, wound repair 5 SERPINA3 0.0005 3.4 1.26x10⁻⁵ 2 Inhibitor of cathepsin G, a neutrophil serine protease 6 MMP7 0.006 3.4 0.07 0.9 Participates in wound healing, and regulating defensins in intestinal mucosa 7 IDO1 0.003 3.3 0.08 0.9 Modulates T-cell behavior
catabolism
tryptophan; expressed in dendritic cells, monocytes, and macrophages 8 FCGR3B 0.003 3.2 0.1 0.8 Trap for immune complexes in the peripheral circulation 9 TNFRSF6B 0.02 3.2 nd na Regulatory role in suppressing Fas L- and LIGHT-mediated cell death 10 MMP10 0.003 3.2 0.1 0.7 Metabolism of extracellular matrix, wound repair 11 ACKR4 0.01 3.2 nd na Binds dendritic cell- and T-cell-activated chemokines including CCL19/ELC, CCL21/SLC, and CCL25/TECK 12 CXCL11 0.002 3.1 0.06 1 Chemotactic for interleukin-activated T cells 13 KRT7 0.001 3.1 0.003 1.4 Epithelial cytokeratin 14 MARCO 0.004 3.1 0.06 1 Expressed in macrophages, pattern recognition receptor, binds bacteria for removal 15 S100A8 0.008 3 0.02 1 Cell cycle progression and differentiation 16 DUOXA2 0.04 2.9 0.3 0.5 Steroid metabolic processes and antimicrobial responses in IBD 17 TM4SF4 0.03 2.9 0.7 0.2 Regulation of cell development, activation and growth 18 FPR2 0.03 2.9 0.0005 1.7 Neutrophil chemotactic
19 CXCR2 0.004 2.8 0.01 1.3
neutrophil
20 CLEC4E 0.01 2.6 0.002 1.5
epithelial cells
by pericellular
of
Mediates
Top 20 upregulated
ARTICLE - RNAseq in acute GI GvHD P. Khandelwal et al.
for evaluation of diarrhea. Fifteen patients had no evidence of acute GvHD while 20 patients had clinical, and biopsy proven acute GI GvHD. Patient demographics and details of acute GvHD including clinical stages and organs involved in addition to the gut are described in the Online Supplementary Table S2. Of the 15 patients with no acute GI GvHD, one patient was positive for CMV by tissue polymerase chain reaction while the remaining 14 had no abnormalities identified on histopathology. A lower GI biopsy was obtained in all patients at onset of acute GI GvHD symptoms, except for one patient included in the freshly frozen biopsy
cohort who was on ruxolitinib and underwent a lower GI biopsy to follow-up on disease response. Apart from this above-mentioned patient on ruxolitinib, all remaining patients were not on treatment for acute GI GvHD at the time of lower GI biopsy.
Differential expression analyses of freshly frozen gastrointestinal biopsies
A primary principal component analysis performed across reasonably expressed 14,229 protein-coding genes shows distinct patient clustering between those with and without
Table 2. Top 20 downregulated genes from freshly frozen gastrointestinal biopsies within the core acute gastrointestinal graftversus-host disease gene signature with false discovery rate-adjusted P value <0.05.
reprogramming in response to dietary availability through coordination of the expression of a wide array of genes involved in glucose and fatty acid
Comparison of top downregulated genes of freshly frozen gastrointestinal (GI) biopsies from paraffin-embedded GI biopsies also shown.13 GvHD: graft-versus-host disease; na: not analyzed; nd: not detected.
Genes Adjusted P value (GvHD vs. no GvHD) Freshly obtained biopsies Log fold change Adjusted P value (GvHD vs. no GvHD) Paraffin-embedded biopsies Log fold change Function 1 GPR15 0.03 -2.5 0.5 -0.4 Chemokine receptor 2 HMGCS2 0.001 -2.2 0.2 -0.6 Mitochondrial enzyme that catalyzes the first reaction of ketogenesis 3 NPY1R 0.03 -1.7 0.1 -0.5 Stimulation of food intake 4 MCOLN2 0.007 -1.7 0.4 -0.3 Regulation of chemokine secretion and macrophage migration 5 YBX2 0.04 -1.3 0.1 -0.7 Regulation of the stability and/or translation of germ cell mRNA 6 PPARGC1A 0.02 -1.3 0.006 -0.8 Metabolic
7 B3GNT8 0.03 -1.2 0.009 -0.8 Protein glycosylation and elongation
N-glycans 8 C9orf24 0.04 -1.2 0.1 -0.6 Plays a role in cyclogenesis 9 MTRNR2L12 0.01 -1.2 0.7 -0.2 Antiapoptotic factor, associated with Hirschsprung’s disease 10 ENPP1 0.002 -1.1 0.1 -0.3 Extracellular ATP metabolism and insulin signaling 11 SLC36A1 0.04 -0.9 0.09 -0.4 Symporter activity and L-alanine transmembrane transporter activity 12 AMACR 0.03 -0.9 0.3 -0.3 Bile acid synthesis 13 CDC14A 0.02 -0.9 0.04 -0.4 Cell cycle control 14 KCNJ2 0.04 -0.9 0.6 -0.2 Potassium transport 15 TMCC3 0.04 -0.9 0.09 -0.4 Protein Coding gene, function unknown 16 FSD1L 0.04 -0.7 0.6 0.1 Protein Coding gene, function unknown 17 PPP2R3A 0.04 -0.7 0.02 -0.5 Inhibition of cell growth and division 18 DMTN 0.009 -0.7 nd na F-actin-binding activity that induces F-actin bundles formation and stabilization 19 PANK1 0.03 -0.7 0.1 -0.4 Pantothenate kinase activity 20 SPATA24 0.02 -0.7 0.8 -0.1 Cytoplasm movement
metabolism
of specific branch structures of multiantennary
Haematologica | 108 July 2023 1807 ARTICLE - RNAseq in acute GI GvHD P. Khandelwal et al.
GI GvHD, indicating distinct transcriptomic mechanisms driving disease (PCA PC1 value difference P=0.035) (Figure 1B). We identified 164 genes that were significantly differentially expressed (false discovery rate [FDR] <=0.05 and fold change [FC] >=1.5) in acute GI GvHD including 23 downregulated and 141 upregulated genes (Online Supplementary Dataset S1 showing the indicative FDR P value, and log2 fold change). Genes with the highest fold change are shown in Figure 1C as a heatmap showing the normalized expression of a specific gene per patient, and the complete heatmap of the 164 genes are shown in the Online Supplementary Figure S1.
Differential expression analyses of paraffin-embedded gastrointestinal biopsies
Eight hundred and fifty-seven genes were up regulated and 485 were downregulated from the paraffin-embedded GI biopsy dataset (FDR<=0.05 and FC>=1.5, P<0.05]. Online Supplementary Figure S2 shows the heatmap of protein-coding genes, log-transformed FPKM values with an adjusted P<0.05, and a FC=3. The complete gene list is presented in the Online Supplementary Dataset S1
The top 40 differentially expressed genes in acute GI GvHD from freshly frozen biopsies are shown in Tables 1
Table 3. Top 10 upregulated GO term molecular functions in acute gastrointestinal (GI) graft-versus-host disease from freshly frozen GI biopsies and comparison values from paraffin-embedded GI biopsies.
GO: gene ontology; FDR: false discovery rate; B&H: Benjamini-Hochberg procedure; nd: not detected.
FDR: false discovery rate; B&H: Benjamini-Hochberg procedure; nd: not detected
Upregulated GO term molecular function FDR B&H P value Freshly frozen GI biopsies FDR B&H P value Paraffin-embedded GI biopsies GO:0050786_RAGE receptor binding 7.04x10⁻⁴ 0.011 GO:0001664_G-protein-coupled receptor binding 4.45x10⁻³ 0.0007 GO:0004175_Endopeptidase activity 5.50x10⁻³ 0.01 GO:0019864_IgG binding 5.50x10⁻³ 0.0006 GO:0035325_Toll-like receptor binding 8.09x10⁻³ 0.009 GO:0042379_Chemokine receptor binding 1.03x10⁻² 0.0005 GO:0008237_Metallopeptidase activity 1.13x10⁻² nd GO:0060089_Molecular transducer activity 1.33x10⁻² nd GO:0005124_Scavenger receptor binding 1.33x10⁻² nd GO:0038187_Pattern recognition receptor activity 1.37x10⁻² nd
Upregulated pathways FDR B&H P value Freshly frozen biopsies FDR B&H P value Paraffin-embedded biopsies REACTOME_1269310_Cytokine signaling in immune system 4.43x10⁻⁷ KEGG_04060 4.3x10⁻¹⁴ REACTOME_1269314_Interferon gamma signaling 2.83x10⁻⁶ 0.9 BIOCARTA_M5885_Ensemble of genes encoding ECM-associated
including ECM-affiliated proteins, ECM regulators and secreted factors 5.98x10⁻⁶ 0.05 REACTOME_1457780_Neutrophil degranulation 8.31x10⁻⁶ 0.001 REACTOME_1269312_Interferon alpha/beta signaling 1.66x10⁻⁵ 0.9 REACTOME_1270258_Activation of matrix metalloproteinases 3.46x10⁻⁵ 0.05 REACTOME_1269203_Innate immune system 8.81x10⁻⁵ nd KEGG_122191_NOD-like receptor signaling pathway 1.87x10⁻⁴ KEGG_04621 0.19 REACTOME_1269547_Chemokine receptors bind chemokines 2.06x10⁻⁴ 6.4x10⁻⁷ KEGG_1474301_IL-17 signaling pathway 1.39x10⁻² nd
proteins
Table 4. Top 10 upregulated pathways in acute gastrointestinal (GI) graft-versus-host disease of genes from freshly frozen GI biopsies and comparison pathway P values from paraffin-embedded GI biopsies.
Haematologica
1808 ARTICLE - RNAseq in acute GI GvHD P. Khandelwal et al.
| 108 July 2023
and 2 with FC and P values of same genes from the paraffin-embedded GI biopsy dataset for comparison. There was upregulated of genes involved in the regulation of key immune effectors, e.g., macrophages and T cells, including CHI3L1 and AQP9.13 Similarly, genes related to the host response to microbes, including CHI3L1, AQP9, and CLEC4E were up regulated in acute GI GvHD.13 We also saw differential expression of genes related to cell migration and chemotaxis, including CXCR2 13 Genes downregulated in acute GI GvHD including several genes related to metabolism of nutrients, including HMGCS2,
NPY1R, PPARGC1A and AMACR from the freshly frozen GI biopsies but these were not significantly downregulated in the paraffin-embedded GI biopsy cohort.13 Of note, we did not observe any aurora kinase gene expression in our dataset from both cohorts, regardless of statistical significance.
Molecular functions
The top 10 upregulated molecular functions from freshly frozen biopsies are shown in Table 3. Comparison values from the paraffin-embedded biopsies are also shown in
Figure 2. Results of weighted gene co-expression network analyses of freshly frozen gastrointestinal biopsies. (A) Heat map generated by the weighted gene co-expression network analyses showing statistically significant gene modules correlated with the disease status (acute gastrointestinal [GI] graft-versus-host disease [GvHD] present or absent) and stage of GI GvHD as previously described in the Online Supplementary Table S1 (stage 1, 2, 3 and 4 GI GvHD) analyzed as stage 1-2 vs. stage 3-4. Four modules, namely, M34, M5, M3, and M51 were significantly correlated with the presence of acute GI GvHD and acute GI GvHD stage. (B) Functional enrichment analyses demonstrating enrichment of genes for the ERK signaling pathway (denoted in yellow) included in the M3 gene module (from Figure 5) and shown separately as a magnified insert below. The circular nodes represent WGCNA gene modules. Orange and purple colored nodes are genes that are upregulated or downregulated respectively in GvHD. The rectangle nodes are enriched biological processes and pathways.

A B Haematologica | 108 July 2023 1809 ARTICLE - RNAseq in acute GI GvHD P. Khandelwal et al.
Table 3 showing overlap between the first five upregulated molecular functions. Functions related to the host response to microbial pathogens were upregulated, including pattern recognition (RAGE-receptor binding, scavenger receptor binding), as were functions of innate immunity (e.g., toll-like receptor binding). Analysis of biological processes showed similar findings. The top 10 upregulated biological processes in acute GI GvHD from freshly frozen biopsies are shown in the Online Supplementary Table S3 with comparisons from the paraffinembedded biopsies also shown, confirming the importance of host defense against microbes, but also highlighting an interferon-driven inflammatory response, also seen in the pathway analysis from freshly frozen GI biopsies (Table 4).
Immune deconvolution
We observed significant enrichment of M1 macrophages and follicular helper T cells in patients with acute GI GvHD compared to patients without acute GI GvHD. Plasma cells were enriched in patients without acute GI GvHD compared to patients with acute GI GvHD (Figure 1D).
Weighted gene co-expression network analysis and ERK signaling
We further investigated biologically significant changes in gene expression with a WGCNA that avoids focusing on one or a small number of differentially expressed genes and examines changes that occur throughout a pathway or network. Figure 2A shows a heat map showing modules generated in the WGCNA grouped by presence or
Figure 3. pERK expression by immunohistochemistry in ten separate acute gastrointestinal (GI) graft-versus-host disease (GvHD) and ten not acute GI GvHD biopsies. No GvHD disease: immunohistochemical stain for pERK in human control tissues (left and center): (A) gastric body (positive control): pERK is strongly expressed in the acid producing oxyntic glands in the gastric body as expected; (B) gastric antrum: weak normal pERK staining observed; (C) duodenum: weak normal pERK staining observed; (D) small intestine: weak normal expression in lamina propria neurites and stromal cells is seen throughout; (E) small intestine: weak normal pERK staining as described in (D); (F) colon: weak focal to patchy expression, is seen in colonic surface mucosal cells. Formalin-fixed paraffin-embedded (FFPE) tissue 4-micron-thick immunohistochemistry tissue sections, 100x magnification. Acute GI GvHD: immunohistochemical stain for pERK in human GvHD colonic tissue sections as follows (right): (A) grade 1 GvHD: note patchy but strong surface expression and focal expression in crypts, including adjacent to apoptotic figures (B); (C) grade 2 GvHD: note patchy surface and crypt expression with increased superficial density and staining of lamina propria neurites and stromal cells; (D) grade 3 GvHD: strong pERK surface expression on epithelium in addition to lamina propria; (E) grade 3-4 GvHD: strong pERK surface expression on epithelium and lamina propria; (F) grade 4 GvHD: diffuse strong pERK expression on surface epithelium. Scattered positive capillary endothelial cells positive in all grades, most notably in grade 4 GvHD ulcer bed with granulation tissue vascularity. FFPE tissue 4-micron thick immunohistochemistry sections, 400x magnification. Grades of GvHD are pathological gradings.

C E F E F D C D B A A B Haematologica | 108 July 2023 1810 ARTICLE - RNAseq in acute GI GvHD P. Khandelwal et al.
absence of acute GI GvHD and stages of acute GI GvHD. The most significant difference was seen in the M3 module, comprised of about 800 genes expressed differentially in the presence of acute GI GvHD compared with no acute GI GvHD ( P =0.04), and in higher stages of acute GI GvHD compared with lower stages of acute GI GvHD ( P =0.004) ( Online Supplementary Dataset S2 ). Functional enrichment analysis of module M3 (Figure 2B) showed upregulation of genes in the ERK signaling pathway in acute GI GvHD compared to patients without acute GI GvHD.
pERK expression on intestinal biopsy specimens
We sought to verify ERK pathway upregulation using immunohistochemistry staining of GI biopsies from children with and without GvHD. We found greater pERK expression on epithelial cells of biopsies in patients with acute GI GvHD compared to HSCT patients without GvHD (Figure 3). The median percent positive pixel count for pERK was 46% (range, 13-54%) in acute GI GvHD compared to 14% (range, 10-17%) in no GI GvHD (P=0.001), supporting our transcriptomic findings (Figure 4).

Shared genes, biological processes, and pathways between graft-versus-host disease and ulcerative colitis
We wanted to compare differentially regulated genes in UC and acute GI GvHD, as successful therapeutic strategies in UC might be applicable to acute GI GvHD if biology is similar. One hundred and twenty-nine (91%) of the 141 genes upregulated in acute GI GvHD were also upregulated in UC, and 17 (17/23, 74%) genes downregulated in acute GI GvHD were also downregulated in UC (Figure 5A, C).
Figure 5B highlights similarities in key pathways and functions between acute GI GvHD and UC. Important upregulated biological processes common to both include responses to microbes, cytokines and innate immune system responses. Notable upregulated pathways common to both diseases include interferon pathway signaling, neutrophil activation and responses to microbes.
Differential expression of genes unique to graft-versushost disease
compared to ulcerative colitis
Twelve genes were upregulated, and six genes were downregulated in acute GI GvHD but not in UC (Online Supplementary Table S4). Notable genes upregulated in acute GI GvHD only are related to macrophage function (MARCO, CXCL16), metabolism (CA8), signaling (COTL1, FAM195B), cell adhesion (TM4SFL) and response to infection (LYAR). Genes downregulated in acute GI GvHD only include a chemokine receptor (GPR15), transcriptional regulators (ZBTB38, YBX2) and nucleotide metabolism (ADAL).13 These genes are involved in the innate immune system, macrophage activation and chemokines signals expressed on macrophages
Plasma CD64
FCγR1A also known as CD64, is expressed on neutrophils and monocytes, and is upregulated by mediators of inflammation such as interferon-γ, G-CSF, infection, or tissue injury.14 Plasma CD64 is elevated in new onset IBD and is a marker of intestinal inflammation.15 Additionally, plasma CD64 and neutrophil CD64 expression have been strongly correlated in IBD.16 Elevated surface expression of CD64 on neutrophils has been associated with loss of responses to steroids and infliximab in IBD.17 In our data, FCγRA1 gene expression was upregulated in acute GI GvHD (log fold increase 1.7, P=0.001) and in UC (FC increase =5.8, P=4.18x10⁻²³).6 As CD64 is associated with mucosal inflammation, steroid and infliximab responsiveness in pediatric IBD, we wanted to study CD64 in acute GI GvHD to confirm our transcriptome findings.
Patient demographics are shown in the Online Supplementary Table S5 (GvHD) and Online Supplementary Table S6 (IBD and non-IBD controls). Median plasma CD64 was 222 ng/mL (range, 35-411 ng/mL) in patients with acute GI GvHD compared to 76 ng/mL (range, 0-360 ng/mL) in patients without acute GvHD, 72 ng/mL (range, 11-208 ng/mL) in patients with isolated skin GvHD, 72 ng/mL (range, 27-174 ng/mL) in patients with IBD and 29 ng/mL (range, 11-72 ng/mL) in non-IBD controls (P<0.001; Figure 5D).
Discussion
We report the first pediatric transcriptome analyses of intestinal tissue involved in acute GI GvHD using freshly frozen GI biopsies. We demonstrate a unique gene signature in acute GI GvHD with differential expression of genes which have been previously described as important in GvHD such as IDO1, 18 CXCL1019 and Granzyme B 20 We observed upregulation of biological processes involved in antimicrobial responses supporting a role for the intestinal
Haematologica | 108 July 2023 1811 ARTICLE - RNAseq in acute GI GvHD P. Khandelwal et al.
Figure 4. Percent positive pixel count of pERK staining in acute gastrointestinal graft-versus-host disease biopsies and no graftversus-host disease biopsies. Graphs represent median values of percentage of positive pixels in each group with P values generated by the Mann Whitney U test. GvHD: graft-versus-host disease; GI: gastrointestinal.
microbiome modulation in acute GI GvHD. Additional biological processes involved in acute GI GvHD included responses to cytokines, specifically interferons and innate immune responses. Important upregulated pathways included interferon-γ signaling and neutrophil degranulation.

We added 35 paraffin-embedded GI biopsies to compare our findings from the freshly obtained GI biopsies. We notably observed that transcriptomics from paraffin-embedded GI biopsies did not identify relevant genes such as FCγR1A or pathways such as ERK, shown to be signifi-
Figure 5. Comparison between transcriptomics and biomarkers in ulcerative colitis and acute gastrointestinal graft-versus-host disease. Venn diagram shows shared upregulted (A) and (C) downregulated genes in patients with acute graft-versus-host disease (GvHD) and ulcerative colitis (UC). Shared upregulated pathways in acute GvHD and UC are shown in (B). (D) Plasma CD64 levels (ng/mL) in non-inflammatory bowel disease (IBD) controls (Ctl) (n=42), IBD (n=47), acute gastrointestinal (GI) GvHD (n=30), hematopoietic stem cell transplant patients without GvHD (n=30) and acute isolated skin GvHD (n=25).
A B C D Haematologica | 108 July 2023 1812 ARTICLE - RNAseq in acute GI GvHD P. Khandelwal et al.
cantly upregulated in acute GI GvHD in correlative studies. However, we also found several areas of overlap of key genes, biological processes, pathways and molecular functions, lending strength to our observations from data obtained from freshly frozen GI biopsies. Notably, CHI3L1 upregulation was observed strongly in transcriptomics from both cohorts. CHI3L1 is of particular interest given its roles in neovascularization, macrophage recruitment, and bacterial adhesion.21-25 There are limited prior data on the role of CHI3L1 in HSCT,26 but one report identified elevated plasma CHI3L1 in patients with a very high HSCT comorbidity index,27 suggesting that CH13L1 could be a pro-inflammatory marker. Several anti-CHI3L1 therapeutics are being studied to alter CHI3L1-induced effector responses, such as monoclonal anti-CHI3L1 (FRG), kasugamycin, and inhibitors of CHI3L1 phosphorylation in the context of SARS-COV2,28 and these could potentially be studied in acute GI GvHD in future clinical trials.
Abnormalities of several mitochondrial genes have been described in acute GI GVHD including GPR43, 29 SIRT3, 30 NLRP631 and Signal 3, 32 none of which were detected in our dataset. However, the second most downregulated gene HMGCS2 in our dataset from freshly frozen GI biopsies is a mitochondrial enzyme that catalyzes the first reaction of ketogenesis.33 Recent work has demonstrated a potential link of HMGCS2 with the butyrate metabolism,34 which is of interest, given data regarding butyrate depletion in acute GI GvHD35 and testing of strategies to optimize intestinal butyrate to decrease acute GvHD incidence. Patients with UC had substantial suppression of all 13 electron transport mitochondrial-encoded genes (Complex I, III, IV, and V), PPARGC1A (PGC1α), and epithelial MMP demonstrating colonic mitochondriopathy.6 PPARGC1A was similarly significantly downregulated in acute GI GvHD.
The Online Supplementary Table S7 shows comparisons between notable genes described in our study from both cohorts with published adult transcriptome data.9 Important similarities between the two include highest differential expression of CHI3L1, upregulation of IDO1 and significant downregulation of HMGCS2.9 Our study supports an important role for macrophages in the pathogenesis of acute GI GvHD, similar to findings in the adult study.9 However, we also observed several differences in our findings compared to the adult study including lack of differential expression of AQP8, CCL18 and ITLN1, which could be due to differences in analysis platform, limiting direct comparisons.
Gene expression profiles of T cells collected at the time of acute GvHD in non-human primates demonstrated aurora kinase A pathway as a possible druggable target.8 We did not observe aurora kinase A pathway involvement in our data, likely due to the differences in sample tissue used for the description of gene expression profiles, as our samples were not enriched specifically for T cells.
Our findings demonstrated a significant overlap between differentially regulated genes and pathways in pediatric GI GvHD and IBD. Expression of the antimicrobial dual oxidase gene (DUOX2) was the highest differentially expressed gene associated with an expansion of Proteobacteria in UC6 and was also upregulated in pediatric GI GvHD. Expression of apolipoprotein A1 (APOA1) was downregulated and predicted 6-month steroid-free remission in IBD, when combined with microbial abundance.7 We did not observe downregulation of APOA1 in pediatric acute GI GvHD but saw upregulation of apolipoprotein L1, which in turn binds to APOA1, perhaps resulting in similar biological effects.
Our findings of upregulation of DUOX2 and downregulation of butyrate metabolism in acute GI GvHD complement current work and understanding of the intestinal microbiome in acute GI GvHD. In UC, an abnormal increase of antimicrobial dual oxidase 2 expression was detected in association with an expansion of Proteobacteria 7 Unlike our comparison cohort of UC patients, we did not perform concurrent stool microbiome analyses to complement our findings, but independent studies have shown lower microbial diversity along with increased relative abundance of Proteobacteria and Enterobacteriaceae in acute GI GvHD.36, 37 We have also previously shown that lower fecal butyrate is observed in acute GI GVHD.38 Efforts are underway to increase intestinal butyrate in adults and pediatrics with various prebiotics such as fructo-oligosaccharide and potato-based starch.39, 40 Additionally, several microbiome-targeted approaches such as fecal microbiome transplant and judicious use of antibiotics are being studied.
We also saw upregulation of FCγR1A, also known as CD64, in pediatric acute GI GvHD, a known marker of neutrophil activation which predicts responses to steroids and infliximab in pediatric IBD15,16 CD64 has also been previously described in skin biopsies of patients with acute skin GvHD.41 Additional experiments demonstrated elevation of plasma CD64 in acute GI GvHD, an independent confirmation of findings observed in our transcriptome analysis. Moreover, plasma CD64 levels were strikingly comparable in patients with acute skin GvHD, allogeneic HSCT recipients without GvHD, and UC and all three groups had higher CD64 levels compared to non-IBD controls. Elevations of plasma CD64 levels in allogeneic HSCT patients without any GvHD compared to non-IBD controls was notable, suggestive of subclinical but widespread tissue injury. CD64 elevation in acute GI GvHD is higher than what is observed in UC despite shared transcriptomic profiles. Plasma CD64 is also elevated in acute GI GvHD compared to acute skin GvHD. Collectively, these findings suggest that plasma CD64 could be a specific and unique marker to study further in acute GI GvHD.
The integrin-mediated signaling pathway, is upregulated in both pediatric GI GvHD and UC, which is of relevance as ve-
Haematologica | 108 July 2023 1813 ARTICLE - RNAseq in acute GI GvHD P. Khandelwal et al.
dolizumab, an α4β7 integrin blocker is used in both pediatric IBD and acute GI GvHD.42,43 We observed upregulation of pathways involved in activation of matrix metalloproteinases 1, 3, 7 and 10 (MMP) in GvHD (Online Supplementary Dataset S1). MMP are expressed in healthy intestinal tissue to assist in the degeneration and remodeling of the extracellular matrix and the basement membrane, leading to improved mucosal barrier function.44 MMP 1 (collagenase 1) expression correlates with the severity of UC.45 Additional shared pathways include a wound healing signature and antimicrobial responses in addition to cytokines and neutrophil activation, further emphasizing rationale for microbiome modulation in both diseases.
We also observed differential expression of genes in acute GI GvHD which are not observed in UC. The biological processes that determine differences in alteration of gene expression in acute GI GvHD and UC is unclear, but a topic of great interest. Macrophages are implicated in pathophysiology of both entities, but it is possible that specific macrophages are involved, based on tissue specific trafficking signaling unique to acute GI GvHD. It is also possible that our small sample size of acute GI GvHD patients did not achieve statistical significance for additional genes which might contribute to biological differences between acute GI GvHD and UC. A pediatric study of transcriptome analyses of biopsies in patients with UC reported the following significant cell types infiltrating biopsies, by immune deconvolution: active dendritic cells (DC), B cells, CD4+ naive T cells, conventional DC, memory B cells, plasma cells, Th1 cells, and monocytes. In contrast, M1 macrophages and follicular helper T cells were identified as significant cell types in acute GI GvHD further suggesting important differences in biology of acute GI GvHD and UC, despite many shared genes and pathways. We observed upregulation of the ERK signaling pathway in our study, a novel finding in pediatric acute GI GvHD. Additionally, pERK expression was detected on immunohistochemistry in ten de-identified intestinal biopsies of acute GI GvHD, further validating our findings. There is preclinical evidence of the role of the ERK pathway in acute GvHD in murine and adult allogeneic transplant studies.46-49 Phosphorylation of ERK1/2 and STAT-3 have been shown as important events during T-cell activation in GvHD in murine studies.48 Single-cell analysis of ERK1/2 phosphorylation in murine T cells suggested that ex vivo MEK inhibition inhibited alloreactivity.47 Low dose trametinib inhibited ERK1/2 phosphorylation and prolonged survival of GvHD mice and attenuated GvHD symptoms and pathology in the gut and skin.49 Administration of selumetinib in a major histocompatibility complex major- and minor-mismatched murine model delayed the onset of GvHD-associated mortality without affecting myeloid engraftment.49 Lastly, phosphorylation of ERK1/2 in T and B cells was analyzed by flow cytometry in 20 adult allogeneic-transplant recipients and
occurrence of acute GvHD was associated with phosphorylation of ERK1/2 in CD4 T cells at day 30, which was suppressed by ex vivo exposure to trametinib at clinically achievable concentrations.46 Our findings complement this body of evidence on ERK upregulation and acute GvHD. Our study has several strengths. This is the first transcriptomic analysis of freshly frozen GI biopsies in children with acute GI GvHD. The findings of this study lend themselves to several translational applications, namely targeting the intestinal microbiome, optimizing intestinal butyrate in patients to prevent acute GI GvHD, and paving the way for future macrophage-directed treatments. ERK pathways may be targeted in future studies to treat acute GI GVHD. CHI3L1 is another therapeutic target for acute GI GvHD, with the availability of monoclonal antibodies targeting this in SARSCOV2.28 We also show a possible role for CD64 as a marker of acute GI GvHD, which may be studied in larger scale studies prospectively as a biomarker of acute GI GvHD. However, our study also has several limitations. Obtaining biopsy material for research from ill children is challenging, and so our sample size is small, and we have no biopsies from healthy children available for comparison, limiting some analyses. In order to address this limitation, we augmented our cohort with 35 allogeneic HSCT patient GI biopsies retrospectively and observed considerable overlap between findings but also observed important differences including lack of expression of DUOAX2 and lack of involvement in the ERK pathway from paraffin embedded biopsies, suggesting important variability of these two approaches. Our patient population is heterogenous with inclusion of differing strengths of conditioning regimens and acute GvHD prophylaxis, inherent to pediatric studies likely contributing to important inter-patient variability. We tried to account for variables which could influence our results. Location of the GI biopsy sample could influence results and we therefore only chose rectal biopsies and excluded the single patient from the freshly frozen biopsy cohort in whom the biopsy was not from the rectum. We attempted to choose patients for analyses whose biopsies were obtained at diagnosis of acute GI GvHD, however one patient in the freshly frozen biopsy cohort underwent endoscopy after an established diagnosis of acute GI GvHD. Further, prior treatments for acute GI GvHD at the time of GI biopsy could influence results but we obtained almost all biopsies at diagnosis of GvHD with only one patient being on treatment before biopsy was obtained. Lastly, we excluded patients with pre-existing colitis due to their underlying disease to reduce additional confounding variables which could influence our results. Our previous work has shown the role of human milk in influencing markers of intestinal inflammation50 but no patient in our cohort was actively breastfeeding, reducing the influence of diet relevant to pediatric studies. In addition, while no patients were on prebiotics before or at the time of lower GI biopsy, there
Haematologica | 108 July 2023 1814 ARTICLE - RNAseq in acute GI GvHD P. Khandelwal et al.
could be additional influences of diet in this study which we cannot comment on as we did not take a detailed dietary history. Our controls underwent endoscopy for clinical symptoms and while the majority had no abnormal findings on histopathology, one patient in the freshly frozen biopsy cohort and one patient from the paraffin-embedded biopsy cohort tested positive for cytomegalovirus from the tissue biopsy, which could have also influenced our results. A more uniform assessment in the future could be enabled if patients are selected with the same underlying diagnosis, similar preparative and acute GvHD prophylactic regimens and enrolling age-matched controls with detailed dietary histories for both cohorts. Furthermore, similar to our current approach, obtaining biopsies in all patients at diagnosis of acute GI GvHD from the same location of the lower intestinal tract and eliminating patients with pre-existing colitis due to their underlying disease will streamline assessments further. Our experiments on plasma CD64 are preliminary and larger scale research is required for confirmation of our findings. Additionally, as we chose patients based on the incidence of acute GvHD in the CD64 experiment, there could be a selection bias.
In summary, our study has several clinical implications including justification of shared therapeutics with pediatric IBD and identification of important similarities with adult acute GI GvHD.
Disclosures
No conflicts of interest to disclose.
References
1. Nassereddine S, Rafei H, Elbahesh E, Tabbara I. Acute graft versus host disease: a comprehensive review. Anticancer Res. 2017;37(4):1547-1555.
2. Harris AC, Levine JE, Ferrara JL. Have we made progress in the treatment of GVHD? Best Pract Res Clin Haematol. 2012;25(4):473-478.
3. Westin JR, Saliba RM, De Lima M, et al. Steroid-refractory acute GVHD: predictors and outcomes. Adv Hematol. 2011;2011:601953.
4. Paczesny S, Hanauer D, Sun Y, Reddy P. New perspectives on the biology of acute GVHD. Bone Marrow Transplant. 2010;45(1):1-11.
5. Teshima T, Reddy P, Zeiser R. Acute graft-versus-host disease: novel biological insights. Biol Blood Marrow Transplant. 2016;22(1):11-16.
6. Haberman Y, Karns R, Dexheimer PJ, et al. Ulcerative colitis mucosal transcriptomes reveal mitochondriopathy and personalized mechanisms underlying disease severity and treatment response. Nat Commun. 2019;10(1):38.
7. Haberman Y, Tickle TL, Dexheimer PJ, et al. Pediatric Crohn disease patients exhibit specific ileal transcriptome and microbiome signature. J Clin Invest. 2014;124(8):3617-3633.
8. Furlan SN, Watkins B, Tkachev V, et al. Transcriptome analysis of GVHD reveals aurora kinase A as a targetable pathway for disease prevention. Sci Transl Med. 2015;7(315):315ra191.
9. Holtan SG, Shabaneh A, Betts BC, et al. Stress responses, M2
Contributions
PK collected intestinal biopsy samples, interpreted the data and wrote the manuscript. DL, AB and ASN enrolled patients on study and collected intestinal biopsies. KL and BL processed intestinal biopsy samples. NL extracted RNA from intestinal biopsy samples. RK, YH, AJ and SG assisted with bioinformatic analyses of data. DL and JK assisted with IHC interpretation of intestinal biopsies. ML performed CD64 ELISA experiments in HSCT patients. PM contributed CD64 data in IBD patients. LAD provided RNA sequencing data from patients with ulcerative colitis and assisted with study design. SMD oversaw the entire study and assisted with data interpretation and edited the manuscript critically. All authors reviewed the manuscript critically for edits.
Acknowledgements
We would like to acknowledge patients, families, and the clinical staff at Cincinnati Children’s Hospital Medical Center who generously participated in this work.
Funding
P30 DK078392 Digestive Diseases Research Core Center in Cincinnati; U01 DK095745 (LAD).
Data-sharing statement
Full gene lists may be found in the Online Supplementary Appendix. RNA sequencing datasets were deposited in GEO (GSE168116 & GSE215068).
macrophages, and a distinct microbial signature in fatal intestinal acute graft-versus-host disease. JCI Insight. 2019;5(17):e129762.
10. Glucksberg H, Storb R, Fefer A, et al. Clinical manifestations of graft-versus-host disease in human recipients of marrow from HL-A-matched sibling donors. Transplantation. 1974;18(4):295-304.
11. Zhang B, Horvath S. A general framework for weighted gene coexpression network analysis. Stat Appl Genet Mol Biol. 2005;4:Article17.
12. Newman AM, Liu CL, Green MR, et al. Robust enumeration of cell subsets from tissue expression profiles. Nat Methods. 2015;12(5):453-457.
13. RefSeq. http://www.ncbi.nlm.nih.gov/refseq.: National Center for Biotechnology Information. Accessed May 2020.
14. Bourgoin P, Biechele G, Ait Belkacem I, Morange PE, Malergue F. Role of the interferons in CD64 and CD169 expressions in whole blood: relevance in the balance between viral- or bacterialoriented immune responses. Immun Inflamm Dis. 2020;8(1):106-123.
15. Minar P, Haberman Y, Jurickova I, et al. Utility of neutrophil Fcgamma receptor I (CD64) index as a biomarker for mucosal inflammation in pediatric Crohn's disease. Inflamm Bowel Dis. 2014;20(6):1037-1048.
16. Minar P, Jackson K, Tsai YT, Sucharew H, Rosen MJ, Denson LA. Validation of neutrophil CD64 blood biomarkers to detect
Haematologica | 108 July 2023 1815 ARTICLE - RNAseq in acute GI GvHD P. Khandelwal et al.
mucosal inflammation in pediatric Crohn's disease. Inflamm Bowel Dis. 2018;24(1):198-208.
17. Minar P, Jackson K, Tsai YT, et al. A Low neutrophil CD64 index is associated with sustained remission during infliximab maintenance therapy. Inflamm Bowel Dis. 2016;22(11):2641-2647.
18. Ratajczak P, Janin A, Peffault de Larour R, et al. IDO in human gut graft-versus-host disease. Biol Blood Marrow Transplant. 2012;18(1):150-155.
19. Piper KP, Horlock C, Curnow SJ, et al. CXCL10-CXCR3 interactions play an important role in the pathogenesis of acute graft-versus-host disease in the skin following allogeneic stemcell transplantation. Blood. 2007;110(12):3827-3832.
20. Graubert TA, DiPersio JF, Russell JH, Ley TJ. Perforin/granzymedependent and independent mechanisms are both important for the development of graft-versus-host disease after murine bone marrow transplantation. J Clin Invest. 1997;100(4):904-911.
21. Buisson A, Vazeille E, Minet-Quinard R, et al. Faecal chitinase 3like 1 is a reliable marker as accurate as faecal calprotectin in detecting endoscopic activity in adult patients with inflammatory bowel diseases. Aliment Pharmacol Ther. 2016;43(10):1069-1079.
22. Deutschmann C, Sowa M, Murugaiyan J, et al. Identification of chitinase-3-like protein 1 as a novel neutrophil antigenic target in Crohn's disease. J Crohns Colitis. 2019;13(7):894-904.
23. Kawada M, Chen CC, Arihiro A, Nagatani K, Watanabe T, Mizoguchi E. Chitinase 3-like-1 enhances bacterial adhesion to colonic epithelial cells through the interaction with bacterial chitin-binding protein. Lab Invest. 2008;88(8):883-895.
24. Low D, Subramaniam R, Lin L, et al. Chitinase 3-like 1 induces survival and proliferation of intestinal epithelial cells during chronic inflammation and colitis-associated cancer by regulating S100A9. Oncotarget. 2015;6(34):36535-36550.
25. Mizoguchi E. Chitinase 3-like-1 exacerbates intestinal inflammation by enhancing bacterial adhesion and invasion in colonic epithelial cells. Gastroenterology. 2006;130(2):398-411.
26. Li Z, Lu H, Gu J, et al. Chitinase 3-like-1-deficient splenocytes deteriorated the pathogenesis of acute graft-versus-host disease via regulating differentiation of Tfh cells. Inflammation. 2017;40(5):1576-1588.
27. Kornblit B, Wang T, Lee SJ, et al. YKL-40 in allogeneic hematopoietic cell transplantation after AML and myelodysplastic syndrome. Bone Marrow Transplant. 2016;51(12):1556-1560.
28. Kamle S, Ma B, He CH, et al. Chitinase 3-like-1 is a therapeutic target that mediates the effects of aging in COVID-19. JCI Insight. 2021;6(21):e148749.
29. Fujiwara H, Docampo MD, Riwes M, et al. Microbial metabolite sensor GPR43 controls severity of experimental GVHD. Nat Commun. 2018;9(1):3674.
30. Toubai T, Tamaki H, Peltier DC, et al. Mitochondrial deacetylase SIRT3 plays an important role in donor T cell responses after experimental allogeneic hematopoietic transplantation. J Immunol. 2018;201(11):3443-3455.
31. Toubai T, Fujiwara H, Rossi C, et al. Host NLRP6 exacerbates graft-versus-host disease independent of gut microbial composition. Nat Microbiol. 2019;4(5):800-812.
32. Kim S, Reddy P. Targeting signal 3 extracellularly and intracellularly in graft-versus-host disease. Front Immunol. 2020;11:722.
33. Cherbuy C, Andrieux C, Honvo-Houeto E, et al. Expression of
mitochondrial HMGCoA synthase and glutaminase in the colonic mucosa is modulated by bacterial species. Eur J Biochem. 2004;271(1):87-95.
34. Vanhoutvin SA, Troost FJ, Hamer HM, et al. Butyrate-induced transcriptional changes in human colonic mucosa. PLoS One. 2009;4(8):e6759.
35. Mathewson ND, Jenq R, Mathew AV, et al. Gut microbiomederived metabolites modulate intestinal epithelial cell damage and mitigate graft-versus-host disease. Nat Immunol. 2016;17(5):505-513.
36. Han L, Zhang H, Chen S, et al. Intestinal microbiota can predict acute graft-versus-host disease following allogeneic hematopoietic stem cell transplantation. Biol Blood Marrow Transplant. 2019;25(10):1944-1955.
37. Han L, Jin H, Zhou L, et al. Intestinal Microbiota at engraftment influence acute graft-versus-host disease via the Treg/Th17 balance in allo-HSCT recipients. Front Immunol. 2018;9:669.
38. Romick-Rosendale LE, Haslam DB, Lane A, et al. Antibiotic exposure and reduced short chain fatty acid production after hematopoietic stem cell transplant. Biol Blood Marrow Transplant. 2018;24(12):2418-2424.
39. Schwabkey ZI, Jenq RR. Microbiome anomalies in allogeneic hematopoietic cell transplantation. Annu Rev Med. 2020;71:137-148.
40. Yoshifuji K, Inamoto K, Kiridoshi Y, et al. Prebiotics protect against acute graft-versus-host disease and preserve the gut microbiota in stem cell transplantation. Blood Adv. 2020;4(19):4607-4617.
41. van Royen-Kerkhof A, Walraven V, Sanders EA, et al. Expression of CD64 (FcgammaRI) in skin of patients with acute GVHD. Bone Marrow Transplant. 2011;46(12):1566-1569.
42. Colombel JF, Sands BE, Rutgeerts P, et al. The safety of vedolizumab for ulcerative colitis and Crohn's disease. Gut. 2017;66(5):839-851.
43. Floisand Y, Lazarevic VL, Maertens J, et al. Safety and effectiveness of vedolizumab in patients with steroid-refractory gastrointestinal acute graft-versus-host disease: a retrospective record review. Biol Blood Marrow Transplant. 2019;25(4):720-727.
44. Nagase H, Visse R, Murphy G. Structure and function of matrix metalloproteinases and TIMPs. Cardiovasc Res. 2006;69(3):562-573.
45. Wang YD, Tan XY, Zhang K. Correlation of plasma MMP-1 and TIMP-1 levels and the colonic mucosa expressions in patients with ulcerative colitis. Mediators Inflamm. 2009;2009:275072.
46. Itamura H, Shindo T, Yoshioka S, Ishikawa T, Kimura S. Phosphorylated ERK1/2 in CD4 T cells is associated with acute GVHD in allogeneic hematopoietic stem cell transplantation. Blood Adv. 2020;4(4):667-671.
47. Itamura H, Shindo T, Tawara I, et al. The MEK inhibitor trametinib separates murine graft-versus-host disease from graft-versus-tumor effects. JCI Insight. 2016;1(10):e86331.
48. Lu SX, Alpdogan O, Lin J, et al. STAT-3 and ERK 1/2 phosphorylation are critical for T-cell alloactivation and graftversus-host disease. Blood. 2008;112(13):5254-5258.
49. Shindo T, Kim TK, Benjamin CL, Wieder ED, Levy RB, Komanduri KV. MEK inhibitors selectively suppress alloreactivity and graftversus-host disease in a memory stage-dependent manner. Blood. 2013;121(23):4617-4626.
50. Khandelwal P, Andersen H, Romick-Rosendale L, et al. A pilot study of human milk to reduce intestinal inflammation after bone marrow transplant. Breastfeed Med. 2019;14(3):193-202.
Haematologica | 108 July 2023 1816 ARTICLE - RNAseq in acute GI GvHD P. Khandelwal et al.
Clonal hematopoiesis
Kyoung Ha Kim,1,2* TaeHyung Kim,1,3,4* Igor Novitzky-Basso,1 Hyewon Lee,1,5 Youngseok Yoo,1
Jae-Sook Ahn,4,6 Ivan Pasic,1 Arjun Law,1 Wilson Lam,1 Fotios V. Michelis,1 Armin Gerbitz,1 Auro Viswabandya,1 Jeffrey Lipton,1 Rajat Kumar,1 Jonas Mattsson,7 Zhaolei Zhang,3,4,8 Nathali Kaushansky,9 Yardena Brilon,9 Noa Chapal-Ilani,9 Tamir Biezuner,9 Liran I. Shlush9# and Dennis Dong Hwan Kim1,10#
1Division of Medical Oncology and Hematology, Princess Margaret Cancer Center, Toronto, Ontario, Canada; 2Department of Internal Medicine, Soonchunhyang University College of Medicine, Soonchunhyang University Hospital, Seoul, Korea; 3Department of Computer Science, University of Toronto, Toronto, Ontario, Canada; 4The Donnelly Center for Cellular and Biomolecular Research, University of Toronto, Toronto, Ontario, Canada; 5Division of Rare and Refractory Cancer, Division of Hemato-Oncology, and Center for Hematologic Malignancy Research Institute and Hospital, National Cancer Center, Goyang, Korea;
6Department of Internal Medicine, Chonnam National University Hwasun Hospital, Chonnam National University, Gwangju, Korea; 7Gloria and Seymour Epstein Chair in Cell Therapy and Transplantation, Department of Medicine, University of Toronto, Toronto, Ontario, Canada;
8Department of Molecular Genetics, University of Toronto, Toronto, Ontario, Canada;
9Department of Immunology, Weizmann Institute of Science, Rehovot, Israel and 10Institute for Medical Science, Faculty of Medicine, University of Toronto, Toronto, Canada
*KHK and TK contributed equally as co-first authors. #LS and DK contributed equally as co-senior authors.
Abstract
Correspondence: D. D. H. Kim dr.dennis.kim@uhn.ca
L. Shlush liran.shlush@weizmann.ac.il
Received: July 24, 2022.
Accepted: January 26, 2023.
Early view: February 2, 2023.
https://doi.org/10.3324/haematol.2022.281806
©2023 Ferrata Storti Foundation
Published under a CC BY-NC license
Donor clonal hematopoiesis may be transferred to the recipient through allogeneic hematopoietic stem cell transplantation (HSCT), but the potential for adverse long-term impact on transplant outcomes remains unknown. A total of 744 samples from 372 recipients who received HSCT and the corresponding donors were included. Bar-coded error-corrected sequencing using a modified molecular inversion probe capture protocol was performed, which targeted 33 genes covering mutations involved in clonal hematopoiesis with indeterminate potential (CHIP) and other acute myeloid leukemia-related mutations. A total of 30 mutations were detected from 25 donors (6.7%): the most frequently mutated gene was TET2 (n=7, 28%), followed by DNMT3A (n=4, 16%), SMC3 (n=3, 12%) and SF3B1 (n=3, 12%). With a median follow-up duration of 13 years among survivors, the presence of CHIP in the donor was not associated with recipient overall survival (P=0.969), relapse incidence (P=0.600) or non-relapse mortality (P=0.570). Donor CHIP did not impair neutrophil (P=0.460) or platelet (P=0.250) engraftment, the rates of acute (P=0.490), or chronic graft-versus-host disease (P=0.220). No significant difference was noted for secondary malignancy following HSCT between the two groups. The present study suggests that the presence of CHIP in allogeneic stem donors does not adversely affect transplant outcomes after HSCT. Accordingly, further study is warranted to reach a clearer conclusion on whether molecular profiling to determine the presence of CHIP mutations is necessary for the pretransplant evaluation of donors prior to stem cell donation.
Introduction
Clonal hematopoiesis with indeterminate potential (CHIP) constitutes a part of the biological aging process,1 and comprises the acquisition of somatic mutations in hematopoietic stem cells (HSC). The presence of CHIP in healthy individuals without any evidence of hematologic
abnormalities is known to increase the risk of hematologic malignancy.2 CHIP-related mutations within genes such as DNMT3A, or TET2 can be detected in up to 95% of healthy individuals with a median age of 50 years when sequencing depth is enhanced up to 100,000× coverage,3 which is at least a thousand times deeper (84× coverage) than that used in the original study which first described the CHIP.1,4
in the donor does not adversely affect long-term outcomes following allogeneic hematopoietic stem cell transplantation: result from a 13-year follow-up
Haematologica | 108 July 2023 1817
ARTICLE - Bone Marrow Transplantation
Nowadays, CHIP is no longer considered a rare phenomenon in healthy individuals, although its biological consequences are still under investigation.
In the context of allogeneic hematopoietic stem cell transplantation (HSCT), the potential transfer of CHIP from donor to recipient may raise concerning implications. An early anecdotal report described transfer of CHIP-mutated HSC to recipients through HSCT.5 Another study suggested an increased risk of poor graft function with HSCT transfer of CHIP hematopoiesis.6 These reports prompted further investigation into whether donors carrying CHIP are acceptable for HSC donation, and it remains unclear whether the use of HSC from donors carrying CHIP correlates with delayed engraftment of HSC after HSCT. In addition to engraftment, the impact of the presence of CHIP in donors (“donor CHIP”) on long-term outcomes following allogeneic HSCT remains to be fully elucidated, including overall survival, relapse incidence or non-relapse mortality (NRM).7,8 Oran et al 8 reported that donor-derived CHIP does not increase the risk of relapse, NRM or survival after allogeneic HCT, while Frick et al. 7 reported somewhat contradicting results, showing reduced incidence of relapse/progression when transplanted with donors with CHIP.
It is a matter of debate whether donor CHIP increases the risk of graft-versus-host disease (GvHD) following HSCT. Frick et al 7 reported that patients who received HSC from a donor with CHIP had a comparatively higher incidence of chronic GvHD (cGvHD) compared to those having a donor without CHIP, while the risk of acute GvHD (aGvHD) was not different between the two groups. In contrast, Oran et al. 8 reported no difference in the risk of cGvHD according to the presence of CHIP in donors but found a higher risk of aGvHD in recipients of a donor with CHIP. This debate also prompted us to evaluate the impact of donor CHIP in detail not only on a/cGvHD incidence, but also on the severity and the extent of organ involvement by a/cGvHD. Interestingly, other work has suggested that the presence of CHIP is associated with an increased risk of solid tumors. CHIP is more prevalent in patients with solid tumors, with a prevalence of approximately 30% in the blood of solid tumor patients compared with the general population.9 A study of paired tumor/blood sequencing was performed in a large cohort of 8,810 patients with non-hematologic cancer using deep coverage. Although it was not completely clear whether shared risk factors, such as smoking, existed between solid cancer and CHIP, it suggested a potential relationship between CHIP and the risk of solid cancer.9 Therefore, we examined whether donor CHIP was associated with the risk of secondary malignancy (SM) in HSCT recipients within our cohort. Given that the present study has a long follow-up duration of 13 years, this work presented a unique opportunity to evaluate whether donor CHIP affected the incidence of SM after allogeneic HSCT.
Methods
Summary of the cohorts and transplant outcomes
A total of 744 samples were included from 372 recipients who received allogeneic HSCT from 2000 to 2007 at the Princess Margaret Cancer Center, Toronto, Canada, and the corresponding donors. GvHD prophylaxis and supportive care adhered to previously described institutional policies.10-12 Genomic DNA samples from consenting donors and recipients were archived from blood samples taken 23 weeks prior to HSCT. This study was approved by the Institutional Ethics Board at the Princess Margaret Cancer Center. Patient characteristics are summarized in Table 1: male 59.9% (n=223); median age 48 years (range, 17-71); predominant use of myeloablative conditioning (n=267, 71.8%), HLA-matched related donor (n=272, 73.1%) and peripheral blood stem cells as a source of stem cells (n=259, 69.6%).
Bar coded error-corrected sequencing for CHIP detection
For the detection of CHIP, bar-coded error-corrected sequencing method was used which is a modified molecular inversion probe capture protocol,13 performed at the Weismann Institute of Science (Rehovot, Israel). Details are provided in the Online Supplementary Appendix. In summary, we designed probes targeting 33 genes covering CHIP-related mutations along with other mutations related to AML: FLT3/ITD, NPM1c and CEBPA. The list of genes targeted is presented in the Online Supplementary Table S1. Bar-coded next-generation sequencing (NGS) library was generated and processed for sequencing with a 150 bp pair-end mode (NovaSeq, Illumina). Somatic variant calling analysis was performed using a customized computational pipeline.14 CHIP mutations were confirmed if they were present with variant allele frequency (VAF) >0.005 in two technical duplicates, with the addition of other filters as described in Online Supplementary Appendix. 14
Definition of statistical endpoints
The day of the stem cell infusion was defined as day 0. Overall survival (OS) duration was calculated as the time from day 0 until death from any cause or last follow-up. NRM was defined as the event of death not related to disease recurrence or progression. Recurrence was defined as recurrence of primary disease following HCT. Engraftment after HCT was determined as a peripheral neutrophil count of ≥0.5×10⁹/L for 3 consecutive days, and a platelet count of ≥20×109/L for at least 3 consecutive days without requiring transfusions or growth factor support. aGvHD and cGvHD were diagnosed and graded using the aGvHD consensus conference criteria15 and the NIH consensus criteria for cGvHD.16 Documentation of secondary malignancy (SM) in the BMT in-house database was captured and summarized for tumor type, tumor site, tumor stage,
Haematologica | 108 July 2023 1818 ARTICLE - Impact of donor CHIP on outcomes after allogeneic HSCT K.H. KIM et al.
the time from day 0 to diagnosis of SM, and the presence of active GvHD at the time of diagnosis of SM.17
Statistical analysis
Patient baseline demographic and disease characteristics as well as transplant procedures are presented with descriptive statistics (Table 1) and were compared according to the presence of donor CHIP using chi-square test for categorical variables and Wilcoxon rank-sum test for continuous variables.
For OS, Kaplan-Meier method was used using the log-rank test, while Cox proportional hazard model was used for univariate and multivariate analysis. For the cumulative incidence analysis of relapse, NRM, engraftment of neutrophil/platelet, aGvHD, cGvHD or SM, Gray method was applied considering the competing events as appropriate. For example, the incidence of SM was defined as time from day 0 until documented date of clinical diagnosis of SM or last follow-up considering death not related to SM or relapse of primary disease as competing events. The Fine-Gray proportional hazard regression model was used for univariate and multivariate analysis of cumulative inci-
dence. For multivariate analysis, stepwise selection procedure was applied including all variables significant in univariate analysis at P value ≤0.1. The presence of donor CHIP variable was mandated for inclusion in the final model throughout the study. Hazard ratio (HR) and 95% confidence interval (CI) were estimated using a predetermined reference risk of 1.0. P values of <0.05 were considered statistically significant. For statistical analyses, R statistical software 3.5.0 (the R Foundation for Statistical Computing, Vienna, Austria; available at http://www.r-project.org) and EZR (Saitama Medical Center, Jichi Medical University, Saitama, Japan) were used. EZR (version 1.41) is a modified version of R commander18 (http://www.jichi.ac.jp/saitamasct/SaitamaHP.files/statmedEN.html).
Results
Detection of clonal hematopoiesis-related mutation in donors and recipients
The mean on-target sequencing coverage was 8,540×. All sequencing data included in this study have been up-
†Other diseases include prolymphocytic leukemia (N=1), NK-cell leukemia (N=1) and chronic eosinophilic leukemia (N=2). CHIP: clo nal hematopoiesis of indeterminate potential; AML: acute myeloid leukemia; MDS: myelodysplastic syndrome; MPN: myeloproliferative neoplasm; ALL: acute lymphoblastic leukemia; CLL: chronic lymphocytic leukemia; NHL: non-Hodgkin lymphoma; MM: multiple myeloma; CML: chronic myeloid leukemia; MAC: myeloablative conditioning; RIC: reduced-intensity conditioning; PBSC: peripheral blood stem cell; HLA: human leukocyte antigen; TBI: total body irradiation; GvHD: graft-versus-host diseases; TCD: T-cell depletion. Haematologica
Patients, N (%) CHIP in donor (N=25) No CHIP in donor (N=347) P Donor age in years, median (range) 55 (24-70) 48 (11-75) 0.074 Recipient age in years, median (range) 51 (21-65) 47 (17-71) 0.158 Recipient sex Male Female 15 (60.0) 10 (40.0) 208 (59.9) 139 (40.1) 1.000 Diagnosis Aplastic anemia AML/MDS/MPN ALL/CLL/NHL CML/MM/Other† 1 (4.0) 13 (52.4)/0 (0)/1 (4.0) 1 (4.0)/1 (4.0)/5 (20.0) 3 (12.0)/0 (0)/0 (0) 15 (4.3) 125 (36.0)/28 (8.1)/19 (5.5) 50(14.4)/24 (6.9)/42 (12.1) 36 (10.4)/4(1.2)/4 (1.2) 0.594 Conditioning regimen by intensity MAC RIC 18 (72.0) 7 (28.0) 249 (71.8) 98 (28.2) 1.000 Source of stem cells Bone marrow PBSC 10 (40.0) 15 (60.0) 103 (29.7) 244 (70.3) 0.270 Donor type HLA-matched related donor HLA-matched unrelated donor Alternative donor 16 (64.0) 4 (16.0) 5 (20.0) 256 (73.8) 70 (20.2) 21 (6.1) 0.049 TBI No TBI TBI (either low dose or myeloablative dose) 7 (28.0) 18 (72.0) 82 (23.6) 265 (76.4) 0.630 GvHD prophylaxis No TCD TCD 22 (88.0) 3 (12.0) 303 (87.3) 44 (12.7) 1.000
Table 1. Demographic, disease, and transplantation characteristics of recipients according to the presence of donor CHIP.
|
July 2023 1819
K.H. KIM et al.
108
ARTICLE - Impact of donor CHIP on outcomes after allogeneic HSCT
loaded into the European Nucleotide Archive. Read processing and variant calling procedures were performed as previously published.14 Detailed descriptions are provided in Online Supplementary Appendix. Analysis of 744 samples from 372 donor-recipient pairs, a total of 92 mutations were detected, of which 25 mutations came from 25 donors (6.7%) (Figure 1A). TET2 was the most frequently mutated gene in donors (n=7, 28%), followed by DNMT3A (n=4, 16%), SMC3 (n=3, 12%), and SF3B1 (n=3, 12%). In the recipients, 67 mutations were de-
tected from 55 recipients (18.0%). DNMT3A was the most frequently detected mutation in 16 recipients, followed by TET2 (n=7). The median number of mutations was 1 (range, 0-1) in donors, and 1 (range, 0-3) in recipients, while median mutation VAF was 1.86% (range, 0.62-48.7%) in donors and 13.1% (range, 0.62-94.4%) in recipients. When recipient characteristics were compared according to donor CHIP status as shown in Table 1, no difference was found between the two groups with respect to diagnosis, conditioning regimen intensity, source of stem cells,
Figure 1. Donor CHIP and survival outcomes (N=372). (A). Frequency and type of clonal hematopoiesis of indeterminate potential (CHIP) mutation detected in donors and recipients (n=372). (B) Overall survival according to the presence of donor CHIP (n=372) (C) Cumulative incidence of relapse according to the presence of donor CHIP (n=372). (D) Cumulative incidence of non-relapse mortality according to the presence of donor CHIP (n=372). HR: hazard ratio; yrs: years.

A B C D Haematologica | 108 July 2023 1820 ARTICLE - Impact of donor CHIP on outcomes after allogeneic HSCT K.H. KIM et al.
donor type or GvHD prophylaxis. Of note, a statistical trend was found towards a higher age in donors with CHIP-related mutation (median 55 years) compared to donors without it (median 48 years; P=0.074 by Mann-Whitney U-test).
Overall outcomes following allogeneic hematopoietic stem cell transplantation
With a median follow-up duration of 13 years (range, 0.318.2 years) in the whole group, the 10-year rate of OS, relapse and NRM were 41.4% (95% CI: 36.4-46.4), 23.8% (95% CI: 19.6-28.3) and 37.6% (95% CI: 32.7-42.6), respectively (Online Supplementary Figure S1). Median day of neutrophil and platelet engraftment was 19 (range, 18-20) and 15 (range, 14-17), while the cumulative incidence of neutrophil and platelet engraftment at day 30 was 91.4% (95% CI: 88.0-93.8) and 81.5% (95% CI: 77.1-85.1), respectively. The cumulative incidence of any grade of aGvHD at day 100 and cGVHD at 3 years was 77.3% (95% CI: 72.6-81.2%) and 62.9% (95% CI: 57.8-67.6) (Table 2), respectively. The incidence of SM at 13 years was 14.3% (95% CI: 10.6-18.4).
No impact of donor CHIP on long-term outcomes following allogeneic hematopoietic stem cell transplantation including overall survival, relapse or non-relapse mortality
We next examined long-term outcomes following HSCT according to the presence of donor CHIP. Consistent with the results from the other studies, we did not find any significant difference in OS, relapse or NRM between the two groups. The 10-year OS rate was not different between the donor CHIP (48.0%) and no donor CHIP group (41.0%), HR=1.010; 95% CI: 0.599-1.706; P=0.969. The 10year cumulative incidence of relapse was not different between the donor CHIP (16.0%) and no donor CHIP group (24.4%), HR=0.788; 95% CI: 0.323-1.918; P=0.60. In addition, the presence of CHIP in donors was not associated with 10-year NRM: 36.0% in the CHIP group compared to 37.7% in the no CHIP group, HR=1.197; 95% CI: 0.639-2.242;
P=0.570 (Figure 1B-D; Online Supplementary Table S2), which was confirmed in multivariate analysis (Figure 2A).
No impact of donor CHIP on engraftment kinetics of neutrophils or platelets following allogeneic hematopoietic stem cell transplantation
A previous study reported that donor cell-derived CHIP is common amongst recipients who developed unexplained cytopenia after allogeneic HCT.6 Thus, we hypothesized that HSC from donors with CHIP could adversely affect engraftment kinetics after allogeneic HSCT, thus increasing the risk of graft failure.6 We examined median day of engraftment and the cumulative incidence rate of engraftment at 30 days after HSCT. Median day of neutrophil engraftment was 19 days (range, 14-24) in the donor CHIP group versus 19 days (range, 16-23) in the no donor CHIP group (data not shown). The cumulative incidence of neutrophil engraftment by day 30 was 88.0% in the donor CHIP group versus 91.6% in no donor CHIP group HR=0.843; 95% CI: 0.5341.331; P=0.460. When considering other clinical risk factors associated with neutrophil engraftment in multivariate analysis, donor CHIP was not an adverse risk factor for delayed neutrophil engraftment (Figure 2B; Online Supplementary Table S3).
Median day of platelet engraftment was 15 days (range, 1125) in the donor CHIP group versus 14 days (range, 11-23) in the no donor CHIP group. The cumulative incidence of platelet engraftment by day 30 was 72.0% in the donor CHIP group versus 82.1% in the no donor CHIP group HR=0.751; 95% CI: 0.461-1.224; P=0.250. Again, when considering other clinical risk factors associated with platelet engraftment, the presence of donor CHIP was not found to increase the risk of delayed platelet engraftment in multivariate analysis (Figure 2B; Online Supplementary Table S3).
No impact of donor CHIP on the risk of overall graftversus-host disease and organ specific graft-versus-host disease
The present study also evaluated the impact of the pres-
CI: confidence interval; CHIP: clonal hematopoiesis of indeterminate potential; OS: overall survival; NRM: non-relapse mortality; aGvHD: acute graft-versus-host disease; cGvHD: chronic GvHD.
Outcomes, % (95% CI) Overall (N=372) CHIP in donor (N=25) No CHIP in donor (N=347) P 10-year OS 41.4 (36.4-46.4) 48.0 (27.8-65.6) 41.0 (35.7-46.1) 0.969 10-year relapse 23.8 (19.6-28.3) 16.0 (4.8-33.1) 24.4 (20.0-29.0) 0.600 10-year NRM 37.6 (32.7-42.6) 36.0 (17.8-54.7) 37.7 (32.6-42.9) 0.570 Day 30 neutrophil engraftment 91.4 (88.0 -93.8) 88.0 (64.0-96.4) 91.6 (88.2-94.1) 0.460 Day 30 platelet engraftment 81.5 (77.1-85.1) 72.0 (48.8-86.0) 82.1 (77.7-85.8) 0.250 Day 100 aGvHD 77.3 (72.6-81.2) 80.0 (56.3-91.7) 77.1 (72.2-81.2) 0.490 3-year cGvHD 62.9 (57.8-67.6) 48.0 (26.9-66.3) 64.0 (58.7-68.8) 0.220 13-year secondary malignancies 14.3 (10.6-18.4) 6.0 (3.0-25.2) 14.8 (11.0-19.2) 0.370
Haematologica | 108 July 2023 1821 ARTICLE - Impact of donor CHIP on outcomes after allogeneic HSCT K.H. KIM et al.
Table 2. Summary of transplant outcomes in the overall population and according to the presence of donor CHIP.
Figure 2. Risk factor analysis of transplant outcomes (N=372).
(A) Multivariate analysis for risk factor of overall survival, relapse incidence, and non-relapse mortality (n=372).

(C ) Multivariate analysis f or risk factor of acute graftversus -host disease (GvHD) and chronic GVHD (n=372). CHIP: clonal hematopoiesis of indeterminate potential; HR: hazard ratio; CI: con fi dence in terval; MAC: myeloablative conditioning;
(B) Multivariate analysis for risk factor of neutrophil and platelet engraftment (n=372);
PBSC: peripheral blood stem cell; HLA: human leukocyte antigen; TCD: T-cell depletion.
A B C
Haematologica | 108 July 2023 1822 ARTICLE - Impact of donor CHIP on outcomes after allogeneic HSCT K.H. KIM et al.
ence of donor CHIP on the risk of aGvHD and cGVHD. The presence of donor CHIP was not associated with the incidence of grade 1-4, 2-4 or 3/4 aGvHD. Similarly, aGvHD grade was not statistically different between the two groups (Figure 3). The incidence of grade 1-4 aGvHD at day 100 was 80.0% in the donor CHIP group versus 77.1% in the no donor CHIP group (P=0.490); grade 2-4 aGvHD was 77.0% in the donor CHIP group versus 69.1% in the no donor CHIP group (P=0.30). Likewise, there was no difference in grade 3/4 aGvHD between the two groups (P=0.110). In terms of the organ involvement by aGvHD, no difference was noted between the two (Online Supplementary Table S4; Online Supplementary Figures 3 and S4A).

The donor CHIP group showed a trend toward lower incidence of 3-year cGvHD. The CHIP group showed 48.0% of cGvHD which was lower than that in the no CHIP group showing 64.0% of cGvHD incidence at 3 years (P=0.220). However, in multivariate analysis, the presence of donor CHIP was not associated with cGvHD (Figure 2C). The distribution of cGvHD severity was similar between the two groups (P=0.389; Figure 3). cGvHD organ involvement was not also significantly different between the two groups (Online Supplementary Table S4). Multivariate analyses confirmed that the presence of donor CHIP was not associated with the risk of acute or chronic GvHD (Online Supplementary Tables S4 and S5; Online Supplementary Figure S3 and S4B).
The risk of secondary malignancies following allogeneic hematopoietic stem cell is not associated with the presence of CHIP in donor

With a median follow-up duration of 13 years, we identified 56 cases (15.1%) of SM after HSCT, with a median la-
tency of 8.4 years from HSCT ( Online Supplementary Table S6). The most common types of SM were non-melanoma skin (n=27, 48%), lung (n=5, 8.9%), prostate (n=5, 8.9%), and hematological cancers (n=5, 8.9%; Figure 4).
Figure 3. Development and severity of acute/chronic graft-versus-host disease according to the presence of CHIP in the donor (N=372). GvHD: graft-versus-host disease; CHIP: clonal hematopoiesis of indeterminate potential.
Haematologica | 108 July 2023 1823 ARTICLE - Impact of donor CHIP on outcomes after allogeneic HSCT K.H. KIM et al.
Figure 4. Secondary malignancies after allogeneic hematopoietic stem cell transplantation (N=372). CHIP: clonal hematopoiesis of indeterminate potential.
The cumulative incidence of SM was 8.9% at 10 years and 16.0% at 15 years post-HSCT, respectively.
Out of 56 patients with a confirmed diagnosis of SM postHSCT, only two patients were in the donor CHIP group: two patients had received HSCT from a donor carrying CHIP (n=2/25, 8.0%), while the remaining 54 patients received HSCT from a donor without CHIP (n=54/347, 15.6%). Due to the small number of patients who developed secondary malignancies and the donor CHIP group, it was difficult to obtain reliable statistical measures. The cumulative incidence of SM at 13 years was 6.0% in the CHIP group versus 14.8% in the no CHIP group.
The two cases diagnosed with SM after HSCT received from a donor carrying CHIP developed non-melanoma skin cancer (n=2) at 13 years and 11 years after HCT, respectively. The CHIP-related mutations in the donors were TET2 (n=1) and EZH2 (n=1), and their HCT indications were AML and NHL, respectively (Online Supplementary Table S7).
Discussion
Allogeneic HSCT involves the transfer of HSC from the donor to the recipient for reconstitution of hematopoiesis.19 Therefore, there are concerns that CHIP mutations from the donor may be engrafted to the recipient through allogeneic HSCT and may affect clinical outcomes after HCT adversely. Previous work has shown that CHIP clones are associated with chronic inflammation and tissue damage.20-23 Donor monocytes and immune cells derived from engrafted HSC carrying CHIP could theoretically promote pro-inflammatory cytokine production and altered epigenetic regulation, thus potentially provoking alloreactivity and GvHD.24-26 This led to concerns that the risk of GvHD and other post-transplant complications might increase when HSC from a donor carrying CHIP are used for HSCT. 7,8 In addition, it was unclear whether HSC from donors with a CHIP-related mutation could affect long-term outcomes of survival, NRM, GvHD and other measures such as engraftment and SM. If the presence of CHIP is concluded to affect transplant outcomes, genetic testing of CHIP should be a part of donor evaluation prior to stem cell donation or prior to donor selection for HSCT. The current study concluded that i) the presence of CHIP in donors does neither reduce OS nor increase risk of relapse or NRM with the observation duration of 13 years of follow-up (range, 0.3-18.2 years); ii) the presence of donor CHIP does not impair engraftment of neutrophil or platelet after HSCT; iii) donor CHIP does not seem to increase the risk of aGvHD or cGvHD; iv) donor CHIP does not increase the risk of SM following HSCT. Accordingly, our result does not support the use of molecular tests to detect donor CHIP mutations during predonation testing.
Previous work reported that patients with CHIP prior to autologous stem cell transplantation (ASCT) had adverse survival after ASCT compared to those without CHIP.27 The same study demonstrated an increased risk of therapyrelated myeloid neoplasm (TMN) in patients carrying CHIP. In addition, an increased risk of NRM, but not risk of relapse, was found to be associated with both higher allele burden and a greater number of CHIP mutations. However, allogeneic HSCT, which may include the transfer of CHIP from healthy donors to recipients, differs from ASCT for several reasons. Donor HSC carrying CHIP will not have been exposed to cytotoxic agents during the HSCT procedure but instead face different and likely stronger immunologic cellular stressors.28-30 In addition, in contrast to ASCT, where HSC carrying CHIP were prepopulated in the marrow prior to ASCT, more time for donor HSC carrying CHIP will be required to expand and become a predominant clone in a new marrow niche of the allogeneic recipient.7 Thus, the prognostic impact of donor CHIP on long-term outcomes following allogeneic HSCT would not be as robust as that after ASCT. Boettcher et al. 19 reported that, in the cases of donor-engrafted CHIP, there was a significant increase in clonal size of CHIP as measured with VAF in recipients after HSCT. However, this increase in VAF was only relatively modest (i.e., 2.3-fold in median VAF between donors and recipients, with VAF in most recipients being ~0.1). This finding indicates transfer of a single CHIP clone, although it is engrafted in the recipient, does not seem to repopulate quickly and dominate recipient’s hematopoietic system quickly.31 Thus, there remains uncertainty on the fate of donor CHIP after transfer to donor hematopoietic system following allogeneic HSCT. Similarly to the two previous studies,7,8 our study confirmed lack of prognostic impact of donor CHIP on OS (P=0.969) or NRM (P=0.570) following HSCT, concluding that the presence of donor CHIP does not increase the risk of overall mortality or NRM after HSCT. Also, in accordance with the previous work,7 the presence of donor CHIP does not negatively affect platelet engraftment rate or engraftment speed following HSCT.
The impact of donor CHIP on relapse risk remains controversial. Frick et al 7 reported reduced risk of relapse in recipients transplanted from a donor with CHIP (HR=0.633; 95% CI: 0.41-0.98; P=0.042), while Oran et al 8 reported no impact of donor CHIP on relapse risk (HR=0.97; 95% CI: 0.61.5; P=0.9), which is in agreement with our result (HR 0.788; 95% CI: 0.323-1.918; P=0.60). The protective effect of donor CHIP from relapse risk observed in the Frick et al.’s study7 can be explained with the finding of higher incidence of cGvHD in patients transplanted with donor CHIP compared to others (HR=1.65; 95% CI:1.15-2.36; P=0.008). However, Oran et al 8 reported no difference in cGvHD incidence between the two groups, similar to our result, with no impact of donor CHIP on relapse risk. In another study by Newell et
Haematologica | 108 July 2023 1824 ARTICLE - Impact of donor CHIP on outcomes after allogeneic HSCT K.H. KIM et al.
al., 32 donor-derived CHIP was not associated with relapse or OS; however, patients with donor-derived CHIP were more likely to develop cGvHD, necessitating systemic immunosuppressive therapy (IST) (P=0.045) and less likely to discontinue IST (P=0.03) compared with controls without donor-derived CHIP. Thus, the differential impact of donor CHIP on relapse risk may not be directly from a putative biological CHIP-related protection from relapse but may instead be related to the occurrence of GvHD, which can indirectly affect the risk of relapse. In the present study, we did not find any difference in cGvHD incidence between the two groups (HR=0.685; P=0.220). Furthermore, Gibson et al. 33 recently reported that donor DNMT3A was associated with reduced relapse (HR=0.59; P=0.014), and increased cGvHD (HR=1.36; P=0.042).
In terms of aGvHD, while the present study and another study7 have reported that the presence of CHIP do not affect the aGvHD incidence, Oran et al 8 reported that donor CHIP increased the risk of grade 2-4 (P=0.001) and 3-4 aGvHD (P=0.008). This different result can result from the different population characteristics and/or transplant procedures which could affect the risk of aGvHD, such as the source of stem cells, GvHD prophylaxis or conditioning regimens. In order to reach a clear conclusion on this issue, further study is strongly warranted to include a larger number of homogenous population transplanted with less diverse conditioning regimen and/or GvHD prophylaxis.
One of the important long-term complications after HSCT is secondary malignancy, which sometimes we miss its importance on its negative impact on survival and quality of life in the transplant survivors. It usually occurs 3-10 years after HSCT. The risk of malignancy is 2-fold higher among recipients of allogeneic HSCT compared to that of the general population.34 In our previous report evaluating the incidence of SM in 2,415 consecutive patients after HSCT, SM were diagnosed in 8.7% of HSCT recipients overall with SM incidence of 6.3% at 10 years17 with a median follow-up duration of 127 months. We here evaluated the impact of donor CHIP on the risk of SM after allogeneic HCT with a median follow-up duration of 13 years. In the present study, follow-up duration was quite long, sufficient to observe SM events occurring after allogenic HSCT. However, because only two patients in the donor CHIP group developed SM, it was difficult to definitively conclude the statistical association between the presence of donor CHIP and the risk
References
1. Jaiswal S, Fontanillas P, Flannick J, et al. Age-related clonal hematopoiesis associated with adverse outcomes. N Engl J Med. 2014;371(26):2488-2498.
2. Genovese G, Kahler AK, Handsaker RE, et al. Clonal hematopoiesis and blood-cancer risk inferred from blood DNA
of SM after HSCT. Based on the result presented here in the current study, we were unable to observe the increased occurrence of SM in the donor CHIP group.
It is still a matter of debate if we have to routinely test the presence of CHIP in the allogeneic donor’s HSC.35,36 As the upper age limit of HCT recipients continues to increase, now we see the use of elderly related donors more frequently, which inevitably raises the concern of using an elderly donor with respect to the transfer of CHIP to the recipient.37 The present result suggests that molecular testing for CHIP mutations may not need to be a part of routine donor evaluation prior to stem cell collection based on its neutral impact on transplant outcomes. However, there are still restricted clinical situations where mutational testing on the donor can be indicated and would be potentially helpful. Further study is warranted to reach a clearer conclusion on these questions.
In summary, based on our analysis as well as those of others, the presence of CHIP in the donor does not seem to increase the risk of adverse outcomes following HSCT. Donor CHIP does neither affect the risk of relapse, survival, GvHD or engraftment adversely, nor does it increase the risk of SM following allogeneic HSCT.
Disclosures
No conflicts of interest to disclose.
Contributions
TK, DK and LS designed the study. INB, HL, YY, JSA, IP, AL, WL, FVM, AG, AV, KL and RK collected samples and performed experiments. TK, ZZ, NK, YB, NCI, TB, and LS analyzed the sequencing data and performed computational analysis. KHK, TK, JSA and DK interpreted the data and statistical analyses. KHK, TK and DK wrote the paper.
Funding
The present study was supported by the Leukemia & Lymphoma Society of Canada (New Idea Award) and by the Princess Margaret Cancer Foundation.
Data-sharing statement
The dataset generated and analyzed during the current study is available in the European Nucleotide Archive (ENA; https://www.ebi.ac.uk/ena/browser/home) under accession number E-MTAB-12472. Code is available on GitHub under https://github.com/ShlushLab.
sequence. N Engl J Med. 2014;371(26):2477-2487.
3. Young AL, Challen GA, Birmann BM, Druley TE. Clonal haematopoiesis harbouring AML-associated mutations is ubiquitous in healthy adults. Nat Commun. 2016;7:12484.
4. Abelson S, Collord G, Ng SWK, et al. Prediction of acute myeloid
Haematologica | 108 July 2023 1825 ARTICLE - Impact of donor CHIP on outcomes after allogeneic HSCT K.H. KIM et al.
leukaemia risk in healthy individuals. Nature. 2018;559(7714):400-404.
5. Rojek K, Nickels E, Neistadt B, et al. Identifying inherited and acquired genetic factors involved in poor stem cell mobilization and donor-derived malignancy. Biol Blood Marrow Transplant. 2016;22(11):2100-2103.
6. Gibson CJ, Kennedy JA, Nikiforow S, et al. Donor-engrafted CHIP is common among stem cell transplant recipients with unexplained cytopenias. Blood. 2017;130(1):91-94.
7. Frick M, Chan W, Arends CM, et al. Role of donor clonal hematopoiesis in allogeneic hematopoietic stem-cell transplantation. J Clin Oncol. 2019;37(5):375-385.
8. Oran B, Champlin RE, Wang F, et al. Donor clonal hematopoiesis increases risk of acute graft versus host disease after matched sibling transplantation. Leukemia. 2022;36(1):298.
9. Coombs CC, Zehir A, Devlin SM, et al. Therapy-related clonal hematopoiesis in patients with non-hematologic cancers is common and associated with adverse clinical outcomes. Cell Stem Cell. 2017;21(3):374-382.
10. Gupta V, Daly A, Lipton JH, et al. Nonmyeloablative stem cell transplantation for myelodysplastic syndrome or acute. Biol Blood Marrow Transplant. 2005;11(10):764-772.
11. Sibai H, Falcone U, Deotare U, et al. Myeloablative versus reduced-intensity conditioning in patients with myeloid malignancies: a propensity score-matched analysis. Biol Blood Marrow Transplant. 2016;22(12):2270-2275.
12. Khalil M, M,I,, Messner HA, Lipton JH, et al. Fludarabine and busulfan plus low-dose TBI as reduced intensity conditioning in. Ann Hematol. 2018;97(10):1975-1985.
13. Hiatt JB, Pritchard CC, Salipante SJ, O'Roak BJ, Shendure J. Single molecule molecular inversion probes for targeted, highaccuracy detection of low-frequency variation. Genome Res. 2013;23(5):843-854.
14. Biezuner T, Brilon Y, Arye AB, et al. An improved molecular inversion probe based targeted sequencing approach for low variant allele frequency. NAR Genom Bioinform. 2022;4(1):lqab125.
15. Przepiorka D, Weisdorf D, Martin P, et al. 1994 Consensus Conference on acute GVHD grading. Bone Marrow Transplant. 1995;15(6):825-828.
16. Jagasia MH, Greinix HT, Arora M, et al. National Institutes of Health Consensus Development Project on criteria for clinical trials in chronic graft-versus-host disease: I. The 2014 Diagnosis and Staging Working Group report. Biol Blood Marrow Transplant. 2015;21(3):389-401.
17. Michelis FV, Kotchetkov R, Grunwald RM, et al. Long-term incidence of secondary malignancies after allogeneic hematopoietic cell transplantation: a single-center experience. Biol Blood Marrow Transplant. 2017;23(6):945-951.
18. Kanda Y. Investigation of the freely available easy-to-use software 'EZR' for medical statistics. Bone Marrow Transplant. 2013;48(3):452-458.
19. Boettcher S, Wilk CM, Singer J, et al. Clonal hematopoiesis in donors and long-term survivors of related allogeneic hematopoietic stem cell transplantation. Blood.
2020;135(18):1548-1559.
20. Fuster JJ, MacLauchlan S, Zuriaga MA, et al. Clonal hematopoiesis associated with TET2 deficiency accelerates atherosclerosis development in mice. Science. 2017;355(6327):842-847.
21. Fuster JJ, Walsh K. somatic mutations and clonal hematopoiesis: unexpected potential new drivers of age-related cardiovascular disease. Circ Res. 2018;122(3):523-532.
22. Sano S, Oshima K, Wang Y, et al. Tet2-mediated clonal hematopoiesis accelerates heart failure through a mechanism involving the IL-1beta/NLRP3 inflammasome. J Am Coll Cardiol. 2018;71(8):875-886.
23. Savola P, Lundgren S, Keranen MAI, et al. Clonal hematopoiesis in patients with rheumatoid arthritis. Blood Cancer J. 2018;8(8):69.
24. Nakata K, Gotoh H, Watanabe J, et al. Augmented proliferation of human alveolar macrophages after allogeneic bone marrow transplantation. Blood. 1999;93(2):667-673.
25. Eisenbarth SC. Dendritic cell subsets in T cell programming: location dictates function. Nat Rev Immunol. 2019;19(2):89-103.
26. Abegunde SO, Buckstein R, Wells RA, Rauh MJ. An inflammatory environment containing TNFα favors Tet2-mutant clonal hematopoiesis. Exp Hematol. 2018;59:60-65.
27. Gibson CJ, Lindsley RC, Tchekmedyian V, et al. Clonal hematopoiesis associated with adverse outcomes after autologous stem-cell transplantation for lymphoma. J Clin Oncol. 2017;35(14):1598-1605.
28. Ogawa S. Clonal hematopoiesis in acquired aplastic anemia. Blood. 2016;128(3):337-347.
29. Schoettler ML, Nathan DG. The pathophysiology of acquired aplastic anemia: current concepts revisited. Hematol Oncol Clin North Am. 2018;32(4):581-594.
30. Stanley N, Olson TS, Babushok DV. Recent advances in understanding clonal haematopoiesis in aplastic anaemia. Br J Haematol. 2017;177(4):509-525.
31. Fabre MA, Vassiliou GS. Home and away: clonal hematopoiesis in sibling transplants. Blood. 2020;135(18):1511-1512.
32. Newell L, Williams T, Liu J, et al. Engrafted donor-derived clonal hematopoiesis after allogenic hematopoietic cell. Transplant Cell Ther. 2021;27(8):662.
33. Gibson CJ, Kim HT, Zhao L, et al. Donor clonal hematopoiesis and recipient outcomes after transplantation. J Clin Oncol. 2022;40(2):189-201.
34. Atsuta Y, Suzuki R, Yamashita T, et al. Continuing increased risk of oral/esophageal cancer after allogeneic hematopoietic stem cell transplantation in adults in association with chronic graftversus-host disease. Ann Oncol. 2014;25(2):435-441.
35. DeZern AE, Gondek LP. Stem cell donors should be screened for CHIP. Blood Adv. 2020;4(4):784-788.
36. Gibson CJ, Lindsley RC. Stem cell donors should not be screened for clonal hematopoiesis. Blood Adv. 2020;4(4):789-792.
37. Randall J, Keven K, Atli T, Ustun C. Process of allogeneic hematopoietic cell transplantation decision making for older adults. Bone Marrow Transplant. 2016;51(5):623-628.
Haematologica | 108 July 2023 1826 ARTICLE - Impact of donor CHIP on outcomes after allogeneic HSCT K.H. KIM et al.
Development and manufacture of novel locally produced anti-BCMA CAR T cells for the treatment of relapsed/refractory multiple myeloma: results from a phase I clinical trial
Nathalie Asherie,1* Shlomit Kfir-Erenfeld,1* Batia Avni,1* Miri Assayag,1 Tatyana Dubnikov,1 Nomi Zalcman,1 Eyal Lebel,2 Eran Zimran,2 Adir Shaulov,2 Marjorie Pick,2 Yael Cohen,3 Irit Avivi,3 Cyrille Cohen,4 Moshe E. Gatt,2# Sigal Grisariu1# and Polina Stepensky1#
1Department of Bone Marrow Transplantation and Cancer Immunotherapy, Hadassah Medical Center, Faculty of Medicine, Hebrew University of Jerusalem; 2Department of Hematology, Hadassah Medical Center, Faculty of Medicine, Hebrew University of Jerusalem; 3Department of Hematology, Tel Aviv Medical Center, Sackler faculty of medicine, Tel Aviv University and 4Laboratory of Tumor Immunology and Immunotherapy, The Mina and Everard Goodman Faculty of Life Sciences, Bar-Ilan University, Ramat Gan 52900-02, Israel
*NA, SK-E and BA contributed equally as co-first authors. #MEG, SG and PS contributed equally as senior authors.
Abstract
Correspondence: P. Stepensky polina@hadassah.org.il
N. Asherie nathaliea@hadassah.org.il
Received: June 24, 2022.
Accepted: September 23, 2022.
Early view: October 6, 2022.
https://doi.org/10.3324/haematol.2022.281628
©2023 Ferrata Storti Foundation
Published under a CC BY-NC license
Anti-B-cell maturation antigen (BCMA) chimeric antigen receptor T-cell (CAR T) therapy shows remarkable efficacy in patients with relapsed and/or refractory (R/R) multiple myeloma (MM). HBI0101, a novel second generation optimized antiBCMA CAR T-cell therapy, was developed in an academic setting. We conducted a phase I dose-escalation study of HBI0101 (cohort 1: 150x106 CAR T cells, n=6; cohort 2: 450x106 CAR T cells, n=7; cohort 3: 800x106 CAR T cells, n=7) in 20 heavily pre-treated R/R MM patients. Grade 1-2 cytokine release syndrome (CRS) was reported in 18 patients (90%). Neither grade 3-4 CRS nor neurotoxicity of any grade were observed. No dose-limiting toxicities were observed in any cohort. The overall response rate (ORR), (stringent) complete response (CR/sCR), and very good partial response rates were 75%, 50%, and 25%, respectively. Response rates were dose-dependent with 85% ORR, 71% CR, and 57% minimal residual disease negativity in the high-dose cohort 3. Across all cohorts, the median overall survival (OS) was 308 days (range 25-466+), with an estimated OS of 55% as of June 27th (data cut-off). The median progression-free survival was 160 days, with 6 subjects remaining progression free at the time of data cut-off. Our findings demonstrate the manageable safety profile and efficacy of HBI0101. These encouraging data support the decentralization of CAR T production in an academic setting, ensuring sufficient CAR T supply to satisfy the increasing local demand. Clinicaltrials.gov NCT04720313.
Introduction
Therapy for multiple myeloma (MM) currently involves novel agents such as proteasome inhibitors (PI) and immune modulators (IMiD) as well as anti-CD38 antibodies that improve patient outcome.1 Achievement of deep hematologic response is well correlated with better progression-free survival (PFS) and overall survival (OS) in MM patients.2 However, despite major advances in therapy, the vast majority of patients will develop resistance to PI, IMiD, and anti-CD38 antibodies, and these individuals pose a major treatment challenge. Advanced-line therapies with second- and third-generation IMiD and PI, or
with other newer agents, induce overall response rates (ORR) of 25-40% with limited PFS.3-5 Patients resistant to five agents (penta-refractory) have an extremely dismal prognosis with a median PFS and OS of 3.88 and 5.97 months, respectively.6 Newer agents, such as anti-B-cell maturation antigen (BCMA)-conjugated antibodies (e.g., belantamab mafodotin) and selective inhibitor of nuclear export (e.g., selinexor), have recently been registered as advanced-line treatments, yet they rarely lead to deep or prolonged responses.7
Adoptive transfer of genetically engineered chimeric antigen receptor T (CAR T) cells targeted to BCMA can induce durable and complete responses in patients with MM
Haematologica | 108 July 2023 1827 ARTICLE - Cell Therapy & Immunotherapy
with favorable safety and efficacy profiles, leading to deep and unprecedented durable responses in heavily pretreated patients.8-12 Results have opened a new era for the treatment of MM in relapsed and refractory (R/R) patients. Idecabtagene vicleucel (Ide-cel) and Ciltacabtagene autoleucel (Cilta-cel) are two anti-BCMA CAR T-based therapies recently approved by the US Food and Drug Administration (FDA) and the European Medicines Agency (EMA) that induce deep responses (over 85% ORR rates) in heavily pretreated patients.9,10 However, economic, logistical, and manufacturing constraints significantly limit access to this "living-drug", and thus represent a major drawback of this approach. Given this, there is an urgent need to develop locally manufactured CAR T-cell treatments. For this purpose, we designed and developed a novel academic antiBCMA CAR construct, named HBI0101.13 Based on the favorable pre-clinical results showing marked in vitro and in vivo efficacy of HBI0101-engineered T cells, we initiated a phase I clinical trial for the treatment of R/R MM patients. Here we present the safety and efficacy outcomes of the first 20 R/R MM patients enrolled in this study. The question as to how to broaden the application of CAR T-based immunotherapy to patients lacking access to the commercial CAR T platform will also be discussed. Beyond the unprecedented clinical results achieved for the first time in Israel, our experience testifies to the feasibility of a decentralized approach for developing, manufacturing, and delivering such treatments, even with modest resources.
Methods
Details of the CAR structure, the generation of a clinical grade HBI0101 retroviral bank, the production of HBI0101 cells (including Quality Control and sterility testing), and patients' follow-up are provided in the Online Supplementary Appendix.
Study design
A single-center phase I clinical trial is being conducted at the Department of Bone Marrow Transplantation and Cancer Immunotherapy, Hadassah Medical Center (HMO). The aim is to explore the safety and efficacy of the HBI0101 CAR T-cell product that we manufactured in-house. Enrolled R/R MM patients had previously undergone at least three lines of treatment including a PI, an IMiD, and an antiCD38 antibody. Details of the complete study protocol, eligibility criteria, and study design are to be found in the Online Supplementary Table S1, Online Supplementary Figures S2 and S3. This study was authorized by the HMO institutional review board and by the Israeli Ministry of Health. The study was registered at clinicaltrials.gov (NCT04720313).
The phase I part of the trial was initiated in February 2021.
Enrolled patients underwent lymphopheresis, and collected cells were delivered to the Good Manufacturing Practice (GMP) facility for further stimulation, transduction, and expansion (Online Supplementary Figure S4). Bridging with local radiotherapy was allowed according to the physician's discretion. Patients' lymphodepletion before HBI0101 infusion was achieved by the administration of fludarabine 25 mg/m2 and cyclophosphamide 250 mg/m2 on days -5 to -3 (Online Supplementary Figure S2). Patients with creatinine clearance <30 mL/min received 90 mg/m2 bendamustine on days -4 and -3. Fresh HBI0101 cells were administered at escalating doses of 150- (cohort 1), 450- (cohort 2), and 800x106 (cohort 3) CAR+ cells. In accordance with the study protocol, patients remained hospitalized for at least 10 days post infusion. During hospitalization, patients were followed daily for adverse events (AE), and according to a pre-defined schedule for safety and efficacy. (See Online Supplementary Figure S2 for details.)
Multiple myeloma clinical monitoring
Response to HBI0101 was evaluated at a pre-defined time schedule according to International Myeloma Working Group (IMWG) criteria.14 Bone marrow biopsies and computed tomography / positron emission tomography (CT/PET) were used to assess response in patients with non-secretory disease.14 Minimal residual disease (MRD) was evaluated by flow cytometry, in accordance with the Euroflow standards.15 Patients were categorized as "no response" and "response" (no response: stable disease (SD) / progressive disease (PD); response: ≥ very good partial response [VGPR]). An analysis of patients' data grouped according to PD/SD, VGPR, and complete response (CR) is also provided in Online Supplementary Figure S7
Primary and secondary end points
The primary end points of the present study were safety and the determination of the maximum tolerated dose (MTD) of HBI0101. Hematologic and non-hematologic adverse events were graded according to National Cancer Institute Common Terminology Criteria for Adverse Events (NCI CTCAE), version 5.00. Cytokine release syndrome (CRS) and immune effector cell-associated neurotoxicity syndrome (ICANS) adverse events were graded according to the 2019 American Society for Transplantation and Cellular Therapy (ASTCT) criteria.16 Secondary end points included ORR, PFS, and OS.
Results
Patients’ and disease characteristics
Between January 24, 2021, and December 23, 2021, 22 patients were screened, enrolled, and leukapheresed. For
Haematologica | 108 July 2023 1828 ARTICLE - Locally produced BCMA.CAR T cells for R/R multiple myeloma N. Asherie et al.
three patients, apheresis material was cryopreserved; two patients left the study (one patient achieved CR, one patient died) before CAR T-cell manufacture (Online Supplementary Figure S5). HBI0101 drug products (DP) were successfully generated from fresh (n=19) and cryopreserved (n=1) raw materials; no production failure occurred, and these were infused back to patients. Three patients received bridging therapy during the manufacturing period. Two patients were treated with localized radiotherapy for pain control, and one patient received high-dose dexamethasone and plasmapheresis due to hyperviscosity. The majority of patients (n=18) underwent lymphodepletion with fludarabine-cyclophosphamide; two patients received bendamustine due to renal impairment (Online Supplementary Figure S5). All the patients were infused with fresh DP after ten days of production. The median duration of hospitalization post-CAR T infu-
sion was 17 days (range 11-166), with the majority of the patients discharged after a maximum of 25 days, except for Patient 2 (P2) who had prolonged neutropenia and thrombocytopenia, and thus remained hospitalized for 166 days.
Patients' characteristics are detailed in Table 1. The median age was 62 years (range 44-75), with a median time of 55 months from initial disease diagnosis (range 8-241) and a median number of 6 previous treatment lines (range 3-13). The majority of patients had undergone previous autologous bone marrow (BM) transplantation (85%), and all were refractory to PI, IMiD, anti-CD38 antibody (daratumumab), and their last treatment line. Seven of twenty patients (35%) were penta-refractory. Nine patients (45%) had previously received and were refractory to an anti-BCMA conjugated antibody (belantamab mafodotin) (Table 1). A detailed description of previous treat-
N: number; F: female; M: male; LDH: lactate dehydrogenase; ECOG: Eastern Cooperative Oncology Group; BM: bone marrow; PET: positron emission tomography; R-ISS: Revised International Staging System; HSCT: hematopoietic stem cell transplantation. *High risk cytogenetic abnormalities included: del(17p), t(4;14), and t(14;16).
Table 1. Patients’ and disease characteristics.
Variables Total N=20 Cohort 1 N=6 Cohort 2 N=7 Cohort 3 N=7 Age in years, median (range) 62 (44-75) 58.5 (44-75) 62 (54-73) 62 (50-72) Gender F/M, N 12/8 4/2 4/3 4/3 Time since diagnosis in months, median (range) 55 (8-241) 42 (20-123) 78 (44-241) 43 (8-104) Extra-medullary disease, N (%) 6 (30) 3 (50) 1 (14) 2 (29) LDH above normal, N (%) 8 (40) 3 (50) 2 (29) 2 (29) ECOG performance status, N (%) 0 7 (35) 3 (50) 2 (29) 2 (29) 1 4 (20) 1 (17) 2 (29) 1 (14) 2 9 (45) 2 (33) 3 (43) 4 (57) Creatinine clearance <60 mL/min, N (%) 7 (35) 1 (17) 3 (43) 3 (43) Ejection fraction <55%, N (%) 3 (15) 0 2 (29) 1 (14) Involved heavy chain, N (%) IGG 4 (20) 1 (17) 1 (14) 2 (29) IGA 5 (25) 1 (17) 2 (29) 2 (29) Involved light chain, N (%) kappa 11 (55) 2 (33) 4 (57) 5 (72) lambda 8 (40) 4 (67) 3 (43) 1 (14) Non-secretory 1 (5) 0 0 1 (14) BM involvement, N (%) 16 (80) 5 (83) 6 (86) 5 (72) ≥50% 6 (30) 3 (50) 2 (29) 1 (14) PET positivity, N (%) 11 (55) 4 (67) 2 (29) 5 (72) R-ISS, N (%) I 1 (5) 1 (17) 0 0 II 11 (55) 0 4 (57) 7 (100) III 2 (10) 2 (33) 0 0 Cytogenetic abnormalities, N (%) High risk* 10 (50) 4 (67) 5 (72) 1 (14) Standard risk 12 (60) 5 (83) 5 (72) 4 (57) Unknown 1 (5) 1 (17) Previous auto HSCT, N (%) 17 (85) 5 (83) 7 (100) 5 (72) >1 8 (40) 2 (33) 4 (57) 1 (14) N of previous lines, median (range) 6 (3-13) 5 (4-7) 9 (3-13) 5 (3-7) Haematologica | 108 July 2023 1829 ARTICLE - Locally produced BCMA.CAR T cells for R/R multiple myeloma N. Asherie et al.
ment lines and refractory patients is available in Online
Supplementary Table S2. Patients in cohort 1 had a higher rate of extramedullary disease and penta-refractory disease, high lactate dehydrogenase (LDH) levels, and extensive BM involvement (as defined by >50% plasma cells in BM biopsy), while patients in cohort 3 had a worse ECOG performance score and a lower incidence of cytogenetic high-risk disease (Table 1).
HBI0101 CAR T-cell manufacture
HBI0101 CAR T cells were locally produced at the GMP-accredited facility for advanced cellular therapy, at Hadassah Medical Center; cells were successfully manufactured for all the patients. Median lymphocyte count at the time of apheresis collection was 1.0x10⁶/mL (range 0.5-2.1), with no negative impact on the successful CAR T-cell manufacture. All final DP were released in compliance with the criteria specified in Online Supplementary Table S3. No significant differences in the production data or in vitro functionality of CAR T cells of the “response” and the “no response” groups (Online Supplementary Table S4) were observed, attesting to the robustness of the production
Table 2. Adverse events.
N: number; d: day.
process, despite the high variability in the materials that were available from the MM patients.
Safety Hematologic toxicities
All patients developed a grade 3-4 neutropenia, twothirds of whom had grade 3 febrile neutropenia (FN) (Table 2). The entire cohort developed grade 3-4 lymphopenia, with approximately 60% developing grade 3-4 thrombocytopenia and anemia. There was a higher incidence of thrombocytopenia and FN in cohort 3 compared to cohorts 1 and 2 (Table 2). The median duration of grade 3-4 neutropenia and grade 3-4 thrombocytopenia were 15 days (range 1-65) and 24 days (range 8-138), respectively (excluding 3 patients who progressed and died without recovery of these values). Less than one-third of patients had grade 3-4 cytopenia persisting for >28 days after CAR T-cell infusion (Table 2).
Cytokine release syndrome and immune effector cellassociated neurotoxicity syndrome
Ninety percent of patients developed CRS of any grade,
Adverse events, N (%) Total Total Grade 3-4 Cohort 1 Cohort 2 Cohort 3 All grades Grade 3-4 Grade 3-4 Grade 3-4 N=20 N=6 N=7 N=7 Hematologic ≤28d Neutropenia 20 (100) 20 (100) 6 (100) 7 (100) 7 (100) Thrombocytopenia 14 (70) 12 (60) 3 (50) 4 (57) 5 (71) Anemia 19 (95) 13 (65) 3 (50) 6 (86) 4 (57) Lymphopenia 20 (100) 20 (100) 6 (100) 7 (100) 7 (100) Febrile neutropenia 13 (75) 13 (75) 3 (50) 4 (57) 6 (86) Hematologic >28d Neutropenia 12 (60) 6 (30) 1 (17) 2 (29) 3 (43) Thrombocytopenia 15 (75) 7 (35) 2 (34) 2 (29) 3 (43) Anemia 14 (70) 0 0 0 0 Lymphopenia 15 (75) 6 (30) 3 (50) 1 (14) 2 (29) Hypogammaglobulinemia 14 (70) 5 (25) 2 (34) 1 (14) 2 (29) Other ≤28d Renal failure 3 (15) 0 0 0 0 Elevated liver enzymes 2 (10) 2 (10) 1 (17) 0 0 Sepsis 3 (15) 3 (15) 0 2 (28) 1 (14) Infectious gastroenteritis 1 (5) 1 (5) 0 1 (14) 0 Atrial fibrillation 1 (5) 0 0 0 0 Pulmonary edema 1 (5) 1 (5) 0 1 (14) 0 Urinary tract infection 1 (5) 0 0 0 0 Deep vein thrombosis 2 (10) 0 0 0 0 Other >28d Atrial fibrillation 1 (5) 1 (5) 1 (17) 0 0 Pulmonary edema 1 (5) 1 (5) 1 (17) 0 0 Elevated liver enzymes 1 (5) 1 (5) 0 0 1 (14) Pneumonia 1 (5) 0 0 0 0 Pulmonary embolism 1 (5) 1 (5) 1 (17) 0 0 Haematologica | 108 July 2023 1830 ARTICLE - Locally produced BCMA.CAR T cells for R/R multiple myeloma N. Asherie et al.
mostly at the day of CAR T infusion (median 0 days; range 0-21), with a median duration of 2 days (range 1-5); none developed grade 3 or over CRS (Online Supplementary Table S4). However, a higher rate of CRS grade 2 was noted in cohorts 3 and 2 as compared with cohort 1 (3/7, 4/7, 1/6, respectively) (Online Supplementary Table S4). Tocilizumab was used in 40% percent of patients with a median of one administered dose (range 1-4). No ICAN event was observed, and none of the patients required glucocorticoids.
Non-hematologic toxicities
Non-hematologic toxicities were reported in 80% (n=16) of patients (Table 2). Bacteremia was documented in 15% of patients. Grade 3-4 reported toxicities were: sepsis (n=3), elevated liver enzymes (n=2), atrial fibrillation (n=1), infectious gastroenteritis (n=1), pulmonary edema which was secondary to cardiac causes with fluid overload and sepsis (n=2); all of these resolved. One patient developed grade 3 pulmonary embolism (PE) 10 months after CAR T therapy while in remission. PE developed due to the patient's immobilization following infection with pseudomonas pneumonia, which was successfully treated with anticoagulation therapy.
Five patients were re-hospitalized during the subsequent follow-up period due to COVID19 infection. The reasons for this were: observation (n=1), 9 months after infusion of cells; pulmonary embolism, pneumonia, and atrial fibrillation, treated with anticoagulation, antibiotics and cardioversion, 8 months after infusion of cells (n=1); infectious gastroenteritis due to salmonella and adenovirus in stool treated with antibiotics and fluids (n=1), 27 days after infusion of cells; fever treated with broad spectrum antibiotics and 2 doses of tocilizumab (n=1), 21 days after infusion of cells; nausea, vomiting, and dyspnea resolved with fluids and antiemetics (n=1), 19 days after infusion of cells (Table 2). No other severe adverse effects (SAE) were observed in any of the cohorts. One patient died within 30 days of infusion due to disease progression. There were no treatment-related mortalities.
Short-term efficacy
At a median follow-up of 136 days (80, 182, and 160 for cohorts 1, 2 and 3, respectively), ORR was 75% for the entire cohort with 50% (3/6), 85% (6/7), and 85% (6/7) responding patients in cohorts 1, 2, and 3, respectively (Figure 1A). Ten patients achieved (stringent) complete response (sCR/CR), with six patients achieving MRD negativity (four in cohort 3); five patients achieved VGPR (four in cohort 2), with two patients achieving MRD negativity (Figure 1A, B). All patients' best responses were achieved one month after CAR T infusion, except patients P7 and P11 who achieved VGPR at their fi rst follow-up, and further deepened their response to sCR/CR and VGPR MRD-, respectively, a few months later (Figure 1B). The
median PFS for the entire cohort was 160 days (range 14326+); 80 days (range 23-248), 182 days (range 33-326+), and not reached (range 14-223+) for cohorts 1, 2, and 3, respectively (Figure 2A and B). Median OS was 308 days (range 25-466+), with an estimated OS of 55% as of data cut-off on June 27th. The median OS was 237 days (range 25-466+), 282 days (range 63-347+), and not reached in cohorts 1, 2, and 3, respectively (Figure 2D). All deaths (9/20, 45%) but one were attributed to disease progression.
The death of one patient (P7) was related to COVID19 infection. Free light chain (FLC) levels prior to and following CAR T-cell infusion in responders versus non-responders are shown in Figure 3A-C. In addition, soluble BCMA (sBCMA) levels, as a biomarker of responsiveness to antimyeloma therapies,9,10,17-19 declined rapidly in the serum of the responders, while serum levels were barely affected in the non-responding patients (Figure 3D). In addition, median LDH levels pre-lymphodepletion tended to be higher in the non-responding patients compared to responders ( P =0.068). No correlation with response was seen for C-reactive protein peak level, fibrinogen levels, and the relative increase in ferritin levels during the first 14 days following CAR T infusion (Online Supplementary Figure S6A-D). No significant difference in terms of CRS was observed between the "response" versus "no response" groups (data not shown).
Evaluation and phenotypic characterization of bone marrow plasma cells
In order to assess patient's response to HBI0101 treatment at the cellular level, BM aspirates were analyzed by flow cytometry prior to (n=12) and one month following (n=11) CAR T administration (Figure 4A). Of these patients, three were non-responsive to HBI0101 therapy, and showed only a minor decline, or even an increase, in the percentage of BM plasma cells (BM-PC) (Figure 4B). In contrast, nine patients who did respond showed a significant reduction in the percentage of BM-PC (Figure 4B). In addition, we found that baseline BCMA and mean fluorescence intensity (MFI) on the surface of PC was significantly higher in patients in the “response” group, compared to patients in the “no response” group (Figure 4C and D; Online Supplementary Figure S7A and B). Interestingly, we found that the CD56 molecule was signi ficantly expressed on the PC of HBI0101-responding patients (Figure 4E).
CAR T-cell kinetics
The pharmacokinetics of HBI0101 cells was assessed at serial time-points in the peripheral blood of MM patients following CAR T administration. Median time to HBI0101 peak concentration (Cmax) was day 10 (range, 6-13) in the "response" group (sCR/CR; range, 6-13), and VGPR (range,
Haematologica | 108 July 2023 1831 ARTICLE - Locally produced BCMA.CAR T cells for R/R multiple myeloma N. Asherie et al.
Figure 1. Objective responses in patients treated with HBI0101 CAR T cells. (A) Overall response rate (ORR). The best responses for each patient are shown according to dose (150-, 450- and 800x106 CAR+ cells/dose). Disease response was determined according to the International Myeloma Working Group (IMWG) consensus criteria.14 Minimal residual disease (MRD) is defined as the number of multiple myeloma (MM) plasma cells detected in the bone marrow per 1x10⁵ total nucleated cells. An MRD of 1x10⁻⁵ or less is considered MRD-negative (MRD-). (B) Response to HBI0101 treatment. Swimmer's plot of best responses among individual MM patients are shown according to cell dose (150- to 800x106 CAR+). Response assessment according to IMWG criteria. Grey: progressive disease (PD) / stable disease (SD); green: very good partial response (VGPR); light blue: stringent complete response/complete response with MRD positive (sCR/CR [MRD+]); blue: stringent complete response/complete response with MRD negative (sCR/CR [MRD-]).

10-13), and day 13 (range, 10-13) in the "no response" group (Figure 5D, Online Supplementary Figure S7F), with a rapid decline in HBI0101 cell proliferation within a month of post CAR T infusion. The area under the curve, as measure of overall CAR T-cell expansion within the first month of post CAR T infusion, was at borderline significance (P=0.0597) between the two groups (Figure 5B); this difference was more pronounced when patients were classified into SD/PD, VGPR and sCR/CR subgroups (Online Supplementary Figure S7C and D). In line with this observation, Cmax values, as a measure of maximal CAR T-cell expansion, were found to differ significantly between the two groups: 60,655 HBI0101 cells/mL blood (range 4,945-493,152) in the “response” group versus 3,740 HBI0101 cells/mL blood (range 1,117-21,857) in the “no response” group (Figure 5C). Online Supplementary Figure S7E further shows that increased C max values correlate with depth of response to HBI0101. It is noteworthy that, while a significant difference in the levels of sBCMA was observed between cohort 1 and cohorts 2 and 3 (P<0.0004), no significant difference in terms of HBI0101 cell kinetics in the peripheral blood was found between these cohorts (Online Supplementary Figure S8A and B). In the “response” group, the decline observed in sBCMA levels is concomitant with HBI0101 CAR T expansion in the peripheral blood in contrast to the "no response" group (Figure 5E and F), suggesting that the decrease in sBCMA is associated with HBI0101 CAR T-cell
anti-myeloma activity, which results in the eradication of PC and subsequent sBCMA clearance.
Cytokine profiling analysis to predict response to HBI0101-therapy
To better understand and potentially predict patients' responsiveness to HBI0101 therapy, we determined the cytokine "signature' which can be associated with the HBI0101 CAR T-cell anti-myeloma function in vivo. To this end, sera were collected from MM patients at baseline (day -10) and at T max (day of Cmax of each patient) and analyzed for cytokine secretion by multiplex array. The multiplex panel included 25 pro- and anti-inflammatory chemokines/ cytokines. (A detailed panel is provided in the Online Supplementary Appendix.) Among the 25 biomarkers analyzed, the cytokines that were differently expressed in the different groups (at baseline and Tmax) are described in the heat-map representation in Online Supplementary Figure S9A. Of these, six cytokines (IL-1ra, IL-10, CCL4, IL-15, GCSF, IL-6) were significantly differentially expressed between the different groups (Online Supplementary Figure S8B). More specifically, at Tmax , IL-10, CCL4, and IL-15 were found at higher levels in the "no response" group, while G-CSF and IL-6 were found at higher levels in the "response" group (Online Supplementary Table S5, Online Supplementary Figure S9A). At Tmax , IL-1ra was significantly upregulated in the "no response" group but not in the "re-
Haematologica | 108 July 2023 1832 ARTICLE - Locally produced BCMA.CAR T cells for R/R multiple myeloma N. Asherie et al. A B
sponse" group. A significant increase at T max in the "response" versus "no response" patient groups was also seen for IFN-γ (Online Supplementary Figure S9A). No statistical difference was observed in the level of TNF-α or IL2 in either group.
Effect of exposure to previous anti-BCMA antibody on HBI0101 therapy
In this study, 9/20 patients (2/6 from cohort 1, 5/7 from cohort 2, and 2/7 from cohort 3) had received belantamab mafodotin prior to HBI0101 therapy. Patients exposed to belantamab (belantamab(+)) tended to have a shorter PFS and a higher progression rate (7/9, 78%) in comparison with the non-exposed (belantamab(-)) patients (6/11, 55%) (Figure 6A). Moreover, OS was lower in belantamab(+) patients (3/9, 33%) than that of belantamab(-) patients (8/11, 73%) (Figure 6B). ORR was higher in the belantamab(-) group in comparison with the belantamab(+) group (91% vs. 55%, respectively) (Figure 6C). Notably, when we looked at depth of response, we found that belantamab(-) patients achieved significantly deeper responses than belantamab(+) patients (sCR/CR, P=0.002; VGPR, P=0.02; by unpaired t test). However, there was no significant difference in the levels of BCMA expression on PC (determined

by MFI) or in the percentage of BCMA-positive PC between the two groups.
Discussion
Access to CAR T therapy for MM patients is still limited. There is a need to explore available, safe and effective methods to deliver this promising technology. We recently presented an optimized novel anti-BCMA CAR molecule and showed that modifications in the transmembrane (TM)/hinge of this CAR construct impact CAR performance both in vitro and in vivo 13 Here we share the safety and efficacy outcomes of the first 20 R/R MM patients enrolled on a phase I academically designed trial on locally manufactured anti-BCMA CAR T cells.
Our safety results are in line with those of approved BCMA-targeted CAR T therapies.9,10 We observed grade 34 neutropenia in the entire cohort, and anemia and thrombocytopenia in less than two-thirds of patients, with a median time to recovery of 3 weeks. Two-thirds of patients experienced FN, with a higher rate in cohort 3. This reversible cytopenia appears to be dose-dependent rather than being driven only by the lymphodepletion-related
Figure 2. Survival of patients with relapsed / refractory multiple myeloma administered with HBI0101 CAR T cells. Kaplan-Meier analysis of progression-free survival (PFS) in all the patients (A) or grouped according to dose (B), overall survival (OS) in all patients (C) or grouped according to dose (D).
A B Haematologica | 108 July 2023 1833 ARTICLE - Locally produced BCMA.CAR T cells for R/R multiple myeloma N. Asherie et al. C D
Figure 3. Multiple myeloma disease monitoring. Free light chain levels were determined at the indicated time points prior to and following HBI0101 infusion in cohort 1 (N=6) (A), cohort 2 (N=6) (B), and cohort 3 (N=6) (C). Normal range for Kappa light chain: 6.7-22.4 mg/L, and Lambda light chain: 8.3-27 mg/L. (D) Soluble BCMA (sBCMA) levels prior to and following CAR T infusion were determined by ELISA in the "response" (blue squares) versus "no response" (black dots) groups.
chemotherapy. However, this AE was not associated with cytopenia-related complications.
CRS was observed at the rates reported in previous studies. We observed a high proportion of any grade manageable CRS without grade 3-4 CRS. This was also reflected by the median of one tocilizumab dose administered, and only in 40% of patients. In addition, there were no ICAN events in the entire cohort. The short-term efficacy data reported here corroborates the results reported in the literature,8,10-12 with higher CAR T doses correlating with higher and deeper responses (ORR of 85% for cell doses 450- and 800x106). Indeed, responses ≥VGPR were observed in more than two-thirds of patients, with half of these achieving sCR/CR. The OS and PFS in this dose-escalating phase I study reflect the poor clinical condition of the subjects, six of whom also had a low dose of HBI0101 CAR T cells. One limitation of our study is the relatively short follow-up (median 136 days); these objectives will, therefore, be re-evaluated in our dose-expansion phase Ib-II study (administering a cell dose of 800x106).
There is still no complete picture of the response to antiBCMA CAR T cells following anti-BCMA antibody. In our study, comparing patients who had received prior belantamab mafodotin therapy to those who had not revealed a trend towards better PFS and OS in those patients who had not been exposed to this treatment. In addition, responses were significantly deeper in patients who had not received belantamab. Some groups have re-targeted BCMA using belantamab after anti-BCMA CAR T-cell therapy.20-22 Our observation suggests that sequential treatment of MM patients with anti-BCMA.CAR T cells following anti-BCMA antibody may impair, but does not exclude, response to CAR T therapy. Interestingly, the majority of patients pre-treated with belantamab were in cohort 2 (55%, 5/9). Although this cohort was treated with a higher dosage of HBI0101 cells compared to cohort 1, the rate of sCR/CR in this cohort was lower. This observation raises the question as to whether the depth of response in cohort 2 was hampered by a higher proportion of patients previously being exposed to belantamab. Since belanta-

A B Haematologica | 108 July 2023 1834 ARTICLE - Locally produced BCMA.CAR T cells for R/R multiple myeloma N. Asherie et al. C D
Figure 4. Efficacy of HBI0101 CAR T-based therapy in eliminating CD38++CD138++ malignant plasma cells. (A) Flow cytometric gating strategy for the assessment of anti-B-cell maturation antigen (BCMA) and CD56 expression on multiple myeloma plasma cells (MM-PC) (indicated by arrows). Samples were gated on CD38++CD138++. (B) Bone marrow (BM) samples prior to and one month (mth) following HBI0101-CAR T infusion were assessed for the presence of PC (as % of CD38++CD138++ cells) by flow cytometry by gating on white blood cells (WBC), as illustrated in (A). (C-E) Analysis of BCMA and CD56 expression on MM-PC, by "response" (blue squares) versus "no response" (black dots) group. (C, D) BCMA expression levels in MM patients (N=12). The mean fluorescence intensity (MFI) (C) and the percent of BCMA-positive PC (D) were determined by flow cytometry. (E) Percent of CD56-positive PC in "response" (N=9) versus "no response" (N=3) groups.

mab consists of a humanized IgG1 anti-BCMA monoclonal antibody originally generated from the murine CA8 clone,23 it is unlikely that anti-drug antibodies (ADA) with a crossreactivity to the 11D5-3-derived scFv of the HBI0101 CAR molecule13,24 could cause the resistance to HBI0101 therapy following exposure to belantamab. In addition, there was no difference in terms of BCMA expression on PC in patients receiving belantamab in comparison with those who had not, suggesting that the reduced depth of response was not associated with a downregulation of the BCMA protein at the PC surface. It is, therefore, evident that additional factors contribute to resistance to anti-BCMA CAR T therapy; thus, unraveling mechanisms of resistance remains of great importance.
Additional biomarkers that predict responsiveness to HBI0101 CAR T therapy will enable a more accurate prediction and understanding of clinical outcome. CD56 is a membrane glycoprotein of the immunoglobulin superfamily that is expressed on clonal PC in 60-80% of MM patients.25 Studies assessing the relationship between MM prognosis and the expression of CD56 have given contradictory results.26 While in some studies CD56 expression
on MM patient PC has been associated with a good prognosis,27 others reported a negative or no effect on patient survival.25,28,29 To the best of our knowledge, there is no study in the literature reporting on the prognostic value of CD56 expression on PC in the context of anti-BCMA CAR T-based therapies. In our study, about 70% of the responsive patients display CD56 expression at the PC surface, while none of the patients that have failed HBI0101 therapy expressed CD56 at the PC surface. Being an adhesion molecule, this implies that the PC-BM microenvironment interaction has a significant role to play. These observations suggest that CD56 may serve as a biomarker to predict a patient's response to HBI0101 therapy. Further studies of surface marker expression are required to establish and validate these findings.
A better understanding of the cytokine profile is important to identify those patients that would benefit most from HBI0101 treatment. Multiplex analysis of pro- and anti-inflammatory biomarkers in the peripheral blood at the day of CAR T peak revealed lower levels of IL-10, IL-1RA, CCL-4 and IL-15 and higher levels of IFN-γ, IL-6 and G-CSF cytokines in the response group. This suggests that production
B C D Haematologica | 108 July 2023 1835 ARTICLE - Locally produced BCMA.CAR T cells for R/R multiple myeloma N. Asherie et al. A E
Figure 5. Soluble anti-B-cell maturation antigen clearance and HBI0101 CAR T-cell in vivo kinetics. (A) The median number of HBI0101-CAR T cells per 1 mL blood in the "response" versus "no response" group was determined by quantification of CAR transgene levels by qRT-PCR method following CAR T infusion at the indicated times and further adjusted to the copy numbers per transduced cell at the day of CAR T infusion. The limit of quantitation (LOQ) was 500 CAR T/mL blood. (B) HBI0101 CAR T-cell overall expansion in the first month of CAR T therapy. Area under the curve (AUC) as a measure of CAR T-cell overall expansion was calculated with Prism software (GraphPad). (C) HBI0101 cells in vivo median concentration at peak (Cmax) in "response" (blue squares) versus "no response" (black dots) groups. (D) Median time to Cmax (Tmax) in "response" (blue squares) versus "no response" (black dots) groups. Upper and lower bars �� represent the maximal and minimal values, respectively. (E, F) Soluble anti-B-cell maturation antigen (sBCMA) levels prior to and following HBI0101 infusion determined by ELISA and further normalized to sBCMA concentration at baseline (right y-axis; empty circles) versus HBI0101-cell expansion indicated by the CAR T/mL (left y-axis; filled circles) in the "no response" group (E), and in the "response" group (F). **P<0.01, by unpaired t test.

of pro-inflammatory cytokines by T and innate immune cells supports response to HBI0101 therapy, while IL-10 and IL1RA anti-inflammatory cytokines may hamper that response. If this observation proves correct in a larger cohort of patients, modulation of the cytokine milieu towards a pro-inflammatory supportive environment for CAR T cells should be considered. Overall, our data suggest that responsiveness to HBI0101 therapy is associated with an early and significant expansion of CAR T cell in the peripheral blood with an upregulation of pro-inflammatory cytokines and with at least minimal expression of BCMA on the PC surface. Although two BCMA-targeted CAR treatments have been approved by the FDA and the EMA for the treatment of R/R MM, a wave of new anti-BCMA CAR-based clinical trials8,11,12 attests to the growing worldwide demand for such treatments, access to which, unfortunately, is still limited due to logistical and financial constraints.
Our results represent the first time an Israeli academic institution has completed the full CAR T-product cycle: development of a new CAR T treatment, proof-of-concept in vitro and in vivo, 13 approval by regulatory authorities, local production in a GMP facility, and delivery to patients (Online Supplementary Figure S10). The main advantages of such an approach over the commercial products are the availability of the DP and the shortened vein-to-vein delivery. Moreover, the significance of these results extends far beyond the clinical dimension. Affordable, locally produced CAR T cells represent a major step in broadening access to this cutting edge advanced cellular therapy. This achievement was made possible through the successive achievements of several key milestones (Online Supplementary Figure S9). It is acknowledged that accreditation from the Joint Accreditation Committee ISCT-Europe and EBMT (JACIE) forms a good basis for the qualification of
B C D E Haematologica | 108 July 2023 1836 ARTICLE - Locally produced BCMA.CAR T cells for R/R multiple myeloma N. Asherie et al. A F
Figure 6. Effect of belantamab pre-treatment on multiple myeloma patients’ response to HBI0101 therapy. Kaplan-Meier analysis of progression-free survival (PFS) (A) and overall survival (OS) (C) in "belantamab(+)" versus "belantamab(-)" group. (B, D) Effect of belantamab prior therapy on plasma cell anti-B-cell maturation antigen (BCMA) expression. Percent of BCMAexpressing bone marrow-plasma cell (BM-PC) (B) and BCMA expression mean fluorescence intensity (MFI) (D) on BM-PC were determined by flow cytometry prior to HBI0101 infusion and analyzed according to patient's pre-exposure to belantamab. Samples were gated on CD38++CD138++ cells. CR: complete response; sCR: stringent complete response; VGPR: very good partial response; MRD: minimal residual disease; ns: not significant.

CAR T-cell therapy centers.30 Thus, in parallel to developing our own CAR T-based therapy, our center applied and was successfully accredited for FACT-JACIE. Another important milestone to support CAR T manufacture was the establishment of a GMP-infrastructure that meets both production and regulatory requirements. The entire process from the beginning of CAR development to the treatment of the first patients was completed within three years, with modest human resources, and without compromising on regulatory requirements or product quality (Online Supplementary Figure S10).
In the interest of making CAR T therapy readily accessible via a decentralized approach, some suggestions may be made. It is important to maintain an open dialogue with the regulatory authorities since promoting such innovative therapies is of mutual benefit. In addition, practitioners should explore how to incorporate newer non-viral genetransfer technologies (e.g., electroporation of naked DNA,31 transposon/transposase systems32,33) to help reduce
costs. Finally, implementing an automated production process (e.g., CliniMACS Prodigy®) will further reduce costs and increase scalability.
Pharma companies currently operate the centralized manufacture of CAR T cells from autologous T cells. Until the promise of safe and efficient off-the-shelf allogeneic CAR T cells becomes a reality,34 it will be essential to decentralize production. Such decentralization can be achieved by academic medical centers with an established translational R&D platform and GMP-grade facilities. This approach will lower costs, promote shorter vein-to-vein delivery times, and provide greater manageability.
In conclusion, we present the good safety profile and favorable results of a phase I clinical trial with locally produced anti-BCMA CAR T cells for highly refractory MM patients. Our experience testifies to the capability of an academic institution to provide the local population with safe, efficient and accessible state-of-the-art CAR T tech-
A B D Haematologica | 108 July 2023 1837 ARTICLE - Locally produced BCMA.CAR T cells for R/R multiple myeloma N. Asherie et al. C E
nology. A continuous Phase Ib clinical trial is ongoing and will provide further data to validate this approach. Implementation of in-house CAR T-based therapy is a complex multi-step process. Successful incorporation of CAR T cells into existing treatment paradigms requires the combined efforts of the scientific community, clinicians and government agencies in order to broaden access to this unique method of treatment for the benefit of the patients. We believe that this approach will help to make CAR T therapy more accessible and significantly advance the treatment of cancer.
Disclosures
No conflicts of interest to disclose.
Contributions
NA and SKE designed and performed the experiments, wrote the protocol, and were responsible for CAR T production and evaluation, patient follow-up, and contributed to manuscript preparation; SG and BA wrote the protocol, were responsible for CAR T treatment, and contributed to manuscript preparation; EZ, EL and AS performed CAR T treatment and evaluation, and contributed to manuscript preparation; MA wrote the protocol, and is responsible for CAR T production and evaluation, and statistical analyses; TDS and NZ performed CAR T production and evaluation, and patients' follow-up; MP performed CAR T evaluation and contributed to manuscript preparation; YC and IA performed CAR T evaluation and contributed to manuscript writing; CC designed the HBI0101 CAR construct, supervised
References
1. Cowan AJ, Green DJ, Kwok M, et al. Diagnosis and management of multiple myeloma: a review. JAMA. 2022;327(5):464-477.
2. Gay F, Larocca A, Wijermans P, et al. Complete response correlates with long-term progression free and overall survival in elderly myeloma treated with novel agents: analysis of 1175 patients. Blood. 2011;117(11):3025-3031.
3. Gandhi UH, Cornell RF, Lakshman A, et al. Outcomes of patients with multiple myeloma refractory to CD38-targeted monoclonal antibody therapy. Leukemia. 2019;33(9):2266-2275.
4. Kumar SK, Dimopoulos MA, Kastritis E, et al. Natural history of relapsed myeloma, refractory to immunomodulatory drugs and proteasome inhibitors: a multicenter IMWG study. Leukemia. 2017;31(11):2443-2448.
5. Pick M, Vainstein V, Goldschmidt N, et al. Daratumumab resistance is frequent in advanced-stage multiple myeloma patients irrespective of CD38 expression and is related to dismal prognosis. Eur J Haematol. 2018;100(5):494-501.
6. Gill SK, Unawane R, Wang S, et al. Inferior outcomes of patients with quad and penta-refractory multiple myeloma (MM) compared to those of patients who have been quad and penta exposed. Blood. 2021;138 (Supplement 1):4742.
7. Vogl DT, Dingli D, Cornell RF, et al. Selective inhibition of nuclear export with oral selinexor for treatment of relapsed or refractory multiple myeloma. J Clin Oncol. 2018;36(9):859-866.
the pre-clinical MM study, and contributed to manuscript preparation; PS designed and supervised the study, wrote the protocol, was responsible for CAR T treatment and evaluation, and contributed to manuscript preparation; MEG wrote the protocol, performed CAR T treatment and evaluation, and contributed to manuscript preparation.
Acknowledgments
We would like to thank the patients and their families for participating in the study. We would also like to express our gratitude to the management of Hadassah Medical Center for their ongoing support and their deep commitment to innovation. We also thank the staff in the clinical units for patient care, Mrs. Avigail Avraham from the apheresis unit, Mrs. Nassreen Hussein for cell manufacturing, and Mrs. Gili Gruzman for QC testing and patient follow-up. We are extremely grateful for the generous support for this clinical research under the leadership of Prof. Polina Stepensky, by The Manfred Steinfeld Family and The Estate of Allan Habelson. We gratefully acknowledge the support of the Amyloidosis Patient Association of Israel.
Funding
CJC is supported by the Adelis Foundation and the Israel Science Foundation (646/20).
Data-sharing statement
For original data, please contact the corresponding authors.
8. Guo R, Lu W, Zhang Y, Cao X, Jin X, Zhao M. Targeting BCMA to treat multiple myeloma: updates from the 2021 ASH Annual Meeting. Front Immunol. 2022;13:839097.
9. Munshi NC, Anderson LD Jr, Shah N, et al. Idecabtagene vicleucel in relapsed and refractory multiple myeloma. N Engl J Med. 2021;384(8):705-716.
10. Berdeja JG, Madduri D, Usmani SZ, et al. Ciltacabtagene autoleucel, a B-cell maturation antigen-directed chimeric antigen receptor T-cell therapy in patients with relapsed or refractory multiple myeloma (CARTITUDE-1): a phase 1b/2 openlabel study. Lancet. 2021;398(10297):314-324.
11. Du J, Wei R, Jiang S, et al. CAR-T cell therapy targeting B cell maturation antigen is effective for relapsed/refractory multiple myeloma, including cases with poor performance status. Am J Hematol. 2022;97(7):933-941.
12. Frigault MJ, Bishop MR, Rosenblatt J, et al. Phase 1 study of CART-ddBCMA for the treatment of subjects with relapsed and refractory multiple myeloma. Blood Adv. 2023;7(5):768-777.
13. Harush O, Asherie N, Kfir-Erenfeld S, et al. Preclinical evaluation and structural optimization of anti-BCMA CAR to target multiple myeloma. Haematologica. 2022;107(10):2395-2407.
14. Kumar S, Paiva B, Anderson KC, et al. International Myeloma Working Group consensus criteria for response and minimal
Haematologica | 108 July 2023 1838 ARTICLE - Locally produced BCMA.CAR T cells for R/R multiple myeloma N. Asherie et al.
residual disease assessment in multiple myeloma. Lancet Oncol. 2016;17(8):e328-e346.
15. Theunissen P, Mejstrikova E, Sedek L, et al. Standardized flow cytometry for highly sensitive MRD measurements in B-cell acute lymphoblastic leukemia. Blood. 2017;129(3):347-357.
16. Lee DW, Santomasso BD, Locke FL, et al. ASTCT consensus grading for cytokine release syndrome and neurologic toxicity associated with immune effector cells. Biol Blood Marrow Transplant. 2019;25(4):625-638.
17. Laurent SA, Hoffmann FS, Kuhn PH, et al. Gamma-secretase directly sheds the survival receptor BCMA from plasma cells. Nat Commun. 2015;6:7333.
18. Ghermezi M, Li M, Vardanyan S, et al. Serum B-cell maturation antigen: a novel biomarker to predict outcomes for multiple myeloma patients. Haematologica. 2017;102(4):785-795.
19. Raje N, Berdeja J, Lin Y, et al. Anti-BCMA CAR T-cell therapy bb2121 in relapsed or refractory multiple myeloma. N Engl J Med. 2019;380(18):1726-1737.
20. Gazeau N, Beauvais D, Yakoub-Agha I, et al. Effective anti-BCMA retreatment in multiple myeloma. Blood Adv. 2021;5(15):3016-3020.
21. Mu W, Long X, Cai H, et al. A model perspective explanation of the long-term sustainability of a fully human BCMA-targeting CAR (CT103A) T-cell immunotherapy. Front Pharmacol. 2022;13:803693.
22. Cohen AD, Garfall AL, Dogan A, et al. Serial treatment of relapsed/refractory multiple myeloma with different BCMAtargeting therapies. Blood Adv. 2019;3(16):2487-2490.
23. Montes de Oca R, Alavi AS, Vitali N, et al. Belantamab mafodotin (GSK2857916) drives immunogenic cell death and immunemediated antitumor responses in vivo. Mol Cancer Ther. 2021;20(10):1941-1955.
24. Carpenter RO, Evbuomwan MO, Pittaluga S, et al. B-cell maturation antigen is a promising target for adoptive T-cell therapy of multiple myeloma. Clin Cancer Res. 2013;19(8):2048-2060.
25. Skerget M, Skopec B, Zadnik V, et al. CD56 expression is an important prognostic factor in multiple myeloma even with
bortezomib induction. Acta Haematol. 2018;139(4):228-234.
26. Lebel E, Nachmias B, Pick M, Gross Even-Zohar N, Gatt ME. Understanding the bioactivity and prognostic implication of commonly used surface antigens in multiple myeloma. J Clin Med. 2022;11(7):1809.
27. Pellat-Deceunynck C, Barille S, Jego G, et al. The absence of CD56 (NCAM) on malignant plasma cells is a hallmark of plasma cell leukemia and of a special subset of multiple myeloma. Leukemia. 1998;12(12):1977-1982.
28. Li G, Huang XJ, Niu T, et al. [Expression of CD56 in multiple myeloma cells and its relationship with extramedullary disease and extramedullary relapse]. Zhongguo Shi Yan Xue Ye Xue Za Zhi. 2021;29(2):553-556.
29. Chang H, Samiee S, Yi QL. Prognostic relevance of CD56 expression in multiple myeloma: a study including 107 cases treated with high-dose melphalan-based chemotherapy and autologous stem cell transplant. Leuk Lymphoma. 2006;47(1):43-47.
30. Hayden PJ, Sirait T, Koster L, Snowden JA, Yakoub-Agha I. An international survey on the management of patients receiving CAR T-cell therapy for haematological malignancies on behalf of the Chronic Malignancies Working Party of EBMT. Curr Res Transl Med. 2019;67(3):79-88.
31. Till BG, Jensen MC, Wang J, et al. CD20-specific adoptive immunotherapy for lymphoma using a chimeric antigen receptor with both CD28 and 4-1BB domains: pilot clinical trial results. Blood. 2012;119(17):3940-3950.
32. Prommersberger S, Reiser M, Beckmann J, et al. CARAMBA: a first-in-human clinical trial with SLAMF7 CAR-T cells prepared by virus-free Sleeping Beauty gene transfer to treat multiple myeloma. Gene Ther. 2021;28(9):560-571.
33. Kebriaei P, Singh H, Huls MH, et al. Phase I trials using Sleeping Beauty to generate CD19-specific CAR T cells. J Clin Invest. 2016;126(9):3363-3376.
34. Townsend MH, Bennion K, Robison RA, O'Neill KL. Paving the way towards universal treatment with allogenic T cells. Immunol Res. 2020;68(1):63-70.
Haematologica | 108 July 2023 1839 ARTICLE - Locally produced BCMA.CAR T cells for R/R multiple myeloma N. Asherie et al.
Allogeneic, off-the-shelf, SARS-CoV-2-specific T cells (ALVR109) for the treatment of COVID-19 in high-risk patients
Correspondence: S. Vasileiou sxvasile@texaschildrens.org
Received: August 16, 2022.
Accepted: October 31, 2022.
Prepublished: November 10, 2022.
Center for Cell and Gene Therapy, Baylor College of Medicine, Texas Children’s Hospital and Houston Methodist Hospital, Houston, TX, USA
*SV and LH contributed equally as co-first authors. #AML and PL contributed equally as co-senior authors.
Abstract
https://doi.org/10.3324/haematol.2022.281946
©2023 Ferrata Storti Foundation
Published under a CC BY-NC license
Defects in T-cell immunity to SARS-CoV-2 have been linked to an increased risk of severe COVID-19 (even after vaccination), persistent viral shedding and the emergence of more virulent viral variants. To address this T-cell deficit, we sought to prepare and cryopreserve banks of virus-specific T cells, which would be available as a partially HLA-matched, off-the-shelf product for immediate therapeutic use. By interrogating the peripheral blood of healthy convalescent donors, we identified immunodominant and protective T-cell target antigens, and generated and characterized polyclonal virus-specific T-cell lines with activity against multiple clinically important SARS-CoV-2 variants (including ‘delta’ and ‘omicron’). The feasibility of making and safely utilizing such virus-specific T cells clinically was assessed by administering partially HLA-matched, third-party, cryopreserved SARS-CoV-2-specific T cells (ALVR109) in combination with other antiviral agents to four individuals who were hospitalized with COVID-19. This study establishes the feasibility of preparing and delivering off-the-shelf, SARS-CoV-2-directed, virus-specific T cells to patients with COVID-19 and supports the clinical use of these products outside of the profoundly immune compromised setting (ClinicalTrials.gov number, NCT04401410).
Introduction
The impact of coronavirus disease 2019 (COVID-19) has been profound with more than 625,000,000 confirmed cases worldwide and emerging variants continuing to be a cause of global concern. Although substantial efforts have been made to develop preventative vaccines that induce protective humoral immunity, defects in the cellular arm of the immune response, including dysregulated and diminished T-cell function and trafficking, have been implicated as risks for severe illness despite vaccination.1-13 Furthermore, immunodeficiency has been identified as a risk factor for infection by severe acute respiratory syndrome coronavirus 2 (SARS-CoV-2) and severe disease, and has also been linked to persistent viral shedding, which has been shown to select for “fitter” viral variants.14-17 One way to prevent severe disease in those at highest risk of COVID-19 would be to prepare and cryopreserve banks of virus-specific T-cell (VST) lines from convalescent healthy donors18-24 which would be available as a partially HLA-matched product for immediate use. Our group has
demonstrated the feasibility, safety and efficacy of “offthe-shelf”, third-party VST reactive against otherwise resistant Epstein-Barr virus, cytomegalovirus, adenovirus, BK virus and human herpes virus-6 in patients who are profoundly immunocompromised after an allogeneic hematopoietic stem cell transplant.25-27 Our phase II trial showed that partially HLA-matched VST adoptively transferred to patients with infection or reactivation of these viruses achieved a 92% response rate.26
To explore the therapeutic potential of a SARS-CoV-2-targeted product we sought to identify immunogenic T-cell antigens to target with our VST by examining the peripheral blood of convalescent individuals. Of the 18 SARS-CoV-2 structural and non-structural/accessory proteins (NSP/AP) examined, we identified five that were immunodominant and that we advanced to clinical VST manufacturing. We now report on the profile of the ex vivo-expanded VST generated (ALVR109), their potential to target emerging viral variants (including delta and omicron), and on their clinical use in four hospitalized COVID-19 patients at our center to whom these cells were administered.
Spyridoula Vasileiou,* LaQuisa Hill,* Manik Kuvalekar, Aster G. Workineh, Ayumi Watanabe, Yovana Velazquez, Suhasini Lulla, Kimberly Mooney, Natalia Lapteva, Bambi J. Grilley, Helen E. Heslop, Cliona M. Rooney, Malcolm K. Brenner, Todd N. Eagar, George Carrum, Kevin A. Grimes, Ann M. Leen# and Premal Lulla#
Haematologica | 108 July 2023 1840 ARTICLE - Cell Therapy & Immunotherapy
Methods
Donors and cell lines
Peripheral blood mononuclear cells (PBMC) were obtained from convalescent healthy volunteers with a history of SARS-CoV-2 infection (confirmed by polymerase chain reaction analysis) following informed consent using Baylor College of Medicine (BCM) Institutional Review Board-approved protocols (H-7666, H-45118) and were used to generate phytohemagglutinin-activated blasts and SARS-CoV-2-VST. The phytohemagglutinin-activated blasts were generated as previously reported and cultured in T-cell medium (45% RPMI 1640 [HyClone Laboratories, Logan, UT, USA], 45% Click medium [Irvine Scientific, Santa Ana, CA, USA], 2 mM GlutaMAX TM-I [Life Technologies, Grand Island, NY, USA], and 10% human AB serum [Valley Biomedical, Winchester, VA, USA]) supplemented with 100 U/mL interleukin 2 (IL2; Proleukin® [aldesleukin], TCH, Houston, TX, USA), which was replenished every 2 days.
Generation of SARS-CoV-2 virus-specific T cells
Pepmixes
For generation and immunodominance studies of VST, pepmixes (15mers overlapping by 11 amino acids) spanning SARS-CoV-2-derived structural (S, M, N, E), accessory (7A, 7B, 8) (JPT Peptide Technologies, Berlin, Germany) and nonstructural proteins (NSP 1, 3, 4, 5, 6, 10, 12, 13, 14, 15, and 16) (Genemed Synthesis, San Antonio, TX, USA) were synthesized. Lyophilized pepmixes were reconstituted in dimethylsulfoxide (DMSO) (Sigma-Aldrich) and stored at -80°C. For SARS-CoV-2 variant studies pepmixes spanning S from each variant (alpha, beta, gamma, delta, epsilon, kappa and omicron variants) or peptides (15mers overlapping by 11 amino acids) spanning individual mutated sequences and their wildtype equivalents (D614G, 69/70del, P681H, K417N, K417T, E484K, E484Q, N501Y, P681R, L452R) (Genemed Synthesis) were generated.
Generation of virus-specific T cells
For preclinical studies SARS-CoV-2-VST were generated by culturing PBMC (1.25x10⁷) in a G-Rex5 (Wilson Wolf Manufacturing Corporation, St. Paul, MN, USA) with 50 mL of VST medium (90% TexMACS™ GMP medium [Miltenyi Biotec, GmbH], 2 mM GlutaMAX, and 10% human AB serum supplemented with IL7 [20 ng/mL], IL4 [800 U/mL] [R&D Systems, Minneapolis, MN, USA]) and pepmixes (2 ng/peptide/mL) and cultured for 10-16 days at 37°C in 5% CO2. For clinical production, VST received a second stimulation with irradiated, autologous, pepmix-pulsed PBMC as antigen-presenting cells (4:1 APC:VST) and were cultured in IL-2-supplemented medium (100 U/mL). The VST lines were checked for identity, phenotype and sterility, and cryopreserved prior to administration. All cell culture ma-
nipulations were carried out in the Center for Cell and Gene Therapy GMP facility using current standard operating procedures. Products that met study-specifi c release criteria were released for clinical use.
Full details on VST phenotypic and functional characterization can be found in the Online Supplementary Materials
Clinical trial
Patients hospitalized with COVID-19 (proven by polymerase chain reaction analysis), and with at least two Center for Disease Control and Prevention-defined risk factors for progression to severe COVID-19 disease were eligible to participate in a protocol that was conducted under an application for an investigational new drug cleared by the Food and Drug Administration with approval from the Baylor College of Medicine Institutional Review Board (H47739, NCT 04401410). Key risk factors were: age ≥60 years, obesity (body mass index ≥30), after hematopoietic stem cell transplantation or solid organ transplantation, diabetes, and cancer diagnosis on active treatment (within 3 months of last therapy). Additional details on the clinical trial design can be found in the Online Supplementary Materials
Statistical analysis
Descriptive statistics were calculated to summarize preclinical data and clinical characteristics. Where applicable, statistical significance was evaluated by a two-tailed paired t test (P<0.05). Details can be found in the Online Supplementary Materials.
Results
Immunogenicity of SARS-CoV-2-derived antigens
To characterize the cellular immune response to SARSCoV-2, we examined the T-cell response of infected healthy individuals (confirmed by polymerase chain reaction from a nasopharyngeal swab) who had cleared the virus without requiring hospitalization. In these individuals we assessed T-cell activity directed against all four structural proteins (spike [S], membrane [M], envelope [E], nucleocapsid [N]) and 14 NSP/AP (1, 3, 4, 5, 6, 7a, 7b, 8, 10, 12, 13, 14, 15 and 16). This was done by exposing PBMC from 16 donors to pepmixes (15mer peptides overlapping by 11 amino acids) spanning each of the individual target antigens and evaluating the frequency of IFNγ-producing antigen-specific T cells in their PBMC by ELIspot assay. While most donors responded to S (n=16; median: 127.5; range, 26-602 spot-forming cells [SFC]/5x105 PBMC), M (n=14; median: 82; range, 8-319) and N (n=15; median: 58; range, 6-328), activity to E and the NSP/AP was weak/undetectable, as summarized in Online Supplementary Table
Haematologica | 108 July 2023 1841 ARTICLE - Allogeneic SARS-CoV-2-specific T cells to treat COVID-19 S. Vasileiou et al.
S1 (left panel) and Figure 1A. To investigate whether the paucity of T cells reactive with E and NSP/AP in peripheral blood was due to the limited immunogenicity of the antigens or simply reflected a frequency of circulating T cells below the ELIspot detection threshold, we performed a single in vitro stimulation designed to selectively amplify SARS-CoV-2-specific T cells. Thus, we exposed PBMC to a mastermix of the SARS-CoV-2 peptide libraries followed by an expansion period of 10-16 days. Subsequently, we repeated our IFNγ ELIspot and, as shown in Figure 1B, we detected increased activity, allowing us to establish a hierarchy of immunodominance based on the frequency of responding donors and magnitude of reactive cells (Online Supplementary Table S1, right panel). Overall, all donors recognized at least three antigens and 87.5% recognized five or more antigens with S, N, M, AP7a and NSP4 identified as immunodominant and hence advanced for clinical VST manufacturing.
SARS-CoV-2-specific T cells are polyclonal
To generate VST that were enriched for activity against our immunodominant target antigens, we exposed donor PBMC to a mastermix of pepmixes spanning S, N, M, AP7a and NSP4 followed by expansion for 10-16 days (Figure 1C). This resulted in a mean 7.3±0.8-fold increase in total cell numbers (Figure 1D), which were enriched for T cells reactive against the stimulating antigens (Figure 1E). One of the objectives of our approach was to generate a VST product that was polyclonal, representing broad T-cell receptor (TCR) diversity. We first examined the phenotypic profile of the expanded cells, which were predominantly CD3+ T cells (95.5±0.7%), representing a mixture of helper cells (CD4+; 77.5±3.0%) and cytotoxic cells (CD8+; 17.5±2.4%), expressing central memory markers (CD45RO+/CD62L+; 57.2±5.0%) and effector memory markers (CD45RO+/CD62L–; 25.3±5.0%); and were activated based on upregulation of CD28 and CD69 (65.0±6.0% and 26.3±4.3%, respectively) (Figure 1F). We further confirmed the TCR diversity present in our VST by assessing the TCR vβ repertoire using a flow cytometric panel that detects more than 70% of all available v β chains. As shown in Figure 1G (representative donor [left] and summary data [right]) all measurable vβ families were present in these ex vivo-expanded cells.
SARS-CoV-2-specific T cells are Th1-polarized, polyfunctional and kill virus-loaded targets but do not exhibit alloreactivity
To examine whether VST reactivity against S, N, M, AP7a and NSP4 was mediated by CD4+, CD8+, or both T-cell subsets, we performed intracellular cytokine staining, gating on CD4+ and CD8+ IFNγ-producing cells. T-cell activity was detected predominantly in the CD4+ compartment, with a minor CD8 response (Figure 2A, representative
donor [left] and summary data [right]). As the production of multiple pro-inflammatory cytokines and effector molecules correlates with enhanced cytolytic function and improved in vivo activity,28,29 we additionally evaluated the production of the Th1 cytokines TNFα and granulocytemacrophage colony-stimulating factor (GM-CSF) and other pro-inflammatory chemokines and effector molecules, including MIP-1α, MIP-1β, and granzyme B, in response to antigenic stimulation.
SARS-CoV-2 antigen-reactive T cells produced Th1-polarized/pro-inflammatory effector molecules including GMCSF, TNFα, MIP-1α, MIP-1β, and granzyme B but not IL6 or IL10, as measured by Luminex and Granzyme-B ELIspot (Figure 2B, C). Furthermore, intracellular cytokine staining and multiparametric FluoroSPOT demonstrated that the majority (>60%) of all IFNγ-producing cells also produced TNFα (Figure 2D, representative donor [left] and summary data [right]) and/or granzyme B (Figure 2E, Online Supplementary Figure S1). Thus, our expanded SARS-CoV-2-specific T-cell lines were polyclonal, Th1-polarized, and polyfunctional. To investigate the cytolytic potential of these VST in vitro, we co-cultured SARS-CoV-2-specific T cells with 51Cr-labeled, peptide-loaded autologous phytohemagglutinin-activated blasts. As shown in Figure 2F, SARS-CoV-2-loaded targets were specifically recognized and lysed by our expanded VST (80:1 effector:target ratio: 35.3±6.6%, n=16). Finally, there was no evidence of activity against non-infected autologous targets nor of alloreactivity (graft-versus-host potential) using allogeneic phytohemagglutinin-stimulated blasts as targets (Figure 2G), an important consideration if these cells are to be administered to individuals including transplant patients with COVID-19 who are at risk of disease progression.
Variant coverage
Our VST were generated using pepmixes spanning S, N, M, AP7a and NSP4, which were synthesized based on the parental strain (NC_045512.2). To address whether our cells were able to target emerging clinically important viral variants we examined the cross-reactive potential of the cells against alpha (B.1.1.7), beta (B.1.351), gamma (P.1), epsilon (B.1.429), kappa (B.1.617.1), delta (B.1.617.2) and omicron (B.1.1.529) strains. In these assessments, we specifically focused on Spike, which is the most mutated antigen across the different variants with 0.3-1.0% sequence variation. Given the polyclonality and TCR diversity of our product we predicted that our cells would be able to react to each of the variants and indeed, when we exposed our VST to variant-derived S sequences we saw activity at a level that was not significantly different from that induced against the stimulating (parental) sequence (P>0.05) (Figure 3A). We next assessed specific cross-reactivity of the T-cell response at the epitope level. To do this we identified a cohort of mutated sequences present
Haematologica | 108 July 2023 1842 ARTICLE - Allogeneic SARS-CoV-2-specific T cells to treat COVID-19 S. Vasileiou et al.

Continued on following page. A C D E F G B Haematologica | 108 July 2023 1843 ARTICLE - Allogeneic SARS-CoV-2-specific T cells to treat COVID-19 S. Vasileiou et al.
Figure 1. Immunogenicity of SARS-CoV-2-derived antigens, target antigen selection, specificity and polyclonality of ex vivoexpanded SARS-CoV-2-specific T cells. (A, B) Reactivity against 18 SARS-CoV-2-derived antigens tested in peripheral blood mononuclear cells (A) and ex vivo-expanded SARS-CoV-2-VST (B) of 16 convalescent donors as measured by IFNγ ELIspot using all 18 antigens as a stimulus. Data are shown in box plots as spot-forming cells (SFC); mean and median values are indicated. (C) Schematic of the ALVR109 manufacturing process using the five selected immunodominant antigens. (D-G) Characterization of ex vivo-expanded SARS-CoV-2-VST. (D) Fold expansion. (E) Specificity as measured by IFNγ ELIspot for 16 lines generated using all five antigens as a stimulus. Data are shown as SFC ± standard error of mean (SEM) and each color represents an individual antigenic specificity. (F) Phenotype and memory/activation profile. Data are shown in box plots; mean and median values are indicated. (G) T-cell receptor vβ repertoire of ex vivo-expanded SARS-CoV-2-VST; representative donor (left) and summary data are shown as mean ± SEM (right). SFC: spot-forming cell; IFNγ: interferon gamma; S: spike; E: envelope; M: membrane; N: nucleocapsid; PBMC: peripheral blood mononuclear cells; IL: interleukin; AP: accessory protein; TEM: effector memory T cells; TCM: central memory T cells; TEMRA: terminally differentiated effector memory T cells; TCR: T-cell receptor; VST: virus-specific T cells; SARS-CoV-2; severe acute respiratory syndrome coronavirus-2.
in the viral variant strains (Figure 3B, Online Supplementary Figure S2) and generated a panel of individual peptides incorporating these mutated sequences and their wildtype counterparts. Additionally, we generated peptides spanning immunogenic epitopes in parts of Spike that were conserved across all sequences, which we called unique immunogenic epitopes and which served as positive controls in our assays (Online Supplementary Figure S2). Figure 3C shows results from a representative donor who had a strong response to Spike antigen and two unique immunogenic epitopes (black bars). When we investigated reactivity to variant peptides we saw that some mutations had no impact on immunogenicity (shown in green - 69/70 del, P681H, N501Y) while others abrogated peptide recognition (shown in yellow - P681R, D614G). Results from 16 donors tested are summarized in Figure 3D. Of note, each donor retained activity against unique immunogenic epitopes and to multiple mutated Spike peptides. Ultimately, these VST also targeted four additional viral antigens, thereby minimizing the potential risk of immune escape from our therapy.30
Feasibility of administering “off-the-shelf”, virus-specific T cells to patients with COVID-19
We prepared a bank of 15 VST lines for clinical use (see Online Supplementary Table S2 for VST characteristics). Four hospitalized patients with COVID-19 who met protocol eligibility criteria were referred for participation in this clinical trial. Low-resolution HLA-typing was conducted on the patients with results available within 48 hours in all cases. We were able to identify and infuse a suitably HLA-matched VST line for all four referrals (100%) within 8 to 72 hours after referral. The infused VST were matched at 2/8 to 5/8 of the recipients’ HLA alleles (Online Supplementary Table S3). Patients infused had a baseline World Health Organization ordinal score of 3 to 4 (Table 1) and had symptoms for 5-14 days prior to receipt of VST. These patients were all at high risk of disease progression due to the presence of risk factors including cancer, prior hematopoietic stem cell transplant, age, hypertension and/or diabetes. They were concomitantly receiving other standard-of-care therapies including corticosteroids,
remdesivir and convalescent plasma but were ineligible for monoclonal antibody therapy as they were hospitalized. None had been vaccinated. As summarized in Online Supplementary Table S4 there were no immediate postinfusion toxicities and none of the patients developed graft-versus-host disease. One patient (#4) developed grade III cytokine release syndrome 13 days after infusion, which was transient in nature and most likely related to COVID-19 progression rather than to VST. Patients #1, #2 and #4 achieved complete resolution of infection while patient #3 had transient disease improvement, followed by COVID-19 progression and death approximately 5 weeks after VST. As shown in Figure 4 we observed a significant increase in the frequency of SARS-CoV-2-reactive T cells after infusion in all four patients, accompanied by detection of infused VST (as assessed by TCR deep sequencing analysis) for up to 6 months following VST treatment. By comparing TCR clonotypes detected against a publicly available COVID-TCR database (immunoSEQ TMAP/COVID) we were able to confirm SARS-CoV-2-antigen specificity of line-derived clones in all patients (Online Supplementary Table S5).
Discussion
In this study, we characterized the cellular T-cell immune response to 18 structural and non-structural proteins encoded by SARS-CoV-2 and established a hierarchy of immunodominance based on the profile of T-cell activity detected in 16 healthy convalescent individuals. Of these proteins, three structural (S, M, and N) and two nonstructural (NSP4 and AP7a) were advanced to clinical VST manufacturing. Our intent was to produce VST that were polyclonal (mix of CD4+ and CD8+ T cells), that were diverse with respect to TCR repertoire and that recognized multiple epitopes within antigens expressed at different stages of the life cycle of the virus, thereby minimizing the risk of immune escape. Indeed, the ex vivo-expanded cells induced using this cohort of antigens were Th1-polarized, produced multiple effector molecules, killed antigen-loaded targets and were able to recognize the
Haematologica | 108 July 2023 1844 ARTICLE - Allogeneic SARS-CoV-2-specific T cells to treat COVID-19 S. Vasileiou et al.

Continued on following page. A C D E B G F Haematologica | 108 July 2023 1845 ARTICLE - Allogeneic SARS-CoV-2-specific T cells to treat COVID-19 S. Vasileiou et al.
Figure 2. Ex vivo-expanded SARS-CoV-2-VST are Th1-polarized, polyfunctional and specifically kill virus-loaded targets. (A) SARS-CoV-2-directed IFNγ production detected within the CD4+ and CD8+ compartments by ICS; representative donor (left) and summary data shown as mean ± standard error of mean (SEM) (right). (B, C) Th1-polarized effector molecule production by SARS-CoV-2-VST as measured by Luminex (B) and Granzyme B ELIspot (C). ELIspot data have been normalized to background levels and are shown as SFC ± SEM. (D, E) Simultaneous production of multiple effector molecules by SARS-CoV-2-VST as measured by intracellular cytokine staining (D): representative donor [left] and summary data [right]) and multi-parametric FluoroSpot analysis (E). (F, G) Specific lysis of virus-expressing targets by SARS-CoV-2-VST (F) and lack of cytolytic activity against autologous or allogeneic targets (G). *Statistically significant differences (P<0.05). SARS-CoV-2; severe acute respiratory syndrome coronavirus-2; IFNγ: interferon gamma; GM-CSF; granulocyte-macrophage colony-stimulating factor; TNFα: tumor necrosis factor alpha; MIP: macrophage inflammatory protein; IL: interleukin; SFC: spot-forming cells; S: spike; M: membrane; N: nucleocapsid; GrB: granzyme B; PBMC: peripheral blood mononuclear cells; PHA: phytohemagglutinin; E:T: effector to target ratio; VST: virus-specific T cell.
parental SARS-CoV-2 strain as well as an array of variant strains including delta and omicron. We have also demonstrated the feasibility of translating these VST to high-risk COVID-19 patients, with clinical experience both at our center and by other groups who have utilized these banked VST under emergency investigational new drug applications.31 In our cohort of four patients, we observed the expansion of SARS-CoV-2-reactive T cells after infusion and the persistence of our cells for up to 6 months
There is emerging evidence that deficiencies in T-cell immunity render SARS-CoV-2-infected individuals at increased risk of disease progression and COVID-19-related death.12,13,17 This signature initially emerged in the pre-vaccine era, with hospitalized patients presenting with severe lymphopenia that was most pronounced in critically ill patients in the Intensive Care Unit and in whom residual T cells exhibited an exhausted/terminally differentiated phenotype.1-7,32-36 Even in the post-vaccine era, patients with underlying immune compromise including those receiving cancer treatment, immunosuppressive agents such as high-dose corticosteroids and TNF blockers,11,37 as well as recipients of solid-organ and stem cell transplants, mount poor immune responses to the vaccine.8-11 Thus, despite the availability of agents that effectively prevent serious infections in the immunocompetent host, there remains a need for effective and safe therapeutic agents to treat vulnerable individuals.
In developing our SARS-CoV-2-targeted T-cell therapy we sought to mirror the cellular immune landscape present in convalescent (never hospitalized) individuals whose endogenous T cells were apparently protective.18-20,38 Hence, we initiated our studies by interrogating the circulating memory T-cell response in these recovered individuals to identify which antigens were most frequently recognized and induced the highest frequency of IFNγ -producing T cells, with the objective of advancing the top candidates for VST manufacturing and clinical testing. To prepare a clinical product that would effectively target any viral strain and prevent the emergence of immune escape variants, we generated VST that recognized multiple immunogenic structural and non-structural proteins. In addition, to preserve the breadth of antigen/epitope specificities present in the circulating memory T-cell pool of
our convalescent donors, we stimulated donor PBMC with overlapping peptide libraries (15mers overlapping by 11 amino acids that contain all possible HLA class I epitopes and many class II) spanning our target antigens. Thus, the resultant VST were polyclonal, and recognized multiple epitopes within multiple antigens. This is in contrast to traditional peptide-based platforms, which typically rely on stimulation with selected epitopes, resulting in VST that can be used only in a subset of individuals bearing the relevant restricting HLA allele(s).39 We selectively enriched for polyclonal SARS-CoV-2-VST by culture in medium supplemented with the pro-inflammatory/survival cytokines IL4 and IL7, which we have previously shown to selectively promote the expansion and survival of both CD4+ and CD8+ VST recognizing multiple epitopes.40 This combination should favor the subsequent sustained expansion of transferred cells in vivo. Notably, this breadth of activity – at both the antigen and epitope level – conferred our VST the ability to react with all clinically important viral variants that have emerged to date, including the delta and omicron strains.
We administered our VST to four patients who were hospitalized with COVID-19 and at high risk of disease progression. VST treatment was not accompanied by clinically relevant alloreactivity as we saw no graft-versus-host disease. One patient did develop transient grade III cytokine release syndrome 13 days after infusion; this was considered likely to be secondary to COVID-19. All recipients had a significant increase in the frequency of VST after infusion, accompanied by detection of the transferred cells, which were confirmed to be COVID-specific, for as long as 6 months. Furthermore, three of the four infused patients achieved complete resolution of infection. The potential of these VST to address viral variants was also clinically confirmed in a heart transplant recipient with recalcitrant COVID-19 due to SARS-CoV-2 delta strain who failed to respond to remdesivir, corticosteroids, and tocilizumab, but proved clinically and virologically responsive to ALVR109 cells administered as an emergency investigational new drug.31
Our group has a long history of preparing and clinically utilizing partially HLA-matched VST targeting viruses, including cytomegalovirus, Epstein-Barr virus, adenovirus,
Haematologica | 108 July 2023 1846 ARTICLE - Allogeneic SARS-CoV-2-specific T cells to treat COVID-19 S. Vasileiou et al.

Continued on following page. A C D B Haematologica | 108 July 2023 1847 ARTICLE - Allogeneic SARS-CoV-2-specific T cells to treat COVID-19 S. Vasileiou et al.
Figure 3. Ex vivo-expanded SARS-COV-2-VST provide coverage against clinically important viral variants. (A) SARS-CoV-2-VST generated against the parental strain maintain Spike-directed reactivity against all variant strains as measured by IFNγ ELIspot. Data are shown as spot-forming cells (SFC) ± standard error of mean (SEM). (B) Selected mutations of the Spike protein and their prevalence among the different viral variants. (C) Example of a representative donor with a strong response to Spike antigen and the two unique immunogenic epitopes and varying levels of reactivity against variant peptides, as shown by IFNγ ELIspot. Data are reported as SFC ± SEM. (D) Summary results of all 16 donors tested. Each donor retains activity against unique immunogenic epitopes and to multiple mutated Spike peptides. SFC: spike-forming cells; IFNγ: interferon gamma; SARS-CoV-2; severe acute respiratory syndrome coronavirus-2; UIE: unique immunogenic epitope; WT: wildtype; Var: variant; ID: identity; VST: virus-specific T cell.
Pt ID: patients’ identification; VST: virus-specific T cells; HLA: human leukocyte antigen; WHO; World Health Organization; F: female; M: male; D: day; CNS; central nervous system; auto: autologous; allo; allogeneic; SCT: stem cell transplantation; CML: chronic myeloid leukemia; COVID-19: coronavirus disease-2019.
Figure 4. Detection of SARS-CoV-2-reactive T cells before and after infusion in the four infused patients. Specific cells are measured by ELIspot using the five targeted antigens as a stimulus. Results are reported as spot-forming cells ± standard error of mean and each color represents an individual antigenic specificity. In addition, the red arrows indicate each time point at which T-cell receptor deep sequencing confirmed the presence of infused virus-specific T cells in the patients. SFC: spotforming

BK virus and human herpes virus-6, for the treatment of refractory viral infections in allogeneic hematopoietic stem cell transplant recipients.25-27,41,42 However, this study establishes the feasibility of preparing and delivering offthe-shelf, SARS-CoV-2-directed VST to patients with COVID-19. In addition it is the first in which VST are used to address a public health issue afflicting other vulnerable groups, including the elderly, the very young and those
with underlying conditions.34,36,43 These VST can be rapidly and efficiently produced in scalable quantities, with excellent long-term stability, so they are suited for clinical use in high-risk individuals in immediate need of therapeutic intervention.
Disclosures
SV, MK and YV are consultants to AlloVir. BJG owns QBRegu-
Pt ID Sex Age, years Risk factors VST dose N of matched HLA alleles Other treatments WHO score at baseline Clinical outcomes 1 F 67 Age Hodgkin lymphoma Diabetes 1x10⁷ 5/8 Steroids, remdesivir, convalescent plasma 4 Recovered, discharged D7 2 F 70 Age Hypertension 1x10⁷ 4/8 Steroids, remdesivir, convalescent plasma 4 Recovered, discharged D6 3 F 50 CNS lymphoma Post auto-SCT 1x10⁷ 2/8 Steroids 3 Died, initial recovery followed by progression on D26 due to worsening COVID-19 4 M 52 CML Post allo-SCT 2x10⁷ 2/8 Steroids, remdesivir 3 Recovered, transferred to outside facility D9
Table 1. Clinical summary of the enrolled patients.
Haematologica | 108 July 2023 1848 ARTICLE - Allogeneic SARS-CoV-2-specific T cells to treat COVID-19 S. Vasileiou et al.
cells; D1: day 1; Wk: week; Mo: month; N: nucleocapsid; M: membrane; S: spike; TCR: T-cell receptor.
latory Consulting which has consulting agreements with Tessa Therapeutics, Marker Therapeutics, LOKON, and ViraCyte. HEH is a co-founder with equity in Allovir and Marker Therapeutics, has served on advisory boards for Tessa Therapeutics, Kiadis, Novartis, Gilead Biosciences, Fresh Wind Biotechnologies and GSK and has received research support from Kuur Therapeutics and Tessa Therapeutics. CMR and MKB have stock and other ownership interests with Coya, Bluebird Bio, Tessa Therapeutics, Marker Therapeutics, AlloVir, Walking Fish, Allogene Therapeutics, Memgen, Kuur Therapeutics, Bellicum Pharmaceuticals , TScan Therapeutics, Abintus Bio; have consulting or advisory roles with Abintus Bio, Adaptimmune, Brooklyn Immunotherapeutic, Onk Therapeutics, Tessa Therapeutics, Memgen, Torque, Walking Fish Therapeutics, TScan Therapeutics, Marker Therapeutics, Turnstone Bio; and have received research funding from Kuur Therapeutics. AML is a co-founder and equity holder of AlloVir and Marker Therapeutics and a consultant to AlloVir. PL is a member of the advisory board for Karyopharm. LH, AGW.
References
1. Arunachalam PS, Wimmers F, Mok CKP, et al. Systems biological assessment of immunity to mild versus severe COVID-19 infection in humans. Science. 2020;369(6508):1210-1220.
2. De Biasi S, Meschiari M, Gibellini L, et al. Marked T cell activation, senescence, exhaustion and skewing towards TH17 in patients with COVID-19 pneumonia. Nat Commun. 2020;1(1):3434.
3. Diao B, Wang C, Tan Y, et al. Reduction and functional exhaustion of T cells in patients with coronavirus disease 2019 (COVID-19). Front Immunol. 2020;11:827.
4. Kusnadi A, Ramirez-Suastegui C, Fajardo V, et al. Severely ill COVID-19 patients display impaired exhaustion features in SARS-CoV-2-reactive CD8(+) T cells. Sci Immunol. 2021;6(55):eabe4782.
5. Liao M, Liu Y, Yuan J, et al. Single-cell landscape of bronchoalveolar immune cells in patients with COVID-19. Nat Med. 2020;26(6):842-844.
6. Mathew D, Giles JR, Baxter AE, et al. Deep immune profiling of COVID-19 patients reveals distinct immunotypes with therapeutic implications. Science. 2020;369(6508):eabc8511.
7. Song JW, Zhang C, Fan X, et al. Immunological and inflammatory profiles in mild and severe cases of COVID-19. Nat Commun. 2020;11(1):3410.
8. Herishanu Y, Avivi I, Aharon A, et al. Efficacy of the BNT162b2 mRNA COVID-19 vaccine in patients with chronic lymphocytic leukemia. Blood. 2021;137(23):3165-3173.
9. Mair MJ, Berger JM, Berghoff AS, et al. Humoral immune response in hematooncological patients and health care workers who received SARS-CoV-2 vaccinations. JAMA Oncol. 2022;8(1):106-113.
10. Ribas A, Dhodapkar MV, Campbell KM, et al. How to provide the needed protection from COVID-19 to patients with hematologic malignancies. Blood Cancer Discov. 2021;2(6):562-567.
11. Romano E, Pascolo S, Ott P. Implications of mRNA-based SARSCoV-2 vaccination for cancer patients. J Immunother Cancer. 2021;9(6):e002932.
Contributions
SV, MK, AGW, AW, YV and SL performed research; SV, MK, AGW and TNE analyzed data; KM was involved in research coordination; BJG was in charge of regulatory issues; NL, HEH, CMR and MKB supervised the study; LH, GC, KAG and PDL were involved in patients’ care; SV, LH, AML and PDL wrote the manuscript.
Acknowledgments
The authors thank Walter Mejia for assistance with figure formatting.
Funding
This work was supported by a sponsored research grant from AlloVir, Inc.
Data-sharing statement
Datasets are maintained in an electronic database at the Center for Cell and Gene Therapy; data are available from the corresponding author on reasonable request.
12. Ameratunga R, Woon ST, Steele R, Lehnert K, Leung E, Brooks AES. Severe COVID-19 is a T cell immune dysregulatory disorder triggered by SARS-CoV-2. Expert Rev Clin Immunol. 2022;18(6):557-565.
13. Fung M, Babik JM. COVID-19 in immunocompromised hosts: what we know so far. Clin Infect Dis. 2021;72(2):340-350.
14. Avanzato VA, Matson MJ, Seifert SN, et al. Case study: prolonged infectious SARS-CoV-2 shedding from an asymptomatic immunocompromised individual with cancer. Cell. 2020;183(7):1901-1912.
15. Corey L, Beyrer C, Cohen MS, Michael NL, Bedford T, Rolland M. SARS-CoV-2 variants in patients with immunosuppression. N Engl J Med. 2021;385(6):562-566.
16. Shah V, Ko Ko T, Zuckerman M, et al. Poor outcome and prolonged persistence of SARS-CoV-2 RNA in COVID-19 patients with haematological malignancies; King's College Hospital experience. Br J Haematol. 2020;190(5):e279-e282.
17. Garcia-Vidal C, Puerta-Alcalde P, Mateu A, et al. Prolonged viral replication in patients with hematologic malignancies hospitalized with COVID-19. Haematologica. 2022;107(7):1731-1735.
18. Ni L, Ye F, Cheng ML, et al. Detection of SARS-CoV-2-specific humoral and cellular immunity in COVID-19 convalescent individuals. Immunity. 2020;52(6):971-977.
19. Peng Y, Mentzer AJ, Liu G, et al. Broad and strong memory CD4(+) and CD8(+) T cells induced by SARS-CoV-2 in UK convalescent individuals following COVID-19. Nat Immunol. 2020;21(11):1336-1345.
20. Sekine T, Perez-Potti A, Rivera-Ballesteros O, et al. Robust T cell immunity in convalescent individuals with asymptomatic or mild COVID-19. Cell. 2020;183(1):158-168.
21. Basar R, Uprety N, Ensley E, et al. Generation of glucocorticoidresistant SARS-CoV-2 T cells for adoptive cell therapy. Cell Rep. 2021;36(3):109432.
22. Bonifacius A, Tischer-Zimmermann S, Santamorena MM, et al. Rapid manufacturing of highly cytotoxic clinical-grade SARS-
Haematologica | 108 July 2023 1849 ARTICLE - Allogeneic SARS-CoV-2-specific T cells to treat COVID-19 S. Vasileiou et al.
CoV-2-specific T cell products covering SARS-CoV-2 and its variants for adoptive T cell therapy. Front Bioeng Biotechnol. 2022;10:867042.
23. Sivapalan R, Liu J, Chakraborty K, et al. Virus induced lymphocytes (VIL) as a novel viral antigen-specific T cell therapy for COVID-19 and potential future pandemics. Sci Rep. 2021;11(1):15295.
24. Papayanni PG, Chasiotis D, Koukoulias K, et al. Vaccinated and convalescent donor-derived severe acute respiratory syndrome coronavirus 2-specific T cells as adoptive immunotherapy for high-risk coronavirus disease 2019 patients. Clin Infect Dis. 2021;73(11):2073-2082.
25. Leen AM, Bollard CM, Mendizabal AM, et al. Multicenter study of banked third-party virus-specific T cells to treat severe viral infections after hematopoietic stem cell transplantation. Blood. 2013;121(26):5113-5123.
26. Tzannou I, Papadopoulou A, Naik S, et al. Off-the-shelf virusspecific T cells to treat BK virus, human herpesvirus 6, cytomegalovirus, Epstein-Barr virus, and adenovirus infections after allogeneic hematopoietic stem-cell transplantation. J Clin Oncol. 2017;35(31):3547-3557.
27. Tzannou I, Watanabe A, Naik S, et al. "Mini" bank of only 8 donors supplies CMV-directed T cells to diverse recipients. Blood Adv. 2019;3(17):2571-2580.
28. Harari A, Dutoit V, Cellerai C, Bart PA, Du Pasquier RA, Pantaleo G. Functional signatures of protective antiviral T-cell immunity in human virus infections. Immunol Rev. 2006;211:236-254.
29. Rossi J, Paczkowski P, Shen YW, et al. Preinfusion polyfunctional anti-CD19 chimeric antigen receptor T cells are associated with clinical outcomes in NHL. Blood. 2018;132(8):804-814.
30. Dolton G, Rius C, Hasan MS, et al. Emergence of immune escape at dominant SARS-CoV-2 killer T cell epitope. Cell. 2022;185(16):2936-2951.
31. Martits-Chalangari K, Spak CW, Askar M, et al. ALVR109, an offthe-shelf partially HLA matched SARS-CoV-2-specific T cell therapy, to treat refractory severe COVID-19 pneumonia in a heart transplant patient: case report. Am J Transplant. 2022;22(4):1261-1265.
32. Bange EM, Han NA, Wileyto P, et al. CD8(+) T cells contribute to
survival in patients with COVID-19 and hematologic cancer. Nat Med. 2021;27(7):1280-1289.
33. Meckiff BJ, Ramirez-Suastegui C, Fajardo V, et al. Imbalance of regulatory and cytotoxic SARS-CoV-2-reactive CD4(+) T cells in COVID-19. Cell. 2020;183(5):1340-1353.
34. Rydyznski Moderbacher C, Ramirez SI, Dan JM, et al. Antigenspecific adaptive immunity to SARS-CoV-2 in acute COVID-19 and associations with age and disease severity. Cell. 2020;183(4):996-1012.
35. Wilk AJ, Rustagi A, Zhao NQ, et al. A single-cell atlas of the peripheral immune response in patients with severe COVID-19. Nat Med. 2020;26(7):1070-1076.
36. Zhou F, Yu T, Du R, et al. Clinical course and risk factors for mortality of adult inpatients with COVID-19 in Wuhan, China: a retrospective cohort study. Lancet. 2020;395(10229):1054-1062.
37. Vormehr M, Lehar S, Kranz LM, et al. Dexamethasone premedication suppresses vaccine-induced immune responses against cancer. Oncoimmunology. 2020;9(1):1758004.
38. Tan AT, Linster M, Tan CW, et al. Early induction of functional SARS-CoV-2-specific T cells associates with rapid viral clearance and mild disease in COVID-19 patients. Cell Rep. 2021;34(6):108728.
39. Hont AB, Powell AB, Sohai DK, et al. The generation and application of antigen-specific T cell therapies for cancer and viral-associated disease. Mol Ther. 2022;30(6):2130-2152.
40. Gerdemann U, Keirnan JM, Katari UL, et al. Rapidly generated multivirus-specific cytotoxic T lymphocytes for the prophylaxis and treatment of viral infections. Mol Ther. 2012;20(8):1622-1632.
41. Gerdemann U, Katari UL, Papadopoulou A, et al. Safety and clinical efficacy of rapidly-generated trivirus-directed T cells as treatment for adenovirus, EBV, and CMV infections after allogeneic hematopoietic stem cell transplant. Mol Ther. 2013;21(11):2113-2121.
42. Papadopoulou A, Gerdemann U, Katari UL, et al. Activity of broad-spectrum T cells as treatment for AdV, EBV, CMV, BKV, and HHV6 infections after HSCT. Sci Transl Med. 2014;6(242):242ra83.
43. Sette A, Crotty S. Adaptive immunity to SARS-CoV-2 and COVID19. Cell. 2021;184(4):861-880.
Haematologica | 108 July 2023 1850 ARTICLE - Allogeneic SARS-CoV-2-specific T cells to treat COVID-19 S. Vasileiou et al.
Sialylation regulates migration in chronic lymphocytic leukemia
Alessandro Natoni,1* Marina Cerreto,1* Maria Stefania De Propris,1 Ilaria Del Giudice,1 Roberta Soscia,1 Nadia Peragine,1 Stefania Intoppa,1 Maria Laura Milani,1 Anna Guarini2 and Robin Foà1
Correspondence: A. Natoni alessandro.natoni@uniroma1.it
Received: August 25, 2022.
Accepted: January 27, 2023.
Early view: February 9, 2023.
*AN and MC contributed equally as co-first authors.
Abstract
https://doi.org/10.3324/haematol.2022.281999
©2023 Ferrata Storti Foundation
Published under a CC BY-NC license
Sialylation is the terminal addition of sialic acid to underlying glycans. It plays a prominent role in cell adhesion and immune regulation. Sialylated structures found on adhesion molecules, such as CD49d, mediate the interactions between cancer cells and the microenvironment, facilitating metastatic seeding in target organs. Chronic lymphocytic leukemia (CLL) is a clonal B-cell malignancy characterized by the accumulation of CD5-positive B cells in the peripheral blood, bone marrow and lymph nodes. CLL cells proliferate mainly in the lymph node “proliferation centers”, where the microenvironment provides pro-survival signals. Thus, migration and homing into these protective niches play a crucial role in CLL biology. In recent years, therapeutic strategies aimed at inducing the egress of CLL cells from the lymph nodes and bone marrow into the circulation have been highly successful. In this study, the sialylation status of 79 untreated and 24 ibrutinib-treated CLL patients was characterized by flow cytometry. Moreover, the effect of sialic acid removal on migration was tested by a transwell assay. Finally, we examined the sialylation status of CD49d by Western blot analysis. We found that CLL cells are highly sialylated, particularly those characterized by an “activated” immune phenotype. Notably, sialylation regulates CLL migration through the post-translational modification of CD49d. Finally, we showed that therapeutic agents that induce CLL mobilization from their protective niches, such as ibrutinib, modulate sialic acid levels. We propose that sialylation is an important regulator of CLL trafficking and may represent a novel target to further improve CLL therapy.
Introduction
Chronic lymphocytic leukemia (CLL) is characterized by the accumulation of clonal, CD5-positive mature B cells in the peripheral blood (PB), bone marrow (BM) and lymph nodes (LN).1 Since circulating PB CLL cells are mainly arrested in the G0/G1 phase of the cell cycle, CLL proliferation essentially occurs in the BM and in the LN.2 In the latter, CLL cells proliferate in a specific compartment called “proliferation centers” (PC) or pseudofollicles.3 Not only does the microenvironment support CLL proliferation, but it also provides malignant cells with survival factors that induce resistance to otherwise extremely effective therapeutic agents.4 Given their dependency on the microenvironment, CLL cells continue to circulate between the PB, BM and LN. CLL homing to the BM and LN is mediated by key molecules including chemokine [C-X-C motif] re-
ceptor 4 (CXCR4) and CD49d.5,6 CXCR4 represents the receptor for the stromal cell-derived factor 1α (SDF1α), an essential chemokine that mediates CLL chemotaxis and transendothelial migration.7,8 Different levels of CXCR4 and CD5 expression have been associated with specific PB CLL immune phenotypes, proliferation, persistence in the PB, and survival.9,10 CD49d is the α4 integrin subunit that, in association with the β1 subunit, forms the very late antigen 4 (VLA4). VLA4 promotes proper localization and recirculation of CLL cells into protective niches by binding to the vascular cell adhesion molecule 1 (VCAM1) and fibronectin (FN) present on endothelial and BM stromal cells, respectively.11 The importance of CD49d in CLL is shown by its clinical application as a prognostic marker.12-16
Novel therapeutic agents, including the Bruton’s tyrosine kinase (BTK) inhibitor ibrutinib, aim at targeting pro-survival and proliferative signals that originate from the
1Hematology, Department of Translational and Precision Medicine and 2Department of Molecular Medicine, Sapienza University, Rome, Italy
Haematologica | 108 July 2023 1851 ARTICLE - Chronic Lymphocytic Leukemia
microenvironment.5,6 A direct outcome of such treatments is the downregulation of key adhesion molecules that induces mobilization of CLL cells from the BM and LN to the PB, resulting in spontaneous apoptosis and re-sensitization to chemotherapeutic agents.17-19
Sialylation represents a post-translational modification of proteins and lipids catalyzed by a class of enzymes, which reside in the Golgi apparatus, known as sialyltransferases (Sts).20 These enzymes mediate the attachment of sialic acids via different glycosidic linkages (α2-3, α2-6, or α2-8) to the underlying glycan chain. Aberrant sialylation contributes to tumor immune evasion, dissemination and metastasis.21 Indeed, hypersialylation impairs natural killer (NK) cell-mediated cytotoxicity in multiple myeloma (MM)22 and CLL23 by promoting the binding to sialic acid-binding immunoglobulin-like lectins (Siglecs), a family of inhibitory receptors that are predominantly expressed by immune cells. Moreover, hypersialylation promotes tumor dissemination and metastasis by modulating the function of different integrins.24 For example, inhibiting sialylation in MM impairs interactions between tumor cells, VCAM1 and mucosal vascular addressin cell adhesion molecule 1 (MADCAM1) by altering the maturation of CD49d.25 Sialylation also participates in the generation of selectin ligands. The α2-3 linked sialic acid is an essential component of the tetrasaccharide structure known as Sialyl Lewisa/x (SLea/x), a key determinant of selectin recognition and binding. SLea/x characterizes tumors with a metastatic phenotype and its expression negatively correlates with patient survival.26 In acute myeloid leukemia (AML), blocking the interactions between E-selectin and its ligands by the small molecule GMI1271/Uproleselan effectively inhibits nichemediated pro-survival signaling, dampens AML blast regeneration, and strongly synergizes with chemotherapy.27 In this study, we investigated the sialylation profile of CLL cells isolated from the PB of untreated and ibrutinibtreated patients. We observed that CLL cells constitutively express high levels of sialic acids that can be modulated by therapeutic agents such as ibrutinib. Importantly, sialylation seems to regulate VCAM1- and FN-dependent CLL migration through the modification of the integrin subunit CD49d.
Methods
Chronic lymphocytic leukemia patients
Peripheral blood samples were collected after informed consent from 79 untreated CLL patients and from 24 CLL patients treated with ibrutinib. The study was conducted in accordance with the Declaration of Helsinki and was approved by the Ethics Committee of the Sapienza University. Patients' clinical features are listed in Online Supplementary Tables S1 and S2.
Flow cytometry analysis
Leukocytes from PB of CLL patients were isolated using an ammonium chloride-based red blood lysis buffer (155 mM ammonium chloride, 10 mM potassium bicarbonate, and 0.2 mM ethylenediaminetetraacetic acid [EDTA] tetrasodium salt, all from Merck; Rahway, NJ, USA). To determine the levels of α 2-3 and α 2-6 linked sialic acids, leukocytes (2x10⁶ per tube) were incubated for 15 minutes (min) at room temperature (RT) with gentle rocking with Maackia amurensis lectin II and Sambucus nigra lectin (1:20000; Vector Laboratories; Newark, CA, USA), which preferentially bind the α 2-3 and α 2-6 linked sialic acids, respectively. After incubation, cells were washed, stained with APC-conjugated streptavidin beads (1:400; BD Bioscience, Franklin Lakes, NJ, USA), FITC-conjugated anti-CD5 and PE-conjugated anti-CD19 antibodies (both from Immunological Science, Rome, Italy), AlexaFluor 647-conjugated cutaneous lymphocyte antigen antibody (clone Heca452; BD Bioscience) and incubated for 30 min at RT with gentle rocking. After incubation, cells were washed, resuspended in 500 µL staining buffer supplemented with 7-aminoactinomycin D (7-AAD, 1:80; Immunological Science) to exclude dead cells. Cells were acquired on a BD FACS Canto I (BD Biosciences). Data were analyzed using the Infinicyt software v 2.0.5.b.007 (Cytognos; Salamanca, Spain).
Migration assay
For the migration assay, only samples containing more than 85% CLL cells were used. Moreover, we selected samples with CD49d-positive CLL cells. CLL cells were isolated by Ficoll gradient centrifugation and seeded in the upper chamber of a transwell (5 µm pore size; Sarstedt; Hildesheim, Germany) at 2x10⁶ in 100 m L of serumfree RPMI 1640. The transwells had been previously coated with human FN (10 m g/cm2, Bio-Techne; Minneapolis, MN, USA), recombinant human VCAM1-Fc Chimera (1 µg/cm 2 , Biolegend; San Diego, CA, USA), or bovine serum albumin (BSA, 1% [v/v] in PBS; Merck) as control. Lower chambers were filled with either 600 mL of serumfree RPMI 1640 medium or serum free RPMI 1640 medium supplemented with recombinant human SDF1 α (200 ng/mL, Peprotech; London, UK). After 5 hours (h) at 37°C, migrated cells in the lower chambers were collected and mixed with 25 m L of CountBright absolute counting beads (ThermoFisher Scientific; Waltham, MA, USA) together with 5 m L of 7AAD to exclude dead cells. Samples were acquired on a BD FACS Canto I. Acquisition was stopped after collecting 2,000 events in the gate drawn around the beads. The cell number was estimated using the following equation: absolute count (cells/ m L) = (cell count x counting bead volume) / (counting bead count x cell volume) x counting bead concentration (beads/ m L).
Haematologica | 108 July 2023 1852 ARTICLE - Sialylation modulates CD49d-mediated CLL migration A. Natoni et al.
Statistical analysis
The Mann-Whitney test or the two-way ANOVA followed by Sidak’s multiple comparison post-hoc testing were used to determine significance, using P<0.05 as the cut-off. *P<0.05; **P<0.01; ***P<0.001. GraphPad Prism 6.02 software (La Jolla, CA, USA) was used to compute all statistical calculations.
Results
Chronic lymphocytic leukemia cells express elevated levels of α2-3 linked sialic acid and α2-6 linked sialic acid and low levels of Sialyl Lewisa/x
To characterize the sialylation status of CLL cells, we used flow cytometry to measure the expression levels of the α 2-3 and α 2-6 linked sialic acids ( α 2-3 Sia, α 2-6 Sia) in CLL cells isolated from the PB of 79 untreated patients, using the Maackia amurensis lectin II (MALII) and the Sambucus nigra lectin (SNA). We also included in our analysis the Heca452 antibody, which recognizes the tetrasaccharide SLea/x, an important determinant in selectin

recognition and binding. All CLL samples analyzed displayed a high proportion of cells positive for MALII and SNA, indicating that the majority of CLL cells express both α 2-3 Sia and α 2-6 Sia (Figure 1A). In contrast, CLL cells were negative or weakly positive to the Heca452 antibody, suggesting low levels of SLea/x expression (Figure 1A). The distribution of the median fluorescence intensity (MFI) for all three markers was rather heterogeneous, particularly for α2-6 Sia, indicating a high degree of inter-patient variability (Figure 1B, C and D). There was no difference in the proportion of α 2-3 Sia, α 2-6 Sia and SLea/x positive cells between CLL cells with either favorable or adverse prognostic indicators including the IGVH mutational status, CD38 and CD49d positivity (Online Supplementary Figures S1-S3). With regard to MFI, we only found a decrease in the SLea/x MFI of the CD38-positive compared to the CD38-negative CLL cells ( Online Supplementary Figure S2F) ; the difference between these two CLL populations was, however, small and its biological significance is, therefore, unclear. In conclusion, PB CLL cells express α2-3 Sia, α2-6 Sia and, to a lesser extent, SLea/x.
Figure 1. Expression of α2-3 linked sialic acid, α2-6 linked sialic acid and Sialyl Lewisa/x in chronic lymphocytic leukemia cells. Peripheral blood (PB) collected from 79 untreated chronic lymphocytic leukemia (CLL) patients were lysed and stained for flow cytometry. CLL cells were identified by the expression of CD5 and CD19. Dead cells were excluded using the 7-aminoactinomycin D (7AAD). The levels of α2-3 linked sialic acid (α2-3 Sia), α2-6 linked sialic acid (α2-6 Sia), and Sialyl Lewisa/x (SLea/x) were determined using Maackia amurensis lectin II (MALII) and Sambucus nigra (SNA) lectins and the Heca452 antibody, respectively. At least 30,000 events were acquired in the CD5 CD19 gated population. Graphs display the percentages of α2-3 Sia, α2-6 Sia and SLea/x positive cells (A), and the median fluorescence intensity (MFI) of the α2-3 Sia (B), α2-6 Sia (C), and SLea/x (D) positive cells. Dots represent individual measurements. Horizontal lines depict median and interquartile range.
A B C D Haematologica | 108 July 2023 1853 ARTICLE - Sialylation modulates CD49d-mediated CLL migration A. Natoni et al.
α2-3 linked sialic acid and Sialyl Lewisa/x are present at higher levels in chronic lymphocytic leukemia cells with an “activated” phenotype
We then investigated whether sialic acids could be differentially expressed in distinct CLL subclones. To this end, we focused on two surface markers, CD5 and CXCR4, whose combined expression discriminates between CLL subclones enriched in recently divided cells that have left a solid lymphoid tissue (CXCR4dim CD5bright) and those that have been circulating in the periphery longer and are characterized by a resting phenotype (CXCR4bright CD5dim).9 Using a similar gating strategy to that used in previous studies (Figure 2A),9,10 we identified CXCR4dim CD5bright and CXCR4bright CD5dim cells in 28 CLL samples from untreated patients and examined the expression levels of α2-3 Sia, α2-6 Sia and SLea/x. We observed that CXCR4dim CD5bright cells displayed higher expression levels of the α2-3 Sia and
of SLea/x compared to CXCR4bright CD5dim cells (Figure 2B and D). These data suggest that the α2-3 Sia, and in particular SLea/x, may be expressed at higher levels in CLL cells with an “activated” phenotype.

Removal of sialic acids on the cell surface by neuraminidase treatment inhibits VCAM1- and fibronectin-dependent chronic lymphocytic leukemia migration
Sialylation is a post-translational modification that occurs on proteins and lipids expressed predominantly on the cell surface. Therefore, one of its major roles is the modulation of cell-cell and cell-environment interaction.28 Indeed, sialylation seems to enhance the metastatic potential of several tumors by promoting migration and invasion.21
Since CLL cells continuously migrate in and out of the LN and BM, which represent essential niches for CLL cell sur-
Figure 2. Expression of α2-3 linked sialic acid, α2-6 linked sialic acid and Sialyl Lewisa/x in CXCR4dim CD5bright and CXCR4bright CD5dim chronic lymphocytic leukemia cells. Peripheral blood (PB) collected from chronic lymphocytic leukemia (CLL) patients were lysed and stained for flow cytometry as described above. CLL cells with chemokine [C-X-C motif] receptor 4dim (CXCR4dim) CD5bright and CXCR4bright CD5dim phenotypes were identified by the expression of CD5 and CXCR4 markers within the CD5 CD19 positive population. (A) Example of the gating strategy used to determine CXCR4dim CD5bright and CXCR4bright CD5dim populations. α2-3 linked sialic acid (α2-3 Sia) (B), α2-6 linked sialic acid (α2-6 Sia) (C), and Sialyl Lewisa/x (SLea/x) (D) median fluorescence intensity (MFI) of the CXCR4dim CD5bright and CXCR4bright CD5dim CLL cells. At least 30,000 events were acquired in the CD5 CD19 population. Dots represent individual measurements. Horizontal lines depict median and interquartile range. Mann-Whitney test: *P<0.05; ***P<0.001; ns: not significant.
A B C D Haematologica | 108 July 2023 1854 ARTICLE - Sialylation modulates CD49d-mediated CLL migration A. Natoni et al.
vival and proliferation, we asked whether sialylation could regulate CLL migration. Given the clinical significance of CD49d (α4) in CLL,12-16 we examined the involvement of sialylation in VCAM1- and FN-dependent migration, which is primarily mediated by CD49d/β1. Indeed, it has been shown that only CLL cells expressing CD49d display strong migration into these protective niches, a process that is dependent on the expression of VCAM1 on targeted endothelium.29,30 We thus selected CD49d-positive CLL cells and tested them in a transwell assay under conditions in which sialic acids were removed from the cell surface by treatment with neuraminidase from Vibro Cholerae. Transwells were coated with BSA, VCAM1 and FN, and migration was stimulated by SDF1α. CLL cells from different patients displayed a considerable variation in their ability to migrate in response to SDF1α (Online Supplementary Figure S4), which could be explained only in part by CXCR4 expression (Online Supplementary Figure S5A). Migration did not correlate with the levels of α2-3 Sia, α2-6 Sia and SLea/x (data not shown). VCAM1 and FN exhibited variable effects on migration of CLL cells. Indeed, VCAM1 and FN inhibited or enhanced migration in response to SDF1α, suggesting a high degree of inter-patient variability (Online Supplementary Figure S4). Moreover, FN-dependent but not VCAM1dependent migration correlated with the expression levels of CXCR4 (Online Supplementary Figure S5B and C), highlighting the importance of this receptor in FN-mediated migration. VCAM1-dependent migration did not correlate with the degree of CD49d positivity (data not shown), suggesting that additional factors besides CXCR4 and CD49d modulate this process. Neuraminidase treatment had no effects on migration stimulated by SDF1α (Figure 3). However, in all CLL samples analyzed, neuraminidase treatment inhibited VCAM1- and FN-dependent migration (Figure 3). Importantly, we observed that neuraminidase from Vibro Cholerae almost exclusively removed the α2-3 Sia (Online Supplementary Figure S6), indicating that this form of sialic acid is predominantly involved in modulating VCAM1- and FN-mediated migration. Since neuraminidase treatment does not specifically remove sialic acids from CD49d but rather induces a global desialylation, we performed the transwell assay on CD49d-negative CLL cells obtained from 4 patients to test whether migration of these cells was also impaired by the treatment. We could observe that CLL cells treated with neuraminidase showed a decrease in the number of migrating cells compared to untreated control (Online Supplementary Figure S7). Although they did not reach statistical significance, these data suggest that removal of sialic acids could affect migration independently of CD49d, an observation that requires further study. Importantly, the presence of VCAM1 and FN did not stimulate migration (Online Supplementary Figure S7), highlighting the importance of CD49d in VCAM1and FN-dependent migration.
Figure 3. Inhibition of VCAM1- and fibronectin-dependent chronic lymphocytic leukemia migration by neuraminidase treatment. Chronic lymphocytic leukemia (CLL) cells were treated/mock treated with neuraminidase from Vibro Cholerae (0.1 U/mL) for 45 minutes and then seeded on top of transwells coated overnight with bovine serum albumin (BSA), vascular cell adhesion molecule 1 (VCAM1)-Fc chimera and fibronectin (FN). The bottom chambers of the transwells were filled with serum free media supplemented with stromal cell-derived factor 1α (SDF1α [200 ng/mL]). Cells were allowed to migrate for 5 hours at 37°C. After incubation, cells in the lower chambers were collected and mixed with 25 µL of counting beads. Migrated CLL cells were counted using a BD FACS Canto I flow cytometer by gating on the counting beads and acquiring, in this gate, 2000 events. Two-way ANOVA followed by Sidak’s multiple comparison post-hoc testing: *P<0.05; ns: not significant.
CD49d is post-translationally sialylated in chronic lymphocytic leukemia
Since VCAM1 and FN represent the main counter-receptors for the integrin α4/β1, we sought to investigate whether sialylation represents a post-translational modification of the α4 and the β1 integrin subunits. To this end, we examined the effects of neuraminidase treatment on the mobility of these integrin subunits on a sodium dodecyl sulphate poly-acrylamide gel electrophoresis (SDS-PAGE) by Western blot analysis. Indeed, we observed that neuraminidase treatment consistently induced a shift in the mobility of the α4 subunit in CLL samples collected from 4 patients (Figure 4), indicating that CD49d is post-translationally sialylated. The β1 subunit became apparent only after a long exposure and was not affected by neuraminidase treatment (Figure 4). Taken together, these data indicate that sialylation of CD49d regulates VCAM1- and FN-dependent migration.

Ibrutinib alters the levels of α2-3 linked sialic acid, α2-6 linked sialic acid and Sialyl Lewisa/x
We next explored whether therapeutic agents that have an impact on the interactions between CLL and the microenvironment could modify the levels of sialic acids. We thus compared the sialylation profile between CLL cells from the untreated patient cohort with that of cells iso-
Haematologica | 108 July 2023 1855 ARTICLE - Sialylation modulates CD49d-mediated CLL migration A. Natoni et al.
Figure 4. Neuraminidase treatment alters the post-translational modification of CD49d. Chronic lymphocytic leukemia (CLL) cells collected from 4 patients were treated/mock treated with neuraminidase from Vibro Cholerae as described above. After treatment, whole cell extracts were prepared and subjected to sodium dodecyl sulfate poly-acrylamide gel electrophoresis (SDS-PAGE), transferred to nitrocellulose membrane and blotted for integrin α 4, β 1 and β -actin as loading control. Numbers above the blots represent patient number. Upper and lower arrows indicate mature and desialylated α4, respectively. Numbers on right-hand side represent molecular weight marker.
lated from a cohort of patients treated with ibrutinib. Although there was no difference between the proportion of CLL cells positive for α2-3 Sia, α2-6 Sia and SLea/x in both cohorts of patients (Figure 5A, C and E), CLL cells from the ibrutinib-treated cohort exhibited a lower α2-3 Sia and α26 Sia MFI compared to that from the untreated cohort (Figure 5B and D), indicating that ibrutinib treatment did have an impact on sialylation. Interestingly, we observed that the SLea/x MFI was higher in CLL cells derived from ibrutinib-treated patients compared to that of cells derived from untreated patients (Figure 5F). We were able to examine the levels of α2-3 Sia, α2-6 Sia and SLea/x in cryopreserved CLL cells taken from the ibrutinib-treated patient cohort prior to ibrutinib treatment and to compare them with those from matched samples after ibrutinib treatment. We observed a decrease in the α2-3 Sia, α2-6 Sia MFI and an increase in the SLea/x MFI after ibrutinib treatment, thus confirming our previous observation (Online Supplementary Figure S8).
Discussion
In this study, we carried out a sialylation profile analysis of CLL cells by measuring the levels of α2-3 Sia, α2-6 Sia and SLea/x expression on the cell surface. We observed that all CLL cells examined invariably expressed α2-3 Sia and α2-6 Sia, although the levels of expression differed considerably between patients. The levels of α2-3 Sia, α2-6 Sia and SLea/x expression did not correlate with the clinical markers examined in this study, namely the IGVH mutational status, and CD38 and CD49d expression. Therefore,
sialylation seems to be a general feature of CLL. However, we cannot exclude the possibility that individual and not global glycoconjugates may be differentially sialylated according to the clinical markers examined in this study. A difference in CLL sialylation has been reported in association with resistance to rituximab (RTX)-mediated complement-dependent cytotoxicity (CDC).31 Treatment of resistant CLL cells with neuraminidase could revert this resistance and increase RTX-mediated CDC in sensitive CLL cells. High expression of sialoglycans has been also found in the context of Siglec 7 ligands in CLL.23 Siglec 7 is a member of immunomodulatory receptors expressed on cells of the immune system, which, upon binding to sialic acids, triggers inhibitory signals that suppress the immune response.32 CLL cells express high levels of the disialyl-T antigen, a Siglec 7 ligand, which is synthesized by ST6GalNAc-IV and blocked by core 2 GlcNAc transferase.23 Importantly, the expression pattern of these two genes, that is predictive of high disialyl-T antigen expression (ST6GalNAC4High and GCNT1Low), is associated with a poor prognosis.23 Taken together, these results indicate that sialylation of CLL cells serves as a means to protect them from the cytotoxic activity of the immune system. Moreover, NK response in CLL patients is markedly impaired,33-36 most likely due to low levels of activating ligands expressed on CLL cells,37 together with low expression of activating receptors on NK cells.38,39 Therefore, sialylation may co-operate with all these mechanisms in generating an immune suppressive phenotype that promotes CLL immune escape.
In the present study, we found that sialylation of CLL cells is also involved in modulating VCAM1- and FN-dependent migration. CLL cells rely on the LN and BM microenvironment for their survival and proliferation; therefore, they constantly circulate between PB, BM and LN. The relevance of CLL recirculation between these different anatomical compartments is proven by the prognostic significance of CD49d, one of the strongest prognostic markers in CLL, predicting OS at diagnosis and shorter time to treatment.13-16 Functionally, CD49d is the α4 subunit of the VLA4 integrin that binds to adhesion molecules such as VCAM1 and FN. Binding to these adhesion molecules stimulates migration into protective niches and promotes survival of CLL cells. Although none of the sialylated markers examined correlated with migration mediated by VCAM1 and FN and stimulated by SDF1α, removal of sialic acids from the cell surface inhibited VCAM1- and FN-dependent migration. Moreover, since the neuraminidase used in this study primarily cleaves α2-3 Sia, this form of sialic acid is clearly implicated in modulating CLL migration, although involvement of α2-8 Sia, not examined in this study, cannot be completely ruled out. By analyzing the mobility of CD49d on SDS PAGE, we observed a reduction in its apparent molecular weight, indicating that

Haematologica | 108 July 2023 1856 ARTICLE - Sialylation modulates CD49d-mediated CLL migration A. Natoni et al.
CD49d is modified by sialylation. This result is similar to that found in MM, where global desialylation interferes with CD49d maturation, and impairs adhesion and rolling on VCAM1 and MADCAM1.25 The mechanisms by which sialylation modulates the adhesive properties of CD49d
still have to be explored. CD49d presents multiple conformations characterized by different binding affinities that allow leukocytes to tether, roll or firmly adhere to the endothelium.40 It could be that sialylation modulates one or more of these different conformations regulating the af-
Figure 5. Expression of α2-3 Sia, α2-6 Sia and SLea/x between chronic lymphocytic leukemia cells from untreated and ibrutinibtreated patients. Peripheral blood (PB) collected from 79 untreated and 24 ibrutinib-treated chronic lymphocytic leukemia (CLL) patients were lysed and stained for flow cytometry as described above. Graphs display the percentages and the median fluorescence intensity (MFI) of α2-3 linked sialic acid (α2-3 Sia) (A and B), α2-6 linked sialic acid (α2-6 Sia) (C and D), and Sialyl Lewisa/x (SLea/x) (E and F) expression levels. Dots represent individual measurements. Horizontal lines depict median and interquartile range. Mann-Whitney test: *P<0.05; **P<0.01; ns: not significant.

A B C D E F Haematologica | 108 July 2023 1857 ARTICLE - Sialylation modulates CD49d-mediated CLL migration A. Natoni et al.
finity of VLA4 for its substrates. How sialylation of CD49d impacts its prognostic value is still not known. Clearly, the presence of a post-translational modification on CD49d adds another layer of complexity. Sialylation seems to increase the affinity of CD49d for its counter-receptors; thus, the presence of a constitutively sialylated form of CD49d in CLL may represent one of the biological determinants underlying the importance of this marker in the clinic. Screening of the CD49d sialylation status in a large cohort of CLL patients will be instrumental in defining the contribution of sialylation on the prognostic power of CD49d.
In contrast to α2-3 Sia and α2-6 Sia, a large proportion CLL cells were negative or weakly positive for the expression of SLea/x, which is consistent with a previous study.41 However, we observed that α2-3 Sia, and in particular SLea/x, were expressed at higher levels in CXCR4dim CD5bright CLL cells, which have been shown to be enriched in cells that have recently divided and have left the LN compartment.9 SLea/x is a tetrasaccharide composed of an N-acetyl-D-glucosamine, β1-4 galactose, α2-3 Sia and α13 or α1-4 fucosylation and represents an essential determinant for selectin binding. It is constitutively expressed on granulocytes and monocytes whereas it can be induced on T and B cells upon activation.42-46 In hematologic malignancies, SLea/x is expressed at high levels in diseases characterized by a more immature phenotype such as AML27 and acute lymphoblastic leukemia.41 It is also expressed on a subpopulation of MM cells that give rise to an aggressive disease and resistance to bortezomib in vivo in nude mice.47 Given this amount of data, it is tempting to speculate that SLea/x marks CLL cells that are more prone to proliferate and to home into the LN or BM, which could be facilitated by selectin binding. The higher expression of α2-3 Sia and the SLea/x in LN-like CLL cells suggests that sialylation may be modulated by microenvironmental signals. It has been shown that CLL cells express surface IgM (sIgM) as a mature glycosylated form similar to normal B cells and as an immature mannosylated form that is characteristic of persistent sIgM engagement.48 These data indicate that, in CLL, the microenvironment can modulate the glycan composition of the cell surface. It will be of interest to understand whether sialylation can be similarly regulated.
Finally, we examined whether sialylation could be modulated by therapeutic agents, such as ibrutinib, that target essential signaling pathways provided by the microenvironment. Indeed, by comparing the untreated CLL cohort to a cohort of patients treated with ibrutinib, we observed that CLL cells from ibrutinib-treated patients displayed lower levels of α2-3 Sia and α2-6 Sia compared to those from untreated individuals. These results were also confirmed in a comparison between matched samples taken before and after ibrutinib treatment.
Whether the decrease in α2-3 Sia and α2-6 Sia is due to a direct effect of ibrutinib on the expression levels of the STs or is a consequence of an ibrutinib-mediated downregulation of sialylated adhesion molecules17-19 is still not known. Notably, we found that the levels of SLea/x were increased in CLL cells from ibrutinib-treated patients. This could be explained by the CLL egress from the LN induced by ibrutinib treatment.49 Indeed, if SLea/x marks “activated”, dividing CLL cells, it should mainly be expressed in CLL cells resident in the LN. Therefore, by inducing cells to egress from the LN, ibrutinib may force them into the PB. This could apparently create a paradoxical situation whereby ibrutinib releases into the circulation CLL cells more prone to proliferate and disseminate. However, it should be emphasized that not only does ibrutinib promote egress of CLL cells, but it also inhibits re-entry and homing into protective niches by down-modulating proadhesive molecules,18,49 and possibly by inducing their desialylation. Moreover, by inducing desialylation, ibrutinib and similar agents could sensitize circulating CLL cells to the immune system.23,31 In this context, it will be of interest to examine whether treatment with ibrutinib down-modulates Siglec 7 ligands on CLL cells and sensitizes them to NK-mediated cytotoxicity, or facilitates RTX-mediated CDC. In conclusion, we have shown that sialylation is an important feature of CLL cells regulating migration through modification of relevant molecules such as CD49d, and may represent a novel therapeutic target to block CLL dissemination and homing, maximizing the efficacy of standard and novel clinical agents. For instance, neuraminidase-conjugated antibodies have been developed to selectively remove sialic acids from the surface of tumor cells potentiating the anticancer immune response.50 Such a strategy could be implemented in CLL by conjugating therapeutically relevant antibodies, such as RTX, with neuraminidase, combining the mechanisms of action of the therapeutic antibody with the targeted removal of sialic acids, which may lead to a superior clinical response.
Disclosures
No conflicts of interest to disclose.
Contributions
AN and MC performed the experiments and analyzed the data. MSDP, SI and MLM carried out the diagnostic CLL immune phenotype. RS performed the IGVH mutational status. NP and AG reviewed the manuscript. AN, IDG and RB designed the study and wrote the paper. RF supervised and funded the research.
Acknowledgments
We would like to acknowledge Prof. Michael O’Dwyer from the National University of Ireland, Galway, for scientific in-
Haematologica | 108 July 2023 1858 ARTICLE - Sialylation modulates CD49d-mediated CLL migration A. Natoni et al.
puts, Dr. Antonio Agostini and Dr. Carmine Carbone from the Fondazione Policlinico Universitario Agostino Gemelli IRCCS for technical assistance, and Roberta Raponi for administrative support.
Funding
The project leading to these results has received funding from the Associazione Italiana Ricerca sul Cancro (AIRC) Special 5x1000 Program Metastases (21198), Milan, Italy (to
References
1. Fabbri G, Dalla-Favera R. The molecular pathogenesis of chronic lymphocytic leukaemia. Nat Rev Cancer. 2016;16(3):145-162.
2. Herishanu Y, Perez-Galan P, Liu D, et al. The lymph node microenvironment promotes B-cell receptor signaling, NFkappaB activation, and tumor proliferation in chronic lymphocytic leukemia. Blood. 2011;117(2):563-574.
3. Lampert IA, Wotherspoon A, Van Noorden S, Hasserjian RP. High expression of CD23 in the proliferation centers of chronic lymphocytic leukemia in lymph nodes and spleen. Hum Pathol. 1999;30(6):648-654.
4. Haselager MV, Kielbassa K, Ter Burg J, et al. Changes in Bcl-2 members after ibrutinib or venetoclax uncover functional hierarchy in determining resistance to venetoclax in CLL. Blood. 2020;136(25):2918-2926.
5. Burger JA, Ghia P, Rosenwald A, Caligaris-Cappio F. The microenvironment in mature B-cell malignancies: a target for new treatment strategies. Blood. 2009;114(16):3367-3375.
6. ten Hacken E, Burger JA. Molecular pathways: targeting the microenvironment in chronic lymphocytic leukemia-focus on the B-cell receptor. Clin Cancer Res. 2014;20(3):548-556.
7. Burger JA, Burger M, Kipps TJ. Chronic lymphocytic leukemia B cells express functional CXCR4 chemokine receptors that mediate spontaneous migration beneath bone marrow stromal cells. Blood. 1999;94(11):3658-3667.
8. Burger JA, Kipps TJ. Chemokine receptors and stromal cells in the homing and homeostasis of chronic lymphocytic leukemia B cells. Leuk Lymphoma. 2002;43(3):461-466.
9. Calissano C, Damle RN, Marsilio S, et al. Intraclonal complexity in chronic lymphocytic leukemia: fractions enriched in recently born/divided and older/quiescent cells. Mol Med. 2011;17(11-12):1374-1382.
10. Kriston C, Plander M, Mark A, et al. In contrast to high CD49d, low CXCR4 expression indicates the dependency of chronic lymphocytic leukemia (CLL) cells on the microenvironment. Ann Hematol. 2018;97(11):2145-2152.
11. Dal Bo M, Tissino E, Benedetti D, et al. Microenvironmental interactions in chronic lymphocytic leukemia: the master role of CD49d. Semin Hematol. 2014;51(3):168-176.
12. Peragine N, De Propris MS, Intoppa S, et al. Early CD49d downmodulation in chronic lymphocytic leukemia patients treated front-line with ibrutinib plus rituximab predicts longterm response. Leuk Lymphoma. 2022;63(12):2982-2986.
13. Gattei V, Bulian P, Del Principe MI, et al. Relevance of CD49d protein expression as overall survival and progressive disease prognosticator in chronic lymphocytic leukemia. Blood. 2008;111(2):865-873.
14. Bulian P, Shanafelt TD, Fegan C, et al. CD49d is the strongest flow cytometry-based predictor of overall survival in chronic
RF), and from the iCARE-2 2019 program co-founded by the AIRC and the European Union’s Horizon 2020 research and innovation program under the Marie Skłodowska-Curie grant agreement n. 800924 (to AN).
Data-sharing statement
The data that support the findings of this study are available from the corresponding author upon reasonable request.
lymphocytic leukemia. J Clin Oncol. 2014;32(9):897-904.
15. Shanafelt TD, Geyer SM, Bone ND, et al. CD49d expression is an independent predictor of overall survival in patients with chronic lymphocytic leukaemia: a prognostic parameter with therapeutic potential. Br J Haematol. 2008;140(5):537-546.
16. Dal Bo M, Bulian P, Bomben R, et al. CD49d prevails over the novel recurrent mutations as independent prognosticator of overall survival in chronic lymphocytic leukemia. Leukemia. 2016;30(10):2011-2018.
17. de Rooij MF, Kuil A, Geest CR, et al. The clinically active BTK inhibitor PCI-32765 targets B-cell receptor- and chemokinecontrolled adhesion and migration in chronic lymphocytic leukemia. Blood. 2012;119(11):2590-2594.
18. Peragine N, De Propris MS, Intoppa S, et al. Modulated expression of adhesion, migration and activation molecules may predict the degree of response in chronic lymphocytic leukemia patients treated with ibrutinib plus rituximab. Haematologica. 2020;106(5):1500-1503.
19. Herman SE, Mustafa RZ, Jones J, Wong DH, Farooqui M, Wiestner A. Treatment with ibrutinib inhibits BTK- and VLA-4dependent adhesion of chronic lymphocytic leukemia cells in vivo. Clin Cancer Res. 2015;21(20):4642-4651.
20. Harduin-Lepers A, Vallejo-Ruiz V, Krzewinski-Recchi MA, Samyn-Petit B, Julien S, Delannoy P. The human sialyltransferase family. Biochimie. 2001;83(8):727-737.
21. Rodrigues E, Macauley MS. Hypersialylation in cancer: modulation of inflammation and therapeutic opportunities. Cancers (Basel). 2018;10(6):207.
22. Daly J, Sarkar S, Natoni A, et al. Targeting hypersialylation in multiple myeloma represents a novel approach to enhance NK cell-mediated tumor responses. Blood Adv. 2022;6(11):3352-3366.
23. Chang LY, Liang SY, Lu SC, et al. Molecular basis and role of Siglec-7 ligand expression on chronic lymphocytic leukemia B cells. Front Immunol. 2022;13:840388.
24. Schultz MJ, Swindall AF, Bellis SL. Regulation of the metastatic cell phenotype by sialylated glycans. Cancer Metastasis Rev. 2012;31(3-4):501-518.
25. Natoni A, Farrell ML, Harris S, et al. Sialyltransferase inhibition leads to inhibition of tumor cell interactions with E-selectin, VCAM1, and MADCAM1, and improves survival in a human multiple myeloma mouse model. Haematologica. 2020;105(2):457-467.
26. Natoni A, Macauley MS, O'Dwyer ME. Targeting selectins and their ligands in cancer. Front Oncol. 2016;6:93.
27. Barbier V, Erbani J, Fiveash C, et al. Endothelial E-selectin inhibition improves acute myeloid leukaemia therapy by disrupting vascular niche-mediated chemoresistance. Nat
Haematologica | 108 July 2023 1859 ARTICLE - Sialylation modulates CD49d-mediated CLL migration A. Natoni et al.
Commun. 2020;11(1):2042.
28. Dobie C, Skropeta D. Insights into the role of sialylation in cancer progression and metastasis. Br J Cancer. 2021;124(1):76-90.
29. Brachtl G, Sahakyan K, Denk U, et al. Differential bone marrow homing capacity of VLA-4 and CD38 high expressing chronic lymphocytic leukemia cells. PLoS One. 2011;6(8):e23758.
30. Pasikowska M, Walsby E, Apollonio B, et al. Phenotype and immune function of lymph node and peripheral blood CLL cells are linked to transendothelial migration. Blood. 2016;128(4):563-573.
31. Bordron A, Bagacean C, Mohr A, et al. Resistance to complement activation, cell membrane hypersialylation and relapses in chronic lymphocytic leukemia patients treated with rituximab and chemotherapy. Oncotarget. 2018;9(60):31590-31605.
32. Daly J, Carlsten M, O'Dwyer M. Sugar free: novel immunotherapeutic approaches targeting Siglecs and sialic acids to enhance natural killer cell cytotoxicity against cancer. Front Immunol. 2019;10:1047.
33. Foa R, Fierro MT, Lusso P, et al. Reduced natural killer T-cells in B-cell chronic lymphocytic leukaemia identified by three monoclonal antibodies: Leu-11, A10, AB8.28. Br J Haematol. 1986;62(1):151-154.
34. Foa R, Fierro MT, Raspadori D, et al. Lymphokine-activated killer (LAK) cell activity in B and T chronic lymphoid leukemia: defective LAK generation and reduced susceptibility of the leukemic cells to allogeneic and autologous LAK effectors. Blood. 1990;76(7):1349-1354.
35. Sportoletti P, De Falco F, Del Papa B, et al. NK cells in chronic lymphocytic leukemia and their therapeutic implications. In J Mol Sci. 2021;22(13):6665.
36. Foa R, Lauria F, Lusso P, et al. Discrepancy between phenotypic and functional features of natural killer T-lymphocytes in B-cell chronic lymphocytic leukaemia. Br J Haematol. 1984;58(3):509-516.
37. Veuillen C, Aurran-Schleinitz T, Castellano R, et al. Primary BCLL resistance to NK cell cytotoxicity can be overcome in vitro and in vivo by priming NK cells and monoclonal antibody therapy. J Clin Immunol. 2012;32(3):632-646.
38. Parry HM, Stevens T, Oldreive C, et al. NK cell function is markedly impaired in patients with chronic lymphocytic leukaemia but is preserved in patients with small lymphocytic
lymphoma. Oncotarget. 2016;7(42):68513-68526.
39. Hofland T, Endstra S, Gomes CKP, et al. Natural killer cell hyporesponsiveness in chronic lymphocytic leukemia can be circumvented in vitro by adequate activating signaling. Hemasphere. 2019;3(6):e308.
40. Chigaev A, Waller A, Zwartz GJ, Buranda T, Sklar LA. Regulation of cell adhesion by affinity and conformational unbending of alpha4beta1 integrin. J Immunol. 2007;178(11):6828-6839.
41. Ohmori K, Yoneda T, Ishihara G, et al. Sialyl SSEA-1 antigen as a carbohydrate marker of human natural killer cells and immature lymphoid cells. Blood. 1989;74(1):255-261.
42. Munro JM, Lo SK, Corless C, et al. Expression of sialyl-Lewis X, an E-selectin ligand, in inflammation, immune processes, and lymphoid tissues. Am J Pathol. 1992;141(6):1397-1408.
43. Silva M, Fung RKF, Donnelly CB, Videira PA, Sackstein R. Cellspecific variation in E-selectin ligand expression among human peripheral blood mononuclear cells: implications for immunosurveillance and pathobiology. J Immunol. 2017;198(9):3576-3587.
44. Postigo AA, Marazuela M, Sanchez-Madrid F, de Landazuri MO. B lymphocyte binding to E- and P-selectins is mediated through the de novo expression of carbohydrates on in vitro and in vivo activated human B cells. J Clin Invest. 1994;94(4):1585-1596.
45. Montoya MC, Holtmann K, Snapp KR, et al. Memory B lymphocytes from secondary lymphoid organs interact with Eselectin through a novel glycoprotein ligand. J Clin Invest. 1999;103(9):1317-1327.
46. Ohta S, Hanai N, Habu S, Nishimura T. Expression of sialyl Lewis(x) antigen on human T cells. Cell Immunol. 1993;151(2):491-497.
47. Natoni A, Smith TAG, Keane N, et al. E-selectin ligands recognised by HECA452 induce drug resistance in myeloma, which is overcome by the E-selectin antagonist, GMI-1271. Leukemia. 2017;31(12):2642-2651.
48. Krysov S, Potter KN, Mockridge CI, et al. Surface IgM of CLL cells displays unusual glycans indicative of engagement of antigen in vivo. Blood. 2010;115(21):4198-4205.
49. Palma M, Mulder TA, Osterborg A. BTK inhibitors in chronic lymphocytic leukemia: biological activity and immune effects. Front Immunol. 2021;12:686768.
50. Gray MA, Stanczak MA, Mantuano NR, et al. Targeted glycan degradation potentiates the anticancer immune response in vivo. Nat Chem Biol. 2020;16(12):1376-1384.
Haematologica | 108 July 2023 1860 ARTICLE - Sialylation modulates CD49d-mediated CLL migration A. Natoni et al.
Plasminogen activator-coated nanobubbles targeting cellbound β2-glycoprotein I as a novel thrombus-specific thrombolytic strategy
Paolo
1Department of Life Sciences, University of Trieste, Trieste, Italy; 2Istituto Auxologico Italiano, IRCCS, Laboratory of Immuno-Rheumatology, Milan, Italy; 3Department of Scienza e Tecnologia del Farmaco, University of Turin, Turin, Italy; 4Translational and Clinical Research Institute, Faculty of Medical Sciences, Newcastle University, Newcastle, UK; 5Experimental and Clinical Pharmacology Unit, C.R.O.-IRCCS, Aviano, Italy; 6Struttura Complessa di Chirurgia Vascolare, ASST GOM Niguarda. Milano, Italy and 7Dipartimento di Scienze Biomediche e Oncologia Umana, Università degli Studi di Bari Aldo Moro, Bari, Italy
Abstract
Correspondence: P. Macor pmacor@units.it
Received: June 8, 2022.
Accepted: September 22, 2022.
Early view: September 29, 2022.
https://doi.org/10.3324/haematol.2022.281505
©2023 Ferrata Storti Foundation
Published under a CC BY-NC license
β2-glycoprotein I (β2-GPI) is a serum protein widely recognized as the main target of antibodies present in patients with antiphospholipid syndrome (APS). β2-GPI binds to activated endothelial cells, platelets and leukocytes, key players in thrombus formation. We developed a new targeted thrombolytic agent consisting of nanobubbles (NB) coated with recombinant tissue plasminogen activator (rtPA) and a recombinant antibody specific for cell-bound β2-GPI. The therapeutic efficacy of targeted NB was evaluated in vitro, using platelet-rich blood clots, and in vivo in three different animal models: i) thrombosis developed in a rat model of APS; ii) ferric chloride-induced mesenteric thrombosis in rats, and iii) thrombotic microangiopathy in a mouse model of atypical hemolytic uremic syndrome (C3-gain-of-function mice). Targeted NB bound preferentially to platelets and leukocytes within thrombi and to endothelial cells through β2-GPI expressed on activated cells. In vitro, rtPA-targeted NB (rtPA-tNB) induced greater lysis of platelet-rich blood clots than untargeted NB. In a rat model of APS, administration of rtPA-tNB caused rapid dissolution of thrombi and, unlike soluble rtPA that induced transient thrombolysis, prevented new thrombus formation. In a rat model of ferric chloride triggered thrombosis, rtPA-tNB, but not untargeted NB and free rtPA, induced rapid and persistent recanalization of occluded vessels. Finally, treatment of C3-gain-of-function mice with rtPA-tNB, that target β2-GPI deposited in kidney glomeruli, decreased fibrin deposition, and improved urinalysis data with a greater efficiency than untargeted NB. Our findings suggest that targeting cell-bound β2-GPI may represent an efficient and thrombus-specific thrombolytic strategy in both APS-related and APS-unrelated thrombotic conditions.
Introduction
Antiphospholipid syndrome (APS) is an autoimmune disease characterized by antibody-mediated vascular thrombosis and adverse pregnancy outcomes including fetal loss, pre-eclampsia, preterm delivery, and intrauterine growth restriction.1,2 Vascular thrombosis is a serious and often recurrent medical condition that affects relatively young individuals with important social and clinical implications.3,4 Vessel occlusion by blood clots is the most common clinical manifestation observed in a 10-year prospective study of 1,000 APS patients followed in various University Hospitals in Europe.5 Although thrombi may potentially form in all arteries and veins of the vascular tree, clinical observation of APS patients has revealed 40%
localization in certain districts of the circulatory system, that are responsible for stroke, myocardial infarction, deep vein thrombosis, pulmonary embolism, and other less frequent vascular manifestations.5
Evidence collected from clinical studies and animal models of APS has documented the critical role played by antibodies to β 2-glycoprotein I ( β 2-GPI) in thrombus formation. Medium-to-high-titer antibodies are detected in APS patients with increased risk of thrombosis and are listed among the classification criteria for the diagnosis of the disease.6 β 2-GPI is a five-domain serum protein now recognized to be the main target of antiphospholipid antibodies. Four domains (DI-IV) are composed of short consensus repeats of approximately 60 amino acids shared with other members of the complement (C) con-
Macor,1 Paolo Durigutto,2 Monica Argenziano,3 Kate Smith-Jackson,4 Sara Capolla,5 Valeria Di Leonardo,1 Kevin Marchbank,4 Valerio Stefano Tolva,6 Fabrizio Semeraro,7 Concetta T. Ammollo,7 Mario Colucci,7 Roberta Cavalli,3 Pierluigi Meroni2 and Francesco Tedesco2
Haematologica | 108 July 2023 1861 ARTICLE - Coagulation & its Disorders
trol protein family, while the fifth domain contains a phospholipid binding site that interacts with the membrane of various cell types involved in thrombus formation including endothelial cells, platelets, and leukocytes.7,8 The binding of β2-GPI to endothelial cells requires cell priming with LPS, as documented by the analysis of the in vivo protein biodistribution in mice,9 and may also be induced by proinflammatory and physical stimuli such as surgery.10 An epitope exposed in the open form of β2-GPI on the N-terminal DI is the preferential target of the pathogenic antibodies that induce thrombus formation.11 The critical role played by the C system in this process is supported by the finding that vascular thrombosis, caused by passive administration of patients’ antibodies or a monoclonal antibody to DI in an animal model of APS, is not observed in C-deficient animals or in animals receiving a non-C fixing antibody.11,12 Despite the beneficial effect of long-term anticoagulation with vitamin K antagonists, recurrent thrombosis has been reported in 30-40% of high-risk patients with triple APL positivity5 and remains a problem to be solved. Resolution of thrombi formed in carotid and cerebral arteries, and less frequently in coronary arteries, that cause serious clinical consequences including death, still represents an unmet clinical need. Thrombolytic agents administered to dissolve thrombi and surgical intervention aimed at removing blood clots in medium-large arteries in a limited number of patients unresponsive to pharmacologic treatment are the therapies currently used to control thrombosis in APS patients. However, despite the beneficial effect observed in patients treated with recombinant tissue plasminogen activator (rtPA), this therapy has significant limitations in safety and efficacy.13 Bleeding is a serious side effect frequently observed in patients with ischemic stroke receiving rtPA and can be reduced, but not abolished, using a lower dose of the drug. Moreover, the rapid clearance of rtPA from the circulation, the relative resistance of large vessels to recanalization and the modest response observed in approximately 40% of patients with small vessel occlusions represent additional limitations of the thrombolytic therapy.14-16
The aim of this work was to devise a strategy to selectively deliver rtPA at sites of vessel-occluding thrombi in an attempt to reduce the systemic side effects of the thrombolytic therapy and to make the treatment more effective. The therapeutic approach was based on the administration of polymer-shelled nanobubbles (NB) conjugated with rtPA and a recombinant antibody specific for β 2-GPI bound to activated endothelial cells lining the occluded vessel, and to activated platelets and leukocytes that accumulate within the thrombus. Moreover, considering that β2-GPI binds to these cells independently of antiphospholipid antibodies, we investigated whether this type of engineered NB had also a beneficial effect in thrombosis models unrelated to APS.
Methods
Nanobubbles preparation and characterization
NB with a perfl uoropentane core and a chitosan shell were prepared by tuning a method previously reported17 and used at the final concentration of 4x10¹¹ NB/mL saline. Further details are available in the Online Supplementary
Appendix
Patients’ sera
Serum samples were obtained from five APS patients with medium-high titer antibodies to the DI domain of β2-GPI after obtaining informed consent and were previously shown to induce clot formation in rats.18 The ethical committee of Istituto Auxologico Italiano approved the study.
Human thrombi
Three patients aged 60-72 years with clinical atherosclerotic disease, undergoing thrombectomy for thrombotic occlusion of descending thoracic aorta, popliteal or femoral arteries gave written informed consent to use surgically removed thrombi for research purposes. In vitro clots were prepared from freshly collected citrated human blood by the addition of thromboplastin and CaCl2 Two different types of clots were generated: i) blood clots prepared under static conditions,19 referred to as plateletpoor clots, and ii) blood clots prepared under flowing conditions (Chandler loop),20 that have been shown to resemble arterial thrombi, and referred to as platelet-rich clots. Patient’s thrombi and in vitro-generated clots (prepared from 3 different donors) were fixed for 24 hours in 10% buffered formalin, snap-frozen and embedded in OCT medium (Diagnostic Division; Miles Inc).
Immunofluorescence analysis
Patients’ thrombi, in vitro blood clots and kidneys from C3 gain-of-function (GOF) mice were examined by immunofluorescence as detailed in the Online Supplementary Appendix.
In vitro fibrinolytic and thrombolytic assays
The fibrinolytic and thrombolytic activities of rtPA-coated NB were estimated as previously reported.20,21 Further details are available in the Online Supplementary Appendix
Animal models
Experimental thrombosis models were established in male Wistar rats (270-290 g) kept under standard conditions in the Animal House of the University of Trieste, Italy, and in C3 GOF mice at Newcastle University, UK. The in vivo procedures were performed in compliance with the guidelines of European (86/609/EEC) and Italian (Legislative Decree 116/92) laws and were approved by the Italian Ministry of University and Research (Prot. N°
Haematologica | 108 July 2023 1862 ARTICLE - rtPA-coated NP targeting β2-GPI lyse APS and aHUS thrombi P. Macor et al.
910/2018PR, rat models) and by the ethics committee of the Comparative Biology Center of Newcastle University (United Kingdom’s Home Office granted license PD86B3678, mice model). The study was conducted in accordance with the Declaration of Helsinki.
Antiphospolipid syndrome model
We used a previously published model of APS.12 Further details are available in the Online Supplementary Appendix
Ferric chloride-induced thrombosis
The experiments were carried out according to Li et al., 22 in anesthetized rats following an incision made through the abdominal wall to exteriorize the ileal mesentery.23 Further details are available in the Online Supplementary Appendix.
C3 gain-of-function mouse model of atypical hemolytic uremic syndrome
The C3 GOF mouse model of atypical hemolytic uremic syndrome (aHUS) has been previously published.24 Further details are available in the Online Supplementary Appendix
Nanobubbles distribution in rat
In vivo biodistribution studies were performed in two anesthetized rats per group that received an intraperitoneal injection of LPS followed by either tNB conjugated with 3 nmol of cyanine 5.5 or saline and euthanized 2 hours later. The organs were analyzed ex vivo by IVIS Lumina III (PerkinElmer, Milan, Italy).25,26
Statistical analysis
Data are presented as mean ± standard deviation. Difference between groups was assessed by one-way analysis of variance (ANOVA) followed by Student-Newman-Keuls test for pairwise comparisons. Survival estimates were calculated according to Kaplan-Meier and compared with the log rank test. A two-sided P value of 0.05 was considered significant. Statistical analyses were done with GraphPad Prism 9 (San Diego, CA).
Results
Expression of β2-GPI on thrombi
In the initial experiments, we sought to determine whether β 2-GPI may represent a potentially valuable target for antibody-coated thrombolytic NB. For this purpose, we searched for the presence of β2-GPI in the thrombi surgically removed from three patients with arterial thrombotic occlusions (Figure 1A) or in vitro-formed blood clots with different composition (Figure 1B). Staining of patient’s
thrombus sections with antibodies to β2-GPI and to either fibrin or CD9 (to detect platelets and leukocytes) revealed co-localization of β 2-GPI with platelets and leukocytes but not with fibrin. Deposits of β2-GPI on nucleated cells were also observed by nuclear staining with DAPI (Figure 1A). The preferential deposition of β2-GPI on platelets and nucleated cells was confirmed by the more intense staining of in vitro clots formed under flow conditions (Chandler thrombi), which resemble platelet-rich arterial thrombi, as compared to platelet-poor clots generated under static conditions (Figure 1B).
Preparation and targeting properties of nanobubble formulations
A recombinant scFv-Fc miniantibody (MBB2) containing the hinge-CH2-CH3 domains of human IgG1 engineered from scFv isolated from phage display library was selected to functionalize the NB as ligand for bound β 2-GPI.11 In order to avoid C activation by the MBB2/β2-GPI complex, a CH2-deleted variant of MBB2 (MBB2 D CH2) was conjugated to NB via a covalent bond. Transmission electron microscopy (TEM) analysis of the NB showed no difference in the morphology of targeted and untargeted NB (Figure 2A). Likewise, the two types of NB had a similar size with an average diameter of 363.5±10.6 nm for the untargeted NB and 359±12.5 nm for the targeted NB and both the polydispersity index, a measure of particle size distribution, and the Z potential, an indicator of particle charge, were within the same range (Figure 2B).
Analysis of NB interaction with thrombi revealed a significant binding of MBB2DCH2-coated NB that was inhibited by 10-fold excess soluble MBB2DCH2, but not by an unrelated recombinant antibody,27,28 preincubated with the clot section (Figure 2C), supporting the targeting specificity for β2-GPI. Search for binding of tNB was extended to thrombi induced in vivo by patients’ sera containing antibodies to β2-GPI. Rhodamine 6G was administered to anesthetized rat to stain platelets and leukocytes prior to infusion of antibodies to β2-GPI. Targeted or control NB loaded with coumarin 6 were infused immediately after formation of thrombi in mesenteric microvessels. Analysis of NB distribution in rats revealed selective co-localization of tNB and platelets/leukocytes in blood clots while untargeted NB were practically undetectable (Figure 2D; Online Supplementary Videos S1 and S2).
Preparation and evaluation of in vitro thrombolytic activity of rtPA-coated nanobubbles
In order to selectively deliver the thrombolytic agent at site of thrombi and avoid its release into the circulation, rtPA was covalently conjugated to the NB shell exploiting two binding methods. The fibrinolytic activity of the two types of rtPA-coated NB was investigated by a turbidimetric clot lysis assay in which the NB were added to plasma
Haematologica | 108 July 2023 1863 ARTICLE - rtPA-coated NP targeting β2-GPI lyse APS and aHUS thrombi P. Macor et al.
prior to clot formation. As shown in Online Supplementary Figure S1, type B rtPA-NB (carbodiimide-mediated amide bond) displayed a concentration-dependent fibrinolytic activity, which was comparable to that of soluble rtPA, whereas type A rtPA-NB (amino-reductive reaction) were inactive at all tested concentrations. Based on these results, type B rtPA-NBs coated with MBB2DCH2 (rtPA-tNB) or untargeted (rtPA-NB) were used for all the in vitro and in vivo experiments.
The physico-chemical properties of rtPA-tNB, including the size, the polydispersity index and the Ζ potential, were essentially similar to those observed with rtPA-NB (Figure 3A). The encapsulation efficiency, expressed as percentage amount of rtPA loaded on NB / total amount of rtPA, was over 90% and the loading capacity, expressed as percentage amount of rtPA loaded / total weight of NB, was about 3.5%. These data did not change when rtPA was loaded on tNB. The amount of rtPA bound to NB stored at
4°C was quantified and functionally evaluated at different time points and found to be stable for up to 6 months.
The in vitro thrombolytic activity of targeted and untargeted rtPA-NB was investigated in a model consisting of platelet-rich blood clots bathed in autologous plasma. Upon addition of the fibrinolytic agent to the plasma surrounding the clot, the degree of lysis by targeted NB was greater than that of untargeted NB and was comparable to that of soluble rtPA (Figure 3B). The thrombolytic activity of untargeted rtPA-NB can be most likely attributed to the static conditions of the in vitro clot lysis and to the continued presence of the thrombolytic agent in the plasma surrounding the clot.
Effect of targeted nanobubbles on thrombi in the rat model of antiphospholipid syndrome
In order to investigate the thrombolytic effect of rtPA-tNB in the rat model of APS, NB were infused intravenously
Figure 1. Detection of β2-GPI on thrombi by immunofluorescence analysis. Clot sections were double stained with rabbit antibody to β2 glycoprotein 1 (β2-GPI) and either antibody to fibrin or to CD9, to investigate the localization of β2-GPI on fibrin, platelets and leukocytes. DAPI was used to stain cell nuclei. The thrombi were obtained from 2 different sources: (A) 3 patients undergoing surgical thrombectomy; (B) in vitro blood clots generated under static (platelet-poor) or flow (platelet-rich) conditions (see Methods for additional details). Representative images of thrombus section from 1 patient showing absence of co-staining of β2GPI and fibrin. Arrows highlight the co-localization of β 2-GPI with CD9-positive structures and arrowheads show the co-localization of β2-GPI with DAPI-positive nucleated cells.
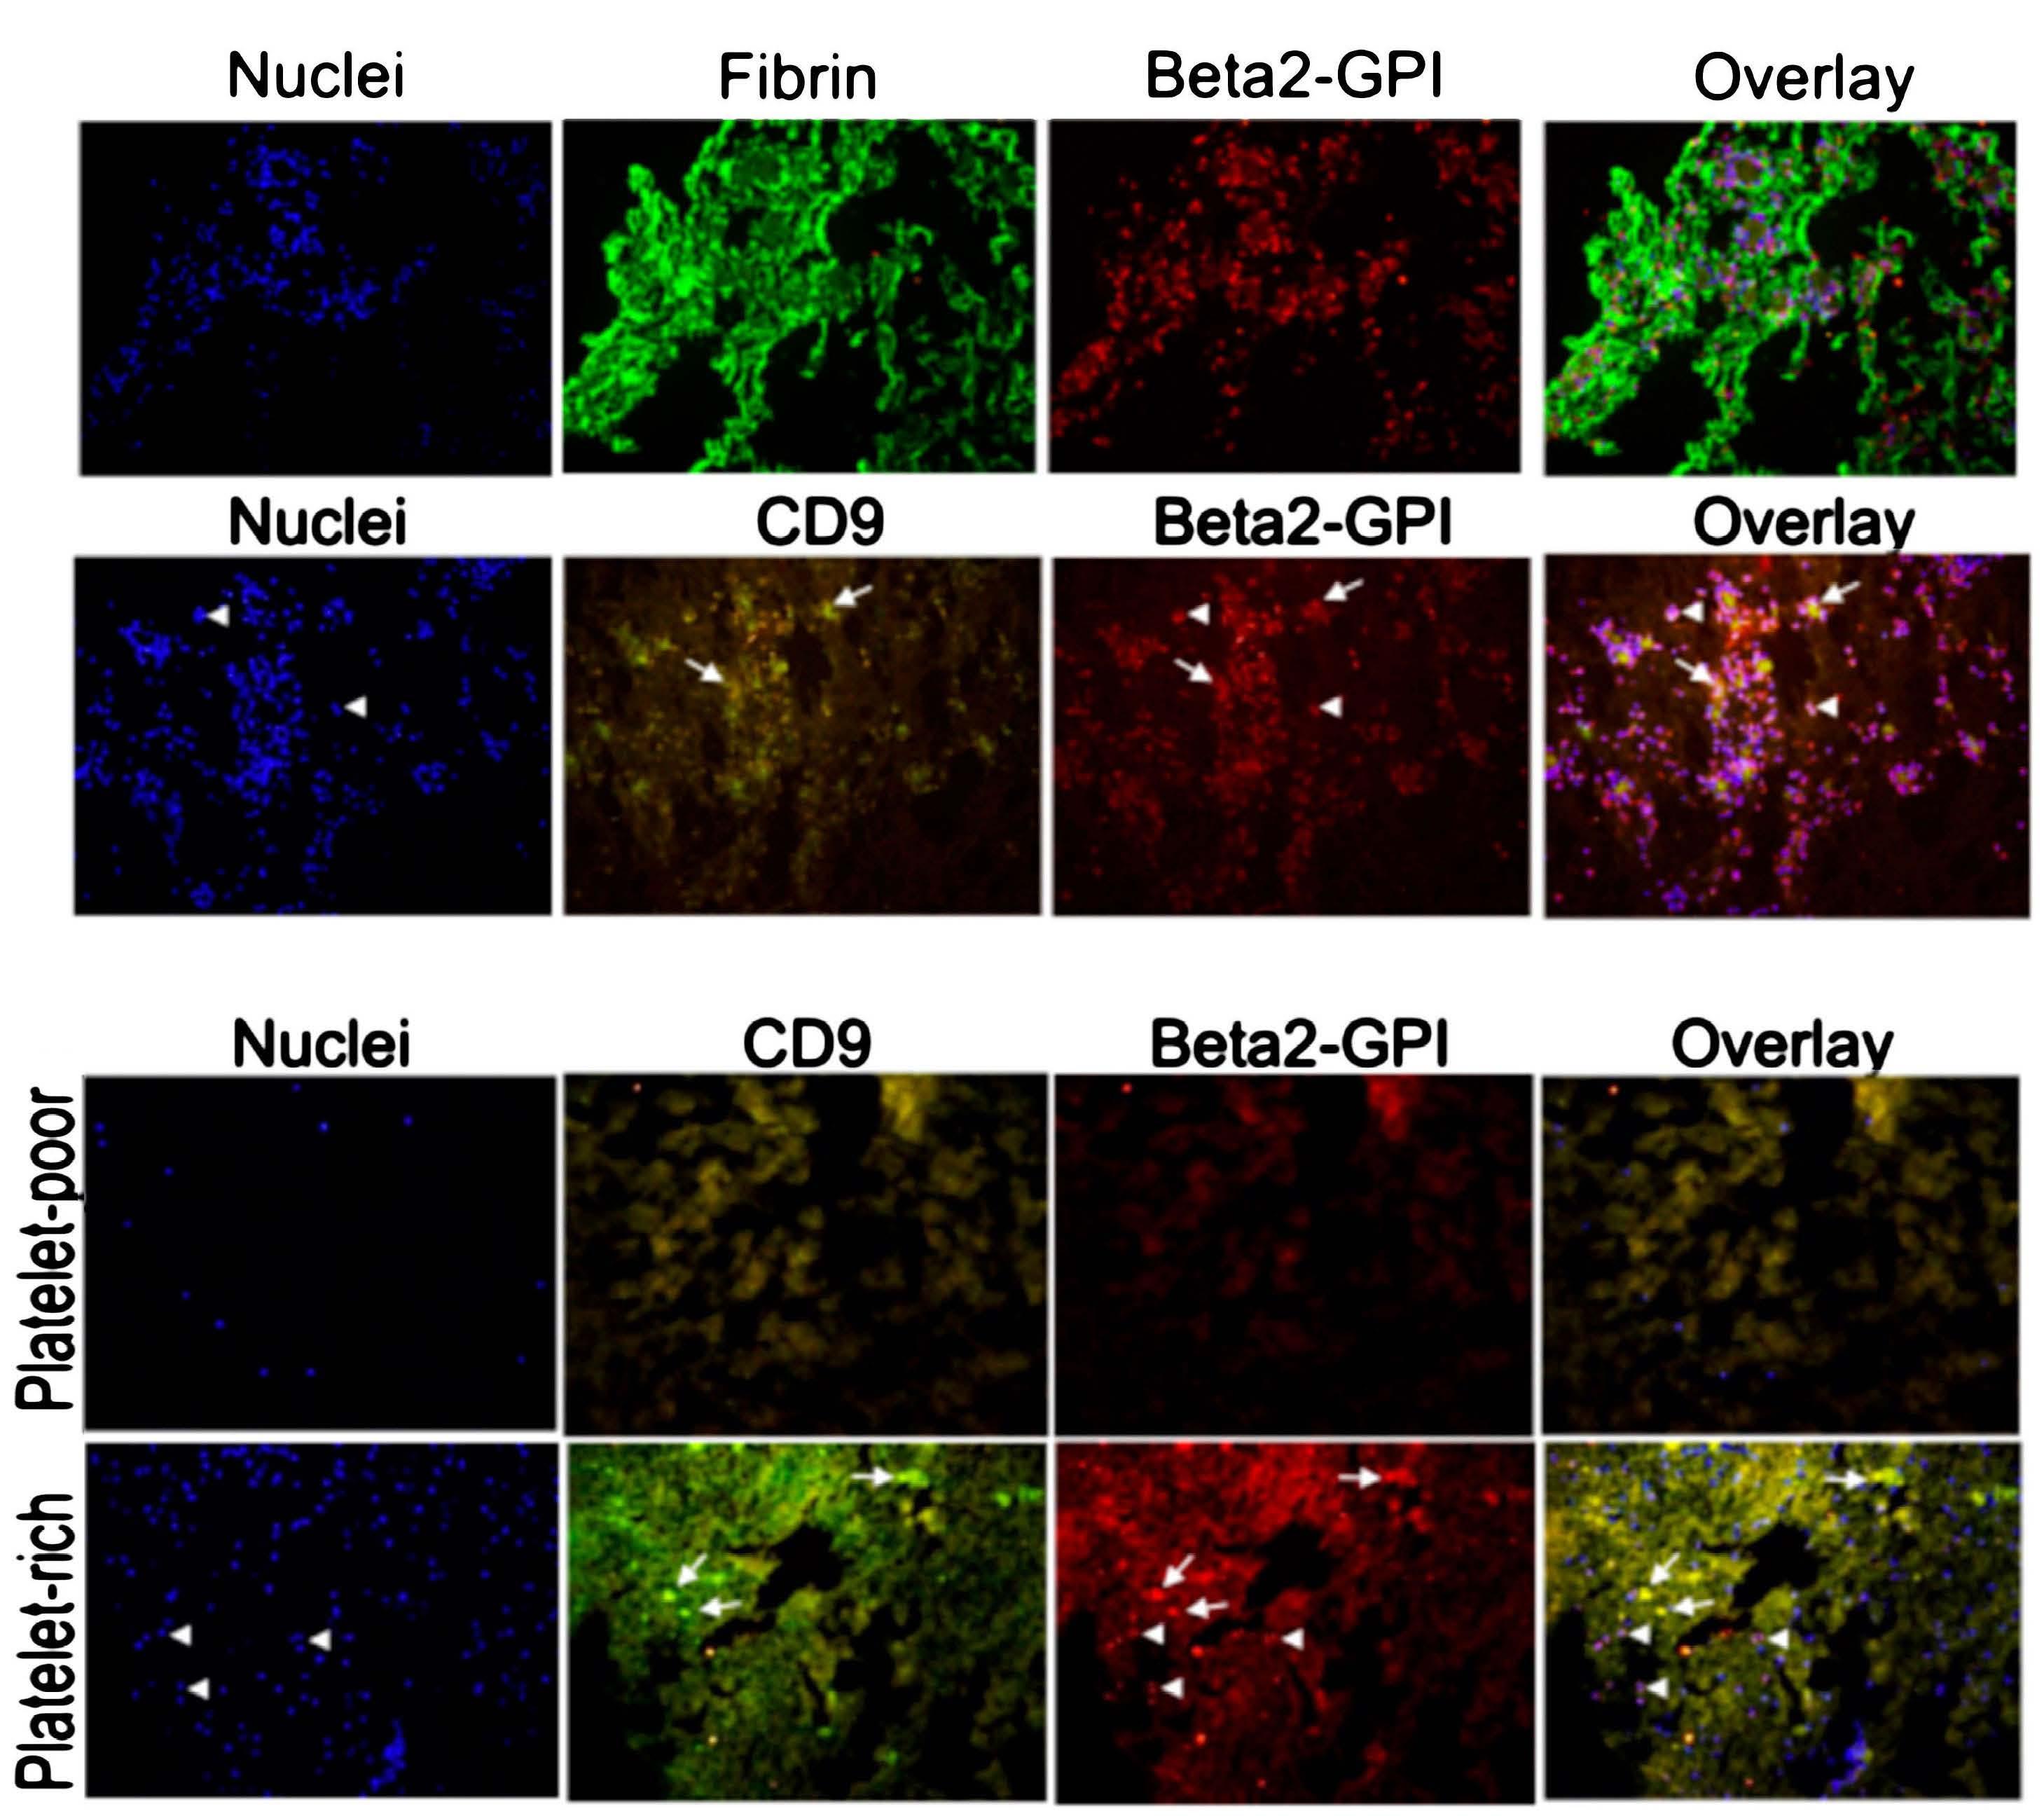
Haematologica | 108 July 2023 1864 ARTICLE - rtPA-coated NP targeting β2-GPI lyse APS and aHUS thrombi P. Macor et al. A B
after thrombus formation, approximately 30 minutes (min) after the injection of antibodies to β2-GPI, and the presence and size of rhodamine 6G-stained thrombi in mesenteric vessels were monitored over time. Administration of rtPA-tNB caused thrombolysis within 1 min (Online Supplementary Video S3) as opposed to the less rapid dissolution of thrombi caused by soluble rtPA ( Online Supplementary Video S4), whereas untargeted rtPA-NB were ineffective (Online Supplementary Video S5). The dissolution of the thrombi, obtained with rtPA-tNB and soluble rtPA, was confirmed by quantitative analysis of rhodamine 6G intensity staining (Figure 4A). A point to emphasize is that the dose of rtPA bound to NB was 10 times lower than that of the soluble rtPA. Moreover, as shown in Figure 4A and Online Supplementary Video S3 and S4, sol-
uble rtPA exhibited a transient thrombolytic effect that lasted less than 3 min and was followed by the formation of new thrombi. Conversely, rtPA-tNB induced fast thrombolysis and prevented the formation of new thrombi during the 90-minute observation period (Figure 4A). Untargeted rtPA-NB failed to lyse the thrombi at all time points (Figure 4A; Online Supplementary Video S5). We further analyzed the efficacy of rtPA-tNB on blood vessels occlusion by evaluating the number of vessels with markedly reduced or absent blood flow. The results presented in Figure 4B show that treatment with rtPA-tNB resulted in vascular recanalization and restoration of blood flow in over 80% of occluded vessels whereas both rtPA and rtPA-NB were ineffective.
The endothelium of the mesenteric vessels examined at
Figure 2. Physico-chemical characteristics and binding of nanobubbles to thrombi. (A) Transmission electron microspcopy (TEM) images showing similar morphology of untargeted nanobubbles (NB) and targeted NB (tNB); (B) average size, size distribution (polydispersity index) and particle charge (Ζ potential); MBB2 D CH2 denotes the recombinant CH2-deleted scFv-Fc miniantibody against the DI domain of β 2-GPI. (C) In vitro binding of tNB to patient’s thrombus sections and inhibition by soluble MBB2DCH2. Tissue sections were pre-incubated either with MBB2DCH2 or an unrelated recombinant antibody (unrelated MB) (100 m g/mL) for 15 minutes (min) prior to exposure to tNB containing 10 mg/mL MBB2DCH2 for further 60 min; (D) in vivo co-localization of platelets and leukocytes (stained in red with rhodamine 6G) and NB loaded with coumarin 6 (green) on thrombi induced in rats by administration of antibodies to β 2-GPI. SD: standard deviation.

A B C Haematologica | 108 July 2023 1865 ARTICLE - rtPA-coated NP targeting β2-GPI lyse APS and aHUS thrombi P. Macor et al. D
the end of the experiment was still covered by tNB indicating a stable interaction of β2-GPI with endothelial cells (Figure 5). This finding might explain the prolonged profibrinolytic effect observed after administration of rtPA-tNB. No sign of vascular leakage, assessed by extravascular diffusion of free rhodamine 6G, or blood extravasation was seen in the ileal mesentery of rats treated with rtPA-tNB throughout the experimental procedure despite the micro-traumas caused by the tissue manipulation during the mesentery exteriorization from the abdominal cavity to petri dishes for the intravital microscopy analysis. It is important to underline that only a small percentage of the infused tNB localized in the thrombi while a large proportion was cleared by the liver and, to a lesser extent, by the lung (Online Supplementary Figure S2).
Effect of targeted nanobubbles on ferric chloride
thrombosis
Having found that β2-GPI was expressed on thrombi independently of the presence of antibodies to this protein, we sought to determine whether rtPA-tNB may also be effective in lysing blood clots induced by ferric chloride (FeCl3) applied to the rat mesentery. As in the case of APS, the NB were infused soon after thrombus formation, which occurred within 10 min after removal of the chemical compound applied to the mesentery. Unlike rtPA and untargeted NB, rtPA-tNB localized at the thrombus site (Figure 6A) and induced rapid and persistent thrombolysis (Online Supplementary Video S6 to S8). The greater effi-
cacy of rtPA-tNB was also confirmed by the substantial decrease in the percentage of occluded vessels that was not seen using either soluble rtPA or untargeted rtPA-NB (Figure 6B).
Effect of targeted nanobubbles on the C3 gain-offunction murine model of atypical hemolytic uremic syndrome
Immunofluorescence analysis confirmed that both β2-GPI and fibrin were co-localized within the glomeruli and renal vessels (Online Supplementary Figure S3), thus proving the rationale to test the in vivo therapeutic effect of rtPA-tNB. Mice exhibiting active disease (evidenced through an active urinary sediment) were randomized into three groups receiving saline, rtPA-NB or rtPA-tNB. As predicted, a modest reduction in fibrin deposition with rtPA-NB treatment was observed due to the thrombolytic effects of rtPA. However, rtPA-tNB, which enabled targeted therapy due to the addition of antibodies to β2-GPI, significantly attenuated fibrin deposition within the glomeruli when compared to untreated animals and rtPA-NB-treated animals (Figure 7A and B).
Survival analysis showed that C3 GOF mice treated with rtPA-tNB had reduced mortality in comparison to salinetreated or rtPA-NB-treated animals (Online Supplementary Figure S4A); the difference, however, did not reach statistical significance because of the small number of animals. Urinalysis data are shown in the Online Supplementary Figure S4B to D. Saline group exhibit persisting hematuria,
Figure 3. Physico-chemical characteristics and functional activity of nanobubbles coated with recombinant tissue plasminogen activator. (A) Size and characteristicsof rtPAtNB and rtPA-NB (see legend of Figure 2 for further details). (B) Thrombolytic activity of recombinant tissue plasminogen activator-bound (rtPA-bound) nanobubbles (NB) and soluble rtPA on blood clot formed under flow conditions (Chandler loop). NB (500 ng/mL bound rtPA) and soluble rtPA (500 ng/mL) were added to the plasma surrounding the clot and the percent lysis was determined at the indicated intervals as detailed in the Methods. The results are presented as mean ± standard deviation (SD) of 3 different experiments. *P<0.05 using one-way ANOVA followed by Student-Newman-Keuls test.

A B Haematologica | 108 July 2023 1866 ARTICLE - rtPA-coated NP targeting β2-GPI lyse APS and aHUS thrombi P. Macor et al.
Figure 4. Effect of targeted and untargeted nanobubbles coated with recombinant tissue plasminogen activator (rtPA) (0,1 mg/g body weight) and of soluble rtPA (1 mg/g body weight) on thrombus dissolution and vascular occlusion in the rat antiphospholipd syndrome model. Thrombosis was induced by administration of antiβ 2 glycoprotein 1 (anti- β 2-GPI) antibodies and treatment with thrombolytic agents was started after thrombus formation as detailed in the Methods. (A) Changes of fluorescence intensity of thrombi shown in the Online Supplementary Videos S3 to S5 during the first 15 minutes after thrombolytic treatment. Note the rapid and persistent decrease of fluorescence intensity in rats receiving targeted nanobubbles (rtPA-tNB), whereas soluble rtPA produced only a transient thrombolysis and untargeted NB (rtPA-NB) were ineffective. (B) Effect of NB and soluble rtPA on vascular occlusion during a 90-minute follow-up, as assessed by blood flow measurement. Consistent with the data of (A), only rtPA-tNB caused a marked and significant reduction of occluded vessels at all time points. The results in (B) are presented as mean ± standard deviation (SD) of experiments conducted in 3 rats. *P<0.05, **P<0.005 using one-way ANOVA followed by Student-Newman-Keuls test.
which reached clinical end point in five of six mice (Online Supplementary Figure S4D). In contrast, three of the five animals receiving rtPA-tNB showed improvement in hematuria after the second dose of the thrombolytic agent.

Discussion
Nanoparticles are being developed as a novel therapeutic tool to deliver a sufficient amount of thrombolytic drugs to vessel-occluding thrombi and to reduce and possibly avoid serious side effects associated with the administration of soluble drugs. This therapeutic approach can be made more effective by coating NB with ligands that bind with reasonably good affinity to target molecules expressed on blood clots. The data presented here provide evidence that rtPA-coated NB targeting cell-bound β2-GPI clear occluded vessels and re-establish blood flow in APS and non-APS thrombosis models.
Chitosan-shelled NB employed in this study have been largely used thanks to their stability, biocompatibility, low immunogenicity and biodegradability and have been
adopted in different biomedical and pharmaceutical fields.29,30 The good biocompatibility of NB is related to their components, such as chitosan and phospholipids, that are biodegradable, safe and admitted by the Regulatory Agencies Food and Drug Administration and European Medicines Agency. Indeed, chitosan-shelled NB have previously been shown to be non-cytotoxic on different cell lines and no signs of acute toxicity was observed after intravenous or intradermal administration in animal models.31-33 The approximately 400 nm size of the NB has the advantage of preventing or markedly reducing their renal excretion and their distribution is favored by the physical property of soft particles.34 An additional advantage of the polymer-shelled NB is to be easily modified by covalently binding antibodies, aptamers, peptides and small molecules that allow selective in vivo localization.33,35 Equally important is the characteristic of the NB to be filled with safe and biologically inert gases or vaporizable compounds such as perfluorocarbons, sulfur hexafluoride, air and carbon dioxide, enabling them to be good ultrasound reflectors and to be used as an ultrasound imaging probe to localize thrombi and monitor their in vivo dissolution.36
A B Haematologica | 108 July 2023 1867 ARTICLE - rtPA-coated NP targeting β2-GPI lyse APS and aHUS thrombi P. Macor et al.
Figure 5. Localization of targeted nanobubbles on endothelium and vascular thrombi during thrombolytic treatment in a rat model of antiphospolipid syndrome. Thrombus formation and nanobubble (NB) deposits were followed by intravital microscopy and the images were collected 90 minutes after injection of NB. Residual intravascular thrombi are visualized in red by in vivo staining with rhodamine 6G and NB loaded with coumarin 6 in green. Arrows show the co-localization of rtPA-tNB and residual vascular thrombi and arrowheads highlight the localization of rtPA-tNB on activated endothelium. Note the absence of untargeted NB and the presence of occluded vessels in rtPA-NB-treated animal. TNB: targeted NB; rtPA: recombinant tissue plasminogen activator.

Platelets and fibrin, being the major components of vascular thrombi, have been investigated as potential targets for the local delivery of nanoparticles coated with thrombolytic agents. Monoclonal antibodies and peptides reacting with fibrin have proven successful for the selective delivery of nanoparticles to thrombi for theranostic purposes.37,38 Satisfactory results have also been obtained targeting the platelets with a monoclonal antibody to the GPIIb/IIIa receptor expressed on both quiescent and activated platelets.39 Unfortunately, treatment with this antibody is often associated with bleeding, which can be markedly reduced by targeting the platelets with a singlechain fragment variable that binds the activated form of GPIIb/IIIa.40 Thrombus dissolution with minimal hemorrhagic risk has also been induced by microbubbles loaded with thrombolytic agents and targeted to blood clots by the arginine-glycine-aspartic acid-serine peptide.41 However, this therapeutic approach has the limitation of having been tested on thrombi induced by either chemical or physical vascular injury, but not in models relevant to human diseases. We addressed this issue by selecting β2GPI as a target for the delivery of rtPA-coated NB to APS and non-APS thrombi. The advantage of β2-GPI over other targets is to interact with different cells involved in throm-
bus formation including platelets, endothelial cells and leukocytes. These cells express several receptors for β2GPI such as ApoER2, Toll-like receptors 2 and 4, annexin A2, glycoprotein Iba, and LRP8,42 though their in vivo relevance in the procoagulant effect of anti- β 2-GPI antibodies in APS patients remains to be established. The endothelium is an important target of β2-GPI and represents the initial site of clot formation triggered by the interaction of antibodies with cell-bound β 2-GPI. It is important to emphasize that binding of β 2-GPI to endothelial cells requires cell activation by LPS and possibly proinflammatory cytokines, and is independent of antibodies.9 This is consistent with the finding reported here that β2-GPI is localized on both renal vascular endothelium and glomeruli of a mouse model of aHUS in the absence of specific antibodies. Activation seems to be also required for the binding of β 2-GPI to platelets, as suggested by the detection of this molecule on platelets incubated with thrombin receptor-activating peptide, but not on resting platelets.43 This observation is supported by our data showing that β2-GPI is expressed in plateletrich thrombi such as human arterial thrombi or in vitro formed platelet-rich blood clots (Chandler thrombi). However, platelets do not seem to be the only target of β2-GPI
Haematologica | 108 July 2023 1868 ARTICLE - rtPA-coated NP targeting β2-GPI lyse APS and aHUS thrombi P. Macor et al.
Figure 6. Localization of targeted and untargeted nonobubbles (tNB and NB) (without recombinant tissue plasminogen activator [rtPA]) on vascular thrombi induced by ferric chloride and effect of rtPA-NB, rtPA-tNB and soluble rtPA on vascular thrombotic occlusion. (A) Intravascular thrombi are visualized in red by in vivo staining with rhodamine 6G and in green by coumarin 6loaded targeted nanobubbles (tNB). The images were collected 30 minutes after injection of NB. Note the absence of thrombus green staining in rats that received untargeted NB. (B) Time course of vascular occlusion after treatment with rtPA-coated tNB or untargeted NB (0,2 mg/g body weight) or soluble recombinant tissue plasminogen activator (rtPA) (2 pg/g body weight), as assessed by intravascular microscopy analysis. A significant reduction in the number of occluded vessels was seen in rats treated with targeted NB (rtPA-tNB) but not in those treated with untargeted NB or soluble rtPA. The results are presented as mean ± standard deviation of experiments conducted in 3 rats. *P<0.05, **P< 0.005 using one-way ANOVA followed by Student-Newman-Keuls test.
in thrombi as positive staining was seen in thrombus-associated nucleated cells, which include monocytes and neutrophils, known to be involved in thrombogenesis by expressing and/or releasing tissue factor and neutrophil extracellular traps.44
The rtPA-coated tNB induced faster dissolution (within 1 min) of thrombi in the mesenteric microcirculation in the rat model of APS than soluble rtPA, whereas untargeted rtPA-NB were ineffective. These results clearly indicate that targeted NB are able to deliver rtPA to blood clots localized in large arteries as well as in microvessels of various organs observed in the classic APS, and in the more severe catastrophic APS. The in vivo effect of rtPA was transient because rethrombosis occurred within a few min and
persisted for the whole observation period. On the contrary, administration of targeted NB prevented the formation of new thrombi despite the presence of circulating thrombusinducing antibodies to β2-GPI. This protection against rethrombosis is most likely due to the binding of rtPA-bearing tNB to β2-GPI deposited on the endothelium at sites of vascular thrombi, thereby creating a profibrinolytic shield. Moreover, the fast and persistent recanalization of occluded vessels by targeted NB was achieved with a dose of rtPA that was 10-fold lower than that of soluble rtPA, which is expected to significantly reduce the bleeding risk as suggested by our failure to detect bleeding in the ileal mesentery during the in vivo experiments. This greater efficiency can be explained by the reduced dispersion and the selec-

A B Haematologica | 108 July 2023 1869 ARTICLE - rtPA-coated NP targeting β2-GPI lyse APS and aHUS thrombi P. Macor et al.
tive delivery of the thrombolytic agent bound to NB at sites of thrombus formation. One possible indication of this therapeutic approach in the clinical setting might be APS patients undergoing vascular surgery, who are known to be at high risk of rethrombosis as a result of β2-GPI deposition on activated endothelium followed by the binding of pathogenic antibodies and C activation.10
Another important finding of this work is the ability of targeted NB to lyse thrombi in non-APS models such as ferric chloride-induced thrombosis45-47 and the more clinically relevant atypical hemolytic uremic syndrome in C3 GOF mice that manifests with hematuria, proteinuria, high creatinine level, hemolysis, fibrin deposition in the glomeruli and occasional intravascular thromboses. As anticipated by our previous observations that chemical and physical stimuli can promote β2-GPI deposition on endothelial cells,10,12 it was not surprising to discover that the tNB were able to dissolve blood clots formed in vessels where the local application of ferric chloride leads to activation of endothelial cells and binding of β2-GPI. Our data also show that thrombotic microangiopathy (TMA) observed in the C3 GOF mouse model of aHUS is a predisposing condition for the deposition of β2-GPI on endothelial cells of glomeruli. The role of bound β2-GPI is to focalize the delivery of rtPAcoated NB at sites of fibrin clots where they induce fibrin dissolution. The successful reduction of fibrin deposition within the microvasculature of the glomeruli in C3 GOF mice suggests this therapy could be a useful adjunct in the treatment of thrombotic microangiopathies. For C-mediated TMA, a C-inhibiting therapy will still be required to extinguish the disease process through restoring C regulation. However, restoration of C regulation takes time and thus a fast-acting prophylactic treatment with targeted fibrinolytic NB could reduce the fibrin burden within the glomeruli, thereby attenuating renal ischemic injury and thus end organ damage. This targeted therapy could be extended to patients with secondary TMA to reduce ischemic injury in the interim, whilst the precipitating factor of the TMA is identified and subsequently removed. Collectively, any reduction in end organ damage will translate to improved clinical outcomes.
In conclusion, rtPA-coated polymer-shelled NB targeted to β2-GPI expressed on activated endothelial cells, platelets and leukocytes have been shown to be effective in dissolving thrombi and prevent rethrombosis in rat models of APS and ferric chloride thrombosis, as well as in removing fibrin deposits in the kidneys of mice that develop aHUS. Targeting cell-bound β2-GPI may represent an efficient and safe strategy to selectively deliver a fibrinolytic agent at sites of thrombotic vessel occlusion as well as at sites at risk of developing thrombosis such as injured vascular districts, where activated endothelial cells, along with activated platelets and leukocytes adhering to their surface, might promote a strong thrombogenic environment.
Figure 7. Recombinant tissue plasminogen activator targeted nanobubbles dissolve clots in the C3 gain-of function mouse model of atypical hemolytic uremic syndrome. (A) Representative image of glomerular fibrin deposition in saline-treated atypical hemolytic uremic syndrome (aHUS) mice (n=3), aHUS mice treated with rtPA-NB, (0,5 mg/g body weight; n=6) or aHUS mice treated with recombinant tissue plasminogen activator targeted nanobubbles (rtPA-tNB) (0,5 mg/g body weight; n=5). (B) Densitometry analysis of glomerular fibrin deposition, 87 glomeruli scored in saline-treated C3 gain of function (GOF), 358 glomeruli scored in rtPA-NB, 459 scored in rtPA-tNB. *P<0.05, **P<0.005, ***P<0.0001 using one-way ANOVA followed by Student-Newman-Keuls test.

A B Haematologica | 108 July 2023 1870 ARTICLE - rtPA-coated NP targeting β2-GPI lyse APS and aHUS thrombi P. Macor et al.
Disclosures
No conflicts of interest to disclose
Contributions
PM, RC, PLM, MC and FT designed the study. MA prepared and characterized the nanobubbles. PD, VDL, KM, SC and K S-J performed the in vivo experiments and analyzed the data. FS and CTA performed the in vitro fibrinolytic and thrombolytic assays and analyzed the data. VST surgically removed the thrombi from patients. FT and PM wrote the draft of the manuscript. RC, MC, PLM, KM and K S-J revised the manuscript.
References
1. Meroni PL, Borghi MO, Grossi C, Chighizola CB, Durigutto P, Tedesco F. Obstetric and vascular antiphospholipid syndrome: same antibodies but different diseases? Nat Rev Rheumatol. 2018;14(7):433-440.
2. Meroni PL, Borghi MO, Raschi E, Tedesco F. Pathogenesis of antiphospholipid syndrome: understanding the antibodies. Nat Rev Rheumatol. 2011;7(6):330-339.
3. Garcia D, Erkan D. Diagnosis and management of the antiphospholipid syndrome. N Engl J Med. 2018;379(13):1290-1291.
4. Sciascia S, Sanna G, Murru V, Roccatello D, Khamashta MA, Bertolaccini ML. The global anti-phospholipid syndrome score in primary APS. Rheumatology (Oxford). 2015;54(1):134-138.
5. Cervera R, Serrano R, Pons-Estel GJ, et al. Morbidity and mortality in the antiphospholipid syndrome during a 10-year period: a multicentre prospective study of 1000 patients. Ann Rheum Dis. 2015;74(6):1011-1018.
6. Miyakis S, Lockshin MD, Atsumi T, et al. International consensus statement on an update of the classification criteria for definite antiphospholipid syndrome (APS). J Thromb Haemost. 2006;4(2):295-306.
7. de Groot PG, Urbanus RT. The significance of autoantibodies against beta2-glycoprotein I. Blood. 2012;120(2):266-274.
8. Giannakopoulos B, Krilis SA. The pathogenesis of the antiphospholipid syndrome. N Engl J Med. 2013;368(11):1033-1044.
9. Agostinis C, Biffi S, Garrovo C, et al. In vivo distribution of beta2 glycoprotein I under various pathophysiologic conditions. Blood. 2011;118(15):4231-4238.
10. Meroni PL, Macor P, Durigutto P, et al. Complement activation in antiphospholipid syndrome and its inhibition to prevent rethrombosis after arterial surgery. Blood. 2016;127(3):365-367.
11. Agostinis C, Durigutto P, Sblattero D, et al. A non-complementfixing antibody to beta2 glycoprotein I as a novel therapy for antiphospholipid syndrome. Blood. 2014;123(22):3478-3487.
12. Fischetti F, Durigutto P, Pellis V, et al. Thrombus formation induced by antibodies to beta2-glycoprotein I is complement dependent and requires a priming factor. Blood. 2005;106(7):2340-2346.
13. Thiebaut AM, Gauberti M, Ali C, et al. The role of plasminogen activators in stroke treatment: fibrinolysis and beyond. Lancet Neurol. 2018;17(12):1121-1132.
14. Campbell BC. Thrombolysis and thrombectomy for acute ischemic stroke: strengths and synergies. Semin Thromb Hemost. 2017;43(2):185-190.
Funding
This work was supported by funds from University of Trieste (to PM) and University of Turin (60% to MA and RC). KSJ is a Medical Research Council (MRC) clinical Fellow (MR/R001359/1). The paper was also supported in part by Ricerca Corrente 2019 and 2020 - Ministero della Salute, Italy (to PLM).
Data-sharing statement
All the data obtained in this study have been included in the article and the Online Supplementary Appendix and are available upon request to the corresponding author.
15. Rabinstein AA. Update on treatment of acute ischemic stroke. Continuum (Minneap Minn). 2020;26(2):268-286.
16. Waqas M, Kuo CC, Dossani RH, et al. Mechanical thrombectomy versus intravenous thrombolysis for distal large-vessel occlusion: a systematic review and meta-analysis of observational studies. Neurosurg Focus. 2021;51(1):E5.
17. Cavalli R, Bisazza A, Trotta M, et al. New chitosan nanobubbles for ultrasound-mediated gene delivery: preparation and in vitro characterization. Int J Nanomedicine. 2012;7(1):3309-3318.
18. Durigutto P, Grossi C, Borghi MO, et al. New insight into antiphospholipid syndrome: antibodies to beta2glycoprotein Idomain 5 fail to induce thrombi in rats. Haematologica. 2019;104(4):819-826.
19. Colucci M, Scopece S, Gelato AV, Dimonte D, Semeraro N. In vitro clot lysis as a potential indicator of thrombus resistance to fibrinolysis - study in healthy subjects and correlation with blood fibrinolytic parameters. Thromb Haemost. 1997;77(4):725-729.
20. Mutch NJ, Moore NR, Mattsson C, Jonasson H, Green AR, Booth NA. The use of the Chandler loop to examine the interaction potential of NXY-059 on the thrombolytic properties of rtPA on human thrombi in vitro. Br J Pharmacol. 2008;153(1):124-131.
21. Colucci M, Binetti BM, Tripodi A, Chantarangkul V, Semeraro N. Hyperprothrombinemia associated with prothrombin G20210A mutation inhibits plasma fibrinolysis through a TAFI-mediated mechanism. Blood. 2004;103(6):2157-2161.
22. Li W, Nieman M, Sen Gupta A. Ferric chloride-induced murine thrombosis Models. J Vis Exp. 2016;(115):1-12.
23. Dobrina A, Pausa M, Fischetti F, et al. Cytolytically inactive terminal complement complex causes transendothelial migration of polymorphonuclear leukocytes in vitro and in vivo. Blood. 2002;99(1):185-192.
24. Smith-Jackson K, Yang Y, Denton H, et al. Hyperfunctional complement C3 promotes C5-dependent atypical hemolytic uremic syndrome in mice. J Clin Invest. 2019;129(3):1061-1075.
25. Capolla S, Mezzaroba N, Zorzet S, et al. A new approach for the treatment of CLL using chlorambucil/hydroxychloroquineloaded anti-CD20 nanoparticles. Nano Research. 2016;9:537-548.
26. Colombo F, Durigutto P, De Maso L, et al. Targeting CD34(+) cells of the inflamed synovial endothelium by guided nanoparticles for the treatment of rheumatoid arthritis. J Autoimmun. 2019;103(2019):102288-102301.
27. Macor P, Secco E, Mezzaroba N, et al. Bispecific antibodies targeting tumor-associated antigens and neutralizing
Haematologica | 108 July 2023 1871 ARTICLE - rtPA-coated NP targeting β2-GPI lyse APS and aHUS thrombi P. Macor et al.
complement regulators increase the efficacy of antibody-based immunotherapy in mice. Leukemia. 2015;29(2):406-414.
28. Mezzaroba N, Zorzet S, Secco E, et al. New potential therapeutic approach for the treatment of B-cell malignancies using chlorambucil/hydroxychloroquine-loaded anti-CD20 nanoparticles. PLoS One. 2013;8(9):E74216.
29. Cavalli R, Argenziano M, Vigna E, et al. Preparation and in vitro characterization of chitosan nanobubbles as theranostic agents. Colloids Surf B Biointerfaces. 2015;129(1):39-46.
30. Xing Z, Wang J, Ke H, et al. The fabrication of novel nanobubble ultrasound contrast agent for potential tumor imaging. Nanotechnology. 2010;21(14):145607-145615.
31. Argenziano M, Occhipinti S, Scomparin A, et al. Exploring chitosan-shelled nanobubbles to improve HER2 + immunotherapy via dendritic cell targeting. Drug Deliv Transl Res. 2022;12(8):2007-2018.
32. Marano F, Frairia R, Rinella L, et al. Combining doxorubicinnanobubbles and shockwaves for anaplastic thyroid cancer treatment: preclinical study in a xenograft mouse model. Endocr Relat Cancer. 2017;24(6):275-286.
33. Shen S, Li Y, Xiao Y, et al. Folate-conjugated nanobubbles selectively target and kill cancer cells via ultrasound-triggered intracellular explosion. Biomaterials. 2018;181(1):293-306.
34. Cavalli R, Bisazza A, Lembo D. Micro- and nanobubbles: a versatile non-viral platform for gene delivery. Int J Pharm. 2013;456(2):437-445.
35. Brown T. Design thinking. Harv Bus Rev. 2008;86(6):84-92.
36. Cavalli R, Soster M, Argenziano M. Nanobubbles: a promising efficient tool for therapeutic delivery. Ther Deliv. 2016;7(2):117-138.
37. McCarthy JR, Patel P, Botnaru I, Haghayeghi P, Weissleder R, Jaffer FA. Multimodal nanoagents for the detection of intravascular thrombi. Bioconjug Chem. 2009;20(6):1251-1255.
38. Marsh JN, Hu G, Scott MJ, et al. A fibrin-specific thrombolytic nanomedicine approach to acute ischemic stroke. Nanomedicine (Lond). 2011;6(4):605-615.
39. Alonso A, Dempfle CE, Della Martina A, et al. In vivo clot lysis of human thrombus with intravenous abciximab immunobubbles and ultrasound. Thromb Res. 2009;124(1):70-74.
40. Wang X, Palasubramaniam J, Gkanatsas Y, et al. Towards effective and safe thrombolysis and thromboprophylaxis: preclinical testing of a novel antibody-targeted recombinant plasminogen activator directed against activated platelets. Circ Res. 2014;114(7):1083-1093.
41. Hua X, Zhou L, Liu P, et al. In vivo thrombolysis with targeted microbubbles loading tissue plasminogen activator in a rabbit femoral artery thrombus model. J Thromb Thrombolysis. 2014;38(1):57-64.
42. Del Papa N, Sheng YH, Raschi E, et al. Human beta 2glycoprotein I binds to endothelial cells through a cluster of lysine residues that are critical for anionic phospholipid binding and offers epitopes for anti-beta 2-glycoprotein I antibodies. J Immunol. 1998;160(11):5572-5578.
43. Lonati PA, Scavone M, Gerosa M, et al. Blood cell-bound C4d as a marker of complement activation in patients with the antiphospholipid Syndrome. Front Immunol. 2019;10(1):773-781.
44. Shantsila E, Lip GY. The role of monocytes in thrombotic disorders. Insights from tissue factor, monocyte-platelet aggregates and novel mechanisms. Thromb Haemost. 2009;102(5):916-924.
45. McCarthy JR, Sazonova IY, Erdem SS, et al. Multifunctional nanoagent for thrombus-targeted fibrinolytic therapy. Nanomedicine (Lond). 2012;7(7):1017-1028.
46. Schwarz M, Meade G, Stoll P, et al. Conformation-specific blockade of the integrin GPIIb/IIIa: a novel antiplatelet strategy that selectively targets activated platelets. Circ Res. 2006;99(1):25-33.
47. Wang X, Gkanatsas Y, Palasubramaniam J, et al. Thrombustargeted theranostic microbubbles: a new technology towards concurrent rapid ultrasound diagnosis and bleeding-free fibrinolytic treatment of thrombosis. Theranostics. 2016;6(5):726-738.
Haematologica | 108 July 2023 1872 ARTICLE - rtPA-coated NP targeting β2-GPI lyse APS and aHUS thrombi P. Macor et al.
Adipocytes control hematopoiesis and inflammation through CD40 signaling
Correspondence: E. Lutgens Lutgens.Esther@mayo.edu
Received: May 30, 2022.
1Department of Medical Biochemistry, Amsterdam Cardiovascular Sciences (ACS), Amsterdam University Medical Centers, University of Amsterdam, Amsterdam, The Netherlands, 2Department of Medical Cell Biology, Uppsala University, Uppsala, Sweden, 3Cardiovascular Research Institute Maastricht (CARIM), Maastricht University, Maastricht, The Netherlands, 4Institute of Cardiovascular Prevention (IPEK), Ludwig-Maximilians Universität, Munich, Germany, 5German Center of Cardiovascular Research (DZHK), partner site Munich Heart Alliance, Munich, Germany, 6Walther-Straub-Institute of Pharmacology and Toxicology, LudwigMaximilians Universität, Munich, Germany, 7Department of Medicine, Division of Endocrinology, and Einthoven Laboratory for Vascular and Regenerative Medicine, Leiden University Medical Center, Leiden, The Netherlands and 8Cardiovascular Medicine, Experimental Cardiovascular Immunology Laboratory, Mayo Clinic, Rochester, MN, USA.
Abstract
Accepted: November 30, 2022.
Early view: December 7, 2022.
https://doi.org/10.3324/haematol.2022.281482
©2023 Ferrata Storti Foundation
Published under a CC BY-NC license
The co-stimulatory CD40-CD40L dyad plays an important role in chronic inflammatory diseases associated with aging. Although CD40 is mainly expressed by immune cells, CD40 is also present on adipocytes. We aimed to delineate the role of adipocyte CD40 in the aging hematopoietic system and evaluated the effects of adipocyte CD40 deficiency on cardiometabolic diseases. Adult adipocyte CD40-deficient mice (AdiCD40KO) mice had a decrease in bone marrow hematopoietic stem cells (Lin–Sca+cKit+, LSK) and common lymphoid progenitors, which was associated with increased bone marrow adiposity and T-cell activation, along with elevated plasma corticosterone levels, a phenotype that became more pronounced with age. Atherosclerotic AdiCD40koApoE–/– (CD40AKO) mice also displayed changes in the LSK population, showing increased myeloid and lymphoid multipotent progenitors, and augmented corticosterone levels. Increased T-cell activation could be observed in bone marrow, spleen, and adipose tissue, while the numbers of B cells were decreased. Although atherosclerosis was reduced in CD40AKO mice, plaques contained more activated T cells and larger necrotic cores. Analysis of peripheral adipose tissue in a diet-induced model of obesity revealed that obese AdiCD40KO mice had increased T-cell activation in adipose tissue and lymphoid organs, but decreased weight gain and improved insulin sensitivity, along with increased fat oxidation. In conclusion, adipocyte CD40 plays an important role in maintaining immune cell homeostasis in bone marrow during aging and chronic inflammatory diseases, particularly of the lymphoid populations. Although adipocyte CD40 deficiency reduces atherosclerosis burden and ameliorates diet-induced obesity, the accompanying T-cell activation may eventually aggravate cardiometabolic diseases.
Introduction
The incidence of chronic low-grade inflammatory diseases, including the metabolic syndrome and cardiovascular disease, increases significantly with age.1 These diseases are perpetuated by an interplay of lipids, metabolism, immune cells, and inflammation. Despite lipid-lowering medications such as statins for patients with cardiovascular disease, residual morbidity and mortality persist, making the search for additional therapeutics important.2 A search to find more effective treatments is echoed for the metabolic syndrome, as the world’s population grows more obese.3 Thus, controlling inflammation in age-related cardiometabolic diseases,
such as obesity and atherosclerosis, will help to reduce secondary risks and limit disease progression.2,4
Adipocytes play a major role in the pathogenesis of these age-related diseases. In young, healthy individuals, the adipose tissue (AT) safely stores and metabolizes lipids. During aging and/or over-nutrition, inadequate cellular processing of nutrients results in the activation of cellular stress pathways, dysfunction and expansion of adipocytes. In that state, adipocytes secrete adipokines, including leptin, tumor necrosis factor-α (TNFα), interleukin 6 (IL6), and CCmotif chemokine ligand 2 (CCL2), which attract numerous immune cells to the AT,5 thereby aggravating local and, eventually, systemic inflammation.6
Myrthe E. Reiche,1,2 Kikkie Poels,1 Laura A. Bosmans,1 Winnie G. Vos,1 Claudia M. van Tiel,1 Marion J.J. Gijbels,1,3 Suzanne A.B.M. Aarts,1 Myrthe den Toom,1 Linda Beckers,1 Christian Weber,3,4,5 Dorothee Atzler,4,5,6 Patrick C.N. Rensen,7 Sander Kooijman7 and Esther Lutgens1,4,5,8
Haematologica | 108 July 2023 1873 ARTICLE - Hematopoiesis
Besides being the prime cell type in peripheral, visceral, and subcutaneous AT, adipocytes are a central component of lymphoid and hematopoietic organs, especially of thymus and bone marrow (BM).7 Aging and over-nutrition lead to adiposity of these hematopoietic and lymphoid organs, which affects immune cell development, activation, and inflammation.7
Adipocytes play a key role in inflammation not only through their capacity to release adipokines; they have also been reported to be avid antigen-presenting cells, expressing major histocompatibility complex-II and CD1d, as well as the costimulatory immune checkpoint protein CD40.8,9
Adipocytes were shown to induce antigen-specific T-cell proliferation, and activate CD4+ T cells by production of proinflammatory cytokines,8 which in part was attributed to costimulation via the CD40-CD40L immune checkpoint.8,10
Immune checkpoints play a crucial role in activating and resolving inflammation, but exert cell-type-specific roles, depending on the inflammatory environment. Deletion of the co-stimulatory immune checkpoints CD40 or CD40L has shown different effects on hematopoiesis, obesity, the metabolic syndrome, and atherosclerosis.4,11-19
CD40L–/– mice that were subjected to an obesogenic diet exhibited less weight gain, improved insulin resistance, and diminished AT inflammation.13 Furthermore, T-cell-specific CD40L deficiency decreased atherosclerosis by affecting Th1 polarization and interferon-γ (IFNγ) production,10 but did not affect weight gain or insulin resistance in mice with diet-induced obesity.14 CD40–/– mice showed reduced atherosclerosis,15 as did mice with CD40 deficiency specifically of macrophages17 and dendritic cells.10 However, mice with full body CD40 deficiency displayed aggravated insulin resistance and severe AT inflammation during diet-induced obesity,16,19 whereas deficiency of macrophage CD40 only caused minor obesity-related metabolic dysfunction.18
These findings highlight the cell-type specific roles of CD40 and CD40L in cardiometabolic disease, and underscore the need to identify the functions and contributions of different CD40- and CD40L-expressing cell types to aging-associated chronic inflammatory diseases.
As CD40 is expressed on adipocytes, and can modulate adipocyte-mediated immune cell activation,8,9 we hypothesized that adipocyte CD40 plays a critical role in mediating chronic, low-grade inflammation associated with aging, atherosclerosis, and diet-induced obesity.
Methods
Animals
Adipocyte CD40-deficient mice were generated by crossbreeding CD40fl/fl mice10 with AdipoQCre mice (Jackson Laboratories, strain B6.FVB-Tg-1Evdr/J). For atherosclerosis development, AdipoQCreCD40fl/fl and CD40fl/fl littermates
were crossbred with CD40fl/fl ApoE–/– mice,10 resulting in AdipoQCreCD40fl/fl-ApoE–/– and CD40fl/fl-ApoE–/– littermates.
Study design
Male AdipoQCreCD40fl/fl (AdiCD40KO) mice and CD40fl/fl (wildtype, WT) littermates were fed a standard chow diet ad libitum for 22 weeks (8 mice in each group) or 52 weeks (5 mice in each group), for analysis of hematopoiesis and immune cell composition.
For atherosclerosis development, female AdipoQCreCD40fl/fl -ApoE–/– mice (CD40AKO, n=20) and CD40fl/fl ApoE–/– littermates (ApoE–/–, n=19) were fed a high cholesterol diet (alto-10185, energy: 66% carbohydrates, 18% protein, and 16% fat with 0.15% cholesterol) for 11 weeks starting at 7 weeks of age. The mice had ad libitum access to food and water.
For diet-induced obesity, male AdiCD40KO mice (n=8) and WT littermates (n=8) were fed a high-fat diet (SSNIFFD12492, energy: 22% carbohydrates, 24% protein, and 54% fat) for 15 weeks starting at 7 weeks of age. Concomitantly, male AdiCD40KO (n=7) and WT (n=7) mice were fed a standard fat diet (SSNIFF-D12450B, energy: 65% carbohydrates, 26% protein, and 9% fat) for 15 weeks starting at 7 weeks of age. Mice had ad libitum access to food and water. Body weight was monitored weekly.
For indirect calorimetric analysis (Promethion line, Sable Systems, Las Vegas, CA, USA), male AdiCD40KO (n=8) and WT (n=8) mice were fed a standard-fat diet starting from 7 weeks of age, and had ad libitum access to food and water. At week 6 of the diet, mice were singly-housed in metabolic home-cages for 5 days. Food and water intake, respiration (O2/CO2), and locomotion were recorded in 5 min bins. After 8 weeks of the standard-fat diet, the mice were fasted for 4 hours and intravenously injected with a solution containing [14C]deoxyglucose and lipoprotein-like particles labeled with glycerol tri[3H]oleate, as described previously,20 and blood was drawn from the tail vein at indicated times. Plasma clearance of the radiolabels was calculated from the estimated total plasma volume (0.04706 x body weight) and expressed as the percentage of total injected dose.
All experimental procedures were approved by the Ethical Committee for Animal Welfare of Amsterdam University Medical Center, location AMC (AVD1180020171666) and Leiden University Medical Center (AVD1160020173305). Additional methods are provided as Online Supplementary Data.
Results
To investigate the effects of adipocyte CD40 on the immune system and inflammation-driven age-related cardiometabolic diseases, we generated mice with an adipocyte-specific deletion of CD40 (AdipoQCre-CD40
fl/fl; Haematologica | 108 July 2023 1874 ARTICLE - Adipocyte CD40 controls hematopoiesis and inflammation M.E. Reiche et al.
AdiCD40KO). WT littermates (CD40fl/fl) served as controls. Adipocyte-specific CD40 deficiency was confirmed in epididymal AT of AdiCD40KO mice, which had approximately 70% less CD40 expression compared to that in the epididymal AT of WT mice (Online Supplementary Figure S1A). No effects on body weight were observed between the two genotypes (Online Supplementary Figure S1B).
Adipocyte CD40 deficiency decreases hematopoiesis and increases T-cell activation
Adipocytes are abundantly present in hematopoietic and lymphoid organs where they interact closely with various cells, including immune cells. Here we investigated the effect of adipocyte CD40 deficiency on immune cell progenitors and immune cells in 22-week-old adult mice.
AdiCD40KO showed a decrease in Lin–Sca+cKit+ (LSK) hematopoietic stem cells (HSC) and common lymphoid progenitor (CLP) cells in BM (Figure 1A, B, Online Supplementary Figure S2A, Online Supplementary Figure, Gating strategies Bone Marrow). The reduction in CLP resulted in a significant decrease in total BM B cells (Figure 1C, Online Supplementary Figure S2B). The total number of BM T cells did not differ between genotypes, but an increase in BM effector memory T cells (CD62L–CD44+) was observed, indicating a state of increased T-cell activation in the BM of adipocyte CD40-deficient mice (Figure 1D, Online Supplementary Figure S2C). Histological analysis of the BM showed minor degenerative changes in the absence of adipocyte CD40, e.g., a trend for increased BM adiposity and a decrease in megakaryocytes (Online Supplementary Figure S2D).
As T-cell development takes place in the thymus, we analyzed the effects of adipocyte CD40 deficiency on the different stages of T-cell development. We observed a slight reduction in total thymocytes in AdiCD40KO mice compared to WT littermates (P=0.23) (Online Supplementary Figure S2E, Online Supplementary Figure, Gating strategies Thymus). Furthermore, the AdiCD40KO mice showed a reduction in thymic T-cell development, with development stagnating at the double-negative 2 stage, while further doublenegative stages until the double-positive stage were decreased (Figure 1E, Online Supplementary Figure S2F). Although the amount of double-positive T cells was decreased, the output of single-positive CD4+ and CD8+ T cells was similar between genotypes (Figure 1F, Online Supplementary Figure S2G), indicating that negative selection on double-positive T cells is decreased in AdiCD40KO mice. Glucocorticoids are closely related to thymocyte selection, with glucocorticoids opposing thymocyte negative selection.21 Adipocyte CD40 deficiency did not result in structural changes to the adrenal glands (Online Supplementary Figure S2H), but AdiCD40KO mice did display increased plasma corticosterone levels (Online Supplementary Figure S2H), which may be responsible for the observed decrease in thymocyte negative selection.
AdiCD40KO mice have altered immune cell composition in lymphoid organs
We further investigated immune cell composition in lymphoid organs of AdiCD40KO mice. We observed a decrease in B cells in spleen and lymph nodes, whereas the number of CD3+, CD4+, CD8+, and regulatory T cells was not affected (Online Supplementary Figure S3A). However, just as in the BM, there was an increase in memory T cells, whereas the naïve T-cell population decreased (Online Supplementary Figure S3A, B). An increase in T-cell activation could be confirmed in vitro, as CD4+ and CD8+ AdiCD40KO T cells stimulated for 72 h with CD3-CD28 antibody-coated beads showed increased IFN γ and IL2 production (Online Supplementary Figure S3C, D). We did not observe changes in the myeloid cells in spleens of adipocyte CD40-deficient mice (Online Supplementary Figure S3E ), and the BM myeloid progenitors also did not show major differences ( Online Supplementary Figure S3F). These findings indicate that adipocyte CD40 deficiency has a direct impact on hematopoiesis and lymphopoiesis, as well as T-cell activation in adult mice.
Aged adipocyte CD40-defi
cient mice have fewer lymphoid progenitors
Aging is associated with similar features of BM degeneration as observed in adult AdiCD40KO mice. We therefore hypothesized that the phenotype described above would be more prominent in aged AdiCD40KO mice. Indeed, in 52-week-old AdiCD40KO mice, we observed a significant increase in BM adiposity (Figure 2A), as well as absolute and relative decreases in LSK cells, including long-term and short-term stem cells, multipotent progenitors 1 (MPP1), MPP2, and MPP4 (Figure 2B). The most pronounced decrease was observed in the MPP4 population, associated with B- and T-cell development. Thus, aged AdiCD40KO mice had a decrease in CLP and late CLP (Lin–CD127+CD27lowCD25low) populations (Figure 2C, Online Supplementary Figure S4A). Myeloid progenitors, derived from MMP3, did not show significant changes (Online Supplementary Figure S4B).
Adipocyte CD40 deficiency results in a compensatory increase in bone marrow effector memory T cells
As most progenitor subclasses were reduced in the absence of adipocyte CD40, the number of BM CD45+ cells decreased slightly ( Online Supplementary Figure S4C ). Remarkably, the total number of BM T cells was not affected in aged AdiCD40 KO mice. Adipocyte CD40 deficiency caused a strong increase in CD4 + and CD8 + effector memory T cells (Figure 2D, Online Supplementary Figure S4D). Elevated corticosterone levels have been reported to mediate recruitment of memory T cells to the BM through induction of chemokine receptor CXCR4 on T cells, thereby promoting homing of these cells. 22
Haematologica | 108 July 2023 1875 ARTICLE - Adipocyte CD40 controls hematopoiesis and inflammation M.E. Reiche et al.
AdiCD40KO mice showed increased plasma corticosterone levels compared to WT mice (Figure 2E), and increased CXCR4 expression on T cells (Online Supplementary Figure S4E). This indicates that although T-cell development in BM is compromised when adipocyte CD40 is absent, effector memory T cells will be retrieved by the BM, thereby ensuring normal T-cell counts.

Aged AdiCD40KO mice have a decrease in B cells in lymphoid organs and bone marrow
In line with observations in adult AdiCD40KO mice, we observed an increase of effector memory T cells in spleens of 52-week-old AdiCD40KO mice (Online Supplementary Figure
S4F). An increase in activated T cells is often accompanied by an increase in B-cell numbers, as T-cell-driven activation of B cells is dependent on the CD40-CD40L axis.23 However, we observed a decrease in total B cells, mostly explained by a decrease in immature B cells (transitional and follicular B cells) in spleens of AdiCD40KO mice (Online Supplementary Figure S4G). Furthermore, in the BM, ProB and PreB cells were decreased (Figure 2F, Online Supplementary Figure S4H), along with a significant decrease of IgG levels in BM interstitial fluid (Online Supplementary Figure S4I). These findings indicate either a decrease in hematopoietic output of, or a differentiation defect in, B cells from aged adipocyte CD40-deficient mice.
Figure 1. Bone marrow composition and thymic selection are altered by adipocyte CD40 deficiency. (A) Flow cytometric gating and analysis of one-tenth of bone marrow Lin–Sca+cKit+ (LSK) cells of 22-week-old AdiCD40KO mice and wildtype littermates. (B) Total number of common lymphoid progenitors (CLP), Early CLP (Lin–CD135+CD127+), CLP, and Late CLP (Lin–CD127+CD27loCD25lo).
(C) Total number of B cells in bone marrow. (D) Activation status of CD4+, naïve (CD62L+CD44–), effector memory (CD62L–CD44+), and central memory (CD62L+CD44+) T cells in bone marrow. (E) Early thymocyte (cKit+) development of double-negative (CD25lohi CD44lo-hi) cells. (F) Selection of double-positive thymocytes (cKit–) into single-positive CD4+ and CD8+ T cells. Data are shown as mean ± standard deviation of eight AdiCD40KO mice and eight wildtype littermates. *P<0.05, **P<0.01, ***P<0.001. WT: wildtype; CLP: common lymphoid progenitor; EM: effector memory; CM: central memory; DN; double-negative; E: early; L: late; DP: double-positive.
B C D E Haematologica | 108 July 2023 1876 ARTICLE - Adipocyte CD40 controls hematopoiesis and inflammation M.E. Reiche et al. A F
Adipocyte CD40 in cardiometabolic disease: atherosclerosis
To further investigate the role of adipocyte CD40 deficiency in hematopoiesis and lymphopoiesis in a chronic inflammatory disease, we backcrossed AdiCD40KO mice with ApoE–/– mice to obtain AdipoQCre-CD40fl/fl-ApoE–/–(CD40AKO) and CD40fl/fl-ApoE–/–(ApoE–/–) littermates to induce atherosclerosis. We found no major differences in body weight, plasma lipid levels including total cholesterol and very low-, low-, and high-density lipoprotein levels, or in total triglyceride levels between CD40AKO and ApoE–/–mice fed a 0.15% high cholesterol diet for 11 weeks (Online Supplementary Figure S5).

Adipocyte CD40 deficiency enhances hypercholesterolemia-associated myelopoiesis and lymphopoiesis
Under hypercholesterolemic conditions, CD40AKO mice exhibited an increase in both MPP3 (myeloid progenitors) and MPP4 (lymphoid progenitors) (Figure 3A), contrasting with the findings in our normocholesterolemic AdiCD40KO mice. Monocytosis was substantiated by an increase in downstream monocyte progenitor subsets such as common monocyte precursors and associated progenitors (Figure 3B, Online Supplementary Figure S6A). Previous studies have shown that hypercholesterolemia and/or ApoE deletion in humans and mice induce(s) BM monocytosis.24,25
Figure 2. Adipocyte CD40 deficiency has degenerative effects on the bone marrow. (A) Quantification of adipocytes per area in the bone marrow of 52-week-old AdiCD40KO mice (n=5) and WT littermates (n=5), along with representative perilipin-1 staining of bone marrow adipocytes (scale bar = 25 mm). (B) Flow cytometric analysis of one-tenth of the total number of long-term and short-term hematopoietic stem cells, and multipotent progenitors in bone marrow. (C) Total number of Early common lymphoid progenitors (CLP), CLP, and Late CLP. (D) Activation status of CD4+ T cells in bone marrow. (E) Plasma corticosterone levels. (F) Flow cytometric analysis of B-cell maturation in bone marrow, indicating ProB, PreB, and immature B cells. Data are shown as mean ± standard deviation for five AdiCD40KO mice and five WT littermates. *P<0.05, **P<0.01, ***P<0.001. WT: wildtype; LT: long-term; ST: short-term; MPP: multipotent progenitors; CLP: common lymphoid progenitors; EM: effector memory T cells; CM: central memory T cells.
B C E F D Haematologica | 108 July 2023 1877 ARTICLE - Adipocyte CD40 controls hematopoiesis and inflammation M.E. Reiche et al. A
Our finding suggests that adipocyte CD40 further contributes to hypercholesterolemia-induced aggravation of myelopoiesis. Downstream of the MPP4 population, early to late CLP were also increased (Figure 3C, Online Supplementary Figure S6B). Furthermore, CD40AKO mice showed T-cell activation in the BM as well as systemically (Online Supplementary Figure S6C-F), similar to AdiCD40KO mice (Figure 1D). These data could be confirmed in vitro (Online Supplementary Figure S6G), and plasma levels of IFNγ and TNFα, related to T-cell activation, were also increased (Online Supplementary Figure S6H). The thymus of CD40AKO mice was seeded with an increased number of pre-thymocytes (cKit+) derived from BM CLP (Online Supplementary Figure S6I), while thymic development and selection were unaltered, leading to a similar output of single-positive T cells as that of ApoE–/– littermates (Figure 3D). This was associated with an increase in plasma corticosterone levels in CD40AKO mice (Figure 3E). These findings underline the direct effect of adipocyte CD40 on T-cell development and activation even under hypercholesterolemic circumstances.

Systemic immune cell composition is affected by adipocyte CD40 in atherosclerotic mice
As we showed that adipocyte CD40 deficiency affects monocytosis and lymphopoiesis, we investigated the impact on peripheral immune cell composition during hypercholesterolemia. Blood and spleen showed a similar number of CD45+ leukocytes in CD40AKO and ApoE–/– littermates (Online Supplementary Figure S7A), but CD40AKO mice displayed an increase in monocytes (Figure 4A, Online Supplementary Figure S7B). In vitro we confirmed that the circulating monocytes were also more activated and had a greater capacity to transmigrate toward the CCL2 chemoattractant in a trans-well assay (Figure 4B, Online Supplementary Figure S7C). A significant decrease in B cells was observed in the spleen and circulation (Figure 4C, Online Supplementary Figure S7D). Similar to the observations in 22-week-old AdiCD40KO mice (Online Supplementary Figure S4H), CD40AKO mice had a decrease in developing B cells in the BM (ProB and PreB cells) (Figure 4D), causing a decrease in plasma IgG, while plasma IgM was similar between CD40AKO and ApoE-/- littermates (Figure 4E). These data
Figure 3. Hypercholesterolemic adipocyte CD40-deficient mice have increased myelopoiesis and lymphopoiesis. (A) Flow cytometric analyses of hematopoietic stem cells and one tenth of the total number of long-term and short-term hematopoietic stem cells, along with multipotent progenitors 1-4 in CD40AKO mice (n=15) and ApoE–/– littermates (n=15). (B) Bone marrow monocyte precursors, macrophage and dendritic cell progenitors, common monocyte precursors, transitional pre-monocytes, classical monocytes, intermediate monocytes, and non-classical monocytes in CD40AKO mice (n=6) and ApoE–/– littermates (n=6). (C) Early CLP, CLP, and Late CLP in bone marrow in CD40AKO mice (n=15) and ApoE–/– littermates (n=15). (D) Selection of doublepositive thymocytes (cKit–) into single-positive CD4+ and CD8+ T cells: CD40AKO mice (n=8) and ApoE–/– littermates (n=8). (E) Plasma corticosterone levels in CD40AKO mice (n=20) and ApoE–/– littermates (n=19). Data are shown as mean ± standard deviation. *P<0.05, **P<0.01, ***P<0.001. HCD: high cholesterol diet; LT: long-term hematopoietic stem cells; ST: short-term hematopoietic stem cells; MPP: multipotent progenitors; MDP: macrophage and dendritic cell progenitors, cMoP: common monocyte precursors; Tpmo: transitional premonocytes; CM: classical monocytes; IntM: intermediate monocyte; NCM: nonclassical monocyte; CLP: common lymphoid progenitors; DP: double-positive.
B C D E Haematologica | 108 July 2023 1878 ARTICLE - Adipocyte CD40 controls hematopoiesis and inflammation M.E. Reiche et al. A
show that adipocyte CD40 deficiency aggravates hypercholesterolemia-induced myelopoiesis and lymphopoiesis, while the opposite is shown for B-cell development.
Adipocyte CD40 deficiency decreases atherosclerotic lesion size but induces necrotic core formation
Histological analysis of the aortic sinus showed mainly advanced lesions (fibrous cap atheromas) in both groups ( Online Supplementary Figure S8A ). The atherosclerotic plaques of CD40 AKO mice were significantly smaller than those of ApoE–/– littermates (Figure 5A). Although atherosclerotic lesions were smaller in CD40AKO mice, the necrotic core size was significantly larger (Figure 5B). Concordant with the increase in necrotic core size, plaque macrophage content decreased (Figure 5C), along with a reduction in plaque T-cell content in CD40 AKO mice (Figure 5D). However, the number of TUNEL + apoptotic cells, or apoptotic MAC3 + macrophages was not significantly different in the absence of adipocyte CD40 ( Online Supplementary Figure S8B ), indicating efferocytosis was not affected in the plaques. Collagen and smooth muscle cell content did not differ ( Online Supplementary Figure S8C, D ).
Flow cytometric analysis revealed a decrease in total
CD45 + lymphocytes in the aortic root and arch of CD40 AKO mice ( Online Supplementary Figure S8E ). Immune cell composition, including percentages of innate cells, B cells, and T cells, did not change, indicating that the absolute numbers of all major aortic immune cell populations had decreased (Online Supplementary Figure S8F ). However, the Ly6C monocyte population showed an increase in Ly6C high /Ly6C low ratio, demonstrating a more activated monocyte profile in CD40 AKO aortas ( Online Supplementary Figure S8G, H ). Additionally, CD3 + T cells showed a more activated phenotype, with an increase in central memory T cells (Figure 5E).
We also investigated AT surrounding the heart and aorta CD40 AKO and ApoE–/– mice, as recent data indicated that cardiac/perivascular AT is associated with severity of cardiovascular disease. 26 Flow cytometric analysis of adipocyte CD40-deficient cardiac/perivascular AT showed an increase in macrophage content (Online Supplementary Figure S8I ). Furthermore, T-cell subsets showed increased activation (Figure 5F). Both these findings indicate more inflamed AT surrounding cardiac/perivascular tissue, which may have contributed to the increase in activated T cells in lesions of CD40 AKO mice.
Figure 4. Hypercholesterolemic adipocyte CD40-deficient mice have an altered immune cell composition. (A) Flow cytometric analysis of Ly6C monocytes in spleens of CD40AKO mice (n=14) and ApoE–/– littermates (n=13). (B) Chemotactic transwell assay, analyzed by flow cytometry, of blood monocytes isolated from the top of the transwell, the bottom of the transwell without chemoattractant (NS), and from the bottom of the transwell with 10 ng/mL CCL2 (CD40AKO mice [n=3]; ApoE-/- littermates [n=3]). (C) Flow cytometric analysis of splenic CD3+ T cells, CD19+ B cells, and CD11b+ innate immune cells (CD40AKO mice [n=14]; ApoE-/littermates [n=13]). (D) B-cell progenitors in bone marrow (CD40AKO mice [n=6]; ApoE-/- littermates [n=6]). (E) Plasma IgM and IgG in CD40AKO mice (n=20) and ApoE–/– littermates (n=19). Data are shown as mean ± standard deviation. *P<0.05, **P<0.01, ***P<0.001.

B C D E Haematologica | 108 July 2023 1879 ARTICLE - Adipocyte CD40 controls hematopoiesis and inflammation M.E. Reiche et al. A
Adipocyte CD40 in peripheral adipose tissue: obesity and the metabolic syndrome
As adipocytes not only play a role in BM and thymus, but certainly in peripheral AT, which significantly expands and changes with age, we examined the role of adipocyte CD40 in a diet-induced obesity model by subjecting adipocyte CD40-deficient AdiCD40KO mice and WT littermates to a standard-fat or high-fat diet for 15 weeks. All mice significantly gained weight during the period of the dietary intervention. However, adipocyte CD40 deficiency resulted in approximately 15% reduction in weight gain in mice fed the standard-fat or high-fat diet compared to the WT littermates (Figure 6A). AdiCD40 KO mice had slight reductions in epididymal AT and liver weights, and adipocyte size was similar between genotypes ( Online Supplementary Figure S9A). After 12 weeks of dietary

intervention, glucose and insulin tolerance tests were performed. AdiCD40 KO mice and WT littermates fed the standard-fat diet remained glucose tolerant, and no differences were detected between genotypes. In contrast, mice fed the high-fat diet became glucose intolerant, but AdiCD40 KO mice exhibited improved glucose tolerance compared to their WT counterparts (Figure 6B, Online Supplementary Figure S9B ). No differences were observed in plasma glucose and insulin levels ( Online Supplementary Figure S9C , D). AdiCD40 KO mice had slightly reduced leptin and cholesterol levels, while plasma triglyceride levels were unaltered between genotypes ( Online Supplementary Figure S9E-G ). These data indicate that adipocyte CD40 deficiency diminishes manifestations of metabolic derangements in obese mice.
Figure 5. Atherosclerotic lesion composition is altered and lesion size is decreased in CD40AKO mice. (A) Histological analysis of total lesion size of aortic roots, along with area under the curve measurements in CD40AKO mice (n=20) and ApoE–/– littermates (n=19), with representative images (scale bar = 100 mm). (B) Percentage total necrotic core area in lesions, along with area under the curve (CD40AKO mice [n=10]; ApoE-/- littermates [n=19]). (C) Percentage macrophage (MAC3+) area in lesion. (D) Number of CD3+ T cells per area in lesion. (E) Central memory CD4+ and CD8+ T cells in aortic root and aortic arch (CD40AKO mice [n=6]; ApoE-/- littermates [n=6]). (F) Activation status of CD4+ and CD8+ T cells in cardiac/perivascular adipose tissue (CD40AKO mice [n=6]; ApoE-/- littermates [n=6]). Data are shown as mean ± standard deviation. *P<0.05, **P<0.01, ***P<0.001. AUC: area under the curve; Avg: average; CM: central memory T cells; EM: effector memory T cells.
B C D E F Haematologica | 108 July 2023 1880 ARTICLE - Adipocyte CD40 controls hematopoiesis and inflammation M.E. Reiche et al. A
Obese AdiCD40KO mice have fewer immune cells in adipose tissue
As inflammation is an important driver of insulin sensitivity, we investigated whether adipocyte CD40 affects immune cell activation status and composition within AT. Histological analysis revealed no major differences between the groups that received the standard-fat diet. However, the epididymal AT of AdiCD40KO mice fed the high-fat diet contained slightly fewer CD45+ leukocytes, MAC3+ macrophages and crown-like structures (Online Supplementary Figure S10A), as well as CD3+ T cells, compared to the epididymal AT of WT mice (Figure 6C). Flow
cytometric analysis of the stromal vascular fraction corroborated the slight decrease in CD45+ cells in epididymal AT of AdiCD40KO mice fed the high-fat diet (Online Supplementary Figure S10B). Furthermore, just as in the aged AdiCD40KO mice and hypercholesterolemic CD40AKO mice, T-cell activation in epididymal AT of AdiCD40KO mice fed the high-fat diet increased. Both naïve and effector memory T cells decreased, while central memory T cells were increased (Figure 6D). We observed similar changes in blood, with a decrease in naïve T cells, and an increase in effector memory T cells ( Online Supplementary Figure S10C). In accordance with the increase in circulating ef-
Figure 6. Adipocyte CD40-deficient mice have decreased weight gain and more activated T cells. (A) Weight gain in AdiCD40KO and wildtype mice fed a standard-fat diet (SFD, n=7) or a high-fat diet (HFD, n=8). (B) Glucose level and clearance over time, evaluated by a glucose tolerance test. (C) Histological quantification of total leukocytes (CD45+), macrophages (MAC3+) and T cells (CD3+), and representative images of epididymal adipose tissue of HFD-fed AdiCD40KO and wildtype mice (scale bar = 100 mm). (D) Flow cytometric analysis of activation status of CD4+ and CD8+ T cells in epididymal adipose tissue. (E) One tenth of LSK cells in bone marrow of HFD-fed AdiCD40KO and wildtype mice. (F) Common lymphoid progenitors in bone marrow. Data are shown as mean ± standard deviation of AdiCD40KO mice fed the SFD (n=7) and HFD (n=8), and wildtype littermates fed the SFD (n=7) and HFD (n=8). *P<0.05, **P<0.01, ***P<0.001. w: week; HFD: high-fat diet; SFD: standard-fat diet; WT: wildtype; EM: effector memory T cells; CM: central memory T cells; Treg: regulatory T cells; CLP; common lymphoid progenitors.
Haematologica | 108 July 2023 1881

B C D E F
ARTICLE - Adipocyte CD40 controls hematopoiesis and inflammation M.E. Reiche et al. A
fector memory T cells, plasma of the AdiCD40KO mice showed increased IFNγ, IL4, and IL17 levels (Online Supplementary Figure S10D). Interestingly, we did not observe significant changes in the thymus of AdiCD40KO mice fed the high-fat diet compared to WT littermates (Online Supplementary Figure S10E).
In the BM, we found that a high-fat diet exacerbated the effect of adipocyte CD40 deficiency on HSC, as LSK and CLP populations were decreased, while T-cell activation status increased (Figure 6E, F, Online Supplementary Figure S10F, G), as was observed in aged and atherosclerotic AdiCD40KO mice. In accordance with the findings in adult and atherosclerotic mice, obese mice have aggravated hematopoietic defects when adipocyte CD40 is deficient.
Fat oxidation is increased in AdiCD40KO mice

As the phenotype of our mice is propagated by adipocytes, and adipocytes play a major role in whole-body metabolism, we wanted to explore whether the adipocyte CD40-deficiency phenotype affected metabolism, and thereby inflammation and hematopoiesis. Therefore, 14-week-old mice that had been fed a standard-fat diet for 6 weeks were individually housed in fully automated metabolic cages; at that time body weights of the AdiCD40 KO mice and their WT littermates were still comparable. Voluntary locomotor activity and food intake were not affected by adipocyte CD40 deficiency (Figure 7A, Online Supplementary Figure S11A ). Energy expenditure, as estimated from VO2 and VCO2 and normalized to fat-free mass,27 was increased during both
Figure 7. Fat oxidation is increased in AdiCD40KO mice. (A) Cumulative voluntary locomotion over time, as observed in a metabolic cage, for AdiCD40KO mice (n=8) and wildtype mice (n=8) fed a standard-fat diet (SFD). (B) Indirect calorimetry measurement of total fat oxidation (kcal/h) rate and quantification during the light period. (C) Clearance of injected tri[3H]oleate over time as determined in blood (AdiCD40KO mice [n=8]; wildtype mice [n=8]). (D) Oil-Red-O staining for lipids in livers of mice fed the SFD (n=8) or the high-fat diet (n=8), with representative images from the latter. (E) mRNA expression of genes involved in metabolism, liver. (F) Expression of genes involved in epididymal adipose tissue metabolism. Data are shown as mean ± standard deviation for AdiCD40KO mice (n=8) and wildtype littermates (n=8) fed the SFD. *P<0.05, **P<0.01. Cum: cumulative; WT: wildtype; SFD: standard-fat diet; HFD: high-fat diet; Rel.: relative.
B C D E F Haematologica | 108 July 2023 1882 ARTICLE - Adipocyte CD40 controls hematopoiesis and inflammation M.E. Reiche et al. A
the (resting) light period and (active) dark period in AdiCD40 KO mice ( Online Supplementary Figure S11B), although the increase was not statistically significant. More specifically, fat oxidation was found to be increased during the light period (Figure 7B, C), resulting in a decreased respiratory quotient ( Online Supplementary Figure S11C-E ).
After 8 weeks of the standard-fat diet, mice were injected with [14 C]deoxyglucose and lipoprotein-like particles containing glycerol tri[3H]oleate. Plasma clearance of the glycerol tri[3 H]oleate tracer tended to be accelerated in AdiCD40 KO mice, although this effect could not be related to enhanced [3 H]oleate uptake by a certain metabolic organ (Figure 7C, Online Supplementary Figure S11F ). Plasma clearance of [14 C]deoxyglucose was comparable between genotypes, although the liver had significantly more uptake of [14 C]deoxyglucose particles ( Online Supplementary Figure S11G, H ). These data indicate some changes in the metabolic profile of AT and liver in adipocyte CD40-deficient mice.
Furthermore, livers of AdiCD40KO mice showed decreased levels of steatosis, which we had previously also observed in AdiCD40KO mice fed the high-fat diet (Figure 7D). Transcriptome analysis of livers from AdiCD40KO mice fed the standard-fat diet showed changes in cholesterol metabolism genes, including Srebp and Pparα, along with a decrease in the fatty acid/cholesterol (Cd36) receptor (Figure 7E). This seems to indicate decreased lipid/fatty acid overflow from the AT to the liver. Indeed, transcriptome analysis of the AT from AdiCD40KO mice fed the standard-fat diet revealed decreased expression of glucose (Glut4) and Cd36 receptors, along with a decrease in the LipE gene, which hydrolyzes stored triglycerides to free fatty acids (Figure 7F, Online Supplementary Figure S11I). These data indicate that adipocyte CD40 deficiency improves fatty acid turnover in AT and the liver, increases fat oxidation, and results in decreased weight gain.
In conclusion, adipocyte CD40 plays an important regulatory role in BM and peripheral AT homeostasis. Absence of adipocyte CD40 aggravates BM degeneration, resulting in reduced levels of HSC and progenitor cells, mainly affecting the lymphoid population. This is accompanied by an increase in glucocorticoid levels, which causes enhanced compensatory recruitment of effector memory T cells to the BM. Adipocyte CD40 deficiency also affected age-related cardiometabolic diseases. In atherosclerosis, deficiency of adipocyte CD40 resulted in decreased plaque burden, but lesions had enlarged necrotic cores and contained more activated T cells. During diet-induced obesity, deficiency of adipocyte CD40 resulted in less weight gain, improved insulin sensitivity, and increased fat oxidation. Additionally, total lymphocytes in AT decreased, but there was an increase in the number of activated T cells.
Discussion
With age, people become more vulnerable to the development of diseases.28 This can be attributed, in part, to “inflammaging ”. Metabolic inflammation brought on by nutrient excess and over-nutrition accelerates disease progression.29 “Inflammaging” impairs hematopoiesis due to disruption of BM niches, limiting HSC survival, self-renewal, and differentiation.30 Adipocytes have been found to play a major role in this process, as adipocytes accumulate and physically disrupt BM niches.7 Furthermore, adipogenesis of the thymus aggravates thymic involution, thereby reducing the immune system’s ability to grow the T-cell repertoire.31,32 These data reveal the indirect effects of adipocytes on the reduced immunity observed in the aged population. Our current study reveals that adipocytes have a direct role in hematopoiesis and immunity via the co-stimulatory protein CD40.
The CD40-CD40L co-stimulatory dyad plays a crucial role in many immunological processes such as T-cell activation and immunoglobulin production.33 We and others have shown that deletion of CD40 or CD40L on different types of cells has different effects on the progression of chronic inflammatory diseases.4,11-18 Genetic studies in both patients and mice have shown that CD40L-CD40 signaling might affect BM hematopoiesis and, thus, inflammatory disease progression.34 It was found that the interaction of CD40L with CD40 on HSC induces CD40-TNF receptor associated factor (TRAF)6 signaling, which activates NFκB in HSC.34 This closely links CD40-CD40L with HSC and BM niche stability, which the data on adipocyte CD40 in the current study corroborate.
Adipocytes are not only a depot for lipid storage and producers of satiety hormones, but also interact directly with immune cells.9,35 Leptin secreted by adipocytes induces IFNγ secretion by T cells.10 IFNγ upregulates expression of major histocompatibility complex II on adipocytes, thereby enhancing adipocyte-T-cell interactions and activation.10 Activation of adipocyte CD40 by CD40L increases the production of pro-inflammatory cytokines, upregulates CD40 expression, and increases adipocyte lipolysis.9,35,36 In obese patients, adipocyte CD40 mRNA levels are positively correlated with body mass index, as well as gene expression of leptin and IL6.35 Deficiency of adipocyte CD40 could therefore improve metabolic function and inflammation in AT, as we indeed observed in AT of adipocyte CD40-deficient mice.
Another observation that we made in adipocyte CD40-deficient mice was an increase in fat oxidation. We propose that this results in a reduction of lipid accumulation in both AT and liver. A previous study found that dietary restriction in mice triggers a state of energy conservation, aimed at preserving immunity by retaining T cells in the BM, which was initiated by an increased release of glucocorticoids by
Haematologica | 108 July 2023 1883 ARTICLE - Adipocyte CD40 controls hematopoiesis and inflammation M.E. Reiche et al.
the adrenal glands.22,37 Dietary restriction paradoxically increased adipogenesis inside the BM, while white AT deposits were decreased.37 Interestingly, when BM adipocytes were depleted in Adipoq-CreERT2×Rosa26-DTA mice, memory T cells could no longer be retained in the BM.37 It was suggested that BM adipocytes are crucial for memory T-cell maintenance and survival through the supply of longchain fatty acids.38 These data underscore our findings, as we found increased glucocorticoid levels and more (CXCR4+) effector T cells in BM and lymphoid organs, probably triggered by decreased availability of nutrients in CD40-deficient BM adipocytes.
It has been reported that BM adipocytes have distinct lipid metabolism compared to white AT, with BM adipocytes being more cholesterol-oriented,39 which is crucial for HSC metabolism.40 Furthermore, in BM adipocytes genes related to lipolysis are strongly reduced,39 while the CD40-CD40L interaction is a strong inducer of lipolysis in white adipocytes.9,35,36 Therefore, the diversity in adipocyte subtypes, their functional adaptation to the different dyslipidemic environments and their environment-dependent nutrient-providing capacities may explain the differences in BM, blood, and lymphoid organs that we observed between adipocyte CD40-deficient aged, atherosclerotic, and obese mice. In hypercholesterolemic adipocyte CD40-deficient ApoE–/–mice, we found a decrease in atherosclerotic lesion size, although necrotic core content was increased. We also found an increase in activated T cells in these lesions. T cells are significant drivers of the inflammatory responses that underlie atherogenesis and can promote necrotic core formation.41 Pro-inflammatory CD8+ T cells have been found to promote the development of a vulnerable plaque, as antibody-mediated depletion of CD8+ T cells in ApoE–/– mice reduces lipid and macrophage accumulation, apoptosis, and necrotic core content.42,43 Furthermore, cytokines produced by activated CD4+ T cells can activate macrophage lipid uptake and apoptosis in the atherosclerotic lesion.41 Concomitantly, activated CD4+ T cells in blood of patients with coronary artery disease are directly correlated with unstable lesion phenotypes.44 From this, we conclude that the activated T cells observed in the atherosclerotic plaque of adipocyte CD40-deficient mice are drivers of plaque instability. To conclude, we have shown a central role for adipocyte
References
1. Rocha VZ, Libby P. Obesity, inflammation, and atherosclerosis. Nat Rev Cardiol. 2009;6(6):399-409.
2. Ridker PM, Everett BM, Thuren T, et al. Antiinflammatory therapy with canakinumab for atherosclerotic disease. N Engl J Med. 2017;377(12):1119-1131.
3. Global Health Observatory; overweight and obesity; 2016 [accessed March 5, 2019]. Available from: http://gamapserver.who.int/gho/interactive_charts/ncd/risk_fact
CD40 in the progression of chronic inflammatory diseases. However, our data are largely descriptive and the direct mechanism by which adipocyte CD40 influences cardiometabolic diseases needs to be further investigated. The plethora of AT interaction sites e.g., BM, thymus, and peripheral AT, as well as the diversity of functions, warrants more in-depth studies. However, we can conclude that adipocyte CD40-deficiency increases fat oxidation and insulin sensitivity, thereby decreasing weight gain. In addition, adipose CD40 has a key regulatory role in BM homeostasis. Its absence affects BM cell composition and thereby hematopoiesis along with lymphopoiesis, resulting in increased T-cell activation, in models of age-related cardiometabolic disease.
Disclosures
No conflicts of interest to disclose.
Contributions
MER, SABMA, CW, DA, SK, and EL conceived the study. MER, SABMA, CW, DA, PCNR, SK, and EL contributed to the design and implementation of the research. MER, MdT, and LAB performed experiments with the aged mice. MER, KP, LAB, CMvT, MdT, and LAB performed experiments with the hypercholesterolemic mice. MER, SABMA, MdT, LB, and SK performed experiments with the diet-induced obesity mice. MER, LAB, WGV, CMvT, and MJJG performed experiments and analysis for the revised manuscript. MER and EL wrote the paper.
Acknowledgments
We truly appreciate the expert technical help from Lisa Willemsen and Johannes H.M. Levels.
Funding
We acknowledge support from the European Research Council (ERC Consolidator grant to EL) and the Deutsche Forschungsgemeinschaft (SFB1123 to EL, CW, and DA). CW is a Van de Laar Professor of Atherosclerosis.
Data-sharing statement
The data will be made available within 3 months from initial request through correspondence with the corresponding author.
ors/overweight/atlas.html.
4. Bosmans LA, Bosch L, Kusters PJH, Lutgens E, Seijkens TTP. The CD40-CD40L dyad as immunotherapeutic target in cardiovascular disease. J Cardiovasc Transl Res. 2021;14(1):13-22.
5. Maurizi G, Della Guardia L, Maurizi A, Poloni A. Adipocytes properties and crosstalk with immune system in obesity-related inflammation. J Cell Physiol. 2018;233(1):88-97.
6. Lumeng CN, Saltiel AR. Inflammatory links between obesity and
Haematologica | 108 July 2023 1884 ARTICLE - Adipocyte CD40 controls hematopoiesis and inflammation M.E. Reiche et al.
metabolic disease. J Clin Invest. 2011;121(6):2111-2117.
7. Ambrosi TH, Scialdone A, Graja A, et al. Adipocyte accumulation in the bone marrow during obesity and aging impairs stem cellbased hematopoietic and bone regeneration. Cell Stem Cell. 2017;20(6):771-784.
8. Deng T, Lyon CJ, Minze LJ, et al. Class II major histocompatibility complex plays an essential role in obesityinduced adipose inflammation. Cell Metab. 2013;17(3):411-422.
9. Chatzigeorgiou A, Phieler J, Gebler J, Bornstein SR, Chavakis T. CD40L stimulates the crosstalk between adipocytes and inflammatory cells. Horm Metab Res. 2013;45(10):741-747.
10. Lacy M, Bürger C, Shami A, et al. Cell-specific and divergent roles of the CD40L-CD40 axis in atherosclerotic vascular disease. Nat Commun. 2021;12(1):3754.
11. Zirlik A, Lutgens E. An inflammatory link in atherosclerosis and obesity. Co-stimulatory molecules. Hamostaseologie. 2015;35(3):272-278.
12. Mavroudi I, Papadaki HA. The role of CD40/CD40 ligand interactions in bone marrow granulopoiesis. Sci World J. 2011;11:2011-2019.
13. Poggi M, Engel D, Christ A, et al. CD40L deficiency ameliorates adipose tissue inflammation and metabolic manifestations of obesity in mice. Arterioscler Thromb Vasc Biol. 2011;31(10):2251-2260.
14. Reiche ME, den Toom M, Willemsen L, et al. Deficiency of T cell CD40L has minor beneficial effects on obesity-induced metabolic dysfunction. BMJ Open Diabetes Res Care. 2019;7(1):e000829.
15. Donners MM, Beckers L, Lievens D, et al. The CD40-TRAF6 axis is the key regulator of the CD40/CD40L system in neointima formation and arterial remodeling. Blood. 2008;111(9):4596-4604.
16. Guo CA, Kogan S, Amano SU, et al. CD40 deficiency in mice exacerbates obesity-induced adipose tissue inflammation, hepatic steatosis, and insulin resistance. Am J Physiol Endocrinol Metab. 2013;304(9):951.
17. Bosmans LA, van Tiel CM, Aarts SABM, et al. Myeloid CD40 deficiency reduces atherosclerosis by impairing macrophages' transition into a pro-inflammatory state. Cardiovasc Res. 2022 May 19. doi: 10.1093/cvr/cvac084. [Epub ahead of print]
18. Aarts SABM, Reiche ME, den Toom M, et al. Macrophage CD40 plays a minor role in obesity-induced metabolic dysfunction. PLoS One. 2018;13(8):e0202150.
19. Yi Z, Stunz LL, Bishop GA. CD40-mediated maintenance of immune homeostasis in the adipose tissue microenvironment. Diabetes. 2014;63(8):2751-2760.
20. Rensen PC, van Dijk MC, Havenaar EC, Bijsterbosch MK, Kruijt JK, van Berkel TJ. Selective liver targeting of antivirals by recombinant chylomicrons--a new therapeutic approach to hepatitis B. Nat Med. 1995;1(3):221-225.
21. Mittelstadt PR, Taves MD, Ashwell JD. Glucocorticoids oppose thymocyte negative selection by inhibiting Helios and Nur77. J Immunol. 2019;203(8):2163-2170.
22. Shimba A, Ikuta K. Immune-enhancing effects of glucocorticoids in response to day-night cycles and stress. Int Immunol. 2020;32(11):703-708.
23. Wang Y, Liu J, Burrows PD, Wang JY. B cell development and maturation. Adv Exp Med Biol. 2020;1254:1-22.
24. Oguro H. The roles of cholesterol and its metabolites in normal and malignant hematopoiesis. Front Endocrinol (Lausanne). 2019;10:204.
25. Stiekema LCA, Willemsen L, Kaiser Y, et al. Impact of cholesterol
on proinflammatory monocyte production by the bone marrow. Eur Heart J. 2021;42(42):4309-4320.
26. Yuan M, Wu B, Zhang L, Wang H, Yang Y. CD40L/CD40 regulates adipokines and cytokines by H3K4me3 modification in epicardial adipocytes. J Cardiovasc Pharmacol. 2021;78(2):228-234.
27. van Beek L, van Klinken JB, Pronk AC, et al. The limited storage capacity of gonadal adipose tissue directs the development of metabolic disorders in male C57Bl/6J mice. Diabetologia. 2015;58(7):1601-1609.
28. Soysal P, Arik F, Smith L, Jackson SE, Isik AT. Inflammation, frailty and cardiovascular disease. Adv Exp Med Biol. 2020;1216:55-64.
29. Franceschi C, Garagnani P, Parini P, Giuliani C, Santoro A. Inflammaging: a new immune-metabolic viewpoint for agerelated diseases. Nat Rev Endocrinol. 2018;14(10):576-590.
30. Yang D, de Haan G. Inflammation and aging of hematopoietic stem cells in their niche. Cells. 2021;10(8):1849.
31. Yang H, Youm YH, Sun Y, et al. Axin expression in thymic stromal cells contributes to an age-related increase in thymic adiposity and is associated with reduced thymopoiesis independently of ghrelin signaling. J Leukoc Biol. 2009;85(6):928-938.
32. Cozzo AJ, Fuller AM, Makowski L. Contribution of adipose tissue to development of cancer. Compr Physiol. 2017;8(1):237-282.
33. Elgueta R, Benson MJ, de Vries VC, Wasiuk A, Guo Y, Noelle RJ. Molecular mechanism and function of CD40/CD40L engagement in the immune system. Immunol Rev. 2009;229(1):152-172.
34. Seijkens T, Engel D, Tjwa M, Lutgens E. The role of CD154 in haematopoietic development. Thromb Haemost. 2010;104(4):693-701.
35. Poggi M, Jager J, Paulmyer-Lacroix O, et al. The inflammatory receptor CD40 is expressed on human adipocytes: contribution to crosstalk between lymphocytes and adipocytes. Diabetologia. 2009;52(6):1152-1163.
36. Missiou A, Wolf D, Platzer I, et al. CD40L induces inflammation and adipogenesis in adipose cells--a potential link between metabolic and cardiovascular disease. Thromb Haemost. 2010;103(4):788-796.
37. Collins N, Han SJ, Enamorado M, et al. The bone marrow protects and optimizes immunological memory during dietary restriction. Cell. 2019;178(5):1088-1101.
38. Wang L, Zhang H, Wang S, Chen X, Su J. Bone marrow adipocytes: a critical player in the bone marrow microenvironment. Front Cell Dev Biol. 2021;9:770705.
39. Attané C, Estève D, Chaoui K, et al. Human bone marrow is comprised of adipocytes with specific lipid metabolism. Cell Rep. 2020;30(4):949-958.
40. Baragetti A, Bonacina F, Catapano AL, Norata GD. Effect of lipids and lipoproteins on hematopoietic cell metabolism and commitment in atherosclerosis. Immunometabolism. 2021;3(2):e210014.
41. Ketelhuth DF, Hansson GK. Adaptive response of T and B cells in atherosclerosis. Circ Res. 2016;118(4):668-678.
42. Kyaw T, Winship A, Tay C, et al. Cytotoxic and proinflammatory CD8+ T lymphocytes promote development of vulnerable atherosclerotic plaques in apoE-deficient mice. Circulation. 2013;127(9):1028-1039.
43. Kyaw T, Peter K, Li Y, Tipping P, Toh BH, Bobik A. Cytotoxic lymphocytes and atherosclerosis: significance, mechanisms and therapeutic challenges. Br J Pharmacol. 2017;174(22):3956-3972.
44. Ammirati E, Cianflone D, Vecchio V, et al. Effector memory T cells are associated with atherosclerosis in humans and animal models. J Am Heart Assoc. 2012;1(1):27-41.
Haematologica | 108 July 2023 1885 ARTICLE - Adipocyte CD40 controls hematopoiesis and inflammation M.E. Reiche et al.
CCRL2 affects the sensitivity of myelodysplastic syndrome and secondary acute myeloid leukemia cells to azacitidine
Correspondence: T. Karantanos tkarant1@jhmi.edu
Received: May 24, 2022.
1Division of Hematological Malignancies, Department of Oncology, Sidney Kimmel Comprehensive Cancer Center; 2Division of Cardiology, Department of Medicine; 3Division of Biostatistics and Bioinformatics, Department of Oncology, Sidney Kimmel Comprehensive Cancer Center; 4Department of Pediatrics and 5Department of Oncology, Sidney Kimmel Comprehensive Cancer Center, Johns Hopkins University School of Medicine, Baltimore, MD, USA
Abstract
Accepted: December 2, 2022. Early view: December 15, 2022.
https://doi.org/10.3324/haematol.2022.281444
©2023 Ferrata Storti Foundation
Published under a CC BY-NC license
Better understanding of the biology of resistance to DNA methyltransferase (DNMT) inhibitors is required to identify therapies that can improve their efficacy for patients with high-risk myelodysplastic syndrome (MDS). CCRL2 is an atypical chemokine receptor that is upregulated in CD34+ cells from MDS patients and induces proliferation of MDS and secondary acute myeloid leukemia (sAML) cells. In this study, we evaluated any role that CCRL2 may have in the regulation of pathways associated with poor response or resistance to DNMT inhibitors. We found that CCRL2 knockdown in TF-1 cells downregulated DNA methylation and PRC2 activity pathways and increased DNMT suppression by azacitidine in MDS/sAML cell lines (MDS92, MDS-L and TF-1). Consistently, CCRL2 deletion increased the sensitivity of these cells to azacitidine in vitro and the efficacy of azacitidine in an MDS-L xenograft model. Furthermore, CCRL2 overexpression in MDS-L and TF-1 cells decreased their sensitivity to azacitidine. Finally, CCRL2 levels were higher in CD34+ cells from MDS and MDS/myeloproliferative neoplasm patients with poor response to DNMT inhibitors. In conclusion, we demonstrated that CCRL2 modulates epigenetic regulatory pathways, particularly DNMT levels, and affects the sensitivity of MDS/sAML cells to azacitidine. These results support CCRL2 targeting as having therapeutic potential in MDS/sAML.
Introduction
Treatment with DNMA methyltransferase (DNMT) inhibitors is the international standard for patients with high-risk myelodysplastic syndrome (MDS) and a subset of patients with secondary acute myeloid leukemia (sAML),1 but overall survival in these patients remains poor.2 Various studies have implicated immune regulation and nucleoside metabolism in the development of resistance to DNMT inhibitors3-6 but these pathways have not been targeted in combination with DNMT inhibitors in preclinical models or in MDS patients. On the contrary, most of the doublet therapies using azacitidine as a backbone have not yet led to significantly improved response rates or survival among MDS patients.7,8 Moreover, there are currently no available biomarkers that can predict the responses of MDS patients to DNMT inhibitors. Together, these facts highlight the need for better understanding of the molecular basis of the reduced activity of DNMT in-
hibitors in order to provide predictive information and develop novel and effective treatment strategies for MDS patients.9
We recently discovered that CCRL2, an atypical chemokine receptor, is overexpressed in CD34+ cells from MDS patients compared to those from healthy controls, and that CCRL2 expression promotes MDS and sAML cell growth in vitro and in vivo. 10 CCRL2 is critical for the activation of the IL-8/CXCR2,11 ERK/MAPK and AKT pathways12 in inflammatory cells. These pathways have been associated with
the induction of MDS and sAML cell growth.13
We found that CCRL2 interacts with JAK2, regulates JAK2/STAT signaling in MDS and sAML cells and alters their sensitivity to JAK2 inhibition.10 The genes found to be upregulated by CCRL2 in MDS cells included DNMT1,10 one of the DNMT that are selectively degraded by hypomethylating agents.14 Understanding the role of CCRL2 and its downstream signaling in resistance to hypomethylating agents could provide critical insights into the molecular
Theodoros Karantanos,1 Patric Teodorescu,1 Marios Arvanitis,2 Brandy Perkins,1 Tania Jain,1 Amy E. DeZern,1 W. Brian Dalton,1 Ilias Christodoulou,1 Bogdan C. Paun,1 Ravi Varadhan,3 Christopher Esteb,1 Trivikram Rajkhowa,1 Challice Bonifant,4,5 Lukasz P. Gondek,1 Mark J. Levis,1 Srinivasan Yegnasubramanian,5 Gabriel Ghiaur1 and Richard J. Jones1
Haematologica | 108 July 2023 1886 ARTICLE - Myelodysplastic Syndromes
biology of MDS, facilitating the discovery of novel biomarkers and, more importantly, new therapeutic strategies for patients with high-risk MDS and sAML. In this study, we found that CCRL2 activation influenced PRC2 complex activity and DNA methylation pathways as well as DNMT expression. Furthermore, its knockdown (KD) enhanced azacitidine-mediated cytotoxicity and blast differentiation in vitro and in vivo. Finally, analysis of primary samples from MDS patients revealed that higher CCRL2 expression is associated with a poorer response to DNMT inhibitors.
Methods
Cell lines and reagents, and CCRL2 manipulation
The cell lines and reagents used are described in the Online Supplementary Methods. Likewise the methods used for CCRL2 lentiviral KD, CRISPR-Cas9 CCRL2 editing and the development of a doxycycline-induced CCRL2 expression method are also described in the Online Supplementary Methods.
RNA sequencing and gene set enrichment analysis
Total RNA was collected using the total RNA Miniprep kit (Monarch #T2010S). RNA-sequencing libraries were constructed using the Illumina TruSeq RNA Sample Preparation Kit v3. Sequencing was performed on an Illumina NovaSeq system to obtain a total of 1.6x10⁹ read pairs. The methods used for the analysis of raw RNA-sequencing data15-17 are described in the Online Supplementary Methods.
Publicly available database
RNA data from 228 MDS samples were extracted from the publicly available BloodSpot database (GSE42519, GSE13159, GSE15434, GSE61804, GSE14468, and TCGA).18
Western blotting
Protein was extracted as previously described.19 Antibodies are reported in the Online Supplementary Methods.
Nuclear and cytoplasmic fractionation
Nuclear/cytoplasmic fractionation was performed using the NE-PER™ Nuclear and Cytoplasmic Extraction kit from ThermoFisher Scientific (# 78833) as previously described.20
Clonogenicity assays
The methods used for clonogenicity assays are described in the Online Supplementary Methods
MDS-L xenograft studies
MDS-L cells transduced with shControl and shCCRL2 shRNA
were transduced with a retroviral vector carrying an enhanced green fluorescent protein (GFP) firefly luciferase fusion gene.21 GFP+ cells were injected intravenously into 10week-old NOD.Cg-PrkdcscidIl2rgtm1WjlTg(CMV-IL3,CSF2,KITLG) 1Eav/MloySzJ male mice (Jackson Laboratory, stock n. 013062) (6x10⁵ cells/mouse) 48 h after intraperitoneal injection of clophosome-A clodronate liposomes (100 mL/mouse).10 The bioluminescence signal was measured by an IVIS spectrum in vivo imaging system at days 3, 23, 40, and 60. Mice with evidence of engraftment at day 23 (with a signal of at least 107 photons/sec) were treated with intravenous dimethylsulfoxide (DMSO) or azacitidine (2.5 mg/kg/day, every 5 days for a total of 5 doses). At day 60, the mice were sacrificed and the percentage of human CD45+ (hCD45+) cells was assessed in the bone marrow by flow cytometry. CD11b expression was assessed in hCD45+ cells by flow cytometry.
Patients and sample processing
Bone marrow aspirates were obtained from 20 patients with MDS and MDS/myeloproliferative neoplasms (MPN) seen at the Johns Hopkins Sidney Kimmel Comprehensive Cancer Center. Patients granted informed consent to participation in the study which was approved by the Johns Hopkins Medical Institutes Institutional Review Board. The process of CD34+ cell collection is described in the Online Supplementary Methods. Karyotyping and next-generation sequencing were performed at the time of sample collection, using our established Johns Hopkins 63-gene panel22,23 (Online Supplementary Table S3). Response to DNMT inhibitors was assessed using International Working Group (IWG) response criteria in MDS.24 The best response during the first 6 months of treatment was used for the analysis.
Flow cytometry analysis
The methods used for flow cytometry analysis are described in the Online Supplementary Methods.
Statistical analysis
Statistical analyses were performed using GraphPad Prism (GraphPad Software, La Jolla, CA, USA). The statistical methods are described in the Online Supplementary Methods
Results
CCRL2 regulates the expression of genes in pathways associated with DNA methylation and PRC2 complex activity
We recently reported that CCRL2 deletion in MDS/AML cell lines suppresses their proliferation and inhibits cytokinemediated JAK2/STAT activation.10 To identify other molecular pathways regulated by CCRL2, we performed
Haematologica | 108 July 2023 1887 ARTICLE - CCRL2 modifies sensitivity of MDS/sAML cell to azacytidine T. Karantanos et al.
unbiased RNA-sequencing in TF-1 cells transduced with either non-targeting vector (shControl) or an shRNA targeting CCRL2 (shCCRL2 – sh1). Subsequently, we identified specific molecular pathways affected by CCRL2 KD using gene set enrichment analysis (GSEA). The volcano plot is presented in Online Supplementary Figure S1A and principal component analysis is shown in Online Supplementary Figure S1B.
Among the top pathways downregulated by CCRL2 KD were PRC2-mediated methylation of histones and DNA (normal enrichment score [NES] -2.28, false discovery rate [FDR] <0.001) and DNA methylation (NES -2.17, FDR <0.001) (Figure 1A, B). Other top pathways downregulated by CCRL2 KD were pathways associated with cell cycle progression, including transferrin receptor (TFRC) targets (NES -2.29, FDR <0.001), human papilloma virus (HPV)-

positive tumors (CDK/RB1/E2F1) (NES -2.26, FDR <0.001), Retinoblastoma pathway (NES -2.2, FDR <0.001), MYC/TFRC targets (NES -2.17, FDR <0.001) and DNA damage repair pathways including the XPRSS network (NES -2.20, FDR <0.001), melanoma relapse (NES -2.25, FDR <0.001) and the BRCA network (NES -2.09, FDR =0.002) (Figure 1A). The top pathways that were upregulated by CCRL2 KD are shown in Online Supplementary Figure S1C
The effect of CCRL2 KD in the top CCRL2-regulated pathways was validated in TF-1 and MDS-L cells by western blot. In particular, CCRL2 KD by two independent shRNA (sh2 and sh3) suppressed the protein levels of DNMT3A and DNMT3B in TF-1 cells and of all of the DNMT in MDSL cells (Figure 1C). Similarly, CCRL2 KD suppressed the protein levels of the PRC2 complex component SUZ12 and the levels of the TFRC targets LIN28B and GNAQ in both
Haematologica | 108 July 2023 1888 ARTICLE - CCRL2 modifies sensitivity of MDS/sAML cell to azacytidine T. Karantanos et al. A B Continued on following page.
cell lines (Figure 1C). Finally, upregulation of the HPV tumor pathway is associated with decreased p27 levels, suppressed cyclin-dependent-kinase (CDK)-mediated retinoblastoma protein (RB1) phosphorylation and increased E2F1 nuclear translocation.25 Indeed, we found that CCRL2 KD increased p27 levels and CDK-mediated RB1 phosphorylation and decreased the E2F1 nuclear levels in both TF-1 and MDS-L cells (Figure 1C).
Within the PRC2 activity and DNA methylation pathways, genes encoding DNMT such as DNMT3A and DNMT3B , histone modifiers such as UHRF1 and RBBP7 , and PRC2 components such as AEBP2 , EED and SUZ12 (Figure 1D) were found to be downregulated by CCRL2 KD in TF-1 cells. The correlation between the expression of CCRL2

Figure 1. CCRL2 knockdown downregulates pathways associated with DNA methylation and PRC2 activity. (A) RNA sequencing and gene set enrichment analysis in RNA collected from TF-1 cells transduced with shControl or shCCRL2 (sh1) lentiviruses and selected with puromycin demonstrated a number of oncogenic pathways downregulated by CCRL2 knockdown (KD). Among the topdownregulated pathways were pathways associated with DNA methylation and PRC2 activity. (B) Enrichment plots showing the suppression of PRC2 methylation activity and DNA methylation pathways by CCRL2 KD. (C) Western blot showing that CCRL2 KD suppressed DNMT3A and DNMT3B in TF-1 cells and all the DNMT in MDS-L cells. CCRL2 KD also increased p27 levels, decreased RB1 phosphorylation, and suppressed the protein levels of the PRCA component SUZ12, and the TFRC targets LIN28B and GNAQ in both TF-1 and MDS-L cells. CCRL2 KD decreased the nuclear levels of E2F1 in both TF-1 and MDS-L cells. (D) Box plot of normalized expression of selected genes encoding DNA methyltransferases (DNMT) and PRC2 components between CCRL2 knockout cells and controls. NES: normalized enrichment score; FDR: false discovery rate.
and the expression of genes involved in DNA methylation and PRC2 activity was further assessed using RNAsequencing data from 228 MDS samples from the BloodSpot database.18 Linear regression analysis showed that CCRL2 RNA levels were positively correlated with DNMT1 (coefficient 0.30, P =0.010), EED (coefficient 0.21, P =0.011), RBBP7 (coefficient 0.45, P <0.001) and SUZ12 levels (coefficient 0.49, P <0.001) and negatively correlated with DNMT3A (coefficient -0.45, P <0.001) and UHFR1 levels (coefficient -0.11, P =0.024) ( Online Supplementary Figure S2 ).
Collectively, these results suggest a possible association of CCRL2 and genes involved in DNA methylation and histone modification in MDS and sAML.
Haematologica | 108 July 2023 1889 ARTICLE - CCRL2 modifies sensitivity of MDS/sAML cell to azacytidine T. Karantanos et al. C D
CCRL2 deletion increases DNMT protein suppression by azacitidine
One of the best-studied mechanisms of DNMT inhibitor activity is the degradation of DNMT proteins in MDS and sAML cells, which leads to upregulation of tumor suppressor and differentiation genes by promoter demethylation.14 Based on our data supporting CCRL2 regulation of DNMT RNA expression,10 we hypothesized that CCRL2 loss increases azacitidine-mediated DNMT protein suppression. MDS92, MDS-L and TF-1 cells were transduced with the shControl and shCCRL2 (sh1) vectors and treated with 0.5 mM azacitidine for 24 hours. We found that the combination of CCRL2 KD and azacitidine treatment markedly suppressed DNMT1 and DNMT3B expression in MDS92 (Figure 2A) and MDS-L (Figure 2B) and DNMT3A and DNTM3B in TF-1 cells (Figure 2C) compared to the single modalities.
CCRL2 knockdown increases the clonogenicity inhibition effect of azacitidine and induces its apoptotic and differentiation effects in myelodysplastic syndrome and secondary acute myeloid leukemia cells

MDS and sAML cells were treated with 0, 0.1, 0.25, 0.5 or 1 m M azacitidine for 3 days and were then plated in
methylcellulose medium to assess clonogenicity. CCRL2 KD decreased the half maximal inhibitory concentration (IC 50) of azacitidine calculated by the clonogenicity of MDS92, MDS-L, and TF-1 cells (Figure 3A-C) (Online Supplementary Figure S3A-C). Serial passage in methylcellulose medium showed that CCRL2 KD and treatment with azacitidine both enhanced the suppression of clonogenic potential of MDS-L and TF-1 cells (Online Supplementary Figure S3D, E).
CCRL2 KD increased azacitidine-mediated apoptosis in MDS92 and MDS-L cells (Figure 3D, E), but not in TF-1 cells (Online Supplementary Figure S4A). The selection of surface markers to study the impact of CCRL2 KD and azacitidine on cell differentiation was based on the previously reported effect of CCRL2 on the expression of differentiation markers in MDS92, MDS-L and TF-1 cells.10 CCRL2 KD increased azacitidine-mediated induction of CD11b, CD14, and CD16 expression on the surface of MDS92 and MDS-L cells (Figure 4A, B, Online Supplementary Figure S4B, C) and CD61, CD71 and CD235a on the surface of TF-1 cells (Figure 4C, Online Supplementary Figure S4D). No significant morphological alterations were identified in cells under different treatments (data not shown).
knockdown increases DNMT protein suppression by azacitidine. (A-C) MDS92, MDS-L and TF-1 cells were treated with 0.5 mM azacitidine for 24 h following transduction with shControl or shCCRL2 (sh1) lentiviruses and selection with puromycin. Quantitative data and a representative western blot are shown. (A) The combination of CCRL2 knockdown (KD) and azacitidine treatment had a more prominent effect on the suppression of DNMT1 and DNTM3B levels in MDS92 cells compared to azacitidine (P=0.014 for DNMT1 and P<0.001 for DNMT3B) and shCCRL2 (P<0.001 for DNMT1 and P=0.009 for DNMT3B) separately. (B) The combination of CCRL2 KD and azacitidine treatment had a more prominent effect on the suppression of DNMT1 and DNTM3B levels in MDS-L cells compared to azacitidine (P<0.001 for both DNMT1 and DNMT3B) and shCCRL2 (P=0.008 for DNMT1 and P=0.001 for DNMT3B). (C). The combination of CCRL2 KD and azacitidine treatment had a more prominent effect on the suppression of DNMT1 and DNTM3B levels in MDS92 cells compared to azacitidine (P<0.001 for both DNMT3A and DNMT3B) and shCCRL2 (P=0.016 for DNMT3A and P=0.047 for DNMT3B).
C
Haematologica | 108 July 2023 1890 ARTICLE - CCRL2 modifies sensitivity of MDS/sAML cell to azacytidine T. Karantanos et al. A B
Figure 2. CCRL2
Figure 3. CCRL2 knockdown increases the clonogenicity inhibition and apoptotic effects of azacitidine. (A) CCRL2 knockdown (KD) by two different lentiviruses (sh1 and sh2) decreased the azacitidine half maximal inhibitory concentration (IC50) for the clonogenicity of MDS92 cells (P<0.001 for both sh1 and sh2). (B) CCRL2 KD by two different lentiviruses (sh1 and sh2) decreased the azacitidine IC50 for the clonogenicity of MDS-L cells (P<0.001 for both sh1 and sh2). (C) CCRL2 KD by two different lentiviruses (sh1 and sh2) decreased the azacitidine IC50 for the clonogenicity of TF-1 cells (P<0.001 for both sh1 and sh2). (D) CCRL2 KD in MDS92 cells increased the percentage of early apoptotic and necrotic cells under treatment with 0.5 mM (P<0.001 with sh1 and P=0.005 with sh2) and 1 mM (P<0.001 with sh1 and P=0.007 with sh2) of azacitidine (n=3). (E) CCRL2 KD in MDS-L cells increased the percentage of early apoptotic and necrotic cells under treatment with 0.5 mM (P=0.028 with sh1 and P=0.003 with sh2) and 1 mM (P=0.003 with sh1 and P=0.035 with sh2) of azacitidine (n=3).

C E A B
Haematologica | 108 July 2023 1891 ARTICLE - CCRL2 modifies sensitivity of MDS/sAML cell to azacytidine T. Karantanos et al. D
CCRL2 overexpression increases the resistance to MDS-L and TF-1 cells to azacitidine
To analyze the effect of CCRL2 expression on the development of resistance to azacitidine, MDS-L cells were transduced with pLV-Puro-TRE-CCRL2- and pLV-HygroCMV>tTS/rtTA-expressing lentiviruses and cells were se-

lected with puromycin and hygromycin. Doxycycline- induced CCRL2 expression was confirmed by western blot and flow cytometry (Figure 5A). CCRL2 overexpression decreased the clonogenicity inhibition effect of 0.5 mM azacitidine and significantly increased the IC50 of azacitidine (Figure 5B). Consistently, CCRL2 overexpression caused a
Figure 4. CCRL2 knockdown increases the differentiation effect of azacitidine. (A) Treatment of MDS92 cells transduced with shCCRL2 (sh1 or sh2) lentiviruses with 0.5 and 1 mΜ azacitidine (Aza) led to a more prominent increase of CD11b (Aza 0.5: P<0.001 for both sh1 and sh2; Aza 1: P=0.001 for sh1 and P<0.001 for sh2), CD14 (Aza 0.5: P<0.001 for both sh1 and sh2; Aza 1: P<0.001 for both sh1 and sh2) and CD16 (Aza 0.5: P<0.001 for both sh1 and sh2; Aza 1: P<0.001 for both sh1 and sh2) expression compared to treatment of cells transduced with shControl lentivirus. Representative flow cytometry graph showing that CCRL2 KD increased the upregulation of CD16 on the surface of MDS92 cells caused by 1 mM azacitidine. (B) Treatment of MDS-L cells transduced with shCCRL2 (sh1 or sh2) lentiviruses with 0.5 and 1 mM azacitidine led to a more prominent increase of CD11b (Aza 0.5: P<0.001 for both sh1 and sh2; Aza 1: P<0.001 for sh1 and P<0.001 for sh2), CD14 (Aza 0.5: P=0.001 for both sh1 and sh2; Aza 1: P<0.001 for both sh1 and sh2) and CD16 (Aza 0.5: P<0.001 for both sh1 and sh2; Aza 1: P<0.001 for both sh1 and sh2) expression compared to treatment of cells transduced with shControl lentivirus. Representative flow cytometry graph showing that CCRL2 KD increased the upregulation of CD16 on the surface of MDS-L cells caused by 1 mM azacitidine. (C) Treatment of TF-1 cells transduced with shCCRL2 (sh1 or sh2) lentiviruses with 0.5 and 1 mM azacitidine led to a more prominent increase of CD41 (Aza 1: P=0.037 for sh2), CD61 (Aza 0.5: P<0.001 for sh1 and P=0.001 for sh2, Aza 1: P<0.001 for sh1 and P=0.005 for sh2), CD71 (Aza 0.5: P<0.001 for sh1, P=0.002 for sh2; Aza 1: P<0.001 for sh1, P=0.002 for sh2), CD235a (Aza 0.5: P=0.002 for sh1 and P=0.007 for sh2; Aza 1: P=0.010 for sh1 and P=0.030 for sh2) expression compared to treatment of cells transduced with shControl lentivirus. Representative flow cytometry graphs showing that CCRL2 KD increased the upregulation of CD71 and CD235a on the surface of TF-1 cells caused by 1 mM azacitidine (n=3).
B
Haematologica | 108 July 2023 1892 ARTICLE - CCRL2 modifies sensitivity of MDS/sAML cell to azacytidine T. Karantanos et al. A C

D C E B Haematologica | 108 July 2023 1893 ARTICLE - CCRL2 modifies sensitivity of MDS/sAML cell to azacytidine T. Karantanos et al. A
Figure 5. Doxycycline-induced CCRL2 overexpression increases the resistance of MDS-L and TF-1 cells to azacitidine. (A) Doxycycline-induced CCRL2 overexpression in MDS-L cells transduced with pLV-Puro-TRE-CCRL2- and pLV-Hygro-CMV>tTS/rtTA-expressing lentiviruses and selected with puromycin and hygromycin treatment was confirmed by western blot and flow cytometry. (B) CCRL2 overexpression by treatment of MDS-L cells with 1 mg/mL doxycycline led to a less prominent suppression of clonogenicity by 0.5 mM azacitidine (P=0.019) and increase of the azacitidine half maximal inhibitory concentration (IC50) (P=0.003). (C) CCRL2 overexpression by treatment of MDS-L cells with 1 mg/mL doxycycline led to a small decrease of the percentage of apoptotic cells under treatment with 0.5 mM (P=0.010) and 1 mM azacitidine (P=0.001). (D) Doxycycline-induced CCRL2 overexpression in TF-1 cells with CRISPR-Cas9 CCRL2 deletion, transduced with pLV-Puro-TRE-CCRL2-and pLV-Hygro-CMV>tTS/rtTA-expressing lentiviruses and selected with puromycin and hygromycin treatment, was confirmed by western blot and flow cytometry. (E) CCRL2 overexpression by treatment of TF-1 cells with 1 mg/mL doxycycline led to a higher clonogenic capacity (P<0.001) in cells treated with dimethylsulfoxide and a less prominent suppression of clonogenicity by 0.5 mM (P=0.001) and 1 mM azacitidine (P=0.002). This led to a less prominent decrease of the relative number of colonies in cells treated with 1 mM azacitidine (P=0.044) and an increased azacitidine IC50 (P=0.011). Doxy: doxycycline; Aza: azacitidine; DMSO: dimethylsulfoxide.
small decrease of the apoptotic effect of 0.5 and 1 mM azacitidine (Figure 5C).
CRISPR-Cas9 delivered via electroporation was used to delete CCRL2 in TF-1 cells. Gene editing was confirmed by DNA sequencing, CCRL2 expression was assessed by flow cytometry and clonogenicity assays confirmed that CCRL2 deletion suppressed the clonogenicity of TF-1 cells (Online Supplementary Figure S5A). TF-1 cells with CCRL2 deletion (sgRNA1) were transduced with pLV-Puro-TRE-CCRL2- and pLV-Hygro-CMV>tTS/rtTA-expressing lentiviruses and cells were selected with puromycin and hygromycin. Doxycycline-induced CCRL2 expression was confirmed by western blot and flow cytometry (Figure 5D). CCRL2 overexpression decreased the clonogenicity inhibition effect of 0.5 and 1 mM azacitidine and increased the IC50 of azacitidine (Figure 5E).
CCRL2 knockdown increases the efficacy of azacitidine in an MDS-L xenograft model
To test the impact of CCRL2 expression on the response of MDS to azacitidine in vivo, MDS-L cells transfected with shControl or shCCRL2 and a GFP+/luciferase+ dual reporter retrovirus were injected intravenously into NSGhSCF/hGM-CSF/hIL3 (NSGS) mice 48 hours after intraperitoneal injection of clophosome-A clodronate liposomes as previously described.10 Cell growth was monitored by the bioluminescence signal at days 3, 23, 40 and 60. Engrafted mice (signal of at least 107 photons/sec at day 23) (11/13 injected with shControl MDS-L cells and 10/18 injected with shCCRL2 MDS-L cells, P=0.129) were treated with intravenous azacitidine (2.5 mg/kg/day) or DMSO every 5 days for a total of five doses starting at day 30.26 Mice engrafted with shCCRL2 cells and treated with azacitidine had the lowest disease burden measured at 60 days (Figure 6A). At that point, all mice were sacrificed and the percentage of MDS-L cells in the bone marrow was recorded. Mice engrafted with shCCRL2 cells and treated with azacitidine had the lowest MDS-L cell burden (Figure 6B). Specifically, their percentage of hCD45+ cells was lower compared to that of mice engrafted with shControl cells and treated with azacitdine (P=0.004) and mice engrafted with shCCRL2 cells and treated with DMSO (P=0.008) (Fig-
ure 6B). CD11b expression of the hCD45+ cells was overall higher in mice engrafted with shCCRL2 cells and treated with azacitidine than in the rest of the groups (Online Supplementary Figure S5B).
Higher CCRL2 expression in CD34+ cells from patients with myelodysplastic syndromes is associated with worse response to DNMT inhibitors
To further study CCRL2 expression and its relation to response to DNMT inhibitors, CCRL2 protein levels in samples from patients with MDS or MDS/MPN were measured by flow cytometry in CD34+ cells sorted from bone marrow aspirates ( Online Supplementary Figure S5C, Online Supplementary Table S1). The median followup of patients treated with DNMT inhibitors was 12 months (±8.74 months). The response to DNMT inhibition was defined as the best response during the first 6 months of therapy according to IWG response criteria in MDS. 24 The genomic profile, gender, subtype (MDS or MDS/MPN) and response of each patient stratified by CCRL2 level are shown in Figure 7A. No significant correlation was found between CCRL2 expression and age, blast percentage, revised International Prognostic Staging System score, karyotype, or number of mutations ( Online Supplementary Table S2 ). MDS/MPN diagnosis, male gender and presence of SETBP1 mutation were positively associated with CCRL2 protein levels (P=0.018, P=0.056 and P=0.031, respectively) (Online Supplementary Table S2 ). Patients with progressive disease ( P =0.002) and stable disease ( P =0.029) had higher CCRL2 levels compared to patients in complete remission or partial remission (Figure 7B).
Three out of six (50%) patients with complete or partial remission and two of five (40%) patients with stable disease, but none (0%) of the nine patients with progressive disease underwent allogeneic bone marrow transplantation (BMT) following DNMT inhibitor therapy. Given that CCRL2 expression was associated with response to DNMT inhibitors, we next evaluated the impact of CCRL2 levels on overall survival in this cohort of MDS and MDS/MPN patients treated with DNMT inhibitors. CCRL2 levels higher than the median were associated with worse overall sur-
Haematologica | 108 July 2023 1894 ARTICLE - CCRL2 modifies sensitivity of MDS/sAML cell to azacytidine T. Karantanos et al.
Figure 6. Combination treatment with CCRL2 knockdown and azacitidine leads to MDS-L growth suppression in NSGS mice. (A) Monitoring the bioluminescence signal showed that NSGS mice engrafted with MDS-L cells transduced with shCCRL2 lentivirus treated with intravenous azacitidine (2.5 mg/kg/day every 5 days for 5 doses) showed the smallest disease growth compared to mice engrafted with MDS-L cells transduced with shControl lentivirus and treated with dimethylsulfoxide (DMSO) or azacitidine and mice engrafted with MDS-L cells transduced with shCCRL2 lentivirus and treated with DMSO. (B) Mice engrafted with MDSL cells transduced with shCCRL2 and treated with azacitidine had lower disease burden in their bone marrow based on the percentage of human CD45 (hCD45+%) cells compared to mice engrafted with shControl transduced cells and treated with azacitidine (P=0.004) and mice engrafted with shCCRL2 transduced cells and treated with DMSO (P=0.008). AZA: azacitidine.

vival compared to CCRL2 levels lower than the median (P=0.039) (Figure 7C).
Discusssion
DNMT inhibitor treatment remains the standard of care for patients with high-risk myeloid neoplasms. Unfortunately, the effect of DNMT inhibitors is transient, with responses usually maintained for less than 12 months in patients with adverse disease biology.27 Patients with progressive disease or relapse following DNMT inhibitor therapy have a particularly poor survival.28 Allogeneic BMT is the only curative option for these patients and can improve their survival, but an initial response to DNMT inhibitors is generally required
for pre-transplant debulking.29 The addition of venetoclax has produced promising results but a significant percentage of MDS and sAML patients fail to respond or develop early resistance.30,31 For this reason, a number of international clinical trials are investigating whether the efficacy of azacitidine can be improved by the addition of novel agents (NCT04313881, NCT03745716). Moreover, there is no available biomarker for the prediction of response to DNTM inhibitors among MDS patients. Thus, a better understanding of the molecular mechanisms of resistance to DNMT inhibitors remains critical for the early prediction of response and discovery of targets for novel therapies that can improve DNMT inhibitor efficacy.
Our in vitro assays revealed that CCRL2 deletion primarily promoted the apoptotic effects of azacitidine in MDS92
B
Haematologica | 108 July 2023 1895 ARTICLE - CCRL2 modifies sensitivity of MDS/sAML cell to azacytidine T. Karantanos et al. A
Figure 7. CCRL2 expression in CD34+ cells is negatively correlated with response to DNMT inhibitors. (A) Genomic landscape of patients with myelodysplastic syndrome (MDS) and MDS/myeloproliferative neoplasms (MPN) included in the analysis sorted by CCRL2 levels with gender, disease subtype (MDS and MDS/MPN) and specific somatic mutations being indicated. MDS/MPN patients had higher levels of CCRL2 (P=0.033) and men had relatively higher levels compared to women (P=0.047). Patients who achieved complete or partial remission (CR or PR) are presented in blue, patients with stable disease (SD) are presented in orange and patients with progressive disease (PD) are presented in red. (B) Patients with CR/PR had lower CCRL2 levels in their CD34+ cells compared to patients with SD (P=0.029) or PD (P=0.002). (C) Kaplan-Meier analysis showed that CCRL2 protein levels above the median were associated with worse overall survival since diagnosis (P=0.039) compared to CCRL2 protein levels below the median.

and MDS-L cells with a relatively lesser effect on cell differentiation. On the contrary, induction of differentiation was more prominent in the sAML TF-1 cells. Inhibition of clonogenicity was observed in all tested cell lines. Inducible CCRL2 overexpression consistently suppressed inhibition of clonogenicity by azacitidine in two cellular models. These findings were further confirmed in an MDSL xenograft model with the combination of CCRL2 suppression and azacitidine treatment more prominently suppressing disease burden when compared to the single modalities. MDS-L is a leukemic subline derived from the MDS92 cell line established from a patient with MDS with 5q deletion and monosomy 7.32,33 These cells carry NRAS and TP53 mutations.33 Although the effect of lenalidomide has been described in MDS-L xenografts,33 to our knowledge this is the first report of the efficacy of azacitidine in the suppression of MDS-L cell growth in vivo. This provides
a very useful tool for the discovery of novel agents with potential to improve the activity of DNMT inhibitors in highrisk MDS.
CCRL2 is an atypical chemokine receptor that acts to intensify cytokine signaling, with usual expression on differentiated myeloid cells.11.34 Our group recently found that this receptor is a mediator of MDS and sAML growth by augmenting cytokine-regulated JAK2/STAT signaling.10 Here, we performed RNA sequencing with subsequent GSEA, to demonstrate that CCRL2 KD affects pathways associated with DNA methylation and PRC2 activity. Among the involved genes, those encoding various DNMT were downregulated by CCRL2 KD. This was consistent with our published results showing that DNMT1 is regulated by CCRL2 in MDS cell lines.10 DNMT inhibitors bind to DNMT after incorporation into newly synthesized DNA;35 this causes DNMT degradation and decreased genomic DNA
A B C
Haematologica | 108 July 2023 1896 ARTICLE - CCRL2 modifies sensitivity of MDS/sAML cell to azacytidine T. Karantanos et al.
methylation.35,36 Higher DNMT levels have been associated with resistance to DNTM inhibitors in MDS/AML cell lines and primary samples.37 Our results show that the combination of CCRL2 deletion and azacitidine leads to a more prominent suppression of DNMT protein levels as compared to single modality therapies. Our observations provide a rationale to explain why cells with lower CCRL2 levels demonstrate increased responsiveness to DNMT inhibition. However, we were unable to develop models with concurrent CCRL2 deletion and DNMT upregulation to provide stronger mechanistic insight into the role of DNMT in CCRL2-mediated resistance to azacitidine. Thus, further studies are required to shed light onto the exact molecular mechanism.
Our GSEA results and validation by western blotting highlight pathways associated with cell cycle progression such as TFRC, CDK/RB1/E2F and DNA damage repair pathways, all negatively affected by CCRL2 suppression. This is consistent with previous findings by our group and others showing that CCRL2 regulates oncogenic pathways implicated in cancer growth10,38 and, particularly, cell cycle progression.10 A number of genes implicated in altered DNA methylation, including genes encoding DNMT proteins, are regulated by oncogenic pathways.39,40 Interestingly, RB1 protein suppresses the transcription of DNMT141 and DNMT3A42 in cancer cells. Our RNA-sequencing data and our western blot analysis suggested that CCRL2 KD is associated with E2F suppression and RB1 induction, providing a possible explanation linking upregulated DNMT and CCRL2 expression. Further studies are required to confirm the exact biology of these associations. Our analysis of primary samples showed higher CCRL2 expression in MDS and MDS/MPN CD34+ cells from poor responders to DNMT inhibitors. Higher CCRL2 expression was also associated with male gender and SETBP1 mutations. Men with chronic myeloid diseases have overall worse outcomes compared to women22,23,43 and SETBP1 mutations have been associated with worse response to DNMT inhibitors.44 Given that response to DNMT inhibitors is generally required to support further treatment with allogeneic BMT,45 it is not surprising that lower CCRL2 levels were associated with better survival in this cohort of patients treated with DNMT inhibitors. We previously reported results based on The Cancer Genome Atlas database demonstrating that higher CCRL2 expression is associated with worse survival among AML patients.10 Overall, these findings suggest that CCRL2 expression probably has a negative impact on the outcomes of patients with myeloid neoplasms. Finally, patients with MDS/MPN had higher CCRL2 expression compared to patients with pure MDS.
This observation underlies the role of CCRL2 as a promoter of cell cycle progression and cell proliferation in myeloid malignancies.10
In conclusion, we provide evidence that CCRL2 influences DNA methylation pathways and increases DNMT protein levels. CCRL2 suppression increases the efficacy of azacitidine in vitro and in vivo. Furthermore, CCRL2 expression in CD34+ cells from MDS and MDS/MPN patients is negatively associated with response to DNMT inhibitors. Additional studies are required to understand the precise mechanisms underpinning these associations.
Disclosures
TJ receives institutional research support from CTI Biopharma, Syneos Health, and Incyte; acts as a consultant for Targeted Healthcare Communications; participates in advisory boards for Care Dx, Bristol Myers Squibb, and CTI. AED has advisory roles for Bristol-Myers Squibb, Geron, Taiho, and CTI Biopharma. The rest of the authors have no conflicts of interest to report.
Contributions
TK and RJJ conceived and designed the study and wrote the manuscript. TK and BP performed the flow cytometry analysis. TK, PT, CE and WBD performed the lentiviral transduction experiments. TK, CE and WBD performed the CRISPR-Cas9 experiments. MA performed the gene set enrichment analysis. TK, and TR performed the western blot analysis. TK, PT, IC, BP, and GG performed the xenograft studies. TJ, AED and MJL provided patients’ samples and clinical data. TK, BP, BCP, and CE processed the primary samples. TK and CE performed the clonogenic assays. TK performed the analysis of publicly available databases. TK, MA and RV performed the statistical analysis. WBD, TJ, AED, LPG, MJL, SV, and GG interpreted the data and edited the manuscript.
Funding
This study was supported by the National Cancer Institute/NIH (P01 CA225618-01A1, P30 CA06973, R01 HL156144, and K08 HL136894), NIH, National Heart, Lung, and Blood Institute (T32 HL007525), the American Society of Hematology Research Training Award for Fellows (ASH RTAF) and the McMillan Pathway to Independence Program Award.
Data-sharing statement
The data generated and/or analyzed during the current study are available from the corresponding author on reasonable request.
Haematologica | 108 July 2023 1897 ARTICLE - CCRL2 modifies sensitivity of MDS/sAML cell to azacytidine T. Karantanos et al.
References
1. Karantanos T, DeZern AE. Biology and clinical management of hypoplastic MDS: MDS as a bone marrow failure syndrome. Best Pract Res Clin Haematol. 2021;34(2):101280.
2. Zeidan AM, Shallis RM, Wang R, Davidoff A, Ma X. Epidemiology of myelodysplastic syndromes: why characterizing the beast is a prerequisite to taming it. Blood Rev. 2019;34:1-15.
3. Bowler EH, Bell J, Divecha N, Skipp P, Ewing RM. Proteomic analysis of azacitidine-induced degradation profiles identifies multiple chromatin and epigenetic regulators including Uhrf1 and Dnmt1 as sensitive to azacitidine. J Proteome Res. 2019;18(3):1032-1042.
4. Unnikrishnan A, Papaemmanuil E, Beck D, et al. Integrative genomics identifies the molecular basis of resistance to azacitidine therapy in myelodysplastic syndromes. Cell Rep. 2017;20(3):572-585.
5. Leung KK, Nguyen A, Shi T, et al. Multiomics of azacitidinetreated AML cells reveals variable and convergent targets that remodel the cell-surface proteome. Proc Natl Acad Sci U S A. 2019;116(2):695-700.
6. Valencia A, Masala E, Rossi A, et al. Expression of nucleosidemetabolizing enzymes in myelodysplastic syndromes and modulation of response to azacitidine. Leukemia. 2014;28(3):621-628.
7. Sekeres MA, Watts J, Radinoff A, et al. Randomized phase 2 trial of pevonedistat plus azacitidine versus azacitidine for higher-risk MDS/CMML or low-blast AML. Leukemia. 2021;35(7):2119-2124.
8. Sekeres MA, List AF, Cuthbertson D, et al. Phase I combination trial of lenalidomide and azacitidine in patients with higher-risk myelodysplastic syndromes. J Clin Oncol. 2010;28(13):2253-2258.
9. Bejar R, Steensma DP. Recent developments in myelodysplastic syndromes. Blood. 2014;124(18):2793-2803.
10. Karantanos T, Teodorescu P, Perkins B, et al. The role of the atypical chemokine receptor CCRL2 in myelodysplastic syndrome and secondary acute myeloid leukemia. Sci Adv. 2022;8(7):eabl8952.
11. Del Prete A, Martínez-Muñoz L, Mazzon C, et al. The atypical receptor CCRL2 is required for CXCR2-dependent neutrophil recruitment and tissue damage. Blood. 2017;130(10):1223-1234.
12. Zhang Y, Li S, Liu Q, et al. Mycobacterium tuberculosis heatshock protein 16.3 induces macrophage M2 polarization through CCRL2/CX3CR1. Inflammation. 2020;43(2):487-506.
13. Schinke C, Giricz O, Li W, et al. IL8-CXCR2 pathway inhibition as a therapeutic strategy against MDS and AML stem cells. Blood. 2015;125(20):3144-3152.
14. Christman JK. 5-Azacytidine and 5-aza-2'-deoxycytidine as inhibitors of DNA methylation: mechanistic studies and their implications for cancer therapy. Oncogene. 2002;21(35):5483-5495.
15. Leek JT, Storey JD. Capturing heterogeneity in gene expression studies by surrogate variable analysis. PLoS Genet. 2007;3(9):1724-1735.
16. Subramanian A, Tamayo P, Mootha VK, et al. Gene set enrichment analysis: a knowledge-based approach for interpreting genomewide expression profiles. Proc Natl Acad Sci U S A. 2005;102(43):15545-15550.
17. Liberzon A, Birger C, Thorvaldsdóttir H, Ghandi M, Mesirov JP, Tamayo P. The Molecular Signatures Database (MSigDB) hallmark gene set collection. Cell Syst. 2015;1(6):417-425.
18. Bagger FO, Kinalis S, Rapin N. BloodSpot: a database of healthy and malignant haematopoiesis updated with purified and single cell mRNA sequencing profiles. Nucleic Acids Res.
2019;47(D1):D881-D885.
19. Karantanos T, Karanika S, Wang J, et al. Caveolin-1 regulates hormone resistance through lipid synthesis, creating novel therapeutic opportunities for castration-resistant prostate cancer. Oncotarget. 2016;7(29):46321-46334.
20. Hung SC, Pochampally RR, Chen SC, Hsu SC, Prockop DJ. Angiogenic effects of human multipotent stromal cell conditioned medium activate the PI3K-Akt pathway in hypoxic endothelial cells to inhibit apoptosis, increase survival, and stimulate angiogenesis. Stem Cells. 2007;25(9):2363-70.
21. Vera J, Savoldo B, Vigouroux S, et al. T lymphocytes redirected against the kappa light chain of human immunoglobulin efficiently kill mature B lymphocyte-derived malignant cells. Blood. 2007;108(12):3890-3897.
22. Karantanos T, Gondek LP, Varadhan R, et al. Gender-related differences in the outcomes and genomic landscape of patients with myelodysplastic syndrome/myeloproliferative neoplasm overlap syndromes. Br J Haematol. 2021;193(6):1142-1150.
23. Karantanos T, Chaturvedi S, Braunstein EM, et al. Sex determines the presentation and outcomes in MPN and is related to sexspecific differences in the mutational burden. Blood Adv. 2020;4(12):2567-2576.
24. Cheson BD, Greenberg PL, Bennett JM, et al. Clinical application and proposal for modification of the International Working Group (IWG) response criteria in myelodysplasia. Blood. 2006;108(2):419-425.
25. Pyeon D, Newton MA, Lambert PF, et al. Fundamental differences in cell cycle deregulation in human papillomavirus-positive and human papillomavirus-negative head/neck and cervical cancers. Cancer Res. 2007;67(10):4605-4619.
26. Sutherland MK, Yu C, Anderson M, et al. 5-azacytidine enhances the anti-leukemic activity of lintuzumab (SGN-33) in preclinical models of acute myeloid leukemia. MAbs. 2010;2(4):440-448.
27. Zeidan AM, Stahl M, Hu X, et al. Long-term survival of older patients with MDS treated with HMA therapy without subsequent stem cell transplantation. Blood. 2018;131(7):818-821.
28. Prébet T, Gore SD, Esterni B, et al. Outcome of high-risk myelodysplastic syndrome after azacitidine treatment failure. J Clin Oncol. 2011;229(24):3322-3327.
29. Nakamura R, Saber W, Martens M, et al. A multi-center biologic assignment trial comparing reduced intensity allogeneic hematopoietic cell transplantation to hypomethylating therapy or best supportive care in patients aged 50-75 with advanced myelodysplastic syndrome: Blood and Marrow Transplant Clinical Trials Network study 1102. Blood. 2020;136(Suppl 1):19-21.
30. DiNardo CD, Pratz K, Pullarkat V, et al. Venetoclax combined with decitabine or azacitidine in treatment-naive, elderly patients with acute myeloid leukemia. Blood. 2019;133(1):7-17.
31. Bazinet A, Darbaniyan F, Jabbour E, et al. Azacitidine plus venetoclax in patients with high-risk myelodysplastic syndromes or chronic myelomonocytic leukaemia: phase 1 results of a single-centre, dose-escalation, dose-expansion, phase 1-2 study. Lancet Haematol. 2022;9(10):e756-e765.
32. Kida JI, Tsujioka T, Suemori SI, et al. An MDS-derived cell line and a series of its sublines serve as an in vitro model for the leukemic evolution of MDS. Leukemia. 2018;32(8):1846-1850.
33. Rhyasen GW, Wunderlich M, Tohyama K, Garcia-Manero G, Mulloy JC, Starczynowski DT. An MDS xenograft model utilizing a patient-derived cell line. Leukemia. 2014;28(5):1142-1145.
34. Schioppa T, Sozio F, Barbazza I, et al. Molecular basis for CCRL2
Haematologica | 108 July 2023 1898 ARTICLE - CCRL2 modifies sensitivity of MDS/sAML cell to azacytidine T. Karantanos et al.
regulation of leukocyte migration. Front Cell Dev Biol. 2020;8:615031.
35. Hurd PJ, Whitmarsh AJ, Baldwin GS, et al. Mechanism-based inhibition of C5-cytosine DNA methyltransferases by 2-H pyrimidinone. J Mol Biol. 1999;286(2):389-401.
36. Flotho C, Claus R, Batz C, et al. The DNA methyltransferase inhibitors azacitidine, decitabine and zebularine exert differential effects on cancer gene expression in acute myeloid leukemia cells. Leukemia. 2009;23(6):1019-1028.
37. Solly F, Koering C, Mohamed AM, et al. An miRNA-DNMT1 axis is involved in azacitidine resistance and predicts survival in higherrisk myelodysplastic syndrome and low blast count acute myeloid leukemia. Clin Cancer Res. 2017;23(12):3025-3034.
38. Farsam V, Basu A, Gatzka M, et al. Senescent fibroblast-derived Chemerin promotes squamous cell carcinoma migration. Oncotarget. 2016;7(50):83554-83569.
39. He S, Wang F, Yang L, et al. Expression of DNMT1 and DNMT3a are regulated by GLI1 in human pancreatic cancer. PloS One. 2011;6(11):e27684.
40. Tsai KL, Sun YJ, Huang CY, Yang JY, Hung MC, Hsiao CD. Crystal structure of the human FOXO3a-DBD/DNA complex suggests the
effects of post-translational modification. Nucleic Acids Res. 2007;35(20):6984-6994.
41. McCabe MT, Davis JN, Day ML. Regulation of DNA methyltransferase 1 by the pRb/E2F1 pathway. Cancer Res. 2005;65(9):3624-3632.
42. Tang YA, Lin RK, Tsai YT, et al. MDM2 overexpression deregulates the transcriptional control of RB/E2F leading to DNA methyltransferase 3A overexpression in lung cancer. Clin Cancer Res. 2012;18(16):4325-4333.
43. Wang F, Ni J, Wu L, Wang Y, He B, Yu D. Gender disparity in the survival of patients with primary myelodysplastic syndrome. J Cancer. 2019;10(5):1325-1332.
44. Karantanos T, Tsai HL, Gondek LP, et al. Genomic landscape of myelodysplastic/myeloproliferative neoplasm can predict response to hypomethylating agent therapy. Leuk Lymphoma. 2011;63(8):1942-1948.
45. Jabbour EJ, Garcia-Manero G, Strati P, et al. Outcome of patients with low-risk and intermediate-1-risk myelodysplastic syndrome after hypomethylating agent failure: a report on behalf of the MDS Clinical Research Consortium. Cancer. 2015;121(6):876-882.
Haematologica | 108 July 2023 1899 ARTICLE - CCRL2 modifies sensitivity of MDS/sAML cell to azacytidine T. Karantanos et al.
Association between the choice of the conditioning regimen and outcomes of allogeneic hematopoietic cell transplantation for myelofibrosis
Guru Subramanian Guru Murthy,1 Soyoung Kim,2,3 Noel Estrada-Merly,3 Muhammad Bilal Abid,4 Mahmoud Aljurf,5 Amer Assal,6 Talha Badar,7 Sherif M. Badawy,8,9 Karen Ballen,10 Amer Beitinjaneh,11 Jan Cerny,12
Saurabh Chhabra,3 Zachariah DeFilipp,13 Bhagirathbhai Dholaria,14 Miguel Angel Diaz Perez,15 Shatha
Farhan,16 Cesar O. Freytes,17 Robert Peter Gale,18 Siddhartha Ganguly,19 Vikas Gupta,20 Michael R. Grunwald,21 Nada Hamad,22 Gerhard C. Hildebrandt,23 Yoshihiro Inamoto,24 Tania Jain,25 Omer Jamy,26 Mark Juckett,27 Matt Kalaycio,28 Maxwell M. Krem,29 Hillard M Lazarus,30 Mark Litzow,31 Reinhold Munker,23
Hemant S. Murthy,32 Sunita Nathan,33 Taiga Nishihori,34 Guillermo Ortí,35 Sagar S. Patel,36 Marjolein van der Poel,37 David A Rizzieri,38 Bipin N Savani,39 Sachiko Seo,40 Melhem Solh,41 Leo F. Verdonck,42 Baldeep Wirk,43 Jean A. Yared,44 Ryotaro Nakamura,45 Betul Oran,46 Bart Scott47 and Wael Saber3
1Division of Hematology and Oncology, Medical College of Wisconsin, Milwaukee, WI, USA; 2Division of Biostatistics, Institute for Health and Equity, Medical College of Wisconsin, Milwaukee, WI, USA;
3CIBMTR® (Center for International Blood and Marrow Transplant Research), Department of Medicine, Medical College of Wisconsin, Milwaukee, WI, USA; 4Divisions of Hematology/Oncology and Infectious Diseases, Department of Medicine, Medical College of Wisconsin, Milwaukee, WI, USA; 5Department of Oncology, King Faisal Specialist Hospital Center and Research, Riyadh, Saudi Arabia; 6Columbia University Irving Medical Center, Department of Medicine, Bone Marrow Transplant and Cell Therapy Program, New York, NY, USA; 7Mayo Clinic, Jacksonville, FL, USA; 8Division of Hematology, Oncology and Stem Cell Transplantation, Ann and Robert H. Lurie Children’s Hospital of Chicago, Chicago, IL, USA;
9Department of Pediatrics, Northwestern University Feinberg School of Medicine, Chicago, IL, USA;
10Division of Hematology/Oncology, University of Virginia Health System, Charlottesville, VA, USA;
11Division of Transplantation and Cellular Therapy, University of Miami Hospital and Clinics, Slyvester Comprehensive Cancer Center, Miami, FL, USA;
12Division of Hematology/Oncology, Department of Medicine, University of Massachusetts Medical Center, Worcester, MA, USA; 13Hematopoietic Cell Transplant and Cellular Therapy Program, Massachusetts General Hospital, Boston, MA, USA; 14Vanderbilt University Medical Center, Nashville, TN, USA; 15Department of Hematology/Oncology, Hospital Infantil, Universitario Niño Jesus, Madrid, Spain; 16Henry Ford Health System Stem Cell Transplant and Cellular Therapy Program, Detroit, MI, USA; 17University of Texas Health Science Center at San Antonio, San Antonio, TX, USA; 18Hematology Research Center, Department of Immunology and In
ammation, Imperial College London, London, UK; 19Division of Hematological Malignancy and Cellular Therapeutics, University of Kansas Health System, Kansas City, KS, USA; 20MPN Program, Princess Margaret Cancer Center, University of Toronto, Toronto, ON, Canada; 21Department of Hematologic Oncology and Blood Disorders, Levine Cancer Institute, Atrium Health, Charlotte, NC, USA; 22St. Vincent Hospital, Darlinghurst, New South Wales, Australia; 23Markey Cancer Center, University of Kentucky, Lexington, KY, USA; 24Division of Hematopoietic Stem Cell Transplantation, National Cancer Center, Tokyo, Japan; 25John Hopkins University School of Medicine, Baltimore, MD, USA; 26University of Alabama at Birmingham, Birmingham, AL, USA; 27University of Minnesota Blood and Marrow Transplant Program – Adults, Minneapolis, MN, USA; 28Cleveland Clinic Taussig Cancer Institute, Cleveland Clinic, Cleveland, OH, USA; 29Kansas City VA Medical Center, Kansas City, MO, USA; 30University Hospitals Cleveland Medical Center, Case Western Reserve University, Cleveland, OH, USA; 31Division of Hematology and Transplant Center, Mayo Clinic Rochester, Rochester, MN, USA; 32Division of Hematology-Oncology, Blood and Marrow Transplantation Program, Mayo Clinic, Jacksonville, FL; 33Section of Bone Marrow Transplant and Cell Therapy, Rush University Medical Center, Chicago, IL, USA;
34Department of Blood and Marrow Transplant and Cellular Immunotherapy (BMT CI), Moffitt Cancer Center, Tampa, FL, USA; 35Vall d’Hebron University Hospital, Barcelona, Spain; 36Blood and Marrow Transplant Program, Huntsman Cancer Institute, University of Utah, Salt Lake City, UT, USA;
37Department of Internal Medicine, Division of Hematology, GROW School for Oncology and Developmental Biology, Masstricht University Medical Center, Maastricht, the Netherlands; 38Division of Hematologic Malignancies and Cellular Therapy, Duke University, Durham, NC, USA; 39Division of Hematology/Oncology, Department of Medicine, Vanderbilt University Medical Center, Nashville, TN, USA; 40Department of Hematology and Oncology, Dokkyo Medical University, Tochigo, Japan; 41The Blood and Marrow Transplant Group of Georgia, Northside Hospital, Atlanta, GA, USA; 42Department of Hematology/Oncology, Isala, Clinic, Zwolle, the Netherlands; 43Bone Marrow Transplant Program, Penn State Cancer Institute, Hershey, PA, USA; 44Transplantation and Cellular Therapy Program, Division of Hematology/Oncology, Department of Medicine, Greenebaum Comprehensive Cancer Center, University of Maryland, Baltimore, MD, USA; 45Department of Hematology and Hematopoietic Cell Transplantation, City of Hope, Duarte, CA, USA; 46Department of Stem Cell Transplantation, Division of Cancer Medicine, The University of Texas MD Anderson Cancer Center, Houston, TX, USA and 47Fred Hutchinson Cancer Research Center, Seattle, WA, USA
Correspondence: G.S. Guru Murthy gmurthy@mcw.edu
Received: September 6, 2022.
Accepted: February 1, 2023.
Early view: February 9, 2023.
https://doi.org/10.3324/haematol.2022.281958
©2023 Ferrata Storti Foundation
Published under a CC BY-NC license
fl
| 108 July 2023 1900 ARTICLE
Myeloproliferative
Haematologica
-
Disorders
Abstract
Allogeneic hematopoietic cell transplantation (allo-HCT) remains the only curative treatment for myelofibrosis. However, the optimal conditioning regimen either with reduced-intensity conditioning (RIC) or myeloablative conditioning (MAC) is not well known. Using the Center for International Blood and Marrow Transplant Research database, we identified adults aged ≥18 years with myelofibrosis undergoing allo-HCT between 2008-2019 and analyzed the outcomes separately in the RIC and MAC cohorts based on the conditioning regimens used. Among 872 eligible patients, 493 underwent allo-HCT using RIC (fludarabine/busulfan n=166, fludarabine/melphalan n=327) and 379 using MAC (fludarabine/busulfan n=247, busulfan/cyclophosphamide n=132). In multivariable analysis with RIC, fludarabine/melphalan was associated with inferior overall survival (hazard ratio [HR]=1.80; 95% confidenec interval [CI]: 1.15-2.81; P=0.009), higher early non-relapse mortality (HR=1.81; 95% CI: 1.12-2.91; P=0.01) and higher acute graft-versus-host disease (GvHD) (grade 2-4 HR=1.45; 95% CI: 1.03-2.03; P=0.03; grade 3-4 HR=2.21; 95%CI: 1.28-3.83; P=0.004) compared to fludarabine/busulfan. In the MAC setting, busulfan/cyclophosphamide was associated with a higher acute GvHD (grade 2-4 HR=2.33; 95% CI: 1.67-3.25; P<0.001; grade 3-4 HR=2.31; 95% CI: 1.52-3.52; P<0.001) and inferior GvHD-free relapse-free survival (GRFS) (HR=1.94; 95% CI: 1.49-2.53; P<0.001) as compared to fludarabine/busulfan. Hence, our study suggests that fludarabine/busulfan is associated with better outcomes in RIC (better overall survival, lower early non-relapse mortality, lower acute GvHD) and MAC (lower acute GvHD and better GRFS) in myelofibrosis.
Introduction
Myelofibrosis is a chronic myeloproliferative neoplasm arising either de novo (primary) or secondary to antecedent essential thrombocytosis or polycythemia vera. Despite the recent advances in disease biology and treatment options such as Janus activating kinase (JAK) inhibitors, allogeneic hematopoietic cell transplantation (allo-HCT) remains the only potentially curative option.1-3 The availability of reduced intensity conditioning (RIC) and the choice of donors have expanded the scope of allo-HCT for these patients who are often older adults.4 While several factors influence outcomes of allo-HCT, conditioning intensity and conditioning regimen are aspects that could be tailored to improve the outcomes. Currently, both myeloablative conditioning (MAC) and RIC platforms are available for allo-HCT in myelofibrosis.5-12 A large study from the European Group for Blood and Marrow Transplant (EBMT) compared the outcomes of allo-HCT with RIC versus MAC in myelofibrosis and demonstrated comparable results with both approaches, but better graft-versus-host disease (GvHD)-free -and relapse-free survival (GRFS) with MAC.9 However, the optimal conditioning regimen either with RIC or MAC is not well known. While some studies have previously compared different RIC regimens with varying results,10-12 similar comparative studies with MAC are lacking and no studies have demonstrated a survival difference based on the conditioning regimen. Hence, we sought to determine the outcomes of allo-HCT for myelofibrosis based on the choice of the conditioning regimen, separately with RIC and MAC.
Methods
Study objective
Our objectives were to compare the overall survival, dis-
ease-free survival, non-relapse mortality, relapse, incidence of acute GvHD, chronic GvHD and GRFS based on the choice of the conditioning regimen used with RIC or MAC.
Data source
CIBMTR is a combined research program of the Medical College of Wisconsin and the National Marrow Donor Program. It comprises a voluntary network of more than 450 transplantation centers worldwide that contribute data on consecutive allo-HCT to a centralized statistical center.13 Observational studies conducted by the CIBMTR are performed in compliance with all applicable federal regulations pertaining to the protection of human research participants. Patients provided written informed consent for research. The Institutional Review Boards of the Medical College of Wisconsin and the National Marrow Donor Program approved this study.
Study population
Adults aged ≥18 years with a diagnosis of myelofibrosis (chronic phase) who underwent allo-HCT between the period 2008-2019 and data reported to the CIBMTR were identified. The cohort was then selected to focus on the most common conditioning regimens used in RIC (fludarabine/busulfan vs fludarabine/melphalan] and MAC (fludarabine/busulfan vs. busulfan/cyclophosphamide] setting (Online Supplementary Figure S1). Conditioning regimens were classified in the CIBMTR dataset based on prior published data.14,15 The donor groups included matched related donors, eight of eight (HLA-A, -B, -C and -DRB1) matched unrelated donors and seven of eight matched unrelated donors. Key exclusion criteria were allo-HCT from haploidentical donor, syngeneic donor, cord blood, and ex vivo Tcell depleted or CD34 selected grafts. In addition, 51 patients in fludarabine/busulfan MAC group who received
Haematologica | 108 July 2023 1901 ARTICLE - Conditioning regimen in myelofibrosis G.S. Guru Murthy et al.
post-transplant cyclophosphamide (post-Cy) were excluded as there were no such corresponding patients in busulfan/cyclophosphamide MAC group.
Statistical analysis
Baseline characteristics were summarized using descriptive statistics with median and range for continuous variables and proportions for categorical variables. Outcomes were compared separately in RIC and MAC cohorts based on the conditioning regimens. Definitions of the outcomes are provided in the Online Supplementary Appendix. Cumulative incidence estimates were calculated for competing risks outcomes including acute GvHD, chronic GvHD, non-relapse mortality, and relapse. Kaplan-Meier method was used to estimate the probabilities for survival. In order to evaluate for other relevant factors that could influence the outcomes, multivariable Cox regression analysis was used (see below for the variables included). The proportional hazards assumption was examined and covariates that violate the proportional hazards assumption were added as time-dependent covariates. In the absence of binary endpoints, hazard ratio (HR) and confidence limits were reported. A pairwise comparison within the non-reference groups was also performed in multivariable models to demonstrate their effect and shown as contrasts. Variables included in multivariable analysis were age, race/ethnicity, disease subtype (primary vs. post essential thrombocythemia [ET] or polycythemia vera [PV]), dynamic international performance scoring system (DIPSS) score, hematopoietic cell transplantation comorbidity index (HCT-CI), Karnofsky performance scale (KPS), systemic symptoms, splenic radiation, splenomegaly, interval from diagnosis to alloHCT, ruxolitinib use pretransplant, donor-recipient HLAmatch, sex match, cytomegalovirus (CMV) match, stem cell source, GvHD prophylaxis (tacrolimus based vs. cyclosporine based vs. post-Cy vs. others), use of antithymocyte globulin (ATG)/alemtuzumab, and year of transplant. A stepwise selection method was used to identify the final model with a significance level of 0.05 and only variables reaching that statistical significance were shown. In addition, adjusted univariate estimates were provided for outcomes that were signifi cantly associated with conditioning regimen. Fine and Gray model was used for analysis of non-relapse mortality, GvHD and relapse.16 Center effect was tested using the score test proposed by Commenges and Andersen and marginal Cox models were used for further adjustments.17 Center effect was noted to be significant only for chronic GvHD and was adjusted accordingly. Missing category was included in the models as one group to avoid loss of data and power.18 All analyses were performed at a two-sided significance level of 0.05 using SAS 9.4 (SAS Institute, Cary, NC).
Results
Baseline characteristics
Of 872 eligible patients, 493 underwent allo-HCT using RIC (fludarabine/busulfan n=166, fludarabine/melphalan n=327) and 379 using MAC (fludarabine/busulfan n=247, busulfan/cyclophosphamide n=132). Key baseline characteristics of the patients are summarized (Table 1; Online Supplementary Tables S1 and S2; unadjusted univariate estimates in Online Supplementary Tables S3 and S4). In the RIC cohort, compared to fludarabine/busulfan patients, fludarabine/melphalan patients had longer median interval from diagnosis to allo-HCT (37 vs. 22 months, P=0.02), lower proportion with antithymocyte globulin/alemtuzumab use (25% vs . 52%, P<0.01), and higher proportion with pretransplant ruxolitinib use (61% vs. 49%, P=0.03). In the MAC cohort, compared to fludarabine/busulfan patients, busulfan/cyclophosphamide patients had younger age (median age 55 vs. 60 years, P<0.01), higher proportion with low-intermediate risk disease (61% vs. 54%, P=0.03), higher proportion with bone marrow graft (12% vs. 4%, P<0.01), lower proportion with antithymocyte globulin/alemtuzumab use (5% vs. 45%, P<0.01), and lower proportion with pretransplant ruxolitinib use (43% vs. 59%, P<0.01). Median follow-up of the cohort was 26 (range, 3-150) months.
Overall survival
In multivariable analysis (Table 2), overall survival in the RIC setting was significantly worse with fludarabine/melphalan (HR=1.80; 95% CI: 1.15-2.81; P=0.009, 2-year adjusted overall survival 54.4% vs. 60.9%) as compared to fludarabine/busulfan (Figure 1). In the MAC setting, overall survival was not significantly different between based on the conditioning regimen (busulfan/cyclophosphamide HR=1.14; 95% CI: 0.75-1.71; P=0.54) (Figure 2). Other factors significantly associated with overall survival were donorrecipient HLA match (higher risk with unrelated donors in the MAC setting) and the use of antithymocyte globulin/alemtuzumab (higher risk in the RIC setting) (Online Supplementary Tables S5 and S6).
Disease-free survival
In multivariable analysis (Table 2), disease-free survival was not significantly different based on the conditioning regimen used in RIC (fludarabine/melphalan HR=1.03; 95% CI: 0.77-1.38; P=0.85) or MAC (busulfan/cyclophosphamide HR=1.03; 95% CI: 0.77-1.38; P=0.83) settings (Online Supplementary Figures S2 and S3). Other factors significantly associated with disease-free survival were Karnofsky performance status (higher risk with lower score in MAC) and pretransplant ruxolitinib use (higher risk in MAC) (Online Supplementary Tables S5 and S6).
Haematologica | 108 July 2023 1902 ARTICLE - Conditioning regimen in myelofibrosis G.S. Guru Murthy et al.
Table 1. Key baseline characteristics.
*P<0.05 significant. Flu: fludarabine; Bu: busulfan; Mel: melphalan; Cy: cyclophosphamide; ET: essential thrombocytosis; PV: polycythemia vera; HCT: hematopoietic cell transplantation; DIPSS: dynamic international prognostic scoring system; ATG: antithymocyte globulin.
Non-relapse mortality
In the RIC setting, there was a significantly higher risk of early non-relapse mortality with fludarabine/melphalan as compared to fludarabine/busulfan (17.4% vs. 4.3%, HR=1.81; 95% CI: 1.12-2.91; P=0.01). Beyond 6 months the risk of nonrelapse mortality was low with fludarabine/melphalan (HR=0.46; 95% CI: 0.23-0.91; P=0.02) (Table 2; Online Supplementary Figure S4) (cut-off of 6 months was chosen due to non-proportional hazard). No significant differences in non-relapse mortality were seen with the MAC-based on the conditioning regimens (busulfan/cyclophosphamide HR=1.36; 95% CI: 0.83-2.21; P=0.22) (Online Supplementary Figure S5). The other factor significantly associated with non-relapse mortality was donor-recipient HLA-match (higher risk with unrelated donors in MAC) (Online Supplementary Tables S5 and S6).
Relapse
The risk of relapse was not significantly different based on the conditioning regimen used in RIC or MAC (RIC - fludarabine/melphalan HR=0.85; 95% CI: 0.64-1.12; P=0.25; MAC - busulfan/cyclophosphamide HR=0.92; 95% CI: 0.64-1.32;
P=0.65) (Online Supplementary Figures S6 and S7; Online Supplementary Tables S5 and S6). Other factors significantly associated with relapse were Karnofsky performance status (higher risk with poor score in MAC), pretransplant ruxolitinib use (higher risk in MAC) and year of transplant (higher risk with recent period in RIC).
Graft-versus-host disease
In the RIC setting, fludarabine/melphalan was associated with a significantly higher risk of acute GvHD grade 2-4 (fludarabine/melphalan 40%, fludarabine/busulfan 35.3%, HR=1.45; 95% CI: 1.03-2.03; P=0.03) and grade 3-4 (fludarabine/melphalan 21.8%, fludarabine/busulfan 12.1%, HR=2.21; 95% CI: 1.28-3.83; P=0.004) (Online Supplementary Figures S8 and S9). In the MAC setting, busulfan/cyclophosphamide was associated with a significantly higher risk of acute GvHD grade 2-4 (busulfan/cyclophosphamide 58.9%, fludarabine/busulfan 34.4%; HR=2.33; 95% CI: 1.67-3.25; P<0.001) and grade 3-4 (busulfan/cyclophosphamide 32.6%, fludarabine/busulfan 11.9%; HR=2.31; 95% CI: 1.523.52; P<0.001) (Online Supplementary Figures S10 and S11).
Chronic GvHD was significantly associated with donor-re-
Characteristic Reduced intensity conditioning Myeloablative conditioning Flu/Bu (N=166) Flu/Mel (N=327) P Flu/Bu (N=247) Bu/Cy (N=132) P Age in years, median (range) 63 (44-75) 63 (38-78) 0.88 60 (27-74) 55 (24-67) <0.01* Disease type, N (%) Primary Post ET Post PV 132 (80) 14 (8) 20 (12) 242 (74) 45 (14) 40 (12) 0.22 191 (77) 20 (8) 36 (15) 100 (76) 13 (10) 19 (14) 0.85 Median time from diagnosis to HCT in months (range) 22 (3-393) 37 (3-594) 0.02* 25 (2-490) 38 (3-377) 0.41 DIPSS Score, N (%) Low/intermediate-1 Intermediate-2/high Missing 71 (43) 69 (42) 26 (16) 107 (33) 168 (51) 52 (16) 0.07 134 (54) 93 (38) 20 (8) 80 (61) 34 (26) 18 (14) 0.03* Donor type, N (%) HLA-identical sibling 8/8-matched unrelated 7/8 matched unrelated 48 (29) 107 (64) 11 (7) 94 (29) 205 (63) 28 (9) 0.75 79 (32) 142 (57) 26 (11) 53 (40) 62 (47) 17 (13) 0.15 ATG/alemtuzumab use, N (%) No Yes 79 (48) 87 (52) 246 (75) 81 (25) <0.01* 135 (55) 112 (45) 125 (95) 7 (5) <0.01* Graft type, N (%) Bone marrow Peripheral blood 6 (4) 160 (96) 13 (4) 314 (96) 0.84 11 (4) 236 (96) 16 (12) 116 (88) <0.01* Pretransplant ruxolitinib, N (%) No Yes Missing 84 (51) 82 (49) 0 125 (38) 201 (61) 1 0.03* 101 (41) 146 (59) 0 75 (57) 57 (43) 0 <0.01*
Haematologica | 108 July 2023 1903 ARTICLE - Conditioning regimen in myelofibrosis G.S. Guru Murthy et al.
Table 2. Multivariable analysis of outcomes based on conditioning regimen.
*P<0.05 significant; **outcomes separated by time points due to non-proportional hazard. Flu: fludarabine; Bu: busulfan; Mel: melphalan; Cy: cyclophosphamide; NRM: non-relapse mortality; GvHD: graft-versus-host disease; GRFS: GvHD-free relapse-free survival.
cipient HLA-match (higher risk with 7/8 matched unrelated donors in RIC) and pretransplant ruxolitinib use (lower risk in MAC), but not by the conditioning regimen (Online Supplementary Tables S5 and S6).
Graft-versus-host disease-free relapse-free survival
In the RIC setting, GRFS was not significantly different be-
tween fludarabine/busulfan and fludarabine/melphalan (HR=1.11; 95% CI: 0.90-1.35; P=0.32) (Online Supplementary Figure S12). However, in the MAC setting, busulfan/cyclophosphamide was associated with significantly inferior GRFS (HR=1.94; 95% CI: 1.49-2.53; P<0.01) (2-year adjusted probability 5.1% vs. 19.4%) as compared to fludarabine/busulfan (Table 2; Figure 3). Other factors significantly associ-
Reduced intensity conditioning Myeloablative conditioning Outcome HR 95% CI P Outcome HR 95% CI P Overall survival** ≤6 months Flu/Bu Flu/Mel >6 months Flu/Bu Flu/Mel 1.00 1.80 1.00 0.82 Ref. 1.15-2.81 Ref. 0.53-1.26 0.009* 0.35 Overall survival Flu/Bu Bu/Cy 1.00 1.14 Ref. 0.75-1.71 0.54 Disease-free survival** ≤6 months Flu/Bu Flu/Mel >6 months Flu/Bu Flu/Mel 1.00 1.03 1.00 0.95 Ref. 0.77-1.38 Ref. 0.68-1.34 0.85 0.76 Disease-free survival Flu/Bu Bu/Cy 1.00 1.03 Ref. 0.77-1.38 0.83 NRM** ≤6 months Flu/Bu Flu/Mel >6 months Flu/Bu Flu/Mel 1.00 1.81 1.00 0.46 Ref. 1.12-2.91 Ref. 0.23-0.91 0.01* 0.02* NRM Flu/Bu Bu/Cy 1.00 1.36 Ref. 0.83-2.21 0.22 Relapse Flu/Bu Flu/Mel 1.00 0.85 Ref. 0.64-1.12 0.25 Relapse Flu/Bu Bu/Cy 1.00 0.92 Ref. 0.64-1.32 0.65 Acute GvHD grade 2-4** ≤2 months Flu/Bu Flu/Mel >2 months Flu/Bu Flu/Mel 1.00 1.45 1.00 0.71 Ref. 1.03-2.03 Ref. 0.43-1.17 0.03* 0.18 Acute GvHD grade 2-4** ≤2 months Flu/Bu Bu/Cy >2 months Flu/Bu Bu/Cy 1.00 2.33 1.00 0.88 Ref. 1.67-3.25 Ref. 0.46-1.68 <0.001* 0.69 Acute GvHD grade 3-4** ≤2 months Flu/Bu Flu/Mel >2 months Flu/Bu Flu/Mel 1.00 2.21 1.00 0.89 Ref. 1.28-3.83 Ref. 0.64-1.24 0.004* 0.48 Acute GvHD grade 3-4 Flu/Bu Bu/Cy 1.00 2.31 Ref. 1.52-3.52 <0.001* Chronic GvHD Flu/Bu Flu/Mel 1.00 0.91 Ref. 0.67-1.25 0.55 Chronic GvHD Flu/Bu Bu/Cy 1.00 1.21 Ref. 0.80-1.84 0.36 GRFS Flu/Bu Flu/Mel 1.00 1.11 Ref. 0.90-1.35 0.32 GRFS Flu/Bu Bu/Cy 1.00 1.94 Ref. 1.49-2.53 <0.001*
Haematologica | 108 July 2023 1904 ARTICLE - Conditioning regimen in myelofibrosis G.S. Guru Murthy et al.
ated with GRFS included recipient age (in MAC) and donorrecipient HLA-match (higher risk with unrelated donors in MAC) (Online Supplementary Tables S5 and S6).
Engraftment
The rates of neutrophil engraftment (30 days) were significantly better with fludarabine/busulfan in RIC (fludarabine/busulfan 95.1% vs. fludarabine/melphalan 92.4%; P=0.006) and MAC (fludarabine/busulfan 95.2% vs. busulfan/cyclophosphamide 87.2%; P=0.02). The rate of platelet engraftment (100 days) was better with fludarabine/busulfan in the RIC setting (RIC - fludarabine/busulfan 84.4% vs. fludarabine/melphalan 73.9%; P<0.001; MACfludarabine/busulfan 86.1% vs. busulfan/cyclophosphamide 83.7%; P=0.27).
Additional analyses
In the RIC cohort, we investigated whether the outcomes differed based on the dose of melphalan (100 vs. 140 mg/m2) used in fludarabine/melphalan group. As shown in the Online Supplementary Table S7, the outcomes did not significantly vary based on the dose of melphalan (shown as contrasts between melphalan 100 vs. 140 mg/m2).
Discussion
Our study highlights the significant differences in outcomes of allo-HCT for myelofibrosis based on the choice of the conditioning regimen. Fludarabine/busulfan conditioning was associated with superior overall survival, lower early non-relapse mortality and lower acute GvHD (all with RIC), and lower acute GvHD and superior GRFS with MAC. A key aspect of conditioning strategy is its ability be tailored in

order to improve the outcomes. Events such as non-relapse mortality and GvHD that affect the morbidity and mortality after allo-HCT could be influenced by the conditioning strategy and efforts to minimize these complications are vital to improve the long-term success. Although RIC and MAC platforms are clinically decided based on factors such as age, comorbidities, performance status, and other aspects that are often not modifiable, our results illustrate the influence of common conditioning regimens used in these settings and provides valuable information for choosing the appropriate regimen in clinical practice. Prior retrospective studies have evaluated the impact of conditioning intensity and regimen in myelofibrosis, albeit with variable results and certain key differences compared to our study.5-12 A study by Robin et al. included 160 patients with myelofibrosis from two European centers (Paris [fludarabine/busulfan] or Hamburg [fludarabine/melphalan]), but with antithymocyte globulin given for all patients who received fludarabine/busulfan conditioning.11 Another CIBMTR study by Gupta et al. included only patients with primary myelofibrosis and RIC (fludarabine/TBI vs. fludarabine/melphalan vs. fludarabine/busulfan) between 19972010 with a relatively younger patient population (median age 55 years).10 Hence, the differences in the study population, the nature of the cohort (registry- vs. individual center-based), treatment received and variations in time period included could have contributed to the differences in results noted between the current study and prior studies. To date, prospective studies of conditioning regimen in myelofibrosis are single-arm or comparative studies with smaller sample size.19,20,21 For example, a phase II study by Patriarca et al. prospectively compared fludarabine/busulfan and fludarabine/thiotepa for allo-HCT in 60 patients with myelofibrosis and showed similar outcomes
 Figure 1. Overall survival with reduced-intensity conditioning. RIC: reduced-intensity conditioning; Flu: fludarabine; Bu: busulfan; Mel: melphalan.
Haematologica | 108 July 2023 1905 ARTICLE - Conditioning regimen in myelofibrosis G.S. Guru Murthy et al.
Figure 2. Overall survival with myeloablative conditioning. MAC: myeloablative conditioning; Flu: fludarabine; Bu: busulfan; Mel: melphalan.
with both these regimens.21 Hence, our study addresses the knowledge gap in this area using a larger dataset with a comparison of commonly reported conditioning regimens. Unfortunately, due to the limited number of patients receiving other less common conditioning regimens such as fludarabine/thiotepa, these regimens could not be compared in our study. Additionally, given the results of a large EBMT study showing no difference in overall survival between MAC and RIC,9 we did not compare the outcomes of MAC versus RIC in our analysis which also helped to minimize the heterogeneity in comparisons. Apart from the conditioning regimen, factors such as donor-recipient HLA-match, performance status and use of antithymocyte globulin/alemtuzumab influenced the outcomes similar to prior studies. The imbalances in baseline characteristics were adjusted in multivariable models and there were no significant interactions noted between the baseline characteristics and main effect (conditioning regimen). Antithymocyte globulin/alemtuzumab was associated with worse overall survival in RIC and was more commonly used with fludarabine/busulfan regimens. Despite this, an early survival advantage was noted with fludarabine/busulfan in RIC. The association between the outcomes and factors such as the route of busulfan administration (oral vs. intravenous, targeted vs. non-targeted; data not shown) and the dose of melphalan (in RIC) were also investigated and none was found. In MAC, ruxolitinib prior to allo-HCT was associated with higher risk of relapse, inferior disease-free survival, higher risk of acute GvHD and lower risk of chronic GvHD. Although prior studies indicate the feasibility and safety of ruxolitinib therapy prior to alloHCT,22,23 we could not evaluate the possible mechanisms behind these differences due to limited information on the
duration, dose, response, and other aspects of ruxolitinib therapy. Other factors such as the role of splenectomy, spleen size or splenic radiation therapy and their association with outcomes could not be evaluated due to the small number of patients with those interventions. Despite the large sample size, our study is limited by the retrospective design and lack in-depth information on factors such as genomic mutations and therapies for myelofibrosis given pre- and post-allo-HCT that could affect the outcomes.24,25 The lack of detailed information on genomic mutations precluded further analyses and calculation of molecular risk scores (such as MIPSS70, MYSEC-PM etc.). For example, a study by Gagelman et al. investigated the prognostic significance of somatic mutations in myelofibrosis patients undergoing allo-HCT and identified that ASXL1 and non-CALR/MPL driver mutations were associated with poor outcomes. This study also established a prognostic model with variables such as patient age, performance status, white blood count, platelet count, HLAmismatched donor and molecular mutations. However, due to the lack of information on these aspects, we could not apply this scoring system in our study.24 We also could not assess the reasons behind the choice of individual conditioning regimens used for these patients, understanding that centers could have their preferences while choosing conditioning regimens. However, we evaluated for centereffects in multivariable analyses and adjustments were made accordingly. As our study mainly focused on patients with chronic phase myelofibrosis, the role of conditioning strategy in advanced-phase disease (accelerated/blast phase) was not evaluated. Due to the nature of the GvHD reporting in the dataset, chronic GvHD was analyzed as a whole outcome without further stratification (mild, moderate, severe).
Our study demonstrates that fludarabine/busulfan-based conditioning is associated with superior overall survival, lower early non-relapse mortality, and lower acute GvHD with RIC and lower acute GvHD and superior GRFS with MAC. The results provide valuable information for tailoring the conditioning strategies to minimize non-relapse mortality and GvHD and improve survival. Prospective comparative studies are warranted to confirm these results and identify the ideal conditioning regimen in myelofibrosis.

Disclosures
GSGM reports the following all outside the submitted work: honoraria from Cardinal Health, DAVA Oncology and Curio science; advisory board membership of TG Therapeutics, consultancy for Gilead, Cancerexpert now, Qessential and Techspert. AA reports research funding from Incyte Corporation. TB reports honorarium from Pfizer Hematology and Oncology. JC reports participation on a Data Safety Monitoring Board for Allovir, Inc.; financial relationships with Actinium Pharmaceuticals, Bluebird Bio Inc ., Dynavax Pharma,
Haematologica | 108 July 2023 1906 ARTICLE - Conditioning regimen in myelofibrosis G.S. Guru Murthy et al.
Figure 3. Graft-versus-host-disease-free relapse-free survival with myeloablative conditioning. MAC: myeloablative conditioning; CY: cyclophosphamide; GvHD: graft-versus-host disease; Flu: fludarabine; Bu: busulfan; Mel: melphalan.
Atyr Pharmac, Gamida Cell, Miragen Therapeutics, Mustang Bio, Novavax, Ovid Therapeutics, Sorrento Therapeutics, TG Therapeutics, Vaxart Inc, and Veru Inc., outside the submitted work. BD reports institutional research funding with Takeda, Janssen, Angiocrine, Pfizer, Poseida, MEI, Sorrento; consultancy with Jazz, Celgene, and Gamida Cell. SG reports financial relationships as speaker with Seattle Genetics and KITE Pharma; and advisory board member with Kadmon, BMS, Sanofi, Astrazeneca, Kite, Daiichi Sankyo and Astellas. VG reports consultancy work for Novartis, Incyte, BMS-Celgene, Sierra Oncology, Morphosys, Pfizer, and Takeda, and received research grant through institution from Novartis and Incyte. MRG reports having worked as a PI with multiple pharmaceutical sponsors and as both consultant and PI for Incyte (manufacturer of ruxolitinib). NH reports as advisory board member of Novartis. TJ reports honoraria for advisory board participation for Care Dx. Bristol Myers Squibb, and Incyte; honoraria for lecture at APP Oncology Summit. TN reports research support (clinical trial support) to the institution by Novartis; research support (drug supply only) to the institution for clinical trial by Karyopharm. GO reports financial relationships with Incyte (grant), BMS (personal fees), Incyte (personal fees), Novartis (personal fees), and Pfizer (personal fees). RM reports research support and stock ownership with Incyte. DRA reports as a consultant and on speaker bureau for Incyte (makers of ruxolitinib used for treatment).
Contributions
GM, WS, SK and NE conceived and designed the study, collected and assembled the data, and wrote the manuscript. All authors performed data analysis and interpretation of data; and GM, WS and SK provided final approval of the manuscript. GM and WS had full access to all the data in the study and takes responsibility for the integrity of the data and the accuracy of the data analysis. The views expressed in this article do not reflect the official policy or position of the NIH, the Department of the Navy, the Department of Defense, the HRSA, or any other agency of the US Government.
Funding
The CIBMTR is supported primarily by Public Health Service
References
1. Tefferi A. Primary myelofibrosis: 2021 update on diagnosis, riskstratification and management. Am J Hematol. 2021;96(1):145-162.
2. Tefferi A, Pardanani A. Myeloproliferative neoplasms: a contemporary eview. JAMA Oncol. 2015;1(1):97-105.
3. Harrison C, Kiladjian JJ, Al-Ali HK, et al. JAK inhibition with ruxolitinib versus best available therapy for myelofibrosis. N Engl J Med. 2012;366(9):787-798.
U24CA076518 from the National Cancer Institute (NCI), the National Heart, Lung and Blood Institute (NHLBI) and the National Institute of Allergy and Infectious Diseases (NIAID); HHSH250201700006C from the Health Resources and Services Administration (HRSA); and N00014-20-1-2705 and N00014-20-1-2832 from the Office of Naval Research; support is also provided by Be the Match Foundation, the Medical College of Wisconsin, the National Marrow Donor Program, and from the following commercial entities: AbbVie; Accenture; Actinium Pharmaceuticals, Inc.; Adaptive Biotechnologies Corporation; Adienne SA; Allovir, Inc.; Amgen, Inc.; Astellas Pharma US; bluebird bio, inc.; Bristol Myers Squibb Co.; CareDx; CSL Behring; CytoSen Therapeutics, Inc.; Daiichi Sankyo Co., Ltd.; Eurofins Viracor, DBA Eurofins Transplant Diagnostics; Fate Therapeutics; Gamida-Cell, Ltd.; Gilead; GlaxoSmithKline; HistoGenetics; Incyte Corporation; Iovance; Janssen Research & Development, LLC; Janssen/Johnson & Johnson; Jasper Therapeutics; Jazz Pharmaceuticals, Inc.; Kadmon; Karius; Karyopharm Therapeutics; Kiadis Pharma; Kite Pharma Inc; Kite, a Gilead Company; Kyowa Kirin International plc; Kyowa Kirin; Legend Biotech; Magenta Therapeutics; Medac GmbH; Medexus; Merck & Co.; Millennium, the Takeda Oncology Co.; Miltenyi Biotec, Inc.; MorphoSys; Novartis Pharmaceuticals Corporation; Omeros Corporation; OncoImmune, Inc.; Oncopeptides, Inc.; OptumHealth; Orca Biosystems, Inc.; Ossium Health, Inc; Pfizer, Inc.; Pharmacyclics, LLC; Priothera; Sanofi Genzyme; Seagen, Inc.; Stemcyte; Takeda Pharmaceuticals; Talaris Therapeutics; Terumo Blood and Cell Technologies; TG Therapeutics; Tscan; Vertex; Vor Biopharma; Xenikos BV. The funding organizations had no role in the design and conduct of the study; collection, management, analysis, and interpretation of the data; preparation, review, or approval of the manuscript; and decision to submit the manuscript for publication.
Data-sharing statement
CIBMTR supports accessibility of research in accord with the National Institutes of Health (NIH) data-sharing policy and the National Cancer Institute (NCI) Cancer Moonshot public access and data-sharing policy. The CIBMTR only releases de-identified datasets that comply with all relevant global regulations regarding privacy and confidentiality.
4. Phelan R, Arora M, Chen M. Current use and outcome of hematopoietic stem cell transplantation: CIBMTR US summary slides, 2020.
5. Hernández-Boluda JC, Pereira A, Kröger N, et al. Determinants of survival in myelofibrosis patients undergoing allogeneic hematopoietic cell transplantation. Leukemia. 2021;35(1):215-224.
6. Robin M, de Wreede LC, Wolschke C, et al. Long-term outcome
Haematologica | 108 July 2023 1907 ARTICLE - Conditioning regimen in myelofibrosis G.S. Guru Murthy et al.
after allogeneic hematopoietic cell transplantation for myelofibrosis. Haematologica. 2019;104(9):1782-1788.
7. Gowin K, Ballen K, Ahn KW, et al. Survival following allogeneic transplant in patients with myelofibrosis. Blood Adv. 2020;4(9):1965-1973.
8. Ballen KK, Shrestha S, Sobocinski KA, et al. Outcome of transplantation for myelofibrosis. Biol Blood Marrow Transplant. 2010;16(3):358-367.
9. McLornan D, Szydlo R, Koster L, et al. Myeloablative and reduced-intensity conditioned allogeneic hematopoietic stem cell transplantation in myelofibrosis: a retrospective study by the Chronic Malignancies Working Party of the European Society for Blood and Marrow Transplantation. Biol Blood Marrow Transplant. 2019;25(11):2167-2171.
10. Gupta V, Malone AK, Hari PN, et al. Reduced-intensity hematopoietic cell transplantation for patients with primary myelofibrosis: a cohort analysis from the center for international blood and marrow transplant research. Biol Blood Marrow Transplant. 2014;20(1):89-97.
11. Robin M, Porcher R, Wolschke C, et al. Outcome after transplantation according to reduced-intensity conditioning regimen in patients undergoing transplantation for myelofibrosis. Biol Blood Marrow Transplant. 2016;22(7):1206-1211.
12. Jain T, Kunze KL, Temkit M, et al. Comparison of reduced intensity conditioning regimens used in patients undergoing hematopoietic stem cell transplantation for myelofibrosis. Bone Marrow Transplant. 2019;54(2):204-211.
13. Horowitz M. The role of registries in facilitating clinical research in BMT: examples from the Center for International Blood and Marrow Transplant Research. Bone Marrow Transplant. 2008;42(Suppl 1):S1-S2.
14. Bacigalupo A, Ballen K, Rizzo D, et al. Defining the intensity of conditioning regimens: working definitions. Biol Blood Marrow Transplant. 2009;15(12):1628-1633.
15. Giralt S, Ballen K, Rizzo D, et al. Reduced-intensity conditioning regimen workshop: defining the dose spectrum. Report of a workshop convened by the center for international blood and marrow transplant research. Biol Blood Marrow Transplant. 2009;15(3):367-369.
16. Fine JP, Gray RJ. A proportional hazards model for the subdistribution of a competing risk. J Am Stat Assoc.
1999;94:496-509.
17. Commenges D, Andersen PK. Score test of homogeneity for survival data. Lifetime Data Anal. 1995;1(2):145-156.
18. Groenwold RHH, Dekkers OM. Missing data: the impact of what is not there. Eur J Endocrinol. 2020;183(4):E7-E9.
19. Rondelli D, Goldberg JD, Isola L, et al. MPD-RC 101 prospective study of reduced-intensity allogeneic hematopoietic stem cell transplantation in patients with myelofibrosis. Blood. 2014;124(7):1183-1191.
20. Kroger N, Holler E, Kobbe G, et al. Allogeneic stem cell transplantation after reduced-intensity conditioning in patients with myelofibrosis: a prospective, multicenter study of the Chronic Leukemia Working Party of the European Group for Blood and Marrow Transplantation. Blood. 2009;114(26):5264-5270.
21. Patriarca F, Masciulli A, Bacigalupo A, et al. Busulfan- or thiotepa-based conditioning in myelofibrosis: a phase II multicenter randomized study from the GITMO Group. Biol Blood Marrow Transplant. 2019;25(5):932-940.
22. Shanavas M, Popat U, Michaelis LC, et al. Outcomes of allogeneic hematopoietic cell transplantation in patients with myelofibrosis with prior exposure to Janus kinase 1/2 inhibitors. Biol Blood Marrow Transplant. 2016;22(3):432-440.
23. Kröger N, Sbianchi G, Sirait T, et al. Impact of prior JAK-inhibitor therapy with ruxolitinib on outcome after allogeneic hematopoietic stem cell transplantation for myelofibrosis: a study of the CMWP of EBMT. Leukemia. 2021;35(12):3551-3560.
24. Gagelmann N, Ditschkowski M, Bogdanov R, et al. Comprehensive clinical-molecular transplant scoring system for myelofibrosis undergoing stem cell transplantation. Blood. 2019;133(20):2233-2242.
25. Tamari R, Rapaport F, Zhang N, et al. Impact of high-molecularrisk mutations on transplantation outcomes in patients with myelofibrosis. Biol Blood Marrow Transplant. 2019;25(6):1142-1151.
26. Przepiorka D, Weisdorf D, Martin P, et al. 1994 Consensus Conference on Acute GVHD Grading. Bone Marrow Transplant. 1995;15(6):825-828.
27. Sullivan KM, Shulman HM, Storb R, et al. Chronic graft-versushost disease in 52 patients: adverse natural course and successful treatment with combination immunosuppression. Blood. 1981;57(2):267-276.
Haematologica | 108 July 2023 1908 ARTICLE - Conditioning regimen in myelofibrosis G.S. Guru Murthy et al.
Exome sequencing in 116 patients with inherited thrombocytopenia that remained of unknown origin after systematic phenotype-driven diagnostic workup
Correspondence: M. Seri marco.seri@unibo.it
Received: March 4, 2022.
Accepted: August 29, 2022.
1Department of Medical and Surgical Science, University of Bologna, Bologna; 2Department of Internal Medicine, University of Pavia, Pavia; 3Medicina Generale 1, IRCCS Policlinico San Matteo Foundation, Pavia; 4Institute for Maternal and Child Health – IRCCS Burlo Garofolo, Trieste; 5Department of Experimental, Diagnostic and Specialty Medicine, University of Bologna, Bologna; 6UO Genetica Medica, IRCCS Azienda Ospedaliero-Universitaria di Bologna, Bologna and 7Department of Medical Sciences, University of Trieste, Trieste, Italy
*CM and AP contributed equally as co-first authors. #PN and TP contributed equally as co-senior authors.
Abstract
Early view: December 15, 2022.
https://doi.org/10.3324/haematol.2022.280993
©2023 Ferrata Storti Foundation
Published under a CC-BY license
Inherited thrombocytopenias (IT) are genetic diseases characterized by low platelet count, sometimes associated with congenital defects or a predisposition to develop additional conditions. Next-generation sequencing has substantially improved our knowledge of IT, with more than 40 genes identified so far, but obtaining a molecular diagnosis remains a challenge especially for patients with non-syndromic forms, having no clinical or functional phenotypes that raise suspicion about specific genes. We performed exome sequencing (ES) in a cohort of 116 IT patients (89 families), still undiagnosed after a previously validated phenotype-driven diagnostic algorithm including a targeted analysis of suspected genes. ES achieved a diagnostic yield of 36%, with a gain of 16% over the diagnostic algorithm. This can be explained by genetic heterogeneity and unspecific genotype-phenotype relationships that make the simultaneous analysis of all the genes, enabled by ES, the most reasonable strategy. Furthermore, ES disentangled situations that had been puzzling because of atypical inheritance, sex-related effects or false negative laboratory results. Finally, ES-based copy number variant analysis disclosed an unexpectedly high prevalence of RUNX1 deletions, predisposing to hematologic malignancies. Our findings demonstrate that ES, including copy number variant analysis, can substantially contribute to the diagnosis of IT and can solve diagnostic problems that would otherwise remain a challenge.
Introduction
Inherited thrombocytopenias (IT) are a heterogeneous group of disorders characterized by low platelet count that can result in a bleeding tendency of variable degree. In these disorders, thrombocytopenia can be isolated or associated with additional congenital defects; moreover, some cases of IT have a predisposition to develop additional diseases over time, such as hematologic malignancies, bone marrow aplasia and renal failure.1
Until recently, the diagnosis of IT was based on a complex process requiring a multi-step clinical and laboratory characterization of patients and subsequent resequencing of candidate genes.2 The introduction of next-generation sequencing revolutionized the diagnostic approach to these
disorders, allowing the analysis of virtually all known genes at one time by exome sequencing (ES). Moreover, application of next-generation sequencing led to the identification of many novel genes underlying IT. These advances revealed a picture of wide genetic heterogeneity, with at least 40 genes implicated;1 it should, however, be noted that only a few genes account for most of the cases, while most genes explain less than 2% cases each.3 In spite of the recent progress, almost half of patients with familial IT still remain without a definite molecular diagnosis,3 which would be of key importance for clinical management and counseling. ES of large numbers of patients, in association with clustering of results according to standardized clinical or functional phenotypes,4,5 has proven effective in the description of novel forms of IT and the identification of causative vari-
Caterina Marconi,1* Alessandro Pecci,2,3* Flavia Palombo,1 Federica Melazzini,2,3 Roberta Bottega,4 Elena Nardi,5 Valeria Bozzi,3 Michela Faleschini,4 Serena Barozzi,3 Tania Giangregorio,4 Pamela Magini,6 Carlo L. Balduini,2 Anna Savoia,4,7 Marco Seri,1,6 Patrizia Noris2,3# and Tommaso Pippucci6#
Haematologica | 108 July 2023 1909 ARTICLE - Platelet Biology & its Disorders
ants in known IT genes, thus achieving a molecular diagnosis for a substantial proportion of patients.6-9 However, phenotype-based approaches may be ineffective when thrombocytopenia is non-syndromic, with no additional phenotypes contributing to the patient’s clinical picture, or is not associated with detectable alterations in platelet function.
Here we report the analysis of 116 patients with non-syndromic IT who had remained without a definite molecular diagnosis after an extensive diagnostic workup. We show the power of the ES approach to improve the diagnostic yield over a phenotype-driven diagnostic algorithm and illustrate the reasons that make ES a strategy of choice in the molecular elucidation of these genetically heterogeneous disorders.
Methods
Patients
We recruited 116 patients among probands and available affected relatives from 89 families (Online Supplementary Table S1) with familial thrombocytopenia who remained without a molecular diagnosis after the application of a validated diagnostic algorithm2 including systematic phenotypic investigation and sequencing of candidate genes among the 21 IT genes defined before the beginning of the study (listed in Online Supplementary Table S2). By this approach, 54%of the probands did not have a definite diagnosis, and all those with the availability of DNA samples of suitable quality for ES analysis were enrolled in this study (Online Supplementary Figure S1). Details about the different forms of IT diagnosed through the application of the phenotype-driven diagnostic algorithm are reported in Online Supplementary Table S3. All the cases recruited into the ES analysis presented apparently non-syndromic forms, with no clinical features additional to thrombocytopenia and no specific platelet function alterations.
The study was approved by the Ethics Committee of the IRCCS Policlinico San Matteo Foundation. All investigated individuals or their legal guardians provided written informed consent to participation in the study, which was conducted in accordance with the Declaration of Helsinki. Individual data were completely de-identified.
Exome sequencing
ES was carried out on DNA from whole blood after enrichment and capture with different strategies (Online Supplementary Methods). Sequence data analysis was performed as already described.10
Analysis of known inherited thrombocytopenia genes
We evaluated each patient for small variants and copy number variants (CNV) in 43 genes associated with IT (On-
line Supplementary Table S2), including 21 genes prescreened as part of the diagnostic algorithm and 22 genes found to be associated with IT in recent years (Online Supplementary Table S2).
Single nucleotide variants (SNV) and small insertions/deletions (indels) were selected according to minor allele frequencies and variant consequences, as detailed in the Online Supplementary Methods, and confirmed by Sanger sequencing in probands and available relatives. Variant classification followed the American College of Medical Genetics (ACMG) guidelines11 and the ClinGen Expert curation panel guidelines for RUNX1 variants.12 We evaluated segregation data as recommended by Jarvik and Browning.13 Analysis of runs of homozygosity was carried out on Family.43 with H3M2 to identify large exomic homozygous regions.14 The genomic inbreeding coefficient was calculated as the percentage of the cumulative length of autosomal runs of homozygosity >1.5 Mb over the overall length of the autosomal genome.
Exome alignments were used to call and genotype CNV with Excavator2.15 Deletions encompassing RUNX1 were confirmed by real-time polymerase chain reaction (RTPCR) and chromosomal microarray analysis (CMA) on an Agilent 8x60K platform.
Gene-based rare variant enrichment analysis
With the aim of identifying possible major contributing IT genes, in terms of prevalence, we carried out exome-wide collapsing of rare variants by gene to identify those bearing an excess of qualifying variants in IT probands compared to population-matched, unrelated controls. These included subjects of our exome datasets who were healthy or had genetic disorders with no hematologic involvement.
Qualifying variants were defined as SNV affecting the canonical transcript of protein-coding sequences (non-synonymous and splice-site variants) with a minor allele frequency ≤0.0001 in the ExAC non-Finnish European subpopulation. All 20,345 Gencode v19 protein-coding genes that were well-covered in most samples were considered (see the Online Supplementary Methods for more details). To exclude population stratification among cases and controls, we removed from the analysis: (i) samples with non-European ancestry, based on self-reported information, and (ii) outlier samples from a principal component analysis carried out on genotypes of our samples together with 2,504 samples from the 1000genomes dataset (https://www.internationalgenome.org/).
For each gene under analysis, we modeled the number of subjects with at least one variant as a binomial distribution. We performed a two-proportion pooled test to verify the null hypothesis of equality of proportions of subjects with at least one variant in patients and controls. Multiple testing control was done applying the false discovery rate
Haematologica | 108 July 2023 1910 ARTICLE - Exome sequencing in inherited thrombocytopenias C. Marconi et al.
criterion proposed by Benjamini and Hochberg choosing a false discovery rate of 0.2.16
Variant confirmation by Sanger sequencing was carried out for the top ranking genes with a non-corrected P≤0.0015. Segregation analysis was performed whenever possible.
Results
First, we wanted to identify variants in IT-associated genes that could be defined as disease-contributing following ACMG criteria for establishing variant pathogenicity.
All the 43 known IT-associated genes, except GP1BB, GP9 and MPIG6B, achieved adequate sequence representation with average coverage of 132X (range: 72X-289X) and coverage higher than 20X on an average of 96.2% of targeted bases (range: 83.3% -100%) (Online Supplementary Table S2).
A total of 104 variants fulfi lling selection criteria were identified in 60/89 probands (67%). According to ACMG criteria, 32 variants were classified as benign (B) or likely benign (LB), 40 were variants of uncertain signifi cance (VUS), and 32 were classified as pathogenic (P) or likely pathogenic (LP). Table 1 reports P/LP variants, while Online Supplementary Table S4 lists the VUS and B/LB variants. Online Supplementary Table S6 reports the ACMG criteria applied for the classification of each variant. P/LP variants affected 30 probands and involved 18 genes. Most (75%; 24/32) were heterozygous variants in genes associated with autosomal dominant or autosomal dominant/recessive forms, while the remaining ones were either heterozygous X-linked variants (6%; 2/32) or heterozygous, compound heterozygous and homozygous variants in autosomal recessive genes (19%; 6/32).
The majority of P/LP variants (62%; 20/32) were in genes that would not have been previously analyzed because they were not included in the diagnostic algorithm,2 and that were already described in our previous publications.10,17-24 Conversely, 9/31 P/LP variants (29%) were heterozygous variants in IT-associated genes which should have been considered for analysis (Table 1), but that were overlooked because of erroneous interpretation or execution of the diagnostic algorithm: five variants affected genes that should have been suspected according to the clinical and laboratory findings of the patients (Family.9, CYCS; Family.21, ITGB3 and GP1BA; Family.26 and Family.27, RUNX1) but sequencing analysis was not performed. In four additional cases, laboratory or genetic tests failed to identify the implicated gene (in Family.8 and Family.35 Sanger sequencing missed the variants in ANKRD26 and GP1BA, respectively; in Family.23 the presence of MYH9 protein aggregates in leukocytes was not recognized at the immunofluorescence assay;25 in Family.17 with a vari-
ant in ITGA2B, flow cytometry failed to detect decreased expression of glycoprotein complex IIb-IIIa on the platelet surface26. Moreover, in vitro platelet aggregation in response to collagen, ADP, and arachidonate resulted within the normal range in the proband of this family). Finally, in three cases the identification of the pathogenic variants had been hindered by non-Mendelian inheritance patterns or gender-related effects and only the unbiased (with respect to suspected inheritance) evaluation of qualifying variants in IT-associated genes allowed their recognition.
In one case (Family.43) (Figure 1A) the unreported consanguinity between both parents (II-1 and II-2) and grandparents (I-1 and I-2) of the probands (III-1 and III-2) resulted in a pseudo-dominant inheritance pattern of the ABCG8 c.1234C>T, p.Arg412Ter variant, which was homozygous in II-1, III-1 and III-2 and heterozygous in II-2.
In a second family (Family.41) (Figure 1B), the LP variant WAS c.134C>T, p.Thr45Met on chromosome X, was inherited by two male siblings (IV-1 and IV-3) from their affected mother (III-4). An X-linked inheritance was initially not suspected, due to a phenocopy in the grandfather (II1), who was considered to be affected because of a platelet count slightly below the normal threshold (120x109/L). In this situation, the high variability of platelet counts between the two probands (19 and 22x109/L) and mother (80x109/L) was attributed to other non-genetic factors, while it is most likely associated with the hemizygous versus heterozygous status of the variant. The status of the grandfather, II-1, revised based on the age- and gender-adjusted reference intervals for platelet count,27 was then classified as non-affected. Unfortunately a DNA sample from II-1 was not available; however, the fact that the other daughter, III-3, does not carry the variant indicates that II-1 is not a variant carrier.
In a third case (Family.40) (Figure 1C) we identified the heterozygous c.146delC, p.Pro50Argfs86Ter variant in GATA1, on the X chromosome, in the female proband (II-1). In this pedigree, an X-linked inheritance was not suspected because of a female-to-female transmission (I-2 also affected, but not available for genetic testing). Moreover, mild isolated thrombocytopenia due to GATA1 pathogenic variants (OMIM #300367) has been rarely reported in heterozygous females.28,29
Details about these three last cases are reported in the Online Supplementary Results.
We then reasoned that not all actual disease-contributing variants may be classified as P/LP, either because they are present in IT-associated genes but not fulfilling ACMG guidelines, or because they are in “novel” genes. We thus needed a method to highlight genes that had a significant burden of disease-contributing variants regardless of their P/LP classification. To this end, we performed a genebased rare variant enrichment analysis focused on qual-
Haematologica | 108 July 2023 1911 ARTICLE - Exome sequencing in inherited thrombocytopenias C. Marconi et al.
ifying variants (defined as predicted protein-altering variants with minor allele frequency ≤0.0001 in ExAC nonFinnish Europeans) in 81 unrelated cases and 215 controls of homogeneous Italian ancestry according to principal component analysis. A total of 6,320 genes with at least one qualifying variant in either cases or controls and ful-
lling thresholds for adequate coverage were left for statistical analysis. Only two of the 18 IT-associated genes mutated in this cohort, namely ACTN130 and ETV6, 31,32 attained a study-wide significant excess of qualifying variants in probands (P=0.0001 and P=0.0004, respectively). ACTN1 had nine qualifying variants in cases and one in controls,
fi
Table 1. Pathogenic and likely pathogenic variants identified in the 43 known inherited thrombocytopenia genes.
c.1234C>T ; p.(Arg412Ter) Hom P
Family 81 1 (1/na) GNE NM_001128227.2: c.1768G>A ; p.(Gly590Arg) Hom LP
Family 82 1 (1/na) GNE NM_001128227.2: c.1427G>T ; p.(Arg476Met) Hom LP
Family 50 1 (1/na) GNE NM_001128227.2: c.98A>G ; p.(Glu33Gly) Het LP*
Family 51 4 (2/2) PTPRJ NM_002843.3: c.97-2A>G ; p.? / NM_002843.3: c.1875del ; p.(Ser627AlafsTer8)
Compound Het P/P
In bold, genes not pre-screened in the diagnostic algorithm. *Variants considered not explicative of the phenotype. na: not applicable; Het: heterozygous; Hom: homozygous; P: pathogenic; LP: likely pathogenic.
Haematologica | 108 July 2023 1912
Family N of tested members (affected carriers/healthy carriers) Gene Variant Status Variant Class AUTOSOMAL DOMINANT INHERITANCE Family 1 4 (4/na) ACTN1 NM_001130004.1: c.2305G>A ; p.(Glu769Lys) Het LP Family 2 3 (3/na) ACTN1 NM_001130004.1: c.673G>A ; p.(Glu225Lys) Het LP Family 3 4 (4/na) ACTN1 NM_001130004.1: c.384G>C ; p.(Trp128Cys) Het LP Family 4 3 (3/na) ACTN1 NM_001130004.1: c.136C>T ; p.(Arg46Trp) Het LP Family 5 3 (3/na) ACTN1 NM_001130004.1: c.136C>T ; p.(Arg46Trp) Het LP Family 6 3 (2/0) ACTN1 NM_001130004.1: c.982G>A ; p.(Val328Met) Het LP Family 7 1 (1/0) ACTN1 NM_001130004.1: c.698C>T ; p.(Pro233Leu) Het LP Family 8 2 (2/na) ANKRD26 NM_014915.2: c.-125T>C ; p.? Het LP Family 9 11 (7/0) CYCS NM_018947.5: c.145T>C ; p.(Tyr49His) Het LP Family 11 2 (2/na) ETV6 NM_001987.4: c.641C>T ; p.(Pro214Leu) Het LP Family 12 2 (2/na) ETV6 NM_001987.4: c.1105C>T ; p.(Arg369Trp) Het LP Family 13 2 (2/na) ETV6 NM_001987.4: c.1105C>T ; p.(Arg369Trp) Het LP Family 17 1 (1/na) ITGA2B NM_000419.4: c.3076C>T ; p.(Arg1026Trp) Het LP Family 21 1 (1/na) ITGB3 NM_000212.2: c.1768A>G ; p.(Thr590Ala) Het LP Family 16 5 (4/0) GFI1B NM_004188.6: c.648+5G>A ; p.? Het LP Family 23 4 (4/na) MYH9 NM_002473.5: c.121T>A ; p.(Phe41Ile) Het LP Family 26 1 (1/na) RUNX1 NM_001754.4: c.351+1G>A ; p.? Het LP Family 27 3 (3/na) RUNX1 NM_001754.4: c.578T>A ; p.(Ile193Asn) Het LP Family 28 3 (3/na) SLFN14 NM_001129820.1: c.667C>T ; p.(Arg223Trp) Het LP Family 29 3 (1/0) SRC NM_198291.2: c.1579G>A ; p.(Glu527Lys) Het LP AUTOSOMAL DOMINANT/RECESSIVE INHERITANCE Family 21 1 (1/na) GP1BA NM_000173.6: c.104del ; p.(Lys35ArgfsTer4) Het LP* Family 35 1 (1/na) GP1BA NM_000173.6: c.169A>G ; p.(Asn57Asp) Het LP Family 18 2 (2/na) THPO NM_000460.4: c.91C>T ; p.(Arg31Ter) Het P Family 39 2 (2/na) THPO NM_000460.4: c.91C>T ; p.(Arg31Ter) Het P X-LINKED INHERITANCE Family 40 1 (1/na) GATA1 NM_002049.3:
Het LP Family 41 6 (3/0) WAS NM_000377.2:
Het LP
43 4 (3/1) ABCG8 NM_022437.2:
c.149del ; p.(Pro50ArgfsTer87)
c.134C>T ; p.(Thr45Met)
AUTOSOMAL RECESSIVE INHERITANCE Family
ARTICLE
Exome
C. Marconi et al.
-
sequencing in inherited thrombocytopenias
while ETV6 had six and zero, respectively (Table 2). Almost all ACTN1 and ETV6 alleles, including VUS and B/LB variants, were characterized by Combined Annotation Dependent Depletion (CADD) and Genomic Evolutionary Rate Profiling (GERP) scores as suggestive of a deleterious effect (i.e., CADD >20, GERP RS>4) as well as an ultra-low frequency in the general population (Table 1, Online Supplementary Table S4) but not all variant alleles could be defined as causative. As supported by our previous work, seven ACTN1 and three ETV6 alleles were classified as P/LP,17,18,22 while the other alleles were VUS or B/LB. No novel genes attained statistical significance. We also asked whether disease-contributing genes could have top-ranking P values although not reaching statistical significance. We chose the highest 25 genes, i.e. showing a non-corrected P value ≤0.0015 (Table 2), finding no additional IT-associated gene. To understand whether novel genes could be present in this list, we performed segregation analysis of the variants in all the available relatives and collected the genes in which we found variants that segregated according to the disease (Online Supplementary Table S5). In this context, we suggest PREX1 as a po-

tentially promising candidate, having no variants in controls and three variants in cases, all with scores indicative of a deleterious effect and of an intolerance to missense variants (Residual Variation Intolerance Score, RVIS 22.30, ExAC constraint 4.11) (Table 2, Online Supplementary Table S5).33 In two families, relatives were available for the analysis and PREX1 variants were segregating with the disorder in two and three affected members, respectively (Online Supplementary Figure S2). This gene has a role in regulating aggregation and dense granule secretion of mouse platelets.34 However, further genetic and/or functional data are needed to prove that this is an IT-associated gene.
We then argued that different types of variation, namely CNV, could play a role in disease. By using Excavator2,15 we identified heterozygous deletions involving RUNX1 in three unrelated families (Table 3, Figure 2). All the deletions were confirmed by RT-PCR, and chromosomal microarray analysis was used to annotate the genomic boundaries of the alterations (Figure 2A). In all the cases, RUNX1 is completely included within the breakpoints and is therefore present in a single copy in the carriers. The deletions were
B Haematologica | 108 July 2023 1913 ARTICLE - Exome sequencing in inherited thrombocytopenias C. Marconi et al. A C
Fiigure 1. Pedigrees of families with inherited thrombocytopenia. (A-C) Families with pathogenic variants in ABCG8 (A), WAS (B) and GATA1 (C). Double lines indicate consanguineous unions. Platelet count (x109/L) and genotype are reported when available. wt: wt allele; mut: mutated allele.
Twenty-four genes showing an uncorrected P value ≤0.0015 are reported. *Genes with significant enrichment after multiple test correction. **Significant score. RVIS: residual variation intolerance score.
confirmed in seven, two and five affected individuals in Family.44 (Figure 2B), Family.66 (Figure 2C) and Family.72 (Figure 2D) respectively, in which they spanned 1.9 Mb (18 genes), 2.7 Mb (29 genes) and 900 Kb (7 genes). RUNX1 haploinsufficiency causes an autosomal-dominant IT with predisposition to myeloid malignancies (FPD-AML, OMIM #601399). Of note, Sanger sequencing of the whole RUNX1 gene had been performed in all the three probands before enrollment in this study, in accordance with the diagnostic algorithm. Few instances of large RUNX1 intragenic deletions have been described.35 The main clinical and laboratory features of our patients with heterozygous deletions involving RUNX1 are detailed in the Online Supplementary Results. A history of myeloid neoplasms was reported in Family.72 and Family.44. Interestingly, if both small variants (SNV and indels) and CNV were included in the enrichment analysis, RUNX1 would be among the top-ranking positions (5 variants in cases, 1 variant in controls; uncorrected P=0.00125).
Overall, ES on all 89 families followed by a targeted analysis of 43 IT-associated genes achieved a 36% diagnostic
yield (29 and 3 families with disease-causative SNV and CNV, respectively, out of 89). Compared to the phenotypedriven diagnostic algorithm on the same target genes, we estimated the increase of the diagnostic yield attained by ES as 16% (14/89), including 11 families with SNV and 3 families with full RUNX1 deletions.
Discussion
Until a few years ago, the diagnosis of IT was based on a multi-step clinical and laboratory characterization of patients and screening of candidate genes. In our experience, this approach made it possible to identify the causative genetic defect in just under 50% of cases.2 More recently, several groups introduced the use of next-generation sequencing techniques for a single-step, parallel sequencing of all the known genes associated with IT as a more effective, easier, and faster diagnostic approach. The results in terms of proportion of cases for which causative variants have been identified vary greatly according to differ-
Ranking position Gene Uncorrected P value Cases with qualifying variants Cases with qualifying variants retained after segregation studies Controls with qualifying variants ExAC constraint z score RVIS 1 ACTN1* 5.20E-06 9 8 1 3,82** 3.43 2 ETV6* 4.10E-05 6 3 0 2.2 20.53 3 PXDN 1.60E-04 5 4 0 2.72 11.47 3 YARS 1.60E-04 5 3 0 1.15 17.20 4 PLA2G4C 3.20E-04 6 1 1 -0.63 91.06 5 TNS1 4.28E-04 8 5 3 -0.64 97.39 6 ADAR 6.70E-04 4 1 0 3.01 2.20 6 ANKRD55 6.70E-04 4 3 0 0.34 17.26 6 CLEC16A 6.70E-04 4 1 0 1.44 25.02 6 GNAS 6.70E-04 4 2 0 4,34** 51.28 6 LY9 6.70E-04 4 2 0 -1.14 76.18 6 NECTIN1 6.70E-04 4 2 0 na 41.08 6 NPAP1 6.70E-04 4 2 0 -1.39 78.58 6 PLBD1 6.70E-04 4 2 0 0.25 61.52 6 PREX1 6.70E-04 4 4 0 4,11** 22.30 7 CC2D2A 1.20E-03 5 4 1 -2.06 92.94 7 CCP110 1.20E-03 5 2 1 0.13 24.49 7 GSG1L2 1.20E-03 5 0 1 na na 7 LAMA4 1.20E-03 5 3 1 -0.67 15.11 7 PHLPP1 1.20E-03 5 2 1 2.46 7.51 7 PTH2R 1.20E-03 5 3 1 -1.72 54.83 7 ZNF394 1.20E-03 5 5 1 1 36.39 8 INPP5D 1.45E-03 7 2 3 3,65** 15.51 8 MGA 1.45E-03 7 5 3 -1.31 2.51
Haematologica | 108 July 2023 1914 ARTICLE - Exome sequencing in inherited thrombocytopenias C. Marconi et al.
Table 2. Gene-based rare variant collapsing analysis.
ent investigations.9,36-39
Differently from previous studies, here we applied ES to a cohort of IT patients who had remained without a definite diagnosis after the application of a systematic, well-defined diagnostic workup based on phenotype characterization and screening of candidate genes.2 For this reason, our population is particularly informative to assess the advantages and issues of ES as a complement to the traditional approach in the diagnosis of these disorders.
We report a 36% diagnostic rate in a large cohort of patients with non-syndromic IT. If we consider the same target genes as those in the phenotype-based diagnostic approach, we observed a 16% increase in the diagnostic yield attained with ES. This increase can be explained by the unbiased approach of ES to the analysis of proteincoding variations that overcomes three major problems. First, the genetic heterogeneity of IT, with more than 40 associated genes, makes the gene-by-gene approach very
Figure 2. RUNX1 deletions. (A) RUNX1 deletions identified by exome sequencing were confirmed by chromosomal microarray analysis. Profiles from probands of Families 44, 66 and 72 (top to bottom panels) are shown. Highlighting indicates deleted regions. The top panel was produced by the UCSC Genome Browser (https://genome.ucsc.edu/) and shows the genomic positions and all genes included in the region. Segregation of deletions was evaluated by real-time polymerase chain reaction in Family.44 (B), Family.66 (C) and Family.72 (D). Genotype is reported when available.

B C Haematologica | 108 July 2023 1915 ARTICLE - Exome sequencing in inherited thrombocytopenias C. Marconi et al. A D
Table 3. Deletions involving RUNX1 identified through analysis of exome data with Excavator2. Annotation of breakpoints identified by chromosomal microarray analysis are reported.
ITSN1, ATP5O, LINC00649, LOC101928126, MRPS6, SLC5A3, LINC00310, KCNE2, SMIM11A, C21orf140, KCNE1, RCAN1, CLIC6, LINC00160, LINC01426, RUNX1, RUNX1-IT1, LOC100506403
LINC00649, LOC101928126, SLC5A3, MRPS6, LINC00310, KCNE2, SMIM11A, C21orf140, KCNE1, RCAN1, CLIC6, LINC00160, LINC01426, RUNX1, RUNX1-IT1, LOC100506403, MIR802, PPP1R2P2, LOC101928269, LINC01436, SETD4, LOC100133286, CBR1, CBR3-AS1, CBR3, DOPEY2, MORC3, CHAF1B, CLDN14
RCAN1, CLIC6, LINC00160, LINC01426, RUNX1, RUNX1-IT1, LOC100506403
ISCN: International System for Human Cytogenomic Nomenclature.
laborious and complex, which may negatively affect the adherence of clinicians to the diagnostic algorithm. As an additional complexity, patients with non-syndromic IT lack straightforward phenotypic features that easily raise diagnostic suspicion about specific genes, making the simultaneous analysis of all the genes the most reasonable strategy. Finally, false negative results from laboratory assays exploited in the diagnosis of IT can confound the process, as we observed in our cohort. Genetic heterogeneity also partially reflects on ES, since the larger the set of genes the higher the chance that candidate regions are not adequately represented (as reported here for GP1BB, GP9 and MPIG6B) and that VUS are found. Indeed, the interpretation of ES-identi fied variants was confirmed to be a major challenge. Here, we found that the proportion of cases carrying at least one VUS in known IT genes was as high as 29% (26/89). Previously reported data range from 13 to 50%, depending on criteria for selecting patients to be analyzed, sequencing techniques, and bioinformatic processing of data.9,36-39 In our analysis, the availability of previous phenotypic and laboratory characterizations of pedigrees and the prompt access to
arr[GRCh37]
21q22.11q22.12(35171289_37082807)x1
arr[GRCh37]
21q22.11q22.13(35289266_38008029)x1
arr[GRCh37]
21q22.12(35888934_36774802)x1
DNA samples from patients’ relatives was essential to define the pathogenic or non-pathogenic role of variants in many cases. In particular, segregation analysis was determinant for downgrading 14 variants from P/LP to VUS and 13 variants from VUS to B/LB, as well as for upgrading one VUS to LP.
This emphasizes the synergistic role of next-generation sequencing and accurate phenotype description of pedigrees for the improvement of the diagnostic process for IT. In particular, such an approach would significantly improve the interpretation of variants, thereby reducing the number of VUS, and overcome the pitfalls of the traditional diagnostic workup. In this framework, interaction between specialists and discussion of cases in multidisciplinary teams including geneticists, hematologists and laboratory experts appears to be the most proficient strategy.25 Moreover, a periodic review of next-generation sequencing data in the light of new discoveries could be useful to refine the classification of variants. Second, we showed that ES discloses causes of disease that could be otherwise overlooked according to assumptions made on the genetic model prior to the analysis. In-
Family ID N of tested members (affected carriers/ healthy carriers) Size (Kb) Average LOG ratio Genes ISCN nomenclature Family 44 9 (7/0) 1911.5 -0.88
Family 66 2 (2/0) 2718.8 -0.913
72 9 (5/0) 885.9
Family
-0.903
Haematologica | 108 July 2023 1916 ARTICLE - Exome sequencing in inherited thrombocytopenias C. Marconi et al.
deed, we observed how instances of pseudo-dominance (Family.43), presence of phenocopies (Family.41) and unexpected female-to-female X-linked transmission (Family.40) can hinder a diagnosis during a process in which the mode of inheritance is incorrectly assumed to drive the selection of the suspected genes. Of note, these events, although occurring rarely, collectively contributed for a non-negligible proportion of cases in our cohort (3.4%) and we therefore suggest that they should be taken into account in IT.
Finally, although ES is tailored to detect small variants (i.e., single nucleotide changes and indels), its data can be successfully used to identify CNV as well. Indeed, based on ES data we detected large deletions encompassing RUNX1 in three cases (3.4%). Notably, this specific gene was suspected during the application of the diagnostic algorithm and its analysis by PCR and Sanger sequencing was correctly requested, but this technology could not identify these whole gene deletions. This finding is important as, if we consider all the IT probands available to us for whom a molecular diagnosis of IT was achieved (>165 families), the relative frequency of FPD-AML due to alterations of RUNX1 was 4.2% and whole deletions accounted for 43% of FPD-AML cases. Thus, deletions involving RUNX1 appear to be a relatively common cause of FPD-AML that may have been overlooked so far.
The gene-based variant enrichment analysis allowed us to identify ACTN1 and ETV6 as main contributing genes in this cohort. No further IT-associated gene, nor any “novel” gene, reached the study-wise statistical significance, confirming a picture of vast genetic heterogeneity for the genetic landscape of IT. It clearly emerged that only the few most frequent genes, including ACTN1, ETV6 and some of the genes that were pre-screened here (MYH9, ANKRD26, GP1BA, GP1BB) are prevalent in IT. Conversely, a constellation of many other genes, each accountable for substantially less than 2% of cases, must be searched for variants in a diagnostic setting. Accordingly, we observed that apart from ACTN1 and ETV6, the only two genes attaining studywise statistical significance in the enrichment analysis, clinically relevant variation was dispersed across five (GNE, PTPRJ, SLFN14, SRC and THPO) of the 22 genes not in the pre-screening (Online Supplementary Table S2), accounting collectively for seven cases and for a maximum of two cases each, thereby emphasizing once again the genetic heterogeneity of IT.
Similarly, ”novel” genes (e.g., PREX1) may be present among those with top-ranking P values in the enrichment analysis, but their prevalence was too low to provide convincing evidence for an association with IT in this study. It is worth noting, in this respect, that if CNV and SNV had been included in the variant enrichment study, RUNX1 would have ranked with a top P value (5 variants in cases, 1 variant in controls; uncorrected P=0.00125). This sup-
ports an important role for RUNX1 in terms of prevalence and further highlights the importance of a comprehensive analysis of CNV and SNV, especially for this gene. We emphasize the importance of recognizing FPD-AML among IT since this disorder associates with a strong predisposition to hematologic neoplasms. Therefore, once a pathogenic variant in RUNX1 has been identified, molecular analysis should be extended to all available family members: all individuals carrying the RUNX1 mutation, including possible subjects with normal blood counts,6 should receive proper genetic counseling and be offered an appropriate follow-up, with at least annual evaluations according to recent recommendations.40 We expect that the application of the gene-based variant enrichment method presented here to larger cohorts might lead to the identification of new IT genes. As a limitation, we note that, in our study, segregation data weakened the role of many top-ranking genes. The application of the method on datasets in which more samples from the same family undergo ES could benefit from prompt enrichment in properly segregating variants.
It should be mentioned that our study was focused on Mendelian forms of IT. We explored the possibility of multigenic or incomplete penetrance, but our data are not sufficient to demonstrate a significant role for these mechanisms.
In conclusion, our results show how the application of an unbiased genomic approach to IT, inclusive of CNV evaluation, substantially increased the diagnostic rate in patients who remained undiagnosed after a thorough phenotype-driven investigation. The combined execution of both ES and accurate clinical-laboratory characterization in all patients with IT is expected to be the initial diagnostic approach with the highest probability of success. However, systematic application of this combined approach in all patients would be expensive and time-consuming, also in view of the increasing number of disorders being discovered as associated with IT, therefore necessitating an increasingly complex diagnostic workup for phenotypic characterization. Moreover, the study of IT patients needs specialized skills that often are not available locally: given that phenotypic characterization requires fresh blood samples, this usually means that patients have to travel long distances to reach the nearest reference center for the study of these rare diseases. Therefore, we consider it reasonable to propose that ES, which is becoming more and more economically convenient and can be performed on shipped samples, represents the initial investigation. The diagnosis indicated by ES should be confirmed though the study of the patient's clinical and laboratory phenotype and family history, in order to provide a correct interpretation of genetic variants. If this approach does not culminate in a diagnosis, then a complete phenotypic characterization needs to be
Haematologica | 108 July 2023 1917 ARTICLE - Exome sequencing in inherited thrombocytopenias C. Marconi et al.
performed at a center with specific expertise in the diagnosis of IT, especially considering the disorders associated with genes not completely covered by ES. We also suggest that segregation of candidate variants is evaluated on all available family members to allow correct classification of variants.
Finally, our study disclosed that no novel genes make major contributions to IT, in terms of prevalence, thereby suggesting the need for larger, collaborative studies to identify the genes associated with the almost 50% cases with unknown molecular causes.
Disclosures
No conflicts of interest to disclose.
Contributions
CM, AP, AS, CLB, PN, TP, and MS conceived the study; FP and TP curated the data; CM, EN, and TP were responsible for the formal analysis; AP, AS, CLB, FM, PN and MS ac-
References
1. Pecci A, Balduini CL. Inherited thrombocytopenias: an updated guide for clinicians. Blood Rev. 2021;48:100784.
2. Pecci A. Diagnosis and treatment of inherited thrombocytopenias. Clin Genet. 2016;89(2):141-153.
3. Balduini CL, Melazzini F, Pecci A. Inherited thrombocytopeniasrecent advances in clinical and molecular aspects. Platelets. 2017;28(1):3-13.
4. Watson SP, Lowe GC, Lordkipanidzé M, Morgan NV; GAPP Consortium. Genotyping and phenotyping of platelet function disorders [published correction appears in J Thromb Haemost. 2013;11(9):1790]. J Thromb Haemost. 2013;11(Suppl 1):351-363.
5. Westbury SK, Turro E, Greene D, et al. BRIDGE-BPD Consortium. Human phenotype ontology annotation and cluster analysis to unravel genetic defects in 707 cases with unexplained bleeding and platelet disorders. Genome Med. 2015;7(1):36.
6. Stockley J, Morgan NV, Bem D, et al. UK Genotyping and Phenotyping of Platelets Study Group. Enrichment of FLI1 and RUNX1 mutations in families with excessive bleeding and platelet dense granule secretion defects. Blood. 2013;122(25):4090-4093.
7. Fletcher SJ, Son B, Lowe GC, et al. SLFN14 mutations underlie thrombocytopenia with excessive bleeding and platelet secretion defects. J Clin Invest 2015;125(9):3600-3605.
8. Turro E, Greene D, Wijgaerts A, et al. A dominant gain-offunction mutation in universal tyrosine kinase SRC causes thrombocytopenia, myelofibrosis, bleeding, and bone pathologies. Sci Transl Med. 2016;8(328):328ra30.
9. Johnson B, Lowe GC, Futterer J, et al. UK GAPP Study Group. Whole exome sequencing identifies genetic variants in inherited thrombocytopenia with secondary qualitative function defects. Haematologica. 2016;101(10):1170-1179.
10. Marconi C, Di Buduo CA, Barozzi S, et al. SLFN14-related thrombocytopenia: identification within a large series of patients with inherited thrombocytopenia. Thromb Haemost. 2016;115(5):1076-1079.
11. Richards S, Aziz N, Bale S, et al. ACMG Laboratory Quality
quired funding; CM, AP, FM, FP, RB, EN, MF, SB, TG, VB, PM, PN, TP, and MS performed the investigations; EN and TP were responsible for the methodology; FP and TP were responsible for the software; AP, TP, and MS supervised the study; CM, AP, TP and MS wrote the original draft of the manuscript; and all the authors reviewed and edited the subsequent versions.
Funding
This work was supported by grants GGP13082 from Telethon Foundation (to MS, PN, and AS), by grant IG 2018-21974 from the Italian Association of Cancer Research (to AS), from the IRCCS Policlinico San Matteo Foundation (to AP) and from the Ministry of Health to IRCCS Burlo Garofolo (RC 2/18) and to FM (GR-2018-12367235).
Data-sharing statement
Original sequencing data cannot be shared for reasons of privacy.
Assurance Committee. Standards and guidelines for the interpretation of sequence variants: a joint consensus recommendation of the American College of Medical Genetics and Genomics and the Association for Molecular Pathology. Genet Med. 2015;17(5):405-424.
12. Luo X, Feurstein S, Mohan S, et al. ClinGen Myeloid Malignancy Variant Curation Expert Panel recommendations for germline RUNX1 variants. Blood Adv. 2019;3(20):2962-2979.
13. Jarvik GP, Browning BL. Consideration of cosegregation in the pathogenicity classification of genomic variants. Am J Hum Genet. 2016;98(6):1077-1081.
14. Magi A, Tattini L, Palombo F, et al. H3M2: detection of runs of homozygosity from whole-exome sequencing data. Bioinformatics. 2014;30(20):2852-2859.
15. D'Aurizio R, Pippucci T, Tattini L, Giusti B, Pellegrini M, Magi A. Enhanced copy number variants detection from whole-exome sequencing data using EXCAVATOR2. Nucleic Acids Res. 2016;44(20):e154.
16. Benjamini Y, Hochberg Y. Controlling the false discovery rate: a practical and powerful approach to multiple testing. J R Stat Soc B Methodol 1995;57(1):289-300.
17. Bottega R, Marconi C, Faleschini M, et al. ACTN1-related thrombocytopenia: identification of novel families for phenotypic characterization. Blood. 2015;125(5):869-872.
18. Melazzini F, Palombo F, Balduini A, et al. Clinical and pathogenic features of ETV6-related thrombocytopenia with predisposition to acute lymphoblastic leukemia. Haematologica. 2016;101(11):1333-1342.
19. De Rocco D, Cerqua C, Goffrini P, et al. Mutations of cytochrome c identified in patients with thrombocytopenia THC4 affect both apoptosis and cellular bioenergetics. Biochim Biophys Acta. 2014;1842(2):269-274.
20. De Rocco D, Melazzini F, Marconi C, et al. Mutations of RUNX1 in families with inherited thrombocytopenia. Am J Hematol. 2017;92(6):E86-E88.
21. Noris P, Marconi C, De Rocco D, et al. A new form of inherited
Haematologica | 108 July 2023 1918 ARTICLE - Exome sequencing in inherited thrombocytopenias C. Marconi et al.
thrombocytopenia due to monoallelic loss of function mutation in the thrombopoietin gene. Br J Haematol. 2018;181(5):698-701.
22. Faleschini M, Melazzini F, Marconi C, et al. ACTN1 mutations lead to a benign form of platelet macrocytosis not always associated with thrombocytopenia. Br J Haematol. 2018;183(2):276-288.
23. Marconi C, Di Buduo CA, LeVine K, et al. Loss-of-function mutations in PTPRJ cause a new form of inherited thrombocytopenia. Blood. 2019;133(12):1346-1357.
24. Barozzi S, Di Buduo CA, Marconi C, et al. Pathogenetic and clinical study of a patient with thrombocytopenia due to the p.E527K gain-of-function variant of SRC. Haematologica. 2021;106(3):918-922.
25. Greinacher A, Pecci A, Kunishima S. Diagnosis of inherited platelet disorders on a blood smear: a tool to facilitate worldwide diagnosis of platelet disorders. J Thromb Haemost. 2017;15(7):1511-1521.
26. Nurden AT, Pillois X, Fiore M, Heilig R, Nurden P. Glanzmann thrombasthenia-like syndromes associated with macrothrombocytopenias and mutations in the genes encoding the α IIb β 3 integrin. Semin Thromb Hemost. 2011;37(6):698-706.
27. Zaninetti C, Biino G, Noris P, Melazzini F, Civaschi E, Balduini CL. Personalized reference intervals for platelet count reduce the number of subjects with unexplained thrombocytopenia. Haematologica. 2015;100(9):e338-340.
28. Millikan PD, Balamohan SM, Raskind WH, Kacena MA. Inherited thrombocytopenia due to GATA-1 mutations. Semin Thromb Hemost. 2011;37(6):682-689.
29. Chou ST, Kacena MA, Weiss MJ, Raskind WH. GATA1-related Xlinked cytopenia. 2006 Nov 22. Updated 2017. In: Adam MP, Ardinger HH, Pagon RA, Wallace SE, Bean LJH, Stephens K, Amemiya A, editors. GeneReviews® [Internet]. Seattle (WA): University of Washington, Seattle; 1993-2019.
30. Kunishima S, Okuno Y, Yoshida K, et al. ACTN1 mutations cause congenital macrothrombocytopenia. Am J Hum Genet. 2013;92(3):431-438.
31. Zhang MY, Churpek JE, Keel SB, et al. Germline ETV6 mutations in familial thrombocytopenia and hematologic malignancy. Nat Genet. 2015;47(2):180-185.
32. Noetzli L, Lo RW, Lee-Sherick AB, et al. Germline mutations in ETV6 are associated with thrombocytopenia, red cell macrocytosis and predisposition to lymphoblastic leukemia. Nat Genet. 2015;47(5):535-538.
33. Petrovski S, Wang Q, Heinzen EL, Allen AS, Goldstein DB. Genic intolerance to functional variation and the interpretation of personal genomes. PLoS Genet. 2013;9(8):e1003709.
34. Qian F, Le Breton GC, Chen J, et al. Role for the guanine nucleotide exchange factor phosphatidylinositol-3,4,5trisphosphate-dependent rac exchanger 1 in platelet secretion and aggregation. Arterioscler Thromb Vasc Biol. 2012;32(3):768-777.
35. Galera P, Dulau-Florea A, Calvo KR. Inherited thrombocytopenia and platelet disorders with germline predisposition to myeloid neoplasia. Int J Lab Hematol. 2019;41 (Suppl 1):131-141.
36. Downes K, Megy K, Duarte D, et al. Diagnostic high-throughput sequencing of 2,396 patients with bleeding, thrombotic and platelet disorders. Blood. 2019;134(23):2082-2091.
37. Bastida JM, Lozano ML, Benito R, et al. Introducing highthroughput sequencing into mainstream genetic diagnosis practice in inherited platelet disorders. Haematologica. 2018;103(1):148-162
38. Leinøe E, Zetterberg E, Kinalis S, et al. Application of wholeexome sequencing to direct the specific functional testing and diagnosis of rare inherited bleeding disorders in patients from the Öresund Region, Scandinavia. Br J Haematol. 2017;179(2):308-322.
39. Romasko EJ, Devkota B, Biswas S, et al. Utility and limitations of exome sequencing in the molecular diagnosis of pediatric inherited platelet disorders. Am J Hematol. 2018;93(1):8-16.
40. Godley LA, Shimamura A. Genetic predisposition to hematologic malignancies: management and surveillance. Blood. 2017;130(4):424-432.
Haematologica | 108 July 2023 1919 ARTICLE - Exome sequencing in inherited thrombocytopenias C. Marconi et al.
Contribution of fetal microchimeric cells to maternal wound healing in sickle cell ulcers
Mansour Alkobtawi,1* Maria Sbeih,1* Karim Souaid,2,3* Qui Trung Ngô,1 Dany Nassar,1,2,3 Hugo Arbes,4 Henri Guillet,5 Anoosha Habibi,5 Pablo Bartolucci,5 Mathieu Castela,1,# Sélim Aractingi1,2,3,# and Bénédicte Oulès1,2,3,#
1Cutaneous Biology Laboratory, Institut Cochin, INSERM U1016, UMR 8104, Paris; 2Department of Dermatology, Hôpital Cochin, AP-HP Centre-Université Paris Cité, Paris; 3University Paris Cité, Faculté de Médecine Paris Centre Santé, Paris; 4Institut de Biologie Intégrative de la Cellule, Genomic Structure and Translation Laboratory, UMR_9198, CEA, CNRS, Université Paris-Saclay, Orsay and 5Department of Internal Medicine, Red Blood Cell Genetic Diseases Unit, Hôpital Mondor, AP-HP, Hôpitaux Universitaires Henri Mondor, Créteil, France
*MA, MS and KS contributed equally as co-first authors. #MC, SA and BO contributed equally as co-senior authors.
Abstract
Correspondence: S. Aractingi selim.aractingi@gmail.com
Received: March 29, 2022.
Accepted: October 31, 2022. Early view: November 10, 2022.
https://doi.org/10.3324/haematol.2022.281140
©2023 Ferrata Storti Foundation
Published under a CC BY-NC license
Leg ulcers are a major complication of sickle cell disease (SCD). They are particularly challenging to treat and innovative therapies are needed. We previously showed that the healing of SCD ulcers is delayed because of decreased angiogenesis. During pregnancy, fetal microchimeric cells (FMC) transferred to the mother are recruited to maternal wounds and improve angiogenesis. After delivery, FMC persist in maternal bone marrow for decades. Here, we investigated whether fetal cells could also improve SCD ulcers in the post-partum setting. We found that skin healing was similarly improved in post-partum mice and in pregnant mice, through increased proliferation and angiogenesis. In a SCD mouse model that recapitulates refractory SCD ulcers, we showed that the ulcers of post-partum SCD mice healed more quickly than those of virgin mice. This was associated with the recruitment of fetal cells in maternal wounds where they harbored markers of leukocytes and endothelial cells. In a retrospective cohort of SCD patients, using several parameters we found that SCD women who had ever had a baby had less of a burden related to leg ulcers compared to nulliparous women. Taken together, these results indicate that healing capacities of FMC are maintained long after delivery and may be exploited to promote wound healing in post-partum SCD patients.
Introduction
Sickle cell disease (SCD), one of the most common genetic diseases around the world,1 leads to leg ulcers in 2% to up to 40% of affected patients.2,3 These ulcers are usually long-lasting, recurrent, and difficult to treat, causing major disabilities and impairing quality of life.4 Treatment of SCD leg ulcers remains a challenge and innovative treatments are urgently needed.4 The prevalence of leg ulcers in SCD patients increases with age, and these ulcers have been associated with the level of anemia.5 In addition, the risk of developing leg ulcers is higher in patients with hyperhemolysis and is associated with pulmonary hypertension, priapism and stroke.6,7 Accordingly, most authors consider that the release of free hemoglobin by hemolysis is responsible for skin ulcers through a reduction of endothelial nitric oxide bioavailability leading to the development of vasoconstriction and endothelial activation.1,8 However, the association of leg ulcers with hyperhemolytic phenotypes has been challenged in sub-
Saharan African SCD patients.9 In addition, pure hemolytic disorders, such as paroxysmal nocturnal hemoglobinuria, are usually not associated with leg ulcers.10 Besides, several cutaneous disorders displaying vasoconstriction and vasculopathy with endothelial activation, such as cryoglobulinemia and vasculitis, may lead to leg ulcers, although these usually resolve in weeks or months upon specific treatment of the causative disease.11 Thus, the exact etiopathogenic mechanisms leading to SCD ulcers remain incompletely understood. Our group previously hypothesized that skin wound healing could be specifically delayed in SCD, leading to ulcers after an initial trauma. We found that wound healing is impaired in a transgenic mouse model of SCD harboring a mutated form of human β-globin (SAD mice).12 Wound healing is a complex process that involves several cell types, both resident in the skin and also circulating cells recruited to the wound.13,14 Using SAD mice, we showed a decreased recruitment of bone marrow-derived endothelial progenitor cells to cutaneous wounds, leading to impaired angiogenesis within the
Haematologica | 108 July 2023 1920 ARTICLE - Red Cell Biology & its Disorders
wound bed, which could be partially rescued by local injections of SDF-1α/CXCL12.12
During pregnancy, fetal cells are transferred to maternal blood and enter the maternal bone marrow niche where they persist for decades.15 We previously showed that fetal microchimeric cells (FMC) can be recruited to maternal wounds during pregnancy, through the CCR2/CCL2 pathway, and play a crucial role in maternal skin repair.16,17 They can differentiate into endothelial cells able to form blood vessels and secrete pro-angiogenic factors, including CXCL1, which stimulate maternal angiogenesis.16,17
Triggering the recruitment of FMC to participate in maternal wound healing is a promising strategy as compared with conventional cell therapies. However, this would require the FMC to have a sustained capacity to promote maternal skin repair over time and after delivery. In this work, we explored whether healing was improved in post-partum mice as is the case during pregnancy, and characterized the properties of circulating FMC after delivery. We also assessed the repair capacities of FMC in post-partum SAD mice. Finally, we investigated the course of leg ulcers and their complications in parous women with SCD.
Methods
Mice
Male transgenic mice expressing enhanced green fluorescence protein (eGFP) were obtained from Riken Laboratories (C57BL/6-Tg(CAG-EGFP)C14-Y01-FM131Osb) and mated to 6- to 8-week-old wildtype C57BL/6 females (Janvier Labs). SAD-1 (SAD) transgenic mice are hemizygous knock-in mice with a mutated form of human β-globin.18 This work was performed in accordance with European Community guidelines and approved by an Institutional Animal Care and Use Committee under the license APAFIS#32354-202102040946663. Surgical wounds and measurements of wound surface were performed as previously described.17
Antibodies
The primary antibodies used were as follows: rabbit antiK14 (1:1000; Biolegend), rabbit anti-Ki67 (1:200; Abcam), rat anti-CD31 (1:40; BD Biosciences), rat anti-F4/80 (1:250; Abcam), rat anti-GR-1 (1:250; eBiosciences), rat anti-CD45 (1:200; BD Biosciences) and rabbit anti-GFP (1:200; ABclonal). Alexa Fluor-conjugated antibodies (ThermoFisher Scientific) were used at 1:1000 as secondary antibodies. Nuclei were counterstained with 0.3 µg/mL DAPI (SigmaAldrich).
Clinical study
We conducted a retrospective, single-center, cohort study using routinely collected data in compliance with good
clinical practice and the Declaration of Helsinki. According to French law, formal ethics committee approval was not required for this study. Female SCD patients aged ≥18 years with at least one current or previous leg ulcer were recruited from the Red Blood Cell Genetic Diseases Unit (Hôpital Mondor, Créteil, France) between January 2020 and September 2021. Patients’ medical histories, treatments, laboratory data and information related to leg ulcers were extracted from medical files. Patients did not undergo a specific medical examination for this study.
Statistical analysis and reproducibility
Statistical analyses were performed with the statistical software Prism 8 (GraphPad). When required, normality of the data was tested with the Shapiro-Wilk test and a statistical method to correct for multiple comparisons was used.
Data availability
The RNA-sequencing datasets produced in this study are available in Online Supplementary Tables S1-S4.
Supplementary methods
Further details of the study methods are available in the Online Supplementary File
Results
Improvement of wound healing is sustained in C57BL/6 post-partum mice
To evaluate how pregnancy affects skin wound healing, we mated virgin C57BL/6 females with homozygous males expressing eGFP. We then performed back skin excisional wounds on pregnant mice at gestational day E15.5 and on age-matched virgin littermates. Wound closure was significantly accelerated in pregnant mice (Online Supplementary Figure S1A). Re-epithelialization, as measured by the length of the K14+ neo-epidermis, was improved in pregnant mice (Online Supplementary Figure S1B). Ki67+ proliferating cells and CD31+ blood vessels were significantly increased in the wound bed of pregnant mice (Online Supplementary Figure S1C, D). As expected, expression of Vegfa, Vegfr1 and Vegfr2 was significantly elevated in wounds of pregnant mice, whereas levels of expression of Vegfc and Vegfr3, implicated in lymphatic angiogenesis, were not (Online Supplementary Figure S2A). Lastly, we found that infiltration by F4/80+ macrophages was not different between virgin and pregnant mice, while GR1+ neutrophils were slightly increased in pregnant mice (Online Supplementary Figure S1B, C). These results confirm that pregnancy promotes wound healing, as we had previously observed.17
We then performed back skin excisional wounds on postpartum mice 12 weeks after their last gestation and on age-
Haematologica | 108 July 2023 1921 ARTICLE - Maternal sickle cell ulcer repair by fetal cells M. Alkobtawi et al.
matched virgin littermates. We observed a significant improvement of wound closure kinetics in post-partum mice (Figure 1A). The epidermal gap was wider, while the K14+ tongue was smaller in virgin mice than in post-partum mice (Figure 1B). The proliferation index was significantly increased (Figure 1C), and CD31+ blood vessels were more
abundant in the wound beds of post-partum mice (Figure 1D). We also observed the presence of eGFP+ FMC in postpartum wounded skin, confirming the survival of these cells in the post-partum condition (Online Supplementary Figure S3A). Together, these results indicate that the improvement of wound healing observed in pregnant mice is sustained
Figure 1. Improvement of skin wound healing is sustained in post-partum mice. (A) Representative images of wounds at days 0, 3, and 5, and planimetry of wound area at each time point relative to the original wound area. (B) Representative images and measurement of anti-K14 labeling of neo-epidermal tongues and wound gap at day 5. (C) Representative images and quantification of Ki67+ cells in the wound bed at day 5. (D) Representative images of CD31+ cells and quantification of vessel area in the wound bed at day 5. Scale bars represent 1000 mm (B) or 50 µm (C, D). In (B-D), nuclei were counterstained with DAPI. In (A-D), four 6-mm excisional wounds were performed in virgin mice (n=4) or post-partum mice (n=2). Data are presented as means with standard deviations and individual values. Statistical analyses were performed with two-tailed t tests with the Welch correction whenever required (A [day 3], C-D) or Mann-Whitney test (A [day 5], B). *P<0.05; **P<0.005; ***P<0.0005.

A C B D Haematologica | 108 July 2023 1922
M. Alkobtawi et al.
ARTICLE - Maternal sickle cell ulcer repair by fetal cells
in post-partum mice months after the last pregnancy and is associated with efficient recruitment of FMC to the wound.
Fetal microchimeric cells display features of hematopoietic progenitor cells
To explore the properties of long-term engrafted FMC, we mated C57BL/6 females with males expressing the eGFP transgene to induce the transfer of eGFP+ FMC to the mothers. Eight weeks after delivery, we harvested bone marrow cells from post-partum females, seeded them at low density in EGM-2 medium, and measured colony size after 9 days. We showed that eGFP+ hematopoietic cells grew in colonies that proliferate significantly more than their adult eGFP– counterparts (Online Supplementary Figure S4A). eGFP+ cells expressed CD45, CD11b and CD31, while a minority expressed CD34 similarly to the adult eGFP– hematopoietic cells (Online Supplementary Figure S4B).
We then sorted eGFP+ FMC circulating in wounded and unwounded post-partum mice and analyzed them by RNA sequencing (Figure 2). We first analyzed the transcriptome of circulating FMC from unwounded mice to characterize the main genes expressed at steady state (Figure 2A). This revealed a high level of expression of membrane receptors previously reported to be enriched in circulating FMC of wounded pregnant mice, such as Cd52, Cd79b, Ccr2, Cd300ld, and Ifngr1 17 Genes associated with hematopoietic stem cells, such as Sca1 and Myc, were also highly expressed in post-partum FMC (Figure 2A). Transcriptional analysis of the post-partum FMC transcriptome using ingenuity pathway analysis showed an enrichment for functions related to immune response, such as “recruitment of neutrophils”, “activation of phagocytes” or “binding of myeloid cells” in parallel with a high expression of cytokine and chemokine genes such as Ccl2, Ifng, Il1b, Il6, and Tnf (Figure 2B). Besides, the ARCHS4 database identified these cells as “dendritic cells”, “cord blood”, “CD34+ cells” or “bone marrow” (Figure 2C). We also analyzed eGFP+ FMC from peripheral blood of post-partum mice after creating a cutaneous wound. This enabled us to describe the fetal cells specifically responding to a maternal wound. When compared to circulating fetal cells at steady state, there were 487 differentially expressed genes (Figure 2D). Several plasma membrane receptor genes were enriched in FMC from wounded post-partum mice, including Ccr8, Il1r2 and Cxcr5, suggesting that several pathways amplify the recruitment of these cells to damaged skin (Figure 2D). Canonical pathway analysis showed a significant enrichment of pathways related to CXCR4 signaling and to integrin signaling and cell motility, through ILK, RHOA and the actin cytoskeleton, in post-partum FMC upon wounding (Figure 2E). In parallel, we observed an underrepresentation of WNT/β-catenin pathways and the stem cell pluripotency program suggest-
ing that wound-mobilized FMC start to acquire a differentiated fate during their journey to the damaged skin. Activated upstream regulators were predicted to be MYCN, MYC and several cytokines (IL1B, IL6, IL4), while inhibited regulators included mTOR-related regulators (LARP1, RICTOR) and methyltransferases (KMT2D, DNMT3A) (Figure 2E). These results indicate a greater clonogenic capacity of FMC as compared to their adult counterparts and reveal that circulating FMC are transcriptionally modified upon wounding to favor cell motility and response to immune attractants.
Wound healing is improved in post-partum SAD mice displaying altered skin healing
We next explored the properties of FMC in post-partum females in the context of delayed wound healing as observed in SAD mice.12
We performed back skin excisional wounds on post-partum SAD mice 12 weeks after their last gestation and on agematched virgin SAD mice. We noted a reduction of the wound area at day 7 after wounding (Figure 3A). Of note, the wound size was also reduced at day 5 after the wound was created, but the difference was not statistically significant (Figure 3A). In agreement, the neo-epidermal tongue was longer (Figure 3B) and Ki67+ cells were increased in the granulation tissue (Figure 3C) of post-partum SAD mice as compared with those in virgin littermates. Interestingly, we observed a significant increase in vessel density in post-partum SAD mice suggesting improved recruitment of endothelial progenitors in these mice (Figure 3D). We also found efficient recruitment of eGFP+ FMC in the granulation tissue of post-partum mice (Online Supplementary Figure S3B).
We then assessed the gene expression profile of cutaneous FMC by performing RNA sequencing analysis of sorted eGFP+ cells from day 3 wounds of post-partum SAD mice (Figure 4A-C). We observed high levels of FMC-enriched membrane receptors and genes associated with hematopoietic stem cells (Figure 4A), as previously found in steady-state circulating FMC (Figure 2A), suggesting their common origin. Besides, “dendritic cell”, “cord blood”, “CD34+ cells” and “bone marrow” signatures were also identified by ARSCHS4 in wound-associated FMC (Figure 4B). Ingenuity pathway analysis showed enrichment for functions related to immune response and angiogenesis (Figure 4C). In order to better identify the characteristics of fetal cells in SAD wounds, we performed immunostaining on wound sections of SAD mice at day 3 after wounding. We observed that eGFP+ cells displayed a phenotype of CD31+ endothelial cells and CD45+ leukocytes (Figure 4D). To analyze the wound changes in relation to fetal cell trafficking, we performed RNA sequencing analysis comparing skin wounds from virgin and post-partum SAD mice at day 3 after wounding (Figure 4E, F). We found 72 significantly
Haematologica | 108 July 2023 1923 ARTICLE - Maternal sickle cell ulcer repair by fetal cells M. Alkobtawi et al.

Continued on following page. A C B D E Haematologica | 108 July 2023 1924 ARTICLE - Maternal sickle cell ulcer repair by fetal cells M. Alkobtawi et al.
Figure 2. Fetal microchimeric cells are related to hematopoietic progenitors and can be mobilized upon injury. (A) Heatmap showing genes, ordered by transcripts per million (TPM) and with TPM >50 expressed in eGFP+ fetal microchimeric cells (FMC) harvested from peripheral blood of unwounded post-partum mice. No comparison was performed in order to display the main genes expressed by circulating FMC at steady state. Membrane receptors previously reported to be enriched in blood FMC of wounded pregnant mice17 are shown. Data are presented as log2 TPM. (B) Graphical summary obtained upon transcriptional analysis, using ingenuity pathway analysis (IPA) software, of blood FMC harvested from unwounded post-partum mice. Only transcripts with at least 50 TPM were kept for the analysis. (C) ARCHS4 enrichment analysis of the 500 most expressed genes in FMC in unwounded post-partum mice. (D) Heatmap showing the significantly (adjusted P<0.05) differentially expressed genes in FMC in post-partum mice with or without wounds. Upregulated membrane receptors are indicated. Data are presented as log2 fold change. (E) Statistically significant (adjusted P<0.05) upregulated and downregulated canonical pathways and upstream regulators were determined using IPA software from differentially expressed genes in blood FMC from wounded post-partum mice as compared with unwounded counterparts. Canonical pathways are expressed as a Z score. In (A-E), RNA sequencing was performed in post-partum mice left unwounded (n=3) or 1 day after performing one 6-mm cutaneous wound (n=3 mice).
upregulated genes and 540 downregulated genes (Figure 4E). Using the Mouse Gene Atlas we identified several factors associated with bone marrow and placenta signatures in upregulated genes (Figure 4F), likely to reflect the contribution of skin-recruited FMC upon wounding. Collectively, these results demonstrate that FMC are able to improve wound healing several months after gestation in a SCD mouse model displaying severely altered healing.
Leg ulcer burden in sickle cell disease patients is decreased during the post-partum period
Complete healing of leg ulcers of SCD patients has been reported during pregnancy,19,20 leading to the hypothesis that this could represent a favorable effect of fetal cell transfer to the mother. As FMC have been described to persist at least several decades after pregnancy in women,15 we investigated the prevalence and severity of leg ulcers in a cohort of female patients followed for a genetic red blood cell disease in Mondor SCD referral center (Paris, France). We identified 79 women who presented with leg ulcers. Nineteen patients were nulliparous, while 60 had had at least one pregnancy. Most of these patients had SCD with a homozygous SS genotype (Table 1).
In the nulliparous and parous groups we investigated different clinical and biological parameters related to disease severity such as history of vaso-occlusive crises, acute chest syndrome or renal dysfunction, and levels of hemoglobin, reticulocytes, leukocytes, lactate dehydrogenase, total bilirubin and fetal hemoglobin. We previously showed that SCD patients with leg ulcers have SCD hemolytic complications more frequently than do patients without ulcers.2,7 Accordingly, patients in this cohort had clinical and biological features of severe disease. However, none of these parameters was statistically different between nulliparous and parous women with ulcers (Table 1). We then assessed the prevalence of other risk factors for leg ulcers including venous insufficiency, arteriopathy, diabetes, arterial hypertension, vein thrombosis, vasculitis, human immunodeficiency virus infection, autoimmunity, history of smoking, and body mass index (Table 1). Again, there were no differences between the two groups. In addition, expo-
sure to hydroxyurea, as measured by the cumulative duration of treatment and dose, was not different between nulliparous and parous SCD patients ruling out an effect of this parameter on leg ulcers (Table 1). Of note, hydroxyurea was suspended during pregnancies in all women but one. However, parous SCD patients were significantly older (by 6.9 years) than nulliparous women (Table 1). We therefore measured the prevalence of leg ulcers after adjustment for age and found that parous SCD patients had a decreased total number of ulcers (P=0.057) and fewer episodes of ulcers (P=0.012) (Figure 5A, B). We also compared the adjusted rate of ulcers between the pre-partum and postpartum periods in parous SCD patients who had had leg ulcers before their first pregnancy. This analysis revealed a significantly reduced total number of leg ulcers (P=0.003) and episodes of leg ulcers (P=0.004) in the post-partum period as compared with the pre-partum period (Figure 5C, D). We also observed a tendency to fewer episodes of ulcers with increased parity, but not gravidity (Figure 5E, F). We then explored eight items reflecting the severity of leg ulcers: need for hospitalization or sick leave, rate of leg ulcer-associated infection and depression, and the following therapeutic options required to treat leg ulcers: morphine, skin graft, bosentan/ilomedin and red blood cell exchange transfusion. Apart from the last, all these items were less frequent in parous SCD patients than in nulliparous ones. However, differences were only statistically significant for morphine use and bosentan or ilomedin treatment (Online Supplementary Figure S1A). In conclusion, these results show a better overall outcome of leg ulcers in parous SCD patients than in nulliparous ones, which could result from FMC mobilization and participation in skin tissue repair.
Discussion
Our work provides evidence that skin wound healing is improved in female mice during and after pregnancy through enhanced vascular angiogenesis and cell proliferation. This was also observed in a mouse model of SCD in which
Haematologica | 108 July 2023 1925 ARTICLE - Maternal sickle cell ulcer repair by fetal cells M. Alkobtawi et al.
wound healing is severely delayed. We demonstrated that cutaneous wounds healed faster in post-partum SAD mice than in virgin littermates. Finally, in SCD female patients with leg ulcers, we found that the course of the ulcers was improved, as assessed through several parameters. We
found that parous women had significantly fewer episodes of leg ulcers throughout their lifetime, particularly during the post-partum period as compared with the pre-partum period, and that their ulcers were less severe. Our data therefore indicate that post-partum females, including
Figure 3. Skin wound healing is improved in post-partum SAD mice with delayed cutaneous healing. (A) Representative images of wounds at days 0, 3, 5 and 7, and planimetry of wound area at days 5 and 7 relative to the original wound area. (B) Representative images of wounds labeled with anti-K14 antibody at day 7. The size of the neo-epidermis relative to the total wound area is provided. (C) Representative images and quantification of Ki67+ cells in the wound bed at day 7. (D) Representative images of CD31+ cells and quantification of vessel area in the wound bed at day 7. Scale bars represent 1000 mm (B) or 50 mm (C, D). In (B-D), nuclei were counterstained with DAPI. In (A-D), one 8-mm excisional wound was performed in virgin mice (n=4) or post-partum SAD mice (n=5). Data are presented as means with standard deviations and individual values. Statistical analyses were performed with two-tailed t tests with the Welch correction whenever required (A, C) or Mann-Whitney test (B, D). ns: not statistically significant; *P<0.05; ***P<0.0005.

A C B D Haematologica | 108 July 2023 1926 ARTICLE - Maternal sickle cell ulcer repair by fetal cells M. Alkobtawi et al.

Continued on following page. A C B D E F Haematologica | 108 July 2023 1927 ARTICLE - Maternal sickle cell ulcer repair by fetal cells M. Alkobtawi et al.
Figure 4. Characterization of fetal microchimeric cells in wounds in post-partum SAD mice. (A) Heatmap showing genes, ordered by transcripts per million (TPM) and with TPM >50, expressed in eGFP+ fetal microchimeric cells (FMC) sorted from digested wounds of post-partum SAD mice at day 3. No comparison was performed in order to display the main genes expressed by FMC recruited in wounds. Membrane receptors previously reported to be enriched in blood FMC of wounded pregnant mice17 are shown. Data are presented as log2 TPM. (B) ARCHS4 enrichment analysis of the 500 most expressed genes in sorted eGFP+ FMC of post-partum SAD wounds. (C) Graphical summary obtained upon transcriptional analysis, using ingenuity pathway analysis (IPA) software, of sorted eGFP+ FMC from harvested wounds of post-partum SAD mice at day 3 after the injury. (D) Representative images of CD31+ and CD45+ cells co-stained with GFP in wound beds of post-partum SAD mice. White arrowheads show double-stained cells. The quantification of double-stained cells at day 5 is shown. Nuclei were counterstained with DAPI. Data are presented as means ± standard deviations and individual values. Scale bars represent 50 mm. (E) Volcano plot showing differentially expressed genes between wounds of post-partum and virgin SAD mice. Blue dots and red dots represent, respectively, downregulated and upregulated genes in wounds in post-partum mice compared with those in virgin mice. The labeled genes correspond to selected bone marrow and placental genes. (F) Mouse Gene Atlas enrichment analysis of upregulated genes in wounds in post-partum SAD mice as compared with wounds in virgin SAD mice. In (A-C, E and F), one 6-mm excisional wound was performed in post-partum SAD mice (n=2 mice for A-C, and n=3 mice for E and F) or virgin SAD mice (n=2 mice). In (D), one 8-mm excisional wound was performed in virgin mice (n=4) or post-partum SAD mice (n=5).
those suffering from SCD, heal better than nulliparous ones. While the transfer of FMC to mothers increases steadily during pregnancy, it decreases swiftly after delivery.21,22 In women, around 40-470 fetal cells per 106 maternal cells were found in maternal organs during or shortly after pregnancy,23 whereas this rate drops to 2-10 fetal cells per 106 maternal bone marrow cells 30 to 50 years after delivery.15 Despite this reduction, FMC seem able to exit their niche in the marrow and reach an injured maternal tissue.24 In this study, we observed an efficient recruitment of FMC to the wound bed of post-partum mice both during normal and altered healing and demonstrated that these cells, despite their low number, may have a beneficial role during skin wound healing long after pregnancy.
Leg ulcers represent a frequent and severe complication of SCD associated with an overall decreased survival.25 Life quality is impaired in SCD patients with leg ulcers, and can be evaluated through the substantial rates of depression, severe pain requiring class III opioid treatment, as well as the prolonged evolution and frequent relapses of the skin ulcers.3,4 Despite extensive efforts, treating leg ulcers remains challenging with high rates of failure or relapse regardless of the cause.26 Stem cell therapy has gained a lot of attention in recent years.27 Two pilot studies evaluating therapies using autologous adipose-derived stem cells28 or bone marrow mononuclear cells29 to treat SCD ulcers showed favorable outcomes. Besides, in another genetic disease leading to severe skin ulcers, namely recessive dystrophic epidermolysis bullosa, recent phase I/II clinical trials found partial efficacy of intravenous infusions of allogeneic ABCB5+ dermal mesenchymal stem cells (MSC),30 human umbilical cord blood-derived MSC,31 or bone marrow-derived MSC.32 While these studies acknowledged the current good tolerance of these donor-derived cell preparations, beneficial effects were only transient despite high concentrations of infused MSC (1x10⁶-4x10⁶ cells per kg of body weight).30–32 This is in agreement with these cells’ primary function as microenvironment modulators, mainly through paracrine factors and extracellular vesicle release, but highlights their limited long-term engraftment.33
Considering the multiple and complex steps needed for stem cell-based therapy as well as its transient effect, an alternative strategy for regenerative medicine consists in triggering FMC recruitment. Fetal cell microchimerism occurs very early during pregnancy and can be detected in the mothers as soon as 6 weeks of gestation.21 Several groups have demonstrated that FMC include CD34+CD38–and CD34+CD38+ hematopoietic progenitors,35,36 CD34+CD31+ endothelial progenitors,37 and CD45–CD14–CD68–CD34–SH2+Vimentin+Collagen type I– MSC.38 A few studies also documented the expression of pluripotent stem cell markers such as Oct-4, Nanog, Rex1 and Sox2 in FMC.39,40 While these cells enter the maternal bone marrow niche at steady state, they are able to respond to a maternal injury, proliferate and migrate to the damaged organ where they have a multilineage potential,41 as demonstrated in the brain, thyroid, lungs, heart, liver, gut, kidney, bone and skin in mice as in humans.42-44 We previously showed that CD34+CD11b+CD31+ FMC are recruited to the granulation tissue of maternal skin wounds in pregnant mice where they contribute to maternal repair similarly to adult marrow cells. During the early stages of wound healing, FMC mainly differentiate into CD45+ leukocytes, while at later stages, they mostly differentiate into αSMA+ mural cells and CXCL1secreting VWF+ endothelial cells that are able to form fetalderived vessels connected to the maternal circulation.16,17 We were able to show here that circulating FMC contained progenitors capable of forming colonies with a higher potential than their adult counterparts. In addition, fetal cells recruited to cutaneous wounds differentiate into leukocytes and endothelial cells in post-partum SAD mice. These results indicate that FMC are still potent contributors to maternal skin repair after parturition, opening the way for a new therapeutic option to treat delayed wound healing in post-partum women.
The relevance of these murine results needs to be confirmed in SCD patients. However, the course and severity of leg ulcers in SCD remain difficult to assess, as retrospective studies have specific biases that may confuse data analysis. We therefore chose to study multiple outcome
Haematologica | 108 July 2023 1928 ARTICLE - Maternal sickle cell ulcer repair by fetal cells M. Alkobtawi et al.
measurements collected from a single center to reduce variability. As a consequence, we cannot be certain that our cohort is fully representative of the general population of female SCD patients, but it is rather representative of SCD patients with ulcers. Indeed, we confirmed a higher rate of SCD hemolytic complications in our patients as previously published in SCD patients with leg ulcers.2,7 Our data indi-
cate that the burden related to leg ulcers is reduced in parous SCD female patients, as measured by the age-adjusted total number of ulcers and ulcer episodes. We found no significant difference between nulliparous and parous SCD women in other risk factors for leg ulcers, including venous insufficiency, arteriopathy, diabetes, obesity, smoking, vasculitis, human immunodeficiency virus infection, or
Data are presented as number of cases with percentage of total events or mean ± standard deviation. Statistical analyses were performed with a *Fisher exact test, °Mann-Whitney test or ^unpaired t test. G6PD: glucose 6-phosphate dehydrogenase; na: not applicable; SD: standard deviation; HIV; human immunodeficiency.
Nulliparous (N=19) Parous (N=60) P value Sickle cell disease diagnosis Sickle cell disease genotype Homozygous sickle cell disease (SS), N (%) Sickle cell ⁄ hemoglobin C (SC), N (%) 18 (94.7) 0 (0.0) 51 (85.0) 6 (10.0) 0.4365* (SS vs non-SS genotypes) Sickle cell ⁄ β-thalassemia (Sβ), N (%) 0 (0.0) 2 (3.3) β-thalassemia (β0), N (%) 1 (5.3) 1 (1.7) Concurrent G6PD deficiency, N (%) 1 (5.3) 6 (10.0) > 0.9999* Concurrent α-thalassemia (> 2 mutated genes), N (%) 0 (0.0) 3 (5.0) > 0.9999* Sickle cell disease severity Prior vaso-occlusive crisis, N (%) 19 (100) 60 (100.0) > 0.9999* Prior acute chest syndrome, N (%) 14 (73.7) 50 (83.3) 0.3383* Renal dysfunction, N (%) 14 (73.7) 34 (56.7) 0.2811* Sickle cell disease biological characteristics at steady state Hemoglobin, g/dL, mean ± SD 7.8 ± 1.0 8.2 ± 1.3 0.4814° Reticulocytes, x 109/L, mean ± SD 224.7 ± 106.7 248.9 ± 114.6 0.4819° Platelets, x 109/L, mean ± SD 401.8 ± 158.7 355.5 ± 114.4 0.1673^ Leukocytes, x 109/L, mean ± SD 10.4 ± 4.1 10.4 ± 3.3 0.6509° Fetal hemoglobin, %, mean ± SD 7.5 ± 5.4 7.3 ± 5.4 0.8301° Lactate dehydrogenase, U/L, mean ± SD 496.5 ± 227.7 466.0 ± 242.3 0.4712° Total bilirubin, mmol/L, mean ± SD 38.8 ± 30.2 44.5 ± 27.7 0.2314° Obstetric history Gravidity, N, mean ± SD na 3.2 ± 2.0 na Parity, N, mean ± SD na 1.7 ± 1.3 na Hydroxyurea taken during pregnancies, N (%) na 1 (1.6) na Risk factors for leg ulcers Venous insufficiency, N (%) 3 (15.8) 13 (21.7) 0.7485* Arteriopathy, N (%) 0 (0.0) 2 (3.3) > 0.9999* Diabetes, N (%) 0 (0.0) 5 (8.3) 0.3293* Arterial hypertension, N (%) 5 (26.3) 17 (28.3) > 0.9999* History of smoking, N (%) 1 (5.3) 13 (21.7) 0.1678* History of venous thrombosis, N (%) 5 (26.3) 23 (38.3) 0.4168* History of vasculitis, N (%) 1 (5.3) 2 (3.3) 0.5673* History of positive autoantibodies, N (%) 6 (31.6) 17 (28.3) 0.7703* HIV infection, N (%) 0 (0.0) 0 (0.0) > 0.9999* Body mass index, kg/m2, mean ± SD 20.9 ± 3.0 22.8 ± 4.4 0.1638° Hydroxyurea: cumulative duration of treatment, months, mean ± SD 104.5 ± 64.4 93.6 ± 73.7 0.4226° Hydroxyurea: cumulative dose, g, mean ± SD 2,646 ± 1529 2,523 ± 2,234 0.3687° Hydroxyurea: cumulative dose, g/year of life, mean ± SD 69.6 ± 48.6 54.3 ± 53.6 0.1466° Age at inclusion, years, mean ± SD 42.2 ± 11.9 49.1 ± 10.5 0.017^
Table 1. Characteristics of the patients included in the study.
Haematologica | 108 July 2023 1929 ARTICLE - Maternal sickle cell ulcer repair by fetal cells M. Alkobtawi et al.
Figure 5. The frequency of leg ulcers was lower in parous women with sickle cell disease than in nulliparous women with sickle cell disease. (A, B) Total number of ulcers (A) and total number of episodes of ulcers (B) expressed as a normalized ratio over the age of each patient in the groups of nulliparous and parous patients with sickle cell disease (SCD). (C, D) Total number of ulcers (C) and total number of episodes of ulcers (D) expressed as a normalized ratio over the duration of prepartum (from the first leg ulcer to the first pregnancy) and post-partum (from the first pregnancy to the last follow-up date) periods for each parous SCD patient who developed leg ulcers before the first pregnancy. (E, F) Correlation of normalized number of episodes of ulcers/year of life with gravidity (E) and parity (F). The linear regression curve is in red and its 95% confidence interval is in dashed black. Nineteen SCD patients with leg ulcers were included in the nulliparous group and 60 in the parous group. For the analysis of prepartum and post-partum periods, 24 SCD patients were included. Data are presented as means ± standard deviations and individual values (A-D) or individual values (E, F). Statistical analyses were performed with a Mann-Whitney test (A, B), Wilcoxon matched-pairs signed rank test (C, D) or simple linear regression (E, F). ns: not statistically significant; *P<0.05; **P<0.005.

A C B D E F Haematologica | 108 July 2023 1930 ARTICLE - Maternal sickle cell ulcer repair by fetal cells M. Alkobtawi et al.
autoimmunity. Besides, there was no difference in the exposure to hydroxyurea. This treatment has been associated with anti-angiogenic effects,45 and with an increased risk for leg ulcers.46 Importantly, in parous SCD patients, there was a significant reduction in total number of leg ulcers and in episodes of leg ulcers during the post-partum period as compared with the pre-partum period. Taken together, these findings support a beneficial effect of pregnancy on the course of SCD leg ulcers, at least partly through fetomaternal microchimerism. Concordantly, male SCD patients are more likely to have leg ulcers than women.5,7 A demonstration of the presence of FMC in post-partum SCD ulcers would have been important; however, it was not possible to obtain this information for ethical reasons, since biopsies worsen leg ulcers, especially in SCD patients. We observed that circulating and wound-recruited FMC in post-partum mice have a transcriptional profile close to that of cord blood cells and CD34+ progenitors. Whether these fetal cells consist of a homogeneous population of multipotent progenitors or a mixture of different progenitors with different potentialities has yet to be investigated. Post-partum FMC express high levels of several cytokine and transmembrane receptors, including Ccr2 mRNA, whose expression we previously found to be enhanced in circulating FMC in pregnant females upon injury.17 This suggests that long-term engrafted fetal progenitors may be poised to respond to a maternal injury.
Since SCD ulcers are very severe and frequently resistant to usual therapies the improvement we observed in parous women appears a major result. We previously showed the possibility of amplifying FMC recruitment using low doses of chemokines that selectively recruit fetal cells;17 this could be an interesting therapeutic strategy in SCD to expand the healing effect of FMC. Self-regenerating properties are likely to explain why a very low number of fetal stem cells is able to rescue healing. While triggering the recruitment and amplification of FMC in situ appears a valid strategy in postpartum women, one would need to identify which FMC types are better at supporting wound repair in order to target them specifically. However, this strategy is not possible in nulliparous women and men, but using other fetal-derived products could be an option in these populations. We could explore pro-healing molecules secreted by FMC and present in the fetal secretome as new treatments for skin wounds. Another interesting option could be to use fetal stem cells from other sources, as demonstrated with human umbilical cord blood-derived MSC.31 Lastly, human amniotic fluid stem cells have been shown to accelerate wound healing by enhancing re-epithelialization and reducing fibrotic scarring.48,49
In conclusion, our work indicates that pregnancy leads to
improved skin repair in mice, as well as in women suffering from SCD, likely through the recruitment of FMC. As FMC are detectable in about 63% of all women in western countries,50 FMC-based therapy could represent a new and original advantage for cutaneous, and presumably extra-cutaneous repair, in women who have previously been pregnant, even in the case of a miscarriage. As the beneficial effects of parity observed in mice studies or in human epidemiological studies remain limited, such a strategy would need a good way to stimulate FMC mobilization to the injured tissue.17 This requires future studies to characterize the FMC repertoire precisely in order to offer safe and effective options to amplify their recruitment and harness their full therapeutic potential in SCD patients.
Disclosures
The authors have no conflicts of interest to disclose regarding the publication of this article. MA, MS, KS, TNQ, HA, HG, AH, and PB declare no conflicts of interest. DN declares having received a research grant from Leo Pharma. MC is currently scientific director of Scarcell Therapeutics. SA has received a research grant from Novartis. SA and BO have received grants from BMS, Abbvie and Novartis to attend congresses.
Contributions
SA, MC and BO conceived the study and designed the experiments. MA, MS, KS, TNQ, DN, HG, AH, PB, MC and BO performed experiments, and collected and analyzed data. HA performed computational analyses . SA and BO wrote the manuscript with input from all the authors.
Acknowledgments
We are grateful to all members of the Cutaneous Biology Laboratory for helpful discussions. We are grateful to the Genom’IC platform and animal facility of Institut Cochin, the flow cytometry facilities of Institut Curie and the imaging centers of Institut Cochin and Centre de Recherche St Antoine for technical support. We particularly thank Benjamin Saintpierre and Lucie Adoux for their help with RNA-sequencing experiments and analyses.
Funding
This work was funded by grants to SA from ANR (19-CE170025-04-NatStem) and to BO from INSERM-Fondation Bettencourt Schueller (R20011KS).
Data-sharing statement
There are no restrictions on the availability of any material, data or information we describe. All data are available from the authors upon reasonable request.
Haematologica | 108 July 2023 1931 ARTICLE - Maternal sickle cell ulcer repair by fetal cells M. Alkobtawi et al.
References
1. Kato GJ, Piel FB, Reid CD, et al. Sickle cell disease. Nat Rev Dis Prim. 2018;4(1):18010.
2. Halabi-Tawil M, Lionnet F, Girot R, Bachmeyer C, Lévy PP, Aractingi S. Sickle cell leg ulcers: a frequently disabling complication and a marker of severity. Br J Dermatol. 2007;158(2):339-344.
3. Senet P, Blas-Chatelain C, Levy P, et al. Factors predictive of leg-ulcer healing in sickle cell disease: a multicentre, prospective cohort study. Br J Dermatol. 2017;177(1):206-211.
4. Halabi-Tawil M, Lionnet F, Girot R, Bachmeyer C, Lévy PP, Aractingi S. Sickle cell leg ulcers: a frequently disabling complication and a marker of severity. Br J Dermatol. 2008;158(2):339-344.
5. Koshy M, Entsuah R, Koranda A, et al. Leg ulcers in patients with sickle cell disease. Blood. 1989;74(4):1403-1408.
6. Kato GJ, McGowan V, Machado RF, et al. Lactate dehydrogenase as a biomarker of hemolysis-associated nitric oxide resistance, priapism, leg ulceration, pulmonary hypertension, and death in patients with sickle cell disease. Blood. 2006;107(6):2279-2285.
7. Nolan VG, Adewoye A, Baldwin C, et al. Sickle cell leg ulcers: associations with haemolysis and SNPs in Klotho, TEK and genes of the TGF-beta/BMP pathway. Br J Haematol. 2006;133(5):570-578.
8. Morris CR. Mechanisms of vasculopathy in sickle cell disease and thalassemia. Hematology. 2008;2008(1):177-185.
9. Dubert M, Elion J, Tolo A, et al. Degree of anemia, indirect markers of hemolysis, and vascular complications of sickle cell disease in Africa. Blood. 2017;130(20):2215-2223.
10. Rietschel RL. Skin lesions in paroxysmal nocturnal hemoglobinuria. Arch Dermatol. 1978;114(4):560.
11. Shanmugam VK, Angra D, Rahimi H, McNish S. Vasculitic and autoimmune wounds. J Vasc Surg Venous Lymphat Disord. 2017;5(2):280-292.
12. Nguyen VT, Nassar D, Batteux F, Raymond K, Tharaux P-L, Aractingi S. Delayed healing of sickle cell ulcers is due to impaired angiogenesis and CXCL12 secretion in skin wounds. J Invest Dermatol. 2016;136(2):497-506.
13. Eming SA, Martin P, Tomic-Canic M. Wound repair and regeneration: mechanisms, signaling, and translation. Sci Transl Med. 2014;6(265):265sr6.
14. Rodrigues M, Kosaric N, Bonham CA, Gurtner GC. Wound healing: a cellular perspective. Physiol Rev. 2019;99(1):665-706.
15. O’Donoghue K, Chan J, De La Fuente J, et al. Microchimerism in female bone marrow and bone decades after fetal mesenchymal stem-cell trafficking in pregnancy. Lancet. 2004;364(9429):179-182.
16. Nassar D, Droitcourt C, Mathieu-d’Argent E, Kim MJ, Khosrotehrani K, Aractingi S. Fetal progenitor cells naturally transferred through pregnancy participate in inflammation and angiogenesis during wound healing. FASEB J. 2012;26(1):149-157.
17. Castela M, Nassar D, Sbeih M, Jachiet M, Wang Z, Aractingi S. Ccl2/Ccr2 signalling recruits a distinct fetal microchimeric population that rescues delayed maternal wound healing. Nat Commun. 2017;8:15463.
18. Trudel M, Saadane N, Garel MC, et al. Towards a transgenic mouse model of sickle cell disease: hemoglobin SAD. EMBO J. 1991;10(11):3157-3165.
19. Droitcourt C, Khosrotehrani K, Girot R, Aractingi S. Healing of sickle cell ulcers during pregnancy: a favourable effect of foetal cell transfer? J Eur Acad Dermatology Venereol. 2008;22(10):1256-1257.
20. Cornbleet T. Spontaneous healing of sickle-cell anemia ulcer in pregnancy. J Am Med Assoc. 1952;148(12):1025-1026.
21. Ariga H, Ohto H, Busch MP, et al. Kinetics of fetal cellular and cell-free DNA in the maternal circulation during and after pregnancy: implications for noninvasive prenatal diagnosis. Transfusion. 2001;41(12):1524-1530.
22. Fujiki Y, Johnson KL, Tighiouart H, Peter I, Bianchi DW. Fetomaternal trafficking in the mouse increases as delivery approaches and is highest in the maternal lung. Biol Reprod. 2008;79(5):841-848.
23. Rijnink EC, Penning ME, Wolterbeek R, et al. Tissue microchimerism is increased during pregnancy: a human autopsy study. Mol Hum Reprod. 2015;21(11):857-864.
24. Cómitre-Mariano B, Martínez-García M, García-Gálvez B, et al. Feto-maternal microchimerism: memories from pregnancy. iScience. 2022;25(1):103664.
25. Minniti CP, Eckman J, Sebastiani P, Steinberg MH, Ballas SK. Leg ulcers in sickle cell disease. Am J Hematol. 2010;85(10):831-833.
26. Aleksandrowicz H, Owczarczyk-Saczonek A, Placek W. Venous leg ulcers: advanced therapies and new technologies. Biomedicines. 2021;9(11):1569.
27. Raghuram AC, Yu RP, Lo AY, et al. Role of stem cell therapies in treating chronic wounds: a systematic review. World J Stem Cells. 2020;12(7):659-675.
28. Farina Junior JA, De Santis GC, Orellana MD, et al. Autologous adipose-derived stem cell for painful leg ulcers in patients with sickle cell disease. A preliminary study. Br J Haematol. 2019;186(3):e47-e50.
29. Meneses JVL, Fortuna V, de Souza ES, et al. Autologous stem cell-based therapy for sickle cell leg ulcer: a pilot study. Br J Haematol. 2016;175(5):949-955.
30. Kiritsi D, Dieter K, Niebergall-Roth E, et al. Clinical trial of ABCB5+ mesenchymal stem cells for recessive dystrophic epidermolysis bullosa. JCI Insight. 2021;6(22):e151922.
31. Lee SE, Lee S-J, Kim S-E, et al. Intravenous allogeneic umbilical cord blood–derived mesenchymal stem cell therapy in recessive dystrophic epidermolysis bullosa patients. JCI Insight. 2021;6(2):e143606.
32. Rashidghamat E, Kadiyirire T, Ayis S, et al. Phase I/II open-label trial of intravenous allogeneic mesenchymal stromal cell therapy in adults with recessive dystrophic epidermolysis bullosa. J Am Acad Dermatol. 2020;83(2):447-454.
33. Krampera M, Le Blanc K. Mesenchymal stromal cells: putative microenvironmental modulators become cell therapy. Cell Stem Cell. 2021;28(10):1708-1725.
34. Kinder JM, Stelzer IA, Arck PC, Way SS. Immunological implications of pregnancy-induced microchimerism. Nat Rev Immunol. 2017;17(8):483-494.
35. Bianchi DW, Zickwolf GK, Weil GJ, Sylvester S, DeMaria MA. Male fetal progenitor cells persist in maternal blood for as long as 27 years postpartum. Proc Natl Acad Sci U S A. 1996;93(2):705-708.
36. Guetta E, Gordon D, Simchen MJ, Goldman B, Barkai G. Hematopoietic progenitor cells as targets for non-invasive prenatal diagnosis: detection of fetal CD34+ cells and assessment of post-delivery persistence in the maternal circulation. Blood Cells Mol Dis. 2003;30(1):13-21.
37. Parant O, Dubernard G, Challier JC, et al. CD34+ cells in maternal placental blood are mainly fetal in origin and express endothelial markers. Lab Investig. 2009;89(8):915-923.
38. O’Donoghue K. Identification of fetal mesenchymal stem cells in maternal blood: implications for non-invasive prenatal
Haematologica | 108 July 2023 1932 ARTICLE - Maternal sickle cell ulcer repair by fetal cells M. Alkobtawi et al.
diagnosis. Mol Hum Reprod. 2003;9(8):497-502.
39. Mikhail MA, M’Hamdi H, Welsh J, et al. High frequency of fetal cells within a primitive stem cell population in maternal blood. Hum Reprod. 2008;23(4):928-933.
40. Cismaru CA, Soritau O, Jurj A-M, et al. Isolation and characterization of a fetal-maternal microchimeric stem cell population in maternal hair follicles long after parturition. Stem Cell Rev Rep. 2019;15(4):519-529.
41. Khosrotehrani K. Transfer of fetal cells with multilineage potential to maternal tissue. JAMA. 2004;292(1):75.
42. Bianchi DW, Khosrotehrani K, Way SS, MacKenzie TC, Bajema I, O’Donoghue K. Forever connected: the lifelong biological consequences of fetomaternal and maternofetal microchimerism. Clin Chem. 2021;67(2):351-362.
43. Boddy AM, Fortunato A, Wilson Sayres M, Aktipis A. Fetal microchimerism and maternal health: a review and evolutionary analysis of cooperation and conflict beyond the womb. Bioessays. 2015;37(10):1106-1118.
44. Cismaru CA, Pop L, Berindan-Neagoe I. Incognito: are microchimeric fetal stem cells that cross placental barrier real emissaries of peace? Stem Cell Rev Rep. 2018;14(5):632-641.
45. Lopes FCM, Ferreira R, Albuquerque DM, et al. In vitro and in vivo anti-angiogenic effects of hydroxyurea. Microvasc Res. 2014;94:106-113.
46. Sirieix M-E, Debure C, Baudot N, et al. Leg ulcers and hydroxyurea. Arch Dermatol. 1999;135(7):818-820.
47. Ritzel RM, Patel AR, Spychala M, et al. Multiparity improves outcomes after cerebral ischemia in female mice despite features of increased metabovascular risk. Proc Natl Acad Sci U S A. 2017;114(28):E5673-E5682.
48. Fukutake M, Ochiai D, Masuda H, et al. Human amniotic fluid stem cells have a unique potential to accelerate cutaneous wound healing with reduced fibrotic scarring like a fetus. Hum Cell. 2019;32(1):51-63.
49. Sun Q, Li F, Li H, et al. Amniotic fluid stem cells provide considerable advantages in epidermal regeneration: B7H4 creates a moderate inflammation microenvironment to promote wound repair. Sci Rep. 2015;5(1):11560.
50. Gilmore GL, Haq B, Shadduck RK, Jasthy SL, Lister J. Fetalmaternal microchimerism in normal parous females and parous female cancer patients. Exp Hematol. 2008;36(9):1073-1077.
Haematologica | 108 July 2023 1933 ARTICLE - Maternal sickle cell ulcer repair by fetal cells M. Alkobtawi et al.
Longitudinal analysis of the evolution of cellular immunity to SARS-CoV-2 induced by infection and vaccination
There is emerging evidence that T-cell immunity plays an important role in preventing severe coronavirus disease 2019 (COVID-19) infection and disease and that cellular immune deficiencies render individuals at increased risk of disease progression and COVID-19-related death.1,2 However, longitudinal studies that comprehensively assess the quantity, quality, diversity, and stability of the Tcell immune response induced by the currently approved vaccines or severe acute respiratory syndrome coronavirus 2 (SARS-CoV-2) infection in healthy subjects are lacking. Here we provide such an assessment of COVID-19 T-cell responses in 27 healthy subjects with diverse HLA types (Table 1), five of whom were first infected and then vaccinated and 22 who were vaccinated. In these individuals we serially assessed immunity over a 2-year period in order to provide a detailed characterization (through kinetics of emergence and expansion, magnitude, polyclonality, functional capacity, and longevity) of COVID-19 T-cell responses.
To characterize the tempo of emergence, profile (polyclonality and specificity), and stability of induced cellular immunity over time, we investigated the frequency of interferon gamma (IFNγ)-producing T cells in samples spanning 2 years. First, we performed a single round of in vitro stimulation in which peripheral blood mononuclear cells (collected with informed consent under a Baylor College of Medicine institutional review board-approved protocol [H-7634]) were exposed to overlapping peptide libraries (pepmixes) spanning four structural proteins (spike [S], nucleocapsid [N], membrane [M], and envelope [E]), and 14 non-structural proteins (NSP) (AP7a, AP7b, AP8, NSP1, 3, 4, 5, 6, 10, 12, 13, 14, 15, and 16) followed by culture in a G-Rex24 well plate in medium supplemented with the cytokines interleukin-4 and interleukin-7 for 10-13 days. The frequency and specificity of reactive cells were quantified by enzyme-linked immunospot analysis, while polyclonality/T-cell receptor (TCR) diversity was assessed by flow cytometric analysis using the IOTest Beta Mark kit.
Five of the 27 study participants became infected with SARS-CoV-2 (but did not require hospitalization) and were subsequently vaccinated (SARS-CoV-2-infected cohort). At baseline these subjects exhibited minimal anti-SARSCoV-2 T-cell activity. However, upon infection all mounted potent and robust immune responses to a range of structural and non-structural antigens (Figure 1A). To identify which antigens were immunodominant we examined T-cell reactivity against these antigens individually. All five sub-
jects recognized S, as determined by spot-forming cells (SFC) (median: 3,892; range, 2,917-7,353 SFC/2×105 peripheral blood mononuclear cells; peak detection, 3-5 months post-infection), M (median: 1,966; range, 547-11,261), and N (median: 1,994; range, 1,712-6,457), while NSP4 and AP7a reactivity was detected in three and two subjects, respectively. Activity against the other antigens was minimal and varied from subject to subject. The data are summarized in Figure 1B and detailed for each subject and timepoint assessed in Online Supplementary Table S1. We next sought to understand the impact of the spiketargeted vaccines on both spike and non-spike-specific T cells in infected subjects with SARS-CoV-2 memory T-cell responses. To do this we analyzed the frequency of reactive T cells over time. Within 3-6 months of infection, all five subjects had been vaccinated with a primary vaccine series (n=2 Pfizer; n=2 Moderna; n=1 J&J), which resulted in a 1.4-fold increase in spike-responsive T cells (from a peak of 4,909 SFC/2×105 peripheral blood mononuclear cells post-infection to a peak of 6,706 SFC/2×105 postvaccination). In contrast, the vaccine had minimal impact on T cells reactive against non-spike SARS-CoV-2 antigens (“bystander” T cells) (Figure 1C). Administration of a booster dose (n=4 Pfizer; n=1 Moderna) resulted in the same pattern of activity with an expansion and subsequent contraction and stabilization of spike-reactive T cells, and minimal impact on bystander T cells. Finally, to assess the stability of the memory T-cell response we examined the frequency of reactive cells in a longitudinal manner. For immunity that was induced by the virus and not boosted thereafter (i.e., bystander cells), T-cell reactivity peaked 3-5 months after the initial infection, then contracted and plateaued approximately 4 months later. Thereafter T-cell levels remained relatively stable for the duration of the study. In contrast, spike-specific T cells induced by the virus were amplified by the primary and booster vaccine series. Hence, proportionally, spike-directed T cells induced by viral infection initially accounted for approximately one third of the total anti-SARS-CoV-2 immune response, but after administration of primary and booster vaccines they accounted for up to 65% of the total anti-SARS-CoV-2 response (Figure 1D).
We next examined T-cell immunity in the 22 infectionnaïve individuals whose first immune exposure to SARSCoV-2 was via vaccination (vaccine-only cohort; n=19 Pfizer; n=3 Moderna). The magnitude, specificity, impact of vaccine (primary and booster), and stability of response
Haematologica | 108 July 2023 1934 LETTER TO THE EDITOR
Infected donors
over time are summarized in Figure 1E-H while Online Supplementary Table S1 includes detailed results for each subject and time-point. Prior to vaccine administration these healthy subjects had minimal anti-SARS-CoV-2 Tcell activity. However, within 2 months of primary vaccination all 22 patients mounted a potent and specific response to the spike protein (median: 7,051; range, 72113,334 SFC/2×105 peripheral blood mononuclear cells), with minimal to no evidence of response to any of the other structural/non-structural proteins. After the primary vaccine series, there was a contraction and subsequent stabilization of spike-reactive T cells, which increased with booster vaccination. In the vaccine-only cohort, age had no impact on magnitude or duration of response to vaccine (6 patients >50 years, 16 patients <50 years) (Online Supplementary Figure S1).
All participants were monitored for SARS-CoV-2 infection for the duration of the study. Notably, one out of 22 of our
initially infection-naïve subjects experienced an infection after administration of the booster dose of vaccine, resulting in the amplification of memory spike-specifi c T cells as well as the induction of de novo T-cell responses against other immunogenic structural and non-structural proteins (Online Supplementary Figure S2). Hence, exposure to the virus in this subject induced a broad and polyclonal response against multiple SARS-CoV-2 antigens post-vaccination.
To investigate the magnitude and breadth of T-cell activity induced by the spike vaccine in infection-naïve subjects (n=22) and those with pre-existing immunity prior to vaccination (n=5), we compared spike T-cell responses between the two cohorts. As shown in Figure 2A, the peak magnitude of the anti-spike T-cell immune response was similar in the two cohorts and stabilized at similar levels post-infection/vaccination. Furthermore, when we compared the TCR diversity by isolating spike-directed IFNγ-
Table 1. Donors’ demographics.
Donor ID Age, years Gender Race HLA-A HLA-B HLA-C HLA-DR HLA-DQ Vaccine/Booster D#1 58 F White 02,11 18,44 05,07 04,04 03,03 Pfizer/Pfizer D#2 34 F Asian 24,68 15,35 nd 11,15 03,05 Moderna/Moderna D#3 28 M Hispanic 02,11 15,40 01,02 08,09 03,04 Moderna/Pfizer D#4 34 M Asian 24,24 07,13 04,07 07,12 02,03 J &J/Pfizer D#5 43 F African American 02,36 35,58 03,04 11,13 03,06 Pfizer/Pfizer
Donor ID Age, years Gender Race HLA-A HLA-B HLA-C HLA-DR HLA-DQ Vaccine/Booster D#6 65 F White 02,03 13,35 04,04 01,01 01,01 Pfizer/Pfizer D#7 33 F White 02,02 44,44 05,16 01,04 05,03 Pfizer/Pfizer D#8 35 M White 26,32 38,44 05,12 01,04 03,03 Pfizer/Pfizer D#9 66 F White 02,11 07,08 07,07 03,15 02,06 Pfizer/Pfizer D#10 39 F Hispanic 02,33 14,15 nd 11, 11 03,03 Pfizer/Pfizer D#11 50 M White 30,33 14,41 nd 03,13 02,06 Pfizer/Pfizer D#12 62 F Asian 02,02 35,52 nd 15,15 06,06 Pfizer/Pfizer D#13 48 F White 25,32 15,53 nd 11,13 03,05 Pfizer/Pfizer D#14 54 F White 02,02 27,44 nd 11,16 03,05 Moderna/Moderna D#15 38 M Asian 02,24 13,35 03,03 12,15 03,06 Pfizer/Pfizer D#16 34 F Asian 02,33 13,51 04,07 04,15 03,06 Pfizer/Pfizer D#17 46 F White 01,24 08,18 07,07 01,03 02,05 Pfizer/Pfizer D#18 26 F Asian 32,33 15,58 03,07 03,16 02,05 Pfizer/Pfizer D#19 37 F Asian 24,31 07,13 03,07 15,15 06,06 Pfizer/Pfizer D#20 29 F Asian 24,33 44,54 01,14 04,13 04,06 Pfizer/Pfizer D#21 53 F White 03,24 08,35 nd 03,04 02,03 Pfizer/Pfizer D#22 37 F Asian 02,33 46,58 03,08 03,09 02,03 Pfizer/Pfizer D#23 30 M Hispanic 02,68 15,35 01,04 09,15 03,06 Pfizer/Pfizer D#24 28 M White 03,23 07,49 07,07 11,15 03,06 Pfizer/Pfizer D#25 42 F White 02,02 07,15 01,07 09,11 03,03 Moderna/Moderna D#26 32 M Hispanic 02,24 35,39 04,07 09,11 03,03 Moderna/Moderna D#27 37 M Asian 11,24 08,52 02,12 03,03 02,02 Pfizer/Pfizer F: female; M: male; nd: not done. Haematologica | 108 July 2023 1935 LETTER TO THE EDITOR
Vaccinated donors
producing T cells (IFNγ secretion assay-detection kit, Miltenyi Biotec) and examining the TCRvβ repertoire we saw no difference in the breadth of T-cell activity (Figure 2B). Considering all the data, there was no quantitative or qualitative difference between the spike-directed T-cell immune response induced by vaccine or SARS-CoV-2 virus.
This longitudinal T-cell study revealed that the kinetics of antiviral immunity induced by the anti-SARS-CoV-2 vaccine and the virus itself were similar. As such, the initial challenge induced a robust expansion in antigen-specific T cells, followed by contraction and then stabilization for ≥1 year of follow-up, which is consistent with a typical Tcell response after the effector phase.3,4 This is in contrast
Figure 1. Immunogenicity of SARS-CoV-2-derived antigens and longitudinal assessment of T-cell immunity. Reactivity against 18 SARS-CoV-2-derived antigens pooled (A, E) and individually (B, F) tested in ex vivo-expanded SARS-CoV-2-specific T cells in 27 healthy subjects as measured by enzyme-linked immunospot assay. Data are shown as spot-forming cells ± standard error of mean. The frequency of spike- and non-spike-reactive T cells is plotted longitudinally in infected+vaccinated (C) and vaccinated subjects (G). Data are shown as spot-forming cells ± standard error of mean; spike immunity is shown as a blue line and non-spike shown in gold. Proportion of anti-SARS-CoV-2 T cells reactive against spike and non-spike proteins in infected+vaccinated subjects (D) versus vaccinated subjects (H). SFC: spot-forming cells; PBMC: peripheral blood mononuclear cells; Pre-I: pre-infection; Mo: month; Post-I: post-infection; Pre-V: pre-vaccination; Post-V: post-vaccination; V1: vaccine dose 1; V2: vaccine dose 2; Pre-B: pre-booster; post-B: post-booster.

A E B C D H G F Haematologica | 108 July 2023 1936 LETTER TO THE EDITOR
to neutralizing antibody levels (induced by either the vaccine or virus) that are associated with protective immunity from re-infection, which decay over time in the majority of individuals.5 Indeed, in a longitudinal analysis performed by Chen and colleagues6 in 92 subjects after symptomatic COVID-19, virus-specific IgG levels decayed substantially in the majority of individuals over 100 days. Similarly, Goel and colleagues7 reported that 61 vaccine recipients had peak antibody levels 1 week after the second vaccine dose and a subsequent decline thereafter with a half-life of ~30 days.
Memory T-cell responses have been shown to be less affected by SARS-CoV-2 viral variants than humoral immunity.8-10 This is likely due to the diverse repertoire of T cells induced by vaccine/viral challenge, which are polyclonal and recognize multiple epitopes within immunogenic antigens. This vast repertoire of activity enables T cells to
react to clinically important viral variants. Given the robust, potent, and stable T-cell activity that is induced upon exposure to the virus and vaccine, as well as the growing evidence of broad T-cell-mediated variant coverage, there are opportunities to exploit this knowledge to guide clinical management. For example, serial monitoring of specific Tcell immunity (in parallel with antibody titers) might serve as a tool to guide the tempo of administration of booster vaccines, particularly in high-risk immune suppressed individuals. Furthermore, a number of groups, including ours, have considered harnessing virus-specific T cells as a COVID-19 therapeutic.11-14 Indeed, our group prepared and cryopreserved banks of virus-specific T cells, which were generated by stimulating peripheral blood mononuclear cells from convalescent healthy donors with pepmixes (overlapping peptide libraries) spanning structural and non-structural immunodominant antigens (based on the
 Figure 2. Spike-specific T-cell immunity in infected versus vaccinated individuals. (A) Levels of spike-reactive T cells in infected and vaccinated subjects as assessed by enzyme-linked immunospot assay in serial samples. Results are presented as spot-forming cells ± standard error of mean. (B) T-cell receptor vβ repertoire of spike-specific T cells present in infected and vaccinated individuals. SFC: spot-forming cells; PBMC: peripheral blood mononuclear cells; Pre-I: pre-infection; Mo: month; Post-I: post-infection; Pre-V: pre-vaccination; Post-V: post-vaccination; V1: vaccine dose 1; V2: vaccine dose 2; Pre-B: pre-booster; post-B: post-booster; TCR: Tcell receptor; Sp+: spike positive; VST: virus-specific T cells.
A B Haematologica | 108 July 2023 1937 LETTER TO THE EDITOR
parental strain sequence). These were administered as a partially HLA-matched product to hospitalized COVID-19 patients and the outcomes are reported in Vasileiou et al.15 We also provided emergency access to a number of investigators including Martits-Chalangari and colleagues,16 who used these cells to successfully treat recalcitrant COVID19 (delta strain) in a heart transplant recipient. These proof-of-concept studies provide further evidence of the importance of T cells in mediating protective antiviral effects and suggest the feasibility of adoptive T-cell therapy for the treatment of COVID-19 in high-risk patients.
Authors
Spyridoula Vasileiou,1* Manik Kuvalekar,1* Yovana Velazquez,1 Ayumi Watanabe,1 Mansi Narula,1 Aster G. Workineh,1 Matthew French-Kim,1 Alejandro Torres Chavez,1 Sarah Gilmore,2 Cliona M. Rooney1 and Ann M. Leen1
1Center for Cell and Gene Therapy, Baylor College of Medicine, Texas Children’s Hospital and Houston Methodist Hospital, Houston, TX and 2AlloVir, Inc., Waltham, MA, USA
*SV and MK contributed equally as co-first authors.
Correspondence:
S. VASILEIOU - sxvasile@texaschildrens.org
https://doi.org/10.3324/haematol.2022.281947
Received: August 16, 2022.
Accepted: October 31, 2022.
Prepublished: November 10, 2022.
References
1. Fung M, Babik JM. COVID-19 in immunocompromised hosts: what we know so far. Clin Infect Dis. 2021;72(2):340-350.
2. Garcia-Vidal C, Puerta-Alcalde P, Mateu A, et al. Prolonged viral replication in patients with hematologic malignancies hospitalized with COVID-19. Haematologica. 2022;107(7):1731-1735.
3. Dan JM, Mateus J, Kato Y, et al. Immunological memory to SARSCoV-2 assessed for up to 8 months after infection. Science. 2021;371(6529):eabf4063.
4. Moss P. The T cell immune response against SARS-CoV-2. Nat Immunol. 2022;23(2):186-193.
5. Qi H, Liu B, Wang X, Zhang L. The humoral response and antibodies against SARS-CoV-2 infection. Nat Immunol. 2022;23(7):1008-1020.
6. Chen Y, Zuiani A, Fischinger S, et al. Quick COVID-19 healers sustain anti-SARS-CoV-2 antibody production. Cell. 2020;183(6):1496-1507.
7. Goel RR, Painter MM, Apostolidis SA, et al. mRNA vaccines induce durable immune memory to SARS-CoV-2 and variants of concern. Science. 2021;374(6572):abm0829.
©2023 Ferrata Storti Foundation
Published under a CC BY-NC license
Disclosures
SV, MK and YV are consultants to AlloVir. CMR has stock and other ownership interests with Coya, Bluebird Bio, Tessa Therapeutics, Marker Therapeutics, AlloVir, Walking Fish, Allogene Therapeutics, Memgen, Kuur Therapeutics, Bellicum Pharmaceuticals, TScan Therapeutics, and Abintus Bio; has a consulting or advisory role with Abintus Bio, Adaptimmune, Brooklyn Immunotherapeutic, Onk Therapeutics, Tessa Therapeutics, Memgen, Torque, Walking Fish Therapeutics, TScan Therapeutics, Marker Therapeutics, and Turnstone Bio; and receives research funding from Kuur Therapeutics. SG is an employee of AlloVir. AML is a co-founder and equity holder of AlloVir and Marker Therapeutics and a consultant to AlloVir.
Contributions
SV, MK, YV, AW, MN, AGW, MFK and ATC performed research; SV, MK, MN and AGW analyzed data; MK and YV organized the study; CMR and AML supervised the study; SV, SG, CMR and AML wrote the manuscript.
Acknowledgments
The authors thank Walter Mejia for assistance with figure formatting.
Funding
This work was supported by a sponsored research grant from AlloVir, Inc.
Data-sharing statement
Datasets are maintained in an electronic database at the Center for Cell and Gene Therapy; data are available from the corresponding author upon reasonable request.
8. Geers D, Shamier MC, Bogers S, et al. SARS-CoV-2 variants of concern partially escape humoral but not T-cell responses in COVID-19 convalescent donors and vaccinees. Sci Immunol. 2021;6(59):eabj1750.
9. Keeton R, Tincho MB, Ngomti A, et al. T cell responses to SARSCoV-2 spike cross-recognize Omicron. Nature. 2022;603(7901):488-492.
10. Tarke A, Sidney J, Methot N, et al. Impact of SARS-CoV-2 variants on the total CD4(+) and CD8(+) T cell reactivity in infected or vaccinated individuals. Cell Rep Med. 2021;2(7):100355.
11. Cooper RS, Fraser AR, Smith L, et al. Rapid GMP-compliant expansion of SARS-CoV-2-specific T cells from convalescent donors for use as an allogeneic cell therapy for COVID-19. Front Immunol. 2021;11:598402.
12. Garcia-Garcia I, Guerra-Garcia P, Ferreras C, et al. A phase I/II dose-escalation multi-center study to evaluate the safety of infusion of natural killer cells or memory T cells as adoptive therapy in coronavirus pneumonia and/or lymphopenia: RELEASE
Haematologica | 108 July 2023 1938 LETTER TO THE EDITOR
study protocol. Trials. 2021;22(1):674.
13. Keller MD, Harris KM, Jensen-Wachspress MA, et al. SARS-CoV-2specific T cells are rapidly expanded for therapeutic use and target conserved regions of the membrane protein. Blood. 2020;136(25):2905-2917.
14. Peter L, Wendering DJ, Schlickeiser S, et al. Tacrolimus-resistant SARS-CoV-2-specific T cell products to prevent and treat severe COVID-19 in immunosuppressed patients. Mol Ther Methods Clin Dev. 2022;25:52-73.
15. Vasileiou S, Hill L, Kuvalekar M, et al. Allogeneic, off-the-shelf, SARS-CoV-2-specific T cells (ALVR109) for the treatment of COVID-19 in high-risk patients. Haematologica 2023: doi: 10.3324/haematol.2022.281946 [Epub ahead of print].
16. Martits-Chalangari K, Spak CW, Askar M, et al. ALVR109, an offthe-shelf partially HLA matched SARS-CoV-2-specific T cell therapy, to treat refractory severe COVID-19 pneumonia in a heart transplant patient: case report. Am J Transplant. 2022;22(4):1261-1265.
Haematologica | 108 July 2023 1939 LETTER TO THE EDITOR
Kaposi sarcoma herpesvirus viral load as a biomarker for leptomeningeal involvement by primary effusion lymphoma
Kaposi sarcoma herpesvirus (KSHV, also known as human herpesvirus 8), is the etiologic agent of primary effusion lymphoma (PEL), a rare, aggressive B-cell lymphoma with a worse prognosis compared to other human immunodeficiency virus (HIV)-associated lymphomas.1,2 Eighty percent of tumors are co-infected with Epstein Barr virus (EBV). KSHV also causes Kaposi sarcoma (KS), a form of multi-centric Castleman disease (MCD), and KSHV inflammatory cytokine syndrome (KICS).3-5 PEL involvement of the cerebrospinal fluid (CSF) and leptomeninges (CSFPEL) has been rarely reported, reflecting either true rarity or underdiagnosis.6-8 A diagnosis of CSF-PEL is essential in both asymptomatic and symptomatic patients to guide therapy as CSF-PEL requires specific therapy directed to the leptomeningeal space.7
The gold standard for diagnosis of leptomeningeal involvement by lymphoma is cytologic examination of the CSF. Flow cytometry and molecular pathology to determine clonality of immunoglobulin gene rearrangements can also aid in diagnosis. However, these tests require experienced pathologists and specialized laboratory techniques generally only available in high-resource settings. Little is known about whether KSHV or EBV DNA viral loads (VL) are elevated in the CSF of patients with PEL with or without CSF involvement, or in other KSHV-associated diseases. The KSHV VL is markedly elevated in peripheral blood mononuclear cells (PBMC) and blood plasma in PEL, MCD, and KICS as well as PEL effusions.1,9-13 We hypothesized the CSF KSHV VL would be elevated in CSF-PEL and could be utilized to diagnose and monitor disease activity. We also hypothesized the EBV VL could be used in a similar way in EBV+ CSF-PEL.
We retrospectively identified patients with KSHV-associated diseases who underwent at least one CSF evaluation in the HIV and AIDS Malignancy Branch at the National Cancer Institute (NCI) between June 2007 and October 2020. All cases of PEL, MCD, and KS were pathologically confirmed in the NCI Laboratory of Pathology. KSHV and EBV tumor status were confirmed by latency-associated nuclear antigen staining or in situ hybridization against EBV-encoded small RNA, respectively. CSF-PEL was diagnosed via cytopathology supported by immunohistochemistry (Figure 1). KICS was diagnosed via published criteria after the exclusion of MCD and PEL.5,13 Those with PEL and concurrent MCD or KS were classified as having PEL and not included in the MCD or KS groups. Patients were enrolled on an NCI Institutional Review Board-approved pro-
tocol to collect and analyze tissue with clinical correlations (clinicaltrails gov. Identifier: NCT00006518) via written informed consent in accordance with the Declaration of Helsinki.
We compared KSHV and EBV VL from fresh PBMC or stored plasma drawn at the same time points as CSF sampling. We measured CSF, plasma, and PBMC-associated KSHV and EBV VL via real-time quantitative polymerase chain reaction (PCR) with primers for KSHV K6 and EBV pol. PBMC-associated KSHV and EBV VL were reported as viral DNA copies/106 PBMC with cellular equivalents quantified using human endogenous retrovirus 3 primers.14 Plasma and CSF KSHV and EBV VL were reported as viral DNA copies/mL. We considered VL >1 copy/mL elevated. We assessed the sensitivity, specificity, and likelihood ratios of CSF KSHV VL at different cut points to predict positive cytology for PEL, performed receiver operator characteristic curve analyses, and evaluated the correlation between CSF, plasma, and PBMC-associated KSHV and EBV VL using Spearman correlation. Statistically significant differences in KSHV VL positivity were determined by Fisher’s exact test.
We assessed 116 paired CSF and PBMC samples for which KSHV VL measurement and cytology were performed on the CSF from 38 HIV+ patients (26 PEL, 4 MCD, 3 KICS, and 5 KS) (Table 1; Online Supplementary Table S1). Of the 26 patients with PEL, four had positive cytology for CSFPEL at baseline, and an additional patient had positive cytology at a later time point. None of the patients with CSF-PEL had neurologic symptoms to suggest CSF involvement. Overall, we analyzed 99 CSF samples from 26 patients with PEL and 17 from patients with other KSHVassociated diseases.
Generally, patients with PEL had well-controlled HIV at the time of their first CSF sampling (median HIV VL 10 copies/mL, interquartile range [IQR]: 0-491) with median CD4+ T-cell count of 194 cells/mL (IQR: 75-309) (Table 1). All four patients with CSF-PEL at first sampling had an elevated KSHV VL (391-360,000 copies/mL) (Table 1; Online Supplementary Table S1). Only two patients of 22 with negative baseline cytology had an elevated CSF KSHV VL (Online Supplementary Table S2). Patient 5 had a KSHV VL of 192 copies/mL with negative cytology, but 4 weeks later, the CSF KSHV VL had increased to 16,000 copies/mL and cytology became positive. Patient 18 with multiply relapsed PEL had a KSHV VL of 960 copies/mL with negative cytology but we were unable to perform subsequent CSF
Haematologica | 108 July 2023 1940 LETTER TO THE EDITOR
sampling as he was treated only briefly at our center. In patients with PEL at first CSF sampling, when using a cutoff of 391 copies/mL, the CSF KSHV VL had a sensitivity of 100% and specificity of 96% to detect CSF-PEL at that time point, with a positive likelihood ratio of 22 to predict
positive cytology, and a negative likelihood ratio of <0.00001 to predict negative cytology.
Among the 12 patients with other KSHV-associated diseases, only one CSF sample had an elevated KSHV VL at 440 copies/mL with negative cytology and no known CSF
Figure 1. Cerebrospinal fluid of patient with leptomeningeal primary effusion lymphoma. Panel (A) shows cytology cerebrospinal fluid (CSF). The white arrow indicates a malignant lymphocyte. Panel (B) shows a paraffin-embedded malignant cell from the same patient’s CSF. The malignant cells are positive for both Kaposi sarcoma herpesvirus by (C) latency nuclear antigen staining (LANA) in brown and for Epstein Barr virus by (D) EBV-encoded small RNA (EBER) staining in dark blue.
*As measured at the time of first cerebrospinal fluid (CSF) sampling. **Elevated Kaposi sarcoma herpesvirus (KSHV) defined as >1 copy/mL. Four patients had cytology positive for CSF-PEL, 1 patient developed positive cytology on subsequent CSF sampling, and 1 patient had elevated CSFKSHV with negative cytology and no further follow-up to determine significance of the elevated KSHV in the CSF. †From 5 patients with CSFPEL with multiple CSF samplings. §Includes 7 patients who had both PEL and MCD. CSF-PEL: leptomeningeal primary effusion lymphoma confirmed by cytology; IQR: interquartile range; KICS: KSHV inflammatory cytokine syndrome; KS: Kaposi sarcoma; MCD: multicentric Castleman disease; PBMC: peripheral blood mononuclear cells; PEL: primary effusion lymphoma; VL: viral load; HIV: human immunodeficiency virus.

PEL MCD KICS KS Number of patients 26§ 4 3 5 Number of samples 99 8 4 5 CD4+ T cells/mL*, median (IQR) 194 (75-309) 76 (55-99) 56 (41-75) 511 (256-2,571) HIV copies/mL*, median (IQR) 10 (0-491) 909 (349-24,285) 38 (14-82) 5,233 (1,271-150,999) Number of CSF baseline samples with elevated KSHV VL** 6 1 0 0 CSF KSHV copies/mL in all samples at all time points, median (IQR) 1 (0-12,400) 0 (0-1) 0 (0-0) 1 (0-1) CSF KSHV copies/mL in patients with PEL at baseline, median (IQR) 0 (0-1) - -CSF KSHV copies/mL in patients with PEL with CSF-PEL all time points†, median (IQR) 4,9750 (7,000-1525,000) - -CSF KSHV copies/mL in patients with PEL without CSF-PEL all time points, median (IQR) 0 (0-1) - -PBMC KSHV copies/106 cells all time points, median (IQR) 1 (0-835) 1 (0,-7,722) 1 (0-618,183) 1 (1-1,538) Plasma KSHV copies/mL all time points, median (IQR) 225 (0-1,850) 8,000 (1,450-20,000) 23,825 (112-76,875) 1050 (0-6,000) A B C
D
Haematologica | 108 July 2023 1941 LETTER TO THE EDITOR
Table 1. Characteristics of patient samples evaluated for Kaposi sarcoma herpesvirus viral load.
pathology (Table 1). This patient had active MCD and a PBMC-associated KSHV VL of 91,000 copies/106 cells. He was successfully treated for MCD and was followed for several years without development of PEL. At first CSF sampling, the CSF KSHV VL in all patients with any KSHVassociated disease revealed that when using a cut-off of 391 copies/mL, the KSHV VL had a sensitivity of 100% and specificity of 94% to detect CSF-PEL with a positive likelihood ratio of 17 and a negative likelihood ratio of <0.00001.
Seventeen patients with PEL, including the five with CSFPEL, had more than one CSF analysis (range, 2-23). Of the 99 CSF samples from patients with PEL, 32 were positive by cytology, and 30 of these 32 samples (93.8%) had an elevated KSHV VL. The median CSF KSHV VL in patients with CSF-PEL at any time point was 49,750 copies/mL (IQR: 7,000-1525,000), and in patients with PEL without CSF-PEL, the median CSF KSHV VL was 0 (IQR: 0-1). Using the cut-off of 391 copies/mL, the KSHV VL had a sensitivity of 91% and specificity of 87% to detect CSF-PEL at any given time point, with a positive likelihood ratio of 6.8 and negative likelihood ratio of 0.11 (Figure 2).
In those with positive cytology undergoing CSF-directed therapy, the KSHV VL generally tracked with treatment response. There were 41 CSF samples taken from the five patients with CSF-PEL receiving CSF-directed therapy (Online Supplementary Table S3). Thirty-one were positive by cytology for CSF-PEL, and 29 had an elevated KSHV VL. In cytology-positive samples, the median CSF KSHV VL was 19,500 copies/mL (IQR: 4,825-1925,000). The KSHV VL remained elevated in patients whose cytology remained positive despite treatment, and it became negative in the one patient who received multiple lines of therapy and re-

markably had eventual clearance of his CSF (Online Supplementary Figure S1).
Among all patients with PEL, the CSF EBV VL was not helpful to diagnose CSF-PEL, irrespective of EBV status of the PEL tumor. Fifteen percent of CSF samples from all patients with PEL and 17% from patients with EBV+ CSF-PEL had an elevated EBV VL. At all time points, the median CSF EBV VL was 0 copies/mL when evaluating all patients with PEL and in those specifically with EBV+ PEL. There was no statistically significant difference in the CSF EBV VL between patients with EBV+ PEL with and without positive CSF cytology (P=0.72). In patients with PEL, there was no correlation between CSF and PBMC or plasma KSHV VL (r=0.05, P=0.63; r=-0.15, P=0.12, respectively). There was a moderately strong correlation (r=0.54, P=<0.00001) between the KSHV VL in PBMC and plasma. The CSF EBV VL was weakly correlated with PBMC EBV VL (r=0.26, P=0.01) and moderately correlated with plasma EBV VL (r=0.36, P=0.004). EBV VL in PBMC and plasma had a moderately strong correlation (r=0.65, P=<0.00001).
To our knowledge this is the largest study of CSF-PEL and the first to report the use of the CSF KSHV VL in any KSHVassociated disease. Our finding of five cases of CSF-PEL among 26 patients with PEL suggests CSF-PEL is underdiagnosed and CSF sampling at baseline should be routine. None of our patients with CSF-PEL had neurologic symptoms suggestive of leptomeningeal disease, reinforcing the importance of specifically looking for CSF-PEL with sensitive diagnostics. In resource-limited settings where PCRbased testing for KSHV is increasingly available, the KSHV VL could be particularly useful to relieve strain on scarce pathologic services by ruling out CSF-PEL in samples with undetectable or very low KSHV VL, negating the need for
A B
Figure 2. Receiver operator characteristic curves of the Kaposi sarcoma herpesvirus viral load in the cerebrospinal fluid to detect leptomeningeal involvement in patients with primary effusion lymphoma. (A) First cerebrospinal fluid (CSF) sampling (area under the curve=0.989) and (B) at any cerebrospinal fluid sampling time point (area under the curve=0.974). ROC: receiver operator characteristics.
Haematologica | 108 July 2023 1942 LETTER TO THE EDITOR
cytology review.15 Moreover, an elevated KSHV VL with negative cytology should prompt additional CSF sampling and close patient follow-up for the development of CSFPEL. In summary, an elevated KSHV-VL in the CSF in patients with PEL is a sensitive and specific test for detecting CSF involvement and can be used as a tumor biomarker for diagnosis and to monitor treatment response.
Authors
Kathryn Lurain,1 Ramya Ramaswami,1 Vickie Marshall,2 Elena M. Cornejo Castro,2 Nazzarena Labo,2 Wendell Miley,2 Kyle Moore,2 Romin Roshan,2 Ralph Mangusan,1 Elaine S. Jaffe,3 Stefania Pittaluga,3 Hao-Wei Wang,3 Mark Roth,3 Armando C. Filie,3 Thomas S. Uldrick,1 Denise Whitby2 and Robert Yarchoan1
1HIV & AIDS Malignancy Branch, Center for Cancer Research (CCR), NCI, Bethesda, MD; 2Viral Oncology Section, AIDS and Cancer Virus Program, Frederick National Laboratory for Cancer Research, Frederick, MD and 3Laboratory of Pathology, CCR, NCI, Bethesda, MD, USA
Correspondence:
K. LURAIN - kathryn.lurain@nih.gov
https://doi.org/10.3324/haematol.2022.281472
Received: May 26, 2022.
Accepted: December 14, 2022. Early view: December 22, 2022.
©2023 NIH (National Institutes of Health)
Disclosures
KL, RR, and RY report receiving research support from Bristol Myers Squibb-Celgene through a CRADA with the NCI; they also report receiving drugs for clinical trials and/or laboratory use from Merck, EMD-Serono, Eli Lilly, Janssen, and CTI BioPharma through CRADA
References
1. Lurain K, Polizzotto MN, Aleman K, et al Viral, immunologic, and clinical features of primary effusion lymphoma. Blood. 2019;133(16):1753-1761.
2. Guillet S, Gerard L, Meignin V, et al. Classic and extracavitary primary effusion lymphoma in 51 HIV-infected patients from a single institution. Am J Hematol. 2016;91(2):233-237.
3. Chang Y, Cesarman E, Pessin MS, et al. Identification of herpesvirus-like DNA sequences in AIDS-associated Kaposi's sarcoma. Science. 1994;266(5192):1865-1869.
4. Soulier J, Grollet L, Oksenhendler E, et al. Kaposi's sarcomaassociated herpesvirus-like DNA sequences in multicentric Castleman's disease. Blood. 1995;86(4):1276-1280.
with the NCI. TU, DW and RY are co-inventors on US Patent 10,001,483 entitled "Methods for the treatment of Kaposi's sarcoma or KSHV-induced lymphoma using immunomodulatory compounds and uses of biomarkers." An immediate family member of RY is a co-inventor on patents related to internalization of target receptors, epigenetic analysis, and ephrin tyrosine kinase inhibitors. All rights, title, and interest to these patents have been assigned to the US Department of Health and Human Services; the government conveys a portion of the royalties it receives to its employee inventors under the Federal Technology Transfer Act of 1986 (P.L. 99-502). TU received research support to his institution from Roche through a CTA and from Merck and Bristol Meyer Squibb-Celgene through a CRADA with the NCI, he has served as a consultant for AbbVie and Seattle Genetics and is currently an employee of Regeneron Pharmaceuticals. No potential conflicts of interest were disclosed by the other authors.
Contributions
KL, RR, VM, DW, and RY designed the study; KL, RR, RM, RY, and TSU cared for patients; KL, VM, and RR collected and analyzed data; EJ, SP, MR, and ACF provided pathologic confirmation of cases; VM, EMCC, WM, KM, and RR performed KSHV viral load assays; KL and RY drafted and revised the initial manuscript. All authors contributed to writing and approving the manuscript.
Funding
This research was supported by the Intramural Research Program of the NIH, National Cancer Institute and by US federal funds from the National Cancer Institute, National Institutes of Health, under Contract No. 75N91019D00024/HHSN261200800001E.
Acknowledgments
We thank our patients and their families, Ms. Kirsta Waldon for research and clinical care co-ordination, and the medical staff of the NIH Clinical Center for their compassionate and expert care of our patients.
Data-sharing statement
The datasets used and/or analyzed during the current study are available from the corresponding author on reasonable request.
5. Polizzotto MN, Uldrick TS, Wyvill KM, et al. Clinical features and outcomes of patients with symptomatic Kaposi sarcoma herpesvirus (KSHV)-associated inflammation: prospective characterization of KSHV inflammatory cytokine syndrome (KICS). Clin Infect Dis. 2016;62(6):730-738.
6. Jain S, Palekar A, Monaco SE, Craig FE, Bejjani G, Pantanowitz L. Human Immunodeficiency virus-associated primary effusion lymphoma: an exceedingly rare entity in cerebrospinal fluid. Cytojournal. 2015;12:22.
7. Santonja C, Medina-Puente C, Serrano Del Castillo C, Cabello Ubeda A, Rodriguez-Pinilla SM. Primary effusion lymphoma involving cerebrospinal fluid, deep cervical lymph nodes and
Haematologica | 108 July 2023 1943 LETTER TO THE EDITOR
adenoids. Report of a case supporting the lymphatic connection between brain and lymph nodes. Neuropathology. 2017;37(3):249-258.
8. Lurain K, Ramaswami R, Mangusan R, et al. Use of pembrolizumab with or without pomalidomide in HIVassociated non-Hodgkin's lymphoma. J Immunother Cancer. 2021;9(2):e002097.
9. Polizzotto MN, Uldrick TS, Hu D, Yarchoan R. Clinical manifestations of Kaposi sarcoma herpesvirus lytic activation: multicentric Castleman disease (KSHV-MCD) and the KSHV inflammatory cytokine syndrome. Front Microbiol. 2012;3:73.
10. Oksenhendler E, Carcelain G, Aoki Y, et al. High levels of human herpesvirus 8 viral load, human interleukin-6, interleukin-10, and C reactive protein correlate with exacerbation of multicentric castleman disease in HIV-infected patients. Blood. 2000;96(6):2069-2073.
11. Haq IU, Dalla Pria A, Papanastasopoulos P, et al. The clinical application of plasma Kaposi sarcoma herpesvirus viral load as
a tumour biomarker: results from 704 patients. HIV Med. 2016;17(1):56-61.
12. Jary A, Leducq V, Palich R, et al. Usefulness of Kaposi's sarcoma-associated herpesvirus (KSHV) DNA viral load in whole blood for diagnosis and monitoring of KSHV-associated diseases. J Clin Microbiol. 2018;56(6):e00569.
13. Ramaswami R, Lurain K, Marshall VA, et al. Elevated IL-13 in effusions of patients with HIV and primary effusion lymphoma as compared with other Kaposi sarcoma herpesvirusassociated disorders. AIDS. 2021;35(1):53-62.
14. Uldrick TS, Wang V, O'Mahony D, et al. An interleukin-6-related systemic inflammatory syndrome in patients co-Infected with Kaposi sarcoma-associated herpesvirus and HIV but without multicentric Castleman disease. Clin Infect Dis. 2010;51(3):350-358.
15. Snodgrass R, Gardner A, Semeere A, et al. A portable device for nucleic acid quantification powered by sunlight, a flame or electricity. Nat Biomed Eng. 2018;2(9):657-665.
Haematologica | 108 July 2023 1944 LETTER TO THE EDITOR
A novel colony stimulating factor 3 receptor activating mutation identified in a patient with chronic neutrophilic leukemia
Activating mutations in the extracellular domain of colony stimulating factor 3 receptor (CSF3R, aka GCSFR) are present in an overwhelming majority of patients with chronic neutrophilic leukemia (CNL). These point mutations have been primarily observed in glycosylation sites located close to the cell membrane. Herein we describe a novel activating mutation in CSF3R (N579Y) in a patient with CNL. This mutation disrupts a putative glycosylation site that is significantly more distant from the membrane than those previously documented. We demonstrate that CSF3RN579Y results in ligand independent activation and is capable of oncogenic transformation. It also causes enhanced activation of JAK/STAT and MAPK signaling, and is sensitive to JAK inhibition. This study characterizes a novel oncogenic variant of CSF3R that is therapeutically relevant, and suggests that mutations in glycosylation sites further from the known major hotspots may be clinically significant.
CSF3R activation is critical for neutrophil production. Leukemia-associated CSF3R mutations lead to aberrant receptor activation.1,2 Mutations in CSF3R are highly enriched in CNL, where they occur in approximately 90% of patients. 3,4 More rarely, mutations in CSF3R can also occur in other myeloid malignancies including atypical chronic myeloid leukemia (aCML), acute myeloid leukemia, chronic myelomonocytic leukemia, and others.2,3,5,6 There are two types of CSF3R mutations: those that truncate the cytoplasmic domain of the receptor and those that activate the receptor through point mutations.1-3 The cytoplasmic truncation mutations lead to a loss of endocytic, degradative, and negative regulatory motifs.7 The loss of these regions causes ligand hypersensitivity.7 In contrast, CSF3R point mutations activate the receptor in a ligand-independent manner.1,3,8 Point mutations either occur in the transmembrane domain (such as T640N), where they promote receptor dimerization through intramolecular interaction of the transmembrane alpha helices,9 or they occur in the membrane-proximal portion of the extracellular domain. These membrane-proximal mutations (such as T618I, T615A and N610H) occur in sites of either O- or N-linked glycosylation,8,10,11 resulting in a loss of the glycan at these sites and ligand-independent receptor dimerization.8,10
The membrane-proximal point mutation CSF3RT618I is the most frequently found mutation in CNL,3,4 although truncating mutations can also occur. Ligand-independent ac-
tivation of CSF3R by the T618I mutation leads to strong constitutive signaling downstream through the JAK/STAT and MAPK signaling pathways.3,12 This results in the expression of pro-proliferation and pro-neutrophil differentiation programs resulting in an overproduction of mature neutrophils, which is one of the characteristics of CNL. Inhibition of CSF3R-driven JAK/STAT signaling has been investigated as a therapeutic strategy for CNL with promising results in trials.3,13
The deployment of JAK inhibitors for CNL requires an understanding of the spectrum of CSF3R mutations that are responsive to therapy. In this study, we characterize a novel mutation in CSF3R identi fi ed in a patient with CNL. This mutation, N579Y, is part of a consensus motif for N-glycosylation, but lies outside the membrane-proximal portion of the cytoplasmic domain where N610H, T615A and T618I reside (Figure 1A). In this study, we characterize the signaling dysregulation, oncogenic potential, and drug sensitivity of the CSF3RN579Y mutation.
CSF3RN579Y was identified in a patient presenting with a myeloproliferative neoplasm with neutrophilia and splenomegaly. The patient was a 55-year-old man with a 3month history of progressive fatigue and a 40-pound weight loss. At the time of his initial presentation, his white blood count was 96.48x10⁹/L with a differential of 3% bands, 74% neutrophils, 4% lymphs, 3% monocytes, 6% metameyelocytes, 8% myelocytes, and 2% promyelocytes. Hemoglobin was 10.9 g/dL and platelets were 740x109/L. One year prior, his WBC had been normal with a mild monocytosis. Bone marrow (BM) biopsy revealed a markedly hypercellular (90% cellular) BM exhibiting myeloid-predominant maturing trilineage hematopoiesis with left-shifted myeloid maturation, mild megakaryocytic atypia (small, hypolobated forms), mild reticulin fibrosis most consistent with a myeloid neoplasm. Given the myeloid-predominant BM without significant dysgranulopoiesis in the context of peripheral leukocytosis with peripheral neutrophilia, a diagnosis of chronic neutrophilic leukemia (CNL) was favored. However, the leftshifted myeloid maturation and reticulin fi brosis is atypical. CML was excluded given the absence of a BCRABL1 positive fusion transcript, and aCML was excluded due to lack of significant dysgranulopoiesis. The patient had had a history of a seizure substance use disorder and had subsequently been found unresponsive with a large intracranial hemorrhage. He was started on hydroxyurea
Haematologica | 108 July 2023 1945 LETTER TO THE EDITOR
Figure 1. CSF3RN579Y is a ligand independent activating mutation that drives myeloid proliferation. (A) Representation of CSF3R with mutations at predicted glycosylation site mapped. TM: transmembrane domain. (B) Table of mutations identified in patient with a myeloproliferative neoplasm (MPN) containing the CSF3RN579Y mutation. Variant allele frequency (VAF) is shown for each mutation. (C) Ba/F3 proliferation assay demonstrating that CSF3RN579Y is capable of driving IL3-independent growth. Ba/F3 cells transduced with an empty vector control, CSF3RWT, CSF3RT618I, or CSF3RN579Y were washed to remove IL3 from the media, growth was measured daily for 7 days on an automated cell counter in triplicate. WT: wild-type. (D) TF-1 proliferation assay demonstrating that CSF3RN579Y is capable of driving granulocyte-macrophage colony-stimulating factor (GM-CSF)-independent growth. TF-1 cells transduced with an empty vector control, CSF3RWT, CSF3RT618I, or CSF3RN579Y were washed to remove GM-CSF from the media, growth was measured daily for 8 days on an automated cell counter in triplicate. (E) Ba/F3 cytokine sensitivity assay demonstrating that CSF3RN579Y-driven growth is insensitive to GCSF concentration. Ba/F3 cells transduced with an CSF3RWT, CSF3RT618I, or CSF3RN579Y were washed out of IL3-containing media and plated in 96-well format with increasing concentrations of GCSF added to the media in triplicate. Plates were analyzed by MTS cell proliferation assay after 72 hours. Standard Error of Mean (SEM) is shown with black error bars. (F) Colony formation assay showing that CSF3RN579Y drives colony formation in the absence of cytokine support. Bone marrow harvested from C57BL/6 mice was transduced with an ecotropic murine retrovirus with empty vector control, CSF3RWT, CSF3RT618I, CSF3RN579Y, sorted by flow cytometry, and plated in methylcellulose (Stem Cell M3234) without added cytokine support in triplicate. Plates were imaged after 7 days, and files were blinded before colonies with at least 50 cells were counted. Representative images of colonies and quantification of colony numbers showing that CSF3RN579Y and CSF3RT618I form significantly more colonies than an empty vector control or CSF3RWT. Statistical significance was determined using an ordinary one-way ANOVA test in GraphPad Prism; ****P<0.0001; ns: not significant.

C B D E Haematologica | 108 July 2023 1946 LETTER TO THE EDITOR A F
and transitioned to a palliative approach before succumbing to his disease. It had not been possible to perform germline testing.
Targeted next-generation sequencing analysis was run using the Dana-Farber/Brigham and Women’s Cancer Center Rapid Heme Panel. This revealed three mutations in CSF3R : Q739* (variant allele frequency [VAF] 26%), Q741* (VAF 24%), and N579Y (VAF 52%). ASXL1 G646fs (38% VAF) and ETNK1 H243Q (VAF 12%) mutations were also present. In CNL, when truncating mutations occur, they most frequently occur alongside an activating point mutation.11,14 Truncations of the cytoplasmic domain are well characterized in this region, and result in enhanced CSF3R half-life and cell surface expression.7,11 When found in combination with an activating mutation, truncations may provide some proliferative advantage to clones harboring both mutations, over those with a point mutation alone.11,15 This, combined with the knowledge that N579 was part of a consensus motif for N-linked glycosylation prompted us to assess the oncogenicity of this variant. To test the oncogenic potential of CSF3RN579Y, we evaluated its ability to transform the Ba/F3 cells (Figure 1C). Ba/F3 is a murine-derived blood cell line that is normally dependent on IL3 for growth and survival. In the absence of IL3, these cells die, but some oncogenes (such as CSF3RT618I) can enable IL-3-independent growth of these cells.3 This makes Ba/F3 cells a simple model to use to assess oncogenic transformation. We used retroviral transduction to express an empty vector control, CSF3RWT, CSF3RT618I, or CSF3RN579Y with an IRES-GFP in the Ba/F3 cells, then selected for expression by flow cytometry. Each line was washed and plated in media (n=3) without IL3. Cell growth was tracked daily using an automated cell counter. Only CSF3RN579Y and CSF3RT618I were able to transform the Ba/F3 cells to IL-3-independent growth. This was replicated in human hematopoietic cell line TF-1 cells dependent on GM-CSF, in which CSF3RN579Y and CSF3RT618I also transformed cells to cytokine-independent growth (Figure 1D). To further assess the ability of CSF3RN579Y to drive cytokine-independent growth, we performed a hematopoietic colony formation assay (CFU) (Figure 1F). Mouse BM is unable to form colonies in CFU assays without added cytokine support or the addition of a proliferative oncogene.8 We transduced murine BM from young mice with an empty vector, CSF3RWT, CSF3RT618I, or CSF3RN579Y in vectors containing an IRES-GFP. GFP-positive cells were sorted by flow cytometry into methylcellulose medium without added cytokines, then plated (n=3). After 7 days plates were imaged and colonies were counted. CSF3RN579Y and CSF3RT618I were able to form colonies without added cytokine support to a similar degree, while the empty vector and CSF3RWT were unable to form colonies. From these experiments, we conclude that CSF3RN579Y is an oncogene capable of transforming Ba/F3
cells and driving cytokine-independent colony formation. To assess whether CSF3RN579Y promotes ligand-independent receptor activation, we performed a GCSF titration curve in the Ba/F3 model (Figure 1E). Cells were washed out of the IL3-containing media and plated in 96-well format in increasing concentrations of GCSF. After 72 hours (h) we performed an MTS-based proliferation assay to assess cell viability and growth. We found CSF3RT618I and CSF3RN579Y exhibit robust growth unaffected by GCSF, while the proliferation of CSF3RWT-expressing cells is dependent on high levels of GCSF in the media. These data indicate that N579Y causes ligand-independent receptor activation.
Next, we wanted to test the ability of CSF3RN579Y to enhance the activation of CSF3R-associated signaling pathways. To accomplish this, we transiently transfected HEK293 cells with an empty vector, CSF3RWT, CSF3RT618I, or CSF3RN579Y (Figure 2A). Cells were harvested 48 h after transfection and lysate was analyzed by western blot for STAT3 activation. Cells expressing CSF3R N579Y had enhanced phosphorylation of STAT3 compared to the empty vector or CSF3RWT. This enhancement was comparable in magnitude to CSF3RT618I. To evaluate CSF3RN579Y signaling activation in a hematopoietic cell line, we performed an immunoblot in the Ba/F3 CSF3R-expressing lines described above. We washed IL3 out of cells, and harvested them 24 h later for analysis alongside CSF3R N579Y- and CSF3RT618I-expressing cells that had been cultured without IL3 for an extended period (Figure 2B). We then assessed JAK/STAT and MAPK activation. In this model, CSF3RN579Y and CSF3RT618I demonstrated enhanced STAT3 and ERK1/2 phosphorylation compared to CSF3RWT and the empty vector. This was true both in cells that had acute IL3-withdrawal and those that were proliferating continuously in media without IL3. Enhanced activation of STAT3 was also found in TF-1 cells, further confirming that this signaling enhancement occurs in a human hematopoietic model (Figure 2C). We find CSF3RN579Y robustly enhances both JAK/STAT and MAPK activation, suggesting that it is an activating mutation in the receptor.
Recently, a clinical trial testing the efficacy of ruxolitinib, a JAK1/2 inhibitor, in patients with CNL or aCML showed an overall response rate of 32%, higher in patients with CNL driven by a CSF3RT618I mutation.12 Since CSF3RN579Y exhibits similar transformation capacity as CSF3RT618I, we decided to test the sensitivity of CSF3RN579Y to ruxolitinib.
For this we used Ba/F3 cells expressing CSF3RN579Y and CSF3RT618I cultured without IL3 (Figure 2D). Cells were plated in 96-well format with ruxolitinib concentrations ranging from 0 nM to 500 nM. After 72 h cells were analyzed by MTS cell proliferation assay. We found that CSF3RN579Y is sensitive to ruxolitinib and has a half-maximal inhibitory concentration (IC 50) closely matching
Haematologica | 108 July 2023 1947 LETTER TO THE EDITOR
CSF3RT618I. This was replicated in TF-1 cells, demonstrating that T618I and N579Y both confer sensitivity to ruxolitinib in a human hematopoietic cell line with comparable IC50 (Figure 2E). We validated this finding by treatment of primary murine hematopoietic cells expressing CSF3RN579Y or CSF3RT618I in a CFU assay with ruxolitinib (Figure 2F).
To further investigate ruxolitinib sensitivity in human leukemia cells, peripheral blood cells from the patient described above were enriched for CD34 positivity using a MACS separation column, and plated in methylcellulose

medium containing 0 nM-10,000 nM of ruxolitinib (Figure 2G and H). Plates were imaged after 10 days and colonies greater than 50 cells were counted. We found that CD34+ cells isolated from the peripheral blood of the patient harboring the CSF3RN579Y, CSF3R741*, and CSF3R739* mutations were sensitive to ruxolitinib.
In this report, we have identified and characterized the novel mutation CSF3RN579Y in a patient with CNL. We find that this mutation causes receptor activation in a ligandindependent manner. This mechanism is like other oncogenic CSF3R point mutations (such as T618I, T615A and
A B D E G H
Haematologica | 108 July 2023 1948 LETTER TO THE EDITOR F C
Figure 2. The activating mutation CSF3RN579Y enhances STAT3 and ERK1/2 activation and confers sensitivity to the JAK1/2 inhibitor ruxolitinib. (A) Western blot showing CSF3RN579Y has enhanced activation of STAT3 in HEK293 cells. HEK293 cells were transiently transfected using Fugene-6 with empty vector control, CSF3RWT, CSF3RT618I, or CSF3RN579Y, and harvested 48 hours (h) later for western blot analysis of pSTAT3 activation. (B) CSF3RN579Y has enhanced STAT3 and ERK1/2 activation in Ba/F3 cells. Ba/F3 cells transduced with an empty vector control, CSF3RWT, CSF3RT618I, or CSF3RN579Y were washed of IL3 24 h prior to analysis, or had been cultured without IL3 for an extended period (annotated with IL3-). 5x10⁶ cells per condition were harvested and analyzed by western blot for STAT3 and ERK1/2 phosphorylation. (C) CSF3RN579Y has enhanced STAT3 activation in TF-1 cells. TF1 cells cultured in IL3 were transduced with an empty vector control, CSF3RWT, CSF3RT618I, or CSF3RN579Y were washed of IL3 24 h and serum starved for 4 h prior to harvest for western blot. 4x10⁶ cells per condition were harvested and analyzed by western blot for STAT3 and ERK1/2 phosphorylation. (D) CSF3RN579Y-dependent Ba/F3 growth is sensitive to ruxolitinib to a similar extent as CSF3RT618I. Ba/F3 cells transduced with a CSF3RT618I or CSF3RN579Y were cultured without IL3 for an extended period and plated in 96-well format with increasing concentrations of ruxolitinib between 0-500 nM (n=3). After 72 h plates were analyzed by an MTS-based cell proliferation assay (CellTiter AQueous One). Half-maximal inhibitory concentration (IC50) was calculated for CSF3RT618I (194 nM) and CSF3RN579Y (213nM) using Graphpad Prism. (E) CSF3RN579Y-dependent TF-1 growth is sensitive to ruxolitinib to a similar extent as CSF3RT618I. TF-1 cells transduced with a CSF3RT618I or CSF3RN579Y were cultured without GM-CSF for an extended period and plated in 96-well format with increasing concentrations of ruxolitinib between 0-500 nM (n=3). After 72 h plates were analyzed by an MTS-based cell proliferation assay (CellTiter AQueous One). IC50 was calculated for CSF3RT618I (147nM) and CSF3RN579Y (162nM) using Graphpad Prism. (F) CSF3RN579Y-dependent mouse bone marrow (BM) colony formation is sensitive to ruxolitinib. Murine BM transduced with CSF3RN579Y or CSF3RT618I was sorted and treated with ruxolitinib at concentrations between 0 nM-1,000 nM and plated in cytokine-free methylcellulose in triplicate. Plates were imaged after 7 days, and files were blinded before counting colonies larger than 50. (G and H) Patient peripheral blood sample harboring CSF3RN579Y is sensitive to ruxolitinib. Peripheral blood was received and immediately enriched for CD34+ cells on a MACS column before plating in methylcellulose treated with ruxolitinib in triplicate. After 10 days, plates were imaged, files blinded, and colonies counted. Representative images of wells from colony assay and quantification of colony numbers are shown.
N610H). However, CSF3RN579Y is much further from the transmembrane domain than those previously identified, suggesting that loss of extracellular glycosylation sites further from the membrane may also confer oncogenic potential. CSF3RN579Y shows enhanced JAK/STAT and MAPK signaling. This mutation is sensitive to the JAK1/2 inhibitor ruxolitinib in vitro, which has previously been used to treat CSF3R-mutant neoplasms. Collectively, this work characterizes N579Y as a novel activating mutation in CSF3R with diagnostic and potential therapeutic relevance.
Authors
Breanna N. Maniaci,1 Jooho Chung,2 Pedro Sanz-Altamira,3 Daniel J. DeAngelo2 and Julia E. Maxson1
1Knight Cancer Institute, Division of Oncologic Sciences, Oregon Health & Science University, Portland, OR; 2Department of Medical Oncology, Dana-Farber Cancer Institute, Boston, MA; 3Dana-Farber Cancer Institute Merrimack Valley, Lawrence, MA, USA
Correspondence:
J.E. MAXSON - maxsonj@ohsu.edu
https://doi.org/10.3324/haematol.2022.281828
Received: August 10, 2022.
Accepted: December 15, 2022.
Early view: December 29, 2022.
©2023 Ferrata Storti Foundation
Published under a CC BY-NC license
Disclosures
PS-A provides consulting for Kura Oncology. DJD received funding from Norvartis, Abbvie, Blueprint Medicines, and Glycomimetrics, and has provided consulting for Agios, Amegen, Autolus, FortySeven, Incyte, Jazz, Norvartis, Pfizer, Servier, and Takeda. JEM received funding from the NIH, Blueprint Medicines, Gilead Sciences, Kura Oncolology, and has an ongoing collaboration with Ionis Pharmaceuticals. The other authors have no conflicts of interest to disclose.
Contributions
BNM, JC, PSA, DJD and JEM are responsible for data collection and analysis. BNM, JC, DJD and JEM prepared and wrote the manuscript.
Funding
Research reported in this publication was supported by an ACS Research Scholar Award RSG-19-184-01-LIB, a Concern Foundation Conquer Cancer Now Award, a Scholar Grant from The Leukemia & Lymphoma Society, and R01 HL157147-02 (to JEM). BNM was supported by an American Society of Hematology Minority Hematology Graduate Award, Knight Cancer Research COVID-relief for PhD scholars award, and a Ruth L Kirschstein T32 PERT training grant.
Data-sharing statement
The datasets generated in this study are available from the corresponding author by request.
Haematologica | 108 July 2023 1949 LETTER TO THE EDITOR
References
1. Beekman R, Valkhof M, van Strien P, Valk PJ, Touw IP. Prevalence of a new auto-activating colony stimulating factor 3 receptor mutation (CSF3R-T595I) in acute myeloid leukemia and severe congenital neutropenia. Haematologica. 2013;98(5):e62-63.
2. Dong F, Brynes RK, Tidow N, Welte K, Lowenberg B, Touw IP. Mutations in the gene for the granulocyte colony-stimulatingfactor receptor in patients with acute myeloid leukemia preceded by severe congenital neutropenia. N Engl J Med. 1995;333(8):487-493.
3. Maxson JE, Gotlib J, Pollyea DA, et al. Oncogenic CSF3R mutations in chronic neutrophilic leukemia and atypical CML. N Engl J Med. 2013;368(19):1781-1790.
4. Pardanani A, Lasho TL, Laborde RR, et al. CSF3R T618I is a highly prevalent and specific mutation in chronic neutrophilic leukemia. Leukemia. 2013;27(9):1870-1873.
5. Maxson JE, Ries RE, Wang YC, et al. CSF3R mutations have a high degree of overlap with CEBPA mutations in pediatric AML. Blood. 2016;127(24):3094-3098.
6. Lavallee VP, Krosl J, Lemieux S, et al. Chemo-genomic interrogation of CEBPA mutated AML reveals recurrent CSF3R mutations and subgroup sensitivity to JAK inhibitors. Blood. 2016;127(24):3054-3061.
7. Touw IP, Palande K, Beekman R. Granulocyte colony-stimulating factor receptor signaling: implications for G-CSF responses and leukemic progression in severe congenital neutropenia. Hematol Oncol Clin North Am. 2013;27(1):61-73.
8. Maxson JE, Luty SB, MacManiman JD, Abel ML, Druker BJ, Tyner
JW. Ligand independence of the T618I mutation in the colonystimulating factor 3 receptor (CSF3R) protein results from loss of O-linked glycosylation and increased receptor dimerization. J Biol Chem. 2014;289(9):5820-5827.
9. Plo I, Zhang Y, Le Couedic JP, et al. An activating mutation in the CSF3R gene induces a hereditary chronic neutrophilia. J Exp Med. 2009;206(8):1701-1707.
10. Spiciarich DR, Oh ST, Foley A, et al. A novel germline variant in CSF3R reduces N-glycosylation and exerts potent oncogenic effects in leukemia. Cancer Res. 2018;78(24):6762-6770.
11. Maxson JE, Luty SB, MacManiman JD, Abel ML, Druker BJ, Tyner JW. Ligand independence of the T618I mutation in the colonystimulating factor 3 receptor (CSF3R) protein results from loss of O-linked glycosylation and increased receptor dimerization. J Biol Chem. 2014;289(9)5820-5827.
12. Rohrabaugh S, Kesarwani M, Kincaid Z, et al. Enhanced MAPK signaling is essential for CSF3R-induced leukemia. Leukemia. 2017;31(8):1770-1778.
13. Dao KT, Gotlib J, Deininger MMN, et al. Efficacy of ruxolitinib in patients with chronic neutrophilic leukemia and atypical chronic myeloid leukemia. J Clin Oncol. 2020;38(10):1006-1018.
14. Gotlib J, Maxson JE, George TI, Tyner JW. The new genetics of chronic neutrophilic leukemia and atypical CML: implications for diagnosis and treatment. Blood. 2013;122(10):1707-1711.
15. Carratt SA, Kong GL, Curtiss BM, et al. Mutated SETBP1 activates transcription of Myc programs to accelerate CSF3R-driven myeloproliferative neoplasms. Blood. 2022;140(6):644-658.
Haematologica | 108 July 2023 1950 LETTER TO THE EDITOR
Clonal dynamics using droplet digital polymerase chain reaction in peripheral blood predicts treatment responses in myelodysplastic syndrome
Treatment response evaluation in myelodysplastic syndrome (MDS) and chronic myelomonocytic leukemia (CMML) currently relies on serial assessment of peripheral blood (PB) counts, bone marrow (BM) morphology, and cytogenetics.1 Acquired genetic alterations are associated with treatment outcomes in MDS 2 and serial assessment of clonal dynamics during therapy could help predict response, refractoriness or progression to acute myeloid leukemia (AML). 3 Most MDS and CMML patients carry somatic driver mutations 2 which can usually be detected in both BM and PB. A good correlation between PB and BM variant allele frequencies (VAF) has been detected in hematological neoplasms.4,5 Compared to BM sampling, the non-invasiveness of PB as sample source enables more frequent molecular followup during treatments, which might be beneficial in several clinical situations, such as in analyzing the role of treatment-induced BM hypoplasia versus disease progression as cause of cytopenia during treatment and earlier detection of refractoriness and need for subsequent therapies. Therefore, serial clone size measurement in PB might provide a non-invasive alternative for monitoring treatment responses, including patients whose BM aspirates show hemodilution, dry tap, or those who decline repeat BM sampling.
High sensitivity mutation-specific droplet digital polymerase chain reaction (ddPCR) has been evaluated in AML,6 but to our knowledge not in MDS patients serially from PB mononuclear cells. As a proof of concept, we evaluated the association between changes in mutational allele burden and treatment outcomes in MDS and CMML using ddPCR of serial PB samples. Patients who started disease-modifying treatment between January 2016 and October 2018 at Helsinki University Hospital were recruited and those with at least one pathogenic mutation in pretreatment next-generation sequencing (NGS) chosen for follow-up sample collection (17 MDS and 2 CMML patients). Written informed consent was obtained from all patients in accordance with the Declaration of Helsinki. The study was approved by the hospital ethics committee. Serial PB samples were collected before treatment and during routine laboratory visits, and mononuclear cell pellets were frozen for retrospective analysis. Pretreatment BM samples were screened at one time point for myeloid driver mutations as part of the routine clinical workup
using an in-house NGS panel of 44 myeloid genes ( Online Supplementary Table S1). Variants which occurred in the gnomAD database with a frequency of more than 1% were interpreted as normal variation. A variant was interpreted as pathogenic if it was described in the COSMIC database or the variant was a truncating mutation and described in the literature. Targeted mutation-specific wild-type and mutant ddPCR probes were designed and prevalidated by Bio-Rad (www.biorad.com). The QX200 Droplet Generator partitioned the DNA samples (100 ng into 20,000 droplets) for PCR amplification. Following amplification, droplets were divided into negative and positive droplets by setting thresholds on the QX200 Droplet Reader. A mutation was interpreted as positive if at least two positive droplets were detected in each duplicate. Absolute quantification of the target DNA was done by the QuantaSoft Analysis Pro Software (v.1.0, BioRad, Hercules, CA, USA). VAF of 0,1% was used as the lower limit of detection.
One probe each was screened for 11 patients, two probes each for seven patients, and three probes for one patient. The on-treatment PB samples, collected at a median of six time points (range, 4-16) per patient, were tested for altogether 28 patient-specific mutation markers. Statistical analyses were performed using Excel Microsoft 365 and IBM SPSS Statistics 25.
Pretreatment patient characteristics are presented in Table 1 and in the Online Supplementary Table S2. The median follow-up between treatment initiation and last ddPCR evaluation was 9.6 months (range, 3.7-39.3 months). Therapy responses were evaluated according to IWG-2006.1 Eighteen patients were treated with hypomethylating agents (HMA), one with lenalidomide. One patient received venetoclax combined with azacitidine (AZA) in second line. The two CMML patients were treated with hydroxyurea (HU) prior to AZA. Six patients proceeded to allogeneic stem cell transplantation after AZA treatment. The 3-year overall survival (OS) from start of treatment was 42.1% and the median OS was 41 months.
The clonal dynamics in all MDS patients during up to 17 months from start of treatment are shown in Figure 1A, B. The VAF dynamics was associated with the clinical course, both before response and preceding progression. Clinical response (complete remission [CR], marrow CR, or hematologic improvement [HI]) was preceded by
Haematologica | 108 July 2023 1951 LETTER TO THE EDITOR
*International Working Group-2006 response criteri; bold: no droplet digital polymerase chain reaction (ddPCR) primer. F: female; M: male; WHO: World Health Organization; MDS: myelodysplastic syndrome; MLD: multilineage dysplasia; MPN: myeloproliferative neoplasms; EB: excess blasts; CMML: chronic myelomonocytic leukemia; AML: acute myeloid leukemia; IPSS-R: revised international prognostic scoring system; CPSS: CMML-specific prognostic scoring; mCR: marrow complete remission; NGS: next-generation sequencing; SD: stable disease; intermed: intermediate; del: deletion; CR: complete remission; HI: hematologic improvement; AZA: azacitidine; DEC: decitabine; HU: hydroxyurea; LEN: lenalidomide; PD: progressive disease; VEN: venetoclax; nd: not determined.
Haematologica | 108 July 2023
Patient Age in years/Sex WHO diagnosis IPSS-R/ CPSS Karyotype Treatment Best response* Progression NGS mutations at diagnosis Clonal evolution at progression 1 48/M MDS-EB2 High t(1;7) AZA mCR DNMT3A, EZH2 2 61/F MDS-EB2 Intermed Monosomy 7 AZA mCR DNMT3A, IDH2 3 64/M MDS-EB2 Very high t(3;3) AZA SD PD SF3B1 NGS and karyotype unchanged 4 71/F MDS-EB2 High del(5q) AZA HI AML TP53 NGS unchanged, new chrom 22 loss 5 84/F MDS-EB2 High t(1;3) AZA CR Relapse SF3B1 New CREBBP Karyotype nd 6 73/F tMDS-EB2 Very high del(5q) AZA CR AML TP53 NGS and karyotype unchanged 7 68/M MDS-RSMLD Low Normal AZA SD SF3B1 8 39/M MDS-RSMLD Intermed Normal AZA SD U2AF1, SRSF2 9 77/F tMDS-EB2 High del(12q) AZA mCR AML RUNX1 New FLT3 Karyotype nd 10 68/F MDS-del5q Very low del(5q) LEN HI SF3B1, EZH2 11 71/M CMML-1 CPSS: Intermed Normal HU+AZA HU: SD, AZA: HI PD NRAS, U2AF1 NGS and karyotype unchanged 12 66/M CMML-2 CPSS: Intermed Normal HU+AZA mCR NRAS, IDH2, SRSF2 13 52/M MDS-EB2 Intermed Normal AZA SD TET2 X 2, SRSF2 14 77/F MDS-EB1 Intermed Normal AZA SD TET2 15 73/M tMDS-EB2 Very high del(7q) AZA SD PD TET2 New PHF6 Karyotype nd 16 67/F tMDS-EB2 High del(7q) AZA+VEN mCR AML WT1, NRAS, IDH1 New NRAS and IDH2 Karyotype nd 17 63/F MDS/ MPN-U Very high Complex DEC CR Relapse TP53 New TP53 Karyotype nd 18 82/M MDS-EB1 Intermed Complex AZA mCR TP53 19 69/F tMDS-EB2 High Normal AZA+DEC mCR TP53, DNMT3A
Table 1. Patients’ characteristics.
LETTER TO THE EDITOR
1952
decrease in VAF in 91% (10/11) of MDS patients and in 14 of their 15 mutations (median relative decrease in VAF, 76%; range, 35-98%). In patients 1, 2 and 19 the nonDNMT3A mutation was chosen for this evaluation.7 The decrease was observed 33 days (median; range, 0-480 days) prior to the detection of the IWG-2006 response. In particular, we saw a rapid decline in VAF of TP53 mutations upon AZA treatment initiation in four of five TP53 -mutated patients (Figure 1A), in accordance with published data. 8
In 71% (5/7) patients with stable disease (SD), the VAF either decreased slightly or were stable (Figure 1B). Two patients (29 %) had a modest increase in VAF at SD response. These two were the only MDS patients with progression after SD response.
At disease progression after first line treatment (n=9), the VAF of the assumed driver mutations increased in all patients (Figure 1C) although also new clonal findings, in either NGS or karyotype, were detected in six patients at progression (Table 1). The median relative increase in VAF for the initially responded patients (CR, marrow CR or HI) was 293% (range, 42-934%) from maintained response to
progression. The VAF increased median 45 days (range, 16327 days) prior to the clinically verified progression.
Evaluation of subclonal hierarchies using ddPCR was possible in patients with multiple driver mutations. All MDS patients with more than one mutation available for ddPCR monitoring are individually shown in Figure 2. Despite marrow CR response in all three patients with DNMT3A mutations, only one patient (patient 1; Figure 2A) had a rapid decrease in DNMT3A VAF, whereas the other two patients had only modest decreases in VAF (Figure 2B, C). Serial assessment of the other mutations ( EZH2, IDH2, TP53 , respectively) more closely followed treatment responses in these patients (Figure 2A-C); these results are in line with prior studies showing limited utility of DNMT3A/TET2/ASXL1 mutations in predicting clonal evolution in AML. 9

In CMML the response to HMA has been found to be associated with changes in DNA methylation and gene expression, without any decrease in the mutation allele burden, arguing for a predominantly epigenetic effect rather than cytotoxic effect of HMA.10 In one CMML patient, the VAF followed this pattern (patient 12; Online
Figure 1. Clonal dynamics during disease-modifying therapies in myelodysplastic syndrome. The non-DNMT3A mutation or the dominant clone was chosen for the figures; i.e., 1 mutation shown per patient. (A, B) Variant allele frequencies (VAF) for the same patients are shown in both figures, up to 17 months from start of treatment. Green dot: VAF from bone marrow sample. Yellow triangle: progression. (A) Red line: TP53 mutations, black line: non-TP53 mutations. (B) Blue line: VAF for patients with stable disease, black line: VAF for patients with complete remission/maintained complete remission/HI: hematologic improvement (CR/mCR/HI) response (International Working Group-2006). (C) Change in VAF prior to disease progression in myelodysplastic syndrome.
A B C
Haematologica | 108 July 2023 1953 LETTER TO THE EDITOR
Supplementary Table S3 ). On the other hand, in our second CMML patient, we saw a dramatic decrease in VAF of both NRAS and U2AF1 mutations during AZA (patient 11; Online Supplementary Table S3).
In summary, we found that the clonal dynamics predicted the clinical course at favorable treatment re -
sponse as well as at progressive disease. The changes in PB mutational burden were seen before the response evaluation with BM samplings, the timings of which were decided by the treating clinicians.

TP53 mutations are associated with poor outcomes in MDS,11 including post-transplant outcomes.12 In line with
Figure 2. Clonal dynamics and therapeutic responses in all myelodysplastic syndrome patients with more than one pathogenic mutation followed. Peripheral blood variant allele frequencies (black dot: bone marrow) from start of treatment to end of follow-up. Red dots: bone marrow blasts, yellow triangles: therapy response according to International Working Group-2006 criteria. Pt: patient. mCR: marrow complete remission, AML: acute myeloid leukemia, SD: stable disease, HI: hematologic improvement.
A B C D E F
Haematologica | 108 July 2023 1954 LETTER TO THE EDITOR
a previous study, 8 we observed a rapid decline in clonal burden of TP53 mutations upon treatment initiation. As reaching minimal residual disease negativity and clearance of TP53 mutations evaluated by NGS are associated with superior OS in MDS and sAML,13 serial monitoring of mutational responses in PB may guide clinical decision-making in the future, for example in designing bridging therapies to find the most optimal timing for allogeneic stem cell transplantation.
The DTA mutations (DNMT3A, TET2 and ASXL1 ) are the most commonly mutated genes in clonal hematopoiesis of indeterminate potential (CHIP) and should usually be excluded as markers for response evaluation, as these mutations may not represent the disease clone.9 Even some non-DTA mutations in myeloid driver genes may fail to fully capture clonal changes in the BM, and larger studies are needed before implementing single mutation follow-up for assessment of treatment response.14 Nevertheless the European LeukemiaNet has recommended that if the only detectable mutations are in the DTA genes, these might be used in assessment of residual disease in AML.15 We saw a robust decrease in VAF of DNMT3A in one of the three DNMT3A mutated patients. In this study, the three TET2 mutated patients had SD during AZA treatment, limiting the evaluation regarding the usefulness of these mutations in response evaluation.
Limitations of this study include small cohort size, heterogeneity in patient characteristics and therapies received, as well as the retrospective nature of the analyses. Clonal evolution during MDS progression may occur3 and PCR-based targeted sequencing is unable to discover new clonal genetic alterations emerging during treatment. Therefore, a new NGS screen should be considered whenever clonal evolution is suspected. Targeted ddPCR is a PCR‐based test method and only known sequences can be amplified. The limited number of fluorescence channels and the lack of commercial ddPCR kits limits the evaluation of clonal dynamics to one or, at most, a few mutations per patient. In addition, the short (less than 200 base pairs) probe design is challenging for variants located in homopolymer regions, repeat motifs, as well as for large insertions and deletions.
In conclusion, we found that detection of PB clonal dynamics using patient- and mutation-specific ddPCR may serve as a non-invasive tool for early response evaluation during treatment with HMA in MDS. On the other hand, in CMML, where the treatment response might be more of a stable type, especially during hydroxyurea, this kind of response evaluation might not be feasible.10 Larger patient series are warranted to evaluate the impact of serial mutational assessment on clinical decision-making and to define the best balance between broad sequencing and more targeted approaches.
Authors
Johanna Illman,1 Soili Kytölä,2 Mikko Myllymäki3,4,5 and Freja Ebeling3
1Department of Internal Medicine, Porvoo Hospital, Helsinki and Uusimaa Hospital District, Porvoo; 2Laboratory of Genetics, HUS Diagnostic Center, Helsinki University Hospital and Helsinki University, Helsinki; 3Helsinki University Hospital, Comprehensive Cancer Center, Division of Hematology, Helsinki; 4Hematology Research Unit Helsinki, University of Helsinki and Helsinki University Hospital Comprehensive Cancer Center, Helsinki and 5Translational Immunology Research Program and Department of Clinical Chemistry and Hematology, University of Helsinki, Helsinki, Finland
Correspondence:
J. ILLMAN - johanna.illman@hus.fi
https://doi.org/10.3324/haematol.2022.281595
Received: July 26, 2022.
Accepted: December 15, 2022.
Early view: December 29, 2022.
©2023 Ferrata Storti Foundation
Published under a CC BY-NC license
Disclosures
No conflicts of interest to disclose.
Contributions
JI recruited patients, organized the collection of the study samples, compiled the clinical and molecular data and wrote the manuscript; SK was responsible for implementing the mutational ddPCR analyses in HUSLAB as well as for the NGS and reviewing the molecular data; MM and FE contributed to research discussion and data interpretation; FE was responsible for designing the study. All authors reviewed the manuscript during its preparation and approved the submission.
Funding
This study was supported by grants from the Helsinki University Hospital Comprehensive Cancer Center, the Southern Finland Regional Cancer Center (FICAN South) and from the Finnish Hematology Association. MM was supported by the Sigrid Juselius Foundation, Academy of Finland, and Finnish Medical Foundation.
Data-sharing statement
The authors confirm that the data supporting the findings of this study are available within the article and its Online Supplementary Appendix
Haematologica | 108 July 2023 1955 LETTER TO THE EDITOR
References
1. Cheson BD, Greenberg PL, Bennett JM, et al. Clinical application and proposal for modification of the International Working Group (IWG) response criteria in myelodysplasia. Blood. 2006;108(2):419-425.
2. Papaemmanuil E, Gerstung M, Malcovati L, et al. Clinical and biological implications of driver mutations in myelodysplastic syndromes. Blood. 2013;122(22):3616-3627.
3. Makishima H, Yoshizato T, Yoshida K, et al. Dynamics of clonal evolution in myelodysplastic syndromes. Nat Genet. 2017;49(2):204-212.
4. Lucas F, Michaels PD, Wang D, Kim AS. Mutational analysis of hematologic neoplasms in 164 paired peripheral blood and bone marrow samples by next-generation sequencing. Blood Adv. 2020;4(18):4362-4365.
5. Duncavage EJ, Uy GL, Petti AA, et al. Mutational landscape and response are conserved in peripheral blood of AML and MDS patients during decitabine therapy. Blood. 2017;129(10):1397-1401.
6. Parkin B, Londono-Joshi A, Kang Q, Tewari M, Rhim AD, Malek SN. Ultrasensitive mutation detection identifies rare residual cells causing acute myelogenous leukemia relapse. J Clin Invest. 2017;127(9):3484-3495.
7. Gaidzik VI, Weber D, Paschka P, et al. DNMT3A mutant transcript levels persist in remission and do not predict outcome in patients with acute myeloid leukemia. Leukemia. 2018;32(1):30-37.
8. Hunter AM, Komrokji RS, Yun S, et al. Baseline and serial
molecular profiling predicts outcomes with hypomethylating agents in myelodysplastic syndromes. Blood Adv. 2021;5(4):1017-1028.
9. Jongen-Lavrencic M, Grob T, Hanekamp D, et al. Molecular minimal residual disease in acute myeloid leukemia. N Engl J Med. 2018;378(13):1189-1199.
10. Merlevede J, Droin N, Qin T, et al. Mutation allele burden remains unchanged in chronic myelomonocytic leukaemia responding to hypomethylating agents. Nat Commun. 2016;7:10767.
11. Bernard E, Nannya Y, Hasserjian RP, et al. Implications of TP53 allelic state for genome stability, clinical presentation and outcomes in myelodysplastic syndromes. Nat Med. 2020;26(10):1549-1556.
12. Lindsley RC, Saber W, Mar BG, et al. Prognostic mutations in myelodysplastic syndrome after stem-cell transplantation. N Engl J Med. 2017;376(6):536-547.
13. Yun S, Geyer SM, Komrokji RS, et al. Prognostic significance of serial molecular annotation in myelodysplastic syndromes (MDS) and secondary acute myeloid leukemia (sAML). Leukemia. 2021;35(4):1145-1155.
14. Kusne Y, Xie Z, Patnaik MM. Clonal hematopoiesis: molecular and clinical implications. Leuk Res. 2022;113:106787.
15. Heuser M, Freeman SD, Ossenkoppele GJ, et al. 2021 Update on MRD in acute myeloid leukemia: a consensus document from the European LeukemiaNet MRD Working Party. Blood. 2021;138(26):2753-2767.
Haematologica | 108 July 2023 1956 LETTER TO THE EDITOR
Covid-19 vaccination in patients with immune-mediated thrombotic thrombocytopenic purpura: a single-referral center experience
Cases of immune-mediated thrombotic thrombocytopenic purpura (iTTP) following the administration of vaccines have been described in the literature.1-2 Recently, de novo and relapsed iTTP have been reported during SARSCov-2 infection3-5 and after the vaccine, mainly with adenoviral and rarely with mRNA vaccines.6-11 The French Reference Center for Thrombotic Microangiopathies conducted a large multicenter retrospective study to investigate the possible link between COVID-19 vaccine and the new onset or recurrence of iTTP. Results showed that vaccination does not trigger relapse in these patients, particularly if they are regularly monitored and do not have low ADAMTS13 enzyme activity.12 Similar results were described by the Vaccine Adverse Event Reporting System (VAERS), the US passive surveillance system for adverse events after immuniziation.13 COVID-19 vaccine did not increase the risk of de novo or relapsed iTTP, except in individuals in hematologic remission with extremely low ADAMTS13 activity (<20%).12-13
We report here our single-center experience in 33 patients with pre-existing iTTP, followed at our Institute, who received regular mRNA COVID-19 vaccination (Pfizer-BioNTech vaccine: 31 cases; Moderna: 2 cases).
All 33 patients had been followed in our Institute since the first acute iTTP episode and had a confirmed iTTP diagnosis based on documented ADAMTS13 activity <10 UI/dL during the acute episodes of thrombotic microangiopathies; the immune-mediated mechanism was confirmed by the demonstration of anti-ADAMTS13 autoantibodies. Between March 2021 and March 2022, all 33 patients received mRNA COVID-19 vaccines, as scheduled for our fragile patients. Thirty-two of the 33 patients received the full scheduled mRNA COVID-19 vaccination; the last patient, who had previously contracted SARSCov-2 infection, without sequelae, received only one dose of the vaccine. Twenty-seven patients received a booster dose and seven patients received a second booster of vaccine during active immunosuppressive treatment. At the time of vaccine injection all patients were in clinical remission; 19 (57%) patients were out of treatment while 14 (43%) were still receiving immunosuppressive therapy. Patients’ characteristics and details about iTTP as well as available laboratory data, including ADAMTS13 activity before and after the vaccine, are reported in Table 1. Eighteen patients had previously presented one acute iTTP episode, eight patients had previously presented two
episodes, five patients three episodes and two patients four iTTP acute episodes. Median time between the most recent acute episode and the first vaccine dose was 88 months (range, 5-259). Median ADAMTS13 activity in the 3 months before vaccination was 75 UI/dL (range, 10-135). Twenty-three patients showed enzyme activity >50 UI/dL (median 99% UI/dl; range, 54-135), eight patients had an enzyme activity ranging between 20 UI/dL and 50 UI/dL (median 39% UI/dl; range, 23-48) and the last two patients a very low activity (<20 UI/dL). Thirteen (39%) patients had received rituximab (CD20-targeted B-cell-depleting antigen), as part of iTTP treatment. The median interval between anti-CD20 therapy and first vaccine dose was 17 months (range, 2-151); in four patients pre-emptive rituximab was still ongoing before vaccination. After vaccine, all patients were checked with a peripheral blood count every week, for a total of 1 month from the date of each injection. The platelet count remained in the normal range; no episodes of anemia, renal impairment, neurologic symptoms were observed. No iTTP clinical relapse within 4 weeks of vaccination (first, second and booster doses) were documented. ADAMTS13 activity was monitored 1-3 months after vaccine in 31 of 33 patients and five of them (16%) showed a reduction in activity below <20 UI/dL. In these last five patients, the median of ADAMTS13 activity before vaccination was 45 UI/dL (range, 23-109), while the median activity after vaccination was 9 UI/dL (range, <3-14). Due to the drop of ADAMTS13 activity four of the five patients in clinical remission received preemptive immunosuppressive treatment (rituximab 3; azathioprine 1) with increase in the ADAMTS13 activity >20 UI/dL after rituximab; the patient, who received azathioprine treatment, remained in clinical remission with enzyme activity >10 UI/dL. The last patient with decreased ADAMTS13 activity after vaccine, contracted SARS-Cov-2 infection 2 months after vaccination with a concomitant iTTP relapse. A total of eight patients developed mild COVID-19 after a median of 3.5 months (range, 2-10) from the last vaccine dose; seven did not require hospitalization and/or anti-viral therapy, one patient was hospitalized for the treatment of iTTP relapse. In all seven patients there no was reduction in ADAMTS13 activity following the infection episode. SARS-Cov-2 infection occurred in two of 14 (14%) patients still receiving immunosuppressive treatment compared with six of 19 (31%) patients out of therapy (>9 months from the last treatment). Five of the
Haematologica | 108 July 2023 1957 LETTER TO THE EDITOR
eight patients who were SARS-Cov-2 infected had already received the vaccine booster dose and only one of them was still in immunosuppressive treatment. No patient performed the anti-COVID-19 immune assessment after vaccine and the value of SARS-CoV-2 spike antibodies is not available.
Vaccinations can rarely induce autoimmune reactions including iTTP. According to the case reports, iTTP occurs within 2 weeks after vaccination, mostly with influenza vaccination, followed by vaccines against pneumococcus, rabies and H1N1.1-2 To date, COVID-19 vaccination-associated iTTP is present in the literature.4-11 The literature review demonstrates only few cases of mRNA COVID-19 vaccine-related iTTP. Giuffrida et al. described five postvaccine recurrences among 32 vaccinated patients.14 The French study showed that COVID-19 vaccination has no
causal relationship with iTTP12 and more recently, the multicenter, retrospective VAERS study confirmed that COVID-19 vaccination does not increase the risk of de novo or relapsed iTTP, particularly if patients are monitored regularly and have normal ADAMTS13 enzyme activity.13 In this study, the rare iTTP clinical relapses (4/79) occurred only in those patients with low (<20%) or unknown ADAMTS13 activity levels within 3 months prior to vaccination.13 Our study confirms that mRNA COVID-19 vaccine can be safely administered to patients with a previous iTTP diagnosis if patients are carefully monitored after vaccination. In order to prevent relapse, peripheral blood count and ADAMTS13 activity should be monitored to promptly initiate immunosuppressive treatment. The preemptive treatment although necessary, may alter the vaccine response for at least 6 months. In our study, no vaccine-related iTTP clinical recurrences were documented, even in patients with very low ADAMTS13 activity. Despite mRNA vaccination, eight patients were infected with SARS-Cov-2. None of them presented a severe viral infection but one patient showed a concomitant iTTP recurrence and required treatment with plasma exchange, caplacizumab, immunosuppressive treatment with steroids and rituximab. COVID-19-associated iTTP has been described in the literature.3-5 Even though a causal relationship remains to be elucidated, viral infections are a known trigger for secondary or immune TTP, with proposed mechanisms including both direct endothelial injury and development of ADAMTS13 autoantibodies.4,15
Time to diagnosis of TTP was 10 days from the onset of SARS-Cov-2 infection.4 Treating TTP relapses during SARS-Cov-2 infection is not easy. The patients need daily plasma exchange and intensive immunosuppressive treatment that may worsen the course of viral infection resulting in a poor outcome.
In summary, our data confirm that mRNA COVID-19 vaccines does not increase the risk of relapsed iTTP, if patients are carefully monitored. Checking patients with blood counts and ADAMTS13 activity after vaccination is recommended, in order to administer preemptive therapy in those cases with very low enzyme activity. The incidence of SARS-Cov-2 infections after vaccination for patients in immunosuppressive therapy is low (14%) and none of them developed severe disease. These data confirm the efficacy of mRNA vaccines. SARS-Cov-2 infection itself can trigger TTP, with many other severe and devastating consequences, hence the benefits of the vaccine outweighs the
Authors
risks.
Characteristics Patients, N 33 Age in years at diagnosis, median (range) 44 (11-68) Sex, male/female, N 6/27 iTTP* episodes, N 1 2 3 4 18 8 5 2 Ongoing treatment prevaccine, N No therapy Prednisone Azathioprine Rituximab Cyclosporine 19 1 8 4 1 Vaccine dose, N First dose Second doses Third doses Fourth doses 33 1 32 27 7 Time in months of last TTP episode to 1st vaccine dose, median (range) 88 (5-259) Prior rituximab therapy, N 13 Time in months from most recent rituximab dose and vaccine Median Range >1 year <6 months 17 2-151 9 4 ADAMTS13 activity pre-vaccine (UI/dL), median (range) 75 (10-135) ADAMTS13 activity post-vaccine (UI/dL), median (range) 75 (<3-137)
Silvia Maria Trisolini,1 Saveria Capria,1 Andrea Artoni,2 Ilaria Mancini,3
Table 1. Demographic and clinical characteristics of the 33 patients with immune-mediated thrombotic thrombocytopenic purpura.
Haematologica | 108 July 2023 1958 LETTER TO THE EDITOR
*iTTP: immune-mediated thrombotic thrombocytopenic purpura.
Mario Biglietto,1 Giuseppe Gentile,1 Flora Peyvandi2,3 and Anna Maria
Testi1
1Division of Hematology, Department of Translational and Precision Medicine, “Sapienza” University of Rome, Rome; 2Fondazione IRCCS Ca’ Granda Ospedale Maggiore Policlinico, Angelo Bianchi Bonomi Hemophilia and Thrombosis Center, Università degli Studi di Milano, Department of Pathophysiology and Transplantation, and Fondazione Luigi Villa, Milan and 3Università degli Studi di Milano, Department of Pathophysiology and Transplantation and Fondazione Luigi Villa, Milan, Italy
Correspondence:
S.M. TRISOLINI - trisolini@bce.uniroma1.it https://doi.org/10.3324/haematol.2022.282311
Received: October 20, 2022.
Accepted: December 19, 2022.
Early view: December 29, 2022.
©2023 Ferrata Storti Foundation
Published under a CC BY-NC license
Disclosures
IM received honoraria for participating as a speaker at educational meetings organized by Instrumentation Laboratory and Sanofi. AA
References
1. Dias PJ, Gopal S. Refractory thrombotic thrombocytopenic purpura following influenza vaccination. Anaesthesia. 2009;64(4):444-446.
2. Kojima Y, Ohashi H, Nakamura T, et al. Acute thrombotic thrombocytopenic purpura after pneumococcal vaccination. Blood Coagul Fibrinolysis. 2014;25(5):512-514.
3. Tehrani HA, Darnahal M, Vaenzi M, et al. Covid-19 associated thrombotic thrombocytopenic purpura TTP: a case series and mini-review. Int Immunopharmacol. 2021;93:107397.
4. Caudhary H, Nasir U, Syed K, et al. COVID-19-associated thrombotic thrombocytopenic purpura: a case report and systematic review. Hematol Rep. 2000;14(3):253-260.
5. Dhingra G, Maji M, Mandal S, Vanyath S, Negi G, Nath UK. Covid 19 infection associated with thrombotic thrombocytopenic purpura. J Thromb Thrombolysis. 2021;52(2):504-507.
6. Greinacher A, Selleng K, Palankar R, et al. Insights in chAdox1 nCoV-19 vaccine-induced immune thrombotic thrombocytopenia. Blood. 2021;138(22):2256-2268.
7. De Bruijn S, Maes MB, De Waele L, Vanhoorelbeke K, Gadisseur A. First report of a de novo iTTP episode associated with an mRNA-based anti-COVID-19 vaccination. J Thromb Haemost. 2021;19(8):2014-2018.
8. Ruhe J, Schnetzke U, Kentouche K, et al. Acquired thrombotic thrombocytopenic purpura after first vaccination dose of BNT162b2
received honoraria for participating as speakers at educational meetings organized by Sanofi. FP has received honoraria for participating as a speaker in educational meetings organized by Grifols and Roche, and she is member of scientific advisory boards of Biomarin, Roche, Sanofi, Sobi, Takeda. The other authors have no conflicts of interest to disclose.
Contributions
ST and AMT managed the patients, collected data, wrote the manuscript and reviewed the literature; VC managed the patients and critically reviewed the manuscript; MB helped in data analysis and in writing the manuscript; GG managed the vaccinations schedule and critically reviewed the manuscript; IM performed ADAMTS-13 testing and critically reviewed the manuscript; AA and FP critically reviewed the manuscript. All authors reviewed the final manuscript revised version and gave approval for submission.
Acknowledgments
The authors thank all patients and their families. The authors wish to thank all the nurses and doctors of the Division of Hematology, Department of Translational and Precision Medicine, Sapienza University of Rome, Italy, for having vaccinated all "frail patients", under treatment at the center.
Data-sharing statement
The analyzed data sets generated during the study are available from the corresponding author on reasonable request.
mRNA COVID-19 vaccine. Ann Hematol. 2022;101(3):717-719.
9. Alislambouli M, Veras Victoria A, Matta J, Yin F. Acquired thrombotic thrombocytopenic purpura following Pfizer COVID19 vaccination. Eur J Haematol. 2022;3(1):207-210.
10. Sissa C, Al-Khaffaf A, Frattini F, et al. Relapse of thrombotic thrombocytopenic purpura after COVID-19 vaccine. Transfus Apheresis Sci. 2021;60(4):103145.
11. Karabulut K, Andronikashvili A, Kapici AH. Recurrence of thrombotic thrombocytopenic purpura after mRNA-1273 COVID19 vaccine administered shortly after COVID-19. Case Rep Hematol. 2021;2021:4130138.
12. Picod A, Rebibou JM, Dossier A, et al. Immune-mediated thrombotic thrombocytopenic purpura following COVID-19 vaccination. Blood. 2022;139(16):2565-2569.
13. Shah H, Kim A, Sukumar S, et al. sARS-CoV-2 vaccination and immune thrombocytopenic purpura. Blood. 2022;139(16):2570-2573.
14. Giuffrida G, Markovic U, Condorelli A, et al. Relapse of immunemediated thrombotic thrombocytopenic purpura following mRNA COVID-19 vaccination: a prospective cohort study. Haematologica. 2022;107(11):2661-2666.
15. Mancini I, Baronciani L, Artoni A, et al. The ADAMTS13-von Willebrand factor axis in COVID-19 patients. J Thromb Haemost. 2020;19(2):513-521.
Haematologica | 108 July 2023 1959 LETTER TO THE EDITOR
Long-term treatment with pacritinib on a compassionate use basis in patients with advanced myelofibrosis
Pacritinib is an oral Janus kinase (JAK) 2/interleukin-1 receptor–associated kinase 1 (IRAK1)/ activin receptor type1 (ACVR1) inhibitor that does not inhibit JAK1.1,2 Pacritinib received accelerated approval in the US in February 2022 for the treatment of adults with intermediate- or high-risk myelofibrosis (MF) with a platelet count <50×109/L. Latestage clinical studies of pacritinib include two randomized, controlled phase III trials (PERSIST-1 and PERSIST-2; clinicaltrials gov. Identifier: NCT01773187 and NCT02055781) and a phase II dose-finding study (PAC203; clinicaltrials gov. Identifier: NCT04884191).3–5 While pacritinib efficacy and safety was demonstrated across these studies, the phase III trials were terminated early due to a full clinical hold on February 8, 2016. The hold was removed on January 5, 2017 after submission of the final study reports, and patients who had benefited from pacritinib on trial were able to resume pacritinib on a compassionate use basis. In order to describe the long-term treatment experience with pacritinib, we analyzed data from 76 patients treated with pacritinib on a compassionate use basis after receiving pacritinib on a clinical trial, representing the longest-term data available. Most of these patients were thrombocytopenic and/or anemic, and most had received prior JAK2 inhibitor therapy. Pacritinib treatment duration was notable in this advanced population, with a median total duration (original study + compassionate use) of 21.1 months (range, 0.9-80.9 months). Similar treatment durations were observed regardless of baseline blood cell counts; however, median treatment duration was longer in patients who were JAK inhibitor naïve compared to those who had prior exposure. Reported serious adverse events (SAE) were consistent with those expected in an advanced MF patient population. Overall, these findings demonstrate that prolonged treatment with pacritinib is feasible in patients with advanced MF, including those with cytopenias. Thrombocytopenia, occurring either as a result of disease progression or from treatment with myelosuppressive therapy, is a common complication in patients with MF and is associated with more advanced disease and shorter survival compared to patients with higher platelet counts.6–9 The prevalence of severe thrombocytopenia (platelet count <50x109/L) in MF is estimated to be as high as 35%.10 Outcomes are particularly poor in patients with prior JAK2 inhibitor therapy: median survival in MF after discontinuing ruxolitinib is 14 months overall and approximately 8 months if the platelet count was <100×109/L at discontinuation.11
The clinical studies of pacritinib are unique in the MF land-
scape, as they allowed enrollment of patients with severe cytopenias: the phase II PAC203 study and the phase III PERSIST-1 and PERSIST-2 studies all included patients with baseline platelet counts <50x109/L as well as those with higher platelet counts. By contrast, other approved JAK2 inhibitors have not been extensively studied in patients with severe thrombocytopenia. In this analysis, we reviewed treatment and safety data from patients who received pacritinib as part of a compassionate use program after participating in a clinical study. Upon study closure, patients enrolled in PERSIST-1, PERSIST-2, or PAC203 were eligible to continue pacritinib on a compassionate use basis if they had an unmet medical need and were experiencing benefit in the opinion of the investigator or patient. Patients were excluded if they had progressed to acute leukemia or experienced high-grade cardiac or bleeding events on study. Eighty-three patients were approved for compassionate use, and 76 received compassionate use pacritinib, of whom 42 were originally enrolled in the PERSIST-1/PERSIST-2 studies and 34 were enrolled in PAC203. Patient characteristics were available from the original study for 74 patients treated with compassionate use pacritinib (Table 1). Median age was 69 years. Most patients (70%) had received prior treatment with a JAK2 inhibitor. Over half (60%) had a baseline peripheral blast count ≥1%. Cytopenias were common, with 34% of patients having a platelet count <50×109/L and 69% having a platelet count <100×109/L; in addition, 50% had hemoglobin <10 g/dL. Between the original study enrollment and the transition to compassionate use, the percentage of patients requiring red blood cell transfusion decreased from 49% to 33%.
Among 30 patients on PAC203 who had myeloid mutations assessed,5 67% had a non-driver mutation and 33% had a high-risk mutation (in ASXL1, SRSF2, U2AF1 Q157, TP53, EZH2, IDH1/2, or NRAS).
Pacritinib dosing data was collected as part of the compassionate use program and was available for 70 of 76 patients. The allowed dosing regimens for pacritinib were 200 mg twice daily (BID), 100 mg BID, and 100 mg daily. For patients treated at lower doses during the original studies, dose escalation up to 200 mg BID was permitted at the discretion of the medical monitor and treating physician.
Among the 70 patients with available dosing data at the start of the compassionate use program, 68% received pacritinib at a starting dose of 200 mg BID, 26% received 100 mg BID, and 6% received 100 mg daily. Nearly all patients (97% [66/68]) received the same dose or a higher dose than they had received on-study.
Haematologica | 108 July 2023 1960 LETTER TO THE EDITOR
Table 1. Baseline characteristicsa of patients receiving compassionate use pacritinib.
aCharacteristics as of the time of original study enrollment unless otherwise noted; denominators are based on N with available data. bMutation analysis was performed in the PAC203 study only; mutation status is based on N=30 patients with available baseline data. cHigh risk includes ASXL1, SRSF2, U2AF1 Q157, TP53, EZH2, IDH1/2, NRAS. JAK: Janus associated kinase; IQR: interquartile range; PLT: platelet count; Hb: hemoglobin; WBC: white blood cell; ANC: absolute neutrophil count; RBC: red blood cell; VAF: variant allele frequency.
Prolonged pacritinib treatment was feasible in patients in the compassionate use program (Figure 1). Overall, the median total duration of treatment with pacritinib (original study + compassionate use) was 21.1 months (range, 0.980.9 months) (Table 2), including a median treatment duration of 7.7 months on the original study and 11.6 months in the compassionate use program. At the time of this analysis (data cut-off February 28, 2022), 15 patients continued to receive compassionate use pacritinib with a median total treatment duration of 41 months (range, 3379 months).
Treatment duration was similar in patients with baseline thrombocytopenia or anemia compared with the 21.1month duration in the overall population: median treatment duration was 20.7 months in patients with platelet count <50×109/L (n=24) and 19.8 months in patients with
hemoglobin <10 g/dL (n=37). Among patients who had previously been enrolled in PAC203 and had mutational analysis data (n=30), the median total treatment duration was 28.7 months in patients with high-risk mutations (n=10) and 22.6 months in patients without high-risk mutations (n=20), indicating the feasibility of long-term pacritinib treatment regardless of molecular risk status. Median treatment duration was longer in patients who were JAK inhibitor naïve (29.4 months, n=22) compared to those with prior JAK inhibitor exposure (17.9 months, n=52). Among patients with prior JAK inhibitor exposure, the median time between prior JAK inhibitor and the start of pacritinib was only 18 days, and the median time from prior JAK inhibitor discontinuation to last day of treatment with compassionate use pacritinib was 27.3 months (range, 7.379.4 months ). This observed total time from prior JAK in-
Characteristic Patients receiving pacritinib (N=76) Prior study participation, % (N) PERSIST-1 PERSIST-2 PAC203 8 (6/76) 47 (36/76) 45 (34/76) Sex, % (N) Male Female 59 (44/74) 41 (30/74) Age in years at start of original study, median (range) 69 (37-84) Peripheral blasts ≥1%, % (N) 60 (38/63) Prior JAK inhibitor, % (N) Yes No 70 (52/74) 30 (22/74) Blood cell counts At original study start Prior to compassionate use Median PLT count x109/L, (IQR) PLT <50x109/L, % (N) PLT <100x109/L, % (N) PLT ≥100x109/L, % (N) Median WBC x109/L, (IQR) Median ANC x109/L, (IQR) Median Hb g/dL, (IQR) Hb <10 g/dL, % (N) 74 (40-117) 34 (24/71) 69 (49/71) 31 (22/71) 7.4 (3.7-16.4) 4.3 (2.1-10.5) 9.9 (8.3-11.2) 50 (37/74) 61 (32-105) 40 (29/73) 74 (54/73) 26 (19/73) 6.8 (3.5-12.0) 4.4 (1.9-8.7) 9.8 (8.2-11.8) 53 (39/74) Platelet transfusion within the past 90 days, % (N) 12.2 (9/74) 9.5 (7/74) RBC transfusion within the past 90 days, % (N) 48.6 (36/74) 32.4 (24/74) Myeloid mutations (PAC203)b, % (N) Non-driver mutation ≥2 non-driver mutations High-risk mutationc Driver mutation Driver allele burden <50% Driver allele burden ≥50% 67 (20/30) 27 (8/30) 33 (10/30) 100 (30/30) 50 (13/26 with baseline VAF data) 50 (13/26 with baseline VAF data)
Haematologica | 108 July 2023 1961 LETTER TO THE EDITOR
hibitor discontinuation compares favorably to the median survival of 14 months (95% confidence interval: 10-18) previously reported in patients discontinuing ruxolitinib,11 although the possibility of selection bias during enrollment in the compassionate use program should be noted. SAE reporting was required on the compassionate use program. Among the 76 patients treated with compassionate use pacritinib, 35 (46%) experienced an SAE (Online Supplementary Table S1). SAE considered possibly related to pacritinib were reported in 16 patients (21%). Most SAE were considered unlikely related to pacritinib and were expected in an end-stage MF population, including bleeding events in 15 patients (20%), infection in ten patients (13%), and heart failure in three patients (4%). Among the infections reported, only one was considered atypical or potentially opportunistic: a case of actinomyces pneumonia in a patient with baseline neutropenia, which resolved with administration of antibiotics. In addition to heart failure,

other cardiac events were reported in four patients (5%) and consisted of QT prolongation in two patients, and myocardial infarction and atrial enlargement in one patient each. There was one reported SAE of skin cancer, which was a case of invasive squamous cell carcinoma in a patient with a history of recurrent squamous cell carcinomas prior to treatment. Transformation to AML was reported in one patient.
Most SAE were grade 3 or 4 (48 events in 28 patients). There were ten fatal (grade 5) SAE reported in nine patients, including infection (n=3), heart failure (n=2), bleeding events (retroperitoneal hemorrhage, subdural hematoma, and hematemesis [n=1 each]), acute kidney injury (n=1) and disease progression (n=1). In the case of fatal subdural hematoma, the patient had been off pacritinib for >1 month at the time of death. In the case of fatal hematemesis, the patient had been on concomitant venetoclax plus decitabine prior to the event. Both events were con-
Figure 1. Time on pacritinib in compassionate use population. Patients ordered by length of time on treatment. Ongoing patients at time of data cut-off February 28, 2022.
Haematologica | 108 July 2023 1962 LETTER TO THE EDITOR
Table 2. Duration of treatment for patients receiving compassionate use pacritinib.
aData on the original study is based on N=73 patients with available baseline data from original study. bMutation analysis was performed in the PAC203 study only; mutation status is based on N=30 patients with available baseline data. Hb: hemoglobin; PLT: platelet count; JAK: Janus associated kinase.
sidered unlikely related to pacritinib by the investigator. This analysis provides unique evidence supporting the feasibility of prolonged treatment with pacritinib, even in patients with cytopenias. While standard clinical trial endpoints were not available on the compassionate use program, the duration of therapy in this advanced MF population suggests that patients were experiencing benefit and tolerating treatment. The duration of therapy in patients with prior JAK2 inhibitor exposure was favorable compared to the expected survival in MF after ruxolitinib discontinuation. The SAE profile of pacritinib on compassionate use was consistent with that previously observed with pacritinib and with the end-stage treatment setting. These data support the use of pacritinib for longterm treatment of patients with MF, including those with cytopenias.
Authors
Claire Harrison,1 Abdulraheem Yacoub,2 Bart Scott,3 Adam Mead,4 Aaron T. Gerds,5 Jean-Jacques Kiladjian,6 Ruben Mesa,7 Miklos Egyed,8 Christof Scheid,9 Valentin Garcia Gutierrez,10 Jennifer O’Sullivan,4 Sarah Buckley,11 Kris Kanellopoulos11 and John Mascarenhas12
1Guy's and St Thomas' NHS Foundation Trust, London, UK; 2The University of Kansas Cancer Center, Kansas City, KS, USA; 3Fred
Hutchinson Cancer Research Center, Seattle, WA, USA; 4University of Oxford, Oxford, UK; 5Cleveland Clinic Taussig Cancer Institute, Cleveland, OH, USA; 6Hôpital Saint-Louis, Université Paris Cité, Paris, France; 7Mays Cancer Center at UT Health San Antonio, San Antonio, TX, USA; 8Somogy County Mór Kaposi General Hospital, Kaposvár, Hungary; 9Universitätsklinikum Köln (AöR), Cologne, Germany; 10Hospital Universitario Ramón y Cajal, Instituto Ramón y Cajal de Investigación Sanitaria, Madrid, Spain; 11CTI BioPharma Corp, Seattle, WA, USA and 12Icahn School of Medicine at Mount Sinai, New York, NY, USA
Correspondence:
C. HARRISON - Claire.Harrison@gstt.nhs.uk
https://doi.org/10.3324/haematol.2022.282089
Received: September 30, 2022.
Accepted: December 21, 2022.
Early view: January 5, 2023.
©2023 Ferrata Storti Foundation
Published under a CC BY-NC license
Disclosures
CH has received Honoria from AbbVie, CTI BioPharma, Geron, Janssen, and Novartis; has acted in a consulting or advisory role for AOP, Celgene/BMS, Constellation Pharmaceuticals, CTI BioPharma, Galecto, Geron, Gilead, Janssen, Keros, Promedior, Roche, Shire, Sierra Oncology, and Novartis; has participated in speakers bureaus
Median pacritinib treatment duration, months (range) Original studya Compassionate use Total All patients (N=75) 7.7 (0-33.0) 11.6 (0.3-69.0) 21.1 (0.9-80.9) PLT <50×109/L (N=24) 8.7 (2.3-24.2) 11.6 (1.2-57.3) 20.7 (6.1-65.5) PLT 50-100×109/L (N=25) 7.1 (1.0-19.8) 13.2 (0.7-68.4) 24.1 (3.5-75.1) PLT >100×109/L (N=22) 7.5 (0.2-33.0) 11.6 (0.9-69.0) 22.7 (4.3-80.9) Hb <10 g/dL (N=37) 7.3 (1.0-24.2) 10.6 (0.3-68.4) 19.8 (3.5-75.1) PLT <50×109/L and Hb <10 g/dL (N=15) 8.5 (2.3-24.2) 13.3 (2.5-57.3) 21.9 (9.7-65.5) With high-risk mutation (N=10)b 12.1 (7.2-17.3) 16.2 (2.5-31.4) 28.7 (9.7-46.0) Without high-risk mutation (N=20)b 7.5 (5.5-16.6) 12.6 (1.1-30.7) 22.6 (7.2-47.1) Prior JAK inhibitor (N=52) 7.5 (1.7-19.8) 9.5 (0.3-31.4) 17.9 (3.5-48.8) No prior JAK inhibitor (N=22) 8.5 (0.2-33.0) 16.4 (0.9-69.0) 29.4 (8.2-80.9)
Haematologica | 108 July 2023 1963 LETTER TO THE EDITOR
for AbbVie, BMS, CTI BioPharma, Geron, Sierra Oncology, and Novartis; and has received research funding from BMS, Constellation Pharmaceuticals, and Novartis. AY has acted in a consulting or advisory role for AbbVie, Acceleron Pharma, Apellis, CTI BioPharma, Gilead, Incyte, Notable Labs., Novartis, Pfizer, PharmaEssentia, and Servier. BS has acted in a consulting or advisory role for Acceleron Pharma, Celgene, and Novartis; has participated in speakers bureaus for Alexion Pharmaceuticals, Celgene, Jazz Pharmaceuticals, and Novartis; has received honoraria from BMS, Incyte, and Taiho Oncology; and has received funding to their institution from Celgene. AM has received honoria for consulting or speakers’ fees from AbbVie, BMS/Celgene, CTI BioPharma, Galecto, Gilead, Incyte, Karyopharm, Novartis, Pfizer, Sensyn, and Sierra Oncology; has received funding to their institution from BMS/Celgene, Galecto, and Novartis, and is a co-founder and equity holder in Alethiomics Ltd, a spin-off company of the University of Oxford. AG has acted in a consulting or advisory role for AbbVie, BMS, Constellation Pharmaceuticals, CTI BioPharma, Novartis, PharmaEssentia, and Sierra Oncology. JJK has acted in a consulting or advisory role for AbbVie, BMS, Incyte, Novartis, and PharmaEssentia. RM has acted in a consulting or advisory role for Constellation Pharmaceuticals, LaJolla Pharmaceutical, Novartis, and Sierra Oncology; has received research support from AbbVie, Celgene, Constellation Pharmaceuticals, CTI BioPharma, Genotech, Incyte, Promedior, and Samus; and has received grants from Mays Cancer Center P30 Cancer Center Support Grant from National Cancer Institute (CA054174). CS has acted in a consulting or advisory role from Amgen, BMS, Janssen, and Roche; has received travel and accommodation expenses from Amgen, BMS, Janssen; has received honoraria from Amgen, BMS, Janssen, Novartis, Pfizer, and Takeda; and has received funding to their institution from Janssen, Novartis,
References
1. Singer JW, Al-Fayoumi S, Ma H, Komrokji RS, Mesa R, Verstovsek S. Comprehensive kinase profile of pacritinib, a nonmyelosuppressive janus kinase 2 inhibitor. J Exp Pharmacol. 2016;8:11-19.
2. Oh S, Mesa R, Harrison C, et al. Retrospective analysis of anemia benefit of pacritinib from the PERSIST-2 trial. Clin Lymphoma Myeloma Leuk. 2022;22(Suppl 2):S327.
3. Mesa R, Vannucchi A, Mead A, et al. Pacritinib versus best available therapy for the treatment of myelofibrosis irrespective of baseline cytopenias (PERSIST-1): an international, randomised, phase 3 trial. Lancet Haematol. 2017;4(5):e225-e236.
4. Mascarenhas J, Hoffman R, Talpaz M, et al. Pacritinib vs best available therapy, including ruxolitinib, in patients with myelofibrosis: a randomized clinical trial. JAMA Oncol. 2018;4(5):652-659.
5. Gerds AT, Savona MR, Scott BL, et al. Determining the recommended dose of pacritinib: Results from the PAC203 dose-finding trial in advanced myelofibrosis. Blood Adv. 2020;4(22):5825-5835.
6. Scotch A, Kosiorek H, Scherber R, et al. Symptom burden
and Takeda. VGG has participated in speakers bureaus, received research funding, and acted in a consulting or advisory role for Incyte, Novartis, and Pfizer; has received travel and accommodation expenses reimbursed from BMS, Incyte, Novartis, and Pfizer. SB and KK are employed by, have stock ownership in, and have travel and accommodation expenses reimbursed by CTI BioPharma. JM has acted in a consulting or advisory role for AbbVie, BMS, Celgene, Constellation Pharmaceutical, CTI BioPharma, Galecto, Geron, Incyte, Kartos, Karyopharm, Novartis, PharmaEssentia, and Sierra Oncology; and has received funding to their institution from AbbVie, BMS, Celgene, CTI BioPharma, Geron, Incyte, Kartos, Merck, Novartis, PharmaEssentia, and Roche. ME and JO’S have no conflicts of interest to disclose.
Contributions
CH, SB, and JM were involved in conception and design of the study; all authors participated in analysis and interpretation of the data; medical writer JL drafted the manuscript; all authors critically revised the manuscript and provided final approval for submission and publication.
Acknowledgments
Medical writing and editorial assistance was provided under the direction of the authors by Janis Leonoudakis, PhD and funded by CTI BioPharma Corp.
Funding
This study was supported by CTI BioPharma Corp.
Data-sharing statement
No shared data are available.
profile in myelofibrosis patients with thrombocytopenia: lessons and unmet needs. Leuk Res. 2017;63:34-40.
7. Hernández-Boluda JC, Correa JG, Alvarez-Larrán A, et al. Clinical characteristics, prognosis and treatment of myelofibrosis patients with severe thrombocytopenia. Br J Haematol. 2018;181(3):397-400.
8. Masarova L, Alhuraiji A, Bose P, et al. Significance of thrombocytopenia in patients with primary and postessential thrombocythemia/polycythemia vera myelofibrosis. Eur J Haematol. 2018;100(3):257-263.
9. Sastow D, Mascarenhas J, Tremblay D. Thrombocytopenia in patients with myelofibrosis: pathogenesis, prevalence, prognostic impact, and treatment. Clin Lymphoma Myeloma Leuk. 2022;22(7):e507-e520.
10. Masarova L, Mesa RA, Hernández-boluda JC, Taylor JA. Severe thrombocytopenia in myelofibrosis is more prevalent than previously reported. Leuk Res. 2020;91:106338.
11. Newberry K, Patel K, Masarova L, et al. Clonal evolution and outcomes in myelofibrosis after ruxolitinib discontinuation. Blood. 2017;130(9):1125-1131.
Haematologica | 108 July 2023 1964 LETTER TO THE EDITOR
Radical surgery and venetoclax plus azacitidine in an octogenarian with acute myeloid leukemia
A 79-year-old female patient was admitted in December 2020 to our hospital due to swelling and redness of her left forearm (Figure 1A). Besides arterial hypertension and a history of sleep apnoea her medical history was unremarkable. Laboratory evaluation revealed a decreased white blood cell count (WBC) of 0.8x10⁹/L (range, 3.5-9.8x10⁹/L), a hemoglobin value of 11.6 g/dL (range, 13.5–17.5 g/dL) and platelet count of 112x109/L (range, 140–360x109/L). A differential blood cell count showed 16% myeloid blast cells. Moreover, laboratory evaluation revealed acute renal failure with a creatinine of 128 mmol/L (range, 45-84 mmol/L) and massively elevated C-reactive protein (CRP) of 229 md/L (range, <5 mg/L). Renal insufficiency improved rapidly and creatinine values normalized within 5 days due to the application of intravenous fluids. Bone marrow evaluation showed myeloid blast cells of 58%. Cytogenetic analysis revealed a complex karyotype (90,XXXX,-17,-21[12]/47,XX,+8[8]/46,XX[7]) and molecular analysis an IDH2 R172K mutation. All other tested mutations (CEBPA, IDH1, NPM1, FLT3-ITD, FLT3-TKD) were unmutated. Thus, the diagnosis of acute myeloid leukemia (AML) with myelodysplasia-related abnormalities was made1 and the patient was classified as high-risk.2 The swelling and reddening on the left forearm were diagnosed as phlegmone and treatment with broad-spectrum antibiotics (clindamycin 600 mg orally, three times daily; meropenem 1 g intravenously, three times daily) as well as mold-active antifungal prophylaxis with posaconazole was started immediately. A computed tomography (CT) scan showed extensive phlegmonous-inflammatory changes of the skin and tissue. Thus, surgical intervention with rapid debridement was urgently indicated. The infection was split surgically, showing a partially avital muscle extensor carpi ulnaris without signs of necrotizing fasciitis. Besides necrosectomy, partial resection of the muscle and fascia were performed, which was covered with synthetic wound dress-

ing (Figure 1B). Histopathological analysis revealed an avital tissue of the muscle and tendon without signs of malignancy, bacteria or necrotizing fasciitis. After surgical intervention, all fingers were moveable and sensitivity was intact. Overall, two surgical wound revisions had to be performed within 5 days with additional necrosectomy, resulting in a severe lesion, which had to be covered with an autologous mesh graft from her left thigh. We started AML treatment with azacitidine (AZA) 75 mg/m² subcutaneously, days 1-5 and venetoclax (VEN) 100 mg orally (dose ramp-up), days 1-18 on day 7 after diagnosis of AML and improvement of the wound conditions. VEN/AZA were dose-reduced due to severe infection as well as concurrent antifungal prophylaxis with posaconazole. No signs of tumor lysis syndrome occurred. Besides, therapy with broad-spectrum antibiotics was continued. In the following 2 weeks, three additional surgical interventions were required for the installation and changing of a vacuum pump. Surprisingly, the wound conditions improved drastically despite AML treatment (Figure 2A). Thus, antibiotics were reduced to monotherapy with meropenem 1 g intravenously three times daily on day 13 after admittance. Overall, only two packed red blood cells were transfused during the first cycle of VEN/AZA.
First AML response assessment was performed on day 13 after the start of VEN/AZA treatment. Bone marrow cytology revealed a decline of myeloid blast cells to 11%. Thus, VEN was stopped on day 18 to allow further wound healing and ingrowing of the mesh graft. Repeated bone marrow evaluation on day 20 showed a further decline to 9% myeloid blast cells. The patient was still bicytopenic with WBC of 0.9x10⁹/L (range, 3.5-9.8x10⁹/L), a hemoglobin value of 7.3 g/dL (range, 13.5–17.5 g/dL), whereas the platelet count rose spontaneously to 194x109/L (range, 140–360x109/L). The vacuum pump was removed 23 days after installation.
A B Haematologica | 108 July 2023 1965 CASE REPORT
Figure 1. Picture of left arm of the patient with acute myeloid leukemia. (A) Left arm at diagnosis showing an infection with edematous swelling and redness. (B) Left arm after first surgery showing the synthetic wound dressing.
Hematologic recovery with WBC 2.2x10⁹/L, a hemoglobin value of 8.9 g/dL and platelet count of 238x109/L occurred 12 days after VEN was stopped. Thus, the patient could be discharged 43 days after admission to our hospital. Antibiotics were reduced to oral prophylaxis with ciprofloxacin 500 mg twice daily. After discharge, the patient was followed-up routinely in our outpatient department for continuation of VEN/AZA treatment in reduced dosage (AZA 75 mg/m² subcutaneously, days 1-5; VEN 100 mg orally once daily, days 114, repeated every 28 days) due to concurrent antifungal prophylaxis with posaconazole. After the second cycle of VEN/AZA treatment bone marrow evaluation revealed complete remission (CR). Besides, the IDH2 mutation was no longer detectable by digital droplet polymerase chain reaction (sensitivity of 1:10,000 for mutated to wild-type IDH2).3 The therapy was continued for two more cycles. Thereafter, VEN/AZA treatment was suspended for 6 weeks due to patient’s wish. In the following cycles the dosage of VEN/AZA was continued as before to prevent hematologic toxicity (AZA 75 mg/m² subcutaneously, days 1-5; VEN 100 mg orally once daily, days 1-14; repeated every 28 days). Treatment with VEN/AZA was well tolerated and no grade 3 or higher toxicity occurred. The wound improved further and finally healed after roughly 5 months (Figure 2B). A recent follow-up phone call in September 2022 revealed that the patient is feeling well roughly 20 months after start of treatment. VEN/AZA treatment is continued as stated above in a close-to-home outpatient setting and AML is still in CR. The combined therapy of VEN and hypomethylating agents (HMA) has led to high CR and improved overall survival rates in newly diagnosed AML not eligible for intensive chemotherapy as compared to monotherapy with HMA,4 leading to the recent Food and Drug Administration and European Medicine Agency approval of VEN in combination with HMA or low-dose cytarabine for older adults with newly diagnosed AML.5 Particularly, impressive survival benefit was shown in patients with IDH2- or NPM1mutated AML.6 Indeed, continued treatment with VEN/AZA resulted in a deep and durable molecular remission in our patient, who harbored an IDH2 mutation at diagnosis.

Thus, VEN/AZA seems currently the best option for older patients with newly diagnosed AML and one of the aforementioned mutations.
O ne of the main obstacles in AML therapy and one of the main reasons for early death are infections due to immunosuppression of the underlying disease as well as myelotoxic effects of the therapy.7 We here present the first case of successful VEN/AZA treatment despite a severe infection, requiring repetitive surgical interventions.
VEN-based regimens are associated with significant myelosuppression, requiring dose adjustment.8 The currently recommended dose of VEN in case of concurrent treatment with strong CYP3A4 inhibitors (posaconazole) is 50 mg/daily.8 In our case, we decided to reduce both, the duration of VEN/AZA as well as the dose of VEN due to significant comorbidities and concurrent antifungal prophylaxis with posaconazole. Antifungal and antibiotic prophylaxis was given only in case of neutrophil count below 0.5x10⁹/L. The patient tolerated the therapy very well without any further toxicities or need to use granulocyte colony stimulating factor. Currently, we continue with lower-intensity VEN/AZA treatment indefinitely.
To date, the optimal treatment duration of VEN-based lower-intensity regimens is unknown.8 However, patients aren’t particularly enamored with the concept of treatment with parenteral VEN/AZA extending indefinitely. Thus, finding some way of using oral VEN/AZA would seem to be an urgent clinical approach.9 Some patients with VEN-sensitive genomics, such as NPM1 and IDH2 mutations, who are in deep remission might also be candidates for treatment discontinuation and active surveillance.10
In conclusion, VEN/AZA seems to be safe and feasible, even in patients with severe infections, although larger data are needed for further evaluation.
Authors
Florian Ramdohr,1 Robert Hennings,2 Astrid Monecke3 and Sabine Kayser1,4,5
A B Haematologica | 108 July 2023 1966 CASE REPORT
Figure 2. Picture of the left arm of the patient with acute myeloid leukemia. (A) Autologous mesh graft and (B) complete wound healing roughly 5 months after diagnosis of acute myeloid leukemia.
1Medical Clinic and Policlinic I, Hematology and Cellular Therapy, University Hospital Leipzig, Leipzig; 2Department of Plastic, Aesthetic and Special Hand Surgery, Clinic and Polyclinic for Orthopaedics, Traumatology and Plastic Surgery, University Hospital Leipzig, Leipzig; 3Department of Pathology, University Hospital Leipzig, Leipzig; 4NCT Trial Center, National Center of Tumor Diseases, German Cancer Research Center (DKFZ), Heidelberg and 5Institute of Transfusion Medicine and Immunology, Medical Faculty Mannheim, Heidelberg University, German Red Cross Blood Service Baden-Württemberg-Hessen, Mannheim, Germany
Correspondence:
S. KAYSER - s.kayser@dkfz-heidelberg.de
https://doi.org/10.3324/haematol.2022.282282
Received: October 24, 2022.
Accepted: December 6, 2022.
Prepublished: December 22, 2022.
References
1. Swerdlow SH, Campo E, Harris NL. WHO classification of tumours of haematopoietic and lymphoid tissues. Revised 4th Edition. 2017.
2. Döhner H, Estey E, Grimwade D, et al. Diagnosis and management of AML in adults: 2017 ELN recommendations from an international expert panel. Blood. 2017;129(4):424-447.
3. Bill M, Jentzsch M, Bischof L, et al. Impact of IDH1 and IDH2 mutation detection at diagnosis and in remission in patients with AML receiving allogeneic transplantation. Blood Adv. 2023;7(3):436-444.
4. DiNardo CD, Jonas BA, Pullarkat V, et al. Azacitidine and venetoclax in previously untreated acute myeloid leukemia. N Engl J Med. 2020;383(7):617-629.
5. DiNardo CD, Tiong IS, Quaglieri A, et al. Molecular patterns of response and treatment failure after frontline venetoclax
©2023 Ferrata Storti Foundation
Published under a CC BY-NC license
Disclosures
No conflicts of interest to disclose.
Contributions
FR and SK were responsible for the concept of this paper, contributed to the literature search data collection, treated the patient, analyzed and interpreted data, and wrote the manuscript; RH treated the patient and critically revised the manuscript; AM performed research and critically revised the manuscript. All authors approved the submission.
Acknowledgments
The authors acknowledge support from the University of Leipzig within the program of Open Access Publishing.
Data-sharing statement
Questions regarding data sharing should be addressed to the corresponding author.
combinations in older patients with AML. Blood. 2020;135(11):791-803.
6. Kayser S, Levis MJ. Updates on targeted therapies for acute myeloid leukaemia. Br J Haematol. 2022;196(2):316-328.
7. Logan C, Koura D, Taplitz R. Updates in infection risk and management in acute leukemia. Hematology Am Soc Hematol Educ Program. 2020;(1):135-139.
8. Maiti A, Konopleva MY. How we incorporate venetoclax in treatment regimens for acute myeloid leukemia. Cancer J. 2022;28(1):2-13.
9. Levis M. By any other name... Blood. 2022;140(15):1657-1658.
10. Chua CC, Hammond D, Kent A, et al. Treatment free remission (TFR) after ceasing venetoclax-based therapy in responding patients with acute myeloid leukemia. Blood Adv. 2022;6(13):3879-3883.
Haematologica | 108 July 2023 1967 CASE REPORT
Omalizumab alleviates pruritus in myeloproliferative neoplasms
Chronic pruritus is common in patients with myeloproliferative neoplasms (MPN), particularly in polycythemia vera (PV). Pruritus is typically of aquagenic character, where an intense pruritus is evoked by skin contact with water, but may also include a stinging, burning, or tingling sensation. In contrast to urticarial disease, aquagenic pruritus is typically not associated with visible skin changes. It is most commonly localized centrally on the body: thorax, abdomen, back and proximal extremities.1 Pruritus in MPN may also be more generalized and be triggered by other factors than water contact. Pruritus is prevalent in PV, where 3169% of patients suffer from chronic pruritus, and 15% report aquagenic pruritus of unbearable intensity.1 Pruritus also occurs in other subtypes of MPN but the prevalence and severity is not as well characterized.2 Chronic pruritus in MPN may result in a substantially compromised quality of life and lead to anxiety and depressive symptoms, as well as wateravoiding behaviors with negative effects on personal hygiene and social interaction.3, 4
Several treatment options have been reported to alleviate MPN-related pruritus, including hydroxyurea, interferons, ruxolitinib, normalization of hematocrit by venesection, antihistamines, SSRI (paroxetine and fluoxetine), narrowband UV-B light, psoralen UV-A light (PUVA), and alkalization of bathing water.5 Interferons are described to have
better effect against pruritus than hydroxyurea with a reported efficacy of 81%.6 JAK2 inhibition with ruxolitinib has also been reported to reduce pruritus.7 Interestingly, SSRI has been shown to alleviate symptoms in eight of ten described patients.8 Despite numerous alternatives, MPNrelated pruritis refractory to current treatments remains a clinical challenge. In addition, pruritus may occur in younger individuals with low risk of thrombosis, where cytoreduction is not otherwise indicated, or in patients with intolerance to available cytoreductive therapies. Therefore, there is a great clinical need to find novel approaches to alleviate refractory MPN-related pruritus. Omalizumab is a humanized monoclonal immunglobulin E (IgE) antibody, that binds with high affinity to free IgE and prevents receptor binding. Omalizumab is Food and Drug Adminstration-approved for refractory asthma, nasal polyps and chronic idiopathic urticaria. Here we describe a series of patients with MPN that were treated with omalizumab for severe pruritus.
We describe seven patients with intense chronic pruritus related to PV and essential thrombocythemia (ET) treated with omalizumab at the Karolinska University Hospital. The diagnoses of PV and ET were defined according to the World Health Organization 2016 criteria. The data presented were retrieved from medical charts. Complete res-
Patient Age in years Sex Diagnosis Driver mutation, VAF% Current treatment Hematologic control with current treatment Previous treatments Character of pruritus IgE (kU/L)* Tryptase ( mg/L)# Effect of omalizumab 1 50 F ET MPL, na IFNα, aspirin Yes Antihistamines P 140 na Complete 2 81 M ET JAK2, 31 HU, apixaban Yes Antihistamines P na na Partial 3 56 M PV JAK2, 39 IFNα, aspirin Yes Antihistamines, HU AP 22 3.9 Complete 4 69 M PV JAK2, 25 HU, warfarin Yes Antihistamines AP na na Partial 5 75 M PV JAK2, 79 HU, apixaban No Antihistamines, HU, IFNα, corticosteroids AP 11 28 Partial 6 55 F PV JAK2, 97 HU, aspirin No Antihistamines, IFNα AP 110 2.7 Complete 7 36 M ET JAK2, na aspirin No IFNα, antihistamines, corticosteroids AP 230 4.1 Partial Table
value <114 kU/L; #reference value <11 mg/L. VAF: variant allele frequency; PV: polycythemia vera; ET: essential thrombocythemia; IgE: immunoglobulin E; F: female; M: male; AP: aquagenic pruritus; P: pruritus; HU: hydroxyurea; IFNα: pegylated interferon-α; na: not available. Haematologica | 108 July 2023 1968 CASE REPORT
1. Descriptive characteristics of patient demographics, pruritic character and effect of omalizumab.
*Reference
olution was defined as patients describing the pruritus as being completely gone, partial resolution as patients describing the pruritus being clearly reduced but not entirely gone.
The MPN subtypes were subtype was PV in four patients and ET in three. The median age of the patients were 56 years (range, 36-81) at time of starting omalizumab, and the duration of pruritus prior to omalizumab treatment ranged from 5 months to several decades (Figure 1; Table 1). Three of the patients were classified as low-risk regarding thrombosis, according to the revised IPSET score in ET and by age above 60 years or previous thrombosis in PV. Six of the patients stated pruritus as their main complaint at the time of initiation of omalizumab. Five of the patients described classic aquagenic pruritus, while two had a more generalized pruritus, not triggered by specific agents or situations. In the patients with aquagenic pruritus, pruritic crisis could also be induced by other triggers such as physical activity, getting dressed, or during sleep. Two of the patients described visible skin changes, both were patients with generalized pruritus. In four of the patients, a dermatologist had been consulted, one of the patients with generalized pruritus had received a diagnosis of chronic urticaria that presented concurrently with the MPN diagnosis, the others did not receive a specific dermatological diagnosis. Previous and current treatments are shown in Table 1. All previous

treatments had either an insufficient effect on their pruritus or were stopped due to intolerable side effects. None had tried ruxolitinib, SSRI or UV light therapies. Pretreatment measurement of IgE and tryptase showed normal values in the majority of the patients (Table 1).
Omalizumab was introduced in doses varying between 150 mg to 300 mg every second to fourth week as a subcutaneous injection, at the discretion of the responsible clinician. The first two to three doses were administered at the hematologic day care unit or in a primary care setting. For the subsequent doses self-administration at home was offered as an alternative. Three patients described complete resolution of pruritus after introduction of omalizumab while four patients described partial resolution. In all four patients with partial resolution, a significant improvement was described, and pruritic symptoms were more manageable. For example, patient 4 graded his pruritus, on a numerical rating scale between 0-10 before (0 no pruritus at all, 10 worst possible pruritus) as grade 8 during treatment with hydroxyurea, grade 7 with the addition of high dose antihistamines, and reduced to grade 1 after introduction of omalizumab, increasing to grade 2-3 during the last week before the next injection.
Treatment response was in general observed already after the first cycle of omalizumab, and further improved during the first 3 months. Three patients described a return of
→ :
Haematologica | 108 July 2023 1969 CASE REPORT
Figure 1. Time of myeloproliferative diagnosis, onset of pruritic symptoms, cytoreduction, omalizumab, and follow-up time. Introduction of omalizumab is set as time point zero. MPN: myeloproliferative; PV: polycythemia vera; ET: essential thrombocythemia; M: male; F: female; HU: hydroxyurea; IFNα: pegylated interferon-
α;
ongoing treatment; CR: complete remission; PR: partial remission.
low-grade pruritus during the last few days before the next scheduled injection of omalizumab, and in one patient this led to shortened dosage interval. One patient with complete resolution of pruritus for an extended period of time was able to taper omalizumab treatment to 300 mg every 10 weeks with a maintained effect (patient 1). The median duration of omalizumab treatment was 13 months (range, 6-31). Three patients are currently still on omalizumab treatment. The four patients who discontinued omalizumab reported doing so due to pruritic symptoms being at a manageable level without omalizumab. No adverse events or side effects related to omalizumab treatment were described by any of the patients. Consent was obtained from all patients to having their cases reported in a scientific journal. The Ethics Review Board was consulted and had no ethical concerns. The pathophysiology behind pruritus in MPN is not fully understood although basophils and mast cells are considered to play important roles. MPN patients have an increased number of activated basophils that are hypersensitized to IL-3 which can be partially reversed by blocking JAK2.9 Mast cells are increased in numbers in MPN and are functionally abnormal with increased sensitivity to several pruritic mediators.10 Omalizumab effectively reduces the level of free IgE in serum, and thus prevents degranulation of mast cells as well as basophils, and thus enables mast cell and eosinophil apoptosis.11, 12 Off-label usage has been explored in a wide range of diagnoses in allergology, rheumatology, pulmonology and dermatology. Accumulated evidence from other indications demonstrate that omalizumab is medically safe with few observed side effects.13 There is one case report of successful treatment with omalizumab of idiopathic aquagenic pruritus.14 A study of chronic urticaria and omalizumab included one patient with concomitant PV where the pruritus responded to omalizumab.15 To our knowledge, no clinical trial with omalizumab is ongoing in hematological disorders (clinicaltrials gov. Identifier: no entry as of October 2022).
There are several limitations to our study, the most important being that this is a retrospective case series and not performed as a study with a preplanned protocol. Further, pruritus was not graded by a validated instrument, for example 5D itch scale or PRURITOOLS. It is conceivable that the pruritus observed in the two patients who had visible skin changes associated was unrelated to their myeloproliferative disease. However, their pruritic symptoms – including chronic urticaria – presented concurrently with the MPN diagnosis.
MPN-related pruritus has a major impact on quality of life and symptom-relief of these patients is an urgent medical need. Our case series suggests that the IgE-blocking monoclonal antibody omalizumab is efficacious in MPN patients with severe refractory pruritic symptoms. The results support an involvement of IgE, basophils and mast cells as
important pathogenic factors, however improved understanding of the pathophysiologic mechanisms is warranted to be able to better tailor effective treatment.
Omalizumab is considered safe and has been widely used in other indications since its Food Drug Administration-approval in 2003, and all seven patients in this cohort responded to treatment, with complete resolution in three patients. We therefore propose that omalizumab could be a valuable addition to the treatment arsenal for the management of refractory chronic pruritus in MPN. Prospective validation of these findings is warranted, preferably in a randomized clinical trial, to establish efficacy and optimal dosing regimen.
Authors
Anna Ravn Landtblom,1,2 Johanna Ungerstedt,2,3 Anette Hedlund,2 Magnus Tobiasson,2,3 Stefan Deneberg2,3 and Martin Jädersten2,3
1Department of Medicine, Solna, Karolinska Institutet; 2Department of Hematology, Karolinska University Hospital and 3Center for Hematology and Regenerative Medicine, Department of Medicine, Huddinge, Karolinska Institutet, Stockholm, Sweden
Correspondence: M. JÄDERSTEN - martin.jadersten@regionstockholm.se
https://doi.org/10.3324/haematol.2022.281639
Received: August 26, 2022.
Accepted: January 5, 2023.
Early view: January 26, 2023.
©2023 Ferrata Storti Foundation
Published under a CC BY-NC license
Disclosures
No conflicts of interest to disclose.
Contributions
All authors took part in clinical treatment and assessment of the patients. ARL and MJ collected the data and wrote the manuscript. All authors critically assessed and approved the final manuscript.
Funding
This work was funded by Blodcancerfonden, The Cancer Research Foundations of Radiumhemmet, CIMED, Karolinska Institutet Translational Seed Grant and the Nordic Cancer Union.
Data-sharing statement
The authors are not allowed to share data.
Haematologica | 108 July 2023 1970 CASE REPORT
References
1. Siegel FP, Tauscher J, Petrides PE. Aquagenic pruritus in polycythemia vera: characteristics and influence on quality of life in 441 patients. Am J Hematol. 2013;88(8):665-669.
2. Le Gall-Ianotto C, Brenaut E, Gouillou M, et al. Clinical characteristics of aquagenic pruritus in patients with myeloproliferative neoplasms. Br J Dermatol. 2017;176(1):255-258.
3. Lelonek E, Matusiak Ł, Wróbel T, Kwiatkowski J, Szepietowski JC. Burden of aquagenic pruritus in polycythaemia vera. Acta Derm Venerol. 2018;98(2):185-190.
4. Lelonek E, Matusiak Ł, Wróbel T, Szepietowski JC. Aquagenic pruritus in polycythemia vera: clinical characteristics. Acta Derm Venerol. 2018;98(5):496-500.
5. Saini KS, Patnaik MM, Tefferi A. Polycythemia vera-associated pruritus and its management. Eur J Clin Invest. 2010;40(9):828-834.
6. Lengfelder E, Berger U, Hehlmann R. Interferon alpha in the treatment of polycythemia vera. Ann Hematol. 2000;79(3):103-109.
7. Vannucchi AM, Kiladjian JJ, Griesshammer M, et al. Ruxolitinib versus standard therapy for the treatment of polycythemia vera. N Engl J Med. 2015;372(5):426-435.
8. Tefferi A, Fonseca R. Selective serotonin reuptake inhibitors are effective in the treatment of polycythemia vera-associated pruritus. Blood. 2002;99(7):2627.
9. Pieri L, Bogani C, Guglielmelli P, et al. The JAK2V617 mutation induces constitutive activation and agonist hypersensitivity in basophils from patients with polycythemia vera. Haematologica. 2009;94(11):1537-1545.
10. Ishii T, Wang J, Zhang W, et al. Pivotal role of mast cells in pruritogenesis in patients with myeloproliferative disorders. Blood. 2009;113(23):5942-5950.
11. Pelaia C, Calabrese C, Terracciano R, de Blasio F, Vatrella A, Pelaia G. Omalizumab, the first available antibody for biological treatment of severe asthma: more than a decade of real-life effectiveness. Ther Adv Respir Dis. 2018;12:1753466618810192.
12. MacGlashan D Jr., Lichtenstein LM, McKenzie-White J, et al. Upregulation of FcepsilonRI on human basophils by IgE antibody is mediated by interaction of IgE with FcepsilonRI. J Allergy Clin Immunol. 1999;104(2 Pt 1):492-498.
13. El-Qutob D. Off-label uses of omalizumab. Clin Rev Allergy Immunol. 2016;50(1):84-96.
14. Murphy B, Duffin M, Tolland J. Aquagenic pruritus successfully treated with omalizumab. Clin Exp Dermatol. 2018;43(7):858-859.
15. Deleanu D, Nedelea I, Petricau C, Leru P, Dumitrascu D, Muntean A. Clinical impact of omalizumab in refractory chronic urticaria: one centre experience. Exp Ther Med. 2019;18(6):5078-5081.
Haematologica | 108 July 2023 1971 CASE REPORT

haematologica
Journal of the Ferrata Storti Foundation
haematologica.org
