haematologica
 Journal of the Ferrata Storti Foundation

VOL.
107 DECEMBER 2022
ISSN 0390 - 6078 haematologica.org

Journal of the Ferrata Storti Foundation
2765 Bence Jones Island in Shepherd Bay, Ninavut: a little known tribute to the legendary physician and chemist’s “thé de voyage” Marshall A. Lichtman and Edward M. Reading https://doi.org/10.3324/haematol.2022.281864
2771 Images from the Haematologica Atlas of Hematologic Cytology: anaplastic large cell lymphoma, ALK-negative Rosangela Invernizzi https://doi.org/10.3324/haematol.2022.281949
2772 Generation of the first monoclonal antibody using mouse hybridomas Brunangelo Falini https://doi.org/10.3324/haematol.2022.281671
2774
2776
A BAFFling ménage à trois in mantle cell lymphoma Eric Eldering https://doi.org/10.3324/haematol.2022.280721
Delving the depths of measurable residual disease negativity in acute myeloid leukemia Sylvie D. Freeman https://doi.org/10.3324/haematol.2022.280747
2779 Is it primary myelofibrosis or chronic megakaryocytic leukemia? Marshall A. Lichtman https://doi.org/10.3324/haematol.2022.280838
2782
Introduction to the Series on Measurable Residual Disease
Jerry Radich https://doi.org/10.3324/haematol.2022.281079
2783
Measurable residual disease in acute lymphoblastic leukemia: methods and clinical context in adult patients Caner Saygin et al. https://doi.org/10.3324/haematol.2022.280638
2794 Measurable residual disease in chronic myeloid leukemia Susan Branford and Jane F. Apperley https://doi.org/10.3324/haematol.2022.281493
2810
The present and future of measurable residual disease testing in acute myeloid leukemia
James S. Blachly et al. https://doi.org/10.3324/haematol.2022.282034
2823
Acute Myeloid Leukemia
Clinical relevance of an objective flow cytometry approach based on limit of detection and limit of quantification for measurable residual disease assessment in acute myeloid leukemia. A post-hoc analysis of the GIMEMA AML1310 trial
Francesco Buccisano et al. https://doi.org/10.3324/haematol.2021.279777
2834 Bone Marrow Failure
Impaired immunosuppressive role of myeloid-derived suppressor cells in acquired aplastic anemia Peiyuan Dong et al. https://doi.org/10.3324/haematol.2021.280292
2846 Hemostasis
Thymosin b4 is essential for thrombus formation by controlling the G-actin/F-actin equilibrium in platelets Inga Scheller et al. https://doi.org/10.3324/haematol.2021.278537
2859 Chronic Myeloid Leukemia
Kinetics of early and late molecular recurrences after first-line imatinib cessation in chronic myeloid leukemia: updated results from the STIM2 trial Stéphanie Dulucq et al. https://doi.org/10.3324/haematol.2022.280811
2870
Complications in Hematology
Clinical features of hepatitis E infections in patients with hematologic disorders Susanne Ghandili et al. https://doi.org/10.3324/haematol.2022.280853
2884
Hematopoiesis
Schlafen2 is a regulator of quiescence in adult murine hematopoietic stem cells Sarah Warsi et al. https://doi.org/10.3324/haematol.2021.279799
2897
Hodgkin Lymphoma
High-risk stage IIB Hodgkin lymphoma treated in the H10 and AHL2011 trials: total metabolic tumor volume is a useful risk factor to stratify patients at baseline Cédric Rossi et al. https://doi.org/10.3324/haematol.2021.280004
2905
Non-Hodgkin Lymphoma
The IL32/BAFF axis supports prosurvival dialogs in the lymphoma ecosystem and is disrupted by NIK inhibition Salomé Decombis et al. https://doi.org/10.3324/haematol.2021.279800
2918 Quality of Life
Comparable long-term outcomes between upfront haploidentical and identical sibling donor transplant in aplastic anemia: a national registry-based study
Zheng-Li Xu et al.
https://doi.org/10.3324/haematol.2022.280758
2928 T-cell Leukemia/lymphoma
Regulation of human T-cell leukemia virus type 1 antisense promoter by myocyte enhancer factor-2C in the context of adult T-cell leukemia and lymphoma
Kiran K. Madugula et al.
https://doi.org/10.3324/haematol.2021.279542
2944
2950
Onset of blast crisis in chronic myeloid leukemia patients in treatment-free remission
Stephanie Dulucq et al.
https://doi.org/10.3324/haematol.2022.280740
Circulating endothelial cells and the study of vascular injury in children undergoing hematopoietic stem cell transplant
Anthony Sabulski et al.
https://doi.org/10.3324/haematol.2022.280788
2955
Investigational venetoclax combination therapy in acute myeloid leukemia – a systematic review and meta-analysis
Shai Shimony et al.
https://doi.org/10.3324/haematol.2022.281453
2961
Under-representation of ethnic minorities in early phase clinical trials for multiple myeloma
Samir Asher et al.
https://doi.org/10.3324/haematol.2022.281322
2966
αbT- and B-cell-depleted HLA-haploidentical hematopoietic stem cell transplantation in children with myelodysplastic syndromes
Pietro Merli et al.
https://doi.org/10.3324/haematol.2022.280698
2972
Structure-function analysis of the role of megakaryoblastic leukemia 1 in megakaryocyte polyploidization
Fiona E. Reed et al.
https://doi.org/10.3324/haematol.2021.280499
2977
An open-label, phase I/II trial to determine the maximum tolerated dose and investigate safety, pharmacokinetics and efficacy of BI 836858, an unconjugated anti-CD33 monoclonal antibody, in combination with decitabine in patients with acute myeloid leukemia
Walter Fiedler et al.
https://doi.org/10.3324/haematol.2022.281128
2983 Mass spectrometry-based proteomics in clinical practice amyloid typing: state-of-the-art from a French nationwide cohort
Magali Colombat et al.
https://doi.org/10.3324/haematol.2022.281431
2988 Discordant SARS-CoV-2 spike protein receptor binding domain IgG and neutralization after B-cell depletion
Ariela Noy and Santosha A. Vardhana
https://doi.org/10.3324/haematol.2022.281484
2990 Interleukin-1 receptor associated kinase 1/4 and bromodomain and extra-terminal inhibitions converge on NF- κB blockade and display synergistic antitumoral activity in activated B-cell subset of diffuse large B-cell lymphoma with MYD88 L265P mutation
Ivan Dlouhy et al.
https://doi.org/10.3324/haematol.2022.281988
1James P. Wilmot Cancer Institute, University of Rochester Medical Center, Rochester, NY and 2Licensed Professional Land Surveyor (P.L.S.), San Luis Obispo, CA, USA
Correspondence: M.A. Lichtman marshall_lichtman@urmc.rochester.edu
Received: August 1, 2022.
Accepted: August 2, 2022.

Prepublished: August 18, 2022.
https://doi.org/10.3324/haematol.2022.281864
©2022 Ferrata Storti Foundation
Published under a CC BY-NC license
Henry Bence Jones is among the esteemed physicians of the mid-19th century. Eighteen biographical medical journal articles, published between 1952 and 2021, describe his life and contributions to medicine. Unmentioned, however, is an island in the waters of Shepherd Bay in northern Canada, now Nunavut, designated Bence Jones Island, by the British explorer John Rae in 1854. Rae had sailed from Great Britain to the regions extending north of Hudson’s Bay in search of information regarding Sir John Franklin and 133 other officers and men who departed from the Kingdom of Great Britain in two ships in 1845 to search for the Northwest Passage to the Pacific Ocean; they disappeared. In anticipation of Rae’s voyage to search for evidence of Franklin’s expedition, Bence Jones provided a special preparation of tea that could be drunk cold, if necessary. It was so meaningful to the crew of Rae’s ship that it resulted in Rae naming an island near Boothia Isthmus in Shepherd Bay in recognition of this contribution to the contentment of his men under arduous conditions and in acknowledgment of Bence Jones’s professional standing, upon which we comment. Rae’s report of his voyage in 1855, cited herein, mentioned the island and showed its position on a map of the region. We have located it on a current map of the waterways and landmasses of Nunavut using Google Earth Pro by showing its position at the approximate coordinates of latitude and longitude cited by Rae.
A desire to acquire furs trapped by indigenous people spurred the exploration of the region of Hudson’s Bay and the subarctic waters and landmasses of North America by the English in the 17th and 18th centuries. The Kingdom of Great Britain under a charter by Charles II (1630-1685) for mally initiated this bountiful trade in 1670. Later, in the mid-19th century, having experienced over 150 years of ex ploration of those regions of the North American continent and their extensive waterways, British seamen searched for a navigable passage through that land mass to the Pacific Ocean, the Northwest Passage, so as to provide a more direct route to Asian markets. Commercial interests in Europe, especially in Great Britain, would have bene fited from such a shipping route to Asia. Discovery of this, then mythical, route became a principal goal of the ex plorers of the northern territories and the subarctic re gions of North America in the 1800’s. Today, such a route
can be traversed during the Arctic summer, with the aid of icebreakers. As a result of global warming transit from the Atlantic to the Pacific Ocean or vice versa may become possible, unassisted, through arctic waters by the mid21st century.
The exploration commanded by Rear Admiral Sir John Franklin (1786-1847), which was his fourth attempt to find the Passage was composed of two ships, HMS Erebus and HMS Terror, previously under sails, but converted to power by installation of special screw propellers driven by a wheel-less locomotive steam engine. The two ships de parted in May 1845 with 134 officers and men and a multiyear supply of food, including approximately 8,000 tins of meat, vegetables and soup. Two whalers encountered Franklin’s ships in late July of 1845 and were the last known of any of his contacts. Franklin died suddenly on the Erebus. His body or grave was never found.1 He, pre sumably, was buried in a sailor’s grave, the icy waters of the Northwest Territories. Despite their large food supply,
Shepherd Bay, Nunavut: a little known tribute to the legendary physician and chemist’s “thé de voyage”
the officers and crew, trapped in ice for over a year, aban doned their ships. Under the leadership of Francis Rawdon Moira Crozier (1796-1848), second in command to Franklin, the surviving officers and crew were lost in the vastness of the North American wilderness.2 The submerged re mains of the two sunken ships were located in 2014 (Ere bus) and 2016 (Terror) by the Parks Canada’s Underwater Archaeology Team and Inuit collaborators and are desig
nated a national historic site. In an effort to find evidence of the fate of Franklin’s ex pedition, Captain John Rae (1813-1893), who had previously explored northern Canada and its extensive waterways and land masses, set out to unravel the mystery. Rae was a physician and sea captain. Franklin’s widow Lady Jane Franklin (1791-1875) urged this effort. Their goal was to de termine the fate of the officers and men who had left their
Figure 1. A replica of John Rae’s original map, dated 1854, of the region of North America in which his search for Sir John Franklin’s expedition was undertaken. He shows the location of the small island named for Bence Jones. The original report describing his action and containing the map can be viewed at (http://www.jstor.com/stable/1798121.) We have added a small red asterisk to this replica of Rae’s map to indicate the location of Bence Jones Island.
Figure 2. This is an expanded view of John Rae’s original map of 1854 shown in Figure 1 with sufficient enlargement to see the island’s contour in Shepherd Bay, which Rae also named. The line denoting the path of his travels crosses what he designated as Bence Jones Island.


ships in search of a haven for the winter. The two ships were presumed crushed by ice, forcing their abandon ment. Rae’s party, while in Pelly Bay, encountered Inuit who had heard of Crozier’s last whereabouts. Based on that guidance and subsequent encounters with Inuit, his party eventually discovered their last encampment. There were several graves, relevant artefacts and some muti lated exposed bodies; the bodily alterations and other evi dence indicated the few remaining survivors had resorted to cannibalism.3 This behavior was, undoubtedly, com pelled by those few of the ship’s crew still alive attempt to escape starvation until the spring when hunting and fishing could resume or, perhaps, rescue might occur. Rae’s report was comprehensive. His forthright description of the evidence led Lady Franklin and other interested parties, including Charles Dickens (1812-1870), to attack Rae’s conclusions for casting aspersions on British seamen and so noble an English gentleman and naval of ficer, and, of course, her husband. Lady Franklin made this attack on Rae despite her husband having died on ship board; he was not part of that last fatal trek. Rae described his journey and findings in appropriate de tail in the Journal of the Royal Geographic Society of Lon don in 1855.3 During the explorations, he entered a body of water that he designated Shepherd Bay and named a small island at its head for the esteemed British phys ician-scientist Henry Bence Jones (Figures 1 and 2). This action was described on page 253 of the Journal contain ing Rae’s report,3 the relevant excerpt of which follows: “On the evening of the 29th [April] the weather was so stormy that, although we were prepared to start at 8 o’clock, we could not get away until past 2 on the follow ing morning. When after travelling little more than 5 miles, a heavy fall of snow and strong wind caused us to take shelter. Our advance was much impeded by thick weather and soft snow that we did not arrive within a few miles Cape Porter of Sir John Ross until the 6th of May. In doing this we tra versed a bay, the head of which was afterwards found to extend as far N. as lat. 68° 54ʹ N. Point Sir H. Dryden, its western boundary, is in lat. 68° 44ʹ N., long. 94° 11ʹ W. To this bay the name of Shepherd was given, in honour of the Deputy-Governor of the Honourable Hudson’s Bay Com pany, and an island near its head was called Bence Jones, after the distinguished medical man and analytical chem ist of that name, to whose kindness I and my party were much indebted for having proposed the use of, and pre pared, some extract of tea for the expedition. This article we found extremely portable, and as the tea could be made without boiling water, we often enjoyed a cup of that refreshing beverage, when otherwise from want of fuel we must have been satisfied with cold water.”3
This report describes the naming of Bence Jones Island in North America and, based on Rae’s coordinates, provides
its location on a Google Earth Map of the region (Figure 3 and 4). We use the term “approximate coordinates” be cause Rae’s coordinates were only to the nearest arc min ute of latitude and longitude, which is approximately a mile.
Rae was a person of accomplishment and was a physician educated at the medical school in Edinburgh and spent considerable part of his adult life in London when not at sea or on explorations for the Hudson’s Bay Company. In deed, even when in Canada on an exploration, he inter rupted his captaincy and devoted a considerable period of time to practicing medicine among the Inuit. He, thus, shared his medical background with the distinguished physician and chemist in London, Henry Bence Jones. I presume this proximity, common interests and record of accomplishment in each case resulted in their acquaint anceship and the provision of this special formulation of tea given to Rae for his voyage by Bence Jones
Henry Bence Jones (1817-1873) was among the most dis tinguished physicians and chemical pathologists of the mid-19th century. Bence was his mother’s family name and Jones his father’s family name. He was elected to the Royal Society at the age of 33 years and was named the Secretary of the Royal Institution of Great Britain, char tered in 1800 to advance science. He was a confidant of Charles Darwin (1809-1882), who was his patient, of Flo rence Nightingale (1820-1910), who sang his praises and of Michael Faraday (1791-1867) about whom he wrote a biog raphy, The Life and Letters of Faraday in 1869, with a sec ond edition in 1870.
Bence Jones involvement in the case of Thomas Alexander McBean (d. 1846), a London grocer, admitted to St. Georges Hospital, is legendary and has been the subject of histori cal commentary in medical journals on at least 18 occa sions in the last 70 years.4-23 It has, also, been cited in innumerable monographs and textbooks of medicine, hematology, immunology or oncology. This fame was the result of positing an answer to the query by the patient’s primary physician William Macintyre (c. 1791-1857) and a consultant Thomas Watson. They sent Bence Jones a urine sample with the accompanying note: “Dear Dr. Bence Jones, The tube contains urine of high specific gravity. When boiled it becomes highly opaque. On the addition of nitric acid, it effervesces, assumes a reddish hue, and becomes quite clear; but as it cools it assumes the consistency of appearance you see. Heat reliquifies it! What is it?”
Bence Jones’s study of the patient’s urine confirmed Ma cintyre’s and Watson’s findings; the urine contained a sub stance that precipitated on heating and then dissolved
Figure 3. The region of North America in which John Rae’s search to locate Sir John Franklin’s lost expedition was conducted, as seen using Google Earth Pro (July 26, 2022). We show the location of Bence Jones Island based on Captain John Rae’s approximate coordinates of longitude and latitude as cited in the excerpt of his report in our text and shown in Figure 1. We use the term “approximate coordinates” because Rae’s coordinates were only to the nearest arc minute of latitude and longitude, which is approximately one mile. On May 25, 1993, an agreement was reached that gave the Inuit control over the central and southern portion of the Northwest Territories, now referred to as Nunavut. Some of the English names assigned by Rae and other British explorers in that region may not be used by the Inuit.
Figure 4. Enlarged image of the site of Bence Jones Island at the head of Shepherd Bay shown in Figure 3, based on Captain John Rae’s approximate coordinates of latitude and longitude as cited in the excerpt of his report in our text and derived from Figure 1. We use the term approximate coordinates because Rae’s coordinates were only to the nearest arc minute of latitude and longitude, which is approximately one mile.


when warmed further. Bence Jones confirmed these find ings, did extensive further chemical studies of the urine and its content and did so on repeated samples. Bence Jones estimated the concentration of the chemical in the urine to be approximately that of serum albumin. He gave it a name “hydrated deuterium of albumen” and published two articles on its description in 184724 and 1848.25 In the mid 1800’s, “albumen” was a generic term for protein and did not refer specifically to the plasma protein albumin. Bence Jones explicitly stated: “Lastly, this peculiar reac tion with nitric acid hinders all possibility of confusing this new substance with albumen. Indeed ordinary albumen may be separated from this new substance by adding ni tric acid, boiling- and filtering whilst hot; on cooling, the hydrated oxide will be precipitated from the filtered liquid, and it will again be dissolved by heat, whilst the albumen will remain on the filter.”24 Drs. Macintyre and Watson first identified the unusual finding in Mr. McBean’s urine. Nevertheless, Bence Jones gained ownership of this discovery by his: (i) repeated and very extensive chemical analyses of Mr. McBean’s urine; (ii) giving the material in the urinary precipitate a name; (iii) rapidly publishing the findings; and (iv) associating it with mollities ossium and offering the admonition to search for it in the urine of all cases of that illness.20,24,25 Dr. Richard Fleischer applied the eponym “Bence-Jones protein bodies” to the urinary finding in a paper published in 1880, 33 years after Bence Jones’s initial report.26 Dr. Macintyre’s report of the case several years after Bence Jones’s two reports contained a description of the
1. Beattie O, Geiger J. Frozen in Time. The Fate of the Franklin Expedition. Greystone Books, Vancouver, British Columbia, pp.1-300, 2017.
2. Smith M. Captain Francis Crozier. Last Man Standing. Collins Press, Cork, Ireland, pp. 1-258, 2007.
3. Rae J. Arctic exploration, with information respecting Sir John Franklin’s missing party. Royal Geographic Soc (London) 1855;25:246-256. (http://www.jstor.com/stable/1798121.)
4. Hodgkinson RG, Hodgkinson R. Henry Bence Jones, 1814-1873. Med Illus. 1952;6:134-138.
5. Rosenbloom J. An appreciation of Henry Bence Jones, M.D., F.R.S. (1814-1873). Bence Jones early applied the principles of chemistry to clinical medicine. R I Med J. 1965;48:141-142.
6. Brighetti A. Il morbo di Kahler-Bozzolo (evoluzione delle conoscenze) [Kahler-Bozzolo disease (evolution of knowledge)]. Policlinico Prat. 1967 22;74(21):702-708.
7. Clamp JR. Some aspects of the first recorded case of multiple myeloma. Lancet. 1967;2(7530):1354-1365.
8. Coley NG. Henry Bence-Jones, M.D., F.R.S. (1813-1873). Notes Rec R Soc Lond. 1973;28:31-56.
9. Lyons JB. Pioneers in medicine: Henry Bence Jones; 1813-1873. Nurs Mirror. Midwives J. 1975;141(20):149.
10. Bauer FW. Mr. McBean's sternal fracture and multiple myeloma.
disease mollities ossium. The description of the cellular content of Mr. McBean’s marrow was compatible with its infi ltration by myeloma (neoplastic plasma) cells. 27 Its publication 3 years after Bence Jones’s reports of his uri nary findings contributed to Bence Jones receiving prior ity for that aspect of the case. This case report of a man in his 60’s with spontaneous fractures, a marrow cellular content compatible with replacement by neoplastic plasma cells and with a urinary protein with physico chemical features later shown to represent a urinary frag ment of monoclonal immunoglobulin, should be given priority as the first description of myeloma. It was, how ever, Bence Jones who gained lasting fame for his de scriptions of the urinary fi ndings, later shown to be monoclonal immunoglobulin light chains by Leonhard Korngold (1921-2010) and Rose Lipari. 28 Their paper re sulted in the designations kappa (from the K in Korngold) and lambda (from the L in Lipari) for the two species of immunoglobulin light chains.
No conflicts of interest to disclose.
Contributions
MAL and EMR co-wrote the manuscript.
This research did not receive any specific grant from fund ing agencies in the public, commercial, or not-for-profit sectors.
N Engl J Med. 1977;297(12):674.
11. [No authors listed]. Classics in oncology. Henry Bence Jones (1813-1873). CA Cancer J Clin. 1978;28(1):47-56.
12. Schoenberg DG, Schoenberg BS. Eponym: Henry Bence Jones: of sugars, stones, and suspicious proteins. South Med J. 1979;72(5):605-606.
13. Rosenfeld L. Henry Bence Jones (1813-1873): the best "chemical doctor" in London. Clin Chem. 1987;33(9):1687-1692.
14. Fine LG. Henry Bence Jones (1813-1873): on the influence of diet on urine composition. Including a previously unpublished treatise on the subject and a bibliography of his writings. Kidney Int. 1990;37(3):1019-1025.
15. Putnam FW. Henry Bence Jones: the best chemical doctor in London. Perspect Biol Med. 1993 Summer;36:565-579.
16. Carlsson M. Bence Jones' äggvita 150 år. Säker markör för multipelt myelom [150 years of Bence Jones protein. A reliable marker for multiple myeloma]. Lakartidningen. 1994;91(44):3993-3995.
17. Stone MJ. Henry Bence Jones and his protein. J Med Biogr. 1998;6(1):53-57.
18. Kyle RA. Henry Bence Jones--physician, chemist, scientist and biographer: a man for all seasons. Br J Haematol. 2001;115(1):13-18.
19. Hajdu SI. A note from history: the first biochemical test for detection of cancer. Ann Clin Lab Sci. 2006;36(2):222-223.
20. Abadie JM. Henry Bence Jones: the father of clinical chemistry. Luminaries. 2009;40:181-182.
21. Rathore R, Coward RA, Woywodt A. Whats’s in a name? Bence Jones protein. Clin Kidney J. 2012;5(5):478-481.
22. Ribatti D. A historical perspective on milestones in multiple myeloma research. Eur J Haematol. 2018;100(3):221-228.
23. Sewpersad S, Pillay TS. Historical perspectives in clinical pathology: Bence Jones protein-early urine chemistry and the impact on modern day diagnostics. J Clin Pathol. 2021;74(4):212-215.
24. Jones HB. Papers on chemical pathology; prefaced by the Gulstonian Lectures, read at the Royal College of Physicians, 1846. Lancet. 1847;50:88-92.
25. Jones HB. On a new substance occurring in the urine of a patient with mollities ossium. Philos Trans R Soc Lond B Biol Sci. 1848;138:55-62.
26. Fleischer R. Ueber das Vorkommen des sogenannten Bence Jones'schen Eiweisskörpers im normalen Knochenmark. [About the occurrence of so-called Bence Jones protein bodies in normal bone marrow] Arch Pathol Anatom Physiol Klin Med. 1880;80:482-489.
27. Macintyre W. Case of mollities and fragilitas ossium, accompanied with urine strongly charged with animal matter. Med Chir Transact. 1850;33:211-232
28. Korngold L, Lipari R. Multiple-myeloma proteins. III. The antigenic relationship of Bence Jones proteins to normal gamma globulin and multiple-myeloma serum proteins. Cancer. 1956;9(2):262-272.
University of Pavia, Pavia, Italy
E-mail: rosangela.invernizzi@unipv.it https://doi.org/10.3324/haematol.2022.281949
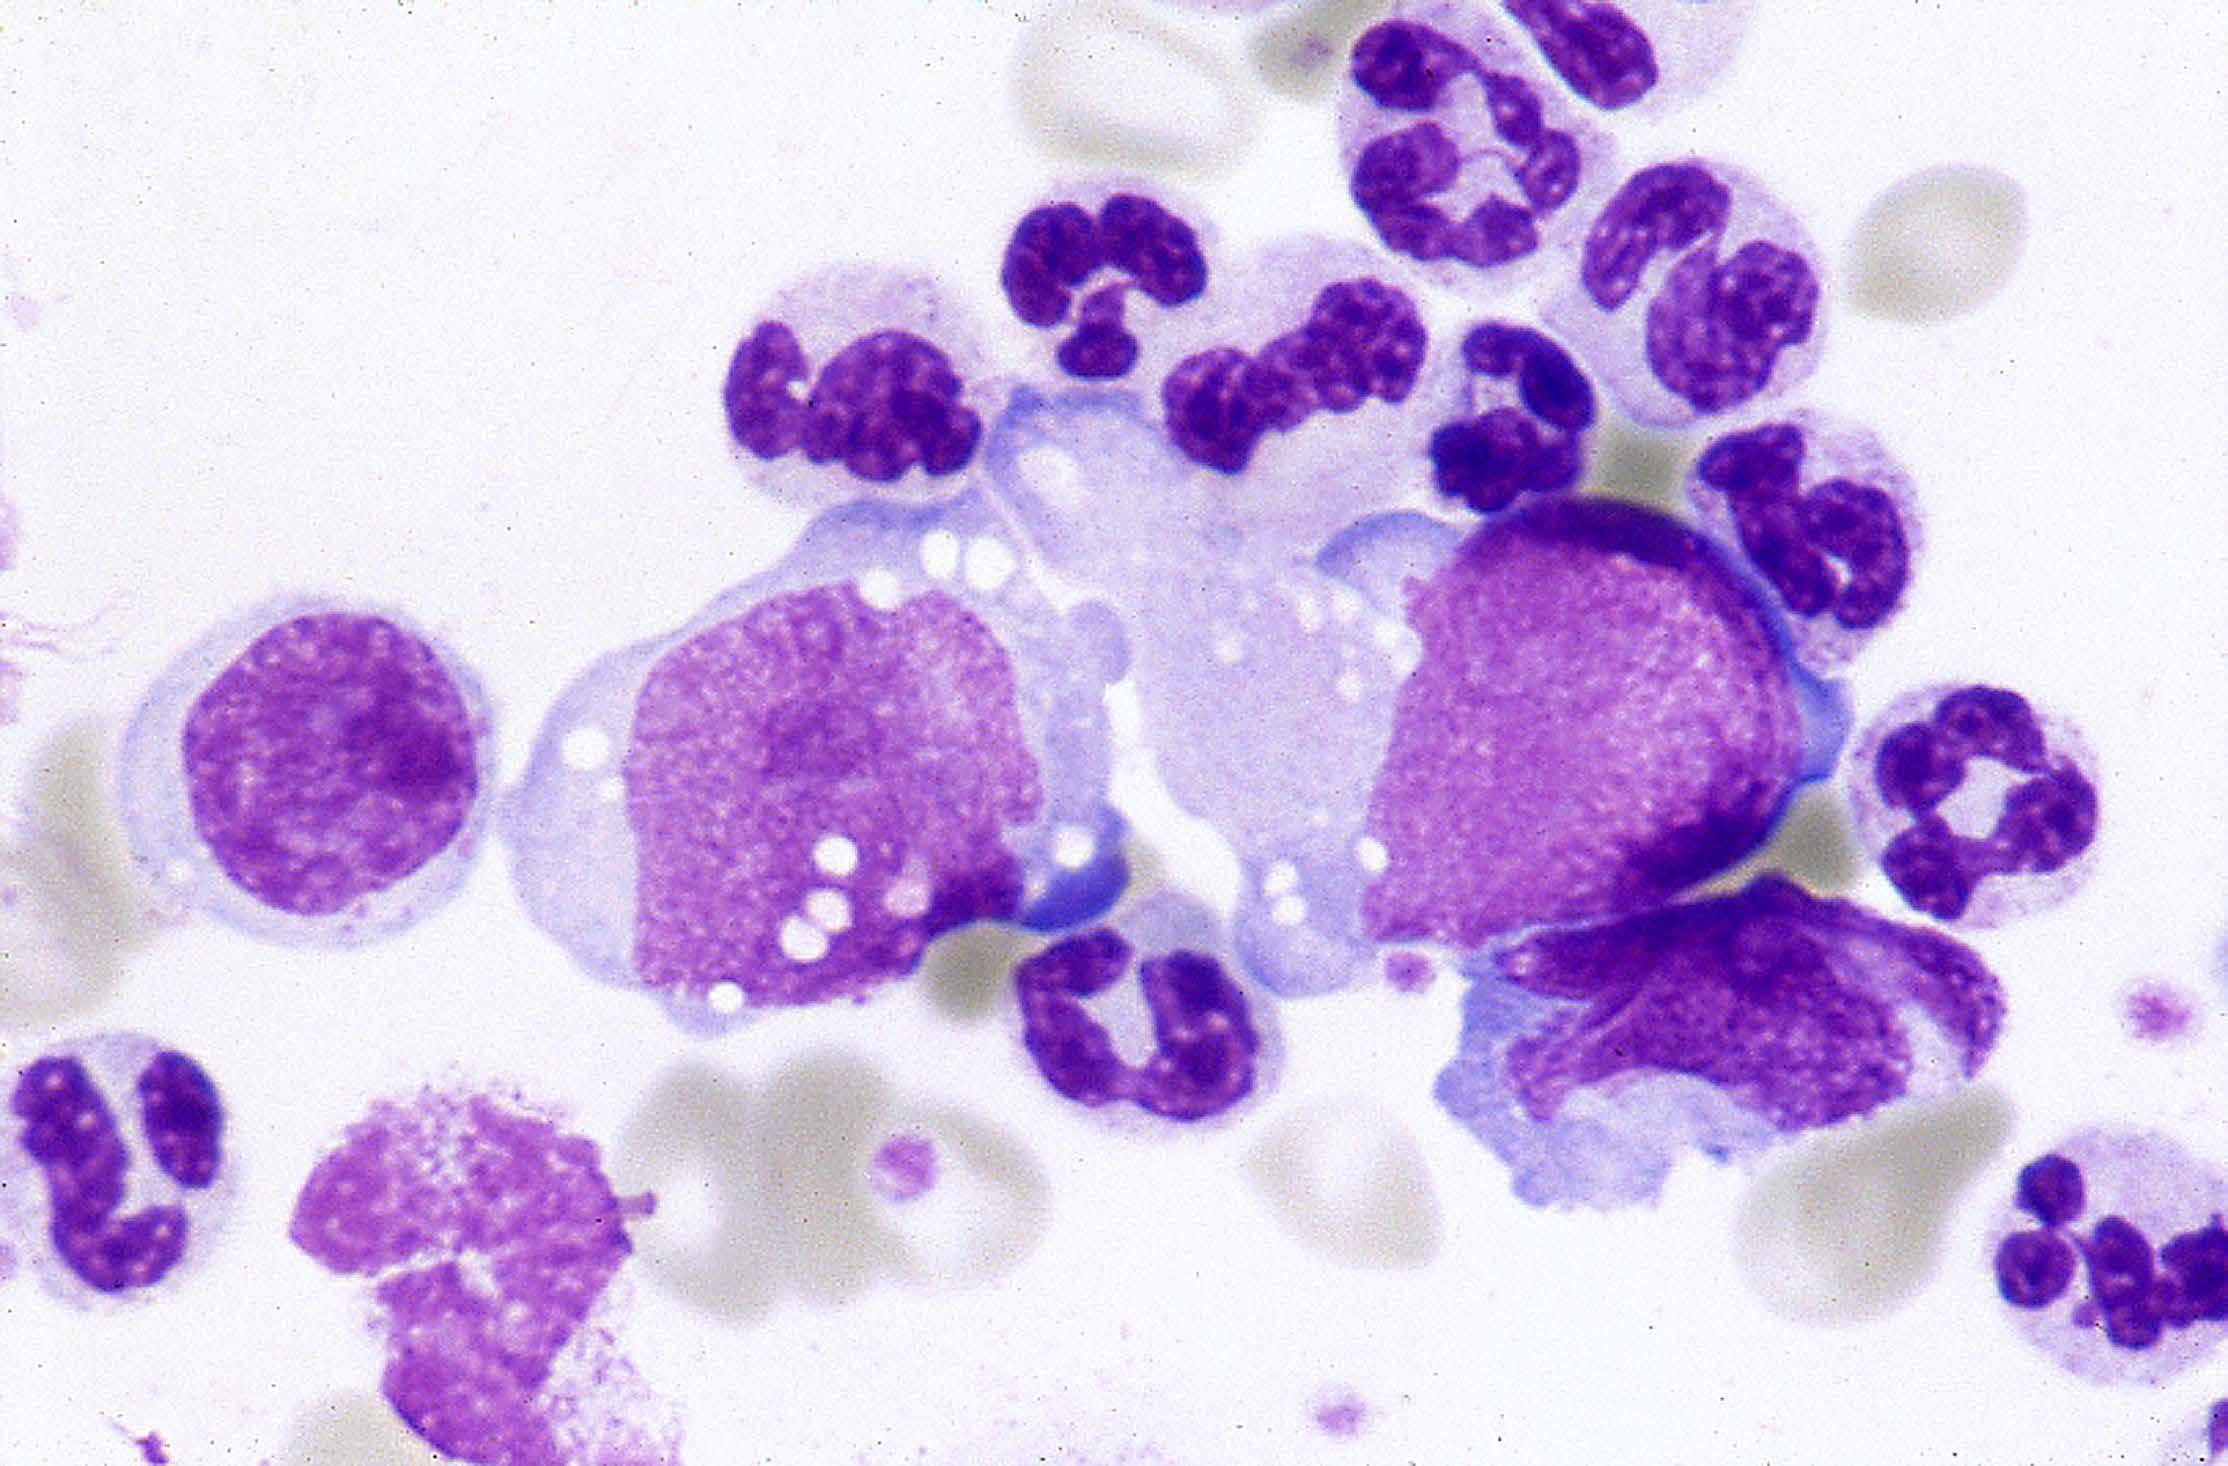
ALK-negative anaplastic large cell lymphoma (ALCL), now included as a full entity in the group of mature T- cell neoplasms, is characterized by very large cells with abundant cytoplasm and prominent nucleoli. These cells are strongly positive for CD30 and in more than half of all patients they express one or more T-cell antigens such as CD2, CD3, CD4 and CD43. By definition, ALK protein is undetectable. Most patients present with advanced disease, peripheral and/or abdominal lym phadenopathy and B symptoms. Besides cutaneous T-cell lymphoma, this type of peripheral T-cell lymphoma may also show, albeit rarely, a leukemic picture at presentation. In particular, as illustrated in the Figure, showing a buffy coat smear from a patient with ALK-negative ALCL, circulating and also bone marrow infiltrating cells may be enormous with a monstrous appearance. Sometimes, multinucleated cells and cells with eccentric, horseshoe-shaped or kidney-shaped nuclei are observed. Cells are larger and more pleomorphic in ALK-negative ALCL than in ALK-positive ALCL. Moreover, ALK-negative ALCL is characterized by older median patients’ age and a more aggressive clinical course than ALK-positive ALCL. Some genetic abnormalities in ALK-negative ALCL are of possible prognostic importance, but none of them has an established diagnostic role.1
No conflicts of interest to disclose.
1. Invernizzi R. Mature T- and NK-cell neoplasms. Haematologica. 2020;105(Suppl 1):162-170.
Institute of Hematology and CREO, University and Hospital of Perugia, Perugia, Italy.
E-mail: brunangelo.falini@unipg.it https://doi.org/10.3324/haematol.2022.281671

Continuous cultures of fused cells secreting antibody of predefined specificity.
AUTHORS Köhler G, Milstein C.
JOURNAL Nature. 1975;256(5517):495-497. PMID 1172191.
Monoclonal antibodies have revolutionized several fields of medicine, especially hematology. The game started in 1975 when Köhler and Milstein, in a Letter to Nature, 1 re ported that it was possible to extract spleen B cells and fuse them with a mouse myeloma cell line to create hy brid cells (hybridomas) producing antibodies specific to the inoculated antigen and to immortalize them (Figure 1). This goal had been the source of frustration for scien tists for decades and achieving it was the result of many efforts in the field of biochemistry, cell culture, immuno logy, and somatic cell genetics. The authors concluded in
their Letter that “Such cultures could be valuable for me dical and industrial use”. The link between monoclonal antibodies and hematology has been very tight since the beginning. Incidentally, the antigen used to generate the first monoclonal antibodies was sheep red blood cells. Köhler and Milstein stated: “It remains to be seen whether similar results can be ob tained using other antigens ”.1 Fortunately, this was the case. In the mid 1980s, the number of monoclonal anti bodies directed against lympho-hematopoietic antigens and applicable for diagnostic purposes in hematology ex
Figure 1. “Isolation of an anti-SRBC antibody secreting cell clone. Activity was revealed by a halo of haemolysed SRBC” (Figure 2 from Köhler G, Mil stein C. Continuous cultures of fused cells secreting antibody of predefined specificity. Nature. 1975 Aug 7;256(5517):495-497. doi:10.1038/256495a0. PMID 1172191, with permission). To achieve continuous cul tures of fused cells secreting antibodies, Köhler and Milstein used the selective culture medium HAT (hy poxanthine, aminopterine, thymidine) that, in the mixture of fused and unfused cells, allowed only the growth of hybrid cells but not mouse myeloma cells (because they lacked hypoxanthine-guanine-pho sphoribosyl transferase-HGPRT) and spleen B cells (because of their limited life span). Thus, hybrido mas could grow indefinitely in HAT medium because the spleen cell partner supplied HGPRT and the myeloma partner (being a cancer cell) made the hy brid immortal and furnished the machinery required to produce antibodies at high rate. The monoclonal antibody of interest was then selected with appro priate screenings, as shown in the Figure.
 Brunangelo Falini
©2022 Ferrata Storti Foundation
Haematologica material is published under a CC BY-NC license
Brunangelo Falini
©2022 Ferrata Storti Foundation
Haematologica material is published under a CC BY-NC license
panded dramatically thanks to screening on lymphoid tissue sections, which enabled the detection of even those cells difficult to bring into suspension, e.g. endo thelial cells, macrophages and follicular dendritic cells within B-cell follicles. This strategy also allowed the type of labeled cells to be recognized by their topographic di stribution (e.g., mantle vs. germinal center B cells). Ano ther major step forward in improving the diagnosis of lymphomas and leukemias occurred in the early 1990s with the demonstration that monoclonal antibodies could recognize antigen epitopes resistant to fixation and paraffin-embedding procedures. The number of mo noclonal antibodies with this property increased hugely over the years, allowing routine paraffin-embedded biopsy samples to be investigated by immunohistoche mistry, contributing to the development of modern clas sifications of lympho-hematopoietic tumors. Finally, monoclonal antibodies recognizing tumor-specific anti gens (e.g. ALK) or atypical distribution of mutated pro teins (e.g. cytoplasmic NPM1)2 led to the identification of specific genetic entities.
In 1986 the Food and Drug Administration approved the first therapeutic anti-CD3 monoclonal antibody (muromo nab) for the prevention of kidney transplant rejection. After that, the field moved very slowly and a third thera peutic monoclonal antibody (rituximab, anti-CD20) was approved by the Food and Drug Administration only in 1997 for the treatment of B-cell lymphomas. The era of
1. Köhler G, Milstein C. Continuous cultures of fused cells secreting antibody of predefined specificity. Nature. 1975;256(5517):495-497.
2. Falini B, Mecucci C, Tiacci E, et al. Cytoplasmic nucleophosmin
chemo-immunotherapy had started, with monoclonal an tibodies directed against many lymphoid and myeloid-as sociated antigens or aimed at blocking signaling pathways (e.g. PD-1/PDL-1) increasing over the years. In April 2021, the monoclonal antibodies approved for clinical use had reached 100.
Antibody engineering, including humanization, construc tion of immunotoxins and generation of bispecific anti bodies to recruit immune cells to cancer cells further contributed to the success of monoclonal antibodies in treating hematologic malignancies. The most recent and revolutionary impact of monoclonal antibodies was in constructing chimeric antigen receptor (CAR) T cells en gineered to express on the cell surface a single-chain fragment variable domain (a monoclonal antibody por tion) able to recognize a given target molecule on tumor cells. 3 CAR T cells have revolutionized the therapy of several hematologic neoplasms, including refractory/re sistant large B-cell lymphomas and lymphoblastic leu kemia. 3
In 1984, Köhler and Milstein shared the Nobel Prize in Phy siology or Medicine with Niels Jerne. Notably, Milstein never patented his extraordinary discovery on monoclonal antibodies since he believed that it was mankind's intel lectual property.
No conflicts of interest to disclose.
in acute myelogenous leukemia with a normal karyotype. N Engl J Med. 2005;352(3):254-266.
3. June CH, Sadelain M. Chimeric antigen receptor therapy. N Engl J Med. 2018;379(1):64-73.
1Department of Experimental Immunology, Amsterdam University Medical Centers, University of Amsterdam and 2Lymphoma and Myeloma Center Amsterdam (LYMMCARE), Cancer Center Amsterdam (CCA) and Amsterdam Infection and Immunity Institute (AIII), Amsterdam, the Netherlands
E-mail: e.eldering@amc.uva.nl https://doi.org/10.3324/haematol.2022.280721
In this issue of Haematologica, Decombis et al. describe a novel tripartite cellular interaction in the tumor micro environment surrounding mantle cell lymphoma (MCL).1 MCL is an aggressive, mostly incurable B-cell malignancy and, like many (hematologic) cancers, heavily dependent on supportive interactions with the tumor microenviron ment. Decombis et al. add a novel layer to this cancer’s ‘ecosystem’ by studying interactions between three cell types; MCL, T cells and macrophages. Through a combina tion of techniques and nifty detective work they uncover several key players that act as messengers between these 'guilty' parties.
Based on expression datasets they pinpoint the relatively unknown cytokine interleukin (IL)-32β as a CD40-respon sive gene in the MCL microenvironment. Immunohisto chemistry made clear that IL-32β expression is enriched
in MCL lymphoid tissue infiltrated by T cells, suggesting that it is the T cells that provide the CD40L. In turn, IL32β polarizes macrophages in vitro, and induces them to secrete B-cell activating factor (BAFF) which is a survival factor for the MCL cells. The secretion of IL-32β as well as the BAFF-induced survival of MCL cells depends on al ternative nuclear factor kappa B (NF-kB) signaling via NFk B-inducing kinase (NIK), and can be blocked using inhibitory compounds (Figure 1). An interesting additional aspect is that the induction of the IL32B gene in MCL cells as opposed to normal B cells is correlated with epigenetic alterations.
Zooming out to the bigger picture, this type of ‘subversive’ interaction between multiple cell types, especially the programming of cancer-conducive monocytic cells, may be exemplary.
Figure 1. Cross-talk between malignant B cells, myeloid cells and T cells. Some general properties of the interactions between malignant B cells (in particular mantle cell lymphoma), myeloid cells and T cells can be established from the research by Decombis et al.1 and work in the references: (1) T cells engage CD40 on malignant B cells; (2) malignant B cells secrete factors (or a factor) that attract/stimulate monocytes; (3) monocytes differentiate into an immune suppressive/cancer supportive M2like phenotype; (4) the differentiated macrophages secrete BAFF, which is a survival factor for the malignant cells; and (5) M2 like macrophages suppress T-cell activation (not addressed in the work by Decombis et al. but inferred from a large body of work). NF-kB; nuclear factor kappa B; NIK: NF-kB-inducing kinase; BAFF: B-cell activating factor.

In solid cancers, the role of tumor-asociated macrophages is well established.2 Our group has described a similar triad in chronic lymphocytic leukemia,3,4 in which T cells trigger CD40 on chronic lymphocytic leukemia cells, which secrete CCL2 that attracts and converts monocytes to the suppressive M2 subtype. In the case of chronic lympho cytic leukemia, inhibitors that block chemokine (receptors) might thus be of therapeutic value. The work of Decombis et al. suggests that NIK inhibition,5,6 or BAFF blockade,7 both currently studied mainly in inflammatory diseases, might be attempted in MCL, as proposed for chronic lym phocytic leukemia.8 Targeting the tumor microenvironment supply routes might also reduce the options of cancer cells to escape selective pressure by direct attack on in trinsic cellular targets.
The authors have previously described the role of socalled MΦ MCL.9 The IL32β induced secretome in mono cytes/macrophages is large and includes many cytokines, chemokines and tumor necrosis factor-family members, and yet only BAFF was able to induce the long-term (measured at 7 days) survival of MCL cells. How BAFF ac complishes this, apart from activating the alternative NFk B pathway, remains unclear. Direct prosurvival factors such as the Bcl-2 family member Bcl-XL, also regulated
1. Decombis S, Papin A, Bellanger C, et al. The IL32/BAFF axis supports prosurvival dialogs in the lymphoma ecosystem and is disrupted by NIK inhibition. Haematologica. 2022;107(12):2905-2917.
2. Ruffell B, Affara NI, Coussens LM. Differential macrophage programming in the tumor microenvironment. Trends Immunol. 2012;33(3):119-126.
3. van Attekum MHA, van Bruggen JAC, Slinger E, et al. CD40 signaling instructs chronic lymphocytic leukemia cells to attract monocytes via the CCR2 axis. Haematologica. 2017;102(12):2069-2076.
4. van Attekum MH, Eldering E, Kater AP. Chronic lymphocytic leukemia cells are active participants in microenvironmental cross-talk. Haematologica. 2017;102(9):1469-1476.
5. Pflug KM, Sitcheran R. Targeting NF-kB-inducing kinase (NIK) in immunity, inflammation, and cancer. Int J Mol Sci. 2020;21(22):8470.
6. Brightbill HD, Suto E, Blaquiere N, et al. NF-kB inducing kinase is a therapeutic target for systemic lupus erythematosus. Nat Commun. 2018;9(1):179.
7. Samy E, Wax S, Huard B, Hess H, Schneider P. Targeting BAFF
via alternative NF-kB signaling,10 or Mcl-1 were excluded, based on quantitative polymerase chain reaction analysis - although this may not be enough proof, as Mcl-1 is known to be regulated by various post-transcriptional mechanisms. This aspect is not without importance, as there are now highly specific inhibitory compounds called BH3 mimetics against these prosurvival Bcl-2 members, which could be applied to probe the contribution of their targets in vitro. 11
Two main questions arise from this valuable work by De combis et al., apart from the question of how to exploit the findings therapeutically. First, how does BAFF work in MCL, in view of its presumed triggering of the non-canonical NFkB pathway? Perhaps the PI3K-Mcl-1 pathway is also in volved, as reported for murine B-cell responses.12 Second, the intriguing finding that IL32β is epigenetically dysregu lated in MCL leads to the obvious next question; what could be the cause of this? Decombis et al. teach us that apart from intrinsic cancer rewiring, and although mechanistically difficult to address, the answer might come from 'affec tionate' signals arriving from surrounding cells.
No conflicts of interest to disclose.
and APRIL in systemic lupus erythematosus and other antibodyassociated diseases. Int Rev Immunol. 2017;36(1):3-19.
8. McWilliams EM, Lucas CR, Chen T, et al. Anti-BAFF-R antibody VAY-736 demonstrates promising preclinical activity in CLL and enhances effectiveness of ibrutinib. Blood Adv. 2019;3(3):447-460.
9. Papin A, Tessoulin B, Bellanger C, et al. CSF1R and BTK inhibitions as novel strategies to disrupt the dialog between mantle cell lymphoma and macrophages. Leukemia. 2019;33(10):2442-2453.
10. Haselager M, Thijssen R, West C, et al. Regulation of Bcl-XL by non-canonical NF-kB in the context of CD40-induced drug resistance in CLL. Cell Death Differ. 2021;28(5):1658-1668.
11. Haselager MV, Kielbassa K, Ter Burg J, et al. Changes in Bcl-2 members after ibrutinib or venetoclax uncover functional hierarchy in determining resistance to venetoclax in CLL. Blood. 2020;136(25):2918-2926.
12. Wensveen FM, Slinger E, van Attekum MH, Brink R, Eldering E. Antigen-affinity controls pre-germinal center B cell selection by promoting Mcl-1 induction through BAFF receptor signaling. Sci Rep. 2016;6:35673.
Institute of Immunology and Immunotherapy, University of Birmingham, Birmingham, UK E-mail: s.freeman@bham.ac.uk https://doi.org/10.3324/haematol.2022.280747
Although remission rates are high after frontline chemo therapy in acute myeloid leukemia (AML), many patients in remission will have residual leukemic cells that may initiate relapse if not cleared sufficiently by further therapy. The advent of measurable residual disease (MRD) assays for AML has resulted in more sensitive estimates of residual leukemia, allowing patients to be subdivided into those with complete morphological remission with negative MRD (CRMRD–) or with positive MRD (CRMRD+).1 These response cat egories have implications for therapeutic decisions as AML patients with an MRD-negative remission have substan tially better outcomes, independently of other factors such as their genetic risk, with an average hazard ratio of 0.36 and 5-year overall survival of 68% according to a large meta-analysis of 11,151 patients.2 Indeed, several AML trial groups have progressed from validation of MRD as a key prognostic marker to clinical trials that use MRD results to direct therapy. Not surprisingly such trials have predomi nantly targeted younger adults with intermediate genetic risk AML in first remission for MRD-guided strategies. This is due to the perceived need for better risk stratification in
this group to inform decisions on allogeneic transplanta tion. Whether intermediate-risk younger adults with a CRMRD– test after one or more courses can be spared the toxicity of an allogeneic transplant without a detrimental effect on their survival is now a central question for the management of AML. Evidence to support this approach has recently emerged from the GIMEMA-AML-13103 and HOVON-SAKK-1324 trials that allocated intermediate-risk younger adults with a CRMRD– test, as assessed by flow cytometry after two courses, to autologous rather than al logeneic transplantation. Both trials documented encour aging 2-year survival rates of over 75% for these patients when they received their autologous transplant. Now an extended analysis of the GIMEMA-AML-1310 trial by Buccisano and colleagues, published in this issue of Hae matologica, 5 sheds light on whether current European LeukemiaNet (ELN) criteria of a flow cytometric MRDnegative test (<0.1% of leukocytes) can be refined to ident ify patients with a deeper remission and, crucially, whether these ‘deeper’ responders have significantly better out comes. In AML, there is a high-level evidence base and
Figure 1. Interpretation of flow cytometric measurable residual disease. *More than 50 cells (absolute limit of quantification in the acute myeloid leukemic aberrant immunophenotype (LAIP) gate may constitute background noise. The level of background noise from non-leukemic blasts will depend on the exclusion of normal regenerating blasts by the LAIP gate and can be estimated by testing a range of control bone marrow samples For example, if the LAIP gate has a background noise of up to 0.02% and 0.5x10⁶ leukocytes are acquired, there may be up to 100 non-acute myeloid leukemia cells. MRD: measurable residual disease; LAIP: leukemic aberrant immunophenotype; DfN; different from normal aberrant immunophenotype; ELN: European LeukemiaaNet; LOB: limit of blank; BM: bone marrow; LOD: limit of detection; LOQ: limit of quantitation.

agreement that flow cytometric MRD of 0.1% or above cor relates with high relapse rates and inferior survival at multiple treatment time-points;1 this includes intermedi ate-risk younger adults with wild-type NPM1 mutations when MRD is measured after the first two chemotherapy courses (cumulative incidence of relapse at 3 years of 89%).6 Flow cytometric MRD below 0.1% may represent technically detectable as well as undetectable residual leukemia commensurate with assay sensitivity and accord ingly has less well-defined prognostic relevance (Figure 1).
By the technical /statistical parameters of rare event analy sis (set by acceptable coefficients of variation for reliability of the measurement), flow cytometric MRD is undetectable with less than 20-30 positive cells and unquantifiable with less than 50. These standardized criteria for the limit of de tection (LOD) and quantitation (LOQ) are applied to report high sensitivity flow cytometric MRD in multiple myeloma,7 chronic lymphocytic leukemia8 and acute lymphoblastic leukemia9 following extensive clinical validation. The GIMEMA investigators sought to establish their prognostic value in AML. Firstly they observed that only two-thirds of patients with MRD-negative tests (categorized in the AML1310 trial as below 0.035% after 2 or 3 courses) had deeper remissions by the LOQ (i.e., <0.01% MRD cells of 0.5x10⁶ leu kocytes). Then, importantly, they showed that this LOQ further discriminated survival in the overall MRD-negative group (as categorized by the trial). Those identified as achieving a deeper remission by the LOQ criteria had a 2year survival of 86.7% compared to 72.5% for the remaining CRMRD– adults (P<0.01). Restricting the analysis to the inter mediate genetic risk group produced similar results. These reproducible flow cytometric criteria may therefore im prove prognostic information in AML by identifying at least some patients with a deeper remission. This new informa tion paves the way for standardized, improved reporting of flow cytometric AML MRD and, in parallel, prompts ques tions on how the results might be used to further guide tar geted de-escalation or intensification of therapy.
While some patients in AML-1310 were re-classified as MRD-positive from the LOQ thresholds, they had a non-in ferior outcome to those with MRD-positivity over 0.035% (2-year survival of 72.5% and 67%, respectively), despite not having been identified for MRD-directed allogeneic trans plantation. This supports the current consensus that inten
1. Heuser M, Freeman SD, Ossenkoppele GJ, et al. 2021 update on measurable residual disease (MRD) in acute myeloid leukemia (AML): a consensus document from the European LeukemiaNet MRD Working Party. Blood. 2021;138(26):2753-2767.
2. Short NJ, Zhou S, Fu C, et al. Association of measurable residual disease with survival outcomes in patients with acute myeloid leukemia: a systematic review and meta-analysis. JAMA Oncol. 2020;6(12):1890-1899.
3. Venditti A, Piciocchi A, Candoni A, et al. GIMEMA AML1310 trial of
sification cannot be recommended simply based on per sisting low-level MRD after frontline treatment, particularly when levels are stable in serial measurements. Of course the prognostic value of low-level MRD may vary according to treatment schedules and genetic risk but, importantly, accurate estimation of this will depend on the robust ex clusion of technical false positives (arising from back ground). This is being addressed in ongoing initiatives by the ELN-DAVID group and others. Conversely, given the excellent survival of the deep re sponders by LOQ criteria, could separating out these pa tients be a first step to sparing them unnecessary intensification or maintenance? It is of interest that about 40% of the AML-1310 cohort with FLT3-ITD mutations or poor-risk cytogenetics were in the ‘deeper’ responder cat egory. With regard to the former, if the AML is also NPM1 mutated, accumulated evidence supports the strategy of serial polymerase chain reaction MRD monitoring for deep responders.1 This will enable the toxicity of an allogeneic or even an autologous transplant to be avoided for some pa tients. A similar watch-and-wait approach could be ex tended to other intermediate-risk patients using serial flow cytometric MRD monitoring. For younger adults with AML in whom allogeneic transplantation is mandatory, the bal ance of benefit for myeloablative versus reduced intensity conditioning remains controversial.10 An early deep MRD re sponse sustained at the pre-transplant MRD assessment could more precisely identify those patients for whom re duced intensity conditioning may suffice to prevent relapse.11
Based on this study, flow cytometric MRD response measurements that incorporate the absolute flow cyto metric LOQ thresholds - already in use for multiple mye loma, chronic lymphocytic leukemia and acute lymphoblastic leukemia - have promise as a useful adjunct to extend the current ELN recommended flow cytometric definition of CRMRD– for AML. Consideration should be given to the collection of these data in ongoing trials to improve interpretation of treatment efficacy.
Speakers bureau for Jazz and Novartis; consultancy or ad visory role for Novartis and Neogenomics; research funding from Jazz and BMS.
risk-adapted, MRD-directed therapy for young adults with newly diagnosed acute myeloid leukemia. Blood. 2019;134(12):935-945.
4. Lowenberg B, Pabst T, Maertens J, et al. Addition of lenalidomide to intensive treatment in younger and middleaged adults with newly diagnosed AML: the HOVON-SAKK-132 trial. Blood Adv. 2021;5(4):1110-1121.
5. Buccisano F, Palmieri R, Piciocchi A, et al. Clinical relevance of an objective flow cytometry approach based on limit of detection and limit of quantification for measurable residual
disease assessment in acute myeloid leukemia. A post-hoc analysis of the GIMEMA AML1310 trial. Haematologica. 2022;107(12):2823-2833.
6. Freeman SD, Hills RK, Virgo P, et al. Measurable residual disease at induction redefines partial response in acute myeloid leukemia and stratifies outcomes in patients at standard risk without NPM1 mutations. J Clin Oncol. 2018;36(15):1486-1497.
7. Costa LJ, Derman BA, Bal S, et al. International harmonization in performing and reporting minimal residual disease assessment in multiple myeloma trials. Leukemia. 2021;35(1):18-30.
8. Rawstron AC, Fazi C, Agathangelidis A, et al. A complementary role of multiparameter flow cytometry and high-throughput sequencing for minimal residual disease detection in chronic
lymphocytic leukemia: an European Research Initiative on CLL study. Leukemia. 2016;30(4):929-936.
9. Theunissen P, Mejstrikova E, Sedek L, et al. Standardized flow cytometry for highly sensitive MRD measurements in B-cell acute lymphoblastic leukemia. Blood. 2017;129(3):347-357.
10. Freeman SD, Craddock C. Selection of conditioning intensity for allogeneic hematopoietic stem cell transplantation in acute myeloid leukemia and myelodysplasia - new evidence emerges. Transplant Cell Ther. 2021;27(6):443-445.
11. Hourigan CS, Dillon LW, Gui G, et al. Impact of conditioning intensity of allogeneic transplantation for acute myeloid leukemia with genomic evidence of residual disease. J Clin Oncol. 2020;38(12):1273-1283.
University of Rochester Medical Center, Rochester, NY, USA
E-mail: marshall_lichtman@urmc.rochester.edu https://doi.org/10.3324/haematol.2022.280838
In 1879, Heuck is credited with describing a disorder under the title “Two Cases of Leukemia and Peculiar Blood and Bone Marrow Findings”,1 which is considered the first de scription of what is today designated primary myelofibro sis by the World Health Organization (WHO) Classification of Tumours of Haematopoietic and Lymphoid Tissues.2 Since the description by Heuck 143 years ago, numerous designations for the disease have been proposed or used, and different ones have been preferred in different coun tries. The designations: (i) agnogenic myeloid metaplasia,a (ii) myelofibrosis with myeloid metaplasia, (iii) primary myelofibrosis–osteosclerosis, and (iv) idiopathic (primary) myelofibrosis are among the over 30 designations given to the disease.3 Remarkably, the first three designations cited above were used in the title of three papers on the topic by the same senior author.4 The current “official’ designation of primary myelofibrosis is a profound patho biological misnomer.
No concise designation can been formulated that accom modates the constellation of 11 characteristic phenotypic features of this clonal (neoplastic) hematopoietic multi potential cell abnormality, which Heuck called “peculiar”: (i) anemia, (ii) dacryocytes in the blood, (iii) myelocytes in the blood, (iv) variable alterations (increases or decreases) in the steady-state level of neutrophils and platelets (usually elevation), (v) orthochromatic erythroblasts in the blood, (vi) increased CD34+ cells in the blood, (vii) domi nant neoplastic megakaryocytopoiesis, (viii) a reactive marrow fibrosis, (ix) a propensity to extramedullary fibro hematopoietic tumors, (x) a risk of developing osteoscle rosis and (xi) splenomegaly, sometimes massive. Its genetic profile consists of mutations of JAK2 (60%), CALR (25%), or MPL (5%) in 90% of cases. In so-called triplenegative disease, other mutations characteristic of hema topoietic neoplasms may be found.2,5 The nosological dilemma is not a surprise since no practical designation could accommodate the varied manifestations of several neoplastic myeloid diseases.6 Which fundamental abnor mality should be given primacy? Not fibrosis, an epiphe nomenon and a connective tissue fiber. The constant, indeed central pathophysiological feature, of so-called primary myelofibrosis is the expansion of neoplastic, profoundly dysmorphicb megakaryocytes in the marrow. It, thus, could (should) be designated chronic megakaryocytic leukemia, adhering to the principle that myelogenous leukemias have multiple phenotypes, re
ecting the differentiation options of both the normal and mutated multipotential hematopoietic progenitor cell, the presumptive site of the foundational mutations of this family of neoplasms. The resultant neoplastic phenotypes are usually designated by the lineage that either domi nates the marrow (e.g., acute promyelocytic leukemia) or is the most important pathobiological feature (e.g., chronic neutrophilic leukemia). The designation may be supplemented by its principal genetic mutations, if relatively prevalent, for example, acute myelogenous leukemia, t(8;21)(q22;q22). In primary myelofibrosis, the megakaryocytic alterations are the most prevalent, the most constant and the most important diagnostically and pathogenically. Neoplastic expansion of megakaryocytopoiesis, megakaryocyte clusters, often around marrow sinuses, loss of anchoring to the abluminal aspect of the marrow sinus with entry of whole megakaryocytes into the sinus lumen, pleomor phic changes of megakaryocytic nuclei, sometimes de scribed as cloud-like, as a result of nuclear ballooning and abnormal variability of nuclear and cytoplasmic features are striking. Dysmorphic platelets, megakaryocyte cyto plasmic fragments and bare megakaryocyte nuclei in the blood may be seen, especially in advanced cases. Follow ing splenectomy, the blood contains a remarkable array of bizarre and giant platelets, megakaryocyte cytoplasmic fragments and dysmorphic micromegakaryocytes. The dominance of neoplastic megakaryocytopoiesis is evident also in cases with intense marrow fibrosis and reductions in erythropoiesis and granulopoiesis. In this setting, the bundles of reticulin (type III collagen) and other types of collagen abut arrays of dysmorphic megakaryocytes. Ab normal megakaryocytopoiesis, also, is the hallmark of pa tients in the prefibrotic phase of the disease.
fl
In striking support of these phenotypic findings, blood CD34 cells isolated from patients with primary myelofi brosis resulted in 24-fold and 800-fold greater numbers of CD41+ cells (putative megakaryocytes) than the CD34+ cells obtained from healthy volunteers administered gra nulocyte colony-stimulating factor or the CD34+ cells iso lated from patients with polycythemia vera, respectively.7 Megakaryocytes from patients with primary myelofibrosis had delayed apoptosis and overexpressed the anti-apop totic protein BCL-xL. Media conditioned with CD61 cells (a megakaryocyte marker) from patients with primary myelofibrosis contained higher levels of transforming
growth factor- β and active matrix metalloproteinase-9 than media from normal individuals or from patients with polycythemia vera.7 These findings were true if the muta tion in the cells of patients with primary myelofibrosis was JAK2 or not. Neoplastic megakaryocytopoiesis is the dominant feature of incipient, prototypic or advanced myelofibrosis and supports the designation of chronic megakaryocytic leukemia. One could ask whether essential (primary) thrombocythe mia is not, also, a chronic megakaryocytic leukemia? It is one in the sense that it is a clonal disorder originating in a primitive multipotential hematopoietic cell in which its principal expression is exaggerated neoplastic megakaryo cytopoiesis and elevated platelet counts, but the term thrombocythemia captures the central issue. It is, in ef fect, an indolent myelogenous leukemia if one uses the term “myelogenous leukemia” to designate the spectrum of neoplasms that originate in a mutated multipotential hematopoietic progenitor cell, as we do for the overwhel ming majority of those disorders. Moreover, primary thrombocythemia is never associated with leukemic blast cells in blood or marrow. Indolent myelogenous leukemia is a counterpoint to acute (polyblastic) and subacute (oli goblastic) myelogenous leukemias and is not meant to imply the absence of morbidity. It, too, carries a risk of clonal evolution to a more severe myeloid neoplasm, no tably acute myelogenous leukemia. I do not suggest changing its name, as the term “leukemia” has come to mean something to the laity with which the patient with thrombocythemia should not be confronted, as is the case with polycythemia vera, another neoplasm of the multi potential progenitor cell (an indolent myelogenous leuke mia with a risk of evolution to acute myelogenous leukemia). In the case of polycythemia, indolent leukemia is characterized by differentiation of the mutant hemato poietic multipotential cell, such that it provides clonal pla telets, neutrophils, other granulocytes and red cells that are phenocopies of normal cells and highly functional. The distinction of thrombocythemia from chronic megakaryo cytic leukemia (primary myelofibrosis in the WHO classifi cation) is a profound one, as noted by the markedly longer life expectancy on average of a patient with thrombo cythemia (median survival of 20 years) at the time of di agnosis as compared to a patient with primary myelofibrosis who has a median survival of 5 years after diagnosis.5 Thus, the nosological grouping (chronic mye loproliferative neoplasms) of polycythemia vera, thrombo cythemia and so-called primary myelofibrosis has a genetic basis but primary myelofibrosis (chronic mega karyocytic leukemia) has a strikingly different course, management and prognosis. In 1942, amidst the Nazi oc cupation of France, and at a time in which there was a primitive understanding of multipotential hematopoietic progenitor cell neoplasms, Chevallier discussed the “odoleukemias”.8 He chose the Greek word, odo, meaning
threshold, to highlight disorders that are on the threshold of overt leukemia. Chevallier proposed “leucoses” as the generic term for “leucémie” so that marked variations in white cell and blast counts and other presenting features would not engender inappropriate terminology. Of the numerous prior designations for primary myelofi brosis, “megakaryocytic myelosis” may have been the most apt. It highlighted the primary phenomenon. Indeed, the choice of primary myelofibrosis by the WHO panel was contentious because of the frequency of a prefibrotic phase of the disease, making “primary myelofibrosis with out fibrosis” a state that Aristotle would find irreconcilable with his dictum that a proposition cannot be both true and false simultaneously (The Principle of Non-Contradic tion). Some preferred the term chronic megakaryocytic–granulocytic myelosis, but that group did not win the day, despite this designation being more accurate. If they had substituted “leukemia” for “myelosis” (a neologism) and dropped the term granulocytic, they would have hit the bulls-eye. Neoplastic granulocytic expansion with neu trophilia is a frequent early event in this disease, but like most other chronic clonal myeloid disorders, this reflects its origin in a primitive hematopoietic multipotential pro genitor cell; the major myeloid lineages are involved in one way or another in all clonal myeloid diseases. The term ‘myelosis’, although euphonious is a euphemism for mye logenous leukemia. There does not seem to be a hesita tion to call the disease acute megakaryocytic leukemia when neoplastic megakaryocytes dominate in that setting. The two most inappropriate features of the WHO desig nation, “primary myelofibrosis” are that: (i) the fibrosis is secondary, an epiphenomenon of the neoplastic mega karyocytes exaggerated cytokine release and their stimu lation of marrow fibroblasts (reticular cells) to synthesize various types of collagen, but notably type III (reticular fibers);c and (ii) it is inappropriate to name a neoplasm after a connective tissue fiber as opposed to a relevant neoplastic cell. The naming decision reflects the failure to give priority to the essential feature and instead to an epi phenomenon and a feature that does not highlight the neoplastic cells central to the malignancy. The designation chronic megakaryocytic leukemia: (i) re flects the principal and most constant neoplastic alter ation in the disease, (ii) corresponds to the nomenclature for other clonal myeloid diseases and neoplasms in gen eral, (iii) assists in decreasing (all too gradually) anachron istic and erroneous terminology, (iv) implies multilineage hematopoietic involvement (myelogenous leukemia), (v) implies the epiphenomena of marrow fibrosis, osteoscle rosis, and fibrohematopoietic extramedullary tumors, and (vi) indicates the propensity, through clonal evolution, to terminate in an acute myelogenous leukemia.
No conflicts of interest to disclose.
Footnotes:
aThe term “metaplasia” was applied inaccurately to this neoplasm over 80 years ago.9 Metaplasia is the transformation of one differentiated cell type to another differentiated cell type, usually evident in epithelia. Technically there is no evidence of metaplasia in the tissues of patients with primary myelofibrosis. That appellation would require cells intrinsic to spleen, liver or lymph nodes changing to a different histology resulting in the spleen, liver or lymph nodes converting to hematopoietic marrow. In addition, metaplasia is not neoplasia. The evidence for effective hematopoiesis in the spleen, its most likely site, is largely dispelled by the improvement in or absence of an effect on blood cell counts after removal of massively enlarged spleens.10 The marked increase in circulating CD34+ cells may seed the spleen, liver or lymph nodes but there is no evidence that they establish effective hematopoiesis. Moreover, the phenomenon of increased circulating CD34+ cells is closer to metastasis than metaplasia, the precise definition of which is not met by any of the changes observed in primary myelofibrosis.
bI use the term dysmorphia, not dysplasia, because neoplastic cells cannot be dysplastic.11 Neoplasia and dysplasia are two qualitatively (uniquely) different pathological states. Aplasia or hypoplasia, hyperplasia, metaplasia, dysplasia, and neoplasia are distinct pathological processes. Only one, neoplasia, is monoclonal; the others are each polyclonal, a fundamental distinction. The Oxford Languages defines dysmorphia in two distinct ways. One designates dysmorphia as a deformity or abnormality in the shape or size of a specific body part that may have a genetic basis, which in the case of myeloid neoplasms is usually an acquired somatic mutation(s).
cThe fibroplasia in marrow is complex and 11 connective tissue proteins may be elevated in the marrow in primary myelofibrosis as well as several cytokines that provoke collagen formation. Collagen types I, II, IV, and V may be elevated in marrow, but type III collagen (reticulin) is increased uniformly and preferentially. Increased peptides of procollagen and other connective tissue proteins (e.g., laminin and fibronectin) are increased in plasma. See Prchal et al.5 for comprehensive details of these epiphenomenologic changes.
1. Heuck G. Zwei Fälle von Leukämie mit eigenthümlichem Blutresp Knochenmarksbefund. [Two cases of leukemia with peculiar blood and bone marrow findings]. Virchows Arch (Pathol Anat). 1879;78:475.
2. Swedlow SH, Campo E, Harris NL, et al. WHO Classification of Tumours of Haematopoietic and Lymphoid Tissue. International Agency for Research on Cancer. 2017:44-49.
3. Pettigrew JD, Ward HP. Correlation of radiologic, histologic, and clinical findings in agnogenic myeloid metaplasia. Radiology. 1969:93:541-548.
4. Lichtman MA. Is it chronic idiopathic myelofibrosis, myelofibrosis with myeloid metaplasia, chronic megakaryocyticgranulocytic myelosis, or chronic megakaryocytic leukemia? Further thoughts on the nosology of the clonal myeloid disorders. Leukemia. 2005;19(7):1139-1141.
5. Prchal JT, Lichtman MA. Primary myelofibrosis, Chap. 85. In: Kaushansky K, Lichtman MA, Prchal JT, Levi M, Burns LJ, Linch DC, eds. Williams Hematology. 10th ed. New York: McGraw Hill Education. 2021:1389-1410.
6. Lichtman MA, Classification and clinical manifestations of the clonal myeloid diseases, Chap. 82. In: Kaushansky K, Lichtman MA, Prchal JT, Levi M, Burns LJ, Linch DC, eds. Williams Hematology. 10th ed. New York: McGraw Hill Education, 2021:1343-1359.
7. Ciurea, SO, Merchant, D, Mahmud N, et al. Pivotal contributions of megakaryocytes to the biology of idiopathic myelofibrosis. Blood. 2007;110(3):986-993.
8. Chevalier, P. Sur la terminologie des leucoses et les affectionsfrontières les odoleucoses. Sang. 1943;15:587-594.
9 Jackson H Jr, Parker F, Lemon HM. Agnogenic myeloid metaplasia of the spleen - a syndrome simulating other more definite hematologic disorders. N Engl J Med. 1940;222:985-994.
10. Green TW, Conley CL, Ashburn LL, Peters HR. Splenectomy for myeloid metaplasia of the spleen. N Engl J Med. 1953;248(6):211.
11. Lichtman MA. Myelodysplasia or myeloneoplasia: thoughts on the nosology of clonal myeloid diseases. Blood Cells Mol Dis. 2000;26(6):572-581.
Correspondence: J. Radich jradich@fredhutch.org
Received: August 30, 2022.
Accepted: September 1, 2022.
https://doi.org/10.3324/haematol.2022.281079
©2022 Ferrata Storti Foundation
Published under a CC BY-NC license
Measurable residual disease (MRD) is playing an increas ingly important role in the management of patients with hematologic malignancies. The detection of MRD, be it by flow cytometry or genetic assays, is associated with an increased risk of relapse in myeloid and lymphoid malig nancies, and MRD is now being used to determine treat ment strategies during therapy and is being explored as an endpoint in phase II clinical trials.
Across many diseases and studies, the association of MRD with outcomes (relapse and survival) is remarkably con sistent, despite differences of therapy, time-points at which it is measured, populations (pediatric vs. adults) or methods being used to measure MRD. However, there are many other features of MRD that need to be explored. First, there are several methodological questions. Do some of the newer genetic approaches (next-generation sequencing, droplet digital polymerase chain reaction) predict outcome better than other standard approaches (flow cytometry)? Does increased sensitivity necessarily make for a better MRD assay (as with increasing sensitiv ity, most patients may have residual disease, yet not re lapse). With better assays, can we move from the painful and costly bone marrow biopsy to peripheral blood testing (à la chronic myeloid leukemia)?
Second there are biological questions, as MRD is not just a measure of disease burden, it is also a measure of disease biology. Why do some patients easily achieve an MRDnegative state, while others do not? Why do some patients
1. Saygin C, Cannova J, Stock W, Muffly L. Measurable residual disease in acute lymphoblastic leukemia: methods and clinical context in adult patients. Haematologica 2022;107(12):2783-2793.
2. Blachly JS, Walter RB, Hourigan CS. The present and future of
with residual disease not relapse, while some without MRD, do relapse? With the advent of single-cell genotyping, can we determine now which gene mutation(s) in which cell subtype influence MRD and relapse?
Lastly, there are clinical questions. How do we best use MRD to guide therapy? Does changing therapy based on MRD really affect the outcome? Can we eventually use MRD as an early endpoint for clinical trials? And, if so, will it be better to use MRD as a smart, quantitative variable rather than a dumb, categorical variable?
Given its increasing importance in clinical and research applications, we have decided to give MRD our full atten tion with reviews of MRD in acute lymphoblastic leukemia, acute myeloid leukemia, chronic myeloid leukemia, chronic lymphocytic leukemia, and myeloma. In this issue we start with acute lymphoblastic leukemia, acute mye loid leukemia, and chronic myeloid leukemia;1-3 chronic lymphocytic leukemia and myeloma will soon follow. We have asked experts in the field to create succinct, inter esting, informative and entertaining reviews, guided by the principle of producing a work that they themselves would want to read. Once the series has been completed, I will end with a summary and a look forward.
We at Haematologica hope that you enjoy the series and, as always, we welcome your comments and suggestions.

No conflicts of interest to disclose.
measurable residual disease testing in acute myeloid leukemia. Haematologica 2022;107(12):2810-2822.
3. Branford S, Apperley JF. Measurable residual disease in chronic myeloid leukemia. Haematologica 2022;107(12):2794-2809.
Fred Hutchinson Cancer Center, Seattle, WA, USACorrespondence: L. Muffly lmuffly@stanford.edu
1Section of Hematology/Oncology, Department of Medicine, University of Chicago, Chicago, IL and 2Division of Blood and Marrow Transplantation and Cellular Therapy, Stanford University, Stanford, CA, USA
Received: January 7, 2022.
Accepted: March 10, 2022.
https://doi.org/10.3324/haematol.2022.280638
©2022 Ferrata Storti Foundation
Published under a CC BY-NC license
Measurable residual disease (MRD) is the most powerful independent predictor of risk of relapse and long-term survival in adults and children with acute lymphoblastic leukemia (ALL). For almost all patients with ALL there is a reliable method to evaluate MRD, which can be done using multi-color flow cytometry, quantitative polymerase chain reaction to detect specific fusion transcripts or immunoglobulin/T-cell receptor gene rearrangements, and high-throughput next-generation sequencing. While next-generation sequencing-based MRD detection has been increasingly utilized in clinical practice due to its high sensitivity, the clinical significance of very low MRD levels (<10-4) is not fully characterized. Several new immunotherapy approaches including blinatumomab, inotuzumab ozogamicin, and chimeric antigen receptor T-cell therapies have demonstrated efficacy in eradicating MRD in patients with B-ALL. However, new approaches to target MRD in patients with T-ALL remain an unmet need. As our MRD detection assays become more sensitive and expanding novel therapeutics enter clinical development, the future of ALL therapy will increasingly utilize MRD as a criterion to either intensify or modify therapy to prevent relapse or de-escalate therapy to reduce treatment-related morbidity and mortality.
Multi-agent chemotherapy and risk-adapted protocols revolutionized the management of pediatric acute lym phoblastic leukemia (ALL), and transformed this histori cally fatal disease into a curable entity in ~90% of children.1 Although outcomes continue to be inferior for adults with ALL relative to children, the successful adop tion of pediatric-inspired intensive chemotherapy in the treatment of young adults (<40 years) with ALL has sig nificantly improved overall survival with rates approaching 65-80%.2,3 Furthermore, novel immunotherapies such as the CD19-directed bi-specific T-cell engager blinatumo mab, the anti-CD22 antibody-drug conjugate inotuzumab ozogamicin, and chimeric antigen receptor (CAR) T-cell therapies offer new treatment options for B-lineage ALL and are now being explored in the front-line setting.4-6 As our therapeutic armamentarium expands, accurate risk stratification at critical time points is essential to deliver optimal treatment to improve outcomes in adults with ALL. After standard multi-agent chemotherapy, the ma jority of adults will achieve complete morphological re mission (CR).7,8 However, response assessment is further
ned by the evaluation of subclinical (not detected mor phologically) measurable (also known as minimal) residual disease (MRD), which strongly and independently associ ates with outcomes across ALL studies and patient co horts.9-12 Furthermore, MRD is increasingly incorporated into risk-adapted protocols in adult ALL populations, in which MRD may inform therapeutic decisions by identify ing patients at high risk of relapse who may benefit from novel treatment approaches and/or allogeneic hemato poietic cell transplant (HCT), or patients with chemosen sitive disease at lower risk of relapse who are likely to do well in the absence of HCT in first complete remission.13,14 The prognostic significance of MRD in adult ALL has been shown in both younger adults (<40 years) and older adults (>40 years).15,16
refi
MRD is defined as measurable leukemia in a sample that is devoid of leukemia cells by morphological assessment with a light microscope. It is estimated that a patient presents with 1012 (a trillion) bone marrow leukemic blasts at diagnosis, and morphological assessment can detect approximately 1% blasts or more (Figure 1). Therefore, MRD theoretically represents anything less than 1010 cells (<1% blasts). In clinical practice, MRD is often used to describe
Caner Saygin,1 Joseph Cannova,1 Wendy Stock1 and Lori Muffly2Figure 1. Measurable residual disease assessment in acute lymphoblastic leukemia. Schematic representation of disease levels in acute lymphoblastic leukemia with corresponding measurable residual disease levels. This can resemble an “iceberg”, with different detection methods offering different levels of sensitivity and breadth of detecting residual disease. MRD: measurable residual disease; PCR: polymerase chain reaction.

any detectable leukemia below the traditional remission definition of 5% blasts by morphological assessment. However, as MRD detection assays have become more sensitive, it is generally recognized that an appropriate assay for the detection of ALL MRD in the clinic should be validated and reproducible at a sensitivity threshold of at least 10-4, or 0.01% leukemia cells in the bone marrow. The fundamental idea behind MRD interpretation is simple: the rate of decline in disease burden in response to systemic therapy is of prognostic value and a measure of risk for relapse, and intervening on lower levels of disease should result in improved outcomes. Herein, we review commonly used methods of MRD detection in ALL and provide clini cal context and guidance to practising clinicians on how to interpret and intervene on MRD in adult ALL.
All MRD detection methods leverage features that are pres ent exclusively in leukemic blasts to differentiate them from normal cells. Commonly used techniques include multicolor flow cytometry (MFC) to detect leukemic cells by immunophenotypic aberrancies, real-time quantitative polymerase chain reaction (qPCR) for detection of recurrent gene fusions (e.g., BCR-ABL1) or rearranged immunoglobulin (IG) and T-cell receptor (TCR) genes.17 A more recent tech
nique which relies on high-throughput next-generation se quencing (NGS) may offer a more sensitive approach to de tect IG and TCR rearrangements in ALL blasts.18 The main advantages and disadvantages of these MRD assessment methods are summarized in Table 1.
MFC is a fast and relatively inexpensive method that is broadly applicable to most ALL cases. It distinguishes leukemic cells based on their aberrant immunophenotype or leukemia-associated immunophenotype. A leukemiaassociated immunophenotype can include antigen overor under-expression, asynchronous antigen expression, cross-lineage antigen expression, and ectopic pheno types.16 It is necessary to obtain information about the immunophenotype at diagnosis in order to track it throughout the clinical course of an individual patient. However, these features may change under therapeutic pressure, and antigens may be lost or new antigens may be over-expressed as the leukemia evolves. To overcome this challenge, an alternative flow-based MRD approach named “different from normal” has been widely utilized.19 The “different from normal” approach involves a standard ized panel of several markers that are used to distinguish leukemic cells from normal hematopoietic cells (Figure 2). The most common markers used to identify leukemic B lymphoblasts include CD10, CD19, CD45, CD34 and CD38. Leukemic cells often have high CD10 and low CD38 ex pression, which may distinguish them from hematogones. Aberrant myeloid marker expression (e.g., CD33, CD13, and CD15), or expression of CD9, CD73, and CD81 may also be
Table 1. Comparison of techniques to measure residual disease in acute lymphoblastic leukemia.
Sensitivity
10-4 10-4 to 10-5 10-4 to 10-5 10-6
Applicability >90% 40-50% 90-95% >90%
Advantages
- Rapid - Relatively inexpensive - DfN method does not require access to dia gnostic specimen
- Sensitive - Standard primers used for specific fusions
- Sensitive - Applicable to most patients
- Standardized guidelines in Europe
- Very sensitive - Applicable to almost all patients
- Clone-unbiased (can track multiple clones and evolution)
- Only US FDA-appro ved assay (ClonoSEQ)
- Data for MRD use in peripheral blood
Limitations - Variable sensitivity - Requires technical expertise
- Fresh cells required
- Less standardized - Immunophenotypic shifts can lead to false negative results
- Not applicable to all patients - Time-consuming - Expensive - Relies on pre-treat ment sample
- Requires extensive experience and labor
- Expensive
- Longer turn-around time than MFC
- Requires diagnostic pre-treatment sample
ALL: acute lymphoblastic leukemia; ASO: allele-specific oligonucleotide; DfN: different-from-normal; FDA: Food and Drug Administration; IG: immunoglobulin; MFC. multicolor flow cytometry; NGS, next-generation sequencing; qPCR, quantitative polymerase chain reaction; TCR, Tcell receptor.
helpful to define B-lymphoblasts.20 Clinical laboratories should be informed if the patient has received CD19-, CD20- or CD22-targeted therapies, as these markers may no longer be reliable in MRD detection for these patients. It is important to identify CD19 antigenic escape with flow MRD, since these patients would not benefit from further CD19-targeted therapies. In patients receiving anti-CD19 agents, other B-cell markers, such as CD20, CD22, and CD79a, can be used to identify the CD19-negative leuke mia population, but can also lead to misidentification of normal B-cell precursors.21 Therefore, flow MRD should be used in conjunction with other methods of MRD evaluation (such as qPCR or NGS-based methods) for patients who have received anti-CD19 therapies. Clinicians and MRD laboratories should also be aware of the rare event of myeloid lineage switch after anti-CD19 therapies, which has been reported in both children and adults treated with blinatumomab or CAR T-cell therapies.22,23 This is more commonly observed in patients with KMT2A-rearranged ALL, but has also been seen in ALL with BCR-ABL1 trans location.23 In these cases, flow cytometry may identify blasts expressing myeloid as opposed to lymphoid markers. Since these cases persistently harbor their cyto genetic rearrangement at the time of myeloid relapse, complementing flow MRD with reverse transcriptase PCR (RT-PCR)-based MRD assessment can enable accurate di agnosis of this entity. Similarly, NGS-based MRD assess ment may be helpful when flow-based MRD assessment
has limitations in these cases. Finally, another recently de scribed rare entity called switch ALL (swALL) may pose challenges for flow-based MRD detection.24 These precur sor B-ALL arise from CD2+ lymphoblasts that do not har bor KMT2A rearrangements but have upregulated CEBPα activity. These cases are characterized by a switch be tween precursor B (CD19+ CD14 ) and monocytoid (CD19 CD14+) immunophenotypes through a transdifferentiation mechanism involving alterations in the expression of CEBP α , PAX5, PU1 and GM-CSFR.25 This disease can be tracked by using IG gene rearrangements that are pre served throughout different switch states. CD34, TdT, CD7, cytoplasmic CD3, and CD1a are commonly utilized markers for flow-based MRD detection in T-ALL; however, MFC for residual T-lymphoblast detection is less developed compared to that for B-ALL.26
Although the sensitivity of MRD MFC from ALL bone mar row aspirate sampling approaches 10-4, results are de pendent upon the quality of sample obtained, and the laboratory operator’s experience.27 The results of MFCbased MRD assessment may be optimized by treating samples with EDTA or heparin anti-coagulation and using 2-5 mL from the first pull of bone marrow aspirate. Since the degree of cellularity in the sample will affect the re corded number of events, up to 5 mL may be required for hypocellular remission samples. There is no evidence for unequal distribution of ALL cells in different parts of the bone marrow compartment as shown in studies of bilat
Figure 2. Multicolor flow cytometry as a method of measurable residual disease detection in acute lymphoblastic leukemia. An example showing multicolor flow cytometry of a bone marrow specimen, obtained after induction with chemotherapy plus rituximab (anti-CD20) in a patient with B-cell acute lymphoblastic leukemia (B-ALL). The measurable residual disease (MRD) population (0.2% of total events) is shown in blue, and distinguished from normal B cells and hematogones by its overexpression of CD10, CD58, and CD34, and underexpression of CD38 and CD81. CD20 expression is lost in leukemic blasts as a result of rituximab therapy. The radar plot visualization easily distinguishes the B-ALL MRD population.

eral bone marrow sampling for MRD detection.28 Fresh samples sent for MFC should be processed within 24-48 hours of collection, and an advantage of MFC is the rapid reporting time for clinical results which may be returned to the clinician within 3 days of collection. Since MFC as says try to identify rare events, the number of events needed to be collected depends on the desired assay sen sitivity and the optimal coefficient of variation as dictated by Poisson statistics.29 For ALL MRD, the recommended current threshold for clinical decisions is 0.01% (10-4) sen sitivity. Thus, to obtain a coefficient of variation of 10%, 106 events must be acquired. Select reference laboratories can reach high sensitivity, as was reported in the PETHEMA study under the EuroFlow MRD Consortium.13,30 By using an optimized erythrocyte bulk-lysis protocol, bone marrow samples containing more than 107 cells can be lysed and resuspended in a small volume of buffer (~100 mL), with which one can achieve the 0.01-0.001% (10 4 to 10-5) sensitivity.19 This bulk-lysis protocol for sample preparation was combined with a two-tube next-gener ation flow approach by the EuroFlow Consortium, which also benefits from an optimized combination of fluoro chromes and antibody reagents to increase specificity at very low MRD levels.31
Although MFC may be performed using peripheral blood, the ability to use blood as a source for MRD detection by MFC is limited by reduced sensitivity.
Real-time quantitative polymerase chain reaction Chimeric gene fusions are major oncogenic drivers that can be found in ~40% of B-ALL, and some T-ALL cases. Since these rearrangements are oncogenic, they are often stable throughout the disease course, making them good targets for MRD assessment (Figure 3A). RT-PCR can be used to track BCR-ABL1, E2A-PBX1, KMT2A and CRLF2 re arrangements in B-ALL, as well as TAL1, TLX1, and TLX3 fusion transcripts in T-ALL. 32 The advantage of fusion transcript detection is the availability of standardized uni versal primers specific for each fusion transcript, which simpli fi es the MRD detection process while offering a sensitivity of 10 -4 to 10 -5 33 Quanti fi cation of BCR-ABL1 transcripts is relatively straightforward, and p210 tran script quanti fi cation can be reported using an inter national standard (IS) because of the work done in chronic myeloid leukemia, while the IS score cannot be applied to the more common (in ALL) p190 transcript, so standard quantification of the BCR-ABL/ABL ratio is used. Fusion transcript detection with RT-PCR is an essential
Figure 3. Molecular methods of measurable residual disease detection in acute lymphoblastic leukemia. (A) Quantitative polymerase chain reaction (qPCR) and digital droplet PCR (ddPCR) can be used to detect fusion mRNA transcripts in acute lymphoblastic leukemia (ALL). (B) Allele-specific oligonucleotide qPCR (ASO-qPCR) leverages IG/TR gene rearrangements to detect measurable residual disease in ALL. It relies on identification of V(D)J sequences in a diagnostic sample, followed by the design of patient-specific primers for the sequences. (C) High-throughput next-generation sequencing (NGS) also targets specific V(D)J rearrangements, but it is fast and clone-unbiased as it uses multiplex PCR and does not require development of patient-specific primers.
method of MRD assessment for patients with BCR-ABL and KMT2A rearrangements, since these patients may ex perience immunophenotypic shifts or myeloid lineage switch under the influence of CD19-directed antibody and CAR T-cell therapies.23
Digital droplet PCR (ddPCR) is a third-generation PCR tech nology, which is based on separation of the sample into at least 20,000 water-oil emulsion droplets, followed by PCR amplification in each droplet. This technique is highly sen sitive with improvement in the limit of detection and does not require a reference curve. Early studies suggest that ddPCR may have utility as a more sensitive MRD detection tool in Philadelphia chromosome-positive (Ph+) B-ALL.34,35 During early stages of lymphocyte development, B- and T-cell progenitors undergo somatic recombination of the variable (V), joining (J), and in some cases, diversity (D) gene segments of their IG and TCR genes, respectively.
Leukemic blasts arising from these precursor lymphoid cells contain clonal V(D)J rearrangements in more than 80% of cases. 33 Given the speci fi city of the rearranged IG/TR DNA sequence for identification of leukemic cells, qPCR-based methods have been developed to track MRD. Allele-specific qPCR (ASO-qPCR) is a labor-intense proce dure, which relies on the identi fi cation of “ fi ngerprintlike” IG/TR V(D)J sequence(s) in a diagnostic leukemia sample, followed by development of patient-speci fi c primers to assess for the presence of these specific se quence(s) in remission samples (Figure 3B).36 The initial characterization requires a panel of screening PCR using established primers for the complementarity-determining region 3 (CDR3), which is the hypervariable heavy chain region of IG/TR genes. This is then followed by Sanger se quencing of products to identify the clones and develop patient-speci fi c primers. Depending on template avail
ability, primer selection, and the amount of DNA in a given specimen, this patient-specific assay can have a sensi tivity between 10-4 and 10-5.37 IG/TR-based methods are applicable to more than 90% of ALL cases, with reduced sensitivity in early T-precursor ALL, since the latter often arises from more immature progenitors that have not undergone TCR rearrangement. In addition to its laborious and time-consuming methodology, ASO-qPCR may be li mited by the loss or emergence of new V(D)J sequences, leading to false negative MRD results.38
In a study in which both BCR-ABL1 level and IG/TR ASO-qPCR were monitored in the bone marrow of Ph+ B-ALL patients, overall concordance between the two methods was ~70%,39 but IG/TR was found to be more reliable at predicting out comes. However, another study investigating the discrepancy between the two methods showed that some patients with persistent BCR-ABL1 transcript levels may in fact contain the fusion gene in myeloid cells, indicating a chronic myeloid leukemia-like stem cell disease, which may be missed by ASO/qPCR.40 In the GRAAPH-2014 study, 38% of adults with de novo Ph+ ALL had residual BCR-ABL1 positivity during treatment, related to BCR-ABL1 “clonal hematopoiesis”.41 The presence of BCR-ABL1 clonal hematopoiesis was not associ ated with poorer outcome, and patients with residual clonal hematopoiesis did not benefit from allogeneic HCT. There fore, RT-PCR and IG/TR MRD techniques may complement each other and should be monitored simultaneously in Ph+ ALL patients in order to guide therapeutic decisions. Several studies compared the sensitivity of MFC- and qPCR-based MRD assessment in peripheral blood versus bone marrow samples. In B-ALL, MRD can be up to threelogs lower in the peripheral blood than in bone marrow, indicating the importance of marrow assessments when these methods are used to track MRD.42 In contrast, MRD levels in T-ALL are roughly equivalent between the two sources, which may in part be explained by the thymic ori gin of this disease.43
Recent advances in NGS have led to a great interest in de veloping NGS-based MRD methods, which can potentially increase the sensitivity of detection. These assays include sequencing the IG/TR gene V(D)J rearrangements as in ASO-qPCR, but have the capability of simultaneously am plifying multiple combinations of rearranged IG/TR genes by multiplex PCR without the need for patient-specific primers (Figure 3C).44 Leveraging the high capacity of NGS, a larger picture of the IG/TR repertoire can be interrogated in one experiment, enabling the detection of clones that are at lower frequency at diagnosis but expand later in the disease trajectory.45 Unlike ASO-qPCR, NGS-based IG/TR MRD is not clone-biased, meaning that new clones may be identified as they emerge in remission and relapse samples if the necessary clonal evolution and new clone identifica
tion tools are included in the assessment.46 The sensitivity of NGS MRD approximates 0.0001% (10-6) in the bone mar row;47 however, the significance of MRD below the tradi tional threshold of 10-4 has not been defined across different clinical scenarios. Similar to flow MRD, the sensi tivity of NGS MRD depends on the amount of input, which is the amount of DNA in this method. The analysis of NGS MRD data also requires a bioinformatic pipeline. The U.S. Food and Drug Administration approved the use of Clo noSEQ NGS technology (Adaptive Biotechnologies, Seattle, WA, USA) as an MRD assessment method in ALL.48 Studies have demonstrated concordance of NGS-based ALL MRD assessment using bone marrow and peripheral blood; thus, NGS may potentially enable MRD quantification from pe ripheral blood without the need for frequent bone marrow sampling.49,50 In addition to RT-PCR and ASO-qPCR, NGSbased MRD may represent another platform to track the disease in the setting of immunophenotypic shifts or mye loid lineage switch. Since it is an IG/TR-based method, NGS MRD technology may have lower sensitivity in early T-pre cursor-ALL, as was the case for ASO-qPCR.
Routine clinical MRD assessment for a given patient often includes at least two methods described above (e.g., flow MRD plus RT-PCR and/or IG/TR-based methods), which pro vide complementary information and are advantageous for overcoming the limitations of one method. EuroClonalityNGS DNA capture (EuroClonality-NDC) is an emerging assay that is designed as an integrated tool to characterize IG/TR rearrangements, chromosomal translocations, copy number alterations, and somatic mutations through a standardized pipeline.51 This assay is a robust tool providing a single work flow for detection of B- and T-cell clonality, as well as fusion transcripts and sequence variants.
As the technology advances, several innovative approaches are promising to improve the technical aspects of current MRD assessment methods, including new flow MRD methods (e.g., spectral flow cytometry which allows the simultaneous analysis of multiple surface markers), novel MFC panels, cell-free DNA-based methods, and novel NGS strategies (e.g., ALL-specific mutation detection). However, none of these techniques has robust clinical validation in ALL yet, therefore we will not discuss them within the scope of this review.
Prognostication in ALL has historically relied on baseline leukemia characteristics including white blood cell count at diagnosis, immunophenotype, and cytogenetic abnor
significance of measurable residual disease in adult acute lymphoblastic leukemia
malities.52 Increasingly, studies have demonstrated that MRD response to front-line therapy outweighs traditional prognostic parameters and has emerged as the strongest independent predictor of ALL outcomes.30,53-55 In a metaanalysis of 39 publications, comprising 13,637 patients of all ages and ALL subtypes, achieving MRD negativity (by flow or qPCR) was associated with hazard ratios of 0.25 (0.24-0.33) for event-free survival and 0.28 (0.19-0.41) for overall survival.56 The authors also showed the significant prognostic utility of MRD at varying time points of assess ment regardless of the MRD detection method used.
Monitoring measurable residual disease during frontline multi-agent chemotherapy
The addition of MRD to the response assessment following front-line multi-agent chemotherapy is standard of care in the management of ALL.57 Given that the traditional thera peutic course of ALL tends to include up to 12 months of in tensive chemotherapy followed by 1.5-2.5 years of maintenance, understanding the optimal timing and fre quency of MRD assessment is important to the delivery of high quality ALL care. Few studies have actually reported the utility of ongoing interval MRD monitoring in patients achiev ing MRD-negative response. The German Multicenter Study Group on Adult ALL (GMALL) evaluated a cohort of adults with ALL in first complete remission and found that the median time between emergence of MRD by ASO-qPCR and clinical relapse was approximately 4 months, suggesting that the interval between MRD assessment time-points should likely be 3 months or less, and that ongoing MRD monitoring may provide a potential window for clinical intervention prior to fulminant disease relapse.58 Given that the majority of ALL relapses occur within the first 3 years following diagnosis,59 MRD monitoring for early relapse detection is likely most critical during this time period. Typically, MRD is first assessed at the completion of re mission induction, which occurs 2-4 weeks following therapy initiation depending on the treatment regimen utilized. Pa tients who achieve MRD negativity (at least <10-4) at this early time point are considered to have chemosensitive disease, which is associated with excellent disease-free survival, and this information guides the initiation of consolidation ther apy.2 For these patients, we generally recommend that MRD be assessed both following induction therapy and following consolidation therapy. For adults who receive a pediatric in spired regimen, current data suggest that persistence of MRD following consolidation therapy (usually 12-16 weeks into treatment) may be the time-point with greatest rel evance for making a change in treatment. Alternative therapy for MRD persistence includes blinatumomab in patients with B-ALL, given the high rates of reported MRD clearance in the BLAST trial among patients with persistent MRD and good outcomes for responding patients, the majority of whom proceeded to allogeneic transplant.60 Currently, the U.S. In
tergroup A041501 study (NCT03150693) is evaluating the in corporation of inotuzumab ozogamicin into a pediatric in spired regimen with the aim of early MRD eradication following induction therapy to improve event-free survival. Unfortunately, there is currently no proven MRD “eraser” for patients with T-ALL. For these patients, persistence of MRD following consolidation or within 3 months of therapy initi ation is a signal to escalate therapy and to strongly consider allogeneic HCT in transplant-eligible adults. MRD should be assessed at shorter intervals, if possible, in patients with persistent, or newly detectable MRD, as impending clinical relapse is often likely. NGS MRD offers a new and sensitive platform for MRD de tection, yet we have limited data for the prognostic signifi cance of low-level (between 10-4 and 10-6) MRD after multi-agent chemotherapy. The recent GMALL 07/2003 study looked at the outcomes of patients who had persistent NGS MRD below the 10-4 detection level after consolidation ther apy.61 Patients with undetectable NGS-MRD had significantly better overall survival when compared to patients with posi tive NGS-MRD. Similarly, a recent retrospective analysis looking at 84 Ph-negative B-ALL patients in complete re mission by flow MRD showed that 38% were MRD-positive by the ClonoSEQ NGS method.62 Patients who were MRD negative by the NGS method had significantly lower risk of relapse, which also translated into longer overall survival. Monitoring of MRD for Ph+ ALL may be performed by a variety of methods, but RT-PCR for BCR-ABL1 transcripts is conveni ent and commonly used in the USA. For adult patients with Ph+ ALL receiving intensive chemotherapy in combination with second- or third-generation tyrosine kinase inhibitors, MRD response at 3 months following therapy has been shown to be highly informative. In a retrospective study con ducted by the group at the MD Anderson Cancer Center, among 85 adult Ph+ ALL patients who received hyper-CVAD plus a tyrosine kinase inhibitor, those who achieved com plete molecular remission by RT-PCR at 3 months had an excellent overall survival even without HCT.63 A phase II study of hyper-CVAD plus ponatinib in Ph+ B-ALL demonstrated higher MRD-negative complete remission rates when com pared to the hyper-CVAD plus dasatinib historic control group.64 The role of MRD response following chemotherapyfree/light regimens for Ph+ ALL remains unclear but MRD re sponse will likely also be important in identifying patients in need of intensification and/or additional therapeutic inter ventions.
hematopoietic
Allogeneic HCT is currently indicated for adults with relapsed or refractory ALL or patients who demonstrate persistent MRD following frontline induction/consolidation therapy. Several studies have shown that achieving an MRD-negative state prior to allogeneic HCT improves relapse-free survival
and overall survival. However, the depth of MRD response prior to traditional myeloablative allogeneic HCT may be im portant. For example, in an international study of 616 ALL patients who underwent allogeneic HCT, patients with low MRD had similar outcomes to those without MRD pre-trans plant.65 MRD positivity after allogeneic HCT was more impor tant than pre-HCT MRD positivity, thus close monitoring with sensitive techniques is warranted. In a smaller study of adult patients with ALL, the presence of pre-transplant MRD at >10-4 detected by an NGS-based method predicted a 7.7times higher risk of relapse after transplantation.66 The prog nostic impact of MRD has been demonstrated across transplant donor source and conditioning regimens.67,68 It is clear that further therapy should be considered to deepen response prior to allogeneic HCT if MRD is present at >10-4; an open question remains whether additional clearance of MRD present at <10-4 is necessary to achieve successful transplant outcomes.
Serial tracking of MRD following allogeneic HCT also predicts for impending disease relapse. In a study of 43 adult patients who underwent HCT for ALL, those with detectable qPCRbased MRD on day +100 had an 80% relapse risk compared to a 7% risk in patients with undetectable post-HCT MRD.69 In another small study of adult ALL HCT recipients, detection of MRD by NGS at any level following HCT heralded clinical relapse; the median time between MRD detection and re lapse was 3 months.66 Finally, MRD tracking using peripheral blood following HCT in adult ALL has been shown to be feas ible and convenient, to correlate closely with bone marrow NGS-based MRD assessment, and to predict for clinical re lapse.49
Measurable residual disease in relapsed/refractory acute lymphoblastic leukemia and novel therapies
In addition to the robust evidence in newly diagnosed ALL, prognostic value of MRD for patients in second complete re mission and beyond has also been demonstrated.70 MRD has also played an important role in establishing eligibility and monitoring treatment response in key studies of novel ther apies such as blinatumomab, inotuzumab ozogamicin, and CAR T-cell therapy.4,5,71 Not only did MRD-positive ALL define the inclusion criteria for the BLAST trial, leading to an ac ceptance of MRD as an indication for blinatumomab in BALL, but MRD was also shown in secondary analyses to predict for relapse-free survival and overall survival in pa tients with relapsed/refractory ALL achieving complete re mission following blinatumomab.72 In the landmark phase III INO-VATE trial comparing inotuzumab ozogamicin versus standard chemotherapy in relapsed/refractory B-ALL, the MRD-negative complete remission rate, assessed by MFC (10-4 sensitivity), was 46% in patients treated with inotuzu mab.73 Patients who had MRD response had longer overall survival and progression-free survival than patients with per
sistent MRD. Among children receiving CAR T-cell therapy, real-world datasets have demonstrated improved survival and reduced toxicity following CAR T-cell therapy when ad ministered to patients with lower level/MRD-positive dis ease, as opposed to patients in full clinical relapse. Although the MRD-negative response rate following CAR T-cell therapy in adult ALL is very high (approximated at 81% in a metaanalysis including 489 adults receiving CAR T-cell therapies across published trials),74 whether early MRD response to CAR T-cell therapy translates into long-term durable re missions in adult ALL patients remains unclear. Re-emergence or persistence of MRD in patients with Ph+ BALL might be associated with the selection of clones har boring ABL1 kinase domain mutations (e.g., T315I).75 It is often difficult to identify the specific resistance mutation given the low level of the transcript in patients without morphological relapse. Blinatumomab has been shown to be effective in eradicating MRD in Ph+ ALL.76 A common strategy would be to combine blinatumomab with ponatinib, since the latter has activity against most of the common resistance muta tions of ABL1.64
Incorporation of MRD assessment is a fundamental com ponent of risk-directed therapy in ALL. For almost all pa tients with ALL there is a reliable method to assess residual disease, which remains the most powerful independent pre dictor of outcomes. Blinatumomab, inotuzumab ozogamicin and CAR T cells are highly effective immunotherapy ap proaches in B-ALL; each is currently being explored alone and in combinations as a mechanism for MRD eradication earlier in the course of disease. The development of novel, active agents for T-ALL patients with persistent MRD re mains an unmet need. As MRD detection assays become in creasingly more sensitive and additional novel therapeutics enter clinical development, the future of ALL management in adults will require nuanced and evidence-based, riskadapted treatment approaches to guide intensification or de-escalation of therapy.
No conflicts of interest to disclose.
All the authors wrote the review article and approved its final version.
The figures in this review were prepared with BioRender. CS is supported by an American Society of Hematology Re search Training Award for Fellows.
1. Pui CH, Evans WE. A 50-year journey to cure childhood acute lymphoblastic leukemia. Semin Hematol. 2013;50(3):185-196.
2. Stock W, Luger SM, Advani AS, et al. A pediatric regimen for older adolescents and young adults with acute lymphoblastic leukemia: results of CALGB 10403. Blood. 2019;133(14):1548-1559.
3. Wieduwilt MJ, Stock W, Advani A, et al. Superior survival with pediatric-style chemotherapy compared to myeloablative allogeneic hematopoietic cell transplantation in older adolescents and young adults with Ph-negative acute lymphoblastic leukemia in first complete remission: analysis from CALGB 10403 and the CIBMTR. Leukemia. 2021;35(7):2076-2085.
4. Kantarjian H, Stein A, Gokbuget N, et al. Blinatumomab versus chemotherapy for advanced acute lymphoblastic leukemia. N Engl J Med. 2017;376(9):836-847.
5. Kantarjian HM, DeAngelo DJ, Stelljes M, et al. Inotuzumab ozogamicin versus standard therapy for acute lymphoblastic leukemia. N Engl J Med. 2016;375(8):740-753.
6. Maude SL, Laetsch TW, Buechner J, et al. Tisagenlecleucel in children and young adults with B-cell lymphoblastic leukemia. N Engl J Med. 2018;378(5):439-448.
7. Kantarjian H, Thomas D, O'Brien S, et al. Long-term follow-up results of hyperfractionated cyclophosphamide, vincristine, doxorubicin, and dexamethasone (Hyper-CVAD), a doseintensive regimen, in adult acute lymphocytic leukemia. Cancer. 2004;101(12):2788-2801.
8. Sive JI, Buck G, Fielding A, et al. Outcomes in older adults with acute lymphoblastic leukaemia (ALL): results from the international MRC UKALL XII/ECOG2993 trial. Br J Haematol. 2012;157(4):463-471.
9. Bartram J, Wade R, Vora A, et al. Excellent outcome of minimal residual disease-defined low-risk patients is sustained with more than 10 years follow-up: results of UK paediatric acute lymphoblastic leukaemia trials 1997-2003. Arch Dis Child. 2016;101(5):449-454.
10. Borowitz MJ, Devidas M, Hunger SP, et al. Clinical significance of minimal residual disease in childhood acute lymphoblastic leukemia and its relationship to other prognostic factors: a Children's Oncology Group study. Blood. 2008;111(12):5477-5485.
11. Vora A, Goulden N, Wade R, et al. Treatment reduction for children and young adults with low-risk acute lymphoblastic leukaemia defined by minimal residual disease (UKALL 2003): a randomised controlled trial. Lancet Oncol. 2013;14(3):199-209.
12. Bassan R, Bruggemann M, Radcliffe HS, Hartfield E, Kreuzbauer G, Wetten S. A systematic literature review and meta-analysis of minimal residual disease as a prognostic indicator in adult Bcell acute lymphoblastic leukemia. Haematologica. 2019;104(10):2028-2039.
13. Ribera JM, Morgades M, Ciudad J, et al. Chemotherapy or allogeneic transplantation in high-risk Philadelphia chromosome-negative adult lymphoblastic leukemia. Blood. 2021;137(14):1879-1894.
14. Dhedin N, Huynh A, Maury S, et al. Role of allogeneic stem cell transplantation in adult patients with Ph-negative acute lymphoblastic leukemia. Blood. 2015;125(16):2486-2496; quiz 2586.
15. Gokbuget N, Kneba M, Raff T, et al. Adult patients with acute lymphoblastic leukemia and molecular failure display a poor prognosis and are candidates for stem cell transplantation and targeted therapies. Blood. 2012;120(9):1868-1876.
16. van Dongen JJ, van der Velden VH, Bruggemann M, Orfao A.
Minimal residual disease diagnostics in acute lymphoblastic leukemia: need for sensitive, fast, and standardized technologies. Blood. 2015;125(26):3996-4009.
17. Chen X, Wood BL. How do we measure MRD in ALL and how should measurements affect decisions. Re: ireatment and prognosis? Best Pract Res Clin Haematol. 2017;30(3):237-248.
18. Ladetto M, Bruggemann M, Monitillo L, et al. Next-generation sequencing and real-time quantitative PCR for minimal residual disease detection in B-cell disorders. Leukemia. 2014;28(6):1299-1307.
19. Theunissen P, Mejstrikova E, Sedek L, et al. Standardized flow cytometry for highly sensitive MRD measurements in B-cell acute lymphoblastic leukemia. Blood. 2017;129(3):347-357.
20. Shaver AC, Seegmiller AC. B lymphoblastic leukemia minimal residual disease assessment by flow cytometric analysis. Clin Lab Med. 2017;37(4):771-785.
21. Mikhailova E, Semchenkova A, Illarionova O, et al. Relative expansion of CD19-negative very-early normal B-cell precursors in children with acute lymphoblastic leukaemia after CD19 targeting by blinatumomab and CAR-T cell therapy: implications for flow cytometric detection of minimal residual disease. Br J Haematol. 2021;193(3):602-612.
22. Haddox CL, Mangaonkar AA, Chen D, et al. Blinatumomabinduced lineage switch of B-ALL with t(4:11)(q21;q23)
KMT2A/AFF1 into an aggressive AML: pre- and post-switch phenotypic, cytogenetic and molecular analysis. Blood Cancer J. 2017;7(9):e607.
23. Rossi JG, Bernasconi AR, Alonso CN, et al. Lineage switch in childhood acute leukemia: an unusual event with poor outcome. Am J Hematol. 2012;87(9):890-897.
24. Slamova L, Starkova J, Fronkova E, et al. CD2-positive B-cell precursor acute lymphoblastic leukemia with an early switch to the monocytic lineage. Leukemia. 2014;28(3):609-620.
25. Novakova M, Zaliova M, Fiser K, et al. DUX4r, ZNF384r and PAX5P80R mutated B-cell precursor acute lymphoblastic leukemia frequently undergo monocytic switch. Haematologica. 2021;106(8):2066-2075.
26. van Dongen JJ, Lhermitte L, Bottcher S, et al. EuroFlow antibody panels for standardized n-dimensional flow cytometric immunophenotyping of normal, reactive and malignant leukocytes. Leukemia. 2012;26(9):1908-1975.
27. Kalina T, Flores-Montero J, van der Velden VH, et al. EuroFlow standardization of flow cytometer instrument settings and immunophenotyping protocols. Leukemia. 2012;26(9):1986-2010.
28. van der Velden VH, Hoogeveen PG, Pieters R, van Dongen JJ. Impact of two independent bone marrow samples on minimal residual disease monitoring in childhood acute lymphoblastic leukaemia. Br J Haematol. 2006;133(4):382-388.
29. Hedley BD, Keeney M. Technical issues: flow cytometry and rare event analysis. Int J Lab Hematol. 2013;35(3):344-350.
30. Ribera JM, Oriol A, Morgades M, et al. Treatment of high-risk Philadelphia chromosome-negative acute lymphoblastic leukemia in adolescents and adults according to early cytologic response and minimal residual disease after consolidation assessed by flow cytometry: final results of the PETHEMA ALLAR-03 trial. J Clin Oncol. 2014;32(15):1595-1604.
31. Pedreira CE, Costa ES, Lecrevisse Q, van Dongen JJ, Orfao A, EuroFlow Consortium. Overview of clinical flow cytometry data analysis: recent advances and future challenges. Trends Biotechnol. 2013;31(7):415-425.
32. van Dongen JJ, Macintyre EA, Gabert JA, et al. Standardized RT-
PCR analysis of fusion gene transcripts from chromosome aberrations in acute leukemia for detection of minimal residual disease. Report of the BIOMED-1 Concerted Action: investigation of minimal residual disease in acute leukemia. Leukemia. 1999;13(12):1901-1928.
33. Bartram J, Patel B, Fielding AK. Monitoring MRD in ALL: methodologies, technical aspects and optimal time points for measurement. Semin Hematol. 2020;57(3):142-148.
34. Ansuinelli M, Della Starza I, Lauretti A, et al. Applicability of droplet digital polymerase chain reaction for minimal residual disease monitoring in Philadelphia-positive acute lymphoblastic leukaemia. Hematol Oncol. 2021;39(5):680-686.
35. Coccaro N, Anelli L, Zagaria A, et al. Droplet digital PCR is a robust tool for monitoring minimal residual disease in adult Philadelphia-positive acute lymphoblastic leukemia. J Mol Diagn. 2018;20(4):474-482.
36. van der Velden VH, van Dongen JJ. MRD detection in acute lymphoblastic leukemia patients using Ig/TCR gene rearrangements as targets for real-time quantitative PCR. Methods Mol Biol. 2009;538:115-150.
37. van der Velden VH, Cazzaniga G, Schrauder A, et al. Analysis of minimal residual disease by Ig/TCR gene rearrangements: guidelines for interpretation of real-time quantitative PCR data. Leukemia. 2007;21(4):604-611.
38. Correia RP, Bento LC, de Sousa FA, Barroso RS, Campregher PV, Bacal NS. How I investigate minimal residual disease in acute lymphoblastic leukemia. Int J Lab Hematol. 2021;43(3):354-363.
39. Cazzaniga G, De Lorenzo P, Alten J, et al. Predictive value of minimal residual disease in Philadelphia-chromosome-positive acute lymphoblastic leukemia treated with imatinib in the European intergroup study of post-induction treatment of Philadelphia-chromosome-positive acute lymphoblastic leukemia, based on immunoglobulin/T-cell receptor and BCR/ABL1 methodologies. Haematologica. 2018;103(1):107-115.
40. Hovorkova L, Zaliova M, Venn NC, et al. Monitoring of childhood ALL using BCR-ABL1 genomic breakpoints identifies a subgroup with CML-like biology. Blood. 2017;129(20):2771-2781.
41. Rathana KIM, Rousselot P, Cayuela JM, et al. Frequency and outcome of Philadelphia chromosome-positive acute lymphoblastic leukemia with BCR-ABL1 clonal hematopoiesis after blast clearance: results from the Graaph-2014 trial. Blood. 2021;138(Supplement 1):3478.
42. Coustan-Smith E, Sancho J, Hancock ML, et al. Use of peripheral blood instead of bone marrow to monitor residual disease in children with acute lymphoblastic leukemia. Blood. 2002;100(7):2399-2402.
43. van der Velden VH, Jacobs DC, Wijkhuijs AJ, et al. Minimal residual disease levels in bone marrow and peripheral blood are comparable in children with T cell acute lymphoblastic leukemia (ALL), but not in precursor-B-ALL. Leukemia. 2002;16(8):1432-1436.
44. Bartram J, Mountjoy E, Brooks T, et al. Accurate sample assignment in a multiplexed, ultrasensitive, high-throughput sequencing assay for minimal residual disease. J Mol Diagn. 2016;18(4):494-506.
45. Bartram J, Goulden N, Wright G, et al. High throughput sequencing in acute lymphoblastic leukemia reveals clonal architecture of central nervous system and bone marrow compartments. Haematologica. 2018;103(3):e110-e114.
46. Wu J, Jia S, Wang C, et al. Minimal residual disease detection and evolved IGH clones analysis in acute B lymphoblastic leukemia using IGH deep sequencing. Front Immunol. 2016;7:403.
47. Faham M, Zheng J, Moorhead M, et al. Deep-sequencing
approach for minimal residual disease detection in acute lymphoblastic leukemia. Blood. 2012;120(26):5173-5180.
48. Monter A, Nomdedeu JF. ClonoSEQ assay for the detection of lymphoid malignancies. Expert Rev Mol Diagn. 2019;19(7):571-578.
49. Muffly L, Sundaram V, Chen C, et al. Concordance of peripheral blood and bone marrow measurable residual disease in adult acute lymphoblastic leukemia. Blood Adv. 2021;5(16):3147-3151.
50. Sala Torra O, Othus M, Williamson DW, et al. Next-generation sequencing in adult B cell acute lymphoblastic leukemia patients. Biol Blood Marrow Transplant. 2017;23(4):691-696.
51. Stewart JP, Gazdova J, Darzentas N, et al. Validation of the EuroClonality-NGS DNA capture panel as an integrated genomic tool for lymphoproliferative disorders. Blood Adv. 2021;5(16):3188-3198.
52. Wetzler M, Dodge RK, Mrozek K, et al. Prospective karyotype analysis in adult acute lymphoblastic leukemia: the Cancer and Leukemia Group B experience. Blood. 1999;93(11):3983-3993.
53. Bruggemann M, Raff T, Kneba M. Has MRD monitoring superseded other prognostic factors in adult ALL? Blood. 2012;120(23):4470-4481.
54. Holowiecki J, Krawczyk-Kulis M, Giebel S, et al. Status of minimal residual disease after induction predicts outcome in both standard and high-risk Ph-negative adult acute lymphoblastic leukaemia. The Polish Adult Leukemia Group ALL 4-2002 MRD study. Br J Haematol. 2008;142(2):227-237.
55. Bruggemann M, Raff T, Flohr T, et al. Clinical significance of minimal residual disease quantification in adult patients with standard-risk acute lymphoblastic leukemia. Blood. 2006;107(3):1116-1123.
56. Berry DA, Zhou S, Higley H, et al. Association of minimal residual disease with clinical outcome in pediatric and adult acute lymphoblastic leukemia: a meta-analysis. JAMA Oncol. 2017;3(7):e170580.
57. Brown PA, Shah B, Advani A, et al. Acute lymphoblastic leukemia, Version 2.2021, NCCN clinical practice guidelines in oncology. J Natl Compr Canc Netw. 2021;19(9):1079-1109.
58. Raff T, Gokbuget N, Luschen S, et al. Molecular relapse in adult standard-risk ALL patients detected by prospective MRD monitoring during and after maintenance treatment: data from the GMALL 06/99 and 07/03 trials. Blood. 2007;109(3):910-915.
59. Stock W, Johnson JL, Stone RM, et al. Dose intensification of daunorubicin and cytarabine during treatment of adult acute lymphoblastic leukemia: results of Cancer and Leukemia Group B study 19802. Cancer. 2013;119(1):90-98.
60. Gokbuget N, Dombret H, Bonifacio M, et al. Blinatumomab for minimal residual disease in adults with B-cell precursor acute lymphoblastic leukemia. Blood. 2018;131(14):1522-1531.
61. Kotrova M, Koopmann J, Trautmann H, et al. Prognostic value of low-level MRD in adult acute lymphoblastic leukemia detected by low- and high-throughput methods. Blood Adv. 2022;6(10):3006-3010.
62. Short NJ, Kantarjian HM, Patel K, et al. Ultrasensitive nextgeneration sequencing-based measurable residual disease assessment in Philadelphia chromosome-negative acute lymphoblastic leukemia after frontline therapy: correlation with flow cytometry and impact on clinical outcomes. Blood. 2020;136(Suppl 1):26-28.
63. Short NJ, Jabbour E, Sasaki K, et al. Impact of complete molecular response on survival in patients with Philadelphia chromosome-positive acute lymphoblastic leukemia. Blood. 2016;128(4):504-507.
64. Jabbour E, Short NJ, Ravandi F, et al. Combination of hyperCVAD with ponatinib as first-line therapy for patients with
Philadelphia chromosome-positive acute lymphoblastic leukaemia: long-term follow-up of a single-centre, phase 2 study. Lancet Haematol. 2018;5(12):e618-e627.
65. Bader P, Salzmann-Manrique E, Balduzzi A, et al. More precisely defining risk peri-HCT in pediatric ALL: pre- vs post-MRD measures, serial positivity, and risk modeling. Blood Adv. 2019;3(21):3393-3405.
66. Logan AC, Vashi N, Faham M, et al. Immunoglobulin and T cell receptor gene high-throughput sequencing quantifies minimal residual disease in acute lymphoblastic leukemia and predicts post-transplantation relapse and survival. Biol Blood Marrow Transplant. 2014;20(9):1307-1313.
67. Baron F, Labopin M, Ruggeri A, et al. Impact of detectable measurable residual disease on umbilical cord blood transplantation. Am J Hematol. 2020;95(9):1057-1065.
68. Yoon JH, Min GJ, Park SS, et al. Minimal residual diseasebased long-term efficacy of reduced-intensity conditioning versus myeloablative conditioning for adult Philadelphiapositive acute lymphoblastic leukemia. Cancer. 2019;125(6):873-883.
69. Spinelli O, Peruta B, Tosi M, et al. Clearance of minimal residual disease after allogeneic stem cell transplantation and the prediction of the clinical outcome of adult patients with high-risk acute lymphoblastic leukemia. Haematologica. 2007;92(5):612-618.
70. Saygin C, Papadantonakis N, Cassaday RD, et al. Prognostic impact of incomplete hematologic count recovery and minimal residual disease on outcome in adult acute lymphoblastic leukemia at the time of second complete response. Leuk
Lymphoma. 2018;59(2):363-371.
71. Turtle CJ, Hanafi LA, Berger C, et al. CD19 CAR-T cells of defined CD4+:CD8+ composition in adult B cell ALL patients. J Clin Invest. 2016;126(6):2123-2138.
72. Zugmaier G, Gokbuget N, Klinger M, et al. Long-term survival and T-cell kinetics in relapsed/refractory ALL patients who achieved MRD response after blinatumomab treatment. Blood. 2015;126(24):2578-2584.
73. Jabbour E, Gokbuget N, Advani A, et al. Impact of minimal residual disease status in patients with relapsed/refractory acute lymphoblastic leukemia treated with inotuzumab ozogamicin in the phase III INO-VATE trial. Leuk Res. 2020;88:106283.
74. Grover P, Veilleux O, Tian L, et al. Chimeric antigen receptor-T cell therapy in adults with B-cell acute lymphoblastic leukemia: a systematic review. Blood Adv. 2022;6(5):1608-1618.
75. Soverini S, De Benedittis C, Papayannidis C, et al. Drug resistance and BCR-ABL kinase domain mutations in Philadelphia chromosome-positive acute lymphoblastic leukemia from the imatinib to the second-generation tyrosine kinase inhibitor era: the main changes are in the type of mutations, but not in the frequency of mutation involvement. Cancer. 2014;120(7):1002-1009.
76. Martinelli G, Boissel N, Chevallier P, et al. Complete hematologic and molecular response in adult patients with relapsed/refractory Philadelphia chromosome-positive Bprecursor acute lymphoblastic leukemia following treatment with blinatumomab: results from a phase II, single-arm, multicenter study. J Clin Oncol. 2017;35(16):1795-1802.
1Department of Genetics and Molecular Pathology, Centre for Cancer Biology, SA Pathology, Adelaide, Australia; 2School of Medicine, University of Adelaide, Adelaide, Australia; 3Clinical and Health Sciences, University of South Australia, Adelaide, Australia; 4Department of Haematology, Hammersmith Hospital, Imperial College Healthcare NHS Trust, London, UK and 5Centre for Haematology, Department of Immunology and Inflammation, Faculty of Medicine, Imperial College London, London, UK
Correspondence: S. Branford susan.branford@sa.gov.au
Received: May 30, 2022.
Accepted: September 9, 2022.
https://doi.org/10.3324/haematol.2022.281493
©2022 Ferrata Storti Foundation
Published under a CC BY-NC license
Chronic myeloid leukemia is characterized by a single genetic abnormality resulting in a fusion gene whose mRNA product is easily detected and quantified by reverse-transcriptase polymerase chain reaction analysis. Measuring residual disease was originally introduced to identify patients relapsing after allogeneic stem cell transplantation but rapidly adopted to quantify responses to tyrosine kinase inhibitors. Real-time quantitative polymerase chain reaction is now an essential tool for the management of patients and is used to influence treatment decisions. In this review we track this development including the international collaboration to standardize results, discuss the integration of molecular monitoring with other factors that affect patients’ management, and describe emerging technology. Four case histories describe varying scenarios in which the accurate measurement of residual disease identified patients at risk of disease progression and allowed appropriate investigations and timely clinical intervention.
Monitoring residual disease has been integral to the man agement of chronic myeloid leukemia (CML) for more than 30 years, and has paved the way for the introduction of similar methodology for assessing measurable residual disease (MRD) in other malignancies. Patients with CML have an ideal marker to directly measure therapy response: the BCR::ABL1 fusion onco gene. BCR::ABL1 is the product of the t(9:22) chromosomal translocation, which in >95% of patients can be visualized in karyotyping as a shortened chromosome 22, termed the Philadelphia chromosome. The genetic breakpoints occur in well-defined regions leading to common RNA transcript types, termed e13a2 and e14a2, in approximately 98% of patients (Figure 1).1 These transcripts only differ by 75 base pairs and can be measured in a single assay. Identifying residual leukemic cells, by cytogenetic and later, molecular technology, was originally employed to recognize disease recurrence after allogeneic stem cell transplantation (SCT).2-5 The ability to identify early re lapse became particularly important after the observation that the infusion of additional donor lymphocytes was ca pable of restoring durable remissions.6 Further work con firmed that donor lymphocyte infusions were more likely to be effective if delivered at the point of low disease burden, and necessitated the development of more sen
sitive methodology to identify and later quantify residual or emerging leukemia.7
As a consequence, reverse transcriptase polymerase chain reaction (RT-PCR) became the molecular monitoring workhorse and over time, the methods advanced from qualitative to quantitative BCR::ABL1 detection when it be came apparent that a positive signal after allogeneic SCT had limited predictive value for relapse.8 Serial analysis of quantitative BCR::ABL1 mRNA levels provided more in formation and identified patients at risk of relapse to allow timely therapeutic intervention.9 This early work in the 1990s heralded the era of quantitative measurement of BCR::ABL1 transcripts, which became highly relevant after the introduction of tyrosine kinase inhibitor (TKI) therapy when most patients rapidly achieved BCR::ABL1 levels that could only be measured using sensitive mol ecular analysis. Techniques advanced from competitive PCR to real-time quantitative PCR (RT-qPCR) and, more recently, to digital PCR.10-16 Recent reviews have compre hensively discussed the standardization of PCR methods,17,18 and future molecular technology for monitor ing patients with CML.19
Molecular monitoring of CML is now well established, widely used, and is the recommended monitoring strategy in international guidelines.20,21 Evidence-based, milestonedriven molecular results define levels of response, guide therapeutic decisions and direct BCR::ABL1 kinase domain
mutation analysis to assess for drug resistance. The cur rent recommendations from the European LeukemiaNet (ELN)20 and the National Comprehensive Cancer Network (NCCN)21 are summarized in Tables 1 and 2. These have evolved over time but maintain a focus on early molecular response in the first 3-12 months of therapy. The initial degree of BCR::ABL1 reduction is a powerful predictor of
response.22-29 Patients who achieve a major molecular re sponse (MMR, BCR::ABL1 ratio ≤0.1% on an international scale [IS]) are highly unlikely to experience disease pro gression. Deep molecular responses (DMR, BCR::ABL1 ratio ≤0.01% IS), sustained for 1-2 years, are a prerequisite to trial treatment discontinuation and possible treatmentfree remission (TFR).
B
Figure 1. Schematic of BCR::ABL1 transcripts. (A) BCR and ABL1 genes showing the general location of breakpoints. The red arrows are breakpoint regions that generate rare BCR::ABL1 transcripts. (B) Size differences of the typical transcripts and some of the rare transcripts. Note that the direct fusion of BCR exon 8 and ABL1 exon 2 does not generate an in-frame protein. The e8a2 BCR::ABL1 transcript requires an inserted sequence or a genomic break within an exon to generate a constitutively activated protein. (C) Characterization of the BCR::ABL1 transcript type is essential at the time of diagnosis. Multiplex reverse transcriptase polymerase chain reaction techniques can simultaneously detect various transcript types. Gel image courtesy of Professor Andreas Hochhaus, Universitätsklinikum Jena, Germany. PCR: polymerase chain reaction; CML: chronic myeloid leukemia.

Table 1. European LeukemiaNet20 and National Comprehensive Cancer Network21 treatment response milestones for chronic myeloid leukemia expressed as BCR::ABL1 on the International Scale. Bold text indicates where the recommendations differ.
ELN 2020 NCCN V3.2022 ELN 2020 NCCN V3.2022 ELN 2020 NCCN V3.2022
Baseline NA NA High-risk ACA, High-risk ELTS score
NA NA NA
3 months ≤10% ≤10% >10% >10% >10% if confirmed within 1-3 months NA 6 months ≤1% ≤10% >1-10% NA >10% >10%
12 months ≤0.1% *≤0.1% or >0.1-1% >0.1-1% >1-10% >1% >10%
Any time
≤0.1% or ≤0.01% for patients with the aim to achieve TFR
>0.1-1%, loss of MMR indicates failure after TFR
>1%, resistance mutations and high-risk ACA
NA: not applicable; ACA: additional chromosome abnormalities in Philadelphia-positive cells; ELTS: EUTOS long-term survival; MMR: major molecular response (≤0.1%); ELN: European LeukemiaNet; NCCN: National Comprehensive Cancer Network; TKI: tyrosine kinase inhibitor; TFR: treatment-free remission. *NCCN guidelines: ≤0.1% is optimal if the treatment goal is treatment-free remission and ≤1% is optimal if the treatment goal is long-term survival.
Despite the widespread use and clinical applicability of monitoring BCR::ABL1 ratios, the molecular methodology is not perfect. It is not always easy to maintain consist ency in the results and clinicians should be aware of the pitfalls. As a consequence, it is important to consider trends in BCR::ABL1 ratios, and avoid making management decisions on the basis of a single result. The use of an in ternal control gene is essential to maintain reliability and reproducibility as it determines the quality of individual RNA samples and compensates for differences in the BCR::ABL1 transcript level due to sample degradation.30 Appropriate control genes are ABL1, GUSB and BCR and molecular values are reported as the percentage ratio of BCR::ABL1 transcripts to the control gene transcripts on the IS. ABL1 is the most widely used control gene. The ef fective measurement range on the IS is for BCR::ABL1 ra tios of ≤10% due to potential methodological inaccuracies at higher levels related to the control genes.31,32 In the lab oratory, vigilance is required to monitor and detect any shift in the ratios that might occur with a myriad of fac tors, such as something as simple as a new lot of re agents. Enrolment in quality assurance programs and regular use of quality control material to identify and miti gate these trends are essential. A change of methodology may require re-calculation of the IS conversion factor. Un fortunately, despite being recommended from the early days of the international effort to harmonize methods, it is often unclear how rigorously these quality controls are used in daily practice.30,31
Molecular monitoring, ongoing for very many years will be essential in the management of most patients. In most patients the BCR::ABL1 decline is rapid upon initiation of
TKI treatment but the trend and dynamics of BCR::ABL1 ratios over time provide information to guide clinical deci sions.33,34 The dynamics of an initial BCR::ABL1 decline can be measured as the BCR::ABL1 halving time. A number of studies using various control genes to measure BCR::ABL1 (ABL1, GUSB or BCR) have reported an association between the halving time and molecular response.32,34-37 Similarly, BCR::ABL1 doubling times provide prognostic information for the disease phase at loss of response, using BCR or ABL1 control genes.35,38 At this stage, BCR::ABL1 halving and doubling times are non-standardized metrics and as such, are not included in guidelines for routine monitoring of CML.
In this review we present examples of long-term molecu lar results, their clinical interpretation and guidance on therapeutic decisions for individual patients diagnosed in chronic phase (CP). Our aim is to provide advice that may ultimately enhance patients’ management and outcome.
By 2013, there was a substantial body of evidence dem onstrating the importance of standardized molecular monitoring for the prediction of response for TKI-treated patients.22-29 At this point the ELN recommended that BCR::ABL1 ratios at specific timepoints should be used to guide therapy decisions.39 This was a decade after the as sociation between achievement of MMR and a reduced risk of progression had been reported.40 All of this work was performed for patients with the most frequent BCR::ABL1 transcript types, e14a2 and e13a2. Note that e14a2 is the primary transcript for patients who co-ex
press e13a2 and e14a2. In these patients e13a2 is ex pressed due to alternative splicing.41 The transcript type must be characterized at diagnosis to ensure an appro priate method is used to monitor the remaining 2% of pa tients with atypical BCR::ABL1 transcripts. Standardized molecular methods for BCR::ABL1 monitoring are not de signed for patients with atypical transcripts and if used will generate false negative results.20,42 Different proteins are translated from each of the BCR::ABL1 transcript types that can theoretically influence
the biological properties of the disease and potentially af fect response to therapy. In the pre-TKI era some studies reported an inferior outcome for patients with the e14a2 transcript, including shorter duration of CP and shorter time to the onset of blast phase (BP)43,44 but these findings were not always corroborated.45-48 Fast forward to the TKI era and several studies have assessed the influence of transcript type on outcome.49-54 Although the findings were occasionally contradictory55,56 the body of evidence suggested that patients with the e13a2 transcript reached
Current treatment should be continued Continue same TKI
For patients considering a TFR trial, the optimal re sponse is BCR::ABL1 ≤0.01% (MR4)
Monitor response and side effects
If BCR::ABL1 is not ≤0.1% in patients for whom the treatment goal is TFR, shared decision-making with the patient is recommended
Current treatment should be carefully considered for continuation or change, depending on patients´ characteristics, comorbidities and tolerance
Evaluate the patient’s compliance and drug interactions
Consider BCR::ABL1 kinase domain mutation analysis
Consider bone marrow cytogenetic analysis to assess for a major cytogenetic response (<35% Ph-positive) at 3 months or a complete cytogenetic response (Ph-negative) at 12 months
Switch to alternate TKI, or Continue same TKI (other than imatinib), or Increase imatinib dose to a maximum of 800 mg, and Consider evaluation for allogeneic hematopoietic cell transplant Failure TKI-resistant disease
Change of therapy is mandatory
Evaluate the patient’s compliance and drug interactions
BCR::ABL1 kinase domain mutation analysis is mandatory Consider BCR::ABL1 kinase domain mutation analysis Cytogenetic analysis to assess for clonal evolution
Additional molecular testing may be indicated if the kinetics of the response are not clear, or if toxicity or intolerance causes dose interruptions or reductions A change of treatment may be considered if MMR is not reached by 36-48 months
Failure to respond may be related to poor or intermittent compliance with treatment, and patients should be questioned closely about their adherence
In the future, analyzing the genome and expression profiles of resistant CML cells may lead to identifying somatic mutations as early signs of progression and to a genomically based risk classification with the potential for non-BCR::ABL1 targeted therapy for resistant patients
Switch to alternative TKI and evaluate for allogeneic hematopoietic cell transplant
Other recommendations
Patients with levels only slightly >10% at 3 months and/or a steep decline from baseline may achieve <10% at 6 months and have generally favorable outcomes. Therefore, it is imperative to interpret the value at 3 months in this context before making drastic changes to the treatment strategy
Consider BCR::ABL1 mutation analysis for: Loss of hematologic response Loss of a complete cytogenetic response or its molecular equivalent (BCR::ABL1 >1% IS) 1-log increase in BCR::ABL1 transcript levels and loss of a major molecular response (≤0.1%)
Disease progression to accelerated or blast phase
Consider myeloid mutation panel for patients with accelerated phase or blast phase to identify BCR::ABL1-independent resistance in patients with no BCR::ABL1 kinase domain mutations
Table 2. European LeukemiaNet20 and National Comprehensive Cancer Network21 treatment response and testing recommendations.milestones, such as complete cytogenetic response (CCyR), MMR and DMR, more slowly than those expressing e14a2. Two studies found a difference in overall survival, but one favored the e14a2 transcript50 and the other the e13a2 transcript.54 Overall, the data do not currently sup port a specific upfront therapy recommendation based on transcript type.20,21
It is also possible that methodological differences could be responsible for some of the associations observed be tween the BCR::ABL1 transcript type and molecular re sponses.57-60 Most real-time PCR methods amplify the e14a2 and the shorter e13a2 transcript in a single reaction using a calibration standard that contains the e14a2 fusion junction. Theoretically, the efficiency of PCR amplification could be enhanced for the shorter e13a2 transcript and generate artificially higher BCR::ABL1 values. A bias in the reported BCR::ABL1 values has indeed been demonstrated between the transcript types for a number of methods.57,59,60 The degree of bias varied and may or may not alter the interpretation of the reported value and in fluence treatment decisions.57,60 Technical differences in the efficiency of PCR amplification do not easily explain recent observations that the BCR::ABL1 transcript type might influence the achievement of TFR. The molecular relapse rate after stopping therapy was twice as high for patients with the e13a2 transcript compared with e14a2 in the Destiny study of TKI de-es calation prior to treatment cessation.61 Similar results
from smaller studies were reported in patients who stopped TKI therapy after achieving sustained DMR.62-64
Digital PCR provides absolute quantification and should not be subject to bias associated with differences in am plification efficiency (Figure 2). These methods allow rep licate analysis to improve the detection of rare transcripts. The sample is divided into thousands of individual rep licate PCR using nanofluidic technology and the reagents and workflows are similar to those of real-time PCR using hydrolysis probes. Digital droplet PCR (ddPCR) uses a water-oil emulsion droplet system and the sample is par titioned into droplets. PCR amplification occurs in each of the droplets and at the end of the reaction each droplet is assessed to establish the fraction of positive droplets. The high number of replicates enhances the precision of target detection.
Digital PCR has demonstrated higher sensitivity for the de tection of BCR::ABL1 transcripts10 and has been used to detect residual disease at the time of stopping TKI in pa tients who attempted a trial of TFR.11,12,14 More sensitive de tection of BCR::ABL1 was associated with a higher rate of molecular relapse after TKI discontinuation. In two studies a cut-off BCR::ABL1 positivity value was established in order to predict relapse.12,14 Nicolini and colleagues in their

2019 study14 stressed that ddPCR was not ready to be in corporated into the criteria for eligibility of a clinical trial of TKI cessation. The assay requires careful calibration of signal-to-noise ratio and standardization across labora tories. Furthermore, excluding patients on the basis of a ddPCR value at the time of considering TKI cessation would exclude a proportion of patients who would main tain TFR. A recent multicenter study has demonstrated the feasibility of using ddPCR to monitor treatment re sponse.65 Broader use of digital PCR would require a thor ough demonstration of comparable results across laboratories and clinical applicability if it were to be used to direct treatment decisions. Toward this goal, the per formance characteristics of the first US Food and Drug Administration approved ddPCR assay for BCR::ABL1 moni toring have been published.66 The study demonstrated re producibility of results across laboratories. Attempts to increase the sensitivity of the methodology for better pre diction of TFR included BCR::ABL1 DNA PCR.67 The method could not reliably predict TFR and is not currently recom mended.
Standardized molecular monitoring is not available in all regions due to economic constraints. Automated systems for measuring BCR::ABL1, such as the Cepheid GeneXpert,68 relieve the burden of resource-intensive in-house method development, optimization, IS standardization and valida tion. The Cepheid technique incorporates a stand-alone microfluidic system in which all processes necessary to generate a standardized BCR::ABL1 ratio occur within a disposable cartridge. Results are generated rapidly and the method requires minimal training. The system may be a viable option for monitoring patients with CML in re source-poor regions. Shipment of dried blood spots by regular mail has also been demonstrated as a means of extracting viable RNA and for generating reliable standard ized BCR::ABL1 ratios.69 This process is a cost-effective al ternative to shipment of samples to a central laboratory for testing.
The impact of genomic heterogeneity at the time of diagnosis for treatment response
Evidence has accumulated using various next-generation sequencing techniques (Figure 3) that mutation of cancerrelated genes is associated with treatment failure and drug resistance in CML.70-76 In patients selected for ge nomic analysis at diagnosis on the basis of their known response to therapy, mutation of cancer genes was as sociated with poor outcome.71,73,74 Research on unselected cohorts of consecutively treated patients is required to establish the true predictive value of these mutations if present at diagnosis. However, it is known that some pa tients with cancer gene mutations at diagnosis can
achieve optimal responses. For example, the most fre quently mutated gene at diagnosis of CML is ASXL172 and some patients with mutated ASXL1 can rapidly achieve MMR.71 The long-term outcome for patients with additional mutations at diagnosis is unknown. However, a recent small study suggested that somatic mutation of epigenetic modifier genes within the leukemic clone at CML diagnosis may impact the chance of TFR.77
Adherence to therapy is known to be a critical factor for achieving and maintaining response.78-80 One study found that as few as 14% of patients were completely adherent in taking all TKI doses and a third of patients were classi fied as non-adherent.78 In a UK population, 26% of patients had less than 90% adherence.79 Factors associated with better adherence were older age, male sex, appropriate management of side effects, taking only one tablet per day, and feeling well informed and supported by the clini cian.81,82 Patients were also less adherent when more than 2 years from diagnosis.82 Long-term, regular molecular monitoring can help to identify patients who are less ad herent. Features of non-compliance include unexpected variations in BCR::ABL1 ratios (usually in patients who have previously achieved at least MMR) and plateauing of re sponse after prior steady declines in transcript levels.
Enhanced detection of BCR::ABL1 kinase domain mutations
BCR::ABL1 kinase domain mutations are the best-recogni zed mechanism of acquired resistance and signal treat ment failure.20,21 Early detection can allow timely therapeutic intervention. Since each leukemic cell has one copy of the BCR::ABL1 gene fusion and one copy of normal ABL1, the mutated allele can be specifically isolated by positioning PCR amplification primers within BCR, just be fore the fusion junction, and in ABL1, immediately after the kinase domain sequence. This allows exquisite sensitivity to detect mutations in patients with MRD and kinase do main mutations can be detected using Sanger sequencing in patients with BCR::ABL1 ratios <0.1%, prior to relapse.30 However, the sensitivity of Sanger sequencing is limited to 10-20%.83,84 The relevance of sensitive BCR::ABL1 mutation detection using next-generation sequencing has been demonstrated for patients with a nonoptimal molecular response, when the actionable threshold of mutant de tection was 3%.83,84 In a prospective study that compared Sanger sequencing and next-generation sequencing, lowlevel TKI-resistant mutants detectable using next-gener ation sequencing invariably expanded over time if the patient was not switched to an appropriate alternate TKI.84 Early detection of mutants at levels as low as 3% could warrant treatment intervention to curtail clonal expansion of the resistant clone and loss of response. The clinical

Figure 3. Next-generation sequencing for the detection of various mutation types. New technology can detect BCR::ABL1 transcripts and kinase domain mutations, plus other clinically relevant variants. Some of these techniques enhance the detection of low level variants. (A) RNA-sequencing detection of e14a2 BCR::ABL1 fusion transcripts. Sequence reads are mapped to the hg19 reference genome and visualized in the Integrative Genomics Viewer. ‘View mate region in split screen’ is selected. The multicolored region in the left panel at the junction of ABL1 exon 2 indicates that the reads are derived from a different genomic location. The dark green color specifies that the reads are derived from chromosome 22. The multicolored region in the right panel at the junction of BCR exon 14 and the light green solid color indicate the reads are derived from chromosome 9 and map to ABL1. (B) Whole exome sequencing or targeted gene sequencing can detect clinically relevant variants in cancer-related genes at the time of diagnosis of chronic myeloid leukemia or at drug resistance. In this case a common ASXL1 23 base pair deletion was detected. (C) Nextgeneration sequencing of the BCR::ABL1 kinase domain provides enhanced sensitivity. A low level T315I mutation was below the level of detection using Sanger sequencing but was retrospectively detected at 2.6% in a drug-resistant patient prior to commencing dasatinib (top panel). The dasatinib-resistant mutant rapidly expanded to 23% after commencing dasatinib (bottom panel). (D) Whole genome sequencing is not suitable for the detection of residual disease but can simultaneously detect multiple different mutation types, with the exception of fusion transcripts. A circos plot provides a snapshot of rearrangements and other variants. In this case, the standard 9;22 translocation was detected and indicated by the arc between chromosomes 9 and 22, plus other rearrangements. Chromosomes are indicated in the outermost track. Circos plot courtesy of Dr Philippi May, Imperial College Healthcare NHS Trust, in conjunction with the Genomics England 100,000 Genomes project. CML: chronic myeloid leukemia.
relevance of TKI-resistant mutations using next-gener ation sequencing that are below the current threshold of 3% has not been established. Furthermore, the introduc tion of next-generation sequencing for routine clinical monitoring requires appropriate validation according to in ternational standards for diagnostic testing.83 Importantly, there is no clinical need for BCR::ABL1 mutation analysis at the time of diagnosis in CP using Sanger sequencing or sensitive next-generation sequencing.
Treatment decisions for patients with long-term measurable residual disease
A major goal for many patients is TFR but not all patients achieve the strict criteria for a trial of stopping therapy. Most patients face life-long TKI therapy, which can cause debilitating side effects. With the introduction of increas ingly potent TKI, clinicians are faced with therapy-related dilemmas for patients on treatment for many years. Should a patient who is tolerating TKI therapy and has minimal or no side-effects, switch to a more potent TKI to achieve a DMR in order to qualify for a trial of drug ces sation? Should prior TKI resistance influence decisions? What are the long-term vascular risks for patients treated with potent TKI over many years and should this influence treatment decisions? How should patients be managed when BCR::ABL1 ratios remain relatively and stubbornly high without meeting the molecular criteria for treatment failure? Are these patients at risk of disease progression? We present theoretical cases in which these treatment di lemmas may arise and discuss the pros and cons of treat ment options.
Patient
A 48-year-old male was diagnosed with CP CML: he had a high-risk EUTOS long-term survival (ELTS) score, ex
pressed the e13a2 transcript, had no additional chromo some abnormalities and no mutations in cancer-related genes. He commenced imatinib 600 mg OD in the context of a clinical trial. Figure 4 shows the BCR::ABL1 ratios measured over time. The BCR::ABL1 ratio was 160% at di agnosis and 12% IS at 3 months. Early research suggested a BCR::ABL1 ratio >10% at 3 months was sufficient to identify patients destined to fare poorly, thereby allowing early treatment intervention.27 However, subsequent studies highlighted the importance of the trend of initial BCR::ABL1 decline using multiple data points.33,34 This strategy is recommended when interpreting the 3-month ratio.20,21 There was a substantial BCR::ABL1 decline at 3 months for this patient although the response fell into the warning/possible TKI resistance categories. A good mantra would be to try to avoid making decisions on any single result and always confirm an unexpected result. It is also important to consider treatment compliance and discuss with the patient the presence of side effects or any other reason why they might have missed any medication.20,21 Assuming good compliance, continuing the initial therapy would be a perfectly reasonable treatment decision. In this case the trial protocol mandated a rapid treatment switch to nilotinib because of failure to achieve time-de pendent molecular milestones at 3, 6 or 12 months
Treatment was therefore changed to nilotinib 400 mg BD at 5 months and a 12-month BCR::ABL1 ratio compatible with CCyR was achieved. As can be seen from Figure 4, the MMR achieved at 2 years was not stable, perhaps again raising issues of compliance, which in turn may re flect the presence of troublesome side effects and/or problems associated with twice daily dosing. Consider ation was given to performing allogeneic SCT at this time, and HLA-typing of the patient and siblings was requested. In the meantime treatment was changed to dasatinib. A stable MMR was maintained for a number of years but a DMR was never achieved. A rapid rise in the BCR::ABL1 ratio occurred at 7 years. This
Figure 4. A rare case of sudden blast phase. Measurement of BCR::ABL1 ratios using realtime quantitative polymerase chain reaction revealed that the patient never achieved a deep molecular response despite switching to second-generation tyrosine kinase inhibitors. The very rapid BCR::ABL1 rise at 7 years after diagnosis heralded blast phase. IS: International Scale; ELTS: EUTOS long-term survival score.
triggered a kinase domain mutation analysis, which was negative. Prior studies had determined that the average rate of a BCR::ABL1 rise after stopping TKI corresponds to a BCR::ABL1 doubling time of 8-9 days.38,85 The BCR::ABL1 doubling time for Patient 1 was 11 days, which is rapid and consistent with complete lack of kinase inhibition. This could indicate complete non-adherence to TKI therapy or could portend a more dangerous scenario for the patient: progression to BP. In a study of 12 CP patients with BCR::ABL1 <10% IS who relapsed into BP, the median BCR::ABL1 doubling time was 9 days.38 In contrast, the BCR::ABL1 doubling time was significantly longer (median 48 days) for 30 patients who acquired BCR::ABL1 muta tions but maintained CP.38
Issues of compliance were addressed and the patient de nied missing his drugs. Unfortunately the patient had also lost complete hematologic response and subsequently progressed to BP within a month. He was treated with two courses of AML-like chemotherapy and achieved a second CP. He has recently undergone a sibling allogeneic SCT and his RT-qPCR confirms undetectable disease. Could we have predicted this tragic turn of events? Progression to advanced phase after the establishment of a durable MMR is unusual but has been described.86,87 Although the achievement of MMR has been termed a ‘safe haven’, Clau
diani and colleagues showed that attainment of DMR, sus tained for at least 12 months, was associated with a re markably low probability of losing MMR in the absence of other events such as a trial of treatment discontinuation, lack of compliance, or reduced drug dosing.88 The mech anism of treatment failure in Patient 1 is unknown. Addi tional chromosome abnormalities were not detected but broader genomic analysis would likely identify mutated cancer-related genes at the time of BP.

Patient 2, a case of non-adherence and late acquisition of BCR::ABL1 mutations
A 28-year-old male was diagnosed in CP in 2003: he had a low risk ELTS score, expressed e14a2 and had no addi tional chromosome abnormalities. He was treated with imatinib 400 mg OD. Figure 5 shows his BCR::ABL1 ratios measured over time. The patient met the current criteria for treatment failure at 6 and 12 months, but maintained CP. A slow BCR::ABL1 rise occurred in the third year of imatinib treatment, when the doubling time was slow at 53 days. A BCR::ABL1 kinase domain mutation was not de tected. The rise was attributed to non-adherence to ther apy and the dynamics of the rise were consistent with intermittent imatinib dosing.38 MMR was achieved at 6 years but was somewhat unstable, again attributed to
Figure 5. A case of non-adherence and late acquisition of BCR::ABL1 kinase domain mutations. Increases in BCR::ABL1 ratio over the first 3 years after diagnosis for this patient were associated with nonadherence to therapy. A deep molecular response on imatinib was never attained and a slow BCR::ABL1 rise at 8 years was accompanied by the detection of BCR::ABL1 mutations and failure of imatinib. This case demonstrates the importance of regular and sustained molecular monitoring. The rise prompted BCR::ABL1 mutation analysis, which confirmed imatinib resistance rather than non-adherence and allowed timely therapeutic intervention. IS: International Scale; ELTS: EUTOS long-term survival score.

non-compliance which was admitted by the patient. This did not seem to be related to any particular side-effect that might have been best treated by a switch of TKI. Un fortunately the patient experienced a significant BCR::ABL1 rise at year 8. At that time two imatinib-resistant BCR::ABL1 mutations were detected using Sanger se quencing: E275K and E459K. BCR::ABL1 mutations are mostly acquired within the first few years of first-line TKI therapy in resistant patients so this was a late occurrence. Whether the persistent, relatively high levels of BCR::ABL1 contributed to an environment conducive to DNA damage and the acquisition of mutations is unknown. Both of the mutations are sensitive to second-generation TKI and a switch to dasatinib reinstated and indeed deepened the response such that the patient is now in stable DMR. What next for this patient who has been on dasatinib for >10 years and maintained a DMR for 3 years? Does the pa tient qualify for a trial of treatment cessation? Could re sidual leukemic cells carry the BCR::ABL1 mutations and does this influence decisions regarding treatment cessa tion? BCR::ABL1 mutations can be selected and dese lected.89,90 In some cases the mutants persist at undetectable levels for many years and even reappear at molecular relapse upon treatment cessation.91 Some BCR::ABL1 mutants may have a proliferative advantage.92 Prior TKI resistance is among the current ELN exclusion criteria for a treatment-cessation trial.20 However, recent
versions of the NCCN guidelines for treatment cessation no longer exclude prior detection of BCR::ABL1 mutations in patients who maintained CP.21 Claudiani and colleagues assessed ten patients with previous BCR::ABL1 mutations who stopped TKI due to intolerance.93 All had maintained MR4 for at least 1 year prior to stopping TKI (median 6.3 years) and the median duration of TKI therapy before stopping was 13 years. The molecular relapse-free survival for the ten patients was 50% with 1 to 4.7 years of followup. Two of the patients who maintained TFR had prior T315I mutations. The rate of TFR for the ten patients with prior resistance is consistent with the rate reported in clinical trials of TKI cessation that excluded patients with prior resistance.94 The authors speculated that if a patient with a BCR::ABL1 mutation promptly receives an effective alternative TKI and a DMR is achieved and maintained, the adverse outcomes associated with BCR::ABL1 mutations can be overcome.93
A 37-year-old female was diagnosed with CML in 2013 and received nilotinib as first-line therapy in a clinical trial. The transcript was e14a2/e13a2, the ELTS score was intermedi ate and there were no additional chromosome abnormal ities at diagnosis. Exploratory genomic analysis at diagnosis revealed an ASXL1 nonsense mutation. Figure 6 shows the BCR::ABL1 ratios measured over time. The pa
Figure 6. A case of early treatment failure. Despite an initial rapid response to firstline nilotinib the patient failed to benefit from nilotinib and subsequent dasatinib therapy, as indicated by the acquisition of successive BCR::ABL1 mutations. T315I detected at the second BCR::ABL1 rise prompted a switch to the third-generation inhibitor, ponatinib. The rapid achievement of a deep molecular response, sustained for many years, indicates that the T315Imutant leukemic cells were highly sensitive to ponatinib. IS: International Scale; ELTS: EUTOS long-term survival score.
tient rapidly developed a nilotinib-resistant mutation, F359V, despite a good initial response. A switch to dasati nib was swiftly followed by the acquisition of the T315I mutation, which is resistant to imatinib and the secondgeneration TKI nilotinib, dasatinib and bosutinib. T315I was acquired in an independent clone, which was indi cated by its clonal dominance and disappearance of the F359V clone. T315I is sensitive to ponatinib and the pa tient rapidly achieved and maintained a DMR after com mencing treatment with ponatinib. The dose of ponatinib at the start of treatment was 45 mg OD and this was re duced to 30 mg OD within 1 month. Recent results from the OPTIC study, in which patients were randomized to one of three doses of ponatinib (45, 30 or 15 mg) and in structed to dose reduce to, or continue on, 15 mg, once the RT-qPCR fell below 1% IS, would suggest that she could now be safely reduced to 15 mg daily. Probably given the length of time she has been on 30 mg, she is not at high risk of arterial thrombotic events but minim izing the dose while maintaining response is a reasonable goal for all patients.95 Monitoring general health is rec ommended and interventions should be made where necessary. Asciminib is a BCR::ABL1 inhibitor recently ap proved by the US Food and Drug Administration for pa
tients in whom prior TKI therapy has failed.96,97 Early data suggest that asciminib, at a higher dose of 200 mg twice daily, has efficacy against T315I and may be better toler ated than ponatinib. However, the follow-up was short. The other possibility is a trial of treatment discontinu ation but as discussed above, data are sparse as to the safety of this approach in patients with kinase domain mutations, particularly T315I. Biomarkers at diagnosis cannot predict the early acquisi tion of TKI-resistant BCR::ABL1 kinase domain mutations. Why did this patient acquire a resistant mutation within months of commencing treatment, whereas Patient 2 only acquired resistant mutations after 8 years? Patient 3 had an ASXL1 mutation at diagnosis, whereas the mu tation status of Patient 2 at diagnosis was unknown. On going genomic studies of cohorts of unselected patients may provide further evidence for enhanced risk stratifi cation on the basis of a cancer gene mutation at diagno sis. Mutated ASXL1 is not only the most frequently detected mutation at diagnosis of CML, but is also among the most frequently observed in BP CML.72 In the largest study of genomic heterogeneity in BP CML, ASXL1 mutations were associated with a poorer outcome, even in this very poor risk setting.76

Figure 7. A case of two failed attempts to achieve treatment-free remission. The patient achieved the optimal milestone BCR::ABL1 ratios and sustained a deep molecular response for more than 5 years before imatinib discontinuation in an attempt to achieve treatment-free remission. Molecular relapse was rapid at both cessation attempts. It is not known why some patients are unsuccessful in multiple attempts to sustain treatment-free remission and the reasons for molecular relapse could be multifactorial. Life-long tyrosine kinase inhibitor therapy may be required for this patient. Regular molecular monitoring could be critical to monitor for potential episodes over time of non-adherence to therapy. A rapid BCR::ABL1 rise associated with non-adherence could potentially lead to loss of complete hematologic response, unless detected promptly by the clinician through molecular monitoring. IS: International Scale; ELTS: EUTOS long-term survival score.

Patient 4, a case of treatment-free remission attempts
A 53-year-old male was diagnosed in CP in 2010 and commenced imatinib 400 mg OD. The transcript was e13a2, the ELTS score was low and there were no addi tional chromosome abnormalities at diagnosis. Explora tory genomic analysis at diagnosis revealed an ASXL1 frameshift mutation. Figure 7 shows the BCR::ABL1 ratios over time. All BCR::ABL1 optimal milestones were achieved. MR4.5 was maintained for 4.5 years before imatinib was discontinued for a trial of TFR. A rapid rise that commenced at 1 month after cessation prompted imatinib restart and MR4.5 was rapidly regained. Imatinib was ceased for a second attempt at TFR after a further 3.5 years of DMR, but relapse was again rapid. The chance of TFR is approximately 50% for patients who attempt TFR. Longer treatment and DMR durations were associated with an increased probability of maintaining TFR at 6 months in the EURO-SKI study, which was the largest TKI cessation trial. 94 The optimal cut-offs were 5.8 years on therapy and 3.1 years of DMR. Patient 4 was on imatinib for 5 years before attempting TFR and the chances of success may have increased with longer time on imatinib. However, the EURO-SKI study determined that the duration of DMR was the most important factor
affecting the probability of TFR. Patients with e13a2, as in this case, may have an inferior probability of TFR.62,64 TFR is achievable after a second TKI cessation attempt for some patients.98 The French RE-STIM study of 70 pa tients reported a TFR rate of 42% at 24 months after ces sation. The relapse pattern at the first cessation attempt was the only factor significantly associated with TFR at the second attempt. Patients who relapsed after 3 months had a significantly higher rate of TFR at the sec ond attempt: 72% versus 36% at 24 months. Patient 4 had a very rapid relapse at the first attempt. This patient had mutated ASXL1 at diagnosis which was not detectable in remission and a recent small study has found an associ ation between mutations in epigenetic modifier genes at diagnosis and a lower rate of TFR.77
What next for this patient? He is now 12 years after diag nosis and has received only imatinib to which he has re sponded deeply and durably. He has tolerated the imatinib well and could remain on the drug life-long. After two unsuccessful attempts at treatment discon tinuation of imatinib it seems unlikely that further treat ment cessation will achieve a better result. If TFR is an important goal for this patient then re-starting treatment using a more potent TKI would be an entirely reasonable
approach but the chance of successful discontinuation must be balanced against the increased risk of side ef fects with a new drug. This is an excellent example of the need for honest and transparent dialogue between patient and physician.
In 2022 it is virtually impossible to imagine managing any patient with CML without accurate molecular monitor ing. The technology accurately identifies patients who are responding well and who might be future candidates for treatment discontinuation. Conversely patients with primary and secondary resistance can be recognized promptly and treatment switched in an attempt to in duce response and prolong survival. If the change in therapy is unsuccessful the patient can be referred for allogeneic SCT while still in CP and thereby maximize their chance of a good outcome. But accurate monitor ing can also highlight issues of compliance, which can then be addressed and the patient supported to adhere to treatment and deepen their response. The methodol ogy continues to evolve and can be adapted to suit most clinical situations and resources. There is little doubt that the efficacy of the TKI in CML has been comple
1. Baccarani M, Castagnetti F, Gugliotta G, et al. The proportion of different BCR-ABL1 transcript types in chronic myeloid leukemia. An international overview. Leukemia. 2019;33(5):1173-1183.
2. Zaccaria A, Rosti G, Sessarego M, et al. Relapse after allogeneic bone marrow transplantation for Philadelphia chromosome positive chronic myeloid leukemia: cytogenetic analysis of 24 patients. Bone Marrow Transplant. 1988;3(5):413-423.
3. Kawasaki ES, Clark SS, Coyne MY, et al. Diagnosis of chronic myeloid and acute lymphocytic leukemias by detection of leukemia-specific mRNA sequences amplified in vitro. Proc Natl Acad Sci U S A. 1988;85(15):5698-5702.
4. Sawyers CL, Timson L, Kawasaki ES, Clark SS, Witte ON, Champlin R. Molecular relapse in chronic myelogenous leukemia patients after bone marrow transplantation detected by polymerase chain reaction. Proc Natl Acad Sci U S A. 1990;87(2):563-567.
5. Morgan GJ, Hughes T, Janssen JW, et al. Polymerase chain reaction for detection of residual leukaemia. Lancet. 1989;1(8644):928-929.
6. Kolb HJ, Mittermuller J, Clemm C, et al. Donor leukocyte transfusions for treatment of recurrent chronic myelogenous leukemia in marrow transplant patients. Blood. 1990;76(12):2462-2465.
7. van Rhee F, Lin F, Cullis JO, et al. Relapse of chronic myeloid leukemia after allogeneic bone marrow transplant: the case for giving donor leukocyte transfusions before the onset of hematologic relapse. Blood. 1994;83(11):3377-3383.
8. Cross NC, Hughes TP, Feng L, et al. Minimal residual disease
mented by the ability to accurately measure residual disease and modify treatment accordingly to optimize outcome.
SB is a member of advisory boards for Qiagen, Novartis and Cepheid; has received honoraria from Qiagen, Novartis, Bris tol-Myers Squibb and Cepheid, and has received research support from Novartis and Cepheid. JFA is a member of ad visory boards for Incyte and Novartis; has received honoraria from Incyte, Novartis and Pfizer; and has received research support from Incyte, Novartis and Pfizer.
SB conducted the literature review, prepared the figures, wrote and reviewed the manuscript. JFA conducted the lit erature review, designed the original layout, wrote and re viewed the manuscript. The authors approved the final version of the manuscript.
SB is supported by National Health and Medical Research Council of Australia: APP1117718. JFA is an emeritus senior in vestigator for the National Institute of Health Research (NIHR) and acknowledges the support of the NIHR Imperial College Biomedical Research Center.
after allogeneic bone marrow transplantation for chronic myeloid leukaemia in first chronic phase: correlations with acute graft-versus-host disease and relapse. Br J Haematol. 1993;84(1):67-74.
9. Cross NC, Feng L, Chase A, Bungey J, Hughes TP, Goldman JM. Competitive polymerase chain reaction to estimate the number of BCR-ABL transcripts in chronic myeloid leukemia patients after bone marrow transplantation. Blood. 1993;82(6):1929-1936.
10. Goh HG, Lin M, Fukushima T, et al. Sensitive quantitation of minimal residual disease in chronic myeloid leukemia using nanofluidic digital polymerase chain reaction assay. Leuk Lymphoma. 2011;52(5):896-904.
11. Mori S, Vagge E, le Coutre P, et al. Age and dPCR can predict relapse in CML patients who discontinued imatinib: the ISAV study. Am J Hematol. 2015;90(10):910-914.
12. Lee SE, Choi SY, Song HY, et al. Imatinib withdrawal syndrome and longer duration of imatinib have a close association with a lower molecular relapse after treatment discontinuation: the KID study. Haematologica. 2016;101(6):717-723.
13. Alikian M, Ellery P, Forbes M, et al. Next-generation sequencingassisted DNA-based digital PCR for a personalized approach to the detection and quantification of residual disease in chronic myeloid leukemia patients. J Mol Diagn. 2016;18(2):176-189.
14. Nicolini FE, Dulucq S, Boureau L, et al. Evaluation of residual disease and TKI duration are critical predictive factors for molecular recurrence after stopping imatinib first-line in chronic phase CML patients. Clin Cancer Res. 2019;25(22):6606-6613.
15. Bernardi S, Malagola M, Zanaglio C, et al. Digital PCR improves
the quantitation of DMR and the selection of CML candidates to TKIs discontinuation. Cancer Med. 2019;8(5):2041-2055.
16. Franke GN, Maier J, Wildenberger K, et al. Comparison of realtime quantitative PCR and digital droplet PCR for BCR-ABL1 monitoring in patients with chronic myeloid leukemia. J Mol Diagn. 2020;22(1):81-89.
17. Salmon M, White HE, Cross NCP, Hochhaus A. Standardization of molecular monitoring for chronic myeloid leukemia: 2021 update. In: Hehlmann R, ed. Chronic Myeloid Leukemia. Cham: Springer International Publishing; 2021:105-117.
18. Jovanovski A, Petiti J, Giugliano E, et al. Standardization of BCRABL1 p210 monitoring: from nested to digital PCR. Cancers (Basel). 2020;12(11):3287.
19. Radich J, Yeung C, Wu D. New approaches to molecular monitoring in CML (and other diseases). Blood. 2019;134(19):1578-1584.
20. Hochhaus A, Baccarani M, Silver RT, et al. European LeukemiaNet 2020 recommendations for treating chronic myeloid leukemia. Leukemia. 2020;34(4):966-984.
21. NCCN Clinical Practice Guidelines in Oncology: Chronic Myeloid Leukemia. Version 3.2022, Accessed 24th March 2022.
22. Merx K, Muller MC, Kreil S, et al. Early reduction of BCR-ABL mRNA transcript levels predicts cytogenetic response in chronic phase CML patients treated with imatinib after failure of interferon alpha. Leukemia. 2002;16(9):1579-1583.
23. Wang L, Pearson K, Ferguson JE, Clark RE. The early molecular response to imatinib predicts cytogenetic and clinical outcome in chronic myeloid leukaemia. Br J Haematol. 2003;120(6):990-999.
24. Branford S, Rudzki Z, Harper A, et al. Imatinib produces significantly superior molecular responses compared to interferon alfa plus cytarabine in patients with newly diagnosed chronic myeloid leukemia in chronic phase. Leukemia. 2003;17(12):2401-2409.
25. Hughes TP, Hochhaus A, Branford S, et al. Long-term prognostic significance of early molecular response to imatinib in newly diagnosed chronic myeloid leukemia: an analysis from the International Randomized Study of Interferon and STI571 (IRIS). Blood. 2010;116(19):3758-3765.
26. Hanfstein B, Muller MC, Hehlmann R, et al. Early molecular and cytogenetic response is predictive for long-term progressionfree and overall survival in chronic myeloid leukemia (CML). Leukemia. 2012;26(9):2096-2102.
27. Marin D, Ibrahim AR, Lucas C, et al. Assessment of BCR-ABL1 transcript levels at 3 months is the only requirement for predicting outcome for patients with chronic myeloid leukemia treated with tyrosine kinase inhibitors. J Clin Oncol. 2012;30(3):232-238.
28. Branford S, Kim D-W, Soverini S, et al. Initial molecular response at 3 months may predict both response and eventfree survival at 24 months in imatinib-resistant or -intolerant patients with Philadelphia chromosome-positive chronic myeloid leukemia in chronic phase treated with nilotinib. J Clin Oncol. 2012;30(35):4323-4329.
29. Marin D, Hedgley C, Clark RE, et al. Predictive value of early molecular response in patients with chronic myeloid leukemia treated with first-line dasatinib. Blood. 2012;120(2):291-294.
30. Hughes T, Deininger M, Hochhaus A, et al. Monitoring CML patients responding to treatment with tyrosine kinase inhibitors: review and recommendations for harmonizing current methodology for detecting BCR-ABL transcripts and kinase domain mutations and for expressing results. Blood. 2006;108(1):28-37.
31. Branford S, Fletcher L, Cross NCP, et al. Desirable performance
characteristics for BCR-ABL measurement on an international reporting scale to allow consistent interpretation of individual patient response and comparison of response rates between clinical trials. Blood. 2008;112(8):3330-3338.
32. Huet S, Cony-Makhoul P, Heiblig M, et al. Major molecular response achievement in CML patients can be predicted by BCR-ABL1/ABL1 or BCR-ABL1/GUS ratio at an earlier time point of follow-up than currently recommended. PLoS One. 2014;9(9):e106250.
33. Hanfstein B, Shlyakhto V, Lauseker M, et al. Velocity of early BCR-ABL transcript elimination as an optimized predictor of outcome in chronic myeloid leukemia (CML) patients in chronic phase on treatment with imatinib. Leukemia. 2014;28(10):1988-1992.
34. Branford S, Yeung DT, Parker WT, et al. Prognosis for patients with CML and >10% BCR-ABL1 after 3 months of imatinib depends on the rate of BCR-ABL1 decline. Blood. 2014;124(4):511-518.
35. Pennisi MS, Stella S, Vitale SR, et al. BCR-ABL1 doubling-times and halving-times may predict CML response to tyrosine kinase Inhibitors. Front Oncol. 2019;9:764.
36. Karpurmath SV, Seshachalam A, Selvaraj K, et al. Halving time of BCR-ABL1 in chronic myeloid leukemia, is it a better bet than day 90 value – multicenter study from south India. Clin Lymphoma Myeloma Leuk. 2020;20(5):e205-e211.
37. Stuckey R, Casado LF, Colomer D, et al. Early prediction of subsequent molecular response to nilotinib in patients with chronic myeloid leukemia: comparison of the quantification of BCR-ABL1 ratios using ABL1 or GUSB control genes. J Mol Diagn. 2020;22(10):1217-1224.
38. Branford S, Yeung DT, Prime JA, et al. BCR-ABL1 doubling times more reliably assess the dynamics of CML relapse compared with the BCR-ABL1 fold rise: implications for monitoring and management. Blood. 2012;119(18):4264-4271.
39. Baccarani M, Deininger MW, Rosti G, et al. European LeukemiaNet recommendations for the management of chronic myeloid leukemia: 2013. Blood. 2013;122(6):872-884.
40. Hughes TP, Kaeda J, Branford S, et al. Frequency of major molecular responses to imatinib or interferon alfa plus cytarabine in newly diagnosed chronic myeloid leukemia. N Engl J Med. 2003;349(15):1423-1432.
41. Branford S, Hughes TP, Rudzki Z. Dual transcription of b2a2 and b3a2 BCR-ABL transcripts in chronic myeloid leukaemia is confined to patients with a linked polymorphism within the BCR gene. Br J Haematol. 2002;117(4):875-877.
42. Sharplin K, Altamura H, Taylor K, Wellwood J, Taylor D, Branford S. Chronic myeloid leukaemia: the dangers of not knowing your BCR-ABL1 transcript. Leuk Res. 2019;87:106231.
43. Mills KI, MacKenzie ED, Birnie GD. The site of the breakpoint within the bcr is a prognostic factor in Philadelphia-positive CML patients. Blood. 1988;72(4):1237-1241.
44. Grossman A, Silver RT, Arlin Z, et al. Fine mapping of chromosome 22 breakpoints within the breakpoint cluster region (bcr) implies a role for bcr exon 3 in determining disease duration in chronic myeloid leukemia. Am J Hum Genet. 1989;45(5):729-738.
45. Shtalrid M, Talpaz M, Kurzrock R, et al. Analysis of breakpoints within the bcr gene and their correlation with the clinical course of Philadelphia-positive chronic myelogenous leukemia. Blood. 1988;72(2):485-490.
46. Dreazen O, Berman M, Gale R. Molecular abnormalities of bcr and c-abl in chronic myelogenous leukemia associated with a long chronic phase. Blood. 1988;71(3):797-799.
47. Zaccaria A, Martinelli G, Buzzi M, et al. M-BCR breakpoint
location does not predict survival in Philadelphia chromosomepositive chronic myeloid leukemia. Haematologica. 1992;77(1):16-20.
48. Shepherd P, Suffolk R, Halsey J, Allan N. Analysis of molecular breakpoint and m-RNA transcripts in a prospective randomized trial of interferon in chronic myeloid leukaemia: no correlation with clinical features, cytogenetic response, duration of chronic phase, or survival. Br J Haematol. 1995;89(3):546-554.
49. Hanfstein B, Lauseker M, Hehlmann R, et al. Distinct characteristics of e13a2 versus e14a2 BCR-ABL1 driven chronic myeloid leukemia under first-line therapy with imatinib. Haematologica. 2014;99(9):1441-1447.
50. Castagnetti F, Gugliotta G, Breccia M, et al. The BCR-ABL1 transcript type influences response and outcome in Philadelphia chromosome-positive chronic myeloid leukemia patients treated frontline with imatinib. Am J Hematol. 2017;92(8):797-805.
51. Dmytrenko IV, Fedorenko VG, Shlyakhtychenko TY, et al. Assessment of response to imatinib therapy in patients with chronic myeloid leukemia with e13a2 and e14a2 transcripts of BCR/ABL1 gene. Probl Radiac Med Radiobiol. 2015;20:328-340.
52. Jain P, Kantarjian H, Patel KP, et al. Impact of BCR-ABL transcript type on outcome in patients with chronic-phase CML treated with tyrosine kinase inhibitors. Blood. 2016;127(10):1269-1275.
53. Greenfield G, McMullan R, Robson N, McGimpsey J, Catherwood M, McMullin MF. Response to imatinib therapy is inferior for e13a2 BCR-ABL1 transcript type in comparison to e14a2 transcript type in chronic myeloid leukaemia. BMC Hematol. 2019;19:7.
54. Marce S, Xicoy B, Garcia O, et al. Impact of BCR-ABL1 transcript type on response, treatment-free remission rate and survival in chronic myeloid leukemia patients treated with imatinib. J Clin Med. 2021;10(14):3146.
55. Lucas CM, Harris RJ, Giannoudis A, et al. Chronic myeloid leukemia patients with the e13a2 BCR-ABL fusion transcript have inferior responses to imatinib compared to patients with the e14a2 transcript. Haematologica. 2009;94(10):1362-1367.
56. Sharma P, Kumar L, Mohanty S, Kochupillai V. Response to imatinib mesylate in chronic myeloid leukemia patients with variant BCR-ABL fusion transcripts. Ann Hematol. 2010;89(3):241-247.
57. Kjaer L, Skov V, Andersen MT, et al. Variant-specific discrepancy when quantitating BCR-ABL1 e13a2 and e14a2 transcripts using the Europe Against Cancer qPCR assay. Eur J Haematol. 2019;103(1):26-34.
58. Bernardi S, Bonifacio M, Iurlo A, et al. "Variant-specific discrepancy when quantitating BCR-ABL1 e13a2 and e14a2 transcripts using the Europe Against Cancer qPCR assay." Is dPCR the key? Eur J Haematol. 2019;103(3):272-273.
59. Machova Polakova K, Salmon M, Zizkova H, et al. Individual molecular response evaluation on both DNA and mRNA BCRABL1 level diminished differences in time to molecular response achievement between CML patients with E13A2 vs E14A2 transcript type. Hemasphere. 2020;4(1):351.
60. Dominy KM, Claudiani S, O'Hare M, et al. Assessment of quantitative PCR for BCR::ABL1 transcripts in CML: are improved outcomes in patients with e14a2 transcripts an artefact of technology? Br J Haematol. 2022;197(1):52-62.
61. Clark RE, Polydoros F, Apperley JF, et al. De-escalation of tyrosine kinase inhibitor therapy before complete treatment discontinuation in patients with chronic myeloid leukaemia (DESTINY): a non-randomised, phase 2 trial. Lancet Haematol. 2019;6(7):e375-e383.
62. Claudiani S, Apperley JF, Gale RP, et al. e14a2 BCR-ABL1 transcript is associated with a higher rate of treatment-free remission in individuals with chronic myeloid leukemia after stopping tyrosine kinase inhibitor therapy. Haematologica. 2017;102(8):e297-e299.
63. D'Adda M, Farina M, Schieppati F, et al. The e13a2 BCR-ABL transcript negatively affects sustained deep molecular response and the achievement of treatment-free remission in patients with chronic myeloid leukemia who receive tyrosine kinase inhibitors. Cancer. 2019;125(10):1674-1682.
64. Shanmuganathan N, Pagani IS, Ross DM, et al. Early BCR-ABL1 kinetics are predictive of subsequent achievement of treatment-free remission in chronic myeloid leukemia. Blood. 2021;137(9):1196-1207.
65. Bochicchio MT, Petiti J, Berchialla P, et al. Droplet digital PCR for BCR-ABL1 monitoring in diagnostic routine: ready to start? Cancers (Basel). 2021;13(21):5470.
66. Shelton DN, Bhagavatula P, Sepulveda N, et al. Performance characteristics of the first Food and Drug Administration (FDA)cleared digital droplet PCR (ddPCR) assay for BCR::ABL1 monitoring in chronic myelogenous leukemia. PLoS One. 2022;17(3):e0265278.
67. Ross DM, Branford S, Seymour JF, et al. Patients with chronic myeloid leukemia who maintain a complete molecular response after stopping imatinib treatment have evidence of persistent leukemia by DNA PCR. Leukemia. 2010;24(10):1719-1724.
68. Winn-Deen ES, Helton B, Van Atta R, et al. Development of an integrated assay for detection of BCR-ABL RNA. Clin Chem. 2007;53(9):1593-1600.
69. Sala Torra O, Beppu L, Smith JL, et al. Paper or plastic? BCRABL1 quantitation and mutation detection from dried blood spots. Blood. 2016;127(22):2773-2774.
70. Kim T, Tyndel MS, Kim HJ, et al. Spectrum of somatic mutation dynamics in chronic myeloid leukemia following tyrosine kinase inhibitor therapy. Blood. 2017;129(1):38-47.
71. Branford S, Wang P, Yeung DT, et al. Integrative genomic analysis reveals cancer-associated mutations at diagnosis of CML in patients with high-risk disease. Blood. 2018;132(9):948-961.
72. Branford S, Kim DDH, Apperley JF, et al. Laying the foundation for genomically-based risk assessment in chronic myeloid leukemia. Leukemia. 2019;33(8):1835-1850.
73. Nteliopoulos G, Bazeos A, Claudiani S, et al. Somatic variants in epigenetic modifiers can predict failure of response to imatinib but not to second-generation tyrosine kinase inhibitors. Haematologica. 2019;104(12):2400-2409.
74. Adnan Awad S, Kankainen M, Ojala T, et al. Mutation accumulation in cancer genes relates to nonoptimal outcome in chronic myeloid leukemia. Blood Adv. 2020;4(3):546-559.
75. Ko TK, Javed A, Lee KL, et al. An integrative model of pathway convergence in genetically heterogeneous blast crisis chronic myeloid leukemia. Blood. 2020;135(26):2337-2353.
76. Ochi Y, Yoshida K, Huang Y-J, et al. Clonal evolution and clinical implications of genetic abnormalities in blastic transformation of chronic myeloid leukaemia. Nat Commun. 2021;12(1):2833.
77. Adnan Awad S, Bruck O, Shanmuganathan N, et al. Epigenetic modifier gene mutations in chronic myeloid leukemia (CML) at diagnosis are associated with risk of relapse upon treatment discontinuation. Blood Cancer J. 2022;12(4):69.
78. Noens L, van Lierde MA, De Bock R, et al. Prevalence, determinants, and outcomes of nonadherence to imatinib therapy in patients with chronic myeloid leukemia: the ADAGIO study. Blood. 2009;113(22):5401-5411.
79. Marin D, Bazeos A, Mahon F-X, et al. Adherence is the critical factor for achieving molecular responses in patients with
chronic myeloid leukemia who achieve complete cytogenetic responses on imatinib. J Clin Oncol. 2010;28(14):2381-2388.
80. Noens L, Hensen M, Kucmin-Bemelmans I, Lofgren C, Gilloteau I, Vrijens B. Measurement of adherence to BCR-ABL inhibitor therapy in chronic myeloid leukemia: current situation and future challenges. Haematologica. 2014;99(3):437-447.
81. Rychter A, Jerzmanowski P, Holub A, et al. Treatment adherence in chronic myeloid leukaemia patients receiving tyrosine kinase inhibitors. Med Oncol. 2017;34(6):104.
82. Geissler J, Sharf G, Bombaci F, et al. Factors influencing adherence in CML and ways to improvement: results of a patient-driven survey of 2546 patients in 63 countries. J Cancer Res Clin Oncol. 2017;143(7):1167-1176.
83. Kizilors A, Crisà E, Lea N, et al. Effect of low-level BCR-ABL1 kinase domain mutations identified by next-generation sequencing in patients with chronic myeloid leukaemia: a population-based study. Lancet Haematol. 2019;6(5):e276-e284.
84. Soverini S, Bavaro L, De Benedittis C, et al. Prospective assessment of NGS-detectable mutations in CML patients with nonoptimal response: the NEXT-in-CML study. Blood. 2020;135(8):534-541.
85. Michor F, Hughes TP, Iwasa Y, et al. Dynamics of chronic myeloid leukaemia. Nature. 2005;435(7046):1267-1270.
86. Jabbour E, Kantarjian H, O'Brien S, et al. Sudden blastic transformation in patients with chronic myeloid leukemia treated with imatinib mesylate. Blood. 2006;107(2):480-482.
87. Okada Y, Sato K, Kobayashi S, et al. Sudden blast phase in chronic myeloid leukemia developed during nilotinib therapy after major molecular response was achieved. Int J Hematol. 2018;107(4):495-497.
88. Claudiani S, Gatenby A, Szydlo R, et al. MR4 sustained for 12 months is associated with stable deep molecular responses in chronic myeloid leukemia. Haematologica. 2019;104(11):2206-2214.
89. Hanfstein B, Muller MC, Kreil S, et al. Dynamics of mutant BCR-
ABL-positive clones after cessation of tyrosine kinase inhibitor therapy. Haematologica. 2011;96(3):360-366.
90. Gruber FXE, Lamark T, Anonli A, et al. Selecting and deselecting imatinib-resistant clones: observations made by longitudinal, quantitative monitoring of mutated BCR-ABL. Leukemia. 2005;19(12):2159-2165.
91. Parker WT, Yeoman AL, Jamison BA, et al. BCR-ABL1 kinase domain mutations may persist at very low levels for many years and lead to subsequent TKI resistance. Br J Cancer. 2013;109(6):1593-1598.
92. Griswold IJ, MacPartlin M, Bumm T, et al. Kinase domain mutants of Bcr-Abl exhibit altered transformation potency, kinase activity, and substrate utilization, irrespective of sensitivity to imatinib. Mol Cell Biol. 2006;26(16):6082-6093.
93. Claudiani S, Apperley J, Khan A, Khorashad J, Milojkovic D. Prolonged treatment-free remission in chronic myeloid leukemia patients with previous BCR-ABL1 kinase domain mutations. Haematologica. 2020;105(5):e225-e227.
94. Saussele S, Richter J, Guilhot J, et al. Discontinuation of tyrosine kinase inhibitor therapy in chronic myeloid leukaemia (EURO-SKI): a prespecified interim analysis of a prospective, multicentre, non-randomised, trial. Lancet Oncol. 2018;19(6):747-757.
95. Valent P, Hadzijusufovic E, Schernthaner G-H, Wolf D, Rea D, le Coutre P. Vascular safety issues in CML patients treated with BCR/ABL1 kinase inhibitors. Blood. 2015;125(6):901-906.
96. Hughes TP, Mauro MJ, Cortes JE, et al. Asciminib in chronic myeloid leukemia after ABL kinase inhibitor failure. N Engl J Med. 2019;381(24):2315-2326.
97. Réa D, Mauro MJ, Boquimpani C, et al. A phase 3, open-label, randomized study of asciminib, a STAMP inhibitor, vs bosutinib in CML after 2 or more prior TKIs. Blood. 2021;138(21):2031-2041.
98. Legros L, Nicolini FE, Etienne G, et al. Second tyrosine kinase inhibitor discontinuation attempt in patients with chronic myeloid leukemia. Cancer. 2017;123(22):4403-4410.
1Division of Hematology/Department of Medicine, The Ohio State University - The James Comprehensive Cancer Center, Columbus, OH; 2Department of Biomedical Informatics, The Ohio State University, Columbus, OH; 3Clinical Research Division, Fred Hutchinson Cancer Center, Seattle, WA; 4Division of Hematology/Department of Medicine, University of Washington, Seattle, WA; 5Department of Laboratory Medicine & Pathology, University of Washington, Seattle, WA, USA; 6Department of Epidemiology, University of Washington, Seattle, WA and 7Laboratory of Myeloid Malignancies, Hematology Branch, National Heart, Lung, and Blood Institute, National Institutes of Health, Bethesda, MD, USA
Correspondence: J.S. Blachly James.Blachly@osumc.edu
Received: September 1, 2022.
Accepted: September 26, 2022.
https://doi.org/10.3324/haematol.2022.282034
©2022 Ferrata Storti Foundation
Published under a CC BY-NC license
Considerable progress has been made in the past several years in the scientific understanding of, and available treatments for, acute myeloid leukemia (AML). Achievement of a conventional remission, evaluated cytomorphologically via small bone marrow samples, is a necessary but not sufficient step toward cure. It is increasingly appreciated that molecular or immunophenotypic methods to identify and quantify measurable residual disease (MRD) – populations of leukemia cells below the cytomorphological detection limit – provide refined information on the quality of response to treatment and prediction of the risk of AML recurrence and leukemia-related deaths. The principles and practices surrounding MRD remain incompletely determined however and the genetic and immunophenotypic heterogeneity of AML may prevent a one-sizefits-all approach. Here, we review the current approaches to MRD testing in AML, discuss strengths and limitations, highlight recent technological advances that may improve such testing, and summarize ongoing initiatives to generate the clinical evidence needed to advance the use of MRD testing in patients with AML.
Acute myeloid leukemia (AML) encompasses a hetero geneous group of clonal neoplastic diseases of the hema topoietic system. Eradication of AML cells without intolerable harm to the production of red blood cells, white blood cells, and platelets is difficult and, combined with the often rapid proliferation kinetics, has earned this disease a reputation as one of the most challenging among all cancers to treat with a high fatality rate despite gradual improvements and expansions of therapies and supportive care measures. Intensive chemotherapy, with or without adjunctive small molecule inhibitors or immu notherapeutics, leads to a cytomorphological complete remission in a majority of AML patients. However, com plete remission does not necessarily equal cure.1 Residual AML cells may persist below the limit of cytomorphologi cal detection and, eventually, cause overt disease recur rence. If leukemia cells capable of disease propagation are not eradicated entirely, or reduced to a level that may self-extinguish or that can be surveilled and removed by the immune system, AML will inevitably relapse.2 Although it is widely recognized and agreed upon that residual leukemia cells, detected or not, lead to recurrent disease,3
there is less agreement on the best ways to identify and quantify such cells, let alone how to approach them therapeutically. As a biomarker, measurable residual dis ease (MRD) can be both prognostic and predictive,4 but the absolute quantifiable level of disease is not the sole determinant of patients’ outcomes, as disease biology and other clinical factors modify the risk associated with MRD test results. Evidence suggests that levels of MRD com patible with long-term disease-free survival differ across molecular subtypes. Defining standards for the detection of and therapeutic approach to MRD has thus emerged as one of the major frontiers of contemporary AML manage ment. Here, we describe residual disease in AML as a con cept, the technologies currently used to detect it, limitations in this endeavor (Box 1) and provide a perspec tive on upcoming advancements in this area, both tech nological and practical.
No matter whether the detection of leukemic cells is by microscopic inspection (hematoxylin & eosin staining, flu orescent in-situ hybridization [FISH], immunohistochem
istry), fluorescent detection of cell surface epitope com binations (flow cytometry), or the end result of polyme rase chain reaction (PCR) or high-throughput DNA sequencing, it is helpful to think of levels of residual dis ease as a logarithmic fraction of total normal cells measured by the same mechanism. For example, a hema topathologist may examine a bone marrow aspirate smear or biopsy core and conclude that 1%, or one in 100 cells, may be residual AML cells. Ultimately, this 10-2 may be the limit of detection in this context; considering a normal myeloblast cannot be distinguished reliably from abnor mal via light microscopy,5 a 5% cutoff to indicate evidence of residual disease has been established since 1956.6 Simi larly, the flow cytometrist may be able to discern one leu kemic cell in 1,000 or in 10,000 cells; this limit of detection, 10-3 to 10-4, is one to two orders of magnitude more sensitive. Nevertheless, as the total cardinality of potential comparator cells is in the billions or trillions, it follows that individually dispersed residual leukemic cells may sink below the limit of detection in the sample evalu ated, but nonetheless remain a significant threat in the patient, waiting to “reemerge” to a level detectable by
such testing (Figure 1). Disease “relapse” from “remission” after treatment therefore most often represents partially sensitive but refractory disease, with the rarer exceptions of cases of therapy-related myeloid neoplasm resulting from the treatment itself or true second malignancies in those with inherited or acquired predisposition to AML. Figure 1 depicts three distinct disease and detection courses. In the first case, colored in red, disease is treated and decreases to less than 0.1% (10-3), a level of sensitivity detectable with conventional flow cytometry. Until the disease relapses clinically, the patient is in an apparent flow cytometric MRD-negative remission. On the other hand, if a more sensitive flow cytometric or PCR assay with a lower limit of detection of 10-5 (1 cell among 100,000) were used, this patient would have been recog nized as having residual disease and could have been sur veilled more closely for incipient relapse or considered for MRD-directed treatments, e.g. with additional treatment such as a maintenance therapy, allogeneic hematopoietic cell transplantation, or ideally a clinical trial, acknowledg ing the current uncertainties about benefits and risks as sociated with such interventions.
Box 1. Potential reasons why current acute myeloid leukemia measurable residual disease testing is suboptimal at relapse prediction.
•
Wrong time-point – single landmark – do serial measurements help?
•
•
Wrong test – MRD there but not recognized as AML?
Wrong LOD – MRD there but sample incompletely characterized?
•
Wrong sample – MRD in patient but not in the tube? (See #1 above)
•
Wrong premise – Who says MRD testing will detect 100% of relapses?
MRD: measurable residual disease; AML: acute myeloid leukemia; LOD: limit of detection.
Figure 1. A conceptual model for measurable residual disease. Quantifiable disease, shown as three colored lines, red, orange, and black, may take very different trajectories. In red, an apparent re mission (see text) is followed by a rapid relapse. In orange, undetec table disease might relapse later, or be extinguished by host immu nity. In black, a cure. MRD: measu rable residual disease; MFC: multiparameter flow cytometry; PCR: polymerase chain reaction; LOD1: limit of detection for te chnology 1. LOD2: limit of detec tion for technology 2.

The patient whose disease burden is drawn in orange, on the other hand, had levels of residual disease largely un measurable by currently available MRD assays, in which a sensitivity of one in 105 or less is most typical. With such assays, this patient then had no measurable residual dis ease. From this low level of disease, relapse may occur at any later point in time, or cure may result, e.g., through additional chemotherapy and/or an immune effector cell. Finally, we could imagine a patient (exemplified in black) who received treatment effective enough to eradicate 100% of existing tumor cells. However, it is essential to recognize that we cannot draw a distinction between pa tients orange and black without the availability of more sensitive MRD assays. In the next section, we describe various techniques for the detection of MRD, and their analytic and practical limits (Figure 2).
Detection, or measurement, of MRD is a sine qua non, but the specific measurement mechanism profoundly affects analytical sensitivity, with different methods having limits of detection ranging over several logs. This assay-sensi tivity dependence, and the recognition that a negative test does not imply the absence of disease, is a primary reason why the field has shifted from the term “minimal residual disease” to “measurable residual disease” in the last few years.7
After 60 years of relative stasis in the response criteria used for AML,8 in 2017 the European LeukemiaNet (ELN) introduced a new category of MRD-negative complete re
Figure 2. Sensitivity of detection depends on technology and technique. Upper left. Morphological examination of the marrow, metaphase karyotypes, or fluorescent in-situ hybridization is limited to a sensitivity of about 1%. Upper right. Multiparameter flow cytometry with carefully chosen markers can achieve a sensitivity of 10-3, or acute myeloid leukemia constituting 0.1% of events. Experts using extensive panels can go lower. Lower left. Polymerase chain reaction (PCR), whether normalized to a re ference transcript such as ABL1 or quantified absolutely with digital PCR can look deeper, between 10-4 and 10-5. Lower right. While conventional next-generation sequencing has an error rate of around 0.1%, error correction technologies can markedly im prove the limit of detection to better than 10-7

mission in their 2017 guidelines update in acknowledg ment that patients who test MRD negative have better outcomes than those who test positive after receipt of the same therapy.9 This was followed in 2018 by the release of the first ELN consensus standard-of-care guidelines containing detailed specifics on flow cytometry, molecular testing, and clinical aspects of AML MRD.10 Molecular test ing by a validated quantitative PCR test was recommended for those patients with an AML containing a stable and characteristic genomic aberration, namely acute promye locytic leukemia, core binding factor leukemias, rare BCRABL translocated AML, or those with the canonical NPM1 insertion. For the approximately 60% of patients without such a mutation to track, the recommendation was - and remains - multiparameter flow cytometry (MFC). The NCRI AML17 study group demonstrated in a large study of 2,450 patients that MFC can be an effective discriminator in se lect patients,11 and meta-analyses suggest that it is broadly applicable.12 In 2021 the ELN AML MRD guidelines were updated (with the expectation that these evidencebased guidelines will be iteratively updated every 2-4 years as new data become available) with nearly 60 re fined recommendations spanning across MFC MRD, mol ecular MRD, clinical use of MRD, and directions for possible future improvements.13 New recommendations were also included for the use of next-generation se quencing in AML MRD detection (NGS-MRD). In contrast to its sibling leukemias, AML is descended from a transformed cell that bears no universally unique
molecular signature. Contrasting with IGHV or TCR gene rearrangements that reliably mark a clonal lineage of acute lymphoblastic leukemia cells, the AML genome is more heterogeneous and does not afford the opportunity for a single all-encompassing assay (viz., IGHV-directed PCR) as in acute lymphoblastic leukemia.14 While it is cur rently unproven for these most sensitive of AML MRD as says what is the optimal combination of targets for monitoring, it is clear that not all mutations found at initial AML diagnosis will have equal clinical utility for MRD moni toring.15,16 The optimal targets for molecular MRD measure ment have also not been defined beyond the recognition that the isolated detection of a mutation found commonly in age-related clonal hematopoiesis (e.g., DNMT3A, TET2, or ASXL1)17–20 or in germline predisposition syndromes (e.g., DDX41, RUNX1, or GATA2) does not necessarily represent residual AML (Figure 3). Moreover, existing data indicate that mutations in signaling pathway genes (FLT3, KIT, RAS, etc.) are useful when positive, but as later clonal acquisi tions, should not lead to false reassurance if negative, perhaps particularly when the mutation is therapeutically targeted (Table 1). Ultimately, accumulated knowledge about each molecular marker’s utility and tradeoffs could inform a patient-directed, multi-mutation testing strategy.21
Acknowledging that the result of any given MRD test may have a different significance (including no negative impact) in different clinical situations, an important area of current thought is the definition of optimal monitoring strategies
Figure 3. Disease context matters. Left. Tracking the subclone in blue may not represent the actual leukemia (orange). Disappea rance of the subclone could lead to wrong conclusions about remission status. The best measurable residual disease surrogate is often, but not always, the most primordially acquired mutation. Right. Clonal hematopoiesis complicates this picture. Mutations in DNMT3A, TET2, and ASXL1, as well as other genes, may exist above the level of leukemic transformation within the hemato poietic hierarchy and complicate tracking of residual disease. HSPC: hematopoietic stem and progenitor cell; LIC: leukemia-ini tiating cell; CH: clonal hematopoiesis.

Table 1. European LeukemiaNet-approved molecular acute myeloid leukemia measurable residual disease targets.
Recommended in ELN AML MRD 2021 or ELN 2022
NPM1 Yes
RUNX1-RUNX1T1 or CBFB-MYH11 Yes
Other fusions such as KMT2A, DEK-NUP214,73 MECOM
Not specifically
Signaling pathway genes: FLT3, KIT, RAS, others Possibly
“DTA” genes: DNMT3A, TET2, ASXL1
Specifically recommended against
Essential to inform postremission therapy.65-67
Measurement of fusion transcripts by qRT-PCR highly informative, but there is evidence that ultra-low levels of disease can be serially monitored.34,68–72
Smaller bodies of evidence but concept is sound. KMT2A has over 40 partners.74
Useful if positive but relapse possible in test-negative subjects.
These may be found in age-related clonal hematopo iesis and should be excluded from consideration.17-20
When present at a variant allele frequency of ~50%, specifically exclude from consideration. ANKRD26, CEBPA, DDX41, ETV6, GATA2, RUNX1,75 TP53
Hereditary predisposition genes: See comment
WT1, EVI1 Disfavored
Expression-based assays may be highly variable.76-89
ELN: European LeukemiaNet; AML: acute myeloid leukemia; MRD: measurable residual disease; qRT-PCR: quantitative reverse transcriptase polymerase chain reaction.
for individual patients, taking into account their unique disease and treatment contexts. The impacts of MRD test ing (and possible subsequent action) are situationally de pendent; thus, data collection and recommendations may need to be individualized. This may include genetic con text (Table 1) but also risk group11 and allogeneic trans plantation status.12,22,23 Finally, in addition to the assay itself, a key ingredient in sensitivity is supplying the assay with an appropriate input. Typically, cells are obtained from bone marrow or peripheral blood samples, or fluids/tissues of other or gans. A hemodilute, hypocellular specimen may defeat the purpose of cell-based analytical techniques and cannot be considered sensitive. However, emerging data suggest that molecular analyses of liquid biopsies may have value for MRD testing in AML. Nakamura and colleagues found that cell-free, circulating tumor DNA may even have higher prognostic value than bulk peripheral blood in some con texts.24 Further studies will be needed to determine what role cell-free DNA testing will play in a hematologic ma lignancy for which tumor-containing compartments can be accessed relatively easily.
⇒ Key point. Cytomorphology, sensitive only to about 1-5%, remains a standard part of complete remission criteria and is widely available. Morphological examination of the bone marrow is the ol dest and best-established technique for the quantification of myeloid leukemia. Typically, cross-sections of bone marrow core biopsies stained with hematoxylin-eosin are visually inspected, and, if needed, stained with antibodies
and immunohistochemistry reagents for more precise cell identification. Bone marrow aspirates are smeared, affor ding more space between distinct cells, and subjected to Wright stain. Finally, some portion of the aspirate is often cultured for visualization of G-banded metaphase karyo types and FISH studies. In direct examination of cells and in FISH analysis, about 200-500 total cells will be exam ined and tabulated with their identity. Clearly, the sensi tivity on average could be no greater than 1:200-1:500, or 0.2-0.5%, but given statistical constraints and normal vari ation, it is reasonable to conclude that the limit of detec tion is in the order of 1%.
Because of the ubiquity, general sensitivity, and inexact art of morphological examination,5 a threshold of 5% mye loblasts was established more than 60 years ago6 as a cutoff for complete remission in conjunction with blood count recovery. This legacy persists today, with national and international expert consensus groups continuing to include <5% bone marrow blasts as a central complete remission criterion.25,26 In FISH studies, the definition of abnormal varies on a per-probe basis, but typically lies be tween 1-5%. Although FISH improves upon microscopy by offering evidence of specific leukemia-associated changes that are definitively not present in normal myeloblasts, many AML cases have a normal karyotype27 (i.e., there is nothing to detect by FISH), and the technique is further limited by cost and throughput. Overall, advancement beyond this will require similarly ubiquitous assay(s) with broad applicability to many (ideally, all) AML patients and read-outs that are non-ambiguous to interpret quanti tatively. As we will see, each of the more modern tech niques remain wanting in some way.
Immunophenotyping by multiparameter flow cytometry
⇒ Key point. Considerable expertise is required for correct interpretation of acute myeloid leukemia measureable re sidual disease flow cytometry using a leukemia-associated immunophenotype-based difference-from-normal ap proach.
⇒ Key point. While recommendations for monoclonal anti body panel compositions hav e been provided, “off-theshelf” standardized pre-mixes are not yet widely available. Immunophenotyping by MFC is a key tool to establish a diagnosis of AML and has proven useful for the detection of MRD. Historically, two separate approaches have been developed as bases for MRD assays, one focusing on the identification of one or more leukemia-associated immu nophenotypes (LAIP) at diagnosis that are then tracked throughout the treatment course, and the other focusing on the identification of cell population(s) showing devi ation(s) from antigen-expression patterns typical of nor mal or regenerating cells of similar lineage and maturation stage (“difference from normal [DfN]”).10,13,28,29 Used in iso lation, the LAIP approach may lead to false negative test ing because of immunophenotypic shifts throughout the course of AML, whereas the DfN approach may be particu larly susceptible to false positive interpretation. Acknowl edging such limitations, it is currently recommended to combine these two approaches (“LAIP-based DfN ap proach”) for the monitoring of diagnostic and emergent leukemic clones.13
Advantages of MFC-based MRD assays are their wide ap plicability with suitability for >90% of all patients with AML if a comprehensive panel of monoclonal antibodies is used, relative ease of quantifying abnormal cell popu lations, rapid turn-around times, assessment of hemodi lution, ability to distinguish live from dead cells, and the possibility to identify immunotherapy targets. As signifi cant limitations, not all cases of AML have an abnormal immune phenotype and/or phenotype(s) may change over time, the sensitivity of the assay is not uniform between patients, fresh material is required for best results, and analysis/data interpretation typically includes subjective elements. Perhaps most importantly, MFC-based MRD as says require experience and expertise, and assay stan dardization or even harmonization has proven challenging. Development and validation of (somewhat simplified) antibody panels that enable a harmonized MFC-based MRD assessment is an important focus of ongoing work to advance this methodology.29 We and others have evalu ated compartmental differences and found that MFCbased MRD testing of peripheral blood samples may yield similar findings to those obtained with testing of bone marrow specimens, with sensitivity and specificity ≥90% in most cases.30 Additional, ideally prospective, com parative evaluations to expand on this work will be helpful to further refine the relative values of peripheral blood
versus bone marrow MFC MRD testing. Other areas for po tential advances involve automated approaches to the analysis and interpretation of MFC MRD data,13 and deter mination of the potential value of including evaluations of less mature (“leukemia stem cell”) populations in MRD as says. While such approaches entail intrinsic challenges (e.g., with regard to the exact definition, or sorting strat egy) of “leukemia stem cell” populations, emerging data indicate that considering such cell populations might re fine risk assessment relative to conventional MFC MRD testing.31,32
Quantitative polymerase chain reaction
⇒ Key point. Polymerase chain reaction requires a specific target mutation or fusion for which to search.
⇒ Key point. Polymerase chain reaction can detect DNA mutations at very sensitive levels; its use for RNA gene ex pression quantification in measurable residual disease is disfavored. Detection of fusion genes from RNA input re mains very valuable.
⇒ Key point. Digital polymerase chain reaction is emerging as a potentially more sensitive and standardizable way to quantify specific mutations absolutely.
The PCR recursively amplifies billions of copies of an orig inal starting template molecule. This sounds like an ideal molecular technology for the detection of low levels of re sidual AML, but it is complicated by a number of factors. The first is the heterogeneity of AML: while there are scores of different mutations and cytogenetic abnormal ities, the genome itself is relatively stable (except in late stages and in some subtypes such as TP53-mutated or complex karyotype AML), with among the lowest tumor mutational burden of all cancers studied in a landmark pan-cancer analysis.33 Functionally and practically, AML is dozens of different diseases, and a specific PCR test or panel must be selected and individualized to each patient. On the other hand, PCR is highly specific and widely avail able, both important characteristics for a test performed in the remission setting.
A second potential difficulty with PCR as an aberrationspecific assay is that it provides only a relative quantifi cation of targets in the analyte. A PCR test is determined to be positive when a fluorescent signal is detected above some pre-specified threshold after a certain number of cyclic amplifications. This cycle number as a power of two (i.e., 2Ct) provides information about the original amount of detected mutation (or fusion transcript, etc.), but only in terms of a relative copy number. Typically, this limitation is overcome by normalizing against a standardized com parator such as ABL1 transcripts. Overall, the lack of ab solute quantification in quantitative reverse transcription PCR (qRT-PCR) complicates standardization and studies of distinct levels of MRD.
Digital PCR (dPCR) is a relatively newer technique that is
based on the fundamental principles of PCR but differs from qRT-PCR in that it provides an absolute quantifica tion of molecules, which can then be normalized to total volume of source analyte (microliter of blood, etc.). dPCR is sometimes referred to as “droplet digital PCR,” as the first commercially successful dPCR assays relied on par titioning an input sample, and its constituent DNA, into thousands of microscopic oil-water emulsion droplets. These droplets then each host individual PCR reactions, and the absolute proportion of detected target molecule could be calculated discretely (“digitally”) by dividing the number of positive droplets by negative droplets. This ab solute quantification has immense advantages: assays are easier to standardize across laboratories, are not depend ent on fluctuations in the normalization target, and the results are more directly interpretable by clinicians and researchers. On the other hand, even with such “standard ization,” the cutoff between positive and negative tests relative to a noise floor, as well as a quantitative level that is actionable remains to be established and must be vali dated in clinical settings. What is more, the relevant stan dards differ for different molecular targets (Table 1), and compartments (marrow vs. blood) can have a 100-fold im pact on detectability of some targets.34 Finally, clinicians must be mindful that even when dPCR is an excellent fit for their patient and disease context, there are important limitations. For example, dozens of distinct NPM1 muta tions exist, but three (types A, B, and D) account for about 90% of cases.35–37 dPCR assays that cover only the most common three could lead to a wrong conclusion of MRD negativity for a patient with a type C mutation that was discovered via NGS, for instance. Overall, the sensitivity of dPCR is similar to that of traditional qRT-PCR, between one in 105 and 106, but because of its advantages, dPCR will likely supplant the other assay over time.
High-throughput sequencing leverages PCR, plus advances in microfluidics and photonics/optics to effectively minia turize and repeat on the scale of billions of times a con ventional Sanger reaction. The individually sequenced fragments can be computationally reassembled into stacks of reads representing a digitally quantized repre sentation of the assayed allele pool. Researchers or clini cians can then examine genomic positions of interest to estimate the fraction of mutant DNA in the sample. This is an exciting and powerful technique for the assess ment of residual AML for several reasons. First, NGS has become a commodity oncology product, widely available at individual hospitals and with numerous send-out op tions – although turnaround time remains a concern in the acute context of AML. Secondly, it greatly simplifies the burden on the clinician who can order a single panel covering multiple pathogenic mutations, albeit at higher cost. The biological limitation in this is that AML is the per fect storm of low mutational burden,33 lacking a unifying or pluralistic driver, and frequently possessing genomic aberrations that are not single point mutations (i.e., fusions and other structural variations) which are more difficult to detect with current NGS approaches. Con sequently, even a broad NGS panel may not effectively query many types of AML genomes.
⇒
Key point. DNA sequencing is both the most versatile and sensitive technique, but standards and advancements are still being established.
⇒
Key point. The error rate intrinsic to conventional nextgeneration sequencing makes false positive measurable residual disease calls likely, but laboratory and bio informatic error-correction techniques can reduce this risk and are strongly recommended. NGS, also called high-throughput sequencing, is one of the most transformational technologies in biology and medi cine in the last 20 years.38 The ability to assay a large number of genes, a small number of genes extremely deeply, or limited only by resources a large number of genes deeply, as well as quantifying either DNA or RNA (in cluding gene expression and fusion detection) has gener ated considerable enthusiasm for NGS-based technology for MRD testing in AML.39
There is also a technical limitation as we seek to look deeper: clinical assays often do not report variants de tected with a frequency lower than 1% due to the error rate of conventional NGS resulting in the risk of false posi tive results. This means that while we might be able to make an estimate of mutant allele fraction ~0.5% when we observe 50 variant reads in 10,000, we cannot simply 10X the coverage of a particular hotspot each time we want another log of sensitivity beyond this. To address these limitations, which primarily stem from propagated PCR errors (Figure 2, lower right), a variety of error sup pression approaches have been introduced. Duplex se quencing40,41 is arguably the most specific of these methods, capable of reducing error rates to a point at which one mutant allele among 108 wild-type alleles can be correctly detected. Unfortunately, these techniques require sophisticated laboratory and bioinformatics per sonnel and are not yet widely available in 2022, although a number of companies have introduced a variety of errorcorrection kits and we expect the number of academic and commercial offerings to grow quickly. The necessity of reducing error rates compared to NGS assays used at diagnosis, particularly for the detection at MRD level of single nucleotide variants, has resulted in the 2022 ELN guidelines now making a specific recommendation for error-corrected sequencing,26 and major studies in AML have now incorporated it.15,16,19,42–44 NGS-based methods may represent the future for AML MRD testing with promises of assay reproducibility, highly
quantitative nature, and the potential to harmonize testing and interpretation across sites. Despite this, there is cur rently insufficient evidence to recommend NGS-MRD as a standalone AML MRD technique.26 The recommended limit of detection for NGS-MRD testing in AML, as for multi parameter flow cytometry and other molecular testing, is at least one in 1,000, although the optimal threshold level that best discriminates subsequent relapse risk has not yet been defined for individual mutations, combinations of mutations, or treatment time-points. There is also evi dence that thresholds lower than 0.1% can significantly in crease sensitivity with only a small loss in specificity.30
There are a variety of potential uses for results from AML MRD assays, including monitoring for relapse detection after treatment, quanti fication of treatment response, identification of patients in remission but at high risk of relapse at key clinical landmark time-points (i.e., for clini cal trial enrollment), and potentially as a surrogate end point for overall survival.45 MRD assays may be most immediately useful in informing the risk of relapse, a no tion supported by findings from large meta-analyses.3,12 However, at the level of individual patients, our ability to predict relapse is suboptimal,46,47 cautioning against overreliance on a negative MRD test result to guide decisionmaking and prognostication. Current MRD testing is limited for many potential reasons (Box 1). Numerous new technologies and approaches are, however, under devel opment to further improve MRD detection and thus early warning of relapse. To overcome technological and physi cal limitations previously mentioned (Box 2), many of these focus on pre-enrichment of target cells. In the RE LAZA study, Platzbecker and colleagues sorted CD34+ cells

Box 2. Can we go lower?
Besides the biological and technical limitations described in the text, there is a physical limitation. The denominator in mutant allele detection is normal genomes, or cells . To achieve 1:109 sensi tivity practically requires 3x10⁹ inputs. At a cellular concentration of 10,000/mL, this requires a sample of 100-300 mL, clearly an impractical enterprise. At 1,000/mL, it is absurd to consider. The figure de picts the theoretical approximate sampling vol ume (bottom row) required for a given limit of detection (top row) assuming 1,000 nucleated cells per microliter. Incorporation of cell-free DNA is one way to overcome this; continuous surveil lance54 at a lower level is another possibility.
for donor chimerism analysis to select patients for main tenance intervention in anticipation of relapse.48 The same investigators also used CD34+ enrichment followed by se quencing to effectively detect MRD in non-transplant AML patients with high sensitivity and specificity, and signifi cantly earlier than un-enriched NGS.49 We have also shown that enhancing the sorting process for a leukemiainitiating cell phenotype provides the ability to interrogate the earliest and smallest compartments responsible for relapse.50 Clearly, dedicated affordable instrumentation to assist in these techniques would need to be developed before pre-enrichment could find more widespread use. Sequencing-based single-cell technologies afford the op portunity to combine informative elements of surface im munophenotype with genetic mutations. Current investigations using joint profiling have been focused on enhancing the understanding of biology from multimodal data,51,52 but future work could leverage these learnings to dissect patients with lower versus higher risk of relapse in the setting of DNMT3A, TET2, and ASXL1 (DTA)-type or IDH mutations according to the expression of higher risk markers on subpopulations. Other technological advancements that will impact prac tical aspects of MRD testing concern not necessarily the depth of interrogation, but the time and place. Different AML subtypes have different relapse kinetics.53 As sche matically depicted in Figure 1, residual leukemic cells below the limit of detection may eventually gain repli cative momentum and return, which may occur between visits.53 Longitudinal testing4,54 in settings out of major leukemia centers, including the home, could facilitate ear lier detection and intervention. Small, portable sequencing instruments that can be deployed in remote settings55 and have already been demonstrated to measure mutations in
Box
What is the degree of discordance between AML MRD measured by FC and NGS? • Can blood substitute for marrow in flow/NGS AML MRD assessments? •
Are all/any detected non-DTA mutations appropriate for NGS tracking in remission? – Or are some more pathogno • monic than others?
What about residual genetic constituents of an antecedent MDS? •
• using highly sensitive MRD-depth NGS measurements? i.e.: can we predict potential escape clones?
How often are subclones responsible for relapse found in remission and/or in the original diagnostic sample when
• apy?
Does AML MRD negativity have the same prognostic significance if achieved after intensive vs. non-intensive ther
AML: acute myeloid leukemia; MRD: measurable residual disease; FC: flow cytometry; NGS: next-generation sequencing. DTA: DNMT3A, TET2, ASXL1; MDS: myelodysplastic syndrome.
AML56 are an exciting development. At-home blood col lection is another area that has seen recent increasing de velopment.57 Widespread availability of at-home blood collection and/or miniaturized, economical sequencers might enable more frequent monitoring with a riskadapted schedule when the point-of-care is not a major leukemia center or from the patient’s own home.
As previously discussed, the ELN produces evidencebased, international consensus clinical standard-of-care guidelines for the use of MRD testing in AML.10,13 In addition, guidance for industry is available from the US Food and Drug Administration.58 Both these documents are limited however due to the lack of available high-quality evidence regarding specific tests, contexts of use, and clinical util ity. Many important fundamental questions remain (Box 3). In the context of this deficiency several new national or international efforts have been initiated to generate evi dence supporting the use of MRD testing in AML. While AML MRD testing for response assessment now rep resents the standard of care and is therefore integrated into most high-quality clinical trials, the clinical evidence basis for the next generation of AML MRD tests, based on genomic assays as described above, is still being devel oped. Planned for launch in late 2022 or early 2023, mye loMATCH is the North American precision medicine master protocol initiative for patients with myeloid malignancies. This program, a collaboration between the National Cancer Institute and the Cancer Cooperative Groups (ECOGACRIN, SWOG, The Alliance, Canadian Cancer Trials Group, Children’s Oncology Group), aims to assign patients to ran domized controlled trials at each stage of therapy. While initial therapy allocations will be made using baseline ge nomic and clinical characteristics, the intent is to use AML MRD results as both an endpoint of trials, but also the in
clusion criterion in randomized controlled trials for sub sequent lines of therapy (i.e., consolidation, transplant, maintenance). MRD will be tested by flow cytometry, but also by novel molecular methodologies such as ultra-deep DNA-sequencing on both blood and bone marrow at key clinical landmarks.
In addition to myeloMATCH, there are also several other ongoing or planned programs of importance to the clinical development of AML MRD testing. The Foundation for the National Institutes of Health (FNIH), established by Con gress in 1990 is a not-for-profit 501(c)(3) charitable organ ization that works with partners to accelerate biomedical research. In early 2022 the FNIH announced the launch of the public-private-academic AML MRD Biomarkers Consor tium, including the National Institutes of Health, Food and Drug Administration, and over 20 private sector research, diagnostic, or pharmaceutical industry partners. The stated goals of this consortium are to generate reference stan dards for AML MRD, compare molecular methods for AML MRD detection, generate evidence of clinical utility using retrospective bio-banked material, and facilitate gener ation of prospective evidence in ongoing or upcoming clini cal trials. An earlier industry-led group, MPAACT (Measurable residual disease Partnership and Alliance in Acute myeloid leukemia Clinical Treatment), with origins dating back to at least 2018, reports a focus on establishing MRD as a surrogate endpoint for overall survival in the treatment of AML. This work, to be performed by the Mayo Clinic Statistics and Data Management Center, would in volve a meta-analysis to assess the association of MRD with overall survival based on data from across multiple clinical trials.59 A large European initiative named HARMONY (Healthcare Alliance for Resourceful Medicine Offensiv e against Neoplasms in Hematology) is a big data program of 100 organizations from 18 European countries with data from over 100,000 patients with hematologic malignancies. HARMONY proposes, in an analysis called “AML-4” of over 7,500 AML patients, to evaluate MRD status after two cycles of chemotherapy as a potential surrogate endpoint for overall survival in AML. This will include analysis of flow
cytometry and molecular (NPM1 quantitative PCR) test re sults, measured in blood and marrow, of patients treated in randomized controlled trials of initial AML treatment.60 Two related, large US-based efforts, each reporting on ap proximately 1,000 patients, will focus on the association between overall survival in patients with AML in remission undergoing allogeneic hematopoietic cell transplantation and the results of genomic MRD testing before (PreMEASURE)61 and after (MEASURE, NCT05224661) transplan tation.
AML has consistently been at the forefront of cancer gen etics and genomics.62,63 In contrast, it has lagged behind the three other major types of leukemia in sensitive and standardized tests for low levels of disease, at least in part because of its molecular and immunophenotypic het erogeneity (i.e., lacking an analogue to IGH, TCR, or BCRABL). In some ways, our standards and expectations of MRD detection remain stuck in a decades-old rut, just as our treatment paradigms were until the targeted therapy revolution began in 2017.64 Newer developments, including sophisticated multicolor flow cytometry assays, a prolif eration of target-specific PCR assays, error-corrected DNA sequencing, and the incorporation of these advanced methods in large studies have led to a new era for the management of AML, but many opportunities and ques tions remain (Box 3). What further developments in technology and under standing of disease biology will have the highest yield in terms of improved patient outcomes? We are particularly excited about the potential for sequencing-based tech niques to interrogate both deeply and broadly across a
1. Döhner H, Wei AH, Löwenberg B. Towards precision medicine for AML. Nat Rev Clin Oncol. 2021;18(9):577-590.
2. Hart JS, Shirakawa S, Trujillo, Frei E 3rd. The mechanism of induction of complete remission in acute myeloblastic leukemia in man. Cancer Res. 1969;29(12):2300-2307.
3. Short NJ, Zhou S, Fu C, et al. Association of measurable residual disease with survival outcomes in patients with acute myeloid leukemia: a systematic review and meta-analysis. JAMA Oncol. 2020;6(12):1890-1899.
4. Walter RB, Ofran Y, Wieerzbowska A, et al. Measurable residual disease as a biomarker in acute myeloid leukemia: theoretical and practical considerations. Leukemia. 2021;35(6):1529-1538.
5. Chen X, Fromm JR, Naresh KN. ‘Blasts’ in myeloid neoplasmshow do we define blasts and how do we incorporate them into diagnostic schema moving forward? Leukemia. 2022;36(2):327-332.
6. Bisel HF. Criteria for the evaluation of response to treatment in acute leukemia. Blood. 1956;11:676-677.
variety of lesions for a continually decreasing cost. The prospect of longitudinal home-based testing could over come the problem of single point-in-time snapshots. Large patient cohort studies, such as HARMONY and MEASURE, are crucial to provide the basis for new knowl edge and insights. Focused partnerships between experts in disease assessment and therapeutic intervention, as in the MRD-focused arms of myeloMATCH, will be essential to translate learnings. Finally, and most pressingly, how can we make present advancements more standard and widely accessible? The convening of groups such as the ELN MRD Working Party and the promulgation of expert consensus recommenda tions is a critical first step, but the molecular heteroge neity of AML makes the practical implementation of these recommendations difficult. Commoditization of a complex decision tree, whether ultimately through centralization or simplification and dissemination, will be required for all AML patients to benefit from these advances.
JSB provides advisory board consulting for Abbvie, Astellas, AstraZeneca, KITE and INNATE; has received clinical trial funding from MingSight Pharmaceuticals (NCT03492125) and holds a patent on a leukemia diagnostic device. RBW has received laboratory research grants and/or clinical trial support from Amgen, Aptevo, Celgene, ImmunoGen, Janssen, Jazz, Kura, MacroGenics, and Pfizer; has owner ship interests in Amphivena; and is (or has been) a consul tant to Abbvie, Amgen, Amphivena, BerGenBio, Bristol Myers Squibb, Celgene, GlaxoSmithKline, ImmunoGen, and Orum. CSH: the National Heart, Lung, and Blood Institute receives research funding for the laboratory of Dr. Hourigan from Sellas and from the Foundation of the NIH AML MRD Bio markers Consortium.
7. Goldman JM, Gale RP. What does MRD in leukemia really mean? Leukemia. 2014;28(5):1131.
8. Hourigan CS, Karp JE. Minimal residual disease in acute myeloid leukaemia. Nat Rev Clin Oncol. 2013;10(8):460-471.
9. Döhner H, Estey E, Grimwade D, et al. Diagnosis and management of AML in adults: 2017 ELN recommendations from an international expert panel. Blood. 2017;129(4):424-447.
10. Schuurhuis GJ, Heuser M, Freeman S, et al. Minimal/measurable residual disease in AML: a consensus document from the European LeukemiaNet MRD Working Party. Blood. 2018;131(12):1275-1291.
11. Freeman SD, Hills RK, Virgo P, et al. Measurable residual disease at induction redefines partial response in acute myeloid leukemia and stratifies outcomes in patients at standard risk without NPM1 mutations. J Clin Oncol. 2018;36(15):1486-1497.
12. Buckley SA, Wood BL, Othus M, et al. Minimal residual disease prior to allogeneic hematopoietic cell transplantation in acute myeloid leukemia: a meta-analysis. Haematologica.
2017;102(5):865-873.
13. Heuser M, Freeman SD, Ossenkoppele GJ, et al. 2021 update on MRD in acute myeloid leukemia: a consensus document from the European LeukemiaNet MRD Working Party. Blood. 2021;138(26):2753-2767.
14. Nizet Y, Van Daele S, Lewalle P, et al. Long-term follow-up of residual disease in acute lymphoblastic leukemia patients in complete remission using clonogeneic IgH probes and the polymerase chain reaction. Blood. 1993;82(5):1618-1625.
15. Jongen-Lavrencic M, Grob T, Hanekamp D, et al. Molecular minimal residual disease in acute myeloid leukemia. N Engl J Med. 2018;378(13):1189-1199.
16. Hourigan CS, Dillon LW, Gui G, et al. Impact of conditioning intensity of allogeneic transplantation for acute myeloid leukemia with genomic evidence of residual disease. J Clin Oncol. 2020;38(12):1273-1283.
17. Pløen GG, Nederby L, Guldberg P, et al. Persistence of DNMT3A mutations at long-term remission in adult patients with AML. Br J Haematol. 2014;167(4):478-486.
18. Bhatnagar B, Eisfeld AK, Nicolet D, et al. Persistence of DNMT3A R882 mutations during remission does not adversely affect outcomes of patients with acute myeloid leukaemia. Br J Haematol. 2016;175(2):226-236.
19. Heuser M, Heida B, Büttner K, et al. Posttransplantation MRD monitoring in patients with AML by next-generation sequencing using DTA and non-DTA mutations. Blood Adv. 2021;5(9):2294-2304.
20. Tanaka T, Morita K, Loghavi S, et al. Clonal dynamics and clinical implications of postremission clonal hematopoiesis in acute myeloid leukemia. Blood. 2021;138(18):1733-1739.
21. Newman AM, Bratman SV, To J, et al. An ultrasensitive method for quantitating circulating tumor DNA with broad patient coverage. Nat Med. 2014;20(5):548-554.
22. Rodríguez-Arbolí E, Orvain C, Othus M, Walter RB. Significance of measurable residual disease in adults with secondary acute myeloid leukemia undergoing allogeneic hematopoietic cell transplantation. Bone Marrow Transplant. 2022 Aug 27. [Epub ahead of print]
23. Orvain C, Wilson JA, Fang M, et al. Relative impact of residual cytogenetic abnormalities and flow cytometric measurable residual disease on outcome after allogeneic hematopoietic cell transplantation in adult acute myeloid leukemia. Haematologica. 2022 Aug 4. [Epub ahead of print]
24. Nakamura S, Yokoyama K, Shimizu E, et al. Prognostic impact of circulating tumor DNA status post–allogeneic hematopoietic stem cell transplantation in AML and MDS. Blood. 2019;133(25):2682-2695.
25. Pollyea DA, Bixby D, Perl A, et al. NCCN Guidelines insights: acute myeloid leukemia, version 2.2021. J Natl Compr Cancer Netw. 2021;19(1):16-27.
26. Döhner H, Wei AW, Appelbaum FR, et al. Diagnosis and management of AML in adults: 2022 ELN recommendations from an international expert panel. Blood. 2022;140(12):1345-1377
27. Pastore F, Dufour A, Benthaus T, et al. Combined molecular and clinical prognostic index for relapse and survival in cytogenetically normal acute myeloid leukemia. J Clin Oncol. 2014;32(15):1586-1594.
28. Wood BL. Acute myeloid leukemia minimal residual disease detection: the difference from normal approach. Curr Protoc Cytom. 2020;93(1):e73.
29. Tettero JM, Freeman S, Buecklein V, et al. Technical aspects of flow cytometry-based measurable residual disease quantification in acute myeloid leukemia: experience of the
European LeukemiaNet MRD Working Party. Hemasphere. 2022;6(1):e676.
30. Godwin CD, Zhou Y, Othus M, et al. Acute myeloid leukemia measurable residual disease detection by flow cytometry in peripheral blood vs bone marrow. Blood. 2021;137(4):569-572.
31. Zeijlemaker W, Grob T, Meijer R, et al. CD34+CD38- leukemic stem cell frequency to predict outcome in acute myeloid leukemia. Leukemia. 2019;33(5):1102-1112.
32. Li S-Q, Xu L-P, Wang Y, et al. An LSC-based MRD assay to complement the traditional MFC method for prediction of AML relapse: a prospective study. Blood. 2022;140(5):516-520.
33. Chalmers ZR, Connelly CF, Fabrizio D, et al. Analysis of 100,000 human cancer genomes reveals the landscape of tumor mutational burden. Genome Med. 2017;9(1):34.
34. Guièze R, Renneville A, Cayuela J-M, et al. Prognostic value of minimal residual disease by real-time quantitative PCR in acute myeloid leukemia with CBFB-MYH11 rearrangement: the French experience. Leukemia. 2010;24(7):1386-1388.
35. Falini B, Mecucci C, Tiacci E, et al. Cytoplasmic nucleophosmin in acute myelogenous leukemia with a normal karyotype. N Engl J Med. 2005;352(3):254-266.
36. Falini B, Nicoletti I, Martelli MF, Mecucci C. Acute myeloid leukemia carrying cytoplasmic/mutated nucleophosmin (NPMc+ AML): biologic and clinical features. Blood. 2007;109(3):874-885.
37. Alpermann T, Schnittger S, Eder C, et al. Molecular subtypes of NPM1 mutations have different clinical profiles, specific patterns of accompanying molecular mutations and varying outcomes in intermediate risk acute myeloid leukemia. Haematologica. 2016;101(2):e55-58.
38. Goodwin S, McPherson JD, McCombie WR. Coming of age: ten years of next-generation sequencing technologies. Nat Rev Genet. 2016;17(6):333-351.
39. Duncavage EJ, Schroeder MC, O'Laughlin M, et al. Genome sequencing as an alternative to cytogenetic analysis in myeloid cancers. N Engl J Med. 2021;384(10):924-935.
40. Schmitt MW, Kennedy SR, Salk JJ, et al. Detection of ultra-rare mutations by next-generation sequencing. Proc Natl Acad Sci U S A. 2012;109(36):14508-14513.
41. Kennedy SR, Schmitt MW, Fox EJ, et al. Detecting ultralowfrequency mutations by duplex sequencing. Nat Protoc. 2014;9(11):2586-2606.
42. Murdock HM, Kim HT, Denlinger N, et al. Impact of diagnostic genetics on remission MRD and transplantation outcomes in older patients with AML. Blood. 2022;139(24):3546-3557.
43. Thol F, Gabdoulline R, Liebich A, et al. Measurable residual disease monitoring by NGS before allogeneic hematopoietic cell transplantation in AML. Blood. 2018;132(16):1703-1713.
44. Patkar N, Kakirde C, Shaikh AF, et al. Clinical impact of panelbased error-corrected next generation sequencing versus flow cytometry to detect measurable residual disease (MRD) in acute myeloid leukemia (AML). Leukemia. 2021;35(5):1392-1404.
45. Gui G, Hourigan CS. Measurable residual disease assessment as a surrogate marker in new drug development in acute myeloid leukemia. Cancer J. 2022;28(1):73-77.
46. Rodríguez-Arbolí E, Othus M, Orvain C, et al. Contribution of measurable residual disease status to prediction accuracy of relapse and survival in adults with acute myeloid leukemia undergoing allogeneic hematopoietic cell transplantation. Haematologica. 2022 Sep 22. [Epub ahead of print]
47. Othus M, Wood BL, Stirewalt DL, et al. Effect of measurable ('minimal’) residual disease (MRD) information on prediction of relapse and survival in adult acute myeloid leukemia. Leukemia. 2016;30(10):2080-2083.
48. Platzbecker U, Wermke M, Radke J, et al. Azacitidine for
treatment of imminent relapse in MDS or AML patients after allogeneic HSCT: results of the RELAZA trial. Leukemia. 2012;26(3):381-389.
49. Stasik S, Burkhard-Meier C, Kramer M, et al. Deep sequencing in CD34+ cells from peripheral blood enables sensitive detection of measurable residual disease in AML. Blood Adv. 2022;6(11):3294-3303.
50. Saygin C, Lozanski A, Doong T-J, et al. Genomic analysis of cellular hierarchy in acute myeloid leukemia using ultrasensitive LC-FACS-Seq. Blood. 2019;134(Suppl 1):186.
51. Miles LA, Bowman RL, Merlinsky TR, et al. Single-cell mutation analysis of clonal evolution in myeloid malignancies. Nature. 2020;587(7834):477-482.
52. Demaree B, Delley CL, Vasudevan HN, et al. Joint profiling of DNA and proteins in single cells to dissect genotype-phenotype associations in leukemia. Nat Commun. 2021;12(1):1583.
53. Ommen HB, Schnittger S, Jovanovic JV, et al. Strikingly different molecular relapse kinetics in NPM1c, PML-RARA, RUNX1RUNX1T1, and CBFB-MYH11 acute myeloid leukemias. Blood. 2010;115(2):198-205.
54. Hokland P, Ommen HB. Towards individualized follow-up in adult acute myeloid leukemia in remission. Blood. 2011;117(9):2577-2584.
55. Quick J, Loman NJ, Duraffour S, et al. Real-time, portable genome sequencing for Ebola surveillance. Nature. 2016;530(7589):228-232.
56. Kautto EA, Gregory CT, Saygin C, Orwick S, Blachly JS. Rapid molecular diagnostics for acute myeloid leukemia using singlemolecule sequencing. Blood. 2019;134(Suppl 1):374.
57. Hendelman T, Chaudhary A, LeClair AC, et al. Self-collection of capillary blood using Tasso-SST devices for anti-SARS-CoV-2 IgG antibody testing. PLoS One. 2021;16(9):e0255841.
58. Hematologic Malignancies: Regulatory Considerations for Use of Minimal Residual Disease in Development of Drug and Biological Products for Treatment. 2020 January. https://www.fda.gov/regulatory-information/search-fdaguidance-documents/hematologic-malignancies-regulatory-con siderations-use-minimal-residual-disease-development-drugand
59. Janssen Pharmaceuticals. MPAACT Consortium Unites Industry and Academia to Establish Measurable Residual Disease as a Surrogate Endpoint in Acute Myeloid Leukemia Drug Development. https://www.prnewswire.com/newsreleases/mpaact-consortium-unites-industry-and-academia-to -establish-measurable-residual-disease-as-a-surrogateendpoint-in-acute-myeloid-leukemia-drug-development-30154 0777.html (2022).
60. Ossenkoppele GJ, Bullinger L, Döhner H, Huntly B, Voso MT. AML-4: using big data to confirm the link between MRD and survival in AML. https://www.harmonyalliance.eu/projects/research-project/aml-4-using-big-data-toconfirm-the-link-between-mrd-and-survival-in-aml- (2021).
61. Hourigan CS, Dillon LW, Gui G, et al. Pre-MEASURE: multicenter evaluation of the prognostic significance of measurable residual disease testing prior to allogeneic transplantation for adult patients with AML in first remission. J Clin Oncol. 2022;40(16 suppl):7006.
62. Ley TJ, Mardis ER, Ding L, et al. DNA sequencing of a cytogenetically normal acute myeloid leukaemia genome. Nature. 2008;456(7218):66-72.
63. Cancer Genome Atlas Research Network; Ley TJ, Miller C, Ding L, et al. Genomic and epigenomic landscapes of adult de novo acute myeloid leukemia. N Engl J Med. 2013;368(22):2059-2074.
64. Levis M. Midostaurin approved for FLT3-mutated AML. Blood.
2017;129(26):3403-3406.
65. Ivey A, Hills RK, Simpson MA, et al. Assessment of minimal residual disease in standard-risk AML. N Engl J Med. 2016;374(5):422-433.
66. Bataller A, Oñate G, Diaz-Beyá M, et al. Acute myeloid leukemia with NPM1 mutation and favorable European LeukemiaNet category: outcome after preemptive intervention based on measurable residual disease. Br J Haematol. 2020;191(1):52-61.
67. Kapp-Schwoerer S, Weber D, Corbacioglu A, et al. Impact of gemtuzumab ozogamicin on MRD and relapse risk in patients with NPM1-mutated AML: results from the AMLSG 09-09 trial. Blood. 2020;136(26):3041-3050.
68. Buonamici S, Ottaviani E, Testoni N, et al. Real-time quantitation of minimal residual disease in inv(16)-positive acute myeloid leukemia may indicate risk for clinical relapse and may identify patients in a curable state. Blood. 2002;99(2):443-449.
69. Martinelli G, Rondoni M, Buonamici S, et al. Molecular monitoring to identify a threshold of CBFbeta/MYH11 transcript below which continuous complete remission of acute myeloid leukemia inv16 is likely. Haematologica. 2004;89(4):495-497.
70. Yin JAL, O'Brien MA, Hills RK, Daly SB, Wheatley K, Burnett AK. Minimal residual disease monitoring by quantitative RT-PCR in core binding factor AML allows risk stratification and predicts relapse: results of the United Kingdom MRC AML-15 trial. Blood. 2012;120(14):2826-2835.
71. Willekens C, Blanchet O, Renneville A, et al. Prospective longterm minimal residual disease monitoring using RQ-PCR in RUNX1-RUNX1T1-positive acute myeloid leukemia: results of the French CBF-2006 trial. Haematologica. 2016;101(3):328-335.
72. Wang T, Zhou B, Zhang J, et al. Allogeneic hematopoietic stem cell transplantation could improve survival for pure CBF-AML patients with minimal residual disease positive after the second consolidation. Leuk Lymphoma. 2021;62(4):995-998.
73. Ommen HB, Touzart A, Macintyre E, et al. The kinetics of relapse in DEK-NUP214-positive acute myeloid leukemia patients. Eur J Haematol. 2015;95(5):436-441.
74. Krivtsov AV, Armstrong SA. MLL translocations, histone modifications and leukaemia stem-cell development. Nat Rev Cancer. 2007;7(11):823-833.
75. Nachmias B, Krichevsky S, Filon D, et al. Monitoring minimal residual disease in RUNX1-mutated acute myeloid leukemia. Acta Haematol. 2022 Aug 5. [Epub ahead of print]
76. Candoni A, Tiribelli M, Toffoletti E, et al. Quantitative assessment of WT1 gene expression after allogeneic stem cell transplantation is a useful tool for monitoring minimal residual disease in acute myeloid leukemia. Eur J Haematol. 2009;82(1):61-68.
77. Cilloni D, Renneville A, Hermitte F, et al. Real-time quantitative polymerase chain reaction detection of minimal residual disease by standardized WT1 assay to enhance risk stratification in acute myeloid leukemia: a European LeukemiaNet study. J Clin Oncol. 2009;27(31):5195-5201.
78. Nomdedéu JF, Hoyos M, Carricondo M, et al. Bone marrow WT1 levels at diagnosis, post-induction and post-intensification in adult de novo AML. Leukemia. 2013;27(11):2157-2164.
79. Malagola M, Skert C, Ruggeri G, et al. Peripheral blood WT1 expression predicts relapse in AML patients undergoing allogeneic stem cell transplantation. Biomed Res Int. 2014;2014:123079.
80. Candoni A, De Marchi F, Zanini F, et al. Predictive value of pretransplantation molecular minimal residual disease assessment by WT1 gene expression in FLT3-positive acute myeloid leukemia. Exp Hematol. 2017;49:25-33.
81. Candoni A, De Marchi F, Zannier ME, et al. High prognostic value
of pre-allogeneic stem cell transplantation minimal residual disease detection by WT1 gene expression in AML transplanted in cytologic complete remission. Leuk Res. 2017;63:22-27.
82. Frairia C, Aydin S, Audisio E, et al. Post-remissional and pretransplant role of minimal residual disease detected by WT1 in acute myeloid leukemia: a retrospective cohort study. Leuk Res. 2017;61:10-17.
83. Lambert J, Lambert J, Thomas X, et al. Early detection of WT1 measurable residual disease identifies high-risk patients, independent of transplantation in AML. Blood Adv. 2021;5(23):5258-5268.
84. Rautenberg C, Lauseker M, Kaivers J, et al. Prognostic impact of pretransplant measurable residual disease assessed by peripheral blood WT1 mRNA expression in patients with AML and MDS. Eur J Haematol. 2021;107(2):283-292.
85. Candoni A, Toffoletti E, Gallina R, et al. Monitoring of minimal
residual disease by quantitative WT1 gene expression following reduced intensity conditioning allogeneic stem cell transplantation in acute myeloid leukemia: WT1 in AML after RIC-SCT. Clin Transplant. 2011;25(2):308-316.
86. Pozzi S, Geroldi S, Tedone E, et al. Leukaemia relapse after allogeneic transplants for acute myeloid leukaemia: predictive role of WT1 expression. Br J Haematol. 2013;160(4):503-509.
87. Duléry R, Nibourel O, Gauthier J, et al. Impact of Wilms’ tumor 1 expression on outcome of patients undergoing allogeneic stem cell transplantation for AML. Bone Marrow Transplant. 2017;52(4):539-543.
88. Nomdedéu JF, Esquirol A, Carricondo M, et al. Bone marrow WT1 levels in allogeneic hematopoietic stem cell transplantation for acute myelogenous leukemia and myelodysplasia: clinically relevant time points and 100 copies threshold value. Biol Blood Marrow Transplant. 2018;24(1):55-63.
of an
based on limit of detection and limit of quantification for measurable residual disease assessment in acute myeloid leukemia. A post-hoc analysis of the GIMEMA AML1310 trial
Francesco Buccisano,1* Raffaele Palmieri,1* Alfonso Piciocchi,2 Valentina Arena,2 Luca Maurillo,1 Maria-Ilaria Del Principe,1 Giovangiacinto Paterno,1 Maria-Antonietta Irno-Consalvo,1 Tiziana Ottone,1 Mariadomenica Divona,1 Consuelo Conti,1 Daniela Fraboni,1 Serena Lavorgna,1 William Arcese,1,3 Maria Teresa Voso1 and Adriano Venditti1
1Ematologia, Dipartimento di Biomedicina e Prevenzione, “Tor Vergata” Università di Roma; 2Centro Dati Fondazione GIMEMA Onlus and 3Rome Transplant Network, Rome, Italy
*FB and RP contributed equally as co-first authors.
Correspondence: F Buccisano francesco.buccisano@uniroma2.it
Received: August 11, 2021.
Accepted: February 9, 2022. Prepublished: March 17, 2022.
https://doi.org/10.3324/haematol.2021.279777
©2022 Ferrata Storti Foundation
Published under a CC BY-NC license
Using a multiparametric flow cytometry assay, we assessed the predictive power of a threshold calculated applying the criteria of limit of detection (LOD) and limit of quantitation (LOQ) in adult patients with acute myeloid leukemia. This was a post-hoc analysis of 261 patients enrolled in the GIMEMA AML1310 prospective trial. According to the protocol design, using the predefined measurable residual disease (MRD) threshold of 0.035% bone marrow residual leukemic cells (RLC) calculated on mononuclear cells, 154 (59%) of the 261 patients were negative (MRD <0.035%) and 107 (41%) were positive (MRD ≥0.035%). Using LOD and LOQ, we selected the following categories of patients: (i) LODneg if RLC were below the LOD (74; 28.4%); (ii) LODpos-LOQneg if RLC were between the LOD and LOQ (43; 16.5%); and (iii) LOQpos if RLC were above the LOQ (144; 54.4%). Two-year overall survival of these three categories of patients was 75.4%, 79.8% and 66.4%, respectively (P=0.1197). Given their superimposable outcomes, the LODneg and LODpos-LOQneg categories were combined. Two-year overall survival of LODneg/LODpos-LOQneg patients was 77.0% versus 66.4% of LOQpos individuals (P=0.043). This figure was challenged in univariate analysis (P=0.046, hazard ratio=1.6, 95% confidence interval: 1.01-2.54) which confirmed the independent role of the LOD-LOQ approach in determining overall survival. In the AML1310 protocol, using the threshold of 0.035%, 2-year overall survival of patients with MRD <0.035% and MRD ≥0.035% was 74.5% versus 66.4%, respectively (P=0.3521). In conclusion, the use of the LOD-LOQ method results in more sensitive detection of MRD that, in turn, translates into a more accurate recognition of patients with different outcomes.
Measurable residual disease (MRD) is being increasingly employed as a biomarker of quality of complete remission in patients with acute myeloid leukemia (AML) treated with intensive chemotherapy.1 Multiparametric flow cyto metry and reverse transcriptase quantitative polymerase chain reaction are the two leading techniques for MRD quantification. Recent studies indicate that, due to tech nical improvements and the availability of up to eight to
ten color immunostains, the specificity and sensitivity of multiparametric flow cytometry may be reliably increased, provided that a sufficient number of relevant events is ac quired.2,3 In B-cell precursor acute lymphoid leukemia and multiple myeloma, the use of standardized panels and the acquisition of large numbers of events (>4x10⁶) led to MRD assessment by multiparametric flow cytometry becoming at least as sensitive as that by polymerase chain reactionbased methods.4,5 Likewise, the sensitivity of MRD deter mination in multiple myeloma and chronic lymphocytic
leukemia improved dramatically up to 10-5-10-6 as soon as larger numbers of events (3-5x10⁶) were acquired, in the context of so-called next-generation flow.6–8
In AML, the number of clustered events and the denomi nator of acquired events necessary for reliable MRD rec ognition are poorly standardized and may be affected by several technical and clinical variables. In myeloid bone marrow, particularly during regenerating phases after chemotherapy, the normal maturational patterns may in terfere with the detection of leukemia-associated immu nophenotypes generating a relevant background noise. Likewise, although to a lesser extent, this background noise may affect the identification of the putative “empty spaces” when MRD is detected by a “different-from-nor mal” approach.9
The consensus of the European LeukemiaNet (ELN) MRD working party suggests that a MRD threshold of 0.1% is in formative for clinical decisions once 500,000-1,000,000 events are acquired.10 Such a target of acquired events guarantees that the threshold of 0.1% has a reliable sen sitivity and a sufficient specificity, because no leukemiaassociated immunophenotypes have been detected above this threshold even in regenerating bone marrow.11 Nonetheless, the same guidelines suggest that MRD tests with MRD quantified below 0.1% may still be consistent with residual leukemia; indeed several studies have shown prognostic significance of MRD levels below 0.1%.12–16
In the GIMEMA AML1310 protocol, post-remission therapy of young patients with AML was decided combining cyto genetic/genetic information and post-consolidation levels of MRD after consolidation as measured by multiparamet ric flow cytometry.17 Intermediate-risk patients were to re ceive autologous or allogeneic stem cell transplant (SCT) depending on the post-consolidation levels of MRD. The threshold of negativity was set at 0.035% residual leu kemic cells (RLC) as measured on mononuclear cells, with values below the threshold being considered negative. This threshold was selected after repeatedly validating it in retrospective, sequential cohorts of patients enrolled in former EORTC/GIMEMA protocols AML10, AML12, AML13, AML15 and AML17.18–21 In the AML1310 protocol we con firmed, prospectively, that the threshold of 0.035% re tained the same predictive value as in the retrospective analyses.16
However, since the previous EORTC/GIMEMA and AML1310 protocols had in common the same therapeutic schedule, either in induction or in consolidation, one could argue that the threshold of 0.035% may be protocol-specific so that it cannot be applied universally. In fact, thresholds in AML are often selected retrospectively based on their as sociation with outcomes. Accordingly, confirmatory, pros pective validations are required.22,23 In an attempt to overcome such a “protocol-effect” and to reliably improve the statistical accuracy of MRD assessment, we revised
the post-consolidation MRD determinations of the GIMEMA AML1310 protocol by calculating, for each case, the limit of detection (LOD) and limit of quantification (LOQ). As in multiple myeloma and chronic lymphocytic leukemia, the target of 20 and 50 relevant events in the final gate, respectively, were adopted. According to the ELN guidelines, the analysis was conducted on CD45-ex pressing elements.3,24 The MRD status of patients was classified as negative (LODneg), positive not quantifiable (LODpos-LOQneg) and positive quantifiable (LOQpos). Due to the retrospective nature of the analysis, we were not able to establish a limit of blank to properly exclude the back ground noise of each aberrant phenotype selected for MRD assessment.
In our exploratory analysis, the new MRD categories were compared to the protocol reference threshold of 0.035%, the genetic/cytogenetic subgroups and the post-re mission treatments. To the best of our knowledge, this is the first time that an absolute threshold based on LOD and LOQ has been applied to assess MRD in AML by multi parametric flow cytometry. We believe that the analysis of a prospective series of homogeneously treated pa tients, represents a unique chance to corroborate the ro bustness of the LOD and LOQ approach in MRD determination in AML.
Previously untreated patients with a diagnosis of de novo AML according to the World Health Organization diag nostic criteria25 were eligible for the GIMEMA AML1310 study (EudraCT number 2010-023809-36; ClinicalTrials. Gov Identifier NCT01452646) (Online Supplementary Methods).16,26 The present analysis was performed with dif ferent purposes on a subgroup of 261 patients whose MRD status was determined after the consolidation cycle of treatment. The study was approved by the ethical com mittees of the participating hospitals or academic insti tutions and was conducted in accordance with the Declaration of Helsinki. All participants gave their in formed consent.
There are numerous studies demonstrating that 20 events are a conservative value for the smallest (homogeneous) population that can be detected in a given flow cytomet ric list mode data file by experienced operators. This implies that the LOD can be estimated as (20/total number of cells analyzed) × 100%.26 Similarly, it is also widely accepted that more than 50 events is a reasonable threshold for reproducible enumeration of a cell popu lation by experienced operators; consequently, the LOQ
can be estimated as (50/total number of cells analyzed) × 100%.27 Thus, the LOD and the LOQ will both be typically de pendent on the total number of cells analyzed. The LOD and LOQ were established at 20 and 50 clustering events ex pressing a leukemia-associated immunophenotype, respect ively, and counted on CD45-expressing events according to the ELN recommendations.10 Based on such an approach, patients were classified as MRD-negative if RLC were below the LOD (LODneg), MRD-positive non-quantifiable if RLC were between the LOD and LOQ (LODpos-LOQneg) and MRD-positive quantifiable if RLC were above the LOQ (LOQpos). Samples were acquired by a FacSCanto II (Becton Dickinson, Moun tain View, CA, USA). Data were analyzed using Infinicyt-soft ware version 1.7 (Cytognos SL, Salamanca, Spain).
Overall survival (time elapsed from the start of treatment to death) and disease-free survival (time from complete re mission to relapse or death in remission) were calculated using the Kaplan-Meier product limit estimator. Differences in terms of overall and disease-free survival were evaluated by means of a log-rank test in univariate analysis and by means of a Cox regression model in multivariate analysis, after assessment of proportionality of hazards. All variables with a P-value less than 0.15 in univariate analysis were con sidered in the multivariate models. The influence of the transplant on the survival outcome was evaluated in the Cox model by means of a time-dependent covariate. The cumu lative incidence of relapse was estimated by cumulative incidence curves using the proper non-parametric method. Patients’ and disease characteristics were summarized by means of cross-tabulations for categorical variables or by quintiles for continuous variables. Differences between cat egorical variables or response rates in subgroups were tested by the χ2 or Fisher exact tests, as appropriate. Con fidence intervals were calculated at the 95% level and all tests were two-sided, accepting P≤0.05 as indicating a stat istically significant difference. All covariates were evaluated in univariate models and all factors with univariate associ ation with a P-value <0.1 were considered in the multivariate models as potential parameters. Backward and stepwise methods were applied to identify the multivariate models with a step-by-step iterative construction that involved the selection of independent variables to be considered in the final model. All analyses were performed using SAS (version 9.4) and R (R Foundation for Statistical Computing, Vienna, Austria) software. Study data were collected and managed using the REDCap20 electronic data capture tools hosted at the GIMEMA Foundation.
The present analysis includes 261 patients from whom a
Table 1. General characteristics of the study population.
Level Overall Number 261
Sex, N (%)
Male 139 (53.3) Female 122 (46.7)
Age in years, median (range) 49.39 (18.32-60.95)
White blood cells x109/L, median (range) 12.66 (0.16-186.00) Platelets x109/L, median (range) 55.00 (7.00-1020.00)
Risk category, N (%)*
Cytogenetic risk, N (%)**
NCCN-FR 87 (33.3)
NCCN-IR 77 (29.5) NCCN-PR 97 (37.2)
Favorable risk 28 (12.3)
Poor risk 29 (12.8) Intermediate risk 170 (74.9)
Negative 190 (73.1) Positive 70 (26.9) NPM1, N (%) Negative 145 (55.6) Positive 115 (44.1)
FLT3 ITD, N (%)
Graft, N (%)
No graft 85 (32.6) Allo-SCT 93 (35.6) Auto-SCT 83 (31.8)
*Genetic/cytogenetic risk group was attributed according to National Comprehensive Cancer Network clinical practice guidelines (version 2009) as follows: “favorable” risk [cases with Inv(16), t(8;21), t(16;16), RUNX1/RUNXT1 without c-Kit mutations, CBFB/MYH11 without c-Kit mutations, NPM1 mutation without FLT3 mutations]; “intermediate” risk [cases with normal karyotype, isolated +8, isolated t(9;11), other karyotypic abnormalities not listed as favorable or adverse, RUNX1/RUNXT1 with c-Kit mutations, CBFB/MYH11 with c-Kit muta tions, no NPM1 mutations, no FLT3-ITD mutations]; “adverse” risk [cases with complete karyotype e.g. >3 abnormalities, -5/5q-, -7/7q, abnormalities of 11q23 excluding t(9;11), inv(3), t(3;3), t(6;9), FLT3-ITD mutations]. **Patients were stratified according to the refined Medical Research Council (MRC) classification of cytogenetic risk, as follows: “favorable” risk [cases with t(8;21), t(15;17) or inv(16)/t(16;16)]; “ad verse” risk [cases with complex cytogenetic changes (>3 unrelated abnormalities), -5, add(5q)/del(5q), -7/add(7q), t(6;11), t(10;11), t(9;22), -17, abn(17p) with other changes, 3q abnormalities excluding t(3;5), inv(3)/t(3;3)]; and “intermediate” risk [cases with normal karyotype and other non-complex]. NCCN: National Comprehensive Cancer Net work; FR: favorable risk; IR: intermediate risk; PR: poor risk; Allo-SCT: allogeneic stem cell transplant; Auto-SCT: autologous stem cell transplant.
post-consolidation bone marrow sample was collected and sent to the central laboratory for MRD determination. Clinical characteristics of the patients are summarized in Table 1. Subjects with a percentage of RLC ≥0.035% the total number of acquired mononuclear cells qualified as MRD≥0.035%. In the same 261 patients, the LOD and LOQ were calculated on CD45-expressing elements. The median number of mono nuclear cells acquired was 559,197 (range, 100,4501,561,221) and the median number of CD45-expressing cells was 538,527 (range, 88,040-1,548,172). Overall, of the
261 cases, 74 (28.4%) were classified as LODneg, whereas 43 (16.5%) and 144 (55.2%) were classified as LODpos LOQneg and LOQpos, respectively (Online Supplementary Table S1). The target of 500,000 processed CD45+ events was reached in 158 (60.5%) of the 261 patients. The cal culated median LOD and LOQ values were 0.0037 (0.00130.0227) and 0.0093 (0.0032-0.0568), respectively (Online Supplementary Table S1).
According to the protocol MRD threshold of 0.035%, 107 (41.0%) of the 261 patients were MRD≥0.035% and 154 (59.0%) MRD<0.035%. The interactions between the different MRD es timates are summarized in Online Supplementary Table S2. Overall, 105/107 (98.1%) MRD≥0.035% patients were LOQpos whereas only 74/154 (48.1%) MRD<0.035% ones were LODneg LOQneg (P<0.001). In fact, 41 (26.6%) and 39 (25.3%) of 154
MRD<0.035% patients were reclassified as LODpos-LOQneg and LOQpos, respectively. In the whole population, 2-year overall and disease-free survival rates were 71.2% and 57.5%, respectively. No dif ference was observed in duration of overall survival be tween MRD<0.035% and MRD≥0.035% patients (74.5% vs. 66.4%, P=0.3521) (Figure 1A). When the survival analysis was con ducted according to the new categories that we identified, patients who were LODneg or LODpos-LOQneg had a superior overall survival as compared to LOQpos patients (75.4% and 79.8% vs. 66.4%), although the difference was not statis tically significant (P=0.119). The equivalent outcome of LODneg and LODpos-LOQneg patients (Figure 1B) persuaded us to aggregate these subgroups. Accordingly, we sorted two categories of patients, (LODneg/LODpos-LOQneg) and
B
Figure 1. Overall survival analysis of the whole series of 261 patients according to different measurable residual disease es timates. Measurable residual disease stratification according to the AML1310 threshold (0.035%) was not statistically differ ent (A). LODneg, LODpos-LOQneg and LOQpos are analyzed separ ately (B) and merging LODneg and LODpos-LOQneg (C), with only the latter reaching a statistically significant difference (P=0.043). OS: overall survival; MRD: measurable residual dis ease; LOD: limit of detection; LOQ: limit of quantification.

LOQpos whose duration of overall survival was statistically different (77.0% vs. 66.4%, P=0.0437), as depicted in Figure 1C.
As a further step of investigation, we repeated our analysis on the 158 (60.5%) of 261 patients in whom ≥500,000 CD45+ events were acquired. This was to test whether a more numerically robust denominator enhanced specifi city and then prognostic power of the LOD-LOQ estimate. The threshold-based MRD allocation (MRD<0.035% 82.4% vs 67.2% of MRD≥0.035% , P=0.064) (Figure 2A) was less effective in discriminating patients with different 2-year overall sur vival rates, whereas 2-year overall survival rates of LODneg and LODpos-LOQneg patients were superior to that of LOQpos patients (82.1% and 95.7% vs. 69.0%, P=0.014) with a sig nificant difference between LOQpos and both LODneg and
LODpos-LOQneg patients (P=0.038 and P=0.024, respectively) (Figure 2B). The LODneg/LODpos-LOQneg category identified a subset of patients with a strongly favorable outcome as compared to the LOQpos subgroup (2-year overall survival of 86.7% vs. 69.0%, P=0.004) (Figure 2C). We then tried to integrate the MRD and LOD-LOQ models. By doing so, we generated three categories of patients (MRD<0.035%LODneg/LODpos-LOQneg, MRD<0.035%LOQpos, and MRD≥0.035%LOQpos), whose features are shown in Table 2. A fourth category (MRD≥0.035%LODneg/LODpos-LOQneg) was dropped from the analysis because it was represented by only two patients.
Notably, MRD<0.035%LODneg/LODpos-LOQneg patients had a better 2-year overall survival not only when compared to MRD≥0.035%LOQpos patients but also when compared to

B
Figure 2. Overall survival analysis of 158 patients from whom >500,000 CD45+ cells were acquired. Stratification according to the AM1310 MRD threshold showed a lower power of dis crimination in terms of 2-year overall survival (P=0.064) (A). LODneg, LODpos-LOQneg and LOQpos are analyzed separately (B) and merging LODneg and LODpos-LOQneg (C); both tests strat ified patients with a statistical significance (P=0.023 and P=0.009, respectively). OS: overall survival; MRD: measurable residual disease; LOD: limit of detection; LOQ: limit of quan tification.
Table 2. Integration of the “relative” 0.035% and “absolute” limit of detection/limit of quantification approaches for measurable residual disease determination.
Number 115 39 105
Sex, N (%)
Male 61 (53.0) 19 (48.7) 57 (54.3) 0.837 Female 54 (47.0) 20 (51.3) 48 (45.7)
Age in years, median (range) 48.7 (18.3-60.3) 44.5 (21.9-60.7) 52.3 (19.4-60.9) 0.066
WBC x109/L, median (range) 9.60 (0.16-181.38) 11.70 (0.74-186.00) 16.73 (0.48-158.30) 0.078
NCCN-FR 42 (36.5) 7 (17.9) 38 (36.2) <0.001
Risk category, N (%)*
Citogenetic risk, N (%)**
NCCN-IR 32 (27.8) 24 (61.5) 20 (19.0) NCCN-PR 41 (35.7) 8 (20.5) 47 (44.8)
Favorable-risk 19 (18.8) 2 (6.7) 7 (7.4) 0.141 Poor-risk 11 (10.9) 4 (13.3) 13 (13.8)
Intermediate-risk 71 (70.3) 24 (80.0) 74 (78.7)
FLT3-ITD, N (%) Negative 83 (72.8) 35 (89.7) 71 (67.6) 0.028 Positive 31 (27.2) 4 (10.3) 34 (32.4) NPM1, N (%) Negative 64 (55.7) 30 (76.9) 50 (48.1) 0.008 Positive 51 (44.3) 9 (23.1) 54 (51.9)
Graft, number, N (%) No graft 38 (33.0) 9 (23.1) 37 (35.2) 0.629 Allo-SCT 38 (33.0) 17 (43.6) 37 (35.2) Auto-SCT 39 (33.9) 13 (33.3) 31 (29.5)
*Genetic/cytogenetic risk group was attributed according to National Comprehensive Cancer Network clinical practice guidelines (version 2009) as follows: “favorable” risk [cases with Inv(16), t(8;21), t(16;16), RUNX1/RUNXT1 without c-Kit mutations, CBFB/MYH11 without c-Kit mutations, NPM1 mutation without FLT3 mutations]; “intermediate” risk [cases with normal karyotype, isolated +8, isolated t(9;11), other karyotypic abnormalities not listed as favorable or adverse, RUNX1/RUNXT1 with c-Kit mutations, CBFB/MYH11 with c-Kit mutations, no NPM1 mutations, no FLT3-ITD mutations]; “adverse” risk [cases with complete karyotype e.g. >3 abnor malities, -5/5q-, -7/7q-, abnormalities of 11q23 excluding t(9;11), inv(3), t(3;3), t(6;9), FLT3-ITD mutations]. **Patients were stratified according to the refined Medical Research Council (MRC) classification of cytogenetic risk, as follows: “favorable” risk [cases with t(8;21), t(15;17) or inv(16)/t(16;16)]; “adverse” risk [cases with complex cytogenetic changes (>3 unrelated abnormalities), -5, add(5q)/del(5q), -7/add(7q), t(6;11), t(10;11), t(9;22), -17, abn(17p) with other changes, 3q abnormalities excluding t(3;5), inv(3)/t(3;3)]; and “intermediate” risk [cases with normal karyotype and other non-complex]. LOD: limit of detection; LOQ: limit of quantification; MRD: measurable residual disease; WBC: white blood cells; NCCN: National Comprehensive Cancer Network; FR: favorable risk; IR: intermediate risk; PR: poor risk; Allo-SCT: allogeneic stem cell transplant; Auto-SCT: autologous stem cell transplant.
MRD <0.035% LOQ pos patients, whose median MRD percen tage was 0.016% (range, 0.006-0.032). This comparison did not reach statistical significance when the overall series was analyzed (76.7% vs . 67.5% and 65.9%, P =0.116) but was clearly significant when patients with at least 500,000 events were taken into account. More in detail, among patients in whom ≥ 500,000 CD45-expressing events were acquired, those who were MRD <0.035% LODneg /LODpos -LOQneg had a longer duration of overall survival as compared to those who were MRD <0.035% LOQpos and MRD ≥ 0.035% LOQpos (86.7%, 72.5% and 67.0%, respectively, P=0.018). Furthermore, MRD<0.035% pa tients had a statistically different overall survival if they tested LODneg /LODpos -LOQneg or LOQpos (86.7% vs . 72.5%,
P =0.007) (Figure 3). To avoid a possible bias deriving from the original design of the protocol, in which MRD was used to address treatment only in the intermedi ate-risk category, we conducted the same analysis in the 77 patients belonging to this category. The results ( Online Supplementary Figure S1 ) were completely superimposable ( P =0.0286). Finally, we explored the interaction of LOD neg , LOD pos LOQ neg and LOQ pos categories with the post-remission treatment received (autologous SCT, allogeneic SCT and no graft). As shown in Online Supplementary Figure S2, LODneg /LODpos -LOQneg patients submitted to autologous SCT had the best 2-year overall survival (88.9%) as com pared to the other categories ( P =0.026). Notably, these
Figure 3. Overall survival analysis of MRD<0.035% and MRD≥0.035% patients according to limit of detection and limit of quantification status. MRD<0.035%LODneg/LODpos-LOQneg patients had a longer duration of overall survival as compared to MRD<0.035%LOQpos and MRD≥0.035%LOQpos (P=0.018). Even more, MRD<0.035% patients had a statistically different overall survival if they tested LODneg/LODpos LOQneg neg or LOQpos (P=0.007). OS: overall survival; MRD: measurable residual disease; LOD: limit of detection; LOQ: limit of quan tification.

patients, benefitted more from autologous SCT (88.9%) than from no-graft (55.9%, P =0.017) or allogeneic SCT (76.5%, P =0.089).
All clinical variables testing significant in univariate analysis were entered in the multivariate model (Table 3). The multivariate analysis confirmed the independent impact on overall survival of poor-risk upfront classifi cation ( P <0.001, hazard ratio [HR]=5.02, 95% confidence interval [CI]: 2.31-10.9), allogeneic SCT (P=0.005, HR=0.47, 95% CI: 0.28-0.80) and MRD <0.035% LOQpos status ( P =0.021, HR=2.19, 95% CI: 1.13-4.27). The multivariate model in cluding LOD-LOQ stratification and transplant as a timedependent covariate resulted in achievement of significant P values in both univariate ( P <0.001, HR=5.02, 95% CI: 2.31-10.9) and multivariable analyses ( P =0.048, HR=0.628, 95% CI: 0.396-0.997) for LOD-LOQ stratifica tion but not for transplantation.
In this preliminary study, we demonstrated that an MRD estimate based on LOD and LOQ of CD45-expressing cells predicts survival of AML patients more accurately than the pre-established threshold of 0.035% RLC of mononuclear cells, which was used in the AML1310 protocol. Moreover, we observed that the predictive power of the LOD-LOQ approach increases proportionally with the number of events acquired (higher or lower than 500,000). The search for the most informative value of MRD for clinical use remains a matter of debate in AML. The gen eral experience indicates that many technical, biological and clinical confounding factors interfere with the identi fication of the “absolute threshold” below or above which the prognosis is more accurately predicted.28 In fact, the background noise due to the normal maturational curves
Table 3. Univariate and multivariate Cox regression models for overall survival.
Characteristic
HR 95% CI P-value HR 95% CI P-value
White blood cells 1.00 0.99-1.00 0.30
FLT3 ITD
Negative Positive 2.40 1.53-3.77 <0.001
NCCN-FR
NCCN-IR NCCN-PR
LOD LOQ stratification
1.95 3.73 1.00-3.81 2.04-6.82 0.051 <0.001 1.99 5.02 0.95-4.15 2.31-10.9 0.068 <0.001
LODneg-LODposLOQneg LOQpos 1.60 1.01-2.54 0.046
BM MRD status after consolidation
Negative Positive 1.23 0.79-1.92 0.35
MRD_LODLOQ
MRD<0.035%/LODneg-LODposLOQneg
MRD>0.035%/LODneg-LODposLOQneg MRD<0.035%/LOQpos MRD>0.035%/LOQpos
No graft
0.00 1.82 1.49
0.00-Inf 0.97-3.41 0.91-2.44
>0.99 0.061 0.11
0.00 2.19 1.29
0.00-Inf 1.13-4.27 0.78-2.13
>0.99 0.021 0.33
Allo-SCT Auto-SCT 0.77 0.41 0.47-1.27 0.23-0.75 0.30 0.003 0.47 0.72 0.28-0.80 0.36-1.46 0.005 0.37
HR: hazard ratio; 95% CI: 95% confidence interval; NCCN: National Comprehensive Cancer Network; FR: favorable risk; IR: intermediate risk; PR: poor risk; LOD: limit of detection; LOQ: limit of quantification; BM: bone marrow; MRD: measurable residual disease; Allo-SCT, allogeneic stem cell transplant; Auto-SCT, autologous stem cell transplant.
of bone marrow precursors has forced researchers to de fine the MRD status as above or below a given level, which is able to anticipate a different clinical outcome, rather than as negative or positive.23,29 Finally, the multifaceted interpretation of MRD is made even more complicated as a consequence of the therapy delivered. Different treat ment schedules may have different thresholds of prog nostic significance. These thresholds are currently selected by different approaches, in some cases applying empirical logarithmic scales or quartile segregation, in others applying specific statistical methods (e.g., receiver operating characteristic curve analysis or maximally-se lected log-rank statistics).23 A comprehensive review of the literature30 prompted the ELN panel to recommend a threshold of 0.1% not because it was the most predictive but because it was used and found relevant in the major ity of the published studies.10 Nevertheless, the panel of experts was well aware that levels of MRD below 0.1% are consistent with residual leukemia and that further efforts should be made to identify and validate lower thresholds. In theory, the validation of MRD as a clinical biomarker should rely on the well-designed analysis of retrospective case series, leading to the identification of informative thresholds. Subsequently, these thresholds should be
validated in prospective, MRD-oriented trials.22 Despite these attempts, doubts will still persist because of the many different therapeutic contexts that can hamper the universal applicability of the selected thresholds. Indeed, the last Food and Drug Administration MRD guidance for the development of novel agents raised concerns about the role of MRD as a surrogate endpoint. Such concerns were due to the biological heterogeneity of AML and the lack of prospective studies having MRD negativity as a pri mary endpoint.31,32 Furthermore, the putative threshold of sensitivity of the MRD assay should be at least 10-fold (1log) below the clinical decision-making threshold.31 At variance, in other pathologies (e.g., acute lymphoblastic leukemia, multiple myeloma, and chronic lymphocytic leukemia), MRD assessment by multiparametric flow cytometry is highly standardized and reproducible in dif ferent treatment scenarios, so that it is proposed as a surrogate endpoint in clinical trials.31 In these diseases, an innovative approach called next-generation flow has sub stantially improved the performance of standard multi parametric flow cytometry which now reaches levels of sensitivity comparable to those of reverse transcriptase quantitative polymerase chain reaction (10-4–10-6).4–6,27 Such an approach requires the application of a minimum
of an eight-color panel and the acquisition of several mil lion relevant events.4,24 Using this approach in chronic lymphocytic leukemia, it was demonstrated that an MRD threshold of 0.01% (10 4) was an independent predictor of progression-free survival in patients treated with either chemo-immunotherapy or novel agents.33
In the GIMEMA AML1310 trial, patients with intermediate risk, defined according to the NCCN 2009,34 were ad dressed to allogeneic or autologous SCT if MRD-positive or -negative, respectively, after the consolidation cycle.17 The threshold defining MRD negativity (0.035%) was vali dated in several retrospective analyses of previous EORTC/GIMEMA trials. In those analyses the threshold of 0.035% allowed discrimination of patients with clearly dis tinct long-term prognoses across different genetic/cyto genetic subgroups.14,18–20 This threshold was prospectively validated in the AML1310 trial, in which delivery of alloge neic SCT prolonged the overall survival of MRD-positive intermediate-risk patients to equalize that of MRDnegative intermediate-risk patients, who underwent auto logous SCT.16
The working hypothesis leading to the current analysis was that an MRD estimate based on the LOD-LOQ ap proach might further refine the outcome prediction of the 0.035% threshold. In the AML1310 trial, we assumed that the MRD-oriented post-remission strategy (allogeneic vs autologous SCT) used for patients belonging to the inter mediate-risk category, nullified the poor prognostic weight of MRD positivity. This resulted in an equivalent duration of overall survival and disease-free survival of MRD-negative and MRD-positive patients, with MRD posi tivity losing its independent prognostic value in multivari ate analysis, as compared to genetic-cytogenetic risk and post-remission treatment.16 In contrast, the LOD-LOQ cal culation of MRD discriminated two populations of patients (LODneg/LODpos-LOQneg and LOQpos) with statistically signifi cant different durations of overall survival. Multivariable analysis confirmed the independent prognostic role of the LOD-LOQ approach.
The power of the LOD-LOQ outcome prediction increased when the analysis included only samples in which the count of CD45-expressing events was at least 500,000. This observation confirms that, when dealing with the identification of rare events, the larger the denominator of relevant events the more accurate the target popu lation estimation, provided that an adequate number of relevant events is collected (i.e., 20 for LOD and 50 for LOQ calculations). Furthermore, the availability of a marker allowing an easier extrapolation of the cell popu lation under study (e.g. CD45) increases the accuracy of the measurement. This has also been proven true by others when MRD was determined only on the population defined by immature markers.35
Based on this, we assume that the LOD-LOQ MRD esti
mate is more accurate than the MRD0.035% threshold be cause it enabled a superior discrimination within the MRD<0.035% category. In fact, among MRD<0.035% patients, the LODneg and LODpos-LOQneg status identified “true negative” or “non-quantifiable” cases with a better outcome. These patients might have been cured of their disease without allogeneic SCT, as demonstrated in a further subgroup analysis in which patients submitted to autologous SCT showed a very favorable outcome (Online Supplementary Figure S2). Interestingly, in our hands, LODneg and LODpos LOQneg patients showed the same overall survival. We hy pothesized at least two technical explanations. First, the median number of CD45+ events acquired may not be suf ficient. In fact, the category of LODpos-LOQneg patients might be progressively narrowed if a very high number of relevant events is acquired. Second, LOD sensitivity may have been affected by the lack of limit-of-blank subtrac tion, whereas the LOQ value may not have been, main taining its predictive value. We are aware of the preliminary nature of our report and of its possible weaknesses. The observation that an MRD estimation system independent of a pre-established threshold performs as well as in retrospective and pros pective contexts is per se relevant, even though far from representing the identification of an absolute threshold. This proof of principle will become standard of care when its predictive value is demonstrated in different series of patients, treated with different schedules. Meanwhile, all MRD-driven clinical studies should rigorously comply with the procedures recommended for the acquisition of rare events. In our analysis, increasing the numbers of events acquired (>500,000) and refining the population under in vestigation (gating CD45+ cells) resulted in a significantly enhanced predictive power of the test. Thresholds for MRD estimation are likely to change in the near future but making them clinically informative requires that for every individual determination, the de tection and quantification limits are described. Along this direction, multiparametric flow cytometry analyses in AML would possibly reach values of sensitivity comparable to those of polymerase chain reaction, as demonstrated in acute lymphoblastic leukemia and multiple myeloma.4
No conflicts of interest to disclose.
FB, RP, and AV designed the study, FB, AP and VA collected and analyzed the data, FB, RP, AP, VA, LM, MIDP, GP, MAIC, TO, MD, CC, DF, SL, WA, MTV and AV wrote the paper and approved its final version.
The authors are indebted to Prof. Bruno Brando and Dr. Ari-
anna Gatti for their critical review of the manuscript and helpful suggestions.
This work was supported by a grant from the Ministero della Salute, Rome, Italy (Finalizzata 2018, NET 2018 12365935, Personalized medicine program on myeloid neoplasms:
1. Döhner H, Estey E, Grimwade D, et al. Diagnosis and management of AML in adults: 2017 ELN recommendations from an international expert panel. Blood. 2017;129(4):424-447.
2. Wood B, Jevremovic D, Béné MC, Yan M, Jacobs P, Litwin V. Validation of cell-based fluorescence assays: practice guidelines from the ICSH and ICCS - part V - performance criteria. Cytometry B Clin Cytom. 2013;84(5):315-323.
3. Wood BL. Principles of minimal residual disease detection for hematopoietic neoplasms by flow cytometry. Cytometry B Clin Cytom. 2016;90(1):47-53.
4. Theunissen P, Mejstrikova E, Sedek L, et al. Standardized flow cytometry for highly sensitive MRD measurements in B-cell acute lymphoblastic leukemia. Blood. 2017;129(3):347-357.
5. Paiva B, Puig N, Cedena MT, et al. Measurable residual disease by next-generation flow cytometry in multiple myeloma. J Clin Oncol. 2020;38(8):784-792.
6. Flores-Montero J, Sanoja-Flores L, Paiva B, et al. Next generation flow for highly sensitive and standardized detection of minimal residual disease in multiple myeloma. Leukemia. 2017;31(10):2094-2103.
7. Rawstron AC, Gregory WM, de Tute RM, et al. Minimal residual disease in myeloma by flow cytometry: independent prediction of survival benefit per log reduction. Blood. 2015;125(12):1932-1936.
8. Rawstron AC, Fazi C, Agathangelidis A, et al. A complementary role of multiparameter flow cytometry and high-throughput sequencing for minimal residual disease detection in chronic lymphocytic leukemia: an European Research Initiative on CLL study. Leukemia. 2016;30(4):929-936.
9. Wood BL. Acute myeloid leukemia minimal residual disease detection: the difference from normal approach. Curr Protoc Cytom. 2020;93(1):e73.
10. Schuurhuis GJ, Heuser M, Freeman S, et al. Minimal/measurable residual disease in AML: consensus document from ELN MRD Working Party. Blood. 2018;131(12):1275-1291.
11. Hanekamp D, Bachas C, van de Loosdrecht A, Ossenkoppele G, Cloos J. Re: myeloblasts in normal bone marrows expressing leukaemia-associated immunophenotypes. Pathology. 2020;52(2):289-291.
12. Venditti A, Buccisano F, Del Poeta G, et al. Level of minimal residual disease after consolidation therapy predicts outcome in acute myeloid leukemia. Blood. 2000;96(12):3948-3952.
13. Buccisano F, Maurillo L, Gattei V, et al. The kinetics of reduction of minimal residual disease impacts on duration of response and survival of patients with acute myeloid leukemia. Leukemia. 2006;20(10):1783-1789.
14. Maurillo L, Buccisano F, Del Principe MI, et al. Toward optimization of postremission therapy for residual diseasepositive patients with acute myeloid leukemia. J Clin Oncol. 2008;26(30):4944-4951.
characterization of the patient's genome for clinical deci sion making and systematic collection of real world data to improve quality of health care)
For original, anonymized data, please contact the cor responding author (francesco.buccisano@uniroma2.it).
15. Buccisano F, Maurillo L, Spagnoli A, et al. Cytogenetic and molecular diagnostic characterization combined to postconsolidation minimal residual disease assessment by flow cytometry improves risk stratification in adult acute myeloid leukemia. Blood. 2010;116(13):2295-2303.
16. Venditti A, Piciocchi A, Candoni A, et al. GIMEMA AML1310 trial of risk-adapted, MRD-directed therapy for young adults with newly diagnosed acute myeloid leukemia. Blood. 2019;134(12):935-945.
17. Venditti A, Piciocchi A, Candoni A, et al. GIMEMA AML1310 trial of risk-adapted, MRD-directed therapy for young adults with newly diagnosed acute myeloid leukemia. Blood. 2019;134(12):935-945.
18. Buccisano F, Maurillo L, Spagnoli A, et al. Cytogenetic and molecular diagnostic characterization combined to postconsolidation minimal residual disease assessment by flow cytometry improves risk stratification in adult acute myeloid leukemia. Blood. 2010;116(13):2295-2303.
19. Maurillo L, Buccisano F, Piciocchi A, et al. Minimal residual disease as biomarker for optimal biologic dosing of ARA-C in patients with acute myeloid leukemia. Am J Hematol. 2015;90(2):125-131.
20. Buccisano F, Maurillo L, Gattei V, et al. The kinetics of reduction of minimal residual disease impacts on duration of response and survival of patients with acute myeloid leukemia. Leukemia. 2006;20(10):1783.
21. Maurillo L, Buccisano F, Del Principe MI, et al. Toward optimization of postremission therapy for residual diseasepositive patients with acute myeloid leukemia. J Clin Oncol. 2008;26(30):4944-4951.
22. Mandrekar SJ, Sargent DJ. Clinical trial designs for predictive biomarker validation: Theoretical considerations and practical challenges. J Clin Oncology. 2009;27(24):4027-4034.
23. Buccisano F, Maurillo L, Del Principe MI, et al. Prognostic and therapeutic implications of minimal residual disease detection in acute myeloid leukemia. Blood. 2012;119(2):332-341.
24. Arroz M, Came N, Lin P, et al. Consensus guidelines on plasma cell myeloma minimal residual disease analysis and reporting. Cytom B Clin Cytom. 2016;90(1):31-39.
25. Vardiman JW, Thiele J, Arber DA, et al. The 2008 revision of the World Health Organization (WHO) classification of myeloid neoplasms and acute leukemia: rationale and important changes. Blood. 2009;114(5):937-951.
26. Hedley BD, Keeney M. Technical issues: flow cytometry and rare event analysis. Int J Lab Hematol. 2013;35(3):344-350.
27. Rawstron AC, Böttcher S, Letestu R, et al. Improving efficiency and sensitivity: European Research Initiative in CLL (ERIC) update on the international harmonised approach for flow cytometric residual disease monitoring in CLL. Leukemia. 2013;27(1):142-149.
28. Othus M, Gale RP, Hourigan CS, Walter RB. Statistics and measurable residual disease (MRD) testing: uses and abuses in hematopoietic cell transplantation. Bone Marrow Transplant. 2020;55(5):843-850.
29. Buccisano F, Maurillo L, Del Principe MI, et al. Minimal residual disease as a biomarker for outcome prediction and therapy optimization in acute myeloid leukemia. Expert Rev Hematol. 2018;11(4):307-313.
30. Ossenkoppele G, Schuurhuis GJ. MRD in AML: does it already guide therapy decision-making? Hematol Am Soc Hematol Educ Progr. 2016;2016(1):356-365.
31. Hematologic Malignancies: Regulatory Considerations for Use of Minimal Residual Disease in Development of Drug and Biological Products for Treatment | FDA. https://www.fda.gov/regulatoryinformation/search-fda-guidance-documents/hematologic-mali gnancies-regulatory-considerations-use-minimal-residual-
disease-development-drug-and (accessed May 2, 2020).
32. Hourigan CS, Gale RP, Gormley NJ, Ossenkoppele GJ, Walter RB. Measurable residual disease testing in acute myeloid leukaemia. Leukemia. 2017;31(7):1482-1490.
33. Zalcberg I, D’Andrea MG, Monteiro L, Pimenta G, Xisto B. Multidisciplinary diagnostics of chronic lymphocytic leukemia: European Research Initiative on CLL - ERIC recommendations. Hematol Transfus Cell Ther. 2020;42(3):269-274.
34. Acute Myeloid Leukemia, Version 1.2009, NCCN Clinical Practice Guidelines in Oncology. https://www.nccn.org/professionals/physician_gls/pdf/aml.pdf [Accessed 6 May, 2018].
35. Hanekamp D, Tettero JM, Ossenkoppele GJ, et al. AML/normal progenitor balance instead of total tumor load (MRD) accounts for prognostic impact of flowcytometric residual disease in AML. Cancers (Basel). 2021;13(11):2597.
Peiyuan Dong,1,2* Lingyun Chen,1* Hongfei Wu,1 Jiali Huo,1 Zhongxing Jiang,2 Yingqi Shao,1 Xiang Ren,1 Jinbo Huang,1 Xingxin Li,1 Min Wang,1 Neng Nie,1 Jing Zhang,1 Peng Jin,1 Yizhou Zheng1 and Meili Ge1
1State Key Laboratory of Experimental Hematology, National Clinical Research Center for Blood Diseases, Haihe Laboratory of Cell Ecosystem, Institute of Hematology and Blood Diseases Hospital, Chinese Academy of Medical Sciences and Peking Union Medical College, Tianjin and 2Department of Hematology, The First Affiliated Hospital of Zhengzhou University, Zhengzhou, China
*PD and LC contributed equally as co-first authors.
Correspondence: M.Ge gemeili503@126.com
Received: November 2, 2021.
Accepted: June 13, 2022.
Prepublished: June 23, 2022.
https://doi.org/10.3324/haematol.2021.280292
©2022 Ferrata Storti Foundation
Published under a CC BY-NC license
Myeloid-derived suppressor cells (MDSC) are a group of heterogeneous immature myeloid cells and display immunosuppressive function. In this study, MDSC populations were evaluated in acquired aplastic anemia (AA) (n=65) in which aberrant immune mechanisms contributed to bone marrow destruction. Our data demonstrate that both the proportion and immunosuppressive function of MDSC are impaired in AA patients. Decreased percentage of MDSC, especially monocytic MDSC, in the blood of AA patients (n=15) is positively correlated with the frequency of T-regulatory cells, bone marrow level of WT1 and decreased plasma level of arginase-1. RNA sequencing analyses reveal that multiple pathways including DNA damage, interleukin 4, apoptosis, and Jak kinase singnal transducer and activator of transcription are upregulated, whereas transcription, IL-6, IL-18, glycolysis, transforming growth factor and reactive oxygen species are downregulated in MDSC of AA (n=4), compared with that of healthy donors (n=3). These data suggest that AA MDSC are defective. Administration of rapamycin significantly increases the absolute number of MDSC and levels of intracellular enzymes, including arginase-1 and inducible nitric-oxide synthase. Moreover, rapamycin inhibits MDSC from differentiating into mature myeloid cells. These findings reveal that impaired MDSC are involved in the immunopathogenesis of AA. Pharmacologically targeting of MDSC by rapamycin might provide a promising therapeutic strategy for AA.
Myeloid-derived suppressor cells (MDSC), derived from myeloid cells, are a group of heterogeneous cells featuring immature state and inhibition of T-cell-mediated immune response, which expand during cancer, infection and some autoimmune diseases.1 Based on phenotypic and morphological features, MDSC are classified into two major subsets: polymorphonuclear and monocytic MDSC, i.e., PMN-MDSC and M-MDSC respectively. Recently, a novel small group of MDSC which comprised more imma ture progenitors were defined as “early-stage MDSC” (eMDSC).2 Multiple lines of evidence indicate that the sup pressive activity of MDSC is associated with the ex pression of interferon (IFN)- γ and the metabolism of L-arginine. L-arginine is the substrate for two enzymes: arginase(Arg)-1, which converts L-arginine into urea and L-ornithine, and nitric oxide synthase 2/inducible nitricoxide synthase (NOS2/iNOS), which generates nitric oxide (NO).1,3 NO and shortage of L-arginine could suppress T-
cell function through a variety of mechanisms including the inhibition of JAK3-STAT5 pathway, the induction of apoptosis and the restraint expression of CD3ξ. 1,4-6 MDSC can also promote M2 macrophage polarization and Tregulatory cell (Treg) induction, probably through interleu kin (IL)-10. In tumors, M-MDSC can rapidly differentiate into tumor-associated macrophages.7
Acquired aplastic anemia (AA) is an immune-mediated bone marrow failure syndrome, in which activated cyto toxic T cells and intrinsically impaired Tregs are involved.8 Moreover, innate immune cells such as dendritic cells and macrophages also contribute to the pathological mech anism of AA.9,10
In the steady state, immature myeloid cells don’t display immune inhibitory functions. Under pathologic conditions such as inflammation, cancer and autoimmune diseases, populations of immature myeloid cells are expanded and converted into immunosuppressive MDSC.7 Nevertheless, little is known about the role of MDSC in AA. In this study, we discovered that the impairment of MDSC played a role
in the pathogenesis of AA. Furthermore, numerous genes associated with apoptosis, JAK3/STAT5 and abnormal im mune-related genes were found differentially expressed in AA MDSC. Our results provide novel insights into a possible mechanism of AA. Rapamycin has been successfully applied to AA patients in clinical therapy.11 Previous literature reports confirmed that rapamycin expanded Treg and inhibited CD8+ T-cell func tion in AA.12 In mice, rapamycin significantly induced MDSC expansion and enhanced their immunosuppressive func tion.13,14 Nevertheless, little has been defined about the pre cise mode of action of rapamycin on MDSC in patients with AA. Our data elucidate that rapamycin can expand MDSC and restore their function in vitro.
Sixty-five acquired AA patients (41 severe AA and 24 nonsevere AA; age, 13-70 years) and twenty-eight age-matched healthy donors (HD) (12 male and 16 female; age, 17-68 years) were included after signing written informed consent which was approved by the Medical Ethics Committee of the Institute of Hematology and Blood Diseases Hospital, Chinese Academy of Medical Sciences and Peking Union Medical College in accordance with the Declaration of Hel sinki (KT2017031-EC-2). The characteristics of patients are listed in the Online Supplementary Table S1. All patients were newly diagnosed. The diagnosis and disease severity classification were abided by Camitta criteria.15 Cases com plicated with active infection, pregnancy and other auto immune diseases were excluded.
Peripheral blood mononuclear cells (PBMNC) were isolated through Ficoll-paque PLUS reagent (GE Healthcare, Sweden) centrifugation and were analyzed within 6 hours (h) after collection.16 The phenotype of MDSC was analyzed for the cell surface markers, including CD33, CD11b, human leukocyte antigen-D-related (HLA-DR), CD14, CD15 and lineage-specific markers (Lin), as described in the Online Supplementary Appendix. This marker combination allows the identification of MDSC (CD33+CD11b+HLA-DR ) and three MDSC subsets: PMN-MDSC (CD33+CD11b+HLA-DR CD15+CD14 ), M-MDSC (CD33+CD11b+HLA-DR CD14+CD15 ) and eMDSC (CD33+CD11b+HLA-DR Lin ). Intracellular ex pression of Arg-1 and iNOS were also determined as de scribed before.17 All stained cells were detected by a FACS Canto II flow cytometer (BD Biosciences) and data were analyzed with FlowJo V10 (BD Biosciences).
Cytometric bead array for cytokines
Plasma levels of interferon (IFN)-γ, Arg-1, tumor necrosis
factor (TNF)-α and IL-10 in AA patients and HD were quantitatively detected using cytometric bead array (CBA) kits (Biolegend, San Diego, CA, USA), according to the manufacturer’s instructions.
Myeloid-derived suppressor cell isolation
HLA-DR+ cells were removed from PBMNC by a negative se lection using HLA-DR microbeads according to the manu facture’s protocols (Miltenyi Biotec, Bergisch Gladbach, Germany), followed by further isolation of CD14+HLA-DR-/low cells by positive selection with anti-CD14 microbeads (Mil tenyi Biotec).14 The purity of the CD14+HLA-DR-/low cell popu lation was >85%, as detected by flow cytometry.
CD3+T cells were isolated from PBMNC of HD by anti-CD3 microbeads (Miltenyi Biotec) and labeled with CellTraceTM Violet Cell Proliferation kit (5 µM; Invitrogen, Waltham, USA). Isolated MDSC were co-cultured with allogeneic CD3+T cells for 72 h at ratios of 1:32, 1:16, 1:8, 1:4, 1:2 or 1:1 in the presence of anti-CD3/anti-CD28 Dynabeads® (Gibco, Grand Island, USA). Cells were then stained with APC-Cy7conjugated anti-human CD3, PerCP-Cy5.5-conjugated antihuman CD4 and APC-conjugated anti-human CD8 (Biolegend) antibodies. The proliferation of CD3+, CD3+CD4+ or CD3+CD8+ T cells was evaluated by flow cytometry.14 For the activation assay, cells were stained with APC-Cy7-con jugated anti-human CD3, FITC-conjugated anti-human CD69 and PE-conjugated anti-human CD25 (Biolegend) antibodies.
Th1 cell induction in vitro CD4+T cells were isolated from PBMNC of HD by anti-CD4 microbeads (Miltenyi Biotec) and were seeded into 96-well culture plates at a density of 1×10⁵ cells per well. CD4+ T cells were stimulated with plate-bound anti-human CD3 (OKT-3, Biolegend) and soluble anti-human CD28 mono clonal antibody (mAb) (CD28.2, Biolegend) in the presence of MDSC at a ratio of 2:1 for 4 days. The cells were further stimulated with PMA (50 ng/mL, Sigma-Aldrich), ionomycin (1 µg/mL, Sigma-Aldrich) and 0.4 µL BD GolgiStopTM Protein Transport Inhibitor (BD Biosciences) for 5 h and then stained intracellularly with FITC-conjugated anti-human IFN-γ and PE-conjugated anti-human IL-4 (Biolegend) anti bodies.18
RNA sequencing and functional annotation analyses MDSC from AA patients and HD were isolated as described before. Both RNA extraction and sequencing (RNA-seq) were undertaken at Novogene Inc, as previously reported.19 The construction of heatmaps, volcano plot analysis, prin cipal component analysis (PCA), gene ontology (GO) analy sis, and Kyoto Encyclopedia of Genes and Genomes (KEGG) pathway analysis were performed on NovoMagic platform
(https://magic.novogene.com). Protein-protein interaction networks (PPI) of differentially expressed genes were con ducted on the STRING database (https://string-db.org/). The selected signaling pathways were mapped on KEGG web site (https://www.kegg.jp). Gene set enrichment analysis (GSEA) was performed on GSEA 4.1.0 software (GSEA, Inc., Massachusetts, USA).
The function of rapamycin on the generation of human myeloid-derived suppressor cells in vitro
Both PBMNC from HD and AA patients were cultured in RPMI Medium 1640 containing 10% fetal bovine serum (Gibco, Thornton, Australia) and 1% glutamine (Gibco, Thornton, Australia) for 6 days. Each culture was supple mented with recombinant human IL-6 (10 ng/mL, Pepro tech, Rocky Hill, USA) and granulocyte macrophage–colony-stimulating factor (GM-CSF) (10 ng/mL, Peprotech, Rocky Hill, USA) in the presence or ab sence of rapamycin.17 Adherent cells were harvested using cell detachment solution ACCUTASETM (Stemcell, Canada). Cell surface and intracellular markers of MDSC were ana lyzed as described before. In order to determine MDSC dif ferentiation, cells were then stained with BV421-conjugated anti-human CD80 and PerCP-Cy5.5-conjugated antihuman CD86 (Biolegend) antibodies.
All results were expressed as mean ± standard deviation of the median (range). Data were analyzed with SPSS 22.0
(SPSS, Inc., Chicago, USA) statistical software. An unpaired student’s t test was performed to compare the two inde pendent groups. For non-normally distributed data, MannWhitney U was used for analysis. P<0.05 was considered statistically significant.
Decreased myeloid-derived suppressor cells in the peripheral blood of aplastic anemia patients In order to examine the MDSC proportion in peripheral blood (PB) of AA patients and HD, the cell surface markers of CD33, CD11b, HLA-DR, CD14, CD15 and Lin on PBMNC were determined. Results showed that the percentage of CD33+CD11b+HLA-DR MDSC in PB was significantly de creased in AA patients compared with that in HD. How ever, there was no difference between patients with SAA and NSAA (Figure 1A and B; Online Supplementary Table S2). CD33+CD11b+HLA-DR MDSC were further divided into CD15+ CD14 PMN-MDSC, CD14+ CD15 M-MDSC and Lin eMDSC. Compared with HD, M-MDSC in AA were signifi cantly decreased (Figure 1A and C), whereas PMN-MDSC and eMDSC in AA were only slightly declined (Online Sup plementary Figure S1; Online Supplementary Table S2). The level of intracellular Arg-1 and iNOS in circulating CD33+CD11b+HLA-DR MDSC was analyzed by flow cyto metry. The mean fluorescence intensity (MFI) of Arg-1 and iNOS were significantly lower in AA MDSC compared with

Figure 1. Decreased myeloid-derived suppressor cells in the peripheral blood of aplastic anemia patients. (A) The representative cytograms of CD33+CD11b+HLA DR myeloid-derived suppressor cells (MDSC) and MDSC subsets CD33+CD11b+HLA DR CD14+ mono cytic (M)-MDSC within the gate of peripheral blood mononuclear cells (PBMNC). (B and C) The percentage of MDSC (B) and MMDSC (C) in PBMNC from non-severe aplastic anemia (NSAA) patients (n=8), severe AA (SAA) patients (n=7) and healthy donors (HD) (n=17). (D and E) The expression of arginase (Arg)-1 (D) and inducible nitric-oxide synthase (iNOS) (E) in MDSC compared be tween AA patients (n=6) and HD (n=7). *P<0.05, **P<0.01; NS: not significant; SS: side scatter; HLA-DR: human leukocyte antigenD-related.
HD MDSC (3,154.25±1,472.09 vs. 1,696.00±403.74, P=0.037, Figure 1D) and (4,611.13±1,160.01 vs. 2,519.33±403.02, P=0.001, Figure 1E).
Compared with newly diagnosed AA patients, not only the percentage of MDSC, but also MFI of Arg-1 and iNOS were elevated (Online Supplementary Figure S1) in patients with partial or complete response. Thus, after treatment, both quantity and function of AA MDSC were improved.
Relationship between myeloid-derived suppressor cells and clinical characteristics of aplastic anemia
The percentage of MDSC was higher in male patients with AA than that in females (1.20±1.05% vs. 0.57±0.63%, P=0.106, Figure 2A), while it was independent of age (On line Supplementary Figure S2A). WT1, mostly expressed in CD34+ HSPC, was reported as a surrogate marker of cell proliferation.20,21 Our team previously confirmed that WT1 was positively associated with disease severity and clini cal outcomes in AA patients.22 In this study, we discovered that percentages of MDSC, especially M-MDSC and eMDSC, were positively correlated with WT1 level (Figure 2B; Online Supplementary Figure 2B and C).
Serum levels of TNF-α, IL-10 and IFN-γ were higher in AA patients compared with HD (11.88±4.02 pg/mL vs. 4.02±3.24 pg/mL, P=0.001; 2.25±1.43 pg/mL vs. 0.74±0.58 pg/mL, P<0.001 and 95.09±63.63 pg/mL vs. 20.09±30.35 pg/mL, P<0.001; Online Supplementary Figure S2D to F), whereas Arg-1 level was lower in AA patients (8.54±6.96 ng/mL vs. 29.87±16.87 ng/mL, P<0.001; Figure 2C). In ad dition, decreased level of Arg-1 was positively correlated with MDSC proportion (Figure 2D). However, there was no significant relationship between MDSC proportion and TNF-α, IL-10 or IFN-γ levels (data not shown). It has been
reported that MDSC could inhibit T-cell proliferation and induce Treg expansion.1,7 In this study, we found that MDSC proportion was positively correlated with the frequency of Treg, while it was negatively associated with the fre quency of CD8+ T cells (Figure 2E and F).
Decreased immunosuppressive functions of myeloidderived suppressor cells in aplastic anemia patients
In order to examine the capacity of MDSC in inhibiting Tcell proliferation, we co-cultured MDSC with CellTraceTM Violet Cell Proliferation kit-labeled CD3+T cells at ratios of 1:1, 1:2, 1:4, 1:8, 1:16, 1:32 or 1:64 in the presence of antiCD3/anti-CD28 Dynabeads for 3 days. MDSC could signifi cantly suppress CD3+ T-cell proliferation at a ratio of 1:1 and 1:2. As the ratio of MDSC to CD3+ T cells decreased, the immunosuppressive functions of MDSC declined (Fig ure 3A and B). In the following experiments, MDSC were co-cultured with CD3+ T cells at a ratio of 1:2. As expected, AA MDSC strongly inhibited the production of IFN- γ in CD3+ T cells (10.67±2.28% vs. 2.83±0.82%, P=0.02; Figure 3C).
MDSC show a prominent ability to suppress T-cell re sponses mediated in part by the secretion of Arg-1.1 Pre viously, we have demonstrated that the intracellular level of Arg-1 was significantly lower in AA MDSC compared to HD MDSC. In order to further evaluate the immunosup pressive functions of MDSC, CD3+ T cells were co-cultured with MDSC from HD and AA patients separately. Compared to HD MDSC, the inhibitory capacities of AA MDSC on pro liferation of CD3+ T, CD3+CD4+ T and CD3+CD8+ T cells were strikingly impaired (81.71±4.18% vs. 34.35±11.67%, P=0.009; 85.59±4.62% vs. 43.66±19.60%, P=0.002; and 75.39±7.10% vs. 51.07±13.86%, P=0.008, respectively; Figure 3D to F).

Figure 2. Relationship between myeloid-derived suppressor cells and clinical characteristics of aplastic anemia. (A) The per centage of myeloid-derived suppressor cells (MDSC) was higher in male patients with aplastic anemia (AA) (n=10) than in female patients (n=11). (B) MDSC proportion was positively correlated with WT1 level (n=15). (C and D) Plasma levels of arginase (Arg)-1 of AA (n=15) and healthy donors (HD) (n=17) were determined by cytometric bead array. The Arg-1 level was positively associated with the percentage of MDSC (n=15) (D). (E and F) MDSC proportion was negatively correlated with the percentage of CD8+T cells (n=9) (E), while positively associated with the frequency of T-regulatory cells (Treg) (n=9) (F). *P<0.05, **P<0.01, ***P<0.001.

Moreover, the ability of AA MDSC to inhibit CD3+ T-cell ac tivation was also decreased compared to HD MDSC (CD25: 53.71±16.33% vs. 81.47±15.26%, P=0.048; CD69: 25.90±20.42% vs. 78.52±21.54%, P=0.012; Figure 4A and B). We then assessed the effect of MDSC on Th1 cell differ entiation in CD4+ T cells. In vitro, the suppression assay re vealed that AA MDSC were less potent than HD MDSC in suppressing Th1 cell differentiation (82.79±17.53% vs. 97.38±3.07%, P=0.025; Figure 4C and D). Taken together, our results implicated the immunosuppressive function of AA MDSC was impaired.
In order to explore the molecular mechanism underlying impaired MDSC in AA patients, we performed genomewide RNA-seq of MDSC from randomly selected treat ment-naïve AA patients (n=4) and HD (n=3). MDSC (CD14+HLA-DR-/low) were enriched by magnetic cell sorting as referred before. Person correlations between samples
were ≥0.92 (Online Supplementary Figure S3A). The hier archical clustering of differentially expressed transcripts showed 702 upregulated and 658 downregulated tran scripts in AA MDSC compared with HD MDSC (fold change >2 and P value <0.05) (Figure 5A and B). The volcano plot showed numerous genes were enriched in HD MDSC (FOS, JAK3, etc) and AA MDSC (HLA-DRA, HLA-DQB1, etc), re spectively (Figure 5B). PCA of the transcriptome showed that MDSC from AA patients and HD were clustered sep arately, which represented the significant differences in the overall gene expression (Online Supplementary Figure S2B). Though the PCA plot showed moderate variability in the expression of MDSC among AA patients (Online Sup plementary Figure S2B), it should not affect the down stream analyses due to the cluster separation of AA and HD MDSC. GO analysis revealed that enriched genes were related to immunoregulation (e.g., adaptive immune re sponse) and cellular process (e.g., chemotaxis, migration, cell-cell adhesion, differentiation, and activation) (Figure 5C). Accordingly, immunologically relevant signaling path
Figure 3. Impaired inhibitory capacities of myeloid-derived suppressor cells in aplastic anemia on the proliferation of T cells. (A) The inhibitory effect of myeloid-derived suppressor cells (MDSC) on T-cell proliferation. The number of peaks represents cell division process in different ratios of MDSC and T-cell groups. (B) The divided cell proportion of T cells co-cultured with MDSC at different ratios. (C) IFN-γ in CD3+ T cells was detected by flow cytometry (n=4). (D and F) Healthy donors (HD) and aplastic anemia (AA) MDSC were co-cultured with CellTraceTM Violet Cell Proliferation kit-labeled CD3+ T cells separately at a ratio of 1:2 in the presence of anti-CD3/anti-CD28 Dynabeads for 3 days (HD n=5; AA n=5). The proliferation of CD3+ T (D), CD4+ T (E) or CD8+ T (F) cells was analyzed by flow cytometry. *P<0.05, **P<0.01, ***P<0.001.

ways (graft versus host disease [GVHD], IL-17 signaling pathway, and TNF signaling pathway), biological processes (necroptosis, galactose metabolism and apoptosis) were enriched as well by utilizing KEGG pathway analysis (Fig ure 5D).
Functional annotation analyses showed that upregulated pathways in AA MDSC were related to DNA damage,
apoptosis, IL-4 and allograft rejection (Figure 6A and B). Besides, we have confirmed that late apoptotic cells rate in AA MDSC was higher than that in HD MDSC ( On line Supplementary Figure S4 ). Interestingly, the genes responsible for regulation of transcription, protein se cretion, glycolysis, IL-6 and immunoregulation (TGF- β , ROS and IL-18) were downregulated in AA MDSC (Figure
6A and B; Online Supplementary Figure S2C). These find ings might partly explain the dysfunction of AA MDSC in immune regulation.
Reports revealed that both growth hormone (GH)23 and leptin 24 can activate intracellular tyrosine kinases (JAK) and the latent cytoplasmic transcriptions factors (STAT), which further induced proliferation, differentiation, cell cycle and anti-apoptosis pathways in normal cells. In this study, we found that leptin receptor (LEPR) and genes related with GH receptor (GHR) pathway were up regulated in AA MDSC (Figure 6C). In addition, PPI analy sis showed that 19 genes related to JAK/STAT pathway formed an interaction network. STRING database ident ified 18 nodes and 60 edges with PPI enrichment P value <1.0e-16, average clustering coefficient of 0.79, and aver age node degree of 6.67 (Figure 6C and D). Interestingly, anti-apoptosis pathway-related genes (JAK3, STAT3, PIM1 and SOCS3 ) were also upregulated in AA MDSC (Figure 6E). Collectively, these data suggest that MDSC reduc
tion could be associated with the upregulation of apop tosis and DNA damage, as well as downregulation of gene expression and development-inducing factors in AA. Moreover, our data imply that upregulated JAK/STAT pathway in AA MDSC may be negative feedback of de creased MDSC numbers.
Rapamycin treatment increased myeloid-derived suppressor cells and improved their immunosuppressive function Wang et al.14 reported that treatment with rapamycin in duces MDSC recruitment. Human MDSC is roughly CD33 + CD11b + HLA-DR low/-. Cytokine-induced CD33 + cells showed high expression of CD11b+ and low to intermedi ate HLA-DR expression. Thus, these cytokine-treated CD33+ cells phenotypically resembled human MDSC. 25 In order to investigate the effect of rapamycin on MDSC expansion, changes in surface expression of CD33, CD11b, CD14, HLA-DR on cytokine-induced MDSC from
Figure 4. Impaired inhibitory capacities of myeloid-derived suppressor cells in aplastic anemia patients on activation and differentiation of T cells. (A and B) Compared to healthy donors (HD) myeloid-derived suppressor cells (MDSC) (n=4), aplastic anemia (AA) MDSC (n=4) showed a defective capacity to inhibit the activation of T cells. (C and F) The capacity to inhibit T cells towards Th1 (CD4+IFN-γ+IL-4 ); (D) was markedly decreased in AA MDSC, while there was no difference in inhibiting T cells towards Th2 (CD4+IFN-γ IL-4+); (E) and the ratio of Th1/Th2 (F) (HD n=6; AA n=6). *P<0.05, **P<0.01, ***P<0.001. NS: not significant; SSC: side scatter; HLA-DR: human leukocyte antigen-D-related.

HD or patients with AA were determined in vitro . After different concentrations of rapamycin (0, 10, 20, 50, 100 and 1,000 nM) were added, absolute number of CD33 + cells as well as the percentages of HLA-DR- in CD33 + CD11b + cells and CD14 + cells were evaluated. As shown in Figure 7A, rapamycin with the concentration of 10 nM could significantly increase the percentage of HLA-DR cells (72.80±7.84% vs. 47.52±17.73%, P =0.019). Conversely, higher concentrations of rapamycin failed to promote MDSC expansion. Therefore, 10 nM rapamycin was applied in the following experiment. Together, the absolute number of CD33 + cells and percentage of HLA-
DR cells showed a significant increase after the addition of rapamycin in vitro compared with control (P<0.05, Fig ure 7B to D). Moreover, rapamycin markedly suppressed lipopolysaccharide-induced CD80 expression in MDSC (P <0.05; Figure 7F). However, rapamycin didn’t signifi cantly reduce CD86 expression ( Online Supplementary Figure S5 ). These data suggest that rapamycin increases MDSC by promoting their proliferation and suppressing their differentiation into mature myeloid cells. MDSC-mediated suppression on T-cell responses was correlated with expression of iNOS and Arg-1.1,3 In order to better characterize the function of rapamycin-treated
Figure 5. Gene expression pattern of myeloid-derived suppressor cells in aplastic anemia patients (n=4) and healthy donors (n=3). (A) Hierarchical clustering of aplastic anemia (AA) myeloid-derived suppressor cells (MDSC) and healthy donors (HD) MDSC on differentially expressed RNA transcripts from RNA sequencing data. Each column represents a sample, and each row repre sents a transcript. The color gradient reveals the expression level of each transcript. (B) Volcano plot analysis shows differentially expressed genes; fold changes (>2 or <-2) with significant P values (<0.05) are highlighted in red (for upregulated genes) and green (for downregulated genes). (C and D) Gene ontology (C) and Kyoto Encyclopedia of Genes and Genomes (D) analysis show significantly upregulated and downregulated pathways involved in AA MDSC based on their functional categorization. GVHD: graft versus host disease; GnRH: gonadotropin-releasing hormone; TNF: tumor necrosis factor; IL: interleukin; NO: genes with no change in expression.

suppressor cells in aplastic anemia
MDSC, these enzymes were evaluated by flow cytometry. Results showed that rapamycin treatment significantly augmented the expression level of iNOS and Arg-1 in cyto
B
kine-induced MDSC (Figure 7G and H). Therefore, rapamy cin modulation proved to reinforce certain suppressive pathways involving iNOS and Arg-1 levels in MDSC.
Figure 6. Dysregulated pathways in aplastic anemia myeloid-derived suppressor cells. (A) Heat map shows that DNA damage and regulation of transcription were dysregulated in aplastic anemia (AA) myeloid-derived suppressor cells (MDSC) compared with healthy donor (HD) MDSC. (B) Gene set enrichment analysis reveals 6 dysregulated pathways in AA MDSC. (C) Heat map shows genes associated with JAK-STAT and GHR pathways were differentially expressed in AA MDSC. (D) PPI network analyses shows the interaction network of dysregulated genes related to JAK-STAT signaling pathway by using the STRING database. The overall network statistics are shown in the boxes. (E) Kyoto Encyclopedia of Genes analysis shows upregulated genes (marked with red boxes) involved in the JAK-STAT pathway. GHR: growth hormone receptor; ES: enrichment score; IL: interleukin.

T-cell mediated autoimmunity targeting bone marrow leads to impaired hematopoiesis in AA.26 Defective Tregs27 and
mesenchymal stem/stromal cells28 were involved in the pa thogenesis of AA. MDSC, identified as regulators of the im mune system, show a remarkable ability to suppress T-cell responses partly mediated by the production of Arg-1 and

Figure 7. Rapamycin treatment increases myeloid-derived suppressor cells and improves their immunosuppressive function.
(A) Rapamycin with concentration gradients from 10 to 1,000 nM stimulated the percentage of HLA-DR in CD33+CD11b+ cells in vitro (n=5). (B) Rapamycin significantly increased the absolute number of CD33+ cells (healthy donor [HD] n=4; aplastic anemia [AA] n=4), while there was no difference for the percentage of CD33+CD11b+ cells (HD n=5; AA n=4). (C and D) Rapamycin signifi cantly increased the percentage of HLA-DR- in CD33+CD11b+ cells and CD14+ cells (HD n=5; AA n=4). (E) Peripheral blood mono nuclear cells were treated with rapamycin or dimethylsulfoxide (DMSO) (control) for 6 days before lipopolysaccharide (1 µg/mL) stimulation for 24 hours. (F) The expression of CD80 from patients with aplastic anemia (AA) and HD was detected by flow cyto metry (HD n=5; AA n=5). (G and H) Expression levels of arginase (Arg)-1 (G) and inducible nitric-oxide synthase (iNOS) (H) with or without treatment of rapamycin from patients with AA and HD (HD n=5; AA n=4). All quantitative data represent mean ± standard error of the mean. *P<0.05, **P<0.01. SSC: side scatter; HLA-DR: human leukocyte antigen-D-related; Rap: rapamycin.
iNOS.1 MDSC consist of two major subsets: PMN-MDSC and M-MDSC. M-MDSC have upregulated expression of iNOS, STAT1 and NO; PMN-MDSC increase the activity of STAT3 and NADPH. Both subsets have elevated levels of Arg-1, which could suppress the immune response of T cells by deletion of arginine.1
Our data verified that MDSC, especially M-MDSC, were re duced in the PB of AA patients. The decreased intracellular levels of Arg-1 and iNOS in AA MDSC might contribute to the impaired immunosuppressive function. Consistently, plasma levels of Arg-1 in AA patients were lower than that of HD. In addition, the percentage of peripheral AA MDSC was positively correlated with the frequency of Tregs and negatively correlated with CD8+T cells, which coincided with the defected immunosuppressive function of AA MDSC. Interestingly, the percentage of MDSC in male AA exceeded that of female AA. It was reported that MDSC were susceptible to sex hormones and that androgen suppression therapy inhibited the expansion of MDSC.29 Herein, we speculated that androgen might play a role in the development of MDSC, which provided evidence for applying androgen in AA therapy. WT1 was reported to control the growth and differentiation of CD34+ HSPC.30 A former study revealed that bone marrow WT1 level in pa tients with AA was related to disease severity and could predict the response to immunosuppressive therapy.22 Our data illustrated that the percentage of MDSC was posi tively associated with bone marrow WT1 level, which further indicated the involvement of MDSC in the impaired hematopoiesis of AA.
In order to elucidate the distinct signaling pathways and biological mechanisms regulated by MDSC in the circula tion of AA patients, we performed comparative analyses of the transcriptomic profiles between AA and HD MDSC. Our data showed that critical pathways associated with MDSC expansion, such as transcription, IL-6, IL-18 and glycolysis, were downregulated in AA MDSC. Additionally, genes related to DNA damage and apoptosis were upregu lated in AA MDSC, which shed light on the reduced number of MDSC in AA patients. Interestingly, the JAKSTAT pathway, which mediated anti-apoptosis, was also found to be upregulated in AA MDSC. Occurring in 7% AA patients, STAT3 mutation was associated with the pres ence of human leukocyte antigen-DR15 and predicted better responses to immunosuppressive therapy.31 More over, both GH23 and leptin24 could activate JAK-STAT. In agreement with these reports, we found that STAT3, LEPR and genes related to the GHR signaling pathway were up regulated in AA MDSC. Furthermore, components of JAKSTAT signaling pathway (STAT1, STAT5, etc.) could expand the immunosuppressive-cell subsets such as MDSC and Tregs.32 Collectively, these data implied that the JAK-STAT signaling pathway in AA MDSC was important to trigger
their proliferation and resist apoptosis. Upregulated JAKSTAT signaling pathway may be negative feedback of de creased MDSC numbers in AA.
Apart from Arg-1 and iNOS, the immunosuppressive prop erty of MDSC could also be mediated by the production of TGF-β and ROS.1 In this study, TGF-β and ROS pathways were found downregulated in AA MDSC, which further ex plained the dysfunction of AA MDSC. MDSC were con firmed to promote immune tolerance in bone marrow transplantation and show a protective effect in GVHD regulation.13,33 Our data indicated that the allograft rejec tion pathway was upregulated in AA MDSC whereas GVHD-related genes (IL1A, PRF1, GZMB and KLRD1) were downregulated. Collectively, there might be an interesting trend for the decreased incidence of GVHD in AA patients with bone marrow transplantation. Many factors affecting MDSC expansion and function were reported.1 However, to date, no clinically effective therapy targeting MDSC has been developed yet. Rapamycin, serv ing as an inhibitor of the intracellular kinase mTOR, was clinically applied in AA as an immunosuppressive agent.11 Consistent with previous reports,14 our results demon strated that rapamycin treatment in vitro increased the number of MDSC and significantly improved the Arg-1 and iNOS levels in MDSC. In addition, the increased proportion of HLA-DR after rapamycin intervention indicated that ra pamycin might affect the differentiation of MDSC. Indeed, rapamycin significantly suppressed lipopolysaccharide-in duced MDSC differentiation into macrophages. This is one of the mechanisms in which rapamycin plays a thera peutic role in AA. In summary, impaired MDSC are involved in the immuno pathogenesis of AA. We have revealed intrinsic defects of MDSC in AA and provided new overwhelming evidence of rapamycin in AA treatment.
No conflicts of interest to disclose.
P-yD and M-lG designed the research and wrote the paper. P-yD and L-yC performed the research and analyzed the data. H-fW, J-lH, Z-xJ, Y-qS, XR, J-bH, X-xL, MW, NN, JZ and PJ contributed to the clinical data collection, and sample preparation. J-lH, Y-zZ and M-lG revised the manuscript. All authors made significant contributions to, reviewed, and approved the final version of the manuscript.
The authors would like to thank all the doctors and nurses in the Therapeutic Center of Anemic Diseases and the re search team of the Clinical Laboratory Center for their professional assistance.
This work was supported by grants from the National Natural Science Foundation of China (grant numbers 81700120, 81770119 and 81970104) and the Haihe Labora tory of Cell Ecosystem Innovation Fund (grant number HH22KYZX0041).
1. Gabrilovich DI, Nagaraj S. Myeloid-derived suppressor cells as regulators of the immune system. Nat Rev Immunol. 2009;9(3):162-174.
2. Bronte V, Brandau S, Chen SH, et al. Recommendations for myeloid-derived suppressor cell nomenclature and characterization standards. Nat Commun. 2016;7:12150.
3. Ostrand-Rosenberg S, Sinha P. Myeloid-derived suppressor cells: linking inflammation and cancer. J Immunol. 2009;182(8):4499-4506.
4. Rodriguez PC, Zea AH, Culotta KS, Zabaleta J, Ochoa JB, Ochoa AC. Regulation of T cell receptor CD3zeta chain expression by Larginine. J Biol Chem. 2002;277(24):21123-21129.
5. Bingisser RM, Tilbrook PA, Holt PG, Kees UR. Macrophage-derived nitric oxide regulates T cell activation via reversible disruption of the Jak3/STAT5 signaling pathway. J Immunol. 1998;160(12):57295734.
6. Rivoltini L, Carrabba M, Huber V, et al. Immunity to cancer: attack and escape in T lymphocyte-tumor cell interaction. Immunol Rev. 2002;188:97-113.
7. Veglia F, Perego M, Gabrilovich D. Myeloid-derived suppressor cells coming of age. Nat Immunol. 2018;19(2):108-119.
8. DeZern AE, Churpek JE. Approach to the diagnosis of aplastic anemia. Blood Adv. 2021;5(12):2660-2671.
9. Zonghong S, Meifeng T, Huaquan W, et al. Circulating myeloid dendritic cells are increased in individuals with severe aplastic anemia. Int J Hematol. 2011;93(2):156-162.
10. Sun W, Wu Z, Lin Z, et al. Macrophage TNF-α licenses donor T cells in murine bone marrow failure and can be implicated in human aplastic anemia. Blood. 2018;132(26):2730-2743.
11. He G, Zhang X, Wu D, Sun A, Wang X. Relapse of aplastic anemia responsive to sirolimus combined with cyclosporine. Pediatr Blood Cancer. 2011;56(7):1133-1135.
12. Feng X, Lin Z, Sun W, et al. Rapamycin is highly effective in murine models of immune-mediated bone marrow failure. Haematologica. 2017;102(10):1691-1703.
13. Lin Y, Wang B, Shan W, et al. mTOR inhibitor rapamycin induce polymorphonuclear myeloid-derived suppressor cells mobilization and function in protecting against acute graft-versus-host disease after bone marrow transplantation. Clin Immunol. 2018;187:122-131.
14. Zhou L, Miao K, Yin B, et al. Cardioprotective role of myeloidderived suppressor cells in heart failure. Circulation. 2018;138(2):181-197.
15. Camitta BM, Rappeport JM, Parkman R, Nathan DG. Selection of patients for bone marrow transplantation in severe aplastic anemia. Blood. 1975;45(3):355-363.
16. He YM, Li X, Perego M, et al. Transitory presence of myeloidderived suppressor cells in neonates is critical for control of inflammation. Nat Med. 2018;24(2):224-231.
17. Hou Y, Feng Q, Xu M, et al. High-dose dexamethasone corrects impaired myeloid-derived suppressor cell function via Ets1 in immune thrombocytopenia. Blood. 2016;127(12):1587-1597.
Dong
All data generated and/or analyzed in this study are in cluded in this published article and its Online Supplemen tary Appendix. Meanwhile, the datasets used and analyzed during the current study are also available from the cor responding author on reasonable request.
18. Xie J, Wen J, Chen C, et al. Notch 1 Is Involved in CD4(+) T Cell Differentiation Into Th1 Subtype During Helicobacter pylori Infection. Front Cell Infect Microbiol. 2020;10:575271.
19. El-Houjeiri L, Possik E, Vijayaraghavan T, et al. The transcription factors TFEB and TFE3 link the FLCN-AMPK signaling axis to innate immune response and pathogen resistance. Cell Rep. 2019;26(13):3613-3628.
20. Shichishima T, Okamoto M, Ikeda K, et al. HLA class II haplotype and quantitation of WT1 RNA in Japanese patients with paroxysmal nocturnal hemoglobinuria. Blood. 2002;100(1):22-28.
21. Olszewski M, Huang W, Chou PM, Duerst R, Kletzel M. Wilms' tumor 1 (WT1) gene in hematopoiesis: a surrogate marker of cell proliferation as a possible mechanism of action? Cytotherapy. 2005;7(1):57-61.
22. You Y, Huo J, Lu S, et al. The diverse expression of the WT1 gene in patients with acquired bone marrow failure syndromes. Leuk Lymphoma. 2018;59(4):950-957.
23. Han Y, Leaman DW, Watling D, et al. Participation of JAK and STAT proteins in growth hormone-induced signaling. J Biol Chem. 1996;271(10):5947-5952.
24. Mullen M, Gonzalez-Perez RR. Leptin-induced JAK/STAT signaling and cancer growth. Vaccines (Basel). 2016;4(3):26.
25. Ugel S, Delpozzo F, Desantis G, et al. Therapeutic targeting of myeloid-derived suppressor cells. Curr Opin Pharmacol. 2009;9(4):470-481.
26. Medinger M, Drexler B, Lengerke C, Passweg J. Pathogenesis of acquired aplastic anemia and the role of the bone marrow microenvironment. Front Oncol. 2018;8:587.
27. Shi J, Ge M, Lu S, et al. Intrinsic impairment of CD4+CD25+ regulatory T cells in acquired aplastic anemia. Blood. 2012;120(8):1624-1632.
28. Huo J, Zhang L, Ren X, et al. Multifaceted characterization of the signatures and efficacy of mesenchymal stem/stromal cells in acquired aplastic anemia. Stem Cell Res Ther. 2020;11(1):59.
29. Boettcher AN, Usman A, Morgans A, VanderWeele DJ, Sosman J, Wu JD. Past, current, and future of immunotherapies for prostate cancer. Front Oncol. 2019;9:884.
30. Menssen HD, Renkl HJ, Entezami M, Thiel E. Wilms' tumor gene expression in human CD34+ hematopoietic progenitors during fetal development and early clonogenic growth. Blood. 1997;89(9):3486-3487.
31. Jerez A, Clemente MJ, Makishima H, et al. STAT3 mutations indicate the presence of subclinical T-cell clones in a subset of aplastic anemia and myelodysplastic syndrome patients. Blood. 2013;122(14):2453-2459.
32. Owen KL, Brockwell NK, Parker BS. JAK-STAT signaling: a doubleedged sword of immune regulation and cancer progression. Cancers. 2019;11(12):2002.
33. Ochando J, Conde P, Utrero-Rico A, Paz-Artal E. Tolerogenic role of myeloid suppressor cells in organ transplantation. Front Immunol. 2019;10:374.
Inga Scheller,1* Sarah Beck,1* Vanessa Göb,1 Carina Gross,1 Raluca A. I. Neagoe,1,2 Katja Aurbach,1 Markus Bender,1 David Stegner,1 Zoltan Nagy1 and Bernhard Nieswandt1
1Institute of Experimental Biomedicine I, University Hospital, University of Würzburg, and Rudolf Virchow Center for Integrative and Translational BioImaging, University of Würzburg, Würzburg, Germany and 2Institute of Cardiovascular Sciences, College of Medical and Dental Sciences, University of Birmingham, Edgbaston, Birmingham, UK
*IS and SB contributed equally as co-first authors.
Correspondence: B. Nieswandt bernhard.nieswandt@virchow.uniwuerzburg.de
Received: February 11, 2021.
Accepted: July 26, 2021.
Prepublished: August 5, 2021.
https://doi.org/10.3324/haematol.2021.278537
©2022 Ferrata Storti Foundation
Published under a CC BY-NC license
Coordinated rearrangements of the actin cytoskeleton are pivotal for platelet biogenesis from megakaryocytes but also orchestrate key functions of peripheral platelets in hemostasis and thrombosis, such as granule release, the formation of filopodia and lamellipodia, or clot retraction. Along with profilin (Pfn) 1, thymosin β4 (encoded by Tmsb4x) is one of the two main G-actin-sequestering proteins within cells of higher eukaryotes, and its intracellular concentration is particularly high in cells that rapidly respond to external signals by increased motility, such as platelets. Here, we analyzed constitutive Tmsb4x knockout (KO) mice to investigate the functional role of the protein in platelet production and function. Thymosin β4 deficiency resulted in a macrothrombocytopenia with only mildly increased platelet volume and an unaltered platelet life span. Megakaryocyte numbers in the bone marrow and spleen were unaltered, however, Tmsb4x KO megakaryocytes showed defective proplatelet formation in vitro and in vivo. Thymosin β4-deficient platelets displayed markedly decreased G-actin levels and concomitantly increased F-actin levels resulting in accelerated spreading on fibrinogen and clot retraction. Moreover, Tmsb4x KO platelets showed activation defects and an impaired immunoreceptor tyrosine-based activation motif (ITAM) signaling downstream of the activating collagen receptor glycoprotein VI. These defects translated into impaired aggregate formation under flow, protection from occlusive arterial thrombus formation in vivo and increased tail bleeding times. In summary, these findings point to a critical role of thymosin β4 for actin dynamics during platelet biogenesis, platelet activation downstream of glycoprotein VI and thrombus stability.
Platelets are small anucleate cells circulating in the blood stream that are essential for hemostasis and maintenance of vascular integrity but are also critically involved in thrombosis under pathological conditions. They are de rived from giant precursor cells, the megakaryocytes (MK), residing in the bone marrow (BM). Mature polyploid MK extend long protrusions, so-called proplatelets, into the sinusoidal vessel lumen, which are shed off by shear forces and further fragment into platelets in the blood stream,1 a process that requires extensive microtubule and actin rearrangements.2,3 Whereas the actin cytoskele ton is thought to regulate proplatelet branching, micro tubule sliding ensures proplatelet elongation.4 In circulating platelets, the actin cytoskeleton is essential to maintain cell morphology and to exert key functions upon activation, such as granule release, as well as the forma
tion of filopodia and lamellipodia.5 The critical role of the actin cytoskeleton for platelet production and function is demonstrated by platelet disorders in humans and mice resulting from defects in proteins regulating actin dy namics.6-8 However, the complex protein network orches trating actin dynamics in MK and platelets remains incompletely understood.
β thymosins are a family of proteins with a molecular weight of approximately 5 kDa that are widely expressed. Of the 15 existing, highly homologous β thymosins, thy mosin β4 is the most abundant isoform.9 Thymosin β4 was first isolated from calf thymus and therefore thought to exert hormone-like activities.10,11 Indeed, various paracrine effects of the protein have been reported, including car diac protection, angiogenesis, wound healing and immu nomodulatory effects9,12-14 although the exact underlying mechanisms have not been fully elucidated. The intracellular concentration of thymosin β4 is particu
- Thymosin β4 in platelet biogenesis and function
larly high in cells that rapidly respond to external signals by increased motility such as neutrophils and macro phages or by profound shape changes like platelets (~140,000 copies per platelet in mice and 320,000 copies per platelet in humans).15-17 For the dynamic spatiotemporal regulation of globular (G)-actin polymerization into fila mentous (F)-actin networks, cells rely on a large reservoir of actin monomers sequestered by the actin monomerbinding proteins thymosin β 4 and profilin (Pfn) 1.18 The main intracellular function of thymosin β 4 is to bind G-actin, thereby inhibiting actin polymerization.19 Thymo sin β4 exclusively binds to actin monomers and not to the filament ends or alongside the filament, and its affinity is 50-fold higher for ATP- than ADP-bound actin monomers maintaining a polymerization-ready pool in reserve.20,21 In resting cells, thymosin β 4 complexes about half of the total G-actin.22 Whereas thymosin β4 prevents actin poly merization, Pfn1 promotes filament assembly.19 Both pro teins bind actin monomers transiently with a stoichiometry of 1:1.23 While Pfn1 catalytically accelerates nucleotide exchange, thymosin β4 strongly inhibits the ex change of the nucleotide bound to actin monomers by blocking its dissociation.23
Conditional MK- and platelet-specific Pfn1 knockout (KO) mice reproduced key features of Wiskott–Aldrich syn drome (WAS) patients including microthrombocytopenia, due to impaired proplatelet formation (PPF), cytoskeletal alterations and accelerated platelet clearance.24 Pfn1 KO MK produced less and smaller-sized platelets into the cir culation, which had a thicker marginal band and a partially disrupted actin cytoskeleton leading to accelerated inte grin inactivation and hence impaired platelet function in vitro and in vivo 25
As dynamic actin reorganization is crucial for both platelet biogenesis and function,24-26 we investigated the role of thymosin β4 in these processes by studying Tmsb4x KO mice. Deficiency of thymosin β4 resulted in macrothrom bocytopenia and defective proplatelet formation due to a dysregulated G- to F-actin ratio. Moreover, Tmsb4x KO pla telets displayed impaired mmunoreceptor tyrosine-based activation motif (ITAM) signaling downstream of glycopro tein VI (GPVI), leading to defective aggregate formation under flow, protection from in vivo thrombus formation, and increased tail bleeding times.
All animal studies were approved by the district govern ment of Lower Franconia (Bezirksregierung Unterfranken). Tmsb4x-/- mice were created by MRC mouse network by injection of embryonic stem cell clone Tmsb4xtm2a(EUCOMM)Wtsi into C57Bl/6/129/SvJ blastocysts and afterwards trans
ferred to our animal facility where the KO mice were kept on the mixed background. Eight to 16-week-old KO mice and matching wild-type (WT) animals were used for ex periments if not stated otherwise. Detailed protocols for platelet preparation, determination of platelet lifespan, count and size, aggregometry, flow ad hesion assays, actin polymerization, tail bleeding time, in travital microscopy models, two-photon microscopy, spreading assays and clot retraction, as well as MK differ entiation and culture, histology, staining procedures and immunoblotting can be found in the Online Supplementary Appendix.
The presented results are mean ± standard deviation (SD) from at least three independent experiments per group, if not stated otherwise. Data distribution was analyzed using the Shapiro-Wilk-test and differences between control and KO mice were statistically analyzed using unpaired, two-tailed Student’s t-test, one-way ANOVA or Fisher’s exact test as indicated in the legends. P-values <0.05 were considered as statistically significant, *P<0.05; **P<0.01; ***P<0.001. Results with a P-value >0.05 were considered as not significant (ns).
Impaired proplatelet formation and macrothrombocytopenia in thymosin β4-deficient mice Constitutive Tmsb4x KO mice were born in the expected Mendelian ratios, viable and fertile. The complete absence of thymosin β 4 in platelets was confirmed by an auto mated quantitative capillary-based immunoassay plat form, Jess (Figure 1A). Tmsb4x KO mice showed no change in basal blood parameters except for platelet count and size (Online Supplementary Table S1). Platelet counts were significantly reduced in Tmsb4x KO mice compared to WT controls (Figure 1B). Mutant platelets exhibited a small, but significant increase in mean platelet volume (Figure 1C). Transmission electron microscopy (TEM) images re vealed that platelet size was quite variable in mutant mice, with platelets comparable to WT size as well as big roundish platelets and platelets with normal shape but increased size (Figure 1D). α- and dense granule numbers were comparable between WT and Tmsb4x KO platelets (Online Supplementary Figure S1A and B). Notably, platelet lifespan in Tmsb4x KO mice was unaltered as compared to the WT controls (Online Supplementary Figure S2A). Moreover, analysis of hematoxylin and eosin-stained (H&E) femora and spleen sections (Figure 1E and F; Online Sup plementary Figure S2B) as well as cryosections of femora (Online Supplementary Figure S2C and D) revealed com parable MK numbers in WT and Tmsb4x KO mice. MK ploidy
Figure 1. Thrombocytopenia and impaired proplatelet formation in thymosin β4 knockout mice. (A) Protein levels of thymosin β4 and integrin β1 in wild-type (WT) and Tmsb4x knockout (KO) platelets were analyzed by an automated quantitative capillarybased immunoassay platform; Jess (ProteinSimple). Platelet count (B) and volume (C) were determined using an automated blood cell analyzer (ScilVet). Mean ± standard deviation (SD) (n= 4, 3 independent experiments). Unpaired, two-tailed Student’s t-test. ***P<0.001. (D) Representative transmission electron microscopic images of 1 WT mouse and 3 Tmsb4x KO mice: (2) platelets comparable to WT size, (3) big roundish platelets, (4) platelets with increased size. Scale bars: 2 mm. (E and F) Hematoxylin-eosin stainings of femur paraffin sections of WT and Tmsb4x KO mice (E) and quantification of megakaryocyte (MK) numbers (F). Arrow heads indicate the MK. Scale bars: 100 mm. Values are mean ± SD (n=3). (G and H) Proplatelet formation of bone marrow MK after lineage depletion and culturing in rHirudin- and TPO-conditioned medium. On day 4, proplatelet-forming MK were counted. Average of 5 analyzed visual fields per MK culture of 3 animals/genotype is shown. Values are mean ± SD. Unpaired, two-tailed Student’s t-test. *P<0.05. (I) Proplatelets were visualized using an α tubulin antibody and phalloidin and analyzed by confocal microscopy (40x objective, Leica TCS SP8) using a 40x objective. Scale bar: 20 mm.

Thymosin β4 in platelet biogenesis and function
levels in mutant mice were not significantly altered com pared to WT animals as assessed by flow cytometric analy sis of freshly isolated BM MK (Online Supplementary Figure S2E). TEM of BM MK revealed a slightly altered demarcation membrane system (DMS) morphology with more and smaller invaginations (Online Supplementary Figure S3).
In order to elucidate whether the macrothrombocytopenia in Tmsb4x KO mice was caused by impaired platelet bio genesis, we analyzed the ability of BM-derived MK27 to form proplatelets in vitro. We found that PPF was significantly re duced in the absence of thymosin β4 (*P<0.05) (Figure 1G and H). Microscopic analysis of proplatelet-forming MK re vealed the presence of thickened and shortened proplatelet shafts and tips, suggesting that defective cytoskeletal or ganization may account for the reduced PPF (Figure 1I). In order to visualize PPF in vivo, we imaged MK in the BM of WT and Tmsb4x KO mice by two-photon intravital micro scopy of the skull. As shown in the Online Supplementary Video S1, proplatelet-forming MK in WT mice formed pro trusions reaching into the vessel sinusoids that were rapidly shed off by the blood flow (Online Supplementary Video S1). In marked contrast, large, abnormally thick protrusions were observed in Tmsb4x KO mice (Online Supplementary Video S2). Interestingly, these aberrant proplatelets dissociated less frequently from the MK and appeared to be more firmly attached to its mother cell (Online Supplementary Video S2). Notably, we did not observe ectopic release of proplateletlike particles into the BM, as previously reported for other proteins involved in actin dynamics such as Pfn1,24 ADAP28 or WASP29 KO mice. This suggests that thymosin β4 defi ciency induces pronounced cytoskeletal defects resulting in impaired platelet biogenesis in vivo but not ectopic platelet release into the BM compartment. Actomyosin contractility plays a crucial role for the fragmentation of protrusions from MK into the blood stream.30 Thus, we assessed myosin levels in MK and platelets. Although non-muscle myosin IIA (NMIIa) levels were comparable in MK (Online Supplementary Figure S4A), Tmsb4x KO platelets displayed significantly de creased NMIIa (Online Supplementary Figure S4B and C) and myosin light chain 2 (MLC2; Online Supplementary Figure S4D and E) levels compared to WT. These findings indicate that in the absence of thymosin β4, myosin enrichment dur ing the late stages of MK/proplatelet maturation is affected. This, together with the disturbed actin dynamics, which play a crucial role for proplatelet branching,1 might explain the existence of abnormal, elongated proplatelets without swellings in Tmsb4x KO mice.
As thymosin β4 is one of the major G-actin sequestering proteins, we analyzed F-actin content and found that rest ing Tmsb4x KO platelets exhibited a significant increase in F-actin levels, as assessed by flow cytometry using fluor
escently labeled phalloidin (*P<0.05) (Figure 2A). Strikingly, Tmsb4x KO platelets were unable to efficiently assemble further F-actin upon activation with different agonists (Fig ure 2B). Furthermore, by separating the actin cytoskeleton into monomeric and polymeric fractions using ultracen trifugation,24 we observed reduced actin protein levels in the supernatant fraction of Tmsb4x KO platelets indicating lower G-actin levels compared to WT platelets (**P<0.01) (Figure 2C and D). In line with these observations, G-actin content was reduced by 50% in Tmsb4x KO platelets spread on fibrinogen as determined by staining with DNase I to label G-actin31 (**P<0.01) (Figure 2E and F).
As Pfn1 might functionally compensate for the loss of thy mosin β4, we determined Pfn1 protein levels by western blotting, and found them unaltered compared to the WT. Moreover, assessment of the activation-dependent phos phorylation of Pfn1 on tyrosine 129, which is known to in crease the affinity of Pfn1 towards actin monomers and its actin polymerization activity, revealed an unaltered activity of Pfn1 (Online Supplementary Figure S5).
Accelerated spreading and clot retraction of thymosin β4-deficient platelets
Platelet spreading on fibrinogen is highly dependent on functional cytoskeletal dynamics. Therefore, we next as sessed the ability of Tmsb4x KO platelets to form filo- and lamellipodia on a fibrinogen matrix. As shown in Figure 3A to C, we found overall accelerated spreading of KO pla telets, which was most evident at the 15-minute time point. We speculate that the formation of protrusions in the KO platelets is facilitated due to the increased F-actin content. We further analyzed the actin filaments of spread platelets on fibrinogen using phalloidin-647 and an anti-tubulin-488 antibody staining (Online Supplementary Figure S6) or plati num replica electron microscopy (PREM) (Figure 3C and D). Of note, we compared earlier time points of spread Tmsb4x KO with later time points of WT platelets to compensate for the faster spreading. When comparing WT platelets spread for 15 minutes (min) with Tmsb4x KO platelet spread for 5 min in the PREM assay (or 30 min WT to 15 min Tmsb4x KO for the staining), we found unaltered F-actin structures. Strik ingly, clot retraction of Tmsb4x KO platelets was also en hanced (Figure 4A and B), indicating faster contraction of the actin cytoskeleton, generating forces transmitted to the external fibrin clot, resulting in retraction and fibrin clot shrinkage. In order to further analyze the dynamics of clot retraction, we performed immunofluorescence staining of the fibrin meshwork of the clots.32 Clots were analyzed by confocal microscopy and strikingly, as shown in Figure 4C, Tmsb4x KO platelets displayed less and shorter fibrin fibers and they also look less branched. These findings indicate that Tmsb4x KO platelets are able to bend and shorten fibrin fibers faster than WT pla
- Thymosin β4 in platelet biogenesis and function

telets, which might explain, or at least contribute to, the observed faster clot retraction.
β4-deficient platelets
Next, we sought to investigate the effect of thymosin β4 deficiency on platelet activation. Washed platelets were stimulated with various agonists and the activation of αIIbβ3
integrin (JON/A-PE) as well as degranulation-dependent surface exposure of P-selectin was determined. Although expression levels of prominent surface glycoproteins were comparable between mutant and WT platelets (Online Sup plementary Table S2), slightly reduced αIIbβ3 activation was consistently detected in Tmsb4x KO platelets in response to stimulation with ADP, thrombin and the snake venom toxin rhodocytin which activates the hemITAM coupled C-
Figure 2. Impaired actin equilibrium and assembly in thymosin β4 knockout platelets. (A and B) Relative F-actin content of resting and activated platelets was determined by flow cytometry. Values are mean ± standard deviation (SD) of 4 mice per group. The values are displayed as the ratio of MFI: mean fluorescence intensity from activated and resting platelets. Unpaired, two-tailed Student’s t-test. *P<0.05, **P<0.005, ***P<0.001. (C and D) The actin cytoskeleton was isolated by ultracentrifugation, immunoblotted with an anti-β actin antibody and analyzed for the content of monomeric vs. filamentous actin using densitometry. GAPDH served as loading control. Values are mean ± SD (n=3). P: pellet, S: supernatant, T: total protein. Unpaired, two-tailed Student’s t-test. **P<0.005. (E and F) Visualization of the cytoskeleton of spread platelets (15 minutes) on fibrinogen, which were stained with DNase I-AlexaF488 (green) to label G-actin and Phalloidin-atto647N (red) for visualization of F-actin and analyzed by confocal microscopy. Scale bar: 20 mm. Values are mean ± SD (n=3). Unpaired, two-tailed Student’s t-test. **P<0.005.
ARTICLE - Thymosin β4 in platelet biogenesis and function

lectin like receptor 2 (CLEC-2), whereas the response to the GPVI-specific agonist, collagen-related peptide (CRP), was strongly reduced (Figure 5A). In order to exclude pre-acti vation of Tmsb4x KO platelets, we performed fluorescenceactivated cell sorting (FACS) analysis of JON/A-PE binding
upon stimulation with epinephrine (Online Supplementary Figure S7) showing no pre-activation. P-selectin expression was also reduced in response to CRP, but not in response to other agonists, in Tmsb4x KO platelets, even at high agonist concentrations (Figure A B
Figure 3. Accelerated spreading of thymosin β4 knockout platelets. (A and B) Washed platelets were stimulated with 0.01 U mL 1 thrombin and allowed to spread (5, 15, 30 minutes [min]) on fibrinogen (100 mg mL-1). DIC pictures were taken (A) and phase abundance was determined (B). Images are representatives of at least 6 animals per group. Scale bar: 3 mm. (C and D) Representative images of the platelet cytoskeleton ultrastructure of wild-type (WT) and Tmsb4x knockout (KO) mice on fibrinogen after 5 min (C) and 15 min (D). Scale bar: 500 nm.
ARTICLE - Thymosin β4 in platelet biogenesis and function

5B). This selective secretion defect was also confirmed when ATP release was determined by luminoaggregom etry. In response to thrombin and U46619 (a stable thromboxane analogue), ATP release was slightly in creased in Tmsb4x KO platelets compared to WT. In contrast, ATP release in response to CRP was signifi cantly reduced in the mutant platelets (e.g., 62±2.5 m M in WT vs. 25±4 m M in Tmsb4x KO for 0.1 mg mL-1 CRP, *** P <0.001) (Figure 5C).
Tmsb4x KO platelets also exhibited a marked aggregation de fect upon thrombin and CRP as well as convulxin (CVX) stimulation, whereas aggregation in response to ADP and U46619 stimulation was unaltered (Figure 5D). Of note, ag
gregation responses of Tmsb4x KO platelets following stimu lation of CLEC-2 were comparable to WT platelets (Online Supplementary Figure S8). Analysis of GPVI signaling revealed a reduced phosphorylation of the FcRγ chain in the mutant platelets (Figure 5E). Moreover, Jess analysis showed de creased phosphorylation of the tyrosine kinase Syk in mutant platelets, indicating a very early signaling defect downstream of GPVI that explains the in vitro platelet defects (Figure 5F and G). Of note, we observed an increase in total Syk protein levels in Tmsb4x KO platelets using the Jess assay where pla telet lysates are centrifuged before immunoblotting, however, when analyzing whole platelet lysates, we could not detect differences in total Syk levels (data not shown).
Figure 4. Accelerated clot retraction of thymosin β4 knockout platelets. (A) Clot retraction of wild-type (WT) and Tmsb4x knockout (KO) platelet-rich plasma (PRP) was determined in response to 4 U mL-1 thrombin and monitored over time. (B) Residual volume at the end of the experiment. Values are mean ± standard deviation (SD) (n=6 per group). Unpaired, two-tailed Student’s t-test. *P<0.05. (C) Analysis of the fibrin meshwork of WT and Tmsb4x KO clots. Washed platelets were labeled with an anti-GPIX Alexa 647 derivative and added to a mix of unlabeled fibrinogen (2 mg mL-1) and Alexa Fluor A488-labeled fibrinogen (50 mg mL 1 f.c.). Platelets were stimulated with 0.1 U mL-1 thrombin and clotting was initiated by addition of 5 mM CaCl2. The mixture was immediately transferred to an uncoated 8-well chamber slide (Ibidi), and allowed to clot. Images were obtained using a Leica SP8 inverted microscope with a 63x oil immersion lens. Optical z-stacks were deconvolved and are shown as maximum projection. Images are representatives of at least 2 z-stacks per mouse and 4 animals per group.
Haematologica | 107 December 2022 2852
Figure 5. Altered αIIb β3 integrin activation, degranulation and aggregation of thymosin β4 knockout platelets. (A and B) Activation of platelet αIIbβ3 integrin (JON/A-PE) (A) and degranulation (α P-selectin-FITC) (B) in wild-type (WT) and Tmsb4x knockout (KO) platelets upon stimulation with the indicated agonists was determined by flow cytometry (n=12). U46: U46619; CRP: collagen-related peptide; Rhd: rhodocytin. Unpaired, two-tailed Student’s t-test. *P<0.05, **P<0.005. (C) Dense granule secretion was assessed by luminometric measurement of released ATP of activated WT and Tmsb4x KO platelets. Results are given as mean ATP concentration [mM] ± standard deviation (SD) (n=12 per group). Unpaired, two-tailed Student’s t-test. *P<0.05, **P<0.005, ***P<0.001. (D) Aggregation responses of washed platelets or platelet-rich plasma (PRP) in turbidometric aggregometry (n=6). (E) Western blot analysis of phosphotyrosine levels in resting and CVX-stimulated WT and Tmsb4x KO platelets using the 4G10 antibody. GAPDH served as loading control. CVX: convulxin; K: Tb4-/-; W: WT. (F and G) Phosphorylation and total protein levels of Syk in resting and CVX-stimulated WT and Tmsb4x KO platelets were analyzed (E) and quantified (F) by an automated quantitative capillary-based immunoassay platform. Values are mean ± SD (n = 3). Unpaired, two-tailed Student’s t-test. *P<0.05, **P<0.005, ***P<0.001. MFI: mean fluorescence intensity.


Thymosin β4 is required for thrombus formation under flow conditions
In order to test the functional consequences of thymosin β 4 deficiency under more physiological conditions, we analyzed platelet adhesion and thrombus formation on a collagen-coated surface under flow in a whole-blood perfusion system. Under high (1,700 s 1 ), intermediate
(1,000 s 1 ), and low (150 s 1 ) shear conditions, WT pla telets rapidly adhered to the collagen surface and re cruited additional platelets from the blood stream resulting in the formation of stable three-dimensional aggregates (Figure 6A, upper panel). In sharp contrast, aggregate formation of Tmsb4x KO platelets was signifi cantly decreased at all tested shear rates (150 s 1 ,
Figure 6. Thymosin β4 is required for thrombus formation and stability in vitro and in vivo. (A-C) Assessment of platelet adhesion (A, B) and aggregate formation (A, C) on Horm collagen (200 mg mL-1) under flow (150, 1,000 and 1,700 s-1) in heparinized whole blood or platelet-count adjusted blood of WT and Tmsb4x knockout (KO) mice. Values are mean ± standard deviation (SD) (n = 12). Scale bar, 50 mm. (D) Representative graph of blood flow of one WT and two Tmsb4x KO mice after mechanical injury of the abdominal aorta. (E) Occlusion times after mechanical injury of the abdominal aorta. Data are mean ± SD of at least 8 mice per group. Fisher’s exact test. **P<0.005. (F) Tail bleeding times in WT and Tmsb4x KO mice (filter paper method). Each symbol represents one individual. Unpaired, two-tailed Student’s t-test. **P<0.005. plt.: platelet. Haematologica
ARTICLE - Thymosin β4 in platelet biogenesis and function
Scheller et al.
In order to assess the hemostatic function of Tmsb4x KO platelets, we performed a tail bleeding assay. Notably, tail bleeding times were overall significantly increased in KO mice demonstrating that thymosin β4 is also required for normal hemostasis (11.6±6.1 min in KO mice vs. 5.4±2.7 min in WT; **P<0.01) (Figure 6F).
Discussion
Impaired thrombosis and hemostasis in thymosin β4-deficient mice
Agonist-induced F-actin assembly was significantly re duced in Tmsb4x KO platelets, which was also reported in Pfn1 deficient platelets, although to a lesser extent. This finding was particularly striking as total F-actin levels were increased in resting Tmsb4x KO platelets. Sedimentation of the actin cytoskeleton of Tmsb4x KO platelets revealed a marked reduction in the content of G-actin, which is in line with studies suggesting that thy mosin β 4 complexes about half of the monomeric actin in resting cells. 36 Thus, the robust reduction of the Gactin pool likely accounts for the reduced agonist-in duced F-actin assembly in Tmsb4x KO platelets. Tmsb4x KO platelets also showed accelerated platelet spreading on fibrinogen, which may in part be explained by increased F-actin levels under resting conditions as this process is highly dependent on actin dynamics37 and the overload of existing actin filaments might facilitate the formation of filo- and lamellipodia.
107
In order to test whether the observed thrombus forma tion defect translates into an in vivo phenotype, mice were first subjected to a model of occlusive arterial thrombus formation in the mechanically injured aorta, which has been shown to be partly collagen-driven. 34 After a transient increase directly after injury, blood flow progressively decreased for several minutes in all ani mals. In all WT mice, this decrease resulted in complete and irreversible occlusion of the artery within 7 min after injury (Figure 6D and E). Out of the 14 tested Tmsb4x KO mice, seven displayed a transient decrease in blood flow, which increased again to normal and led to essentially normal flow rates in the injured vessel at the end of the observation period (30 min; occlusion times; **P<0.01). The other group of KO mice showed a progressive de crease in blood flow, which resulted in full occlusion of the vessel within 8 minutes after injury, almost com parable to that of WT mice. The protection in the sub group of the mutant mice was most likely due to embolization, a phenomenon that was also observed in a second thrombosis model. Upon FeCl3-induced injury of the mesenteric arterioles, Tmsb4x KO mice displayed variable time to occlusion that was overall prolonged and displayed a higher rate of embolization (WT embolization: 3/17 arterioles, KO embolization: 12/19 arterioles ana lyzed) (Online Supplementary Figure S10; Online Supple mentary Videos S3 and S4 ). These results demonstrate that thymosin β 4 is essential for stable occlusive arterial thrombus formation in vivo
Moreover, clot retraction was significantly enhanced in Tmsb4x KO mice. During blood clot development, pla telets interact with fibrin polymers, with contractile force generated internally within the platelet transmitted to the external fibrin clot, resulting in retraction and fibrin clot shrinkage.38 Platelet-mediated contractile forces and hence the level of platelet-mediated clot shrinkage are opposed by the rigidity of the 3D fibrin network.38 In line with this, Tmsb4x KO platelets showed fewer, less branched and shorter fibrin fibers, indicating that these platelets are able to bend and shorten fibrin fibers faster than WT platelets, which might explain the observed faster clot retraction. In line with other studies on actin-binding proteins,25,35 Tmsb4x KO platelets showed significantly impaired αIIbb3 integrin activation and degranulation. We speculate that the increased F-actin content in Tmsb4x KO platelets fa cilitates shape change but disturbs actin dynamics necessary for integrin inside-out signaling during platelet activation and for clot stability. Moreover, these findings point to a specific role of the G-actin/F-actin ratio and the related actin dynamics in αIIbβ3 activation, granule secre tion and aggregation. We assume that the increased ATP release results from an enhanced granule mobilization, which might be attributed to the higher F-actin content of Tmsb4x KO platelets. In case of GPVI agonists the defective GPVI signaling ‘overrules’ the accelerated degranulation observed with other agonists. This selective defect in ATP release is responsible for the reduction of integrin activa tion downstream of GPVI, which may be a consequence of reduced Syk phosphorylation. In line with this, Tmsb4x KO platelets showed significantly reduced FcRγ chain phos phorylation. Therefore, an explanation for the reduced GPVI signaling in Tmsb4x KO platelets might be that lack of thy mosin b4 prevents GPVI receptor clustering,39 as this pres ents a mechanism for sustained GPVI signaling essential for prolonged platelet activation trough inhibition of GPVI shedding.40-42
Under flow, defective GPVI signaling leads to impaired ag gregate formation on collagen and protection from arterial thrombus formation43,44 which was also evident in Tmsb4x KO mice. Grb2-deficient platelets show a GPVI-signaling defect that is slightly more severe than that of Tmsb4x KO platelets and consequently form even smaller platelet ag gregates under flow conditions. Interestingly, however, ar terial thrombus formation following mechanical injury of the abdominal aorta was only mildly affected by the lack of Grb2.45 Consequently, the defective GPVI-signaling clearly contributes to the reduced thrombus formation of Tmsb4x KO mice, but other factors are most likely involved. Of note, both FlnA-deficient mouse46 as well as human47 platelets show comparable defects in integrin signaling, thrombus formation under flow and GPVI signaling. Here, an interaction between Syk and FlnA was shown to regu
late ITAM receptor signaling and platelet function, which could explain the observed defects in FlnA-deficient pla telets. However, upon thymosin β4 deficiency, the defects seem more complex, as the reduction in integrin activation is not limited to GPVI signaling and Tmsb4x KO platelets show enhanced integrin outside-in signaling. GPVI signaling is critical for the procoagulant activity of platelets48 and procoagulant platelets are predominantly localized at the thrombus surface, as a result of their contraction-driven extrusion from the inner core of the thrombus and that such distribution results in surface-enhanced fibrin gen eration.49 Thus, the reduced platelet activation in response to GPVI stimulation in Tmsb4x KO platelets might also af fect the fibrin meshwork further destabilizing formed thrombi and thereby enhancing embolization. In addition, to the defective GPVI signaling and enhanced embolization, the accelerated clot retraction is another factor that con tribute to the reduced rate of occlusive arterial thrombi observed in Tmsb4x KO mice as compared to WT mice. Increased tail bleeding times have also been observed in other KO models of actin binding proteins such as Pfn125 and Cotl150 KO or Twf1/Cof126 DKO mice. It seems that thrombus stability is reduced in these mouse lines, poten tially due to the disturbed actin dynamics. Therefore, we think that the combined defect in the actin-regulating function of thymosin β4, the defective GPVI signaling and the reduced thrombus stability led to the increased tail bleeding times.
In summary, we show that thymosin β4 controls the poly merization-ready G-actin pool in the megakaryocytic line age, which inevitably impacts on MK and platelet function. MK displayed abnormal proplatelet shafts and tips, and re duced PPF whereas platelets exhibited accelerated spreading and clot retraction, but reduced GPVI-mediated platelet activation. Our findings highlight that the regula tion of the G-actin/F-actin ratio by thymosin β4 is not only relevant during platelet biogenesis and activation but is also necessary for the formation of stable thrombi (Online Supplementary Figure S11). Our findings may thus con tribute to a better understanding of the molecular path ways orchestrating actin dynamics in cells.
No conflicts of interest to disclose.
IS, ZN, SB, VG, CG, RAIN, KA and MB acquired data; BN de signed the research; IS , SB, ZN, DS, MB and BN analyzed data and wrote the manuscript.
We thank Stefanie Hartmann, Juliana Goldmann and Bir git Midloch for excellent technical assistance and the microscopy platform of the Bioimaging Center (Rudolf Vir
chow Center) for providing technical infrastructure and support.
This work was supported by the Deutsche Forschungs gemeinschaft (DFG, German Research Foundation; project number 374031971 – TRR 240 and NI 556/11-2 to BN) and the European Union (EFRE - Europäischer Fond für regionale
1. Italiano JE Jr., Lecine P, Shivdasani RA, Hartwig JH. Blood platelets are assembled principally at the ends of proplatelet processes produced by differentiated megakaryocytes. J Cell Biol. 1999; 147(6):1299-1312.
2. Machlus KR, Thon JN, Italiano JE Jr. Interpreting the developmental dance of the megakaryocyte: a review of the cellular and molecular processes mediating platelet formation. Br J Haematol. 2014165(2):227-236.
3. Italiano JE Jr., Patel-Hett S, Hartwig JH. Mechanics of proplatelet elaboration. J Thromb Haemost. 2007;5(Suppl 1):S18-23.
4. Bender M, Thon JN, Ehrlicher AJ, et al. Microtubule sliding drives proplatelet elongation and is dependent on cytoplasmic dynein. Blood. 2015;125(5):860-868.
5. Hartwig JH. Mechanisms of actin rearrangements mediating platelet activation. J Cell Biol. 1992;118(6):1421-1442.
6. Stritt S, Nurden P, Turro E, et al. A gain-of-function variant in DIAPH1 causes dominant macrothrombocytopenia and hearing loss. Blood. 2016;127(23):2903-2914.
7. Nurden P, Debili N, Coupry I, et al. Thrombocytopenia resulting from mutations in filamin A can be expressed as an isolated syndrome. Blood. 2011;118(22):5928-5937.
8. Kunishima S, Okuno Y, Yoshida K, et al. ACTN1 mutations cause congenital macrothrombocytopenia. Am J Hum Genet. 2013;92(3):431-438.
9. Goldstein AL, Hannappel E, Kleinman HK. Thymosin beta4: actin-sequestering protein moonlights to repair injured tissues. Trends Mol Med. 2005;11(9):421-429.
10. Low TL, Hu SK, Goldstein AL. Complete amino acid sequence of bovine thymosin beta 4: a thymic hormone that induces terminal deoxynucleotidyl transferase activity in thymocyte populations. Proc Natl Acad Sci U S A. 1981;78(2):1162-1166.
11. Freire M, Hannappel E, Rey M, Freire JM, Kido H, Horecker BL. Purification of thymus mRNA coding for a 16,000-dalton polypeptide containing the thymosin alpha 1 sequence. Proc Natl Acad Sci U S A. 1981;78(1):192-195.
12. Bock-Marquette I, Saxena A, White MD, DiMaio JM, Srivastava D. Thymosin β4 activates integrin-linked kinase and promotes cardiac cell migration, survival and cardiac repair. Nature. 2004;432(7016):466-472.
13. Shrivastava S, Srivastava D, Olson EN, DiMaio JM, BockMarquette I. Thymosin beta4 and cardiac repair. Ann N Y Acad Sci. 2010;1194:87-96.
14. Srivastava D, Saxena A, Dimaio JM, Bock-Marquette I. Thymosin beta4 is cardioprotective after myocardial infarction. Ann N Y Acad Sci. 2007;1112:161-70.
15. Huff T, Ballweber E, Humeny A, et al. Thymosin 4 serves as a glutaminyl substrate of transglutaminase. Labeling with fluorescent dansylcadaverine does not abolish interaction with G actin 1. FEBS Lett. 1999;464(1-2):14-20.
16. Zeiler M, Moser M, Mann M. Copy number analysis of the murine
Entwicklung, Bavaria). MB is supported by an Emmy Noether grant of the DFG (BE5084/3-2). ZN was supported by a grant of the German Excellence Initiative to the Graduate School of Life Sciences, University of Würzburg.
Please direct requests for original data to the corresponding author: bernhard.nieswandt@virchow.uni-wuerzburg.de.
platelet proteome spanning the complete abundance range. Mol Cell Proteomics. 2014;13(12):3435-3445.
17. Burkhart JM, Vaudel M, Gambaryan S, et al. The first comprehensive and quantitative analysis of human platelet protein composition allows the comparative analysis of structural and functional pathways. Blood. 2012;120(15):e73-e82.
18. Skruber K, Read TA, Vitriol EA. Reconsidering an active role for G-actin in cytoskeletal regulation. J Cell Sci. 2018;131(1):jcs203760.
19. Xue B, Leyrat C, Grimes JM, Robinson RC. Structural basis of thymosin-β4/profilin exchange leading to actin filament polymerization. Proc Natl Acad Sci U S A. 2014; 111(43):E4596E4605.
20. Carlier MF, Jean C, Rieger KJ, Lenfant M, Pantaloni D. Modulation of the interaction between G-actin and thymosin beta 4 by the ATP/ADP ratio: possible implication in the regulation of actin dynamics. Proc Natl Acad Sci U S A. 1993;90(11):5034-5038.
21. Hertzog M, van Heijenoort C, Didry D, et al. The betathymosin/WH2 domain; structural basis for the switch from inhibition to promotion of actin assembly. Cell. 2004;117(5):611-623.
22. Didry D, Cantrelle FX, Husson C, et al. How a single residue in individual beta-thymosin/WH2 domains controls their functions in actin assembly. EMBO J. 2012;31(4):1000-1013.
23. Goldschmidt-Clermont PJ, Furman MI, Wachsstock D, Safer D, Nachmias VT, Pollard TD. The control of actin nucleotide exchange by thymosin beta 4 and profilin. A potential regulatory mechanism for actin polymerization in cells. Mol Biol Cell. 1992;3(9):1015-1024.
24. Bender M, Stritt S, Nurden P, et al. Megakaryocyte-specific Profilin1-deficiency alters microtubule stability and causes a Wiskott-Aldrich syndrome-like platelet defect. Nat Commun. 2014;5:4746.
25. Stritt S, Birkholz I, Beck S, et al. Profilin 1–mediated cytoskeletal rearrangements regulate integrin function in mouse platelets. Blood Advs. 2018;2(9):1040-1045.
26. Becker IC, Scheller I, Wackerbarth LM, et al. Actin/microtubule crosstalk during platelet biogenesis in mice is critically regulated by Twinfilin1 and Cofilin1. Blood Adv. 2020;4(10):2124-2134.
27. Heib T, Gross C, Müller ML, Stegner D, Pleines I. Isolation of murine bone marrow by centrifugation or flushing for the analysis of hematopoietic cells - a comparative study. Platelets. 2021;32(5):601-607.
28. Spindler M, van Eeuwijk JMM, Schurr Y, et al. ADAP deficiency impairs megakaryocyte polarization with ectopic proplatelet release and causes microthrombocytopenia. Blood. 2018;132(6):635-646.
29. Sabri S, Foudi A, Boukour S, et al. Deficiency in the Wiskott-
Aldrich protein induces premature proplatelet formation and platelet production in the bone marrow compartment. Blood. 2006;108(1):134-140.
30. Bächer C, Bender M, Gekle S. Flow-accelerated platelet biogenesis is due to an elasto-hydrodynamic instability. Proc Natl Acad Sci U S A. 2020;117(32):18969-18976.
31. Cramer LP, Briggs LJ, Dawe HR. Use of fluorescently labelled deoxyribonuclease I to spatially measure G-actin levels in migrating and non-migrating cells. Cell Motil Cytoskeleton. 2002;51(1):27-38.
32. Campbell RA, Overmyer KA, Selzman CH, Sheridan BC, Wolberg AS. Contributions of extravascular and intravascular cells to fibrin network formation, structure, and stability. Blood. 2009;114(23):4886-4896.
33. Turitto VT, Weiss HJ, Baumgartner HR. The effect of shear rate on platelet interaction with subendothelium exposed to citrated human blood. Microvasc Res. 1980;19(3):352-365.
34. Bender M, Hagedorn I, Nieswandt B. Genetic and antibodyinduced glycoprotein VI deficiency equally protects mice from mechanically and FeCl3-induced thrombosis. J Thromb Haemost. 2011;9(7):1423-1426.
35. Stritt S, Beck S, Becker IC, et al. Twinfilin 2a regulates platelet reactivity and turnover in mice. Blood. 2017;130(15):1746-1756.
36. Mannherz HG, Hannappel E. The beta-thymosins: intracellular and extracellular activities of a versatile actin binding protein family. Cell Motil Cytoskeleton. 2009;66(10):839-851.
37. Varga-Szabo D, Braun A, Nieswandt B. Calcium signaling in platelets. J Thromb Haemost. 2009;7(7):1057-1066.
38. Samson AL, Alwis I, Maclean JAA, et al. Endogenous fibrinolysis facilitates clot retraction in vivo. Blood. 2017; 130(23):2453-2462.
39. Poulter NS, Pollitt AY, Owen DM, et al. Clustering of glycoprotein VI (GPVI) dimers upon adhesion to collagen as a mechanism to regulate GPVI signaling in platelets. J Thromb Haemost. 2017;15(3):549-564.
40. Pallini C, Pike JA, O’Shea C, et al. Immobilized collagen prevents shedding and induces sustained GPVI clustering and signaling in platelets. Platelets. 2021;32(1):59-73.
41. Moroi M, Jung SM. Platelet glycoprotein VI: its structure and function. Thromb Res. 2004;114(4):221-233.
42. Berlanga O, Bori-Sanz T, James JR, et al. Glycoprotein VI oligomerization in cell lines and platelets. J Thromb Haemost. 2007;5(5):1026-1033.
43. Massberg S, Gawaz M, Grüner S, et al. A crucial role of glycoprotein VI for platelet recruitment to the injured arterial wall in vivo. J Exp Med. 2003;197(1):41-49.
44. Nieswandt B, Brakebusch C, Bergmeier W, et al. Glycoprotein VI but not alpha2beta1 integrin is essential for platelet interaction with collagen. EMBO J. 2001;20(9):2120-2130.
45. Dutting S, Vogtle T, Morowski M, et al. Growth factor receptorbound protein 2 contributes to (hem)immunoreceptor tyrosine-based activation motif-mediated signaling in platelets. Circ Res. 2014;114(3):444-453.
46. Falet H, Pollitt AY, Begonja AJ, et al. A novel interaction between FlnA and Syk regulates platelet ITAM-mediated receptor signaling and function. J Exp Med. 2010;207(9):1967-1979.
47. Berrou E, Adam F, Lebret M, et al. Heterogeneity of platelet functional alterations in patients with filamin A mutations. Arterioscler Thromb Vasc Biol. 2013;33(1):e11-18.
48. Swieringa F, Spronk HMH, Heemskerk JWM, van der Meijden PEJ. Integrating platelet and coagulation activation in fibrin clot formation. Res Pract Thromb Haemost. 2018;2(3):450-460.
49 Nechipurenko DY, Receveur N, Yakimenko AO, et al. Clot contraction drives the translocation of procoagulant platelets to thrombus surface. Arterioscler Thromb Vasc Biol. 2019;39(1):37-47.
50. Scheller I, Stritt S, Beck S, et al. Coactosin-like 1 integrates signaling critical for shear-dependent thrombus formation in mouse platelets. Haematologica. 2020;105(6):1667-1676.
Stéphanie Dulucq,1,2 Franck E. Nicolini,2,3,4 Delphine Rea,2,5 Pascale Cony-Makhoul,2,6 Aude Charbonnier,2,7 Martine Escoffre-Barbe,2,8 Valérie Coiteux,2,9 Pascal Lenain,2,10 Françoise Rigal-Huguet,2,11 Jixing Liu,2,12 Agnès Guerci-Bresler,2,13 Laurence Legros,2,14 Jean-Christophe Ianotto,2,15 Martine Gardembas,2,16 Pascal Turlure,2,17 Viviane Dubruille,2,18 Philippe Rousselot,2,19 Juliana Martiniuc,2,20 Henry Jardel,2,21 Hyacinthe Johnson-Ansah,2,22 Bertrand Joly,2,23 Tawfiq Henni,2,24 Emilie Cayssials,2,25 Patricia Zunic,2,26 Marc G. Berger,2,27 Bruno Villemagne,2,28 Fanny Robbesyn,1 Stephane Morisset,3 François-Xavier Mahon2,29# and Gabriel Etienne2,29#
1Laboratory of Hematology, University Hospital of Bordeaux, Hôpital Haut Lévêque, Pessac; 2Groupe Fi-LMC, Centre Léon Bérard, Lyon; 3INSERM U1052, Centre de Recherche de Cancérologie de Lyon, Centre Léon Bérard, Lyon; 4Hematology Department, Centre Léon Bérard, Lyon; 5Adult Hematology Department, Hôpital Saint Louis, Paris; 6Hematology Department & Clinical Investigation Center, Centre Hospitalier Annecy-Genevois, Metz-Tessy, Pringy; 7Hematology Department, Institut Paoli-Calmettes, Marseilles; 8Hematology Department, CHU de Pontchaillou, Rennes; 9Hematology Department, CHU Huriez, Lille; 10Hematology Department, Institut Henri Becquerel, Rouen; 11Hematology Department, Institut Universitaire du Cancer, CHU de Toulouse, Toulouse; 12Hematology & Oncology Department, Centre Hospitalier de Valence, Valence; 13Hematology Department, CHRU Brabois, Nancy; 14Hematology Department, Hôpital Bicêtre, Le Kremlin-Bicêtre; 15Hematology Department, Morvan Hospital, CHU, Brest; 16Hematology Department, CHU, Angers; 17Hematology Department, CHU Dupuytren, Limoges; 18Hematology Department, Hôtel Dieu, Nantes; 19Hematology Department, Centre Hospitalier de Versailles, Le Chesnay; 20Hematology Department, Centre Hospitalier de Saint Brieuc, Saint Brieuc; 21Hematology Department, Centre Hospitalier de Bretagne, Vannes; 22Institute of Normandy, CHU de la Côte de Nacre, Caën; 23Hematology Department, CH Sud Francilien, Corbeil-Essonne; 24Hematology Department, CHR La Réunion; 25Hematology Department, CHU de Poitiers, Poitiers; 26Hematology Department, Centre Hospitalier, Saint Pierre de La Réunion; 27Hematology (Biology) Department, CHU Estaing, Clermont-Ferrand; 28Internal Medicine and Oncohematology Department, La Roche sur Yon and 29Hematology Department, Institut Bergonié, Bordeaux, France
Correspondence: S. Dulucq stephanie.dulucq@chu-bordeaux.fr
Received: February 8, 2022.
Accepted: May 18, 2022.
Prepublished: May 26, 2022.
https://doi.org/10.3324/haematol.2022.280811 ©2022 Ferrata Storti Foundation Published under a CC BY-NC license
#F-XM and GE contributed equally as co-senior authors. Discontinuation of tyrosine kinase inhibitors in chronic phase chronic myeloid leukemia is feasible in clinical practice based on recently published international recommendations. Nevertheless, factors predictive of molecular recurrence have not been fully elucidated and long-term follow-up of patients enrolled in clinical studies are required in order to update knowledge on discontinuation attempts particularly in terms of the safety and durability of treatment-free re mission (TFR). In the current study, we updated results from the STIM2 study in the light of the consensual criterion of molecular recurrence reported in different international recommendations. Among the 199 patients included in the perprotocol study, 108 patients lost a major molecular response. With a median follow-up of 40.8 months (5.5-111 months), the probability of treatment-free remission was 43.4% [36.3-50.4] at 5 years, 40.9% [32.8-47.3] at 7 years and 34.5% [25.643.3] at 9 years. Molecular recurrence occurred between 0 to 6 months, 6 to 24 months and after 24 months in 75 patients (69%), 15 patients (14%) and 18 patients (17%), respectively. Notably, the kinetics of molecular recurrence differed signifi cantly between these three subgroups with a median time from loss of MR4 (BCR::ABL1 IS≤0.01%) to loss of major molecular response of 1, 7 and 22 months, respectively. Predictive factors of molecular recurrence differed according to the time of occurrence of the molecular recurrence. Durations of imatinib treatment and deep molecular response as well as BCR::ABL1/ABL1 levels at cessation of tyrosine kinase inhibitor treatment, as quantified by reverse transcriptase droplet digital polymerase chain reaction, are involved in molecular recurrence occurring up to 24 months but not beyond. (Clini calTrial.gov Identifier NCT#0134373).
Treatment of chronic myeloid leukemia (CML) has been revolutionized by tyrosine kinase inhibitors (TKI) and the life expectancy of CML patients is now close to that of the general population in countries with access to healthcare.1 Improving patients’ quality of life, by successful discon tinuation of TKI treatment in patients in deep molecular response (DMR), is now the goal to reach. Besides the two independent preliminary studies, i.e. the STIM12 and TWISTER3 trials, several TKI discontinuation studies have been performed worldwide4,5 and have confirmed the proof of concept of a possible prolonged treatment-free remission (TFR) in some chronic phase CML patients. Based on these large studies, international recommenda tions for TKI discontinuation have been proposed and de fine the optimal selection of the patients before cessation as well as adequate molecular follow-up after cessation and molecular recurrence leading to TKI resumption.6,7 However, the probability of remaining free from TKI treat ment after discontinuation has been assessed differently depending on patients’ characteristics before discontinu ation, the definition of molecular recurrence leading to TKI resumption, and the follow-up duration after TKI dis continuation. This statistical point is important and the occurrence of other events, as compared to molecular re currence, may influence TFR results. These competing events include CML-unrelated deaths without molecular recurrence and TKI resumption before molecular recur rence. The latter may be partly explained by the evolution of the definition of molecular recurrence over time, which has evolved from loss of undetectable residual molecular disease with a 1-log BCR::ABL1IS increase to loss of major molecular response (MMR) at any time.7,8 With the benefit of hindsight, it has been observed that the detection and quantification of low levels of BCR::ABL1 transcripts after discontinuation of TKI treatment does not necessarily lead to loss of MMR and that TKI resumption after MMR loss is associated with the achievement of a second DMR in most, if not all, patients.8 Thus, molecular recurrence after TKI discontinuation can be defined as a BCR::ABL1IS higher than 0.1%IS (MMR loss).
Given that molecular recurrence may occur late, the fre quency, kinetics and potential predictive factors of such recurrences remain to be clarified, and updates of TKI dis continuation studies with a prolonged follow-up are necessary.
We previously reported the preliminary results of the STIM2 study (NCT#01343173)9 and confirmed the impor tance of the duration of treatment with imatinib before it was stopped and the depth of molecular remission at cessation on molecular recurrence-free survival (MRFS). In the current work, we updated and re-analyzed the out come of the STIM2 cohort of patients with a longer
median follow-up (40.8 vs. 23.5 months) taking into ac count the updated recommended criterion of molecular recurrence i.e., MMR loss instead of a 1-log increase be tween two consecutive assessments or MMR loss on a single assessment, as initially defined.8
The objectives of this study were to re-evaluate TFR strat egies according to different indicators, allowing a com parison of the results with other discontinuation studies and to determine the incidence, kinetics and potential predictive factors of molecular recurrence according to their time of occurrence.
Patients at least 18 years old, diagnosed with chronic phase CML, who had undetectable major BCR::ABL1 for 2 consecutive years and had been treated with imatinib as first-line treatment at any dose for at least 3 years were included in 29 different centers belonging to the France Intergroupe Leucemie Myeloide Chronique (Fi-LMC) group. This study (NTC#01343173) was started in 2011 and was conducted in accordance with the Declaration of Helsinki. The ethics committee, in concordance with the French public health code, approved the protocol (EudraCT number: 2011-000068-91). Written informed consent was obtained from all patients.
Molecular follow-up was performed until 24 months as described previously,9 and in the local laboratory beyond 24 months, every 3 to 6 months. All local laboratories be long to the French “Groupe des Biologistes Moléculaires des Hémopathies Malignes” with regular rounds of valida tion of the European Treatment Outcome Study (EUTOS) conversion factor and programs of external quality con trol. BCR::ABL1/ABL1 ratios were aligned on the inter national scale. Each molecular response was scored according to the European LeukemiaNet recommenda tions.10
All the analyses were conducted in the per-protocol population.
Molecular recurrence-free remission (MRFR) was measured as the time from imatinib cessation to molecu lar recurrence and TFR as the time from imatinib cessa tion to molecular recurrence or TKI resumption (whichever came first). MRFS was measured as the time from imatinib cessation to molecular recurrence or death and treatment-free survival (TFS) as the time from imati nib cessation to molecular recurrence, TKI resumption or death. Molecular recurrence was defined as the first oc
currence of MMR loss.
Depending on each type of survival, the other events which were not taken into account were considered as competing events: resumption of treatment before mol ecular recurrence for MRFR/MRFS and/or death before molecular recurrence for MRFR/TFR (Table 1).
The cumulative incidence of events for TFR, MRFS and MRFR were estimated by a Fine and Gray model taking into account potential competing events. TFS was esti mated by Kaplan-Meier and Fine and Gray models to as sess the cumulative incidence of events. Patients with no event were censored at the date of the last available mol ecular follow-up. TFS and TFR were also analyzed by land mark analysis at 6 and 24 months for patients without molecular recurrence at these time points.
In order to analyze the kinetics of molecular recurrence, time from the first assessment of detectable BCR::ABL1 transcripts to a 1-log increase of the transcripts, and time from MR4 loss to MMR loss (DMR4-MMR loss) were com pared using a t-test between patients who experienced molecular recurrence ≤6 months versus 6-24 months ver sus >24 months after imatinib discontinuation.
We analyzed factors associated with loss of MMR before and after 6 months and before and after 24 months as compared with patients with no molecular recurrence at the last follow-up.
We assessed age, sex, type of transcript, Sokal and EUTOS long-term survival (ELTS) scores, quantity of transcript (determined by reverse transcriptase droplet digital polymerase chain reaction, RT-ddPCR) at TKI cessatioin,9
duration of undetectable MR4.5 and duration of treatment. Quantitative factors were categorized into groups, with cut-offs set at the median. All variables were assessed by univariate analysis using usual tests: the Pearson χ2 and Kruskal-Wallis tests. P-values were corrected using the Holm-Bonferroni method after pairwise analyses with the Dunn test for continuous variables and χ2 tests for quali tative variables. Patients in whom competing events oc curred (death or resumption of treatment before MMR loss) or who were lost to follow-up were considered not to have relapsed in the univariate analysis. Analyses were performed with R software.
One hundred and ninety-nine patients were included. The baseline characteristics of the patients are summarized in Online Supplementary Table S1. With a median follow-up of 40.8 months (range, 5.5- 111) from imatinib discontinuation, 108 (54%) patients lost a MMR. Ten patients resumed their treatment before MMR loss. Twelve patients were lost to follow-up after 24 months. Four patients died from a cause unrelated cause to their disease before the loss of MMR (n=3) or after loss of MMR but before resumption of treat ment (n=1). Two additional patients died from an cause un related to their disease after MMR loss and resumption of treatment while they were in DMR.
Table 1. Cumulative incidence of events according to the definition of the event.
TFS TFR MRFS MRFR
Cumulative incidence % 58.32 56.64 53.29 51.62 (95% CI) at 5 years (51.29-65.34) (49.6-63.68) (46.19-60.40) (44.52-58.71) Cumulative incidence % 67.2 65.52 62.17 60.50 (95% CI) at 9 years (58.4-76) (56.67-74.37) (53.21-71.13) (51.50-69.49) N of events 121 118 111 108 Molecular recurrence 108 108 108 108 Death 3 0 3 0
TKI resumption without molecular recurrence 10 10 0 0 N of competing events 0 3 10 13 Death 0 3 0 3 TKI resumption without molecular recurrence 0 0 10 10 Median time to the event 4.37 4.31 4.53 4.26 (range) months (1.08; 98.92) (1.08; 98.92) (1.08; 98.92) (1.08; 98.92)
TFS: treatment-free survival; TFR: treatment-free remission; MRFS: molecular recurrence-free survival; MRFR: molecular recurrence-free remission; TKI: tyrosine kinase inhibitor.
Treatment-free survival and remission and molecular recurrence-free survival and remission
The TFS and TFR probabilities were, respectively, 41.7% [34.7-48.7] and 43.4% [36.3-50.4] at 5 years, 38.4% [31.245.6] and 40.9% [32.8-47.3] at 7 years and 32.8% [24.041.6] and 34.5% [25.6-43.3] at 9 years. Depending on the event taken into account (molecular recurrence and/or TKI resumption, molecular recurrence, death and/or TKI re sumption), the cumulative incidence of events varied from 51.6% to 58.32% at 5 years and from 60.5% to 67.2% at 9 years (Figure 1, Table 1).
Among patients who experienced molecular recurrence and resumed TKI (n=106), 103 (97%) regained MR4 within 3 months (median; min-max: 1-22 months) and MR4.5 within 5.5 months (median; min-max: 2-61 months). Three patients were lost to follow-up after the MMR was re-obtained. Imatinib, dasatinib, nilotinib or bosutinib were resumed in 90, six, nine and one patients, respectively.
When considering patients without molecular recurrence at 6 months or 24 months, the cumulative incidences of molecular recurrence or TKI resumption were then 28.1% [19.7-36.5] and 12.97% [5.8-20.2] at 5 years after TKI dis continuation respectively (Figure 2) and the TFS rates at 5 years after TKI discontinuation were 69.1% [61.05- 78.3] and 84.7% [77.3- 92.7], respectively (Online Supplementary Figure S1).

Time to loss of major molecular response and kinetics of molecular recurrence
Among the 108 patients who lost a MMR, 25 were pre viously reported as “relapsers” with 1-log increase in tran scripts. Among them three had lost their MMR beyond 24 months (at 25, 38 and 90 months after the 1-log increase in transcripts, which had occurred at 11, 4 and 6 months, respectively).
Seventy-five patients lost their MMR before 6 months
Figure 1. Cumulative incidences of events according to treatment-free and molecular recurrence-free status. TFS: treatmentfree survival; TFR: treatment-free remission; MRFS: molecular recurrence-free survival; MRFR: molecular recurrence-free remission.
Figure 2. Cumulative incidences of molecular recurrence or tyrosine kinase inhibitor resumption for patients without molecular recurrence at (A) 6 months and (B) 24 months. TFR: treatment-free remission.

Table 2. Kinetics of molecular recurrences according to the time of losing the major molecular response.
≤6 months (N=75)
6-24 months (N=15) >24 months (N=18)
Time from imatinib stop to MMR loss, months, mean 3.7 13.7 51.8
DMR4-MMR loss ≤1 months (N=60) 59 (79%) 1 (7%) 0 (0%) Mean: 0.7 months
DMR4-MMR loss 1-3 months (N=18) 15 (20%) 2 (13%) 1 (5%) Mean: 2.3 months
DMR4-MMR loss 3-6 months (N=10) 1 (1%) 6 (40%) 3 (17%) Mean: 5.6 months
DMR4-MMR loss >6 months (N=20) 0 (0%) 6 (40%) 14 (78%) Mean: 22.5 months
MMR: major molecular response; DMR4-MMR loss: time from loss of deep molecular response (MR4) to loss of major molecular response; MR4: molecular response 4-log.
whereas 15 molecular recurrences occurred between 6 and 24 months and 18 occurred beyond 24 months. The kinetics of the molecular recurrences differed between these three groups. Molecular recurrences occurring be fore 6 months showed fast kinetics with a 1-log increase within a median time from stopping imatinib to the mol ecular recurrence of 2 months (range, 1 to 5 months) as compared to 5 months (range, 2 to 10 months) for mol ecular recurrences between 6 and 24 months and 19.5 months (range, 3 to 77 months) for molecular recurrences after 24 months.
To illustrate the different kinetics of molecular recurrence, the time between MR4 and MMR loss were determined in these three groups (Table 2). Thus, 60 (55.5%) patients had DMR4-MMR loss within 1 month, 18 (16.7%) patients had DMR4-MMR loss between
1 and ≤3 months, 10 (9.3%) patients had DMR4-MMR loss between 3 and ≤ 6 months and 20 (18.5%) patients had DMR4-MMR loss beyond 6 months. Almost all the patients who lost a MMR before 6 months had a DMR4-MMR loss in ≤3 months (74/75) and 79% (59/75) had a DMR4-MMR loss in ≤1 month. Among patients who lost a MMR be tween 6 and 24 months only one had a DMR4-MMR loss in ≤1 month, 3/15 (20%) showed DMR4-MMR loss in ≤3 months, and 6/15 (40%) had a DMR4-MMR loss beyond 6 months. Among patients who experienced MMR loss beyond 24 months, overall the DMR4-MMR loss occurred after 6 months in 77.8% (14/18). Only one late molecular recurrence occurred beyond 24 months in a patient with fast kinetics (DMR4-MMR loss: 3.3 months) (Table 2). The mean DMR4-MMR loss was significantly different between patients who lost their MMR before 6 months and those
Figure 3. Kinetics of the 108 molecular recurrences in the per-protocol population. (A) Loss of major molecular response (MMR) before 6 months (n=75). (B) Loss of MMR between 6 and 24 months (n=15). (C) Loss of MMR beyond 24 months (n=18). IS: International Scale; TKI: tyrosine kinase inhibitor.

who lost the MMR between 6 and 24 months or beyond 24 months (P<0.0001) with a median time from loss of MR4 to MMR loss of 1, 7 and 22 months, respectively. The kinetics of the BCR::ABL1/ABL1 transcripts of the 108 mol ecular recurrences are shown in Figure 3.
Of note, among the 78 patients alive who did not experi ence molecular recurrence and/or TKI resumption, 12 (15%) patients lost a MR4.5 on at least one assessment within 24 months after TKI discontinuation. Three of them also lost MR4 and two among 12 showed a 1-log increase between two assessments. These 12 patients who had fluctuating levels of BCR::ABL1 maintained their MMR with a median follow-up from TKI discontinuation of 83 months (range, 54-114 months).
Conversely, among the 18 patients with molecular recur rences beyond 24 months, only one patient (5%) had un detectable BCR::ABL1 (only one positive assessment in MR5) within 24 months after TKI discontinuation and lost the MMR at 69 months after TKI discontinuation. So, if we exclude patients with molecular recurrence or resumption of treatment before molecular recurrence within 24 months after TKI discontinuation or who died
before molecular recurrence, 12/29 (41%) patients who had fluctuating BCR::ABL1 within 24 months did not lose their MMR and 17/29 (59%) lost the MMR.
Factors predictive of loss of major molecular response according to the time of the molecular recurrence Using univariate analysis, predictive factors associated with molecular recurrence were analyzed in patients in whom the molecular recurrence occurred before or after 6 months and before or after 24 months from discontinu ing imatinib and compared to patients without molecular recurrence at the last follow-up (Tables 3 and 4). The median duration of DMR, the median duration of imatinib treatment and BCR::ABL1 ratio (assessed by RT-ddPCR) ≥0.0023% (IS) at imatinib cessation were significantly as sociated with a higher probability of molecular recurrence within 24 months following treatment discontinuation. These differences were not observed when we compared patients who lost their MMR beyond 24 months and those who did not lose the MMR.
It should be noted that when we removed patients with potential competing events (death, resumption of treat
Table 3. Characteristics of the STIM2 patients (per-protocol population) according to the patients' outcome (with late molecular recurrence >24 months).
Variables No MRec MRec P-value P-value P-value no P-value MRec ≤24 m >24 m no vs. vs. MRec MRec ≤24 m (N=91) (N=90) (N=18) MRec ≤24 m >24 m vs. >24 m
Age, years; median (min; max) 52 (15; 78 ) 55 (24; 84) 58 (32; 77) 0.310
Gender, N (%)
Female 56 (61.5) 49 (54.4) 5 (27.8) 0.030 0.414 0.030 0.178 Male 35 (38.5) 41 (45.6) 13 (72.2) Sokal score, N (%) 0.314
Low 33 (36.3) 43(47.8) 6 (33.3)
Intermediate 40 (39.9) 27(30) 7(38.9)
High 12 (13.2) 16 (17.8) 2 (11.1) Unknown 6 (6.6) 4 (4.4) 3 (16.7)
ELTS score, N (%) 0.123
Low 63 (69.2) 61 (67.8) 11 (61.1) Intermediate 8 (8.8) 10 (11.1) 0 (0) High 1 (1.1) 7 (7.8) 0 (0) Unknown 19 (20.9) 12(13.3) 7 (38.9)
BCR::ABL1 transcript type, N (%) 0.065
e14a2 43 (47) 42 (46.7) 4 (22.2) e13a2 13 (14.3) 34 (37.8) 5 (27.8) e14a2 + e13a2 13 (14.3) 13 (14.4) 3 (16.7) Unknown 22 (24.2) 1 (1.1) 6 (33.3)
DMR duration, mth; 41.3 33.9 43.3 0.017 0.015 0.624 0.452 median (min; max) (23.0; 124.3) (24.5; 117.5) (24.1; 65.7) Imatinib duration, mth; 82.7 71.5 79.5 0.020 0.021 0.775 0.392 median (min; max) (38.5; 149.9) (38.4; 143.5) (56.7; 110.5)
BCR::ABL1a at TKI stop N (%)
<0.0023%IS 68 (74.7) 56(62.2) 13 (72.2) ≥0.0023%IS 8 (8.8) 24 (26.7) 5 (27.8) 0.010 0.015 0.144 1.000 Unknown 15(16.5) 10 (11.1)
aTranscript levels determined by droplet digital polymerase chain reaction. P values corrected by the Holm-Bonferroni method. Statistically significant values are shown in bold. MRec: molecular recurrence; ELTS: EUTOS long-term survival; DMR: deep molecular response; mth: months; TKI: tyrosine kinase inhibitor; IS: International Scale.
ment before MMR loss or loss of follow-up beyond 24 months) from the group of patients without molecular re currence within 24 months, durations of imatinib treat ment and DMR were the only significant variables with an impact on the rate of molecular recurrence occurring be fore 24 months (data not shown).
Interestingly, proportions of males were higher in the groups of patients relapsing beyond 6 or 24 months than in the group who did not lose the MMR (66.7% or 72.2% vs. 38.5%; P=0.030). Nevertheless when we restricted the
analysis to non-relapse patients without competing events, only a trend was observed (data not shown).
In the current work we updated the follow-up of the STIM2 study using loss of MMR at any time after imatinib discontinuation as the single criterion for molecular re currence. In previous analyses, molecular recurrence was
- Updated results from the STIM2 trial
defined as a 1-log BCR::ABL1 transcript increase in two consecutive assessments or MMR loss at any time. This new analysis was feasible because most of the patients who experienced a 1-log increase and were previously considered as “relapsers” did not resume TKI treatment
until they lost their MMR. Based on this STIM2 update, and with a median follow-up after imatinib discontinuation of 40.8 months, the 5- and 9-year cumulative incidences of molecular recurrence, TKI resumption and death were es timated at 58.32% and 67.2%, respectively. Taking into ac
Table 4. Characteristics of the STIM2 patients (per-protocol population) according to the patients' outcome (with late molecular recurrence >6 months).
Variables No MRec MRec ≤6 m MRec >6 m P-value P-value P-value P-value (N=91) (N=75) (N=33) no vs. MRec no vs. MRec MRec ≤6 m >6 m ≤6 m vs. >6 m
Age, years, median (min; max) 52 (15; 78) 56 (24; 84) 58 (32; 77) 0.450
Female 56 (61.5) 43 (57.3) 11 (33.3) 0.018 0.696 0.030 0.101
Male 35 (38.5) 32 (42.7) 22 (66.7)
Sokal score, N (%) 0.414
Low 33 (36.3) 36 (48) 13 (39.4) Intermediate 40 (39.9) 23 (30.7) 11 (33.3) High 12 (13.2) 12 (16) 6 (18.2) Unknown 6 (6.6) 4 (5.3) 3 (9)
ELTS score, N (%) 0.065 Low 63 (69.2) 49 (65.3) 23 (69.7) Intermediate 8 (8.8) 8 (10.7) 2 (6.1) High 1 (1.1) 7 (9.3) 0 (0) Unknown 19 (20.9) 11 (14.7) 8 (24.2)
BCR::ABL1 transcript type N(%) 0.064 e14a2 43 (47.3) 34 (45.3) 12 (36.4) e132a2 13 (14.3) 30 (40) 9 (27.3) e14a2 + e13a2 13 (14.3) 10 (13.3) 6 (18.2) Unknown 22 (24.2) 1 (1.3) 6 (18.2)
DMR duration, mth; 41.3 34.6 34.7 0.032 0.048 0.158 0.731 median (min;max) (23.0; 124.3) (24.5; 117.5) (24.1; 65.7)
Imatinib duration, mth; 82.7 75.8 71.3 0.033 0.112 0.059 0.399 median (min;max) (38.5; 149.9) (38.4; 143.5) (56.7; 84.9)
BCR::ABL1a at TKI stop, N (%) 0.006 0.042 0.015 0.528 <0.0023%IS 68 (89.5) 49 (65.3) 20 (60.6) ≥0.0023%IS 8 (10.5) 18 (24) 11 (33.3) Unknown 15 (16.5) 8 (10.7) 2 (6.1)
aTranscript levels determined by droplet digital polymerase chain reaction. P values corrected by the Holm-Bonferroni method. Statistically significant values are shown in bold. MRec: molecular recurrence; ELTS: EUTOS long-term survival; DMR: deep molecular response; mth: months; TKI: tyrosine kinase inhibitor; IS: International Scale.
Haematologica | 107 December 2022 2866
count the reported competing events (10 patients re sumed TKI without MMR loss according to the initial defi nition of molecular recurrence and protocol recommendations and 3 patients died before MMR loss), the 5- and 9-year cumulative incidences of molecular re currence and resumption of treatment, molecular recur rence and death, or molecular recurrence alone were estimated at 56.64%, 53.29%, and 51.62% and 65.52%, 62.17% and 60.5%, respectively. The differences are slight but considering the median age at imatinib discontinuation (61.9 years) and a longer fol low-up, the incidence of CML-unrelated deaths would in crease over time and emphasize these differences. Furthermore, more deaths reported in large cohorts of pa tients treated with imatinib front-line are now not related to CML.11,12 Among these, deaths related to second malig nancies are not unusual and raise another question con cerning additional potential competing events in the evaluation of a TFR strategy. Indeed, we do not know the effect of various chemotherapeutic regimens on leukemic CML stem cells and their possible role in the maintenance of DMR after TKI discontinuation. Although such treatment was not reported in this update, we believe that chemo therapy for another malignancy after TKI discontinuation should also be considered and reported as a competing event.
The second objective of this update of the STIM2 study was to identify and characterize potential late molecular recurrences. Indeed, updates with a longer follow-up of the two pivotal studies (STIM1 and TWISTER) did not re port any molecular recurrence beyond 27 months after imatinib discontinuation, with a median follow-up of 6.4 and 8.6 years, respectively.13,14 Since these reports we have identified one molecular recurrence 7 years after imatinib discontinuation in the STIM1 study (update currently on going) and preliminary results of the EURO-SKI discon tinuation trial based on a larger cohort of patients show that the cumulative incidence of molecular recurrences continues to increase slowly 24 months after TKI discon tinuation,15 with late molecular recurrences beyond 36 months estimated to occur in approximately 10% of pa tients in the AFTER-SKI study.16 Rousselot et al.17 recently reported the occurrence of late molecular recurrences, defined as loss of MMR after 2 years of TKI cessation, in nine out of 65 patients for an estimated incidence of 13.8% and a median time from stopping TKI treatment to molecular recurrence of 3.6 years. With respect to the first report published 2 years ago and in order to identify potential predictive factor(s) of late molecular recur rences, we performed this analysis in the “per-protocol” population (199 patients).9 The long-term follow-up of the STIM2 study confirms that late molecular recurrence can occur beyond 24 months. In this study, molecular recurrences occurred between 0
to 6 months, 6 to 24 months and after 24 months in 75 (69%), 15 (14%) and 18 (17%) patients, respectively. Notably, the kinetics of the molecular recurrence, based on DMR4MMR loss, were significantly different between these three subgroups with a median time from loss of MR4 to MMR loss of 1, 7 and 22 months, respectively.
As previously reported,4 most molecular recurrences occur during the first 6 months following imatinib discontinu ation and although molecular recurrences continue to occur beyond 6 months, the probability of remaining treatment-free increases over time. Taking into account the late molecular recurrences reported in this study, the TFR at 5 years among patients without molecular recur rence at 6 months or 24 months were 71.9% [61.03- 80.3] and 87.03% [79.8- 94.2], respectively. We analyzed predictive factors for the loss of MMR before and after 6 months or 24 months. While DMR duration as well as duration of imatinib treatment and BCR::ABL1 levels at TKI cessation, quantified by RT-ddPCR, are as sociated with the risk of molecular recurrence as pre viously reported, these factors were unable to predict molecular recurrence after 24 months. We therefore hypothesize that these late molecular recur rences may be explained by mechanisms that are intrinsic to the host rather than to the disease. It has been sug gested by several studies18–23 that these mechanisms in clude the involvement of the immune system in the control of molecular residual disease after TKI cessation. Indeed, quantitative changes in several immune effectors (such as natural killer cells,18,20,22,23 innate CD8+ T cells,21 CD86+ plasmacytoid dendritic cells,19 γδ + T cells, CD4+ regulatory T cells22,23 and myeloid-derived suppressor cells23) have been associated with a higher likelihood of achieving TFR. Interestingly, patients with a molecular re currence occurring before 6 months had higher natural killer-cell levels compared to patients with no molecular recurrence whereas patients relapsing beyond 6 months had similar natural killer-cell counts to those of non-re lapsing patients.20 It would be interesting to see whether, with a longer follow-up and using the 24-month thresh old, these differences are maintained or not. It is possible that other elements of the immune system are also in volved in the occurrence of molecular recurrences beyond 24 months. Unfortunately, no immunological data were collected in STIM2 and only a prospective study with a long-term follow-up evaluating all the potential factors would allow these hypotheses to be investigated. In conclusion, despite a decrease in the risk of molecular recurrence over time, late events are possible and warrant the need for sustained, long-term molecular monitoring. However, based on the kinetics of late molecular recur rences observed in this study with a median time from MR4 loss to MMR loss of 22 months, BCR::ABL1IS assess ment can be safely performed every 6 months in patients
without molecular recurrence 2 years after imatinib ces sation.
SD is a speaker for Novartis and Incyte. FEN is a consultant for BMS, Incyte Biosciences, Sun Pharma Ltd and Novartis, and a speaker for Novartis, Incyte Biosciences and BMS. DR is a consultant for Novartis, and a speaker for Novartis, BMS, Incyte Biosciences and Pfizer. PC-M. is a speaker for Novartis, BMS and Pfizer. AC is a speaker for BMS, Incyte Biosciences and Novartis. VC is a speaker for Incyte Bio sciences. FR-H is a speaker for Novartis, BMS, Incyte Bio sciences and Pfizer; AG-B is a speaker for Novartis, BMS, Incyte Biosciences and Pfizer. LL is a speaker for Novartis, Incyte Biosciences, BMS and Pfizer. PR is a consultant for Pfizer, and a speaker for BMS, Novartis, Incyte Biosciences and Pfizer. MB is a speaker for Novartis and BMS. GE is a speaker for BMS, Incyte Biosciences, Novartis and Pfizer. FXM is a consultant for Novartis and a speaker for Incyte Biosciences, BMS, Novartis and Pfizer. VD, PL, JL, MEB, MG, JCI, PT, HJ-A, JM, HJ, BJ, PZ, TH, BV, EC, FL , FR and SM have nothing to disclose.
SD, FXM, GE, FEN and DR designed the study. SD, GE and FXM wrote the manuscript. SM performed the statistical
1. Gunnarsson N, Sandin F, Höglund M, et al. Population-based assessment of chronic myeloid leukemia in Sweden: striking increase in survival and prevalence. Eur J Haematol. 2016;97(4):387-392.
2. Mahon F-X, Réa D, Guilhot J, et al. Discontinuation of imatinib in patients with chronic myeloid leukaemia who have maintained complete molecular remission for at least 2 years: the prospective, multicentre Stop Imatinib (STIM) trial. Lancet Oncol. 2010;11(11):1029-1035.
3. Ross DM, Branford S, Seymour JF, et al. Safety and efficacy of imatinib cessation for CML patients with stable undetectable minimal residual disease: results from the TWISTER study. Blood. 2013;122(4):515-522.
4. Dulucq S, Astrugue C, Etienne G, et al. Risk of molecular recurrence after tyrosine kinase inhibitor discontinuation in chronic myeloid leukaemia patients: a systematic review of literature with a meta-analysis of studies over the last ten years. Br J Haematol. 2020;189(3):452-468.
5. Rea D, Cayuela J-M. Treatment-free remission in patients with chronic myeloid leukemia. Int J Hematol. 2018;108(4):355-364.
6. Rea D, Ame S, Berger M, et al. Discontinuation of tyrosine kinase inhibitors in chronic myeloid leukemia: recommendations for clinical practice from the French Chronic Myeloid Leukemia Study Group. Cancer 2018;124(14):2956-2963.
7. Hochhaus A, Baccarani M, Silver RT, et al. European LeukemiaNet 2020 recommendations for treating chronic myeloid leukemia. Leukemia. 2020;34(4):966-984.
8. Rousselot P, Charbonnier A, Cony-Makhoul P, et al. Loss of
analyses. FR monitored all the centers and helped in col lecting the data. FEN, PCM, AC, ME-B, FR-H, VC, BV, VD, PL, PR, D, AG-B, LL, JL, MG, J-CI, PT, HJ-A, JM, HJ, BJ, PZ, TH, BV, MB, EC, FG, FL, GE and FXM enrolled patients in the study, followed them up, and provided clinical data. All authors proof-read the manuscript and agree on its con tent.
We thank all the clinical research associates for their valu able help in collecting and monitoring the data. We thank the biologists of the French group “Groupe des Biologistes Moléculaires des Hémopathies Malignes” (GBMHM) who performed local quantification of BCR::ABL1 transcripts and helped in the collection of data, especially Jean-Michel Cayuela, Eric Delabesse, Sandrine Hayette, Yannick Lebris, Eric Lippert, Marie-Joelle Mozziconacci, Marc Muller, Olivier Nibourel and Sophie Raynaud. We are grateful to Joëlle Guilhot, PhD, CIC-INSERM, CHU de Poitiers France, for her helpful discussions. The authors are also grateful to Mrs Barbara Meunier-White (Chasselay, France) for proof-read ing the English and providing suggestions.
All the data are available on request to the corresponding author.
major molecular response as a trigger for restarting tyrosine kinase inhibitor therapy in patients with chronic-phase chronic myelogenous leukemia who have stopped imatinib after durable undetectable disease. J Clin Oncol. 2014;32(5):424-430.
9. Nicolini FE, Dulucq S, Boureau L, et al. The evaluation of residual disease by droplet digital PCR and TKI duration are critical predictive factors for molecular recurrence after stopping imatinib first-line in chronic phase CML patients: results of the STIM2 study. Clin Cancer Res. 2019;25(22):6606-6613.
10. Cross NCP, White HE, Colomer D, et al. Laboratory recommendations for scoring deep molecular responses following treatment for chronic myeloid leukemia. Leukemia. 2015;29(5):999-1003.
11. Hehlmann R, Lauseker M, Saußele S, et al. Assessment of imatinib as first-line treatment of chronic myeloid leukemia: 10-year survival results of the randomized CML study IV and impact of non-CML determinants. Leukemia. 2017;31(11):2398-2406.
12. Guilhot F, Rigal-Huguet F, Guilhot J, et al. Long-term outcome of imatinib 400 mg compared to imatinib 600 mg or imatinib 400 mg daily in combination with cytarabine or pegylated interferon alpha 2a for chronic myeloid leukaemia: results from the French SPIRIT phase III randomised trial. Leukemia. 2021;35(8):2332-2345.
13. Etienne G, Guilhot J, Rea D, et al. Long-term follow-up of the French Stop Imatinib (STIM1) study in patients with chronic myeloid leukemia. J Clin Oncol. 2017;35(3):298-305.
14. Ross DM, Masszi T, Gómez Casares MT, et al. Durable treatment-free remission in patients with chronic myeloid leukemia in chronic phase following frontline nilotinib: 96-week update of the ENESTfreedom study. J Cancer Res Clin Oncol. 2018;144(5):945-954.
15. Saussele S, Richter J, Guilhot J, et al. Discontinuation of tyrosine kinase inhibitor therapy in chronic myeloid leukaemia (EURO-SKI): a prespecified interim analysis of a prospective, multicentre, non-randomised, trial. Lancet Oncol. 2018;19(6):747-757.
16. Richter J, Lübking A, Söderlund S, et al. Molecular status 36 months after TKI discontinuation in CML is highly predictive for subsequent loss of MMR-final report from AFTER-SKI. Leukemia. 2021;35(8):2416-2418.
17. Rousselot PLoiseau C, Delord M. Late molecular recurrences in patients with chronic myeloid leukemia experiencing treatmentfree remission. Blood Adv. 2020;4(13):3034-3040.
18. Rea D, Henry G, Khaznadar Z, et al. Natural killer-cell counts are associated with molecular relapse-free survival after imatinib discontinuation in chronic myeloid leukemia: the IMMUNOSTIM study. Haematologica. 2017;102(8):1368-1377.
19. Schütz C, Inselmann S, Saussele S, et al. Expression of the CTLA-4 ligand CD86 on plasmacytoid dendritic cells (pDC) predicts risk of disease recurrence after treatment discontinuation in CML. Leukemia. 2017;31(4):829-836.
20. Ilander M, Olsson-Strömberg U, Schlums H, et al. Increased proportion of mature NK cells is associated with successful imatinib discontinuation in chronic myeloid leukemia. Leukemia. 2017;31(5):1108-1116.
21. Cayssials E, Jacomet F, Piccirilli N, et al. Sustained treatmentfree remission in chronic myeloid leukaemia is associated with an increased frequency of innate CD8(+) T-cells. Br J Haematol. 2019;186(1):54-59.
22 Okada M, Imagawa J, Tanaka H, et al. Final 3-year results of the dasatinib discontinuation trial in patients with chronic myeloid leukemia who received dasatinib as a second-line treatment. Clin Lymphoma Myeloma Leuk. 2018;18(5):353-360.e1.
23. Irani YD, Hughes A, Clarson J, et al. Successful treatment-free remission in chronic myeloid leukaemia and its association with reduced immune suppressors and increased natural killer cells. Br J Haematol. 2020;191(3):433-441.
Susanne Ghandili,1* Cecilia Lindhauer,1* Sven Pischke,2 Julian Schulze zur Wiesch,2 Philipp H. von Kroge,3 Susanne Polywka,4 Carsten Bokemeyer,1 Walter Fiedler,1 Nicolaus Kröger,5 Francis Ayuk,5 Raissa Adjallé5# and Franziska Modemann1,6#
1Department of Oncology, Hematology and Bone Marrow Transplantation with Section Pneumology, University Cancer Center Hamburg, University Medical Center HamburgEppendorf; 2The I. Department of Internal Medicine, Division of Infectious Diseases, University Medical Center Hamburg-Eppendorf; 3Department of General, Visceral and Thoracic Surgery, University Medical Center Hamburg-Eppendorf; 4The Institute of Medical Microbiology, Virology and Hygiene, University Medical Center Hamburg-Eppendorf; 5Department of Stem Cell Transplantation, University Medical Center Hamburg-Eppendorf and 6Mildred Scheel Cancer Career Center, University Cancer Center Hamburg, University Medical Center HamburgEppendorf, Hamburg, Germany
*SG and CL contributed equally as co-first authors. #RA and FM contributed equally as co-last authors.
Correspondence: F. Modemann f.modemann@uke.de
R. Adjallé r.adjalle@uke.de
Received: February 13, 2022.
Accepted: June 16, 2022. Prepublished: June 30, 2022. https://doi.org/10.3324/haematol.2022.280853 ©2022 Ferrata Storti Foundation Published under a CC BY-NC license
Hepatitis E virus is increasingly being reported to cause chronic infection in immunocompromised patients. However, less is known about patients with an underlying hematologic disease. In particular, the impact of hepatitis E infection on oncological therapy has been poorly described. In this retrospective single-center study, we analyzed 35 hematologic patients with hepatitis E, including 20 patients under active oncological treatment and 15 patients who were in the posttreatment follow-up or under active surveillance. The primary aim was to describe the clinical courses with particular focus on any hepatitis E-related therapy modifications of cancer-directed therapy. In the majority (60%) of patients who were under active oncological treatment, hepatitis E-related therapy modifications were made, and 25% of deaths were due to progression of the hematologic disease. In patients receiving concomitant oncological treatment, no hepatitis Erelated deaths occurred. In contrast, two patients in the follow-up group died from hepatitis E-associated acute-onchronic liver failure. Chronic hepatitis E was observed in 34% of all cases and 43% received ribavirin therapy; of those, 27% achieved a sustained virological response. CD20-directed therapy was the only independent risk factor for developing chronic hepatitis E. We conclude that CD20-directed treatment at any time point is a risk factor for developing chronic hepatitis E. Nevertheless, since mortality from the progression of hematologic disease was higher than hepatitis E-related mortality, we suggest careful case-by-case decisions on modifications of cancer treatment. Patients in the posttreatment follow-up phase may also suffer from severe courses and hepatitis E chronicity occurs as frequently as in patients undergoing active therapy.
Hepatitis E virus (HEV) is one of the most common causes of acute hepatitis worldwide, with more than 20 million estimated new infections per year, about 3.3 million cases of symptomatic infections, and approximately 44,000 HEVrelated deaths each year.1 In immunocompetent patients, HEV causes a self-limiting acute hepatitis which is usually asymptomatic or runs a mild course and acute fulminant hepatitis with acute liver failure or acute-on-chronic liver failure (ACLF) is rare, whereas more severe courses with ACLF are observed in patients with other pre-existing liver diseases and during pregnancy.2-5 In contrast to their
course in immunocompetent patients, HEV infections in strongly immunosuppressed patients, such as solid organ and hematopoietic stem cell transplant recipients, prog ress into chronic hepatitis E in about 50% of cases.5-13 Overall, there are limited data from Europe on the preva lence of HEV in hematologic patients. However, in a Chi nese population, the seroprevalence of HEV was significantly higher in cancer patients (26%) than in healthy controls (13%), with the highest prevalence of 32.2% being found in patients with leukemia.14 Most of the available data on HEV infections in patients with hematologic disorders are derived from single case reports and small case series.7,15-34 Even in the current ver
sion of the European Conference on Infection in Leukemia (ECIL) and the European Association for Study of the Liver (EASL) guidelines,35,36 questions such as whether HEV in fection makes changes of systemic cancer therapy necessary in patients with hematologic disorders, how often hepatitis E-related therapy modifications are per formed in patients with hematologic disorders, what kind of therapy modifications are made and what their impact on the overall treatment schedule is remain unanswered. Additionally, it is not known yet whether hematologic pa tients during follow-up potentially have a higher hepatitis E-associated mortality rate or are at higher risk of devel oping chronic hepatitis E. Another unresolved issue is the feasibility of off-label treatment of chronic hepatitis E with ribavirin, a nucleoside analog used as a virostatic agent for the treatment of chronic hepatitis C, in patients with hematologic disorders who usually suffer from pre-exist ing, prolonged and profound cytopenia. One of the few larger analyses that reported on a popu lation of hematologic patients is a European multicenter, retrospective, cohort study that investigated the burden of HEV infections in 50 patients with hematologic malig nancies: in 2019, von Felden and colleagues documented a hepatitis E-related overall mortality, defined as death with ongoing hepatitis E, of 16% (8/50), an overall acute liver failure rate of 8% (4/50) and an overall progression rate into chronic hepatitis E of 37% (17/50).7
Here, we evaluated the impact of HEV infections on onco logical treatment in patients with hematologic disorders by investigating the frequency, the dose modifications and delays of therapy courses as well as the overall mortality in a large, retrospective, single-center cohort. Additionally, we report on the clinical course of hepatitis E as well as response to virological treatment in hematologic patients during the follow-up period after chemotherapy and the special features of virological assessments in patients with hematologic disorders.
This single-center retrospective study included patients who met all the following criteria: (i) aged ≥18 years; (ii) laboratory-confirmed diagnosis of hepatitis E made by polymerase chain reaction; and (iii) a co-existing or pre viously existing underlying hematologic disorder. For further analysis, patients were divided into two groups: group A consisted of HEV-infected patients with hematologic dis orders under active oncological treatment, defined as treatment in the last 6 months prior to hepatitis E infection or during hepatitis E infection, while group B consisted of HEV-infected patients with hematologic disorders during active surveillance or post-treatment follow-up. Thirty-five
patients met the study inclusion criteria, 20 were assigned to group A, and 15 group B (Figure 1).
All patients were identified by having been tested positive for HEV-RNA in blood samples at the University Medical Center Hamburg-Eppendorf, Germany between January 2012 and December 2021. Clinical data regarding treatment and disease characterization were collected from the pa tients’ electronic medical records. The data cut-off was Ja nuary 2022.
The Common Terminology Criteria for Adverse Events, ver sion 5, was used to assess toxicity.37 Remission status was defined according to international remission criteria.38-42 Chronic hepatitis E was defined as the persistence of HEV viremia for more than 3 months.35 Hepatitis E mortality was defined as death due to HEV-associated acute liver failure or ACLF. Acute liver failure and ACLF were defined as the development of hepatic encephalopathy and impaired syn thetic liver function (International Normalized Ratio >1.4) in patients without or with pre-existing liver disease, respect ively. The dosage and duration of off-label ribavirin treat ment were not standardized. A sustained virological response (SVR) was defined as the absence of detectable HEV-RNA in blood samples and/or, if available, in stool or urine samples 24 weeks after the completion of antiviral therapy.
Data were collected in compliance with local legislation requirements and the collection procedure was reviewed and approved by the ethics committee of the Medical Council of Hamburg (WF-138/20). Informed consent was waived by the ethics committee since only anonymous data were analyzed and published. Some patients included in this study have already been investigated and the findings were published by von Felden et al. and Mikulska et al.7,13
An in-house test was used for the detection of HEV-RNA, as described earlier.43,44 Since 2017 the fully automated Cobas® HEV test has been used on a Roche Cobas 6800 platform according to the manufacturer’s instructions (Roche Diagnostics, Mannheim, Germany) for the detection of HEV in blood, stool, and urine samples.
All statistical analyses were performed, and figures were designed using the Statistical Package for Social Sciences statistical software, version 27.0 (IBM Corp., Armonk, NY, USA) and GraphPad Prism, version 9 (GraphPad Software, La Jolla, CA, USA). Continuous values are presented as medians with interquartile ranges (IQR). Nominal variables are expressed as numbers with percentages and compared by Cramér’s V. For evaluation of associations between nom inal and metric variables of interest, the Eta (η) correlation
coefficient was calculated, and statistical significance was tested with analysis of variance. A multivariant linear re gression analysis was carried out. The association of metric variables of interest was compared using the Pearson cor relation coefficient. Significant differences in means be tween two groups were calculated by using a t-test. A two-sided P value <0.05 was considered statistically sig nificant.
The primary aim was to evaluate the impact of HEV infec tions on oncological treatment in patients with hematologic disorders. Secondary aims were to investigate the clinical courses and virological features of HEV-infected patients with hematologic disorders.

A total of 35 patients were included in this retrospective analysis. At the time of laboratory-confirmed hepatitis E in fection, 20 patients (57%) were receiving systemic oncologi cal treatment (group A). Of the remaining 15 patients (group B), 11 were diagnosed with hepatitis E during post-treatment follow-up and four were under active surveillance. Detailed information about the patients’ demographics and char acteristics are presented in Table 1.
In four patients, blood products were identified as the
source of HEV infection. Three patients had been infected by red blood cell concentrates and one by a peripheral blood allogeneic stem cell concentrate containing HEV. In one patient, contaminated food was identified as the source of HEV infection, whereas in 30 patients, the trans mission route remains unknown.
At the time of the first laboratory-confirmed diagnosis of HEV infection, the median viral load in EDTA blood samples from patients in group A was 87,675 IU/mL (IQR: 1,415-575,367) or 1,000,000 copies/mL (IQR: 74013,000,000). In patients of group B, the median viral load in EDTA blood samples at first laboratory-confirmed diag nosis was 730,000 IU/mL (IQR: 7,421-9,882,778) or 176,500 copies/mL (IQR: 2,105-541,250). In group A, stool samples were available for 17 patients and urine samples for ten patients at variable time points during the entire duration of the HEV infection. HEV was detectable in the stool or urine samples in 15 (88%) and five (50%) of these patients, respectively. In group B, stool samples were available for nine patients and urine samples for two patients at vari able time points. HEV was detectable in stool and urine samples in four (44%) and one (50%) of these patients, re spectively.
The median time to viral clearance in EDTA blood samples and/or other tested samples was 55 days (IQR: 41-190) in group A patients and 45 days (IQR: 16.5-327) in group B patients. In three patients in group A (18%), HEV-RNA was still detectable in stool or urine samples, although no HEV-RNA could be detected in repeated tests of blood
Table 1. Patients‘ characteristics.
Total cohort (N=35)
Group A: under active treatment (N=20)
Group B: under active surveillance and post-treatment follow-up (N=15)
Age in years, median (IQR) 56 (47-67) 55 (46.3-64.5) 58 (49-69) Male, N (%) 23 (64.7) 12 (60) 11 (73.3) CCI 2.5 3 Pre-existing liver diseases*, N 5 5
Myeloid neoplasm (n=6) Lymphoid neoplasm (n=22) Plasmacell-related dyscrasia (n=6) Other (n=1) N N
AML 3 AML 1 CML 1 ET-related MF 1 ALL 1 Hodgkin lymphoma 3 Indolent B-NHL 6 Indolent B-NHL 6 Aggressive B-NHL 1 Aggressive B-NHL 2 Indolent B-NHL with transformation into aggressive B-NHL 2 Indolent B-NHL with transformation into aggressive B-NHL 1 MM 5 MGUS 1 Hypocellular refractory cytopenia 1 Other NA
Remission status Newly diagnosed 12 Under active surveillance 4 Relapsed/refractory 8 Post-treatment follow-up 11 Lines of therapy 1 9 1 7 2 4 2 3 3 4 3 1 ≥ 3 3 ≥ 3 0 NA 0 NA 4
Treatment regimen under active HEV infection**
Monoclonal antibody therapies 10 NA
Chemotherapy-based regimens 13
Autologous PBSCT 1 Allogeneic PBSCT 6 CAR T-cell therapy 1 Checkpoint inhibitorbased treatment 1
on following page.
Previous systemic therapies***
Total cohort (N=35)
Group A: under active treatment (N=20)
CD20-directed treatments 8
Chemotherapy-based treatments 11
Group B: under active surveillance and post-treatment follow-up (N=15)
CD20-directed treatments 5
Chemotherapy based treatments 10
Autologous PBSCT 4 Autologous PBSCT 2
Allogeneic PBSCT 1 Allogeneic PBSCT 3 Oral signal transduction inhibitors 6 Oral signal transduction inhibitors 2
Proteasome inhibitor 2 Proteasome inhibitor 0 Without systemic oncological treatment 8 Without systemic oncological treatment 4
*Including steatosis, drug-related hepatotoxicity, infiltration by underlying disease, liver transplantation, hepatitis B or C infection, liver cirrhosis. **Defined as active oncological treatment in the last 6 months prior to hepatitis E infection or during hepatitis E infection. ***Defined as active surveillance or post-treatment follow-up. IQR: interquartile range; CCI: Charlson Comorbidity Index;48 AML: acute myeloid leukemia; CML: chronic myeloid leukemia; ET: essential thrombocythemia; MF: myelofibrosis; ALL: acute lymphoblastic leukemia; BNHL: B-cell non-Hodgkin lymphoma; MGUS: monoclonal gammopathy of unknown significance; MM: multiple myeloma; PBSCT: peripheral blood stem cell transplantation; CAR: chimeric antigen receptor; HEV: hepatitis E virus.
samples. In one patient in group B (11%), HEV-RNA was de tected in stool samples despite viral clearance in blood samples.
In group A, 12 of the 20 patients (60%) developed acute hepatitis; further virological assessment was lacking for one case. Chronic hepatitis E occurred in seven of the 20 patients (35%) and two patients (10%) developed ACLF. HEV relapse after temporary clearance of the virus was ob served in two of 20 patients (10%). In all 20 patients (100%), an elevation of liver enzymes, particularly alanine-amino transferase (ALT) and gamma-glutamyl-transferase (GGT), was observed during hepatitis E infection with a median peak ALT of 326.5 U/L (IQR: 125.3-943.3) and a median peak GGT of 285 U/L (IQR: 181-570). In group A, neutrophil and lymphocyte counts at the time of the first laboratory-con firmed hepatitis E infection were available for 15 patients. Of these, two patients (13%) had grade 3 or 4 decreased neutrophil and lymphocyte counts. Seven out of the 20 pa tients in group A died, leading to an overall mortality of 35%, with five deaths due to cancer progression and one due to intracerebral bleeding and secondary malignancy. No hepatitis-related death occurred in group A (Table 2). In group B, the median time from the first diagnosis of the hematologic disorder until the first diagnosis of HEV infec tion was 4 years (range, 1-33 years). Ten patients (67%) de veloped acute hepatitis. Chronic hepatitis E occurred in five of the 15 patients (33%) in group B, including two pa tients who died of ACLF. One patient in complete remission after high-dose chemotherapy with autologous stem cell transplantation, performed to treat aggressive lymphoma, died of HEV-associated ACLF and, together with hepatore nal syndrome, developed spontaneous bacterial peritonitis.
The second patient in complete remission after treatment with six cycles of rituximab and bendamustine, again given to treat an aggressive lymphoma, died due to a combina tion of ACLF and septic shock. Neither of the two patients had. any other relevant comorbidities. HEV relapse after transient viral clearance was observed in two of the 15 pa tients (13%) in group B. In 14 of 15 patients (93%), elevation of liver enzymes, particularly ALT and GGT, was observed during the hepatitis E infection with a median peak ALT of 403 U/L (IQR: 136-1,039) and a median peak GGT of 203.5 U/L (IQR: 98.3-381.3). Data on neutrophil and lymphocyte counts were not routinely assessed in patients in group B. Two of the 15 patients died, leading to an overall mortality of 13%. Both patients died due to hepatitis E-related ACLF. No cancer-related death occurred in group B (Table 2).
Impact of hepatitis E infection on oncological treatment in patients with hematologic disorders
We analyzed hepatitis E-related therapy modifications which occurred in 12 of the 20 patients (60%) in group A (Table 3). In six patients, there was a delay of 6 to 8 weeks in the administration of high-dose therapy and autologous PBSCT, because of HEV-contaminated autologous grafts or pending HEV clearance, which led to the need for bridging therapies in three cases. Moreover, two patients were dia gnosed with hepatitis E infection immediately prior to al logeneic PBSCT, leading to a delay of the allogeneic transplant until HEV clearance. In one patient, the first re lapse of multiple myeloma was diagnosed simultaneously with the hepatitis E infection, leading to a 6-week delay of second-line therapy until HEV clearance was achieved. Furthermore, in one case of aggressive B-cell non-Hodgkin lymphoma, immunochemotherapy was terminated pre maturely due to HEV positivity, as was CD20-directed
Table 2. Treatment and hepatitis E-related parameters.
Form of hepatitis E, N (%)
Total cohort (N=35)
Group A: under active treatment (N=20)
Group B: under active surveillance and post-treatment follow-up (N=15)
Acute 12 (60) 10 (67) Chronic 7 (35) 5 (33)
HEV relapse 2 (10) 2 (13)
ACLF 2 (10) 2 (13)
Unknown 1 (5) NA
Viral load* in copies/mL, median (IQR) 310,000 (1,720-2,700,000) 1,000,000 (740-13,000,000) 176,500 (2,105-541,250)
Viral load* IU/mL, median (IQR) 297,060 (3,723-764,672) 87,675 (1,415-575,367) 730,000 (7,421-9,882,778)
Days to virus clearance, median (IQR) 52.5 (35.7-160) 55 (41-190) 45 (16.5-327)
Peak GGT in U/L, median (IQR) 254 (159-445) 285 (181-570) 203.5 (98.3-381.3)
Peak ALT in U/L, median (IQR) 391 (137-973) 326.5 (125.3-943.3) 403 (136-1039) Ribavirin therapy, N (%) 9 (45) 6 (40)
Days of treatment with ribavirin, median (IQR) 154 (49-210.5) 162 (50.3-309.5) 121 (9.8-181.3)
Time to treatment start with ribavirin in days, median (IQR) 40 (13-81) 30 (11.5-73.3) 49.5 (28.5-121.3) Sustained virological response, N (%) 3 (33) 1 (17) Overall mortality, N (%) 7 (35) 2 (13) HEV-related deaths, N (%) 0 (0) 2 (13) Cancer-related deaths, N (%) 5 (25) 0 (0) Death from other causes, N (%) 2 (10) 0 (0)
*Defined as viral load at first laboratory-confirmed detection of hepatitis E infection. HEV: hepatitis E virus; ACLF: acute-on-chronic liver failure; IQR: interquartile range; GGT: gamma-glutamyl transferase; ALT: alanine aminotransferase.
maintenance therapy in two other patients for the same reason. Dose modifications did not occur. No hepatitis Erelated deaths occurred in these 12 patients. However, four of those whose treatment schedules were modified sub sequently became refractory to treatment or relapsed and three cancer-related deaths occurred (Table 3, Figure 2). Next, we compared the clinical courses between the two groups of patients. We did not observe significant differ ences regarding the rate of acute and chronic hepatitis, the viral load, the duration of HEV clearance, and the increase of liver enzymes. However, the only two HEV-related deaths both occurred in group B (Table 2).
Hepatitis E infection in patients undergoing allogeneic stem cell transplantation
Ten patients underwent allogeneic PBSCT. The median duration between the allogeneic transplant and labora
tory-confi rmed HEV infection was 3.5 months (IQR: 013.8). Chronic hepatitis was observed in fi ve of ten pa tients (50%) and one patient had a HEV relapse. No acute liver failure or ACLF occurred and there were no hepatitis E-related deaths in this subgroup. The median time to HEV clearance was 110 days (IQR: 53.5-613). In all eight tested patients, HEV-RNA was detectable in stool samples and in three of six (50%) in urine samples. Im portantly, in one case HEV was transmitted by allogeneic PBSCT in a patient who then developed chronic hepatitis E with spontaneous HEV clearance without requiring modification of immunosuppressive therapy. In one pa tient, immunosuppressive therapy was interrupted until HEV clearance. Likewise, in eight other patients, no change in graft- versus -host disease (GvHD) prophylaxis was required. No patient developed signs of acute or chronic liver GvHD.
NA ARTICLE - Hepatitis E infections in hematology patients S. Ghandili et al.
Table 3. Overview of the hematologic outcome of all patients with hepatitis E virus-related cancer-directed treatment modi fi cations.
Outcome
Response a ft er end of treatment
Systemic treatment during HEV infection including treatment modi fi ca tion
Last response prior to HEV infection
Systemic treatment prior to HEV infection
Underlying hematologic disease
Age, years
Sex
Case
Dead
PD
5 cycles of R-CHOP, treatment delay, R-Ven, allogeneic PBSCT
PR
6 cycles of FCR 6 cycles of R-Benda Ibrutinib
CLL transformation into DLBCL
66
Cause of death 1
page.
M
Alive
NA
4 cycles of IsaKRd (EMN24 trial), cyclophosphamide mobilization, instead of high-dose melphalan and autologous PBSCT bridging with 2 cycles of VRd
sCR
None
MM
60
Cancer- related 2
F
Alive
CR
2 cycles of R-CHOP, 1 cycle of RDHAP, 1 cycle of R-DHAOx, premature discontinuation of therapy, delay of high-dose TEAM
CR
None
MCL
55
NA 3
F
Alive
VGPR
4 cycles of VCd, CE-mobilization, delay of high-dose melphalan and autologous PBSCT
VGPR
None
MM
NA 4
Cancer- related
58
M
Alive
CR
2 cycles of R-DHAP, 2 cycles of RICE, ofatumumab-BEAM and autologous PBSCT, autologous stem cell support due to ribavirin toxicity, delay of allogeneic PBSCT
PR
6 cycles of R-CHOP
GZL
NA 5
Intra- cranial bleeding
on
42
F
Alive
Dead
Unknown, lost to follow-up
Delay of second high-dose melpha lan and autologous PBSCT during first relapse and bridging with Vd
VGPR
PD
2 cycles of Vd, steady-state mobilization, delay of high-dose melphalan and autologous PBSCT and 2 cycles of Vd for bridging
Unknown
4 cycles of VCd, high-dose melphalan and autologous PBSCT
None
Dead
n.a.
Non-intensive induction with azacyti dine and delay of allogeneic PBSCT
MM
NA 6
MM
PD
51
57
None
F
NA 7
sAML
None
59
MCL
46
F
M
Alive Haematologica | 107 December 2022 2876
M
Cause of death ARTICLE - Hepatitis E infections in hematology patients S. Ghandili et al.
Response a ft er end of treatment
Systemic treatment during HEV infection including treatment modi fi ca tion
Last response prior to HEV infection
Systemic treatment prior to HEV infection
Underlying hematologic disease
Age, years
Sex
Dead
PD
VCd and premature discontinuation of therapy
PR
4 cycles of VCd, high-dose melphalan and autologous PBSCT, MMY2060 trial
MM
52
M
10
Alive
Unknown, lost to follow-up
Obinutuzumab maintenance, premature discontinuation of therapy
CR
6 cycles of ObiBenda, 3 cycles of Obi-maintenance
FL
55
Cancer- related 11
M
Alive
Relapse
Rituximab maintenance, premature discontinuation of therapy, VR-CAP and CAR T-cell therapy during relapse
CR
5 cycles of R-CHOP, 1 cycle of R-DHAP, autologous PBSCT, R-ICE, high-dose BEAM, autologous PBSCT, ibrutinib, 6 cycles of R-Benda
MCL
70
R-CHOP: rituximab, cyclophosphamide, doxorubicin, vincristine, prednisolone; VCd: bortezomib, cyclophosphamide, dexamethasone; PBSCT: peripheral blood stem cell transplantation; MMY2060 trial: NCT01286077; Obi-Benda: obinutuzumab, bendamustine; R-DHAP: rituximab, dexamethasone, cytarabine, cisplatin; R-ICE: rituximab, if osfamide, carboplatin, etoposide; R-BEAM: rituximab, carmustine, etoposide, cytarabine, melphalan; PR: partial remission; CR: complete remission; sCR: stringent complete r emission; VGPR: very good partial remission; PD: progressive disease; R-Ven: rituximab, venetoclax; IsaKRd: isatuximab, car fi lz omib, lenalidomide, dexamethasone; VRd: bortezomib, lenalidomide, dexamethasone; R-DHAOx: rituximab, dexamethasone, cytarabine, oxaliplatin; TEAM: thioptepa, etoposide, cytarabine, melphalan; CE: cyclophosphamide, etoposide; Vd: bortezomib, dexamethasone; VR-CAP: rituximab, cyclophosphamide, doxorubicin, prednisolone, bortezomib; CAR: chimeric antigen receptor; NA: not applicable. Case
NA 12
NA M: male; F: female; CLL: chronic lymphocytic leukemia; DLBCL: diffuse large B-cell lymphoma; MM: multiple myeloma; MCL: mantle cell lymphoma; GZL: gray zone lymphoma; sAML: secondary acute amyloid leukemia; FL: follicular lymphoma; FCR: fl udar abine, cyclophosphamide, rituximab; R-Benda: rituximab, bendamustine;
M
Analysis of factors influencing hepatitis E infection As CD20-directed therapy is known to have an impact on immune responses, we assessed a possible relation be tween CD20-directed treatment and the time to HEV clearance. CD20-directed treatment during the period of HEV-RNA positivity and/or during the last 12 months prior to the first laboratory confirmation of hepatitis E infection (group A) correlated significantly with the development of chronic hepatitis (P=0.035) (Figures 3 and 4). Furthermore, we observed a significant correlation between CD20-di rected therapy alone or in combination with chemotherapy and a prolonged time to HEV clearance in uni- and multi variate analyses (P=0.01 and P=0.009, respectively) (Figure 3). In contrast, in patients treated with chemotherapybased approaches, no significant correlation with slow HEV clearance was observed (P=0.149). Next, we assessed other possible reasons and risk fac tors for the development of chronic hepatitis E. However,
no other risk factors could be identified, including preexisting liver disease, allogeneic stem cell transplanta tion, underlying hematologic disorder, and remission status (Table 4).
As in group A patients, chronic hepatitis E correlated sig nificantly with previous CD20-directed therapy (P=0.007) with a significant correlation between CD20-directed ther apy alone or in combination with chemotherapy and pro longed time to HEV clearance in uni- and multivariate analyses (P=0.049 each) in group B patients (Figures 3 and 4). Since rituximab can be detected for up to 12 months in the plasma, only patients with CD20-directed therapy 12 months before first confirmation of HEV were assigned to group B. Again, in chemotherapy-based treatment ap proaches, no significant correlation regarding a prolonged time to HEV clearance was observed (P=0.434).
As in group A patients, no other risk factors for developing chronic hepatitis E could be found (pre-existing liver dis
Figure 2. Overview of hepatitis E virus-related modifications of cancer treatment in group A. PBSCT: peripheral blood stem cell transplantation.
Figure 3. Comparison of the time to achieve hepatitis E virus clearance depending on whether the patient had received CD20-directed treatment. In both groups A and B, the time to achieve hepatitis E virus clearance (in days) was significantly longer in patients who had received CD20-directed treatments than in those who had not (P=0.01 and P=0.049, respectively).


Table 4. Analysis of disease- and treatment-specific factors and their impact on the risk of progression into chronic hepatitis E infection.
Patients without progression to chronic hepatitis E (N=22)
Patients with progression to chronic hepatitis E (N=12) P valuec
Male, N 15 7 0.56 Age in years, median 55 67 0.14
Underlying hematologic disease,* N
Myeloid neoplasm 5 1 0.34 Lymphatic disease 12 9 0.24 Plasma-cell dyscrasia 5 1 0.34 In remission,a N 6** 7** 0.45
CD20-directed treatment,b N 4 9 0.001 CD20-directed induction treatment,b N 3 8 NA CD20-directed maintenance treatment,b N 1 1 NA
aDefined as complete remission and very good partial remission (in the case of multiple myeloma). bAs part of the following treatment regimens: R-CHOP: Rituximab, cyclophosphamide, doxorubicin, vincristine, prednisolone; Rituximab and venetoclax; R-DHAP: Rituximab, dexamethasone, cytarabine, cisplatin; R-BEAM: Rituximab, carmustine, etoposide, cytarabine, melphalan; R-ICE: Rituximab, ifosfamide, carboplatin, etoposide; Ofatumumab, R2: Rituximab-Lenalidomide, rituximab and bendamustine, rituximab maintenance; VR-CAP: Rituximab, cyclophosphamide, doxorubicin, prednisolone, bortezomib; R-DHAOx: Rituximab, dexamethasone, cytarabine, oxaliplatin; Obinutuzumab cP value for assessing the risk factor for progression to chronic hepatitis E. *One patient not assessable and one other hematologic disease. **One patient not assessable. PBSCT: peripheral blood stem cell transplantation, NA: not assessable.
eases, allogeneic stem cell transplantation, or underlying hematologic disorder) in group B patients (Table 4).
Nine patients (45%) in group A received off-label treatment with ribavirin: three of them (33%) achieved a SVR, two have not undergone assessment for SVR and two others con tinue to be treated with ribavirin at data cutoff. It should be noted that one patient was treated with sofosbuvir, be cause of refractoriness to ribavirin and ribavirin-associated cytopenia with the need for a PBSCT boost. The median duration of ribavirin treatment was 162 days (IQR: 50.3309.5) with a median maximal dose of ribavirin of 800 mg/day (Table 2).
Six of 15 patients (40%) in group B received off-label treat ment with ribavirin. One of these six patients achieved a SVR (17%) and two have not yet reached the time for SVR assessment; three patients did not have a response to ri bavirin treatment (defined as a SVR). The median duration of ribavirin treatment was 121 days (IQR: 9.8-181.3) with a median maximal dose of ribavirin of 600 mg/day. Pre-exist ing liver disease was less frequently observed in patients responding to ribavirin than in patients who did not achieve SVR (0/4 vs. 4/5). Other possible influencing factors pre dicting response to ribavirin could not be identified.
Although hepatitis E is known to be one of the most com
mon causes of self-limiting acute hepatitis, the risk of de veloping chronic hepatitis E is increased in immunocom promised patients.9-12 Little is known about the impact of hepatitis E infection in patients with hematologic dis orders under active oncological treatment and in patients under active surveillance or during post-treatment followup.
By investigating the clinical course of 20 patients with hematologic disorders undergoing systemic oncological treatment with concomitant hepatitis E infection, we ob served hepatitis E-related therapy modifications, particu larly delays, in more than half of the patients (60%). Interestingly, we did not observe any hepatitis E-related deaths in this group, whereas 25% died of cancer-related causes, and included nearly two-thirds of patients whose therapy had been modified. One of the few publications reporting the burden of HEV infections in 50 patients with hematologic malignancies is a European multicenter retrospective analysis by von Felden et al 7 With an overall rate of hepatitis E-related therapy modifications of 12%, the authors reported a significantly lower proportion of modified cancer therapies compared to ours, which may be explained by a lack of subdivision into patients under active systemic oncological treatment and those under active surveillance or post-treatment follow-up.7 Overall, the hepatitis E-related mortality rate was 6% in our cohort, which is in line with liver-associated death rates of 8% and 9% previously reported for European pa tients.7,13 It is worth noting that in our study population, while two deaths happened in the post-treatment follow-
up patients, no hepatitis E-related deaths occurred in the group of patients undergoing active treatment. Both pa tients who died from ACLF had been previously treated with rituximab. Furthermore, no patient who underwent allogeneic stem cell transplantation died from hepatitis E. In this cohort, hepatitis E infection did not lead to acute or chronic GvHD of the liver. Adjustment of immunosup pressive therapy after allogeneic stem cell transplantation was required in only one patient. In contrast to the study by von Felden et al., in which reduction of immunosup pressive therapy was associated with fulminant GvHD, the patient in our cohort did not develop GvHD.7
Chronic hepatitis E occurred in 34% of all the patients, while corresponding percentages in group A, group B, and the group of allogeneic stem cell recipients were 35%, 33%, and 50%, respectively. Our results are in line with previously reported results showing high rates of chronic hepatitis E (41-62%) in allogeneic stem cell recipients.7,8,13 The rate of chronic hepatitis E in our cohort is higher than that reported by Tavitian et al. who observed chronic hepatitis in 23% of a cohort of 26 patients with hemato logic disorders.6 To the best of our knowledge, we were able to show for the first time that the proportion of pa tients with chronic hepatitis among patients with hema tologic disorders is just as high among those undergoing post-treatment follow-up/active surveillance as among those receiving active systemic therapy. Based on the high
rate of chronicity in both subgroups, consideration should be given to performing regular liver assessments in pre viously infected patients, due to the residual risk of de veloping chronic hepatitis E-related liver cirrhosis and to screen for HEV relapse. Interestingly, we were able to show that in about 15% of all cases HEV-RNA was detectable longer in stool or urine samples, remaining present after clearance from blood samples. We, therefore, propose intensified monitoring in cluding stool and urine samples on a regular basis. Given the absence of established guidelines, the indication for ribavirin in hematologic patients is still based on a case-by-case decision.35,36,45 In our cohort, 43% of patients received antiviral treatment with ribavirin after a median time to start this treatment of 40 days. Of these patients, 27% achieved a SVR which is in contrast to previously re ported SVR rates of up to 90%.6,7,11,46 Interestingly, the ma jority of ribavirin non-responders had pre-existing liver disease (including one patient with drug-related hepato toxicity, one patient with chronic hepatitis B infection, one patient with liver cirrhosis of unknown origin and one pa tient with previous hepatitis C infection), which might ex plain the comparably large differences in SVR between our cohort and previously described SVR rates. However, due to the small number of available SVR assessments in our patients, reliable statistical analysis of factors predicting response are not possible. Cytopenia is a frequently ob
Figure 4. Overview of the clinical courses of hepatitis E in patients under active CD20-directed treatment (group A) and in patients previously treated with CD20-directed monoclonal antibodies. SVR: sustained virological response. aAll patients receiving CD20-directed treatment at any timepoint; bPatients who received CD20-directed treatment during the last 12 months prior to hepatitis E infection; cPatients who received CD20-directed treatment more than 12 months before hepatitis E infection.

served ribavirin-related adverse reaction.47 We observed only one case of ribavirin-associated cytopenia, which may indicate the feasibility of ribavirin treatment in hemato logic patients.
Remarkably, we found a significant correlation between CD20-directed treatment and a prolonged time to HEV clearance not only in patients under current treatment but also in patients previously treated with CD20-directed monoclonal antibodies, leading to the conclusion that CD20-directed therapy at any time seems to be a risk fac tor for chronic hepatitis E and underlining the importance of B-lymphocytes in the cellular immune response. This finding seems similar to the already known significantly increased rate of hepatitis B virus reactivation after expo sure to rituximab.36 Consistently, the longest duration of HEV positivity, 1,051 days, was observed in a patient who underwent long-term CD20-directed therapy. Overall, this analysis of hepatitis E in patients with hematologic dis orders highlights the impact of CD20-directed treatment as a risk factor for chronic hepatitis E (P=0.001 overall). Based on our results for HEV-infected patients, we sug gest that, in particular in patients with a pronounced need for systemic oncological therapy, the initiation of chemo therapy should not be delayed, but that the efficacy and risks of CD20-directed therapy should be discussed ex haustively. Since cancer-related mortality outweighed hepatitis E-related mortality in our cohort of patients re ceiving systemic oncological treatment, we suggest a careful case-by-case decision of cancer-treatment modi fication and/or delays. We also suggest, especially in pa tients with HEV-contaminated autologous stem cells, that ribavirin treatment should be considered at an early stage for rapid HEV clearance in order to avoid long ther apy delays and to enable further stem cell harvest. Fur thermore, based on our results concerning HEV monitoring, we suggest intensifying HEV-RNA monitoring by including stool and urine samples to identify the time point of defi nite virological clearance more precisely in patients, even when HEV-RNA is no longer detectable in blood samples. Moreover, we conclude that hematologic patients during post-treatment follow-up or those under active surveillance are at risk of developing chronic hepa titis E or ACLF even if the oncological treatment has been completed several years previously. Due to the relatively small cohort of this study, its retro spective design, the heterogeneous timing of HEV-RNA testing and non-systematic screening, there is a risk of potential selection biases and residual confoundings in our analysis. Furthermore, due to missing reliable data on the dosage and duration of ribavirin treatment, no con clusions about the efficacy and safety of this drug can be made in patients with hematologic disorders. Fur thermore, flow cytometric analyses of lymphocytes at de fined timepoints were not part of clinical routine. For this
reason, no further information on any relationship be tween lymphopenia and the development of chronic hepatitis E can be gained from this study. Overall, several questions remain unaddressed: is antiviral prophylaxis for HEV recommended and if so, for how long should it be administered, particularly in patients with CD20-directed treatments? Should ribavirin-induced cytopenia not be considered a dose-limiting toxicity in these patients? Na tional and international registers are urgently needed to collect reliable data and provide evidence-based recom mendations on the treatment of HEV infection in hema tologic patients.
To our knowledge, we report here on the largest singlecenter cohort of patients with hematologic disorders and concomitant HEV infections. We observed that hepatitis E-related therapy modifications were made in the major ity of patients who were under active oncological treat ment. Interestingly, the mortality from progression of the hematologic disease significantly outweighed HEV-related mortality. Chronicity of HEV was seen in one-third of pa tients and we were the fi rst to identify CD20-directed treatment as the only independent risk factor for devel oping chronic HEV. With our data, we hope to contribute to the development of recommendations for the manage ment of hepatitis E infection in hematologic patients, an important combination for hemato-oncologists world wide.
SG, CL, JSzW, PHvK, SP, NK, FA and RA have nothing to de clare. SP received honoraria from MSD, Abbvie, the Gov ernment of Hong Kong, Falk Foundation, Gilead, Diarsorin and Shionogi. CB received speaker’s honoraria from AOK Germany, Bristol Myers Squibb, Med update, Merck Serono, Roche Pharma, Sanofi Aventis and participated on advisory boards for Astra Zeneca, Bayer Healthcare, Berlin Chemie, Bristol Myers Squibb, GSO Research Organisation, Jansen Cilag, Merck Serono, Merck Sharp Dohme, Novartis, and Sanofi Aventis. WF participated in advisory boards for Mor phosys, AbbVie, Pfizer, Amgen, Jazz Pharmaceuticals and Clinigen; received support for meeting attendance from Amgen, Jazz Pharmaceuticals, Daiichi Sankyo Oncology, Bristol-Myers Squibb and Servier; and received support for medical writing from Amgen, Boehringer Ingelheim, Pfizer, and AbbVie. FM received support for meeting attendance from Servier, Abbvie, Incyte, Gilead, Jazz Pharmaceuticals, Novartis, Teva, P fi zer and Amgen; received support for medical writing from Servier; received research grants from Apis Technologies and Daiichi Sankyo; and received speaker’s honoraria from Servier, Jazz Pharmaceuticals and Abbvie.
SG, CL, PvK, SP, RA and FM collected the clinical and epi
demiological data. SG, CL, RA and FM summarized all the data. SG, CL, RA and FM drafted the manuscript; SG, CL, SP, JSzW, PHvK, SP, CB, WF, NK, FA, RA and FM revised the final version. All authors read and agreed to the published version of the manuscript.
1. WHO. Hepatits E. 27th July 2021. Available from: https://www.who.int/en/news-room/fact-sheets/detail/hepatitis-e Accessed May 19, 2022.
2. Patra S, Kumar A, Trivedi SS, Puri M, Sarin SK. Maternal and fetal outcomes in pregnant women with acute hepatitis E virus infection. Ann Intern Med. 2007;147(1):28-33.
3. Hamid SS, Atiq M, Shehzad F, et al. Hepatitis E virus superinfection in patients with chronic liver disease. Hepatology. 2002;36(2):474-478.
4. Kamar N, Bendall R, Legrand-Abravanel F, et al. Hepatitis E. Lancet. 2012;30;379(9835):2477-2488.
5. European Association for the Study of the Liver. EASL clinical practice guidelines for the management of patients with decompensated cirrhosis. J Hepatol. 2018;69(2):406-460.
6. Tavitian S, Peron JM, Huguet F, et al. Ribavirin for chronic hepatitis prevention among patients with hematologic malignancies. Emerg Infect Dis. 2015;21(8):1466-1469.
7. von Felden J, Alric L, Pischke S, et al. The burden of hepatitis E among patients with haematological malignancies: a retrospective European cohort study. J Hepatol. 2019;71(3):465-472.
8. Versluis J, Pas SD, Agteresch HJ, et al. Hepatitis E virus: an underestimated opportunistic pathogen in recipients of allogeneic hematopoietic stem cell transplantation. Blood. 2013;122(6):1079-1086.
9. Haagsma EB, van den Berg AP, Porte RJ, et al. Chronic hepatitis E virus infection in liver transplant recipients. Liver Transpl. 2008;14(4):547-553.
10. Abravanel F, Lhomme S, Chapuy-Regaud S, et al. Hepatitis E virus reinfections in solid-organ-transplant recipients can evolve into chronic infections. J Infect Dis. 2014;209(12):1900-1906.
11. Kamar N, Selves J, Mansuy JM, et al. Hepatitis E virus and chronic hepatitis in organ-transplant recipients. N Engl J Med. 2008;358(8):811-817.
12. Haagsma EB, Niesters HG, van den Berg AP, et al. Prevalence of hepatitis E virus infection in liver transplant recipients. Liver Transpl. 2009;15(10):1225-1228.
13. Mikulska M, Penack O, Wendel L, et al. HEV infection in stem cell transplant recipients-retrospective study of EBMT Infectious Diseases Working Party. Bone Marrow Transplant. 2022;57(2):167-175.
14. Bai MJ, Zhou N, Dong W, Li GX, Cong W, Zhu XQ. Seroprevalence and risk factors of hepatitis E virus infection in cancer patients in eastern China. Int J Infect Dis. 2018;71:42-47.
15. Boudin L, Patient M, Tsitsi Nding Tsogou P, Roméo E, Bladé JS, de Jauréguiberry JP. Successful treatment with ribavirine for chronic hepatitis E in chronic lymphocytic leukemia treated with Ibrutinib. Bull Cancer. 2019;106(1):84-85.
16. Alric L, Bonnet D, Beynes-Rauzy O, Izopet J, Kamar N. Definitive clearance of a chronic hepatitis E virus infection with ribavirin treatment. Am J Gastroenterol. 2011;106(8):1562-1563.
17. Chandak S, Mandot A, Rathi S. An unusual case of chronic hepatitis E in haematological malignancy. J Ass Physicians India. 2018;66(6):97-98.
The datasets generated during and/or analyzed in the cur rent study are available from the corresponding authors on reasonable request.
18. Field Z, Russin M, Murillo Alvarez RM, Madruga M, Carlan S. Acute hepatitis E: a rare cause of acute liver failure in a patient with acute myeloid leukemia. Cureus. 2020;12(9):e10628.
19. Fuse K, Matsuyama Y, Moriyama M, et al. Late onset posttransfusion hepatitis E developing during chemotherapy for acute promyelocytic leukemia. Int Med. 2015;54(6):657-661.
20. Gauss A, Wenzel JJ, Flechtenmacher C, et al. Chronic hepatitis E virus infection in a patient with leukemia and elevated transaminases: a case report. J Med Case Rep. 2012;6:334.
21. Geng Y, Zhang H, Huang W,et al. Persistent hepatitis E virus genotype 4 infection in a child with acute lymphoblastic leukemia. Hepat Mon. 2014;14(1):e15618.
22. Giordani MT, Fabris P, Brunetti E, Goblirsch S, Romanò L. Hepatitis E and lymphocytic leukemia in man, Italy. Emerg Infect Dis. 2013;19(12):2054-2056.
23. Haboubi HN, Diyar R, Benton A, Ch'ng CL. A case of acute hepatitis E infection in a patient with non-Hodgkin lymphoma treated successfully with ribavirin. Case Rep Gastrointest Med. 2017;2017:8941218.
24. Kootte RS, Faber LM. Hepatitis E during lenalidomide treatment for multiple myeloma in complete remission. Neth J Med. 2017;75(3):117-121.
25. Lemons-Estes FM, Capt HP, Skelton H, Smith KJ. A clonal cutaneous CD30+ lymphoproliferative eruption in a patient with evidence of past exposure to hepatitis E. Int J Dermatol. 2000;39(7):521-527.
26. Mainardi V, Gerona S, Ardao G, et al. Locally acquired chronic hepatitis E followed by Epstein-Barr virus reactivation and Burkitt lymphoma as a suspected extrahepatic manifestation in a liver transplant recipient. Am J Case Rep. 2019;20:1016-1021.
27. Mallet V, Bruneau J, Zuber J, et al. Hepatitis E virus-induced primary cutaneous CD30(+) T cell lymphoproliferative disorder. J Hepatol. 2017;67(6):1334-1339.
28. Okano H, Nakano T, Ito R, et al. The spontaneous clearance of hepatitis E virus (HEV) and emergence of HEV antibodies in a transfusion-transmitted chronic hepatitis E case after completion of chemotherapy for acute myeloid leukemia. Clin J Gastroenterol. 2020;13(2):252-259.
29. Pfefferle S, Frickmann H, Gabriel M, Schmitz N, Günther S, Schmidt-Chanasit J. Fatal course of an autochthonous hepatitis E virus infection in a patient with leukemia in Germany. Infection. 2012;40(4):451-454.
30. Tessé S, Lioure B, Fornecker L, et al. Circulation of genotype 4 hepatitis E virus in Europe: first autochthonous hepatitis E infection in France. J Clin Virol. 2012;54(2):197-200.
31. Verbeeck A, De Becker A, Reynaert H. An unexpected cause of recurrent jaundice after resolution of acute hepatitis E. Case Rep Gastroenterol. 2020;14(2):415-419.
32. Ollier L, Tieulie N, Sanderson F, et al. Chronic hepatitis after hepatitis E virus infection in a patient with non-Hodgkin lymphoma taking rituximab. Ann Intern Med. 2009;150(6):430-431.
33. Desai R, Singh S, Zalavadia D, Bansal P, Goyal H. Burden of hepatitis E infection and associated healthcare resource utilization among
hematological malignancy-related hospitalizations: a national perspective in the United States, 2007-2014. J Hepatol. 2019;71(6):1266-1268.
34. Alnuaimi K, Lavole J, Lascoux-Combes C, et al. Chronic hepatitis E in patients with indolent lymphoma after treatment with rituximab and bendamustine. Hepatology. 2018;67(6):2468-2470.
35. European Association for the Study of the Liver. EASL clinical practice guidelines on hepatitis E virus infection. J Hepatol. 2018;68(6):1256-1271.
36. Mallet V, van Bommel F, Doerig C, et al. Management of viral hepatitis in patients with haematological malignancy and in patients undergoing haemopoietic stem cell transplantation: recommendations of the 5th European Conference on Infections in Leukaemia (ECIL-5). Lancet Infec Dis. 2016;16(5):606-617.
37. Common Terminology Criteria for Adverse Events (CTCAE) Version 5.0. 2017. Available from: https://ctep.cancer.gov/protocoldevelopment/electronic_application s/docs/ctcae_v5_quick_reference_5x7.pdf Accessed May 19, 2022.
38. Cheson BD, Bennett JM, Kopecky KJ, et al. Reporting Standards for Therapeutic Trials in Acute Myeloid L. Revised recommendations of the International Working Group for Diagnosis, Standardization of Response Criteria, Treatment Outcomes, and Reporting Standards for Therapeutic Trials in Acute Myeloid Leukemia. J Clin Oncol. 2003;21(24):4642-4649.
39. Dohner H, Estey E, Grimwade D, et al. Diagnosis and management of AML in adults: 2017 ELN recommendations from an international expert panel. Blood. 2017;129(4):424-447.
40. Gökbuget N. Recommendations of the European Working Group for Adult ALL, available from https://www.uni-
med.de/recommendations-of-the-european-working-group-foradult-all.html Accessed May 19, 2022.
41. Cheson BD, Fisher RI, Barrington SF, et al. Recommendations for initial evaluation, staging, and response assessment of Hodgkin and non-Hodgkin lymphoma: the Lugano classification. J Clin Oncol. 2014;32(27):3059-3068.
42. Kumar S, Paiva B, Anderson KC, et al. International Myeloma Working Group consensus criteria for response and minimal residual disease assessment in multiple myeloma. Lancet Oncol. 2016;17(8):e328-e346.
43. Westholter D, Hiller J, Denzer U, et al. HEV-positive blood donations represent a relevant infection risk for immunosuppressed recipients. J Hepatol. 2018;69(1):36-42.
44. Garson JA, Ferns RB, Grant PR, et al. Minor groove binder modification of widely used TaqMan probe for hepatitis E virus reduces risk of false negative real-time PCR results. J Virol Methods. 2012;186(1-2):157-160.
45. O'Gorman J, Burke A, O'Flaherty N. Hepatitis E virus - key points for the clinical haematologist. Br J Haematol. 2018;181(5):579-589.
46. Xhaard A, Roque-Afonso AM, Mallet V, et al. Hepatitis E and allogeneic hematopoietic stem cell transplantation: a French nationwide SFGM-TC retrospective study. Viruses. 2019;11(7):622.
47. Ribavirin SmPC. 2021 29.01.2022. Available from: https://www.medicines.org.uk/emc/product/7108/smpc Accessed May 19, 2022.
48. Charlson ME, Pompei P, Ales KL, MacKenzie CR. A new method of classifying prognostic comorbidity in longitudinal studies: development and validation. J Chronic Dis. 1987;40(5):373-383.
Sarah Warsi,1,2 Maria Dahl,1 Emma M. K. Smith,1 Anna Rydström,1 Els Mansell,1 Valgardur Sigurdsson,1 Julia Sjöberg,1 Shamit Soneji,3,4 Emma Rörby,1 Kavitha Siva,1 Tan H. M. Grahn,1 Yang Liu,1 Ulrika Blank,1 Göran Karlsson3 and Stefan Karlsson1
1Division of Molecular Medicine and Gene Therapy, Lund Stem Cell Center, Lund University; 2Skåne University Hospital, Region Skåne; 3Division of Molecular Hematology, Lund Stem Cell Center, Lund University and 4Lund University Bioinformatics Core, Lund Stem Cell Center, Lund University, Lund, Sweden
Correspondence: S. Warsi sarah.warsi@med.lu.se
Received: August 22, 2021.
Accepted: May 18, 2022.
Prepublished: May 26, 2022.
https://doi.org/10.3324/haematol.2021.279799
©2022 Ferrata Storti Foundation
Published under a CC BY-NC license
Even though hematopoietic stem cells (HSC) are characterized by their ability to self-renew and differentiate, they primarily reside in quiescence. Despite the immense importance of this quiescent state, its maintenance and regulation is still incompletely understood. Schlafen2 (Slfn2) is a cytoplasmic protein known to be involved in cell proliferation, differentiation, quiescence, interferon response, and regulation of the immune system. Interestingly, Slfn2 is highly expressed in primitive hematopoietic cells. In order to investigate the role of Slfn2 in the regulation of HSC we have studied HSC function in the elektra mouse model, where the elektra allele of the Slfn2 gene contains a point mutation causing loss of function of the Slfn2 protein. We found that homozygosity for the elektra allele caused a decrease of primitive hematopoietic compartments in murine bone marrow. We further found that transplantation of elektra bone marrow and purified HSC resulted in a significantly reduced regenerative capacity of HSC in competitive transplantation settings. Importantly, we found that a significantly higher fraction of elektra HSC (as compared to wild-type HSC) were actively cycling, suggesting that the mutation in Slfn2 increases HSC proliferation. This additionally caused an increased amount of apoptotic stem and progenitor cells. Taken together, our findings demonstrate that dysregulation of Slfn2 results in a functional deficiency of primitive hematopoietic cells, which is particularly reflected by a drastically impaired ability to reconstitute the hematopoietic system following transplantation and an increase in HSC proliferation. This study thus identifies Slfn2 as a novel and critical regulator of adult HSC and HSC quiescence.
Hematopoietic stem cells (HSC) typically reside in a dor mant state in the bone marrow (BM). They are kept under tight regulation by both intrinsic factors and extrinsic fac tors provided by surrounding cells in the BM niche,1 af fecting the various fate options of HSC, such as quiescence, self-renewal, and differentiation. The longev ity of adult HSC is in large due to their maintenance in a quiescent (G0) state.2 Several factors regulate entry into the proliferating G1 phase (followed by S/G2/M phases), in cluding Cyclin-Cdk complexes, the Ink4 proteins (e.g., p15, p16, p18), as well as CIP/KIP family members (p21, p27, p57) and their regulators such as p53.2 It has been sug gested that HSC quiescence correlates with repopulation potential and self-renewal capacity.3 Considerable work remains in the long-term aim of mapping the HSC regu
latory network, in particular regarding the regulation of quiescence.
The Schlafen (Slfn) proteins are a largely uncharacterized protein family with roles in cell proliferation, differenti ation, immune system regulation, and interferon (IFN) re sponse.4-7 Slfn2 belongs to subgroup I, the shortest of the Slfn proteins, and has in cell lines been shown to localize exclusively in the cytoplasm.8 In previous studies, the function of Slfn2 has primarily been characterized in cell lines and to a lesser extent in immune cells. Recent work identified Slfn2 as a critical regulator of T-cell quiescence and apoptosis. Using a mouse model containing a loss of function point mutation in the Slfn2 gene (the so called elektra allele, which renders an isoleucine-to-asparagine substitution of residue 135 of the 378 amino acid protein), it was shown that elektra homozygous T cells proliferated excessively and underwent apoptosis upon cytokine-me
ARTICLE - Slfn2 is a regulator of adult HSC quiescence
diated activation.9 Additionally, small interfering RNA (siRNA)-mediated knockdown (KD) of Slfn2 in Sca1+ mouse BM cells enhances proliferation in colony formation assays.5 Slfn2 is also known to be expressed in a primitive self-renewing hematopoietic cell line, and its expression is downregulated when these cells are differentiated to vari ous lineages.10
Cell proliferation, differentiation, and quiescence are impor tant features for HSC regulation, where quiescence is a fun damental characteristic of HSC. Due to the decrease in expression of Slfn2 with hematopoietic cell differentiation, and the apparent link between Slfn2 and quiescence, we hy pothesized that Slfn2 has a role in the regulation of HSC. In order to investigate the role of Slfn2 in vivo, we made use of the previously characterized elektra mouse model.9 Interest ingly, we can show that elektra HSC have a severely impaired capacity to regenerate the hematopoietic system of irradi ated mice and elektra hematopoietic stem and progenitor cells (HSPC) are in a state of excessive cycling and apoptosis. Our study thus identifies Slfn2 as a critical regulator of adult murine HSC quiescence and function.
All animal experimental procedures were approved by the regional Animal Ethical Committee in Lund.
Flow cytometry and fluorescense-activated cell sorting Flow cytometry analyzes were performed on a Beckton Dickinson CantoII or custom order LSRII at the Lund Uni versity FACS core. Sorting was performed on a custom order AriaII or AriaIII. A list of antibodies is provided in the Online Supplementary Table S1. HSPC compartments were defined by using markers for lineages (Ter119, B220, CD3, Mac1, Gr1), Sca1, and c-kit, with CD34/Flt3 or CD150/CD48 and CD9.11 Progenitor analyzis was done as previously de scribed.12 Apoptotic cells were defined using AnnexinV and cell cycle analysis was done by intracellular staining for Ki67/DAPI (Molecular Probes, Invitrogen). For cell cycle analysis, cells were fixed and permeabilized using 0.4% for maldehyde and 0.2% Triton-X. Flow cytometry data was analyzed in FlowJo (TreeStar software). In this study, analy sis of primitive hematopoietic cells was done using LSK (Lineage Sca1+c-kit+) with either CD34/Flt3 or CD150/CD48. In order to distinguish between these analyzed populations of primitive hematopoietic cells we use the following ter minology. LSK CD34 Flt3 stem cells are called CD34LTHSC (long-term HSC) or defined by markers if only abbreviated LTHSC. Other populations in this analysis mo dality are short-term HSC (ST-HSC; LSK CD34+Flt3 ) and lymphoid-primed multipotent progenitors (LMPP; LSK CD34+Flt3+). LSK CD150+CD48 stem cells are called SLAM-
LTHSC or defined by markers if only abbreviated LTHSC. Other populations in this modality are MPP (LSK CD150 CD48 ) and lineage restricted progenitor (LRP; LSK CD150 CD48+). The abbreviation HSC is also used as a broader term for hematopoietic stem cells regardless of cell sur face markers.
Recipient mice (C57Bl/6 x B6SJL, CD45.1/45.2) were lethally irradiated (900 cGy or 2x 500 cGy) 16-24 hours (h) prior to transplant. Whole BM competitive transplants contained 200,000 elektra (or wild-type [WT] littermate) BM cells (C57Bl/6, CD45.2) as well as 200,000 WT (B6SJL, CD45.1) competitor BM cells. Transplants of purified HSC contained 20 sorted elektra/littermate LSK CD9highCD48 CD150+ LTHSC and 200,000 competitor cells. Donor cells were identified (in flow cytometry analysis) using the markers CD45.1/45.2. Mice were bled and sacrificed at 16-18 weeks post-trans plantation for end point analyses and serial transplantation. Secondary recipients received 2 million cells from primary recipients, and tertiary recipients received 20 million cells. Reverse transplantation assay was performed by trans planting 200,000 whole BM cells (WT B6SJL; CD45.1) into lethally-irradiated elektra mice or littermates (C57Bl/6; CD45.2). Homing analysis was done by transplantation of 20 million whole BM cells with analysis of recipient BM after 24 h. All transplants were done through intravenous bolus injection into the tail vein.
For knockdown (KD) of Slfn2, lentiviral plasmid pGFP-CshLenti containing short hairpin RNA (shRNA) targeting Slfn2 or scrambled (Scr) shRNA (OriGene) was used to pro duce lentiviral particles at the Stem Cell Center Vector Core Facility (Lund University). C-kit-enriched BM cells from WT mice were placed into virus-loaded plates at an MOI of 50 and incubated overnight (37°C, 5% CO2). Transduced cells were collected and transplanted into lethally-irradiated re cipient mice. An aliquot of cells was cultured for flow cyto metry analysis of transduction efficiency after 48 h. Experiment schematic is outlined in the Online Supplemen tary Figure S1A. BM of transplanted animals was analyzed at 16-18 weeks after transplantation. Recipient and donor cells were discriminated using the markers CD45.1 versus CD45.2.
Additional methods are included in the Online Supplemen tary Appendix.
Slfn2 is highly expressed in long-term hematopoietic stem cells
compartments, quantitative polymerase chain reaction (qPCR) analysis was performed on WT murine BM. We found that CD34-LTHSC (LSK CD34 Flt3 ) had higher ex pression of Slfn2 than short-term HSC (ST-HSC; LSK CD34+Flt3 ) and lymphoid-primed multipotent progenitors (LMPP; LSK CD34+Flt3+) (Figure 1A) and hypothesized that Slfn2 has a role in regulation of LTHSC specifically. We also saw a high expression in Lin+ cells (Figure 1A), which can be explained by the role of Slfn2 in lymphocytes and lym phocyte progenitors. Our data is in line with findings pres ented in the online gene expression tool BloodSpot.13
The elektra point mutation does not affect mRNA level or subcellular localization
As previous studies have shown that Slfn2 localizes ex clusively in the cytoplasm in cell lines,8 we investigated whether this was the case also for its mutated form elek tra. Myc-tagged Slfn2 and elektra were overexpressed in transfected HT1080 cells, which were then stained using anti-Myc and DAPI and analyzed for fluorescent signal. In contrast to previous findings, we saw that both Slfn2 and elektra localize to both the cytoplasm and nucleus in the above cell line (Online Supplementary Figure S2A).
Figure 1. A mutation in Slfn2 perturbs steady state hematopoietic parameters. (A) Quantitative polymersase chain reaction (qPCR) data showing that Slfn2 is expressed at a higher level in long-term hematopoietic stem cells (LTHSC) (LSK CD34 Flt3 ) than in short-term hematopoietic stem cells (ST-HSC) (LSK CD34+Flt3 ) or lymphoid-primed multipotent progenitors (LMPP) (LSK CD34+Flt3+) (n=3 per group). (B) Mice homozygous for the elektra allele have decreased T cells and otherwise normal steady state hematopoiesis, as measured by flow cytometry analysis of lineage markers CD3, B220, and Mac1/Gr1 (n=6-7). (C and D) Elektra bone marrow (BM) shows reduced immunophenotypic hematopoietic stem and progenitor cells (HSPC) fractions (n=711), analyzed by both LSK CD34/Flt3 (C) and CD48/CD150 (D) expression. (E) There is a reduced number of granulocyte-macro phage progenitors (GMP) (L S K+ CD41 FcR+CD150 ) and PreGM (L S K+ CD41 FcR CD150 CD105 ) cells in elektra mice (n=7-8). (F) Elektra BM cells show reduced colony formation capacity in CFU-GM assays (n=6-9). Steady state analyses were also done in mice heterozygous for the elektra allele; these data are not shown, as they did not differ significantly compared to wild-type (WT) mice.

Previous research also suggests a possible, though de bated, connection between the Schlafen proteins and CyclinD1.14,15 Quantitative PCR analysis of mRNA in Slfn2 WT or deficient (elektra) murine SLAM-LTHSC (LSK CD48 CD150+) showed no difference in levels of CyclinD1 mRNA. We further confirmed that the Slfn2 mRNA levels are not changed, i.e., the elektra mutation does not cause degra dation or dysregulation at the mRNA level (Online Supple mentary Figure S2B).

Slfn2 deficiency causes perturbations in steady state hematopoietic parameters
In order to investigate the effect of Slfn2 on steady state hematopoietic parameters we performed flow cytometry analyses on blood and BM of elektra mice. Mice homozy gous for the elektra allele had unaltered steady state blood parameters (Figure 1B; Online Supplementary Figure S3A), except for a significant reduction in T cells (Figure 1B) at 8 weeks of age. This was, however, not observed in blood of 12-week-old mice (Online Supplementary Figure S3B) or in BM (data not shown). We found reduced HSPC compartments in BM, with a significant reduction in the LSK and LMPP fraction (Figure 1C) and when staining for SLAM markers we similarly saw a reduction in the multi potent progenitor (MPP) fraction (Figure 1D). We also found that elektra mice had a significantly lower number of granulocyte-macrophage progenitors (GMP) and PreGM
cells (Figure 1E). Accordingly, when assessing progenitor colony formation in methylcellulose (CFU-GM) assays there was a reduced colony-forming activity in elektra BM cells (Figure 1F). Heterozygous mice did not show any sig nificant differences in steady state hematopoietic par ameters (data not shown). Together, our data show that dysregulation of Slfn2 causes perturbed steady state hematopoietic parameters in BM, such as reduced HSPC compartments and colony-forming activity.
Reduced regenerative capacity of hematopoietic stem cells following loss of Slfn2 function
In order to assess the role of Slfn2 in long-term repopu lation potential of HSC we performed serial transplanta tions of whole BM as well as of purified SLAM-LTHSC (LSK CD9highCD150+CD48 ) (schematic in Figures 2A and 3A). Fol lowing competitive whole BM transplantation into irradi ated recipient mice, we found that elektra homozygosity causes a significant and robust reduction in reconstitution of blood and BM compared to WT littermates 16 weeks after transplantation (Figure 2B and C). There were no sig nificant differences in lineage repopulation of blood (On line Supplementary Figure S4A to C). When analyzing reconstitution of HSPC compartments in primary recipi ents we observed a significant decrease in frequency of immunophenotypic LTHSC and MPP as defined by LSK ex pressing CD150 and CD105 (endoglin), but not based on
- Slfn2 is a regulator of adult HSC quiescence
Figure 2. Elektra hematopoietic stem cells have reduced reconstitution following whole bone marrow transplantation. (A) Sche matic overview of serial transplantation assays using whole bone marrow. (B and C) Whole bone marrow (BM) competitive trans plantation assays with elektra BM cells showing reduced reconstitution capacity (blood and BM at 16 weeks, n=7-8). Primary, secondary, and tertiary transplantations are indicated by 1’, 2’, and 3’ respectively. (D and E) Flow cytometry data showing fre quency (D) and absolute numbers (per one femur) (E) of engrafted donor LSK cells, LSK CD34/Flt3 hematopoietic stem and pro genitor cells (HSPC) (LTHSC, ST-HSC, LMPP), and LSK CD150/CD105 HSPC (HSC, MPP) in BM of primary recipients 16 weeks after whole BM competitive transplants (n=7-8).
expression of CD34 and Flt3 (Figure 2D). When comparing absolute numbers of engrafted HSPC we saw similar re sults, but with a near-significant decrease in CD34-LTHSC as well as a significant decrease in ST-HSC (Figure 2E). When following CD34-LTHSC engraftment through pri mary, secondary, and tertiary transplantations, we con tinued to find no significant differences in either frequency or number of engrafted WT versus elektra LTHSC (Online Supplementary Figure S5A and B).
The FACS gating strategy used for purifying HSC for trans plantation is shown in Figure 3B. The above-described re duced regenerative capacity was recapitulated and exacerbated following transplantation of purified SLAMLTHSC (Figure 3C and D), indicating that Slfn2 is essential for LTHSC specifically and that reconstitution levels fol lowing whole BM transplant is partially rescued by down stream progenitor cells. There were again no significant differences in lineage repopulation of blood (Online Sup plementary Figure S4D and F). All primitive HSPC popu lations as defined by LSK with SLAM markers CD150 and CD48 were significantly reduced in both frequency and number in the BM of primary recipients (Figure 3E and F). When analyzing primitive cells by the LSK CD34 Flt3 im munophenotype we found a significant decrease in LSK cells (frequency and absolute numbers engrafted) as well as frequency of ST-HSC and engrafted number of LMPP (Figure 3G and H). Though LSK CD48 CD150+ LTHSC con tinued to show a clear decrease in secondary and tertiary recipients, the differences no longer reached statistical significance (Online Supplementary Figure S5C and D). These data establish an essential role for Slfn2 in HSC transplantation, where loss of Slfn2 function leads to a dramatic decrease in engrafting LTHSC.
Gene expression analysis reveals elektra-induced changes in molecular programs important for hematopoietic stem cell function
In order to map the mechanism through which Slfn2 exerts its effect on HSC, we purified SLAM-LTHSC (LSK CD9highCD48 CD150+) and performed microarray analysis. Differentially-ex pressed genes in elektra SLAM-LTHSC are depicted in the heat map in Figure 4A. Interestingly, both gene ontology analysis (DAVID) and gene set enrichment analysis (GSEA) rendered several clusters of enriched genes in elektra LTHSC, where many of these were associated with HSC fate deci sion-related processes like cell cycling, differentiation, and apoptosis (Table 1; Online Supplementary Figure S6).
As the MPP population was also decreased in frequency in elektra homozygous mice (Figure 1D), we similarly puri fied LSK CD150 CD48 cells for microarray analysis. The number of differentially-expressed genes caused by the elektra mutation in MPP (visualized in the heat map in Fig ure 4B) was substantially lower compared to that in HSC and only very few genes were involved in functions related to primitive hematopoietic cells or self-renewal (Online Supplementary Figure S7). Together, this data supports a relevant function for Slfn2 in the most primitive HSC and less of a role in the downstream progenitor cells. How ever, note that these results may be affected by a high fraction of apoptotic MPP in elektra mice (see below) and future studies may need to investigate differentially-ex pressed genes specifically in the subpopulation consisting of apoptotic MPP.
Increased cycling and apoptosis of Slfn2-deficient hematopoietic stem cells
The previously established role of Slfn2 in cell prolifer ation together with our microarray findings indicate that dysregulation of Slfn2 would have an effect on apoptosis and cell cycle status of HSC. Indeed, flow cytometry analysis of Ki67 expression and DAPI staining in LSK SLAM compartments (Figure 5A) showed that elektra HSPC had an increased fraction of cycling cells. We found a signifi cantly lower fraction of cells in G0 in LSK, MPP, and LRP (LSK CD150 CD48+) compartments, as well as a higher fraction of G1 cells in the SLAM-LTHSC and MPP compart ments (Figure 5B to E). In order to determine the apop totic status of elektra HSPC we similarly analyzed Annexin V expression in LSK SLAM populations (Figure 5A), and found a significantly higher fraction of apoptotic HSC and MPP (Figure 5F). In order to further assess the effect of Slfn2 on HSPC cycling, we investigated recovery after treatment with the myelotoxic agent 5FU. In accordance with the already increased fraction of cycling elektra SLAM-LTHSC, 10-11 days after a 0.15 mg/g dose of 5FU, two of three elektra mice died while all WT mice survived (Figure 5G). We also found that elektra mice treated with 5FU could be rescued by a subsequent transplantation of fresh WT BM cells (Figure 5G). Finally we analyzed Slfn2 gene expression 2 days after 5FU injection, where Slfn2 is found to be upregulated (Figure 5H). This establishes a role for Slfn2 in HSC stress response. Taken together, our data shows excessive cycling and apoptosis of cells with dysregulated Slfn2. We also find
Figure 3. Elektra hematopoietic stem cells have reduced reconstitution following purified SLAM-long-term hematopoietic stem cell transplantation. (A) Schematic overview of serial transplantation assays where primary recipient mice were transplanted with sorted hematopoietic stem cells (HSC). (B) Schematic overview of FACS gating strategy. Upper panel shows gating when sorting long-term hematopoietic stem cells (LTHSC) (LSK CD48 CD150+CD9high). Wider gates are based on FMO (for comparison), but to obtain a pure sorted population a much stricter gate is set. Lower panel shows, for comparison, the same specimen in conventional analysis gating (when CD9high gating is not used). (C and D) Reduced reconstitution following transplantations of sorted elektra LTHSC (blood and bone marrow [BM] at 16 weeks, n=4-5). Primary, secondary, and tertiary transplantations are indicated by 1’, 2’, and 3’ respectively. (E and F) Frequency (E) and absolute numbers (per one femur) (F) of engrafted donor LSK CD48/CD150 hematopoietic stem and progenitor cells (HSPC) in BM of primary recipients 16 weeks after sorted HSC competitive transplants (n=4-5). (G and H) Frequency (G) and absolute numbers (per one femur) (H) of engrafted donor LSK CD34/Flt3 HSPC in BM of primary recipients 16 weeks after sorted HSC competitive transplants (n=4-5).

Slfn2 upregulated following 5FU treatment in vivo, and de creased survival of 5FU-treated elektra homozygous mice.
Slfn2 knockdown is similar to Slfn2 elektra, a loss of function mutation
The elektra mutation is considered a Slfn2 loss-of-func tion.9 However, since both Slfn2 elektra mRNA and protein levels are readily detected in elektra mice, we further in
vestigated the effect of loss of Slfn2 using shRNA KD transplantation experiments. Here, ckit-enriched WT BM cells underwent viral transduction with either a Slfn2-KD or a Scr shRNA vector prior to transplantation. The trans duction efficiency at transplantation was significantly higher for the Slfn2-KD vector (Figure 6A). Despite this, 16 weeks post-transplantation we found a trend towards de creased engraftment of Slfn2-KD cells in most analyzed
Figure 4. Microarray of elektra hematopoietic stem cells shows several differentially expressed genes. (A) Heat map showing differentially expressed genes in elektra long-term hematopoietic stem cells (LTHSC) (LSK CD9hiCD48 CD150+) in comparison to wild-type (WT) LTHSC. A select number of genes of interest are indicated: yellow highlights genes associated with cell prolifer ation, cell division, and/or stem cell functions. Pink highlights genes associated with hematopoiesis, stem cell functions, stress response, inflammatory response and/or leukemia. (B) Heat map of differentially expressed genes in elektra multipotent pro genitors (MPP) (LSK CD48 CD150 ) in comparison to WT MPP, resulting in a much shorter list.

ARTICLE - Slfn2 is a regulator of adult HSC quiescence
Table 1. Gene ontology analysis of the microarray data shows several cell cycle-associated clusters upregulated in elektra long-term hematopoietic stem cells.
Category Term
Upregulated
Enrichment score P-value
Annotation Cluster 1 3.00
GOTERM_BP_DIRECT
GO:0071241~cellular response to inorganic substance <0.001
GOTERM_CC_DIRECT GO:0035068~micro-ribonucleoprotein complex 0.009
Annotation Cluster 2 2.63
GOTERM_BP_DIRECT GO:0001701~in utero embryonic development <0.001
KEGG_PATHWAY mmu05206:MicroRNA in cancer <0.001
GOTERM_BP_DIRECT GO:0002329~pre-B-cell differentiation 0.001
GOTERM_BP_DIRECT GO:0001783~B-cell apoptotic process 0.001
GOTERM_BP_DIRECT GO:0021522~spinal cord motor neuron differentiation 0.006
GOTERM_BP_DIRECT GO:0060412~ventricular septum morphogenesis 0.011
Annotation Cluster 3 1.77
GOTERM_BP_DIRECT
GO:0051301~cell division 0.004
GOTERM_BP_DIRECT GO:0007049~cell cycle 0.013
GOTERM_BP_DIRECT GO:0007067~mitotic nuclear division 0.027
Annotation Cluster 4 1.30
GOTERM_BP_DIRECT GO:0007049~cell cycle 0.013
Downregulated
Annotation Cluster 1 2.26
GOTERM_CC_DIRECT GO:0005737~cytoplasm 0.043 Annotation Cluster 2 1.84
KEGG_PATHWAY mmu03040:Spliceosome 0.001
GOTERM_MF_DIRECT GO:0031072~heat shock protein binding 0.006
GOTERM_MF_DIRECT GO:0098641~cadherin binding involved in cell-cell adhesion 0.023
GOTERM_CC_DIRECT GO:0005913~cell-cell adherens junction 0.030
GOTERM_CC_DIRECT GO:0005925~focal adhesion 0.051
Annotation Cluster 3 1.80
KEGG_PATHWAY mmu03040:Spliceosome 0.001
KEGG_PATHWAY mmu04010:MAPK signaling pathway 0.001
KEGG_PATHWAY mmu05162:Measles 0.010
KEGG_PATHWAY mmu05134:Legionellosis 0.016
KEGG_PATHWAY mmu04141:Protein processing in endoplasmic reticulum 0.018
KEGG_PATHWAY mmu05164:Influenza A 0.019
KEGG_PATHWAY mmu04612:Antigen processing and presentation 0.031
KEGG_PATHWAY mmu04915:Estrogen signaling pathway 0.043
KEGG_PATHWAY mmu05145:Toxoplasmosis 0.049
Annotation Cluster 4 1.29
GOTERM_CC_DIRECT
GO:0031012~extracellular matrix <0.001
KEGG_PATHWAY mmu03040:Spliceosome 0.001
GOTERM_MF_DIRECT GO:0005515~protein binding 0.008
GOTERM_MF_DIRECT
GO:0044822~poly(A) RNA binding 0.009
GOTERM_BP_DIRECT GO:0045444~fat cell differentiation 0.013
GOTERM_CC_DIRECT
GOTERM_BP_DIRECT
GOTERM_MF_DIRECT
GO:0005681~spliceosomal complex 0.034
GO:0045893~positive regulation of transcription, DNA-templated 0.038
GO:0008134~transcription factor binding 0.038
GOTERM_CC_DIRECT GO:0070062~extracellular exosome 0.051
List of gene clusters (gene ontology terms or KEGG pathway terms) upregulated or downregulated in elektra long-term hematopoietic stem cells (LTHSC, LSK CD9hiCD48 CD150+) in comparison to wild-type (WT) LTHSC. This list was created from online analysis (using the tool DAVID) of our in-house generated list of genes up- and downregulated in the microarray of elektra LTHSC.
BM populations (Figure 6B-I) with a near significant de crease in engrafted GFP+ donor LTHSC (LSK CD34 Flt3 ) (Figure 6I; P=0.0501). We also found a near significant de crease of engraftment of Slfn2-KD cells in blood (Online Supplementary Figure S1B). In conclusion, Slfn2-KD cells behave, in a transplantation setting, similarly to Slfn2 elektra cells, further supporting the hypothesis that Slfn2 is critical for HSC function.
The elektra isoleucine-to-asparagine substitution is predicted to be damaging
The elektra mutation is a so-called missense mutation where mutation of a single nucleotide leads to a single amino acid substitution at residue 135 of the 378 amino acid protein (Online Supplementary Figure S8A and B). Analysis of protein secondary structure using AlphaFold16 shows that residue 135 is localized in a β sheet structure and is buried, not exposed (Online Supplementary Figure
Figure 5. Elektra hematopoietic stem and progenitor cells have increased cycling and apoptosis. (A) Schematic overview of LSK CD48/CD150 HSPC compartments with Annexin V staining for apoptotic cells and cell cycle status assessed using Ki67 and DAPI. (B to E) Elektra hematopoietic stem and progenitor cells (HSPC) show increased proliferation, with a generally lower fraction of cells in G0 and an increased G1 fraction (n=8). (F) Elektra HSPC are apoptotic to a higher extent than cells of littermate mice (n=7-8). (G) Kaplan-Meier plot showing the effect of full dose (0.15 mg/g) 5FU-treatment, with a significantly lower survival of elektra mice. A full dose of 5FU causes death of 2/3 elektra mice before day 12 after treatment, while 5FU-treated elektra mice that were subsequently given a bone marrow transplant (BMT) did not die (n=3-6). (H) Slfn2 mRNA expression, relative to B2M expression, analyzed in sorted hematopoietic stem cells (HSC) 2 days after full dose 5FU treatment of wild-type (WT) mice. Con trol cells sorted as LSK CD150+CD48 . Cells from 5FU-treated mice sorted as LS CD150+CD48 . Slfn2 expression is upregulated following 5FU.

S8C). The substitution is predicted to affect both second ary structure and protein binding as analyzed by Predict Protein17 (Online Supplementary Figure S9). It is also predicted to have a damaging effect in PolyPhen-218 analy sis with a high likelihood score of 0.998. This is in line with our data and previous studies. Additional results in are included in the Online Supple mentary Appendix
Knowledge of the role of Slfn2 in hematopoiesis is limited to studies on immune cells and osteoclastogenesis. RANKL-mediated osteoclast differentiation has been shown to induce Slfn2 expression in BM-derived mono cytes/macrophages and in an osteoclast precursor cell line.6 Slfn2 is also a critical regulator of T-cell quiescence, as it has been shown that the dysregulation of Slfn2 causes increased proliferation and apoptosis in T cells.9 Thus, there is a clear need for further investigations of the role of Slfn2 in hematopoiesis and stem cell biology. Slfn2 is known as a regulator of quiescence, proliferation, and differentiation – properties that are all fundamental for HSC function. The novel data presented here implicates Slfn2 as a critical regulator of adult murine HSC, particu larly regarding cell cycle status, apoptosis, and hemato poietic regeneration. We initially found that Slfn2 is expressed in LTHSC at a higher level than in ST-HSC and LMPP, supporting our hypothesis that this protein has a role in LTHSC. We then investigated the function of Slfn2 by using the loss-of- function elektra mouse model, where the so-called elektra allele contains a point muta tion in the Slfn2 gene.9 Here, we report that elektra homozygosity leads to re duced fractions of HSPC in vivo, including significantly re duced LSK CD34 Flt3 LTHSC. We also found decreased amounts of GMP and PreGM cells and a corresponding de crease in colony formation capacity following loss of Slfn2 function. These data indicate a role for Slfn2 in the regu lation of early hematopoietic cells. In order to assess the role of Slfn2 in HSC function, elektra BM cells and purified SLAM-LTHSC (LSK CD9highCD48 CD150+) were serially transplanted. We found a drastic reduction in reconstitu tion in comparison to WT littermate mice, in particular fol lowing transplantations of sorted LTHSC, suggesting a role for Slfn2 specifically in LTHSC. The comparatively higher engraftment following whole BM transplantation, in com parison to transplantation of purified LTHSC, could be ex plained by residual activity of intermediate term HSC at 16 weeks post-transplantation;19 cells which may not have a similar dependence on Slfn2 as LTHSC.
In order to assess the effect of Slfn2 dysregulation on the BM niche we performed reverse transplantations, which
showed no differences in overall engraftment in elektra or WT littermate recipients. However, we found a trend to wards increased engraftment of LTHSC in the BM of elek tra recipients. This can also be due to decreased fitness of elektra HSC, with fewer competing residual HSC in the elektra BM after irradiation.
The mechanism through which Slfn2 acts is still largely unexplored. Previous studies have suggested (and de bated) a connection between Slfn proteins and Cyc linD1,14,15 which would fit with our observations. However, we found that CyclinD1 is not differentially expressed in elektra LTHSC. Instead we found, in a microarray analysis of elektra LTHSC, dysregulation of several other cell cycleassociated genes. Gene ontology analysis and GSEA of the microarray hits show upregulation of clusters of cell cycle and cell division genes in elektra HSC. In order to exemp lify, in our list of genes upregulated in elektra HSC we found Cdk6 (involved in G1/S transition and regulated by CyclinD proteins), Ccna2 (involved in S/G2/M progression), Cks2 (involved in CDK regulation and cell cycle progres sion), and Ccnb2 (suggested involvement in TGF β me diated cell cycle control). Interestingly, Meg3 and Rian, known to be expressed in quiescent long-term HSC,20 are downregulated in elektra HSC. We also found down-regu lation of Igf2bp2, which has recently been shown to be important for the function of young HSC in mice.21 Addi tionally Ccnb2 along with the also upregulated gene Ifi27l1 have previously been found upregulated in HSC of IFNtreated mice.22 We also found upregulation of Cd53, which is involved in IL2 signaling and thus also connected to in flammation and IFN. The putative connection between Slfn2 and IFN is discussed further below. In accordance with our microarray data, as well as the known role of Slfn proteins in cell quiescence and prolif eration and a similar phenotype previously reported for elektra T cells,9 we found that Slfn2 deficiency leads to a lower fraction of cells in G0 and a higher fraction in G1 in HSPC compartments. Additionally, we found an aug mented fraction of apoptotic (Annexin V+) HSC and MPP in the elektra BM. Cell cycling was also indirectly investi gated through assessment of hematopoietic stress re sponse, specifically recovery following 5FU treatment. 5FU is a chemotherapeutic agent, causing death of cycling cells and a subsequent increase in cycling of quiescent cells to replenish lost cell populations.23 Two days after 5FU treatment in WT mice Slfn2 is upregulated in HSC. At day 10-11 after 5FU treatment, two of three Slfn2-deficient mice had died whereas all WT littermates survived. Inter estingly, elektra mice treated with 5FU were rescued if transplanted with fresh BM cells, showing that death in these mice is likely due to BM failure and not due to sys temic effects of 5FU on elektra cells in other organ sys tems. A possible explanation of these observations could be that the already increased cycling and apoptosis at
Figure 6. Slfn2 knockdown in wild-type c-kit+ bone marrow cells results in a slight decrease in primitive cell engraftment. (A) Transduction efficiency at transplantation (n=4). (B and C) Engraftment of GFP+ donor cells and LSK cells in bone marrow (BM) 16-18 weeks after transplantation of transduced cells (n=8-9). (D to F) Engraftment of GFP+ donor SLAM-long-term hematopoietic stem cells (SLAM-LTHSC), multipotent progenitors (MPP), and LRP (as defined by LSK with CD150 and CD48) in BM 16-18 weeks after transplantation of transduced cells (n=8-9). (G to I) Engraftment of GFP+ donor LTHSC, short-term HSC (ST-HSC), and lym phoid-primed multipotent progenitors (LMPP) (as defined by LSK with CD34 and Flt3) in BM 16-18 weeks after transplantation of transduced cells (n=8-9).
steady state is exacerbated by 5FU treatment and leads to HSC exhaustion in elektra mice.
Our results are also in line with previous work showing how increased cycling of HSC is associated with reduced engraftment,24,25 i.e., the cycling phenotype seen here also explains at least in part the reduced engraftment of elek tra HSC.

Our study also shows that both the Slfn2 and elektra pro
tein localize to both cytoplasm and nucleus in HT1080 cells, which is in contrast to previous studies showing ex clusive cytoplasmic localization.8 This new data opens up the possibility of nuclear transcriptional activity of the Slfn2 protein, though localization of Slfn2 is likely to be cell type specific. Finally, we demonstrate that KD of Slfn2 in BM cells prior to transplantation leads to an engraftment phenotype
similar to that of the elektra cells. This in combination with lack of phenotype in elektra heterozygotes supports the current standing hypothesis that elektra is a loss-offunction mutation.
Previous studies in cell lines have shown that Slfn gene expression is induced by IFN treatment.5,26 Interestingly, our phenotype has several similarities to a knockout mouse model of Irgm1, which is an IFN-inducible GTPase. It has been shown that the protective effect of Irgm1 is exerted through negative regulation of IFN signaling.27,28 In addition, it is known through earlier work that IFN treat ment causes HSC to exit G0 and enter an active cell cycle state.22,29 As our data shows that dysregulation of Slfn2 leads to an increase in cycling cells, we find it unlikely that the proliferative effect of IFN on HSC is mediated by Slfn2. It would seem more probable that Slfn2, like Irgm1, is part of the negative feedback inhibition of IFN signaling, to induce re-entry into quiescence and, thus prevent HSC exhaustion following a physiological IFN response.
Earlier work has also suggested p53 as an inducer of qui escence, in addition to its role in apoptosis initiation.30,31 Similarly, p57 has been implicated in the maintenance of the G0 (quiescent) state of HSC.32,33 Mice with a conditional knockout of p57 also have a phenotype similar to that of the elektra mouse model investigated here. It has been shown that p57-deficiency causes a severe defect in HSC self-renewal, a reduction in HSPC populations, reduction of HSPC in G0 phase, increased apoptosis, as well as a de crease in colony-forming activity of the HSC.32 Though we found that neither p53 nor p57 were directly affected in elektra HSC, it would be of value in future work to also investigate a putative connection between these two genes and Slfn2 in HSC.
In summary, this study identifies Slfn2 as a novel and criti cal regulator of adult murine HSC, through regulation of their quiescence status. We show that loss of Slfn2 func tion, via homozygosity for the elektra mutation in the Slfn2 gene, leads to abnormal cell cycle status and apoptosis, which results in a drastic reduction in reconstitution fol lowing HSC transplantation and a poor response to hema
1. Zon LI. Intrinsic and extrinsic control of haematopoietic stem-cell self-renewal. Nature. 2008;453(7193):306-313.
2. Pietras EM, Warr MR, Passegue E. Cell cycle regulation in hematopoietic stem cells. J Cell Biol. 2011;195(5):709-720.
3. Nakamura-Ishizu A, Takizawa H, Suda T. The analysis, roles and regulation of quiescence in hematopoietic stem cells. Development. 2014;141(24):4656-4666.
4. Mavrommatis E, Fish EN, Platanias LC. The schlafen family of proteins and their regulation by interferons. J Interferon Cytokine Res. 2013;33(4):206-210.
5. Katsoulidis E, Carayol N, Woodard J, et al. Role of Schlafen 2 (SLFN2) in the generation of interferon alpha-induced growth
topoietic stress induced by 5FU. Further studies are needed to map the effect of Slfn2 activation in the maintenance of the stem cell state. Additionally, it is known that HSC cyc ling and quiescence is altered in aging and hematopoietic malignancies2 and Slfn2, as a new cell cycle regulator in volved in HSC function, may therefore be of value for future work in these research areas.
No conflicts of interest to disclose.
SW, EM, VS, UB, GK, and SK designed experiments and analyzed data; SW, MD, ES, AR, EM, VS, JS, ER, KS, THMG, YL, UB and GK performed experiments; SS aided in design of the microarray, processed its data, and helped writing the corresponding methods section; SW, GK, and SK wrote the paper; GK and SK supervised the study.
The authors would like to thank the Lund Stem Cell Center Vector Core facility, FACS Core facility, and animal housing facility for their supportive work.
This work was supported by the European Commission (Stemexpand); Hemato-Linné and Stemtherapy program project grants from the Swedish Research Council; a pro ject grant to SK from the Swedish Research Council; Swed ish Cancer Society; Swedish Children Cancer Foundation; Clinical Research Award from Lund University Hospital; a grant to SK from The Tobias Foundation awarded by the Royal Academy of Sciences; and project grants to SW from The Olle Engkvist Foundation and The Royal Physiographic Society in Lund.
Original data and protocols are available to other investi gators upon request by contacting the corresponding author or last author.
inhibitory responses. J Biol Chem. 2009;284(37):25051-25064.
6. Lee NK, Choi HK, Yoo HJ, Shin J, Lee SY. RANKL-induced schlafen2 is a positive regulator of osteoclastogenesis. Cell Signal. 2008;20(12):2302-2308.
7. Schwarz DA, Katayama CD, Hedrick SM. Schlafen, a new family of growth regulatory genes that affect thymocyte development. Immunity. 1998;9(5):657-668.
8. Neumann B, Zhao L, Murphy K, Gonda TJ. Subcellular localization of the Schlafen protein family. Biochem Biophys Res Commun. 2008;370(1):62-66.
9. Berger M, Krebs P, Crozat K, et al. An Slfn2 mutation causes lymphoid and myeloid immunodeficiency due to loss of
ARTICLE - Slfn2 is a regulator of adult HSC quiescence S. Warsi et al.
immune cell quiescence. Nat Immunol. 2010;11(4):335-343.
10. Bruno L, Hoffmann R, McBlane F, et al. Molecular signatures of self-renewal, differentiation, and lineage choice in multipotential hemopoietic progenitor cells in vitro. Mol Cell Biol. 2004;24(2):741-756.
11. Karlsson G, Rorby E, Pina C, et al. The tetraspanin CD9 affords high-purity capture of all murine hematopoietic stem cells. Cell Rep. 2013;4(4):642-648.
12. Pronk CJ, Rossi DJ, Mansson R, et al. Elucidation of the phenotypic, functional, and molecular topography of a myeloerythroid progenitor cell hierarchy. Cell Stem Cell. 2007;1(4):428-442.
13. Bagger FO, Kinalis S, Rapin N. BloodSpot: a database of healthy and malignant haematopoiesis updated with purified and single cell mRNA sequencing profiles. Nucleic Acids Res. 2019;47(D1):D881-D885.
14. Brady G, Boggan L, Bowie A, O'Neill LA. Schlafen-1 causes a cell cycle arrest by inhibiting induction of cyclin D1. J Biol Chem. 2005;280(35):30723-30734.
15. Zhao L, Neumann B, Murphy K, Silke J, Gonda TJ. Lack of reproducible growth inhibition by Schlafen1 and Schlafen2 in vitro. Blood Cells Mol Dis. 2008;41(2):188-193.
16. Jumper J, Evans R, Pritzel A, et al. Highly accurate protein structure prediction with AlphaFold. Nature. 2021;596(7873):583-589.
17. Bernhofer M, Dallago C, Karl T, et al. PredictProteinpredicting protein structure and function for 29 years. Nucleic Acids Res. 2021;49(W1):W535-W540.
18. Adzhubei IA, Schmidt S, Peshkin L, et al. A method and server for predicting damaging missense mutations. Nat Methods. 2010;7(4):248-249.
19. Benveniste P, Frelin C, Janmohamed S, et al. Intermediateterm hematopoietic stem cells with extended but time-limited reconstitution potential. Cell Stem Cell. 2010;6(1):48-58.
20. Venkatraman A, He XC, Thorvaldsen JL, et al. Maternal imprinting at the H19-Igf2 locus maintains adult haematopoietic stem cell quiescence. Nature. 2013;500(7462):345-349.
21. Suo M, Rommelfanger MK, Chen Y, et al. Age-dependent effects of Igf2bp2 on gene regulation, function, and aging of hematopoietic stem cells in mice. Blood.
2022;139(17):2653-2665.
22. Essers MA, Offner S, Blanco-Bose WE, et al. IFNalpha activates dormant haematopoietic stem cells in vivo. Nature. 2009;458(7240):904-908.
23. Harrison DE, Lerner CP. Most primitive hematopoietic stem cells are stimulated to cycle rapidly after treatment with 5fluorouracil. Blood. 1991;78(5):1237-1240.
24. Foudi A, Hochedlinger K, Van Buren D, et al. Analysis of histone 2B-GFP retention reveals slowly cycling hematopoietic stem cells. Nat Biotechnol. 2009;27(1):84-90.
25. Passegué E, Wagers AJ, Giuriato S, Anderson WC, Weissman IL. Global analysis of proliferation and cell cycle gene expression in the regulation of hematopoietic stem and progenitor cell fates. J Exp Med. 2005;202(11):1599-1611.
26. Mavrommatis E, Arslan AD, Sassano A, Hua Y, Kroczynska B, Platanias LC. Expression and regulatory effects of murine Schlafen (Slfn) genes in malignant melanoma and renal cell carcinoma. J Biol Chem. 2013;288(46):33006-33015.
27. Feng CG, Weksberg DC, Taylor GA, Sher A, Goodell MA. The p47 GTPase Lrg-47 (Irgm1) links host defense and hematopoietic stem cell proliferation. Cell Stem Cell. 2008;2(1):83-89.
28. King KY, Baldridge MT, Weksberg DC, et al. Irgm1 protects hematopoietic stem cells by negative regulation of IFN signaling. Blood. 2011;118(6):1525-1533.
29. Sato T, Onai N, Yoshihara H, Arai F, Suda T, Ohteki T. Interferon regulatory factor-2 protects quiescent hematopoietic stem cells from type I interferon-dependent exhaustion. Nat Med. 2009;15(6):696-700.
30. Asai T, Liu Y, Bae N, Nimer SD. The p53 tumor suppressor protein regulates hematopoietic stem cell fate. J Cell Physiol. 2011;226(9):2215-2221.
31. Liu Y, Elf SE, Asai T, et al. The p53 tumor suppressor protein is a critical regulator of hematopoietic stem cell behavior. Cell Cycle. 2009;8(19):3120-3124.
32. Matsumoto A, Takeishi S, Kanie T, et al. p57 Is required for quiescence and maintenance of adult hematopoietic stem cells. Cell Stem Cell. 2011;9(3):262-271.
33. Zou P, Yoshihara H, Hosokawa K, et al. p57(Kip2) and p27(Kip1) cooperate to maintain hematopoietic stem cell quiescence through interactions with Hsc70. Cell Stem Cell. 2011;9(3):247-261.
Cédric Rossi,1,2 Marc André,3 Jehan Dupuis,4 Franck Morschhauser,5 Bertrand Joly,6 Julien Lazarovici,7 Hervé Ghesquières,8 Aspasia Stamatoullas,9 Emmanuelle Nicolas-Virelizier,10 Pierre Feugier,11 Anne-Claire Gac,12 Hannah Moatti,13 Luc-Matthieu Fornecker,14 Bénédicte Deau,15 Clémentine Joubert,16 Catherine Fortpied,17 John Raemaekers,18 Massimo Federico,19 Salim Kanoun,20 Michel Meignan,21 Alexandra Traverse-Glehen,22 Anne-Ségolène Cottereau23 and René-Olivier Casasnovas1,2
1Department of Hematology, Dijon-Bourgogne University Hospital, Dijon, France; 2INSERM 1231, University of Burgundy Franche-Comté, Franche-Comté, France; 3Department of Hematology, CHU UCL Namur, Université Catholique de Louvain, Yvoir, Belgium; 4Lymphoid Malignancies Unit, Henri Mondor University Hospital (AP-HP), Créteil, France; 5Groupe de Recherche sur les Formes Injectables et les Technologies Associees (GRITA), Department of Hematology, CHU Lille, Université de Lille, Lille, France; 6Department of Hematology, Hospital Sud Francilien, Corbeille-Essonnes, France; 7Department of Hematology, Université Paris-Saclay, Gustave Roussy, Villejuif, France; 8Department of Hematology, Centre Hospitalier Lyon Sud and Université Claude Bernard Lyon-1, Pierre-Bénite, France; 9Department of Hematology, Centre Henri Becquerel, Rouen, France; 10Department of Hematology, Centre Léon Bérard, Lyon, France; 11Department of Hematology, University Hospital of Nancy, Vandoeuvre les Nancy, France; 12Department of Hematology, Institut d'Hématologie de Basse Normandie, Caen, France; 13Department of Hematology, CHU ParisGH St-Louis Lariboisière F-Widal - Hôpital Saint-Louis, Paris, France; 14Department of Hematology, University Hospital of Strasbourg, Strasbourg, France; 15Department of Hematology, CHU Cochin, Paris, France; 16Lymphoma Academic Research Organization, CHU Lyon-Sud, Lyon, France; 17European Organization for Research and Treatment of Cancer, Brussels, Belgium; 18Department of Hematology, Radboud University Medical Center, Nijmegen, the Netherlands; 19CHIMOMO Department, University of Modena and Reggio Emilia, Policlinico, Modena, Italy; 20Nuclear Medecine Unit, Institut Universitaire du Cancer Toulouse-Oncopole, Toulouse, France; 21LYSA Imaging, University Hospital H Mondor, Creteil, France; 22Department of Pathology, Centre Hospitalier Lyon Sud and Université Claude Bernard Lyon-1, Pierre-Bénite, France and 23Nuclear Medicine Department, Hôpital Cochin, AP-HP, Université de Paris, Paris, France
Correspondence: C. Rossi cedric.rossi66@gmail.com
Received: September 13, 2021.
Accepted: May 27, 2022. Prepublished: May 31, 2022.
https://doi.org/10.3324/haematol.2021.280004
©2022 Ferrata Storti Foundation
Published under a CC BY-NC license
Stage IIB Hodgkin lymphoma (HL) patients, with a mediastinum-to-thorax (M/T) ratio of ≥0.33 or extranodal localization have a poor prognosis and are treated either as limited or advanced stage. We compared these two approaches in patients included in two randomized phase III trials enrolling previously untreated early (H10) or advanced stage HL (AHL2011). We included HL patients with Ann-Arbor stage IIB with M/T ≥0.33 or extranodal involvement enrolled in the H10 or AHL2011 trials with available positron emission tomography at baseline (PET0) and after two cycles of chemotherapy (PET2). Base line total metabolic tumor volume (TMTV) was calculated using the 41% SUVmax method. PET2 response assessment used the Deauville score. One hundred and fourty-eight patients were eligible, including 83 enrolled in the AHL2011 trial and 65 in the H10 trial. The median TMTV value was 155.5 mL (range, 8.3-782.9 mL), 165.6 mL in AHL2011 and 147 mL in H10. PET2 positivity rates were 16.9% (n=14) and 9.2% (n=6) in AHL2011 and H10 patients, respectively. With a median follow-up of 4.1 years (95% confidence interval [CI]: 3.9-4.4), overall 4-year PFS was 88.0%, 87.0% in AHL2011 and 89.2% in H10. In uni variate and mutivariate analyses, baseline TMTV and PET2 response influenced significantly progression-free survival (ha zard ratio [HR]=4.94, HR=3.49 respectively). Notably, among the 16 patients who relapsed, 13 (81%) had a baseline TMTV baseline ≥155 mL. Upfront ABVD plus radiation therapy or upfront escBEACOPP without radiotherapy provide similar pa tient’s outcome in high-risk stage IIB HL. TMTV is useful to stratify these patients at baseline.
Recent clinical trials report the long-term survival rates in classical Hodgkin lymphoma (HL) depend on age and dis ease stage, but are as high as 90-95% at 10 years.1 Accurate pretreatment stratification based on clinico-biological scores and baseline fluorodeoxyglucose (FDG) positron emission tomography (PET) and interim PET results for chemosensitivity to treatment are the main tools for se lecting risk-adapted therapies in HL patients. Before the PET era, significant efforts were invested in the validation of clinically and internationally accepted scoring, which are still used in routine practice. Ann Arbor stage, number of involved lymph node areas, bulky mediastinal mass, extra nodal involvement, erythrocyte sedimentation rate, and Bsymptoms were the major factors for patientsstratification in the European Organization for Research and Treatment of Cancer/Lymphoma Study Association (EORTC/LYSA) or the German Hodgkin Study Group (GHSG) systems.2 Stan dard care in patients with early disease includes two to four cycles of chemotherapy followed by radiation therapy (combined modalities)3,4 and in patients with advancedstage disease it is six cycles of chemotherapy.5 Stage IIB with bulky or extranodal disease (‘high-risk’ IIB) were con sidered as advanced disease in the GHSG scoring system and treated accordingly with six cycles of escalated BEA COPP (escBEACOPP) chemotherapy, while they were con sidered as unfavorable early stage in the EORTC/LYSA scoring system and treated with combined modalities using an upfront ABVD chemotherapy regimen. Thus, there is no properly established standard of care in this subset of patients. The high-risk IIB patient population represent 10-15% of early stage patients4,6,7 in some series, but could be overestimated since these cases are not in dividualized among stages IIB in most series. To date, there is not enough robust data to determine whether chemotherapy alone or ABVD-based combined modality is the better treatment option for this subset of patients. PET-tailored4,6-9 strategies have demonstrated a better benefit/risk ratio for all stages since they decrease acute and late toxicities without impairing tumor control. Whether PET-guided strategies could influence the choice of treatment in this population remains to be determined. In order to compare the outcomes of high-risk IIB HL pa tients treated with a combined modality treatment or as advanced stage disease, we retrospectively analyzed pa tients enrolled in two prospective phase III trials, H10 and AHL2011, conducted by LYSA, EORTC and FIL.
Patients and study design 2,748 patients with newly diagnosed, biopsy-proven clas
sical HL according to the World Health Organization 2008 classification10 were enrolled in two multi-center random ized trials, dedicated to early stage (H10, n=1,925)3,4 and ad vanced stage HL (AHL2011, n=823).7
Briefly, the H10 trial enrolled patients aged 15 to 70 years, both favorable (F) and unfavorable (U) patients according to EORTC criteria.3,4 The AHL2011 trial7 enrolled patients aged 16 to 60 years who had Ann Arbor stage III, IV or IIB with a mediastinum-to-thorax ≥0.33 or extranodal local ization. The complete eligibility criteria and strategies of treatment tailored by interim PET in both trials are pres ented in the H103,4 and AHL20117 trials.
The present study enrolled patients from the H10 or AHL2011 trial with high-risk IIB HL according to the GHSG stratification which is used by several groups worldwide2 (Ann Arbor stage IIB with mediastinum-to-thorax [M/T] ratio ≥0.33 or extranodal localization), with available base line PET (PET0) and after two cycles of chemotherapy im ages (PET2) and treated in LYSA centers as metabolic tumor volume (MTV) PET calculation was only done in LYSA pa tients (Figure 1). Thus, in the H10 study, PET0 and PET2 im ages were not available for 182 patients. Both studies were carried out in accordance with the Dec laration of Helsinki and the International Conference on Harmonization guidelines for Good Clinical Practice. All pa tients provided written informed consent before study in clusion. The H10 and AHL2011 studies were registered at clinicaltrials gov. Identifier: NCT00433433 and NCT01358747.
PET0 acquisition was performed before any treatment. The details of instructions and quality criteria are presented in the H10 and AHL trials.
PET0 images were centrally reviewed by three readers (SK, ASC, MM) blinded to medical information, and analyzed using the free open-source software, Beth Israel Plugin for Fiji (http://petctviewer.org).
Pathological uptake was defined by an increase uptake of 18-FDG over physiological background. Total metabolic tumor volume (TMTV) at baseline was calculated using a 41% SUV max cutoff for each lesion.11 In this study, all PET2 responses were centrally evaluated using the Deauville score (DS)12,13 and PET positivity was defined according to the criteria used in the AHL2011 study7 considered more reproducible with better positive predictive value than classic DS. Indeed, interim PET with DS 5 or 4 with SUVmax of the residual mass greater than 140% of the liver back ground were considered positive in the AHL study based on previous data showing the better reproducibility and accuracy of this threshold compared to visual analysis.14 So, in the H10 study, interim PET were re-analyzed ac cordingly.
We assessed the efficacy of various treatment strategies, and compared the two trials in terms of interim PET re sponse, progression-free survival (PFS) and overall survival (OS). PFS was defined as the time from randomization to first progression, relapse or death from any cause or last follow-up. OS was defined as the time from randomiza tion to death from any cause or last follow-up. The data cutoff for the analyses presented here was October 31st 2017, for the AHL trial and February 5th 2018, for the H10 trial. PFS and OS were analyzed on an intention-to-treat basis. Survival estimates with 95% confidence intervals (CI) were calculated with the Kaplan-Meier method. The survival distributions were compared with stratified logrank tests according to the study, and Cox proportional hazard regression models were used to estimate hazard ratios (HR) and associated 95% CI. Multivariate analyses were conducted using a Cox proportional hazard model and including 120 patients due to missing index prognosis scoring (IPS) in 28 patients.
Three different approaches (X tile analysis,15 receiver-op erating characteristic analysis, and using the median) were used to define the optimal cutoff for survival prediction of TMTV.
Differences between groups were significant if P-values were less than 0.05. Population characteristics were com
pared using Fisher’s exact test or X2 test for discrete vari ables and t-test or Mann-Withney test for continous vari ables.
All analyses were produced with SAS software (version 9.3).
Among the 1,091 patients assigned to the H10 trial by LYSA centers, 133 patients (12%) were enrolled with IIB staging. Among those patients, 65 (6%) met high-risk criteria: 58 had a M/T ratio ≥ 0.33 and the two others had at least one extra nodal involvement (Figure 1A). Among the 823 pa tients enrolled in the AHL2011 trial, 83 patients (10%) had stage IIB (all with high-risk criteria), including 74 with M/T ratio ≥0.33 and nine with at least one extra nodal involve ment (Figure 1B). In the whole cohort of 148 patients (Table 1), the median age at baseline was 27 years (range, 16-59 years) and 53% (n=79) of patients were male. In the 120 of 148 patients with available data, the IPS was high (at least 3 or higher) in 43 (29%) of them. Baseline median TMTV was 155.5 mL (range, 8.3-782.9 mL; interquartile range [IQR], 97.3-256.2).
The patient characteristics were well-balanced in both studies except for two parameters. IPS was more fre

Table 1. Patient characteristics.
Sex, N (%)
Chi-2, P=0.059
Male Female 50 (60%) 33 (40%) 29 (45%) 36 (55%) 79 (53%) 69 (47%)
Age in years
Median (range) 26 (16-58) 29 (17-59) 27 (16-59)
IPS group, N (%) 0-2 ≥ 3 Unknown
Baseline TMTV (mL)
t-test, P=0.119
Chi-2, P<0.001
51 (61%) 32 (39%) 0 (0%)
26 (40%) 11 (17%) 28 (43%)
77 (52%) 43 (29%) 28 (19%)
Median (range) IQR 165.6 (43.6-782.9) 121.7-294.9 147 (8.3-572.3) 121.7-294.9 155.5 (8.3-782.9) 121.7-294.9
Arm according to randomization, N (%) Standard Experimental 41 (49%) 42 (51%) 31 (48%) 34 (52%) 72 (49%) 76 (51%)
IPS: international prognostic score; TMTV: total metabolic tumor volume; IQR: interquartile range.
quently unfavorable (IPS 3 or higher: 39% vs. 17%; P<0.001) and TMTV was significantly higher (165.6 mL vs. 147 mL; P=0.043) in AHL patients (Table 1; Online Supplementary Figure S1).
In the cohort as a whole, 72 patients (49%) were assigned to standard arms, while 76 (51%) were randomized to ex perimental arms and the treatment actually received are detailed in the Online Supplementary Table S1: 92 (62%) pa tients received a treatment including at least two cycles of escBEACOPP, including 51 (34%) patients treated with six cycles, 32 (22%) who received two cycles of upfront esc BEACOPP followed by four cycles of ABVD and nine (6%) patients who received two cycles of escBEACOPP after two cycles of ABVD and followed by INRT. Overall, 47 (32%) pa tients received radiotherapy.
Centrally reviewed PET2 was negative in 126 (85.1%) pa tients, including 67 of 83 (80.7%) in the AHL2011 study and 59 of 65 (90.8%) in the H10 study. Among the six positive PET2 patients in the H10 study, five (83%) had a DS5 while one DS5 was observed among 16 (6%) positive PET2 pa tients in the AHL study (Online Supplementary Table S2). With a median follow-up of 4.1 years (95% CI: 3.9-4.4), a total of 17 PFS events occured: nine patients relapsed and one patient died from causes unrelated to HL in the AHL2011 trial, and seven patients relapsed in the H10 trial. Median PFS and OS were not reached in the whole cohort or either treatment group with the current follow-up. Over all, 4-year PFS was 88.0% (95% CI: 81.2-92.4) and by study 87.0% (95% CI: 76.8-92.9) and 89.2% (95% CI: 78.7-94.7) in AHL2011 and in H10, respectively (Figure 2). Five deaths oc curred (3.4%): one unrelated to HL in AHL2011, and four in H10, among whom three were due to HL progression and one due to acute cardiorespiratory failure not related to
t-test, P=0.043
Chi-2, P=0.837
lymphoma. Four-year OS was 96.1% (95%: CI 90.7-98.4) in the whole cohort, and 98.0% (95% CI: 86.6-99.7) versus 93.6% (95% CI: 84.4-97.6) in the AHL2011 and in H10 groups, respectively (Figure 2).
The characteristics of the 16 patients who relapsed are de tailed in the Table 2, nine of them were treated in the AHL2011 trial and seven in the H10 trial including three pa tients who received ABVD only.
Eleven of 16 relapses occurred in the mediastinum, one of four (25%) patients who received radiation versus ten of 12 (83%) who did not. Therefore, 7.4% of patients relapsed in our series, compared with 126 (4.6%) among the 2,748 pooled patients of the two trials. Among the 11 patients with progression in the mediastinum, only two (18.2%) had lesions outside the mediastinum.
TMTV, either as a continuous variable or with a 155 mL threshold corresponding to the TMTV median value, was found to influence PFS estimates (HR=3.35; 95% CI: 1.09310.285, P=0.035) (Figure 3) in univariate analysis. In the multivariate analysis, TMTV as a continuous variable was an independent predictor of PFS (P=0.048).
The cutoff sensitivity was 76% in the whole cohort, and 80% and 71% in AHL2011 and in H10 trials, respectively (AHL2011 area under the curve [AUC]=0.711, H10 AUC=0.632).
The specificity of this cutoff for PFS was 52%. Among the 16 patients who experienced disease progression, 13 (81%) had a baseline TMTV ≥155 mL.
In univariate analysis (Table 2), no other baseline parameter was found to impact PFS estimates though there was a trend towards lower PFS in patients with high IPS. Indeed, among all evaluable patients (n=120) in the cohort, 4-year
Figure 2. Progression-free survival according to the study assigned. PFS: pro gression free survival; CI: confidence interval.
PFS was 93.5% (95% CI: 85.5-97.2) for patients with IPS 02 versus 79.6% (95% CI: 62.8-89.4) for those with high IPS 3-7 (HR=2.89; P=0.064) (Table 2; Online Supplementary Fig ure S2). High IPS (≥3) was associated with a higher median TMTV (212.7 mL) than low IPS patients (148 mL). High TMTV was observed in 43% of the IPS ≥3 group and 34% in the IPS <3 group. To note, patients with missing IPS had similar PFS and inclusion in these analyses did not modify results.

Impact of treatment and positron emission tomography after two cycles of chemotherapy response on patient’s outcome
In the whole cohort, patients with positive PET2 using modified DS assessment (n=20, 14% with 14 in AHL2011 and 6 in H10) had shorter PFS, than those with negative PET2 (4-year PFS: 91.5% [95% CI: 84.6–95.4] vs. 67.2% [95% CI: 53.1-82.8]; HR=0.181 [95% CI: 0.066-0.5]; P=0.001). PET2 was also centrally assessed using standard DS. PFS was still significantly influenced by stantard DS (4-year PFS in 1/2/3 vs. 4/5: 91.9% [95% CI: 84.2–96] vs. 76.5% [95% CI: 59.7-87]; HR=0.263 [95% CI: 0.098-0.706]; P=0.0046), but modified DS better discrimates populations of patients with different outcome and was used for further analysis.
PFS was similar in patients who did or did not receive esc BEACOPP (HR=1.12, 95% CI: 0.42-3.05; P=0.81) and those who did (n=47) or did not receive (n=101) radiotherapy (HR=0.64, 95% CI: 0.21-1.95; P=0.42).
Overall, 4-year PFS was 63.8% (95% CI: 38.6-80.8) versus 91.6% (95% CI: 84.8-95.5) (Figure 3B; Table 2).
Baseline total metabolic tumor volume and positron emission tomography after two cycles of chemotherapy response predict patient outcome
In multivariate analysis with IPS, TMTV and PET2 as covari
ates, only baseline TMTV (HR=4.94; 95% CI: 1.05-23.16; P=0.043) and PET2 result (HR=3.49; P=0.031) were statis tically independant predictors of PFS (Table 2). The TMTV as a continuous variable was also an independent predictor of PFS (P=0.048).
The combination of TMTV and PET2 results can be used to stratify patients in thre risk categories (Figure 3C). The group of patients with baseline TMTV ≥155 mL and positive PET2 (n=13) had the poorest PFS (46.2%), while patients with either one or none of the two parameters had PFS in more 90% (4-year PFS: 91.3 and 92.7 respectively). The HR of these combined factors (baseline TMTV ≥155 mL and positive PET2) versus one of them (either baseline TMTV ≥155 mL or positive PET2) was 13.356 (95% CI: 3.8-45.8; P<0.001).
Lastly, patients with high TMTV, high IPS and positive PET2 were scarce (4%, n=6) but three of them relapsed, while none of the patients without these factors relapsed and only 11.2% of patients with one or two of these factors re lapsed.
To the best of our knowledge, this is the first report to compare treatment strategies in high-risk stage IIB pa tients, with a large mediastinal mass or extranodal lesions according to the GHSG stratification system. No previous analysis of bulky stage IIB patients was previously reported. The CALGB study16 which enrolled bulky stages I and II pa tients treated with ABVD followed by a PET-driven radio therapy did not present data separately for patients with stage IIB. Similarly, the RATHL study enrolled 42% of stage II patients but no data was available in stage IIB patients.
Table 2. Univariate and multivariate analysis of prognostic factors associated with progression-free survival.
Number of patients (%)
IPS
High IPS (IPS ≥ 3)
Low IPS (IPS 0-2)
Unknown
Baseline TMTV
43 (29) 77 (52) 28 (19%)
4-year progressionfree survival, %
79.6 93.5 85.6
Stratified Logrank test (1)
Univariate analysis (Cox model) (1)
Multivariate analysis (Cox model)
P-value HR (95% CI) P-value HR (95% CI) P-value
0.22 2.23 (0.6-8.32) 0.15
High TMTV (≥ 155) Low TMTV (<155) 72 (49) 76 (51) 82.9 93.3 0.025 3.37 (1.09-10.37) 0.035 4.94 (1.05-23.16) 0.043
Centrally reviewed PET2
Positive Negative 20 (14) 128 (86) 63.8 91.6 <0.0001 6.26 (2.29-17.07) 0.0003 3.49 (1.12-10.88) 0.031
HR: hazard ratio; TMTV: total metabolic tumor volume, DS: Deauville score; IPS: IPS: international prognostic score: CI: confidence interval; PET2: positron emission tomography after 2 cycles of chemotherapy. (1) Cox regression model stratified by trial with fixed effects (as well as univariate Cox model and log-rank test)
Treatment strategies, including upfront ABVD chemother apy (RATHL study,8 H10 trial3,4) or upfront BEACOPP (AHL20117) with no radiotherapy, seem to provide similar efficacy. However, compared with patients included in the H10 study, patients enrolled in the AHL2011 study had more severe disease at baseline with both more frequent high IPS and TMTV ≥155 mL and despite more unfavorable up front profile in AHL patients, a post hoc analyses showed a similar outcome between H10 and AHL2011 patients, sug gesting that the upfront dose intensity of chemotherapy delivered when using escBEACOPP is able to reverse the unfavorable prognosis value of baseline factors. However, because of the low number of patients and events in each treatment subgroup, we are unable to conclude definitively, and validation is required in a larger series. Additionally, in our study some patients with unfavorable risk factors ex perienced relapse even after escBEACOPP, suggesting there is an unmet medical need for these patients. While CALGB and RATHL studies confirm the reliability of PET-guided strategy (radiotherapy in CALGB study and chemo regimen in RATHL) no data on the baseline TMTV characteristics were available allowing to compare these results with ours. As underlined in the CALGB study,16 one caveat for these li mited staged patients is that bulk mass is defined differ ently according to groups in the world. In order to overcome this issue, the TMTV measure could be a better indicator in the very bulky mass and be helpful to the gen eralizability of better strategies of treatment. In line with this objective, we demonstrated in this study that baseline TMTV ≥155 mL was associated with an unfavorable prog nostic impact independently of treatment strategy. This TMTV threshold is relatively in line with values reported in the literature for HL17,18,19 (ranging from 147 to 313 mL). It is
worth noting that the threshold of 147 mL17 was determined from H10 patients with stage I-II. Also, all of the cutoffs de scribed in study AHL2011 and H10 and in the whole cohort indicate that high baseline TMTV predicts significantly worse PFS. Indeed, TMTV reflects both the 3-dimensional tumor burden and metabolic activity, and provides addi tional prognostic information beyond classical risk, includ ing the unidimensional measurement of tumor bulky such as M/T ratio.19 In the present series, all patients (with avail able IPS) who experienced relapse had at least one of the baseline risk factors either TMTV ≥155 mL or IPS >3. Early PET response remains an independent prognostic factor in bulky mediastinal HL. However, less than half of relapses occured in positive PET2 patients, and other parameters including TMTV and IPS are required to better stratify. PET radiomics could also help to predict outcomes in patients with mediastinal HL.20
HL is a radiosensitive disease, and omitting radiotherapy as consolidation treatment in early stage HL was associated with a higher risk of treatment failure in patients respond ing to upfront ABVD.6 However, omitting radiation therapy consolidation is possible in patients achieving complete metabolic response after two cycles of escBEACOPP plus two cycles of ABVD without loss of tumor control21 in un favorable localized HL. In the present study, patients treated with upfront escBEACOPP with neither radiother apy consolidation nor radiotherapy after relapse had out comes similar to patients receiving radiotherapy despite a more unfavorable profile at baseline. In addition, four (8.5%) of the 47 patients who received radiation therapy re lapsed, including three relapses outside of the mediasti num, compared to 12 (11.8%) of the 101 of patients who received only chemotherapy, suggesting that radiation ther
apy had probably little effect on tumor control as shown in the unfavorable group of the H10 trial.4 In the HD15 trial, a relapse was recorded in 28 of 152 advanced HL patients with a PET-positive residual mass at the end of chemo therapy and with documented radiotherapy, of which seven relapses occurred outside of the irradiated sites.22

In high-risk stage IIB patients, the fields targeted by radio therapy are usually large, even in case of involved node radiotherapy, as most patients have bulky mediastinal mass, leading to an increased risk of toxicity in non-tar geted organs such as the heart or breast. In terms of benefit-risk balance, our results do not allow to deter mine if a radiotherapy-free strategy using more intense upfront chemotherapy regimen such as escBEACOPP might be more suitable in these patients with bulky mass allowing to avoid long-term radiotherapy side effects without loss of tumor control or if radiotherapy is man datory to decrease the risk of relapse. The present study has several limitations. Firstly, even though we analyzed patients enrolled in two prospective trials, this is a retrospective analysis which involves inevi table biases: IPS was not available for 19% of patients of H10 study because it was not designed or required for baseline stratification of patients with early stage disease. Secondly, patients with high-risk stage IIB were quite rare
Figure 3. Progression-free survival according to total meta bolic tumor volume and positron emission tomography after two cycles of chemotherpy response. (A) Progression-free sur vival (PFS) according to total metabolic tumor volume (TMTV) with a cutoff of 155 mL, (B) according to positron emission to mography results after 2 cycles of chemotherpay (PET2) as sessed with modified Deauville score (see Methods) and (C) according to the TMTV and PET2 result combination.
representing 11% of patients included in AHL2011 and 6% in patients included in H10 studies. There was also a low rate of treatment failure, limiting the power of statistical analysis. However, few studies have focused on this sub set of patients in the literature, and a randomized study cannot easily be conducted in such a limited population Altogether, our results stemming from patients enrolled in two randomized trials with different treatment options are important to demonstrate that patients with high risk stage IIB HL could be treated either by combined modalities or with upfront escBEACOPP without radiotherapy consolida tion. While the optimal treatment for patients with very bulky mass remains unclear, the TMTV seems a better in dicator to stratify patients at diagnosis and very helpful to the decision. The potential benefit of escBEACOPP in pa tients high TMTV stage IIB has to be further investigated in larger series.
CR has received a research grant from Roche and personal fees as well as non-financial support from Janssen, Roche, Takeda. ROC has received research grant from Gilead and Takeda and personal fees as well as non-financial support from Janssen, Roche, Takeda, Merck/BMS, Abbvie and Amgen. All other authors have no conflits of interest to dis
close. The work was presented in part at the ASH annual meeting Orlando 2019, oral session 624, abstract # 128 and at the SFH (Société Française d’Hématologie) annual meet ing 2020, oral session SCO-16.
CR, MA, MM, ASC and OC developed and designed the study and collected and assembled the data. All authors analyzed and interpreted the data, wrote the manuscript, gave their final approval of the manuscript and are accountable for all aspects of work.
We acknowledge the groups European Organisation for Re search and Treatment of Cancer (EORTC) and Fondazione
1. Driessen J, Visser O, Zijlstra JM, et al. Primary therapy and relative survival in classical Hodgkin lymphoma: a nationwide population-based study in the Netherlands, 1989-2017. Leukemia. 2021;35(2):494-505.
2. Draube A, Behringer K, Diehl V. German Hodgkin’s Lymphoma Study Group Trials: lessons from the past and current strategies. Clin Lymphoma Myeloma. 2006;6(6):458-468.
3. Raemaekers JMM, André MPE, Federico M, et al. Omitting radiotherapy in early positron emission tomography–negative stage I/II Hodgkin lymphoma is associated with an increased risk of early relapse: clinical results of the preplanned interim analysis of the randomized EORTC/LYSA/FIL H10 trial. J Clin Oncol. 2014;32(12):1188-1194.
4. André MPE, Girinsky T, Federico M, et al. Early positron emission tomography response-adapted treatment in stage I and II Hodgkin lymphoma: final results of the randomized EORTC/LYSA/FIL H10 trial. J Clin Oncol. 2017;35(16):1786-1794.
5. Engert A, Goergen H, Markova J, et al. Reduced-intensity chemotherapy in patients with advanced-stage hodgkin lymphoma: updated results of the open-label, international, randomised phase 3 HD15 Trial by the German Hodgkin Study Group. Hemasphere. 2017;1(1):e5.
6. Radford J, Illidge T, Counsell N, et al. Results of a trial of PETdirected therapy for early-stage Hodgkin’s lymphoma. N Engl J Med. 2015;372(17):1598-1607.
7. Casasnovas R-O, Bouabdallah R, Brice P, et al. PET-adapted treatment for newly diagnosed advanced Hodgkin lymphoma (AHL2011): a randomised, multicentre, non-inferiority, phase 3 study. Lancet Oncol. 2019;20(2):202-215.
8. Johnson P, Federico M, Kirkwood A, et al. Adapted treatment guided by Interim PET-CT scan in advanced Hodgkin’s lymphoma. N Engl J Med. 2016;374(25):2419-2429.
9. Press OW, Li H, Schöder H, et al. US Intergroup trial of response-adapted therapy for stage III to IV Hodgkin lymphoma using early interim fluorodeoxyglucose–positron emission tomography imaging: Southwest Oncology Group S0816. J Clin Oncol. 2016;34(17):2020-2027.
10. Swerdlow SH, Campo E, Pileri SA, et al. The 2016 revision of the World Health Organization classification of lymphoid neoplasms. Blood. 2016;127(10):2375-2390.
11. Boellaard R, Delgado-Bolton R, Oyen WJG, et al. FDG PET/CT:
Italiana Linfomi (FIL) for their support in using data coming from the H10 trial. We thank the patients and their families, the investigators of the LYSA, LYSARC team, the Hodgkin committee of LYSA (particularly C. Bailly and Andréa Galla mini), PET reviewers and pathology reviewers. We also thank Suzanne Rankin from the Dijon-Bourgogne University Hos pital for proofreading the manuscript.
This work was supported by The Lymphoma Academic Re search Organization and association for the statistics.
The original data cannot be shared due to the limited ac cess to data bases.
EANM procedure guidelines for tumour imaging: version 2.0. Eur J Nucl Med Mol Imaging. 2015;42(2):328-354.
12. Barrington SF, Trotman J, Sahin D, et al. Baseline PET-derived metabolic tumor volume metrics did not predict outcomes in follicular lymphoma patients treated with first-line immunochemotherapy and antibody maintenance in the phase III GALLIUM Study. Blood. 2018;132(Suppl 1):S2882.
13. Meignan M, Gallamini A, Meignan M, et al. Report on the First International Workshop on interim-PET scan in lymphoma. Leuk Lymphoma. 2009;50(8):1257-1260.
14. Itti E, Juweid ME, Haioun C, et al. Improvement of early 18FFDG PET interpretation in diffuse large B-cell lymphoma: importance of the reference background. J Nucl Med. 2010;51(12):1857-1862.
15. Camp RL, Dolled-Filhart M, Rimm DL. X-tile: a new bioinformatics tool for biomarker assessment and outcome-based cut-point optimization. Clin Cancer Res. 2004;10(21):7252-7259.
16. LaCasce AS, Dockter Travis, Ruppert Amy, et al. CALGB 50801 (ALLIANCE): PET adapted therapy in bulky stage I/II classic hodgkin lymphoma (cHL). J Clin Oncol. 2021;39(Suppl 15):S7507.
17. Cottereau A-S, Versari A, Loft A, et al. Prognostic value of baseline metabolic tumor volume in early-stage Hodgkin lymphoma in the standard arm of the H10 trial. Blood. 2018;131(13):1456-1463.
18. Kanoun S, Rossi C, Berriolo-Riedinger A, et al. Baseline metabolic tumour volume is an independent prognostic factor in Hodgkin lymphoma. Eur J Nucl Med Mol Imaging. 2014;41(9):1735-1743.
19. Akhtari M, Milgrom SA, Pinnix CC, et al. Reclassifying patients with early-stage Hodgkin lymphoma based on functional radiographic markers at presentation. Blood. 2018;131(1):84-94.
20. Milgrom SA, Elhalawani H, Lee J, et al. A PET radiomics model to predict refractory mediastinal Hodgkin lymphoma. Sci Rep. 2019;9(1):1322.
21. Borchmann P, Plütschow A, Kobe C, et al. PET-guided omission of radiotherapy in early-stage unfavourable Hodgkin lymphoma (GHSG HD17): a multicentre, open-label, randomised, phase 3 trial. Lancet Oncol. 2021;22(2):223-234.
22. Kriz J, Reinartz G, Dietlein M, et al. Relapse analysis of irradiated patients within the HD15 trial of the German Hodgkin Study Group. Int J Radiat Oncol. 2015;92(1):46-53.
Salomé Decombis,1,2,3 Antonin Papin,1,2,3 Céline Bellanger,1,2,3 Clara Sortais,1,2,3,4 Christelle Dousset,1,2,3,4 Yannick Le Bris,1,2,3,5 Thiphanie Riveron,1,2,3 Stéphanie Blandin,6 Philippe Hulin,6 Benoit Tessoulin,1,2,3,4 Mathieu Rouel,1,2,3 Steven Le Gouill,1,2,3,4 Agnès Moreau-Aubry,1,2,3 Catherine Pellat-Deceunynck1,2,3 and David Chiron1,2,3
1Nantes Université, INSERM, CNRS, Université d'Angers, CRCI2NA; 2L’Héma-NexT, i-Site NexT; 3GDR3697 Micronit, CNRS; 4Service d’Hématologie Clinique, Unité d’Investigation Clinique, CHU; 5Service d’Hématologie Biologique, CHU and 6SFR-Santé, INSERM UMS016, CNRS UMS 3556, FED 4202, Nantes Université, CHU, Nantes, France
Correspondence: D. Chiron david.chiron@univ-nantes.fr
Received: August 11, 2021.
Accepted: February 9, 2022.
Prepublished: March 10, 2022.
https://doi.org/10.3324/haematol.2021.279800
©2022 Ferrata Storti Foundation Published under a CC BY-NC license
Aggressive B-cell malignancies, such as mantle cell lymphoma (MCL), are microenvironment-dependent tumors and a better understanding of the dialogs occurring in lymphoma-protective ecosystems will provide new perspectives to in crease treatment efficiency. To identify novel molecular regulations, we performed a transcriptomic analysis based on the comparison of circulating MCL cells (n=77) versus MCL lymph nodes (n=107) together with RNA sequencing of malignant (n=8) versus normal B-cell (n=6) samples. This integrated analysis led to the discovery of microenvironment-dependent and tumor-specific secretion of interleukin-32 beta (IL32β), whose expression was confirmed in situ within MCL lymph nodes by multiplex immunohistochemistry. Using ex vivo models of primary MCL cells (n=23), we demonstrated that, through the secretion of IL32β, the tumor was able to polarize monocytes into specific MCL-associated macrophages, which in turn favor tumor survival. We highlighted that while IL32β stimulated macrophages secreted several protumoral factors, they supported tumor survival through a soluble dialog, mostly driven by BAFF. Finally, we demonstrated the ef ficacy of selective NIK/alternative-NFkB inhibition to counteract microenvironment-dependent induction of IL32β and BAFF-dependent survival of MCL cells. These data uncovered the IL32β/BAFF axis as a previously undescribed pathway involved in lymphoma-associated macrophage polarization and tumor survival, which could be counteracted through se lective NIK inhibition.
Although for years most studies have focused on tumor cells, allowing the discovery of numerous key (epi)-genetic aberrations and oncogenic pathways, it is now widely ac cepted that ecosystem integration is also critical for the understanding of cancer progression. Evidence demon strating that the tumor ecosystem plays a central role in tumoral expansion and treatment resistance has con tinued to accumulate since the emergence of the tumor microenvironment concept more than a century ago.1 In deed, the tumor ecosystem has shown multiple facets, from its critical role in cancer metabolism to the influence of mechanical constraints, not to mention the diversity of immune infiltrates.2 A better understanding of the tumor microenvironment now supports the development of next-generation therapeutic strategies, such as rational targeted therapy combinations to bypass microenviron
ment-dependent resistance,3 immune checkpoint in hibitors and bi-specific antibodies.4 Mantle cell lymphoma (MCL) is a rare and mostly incur able B-cell malignancy and strategies to overcome resis tance and treat MCL relapses are an unmet medical need.5 Over the past decades, most studies have focused on structural and functional genomic anomalies which have led to important discoveries regarding the molecular ori gin of MCL (e.g., t(11;14)), factors involved in the highly het erogeneous clinical course of this disease (e.g., SOX11 , TP53, and CDKN2A),6-8 as well as markers of drug resis tance.9-11 In contrast to intrinsic tumoral anomalies, the dialog between MCL and its tumor microenvironment was largely ignored. Nevertheless, we, and others, have sug gested a dynamic dialog within lymph nodes, which are the primary zone of MCL expansion. MCL cells are able to shape their microenvironment,12 whereas the latter is necessary to trigger cell cycle activation,13 inhibition of apoptosis and drug
The IL32/BAFF axis supports
dialogs in the
ecosystem and is disrupted by NIK inhibition
resistance14 as well as activation of oncogenic pathways, such as nuclear factor kappa B (NFkB) and B-cell receptor (BCR) pathways.15 These findings confirmed the need to consider the biology of the tumor microenvironment in MCL and encourage further studies to understand the complexity of its dialogs and the supporting molecular regulations.
Unlike other B-cell lymphomas, MCL is characterized, as promptly as at diagnosis, by early dissemination in vir tually all patients, with a significant number of circulating lymphoma cells, mostly in the bone marrow and periph eral blood (PB).16 This characteristic allows the compari son of tumor cells within several organs and the identi fi cation of regulations speci fi cally induced in the lymphoid niches. To identify tumor microenvironmentdependent molecular regulations in MCL, we fi rst per formed a global unbiased transcriptomic analysis integrating samples from PB and lymph node (LN) tissue and cells from ex vivo models. Our analysis uncovered the microenvironment-dependent and tumor-speci fi c ex pression of interleukin-32 (IL32), a soluble factor whose role in lymphomas is unknown. We showed that tumorspecific IL32 plays a major role in the corruption of the immune ecosystem that supports MCL survival and ident ified druggable therapeutic targets involved in these in terplays.
Primary cell culture MCL cells were obtained after informed consent from pa tients according to protocols approved by local institu tional review boards (REFRACT-LYMA cohort; ethical approval GNEGS-2015-09-1317) and in accordance with the Declaration of Helsinki. The patients’ characteristics are summarized in Online Supplementary Table S1. For com parison with normal naïve CD5+ B cells (NBC), cord blood B cells were isolated and cultured using the same proto col. As previously described, MCL and NBC were cultured with growth factors (interleukin [IL]10: 50 ng/mL, B-cell activating factor [BAFF]: 50 ng/mL, insulin-like growth factor-1 [IGF1]: 10 ng/mL, IL6: 1 ng/mL) on adherent CD40L-expressing fibroblasts previously treated with mi tomycin-C.13 The ratio of adherent cells to MCL cells was 1:10.
PB was obtained from age-matched (>60 years) healthy donors. Monocytes were obtained by elutriation and T cells were separated using anti-human CD3 magnetic beads. M1 and M2-10 monocyte-derived macrophages (M φ) were generated in vitro as previously described.12 Regard ing Mφ-32, monocytes were differentiated with CSF1 (MCSF, 50 ng/mL, for 5 days) before activation with recombinant human (rh)IL32β (100 ng/mL, for 2 days).
Gene expression profiling Publicly available datasets for MCL cells in LN (n=107) or PB (n=77) were collected from the Gene Expression Om nibus database (GSE70910, GSE16455, GSE21452, GSE35426, GSE36000, GSE124931 and GSE95405) and analyzed as previously described.14
Full-length RNA-sequencing CD19+CD5+ MCL cells from PB (n=4) and CD19+CD5+ B cells from cord blood (NBC, n=3) were cultured ex vivo on CD40L-expressing fi broblasts with growth factors for 7 days.13 RNA was sequenced at baseline (day 0) and after 7 days of culture. “Tumor-specific” and “Shared with NBC” genes were determined by comparing the transcriptome of MCL cells with that of NBC. "Tumor-speci fi c” genes were found to be upregulated in culture ex vivo and in LN in vivo but not in NBC samples.
3’seq-RNA profiling18 Briefly, raw counts were normalized and transformed and differential gene expression was assessed with the DESeq2 package in R. Similar results were obtained using the EdgeR package in R. Principal component analysis was performed by FactoMineR and factoextra packages. A hierarchical ascendant clustering was performed using Euclidean distances and the Ward.D2 method. Heatmaps were created using the ComplexHeatmap package. All datasets were deposited in the Gene Expression Om nibus database (GSE179636 and GSE179766).
Multiplex immunohistochemistry
Formalin-fixed paraffin-embedded tissue sections were subjected to pretreatment involving antigen retrieval by heating in EDTA buffer at the beginning of the experiment and to a TR1 retrieval between each staining. Tissue sec tions were then stained for Cyclin D1, IL32, CD68 and CD3 with polymer enhancer and HRP 2-Step polymer and the buffer 1X Plus Amplification Diluent with Opal 570, 650, 520 and 690 for the detection of Cyclin D1, IL32, CD68 and CD3, respectively. We used DAPI (1:4000) to stain the nuclei. The experiment was conducted in an automated lmpath36. Images were acquired on a Nikon A1 RSi con focal fluorescence microscope with spectral module. Additional methods are detailed in the Online Supple mentary Methods section and Online Supplementary Table S2.
Microenvironment-dependent IL32 expression in mantle cell lymphoma cells is tumor specific We fi rst analyzed differential gene expression between
unpaired MCL samples from LN (n=107) and PB (n=77): 6,887 genes were differentially expressed (log2Fc >0.5 and <-0.5; adjusted P-value <0.05) suggesting a central role of the LN ecosystem in MCL transcriptional programs (Figure 1A). The 22 most differentially expressed genes (log2Fc >5 and <-5) were predicted to belong to the extracellular region (On line Supplementary Figure S1A), and this was also highlighted by top functional annotations, including extracellular matrixreceptor interactions (hsa#04512), cytokines-cytokine recep tor interactions (hsa#04060) and cell adhesion molecules (hsa#04514), reflecting active cellular communication be tween tumor cells and their ecosystems (Online Supplemen tary Figure S1B).
Because LN sections used for gene expression profiling displayed heterogeneous tumor and immune cell infiltra tions, we needed to perform additional analyses to ident ify MCL-specific transcriptomic regulations. To this end, we compared transcriptomic data from LN with transcrip tomic data from CD19+ circulating MCL cells cultured on CD40L-expressing cells (Figure 1B). This ex vivo culture model was designed to mimic signals occurring in the LN
and was composed of CD40L-expressing cells comple mented by several protumoral growth factors.13 More than 70% of the genes upregulated ex vivo in the culture model were also overexpressed in LN as compared with MCL PB (n=3217/4524) (Figure 1B). Accordingly, an MCL “LN signa ture”, as well as previously described signatures enriched in MCL tissue, such as “NFkB”, “BCR” or “NFkB-inducing kinase (NIK)”,15 were significantly upregulated in the ex vivo culture model (Online Supplementary Figure S1C).
By comparing the upregulated gene set (upregulated in both LN and culture, n=3,217) with CD40L-stimulated CD5+ NBC, we identified that 39% of the differentially ex pressed genes were tumor-specific (i.e., were not upregu lated in NBC) (Figure 1B). Functional annotations showed that the soluble dialog (hsa#04060) was specifically en riched in the tumor ecosystem, in contrast to extracellular matrix-receptor interactions or cell cycle activation, which were shared with NBC (Online Supplementary Figure S1D). Scoring of the top genes revealed that CCL22 and IL32 were the most upregulated genes within “Shared with NBC” and “Tumor-specific” transcriptional programs, re
A B C D ARTICLE - MCL protumoral ecosystem S. Decombis et al.

spectively (Figure 1C). While CCL22 production has been previously characterized as microenvironment-dependent in several B-cell malignancies,19 the mechanisms of regu lation and the biological role of IL32 have remained un known. Constitutive expression of IL32 in three of nine cell lines first confirmed that MCL does indeed have the ability to produce and secrete IL32 (Figure 1D, Online Sup plementary Figure S2A). Finally, splicing analysis of RNAsequencing data showed that the predominant isoform in MCL was IL32β (Online Supplementary Figure S2B).
IL32 is expressed in mantle cell lymphoma lymph nodes and is induced in vitro upon CD40 triggering We showed that PB MCL displayed a slight, but significant, overexpression of IL32 when compared to NBC, and high expression was observed in most LN MCL studied (Figure 2A). IL32 induction in LN was confirmed in paired samples both at the RNA (n=8) and protein (n=3) levels (Figure 2B). Consistently with our observation in cell lines, constitutive RNA expression was detected in 24% of PB MCL samples (5 out of 21), independently of p53 status or disease sub type (Online Supplementary Table S1). CD40L induced IL32 expression in ten out of 13 MCL samples but not in NBC (Figure 2C, D). Of note, the three samples in which IL32

induction was not detected were all from the indolent leukemic non-nodal subtypes of MCL. A similar CD40-de pendent induction of IL32 was observed in MCL cell lines (Online Supplementary Figure S2C, D).
To further characterize the pattern of IL32 expression in situ, we performed immunohistochemistry on four MCL tissue samples. Figure 3A shows IL32+ cells in all four of the four MCL samples. We further used multiplex immu nohistochemistry in two samples for the concurrent de tection of MCL cells (Cyclin D1), macrophages (CD68), T cells (CD3) and IL32. We observed that IL32 expression was enriched in situ in tumor zones infiltrated with T cells (ROI#1 and ROI#2 of sample LN#2, ROI#1 of sample LN#3), compared to areas containing only tumor cells (ROI#2 of LN#3) (Figure 3B, C). Taken together these results show that IL32 is expressed in situ by MCL cells in the vicinity of T cells.
CD40L-dependent IL32 expression in mantle cell lymphoma cells depends on the alternative NFκB pathway
We next determined whether NFkB pathways controlled IL32 induction. CD40 triggers activation of both the clas sical (ser32/34 IkBα phosphorylation, pIkB) and the alter
Figure 2. IL32 is expressed in mantle cell lymphoma lymph nodes and induced in vitro upon CD40 triggering. (A) IL32 gene ex pression in normal B cells (NBC, n=24) and mantle cell lymphoma (MCL) cells from peripheral blood (PB, n=81) or lymph nodes (LN, n=165) was assessed by gene expression profiling (GEP). Mann-Whitney test. ***P<0.0005, ****P<0.0001. (B) IL32 expression was analyzed by GEP in paired MCL cells from PB (n=8) or LN (n=8) and by immunoblot in paired PB and LN tissues (frozen sec tions) from MCL patients (n=3). *Represents higher exposure for immunoblotting. Wilcoxon-matched pairs sign-rank test. **P<0.008 (C) Quantitative reverse transcriptase polymerase chain reaction (RT-qPCR) analysis of IL32 gene was performed in CD5+ NBC (n=3) or MCL cells (n=13) cultured on CD40L-expressing cells for 7 days. Wilcoxon-matched pairs sign-rank test. ***P<0.0005. (D) Immunoblot analysis of IL32 protein expression was performed in CD5+ NBC (n=1) or MCL cells (n=4) cultured on CD40L-expressing cells for 7 days.
Figure 3.
expression
in situ. (A) Expression of IL32 was determined using immunohistochemistry on one spleen (SPL) and three lymph node (LN) sections from four patients

mantle cell lymphoma (MCL). Scale bars, 50 µm. (B, C) Multiplex immunohistochemistry staining for Cyclin D1 (opal 570; white), CD3 (opal 690; green), CD68 (opal 520; magenta) and IL32 (opal 650; red) was performed on LN sections from two MCL patients (MCL_LN#2, MCL_LN#3). Individual stains and DAPI are shown in Online Supplementary Figure S9. For MCL-LN#2, the left panel represents a mosaic, the middle panel (region of interest, ROI#1) a zoom on the sample (scale bars, 50 µm) and the right panel (ROI#2) represents a projection of 26 Z stacks (range 10 µm; scale bar 10 µm). For MCL-LN#3, the left panel represents a large area (scale bar, 100 µm), the middle panel (ROI#1) shows a CD3-infiltrated area and the right panel (ROI#2) represents a tumor-only area (scale bars, 50 µm).
native (p52 increase) NFkB pathways (Figure 4A). Inhibition of IkB kinases IKK-1/2, using BMS-345541,20 dramatically reduced the activation of both NF k B pathways and re sulted in the complete inhibition of IL32 (Online Supple mentary Figure S3A). However, siRNA against NFKB1 failed to reduce IL32 expression in Mino cells (Online Supple mentary Figure S3B), suggesting that the classical NFkB pathway was not involved. To confirm the role of the al ternative pathway, we used the NIK inhibitor SMI-1, which was recently described as selectively inhibiting the alter native NFkB pathway.21 This NIK inhibitor, which inhibited
p52 processing from p100 without inducing any modula tion of pIkB, resulted in the inhibition of both constitutive (Mino) and CD40L-induced (NTS3, REC1 and primary MCL) IL32 (Figure 4B,C). Of note, the detection of high p52 ex pression in LN tissue further confirmed the activation of an alternative NFkB pathway in vivo (Online Supplementary Figure S3C). Nevertheless, even though IL32 induction was restricted to tumor cells, activation of the alternative NFkB pathway was observed in both NBC and MCL cells upon CD40 triggering (Figure 4D). Moreover, p52 consti tutive cell lines did not necessarily express IL32 (Figure
Figure 4. CD40L-dependent IL32 expression depends on the alternative NFκB signaling pathway. (A) Immunoblotting of the clas sical (pIkB) and alternative (p52) NF-kB pathways and IL32 protein was performed in mantle cell lymphoma (MCL) cell lines cul tured on CD40L-expressing cells for the indicated time. (B, C) Quantitative reverse transcriptase polymerase chain reaction (RT-qPCR) analysis of the IL32 gene (B) and immunoblotting of the indicated proteins (C) were performed in MCL cell lines cultured on CD40L-expressing cells for 96 h in the presence or absence of the NIK inhibitor SMI-1 (NIK-i, 10 µM). (D, E) Immunoblotting of p52 and IL32 proteins in: (D) CD19+CD5+ NBC (n=2) or CD19+CD5+ MCL cells (n=3) at day 0 and after culture on CD40L-expressing cells for 7 days and (E) MCL cell lines (n=10).
4E), suggesting that the alternative NFkB pathway may not be sufficient for IL32 induction, leading us to investigate another layer of regulation.
IL32 is hypomethylated in mantle cell lymphoma cells
We wondered whether the IL32 locus could also be epi genetically regulated. Indeed, decitabine induced IL32 ex pression in IL32-negative MCL cells (Online Supplementary Figure S4A). Bisulfite sequencing showed that IL32-posi tive and negative MCL cells displayed a significantly dif ferent methylation pattern in both the promoter and CpG islands of the IL32 gene locus (40.5% vs. 73% and 24% vs 97%, respectively), suggesting that hypomethylation fa vored IL32 expression (Online Supplementary Figure S4B). Similarly, the IL32 promoter was hypermethylated in NBC compared to MCL cells (100% vs. 40.5%, respectively) and this pattern remained stable even after the NBC were stimulated with CD40L (Online Supplementary Figure S4C, D). Collectively our data argue for epigenetic-driven ex pression of IL32, explaining the tumor-restricted ex pression.

We next decided to assess the biological consequences of IL32β production within the MCL ecosystem. We first addressed the role of rhIL32β on the tumor itself, but did not observe any changes, either on MCL cell survival and proliferation ex vivo or on previously-described IL32-in duced signaling pathways and expression of protumoral factors22 (Figure 5A, B and data not shown).
As the IL32 receptor has yet to be identified, we per formed functional annotations of IL32 co-regulated genes within lymphoma LN to decipher the cell types that could respond to MCL-produced IL32β. We observed enrichment in pathways such as phagosome (hsa#04145), chemokine (hsa#04062) and Th17 differentiation (hsa#04659), sug gesting myeloid and T-cell involvement in MCL-related IL32β functions (Online Supplementary Figure S5A). In ad dition, the top IL32 co-regulated genes were enriched with key regulators of macrophage function as well as the T-cell-related marker CD2 (adjusted P value <0.0001) (On line Supplementary Figure S5B). Consistently, the induc tion of STAT3 phosphorylation on Tyr705 (pSTAT3) in both cell types confirmed the cells’ ability to respond to IL32, with monocytes also displaying additional induction of NFkB pathways (Figure 5C). We next analyzed the tran scriptome of rhIL32β-stimulated monocytes (Mono, n=3), monocyte-derived macrophages (Mφ, n=3) and T cells (T, n=3). As shown in the principal component analysis, IL32β greatly modulated both monocytes and M φ , but only slightly the T-cell transcriptome (Figure 5D). Consistently, hierarchical clustering was able to discriminate myeloid cells according to IL32β stimulation by not T cells (Figure 5E).
We then focused on common modulations and their re sulting functional annotations, arising from IL32β-stimu lated monocytes and M φ (Online Supplementary Figure S5C,D). Consistent with the activation of STAT3 and NFkB pathways at the protein level (Figure 5C), we observed a significant enrichment in JAK-STAT (hsa#04630) and NF-
Figure 5. Myeloid cells, but not mantle cell lymphoma cells, respond to IL32β. (A) Survival of mantle cell lymphoma (MCL) cells (n=8) cultured with or without recombinant human (rh)IL32β (100 ng/mL) for 7 days was measured by lack of annexin-V staining. Wilcoxon-matched pairs sign-rank test: n.s: not significant. (B, C) Immunoblotting of the indicated proteins was performed in (B) MCL cell lines cultured with or without (rh)IL32β for 6 h or (C) CD14+ monocytes and CD3+ T cells isolated from healthy donors and cultured with 100 ng/mL of (rh)IL32β for the indicated times. (D) The figure represents the principal component analysis of monocytes (Mono, n=3), macrophages (Mφ, n=3) and T cells (T, n=3) cultured for 24 h with or without 100 ng/mL of (rh)IL32β. Mφ were first polarized with macrophage colony-stimulating factor (50 ng/mL, for 5 days) and then stimulated during 48 h with 100 ng/mL of (rh)IL32β. Colored ellipses are drawn around the mean of the group (barycenter), with the 95% confidence interval of the mean in the corresponding plan. (E) An ascendant hierarchical clustering based on 19,203 genes was constructed with the ward.D2 method of Euclidiean distances.
kB (hsa#04064) pathways (Online Supplementary Figure S5D). In addition, enrichment of several pathways related to soluble factors, such as IL17 (hsa#04657), TNF (hsa#04668), chemokine and cytokine signaling (hsa#04062, hsa#04060), suggested that IL32 β might regulate the secretome of monocytes/Mφ (Online Supple mentary Figure S5D). Taken together these results sug gested that IL32β secreted by MCL in its ecosystem would result in the stimulation of monocytes/Mφ and potentially influence their secretome.
Mantle cell lymphoma-secreted IL32 led to specific differentiation of monocytes into protumoral CD163+ macrophages Mφ-32
To determine the nature of the secretome modifications in monocytes/macrophages stimulated by IL32 β , we further focused our analysis on a list of 370 cytokines and chemokines (annotated in GO#0008009 and #0005125). Among them 108 were expressed in at least one sample
and many of them were induced after IL32β stimulation in monocytes (n=48) or macrophages (n=40) (Figure 6A). Most of these modulations were observed in both mono cytes and macrophages (n=29) and were validated by quantitative reverse transcriptase polymerase chain reac tion and cytokine array (Online Supplementary Figure S6). To confirm these results with MCL-secreted IL32 β , we generated IL32-/- Mino cells (Online Supplementary Figure Figure S7A, B) and evaluated the ability of their super natant to induce the validated rhIL32β-modulated genes on monocyte/macrophages (IL1A, IL1B, IL6, IL24, CXCL8, TNFSF13B, and IL32). As expected, IL32-/- MINO super natant was characterized by a lesser ability to induce these genes in monocytes/macrophages compared to IL32+/+ cells (Figure 6B). These results were confirmed with CD40L-stimulated IL32-/- NTS3 cells (Online Supple mentary Figure S7C). Using previously published macrophage subtype char acterization,12 we determined that IL32β-induced soluble

Figure 6. IL32β secreted
cells induces differentiation of monocytes into protumoral Mφ-32. (A) Heat maps of soluble factor transcripts modulated (log2Fc >0.1) in monocytes (Mono, n=3) and monocyte-derived macrophages (Mφ n=3) cultured with or without recombinant human (rh)IL32β as described in Figure 5D. For each cell type, the median gene ex pression was calculated on normalized and transformed data (DESeq2 package). The colors indicate the intensity of the median gene expression as indicated (log scale). *Indicates that gene expression was confirmed by quantitative reverse transcriptase polymerase chain reaction (RT-qPCR) as represented in Online Supplementary Figure S6A. (B) The left panel details the experi mental protocol related to the right panel. The right panel represents RT-qPCR analysis of seven genes (IL1A, IL1B, IL6, IL24, CXCL8, IL32 and BAFF) in Mono or Mφ cultured, for 24 h or 48 h, respectively, with wild-type (-) or IL32-/- (Cr#1) Mino supernatant. (C) Forty-eight IL32β-induced soluble factors on Mono or Mφ were classified as M1-like, M2-like (upper panel) or MφMCL-like (lower panel) as previously reported.12 (D) CD163 mean fluorescence intensity ratio was determined by flow-cytometry for M1 (n=3), M2-10 (n=4) and Mφ32 (monocyte-derived macrophages differentiated with 50 ng/mL CSF1 for 5 days and then stimulated with 100 ng/mL rhIL32β for 48 h, n=3) and MφMCL (monocyte-derived macrophages in the presence of MCL cells, n=3). M1, M210 and MφMCL were generated as previously described.12 (E) The percentage of MCL live cells was assessed by lack of annexinV staining after 3 days of culture alone (-) or with Mφ32 and separated by transwell inserts (n=10). Wilcoxon-matched pairs sign-rank test. **P<0.005.
factors were associated with both M1-like (53%) and M2like (47%) secretomes. We recently described such a dual M1/M2 profile in MCL-associated macrophages (Mφ-MCL) and accordingly 85% of IL32β-induced factors were found to be expressed by M φ -MCL (Figure 6C).12 In addition, these macrophages (Mφ-32) displayed similar CD163mid ex pression, a marker of protumoral macrophages, which we previously described regarding M φ -MCL (Figure 6D). Fi nally, using culture inserts, we confirmed that the Mφ-32 secretome was protumoral, inducing a 3-fold increase in MCL cell survival compared to that of MCL cells alone (median survival 12.5% vs. 38%; P<0.01) (Figure 6E).
Collectively these results showed that monocytes/mac rophages responded to MCL-secreted IL32β, resulting in their polarization into protumoral CD163mid Mφ-32 express ing both an M1 and an M2-associated secretome, which was similar to that of Mφ-MCL.
BAFF is involved in Mφ-32 prosurvival dialog through activation of the alternative NFkB pathway in mantle cell lymphoma cells Lastly, we aimed to discover the factors involved in the prosurvival soluble dialog between Mφ-32 and MCL cells. We first tested a panel of nine growth factors induced by

IL32β for their capacity to support long-term (7 days) sur vival of MCL cells (Figure 7A). Remarkably, only BAFF was able to support MCL-cell survival alone (n=9) at a level simi lar to that of Mφ-32 supernatant (s_ Mφ-32) (Figure 7B). BAFF binds to three receptors, BAFF-R, TACI and BCMA, the last two being shared with the growth factor, A prolifer ation-inducing ligand (APRIL). In contrast to BAFF, APRIL did not support MCL survival (Figure 7B), suggesting that TACI and BCMA were not involved in the protumoral dialog studied here. We showed that most MCL cells highly ex pressed BAFFR and that TNFSF13B expression was enriched in MCL LN when compared to PB (P<0.0001), suggesting a key role of this growth factor in MCL tissue (Online Supple mentary Figure S8A, B). We also confirmed that Mφ-32 were able to secrete a significant amount of BAFF, in contrast to MCL (Figure 7C), and showed that rhBAFF induced the se lective activation of the alternative NFkB pathway in MCL cells and cell lines (processing of p52) (Online Supplemen tary Figure S8C). Accordingly, NIK inhibition was able to counteract the survival support provided by rhBAFF in MCL cells (median reduction of 95%, n=4, P<0.05) (Online Sup

plementary Figure S8D). NIK inhibition also reduced the sur vival support provided by Mφ-32 supernatant, with a median reduction of 47% (n=6, P<0.05) and almost complete reduc tion in three of six samples, suggesting an involvement of BAFF in Mφ-32 supernatant (Figure 7D). Indeed, in these NIK-inhibitor-sensitive samples, BAFF-R-neutralizing anti bodies resulted in the inhibition of Mφ-32 supernatnat pro tumoral support with a level similar to that of the NIK inhibitor (Figure 7E). Accordingly, Mφ-32 supernatant re sulted in activation of the alternative NFkB pathway, which was counteracted using BAFF/BAFF-R-neutralizing anti bodies (Figure 7F, Online Supplementary Figure S8E). Taken together, these data showed that BAFF secreted by Mφ-32 was involved in the protumoral dialog with MCL, which can be counteracted by a selective NIK inhibitor or BAFF-R-neu tralizing antibodies.
IL32 is a newly characterized cytokine of which there are
B C
Figure 7. BAFF supports the Mφ-32 prosurvival effect through activation of the alternative NFkB pathway. (A) Schematic repre sentation of the protocol used. (B) Mantle cell lymphoma (MCL) cells (5x10⁵ cells/mL) were cultured with macrophages polarized with IL32 supernatant (s_Mφ-32, n=6) or growth factors: BAFF (100 ng/mL), IL6 (20 ng/mL), IL10 (100 ng/mL), IL32β (100 ng/mL), TNFα (20 ng/mL), IL15 (20 ng/mL), APRIL (100 ng/mL), IL1β (50 ng/mL), IL1α (50 ng/mL), IL24 (100 ng/mL), IL18 (50 ng/mL) and WNT5A (200 ng/mL) (n≥3). The percentage of cell rescue was assessed after 7 days of ex vivo culture. (C) Concentration of BAFF protein was evaluated by enzyme-linked immunosorbent assay in the supernatant of MCL cell lines (n=5), M1 (n=3) and Mφ-32 (n=5) monocyte-derived macrophages. Unpaired t test. *P<0.05. (D) The percentage of cell rescue dependent on Mφ-32 super natant (s_Mφ-32) in MCL cells (n=6) cultured with or without an NIK inhibitor (NIK-i, 10 µM) for 7 days was determined by annexin V staining. Paired t test. *P<0.05. (E) Percentage of cell rescue dependent on Mφ-32 supernatant (s_Mφ-32) in primary MCL (n=3) cultured with or without NIK inhibitor (NIK-i, 10 µM) or anti-BAFFR neutralizing antibody (4 µg/mL) for 7 days. (F) Immunoblotting of classical (pIkB, IkB) and alternative (p100, p52) NF-kB pathways in MCL cells cultured with Mφ-32 supernatant (s_Mφ-32) for 24 h with or without anti-BAFFR neutralizing antibody (4 µg/mL) as indicated.
seven variants, generated by alternative splicing, with dif ferential biological roles.23,24 IL32α, IL32β and IL32ɣ are the isoforms that have been studied the most up to now, with IL32β being the most frequently expressed in cancer,25 as shown here for MCL. The putative receptor for IL32 is un known and the lack of IL32 expression in rodents con siderably limits our knowledge on its physiological roles. Nevertheless, IL32β expression has been documented in several solid cancers and this cytokine seems to be in volved in many biological processes such as migration, metastasis, proliferation, and apoptosis.25 We have shown here that IL32β, which was secreted by lymphoma cells, did not directly increase tumor cell survival, but partici pated in the tumor-specific shaping of macrophages. Such a paracrine role of IL32 has been recently described in multiple myeloma, a plasma cell neoplasm,26 reinforcing the critical role of this soluble factor in the ecosystem of B-cell malignancies.
Whereas IL32 was initially characterized for its pro-in flammatory properties,27 recent studies have highlighted that IL32 was preferentially expressed in regulatory T cells in the bone marrow28 and that it was able to promote im munoregulatory responses, especially through the induc tion of IL10 or indoleamine 2, 3-dioxygenase (IDO) by macrophages.29-31 Here we have confirmed, through a tran scriptomic analysis of IL32 β -induced genes in mono cytes/macrophages, the ability of IL32 β to induce the production of both pro-inflammatory (e.g., IL6, OSM, IL1α, and IL1β) and anti-inflammatory (e.g., IL10, IDO, IL18, IL4L1, and CCL22)19,32,33 soluble factors (Figure 5). We have recently published that, through a soluble inter play, MCL cells polarize monocytes into tumor-specific macrophages (Mφ-MCL), which in turn favor tumor sur vival.12 We have demonstrated that Mφ-MCL express both pro- (M1) and anti- (M2) inflammatory associated secre tomes, suggesting that factors other than classical M2polarizing factors (such as MCL-secreted IL10 and CSF-1) might be involved in the Mφ-MCL phenotype. Herein, we have shown that MCL-secreted IL32β is most likely to be involved in this specific MCL-associated macrophage pro file, with most of these M1 and M2-like factors being com mon to both Mφ-MCL and Mφ-32. In addition, Mφ-32 share M φ -MCL phenotypic and functional characteristics i.e., CD163mid expression or MCL survival support through sol uble dialog, respectively (Figure 6). Only a few studies have addressed the crosstalk between tumor-associated macrophages and MCL cells, so far.12,34,35 Of note, a recent publication highlighted that LN infiltrating CD163+ MCLassociated macrophages correlate with a poor prognosis in MCL,36 suggesting that targeting this interplay could be an interesting perspective for novel therapeutic options. Of the various IL32 β -induced secretomes, several have been previously described as being involved in MCL ex pansion, such as IL6, IL10, BAFF and WNT5A.37-40 Never
theless, we have shown that only BAFF supported the long-term survival of MCL cells alone, at a level similar to that observed with the Mφ-32 supernatant. Although BAFF is a well-described survival and growth factor for both normal and malignant B cells,39 only a few publications have addressed the functional consequences of BAFF stimulation in MCL.41 We have shown that most MCL samples express BAFF-R, and its activation leads to se lective processing of the alternative NFkB pathway (Figure 7). Of note, Medina and colleagues previously demon strated that mesenchymal stem cell-dependent MCL sur vival was also mediated by BAFF, suggesting a central role for this growth factor in MCL ecosystems.42 Neutralizing antibodies are available for targeting either BAFF (belimu mab) or BAFF-R (VAY-736), both of which display interest ing preclinical activity, alone or in combination with BTK inhibitors, in B-cell malignancies such as chronic lympho cytic leukemia.43,44 Our results highlight a major role of the alternative NFkB pathway in the interplay between CD40-activated MCL cells and macrophages, especially through the IL32/BAFF axis. Saba and colleagues highlighted that a so-called “NIK signature”, reflecting the activity of the alternative NFkB pathway, was enriched in MCL LN tissue compared to PB.15 Consistent with these results, we previously demon strated strong processing of p52 in our CD40L culture model designed to mimic signals occurring within the LN.13 Here we have confirmed that MCL cells cultured in this model are also characterized by the NIK signature (Online Supplementary Figure S1). The alternative NFkB pathway is frequently constitutively activated in MCL by intrinsic anomalies in several key elements of this pathway, such as MAP3K14 (coding for NIK), TRAF2, BIRC3 and TRAF3 45 In the present work, we have shown that activation of the alternative NF k B pathway is also able to influence the MCL ecosystem through microenvironment-dependent and tumor-specific IL32 induction and consecutive mac rophage (re)programming. Thus, the alternative NF k B pathway activation can be the consequence of both in trinsic anomalies and microenvironment interactions, highlighting a central role of this pathway, which appeared to be involved in drug resistance. Indeed, Rahal and col leagues showed that its constitutive activity was involved in resistance to ibrutinib in MCL cell lines.11 We previously demonstrated that CD40L-dependent sur vival was associated with an NFkB-dependent imbalance of the BCL-2 family in MCL, including dramatic induction of anti-apoptotic proteins such as BCLxL.13,14 Even though BAFF is a well-described pro-survival factor, the precise molecular mechanisms involved in BAFF-dependent sur vival remain elusive and cell-type dependent4.6,47 In contrast to CD40L, BAFF did not induce BCLxL or MCL1 in MCL cells and only a transitory increase of BCL2A1 was detected in cell lines (Online Supplementary Figure S8F-
Figure 8. The IL32/BAFF axis supports prosurvival dialogs in the lymphoma ecosystem and is disrupted by NIK inhibition. Inter actions between tumor cells and T cells, through the CD40-CD40L axis, result in activation of the NFkB pathways (NFkB1/2) and in NFkB2-dependent secretion of IL32 by tumor cells within their ecosystem. IL32 promoter is hypomethylated in mantle cell lymphoma (MCL) cells compared to normal B cells (NBC) resulting in tumor-restricted IL32 expression. The latter is involved in monocyte differentiation into lymphoma-associated CD163+ macrophages (Mφ-32). Mφ-32 are characterized by a specific secre tome, which includes BAFF, and supports BAFF-R/NFkB2-dependent tumoral survival. Selective NIK inhibition counteracts NFkB2 activation and consequently prevents both IL32 secretion by MCL cells and BAFF-dependent MCL-survival.

H). Taken together, our data suggest that complementary protumoral pathways occur within the ecosystem. Further studies, such as modulations of BCL2-family complexes at the mitochondrial level and characterization of mito chondrial priming upon BAFF stimulation, are now necess ary to decipher the molecular mechanisms involved in BAFF/NFkB2 dependent regulation of apoptosis in MCL. The specific inhibition of the alternative NF k B pathway was barely achievable until the very recent development of specific NIK inhibitors.21,48 NIK is a kinase selectively in volved in the alternative pathway by activating IkKα, which in turn induces the cleavage of p100 to p52, without af fecting the canonical pathway. Here, we have confirmed the efficacy of NIK inhibition in counteracting micro environment-dependent induction of IL32 (Figure 4) and BAFF-dependent survival of MCL cells (Figure 7). The cen tral role of the NF k B pathways in mature B-cell malig nancies is well-documented,49,50 reinforcing the strong rationale to specifically target this pathway. Further de velopment of molecules that selectively target key el ements of the alternative NF k B pathway (e.g., NIK and RELB) as well as their evaluation in early phase clinical trials are now needed to address their potential thera peutic value.
In summary, our data reveal the involvement of the
IL32β/BAFF axis in MCL-associated macrophage polariza tion and tumor survival. Our data show that targeting IL32β, BAFF or the alternative NFkB pathway could be of major interest for counteracting the multiple cross-talk that occurs in the MCL microenvironment and, especially, the CD40L+ T-cell/MCL/CD163+ MCL-associated macro phage triad (Figure 8).
No conflicts of interest to disclose.
SD and AP designed and performed the experiments and analyzed data. CB performed experiments and participated in bioinformatics. CS, CD, TR, AMA and YLB performed ex periments and analyzed data. BT and MR participated in the bioinformatics analysis . SB and PH participated in im munohistochemistry experiments and analysis. SLG partici pated in the design of the study. CPD participated in the design of the study, in the data analysis, and in writing the article. DC designed the study, performed experiments, analyzed data, and wrote the article.
The authors thank la Ligue Contre le Cancer Grand-Ouest,
i-Site NexT (ANR-16-IDEX-0007), the SIRIC ILIAD (INCaDGOS-Inserm_12558), ERRATA (Région Pays de la Loire pro gram 2015-2018) and Actions Cancer 44. CS is the recipient of a fellowship from Plan Cancer (FRFT). MicroPICell facility is a member of the national infrastructure France-Bio Imaging supported by the French National Research Agency (ANR-10-INBS-04). The authors thank Dr. Martine Amiot for her critical review of the manuscript. The authors are also most grateful to the Genomics and Bioinformatics Core Fa
1. Maman S, Witz IP. A history of exploring cancer in context. Nat Rev Cancer. 2018;18(6):359-376.
2. Jin M-Z, Jin W-L. The updated landscape of tumor microenvironment and drug repurposing. Signal Transduct Target Ther. 2020;5(1):1-16.
3. Le Gouill S, Morschhauser F, Chiron D, et al. Ibrutinib, obinutuzumab and venetoclax in relapsed and untreated patients with mantle-cell lymphoma, a phase I/II trial. Blood. 2020;137(7):877.
4. Pytlik R, Polgarova K, Karolova J, Klener P. Current immunotherapy approaches in non-Hodgkin lymphomas. Vaccines. 2020;8(4):708.
5. Campo E, Rule S. Mantle cell lymphoma: evolving management strategies. Blood. 2015;125(1):48-55.
6. Delfau-Larue M-H, Klapper W, Berger F, et al. High-dose cytarabine does not overcome the adverse prognostic value of CDKN2A and TP53 deletions in mantle cell lymphoma. Blood. 2015;126(5):604-611.
7. Eskelund CW, Dahl C, Hansen JW, et al. TP53 mutations identify younger mantle cell lymphoma patients who do not benefit from intensive chemoimmunotherapy. Blood. 2017;130(17):1903-1910.
8. Nadeu F, Martin-Garcia D, Clot G, et al. Genomic and epigenomic insights into the origin, pathogenesis, and clinical behavior of mantle cell lymphoma subtypes. Blood. 2020;136(12):1419-1432.
9. Agarwal R, Chan Y-C, Tam CS, et al. Dynamic molecular monitoring reveals that SWI–SNF mutations mediate resistance to ibrutinib plus venetoclax in mantle cell lymphoma. Nat Med. 2019;25(1):119-129.
10. Chiron D, Di Liberto M, Martin P, et al. Cell-cycle reprogramming for PI3K inhibition overrides a relapse-specific C481S BTK mutation revealed by longitudinal functional genomics in mantle cell lymphoma. Cancer Discov. 2014;4(9):1022-1035.
11. Rahal R, Frick M, Romero R, et al. Pharmacological and genomic profiling identifies NF-κB–targeted treatment strategies for mantle cell lymphoma. Nat Med. 2014;20(1):87-92.
12. Papin A, Tessoulin B, Bellanger C, et al. CSF1R and BTK inhibitions as novel strategies to disrupt the dialog between mantle cell lymphoma and macrophages. Leukemia. 2019;33(10):2442-2453.
13. Chiron D, Bellanger C, Papin A, et al. Rational targeted therapies to overcome microenvironment-dependent expansion of mantle cell lymphoma. Blood. 2016;128(24):2808-2818.
14. Tessoulin B, Papin A, Gomez-Bougie P, et al. BCL2-family dysregulation in B-cell malignancies: from gene expression regulation to a targeted therapy biomarker. Front Oncol. 2018;8:645.
cility of Nantes (GenoBiRD, Biogenouest, IFB) and the flow cytometry core facility (Cytocell, SFR Bonamy) for their technical support.
Data-sharing statement RNA-sequencing datasets are publicly available in the Gene Expression Omnibus. All other datasets analyzed dur ing the current study are av ailable from the corresponding author on reasonable request.
15. Saba NS, Liu D, Herman SE, et al. Pathogenic role of B-cell receptor signaling and canonical NF-κB activation in mantle cell lymphoma. Blood. 2016;128(1):82-92.
16. Ferrer A, Salaverria I, Bosch F, et al. Leukemic involvement is a common feature in mantle cell lymphoma. Cancer. 2007;109(12):2473-2480.
17. Hanf M, Chiron D, de Visme S, et al. The REFRACT-LYMA cohort study: a French observational prospective cohort study of patients with mantle cell lymphoma. BMC Cancer. 2016;16(1):802.
18. Charpentier E, Cornec M, Dumont S, et al. 3’RNA sequencing for robust and low-cost gene expression profiling. 2021 Jan 15: https://doi.org/10.21203/rs.3.pex-1336/v1 [preprint, not peer-reviewed].
19. Rawal S, Chu F, Zhang M, et al. Cross talk between follicular Th cells and tumor cells in human follicular lymphoma promotes immune evasion in the tumor microenvironment. J Immunol. 2013;190(12):6681-6693.
20. Burke JR, Pattoli MA, Gregor KR, et al. BMS-345541 is a highly selective inhibitor of IκB kinase that binds at an allosteric site of the enzyme and blocks NF-κB-dependent transcription in mice. J Biol Chem. 2003;278(3):1450-1456.
21. Brightbill HD, Suto E, Blaquiere N, et al. NF-κB inducing kinase is a therapeutic target for systemic lupus erythematosus. Nat Commun. 2018;9(1):1-14.
22. Sloot YJ, Smit JW, Joosten LA, Netea-Maier RT. Insights into the role of IL-32 in cancer. Semin Immunol. 2018;38:24-32.
23. Aass KR, Kastnes MH, Standal T. Molecular interactions and functions of IL 32. J Leuk Biol. 2021;109(1):143-159.
24. Sohn DH, Nguyen TT, Kim S, et al. Structural characteristics of seven IL-32 variants. Immune Netw. 2019;19(2):e8.
25. Han S, Yang Y. Interleukin-32: frenemy in cancer? BMB Rep. 2019;52(3):165.
26. Zahoor M, Westhrin M, Aass KR, et al. Hypoxia promotes IL-32 expression in myeloma cells, and high expression is associated with poor survival and bone loss. Blood Adv. 2017;1(27):2656-2666.
27. Kim S-H, Han S-Y, Azam T, Yoon D-Y, Dinarello CA. Interleukin32: a cytokine and inducer of TNFα. Immunity. 2005;22(1):131-142.
28. Zavidij O, Haradhvala NJ, Mouhieddine TH, et al. Single-cell RNA sequencing reveals compromised immune microenvironment in precursor stages of multiple myeloma. Nat Cancer. 2020;1(5):493-506.
29. Kang JW, Choi SC, Cho MC, et al. A proinflammatory cytokine interleukin-32β promotes the production of an antiinflammatory cytokine interleukin-10. Immunology. 2009;128(1pt2):e532-e540.
30. Smith AJ, Toledo CM, Wietgrefe SW, et al. The immunosuppressive role of IL-32 in lymphatic tissue during HIV-1 infection. J Immunol. 2011;186(11):6576-6584.
31. Yan H, Dong M, Liu X, et al. Multiple myeloma cell-derived IL32γ increases the immunosuppressive function of macrophages by promoting indoleamine 2, 3-dioxygenase (IDO) expression. Cancer Lett. 2019;446:38-48.
32. Carbonnelle-Puscian A, Copie-Bergman C, Baia M, et al. The novel immunosuppressive enzyme IL4I1 is expressed by neoplastic cells of several B-cell lymphomas and by tumorassociated macrophages. Leukemia. 2009;23(5):952-960.
33. Nakamura K, Kassem S, Cleynen A, et al. Dysregulated IL-18 is a key driver of immunosuppression and a possible therapeutic target in the multiple myeloma microenvironment. Cancer Cell. 2018;33(4):634-648.
34. Song K, Herzog BH, Sheng M, et al. Lenalidomide inhibits lymphangiogenesis in preclinical models of mantle cell lymphoma. Cancer Res. 2013;73(24):7254-7264.
35. Le K, Sun J, Khawaja H, et al. Mantle cell lymphoma polarizes tumor-associated macrophages into M2-like macrophages, which in turn promote tumorigenesis. Blood Adv. 2021;5(14):2863-2878.
36. Rodrigues JM, Nikkarinen A, Hollander P, et al. Infiltration of CD163-, PD-L1- and FoxP3-positive cells adversely affects outcome in patients with mantle cell lymphoma independent of established risk factors. Br J Haematol. 2021;193(3):520-531.
37. Baran-Marszak F, Boukhiar M, Harel S, et al. Constitutive and Bcell receptor-induced activation of STAT3 are important signaling pathways targeted by bortezomib in leukemic mantle cell lymphoma. Haematologica. 2010;95(11):1865.
38. Karvonen H, Chiron D, Niininen W, et al. Crosstalk between ROR1 and BCR pathways defines novel treatment strategies in mantle cell lymphoma. Blood Adv. 2017;1(24):2257-2268.
39. Yang S, Li J-Y, Xu W. Role of BAFF/BAFF-R axis in B-cell nonHodgkin lymphoma. Crit Rev Oncol Hematol. 2014;91(2):113-122.
40. Zhang L, Yang J, Qian J, et al. Role of the microenvironment in mantle cell lymphoma: IL-6 is an important survival factor for the tumor cells. Blood. 2012;120(18):3783-3792.
41. Novak AJ, Grote DM, Stenson M, et al. Expression of BLyS and its receptors in B-cell non-Hodgkin lymphoma: correlation with disease activity and patient outcome. Blood. 2004;104(8):2247-2253.
42. Medina DJ, Goodell L, Glod J, Gélinas C, Rabson AB, Strair RK. Mesenchymal stromal cells protect mantle cell lymphoma cells from spontaneous and drug-induced apoptosis through secretion of B-cell activating factor and activation of the canonical and non-canonical nuclear factor κB pathways. Haematologica. 2012;97(8):1255-1263.
43. McWilliams EM, Lucas CR, Chen T, et al. Anti–BAFF-R antibody VAY-736 demonstrates promising preclinical activity in CLL and enhances effectiveness of ibrutinib. Blood Adv. 2019;3(3):447-460.
44. Tandler C, Schmidt M, Heitmann JS, et al. Neutralization of Bcell activating factor (BAFF) by belimumab reinforces small molecule inhibitor treatment in chronic lymphocytic leukemia. Cancers. 2020;12(10):2725.
45. Hill HA, Qi X, Jain P, et al. Genetic mutations and features of mantle cell lymphoma: a systematic review and meta-analysis. Blood Adv. 2020;4(13):2927-2938.
46. Hatada EN, Do RK, Orlofsky A, et al. NF-κB1 p50 is required for BLyS attenuation of apoptosis but dispensable for processing of NF-κB2 p100 to p52 in quiescent mature B cells. J Immunol. 2003;171(2):761-768.
47. Paiva C, Rowland TA, Sreekantham B, et al. SYK inhibition thwarts the BAFF-B-cell receptor crosstalk and thereby antagonizes Mcl-1 in chronic lymphocytic leukemia. Haematologica. 2017;102(11):1890.
48. Mondragón L, Mhaidly R, De Donatis GM, et al. GAPDH overexpression in the T cell lineage promotes angioimmunoblastic T cell lymphoma through an NF-κBdependent mechanism. Cancer Cell. 2019;36(3):268-287.
49. Kennedy R, Klein U. Aberrant activation of NF-κB signalling in aggressive lymphoid malignancies. Cells. 2018;7(11):189.
50. Eluard B, Nuan-Aliman S, Faumont N, et al. The alternative RelB NF-κB subunit is a novel critical player in diffuse large B-cell lymphoma. Blood. 2022;139(3):384-398.
Zheng-Li Xu,1,2* Lan-Ping Xu,1,2* De-Pei Wu,3* Shun-Qing Wang,4* Xi Zhang,5 Rui Xi,6 Su-Jun Gao,7 Ling-Hui Xia,8 Jian-Min Yang,9 Ming Jiang1,0 Xin Wang,11 Qi-Fa Liu,12 Jia Chen,3 Ming Zhou,4 and Xiao-Jun Huang1,2,13,14
1Peking University People’s Hospital, Peking University Institute of Hematology, Beijing; 2National Clinical Research Center for Hematologic Disease, Beijing; 3The First Hospital affiliated to Soochow University, Soochow; 4Guangzhou First People’s Hospital, Guangzhou; 5Xinqiao Hospital affiliated to Third Military Medical University, Chongqing; 6General Hospital of Lanzhou Military Region of PLA, Lanzhou; 7The First Hospital of Jilin University, Changchun; 8Xiehe Hospital affiliated to Huazhong University of Science and Technology, Wuhan; 9Changhai Hospital affiliated to Second Military Medical University, Shanghai; 10The First Hsopital affiliated to Xinjiang Medical University, Urumchi; 11Shandong Provincial Hospital, Jinan; 12Nanfang Hospital affiliated to Southern Medical University, Guangzhou; 13Beijing Key Laboratory of Hematopoietic Stem Cell Transplantation, Beijing and 14PekingTsinghua Center for Life Sciences, Beijing, China
*Z-LX, L-PX, D-PW, S-QW contributed equally as co-first authors.
Correspondence: X-J. Huang xjhrm@medmail.com.cn
Received: January 27, 2022.
Accepted: May 13, 2022. Prepublished: May 26, 2022.
https://doi.org/10.3324/haematol.2022.280758
©2022 Ferrata Storti Foundation Published under a CC BY-NC license
Allogeneic hematopoietic stem cell transplantation (allo-HSCT) remains a curative option for severe aplastic anemia (SAA), and transplantation from identical sibling donors (ISD) has been recommended as a first-line treatment. Haploidentical donor (HID) transplantation for SAA has made great advances; thus, an increased role of HID-SCT in SAA should be considered. We performed a national registry-based analysis comparing long-term outcomes in the upfront HID or upfront ISD SCT setting. A total of 342 SAA patients were enrolled, with 183 patients receiving HID SCT and 159 receiving ISD SCT. The estimated 9-year overall survival and failure-free survival were 87.1±2.5% and 89.3±3.7% (P=0.173) and 86.5±2.6% versus 88.1±3.8% (P=0.257) for patients in the HID and ISD SCT groups, respectively. Transplantation from HID or ISD SCT has greatly improved quality of life (QoL) levels post-HSCT compared to pre-HSCT. The occurrence of chronic graft-versus-host disease was the only identified adverse factor affecting each subscale of QoL. Physical and mental component summaries in adults as well as physical, mental, social, and role well-being in children were all similar between HID and ISD SCT at 5-year time points. At the last follow-up, the proportion of returning to society was comparable between the HID and ISD groups, showing 78.0% versus 84.6% among children and 74.6% versus 81.2% among adults. These data suggest that haploidentical transplant can be considered a potential therapeutic option in the upfront setting for SAA patients in the absence of an HLA-identical related or unrelated donor.
Severe aplastic anemia (SAA) is a potentially fatal bone marrow failure disorder characterized by pancytopenia, transfusion dependency, and susceptibility to various in fections.1 Allogeneic hematopoietic stem cell transplanta tion (allo-HSCT) and immunosuppressive therapy (IST) are two effective treatment options in SAA.2 In consideration of long-term recovery following treatment, allo-HSCT has the advantage of rapid complete hematopoietic recovery, better health-related quality of life, while virtually elimin
ating the risk of relapse and secondary clonal disease.3-5 Transplantation from identical sibling donors (ISD) has pro duced a long-term survival of approximately 90% and has been recommended as a first-line choice among younger patients according to the current treatment algorithm.2,6 The recent outcomes of upfront matched unrelated donor (MUD) transplants are also similar with ISD especially in children and adolescents with SAA.7 However, rapid donor availability remains an issue for certain patients.
During the last decade, the results of allo-HSCT for SAA with a haploidentical donor (HID) have improved remark
ably.8 HID transplantation (haplo-SCT) has achieved simi lar overall survival (OS) as ISD-SCT (89% vs. 91%) as sal vage therapy for SAA.9 Due to the improved results of allo-HSCT with HID, it is considered whether this treat ment should be given an increased role among SAA pa tients in the absence of HLA-identical sibling donors.10 Based on a previous registry-based comparison, haploSCT as upfront therapy has been indicated to be com parable to upfront ISD-SCT, showing an estimated 3-year OS of 86% and 91% with a median follow-up of 21.4 and 26.0 months.11 However, the long-term outcomes of up front haplo-SCT and the comparison with upfront ISDSCT in SAA have not been evaluated. For long-term evaluation, survival is a vital indicator but not the only goal for SAA patients receiving allo-HSCT. For such a non-malignant disease, the major concern for long-term survivors also includes hematologic recovery, health-related quality of life (QoL), and return to society. The current study aimed to compare the long-term effi cacy of SAA patients who received an upfront transplant from HID or ISD, focusing on survival, late complications, QoL including psychological status and physical function, and the return to work or school. This analysis will provide evidence in favor of haplo-SCT as a therapeutic option in the upfront setting for SAA patients in the absence of an HLA-identical donor.
This was a multi-center retrospective study based on data from the Chinese Blood and Marrow Transplantation Reg istry Group (CBMTRG). The data were collected from 11 transplantation centers. The study was approved by the Institutional Review Board at the 11 participating centers. Written informed consent was obtained from each patient in accordance with the Declaration of Helsinki.
Patients with SAA who received upfront allo-HSCT from HID or ISD during the period from January 2012 to De cember 2018 were included. None of the patients had been previously treated with antithymocyte globulin (ATG)-based immunosuppressive therapy. All enrolled pa tients underwent upfront allo-HSCT within 4 months after the definite diagnosis of SAA. A total of 158 patients were reported in the published study11 and outcomes were up dated with extended follow-up.
The conditioning regimen was uniform in haploidentical transplantation, which consisted of the following: 3.2 mg/kg/day intravenous (i.v.) busulfan (Bu) on days -7 and
-6; 50 mg/kg/day i.v. cyclophosphamide (Cy) and 2.5 mg/kg/day i.v. rabbit ATG (r-ATG) from day -5 to day -2.12 In ISD SCT cohort, the applied regimens included the fol lowing: Cy (200 mg/kg) + r-ATG (10-12 mg/kg), Flu (120 mg/m2) + Cy (100-200 mg/kg) + r-ATG (10-12.5 mg/kg), and Bu (6.4 mg/kg) + Cy (160 mg/kg) + r-ATG (10 mg/kg). Graft-versus-host disease (GVHD) prophylaxis consisted of ciclosporin (CsA), mycophenolate mofetil (MMF), and short-term methotrexate (MTX). CsA at 3 mg/kg/day in di vided doses was started from day -9, and was continued for up to 1 year post-SCT. Mycophenolate mofetil (MMF) was administered orally (0.5 g every 12 hours in adults and 0.25 g every 12 hours in children) from day 9 and the dose was halved on day +30 and then stopped on day +60 in HID cohort. In the ISD cohort, MMF was tapered upon engraftment. MTX was administered at a dose of 15 mg/m2 on day +1 and at a dose of 10 mg/m2 on days +3, +5, and +11 in HID cohort (MTX +1, +3, and +6 in ISD cohort). In both HID and ISD cohorts, unmanipulated G-CSF mobi lized bone marrow (BM) or G-CSF mobilized peripheral blood stem cells (PBSC) or combination of BM with PB were infused as grafts. The other details of transplanta tion were performed as described previously.11
The following outcomes were examined in the present study: chronic GVHD (cGVHD), hematologic reconstitution, OS, failure-free survival (FFS), GVHD-free failure-free sur vival (GFFS), QoL and social status (returning to work or school). cGVHD was assessed according to the National Institutes of Health Consensus Criteria.13 The definition of mixed chimerism or graft failure has previously been re ported in detail.14 FFS was defined as survival with a re sponse to therapy which meant transfusion independence and no longer meeting the criteria for severe disease. Death, primary or secondary graft failure and relapse were considered treatment failure. GFFS was defined as sur vival without grades III–IV acute GVHD (aGVHD), extensive cGVHD, and treatment failures. All outcomes were as sessed at the time of last contact.
Late complications requiring treatment were evaluated at the last follow-up. The late complications included sec ond malignancy, cardiovascular, respiratory, kidney, and skeletal complications. Besides, the successful fertility data post-SCT was also collected in the two cohorts.
For SAA recipients, the participating transplant centers were required to report their evaluation of QoL to the CBMTRG pre-HSCT, at 3 years and 5 years post-HSCT. The SF-36 questionnaire reflects eight subscales in adults: physical functioning (PF), role-physical (RP), bodily pain
(BP), general health (GH), vitality (VT), social functioning (SF), role-emotional (RE), and mental health (MH). Fur thermore, PF, RP, BP, and GH were aggregated to form a physical component summary (PCS) scale, and VT, SF, RE, and MH were aggregated to form a mental component summary (MCS) scale.15 The PedsQL 4.0 questionnaire con tains subscales that assess four QoL domains in children, involving physical, emotional, social, and role status.16
Comparisons of patient characteristics between the groups were performed using the Mann–Whitney U test for continuous variables and χ2 and Fisher’s exact tests for categorical data. The probabilities of survival were cal culated using the Kaplan–Meier estimator. Cumulative incidences were estimated for engraftment and GVHD to accommodate competing risks, with death as the com peting event. Variables with P<0.1 in univariate analysis (Online Supplementary Table S1) and donor source were included in Cox proportional hazards regression. The level of significance was set at P<0.05. SPSS 16.0 (Mathsoft, Se attle, WA, USA) and the R software package (version 3.6.2; http://www.r-project.org) were used for data analyses.
A total of 342 consecutive patients who received upfront allo-HSCT were enrolled in the present study. The baseline characteristics are summarized in Table 1. There were no statistically significant differences between the HID (n=183) and ISD (n=159) groups with regard to sex, Eastern Coop erative Oncology Group scale (ECOG), or donor-recipient blood type. As indicated in Table 1, the median age at trans plant was 21 (range, 1-51) and 32 (range, 7-61) years in the HID and ISD groups, respectively (P<0.001). A higher pro portion of BM plus peripheral blood (PB) grafts was infused in the HID group (91.3% vs. 79.2% in the ISD group, P<0.001). Patients receiving HID-SCT had a longer interval between disease diagnosis and transplant, with a median of 2.0 months, than patients receiving ISD-SCT who were trans planted within a median of 1.5 months after diagnosis.
As the sample size was enlarged, early-phase outcomes were updated and presented briefly. The cumulative inci dences (CI) of 28-day neutrophils (97.3±0.1% vs. 97.5±0.1%, P=0.328; Online Supplementary Figure S1A) and 100-day platelet engraftment (95.6±0.1% vs. 96.2±0.1%, P=0.275; Online Supplementary Figure S1B) were similar between the HID and ISD groups. As indicated in Table 1, the median time to achieve neutrophil engraftment was 1 day shorter (P=0.039) after ISD-HSCT, whereas that of platelet engraft
ment was 2 days shorter after ISD-HSCT (P=0.010). Haploi dentical donors were associated with a significantly higher incidence of grade II-IV aGVHD and III-IV aGVHD of 31.3±0.1% and 8.9±0.1%, respectively, compared to 4.5±0.1% and 1.9±0.1% in the ISD group (P <0.001, P=0.005; Online Supplementary Figure S2).
The cumulative 5-year incidence of overall cGVHD in the HID group (29.3±0.1%) was significantly higher than that in the ISD group (10.4±0.1%, P < 0.001 ). The cumulative incidence of moderate to severe cGVHD seemed to be higher in patients receiving HID-SCT (7.0±0.1%) with close to statistical difference, when compared to 2.6±0.1% in the ISD-SCT group (P=0.065; Online Supplementary Fig ure S3).
The median follow-up for surviving patients was 75.5 months (range, 37.1-117.7) and 70.3 months (range, 39.9115.6) in the HID and ISD groups, respectively. The esti mated 9-year probabilities of OS were 87.1±2.5% and 89.3±3.7% among HID and ISD patients, respectively (Fig ure 1A, P=0.173). The FFS at 9 years was 86.5±2.6% in the HID group and 88.1±3.8% in the ISD group (Figure 1B, P=0.257). No differences in terms of either OS or FFS were found according to patient age (children vs. adults). The estimated 9-year OS and FFS were 88.8±3.6% versus 87.7±2.7% (P=0.963) and 87.7±3.8% versus 87.0±2.8% (P=0.974) in the child and adult cohorts, respectively. The GFFS at 9 years was 82.0±2.8% versus 87.3±3.9% in the HID and ISD groups (P=0.028). We also calculated the survival outcomes among adults stratified by age. The estimated 9-year OS were 88.0±3.4% and 86.4±4.5% among adults aged 18-39 and those aged 40 years or older (P=0.394). Similarly, the 9-year OS were 87.6±3.3% versus 85.7±9.4% in the HID group, and 88.7±5.6% versus 86.7±5.1% in the ISD group among adults 18-39 years and those aged 40 years or older. In the multivariate analyses (Table 2), significant factors influencing overall survival included SAA course (>2 months or not, hazard ratio [HR] =2.138, P=0.044) and ECOG score (>1 or not, HR=2.291, P=0.017). In addition, a longer SAA course (>2 months or not, HR=2.093, P=0.040) and a higher ECOG score (>1 or not, HR=2.370, P=0.009) were also identified risk factors for inferior FFS.
A total of 23 patients in the HID group and 13 patients in the ISD group experienced transplant-related mortality (TRM), which occurred at a median of 96 days (range, 11,811 days) and 106 days (range, 2-2,893 days) after HID or ISD-SCT. Death was mainly attributable to infections (65.2% vs. 69.2%), followed by GVHD (21.7% vs. 15.4%) in the HID and ISD groups, respectively. The detailed descrip tion of TRM is summarized in Table 3.
Table 1. Patient and graft characteristics.
Age in years, median (range) 21 (1-51) 32 (7-61) <0.001
Children, N (%) 72 (39.3) 16 (10.1) Adult, N (%) 111 (60.7) 143 (89.9)
Male/Female, N 111/72 93/66 0.684 Disease course, mth, median (range) Interval from SAA diagnosis to SCT 2.0 (0.5-4.0) 1.5 (0.5-4.0) 0.012
Previous transfusion
Median units of RBC (range) 8 (0-60) 7.5 (0-92) 0.091 Median units of PLT (range) 12 (1-160) 10 (1-130) 0.004
#ECOG pre-SCT, median, (range) 1 (0-3) 1 (0-3) 0.682
Donor-patient sex match, N (%) <0.001
Male-male 81 (44.3) 35 (22.0) Male-female 50 (27.3) 36 (22.6) Female-male 33 (18.0) 57 (35.8) Female-female 19 (10.4) 31 (19.5)
ABO match, N (%) 0.256
Matched 95 (51.9) 96 (60.4)
Minor mismatched 36 (19.7) 25 (15.7)
Major mismatched 38 (20.8) 23 (14.5) Different 14 (7.7) 15 (9.4)
Graft type, N (%) <0.001
BM+PB 167 (91.3) 126 (79.2) BM only 10 (5.5) 5 (3.1) PB only 6 (3.3) 28 (17.6)
Median MNC, ×108/kg (range) 10.1 (3.4-34.8) 10.5 (4.6-26.4) 0.728
Median CD34+ count, ×106/kg (range) 3.8 (0.1-18.8) 4.0 (1.0-14.6) 0.252
Median CD3+ count, ×108/kg (range) 2.2 (0.1-14.5) 2.0 (0.2-7.7) 0.033
Median CD4+ count, ×108/kg (range) 1.3 (0.1-7.4) 1.1 (0.1-5.0) 0.011
Median CD8+ count, ×108/kg (range) 0.8 (0.1-7.7) 0.7 (0.1-2.7) 0.135
Median follow-up among alive patients, months (range) 75.5 (37.1-117.7) 70.3 (39.9-115.6) 0.718
Neutrophil engraftment, median (range) 12 (9-26) 11 (6-23) 0.039
Platelet engraftment, median (range) 15 (5-91) 13 (7-40) 0.010
ECOG (Eastern Cooperative Oncology Group scale) is used to evaluate patients’ performance status. SAA: severe aplastic anemia; SCT: stem cell transplantation; RBC: red blood cell count; PLT: platelet; BM: bone marrow; PB: peripheral blood; MNC: mononuclear cell count.
Primary graft failure (PGF) occurred in three cases from the HID group. Two patients underwent a second trans plant from an unrelated donor or an original donor. The remaining patient experienced hematologic recovery with complete recipient chimerism. One patient from the HID group and one from the ISD group developed secondary graft failure (SGF) at 2.5 months and 1.5 months post-
transplantation, and both died of viral infection. Mixed chimerism occurred more frequently in the ISD group than in the HID group. Five cases in the HID group and 29 cases in the ISD group suffered mixed chimerism, with median occurrences of 2 months (range, 1-2) and 3 months (range, 1-18).
Among the 308 patients (161 HID and 147 ISD) who were followed up for more than 3 years, 96.7% in the HID group
Figure 1. The survival outcomes stratified by donor source. (A) Overall survival in haploidentical donor (HID) or identical sibling donor (ISD) stem cell transplantation (SCT) cohort. (B) Failure-free survival in HID or ISD SCT cohort.

and 96.5% in the ISD group achieved normal complete blood counts (P=0.913). All of these patients achieved transfusion independence.
Late complications in both cohorts were not common (Table 4), including cardiovascular, respiratory, kidney complications, second malignancy, and femoral head ne crosis. During our follow-up, a total of 16 recipients (6 male in HID, 9 male and 1 female in ISD) successfully gave birth to children post allo-HSCT.
The estimated QoL trends are shown in Figures 2 and 3 for children and adults, respectively. Longitudinal trends were examined separately by donor sources. In children with HID HSCT, psychological, emotional, social, and role well-being improved from pre-HSCT to the 3-year time point and then further improved to the 5-year time point with significance (Figure 2). In children from the ISD HSCT group, four domain well-being improved significantly from pre-HSCT to the 3-
year time point and then remained stable up to the 5-year time point (Figure 2). Among adults with HID or ISD, both physical component summary (PCS) and mental component summary (MCS) levels improved significantly at 3 years and further became more elevated through 5 years (Figure 3). Outcome
Table 2. Multivariate analysis of adverse factors associated with survival outcomes.
Hazard ratio (95% confidence interval) P value
Overall survival SAA course >2 in months (range) 2.138 (1.022-4.474) 0.044 ECOG >1 (range) 2.291 (1.161-4.517) 0.017
Failure-free survival SAA course >2 in months (range) 2.093 (1.033-4.239) 0.040 ECOG >1 (range) 2.370 (1.243-4.518) 0.009
SAA: severe aplastic anemia; ECOG: Eastern Cooperative Oncology Group scale.
Table 3. The detailed reasons of transplant-related mortality in the haploidentical and identical sibling donor cohorts.
Cohort (N)
Early TRM (within 1 year post SCT) (N)
Late TRM (1 year later post SCT) (N)
Severe infection (1) GVHD (5) Intracerebral hemorrhage (1) PTLD (1) TMA (1) ISD group (13) Severe infection (8) Severe infection (1) GVHD (2) DAH (1) SOS (1)
HID group (23) Severe infection (14)
TRM: transplant-related mortality; SCT: stem cell transplantation; HID: haploidentical donor; ISD: identical sibling donor; GVHD: graft-versus host disease; PTLD: post transplant lymphoproliferative disorders; DAH: diffuse alveolar hemorrhage; TMA: thrombotic microangiopathy; SOS: sinus vein obstruction syndrome.
A comparison based on donor sources was also con ducted. In the child cohort, physical, emotional, social, and role well-being did not differ by donor source at the time points of pre-HSCT, at 3 years and at 5 years (Figure 2). As shown in Figure 3A, the levels of PCS, including GH, RP, PF, and BP, were not significantly different for adults who received HID or ISD HSCT at different time points. For the assessment of MCS, patients treated with HID HSCT functioned worse than ISD HSCT at 3 years post-HSCT, mainly due to lower scores of VT, SF, and MH at 3 years. At 5 years, the levels of MCS were comparable between the HID and ISD HSCT cohorts.
Factors other than donor source affecting QoL scores at the 3-year point after transplantation were analyzed in the respective child and adult cohorts (Online Supplementary Tables S2 and S3). The physical, social and role subscale scores were worse among children with a longer disease course before transplantation. In addition, the following factors affected at least one subscale among adults: age at transplant (GH, PF, SF, VT, MH) and marital status (BP and MH). The occurrence of cGVHD indicated a significant adverse impact on both eight subscales among adults and four subscales among children.
Table 4. Late complications and fertility in the haploidentical and identical sibling donor cohorts.
Long-term evaluation post HSCT HID (N), time in years* (range) ISD (N), time in years* (range)

Second malignancy None
Hypophysoma (1), 8.1
Cardiovascular complication None Ventricular premature beats (1), 5.8
Respiratory complication Bronchiolitis obliterans (1), 1.3 None
Kidney complication Chronic renal failure (1), 6.6 IgA nephropathy (1), 7.9 Chronic renal failure (1), 8.1
Femoral head necrosis (3), 1.4 (1.2-4.3) (4), 1.2 (0.8-5.8)
Birth experience in female adults None (1), 5.5
Birth experience in male adults (6), 6.9 (3.8-8.5) (9), 4.5 (2.2-8.1)
*The time in the table refers to the interval between allogeneic stem cell transplantation to the incidence of events, median (range) years. HSCT: hematopoietic stem cell transplantation, HID: haploidentical donor; ISD: identical sibling donor.
Figure 2. Comparison of longitudinal results for quality of life (PedsQL 4.0) in severe aplastic anemia children with haploidentical donor or identical sibling donor stem cell transplantation. HID: haploidentical donor (HID); ISD: identical sibling donor; SAA: severe aplastic anemia; QoL: quality of life; HSCT: hematopoietic stem cell transplantation.
Figure 3. The comparison of longitudinal results for quality of life (SF-36) in severe aplastic anemia adults with haploidentical donor or identical sibling donor stem cell transplantation. (A) Physical component summary (PCS), including general health, role-physical, physical functioning and bodily pain. (B) Mental component summary (MCS), including role-emotional, social functioning, mental health and vitality. SF-36: social functioning questionaire.
Haematologica | 107 December 2022 2924

At the final follow-up, a total of 306 patients, including 79 children and 227 adults, were alive. In the database, the data on whether returning to society were missing were as follows: 13 children with HID-SCT, three children with ISD-SCT, 30 adults with HID-SCT, and 29 adults with ISDSCT. In the child cohort, 39 of 50 (78.0%) in the HID group and 11 of 13 (84.6%) in the ISD group returned to school, with a median of 24.7 (range, 6.5-45.2) and 26.1 (range, 12.5-49.3) months post-transplantation (P=0.582). In the adult cohort, 50 of 67 (74.6%) and 82 of 101 (81.2%) re turned to school or work, with medians of 24.1 (5.7-60.2) and 21.4 (5.8-86.5) months post-transplantation, respect ively (P=0.147).
This study compares long term outcomes between up front HID and upfront ISD transplantation for SAA, with the largest number of SAA patients. Similar to the upfront ISD setting, upfront HID SCT had inspiring survival, com plete hematologic recovery, excellent quality of life, rare late complications, and a high proportion of returning to society during the long-term follow-up. Achieving long-term survival is a vital goal in SAA recipi ents. As reported previously, first-line ISD-SCT has re sulted in a 10-year OS of 92% and FFS of 87% among SAA children.5 The EBMT data for SAA patients grafted from up front ISD demonstrated survival at 10 years of 86%, 76%, and 55% for patients aged 1-20, 21-40, and over 40 years, respectively.2 For unrelated donor transplants, the 10-year OS were 85%, 77%, 66% and 49% for SAA patients aged 110, 11-30, 31-40 and over 40 years.2 However, long-term survival from upfront HID SCT has rarely been reported. DeZern et al. reported favorable results in 37 patients (20 with refractory and 17 with treatment naïve SAA) receiving upfront HID SCT with the application of post-transplan tation cyclophosphamide (PT-Cy), showing a 2-year OS of 86% among 17 patients in upfront cohort with a median follow-up of 32 months.17 In our cohort, we showed com parable long-term survival outcomes in terms of 9-year OS (87.1% vs. 89.3%) and FFS (86.5% vs. 88.1%) with the use of upfront HID compared to ISD. Our group has pre viously compared haplo-SCT and IST in SAA as first-line treatment in the respective child and adult cohorts.18,19 Al though OS was comparable, FFS was superior in the firstline haplo-SCT setting, showing FFS rates of 89.3% versus 52.6% among children and 83.7% versus 38.5% among adults with upfront HID SCT or upfront IST. These data suggest that upfront HID SCT had similar long-term sur vival outcomes as ISD SCT but more favorable FFS than IST.
As for the prognostic factors affecting survival, our multi
variate analysis proved that longer SAA course and higher ECOG score were associated with worse survival. However, we failed to indicate that age affected survival, which was inconsistent with previous studies.2,20 Age was also an identified factor in our relapsed/refractory SAA cohort.21 It is speculated that upfront transplants blunt the adverse effects of older age by protecting organ reserves mainly due to less transfusions and infections. Stable hematologic recovery was another advantage of upfront allo-HSCT. Allo-HSCT has been indicated to re store hematopoiesis faster than IST in SAA.4,18,19 Historically, the widespread use of haplo-SCT in SAA has been ham pered due to the high incidence of graft failure, with the reporting rates of over 50% in the initial attempts.22,23 Re cently, the application of an intensive conditioning regimen has sovled this problem with the introduction of G-CSF/ATG-based or PT-Cy-based protocols.11,24 The mod ified PT-Cy regimen by adding ATG has resulted in graft failure rates of 11%.17 Our previous and current cohorts using G-CSF/ATG based protocol supported a similar inci dence of engraftment with upfront HID and ISD.11 With ex tended follow-up, long-term survivors showed stable donor-derived hematopoiesis, especially in the upfront HID cohort. Our findings underline that ISD SCT was as sociated with a higher incidence of mixed chimerism (18.7% vs. 2.8%), in line with results reported previously.14,25 The results suggest that more intensive regimens might be attempted in ISD-SCT. For the recovery of routine blood tests in HID or ISD SCT, more than 95% of patients achieved normal complete blood counts at the final fol low-up.
The recovery of health-related quality of life has been rec ognized as a major concern in allo-HSCT recipients, es pecially in non-malignant diseases.15 A recent study has proven that SAA patients treated with upfront haplo-SCT scored significantly better in QoL than those treated with IST.4 Regardless of the donor source, physical and mental well-being among SAA children and adults significantly improved at 3 years after HSCT in comparison with those before HSCT in our longitudinal analysis. Among children treated with HID SCT, the levels of QoL were further elev ated to 5 years post-HSCT, which was not observed in children with ISD-SCT. Among adults treated with HID or ISD, QoL scores improved from pre-HSCT to 3 years postHSCT and further improved to 5 years post-HSCT with re gard to physical or mental evaluation. Due to the excellent QoL, the majority of children and adults returned to school or work without a significant difference between the up front HID and ISD SCT groups.
GVHD was a major complication post allo-HSCT, especially in haploidentical cohort. Consistent with our previous re port, the incidence of aGVHD was higher in HID-SCT than ISD-SCT.11 The GFFS in recipients from HID-SCT was also inferior, however, it might be unsuitable as a long-term in
dicator because the majority of aGVHD could be con trolled in short term. Importantly, severe GVHD-related TRM was similar between the two cohorts. The occurrence of cGVHD was an identified risk factor for predicting poor QoL at 3 years, including eight subscales in adults and four subscales in children. Numerous studies have supported this finding.26-28 Compared with the ISD group, children in the HID group had comparable scores in physical, emo tional, social and role functioning at different time points. At 3 years, adults with HID SCT had a worse mental com ponent summary than those with ISD SCT, which was pro bably due to a higher incidence of cGVHD history. At 5 years, the physical and mental scores were similar be tween the two cohorts. In the future, how to further re duce the incidence of GVHD in HID-SCT cohort is very meaningful to further improve outcomes. We acknowledge important limitations of our study, mainly related to its retrospective nature. However, this is the largest reported series to date providing proof of longterm outcomes from upfront HID or ISD SCT, not only in survival results but also in terms of QoL and returning to society. Currently, the consensus from the Chinese Society of Hematology recommends haplo-SCT for newly diag nosed SAA patients without HLA-matched donors.10 In summary, the current national registry-based study pres ented comparable long-term transplantation outcomes with upfront haploidentical or identical sibling donors. In spired survival, sustained donor-derived hematologic re covery, excellent QoL, and high rates of returning to society are advantages of upfront transplantation approaches. The
1. Young NS. Aplastic Anemia. N Engl J Med. 2018;379(17):1643-1656.
2. Bacigalupo A. How I treat acquired aplastic anemia. Blood. 2017;129(11):1428-1436.
3. Georges GE, Doney K, Storb R. Severe aplastic anemia: allogeneic bone marrow transplantation as first-line treatment. Blood Adv. 2018;2(15):2020-2028.
4. Liu L, Zhang Y, Jiao W, et al. Comparison of efficacy and healthrelated quality of life of first-line haploidentical hematopoietic stem cell transplantation with unrelated cord blood infusion and first-line immunosuppressive therapy for acquired severe aplastic anemia. Leukemia. 2020;34(12):3359-3369.
5. Yoshida N, Kobayashi R, Yabe H, et al. First-line treatment for severe aplastic anemia in children: bone marrow transplantation from a matched family donor versus immunosuppressive therapy. Haematologica. 2014;99(12):1784-1791.
6. Killick SB, Bown N, Cavenagh J, et al. Guidelines for the diagnosis and management of adult aplastic anaemia. Br J Haematol. 2016;172(2):187-207.
7. Iftikhar R, Chaudhry QUN, Anwer F, et al. Allogeneic hematopoietic stem cell transplantation in aplastic anemia: current indications and transplant strategies. Blood Rev. 2021;47:100772.
comparable data suggest that haploidentical transplant can be considered a potential therapeutic option in the upfront setting for SAA patients in the absence of an HLA-identical related or unrelated donor.
No conflicts of interest to disclose
X-JH designed the research. Z-LX, L-PX and X-JH. analyzed the data and wrote the manuscript. D-PW, S-QW, XZ, RX, S-JG, L-HX, J-MY, MJ, XW, Q-FL, JC and MZ provided pa tient data. All authors gave final approval for the manu script.
The authors would like to thank the American Journal Experts for their assistance with the language editing.
This work was supported by the National Key Research and Development Program (grant numbers 2021YFA1100904 and 2019YFC0840606), National Natural Science Foundation of China (grant numbers 82100227 and 81930004), and the Foun dation for Innovative Research Groups of the National Natural Science Foundation of China (grant number 81621001).
The data that support the findings of this study are available upon reasonable request from the corresponding author.
8. Xu ZL, Huang XJ. Haploidentical stem cell transplantation for aplastic anemia: the current advances and future challenges. Bone Marrow Transplant. 2021;56(4):779-785.
9. Xu LP, Wang SQ, Wu DP, et al. Haplo-identical transplantation for acquired severe aplastic anaemia in a multicentre prospective study. Br J Haematol. 2016;175(2):265-274.
10. Zhang XH, Chen J, Han MZ, et al. The consensus from The Chinese Society of Hematology on indications, conditioning regimens and donor selection for allogeneic hematopoietic stem cell transplantation: 2021 update. J Hematol Oncol. 2021;14(1):145.
11. Xu LP, Jin S, Wang SQ, et al. Upfront haploidentical transplant for acquired severe aplastic anemia: registry-based comparison with matched related transplant. J Hematol Oncol. 2017;10(1):25.
12. Xu LP, Liu KY, Liu DH, et al. A novel protocol for haploidentical hematopoietic SCT without in vitro T-cell depletion in the treatment of severe acquired aplastic anemia. Bone Marrow Transplant. 2012;47(12):1507-1512.
13. Jagasia MH, Greinix HT, Arora M, et al. National Institutes of Health Consensus Development Project on Criteria for Clinical Trials in Chronic Graft-versus-Host Disease: I. The 2014 Diagnosis and Staging Working Group report. Biol Blood Marrow Transplant. 2015;21(3):389-401.e1.
14. Xu ZL, Cheng YF, Zhang YY, et al. The incidence, clinical
outcome, and protective factors of mixed chimerism following hematopoietic stem cell transplantation for severe aplastic anemia. Clin Transplant. 2021;35(2):e14160.
15. Pidala J, Anasetti C, Jim H. Quality of life after allogeneic hematopoietic cell transplantation. Blood. 2009;114(1):7-19.
16. Caocci G, Efficace F, Ciotti F, et al. Prospective assessment of health-related quality of life in pediatric patients with betathalassemia following hematopoietic stem cell transplantation. Biol Blood Marrow Transplant. 2011;17(6):861-866.
17. DeZern AE, Zahurak ML, Symons HJ, et al. Haploidentical BMT for severe aplastic anemia with intensive GVHD prophylaxis including posttransplant cyclophosphamide. Blood Adv. 2020;4(8):1770-1779.
18. Cheng Y, Xu Z, Zhang Y, et al. First-line choice for severe aplastic anemia in children: Transplantation from a haploidentical donor vs immunosuppressive therapy. Clin Transplant. 2018;32(2).
19. Xu ZL, Zhou M, Jia JS, et al. Immunosuppressive therapy versus haploidentical transplantation in adults with acquired severe aplastic anemia. Bone Marrow Transplant. 2019;54(8):1319-1326.
20. Gupta V, Eapen M, Brazauskas R, et al. Impact of age on outcomes after bone marrow transplantation for acquired aplastic anemia using HLA-matched sibling donors. Haematologica. 2010;95(12):2119-2125.
21. Xu LP, Xu ZL, Wang SQ, et al. Long-term follow-up of haploidentical transplantation in relapsed/refractory severe aplastic anemia: a multicenter prospective study. Science
Bulletin. 2022;67(9):963-970.
22. Bacigalupo A, Giammarco S. Haploidentical donor transplants for severe aplastic anemia. Semin Hematol. 2019;56(3):190-193.
23. Storb R, Thomas ED, Weiden PL, et al. Aplastic anemia treated by allogeneic bone marrow transplantation: a report on 49 new cases from Seattle. Blood. 1976;48(6):817-841.
24. Prata PH, Eikema DJ, Afansyev B, et al. Haploidentical transplantation and posttransplant cyclophosphamide for treating aplastic anemia patients: a report from the EBMT Severe Aplastic Anemia Working Party. Bone Marrow Transplant. 2020;55(6):1050-1058.
25. Zhang Y, Li Y, Wu L, et al. Mixed chimerism after allogeneic hematopoietic stem cell transplantation for severe aplastic anemia. Hematology. 2021;26(1):435-443.
26. Fraser CJ, Bhatia S, Ness K, et al. Impact of chronic graftversus-host disease on the health status of hematopoietic cell transplantation survivors: a report from the Bone Marrow Transplant Survivor Study. Blood. 2006;108(8):2867-2873.
27. Wong FL, Francisco L, Togawa K, et al. Long-term recovery after hematopoietic cell transplantation: predictors of quality-of-life concerns. Blood. 2010;115(12):2508-2519.
28. Mo XD, Xu LP, Liu DH, et al. Patients receiving HLAhaploidentical/partially matched related allo-HSCT can achieve desirable health-related QoL that is comparable to that of patients receiving HLA-identical sibling allo-HSCT. Bone Marrow Transplant. 2012;47(9):1201-1205.
Kiran K. Madugula,1 Julie Joseph,1 Catherine DeMarino,2 Rashida Ginwala,3 Vanessa Teixeira,1,4 Zafar K. Khan,1 Dominic Sales,1 Sydney Wilson,1 Fatah Kashanchi,2 Amanda W. Rushing,5 Isabelle Lemasson,5 Edward W. Harhaj,6 Murali Janakiram,7 B. Hilda Ye8 and Pooja Jain1
1Department of Microbiology and Immunology, Drexel University College of Medicine, Philadelphia, PA, USA; 2Laboratory of Molecular Virology, George Mason University, Manassas, VA, USA; 3Fox Chase Cancer Center, Thomas Jefferson University, Philadelphia, PA, USA; 4Instituto de Ciencias Biológicas, Universidad de Pernambuco, Recife, PE, Brazil; 5Department of Microbiology and Immunology, Brody School of Medicine, East Carolina University, Greenville, NC, USA; 6Department of Microbiology and Immunology, Penn State College of Medicine, Hershey, PA, USA; 7Department of Oncology, Montefiore Medical Center and 8Department of Cell Biology, Albert Einstein College of Medicine, Bronx, NY, USA
Correspondence: P. Jain pj27@drexel.edu
Received: June 28, 2021.
Accepted: May 18, 2022.
Prepublished: May 26, 2022.
https://doi.org/10.3324/haematol.2021.279542
©2022 Ferrata Storti Foundation
Published under a CC BY-NC license
Adult T-cell leukemia and lymphoma (ATLL) is an intractable T-cell neoplasia caused by a retrovirus, namely human T-cell leukemia virus type 1 (HTLV-1). Patients suffering from ATLL present a poor prognosis and have a dearth of treatment options. In contrast to the sporadic expression of viral transactivator protein Tax present at the 5’ promoter region long terminal repeats (LTR), HTLV-1 bZIP gene (HBZ) is encoded by 3’LTR (the antisense promoter) and maintains its constant expression in ATLL cells and patients. The antisense promoter is associated with selective retroviral gene expression and has been an understudied phenomenon. Herein, we delineate the activity of transcription factor MEF (myocyte enhancer factor)-2 family members, which were found to be enriched at the 3'LTR and play an important role in the pathogenesis of ATLL. Of the four MEF isoforms (A to D), MEF-2A and 2C were highly overexpressed in a wide array of ATLL cell lines and in acute ATLL patients. The activity of MEF-2 isoforms were determined by knockdown experiments that led to decreased cell proliferation and regulated cell cycle progression. High enrichment of MEF-2C was observed at the 3'LTR along with cofactors Menin and JunD resulting in binding of MEF-2C to HBZ at this region. Chemical inhibition of MEF-2 proteins resulted in the cytotoxicity of ATLL cells in vitro and reduction of proviral load in a humanized mouse model. Taken together, this study provides a novel mechanism of 3’LTR regulation and establishes MEF-2 signaling a potential target for therapeutic intervention for ATLL.
The development of adult T-cell leukemia and lymphoma (ATLL) is attributed to human T-cell leukemia virus type 1 (HTLV-1) infection,1,2 which infects an estimated 20 million people worldwide,3 with a recent outbreak among aborig inal populations in central Australia.4 HTLV-1 is endemic to regions of southwestern Japan, South American coun tries, equatorial Africa, and small groups in the Middle East.5,6 HTLV-1 possesses common retroviral genes (gag, pol, env) and some regulatory genes such as transactiv ation protein Tax and HTLV-1 bZIP factor (HBZ). Tax along with other viral genes are expressed through promoter ac tivity from the 5’LTR (long terminal repeats) region. The only protein encoded on the negative strand and tran
scribed from the 3’LTR is HBZ.7 ATLL cells from patients frequently express HBZ8 while other viral proteins are transcriptionally repressed.9-11 HBZ inhibits Tax-mediated viral transcription from the 5’LTR via interactions with CREB/ATF that impede their DNA binding ability and pre vents binding to Tax at the 5’LTR.12 HBZ also interacts with AP-1 transcription factor family members including c-Jun, JunB, and JunD, and modulates their transcriptional ac tivity.13
Previously, we showed that a member of the Myocyte en hancer factor transcription family, MEF-2A, interacts di rectly with Tax at the 5’LTR and recruits transcriptional machinery such as CREB/p300 while disassociating the repressive histone deacetylase (HDAC) complex to pro mote viral gene expression and T-cell proliferation.14 MEF-
2 is a member of the MCM-Agamous-Deficiens-Serum re sponse factor (MADS) box group of transcription factors. The MEF-2 family consists of four isoforms (A to D, re viewed in15), which are well studied in the development of skeletal, cardiac, and neural tissues. Interestingly, some of these isoforms play critical roles in T-cell development by regulating the transcription of the T-cell growth factor interleukin-2 (IL-2).16 MEF-2 dysregulation has been impli cated in several T-cell leukemias/lymphomas including peripheral T-cell lymphoma (PTCL)17 and T-cell acute lym phoblastic leukemia (T-ALL).18 In the study presented herein, we demonstrate the gene and protein level expression patterns of MEF-2 isoforms in multiple ATLL cell lines, and in a specific ATLL cohort termed North American (NA)-ATLL, who exhibit acute clinical manifestations with higher rates of aggressive subtypes compared to chronic counterparts.19 NA-ATLL patients demonstrate chemoresistance and a distinct pat tern of somatic mutations.20 Most patients in this cohort showed drastically higher expression of MEF-2A and MEF2C. The transient silencing of both isoforms decreased Tax and HBZ expression in ATLL cells. Similarly, chemical in hibition of MEF-2 by MC1568, a selective class I HDAC in hibitor known to suppress its activity,21-23 caused cytotoxicity exclusively in HTLV-1-infected T cells along with the downregulation of viral proteins in a MEF-2-de pendent manner. Similarly, in HTLV-1-infected humanized mice, MC1568 exposure led to a reduction in the proviral load and viral gene expression. MEF-2 genes are required for G0/G1 transition in response to growth factor stimu lation.24 Consequently, the suppression of MEF-2A and MEF-2C expression led to a decrease in proliferation and cell cycle arrest of ATLL cells suggesting its involvement in ATLL pathogenesis. In order to further tease out the molecular mechanisms underlying MEF-2 activity in ATLL, we examined direct interactions of MEF-2A/C with HBZ and their recruitment to the 3’LTR along with Menin, a tumor suppressor protein. Together, these proteins as sembled at the 3’LTR along with MEF-2A and MEF-2C pro vide a novel mechanism of transcriptional regulation of HBZ at the antisense promotor regulation of HTLV-1 gene expression. Collectively, this study sheds light on the complex mechanism of ATLL pathogenesis, HTLV-1 gene regulation from the 3’LTR and establishes MEF-2 signaling as a potential target for therapeutic intervention for treat ment of ATLL.
Patient samples and primary cells
Samples from NA-ATLL patients were obtained from the Albert Einstein College of Medicine (NY, USA) as published before.19,20,25 In addition, samples from nine HTLV-1-associ
ated myelopathy/tropical spastic paraparesis (HAM/TSP) patients (82% female) and ten asymptomatic HTLV-1-in fected individuals (60% female) were studied. These were followed up at a reference outpatient clinic of Infectious and Parasitic Diseases Service (DIP) at the Hospital Uni versitário Oswaldo Cruz (HUOC/UPE), located in Recife, Pernambuco, Brazil. HAM/TSP was diagnosed according to World Health Organization guidelines. Samples from ten non-infected healthy Brazilian individuals (70% female) were also included in this study. HTLV-1 serological screening and confirmation was performed at HEMOPE Blood Bank Center, in Recife, Brazil. Infection was addi tionally confirmed at Fiocruz-PE Institute, also in Recife, Brazil, through quantitative polymerase chain reaction (qPCR) using a previously described protocol.26 Samples were blinded throughout the study and categorized as control/seronegative, asymptomatic carriers (AC), ATLL, and HAM/TSP. The median age range for females and males was: 46-49 and 38-45 (control); 42-43 and 37.5-60 (AC); 48-49 and 38-53 (ATLL); 45-48 and 46-59 (HAM/ TSP), respectively. As for ATLL group, we used ten samples with case ID/Genoptix ID: Pt-4a, Pt-5a, Pt-7a, Pt-15a, Pt16b, Pt-30a, Pt-32a, ATL30, ATL21, ATL18 as seen in19. De tailed characteristics of ATLL patient samples are mentioned in the supplementary of19. HTLV-1 proviral load measurement and determination, molecular and immu nological methods such as immunoblots, immunoprecipi tation, flow cytometry, reverse transcription qPCR (RT-qPCR), and chromatin-immunoprecipitation are pro vided in the Online Supplementary Appendix. The primers and antibodies used in RT-qPCR, western blotting and chromatin immunoprecipitation (ChIP) assays are also provided in various tabular forms in the Online Supple mentary Appendix
This manuscript utilizes patient-derived samples and blinded data from the Albert Einstein College New York from a retrospective study. The patient cohort has been published before and was handled according to the Insti tutional Ethics Committee approval.
MEF-2A and MEF-2C are the two predominantly expressed isoforms in HTLV-1-infected/adult T-cell leukemia and lymphoma cell lines
All cell lines were maintained at minimum 85% viability to ensure the utilization of exponential growth phase culture (Online Supplementary Figure S1A). Standard curve-based analysis revealed that non-virus-producing cell lines (SP, ATL-2S, ATL-55T, ATL-ED and M8166) contained lower copies of HTLV-1 provirus Online Supplementary Figure S1B
and C), whereas virus-producing cell lines (MT-2, MT-4 and SLB-1) contained higher copy numbers. Western blot analysis showed comparable HBZ expression across all cell lines tested (Online Supplementary Figure S1D). Tax was mostly observed in viral-producing like cell lines such as MT-2, MT-4 and SLB-1 with the exception of ATL-2S and M8166, which displayed Tax expression at higher levels. Extracellular secretion of p19 confirmed the viral-produc ing status of MT-2, MT-4 and SLB-1 (Online Supplementary Figure S1E and F) and fluorescence-activated cell sorting (FACS) phenotyping confirmed their T-cell status and in tracellular Tax presence (Online Supplementary Figure S1G). Herein, we stratified the cells in two groups: 1) viralproducing cells (MT-2, MT-4, and SLB-1); 2) non-viral-pro ducing ATLL-like cells (ATL-2S, SP, ATL-55T, ATL-ED, and M8166). In order to understand the role of MEF-2 isoforms in these cell lines, we performed RT-qPCR on all cell lines including naïve and activated T cells (CD3+/CD28+) to de termine MEF-2 isoform(s) expression. 100,000-fold up regulation of MEF-2A was observed in MT-4, SP, ATL-ED, and M8166 cells in comparison to activated T cells (Figure 1A). MEF-2C showed significant upregulation in all cell lines (up to 100-fold change), except in SP, ATL-55T, and M8166. However, MEF-2B/2D expression levels remained unchanged across all cell lines. Collectively, these results suggest that MEF-2A/2C are highly overexpressed in all viral-producing cell line (MT-2, MT-4, SLB-1) and in only two (ATL-2S and ATL-ED) of the five non-viral-producing ATLL cell lines. Furthermore, mRNA changes for MEF-2
isoforms at the single-cell level within CD4+ T-cell popu lations showed MEF-2A/2C expression peaks shifted among cell lines compared to Jurkat (Online Supplemen tary Figure S2A). Additionally, HTLV-1-negative non-ATLL cell lines, HUT78, HH and Ly13.2 were also analyzed as controls for MEF-2 expression. Of all isoforms analyzed, only MEF-2C mRNA expression exhibited a slight increase but this was nowhere close to what was observed in ATLL cell line (Online Supplementary Figure S2B). Consistent with the mRNA expression, western blotting for protein expression showed an increase in MEF-2A ex pression in almost all cell lines in comparison to Jurkat, naïve and activated T cells (Figure 1B). MEF-2C expression was increased compared to naïve and activated T cells implying it could be activation dependent. However, we observed a post-translational modification (a distinct upper band) in most of infected cell lines, except for MT4 and SP (Figure 1B), which may suggest a divergence of activity in MEF-2C in these cell types. In order to quanti tatively corroborate our western blotting results, we util ized an automated capillary-based protein electrophoresis system (WES, Protein Simple) that pro vides quantitative values of protein expression (Figure 1C) and saw comparable results. Altogether, these results provide additional support for MEF-2A and MEF-2C in HTLV-1/ATLL pathogenesis. Out of the two non-viral pro ducing ATLL cell line, only ATL-ED expressed HBZ and not Tax. Therefore, for further studies to understand the role of MEF-2A/2C in HBZ mediated anti-sense transcriptional

Figure 1.
of
expression and protein expression of MEF-2 isoforms in CD4+ HTLV-1 infected and uninfected Tcell lines. (A) Quantitative reverse transcription polymerase chain reaction (RT-qPCR) was performed to assess the expression of MEF-2 isoforms in several cell lines. MEF-2 mRNA expression in HTLV-1-negative control, Jurkat cells, was compared to ex pression in HTLV-1-transformed and ATL-derived cell lines. MEF-2 mRNA expression is presented as the mean fold-change of 2 independent experiments relative to activated T cells, which were normalized to 1. Error bars represent the standard deviation of duplicate samples. (B) Top panel illustrates representative western blot of protein expression on MEF-2 isoforms with control (Jurkat) and various HTLV-1-infected T-cell lines. Bottom panel illustrated quantified images using densitometry. Cofilin was used as a loading control. (C) Results from traditional immunoblotting were validated with the automated western blot system, Wes (Protein Simple) with GAPDH used as a loading control. All data represent one of 2 separate experiments. *P<0.05, **P<0.01.
activity, we used ATL-ED as a representative cell line. MT4 was used as a representative viral producing cell line as it had the highest expression of MEF-2A/2C together in comparison to other virus-producing cells.
Knockdown of MEF-2A and MEF-2C downregulates viral protein expression

Increased expression of MEF-2A/2C in ATLL cell lines led us to further understand the role of these two isoforms in ATLL using a SMART pool of small interfering RNA (siRNA) per isoform (Dharmacon). MEF-2A knockdown (K/D) in Jurkat, ATL-ED (representative Tax-negative cell line) and MT-4 (Tax-positive virus-producing cell line) was assessed by RT-qPCR and immunoblotting. Dose-depend ent downregulation of MEF-2A at both mRNA and protein level was observed in all cell lines but no changes in the other isoforms indicated the specificity of our knockdown
(Figure 2A-B; Online Supplementary Figure S3A). HBZ was downregulated in ATL-ED cell line in a dose-dependent manner similar to MEF-2A K/D (Figure 2A). When MEF-2A was depleted in MT-4 cells, a slight decrease in MEF2C mRNA expression was observed at the highest con centration of siRNA, nonetheless, as expected, a dose-dependent reduction of Tax and HBZ was also ob served (Figure 2B). In ATL-ED, decrease of MEF-2C ex pression was observed along with Tax and HBZ at both mRNA and protein level (Figure 3A). In MT-4, however, decrease in MEF-2C was not dose-dependent at mRNA level (Figure 3B). Further analysis using western blotting indicated the 50 nM dose of siRNA had the highest de gree of MEF-2C depletion as well as significant decrease in HBZ expression. As a result, 50 nM of siRNA was used as optimal concentration for further experiments. These results indicate that MEF-2A and MEF-2C K/D in ATL-ED
B
Figure 2. Evaluation of knockdown of MEF-2A with small interfering RNA transfection and downmodulation of viral genes. (A) Upper left- transfection of MEF-2A small interfering (siRNA) at 2 concentrations (10 nM and 50 nM) and quantitative reverse tran scription polymerase chain reaction (RT-qPCR) conducted to assess the expression of MEF-2 isoforms in ATL-ED. Upper rightthe effect of MEF-2A knockdown on HBZ represented as fold-change compared to scrambled control. Lower left- immunoblots of protein expression after MEF-2A knockdown from respective experiments; and lower right- corresponding densitometry analy sis is shown. Error bars represent the standard deviation of duplicate samples. (B) Upper left- transfection of MEF-2A siRNA per formed at 2 concentrations (10 nm, 50 nm) in MT-4 cells and RT-qPCR conducted to assess the expression of MEF-2 isoforms. Upper right- Tax and HBZ expression as the mean fold-change compared to scrambled control. Lower left- immunoblots of pro tein expression after MEF-2A knockdown, and lower right – corresponding densitometry analysis is shown. All data represents one of three separate experiments. *P<0.05, **P<0.01.

and MT-4 significantly downregulate HBZ and are es sential for its transcriptional activity. Additionally, in order to validate that viral protein expression depended on MEF-2A/2C expression, we performed K/D studies in an another common HTLV-1 viral producing cell line, MT2, and saw that K/D of MEF-2A/2C exhibited decrease in Tax and HBZ ( Online Supplementary Figure S3B ), simi lar to what was observed from previous experiments.

Knockdown of MEF-2A and MEF-2C decreases proliferation and cell cycle progression in adult T-cell leukemia and lymphoma cell lines
In order to determine if K/D of MEF-2A/2C modulated physiological and phenotypic changes in ATLL cell lines, we assessed the proliferation and cell cycle progres sion. Since depletion of MEF-2A/2C was already vali dated in Jurkat, ATL-ED and MT-4, we sought to determine the proliferation profile via Ki-67 staining. Decreased Ki-67 expression after depletion of MEF2A/2C suggested that the proliferation of these ATLL cell lines was dependent on these two isoforms of MEF2 (Figure 4A and B) but there was no considerable change in proliferation in Jurkat cells after K/D. More specifically, there was a stronger inhibition in prolifer ation with siMEF-2C (~38% decrease) than siMEF2A
(~15% decrease) in ATL-ED and MT-4 cell lines (Figure 4C). These results indicate a stronger role of MEF-2C in ATLL progression. We next sought to determine if proliferation defects were due to any perturbations in cell cycle regulation. Propidium iodide (PI) staining was done following K/D of MEF-2A/2C to observe different phases of the cell cycle. In Jurkat cells, there was a modest decrease in the G2-M proliferating cells compared to scrambled control and siMEF-2A/2C , whereas in ATL-ED and MT-4 cells there was an accumulation of cells in the G1-S phase and a ~50% decrease in the G2-M mitotic cells following K/D (Figure 4C and D). Concurrently, treat ment with siMEF-2A/2C resulted in accumulation of cells in G0-G1 phase. These results indicate that MEF2A/2C K/D regulated cell cycle progression in actively proliferating ATLL cells. In order to further validate the proliferation and cell cycle progression defect, we util ized miR-21C which was previously shown to target the mRNA of MEF-2C . 27 After treatment of MT-4, ATL-ED and Jurkat with miR-21C, we observed decrease in MEF-2C expression but not MEF-2D ( Online Supplementary Fig ure S3C ). We observed a similar decreasing trend in pro liferation and cell cycle progression as seen with K/D of MEF-2A/2C ( Online Supplementary Figure S3D and E ).
Figure 3.
knockdown of MEF-2C with small interfering RNA transfection and downmodulation of viral genes. (A) Upper left- transfection of small interfering RNA (siRNA) at different concentrations (10 nM, 25 nM, 50 nM and 100 nM) and quantitative reverse transcription polymerase chain reaction (RT-qPCR) conducted to assess the expression of MEF-2 isoforms in ATL-ED. Upper right- effect of MEF-2C knockdown (K/D) on HBZ as represented as fold-change compared to scrambled control. Lower left- immunoblot of protein expression after (K/D) of MEF-2C from respective experiments; lower right- corresponding densitometry values are shown. Error bars represent the standard deviation of duplicate samples. (B) Upper left- transfection of MEF-2C siRNA was performed at various concentrations (10 nM, 50 nM and 100 nM) in MT-4 cells and RT-qPCR conducted to as sess the expression of MEF-2 isoforms. Upper right- effect of MEF-2C K/D on Tax and HBZ as the mean fold-change compared to scrambled control. Lower left and right panels show representative immunoblots and densitometric analysis from K/D ex periments. All data represents one of three separate experiments. *P<0.05, **P<0.01.
MEF-2A and MEF-2C are significantly upregulated in an acute North American adult T-cell leukemia and lymphoma patient cohort
In order to ascertain the clinical importance of MEF-2 iso forms, we investigated their expression and relevance within patient cohorts. We obtained mRNA from periph eral blood mononuclear cells (PBMC) of ten NA-ATLL pa tients20,28 along with nine seronegative, nine AC, and nine HAM/TSP patients from the same geographic areas of South America (all patient characteristics and related ref erences are listed in the methods section). Our results showed a significant logarithmic increase of MEF-2A and MEF-2C in NA-ATLL samples (P<0.05) but also a signifi cantly higher fold-change (P<0.01) in the expression of MEF-2C in comparison to seronegative, AC, and HAM/TSP patients (Figure 5). Differences in MEF-2B/2D expression were not statistically significant. We noticed a logarithmic fold-change in MEF-2C expression in most NA-ATLL
samples. We also assessed three immortalized NA-ATLL patient-derived cell lines20 for MEF-2 isoforms (Online Supplementary Figure S4A and B) and observed upregu lated expression of Tax and HBZ correlated with increased expression of MEF-2A/2C in ATL18 and ATL21. In ATL13, the absence of MEF-2A/2C correlated with lower viral protein expression. In ATL21 cells, lower expression of MEF-2C correlated with the decreased expression of HBZ but not Tax, suggesting a direct relation of MEF-2C to HBZ. These results were corroborated using whole exome sequencing (WES) capillary electrophoresis (Online Supplementary Figure S4C), suggesting linkage between MEF-2A/2C ex pression and viral protein expression.
MEF-2C is enriched in the 3’LTR and bind with HBZ to control viral expression via Menin, JunD and Sp1/Sp3 We previously reported that MEF-2A is enriched in the 5’LTR of the provirus and interacts with Tax to regulate

Figure 4. Analyzing the proliferation and cell cycle of adult T-cell leukemia and lymphoma cell lines post si-MEF-2A/2C trans fection by Ki-67 and propidium iodide staining. (A) Dot plots represent cells stained with Ki-67 and subjected to flow cytometric assays to measure cellular proliferation. (B) Analysis was carried out with Flow-Jo software to quantify the percent proliferation profiles for each cell line and represented as a bar graph. (C) Jurkat, ATL-ED, and MT-4 cells were collected, fixed, and stained with propidium iodide (PI, 25 µg/mL) to assess cell cycle progression via flow cytometry. Left- mock transfected, right- si-MEF2A and si-MEF-2C transfection with 50 nM respectively. (D)The percentage of sub-G1 cells, G0/G1, S and G2-M cells was analyzed using Flow-Jo software and represented as a stacked column plot.

viral gene expression.14 However, the role of MEF-2C in this context is unknown. Additionally, it remains unclear how viral gene expression is controlled at the 3’LTR. Nuclear/cytoplasmic fractionation of ATL-ED cells showed MEF-2A/2C were only seen in the nuclear fraction along with HBZ (Figure 6A). We then evaluated enrichment of
MEF-2A/2C, viral proteins, and various known co-factors including Menin, JunD, Sp1/Sp3 (activator of 3’LTR29) at both 3’LTR and 5’LTR. MEF-2’s canonical promoter in T cells, NR4A1, was utilized as a control.30 At the 3’LTR, we observed a basal level enrichment of MEF-2A and a higher recruitment of MEF-2C along with JunD, Menin, Sp1, and
Figure 5. Expression of MEF-2 isoforms in North American-adult T-cell leukemia and lymphoma. Quantitative reverse transcrip tion polymerase chain reaction (RT-qPCR) was performed to evaluate the expression of MEF-2 isoforms in activated peripheral blood mononuclear cells (PBMC) (control n=3), seronegative (n=9), asymptomatic carriers (AC, n=9), adult T-cell leukemia and lymphoma (ATLL, n=10), and HTLV-1-associated myelopathy/tropical spastic paraparesis (HAM/TSP, n=9), patient samples. Foldchange is normalized to activated PHA-treated PBMC and compared to asymptomatic carriers and seronegative subjects. Stat istical analyses were performed using GraphPad Prism8, where the distribution of each dataset was tested for normality (Kolmogorov-Smirnov and Shapiro-Wilks Normality Testing) and histograms were compared across groups. Data that were not normally distributed underwent non-parametric analysis. All data are presented as mean ± standard error of the mean. Statistical testing included the one-way Anova non-parametric t-test. Data that violated normality did so because of the nature of the het erogeneity of patient cohort. *P<0.05, **P<0.01.

Sp3 but not C/EBPα representing a transcriptionally ac tive state (Figure 6C). At the NR4A1 promoter, both re pressor and activator were recruited similarly (Figure 6C) thus reaffi rming our previous observations 29,31 that the ratio of activators and repressors are key to controlling transcription. At the 5’LTR (Online Supplementary Figure S5A), recruitment of RNA pol II, MEF-2A, and CREB was observed, which is a known binding factor at CRE el ements.32 High level enrichment of C/EBPα, HBZ but not Sp1/Sp3, was also observed. Interestingly, HBZ is known to bind with C/EBPα to inhibit the activation of 5’LTR.33

Together, these observations suggest inhibition of tran scription at 5’LTR. In order to further validate the recruit ment of factors at the 5’ and 3’LTR, we utilized the MT-4 cell line. We observed a higher enrichment of MEF-2A than MEF-2C at 5’LTR and an ~40-fold enrichment of Tax, which is expected for the 5’LTR activity (Online Supple mentary Figure S5B ). We observed the enrichment of MEF-2C, Menin (a tumor suppressor34), JunD, and HBZ at 3’LTR suggesting their presence within one complex. In order to assess this, we performed protein-protein bind ing assay in ATL-ED and other representative cell lines.
Figure 6. Cell fractionation and chromatin immunoprecipitation of ATL-ED cells for various transcriptional targets, viral genes, and MEF-2 isoforms at the viral long terminal repeats. (A) Immunoblots representing nuclear and cytoplasmic fractions for protein expression. with Lamin B1 was used as nuclear fraction control in ATL-ED cells. (B) Chromatin immunoprecipitation (ChIP) analysis of ATL-ED for enrichment of transcriptional targets in the 3’ long terminal repeats (3’LTR) of the viral promoter. (C) ChIP analysis of ATL-ED cells for enrichment of transcriptional targets at the 3’ LTR and in the canonical MEF-2 promoter, NR4A1. Shown is the representative image of an average of at least 3 experiments. All targets are represented as fold-change based on 10% input and immunoglobulin G negative control. *P<0.05, **P<0.01.
MEF-2C interacted with Menin along with HBZ at steady state, indicating that these proteins exist in the same complex (Figure 7A), while MEF-2A although bound to Menin rather weakly, and was not enriched in the 3’LTR. Additionally, we found that Menin did not bind to JunD in ATL-ED cells but bound in Jurkat cells (Figure 7B). Transient K/D of both siMEF-2A/2C showed no recruit ment of JunD at the 3’ LTR compared to control (Figure 7B and C). From these results we conclude that MEF-2C forms complexes with HBZ and Menin at the 3’LTR, which liberates JunD to activate the antisense promoter (Figure 7D).
Chemical inhibition and small interfering RNA-mediated knockdown of MEF-2A/2C modulates viral gene expression in vitro and in vivo

Due to the known interactions between MEF-2, class IIa HDAC,35 and associated repressor complexes that keep MEF-2 isoform(s) expression in a repressed state,21 we aimed to investigate the effect of MC156821,22 on MEF-2 ac tivity and ATLL cell line survival. We calculated half maxi mal inhibitory concentration (IC50) curves for primary activated T cells, Jurkat, ATL-ED, and MT-4 cells (Figure 8A). There was no toxicity in activated T cells and calcu lated IC50 values of 3.011 µM and 0.389 µM for ATL-ED and
Figure 7. Protein-protein interactions of MEF-2, Menin and JunD and enrichment of JunD in transient knockdown of MEF-2 isoforms. (A) Representative immunoblots after co-immunoprecipitation with MEF-2A and MEF-2C showing endogenous binding of HBZ and Menin in 4 different representative cell lines. (B) Representative immunoblots showing the binding of Menin and JunD in Jurkat and ATL-ED. (C) Cromatin immunoprecipitation (ChIP) analysis of ATL-ED cells for enrichment of JunD at 3’LTR and the canonical MEF-2 NR4A1 promoter after transiently knocking down MEF-2A and MEF-2C. (D) Mechanistic model of MEF-2 isoforms activity in adult T-cell leukemia and lymphoma (ATLL) pathogenesis and viral gene expression. At the 3’ long terminal repeats (3’LTR), we posit that complexes of HBZ, Menin, and MEF-2A/2C are sequestered together to liberate JunD- which controls the transcriptional activity at the antisense promoter for viral gene expression. (E) Role of MEF-2C in the modulation of 3’LTR, aiding in the maintenance of proliferation and survival phenotype from the anti-sense region, in the absence of 5’LTR in ATLL patho genesis.
MT-4, respectively. Furthermore, we derived an IC50 value of 13.38 µM in Jurkat cells, supporting the ATLL-specific cytotoxic activity of MC1568. In order to ensure that the observed cytotoxic activity was due to specific inhibition of MEF-2 activity, we K/D MEF-2A/2C using siMEF-2A/2C and then treated with MC1568 in representative cells. We observed that MEF-2A K/D resulted in increased IC50 values in all ATLL cell lines except Jurkat. Conversely, with MEF-2C K/D, MT-4 and ATL-ED showed no cytotoxicity (Figure 8B). K/D of Serum Response Factor (SRF, tran scription factor of the MEF-2 family that has similar inter actions with class II HDAC36,37) resulted in no or modest change in IC50 values as shown in Figure 8B. In order to ascertain that observed effects are HTLV-1 mediated, we performed gain-of-function studies with pSG-Tax-His and pSG-HBZ-His overexpression plasmids in all three cell types. As expected, Jurkat did not show any change but both ATL-ED and MT-4 cells showed increase in IC50 upon HBZ (3.02/11.7, 0.38/1.32, respectively) and Tax (3.02/16.65, 0.38/2.65, respectively). In order to assess the in vivo ef
fects of MC1568 treatment, humanized NOD/SCID/γ null mice were injected with MT-2 cells for 2 weeks to estab lish HTLV-1 infection followed by MC1568 treatment (Fig ure 8C). Proviral load in the blood and spleen of MC1568-treated mice was significantly reduced in com parison to control. A decrease of at least ten copies of Tax and HBZ in the DNA, and a 10-to-20-fold decrease of Tax expression was observed in comparison to control, in cluding a massive downregulation of HBZ at the RNA level (Figure 8D). Similar downregulation of Tax and HBZ was observed in in the spleens of MC1568 treatment group.
Despite extensive efforts to understand the etiology and pathogenesis of HTLV-1-induced leukemogenesis, much remains unknown. After integration of the provirus, the LTR are duplicated in identical promoters which influence transcriptional activity of viral proteins along with other

Figure 8. MC1568 activity in vitro and in vivo. (A) Percent viability of activated T cells, Jurkat, ATL-ED (TAX-HBZ+), and MT-4 (TAX+HBZ+) after being treated with varying concentrations of MC1568. Compound was serially diluted in DMSO ranging from 50 µM to 0.39 µM, with respective vehicle and untreated controls. Each data point represents the average value obtained from 3 independent experiments. Error bars represent the standard error of mean. Half-maximal inhibitory concentration (IC50) values (µM/L) were determined using a 4-parameter logistic model derived by GraphPad Prism8 software. (B) Cells were treated with either siSRF, siMEF-2A or siMEF-2C for 48 hours and the IC50 curves were derived using GraphPad Prism8. (C) Treatment regimen of the humanized HTLV-1 infection mouse model for induction of infection and treatment with MC1568. (D) Left- evaluation of proviral load after chemical inhibition by MC1568 in isolated peripheral blood mononuclear cells (PBMC) and splenocytes from ATLL NOD/SCID/γnull humanized mice, and right- analyzed for relative expression of viral genes, Px and HBZ using quantitative reverse transcription polymerase chain reaction. Data is represented the standard error of mean of 2 independent experiments. Box-whisker plots represent the median, 25th and 75th percentile values of the untreated and treated groups. Graphs were gen erated using GraphPad Prism8 software.

co-factors in the pathogenesis of ATLL. Tax and other viral genes are expressed through transcripts initiated by promoter activity from the 5’ LTR region,38 whereas the only protein encoded on the negative strand and tran scribed from the 3’LTR is HBZ.7 ATLL cells from patients frequently only express HBZ,8 as all the other viral pro teins are transcriptionally repressed.11 Previous studies including ours identified various factors including MEF2A in facilitating T-cell transformation and leukemogen esis via Tax-mediated 5’ LTR activation and viral replication.14 Classically, retroviruses are known to have active 5’LTR and transcriptionally silent 3’LTR. 39 In the pathogenesis of HTLV-1-induced ATLL, there is a loss of 5’ LTR activity due to a variety of reasons including com plete loss via mutation or deletion and methylation of the 5’LTR.40 Additionally, Tax is an immunodominant epi tope and it is eliminated by immunosurveillance, which abrogates its activity at the 5’LTR.41 Despite the loss of 5’LTR activity, ATLL patients still have aggressive disease progression which may be through the transcriptionally active 3’LTR.32
In the event of loss of 5’LTR, there would be an inactivity of multiple transcriptional complexes involving MEF-2A and Tax, among others, which drive the pathogenesis HTLV-1 and subsequent ATLL progression. In this study we demonstrated that MEF-2C is another predominant isoform that is highly expressed in the acute ATLL pa tients, various ATLL cell lines, and is also overexpressed in non-ATLL cell lines. Furthermore, evidence suggests that K/D of MEF-2C results in a decrease in viral protein expression of HBZ, which has resulted in the decrease in the ATLL cell proliferation and blockade of the cell cycle progression. Our results point to the direction of MEF2C being a crucial factor in ATLL cell fitness. MEF-2C has also been implicated in various leukemias such as TALL,42 progression in chronic myelogenous leukemia,43 and in pediatric patient samples of early T-cell precursor acute lymphoblastic leukemia (EPT-ALL).44 Additionally, the activation of MEF-2C showed a post translational modification in ATLL cells, which is currently unknown, and requires further proteomic analysis. Furthermore, we present data that implicates MEF-2A/2C
isoforms in exacerbating aggressive carcinogenesis and related symptoms in NA-ATLL patients. Cell line obser vations validated in a specific NA-ATLL patient cohort19,20 reaffirmed a significant logarithmic increase in MEF-2A in all ATLL patients compared to seronegative, asympto matic carriers, and HAM/TSP patients, whereas MEF-2C over expression was observed only in 80% of the cohort. This may be due to multiple reasons, such as the varying degrees of ATLL progression, chemotherapeutic drug pressure, or the presence and/or absence of varying 5’ LTR activity and viral proteins. This was evident from the immortalized patient cell lines where ATL18 cells had a higher expression of MEF-2A/2C and correlated with the presence of Tax and HBZ expression. While in ATL-21 cells, the lower expression of MEF-2C correlated with the absence of HBZ, but MEF-2A correlated with upregulated Tax expression, establishing a clear connection between MEF-2A-Tax, as seen in previously published studies,14 and MEF-2C-HBZ. Although quite promising, further vali dation is necessary to assess if these correlations seen in our NA-ATLL will hold true in all ATLL patients despite their origin, since a new subgroup of high risk ATL muta tional signature has been identified.45,46 Taken together, we demonstrate MEF-2A and MEF-2C as the two pre dominantly expressed isoform across most HTLV-1 in fected cell systems with tangible clinical relevance in the ATLL patients, providing evidence that MEF-2C is an im portant factor in leukemogenesis.
In order to further explore this newly established linkage between MEF-2C and HBZ, we utilized ATL-ED cells, that lack the activity of 5’LTR thereby allowing possible acti vation of 3’LTR. At this promoter, significant enrichment of MEF-2C, but not MEF-2A, along with known transcrip tion factors, JunD and Menin, control the activity of the 3’LTR. Although, the 5’LTR was able to recruit MEF-2A/2C, it also recruited CEBP α , a known suppressor of HTLV-1 sense promoter thus explaining why 5’LTR is transcrip tionally silent in ATL-ED cells.31 Due to the enrichment of these factors, we hypothesized that these factors are in complex, and our protein-protein binding studies re vealed that MEF-2C strongly bound with HBZ forming a complex with a tumor suppressor Menin,47,48 but not with MEF-2A. Interestingly, the tumor suppressor Menin,47,48 bound with JunD in uninfected Jurkat cells but not in ATL-ED implying that a different JunD complex exist in ATLL cells. When 3’LTR is active, Menin interacts with MEF-2C and HBZ, which subsequently allows the release of JunD from Menin’s anti-tumor activity. MEF-2A/2C K/D studies further fortified that there was enrichment of JunD at the 3’LTR and is dependent on the presence of MEF-2C for the transcriptional activation of JunD and the antisense promoter activity of HTLV-1 (Figure 7D). MEF2 transcription factors act as both activators and re pressors depending on the specific kind of interaction
with the co-activators or co-repressors respectively.49 Class IIA HDAC (HDAC 4/5/7/9) are known binding partners of MEF-2, which when scaffolded with MEF-2 becomes a transcriptional repressor,50 making MEF-2 iso forms druggable targets. We have shown a specific class II HDAC inhibitor, MC1568, induced cytotoxicity in ATLL cell lines selectively. This inhibitor works in a non-ca nonical way of HDAC inhibition and allows the repressed state of MEF-2 proteins and their binding entities, in this case viral proteins such as Tax and HBZ. This was evident from the decrease of copy numbers and mRNA ex pression of both Tax and HBZ in the humanized HTLV-1 model of infection. Further studies using models of pa tient-derived xenografts, which mimic real-time infection as in patients, will be necessary to assess MEF-2 iso forms as a potential therapeutic target. In conclusion, we establish MEF-2C as a novel target in ATLL pathogenesis especially against the 3’LTR antisense transcriptional ac tivity in the absence of the 5’LTR and MEF-2A (Figure 7E) and can serve as a major therapeutic target for treat ment of ATLL.
No conflicts of interest to disclose.
KM performed most of the experimentation and drafted manuscript under direct guidance of PJ. JJ performed ChIP experiments and assisted in the revision of the manuscript. CD performed MC1568 in vivo evaluation under supervision from FK. VT generated some patient data and drafted related method section. RG generated prime flow data and reviewed manuscript drafts. ZKK as sisted in the editing of the manuscript. DS performed ex periments with WES technique and contributed some data. SW extended some help in early drafts of manu script. AWR provided 3’LTR CHIP data under the super vision of IL. MJ contributed to manuscript editing and improvements. EWH and IL provided cell lines and plas mids used in the study and edited the paper. BHY provided expert opinion and NA-ATLL samples. PJ conceptualized the study, designed, and monitored experiments, con ducted data analysis with KM, finalized data flow and presentation for the submission of manuscript.
We thank NIH AIDS reagents program for providing HTLV1-infected/ATLL cell lines. HBZ antibody was a gift from Dr. Patrick Green (Ohio State University). TAX (LT-4) anti body was gifted by Dr. Yuetsu Tanaka (Japan).
These studies are fully supported by the funding from NIH/NINDS via R01 NS097147 to PJ.
1. Nakao K, Abematsu N, Sakamoto T. Systemic diseases in patients with HTLV-1-associated uveitis. Br J Ophthalmol. 2018;102(3):373-376.
2. Eusebio-Ponce E, Anguita E, Paulino-Ramirez R, Candel FJ. HTLV-1 infection: an emerging risk. Pathogenesis, epidemiology, diagnosis and associated diseases. Rev Esp Quimioter. 2019;32(6):485-496.
3. Coffin JM. The discovery of HTLV-1, the first pathogenic human retrovirus. Proc Natl Acad Sci U S A. 2015;112(51):15525-15529.
4. Gruber K. Australia tackles HTLV-1. Lancet Infect Dis. 2018;18(10):1073-1074.
5. Ngoma AM, Omokoko MD, Mutombo PB, Nollet KE, Ohto H. Seroprevalence of human T-lymphotropic virus (HTLV) in blood donors in sub-Saharan Africa: a systematic review and metaanalysis. Vox Sang. 2019;114(5):413-425.
6. Chihara D, Ito H, Katanoda K, et al. Increase in incidence of adult T-cell leukemia/lymphoma in non-endemic areas of Japan and the United States. Cancer Sci. 2012;103(10):1857-1860.
7. Gaudray G, Gachon F, Basbous J, Biard-Piechaczyk M, Devaux C, Mesnard JM. The complementary strand of the human T-cell leukemia virus type 1 RNA genome encodes a bZIP transcription factor that down-regulates viral transcription. J Virol. 2002;76(24):12813-12822.
8. Polakowski N, Pearce M, Kuguyo O, Boateng G, Hoang K, Lemasson I. The splice 1 variant of HTLV-1 bZIP factor stabilizes c-Jun. Virology. 2020;549:51-58.
9. Taniguchi Y, Nosaka K, Yasunaga J, et al. Silencing of human Tcell leukemia virus type I gene transcription by epigenetic mechanisms. Retrovirology. 2005;2:64.
10. Tamiya S, Matsuoka M, Etoh K, et al. Two types of defective human T-lymphotropic virus type I provirus in adult T-cell leukemia. Blood. 1996;88(8):3065-3073.
11. Koiwa T, Hamano-Usami A, Ishida T, et al. 5'-long terminal repeat-selective CpG methylation of latent human T-cell leukemia virus type 1 provirus in vitro and in vivo. J Virol. 2002;76(18):9389-9397.
12. Lemasson I, Lewis MR, Polakowski N, et al. Human T-cell leukemia virus type 1 (HTLV-1) bZIP protein interacts with the cellular transcription factor CREB to inhibit HTLV-1 transcription. J Virol. 2007;81(4):1543-1553.
13. Matsumoto J, Ohshima T, Isono O, Shimotohno K. HTLV-1 HBZ suppresses AP-1 activity by impairing both the DNA-binding ability and the stability of c-Jun protein. Oncogene. 2005;24(6):1001-1010.
14. Jain P, Lavorgna A, Sehgal M, et al. Myocyte enhancer factor (MEF)-2 plays essential roles in T-cell transformation associated with HTLV-1 infection by stabilizing complex between Tax and CREB. Retrovirology. 2015;12:23.
15. Madugula K, Mulherkar R, Khan ZK, et al. MEF-2 isoforms' (A-D) roles in development and tumorigenesis. Oncotarget. 2019;10(28):2755-2787.
16. Pan F, Ye Z, Cheng L, Liu JO. Myocyte enhancer factor 2 mediates calcium-dependent transcription of the interleukin-2 gene in T lymphocytes: a calcium signaling module that is distinct from but collaborates with the nuclear factor of activated T cells (NFAT). J Biol Chem. 2004;279(15):14477-14480.
17. Tsukasaki K, Tobinai K. Human T-cell lymphotropic virus type Iassociated adult T-cell leukemia-lymphoma: new directions in clinical research. Clin Cancer Res. 2014;20(20):5217-5225.
18. Zuurbier L, Gutierrez A, Mullighan CG, et al. Immature MEF2Cdysregulated T-cell leukemia patients have an early T-cell
precursor acute lymphoblastic leukemia gene signature and typically have non-rearranged T-cell receptors. Haematologica. 2014;99(1):94-102.
19. Shah UA, Chung EY, Giricz O, et al. North American ATLL has a distinct mutational and transcriptional profile and responds to epigenetic therapies. Blood. 2018;132(14):1507-1518.
20. Chung EY, Mai Y, Shah UA, et al. PAK kinase inhibition has therapeutic activity in novel preclinical models of adult T-cell leukemia/lymphoma. Clin Cancer Res. 2019;25(12):3589-3601.
21. Nebbioso A, Manzo F, Miceli M, et al. Selective class II HDAC inhibitors impair myogenesis by modulating the stability and activity of HDAC-MEF2 complexes. EMBO Rep. 200;10(7):776-782.
22. Panella S, Marcocci ME, Celestino I, et al. MC1568 inhibits HDAC6/8 activity and influenza A virus replication in lung epithelial cells: role of Hsp90 acetylation. Future Med Chem. 2016;8(17):2017-2031.
23. Venza I, Visalli M, Oteri R, Cucinotta M, Teti D, Venza M. Class IIspecific histone deacetylase inhibitors MC1568 and MC1575 suppress IL-8 expression in human melanoma cells. Pigment Cell Melanoma Res. 2013;26(2):193-204.
24. Di Giorgio E, Gagliostro E, Clocchiatti A, Brancolini C. The control operated by the cell cycle machinery on MEF2 stability contributes to the downregulation of CDKN1A and entry into S phase. Mol Cell Biol. 2015;35(9):1633-1647.
25. Shah UA, Shah N, Qiao B, et al. Epidemiology and survival trend of adult T-cell leukemia/lymphoma in the United States. Cancer. 2020;126(3):567-574.
26. Costa EA, Magri MC, Caterino-de-Araujo A. The best algorithm to confirm the diagnosis of HTLV-1 and HTLV-2 in at-risk individuals from Sao Paulo, Brazil. J Virol Methods. 2011;173(2):280-286.
27. Yelamanchili SV, Chaudhuri AD, Chen LN, Xiong H, Fox HS. MicroRNA-21 dysregulates the expression of MEF2C in neurons in monkey and human SIV/HIV neurological disease. Cell Death Dis. 2010;1:e77.
28. Ye BH, Chung E, Pradhan K, et al. S-Phase progression of North American ATLL cells is critically regulated by the protooncogene BCL6 and targetable by PARP inhibition. Blood. 2019;134(Suppl 1):S3779.
29. Yao J, Grant C, Harhaj E, et al. Regulation of human T-cell leukemia virus type 1 gene expression by Sp1 and Sp3 interaction with TRE-1 repeat III. DNA Cell Biol. 2006;25(5):262-276.
30. Lehmann LH, Jebessa ZH, Kreusser MM, et al. A proteolytic fragment of histone deacetylase 4 protects the heart from failure by regulating the hexosamine biosynthetic pathway. Nat Med. 2018;24(1):62-72.
31. Grant C, Nonnemacher M, Jain P, et al. CCAAT/enhancer-binding proteins modulate human T cell leukemia virus type 1 long terminal repeat activation. Virology. 2006;348(2):354-369.
32. Lemasson I, Polakowski NJ, Laybourn PJ, Nyborg JK. Transcription regulatory complexes bind the human T-cell leukemia virus 5' and 3' long terminal repeats to control gene expression. Mol Cell Biol. 2004;24(14):6117-6126.
33. Clerc I, Polakowski N, Andre-Arpin C, et al. An interaction between the human T cell leukemia virus type 1 basic leucine zipper factor (HBZ) and the KIX domain of p300/CBP contributes to the down-regulation of tax-dependent viral transcription by HBZ. J Biol Chem. 2008;283(35):23903-23913.
34. Borowiak M, Kuhlmann AS, Girard S, et al. HTLV-1 bZIP factor
impedes the menin tumor suppressor and upregulates JunDmediated transcription of the hTERT gene. Carcinogenesis. 2013;34(11):2664-2672.
35. Cosenza M, Pozzi S. The therapeutic strategy of HDAC6 inhibitors in lymphoproliferative disease. Int J Mol Sci. 2018;19(8):2337.
36. Davis FJ, Gupta M, Camoretti-Mercado B, Schwartz RJ, Gupta MP. Calcium/calmodulin-dependent protein kinase activates serum response factor transcription activity by its dissociation from histone deacetylase, HDAC4. Implications in cardiac muscle gene regulation during hypertrophy. J Biol Chem. 2003;278(22):20047-20058.
37. Zhang M, Urabe G, Little C, et al. HDAC6 regulates the MRTFA/SRF axis and vascular smooth muscle cell plasticity. JACC Basic Transl Sci. 2018;3(6):782-795.
38. Azran I, Schavinsky-Khrapunsky Y, Aboud M. Role of Tax protein in human T-cell leukemia virus type-I leukemogenicity. Retrovirology. 2004;1:20.
39. Guntaka RV. Transcription termination and polyadenylation in retroviruses. Microbiol Rev. 1993;57(3):511-521.
40. Katsuya H, Islam S, Tan BJY, et al. The nature of the HTLV-1 provirus in naturally infected individuals analyzed by the viral DNA-Capture-Seq approach. Cell Rep. 2019;29(3):724-735.
41. Bangham CR. CTL quality and the control of human retroviral infections. Eur J Immunol. 2009;39(7):1700-1712.
42. Homminga I, Pieters R, Langerak AW, et al. Integrated transcript and genome analyses reveal NKX2-1 and MEF2C as potential oncogenes in T cell acute lymphoblastic leukemia. Cancer Cell.
2011;19(4):484-497.
43. Agatheeswaran S, Chakraborty S. MEF2C and CEBPA: possible co-regulators in chronic myeloid leukemia disease progression. Int J Biochem Cell Biol. 2016;77(Pt A):165-170.
44. Neumann M, Heesch S, Gokbuget N, et al. Clinical and molecular characterization of early T-cell precursor leukemia: a high-risk subgroup in adult T-ALL with a high frequency of FLT3 mutations. Blood Cancer J. 2012;2(1):e55.
45. Kataoka K, Nagata Y, Kitanaka A, et al. Integrated molecular analysis of adult T cell leukemia/lymphoma. Nat Genet. 2015;47(11):1304-1315.
46. Marcais A, Lhermitte L, Artesi M, et al. Targeted deep sequencing reveals clonal and subclonal mutational signatures in adult T-cell leukemia/lymphoma and defines an unfavorable indolent subtype. Leukemia. 2021;35(3):764-776.
47. Yang YJ, Song TY, Park J, et al. Menin mediates epigenetic regulation via histone H3 lysine 9 methylation. Cell Death Dis. 2013;4:e583.
48. Thakker RV. Multiple endocrine neoplasia type 1 (MEN1) and type 4 (MEN4). Mol Cell Endocrinol. 2014;386(1-2):2-15.
49. Di Giorgio E, Hancock WW, Brancolini C. MEF2 and the tumorigenic process, hic sunt leones. Biochim Biophys Acta Rev Cancer. 2018;1870(2):261-273.
50. Di Giorgio E, Franforte E, Cefalu S, et al. The co-existence of transcriptional activator and transcriptional repressor MEF2 complexes influences tumor aggressiveness. PLoS Genet. 2017;13(4):e1006752.
In 2022, the obtention of sustained deep molecular response (DMR) with successful subsequent treatment-free remission (TFR) is part of the new paradigm of treatment of chronic phase chronic myeloid leukemia (CP-CML).1 Although gen erally known as being “feasible and safe”, we observed six cases of blast crises (BC) after tyrosine kinase inhibitor (TKI) cessation, reported here. Physicians of the French CML Study Group (Fi-LMC) were asked to report any cases of BC occurring in TFR patients; TFR being considered as ≥2 years of 4.5-log reduction (MR4.5) as recommended.2 All patients were informed by the appropriate procedures approved by local ethical commit tees. Hematologic assessments were performed locally. BCR::ABL1 transcripts were quantified by reverse transcrip tion quantitative polymerase chain reaction (RT-qPCR) and reported as BCR::ABL1/ABL1 in percent international scale (%IS),1 TK domain mutations were screened by next-gener ation sequencing (NGS) and copy number variation (CNV) analyses were performed on marrow cell DNA at CP (all pa tients except patient 2) and BC (all patients) diagnoses. Pa nels included 48 “myeloid” genes (Online Supplementary Table S1) and 62 additional “lymphoid” genes for lymphoid blast crises (LBC) (Online Supplementary Table S2).
Chronic phase chronic myeloid leukemia descriptive analysis (Table 1)
Patient 1 is a 37-year-old male, with CP-CML diagnosed in 2000 treated with IFN-α+AraC from 2000-2001. He was switched to imatinib (IM) following IFN-α failure. After >5 years of IM and 2 years of DMR, he made a first cessation attempt, but lost major molecular response (MMR) at 12 months (M12). After IM resumption he switched to dasatinib 2011-2013 before attempting TFR for a second time. Patient 2 is a 56-year-old female, with CP-CML diagnosed in 2003 treated with IFN-α for 7 months and then with IM from 2003 to 2016. After 10 years of MR4.5 she stopped IM for TFR. Pa tient 3 is a 32-year-old female, partly reported in,6 diagnosed in CP in 1996, treated with IFN-α+AraC from 1996 to 1999 who became intolerant while in DMR. She started IM in 2006, following molecular recurrence. After 3 years IM and 30 months MR4.5 she stopped IM in 2009 for a second at tempt at TFR. Patient 4 is a 60-year-old female with CP-CML diagnosed in 2012, treated with nilotinib from 2012 to 2016. After nilotinib intolerance, while in sustained DMR, she switched to dasatinib that was also withdrawn 4 months later due to intolerance. Patient 5 is a 51-year-old male, CPCML diagnosed in 2007 and treated with IM until 2013. After 6.25 years and 4.5 years of MR4, he stopped IM in 2013 for
TFR. Patient 6 is a 58-year-old, CP-CML diagnosed in 2010 and treated with nilotinib from 2011-2014. Discovery of athe rosclerosis resulted in nilotinib dose reduction from 2014 to 2016 and suspension after 5 years and >3 years in sustained MR4.5.
Blast crisis chronic myeloid leukemia descriptive analysis (Table 2)
BC occurred during the TFR phase in four of the six patients. MBC was observed in patients 5 and 6 whereas the remain ing four patients were in B-lineage LBC. BC occurred in TFR phase for patients 1, 2, 4, and 6 (Figure 1A, B, D and F) whereas patients 3 and 5 experienced BC 9 months after IM resumption following MMR loss (Figure 1C and E). For patient 5, IM was switched to dasatinib after 4 months due to mol ecular progression and the emergence of ACA in Philadelphia chromosome-positive (Ph+) cells was demonstrated 5 months prior to BC. For patients with transformation during TFR, time to BC from TKI cessation varied from 6 to 63 months but the kinetics of BC followed similar dramatic pat terns. The intervals from last MMR to BC were 1, 2, 3 and 6 months for patients 2, 5, 4, and 1 respectively. MMR loss oc curred at the same time as BC for three of four patients (pa tients 1, 2 and 4) and belatedly following TKI cessation for these three patients (M48, M32 and M63 respectively). A Ph duplication was present at BC for patients 2 and 3. For MBC (patients 5 and 6) a 3q26 (involving EVI1), already present in accelerated phase prior to BC for patient 5, was identified again in BC. Patient 3 had a variant t(9;22)(q34;q11) and pa tient 1 a Y chromosome loss. CNV analysis detected ABL1 amplification for patients 2 and 3. Double deletions of IKZF1 (exons 2-8) were reported for patients 1, 2 and 4. SETD2 deletions (whole gene or exons 16-21) were found for pa tients 2 and 4. Other CNV were also reported: RhoA, CRBN, MYD88, CDKN2A, CDKN2B deletions for patient 2, or RUNX1, U2AF1 amplification for patient 3, and XBP1 for patient 5. Of note, XBP1 deletion was present in patient 5 whereas dele tions of SETD2, FLT3 and TP53 with amplification of IKZF1 and MECOM were reported in patient 1, all at CP diagnosis. Multiple gene mutations were found for MBC patients (pa tients 1, 4, 5 and 6). For patient 6, a nonsense mutation in ASXL1 with a variant allele frequency (VAF) of 37% in exon 12 was observed. This clone was also present at CP (VAF: 33%) but not on a CCyR sample. For patient 5 a nonsense muta tion ASXL2 (VAF: 50%) in exon 12 was found with two EP300 mutations. This clone was also present at CP (VAF: 25.2% for ASXL2 and 52.7% and 50.8% for EP300). Interestingly, muta tions were observed in SETD2 for two patients (1 and 4) at
Treatment for 1 st loss of MMR
Treatment before 1 st TFR Duration of treatment before 1 st TFR, mth* Loss of MMR a ft er 1 st TFR
CNV
NGS at diag. Mutated gene, (VAF % of mut.)
Cytogenetics
Table 1. Patient characteristics at diagnosis of chronic phase chronic myleoid leukemia. Pt Age at diag. (yrs)
Risk scores Type of Trans.
WBC x10 9 /L and blasts % at diag
No
Yes (mth 12) Imatinib+/- IFNα Dasatinib
Yes
15+69
IFNα +AraC Imatinib
SETD2, FLT-3, TP53 deletions. IKZF1 and MECOM amplifications
No mutation
46,XY,t(9;22)(q34;q11) [2]/idem,-Y[20]
e14a2
Sokal low ELTS low
57/3
2 nd TFR Loss of MMR a ft er 2 nd TFR Follow-up of CP (Mo.) 1
37
/
No
Yes (mth 10)
/
No
7+157
IFNα Imatinib
NA
46,XX,t(9;22)(q34;q11) [20]
NA
e14a2
NA
21.9/0
198 2
56
Yes
Imatinib
Yes
36
IFNα +AraC
No
No mutation
46,XX[1]/46,XX,del(22) (q11),der(9)t(9;?),der14t (14;?)del(12q)[16]
ND
Sokal low ELTS low
67.8/0
196 3
32
/
No
/
No
39+4
Nilotinib+ Dasatinib
No
No mutation
46,XX,t(9;22)(q34;q11) [20]
e14a2
Sokal Int ELTS low
70.7/1
182 4
60
/
Imatinib Dasatinib IFNα
Yes (mth 6)
68
/
No
No
/
Yes (mth 5)
75
Imatinib
XBP1 deletion
ASXL2 (25.2%) EP300 (52.7% and 50.8%)
46,XY,t(9;22)(q34;q11) [20]
ND
Sokal Int. ELTS low
391/2
107 5
60
Nilotinib
No
ASXL1 (33%)
46,XX,t(9;22)(q34;q11) [20]
e14a2
Sokal Int ELTS low
104.6/3
51
58
90 6
Ara-C: Cytarabine; CP: chronic phase; diag: diagnosis; IFN: interferon; MMR: major molecular response; mth: months; Mut.: mutation; ND: not done; CNV: copy number variation; NGS: next-generation sequencing; Pt: patient; TFR: treatment-free remission; Trans.: transcript BCR-ABL1; VAF: value allele frequency; WBC: white blood cells. *These numbers refer to the number of months of treatments before 1st TFR mentioned in the previous column
BC, not detectable at CP. Patient 1 had two low-level SETD2 variants whereas a stop-gain variant was estimated as 40.7% for patient 4. An additional KMT2A splice-acceptor variant was found for patient 1. In addition, patient 2 showed a T315I (VAF: 2%) + E255K (VAF: 5%) + Y253H (VAF: 5%) ABL1 TK do main mutations at BC relapse (18 months after BC diagnosis).
Patient 5 had three mutations at BC: F317L (VAF: 10.6%); T315I (VAF: 4.9%) and E255V (VAF:23.6%), but the patient had been on TKI for 9 months.
Allogeneic stem cell transplantation (allo-SCT) was per formed for patients 3, 5, 6, and autologous-SCT (auto-SCT) in CR for patient 1. Patient 2 received EWALL induction
Figure 1. Kinetics of transcript aligned on international scale (BCR::ABL1/ABL1IS). (A) Patient 1, (B) patient 2, (C) patient 3, (D) patient 4 (E) patient 4 and (F) patient 6. Months (M) corresponding to the dates from which transcript was aligned on international scale, treatment discontinuation, blast crisis, and last molecular follow-up from chronic phase chronic myeloid leukemia (CPCML) diagnosis are indicated on the x axis. IM: Imatinib; D: Dasatinib; N: Nilotinib; IFN: interferon; Ara-C: Cytarabine; Allo-SCT: allogeneic stem cell transplantation; auto-SCT: autologous stem cell transplantation; AP: accelerated phase; LBC: lymphoid blast crisis; MBC: myeloid blast crisis; MMR: major molecular response; DMR: deep molecular response (i.e., MR4 and MR4.5).

Table 2. Patient characteristics at onset of blast crisis.
Follow-up since BC (Mo.)
Treatment of BC Allo/Auto SCT
ABL1 TKD mut.
Alive in CR
41
Auto-SCT
Vincristine + DXM + Nilotinib then IV MTX + Ara-C
No
CNV
NGS Mutated gene, (VAF % of mut.)
IKZF1 (e2-8)(x2), deletions
SETD2 (1% and 1.3%) KMT2A (5.2%)
Cytogenetics at BC
BC phenotype
BC onset since diag, mth
Pt Age at BC, yr
46,XY,t(9;22)(q34;q11)[2]/idem,- Y[20]
Lymphoid
Alive in relapse
25
/
Vincristine + DXM + Nilotinib
T315I E255K Y253H
RhoA, CRBN, MYD88, SETD2, CDKN2A ( e1) CDKN2B(e2)IKZF1 (e2-8 )( (x2) deletions ABL1 amplification
Lymphoid 47,XX,del(3)(p11),t(9;22) (q34;q11), +der22 t(9;22)(q34;q11)[6]/46,XX[9] No mutation
198
53
Outcome 1
29
Allo-SCT
Vincristine + DXM + Dasatinib then Nilotinib alone
No
No mutation ABL1, RUNX1, U2AF1 amplifications
46-49,XX,+X,-13,- 14,der(22)t(9;22)(q34;q11)X2,3- 5mar[cp20]/46,XX[1]
Lymphoid
1
/
Vincristine + DXM + Ponatinib then Dasatinib
No
SETD2 (e16-21) IKZF1 (e2-8)(x2) deletions
SETD2 (40.7%)
46,XX,t(9;22)(q34;q11)[11]/47, idem,+X[7]/46,XX[10]
Lymphoid
Alive in CR
106
Alive in CR 4
68
16
55
Allo-SCT
Idarubicin + Ara-C + Ponatinib
F317L T315I E255V
XBP1 deletion
ASXL2 (50%) EP300 (51.8% and 45.5%)
46,XY,t(2;3)(p21;q26); t(9;22)(q34;q11)[20]
Allo-SCT
Daunorubicin+ Ara-C + Ponatinib
No
Myeloid
No
ASXL1 (37%)
46,XX,inv(3)(q21;q26), t(9;22)(q34;q11)[2]/46,XX[19]
Myeloid
90
Alive in CR 5
66
58
63
Death 6
Ara-C: Cytarabine; BC: blast crisis; CNV: copy number variation, e: exon; CR: complete remission; diag.: diagnosis; DXM: dexamethasone; mth: months; MTX: methotrexate; NGS: nexteneration sequencing; Pt: patient; auto-SCT: autologous stem cell transplantation; allo-SCT: allogeneic SCT; TKD: tyrosine kinase domain; VAF: variant allele frequency; Yr: years.
chemotherapy+nilotinib. A stroke during induction led to dose interruption. Relapse was observed at 18 months from induction with BCR::ABL1 at 0.04% IS in the blood and 9.5% IS in the marrow. She received four injections of vincristine/dexamethasone+ponatinib but acute pancreatitis onset led to a switch to dasatinib. Blasts and transcripts progressed particularly from the T315I clone (VAF: 100%) at latest follow-up. Patient 5 was refractory to induction and received hydroxyurea+6-mercaptopurine+ponatinib, result ing in a partial response, a sibling donor allo-SCT was per formed after conditioning with clofarabine+cytarabine+cyclophosphamide+busulfan+ATG. The patient progressed after allo-SCT and received three DLI+dasatinib with no success. Haplo-SCT with his daughter was further proposed. Unfortunately, thrombotic micro angiopathy and multiple infections resulted in death. At la test follow-up the three other patients are in sustained DMR >12 months after transplant (M37, M25, M49) (Figure 1A, C and F). After 1.5 months follow-up, patient 4 is currently in cytological remission and recovering from induction chemo therapy with dexamethasone+vincristine+ponatinib and has been switched to dasatinib due to liver toxicity. BC currently is an exceptional event during the course of CML with 0.7-4.5% of CP-CML patients on IM front-line treatment progressing to BC3 especially during early years.4 These progressions occur in patients with secondary resis tance or suboptimal response or failure to TKI,1 and are mye loid in 75%, or lymphoid in 25% of the cases.11,13 The prognosis of BC remains poor4,5,13 despite intensification procedures. According to the large number of patients enrolled, France is currently a pioneer in TFR clinical studies (≥600 patients). Based on these studies we estimate the risk of BC in TFR as being very low, below 0.1%. Until now, only two cases have been reported.6,7 We hereby report six cases occurring after 41 (range, 6-124) months median sustained MR4.5 prior to cessation and for four of these six cases after a median of 40 months of cessation, while the two remaining patients went into BC following TKI resumption after 6 and 11 months of TFR. Interestingly, four of six BC were lymphoid which is not the current pattern of BC seen in TKI first-line treatment (75% myeloid8,13), and all of the cases with one exception (pa tient 5) occurred suddenly as seen in BC cases observed in patients in cytogenetic response on imatinib or IFN-α9,17 and in Al Fayez et al. in TFR.7 The same clone as identified by identical ASXL-1 mutation (patient 6) or a derived sub-clone identified by identical ASXL-2 and EP300 mutations, with clonal evolution (patient 5) were detected again at BC. This suggests that stem cells, had survived the various TKI chal lenges and although undetectable, had remained unstable and capable of promoting disease transformation. Clearly, the malignant cells or an aggressive subfraction of them had not been eradicated. In addition, these two patients har bored a myeloid phenotype. ABL-1 mutations may be ob served in up to 80% of BC cases and while occurring in
late-CP patients, are associated with a greater likelihood of progression. Other mutations or CNV are historically known to be associated with progression,10 particularly genes in volved in myeloid (~25% TP53 mutated or deleted11) or lym phoid phenotypes (50% p16 deleted). Recently, other genes have been identified as being involved at CP diagnosis as well as at BC diagnosis, such as RUNX-1, IKZF1, ASXL1, DNMT3A, SETBP1, WT1, TET2, IDH1, NRAS, KRAS, CBL 12-14 In this article, mutation(s) and/or CNV were identified in all the BC patients, which is a common finding, however, in two of six patients some mutations/deletions in two genes, EP300 (pa tients 3 [LBC] and 5 [MBC]) and SETD2 genes (patients 1 and 4, [both LBC] were found to have recurred. These two genes are involved in epigenetic regulations and are rarely reported in de novo lymphoblastic B-ALL (~3.86-10% of cases15,16) or in CML-BC (<5%13). Whether or not these represent BC-TFRrelated markers requires further investigation. Complex copy number alterations were found in two of six patients, com parable to that of Ochi et al. 13 TKI probably exert sustained therapeutic pressure on residual leukemia stem cells and progeny, thus preventing overt genetic instability for being induced in BCR::ABL1+ stem cells.8 These six cases underline the necessity for sustained longlasting molecular follow-up for patients in TFR.
Stephanie Dulucq,1,2,3 Sandrine Hayette,2,3,4 Jean-Michel Cayuela,2,3,5 Frédéric Bauduer,2,6 Kaddour Chabane,4 Patrice Chevallier,7 Pascale Cony-Makhoul,2,8 Pascale Flandrin-Gresta,2,3,9 Caroline Le Jeune,2,10 Yannick Le Bris,3,11 Laurence Legros,2,12 Hervé Maisonneuve,13 Lydia Roy,2,14 Francois-Xavier Mahon,3,15 Ivan Sloma,2,3,16 Delphine Rea2,17 and Franck Emmanuel Nicolini2,18
1Laboratory of Hematology, University Hospital of Bordeaux, Pessac; 2Groupe Fi-LMC, Centre Léon Bérard, Lyon; 3Groupe GBMHM, Hôpital Saint Louis, Paris; 4Laboratory of Hematology, Centre Hospitalier Lyon Sud, Pierre-Bénite; 5Laboratory of Hematology, Hôpital Saint Louis, Paris; 6Department of Hematology, Côte Basque Hospital, Bayonne; 7Department of Hematology, Hôtel Dieu, Nantes; 8Department of Hematology, Annecy-Genevois Hospital, Pringy; 9Laboratory of Hematology, University Hospital of Saint-Etienne, Saint Etienne; 10Department of Hematology, Institut de Cancérologie Lucien Neuwirth, Saint Etienne; 11Laboratory of Hematology, Hôtel Dieu, Nantes; 12Department of Hematology, Hôpital Paul Brousse, Villejuif; 13Department of Hematology aqnd Oncology, La Roche sur Yon Hospital, La Roche sur Yon; 14Department of Hematology, Hôpital Henri Mondor, Créteil; 15Cancer Center of Bordeaux, lnstitut Bergonié, Bordeaux; 16Laboratory of Hematology, Hôpital Henri Mondor, Créteil; 17Department of Hematology, Hôpital Saint Louis, Paris and 18Department of Hematology and CRCL, INSERM U1052, Centre Léon Bérard, Lyon, France
Correspondence:
F.E. NICOLINI - franck-emmanuel.nicolini@lyon.unicancer.fr
https://doi.org/10.3324/haematol.2022.280740
Received: January 29, 2022. Accepted: July 26, 2022. Prepublished: August 4, 2022.
©2022 Ferrata Storti Foundation
Published under a CC BY-NC license
FEN is a consultant for Incyte Biosciences, Sun Pharma Ltd, and Kartos Inc; is a speaker for Novartis, Incyte Biosciences and a board member for Novartis, Pfizer and Incyte Biosciences. SD is a speaker for Novartis and Incyte Biosciences. JMC is a speaker for Novartis and Incyte Biosciences. IS is a speaker for Incyte Biosciences. PCM is a speaker for Novartis, BMS and Pfizer. LL is a speaker for Novartis, Incyte Biosciences, BMS, Pfizer and Amgen. FXM is a consultant for Novartis and a speaker for Incyte Biosciences, BMS, Novartis and Pfizer. SH, PFG, YLB, FB, PC, CLJ, HM, KC, and LR have no conflicts of interest to disclose.
1. Hochhaus A, Baccarani M, Silver RT, et al. European LeukemiaNet 2020 recommendations for treating chronic myeloid leukemia. Leukemia. 2020;34(4):966.984.
2. Rea D, Ame S, Berger M, et al. Discontinuation of tyrosine kinase inhibitors in chronic myeloid leukemia: recommendations for clinical practice from the French Chronic Myeloid Leukemia Study Group. Cancer. 2018;124(14):2956,2963.
3. Hehlmann R, Lauseker M, Saußele S, et al. Assessment of imatinib as first-line treatment of chronic myeloid leukemia: 10year survival results of the randomized CML study IV and impact of non-CML determinants. Leukemia. 2017;31(11):2398-2406.
4. Nicolini FE, Alcazer V, Cony-Makhoul P, et al. Long-term followup of de novo chronic phase chronic myelogenous leukemia patients on front-line imatinib. Exp Hematol. 2018;64:97-105.
5. Kantarjian H, O’Brien S, Jabbour E, et al. Improved survival in chronic myeloid leukemia since the introduction of imatinib therapy: a single-institution historical experience. Blood. 2012;119(9):1981-1987.
6. Rousselot P, Charbonnier A, Cony-Makhoul P, et al. Loss of major molecular response as a trigger for restarting tyrosine kinase inhibitor therapy in patients with chronic-phase chronic myelogenous leukemia who have stopped imatinib after durable undetectable disease. J Clin Oncol. 2014;32(5):424-430.
7. Alfayez M, Richard-Carpentier G, Jabbour E, et al. Sudden blastic transformation in treatment-free remission chronic myeloid leukaemia. Br J Haematol. 2019;187(4):543-545.
8. Perrotti D, Jamieson C, Goldman J, Skorski T. Chronic myeloid leukemia: mechanisms of blastic transformation. J Clin Invest. 2010;120(7):2254-2264.
SD, FEN compiled the data and wrote the article. FB, PC, PCM, CLJ, LL, HM, LR, FXM, DR and FEN enrolled the patients and conducted the follow-up. SD, SH, JMC, PFG, YLB and IS performed molecular followup. SH performed NGS and CNV analysis. All the authors contributed to the collection of data, have proofread the manuscript and agree on its content.
The authors acknowledge Dr Emmanuelle Clappier hôpital Saint Louis, Dr Audrey Bidet Hôpital Haut Lévêque, Pessac, Dr Viviane Dubruille Hôtel Dieu, Nantes, and Dr Emmanuel Beillard, Centre Léon Bérard, Lyon, France for advice and help in data collection. We are grateful for the association Anim’ Montbernier (Ruy-Montceau, France) and its president Mr Armand Glasson for continuous support. We thank Mrs Barbara Meunier-White (Chasselay, France) for proofreading the English.
Anonymous clinical and molecular data were collected and entered in password-protected Excel worksheets and files and exchanged between the first and last author securely. They are available to thirdparty individuals with a password via two separate mails upon request to the corresponding author.
9. Kantarjian H, O’Brien S, Cortes J, et al. Sudden onset of the blastic phase of chronic myelogenous leukemia: patterns and implications. Cancer. 2003;98(1):81-85.
10. Radich JP, Dai H, Mao M, et al. Gene expression changes associated with progression and response in chronic myeloid leukemia. Proc Natl Acad Sci U S A. 2006;103(8):2794-2799.
11. Prokocimer M, Rotter V. Structure and function of p53 in normal cells and their aberrations in cancer cells: projection on the hematologic cell lineages. Blood. 1994;84(8):2391-2411.
12. Branford S, Kim DDH, Apperley JF, et al. Laying the foundation for genomically-based risk assessment in chronic myeloid leukemia. Leukemia. 2019;33(8):1835-1850.
13. Ochi Y, Yoshida K, Huang Y-J, et al. Clonal evolution and clinical implications of genetic abnormalities in blastic transformation of chronic myeloid leukaemia. Nat Commun. 2021;12(1):2833-2846.
14. Grossmann V, Kohlmann A, Zenger M, et al. A deep-sequencing study of chronic myeloid leukemia patients in blast crisis (BCCML) detects mutations in 76.9% of cases. Leukemia. 2011;25(3):557-560.
15. Jing Y, Li Y-F, Wan H, Liu D-H. Detection of EP300-ZNF384 fusion in patients with acute lymphoblastic leukemia using RNA fusion gene panel sequencing. Ann Hematol. 2020;99(11):2611-2617.
16. Li J, Duns G, Westers H, Sijmons R, van den Berg A, Kok K. SETD2: an epigenetic modifier with tumor suppressor functionality. Oncotarget. 2016;7(31):50719-50734.
17. Kantarjian H, O'Brien S, Cortes J et al. Sudden onset of the blastic phase of chronic myelogenous leukemia. Patterns and implications. Cancer. 2003;98(1):81-85.
Little is known about the timing or mechanisms of en dothelial injury after pediatric hematopoietic stem cell transplant (HSCT) because blood vessels are hard to di rectly observe. Circulating endothelial cells (CEC) are a marker of endothelial injury.1 Only one study evaluated CEC in children after HSCT and included only patients with pri mary immune deficiencies.2 We prospectively evaluated CEC as a biomarker of outcomes in children undergoing HSCT and determined if CEC could be used to study en dothelial injury. We observed that endothelial injury was common, particularly among patients with high-risk thrombotic microangiopathy (TMA). Although CEC are li mited as a predictive biomarker by their rapid kinetics, our transmission electron microscopy (TEM), immunofluor escence microscopy (IFM) and RNA sequencing (RNAseq) data confirm CEC are a non-invasive tool to study mech anisms of endothelial injury after HSCT. CEC were collected from allogeneic or tandem autologous HSCT recipients (for neuroblastoma, associated with TMA3)

between July 2019 and July 2020. All subjects consented to an Institutional Review Board-approved HSCT reposi tory. Samples were obtained weekly during inpatient ad missions and weekly, when feasible, as outpatients. Established protocols were used for CEC isolation.4 Briefly, invitrogen M450 tosylactivated dynabeads were coupled to a CD146 antibody (FisherSci, 5012898) and combined with patient blood. CEC were isolated with immunomag netic separation (StemCell Technologies), loaded on a Na geotte cell chamber and imaged using a Zeiss Axio Imager.Z1 microscope. UEA-1 staining (Vector Lab, B1065) was performed to further confirm endothelial origin. CEC were defined as cells having five or more CD146 immuno magnetic beads attached, >10 mm in diameter, a morphol ogy consistent with a single cell, damaged cell, or cluster of cells, and fluorescence with acridine orange (AO) stain ing.
A total of 642 CEC samples (median, 13 samples/patient) from 53 HSCT recipients (Online Supplementary Table S1)
Figure 1. Circulating endothelial cells identify complement-mediated endothelial damage in high and moderate-risk thrombotic microangiopathy treated with eculizumab. (A) Circulating endothelial cell elevations from baseline (Δ CEC) and sC5b-9 levels vs. time in patients with thrombotic microangiopathy (TMA) requiring treatment with eculizumab. TMA diagnosis (red arrow) and start of eculizumab therapy (green arrow) are labeled along with TMA risk category using criteria by Jodele et al.
were analyzed. Baseline samples were obtained prior to (n=41) or during conditioning (n=12). Peak CEC counts oc curred prior to stem cell infusion in 15 of 53 (28.3%) sub jects or in the first 30 days after HSCT in 19 of 53 (35.9%) subjects. However, CEC peaks that occurred between days 61-90 after HSCT were significantly higher than peaks that occurred before HSCT (P=0.009), in the first 30 days after HSCT (P=0.01) or between days 31-60 (P=0.03; Online Sup plementary Figure S1). There were no associated clinical complications to explain these late CEC elevations. CEC were evaluated based on their increase relative to the first collected pre-HSCT sample for each patient (ΔCEC score). Most HSCT recipients (n=31, 58.5%) had a ΔCEC score >2 at least once after HSCT. We then evaluated clinical associations with ΔCEC scores (Online Supplementary Table S2). HSCT recipients were prospectively screened for TMA and assigned to risk groups using Jodele criteria.5,6 Moderate- or high-risk TMA occurred in 14 subjects during CEC collection. CEC elev ations were temporally correlated with terminal comple ment (sC5b-9) activation in subjects who required eculizumab therapy (Figure 1) and in those with high-risk TMA. All subjects with high-risk TMA had a ΔCEC score >2 after HSCT. Similarly, all subjects with TMA who required treatment with eculizumab had a Δ CEC score >2 after HSCT. One patient developed high-risk TMA immediately after being diagnosed with hepatic VOD, received defibro tide, and their TMA improved without eculizumab. One pa tient with moderate-risk TMA was treated with eculizumab for persistent proteinuria.
Three subjects required defibrotide for hepatic VOD (grade 4 [n=2], grade 2 [n=1)]7) and all three had ΔCEC scores >2. Seven subjects were diagnosed with acute or chronic graft-versus-host disease (GvHD) during the study period. GvHD diagnosed outside of the collection period was ex cluded. ΔCEC scores were not different in subjects with GvHD compared to those without GvHD (P>0.99). There were also no observed differences in ΔCEC scores or ab solute CEC values in MAC versus RIC regimens (P>0.99) or total body irradiation (TBI) versus no TBI regimens (P=0.64).
Epstein-Barr virus (EBV), cytomegalovirus (CMV), human herpes virus 6 (HHV-6), herpes simplex virus (HSV) and adenovirus viremia were not temporally associated with CEC elevations. In contrast, BK polyomavirus (BKPyV) vire mia was temporally associated with endothelial injury. BKPyV viremia occurred in 16 subjects (30.2%) and oc curred during CEC collection in 11 subjects. Plasma BKPyV copy number was commonly, although not always, associ ated with absolute CEC counts and ΔCEC scores (Figure 2), perhaps reflecting a limitation of weekly testing. Sub ject 1 in Figure 2 had two separate episodes of BKPyV vire mia and cystitis, both of which were associated with a rise in CEC and plasma BKPyV copy number. Eight of 11 sub jects with BKPyV viremia had a ΔCEC score >2, and six of seven subjects with BKPyV viremia and cystitis had a ΔCEC score >2.
Given the observed association between CEC and BKPyV viremia, we hypothesized that BKPyV directly infects the endothelium and causes cellular injury. We therefore per
Figure 2. Circulating endothelial cell elevations are closely associated with rising BK polyomavirus viremia. Circulating endothelial cell elevations from baseline (Δ CEC) and plasma BK polyomavirus (BKPyV) copy number are shown vs. time in patients with cys titis (A) and without cystitis (B). Timing of hrombotic microangiopathy (TMA) onset is marked with an arrow in patients who de veloped TMA. Plasma BKPyV levels were obtained clinically.

formed IFM of CEC from “cystitis patient 4” in Figure 2 at two different time points using a polyomavirus-specific marker (VP1) and an endothelial marker (UEA-1). CEC in both samples co-stained with VP1 and UEA-1, confirming BKPyV infection of CEC (Figure 3A). In order to better char acterize CEC morphology, TEM8 was performed on CEC isolated from a subject with chronic high-level BKPyV viremia after HSCT. These CEC had nuclear inclusions and abnormal, fragmented mitochondria (Figure 3B). The latter indicates mitochondrial injury which is reported as a key mechanism of cellular infection with BKPyV.9 RNAseq (Takara SMART-Seq v4 full-length transcriptome analysis) was performed on CEC isolated from a HSCT re cipient with BKPyV viremia and a HSCT recipient without an active viral infection. Genes were ranked based on the fold change between subjects. Gene set enrichment analysis (GSEA) was performed with a focus on hallmark gene set and cell type signature analysis.10-12 CEC from the BKPyV viremia patient had upregulated KRAS (P=0.008, false discovery rate [FDR]=0.15), TNF α (P=0.002, FDR=0.11) and interferon γ (P=0.008, FDR=0.11) signaling on hallmark gene set analysis compared to the patient without any viral infection. Cell type signature analysis showed
multiple cell signatures upregulated in the subject with BKPyV viremia. These included cardiac endothelial cells (P<0.001, FDR=0.14), large intestine mesenchymal cells (P<0.001, FDR=0.04), and hepatic NK/T cells (P<0.001, FDR=0.04), among others. Multiple cell signatures were upregulated in CEC from the subject without BKPyV vire mia as well. These included kidney endothelial cells (P<0.001, FDR<0.001), pulmonary capillary intermediate cells (P <0.001, FDR<0.001), and pulmonary NK/T cells (P<0.001, FDR<0.001). The overall composition of cell sig natures in these samples confirmed i) CEC originate from multiple organ systems and ii) mesenchymal cells and lymphocytes were present in the analysis.

To our knowledge, this is the largest analysis of CEC in pediatric HSCT patients. We observed that CEC were com monly elevated during conditioning and early post trans plant. This supports that early endothelial injury occurs from release of toxic intracellular molecules as a con sequence of massive cell lysis of host hematopoietic tis sue during conditioning.13 Interestingly, CEC peaks between days 61-90 were frequent and of greater magni tude than earlier peaks. These peaks were not associated with any specific clinical complication, such as TMA, VOD
A B
Figure 3. Multimodal imaging of circulating endothelial cells isolated from hematopoietic stem cell transplant patients with BK polyomavirus viremia. (A) Immunofluorescence microscopy (IFM) imaging of 2 circulating endothelial cells (CEC) (top, bottom) from a patient with BK polyomavirus (BKPyV) viremia shows positive staining for polyomavirus (VP-1, green), endothelial (UEA-1, red) and nuclear (DAPI, blue) markers. These CEC were isolated at two separate time points. The CEC in the top image was iso lated when this subject had a plasma BKPyV copy number of 1,200 copies/mL. The CEC in the bottom image was isolated when the subject had a plasma BKPyV copy number of 251,264 copies/mL. (B) Transmission electron microscopy of a CEC from a HSCT patient with BKPyV viremia shows nuclear inclusions (red arrows) and an abnormal, fragmented mitochondrion (yellow arrow). The plasma BKPyV copy number in this subject was 7,006,235 copies/mL on the day of sample collection.
or infection. A prior longitudinal study of CEC in adults showed that CEC could remain elevated for at least 1 year after HSCT.14 We speculate that the later CEC peaks reflect cumulative vascular injury from multiple “hits” throughout transplant (e.g., conditioning, infection, TMA). TMA and VOD injure the endothelium and were specifically evaluated. All subjects with high-risk TMA, TMA requiring eculizumab, and VOD requiring defibrotide more than doubled their baseline CEC. CEC elevation also correlated with terminal complement activation in most, but not all patients treated with eculizumab. These findings suggest that CEC increase in children with severe HSCT-related endothelial injury but are too non-specific to serve as a biomarker. While we performed weekly CEC testing, more frequent testing would be needed to capture all early CEC peaks.
GvHD may injure the endothelium, although we did not identify a difference between CEC levels in patients with or without GvHD. The association between GvHD and CEC is complex and a prior study reported lower CEC counts in patients who develop GvHD.15 Any associations between CEC and GvHD are limited by sample size since few pa tients developed GvHD during sample collection. In addition to studying CEC kinetics, we evaluated the use of CEC as a liquid biopsy of the vascular wall. We observed a novel association between BKPyV viremia and CEC and have previously associated BKPyV viremia with a higher risk of TMA after HSCT. We hypothesized that BKPyV di rectly injures the endothelium and used CEC as a source of vascular tissue. IFM and TEM analyses confirmed that BKPyV can infect CEC. RNAseq of CEC was feasible and identified differences in inflammatory pathways and en dothelial cell origin. Larger studies are needed to test if patterns of organ-specific endothelial cell enrichment correlate with clinical disease. In summary, we observed that endothelial injury com monly occurs in pediatric HSCT recipients and CEC elev ations correlate with endothelial injury. Although there are limitations to the use of CEC as a clinical biomarker, CEC can serve as a liquid biopsy and are a tractable, non-in vasive tool to study vascular biology. This type of applica tion led to the novel association between BKPyV and endothelial injury, which merits further study to establish clinical relevance.
Anthony Sabulski,1,2 Sheyar Abdullah,1 Nathan Luebbering,1 Benjamin Aunins,1,2 Caitlin Castillo,1 Kelly Lake,1 Alexandra Duell,1 Lauren Strecker,1 Lucille Giordullo,1 William Broomhead,1 Scott Dimeo,2 Elizabeth A. Odegard,3 Jason T. Blackard,3 Assem Ziady,1,2 Alix E. Seif,4 Christopher E. Dandoy,1,2 Benjamin L. Laskin,5 Sonata Jodele,1,2
and Stella M. Davies1,2
1Division of Bone Marrow Transplantation and Immune Deficiency, Cincinnati Children’s Hospital Medical Center, Cincinnati, OH; 2Department of Pediatrics, University of Cincinnati College of Medicine, Cincinnati, OH; 3Department of Internal Medicine, University of Cincinnati College of Medicine, Cincinnati, OH; 4Division of Oncology, The Children’s Hospital of Philadelphia, Philadelphia, PA and 5Division of Nephrology, The Children’s Hospital of Philadelphia, Philadelphia, PA, USA
Correspondence:
A. SABULSKI - Anthony.Sabulski@cchmc.org
https://doi.org/10.3324/haematol.2022.280788
Received: February 4, 2022. Accepted: August 11, 2022. Prepublished: August 18, 2022.
©2022 Ferrata Storti Foundation
Published under a CC BY-NC license
AS has consulted for SOBI. SJ holds US Patent US 10815,296 B2, has received research support from Alexion Pharmaceuticals, and consultancies from Omeros, SOBI and Alexion. SMD has received research support from Alexion Pharmaceuticals and consultancies with Novartis, Rocket Pharma, CIRM and neurogene. SJ and BL are co-inventors on US Patent PCT/US2014/055922 Compositions and Methods for Treatment of HSCT-Associated Thrombotic Microangiopathy. The remaining authors have no conflicts of interest to disclose.
AS wrote the manuscript, designed the study, performed the experiments, analyzed the data, performed statistical analyses and performed chart reviews. SA, NL, BA and CC collected specimens, performed the experiments and analyzed the data. SD performed statistical analyses. KL, AD, LS, WB and LG collected, processed and stored patient samples. CED and AES analyzed data and reviewed and edited the manuscript. EAO and JTB reviewed and edited the manuscript and provided virologic expertise. AZ reviewed and interpreted RNAseq data. BLL analyzed data, performed statistical analyses, and reviewed and edited the manuscript. SJ analyzed the data, contributed to study design, performed chart reviews and reviewed and edited the manuscript. SMD designed and supervised the study, wrote and edited the manuscript, and analyzed the data.
We would like to acknowledge Xiang Zhang from the Genomics, Epigenomics and Sequencing Core in the Department of Environmental Health at the University of Cincinnati, and Phil Dexheimer and Aditi Paranjpe from the Division of Biomedical
Informatics at Cincinnati Children’s Hospital for their assistance with RNAseq processing and interpretation.
Research and investigators reported in this publication are supported by the Eunice Kennedy Shriver National Institute of Child Health and Human Development of the National Institute of Health
1. Woywodt A, Scheer J, Hambach L, et al. Circulating endothelial cells as a marker of endothelial damage in allogeneic hematopoietic stem cell transplantation. Blood. 2004;103(9):3603-3605.
2. Touzot F, Moshous D, Cros G, et al. Circulating endothelial cells as markers of endothelial dysfunction during hematopoietic stem cell transplantation for pediatric primary immunodeficiency. J Allergy Clin Immunol. 2014;134(5):1203-1206.
3. Jodele S, Dandoy CE, Myers K, et al. High-dose Carboplatin/Etoposide/Melphalan increases risk of thrombotic microangiopathy and organ injury after autologous stem cell transplantation in patients with neuroblastoma. Bone Marrow Transplant. 2018;53(10):1311-1318.
4. Woywodt A, Blann AD, Kirsch T, et al. Isolation and enumeration of circulating endothelial cells by immunomagnetic isolation: proposal of a definition and a consensus protocol. J Thromb Haemost. 2006;4(3):671-677.
5. Jodele S, Dandoy CE, Lane A, et al. Complement blockade for TA-TMA: lessons learned from a large pediatric cohort treated with eculizumab. Blood. 2020;135(13):1049-1057.
6. Jodele S, Davies SM, Lane A, et al. Diagnostic and risk criteria for HSCT-associated thrombotic microangiopathy: a study in children and young adults. Blood. 2014;124(4):645-653.
7. Cairo MS, Cooke KR, Lazarus HM, Chao N. Modified diagnostic criteria, grading classification and newly elucidated pathophysiology of hepatic SOS/VOD after haematopoietic cell transplantation. Br J Haematol. 2020;190(6):822-836.
8. Kumar S, Filippi MD. An alternative approach for sample
(NIH) under award number R01HD093773 (to SJ and SMD), the Thrasher Research Fund Early Career Award 15712 (to AS), and NIDDK grant DK125418 (to BL and JTB).
Data-sharing statement
All data presented in this manuscript will be shared upon email request.
preparation with low cell number for TEM analysis. J Vis Exp. 2016;(116):54724.
9. Manzetti J, Weissbach FH, Graf FE, et al. BK polyomavirus evades innate immune sensing by disrupting the mitochondrial network and promotes mitophagy. iScience. 2020;23(7):101257.
10. Liberzon A, Subramanian A, Pinchback R, Thorvaldsdóttir H, Tamayo P, Mesirov JP. Molecular signatures database (MSigDB) 3.0. Bioinformatics. 2011;27(12):1739-1740.
11. Subramanian A, Tamayo P, Mootha VK, et al. Gene set enrichment analysis: a knowledge-based approach for interpreting genome-wide expression profiles. Proc Natl Acad Sci U S A. 2005;102(43):15545-15550.
12. Liberzon A, Birger C, Thorvaldsdóttir H, Ghandi M, Mesirov JP, Tamayo P. The Molecular Signatures Database (MSigDB) hallmark gene set collection. Cell Syst. 2015;1(6):417-425.
13. Luebbering N, Abdullah S, Lounder D, et al. Endothelial injury, F-actin and vitamin-D binding protein after hematopoietic stem cell transplant and association with clinical outcomes. Haematologica. 2020;106(5):1321-1329.
14. Beije N, Versluis J, Kraan J, Gratama JW, Sleijfer S, Cornelissen JJ. Circulating endothelial cell enumeration demonstrates prolonged endothelial damage in recipients of myeloablative allogeneic stem cell transplantation. Haematologica. 2015;100(6):e246-249.
15. Almici C, Skert C, Verardi R, et al. Changes in circulating endothelial cells count could become a valuable tool in the diagnostic definition of acute graft-versus-host disease. Transplantation. 2014;98(7):706-712.
Venetoclax is approved for patients with newly diag nosed (ND) acute myeloid leukemia (AML) aged ≥ 75 years or patients who are ineligible for intensive chemo therapy.1 To improve response rates and survival, vene toclax has been evaluated in combination with intensive and lower intensity chemotherapy, targeted therapy, and immunotherapy.2 Here, we conducted a systematic re view and meta-analysis to assess the efficacy and safety of these novel venetoclax combination therapies in AML. This systematic review was conducted according to a published protocol (CRD42022307023) and reported ac cording to Preferred Reporting Items for Systematic Re views and Meta-Analysis (PRISMA) 3 ( Online Supplementary Figure S1 ). A systematic review of the lit erature was conducted by a medical librarian in the fol lowing databases, Cochrane Library, Ovid Embase, Google Scholar, Ovid MEDLINE, PubMed, Scopus, and Web of Science Core Collection, to find relevant articles published from inception of the database to January 24, 2022. The search was formulated using a combination of controlled vocabulary and keywords for AML and venetoclax. Studies on pediatric patients, review ar ticles, commentaries or basic research articles, case series with fewer than ten patients, any retrospective studies with fewer than 30 patients, duplicate publica tions from the same cohort of patients, and studies without an available English full text were also excluded. A Downs and Black checklist was used to assess study quality.4 The primary endpoint was the overall response rate (ORR) as reported by the individual studies. Ran dom-effects models were used to pool ORR and rates of complete response (CR), minimal residual disease (MRD) response, febrile neutropenia (FN), and 30-day mortality in each study group. Heterogeneity of studies was determined using Cochran Q and I 2 indices and was graded as low, moderate, and high for I 2 indices of 30%, 30-60%, and >60%, respectively. Pre-planned subgroup analyses and univariate meta-regression analyses were performed to statistically compare safety effect sizes of different subgroups based on the type of added therapy. All analyses were performed with Comprehensive MetaAnalysis (CMA 2.2, Biostat).
The electronic search yielded 2,471 unique articles, of which 2,345 were excluded based on title and abstract, leaving 126 articles for full-text review. An additional 90 papers were excluded, with 36 studies included in the final analysis ( Online Supplementary Figure S1). Among the 36 studies included, 13 reported outcomes of pa tients with ND AML, 14 studies reported outcomes of pa
tients with relapsed/refractor (R/R) AML and nine studies reported outcomes of patients with R/R and ND AML ( Online Supplementary Table S1). Study quality was limited by the single-arm design employed in all studies. Studies achieved 11-14 points on the rating scale with a median score of 13 ( Online Supplementary Table S2). The pooled ORR in all nine studies in the ND intensively treated group was 86.2% (95% confidence interval [95% CI]: 72.8-93.6%) (Figure 1A). The heterogeneity among the various studies was high (I2 =69.1%). The CR rate was reported in all nine studies, with a combined CR rate of 69% (95% CI: 49.9-83.1) (Figure 1B). The MRD rate among responders was reported in seven out of the nine studies, with a combined MRD negativity rate of 79.4% (95% CI: 0.7-0.86) (Figure 1C). In contrast to other re sponses, MRD rates among evaluated patients had a low heterogeneity (I2 =12.7%).
Among 12 studies included in the ND AML non-inten sively treated group, the combined ORR was 82% (95% CI: 75.1-87.8%) with overall moderate heterogeneity (I2=59.1%) (Figure 1D). ORR rates were 73.7% (95% CI: 6084), 84.3% (95% CI: 71.4-92%) and 93.3% for targeted therapy, immunotherapy and low dose chemotherapy, respectively. All 12 studies reported CR rates and the combined CR rate was 59.9% (95% CI: 51.5-67.8%) with high heterogeneity among studies (I 2 =64.3%) (Figure 1E). The CR rates were 47.3% (95% CI: 36.3-58.6%), 60.4% (95% CI: 37.7-79.4%) and 80% in the targeted therapy, immunotherapy and low dose chemotherapy groups, re spectively. MRD clearance rate was reported in seven studies, with an overall MRD negativity rate of 58.8% (95% CI: 49.2-67.8%) (Figure 1F).
The pooled ORR in 23 studies included in the R/R group was 56.6% (95% CI: 49.5-63.6%) with high inter-study heterogeneity (I2=68.5%) (Figure 2A). Within the different subgroups, the ORR was 47.6% (95% CI: 34.3-61.3%) in the targeted therapy subgroup, 44.3% (95% CI: 31.657.9%) in the immune therapy group, 64.6% (95% CI: 46.8-79.1%) in the intensive chemotherapy subgroup and 71.1% (95% CI: 59-80.8%) in the low-intensity chemo therapy group. The CR rates were evaluated in 17 studies showing a pooled CR rate of 24.4% (95% CI: 19.2-30.6%) (Figure 2B). The CR rates were 11.3% (95% CI: 7.2-17.3%), 14.8% (95% CI: 7.4-27.4%), 28.6% (95% CI: 8.9-62.2%) and 50% (95% CI: 38-62%) in the groups receiving targeted therapy, immunotherapy, intensive chemotherapy and low dose chemotherapy, respectively. Among re sponders, the pooled MRD negative response rate was 57.8% (95% CI: 48.5-66.5%) reported in 11 studies within
the R/R group (Figure 2C). The MRD negative rates were 53.5% (95% CI: 41.8-64.8%) in the targeted therapy sub group, 67.7% (95% CI: 0.45-85.8%) in the low-dose chemotherapy subgroup and 63.2% (95% CI: 44.9-78.4%) in the intensive chemotherapy subgroup. The rate of FN was reported in six studies within the ND AML intensively treated group and was 67.6% (95% CI: 49.3-81.8%) (Figure 3A). In the ND AML non-intensively treated group, the combined rate of FN from five trials

was 36.6% (95% CI: 29.2-44.6%) (Figure 3B). The overall FN rate in 12 studies in the R/R group was 38.6% (95% CI: 31.2-46.4%) (Figure 3C). The rate of FN among studies in the R/R group was lowest in the immunotherapy group – 23% (95% CI: 12.5-38.6%), followed by 38% (95% CI: 28.7-48.4) in the targeted therapy subgroup, 38.5% (95% CI: 14-70.7%) in the low-dose chemotherapy sub group and highest – 60.2% (95% CI: 41-76.7%) in the in tensive subgroup.
Figure 1. Response to venetoclax combination therapy in newly diagnosed acute myeloid leukemia. (A-C) Venetoclax in com bination with intensive chemotherapy: overall response rate (A); complete response rate; (B): minimal residual disease rate (C) (D-F) Venetoclax in combination with non-intensive therapy: overall response rate (D); complete response rate (E); minimal re sidual disease rate (F). ORR: overall response rate; 95% CI: 95% confidence interval; CR: complete response; MRD: minimal re sidual disease.
The all-cause 30-day mortality rate was 6.4% (95% CI: 3.5-11.4%) in the ND AML intensive therapy group, 6.2% (95% CI: 3.6-10.6%) in seven trials within the ND non-in tensive chemotherapy group and 6.1% (95% CI: 3.610.3%) among ten trials in the R/R group (Figure 3D-F). The heterogeneity for 30-day mortality in every sub group (intensive, non-intensive and R/R) was low (I 2 =0%).
When comparing subgroups within the ND AML, non-in tensively treated group (low-dose chemotherapy as ref erence) by meta-regression analysis, targeted therapy was associated with a statistically significant higher rate of FN ( P =0.0017) compared to low-dose chemotherapy whereas the rate of FN was not statistically different be tween groups treated with immunotherapy and lowdose chemotherapy ( P =0.0939). However, the 30-day mortality rates were not statistically different between the groups treated with low-dose chemotherapy and targeted therapy ( P =0.1201) or immunotherapy ( P =0.4378). In the R/R subset of patients, meta-regres sion analysis showed that immunotherapy and targeted therapy were associated with a statistically significant lower rate of FN ( P =0.0097 and P =0.0492, respectively) when compared to intensive chemotherapy. In contrast, the rate of FN and 30-day mortality rates were not stat istically different between subgroups. How do the results of our meta-analysis compare to his toric data for non-venetoclax-based treatment ap proaches in AML?

In the intensive ND AML group, high ORR and CR rates of 86% and 69%, respectively, were seen. Although di rect comparison is impossible, these response rates ap pear at least comparable and possibly higher compared to what was recently reported for “7+3” induction chemotherapy alone.5,6 Although survival data are largely premature, several studies in the intensively treated group found encouraging overall survival rates of 8596% at 12 months.7,8 Regarding safety, the rate of FN was 67.6%, but with low rates of 30-day mortality of 6.4% as compared to up to 15% in previous reports. 9 However, three trials reported early mortality rates of >10%, with one of these studies using venetoclax for 20 days during induction. In addition, the FN rate was 91.7% in one study, which used venetoclax for 28 days during induc tion and consolidation (Figure 3). As was shown pre viously and led to protocol amendments,10 prolonged use of venetoclax in combination with intensive chemother apy increases the rates of prolonged cytopenia, FN and infections. Overall, the early reports of adding veneto clax to intensive regimens seem promising, but early mortality and FN rates remain a challenge in some studies, and the benefits of prolonged venetoclax use should be weighed against higher risks of FN, infection and possible early mortality.
Figure 2. Response to venetoclax combination therapy in re lapsed/refractory acute myeloid leukemia. (A) Overall response rate; (B) complete response rate; (C) minimal residual disease rate. ORR: overall response rate; 95% CI: 95% confidence in terval; CR: complete response; MRD: minimal residual disease.
Figure 3. Safety of venetoclax combination therapy. (A) Febrile neutropenia rate for venetoclax together with an intensive chemo therapy combination in newly diagnosed acute myeloid leukemia. (B) Febrile neutropenia rate for venetoclax together with a non-intensive therapy combination in newly diagnosed acute myeloid leukemia. (C ) Febrile neutropenia rate for venetoclax com bination therapy in relapsed/refractory acute myeloid leukemia. (D) Thirty-day mortality rate for venetoclax together with an in tensive chemotherapy combination in newly diagnosed acute myeloid leukemia. (E) Thirty-day mortality rate for venetoclax together with a non-intensive therapy combination in newly diagnosed acute myeloid leukemia. (F) Thirty-day mortality rate for venetoclax combination therapy in relapsed/refractory acute myeloid leukemia. FN: febrile neutropenia; 95% CI: 95% confidence interval.
In the ND AML non-intensively treated group, the ORR was 82.4% with 59.9% of patients achieving a CR and 58.8% of responders achieving MRD negativity. In the VIALE-A trial, the composite CR rate (CR + incomplete CR) was 66.5% with CR and MRD negativity rates of 36.7% and 23.4% respectively. With the caveat of crosstrial comparisons, the rates of CR and negative MRD seem higher in the combined estimates of the ND non-
intensively treated group compared to the results re ported in VIALE-A. As most of the patients in this popu lation would not proceed to allogeneic stem cell transplant, durability of response is an essential con sideration, but was not broadly reported. Yet, in patients who would proceed to allogeneic stem cell transplant, the ability to achieve higher rates of short-term CR is associated with improved survival, as seen with patients

who did proceed with allogeneic stem cell transplant after combinations of hypomethylating agents and vene toclax.11 FN rates and 30-day mortality rates were 36.6% and 6.2%, respectively, which are similar to the rates seen in VIALE-A (FN 30% and 30-day mortality of 7%). Of note, the higher rate of FN seen in the targeted ther apy subgroup did not translate into higher early mortal ity rates.
The R/R AML group encompass some of the most chal lenging and frequently heavily pre-treated cases with an unmet need for better care options. For patients receiv ing intensive chemotherapy, the pooled ORR and CR rates were 64.7% and 28.6%, which compare favorably with historically reported ORR and CR rate of 21% and 12%, respectively, in the control arm of a phase III trial evaluating various intensive salvage regimens versus elacytarabine.12 Venetoclax in combination with a hypo methylating or low-dose cytarabine previously demon strated ORR rates of 49% and CR rates of 14%,13 which are similar to the pooled ORR and CR rates in the tar geted, immunotherapy or low-dose chemotherapy sub groups in our analysis. In contrast, encouraging pooled MRD-negativity rates among responders ranged between 53.5%-67.7% as compared to 13% reported in the pre vious study,13 suggesting that a subset of patients may benefit from this combination therapy.
The limitations of our meta-analysis are heterogeneity, which was partially addressed with sub-group analysis, and short term follow-up. Nevertheless, this is the first meta-analysis evaluating the initial efficacy and safety of investigational venetoclax-based combination treate ments.
In conclusion, we observed that investigational veneto clax-based combinations resulted in response rates that are at least comparable as and appear higher than those found in previous trials. Although response outcomes seems promising, the durability of responses and impact on long-term survival are unclear. In terms of safety, we show that venetoclax in combination with intensive chemotherapy leads to higher rates of FN. However, these differences in FN did not translate into statis tically significant different 30-day mortality rates, which remained relatively low in the various therapy sub groups. As data regarding long term outcomes are still immature, further follow-up is needed to determine the long-term benefit and risk of adding venetoclax to vari ous combination therapy regimens.
Shai Shimony,1,2* Alon Rozental,2* Jan P. Bewersdorf,3 Aaron D. Goldberg,3 Eytan M. Stein,3 Alyssa A. Grimshaw,4 Richard M. Stone,1
Daniel J. DeAngelo,1 Ofir Wolach2 and Maximilian Stahl1
1Medical Oncology, Dana Farber Cancer Institute, Boston, MA, USA; 2Rabin Medical Center, Petah Tikva, Israel and Sackler Medical School, Tel Aviv, Israel; 3Leukemia Service, Memorial Sloan Kettering Cancer Center, New York City, NY, USA and 4Harvey Cushing/John Hay Whitney Medical Library, Yale University, New Haven, CT, USA
*SS and AR contributed equally as co-first authors.
Correspondence: M. STAHL - maximilian_stahl@dfci.harvard.edu https://doi.org/10.3324/haematol.2022.281453
Received: May 24, 2022. Accepted: August 16, 2022. Prepublished: August 25, 2022.
©2022 Ferrata Storti Foundation Published under a CC BY-NC license
ADG received research funding from Celularity, ADC Therapeutics, Aprea, AROG, Pfizer, Prelude, and Trillium; received research funding from and served as a consultant for Aptose and Daiichi Sankyo; served as a consultant and member of advisory committees for Astellas, Celgene, and Genentech; received research funding from, served as a consultant for, and was a member of advisory committees for AbbVie; and received honoraria from Dava Oncology. EMS received research funding from Bayer; was a consultant for Amgen, AbbVie, Seattle Genetics, and Biotheryx; served as a consultant and received research funding from Syndax; was a member of the Board of Directors or advisory committee for PTC Therapeutics and Syros; served as a consultant and was member of the Board of Directors or advisory committee for Astellas Pharmaceutical, Agios Pharmaceuticals, and Genentech; served as a consultant, received research funding, and was a member of the Board of Directors or advisory committee for Daiichi-Sankyo, Celgene Pharmaceuticals, and Novartis; and is a current equity holder in the privately held Auron Therapeutics. OW reports speaker’s honoraria and past membership on an advisory board of AbbVie. RMS reports grants and personal fees from Abbvie, Agios, and Novartis; grants from Arog; personal fees from Actinium, Argenx, Astellas, AstraZeneca, Biolinerx, Celgene, Daiichi-Sankyo, Elevate, Gemoab, Janssen, Jazz, Macrogenics, Otsuka, Pfizer, Hoffman LaRoche, Stemline, Syndax, Syntrix, Syros, Takeda, and Trovagene, outside the submitted work. DJD reports grants and research funding from Abbvie, Novartis, Blueprint and Glycomimetrics; consulting and personal fees from Abbvie, Amgen, Autolus, Blueprint, FortySeven, Glycomimetrics, Incyte, Jazz, Kite, Novartis, Pfizer, Servier, and Takeda. MS reports consulting and personal fees from Curtis
Oncology, Haymarket Media, and Boston Consulting; membership on advisory boards of Novartis, and Kymera. SS, AR, JPB, and AAG do not have potential conflicts of interest to declare.
SS, JBP, and MS designed the study. SS and AR performed the data extraction. SS, AR, JBP, AG, and MS wrote the initial draft of the manuscript. SS, AR, AG, and MS analyzed the data. All authors interpreted the data, and critically reviewed and contributed to all subsequent drafts of the manuscript.
1. DiNardo CD, Jonas BA, Pullarkat V, et al. Azacitidine and venetoclax in previously untreated acute myeloid leukemia. N Engl J Med. 2020;383(7):617-629.
2. Shimony S, Stone RM, Stahl M. Venetoclax combination therapy in acute myeloid leukemia and myelodysplastic syndromes. Curr Opin Hematol. 2022;29(2):63-73.
3. Page MJ, Mckenzie JE, Bossuyt PM, et al. The PRISMA 2020 statement: an updated guideline for reporting systematic reviews. Syst Rev. 2021;10(1):89.
4. Downs SH, Black N. The feasibility of creating a checklist for the assessment of the methodological quality both of randomised and non-randomised studies of health care interventions. J Epidemiol Community Health. 1998;52(6):377-384.
5. Fernandez HF, Sun Z, Yao X, et al. Anthracycline dose intensification in acute myeloid leukemia. N Engl J Med. 2009;361(13):1249-1259.
6. Löwenberg B, Ossenkoppele GJ, Van Putten W, et al. High-dose daunorubicin in older patients with acute myeloid leukemia. N Engl J Med 2009;361(13):1235-1248.
7. Lachowiez C, DiNardo CD, Takahashi K, et al. Venetoclax combined with FLAG-IDA induction and consolidation in newly diagnosed acute myeloid leukemia. Blood. 2021;138(Suppl 1):701.
8. Kadia TM, Reville PK, Borthakur G, et al. Venetoclax plus intensive chemotherapy with cladribine, idarubicin, and
We acknowledge Tomer Hoffman, MD, for his assistance with preparing the figures.
All data are available upon request and the protocol is available online at www.crd.york.ac.uk. CRD42022307023
cytarabine in patients with newly diagnosed acute myeloid leukaemia or high-risk myelodysplastic syndrome: a cohort from a single-centre, single-arm, phase 2 trial. Lancet Haematol. 2021;8(8):e552-e561.
9. Zeidan AM, Podoltsev NA, Wang X, et al. Patterns of care and clinical outcomes with cytarabine-anthracycline induction chemotherapy for AML patients in the United States. Blood Adv. 2020;4(8):1615-1623.
10. DiNardo CD, Lachowiez CA, Takahashi K, et al. Venetoclax combined with FLAG-IDA induction and consolidation in newly diagnosed and relapsed or refractory acute myeloid leukemia. J Clin Oncol. 2021;39(25):2768-2778.
11. Pasvolsky O, Shimony S, Ram R, et al. Allogeneic hematopoietic cell transplantation for acute myeloid leukemia in first complete remission after 5-azacitidine and venetoclax: a multicenter retrospective study. Ann Hematol. 2021;101(2):379-387.
12. Roboz GJ, Rosenblat T, Arellano M, et al. International randomized phase III study of elacytarabine versus investigator choice in patients with relapsed/refractory acute myeloid leukemia. J Clin Oncol. 2014;32(18):1919-1926.
13. Stahl M, Menghrajani K, Derkach A, et al. Clinical and molecular predictors of response and survival following venetoclax therapy in relapsed/refractory AML. Blood Adv. 2021;5(5):1552-1564.
Differences in outcomes and access to clinical trials for patients with multiple myeloma (MM) from ethnic minor ities have been previously reported predominantly from the US.1-5 This study investigated if disparities by ethnicity existed for MM patients enrolled onto clinical trials at a state-funded UK National Health Service (NHS) hematol ogy specialist-center. Retrospective data compared clini cal trial enrollment to standard of care (SOC) outpatient clinic cohorts and the expected incidence of MM. Overall, non-White groups had lower representation in early phase clinical trials than expected by overall incidence and dis tribution within SOC clinics.
MM is an incurable hematological malignancy with ap proximately 6,000 new UK cases per year and a projected rise in incidence of 11% by 2035.1,2 Black patients have a higher prevalence of MM than White and Asian patients (per 100,000: White males: 6.1-6.5; Asian males: 3.6-6.4; Black males: 10.9-18.2).3,4
Population-based studies have reported that diseasespecific survival outcomes for Black compared to White MM patients in the US can be equivalent or potentially better with equivalent availability of healthcare.5,6 Biolog ical differences including genetic events between ethnicity have been identified; however whilst they maybe associ ated with differences in survival, this has not been con clusively determined.7,8 The odds ratio in the US for receiving an autologous stem cell transplant (SCT) was higher for White than Black MM patients despite SCT being beneficial for both groups.9,10 When controlling for overall health and potential access barriers including so cioeconomic status, Black patients were 37% less likely to undergo an SCT.11 Lower enrollment of ethnic minority patients have also been demonstrated across clinical trials in the US, likely due to socioeconomic and cultural reasons.12,13 Given the increased incidence of MM in the Black population and underlying biological differences, such disparities may limit the applicability of trial results to real-world populations and limit survival gains for the communities not enrolled.
In order to investigate if disparities in trial enrollment and SCT existed in the UK, we conducted a retrospective study from electronic health records at University College Hos pital, London. MM patients enrolled into sequential clinical trials between 2014-2021 were grouped as early (phase I, phase I/II) or late phase (phase II, phase III). Trial enroll ment was compared with patients attending SOC MM clinics from May-August 2019 and November-December 2020, and the prevalence of MM in England and London
according to the National Cancer Registration and Analysis Service (NCRAS) between 2006-2015.14 Self-reported eth nicity was categorized to White, Black, Asian and Mixed/other according to the Office for National Statistics (Online Supplementary Table S1).15 Analysis of “Non-White” included Black, Asian and Mixed/other groups. High risk (HR) fluorescence in situ hybridization (FISH) was defined as having one or more of 17p deletion, t(4;14), t(14;16), t(14;20). ANOVA, Mann-Whitney, Fisher’s exact test, Kaplan Meier analysis were performed (GraphPad Prism v9.0). The clinical trial cohort included 197 MM patients enrolled from 25 trials (57 (28.9%) early phase, 140 (71.1%) late phase). Median age was 62 years (range, 38-85) with a median of five prior lines of therapy (range, 0-13; early phase, 4 [2-13]; late phase, 2 [0-8]). Ethnic grouping was: White, 143 (72.6%); Black 23 (11.7%); Asian, 8 (4.1%); Mixed/other seven (3.6%); unknown 15 (7.6%) giving a Black:White ratio of 0.16. This skewing was more marked for early (Black:White 0.10) than late phase trials (Black:White 0.19) (Table 1). Ethnic distribution was vari able across age (P=0.027) with Black patients having a lower median age compared to White patients at trial en rolment (59 vs. 66 years; P=0.015). This was not significant for Asian (61.5 years; P=0.13) or Mixed/other groups (71 years; P=0.97). There was no difference between ethnicity and number of prior lines (P=0.51). Of the 173 patients with FISH results, 20.8% were HR. This was not significant be tween early and late phase sub-groups (P=0.68). No sig nificant difference was seen in HR FISH between White and Black patients (P=0.41) and White and non-White pa tients (P=0.64). When analyzing each individual HR lesion, no difference was identified between White and Black (del(17p) 18 vs. 2, p=0.74; t(4;14) 11 vs. 2, P>0.99) and White and non-White patients (del(17p) 18 vs. 6, p>0.99; t(4;14) 11 vs. 2, P=0.52). As with other studies, there were in creased numbers of t(11;14) in Black compared to White patients (29.2% vs. 14.2%) although not statistically sig nificant (P=0.079).7 There was no significant difference in median overall survival (OS) between ethnic groups (P=0.93); White, 10.9 years; Black 11.8 years; Asian 15.1 years; Mixed/other 13.5 years with a median follow-up of 7.6 years.
The SOC cohort comprised of 362 patients with a median age of 65 years (range, 33-90) and had received a median of two prior lines (range, 0-10). Ethnic grouping was: White, 243 (67.1%); Black, 54 (14.9%); Asian, 31 (8.6%); Mixed/other 27 (7.5%); unknown seven (2.9%) giving a Black:White ratio of 0.22. White patients were older com
Table 1. Patient characteristics.
Patients
Trial EP Trial
LP Trial SOC clinic
All 197 57 140 362
Sex
Male Female 105 77 34 23 79 61 201 161
Ethnicity
White Black Asian Mixed/Other Unknown
All White Black Asian Mixed/Other Unknown
Median lines of Rx
All White Black Asian Mixed/Other Unknown
Cytogenetics available
All White Black Asian Mixed/Other Unknown
HR cytogenetics
All White Black Asian Mixed/Other Unknown
144 23 8 7 15
67.5 66 59 61.5 71 61.5
4 4 4 2 1 1
173 125 23 6 7 12
36 28 <5 <5 <5 <5
50 5 <5 <5 <5
59.5 65 65 65.5 N/A N/A
3 7 8 7 N/A N/A
51 44 5 <5 N/A N/A
12 11 <5 <5 N/A N/A
94 18 6 7 15
65 66 59 59 71 61.5
1 3 2 1 1 1
122 81 18 <5 7 12
47 17 <5 <5 <5 <5
243 54 31 27 7
65 66.5 61 60 60 65.5
2 2 2 3 2 1
Trial: refers to all patients enrolled onto trials; EP: early phase; LP: late phase; SOC: standard of care; HR: high risk; Rx: race.
pared to other ethnic groups (White, 66.5 years; Black, 61.0 years; Asian 60.0 years, Mixed/other, 60.0 years; P=0.008). Ethnicity did not vary by prior lines of therapy (P=0.20). OS was similar across all ethnic groups (median OS: White, not reached; Black not reached; Asian 11.8 years; Mixed/other not reached). MM prevalence by ethnicity was reported by NCRAS from 17,618 patients across England and 2,618 patients within London. In London ethnicity was: White 1,510 (57.7%); Black 618 (23.6%); Asian 318 (12.1%); Mixed/other 172 (6.57%). The Black:White ratio in England and London was 0.06 and 0.41 respectively.14
Non-White patients were underrepresented in the trials cohort compared to SOC (P=0.01). This difference was
more significant when comparing early phase trials to SOC (P=0.003). No difference, however, was seen between White and non-White patients in late phase trials com pared to SOC (P=0.17) (Figure 1). Comparing the prevalence of MM in London to trial enrollment, lower proportions of non-White to White patients were enrolled into early phase trials (P<0.0001). This was not significant for late phase trials (P=0.24) (Figure 2). Black patients were under represented in early phase trials compared to non-Black patients (P=0.012), not reflected in late phase trials (P=0.064). No significant differences were seen in enroll ment of White and Asian or Mixed/other groups versus MM prevalence in London. Three hundred and sixty-five patients in both the trial and
SOC clinic cohorts received prior SCT. Ethnic grouping was: White 270 (74.0%); Black 36 (9.9%); Asian 32 (8.8%); Mixed/other 16 (4.4%); unknown 11 (3.0%). White patients were more likely to have received a SCT compared to nonWhite (P<0.03), Black (P=0.01) and Mixed/other (P =0.01) patients. There was no significant difference between White versus Asian (P=0.14) patients receiving a SCT. Black and Asian patients who underwent ASCT were younger than White patients (median age 59 years; P=0.0002 and 59 years; P=0.001 vs. 65 years respectively). Whilst there is evidence discrepancies in clinical trial en rollment exist within the US, limited data exists from other countries, particularly those with state-funded healthcare systems. This UK dataset demonstrates that ethnic disparity in clinical trial participation persists de spite equal healthcare availability particularly for early phase trials, where there were differences compared to

Figure 1. Lower proportions of non-White patients enrolled into clinical trials, and more significant for early phase trials, compared to standard of care clinic cohort. SOC: standard of care.
Figure 2. Lower proportions of non-White patients enrolled into early phase clinical trials compared to NCRAS London cohort.
the expected prevalence of MM and the population seen in SOC clinics. These differences were predominantly ob served for Black patients rather than the other minorities. Several reasons have been proposed for this including socio-economic class, mistrust/previous negative experi ences with healthcare professionals (HCP) or healthcare systems, lack of culturally appropriate communication and a discrepancy between the ethnicity of HCP compared to patients. Co-morbidities may vary between ethnicities although not assessed in this analysis. There may be bio logical factors such as a higher burden of comorbidities preventing trial eligibility.5,6,8-11,13 These factors may be more apparent when experimental early phase trials with an in tense treatment schedule are offered compared to a phase III trial that may more closely resemble SOC. In ad dition, patients for early phase trials were referred from a wider geography to those entering late phase trials, indi

cating potential selection bias at local centers. Despite differences in enrollment, there were no differences in OS observed by ethnicity in either the trial or SOC cohorts suggesting that different ethnic groups can do equally well. The lower proportion of Black patients undergoing SCT requires further investigation.
Whilst this study provides insight to the ethnic distribu tion of patients at an academic MM center, there may be selection bias of the population treated due to its location versus other geographies. Given London is one of the most ethnically diverse cities in the UK, higher proportions of minorities were expected to be enrolled. Data reported from the trial, SOC and NCRAS cohorts have been col lected at different time points and should be considered when comparing population groups. The numbers of Asian and Mixed/other were small which limits further analysis and national or multi-national datasets are required to fully understand these.
Further studies are required to understand and mitigate financial, cultural and religious barriers influencing trial recruitment. Additionally, study design and eligibility crite ria e.g., taking into consideration racial neutropenia should also be reassessed to be more inclusive of the wider population.
In conclusion, this data highlights disparities in trial en rollment of ethnic minorities exist in state funded health care systems and recommends further work to resolve this.
Samir Asher,1 Aikaterini Kazantzi,1 Fatjon Dekaj,1 Luke Steventon,2 Aisha Khatun,2 Louise Ainley,3 Annabel McMillan,3 Neil Rabin,3 Ashu Wechalekar,3 Jonathan Sive,3 Charalampia Kyriakou,3 Xenofon Papanikolaou,3 Ke Xu,3 Shameem Mahmood,3 Brendan Wisniowski,3
1. Cancer Research UK. 2018. Myeloma statistics. [online] Available at: <https://www.cancerresearchuk.org/healthprofessional/cancer-statistics/statistics-by-cancer-type/myelo ma#heading-Zero> [Accessed 12 October 2021].
2. Becker N. Epidemiology of multiple myeloma. Recent Results Cancer Res. 2011;183:25-35.
3. Greenberg AJ, Vachon CM, Rajkumar SV. Disparities in the prevalence, pathogenesis and progression of monoclonal gammopathy of undetermined significance and multiple myeloma between blacks and whites. Leukemia. 2012;26(4):609-614.
4. National Cancer Intelligence Network and Cancer Research UK. Cancer incidence and survival by major ethnic group, England, 2002-2006. [online] Available at: <www.ncin.org.uk/piblications/reports>
Lydia Lee,3 Kwee Yong3 and Rakesh Popat1,3
1National Institute for Health Research Clinical Research Facility, University College London Hospitals NHS Trust; 2Cancer Clinical Trials Unit, University College London Hospitals NHS Trust and 3Department of Hematology, University College London Hospitals NHS Trust, London, UK
Correspondence: R. POPAT - rakesh.popat@ucl.ac.uk
https://doi.org/10.3324/haematol.2022.281322
Received: April 28, 2022. Accepted: August 17, 2022. Prepublished: August 25, 2022.
©2022 Ferrata Storti Foundation
Published under a CC BY-NC license
Disclosures
No conflicts of interest to disclose.
Contributions
SA, AK, FD, LS and AK performed research. SA performed data analysis. All other authors reviewed the manuscript.
RP and KY are supported by the National Institute for Health Research University College London Hospitals Biomedical Research Center.
Original data can be made available through direct contact with the corresponding author.
[Accessed 12 October 2021].
5. Waxman AJ, Mink PJ, Devesa SS, et al. Racial disparities in incidence and outcome in multiple myeloma: a populationbased study. Blood. 2010;116(25):5501-5506.
6. Costa LJ, Brill IK, Omel J, Godby K, Kumar SK, Brown EE. Recent trends in multiple myeloma incidence and survival by age, race, and ethnicity in the United States. Blood Adv. 2017;1(4):282-287.
7. Baker A, Braggio E, Jacobus S, et al. Uncovering the biology of multiple myeloma among African Americans: a comprehensive genomics approach. Blood. 2013;121(16):3147-3152.
8. Manojlovic Z, Christofferson A, Liang WS, et al. Comprehensive molecular profiling of 718 Multiple Myelomas reveals significant differences in mutation frequencies between African and European descent cases. PLoS Genet. 2017;13(11):e1007087.
9. Joshua TV, Rizzo JD, Zhang MJ, et al. Access to hematopoietic
stem cell transplantation. Cancer. 2010;116(14):3469-3476.
10. Hari PN, Majhail NS, Zhang MJ, et al. Race and outcomes of autologous hematopoietic cell trans-plantation for multiple myeloma. Biol Blood Marrow Transplant. 2010;16(3):395-402.
11. Fiala, M.A., Wildes, T.M. Racial disparities in treatment use for multiple myeloma. Cancer. 2017;123(9):1590-1596.
12. Duma N, Azam T, Riaz IB, Gonzalez Velez M, Ailawadhi S, Go R. Representation of minorities and elderly patients in multiple myeloma clinical trials. Oncologist. 2018;23(9):1076-1078.
13. Costa LJ, Hari PN, Kumar SK. Differences between unselected patients and participants in multiple myeloma clinical trials in US: a threat to external validity. Leuk Lymphoma.
2016;57(12):2827-2832.
14. National cancer registration and analysis service (ncras). Haematological Cancers . [Online]. Available from: http://www.ncin.org.uk/cancer_type_and_topic_specific_work/c ancer_type_specific_work/haematological_cancers/ [Accessed 27 May 2021].
15. Ethnic group, national identity and religion. Ethnic group, national identity and religion - Office for National Statistics. [Online]. Available from: https://www.ons.gov.uk/methodology/classificationsandstandar ds/measuringequality/ethnicgroupnationalidentityandreligion [Accessed 24 January 2022].
In this study, we investigated the outcomes of pediatric patients affected by myelodysplastic syndromes (MDS) and lacking an HLA-matched donor undergoing αβT-cell receptor (TCRαβ) and CD19 B-cell depleted HLA-haploi dentical hematopoietic stem cell transplantation (TBdeplhaploHSCT), showing low incidence of transplant-related mortality (TRM), acute and chronic GvHD (aGvHD and cGvHD), as well encouraging overall (OS) and event-free survival (EFS).
Pediatric MDS are a heterogeneous group of clonal dis orders, accounting for less than 5% of childhood hema tologic malignancies; the incidence is estimated 1-4 per million.1 They are characterized by peripheral cytopenia, ineffective hematopoiesis, and, most important in pedi atrics, an increased risk of progression to acute myeloid leukemia (AML). Up to 20-30%,2,3 of pediatric MDS develop in the context of inherited bone marrow failure syndromes (IBMFS) or genetic predisposition syndromes.4 The genetic somatic landscape of pediatric MDS is characterized by driver mutations in SETBP1, ASXL1, RUNX1 and RAS onco genes.3 Allogeneic HSCT is the sole curative treatment available. Recognized indications to transplantation are: MDS with excess of blasts, MDS secondary to previously administered chemoradiotherapy, refractory cytopenia of childhood (RCC) associated with monosomy 7, complex karyotype, severe neutropenia, or erythrocyte/platelet transfusion dependence.1 We previously demonstrated that TBdepl-haploHSCT is a suitable option for children with acute leukemia lacking a readily available, HLAmatched donor.5 Here we present the results of this trans plant platform in children with MDS.
Between 03/2013 and 09/2021, 28 children with MDS re ceived TBdepl-haploHSCT from an HLA-partially matched relative at Ospedale Pediatrico Bambino Gesù, Rome, Italy or at Fondazione IRCCS Policlinico San Matteo, Pavia, Italy as part of a prospective study (clinicaltrials gov. Identifier: NCT01810120). The trial was approved by the local Ethics Committees and was conducted according to the Declar ation of Helsinki. All patients or their parents/legal guard ians provided written informed consent. All patients were conditioned using a fully-myeloablative regimen including a combination of cytotoxic drugs, such as treosulfan, thiotepa and fludarabine, and/or total body irradiation (TBI). Anti-T-lymphocyte globulin was used be fore transplantation (12 mg/kg total dose, from days -5 to day -3) to modulate bi-directional donor/recipient allore
activity. Rituximab (200 mg/m2) was administered on day -1 to prevent post-transplantation Epstein-Barr virus-in duced lymphoproliferative disorders. No patient received any post-transplant pharmacological GvHD prophylaxis. Mobilization, apheresis and graft manipulation were per formed as follows6: i) donor CD34+ cells were mobilized by administration of subcutaneous G-CSF 10-12 mg/kg per day from day 5 until leukapheresis (day 1); ii) if the cut off of ≥40 CD34+ cells/ m L was not achieved, plerixafor (Mozobil, Genzyme) 0.24 mg/kg was given; iii) Spectra Optia Cell Separator (Terumo BCT, Leuven, Belgium) was used for apheresis; iv) the fully automated CliniMACS de vice (Miltenyi Biotec, Bergisch-Gladbach, Germany) was used for graft manipulation. Genomic DNA from peripheral blood was available from 21 subjects. Moreover, DNA specimens from parents were available in 17 cases, and DNA from tissues other than blood were used to discriminate mosaicism events. Ge nomic DNA was used to assess the mutational profile by capture-based parallel sequencing using a NextSeq550 platform (Illumina) as previously described.7 End-points for survival were OS and EFS. Other endpoints were: i) cumulative incidence and median time of neutrophil and platelet engraftment; ii) cumulative inci dence of aGvHD and cGvHD; iii) cumulative incidence of relapse and iv) TRM. OS and EFS were estimated by using the Kaplan-Meier method. TRM, relapse incidence, aGvHD and cGvHD were expressed as cumulative incidences to adjust the estimations for competing risks. Statistical analysis was performed using EZR version 1.32 (Saitama Medical Center, Jichi Medical University), a graphical user interface for R (The R Foundation, Vienna, Austria; http://www.R-project.org).
Characteristics of patients enrolled in the study are shown in Table 1 (which reports also donor and graft char acteristics). Median follow-up of surviving patients was 2.9 years (range, 0.3–8.5 years). The diagnosis of pediatric MDS was confirmed in the national reference laboratory of pathology (Rome). Twenty children had RCC (3 cases occurring in the context of inherited bone marrow failure syndromes: two had GATA2 germline pathogenic variants and one SAMD9L variant, associated with monosomy of chromosome 7), while two and six were affected by MDS with excess of blasts 1 (EB1) and EB2/AML (1 had GATA2 deficiency), respectively. Regarding genetic predisposition syndromes, three additional patients had variants of un
known significance (VUS) in TP53, MECOM and ANKRD26 In addition, with regards to somatic events, one patient had a pathogenic variant in the PTPN11 gene, one patient showed two mutational events, respectively in RUNX1 and CBL genes and one had a likely pathogenic variant in KRAS. The different detected VUS are detailed in the Online Sup plementary Table S1. No patients had therapy-related MDS and nobody was diagnosed to be evolved from SAA. Median time to neutrophil and platelet recovery was 15 (range, 10-19) and 11 (range, 9-14) days (Figure 1A), respect ively, with four patients (3 with RCC and 1 with EB2; this latter patient received chemotherapy and 5-azacytidine before HSCT, while the others did not received any therapy before transplant) experiencing primary graft failure, the cumulative incidence of this complication being 14.2% (95% confidence interval [CI]: 5.6-33.7). This was signifi cantly lower than that experienced by patients with SAA (details are reported in the Online Supplementary Table S2) transplanted at our center with the same strategy and a TBI-free conditioning regimen (58.3%, 95% CI: 33.4-84.8; P=0.004) (Figure 1B).8 Two of these four GF patients had chromosomal abnormalities (1 monosomy of chromosome 7 and 1 trisomy of chromosome 8), but none had GATA2 and SAMD9L germline mutations. The cumulative inci dence of GF was higher in patients with chromosomal ab normalities (28.6%, 95% CI: 8.0-74.2) than in those without (9.5%, 95%: CI 2.4-33.3), although this difference was not statistically significant (P=n.s.; Online Supplementary Fig ure S1). All four patients were rescued with a second TBdepl-haploHSCT from either the same or the other par ent. Cumulative incidence of grade I-IV and II-IV aGvHD was 21.0% (95% CI: 9.3-43.4) and 8.3% (95% CI: 0.5-29.4), respectively. One additional patient developed stage 2 skin and stage 4 gut aGvHD after the second TBdepl-ha ploHSCT, while for all other patients skin was the sole organ involved; no case of grade IV aGvHD was observed in patients primarily engrafting. Of the 21 patients at risk, two developed cGvHD (one mild [skin] and the other mod erate [lung]; cumulative incidence 9.7% [95% CI 2.5-33.8]), which completely resolved with low-dose steroids and ru xolitinib. Another patient developed moderate cGvHD of the lung after a DLI administered for minimal residual dis ease reappearance at flow-cytometry analysis. Ten pa tients experienced Cytomegalovirus (CMV), three human Herpesvirus 6 and one adenovirus infection/reactivation, the cumulative incidence of these infectious complica tions being 50.6% (95% CI: 33.8-70.2). In the patient with grade IV aGvHD after the second allograft, CMV infection with central nervous system, lung and gut involvement did not respond to specific treatment (including CMV-specific donor lymphocyte infusion), leading to transplant-related death; thus, cumulative incidence of transplant-related mortality (TRM) was 4% (95% CI: 0.3-17.0). One patient de veloped lung aspergillosis, which resolved with specific
Table 1. Patient, donor and transplant characteristics.
Patients
Sex
N=28 %
Male 14 50
Female 14 50
Median (range) age at diagnosis, yr 9.6 (1.3-17.5)
Median (range) age at HSCT, y 10.2 (1.8-18.0)
Median (range) time from diagnosis to HSCT, mth 7.7 (1.7-120.4)
Initial diagnosis
RCC 20 72 EB1 2 7 EB2/AML 6 21
IBMFS
GATA2 2 7 SAMD9L* 1 4 ANKRD26 (VUS) 1 4 TP53 (VUS) 1 4 MECOM (VUS) 1 4
Recurrent cytogenetic lesions monosomy of chr 7 6 21 trisomy of chr 8 1 4 RUNX1 + CBL 1 4 PTPN11 1 4 KRAS 1 4
Treatment before TBdepl-haploHSCT
None§ 13 47 Immunosuppressive therapy 6 21 5-azacytidine 5 18 chemotherapy 4 14
Disease status at transplantation Active disease 25 89 CR 3 11
Previous HSCT 2 7
Conditioning regimen
Treo+TT+Flu 22 79 TBI+TT+L-PAM 2 7 Bu+Cy+L-PAM 4 14 CMV serology (donor/recipient) Neg/Neg 2 7 Neg/Pos 2 7 Pos/Neg 2 7 Pos/Pos 22 79
Donor
Mother 11 39
Father 17 61
Sex mismatch 15 54
Female donor →
Male recipient 6 40
Cell dose infused, median (range)
CD34+ cells × 106/kg 14.7 (8.3-28.6)
αβ+ T cells × 106/kg 0.027 (0.008-0.098)
γδ+ T cells × 106/kg 8.8 (1.6-40.0)
NK cells × 106/kg 23.9 (2.8-80.5)
CD20+ cells × 106/kg 0.016 (0.003-0.230)
AML: acute myelogenous leukemia; Bu: busulfan; chr: chromosome; CR: complete response; Cy: cyclophosphamide; EB: MDS with excess of blasts; Flu: fludarabine; IBMFS: inherited bone marrow failure syndromes; L-PAM: melphalan; neg: negative; pos: positive; RCC: refractory cytopenia of childhood; TBI: total body irradiation; Treo: treosulfan; TT: thiotepa; VUS: variant of unknown significance. *Although formally identified as VUS, given the young age (1.6 years) and the presence of monosomy 7 this mutation was deemed as clinically relevant. §Not including supportive therapy.
1.
treatment. No patient experienced VOD/SOS, while one patient developed, 3 month after HSCT, TA-TMA which re solved after treatment with eculizumab. Two patients, both affected by EB2, one in remission and one not at time of transplant, relapsed at 3 and 27 months after HSCT, respectively. The 5-year cumulative incidence of re lapse was 9.4% (95% CI: 1.6-26.1) for the whole cohort, while it was 42.9% (95% CI: 11.4-92.4) for patients with EB1 and EB2. The patient with the early relapse was res cued with DLI and 5-azacytidine, being now alive and dis ease-free 3 years after HSCT; the other patient died of disease progression after a second HSCT failed. The 5year probability of OS and EFS were 88.6% (95% CI: 59.597.2; Figure 2A) and 76.2% (95% CI: 53.8-88.8; Figure 2B), respectively. In line with previously reported data,9 mono somy of chromosome 7 was associated with a reduced OS (53.3% vs. 100%, P=0.007, Figure 2C) and EFS (33.3% vs. 85.9%, P=0.03, Figure 2D); although MDS variant had no influence on the patient’s outcome, this may be due to the small sample size; moreover, since three of eight pa tients with advanced MDS had monosomy of chromosome 7, this may have had an impact on survival analysis. How ever, multivariable analysis was inconclusive due to small sample size (not shown). No other variable had an impact on survival. The median cell counts on day +30, +90, +180 and +360 were: i) for CD3+, 246, 274, 556 and 1,242/mcL, respectively; ii) for CD4+, 15, 42, 121, 410/mcL, respectively; iii) for CD8+, 23, 106, 128, 486/mcL, respectively. Although data on HSCT in this setting are scarce, these data compare favorably with those reported in the litera ture. In particular, OS and EFS are comparable to those of single-10 and multicenter studies,11 including HSCT from matched family donor, cord blood or matched unrelated donor12 in children with RCC13 or advanced diseases.14
Moreover, TRM remains low, as already reported in pa tients with acute leukemia5 or non-malignant disorders.8 Graft failure, a risk which is notoriously increased in T-cell depleted transplants, seems less frequent than in pa tients with SAA, highlighting once more the importance of a correct diagnosis (which can be difficult in the pediatric setting). This could be due to a higher “degree of activa tion” of the immune system, as well as higher circulating levels of Iinterferon γ (which has deleterious effects on hematopoietic progenitors), in patients with SAA.15 The ob servation that GF seems more frequent in patients with chromosomal abnormalities suggests that this group might require intensified monitoring and immune prophy laxis for rejection either pre- and/or post-transplant. Recently, Suo and colleagues reported on the results of a T-cell replete haploHSCT approach (based on G-CSF priming, ATLG, Cyclosporine-A, mofetil-mycophenolate and short-term methotrexate) in 27 children with MDS (17 with advanced disease).16 Although the two cohorts are not fully comparable, especially with regards to the cumulative incidence of relapse (7.4%), EFS (81.9%) and OS (81.9%) (because of the “more advanced” population”), the cumulative incidence of both aGvHD (52.6% for grade II-IV) and cGvHD (21.1% for extensive) are lower with the strategy of ex-vivo TBdepl-haploHSCT. Yoo and coauthors, describing their cohort of patients transplanted for pediatric MDS, reported nine patients who received a T-cell depleted haploHSCT, with comparable outcomes.17 In details: i) one patient died of transplant-related cause (14%); ii) three patients experienced grade II aGvHD (33.3%) and one patient extensive cGvHD (14%), while iii) 5-year EFS was 78%. Notably, before a targeted dose of αβ+ T cells <5×10⁴/kg was implemented at the Center, five of these patients received, differently from our cohort,

Figure 2. Survival outcomes. (A) Kaplan-Meier curve of overall survival (OS). (B) Kaplan-Meier curve of event-free survival (EFS). (C) Kaplan-Meier curve of OS according to monosomy of chromosome 7 (chr 7). (D) Kaplan-Meier curve of EFS according to monosomy of chr 7. CI: confidence interval.
post-transplant GvHD pharmacological prophylaxis with tacrolimus and mycophenolate mofetil. Relapse, es pecially in patients with EB1-EB2 MDS, remains the main cause of treatment failure; thus, strategies aimed at pre venting/pre-emptive treating impending relapse are de sirable. In this regard, this haploHSCT platform, characterized by the absence of post-transplant phar macological GvHD prophylaxis is the ideal setting for im plementing post-transplant adoptive cell therapies. Another open issue concerns the outcome of patients with MDS due to genetic predisposition syndromes; in our cohort (in which the percentage of patients with proven or suspected [VUS] genetic predisposition syn dromes was in line with the literature),2,3 the six patients with this type of MDS (proven or suspected because of VUS) are all alive and disease-free. A recent study con
ducted by the EWOG-MDS study group demonstrated that transplant outcomes are not influenced by GATA2 germline variants; this finding supports the application of standard treatment algorithms also to this group of patients, advising to consider HSCT early in the course of GATA2 deficiency in order to avoid complications.18 Thus, HSCT from a haploidentical donor has the advan tage of being available for almost all patients. However, in case an IBMFS/genetic predisposition syndrome is suspected, an accurate familiar study (especially regard ing possible related donors) is mandatory. In summary, these data indicate that TBdepl-haploHSCT is a safe and effective transplant option also in children with MDS. The low risk of both non-relapse mortality and a/cGvHD makes this a pproach particularly attractive in the pediatric setting.

Pietro Merli,1 Daria Pagliara,1 Tommaso Mina,2 Valentina Bertaina,1 Giuseppina Li Pira,1 Stefania Lazzaro,3 Simone Biagini,1 Federica Galaverna,1 Luisa Strocchio,1 Roberto Carta,1 Maria Luigia Catanoso,1 Francesco Quagliarella,1 Marco Becilli,1 Emilia Boccieri,1 Francesca Del Bufalo,1 Arianna Panigari,2 Annalisa Agostini,2 Lucia Pedace,1 Simone Pizzi,4 Cesare Perotti,5 Mattia Algeri,1 Marco Zecca2 and Franco Locatelli1,6
1Department of Pediatric Hematology/Oncology, Cell and Gene Therapy, Bambino Gesù Children's Hospital, IRCCS, Rome; 2Pediatric Hematology/Oncology, Fondazione IRCCS Policlinico San Matteo, Pavia; 3Transfusion Unit, Department of Laboratories, Bambino Gesù Children's Hospital, IRCCS, Rome; 4Genetics and Rare Diseases Research Division, Bambino Gesù Children's Hospital, IRCCS, Rome; 5Departments of Immunohematology and Transfusion, Infectious Diseases, Respiratory Diseases, Intensive Care, Virology and Clinical Epidemiology & Biometry, Fondazione IRCCS Policlinico San Matteo, Pavia and 6Department of Life Sciences and Public Health, Catholic University of Sacred Heart, Rome, Italy
Correspondence: P. MERLI - pietro.merli@opbg.net
https://doi.org/10.3324/haematol.2022.280698
Received: January 20, 2022. Accepted: August 17, 2022. Prepublished: August 25, 2022.
©2022 Ferrata Storti Foundation Published under a CC BY-NC license
1. Locatelli F, Strahm B. How I treat myelodysplastic syndromes of childhood. Blood. 2018;131(13):1406-1414.
2. Schwartz JR, Ma J, Lamprecht T, et al. The genomic landscape of pediatric myelodysplastic syndromes. Nat Commun. 2017;8(1):1557.
3. Pastor V, Hirabayashi S, Karow A, et al. Mutational landscape in children with myelodysplastic syndromes is distinct from adults: specific somatic drivers and novel germline variants. Leukemia. 2017;31(3):759-762.
4. Kennedy AL, Shimamura A. Genetic predisposition to MDS: clinical features and clonal evolution. Blood. 2019;133(10):1071-1085.
5. Locatelli F, Merli P, Pagliara D, et al. Outcome of children with acute leukemia given HLA-haploidentical HSCT after alphabeta T-cell and B-cell depletion. Blood. 2017;130(5):677-685.
6. Strocchio L, Pagliara D, Algeri M, et al. HLA-haploidentical TCRalphabeta+/CD19+-depleted stem cell transplantation in children and young adults with Fanconi anemia. Blood Adv.
PM is on the advisory board of Sobi and is part of the speaker's bureau of Bellicum; he has receieved honoraria from Jazz. MZ is on the advisory board of Amgen, Jazz, Novartis and Sanofi. FL has received research support from Bellicum; he is part of the speaker's bureau of Miltenyi, Bellicum, Amgen, Medac, Neovii, Novartis, Sanofi, Gilead and bluebird bio; he is on the advisory board of Bellicum, Amgen, Neovii, Novartis and Sanofi All other authors have no conflicts of interest to disclose.
FL designed the study and supervised the project. PM, DP, TM, FG, LS, EB, RC and FdB collected the data. PM, LS and FL analyzed and interpreted the data. PM, DP, TM, FG, LS, MLC ,RC, FQ, MB, EB, FdB, AP, AA, MA and FL were involved in the clinical management of patients. SL performed donor apheresis. GLP, SB and CP performed graft manipulation and graft characterization. VB performed immune monitoring. LP and SP performed genetic analysis. PM, LS, MZ and FL wrote and edited the manuscript. All authors had access to primary clinical trial data, contributed to the intellectual content of this article, and reviewed and approved the final manuscript.
This work was partially supported by grants from Italian Ministry of Health (GR-2011-02350175 to PM) and from the Associazione Italiana Ricerca sul Cancro, (Investigator Grant ID 21724 to FL).
The datasets used and/or analyzed during the current study are available from the corresponding author on request.
2021;5(5):1333-1339.
7. Cacchione A, Lodi M, Carai A, et al. Upfront treatment with mTOR inhibitor everolimus in pediatric low-grade gliomas: A single-center experience. Int J Cancer. 2020 Dec 15. [Epub ahead of print]
8. Merli P, Pagliara D, Galaverna F, et al. TCRalphabeta/CD19 depleted HSCT from an HLA-haploidentical relative to treat children with different non-malignant disorders. Blood Adv. 2022;6(1):281-292.
9. van Gelder M, de Wreede LC, Schetelig J, et al. Monosomal karyotype predicts poor survival after allogeneic stem cell transplantation in chromosome 7 abnormal myelodysplastic syndrome and secondary acute myeloid leukemia. Leukemia. 2013;27(4):879-888.
10. Inagaki J, Fukano R, Kurauchi K, Noguchi M, Tanioka S, Okamura J. Hematopoietic stem cell transplantation in children with refractory cytopenia of childhood: single-center experience using high-dose cytarabine containing
myeloablative and aplastic anemia oriented reduced-intensity conditioning regimens. Biol Blood Marrow Transplant. 2015;21(3):565-569.
11. Munoz A, Diaz-Heredia C, Badell I, et al. Allogeneic stem cell transplantation for myelodysplastic syndromes in children: a report from the Spanish Working Party for Blood and Marrow Transplantation in Children (GETMON). Pediatr Hematol Oncol. 2009;26(5):345-355.
12. Yamamoto S, Kato M, Watanabe K, et al. Prognostic value of the revised International Prognostic Scoring System five-group cytogenetic abnormality classification for the outcome prediction of hematopoietic stem cell transplantation in pediatric myelodysplastic syndrome. Bone Marrow Transplant. 2021;56(12):3016-3023.
13. Hasegawa D, Chen X, Hirabayashi S, et al. Clinical characteristics and treatment outcome in 65 cases with refractory cytopenia of childhood defined according to the WHO 2008 classification. Br J Haematol. 2014;166(5):758-766.
14. Strahm B, Nollke P, Zecca M, et al. Hematopoietic stem cell
transplantation for advanced myelodysplastic syndrome in children: results of the EWOG-MDS 98 study. Leukemia. 2011;25(3):455-462.
15. Merli P, Quintarelli C, Strocchio L, Locatelli F. The role of interferon-gamma and its signaling pathway in pediatric hematological disorders. Pediatr Blood Cancer. 2021;68(4):e28900.
16. Suo P, Wang S, Xue Y, et al. Unmanipulated haploidentical hematopoietic stem cell transplantation for children with myelodysplastic syndrome. Pediatr Transplant. 2020;24(7):e13864.
17. Yoo JW, Im HJ, Kim H, et al. Improved outcomes of allogeneic hematopoietic stem cell transplantation including haploidentical transplantation for childhood myelodysplastic syndrome. Bone Marrow Transplant. 2020;55(8):1595-1603.
18. Bortnick R, Wlodarski M, de Haas V, et al. Hematopoietic stem cell transplantation in children and adolescents with GATA2related myelodysplastic syndrome. Bone Marrow Transplant. 2021;56(11):2732-2741.
Megakaryoblastic leukemia 1 (MKL1; also known as MRTFA, MAL, or BSAC) is a coactivator of serum response factor (SRF). SRF is a transcription factor that participates in the activation of immediate-early genes as well as genes as sociated with the cytoskeleton, proliferation, and apop tosis by binding promoter sequences known as serum response elements (SRE).1 The MKL1/SRF complex plays a critical role in megakaryocyte maturation.2,3 As mega karyocytes mature, they undergo successive rounds of en domitosis to become highly polyploid; Mkl1 knockout (KO) murine megakaryocytes exhibit reduced polyploidization, a phenotype that is more severe in double KO (dKO) megakaryocytes lacking both Mkl1 and the closely related Megakaryoblastic leukemia 2 (Mkl2, or Mrtfb).3,4 Addi tionally, MKL1 is part of the recurrent t(1;22) chromosomal translocation found in acute megakaryoblastic leukemia, which results in a fusion protein known as RBM15-MKL1.5 MKL1 and MKL2 each contain five highly conserved do mains which have been investigated in the context of SRF coactivation using luciferase reporter assays.1,3,6,7 However, their functional effects in megakaryocyte polyploidization remain unknown, so structure-function analysis of these domains in primary megakaryocyte polyploidization is needed.7,8 Furthermore, the pro-tumorigenic mechanism of RBM15-MKL1 remains unclear, warranting further inves tigation of the individual proteins’ roles in both normal and pathological megakaryocyte development – particu larly considering that all functional domains of MKL1 are retained in the fusion protein. In order to define which do mains of MKL1 are necessary for polyploidization, we transduced wild-type (WT), Mkl1 KO and dKO murine bone marrow with domain-specific deletion constructs of MKL1, and analyzed subsequent megakaryocyte polyploidization. Published data have established that Mkl1 KO and dKO megakaryocytes have reduced polyploidization relative to WT cells in vivo. We expanded upon this by demonstrating reduced polyploidization of megakaryocytes differentiated in culture from hematopoietic stem and progenitor cells (HSPC).2,3,7 Murine bone marrow-derived HSPC were cul tured for 48 hours in expansion medium (50 ng/mL murine Flt3, 20 ng/mL murine interleukin-3, 100 ng/mL murine stem cell factor, 50 ng/mL murine thrombopoietin in StemSpan [Stemcell Technologies]), then switched into megakaryocyte maturation medium (50 ng/mL murine thrombopoietin) for 4 days. Polyploidization was analyzed via flow cytometry using propidium iodide to visualize DNA
content, and anti-CD41 to identify megakaryocytes. In order to capture the full spectrum of polyploidization, the mean fluorescence intensity (MFI) of propidium iodide was determined for each population. MFI was normalized to the WT value within each experiment to account for variations in fluorescence intensity between experiments and cytometers. Mkl1 KO and dKO megakaryocytes showed decreased MFI relative to WT, indicating a lower degree of polyploidization.2,3,7 This decrease was statis tically significant for dKO cells ( P=0.01, n=4). Mkl1 KO megakaryocytes exhibited a directional decrease in MFI which did not reach statistical significance (P=0.05, n=6) (Figure 1A).
To test whether restoration of Mkl1 expression restores polyploidization, we overexpressed full-length (FL) MKL1 in WT, Mkl1 KO, and dKO megakaryocytes. We cloned FL MKL1 into a pMSCV-GW-RfA-PGK-EGFP retroviral back bone using vectors VB160922-1087ttu and VB1609221086xsa (VectorBuilder). Constructs were validated in HEL cells via western blot (Online Supplementary Figure S1A). Murine HSPC were cultured according to the above pro tocol, and transduced after 24 hours in expansion medium with 8 µg/mL polybrene via spinfection for 1 hour at 800 x g. The transduced megakaryocyte population was gated based on CD41/GFP fluorescence. Representative ploidy histograms are shown in Figure 1C and indicate that over expression of FL MKL1 increases the number of high ploidy cells. Overexpression of MKL1 resulted in a statistically significant increase in polyploidization (as represented by the MFI of propidium iodide) of cells from each genotype (WT n=5, Mkl1 KO n=6, and dKO n=4), compared to empty vector controls (Figure 1B).
Previous work has defined the roles of each domain in MKL1-mediated regulation of SRF in luciferase reporter assays.9 Two canonical N-terminal RPEL domains serve as negative regulators of MKL1/SRF by binding to G-actin, which promotes nuclear export;8,9,10 the Basic domain con tains a nuclear localization signal and promotes dimeriza tion of MKL1 with SRF;9,11 the LZ domain permits MKL1 hetero- and homodimerization;1 and the C-terminal TAD domain is required for transcriptional activation of MKL1/SRF target genes.1 The SAP domain does not affect MKL1-induced luciferase reporter activity and has no clear role in MKL1 function.11 While SRF-independent functions have been reported for the SAP domain of MKL1, these findings have not been reproduced.12 We therefore tested
C
Figure 1. Effect of MKL1 on polyploidization of primary murine megakaryocytes. (A) Mean fluorescence intensity (MFI) of propidium iodide (PI) for megakaryocytes derived from wild-type (WT), Mkl1 kockout (KO), or double knockout (dKO) murine bone marrow, normalized to the MFI of the WT in each trial (dKO vs. WT: P=0.01, n=2). (B) MFI for megakaryocytes derived from WT, Mkl1 KO, or dKO murine bone marrow transduced with empty vector (EV) backbone or full-length (FL) MKL1 retrovirus. Each experiment was normalized to the MFI of the EV (WT: P=0.011, n=5; Mkl1 KO: P=0.007, n=6; dKO: P=0.028, n=4). (C) Representative ploidy peaks for WT, Mkl1 KO, and dKO marrow-derived megakaryocytes transduced with EV or FL MKL1 retroviruses, with cell number as a function of PI fluorescence. Far right: overlay of the mode-normalized ploidy peaks with EV (blue) and FL (red).
for effects of the SAP domain on megakaryocyte polyploi dization in addition to the known functional domains of MKL1. We generated retroviruses encoding mutant MKL1 on the same backbone as above with deletions in each of the five key functional domains (Figure 2A), which were validated by western blot (Online Supplementary Figure S1A).
Mkl1 KO murine HSPC were transduced with each of the MKL1 domain deletion constructs and cultured as above. We found that the ΔRPEL construct significantly increased
megakaryocyte polyploidization, as expected. Neither the Δ Basic nor the ΔTAD constructs induced an increase in polyploidization, indicating that these two domains are required for the function of MKL1 in polyploidization. Simi lar data were obtained for the ΔLZ construct, which was somewhat surprising given the ability of Δ LZ to induce SRE-luciferase reporter activity.1 Taken together, we con clude that the TAD, LZ and Basic domains are important for MKL1’s functional enhancement of megakaryocyte polyploidization (Figure 2B). Interestingly, the SAP domain,

which has shown little effect on SRF in luciferase assays,11 may play an inhibitory role in MKL1-induced polyploidiza tion; deletion of the SAP domain resulted in a statistically significant increase in polyploidization (Figure 2B), to a de gree similar to that of Δ RPEL and even greater than FL MKL1 (P< 0.05 for ΔSAP vs. FL).

We repeated these studies with dKO megakaryocytes to determine whether loss of expression of both Mkl2 and Mkl1 reveals an even stronger effect of enforced MKL1 ex pression. We observed the same trends as in Mkl1 KO megakaryocytes: FL MKL1, ΔRPEL, and ΔSAP constructs all produced significant increases in polyploidization, while ΔBasic, ΔLZ, and ΔTAD constructs did not increase poly ploidization relative to that of the empty vector control (Figure 2C). The effects of the FL, ΔRPEL, and ΔSAP con structs appeared stronger in dKO than in Mkl1 KO mega karyocytes (Figure 2D). These data support the redundant
relationship between Mkl1 and Mkl2 3
We also transduced WT murine HSPC with the ΔRPEL and ΔTAD constructs because these two constructs were ob served to have, respectively, a constitutively active and dominant negative effect on SRF coactivation in luciferase assays.1,13 Transduction with ΔRPEL caused a statistically significant increase in ploidy relative to the empty vector control and a non-significant increase relative to the FL construct; no increase in polyploidization was seen with the ΔTAD construct, but the reduction expected from a dominant negative effect was not observed (Online Sup plementary Figure S1B).
We next sought to further elucidate the function of each MKL1 domain in downregulating GEF-H1 during endomito sis. Previously, we showed that MKL1 downregulates GEFH1, a guanine exchange factor that couples Rho activation to microtubule dynamics, during the first endomitotic
Figure 2. Investigation of MKL1 domains needed for polyploidization. (A) Schematic of domain deletion constructs (empty vector [EV] not shown): full-length (FL) MKL1, ΔRPEL, ΔBasic, ΔSAP, ΔLZ, and ΔTAD. (B) Mean fluorescence intensity (MFI) of propidium iodide for Mkl1 knockout (KO) murine bone marrow-derived megakaryocytes transduced with each deletion construct (see Figure 2A), normalized to the EV value for each experiment. Individual experiments are indicated by data point colors (FL: P=0.007, n=6; ΔRPEL: P=0.037, n=4; ΔSAP: P=0.014, n=5). (C) MFI of propidium iodide for double knockout (dKO) murine bone marrow-derived megakaryocytes transduced with each deletion construct, normalized to the EV value for each trial. Individual trials are indicated by data point colors (FL: P=0.028, n=4; ΔRPEL: P=0.0004, n=4; ΔSAP: P=0.017, n=4). (D) Summary of data, showing mean foldchange in ploidy driven by each construct relative to EV.
division, which is the mechanism by which MKL1 promotes megakaryocyte polyploidization.14 To investigate the role of Mkl1 deletion mutants in GEF-H1 expression, we used our published protocol.14 Sorted megakaryocyte progen itors were transduced and cultured in thrombopoietinonly medium for 24 hours to induce megakaryocyte differentiation. Cells were then immunostained for tubulin and GEF-H1 as described by Gao et al.14 Representative images are shown in Figure 2. Qualitatively, there was a decrease in GEF-H1 fluorescence in megakaryocyte pro genitors transduced with FL, ΔRPEL, and ΔSAP constructs relative to the empty vector control, which is consistent with the increased polyploidization these constructs achieve. The ΔBasic, ΔLZ, and ΔTAD constructs all showed GEF-H1 expression similar to that of the empty vector control. These effects achieved statistical signi ficance when average GEF-H1/tubulin fluorescence over the spindle region was measured, but with very few replicates (Online Supplementary Figure S1C). We conclude that Mkl1 mutants that lack the ability to direct megakaryocyte polyploidization are equally unable to downregulate GEFH1.
In summary, we have demonstrated the critical impor tance of the Basic, LZ, and TAD domains for the proper
function of MKL1 in megakaryocyte polyploidization, as di rected by their roles in GEF-H1 downregulation (Figures 2D and 3). We have confirmed that the RPEL domain serves as a negative regulatory domain of MKL1. Our re sults are the first to link the function of MKL1 domains in transfection assays to a physiologically important out come in primary cells. We have also identified a novel role for the LZ domain; although previously shown to play a minimal role in SRF coactivation, it is important for poly ploidization and regulation of GEF-H1. These data confirm that megakaryocyte polyploidization is an SRF-dependent process that requires homo- or hetero-dimerization of MKL1. We also further explored the redundancy between Mkl1 and Mkl2 in megakaryocyte polyploidization. Finally, we have shown that the SAP domain may play an in hibitory role in polyploidization, potentially through its ability to bind DNA and localize MKL1 to non-SRF target sites. Having defined the functions of the five domains of MKL1 in normal megakaryocyte maturation, future studies may seek to shed light on how these domains function in acute megakaryoblastic leukemia, including how over expression of MKL1 in leukemic cells expressing the fusion protein may affect cell proliferation and megakaryocyte maturation including polyploidization.
Figure 3. Expression of GEF-H1 in response to wild-type and mutant forms of MKL1. Representative images of megakaryocyte progenitors transduced with MKL1 deletion constructs, cultured in thrombopoietin-only medium, and immunostained for α tubulin and GEF-H1. Tubulin was detected with mouse anti-tubulin (1:250, ThermoFisher A11126) and AlexaFluor 488-labeled donkey anti-mouse AlexaFluor 488 (1:500, LifeTechnologies A21202). GEF-H1 was detected with rabbit anti-GEF-H1 (1:50, AbCam ab155785) and AlexaFluor 555-labeled donkey anti-rabbit (1:500, LifeTechnologies A31572). Hoechst 33342 was used to identify nuclei.

Fiona E. Reed,1,2,3 Nicole M. Eskow,1,2,4 Elizabeth Min,5 Maximillian Carlino,1,2 Rubia Mancuso,1,2 Nayoung Kwon,1,5 Elenoe C. Smith,2,5 Shannon T. Larsuel,1,2,4 Lin Wang,1,2 Vanessa Scanlon1,2 and Diane S. Krause1,2,5,6
1Department of Laboratory Medicine, Yale School of Medicine, 2Yale Stem Cell Center, Yale School of Medicine, 3Department of Molecular Biophysics & Biochemistry, Yale University, 4Department of Molecular, Cellular, and Developmental Biology, Yale University, 5Department of Cell Biology, Yale School of Medicine and 6Department of Pathology, Yale School of Medicine, New Haven, CT, USA
Correspondence: D. S. KRAUSE - diane.krause@yale.edu
https://doi.org/10.3324/haematol.2021.280499
Received: December 21, 2021.
Accepted: August 17, 2022
Prepublished: August 25, 2022
©2022 Ferrata Storti Foundation
Published under a CC BY-NC license
1. Cen B, Selvaraj A, Burgess RC, et al. Megakaryoblastic leukemia 1, a potent transcriptional coactivator for serum response factor (SRF), is required for serum induction of SRF target genes. Mol Cell Biol. 2003;23(18):6597-6608.
2. Cheng EC, Luo Q, Bruscia EM, et al. Role for MKL1 in megakaryocytic maturation. Blood. 2009;113(12):2826-2834.
3. Smith EC, Thon JN, Devine MT, et al. MKL1 and MKL2 play redundant and crucial roles in megakaryocyte maturation and platelet formation. Blood. 2012;120(11):2317-2329.
4. Vitrat N, Cohen-Solal K, Pique C, et al. Endomitosis of human megakaryocytes are due to abortive mitosis. Blood. 1998;91(10):3711-3723.
5. Ma Z, Morris SW, Valentine V, et al. Fusion of two novel genes, RBM15 and MKL1, in the t(1;22)(p13;q13) of acute megakaryoblastic leukemia. Nat Genet. 2001;28(3):220-221.
6. Guettler S, Vartiainen MK, Miralles F, Larijani B, Treisman R. RPEL motifs link the serum response factor cofactor MAL but not myocardin to Rho signaling via actin binding. Mol Cell Biol. 2008;28(2):732-742.
7. Halene S, Gao Y, Hahn K, et al. Serum response factor is an essential transcription factor in megakaryocytic maturation. Blood. 2010;116(11):1942-1950.
8. Posern G, Miralles F, Guettler S, Treisman R. Mutant actins that
No conflicts of interest to disclose.
FR designed and performed experiments and wrote the manuscript; NME, VS, EM, MJC, RM, and NK performed experiments; ECS, STL, LW, and VS provided technical expertise and contributed scientific knowledge; and DSK provided mentorship and wrote the manuscript.
The authors would like to thank Dr. Jun Lu for the generous donation of the retroviral backbone.
This work was supported by National Institutes of Health grants R01 DK114031 (to DSK), R01 DK094934 (to DSK), U54 DK106857 (to DSK, Yale Cooperative Center of Excellence in Hematology), T32 HL007974 (to DSK), and K01 DK120798 (to VMS), as well as the Sherwood E. Silliman Summer Fellowship (to FER), Yale Science, Technology, and Research Scholars Program (to FER), Yale Rosenfeld Science Scholars Program (to NME), and Yale College Freshman Summer Research Fellowship (to NME).
Original data can be made available on reasonable request to the corresponding author.
stabilise F-actin use distinct mechanisms to activate the SRF coactivator MAL. EMBO J. 2004;23(20):3973-3983.
9. Miralles F, Posern G, Zaromytidou AI, Treisman R. Actin dynamics control SRF activity by regulation of its coactivator MAL. Cell. 2003;113(3):329-342.
10. Reed F, Larsuel ST, Mayday MY, Scanlon V, Krause DS. MRTFA: a critical protein in normal and malignant hematopoiesis and beyond. J Biol Chem. 2021;296:100543.
11. Zaromytidou AI, Miralles F, Treisman R. MAL and ternary complex factor use different mechanisms to contact a common surface on the serum response factor DNA-binding domain. Mol Cell Biol. 2006;26(11):4134-4148.
12. Asparuhova MB, Ferralli J, Chiquet M, Chiquet-Ehrismann R. The transcriptional regulator megakaryoblastic leukemia-1 mediates serum response factor-independent activation of tenascin-C transcription by mechanical stress. FASEB J. 2011;25(10):3477-3488.
13. Descot A, Rex-Haffner M, Courtois G, et al. OTT-MAL is a deregulated activator of serum response factor-dependent gene expression. Mol Cell Biol. 2008;28(20):6171-6181.
14. Gao Y, Smith EC, Ker E, et al. Role of RhoA-specific guanine exchange factors in regulation of endomitosis in megakaryocytes. Dev Cell. 2012;22(3):573-584.
Despite significant developments over the last decade, including the emergence of the hypomethylating agents, azacitidine and decitabine, and the bcl-2 antagonist, venetoclax, further treatment options for patients with acute myeloid leukemia (AML) remain an unmet medical need, especially in elderly patients. While hypomethyl ating agents, alone or in combination with venetoclax, have improved outcomes in elderly patients ineligible for intensive chemotherapy, survival is modest (median overall survival of ~7–15 months in clinical trials).1-3 Re gardless of treatment intensity, resistance and relapse to treatment remains a clinical challenge in patients with AML, particularly in elderly patients (>65 years).4 CD33 is an established drug target of interest in AML due to its detectable expression on blast cells in >80–90% of patients5 and has been validated in this setting by the clinical development of the antibody-drug conjugate, gemtuzumab ozogamicin.6-8 BI 836858 is a fully human ized IgG1 unconjugated anti-CD33 monoclonal antibody.9
In an in vitro study, BI 836858 significantly induced both autologous and allogeneic natural killer (NK)-cell de granulation and NK-cell–mediated antibody-dependent cellular cytotoxicity in AML blasts. Pretreatment of AML cells with decitabine rendered the cells more suscep tible to the effects of BI 836858, providing a rationale for the use of BI 836858 in combination with decitabine in the clinical setting.9
We report herein the results of an open-label, phase I/II, multicenter trial conducted in Europe and the United States (US) to determine the maximum tolerated dose (MTD) and investigate the safety, pharmacokinetics (PK) and efficacy of BI 836858 in combination with decitabine in patients with AML (clinicaltrials gov. Identifier: NCT02632721). The trial was performed in compliance with the Declaration of Helsinki and the ICH Harmonized Tripartite Guideline for Good Clinical Practice. All pa tients provided written informed consent. The trial con sisted of a phase I dose escalation period to determine the MTD of BI 836858/decitabine and the recommended dose for the phase I extension (RExP1D), a phase I exten sion period to determine whether the BI 836858/decita bine RExp1D would become the recommended phase II
dose, and a phase II period to assess BI 836858 plus decitabine versus decitabine monotherapy. All trial phases were to collect data on the safety, PK and effi cacy of BI 836858 plus decitabine. Due to a strategic decision by the sponsor to discontinue the clinical de velopment of BI 836858, the phase II part of the trial was not conducted.
The phase I period enrolled patients ≥65 years of age with previously untreated AML and considered ineligible for standard intensive therapy, or patients ≥18 years of age with refractory/relapsed (R/R) AML, while the phase I ex tension enrolled patients ≥65 years of age with previously untreated AML and considered ineligible for standard in tensive therapy only. The dose escalation proceeded using a Bayesian logistic regression model (BLRM) with overdose control. Dose escalation was overseen by a Safety Moni toring Committee (SMC) who considered the BLRM and additional factors (e.g., PK, pharmacodynamics and ad verse events [AE]) at each dose level. BI 836858 was ad ministered as weekly intravenous (i.v.) rate-controlled infusions (20–80 mL/hour) in 28-day cycles in combina tion with daily infusion of decitabine 20 mg/m2. In cycle 1, decitabine was infused for 10 consecutive days (intensive schedule).10 From cycle 2 onwards, decitabine was infused for 5 consecutive days (standard schedule) provided that there were no blasts in the peripheral blood and bone marrow blasts were <5%. Premedication (acetamin ophen/paracetamol 650–1,000 mg; antihistamine orally or i.v. equivalent to diphenhydramine 50 mg i.v.; glucocor ticoid i.v. equivalent to prednisolone 100 mg) to prevent infusion-related reactions (IRR) was obligatory 30–120 minutes prior to the first administrations of BI 836858 un less a contraindication for premedication existed. In the absence of IRR, the glucocorticoid dose was halved for the second administration and eliminated thereafter (with the option of re-escalation in the event of grade ≥2 IRR). The phase I extension consisted of two consecutive groups, one treated with BI 836858 plus intensive decita bine (Cohort A), and one treated with BI 836858 plus deci tabine 20 mg/m2/day for 5 days (standard dose schedule; Cohort B).
The primary endpoints of the phase I period were the
An open-label, phase I/II trial to determine the maximum tolerated dose and investigate safety, pharmacokinetics and efficacy of BI 836858, an unconjugated anti-CD33 monoclonal antibody, in combination with decitabine in patients with acute myeloid leukemia
MTD of BI 836858 plus decitabine and the number of pa tients with dose-limiting toxicity (DLT) for BI 836858 plus decitabine during cycle 1. The phase I secondary endpoint was the number of patients with an objective best re sponse, defined as complete remission (CR) plus com plete remission with incomplete hematologic recovery (CRi) according to International Working Group criteria.11 Incidence and intensity of treatment-related AE (based on Common Terminology Criteria for Adverse Events [CTCAE] version 4.0) was also assessed. All analyses were descriptive and exploratory. A total of 63 patients were screened in Germany (6 centers), Italy (1 center), Spain (3 centers), and the US (4 centers). Fourteen patients were screening failures and did not receive the study drug, so a total of 49 patients received at least one dose of the study drug and were included in the analysis (Figure 1; Table 1). The median duration of treatment was 98.0 days (range, 5–941 days), and the median number of cycles initiated was 3.0 (range, 1–33 cycles). During the dose escalation phase, no DLT were observed at BI 836858 doses of 20 mg, 40 mg, or 80 mg plus decitabine, and 80 mg BI 836858 was defined as the RExP1D by the SMC. The expansion phase was then opened with BI 836858 80 mg plus decitabine as the regimen. A total of two patients of 31 treated at this dose level experienced a DLT (grade 3 alanine ami notransferase [ALT] increased and grade 3 γ glutamyl transferase [GGT] increased in 1 patient in Cohort A;

grade 3 acute febrile neutrophilic dermatosis in 1 patient in Cohort B). No formal MTD was determined due to the low number of DLT reported; the highest BI 836858 dose of 80 mg was still considered safe, so the MTD of BI 836858 is ≥80 mg. A final recommendation on the phase II dose of BI 836858 was not made due to the early ter mination of the study.
All 49 patients who received the study drug reported at least one AE during the treatment period, with the most frequent AE being IRR (63.3%), constipation (42.9%), ane mia (40.8%), and peripheral edema (40.8%) (Table 2). Of the 46 patients who discontinued trial medication, the primary reason for discontinuation were listed as pro gressive disease (PD) (n=18), AE in the absence of PD (n=10); 20.4%, refusal to continue medication (n=5), DLT (n=1; elevated ALT/GGT) and other reasons (n=12). AE leading to discontinuation included IRR (3 patients; 6.1%); general physical health deterioration, pneumonia, and sepsis (each in 2 patients; 4.1%); and leukocytosis, septic shock, GGT increased, tumor lysis syndrome, and acute febrile neutrophilic dermatosis (each in 1 patient, 2.0%). A total of 45 patients (91.8%) reported a serious AE (SAE). SAE that occurred in >10% of patients were febrile neu tropenia (19 patients; 38.8%), disease progression (16 pa tients; 32.7%) and pneumonia (10 patients, 20.4%). Death was reported in 15 patients during the on-treatment period (Table 2). Reasons for death were disease progres sion (6 patients; 12.2%), sepsis (3 patients; 6.1%), pneu
Figure 1. Study profile. *All patients received BI 836858 and decitabine. AE: adverse event; DLT: dose-limiting toxicity; PD: pro gressive disease.
Characteristic
BI 836858 BI 836858 BI 836858 Extension Extension All 20 mg 40 mg 80 mg Cohort A Cohort B patients N=4 N=3 N=9 N=15 N=18 N=49
Male, N (%) 3 (75.0) 1 (33.3) 5 (55.6) 8 (53.3) 12 (66.7) 29 (59.2) Race, N (%) White 4 (100) 3 (100) 9 (100) 15 (100) 18 (100) 49 (100)
Age, years
Median (range) 75.5 (56-81) 59.0 (22-76) 70.0 (43-79) 74.0 (65-89) 77.5 (69-84) 75.0 (22-89) <65 1 (25.0) 2 (66.7) 3 (33.3) 0 0 6 (12.2) ≥65 3 (75.0) 1 (33.3) 6 (66.7) 15 (100.0) 18 (100) 43 (87.8)
0 0 0 1 (11.1) 2 (13.3) 3 (16.7) 6 (12.2) 1 4 (100) 3 (100) 5 (55.6) 10 (66.7) 11 (61.1) 33 (67.3) 2 0 0 3 (33.3) 3 (20.0) 4 (22.2) 10 (20.4)
Type of AML
De novo 2 (50.0) 2 (66.7) 5 (55.6) 10 (66.7) 14 (77.8) 33 (67.3)
Secondary 2 (50.0) 1 (33.3) 4 (44.4) 5 (33.3) 4 (22.2) 16 (32.7)
Previous systemic anti-leukemia therapy, N (%)
Yes 1 (25.0) 1 (33.3) 5 (55.6) 0 0 7 (14.3)
N of previous systemic anti-leuke mia therapies, median (range) 2.0 (2-2) 6.0 (6-6) 2.0 (1-4) 2.0 ( 1-6)
Type of previous systemic anti-leukemia therapies, N (%)
≥1 line of iHD
1 (25.0) 1 (33.3) 5 (55.6) 7 (14.3)
≥1 line of pLD 0 1 (33.3) 0 1 (2.0)
≥1 line of autologous SCT 0 0 0 0
≥1 line of allogeneic SCT 1 (25.0) 1 (33.3) 1 (11.1) 3 (6.1)
≥1 line of other 0 0 0
monia (2 patients; 4.1%), infection, septic shock, subdural hematoma, and tumor lysis syndrome (all in 1 patient). Two deaths, due to tumor lysis syndrome and septic shock were considered to be related to the study drug by the investigator. Seven patients (14.3%) reported AE of special interest: IRR of grade 3 or higher or IRR that were DLT were reported in four patients (8.2%), two pa tients (4.1%) reported tumor lysis syndrome, and ALT in creased, GGT increased, and acute febrile neutrophilic dermatosis were reported in one patient (2.0%) each. As part of the pharmacodynamic assessments, an ex ploratory analysis of CD33 expression and target engage ment and NK cell numbers and expression of activation markers by NK cells was undertaken. Partial reductions in the percentage of peripheral blood CD33+ blasts were observed in most patients e.g., eight of nine patients in the 80 mg BI 836858 mg cohort (Online Supplementary Figure S1). However, for some patients, CD33+ blasts were still detectable in the bone marrow and blood after ad ministration of 80 mg BI 836858, indicating that CD33 molecules were not fully saturated by BI 836858. In most patients there were no changes of note in the numbers
of activated NK cells; however, in some patients there was an increase in activated NK cells in the blood during and shortly after BI 836858 infusion e.g., two of nine pa tients in the 80 mg BI 836858 mg cohort (Online Supple mentary Figure S1).
In this study, individual plasma concentrations of BI 836858 were listed by dose group, cycle and day of treat ment. Descriptive statistics were calculated for cycle 1, days 9 to 16 and day 23 to 24. On day 9, maximum plasma concentration of BI 836858 demonstrated a more than dose proportional increase between the 20 and 40 mg groups, whereas the geometric mean for the maxi mum plasma concentration of the 80 mg dose group is in line with which was expected. For day 23 in cycle 1, all dose groups increase in a more linear manner ( Online Supplementary Table S1). However, steady state was not reached. Decitabine plasma concentrations were not cal culated. The objective best response rate (ORR; CR + CRi) was 38.8% (19/49); one patient (2.0%) had partial re mission, 16 patients (32.7%) had stable disease, and five patients (10.2%) had PD. Across the 20 mg, 40 mg, 80 mg, extension A and extension B cohorts the ORR was 50.0%,
Table 1. Baseline demographics and characteristics of patients with acute myeloid leukemia treated with BI 836858 in combination with decitabine.Table 2. All-cause adverse events by Medical Dictionary for Drug Regulatory Activities preferred terms and highest Common Terminology Criteria for Adverse Events grade in patients with acute myleoid leukemia treated with BI 836858 in combination with decitabine: on treatment period.
Adverse event, N (%) All grades Grade 1/2 Grade 3 Grade 4 Grade 5
Total with AE 49 (100) 0 12 (24.5) 22 (44.9) 15 (30.6)
Infusion-related reaction 31 (63.3) 27 3 (6.1) 1 (2.0) 0
Constipation 21 (42.9) 21 (42.9) 0 0 0
Anemia 20 (40.8) 0 20 (40.8) 0 0
Edema peripheral 20 (40.8) 20 (40.8) 0 0 0
Febrile neutropenia 19 (38.8) 0 19 (38.8) 0 0
Pyrexia 16 (32.7) 12 (24.5) 4 (8.2) 0 0
Platelet count decreased 15 (30.6) 1 (2.0) 0 14 (28.6) 0
Nausea 14 (28.6) 13 (26.5) 1 (2.0) 0 0
Pneumonia 14 (28.6) 2 (4.1) 10 (20.4) 0 2 (4.1) Diarrhea 13 (26.5) 11 (22.4) 2 (4.1) 0 0 Vomiting 13 (26.5) 13 (26.5) 0 0 0
WBC count decreased 13 (26.5) 1 (2.0) 2 (4.1) 10 (20.4) 0
Decreased appetite 12 (24.5) 12 (24.5) 0 0 0 Hypertension 12 (24.5) 6 (12.2) 6 (12.2) 0 0 Hypokalemia 12 (24.5) 10 (20.4) 2 (4.1) 0 0
Mucosal inflammation 12 (24.5) 11 (22.4) 1 (2.0) 0 0 Epistaxis 11 (22.4) 10 (20.4) 1 (2.0) 0 0 Fatigue 11 (22.4) 9 (18.4) 2 (4.1) 0 0 Rash 11 (22.4) 11 (22.4) 0 0 0 Neutropenia 10 (20.4) 0 1 (2.0) 9 (18.4) 0 Cough 9 (18.4) 8 (16.3) 1 (2.0) 0 0 Dyspnea 9 (18.4) 7 (14.3) 2 (4.1) 0 0 Fall 9 (18.4) 8 (16.3) 1 (2.0) 0 0 Headache 9 (18.4) 7 (14.3) 2 (4.1) 0 0 Hematoma 9 (18.4) 9 (18.4) 0 0 0 Back pain 8 (16.3) 7 (14.3) 1 (2.0) 0 0 Dizziness 8 (16.3) 8 (16.3) 0 0 0 Hypotension 8 (16.3) 8 (16.3) 0 0
Adverse events (AE) events shown are those occurring in >15% of patients for all grades. AML: acute myeloid leukemia; WBC: white blood cell.
0%, 66.7%, 46.7% and 22.2%, respectively. No conclusions could be drawn regarding the efficacy of BI 836858 added to the established decitabine treatment as the trial was stopped prematurely during the phase I exten sion cohort stage. In conclusion, the results of this study show that al though the MTD was not determined due to the termina tion of the trials, BI 836858, in conjunction with decitabine, had a manageable tolerability profile, and showed potential signals of efficacy in elderly patients with AML and those with R/R AML, in contrast to a pre vious phase I study of BI 836858 monotherapy in R/R AML that reported no response to therapy.12 Evidence of target engagement in this study, and the observation of modest clinical activity, indicate that further devel opment of unconjugated anti-CD33 antibodies, in com bination with hypomethylating agents, warrants further
consideration. However, other CD33 targeted approaches such as bispecific T-cell engagers,13 or bifunctional checkpoint inhibitory T-cell engagers,14 could potentially be considered in future combination regimens with the aim of improving immune effector cell recruitment and function.
Walter Fiedler,1 Pau Montesinos,2,3 Christoph Schliemann,4 Jan Middeke,5 Sumithira Vasu,6 Christian W. Scholz,7 Jordi Esteve,8 Shoubhik Mondal,9 Björn Rüter,10 Ute Burkard,10 Annika Osswald10 and William Blum11
1Department of Oncology, Hematology and Bone Marrow Transplantation with Section Pneumology, University Medical
Center Hamburg-Eppendorf, Hamburg, Germany; 2Hospital Universitari i Politècnic La Fe, Valencia, Spain; 3CIBERONC, Instituto Carlos III, Madrid, Spain; 4Department of Medicine A, Hematology and Oncology, University Hospital Muenster, Muenster, Germany; 5Uniklinikum Dresden, Dresden, Germany; 6Division of Hematology, The Ohio State University Comprehensive Cancer Center, Columbus, OH, USA; 7Department of Hematology and Oncology, Vivantes Klinikum Am Urban, Berlin, Germany; 8Hematology Department, Hospital Clínic of Barcelona, IDIBAPS, University of Barcelona, Barcelona, Spain; 9Boehringer Ingelheim Pharmaceuticals, Inc., Ridgefield, CT, USA; 10Boehringer Ingelheim Pharma GmbH & Co. KG, Biberach/Riss, Germany and 11Department of Hematology and Medical Oncology, Winship Cancer Institute, Emory University School of Medicine, Atlanta, GA, USA.
Correspondence: W. BLUM - william.g.blum@emory.edu
https://doi.org/10.3324/haematol.2022.281128
Received: March 21, 2022. Accepted: August 18, 2022. Prepublished: August 25, 2022.
©2022 Ferrata Storti Foundation
Published under a CC BY-NC license
WF reports consulting fees from Amgen, Pfizer, Jazz Pharmaceuticals, Abbvie, Novartis, Servier, Celgene, Morphosys, Stemline, Clinigen; honoraria from Abbvie; medical writing support from Pfizer, Abbvie, Novartis; support for meeting attendance from Servier Daiichi Sankyo Jazz Pharmaceuticals, and Amgen. CS reports honoraria from AbbVie, Astellas, AstraZeneca, Bristol Myers Squibb, Jazz Pharmaceuticals, Novartis, Pfizer, Roche; institutional grant from Boehringer Ingelheim not related to the present study. CWS reports consulting fees from Bristol Myers Squibb, Celgene, Daiichi Sankyo, Gilead, Hexal, Incyte, Janssen, Merck Serono, Novartis, Roche, Takeda; honoraria from Gilead, Janssen, Pfizer, Roche, Lilly, Takeda. JE reports consulting
1. Dombret H, Seymour JF, Butrym A, et al. International phase 3 study of azacitidine vs conventional care regimens in older patients with newly diagnosed AML with >30% blasts. Blood. 2015;126(3):291-299.
2. Kantarjian HM, Thomas XG, Dmoszynska A, et al. Multicenter, randomized, open-label, phase III trial of decitabine versus patient choice, with physician advice, of either supportive care or low-dose cytarabine for the treatment of older patients with newly diagnosed acute myeloid leukemia. J Clin Oncol. 2012;30(21):2670-2677.
3. DiNardo CD, Jonas BA, Pullarkat V, et al. Azacitidine and venetoclax in previously untreated acute myeloid leukemia. N Engl J Med. 2020;383(7):617-629.
honoraria from Abbvie, Novartis, Astellas, Jazz Pharmaceuticals, Bristol Myers Squibb, Pfizer, Amgen. SM, BR, UB, and AO report employment with Boehringer Ingelheim Pharmaceuticals Inc. WB reports consulting fees from Amerisource Bergen; grants or funds from Leukemia and Lymphoma Society, Xencor, Forma, Celyad and Novartis. PM, JM, and SV report no conflicts of interest.
Conception and design by SM, BR, UB, AO and WB. Collection and assembly of data by WF, PM, CS, JM, SV, CWS, JE and WB. Data analysis and interpretation by WF, SM, BR, UB, AO and WB. Drafting the manuscript by WF, PM, JM, SV, JE and SM. Manuscript writing by CS, CWS, BR, UB, AO and WB. All authors approved the final manuscript.
This work was supported by Boehringer Ingelheim. The sponsor was involved in the study design and the collection, analysis and interpretation of the data. Boehringer Ingelheim was given the opportunity to review the manuscript for medical and scientific accuracy as well as intellectual property considerations. Medical writing support for the development of this manuscript, under the direction of the authors, was provided by Sheridan Henness, and Lynn Pritchard, DPhil, of Ashfield MedComms, an Inizio Company, and was funded by Boehringer Ingelheim.
To ensure independent interpretation of clinical study results and enable authors to fulfill their role and obligations under the ICMJE criteria, Boehringer Ingelheim grants all external authors access to clinical study data pertinent to the development of the publication. In adherence with the Boehringer Ingelheim Policy on Transparency and Publication of Clinical Study Data, scientific and medical researchers can request access to clinical study data when it becomes available on https://vivli.org/, and earliest after publication of the primary manuscript in a peer-reviewed journal, regulatory activities are complete, and other criteria are met. Please visit https://www.mystudywindow.com/msw/datasharing for further information.
4. Gurnari C, Pagliuca S, Visconte V. Deciphering the therapeutic resistance in acute myeloid leukemia. Int J Mol Sci. 2020;21(22):8505.
5. Tabata R, Chi S, Yuda J, Minami Y. Emerging immunotherapy for acute myeloid leukemia. Int J Mol Sci. 2021;22(4):1944.
6. Chevallier P, Delaunay J, Turlure P, et al. Long-term disease-free survival after gemtuzumab, intermediate-dose cytarabine, and mitoxantrone in patients with CD33(+) primary resistant or relapsed acute myeloid leukemia. J Clin Oncol. 2008;26(32):5192-5197.
7. Castaigne S, Pautas C, Terré C, et al. Effect of gemtuzumab ozogamicin on survival of adult patients with de-novo acute myeloid leukaemia (ALFA-0701): a randomised, open-label,
phase 3 study. Lancet. 2012;379(9825):1508-1516.
8. Hills RK, Castaigne S, Appelbaum FR, et al. Addition of gemtuzumab ozogamicin to induction chemotherapy in adult patients with acute myeloid leukaemia: a meta-analysis of individual patient data from randomised controlled trials. Lancet Oncol. 2014;15(9):986-996.
9. Vasu S, He S, Cheney C, et al. Decitabine enhances anti-CD33 monoclonal antibody BI 836858-mediated natural killer ADCC against AML blasts. Blood. 2016;127(23):2879-2889.
10. Blum W, Garzon R, Klisovic RB, et al. Clinical response and miR29b predictive significance in older AML patients treated with a 10-day schedule of decitabine. Proc Natl Acad Sci U S A. 2010;107(16):7473-7478.
11. Cheson BD, Bennett JM, Kopecky KJ, et al. Revised recommendations of the International Working Group for Diagnosis, Standardization of Response Criteria, Treatment
Outcomes, and Reporting Standards for Therapeutic Trials in Acute Myeloid Leukemia. J Clin Oncol. 2003;21(24):4642-4649.
12. Vasu S, Altman JK, Uy GL, et al. A phase I study of the fully human, fragment crystallizable-engineered, anti-CD-33 monoclonal antibody BI 836858 in patients with previouslytreated acute myeloid leukemia. Haematologica. 2022;107(3):770-773.
13. Ravandi F, Walter RB, Subklewe M, et al. Updated results from phase I dose-escalation study of AMG 330, a bispecific T-cell engager molecule, in patients with relapsed/refractory acute myeloid leukemia (R/R AML). J Clin Oncol. 2020;38(15_suppl):7508.
14. Herrmann M, Krupka C, Deiser K, et al. Bifunctional PD-1 × αCD3 × αCD33 fusion protein reverses adaptive immune escape in acute myeloid leukemia. Blood. 2018;132(23):2484-2494.
Amyloidosis refers to a large spectrum of diseases, all characterized by the deposition of extracellular misfolded proteins in the form of insoluble highly ordered amyloid fibrils in one (localized amyloidosis) or multiple tissues (systemic amyloidosis).1-3 Amyloid deposits progressively disrupt tissue structure and exert a toxic effect on the ad jacent cells that ultimately result in organ dysfunction. To date, 36 different proteins are known to form amyloid fi brils in humans.1 The identification of the causal protein is of paramount importance for patient management be cause effective treatments are now available, especially for the main amyloid types derived from immunoglobulin light chain (AL) and transthyretin (ATTR).2 Although there is a predilection for particular organs de pending on the amyloid type, clinical manifestations are heterogeneous and may overlap between the different types.2,3 Therefore, determination of the amyloid type can not rely on the sole clinical findings. Traditionally, amyloid typing is performed using immunofluorescence (IF) on frozen sections and immunohistochemistry (IHC) on paraf fin sections. Interpretation of antibody labeling with mod ified proteins is often challenging despite experience.3-5 Indeed, commercial antibodies are not optimized for rec ognizing mutant and truncated amyloid proteins and the β pleated conformation may elicit non-specific positivity. Therefore, laser microdissection from formalin-fixed paraf fin-embedded (FFPE) tissue combined with tandem mass spectrometry (LMD-MS/MS) has been developed and pro gressively implemented in routine practice.6-13 The rationale for the application of this method is based on the relative abundance of amyloid protein that usually corresponds to one of the dominant proteins within the studied biopsy sample.6-13 In recent years, MS-based proteomics has be come the reference method because of its excellent identification capacity.6-13 However, its performance on various tissues/organs remains still limited to a few expert centers worldwide.6-13 In the present study, we document our experience of amyloid typing by LMD-MS/MS, over a 10-year period.
We conducted a retrospective study including 833 amy loidosis specimens retrieved from our collection from Ja nuary 2010 to Sept 2021. The diagnosis of amyloidosis was established on biopsy specimens using Congo red (CR) staining. As Vrana et al. in their pioneering report in 2009, we studied two independent sets of amyloidosis speci mens.6 The first set was a training set that consisted of
92 tissue specimens (90 patients, 67.6±14.0 years, 29 fe male[F]/61 male[M]). Each case of this set was well clas sified using the IF/IHC method and the identified amyloid type was in keeping with the extensive clinical, biological, genetic and imaging workup. The training set included 42 ATTR, 38 AL (35 λ, 3 k) and 12 AA amyloidosis. The second set was a validation set that consisted of 741 tissue speci mens (686 patients, 68.6±13.3 years, 249 F/437 M). For each case, LMD-MS/MS was indicated because of inad equate or absence of frozen sample available for IF, negative IF/IHC, equivocal IF/IHC, and IF/IHC inconsistent with clinical, biological, genetic and imaging investiga tions. Patient consent was obtained according to the In stitutional Review board of CHU de Toulouse. We used a previously established proteomics method.13,14 For each sample, a 10 µm-thick section of FFPE tissue was mounted on slides (Expression Pathology, USA) and stained with CR (Merck, Germany). One hundred thousand µm2 of deposits were selected by laser microdissection under fluorescent light (Leica 6500, Germany). Proteins were extracted from the collected material in ammonium bicarbonate buffer, reduced with dithiothreitol, and alky lated with iodoacetamide. Then, proteins were digested into peptides with trypsin (SIGMA, France) and analyzed by nano-liquid chromatography (nanoLC) coupled to tan dem MS (LMD-MS/MS) using an Ultimate 3000 RSLCnano system (Dionex, Netherlands) coupled to an LTQ-Orbitrap Velos or to a Q-Exactive Plus mass spectrometer (Thermo Fischer Scientific, Germany). Data were processed with Mascot against human entries of the SwissProt protein database. Validation of results was performed through a false discovery rate set to 1% at protein and peptide se quence match levels determined by target decoy search using the in-house-developed Proline software (http://proline.profiproteomics.fr/). The spectral count metrics (number of MS/MS spectra) was used to rank the proteins according to their relative abundance in the sample. The most abundant protein identified was con sidered to be the causative protein. This allowed us to de termine the amyloid subtype and the presence/absence of four proteins usually associated with amyloid deposits: serum amyloid-P component (SAP), apolipoprotein E (ApoE), apolipoprotein A4 (ApoA4), and apolipoprotein A1 (ApoA1).6,15 A minimum number of four MS/MS spectra per protein was considered clinically valid. Univariate testing was performed using Fisher exact test,
Table 1. Amyloid types identified by mass spectrometry and their frequency (N=705).
Type Precursor protein N % Age in years Sex, F/M
AL* Immunoglobulin light chain 407# 57.7 67.3±11.9 171/236
ATTR Transthyretin 182 25.8 76.6±10.9 36/146
AA Serum amyloid A 43 6.1 63.0±15.7 17/26
AApoAI Apolipoprotein A I 16 2.3 53.3±10.3 9/7
ASem1 Semenogelin 1 12 1.7 67.1±5.0 0/12
AApoAIV Apolipoprotein A IV 8 1.1 67.1±11.5 2/6
AFib Fibrinogen α 6 0.9 61.0±12.4 2/4
AKRT5-14 Keratin 5 and keratin 14 4 0.6 60.3±12.1 3/1
ALac Lactoferrin 4 0.6 41.5±27.6 4/0
BGH3 Transforming growth factor-β induced protein ig-h3 4 0.6 64.5±9.7 2/2
AIns Insulin 4 0.6 37.5±13.4 2/2
ACal Calcitonin 4 0.6 47.5±6.4 2/2
AApoCII Apolipoprotein C II 3 0.4 74.7±6.1 1/2
Aβ2M β2-microglobulin 2 0.3 53±5.7 1/1
APTH Parathyroid hormone 2 0.3 52.5±6.4 1/1
AApoAII Apolipoprotein A II 1 0.1 52 0/1
ALECT2 Leukocyte chemotactic factor-2 1 0.1 67 0/1
AANF Atrial natriuretic factor 1 0.1 74 1/0
AH Immunoglobulin heavy chain 1 0.1 70 1/0 *Co-deposition of a heavy chain (IGG, IGA, IGM or IGD) was found in 20% of cases; #194 k and 213 λ. F: female; M, male.
with Benjamini-Hochberg adjustment for multiple com parisons. Multivariate adjustment was done using multi variate logistic regression with age, sex and tissue origin explicative covariables. In the training set, we found that LMD-MS/MS success fully identified the amyloid type in all cases and the con cordance rate between LMD-MS/MS and IF/IHC was of 100%. In the validation set, the indications of proteomic analysis were in order of frequency: absence of frozen sample available for IF (70.5%), equivocal IF/IHC (15.7%), negative IF/IHC (9.9%), and inconsistent result (3.9%). LMD-MS/MS successfully identified the amyloid protein in 95.0% with 19 different amyloid types. The main amy loid types were AL (n=407), ATTR (n=182) and AA (n=43) accounting for 89.6% of our cohort. The patient demo graphics and the frequency of the 19 amyloid types are reported in Table 1. The tissue/organ tropism and the tis sue/organ amyloid protein identification rate are detailed in Figure 1. Specific analysis of the AL (n=101) and ATTR
(n=58) subgroups with equivocal or negative IHC/IF re vealed false-negative and false-positive staining in 48.5% and 41.5% for immunoglobulin light chain antibodies and, in 12.0% and 56.8% for TTR antibody, respectively. The uni versal amyloid signature SAP/ApoE/ApoA4 was present in 81.6% of cases with an overrepresentation of ApoA1 in AL amyloidosis compared to ATTR and AA amyloidosis (64.3% vs. 27.0% and 29.3% respectively, P<0.001), and an under representation of ApoA4 in AA amyloidosis compared to AL and ATTR amyloidosis (56.1% vs. 91.6% and 90.4% re spectively, P<0.001), that persisted after adjustment for age, sex and organ/tissue (P<0.001). Overall, our study, based on one of the largest cohort ever reported,6-13 confirms that MS-based proteomics after laser microdissection is the new gold standard for typing amyloidosis. In the literature, the identification rate of the amyloid protein ranged from 85% to 100%. In the largest series by the Mayo Clinic, Rochester, USA, 21 amyloid types were detected, the frequency of AL (58.9%) and
Figure 1. Tissue/organ tropism and identification rate of the amyloid protein per tissue/organ. The tissue/organ distribution of the 19 amyloid types identified in the present study is illustrated in decreasing order of frequency. Among the 26 tissue/organs analyzed herein, the 5 most commonly (67.5% of cases) analyzed anatomic sites were secondary salivary glands (21.0%), heart (17.2%), lung (10.8%), gastrointestinal tract (9.4%), and kidney (9.1%). Fat aspirate/biopsy was not analyzed in this series because this procedure is not as commonly performed in France as in other countries. The diversity of the amyloid types was greater in the kidney and the heart with 10 and 6 different types identified, respectively. The amyloid protein identification rate (IR) is re ported for each of the 26 tissues/organs. CNS: central nervous system; GI tract: gastrointestinal tract; PTH: parathyroid hormon.
ATTR (28.4%) being quite similar to that found in our co hort (Table 1).11 We confirm that AL patients were also a decade younger than ATTR patients (Table 1).11 For the re maining types, the main difference was represented by the lower proportion of ALECT2, the rarity of which in our cohort being explained by ethnic bias as >92% of ALECT2 patients are Hispanic and particularly Mexican.3,11 As ex pected, the present study demonstrates again that IHC/IF alone may lead to misdiagnosis, especially for ATTR and AL.4,5
A key finding of our study was the significant differential expression of ApoA1 and ApoA4 between AL, ATTR and AA amyloidosis, suggesting a singular implication of these proteins in the amyloid formation mechanisms. In conclusion, in addition to its reliability, the several ad vantages of MS over IHC/IF are now well documented: i) no frozen tissue sample required, ii) very small amounts of material needed, easily obtained from routine biopsy sampling, iii) detection in a single assay of all amyloid types and, iv) determination of the organ tropism for each amyloid protein that can be visualized in a comprehensive map.

Magali Colombat,1 Margot Gaspard,1 Mylène Camus,2,3 Jessica Dalloux-Chioccioli,1 Audrey Delas,1 Elsa Poullot,4 Anissa Moktefi, 4,5 Arnaud François,6 Anne Moreau,7 Jean-Bapiste Gibier,8 Pierre Raynaud,9 Antoine Huart,10 Alexis Piedrafita,10,11 Julia Gilhodes,12 Olivier Lairez,13 Gilles Grateau,14 Sophie Georgin-Lavialle,14 Hervé Maisonneuve,15 Philippe Moreau,16 Arnaud Jaccard,17 Franck Bridoux,18 Violaine Plante-Bordeneuve,5,19 Thibaud Damy,20 Hervé Mal,21 Pierre Brousset,1 Sophie Valleix22,23 and Odile Burlet-Schiltz2,3
1Département d’Anatomie Pathologique, Institut Universitaire du Cancer IUCT-O, CHU Toulouse, Toulouse; 2Institut de Pharmacologie et de Biologie Structurale (IPBS), Université de Toulouse, CNRS, UPS, Toulouse; 3Infrastructure Nationale de Protéomique, ProFI, Toulouse; 4Département d’Anatomie Pathologique, Réseau Amylose, Assistance Publique des Hôpitaux de Paris (AP-HP), Hôpitaux Universitaires Henri Mondor, Créteil; 5Institut Mondor de Recherche Biomédicale Université Paris Est Créteil, INSERM U955, Créteil; 6Service d’Anatomie et Cytologie Pathologiques, CHU Rouen, Rouen; 7Service d’Anatomie et Cytologie Pathologiques, CHU Nantes,
Nantes; 8Institut de Pathologie, CHU Lille, Lille; 9Service d’Anatomie et Cytologie Pathologiques, Centre Hospitalier Maréchal Joffre, Perpignan; 10Service de Néphrologie Dialyse et Transplantation, CHU Toulouse, Toulouse; 11Institut des Maladies Cardiovasculaires et Métaboliques, INSERM, UMR 1297, Université Toulouse, Toulouse; 12Service de Biostatistiques, Institut Claudius Regaud IUCT-O, Toulouse; 13Service de Cardiologie, CHU Toulouse, Toulouse; 14Sorbonne Université, GRC GRAASU N°28, Service de Médecine Interne, Hôpital Tenon, AP-HP, DMU3ID, CEREMAIA (Centre national de référence des maladies autoinflammatoires et amyloses AA) Paris; 15Service de Médecine Interne Oncohématologie, Centre Hospitalier Départemental Vendée, La Roche-sur-Yon; 16Département d’Hématologie, CHU Hotel-Dieu, Nantes; 17Service d’Hématologie Clinique et Centre de Référence « Amylose AL et autres maladies à dépôt d’immunoglobulines monoclonales », CHU Limoges, Limoges; 18Service de Néphrologie et Centre de Référence « Amylose AL et autres maladies à dépôt d’immunoglobulines monoclonales », CHU Poitiers, Poitiers; 19Département de Neurologie, Réseau Amylose, Hôpital Henri Mondor, Assistance Publique des Hôpitaux de Paris (AP-HP), Hôpitaux Universitaires Henri Mondor, Créteil; 20Service de Cardiologie, Unité Insuffisance Cardiaque et Amylose, Centre de Référence National des Amyloses Cardiaques (filière CARDIOGEN), CHU Henri Mondor, Créteil; 21Service de Pneumologie, Hôpital Bichat, Paris; 22Service de Médecine Génomique des Maladies de Système et d’Organe, APHP, Centre Université de Paris, Fédération de Génétique et de Médecine Génomique, Hôpital Cochin, Paris and 23Centre de Recherche des Cordeliers, INSERM UMR1138, Université de Paris, France.
Correspondence:
M. COLOMBAT - colombat.m@chu-toulouse.fr
https://doi.org/10.3324/haematol.2022.281431
Received: May 23, 2022. Accepted: July 26, 2022. Prepublished: August 4, 2022.
©2022 Ferrata Storti Foundation Published under a CC BY-NC license
No conflicts of interest to disclose.
MCo initiated and supervised the study, performed histological analysis, clinical data collection, prepared samples for MS analysis, performed MS analysis, bioinformatic MS data analysis, and wrote the paper. MG performed histological analysis, clinical data collection, and interpreted MS data analysis. MCa, JD-C performed histological preparations, laser microdissection, and MS analysis. AD, EP, AM, A.F, A.M, J-BG, PR, AH, OL, GG, SG-L, HM, P M, AJ, FB, VP-B, TD and SV provided tissue samples from patients, and carefully read the paper. AP and JG performed statistical analysis.
HM and PB carefully read the paper.OB-S provided access to the proteomics facility of Toulouse at IPBS, and carefully read the paper.
The authors thank the following colleagues who provided tissue samples: Marine Abad, Aurélie Achille, Blandine Acket, Laurent Alric, Laure André-Ledun, Emilie Angot, Bernard Anzieu, Bertrand Arnulf, Elisabeth Auberger, Vincent Audard, Eloge Backobi, Cécile Badoual, Cendra Barbey, Nazim Benzerdjeb, Claire Billey-Kijner, Virginie Blanchard, Diane Bodez, Anne-Marie Boudat, Camille Boulagnon Rombi, Jean-Louis Bourges, Karine Boye, Florence Breibach, David Buob, Stéphane Busca, Philippe Camparo, Eve Carriou, Francois Casteillo, Marie-Christine Chapeau, Frédéric Charlotte, Philippe Charron, Denis Chatelain, Dominique Chaveau, Marie-Pierre Chenard-Neu, Anne-Laure Chesnais, Ramy Chiry, Arnaud Chong-SiTsaon, Pascal Cintas, Marion Classe, Laetitia Collin, François Comoz, Valérie Costes-Martineau, Vincent Cottin, Marie Crahes, Laurent Daniel, Delphine Dansette, Claude Darcha, Yves Dauzan, Gonzague De Pinieux, Olivier Decaux, Audrey Delas, Estelle Desport, Carmen Dinu, Laurent Doucet, Dominique Douvin, Éric Dupont, Hélène Duval, Jean-Christophe Eicher, Myriam El Gani-Mesrar, Damien Eyharts, Stanislas Faguer, Fereshteh Farkhondeh, Sophie Felix, Carla Fernandez, Pauline Fournier, Éric Frouin, Mathilde Funes De La Vega, Arnault Galat, Françoise Galateau-Salle, Bernard Gasser, Hugo Gil, Viviane Gnemi, Jean-Michel Goujon, Lisa Green, Soulef Guendouz, Damien Guijarro, Gilbert Habib, Cécile Hartog, Sandrine Hirschi, Paul Hofman, Véronique Hofman, Toufik Homsi, Muriel Hourseau, Nadia Hoyeau-Idrissi, Antoine Huart, Samira Icher, Marius Ilier, Muriel Jamme, Vincent Javaugue, Noémie Jourde-Chiche, Jean-Louis Keminy, Hélène L’Hostis, Sandra Lassalle, Caroline Lavignac, Marion Lavigne, Sophie Le Guellec, François Le Loarer, Cécile Le Naoures, Sarah Le Roux, Francois Leclair, Sébastien Lepreux, Emmanuelle Leteurtre, Véronique Lindner, Marie-Christine Machet, Margaret Macro, Nadine Magy-Bertrand, Claire Mainguene, Claudie Makarawiez, Justine Mallet, Valérie Marson, Françoise Martin, Laurent Martin, Sylvie Mehaut, Véronique Meignin, Julie Meilleroux, Elodie Miquelestorena-Standley, Philippe Moguelet, Marie Morcelet, Aline Moryoussef-Brousset, Jean-François Mosnier, Guillaume Moulis, Carole Musso-Rigal, Dominique Nochy, Francois Nollez, Silvia Oghina, Jérôme Olagne, Eva Ott, Romain Perallon, Hélène Perrochia, Cécile Picard, Nicolas Piton, Raluca Ples, Marc Polivka, Grégoire Prévot, Sophie Prévot, Grégory Pugnet, Marie-Laure Quintyn-Ranty, Marion Rabant, Pierre Raynaud, David Ribes, Pascal Richard, Pomone Richard, Nathalie Rioux-Leclercq, Olivier Roques, Mélanie Roriz, François Roubille, Murielle Roussel, Laurent Sailler, Jean-Paul Saint-Andre, Henri Sevestre, Marie Soulier, Paul Strock, Hachemi Taa, Sébastien Taix, Romulus Takin, Anne-Marie Tasei, Abdellatif Tazi, Brigitte Teron, Julia Torrents, Bruno Turlin, Séverine Valmary-Degano, Philippe Vanhille, Jérôme Verine, Franck Vitte, Noëlle Weingertner, Anabelle Werbrouck-Chiraux, Ilyass Zouhry The authors thank Mathilde Bourderioux, Lucie Combes-Soia, and Emmanuelle Mouton for mass spectrometry data acquisition and bioinformatics mass spectrometry data analysis. We also thank
Rodica Anesia, Yseult Brut, Carol Florian, Sonia Holifanjaniaina and Sandra Holifanjaniaina for sample preparation for mass spectrometry.
The work was supported in part by grants to OB-S from the Région Occitanie, European funds (Fonds Européens de Développement Régional, FEDER), Toulouse Métropole, and the French Ministry of Research with the Investissement d’Avenir Infrastructures
1. Benson MD, Buxbaum JN, Eisenberg DS, et al. Amyloid nomenclature 2020: update and recommendations by the International Society of Amyloidosis (ISA) nomenclature committee. Amyloid. 2020;27(4):217-222.
2. Muchtar E, Dispenzieri A, Magen H, et al. Systemic amyloidosis from A (AA) to T (ATTR): a review. J Intern Med. 2021;289(3):268-292.
3. Picken MM. The Pathology of amyloidosis in classification: a review. Acta Haematol. 2020;143(4):322-334.
4. Satoskar AA, Efebera Y, Hasan A, et al. Strong transthyretin immunostaining: potential pitfall in cardiac amyloid typing. Am J Surg Pathol. 2011;35(11):1685-1690.
5. Gonzalez Suarez ML, Zhang P, Nasr SH, et al. The sensitivity and specificity of the routine kidney biopsy immunofluorescence panel are inferior to diagnosing renal immunoglobulin-derived amyloidosis by mass spectrometry. Kidney Int. 2019;96(4):1005-1009.
6. Vrana JA, Gamez JD, Madden BJ, et al. Classification of amyloidosis by laser microdissection and mass spectrometrybased proteomic analysis in clinical biopsy specimens. Blood. 2009;114(24):4957-4959.
7. Mollee P, Boros S, Loo D, et al. Implementation and evaluation of amyloidosis subtyping by laser-capture microdissection and tandem mass spectrometry. Clin Proteomics. 2016;13:30.
8. Tasaki M, Ueda M, Obayashi K, et al. Identification of amyloid precursor protein from autopsy and biopsy specimens using
Nationales en Biologie et Santé program (ProFI, Proteomics French Infrastructure project, ANR-10-INBS-08)
Data-sharing statement LC-MS/MS data acquired at the Institute of Pharmacology and Structural Biology (CNRS, Toulouse, France) are stored on local servers. They can be made available to investigators upon specific request.
LMD-LC-MS/MS: the experience at Kumamoto University. Amyloid. 2017;24(sup1):167-168.
9. Rezk T, Gilbertson JA, Mangione PP, et al. The complementary role of histology and proteomics for diagnosis and typing of systemic amyloidosis. J Pathol Clin Res. 2019;5(3):145-153.
10. Abildgaard N, Aleksandra M Rojek AM , et al. Immunoelectron microscopy and mass spectrometry for classification of amyloid deposits. Amyloid. 2020;27(1):59-66.
11. Dasari S, Theis JD, Vrana JA, et al. Amyloid typing by mass spectrometry in clinical practice: a comprehensive review of 16175 samples. Mayo Clin Proc. 2020;95(9):1852-1864.
12. Colombat M, Aldigier JC, Rothschild PR, et al. New clinical forms of hereditary apoA-I amyloidosis entail both glomerular and retinal amyloidosis. Kidney Int. 2020;98(1):195-208.
13. Colombat M, Barres B, Renaud C, et al. Mass spectrometrybased proteomic analysis of parathyroid adenomas reveals PTH as a new human hormone-derived amyloid fibril protein. Amyloid. 2021;28(3):153-157.
14. Camus M, Hirschi S, Prevot G, et al. Proteomic evidence of specific IGKV1-8 association with cystic lung light chain deposition disease. Blood. 2019;133(26):2741-2744.
15. Vrana JA, Theis JD, Dasari S, et al. Clinical diagnosis and typing of systemic amyloidosis in subcutaneous fat aspirates by mass spectrometry-based proteomics. Haematologica. 2014;99(7):1239-1247.
Numerous publications have reported that patients re ceiving B-cell-depleting therapies do not mount humoral responses to severe acute respiratory syndrome coronavi rus-2 (SARS-CoV-2) vaccination.1-3 B-cell recovery follow ing B-cell depleting therapies is variable, with B-cell aplasia often lasting 9 months or longer. It remains unclear when patients who have previously received Bcell depleting therapies are capable of mounting a func tional humoral response to vaccination. We report the case of an 87-year-old woman who devel oped coronavirus disease (COVID-19) pneumonia shortly after initiating rituximab + etoposide, prednisone, vincris tine, cyclophosphamide and doxorubicin (R-EPOCH) chemotherapy for highly aggressive diffuse large B-cell lymphoma with ‘double-hit’ biology (IgH-Myc and IgH-
BCL2 translocations) (Figure 1). Following a 6-week treat ment delay to allow for recovery from pneumonia, she had a complete metabolic remission and completed an addi tional five cycles of R-EPOCH. Her lymphoma remains in remission. Surprisingly, despite the dose of rituximab, she mounted an IgG response to the nucleocapsid region of SARS-CoV-2, (AdviseDx SARS-CoV-2 IgG II assay; Abbott) which was detectable 1 month after infection and was sustained for at least 7 months.
Six months after her final dose of anti-CD20 therapy, the patient received her first of several doses of the PfizerBioNTech SARS-CoV-2 mRNA vaccine. As expected in the setting of ongoing B-cell depletion, she did not mount a humoral vaccine response after two doses as measured by semi-quantitative IgG to spike protein receptor binding
Figure 1. Schematic showing the timeline relative to the first vaccine dose in days. (A) Treatment and B-cell recovery by flow cytometry. (B) Time of infection. (D) Doses of vaccine. (E) Anti-spike receptor binding domain IgG levels. (F) Neutralizing assays to wild-type and Omicron variant SARS-CoV-2. F: female; DLBCL: diffuse large B-cell lymphoma; R-EPOCH: rituximab + etoposide, prednisone, vincristine, cyclophosphamide and doxorubicin; WT: wild-type.

domain (RBD). Her third dose, administered 1 year after her final dose of anti-CD20, resulted in only a low-titer quantitative IgG response with no neutralizing activity. Despite flow cytometry analysis of her peripheral blood mononuclear cells showing minimal B-cell reconstitution (CD19+ cells 11/mL), she independently sought out and re ceived a fourth vaccine dose 4 months after her third dose. Surprisingly, her anti-spike RBD IgG titer rose to >25,000 AU/mL with high neutralizing activity (80%) against the wild-type RBD but minimal neutralizing activ ity (below the limit of detection) against the Omicron vari ant (SARS-CoV-2 surrogate virus neutralization test kit [Genescript]) Given this improvement, she received a fifth vaccine dose 10 weeks after her fourth dose and demon strated not only deepening (95% neutralization of WTRBD) but diversification (66% neutralization against Omicron-RBD) of her humoral antibody response.
These data strongly suggest that patients with a history of anti-CD20 antibody treatment may mount functional humoral immune responses to SARS-CoV-2 vaccines even in the setting of minimal quantitative B-cell recovery. However, this response may require several rounds of vac cination. Furthermore, functional immunity, particularly against the Omicron variants, cannot be inferred from currently available spike IgG antibody titers, which may therefore provide false reassurance about protection in this high-risk population.
Authors Ariela Noy and Santosha A. Vardhana1. Shree T, Shankar V, Lohmeyer JJK, et al. CD20-targeted therapy ablates de novo antibody response to vaccination but spares preestablished immunity. Blood Cancer Discov. 2022;3(2):95-102.
2. Bacova B, Kohutova Z, Zubata I, et al. Cellular and humoral immune response to SARS-CoV-2 mRNA vaccines in patients
Correspondence:
A. NOY - noya@mskcc.org
https://doi.org/10.3324/haematol.2022.281484
Received: June 21, 2022. Accepted: July 29, 2022. Prepublished: August 11, 2022.
©2022 Ferrata Storti Foundation Published under a CC BY-NC license
AN has received grants and research support from Pharmacyclics/Abbvie, Kite/Gilead, and Rafael; has acted as a consultant for Janssen, Morphosys, Rafael, Epizyme, EUSA, TG Therapeutics, and ADC therapeutics; and has received honoraria from Medscape, Pharmacyclics/Abbvie and Physician Education Resource, all outside of the present work. SAV has acted as a consultant for Immunai and Koch Disruptive Technologies outside of the present work.
AN and SAV conceived the study, generated data, interpreted data and wrote the manuscript.
Data-sharing statement
Anonymized data are available to independent researchers through a standard process, which includes an internal feasibility assessment and scientific review process. Any data release is subject to the participant’s consent.
treated with either ibrutinib or rituximab. Clin Exp Med. 2022 Mar 29:1–9. doi: 10.1007/s10238-022-00809-0. [Epub ahead of print]
3. Greenberger LM, Saltzman LA, Senefeld JW, et al . Antibody response to SARS-CoV-2 vaccines in patients with hematologic malignancies. Cancer Cell. 2021;39(8):1031-1033.
Memorial Sloan Kettering Cancer Center and Weill Cornell Medical Center, New York, NY, USAIvan Dlouhy,1,2* Marc Armengol,3* Clara Recasens-Zorzo,2 Marcelo L Ribeiro,3,4 Patricia PérezGalán,2 Francesc Bosch,5 Armando López-Guillermo1,2# and Gaël Roué3#
.
Correspondence: G. Roué groue@carrerasresearch.org
Received: August 22, 2022.
Accepted: August 22, 2022.
https://doi.org/10.3324/haematol.2022.281988
©2022 Ferrata Storti Foundation Published under a CC BY-NC license
Erratum to ms. HAEMATOL/2020/278258. “Interleukin-1 receptor associated kinase 1/4 and bromodomain and extra-terminal inhibitions converge on NF-kB blockade and display synergistic antitumoral activity in activated B-cell subset of diffuse large B-cell lymphoma with MYD88 L265P mutation” Haematologica. 2021 Oct 1;106(10):2749-2753. doi: 10.3324/haema tol.2020.278258. PMID: 33979991; PMCID: PMC8485659.
Gaël Roué, as corresponding author of the above-referenced article, declares that the request for an addition of a new af filiation for one of the authors (M. Armengol) has been approved by all co-authors. This modification is a prerequisite of Barcelona Autonomous University’s Doctorate program to enable the inclusion of this work in the doctoral thesis of M. Ar mengol.
The author and affiliation information should be indicated as follows:
Ivan Dlouhy,1,2* Marc Armengol,3,4* Clara Recasens-Zorzo,2 Marcelo L Ribeiro,3,5 Patricia Pérez-Galán,2 Francesc Bosch,6 Armando López-Guillermo1,2# and Gaël Roué3#
1Department of Hematology, Hospital Clínic, BarceIona, Spain; 2Division of Hematology and Oncology, Institut d’Investigacions Biomèdiques August Pi i Sunyer (IDIBAPS), CIBERONC, Barcelona, Spain; 3Lymphoma Translational Group, Josep Carreras Leukaemia Research Institute (IJC), Badalona, Spain; 4Department of Biochemistry and Molecular Biology, Autonomous University of Barcelona, Barcelona, Spain 5Post Graduate Program in Health Science, Universidade São Francisco (USF), Bragança Paulista, Brazil and 6Laboratory of Experimental Hematology, Department of Hematology, Vall d'Hebron Institute of Oncology (VHIO), Vall d’Hebron University Hospital, Universitat Autònoma de Barcelona, Barcelona, Spain.
Interleukin-1 receptor associated kinase 1/4 and bromodomain and extra-terminal inhibitions converge on NF-kB blockade and display synergistic antitumoral activity in activated B-cell subset of diffuse large B-cell lymphoma with MYD88 L265P mutation