
Journal of the Ferrata Storti Foundation

VOL. 107 OCTOBER 2022
haematologica
ISSN 0390 - 6078haematologica.org
Temsirolimus combined with cyclophosphamide and etoposide for pediatric patients with relapsed/refractory acute lymphoblastic leukemia: a Therapeutic Advances in Childhood Leukemia Consortium trial (TACL 2014-001)
Ashley Pinchinat and Elizabeth https://doi.org/10.3324/haematol.2021.280395Raetz
2290 YTHDF3 as a new player in hematopoietic stem cell regulation
Sarah K. Tasian et al. https://doi.org/10.3324/haematol.2021.279520
Images from the Haematologica Atlas of Hematologic Cytology: myelodysplastic syndrome with isolated del(5q) Rosangela Invernizzi https://doi.org/10.3324/haematol.2022.281643
Xinjian Mao and Linheng https://doi.org/10.3324/haematol.2021.280467Li
2318
Haematologica | 107 - October 2022 I
2286 How we changed our approach to venous thromboembolism
Volume 107, Issue 10: October 2022
2295 Acute Lymphoblastic Leukemia
Editorials
Walter Ageno https://doi.org/10.3324/haematol.2022.281748
2304
TAL1 cooperates with PI3K/AKT pathway activation in T-cell acute lymphoblastic leukemia
Acute Lymphoblastic Leukemia
Naomi Thielemans et al. https://doi.org/10.3324/haematol.2021.279718
Jatinder K. Lamba and Stanley https://doi.org/10.3324/haematol.2021.280305Pounds
Acute Lymphoblastic Leukemia
Acute central nervous system toxicity during treatment of pediatric acute lymphoblastic leukemia: phenotypes, risk factors and genotypes Stavroula Anastasopoulou et al. https://doi.org/10.3324/haematol.2021.280016
2292 How do mTOR inhibitors fit in the landscape of treatment for relapsed acute lymphoblastic leukemia?
Articles
2288 Proteomics: a new era in pediatric acute myeloid leukemia research
Table of Contents
About the Cover2285
Landmark Papers in Hematology
2344
Fc galactosylation of anti-platelet human IgG1 alloantibodies enhances complement activation on platelets
Non-Hodgkin Lymphoma
Xi Xu et al.
Chronic Myeloid Leukemia
2432
Clinical relevance of proteomic profiling in de novo pediatric acute myeloid leukemia: a Children’s Oncology Group study Fieke W. Hoff et al
https://doi.org/10.3324/haematol.2021.279672
Hematopoiesis
Thijs L.J. van Osch et al.
Genomic determinants impacting the clinical outcome of mogamulizumab treatment for adult T-cell leukemia/lymphoma
Acute Myeloid Leukemia
Platelet Biology & its Disorders
Complications in Hematology
2381
https://doi.org/10.3324/haematol.2021.280169
Multiple Myeloma
https://doi.org/10.3324/haematol.2021.279459
The glycolytic enzyme PFKFB3 determines bone marrow endothelial progenitor cell damage after chemotherapy and irradiation
Acute Myeloid Leukemia
Final analysis of the phase III non-inferiority COLUMBA study of subcutaneous versus intravenous daratumumab in patients with relapsed or refractory multiple myeloma Saad Z. Usmani et al.
https://doi.org/10.3324/haematol.2021.280493
2356
2329
Preclinical evaluation and structural optimization of anti-BCMA CAR to target multiple myeloma Ortal Harush et al.
Haematologica | 107 - October 2022 II
Norio Tanaka et al.
2395
2408
A self-assembled leucine polymer sensitizes leukemic stem cells to chemotherapy by inhibiting autophagy in acute myeloid leukemia
Multiple Myeloma
2365
https://doi.org/10.3324/haematol.2021.279739
YTHDF3 modulates hematopoietic stem cells by recognizing RNA m6A modification on Ccnd1 Xiaofei Zhang et al.
2418
https://doi.org/10.3324/haematol.2021.280290
https://doi.org/10.3324/haematol.2021.280175
https://doi.org/10.3324/haematol.2021.279756
https://doi.org/10.3324/haematol.2021.280352
Treatment-free remission in chronic myeloid leukemia patients treated front-line with nilotinib: 10-year follow-up of the GIMEMA CML 0307 study Gabriele Gugliotta et al.
Zhong-Shi Lyu et al.
Platelet Biology & its Disorders
2506
Letters to the Editor2474
https://doi.org/10.3324/haematol.2021.280251
Najibah A. Galadanci et al.
Factors associated with left ventricular hypertrophy in children with sickle cell disease: results from the DISPLACE study
The deglycosylated form of 1E12 inhibits platelet activation and prothrombotic effects induced by VITT antibodies
2454 Platelet Biology & its Disorders
2480 SARS-CoV-2-specific cellular response following third COVID-19 vaccination in patients with chronic lymphocytic leukemia
Red Cell Biology & its Disorders
https://doi.org/10.3324/haematol.2022.280732
2466
https://doi.org/10.3324/haematol.2022.280660
2501
https://doi.org/10.3324/haematol.2022.281214
Tom Martin et al.
Hanna Grauers Wiktorin et al.
Daunorubicin-60 versus daunorubicin-90 versus idarubicin-12 for induction chemotherapy in acute myeloid leukemia: a retrospective analysis of the Mayo Clinic experience
Caroline Vayne et al.
Iron- and erythropoietin-resistant anemia in a spontaneous breast cancer mouse model Nuria Fabregas Bregolat et al.
Ayalew Tefferi et al.
https://doi.org/10.3324/haematol.2021.280480
2492
Uday R. Popat et al.
2496
A myeloablative fractionated busulfan conditioning regimen with post-transplant cyclophosphamide in HLA-matched and haploidentical transplantation: results of a phase II study
Tobias B. Polak et al.
2485
Sibylle C. Mellinghoff et al.
https://doi.org/10.3324/haematol.2022.281045
2445
https://doi.org/10.3324/haematol.2022.280982
https://doi.org/10.3324/haematol.2022.281218
Association of FLT3 internal tandem duplication length with overall survival in acute myeloid leukemia: a systematic review and meta-analysis
Haematologica | 107 - October 2022 III
https://doi.org/10.3324/haematol.2022.280813
https://doi.org/10.3324/haematol.2022.280778
Primary outcomes by 1q21+ status for isatuximab-treated patients with relapsed/refractory multiple myeloma: subgroup analyses from ICARIA-MM and IKEMA
Molecular predictors of response to venetoclax plus hypomethylating agent in treatment-naïve acute myeloid leukemia Naseema Gangat et al.
COVID-19 vaccine-induced adverse events predict immunogenicity among recipients of allogeneic hematopoietic stem cell transplantation
2517
https://doi.org/10.3324/haematol.2022.281340
Case Reports
The successful use of eculizumab for treatment of thrombotic microangiopathy in pediatric acute SARS-CoV2 infection and multisystem inflammatory syndrome in children
Tarun Aurora et al.
2511 Platelet functional abnormalities and clinical presentation in pediatric patients with germline RUNX1, ANKRD26, and ETV6 mutations
https://doi.org/10.3324/haematol.2021.280603
2523
Naseema Gangat et al.
https://doi.org/10.3324/haematol.2022.281398
Haematologica | 107 - October 2022 IV
Daratumumab for treatment-refractory acquired idiopathic pure red cell aplasia
Galina S. Ovsyannikova et al.
References
Disclosures
E-mail: rosangela.invernizzi@unipv.it https://doi.org/10.3324/haematol.2022.281643
University of Pavia, Pavia, Italy
Images from the Haematologica Atlas of Hematologic Cytology: myelodysplastic syndrome with isolated del(5q)
ABOUT THE COVER R. Invernizzi
1. Invernizzi R. Myelodysplastic syndromes. Haematologica. 2020; 105(Suppl 1):78-97.
No conflicts of interest to disclose.
Haematologica | 107 October 2022 2285
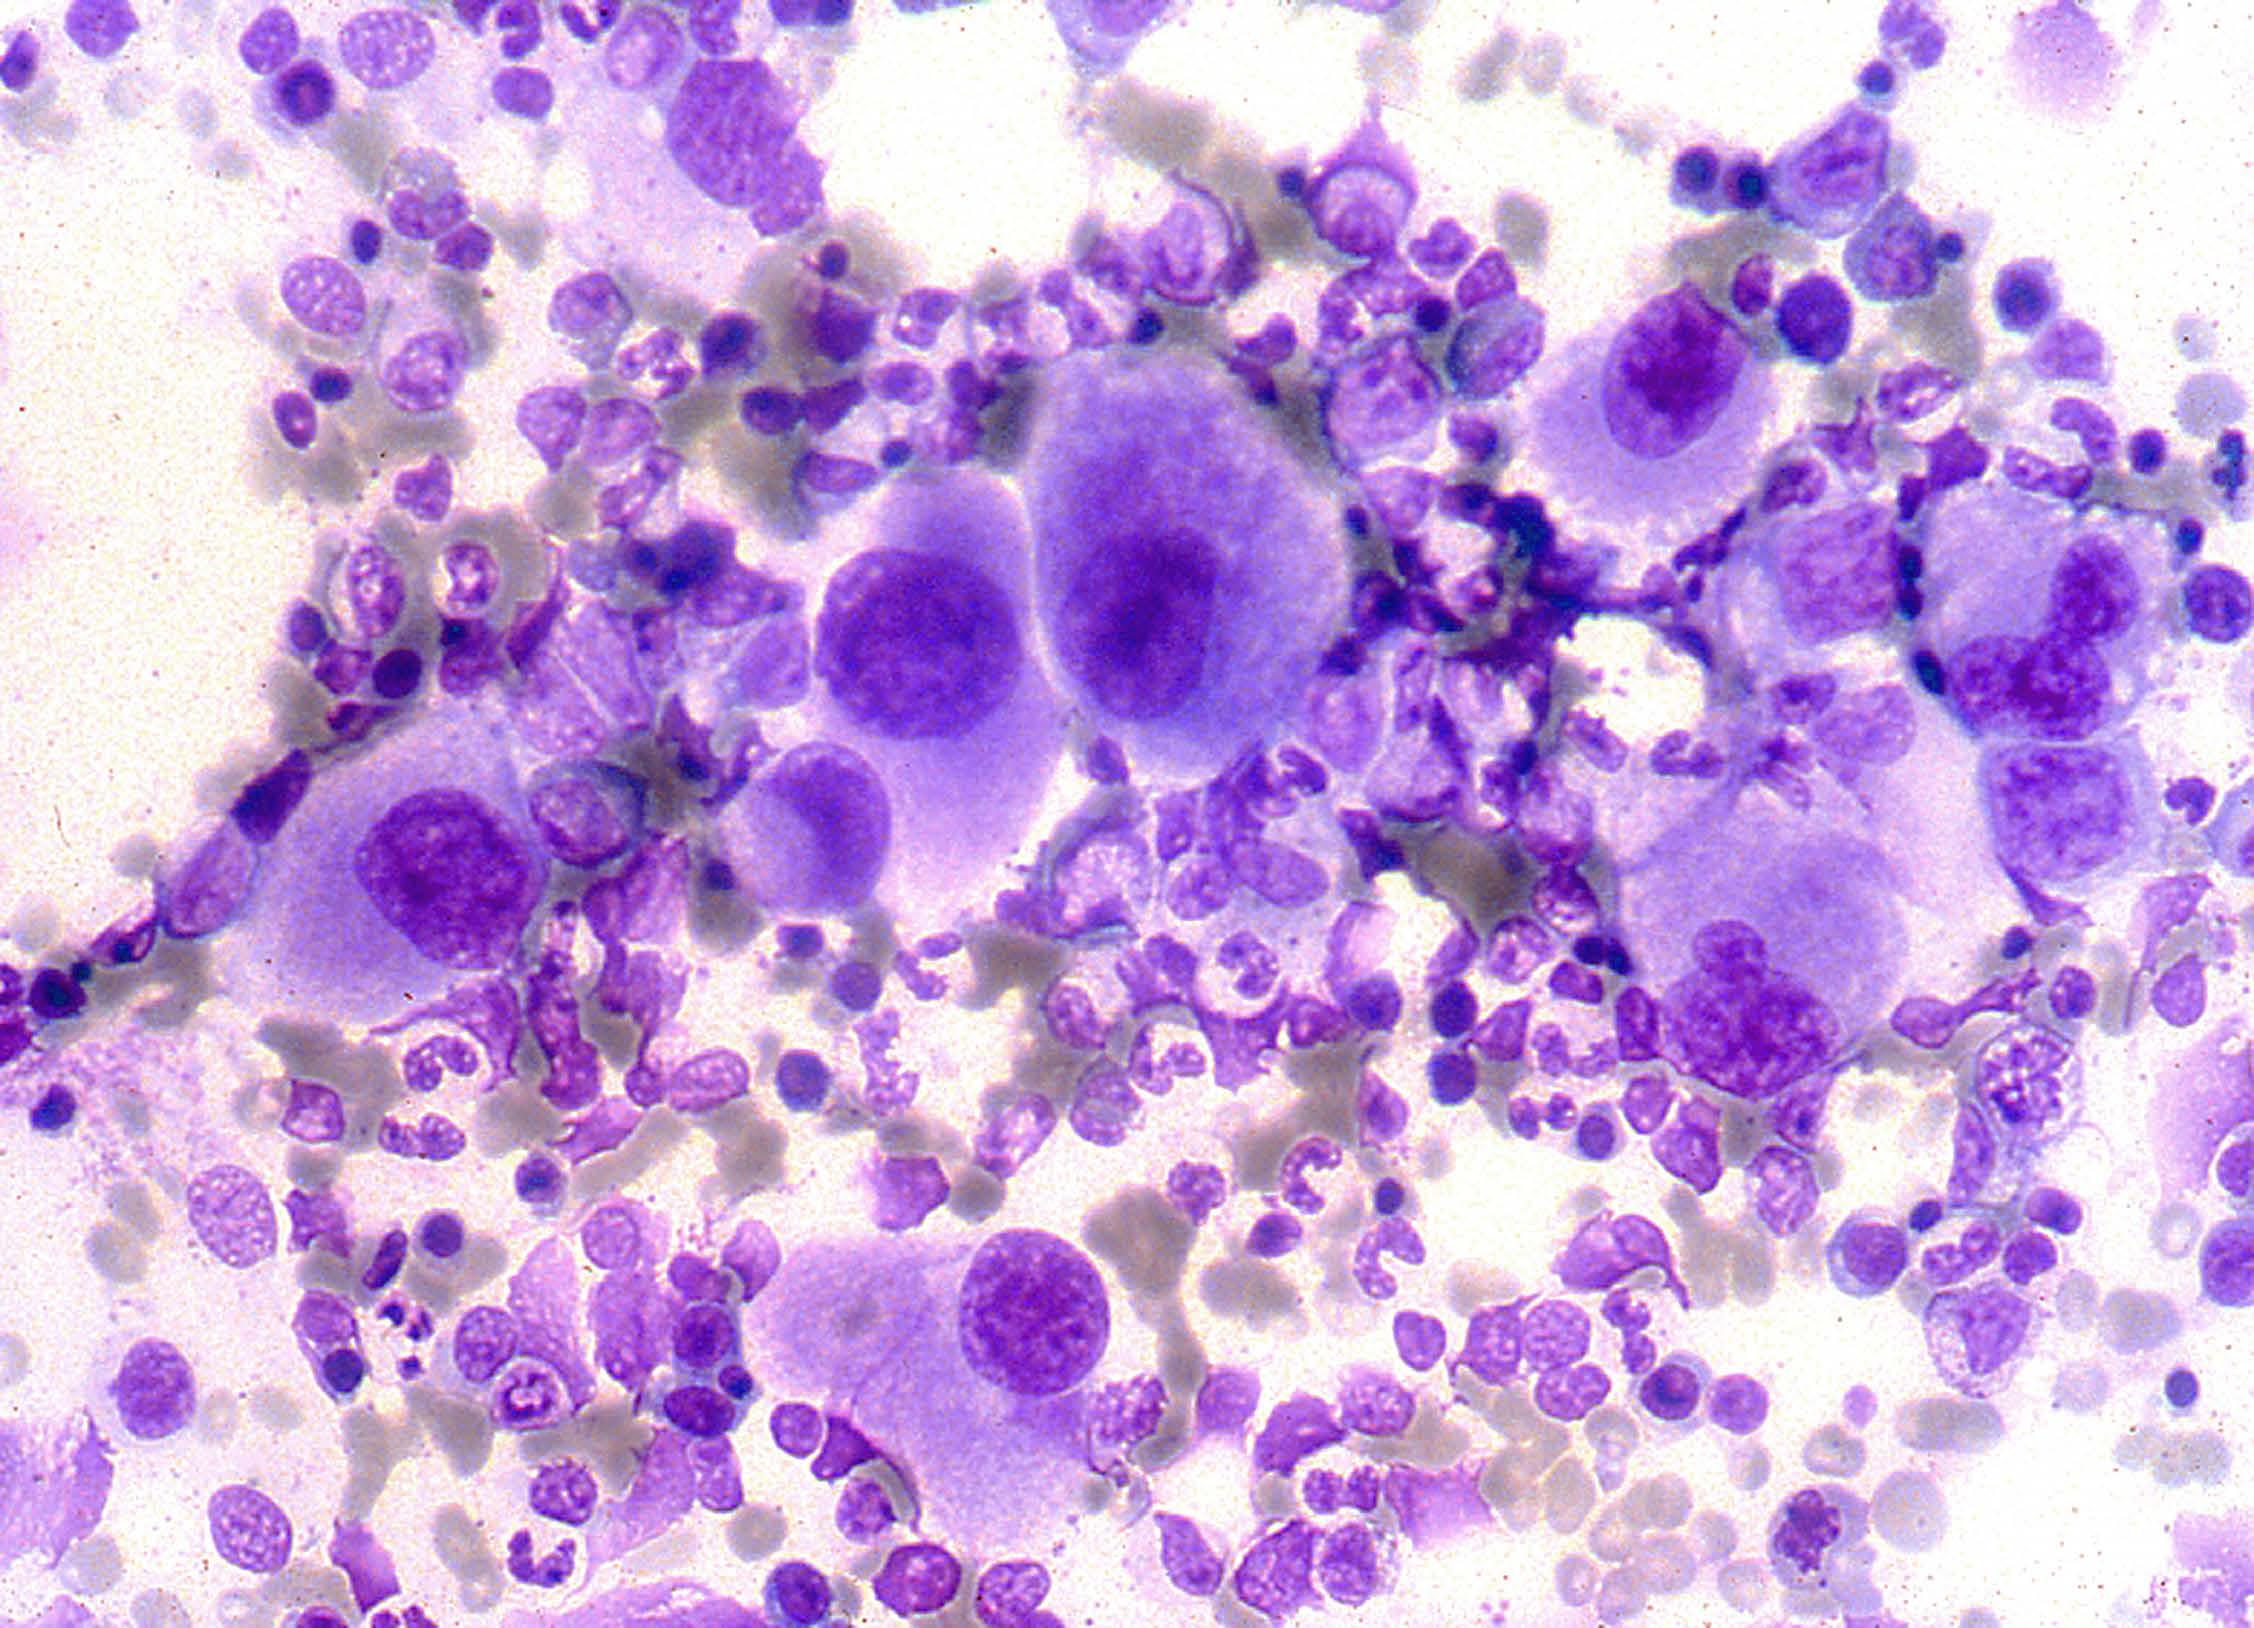
According to the World Health Organization 2016 classification, interstitial deletion of the long arm of chromosome 5, del(5q), is the only cytogenetic anomaly used in the definition of a specific subtype of myelodysplastic syndrome (MDS). MDS with isolated del(5q) is characterized by anemia, usually macrocytic, with or without neutropenia and/or thrombo cytosis, blast percentage <5% in the bone marrow and <1% in the peripheral blood, and increased megakaryocytes with the pathognomonic morphological features shown in the figure. Megakaryocytes are normally sized or small with a single round or oval non-lobated or hypolobated nucleus and granular cytoplasm. On the bone marrow smear from this case of MDS with isolated del(5q), note also normal cellularity, erythroid hypoplasia, a normal granuloblastic series, no excess blasts, and no Auer rods. In MDS with del(5q), the 5q deletion may occur either in isolation, or with one other cytogenetic abnormality, apart from -7 or del(7q). The size of the 5q deletion varies but bands q31-q33 are always deleted with the loss of genes important for the development of the characteristic features of the disease. MDS with isolated del(5q) has a relatively good prognosis. The TP53 gene mutation is associated with an increased risk of leukemic evolution, poor re sponse to lenalidomide (which is usually effective in suppressing the abnormal clone in subjects without this mutation), and shorter survival.1
Rosangela Invernizzi
At that time, the standard treatment for DVT and pulmonary embolism (PE) consisted of UFH, administered by a conti nuous intravenous infusion for approximately 10 days, fol lowed by vitamin K antagonists. This treatment relied on laboratory measurements of the activated partial thrombo plastin time (aPTT) and prothrombin time/International Nor malized Ratio and on consequent dose adjustments. Not uncommonly, patients were hospitalized (and confined to bed) for 2 weeks or more.
More than 10 years later, LMWH also became the standard treatment for cancer-associated venous thrombosis, as a single-drug approach, and more than 20 years later direct oral anticoagulants are further contributing to simplify the management of venous thrombosis.
Disclosures
Walter DepartmentAgenoof Medicine and Surgery, University of Insubria, Varese, Italy E-mail: walter.ageno@uninsubria.it https://doi.org/10.3324/haematol.2022.281748

It was about time to test LMWH without laboratory support and to assess the occurrence of symptomatic events, re currence or extension of DVT and bleeding, to reflect clinical practice. Needless to say, the idea of administering an an ticoagulant drug to a patient with an extensive thrombosis and at potential risk of fatal PE without any information on treatment intensity from the laboratory was not as easy to accept as we may find it now.
Haematologica1346817 | 107 October 2022 2286 LANDMARK PAPER IN HEMATOLOGY W. Ageno
TITLE Comparison of subcutaneous low-molecular-weight heparin with intravenous standard heparin in proximal deep-vein thrombosis.
JOURNAL The Lancet. 1992;339(8791):441-445. PMID:
In the 1980s, LMWH were developed and proposed as an alternative to UFH for the prevention and treatment of thromboembolic disorders. LMWH offered, for the first time, the possibility of administering an anticoagulant drug at fixed doses, without the need for laboratory monitoring. Ho wever, the first studies comparing LMWH with UFH in the treatment of venous thrombosis still used the laboratory to determine the correct dose of LMWH and all studies publi shed before the Italian trial used surrogate markers to as sess therapeutic efficacy.
No conflicts of interest to disclose.
In the study published in The Lancet, 85 patients received intravenous UFH with a target aPTT of 1.5 to 2.0 times the pretreatment value and 85 patients received twice daily fixed, weight-adjusted doses of the LMWH nadroparin. War farin was started after 7 days of heparin treatment and he
parins were discontinued on day 10, or later if the INR was still below 2.0. After a 6-month follow-up, 12 recurrent thrombotic events had occurred in the group treated with UFH and six in the LMWH group; four and one of these events, respectively, were diagnosed during parenteral tre atment. As shown in Figure 1, three recurrent events in each group were fatal PE, but only one (in a patient on LMWH) occurred during parenteral treatment. Bleeding events de fined as severe occurred in three patients receiving UFH (all retroperitoneal bleeds) and in one patient receiving LMWH (hematemesis). The study was not sufficiently powered to show statistically significant differences between groups, but LMWH clearly appeared to be at least as effective and safe as UFH and the authors hypothesized future changes in the management of venous thrombosis. These changes included the possibility of allowing patients to be fully am bulant thanks to the subcutaneous administration of LMWH and the possibility of outpatient management thanks to the fact that laboratory monitoring was not needed. These hypotheses were confirmed a few years later by two randomized studies that demonstrated that subcutaneous LMWH administered out of hospital without laboratory mo nitoring is as effective and safe as continuous infusion of UFH given in hospital.2,3 Following the results of these stu dies, in a few years the management of venous thrombosis changed dramatically, with more than 90% of patients with DVT and selected patients with low-risk PE being treated out of hospital. These changes clearly improved the quality of life of patients with venous thrombosis and resulted in lower costs of management.
Thirty years ago, The Lancet published the results of a ran domized clinical trial comparing low molecular weight he parin (LMWH) with unfractionated heparin (UFH) for the treatment of proximal deep vein thrombosis (DVT).1 The study was carried out at a single Italian center and enrolled a total of 170 patients over 5 years (from 1986 to 1991).
AUTHORS Prandoni P, Lensing AW, Büller HR, et al.
How we changed our approach to venous thromboembolism
1. Prandoni P, Lensing AW, Büller HR, et al. Comparison of subcutaneous low-molecular-weight heparin with intravenous standard heparin in proximal deep-vein thrombosis. Lancet. 1992;339(8791):441-445.
proximal deep vein thrombosis. N Engl J Med. 1996;334(11):677-681.
Haematologica | 107 October 2022 2287 LANDMARK PAPER IN HEMATOLOGY W. Ageno

2. Levine M, Gent M, Hirsh J, et al. A comparison of low molecular weight heparin administered primarily at home with unfractionated heparin administered in the hospital for
References
3. Koopman MM, Prandoni P, Piovella F, et al. Treatment of venous thrombosis with intravenous unfractionated heparin administered in the hospital as compared with subcutaneous low molecular weight heparin administered at home. N Engl J Med. 1996;334(11):682-687.
Figure 1. Outcome events in patients receiving unfractionated “standard” heparin or low molecular weight heparin. DVT: deep vein thrombosis; PE: pulmonary embolism; LMW: low molecular weight; +: fatal event.
The paper by Hoff et al.1 thus marks the dawn of a new era in pediatric AML multi-omics research, instigating re searchers to evaluate the global pediatric AML proteome and integrate its key components with relevant elements of other -omics profiles, such as the transcriptomic leukemia stem cell scores (LSC17,8 and pLSC69), prog nostic transcriptomic subgroups10 and the pediatric AML methylome.11 In this new era it will be imperative to de velop and apply scientifically innovative and statistically rigorous methods of data analysis in order to obtain clini cally and biologically useful insights based on widely re producible results. We have incorporated subject-level bootstrap resampling of entire intact molecular profiles1214 into our own recent work because these methods can help to quantify the reproducibility of the results of com plex multistage data analysis algorithms. We look forward to exploring how to incorporate annotation-informed data reduction schemes, such as the one used in MetaGalaxy, into the subject-level bootstrap resampling framework of well-established statistical rigor. Advances in the field of mass spectrometry in the last couple of decades have enabled high-throughput collec tion of global proteomic profiles. Integrating these profiles with genomics and transcriptomics can enhance our abil ity to perform systems-biology-based investigations to accelerate clinical translation by defining disease het erogeneity, establishing biomarkers predictive of re sponse/relapse and last but not least identify promising novel drug targets. Although clinical translation of re search discoveries is challenging, there are successful
In this issue of Haematologica, Hoff et al.1 report their find ings on the proteome of 500 pediatric cases of acute mye loid leukemia (AML) and 30 control CD34+ samples. Over the past few years, it has become clear that proteomic evaluations are critical to fully understand tumor biology and develop promising therapies in oncology. As recently reviewed by Kwon et al.,2 several studies in solid tumors have led to identification of druggable protein targets as well as protein biomarkers of prognostic relevance. Largescale efforts such as the National Cancer Institute’s Clinical Proteomics Tumor Analysis Consortium (CPTAC) program have successfully identified relevant signatures for multiple cancers (https://proteomics.cancer.gov/programs/cptac). De spite these efforts, proteomic profiling of hematologic ma lignancies has been sparse and limited, especially in pediatric AML. One study evaluated a few proteins by two dimensional gel electrophoresis and matrix assisted laser desorption ionization - time of flight (MALDI-TOF) analysis in three pediatric AML patients;3 another study compared 31 proteins between 16 pediatric AML patients and five con trols4 and we recently evaluated global proteomic profiles of 16 pediatric AML patients.5 We applaud Hoff et al.1 for collecting, analyzing, and sharing their data from a very large cohort of patients treated uniformly under a large co operative group clinical trial protocol. The pediatric AML research community will gain valuable insights from these results and data for decades to come. The article reports the results of profiling 296 candidate proteins by reverse phase protein arrays, a technology that this team has previously shown to produce reliable data that are robust against technical pre-analytical factors such as shipping, transit time, and temperature.6 Using their own MetaGalaxy (https://www.leukemiaatlas.org/code) and progenyClust methods7 the authors compressed these 296 individual protein variables into 31 biologically anno tated protein function groups and then 12 protein con stellations to eventually assign each patient to one of nine protein signature classes. Intriguingly, their downstream analyses found that patients with one protein signature class had better outcomes with Ara-C (cytarabine), dau norubicin, and etoposide (ADE) plus bortezimib (ADEB) than with ADE alone and that patients with another pro tein signature class had better outcomes with ADE than with ADEB. This raises the tantalizing hope that it may be
The study additionally showed that this kind of clinically vital information is unlikely to be available from RNA tran scriptomic profiling. In this study, RNA expression levels typically showed a fairly weak correlation with protein ex pression levels (median Pearson correlation = 0.17). We obtained similar results in our pilot global proteomic study.5 These findings provide the motivation to system atically evaluate the global proteome in large clinical trial cohorts to uncover valuable biological and clinical insights regarding the impact of other proteins in pediatric AML.
Haematologica | 107 October 2022 2288 EDITORIAL J.K. Lamba and S. Pounds
Proteomics: a new era in pediatric acute myeloid leukemia research
Jatinder K. Lamba1 and Stanley Pounds2,3
E-mail: jlamba@cop.ufl edu https://doi.org/10.3324/haematol.2021.280305
possible to use proteomic evaluations to develop person alized therapy and that patients with some protein signa ture classes may also have reasonable targeted drug options available to them.
1Pharmacotherapy and Translational Research, Center for Pharmacogenomics and Personalized Medicine, UF Health Cancer Center, University of Florida, Gainesville, FL, 2Biostatistics, St. Jude Children’s Research Hospital, Memphis, TN and 3Oncology, St. Jude Children’s Research Hospital, Memphis, TN, USA
Haematologica | 107 October 2022 2289 EDITORIAL J.K. Lamba and S. Pounds
1. Hoff FW van Dijk AD, Qiu Y, et al. Clinical relevance of proteomic profiling in de novo pediatric acute myeloid leukemia: a Children's Oncology Group study. Haematologica. 2022;107(10):2329-2343.
12. Efron B. Bootstrap methods: another look at the jackknife. Annals Stat. 1979;7:26.
9. Elsayed AH, Rafiee R, Cao X, et al. A six-gene leukemic stem cell score identifies high risk pediatric acute myeloid leukemia. Leukemia. 2020;34(3):735-745.
10. Fornerod M, Ma J, Noort S, et al. Integrative genomic analysis of pediatric myeloid-related acute leukemias identifies novel subtypes and prognostic indicators. Blood Cancer Discov. 2021;2(6):586-599.
clustering. The R Journal. 2016;8:10.
4. Levine JH, Simonds EF, Bendall SC, et al. Data-driven phenotypic dissection of AML reveals progenitor-like cells that correlate with prognosis. Cell. 2015;162(1):184-197.
5. Nguyen NHK, Wu H, Tan H, et al. Global proteomic profiling of pediatric AML: a pilot study. Cancers (Basel). 2021;13(13):3161.
8. Ng SW, Mitchell A, Kennedy JA, et al. A 17-gene stemness score for rapid determination of risk in acute leukaemia. Nature. 2016;540(7633):433-437.
7. Hu CW, Qutub AA. progenyClust: an R package for progeny
No conflicts of interest to disclose.
6. Horton TM, Hoff FW, van Dijk A, et al. The effects of sample handling on proteomics assessed by reverse phase protein arrays (RPPA): functional proteomic profiling in leukemia. J Proteomics. 2021;233:104046.
Contributions
2. Kwon Y-W, Jo HS, Bae S, et al. Application of proteomics in cancer: recent trends and approaches for biomarkers discovery. Front Med (Lausanne). 2021;8:747333.
14. Dudoit S, Fridlyand J. Bagging to improve the accuracy of a clustering procedure. Bioinformatics. 2003;19(9):1090-1099.
JKL and SP wrote the editorial.
JKL and SP are supported by NIH R01CA132946-12A1.
References
studies are required not only to establish and validate po tential biomarkers in large, independent cohorts of pa tients but also to develop diagnostic tests with rapid turnaround to enhance the clinical translation of pro teomics into treatment decision-making.
3. Braoudaki M, Tzortzatou-Stathopoulou F, Anagnostopoulos AK, et al. Proteomic analysis of childhood de novo acute myeloid leukemia and myelodysplastic syndrome/AML: correlation to molecular and cytogenetic analyses. Amino Acids. 2011;40(3):943-951.
Disclosures
13. Dudoit S, Fridlyand J. A prediction-based resampling method for estimating the number of clusters in a dataset. Genome Biol. 2002;3(7):RESEARCH0036.
11. Lamba JK, Cao X, Raimondi SC, et al. Integrated epigenetic and genetic analysis identifies markers of prognostic significance in pediatric acute myeloid leukemia. Oncotarget. 2018;9(42):26711-26723.
examples such as various Food and Drug Administration (FDA)-cleared/approved proteomic biomarkers currently in clinical use (predominantly immunohistochemistry or immunoassay-based testing of PSA, AFP, Her-2/neu, PR, ER, c-kit, etc.) for several solid malignancies. The recent introduction of FDA-approved biomarkers (such as PD-L1) has enhanced the personalized use of immune checkpoint inhibitors. The advances in other malignancies should stimulated the expansion of these strategies to pediatric cancer and, specifically, to hematologic malignancies such as AML. As also reflected by the authors, longitudinal un biased global proteomic studies in bulk tissue and single cells hold promise for identifying relapse/resistant clones and specifically targeting them using novel agents. Future
Funding
1Stowers Institute for Medical Research and 2Department of Pathology and Laboratory Medicine, University of Kansas, Kansas City, MO, USA E-mail: LIL@stowers.org https://doi.org/10.3324/haematol.2021.280467
Xinjian Mao1 and Linheng Li1,2
YTHDF3 as a new player in hematopoietic stem cell regulation
As described in their paper in this issue of Haematologica, to test the hypothesis that other readers in the cytoplasm may be responsible for the hematopoietic phenotype in Mettl3-/- mice, Zhang et al. first investigated the hemato poietic system in Ythdf1-/- and Ythdf3-/- mice.9 Both the fre quency and the absolute number of HSC in Ythdf3-/- mice, unlike in Ythdf1-/- mice, were significantly increased when compared with those in wild-type mice. Of note, the mag nitude of the increase in HSC in Ythdf3-/- mice was much smaller than that in Mettl3-/- mice. No other significant dif ferences in hematopoietic cells were found between Ythdf3-/- and the littermate mice. In contrast, bone marrow cellularity and hematopoietic cells declined markedly in Mettl3-/- mice. Consistent with the severely impaired re constitution ability of Mettl3-/- HSC, the Ythdf3-/- HSC ex hibited poor reconstitution capacity with similar multilineage differentiation, comparable homing capacity,
The m6A modification has recently been discovered to play a critical role in the regulation of HSC, although the mech anisms are still not fully understood. Zhang et al. were able to establish that the Mettl3-Ccnd1-Ythdf3 axis regulates the characteristics of HSC. Their study uncovers the missing piece of the puzzle by revealing that the m6A reader YTHDF3 is partially responsible for Mettl3 deficiency in HSC, broad ening the knowledge of how RNA m6A components el
Ythdf3-/- HSC resemble Mettl3-/- HSC to some ex tent, and that targets of Ythdf3 and Ythdf2 overlap partially, Zhang et al. reasoned that Ythdf3 may mediate HSC via re versely regulating the targets of Ythdf2. Among six mRNA previously identified to be increased in Ythdf2-/- HSC,8 only Ccnd1 was decreased in Ythdf3-/- HSC. Based on these find ings, the next question to be explored in the future is: how do YTHDF2 and YHTDF3 orchestrate the regulation of Ccnd1 expression and in what context do YTHDF2 and YTHDF3 each dominate such regulation? Knockdown assays con firmed that the protein level of Ccnd1, rather than the mRNA level, decreased significantly in both Ythdf3 shRNA-carrying and Mettl3 shRNA-carrying HSC. This result is congruent with the role of the m6A modification in regulating gene ex pression at a post-transcriptional level. The 5’ untranslated region of Ccnd1 in the -180 to -184 region was identified as the major m6A motif recognized by YTHDF3 and METTL3. YTHDF3 cooperated with PABPC1 and eIF4G2 to promote the translation of Ccnd1. Furthermore, knockdown of Ccnd1 recapitulated the compromised reconstitution capacity of Ythdf3-/- HSC. On the other hand, forced expression of Ccnd1 completely rescued the reconstitution potential of Ythdf3 shRNA-carrying HSC, but not of Mettl3 shRNA-carrying HSC. Myc has previously been reported to be an important target gene of Mettl3, and enforced expression of Myc rescued the lineage differentiation bias of Mettl3-/- HSC. To investigate the role of Myc in reconstitution potential, Zhang et al. over expressed Myc in Mettl3-/- HSC and evaluated the engraft ment capacity of these cells. The result showed that forced expression of Myc failed to rescue the reconstitution ability of Mettl3-/- HSC, although it consistently rescued the lineage differentiation bias of Mettl3-/- HSC. These data indicate that, besides Ythdf3 and Myc, other unknown players are responsible for the characteristics of Mettl3-/- HSC. Could the other m6A readers (e.g., YTHDC1 and YTHDC2) be the missing link?
Hematopoietic stem cells (HSC) are characterized by selfrenewal and multipotent differentiation potential, and are required to maintain the hematopoietic system throughout life. Since HSC transplantation is a life-saving treatment for various hematopoietic disorders, dissecting the mechan isms underlying how intrinsic programs and extrinsic niche signals are orchestrated to regulate HSC in vivo would en able development of new methods for ex vivo HSC expan sion, and would potentially benefit clinical treatment for blood N6-methyladenosinedisorders. (m6A) is the most prevalent mess enger RNA (mRNA) modification in mammals.1 The proteins involved in the deposition, removal, and execution of the m6A modification are referred to as m6A ‘writers’, ‘erasers’ and ‘readers’, respectively.2 Over the last decade, the m6A modification has been demonstrated to play essential and broad roles in the regulation of RNA stability and trans lation in various types of cells, although the detailed mechanisms require further exploration and seem to be cell- and context-dependent.2,3 In recent years, several studies have revealed that deficiency of the m6A writer Mettl3 or Mettl14 impairs self-renewal and differentiation capacity of HSC.4-6 In contrast, two groups independently discovered that loss of Ythdf2 promotes HSC expansion and regeneration.7,8 Given that the m6A readers are the pri mary component responsible for exerting the function of m6A-containing RNA deposited by METTL3, an important question is: which readers are responsible for the char acteristics of Mettl3-/- HSC?
higher sensitivity to replication stress, and diminished pro tein Givensynthesis.that
Haematologica | 107 October 2022 2290 EDITORIAL X. Mao and L. Li
3. Hsu PJ, Shi H, He C. Epitranscriptomic influences on development and disease. Genome Biol. 2017;18(1):197.
1. Dominissini D, Moshitch-Moshkovitz S, Schwartz S, et al. Topology of the human and mouse m6A RNA methylomes revealed by m6A-seq. Nature. 2012;485(7397):201-206.
7. Li Z, Qian P, Shao W, et al. Suppression of m(6)A reader Ythdf2 promotes hematopoietic stem cell expansion. Cell Res. 2018;28(9):904-917.
5. Lee H, Bao S, Qian Y, et al. Stage-specific requirement for Mettl3-dependent m(6)A mRNA methylation during haematopoietic stem cell differentiation. Nat Cell Biol. 2019;21(6):700-709.
No conflicts of interest to disclose.
4. Cheng Y, Luo H, Izzo F, et al. m(6)A RNA methylation maintains hematopoietic stem cell identity and symmetric commitment. Cell Rep. 2019;28(7):1703-1716.

2. Shi H, Wei J, He C. Where, when, and how: context-dependent functions of RNA methylation writers, readers, and erasers. Mol Cell. 2019;74(4):640-650.
Figure 1. Proposed model of the Mettl3 → RNA m6A → Ccnd1 → Ythdf3 axis regulating the reconstitution capacity of mouse hematopoietic stem cells. METTL3, along with other components including METTL14 and WTAP, form a complex and deposit m6A to Ccnd1 mRNA in the nucleus. The m6A-containing Ccnd1 mRNA then travels from the nucleus to the cytoplasm for translation. YTHDF3 specifically recognizes the m6A motif, mainly at the 5’ UTR of Ccnd1 mRNA in the region from -180 to -184, and increases the expression of Ccnd1 by recruiting PABPC1 and eIF4G2 to enhance protein synthesis. The up- regulated expression of Ccnd1 is responsible for YTHDF3-mediated reconstitution capacity of mouse hematopoietic stem cells.
egantly combine to regulate HSC (Figure 1). Based on this discovery, there are several questions to be explored further in the future: (i) Besides mRNA, METTL3 has recently been discovered to influence chromatin state and transcription of mouse embryonic stem cells via YTHDC1-mediated regu lation of chromosome-associated regulatory RNA. Is this regulatory mechanism also applicable to adult stem cells, for example HSC? (ii) Do the regulatory mechanisms that govern mouse HSC properties, such as self-renewal and dif ferentiation, also regulate similar properties in human HSC?
Haematologica | 107 October 2022 2291 EDITORIAL X. Mao and L. Li
Contributions
9. Zhang X, Cong T, Wei L, et al. YTHDF3 modulates hematopoietic stem cells by recognizing RNA m(6)A modification on Ccnd1. Haematologica. 2022;107(10):2381-2394.
References
XM wrote the editorial; LL supervised and edited it.
6. Vu LP, Pickering BF, Cheng Y, et al. The N(6)-methyladenosine (m(6)A)-forming enzyme METTL3 controls myeloid differentiation of normal hematopoietic and leukemia cells. Nat Med. 2017;23(11):1369-1376.
Although a study previously demonstrated the opposite role of Mettl3 in human hematopoietic stem and progenitor cells and in murine HSC, a series of experiments using purified human HSC, as opposed to human CD34+ hematopoietic
8. Wang H, Zuo H, Liu J, et al. Loss of YTHDF2-mediated m(6)Adependent mRNA clearance facilitates hematopoietic stem cell regeneration. Cell Res. 2018;28(10):1035-1038.
stem and progenitor cells, which only contain a very small population of HSC, is warranted to answer this question. (iii) Given that Mettl3 deficiency leads to increased numbers and decreased differentiation of HSC, and that rapid differenti ation of HSC in in vitro culture is a major challenge in the field, a pertinent question becomes: is it possible to inhibit METTL3 pharmacologically using small molecules to block differentiation of HSC in ex vivo cultures?
Disclosures
Ashley Pinchinat and Elizabeth Raetz
NCT03740334 Ongoing
NCT01403415
NCT01523977 rate 86% toxicity
Temsirolimus plus vincristine, dexamethasone, pegaspargase and mitoxantrone
(PI3K)/mammalian target of rapamycin (mTOR) signaling is commonly dysregulated in ALL, coupled with preclinical studies showing robust responses to mTOR inhibitors in ani mal models of human ALL,5 Tasian et al. expanded the port folio of mTOR inhibitor trials in pediatric relapsed ALL (Table 1), with the TACL 2014-001 phase I trial (NCT01614197) de scribed in this issue of Haematologica. The mTOR inhibitor temsirolimus was administered in combination with cyclo phosphamide and etoposide in pediatric patients 1-21 years of age with second or subsequent relapses or refractory B and T-cell ALL. Lessons learned from the prior Children’s Oncology Group (COG) ADVL1114 phase I trial (NCT01403415) informed temsirolimus dosing and the chemotherapy plat form. Treatment on COG ADVL1114 consisted of three weekly doses of temsirolimus in combination with UKALL R3 rein duction chemotherapy (vincristine, dexamethasone, pegas pargase and mitoxantrone). Seven of 15 patients (47%) achieved remission; however, the toxicity associated with temsirolimus in combination with asparaginase and steroids was excessive with dose-limiting toxicity at all dose levels despite two dose de-escalations of temsirolimus to 7.5 mg/m2/dose.6 The toxicity observed with a four-drug rein duction on COG ADVL1114 prompted the use of an alter
Haematologica | 107 October 2022 2292 EDITORIAL A. Pinchinat and E. Raetz
How do mTOR inhibitors fit in the landscape of treatment for relapsed acute lymphoblastic leukemia?
(6) I
NCT03328104 Ongoing
CR: complete response; CRi: complete response with incomplete count recovery; CR1: first complete remission; ALL: acute lymphoblastic leukemia; ORR: overall response rate.
I
I
Department of Pediatrics and Perlmutter Cancer Center, NYU Langone Health, New York, NY, USA E-mail: elizabeth.raetz@nyulangone.org https://doi.org/10.3324/haematol.2021.280395
Second or greater relapse B- and T-ALL
I
Population
CR/CRi rate toxicity
identiClinicalTrials.gov Major ndings
fier Phase
Everolimus plus cyclophosphamidenelarabine,andetoposide
Temsirolimus plus cyclophosphamide and etoposide
Second or greater relapse or refractory B- and T-ALL
and
fi
Everolimus plus vincristine, prednisone, pegaspargase doxorubicin
First or greater relapse or refractory T-ALL
Treatment regimen
In this issue of Haematologica, Tasian et al.1 report the out comes of a phase I trial of temsirolimus in relapsed/refrac tory pediatric acute lymphoblastic leukemia (ALL). While the survival rates for children with ALL have improved sig nificantly over time, approximately 20% will relapse and this remains a significant challenge with survival rates <50% fol lowing initial relapses and far inferior outcomes for multiply relapsed disease.2 Historical remission rates after second and third bone marrow relapse are only 44% and 27%, re spectively, with a 5-year disease-free survival in second and third remission of 27% and 15%, respectively.3 Similar re sponse rates and outcomes were reported by Sun et al.4 in a retrospective analysis of over 500 relapsed/refractory ALL salvage treatment attempts at Therapeutic Advances in Childhood Leukemia and Lymphoma (TACL) institutions, setting the benchmark for remission rates of approximately 40% after second or subsequent relapse. To address the challenges of relapse and inferior outcomes with intensive cytotoxic chemotherapy alone, molecularly targeted agents with compelling preclinical rationale have been investi gated, most commonly in a combinatorial approach given limited single-agent responses in the salvage setting. Building on observations that phosphatidylinositol 3-kinase
(10) I CR
NCT01614197 (1) ORR Tolerable49%toxicity
Everolimus plus ribociclib and dexamethasone
47% Excessive
Second or greater relapse or refractory B- and T-ALL
Tolerable
First relapse B- and T-ALL with CR1 >18 months
Table 1. Early-phase mTOR inhibitor trials for relapsed pediatric acute lymphoblastic leukemia.
3. Ko RH, Ji L, Barnette P, et al. Outcome of patients treated for relapsed or refractory acute lymphoblastic leukemia: a Therapeutic Advances in Childhood Leukemia Consortium study. J Clin Oncol. 2010;28(4):648-654.
Although the numbers are small, the responses in three of five patients with relapsed T-ALL on this trial is notable as there is a particularly urgent need for salvage regimens in T-ALL, for which there has been a paucity of effective treat ment options relative to B-ALL. Another potential role for mTOR inhibitors is as a possible less toxic bridge to HSCT or chimeric antigen receptor T-cell therapy. In the multiply relapsed setting, in which achieving a minimal residual dis ease-negative complete remission can be challenging, mTOR inhibitors could have a potential role as part of a cytoreductive strategy, which could be followed by immu notherapy (e.g., chimeric antigen receptor T cells or blina tumomab/HSCT). Finally, this regimen is also an option following failure of HSCT or immunotherapy or in cases in which there is a lack of target antigen expression for avail able immunotherapies.
In summary, relapsed ALL remains a challenge and while newer treatments with immunotherapy, chimeric antigen receptor T cells, and advances in HSCT are improving out comes, this is not without significant treatment-related toxicity and responses to salvage therapy remain unpredict able. Tasian et al. demonstrated that it is feasible to deliver an mTOR inhibitor in combination with chemotherapy and achieved responses in nearly half of a heavily pretreated pa tient population, presenting another option to consider as part of a strategy aimed at sustainable cure.
1. Tasian SK, Silverman LB, Whitlock JA, et al. Temsirolimus combined with cyclophosphamide and etoposide for pediatric patients with relapsed/refractory acute lymphoblastic leukemia: a Therapeutic Advances in Childhood Leukemia Consortium trial (TACL 2014-001). Haematologica. 2022;107(10):2295-2303.
Contributions
ER receives institutional research funding from Pfizer and serves on a Data and Safety Monitoring Board for Celgene/BMS.
AP and ER contributed equally.
One of the challenges in treating multiply relapsed ALL is prioritizing regimens. The expansion of immunothera peutic options, particularly in B-ALL, raises questions re garding the role for small molecule therapy and optimal ways to deliver these agents in a growing treatment land scape. An important lesson from this trial is the benefit of using a tolerable platform when pursuing a combinatorial approach to reduce toxicity and optimize the delivery of targeted agents. Future options include combining mTOR inhibitors with other targeted therapies or immunotherapy. Studies have shown superior signaling phosphoprotein in hibition and antileukemia efficacy in vivo when PI3K/mTOR inhibitors are used in combination with tyrosine kinase in hibitors in models of Philadelphia chromosome-like ALL.7
Haematologica | 107 October 2022 2293 EDITORIAL A. Pinchinat and E. Raetz
2. Rheingold SR, Ji L, Xu X, et al. Prognostic factors for survival after relapsed acute lymphoblastic leukemia (ALL): a Children’s Oncology Group (COG) study. J Clin Oncol. 2019;37(15_suppl):10008.
5. Tasian SK, Teachey DT, Rheingold SR. Targeting the PI3K/mTOR
References
the CDK4/6 inhibitor ribociclib (NCT03740334) is also underway based on encouraging preclinical data. Addi tionally, recent trials in adults have demonstrated the promise of combining small molecule inhibitors with im munotherapy, such as the bispecific CD19-directed anti body blinatumomab, although these approaches may require ongoing assessment of any potential impact of the targeted agents on T-cell function.8,9
native and historically more tolerable cyclophosphamide and etoposide chemotherapy platform on the TACL2014-001 trial and a reduction to two versus three doses of temsiroli mus at a starting dose of 7.5 mg/m2/dose. Among the 15 evaluable T- and B-ALL patients, the addition of temsirolimus to the cyclophosphamide and etoposide backbone was safe and feasible in this heavily pretreated group, who had received a median of three (range, 2-7) prior salvage regimens and more than half of whom had under gone prior hematopoietic stem cell transplantation (HSCT). Only one patient experienced dose-limiting pneumonitis, pleural and pericardial effusions. Rates of fever and neu tropenia, infectious toxicities and metabolic abnormalities were similar to those observed in other trials of cytotoxic therapy for relapsed ALL. There was a 47% overall response rate (complete, incomplete and partial responses) with 27% achieving a complete response and with responses at all four dose levels. Basal activation of the PI3K/mTOR signaling pathway inhibition with dose-dependent in vivo inhibition of phosphosignaling was observed in all patients who partici pated in these exploratory studies. Based on these data, the recommended phase II dose of temsirolimus in combination with cyclophosphamide and etoposide was deemed to be 15 mg/m2/dose, the equivalent of the Food and Drug Admin istration-approved dose in adults, on days 1 and 8, although 25 mg/m2 was tolerated and showed the greatest in vivo in hibition of PI3K pathway signaling.
Disclosures
4. Sun W, Malvar J, Sposto R, et al. Outcome of children with multiply relapsed B-cell acute lymphoblastic leukemia: a Therapeutic Advances in Childhood Leukemia & Lymphoma study. Leukemia. 2018;32(11):2316-2325.
A clinical trial investigating everolimus in combination with
10. Place AE, Pikman Y, Stevenson KE, et al. Phase I trial of the mTOR inhibitor everolimus in combination with multi-agent chemotherapy in relapsed childhood acute lymphoblastic leukemia. Pediatr Blood Cancer. 2018;65(7):e27062.
pathway in pediatric hematologic malignancies. Front Oncol. 2014;4:108.
9. Foa R, Bassan R, Vitale A, et al. Dasatinib-blinatumomab for Phpositive acute lymphoblastic leukemia in adults. N Engl J Med. 2020;383(17):1613-1623.
7. Tasian SK, Teachey DT, Li Y, et al. Potent efficacy of combined PI3K/mTOR and JAK or ABL inhibition in murine xenograft models of Ph-like acute lymphoblastic leukemia. Blood. 2017;129(2):177-187.
6. Rheingold SR, Tasian SK, Whitlock JA, et al. A phase 1 trial of temsirolimus and intensive re-induction chemotherapy for 2nd or greater relapse of acute lymphoblastic leukaemia: a Children's Oncology Group study (ADVL1114). Br J Haematol. 2017;177(3):467-474.
Blinatumomab administered concurrently with oral tyrosine kinase inhibitor therapy is a well-tolerated consolidation strategy and eradicates measurable residual disease in adults with Philadelphia chromosome positive acute lymphoblastic leukemia. Leuk Res. 2019;79:27-33.
8. King AC, Pappacena JJ, Tallman MS, Park JH, Geyer MB.
Haematologica | 107 October 2022 2294 EDITORIAL A. Pinchinat and E. Raetz
https://doi.org/10.3324/haematol.2021.279520
©2022 Ferrata Storti Foundation
Received: June 25, 2021.
Sarah K. Tasian,1,2 Lewis B. Silverman,3 James A. Whitlock,4 Richard Sposto,5 Joseph P. Loftus,1 Eric S. Schafer,6 Kirk R. Schultz,7 Raymond J. Hutchinson,8 Paul S. Gaynon,9 Etan Orgel,9 Caroline M. Bateman,10 Todd M. Cooper,11 Theodore W. Laetsch,1,2 Maria Luisa Sulis,12 Yueh-Yun Chi,9 Jemily Malvar,9 Alan S. Wayne9 and Susan R. Rheingold1,2
Accepted: December 7, 2021.

Abstract
Temsirolimus combined with cyclophosphamide and etoposide for pediatric patients with relapsed/refractory acute lymphoblastic leukemia: a Therapeutic Advances in Childhood Leukemia Consortium trial (TACL 2014-001)
Prepublished: February 3, 2022.
Published under a CC BY-NC license
Phosphatidylinositol 3-kinase (PI3K)/mammalian target of rapamycin (mTOR) signaling is commonly dysregulated in acute lymphoblastic leukemia (ALL). The TACL2014-001 phase I trial of the mTOR inhibitor temsirolimus in com bination with cyclophosphamide and etoposide was performed in children and adolescents with relapsed/refractory ALL. Temsirolimus was administered intravenously (IV) on days 1 and 8 with cyclophosphamide 440 mg/m 2 and etoposide 100 mg/m 2 IV daily on days 1-5. The starting dose of temsirolimus was 7.5 mg/m 2 (DL1) with escalation to 10 mg/m 2 (DL2), 15 mg/m 2 (DL3), and 25 mg/m 2 (DL4). PI3K/mTOR pathway inhibition was measured by phospho flow cytometry analysis of peripheral blood specimens from treated patients. Sixteen heavily-pretreated patients were enrolled with 15 evaluable for toxicity. One dose-limiting toxicity of grade 4 pleural and pericardial effusions occurred in a patient treated at DL3. Additional dose-limiting toxicities were not seen in the DL3 expansion or DL4 cohort. Grade 3/4 non-hematologic toxicities occurring in three or more patients included febrile neutropenia, elev ated alanine aminotransferase, hypokalemia, mucositis, and tumor lysis syndrome and occurred across all doses. Response and complete were observed at all dose levels with a 47% overall response rate and 27% complete re sponse rate. Pharmacodynamic correlative studies demonstrated dose-dependent inhibition of PI3K/mTOR pathway phosphoproteins in all studied patients. Temsirolimus at doses up to 25 mg/m 2 with cyclophosphamide and eto poside had an acceptable safety profile in children with relapsed/refractory ALL. Pharmacodynamic mTOR target inhibition was achieved and appeared to correlate with temsirolimus dose. Future testing of next-generation PI3K/mTOR pathway inhibitors with chemotherapy may be warranted to increase response rates in children with relapsed/refractory ALL.
1Division of Oncology and Center for Childhood Cancer Research, Children’s Hospital of Philadelphia, Philadelphia, PA, USA; 2Perelman School of Medicine at the University of Pennsylvania, Philadelphia, PA, USA; 3Department of Pediatric Oncology, Dana-Farber Cancer Institute and Division of Pediatric Hematology-Oncology, Boston Children’s Hospital, Boston, MA, USA; 4Division of Haematology/Oncology, Hospital for Sick Children and the University of Toronto, Toronto, Ontario, Canada; 5Department of Preventive Medicine, Keck School of Medicine, University of Southern California, Los Angeles, CA, USA; 6Dan L. Duncan Institute for Clinical and Translational Research, Baylor College of Medicine and Texas Children’s Cancer Center, Houston, TX, USA; 7Division of Hematology/Oncology/Bone Marrow Transplant, British Columbia Children's Hospital, Vancouver, British Columbia, Canada; 8Division of Hematology/Oncology, CS Mott Children's Hospital, Ann Arbor, MI, USA; 9Division of Hematology/Oncology, Children’s Hospital Los Angeles, Norris Comprehensive Cancer Center, Keck School of Medicine, University of Southern California, Los Angeles, CA, USA; 10Cancer Centre for Children, The Children's Hospital at Westmead, Westmead, New South Wales, Australia; 11Division of Hematology/Oncology, Seattle Children's Hospital Cancer and Blood Disorders Center, Seattle, WA, USA and 12Department of Pediatrics, Memorial Sloan Kettering Cancer Center, New York, NY, USA
Haematologica | 107 October 2022 2295 ARTICLE - Acute Lymphoblastic Leukemia
Correspondence: S. R. Rheingold rheingold@chop.edu
Other eligibility requirements included a normal age-ad justed serum creatinine or glomerular filtration rate ≥70 mL/min/1.73m2, normal cardiac function defined by short ening fraction ≥27% or ejection fraction ≥50%, adequate
Eligibility
Haematologica | 107 October 2022 2296 ARTICLE - TACL2014-001 trial for relapsed childhood ALL S. Tasian et al.
Methods
Phosphatidylinositol 3-kinase (PI3K)/mammalian target of rapamycin (mTOR) signaling, a critical pathway in cell pro liferation, metabolism, and apoptosis, is commonly dys regulated in acute lymphoblastic leukemia (ALL) and may confer chemotherapy resistance.1 While MTOR mutations are themselves uncommon in human cancer, other PI3K pathway gene mutations and expression changes that ac tivate PI3K/mTOR signal transduction have been reported in many hematologic malignancies.1-4 For example, loss of tumor suppressors that normally regulate PI3K signaling, such as PTEN (phosphatase and tensin homolog), can dys regulate normal cellular equilibrium and facilitate aber rant signaling activation.5 Constitutive PI3K/mTOR signaling activation in ALL may also result from increased surface expression of growth factor receptors on leukemia cells or from mutation of intracellular downstream effec tor genes.6 Preclinical studies of mTOR inhibitors in murine models of human ALL have shown potent in vivo inhibition of leukemia proliferation and prolonged animal survival in comparison to that of vehicle-treated controls.7-10 Despite aggressive retrieval strategies, the prognosis for children with relapsed/refractory ALL is poor.11-14 Molecu larly-targeted agents, including mTOR inhibitors, have shown promise in treating some patients.1 Two pediatricspecific trials of mTOR inhibition in combination with chemotherapy have been performed to date. The Children’s Oncology Group (COG) ADVL1114 phase I trial ex plored the safety and tolerability of combining three weekly doses of temsirolimus with UK ALLR3 reinduction therapy in children with second or greater relapse/refrac tory ALL (www.clinicaltrials.gov NCT01403415).15 The study required two de-escalations of temsirolimus down to 7.5 mg/m2/dose due to observed dose-limiting toxicity (DLT), and this regimen was determined to be too toxic for further assessment in a phase II clinical trial setting. DLT seen in this study specifically appeared to be exacerbated by the combinatorial toxicity of mTOR inhibitors with the known toxicities of steroids and asparaginase. Despite DLT, complete responses (CR) occurred in seven of 15 treated patients. Dose-dependent inhibition of PI3K/mTOR pathway signaling was also detected in most patients via correlative pharmacodynamic studies.15 The Dana-Farber Cancer Institute Consortium (DFCI) 11-237 phase I trial (www.clinicaltrials.gov NCT01523977) combined daily oral everolimus with four-drug re-induction in pediatric pa tients with first relapse of ALL,16 which was tolerated well. Nineteen of 22 patients achieved CR, 12 with minimal re sidual disease (MRD) <0.1%.
phosphamide and etoposide chemotherapy chosen as a non-steroid/non-asparaginase regimen to mitigate toxicity observed in the ADVL1114 study in children and adoles cents with second or greater relapsed ALL. Exploratory study aims included preliminary assessment of treatment efficacy within the context of a phase I trial and phar macodynamic measurement of PI3K/mTOR signaling path way inhibition.
Introduction
Patients ≥1 and <21 years of age with second or greater relapse or chemotherapy-refractory B-ALL or T-ALL were eligible for study participation. Relapsed leukemia was de fined as >25% blasts in bone marrow (M3) or 5-25% blasts in bone marrow (M2) with evidence of concurrent extramedullary disease. Refractory disease was allowed with no more than one prior failed salvage attempt fol lowing the current relapse or no more than two additional treatment cycles after initial induction failure in newly di agnosed patients. After temsirolimus dosing was shown to be tolerable at 10 mg/m2 (DL2), eligibility was amended to include T-ALL in first relapse, and marrow involvement for eligibility was changed to ≥5% blasts regardless of extramedullary leukemia involvement. The definition of refractory leukemia was also expanded to include patients with any relapse of ALL with MRD ≥0.1% after a reinduction attempt and patients with newly-diagnosed ALL with per sistent MRD ≥0.1% in bone marrow following high-risk ALL consolidation therapy.
Eligibility criteria included a Lansky/Karnofsky perform ance score ≥50, recovery from acute toxic effects of prior therapy, and no active infections. Patients had to be ≥2 weeks from prior cytotoxic therapy with the exception of maintenance-type ALL therapy for which there was no washout period. Intrathecal chemotherapy was allowed within 7 days of initiation of systemic therapy. Patients had to be ≥7 or ≥14 days from short-acting or long-acting growth factor therapy, respectively, ≥7 days from biologic anti-neoplastic therapy, ≥30 days from cellular immuno therapy, and ≥3 half-lives from prior monoclonal antibody therapy. Patients also had to be ≥3 months from prior hematopoietic stem cell transplantation (HSCT) and with out evidence of graft-versus-host disease. Patients receiv ing corticosteroids must have been on a stable or decreasing dose for 7 days prior to enrollment. Hydroxy urea use was permitted until 24 hours prior to the first dose of study chemotherapy.
The Therapeutic Advances in Childhood Leukemia and Lymphoma (TACL) Consortium conducted the 2014-001 phase I clinical trial to define the recommended phase 2 dose (RP2D) of temsirolimus in combination with cyclo
pulmonary function with a baseline oxygen saturation >94% on room air, and adequate liver function defined as total bilirubin ≤1.5 times, γ-glutamyl transferase ≤2.5 times, alanine amino transaminase and aspartate transaminase ≤3 times the institutional upper limits of normal for age. Fasting serum triglyceride and cholesterol were required to be ≤300 mg/dL, and a fasting glucose had to be within nor mal limits for age.
Toxicities were graded according to the Common Terminol ogy Criteria for Adverse Events version 4.03 (http://ctep.cancer.gov). Hematologic DLT for patients with ALL was defined as bone marrow aplasia at day 42 or beyond not attributable to leukemic involvement. Nonhematologic DLT were defined as treatment-related grade ≥3 adverse events at least possibly attributable to temsi rolimus with exceptions for specific toxicities if they re turned to grade ≤2 by day 36 of protocol therapy. Any toxicity resulting in temsirolimus dose omission or those attributable to temsirolimus that did not resolve to grade ≤2 by day 36 were considered dose-limiting.
Haematologica | 107 October 2022 2297 ARTICLE - TACL2014-001 trial for relapsed childhood ALL S. Tasian et al.
This phase I study was registered at www.clinicaltrials.gov (NCT01614197) and approved by the local institutional review boards at all participating centers. Written informed con sent (and assent as appropriate) was obtained for treat ment and for optional correlative biology studies from patients ≥18 years or parents/legal guardians of children aged <18 years according to institutional policies and in ac cordance with the Declaration of Helsinki.
anti-cancer therapy, including tyrosine kinase inhibitors, while on study. Each chemotherapy cycle was 29 days long. If the patient had no evidence of progressive disease (de fined as an increase of >25% in the absolute number of bone marrow blasts or development of new extramedullary disease) he or she could receive a second cycle if recovered from all relevant toxicities. Therapy-associated toxicities were monitored in all administered treatment cycles but were only evaluated for DLT in cycle 1.
cohort escalation design was used.17 Temsi rolimus was supplied by Pfizer, Inc. Commercially-available cyclophosphamide (440 mg/m2) and etoposide (100 mg/m2) were administered intravenously once daily on days 1-5. Temsirolimus was administered intravenously on day 1 (prior to chemotherapy) and as monotherapy on day 8 (On line Supplementary Figure S1). The starting dose of temsi rolimus at dose level 1 (DL1) was 7.5 mg/m2/dose based upon the prior combination trial toxicity15 and a lower dose than the Food and Drug Administration (FDA)-approved dose of 25 mg weekly for adults with renal cell carcinoma. Dose escalation to 10 mg/m2/dose (DL2), 15 mg/m2/dose (DL3, equivalent to FDA-approved adult dosing of 25 mg weekly), and 25 mg/m2/dose (DL4) was planned. Temsiroli mus dosing was capped at a maximal body surface area of 2 m2. No intra-patient dose escalation of temsirolimus was permitted. Intrathecal methotrexate was administered once via lumbar puncture on day -6 to 1 for all patients. If cerebrospinal fluid involvement was present (CNS2 or CNS3), intrathecal triple chemotherapy (cytarabine, hydro cortisone, methotrexate) was administered weekly until achievement of negative cerebrospinal fluid (CNS1). En rolled patients were not permitted to receive non-protocol
Drug administration and study design
The primary objectives of the study were: (i) to determine the maximum tolerated dose or highest tested dose of temsirolimus administered in combination with cyclophos phamide and etoposide in pediatric and young adult pa tients with relapsed/refractory ALL; and (ii) to define the DLT and describe other serious toxicities of temsirolimus when combined with cyclophosphamide and etoposide. The secondary objectives were: (i) to determine the CR rate, (ii) to measure MRD levels by flow cytometry after one cycle of therapy, and (iii) to evaluate single-cell phar macodynamic PI3K/mTOR pathway inhibition in patients’ lymphoblasts during administration of temsirolimus and Achemotherapy.3+3patient
Guidelines from the International Consensus Conference on Toxicity were utilized to identify expected toxicities of the multi-agent chemotherapy backbone and to help to define DLT of combination therapy.18 Grade 3 and 4 labora tory abnormalities included in this category were electro lyte abnormalities, elevated liver function tests, hypoalbuminemia, hypofibrinogenemia, fasting hyperglyce mia, hypercholesterolemia, and hypertriglyceridemia. Toxic ities common in children with relapsed ALL were excepted from DLT criteria, including grade 3 constitutional toxicities (fatigue, malaise, dehydration, weight loss) or gastrointes tinal toxicities (nausea, vomiting, anorexia, diarrhea, mu cositis) and grade 3/4 fever, infection, and febrile neutropenia regardless of need for hospitalization.18
Disease evaluations were obtained at baseline and at the end of each cycle of therapy. CR was defined as bone mar row morphology with <5% blasts (M1), no evidence of extramedullary disease, and recovery of peripheral blood counts (absolute neutrophil count ≥500/μL and a platelet count ≥50,000/μL independent of transfusion). A CR with incomplete hematologic recovery (CRi) was achievement of an M1 marrow and absence of extramedullary disease with out normalization of absolute neutrophil count and/or pla telet count. Partial response was defined as clearance of peripheral blasts with 5-25% residual blasts in bone mar row (M2) or an M1 bone marrow without complete eradi cation of extramedullary disease. Patients who failed to qualify as having a CR, CRi, or partial response were defined as having stable disease or progressive disease. Flow cyto metric MRD assessment of bone marrow specimens with morphological CR/CRi at end-cycle 1 was performed at the University of Washington. MRD <0.01% was considered negative.19,20
No patient treated at DL1 or DL2 experienced DLT. A pa tient at DL3 developed dose-limiting pneumonitis and pleural and pericardial effusions without an infectious or ganism being identified. Three additional patients were enrolled at DL3, none of whom experienced DLT. Based in part upon safety data in the first three dose level cohorts and real-time pharmacodynamic studies described below, temsirolimus dosing was subsequently explored at DL4 (above the FDA-approved adult dosing) in three patients for biology, toxicity, and response assessment with no DLT observed.
Toxicity assessment
Clinical responses were observed in patients treated at all dose levels of temsirolimus (Table 2). The overall response rate (CR + Cri + partial response) was 47%, occurring in three of five patients with T-ALL and four of ten patients with B-ALL. Three of the four patients with CR or CRi also had MRD <0.01%, and two of these patients underwent subsequent allogeneic HSCT.
Table 3 delineates non-dose-limiting grade 3/4 nonhematologic toxicities that were at least possibly at tributed to temsirolimus and occurred in >10% of patients during cycle 1 of therapy. The most common non-hema tologic toxicities were febrile neutropenia (67%) and in fection/sepsis (40%). The majority of blood infections were due to Gram-positive cocci. Two Gram-negative in fections occurred; one patient had Pseudomonas aerugi nosa bacteremia, urinary tract infection, and labial wound infection, and a second patient had Klebsiella pneumoniae bacteremia. Three patients had Clostridium difficile-as sociated enterocolitis. Four patients had viral infections caused by rhinovirus (n=2), influenza B (n=1), and enterovi rus (n=1). Electrolyte and metabolic abnormalities in cluded hyperkalemia (40%), hypophosphatemia (20%), tumor lysis syndrome (20%), and hyperglycemia (13%). Gastrointestinal toxicities included mucositis (27%), elev ated alanine transaminase (27%), abdominal pain (20%), and elevated γ-glutamyl transferase (13%). Hypertriglyce ridemia and hypercholesterolemia were not observed.
Baseline and post-treatment peripheral blood and bone marrow specimens were obtained from consenting pa tients for assessment of in vitro and ex vivo inhibition of PI3K/mTOR pathway phosphoproteins within ALL cells via single-cell phosphoflow cytometry assays as described elsewhere.15,21 Peripheral blood samples were obtained at three time points: immediately prior to temsirolimus ther apy (day 0), at day 3-5 of therapy after the first dose of temsirolimus, and at day 29 at the end of re-induction therapy (Online Supplementary Figure S1). Specimens at each timepoint were processed immediately upon receipt and stored for subsequent batched phosphoflow cyto metry analysis of all samples from each temsirolimus dose level.
Pharmacodynamic analyses
Results
Patients’ characteristics
Responses
Sixteen patients aged 2-19 years (median 10 years) were enrolled between June 2015 and September 2019 (Table 1). One patient chose not to initiate protocol therapy after signing consent and was thus not evaluable. Ten evaluable patients had relapsed/refractory B-ALL, and five had re lapsed/refractory T-ALL (Table 2). One patient was in first relapse, eight were in second relapse, and six were in third or subsequent relapse, of whom two patients were re fractory to prior therapy. Patients had previously under gone a median of three salvage chemotherapy regimens prior to study entry (range, 2-7). Eight of 15 patients had relapsed after HSCT, and four patients had received prior CD19-targeted chimeric antigen receptor T-cell immuno therapy (CD19, targeted CAR T cells). All patients had >25% bone marrow involvement (median 60% bone marrow blasts) and were CNS1 (n=14) or CNS2 (n=2) at enrollment. Six patients had unfavorable ALL-associated genetic al terations, including the BCR-ABL1 rearrangement or Phil adelphia chromosome-like kinase fusions. All evaluable patients completed one cycle of therapy, and two patients received a second cycle on study.
Table 1. Summary of characteristics of patients enrolled on TACL 2014-001.
Characteristic Total N=15 Age at enrollment, years RangeMedian 2-1910 Sex,FemaleMaleN 69 Race, N (%) Asian/PacificWhite Islander Black or African American Other/Unknown 8 (53%) 2 41(14%)(7%)(26%) Ethnicity, N UnknownHispanicNon-Hispanic(%) 7 (47%) 71(47%)(6%) Prior therapy regimens, N (%) PriorPriorRangeMediantransplantCART-cell 4/158/152-73(53%)(27%) CAR: chimeric antigen receptor. Haematologica | 107 October 2022 2298 ARTICLE - TACL2014-001 trial for relapsed childhood ALL S. Tasian et al.
8
1
3
had multiple infectious incidents; one with the pseu domonas at three different sites, and two with grade 3 Clostridium difficile enterocolitis. Maximum infection grade included in table. Gr: grade; ALT: alanine transaminase; γGT: gamma glutamyltransferase.Haematologica | 107 October 2022 2299 ARTICLE - TACL2014-001 trial for relapsed childhood ALL S. Tasian et al.
ALL-associated genetic alterations
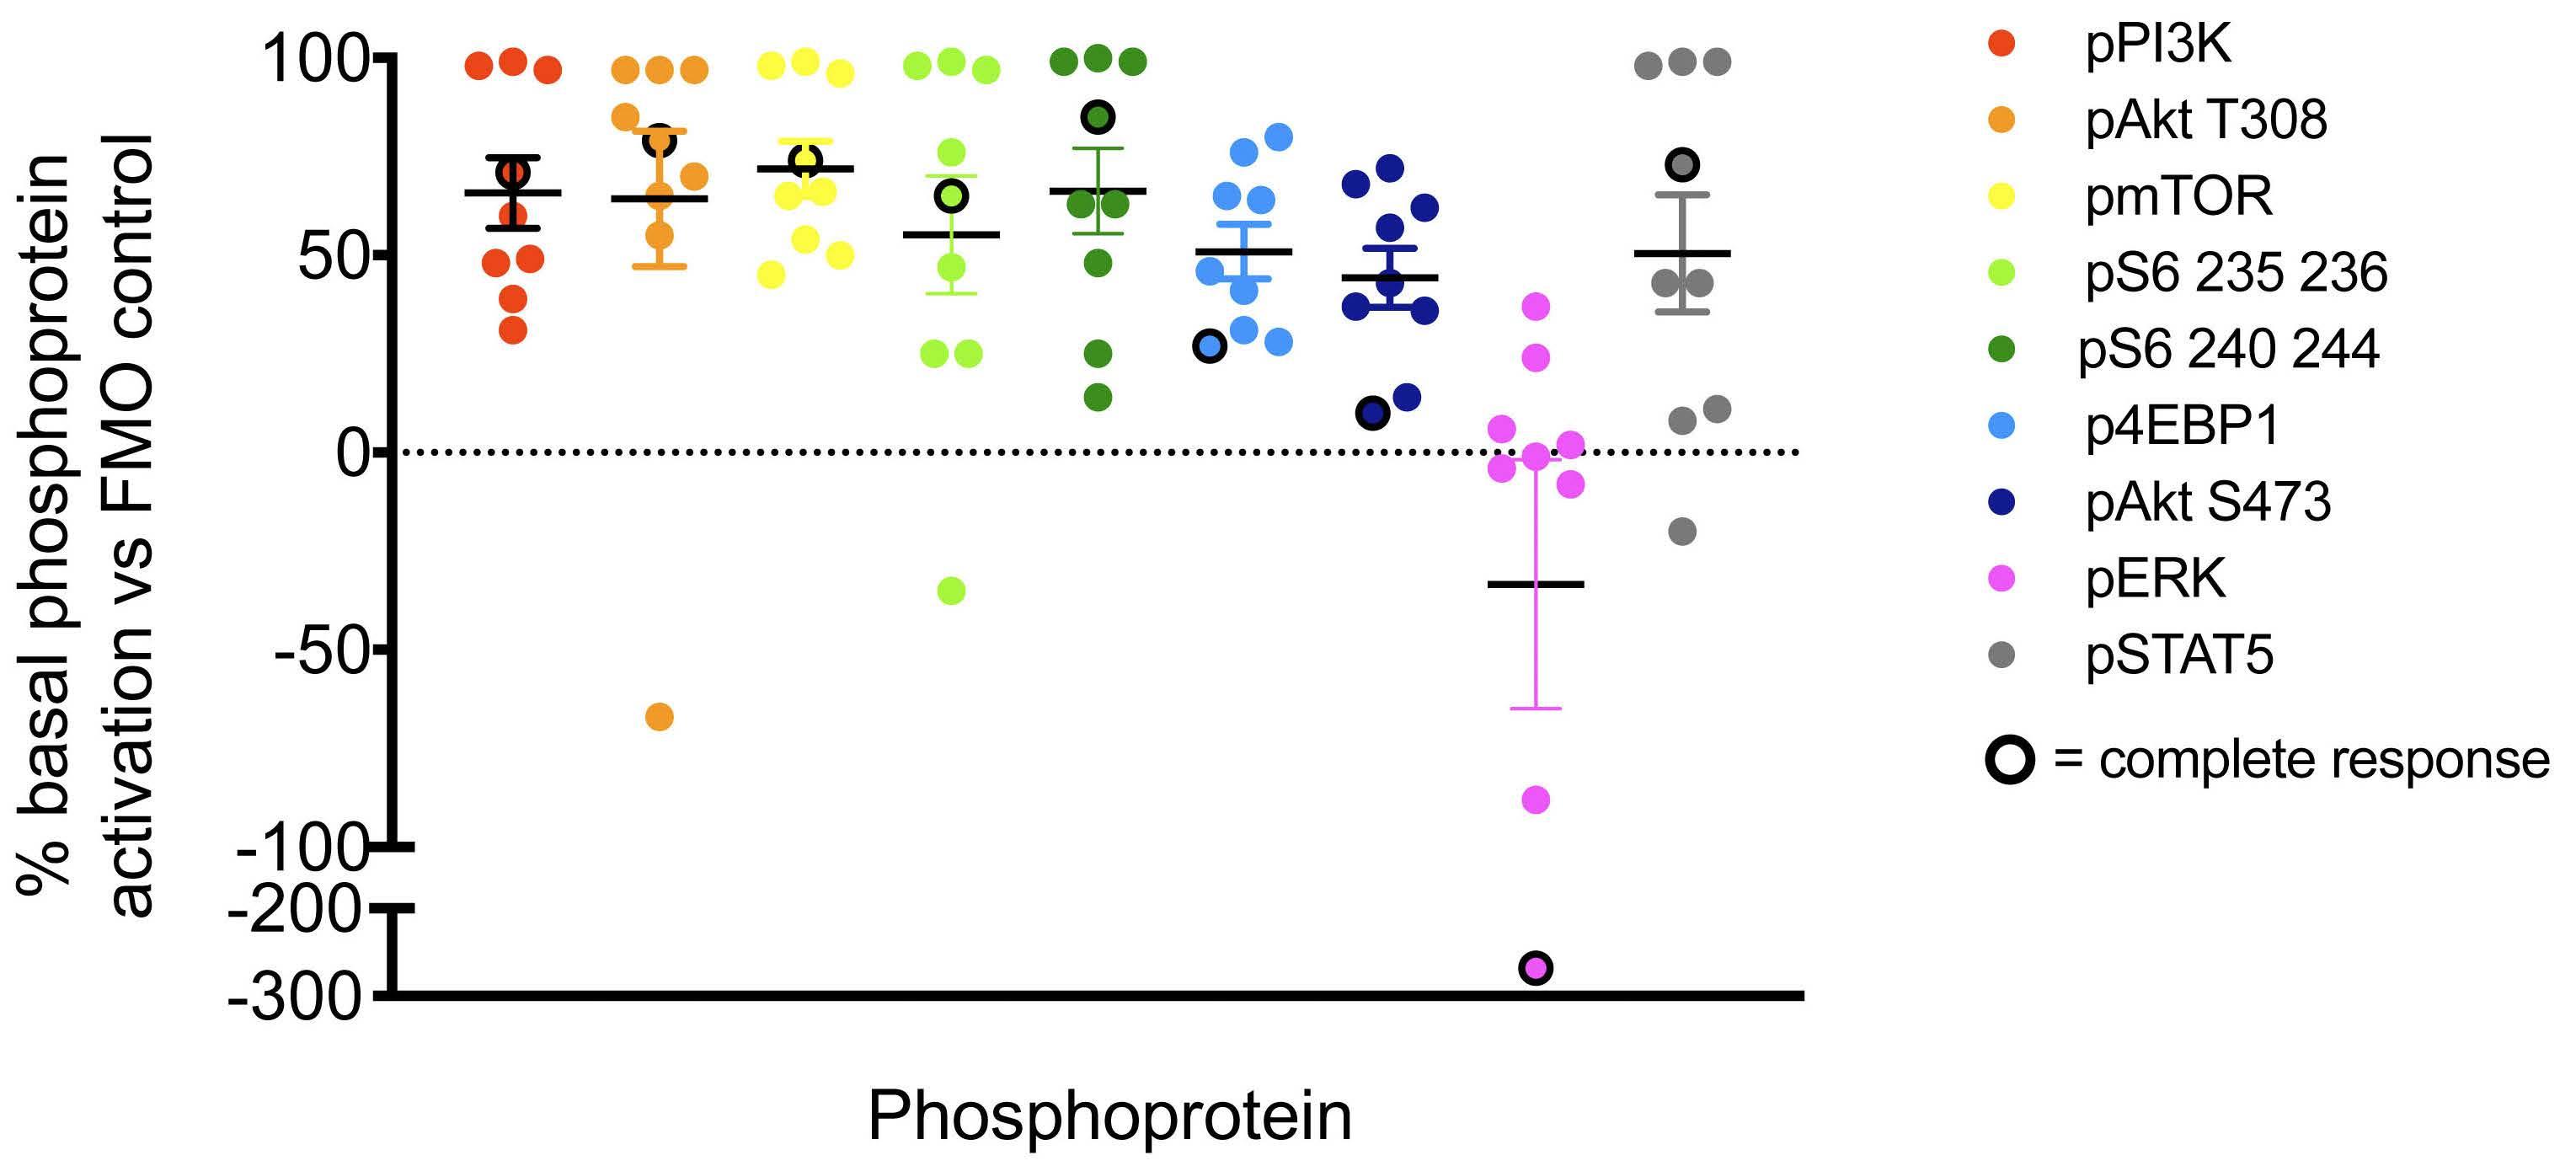
B-ALL (n=7) and T-ALL (n=2) were obtained from patients treated at DL1 (n=1), DL2 (n=1), DL3 (n=6), and DL4 (n=1) and analyzed by leukemia cell-specific phosphoflow cyto metry. We observed basal activation of PI3K/mTOR path way phosphoproteins in all tested samples at the day 0 pre-treatment time point (Figure 1). Although limited by small numbers, a trend towards dose-dependent in vivo inhibition of phosphosignaling was detected in studied specimens at 3-5 days after the first dose of temsirolimus (Figure 2; summary data in Online Supplementary Figure S2). In vitro incubation of pre-treatment and day 3-5 blood samples with the mTOR inhibitor rapamycin performed to define maximal achievable PI3K pathway signaling in hibition for each patient’s leukemia cells further sup ported clinical temsirolimus dose escalation with greatest inhibition detected in vivo for a patient treated at DL4 (Figure 2). Correlative blood specimens were not sub mitted for three of the four patients who achieved CR/CRi, so it was unfortunately not possible to assess potential correlation of pharmacodynamic signaling inhibition with clinical responses.
2
Based upon safety data with DLT assessment, phar macodynamic assay results, and evaluation of dosing higher than that approved by the FDA in the DL4 cohort, temsirolimus 15 mg/m2 (DL3) in combination with cyclo phosphamide/etoposide was selected as the RP2D for fu ture clinical trial investigation.
*Three patients
Level USI
14
er
Recommended phase 2 dose determination
Peripheral blood samples from consenting patients with
Table therapy
5
13
12
*Patient with dose limiting toxicity, ALL: acute lymphoblastic leukemia; CR: complete response; CRi: complete response with incomplete platelet recovery; DL: dose level; MRD: minimal residual disease; na: not available; PD: progressive disease; ref: refractory; SD: stable disease; USI: unique specimen identifi
Table 2. Disease status and clinical responses of patients treated on TACL 2014-001.
10
9*
and observed in >10% of evaluable patients (n=15). Toxicity Grade 1/2 Grade 3 Grade 4 % Gr 3/4 Febrileneutropenia 0 9 1 67% Infection/sepsis 1 5 1 40% Hyperkalemia 4 2 4 40% Mucositis 6 4 0 27% ALT increase 5 3 1 27% Hypo-phosphatemia 2 2 1 20% Tumor syndromelysis 0 3 0 20% Abdominal pain 4 3 0 20% γGT increased 4 2 0 20% Hyperglycemia 5 2 0 13% Hypoxia 0 2 0 13%
Pharmacodynamic studies
DL1 B-ALL 2 Complex cytogenetics PR B-ALL >4 ETV6-RUNX1 PD T-ALL 2 na CRi, MRD 2.4%
15
3. Non-dose-limiting non-hematologic toxicities related to protocol
7
Dose Diagnosis Relapse#
End-Cycle 1 response
6
DL2 B-ALL 2 KMT2A rearrangement CR, MRD <0.01 T-ALL 2 na SD B-ALL 3 BCR-ABL1 PR DL3 B-ALL 2 na PD B-ALL 3 ref EBF1-PDGFRB SD T-ALL 1 na PR B-ALL 3 ref ETV6-RUNX1 PD B-ALL 2 P2RY8-CRLF2 CR, MRD <0.01 B-ALL 2 RCSD1-ABL2 PD
DL4 T-ALL >4 na SD T-ALL 2 na CRi, MRD <0.01 B-ALL >3 Ph-like ABL class PD
16
11
Figure 1. Constitutive activation of PI3K pathway signaling in children with relapsed/refractory acute lymphoblastic leukemia enrolled on TACL2014-001. Pre-treatment (basal, day 0) peripheral blood samples were obtained from study patients with acute lymphoblastic leukemia (ALL) for single-cell phosphoflow cytometry analysis of the PI3K pathway and other phosphoproteins as previously described.15 Pre-treatment blood specimens from most patients show basal activation of multiple PI3K/mTOR pathway phosphoproteins in gated human leukemia cells (CD45+/CD19+ B-ALL or CD45+/CD3+ for T-ALL) when compared to fluorescenceminus-one (FMO)-stained control cells. Solid symbols represent patients with partial response, stable disease, or progressive disease after cycle 1. Black-ringed symbols represent patients with complete response.
Therapy for children and adolescents with multiply re lapsed ALL is hampered by low remission rates and sig nificant risk of morbidity and mortality with intensive salvage therapy.13-15, 22-24 Many promising molecularly tar geted agents have been approved for adults with a variety of cancers, but these likely must be combined with multiagent cytotoxic chemotherapy regimens to improve longterm survival appreciably in children with ALL. The TACL 2014-001 phase I trial was conducted to evaluate the safety and tolerability of the mTOR inhibitor temsirolimus in combination with the commonly used cyclophospha mide and etoposide salvage regimen for relapsed/refrac tory ALL.
Haematologica | 107 October 2022 2300 ARTICLE - TACL2014-001 trial for relapsed childhood ALL S. Tasian et al.
Discussion
lapsed/refractory pediatric population. Although no DLT were observed in the three patients treated at DL4 (25 mg/m2/dose; the highest tested dose), the RP2D of tem sirolimus in combination with cyclophosphamide and eto poside from this trial is 15 mg/m2/dose (DL3), which is consistent with the defined RP2D in adult patients. Given the observed intolerability of lower temsirolimus dosing with more intensive chemotherapy in our prior ADVL1114 phase I clinical trial,15 temsirolimus 15 mg/m2/dose for two doses represents an appropriately cautious recommen dation for incorporation into ALL salvage regimens. Combining temsirolimus with cyclophosphamide and eto poside avoided many severe combinatorial toxicities, such as hyperglycemia, hypertriglyceridemia, mucositis, and poor wound healing, reported in earlier studies combining mTOR inhibition with other intensive chemotherapy regimens.15,25,26 A pediatric phase I trial of temsirolimus combined with irinotecan and temozolomide in children with relapsed/refractory solid tumors similarly required modification to exclude patients on concomitant steroids due to dose-limiting hyperlipidemia.27 However, combina tion of the oral mTOR inhibitor everolimus with a four-drug re-induction in children with a first relapse of ALL in the DFCI trial 11-237 appeared well-tolerated with less meta bolic toxicity,16 suggesting that the number of relapses and therapy lines may also influence toxicity. Several recent relapsed pediatric ALL trials and reviews have reported 45% mortality rates and 45-92% rates of grade 3-4 infec tions during re-induction therapy.22,23 On our trial, expected rates of febrile neutropenia (67%) and grade 3/4 infection (40%), with viral and bacterial etiologies, were observed.
In this study, we observed acceptable safety and toler ability of temsirolimus on this backbone regimen, as well as clinical responses in nearly half of treated patients. Due to the observed prior toxicity of temsirolimus with other combination chemotherapy regimens in early-phase pedi atric oncology trials, we chose a priori to decrease the number of weekly doses of temsirolimus from three to two when designing this protocol. An identical overall re sponse rate (47%) in this trial using two doses of temsi rolimus on the cyclophosphamide/etoposide backbone was reported among patients on the COG ADVL1114 trial initially using three (and then two) doses of temsirolimus combined with the more toxic UK ALLR3 reinduction chemotherapy platform.15 We demonstrate that two weekly temsirolimus doses may be sufficiently effective on a less toxic chemotherapy backbone in a similar re
Haematologica | 107 October 2022 2301 ARTICLE - TACL2014-001 trial for relapsed childhood ALL S. Tasian et al.
Clinical responses were observed in patients treated at every dose level with an overall response rate of 47% and a CR/CRi of 27% and did not appear to be temsirolimus dose-related, further supporting the selected RP2D. Achievement of MRD-negative remission with study ther apy also facilitated subsequent allogeneic HSCT in two patients. Although MRD-negative CR are the “gold stan dard” to enable consolidative HSCT, partial responses or even stable disease in patients with B-ALL can serve as meaningful clinical outcomes that enable disease stability as a bridge to CAR T-cell immunotherapy during the manufacturing process. Although limited by small numbers, the CR rate of patients with T-ALL (40%, one of whom achieved morphological remission but remained MRD positive) in this study was encouraging given the his toric difficulty in successful salvage of children with re lapsed T-ALL.28 Not unexpectedly, higher rates of clinical response occurred in patients in second relapse (6 of 9) compared to those in third or subsequent relapse (1 of 6), which is consistent with prior literature.14,28 Four of eight
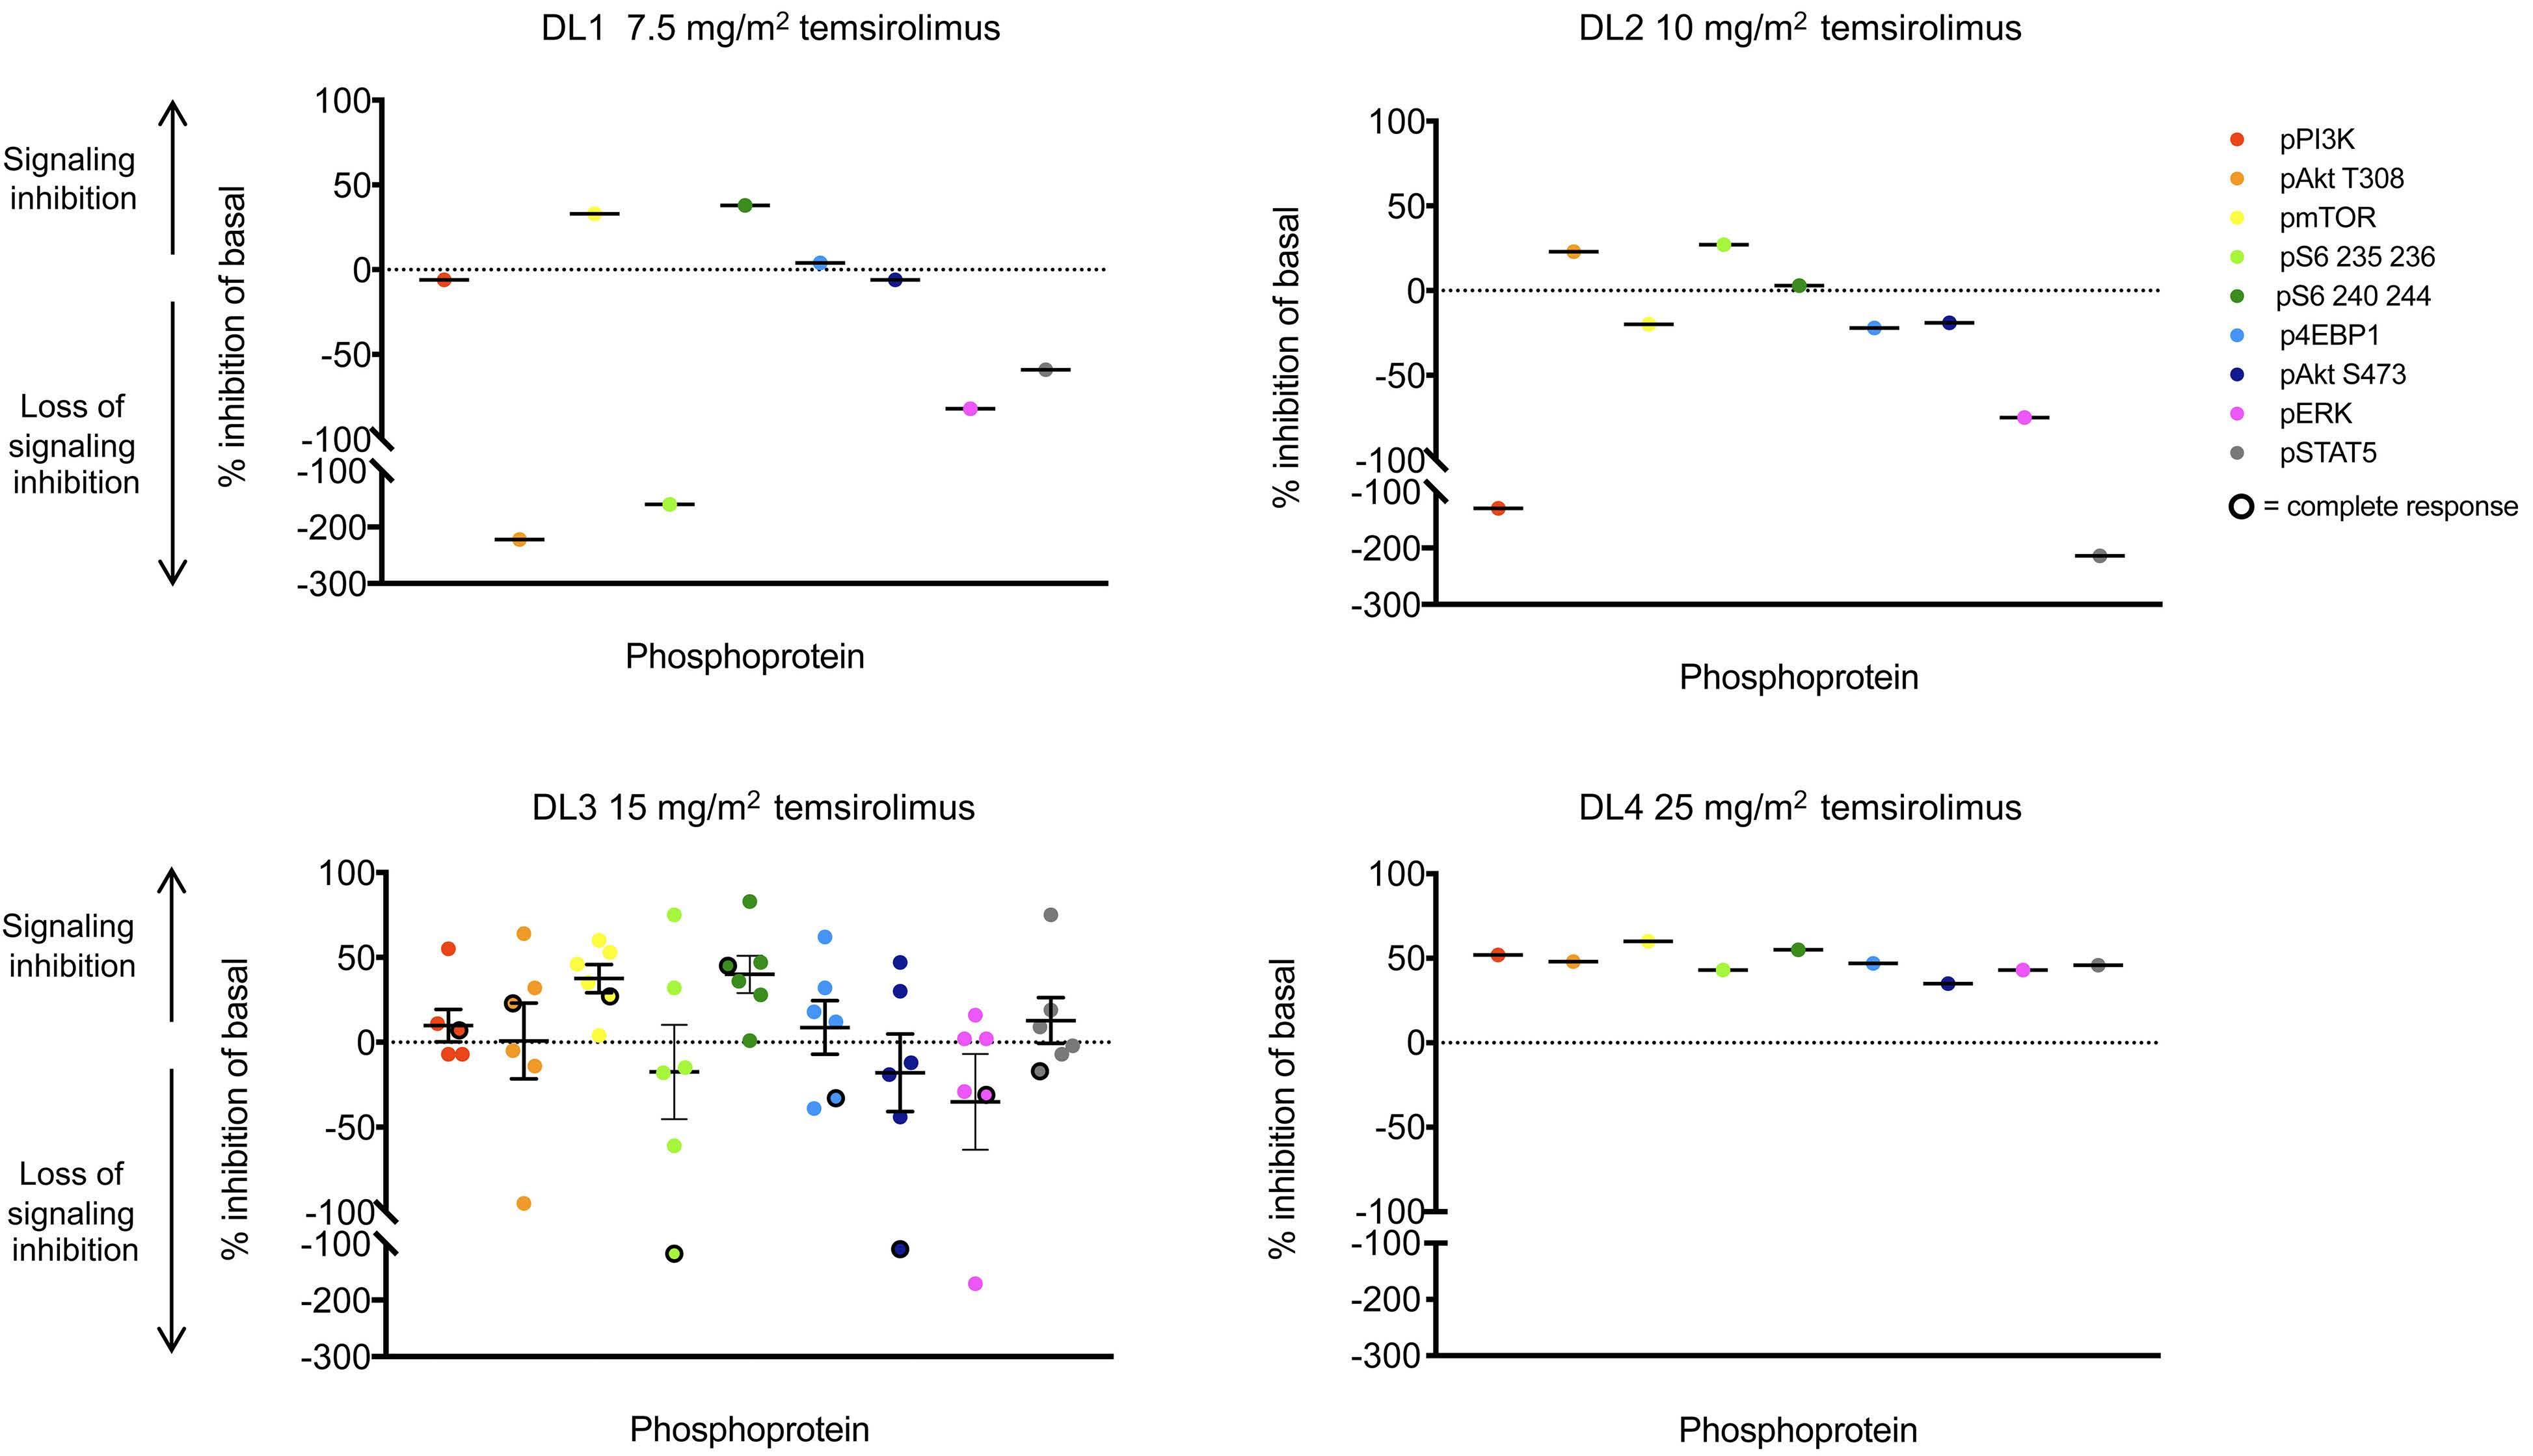
Figure 2. Abrogation of constitutively-activated PI3K/mTOR pathway signaling with temsirolimus therapy. Pre-treatment (basal, day 0) and post-treatment (day 3-5) levels of PI3K/mTOR pathway phosphoproteins were measured as median fluorescence in tensity (MFI) by single-cell phosphoflow cytometry in gated B-acute lymphoblastic leukemia (ALL) or T-ALL cells in peripheral blood specimens from TACL2014-001 patients. Phosphoprotein inhibition in peripheral blood ALL cells at day 3-5 of therapy after the first dose of temsirolimus in comparison to basal phosphoprotein levels is shown for each patient treated at the designated dose levels (DL1, DL2, DL3, DL4). MFI data were normalized intra-patient to pre-treatment levels of each phosphoprotein. Central horizontal solid lines depict mean phosphoprotein inhibition for inter-patient comparison. Dotted line set at y=0 indicates no change in phosphoprotein from baseline. Solid symbols represent patients with partial response, stable disease, or progressive disease after cycle 1. Black-ringed symbols represent patients with complete response. Summary pharmacodynamic data of all dose levels are shown in Online Supplementary Figure S2
patients who had relapsed after allogeneic HSCT re sponded to the temsirolimus, cyclophosphamide, and etoposide study regimen, whereas the four patients with B-ALL who had relapsed after CD19-targeted CAR T cells had progressive disease on the current trial. The protocol was amended to incorporate more modern pediatric definitions of relapse including morphological disease of ≥5% or COG-certified flow cytometry MRD of ≥0.1% in accordance with a recent international consensus study by the Ponte-di-Legno Consortium.29 Despite the study amendment, all patients who enrolled on TACL2014001 had ≥25% bone marrow involvement. Future leukemia trials will need to assess whether patients with lower dis ease burden at time of enrollment using more modern definitions of relapse will have differential response rates and/or less trial toxicity when treated with lower disease Inburden.summary, we report that the mTOR inhibitor temsiroli mus can be safely administered as two weekly doses in combination with 5 days of cyclophosphamide and eto
4. Grabiner BC, Nardi V, Birsoy K, et al. A diverse array of cancerassociated MTOR mutations are hyperactivating and can predict
2. Bjornsti MA, Houghton PJ. The TOR pathway: a target for cancer therapy. Nat Rev Cancer. 2004;4(5):335-348.
Acknowledgements
Disclosures
Funding
Data-sharing statement
rapamycin sensitivity. Cancer Discov. 2014;4(5):554-563.
5. Gutierrez A, Sanda T, Grebliunaite R, et al. High frequency of PTEN, PI3K, and AKT abnormalities in T-cell acute lymphoblastic leukemia. Blood. 2009;114(3):647-650.
Research reported in this publication was supported by the Pfizer 2B clinical trial program, NCI award P30CA014089, the Higgins Family Foundation, and the Leukemia & Lym phoma Society. SKT was supported by NIH/NCI K08CA184418, R21HD081319, U01CA232486, U01CA243072, Department of Defense Translational Team Science Award CA180683P1, the Rally Foundation for Childhood Cancer Re search, and the V Foundation for Cancer Research.
References
3. Smolewski P. Investigating mammalian target of rapamycin inhibitors for their anticancer properties. Expert Opin Investig Drugs. 2006;15(10):1201-1227.
7. Teachey DT, Obzut DA, Cooperman J, et al. The mTOR inhibitor
Haematologica | 107 October 2022 2302 ARTICLE - TACL2014-001 trial for relapsed childhood ALL S. Tasian et al.
SKT, LBS, JAW, and SRR designed and performed the re search, analyzed data, and wrote the clinical protocol and manuscript. JPL conducted experiments and analyzed data. RS, JM, and YC analyzed data and performed statis tical analyses. EO, ESS, KRS, RJH, PG, CMB, TMC, TWL, MLS, and ASW enrolled patients on study, contributed data, and edited the manuscript. All authors approved the final ver sion of the manuscript. .
1. Tasian SK, Teachey DT, Rheingold SR. Targeting the PI3K/mTOR pathway in pediatric hematologic malignancies. Front Oncol. 2014;4:108.
6. Chapuis N, Tamburini J, Cornillet-Lefebvre P, et al. Autocrine IGF-1/IGF-1R signaling is responsible for constitutive PI3K/Akt activation in acute myeloid leukemia: therapeutic value of neutralizing anti-IGF-1R antibody. Haematologica. 2010;95(3):415-423.
poside, a commonly used chemotherapy backbone regimen for patients with relapsed/refractory ALL, with a temsirolimus RP2D of 15 mg/m2/dose. Our small cor relative pharmacodynamic dataset also identified elev ated basal PI3K/mTOR phosphoprotein levels in all studied patients with seemingly dose-dependent in vivo signaling inhibition after temsirolimus being detected. The con tribution of temsirolimus to the responses observed in our study seems biologically plausible given known mTOR pathway activation in children with relapsed ALL and merits more detailed exploration in future larger studies.1,30 Future trials may also explore targeting of more proximal or multiple proteins in the PI3K/mTOR pathway or combination of mTOR inhibitors with other signaling pathway inhibitors, such as JAK- or ABL-targeted in hibitors31-33 with goals of improving deep remission rates and possibly less dependence on conventional cytotoxic chemotherapy to achieve cure.
SKT receives research funding from Incyte Corporation, Gi lead Sciences, and MacroGenics, has consulted for Kura Oncology, and is a scientific advisory board member at Aleta Biotherapeutics. LBS receives research funding from Servier and has received consulting fees from Takeda, Ser vier, and Syndax. JAW receives research funding from No vartis and Daichii for unrelated studies and consulting fees from Amgen. KRS receives consulting fees from Juno/BMS as a data safety monitoring board member for unrelated clinical trials. He has also received consulting fees from Jazz, Janssen, Incyte, and Novartis for unrelated studies. EO is a scientific advisory board member for Jazz Phar maceuticals and receives research and consulting funding from Servier Pharmaceuticals unrelated to this work. CMB receives research funding from Merck Sharp and Dohme for unrelated studies. TWL has received consulting funding from Novartis, P fizer, Loxo Oncology/Eli Lilly, Bayer, and Cellectis and research funding from Novartis, Pfizer, and Bayer. TMC receives consulting fees from Kura Oncology. He also acknowledges employment of spouse by Juno/Cel gene until August 2019 ASW receives research funding from
Contributions
Qualified researchers can request reasonable access to de-identified patient-level clinical data that support the manuscript and the clinical trial protocol from the cor responding author (SRR).
Kite Pharma and Institut de Recherches Internationales Servier. SRR receives research and consulting funding from Pfizer, Inc for this and unrelated studies. She also acknowl edges employment of spouse by OptiNose, Inc. The remain ing authors declare no financial conflicts of interest.
We gratefully acknowledge the patients and families who participated in the clinical trial. We acknowledge the TACL Consortium’s scientific contribution to and participation in this study, including participating member institutions, in vestigators, research teams, and the TACL Operations Center. We thank Mr. John Chukinas and Dr. David Hottman Allen at the Children’s Hospital of Philadelphia for assis tance with correlative biology studies.
21. Loh ML, Tasian SK, Rabin KR, et al. A phase 1 dosing study of ruxolitinib in children with relapsed or refractory solid tumors, leukemias, or myeloproliferative neoplasms: A Children's Oncology Group phase 1 consortium study (ADVL1011). Pediatr Blood Cancer. 2016;62(10):1717-1724.
15. Rheingold SR, Tasian SK, Whitlock JA, et al. A phase 1 trial of temsirolimus and intensive re-induction chemotherapy for 2nd or greater relapse of acute lymphoblastic leukaemia: a Children's Oncology Group study (ADVL1114). Br J Haematol. 2017;177(3):467-474.
14. Sun W, Malvar J, Sposto R, et al. Outcome of children with multiply relapsed B-cell acute lymphoblastic leukemia: a Therapeutic Advances in Childhood Leukemia & Lymphoma study. Leukemia. 2018;32(11):2316-2325.
28. Nguyen K, Devidas M, Cheng SC, et al. Factors influencing survival after relapse from acute lymphoblastic leukemia: a Children's Oncology Group study. Leukemia. 2008;22(12):2142-2150.
29. Buchmann S, Schrappe M, Baruchel A, et al. Remission, treatment failure, and relapse in pediatric ALL: an international consensus of the Ponte-di-Legno Consortium. Blood. 2022;139(12):1785-1793.
33. Hurtz C, Wertheim GB, Loftus JP, et al. Oncogene-independent BCR-like signaling adaptation confers drug resistance in Ph-like ALL. J Clin Invest. 2020;130(7):3637-3653.
32. Tasian SK, Teachey DT, Li Y, et al. Potent efficacy of combined PI3K/mTOR and JAK or ABL inhibition in murine xenograft models of Ph-like acute lymphoblastic leukemia. Blood. 2017;129(2):177-187.
23. Messinger YH, Gaynon PS, Sposto R, et al. Bortezomib with chemotherapy is highly active in advanced B-precursor acute lymphoblastic leukemia: Therapeutic Advances in Childhood Leukemia & Lymphoma (TACL) study. Blood. 2012;120(2):285-290.
9. Teachey DT, Sheen C, Hall J, et al. mTOR inhibitors are synergistic with methotrexate: an effective combination to treat acute lymphoblastic leukemia. Blood. 2008;112(5):2020-2023.
2015;126(8):964-971.
30. Fruman DA, Rommel C. PI3K and cancer: lessons, challenges and opportunities. Nat Rev Drug Discov. 2014;13(2):140-156.
Haematologica | 107 October 2022 2303 ARTICLE - TACL2014-001 trial for relapsed childhood ALL S. Tasian et al.
8. Houghton PJ, Morton CL, Kolb EA, et al. Initial testing (stage 1) of the mTOR inhibitor rapamycin by the pediatric preclinical testing program. Pediatr Blood Cancer. 2008;50(4):799-805.
CCI-779 induces apoptosis and inhibits growth in preclinical models of primary adult human ALL. Blood. 2006;107(3):1149-1155.
31. Tasian SK, Doral MY, Borowitz MJ, et al. Aberrant STAT5 and PI3K/mTOR pathway signaling occurs in human CRLF2rearranged B-precursor acute lymphoblastic leukemia. Blood. 2012;120(4):833-842.
27. Bagatell R, Norris R, Ingle AM, et al. Phase 1 trial of temsirolimus in combination with irinotecan and temozolomide in children, adolescents and young adults with relapsed or refractory solid tumors: a Children's Oncology Group Study. Pediatr Blood Cancer. 2014;61(5):833-839.
13. Reismuller B, Peters C, Dworzak MN, et al. Outcome of children and adolescents with a second or third relapse of acute lymphoblastic leukemia (ALL): a population-based analysis of the Austrian ALL-BFM (Berlin-Frankfurt-Munster) study group. J Pediatr Hematol Oncol. 2013;35(5):e200-204.
17. Le Tourneau C, Lee JJ, Siu LL. Dose escalation methods in phase I cancer clinical trials. J Natl Cancer Inst. 2009;101(10):708-720.
24. Parker C, Waters R, Leighton C, et al. Effect of mitoxantrone on outcome of children with first relapse of acute lymphoblastic leukaemia (ALL R3): an open-label randomised trial. Lancet. 2010;376(9757):2009-2017.
19. Borowitz MJ, Devidas M, Hunger SP, et al. Clinical significance of minimal residual disease in childhood acute lymphoblastic leukemia and its relationship to other prognostic factors: a Children's Oncology Group study. Blood. 2008;111(12):5477-5485.
26. Spunt SL, Grupp SA, Vik TA, et al. Phase I study of temsirolimus in pediatric patients with recurrent/refractory solid tumors. J Clin Oncol. 2011;29(21):2933-2940.
10. Crazzolara R, Cisterne A, Thien M, et al. Potentiating effects of RAD001 (everolimus) on vincristine therapy in childhood acute lymphoblastic leukemia. Blood. 2009;113(14):3297-3306.
16. Place AE, Pikman Y, Stevenson KE, et al. Phase I trial of the mTOR inhibitor everolimus in combination with multi-agent chemotherapy in relapsed childhood acute lymphoblastic leukemia. Pediatr Blood Cancer. 2018;65(7):e27062.
25. Hudes G, Carducci M, Tomczak P, et al. Temsirolimus, interferon alfa, or both for advanced renal-cell carcinoma. N Engl J Med. 2007;356(22):2271-2281.
12. Gaynon PS, Qu RP, Chappell RJ, et al. Survival after relapse in childhood acute lymphoblastic leukemia: impact of site and time to first relapse--the Children's Cancer Group experience. Cancer. 1998;82(7):1387-1395.
20. Borowitz MJ, Wood BL, Devidas M, et al. Prognostic significance of minimal residual disease in high risk B-ALL: a report from Children's Oncology Group study AALL0232. Blood.
18. Horton TM, Sposto R, Brown P, et al. Toxicity assessment of molecularly targeted drugs incorporated into multiagent chemotherapy regimens for pediatric acute lymphocytic leukemia (ALL): review from an international consensus conference. Pediatr Blood Cancer. 2010;54(7):872-878.
11. Chessells JM. Relapsed lymphoblastic leukaemia in children: a continuing challenge. Br J Haematol. 1998;102(2):423-438.
22. Raetz EA, Borowitz MJ, Devidas M, et al. Reinduction platform for children with first marrow relapse of acute lymphoblastic leukemia: a Children's Oncology Group Study [corrected]. J Clin Oncol. 2008;26(24):3971-3978.
Haematologica | 107 October 2022 2304 ARTICLE - Acute Lymphoblastic Leukemia
In up to 30% of T-ALL patients TAL1 expression is reacti vated via various mechanisms, including translocation, deletion, or non-coding mutations creating a de novo en hancer region close to TAL1.6,7 TAL1 belongs to the class II basic helix-loop-helix (bHLH) transcription factors which obligatory dimerizes with class I bHLH transcription fac tors called E proteins (E2A, HEB E and E2-proteins). TAL1 is known to play an important role in the regulation of normal embryonic and adult hematopoiesis, but is si lenced during normal T-cell development.8 Despite numerous studies on the function of TAL1 and its known transcriptional activities in hematopoietic progen itor cells, the exact mechanism by which TAL1 is impli
Prepublished: March 31, 2022.
1Center for Human Genetics, KU Leuven; 2Center for Cancer Biology, VIB and 3Leuven Cancer Institute (LKI), KU Leuven – UZ Leuven, Leuven, Belgium
Naomi Thielemans,1,2,3 Sofie Demeyer,1,2,3 Nicole Mentens,1,2,3 Olga Gielen,1,2,3 Sarah Provost1,2,3 and Jan Cools1,2,3
T-cell acute lymphoblastic leukemia (T-ALL) is an aggres sive disease and symptoms are mostly caused by high proliferation of leukemic blasts in the bone marrow, lead ing to failure of normal hematopoiesis. Treatment of T-ALL remains a challenge. Although children have a good prog nosis and a high chance of overall survival, this comes with important treatment toxicity leading to both shortand long-term side effect.1 Furthermore, adults and children with resistant or relapsed disease are often in curable. Therefore, further understanding of the patho genesis of T-ALL can lead to identification of new and specific therapeutic targets which can improve the sur vival and quality of life of these patients.
sequencing and RNA sequencing on 264 T-ALL samples defined eight different subgroups based on genomic re arrangements and/or ectopic expression of one specific transcription factor: TAL1, TAL2, TLX1, TLX3, HOXA, LMO1/LMO2, LMO2/LYL1 and NKX2-1.5 In these classifica tions, each subgroup correlates to a differentiation arrest at specific stages of normal T-cell development.3
Accepted: March 22, 2022.
Abstract
Received: July 28, 2021.
https://doi.org/10.3324/haematol.2021.279718
Correspondence: J. jan.cools@kuleuven.beCools
©2022 Ferrata Storti Foundation
Haematologica material is published under a CC BY-NC license
TAL1 cooperates with PI3K/AKT pathway activation in T-cell acute lymphoblastic leukemia
Based on gene expression profiling and molecular genetic analysis, T-ALL cases were initially classified into five major subgroups.2,3 Homminga et al. identified an addi tional subgroup represented by aberrant expression of NKX2-1 4 Genomic characterization based on whole-exome
TAL1 is ectopically expressed in about 30% of T-cell acute lymphoblastic leukemia (T-ALL) due to chromosomal rearrange ments leading to the STIL-TAL1 fusion genes or due to non-coding mutations leading to a de novo enhancer driving TAL1 expression. Analysis of sequence data from T-ALL cases demonstrates a significant association between TAL1 expression and activating mutations of the PI3K-AKT pathway. We investigated the oncogenic function of TAL1 and the possible co operation with PI3K-AKT pathway activation using isogenic pro-T-cell cultures ex vivo and in vivo leukemia models. We found that TAL1 on its own suppressed T-cell growth, in part by affecting apoptosis genes, while the combination with AKT pathway activation reduced apoptosis and was strongly driving cell proliferation ex vivo and leukemia development in vivo. As a consequence, we found that TAL1+AKTE17K transformed cells are more sensitive to PI3K-AKT pathway inhibition compared to AKTE17K transformed cells, related to the negative effect of TAL1 in the absence of activated PI3K-AKT signaling. We also found that both TAL1 and PI3K-AKT signaling increased the DNA-repair signature in T cells resulting in synergy between PARP and PI3K-AKT pathway inhibition. In conclusion, we have developed a novel mouse model for TAL1+AKTE17K driven T-ALL development and have identified a vulnerability of these leukemia cells to PI3K-AKT and PARP inhibitors.
Introduction
Cells were lysed in cold lysis buffer containing 5 mM Na3VO4 and protease inhibitors (complete EDTA-free), antibodies used for western blotting: TAL1 (Santa Cruz393287), p-AKT (CST Ser473 D9E 4060); AKT (Thermo MA5-14916), p-GSK3β (CST 5558), GSK3β (Merck Milipore 05-412), β-Actin (Sigma Aldrich A5441). Secondary anti bodies: anti-rabbit IgG (CST 7074), anti-mouse IgG (Cytiva, NA931).
Laboratory animals and mouse bone marrow transplantation assays
RNA-sequencing and analysis
despite leukemia development in these elegant mouse models, more complete genomic and transcrip tomic data on T-ALL have not supported an important role for deregulated LMO1 or LMO2 expression in TAL1 positive T-ALL. In contrast, it has become clear that PTEN deletion and variant mutations leading to PI3K-AKT pathway acti vation are very common in TAL1 expressing T-ALL, while these are less frequent in the other T-ALL subgroups.6,16-18 We present here novel in vivo and ex vivo mouse models for TAL1/AKT driven T-ALL development and use these models to identify novel vulnerabilities in these leukemias.
Methods
All mice were monitored daily and housed in individually ventilated cages cages in specific pathogen free (SPF) or semi-SPF conditions in the KU Leuven animal facility. Mouse experiments were approved and supervised by the KU Leuven ethical committee (ECD P013/2018).
RNA was extracted from tissue and cells using the Max well 16 LEV Simply RNA purification kit (Promega). Nextgeneration sequencing libraries were constructed from 500 ng of total RNA, using the Truseq RNA sample prep kit v2 (Illumina) and subjected to 150 bp single-end se quencing on a HiSeq 4000 instrument (Illumina). The se quencing data was then processed with our in-house pipeline, which consist of cleaning the data with fastqmcf, performing a quality control with FastQC and map ping to the Mus musculus reference genome (mm10) with HISAT2. Subsequently, htseq-count was applied to count the number of reads per gene and a differential gene ex pression analysis was performed with the R-package DESeq2. The output of this DESeq2 algorithm was used to construct ranked gene lists with a ranking value calcu
Haematologica | 107 October 2022 2305 ARTICLE - TAL1 cooperation with PI3K-AKT pathway mutations N. Thielemans et al.
duced with retroviral vectors for expression of the genes of interest, with MSCV-based vectors giving constitutive expression or inducible expression based on inversion of a floxed region in the viral vector as described previously.19 Cells were injected via tail vein injection into sublethal ir radiated (5Gy) female recipients C57BL/6 mice. Leukemia development was followed by blood collection from the facial vein every 2 weeks. Secondary and tertiary trans plants were performed through injection of malignant cells via tail vein into irradiated (2.5 Gy) female recipients C57BL/6 mice recipient mice. Mice were sacrificed when white blood cell count was over 25,000/µL, when they lost 10% of initial weight or other signs of severe morbidity.
cated in T-ALL development is still poorly characterized. A first transgenic mouse models with TAL1 expression under control of the T-cell specific LCK promotor devel oped T-cell malignancy with a very long latency and low penetrance,9 and TAL1 expression under control of lym phoid specific CD2 promotor did not cause any disease.10 These findings suggested that additional mutations were needed in addition to TAL1 expression to cause T-cell ma lignancy. Subsequently, several mouse models were de veloped that focused on the potential cooperation between TAL1 and LMO1 or LMO2 expression, because coexpression between TAL1 and LMO1 or LMO2 was reported in human T-ALL.11 These models were successful and Lar son et al. reported leukemia development in a Tal1/Lmo2 transgenic mice and Tatarak et al. reported rapid devel opment of T-ALL upon thymic expression of Tal1 and Lmo1 12-13 Moreover, in the majority of the leukemias spon taneous mutations in Notch1 were identified. Tremblay and colleagues generated Notch1/Tal1/Lmo1 triple trans genic mice and reported that these animals developed leukemia with shorter latency compared to single or double transgenic animals.14 CD4/CD8 double negative cells from Notch1/Tal1/Lmo1 triple transgenic mice were able to induce T-ALL in secondary recipient animals with high efficiency compared with Tal1/Lmo1 double trans genic mice. A subsequent study further suggested that Notch1 drives self-renewal of thymocytes from the Tal1/Lmo1 mouse model via its target genes Hes1 and Myc However,.15
Bone marrow transplantation was performed with hema topoietic stem/progenitor cells harvested from male rosa26 CD2cre C57BL/6 mice. These cells were trans
Primary mouse pro-T-cell cultures
Pro-T cell cultures were established as described.18,20 Hematopoietic stem and progenitor cells (HSPC) were iso lated from Rosa26-CreER knockin or Cas9 knockin trans genic mice. CreER cells have a tamoxifen-inducible Cre-mediated recombination system,21 while the Cas9 cells were used to inactivate genes with guide RNA, as described previously.22 Pro-T cells were cultured on DLL4coated plates in RPMI media containing 20% fetal bovine serum (FBS), primocin (100 µL/mL), IL7 and SCF (both 20 ng/mL). Pro-T cells were spinfected with retroviral con structs. Growth was followed over time by measuring growth density and percentage of fluorescent cells.
Western blotting
TAL1 positive cases show high expression of LMO1 or LMO2, with only five TAL1 positive cases harboring a gen etic alteration of LMO2.5,27 Overall, expression of LMO1/LMO2 was not significantly different in the TAL1 sub group compared to other subgroups, indicating that no in creased expression of LMO1/LMO2 factors is required in the TAL1 subgroup (Figure 1A).
TAL1 cooperates with PI3K activating mutations in driving T-cell acute lymphoblastic leukemia in vivo Here we used a bone marrow transplant model to deter mine the oncogenic potency of TAL1 and activated PI3KAKT signaling (by expressing AKTE17K, an active AKT mutant) alone or in combination to induce T-ALL development in vivo
Different T-ALL cell lines (both TAL1 positive and TAL1 negative) were cultured in RPMI containing 20% FBS. For drug treatment, cells were seeded at 1-4x10⁵ cells/mL in 96 well plates (100 µL/well). Pro-T cells were cultured as described above and seeded at 5x10⁵ cells/mL in 96 well plates (100 µL/well). Leukemia mouse thymus cells were cultured ex vivo in RPMI containing 20% FBS with IL7, stem cell factor and primocin and seeded at 3x10³cells/mL in 96 well plates (100 µL/well). Dactoslibib, MK-2206 or di methyl sulfoxide (Sigma Aldrich), Olaparib (MedChemEx press) were dispensed at the desired concentrations using a Tecan D300e Digital Dispenser. Experiments were per formed as biological triplicates. Cell viability was measured after 48 hours (h) (cellines) or 24 h (pro-T cells and thymic cells) of drug treatment with the ATPlite Lumi nescence Assay System kit (PerkinElmer) on a VICTOR Multilabel Plate Reader (PerkinElmer).
The Liu et al. study contains the most complete data on mutations, expression and copy number variation and shows that 55% of all TAL1 positive cases harbor an acti vating mutation in the PI3K-AKT pathway (Figure 1B).5 The majority (69%) of these cases have a deletion, frameshift or nonsense mutation in PTEN and other cases have mu tations in the PI3K complex or in AKT1 or AKT2 genes. Analysis of the expression data of these cases confirmed increased expression of PI3K-AKT pathway associated genes in the cases with PTEN inactivation or other PI3KAKT pathway mutations compared to the TAL1-positive cases without such mutations (Figure 1C), indicating stronger PI3K-AKT pathway activation in the TAL1 cases with PI3K-AKT-PTEN mutations compared to the other TAL1-positive cases.
Haematologica | 107 October 2022 2306 ARTICLE - TAL1 cooperation with PI3K-AKT
We re-analyzed sequencing data from >500 T-ALL pa tients from Belgian (n=155), Chinese (n=130) and American (n=264) T-ALL cohorts.5,27,28 In all studies, there was a clear association between TAL1 expression and activating mu tations in the PI3K-AKT pathway (Figure 1B). In contrast, mutations in the JAK-STAT and RAS pathways were found to be rare in TAL1 positive T-ALL, but more frequent in the other T-ALL subgroups (Figure 1B).
Drug treatment experiments
lated as -sign(log2FC)*log(padj). Ranked gene set enrich ment analyses were performed with the BROAD gene set enrichment analysis (GSEA) software. Multiple gene sets were used, such as the KEGG pathway database, the hall mark gene sets from MSigDB, and several in-house gene sets.
The statistical analysis were performed using Graphad Prism 8. Results were considered statistically significant at P<0.05. The appropriate statistical test are specified in the figure legends. Limiting dilution analysis of mouse leukemia cells was calculated using the free ELDA soft ware (https://bioinf.wehi.edu.au/software/elda/).23
In order to study the role of TAL1 in T-ALL and its associ ation with other gene expression or mutations, we reana lyzed genomic and transcriptomic data from previous studies. TAL1 expression is high in up to 30% of T-ALL cases due to chromosomal rearrangements (STIL-TAL1 fusion or translocations involving TAL1 ) or due to noncoding mutations that create a de novo enhancer up stream of the TAL1 promoter (Figure 1A).5-7 Historically, studies on TAL1 have focused on the cooperation between TAL1 and LMO2 since initial studies reported rearrange ment of both TAL1 and LMO2 in (rare) T-ALL samples and TAL1 is regularly co-expressed with LMO1 or LMO2 in TALL cell lines.24-26 However, recent transcriptomic data from large T-ALL cohorts showed that only a minority of
TAL1-positive T-cell acute lymphoblastic leukemia patients frequently harbor hyperactivating mutation of the PI3K pathway
When. using a retroviral vector to constitutively express TAL1 together with AKTE17K in HSPC of C57BL/6 mice, this led to leukemic disease with variable immunophenotype with both myeloid and lymphoid markers (data not shown). In this way, no T-ALL model could be generated and could reflect the fact that we are not targeting the right cell of origin to obtain T-ALL. In order to overcome this problem, we set up a bone marrow transplant assay using our recently developed Cre-inducible retroviral vec tor in which oncogene expression can be limited to spe cific cell types when used in combination with transgenic Cre mice (Figure 2A).19 In order to get lymphoid-restricted expression of the oncogenes, we isolated HSPC from CD2Cre mice and transduced these cells with the inducible pathway
Statistics and other methods
Interestingly, several studies have indicated that TAL1 positive T-ALL cases often harbor PTEN deletions.5,16-17,27-29
Results
mutations N. Thielemans et al.
Strikingly, only the TAL1+AKTE17K lymphoma cells were transplantable to secondary mice and caused leukemia with leukocytosis in secondary recipients, while the AKTE17K lymphoma cells were not transplantable (Figure 3A). Immunophenotype in the secondary recipients was again CD4+CD8+, and white blood cell counts were now elevated in all secondary recipients of TAL1+AKTE17K trans formed cells (Figure 3B to D). These data indicate that AKT pathway activation in lymphoid progenitor cells is suffi cient to activate proliferation and survival pathways, but that TAL1 expression is required to induce more stem cell properties. TAL1+AKTE17K lymphoma cells were transplant able to secondary mice even when only 50,000 cells were transplanted, but only rarely when 25,000 cells were transplanted, resulting in an estimate of 1/40,000 leuke mia initiating cells (LIC).
Figure 1. Aberrant expression of TAL1 co-occurs with PI3K pathway mutations in T-cell acute lymphoblastic leukemia patients. (A) Violin plots showing expression of TAL1, LMO2 and LMO1 in different T-cell acute lymphoblastic leukemia (T-ALL) patient sub groups (Mullighan data set). (B) Distribution of hyperactivation of signaling pathways in TAL1 and non-TAL1 subgroups in two pa tient cohorts: (USA) Liu data set 87/264 (33%) and (China) Chen data set 56/130 (43%). Using Fisher’s exact test, P-values were calculated for testing significance of positive association between TAL1 subgroup and hyperactivation of different pathways. (C) Gene set enrichment analysis showing significant positive enrichment of PI3K pathway in TAL1 patients harboring PI3K-AKTmTOR pathway mutation compared to TAL1 pathways without associated mutations. TAL1 cooperation with PI3K-AKT pathway mutations Thielemans
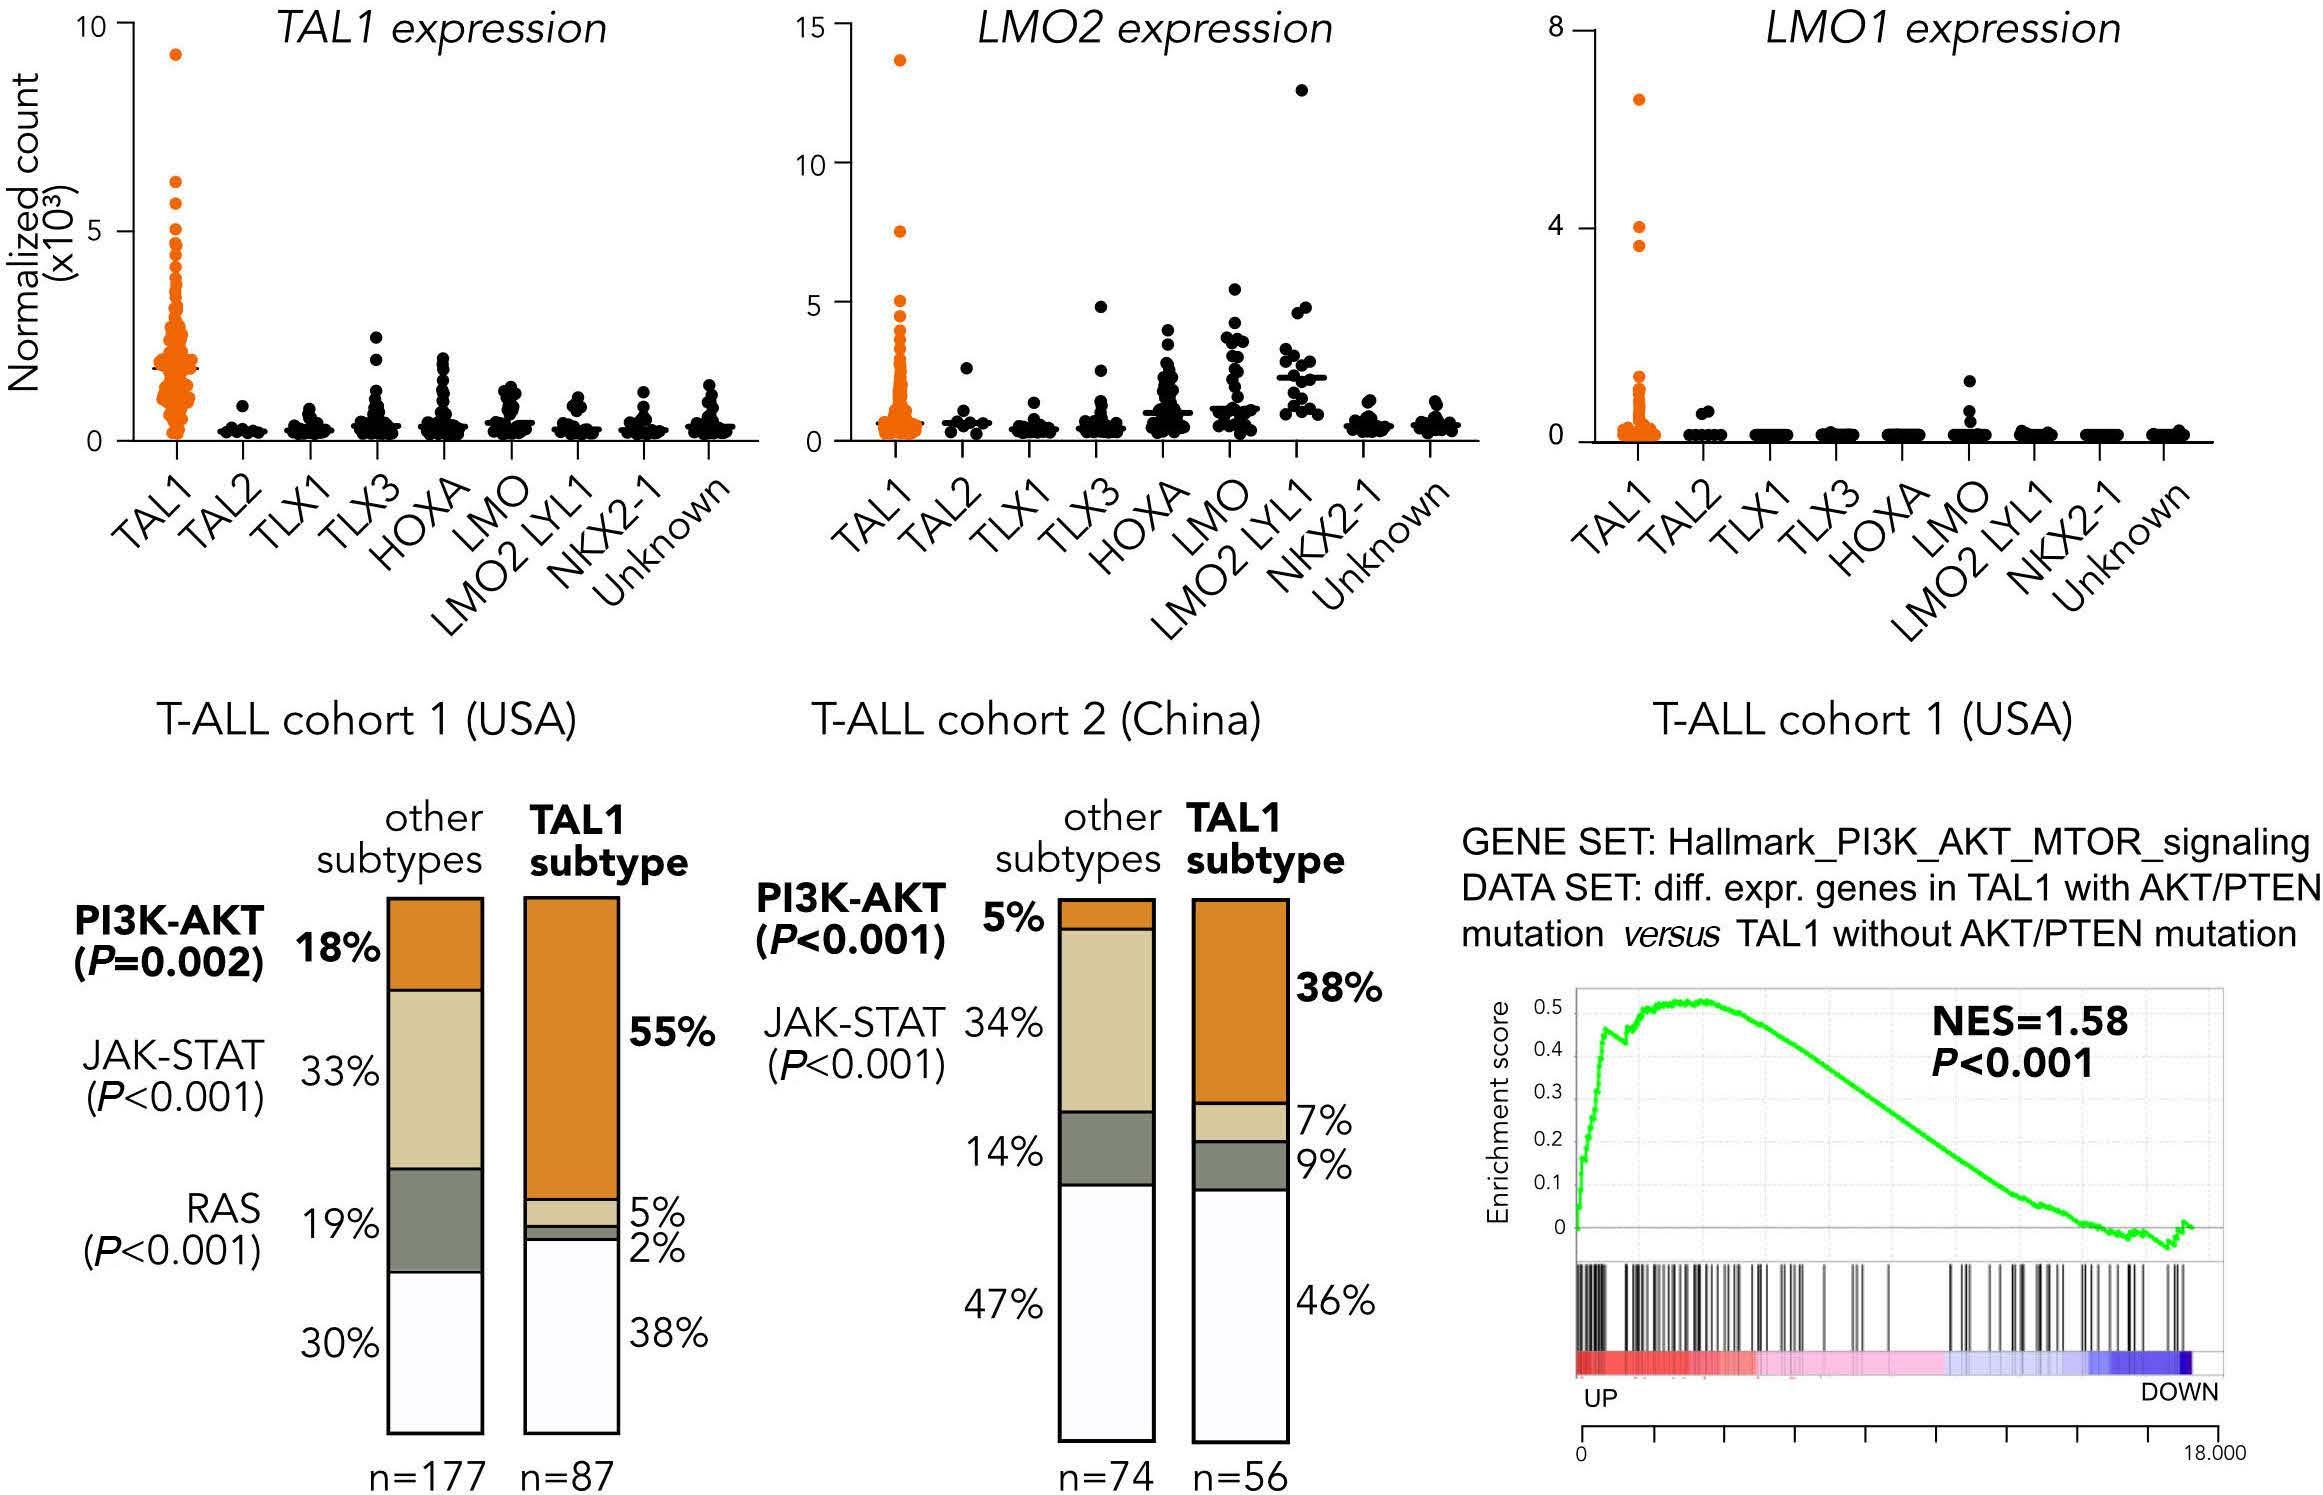
retroviral vectors containing TAL1 or AKTE17K or TAL1+AKTE17K The transduced cells were injected in sub-lethally irradi ated wild-type recipient mice to follow disease devel opment over time (Figure 2A).
Transplantation of TAL1-transduced cells did not cause any disease. In contrast, transplantation of cells expressing AKTE17K alone caused T-cell lymphoblastic lymphoma with an average latency of 83 days (Figure 2B). Expression of TAL1+AKTE17K also caused T-cell lymphoblastic lymphoma with a similar latency as AKTE17K alone (average 89 days). These animals did not show elevated white blood cell count and almost no mice had infiltration of peripheral or gans such as blood, spleen, liver and bone marrow (Figure 2C and D; Online Supplementary Figure S1). Sporadically, mice had infiltration of leukemic cells in the spleen and bone marrow, but always below 20%. The lymphoma cells were late cortical stage (CD4+CD8+) T cells in both con ditions and the disease was oligoclonal as determined by expression of a limited set of variable regions of the T-cell receptors α and β (Online Supplementary Figure S2). Despite the similar disease latency, there were marked differences between TAL1+AKTE17K and AKTE17K driven lym phoma. TAL1 expression was confirmed at protein level in
N.
lymphoma cells of TAL1+AKTE17K mice (Figure 2E). Lym phoma cells of the TAL1+AKTE17K condition expressed CD25, a marker of activated T cells, which was absent in AKTE17K lymphoma cells (Figure 2F). Moreover, TAL1+AKTE17K cells showed increased expression of TRIB2, a gene known to be implicated in TAL1 positive T-ALL,30 as well as of IKZF2 and LMO4 (Figure 2G).
BA C Haematologica | 107 October 2022 2307 ARTICLE -
et al.
Figure 2. TAL1 expression and PI3K-AKT activating mutations cooperate in driving T-cell malignancies. (A) Scheme of bone mar row transplantation set-up. We used inducible vectors (indicated as ‘i’) with constructs of interest initially cloned in antisense orientation flanked by two inverted loxP sites. Hematopoietic stem and progenitor cells (HSPC) were isolated from the bone marrow of CD2-Cre donor mice, followed by retroviral transduction with empty vector (EV), inducible TAL1, inducible AKTE17K or inducible TAL1+AKTE17K. HSPC were checked for transduction efficiencies (based on green fluorescent protein [GFP] that is always expressed; blue fluorescent proteinn [BFP] only becomes expressed in lymphoid cells) but were not sorted prior to injection into irradiated recipient mice. (B) Survival plot showing disease-free survival (DFS) of mice which were primary transplanted with above mentioned constructs P-values were calculated with Gehan-Breslow-Wilcoxon test. (C and D) Plots showing thymus weight (C) and white blood cell (D) count at time of sacrifice. P-values were calculated using the one-way ANOVA with Tukey correction to account for multiple comparisons. (E) Protein expression of TAL1 and PI3K pathway components in thymus’ cells of sacrificed mice. (F) Flow cytometry analysis of bone marrow and thymus at time of sacrifice- BFP y-axis; GFP x-axis. Thymus lymphoma cells of AKTE17K mice (BFP + GFP double positive) and TAL1+AKTE17K (GFP only) were stained for CD8 (APC-eFluor 780, X-axis) and CD4 (PE-Cy7, Y axis) and stained for CD25 (APC, X-axis) and CD44 (PerCP-Cy5, Y-axis). (G) Violin plots showing ex pression of Trib2, Ikzf2 and Lmo4 in lymphoma cells of AKTE17K and TAL1-AKTE17K mice. P-values were calculated using unpaired t test.
BA C D E F G Haematologica | 107 October 2022 2308 ARTICLE - TAL1 cooperation with PI3K-AKT pathway mutations N. Thielemans et al.
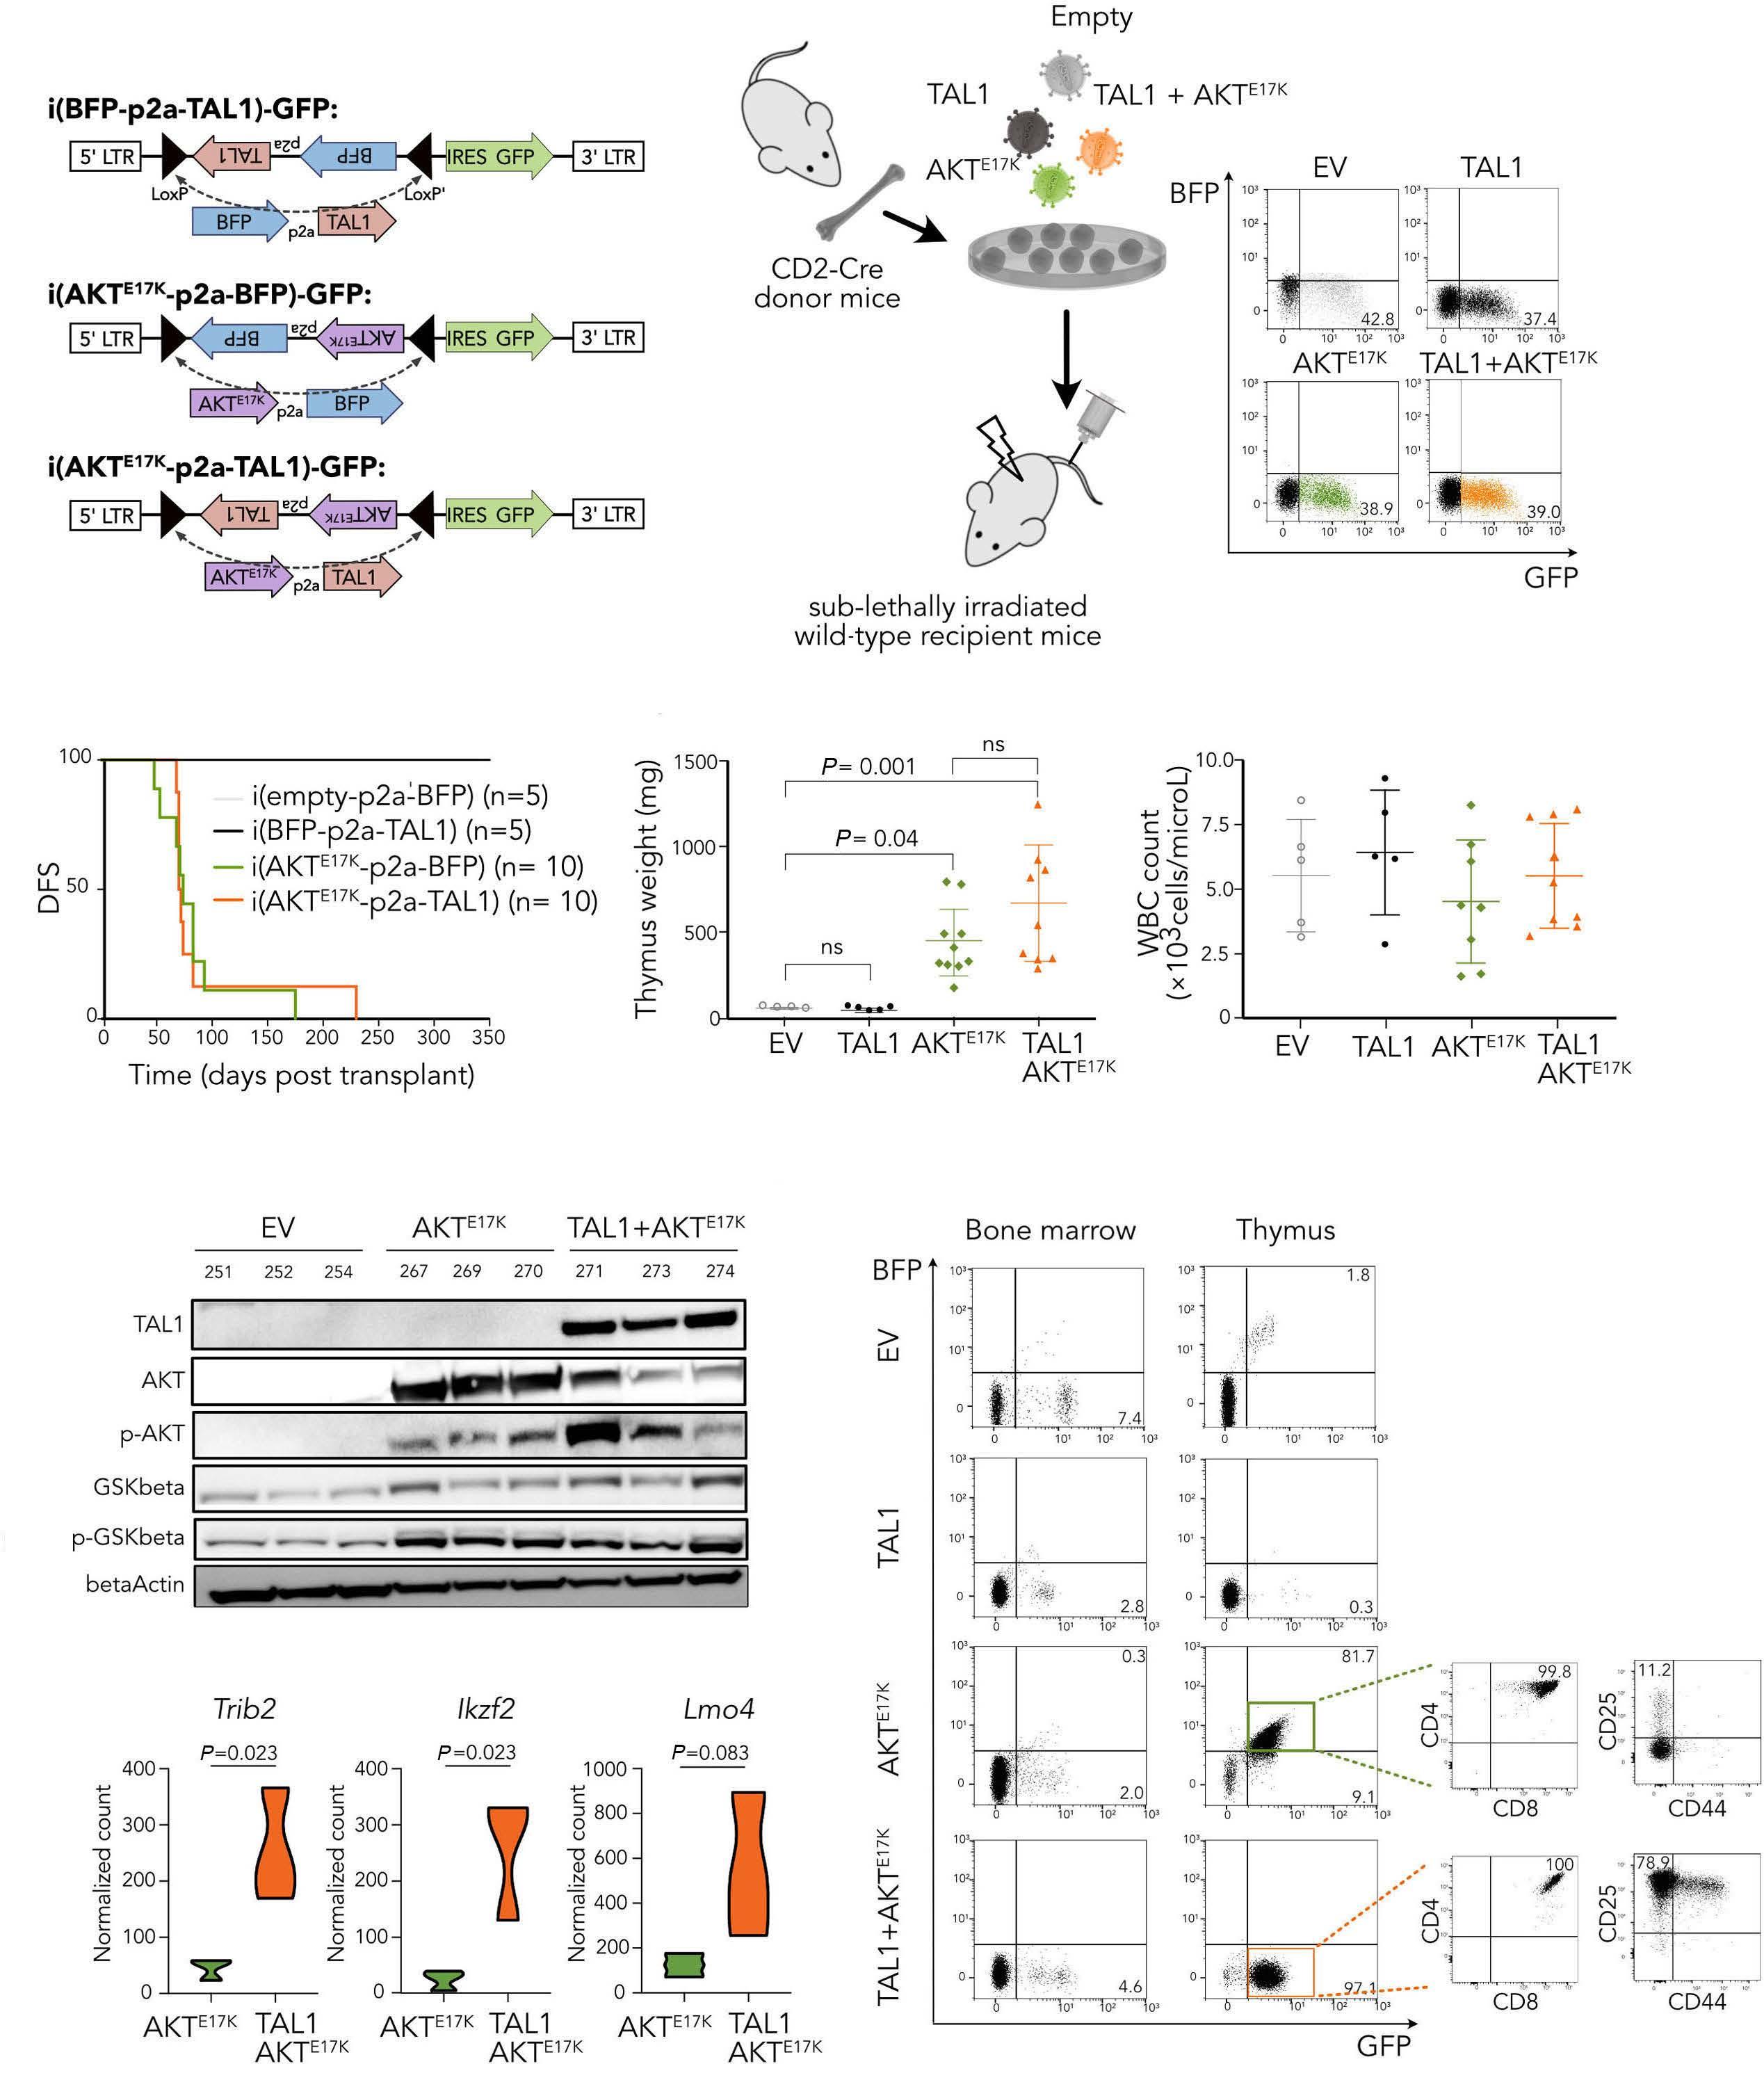
Expression of TAL1 in pro-T cells leads to growth disadvantage which can be rescued by AKTE17K or Ptendel In order to study the effects of TAL1 with and without coexpression of AKTE17K we used ex vivo mouse pro-T-cell cul tures in which TAL1 expression could be induced at a specific time point. For this, pro-T cells were derived from CreER-recombinase transgenic mice and cultured in the presence of Scf, Il7 and immobilized Dll4, as described pre viously18 (Figure 4A). These pro-T cells were transduced with inducible retroviral vectors containing either TAL1, AKTE17K or TAL1+AKTE17K cloned in the antisense orientation between mutant LoxP sites to make the expression inducible19 (Fig ure 4B). Green fluorescent protein (GFP) was constitutively expressed from these vectors, while blue fluorescent pro tein (BFP) was expressed together with TAL1 or AKTE17K, but no additional fluorescent protein was present when both TAL1 and AKTE17K were co-expressed (Figure 4B). Different treatment conditions with 4OH-tamoxifen were tested to determine the best recombination efficiency (Online Sup plementary Figure 3A). Treatment of these cells with 1 µM 4OH-tamoxifen successfully induced inversion of the DNA between the mutant LoxP sites resulting in the expression of the inserted cDNA (Online Supplementary Figure 3B). Induced expression of TAL1 (determined by BFP ex pression) led to a selective growth disadvantage with the
percentage of TAL1 expressing pro-T cells decreasing over time (Figure 4C). This growth disadvantage could be over come by constitutive expression of AKTE17K (+mCherry) in the pro-T cells. The AKTE17K + TAL1 double positive pro-T cells became the major clone over time in these cultures (determined by BFP and mCherry expression) (Figure 4C). In order to further characterize this negative effect of TAL1 expression and the rescue by AKT pathway activation, we generated isogenic pro-T cells with inducible expression of TAL1, AKTE17K or TAL1+AKTE17K and followed these cultures in the presence or absence of induction by absolute cell counts. Induction of TAL1 caused again a growth disadvan tage as cell numbers were lower than in uninduced cells (Figure 4D). Induced expression of AKTE17K provided a growth advantage to the cells and induction of TAL1+AKTE17K provided an even stronger growth advantage, indicating that TAL1 expression cooperated with AKTE17K to drive stronger proliferation in these pro-T cell cultures (Figure 4D). Furthermore, pro-T-cells expressing TAL1+AKTE17K showed IL7 independent growth with also here TAL1+AKTE17K double positive cells becoming the pre dominant clone over time (Figure 4E).
In order to verify that Pten inactivation had similar effects compared to AKTE17K, we also repeated these experiments using pro-T cells derived from Cas9 transgenic mice and
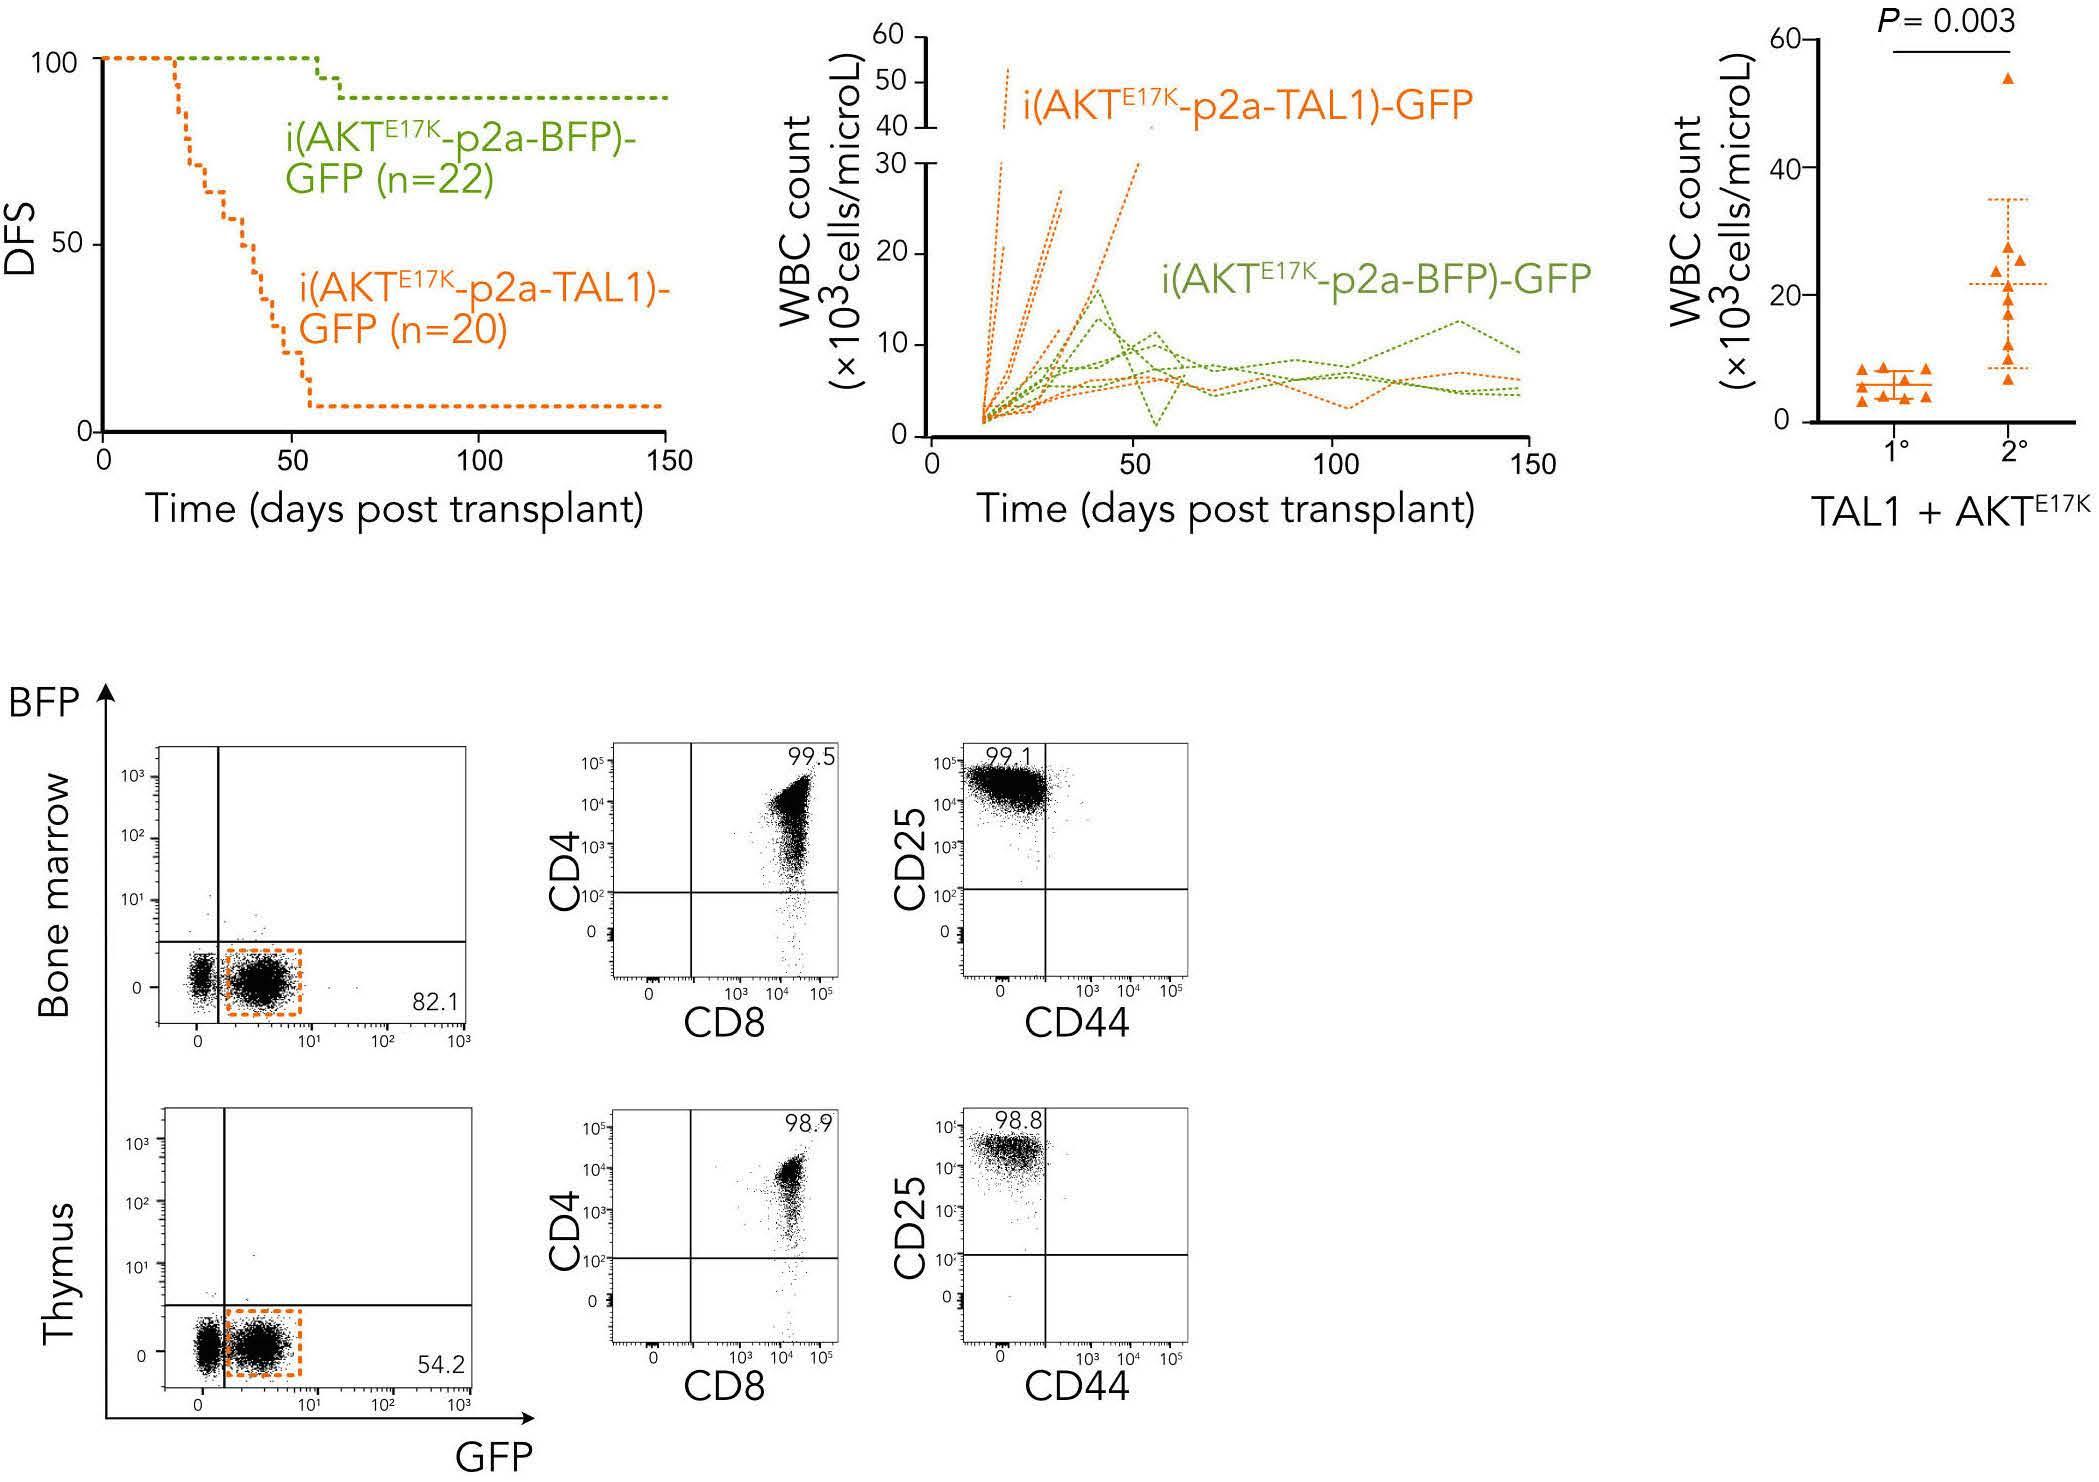
A B C D Haematologica | 107 October 2022 2309 ARTICLE - TAL1 cooperation with PI3K-AKT pathway mutations N. Thielemans et al.
Figure 3. TAL1-AKTE17K malignant cells are transplantable. (A) Survival plot showing disease-free survival (DFS) of secondary recipient mice transplanted with thymic lym phoma cells of the primary mouse models. P-value was calculated with Gehan-Breslow-Wilcoxon test. (B) White blood cell count of secondary transplanted mice fol lowed over time. (C) White blood cell count of TAL1AKTE17K mice: primary transplantation compared to secondary transplantation. P-value was calculated using unpaired t-test. (D) Flow cytometry analysis of periph eral blood, bone marrow, spleen and thymus of second ary transplanted mice (m133 – primary m119). Green fluorescent protein (GFP)-positive cells were stained as in Figure 2F.
we inactivated Pten via retroviral transduction of a Pten targeting gRNA. These cells showed again the TAL1 growth disadvantage, which could be rescued by Pten inactivation (Online Supplementary Figure S3C). Palamarchuk et al. showed that the TAL1 protein can be phosphorylated by AKT at a threonine residue at position 90, leading to inhibition of its repressor activity.31 In order to test whether via this mechanism TAL1 growth disadvan tage can be rescued, we performed polymerase chain re
A B DC E Haematologica | 107 October 2022 2310 ARTICLE - TAL1 cooperation with PI3K-AKT pathway mutations N. Thielemans et al.
Figure 4. TAL1 expressing pro-T cells show a growth disadvantage, which can be rescued by co-expressing mutant AKT. (A) Scheme of ex vivo pro-T-cell culture derived from Cre-ER mice, requiring interleukin-7 (IL7), stem cell factor (SCF) and immobi lized Delta-like ligand 4 (DLL4) for proliferation. (B) Pro-T cells were transduced with inducible retroviral constructs for expression of TAL1, AKTE17K or TAL1+AKTE17K. Pro-T cells were sorted for green fluorescent protein (GFP) and treated with 1 mM 4-OH tamoxifen for 48 hours to activate Cre-ER and induce LoxP-mediated inversion and expression of the oncogenes. Constructs having TAL1 and AKTE17K become blue fluorescent protein (BFP)-positive, indicating the construct has successfully flipped. The construct con taining both TAL1 and AKTE17K does not contain BFP. (C) The percentages of each population in pro-T cells having TAL1 or TAL1+AKTE17K were followed over time (BFP) cells when co-expression with mutant AKT (mcherry). Co-transduced cells in which the constructs were flipped become the largest population (BFP + mcherry). (D) Cell densities (mean +/- standard deviation) over time for different proT-cells conditions. (E) Cell densities (mean with standard deviation), as measure of absolute prolifer ation, were measured over time for different pro-T cell conditions: TAL1, AKTE17K, TAL1+AKTE17K and WT empty control. F, TAL1AKTE17K expressing pro-T cells were able to grow in the absence of IL7.
action (PCR) mutagenesis to create TAL1T90A and TAL1T90D mutants. TAL1T90D would mimic the phosphorylated form of TAL1, while TAL1T90A would prevent phosphorylation and mimic the unphosphorylated form of TAL1. However, growth of the pro-T cells was still negatively affected by TAL1T90D or TAL1T90A and their survival could still be rescued by AKTE17K. Both observations indicate that phosphorylation of TAL1 by AKT at Thr90 is not the major mechanism of coop eration (Online Supplementary Figure 3D).
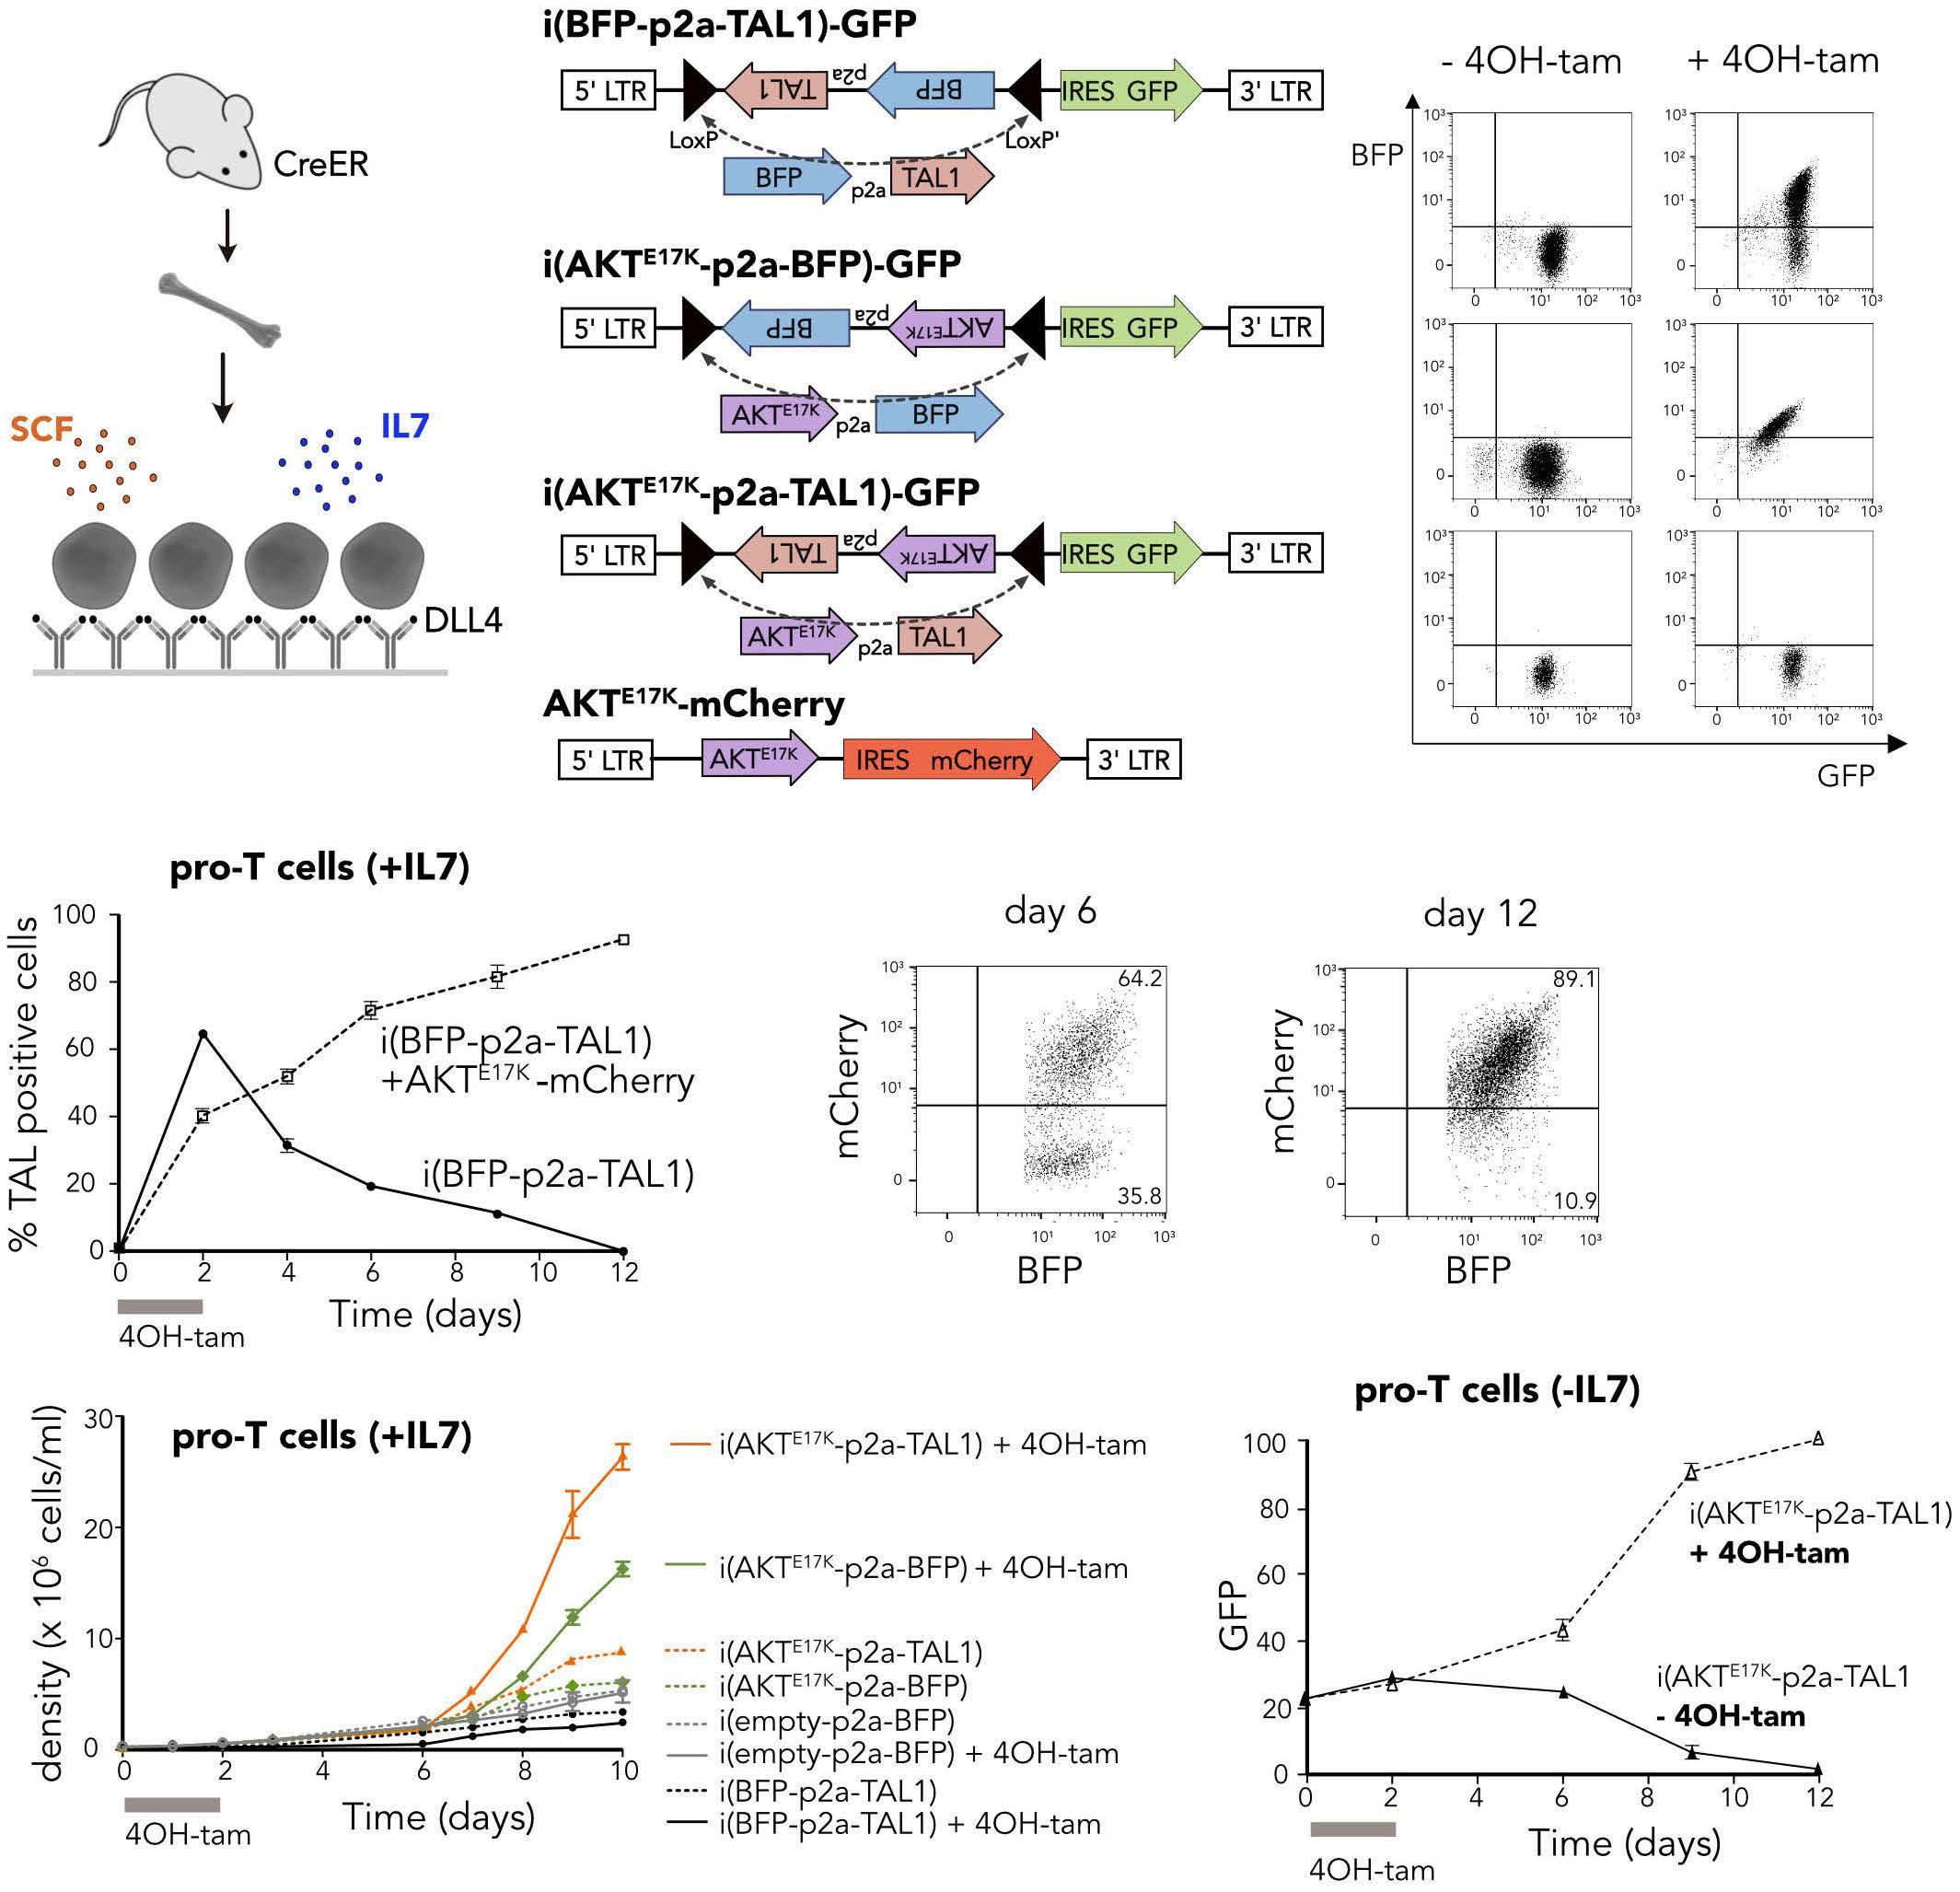
When performing a constitutive bone marrow transplan tation with TAL1 compared to empty vector, we observed that when TAL1 was constitutively expressed in the ab sence of AKT signaling, the TAL1-positive cells were in itially engrafted, but showed lower numbers in bone marrow and blood compared to empty vector and were slowly disappearing over time (Figure 5A), indicating that TAL1 cannot induce leukemia on its own, and could even be a negative factor suppressing hematopoietic growth.
We used the inducible TAL1 expression in the pro-T cells to
extract RNA on different times points after induction. Pro-T cells with induced TAL1 expression were sorted for GFP and RNA was extracted at 0, 6, 12, 18 and 24 h after treatment with 1 µM 4OH tamoxifen (Figure 5B). Expression of TAL1 was confirmed by western blotting (Figure 5C). Six hours after induction of TAL1 expression there was no significant dif ference in gene expression compared to uninduced cells, but at 12 h of induction the first gene expression changes were observed that were further enhanced at 18 and 24 h after induction (Figure 5D). At time point 18 h and 24 h there was upregulation of known TAL1 target genes such as Runx1 and Gata3, as well as strong signatures of E2f target genes and Myc target genes. In agreement with immunophenotype of TAL1+AKTE17K thymic cells, a significant upregulation of IL2ra (CD25) was observed at all time points.
TAL1 induces growth disadvantage by upregulating pro-apoptotic genes
Interestingly, at 18 h and 24 h after induction of TAL1 there was upregulation of cell-cycle and proliferation markers (upregulation of Cdk1, Hes1, Nmyc, Mki67; downregulation of
In order to get insight in the mechanism of TAL1-induced growth disadvantage and rescue mechanism of PI3K-AKT pathway hyperactivation we performed gene expression profiling on TAL1 expressing pro-T cells and on TAL1 trans duced T cells from the mouse model and in TAL1+AKTE17K lymphoma cells.
Continued on following page. CBA D Haematologica | 107 October 2022 2311 ARTICLE - TAL1 cooperation with PI3K-AKT pathway mutations N. Thielemans et al.
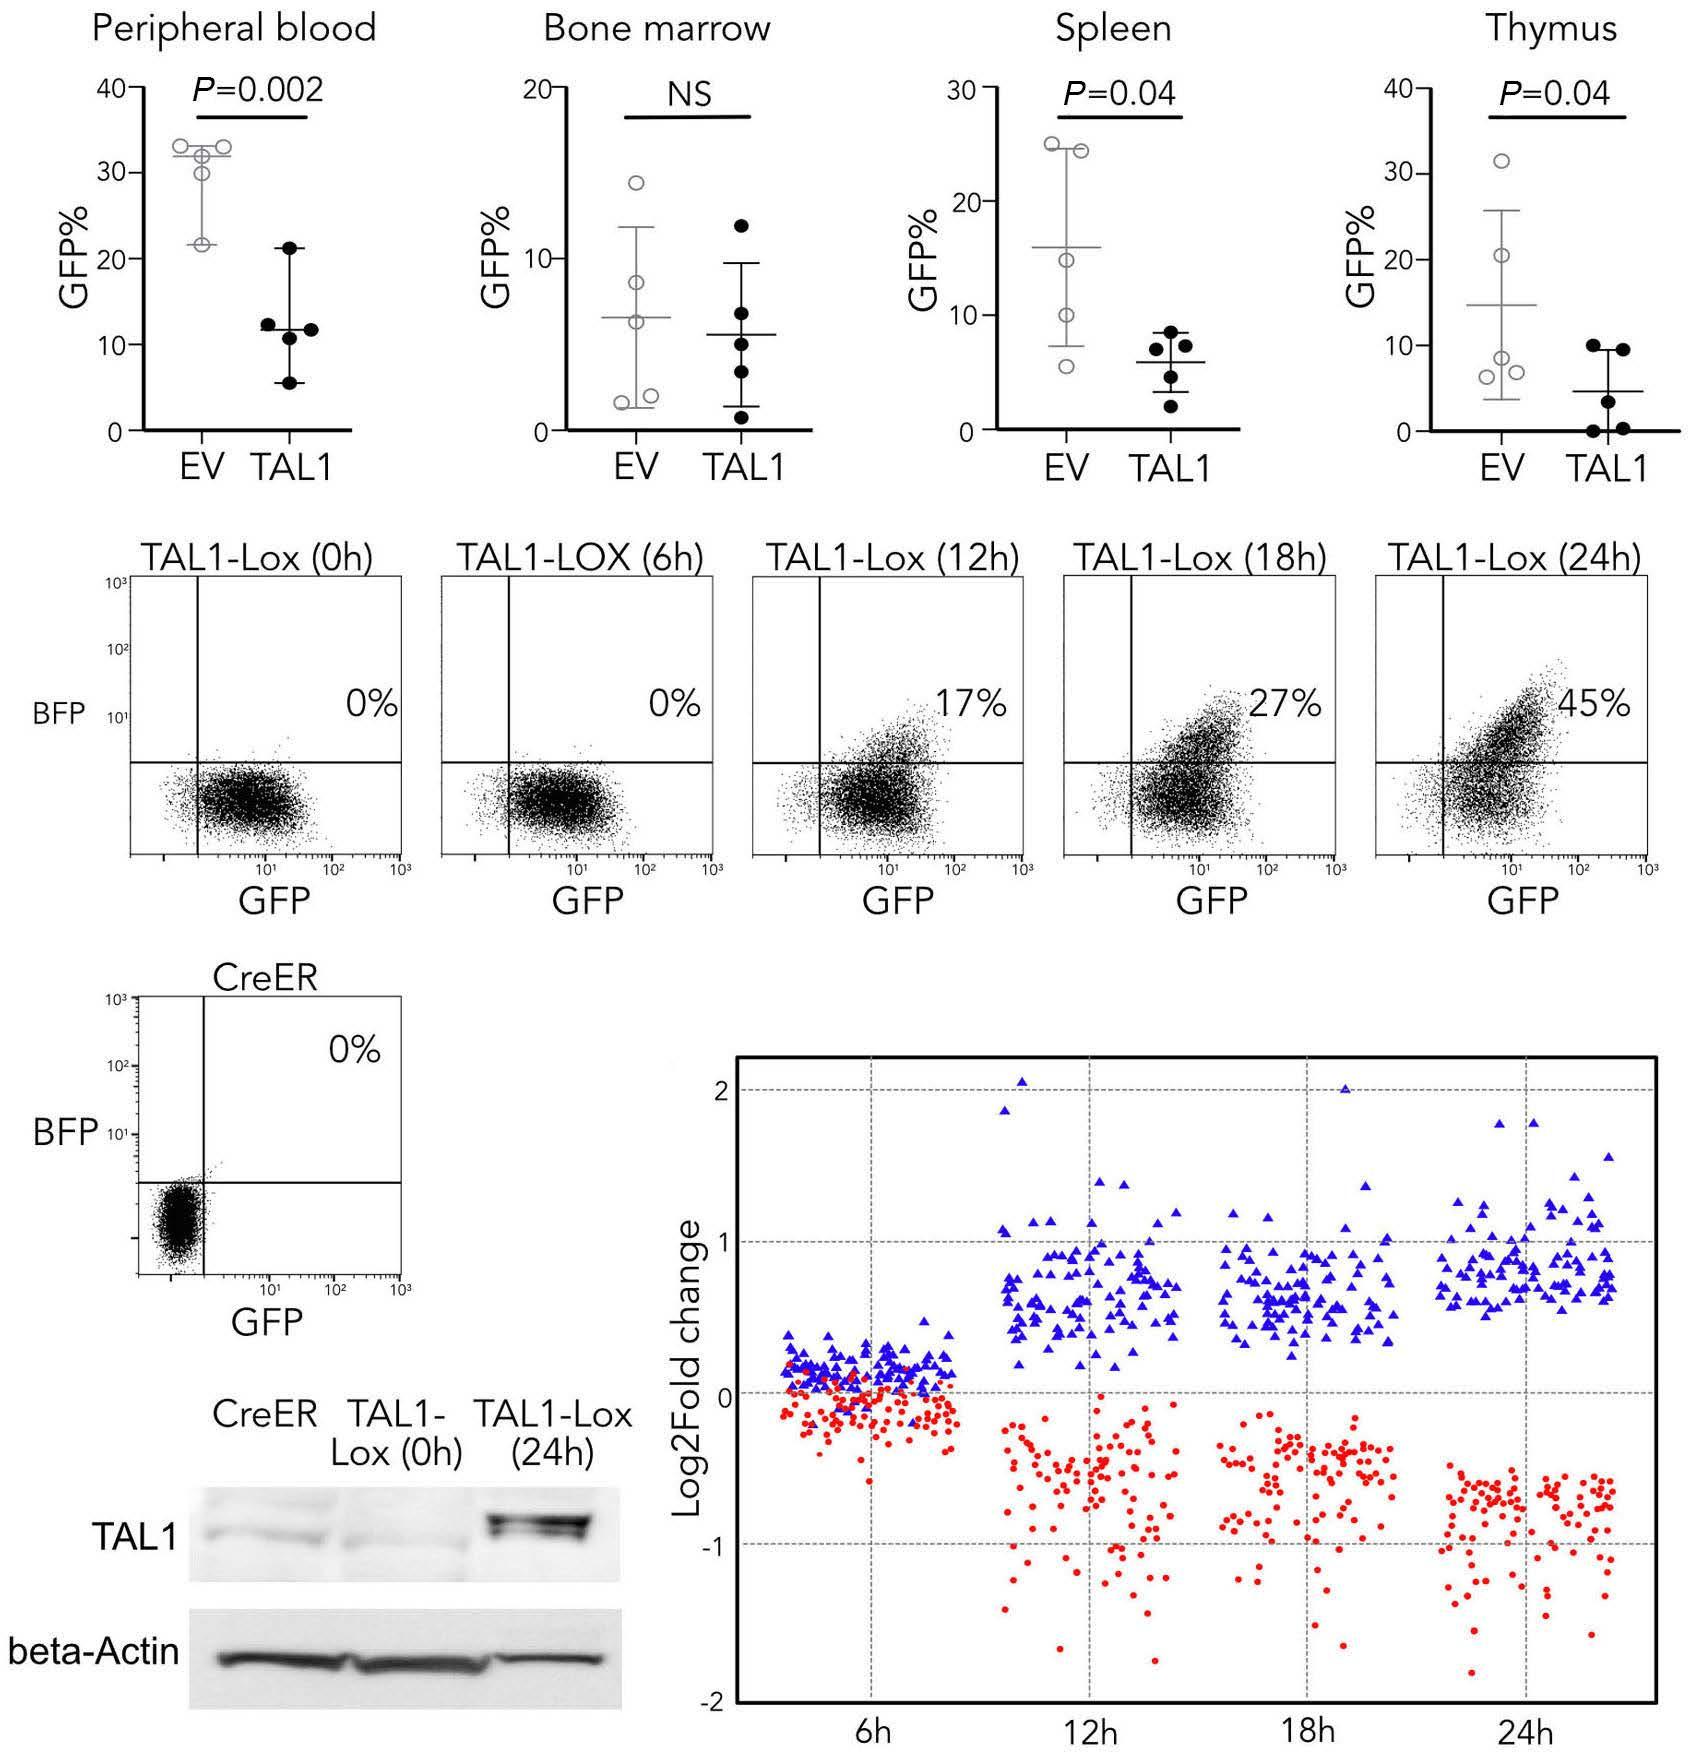
Figure 5. TAL1 induces a growth disadvantage in vitro by direct upregulation of apoptosis. (A) Plots showing percentage green fluorescent protein (GFP)-positive cells in peripheral blood, bone marrow, spleen and thymus at time of sacrifice: TAL1-positive vs. empty vector cells. P-values were calculated using unpaired t-test. (B) CreER pro-T cells were transduced with TAL1-inducible constructs, which were sorted for GFP. Next these cells were cultured in presence of 4OH tamoxifen. Successful flipping of the construct is seen over time as blue fluorescent protein (BFP) signal increases over time. RNA extraction was performed on in dicated time points. (C) At 48 hours (h) cells were sorted for BFP and expression of TAL1 was confirmed by western blot. (D) Rep resentation of the 100 most up- and downregulated genes at 24 h compared to 0 h over time. (E) Gene set enrichment analysis (GSEA) showing significantly positive enrichment of pro-apoptotic genes after TAL1 induction compared to non-treated pro-T cells. NES: normalized enrichment score; P: nominal P-value. (F) GSEA showing significantly negative enrichment of IL2-STAT5 signaling in TAL1-positive thymus cells compared to empty vector (EV) thymus cells. NES: normalized enrichment score; P: nom inal P-value. (G) Growth curve showing percentage of TAL1-positive (mcherry positive) cells over time.
data indicate that TAL1 expression can both induce pro-proliferation and pro-apoptosis effects and that its on cogenic characteristics can only become evident in the right signaling background such as in the presence of strong AKT signaling.
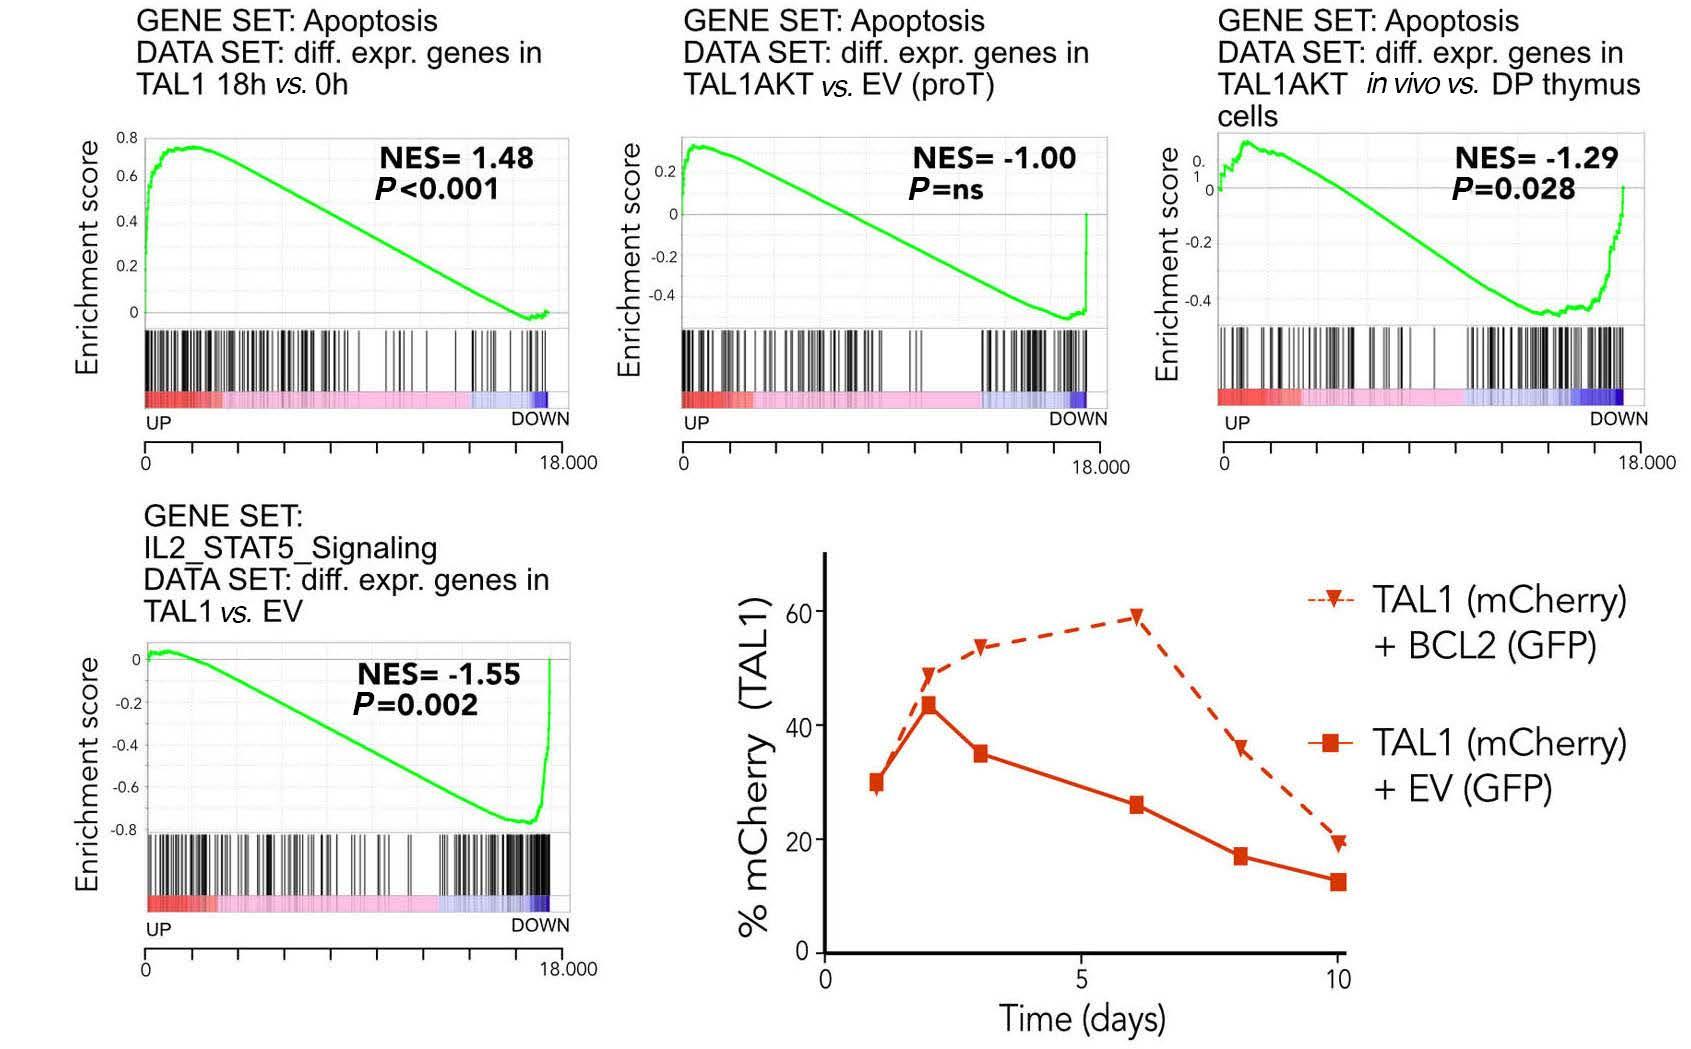
TAL1-AKTE17K leukemic cells are more sensitive to PI3K inhibitors
Based on our data that TAL1 expression in the absence of strong AKT signaling is having a negative effect on cell sur vival, we hypothesized that PI3K/AKT pathway inhibition in TAL1-positive T-ALL cells could elicit a stronger anti-leuke mia effect compared to TAL1-negative cells. In order to study this, we tested if TAL1+AKTE17K transformed pro-T cells were more sensitive to PI3K-AKT inhibition compared to AKTE17K transformed pro-T cells. These transformed pro-T cells were cultured in multi-well plates and treated with in creasing concentrations of Dactolisib or MK2206, respect ively a potent PI3K-mTOR and AKT inhibitor (Figure 6A). Both TAL1+AKTE17K and AKTE17K transformed pro-T cells were sen sitive to these inhibitors and the TAL1+AKTE17K expressing cells were clearly more sensitive with an half maximal in hibitory concentration (IC50) value >10-times lower than AKTE17K transformed pro-T cells (Figure 6A). Similarly, we also treated thymic cells derived from the TAL1+AKTE17K and AKTE17K mouse lymphoma/leukemia models (Figure 6B). Cells were cultured for short term ex vivo and treated for 24 h with either Dactolisib or MK2206. In both conditions, cells were very sensitive to PI3K inhibitors com
Rb1, Pten), but at the same time also a significant enrich ment for apoptotic genes, including upregulation of several pro-apoptotic caspases (Figure 5E; Online Supplementary Figure S4). In contrast, AKTE17K and TAL1+AKTE17K expressing pro-T cells showed no or negative enrichment of apoptosis genes, suggesting that AKTE17K can counteract TAL1-induced apoptosis (Figure 5E). RNA-sequecing analysis of sorted TAL1-positive T cells harvested from the thymus of the in vivo mouse models showed strong downregulation of IL7JAK-STAT pathway genes with Bcl2 and IL7 receptor genes as most significantly downregulated genes (Fig. 5F). In order to confirm the role of apoptosis in TAL1 induced growth dis advantage, we overexpressed Bcl2 in pro-T cells expressing TAL1. Expression of Bcl2 allowed the TAL1-expressing cells to grow initially and the growth retardation was now clearly delayed, indicating that apoptosis was at least partially re sponsible for the observed negative effect of TAL1 (Figure These5G).
EF G Haematologica | 107 October 2022 2312 ARTICLE - TAL1 cooperation with PI3K-AKT pathway mutations N. Thielemans et al.
Figure 6. TAL1-AKTE17K pro-T and leukemic cells are more sensitive to PI3K inhibition compared to AKTE17K only cells. (A) Dose re sponse curves showing relative (to dimethyl sulfoxide [DMSO] concentration) viability of leukemic cells in response to 24 hours of treatment with increasing concentrations of PI3K-mTOR inhibitor Dactolisib and AKT inhibitor MK2206. Thymic mouse cells (left): m267 (AKTE17K), m271 (TAL1+AKTE17K) and Cas9 pro-T cells (right). (B) Bar plots showing half maximal inhibitory concentration (IC50) values for different Leukemic cells/ pro-T cell conditions treated with PI3k-mTOR inhibitor Dactolisib and AKT inhibitor MK2206. P-values were calculated using the one-way ANOVA with Tukey correction to account for multiple comparisons.
BA Haematologica | 107 October 2022 2313 ARTICLE - TAL1 cooperation with PI3K-AKT pathway mutations N. Thielemans et al.
pared to wild-type thymic cells and TAL1+AKTE17K thymic cells were about three-times more sensitive to MK2206 compared to AKTE17K expressing cells (P<0.001), while this difference was not significant for dactolisib (P=0.09) due to more variability in the growth of the primary cells (Figure Together,6B).
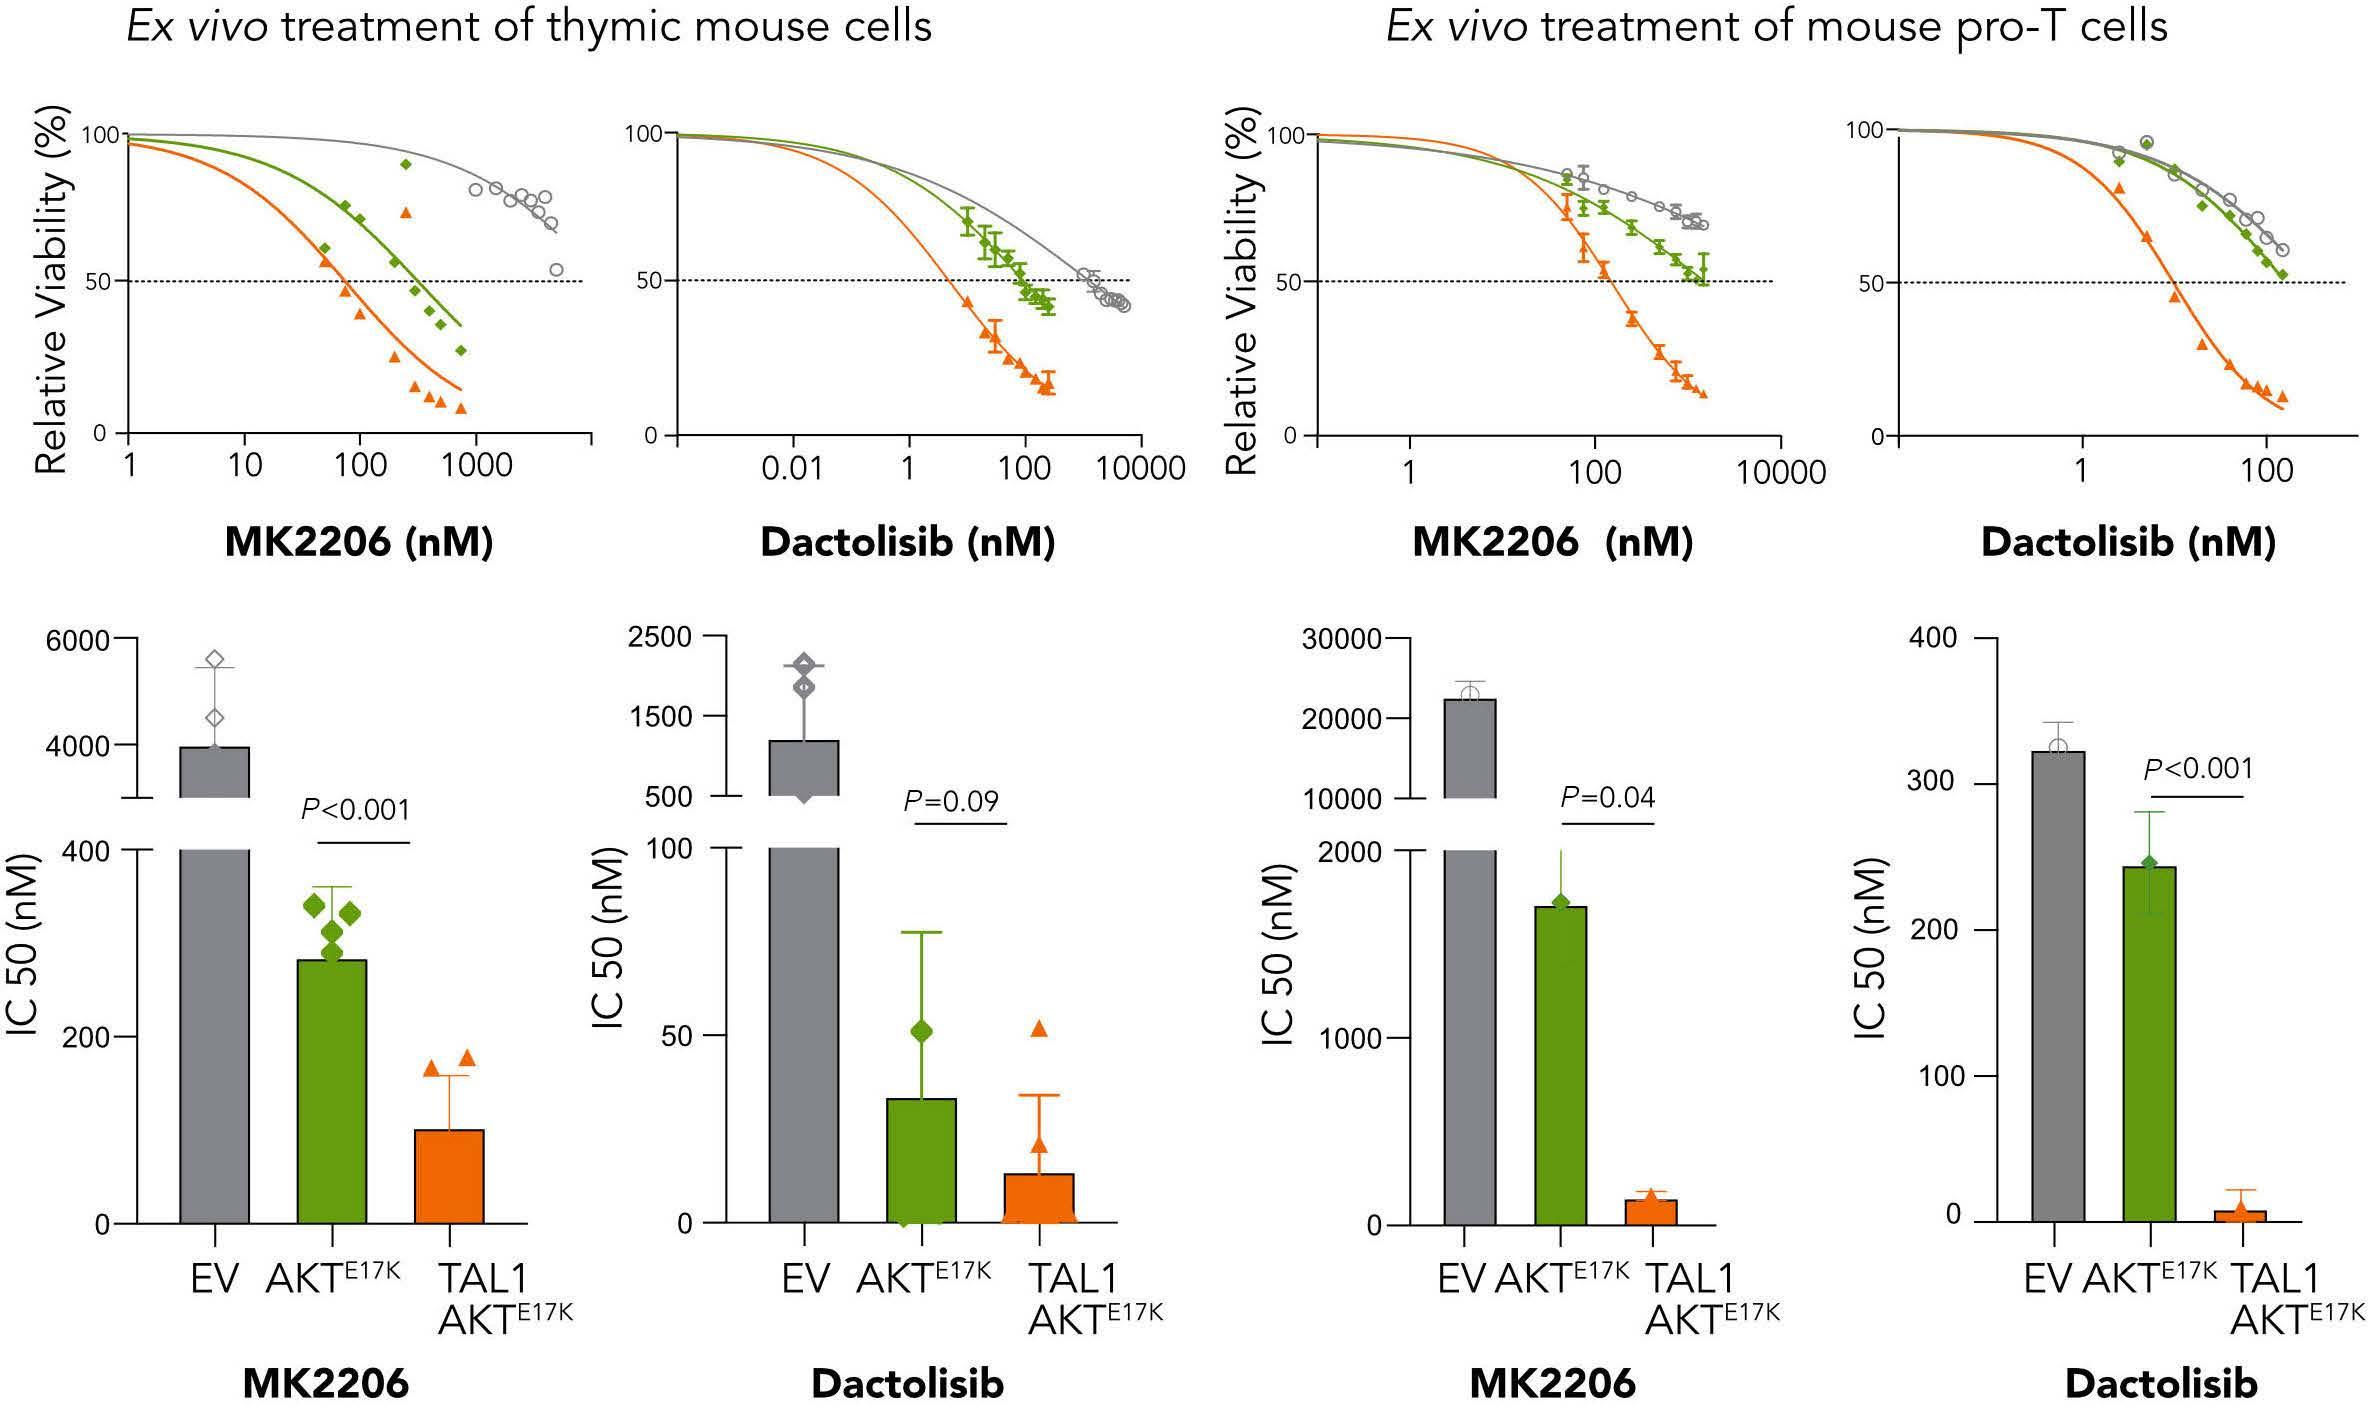
Expression analysis of TAL1 positive pro-T cells (Figure 7A) and TAL1 expressing thymic cells (Figure 7B) showed that TAL1 expression was associated with an enrichment of ge nomic instability markers. Interestingly, there was also positive enrichment for DNA repair and TP53 pathway genes in human T-ALL samples with TAL1 expression and PI3K-AKT pathway mutations, indicating that the subgroup of TAL1 positive T-ALL cases with PI3K-AKT pathway muta
tions could have increased dependency on DNA repair genes compared to other T-ALL cases (Figure 7C). TAL1-ex pressing cells had an upregulation of DNA repair genes and downregulation of genes involved with the response to UV induced damage (Figure 7D). There was upregulation of genes in each of the DNA repair pathways including nonhomologous end joining, homologous end joining, base ex cision repair and nucleotide excision repair and the strongest association was observed with nucleotide ex cision repair (NER) (Figure 7E), which is a DNA repair mech anism for single stranded DNA breaks involving PARP1. In agreement with this, publicly available data from the Can cerRx data set revealed sensitivity of JURKAT, a TAL1-posi tive T-ALL cell line, for the PARP1 inhibitor Olaparib. Together, these data suggest that TAL1 expression and PI3KAKT pathway activation might sensitize cells towards PARP1 Ininhibition.orderto investigate this further, we used the pro-T cell model with AKTE17K or TAL1+AKTE17K and compared the sen sitivity of these cells to empty vector transduced pro-T cells. Empty vector transduced pro-T cells were not very sensitive to Olaparib (Figure 7F). There was also no synergy detected between Olaparib and Dactolisib in the normal
these data from the mouse lymphoma/leukemia cells and the pro-T cells clearly indicate that TAL1+AKTE17K transformed cells are more sensitive to PI3K/AKT pathway inhibition compared to AKTE17K transformed cells, illustrat ing the negative impact of TAL1 expression in the absence of PI3K-AKT signaling.
TAL1-AKT positive cells upregulate DNA repair genes and show increased sensitivity to PARP inhibitors
Figure 7. TAL1 positive cells are characterized by a DNA repair signature and show increased sensitivity to PARP inhibitors. (A to C) Gene set enrichment analysis (GSEA) showing significant enrichment of DNA repair pathway in (A) TAL1-positive pro-T cells, (B) TAL1-positive thymus cells compared to empty vector (EV) thymus cells or (C) TAL1 positive T-ALL with PI3K pathway activating mutations compared to TAL1 T-ALL without mutations in PI3K pathway. NES: normalized enrichment score; P: nominal P-value. (D to E) GSEA showing significant negative enrichment of (D) UV response and positive enrichment of (E) nucleotide excision repair genes in TAL1-positive thymus cells compared to empty vector (EV) thymus cells. (F) Bar plots showing IC50 values for different pro-T cell conditions treated with PARP-inhibitor olaparib. P-values were calculated using the one-way ANOVA with Tukey correction to account for multiple comparisons. (G) Synergy matrix plots showing γ scores for pro-T cells or Jurkat cells treated with dactolisib and olaparib (synergy score = the average γ score for the whole range of concentrations shown in the synergy matrix).
Discussion
TAL1 is a transcriptional regulator, that heterodimerizes with bHLH proteins such as E12, E47, HEB and E2-2 and is part of a large transcriptional complex with GATA1,
A B C D E F G Haematologica | 107 October 2022 2314 ARTICLE - TAL1 cooperation with PI3K-AKT pathway mutations N. Thielemans et al.
signaling and become sensitive to PI3K/AKT pathway in hibitors, with the TAL1+AKTE17K transformed cells being the most sensitive cells.
pro-T-cell cultures (Figure 7G). Strikingly, both AKTE17K and TAL1+AKTE17K transformed pro-T cells showed sensitivity to wards Olaparib and there was a strong synergy detected with Dactolisib that was more pronounced in cells trans formed by TAL1+AKTE17K compared to AKTE17K alone (Figure 7F and G). Such synergy was also detected in JURKAT cells, a human T-ALL cell line with TAL1 expression and AKT path way activation (Figure 7G). These data in the isogenic proT cells clearly illustrate that AKTE17K and TAL1+AKTE17K transformed pro-T cells become dependent on PI3K/AKT
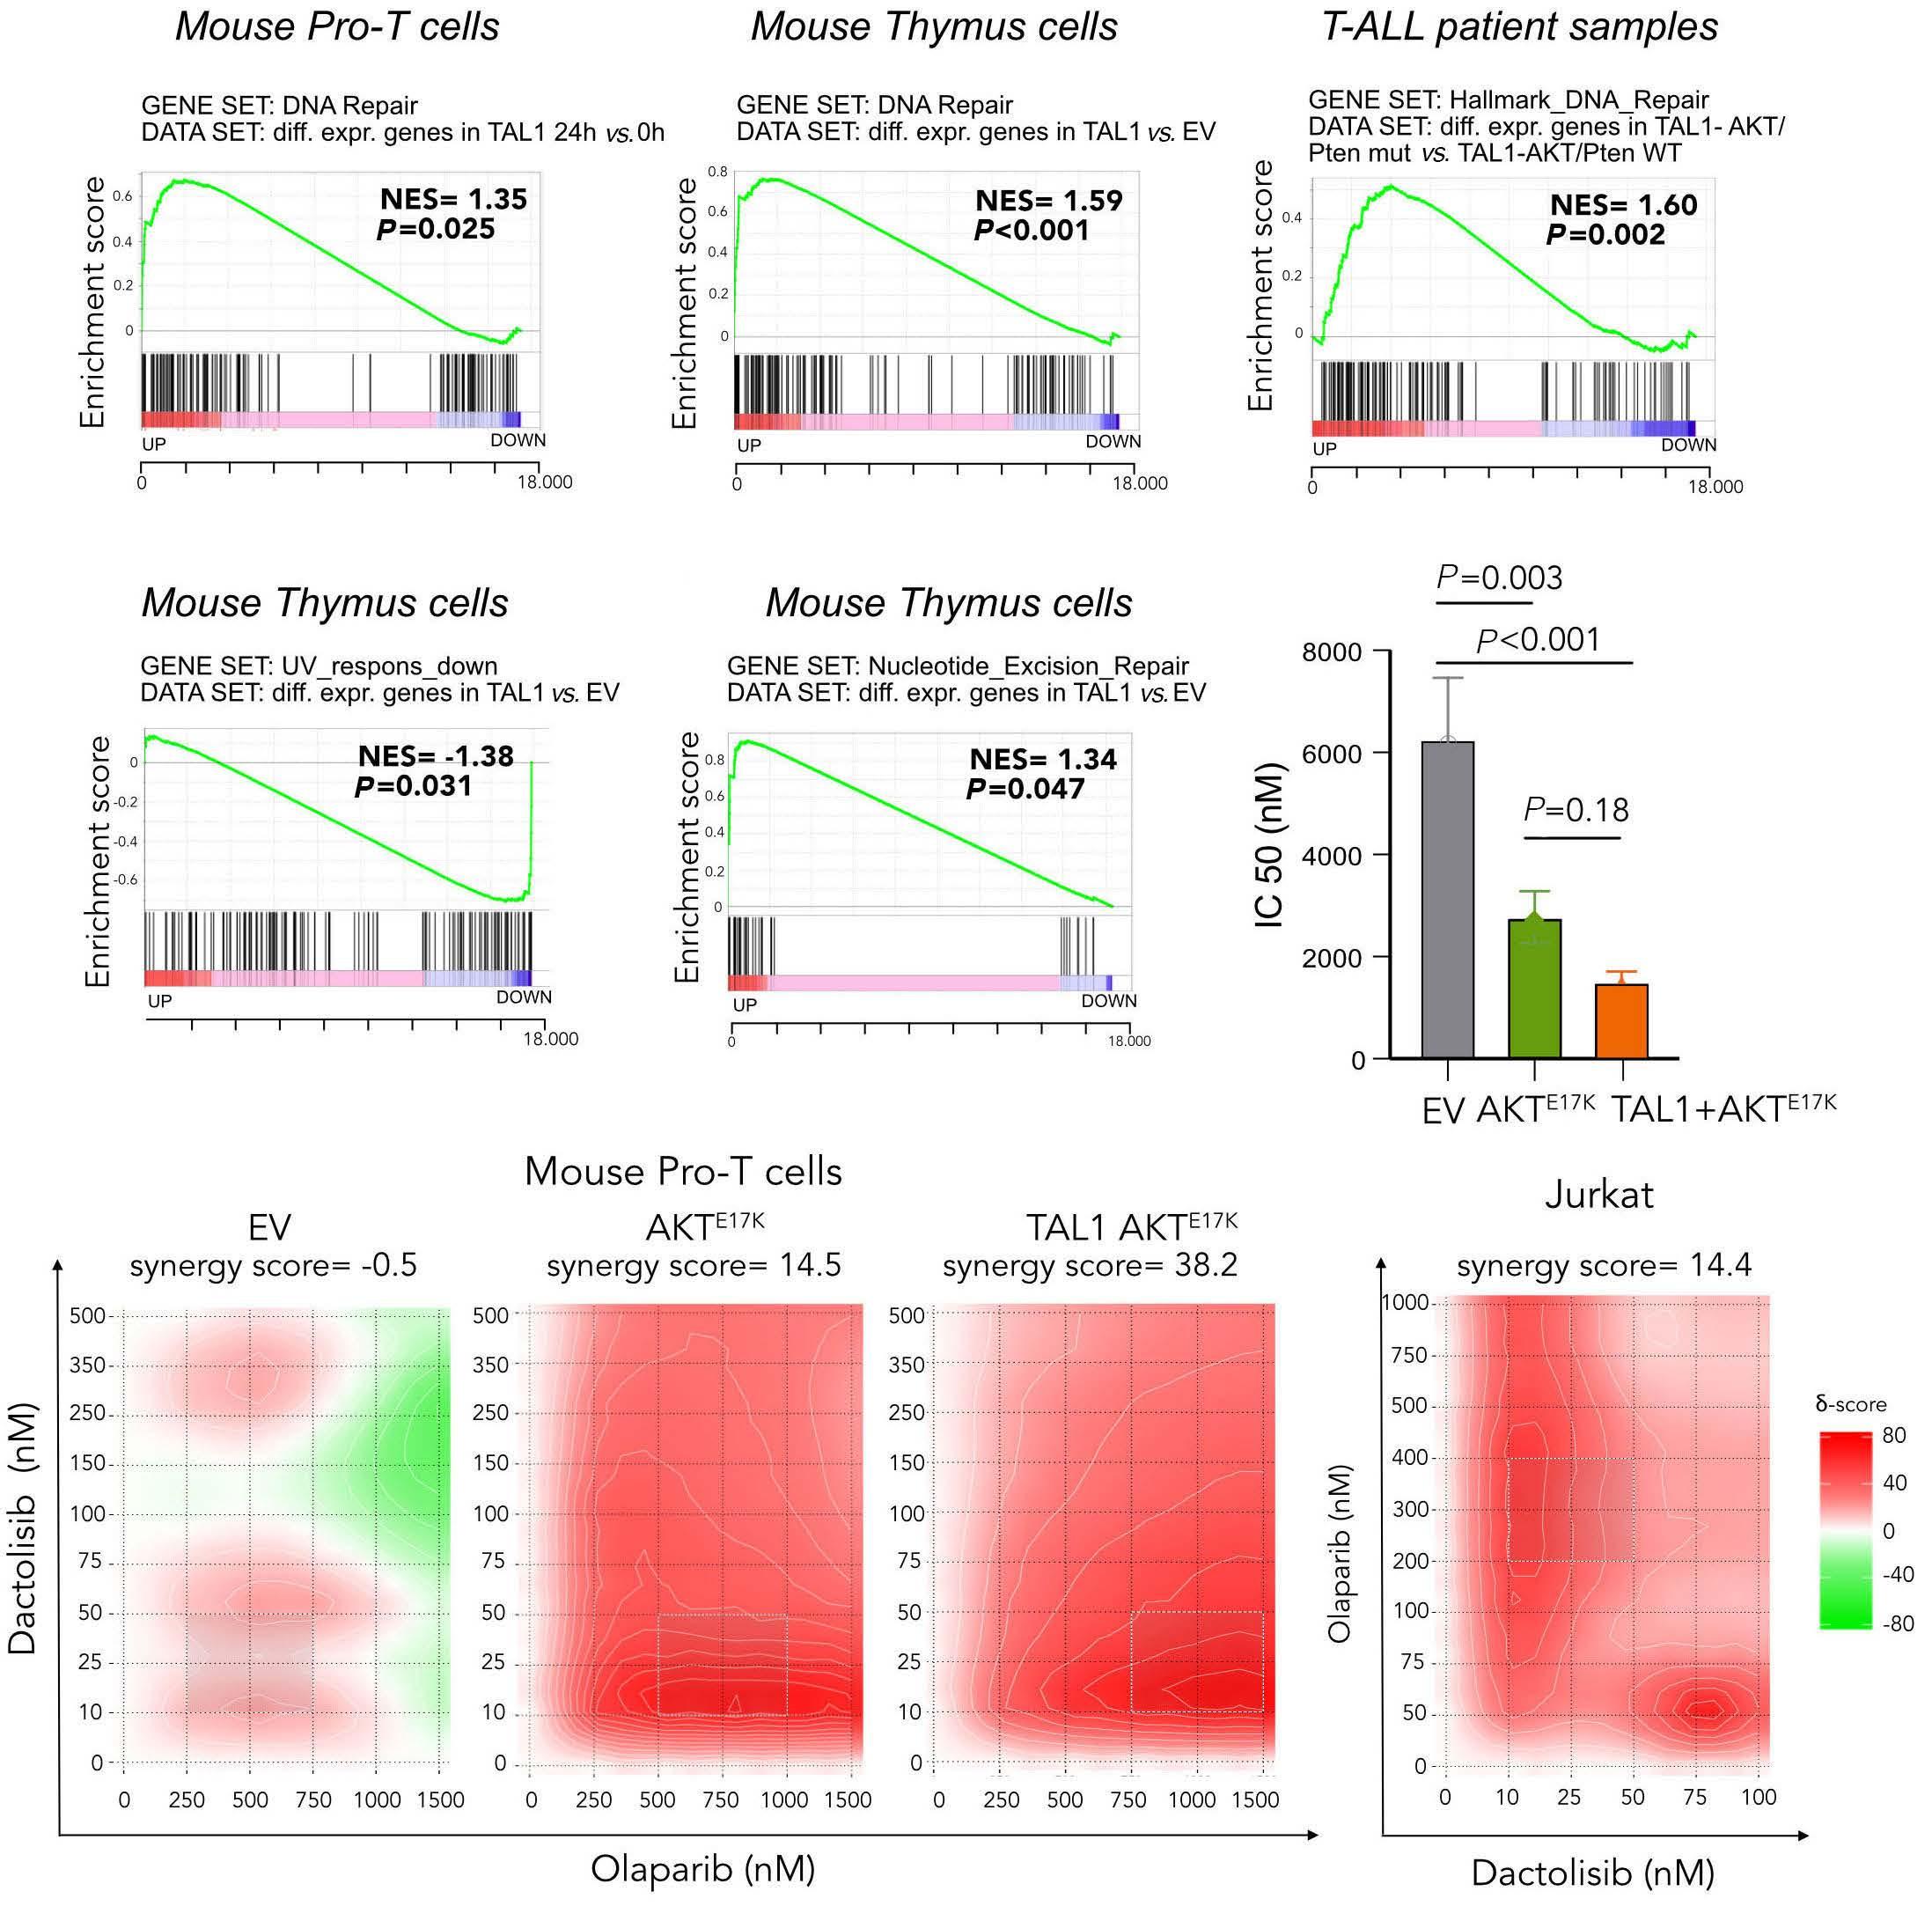
LMO1/LMO2 and Ldb1.32-36 Some cases with TAL1 expression also show increased LMO1 or LMO2 expression, explaining why previous mouse models for TAL1 studies have focused on the cooperation between TAL1 and LMO1/2. However, de tailed RNA-sequencing analyses of T-ALL cases with TAL1 expression indicates that only a minority of TAL1 positive cases show increased LMO1 or LMO2 expression. In contrast, several studies have indicated that there is an overrepresentation of PTEN deletions and other mutations in the PI3K/AKT signaling pathway in TAL1-positive TInALL.5,16,17thisstudy
Contributions
studies in refractory lymphomas have shownd a favorable safety profile.41
No conflicts of interest to disclose.
NT, NM, OG, SP performed experiments. NT, SD, JC de signed experiments, analyzed data and wrote the paper.
NT holds a fellowship of the FWO-Vlaanderen. SD holds a fellowship of the Foundation Against Cancer. This work was funded by a grant from FWO-Vlaanderen (to JC).
Disclosures
All RNA-seq data have been deposited to Gene Expression Omnibus (GEO) with number GSE199823.
we provide proof that TAL1 expression and PI3K/AKT pathway activation indeed cooperate in driving TALL. We developed an inducible bone marrow transplant T-ALL model, where expression of TAL1+AKTE17K leads to a transplantable leukemic disease whereas an AKTE117K dis ease is not transplantable and TAL1 alone does not gener ate any disease at all. These data indicate that AKT pathway activation in lymphoid progenitor cells is sufficient to acti vate proliferation and survival pathways, but that TAL1 ex pression is required to induce stem cell properties and increase the number of leukemia initiating cells. Most im portantly, these data clearly demonstrate that TAL1 and PI3K-AKT pathway activation cooperate and drive leukemia Interestingly,development.we find that both in vivo and in vitro TAL1 ex pression in the absence of PI3K/AKT activation has a negative effect on cell growth. Pharmacologic inhibition of PI3K-AKT signaling showed pronounced anti-proliferative effects and induced apoptosis in pre-clinical models using leukemia cell lines or primary leukemia samples.37-41 Given the negative effect of TAL1 on cell growth and the key role of PI3K signaling in TAL1-positive T-ALL, we examined the effect of PI3K-AKT inhibitors in our different models. In agreement with the negative effect of TAL1 on cell growth, we show that inactivation of PI3K/AKT pathway has a stronger effect on viability in TAL1+AKTE17K cells compared to AKT cells. These findings have potentially important therapeutic potential, as we demonstrate that TAL1+AKTE17K cells are highly sensitive to AKT pathway inhibition, more sensitive than expected due to the negative effects of TAL1 on T-cell survival in the absence of AKT pathway activation. With several PI3K/AKT pathway inhibitors in development,3741 these data could find clinical applications for high risk TALL patients with PI3K/AKT pathway activation in whom stardard treatment does not lead to MRD negativity. Dac tolisib (BEZ235) is a dual pan-PI3K and mTOR inhibitor for which a phase I study in acute leukemia showed positive effect in a subset of ALL patients.39 However, digestive toxicity (mostly dose-dependent) remains an important problem. MK2206, an allosteric pan-AKT inhibitor, has been shown to induce apoptosis and autophagy in T-ALL cell lines and primary patient samples.40 Phase II clinical
Haematologica | 107 October 2022 2315 ARTICLE - TAL1 cooperation with PI3K-AKT pathway mutations N. Thielemans et al.
The role of poly (ADP-ribose) polymerases (PARP) in ma lignancy is well known in BRCA1/2 mutant tumors known to be deficient in homologous recombination mechan isms.42 Mutations in BRCA1/2 genes are uncommon in hematological cancers, but data have shown that the clinical benefits of PARP inhibition are not restricted to BRCA mutant cancers.42,43 In our study we found enrich ment of DNA repair genes in TAL1-positive T-ALL patients with PI3K pathway compared to TAL1-positive T-ALL pa tients without PI3K hyperactivation, suggesting a role for PI3K pathway in DNA repair. Furthermore, our RNA-se quencing data showed an upregulation of DNA repair in TAL1-positive pro-T cells and thymic mouse cells. Upregu lation of DNA repair is a known mechanism of cancer cells to maintain oncogenic growth and chemoresistance and to protect the cells from DNA damage. Our data thus in dicated that both TAL1 expression and PI3K-AKT pathway activation could increase the dependency on DNA repair mechanisms. Indeed, AKTE17K and TAL1+AKTE17K pro-T cells are much more sensitive to PARP inhibition compared to control pro-T cells. Moreover, when combining Olaparib with Dactolisib, synergy was observed in AKTE17K and TAL1AKTE17K transformed cells with the strongest synergy in TAL1-AKTE17K transformed cells.
In conclusion, we demonstrate direct cooperation between TAL1 and PI3K/AKT pathway signaling to drive T-ALL devel opment using ex vivo T-cell cultures and a novel in vivo mouse model. We identify TAL1 as an apoptosis promoting factor in T cells in the absence of strong PI3K/AKT signaling, making TAL1 positive T-ALL cells highly sensitive to PI3K/AKT pathway inhibition. Moreover, we find that both TAL1 and PI3K/AKT induce a DNA repair signature in T-ALL and demonstrate that PARP inhibitors may be attractive therapeutic agents in combination with PI3K inhibitors in TAL1-positive T-ALL.
Funding
Data-sharing statement
1. Raetz EA, Teachey DT. T-cell acute lymphoblastic leukemia. Hematology. 2016;2016(1):580-588.
28. Vicente C, Schwab C, Broux M, et al. Targeted sequencing identifies associations between IL7R-JAK mutations and epigenetic modulators in T-cell acute lymphoblastic leukemia. Haematologica. 2015;100(10):1301-1310.
10. Robb L, Rasko JE, Bath M L, Strasser A, Begley CG. Scl, a gene frequently activated in human T cell leukaemia, does not induce lymphomas in transgenic mice. Oncogene. 1995;10(1):205-209.
16. Zuurbier L, Petricoin EF, Vuerhard MJ, et al. The significance of PTEN and AKT aberrations in pediatric T-cell acute lymphoblastic leukemia. Haematologica. 2012;97(9):1405-1413.
13. Tatarek J, Cullion K, Ashworth T, Gerstein R, Aster JC, Kelliher MA. Notch1 inhibition targets the leukemia-initiating cells in a Tal1/Lmo2 mouse model of T-ALL. Blood. 2011;118(6):1579-1590.
2. Ferrando AA, Neuberg DS, Staunton J, et al. Gene expression signatures define novel oncogenic pathways in T cell acute lymphoblastic leukemia. Cancer Cell. 2002;1(1):75-81.
3. Soulier J, Clappier E, Cayuela J-M, et al. HOXA genes are included in genetic and biologic networks defining human acute T-cell leukemia (T-ALL). Blood. 2005;106(1):274-286.
18. Bornschein S, Demeyer S, Stirparo R, et al. Defining the molecular basis of oncogenic cooperation between TAL1 expression and Pten deletion in T-ALL using a novel pro-T-cell model system. Leukemia. 2018;32(4):941-951.
22. Broux M, Prieto C, Demeyer S, et al. Suz12 inactivation cooperates with JAK3 mutant signaling in the development of T-cell acute lymphoblastic leukemia. Blood. 2019;134(16):1323-1336.
development. Cancer Disc. 2018;8(5):616-631.
25. Aplan PD, Jones CA, Chervinsky DS, et al. An scl gene product lacking the transactivation domain induces bony abnormalities and cooperates with LMO1 to generate T-cell malignancies in transgenic mice. EMBO J. 1997;16(9):2408-2419.
7. Mansour MR, Abraham BJ, Anders L, et al. Oncogene regulation. An oncogenic super-enhancer formed through somatic mutation of a noncoding intergenic element. Science. 2014;346(6215):1373-1377.
31. Palamarchuk A, Efanov A, Maximov V, Aqeilan RI, Croce CM, Pekarsky Y. Akt phosphorylates Tal1 oncoprotein and inhibits its repressor activity. Cancer Res. 2005;65(11):4515-4519.
9. Condorelli GL, Facchiano F, Valtieri M, et al. T-cell-directed TAL1 expression induces T-cell malignancies in transgenic mice. Cancer Res. 1996;56(22):5113-5119.
17. Mendes RD, Sarmento LM, Canté-Barrett K, et al. PTEN microdeletions in T-cell acute lymphoblastic leukemia are caused by illegitimate RAG-mediated recombination events. Blood. 2014;124(4):567-578.
32. Voronova AF, Lee F. The E2A and tal-1 helix-loop-helix proteins associate in vivo and are modulated by Id proteins during interleukin 6-induced myeloid differentiation. Proc Natl Acad Sci U S A. 1994;91(13):5952-5956.
29. Trinquand A, Tanguy-Schmidt A, Abdelali R ben, et al. Toward a NOTCH1/FBXW7/RAS/PTEN-based oncogenetic risk classification of adult T-Cell acute lymphoblastic leukemia: a group for research in adult acute lymphoblastic leukemia study. J Clin Oncol. 2013;31(34):4333-4342.
20. Gehre N, Nusser A, von Muenchow L, et al. A stromal cell free culture system generates mouse pro-T cells that can reconstitute T-cell compartments in vivo. Eur J Immunol. 2015;45(3):932-942.
24. Lécuyer E, Hoang T. SCL: From the origin of hematopoiesis to stem cells and leukemia. Exp Hematol. 2004;32(1):11-24.
11. Ferrando AA, Herblot S, Palomero T, et al. Biallelic transcriptional activation of oncogenic transcription factors in T-cell acute lymphoblastic leukemia. Blood. 2004;103(5):1909-1911.
12. Larson RC, Lavenir I, Larson TA, Baer R, Warren AJ, Wadman I, et al. Protein dimerization between Lmo2 (Rbtn2) and Tall alters thymocyte development and potentiates T cell tumorigenesis in transgenic mice. EMBO J. 1996;15(5):1021-1027.
27. Chen B, Jiang L, Zhong ML, et al. Identification of fusion genes and characterization of transcriptome features in T-cell acute lymphoblastic leukemia. Proc Natl Acad Sci U S A. 2017;115(2):373-378.
8. Porcher C, Chagraoui H, Kristiansen MS. SCL/TAL1: a multifaceted regulator from blood development to disease. Blood. 2017;129(15):2051-2060.
35. Valge-Archer VE, Osada H, Warren AJ, et al. The LIM protein RBTN2 and the basic helix-loop-helix protein TALl are present in a complex in erythroid cells. Proc Natl Acad Sci U S A. 1994;91(18):8617-8621.
15. Gerby B, Tremblay CS, Tremblay M, et al. SCL, LMO1 and Notch1 reprogram thymocytes into self-renewing cells. PLoS Genet. 2014;10(12):e1004768.
References
6. Girardi T, Vicente C, Cools J, De Keersmaecker K. The genetics and molecular biology of T-ALL. Blood. 2017;129(9):1113-1123.
23. Hu Y, Smyth GK. ELDA: Extreme limiting dilution analysis for comparing depleted and enriched populations in stem cell and other assays. J Immunol Methods. 2009;347(1-2):70-78.
33. O’Neil J, Shank J, Cusson N, Murre C, Kelliher M. TAL1/SCL induces leukemia by inhibiting the transcriptional activity of E47/HEB. Cancer Cell. 2004;5(6):587-596.
30. Tan SH, Yam AW, Lawton LN, et al. TRIB2 reinforces the oncogenic transcriptional program controlled by the TAL1 complex in T-cell acute lymphoblastic leukemia. Leukemia. 2016;30(4):959-962.
34. O’Neil J, Billa M, Oikemus S, Kelliher M. The DNA binding activity of TAL-1 is not required to induce leukemia/lymphoma in mice. Oncogene. 2001;20(29):3897-3905.
4. Homminga I, Pieters R, Langerak AW, et al. Integrated transcript and genome analyses reveal NKX2-1 and MEF2C as potential oncogenes in T cell acute lymphoblastic leukemia. Cancer Cell. 2011;19(4):484-497.
21. Kim H, Kim M, Im S-K, Fang S. Mouse Cre-LoxP system: general principles to determine tissue-specific roles of target genes. Lab Anim Res. 2018;34(4):147-159.
36. Wadman IA, Osada H, Grü Tz GG, Agulnick AD, Westphal H, Forster A. The LIM-only protein Lmo2 is a bridging molecule assembling an erythroid, DNA-binding complex which includes
19. de Bock CE, Demeyer S, Degryse S, et al. HOXA9 cooperates with activated JAK/STAT signaling to drive leukemia
26. Draheim KM, Hermance N, Yang Y, Arous E, Calvo J, Kelliher MA. A DNA-binding mutant of TAL1 cooperates with LMO2 to cause T cell leukemia in mice. Oncogene. 2011;30(10):1252-1560.
14. Tremblay M, Tremblay CS, Herblot S, et al. Modeling T-cell acute lymphoblastic leukemia induced by the SCL and LMO1 oncogenes. Genes Dev. 2010;24(11):1093-1105.
Haematologica | 107 October 2022 2316 ARTICLE - TAL1 cooperation with PI3K-AKT pathway mutations N. Thielemans et al.
5. Liu Y, Easton J, Shao Y, et al. The genomic landscape of pediatric and young adult T-lineage acute lymphoblastic leukemia. Nat Genet. 2017;49(8):1211-1218.
refractory acute leukemia. BMC Pharmacol Toxicol. 2020;21(1):70.
38. Martelli AM, Evangelisti C, Chiarini F, McCubrey JA. The phosphatidylinositol 3-kinase/Akt/mTOR signaling network as a therapeutic target in acute myelogenous leukemia patients. Oncotarget. 2010;1(2):89-103.
42. Pilié PG, Gay CM, Byers LA, O’Connor MJ, Yap TA. PARP inhibitors: extending benefit beyond BRCA-mutant cancers. Clin Cancer Res. 2019;25(13):3759-3771.
the TAL1, E47, GATA-1 and Ldb1/NLI proteins the GATA-1 gene in embryonal stem (ES) cells, which are The phenotypes of the. EMBO J. 1997;16(11):3145-3157.
Haematologica | 107 October 2022 2317 ARTICLE - TAL1 cooperation with PI3K-AKT
41. Oki Y, Fanale M, Romaguera J, et al. Phase II study of an AKT inhibitor MK2206 in patients with relapsed or refractory lymphoma. Br J of Haematol. 2015;171(4):463-470.
mutations N. Thielemans et al.
43. Fritz C, Portwood SM, Przespolewski A, Wang ES. PARP goes the weasel! Emerging role of PARP inhibitors in acute leukemias. Blood Rev. 2021;45:100696. pathway
39. Lang F, Wunderle L, Badura S, et al. A phase i study of a dual PI3kinase/mTOR inhibitor BEZ235 in adult patients with relapsed or
37. Chiarini F, Grimaldi C, Ricci F, et al. Activity of the novel dual phosphatidylinositol 3-kinase/mammalian target of rapamycin inhibitor NVP-BEZ235 against T-cell acute lymphoblastic leukemia. Cancer Res. 2010;70(20):8097-8107.
40. Simioni C, Neri LM, Tabellini G, et al. Cytotoxic activity of the novel Akt inhibitor, MK-2206, in T-cell acute lymphoblastic leukemia. Leukemia. 2012;26(11):2336-2342.
©2022 Ferrata Storti Foundation
Published under a CC BY-NC license
1Astrid Lindgren Children’s Hospital, Karolinska University Hospital, Stockholm, Sweden; 2Childhood Cancer Research Unit, Department of Women's and Children's Health; Karolinska Institutet, Stockholm, Sweden; 3Department of Pediatrics and Adolescent Medicine, University Hospital Rigshospitalet, Copenhagen, Denmark; 4Department of Health Technology, Technical University of Denmark, Kgs. Lyngby, Denmark; 5Division of Pediatric Hematology and Oncology and Stem Cell Transplantation, Helsinki University Hospital and Helsinki University, Helsinki, Finland; 6Neuropediatric Unit, Department of Women's and Children's Health, Karolinska Institutet, Stockholm, Sweden; 7Department of Pediatric Hematology/Oncology, Oslo University Hospital, Oslo, Norway; 8Department of Pediatrics, Landspitali University Hospital, Reykjavík, Iceland; 9QIMR Berghofer Medical Research Institute, Brisbane, Queensland, Australia; 10Kids Cancer Centre, Sydney Children’s Hospital Randwick, Sydney, New South Wales, Australia; 11Discipline of Paediatrics and Child Health, School of Clinical Medicine, University of New South Wales, Sydney, New South Wales, Australia; 12Children’s Cancer Institute, Lowy Cancer Research Centre, University of New South Wales, Sydney, New South Wales, Australia; 13Department of Hematology and Oncology, University of Tartu, Tartu, Estonia; 14Division of Biostatistics, Institute of Environmental Medicine, Karolinska Institutet, Stockholm, Sweden; 15Department of Children and Adolescents, Oulu University Hospital and University of Oulu, PEDEGO Research Unit, Oulu, Finland; 16Institute of Clinical Medicine, Faculty of Medicine, University of Copenhagen, Copenhagen, Denmark; 17Children’s Hospital, affiliate of Vilnius University Hospital Santaros Klinikos and Vilnius University, Vilnius, Lithuania and 18Department of Women’s and Children’s Health, Uppsala University, Uppsala, Sweden
Stavroula Anastasopoulou,1,2 Rikke Linnemann Nielsen,3,4,° Bodil Als-Nielsen,3 Joanna Banerjee,5 Mats A. Eriksson,1,6 Marianne Helenius,3,4 Mats M. Heyman,1,2 Inga Maria Johannsdottir,7 Olafur Gisli Jonsson,8 Stuart MacGregor,9 Marion K. Mateos,10-12 Chelsea Mayoh,11,12 Sirje Mikkel,13 Ida Hed Myrberg,2,14 Riitta Niinimäki,15 Kjeld Schmiegelow,3,16 Mervi Taskinen,5 Goda Vaitkeviciene,17 Anna Warnqvist,14 Benjamin Wolthers,3 Arja Harila-Saari,18# and Susanna Ranta1,2#
Haematologica | 107 October 2022 2318 ARTICLE - Acute Lymphoblastic Leukemia
°Current address: Novo Nordisk Research Centre Oxford, Oxford, UK #AH-S and SR contributed equally to this study as co-last authors.
Correspondence: S. stavroula.anastasopoulou@ki.seAnastasopoulou
Central nervous system (CNS) toxicity is common at diagnosis and during treatment of pediatric acute lymphoblastic leukemia (ALL). We studied CNS toxicity in 1,464 children aged 1.0–17.9 years, diagnosed with ALL and treated according to the Nordic Society of Pediatric Hematology and Oncology ALL2008 protocol. Genome-wide association studies, and a candidate single-nucleotide polymorphism (SNP; n=19) study were performed in 1,166 patients. Findings were validated in an independent Australian cohort of children with ALL (n=797) in whom two phenotypes were evaluated: diverse CNS toxicities (n=103) and methotrexate-related CNS toxicity (n=48). In total, 135/1,464 (9.2%) patients experienced CNS toxicity for a cumulative incidence of 8.7% (95% confidence interval: 7.31–10.20) at 12 months from diagnosis. Patients aged ≥10 years had a higher risk of CNS toxicity than had younger patients (16.3% vs. 7.4%; P<0.001). The most common CNS toxicities were posterior reversible encephalopathy syndrome (n=52, 43 with seizures), sinus venous thrombosis (n=28, 9 with seiz ures), and isolated seizures (n=16). The most significant SNP identified by the genome-wide association studies did not reach genomic significance (lowest P-value: 1.11x10⁻⁶), but several were annotated in genes regulating neuronal functions. In candidate SNP analysis, ATXN1 rs68082256, related to epilepsy, was associated with seizures in patients <10 years (P=0.01). ATXN1 rs68082256 was validated in the Australian cohort with diverse CNS toxicities (P=0.04). The role of ATXN1 as well as the novel SNP in neurotoxicity in pediatric ALL should be further explored.
Received: September 13, 2021.
Abstract
Accepted: March 23, 2022.
Prepublished: March 31, 2022.
Acute central nervous system toxicity during treatment of pediatric acute lymphoblastic leukemia: phenotypes, risk factors and genotypes
https://doi.org/10.3324/haematol.2021.280016
seizures).14-16 Patients with CNS toxicities were identified in the NOPHO ALL2008 registry (Online Supplementary Methods).
Introduction
The study included all children aged between 1 and 17.9 years at diagnosis of B-cell precursor or T–cell ALL be tween 2008 and 2015. All patients were treated according to the Nordic Society of Pediatric Hematology and Oncol ogy (NOPHO) ALL2008 protocol, which has a prospective online registration system encompassing detailed data on patients’ characteristics, treatment, response to treat ment, and toxicities (including any CNS toxicity, posterior reversible encephalopathy syndrome [PRES] and
Haematologica | 107 October 2022 2319 ARTICLE - CNS toxicity during treatment of pediatric ALL S. Anastasopoulou et al.
Nineteen(GSEA).21SNPpreviously found to be associated with epi lepsy and methotrexate-related central CNS toxicity quali fied for testing for association with seizures in imputed genotype data (Online Supplementary Table S3).10,12 Of them, those SNP reaching statistical significance for as sociation with seizures (P<0.05) before corrections were also tested separately for children with seizures <10 years and ≥10 years of age. Two polygenic risk scores were es timated for risk for seizures based on all candidate SNP and on six SNP associated with methotrexate-related CNS
Genome-wide association and candidate single nucleotide polymorphism analyses
Statistical analyses were performed using R and SPSS. Time to CNS toxicity was counted as days from diagnosis until the first CNS toxicity, or censored at the time of re lapse, stem cell transplantation, second malignant neo plasm, death, or last follow-up, whichever came first. Overall survival was defined as days from diagnosis until death or last follow-up. Event-free survival was defined as days from diagnosis to the last follow-up, relapse, stem cell transplantation, or second malignant neoplasm (Online Supplementary Methods).
Genotype associations were explored using GWAS, candi date SNP analysis and polygenic risk scoring (Online Sup plementary Methods). Genome-wide association analysis on the SNP array data was performed in PLINK2/ 1.90beta6.18 using logistic regression adjusted for age, sex, CNS leukemia, and genetic ancestry by the first four prin cipal components.17 A suggestive threshold of P<5×10⁻⁶ and a Bonferroni-corrected P<2×10⁻⁸, which were regarded as significant, were used to explore the top findings from the Genome-wideGWAS.
Methods
Classification of central nervous system toxicities CNS toxicities were classified as “defined” or “other”, based on systemic or unclear conditions according to es tablished nomenclature, as previously described (Online Supplementary Methods).2
Patients
Therapeutic advances in recent decades have greatly im proved the outcome of pediatric acute lymphoblastic leukemia (ALL), with a current survival rate above 90%.1 However, severe acute adverse events involving the cen tral nervous system (CNS), from here on referred to as CNS toxicities, still have an incidence of up to 18.4% with significant morbidity and mortality and remain a signifi cant challenge in ALL treatment.2-5 Certain chemotherapy regimens, individual patients’ vulnerability, underlying co morbidities, drug-drug interactions, and the distribution and tumor load of the ALL itself may predispose patients to CNS toxicities, while the role of CNS leukemia in CNS toxicities is still unclear.2,3,6-11 Accumulating data on phar macogenetic associations with CNS toxicities and the genetic background of neurological diseases, such as seizures and epilepsy, support possible existence of gen etic susceptibility to CNS toxicities during ALL treat ment.7,10,12 Recent research has used genome-wide association studies (GWAS) to identify single nucleotide polymorphisms (SNP) related to methotrexate-induced leukoencephalopathy in pediatric ALL.7,10 Mateos et al. identified SNP in genes regulating neuronal growth, dif ferentiation, and cytoskeletal organization at a signifi cance level of P<1.0x10⁻⁶ 10
In this study, we explored the phenotypes, outcome, clini cal and genetic risk factors for all severe acute CNS toxic ities in pediatric patients with ALL. We applied both GWAS and candidate SNP analyses to identify genotypes associ ated with CNS toxicities.10,12 We hypothesized that genetic variants that predispose healthy children to epilepsy may also predispose them to seizures during ALL treatment and studied multi-SNP genetic risk scores for the risk of seizures in ALL patients.13 We collaborated with an inde pendent Australian research group to test whether our most significant findings would be validated in a cohort of pediatric ALL patients in whom two phenotype groups, diverse CNS toxicities and methotrexate-related CNS toxicity, were studied.
associations were analyzed on three phe notype groups: all CNS toxicities, PRES, and seizures. The group of patients with PRES showed signs of genomic in flation and were excluded from further analyses. The most significant SNP were annotated using the variant effect predictor (GRCh37.p13) and genes were checked using the Ensembl GRCh37 and GeneCards genetic databases for function and related disorders.18-20 Genes were further tested for functional enrichment by gene set overlap analysis
Statistical methods
The study group consisted of 1,464 children, 1 274 with Bcell precursor and 190 with T–cell ALL. The median fol low-up time for survivors was 5.04 years (range, 0.05–9.28, n=1,351).
Severe anoxic brain injury secondary to cardiac arrest 1
Haematologica | 107 October 2022 2320 ARTICLE - CNS toxicity during treatment of pediatric ALL S. Anastasopoulou et al.
toxicity. The candidate 19-SNP polygenic risk score were unweighted, and for the 6-SNP polygenic risk score, each SNP was weighted by the log-transformed odds ratio (OR) from Mateos et al.10
Older age, T-cell immunophenotype, CNS leukemia, and therapy induction with dexamethasone were associated with a higher risk of CNS toxicity in univariate analyses. Older age remained a statistically significant risk in a multivariate analysis adjusting for age, sex, immunophe notype, CNS status, and therapy induction (Table 3, Figure 3). Stratification into block treatment at the end of induc tion was a significant risk factor for CNS toxicity in uni variate analysis (hazard ratio [HR]=1.81; 95% CI: 1.21–2.70, P=0.004) but not in a multivariate analysis adjusting for age group, sex, immunophenotype, induction therapy and CNS status (HR=1.29; 95% CI: 0.81–2.06, P=0.28).
NOPHO: Nordic Society of Pediatric Hematology and Oncology; ALL: acute lymphoblastic leukemia; CNS: central nervous system; PRES: posterior reversible encephalopathy syndrome; SLS: stroke-like syn drome; ICP: intracranial pressure; NOS: not otherwise specified.
Steroid psychosis 1
Hypertensive encephalopathy 8
Ethical approval
The most common defined CNS toxicity was PRES (n=52), followed by sinus venous thrombosis (n=28) and isolated seizures (n=16); the most common neurological symptoms were seizures (n=82) (Table 1, Figure 1). In the Australian cohort, the most common CNS toxicity was methotre xate-related stroke-like syndrome (Table 2).
N of patients
was 4.8% (95% confidence interval [95% CI]: 3.77–5.97), at 6 months it was 7.5% (95% CI: 6.24–8.95), and at 1 year the cumulative incidence was 8.7% (95% CI: 7.31–10.20).
Seizures secondary to hyponatremia (sodium <125 mmol/L) 3
At the last follow-up, 121/135 (89.6%) patients with CNS
Isolated seizures 16
Survival
Sinus venous thrombosis 28
Pontine myelinolysis secondary to hypernatremia (sodium >160 mmol/L) 1
Intracranial hemorrhage 3
In total, 135 children had acute CNS toxicities, of whom 120 had a defined CNS toxicity and 15 had other CNS toxicities (Table 1). Ten patients with CNS toxicity had a neurological or neurodevelopmental disorder prior to the diagnosis of ALL, including febrile seizures (n=3), intellec tual disability (n=3), epilepsy (n=2), migraine (n=1), and at tention-deficit hyperactivity disorder (n=1).
Results
Aseptic meningitis 2
The ALL2008 study (EudraCT 2008-003235-20) was ap proved by the scientific ethical review boards of the in volved countries. The genetic study was approved by local ethical review boards with separate verbal and written consent. The genetic data were compiled in Denmark (Danish Data Protection Agency j.nr.: 2012-58-0004; Re gional Ethical Institutional Review Board in the capital re gion of Denmark, protocol number: H-2-2010-002). The Australian study was approved by Hunter New England Human Research Ethics Committee (reference number: 12/11/21/4.01).
Table 1. Acute severe central nervous system toxicities reported in children with acute lymphoblastic leukemia treated with the NOPHO ALL2008 protocol.
Methotrexate-related SLS 6 Encephalopathy NOS 4
Seizures secondary to hypoglycemia (glucose <2.5 mmol/L) 2
CNS toxicity
Seizures secondary to multi-organ failure 1
Overall, 9.2% (135/1,464) of the patients displayed at least one CNS toxicity during the course of ALL treatment. The majority of CNS toxicities occurred during the first 6 months of treatment (110/135), while eight cases of first CNS toxicity were reported after the first year (Figure 2). The cumulative incidence of CNS toxicities at 2 months
Our GWAS findings passing the suggestive threshold and candidate SNP showing a trend for association with seiz ures were evaluated in the Australian cohort including pa tients who displayed either diverse CNS toxicities (n=103) or methotrexate-related CNS toxicity (n=48) (Online Sup plementary Methods).10
Incidence and clinical risk factors
Validation study
Defined leukemia and/or treatment-related CNS toxicities PRES 52
Other or unclear symptoms (visual field defects, elevated ICP, cognitive difficulties) 3
Total 135
Systemic or unclear conditions with CNS toxicities CNS infection 4
Defined leukemia and/or treatment-related CNS toxicities
Haematologica | 107 October 2022 2321 ARTICLE - CNS toxicity during treatment of pediatric ALL S. Anastasopoulou et al.
PRES 4
Overall, 18 of the 50 most important SNP in the all CNS toxicities group and 13 of the 50 most important SNP in the seizures group were mapped in genes related to neur
In the group of patients with all CNS toxicities, five of the 50 most important SNP passed the suggestive P-value threshold of <5×10⁻⁶, of which one was mapped in a gene related to neurological functions (Table 4). In the seizure group, 12 of the 50 most important SNP passed the sug gestive P-value; one was mapped in a gene related to autophagy and regulation of proinflammatory cytokine production (Table 4).
Total 103
Isolated seizures 14
Genome-wide association studies of central nervous system toxicities
Possible methotrexate-related SLS* 17
Figure 1. Venn diagram showing total cases with seizures and underlying central nervous system toxicities. Data on seizures were not available for one patient with sinus venous thrombo sis and one patient with other central nervous system toxicity. PRES: posterior reversible encephalopathy syndrome; SVT: sinus venous thrombosis; SLS: stroke-like syndrome (methotrexate-related).
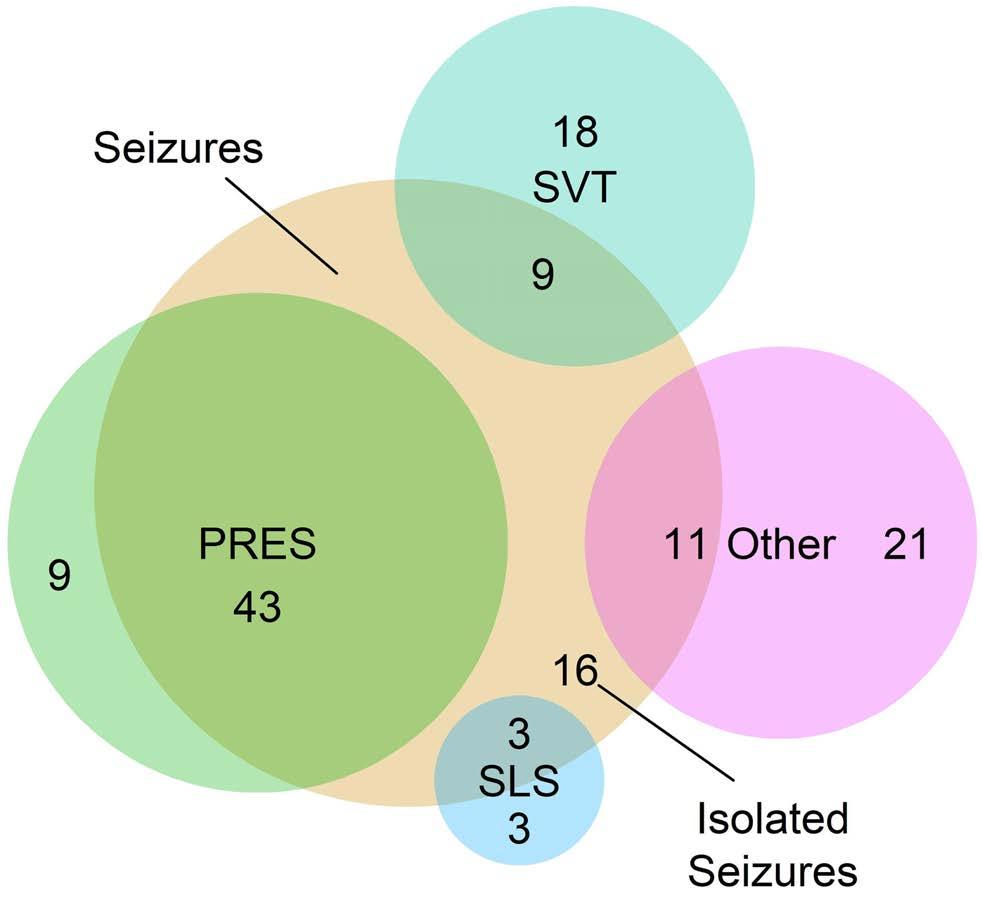
CNS toxicity
Motor deficits central** 11
Systemic or unclear conditionswith CNS toxicities
One hundred and nine of the 135 patients with CNS toxic ities participated in GWAS, of whom 67 had seizures (On line Supplementary Table S4). In total, 2,146,021 SNP qualified for GWAS of the two phenotype groups: all CNS toxicities (n=109 patients) and seizures (n=67 patients). The two groups were tested against 1,057 controls. No Bonferroni-corrected genome-wide significant hits (P<2×10⁻⁸) were obtained. GWAS on all CNS toxicities or seizures showed no signs of genomic inflation (Online Supplementary Figure S1). When no SNP reached genomewide significance, the top 50 SNP were assessed for bio logical function of the affected genes for the two groups, all CNS toxicities and seizures (Online Supplementary Table S5).
Elevated Intracranical pressure 4
CNS: central nervous system; SLS: stroke-like syndrome, NOS: not otherwise specified; PRES: posterior reversible encephalopathy syn drome. *Patients with methotrexate leukoencephalopathy who did not fit strict methotrexate-related SLS definition, **two patients with stroke/transient ischemic attack and patients with motor defi cits of central origin, such as cerebellar ataxia, ***altered mental state that did not fulfil criteria for encephalopathy NOS (1=suspected infarct, 1=non-specific changes on magnetic resonance imaging 1=progressive neurocognitive deterioration).
Encephalopathy NOS 8
Intracranial hemorrhage 3
toxicities were alive. Eight patients with CNS toxi cities(5.9%) died within 15 days of the episode of toxicity (median 5 days; range, 0–15 days). CNS toxicity was re ported to be the cause of death in 2/14 cases. There was no statistically significant difference in overall survival or event-free survival between patients with and without CNS toxicities (both considering defined CNS toxicities or any CNS toxicities; data not shown).
Aseptic meningitis 1
N patientsof
Methotrexate-related SLS 28
After recovery from the first CNS toxicity, 12/103 (11.7%, data missing for 32 patients) patients were reported to have been diagnosed with epilepsy. One patient with in tracranial hemorrhage had spastic tetraparesis and one patient with PRES had right-sided hemiplegia. Systematic neurocognitive evaluation was reported in only two cases showing impaired working memory, but clinical suspicion of impaired cognition was reported in a total of 12/110 (10.9%, data missing for 25 patients) patients at the time of data gathering.
Table 2. Acute severe central nervous system toxicities reported in children with acute lymphoblastic leukemia in the Australian cohort.
Sequelae
Symptoms from cognition*** 3
Leukoencephalopathy 10
1,159 (87.2) 166 (12.5) 110 (81.5) 25 (18.5)
BCP T–cellALL 1,168 (87.9) 161 (12.1) 106 (78.5) 29 (21.5)
Haematologica | 107 October 2022 2322 ARTICLE - CNS toxicity during
CNS(N=135)toxicities
CNS status**, N (%)
Multivariable HR (95% CI; P)*
FemaleMale 726 (54.6) 603 (45.4) 66 (48.9) 69 (51.1)
ological, neuropsychological and developmental disorders (Online Supplementary Table S5). Functional enrichment testing of genes in which SNP related to all CNS toxicities or seizures were located showed no significant gene set overlaps.
Univariable HR (95% CI; P)
We tested the seizure group for 19 candidate SNP, of which 13 were associated with epilepsy and six with me thotrexate-related CNS toxicity, against 1,057 controls (Table 5, Online Supplementary Table S3). Two SNP, rs2833098 located in GRIK1 and rs68082256 located in
Ref 1.84 (1.27-2.67; 0.001)
Table 3. Clinical characteristics of patients with and without central nervous system toxicities and risk factors for these toxicities. treatment of
Ref 1.99 (1.32-3.00; 0.001) Ref 1.33 (0.65-2.72 ; 0.43)
pediatric ALL S. Anastasopoulou et al.
Association of candidate single nucleotide polymorphisms with seizures
Induction therapy***, N (%)
1-9 10-17yearsyears
Immunophenotype, N (%)
Age group, N (%)
DexamethasonePrednisolone 1,080 (81.3) 237 (17.8) 96 (71.1) 39 (28.9)
ATXN1, both associated with generalized epilepsy, had sig nificant (P<0.05) associations. One SNP associated with methotrexate-related CNS toxicity, rs4712462 located in MBOAT1, showed a trend for association but without reaching statistical significance (P=0.07). However, the statistical significance of the associations did not survive after adjusting for multiple testing by Benjamini-Hochberg for any of these three SNP (Table 5).
1,078 (81.1) 251 (18.9) 86 (63.7) 49 (36.3)
CNS 1 CNS 2 or 3
Figure 2. Distribution of central nervous system toxicities over time after the diagnosis of acute lymphoblastic leukemia. PRES: posterior reversible encephalopathy syndrome; SLS: stroke-like syndrome (methotrexate-related); ALL: acute lymphoblastic leukemia.
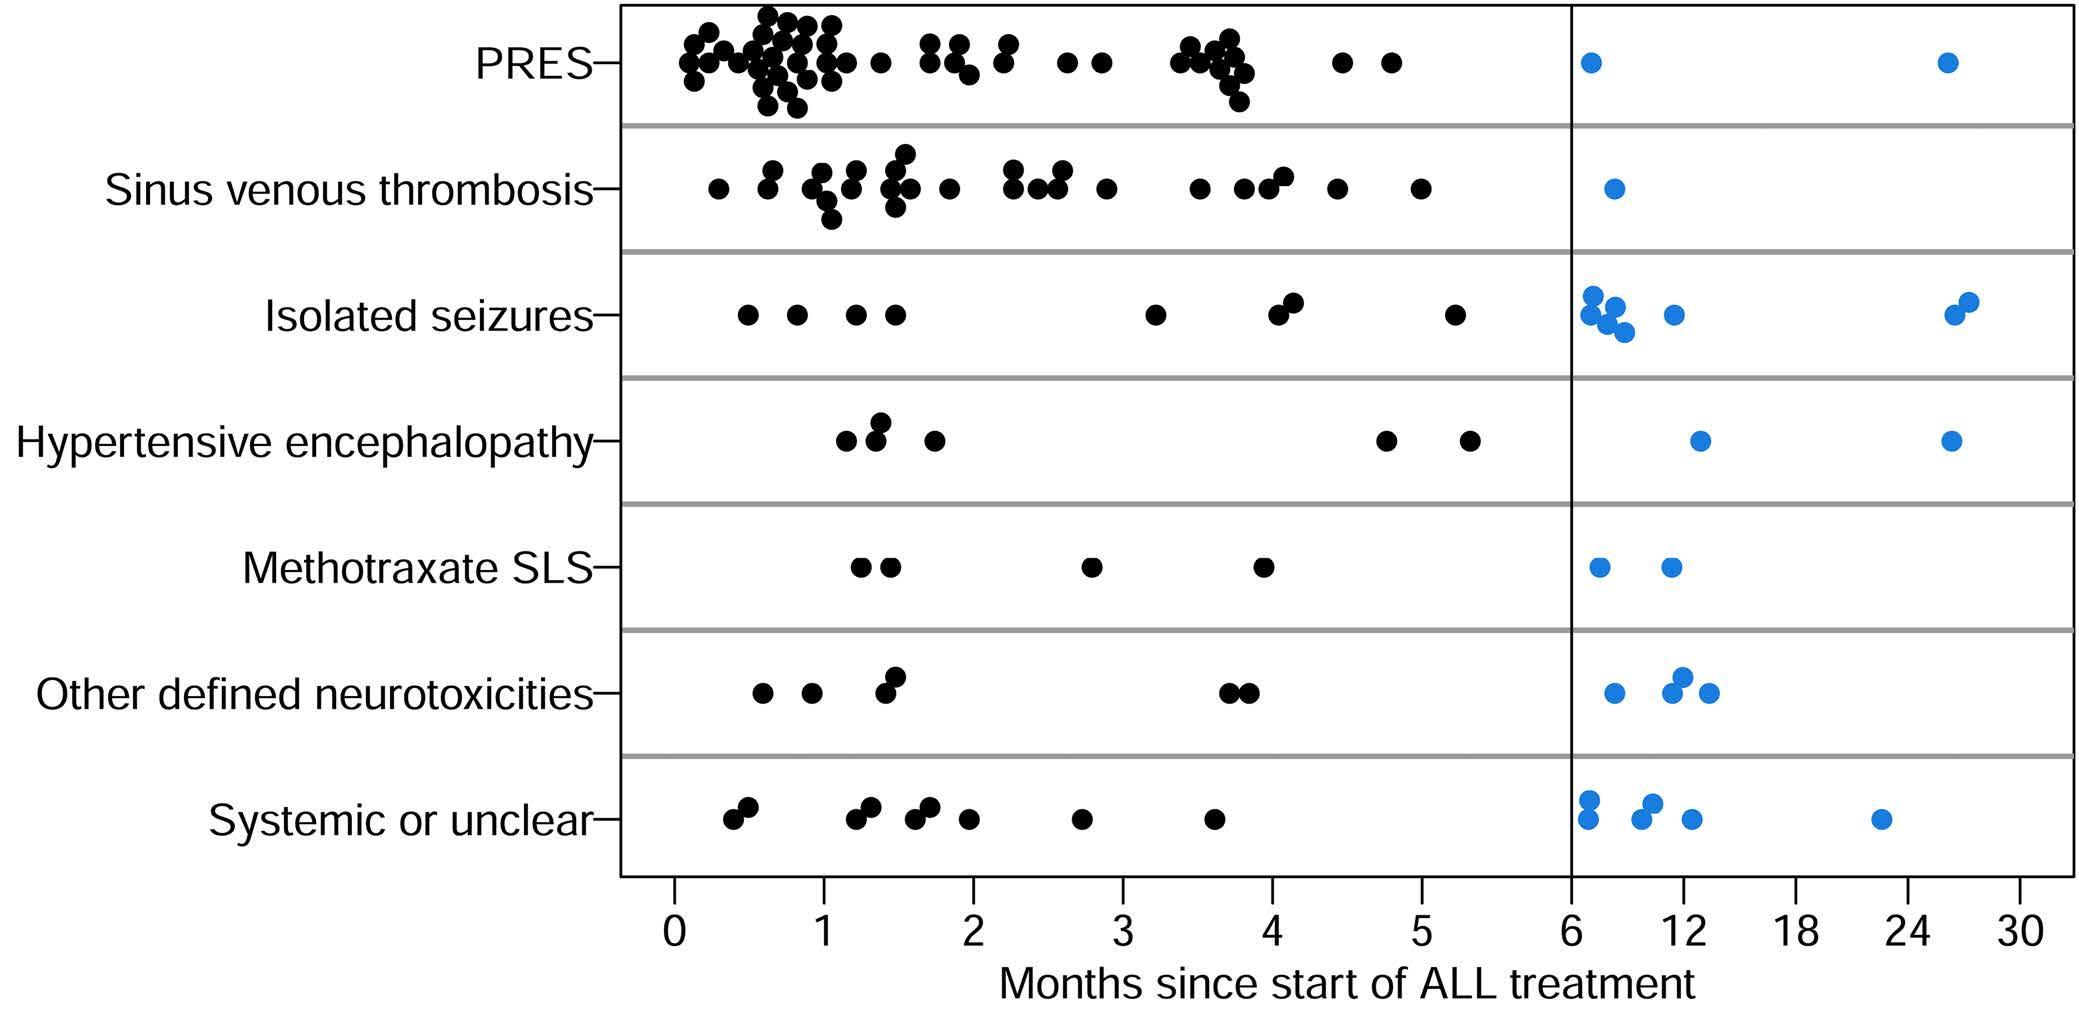
Sex, N (%)
Ref 1.59 (1.03-2.46; 0.04) Ref 1.42 (0.91-2.22; 0.12)
(N=1,329)Controls
Ref 1.25 (0.89-1.75; 0.19) Ref 1.37 (0.97-1.93; 0.07)
Ref 1.26 (0.66-2.40; 0.48)
Ref 2.38 (1.68-3.38; <0.001) Ref 2.22 (1.55-3.19; <0.001)
CNS: central nervous system; HR: hazard ratio; 95% CI: 95% confidence interval; BCP-ALL: B-cell precursor acute lymphoblastic leukemia. *Including age group, sex, immunophenotype, induction therapy, CNS status. **Four missing values for the controls. ***Three controls received other induction, nine missing values for the controls.
A weighted additive genetic score based on six SNP as sociated with methotrexate-related CNS toxicity was not significantly associated with seizures (HR=0.94 per weighted risk allele, 95% CI: 0.85-1.05; P=0.29). We have subsequently calculated an unweighted additive 19-SNP
Figure 3. Cumulative incidence of central nervous system toxicities (neurotoxicity). ALL: acute lymphoblastic leukemia.
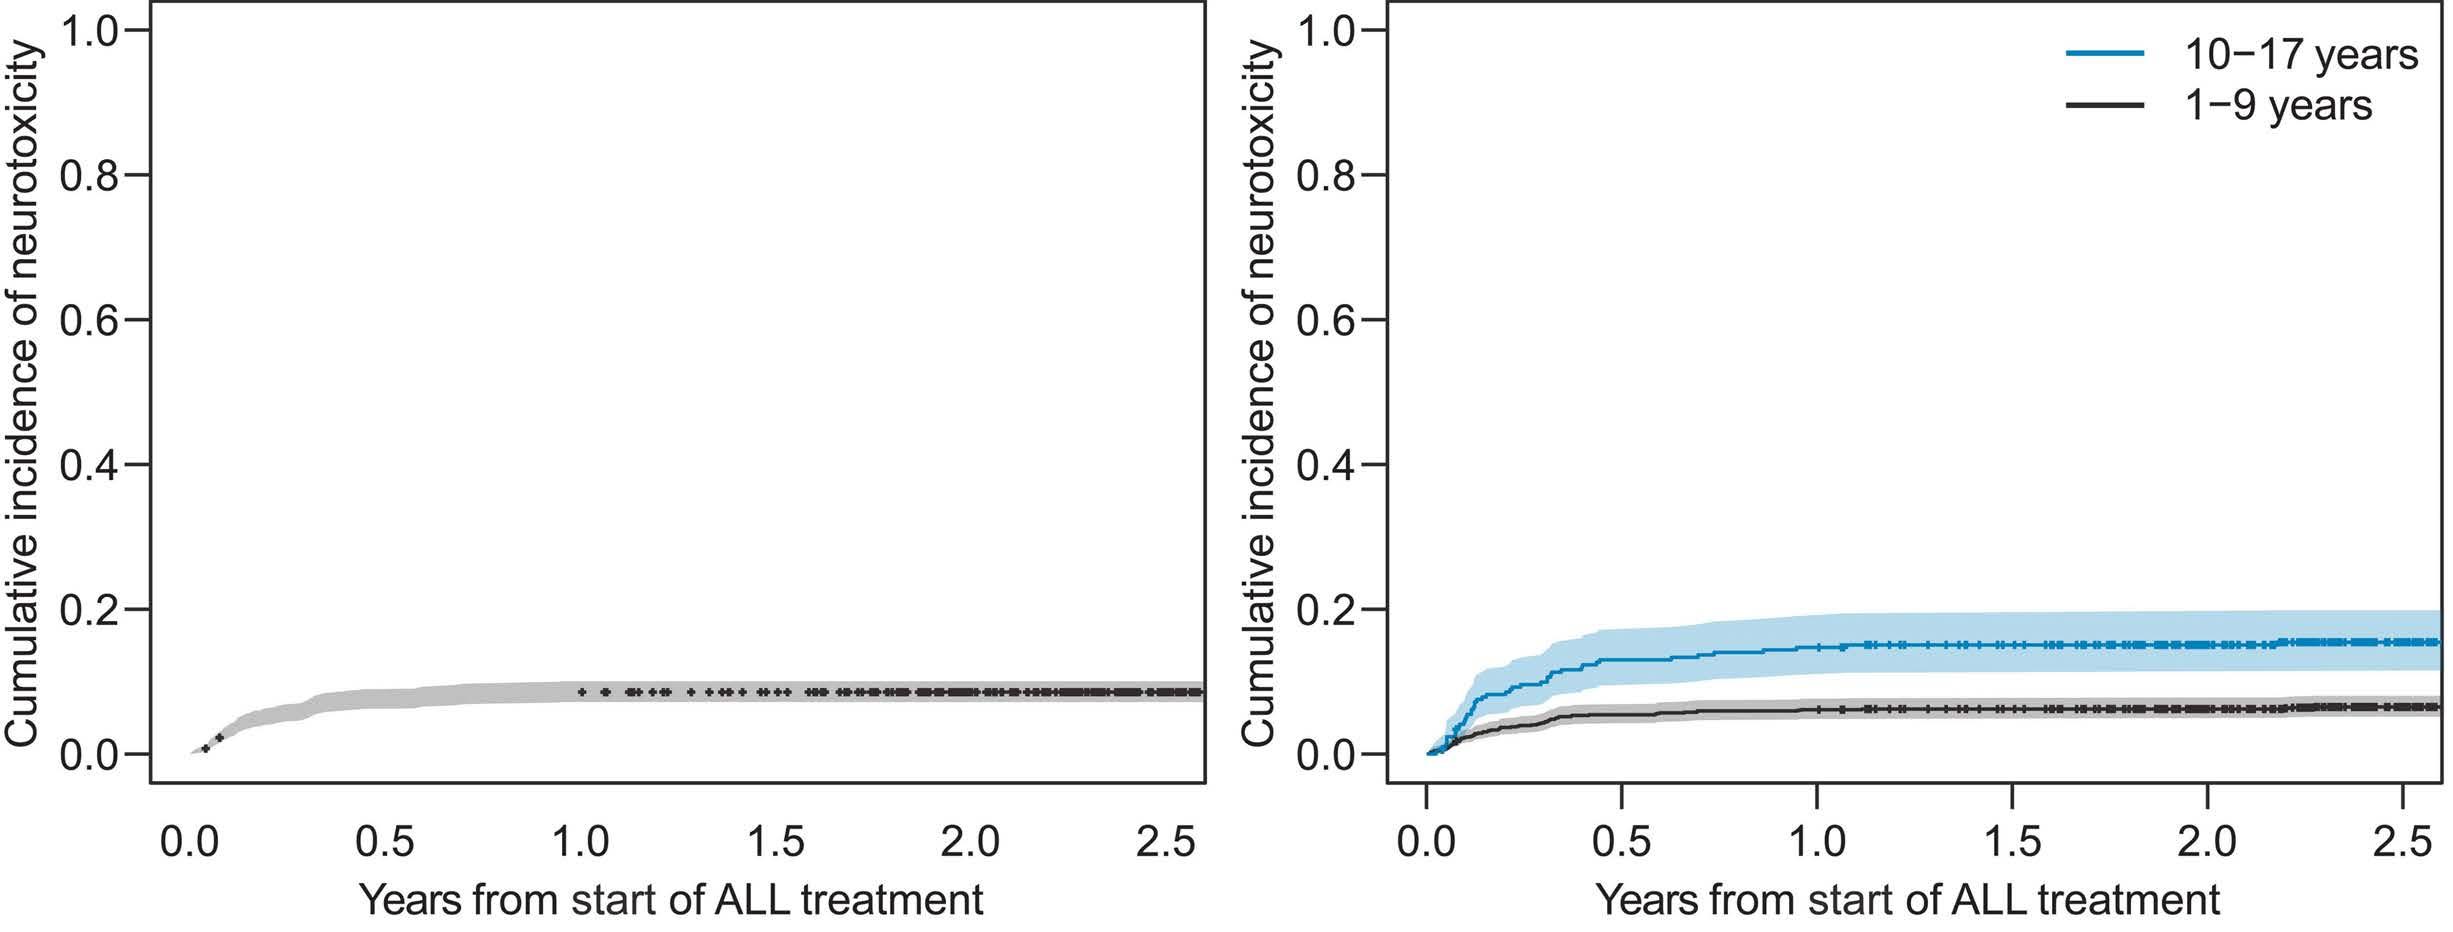
We previously studied the occurrence of PRES and seiz ures in children treated according to the NOPHO ALL2008 protocol, and found that PRES and seizures are relatively common during ALL treatment, and that a diagnosis of epilepsy is occasionally reported during long-term followup.6,22 Here, we expanded the scope and explored the inci dence, phenotypes, possible long-term effects, and risk
Discussion
The most significant SNP from GWAS that passed the sug gestive threshold, 12 related to seizures and five related to all CNS toxicities, as well as the two candidate SNP which showed significant association with seizures before multiple correction were included in the validation study (Tables 4 and 5, Online Supplementary Data). ATXN1 rs6802256 was replicated in the diverse CNS toxicities co hort (P=0.04).
genetic score based on all candidate SNP which was not significantly associated with seizures (HR=0.94 per risk al lele, 95% CI: 0.86-1.03; P=0.17).
factors for all severe acute CNS toxicities. In total, 9.2% of pediatric patients with ALL had at least one episode of CNS toxicity during the course of their disease and treat ment; PRES was the most common CNS toxicity (38.5%). CNS toxicities occurred most often within the first 6 months of treatment, confirming previous findings that CNS toxicities are common during the first months of ALL treatment, especially during induction.2,5,6,22 Children aged ≥10 years had a higher risk of CNS toxicities. None of the SNP identified by GWAS reached genome-wide signifi cance, but GRIK1 rs2833098 and ATXN1 rs68082256 ident ified by the candidate SNP approach, may play a role in predisposition to seizures in children with ALL. The repli cation of ATXN1 rs68082256 in the Australian cohort with diverse CNS toxicities further supports this hypothesis. The incidence of CNS toxicities in children with ALL has previously been found to vary between 3.6% and 18.4%.2,3,5,23-27 This wide spectrum of incidences mirrors dif ferent study designs, treatment protocols, and potential differences in documentation and classification of CNS toxicities; for example, in the Australian cohort with di verse CNS toxicities cases of sinus venous thrombosis were not included because they were examined in a sep arate study (Tables 1 and 2).2,3,5,23-26,28,29 The chemothera peutic agents most often associated with CNS toxicity in ALL are methotrexate, glucocorticosteroids, vincristine, asparaginase, and cytarabine.30-32 The NOPHO ALL2008 protocol includes intensive treatment with vincristine, high-dose methotrexate and asparaginase, which might have contributed to a higher incidence of CNS toxicity compared to that in patients treated with other proto cols.14-16,22,33 In our study the incidence of PRES, which was reported separately, was high whereas methotrexate-re lated stroke-like syndrome was rare, contrasting with the findings in the Australian cohort in which the incidence of methotrexate-related stroke-like syndrome was clearly higher (Tables 1 and 2).22 Methotrexate-related CNS toxic
Validation study
Stratification by age group showed a significant associ ation with seizures for ATXN1 rs68082256 (P=0.01) in pa tients <10 years (n=44, controls: n=867) and a trend for a significant association with seizures in this group of pa tients’ for GRIK1 rs2833098 (P=0.06). The difference in findings between the two age groups might depend on different group sizes (patients ≥10 years old: cases with seizures, n=23, controls: n=190) and therefore heteroge neity between effect sizes of the age groups was tested by adding an interaction term between age group and SNP to the logistic regression model. No interaction term was statistically significant, and thus heterogeneity between the effect sizes could not be supported by our data.
Haematologica | 107 October 2022 2323 ARTICLE - CNS toxicity during treatment of pediatric ALL S. Anastasopoulou et al.
rs12340816 9 Intergenic variant 2005105 G T 0.03 4.41 4.91e-06
Gene (bpfromdistancegene) Gene function Position (minor)Effectallele Referenceallele(major)
SNP: single nucleotide polymorphism; bp: base pairs; MAF: minor allele frequency, OR: odds ratio; CNS: central nervous system; OR=odds ratio.
Haematologica | 107 October 2022 2324 ARTICLE - CNS toxicity during treatment of pediatric ALL S. Anastasopoulou et al.
Table 4. Top single nucleotide polymorphisms identified by genome-wide association studies related to all central nervous system toxicities and seizures with significance level P<5x10⁻⁶
rs17641985 13 Intron Upstreamvariantgenevariant AL355390.1LINC00381(2394) UnknownUnknown 74990916 C T 0.01 8.03 3.48e-06 rs16936230 Upstreamvariantgene pseudogene443B9.1RP11-(3432) 1981979 G A 0.03 4.48 4.09e-06
rs13407218 2
Intron variant, Non codingvarianttranscript AC068490.2 Unknown 22448244 A C 0.08 2.88 1.11e-06
rs62325077 4 Intergenic variant 162120255 C A 0.11 2.43 4.89e-06 Seizures rs75487096 3
Intron Non coding transcript variant CTNNA2
rs72798143 2
MAF OR P
rs1528779 2 Intergenic variant 22969224 C T 0.48 0.39 4.14e-06
9
ity including stroke-like syndrome is a well-known entity but it is possible that mild cases may have been unde
SNP Chromo-some Consequence (most severe shown first)
Regulation of stabil ity and plasticity of synapses, differenti ation in the nervous system, neuronal mi gration,growthneurite 80600505
Intron variant, Non coding Regulatoryvarianttranscriptregionvariant KIAA0226 flammatoryregulationregulationNegativeofautophagy.Negativeofpro-incytokineproductionfollowingfungalorviralinfection 197436685 C T 0.02 7.01 2.11e-06
rs353999 Downstream gene variant pseudogeneSUMO1P4(3944) 49782621 A G 0.29 2.32 4.24e-06 rs10478527 5 Downstream gene variant pseudogene510I6.2RP11-(1545) 120954047 G A 0.32 2.35 4.87e-06
tected and not registered as CNS toxicity or they might have been registered as isolated seizures without further
19
rs16936423 9 Intergenic variant 2000098 G A 0.03 4.68 2.27e-06 rs116011797 5 Intergenic variant 121924081 T C 0.02 7.36 2.46e-06 rs114884102 6 Intergenic variant 8685785 T C 0.01 9.24 2.78e-06 rs79566233 6 Intergenic variant 8623113 G A 0.01 9.23 2.81e-06 rs78682412 8 Regulatory Intergenicvariantregionvariant 142606705 A G 0.05 3.62 2.97e-06
rs79459815 4 Intergenic variant 180706970 A G 0.01 11.5 2.29e-06
All CNS toxicities
T C 0.02 5.61 3.50e-06
rs35916740 7 Regulatory Intergenicvariantregionvariant 93028950 G T 0.09 2.63 3.71e-06
Methotrexate related central CNS toxicity 20196934
T C 0.93 0.14 (T) 1.16 0.58 0.86
A G 0.95 0.15 (A) 0.85 0.45 0.86
A G 1.00 0.37 (G) 0.95 0.71 0.97 rs4596374 KCNN2 5 Generalized epilepsy 114221505
G C 0.93 0.20 (G) 0.80 0.34 0.86
rs4671319 BCL11AFANCL, 2
rs6432877
C T 1.00 0.41 (C) 1.19 0.24 0.75
CNS: central nervous system; MAF: minor allele frequency; OR: odds ratio; FDR: false dis
SNP ID Gene Chromo-some Phenotype Position Effectallele Referenceallele scoreInfo MAFallele)(minor OR P- value FDR
T C 1.00 0.28 (T) 0.98 0.87 0.98 rs13200150 PTPRK 6
T C 1.00 0.10 (C) 1.02 0.98 0.98 rs11943905 GABRA2 4
A G 0.99 0.05 (A) 0.55 0.23 0.75
Generalized epilepsy 23898317
Methotrexate related central CNS toxicity 14590919
nucleotide polymorphism; ID:
G GC 0.96 0.18 (G) 0.86 0.48 0.86 rs74956940 PKN1 19
A G 0.99 0.19 (A) 0.47 0.01 0.13 rs4712462 MBOAT1 6
A G 1.00 0.47 (G) 0.89 0.45 0.86
rs2212656
A G 1.00 0.37 (G) 0.71 0.04 0.36 rs68082256 ATXN1 6 Generalized epilepsy 16971575
G A 1.00 0.33 (G) 0.99 0.86 0.98 rs1402398 BCL11AFANCL, 2 Generalized epilepsy 58042241
Generalized epilepsy 128309768
2
A G 1.00 0.09 (A) 0.88 0.55 0.86
G C 1.00 0.23 (G) 1.07 0.92 0.98
rs2833098 GRIK1 21 Generalized epilepsy 32183996
TTC21B,SCN2A,SCN3A,SCN1A
Older age was associated with a higher risk of CNS toxic ity, which is in line with previous findings that older age is a risk factor for PRES, seizures, and methotrexate-in duced CNS toxicity.6,10,22 Moreover, older age has previously been shown to be a risk factor for non-CNS treatmentrelated toxicities such as thrombosis, pancreatitis, and osteonecrosis in childhood ALL.29,34,35 Immunophenotype (T–cell) and induction therapy (dexamethasone) were sig nificant in univariate analyses, but did not reach signifi
All epilepsy 166998767
A C 1.00 0.23 (A) 1.07 0.93 0.98 rs4665630 KLHL29 2
SNP: single identify; covery rate.
evaluation with neuroimaging. Patients with CNS leukemia were excluded from some studies on the occurrence of CNS toxicities.5,23 Here, we included patients with CNS leukemia to explore whether CNS involvement at diagno sis was associated with a higher risk of CNS toxicity. Un like in a recent study of Finnish children with ALL, leukemic involvement of the CNS was not an independent risk factor for CNS toxicity in our cohort or the Australian cohort studying methotrexate-related CNS toxicity.2,10
rs9590003 none 13
Methotrexate related central CNS toxicity 95072136
rs11890028
rs4638568 HEATR3,BRD7
Table 5. Results of candidate single nucleotide polymorphism approach in children with acute lymphoblastic leukemia and seizures.
G T 1.00 0.26 (G) 0.76 0.22 0.75
rs35307996 NXN 17
TTC21B,SCN2A,SCN3A,SCN1A 2
Methotrexate related central CNS toxicity 14571966
rs2241357 GIPC1 19
All epilepsy 57950346
Generalized epilepsy 166943277
Methotrexate related central CNS toxicity 747700
G A 0.95 0.28 (A) 1.52 0.07 0.44
16
T C 0.98 0.48 (T) 0.91 0.59 0.86 rs4794333 PNPO 17 Generalized epilepsy 46045495
Generalized epilepsy 46397617
Focal epilepsy 167000843
Methotrexate related central CNS toxicity 195925355
All epilepsy 50045839
TTC21B,SCN3A,SCN2A,SCN1A
Haematologica | 107 October 2022 2325 ARTICLE - CNS toxicity during treatment of pediatric ALL S. Anastasopoulou et al.
rs1106479 ZDHHC19 3
2
tients (Online Supplementary Table S5). Overall, 18 SNP in the all CNS toxicities group and 13 SNP in the seizures group were mapped in genes associated with neurologi cal, neuropsychological and developmental disorders but since they did not reach genomic significance, the sug gestive P threshold or any functional enrichment by gene set overlap analysis this finding is non-specific.18,19 None of the previously described genes associated with CNS toxicity in pediatric ALL was replicated with GWAS in our study.7,10 Similarly, none of SNP passing the suggestive threshold was replicated in the independent Australian cohort, which might reflect small sizes of the cohorts or variation between the phenotypes. The replication of ATXN1 rs68082256 in both our cohort and the Australian cohort does, however, indicate that pathogenesis of seiz ures in childhood ALL possibly includes genetic aspects. Genome-wide association analyses and validation studies in larger cohorts of pediatric patients with ALL are war ranted to further study genetic predisposition to CNS toxicities among ALL patients.7,10
as a late effect after PRES or other CNS toxicity in childhood ALL has been described in previous studies.2,5,6,10,22,33 We do not have data on epilepsy among controls, but the incidence of epilepsy among ALL pa tients with CNS toxicity in our study was higher than that in the general population in developed countries.36 This was true even if we assumed that none of the controls in this ALL cohort had a diagnosis of epilepsy and the 12 re ported patients with epilepsy would represent the overall prevalence of epilepsy in this population.36 In the latest Australian study 3/95 (3.2%) children with methotrexaterelated CNS toxicity had epilepsy at last follow-up, as compared to 4/427 (1.0%) controls with epilepsy at last follow-up, which further illustrates that epilepsy as a se quel is more common in ALL patients who displayed CNS toxicities.10 ATXN1, encoding ataxin-1 protein, is the gene underlying spinocerebellar ataxia type 1 and is implicated in seizures.12,37 The replication of ATXN1 rs68082256 in the group of younger patients and in the Australian cohort suggests a genetic predisposition to seizures in younger ALL patients, even if we cannot conclude whether it re flects risk for CNS toxicity or comorbidity with epilepsy. Larger studies might clarify the role of ATXN1 rs68082256 in seizures in ALL and of age as a mediator of genetic pre disposition and give insight into the pathogenesis. Cognitive impairment was reported in 12 patients, but for mal neuropsychiatric assessment was performed in only two cases. Accumulating data indicate a risk of cognitive sequelae in patients with ALL, including working memory difficulties, highlighting the need for more standardized neurocognitive follow-up of pediatric patients with ALL.38,39 The mortality of patients from CNS toxicity in our study was lower than that previously described, but still considerable.5,28Thisstudydidnot reveal any novel genome-wide signifi cant genetic associations with CNS toxicities, probably due to the limited number of patients with CNS toxicities, diverse underlying conditions, and available phenotype data. When the suggestive P-value was applied, KIAA0226 rs75487096 was associated with seizures and CTNNA2 rs13407218 was associated with all CNS toxicities. Notably, the KIAA0226 gene is a negative regulator in autophagy which is involved in neuron function and the CTNNA2 gene may contribute to the differentiation of the nervous sys tem, to neurite growth, stability and the morphological plasticity of synapses; both genes are related to neuro logical disorders.18,19,40 CTNNA2 rs13407218 was among the 50 most important SNP even in the seizures group. Among the 50 most important SNP, seven (CTNNA2 rs13407218, ABI1 rs12357198, ABI1 rs11015279, ABI1 rs79349206, CEP128 rs12435954, MRE11A rs78817171 and HHLA3 rs114310506) were present in both groups, reflecting the overlap of pa
In conclusion, CNS toxicities are common and potentially life-threatening complications of pediatric ALL treatment which occur most commonly during the first 6 months of treatment. Age is a modifier of CNS toxicity with an overall higher risk of CNS toxicity in children 10 years and older, and a possible genetic predisposition to seizures in children younger than 10 years. Our findings motivate further GWAS and validation studies in larger cohorts of pediatric patients with ALL.
Disclosures
SA collected phenotype data, wrote the manuscript and contributed to the interpretation of the results. RLN, MH, BW and SA collected the genetic data, analyzed the GWAS and contributed to the interpretation of the results. IMM and AW contributed with statistical analyses. BA-N, JB, IMJ, OGJ, SM, RN, MT and GV provided phenotype data from all countries participating in the study. SM and CM conducted additional GWAS analyses and contributed to the interpre tation of the results. MKM provided clinical data and ge notype-phenotype correlations for the Australian cohort of patients and contributed to the interpretation of the re sults, MAE supervised the interpretation of neurological findings . KS provided access to genetic data and con tributed to the study design and interpretation of results. MMH contributed to the study design and interpretation of results. SR and AH-S conceived the study concept, super vised the writing of the manuscript and interpretation of results. All authors reviewed and approved the final version of the manuscript.
Haematologica | 107 October 2022 2326 ARTICLE - CNS toxicity during treatment of pediatric ALL S. Anastasopoulou et al.
Contributions
No conflicts of interest to disclose.
cance in the multivariate model, probably due to co-vari Epilepsyation.
13. Jarvis KB, LeBlanc M, Tulstrup M, et al. Candidate single nucleotide polymorphisms and thromboembolism in acute lymphoblastic leukemia - a NOPHO ALL2008 study. Thromb Res. 2019;184:92-98.
Rigshospitalet, Lund University, Region Skåne and Technical University Denmark (DTU), supported by the European Re gional Development Fund. This work was part of Childhood Oncology Network Targeting Research, Organisation & Life expectancy (CONTROL) and supported by the Danish Cancer Society (R-257-A14720) and the Danish Childhood Cancer Foundation (2019-5934). This work was also supported by a Cancer Institute NSW Fellowship (grant ECF181430).
9. Khan RB, Sadighi ZS, Zabrowski J, Gajjar A, Jeha S. Imaging patterns and outcome of posterior reversible encephalopathy syndrome during childhood cancer treatment. Pediatr Blood Cancer. 2016;63(3):523-526.
11. Thastrup M, Marquart HV, Levinsen M, et al. Flow cytometric detection of leukemic blasts in cerebrospinal fluid predicts risk of relapse in childhood acute lymphoblastic leukemia: a Nordic Society of Pediatric Hematology and Oncology study. Leukemia. 2020;34(2):336-346.
References
7. Bhojwani D, Sabin ND, Pei D, et al. Methotrexate-induced neurotoxicity and leukoencephalopathy in childhood acute lymphoblastic leukemia. J Clin Oncol. 2014;32(9):949-959.
Epilepsies. Genome-wide mega-analysis identifies 16 loci and highlights diverse biological mechanisms in the common epilepsies. Nat Commun. 2018;9(1):5269.
5. Baytan B, Evim MS, Guler S, Gunes AM, Okan M. Acute central nervous system complications in pediatric acute lymphoblastic leukemia. Pediatr Neurol. 2015;53(4):312-318.
16. Toft N, Birgens H, Abrahamsson J, et al. Risk group assignment differs for children and adults 1-45 yr with acute lymphoblastic leukemia treated by the NOPHO ALL-2008 protocol. Eur J Haematol. 2013;90(5):404-412.
10. Mateos MK, Marshall GM, Barbaro PM, et al. Methotrexaterelated central neurotoxicity: clinical characteristics, risk factors and genome-wide association study in children treated for acute lymphoblastic leukemia. Haematologica. 2021;107(3):635-643.
12. International League Against Epilepsy Consortium on Complex
Haematologica | 107 October 2022 2327 ARTICLE - CNS toxicity during treatment of pediatric ALL S. Anastasopoulou et al.
4. Schmiegelow K, Attarbaschi A, Barzilai S, et al. Consensus definitions of 14 severe acute toxic effects for childhood lymphoblastic leukaemia treatment: a Delphi consensus. Lancet Oncol. 2016;17(6):e231-e239.
Acknowledgments
3. Parasole R, Petruzziello F, Menna G, et al. Central nervous system complications during treatment of acute lymphoblastic leukemia in a single pediatric institution. Leuk Lymphoma. 2010;51(6):1063-1071.
17. Chang CC, Chow CC, Tellier LC, Vattikuti S, Purcell SM, Lee JJ. Second-generation PLINK: rising to the challenge of larger and richer datasets. Gigascience. 2015;4:7.
18. GeneCards®: The Human Gene Database, Weizmann Institute of Science. v5.9.0 Build 592; https://www.genecards.org/.1996-2021.Accessed 24 Jan, 2022.
8. Khan RB, Morris EB, Pui CH, et al. Long-term outcome and risk factors for uncontrolled seizures after a first seizure in children with hematological malignancies. J Child Neurol. 2014;29(6):774-781.
23. Kuskonmaz B, Unal S, Gumruk F, Cetin M, Tuncer AM, Gurgey A. The neurologic complications in pediatric acute lymphoblastic leukemia patients excluding leukemic infiltration. Leuk Res. 2006;30(5):537-541.
15. Raja RA, Schmiegelow K, Albertsen BK, et al. Asparaginaseassociated pancreatitis in children with acute lymphoblastic leukaemia in the NOPHO ALL2008 protocol. Br J Haematol. 2014;165(1):126-133.
1. Pui CH, Pei D, Campana D, et al. A revised definition for cure of childhood acute lymphoblastic leukemia. Leukemia. 2014;28(12):2336-2343.
19. Ensembl GRCh37 Release http://grch37.ensembl.org/index.html.104. Accessed 5 May, 2021.
14. Frandsen TL, Heyman M, Abrahamsson J, et al. Complying with the European Clinical Trials directive while surviving the administrative pressure - an alternative approach to toxicity registration in a cancer trial. Eur J Cancer. 2014;50(2):251-259.
2. Banerjee J, Niinimaki R, Lahteenmaki P, et al. The spectrum of acute central nervous system symptoms during the treatment of childhood acute lymphoblastic leukaemia. Pediatr Blood Cancer. 2020;67(2):e27999.
20. McLaren W, Gil L, Hunt SE, et al. The Ensembl variant effect predictor. Genome Biol. 2016;17(1):122.
Funding
Data-sharing statement
The authors acknowledge the Sydney Children’s Tumour Bank Network, which provided samples for the Australian GWAS that was used for validation purposes.
21. GSEA, Gene Set Enrichment Analysis. Broad Institute, Inc., Massachusetts Institute of Technology, and Regents of the University of California. msigdb.org/gsea/index.jsp.http://www.gsea-Accessed19Jan,2022..
This work was supported by the Swedish Childhood Cancer Fund (grants KP2017-0010, TJ2020-0082, TJ2019-0031), Stockholm county, the Danish Childhood Cancer Foundation (TRAVERSE, 2018-3755) and the Interregional Childhood On cology Precision Medicine Exploration (iCOPE), a cross-Ore sund collaboration between University Hospital Copenhagen,
6. Anastasopoulou S, Heyman M, Eriksson MA, et al. Seizures during treatment of childhood acute lymphoblastic leukemia: a population-based cohort study. Eur J Paediatr Neurol. 2020;27:72-77.
22. Anastasopoulou S, Eriksson MA, Heyman M, et al. Posterior reversible encephalopathy syndrome in children with acute lymphoblastic leukemia: Clinical characteristics, risk factors, course, and outcome of disease. Pediatr Blood Cancer. 2018;66(5):e27594.
24. Lo Nigro L, Di Cataldo A, Schiliro G. Acute neurotoxicity in children with B-lineage acute lymphoblastic leukemia (B-ALL)
Peer investigators wishing to see the study data may con tact the corresponding author.
28. Millan NC, Pastrana A, Guitter MR, Zubizarreta PA, Monges MS, Felice MS. Acute and sub-acute neurological toxicity in children treated for acute lymphoblastic leukemia. Leuk Res. 2018;65:86-93.
36. Camfield P, Camfield C. Incidence, prevalence and aetiology of seizures and epilepsy in children. Epileptic Disord. 2015;17(2):117-123.
Haematologica | 107 October 2022 2328 ARTICLE - CNS toxicity during treatment of pediatric ALL S. Anastasopoulou et al.
33. Banerjee JS, Heyman M, Palomaki M, et al. Posterior reversible encephalopathy syndrome: risk factors and impact on the outcome in children with acute lymphoblastic leukemia treated with Nordic protocols. J Pediatr Hematol Oncol. 2018;40(1):e13-e18.
31. How J, Blattner M, Fowler S, Wang-Gillam A, Schindler SE. Chemotherapy-associated posterior reversible encephalopathy syndrome: a case report and review of the literature. Neurologist. 2016;21(6):112-117.
25. Winick NJ, Bowman WP, Kamen BA, et al. Unexpected acute neurologic toxicity in the treatment of children with acute lymphoblastic leukemia. J Natl Cancer Inst. 1992;84(4):252-256.
2009;16(12):1688-1690.
38. Buizer AI, de Sonneville LM, van den Heuvel-Eibrink MM, Veerman AJ. Chemotherapy and attentional dysfunction in survivors of childhood acute lymphoblastic leukemia: effect of treatment intensity. Pediatr Blood Cancer. 2005;45(3):281-290.
26. DiMario FJ Jr, Packer RJ. Acute mental status changes in children with systemic cancer. Pediatrics. 1990;85(3):353-360.
34. Toft N, Birgens H, Abrahamsson J, et al. Results of NOPHO ALL2008 treatment for patients aged 1-45 years with acute lymphoblastic leukemia. Leukemia. 2018;32(3):606-615.
40. Stavoe AKH, Holzbaur ELF. Autophagy in neurons. Annu Rev Cell Dev Biol. 2019;35:477-500.
27. Mahoney DH Jr., Shuster JJ, Nitschke R, et al. Acute neurotoxicity in children with B-precursor acute lymphoid leukemia: an association with intermediate-dose intravenous methotrexate and intrathecal triple therapy--a Pediatric Oncology Group study. J Clin Oncol. 1998;16(5):1712-1722.
32. Nguyen MT, Virk IY, Chew L, Villano JL. Extended use dexamethasone-associated posterior reversible encephalopathy syndrome with cisplatin-based chemotherapy. J Clin Neurosci.
37. An Online Catalog of Human Genes and Genetic Disorders, OMIM® and Online Mendelian Inheritance in Man® https://www.omim.org/. Accessed feb 10, 2022.
39. Nassar SL, Conklin HM, Zhou Y, et al. Neurocognis during treatment for acute lymphoblastic leukemia. Pediatr Blood Cancertive outcomes among children who experienced seizure. Pediatr Blood Cancer. 2017;64(8):10.
35. Toft N, Birgens H, Abrahamsson J, et al. Toxicity profile and treatment delays in NOPHO ALL2008-comparing adults and children with Philadelphia chromosome-negative acute lymphoblastic leukemia. Eur J Haematol. 2016;96(2):160-169.
29. Mateos MK, Trahair TN, Mayoh C, et al. Risk factors for symptomatic venous thromboembolism during therapy for childhood acute lymphoblastic leukemia. Thromb Res. 2019;178:132-138.
treated with intermediate risk protocols. Med Pediatr Oncol. 2000;35(5):449-455.
30. Peddi PF, Peddi S, Santos ES, Morgensztern D. Central nervous system toxicities of chemotherapeutic agents. Expert Rev Anticancer Ther. 2014;14(7):857-863.
h
genetic “drivers” have been implicated in pediatric AML disease pathology and risk stratification. However, only a minority of these drivers have been exploited by targeted therapeutic interventions.3 Current risk-stratifi cation considers genetic abnormalities (e.g., inv (16),
Correspondence: S.M. skornblau@mdanderson.orgKornblau
#TMH and SMK contributed equally as co-senior authors.
Fieke W. Hoff,1,2 Anneke D. van Dijk,1 Yihua Qiu,3 Chenyue W. Hu,4 Rhonda E. Ries,5 Andrew Ligeralde,6 Gaye N. Jenkins,7 Robert B. Gerbing,8 Alan S. Gamis,9 Richard Aplenc,10 E. Anders Kolb,11 Todd A. Alonzo,8 Soheil Meshinchi,5 Amina A. Qutub,12 Eveline S.J.M. de Bont,1 Terzah M. Horton7,# and Steven M. Kornblau3,#
Accepted: November 18, 2021.
Pediatric acute myeloid leukemia (AML) is a heterogene ous disease resulting from clonal expansion of myeloid precursors that have lost the ability to differentiate nor mally.1 Despite improvements in outcome, the 5-year over all survival of affected patients approximates 70% and serious long-term complications are common among sur vivors.2 With the exception of acute promyelocytic leuke
IntroductionAbstract
Received: July 26, 2021.
Prepublished: January 13, 2022.
Pediatric acute myeloid leukemia (AML) remains a fatal disease for at least 30% of patients, stressing the need for improved therapies and better risk stratification. As proteins are the unifying feature of (epi)genetic and environmental alterations, and are often targeted by novel chemotherapeutic agents, we studied the proteomic landscape of pediatric AML. Protein expression and activation levels were measured in 500 bulk leukemic patients’ samples and 30 control CD34+ cell samples, using reverse phase protein arrays with 296 strictly validated antibodies. The multistep MetaGalaxy analysis methodology was applied and identified nine protein expression signatures (PrSIG), based on strong recurrent protein expression pat terns. PrSIG were associated with cytogenetics and mutational state, and with favorable or unfavorable prognosis. Analysis based on treatment (i.e., ADE vs. ADE plus bortezomib) identified three PrSIG that did better with ADE plus bortezomib than with ADE alone. When PrSIG were studied in the context of cytogenetic risk groups, PrSIG were independently prog nostic after multivariate analysis, suggesting a potential value for proteomics in combination with current classification systems. Proteins with universally increased (n=7) or decreased (n=17) expression were observed across PrSIG. Certain proteins significantly differentially expressed from normal could be identified, forming a hypothetical platform for per sonalized medicine.
mia, leukemia with FLT3-internal tandem duplication (ITD) mutations, and mixed phenotype acute leukemia, pedi atric AML has been treated as a homogeneous disease, as therapy does not differ based on the underlying muta Manytions.
©2022 Ferrata Storti Foundation
Published under a CC BY-NC license
1Department of Pediatric Oncology/Hematology, University Medical Center Groningen, University of Groningen, Groningen, the Netherlands; 2Department of Internal Medicine, University of Texas, Southwestern Medical Center, Dallas, TX, USA; 3Department of Leukemia, The University of Texas M.D. Anderson Cancer Center, Houston, TX, USA; 4Department of Bioengineering, Rice University, Houston, TX, USA; 5Clinical Research Division, Fred Hutchinson Cancer Research Center, Seattle, WA, USA; 6Biophysics, University of California, Berkeley, CA, USA; 7Department of Pediatrics, Texas Children’s Cancer Center, Baylor College of Medicine, Houston, TX, USA; 8University of Southern California, Los Angeles, CA, USA; 9Department of Hematology-Oncology, Children's Mercy Hospitals and Clinics, Kansas City, MO, USA; 10Division of Pediatric Oncology/Stem Cell Transplant, Children's Hospital of Philadelphia, Philadelphia, PA, USA; 11Nemours Center for Cancer and Blood Disorders, Emory University, Atlanta, GA, USA and 12Department of Biomedical Engineering, The University of Texas at San Antonio, San Antonio, TX, USA
ttps://doi.org/10.3324/haematol.2021.279672
Clinical relevance of proteomic profiling in de novo pediatric acute myeloid leukemia: a Children’s Oncology Group study
Haematologica | 107 October 2022 2329 ARTICLE - Acute Myeloid Leukemia
Patients’ samples
monosomy 7), but otherwise relies on early response to therapy (minimal residual disease status). However, riskstratification is imperfect and outcome within risk groups is heterogeneous. Since many drivers may prove to be di rectly “undruggable”, targeting downstream proteins may be efficacious. This requires knowledge of the proteomic landscape that emerges from the combined “net” con sequences of genetic and epigenetic events. However, little is known about the proteomic landscape in pediatric AML. Improved understanding of this might enhance pretreatment risk stratification and guide the selection of therapies against targetable molecular lesions, especially agents targeting protein function.
Peripheral blood samples were collected from 500 pedi atric patients with de novo AML participating in the COG AAML1031 (#NCT01371981) phase III clinical trial (n=483)9 or in older clinical trials (n=17), and 30 control CD34+ bone marrow samples from healthy donors (20 children and 10 adults) between July 2011 and February 2017.9 Samples with <80% blasts were enriched for leukemic cells by CD3/CD19 depletion. Samples were collected before the start of chemotherapy (n=500), and 10 hours (h) (n=463) and 24 h (n=466) after the start of induction chemother apy. At both 10 h and 24 h, one dose of each chemothera peutic agent had been administered.10 Written informed consent was obtained in accordance with the Declaration of Helsinki and local institutional review boards. Outcome data were restricted to 410 of the 483 patients enrolled on the AAML1031 trial. Outcome was not deter mined for 69 patients treated with ADE after trial closure by the Data and Safety Monitoring Board, and for four pa tients who did not meet eligibility criteria. Two-hundred patients received standard ADE induction therapy, includ ing 36 who also received sorafenib (ADES), while 210 pa tients received ADEB. Induction therapy produced complete remission by the end of induction II in 348 (85%) patients, 31 (8%) were either refractory or died early. Re lapse occurred in 156 (45%) patients, and 286 (70%) were still alive with a median follow-up of 4.4 years (range, 0.37.5 years). Outcome data were calculated as published previously.9 Mutation data were available for CEBPA, NPM1, KIT (exons 8 and 17) and FLT3-ITD.11
Methods
Reverse phase protein microarray methodology
Genomic mutations influence cellular physiology via al tered protein abundance or activity, but several factors diminish the correlation between genetic alterations and protein effects, including the general lack of correlation between cellular messenger RNA (mRNA) abundance and protein expression,4,5 and the inability to assess posttranslational modifications of proteins with genomic tech niques. In other tumor types, protein quantification commonly influences diagnosis, classification and therapy (e.g., estrogen and progestin receptors, programmed cell death ligand 1).6,7 Despite these advantages, proteomics has not been used to guide AML therapy. We previously performed a pilot study of the proteomic landscape examining 194 proteins in 95 de novo pediatric AML patients using an approach that recognized protein expression patterns within protein functional groups (PFG).8 After determining the characterization of each pa tient’s PFG, we built higher order structures based on strong correlations between PFG patterns, recognizing eight protein expression signatures (PrSIG) that were prog nostic. Here, we used this same approach to prospectively examine 500 pediatric AML patients treated on a Children’s Oncology Group (COG) randomized phase III clinical trial (AAML1031). The hypothesis tested in this trial was that the addition of the proteasome inhibitor borte zomib could improve therapy based on Ara-C (cytarabine), daunorubicin, and etoposide (ADE). This trial closed early when it was determined that adding bortezomib to ADE (ADEB) did not improve either event-free or overall survival at 3 years across the entire group of patents. We aimed to: (i) validate the ability to classify pediatric AML patients based on proteomics in a larger cohort, with significantly more protein targets; (ii) determine whether protein class ification could enhance risk stratification; (iii) identify pa tients who could benefit from ADEB; and (iv) identify additional targets for potential combination therapy.
The methodology and validation of the reverse phase pro tein microarray (RPPA) technique, including antibody vali dation, are described elsewhere.12-14 Briefly, slides were probed with 301 validated antibodies (Online Supplemen tary Table S1). Stained slides were analyzed using Microvi gene® software version 3.0 (VigeneTech, Inc., Carlisle, MA, USA) to produce quantified data. Samples were printed in five serial dilutions and SuperCurve algorithms were used to generate a single protein concentration value in log2 format.15 Loading control16 and topographical normaliza tion17 were performed to account for protein concentra tion and background staining variations. Replicate-based normalization18 was used to align samples from two dif ferent slides. Five antibodies were excluded for different reasons yielding a final set of 296 antibodies used for analysis.9 Median expression levels of the normal bone marrow CD34+ samples were subtracted from the ex pression in the patients’ samples to equalize the median of the control samples to zero.
Haematologica | 107 October 2022 2330 ARTICLE - Proteomic landscape in pediatric AML F.W. Hoff et al.
The remaining parts of the methods are described in the Online Supplementary Material. Online Supplementary Table S2 summarizes the Cox analyses for outcome re ported in Figures 3D, 5, and Online Supplementary Figures S3, S7 and S8
Principal component analysis was applied to graphically compare patients’ PrCL expression patterns to those of non-malignant CD34+ cells. Although the overall proteomic profiles of the pediatric AML patients were distinct from those of normal CD34+ cells (Online Supplementary Figure S1), we found overlapping “normal-like” expression pat terns for 31 (27%) of the PrCL (Figure 2A). In four PFG, more than one cluster was defined as “normal-like”, and in five PFG no “normal-like” pattern was found. PrCL with out dominant co-localization to CD34+ samples on the principal component plot were defined as “leukemia-spe cific”
To visually map how proteins interact with other PFG core-members and RPPA dataset proteins, networks were generated for each PrCL. Proteins were connected if they were known to interact with other proteins based on the STRING database or correlation in our dataset. The median protein expression was calculated for each PrCL and over laid onto the networks to visualize relative expression. Networks can be viewed online at: http://leukemiaprotei natlas.org/pediatric-aml/.
Correlation of protein expression identifies functional protein patterns within a protein functional group
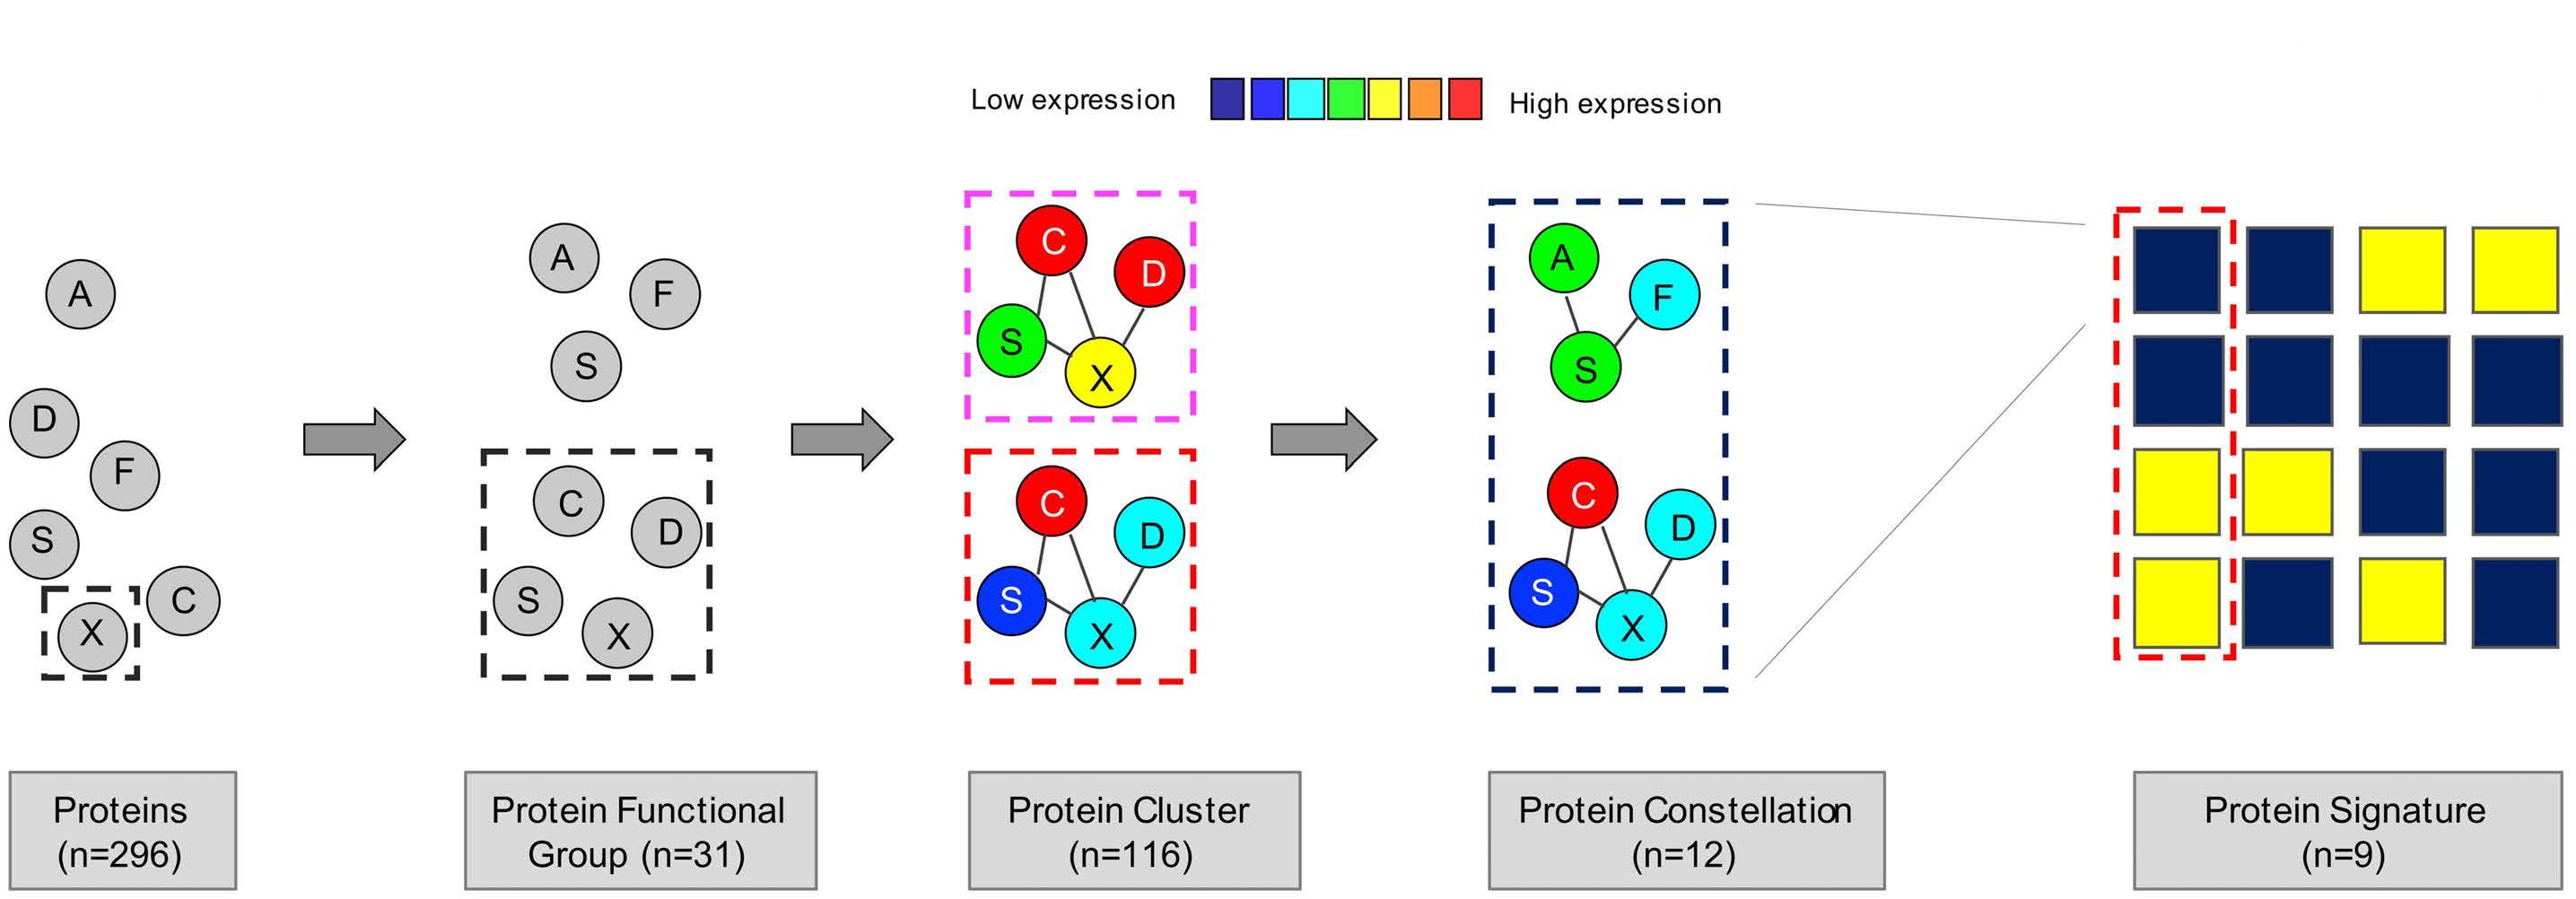
Figure 1. Computational MetaGalaxy work flow. Multistep analysis that starts with relative expression of 296 protein targets. Proteins were allocated into 31 protein functional groups (PFG) based on their known functionality or strong correlation from the dataset. The progeny clustering algorithm identified an optimal number of protein clusters (PrCL) in each PFG. Block clustering was applied to a binary matrix indicating PrCL-membership for all patients, and identified the existence of protein constellations (PrCON) (i.e., strongly correlated PrCL from various PFG). Patients who expressed similar combinations of PrCON were defined as having a given protein expression signature
Computational analysis
As an example, the PFG “Heat shock” comprises five anti bodies recognizing total proteins and two recognizing phosphorylated proteins. We discerned four “Heat shock” PrCL (Figure 3A). Expression levels in PrCL-1 were ident ified as most “normal-like” (Figure 3B). Protein networks were generated for the seven heat shock protein members. For PrCL-2 to PrCL-4, expression of HSPA1A_L and HSBP1-pSer82 changed between the four PrCL, as did AKT1S1 (connected to HSF1 and HSF1-pSer326) and CAV1
pression (negatively or positively) between patients within each PFG. PrCL numbers ranged from three to five per PFG (Figure 2A) and the total number of PrCL was 116.
Results
The MetaGalaxy computational analysis was done as pub lished previously (Figure 1).8,21,22 It takes a multistep ap proach that starts with separating proteins into 31 PFG based on prior knowledge from the literature or strong correlations within this dataset (Online Supplementary Table S1). K-means23 coupled with the progeny clustering algorithm24 was applied to identify an optimal number of protein clusters (PrCL), i.e., patient subgroups with a simi lar correlated protein expression profile within each PFG. Collective PrCL-memberships for each patient were com bined into a binary matrix. Block-clustering25 was used to search for correlations between PrCL (protein expression constellation [PrCON]), and to cluster patients with similar PrCON-membership into a PrSIG. Statistical analyses were performed in R version 1.3.959 2009-2020 (RStudio, Inc., Boston, MA, USA) or SAS version 9.4 (SAS Institute, Inc., Cary, NC, USA).
(PrSIG).Haematologica | 107 October 2022 2331 ARTICLE - Proteomic landscape in pediatric AML F.W. Hoff et al.
The 296 proteins that were analyzed in this study were al located into 31 PFG (autophagy, cell cycle, metabolism, etc.).8,20,21 Clustering analysis identified an optimal number of patterns (i.e., PrCL) of similar correlated protein ex
Haematologica | 107 October 2022 2332 ARTICLE - Proteomic landscape in pediatric AML F.W. Hoff et al. A CB
Protein clusters correlate with clinical outcome
To evaluate the effect of protein expression alone on prognosis, PrCL were correlated to outcome. Seven (23%) PFG were found to be significantly associated with out come ( Online Supplementary Figure S2 ). For instance, heat shock PrCL were prognostic, in the whole group of patients, for overall survival (P=0.004), event-free survival (P=0.0009), and relapse risk (P=0.0016), as well as in pa tients treated with either ADE or ADEB (ADE: overall sur vival, P =0.0035; event-free survival, P =0.0097; relapse risk, P =0.0207; ADEB: overall survival, P =0.0002; event-
(connected to HSP90AA1_B1 and HSPA1_L1), showing that associated nodes correlate with core-protein PFGmembers. Simplified versions of the networks are shown for PrCL-1 and PrCL-4 (Figure 3C). It is important to note that heatmaps presented in other analyses have typically been median normalized to 0 with the variance set from -1 to +1, so that all variables are shown as ranging from the minimum to the maximum of the scale (color range). In contrast, our expression levels are shown relative to normal, and therefore may only use a portion of the scale (color) range.
Figure 2. Protein functional group classification and similarity to that of normal CD34+ cells. (A) The progeny clustering algorithm was applied to the 31 protein functional groups (PFG) and identified an optimal number of protein clusters (PrCL). PrCL were compared with those of normal CD34+ cells using principal component analysis, (PCA) and classified as either “normallike” or “leukemia-like”. “Normal-like” patterns are represented by hatched boxes, “leukemia-specific” patterns by full boxes. (B, C) PCA with each PrCL being assigned to a color within the PFG to illustrate its similarity to, or difference from, normal CD34+ cells. Two examples of PCA mapping include (B) cell cycle and (C) mTOR-signaling Normal CD34+ samples are represented by small black squares and large black circles. There was no co-localization with CD34+ cells for cell cycle.
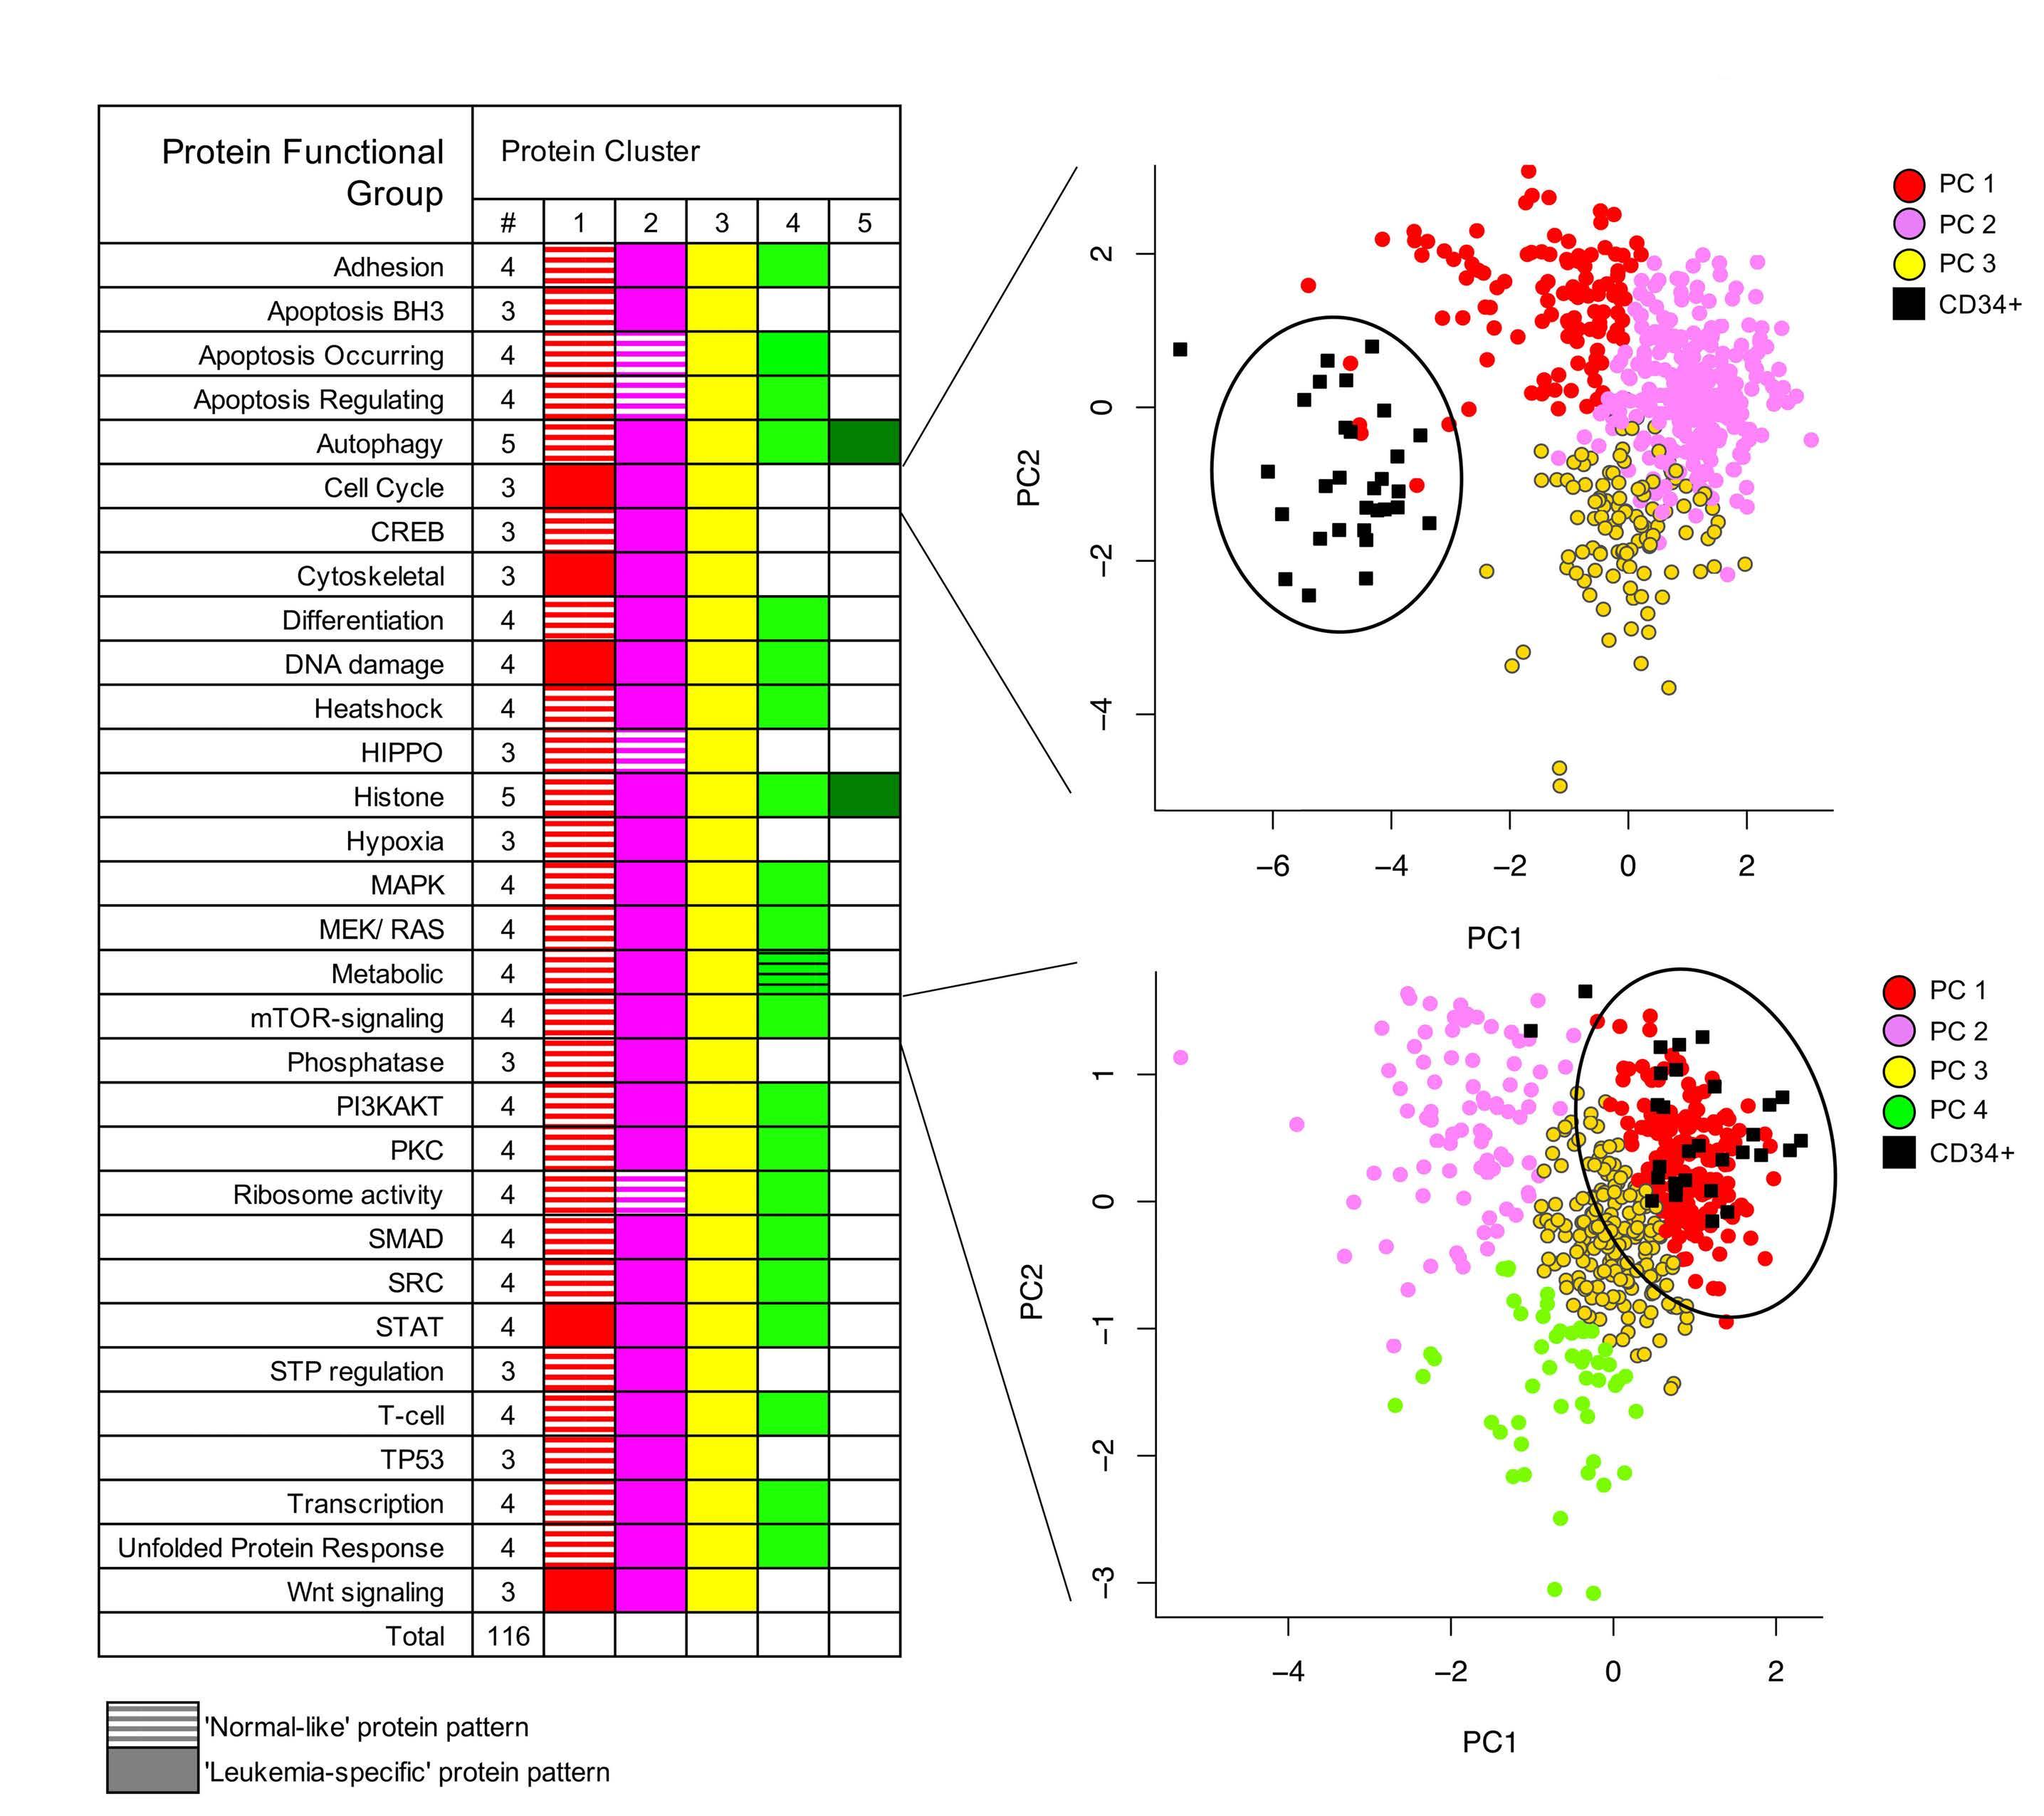
Continued on following page. Haematologica | 107 October 2022 2333 ARTICLE - Proteomic landscape in pediatric AML F.W. Hoff et al. CA B D
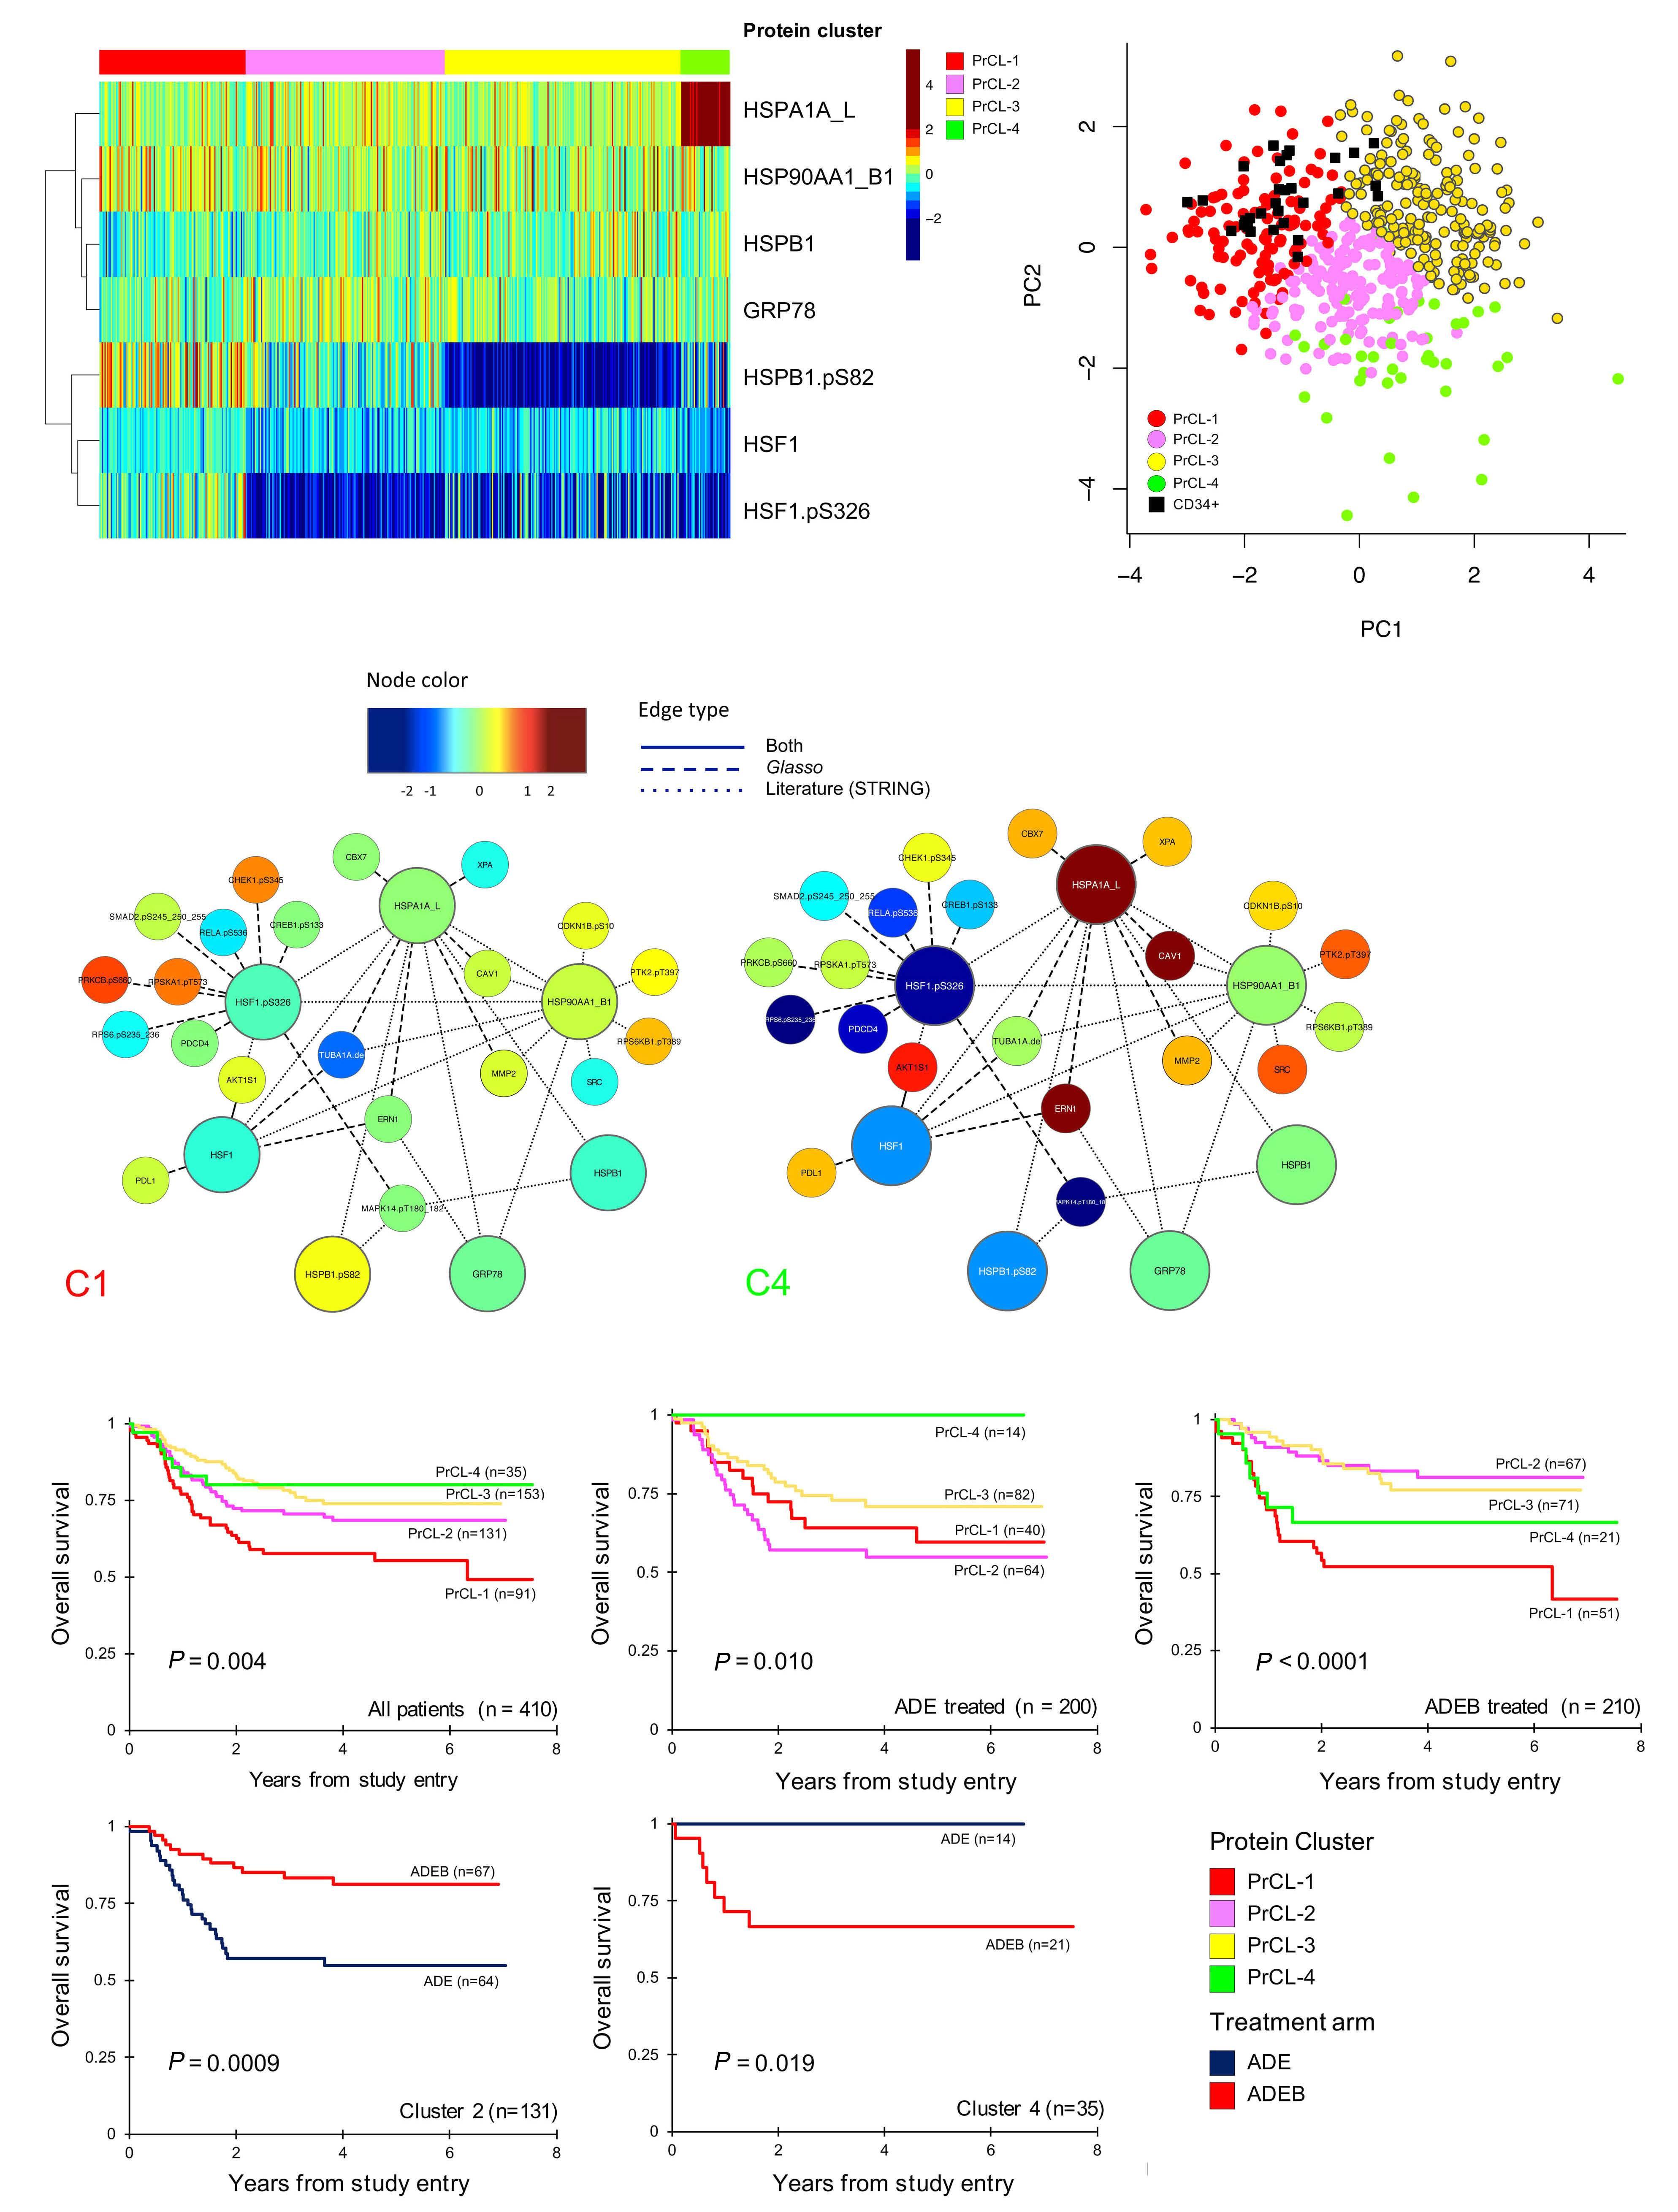
Haematologica | 107 October 2022 2334 ARTICLE - Proteomic landscape in pediatric AML F.W. Hoff et al.
Correlation with patients’ characteristics and clinical variables
To obtain a more systemic understanding of the 116 identified PrCL, pattern recognition of the relations be tween PrCL from various PFG was done using co-clus tering. PrCL-memberships for the 31 PFG were assigned to all 500 pediatric AML patients and compiled in a binary matrix (MetaGalaxy) (Figure 4). Optimization calcula tions 8,22 identified 12 patterns of recurrent (i.e., cor related) PrCL, defined as PrCON. From this, nine PrSIG were defined as clusters of patients who expressed simi lar combinations of PrCON. Robustness of the PrCON and PrSIG was tested on a training set (n=355) and test set (n=145) and showed high reproducibility (P<0.0001) (On line Supplementary Figure S4 ). Sets were created by using random sampling. 26 None of the PrCON was pre dominantly associated with the “normal-like” clusters ( P =0.200). The PrCL in each PrCON are listed in Online Supplementary Table S4.
Correlation between mRNA expression from RNA-se quencing and RPPA protein abundance was determined for 205 total-proteins in 390 samples, with a mean correla tion of 0.17. Thirty-four (17%) proteins were negatively cor related, while 83% were positively correlated (Online Supplementary Figure S5).
free survival, P <0.0001; relapse risk, P =0.0009) (Figure 3D). When we compared outcome after ADE to that after ADEB, patients with PrCL-2 significantly benefited from ADEB (n=131, 5-year overall survival, 54% vs . 81%, P =0.00087), whereas patients with PrCL-4 did worse (n=35, 5-year overall survival, 100% vs. 67%, P =0.019). Bortezomib had no effect on patients with PrCL-1 (n=91) (P=0.190), which was an unfavorable prognostic indicator after both ADE and ADEB; this cluster was characterized by high-HSF1-pSer 326 and HSB1-pSer 82 . Event-free sur vival and relapse risk curves are shown in Online Supple mentary Figure S3 Online Supplementary Table S3 shows the distribution across the PrCL and the different treat ment arms.
We found associations between PrSIG and cytogenetics and mutation states. Data were available for CEBPA, NPMI, FLT3-ITD, KIT (exons 8 and 17), KRAS, NRAS, GATA2, PTPN11, MYH11 and IDH1/2. Mutations present in ≤10 of the patients were not analyzed (Table 1). Translocation t(8;21) was more frequently detected in PrSIG-4 (35% vs. 6% overall) (P=0.001). Inversion (16) was associated with PrSIG-1, -6 and -8 (25%, 25%, 30% vs. 14%, overall), but scarcely seen in PrSIG-2, -3, -5 and -7 (2%, 5%, 0% and 3%) (P<0.001). Normal karyotype (diploid) was enriched in PrSIG-3, -5 and -6 (59%, 42%, 38% vs. 28% overall) that shared PrCON-3. Those three also had the highest frequencies of CEBPA mutation (PrSIG-3) and FLT3-ITD (PrSIG-3, -5 and -6). While the MLL-rearrangement (11q23) was not exclus ive to the PrSIG-7 protein expression pattern, 85% of pa tients with this signature harbored the MLL rearrangement (vs. 18% overall). KIT mutations were mostly in patients with PrSIG-4 and -6 (P=0.004), and NRAS and MYH11 in those with PrSIG-1 (P=0.024, P=0.037, respectively). Although only 3% (n=12) of the patients had mutated GATA2, 19% of those with PrSIG-3 had this muta tion. Patients with the fusion gene NUP98-KDM5A (n=4) were all present in PrSIG-4 (P=0.007). NPM1, KRAS, PTPN11 and IDH were not associated with specific PrSIG.
Protein expression partially correlates with cytogenetics and mutational state, but not with gene expression
We previously published that low HSF1-pSer326 was as sociated with a better outcome after ADEB.10 In the cur rent analysis, this effect was true for PrCL-2 and PrCL-3 (characterized by low HSF1-pSer326), but was absent for PrCL-4, which also had concomitant increased ex pression of HSPA1A_L, emphasizing that a simultaneous integrated analysis of multiple proteins, rather than a single protein, could identify more detailed protein ex pression patterns and better characterize subpopulations that could benefit from the addition of novel agents.
Figure 3. Analysis of the heat shock protein functional group. (A) Optimal number of four protein clusters (PrCL) was identified as shown by the heatmap (annotation bar: PrCL-1 [red], PrCL-2 [pink], PrCL-3 [yellow] and PrCL-4 [light green]). (B) Principal component analysis shows relative expression of the four clusters in relation to normal CD34+ cells (black squares). (C) Simplified version of the protein networks for PrCL-1 and PrCL-4. Networks illustrate the median expression of protein functional group (PFG) core-protein members (large nodes) in relation to associated proteins (small nodes). Interactions between nodes are based on the literature (…), reverse phase protein microarray data (- - -) or both (—). Associated nodes with most differences between PrCL-1 and PrCL-4 are selected. As an example, AKT1S1 and CAV1 both have relatively normal expression in PrCL-1, while their expression is relatively high in PrCL-4. (D) Outcome data stratified by PrCL. Outcomes for all patients (upper left panel), patients treated with ADE (upper middle panel) and those treated with ADEB (upper right panel). Lower panels show outcome data in cluster 2 (left) and cluster 4 (right) for patients treated with ADE (dark blue) or ADEB (red).
Recurrences in protein patterns classify patients into nine protein expression signatures
Patients aged ≤1 year at the time of diagnosis were most frequently clustered in PrSIG-7 to -9, which are associated with PrCON-5. Low white blood cell count (≤100,000 cells/μL) strongly correlated with PrCON-7, with 81-89% of the patients in PrSIG-1 to -4 and -9 having a low white blood cell count versus 76% overall (P=0.001). Gender, eth nicity, race and central nervous system status at the time of diagnosis were not associated with any PrSIG or PrCON (Online Supplementary Figure S6).
PrSIG were associated with response to therapy (Figure 5A) with greater spread in 5-year overall survival in ADEBtreated cases compared to ADE-treated cases (Online Sup plementary Figure S7). Similar to what was previously done with cytogenetics prognostication, we identified PrSIG as sociated with favorable (PrSIG-3), intermediate (PrSIG-1,4, -6, -8, -9) and unfavorable (PrSIG-2, -5, -7) prognosis (overall survival, P=0.007; event-free survival, P=0.046; re lapse risk, P=0.045) (Figure 5B). PrSIG-risk groups did not correlate with AAML1031 risk group stratification or con ventional risk group stratification (Online Supplementary Table S5). Unfavorable PrSIG remained an independent prognostic factor using multivariate Cox regression analysis in overall and event-free survival and relapse risk (Table
Protein expression signatures provide prognostic information
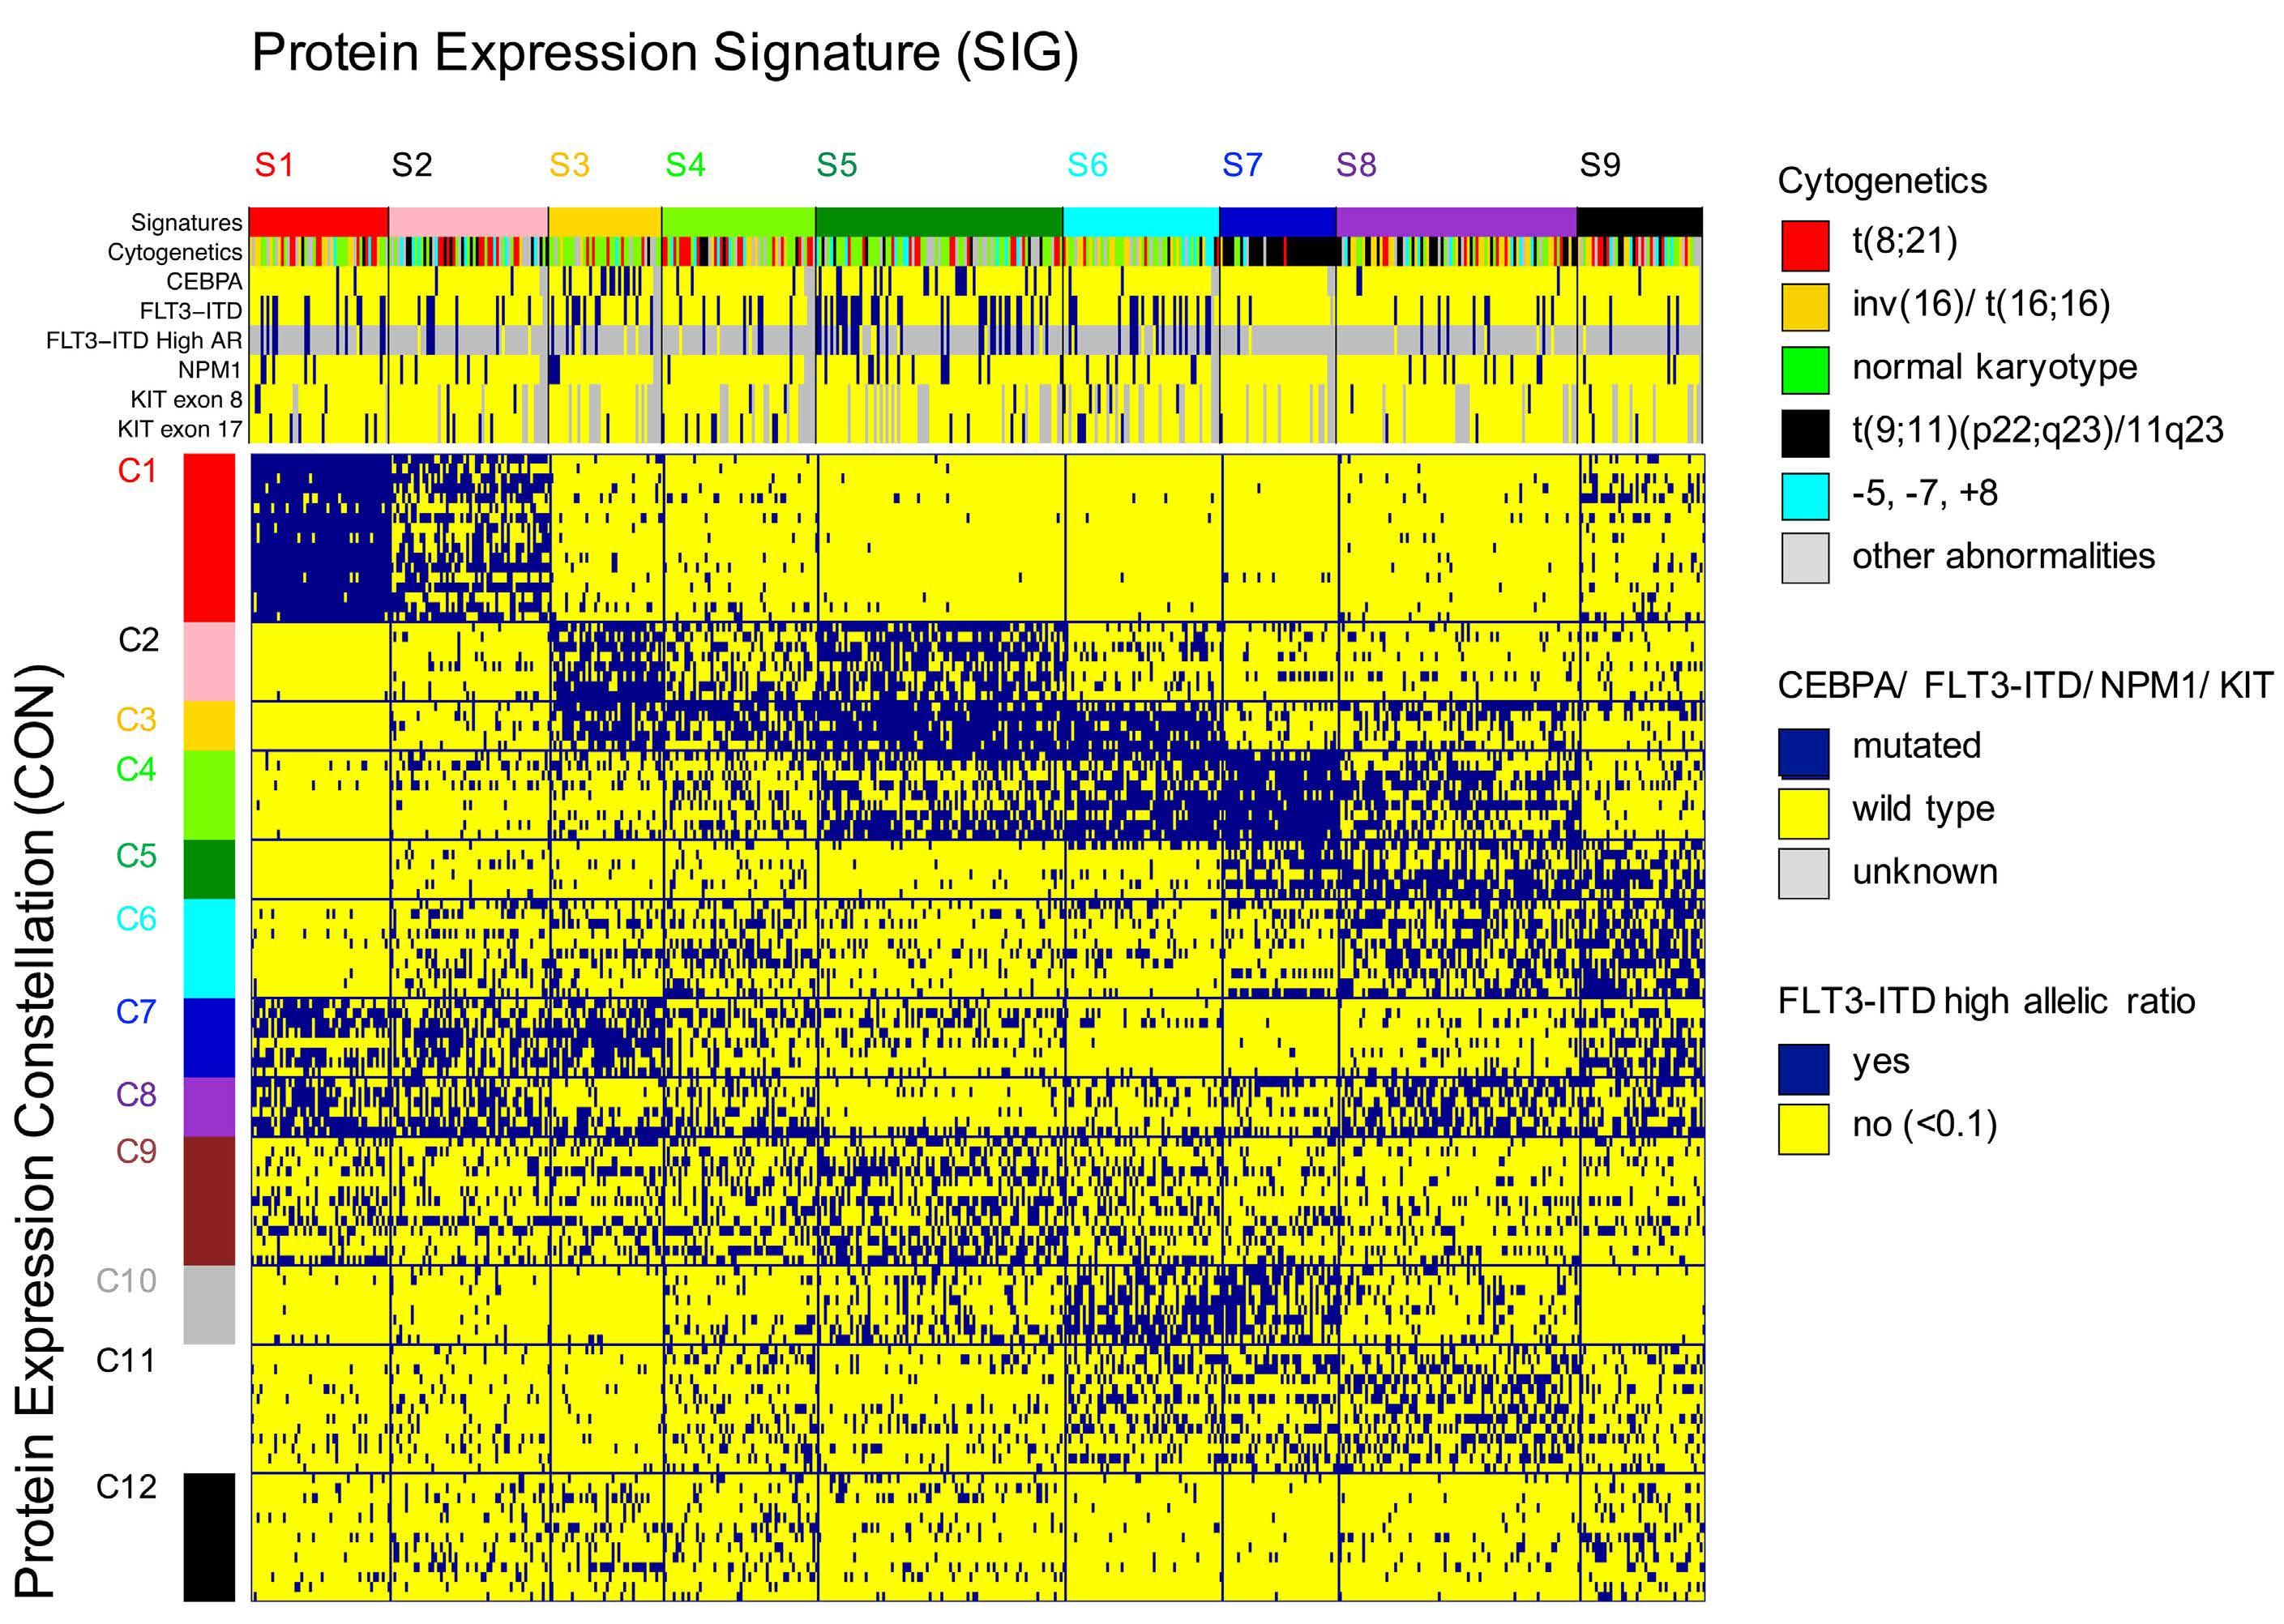
Haematologica | 107 October 2022 2335 ARTICLE - Proteomic landscape in pediatric AML F.W. Hoff et al.
Figure 4. MetaGalaxy analysis identified the existence of 12 protein constellations and nine protein expression signatures. Block clustering was applied to a binary matrix constructed from 116 protein clusters (PrCL) from 31 protein functional groups (PFG). Each column indicates one patient (n=500) and his or her PrCL-membership. This identified the existence of 12 protein constellations (PrCON; horizontally); i.e., PrCL that strongly correlated with each other. Patients with a similar pattern of PrCON were defined as having a given a protein expression signature (PrSIG; vertically). The annotation bar shows nine PrSIG, cytogenetics (t(8;21) [red], inv(16) [yellow], normal karyotype [green]), MLL (11q23) rearrangement [black], -5, -7, +8 abnormalities [light blue], and other [gray]), and mutational status for CEBPA, FLT3-ITD, FLT3-ITD high allelic ratio (≥0.1), NPM1 and KIT (exons 8 and 17) (wildtype [blue], mutated [yellow]). Those with unknown mutational status are represented in gray.
2A). PrSIG with poorest prognosis in ADE-treated patients were PrSIG-5 to -8, all characterized by PrCON-4-mem bership. Addition of bortezomib was beneficial for 5-year overall survival in PrSIG-6 (62% vs. 84%, n=41, P=0.07, ha zard ratio [HR]=0.32) and PrSIG-8 (56% to 79%, n=72, P=0.06, HR=0.43) (Figure 5C), and a similar trend was ob served in PrSIG-7. As PrSIG-6 to -8 were most strongly as sociated with PrCON-11, we compared ADE versus ADEB in the PrCON-11 PrSIG. Overall survival at 5 years increased from 58% to 78% (P=0.011, HR=0.46). Across the nine PrSIG, relapse risk showed a significant dispersion, ranging from 24% to 63% at 5-year complete remission (P=0.03). In PrSIG-3, relapse risk decreased from 45% to 11% with ADEB (n=21, P=0.09, HR=0.18), while PrSIG-6 patients did worse with ADEB (36% vs. 12%, n=34, P=0.10, HR=3.54) (Figure 5C). While analysis of CEBPA-mutated patients as a group did
9% 4% 4%
FLT3-ITD(N=489)
Mutated 10% 13% 10% 11% 4% 16% 14% 0% 11% 7% 0.192 CEBPA(N=483) Mutated 33% 6% 21% 4% 0% 4% 2% <0.001 (exonc-KIT (N=399)8) Mutated 5% 2% 13% 0% 3% 3% 0.125 (exonc-KIT (N=399)17) Mutated 8% 13% 9% 20% 6% 10% 3% 3% 6% 0.068 (N=399)(combined)c-KIT Mutated 12% 20% 11% 4% 25% 8% 23% 3% 6% 9% 0.004
Race(N=488) AmericanBlack 12% 8% 13% 10% 11% 13% 15% 8% 13% 16% 0.950 CNS status (at (N=497)Dx) Positive 40% 42% 28% 21% 42% 47% 47% 33% 47% 36% 0.050
Variable (N=500)Total (N=48)S1 (N=55)S2 (N=39)S3 (N=53)S4 (N=85)S5 (N=54)S6 (N=40)S7 (N=83)S8 (N=43)S9 P (N=410)armTreatment ADESADEBADE 40%51%9% 36%48%16% 43%50%7% 44%44%11% 38%57%5% 27%55%18% 34%49%17% 48%52%0% 44%54%1% 56%44%0% 0.793 (N=498)Gender Female 49% 56% 48% 46% 49% 56% 37% 48% 52% 47% 0.620
4%
(N=492)geneticsCyto- karyotypeNormalt(8;21)inv16t(9;11)(p22;q23)/11q23-5,-7,or+8Other 15%18%28%13%16%9% 21%27%25%19%4%4% 17%15%23%23%21%2% 18%59%13%5%3%3% 13%10%10%21%12%35% 22%42%16%0%8%11% 12%12%38%25%8%6% 85%5%3%3%3%3% 28%16%30%10%9%7% 23%12%12%16%16%21% <0.001
riskAAML1031group†(N=485)
Mutated 21% 25% 15% 31% 16% 39% 32% 5% 12% 10% <0.001 (N=483)NPM1
4% 7% 4% 0%
High risk 28% 29% 31% 28% 22% 41% 40% 10% 16% 26% 0.002
Age (years) 2-100-111+ 12%55%33% 38%54%8% 33%56%11% 26%72%3% 28%60%11% 40%56%4% 24%69%7% 18%45%38% 23%43%34% 21%49%30% 0.007 (N=497)Ethnicity Hispanic 20% 17% 26% 21% 30% 21% 20% 15% 14% 17% 0.479
WBC (at study entry) >100,000 24% 19% 15% 13% 11% 33% 30% 43% 31% 16% 0.001
Table 1. Patients’ characteristics stratified by protein expression signatures. Continued on following page. Haematologica | 107 October 2022 2336 ARTICLE - Proteomic landscape in pediatric AML F.W. Hoff et al.
(N=339)tionclassificaFAB M7M6M5M4M2M1M0 27%24%19%22%2%1%4% 17%26%14%29%0%3%11% 23%17%23%31%3%0%3% 41%44%4%7%0%4%0% 18%25%36%7%11%0%4% 16%25%40%5%11%0%4% 26%40%17%14%0%0%3% 69%24%3%3%0%0%0% 48%38%8%3%0%0%3% 13%31%16%28%6%3%3% <0.001
†AML1031 protocol risk group definition: low risk: inv(16)/t(16;16) or t(8;21), or NPM or CEBPA mutation; high risk: FLT3-ITD+ with high allelic ratio ≥ 0.4, or monosomy 5/del5q or 7, without low-risk features. Unknown or unavailable values were not considered in P-value calculations and are excluded from the results. ADE: Ara-C, daunorubicin, and etoposide); ADEB; ADE plus bortezomib; ADES: ADE plus sorafenib; Dx: diagnosis; WBC: white blood cell count; FAB.
Mutated 7% 2% 7% 0% 3% 8% 8% 13% 13% 9% 0.291 (N=390)NRAS Mutated 25% 42% 23% 12% 16% 16% 23% 32% 33% 27% 0.024 KRASand/orNRAS(N=390)
Mutated 31% 44% 27% 12% 18% 22% 28% 42% 41% 30% 0.012 (N=390)PTPN11
Proteomics augment cytogenetic risk stratification
Proteins significantly different from normal can be identified for each protein expression signature and protein constellation
The majority of targeted drugs in development act on pro tein function. Recognition of proteins with an abnormal expression could identify targets for therapy across AML subgroups. We identified proteins significantly different from normal for each PrSIG/PrCON (Figure 6) (available online at: http://leukemiaproteinatlas.org/pediatric-aml/). As an example, two proteins, VEGFR and PARP1, are shown in particular, as they may also function as potential thera peutic targets for inhibitory drugs. Twenty-four proteins were identified as having universally higher (n=7) or lower (n=17) expression across all PrSIG with vimentin (VIM) most strongly expressed.
Proteins involved in cell cycle regulation and DNA damage change following exposure to chemotherapy
Mutated 7% 2% 16% 0% 5% 5% 10% 10% 11% 0% 0.063 (N=390)MYH11
Mutated 4% 2% 0% 8% 5% 5% 0% 0% 6% 6% 0.455 (N=352)KDM5ANUP98- Positive 1% 0% 0% 0% 11% 0% 0% 0% 0% 0% 0.007
not show benefit from bortezomib,12 none of the patients in PrSIG-3 relapsed or died after ADEB versus a 60% event and relapse-rate (n=3/5, P=0.039, P=0.037, respectively) with ADE (Figure 5D). Survival analysis stratified by PrSIGrisk restricted to patients with a normal karyotype again identified low- versus high-risk AML patients (P=0.044) (Online Supplementary Figure S8). Of note, while heat shock proteins were strongly associated with outcome in the above analysis, they were not among the main drivers of PrCON and PrSIG clustering.
To assess whether cells would adapt their PrSIG differ entially following chemotherapy, unsupervised hierarchi cal clustering of pre-treatment and post-treatment samples was performed. None of the expression patterns was speci fi c to a given time-point or treatment arm. Comparison of individual protein expression levels ident i fi ed 87 (29%) proteins that had changed by 10 h after treatment and 173 (58%) by 24 h after treatment. Sixtyseven (77%) proteins were changed at both time-points, and were predominantly involved in the TP53 pathway (TP53, MDM4), DNA damage response (ATM, Chek2) and cell cycle regulation (Wee1, CCND3, RB1-pSer) ( Online Supplementary Table S6).
KRAS(N=390)
Mutated 3% 0% 2% 19% 3% 5% 0% 0% 1% 3% 0.001 IDH1/2(combined)(N=390)
Mutated 4% 16% 5% 4% 0% 3% 3% 3% 3% 3% 0.037 (N=390)GATA2
French-American-British.Haematologica|107 October 2022 2337 ARTICLE - Proteomic landscape in pediatric AML F.W. Hoff et al.
We analyzed AAML1031 low-risk patients (defined by inv(16)/t(16;16), t(8;21), NPM1 or CEBPA mutations) separately to determine whether proteomics were informative for out come. We found stratification for event-free survival and relapse risk by PrSIG with favorable prognosis in PrSIG-1,3, -6 and -9 and unfavorable prognosis in PrSIG-5 and -7 (overall survival, P=0.071; event-free survival, P=0.027; re lapse risk, P=0.014) (Online Supplementary Figure S9). Cox proportional hazards regression models identified unfavor able proteomic signatures as a significant independent prognostic factor in multivariate analysis (Table 2B). Within the AAML1031 high-risk patients (i.e., those with FLT3-ITD+ high allelic ratio, monosomy 5 or 7 or del(5q), or minimal residual disease >0.1% at end of induction 1) PrSIG were also significantly prognostic. While prognosis of PrSIG-1, -3 and -6 was consistent between AAML1031 risk groups, prognosis of PrSIG-9 was favorable among the low-risk, but highly un favorable among the high-risk patients.
Haematologica | 107 October 2022 2338 ARTICLE - Proteomic landscape in pediatric AML F.W. Hoff et al. ACBD
Figure 5. Kaplan-Meier curves for overall survival, event-free survival and relapse risk. Left upper three panels: overall survival curves (log-rank), right panels: relapse risk (Gray statistics). (A) Overall survival and relapse risk stratified by the nine protein expression signatures (PrSIG). (B) Proteomic risk groups defined as “favorable”, “intermediate”, “unfavorable”. (C) Comparison of outcomes in patients treated with ADE or. ADEB in PrSIG-8 (left) and PrSIG-3 (right). (D) Event-free survival and relapse risk for CEBPA-mutated patients in PrSIG-3 treated with ADE (blue) or ADEB (red).
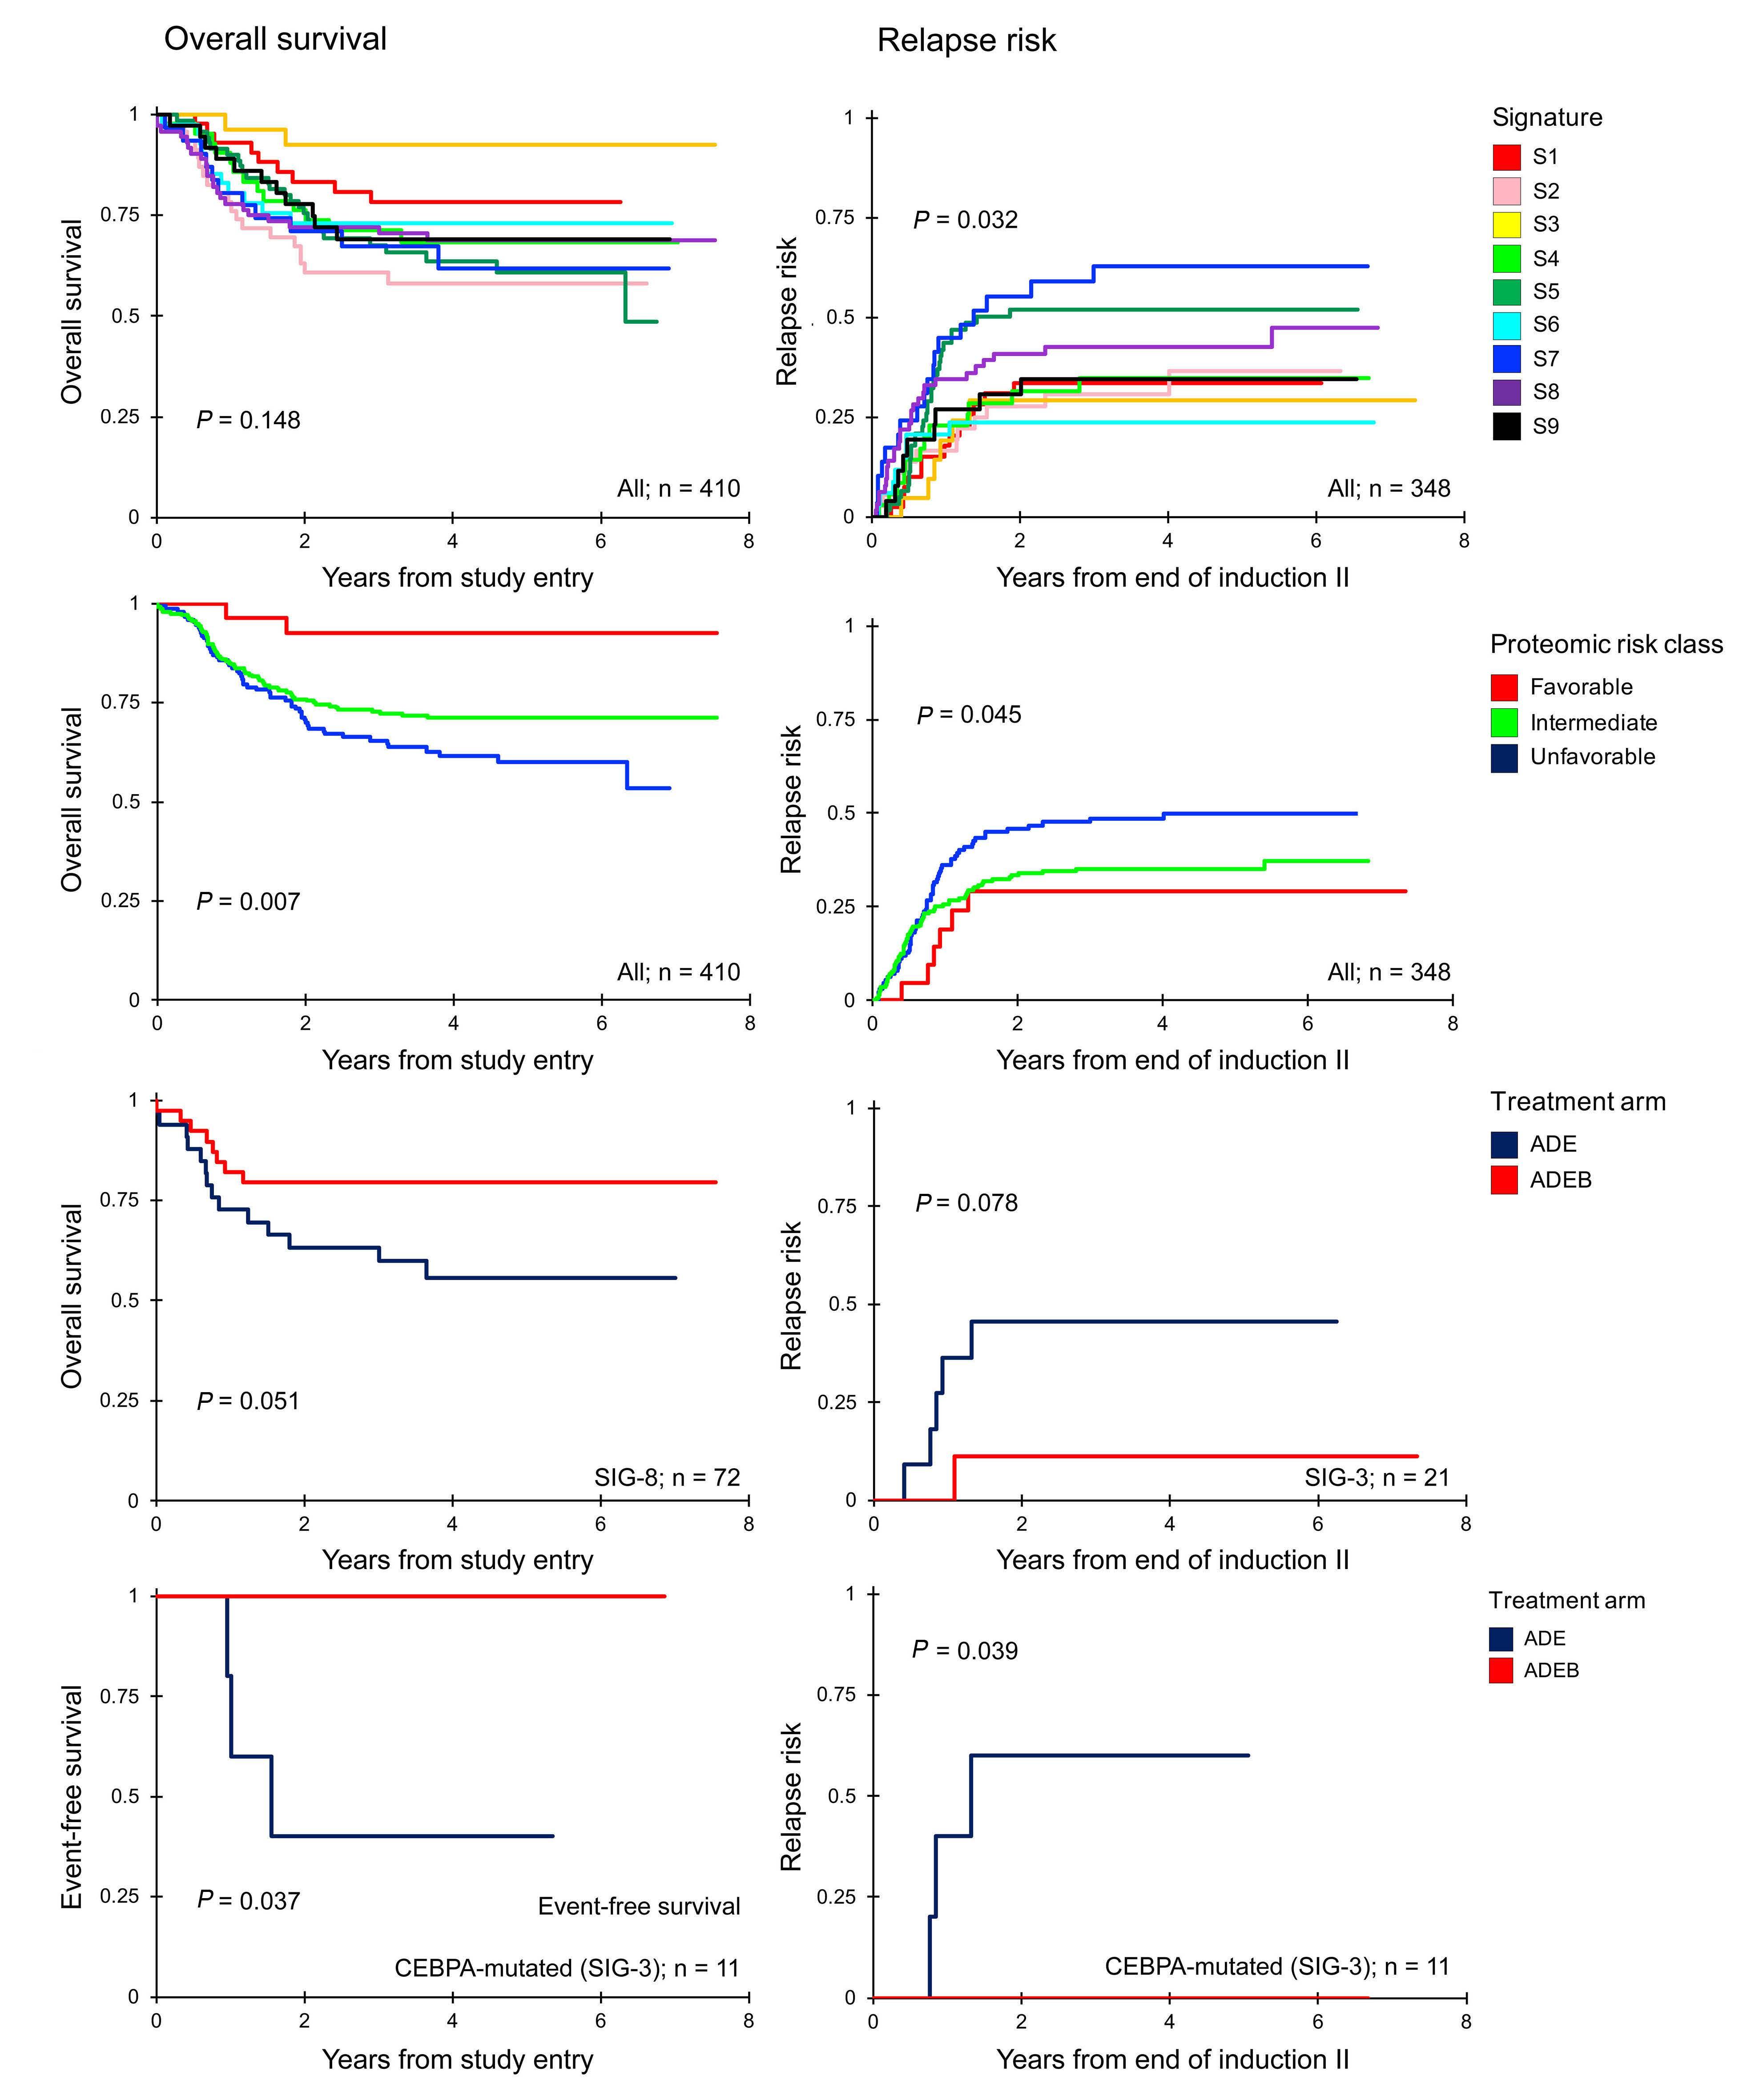
Haematologica | 107 October 2022 2339 ARTICLE - Proteomic landscape in pediatric AML F.W. Hoff et al.
Favorable 27 0.31 0.08-1.27 0.102 0.78 0.40-1.55 0.484 21 0.82 0.35-1.90 0.643 Unfavorable 147 1.55 1.07-2.25 0.022 1.40 1.04-1.87 0.026 127 1.59 1.12-2.25 0.010 AAML1031 risk groupLow 281 1 1 265 1 High 119 2.56 1.75-3.73 <0.001 1.76 1.30-2.39 <0.001 83 1.10 0.73-1.66 0.658 Age (years old)
N HR 95% CI P HR 95% CI P N HR 95% CI P
MultivariateBA
≥2 354 1 1 311 1
signatures.†Tenpatients
OS from study entry EFS from study entry RR from end of induction II N HR 95% CI P HR 95% CI P N HR 95% CI P
analysis, all patients (n=400)†
OS from study entry
0-1 36 1.82 0.99-3.34 0.055 2.25 1.44-3.52 <0.001 32 2.36 1.42-3.92 0.001
have unknown classification for protocol risk group and are excluded from analyses because all patients must have complete data for a multivariable analysis. OS: overall survival; EFS: event-free survival; RR_ relapse risk; HR: hazard ratio; 95% CI: 95% confidence interval: SIG: signatures.
Multivariate analysis, AAML1931 low risk patients (n=281)
Favorable 98 0.58 0.30-1.13 0.112 0.72 0.46-1.11 0.137 90 0.57 0.35-0.95 0.029
When survival analysis was performed for each individual protein (stratified by median, thirds or quartiles), a similar number of proteins was prognostic within each group re gardless of whether the pre-treatment or the post-treat ment expression was assessed. Approximately 20% of the proteins that were significantly prognostic before treat ment, remained prognostic after treatment. Seven pro teins were significantly prognostic at all three time-points when considering all patients together; BCL2A1, CCND3, CD74, EIF2S1, GSK3A_B, HSPB1.pSer82, and MKNK1. Nine other proteins, mostly involved in protein translation or signal transduction, were prognostic at both 10 h and 24 h after treatment, but not before treatment. These pro teins were: ATF3, EIF2S1.pS51, EIF4EBP1, EIF4G1, HSF1, MET.pY1230_1234_1235, PTEN, RPS6KB1, and YAP1.
Intermediate 226 1 1 200 1
0-1 46 2.33 1.43-3.77 0.001 2.60 1.77-3.82 <0.001 37 2.29 1.42-3.71 0.001
NPM1Negative 355 1 1 305 1 Positive 45 0.36 0.15-0.88 0.026 0.52 0.30-0.92 0.026 43 0.62 0.33-1.15 0.129
Unfavorable 66 1.88 1.08-3.26 0.025 1.77 1.18-2.67 0.006 65 1.66 1.07-2.58 0.025 Age (years old)
Discussion
EFS from study entry RR from end of induction II
117 1 1 110 1
Proteomic-SIGIntermediate
In this study, to our knowledge the largest proteomic study in pediatric AML, we validated our central hypoth esis that the genetic heterogeneity of pediatric AML co alesces into a finite number of recurrent protein expression patterns. Unique to this study is the use of a multistep protein analysis, which moves beyond individual protein expression and activation, to a combined analysis in functionally related protein groups, and then into a sys tem spanning structure based on strongly correlated PrCL. We believe that this is a more complete approach, utilizing known functional interactions, and is superior to conven tional unsupervised clustering which weights all proteins equally and ignores known relationships. Furthermore, this
Table 2. Multivariable analysis for overall survival, event-free survival and relapse risk, including proteomic-based
≥2 245 1 1 233 1
Haematologica | 107 October 2022 2340 ARTICLE - Proteomic landscape in pediatric AML F.W. Hoff et al. A CB
study uses proteomics for the first time in samples col lected from a phase III randomized clinical trial, and ident ified patients who responded well to a specific therapy. Traditional risk stratification in pediatric AML considers se lected cytogenetics and molecular features, and early re sponse to induction chemotherapy, but predicts outcome for only 40% of patients.32 When prognostically similar PrSIG were grouped as “favorable”, “intermediate”, or “unfavor able”, we demonstrated increased prognostic significance when added to traditional risk stratifying factors in multi variate analysis. PrSIG were more strongly predictive when combined with AAML1031 risk groups, demonstrating that adding proteomics to genetic risk-stratification can direct therapy leading to improved outcome. Proteins were also individually significantly prognostic, including several that had previously been published as being so in adult AML. We identified three PrSIG (PrSIG-3, -6, and -8; 34% of all patients) that benefited from proteasome inhibitor ther
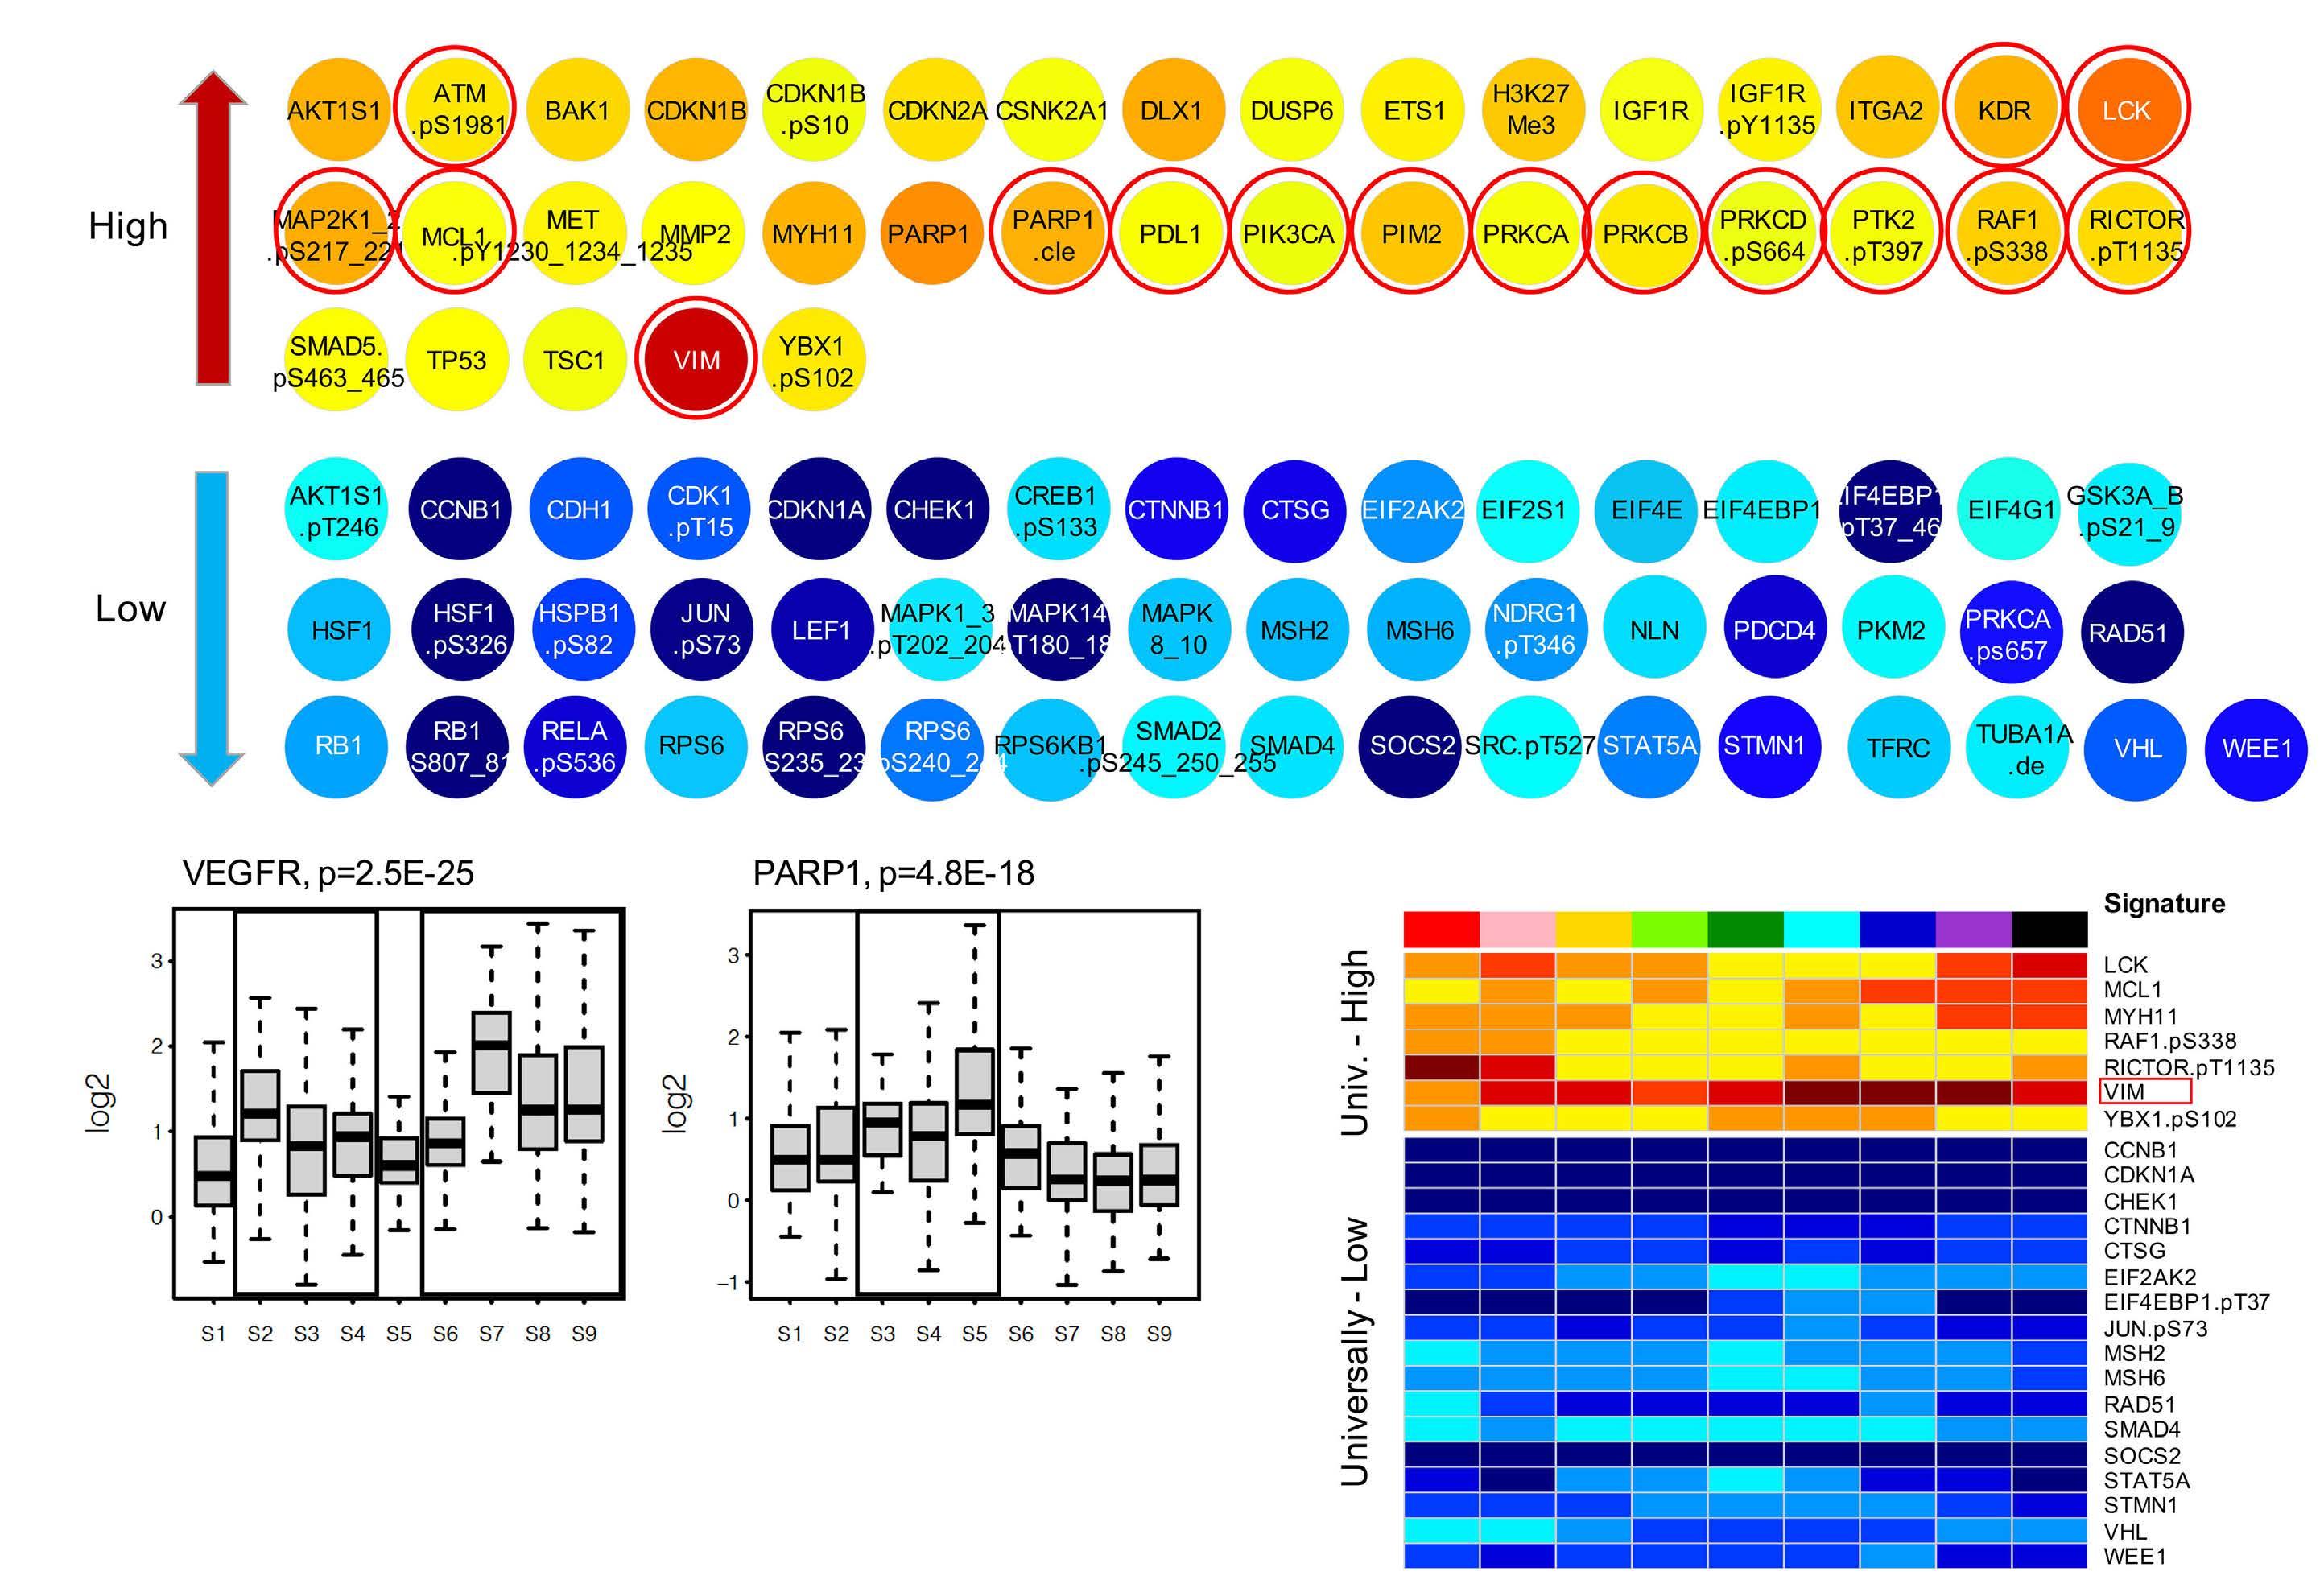
Figure 6. Protein expression significantly different from normal. (A) Protein expression deviated significantly from normal in protein expression signature (PrSIG)-3 (P<0.05, and log2 change ≥0.50 log2). Proteins indicated by red circles are potentially targetable. (B) Relative VEGFR (KDR) (left, potential target for PrSIG-2 to 4, and PrSIG-6 to -9) and PARP1 (right, target for patients in PrSIG-3 to -5) protein expression levels across the nine PrSIG. (C) Twenty-four proteins with universally higher (n=7) or lower (n=17) expression (P<0.05, and log2 change ≥0.50) compared to that in normal CD34+ cells. VIM (indicated by the red box) was most strongly upregulated across the nine PrSIG.
apy, a finding not appreciated by analysis of the entire co hort. This finding suggests that proteomic analysis is able to predict a-priori those who would benefit from a spe cific therapy. PrSIG-6 and -8 both contained PrCON-11 and were characterized by upregulation of autophagy proteins (ATG3, ATG7, BECN1).33 We hypothesize that these auto phagy effectors are required for bortezomib-induced autophagy, given that the ubiquitin-proteasome system has active crosstalk with autophagy, and bortezomib stimulates this compensatory autophagy mechanism re sulting in cell death.34 PrCON-11 was associated with a prevalence of M4/M5 (monocytic) patients and least M0/M1/M2 cases (P<0.001) as well as a high frequency of high white blood cell counts (P<0.001). In PrSIG-7, which shares PrCON-11, a similar but less strong beneficial effect of bortezomib was observed. Unlike PrSIG-6 and -8, PrSIG-7 had higher phosphorylation levels of heat shock binding protein 1 (HSPB1-pSer82), a strongly unfavorable
In summary, we confirmed the existence of recurrent pro tein patterns in pediatric AML which enabled separation of AML patients into recurrent PrSIG that were prognostic, particularly when combined with known pediatric AML risk factors. We identified PrSIG that benefited from ADEB, and postulate that recognition of abnormal proteins can aid in risk stratification and therapy selection in pediatric, and perhaps adult AML.
S7 lists matched proteins and drugs used in the clinical setting. If validated, rapid real-time classification, based on measuring expression of a restricted number of proteins with the highest discriminative value between PrSIG (a “classifier set”), could enable PrSIG determination and fa cilitate initial therapy selection as well as classification. We identified 24 universally altered proteins, identifying novel potential targets for all patients. The most highly overexpressed protein was VIM, a protein involved in epithelial-to-mesenchymal transition. The role for VIM in AML is uncertain, but there is evidence that epithelial-tomesenchymal transition occurs in hematologic malig nancies.39,40 Fluvastatin targets VIM via caspase-3-mediated proteolysis,41,42 and prior trials in AML demonstrated that the addition of pravastatin to idarubicin and high-dose cy tarabine counteracted the chemoresistance associated with the defensive adaptation of increasing cellular cho lesterol.43,44 MCL1, previously found to be upregulated in six of the eight PrSIG in another study,8 was also universally highly expressed, most prominently in PrSIG-7 to -9, which had the highest frequency of infants, a historically chemo resistant population.8,45 MCL1 is also strongly associated with chemoresistance to venetoclax. Although clinical trials have evaluated the benefit of (combinational) treatment with venetoclax in adults and relapsed pediatric AML, no studies evaluating the effect of venetoclax in de novo pedi atric AML have yet been published. Our finding predicts for lower efficacy in pediatric de novo AML, and suggests that venetoclax could be combined with MCL1 inhibitors.
prognostic factor in our dataset, but without a benefit from proteasome inhibitor therapy. This protein could possibly work by preventing the toxic build-up of mis folded proteins due to bortezomib.35 PrSIG-7 had a protein expression profile suggesting high cell cycle turnover (high CCND3, CDKN1B-pThr198, and RB1-phospho), high white cell count, and a high frequency of MLL-rearrangements. This highlights the need to apply a holistic system approach to be able to predict response to drugs. The importance of studying protein expression and activa tion is stressed by the low correlation (r=0.17) between pro tein and mRNA expression and the inability of mRNA data to replicate protein-determined PrSIG. The lack of correla tion was expected, as the presence of mRNA does not imply that translation is occurring (non-coding RNA could impede it); nor does it dictate the rate of translation or pro tein longevity after translation. Moreover, environmental ef fects from mesenchymal stromal cells, including chemokine and cytokine production, affect how emerging leukemia cells develop and behave. Nonetheless, PrSIG were partially correlated with cytogenetics and mutational state. “Driver” mutations would be expected to have a de fining effect on biology/protein expression even though the combination of other events might further alter these sig nals. For instance, the majority of PrSIG-7 (85%) had MLL rearrangements and, similar to the recognition of Ph+-like acute lymphoblastic leukemia, this may point toward the existence of MLL-like cases based on protein expression. This study demonstrates that the “hallmarks of cancer”36,37 are achieved via different patterns of protein utilization within the defined PrCON. As an example of the five apop tosis PFG used in this study, PrCON-6 demonstrated high BH3 pro-apoptotic member activation (BAX, BBC3, and BCL2L11) and simultaneously high expression of the antiapoptotic BH3-member MCL1, a protein associated with resistance to chemotherapy.38 PrCON-11 demonstrated a different pathway with high expression of autophagy pro teins, but no associations with the other apoptotic PFG. PrCON-9 had modest upregulation of autophagy proteins and evidence of increased spontaneous apoptosis pro teins (high PARP1-cleavage, apoptosis-occurring PrCL-2, and TargetedPrCL-3).therapies offer the promise of improved out come, often with less toxicity, compared to current chemotherapy, but an effective means of matching the appropriate patient to the correct agent hampers imple mentation. To select drugs rationally for specific sub groups of patients, we identified proteins that were expressed significantly differently between cases of AML and normal subjects, raising the hypothesis that those could be targeted by inhibitory/replacement or (re)activa tion agents, potentially even combined with targeting gen etic molecular events (e.g., midostaurin [FLT3] enasidenib [IDH2], or ivosidenib [IDH1]). Online Supplementary Table
A final feature of this RPPA study was the measurement of therapy effects on protein expression over time. We ex pected to find specific treatment-induced changes in pro tein expression, and different adaptation of proteins across the PrSIG; however, changes were limited to DNA damage, cell cycle regulation, protein translation and histone modi fication pathways. This likely reflects the presence of many pre-apoptotic cells trying to repair DNA damage. Single-cell proteomics might better profile post-treatment AML het erogeneity and predict which changes are associated with resistance or relapse by identifying “survivor cells”, which cannot be identified in studies of bulk cells.46 Proteomics may also enable identification and analysis of stem cell pro teomics, which differ from bulk cells.47-49 Moreover, unbiased approaches such as mass spectrometry, which allow evalu ation of global proteomics, might also be of use.50
Haematologica | 107 October 2022 2341 ARTICLE - Proteomic landscape in pediatric AML F.W. Hoff et al.
2. Elgarten CW, Aplenc R. Pediatric acute myeloid leukemia: updates on biology, risk stratification, and therapy. Curr Opin Pediatr. 2020;32(1):57-66.
Non-parametric quantification of protein lysate arrays. Bioinformatics. 2007;23(15):1986-1994.
8. Hoff FW, Hu CW, Qiu Y, et al. Recognition of recurrent protein expression patterns in pediatric acute myeloid leukemia identified new therapeutic targets. Mol Cancer Res. 2018;16(8):1275-1286.
Disclosures
11. Aplenc R, Meshinchi S, Sung L, et al. Bortezomib with standard chemotherapy for children with acute myeloid leukemia does not improve treatment outcomes: a report from the Children's Oncology Group. Haematologica. 2020;105(7):1879-1886.
5. Gygi SP, Rochon Y, Franza BR, Aebersold R. Correlation between protein and mRNA abundance in yeast. Mol Cell Biol. 1999;19(3):1720-1730.
22. Hoff FW, Hu CW, Qiu Y, et al. Recurrent patterns of protein expression signatures in pediatric acute lymphoblastic leukemia: recognition and therapeutic guidance. Mol Cancer Res. 2018;16(8):1263-1274.
References
TMH receives research funding from Takeda Pharmaceuticals.
14. Tibes R, Qiu Y, Lu Y, et al. Reverse phase protein array: validation of a novel proteomic technology and utility for analysis of primary leukemia specimens and hematopoietic stem cells. Mol Cancer Ther. 2006;5(10):2512-2521.
12. Kornblau SM, Singh N, Qiu Y, Chen W, Zhang N, Coombes KR. Highly phosphorylated FOXO3A is an adverse prognostic factor in acute myeloid leukemia. Clin Cancer Res. 2010;16(6):1865-1874.
24. Hu CW, Kornblau SM, Slater JH, Qutub AA. Progeny clustering: a method to identify biological phenotypes. Sci Rep. 2015;5:12894.
TMH, RBG, ASG, RA, EAK, and RAA were funded by the NIH COG grants U10 CA98543, U10 CA98413, U10 CA180886, U24
28. Zhao T, Liu H, Roeder K, Lafferty J, Wasserman L. The huge package for high-dimensional undirected graph estimation in R. J Mach Learn Res. 2013;13(1):1059-1062.
20. Bolouri H, Farrar JE, Triche J, et al. The molecular landscape of pediatric acute myeloid leukemia reveals recurrent structural alterations and age-specific mutational interactions. Nat Med. 2018;24(1):103-112.
FWH, CWH, AAQ, ESJMdB, TMH, and SMK designed and supervised the research, FWH, ADvD, YQ, RER, AL, RBG, TMH, and SMK performed the research, YQ, GNJ, ASG, RA, EAK, TAA, SM, TMH, and SMK collected data, FWH, TMH, and SMK analyzed the data, and wrote the paper
1. Estey E, Dohner H. Acute myeloid leukaemia. Lancet. 2006;368(9550):1894-1907.
Funding
17. Neeley ES, Baggerly KA, Kornblau SM. Surface adjustment of reverse phase protein arrays using positive control spots. Cancer Inform. 2012;11:77-86.
30. Lopes CT, Franz M, Kazi F, Donaldson SL, Morris Q, Bader GD.
29. Liu H, Roeder K, Wasserman L. Stability approach to regularization selection (StARS) for high dimensional graphical models. Adv Neural Inf Process Syst. 2010;24(2):1432-1440.
The complete RPPA dataset and all of the analyses performed in this study, including those not discussed in this paper, are published online at: http://leukemiaproteinatlas.org/pediatric-aml/.22
25. Govaert G, Nadif M. Clustering with block mixture models. Pattern Recognit. 2003;36(2):463-473.
CA196173 and U10 CA180899. TMH was funded by the NCI R01-CA164024, a grant from Hope on Wheels, Hyundaii Foundation, the St. Baldrick’s Foundation, and a grant from Takeda Pharmaceuticals. FWH was funded by the Junior Scientific Masterclaas and the Van der Meer-Boerema Stichting
15. Hu J, He X, Baggerly KA, Coombes KR, Hennessy BT, Mills GB.
26. Kuhn M. Building predictive models in R using the caret package. J Statistic Software. 2008;28(5).
3. Eryılmaz E, Canpolat C. Novel agents for the treatment of childhood leukemia: an update. Onco Targets Therapy. 2017;10:3299-3306.
Contributions
Data-sharing statement
6. Wu X, Gu Z, Chen Y, et al. Application of PD-1 blockade in cancer immunotherapy. Comput Struct Biotechnol J. 2019;17:661-674.
27. Szklarczyk D, Franceschini A, Wyder S, et al. STRING v10: proteinprotein interaction networks, integrated over the tree of life. Nucleic Acids Res. 2015;43:447.
21. Hu CW, Qiu Y, Ligeralde A, et al. A quantitative analysis of heterogeneities and hallmarks in acute myelogenous leukaemia. Nat Biomed Eng. 2019;3(11):889-901.
13. Kornblau SM, Tibes R, Qiu YH, et al. Functional proteomic profiling of AML predicts response and survival. Blood. 2009;113(1):154-164.
16. Neeley ES, Kornblau SM, Coombes KR, Baggerly KA. Variable slope normalization of reverse phase protein arrays. Bioinformatics. 2009;25(11):1384-1389.
Haematologica | 107 October 2022 2342 ARTICLE - Proteomic landscape in pediatric AML F.W. Hoff et al.
4. Maier T, Güell M, Serrano L. Correlation of mRNA and protein in complex biological samples. FEBS Lett. 2009;583(24):3966-73.
9. Hoff FW, van Dijk AD, Qiu Y, et al. Heat shock factor 1 (HSF1pSer326) predicts response to bortezomib-containing chemotherapy in pediatric AML: a COG report. Blood. 2021;137(8):1050-1060.
10. Horton TM, Hoff FW, van Dijk AD, et al. The effects of sample handling on proteomics assessed by reverse phase protein arrays (RPPA): functional proteomic profiling in leukemia. J Proteomics. 2021;233:104046.
18. Akbani R, Ng PK, Werner HM, et al. A pan-cancer proteomic perspective on The Cancer Genome Atlas. Nat Commun. 2014;5:3887.
19. Smith JL, Ries RE, Hylkema T, et al. Comprehensive transcriptome profiling of cryptic CBFA2T3–GLIS2 fusion–positive AML defines novel therapeutic options: a COG and TARGET pediatric AML study. Clin Cancer Res. 2020;26(3):726-737.
7. Brunnström H, Johansson A, Westbom-Fremer S, et al. PD-L1 immunohistochemistry in clinical diagnostics of lung cancer: inter-pathologist variability is higher than assay variability. Mod Pathol. 2017;30(10):1411-1421.
23. Hartigan JA, Wong MA. Algorithm AS 136: a K-means clustering algorithm. J Royal Stat Soc Series C. 1979;28(1):100-108.
31. Shannon P, Markiel A, Ozier O, et al. Cytoscape: a software environment for integrated models of biomolecular interaction networks. Genome Res. 2003;13(11):2498-2504.
40. Chen S, Liao T, Yang M. Emerging roles of epithelial-mesenchymal transition in hematological malignancies. J Biomed Sci. 2018;25(1):37.
33. Li X, Zhou Y, Li Y, et al. Autophagy: a novel mechanism of chemoresistance in cancers. Biomed Pharmacother. 2019;119:109415.
Cytoscape web: an interactive web-based network browser. Bioinformatics. 2010;26(18):2347-2348.
32. Cooper TM, Ries RE, Alonzo TA, et al. Revised risk stratification criteria for children with newly diagnosed acute myeloid leukemia: a report from the Children's Oncology Group. Blood. 2017;130 (Suppl 1):407.
46. Kornblau SM, Qiu YH, Bekele BN, et al. Studying the right cell in acute myelogenous leukemia: dynamic changes of apoptosis and signal transduction pathway protein expression in chemotherapy resistant ex-vivo selected "survivor cells". Cell Cycle. 2006;5(23):2769-77.
44. Sassano A, Katsoulidis E, Antico G, et al. Suppressive effects of statins on acute promyelocytic leukemia cells. Cancer Res. 2007;67(9):4524-4532.
45. Bose P, Gandhi V, Konopleva M. Pathways and mechanisms of venetoclax resistance. Leuk Lymphoma. 2017;58(9):2026-2039.
43. Kornblau SM, Banker DE, Stirewalt D, et al. Blockade of adaptive defensive changes in cholesterol uptake and synthesis in AML by the addition of pravastatin to idarubicin + high dose Ara-C: a phase 1 study. Blood. 2007;109(7):2999-3006.
34. Zhuang L, Ma Y, Wang Q, et al. Atg3 overexpression enhances bortezomib-induced cell death in SKM-1 cell. PloS One. 2016;11(7):e0158761.
49. Zhou J, Chng W. Identification and targeting leukemia stem cells: the path to the cure for acute myeloid leukemia. World J Stem Cells. 2014;6(4):473-484.
50. Mertins P, Tang LC, Krug K, et al. Reproducible workflow for multiplexed deep-scale proteome and phosphoproteome analysis of tumor tissues by liquid chromatography–mass spectrometry. Nat Protoc. 2018;13(7):1632-1661.
Haematologica | 107 October 2022 2343 ARTICLE - Proteomic landscape in pediatric AML F.W. Hoff et al.
35. Ciocca DR, Calderwood SK. Heat shock proteins in cancer: diagnostic, prognostic, predictive, and treatment implications. Cell Stress Chaperones. 2005;10(2):86-103.
37. Hanahan D, Weinberg RA. Hallmarks of cancer: the next generation. Cell. 2011;144(5):646-674.
36. Hanahan D, Weinberg RA. The hallmarks of cancer. Cell. 2000;100(1):57-70.
41. Strouhalova K, Přechová M, Gandalovičová A, Brábek J, Gregor M,
39. Stavropoulou V, Kaspar S, Brault L, et al. MLL-AF9 expression in hematopoietic stem cells drives a highly invasive AML expressing EMT-related genes linked to poor outcome. Cancer Cell. 2016;30(1):43-58.
Rosel D. Vimentin intermediate filaments as potential target for cancer treatment. Cancers. 2020;12(1):184.
42. Kanugula AK, Dhople VM, Völker U, Ummanni R, Kotamraju S. Fluvastatin mediated breast cancer cell death: a proteomic approach to identify differentially regulated proteins in MDA-MB231 cells. PLoS One. 2014;9(12)::e108890.
48. Majeti R, Becker MW, Tian Q, et al. Dysregulated gene expression networks in human acute myelogenous leukemia stem cells. Proc Natl Acad Sci U S A. 2009;106(9):3396-3401.
38. Michels J, Obrist F, Vitale I, et al. MCL-1 dependency of cisplatin-resistant cancer cells. Biochem Pharmacol. 2014;92(1):55-61.
47. Kornblau SM, Qutub A, Yao H, et al. Proteomic profiling identifies distinct protein patterns in acute myelogenous leukemia CD34+CD38- stem-like cells. PLoS One. 2013;8(10):e78453.
Prepublished: March 17, 2022.
A self-assembled leucine polymer sensitizes leukemic stem cells to chemotherapy by inhibiting autophagy in acute myeloid leukemia
©2022 Ferrata Storti Foundation
1Guangdong Provincial Key Laboratory of Malignant Tumor Epigenetics and Gene Regulation, Sun Yat-sen Memorial Hospital, Sun Yat-sen University; 2Key Laboratory of Stem Cells and Tissue Engineering (Ministry of Education), Zhongshan School of Medicine, Sun Yat-sen University; 3Department of Pediatrics, Sun Yat-sen Memorial Hospital, Sun Yat-sen University; 4Key Laboratory of Sensing Technology and Biomedical Instrument of Guangdong Province, School of Biomedical Engineering, Sun Yat-sen University and 5Department of Hematology, Guangzhou First People's Hospital, School of Medicine, South China University of Technology, Guangzhou, Guangdong, China.
Acute myeloid leukemia (AML) is a heterogeneous hema tologic malignancy originating from hematopoietic stem/progenitor cells with gene mutations and genomic rearrangements.1,2 The chromosomal translocation at t(9;11)(p22;q23) that encodes the MLL (mixed-lineage leukemia)-AF9 fusion protein was detected in AML pa tients with poor prognosis.3,4 The traditional 7+3 chemo therapy regimen, consisting of 7 days of cytarabine (Ara-C) and 3 days of doxorubicin (DOX), remained the standard treatment against AML for decades.5-7 However, less than 50% of AML patients achieve an overall 5-year survival after initial remission8-10 due to the chemoresistant leu kemic stem cells (LSC) that survive chemotherapy and
Autophagy is an important cell survival mechanism that senses the cellular metabolic stress to provide energy and molecular structure by digesting and recycling damaged cellular components through lysosomes.15-17 Multiple in tracellular and extracellular stress signals, including metabolic stress, hypoxia, redox stress, and immune sig nals, induce autophagy, which alters chemotherapeutic responses in solid tumor cells.18 For example, gut micro biota regulates autophagy through inflammation pathways for chemoresistance in colorectal cancer.19 Co-treatment with chemotherapy and autophagy inhibitor overcomes the chemoresistance in hepatoma carcinoma cells.20 De pletion of the autophagy-key regulator, Atg5 or Atg7, re Leukemia
Introduction
Xi Xu,1,2* Jian Wang,3* Tong Tong,4* Wenwen Zhang,2 Jin Wang,2 Weiwei Ma,5 Shunqing Wang,5 Dunhua Zhou,3 Jun Wu,1,4 Linjia Jiang1 and Meng Zhao2
*XX, JW and TT contributed equally as co-first authors.
Received: November 4, 2021.
Haematologica | 107 October 2022 2344 ARTICLE - Acute Myeloid
Published under a CC BY-NC license
Chemotherapy is the primary treatment option for acute myeloid leukemia (AML), but leukemic stem cells (LSC) can sur vive chemotherapy for disease recurrence and refractory. Here, we found that AML cells obtained from relapsed patients had increased autophagy levels than de novo AML cells. Furthermore, doxorubicin (DOX) treatment stimulated autophagy in LSC by repressing the mTOR pathway, and pharmaceutical inhibition of autophagy rendered chemoresistant LSC sen sitive to DOX treatment in MLL-AF9 induced murine AML. Moreover, we developed a self-assembled leucine polymer, which activated mTOR to inhibit autophagy in AML cells by releasing leucine. The leucine polymer loaded DOX (Leu-DOX) induced much less autophagy but more robust apoptosis in AML cells than the DOX treatment. Notably, the leucine polymer and Leu-DOX were specifically taken up by AML cells and LSC but not by normal hematopoietic cells and hema topoietic stem/progenitor cells in the bone marrow. Consequently, Leu-DOX efficiently reduced LSC and prolonged the survival of AML mice, with more limited myeloablation and tissue damage side effects than DOX treatment. Overall, we proposed that the newly developed Leu-DOX is an effective autophagy inhibitor and an ideal drug to efficiently eliminate LSC, thus serving as a revolutionary strategy to enhance the chemotherapy efficacy in AML.
https://doi.org/10.3324/haematol.2021.280290
Correspondence:M. wujun29@mail.sysu.edu.cnJ.jianglj7@mail.sysu.edu.cnL.zhaom38@mail.sysu.edu.cnZhaoJiangWu
Accepted: March 10, 2022.
generate progeny leukemic cells for disease recurrency through multiple mechanisms.11-14
Abstract
Results
Cell culture and in vitro treatment
Haematologica | 107 October 2022 2345 ARTICLE - Eliminate leukemic stem cells by inhibiting autophagy X. Xu et al.
duces functional leukemia-inhibiting cells and enhances the efficacy of chemotherapy drugs in AML treatment.21 Pharmaceutical inhibition of autophagy is also suggested to improve chemotherapy efficacy in leukemia cells.22 However, a therapeutic approach to inhibit autophagy and improve chemotherapy efficacy in eliminating LSC for AML treatment remains undeveloped.
Synthesis of leucine polymer (8L6)
THP-1 cells were cultured in RPMI 1640 with 10% fetal bov ine serum and 2 mM glutamine. Murine AML cells were cultured in StemSpanTM serum-free expansion medium (SFEM) (09650, STEMCELLTM Technologies) supplemented with 50 ng ml-1 SCF (Peprotech), 10 ng mL-1 TPO (Pepro
Acute myeloid leukemia model and in vivo treatment C57BL/6J mice were purchased from the Laboratory Ani mal Center of Sun Yat-sen University. For the AML murine model, MSCV-MLL-AF9-IRES-GFP infected preleukemic cells (4x10⁵) were intravenously injected into lethally ir radiated (9 Gy) recipients (6–8-weeks old) together with 1x10⁵ rescue cells. For chemotherapy, cytarabine (Ara-C, HY-13605, MCE) at 100 mg kg–1 bodyweight, and doxorubi cin (DOX, HY-15142A, MCE) at 3 mg kg–1 bodyweight, were intravenously injected into AML mice for a 5-day-treat ment protocol (3-day-DOX and 5-day-Ara-C). For DOX treatment, DOX or Leu-DOX were intravenously injected into AML mice at 3 mg kg–1 bodyweight for 3 consecutive days as indicated. Chloroquine (CQ) was intravenously in jected into AML mice at 50 mg kg–1 bodyweight for 5 con secutive days as indicated. The numbers of animals used per experiment are shown in the figure legends. All animal experiments were performed according to protocols ap proved by the Institutional Animal Care and Use Commit tee.
tech), 10 ng mL-1 IL-3 (Peprotech), and 10 ng mL-1 IL-6 (Pe protech). Cells were treated with DOX (1 µM), Leu-DOX (1 µM), DOX@PLGA (1 µM), 8L6 (10 µM), CQ (HY-17589A, MCE, 10 µM), rapamycin (HY-10219, MCE, 10 nM) where indicated. Cell proliferation fold changes were calculated by the ratio between the cell numbers at indicated time points after treatments compared to cell numbers before treatment. For apoptosis analysis, cells were stained by Annexin V\* ROMAN (640907, Biolegend) and further incubated with 0.01 µg µL–1 Dapi (1306, Thermo Fisher Scientific) or 7-AAD (00699350, eBioscience) for 30 minutes (min) at room temperature. For γ H2AX and LC3 staining, the cells were transferred to a glass slide and allowed to stand for 1 hour (h) to make the cells adhere to the glass slide. After fix ation with 4% paraformaldehyde for 15 min, cells were permeabilized with 0.5% Triton X-100 at room temperature for 30 min, blocked with 10% goat serum solution at room temperature for 1 h, washed, and incubated with anti-γ H2AX primary antibody (rabbit, 1:100, 613404, Biolegend) and LC3 primary antibody (rabbit, 1:100, 4108S, Cell Sig naling Technology) for overnight. After that, the secondary antibody was added dropwise and incubated at room temperature for 1 h, and the high-speed confocal imaging system (Dragonfly CR-DFLY-202 2540, Andor) was used for imaging.
The leucine polymer was synthesized through three steps: (1) The monomer-1 (N8, dip-nitrophenyl ester of dicar boxylic acids) was synthesized from the reaction of di-pnitrophenol and succinyl chloride; (2) the monomer-2 (Leu-6, toluenesulfonic acid salt of L-leucine) was ob tained from the reaction between L-leucine and 1,6-hexy lene glycol; (3) the leucine polymer (8L6) was synthesized from the polycondensation of monomer-1 and monomer2. Other methods are described in the Online Supplemen tary Appendix.
Methods
Autophagy protects leukemic stem cells from chemotherapy in acute myeloid leukemia
The mTOR complex 1 (mTORC1) acts as the master regu lator of autophagy by regulating various processes of autophagosome formation.23 Deprivation of nutrients, growth factors, or cellular energy, inhibits mTORC1 activity to induce autophagy.24 Branched-chain amino acids, es pecially leucine, are effective autophagy repressors by ac tivating the mTORC1 complex.25-28 Therefore, inhibition of autophagy by leucine might be a rational strategy to en hance the chemotherapy efficacy to eradicate the chemo resistant LSC, thus overcoming disease recurrence. Here, we developed a novel self-assembled leucine polymer (8L6) as a functional drug carrier that specifically targeted LSC in the bone marrow (BM) to inhibit their autophagy levels in AML mice. Furthermore, we developed a leucine polymer-loaded doxorubicin (Leu-DOX) to improve the DOX efficacy in eliminating LSC in preclinical AML models.
In order to investigate the autophagy pathways, we ana lyzed the clinical response and gene expression profile of AML patients from the Therapeutically Applicable Re search To Generate Effective Treatments (TARGET) data set, which included the remission group (n=91), relapse group (n=163), and death group (n=41). The gene set en richment analysis (GSEA) showed that autophagy-related genes were significantly more enriched in the relapsed group than in the remission group (Figure 1A), indicating that autophagy might be involved in the disease recur rence after chemotherapy. We then compared the ex
lower in specimens from relapsed AML patients com pared to remission AML patients, indicating autophagy activity is higher in relapsed samples (Figure 1C). We next investigated how chemotherapy influences leukemic cell transcriptional profile at single-cell res olution. We transduced wild-type BM with retrovirus expressing MLL-AF9 to recapitulate aggressive human
pression of canonical autophagy genes, ATG5, ATG7, and microtubule-associated protein light chain 3B-II (LC3BII) in each group. AML patients with higher ATG5 or ATG7 expression had a higher risk of relapse and cancer-re lated death after chemotherapy (Figure 1B). The protein levels of LC3B-II were higher, but autophagy targeted LC3 interacting protein p62/SQSTM1 (p62) 29 levels were
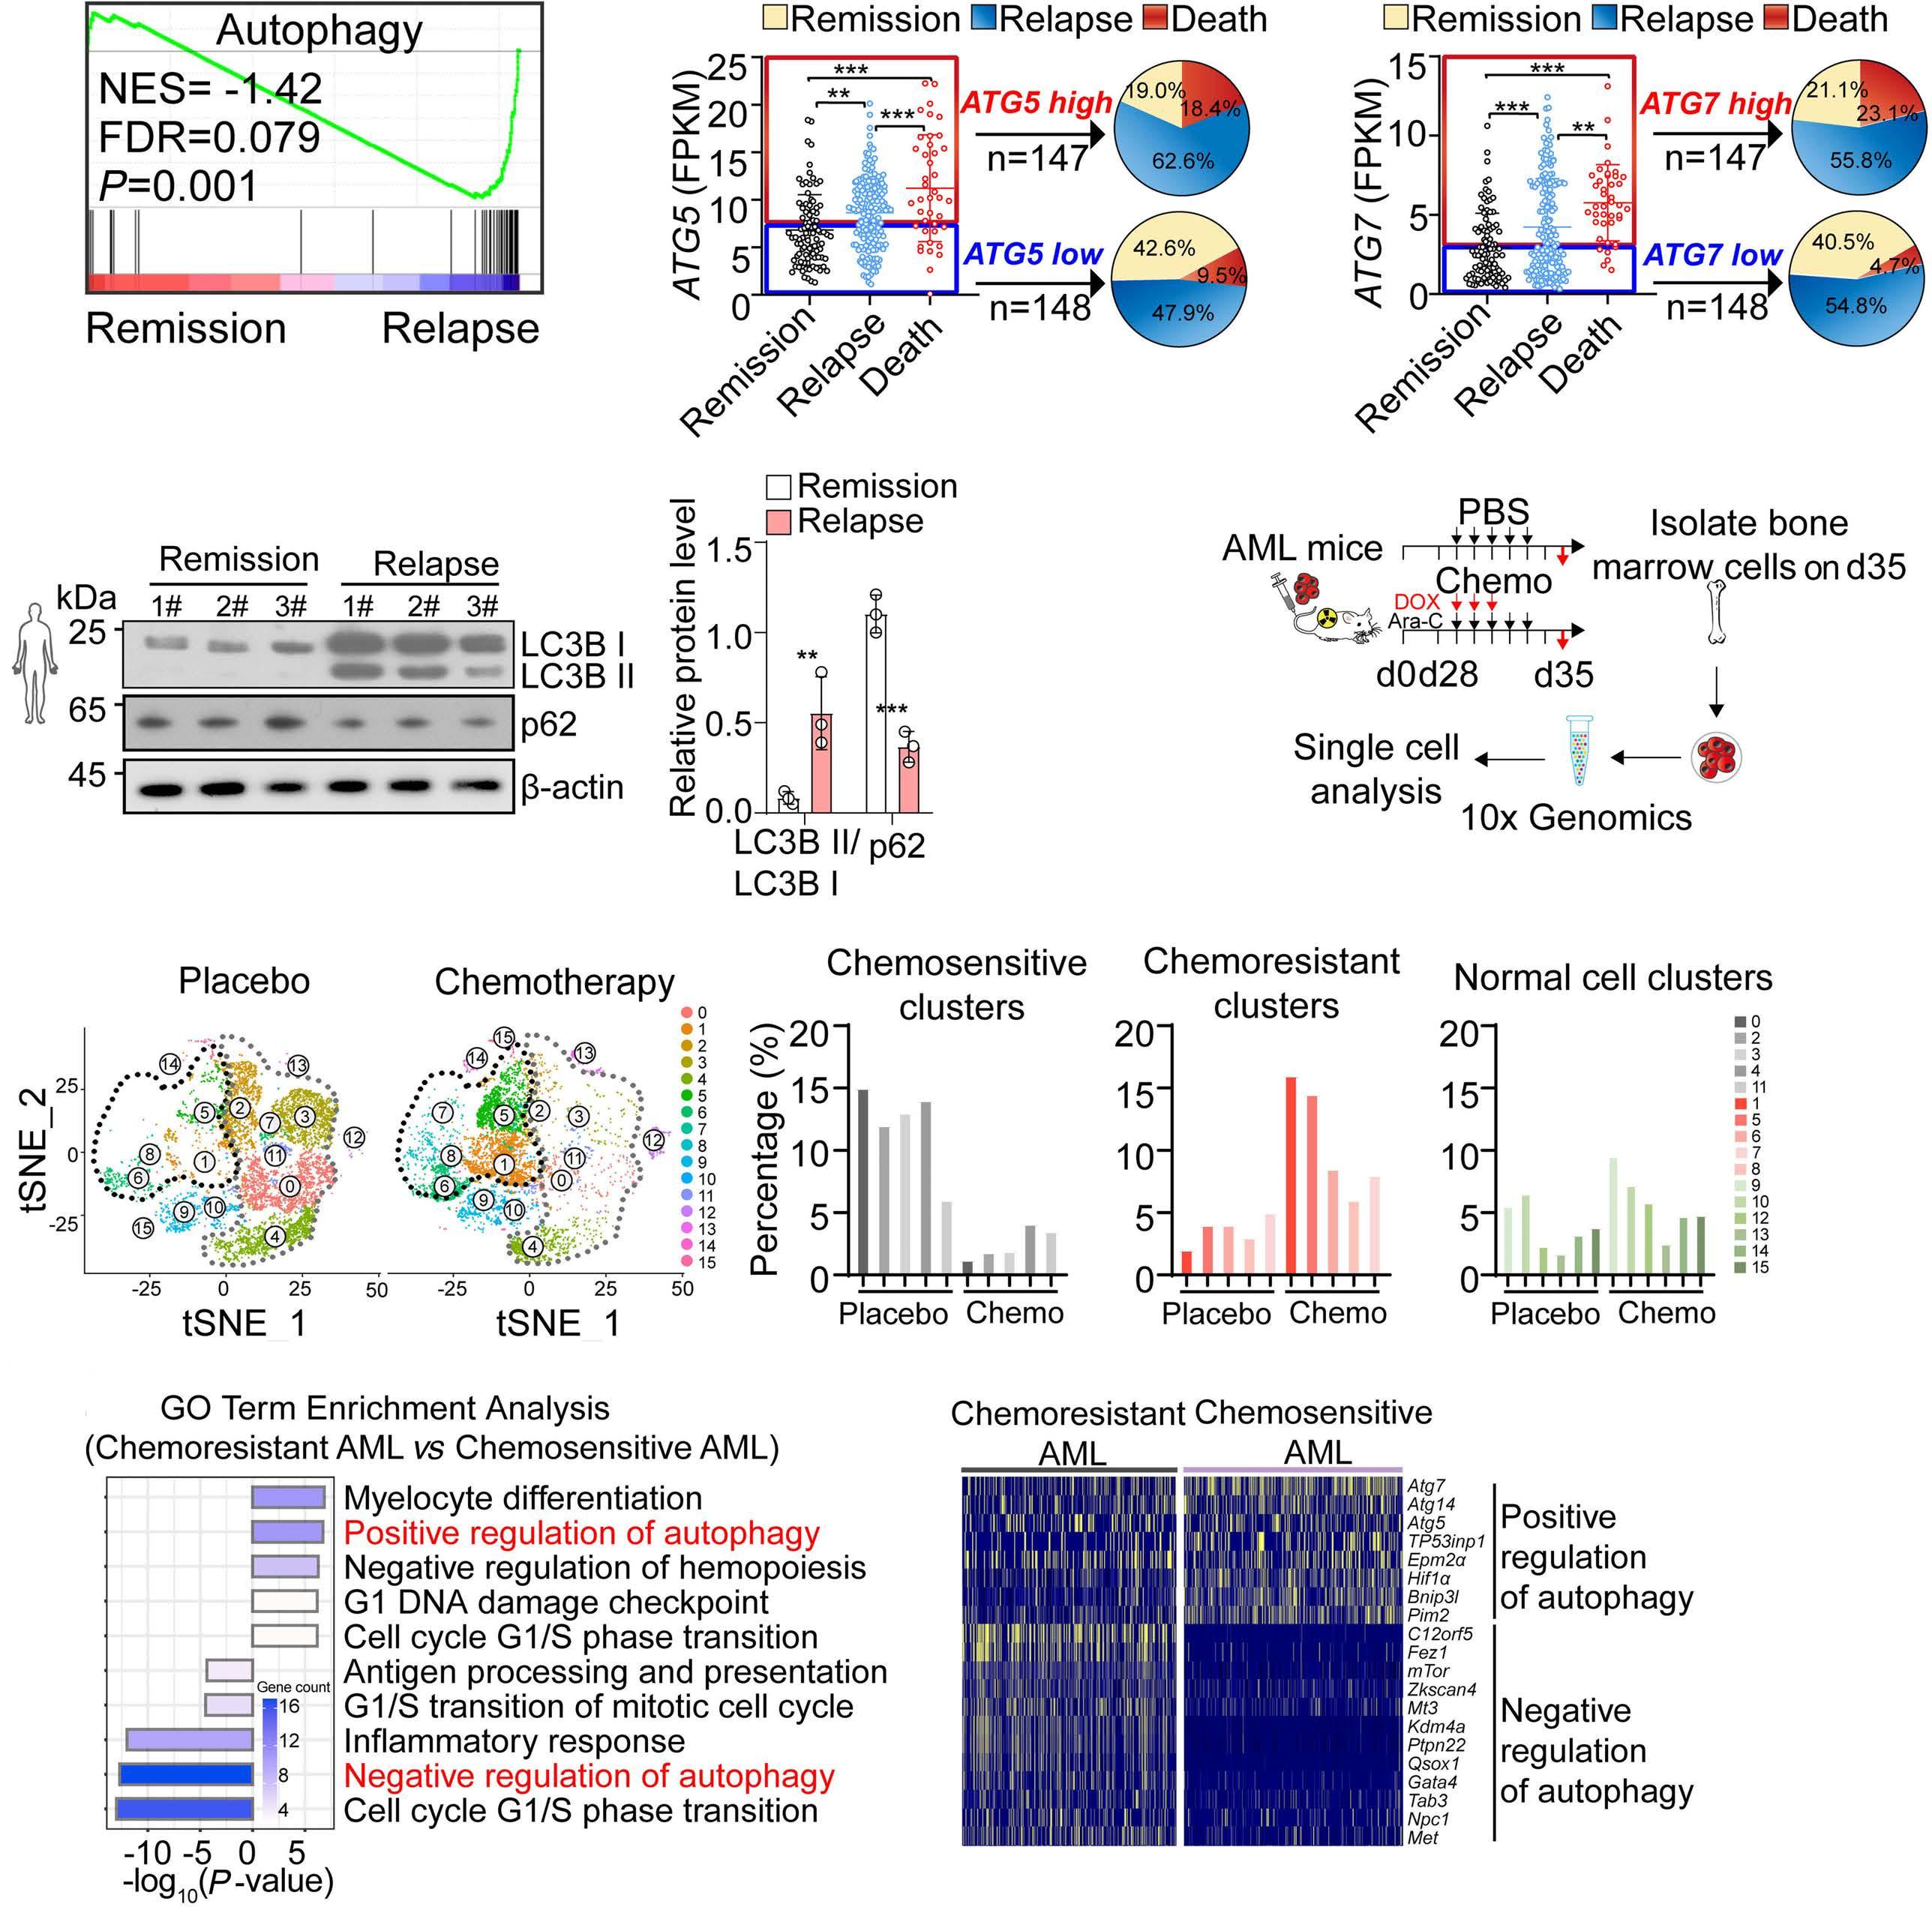
A B C D FigureEF1.
Autophagy activity is high in chemoresistant acute myeloid leukemia cells. (A) Gene set enrichment analysis of auto phagy pathways in acute myeloid leukemia (AML) patients with remission or relapse. (B) Distribution of ATG5 (left) and ATG7 (right) expression in AML patients. (C) Western blots (left) and quantification (right) of LC3B and p62 in primary-diagnosed and relapsed AML patients. 1#, 2#, 3# indicate 3 individual patients. (D) Schematic depicting the strategy to analyze murine AML cells by single-cell RNA-sequencing. Chemotherapy (chemo) included doxorubicin (DOX) and cytarabine (Ara-C) treatments. (E) tSNE (left) and quantification of clusters (right) of bone marrow cell from AML mice with chemotherapy (right, n=5 mice) or placebo (left, n=5 mice) treatment. (Black circle: chemoresistant leukemic cell clusters; grey circle: chemosensitive leukemic cell clusters). (F) Gene ontology (GO) analysis of pathways enriched in chemoresistant AML cells compared to chemosensitive AML cells (left) and differentially-expressed autophagy-related genes in chemosensitive AML cells and chemoresistant AML cells (right).
Haematologica | 107 October 2022 2346 ARTICLE - Eliminate leukemic stem cells by inhibiting autophagy X. Xu et al.
A B C D
Haematologica | 107 October 2022 2347 ARTICLE - Eliminate leukemic stem cells by inhibiting autophagy X. Xu et al.
these data indicated that chemotherapy stimu lated autophagy in LSC, and inhibition of autophagy in creased the efficacy of chemotherapy to more efficiently reduce chemoresistant LSC. E F
vestigated the potential function of autophagy in chemotherapeutic responses by pharmaceutically in hibiting autophagy using autophagy inhibitor chloro quine (CQ), a lysosome inhibitor blocking downstream effects of autophagy, in purified GFP + c-KIT + cells from AML mice for in vitro treatment. We found that the cell proliferation rate was significantly decreased in the DOX treatment group when CQ was administrated (CQ 21.4% decrease, DOX 40.2% decrease, DOX+CQ 78.9% decrease, Figure 2B). More importantly, autophagy in hibition dramatically increased the DOX-induced apop tosis in GFP + c-KIT + cells compared to DOX treatment (Figure 2C). Furthermore, we explored the effect of CQ treatment in vivo (Figure 2D). Consistent with the in vitro observations, DOX in vivo treatment increased LC3B-II and decreased p62 to activate the autophagy pathway in AML cells. However, CQ treatment attenu ated the activation of the autophagy pathway in AML cells induced by DOX treatment in AML mice (Figure 2E). Consequently, combined treatment with DOX and CQ more efficiently reduced the leukemic burden in pe ripheral blood of AML mice than DOX treatment (Figure Overall,2F).
We further investigated the autophagy levels in AML cells after chemotherapy treatment in AML mice. We found that phosphorylated mTOR, S6, 4EBP1 decreased, but LC3B-II increased in the LSC-enriched cells (GFP + cKIT + , GFP co-expressed from the MLL-AF9-carrying retrovirus) 31 obtained from MLL-AF9 induced AML mice (hereafter referred as to AML mice) 2 days after chemo therapy treatment in vivo (Figure 2A). These results in dicated that chemotherapy might inhibit the mTOR pathway to stimulate autophagy in LSC. Next, we in
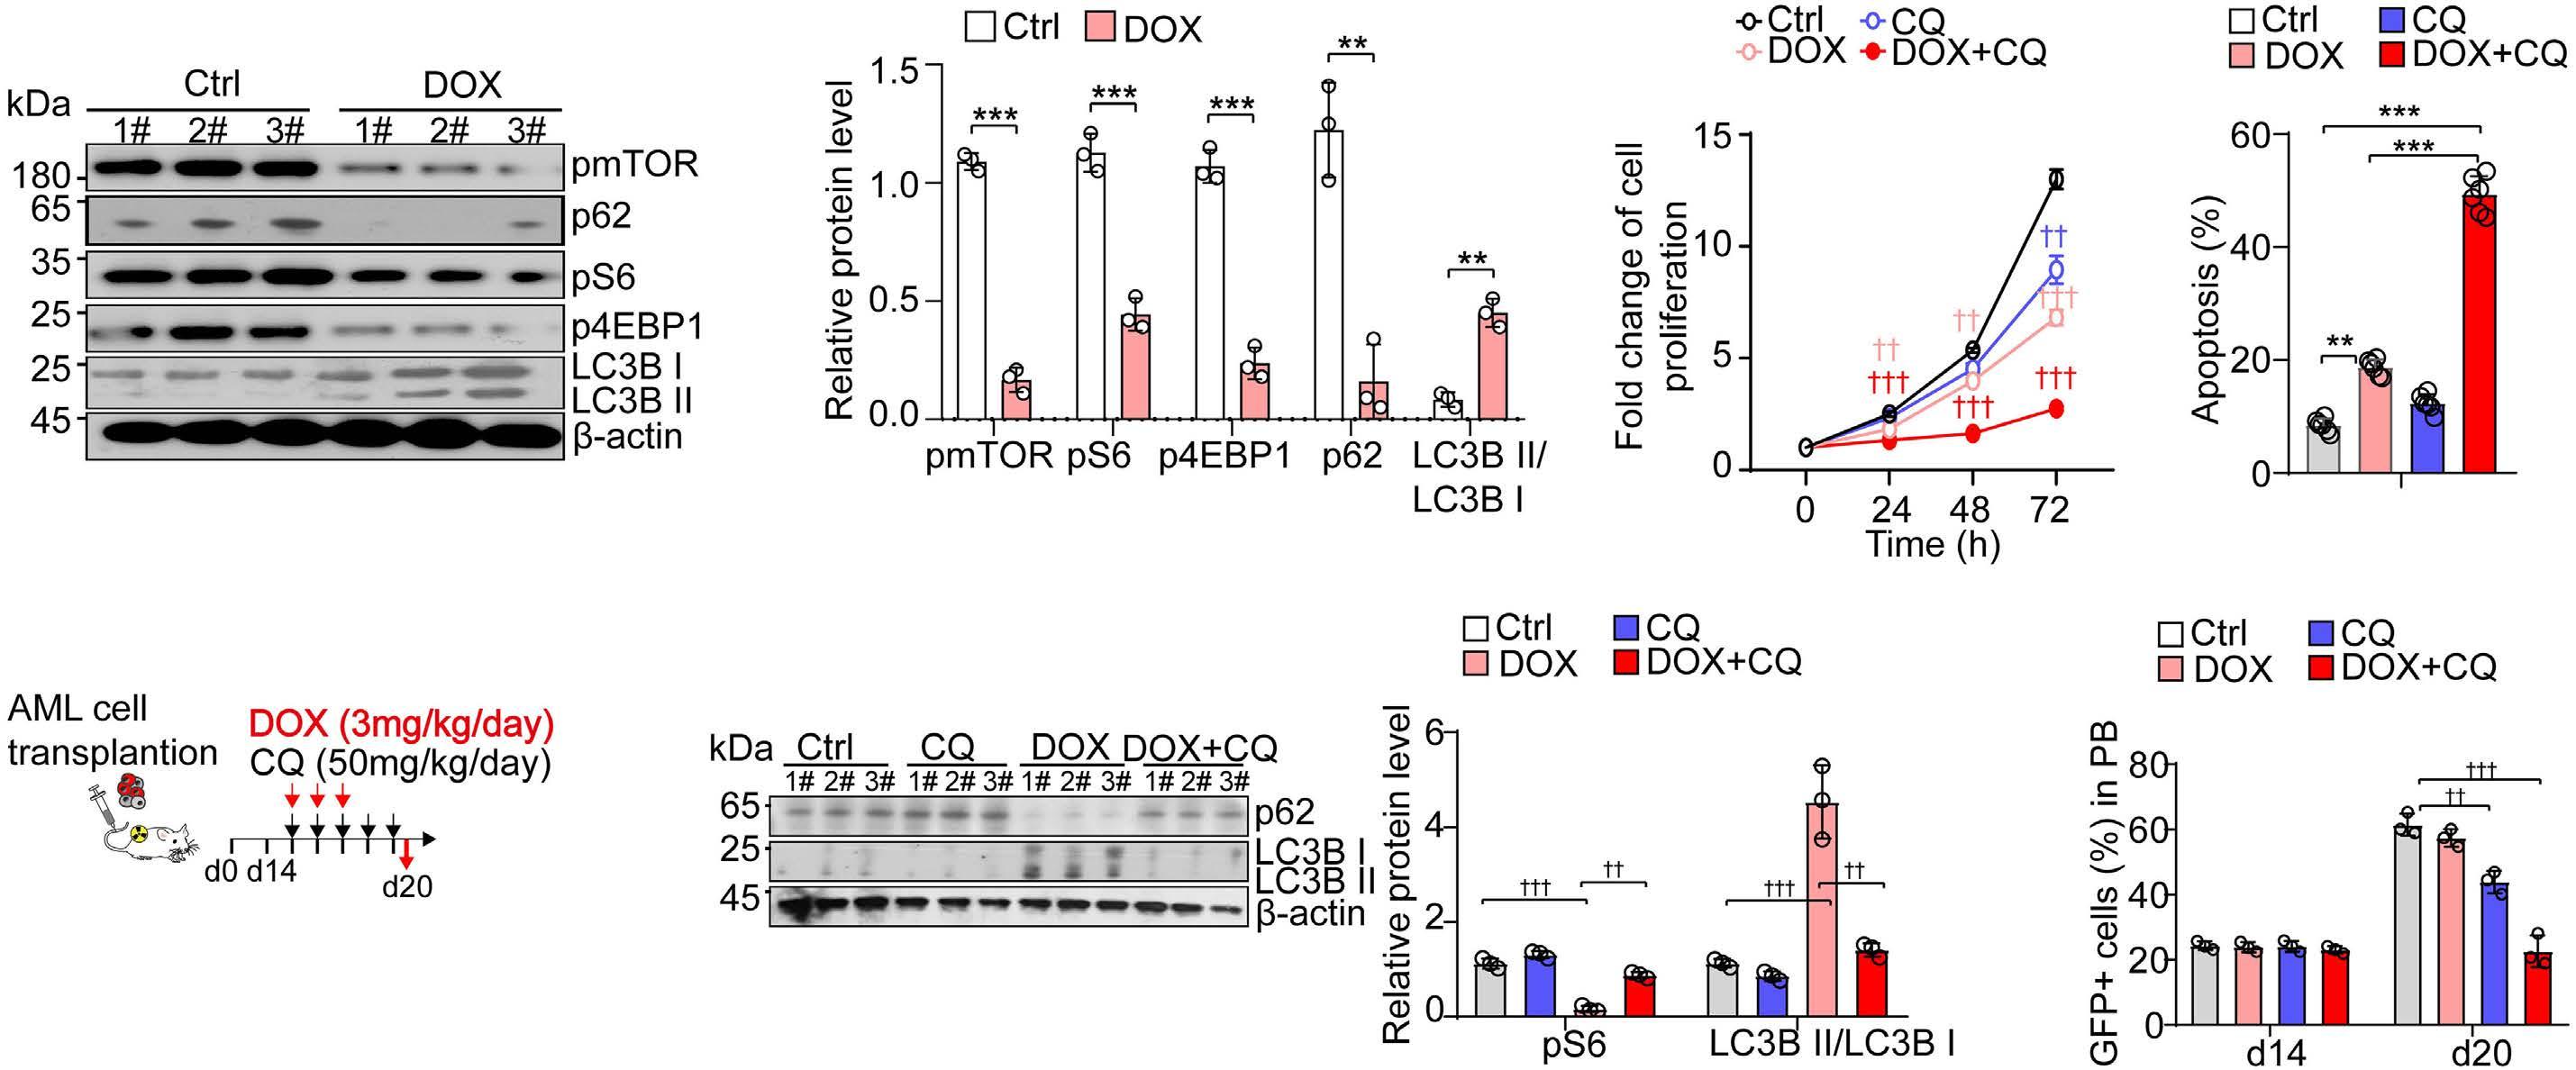
t(9;11) + AML in mice. 30 Using single-cell RNA sequencing (scRNA-seq), we profiled the AML cells in BM 2 days after Ara-C and DOX combined chemotherapy or placebo treatment (Figure 1D). Unbiased clustering of the BM cells from AML mice defined 16 clusters with three major groups: chemoresistance leukemic cell clusters (cluster 1, 5, 6, 7, and 8), chemosensitive leu kemic cell clusters (cluster 0, 2, 3, 4, and 11), and the normal hematopoietic cell clusters (cluster 9, 10, 12, 13, 14, and 15) (Figure 1E). Gene ontology (GO) analysis re vealed that chemoresistance leukemia cell clusters had distinguished pathways in the cell cycle, myelocyte dif ferentiation, and autophagy compared to chemosensi tive leukemia cell clusters (Figure 1F). Notably, autophagy-related genes were significantly enriched in chemoresistance leukemia cells than in chemosensitive leukemic cells (Figure 1F).
Figure 2. Autophagy protects leukemic stem cells from chemotherapy in acute myeloid leukemia. (A) Western blots (left) and quantification (right) of the mTOR pathway and LC3B in GFP+c-KIT+ cells from acute myeloid leukemia (AML) mice bone marrow (BM) 2 days after chemotherapy or placebo treatment as indicated. 1#, 2#, 3# indicate 3 individual AML mice. Chemotherapy (chemo) included doxorubicin (DOX) and cytarabine (Ara-C) treatments. (B) The cell proliferation rate of isolated GFP+c-KIT+ cells with indicated in vitro treatment (n=5 mice per group). GFP+c-KIT+ cells were purified from AML mice 2 days after indicated treat ment. (C) The apoptosis rate of GFP+c-KIT+ cells at 72 hours (h) after indicated in vitro treatment (n=6 replicates from 3 mice per group). (D) Schematic depicting the treatment strategy for AML mice. (E) Western blots (left) and quantification (right) of the p62 and LC3B in isolated GFP+c-KIT+ cells from the BM of AML mice received DOX and CQ treatment as indicated. (F) The percentage of GFP+ leukemic cells in peripheral blood with indicated treatments (n=3 mice).
A B C D E F
As the branched-chain amino acids, especially leucine, can inhibit autophagy by activating mTOR,32,33 we proposed that self-assembled leucine polymer might facilitate chemo therapy by inhibiting autophagy. Therefore, we synthesized the leucine polymer, 8L6 (Online Supplementary Figure S1A), and loaded DOX in 8L6 to generate Leu-DOX for the first time. The average size of Leu-DOX was 104.3±1.19 nm with a narrow polydispersity index (Online Supplementary Figure S1B). Leu-DOX showed a uniform spherical shape under the electron microscope (Online Supplementary Figure S1C). The encapsulation efficiency and drug loading of DOX in LeuDOX detected by fluorescence spectrophotometry were 58.9±0.3% and 5.9%±0.03%, respectively (Online Supple mentary Figure S1D). The particle size of Leu-DOX did not change significantly after long-term storage in vitro, indi cating the favorable stability of Leu-DOX (Online Supple mentary Figure S1E). Considering that Leu-DOX will transport through different pH environments in the body,34 we incubated Leu-DOX in a series of pH solutions to exam ine the release efficiency. The release of DOX at pH 5.0 was significantly higher than at pH 7.4 (Online Supplementary
Figure S1F), suggesting that Leu-DOX might rapidly release DOX in the acid tumor microenvironment.
Leucine polymer-loaded doxorubicin specifically targets leukemic cells but spares normal tissues in acute myeloid leukemia mice
Haematologica | 107 October 2022 2348 ARTICLE - Eliminate leukemic stem cells by inhibiting autophagy X. Xu et al.
In order to evaluate the biodistribution of Leu-DOX in vivo, we intravenously injected DiR, a near-infrared dye for in vivo imaging or DiR@8L6, and imaged the dynamic bio luminescence levels in AML mice (Online Supplementary Figure S2B). The fluorescence intensity of free DiR ac cumulated in the epigastrium peaking at 24 h, but dim DiR signals were detected in the BM of the femur and tibia, indicating a low drug delivery efficiency in the BM. In contrast, the DiR@8L6 had a 6.92-fold increased accumu
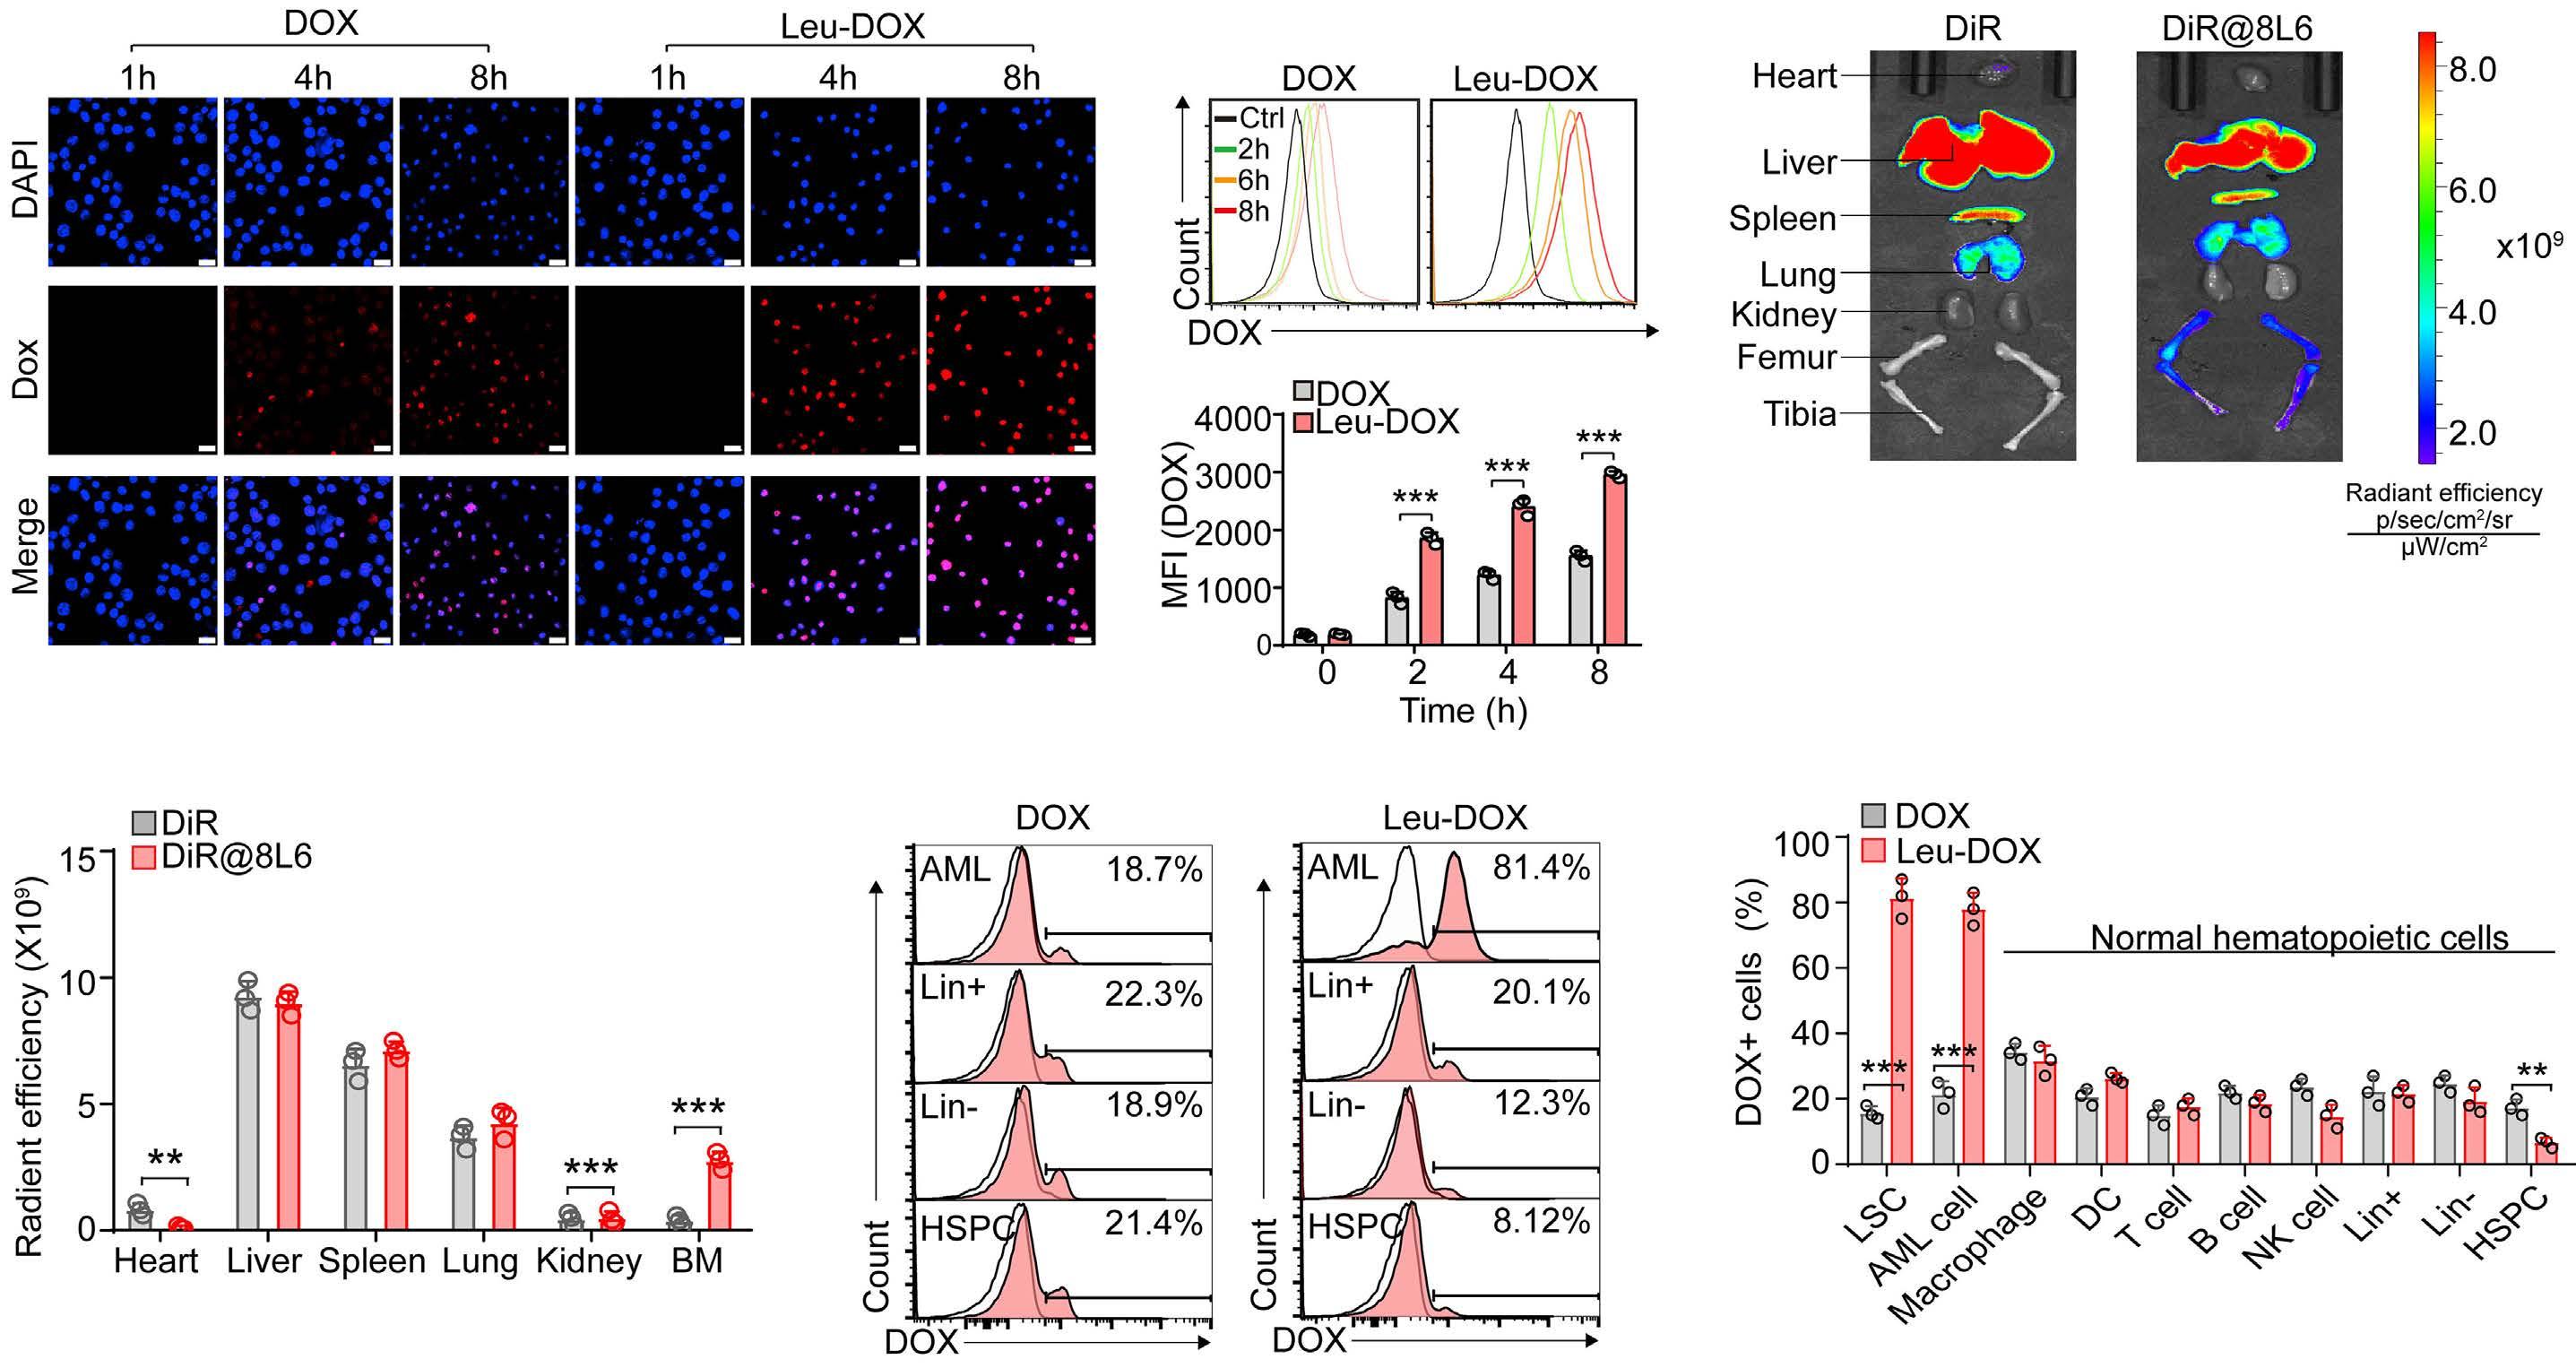
Figure 3. Leucine polymer-loaded doxorubicin specifically targets leukemic cells but spares normal tissues in acute myeloid leukemia mice. (A) Images of THP-1 cells with doxorubicin (DOX) or leucine polymer-loaded doxorubicin (Leu-DOX) treatment for the indicated time (scale bar=20 µm). (B) Representative flow cytometry profile (up) and quantitative cellular uptake (down) of DOX in THP-1 cells incubated with DOX or Leu-DOX for the indicated time. (C and D) The fluorescence images (C) and quan tification (D) of DiR in the indicated organs of acute myeloid leukemia (AML) mice 24 hours (h) after DiR or DiR@8L6 injection. (E and F) Representative flow cytometry profile (E) and quantitative (F) of the intensity of DOX fluorescence in different hema topoietic cell populations of AML mice. The DOX fluorescence was quantified 4 h after injection (n=3 mice per group).
Drug internalization and persistent retention are critical for cancer treatment.35 In order to explore the uptake of Leu-DOX by AML cells, we treated THP-1, a human MLL AF9+ AML cell line,36 with DOX or Leu-DOX and measured the DOX uptake by characterizing the DOX-inherited red fluorescence.37 Notably, Leu-DOX achieved higher DOX content in THP-1 cells than free DOX after incubation (Fig ure 3A), although DOX and Leu-DOX represented similar inherent fluorescent intensity (Online Supplementary Fig ure S2A). Flow cytometry analysis of the DOX fluorescence intensity further confirmed the higher drug content in THP-1 cells with Leu-DOX treatment than with DOX treat ment (Figure 3B).
In order to explore the therapeutic effects of Leu-DOX in vitro, we treated THP-1 cells with 8L6, DOX, and Leu-DOX,
A B C E F
Figure 4. Leucine polymer-loaded doxorubicin enhances the chemotherapy efficacy for acute myeloid leukemia cells in vitro. (A) The cell proliferation rate of THP-1 cells treated with phospate-buffered saline (PBS) (control [Ctrl]), 8L6, doxorubicin (DOX), or leucine polymer-loaded doxorubicin (Leu-DOX) as indicated (n=5 independent replicates per group). (B) Representative fluor escence activated cell sorting plots (left) and the quantification (right) of Annexin V+ apoptotic THP-1 cells 48 hours (h) after treatment (n=6 replicates). (C) Representative Images (left) and quantification (right) of the γ H2AX intensity in THP-1 cells 48 h after indicated treatment (scale bar=1 µm) (n=6 replicates). (D) Representative Images (left) and quantification (right) of DOX flu orescent signal in THP-1 cells at indicated time after treatment with DOX, Leu-DOX, or DOX@polylactic coglycolic acid (PLGA) (scale bar=20 µm). (E) The cell proliferation rate of THP-1 cells treated with PBS (Ctrl), DOX, Leu-DOX, and DOX@PLGA. (n=5 in dependent replicates per group). (F) Apoptotic THP-1 cells at 72 h after indicated treatment (n=6 independent replicates per group).
Leucine polymer-loaded doxorubicin enhances the chemotherapy efficacy for acute myeloid leukemia cells in vitro
In order to further evaluate the cellular targeting specifi city of Leu-DOX within the BM of AML mice, we examined the fluorescence intensity in various cell populations in the BM of AML mice using in vivo cell trace. Notably, LeuDOX targeted over 80% of leukemic cells and GFP+ckit+ LSC-enriched cells. Conversely, Leu-DOX targeted ~2040% of normal mature hematopoietic cells, such as mac rophages, dendritic cells (DC), T cells, B cells, and natural killer (NK) cells, and much fewer hematopoietic stem and progenitor cells (~7.89%) in the BM of AML mice. However, DOX had no cell type specificity. (Figure 3E and F). These observations indicated that Leu-DOX specifically targets AML cells but spares normal hematopoietic cells. We con sistently observed the similar leukemic cell targeting ef ficiency of Dil@8L6 compared to free Dil (red fluorescence better for single-molecule imaging) (Online Supplementary Figure S2C and D), indicating that 8L6 might be an effi cient and specific drug carrier for AML treatment.
In order to exclude the possibility that increased cell toxicity of Leu-DOX was mainly due to nanoparticle facili tated cell uptake efficacy, we compared 8L6 with another Food and Drug Administration (FDA) approved drug nano carrier PLGA (polylactic-co-glycolic acid).39 DOX@PLGA and Leu-DOX showed comparable increased cellular up take of DOX than free DOX in THP-1 cells (Figure 4D), in dicating the enhanced drug delivery efficiency in AML cells of these two drug carriers. However, DOX@PLGA showed less advantage in inhibiting cell growth and inducing apoptosis of THP-1 cells than Leu-DOX (Figure 4E and F), suggesting that 8L6 might facilitate chemotherapy more than a canonical drug carrier for AML treatment.
D Haematologica | 107 October 2022 2349 ARTICLE - Eliminate leukemic stem cells by inhibiting autophagy X. Xu et al.
lation in the BM than free DiR, an 84.8% decrease in the heart at 48 h after injection, suggesting that 8L6 might be an efficient drug carrier for leukemic treatment with re duced tissue damage (Figure 3C and D).
respectively. Our data showed that Leu-DOX inhibited THP-1 cell proliferation more efficiently than DOX treat ment (Figure 4A). Furthermore, Leu-DOX induced more dramatic apoptosis in THP-1 cells than DOX treatment at 48 h after treatment (Figure 4B). Since DOX blocks topoi somerase 2 to trigger DNA damage,38 we further showed that Leu-DOX treated THP-1 cells had much more DNA damage than THP-1 cells with DOX treatment examined by the intensity of γH2AX (Figure 4C) and comet assay (On line Supplementary Figure S3).
Leucine polymer-loaded doxorubicin inhibits autophagy to enhance chemotherapy efficacy in acute myeloid leukemia cells
As leucine can activate the mTORC1 complex to inhibit
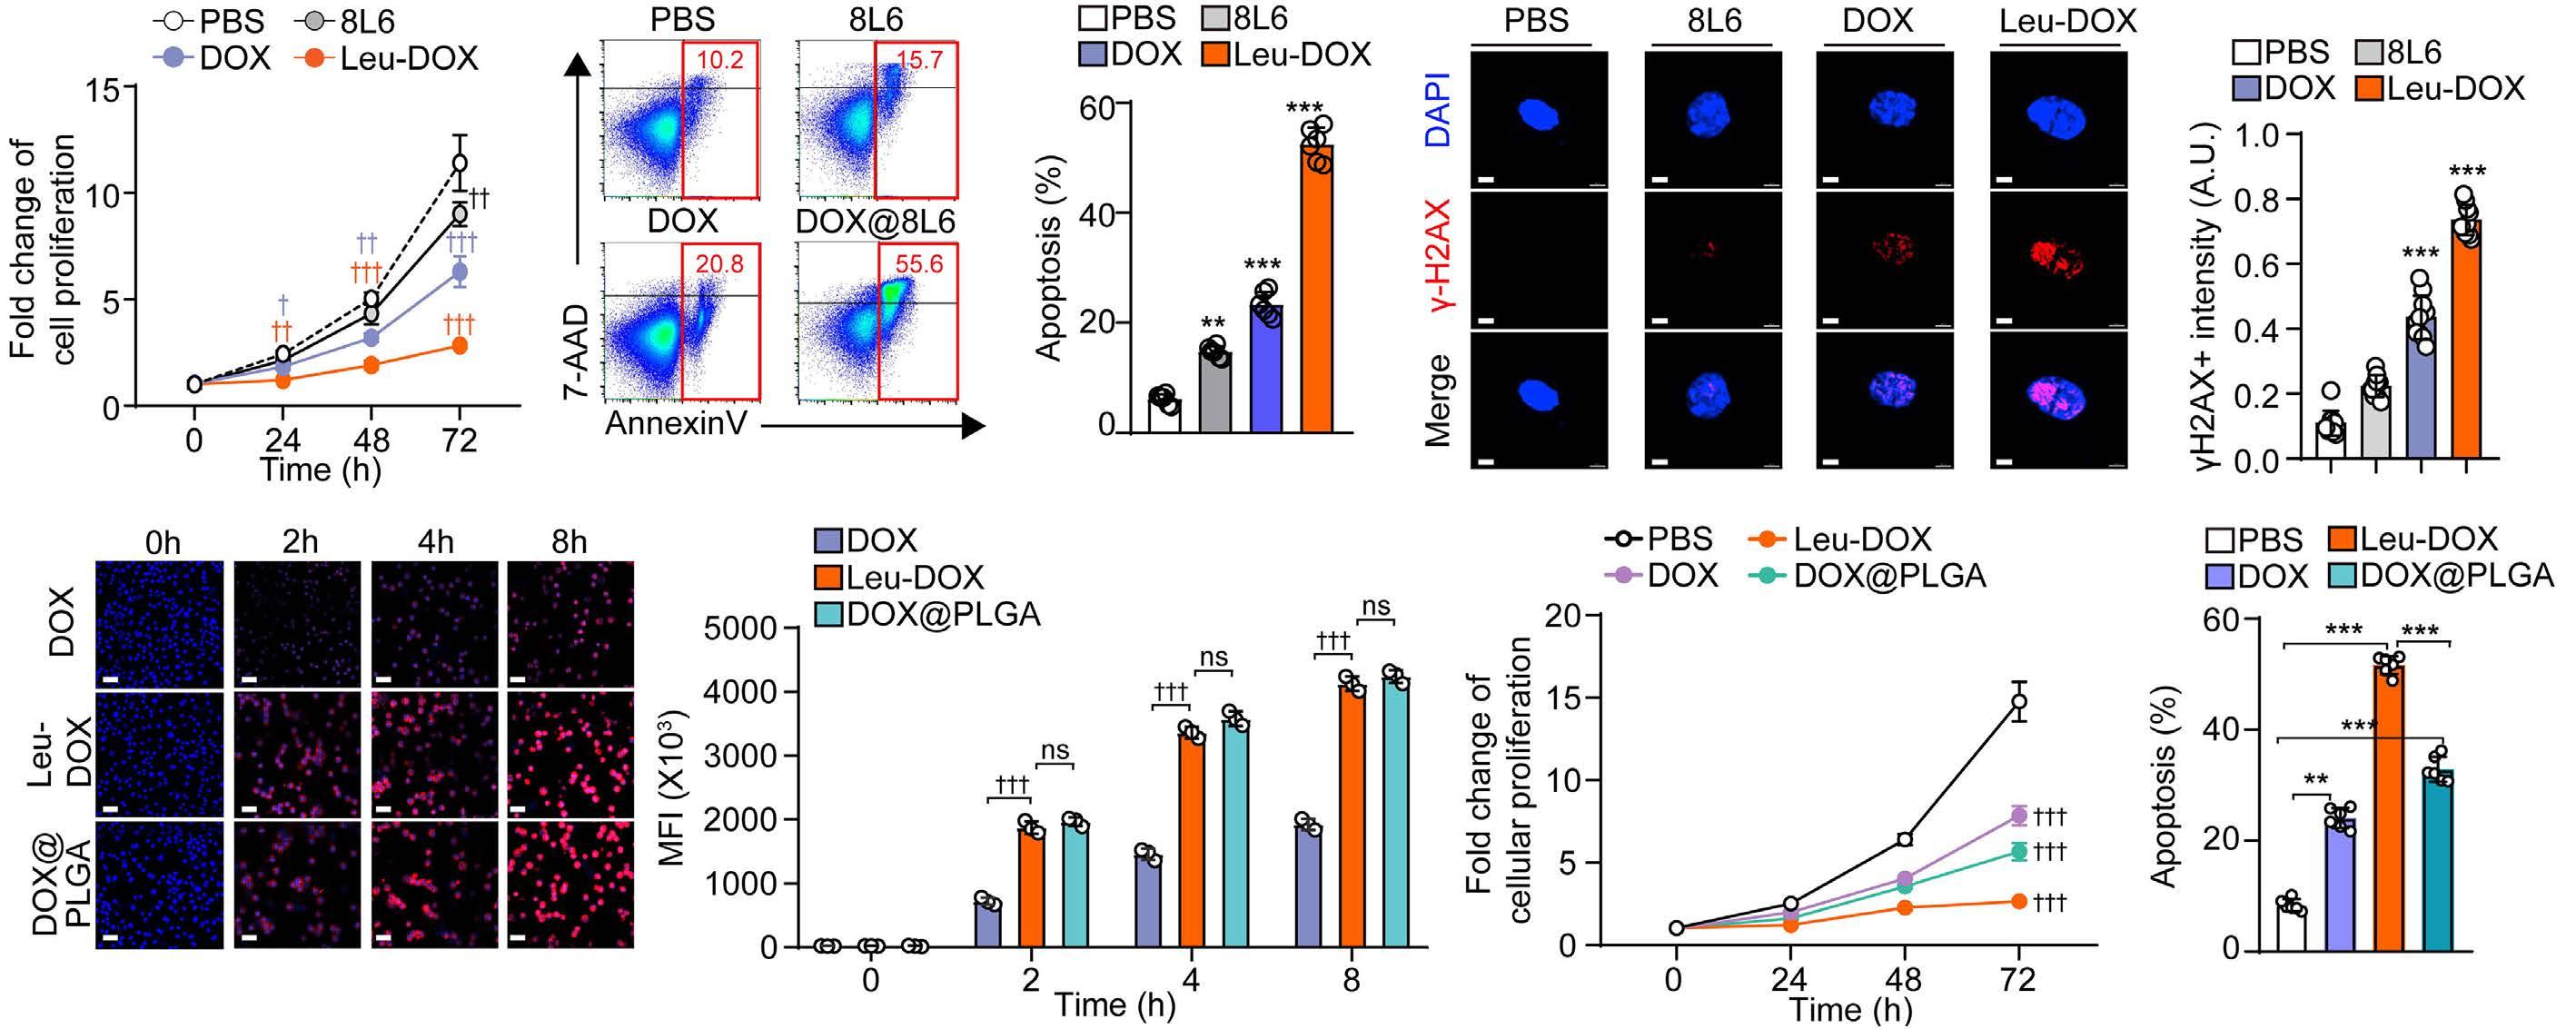
A B C D E F Haematologica | 107 October 2022 2350 ARTICLE - Eliminate leukemic stem cells by inhibiting autophagy X. Xu et al.
treatment in vivo, we started the treatment 14 days after transplantation when the chimeric rate of leukemia cells (GFP+) reached about 15% in the peripheral blood of AML mice (Figure 6A). Leu-DOX treatment dramatically reduced the frequency, and absolute numbers of LSC-enriched cells due to increased apoptosis in the BM of AML mice, including GFP+c-KIT+ cells, GFP+Lin Sca1 cKIT+CD34+FcgRII/III+ (L-GMP) cells41 (Figure 6B and E), GFP+Lin Sca1+c-KIT+ (LSK) cells (Online Supplementary Fig ure S5A to C), and GFP+Lin Sca1 c-KIT+ (LK) cells (Online Supplementary Figure S5D to F).42 Conversely, we also no ticed that DOX treatment triggered apoptosis and reduced the absolute number of LSC-enriched cells but enriched their frequency in the BM of AML mice (Figure 6B to E; On line Supplementary Figure S5).
In order to investigate the effects of Leu-DOX for AML
Our data showed that DOX treatment for AML mice signifi cantly inactivated the mTOR pathway to induce autophagy in LSC enriched GFP+c-KIT+ cells, examined by the in creased LC3B-II and reduced p62. However, Leu-DOX treatment did not affect the mTOR pathway or influence autophagy protein LC3B-II and p62 levels in GFP+c-KIT+ cells (Figure 6F). In line with this, Leu-DOX dramatically reduced the colony-forming leukemic cells in the BM of AML mice and compromised their self-renewal capacity in
Leucine polymer-loaded doxorubicin inhibits autophagy and reduces leukemic stem cell frequency in vivo
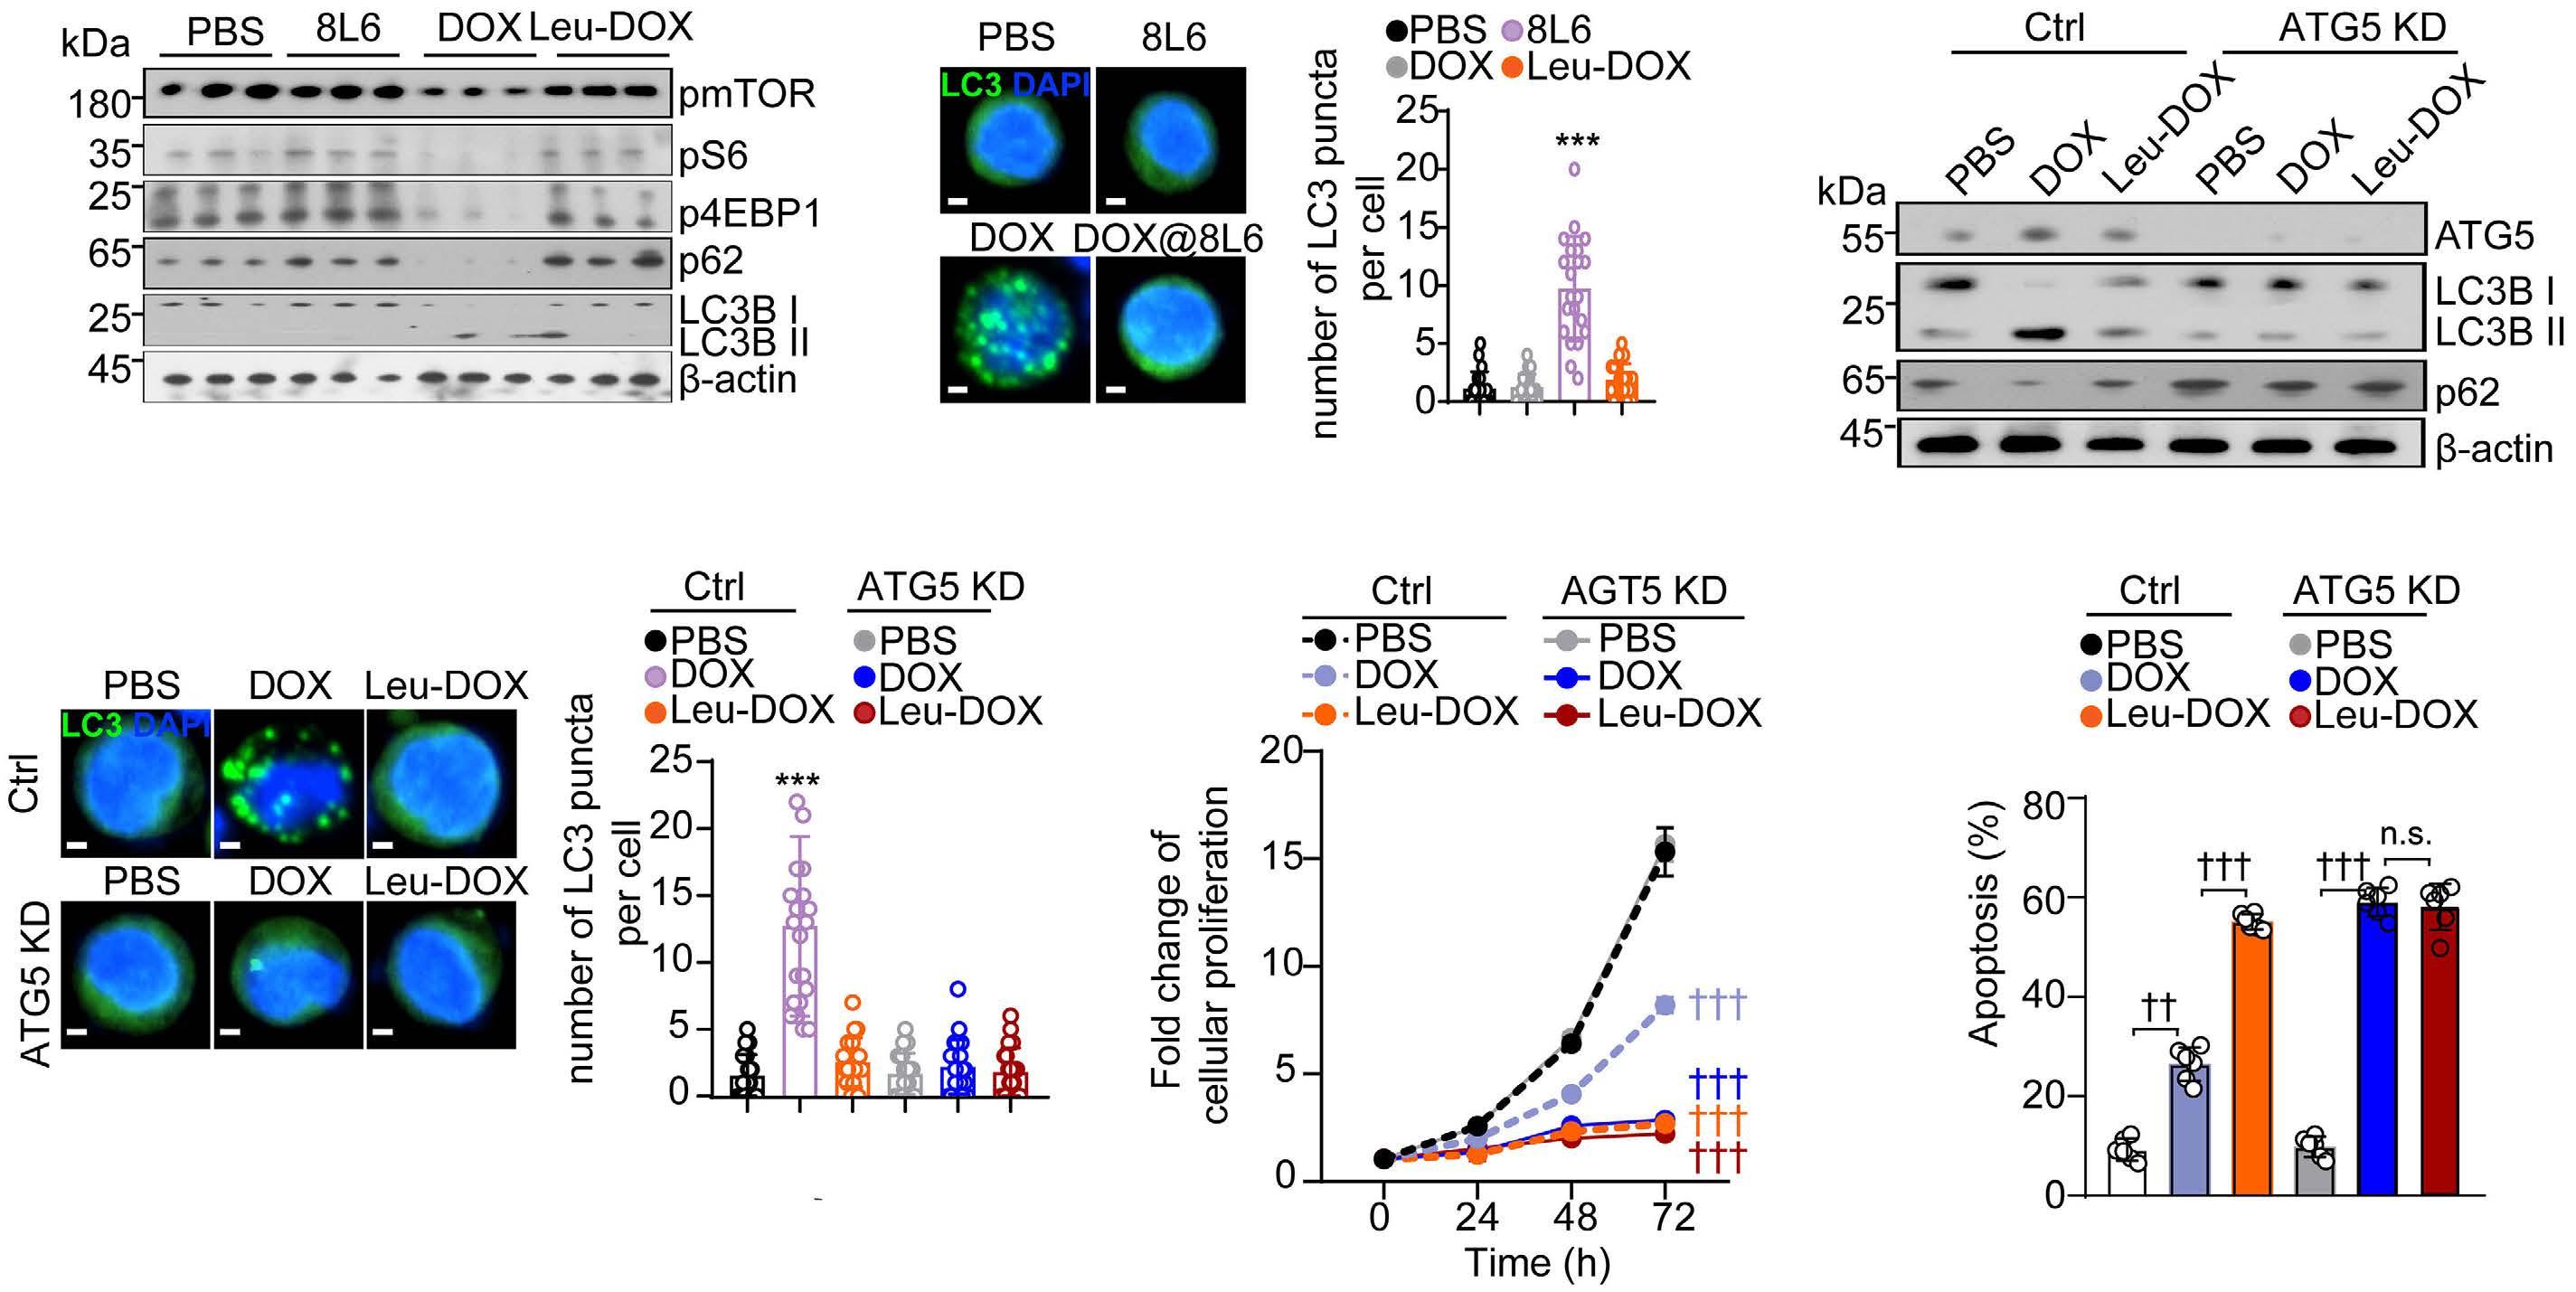
Figure 5. Leucine polymer-loaded doxorubicin inhibits autophagy to enhance chemotherapy efficacy in acute myeloid leukemia cells. (A) Western blots of the mTOR pathway, LC3B and p62 in THP-1 cells 48 hours (h) after indicated treatment. (n=3 indepen dent replicates per group). (B) Representative image (left) and quantification (right) of LC3 puncta in THP-1 cells 48 h after treat ment (scale bar=3 µm) (n=20 cells). (C) Western blots of the AGT5, LC3B, and p62 in control and ATG5 KD THP-1 cells 48 h after indicated treatment. (D) Representative images (left) and quantification (right) of LC3 puncta in control and ATG5 KD THP-1 cells 48 h after indicated treatment (scale bar=2 µm) (n=20 cells). (E) The cell proliferation rate of control and ATG5 KD THP-1 cells after indicated treatment. (n=6 replicates). (F) The apoptosis rate of control and ATG5 KD THP-1 cells 72 h after indicated treat ment, knockdown (KD) (n=6 replicates).
autophagy,40 we further investigated the role of 8L6 and Leu-DOX in regulating autophagy in AML cells. Intriguingly, we found that Leu-DOX did not repress the mTORC1 path way and induce autophagy as DOX treatment did in THP1 cells after in vitro treatment, examined by the pmTOR, pS6, and p4EBP, LC3B-II, and LC3 puncta (Figure 5A and B; Online Supplementary Figure S4A), indicating that LeuDOX might enhance the efficacy of DOX treatment by in hibiting autophagy. In line with this, we found that inhibiting autophagy in THP-1 cells by lentivirus-mediated ATG5 knockdown (Figure 5C and D; Online Supplementary Figure S4B) improved the cell growth inhibition and apop tosis-inducing effects of DOX treatment to similar levels as Leu-DOX treatment (Figure 5E and F). By contrast, in hibiting the mTORC1 pathway by rapamycin (Online Sup plementary Figure S4C and D) increased autophagy (Online Supplementary Figure S4E), which compromised the growth inhibition and apoptosis-inducing effects of LeuDOX treatment to the similar levels as DOX treatment in THP-1 cells (Online Supplementary Figure S4F and G).
Figure 6. Leucine polymer-loaded doxorubicin inhibits autophagy and reduces leukemic stem cell-enriched cells in acute myeloid leukemia mice. (A) Schematic of drug treatment and analysis. (B) Representative fluorescence activated cell sorting (FACS) plots of GFP+c-KIT+ cells (left) and GFP+Lin Sca1 c-KIT+CD34+FcgRII/III+ cells (right, L-GMP) in the bone marrow (BM) of acute myeloid leukemia (AML) mice 2 days after indicated treatments. (C) The frequency of GFP+c-KIT+ cells (up) and GFP+Lin Sca1 cKIT+CD34+FcgRII/III+ cells (down) in the BM of AML mice 2 days after indicated treatments (n=4 mice). (D) The absolute number of GFP+c-KIT+ cells (up) and GFP+Lin Sca1 c-KIT+CD34+FcgRII/III+ cells (down) in the BM of AML mice 2 days after indicated treat ments (n=4 mice). (E) The apoptosis rate of GFP+c-KIT+ cells (up) and GFP+Lin Sca1 c-KIT+CD34+FcgRII/III+ cells (down) in the BM of AML mice 2 days after indicated treatments (n=4 mice). (F) Western blots (left) and quantification (right) of mTOR pathway, LC3B, and p62 in GFP+c-KIT+ cells from AML mice 2 days after indicated treatment. 1#, 2#, 3# indicate 3 individual AML mice.
A B C D E F Haematologica | 107 October 2022 2351 ARTICLE - Eliminate leukemic stem cells by inhibiting autophagy X. Xu et al.
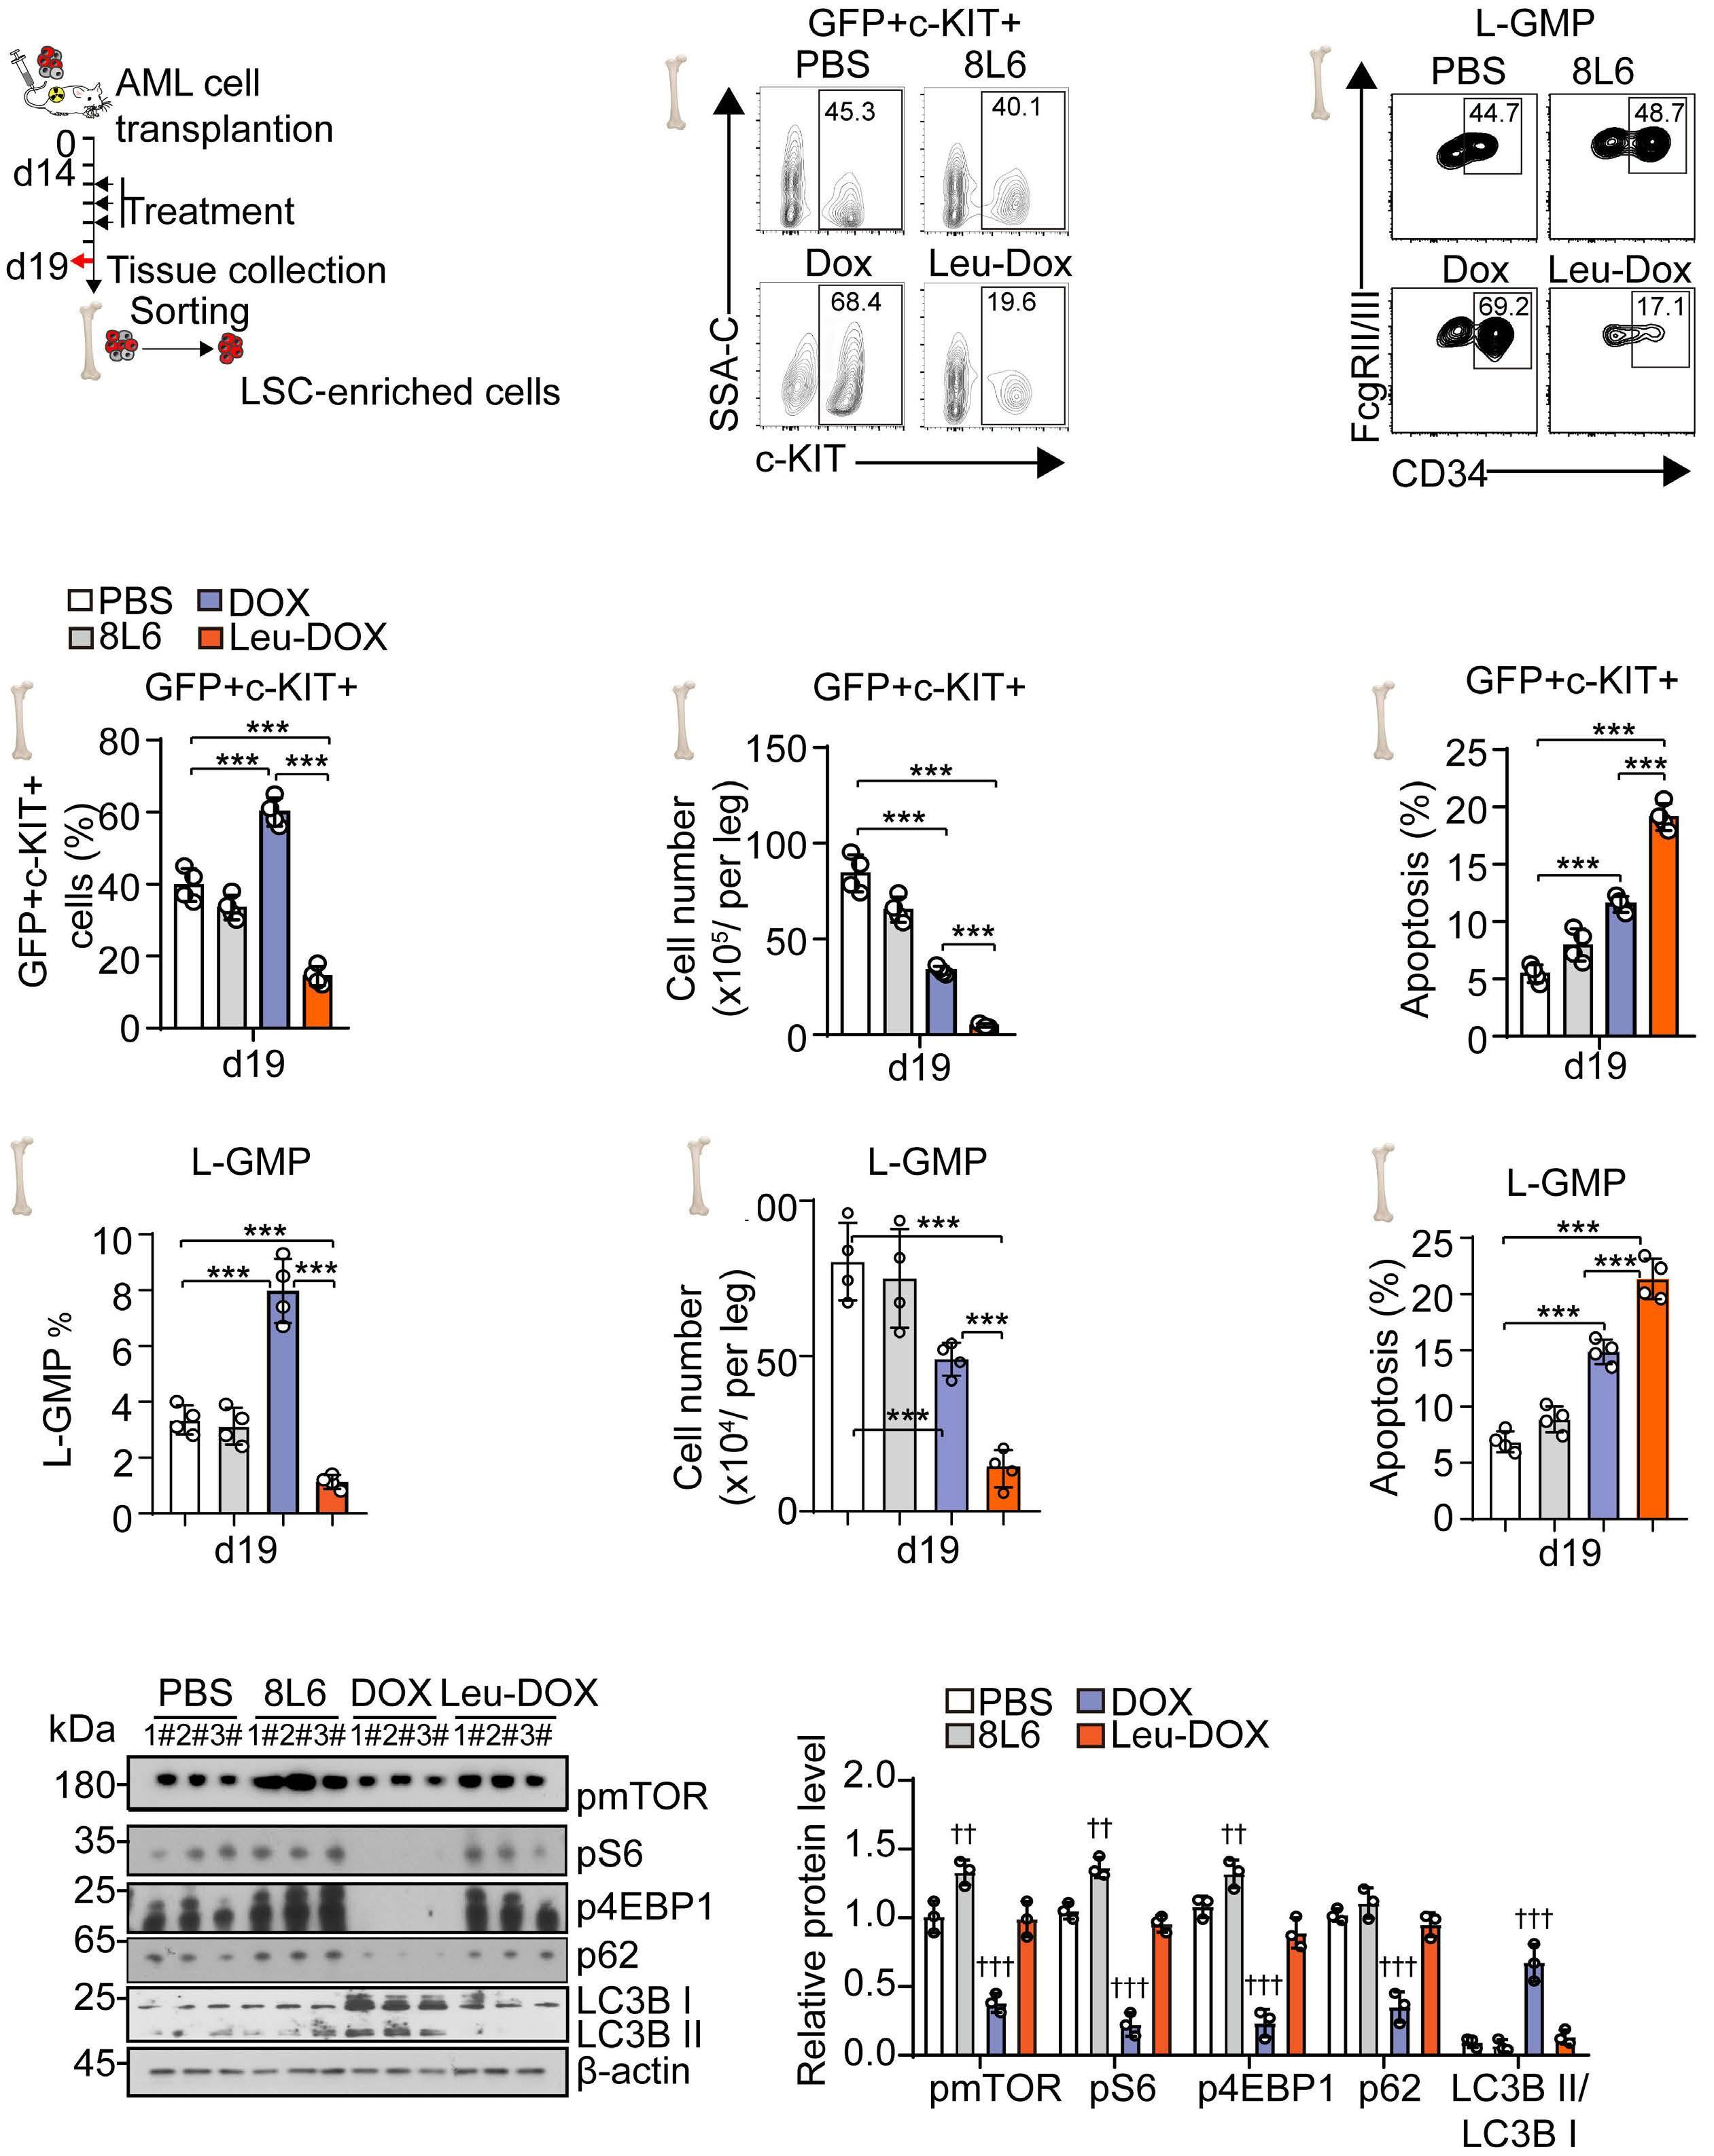
Figure 7. Leucine polymer-loaded doxorubicin reduces leukemic stem cells in acute myeloid leukemia mice. (A and B) Repre sentative images (A) and quantification (B) of colony-forming cells in the bone marrow (BM) of acute myeloid leukemia (AML) mice 2 days after indicated treatments. (C) Schematic illustration of limited dilution assay of BM cells of AML mice 2 days after indicated treatments. (D and F) The percentage of GFP+ leukemic cells in peripheral blood (D), the quantification of morbidity in recipients (E), and competitive repopulating unit (CRU) analysis for the leukemic stem cell (LSC) frequency (F) (n=5 mice per group).
A B C D E F Haematologica | 107 October 2022 2352 ARTICLE - Eliminate leukemic stem cells by inhibiting autophagy X. Xu et al.
Leu-DOX treatment also more efficiently recovered the bodyweight of AML mice than DOX treatment (Online Sup plementary Figure S6A) compared to placebo treatment, indicating the reduced tissue toxicity in Leu-DOX treated mice. DOX exhibits toxicity in the heart, liver, kidney, and nervous tissue, which causes severe complications in AML patients receiving standard chemotherapy in clinical.43-45 Our data showed that Leu-DOX treatment caused much less side effect toxicity in the structural integrity and re duced leukemic cell infiltration in the heart, liver, spleen, lung, and kidney than DOX treatment in AML mice (Online Supplementary Figure S6B to D).
Furthermore, Leu-DOX significantly reduced the leukemia burden in BM (68.7% reduction) than placebo treatment, which was much more efficient than the DOX treatment (31.8% reduction) (Figure 8D). Consistently, Leu-DOX more efficiently reduced the weight of the liver and spleen, which were infiltrated with leukemic cells in AML mice (61.9% reduction spleen and 37.3% reduction liver) than DOX treatment (39.4% reduction spleen, and 24.4% reduc tion liver, Figure 8E). More importantly, the Leu-DOX treat ment significantly prolonged the overall survival of AML mice than AML mice receiving placebo or DOX treatment (Figure 8F).
We further investigated the therapeutic efficacy of LeuDOX in treating AML mice (Figure 8A). Leu-DOX treatment robustly reduced the leukemia burden in peripheral blood (73.6% decrease on d21, and 64.3% decrease on d28), which was much more efficient than DOX treatment alone (36.8% decrease on d21, and 29.9% decrease on d28) (Fig ure 8B). Blood smear assay showed that Leu-DOX-treated
group had much fewer immature leukemic cells than DOX or placebo groups (Figure 8C).
serial plating assay (81.6% reduction in the primary plating, 89.9% reduction in the secondary plating). However, DOX treatment enriched the frequency of colony-forming cells in an equal number of BM cells from AML mice than mice receiving placebo treatment (1.72-fold increase in the pri mary plating, 1.56-fold increase in the secondary plating) (Figure 7A and B). In order to investigate how Leu-DOX treatment impacts functional LSC in vivo, we further per formed a limiting dilution assay using BM cells from AML mice 2 days after DOX, Leu-DOX, or placebo treatment (Figure 7C). We found that Leu-DOX treatment dramatically reduced the frequency of functional LSC in the BM of AML mice. Notably, Leu-DOX treatment reduced ~1,000-fold functional LSC (1/58) in the BM of AML mice than AML mice received DOX treatment (1/50,385) (Figure 7D to F).
Leucine polymer-loaded doxorubicin enhances the chemotherapy efficacy in acute myeloid leukemia mice with reduced tissue toxicity
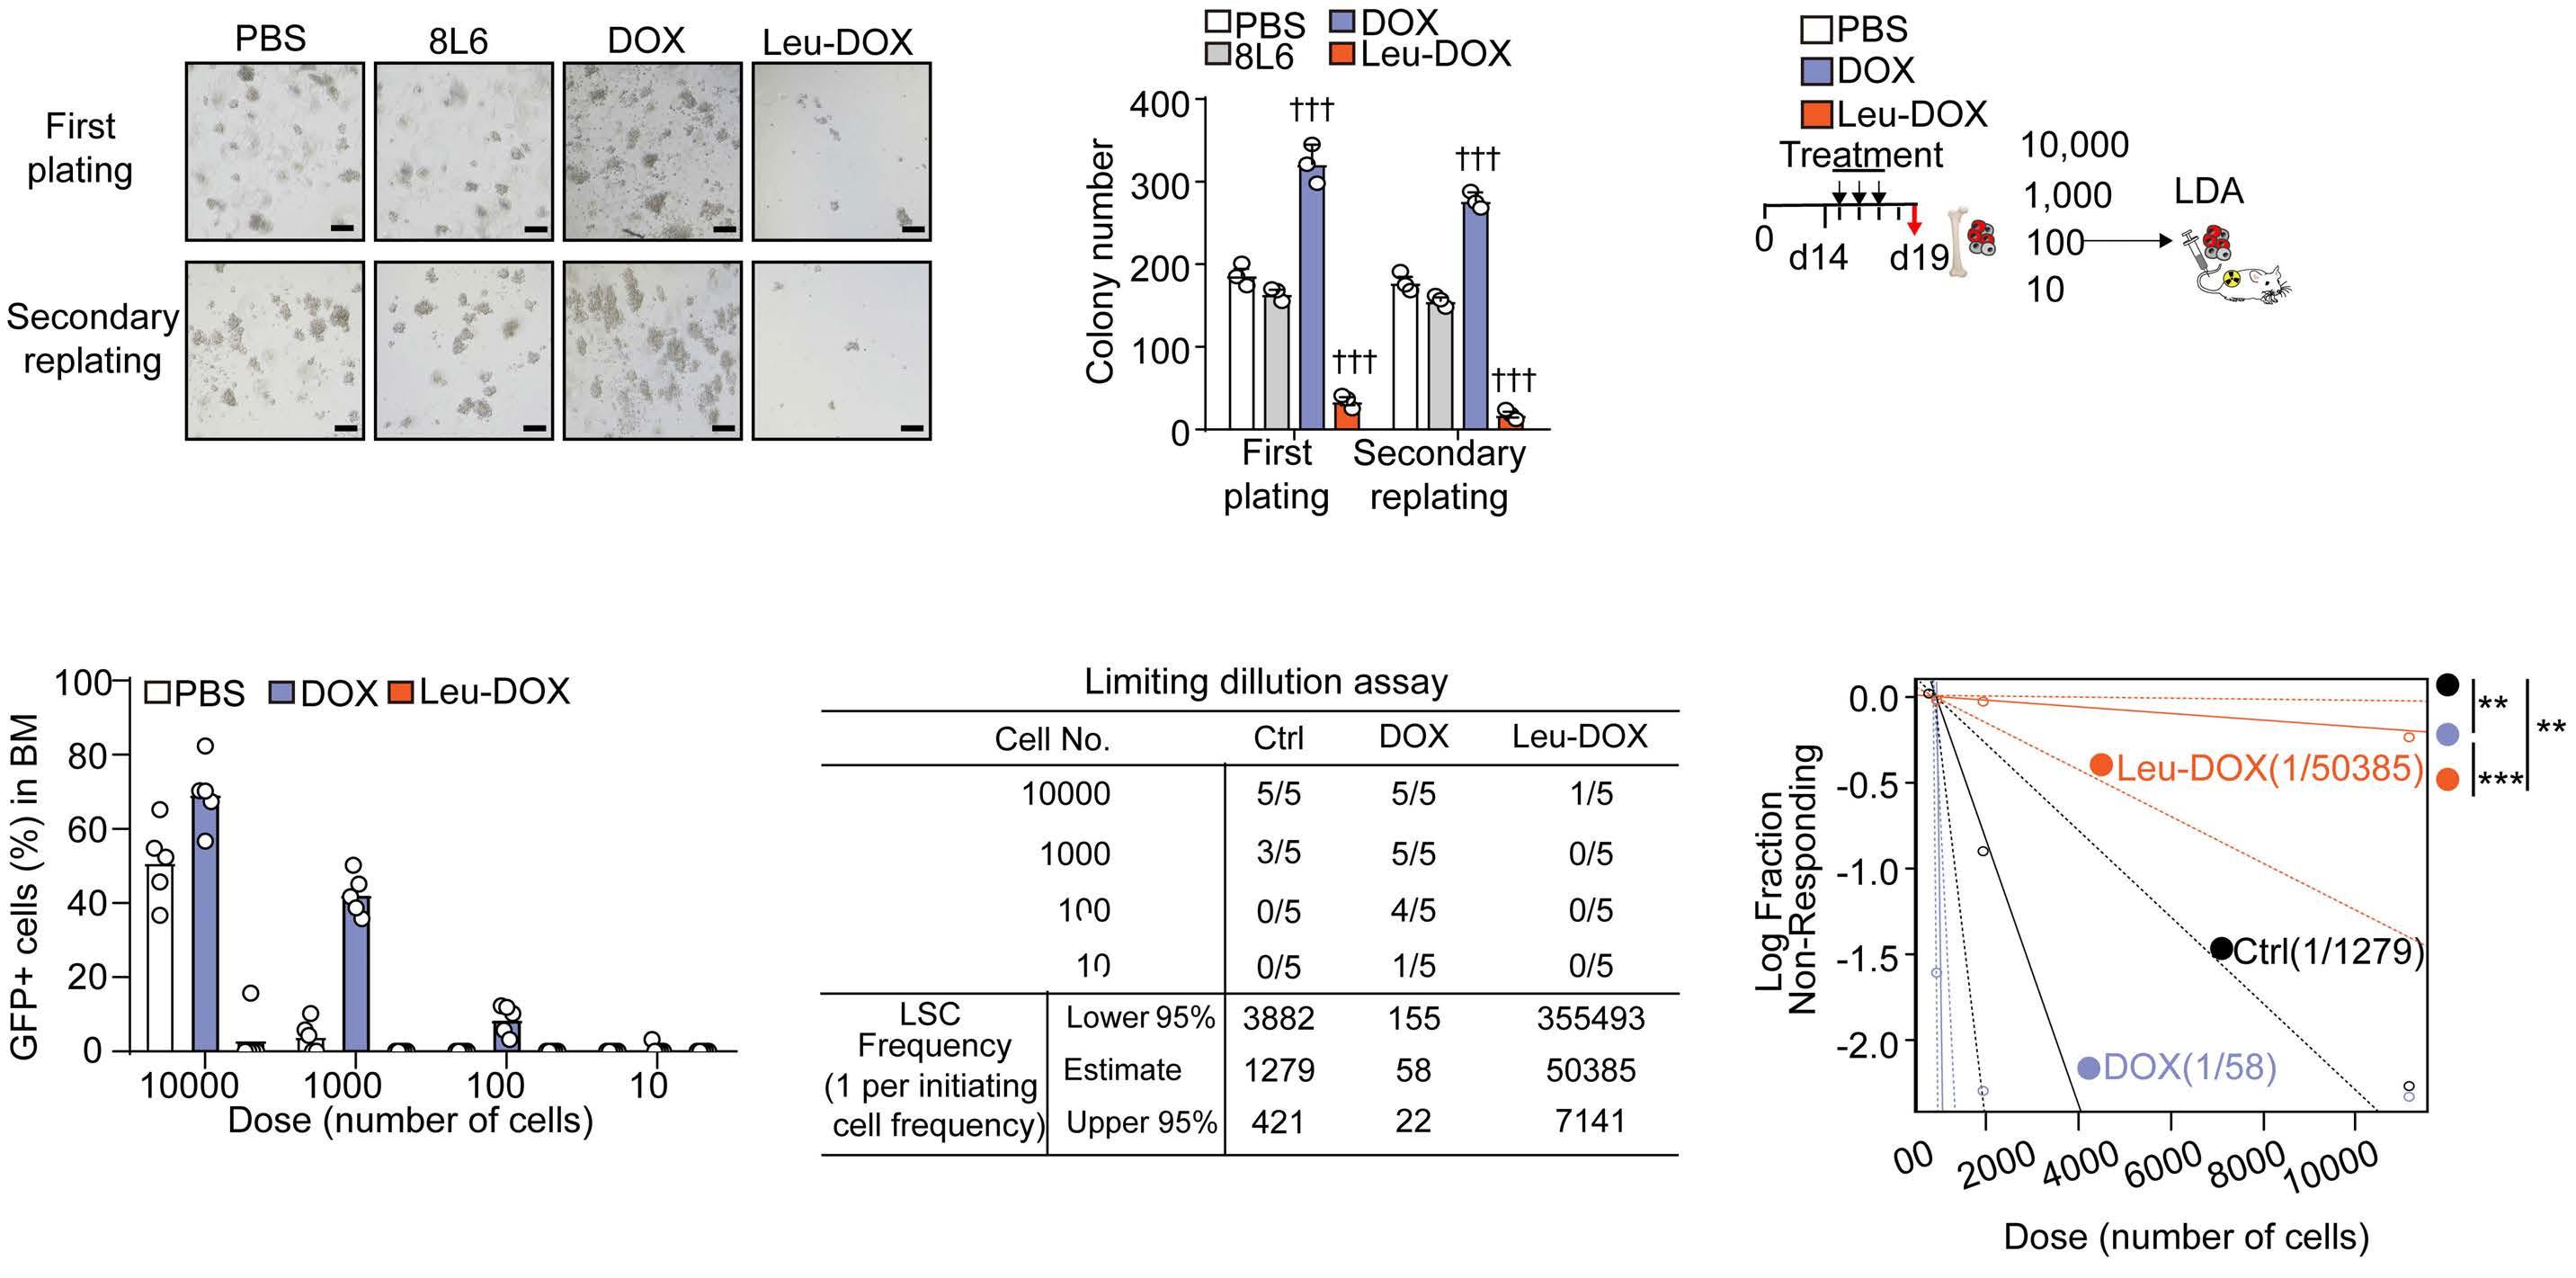
Discussion
Disclosures
A B C D E F Haematologica | 107 October 2022 2353 ARTICLE - Eliminate leukemic stem cells by inhibiting autophagy X. Xu et al.
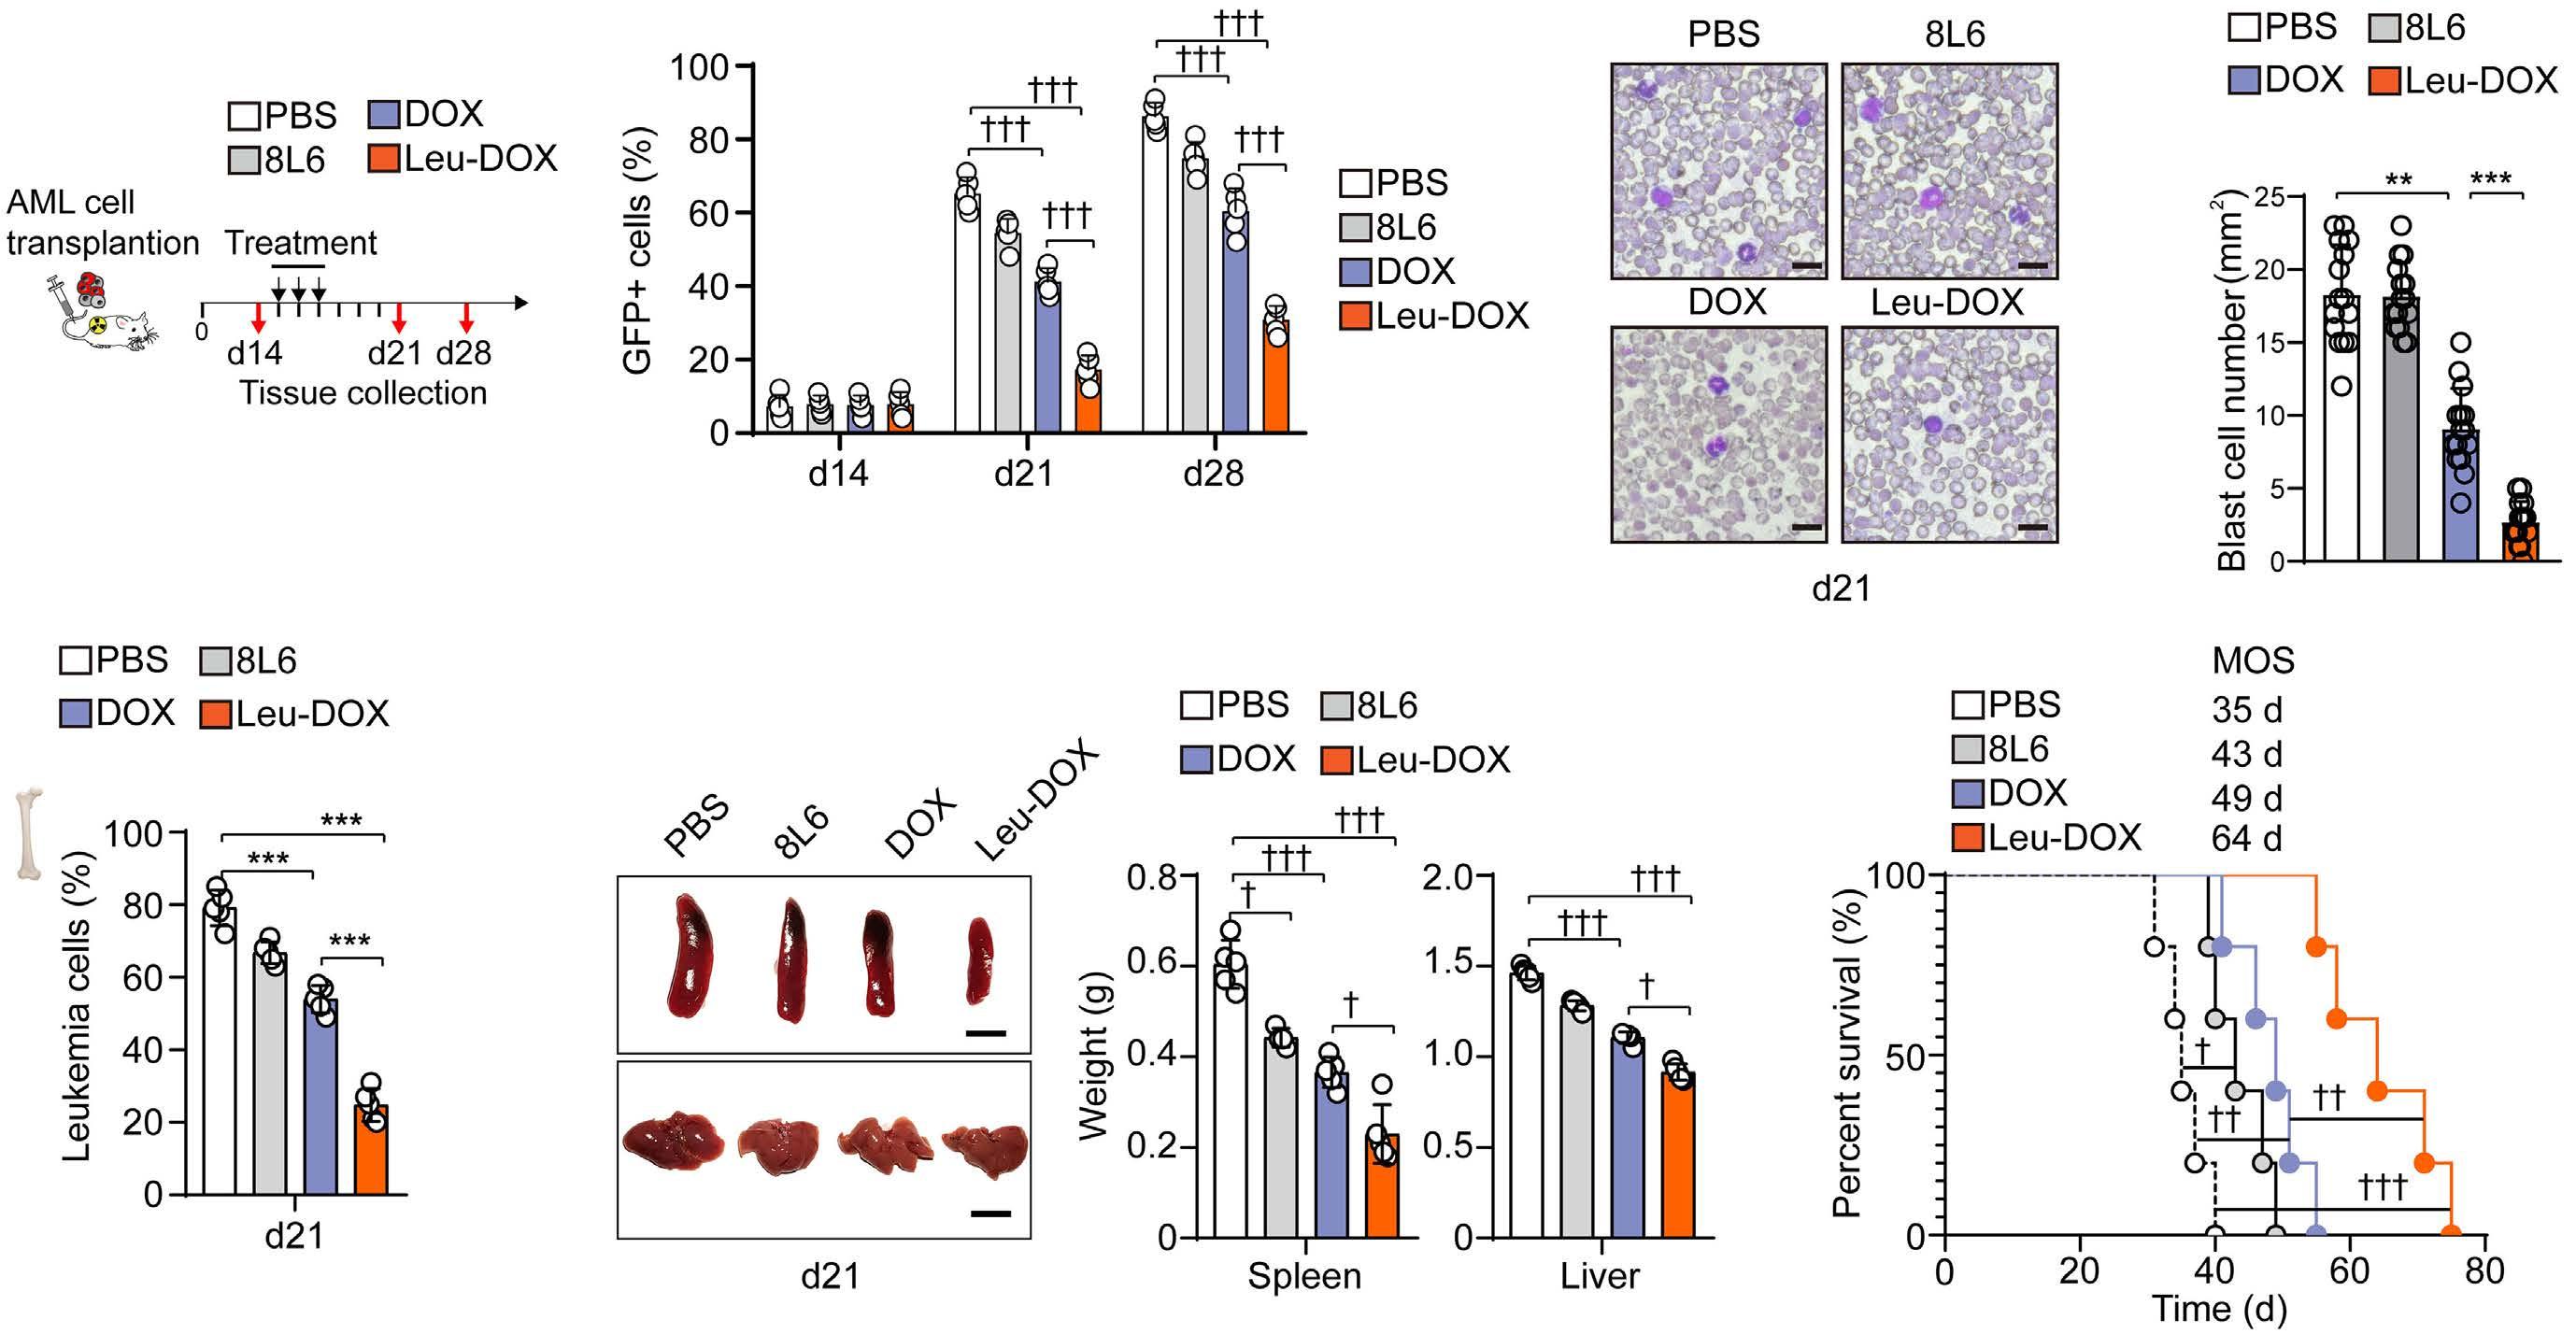
mTORC1 pathway to stimulate autophagy in LSC enriched cells of AML mice. Leucine activates mTOR complex 1 (mTORC1) by directly destroying the mTORC1 repressor, Sestrin2-GATOR2 complex, and producing the metabolite acetyl-coenzyme A (AcCoA), which indirectly activates mTORC1.56,57 Recent work shows that leucine directly acti vates SAR1B, a small GTPase, which undergoes a con formational change and dissociates from GATOR2, resulting in mTORC1 activation.40 In line with this, we found that our newly developed self-assembled leucine polymer, 8L6, inhibited autophagy by activating mTORC1 in leukemic cells. Furthermore, Leu-DOX had enhanced the chemo therapeutic efficacy in eliminating functional LSC in AML than DOX treatment. We also found that this amino acidbased delivery system can release drugs in a low pH en vironment. Therefore, the high intracellular acidity in leukemic cells caused by high aerobic glycolysis58 allowed Leu-DOX to specifically target leukemic cells and LSC in Overall,AML. the bifunctional Leu-DOX, which inhibits auto phagy and targets leukemic cells simultaneously, is a promising therapeutic approach for AML treatment.
No conflicts of interest to disclose.
Figure 8. Leucine polymer-loaded doxorubicin enhances the chemotherapy efficacy in acute myeloid leukemia mice. (A) Sche matic of acute myeloid leukemia (AML) mouse treatment. (B) The percentage of GFP+ leukemic cells in peripheral blood at the indicated time after treatment. (C) Representative peripheral blood smear (left) and quantification (right) of blast cells in the pe ripheral blood smear from AML mice at day 21 (d21) with indicated treatment (n=15 replicates from 5 mice). (D) The percentage of GFP+ leukemic cells in the bone marrow (BM) of AML mice at d21 with indicated treatment (n=5 mice). (E) Images (left) and weight of spleen and liver (right) of AML mice at d21 with indicated treatment (n=5 mice) (scale bar=1 cm). (F) The survival curve of AML mice with indicated treatments (n=5 mice). MOS: median overall survival.
Autophagy plays an essential role in normal hematopoietic stem cell maintenance.46,47 Depletion of autophagy-associ ated genes, such as Atg5 or Atg7, impairs the self-renewal and hematopoietic reconstruction of HSC by increasing the accumulation of dysfunctional mitochondria and reactive oxygen species.48 Furthermore, inhibition of autophagy re pressed leukemia progress when the disease enters the maintenance phase.49,50 However, the therapeutic approach targeting the enhanced autophagy in chemoresistant LSC to improve chemotherapy efficiency for AML treatment re mains unexplored. Here, we found that autophagy upregulation was associated with chemotherapy recurrence in AML patient specimens. More importantly, inhibition of autophagy by a self-assembled leucine polymer dramati cally enhanced the effect of DOX in eliminating LSC. mTORC1 can phosphorylate and inactivate the autophagy mediators, such as ULK1, ATG13, AMBRA1, and ATG14L,51 to suppress the autophagy initiation, autophagosome nucle ation, and autophagy elongation.52,53 Furthermore, mTORC1 promotes TFEB (transcription factor EB) nuclear entry to repress autophagy-associated genes.54 It is known that DOX treatment can induce autophagy in cancer cells.55 Consistently, we found that DOX treatment inactivated the
22. Palmeira dos Santos C, Pereira GJ, Barbosa CM, et al. Comparative study of autophagy inhibition by 3MA and CQ on Cytarabine induced death of leukaemia cells. J Cancer Res Clin Oncol. 2014;140(6):909-920.
8. Mäkelä E, Pavic K, Varila T, et al. Discovery of a novel CIP2A variant (NOCIVA) with clinical relevance in predicting TKI resistance in myeloid leukemias. Clin Cancer Res. 2021;27(10):2848-2860.
7. Zhitnyak IY, Bychkov IN, Sukhorukova IV, et al. Effect of BN nanoparticles loaded with doxorubicin on tumor cells with multiple drug resistance. ACS Appl Mater Interfaces. 2017;9(38):32498-32508.
Funding
We would like to thank the National Key Research and De velopment Program of China (grant numbers: 2018YFA0107200, 2017YFA0103403), the Key Research and Development Program of Guangdong Province (grant
Contributions XX, Jian W, TT designed and performed most experiments and analyzed the data; WZ, WM, SW, and DZ contributed to animal experiments and patient sample assays; Jian W contributed to bioinformatics analysis; TT and Jun W con tributed to nanocarriers; XX, MZ, and LJ wrote the paper; MZ, Jun W and LJ supervised the project.
6. Yang L, Li M, Wang F, et al. Ceritinib enhances the efficacy of substrate chemotherapeutic agent in human ABCB1overexpressing leukemia cells in vitro, in vivo and ex-vivo. Cell Physiol Biochem. 2018;46(6):2487-2499.
12. Pullarkat VA, Newman EM. BCL2 inhibition by venetoclax: targeting the Achilles' heel of the acute myeloid leukemia stem cell? Cancer Discov. 2016;6(10):1082-1083.
16. Mizushima N, Komatsu M. Autophagy: renovation of cells and tissues. Cell. 2011;147(4):728-741.
28. Siddik MAB, Shin AC. Recent progress on branched-chain amino acids in obesity, diabetes, and beyond. Endocrinol Metab (Seoul). 2019;34(3):234-246.
1. Klco JM, Mullighan CG. Advances in germline predisposition to acute leukaemias and myeloid neoplasms. Nat Rev Cancer. 2021;21(2):122-137.
3. Forte D, García-Fernández M, Sánchez-Aguilera A, et al. Bone marrow mesenchymal stem cells support acute myeloid leukemia bioenergetics and enhance antioxidant defense and escape from chemotherapy. Cell Metab. 2020;32(5):829-843.
9. Giacopelli B, Wang M, Cleary A, et al. DNA methylation epitypes highlight underlying developmental and disease pathways in acute myeloid leukemia. Genome Res. 2021;31(5):747-761.
29. Pankiv S, Clausen TH, Lamark T, et al. p62/SQSTM1 binds directly to Atg8/LC3 to facilitate degradation of ubiquitinated
13. Crews LA, Balaian L, Delos Santos NP, et al. RNA splicing modulation selectively impairs leukemia stem cell maintenance in secondary human AML. Cell Stem Cell. 2016;19(5):599-612.
19. Yu T, Guo F, Yu Y, et al. Fusobacterium nucleatum promotes chemoresistance to colorectal cancer by modulating autophagy. Cell. 2017;170(3):548-563.
number: 2019B020234002), NSFC ( grant numbers: 82170112, 52173150, 81900101, 81970139), Guangdong Introducing Inno vative and Entrepreneurial Research Teams (grant number: 2019ZT08Y485), Guangdong Natural Science Funds for Dis tinguished Young Scholar (grant number: 2021B1515020012), Sanming Project of Medicine in Shenzhen (grant number: SZSM201911004), and Advanced Medical Technology Center, The First Affiliated Hospital, Zhongshan School of Medicine, Sun Yat-sen University for generous support.
10. Begna KH, Ali W, Naseema G, et al. Mayo Clinic experience with 1123 adults with acute myeloid leukemia. Blood Cancer J. 2021;11(3):46.
26. Jewell JL, Russell RC, Guan KL. Amino acid signalling upstream of mTOR. Nat Rev Mol Cell Biol. 2013;14(3):133-139.
Haematologica | 107 October 2022 2354 ARTICLE - Eliminate leukemic stem cells by inhibiting autophagy X. Xu et al.
21. Sumitomo Y, Koya J, Nakazaki K, et al. Cytoprotective autophagy maintains leukemia-initiating cells in murine myeloid leukemia. Blood. 2016;128(12):1614-1624.
References
4. Mercher T, Schwaller J. Corrigendum: pediatric acute myeloid leukemia (AML): from genes to models toward targeted therapeutic intervention. Front Pediatr. 2019;7:466.
11. Park SM, Cho H, Thornton AM, et al. IKZF2 drives leukemia stem cell self-renewal and inhibits myeloid differentiation. Cell Stem Cell. 2019;24(1):153-165.
2. Short NJ, Konopleva M, Kadia TM, et al. Advances in the treatment of acute myeloid leukemia: new drugs and new challenges. Cancer Discov. 2020;10(4):506-525.
14. Zipeto MA, Court AC, Sadarangani A, et al. ADAR1 activation drives leukemia stem cell self-renewal by impairing Let-7 biogenesis. Cell Stem Cell. 2016;19(2):177-191.
20. Chen Y, Wu J, Liang G, et al. CHK2-FOXK axis promotes transcriptional control of autophagy programs. Sci Adv. 2020;6(1):eaax5819.
18. Xia H, Green DR, Zou W. Autophagy in tumour immunity and therapy. Nat Rev Cancer. 2021;21(5):281-297.
15. Horigome Y, Ida-Yonemochi H, Waguri S, et al. Loss of autophagy in chondrocytes causes severe growth retardation. Autophagy. 2020;16(3):501-511.
Data that support the findings of this study are available from the corresponding author upon reasonable request.
5. Perloff M, Lesnick GJ, Korzun A, et al. Combination chemotherapy with mastectomy or radiotherapy for stage III breast carcinoma: a Cancer and Leukemia Group B study. J Clin Oncol. 1988;6(2):261-269.
23. Dossou AS, Basu A. The emerging Roles of mTORC1 in macromanaging autophagy. Cancers (Basel). 2019;11(10):1422.
Data-sharing statement
27. Bonvini A, Coqueiro AY, Tirapegui J, et al. Immunomodulatory role of branched-chain amino acids. Nutr Rev. 2018;76(11):840-856.
24. Yu L, McPhee CK, Zheng L, et al. Termination of autophagy and reformation of lysosomes regulated by mTOR. Nature. 2010;465(7300):942-946.
17. Mortimore GE, Schworer CM. Induction of autophagy by aminoacid deprivation in perfused rat liver. Nature. 1977;270(5633):174-176.
25. Mitchener JS, Shelburne JD, Bradford WD, et al. Cellular autophagocytosis induced by deprivation of serum and amino acids in HeLa cells. Am J Pathol. 1976;83(3):485-492.
35. Casares S, Stan AC, Bona CA, et al. Antigen-specific downregulation of T cells by doxorubicin delivered through a recombinant MHC II-peptide chimera. Nat Biotechnol. 2001;19(2):142-147.
38. Zhang S, Liu X, Bawa-Khalfe T, et al. Identification of the molecular basis of doxorubicin-induced cardiotoxicity. Nat Med. 2012;18(11):1639-1642.
37. Kauffman MK, Kauffman ME, Zhu H, et al. Fluorescence-Based Assays for Measuring Doxorubicin in Biological Systems. React Oxyg Species (Apex). 2016;2(6):432-439.
58. Hao X, Gu H, Chen C, et al. Metabolic imaging reveals a unique preference of symmetric cell division and homing of leukemiainitiating cells in an endosteal niche. Cell Metab. 2019;29(4):950-965.
Haematologica | 107 October 2022 2355 ARTICLE - Eliminate leukemic stem cells by inhibiting autophagy X. Xu et al.
55. Cai Q, Wang S, Jin L, et al. Long non-coding RNA GBCDRlnc1 induces chemoresistance of gallbladder cancer cells by activating autophagy. Mol Cancer. 2019;18(1):82.
53. Settembre C, Fraldi A, Medina DL, et al. Signals from the lysosome: a control centre for cellular clearance and energy metabolism. Nat Rev Mol Cell Biol. 2013;14(5):283-296.
44. Oleaga C, Bernabini C, Smith AS, et al. Multi-organ toxicity demonstration in a functional human in vitro system composed of four organs. Sci Rep. 2016;6:20030.
30. Krivtsov AV, Twomey D, Feng Z, et al. Transformation from committed progenitor to leukaemia stem cell initiated by MLLAF9. Nature. 2006;442(7104):818-822.
57. Nicklin P, Bergman P, Zhang B, et al. Bidirectional transport of amino acids regulates mTOR and autophagy. Cell. 2009;136(3):521-534.
39. Makadia HK, Siegel SJ. Poly Lactic-co-Glycolic Acid (PLGA) as Biodegradable Controlled Drug Delivery Carrier. Polymers (Basel). 2011;3(3):1377-1397.
33. Tsien C, Davuluri G, Singh D, et al. Metabolic and molecular responses to leucine-enriched branched chain amino acid supplementation in the skeletal muscle of alcoholic cirrhosis. Hepatology. 2015;61(6):2018-2029.
41. Salik B, Yi H, Hassan N, et al. Targeting RSPO3-LGR4 signaling for leukemia stem cell eradication in acute myeloid leukemia. Cancer Cell. 2020;38(2):263-278.
45. Pugazhendhi A, Edison T, Velmurugan BK, et al. Toxicity of Doxorubicin (Dox) to different experimental organ systems. Life Sci. 2018;200:26-30.
42. Ueda K, Kumari R, Schwenger E, et al. MDMX acts as a pervasive preleukemic-to-acute myeloid leukemia transition mechanism. Cancer Cell. 2021;39(4):529-547.
54. Settembre C, Zoncu R, Medina DL, et al. A lysosome-to-nucleus signalling mechanism senses and regulates the lysosome via mTOR and TFEB. Embo j. 2012;31(5):1095-1108.
56. Son SM, Park SJ, Lee H, et al. Leucine signals to mTORC1 via its metabolite acetyl-coenzyme A. Cell Metab. 2019;29(1):192-201.
40. Chen J, Ou Y, Luo R, et al. SAR1B senses leucine levels to regulate mTORC1 signalling. Nature. 2021;596(7871):281-284.
Int. 2012;19(3):241-244.
43. Shivakumar P, Rani MU, Reddy AG, et al. A study on the toxic effects of Doxorubicin on the histology of certain organs. Toxicol
48. Lee IH, Kawai Y, Fergusson MM, et al. Atg7 modulates p53 activity to regulate cell cycle and survival during metabolic stress. Science. 2012;336(6078):225-228.
36. Suzuki H, Forrest AR, van Nimwegen E, et al. The transcriptional network that controls growth arrest and differentiation in a human myeloid leukemia cell line. Nat Genet. 2009;41(5):553-562.
49. Karvela M, Baquero P, Kuntz EM, et al. ATG7 regulates energy metabolism, differentiation and survival of Philadelphiachromosome-positive cells. Autophagy. 2016;12(6):936-948.
46. Ho TT, Warr MR, Adelman ER, et al. Autophagy maintains the metabolism and function of young and old stem cells. Nature. 2017;543(7644):205-210.
34. Eskandari S, Guerin T, Toth I, et al. Recent advances in selfassembled peptides: Implications for targeted drug delivery and vaccine engineering. Adv Drug Deliv Rev. 2017;110-111:169-187.
47. Zhang J, Randall MS, Loyd MR, et al. Mitochondrial clearance is regulated by Atg7-dependent and -independent mechanisms during reticulocyte maturation. Blood. 2009;114(1):157-164.
50. Smith AG, Macleod KF. Autophagy, cancer stem cells and drug resistance. J Pathol. 2019;247(5):708-718.
31. Somervaille TC, Cleary ML. Identification and characterization of leukemia stem cells in murine MLL-AF9 acute myeloid leukemia. Cancer Cell. 2006;10(4):257-268.
protein aggregates by autophagy. J Biol Chem. 2007;282(33):24131-24145.
52. Kim J, Kundu M, Viollet B, et al. AMPK and mTOR regulate autophagy through direct phosphorylation of Ulk1. Nat Cell Biol. 2011;13(2):132-141.
51. Kamada Y, Funakoshi T, Shintani T, et al. Tor-mediated induction of autophagy via an Apg1 protein kinase complex. J Cell Biol. 2000;150(6):1507-1513.
32. Yan X, Sun Q, Ji J, et al. Reconstitution of leucine-mediated autophagy via the mTORC1-Barkor pathway in vitro. Autophagy. 2012;8(2):213-221.
Nilotinib is a tyrosine-kinase inhibitor (TKI) that was in
Gabriele Gugliotta,1 Fausto Castagnetti,1 Massimo Breccia,2 Luciano Levato,3 Tamara Intermesoli,4 Mariella D’Adda,5 Marzia Salvucci,6 Fabio Stagno,7 Giovanna Rege-Cambrin,8 Mario Tiribelli,9 Bruno Martino,10 Monica Bocchia,11 Michele Cedrone,12 Elena Trabacchi,13 Francesco Cavazzini,14 Ferdinando Porretto,15 Federica Sorà, 16 Maria Pina Simula,17 Francesco Albano,18 Simona Soverini,1 Robin Foà, 2 Fabrizio Pane,19 Michele Cavo,1 Giuseppe Saglio,20 Michele Baccarani21 and Gianantonio Rosti22 on behalf of the GIMEMA CML Working Party
1Istituto di Ematologia Seragnoli, IRCCS Azienda Ospedaliero-Universitaria di Bologna, Bologna; 2Hematology, Department of Translational and Precision Medicine, Policlinico Umberto I, Sapienza University, Rome; 3Unità di Ematologia, Azienda Ospedaliera Pugliese-Ciaccio, Catanzaro; 4Unità di Ematologia, ASST Papa Giovanni XXIII, Bergamo; 5Unità di Ematologia, ASST Spedali Civili Brescia, Brescia; 6Unità di Ematologia, Ospedale S. Maria delle Croci, Ravenna; 7Hematology Section and BMT Unit, Rodolico Hospital, AOU Policlinico Rodolico - San Marco, Catania; 8Unità di Medicina Interna, Ospedale San Luigi Gonzaga, Università di Torino, Orbassano; 9Clinica Ematologica, Dipartimento di Area Medica, Azienda Sanitaria Universitaria Friuli Centrale, Udine; 10Unità di Ematologia, Grande Ospedale Metropolitano-G.O.M. BianchiMelacrino-Morelli, Reggio Calabria; 11Hematology Unit, Azienda Ospedaliero-Universitaria Senese, Siena University, Siena; 12Unità di Ematologia, Ospedale San Giovanni Addolorata, Rome; 13Unità di Ematologia, Ospedale Guglielmo da Saliceto, Piacenza; 14Unità di Ematologia, Azienda Ospedaliera-Universitaria, Ferrara; 15Unità di Ematologia, Ospedale La Maddalena, Palermo; 16Unità di Ematologia, Fondazione Policlinico Universitario A Gemelli IRCSS, Università Cattolica, Roma; 17Ematologia e Centro Trapianti Midollo Osseo, Ospedale Oncologico Businco, Cagliari; 18Hematology and Stem Cell Transplantation Unit, Department of Emergency and Organ Transplantation (D.E.T.O.), Aldo Moro University, Bari; 19Unità di Ematologia, Università Federico II, Naples; 20Divisione Universitaria di Ematologia e Terapie Cellulari, A.O. Ordine Mauriziano, Turin; 21Istituto di Ematologia Seragnoli, Università di Bologna, Bologna and 22IRCSS - Istituto Scientifico Romagnolo per lo Studio e la Cura dei Tumori (IRST), Meldola (FC), Italy.
https://doi.org/10.3324/haematol.2021.280175
itially shown to be effective and well tolerated at a dose of 400 mg twice daily in patients with chronic phase (CP) chronic myeloid leukemia (CML) resistant or intolerant to
Received: October 13, 2021.
Correspondence: G. gabriele.gugliotta@unibo.itGugliotta
Published under a CC BY-NC license
Accepted: March 25, 2022.
Treatment-free remission in chronic myeloid leukemia patients treated front-line with nilotinib: 10-year followup of the GIMEMA CML 0307 study
Abstract
Introduction
Prepublished: April 7, 2022.
©2022 Ferrata Storti Foundation
We report the final analysis, with a 10-year follow-up, of the phase II study GIMEMA CML 0307 (NCT 00481052), which enrolled 73 adult patients (median age 51 years; range, 18-83) with newly diagnosed chronic-phase chronic myeloid leukemia to in vestigate the efficacy and the toxicity of front-line treatment with nilotinib. The initial dose was 400 mg twice daily; the dose was reduced to 300 mg twice daily as soon as this dose was approved and registered. The 10-year overall survival and pro gression-free survival were 94.5%. At the last contact, 36 (49.3%) patients were continuing nilotinib (22 patients at 300 mg twice daily, 14 at lower doses), 18 (24.7%) patients were in treatment-free remission, 14 (19.2%) were receiving other tyrosine kinase inhibitors and four (5.5%) patients have died. The rates of major and deep molecular responses by 10 years were 96% and 83%, respectively. The median times to major and deep molecular response were 6 and 18 months, respectively. After a median duration of nilotinib treatment of 88 months, 24 (32.9%) patients discontinued nilotinib while in stable deep molecular response. In these patients, the 2-year estimated treatment-free survival was 72.6%. The overall treatment-free remission rate, calculated on all enrolled patients, was 24.7% (18/73 patients). Seventeen patients (23.3%), at a median age of 69 years, had at least one arterial obstructive event. In conclusion, the use of nilotinib front-line in chronic phase chronic myeloid leukemia can induce a stable treatment-free remission in a relevant number of patients, although cardiovascular toxicity re mains of concern.
Haematologica | 107 October 2022 2356 ARTICLE - Chronic Myeloid Leukemia
Thetreatment.trialwas approved by Ethics Committees of all par ticipating Centers and it was registered in ClinicalTrials.gov (NCT00481052) and the EUDRACT (2007000597-22) database.
the GIMEMA protocol was amended and then approved by local ethics committees, so that all patients still receiving the dose of 400 mg twice daily had their dose reduced to 300 mg twice daily by September 2012. Moreover, the dur ation of the study was extended to 10 years. Detailed methods, and early and mid-term results have been reported previously.4,10 Here, we report the final analysis of this study, with a minimum follow-up of 10 years, focusing on the rate of TFR, molecular response, survival, causes of death, as well as on the type and the severity of adverse events, particularly of AOE.
imatinib.1,2 Therefore, this dose was selected to test niloti nib for the front-line treatment of CP CML in two, inde pendent pilot studies designed in 2007 by the GIMEMA CML Working Party (CML 0307 trial) and by the MD Ander son Cancer Center (MDACC).3,4 The dose of nilotinib in the GIMEMA trial was reduced to 300 mg twice daily after the approval of this dose for the front-line treatment of CP CML, according to the early results of the prospective, randomized ENESTnd trial,5 which compared imatinib with two initial doses of nilotinib (400 mg twice daily and 300 mg twice daily). This study showed that the rate and depth of molecular response were greater with both doses of nilotinib than with imatinib, but that nilotinib 300 mg twice daily was as effective as and less toxic than ni lotinib 400 mg twice daily. Reports updating the outcome of the patients enrolled in the ENESTnd trial confirmed, over a follow-up time extended up to 10 years, the greater efficacy of nilotinib over imatinib as a front-line treatment, with regard to the speed, rate and depth of molecular re sponse, and also the rate of progression to advanced phase. However, there was no advantage in overall sur vival, which was around 90% in all arms, and the fre quency of arterial obstructive events (AOE) was higher with both nilotinib doses than with imatinib.6-9
Haematologica | 107 October 2022 2357 ARTICLE - Treatment-free remission after nilotinib frontline G. Gugliotta et al.
Patients enrolled in the GIMEMA CML 0307 trial have now been followed for a minimum of 10 years, providing an academic, independent source of information on efficacy, tolerability and toxicity of nilotinib. Moreover, as TFR evolved as a safe option in selected patients, although it was not an original aim of this clinical trial, we provide here for the first-time detailed data on TFR.
Results
The GIMEMA CML Working Party initiated in 2007 a phase II study (NCT 00481052) with nilotinib front-line. Seventythree adult (≥18 years old) patients with newly diagnosed CP-CML were enrolled at 18 GIMEMA Centers in Italy be tween June 2007 and February 2008. The initial dose of nilotinib was 400 mg twice daily. Following the authoriza tion in Italy in November 2011 of nilotinib at the dose of 300 mg twice daily for the front-line treatment of CP-CML,
The median follow-up for this analysis was 123 months (range, 111-130). The cumulative probabilities of events and survival were estimated by the Kaplan-Meier method. Un less specifically reported, all the analyses are referred to the intention-to-treat population (73 patients). Disease risk at baseline was calculated according to the Sokal11 and EUTOS long-term survival (ELTS)12 scores. Molecular response was evaluated on peripheral blood every 3 months until a major molecular response (MMR) was achieved and confirmed, then at least every 6 months. MMR was assessed and expressed according to the Inter national Scale, as a BCR-ABL1 transcript level ≤0.1%, cor responding to a 3-log decrease from the International Scale standard, in samples with more than 10,000 ABL1 copies. A DMR (MR4) was defined as a BCR-ABL1 transcript level ≤0.01%, corresponding to a 4-log reduction, in samples with more than 10,000 ABL1 copies.13 The re sponse at milestones was defined according to the last version of the European LeukemiaNet (ELN) recommen dations14 and also according to the recent GIMEMA pro posals for a TFR-oriented strategy.15 Treatment discontinuation in stable DMR (defined as a MR4 or better lasting 2 years or more) aiming at TFR was not originally planned in the protocol, but it was attempted in some pa tients in agreement with the evolving clinical practice in recent years. For descriptive purposes, we applied the ELN requirements for treatment discontinuation.14 TFR was defined as a MMR (or better) without ongoing TKI
Methods
Patients’ characteristics
Considering the excellent overall survival obtained with TKI, the next main goals for CML patients became the avoidance of long-term adverse events and the achievement of treatment-free remission (TFR). Since a precon dition for TFR is a stable deep molecular response (DMR), it is expected that the use of second-generation TKI may increase the proportion of patients eligible for TFR com pared to imatinib;9 however, the higher risk of adverse events may at least partially weaken this advantage. Therefore, the benefit-risk profile should be carefully evaluated for each patient.
The median age of enrolled patients was 51 years (range, 18-83); 51% of patients were males. The Sokal risk score11 was low, intermediate or high in 33 (45.2%), 30 (41.1%) and ten (13.7%) patients, respectively; the ELTS risk score12 was low, intermediate or high in 47 (64.4%), 22 (30.1%) and four
At that time, 11 (15%) patients had already permanently discontinued nilotinib because of adverse events (9 pa tients), progression (1 patient) or TFR (1 patient). In addi tion, 22 (30.1%) patients had already permanently reduced their nilotinib dose because of intolerance/adverse events (20 patients to 400 mg once daily and two patients to 400 + 200 mg daily); the median time on nilotinib 400 mg twice daily for these patients was 8 months (range,1-54).
Males / females, N 37 / 36
Patients N=73
Haematologica | 107 October 2022 2358 ARTICLE - Treatment-free remission after nilotinib frontline G. Gugliotta et al.
Age in years, median (range) 51 (18-83)
aPatients with at least one cardiovascular risk factor. ELTS: EUTOS long-term risk score.
Risk score, N (%)
Considering the whole cohort of 73 patients, the median duration of nilotinib 400 mg twice daily prior to perma nent nilotinib dose reduction or discontinuation was 51 months (range, 1-60) (Figure 1).
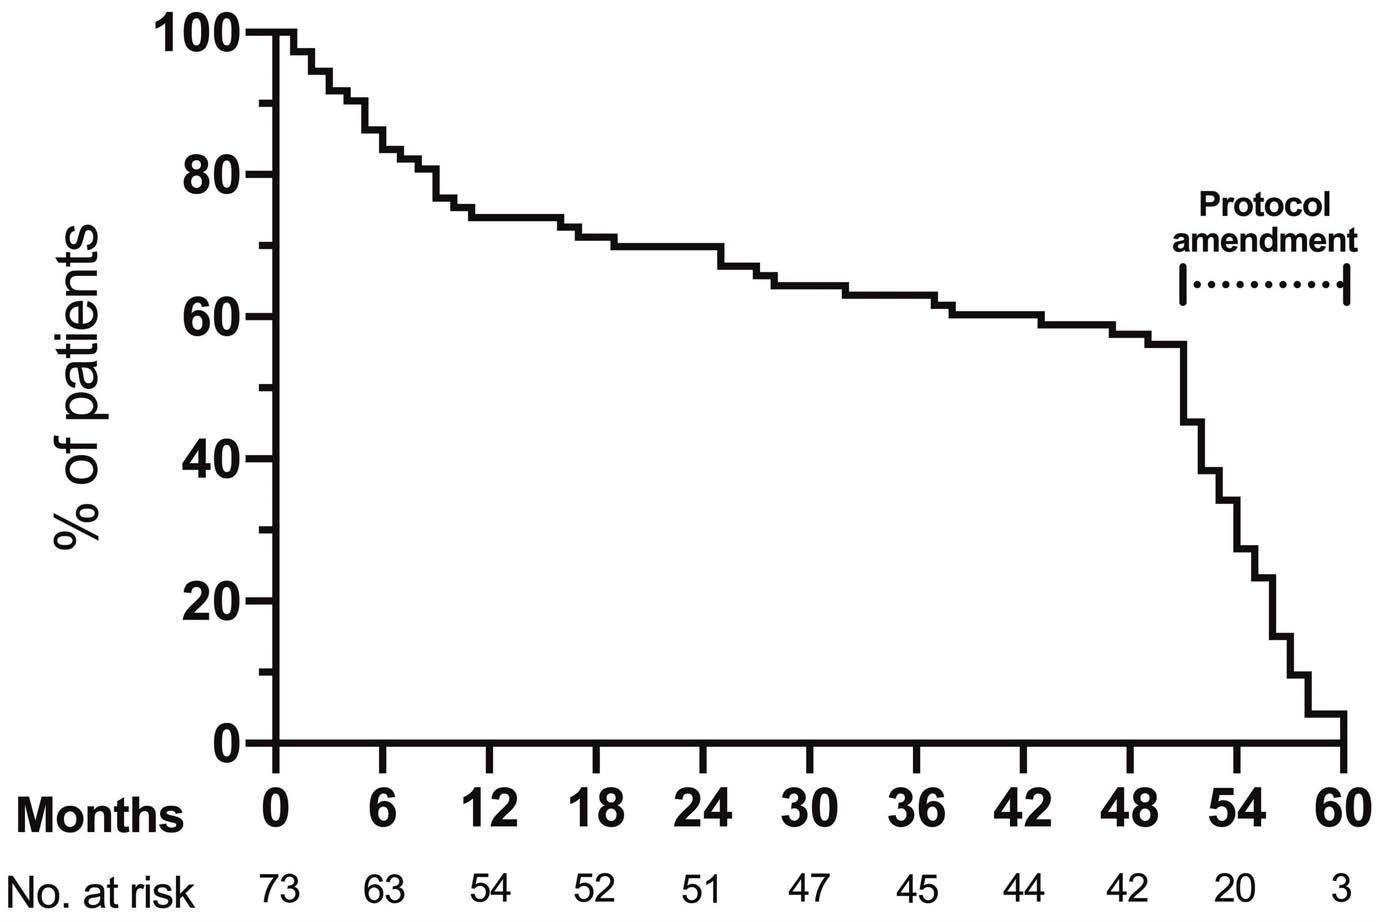
Cardiovascular risk factors, N (%)
HighIntermediateLow
PriorHypercholesterolemiamellituscardiovascularevent 35 (47.9)a 16 (21.9) 14 (19.2) 13 (17.8) 6 (8.2) 4 (5.5) 2 (2.7)
Survival
Overall, four patients have died (1 in blast phase, 3 in CP). The 10-year overall survival (Figure 2) and progression-free survival were 94.5% (95% confidence interval: 86-97.9). In detail: one patient died 9 months after beginning treat ment, at the age of 63, following a blast phase progression carrying a T315I mutation (before ponatinib became avail able); two patients, aged 75 and 78, died in a condition of progressive cerebral deterioration without any specific cardiovascular or cerebral event, after 32 months (still on nilotinib) and 121 months (57 months after nilotinib dis continuation and while on dasatinib) of follow-up, re
103033Sokal(45.2)(41.1)(13.7)
2247ELTS(64.4)(30.1)4(5.5)
(5.5%) patients, respectively. Thirty-five patients (47.9%) had at least one cardiovascular risk factor. The character istics of the patients are detailed in Table 1.
Table 1. Patients’ characteristics.
Patients’ disposition
All patients started nilotinib 400 mg twice daily in the years 2007 and 2008, but in 2012, according to a protocol amendment made after the approval of nilotinib for frontline treatment of CP CML in Italy, the nilotinib dose was reduced to 300 mg twice daily in all eligible patients.
Transcript type, N (%)
Follow-up, months; median (range) 123 (111-130)
Nilotinib dosing and discontinuation in the first 5 years
while still on nilotinib 400 twice daily, for administrative reasons.
e13a2/e14a2e13a2e14a2 32 (43.8) 29 (39.7) 12 (16.4)
Therefore, at the time of the protocol amendment, only 40 (54.7%) patients were still receiving nilotinib 400 mg twice daily and had a dose reduction to 300 mg twice daily; the median time on nilotinib 400 mg twice daily for these patients was 55 months (range, 49-60).
Diabetes
The patients’ disposition at the last contact is summar ized in Table 2 and Online Supplementary Figure S1. Twenty-two patients (30.1%) were continuing nilotinib at the standard dose of 300 mg twice daily, ten patients (13.7%) at 400 mg once daily and four patients (5.5%) at 300 mg once daily. Eighteen (24.7%) patients were in TFR after nilotinib discontinuation. Fourteen (19.2%) patients were receiving other TKI (imatinib, 7 [9.5%]; dasatinib, 4 [5.4%]; bosutinib, 3 [4.1%]). Four (5.4%) patients have died. One patient was withdrawn from the study at 5 years,
BodyHypertensionSmokingmassindex ≥30
Figure 1. Duration of treatment with nilotinib 400 mg twice daily in the first 5 years of the study. All patients started ni lotinib at the dose of 400 mg twice daily between 2007 and 2008. Following the authorization in Italy in November 2011 of nilotinib at the dose of 300 mg twice daily for the front-line treatment of chronic phase chronic myeloid leukemia, the GIMEMA protocol was amended, so that the dose in all patients still receiving the dose of 400 mg twice daily was reduced to 300 mg twice daily by September 2012. The median duration of nilotinib 400 mg was 51 months (interquartile range, 25-56).
Off-study for administrative reasons, N 1e
Figure 2. Ten-year overall survival. Treatment-free remission after nilotinib
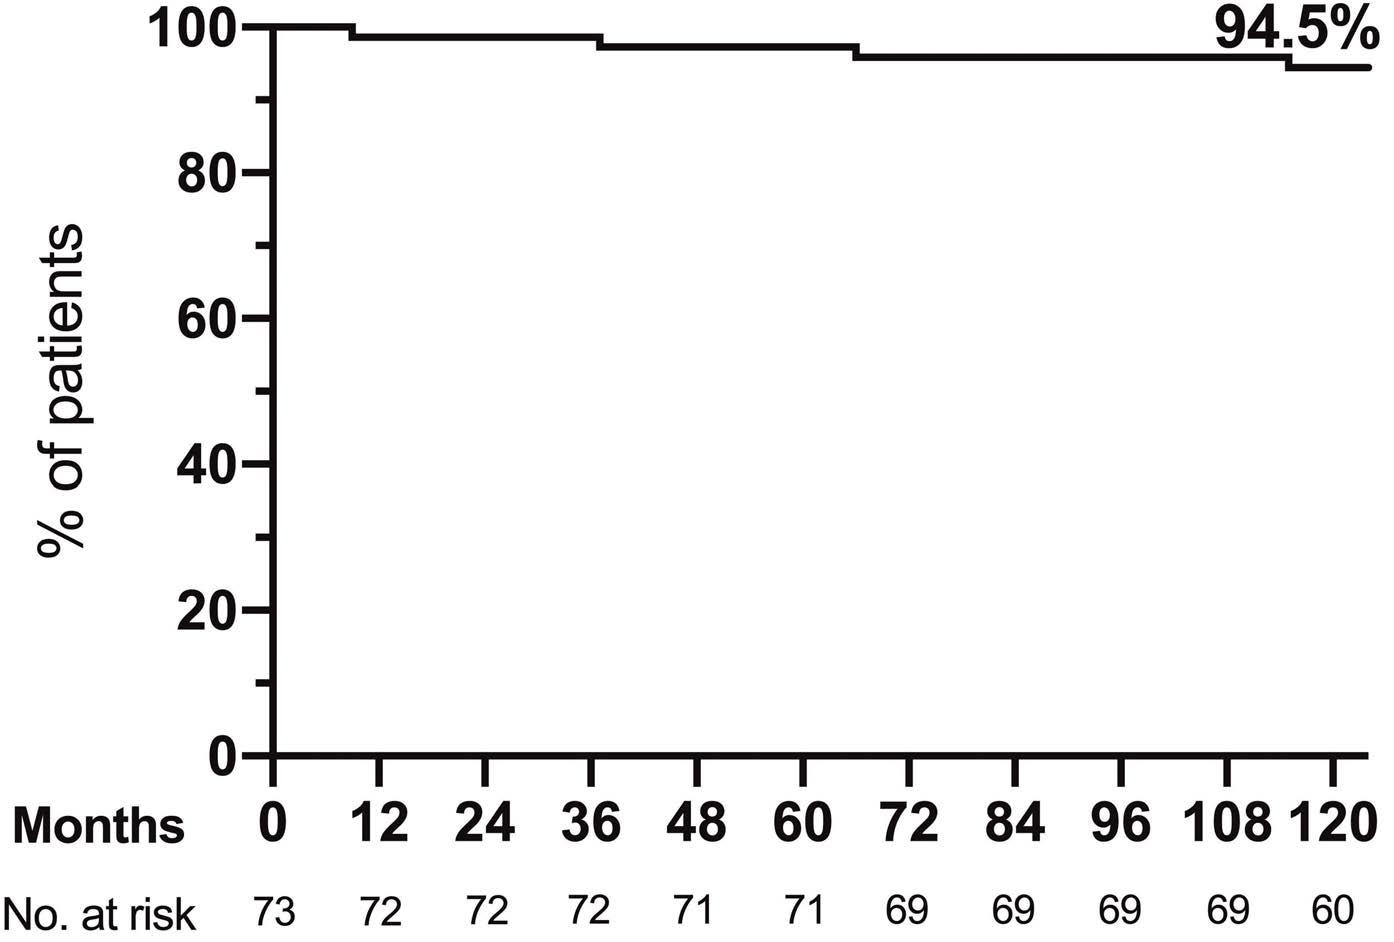
Haematologica | 107 October 2022 2359 ARTICLE -
spectively; one patient died 68 months after the start of nilotinib, at the age of 90, due to congestive heart failure, as a complication of a myocardial infarct that happened 4 months previously (while still on nilotinib).
Table 2. Patients’ disposition.
On nilotinib, N (%)
400 mg once daily
Dasatinib 2nd line Dasatinib 3rd line Bosutinib 2nd line Bosutinib 3rd line 14 (19.2) 6 (8.2)1b 2 (2.7) 2 (2.7)c1 2 (2.7)d
Deaths, N (%) 4 (5.5)
Imatinib 3rd line
300 mg twice daily
Patients N=73
Treatment-free remission
During the study 36 (49.3%) patients met the ELN minimal requirements for treatment discontinuation (nilotinib treat ment duration >4 years and MR4 or better lasting >2 years), but not all of these patients attempted TFR.
Overall, 24 (32.8%) patients (13 females, 11 males) discon tinued nilotinib while in stable DMR (Table 3). In 18 patients the decision to stop nilotinib was specifically made aiming at TFR; in the remaining six, the occurrence of an adverse event prompted discontinuation of nilotinib. The median age at treatment discontinuation was 62 years (range, 2980). The Sokal score was low, intermediate or high in 14, seven and three patients, respectively; the ELTS score was
Response
During the 10 years of the study, 29 (39.7%) patients have had a permanent reduction in the dose of nilotinib to 400 or 300 mg once daily: 17 patients held a stable DMR (11 subsequently attempted TFR); 11 maintained a stable MMR; and one patient lost the molecular response (with a BCR-ABL1 level >1%) and was switched to another TKI.
ation, 22 (30.1%) and 14 (19.2%) were in DMR and MMR, re Treatmentspectively. failure leading to permanent nilotinib discon tinuation occurred in three (4.1%) patients. In one patient (high Sokal risk; intermediate ELTS risk) it occurred early, following a blast phase progression carrying a T315I mu tation at 6 months. In the other two patients (both low Sokal and ELTS risk) it was a very late event: these pa tients had a confirmed loss of molecular response, with a BCR-ABL1 transcript level >1% at 101 and 110 months after the start of treatment, without detectable kinase domain mutations; one patient was on nilotinib 300 mg twice daily, the other on 300 mg once daily.
300 mg once daily 36 (49.3)a 22 (30.1) 10 (13.7) 4 (5.5)
aFifteen out of 36 patients had the European LeukemiaNet minimal requirements for treatment discontinuation but never attempted TFR. bAfter dasatinib. cAfter imatinib. dOne patient after imatinib and one after dasatinib. eStudy extension not approved by local Ethics Com mittee; at the end-of-study visit (2012) the patient was continuing nilotinib. TFR: treatment-free remission; CP: chronic phase.
Treatment discontinuation in stable DMR, aiming at TFR, was not planned in the protocol. Therefore, the decision for treatment discontinuation and its management re flected the evolving clinical practice in the participating Ita lian centers over the last decade.
frontline G. Gugliotta et al.
In TFR after nilotinib front-line, N (%) 18 (24.7)
The cumulative rates of MMR and MR4 by 10 years were 96% and 83%, respectively. The median time to MMR and MR4 were 6 and 18 months, respectively.10 At 3 months, 66 (90.4%) patients had a BCR-ABL1 transcript level <10% (Online Supplementary Table S1); at 6 months 61 (83.5%) patients had a BCR-ABL1 <1%; at 12 months 55 (75.3%) pa tients had a BCR-ABL1 ≤0.1%; and at 24 months 33 (45.2%) patients had a BCR-ABL ≤0.01%. Response at milestones according to the ELN and GIMEMA recommendations are reported in Online Supplementary Table S2. Overall, of the 36 (49.3%) patients continuing nilotinib at the last evalu
Alive in CP, on treatment with other TKI, N (%)
Imatinib 2nd line
The management of AOE included angioplasty with stent insertion in 5/17 patients, amputation of a lower limb in three, vascular surgery in three, and medical treatment alone in six. Nine of 15 (60%) patients still on nilotinib per manently discontinued nilotinib due to the occurrence of the AOE; the remaining six patients continued nilotinib at a lower dose, but two of them experienced additional RegardingAOE.
ELN 2020 requirements for treatment D/C, N minimal(%)(stop allowed)d optimal (stop recommended for consideration)e
Haematologica | 107 October 2022 2360 ARTICLE - Treatment-free remission after nilotinib frontline G. Gugliotta et al.
aIn 18 patients the decision to stop nilotinib was specifically made aiming at treatment-free remission (TFR); in the remaining six, the occurrence of an adverse event prompted nilotinib discontinuation. bPercent of patients in the same Sokal or ELTS risk group. cPercent of patients in the same transcript type group. dNilotinib duration >4 years and duration of deep molecular response (MR4) or better >2 years. eNilotinib duration >5 years and duration of MR4 or better >3 years. fDetails of the three patients without the European Leukemia Net (ELN) minimal criteria for stopping treatment: one patient (male, age 70 years, ELTS low, transcript type e14a2) stopped nilotinib after 25 months because of an adverse event; while being in stable MR4 for 18 months; the patient maintained the TFR. Another patient (male, 76 years, ELTS intermediate, transcript type e13a2) stopped nilotinib after 38 months because of an adverse event, while being in stable MR4 for 24 months; he soon lost MMR (at 3 months). The third patient (female, 66 years, ELTS intermediate, transcript type e14a2) stopped nilotinib after 43 months because of an adverse event, while being in stable MR4 for only 7 months; despite this she maintained the TFR. gDetails of the additional patient without the ELN optimal criteria for stopping treatment: the patient (female, 70 years, ELTS low, tran script type e13a2) stopped nilotinib aiming at TFR after 51 months, with a stable MR4 lasting 48 months; she maintained the TFR. hIn 15 patients the decision to stop nilotinib was specifically made aiming at the TFR; three patients discontinued nilotinib following an adverse event. CP: chronic phase; TKI: tyrosine kinase inhibitor; TFR: treat ment-free remission; ELTS: EUTOS long-term risk score; D/C: discon tinuation; ELN: European LeukemiaNet; MMR: major molecular response.
Patients with confirmed loss of MMR in TFR, N (%) 6/24 (25%)
Table 3. Characteristics of patients attempting treatment-free remission.
The median age at the time of the first AOE was 69 years (range, 49-88), after a median duration of nilotinib treat ment of 64 months (range, 24-113). The dose of nilotinib at the time of the AOE was 400 mg twice daily in 6/17 pa tients (4 PAD; 2 coronary syndrome), 300 mg twice daily in five (2 PAD; 2 carotid stenosis; 1 ischemic stroke), and 400 mg once daily in four patients (2 with coronary syn drome; 1 PAD; 1 transient ischemic attack); moreover, two patients were already in TFR (1 coronary syndrome; 1 ca rotid stenosis).
9/32 13/29(28.1)(44.8)2/12(16.7)
14/33Sokal(42.4)7/30(23.3)3/10(30) 7/2216/47ELTS(34)(31.8)1/4(25)
Interval from achievement of MR4 to treatment D/C, months; median (range) 74 (7n110)
Duration of nilotinib treatment prior to D/C, months; median (range) 88 (25-118)
Patients in TFR at last evaluation in patients attempting TFR, N (%) in the whole cohort, N (%)
Males / females, N 11 / 13
18/24 (75)h 18/73 (24.7)h
Overall, 17 (23.3%) patients developed AOE: 15 had a single AOE while two had multiple AOE during the follow-up (Fig ure 4, Table 4, Online Supplementary Table S4). In detail, the first-occurring AOE was peripheral arterial disease (PAD) in seven (9.5%) patients, a coronary syndrome in five (6.8%; 4 acute and 1 chronic), carotid stenosis in three (4.1%), ischemic stroke in one and a transient ischemic at tack in one. These events were symptomatic in 13/17 (76.5%) patients, while in four patients the AOE (3 carotid stenosis, 1 PAD) were diagnosed only after routine screen ing examinations, while still asymptomatic.
Arterial obstructive events
low, intermediate or high in 16, seven and one patient, re spectively. In these patients, the median duration of niloti nib treatment prior to discontinuation was 88 months (range, 25-117); the median interval from first detection of MR4 to treatment discontinuation was 74 months (range, 7-110) and the median follow-up after treatment discon tinuation was 34 months (range, 7-98). The time from start ing nilotinib to the TFR attempt is reported in Figure 3A. Of the 24 patients who discontinued nilotinib, 18 (75%) maintained a stable TFR up to the last evaluation (17 pa tients in stable DMR and 1 patient in stable MMR). Six (25%) patients had a confirmed loss of MMR (after 3, 3, 6, 7, 13 and 23 months) and restarted therapy (nilotinib 4 patients, imatinib 1, dasatinib 1); they all regained the MMR (4 of them obtained a DMR again). The estimated treatment-free sur vival at 24 months was 72.6% (95% confidence interval: 48.3-86.9%) (Figure 3B). Considering the whole cohort of enrolled patients, the rate of stable TFR was 24.7% (18 out of 73 patients). TFR rates according to response at the ELN and GIMEMA milestones are reported in Online Supplemen tary Table S3.
Transcript type, N (%)c e13a2/e14a2e14a2e13a2
Risk score, N (%b) HighIntermediateLow
21/24 (87.5)f 20/24 (83.3)g
Patients attempting TFR 24/73 (32.8%)a
two patients were switched to imatinib, one reduced the dose of nilotinib and then entered the TFR phase, and one was already in TFR.
the management of the four asymptomatic pa tients diagnosed after routine screening examinations,
Follow-up after treatment D/C, months; median (range) 34 (7-98)
Age in years (median) 62 (29-80)
The prospective, long-term, 10-year observation of newly diagnosed CP-CML patients who were treated front-line in the GIMEMA CML 0307 trial with nilotinib 400 mg twice daily and then continued with lower doses of nilotinib provides an academic independent confirmation of the ef ficacy and the cardiovascular toxicity of this TKI. These features were already highlighted in the ENESTnd
Haematologica | 107 October 2022 2361 ARTICLE - Treatment-free remission after nilotinib frontline G. Gugliotta et al.
trial, the regulatory, company-sponsored study that com pared front-line treatment with nilotinib 400 mg or 300 mg twice daily and imatinib 400 mg once daily.5-9 In that trial, 281 and 282 newly diagnosed CP CML patients (median age 47 years in both groups) were assigned to re ceive nilotinib 400 or 300 mg twice daily, respectively. In both arms, 37%, and 28% of the patients had low and high Sokal risk scores, respectively. The 10-year overall survival was 87.6% in the 300 mg twice daily group and 90.3% in the 400 mg twice daily group. At 10 years, the cumulative probability of MR4 was 68.3% in the 400 mg mg twice daily arm and 69.5% in the 300 mg twice daily arm. Based on a retrospective evaluation of the patients who might have met the criteria for treatment discontinuation (de fined as MR4.5 for more than 1 year), over the whole 10year period, 48.6% and 47.3% of patients would have been eligible for treatment discontinuation in the 400 mg twice daily and 300 mg twice daily group, respectively.9
A B
Discussion
With a median follow-up after AOE of 47 months (range, 1-101), two patients have died: one patient (90 years old) died from congestive heart failure, 4 months after an acute coronary syndrome; the other one (78 years old) died for reasons unrelated to the previous AOE. At the last contact, 4/17 (24.6%) patients who suffered from an AOE were in stable TFR.
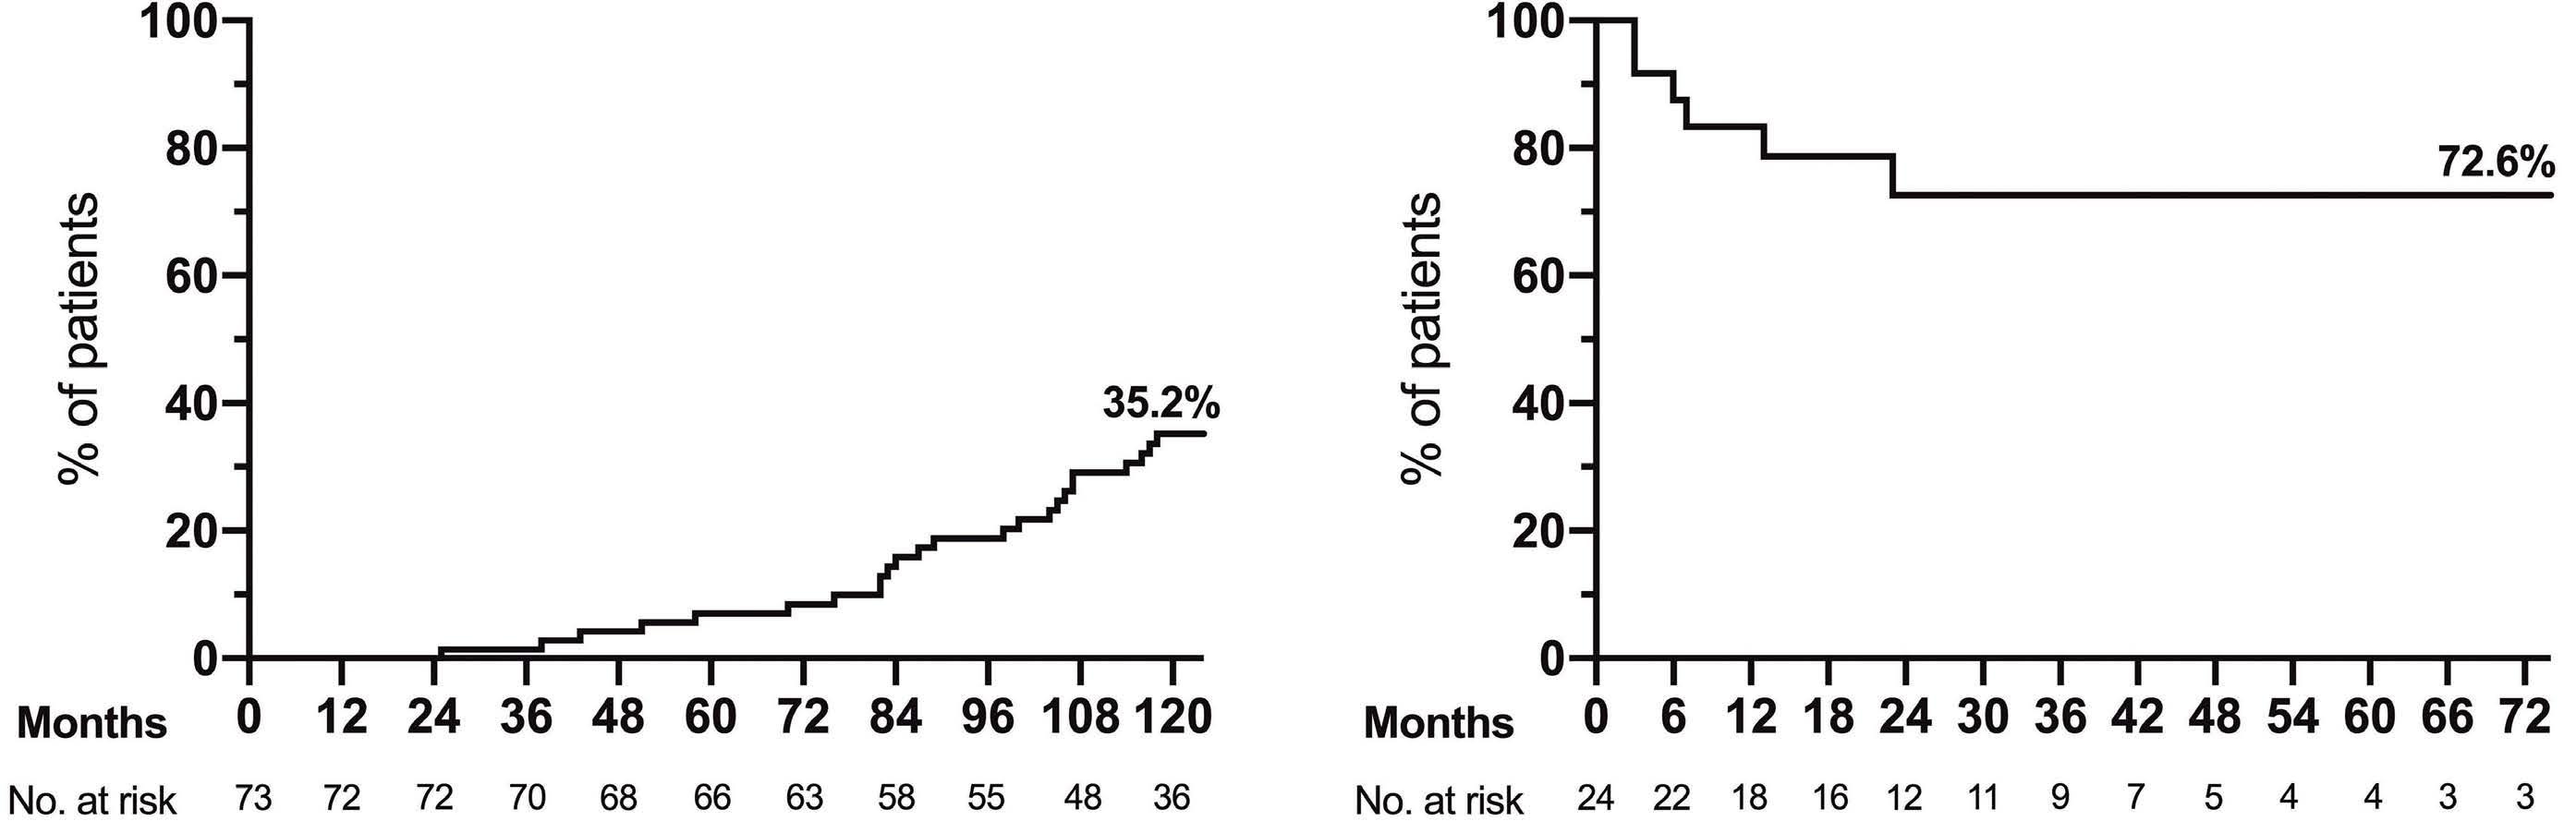
Other adverse events
The GIMEMA CML 0307 trial was initiated before the ENESTnd study and almost at the same time as the phase II MDACC trial of nilotinib 400 mg twice daily in front-line.3 Interestingly, an update of the data of the MDACC trial was published recently.16 One hundred and twenty-two pa tients were enrolled: the patients had a median age of 51 years and 68% and 7% had a low and high Sokal risk score, respectively. At the last follow-up (median 78.3 months), 51% of patients were still on nilotinib, with more than 50% at daily doses of 400 to 150 mg. Six of the 122 patients had progressed to blast phase. The 5-year overall survival was 93%. At 10 years, the cumulative probability of achiev ing MR4 and MR4.5 was 82% and 75%, respectively. Over all, these data are quite similar to the data of this GIMEMA CML 0307 study, highlighting the efficacy of nilotinib in terms of molecular response.
Other common emerging adverse events during the fol low-up were hypercholesterolemia (in 28 [38.3%] pa tients), hypertension (in 7 [9.6%] patients) and diabetes (in 4 [5.5%] patients); none of these events was severe, but in most instances a specific therapy was started.
Hematologic toxicity, hepatic and pancreatic laboratory abnormalities (increases in aspartate aminotransferase, alanine aminotransferase, bilirubin, amylase, and lipase) as well as other well-known nilotinib-related clinical ad verse events (skin rash, pruritus and muscle and joint pain) developed early during the study,4 with no new events recorded in patients continuing nilotinib in the long-term. Recurrent grade 3 or grade 4 elevation of lipase levels, without clinical pancreatitis, led to permanent dis continuation of nilotinib in three patients, after 9, 17 and 27 months of treatment.
Of note, our study is the first to report extensive data of TFR based on all enrolled patients. The rate of treatment
Figure 3. Treatment-free remission. (A) Cumulative incidence of attempted treatment-free remission (TFR). Twenty-four out of 73 patients attempted TFR while in stable deep molecular response (DMR). (B) Treatment-free survival in 24 patients discontinuing nilotinib in stable DMR. Eighteen patients maintained the TFR (17 with a stable DMR and 1 with a stable major molecular response), while six patients lost the major molecular response and resumed treatment with a tyrosine kinase inhibitor.
Cardiovascular risk factorsa at CML diagnosis in patients with AOE, N (%):
In this GIMEMA study, considering all enrolled patients, the proportion of patients who did not relapse molecu larly and remained treatment-free was 24.7%. Since not all eligible patients made an attempt at TFR, the potential proportion of patients in TFR at 10 years could have been even higher. While awaiting the results of prospective trials in newly diagnosed patients specifically designed to assess the TFR rates, our data are in line with the current expectation that 20-30% of CML patients treated with second-generation TKI in front-line can reach a stable RegardingTFR.
discontinuation
Angioplasty + stent
Deaths from AOE, N 1c
aSmoking, arterial hypertension, obesity, diabetes mellitus, dyslipide mia, prior ischemic event bTwo additional patients were already in treatment-free remission (TFR) at the time of an arterial obstructive event (AOE). cOne patient had three AOE, namely peripheral arterial disease, stroke and myocardial infarction; the patient died at the age of 90 due to congestive heart failure, 4 months after the infarct, while continuing nilotinib at a low dose dOne patient had multiple coronary events but continued on a low dose of nilotinib until he discontinued the treatment in stable deep molecular response, aiming at
Patients experiencing AOE N = 17/73 (23.3%)
long-term tolerability and safety, it is worth noting that after 10 years of follow-up 49.3% of patients were still on treatment with nilotinib, with only a minority of patients (19.2%) receiving other TKI. No new safety is sues have emerged, but the 10-year rate of AOE was 23.3% (17.8% considering only symptomatic events). We observed AOE almost exclusively (all but one) in elderly patients (median age 69 years) and/or in patients with pre-existing cardiovascular risk factors (76.4%). Older age, the pres ence of cardiovascular risk factors, the high initial dose of nilotinib, and the unawareness of nilotinib cardiovascular toxicity in the first phase of the study may all have con tributed to the high incidence of AOE.
Mortality from AOE was low, with only one patient (90 years old) who may have died from later consequences of an AOE. However, morbidity was relevant, as almost twothirds of patients with AOE needed an invasive treatment (angioplasty with stenting, vascular surgery, or, in a few cases, limb amputation).
HaematologicaTFR. | 107 October 2022 2362 ARTICLE - Treatment-free remission after nilotinib frontline G. Gugliotta et al.
5 (29.4) 3 (17.6) 3 (17.6) 6 (35.3) 9 (52.9)b
Carotid stenosis
CerebralStroke transient ischemic attack
Duration of NIL treatment prior to first AOE, months; median (range) 64 (24-113)
Coronary events
10
In the ENEST-freedom study,18 which enrolled patients treated front-line with nilotinib, the 96-week treatmentfree survival was 50.9%. Even if no direct comparison be tween these studies is possible, the longer nilotinib
Management of AOE, N (%)
The rate of AOE in our study was similar to that observed in the nilotinib arms of the ENESTnd study (23.5% with 400 mg twice daily and 16.5% with 300 mg twice daily)14 but higher compared to that in the MDACC trial, in which ischemic adverse events were reported in 8.2% of pa tients, with a surprisingly low rate of PAD (<1%).16 This dif ference from our study may in part be explained by a shorter follow-up (median 78.3 vs. 123 months) but other factors (patients’ baseline characteristics, management of risk factors, dose reductions, AOE screening and repor ting) could be involved; in any case, the small numbers do not allow the statistical significance of this difference to be determined.
Type of first AOE, N (%)
≥2 4 (23.5) 7 (41.2) 6 (35.3)
As expected,14 our study confirms the cardiovascular toxicity of nilotinib in the long-term, which is higher than that observed with imatinib in the ENESTnd study (3.5%)9
Table 4. Arterial obstructive events.
Nilotinib 400 mg twice daily
Peripherial arterial disease
Nilotinib 400 mg once daily
6 (35.3) 5 (29.4) 4 (23.5) 2 (11.7)
7 (41.1) 5 (29.4) 311(17.6)(5.9)(5.9)
Follow-up after AOE, median (range), months 47 (1-101)
Patients with additional AOE during the followup 2c d
PermanentMedicalVascularAmputationsurgerynilotinib
discontinuation aiming at TFR was 32.8%, a “real-life” rate that is considerably lower than the theoretical estimated rates from the ENESTnd trial (48.6% and 47.3%).9 Phys icians’ and/or patients’ cautiousness in years when TFR was not yet widely accepted as a standard clinical prac tice may have hampered treatment discontinuation in some eligible patients. In our patients who attempted TFR, the estimated 24-month treatment-free survival was 72.6%, similar to that documented in a large Italian retro spective analysis of patients discontinuing TKI,17 but ap parently higher than that in prospective studies of TFR.18,19
Treatment at AOE:
Treatment-free remission
Nilotinib 300 mg twice daily
treatment duration (median 88 vs. 43.5 months) as well as the longer duration of DMR (median 74 vs. 30 months) in our study may have favored this better outcome. In deed, in the EURO-SKI study, in patients receiving imatinib front-line, longer treatment duration (odds ratio per year 1.14) and longer DMR duration (odds ratio per year 1.13) were associated with an increasing probability of main tenance of MMR at 6 months.19
Age in years at first AOE, median (range) 69 (49-88)
Disclosures
Seventeen patients had at least one arterial obstructive event. Two patients had multiple events (only the first event is re ported in the graph).
Takenrates. together, the long-term results of the GIMEMA CML 0307 study show that the use of nilotinib front-line is ca pable of inducing a stable TFR in a relevant number of pa tients. This approach is however associated with AOE. It is likely that the number of CML patients who can obtain TFR may increase, and that the number of cardiovascular complications may decrease, through a more accurate se lection of patients according to age and individual cardio vascular risk factors, and through careful dose adaptation over time.
Contributions
The original protocol is available upon request. Individual participant data will not be shared.
Figure 4. Cumulative incidence of arterial obstructive events
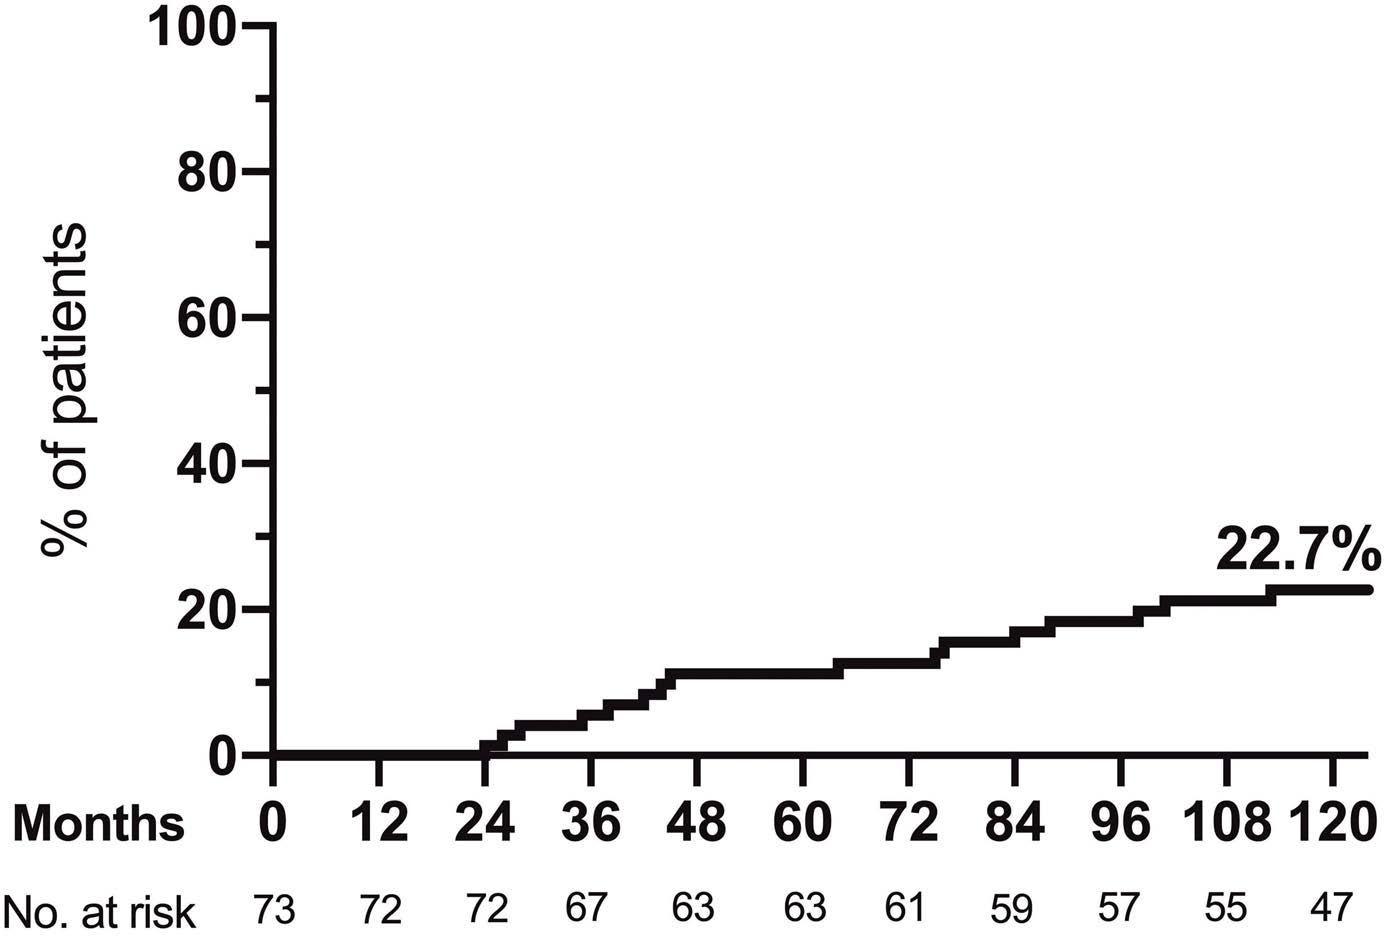
References
GG analyzed the data; GG and MBa wrote the first draft of the manuscript; all authors contributed to the design of the study, to the collection of the data, and to the final report.
4. Rosti G, Palandri F, Castagnetti F, et al. Nilotinib for the frontline treatment of Ph(+) chronic myeloid leukemia. Blood. 2009;114(24):4933-4938.
7. Larson RA, Hochhaus A, Hughes TP, et al. Nilotinib vs imatinib in patients with newly diagnosed Philadelphia chromosomepositive chronic myeloid leukemia in chronic phase: ENESTnd 3-year follow-up. Leukemia. 2012;26(10):2197-2203.
imatinib for the treatment of patients with newly diagnosed chronic phase, Philadelphia chromosome-positive, chronic myeloid leukaemia: 24-month minimum follow-up of the phase 3 randomised ENESTnd trial. Lancet Oncol. 2011;12(9):841-851.
2. Kantarjian HM, Giles F, Gattermann N, et al. Nilotinib (formerly AMN107), a highly selective BCR-ABL tyrosine kinase inhibitor, is effective in patients with Philadelphia chromosome-positive chronic myelogenous leukemia in chronic phase following imatinib resistance and intolerance. Blood. 2007;110(10):3540-3546.
Financial support and the drug nilotinib for the study core phase were provided by Novartis Farma SpA. This study was also supported by GIMEMA Onlus, BolognAIL, and European LeukemiaNet (LSHC-CT-2004-503216).
5. Saglio G, Kim DW, Issaragrisil S, et al. Nilotinib versus imatinib for newly diagnosed chronic myeloid leukemia. N Engl J Med. 2010;362(24):2251-2259.
Data-sharing statement
cyte; GR has received honoraria from Novartis, Celgene, Pfizer, and Incyte; the remaining authors declared no com peting financial interests.
3. Cortes JE, Jones D, O'Brien S, et al. Nilotinib as front-line treatment for patients with chronic myeloid leukemia in early chronic phase. J Clin Oncol. 2010;28(3):392-397.
GG has received honoraria from Novartis and Incyte; FC has received honoraria from Novartis, Celgene, Pfizer, and In
6. Kantarjian HM, Hochhaus A, Saglio G, et al. Nilotinib versus
Funding
8. Hochhaus A, Saglio G, Hughes TP, et al. Long-term benefits and risks of frontline nilotinib vs imatinib for chronic myeloid leukemia in chronic phase: 5-year update of the randomized ENESTnd trial. Leukemia. 2016;30(5):1044-1054.
10. Gugliotta G, Castagnetti F, Breccia M, et al. Long-term outcome of a phase 2 trial with nilotinib 400 mg twice daily in first-line treatment of chronic myeloid leukemia. Haematologica.
Haematologica | 107 October 2022 2363 ARTICLE - Treatment-free remission after nilotinib frontline G. Gugliotta et al.
9. Kantarjian HM, Hughes TP, Larson RA, et al. Long-term outcomes with frontline nilotinib versus imatinib in newly diagnosed chronic myeloid leukemia in chronic phase: ENESTnd 10-year analysis. Leukemia. 2021;35(2):440-453.
or in other trials.20,21 Studies with dasatinib, bosutinib and ponatinib in front-line have a shorter follow-up,22-24 pre venting any suitable long-term comparison of the AOE
1. Kantarjian H, Giles F, Wunderle L, et al. Nilotinib in imatinibresistant CML and Philadelphia chromosome-positive ALL. N Engl J Med. 2006;354(24):2542-2551.
14. Hochhaus A, Baccarani M, Silver RT, et al. European LeukemiaNet 2020 recommendations for treating chronic myeloid leukemia. Leukemia. 2020;34(4):966-984.
leukemia in chronic phase following frontline nilotinib: 96-week update of the ENESTfreedom study. J Cancer Res Clin Oncol. 2018;144(5):945-954.
21. Kalmanti L, Saussele S, Lauseker M, et al. Safety and efficacy of imatinib in CML over a period of 10 years: data from the randomized CML-study IV. Leukemia. 2015;29(5):1123-1132.
15. Baccarani M, Abruzzese E, Accurso V, et al. Managing chronic myeloid leukemia for treatment-free remission: a proposal from the GIMEMA CML WP. Blood Adv. 2019;3(24):4280-4290.
19. Saussele S, Richter J, Guilhot J, et al. Discontinuation of tyrosine kinase inhibitor therapy in chronic myeloid leukaemia (EURO-SKI): a prespecified interim analysis of a prospective, multicentre, non-randomised, trial. Lancet Oncol. 2018;19(6):747-757.
18. Ross DM, Masszi T, Gomez Casares MT, et al. Durable treatment-free remission in patients with chronic myeloid
11. Sokal JE, Cox EB, Baccarani M, et al. Prognostic discrimination in "good-risk" chronic granulocytic leukemia. Blood. 1984;63(4):789-799.
Haematologica | 107 October 2022 2364 ARTICLE - Treatment-free remission after nilotinib frontline G. Gugliotta et al.
12. Pfirrmann M, Baccarani M, Saussele S, et al. Prognosis of longterm survival considering disease-specific death in patients with chronic myeloid leukemia. Leukemia. 2016;30(1):48-56.
23. Cortes JE, Saglio G, Kantarjian HM, et al. Final 5-year dtudy tesults of DASISION: the dasatinib versus imatinib study in treatment-naive chronic myeloid leukemia patients trial. J Clin Oncol. 2016;34(20):2333-2340.
16. Masarova L, Cortes JE, Patel KP, et al. Long-term results of a phase 2 trial of nilotinib 400 mg twice daily in newly diagnosed patients with chronic-phase chronic myeloid leukemia. Cancer. 2020;126(7):1448-1459.
24. Lipton JH, Chuah C, Guerci-Bresler A, et al. Ponatinib versus imatinib for newly diagnosed chronic myeloid leukaemia: an international, randomised, open-label, phase 3 trial. Lancet Oncol. 2016;17(5):612-621.
17. Fava C, Rege-Cambrin G, Dogliotti I, et al. Observational study of chronic myeloid leukemia Italian patients who discontinued tyrosine kinase inhibitors in clinical practice. Haematologica. 2019;104(8):1589-1596.
2015;100(9):1146-1150.
20. Hochhaus A, Larson RA, Guilhot F, et al. Long-term outcomes of imatinib treatment for chronic myeloid leukemia. N Engl J Med. 2017;376(10):917-927.
13. Cross NC, White HE, Muller MC, Saglio G, Hochhaus A. Standardized definitions of molecular response in chronic myeloid leukemia. Leukemia. 2012;26(10):2172-2175.
22. Brümmendorf TH, Cortes JE, Milojkovic D, et al. Bosutinib (BOS) versus imatinib for newly diagnosed chronic phase (CP) chronic myeloid leukemia (CML): final 5-year results from the Bfore trial. Blood. 2020;136(Suppl 1):41-42.
The glycolytic enzyme PFKFB3 determines bone marrow endothelial progenitor cell damage after chemotherapy and irradiation
Accepted: March 24, 2022.
Published under a CC BY-NC license
https://doi.org/10.3324/haematol.2021.279756
Zhong-Shi Lyu,1,2 Shu-Qian Tang,1 Tong Xing,1,2 Yang Zhou,1 Meng Lv,1 Hai-Xia Fu,1 Yu Wang,1 LanPing Xu,1 Xiao-Hui Zhang,1 Hsiang-Ying Lee,2,3 Yuan Kong1 and Xiao-Jun Huang1,2
unclear, so the optimal therapeutic approaches have not been well Endothelialestablished.cells(EC)are responsible for tissue growth and regeneration under homeostasis and stress in multiple or gans.2 In the hematopoietic system, EC are an important constituent of the bone marrow (BM) microenvironment and play an essential role in regulating hematopoietic stem cell (HSC) homeostasis.3-6 Besides affecting malignant cells, chemo-radiotherapy also damages both HSC and their supportive BM microenvironment, especially EC.4, 7-12
1Peking University People’s Hospital, Peking University Institute of Hematology, National Clinical Research Center for Hematologic Disease, Beijing Key Laboratory of Hematopoietic Stem Cell Transplantation, Collaborative Innovation Center of Hematology, Peking University; 2Peking-Tsinghua Center for Life Sciences, Academy for Advanced Interdisciplinary Studies, Peking University and 3School of Life Sciences, Peking University, Beijing, China
Correspondence: XJ. yuankong@bjmu.edu.cnY.huangxiaojun@bjmu.edu.cnHuagKong
Abstract
©2022 Ferrata Storti Foundation
Introduction
Prepublished: MArch 31, 2022.
Bone marrow (BM) endothelial progenitor cell (EPC) damage of unknown mechanism delays the repair of endothelial cells (EC) and recovery of hematopoiesis after chemo-radiotherapy. We found increased levels of the glycolytic enzyme PFKFB3 in the damaged BM EPC of patients with poor graft function, a clinical model of EPC damage-associated poor hemato poiesis after allogeneic hematopoietic stem cell transplantation. Moreover, in vitro the glycolysis inhibitor 3-(3-pyridinyl)1-(4-pyridinyl)-2-propen-1-one (3PO) alleviated the damaged BM EPC from patients with poor graft function. Consistently, PFKFB3 overexpression triggered BM EPC damage after 5-fluorouracil treatment and impaired hematopoiesis-supporting ability in vitro. Mechanistically, PFKFB3 facilitated pro-apoptotic transcription factor FOXO3A and expression of its down stream genes, including p21, p27, and FAS, after 5-fluorouracil treatment in vitro. Moreover, PFKFB3 induced activation of NF-κB and expression of its downstream adhesion molecule E-selectin, while it reduced hematopoietic factor SDF-1 ex pression, which could be rescued by FOXO3A silencing. High expression of PFKFB3 was found in damaged BM EC of murine models of chemo-radiotherapy-induced myelosuppression. Furthermore, a murine model of BM EC-specific PFKFB3 over expression demonstrated that PFKFB3 aggravated BM EC damage, and impaired the recovery of hematopoiesis after chemotherapy in vivo, effects which could be mitigated by 3PO, indicating a critical role of PFKFB3 in regulating BM EC damage. Clinically, PFKFB3-induced FOXO3A expression and NF-κB activation were confirmed to contribute to the damaged BM EPC of patients with acute leukemia after chemotherapy. 3PO repaired the damaged BM EPC by reducing FOXO3A ex pression and phospho-NF-κB p65 in patients after chemotherapy. In summary, our results reveal a critical role of PFKFB3 in triggering BM EPC damage and indicate that endothelial-PFKFB3 may be a potential therapeutic target for myelosup pressive injury.
Chemotherapy, irradiation and allogeneic hematopoietic stem cell transplantation (HSCT) are all commonly used in patients with hematopoietic cancers. However, many pa tients who undergo these therapies will suffer poor hema topoietic function, characterized by delayed recovery of hematopoiesis, resulting in prolonged cytopenia and an in creased risk of infections, bleeding and hospitalization.1 The pathogenesis of poor hematopoietic function is
Haematologica | 107 October 2022 2365 ARTICLE - Complications in Hematology
Received: August 2, 2021.
validated in a cohort of patients with acute leukemia after chemotherapy. Our aim was to uncover the critical role and underlying mechanism of action of PFKFB3 in BM EPC damage and provide a potential therapeutic approach for patients exposed to chemo-radiotherapy in the future.
Methods
A prospective nested case-control study was per formed to compare PFKFB3 levels in BM EPC between patients with poor graft function (n=15) and matched patients with good graft function (n=30) from the same cohort of patients who underwent allogeneic HSCT be tween February 5, 2018 and October 30, 2020 at Peking University Institute of Hematology (Beijing, China). There were no significant differences between the two groups of subjects with regard to any clinical char acteristics ( Online Supplementary Table S1 ). Moreover, PFKFB3 levels were compared in BM EPC col lected from acute leukemia patients (n=15) before and after chemotherapy for conditioning prior to haplo identical HSCT. In-vivo T-cell-depleted myeloablative chemotherapy-based conditioning regimens adminis tered prior to haploidentical HSCT include busulfan (9.6 mg/kg)/cyclophosphamide (3.6 g/m 2 ), cytarabine (4 g/m 2), and antithymocyte globulin (10 mg/kg) 29-31 ( Online Supplementary Table S2 ).
Haematologica | 107 October 2022 2366 ARTICLE - PFKFB3 contributes to endothelial cell damage Z. Lyu et al.
evidence that EC rely largely on gly colysis in order to produce energy. Glycolysis is relatively low in EC from healthy adults, whereas it is increased in angiogenic EC. Aberrant glycolysis has been reported to be an important pathogenic mechan ism in EC-associated diseases, such as pulmonary hy pertension and tumor vessels. 24-28 In EC, glycolysis is mainly stimulated by the regulatory enzyme, eases.dothelial(PFKFB3),phofructo-2-kinase/fructose-2,6-bisphosphatase6-phos324whereasblockadeorgeneticdeletionofenPFKFB3attenuatestheabovevasculardis26,27Glycolysisis,therefore,becominganattractivetargetformanipulationinthesediseases.However,themetabolicregulatorymechanisminBMEPC,especiallytheroleofdefectiveglycolysisinBMEPCdamagebychemo-radiotherapy,remainstobeinvestigated.We,therefore,usedpoorgraftfunction,aclinicalmodelofBMEPCdamage-associatedpoorhematopoiesisafterallogeneicHSCT,toevaluatetherelationshipbetweentheexpressionoftheglycolyticenzyme,PFKFB3,andBMEPCdamage.Moreover,westudiedthemechanisticroleofdefectiveglycolysisregulatedbyPFKFB3inBMEPCdamage,usingwell-established in vitro models of BM EPC damage, murine models of chemo therapy- or irradiation-induced myelosuppression and a murine model of BM EC-specific PFKFB3 over expression. The PFKFB3-induced BM EPC damage was
Forty healthy donors (25 males and 15 females; age range, 25-63 years; median age, 30 years) were enrolled as controls. The study was approved by the Ethics Committee of Peking University People's Hospital, and written informed consent was obtained from all sub jects in compliance with the Declaration of Helsinki.
Poor graft function13-17,23,32,33 is characterized by hypoplastic or aplastic BM with the presence of two or three cytope nias: (i) an absolute neutrophil count less than 0.5×10⁹/L; (ii) a platelet count less than 20×109/L; or (iii) a hemoglo bin concentration less than 70 g/L on at least 3 consecu tive days beyond day +28 after HSCT or requiring transfusion and/or granulocyte colony-stimulating factor administration in the presence of complete donor chim erism. Good graft function13-17,23,32-35 is defined as an abso lute neutrophil count greater than 0.5×10⁹/L for 3 consecutive days, a platelet count greater than 20×109/L for 7 consecutive days, and a hemoglobin level greater than 70 g/L without transfusion support beyond day +28 after HSCT. Patients with hematologic relapse after al logeneic HSCT were excluded. The transplantation proto cols were reported previously.29-31
As a result, BM EC damage, with a high level of apop tosis and a sustained state of inflammation, limits the recovery of hematopoiesis after chemo-radiother apy, 4,9,10,13-18 whereas inhibition of EC apoptosis or an in fusion of EC accelerates hematopoietic recovery,10,18,19 indicating that BM EC are a prerequisite for hemato poietic recovery. It is, therefore, critical to identify the mechanism(s) underlying BM EC damage in order to be able to promote hematopoietic recovery. The endothelial progenitor cell (EPC),derived from BM, is a primitive endothelial precursor with a distinctive potential for differentiation into EC, and is a critical source of EC repair. 20, 21 Murine studies revealed that in fusion of EPC can restore BM EC and promote hema topoiesis following radiotherapy. 22 Clinically, in serial studies we showed that BM EPC damage, characterized by higher levels of reactive oxygen species (ROS) and apoptosis, impairs cell migration and angiogenesis, and contributes to BM EC damage and the subsequent oc currence of poor graft function,13-16,23 defined by pan cytopenia after allogeneic HSCT, whereas improvement of BM EPC prior to HSC-transplantation (HSCT) pro motes hematopoietic reconstitution of donor HSC after the transplant.15 However, the mechanism underlying BM EPC damage after chemo-radiotherapy is largely Thereunknown.isemerging
Patients and controls
Definitions of poor and good graft function
Murine models of myelosuppression4,9,11,41 were constructed using C57BL/6J female mice (6-9 weeks old) treated with 5FU (150 or 250 mg/kg) or irradiation (500 or 650 cGy total body irradiation via X-ray). To generate the murine model of BM EC-specific PFKFB3 overexpression, an adeno-as sociated virus (AAV)-mediated gene delivery system (re combinant AAV-VEC, an optimized AAV variant for EC transduction), under the control of an EC-specific Tie pro moter, was injected intraosseously.42-45
Results
Quantification, culture, characterization and functional analyses of primary bone marrow endothelial progenitor cells
In vitro models of bone marrow endothelial progenitor cell damage
Statistical analysis
We performed a prospective nested case-control study to compare the expression of PFKFB3, a glycolytic enzyme, in BM EPC from patients with poor graft func tion (PGF-EPC) and from matched patients with good graft function (GGF-EPC). PFKFB3 expression was signifi cantly higher in PGF-EPC than in GGF-EPC (5782±1094 vs . 2584±272.9; P =0.0004) (Figure 1A-C). Likewise, glu cose uptake was significantly increased in PGF-EPC (2.91±0.35-fold vs . 1.30±0.19-fold; P =0.008) (Figure 1D). Consistently, in situ immunofluorescent staining of BM biopsies revealed that PFKFB3 was increased in PGF-EPC (Figure 1E). Thus, our findings indicate that PFKFB3-in duced glycolysis is hyperactivated in PGF-EPC. To determine whether hyperglycolysis contributes to BM EPC damage in patients with poor graft function, PGFEPC were treated with 3PO, an inhibitor of glycolysis. 3PO markedly decreased glucose consumption (0.41±0.01fold; P =0.03) (Figure 2A) and lactate production (0.72±0.03-fold; P =0.03) (Figure 2B) in PGF-EPC. More over, 3PO significantly reduced apoptosis (0.70±0.12-fold;
PFKFB3 is enhanced in the damaged bone marrow endothelial progenitor cells of patients with poor graft function
mouse experiments were approved by the Ethics Committee of Peking University People’s Hospital.
Methods to determine the functionality of BM EPC13,15,23,3537 include measurements of apoptosis, intracellular levels of ROS or PFKFB3, double-positive staining with both DiI-AcLDL and FITC-UEA-1, tube-formation and migration assays. The hematopoiesis-supporting ability of EPC was evaluated by colony-forming unit assays after co-culture of EPC with BM CD34 + cells from healthy donors. The levels of glucose and lactic acid in culture medium were measured by a glucose assay kit and a lactic acid assay kit, respectively.
The isolation, quantification, culture, and characteriza tion of BM EPC were performed as previously re ported.13,15,23,35-37 Briefly, BM mononuclear cells were cultured in fibronectin-precoated 24-well culture plates with EGM-2-MV-SingleQuots and 10% fetal bovine serum. Pre-cultured and 7-day-cultured BM EPC were identified by mouse anti-human CD34, CD45, vascular endothelial growth factor receptor 2 (CD309) and CD133 monoclonal antibodies and analyzed using a BD LSRFortessa cell analyzer. Aliquots of isotype-identical antibodies served as negative controls.
In situ immunofluorescence staining of EPC15,35-37 in BM trephine biopsies was performed with mouse antihuman CD34, rabbit anti-human PFKFB3 antibodies and 4’,6-diamidino-2-phenylindole (DAPI), and analyzed under a Leica TCS SP8 microscope.
Establishment of murine models of myelosuppression and of bone marrow endothelial cell-specific PFKFB3 overexpression
Haematologica | 107 October 2022 2367 ARTICLE - PFKFB3 contributes to endothelial cell damage Z. Lyu et al.
Prism 6.0 software (GraphPad, San Diego, CA, USA) was used to compute the statistical data. The results are ex pressed as the mean ± standard error of mean, and the Mann-Whitney U test was used to analyze continuous variables. The Wilcoxon matched-pairs signed rank test was applied to analyze matched or paired data collected from in vitro studies. One-way analysis of variance was performed for multiple comparisons. A P -value ≤ 0.0 5 was considered statistically significant. Detailed methods can be found in the Online Supple mentary Methods
To construct the models of BM EPC damage, primary BM EPC derived from healthy donors were treated with 5fluorouracil (5FU; 20 µ M) 38 or hydrogen peroxide (200 µM)39 in vitro. To determine the effect of hyperglycolysis or nuclear factor kappa B (NF-κB) inhibition on EPC func tion, EPC were treated with the glycolysis inhibitor 3PO (10 µM)27 or the NF- κ B inhibitor SC-514 (10 µM).40
BM EC damage, mice were treated with 5FU (250 mg/kg) on day 0 and then with 3PO (25 mg/kg) on days 3, 5, and 7. The kinetics of peripheral blood were analyzed. HSC (lineage cKIT + SCA1 + CD150 + CD48 ), hematopoietic stem and progenitor cells (HSPC, lineage cKIT+SCA1+), myeloid progenitors (lineage cKIT+SCA1 ),46 myeloid cells, T cells, B cells and EC (CD45 Ter119 CD31+VE-Cadherin+), intracel lular levels of FOXO3A, NF-κB p65 and PFKFB3 were ana lyzed in murine BM by flow cytometry. Cells from all mice were stained with hematoxylin and eosin and with an immunohistochemical stain for the EC marker endomu Allcin.
To evaluate the effects of BM EC-specific PFKFB3 over expression and pharmacological inhibition of PFKFB3 on
Z. Lyu et al.
PGF-EPC. These results suggest that increased PFKFB3 is involved in the damaged EPC of patients with poor graft function.
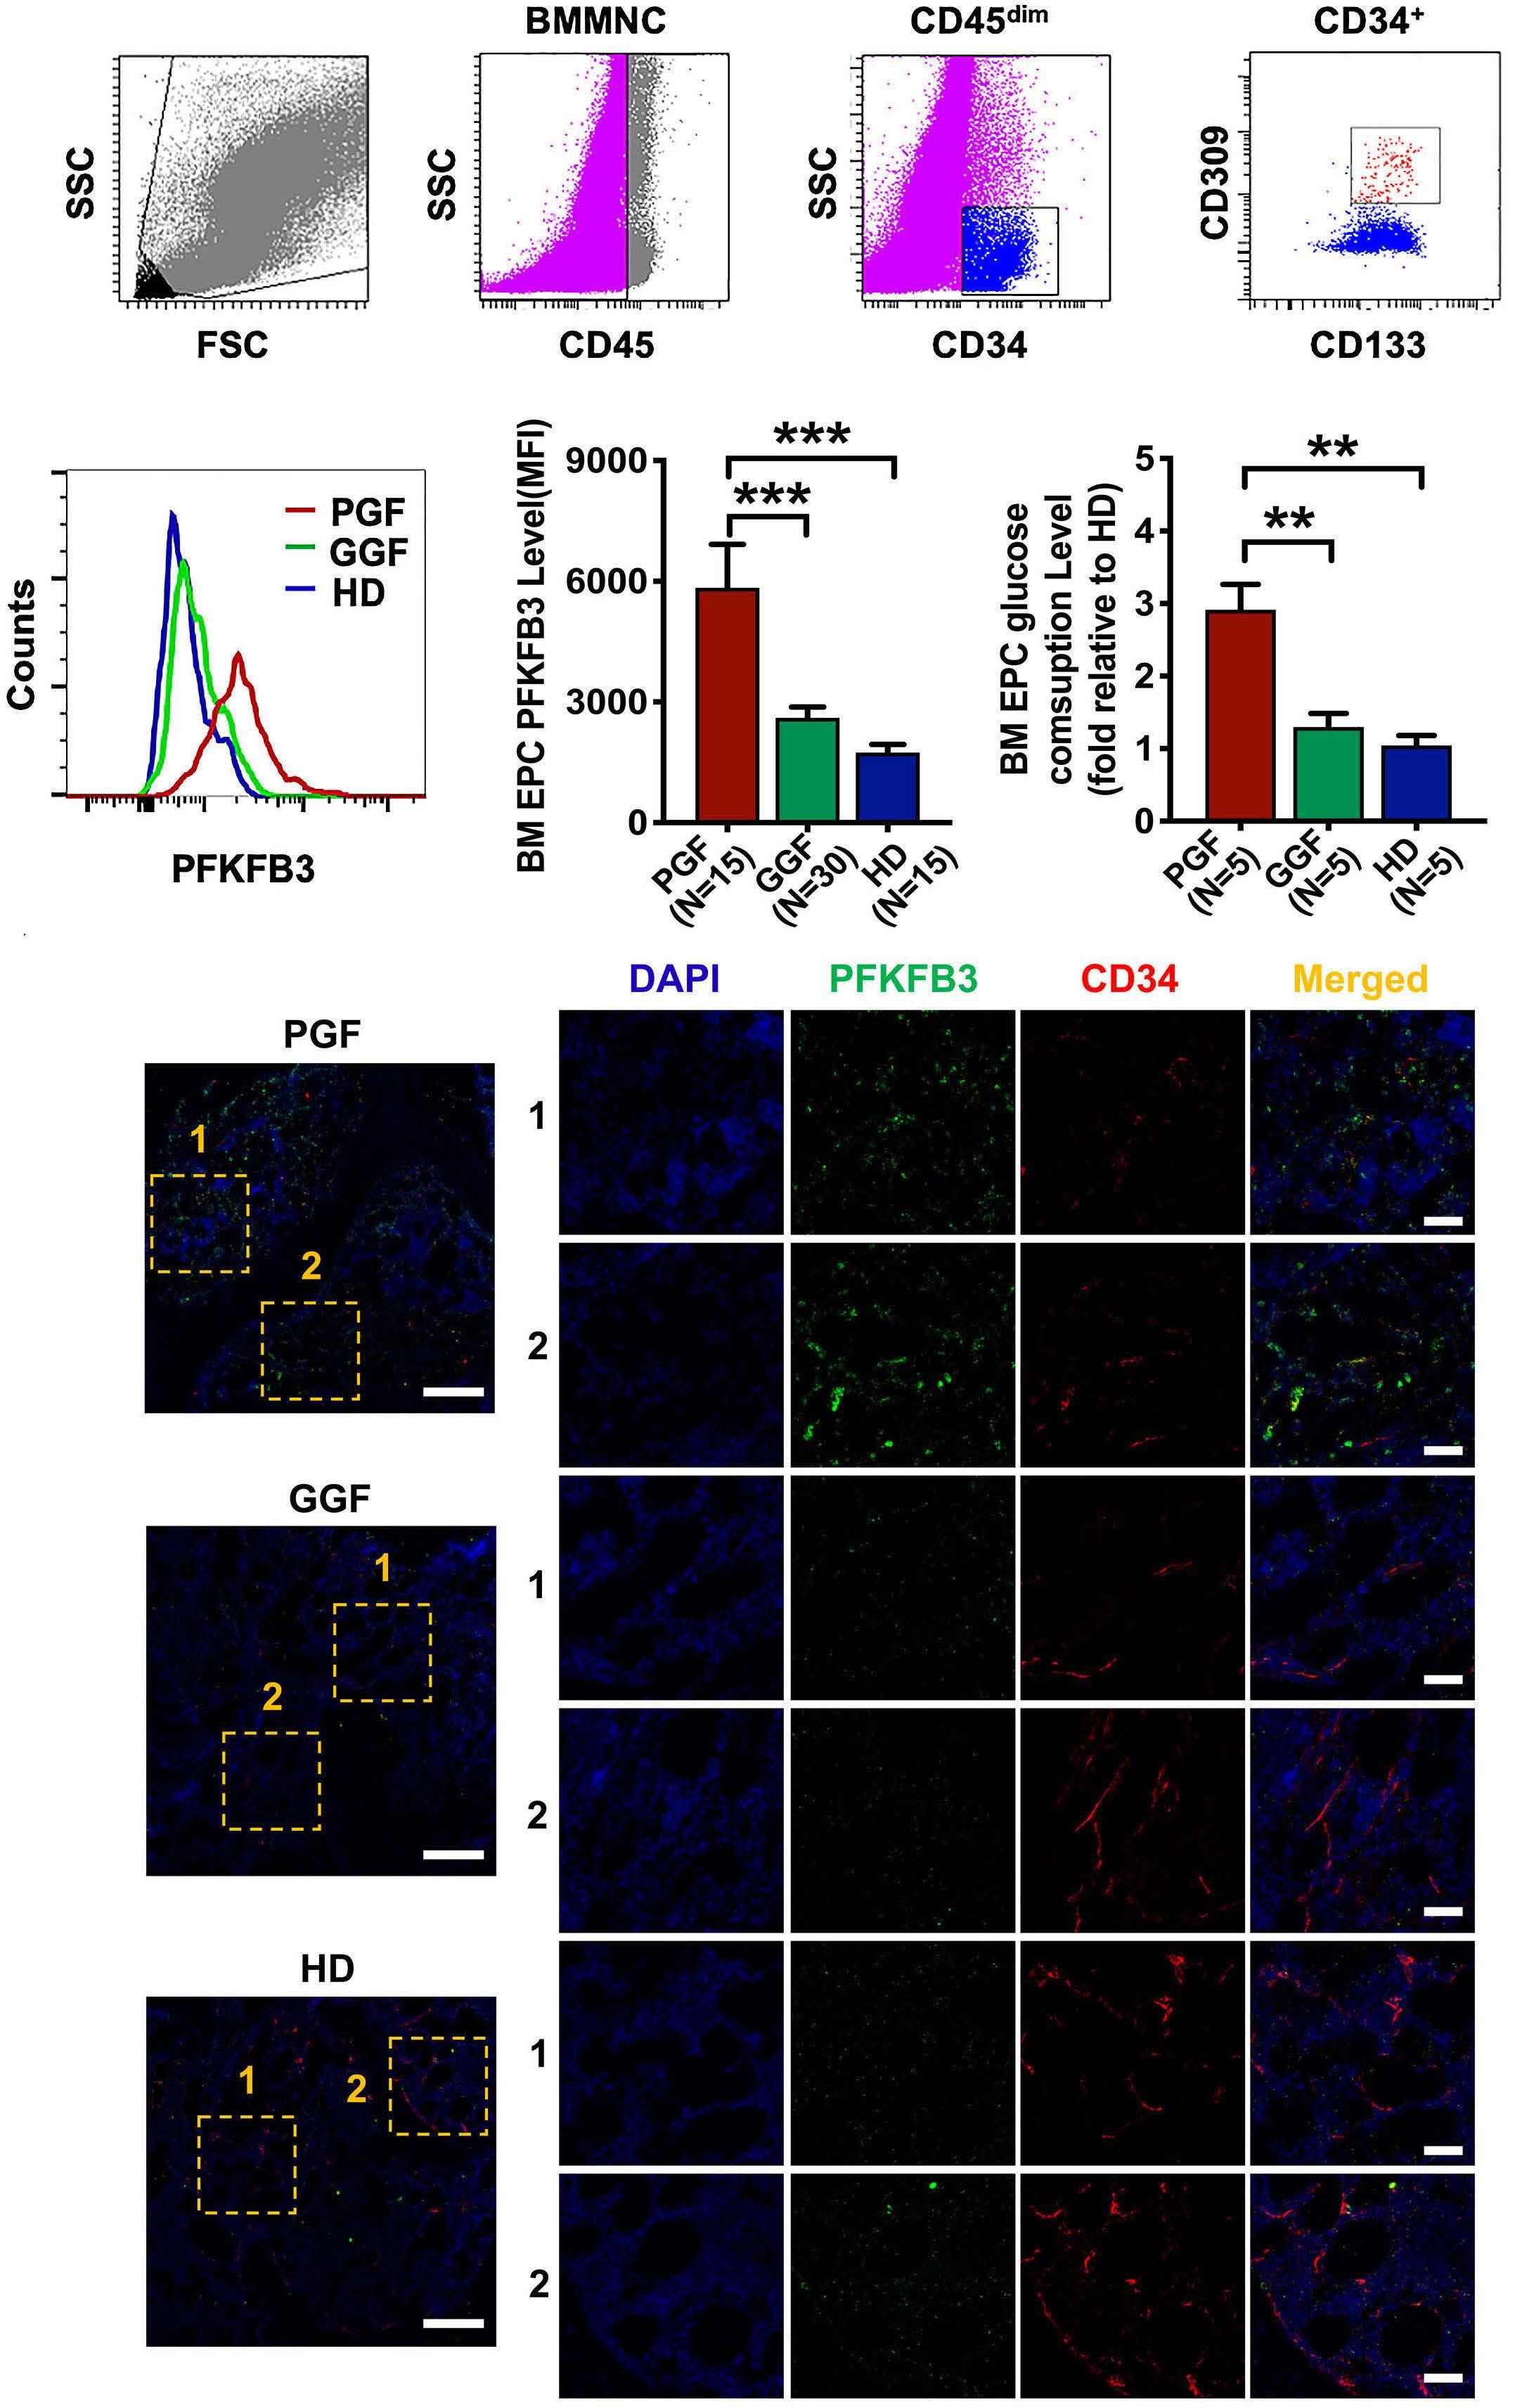
AB C D E Haematologica | 107 October 2022 2368 ARTICLE -
Figure 1. Defective glycolysis in bone marrow endothelial progenitor cells from patients with poor graft function. (A) To detect intracellular PFKFB3 levels in pre-cultured bone marrow (BM) mononuclear cells, BM endothelial progenitor cells (EPC) demon strating the typical expression of CD34, CD309, and CD133 were first gated by flow cytometry. (B, C) Representative images (B) and quantification (C) of intracellular PFKFB3 levels in the gated pre-cultured BM EPC from patients with poor graft function (PGF), patients with good graft function (GGF) and healthy donors (HD) were analyzed by flow cytometry mean fluorescence in tensity (mean ± standard error of mean). (D) Glucose consumption was determined in the media of cultured BM EPC from patients with PGF or GGF and from HD. (E) In situ immunofluorescence of BM biopsies (scale bar=50 µm) showed that PFKFB3 was in creased in BM EPC from patients with PGF compared to the amounts in patients with GGF or in HD. **P≤ 0.01, ***P≤0.001. BMMNC: bone marrow mononuclear cells; MFI: mean fluorescence intensity. PFKFB3 contributes to endothelial cell damage
P=0.03) (Figure 2C), improved tube formation (6672±341.2 vs . 3855±390.4; P =0.03) (Figure 2D) and enhanced the migration ability (1.60±0.11-fold; P =0.03) (Figure 2E) of
ED Haematologica | 107 October 2022 2369 ARTICLE - PFKFB3 contributes to endothelial cell damage Z. Lyu et al.
PGF-EPC and GGF-EPC were found for 5,964 genes (ad justed P-values <0.05) (Online Supplementary Figure S1B). Following further filtering using the 1.5-fold change cri terion, 3,075 genes were upregulated in PGF-EPC, whereas 1,868 genes were increased in GGF-EPC (Online Supplemen tary Figure S1B). PGF EPC showed overexpression of genes in the glycolytic pathway, including PFKFB3 (Online Supple mentary Figure S1C). PANTHER-based analysis of gene on
Figure 2. In vitro PFKFB3 inhibition increased the number and function of bone marrow endothelial progenitor cells from patients with poor graft function. (A, B) The media of cultured bone marrow (BM) endothelial progenitor cells (EPC) from patients with poor graft function (PGF) which were or were not treated in vitro with the glycolysis inhibitor 3PO were analyzed for glucose consumption (A) and lactate production (B). (C) Apoptosis rates of cultured BM EPC from patients with poor or good graft function treated or not with 3PO in vitro. (D) Representative images (left, scale bars=200 µm) and quantification (right) of the tube length of BM EPC per field of view, measured in three random low-power fields and averaged. (E) Representative images (left, scale bars= 50 µm) and quantification (right) of migrated BM EPC per field of view, counted in three random high-power fields and averaged. *P≤0.05. PGF: poor graft function; GGF: good graft function; CTL: control; DMSO: dimethylsulfoxide. B C
To further understand the metabolic profile and regulatory mechanisms underlying damaged BM EPC, PGF-EPC and GGF-EPC were sorted via fluorescence-activated cell sort ing and analyzed by RNA-sequencing (Online Supplementary Figure S1A). Markedly different levels of expression between
The FOXO, NF-?B and glycolysis pathways are activated in the damaged bone marrow endothelial progenitor cells of patients with poor graft function
A
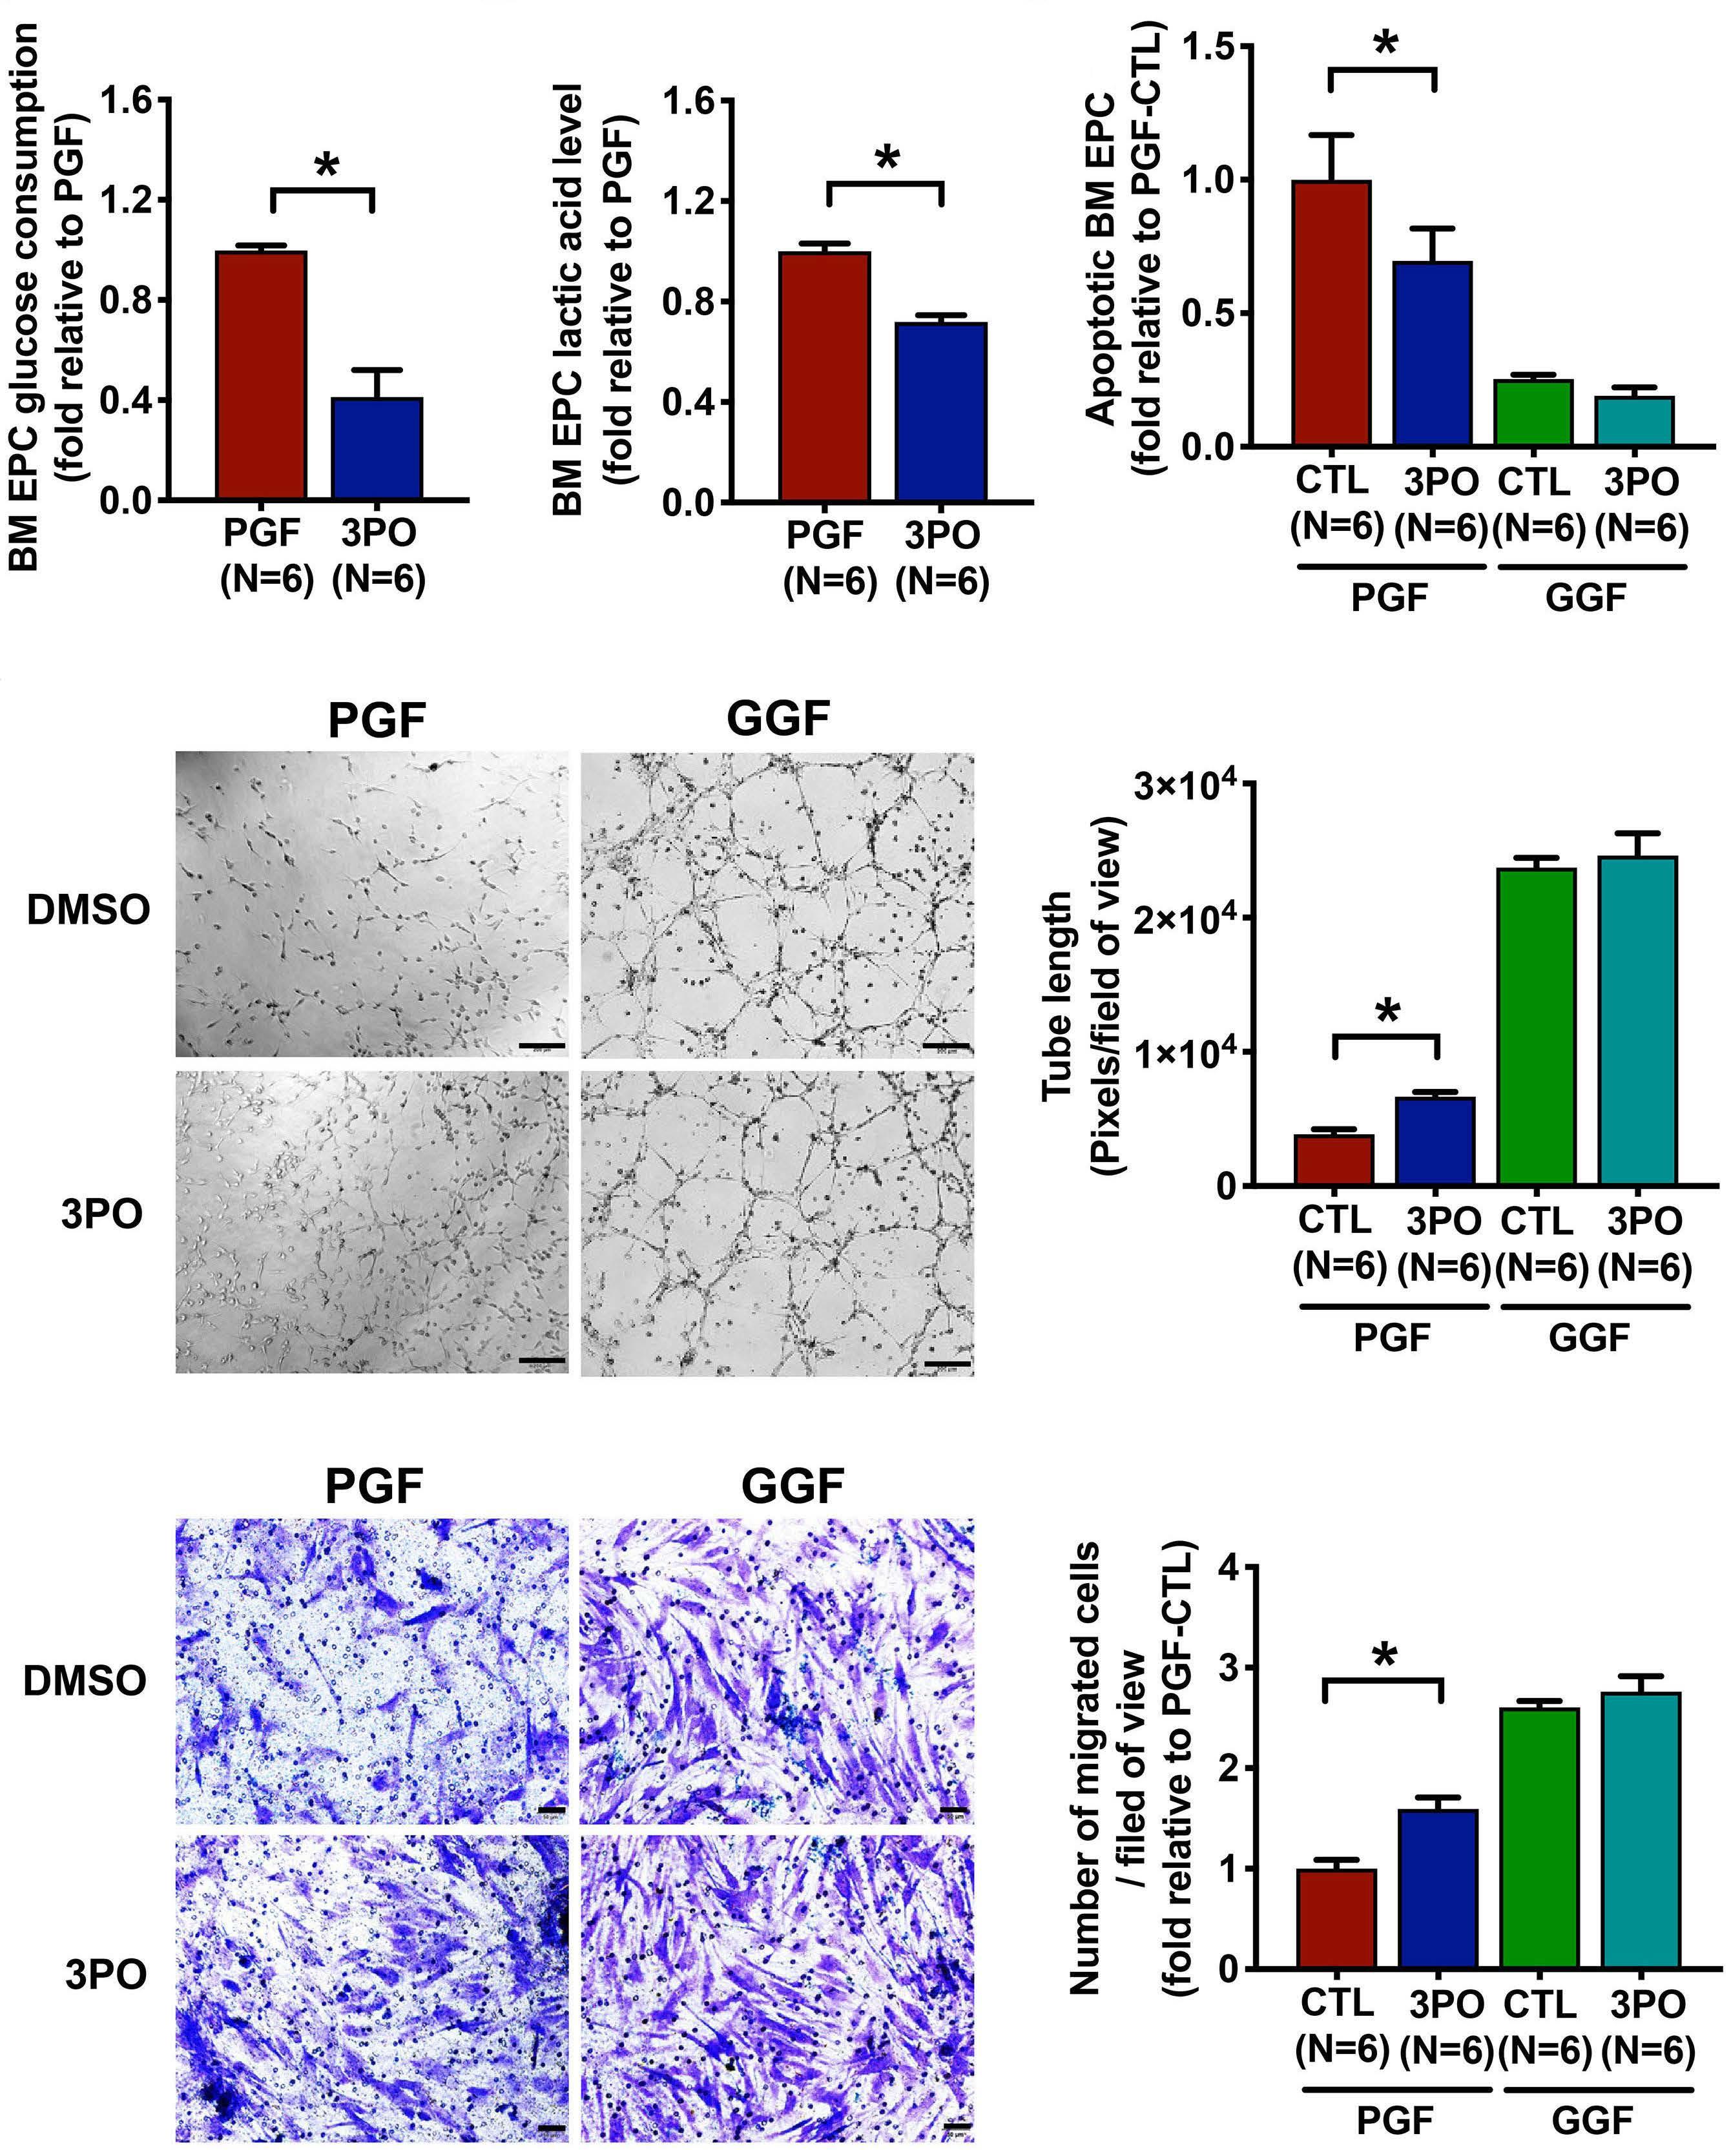
Figure 4. PFKFB3 promoted pro-apoptotic gene expression after 5-fluorouracil treatment via FOXO3A in vitro. (A) Western blot ana lyses were performed on cultured bone marrow (BM) endothelial progenitor cells (EPC) transfected with a control vector or a vector expressing PFKFB3 and treated with dimethylsulfoxide (DMSO, DM) or 5-fluorouracil (5FU). (B) Western blot analyses were performed on the cultured BM EPC transfected with a control vector or a vector expressing PFKFB3, combined with non-targeting siRNA controls or siRNA targeting PFKFB3 or FOXO3A, and with or without 5FU treatment. All the western blot analyses were performed in triplicate at least and representative images are shown. (C, D) The media of cultured BM EPC treated or not with 5FU and with or without PFKFB3 overexpression were analyzed for glucose consumption (C) and lactate production (D). (E, F) Apoptosis (E) and migration (F) (scale bars represent 50 µm) were assessed in the cultured BM EPC transfected with a control vector or a vector expressing PFKFB3 and treated with DM or 5FU. The data represent the mean ± standard error of mean. *P≤0.05.
whether activated FOXO and NF-κB signaling pathways con tribute to defective glycolysis-induced BM EPC damage.
damage, in vitro models of BM EPC damage triggered by 5FU or hydrogen peroxide were used. Time response effect data indicate that 5FU (20 µM) treatment led to a gradual increase in EPC damage at 6 h, 24 h, and 48 h, with the greatest damaging effect at 48 h, as indicated by reduced double-positive staining of DiI-AcLDL and FITC-UEA-1 (the typical markers of functional EPC) and EPC counts,
A B C D E F Haematologica | 107 October 2022 2371 ARTICLE - PFKFB3 contributes to endothelial cell damage Z. Lyu et al.
PFKFB3 promotes FOXO3A and its downstream proapoptotic gene expression in bone marrow endothelial progenitor cells after 5-fluorouracil treatment in vitro To further elucidate the mechanism underlying BM EPC
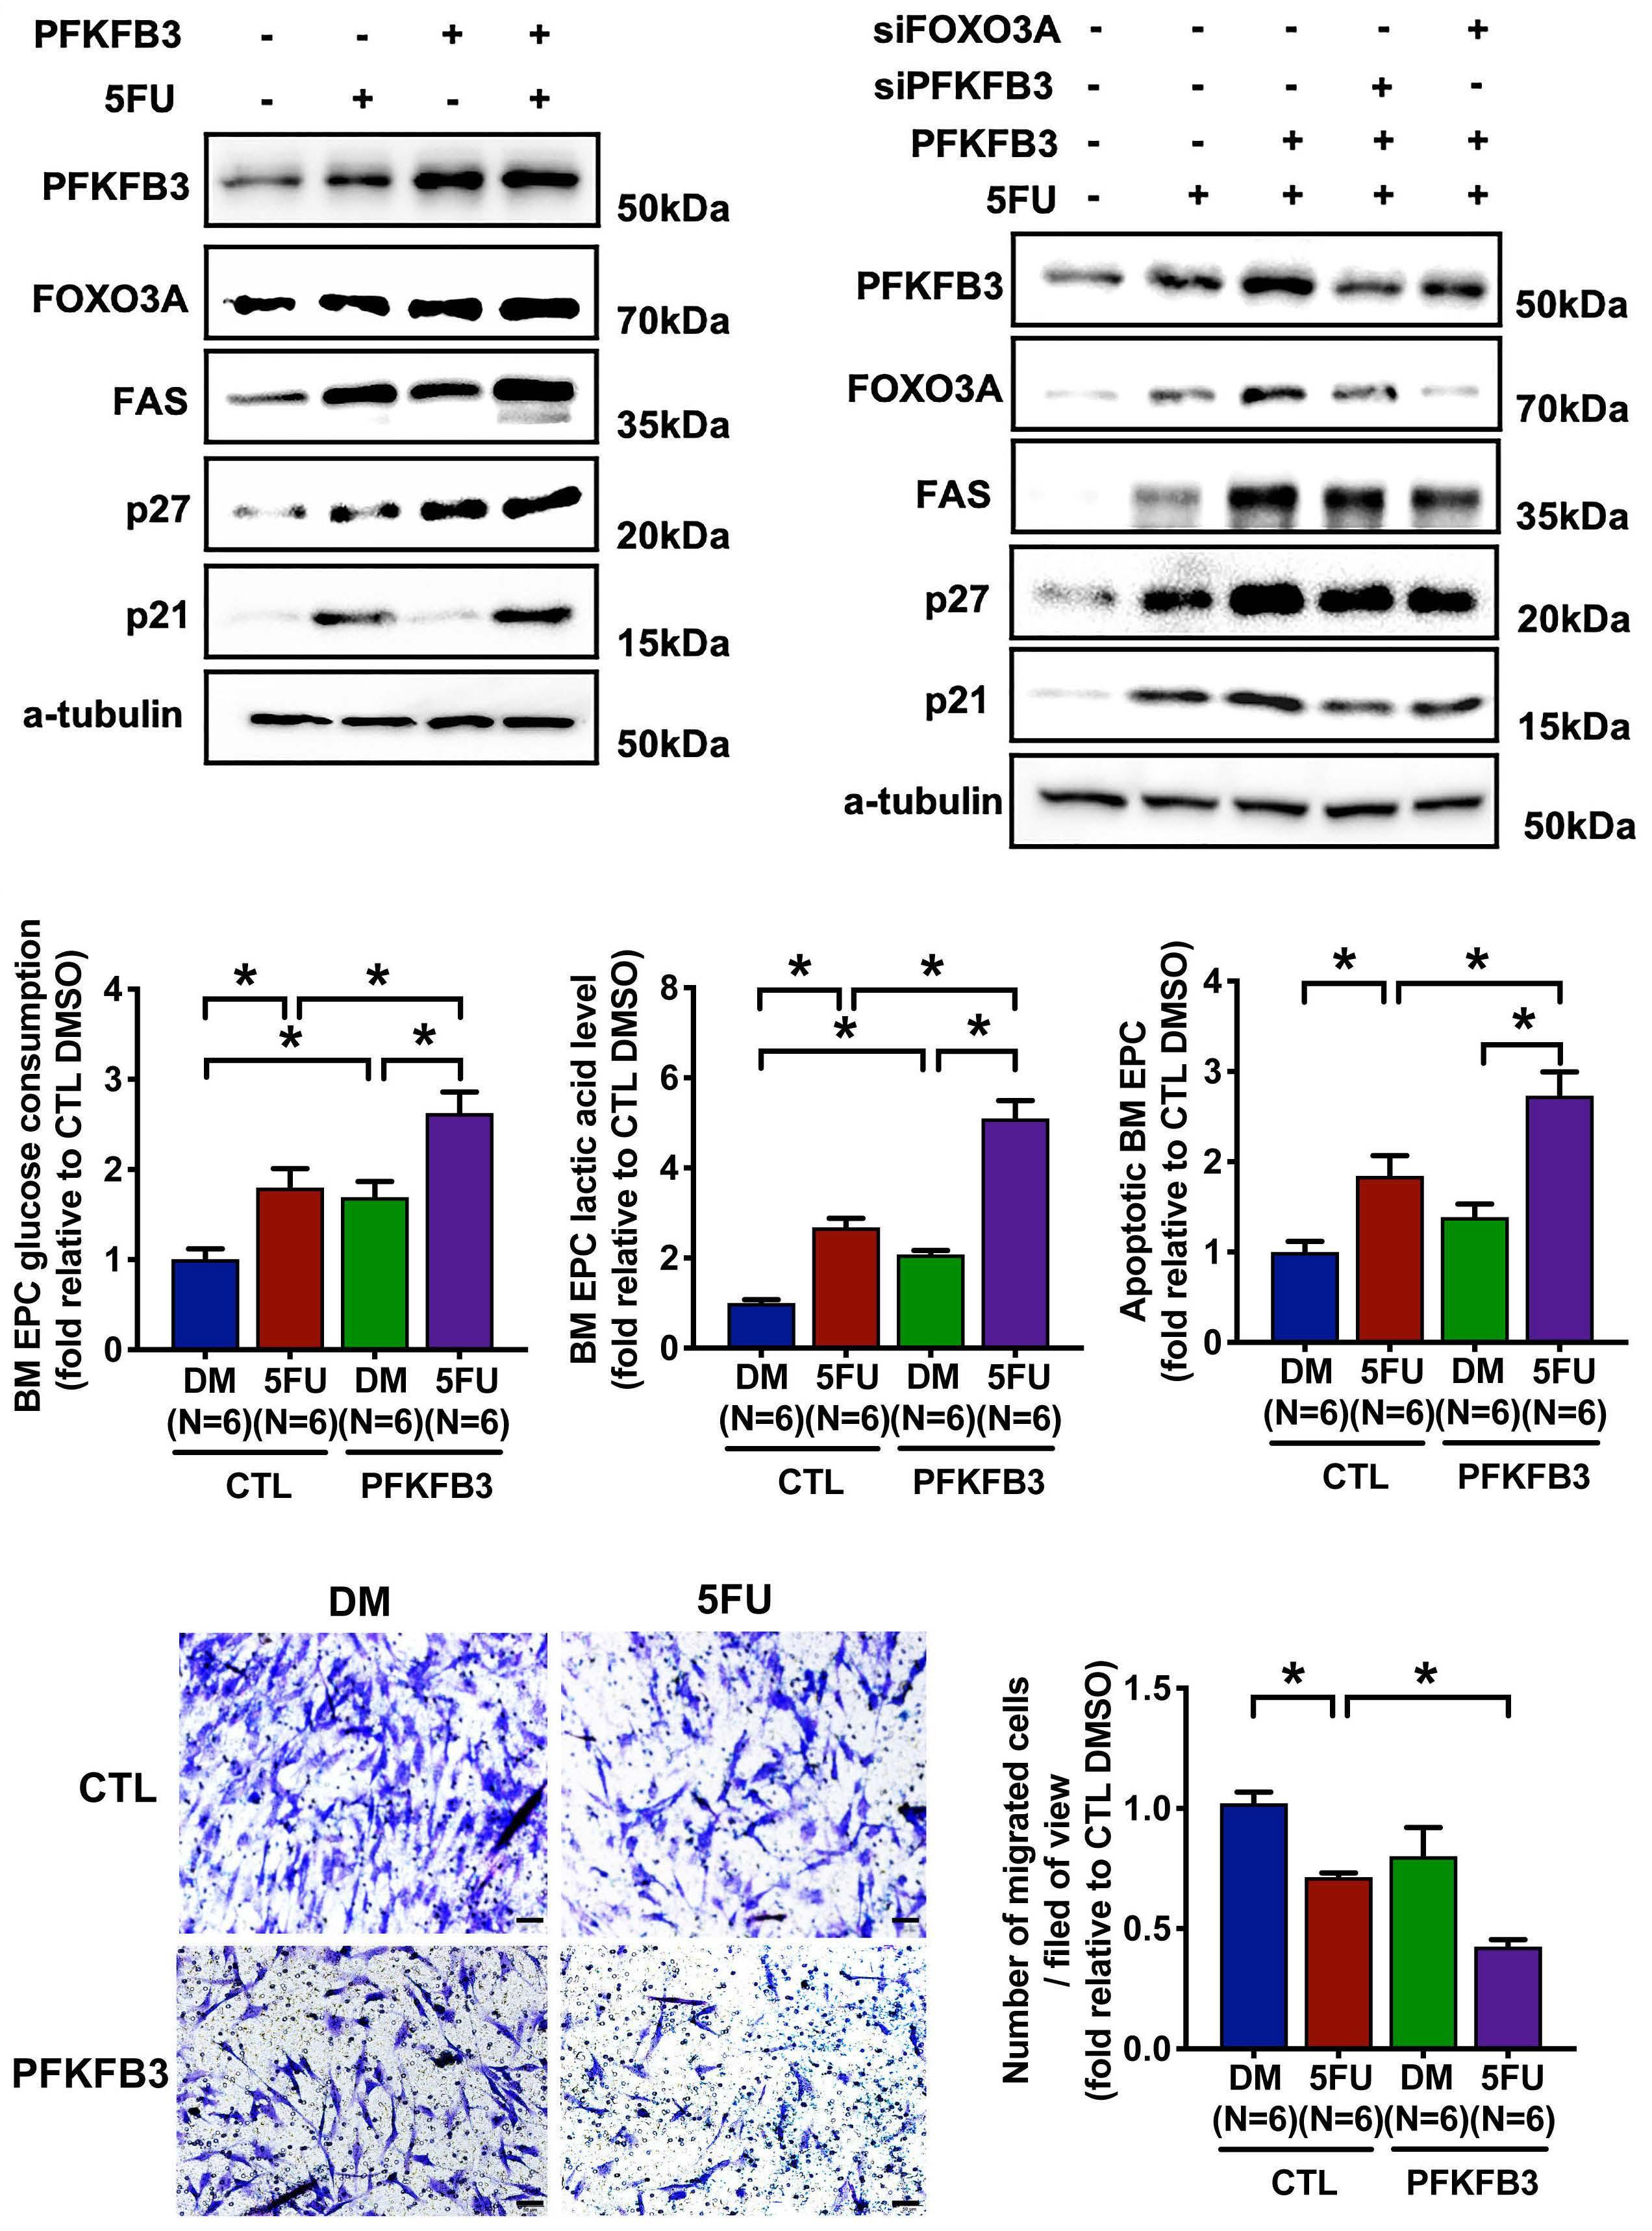
whereas ROS levels in the EPC increased (Figure 3A-C). 5FU treatment significantly increased glucose consumption (4.23±0.98-fold at 48 h; P=0.03) (Figure 3D) and lactate pro duction (3.27±0.46-fold at 48 h; P=0.03) (Figure 3E). Con sistently, 5FU treatment increased PFKFB3 expression in EPC (Figure 3F), indicating that enhanced PFKFB3 ex pression is involved in chemotherapy-induced BM EPC Hydrogendamage. peroxide markedly triggered BM EPC damage compared with the control (Online Supplementary Figure S2A-C). Moreover, hydrogen peroxide significantly increased glucose consumption (Online Supplementary Figure S2D) and lactate production (Online Supplementary Figure S2E). Consistently, hydrogen peroxide increased the expression of PFKFB3 protein in BM EPC (Online Supplementary Figure S2F). These results indicated that enhanced PFKFB3 ex pression is involved in ROS-induced BM EPC damage. To investigate the role of the FOXO signaling pathway in de fective glycolysis-induced BM EPC damage, BM EPC derived from healthy donors were transfected or not with PFKFB3 plasmids and treated or not with 5FU in vitro. PFKFB3 over expression induced expression of the pro-apoptotic tran scription factor FOXO3A and its downstream genes, including FAS, p27 and p21, after 5FU treatment (Figure 4A). Silencing of PFKFB3 decreased expression of these genes after 5FU treatment (Online Supplementary Figure S3A), which is consistent with the effects of FOXO3A silencing on expression of these genes after 5FU (Online Supplemen tary Figure S3B). Moreover, knockdown of FOXO3A attenu ated the PFKFB3-induced expression of FOXO3A and its downstream genes (Figure 4B). Compared with the effect of 5FU treatment, PFKFB3 overexpression combined with 5FU treatment further increased the levels of glucose con sumption (2.63±0.23-fold vs. 1.80±0.21-fold; P=0.03) (Figure 4C) and lactate production (5.10±0.39-fold vs. 2.69±0.20fold; P=0.03) (Figure 4D) in BM EPC. PFKFB3 overexpression combined with 5FU treatment significantly aggravated the effect of 5FU on the number (Online Supplementary Figure S3C), apoptosis (2.73±0.26-fold vs. 1.85±0.22-fold; P=0.03) (Figure 4E) and migration (0.43±0.03-fold vs. 0.72±0.02-fold; P=0.03) (Figure 4F) of BM EPC, which is consistent with the effects of FOXO3A silencing on these cell events, such as apoptosis level after 5FU (Online Supplementary Figure S3D). Considering that FOXO3A silencing alters the ex pression of PFKFB3 moderately (Online Supplementary Fig ure S3B), these results revealed that FOXO3A may be a downstream factor of PFKFB3 and mediate the effect of PFKFB3 on BM EPC pro-apoptotic gene expression, leading to BM EPC damage.
Haematologica | 107 October 2022 2372 ARTICLE - PFKFB3 contributes to endothelial cell damage Z. Lyu et al.
PFKFB3 inhibits the hematopoiesis-supporting ability of bone marrow endothelial progenitor cells by inducing NFκB pathway activation in vitro
FOXO3A and its downstream pro-apoptotic genes, we next sought to identify the regulatory relationship between PFKFB3 and the NF-κB signaling pathway in the damaged EPC in vitro. PFKFB3 overexpression increased the levels of phospho-NF-κB-p65 and its downstream adhesion mol ecule E-selectin and decreased hematopoietic or niche fac tor CXCL12 (also known as SDF-1) (Figure 5A, Online Supplementary Figure S4A) after 5FU treatment, while PFKFB3 knockdown inhibited the levels of phospho-NF-κBp65 and E-selectin and enhanced SDF-1 expression (Figure 5B, E).
In order to further investigate whether PFKFB3 affects the ability of the damaged BM EPC to support hematopoiesis in vitro, we performed co-culture assays using BM CD34+ cells from healthy donors and the EPC from healthy donors with PFKFB3 overexpression after 5FU treatment. Consistent with PFKFB3-induced NF-κB activation and decreased SDF1 in the damaged BM EPC after 5FU treatment, PFKFB3 overexpression decreased the ability of BM EPC to support CD34+ cells, as determined by the increased levels of ROS (Figure 5C) and apoptosis of the CD34+ cells (Figure 5D, On line Supplementary Figure S4B), whereas it decreased col ony-forming unit efficiency (Online Supplementary Figure S4C). Pharmacological inhibition of NF-κB via SC-514 at tenuated the PFKFB3-induced increase in phospho-NF-κBp65, E-selectin expression, decrease in SDF-1 expression and impaired hematopoiesis-supporting ability of BM EPC (Figure 5E, F). These results indicated that PFKFB3 over expression could lead to impaired hematopoiesis-suppor ting ability after chemotherapy by inducing NF-κB pathway activation.
To investigate the regulatory relationship between FOXO3A and the NF-κB pathway in the context of PFKFB3-induced BM EPC damage, we examined the activity of NF-κB and ex pression of its downstream genes in human BM EPC derived from healthy donors co-transfected with PFKFB3 plasmids and FOXO3A siRNA in vitro. FOXO3A silencing mitigated the increase in phospho-NF-κB-p65, E-selectin expression and decrease in SDF-1 expression, which were induced by PFKFB3 overexpression (Figure 5E) and attenuated the PFKFB3-impaired hematopoiesis-supporting ability of BM EPC after 5FU treatment (Figure 5F). These results indicate that FOXO3A contributes to PFKFB3-induced NF-κB path way activation and impaired hematopoiesis-supporting abil ity of BM EPC after chemotherapy.
In addition to the effect of PFKFB3-induced glycolysis on
PFKFB3 is highly expressed in the damaged bone marrow endothelial cells of murine models of myelosuppression To confirm the role of PFKFB3 in the progression of BM EC damage in vivo, murine models of myelosuppression in
FOXO3A contributes to the PFKFB3-impaired hematopoiesis-supporting ability of bone marrow endothelial progenitor cells
Figure 5. PFKFB3 induced NF-κB pathway activation and impaired the hematopoiesis-supporting ability of bone marrow en dothelial progenitor cells in vitro. (A) Western blot analyses were performed on cultured bone marrow (BM) endothelial progenitor cells (EPC) transfected with a control vector or a vector expressing PFKFB3 and treated with dimethylsulfoxide (DMSO, DM) or 5-fluorouracil (5FU). (B) Western blot analyses were performed on the cultured BM EPC transfected with a non-targeting siRNA control or siRNA targeting PFKFB3 and treated or not with 5FU. (C, D) Intracellular levels of reactive oxygen species (C), and apoptosis rates (D) of BM CD34+ cells from healthy donors were analyzed after co-culture with BM EPC transfected with a control vector or a vector expressing PFKFB3 and with or without 5FU treatment. (E) Western blot analyses were performed on the cul tured BM EPC with the indicated treatments. BM EPC in all groups were treated with lipopolysaccharide (100 ng/mL) for 4 h before collection to stimulate the expression of adhesion molecules. All the western blot analyses were performed in triplicate at least and representative images are shown. (F) The colony-forming unit plating efficiency of BM CD34+ cells from healthy donors following single culture (BM EPC-free group) and co-culture with BM EPC with the indicated treatments was analyzed. The data represent the mean ± standard error of mean. *P≤0.05. CFU: colony-forming unit; CFU-E: CFU erythroid; BFU-E: burstforming unit erythroid, CFU-GM: CFU granulocyte-macrophage, CFU-GEMM: CFU granulocyte, erythrocyte, monocyte, macro phage.
A B DC E F Haematologica | 107 October 2022 2373 ARTICLE - PFKFB3 contributes to endothelial cell damage Z. Lyu et al.
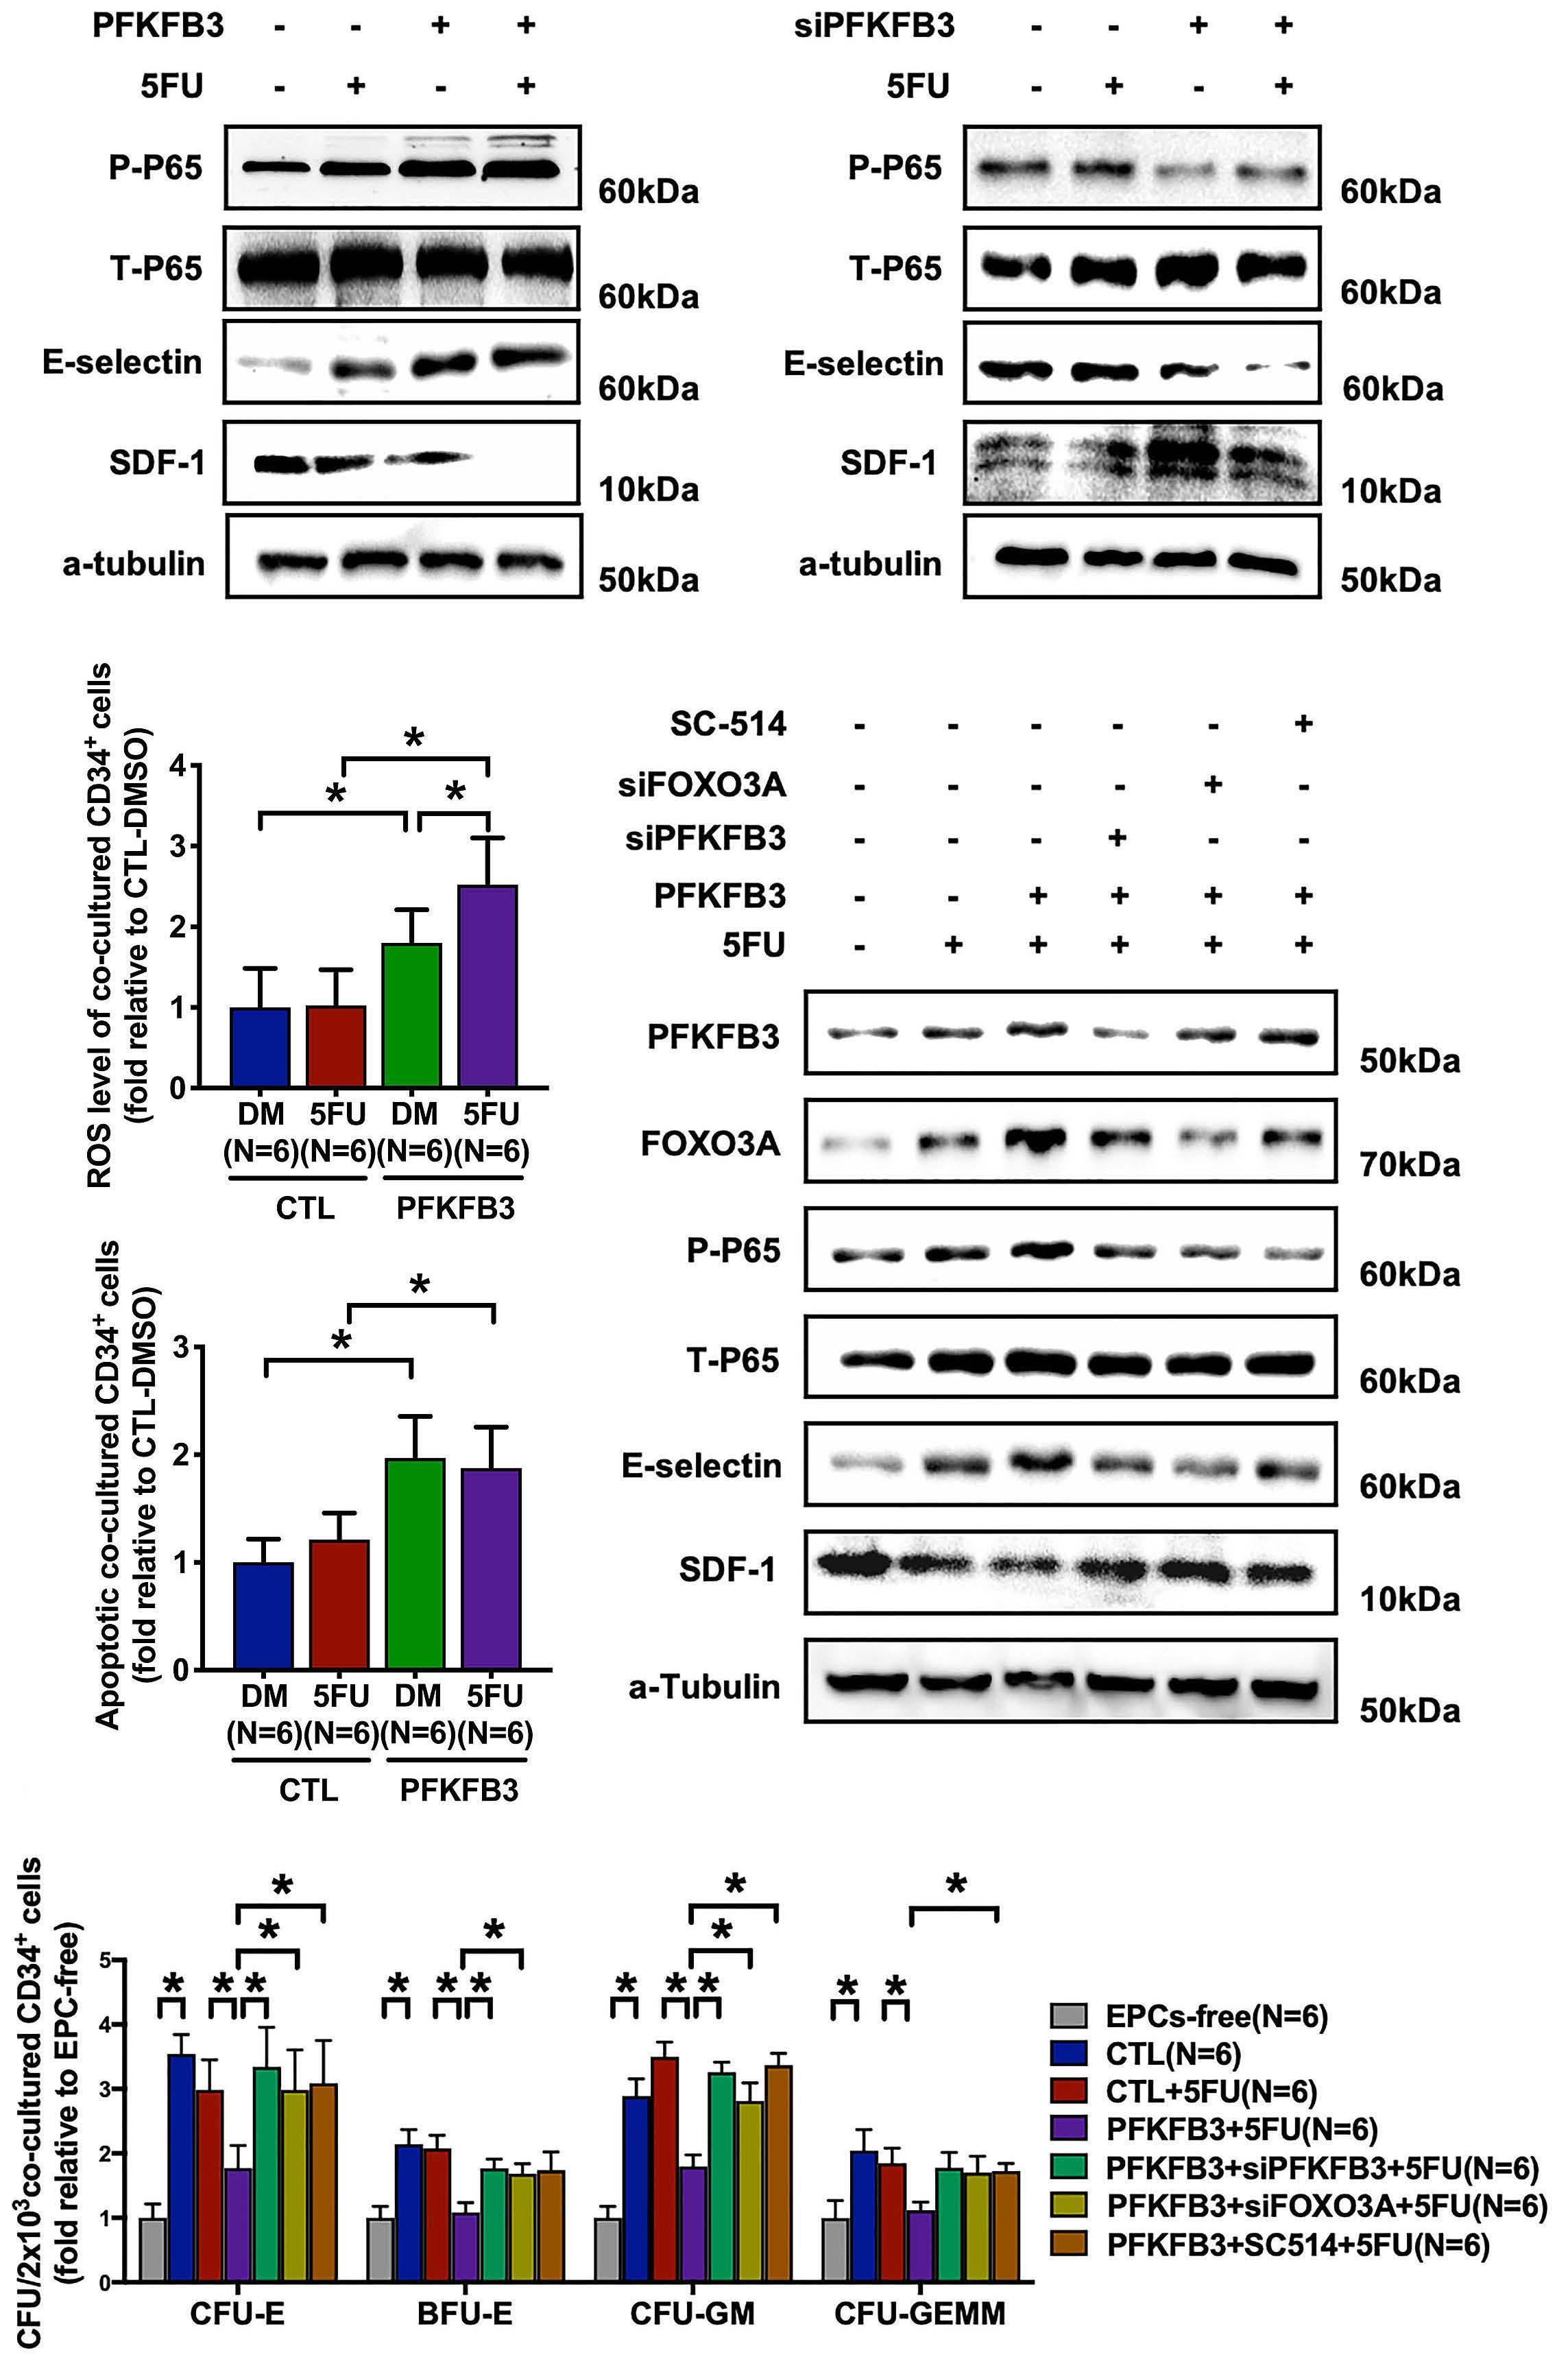
A B C D E F Haematologica | 107 October 2022 2374 ARTICLE - PFKFB3 contributes to endothelial
duced by 5FU or irradiation were generated. As shown in Figure 6A-C and Online Supplementary Figure S5, the de crease in the levels of white blood cells, hemoglobin and platelets in peripheral blood, and the damage to BM hema topoietic tissue (shown by hematoxylin and eosin staining)
and BM EC (visualized by immunohistochemistry) were greatest at day 7 and recovered by day 14 after 5FU treat ment in mice. PFKFB3 levels in BM EC were significantly in creased at day 7 and reverted to steady-state levels by 14 days after 5FU treatment. Moreover, severe BM EC damage
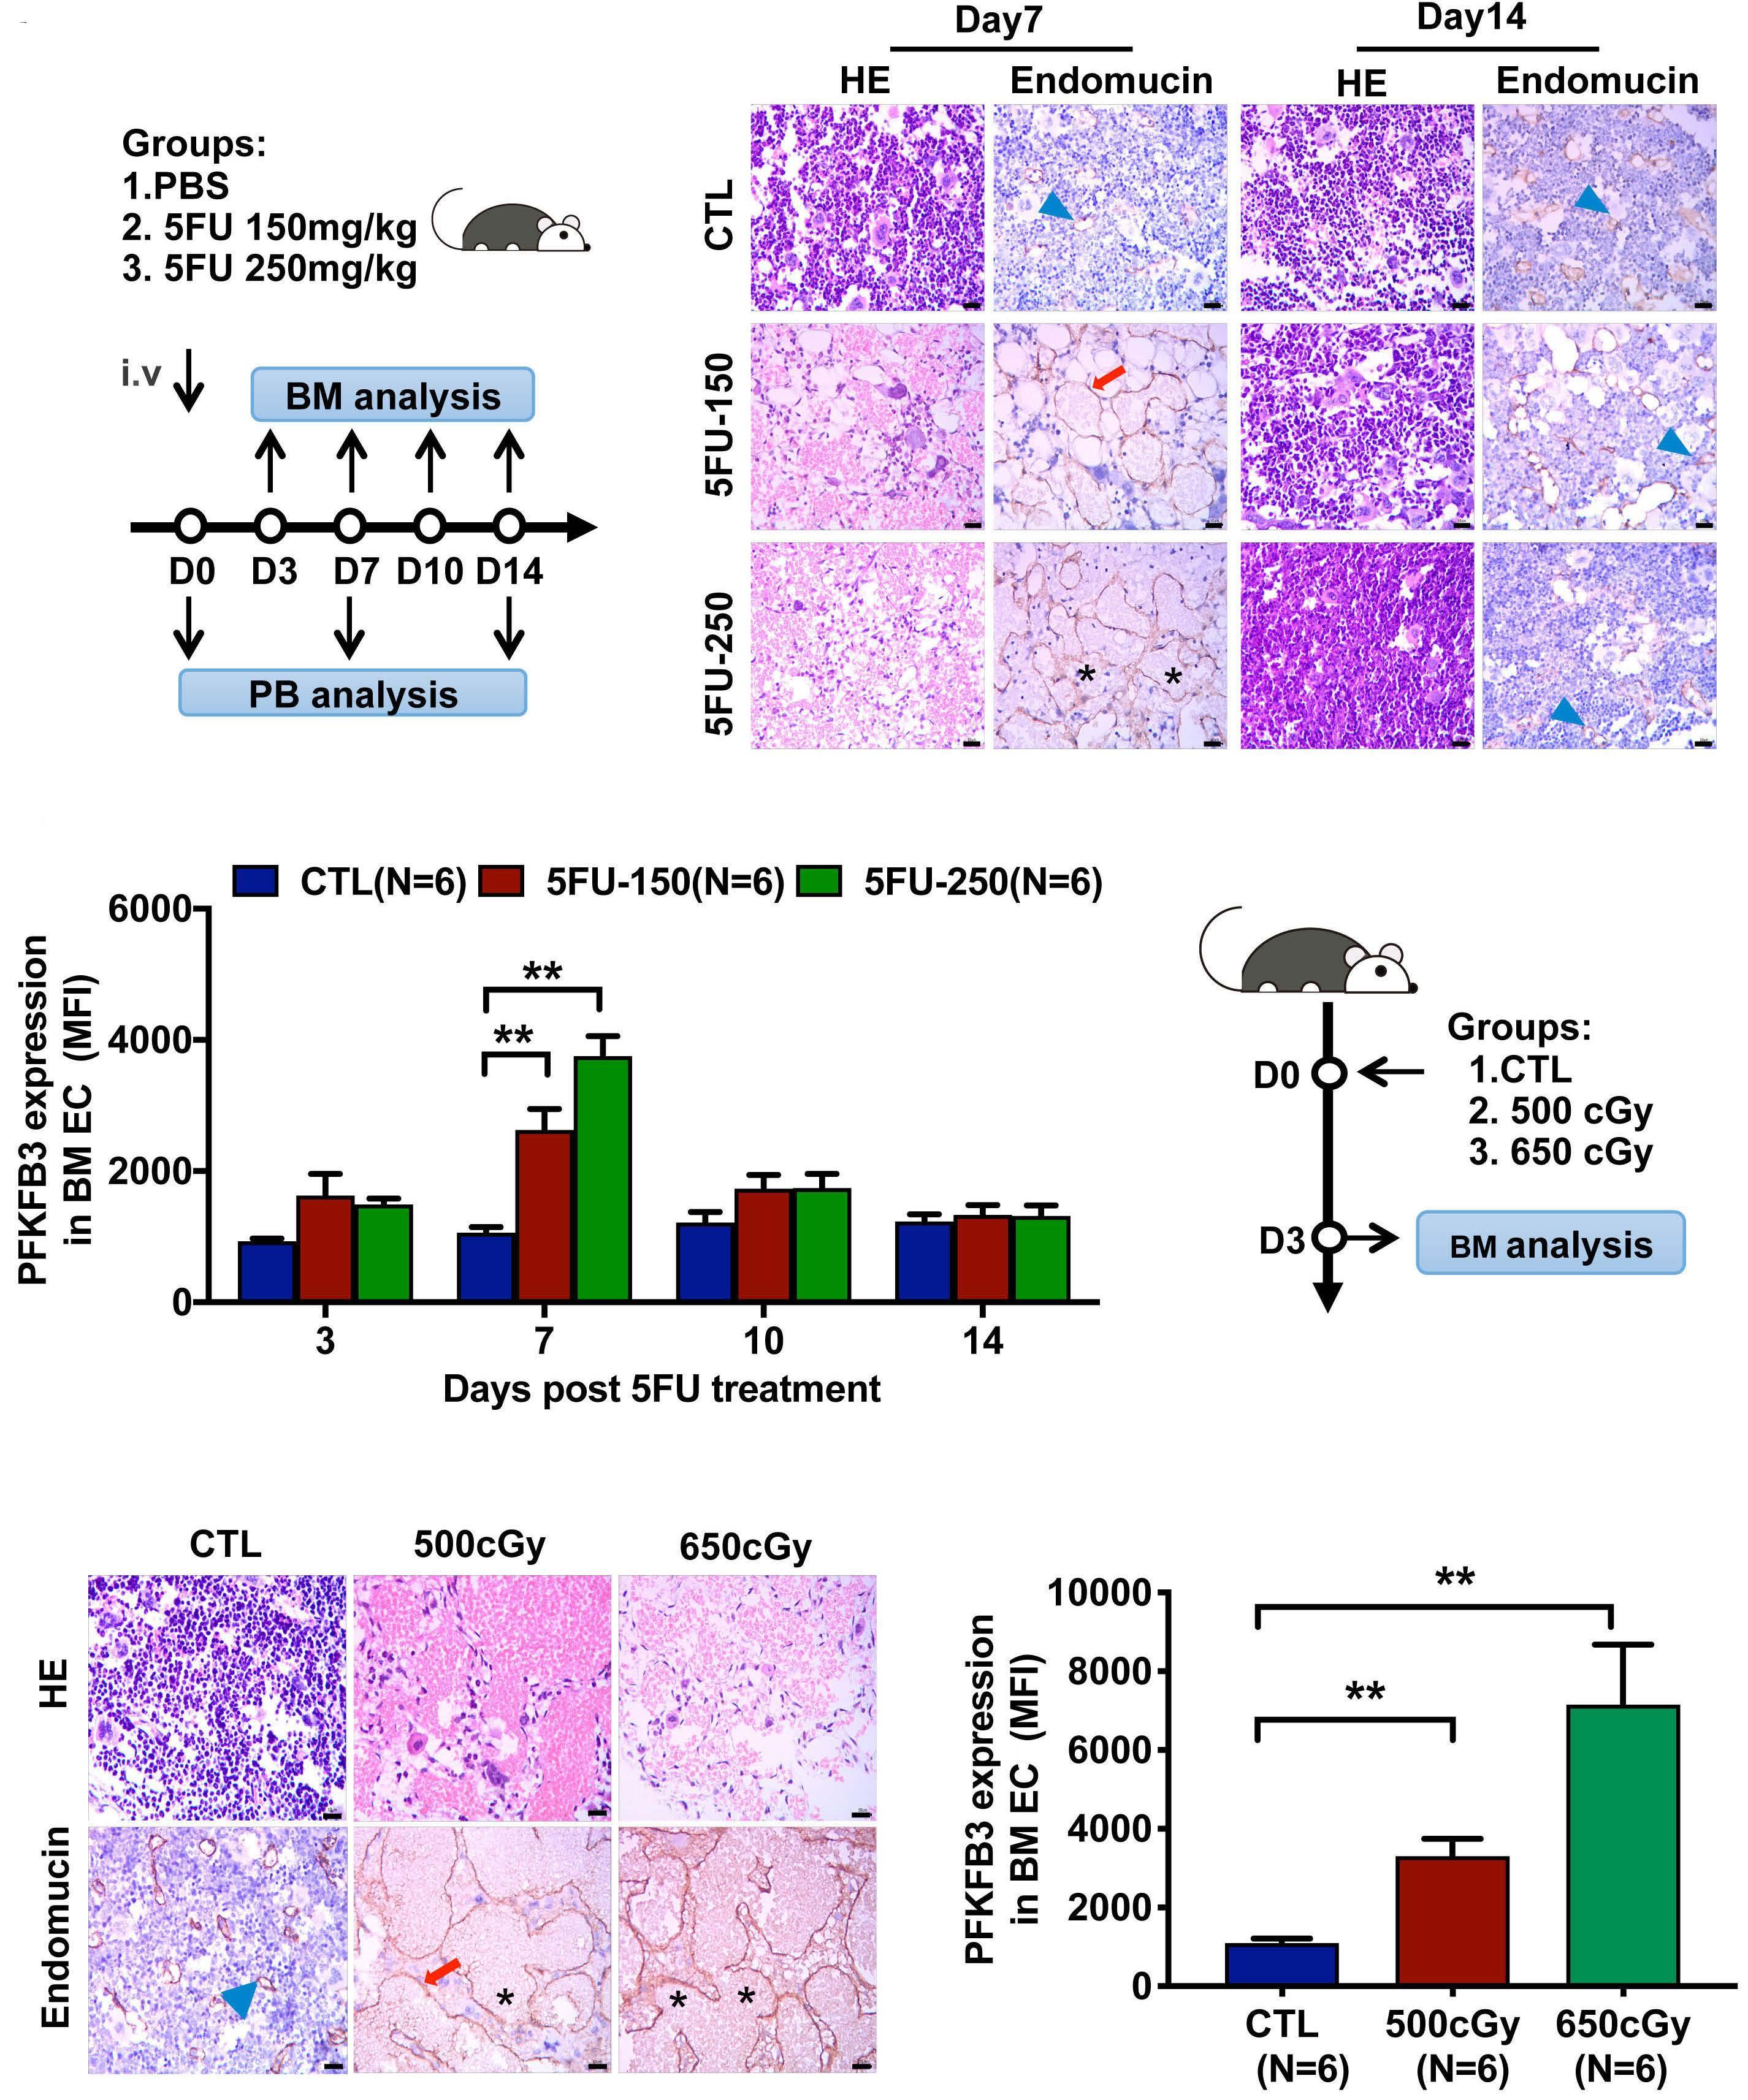
damage Z. Lyu et al.
Figure 6. PFKFB3 was increased in damaged bone marrow endothelial cells in murine models of chemotherapy- or irradiationinduced myelosuppression. (A) Schematic diagram of the design of the study on the murine model of chemotherapy-induced myelosuppression. A single dose of 5-fluorouracil (5FU) 150 mg/kg or 250 mg/kg was injected intravenously into C57BL/6J adult female mice. (B) The mice were sacrificed at the indicated times after 5FU treatment. Femoral sections stained with hematoxylin and eosin (HE) and anti-endomucin antibody showed representative bone marrow (BM) damage and BM endothelial cell (EC) damage, respectively, 7 and 14 days after 5FU treatment when compared to that in the steady state control (CTL) group. Scale bar=10 µm. Normal (blue arrowhead), dilated (red arrow) and dilated and discontinuous (black asterisk) vessels were noted. (C) The levels of PFKFB3 in BM EC of the CTL mice and at the indicated times after 5-FU treatment. (D) Schematic diagram of the design of the study on the murine model of irradiation-induced myelosuppression. C57BL/6J female mice (6-9 weeks old) were exposed to a sublethal dose of irradiation of 500 cGy or 650 cGy. The mice were sacrificed at the indicated times after irradiation. (E) Femoral sections stained with HE and anti-endomucin antibody showed representative BM damage and BM EC damage, re spectively, 3 days after irradiation, when compared to that in steady state (CTL group). Scale bar=10 µm. Normal (blue arrowhead), dilated (red arrow) and dilated and discontinuous (black asterisk) vessels were noted. (F) The levels of PFKFB3 in BM EC of CTL mice and at day 3 after irradiation. The data represent the mean ± standard error of mean. **P≤0.01. cell
Continued on following page. CBA D E F Haematologica | 107 October 2022 2375 ARTICLE - PFKFB3 contributes to endothelial cell damage Z. Lyu et al.
To further assess the role of high expression of PFKFB3 within the BM EC in vivo, mice with BM EC-specific PFKFB3
was observed at day 3 in mice irradiated with 500 cGy or 650 cGy (Figure 6D, E), which is consistent with the signifi cantly increased PFKFB3 expression in BM EC (Figure 6F). These results support the concept that increased PFKFB3 is correlated with the damaged BM EC after chemotherapy or irradiation in vivo.
Bone marrow endothelial-specific PFKFB3 overexpression aggravates damage to the bone marrow endothelial cells and delays the recovery of hematopoiesis after chemotherapy in mice
overexpression were generated via an AAV-mediated gene delivery system under the control of an EC-specific Tie pro moter, administered by injection into the BM (Figure 7A). The transduction efficiency was similarly high in BM EC from control (AAV-CTL) mice and from AAV-PFKFB3 (AAVPF3) mice, whereas transduction was not detectable in HSC from these mice (Online Supplementary Figure S6AD). Consistently, PFKFB3 expression was significantly in creased in BM EC from AAV-PF3 mice, compared to AAV-CTL mice (Online Supplementary Figure S6E). Under steady state, AAV-PF3 mice displayed similar numbers of BM EC and hematopoietic parameters, compared to AAVCTL mice. No differences were observed in the percentages
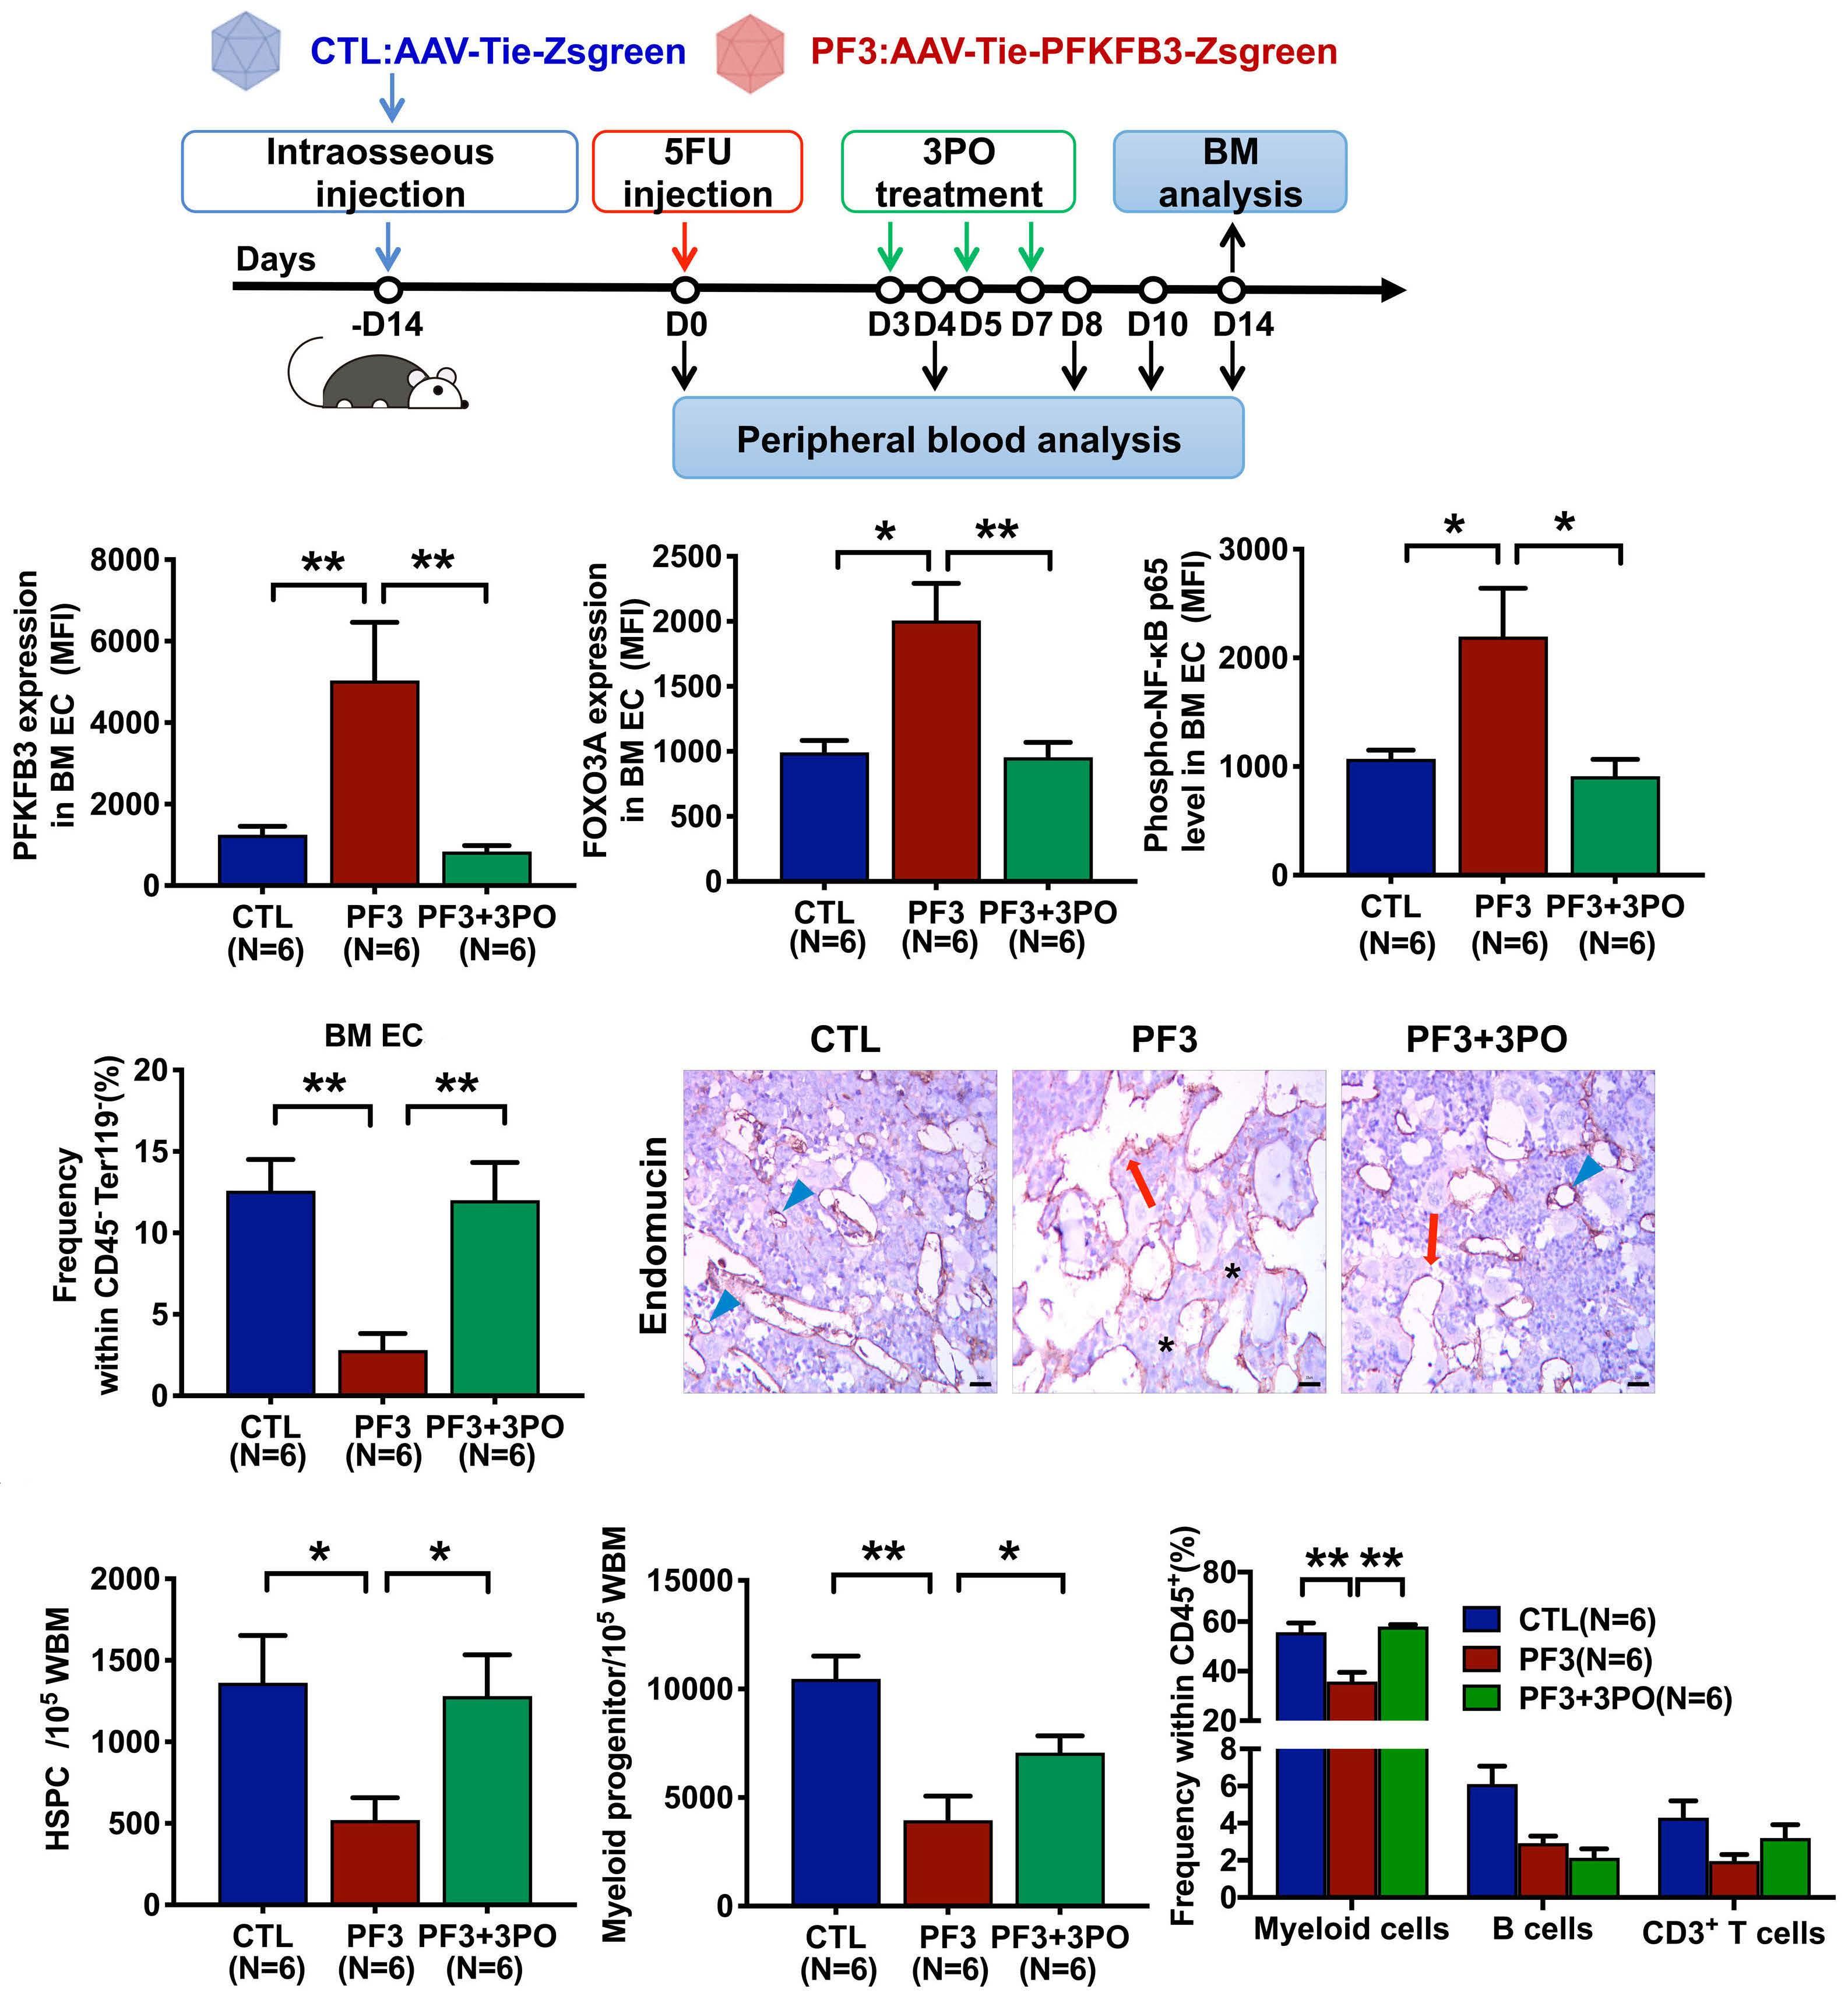
To investigate the role of PFKFB3 in damaged BM EC after chemotherapy in vivo, AAV-CTL mice and AAV-PF3 mice were treated with 5FU. At day 14 after 5FU treatment, the levels of PFKFB3, FOXO3A, and phospho-NF-κB-p65 were significantly elevated in AAV-PF3 mice (PFKFB3: 5037±1424 vs. 1249±206.9, P=0.009; FOXO3A: 2007±285.2 vs. 992.8±91.4, P=0.02; phospho-NF-κB-p65: 2197±444.3 vs. 1071±79.67, P=0.03) (Figure 7B) compared to AAV-CTL mice. Analysis of peripheral blood from AAV-CTL mice and AAVPF3 mice revealed that endothelial-specific PFKFB3 over expression delayed the recovery of peripheral blood cells following 5FU treatment (Online Supplementary Figure S7A). Consistently, we observed a significantly decreased number of BM EC (2.80±1.02 vs. 12.58±1.92; P=0.004) (Figure 7C, Online Supplementary Figure S7B) and impaired BM vessel structure (normal: 0.26±0.04 vs. 0.89±0.02, P=0.002; dilated: 0.37±0.02 vs. 0.11±0.02, P=0.002, dilated+discon tinuous: 0.36±0.03 vs. 0, P=0.002) in AAV-PF3 mice (Figure 7D, Online Supplementary Figure S7C). In agreement with the BM EC damage in AAV-PF3 mice, at day 14 following 5FU treatment, we observed decreases in the percentages of HSPC (520.0±137.7 vs. 1363.0±289.1; P=0.04) (Figure 7E, left panel, Online Supplementary Figure S8), myeloid pro genitors, including granulocyte-macrophage progenitors, common myeloid progenitors and megakaryocyte-erythro cyte progenitors: (3957±1110 vs. 10465±1059, P=0.004) (Fig ure 7E, right panel, Online Supplementary Figure S8) and hematopoietic lineages, especially myeloid cells (35.87±3.65 vs. 55.72±3.75; P=0.009) (Figure 7F) in the BM of AAV-PF3 mice. These data support the concept that PFKFB3 overexpression in BM EC triggers the BM EC dam age and delays post-chemotherapy recovery of hemato poiesis in vivo.
of HSPC and lineage cells, BM vessels and peripheral blood cell counts (Online Supplementary Figure S6F-L).
To further confirm the clinical relevance of the BM EPC damage induced by the glycolytic enzyme PFKFB3, we performed a prospective cohort study of 15 patients with acute leukemia who were scheduled for haploidentical HSCT to investigate the role of PFKFB3 in the damaged BM EPC after chemotherapy (all patients received an invivo T-cell-depleted myeloablative chemotherapy-based conditioning regimen). BM samples were collected from these patients before and after chemotherapy to compare PFKFB3 levels in their BM EPC. Considering the values from each patient, the PFKFB3 levels were significantly higher before chemotherapy than after it (5344±798.5 vs. 2564±377.2; P=0.0009) (Figure 8A). Moreover, glucose up take and lactate production were significantly increased in BM EPC after chemotherapy (2.64±0.69-fold, P=0.03; 2.73±0.84-fold, P=0.03, respectively) (Figure 8B), suppor
Figure 7. Bone marrow endothelial cell-specific PFKFB3 overexpression aggravated damage to these cells and delayed the recovery of hematopoiesis after chemotherapy in mice. (A) Schematic diagram of the design of the study on mice with bone marrow (BM) endothelial cell (EC)-specific PFKFB3 overexpression. Adult C57BL/6J female mice (8-10 weeks) were given a single dose of a re combinant AAV-VEC (an optimized adeno-associated virus variant for EC transduction encoding the PFKFB3 and Zsgreen genes under the control of an EC-specific Tie promoter; intraosseous injection with a dose of 1×10¹³ vg/mL, 30 µL per femur); control mice (age- and sex-matched) received AAV-VEC that encoded the Zsgreen gene under the control of the Tie promoter. Cohorts of mice were treated with 5-fluorouracil (5FU) 250 mg/kg at day 0 and then with 3PO or dimethylsulfoxide control on days 3, 5 and 7. The mice were sacrificed on day 14. (B) The levels of PFKFB3 (left), FOXO3A (middle) and phospho-NF-κB p65 (right) in BM EC were ana lyzed by flow cytometry. (C) Frequency of CD31+VE-Cadherin+ EC within the CD45 Ter119 BM cells from mice given the indicated treatments were analyzed by flow cytometry. (D) Representative images of damaged BM EC in a murine femur stained with antiendomucin antibody. Scale bars represent 10 µm. Normal (blue arrowhead), dilated (red arrow) and dilated and discontinuous (black asterisk) vessels were noted. (E) The frequencies of Lineage cKIT+SCA1+ hematopoietic stem and progenitor cells (left), and Line age cKIT+SCA1 myeloid progenitors (right) in whole BM cells were analyzed by flow cytometry. (F) Frequency of lineage-committed hematopoietic cells within the murine CD45+ BM cells was analyzed by flow cytometry. The data represent the mean ± standard error of mean. *P≤0.05. **P≤0.01. HSPC: hematopoietic stem and progenitor cells; WBM: whole bone marrow.
To examine the effect of PFKFB3 inhibition on the repair of BM EC damage in vivo, the glycolysis inhibitor 3PO was ad ministered to AAV-PF3 mice after 5FU treatment (Figure 7A). 3PO significantly decreased the expression of PFKFB3, FOXO3A and phospho-NF-κB p65 in BM EC (PFKFB3:
837.3±145.2 vs. 5037±1424, P=0.002; FOXOX3A: 956.2±112.6 vs. 2007±285.2, P=0.009; phospho-NF-κB p65: 911.7±155.6 vs. 2197±444.3, P=0.02) (Figure 7B). Analysis of peripheral blood from AAV-PF3 mice treated or not with 3PO revealed that PFKFB3 inhibition promoted peripheral blood cell re covery following 5FU treatment (Online Supplementary Fig ure S7A). Consistently, an increased number of BM EC (12±2.32% vs. 2.8±1.02%; P=0.009) (Figure 7C, Online Sup plementary Figure S7B) and repaired BM vessel structures (normal: 0.72±0.04 vs. 0.26±0.04, P=0.002; dilated: 0.18±0.03 vs. 0.37±0.02, P=0.002; dilated+discontinuous: 0.10±0.02 vs. 0.36±0.03, P=0.002) (Figure 7D, Online Supplementary Fig ure S7C) were found in AAV-PF3 mice treated with 3PO. These mice displayed increased percentages of HSPC (1282.0±252.4 vs. 520.0±137.7; P=0.04) (Figure 7E, left panel, Online Supplementary Figure S8), myeloid progenitors (7057.0±779.9 vs. 3957±1110; P=0.04) (Figure 7E, right panel, Online Supplementary Figure S8) and hematopoietic line ages, especially myeloid cells (58.03±0.80 vs. 35.87±3.65; P=0.002) (Figure 7F) at day 14 after 5FU treatment, sug gesting a BM EC-mediated hematopoietic protection.
Haematologica | 107 October 2022 2376 ARTICLE - PFKFB3 contributes to endothelial cell damage Z. Lyu et al.
3PO diminishes bone marrow endothelial progenitor cell damage in patients after chemotherapy
Figure 8. Glycolysis inhibition repaired the bone marrow endothelial cell damage of acute leukemia patients after chemotherapy in vitro. (A) The intracellular PFKFB3 levels in gated pre-cultured bone marrow (BM) endothelial progenitor cells (EPC) from acute leukemia patients before and after chemotherapy were analyzed by flow cytometry (mean fluorescence intensity, mean ± stan dard error of mean). Blue lines indicate patients with poor hematopoietic recovery after chemotherapy (absolute neutrophil count <1×10⁹/L or platelet count <50×109/L). Red symbols indicate the six patients whose BM EPC were cultured for the following analysis. (B) The media of cultured BM EPC from patients before and after chemotherapy and treated or not with the glycolysis inhibitor 3PO were analyzed for glucose consumption (left) and lactate production (right). (C) Western blot analyses were per formed on the cultured BM EPC from patients before and after chemotherapy treated or not with 3PO. All the western blot ana lyses were performed in triplicate at least and representative images are shown. (D) Apoptosis rates of cultured BM EPC from patients before and after chemotherapy treated or not with 3PO. (E) Representative images (scale bars=200 µm) of the tube length of BM EPC. (F) Representative images (scale bars=50 µm) of migrated BM EPC. (G) Graphical summary of the current study: schematic illustration of the contribution of glycolysis to the damage and repair of BM EPC after chemo-radiotherapy stress. *P≤0.05. **P≤0.01, ***P≤0.001. MFI: mean fluorescence intensity; DM: dimethylsulfoxide; HSC: hematopoietic stem cells.
A B C D E F G Haematologica | 107 October 2022 2377 ARTICLE - PFKFB3 contributes to endothelial cell damage Z. Lyu et al.
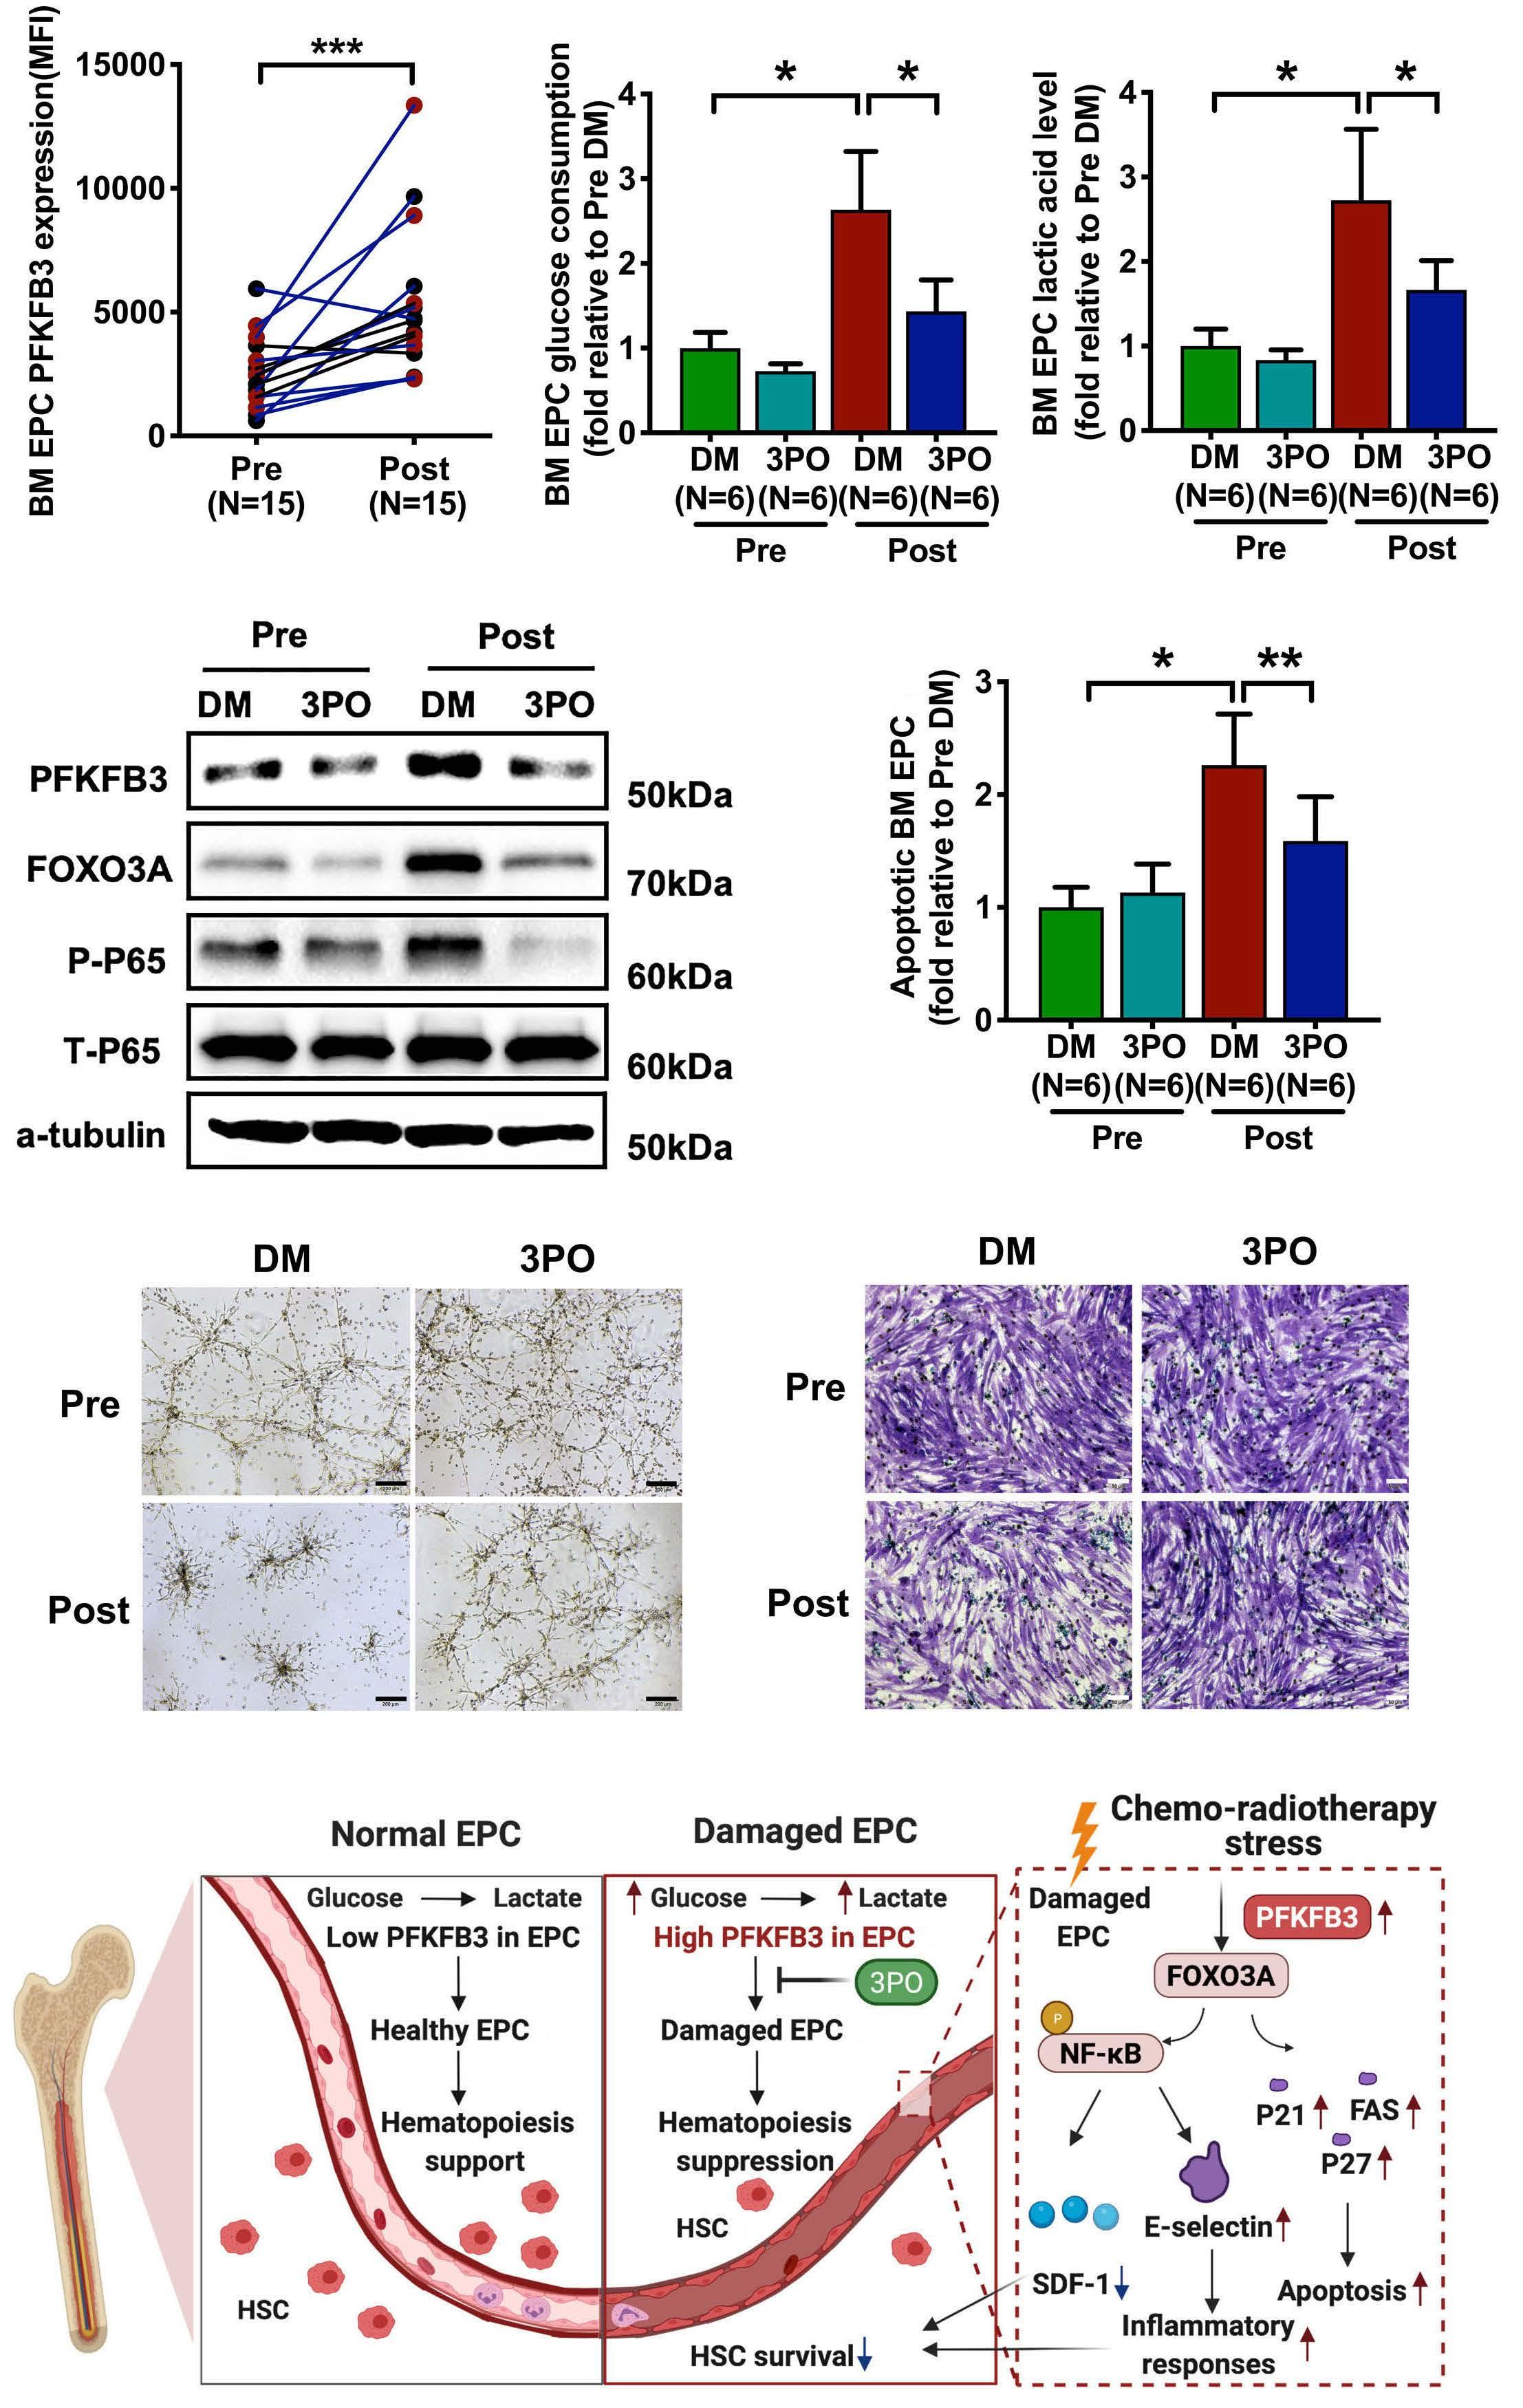
Haematologica | 107 October 2022 2378 ARTICLE - PFKFB3 contributes to endothelial cell damage Z. Lyu et al.
ting the concept that BM EPC are hyperglycolytic in pa tients after chemotherapy. The levels of FOXO3A and phospho-NF-κB p65 in BM EPC (Figure 8C) were increased after chemotherapy, accompanied by a decrease in cell number (0.49±0.15-fold; P=0.03) (Online Supplementary Figure S9A), an increase in apoptosis (2.26±0.45-fold; P=0.03) (Figure 8D), as well as impaired tube formation (Figure 8E, Online Supplementary Figure 9B) and migration (Figure 8F, Online Supplementary Figure S9C), indicating that PFKFB3-induced glycolysis is hyperactivated in the damaged BM EPC of patients after chemotherapy. The glycolysis inhibitor 3PO markedly decreased glucose consumption (1.43±0.37-fold vs. 2.64±0.69-fold; P=0.03) (Figure 8B) and lactate production (1.66±0.35-fold vs. 2.73±0.84-fold; P=0.03) (Figure 8B) in BM EPC in patients following chemotherapy. Moreover, 3PO treatment signifi cantly downregulated the levels of FOXO3A and phosphoNF-κB p65 in BM EPC (Figure 8C), leading to an increased number of cells (0.69±0.16-fold vs. 0.49±0.15-fold; P=0.008) (Online Supplementary Figure S9A), reduced apoptosis (1.59±0.39-fold vs . 2.26±0.45-fold; P =0.004) (Figure 8D), improved tube formation (Figure 8E, Online Supplementary Figure S9B) and better migration (Figure 8F, Online Supplementary Figure S9C) of BM EPC after chemotherapy. These results suggest that inhibition of PFKFB3 could attenuate the damaged BM EPC in patients after chemotherapy.
With regard to the mechanism underlying PFKFB3-in duced BM EPC damage, we found that PFKFB3 facilitated pro-apoptotic gene expression via FOXO3A after 5FU treatment in vitro and in vivo. As previously reported,48,49 the transcription factors of the FOXO family, especially FOXO3A, are involved in the regulation of many cellular processes, including apoptosis. They play critical roles in the response to environmental stress, such as genotoxic and metabolic stress, rather than being indispensable mediators of normal physiology. Our data revealed for the first time that the glycolytic enzyme PFKFB3 could trigger BM EPC damage by inducing EPC apoptosis via the acti vation of FOXO3A. Moreover, our work suggests a link be tween PFKFB3 and the activated NF-κB signaling pathway and the impaired ability of BM EPC to support hemato poiesis after injury, which is consistent with previous re ports indicating the pivotal role of NF-κB in BM EC damage and impaired hematopoietic regeneration in mice.9 However, we are aware that the details of the mechanism through which PFKFB3 regulates the hematopoiesis-sup portive function of BM-EPC have yet to be fully elucidated: for example, is the effect of 3PO and/or PFKFB3-over expression in BM EPC on hematopoietic progenitors rather than on HSC or HSPC? The relationship between the im mune microenvironment and BM EPC damage also needs to be explored further in the future. Moreover, we noted that PFKFB3 overexpression increased the expression of CXCL12 (SDF-1) mRNA without 5FU treatment, whereas PFKFB3 overexpression significantly inhibited the ex pression of CXCL12 mRNA and protein after 5FU treat ment, indicating that chemotherapy may change the protein function and downstream cell signaling of PFKFB3. Additionally, the mechanism by which chemotherapy up regulates PFKFB3 remains to be clarified. It has been re ported that ROS induce PFKFB3 in leukemia cells and promote glycolysis,50 although the mechanism by which
BM EC damage is responsible for impaired hematopoietic regeneration following chemo-radiotherapy.4,9,10,13-18,47 Al though targeting BM EC in mice has recently been shown to be a viable strategy to accelerate hematopoietic re covery, the strategy is still in its infancy.9-11,19,22 The current study demonstrated the critical role and underlying mechanism of action of PFKFB3 in BM EPC damage after chemotherapy or irradiation. The role of PFKFB3-mediated hyperglycolysis in BM EPC damage was confirmed in pa tients with poor graft function after allogeneic HSCT and in acute leukemia patients after chemotherapy, following in vitro studies , in vivo studies using murine models of myelosuppression induced by 5FU or irradiation, and a murine model of BM EC-specific PFKFB3 overexpression. Importantly, we first demonstrated that the glycolytic enzyme PFKFB3 mechanistically triggers BM EPC damage after chemotherapy via FOXO3A-induced pro-apoptotic gene expression and NF- κ B pathway activation (Figure 8G). Thus, our findings may indicate a potential thera peutic target for patients exposed to chemo-radiotherapy. Glycolysis-induced hyperproliferation was reported and became an attractive target in vascular diseases, such as pulmonary hypertension and tumor vessels.24,25 BM EPC
are considered to be the primitive precursor of EC and a critical contributor to vascular repair.20,21 However, the metabolic regulatory mechanism in BM EPC, especially in the damaged BM EPC after chemo-radiotherapy, is largely unknown. In the current study, the role of glycolysis in BM EPC, especially in BM EPC damage following chemo-radio therapy, was investigated using clinical models of BM EPC damage-associated poor hematopoiesis, in vitro and in vivo studies. We found that PFKFB3 was upregulated in the damaged BM EPC in patients with poor graft function after allogeneic HSCT and acute leukemia patients after chemotherapy. Moreover, PFKFB3 overexpression aggra vated BM EPC damage both in vitro and in murine models of chemo-radiotherapy damage. By contrast, PFKFB3 in hibition attenuated BM EPC damage both in vitro and in vivo. These results provide direct evidence that hypergly colysis induced by PFKFB3 contributes to BM EPC damage after chemotherapy or irradiation.
Discussion
sity Institute of Hematology for caring for the patients and sample collection. The authors thank Cai-Wen Duan from Shanghai Jiao Tong University School of Medicine for excel lent assistance with the immunofluorescent staining. The authors thank Ying-chun Wang and Yuanya Zhang (Institute of Genetics and Developmental Biology, Chinese Academy of Sciences) for providing technical help. The authors also thank the Flow Cytometry Core staff at the National Center for Protein Sciences at Peking University, particularly Ying hua Guo for technical help. American Journal Experts (www.journalexperts.com) provided editorial assistance to the authors during the preparation of the manuscript. The model in Figure 8G was created with biorender.com.
This work was supported by the National Key R&D Program of China (2021YFA1100904), National Natural Science Foun dation of China (82070188, 81870139 and 81930004), and the Foundation for Innovative Research Groups of the Na tional Natural Science Foundation of China (81621001).
8. Palomo M, Diaz-Ricart M, Carbo C, et al. Endothelial dysfunction after hematopoietic stem cell transplantation: role of the conditioning regimen and the type of transplantation. Biol Blood Marrow Transplant. 2010;16(7):985-993.
ROS regulate PFKFB3 on the damaged BM EPC after chemotherapy or irradiation needs to be further investi Ingated.summary, the current work demonstrates that in creased levels of the glycolytic enzyme PFKFB3 contribute to BM EPC damage after chemo-radiotherapy. Although further validation is required, our data suggest that tar geting PFKFB3 in BM EPC is a potential, future therapeutic approach for myelosuppression, not only for patients with leukemia but also for those with other cancers.
16. Kong Y, Chang YJ, Wang YZ, et al. Association of an impaired bone marrow microenvironment with secondary poor graft function after allogeneic hematopoietic stem cell transplantation. Biol Blood Marrow Transplant. 2013;19(10):1465-1473.
No conflicts of interest to disclose.
6. Ho YH, Mendez-Ferrer S. Microenvironmental contributions to hematopoietic stem cell aging. Haematologica. 2020;105(1):38-46.
References
Data-sharing statement
13. Shi MM, Kong Y, Song Y, et al. Atorvastatin enhances endothelial cell function in posttransplant poor graft function. Blood. 2016;128(25):2988-2999.
7. Hassanshahi M, Hassanshahi A, Khabbazi S, Su YW, Xian CJ. Bone marrow sinusoidal endothelium: damage and potential regeneration following cancer radiotherapy or chemotherapy. Angiogenesis. 2017;20(4):427-442.
Funding
endothelial cells regulate hematopoietic stem cell regeneration following radiation injury. Stem Cells. 2013;31(2):327-337.
14. Kong Y. Poor graft function after allogeneic hematopoietic stem cell transplantation-an old complication with new insights. Semin Hematol. 2019;56(3):215-220.
9. Poulos MG, Ramalingam P, Gutkin MC, et al. Endothelial-specific inhibition of NF-kappaB enhances functional haematopoiesis. Nat Commun. 2016;7:13829.
3. Crane GM, Jeffery E, Morrison SJ. Adult haematopoietic stem cell niches. Nat Rev Immunol. 2017;17(9):573-590.
2. Pober JS, Min W, Bradley JR. Mechanisms of endothelial dysfunction, injury, and death. Annu Rev Pathol. 2009;4:71-95.
4. Hooper AT, Butler JM, Nolan DJ, et al. Engraftment and reconstitution of hematopoiesis is dependent on VEGFR2mediated regeneration of sinusoidal endothelial cells. Cell Stem Cell. 2009;4(3):263-274.
18. Gadomski S, Singh SK, Singh S, et al. Id1 and Id3 maintain
XJH and YK designed the study, supervised the preparation of the manuscript, and contributed equally to the study. ZSL and YK performed the research, analyzed the data and wrote the manuscript. All other authors participated in the collection of patients’ data. All of the authors read and ap proved the final manuscript.
Acknowledgements
10. Doan PL, Russell JL, Himburg HA, et al. Tie2(+) bone marrow
12. Henry E, Souissi-Sahraoui I, Deynoux M, et al. Human hematopoietic stem/progenitor cells display reactive oxygen species-dependent long-term hematopoietic defects after exposure to low doses of ionizing radiations. Haematologica. 2020;105(8):2044-2055.
Disclosures
The authors thank all of the core facilities at Peking Univer
1. Mauch P, Constine L, Greenberger J, et al. Hematopoietic stem cell compartment: acute and late effects of radiation therapy and chemotherapy. Int J Radiat Oncol Biol Phys. 1995;31(5):1319-1339.
5. Butler JM, Nolan DJ, Vertes EL, et al. Endothelial cells are essential for the self-renewal and repopulation of Notchdependent hematopoietic stem cells. Cell Stem Cell. 2010;6(3):251-264.
Haematologica | 107 October 2022 2379 ARTICLE - PFKFB3 contributes to endothelial cell damage Z. Lyu et al.
The data in this study are available from the corresponding author upon reasonable request.
15. Kong Y, Wang Y, Zhang YY, et al. Prophylactic oral NAC reduced poor hematopoietic reconstitution by improving endothelial cells after haploidentical transplantation. Blood Adv. 2019;3(8):1303-1317.
Contributions
11. Kopp HG, Avecilla ST, Hooper AT, et al. Tie2 activation contributes to hemangiogenic regeneration after myelosuppression. Blood. 2005;106(2):505-513.
17. Kong Y, Wang YT, Hu Y, et al. The bone marrow microenvironment is similarly impaired in allogeneic hematopoietic stem cell transplantation patients with early and late poor graft function. Bone Marrow Transplant. 2016;51(2):249-255.
45. Selenica ML, Reid P, Pena G, et al. Adeno associated viralmediated intraosseous labeling of bone marrow derived cells for CNS tracking. J Immunol Methods. 2016;432:51-56.
25. Schoors S, De Bock K, Cantelmo AR, et al. Partial and transient reduction of glycolysis by PFKFB3 blockade reduces pathological angiogenesis. Cell Metab. 2014;19(1):37-48.
37. Cao XN, Kong Y, Song Y, et al. Impairment of bone marrow endothelial progenitor cells in acute graft-versus-host disease patients after allotransplant. Br J Haematol. 2018;182(6):870-886.
49. Fitzwalter BE, Thorburn A. FOXO3 links autophagy to apoptosis. Autophagy. 2018;14(8):1467-1468.
32. Song Y, Zhao HY, Lyu ZS, et al. Dysfunctional bone marrow mesenchymal stem cells in patients with poor graft function after allogeneic hematopoietic stem cell transplantation. Biol Blood Marrow Transplant. 2018;24(10):1981-1989.
22. Salter AB, Meadows SK, Muramoto GG, et al. Endothelial progenitor cell infusion induces hematopoietic stem cell reconstitution in vivo. Blood. 2009;113(9):2104-2107.
46. Spevak CC, Elias HK, Kannan L, et al. Hematopoietic stem and progenitor cells exhibit stage-specific translational programs via mTOR- and CDK1-dependent mechanisms. Cell Stem Cell. 2020;26(5):755-765.e7.
34. Zhao HY, Zhang YY, Xing T, et al. M2 macrophages, but not M1 macrophages, support megakaryopoiesis by upregulating PI3KAKT pathway activity. Signal Transduct Target Ther.
36. Kong Y, Cao XN, Zhang XH, et al. Atorvastatin enhances bone marrow endothelial cell function in corticosteroid-resistant immune thrombocytopenia patients. Blood. 2018;131(11):1219-1233.
48. Luo X, Puig O, Hyun J, Bohmann D, Jasper H. Foxo and Fos regulate the decision between cell death and survival in response to UV irradiation. EMBO J. 2007;26(2):380-390.
47. Ramalingam P, Poulos MG, Lazzari E, et al. Chronic activation of endothelial MAPK disrupts hematopoiesis via NFKB dependent inflammatory stress reversible by SCGF. Nat Commun. 2020;11(1):666.
24. Li X, Kumar A, Carmeliet P. Metabolic pathways fueling the endothelial cell drive. Annu Rev Physiol. 2019;81:483-503.
steady-state hematopoiesis by promoting sinusoidal endothelial cell survival and regeneration. Cell Rep. 2020;31(4):107572.
41. Himburg HA, Sasine J, Yan X, Kan J, Dressman H, Chute JP. A molecular profile of the endothelial cell response to ionizing radiation. Radiat Res. 2016;186(2):141-152.
31. Wang Y, Liu Q-F, Lin R, et al. Optimizing antithymocyte globulin dosing in haploidentical hematopoietic cell transplantation: long-term follow-up of a multicenter, randomized controlled trial. Sci Bull. 2021;66(24):2498-2505.
26. Cao Y, Zhang X, Wang L, et al. PFKFB3-mediated endothelial glycolysis promotes pulmonary hypertension. Proc Natl Acad Sci U S A. 2019;116(27):13394-13403.
38. Focaccetti C, Bruno A, Magnani E, et al. Effects of 5-fluorouracil on morphology, cell cycle, proliferation, apoptosis, autophagy and ROS production in endothelial cells and cardiomyocytes. PLoS One. 2015;10(2):e0115686.
35. Kong Y, Shi MM, Zhang YY, et al. N-acetyl-L-cysteine improves bone marrow endothelial progenitor cells in prolonged isolated thrombocytopenia patients post allogeneic hematopoietic stem cell transplantation. Am J Hematol. 2018;93(7):931-942.
23. Lyu ZS, Cao XN, Wen Q, et al. Autophagy in endothelial cells regulates their haematopoiesis-supporting ability. EBioMedicine. 2020;53:102677.
28. Goveia J, Stapor P, Carmeliet P. Principles of targeting endothelial cell metabolism to treat angiogenesis and endothelial cell dysfunction in disease. EMBO Mol Med. 2014;6(9):1105-1120.
40. Kishore N, Sommers C, Mathialagan S, et al. A selective IKK-2 inhibitor blocks NF-kappa B-dependent gene expression in interleukin-1 beta-stimulated synovial fibroblasts. J Biol Chem. 2003;278(35):32861-32871.
43. Zhang L, Rossi A, Lange L, et al. Capsid engineering overcomes barriers toward adeno-associated virus vector-mediated transduction of endothelial cells. Hum Gene Ther. 2019;30(10):1284-1296.
20. Wang L, Wang X, Xie G, Wang L, Hill CK, DeLeve LD. Liver sinusoidal endothelial cell progenitor cells promote liver regeneration in rats. J Clin Invest. 2012;122(4):1567-1573.
50. Robinson AJ, Hopkins GL, Rastogi N, et al. Reactive oxygen species drive proliferation in acute myeloid leukemia via the glycolytic regulator PFKFB3. Cancer Res. 2020;80(5):937-949.
33. Zhao HY, Lyu ZS, Duan CW, et al. An unbalanced monocyte macrophage polarization in the bone marrow microenvironment of patients with poor graft function after allogeneic haematopoietic stem cell transplantation. Br J Haematol. 2018;182(5):679-692.
42. Wang D, Tai PWL, Gao G. Adeno-associated virus vector as a platform for gene therapy delivery. Nat Rev Drug Discov. 2019;18(5):358-378.
29. Zhang XH, Chen J, Han MZ, et al. The consensus from The Chinese Society of Hematology on indications, conditioning regimens and donor selection for allogeneic hematopoietic stem cell transplantation: 2021 update. J Hematol Oncol. 2021;14(1):145.
19. Chute JP, Muramoto GG, Salter AB, et al. Transplantation of vascular endothelial cells mediates the hematopoietic recovery and survival of lethally irradiated mice. Blood. 2007;109(6):2365-2372.
21. Zhang M, Malik AB, Rehman J. Endothelial progenitor cells and vascular repair. Curr Opin Hematol. 2014;21(3):224-228.
2021;6(1):234.
44. Gustafsson E, Brakebusch C, Hietanen K, Fassler R. Tie-1directed expression of Cre recombinase in endothelial cells of embryoid bodies and transgenic mice. J Cell Sci. 2001;114(Pt 4):671-676.
27. Cantelmo AR, Conradi LC, Brajic A, et al. Inhibition of the glycolytic activator PFKFB3 in endothelium induces tumor vessel normalization, impairs metastasis, and improves chemotherapy. Cancer Cell. 2016;30(6):968-985.
Haematologica | 107 October 2022 2380 ARTICLE - PFKFB3 contributes to endothelial cell damage Z. Lyu et al.
39. Wang B, Luo T, Chen D, Ansley DM. Propofol reduces apoptosis and up-regulates endothelial nitric oxide synthase protein expression in hydrogen peroxide-stimulated human umbilical vein endothelial cells. Anesth Analg. 2007;105(4):1027-1033.
30. Wang Y, Chen H, Chen J, et al. The consensus on the monitoring, treatment, and prevention of leukemia relapse after allogeneic hematopoietic stem cell transplantation in China. Cancer Lett. 2018;438:63-75.
Received: July 30, 2021.
Haematologica | 107 October 2022 2381 ARTICLE - Hematopoiesis
https://doi.org/10.3324/haematol.2021.279739
YTHDF3 modulates hematopoietic stem cells by recognizing RNA m6A modification on Ccnd1
IAbstractntroduction
Hematopoietic stem cells (HSC) give rise to the cells of the blood system over the whole lifespan. N6-methyladenosine (m6A), the most prevalent RNA modification, modulates gene expression via the processes of “writing” and “reading”. Recent studies showed that m6A “writer” genes (Mettl3 and Mettl14) play an essential role in HSC. However, which reader deciphers the m6A modification to modulate HSC remains unknown. In this study, we observed that dysfunction of Ythdf3 and Ccnd1 severely impaired the reconstitution capacity of HSC, which phenocopies Mettl3-deficient HSC. Dysfunction of Ythdf3 and Mettl3 results in a translational defect of Ccnd1. Ythdf3 and Mettl3 regulate HSC by transmitting m6A RNA methylation on the 5’ untranslated region of Ccnd1. Enforced Ccnd1 expression completely rescued the defect of Ythdf3-/- HSC and partially rescued Mettl3-compromised HSC. Taken together, this study identified, for the first time, that Ccnd1 is the target of METTL3 and YTHDF3 to transmit the m6A RNA methylation signal and thereby regulate the reconstitution capacity of HSC.
Prepublished: February 3, 2022.
Yao et al. reported that in the hematopoietic system, the METTL3 and METTL14 complex regulates the self-re newal capacity of HSC.16 Two more studies documented that Mettl3 modulates the differentiation and symmetric commitment of HSC by targeting Myc.17,18 Given that m6A methylation exerts its effects through reader proteins, and that RNA m 6 A modification participates in diverse eukaryotic biological processes 19-20 and tumor initi
Correspondence: Ping jianweiwang@mail.tsinghua.edu.cnJianweijianghong961106@zju.edu.cnHongzhuping301hospital@163.comZhuJiangWang
Published under a CC BY-NC license
©2022 Ferrata Storti Foundation
Xiaofei Zhang,1* Tingting Cong,1* Lei Wei,2 Bixi Zhong,2 Xiaowo Wang,2 Jin Sun,3 Shuxia Wang,3 Meng Michelle Xu,4 Ping Zhu,3 Hong Jiang5 and Jianwei Wang1
1School of Pharmaceutical Sciences, Tsinghua University, Beijing; 2Ministry of Education Key Laboratory of Bioinformatics, Center for Synthetic and Systems Biology, Bioinformatics Division, BNRIST, Department of Automation, Tsinghua University, Beijing; 3Department of Geriatrics, The Second Medical Center & National Clinical Research Center for Geriatric Diseases, Chinese PLA General Hospital, Beijing; 4Department of Basic Medical Sciences, School of Medicine, Institute for Immunology, Beijing Key Lab for Immunological Research on Chronic Diseases, THU-PKU Center for Life Sciences, Tsinghua University, Beijing and 5Kidney Disease Center, the First Affiliated Hospital, College of Medicine, Zhejiang University, Hangzhou, China
Accepted: November 25, 2021.
*XZ and TC contributed equally as co-first authors.
and Rbm15b ,6-8 with Mettl3 being the catalytic core; 6,9 m 6 A methylation can be reversed via active demethyl ation by m6A demethylases FTO or ALKBH5. YTH domaincarrying genes, including Ythdf1, Ythdf2 and Ythdf3,10 are responsible for the process of “reading” the m6A code by selectively binding to m 6 A-containing transcripts and have the function of modifying m6A.10-13 Ythdf1 regulates the translation efficiency by binding m 6 A-modified mRNA,13 Ythdf2 decreases mRNA stability by recruiting the CCR4-NOT deadenylase complex,12,14 and Ythdf3 fa cilitates translation or decay of m 6 A-modified mRNA through cooperation with Ythdf1 or Ythdf2.11,15
Hematopoietic stem cells (HSC) generate all blood cells and themselves throughout life, a function that is achieved through differentiation and self-renewal.1,2 Therefore, discovering the molecular mechanisms modu lating HSC differentiation and self-renewal is of great im portance to understand the nature of the blood system and hematopoietic malignancies. Although some studies have revealed several molecular mechanisms regulating HSC, 3 the exact mechanisms are still not fully under stood. In recent years, post-transcriptional chemical modifications, which are introduced at specific sites of RNA, have become an emerging field of interest.4 Among the various RNA alterations, N6-methyladenosine (m6A) is the most abundant nucleotide modification in mess enger RNA (mRNA), which functions through the pro cesses of “writing”, “erasing” and “reading”.5 A few genes are responsible for the process of "writing" the m6A code, including Mettl3, Mettl14, Wtap, Zc3h13, Kiaa1429, Rbm15
The reconstitution capacity of Ythdf3-deficient hematopoietic stem cells is impaired
trol mice (Figure 1C, D). In addition, the bone marrow cel lularity of Ythdf1-/- and Ythdf3-/- was indistinguishable from that of control mice (Online Supplementary Figure S1A-D). We then sought to investigate the lineage composition, in cluding T, B and myeloid cells, in peripheral blood and bone marrow of Ythdf1-/- and Ythdf3-/- mice. The results revealed no difference between Ythdf1-/- and WT mice in either the peripheral blood (Figure 1E) or the bone marrow (Online Supplementary Figure S1G). As for Ythdf3-/- mice, the per centages of B and myeloid cells remained stable in periph eral blood and bone marrow compared to those in WT mice (Figure 1F and Online Supplementary Figure S1H), while the percentages of CD4+ and CD8+ T cells decreased slightly in bone marrow (1.58±0.24 vs. 1.11±0.14, 1.62±0.26 vs. 1.15±0.14), but not in peripheral blood (10.94±1.50 vs. 10.54±1.65, 12.52±0.99 vs. 12.95±0.78) (Figure 1F and Online Supplemen tary Figure S1H). We then compared the frequencies of T cells in spleen and thymus between Ythdf3-/- and WT mice, without finding a significant difference (Online Supplemen tary Figure S1I, J). We next analyzed hematopoietic stem and progenitor cells of Ythdf1-/- and Ythdf3-/- mice, including common myeloid progenitors, granulocyte-macrophage progenitors, mega karyocyte-erythroid progenitors, common lymphoid pro genitors, multipotent progenitor cells and HSC. We observed that the frequencies and absolute numbers of these cells remained the same between Ythdf1-/- and WT mice (Figure 1G, H and Online Supplementary Figure S1B, C). Likewise, the frequencies and absolute numbers of common myeloid, granulocyte-macrophage, megakaryo cyte-erythroid, and common lymphoid progenitors, as well as multipotent progenitor cells in Ythdf3-/- mice were com parable with those in WT mice (Figure 1I and Online Sup plementary Figure S1E). However, the frequency and absolute number of Ythdf3-/- HSC were iincreased signifi cantly (64.31±10.34 vs. 106.01±6.99, 1.90±0.31 vs. 2.82 vs 0.23) (Figure 1J and Online Supplementary Figure S1F), re sembling those of Mettl3-/- mice.16,17 Cell cycle analysis re vealed no difference between Ythdf3-/- and WT HSC (Online Supplementary Figure S1K, L).
Haematologica | 107 October 2022 2382 ARTICLE - YTHDF3 modulates HSC via m6A modification on Ccnd1 M. Capra et al.
Methods
Mettl3fl/fl, Ythdf1-/- and Ythdf3-/- mice were generated in Cyagen Biosciences Inc. (Guangzhou, China). All mice were kept in specific pathogen-free conditions and all procedures were approved by the Institutional Animal Care and Use Committee of Tsinghua University. Full de tails are supplied in the Online Supplementary Methods.
To further investigate the reconstitution capacity of Ythdf1 -/- and Ythdf3-/- HSC, 25 freshly isolated Ythdf1-/-, Ythdf3-/- and WT HSC were transplanted into lethally ir radiated recipients together with 2.5×10⁵ competitor cells (Figure 2A). We observed no obvious differences of periph eral blood chimera and lineage distribution between Ythdf1-/- and WT HSC (Figure 2B and Online Supplementary Figure S2A). By contrast, the reconstitution capacity of Ythdf3-/- HSC was severely impaired (71.63±4.66 vs 29.03±10.82 at the fourth month), including B, T and mye loid lineages (Figure 2C). The lineage distribution exhibited
Given that m6A reader proteins are responsible for exerting the action of m6A, and that Ythdf2-deficient HSC exhibit increased self-renewal capacity,23,24 which is not consistent with the phenotype of Mettl3-/- HSC,16-18 we generated Ythdf1 and Ythdf3 knockout mice to investigate the func tion of these two m6A readers in HSC (Figure 1A, B). Both strains of mice develop normally and can reproduce. Com plete blood counts, including white blood cell, lympho cyte, neutrophil, red blood cell and platelet counts, revealed no difference between Ythdf1-/-, Ythdf3-/- and con
Dysfunction of Ythdf3, but not Ythdf1, mildly disturbs the hematopoietic system
Results
ation,21,22 elucidating the function of m6A reader proteins will probably be crucial to uncovering the biological sig nificance of the m 6 A modification. Two recent studies have shown that loss of Ythdf2 promotes HSC expansion and regeneration,23,24 which is completely different from the phenotype of Mettl3 or Mettl14 dysfunctional HSC in which loss of these genes severely impairs HSC func tion.16-18 It would, therefore, be intriguing to know on which gene(s) METTL3 writes the m6A signal and which reader recognizes this modification to regulate HSC Infunction.thisstudy, we observed that dysfunction of Ythdf3, but not of Ythdf1, impairs the reconstitution capacity of HSC, recapitulating the phenotype of Mettl3 dysfunctional HSC. The 5’-untranslated region (UTR) of Ccnd1 is the hub of METTL3 and YTHDF3 to transmit the m 6 A signal to regulate the translation of Ccnd1 , and furthermore to modulate the reconstitution capacity of HSC. Enforced Ccnd1 expression completely rescued the functional de fect of Ythdf3-/- HSC, and partially rescued Mettl3-com promised HSC. Ectopic MYC only rescued the differentiation skewing of Mettl3-compromised HSC, but not the reconstitution capacity. Taken together, our study reveals, for the first time, that Ythdf3 deciphers the m6A modification on Ccnd1 to modulate HSC, and provides a reference for how the RNA m 6 A modification regulates stem cell function.
Mice
Figure 1. Dysfunction of Ythdf3, but not Ythdf1, mildly disturbs the hematopoietic system. (A) Diagram of the production of Ythdf1 knockout mice. (B) Diagram of the production of Ythdf3 knockout mice. (C, D) The scatter plots show the differences in counts of white blood cells, lymphocytes, neutrophils, red blood cells and platelets between wildtype (WT) and Ythdf1-/- mice (C), as well as WT and Ythdf3-/- mice (D) (2 months old) as determined by an automatic peripheral blood analyzer. Six mice per group. Data are shown as mean ± standard error of mean (SEM). (E, F) The scatter plots depict the percentages of myeloid, B and T cells in peripheral blood for WT and Ythdf1-/- mice (E), as well as for WT and Ythdf3-/- mice (F) (2 months old). Six mice per group. Data are shown as mean ± SEM. (G-J) The scatter plots depict the numbers of common myeloid progenitors, granulocyte-macrophage progenitors, megakaryocyte-erythroid progenitors, common lymphoid progenitors, and multipotent progenitor cells per 106 bone marrow cells in WT and Ythdf1-/- mice (G), as well as in WT and Ythdf3-/- mice (I) (2 months old), and the number of hematopoietic stem cells per 106 bone marrow cells in WT and Ythdf1-/- mice (H), and WT and Ythdf3-/- mice (J) (2 months old). Six mice per group. Data are shown as mean ± SEM. WBC: white blood cells; LYM: lymphocytes; NEUT: neutrophils; RBC: red blood cells; PLT: platelets; CMP: common myeloid progenitors; GMP: granulocyte-macrophage progenitors; MEP: megakaryocyte-erythroid progenitors; CLP: common lymphoid progenitors; MPP: multipotent progenitor cells; HSC: hematopoietic stem cells.
Haematologica | 107 October 2022 2383 ARTICLE - YTHDF3 modulates HSC via m6A modification on Ccnd1 X. Zhang et al. A B C D E F G H I J
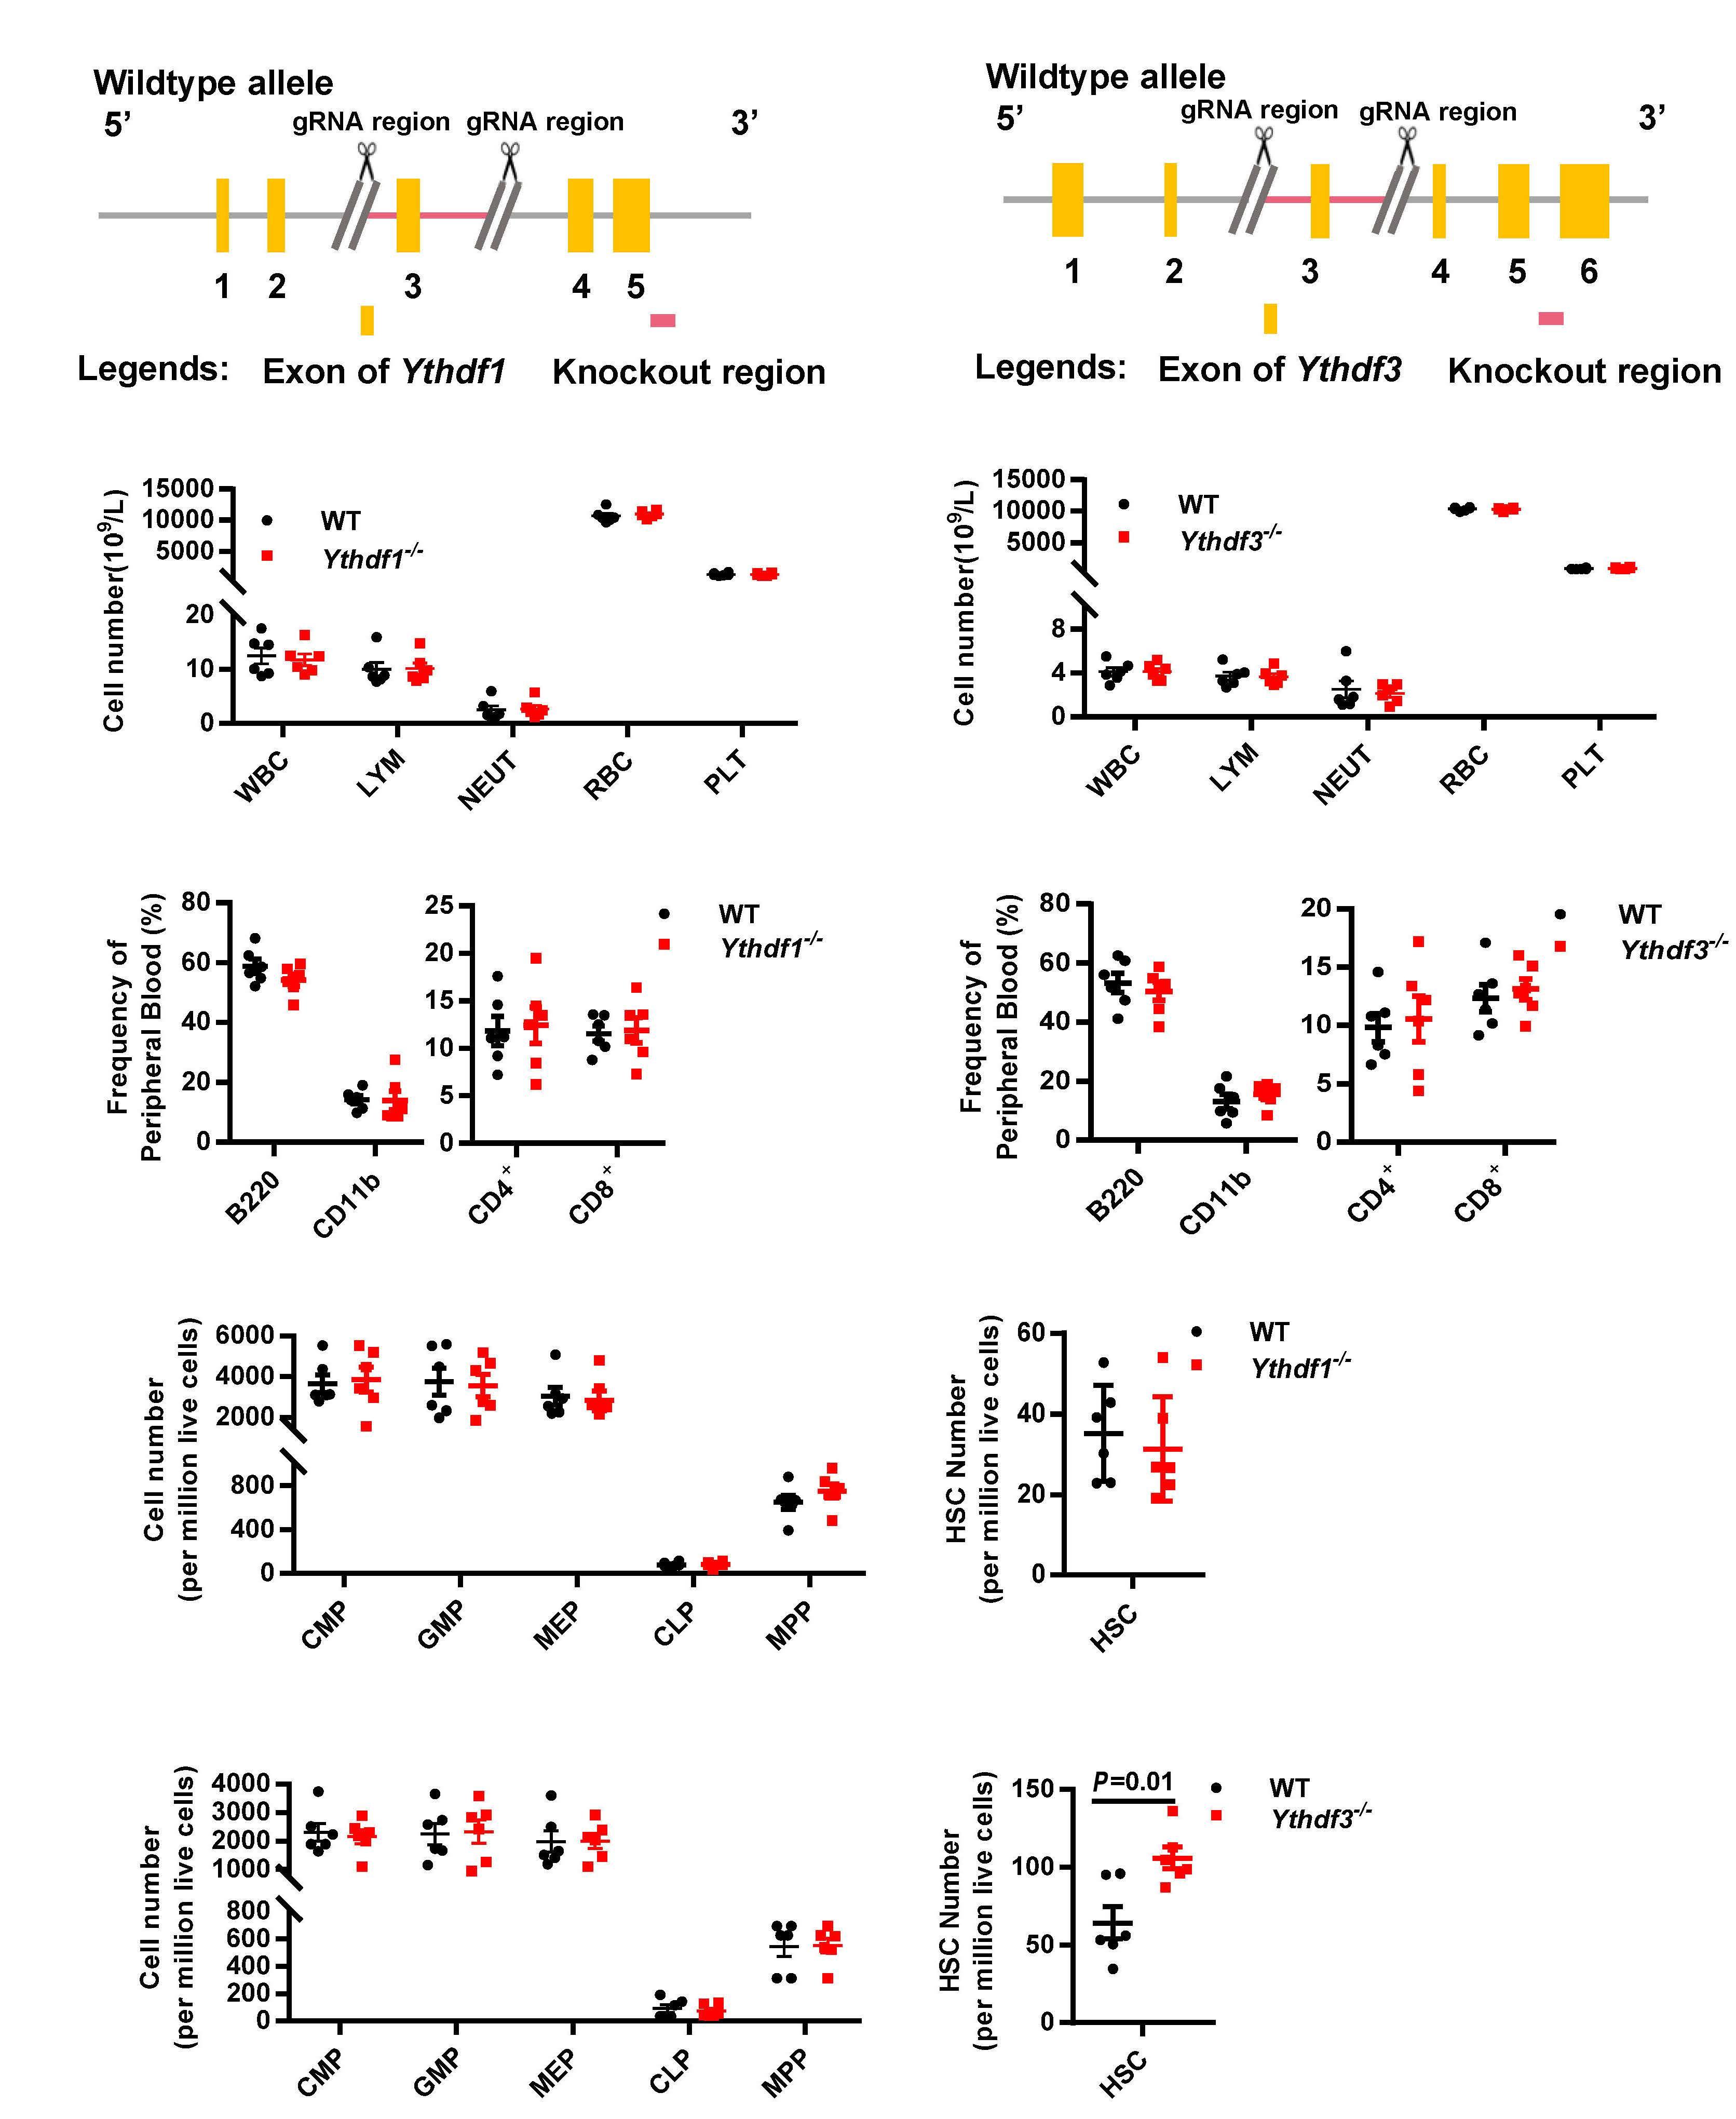
Haematologica | 107 October 2022 2384 ARTICLE - YTHDF3 modulates HSC via m6A modification on Ccnd1 X. Zhang et al. DCBA E F G H I
Figure 2. The reconstitution capacity of Ythdf3-deficient hematopoietic stem cells is impaired. (A) Scheme of the competitive transplantation strategy for Ythdf1-/- and Ythdf3-/- hematopoietic stem cells (HSC). (B, C) Freshly isolated HSC (n=25) from 2-monthold knockout mice or wildtype (WT) mice were transplanted into lethally irradiated recipients together with 2.5×10⁵ competitor cells. Engraftment of donor cells was determined in overall (CD45.2+), myeloid (Mac-1+), B (B220+) and T (CD3+) cells every month after transplantation. The line plots depict the percentages of donor-derived cells (overall, B cells, myeloid cells, T cells) in recipient WT and Ythdf1-/- mice (B), and WT and Ythdf3-/- mice (C) at the indicated time points. Five mice per group. Data are shown as mean ± standard error of mean (SEM). (D) The scatter plots show the percentage of Ythdf3-/- Lin Sca1+ cells that homed to the bone marrow relative to control. Five mice per group. Data are shown as mean ± SEM. (E) Freshly isolated LSK cells were infected by lentivirus carrying Ythdf3 shRNA or control shRNA; 4 days later, 105 GFP+ cells were purified for western blot to evaluate the expression of YTHDF3. (F, G) Freshly isolated WT LSK cells were infected by lentivirus carrying Ythdf3 shRNA or control; 72 h later, 20,000 GFP+ cells were purified and transplanted into lethally irradiated recipients together with 2.5×10⁵ competitor cells. Chimerism in peripheral blood was evaluated every month until the fourth month. (F) Experimental design to evaluate the reconstitution capacity of Ythdf3 shRNA-carrying HSC. (G) Line plots depicting the percentages of GFP+ cells in donor-derived cells every month after transplantation. Six or seven mice per group. Data are shown as mean ± SEM. (H) Experimental design of the RNA-sequencing assay (see Methods). (I) These figures show the gene set enrichment analysis of HSC fingerprint genes in Ythdf3-/- HSC versus WT HSC. The normalized enrichment score is |>0.3; P<0.05 represents a statistically significant difference. KO: knockout; PB: peripheral blood; HSCT: hematopoietic stem cell transplantation; NES: normalized expression score.
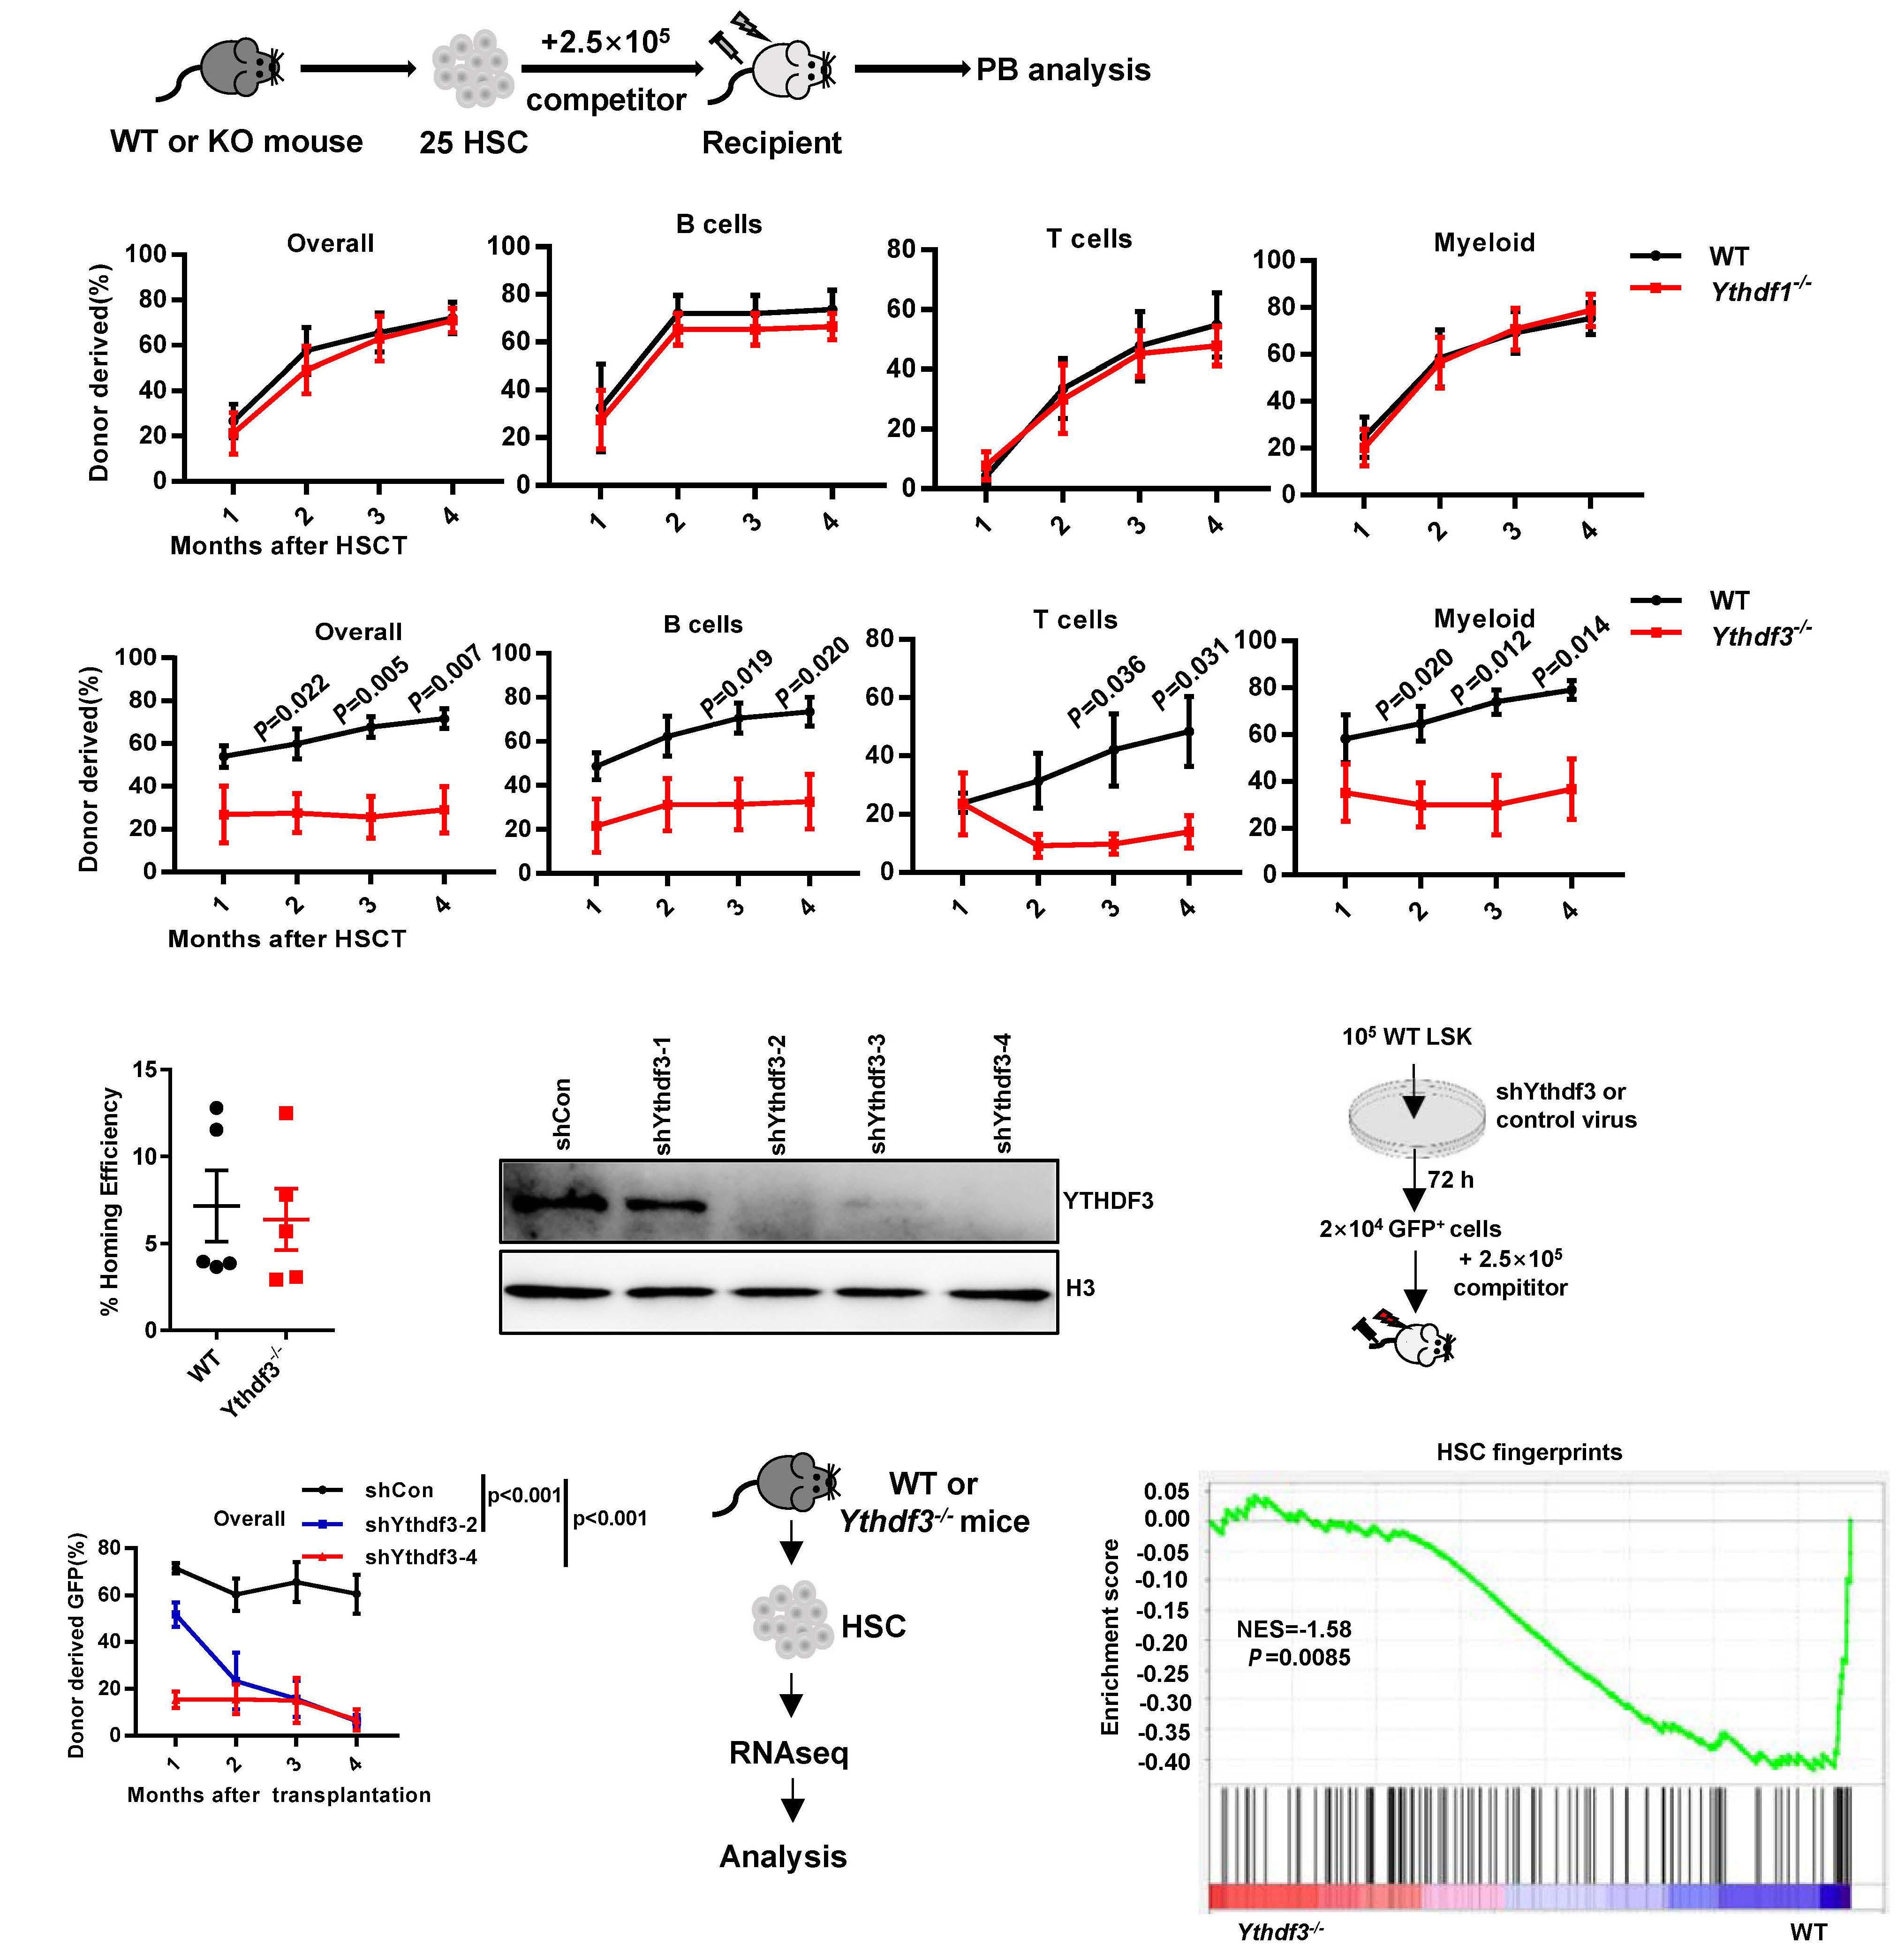
no obvious differentiation bias between Ythdf3-/- and WT mice (Online Supplementary Figure S2B). We also counted the donor-derived HSC in the bone marrow of recipients at the end of the fourth month after transplantation and found no significant difference between Ythdf3-/- and WT recipients (Online Supplementary Figure S2C, D).
to measure protein synthesis in Ythdf3-/- LSK cells. In this assay, LSK cells were incubated with a puromycin analog (OPP), which is incorporated into nascent polypeptide chains and then fluorescently labeled via a “click reaction”. The results showed that the protein synthesis of Ythdf3-/LSK cells was significantly decreased (Online Supplemen tary Figure S3C-E). Briefly, these data provide the confir mation that Ythdf3, but not Ythdf1, modulates the reconstitution capacity of HSC.
Our data indicate that the reconstitution capacity of Ythdf3-/- HSC resembles that of Mettl3-/- HSC,16,17 and a pre vious study revealed that Ythdf3 plays a critical role in translating m6A-modified mRNA.11 Moreover, two recent studies found that Ythdf2-/- HSC exhibit enhanced recon stitution capacity23,24 and Ythdf3 shares targets with Ythdf2 11 We speculated that Ythdf3 may modulate the tar gets of Ythdf2 oppositely to regulate the function of HSC. We therefore investigated the six genes (MYC, CCND1, AXIN2, MCL-1, CD133 and BCL2) which were significantly in creased in Ythdf2-/- HSC,23 determining their expression in Ythdf3-/- LSK cells by western blotting assays. The assays showed that only CCND1 was decreased, while MYC, MCL1, CD133, AXIN2 and BCL2 remained stable compared to those in the controls (Figure 3A). Moreover, we found that knockout of Ythdf3 did not affect the mRNA expression level of Ccnd1 in LSK cells (Figure 3B).
To further investigate the transcriptional difference be tween Ythdf3-/- and WT HSC, we performed RNA sequenc ing for those cells (Figure 2H). With principal component analysis, we found that the expression patterns of the Ythdf3-/- HSC were distinct from those of WT ones (Online Supplementary Figure S2F). Gene set enrichment analysis (GSEA) revealed that the HSC fingerprint genes were no longer enriched among Ythdf3-/- HSC (Figure 2I), coinciding with the impaired reconstitution capacity of Ythdf3-/- HSC. Furthermore, we analyzed apoptosis-related genes be tween Ythdf3-/- and WT HSC by GSEA, and found no sig nificant difference (Online Supplementary Figure S2G). We then wondered whether Ythdf3-/- HSC undergo cell death during in vitro culture. Freshly isolated LSK cells from Ythdf3-/- and WT mice were cultured in serum-free expan sion medium with the cytokines, stem cell factor and thrombopoietin. The percentage of annexin V-positive cells was analyzed 24 h later (Online Supplementary Figure S2H) and found to be significantly increased in Ythdf3-/- LSK cells (Online Supplementary Figure S2I,J). This result indi cates that Ythdf3-/- hematopoietic stem and progenitor cells are more sensitive to replication stress. Given that ribosomes are the site of protein synthesis, we then evaluated protein synthesis-related signaling and ob served that ribosome pathway and ribosome-related genes were downregulated in Ythdf3-/- HSC (Online Supplemen tary Figure S3A, B). To further investigate this, we sought
YTHDF3, but not YTHDF1, modulates the translation of CCND1
To further confirm this observation, we infected WT LSK cells by lentivirus carrying shRNA against Ythdf3 to evalu ate the expression of Ccnd1 (Figure 3C). Knockdown of Ythdf3 significantly reduced the protein level of CCND1 (Figure 3D), but not the mRNA level (Figure 3E). A previous study showed that YTHDF3 promotes protein synthesis in synergy with YTHDF1,11 so we wondered whether YTHDF1 is involved in CCND1 translation. We evaluated the protein ex pression of CCND1 in Ythdf1-/- LSK cells and found no dif ference of CCND1 between Ythdf1-/- and WT LSK cells (Online Supplementary Figure S4A), indicating that YTHDF3 modulates the translation of Ccnd1 via a YTHDF1-indepen dent manner. In brief, the above data suggest that Ythdf3, but not Ythdf1, regulates Ccnd1 through post-transcrip tional modification.
YTHDF3 promotes the translation of CCND1 by binding to the 5’ untranslated region
In order to rule out the possibility that the impaired recon stitution capacity of Ythdf3-/- HSC was due to impaired homing capacity, we performed short-term homing assays for Ythdf3-/- and WT HSC according to standard proto cols.25,26 The results showed no significant difference in homing efficiency between Ythdf3-/- and WT Lin Sca1+ cells (Figure 2D).
A previous study revealed that FTO demethylates m6Amodified Ccnd1 mRNA 27 and our results indicated that Ccnd1 is regulated post-transcriptionally by Ythdf3 (Fig ure 3A-E). We were tempted to speculate that Ccnd1 may be regulated by YTHDF3 through m 6 A modification. To test our hypothesis, we predicted the putative m6A motif on Ccnd1 by using SRAMP. 28 In silico analysis predicted
Haematologica | 107 October 2022 2385 ARTICLE - YTHDF3 modulates HSC via m6A modification on Ccnd1 X. Zhang et al.
To rule out the possibility that Ythdf3 is compensated for during the embryonic stage of Ythdf3-/- mice, we generated two efficient short hairpin RNA (shRNA) against Ythdf3: shYthdf3-2 and shYthdf3-4 (Figure 2E). Freshly isolated WT LSK cells (Lin Sca1+ cKit+) were infected by Ythdf3 shRNAcarrying lentivirus. Seventy-two hours later, 20,000 green fluorescent protein (GFP)+ cells were purified and trans planted into lethally irradiated recipients together with 2.5×10⁵ competitor cells (Figure 2F). The results showed that the reconstitution capacity of Ythdf3 shRNA-carrying cells was severely impaired (shRNA-2: 6.13±2.82 vs 60.51±8.33; shRNA-4: 6.74±4.55 vs. 60.51±8.33 at the fourth month), including the rconstitituion of B, T and myeloid lineages (Figure 2G and Online Supplementary Figure S2E).
Haematologica | 107 October 2022 2386 ARTICLE - YTHDF3 modulates HSC via m6A modification on Ccnd1 X. Zhang et al. A B C D F G H I J K E
Figure 3. YTHDF3 promotes the translation of CCND1 through binding on the m6A site of the 5’ untranslated region. (A) Representative western blot showing the expression of YTHDF3, CCND1, CD133, BCL2, MYC, AXIN2 and MCL-1 in wildtype (WT) and Ythdf3-/- LSK cells. Freshly isolated LSK cells from WT and Ythdf3-/- mice were lysed in sodium dodecylsulfate loading buffer. Western blot analysis was performed with the indicated antibodies. (B) Histogram depicting the mRNA expression of Ccnd1 in WT and Ythdf3-/- LSK cells. (C-E) Freshly isolated LSK cells were infected by lentivirus carrying Ythdf3 shRNA or control, and 4 days later, GFP+ cells were purified for western blot (5×10⁴ cells/well) and quantitative polymerase chain reaction (qPCR) (105 cells) to evaluate the expression of Ccnd1. (C) Diagram showing the experimental design to evaluate the expression of Ccnd1. (D) Representative western blot showing the expression of YTHDF3 and CCND1. (E) Histogram depicting the mRNA expression of Ythdf3 and Ccnd1. Data are shown as mean ± standard error of mean (SEM). (F, G) Histograms showing the relative luciferase activity of Ccnd1-5’UTR-WT1 or Ccnd1-5’UTR-Mut1 (F) and Ccnd1-5’UTR-WT2 or Ccnd1-5’UTR-Mut2 (G) luciferase reporter in 293T cells transfected with control or YTHDF3 plasmid (see Online Supplementary Figure S3C and Methods). Firefly luciferase activity was measured and normalized to Renilla luciferase activity. Data are shown as mean ± SEM. (H, I) Freshly isolated LSK cells were infected by lentivirus carrying Pabpc1 shRNA, eIF4G2 shRNA or control, and 4 days later, GFP+ cells were purified for western blot to evaluate the expression of Ccnd1. Representative western blot showing the expression of PABPC1 and CCND1 (H), and eIF4G2 and CCND1 (I). (J, K) HEK293T cells were co-transfected with S-protein, Flag, and streptavidin-binding peptide (SFB)-tagged-YTHDF3 and MYC-PABPC1 or MYC-eIF4G2 plasmids for 24 h. Cell lysates were immunoprecipitated with S beads, and western blot analysis was performed with the indicated antibodies. The results show that YTHDF3 interacts with PABPC1 (J) and eIF4G2 (K). qPCR: quantitative polymerase chain reaction; IP: immunoprecipitation; WB: western blot.
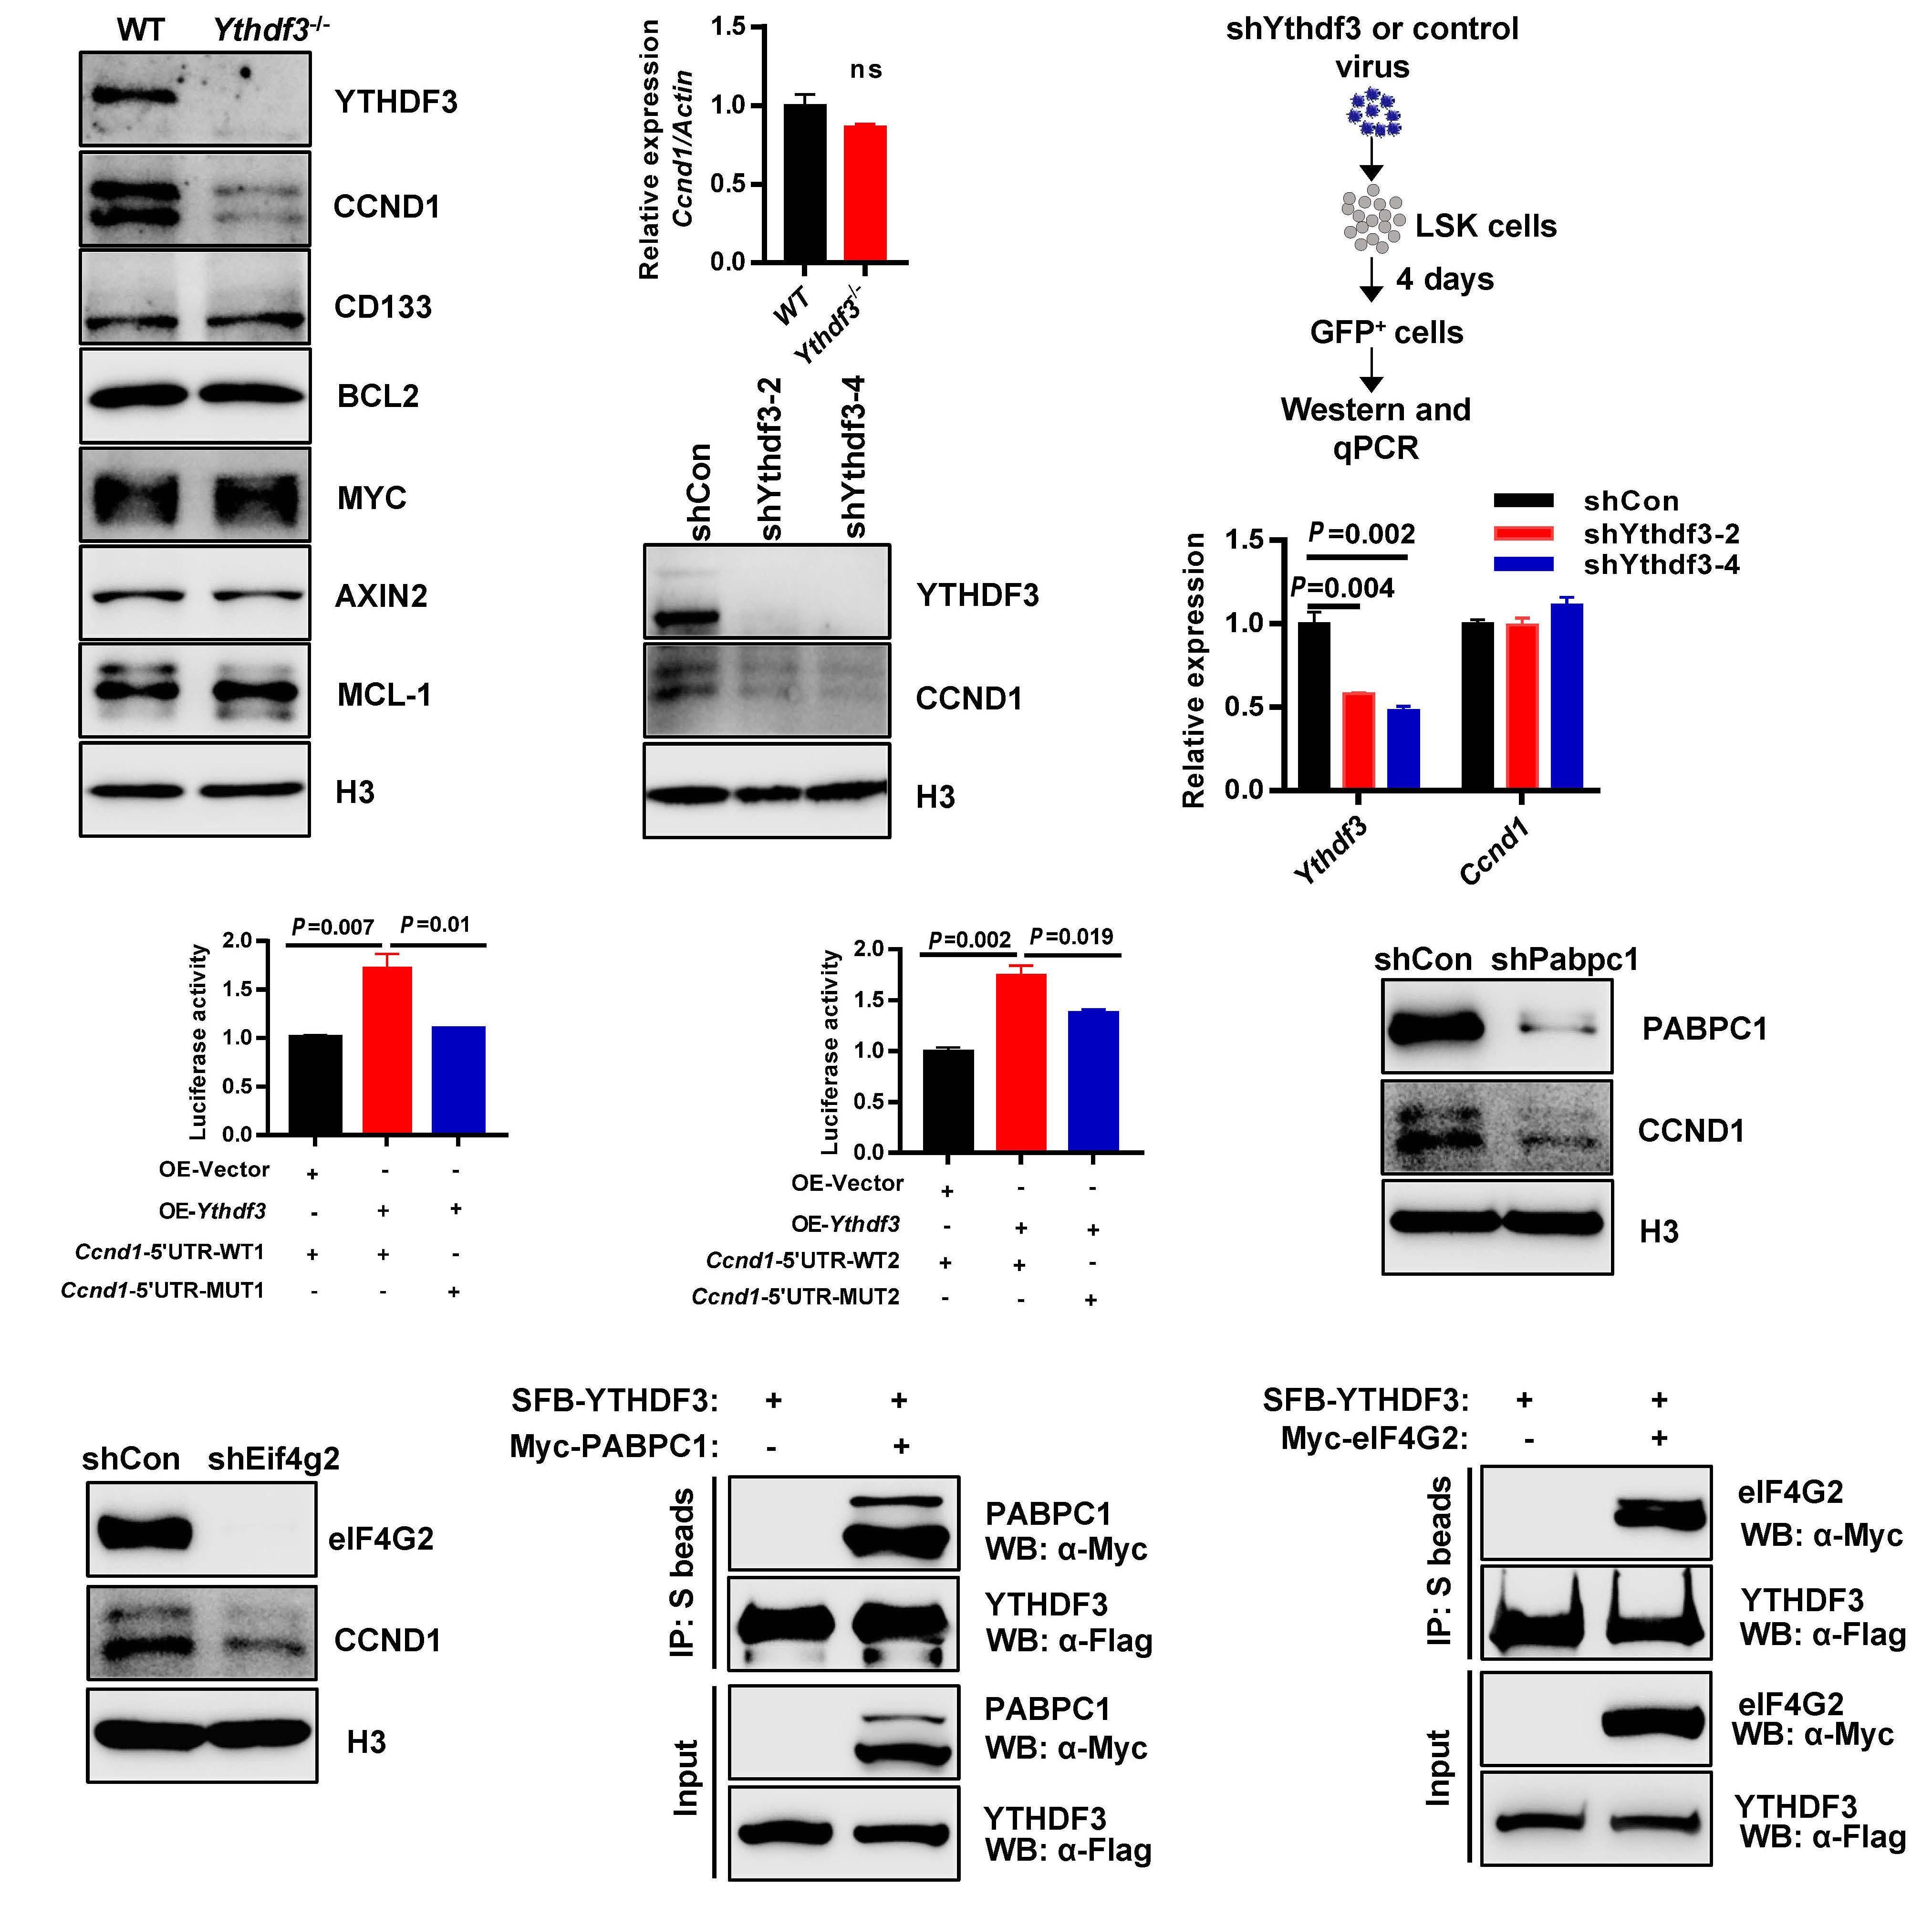
cells (Online Supplementary Figure S3E). A previous study revealed that YTHDF3 interacts directly with the translation factor PABPC1 and eIF4G2 to promote protein trans lation.29 We then explored whether YTHDF3 promotes the translation of CCND1 by interacting with PABPC1 and eIF4G2. We generated two efficient shRNA against Pabpc1 and Eif4g2 separately (Online Supplementary Figure S4J, K). We infected WT LSK cells with lentivirus carrying shRNA against Pabpc1 and Eif4g2 to evaluate the ex pression of CCND1. The results showed that knockdown of PABPC1 and eIF4G2 significantly reduced the protein level of CCND1 (Figure 3H, I).
four putative DRACH motifs in which m6A occurs prefer ably: two are located at the 5’UTR and two are located at the 3’UTR of Ccnd1 (Online Supplementary Figure S4B).
A previous study indicated that two residues of YTHDF3, W438 and W492, contribute to the specific recognition of m6A modification.29 We therefore mutated the W438 and W492 to A (alanine) to generate a YTHDF3 mutant (YTHDF3-Mut), and overexpressed YTHDF3-WT and YTHDF3-Mut plasmids in 3T3 cells. RNA immunoprecipi tation (RIP) quantitative polymerase chain reaction (qPCR for Ccnd1 revealed that YTHDF3 could bind to Ccnd1 mRNA (Online Supplementary Figure S4I). These results suggest that YTHDF3 regulates the trans lation of CCND1 by directly binding to the 5 ’UTR of Ccnd1, in which the -180 to -184 region is essential.
To explore whether YTHDF3 interacted directly with PABPC1 and eIF4G2, co-immunoprecipitation was per formed using anti-Flag or Myc antibody in HEK293T cells, which showed that YTHDF3 interacts directly with PABPC1 and eIF4G2 (Figure 3J, K). In addition, using RIP-qPCR as says, we found that PABPC1 and eIF4G2 bind directly with the mRNA of Ccnd1 (Online Supplementary Figure S4L, M). Together, these results suggest that YTHDF3 promotes the translation of CCND1 by cooperating with PABPC1 and eIF4G2.
It is notable that the first putative m6A motif (-180 to184, GGATC) is completely conserved among mice, rats and humans, while the second putative one (-102 to -106, AGACT) is only conserved between mice and humans (Online Supplementary Figure S4C). However, the two pu tative ones (GGACT) at the 3’UTR of Ccnd1 are not con served (Online Supplementary Figure S4C). This indicates that an m6A motif at the 5’UTR of Ccnd1 might play an important role in regulating Ccnd1 mRNA translation. We then cloned the 3’UTR of Ccnd1 into psiCHECK2 vec tor (Online Supplementary Figure S4D) and conducted a luciferase reporter assay. The results revealed that over expression of Ythdf3 promotes the translation of luci ferase reporters with both motifs (Online Supplementary Figure S4F-H). We then mutated the A at positions 1631 and 1532 to G, which is the key site of the m6A motif. We observed that the translation of luciferase reporter re mained unchanged (Online Supplementary Figure S4G, H), suggesting that these two m6A motifs are not the direct region where m6A modification occurs.
The above data indicate that Ccnd1 is the target of YTHDF3 to transmit the m6A signal. To investigate whether Ccnd1 plays a role in regulating HSC function, we generated two efficient guide RNA (gRNA) against Ccnd1 and cloned them (gRNA 2 and 3) (Figure 4A) into a self-made lentiviral vector (mCherry-labeled) (Online Supplementary Figure S5A). Cas9flox/flox GFP mice30 were crossed with Vav1-cre to gen erate mice expressing CAS9 in the blood system: Cas9flox/flox; Vav1-Cre mice (hereafter named Cas9+/+ mice).
Freshly isolated LSK cells of Cas9+/+ mice were infected by Ccnd1 gRNA-carrying lentivirus and 72 h later, 10,000 GFP+ mCherry+ cells were purified and transplanted into lethally irradiated recipients together with 2.5×10⁵ competitor cells (Online Supplementary Figure S5B). It was found that knockdown of Ccnd1 severely impaired the reconstitution capacity of HSC (Figure 4B and Online Supplementary Fig ure S5D), which recapitulates the phenotype of Mettl3-/-1617 and Ythdf3-/- HSC (Figure 2C).
Forced Ccnd1 expression rescues the reconstitution capacity of Ythdf3-/- hematopoietic stem cells
YTHDF3 promotes the translation of CCND1 by cooperating with PABPC1 and EIF4G2
Given that our data revealed that Ccnd1 is the hub of YTHDF3 to transmit the m6A signal in order to regulate its translation, and that knockdown of Ccnd1 impaired HSC, we wondered whether forced Ccnd1 expression could res cue the functional defect of Ythdf3-/- HSC. We, therefore, cloned Ccnd1 complementary DNA into a lentiviral vector (GFP-labeled), producing efficient overexpression of CCND1 (Online Supplementary Figure S5C). Ythdf3-/- LSK cells were
Haematologica | 107 October 2022 2387 ARTICLE - YTHDF3 modulates HSC via m6A modification on Ccnd1 X. Zhang et al.
Two previous studies showed that Ythdf3 plays a critical role in translating m6A-modified mRNA.11,15 We observed that Ythdf3 deficiency resulted in a significant decrease of protein synthesis in hematopoietic stem and progenitor
We next cloned the 5’UTR of Ccnd1 containing the afore mentioned DRACH motif into pGL3-Basic vector (Online Supplementary Figure S4E), and performed luciferase re porter assays. The results revealed that overexpression of Ythdf3 promoted the translation of luciferase activity with both m6A motifs (-180 to -184 and -102 to -106) (Fig ure 3F, G). We then mutated the A at positions -182 and -104 to G, and observed that luciferase activity was sig nificantly decreased in both situations, wherein the A (182) G mutation completely abolished the luciferase activity, while the A (-104) G mutation slightly reduced luciferase activity (Figure 3F, G).
Ccnd1 is indispensable for maintaining hematopoietic stem cells
infected with Ccnd1-overexpressing lentivirus, and 3,000 CD48 Sca1+ GFP+ cells were FACS-purified 72 h after in fection. These cells were then transplanted into lethally irradiated recipients together with 3×10⁵ competitor cells (Figure 4C). The results showed that enforced Ccnd1 ex pression rescued the reconstitution capacity of Ythdf3-/-
Figure 4. Overexpression of CCND1 rescues the reconstitution capacity of Ythdf3-/- hematopoietic stem cells. (A) 3T3 cells were infected by lentivirus carrying Ccnd1 gRNA or control (GFP-labeled) and Cas9 virus (mCherry-labeled), and 6 days later, 105 GFP+ mCherry+ cells were purified for western blot to evaluate the expression of CCND1. (B) Freshly isolated LSK cells of Cas9+/+ mice were infected by Ccnd1 gRNA-carrying lentivirus, and 72 h later, 10,000 GFP+ mCherry+ cells were purified and transplanted into lethally irradiated recipients together with 2.5×10⁵ competitor cells. Engraftment of donor-derived cells was determined in overall (mCherry+) cells every month after transplantation. Three or four mice per group. Data are shown as mean ± standard error of mean (SEM). (C, D) Freshly isolated LSK cells from wildtype (WT) or Ythdf3-/- mice were infected with Ccnd1-overexpressing or control virus (GFP-labeled), and 3,000 CD48 Sca1+ GFP+ cells were FACS-purified 72 h after infection. These cells were then transplanted into lethally irradiated recipients together with 3×10⁵ competitor cells. (C) Experimental design to evaluate the role of CCND1 in regulating the reconstitution capacity of Ythdf3-/- hematopoietic stem cells (HSC). (D) Line plots depicting the percentages of donor-derived cells in overall (GFP+) cells every month after transplantation. Five or six mice per group. Data are shown as mean ± SEM. (E, F) Freshly isolated LSK cells from WT mice were infected with Ccnd1-overexpressing virus (mCherry-labeled) and shYthdf3-carrying virus (GFP-labeled), and 2,000 CD48 Sca1+ GFP+ mCherry+ cells were FACS-purified 72 h after infection. These cells were then transplanted into lethally irradiated recipients together with 3×10⁵ competitor cells. (E) Experimental design to evaluate the role of CCND1 in regulating the reconstitution capacity of shYthdf3 HSC. (F) Line plots depicting the percentages of donor-derived cells in overall (mCherry+) cells every month after transplantation. Six or seven mice per group. Data are shown as mean ± SEM.
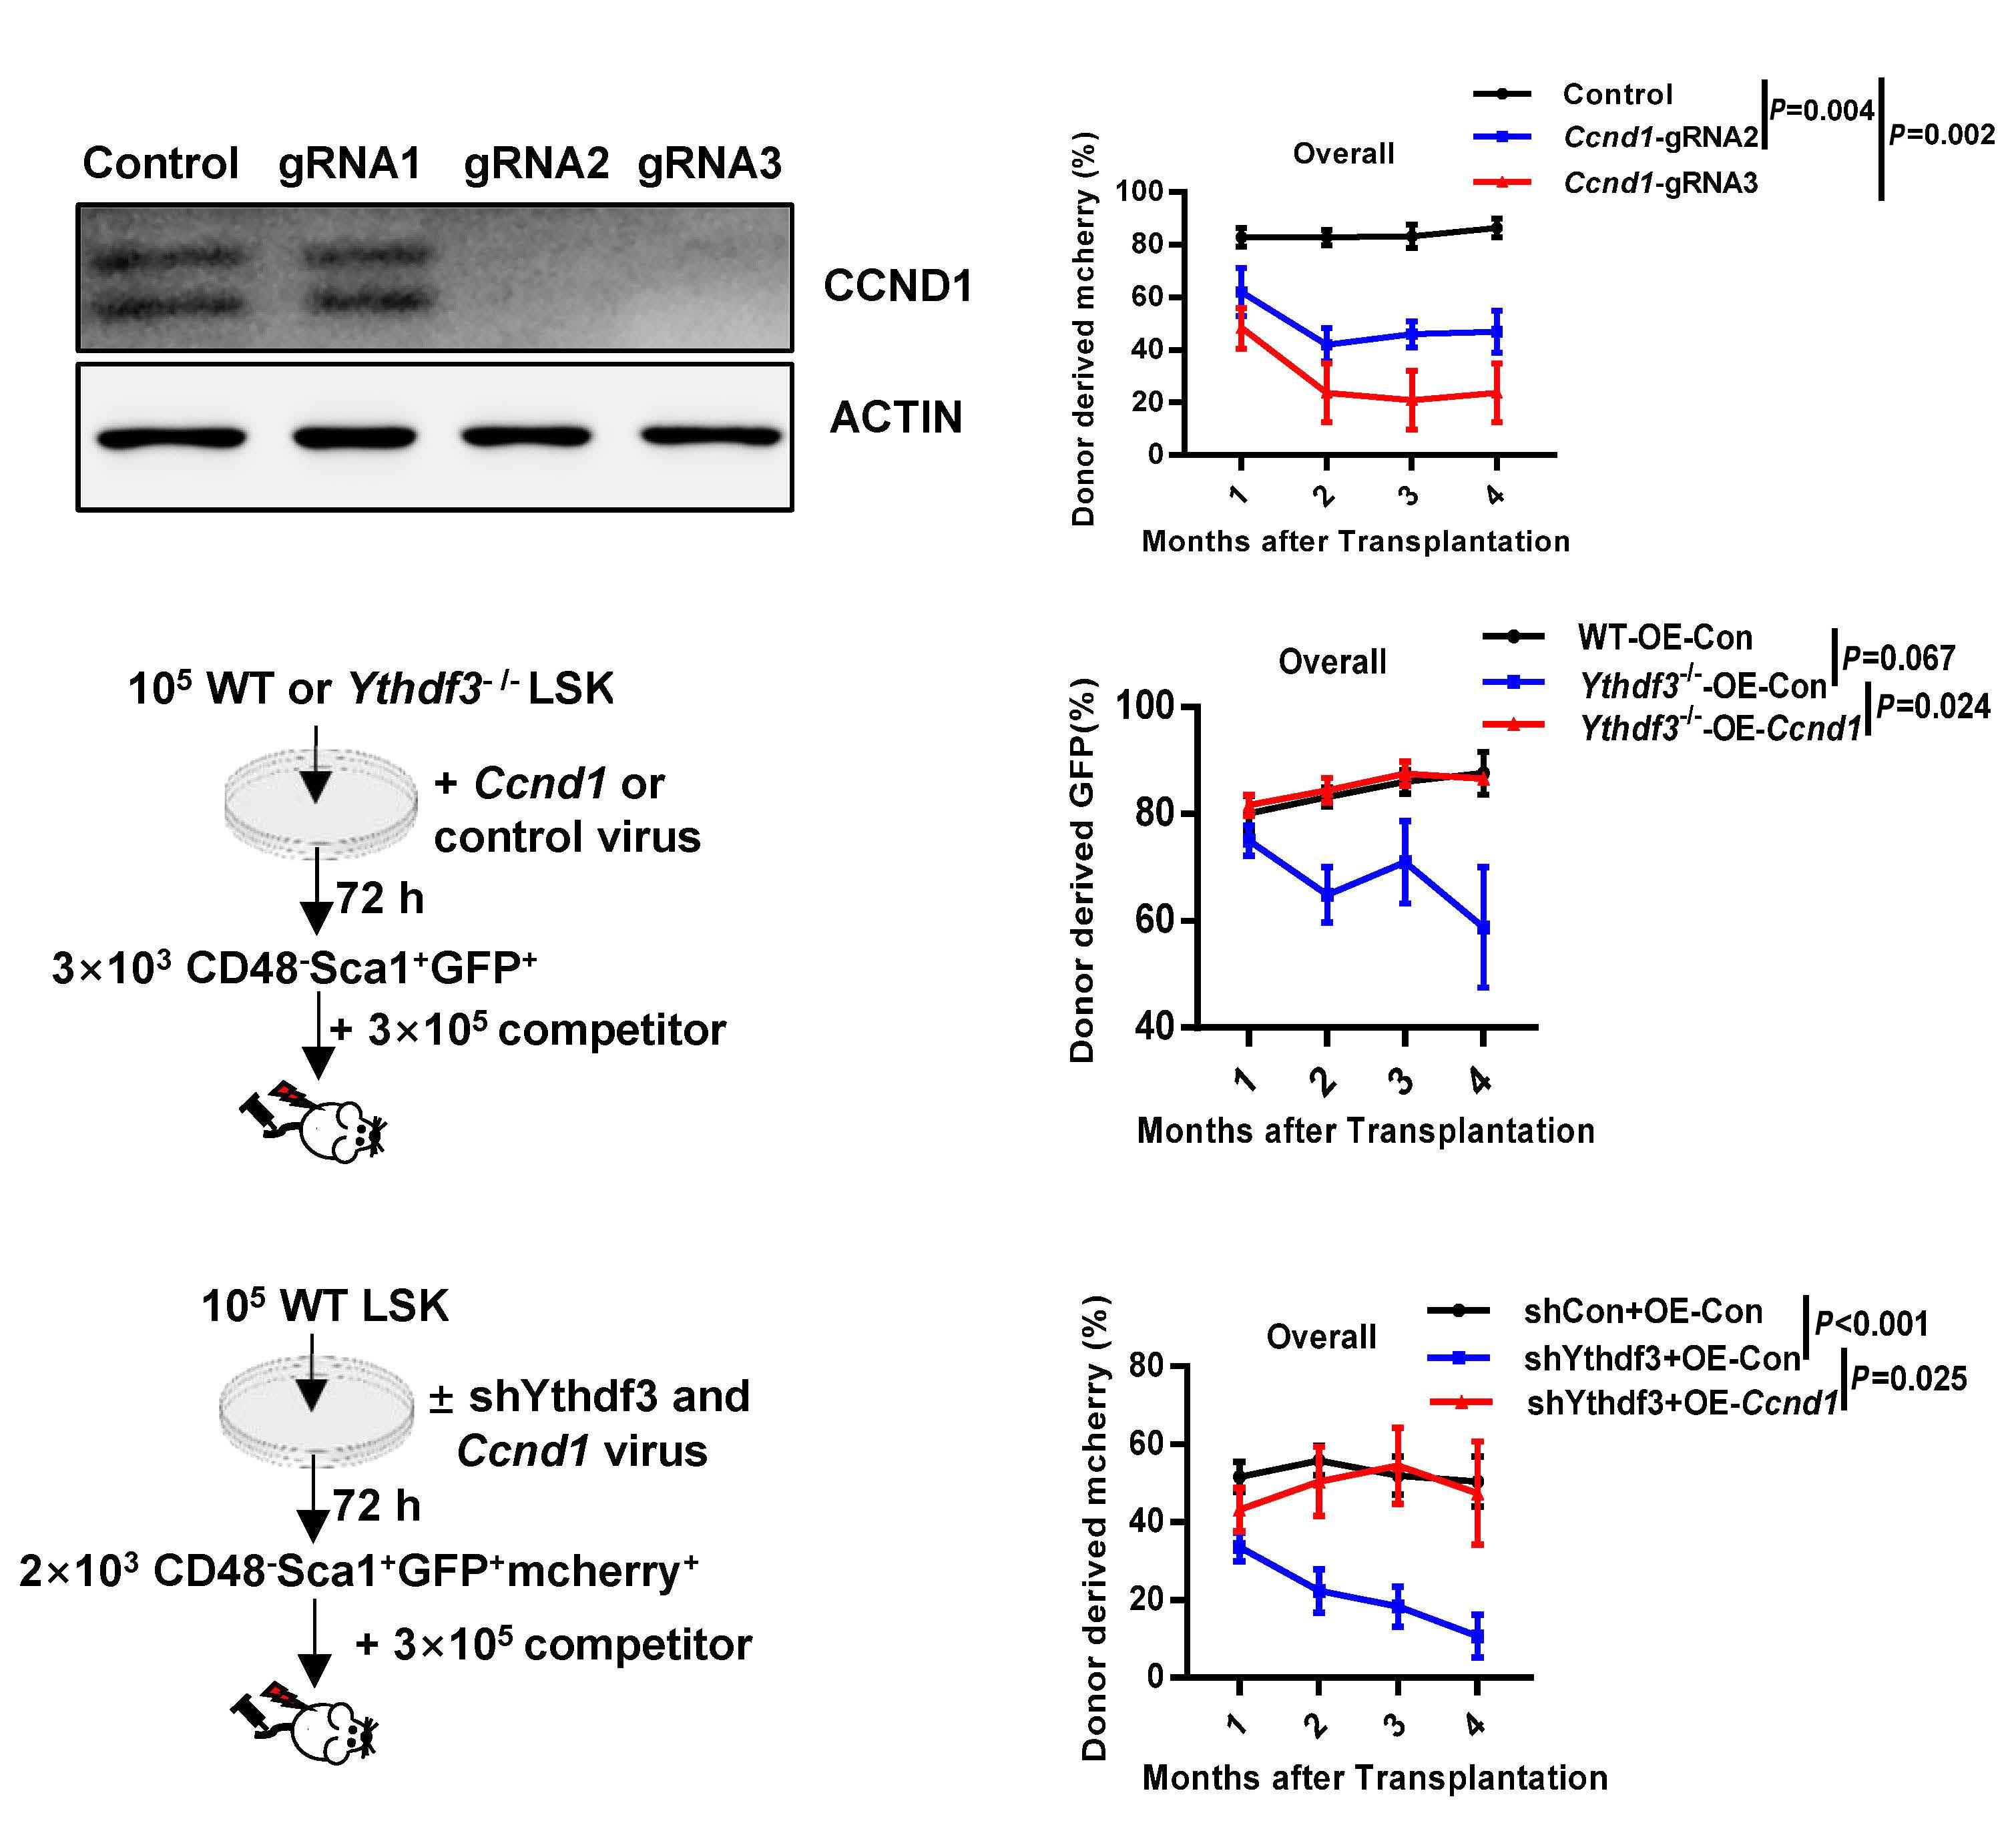
Haematologica | 107 October 2022 2388 ARTICLE - YTHDF3 modulates HSC via m6A modification on Ccnd1 X. Zhang et al. A BDC FE
HSC, including B, T and myeloid cells (Figure 4D and Online Supplementary Figure S5E).
To further verify this finding, we simultaneously infected freshly isolated WT LSK cells with Ythdf3 shRNA-carrying lentivirus (GFP-labeled) and Ccnd1-overexpressing lentivi rus (mCherry-labeled); 2,000 CD48 Sca1+ GFP+ mCherry+
Figure 5. Dysfunction of Mettl3 disturbs hematopoietic homeostasis and severely impairs hematopoietic stem cell reconstitution capacity. (A) Schematic illustration of the Mettl3 conditional knockout mice. (B) Representative western blot showing the protein expression of METTL3 and CCND1 in Mettl3-/- and control LSK cells. (C) Histogram depicting the mRNA expression of Ccnd1 in Mettl3-/- and control LSK cells. Data are shown as mean ± standard error of mean (SEM). (D, E) Histograms displaying the relative luciferase activity of Ccnd1-5’UTR-WT1 or Ccnd1-5’UTR-Mut1 (D) and Ccnd1-5’UTR-WT2 or Ccnd1-5’UTR-Mut2 (E) luciferase reporter in 293T cells transfected with control or METTL3 plasmid (see Online Supplementary Figure S4E and Methods). Firefly luciferase activity was measured and normalized to Renilla luciferase activity. Data are shown as mean ± SEM. (F) RNA immunoprecipitation quantitative polymerase chain reaction analysis detecting the binding of METTL3-WT or METTL3-Mut to the transcripts of Ccnd1 in 3T3 cells. (G, H) Thirty freshly isolated hematopoietic stem cells from Mettl3-/- or control mice were transplanted into lethally irradiated recipients together with 3×10⁵ competitor cells. Engraftment of donor cells was determined in overall (CD45.2+), myeloid (Mac-1+), B (B220+) and T (CD3+) cells every month after transplantation. (G) Scheme of the competitive transplantation strategy. (H) Line plots depicting the percentage of donor-derived cells (overall, myeloid cells, B cells, T cells) in recipients at the indicated time points. Seven mice per group. Data are shown as mean ± SEM. cKO: conditional knockout; HSC: hematopoietic stem cells; PB: peripheral blood; HSCT: hematopoietic stem cell transplantation.
the reconstitution capacity of Ythdf3 shRNA-carrying HSC (Figure 4F and Online Supplementary Figure S5F), which is consistent with the aforementioned results (Figure 4D and Online Supplementary Figure S5E). Taken together, the
cells were FACS-purified 72 h after infection and sub sequently transplanted into lethally irradiated recipients together with 3×10⁵ competitor cells (Figure 4E). It was found that enforced Ccnd1 expression completely rescued
Haematologica | 107 October 2022 2389 ARTICLE - YTHDF3 modulates HSC via m6A modification on Ccnd1 X. Zhang et al. A B C HGD E F
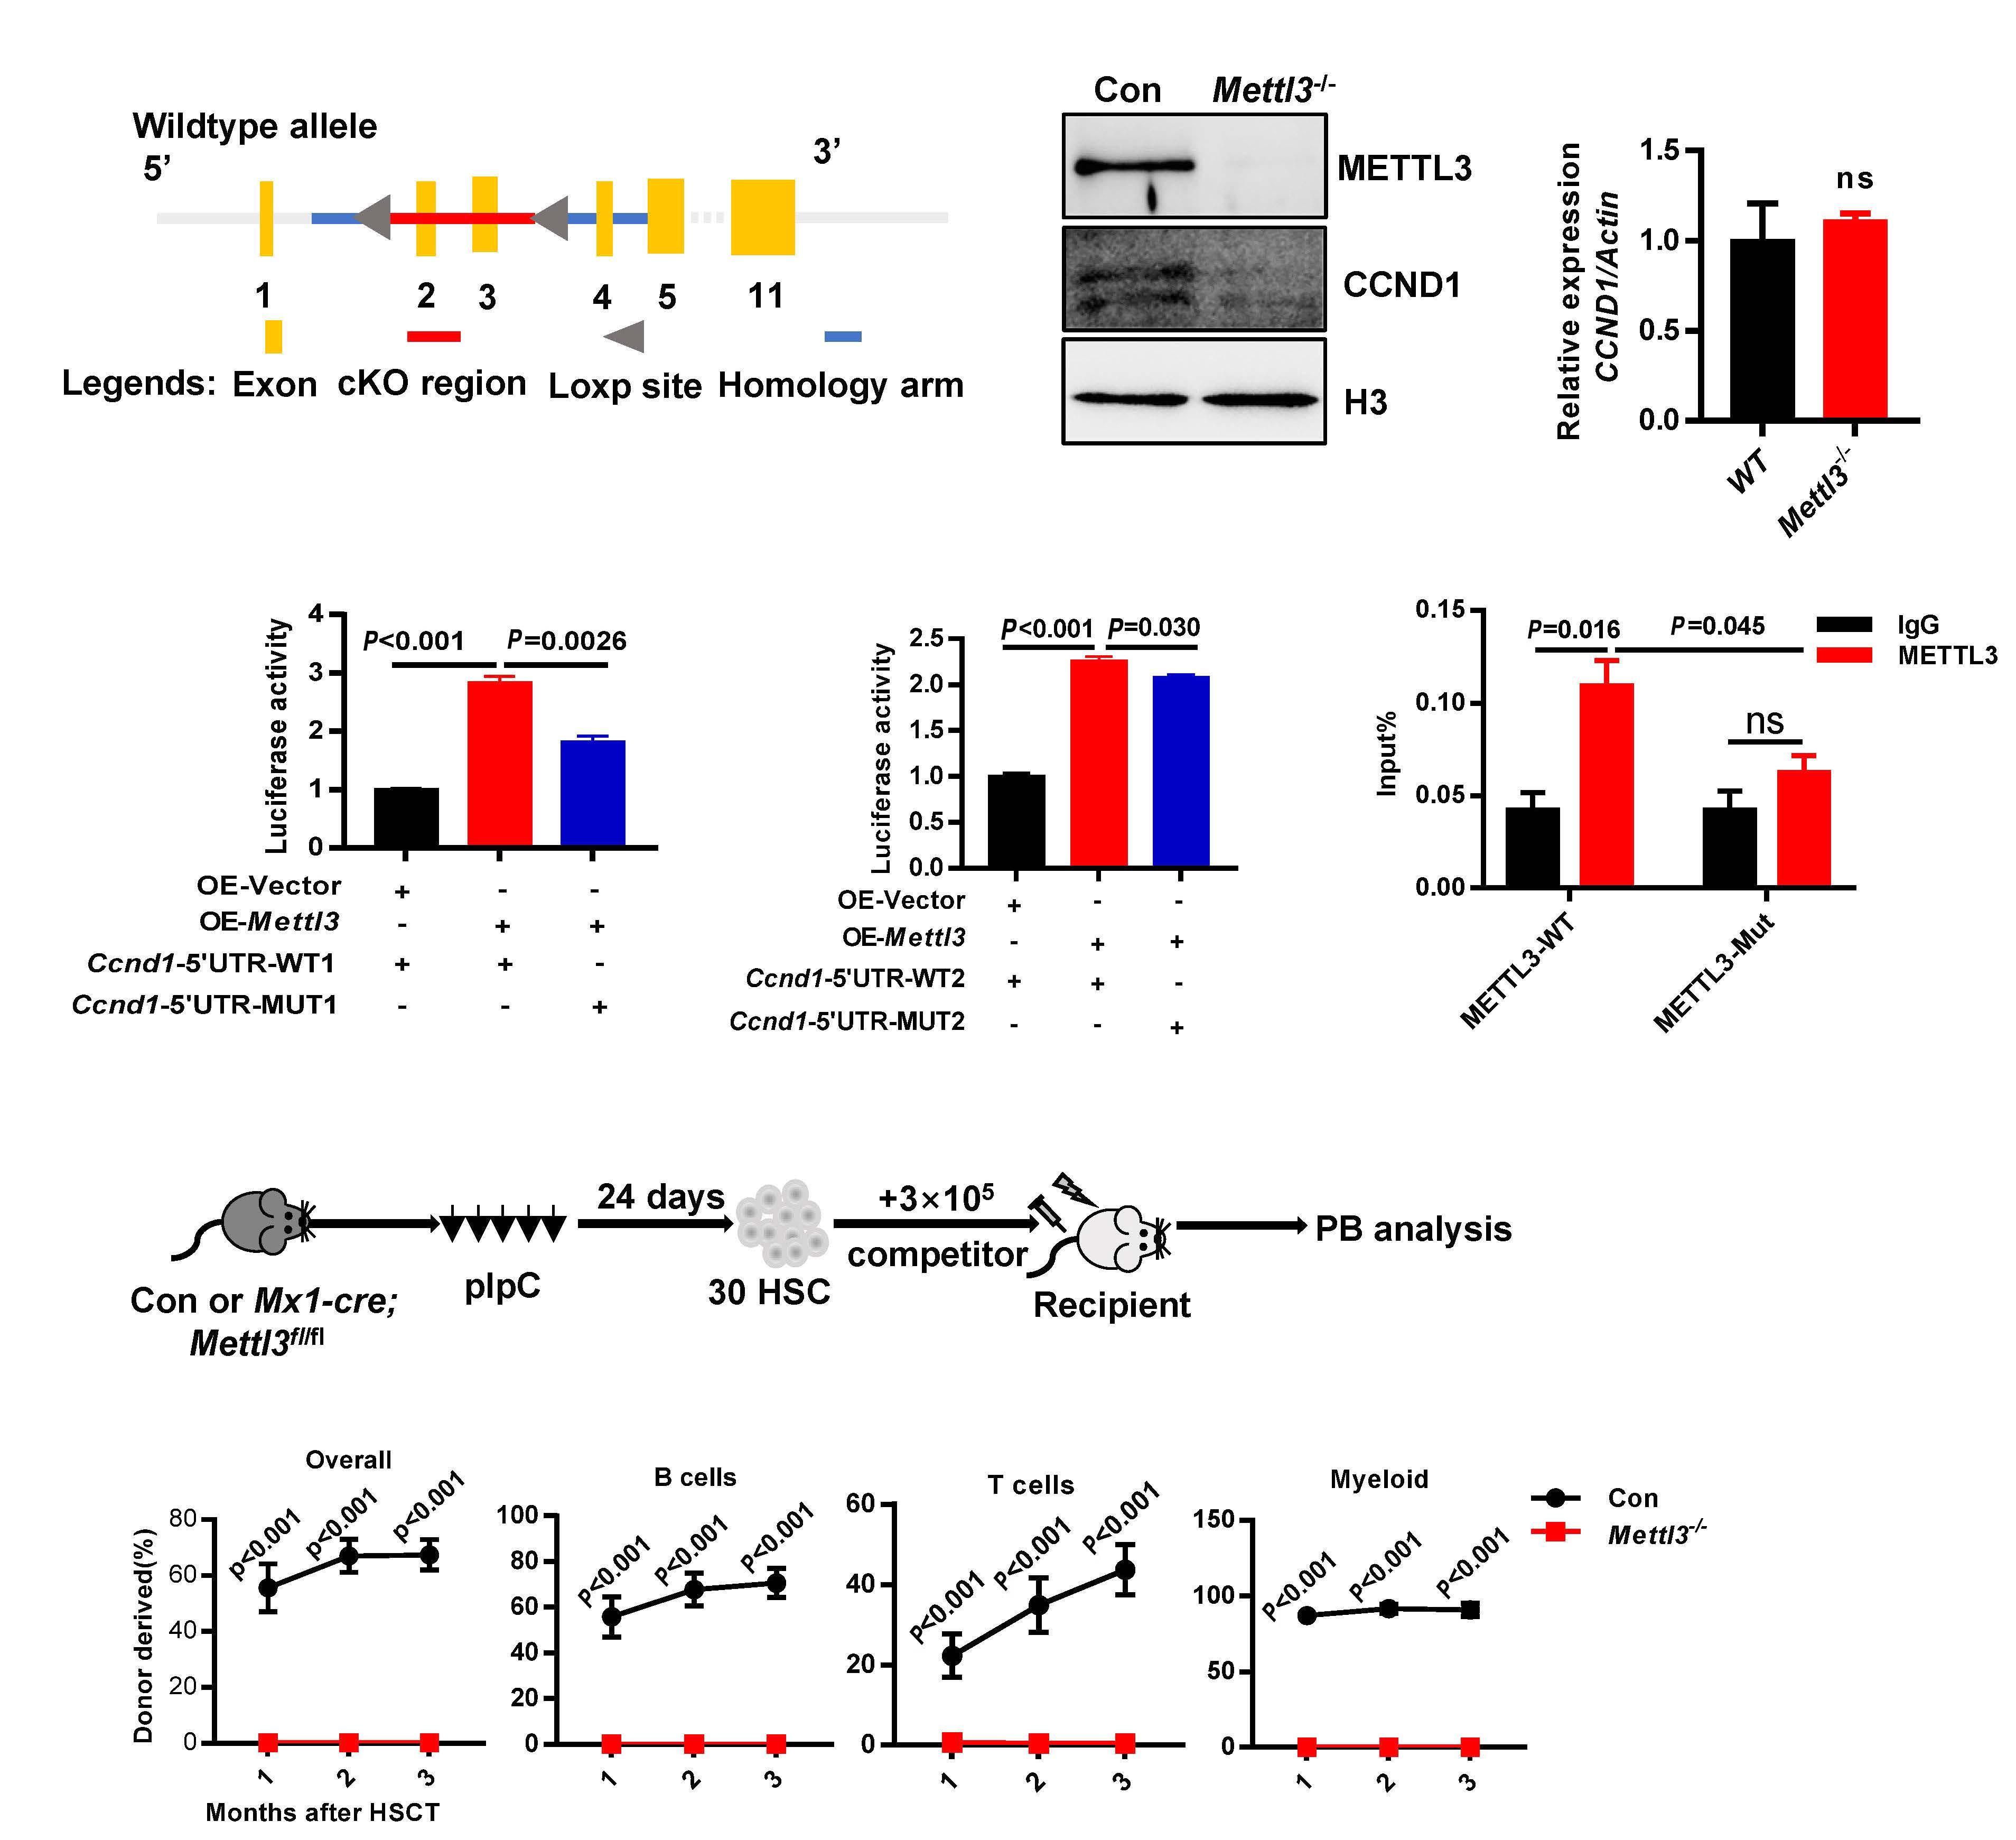
above results show that Ccnd1 is the direct target of YTHDF3 to modulate HSC reconstitution capacity.
Given that Ythdf3 promotes the translation of Ccnd1 by re cognizing the m6A modification at the 5’UTR, we next won dered whether METTL3 installs the m6A signal in the 5’UTR of Ccnd1 and furthermore modulates the translation of
Ccnd1 through the same region. We performed a RIP-qPCR assay which showed that knockdown of Mettl3 reduced the binding of the m6A modification to Ccnd1 transcripts (On line Supplementary Figure S6A, B), which revealed that METTL3 installs the m6A signal on Ccnd1 mRNA. We then generated Mettl3flox/flox mice (Figure 5A), and crossed Mettl3flox/flox with Mx1-cre mice to generate Mx1-Cre; Mettl3flox/flox mice. By administering polyinosine–polycyto sine to these mice every other day for 10 days, we achieved B C E F H J K I
Mettl3 modulates Ccnd1 translation through the m6A motif at the 5’ untranslated region of Ccnd1
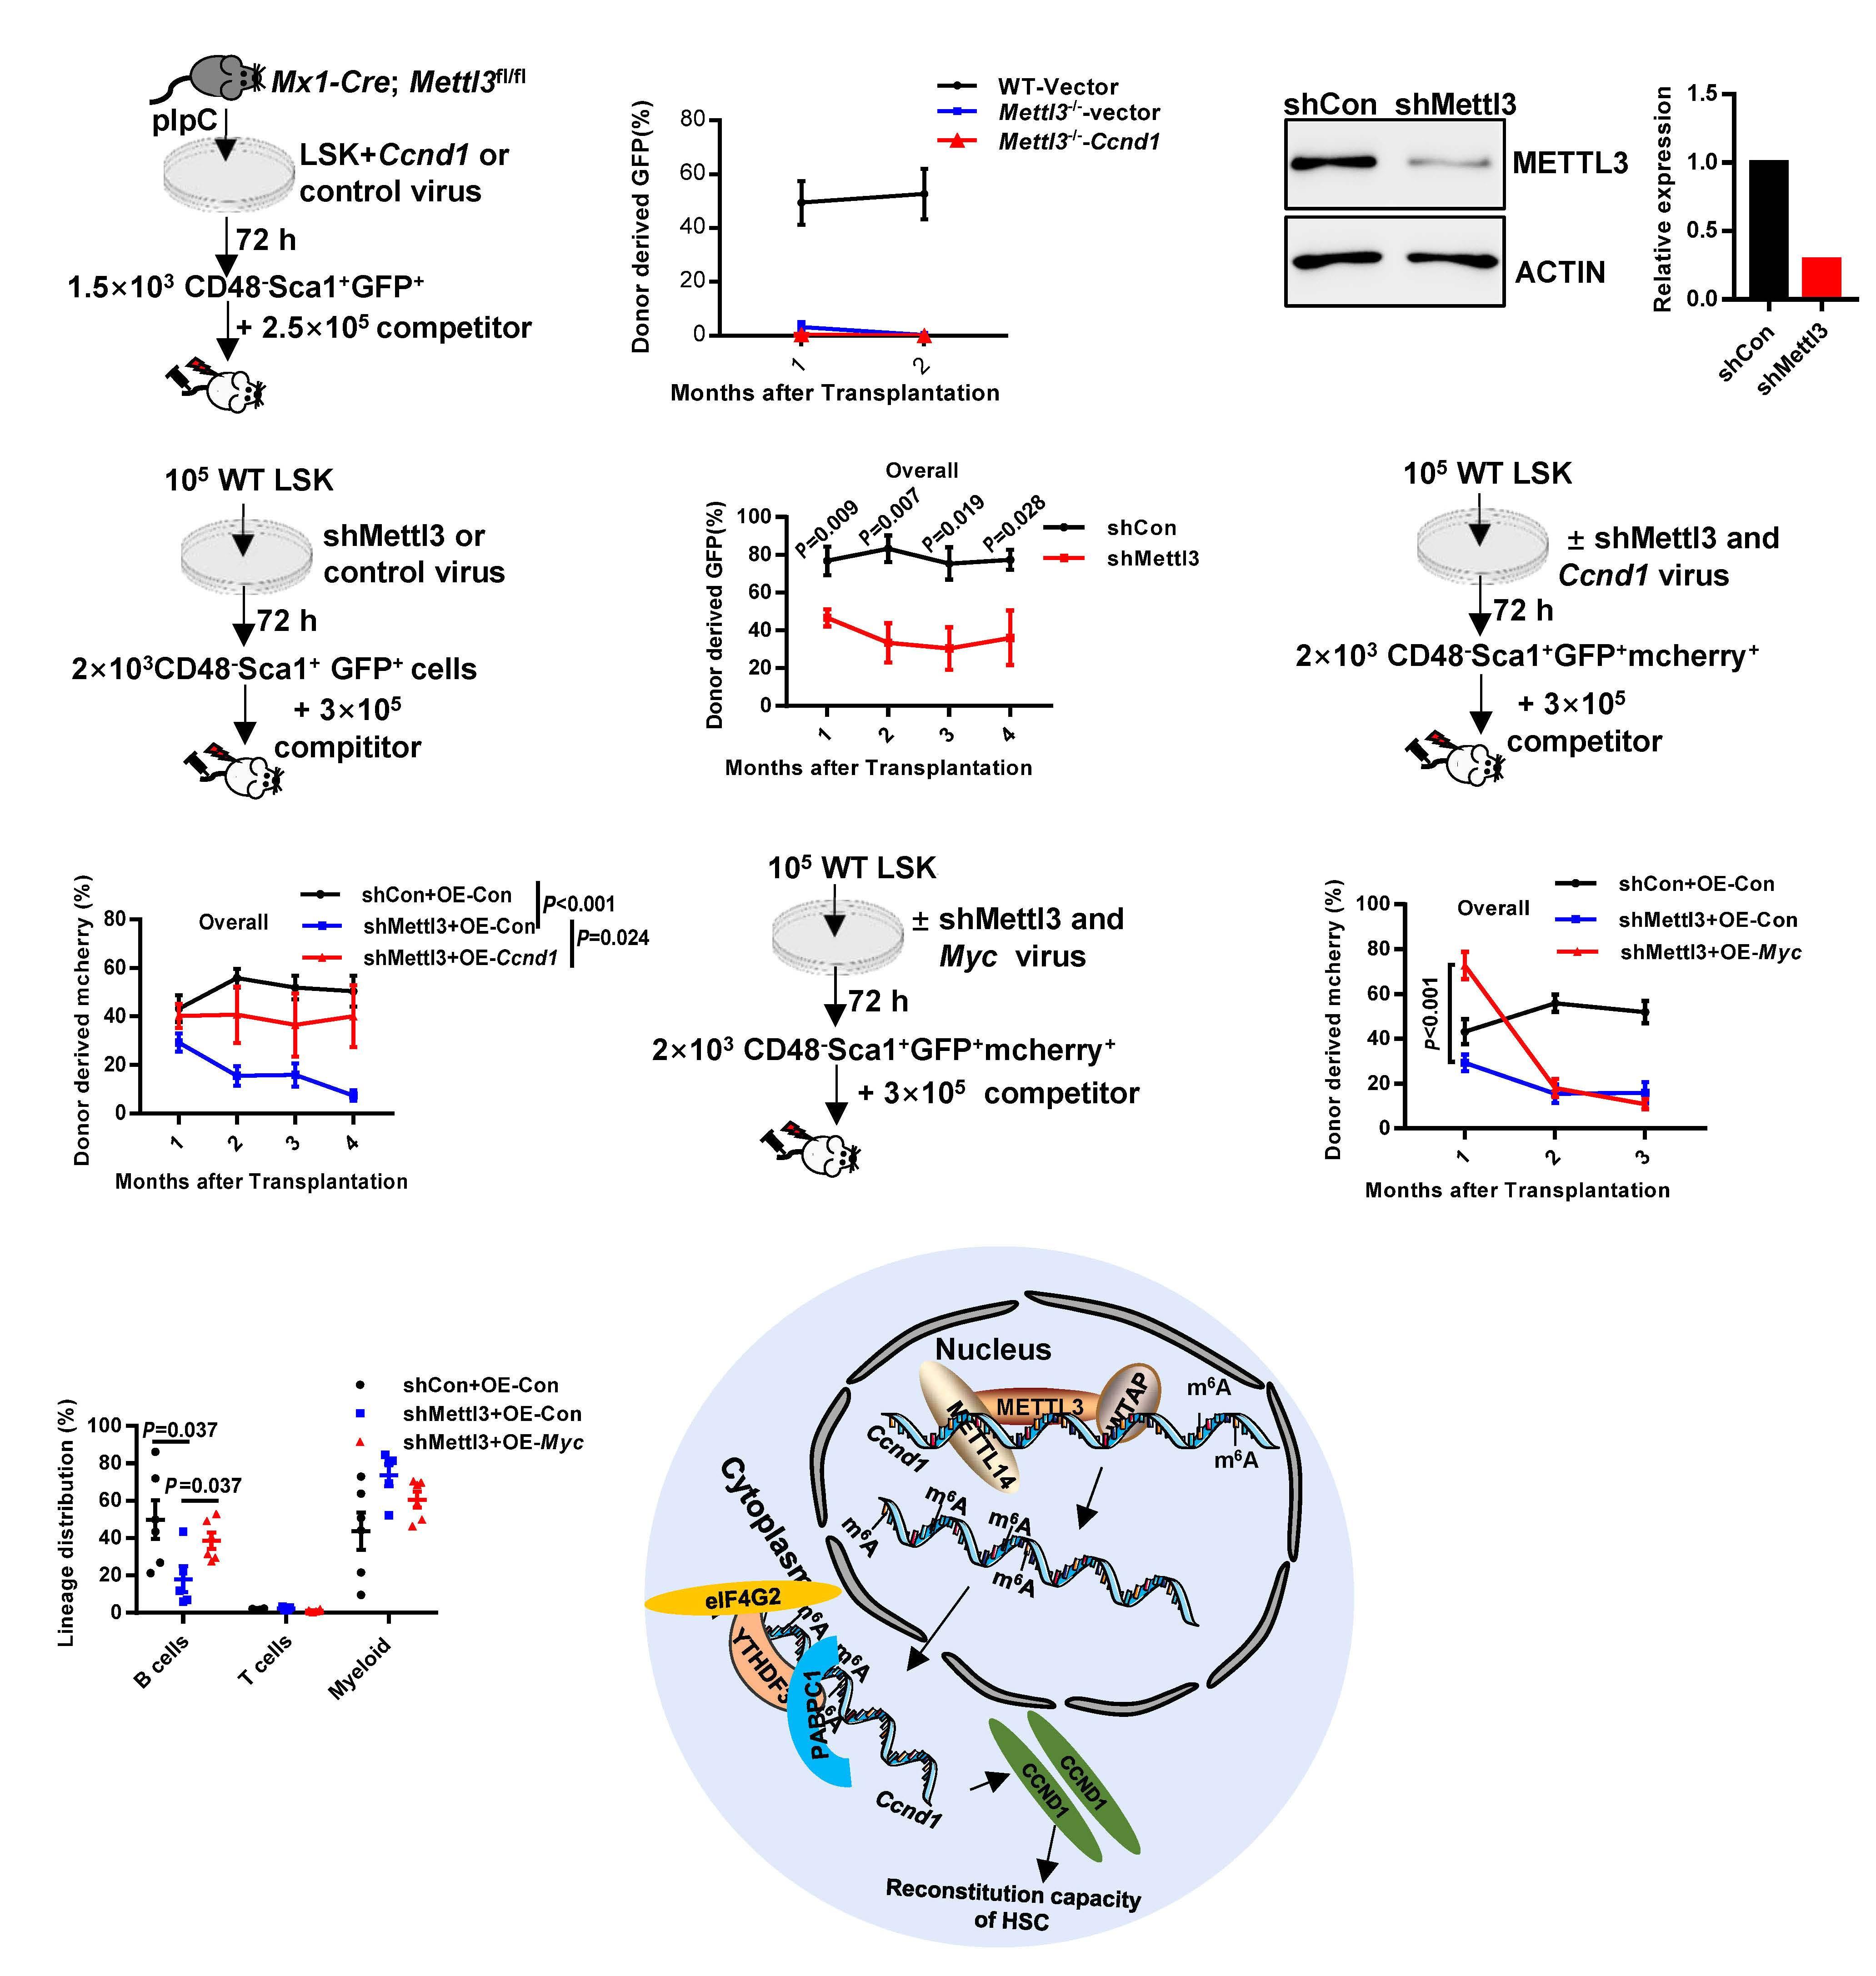
D
G
Continued on following page. Haematologica | 107 October 2022 2390 ARTICLE - YTHDF3 modulates HSC via m6A modification on Ccnd1 X. Zhang et al. A
total deletion of Mettl3 in LSK cells (Figure 5B) (hereafter named Mettl3-/-). Meanwhile, we investigated the mRNA and protein expression of Ccnd1 in Mettl3-/- LSK cells and found that deficiency of Mettl3 resulted in a significant re duction of protein level, but not of mRNA level of Ccnd1, in LSK cells (Figure 5B, C).
Taken together, these data suggest that METTL3 modulates the translation of Ccnd1 by binding directly to the m6A motif in the 5’ UTR region.
To further test whether Mettl3 modulates Ccnd1 through m6A modification, we conducted a luciferase reporter assay as for Ythdf3. The results showed that Mettl3 regu lated the translation of Ccnd1 through the 5’UTR region, es pecially the region from -180 to -184 (Figure 5D, E and Online Supplementary Figure S6F, H). Furthermore, based on published results, we constructed a plasmid to express the catalytic mutant METTL3 (METTL3-Mut, D395A).9,31,32 RIP-qPCR for Ccnd1 revealed that METTL3 could bind to Ccnd1 mRNA (Figure 5F).
To determine the influence of Mettl3 on the production of blood cells, we performed complete blood counts of Mettl3
Haematologicapathway. | 107 October 2022 2391 ARTICLE - YTHDF3 modulates HSC via m6A modification on Ccnd1 X. Zhang et al.
Dysfunction of Mettl3 disturbs hematopoietic homeostasis and severely impairs hematopoietic stem cell reconstitution capacity
Figure 6. Ccnd1 , but not Myc , is the target of METTL3 to regulate hematopoietic stem cell reconstitution capacity. (A, B) Freshly isolated LSK cells from wildtype (WT) or Mettl3 -/- mice were infected with Ccnd1 -overexpressing or control virus (GFP-labeled), and 1,500 GFP + CD48 Sca1 + cells were FACS-purified 72 h after infection. These cells were then transplanted into lethally irradiated recipients together with 2.5×10 5 competitor cells. (A) Experimental design to evaluate the role of CCND1 in regulating the reconstitution capacity of Mettl3 -/- hematopoietic stem cells (HSC). (B) Line plots depicting the percentage of GFP + cells in donor-derived cells every month after transplantation. Four to six mice per group. Data are shown as mean ± standard error of mean (SEM). (C) 3T3 cells were infected by lentivirus carrying Mettl3 shRNA or control, and 4 days later, 10 5 GFP + cells were purified for western blot to evaluate the expression of METTL3: the quantitative plots are presented. (D, E) Freshly isolated WT LSK cells were infected by lentivirus carrying Mettl3 shRNA or control and 72 h later, 2,000 CD48 Sca1 + GFP + cells were purified and transplanted into lethally irradiated recipients together with 3×10 5 competitor cells. (D) Experimental design to evaluate the role of Mettl3 in regulating the reconstitution capacity of HSC. (E) Line plots depicting the percentages of GFP + cells in donor-derived cells every month after transplantation. Five mice per group. Data are shown as mean ± SEM. (F, G) Freshly isolated LSK cells from WT mice were infected with Ccnd1 overexpressing virus (mCherry-labeled) and shMettl3-carrying virus (GFP-labeled), and 2,000 CD48- Sca1 + GFP + mcherry + cells were FACS-purified 72 h after infection. These cells were then transplanted into lethally irradiated recipients together with 3×10 5 competitor cells. (F) Experimental design to evaluate the role of CCND1 in regulating the reconstitution capacity of Mettl3- compromised HSC. (G) Line plots depicting the percentage of donor-derived cells in overall (mCherry + ) cells every month after transplantation. (H-J) Freshly isolated LSK cells from WT mice were infected with Myc -overexpressing virus (mCherry-labeled) and shMettl3-carrying virus (GFP-labeled), and 2,000 CD48 Sca1 + GFP + mCherry + cells were FACSpurified 72 h after infection. These cells were then transplanted into lethally irradiated recipients together with 3×10⁵ competitor cells. (H) Experimental design to evaluate the role of MYC in regulating the reconstitution capacity of Mettl3 compromised HSC. (I) Line plots depicting the percentages of mCherry + cells in donor-derived cells every month after transplantation. (J) Scatter plot showing the lineage distribution of donor-derived mCherry v cells in recipients at the first month. Five to seven mice per group. Data are shown as mean ± SEM. The gating strategy to generate these line plots is presented Online Supplementary Figure S5H . (K) This figure illustrates the proposed model of the reconstitution capacity of HSC reduced by a Mettl3 → RNA m 6 A → Ccnd1 → Ythdf3
/- and littermate controls, which revealed that the white blood cell, lymphocyte, neutrophil, red blood cell and pla telet counts were significantly decreased in Mettl3-/- mice (Online Supplementary Figure S6I). Meanwhile, we ob served that the frequency of Mettl3-/- HSC was increased significantly compared to controls (Online Supplementary Figure S6K). Considering that bone marrow cellularity of Mettl3-/- mice dropped significantly (Online Supplementary Figure S6J), we then counted the absolute number of HSC and found that the absolute number of HSC was still in creased significantly in Mettl3-/- mice (Online Supplemen tary Figure S6L), but not as dramatically as the frequency (Online Supplementary Figure S6K). It is notable that the expansion of HSC of Ythdf3-/- mice was much less pro nounced than that of Mettl3-/- mice. The frequency of Ythdf3-/- HSC increased by 1.65 times, while the frequency of Mettl3-/- HSC increased by 82.01 times (Online Supple mentary Figure S6M); the absolute number of Ythdf3-/- HSC increased by 1.48 times, while Mettl3-/- HSC increased by 14.51 times (Online Supplementary Figure S6N).
To further investigate the reconstitution capacity of Mettl3-/- HSC, 30 freshly isolated Mettl3-/- and control HSC were transplanted into lethally irradiated recipients to gether with 3×10⁵ competitor cells (Figure 5G). The results showed that Mettl3-/- HSC failed to reconstitute the blood system (Figure 5H), which is consistent with previous re ports.16-18Toexclude the influence of homing, 30 freshly isolated HSC from either Mx1-Cre; Mettl3flox/flox or control mice were transplanted into lethally irradiated recipients together with 3×10⁵ competitor cells. One month after transplan tation, all recipients were administered polyinosine–poly
To further confirm this result, we infected WT LSK cells with lentivirus carrying shRNA against Mettl3 to evaluate the expression of CCND1 (Online Supplementary Figure S6C) and found that knockdown of Mettl3 significantly re duced the level of CCND1 protein (Online Supplementary Figure S6D), but not mRNA (Online Supplementary Figure S6E).
Given that Ccnd1 is the hub of METTL3 and YTHDF3 to transmit the m6A signal to modulate HSC, and that forced Ccnd1 expression rescued Ythdf3-/- HSC (Figure 4D), we then investigated whether forced Ccnd1 expression could rescue the reconstitution capacity of Mettl3-/- HSC. We in fected freshly isolated Mettl3-/- LSK cells with Ccnd1-over expressing lentivirus (GFP-labeled), and 1,500 CD48 Sca1+ GFP+ cells were FACS-purified 72 h after infection and subsequently transplanted into lethally irradiated recipi ents together with 2.5×10⁵ competitor cells (Figure 6A). We could not detect Mettl3-/--derived cells in the peripheral blood of recipients, while chimerism of the control group was 52.66% at the second month (Figure 6B). Thus, forced Ccnd1 expression could not restore the reconstitution ca pacity of Mettl3-/- HSC.
Both previous studies16-18 and our current results (Figure 5H and Online Supplementary Figure S7B) showed that Mettl3 deficiency resulted in severe impairment of HSC, indicating that METTL3-mediated m6A modification is pi votal in maintaining HSC. Chen et al. found that the cell function exhibited a Mettl3 dosage-dependent effect,33 which is an interesting observation for exploring the func tional target of Mettl3. We, therefore, generated one shRNA against Mettl3, which inhibited METTL3 by 71% (Figure 6C). We then infected freshly isolated WT LSK cells with Mettl3 shRNA-carrying lentivirus and 2,000 CD48 Sca1+ GFP+ were FACS-purified 72 h after infection and transplanted into lethally irradiated recipients together with 3×10⁵ com petitor cells (Figure 6D). The results revealed that knock down of Mettl3 significantly impaired the reconstitution capacity of HSC, but still retained ~36% chimerism at the fourth month (Figure 6E). This result indicates that a cer tain amount of METTL3 can maintain HSC function to some extent. We infected freshly isolated WT LSK cells with Mettl3 shRNA-carrying lentivirus (GFP-labeled) and Ccnd1-overexpressing lentivirus (mCherry-labeled), and 2,000 CD48 Sca1+ GFP+ mCherry+ cells were FACS-puri fied 72 h after infection. These cells were then trans planted into lethally irradiated recipients together with 3×10⁵ competitor cells (Figure 6F). It was found that en forced Ccnd1 expression partially rescued the reconstitu tion capacity of Mettl3 shRNA-carrying HSC (7.44±2.07 vs 40.05±12.7 at the fourth month) including B, T and myeloid cells (Figure 6G and Online Supplementary Figure S7C).
To confirm this result, we infected freshly isolated WT LSK cells using Mettl3 shRNA-carrying lentivirus (GFP-la beled) and Myc -overexpressing lentivirus (mCherry-la beled), and 2,000 CD48 Sca1+ GFP+ mCherry+ cells were FACS-purified 72 h after infection. These cells were then transplanted into lethally irradiated recipients together with 3×10 5 competitor cells (Figure 6H). The results showed that overexpression of MYC significantly im proved the chimera of donor-derived cells at the end of the first month (Figure 6I), and lineage analysis showed that enforced MYC expression rescued the differentiation defect of Mettl3-compromised HSC (Figure 6J). However, the chimera of MYC-overexpressing cells dropped rapidly in the second and third months (Figure 6I). These results suggest that overexpression of MYC did indeed rescue the differentiation defect in the first month, but was not able to rescue the reconstitution capacity of Mettl3-com promised HSC in the long term.
Discussion
Disclosures
cytosine every other day for 10 days (Online Supplementary Figure S7A). It was found that deletion of Mettl3 severely decreased the reconstitution capacity of HSC (Online Sup plementary Figure S7B1A, B). In brief, the above results in dicate that Mettl3 is indispensable for maintaining hematopoietic homeostasis and the reconstitution capa city of HSC.
JW and HJ conceived the study and wrote the paper; JW, HJ, FZ and TC were responsible for the methodology; FZ, TC, LW, BZ, XW, SW, JS and ZP conducted the investiga tion; JW, HJ and MX performed the analyses and were re
Haematologica | 107 October 2022 2392 ARTICLE - YTHDF3 modulates HSC via m6A modification on Ccnd1 X. Zhang et al.
Ccnd1 is the target of METTL3 to regulate hematopoietic stem cell reconstitution capacity
Our study provides the first experimental evidence that the reconstitution capacity of HSC is regulated by the Mettl3→ Ccnd1→ Ythdf3 pathway (Figure 6K). The 5’UTR of Ccnd1 is the hub for METTL3 and YTHDF3 to transmit the m 6 A modification. This study is of great significance in revealing how a RNA m6A writer and reader cooperate to modulate HSC. A more in-depth discussion is provided in the Online Supplementary Information
No conflicts of interest to disclose.
Forced Myc expression cannot rescue the reconstitution capacity of Mettl3-/- hematopoietic stem cells in the long term Previous studies showed that enforced Myc expression rescues the differentiation defects of Mettl3-/- HSC.17 We therefore wondered whether forced Myc expression could rescue the reconstitution capacity of Mettl3-/- HSC. We in fected freshly isolated Mettl3-/- LSK cells with Myc-over expressing lentivirus (GFP-labeled), and 1,500 CD48 Sca1+ GFP+ cells were FACS-purified 72 h after infection and subsequently transplanted into lethally irradiated recipi ents together with 2.5×10⁵ competitor cells (Online Sup plementary Figure S7D, E). The results revealed that forced Myc expression could not rescue the reconstitution capa city of Mettl3-/- HSC (Online Supplementary Figure S7F).
Contribution
81870118, 91849106, 2018YFA0800200, 2017YFA0104000 and Z200022 to JW, 61773230, 61721003, and 2020YFA0906900 to XW., and 2020YFC2008900 to PZ from the National Key R&D Program of China or the Beijing Municipal Science & Technol ogy Commission and the National Natural Science Foundation of China.
2. Dzierzak E, Bigas A. Blood development: hematopoietic stem cell dependence and independence. Cell Stem Cell. 2018;22(5):639-651.
5. Shi H, Wei J, He C. Where, when, and how: context-dependent functions of RNA methylation writers, readers, and erasers. Mol Cell. 2019;74(4):640-650.
13. Wang X, Zhao BS, Roundtree IA, et al. N(6)-methyladenosine modulates messenger RNA translation efficiency. Cell. 2015;161(6):1388-1399.
28. Zhou Y, Zeng P, Li YH, Zhang Z, Cui Q. SRAMP: prediction of mammalian N6-methyladenosine (m6A) sites based on sequence-derived features. Nucleic Acids Res. 2016;44(10):e91.
10. Patil DP, Pickering BF, Jaffrey SR. Reading m(6)A in the transcriptome: m(6)A-binding proteins. Trends Cell Biol. 2018;28(2):113-127.
References
Mettl3-dependent m(6)A mRNA methylation during haematopoietic stem cell differentiation. Nat Cell Biol. 2019;21(6):700-709.
19. Roundtree IA, Evans ME, Pan T, He C. Dynamic RNA modifications in gene expression regulation. Cell. 2017;169(7):1187-1200.
21. Deng X, Su R, Weng H, Huang H, Li Z, Chen J. RNA N(6)methyladenosine modification in cancers: current status and perspectives. Cell Res. 2018;28(5):507-517.
Funding
Haematologica | 107 October 2022 2393 ARTICLE - YTHDF3 modulates HSC via m6A modification on Ccnd1 X. Zhang et al.
27. Hirayama M, Wei FY, Chujo T, et al. FTO demethylates cyclin D1 mRNA and controls cell-cycle progression. Cell Rep. 2020;31(1):107464.
1. Morrison SJ, Scadden DT. The bone marrow niche for haematopoietic stem cells. Nature. 2014;505(7483):327-334.
17. Lee H, Bao S, Qian Y, et al. Stage-specific requirement for
6. Wang X, Feng J, Xue Y, et al. Structural basis of N(6)-adenosine methylation by the METTL3-METTL14 complex. Nature. 2016;534(7608):575-578.
Data-sharing statement
4. Frye M, Harada BT, Behm M, He C. RNA modifications modulate gene expression during development. Science. 2018;361(6409):1346-1349.
16. Yao QJ, Sang L, Lin M, et al. Mettl3-Mettl14 methyltransferase complex regulates the quiescence of adult hematopoietic stem cells. Cell Res. 2018;28(9):952-954.
14. Du H, Zhao Y, He J, et al. YTHDF2 destabilizes m(6)A-containing RNA through direct recruitment of the CCR4-NOT deadenylase complex. Nat Commun. 2016;7:12626.
8. Patil DP, Chen CK, Pickering BF, et al. m(6)A RNA methylation promotes XIST-mediated transcriptional repression. Nature. 2016;537(7620):369-373.
All raw sequencing data were deposited into the National Center for Biotechnology Information Gene Expression Om nibus with accession number GSE176458.
12. Wang X, Lu Z, Gomez A, et al. N6-methyladenosine-dependent regulation of messenger RNA stability. Nature. 2014;505(7481):117-120.
11. Shi H, Wang X, Lu Z, et al. YTHDF3 facilitates translation and decay of N(6)-methyladenosine-modified RNA. Cell Res. 2017;27(3):315-328.
26. Bubnic SJ, Keating A. Donor stem cells home to marrow efficiently and contribute to short- and long-term hematopoiesis after low-cell-dose unconditioned bone marrow transplantation. Exp Hematol. 2002;30(6):606-611.
20. Zhao BS, Roundtree IA, He C. Post-transcriptional gene regulation by mRNA modifications. Nat Rev Mol Cell Biol. 2017;18(1):31-42.
25. Hendrikx PJ, Martens CM, Hagenbeek A, Keij JF, Visser JW. Homing of fluorescently labeled murine hematopoietic stem cells. Exp Hematol. 1996;24(2):129-140.
24. Li Z, Qian P, Shao W, et al. Suppression of m(6)A reader Ythdf2 promotes hematopoietic stem cell expansion. Cell Res. 2018;28(9):904-917.
Acknowledgments
We thank the Beijing Advanced Innovation Center for Structural Biology, the Tsinghua-Peking Center for Life Sciences and the China Telecom Corporation Limited for facilities and financial support.
30. Platt RJ, Chen S, Zhou Y, et al. CRISPR-Cas9 knockin mice for genome editing and cancer modeling. Cell. 2014;159(2):440-455.
This work was supported by grant numbers Z181100001818005,
15. Li A, Chen YS, Ping XL, et al. Cytoplasmic m(6)A reader YTHDF3 promotes mRNA translation. Cell Res. 2017;27(3):444-447.
29. Zhang Y, Wang X, Zhang X, et al. RNA-binding protein YTHDF3 suppresses interferon-dependent antiviral responses by promoting FOXO3 translation. Proc Natl Acad Sci U S A. 2019;116(3):976-981.
23. Wang H, Zuo H, Liu J, et al. Loss of YTHDF2-mediated m(6)Adependent mRNA clearance facilitates hematopoietic stem cell regeneration. Cell Res. 2018;28(10):1035-1038.
22. He L, Li H, Wu A, Peng Y, Shu G, Yin G. Functions of N6methyladenosine and its role in cancer. Mol Cancer. 2019;18(1):176.
sponsible for the resourc es for this study; and JW ac quired funding and supervised the study
9. Wang P, Doxtader KA, Nam Y. Structural basis for cooperative function of Mettl3 and Mettl14 methyltransferases. Mol Cell. 2016;63(2):306-317.
3. He H, Xu P, Zhang X, et al. Aging-induced IL27Ra signaling impairs hematopoietic stem cells. Blood. 2020;136(2):183-198.
31. Wu R, Liu Y, Zhao Y, et al. m(6)A methylation controls pluripotency of porcine induced pluripotent stem cells by targeting SOCS3/JAK2/STAT3 pathway in a YTHDF1/YTHDF2-
18. Cheng Y, Luo H, Izzo F, et al. m(6)A RNA methylation maintains hematopoietic stem cell identity and symmetric commitment. Cell Rep. 2019;28(7):1703-1716.
7. Knuckles P, Lence T, Haussmann IU, et al. Zc3h13/Flacc is required for adenosine methylation by bridging the mRNAbinding factor Rbm15/Spenito to the m(6)A machinery component Wtap/Fl(2)d. Genes Dev. 2018;32(5-6):415-429.
43. Choi YJ, Saez B, Anders L, et al. D-cyclins repress apoptosis in hematopoietic cells by controlling death receptor Fas and its ligand FasL. Dev Cell. 2014;30(3):255-267.
47. Rossi L, Lin KK, Boles NC, et al. Less is more: unveiling the functional core of hematopoietic stem cells through knockout mice. Cell Stem Cell. 2012;11(3):302-317.
35. Roundtree IA, Luo GZ, Zhang Z, et al. YTHDC1 mediates nuclear export of N(6)-methyladenosine methylated mRNAs. Elife. 2017;6:e31311.
36. Hsu PJ, Zhu Y, Ma H, et al. Ythdc2 is an N(6)-methyladenosine binding protein that regulates mammalian spermatogenesis. Cell Res. 2017;27(9):1115-1127.
32. Śledź P, Jinek M. Structural insights into the molecular mechanism of the m(6)A writer complex. Elife. 2016;5:e18434.
45. Anders S, Pyl PT, Huber W. HTSeq--a Python framework to work with high-throughput sequencing data. Bioinformatics. 2015;31(2):166-169.
37. Liu J, Dou X, Chen C, et al. N(6)-methyladenosine of chromosome-associated regulatory RNA regulates chromatin state and transcription. Science. 2020;367(6477):580-586.
39. Wilson A, Murphy MJ, Oskarsson T, et al. c-Myc controls the balance between hematopoietic stem cell self-renewal and differentiation. Genes Dev. 2004;18(22):2747-2763.
41. Meyer KD, Patil DP, Zhou J, et al. 5' UTR m(6)A promotes Capindependent translation. Cell. 2015;163(4):999-1010.
42. Chaves-Ferreira M, Krenn G, Vasseur F, et al. The cyclin D1 carboxyl regulatory domain controls the division and differentiation of hematopoietic cells. Biol Direct. 2016;11:21.
orchestrated manner. Cell Death Dis. 2019;10(3):171.
33. Chen WW, Qi JW, Hang Y, et al. Simvastatin is beneficial to lung cancer progression by inducing METTL3-induced m6A modification on EZH2 mRNA. Eur Rev Med Pharmacol Sci. 2020;24(8):4263-4270.
Haematologica | 107 October 2022 2394 ARTICLE - YTHDF3 modulates HSC via m6A modification on Ccnd1 X. Zhang et al.
34. Xiao W, Adhikari S, Dahal U, et al. Nuclear m(6)A reader YTHDC1 regulates mRNA splicing. Mol Cell. 2016;61(4):507-519.
46. Subramanian A, Tamayo P, Mootha VK, et al. Gene set enrichment analysis: a knowledge-based approach for interpreting genome-wide expression profiles. Proc Natl Acad Sci U S A. 2005;102(43):15545-15550.
38. Liao S, Sun H, Xu C. YTH domain: a family of N(6)methyladenosine (m(6)A) readers. Gen Proteomics Bioinformatics. 2018;16(2):99-107.
44. Kim D, Paggi JM, Park C, Bennett C, Salzberg SL. Graph-based genome alignment and genotyping with HISAT2 and HISATgenotype. Nat Biotechnol. 2019;37(8):907-915.
40. Reavie L, Della Gatta G, Crusio K, et al. Regulation of hematopoietic stem cell differentiation by a single ubiquitin ligase-substrate complex. Nat Immunol. 2010;11(3):207-215.
©2022 Ferrata Storti Foundation
Multiple myeloma (MM) develops in the bone marrow by clonal expansion of malignant plasma cells and is associ ated with excessive production of monoclonal immuno globulins in blood and urine.1,2 Despite significant progress achieved in the treatment of MM, this disease remains in curable with a poor prognosis in relapsed/refractory (R/R) patients. Therefore, the development of novel therapeutic approaches to target MM is essential. Following the major success of CD19-targeted chimeric antigen receptor (CAR) therapy to hematological malignancies and its Food and Drug Administration (FDA) approval in 2017, new potential targets for CAR therapy are required.3 In this regard, B-cell maturation antigen (BCMA) is a cell-surface protein be longing to the tumor necrosis factor receptor superfamily which promotes B-cell survival and proliferation.4 Besides
Haematologica | 107 October 2022 2395 ARTICLE - Multiple Myeloma
https://doi.org/10.3324/haematol.2021.280169
Abstract
Accepted: March 23, 2022.
Received: October 12, 2021.
Introduction
Published under a CC BY-NC license
Preclinical evaluation and structural optimization of antiBCMA CAR to target multiple myeloma
Prepublished: March 31, 2022.

1Laboratory of Tumor Immunology and Immunotherapy, The Mina and Everard Goodman Faculty of Life Sciences, Bar-Ilan University, Ramat Gan; 2Department of Bone Marrow Transplantation and Cancer Immunotherapy, Hadassah Medical Center, Faculty of Medicine, Hebrew University of Jerusalem, Jerusalem and 3Department of Hematology, Hadassah Medical Center, Faculty of Medicine, Hebrew University of Jerusalem, Jerusalem, Israel
Correspondence: C. J. Cohen Polina@hadassah.org.ilP.Cyrille.Cohen@biu.ac.ilStepensky
Ortal Harush,1* Nathalie Asherie,2* Shlomit Kfir-Erenfeld,2* Galit Adler,1 Tilda Barliya,1 Miri Assayag,2 Moshe E. Gatt,3 Polina Stepensky2 and Cyrille J. Cohen1
mature B-lymphocytes and plasma cells, BCMA is highly expressed in most cases of MM, making it an attractive target for CAR therapy.5,6 Kochenderfer and colleagues tested an anti-BCMA CAR in a clinical trial which resulted in 20% objective response rate (ORR) in the patient group treated with 0.3-3x10⁶ CAR-T cells/kg.7 A higher ORR (81%) was achieved when using a higher dose (9x10⁶ cells/kg).8,9 Several recent trials demonstrate the potential of anti-BCMA CAR approach in promising phase I/II studies, reaching up to 80% ORR with deep and durable responses in heavily pretreated patients with R/R multiple myeloma.10-16 Based on the encouraging results of a phase II trial,15 the FDA and European Medi cines Agency approved Idecabtagene-Vicleucel (Ide-cel or bb2121) for the treatment of R/R MM patients. Another CAR-T-cell product, Ciltacabtagene-autoleucel (Cilta-cel), incorporates two anti-BCMA single heavy-chain domains
*OH, NA and SKE contributed equally as co-first authors.
Chimeric antigen receptor (CAR) T-cell based immunotherapy has become a promising treatment mainly for hematological malignancies. Following the major success of CD19-targeted CAR, new potential targets for other malignancies are required. As such, B-cell maturation antigen (BCMA) is an attractive tumor-associated antigen to be targeted in multiple myeloma (MM). Herein, we aimed at assessing the function and optimal configuration of different BCMA-specific CAR, based on the same targeting moiety but with a different hinge and co-stimulatory domain. We compared their function to that of a previously characterized BCMA-CAR used in clinical trials. All constructs were expressed at high levels by primary human T cells and could trigger cytokine production and cytotoxicity upon co-culture with multiple myeloma targets. Nonetheless, critical differences were observed in off-target activation, exhaustion, and activation marker expression and in vivo antitumoral activity mediated by these different constructs. Interestingly, we noted that CD8-based hinge, combined with a 4-1BB intracellular domain, proved superior compared to IgG4-connecting regions, and/or a CD28-signaling moiety re spectively. Overall, this study emphasizes the influence of CAR primary structure on its function and led to the identifi cation of a highly efficient BCMA-specific CAR, namely H8BB, which displayed superior anti-tumoral activity both in vitro and long-term in vivo efficacy.
Haematologica | 107 October 2022 2396 ARTICLE - BCMA-CAR optimization and evaluation O. Harush et al.
CAR-T cells were co-cultured with target cells IL-2 medium overnight at an effector to target (E:T) ratio of 10:1, in T-cell medium without IL-2 and incubated for 24 hours at 37°C. Cells were stained with the indicated anti bodies and analyzed by flow cytometry, gated on BCMACAR+
ICBB, IC28 and H8BB (Figure 1A) were created by overlap ping polymerase chain reaction (PCR) based on the heavy chain followed by the light chain derived from the pre viously described C11D5.3 antibody.7 ICBB and IC28 incor porated an optimized short IgG4-derived spacer and a Strep Tag27, while H828 and H8BB incorporated CD8α de rived hinge and TM. The H828-CAR was a kind gift from Dr. Kochenderfer, NCI, NIH.7 These chimeras were sub cloned into the retroviral backbone pMSGV1 (a kind gift from Dr Steven Rosenberg, NCI). Retroviral transduction, co-cultures, enzyme-linked immunosorbant assay (ELISA) and cytotoxicity assays were performed as previously de scribed.28-30
Immunohistochemistry
T-cell exhaustion/activation following antigen stimulation
Methods
37°C and 5% CO2. Bone marrow (BM) aspirates from pa tients with plasma cell dyscrasias were obtained in ac cordance with Helsinki approval from the Ethical Committee of Hadassah Ein-Kerem Medical Center. BMderived mononuclear cells were isolated by centrifugation over a density gradient medium (lymphocyte separation medium, Lonza). Lymphocytes were cultured in BioTarget medium (Biological Industries, Israel) with 10% fetal bov ine serum, 1% L-glutamine, 1% penicilin/streptomycin and 300 IU/mL IL-2 (Peprotech-Asia, Israel).24-26
and a 4-1BB co-stimulatory domain, demonstrated an ORR over 97% without excessive toxicity in terms of cyto kine release syndrome or neurotoxicity.16
Peripheral blood mononuclear cells, bone marrowderived manonuclear cells and cell lines
Anti-BCMA chimeric receptors
Established tumor assay
Peripheral blood mononuclear cells (PBMC) were from healthy donors obtained from the Israeli Blood Bank (TelHashomer, Israel), the Pheresis Collection Unit, (IRB-appro val #0458-19-HMO) or from blood of patients with plasma cell malignancies (IRB-approval #0253-20-HMO). BCMA+ cell lines are RPMI8226(ATCC/CCL-155), (NCI)-H929(ATCC/CRL9068) and MM1.S(ATCC/CRL-2974). K562(ATCC/CCL-243) is an erythroleukemia line BCMAneg. K562-BCMA was engin eered to overexpress BCMA. Cell lines were cultured in RPMI medium (Invitrogen, Carlsbad, CA), with 10% heat-inactiv ated fetal bovine serum (Biological Industries, Israel), at
Four micron-thick formalin-fixed paraffin-embedded (FFPE) tumor sections were stained with the anti-human CD3 antibody (103A-76/1507011D, CellMarque, 1:1,000), on
Six to 12 week-old NOD/SCID/Gamma mice were subcu taneously injected with 4x10⁶ NCI H929 cells resuspended in 100 µL HBSS medium (Biological Industries, Beth Hae mek, Israel) and 100 µL Cultrex matrix (Trevigen, MD). Transduced lymphocytes resuspended in 200 µL HBSS medium were injected after tumor inoculation. Tumor size was measured every 2-3 days using a caliper in a blinded fashion or assessed by injecting luciferin solution (5 mg/ml, 200 µLmouse, Promega) and bioluminescence im aging (BLI) evaluation. Animals were humanely euthanized if the tumor exceeded 16 mm in diameter. All the proce dures were performed according to the guidelines of the University Committee for Animal Welfare.
CAR consist of two essential moieties: an extracellular binding domain and a signaling domain. The first is usually composed of a single-chain fragment variable (scFv) tar geting a designed antigen, whereas the signaling domain, usually composed of co-stimulatory moiety (e.g., CD28 and/or 4-1BB), along with CD3��, facilitates T-cell activa tion. The type of co-stimulation can greatly facilitate CART-cell persistence and metabolic activity (like in 4-1BB-based CAR), while CD28 promotes more potent but short-lived responses.17 Connecting both CAR moieties, the hinge and transmembrane domains provide proper linkage and flexibility, influencing CAR-T-cell function, sta bility, and expression.18,19 CAR hinge domain is often chosen according to the target ligand proximity to the cell membrane20-22 and CAR structure must be optimized em pirically to enhance its function. Moreover, a recent retro spective analysis of anti-CD19 CAR-T-based clinical studies further supports the idea that the structural com position of CAR domains, beyond scFv and co-stimulatory moieties, impacts clinical outcomes and related toxicities.23Thus,wehypothesized that modifications in the primary structure of an originally described BCMA-specific CAR (referred to as “H828” herein) would improve its function.7 In order to assess this, we constructed three novel antiBCMA CAR and compared their function to that of H828. We performed extensive analysis of expression, cytokine production and cytotoxicity against myeloma cells while focusing also on "off-target", activation and exhaustion profiles, and on the in vivo efficacy of CAR-T cells. Our findings exemplify the contribution of different domains (i.e., hinge, TM and co-stimulatory portions) on CAR spe cificity and function, which may bear important implica tions for its implementation in clinical settings.
Herein, we designed and constructed three second-gen eration anti-BCMA CAR based on the heavy and light chains derived from the C11D5.3 antibody.7 As co-stimu latory molecules, these CAR incorporate either an intra cellular domain derived from 4-1BB (for H8BB and ICBB) or CD28 (for IC28) (Figure 1A). More specifically, H8BB in cludes hinge and transmembrane (TM) domains derived from CD8α, while these were replaced by an IgG4 hinge and a CD28 TM in the ICBB. IC28 shares the same hinge and CD28 TM domain as ICBB, but its co-stimulatory do main was switched from 4-1BB to CD28 (Figure 1A). As a reference, we used the previously described7 and clinically
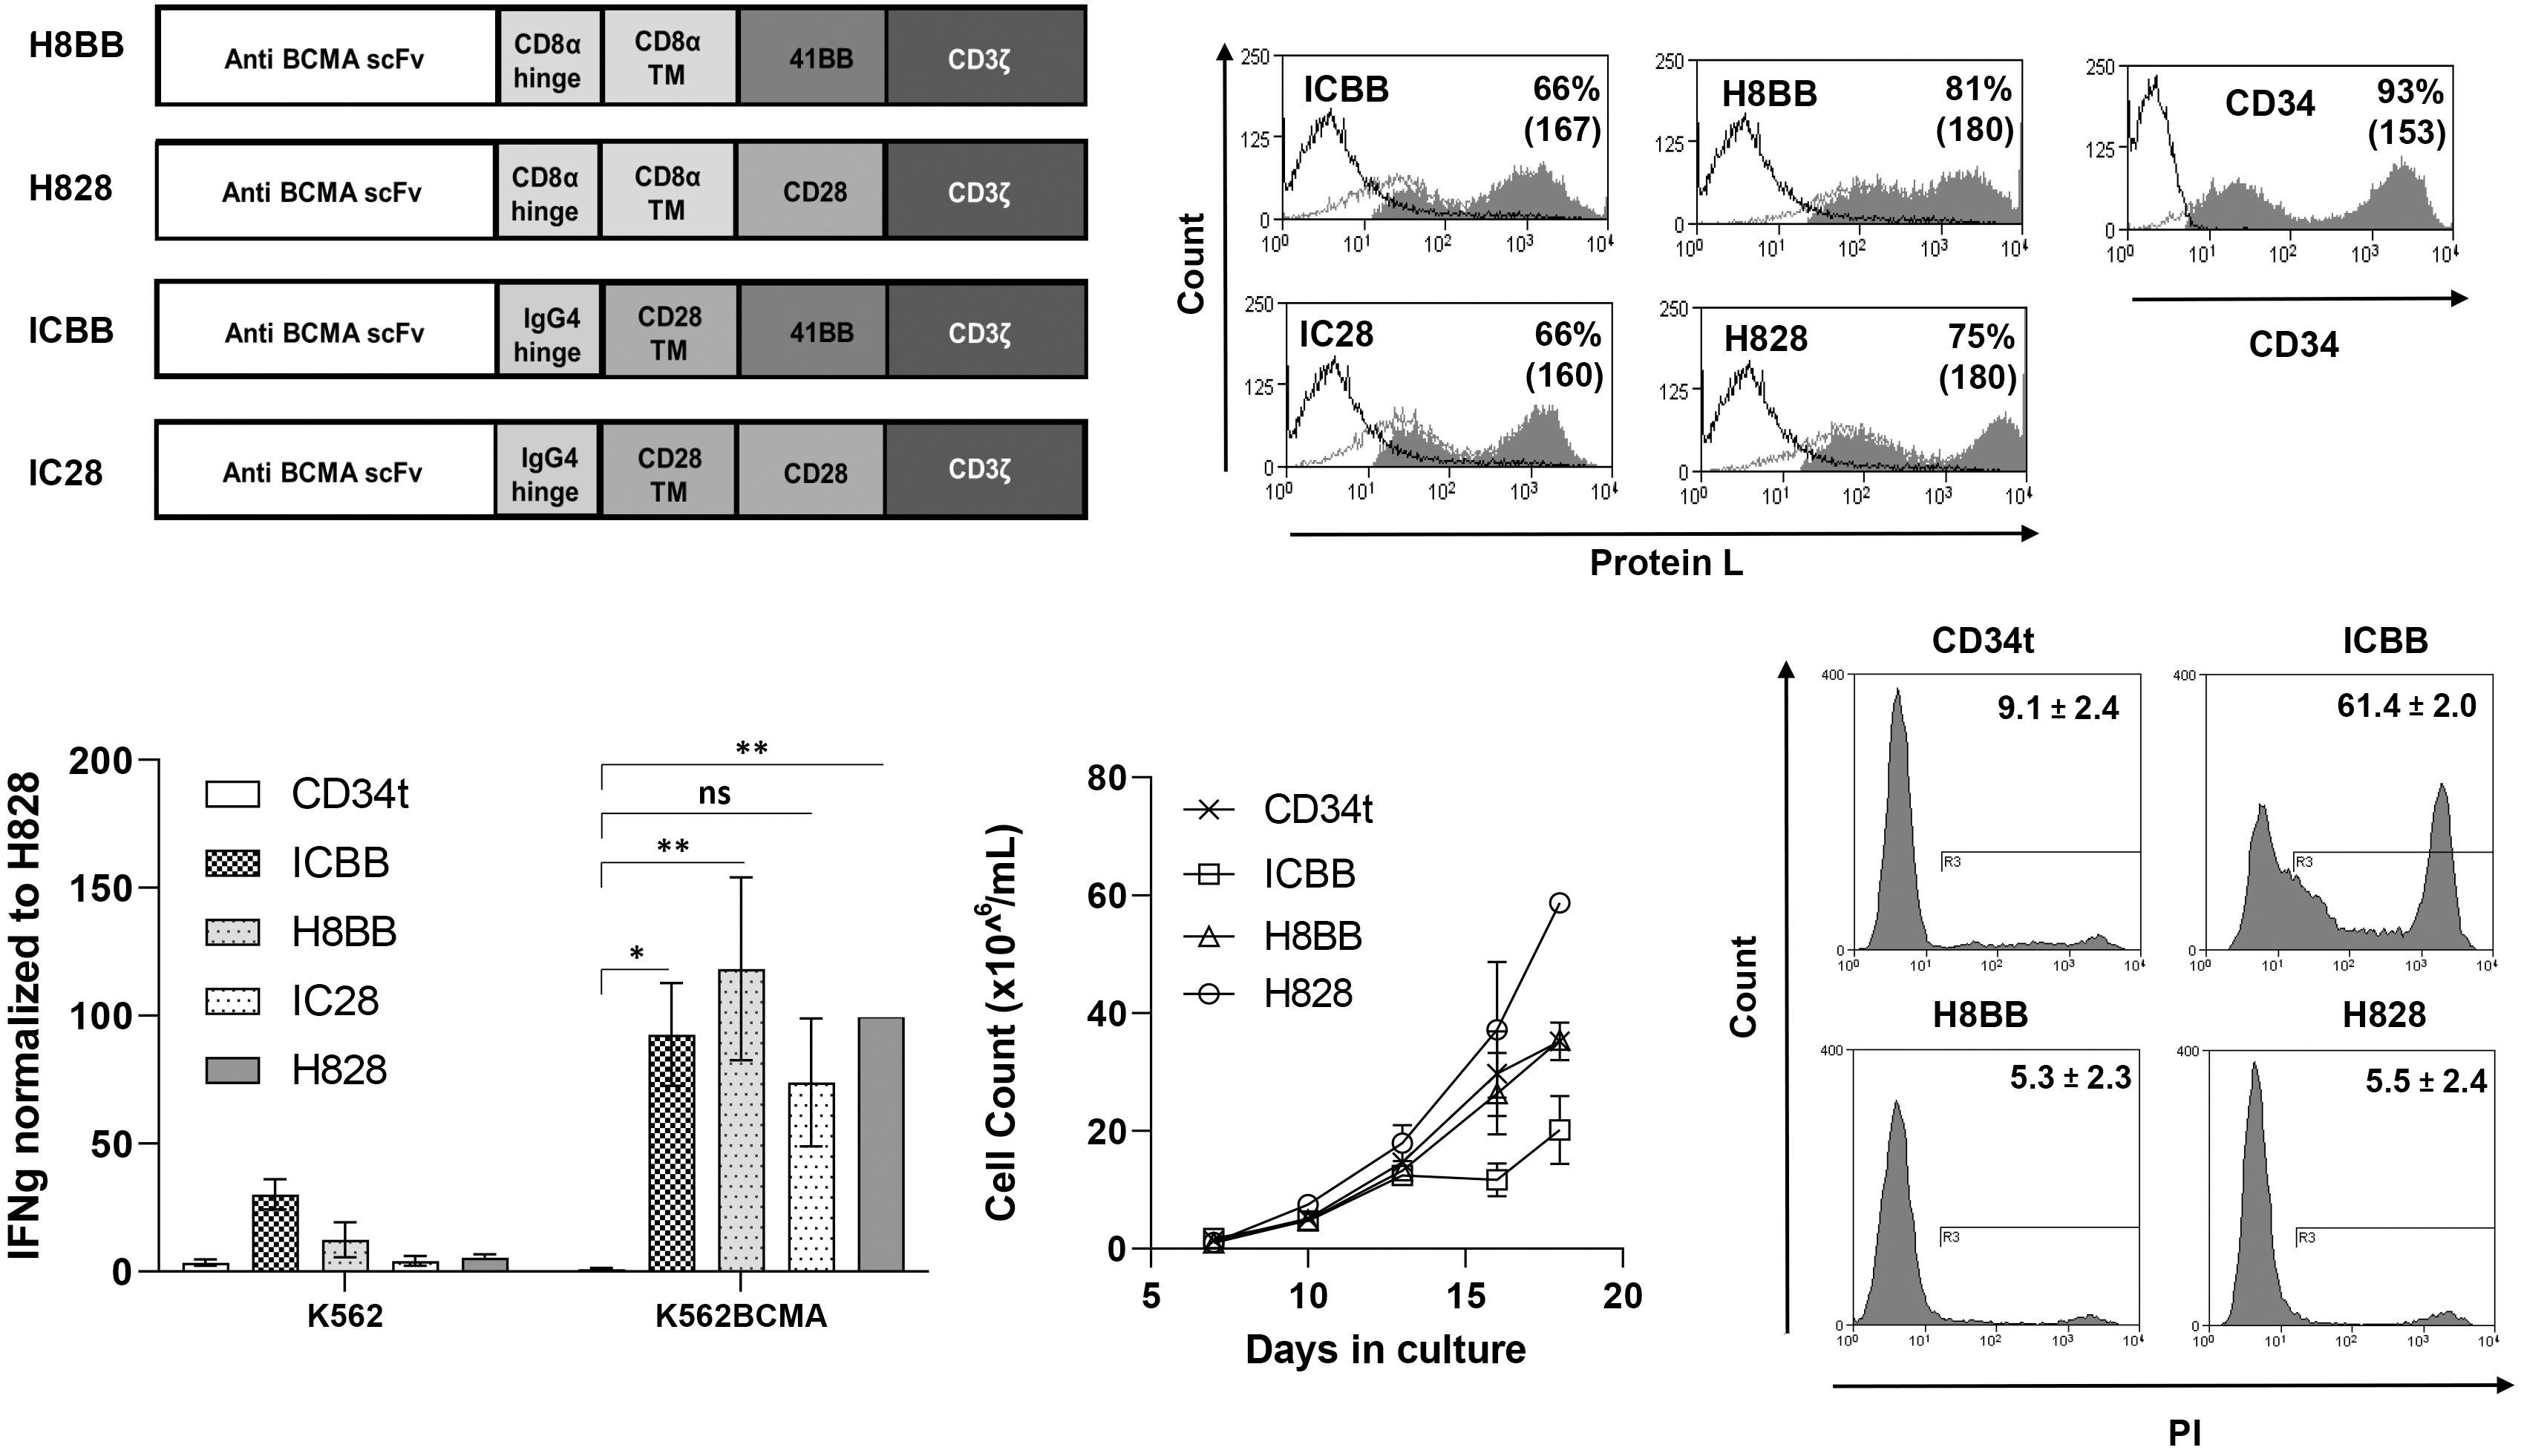
Statistical analyses were performed using GraphPad Prism (V9.1.0). Unless otherwise stated, paired Student’s t-test or two-way ANOVA tests were used for normal data at equal variance. P<0.05 was considered significant and is marked as * in the figures. T cells from at least three dif ferent healthy donors were used for all in vitro and in vivo experiments. Kruskal-Wallis analysis with Dunn's post hoc analysis was performed for mouse tumor volumes. Analy sis of variance or log-rank (Mantel-Cox) test for survival data were performed.
A B C D E Haematologica | 107 October 2022 2397 ARTICLE - BCMA-CAR optimization and evaluation O. Harush et al.
Results
Generation of different anti-BCMA CAR and preliminary evaluation
a BenchMark ULTRA-autostainer (Ventana Medical Sys tems) with standard antigen retrieval (CC1-buffer, 40 min utes). Detection was performed using the ultraView Universal-DAB Detection-Kit (Ventana Medical Systems).
Statistical analysis
Figure 1. Characterization of anti-BCMA based chimeras. (A) Schematic representation of the different designs of anti-BCMA chimeric receptors described in the Materials and Methods section. (B) Anti-CD3-activated human primary peripheral blood mononuclear cells (PBMC) were transduced with the different anti-BCMA chimeric antigen receptor (CAR) or with truncated CD34 (CD34t, control gene), as indicated. These cells were stained using Protein L or anti-CD34 antibody, respectively. Transgene ex pression was assessed by flow cytometry. The dotted line represents the staining of the mock-transduced control cells. The percentage of positive cells and the mean fluorescence intensity (MFI) (in brackets) are shown. The graph represents the average of 4 different donors and the difference in the staining between the population transduced with BCMA-CAR and the control population was found statistically significant (P<0.05; calculated using a Student’s paired t-test). (C) Co-culture of 1e5 transduced cells with 1e5 K562-BCMA or K562 cells (negative control) for 16 hours. Interferon γ (IFNγ) secreted in the co-culture supernatant was measured by enzyme-linked immunosorbant assay. These results are representative of 3 independent experiments. (D) Cell concentration was determined for BCMA-CAR-T cells and control T cells every 2-3 days for 3 weeks. These results are represen tative of 3 independent experiments with different donors (ICBB vs. H8BB/H828, P<0.05; by two-way ANOVA). (D) Cell viability was assessed 3 weeks following transduction. BCMA-CAR T cells were stained with propidium iodide (PI) and analyzed by flow cytometry, ICBB vs. H8BB/H828, P<0.001, by paired Student’s t-test. BCMA: B-cell maturation antigen.
Growth and viability of T cells transduced with the different anti-BCMA chimeras
tested8 H828 CAR (also based on the C11D5.3 antibody), which incorporates a CD8α derived hinge-TM and CD28 as co-stimulatory domain. We then evaluated the function of the BCMA-specific CAR. To that end, anti-CD3-stimulated human PBMC were trans duced with these different CAR. As shown in Figure 1B, BCMA CAR molecules were expressed at high levels, ranging from 66% for ICBB to 81% for H8BB. We performed an over night co-culture of CAR-transduced T cells with target cells (K562 vs. K562-BCMA) and measured IFNγ secretion by ELISA. All four anti-BCMA CAR mediated IFNγ release (Figure 1C). Yet, although IC28 could induce cytokine release upon specific stimuli, it was less efficient than the other CAR in mediating cytokine release (Figure 1C, IC28 vs. CD34t, ns), in killing assays and at upregulating activation markers upon antigen stimulation (data not shown). Additionally, H8BB CAR-T cells secreted less IFNγ than corresponding ICBB CAR-T cells (P<0.05) in the presence of the BCMA-negative control cell line K562. Since both chimeras share the same scFv and co-stimulatory domains, this observation may in dicate that the hinge and TM moieties incorporated into these CAR may affect their "off-target" specificity. Given these preliminary data and based on emerging studies demonstrating 4-1BB co-stimulation benefits,17,31 we decided to focus on 4-1BB-based CAR, namely ICBB and H8BB.
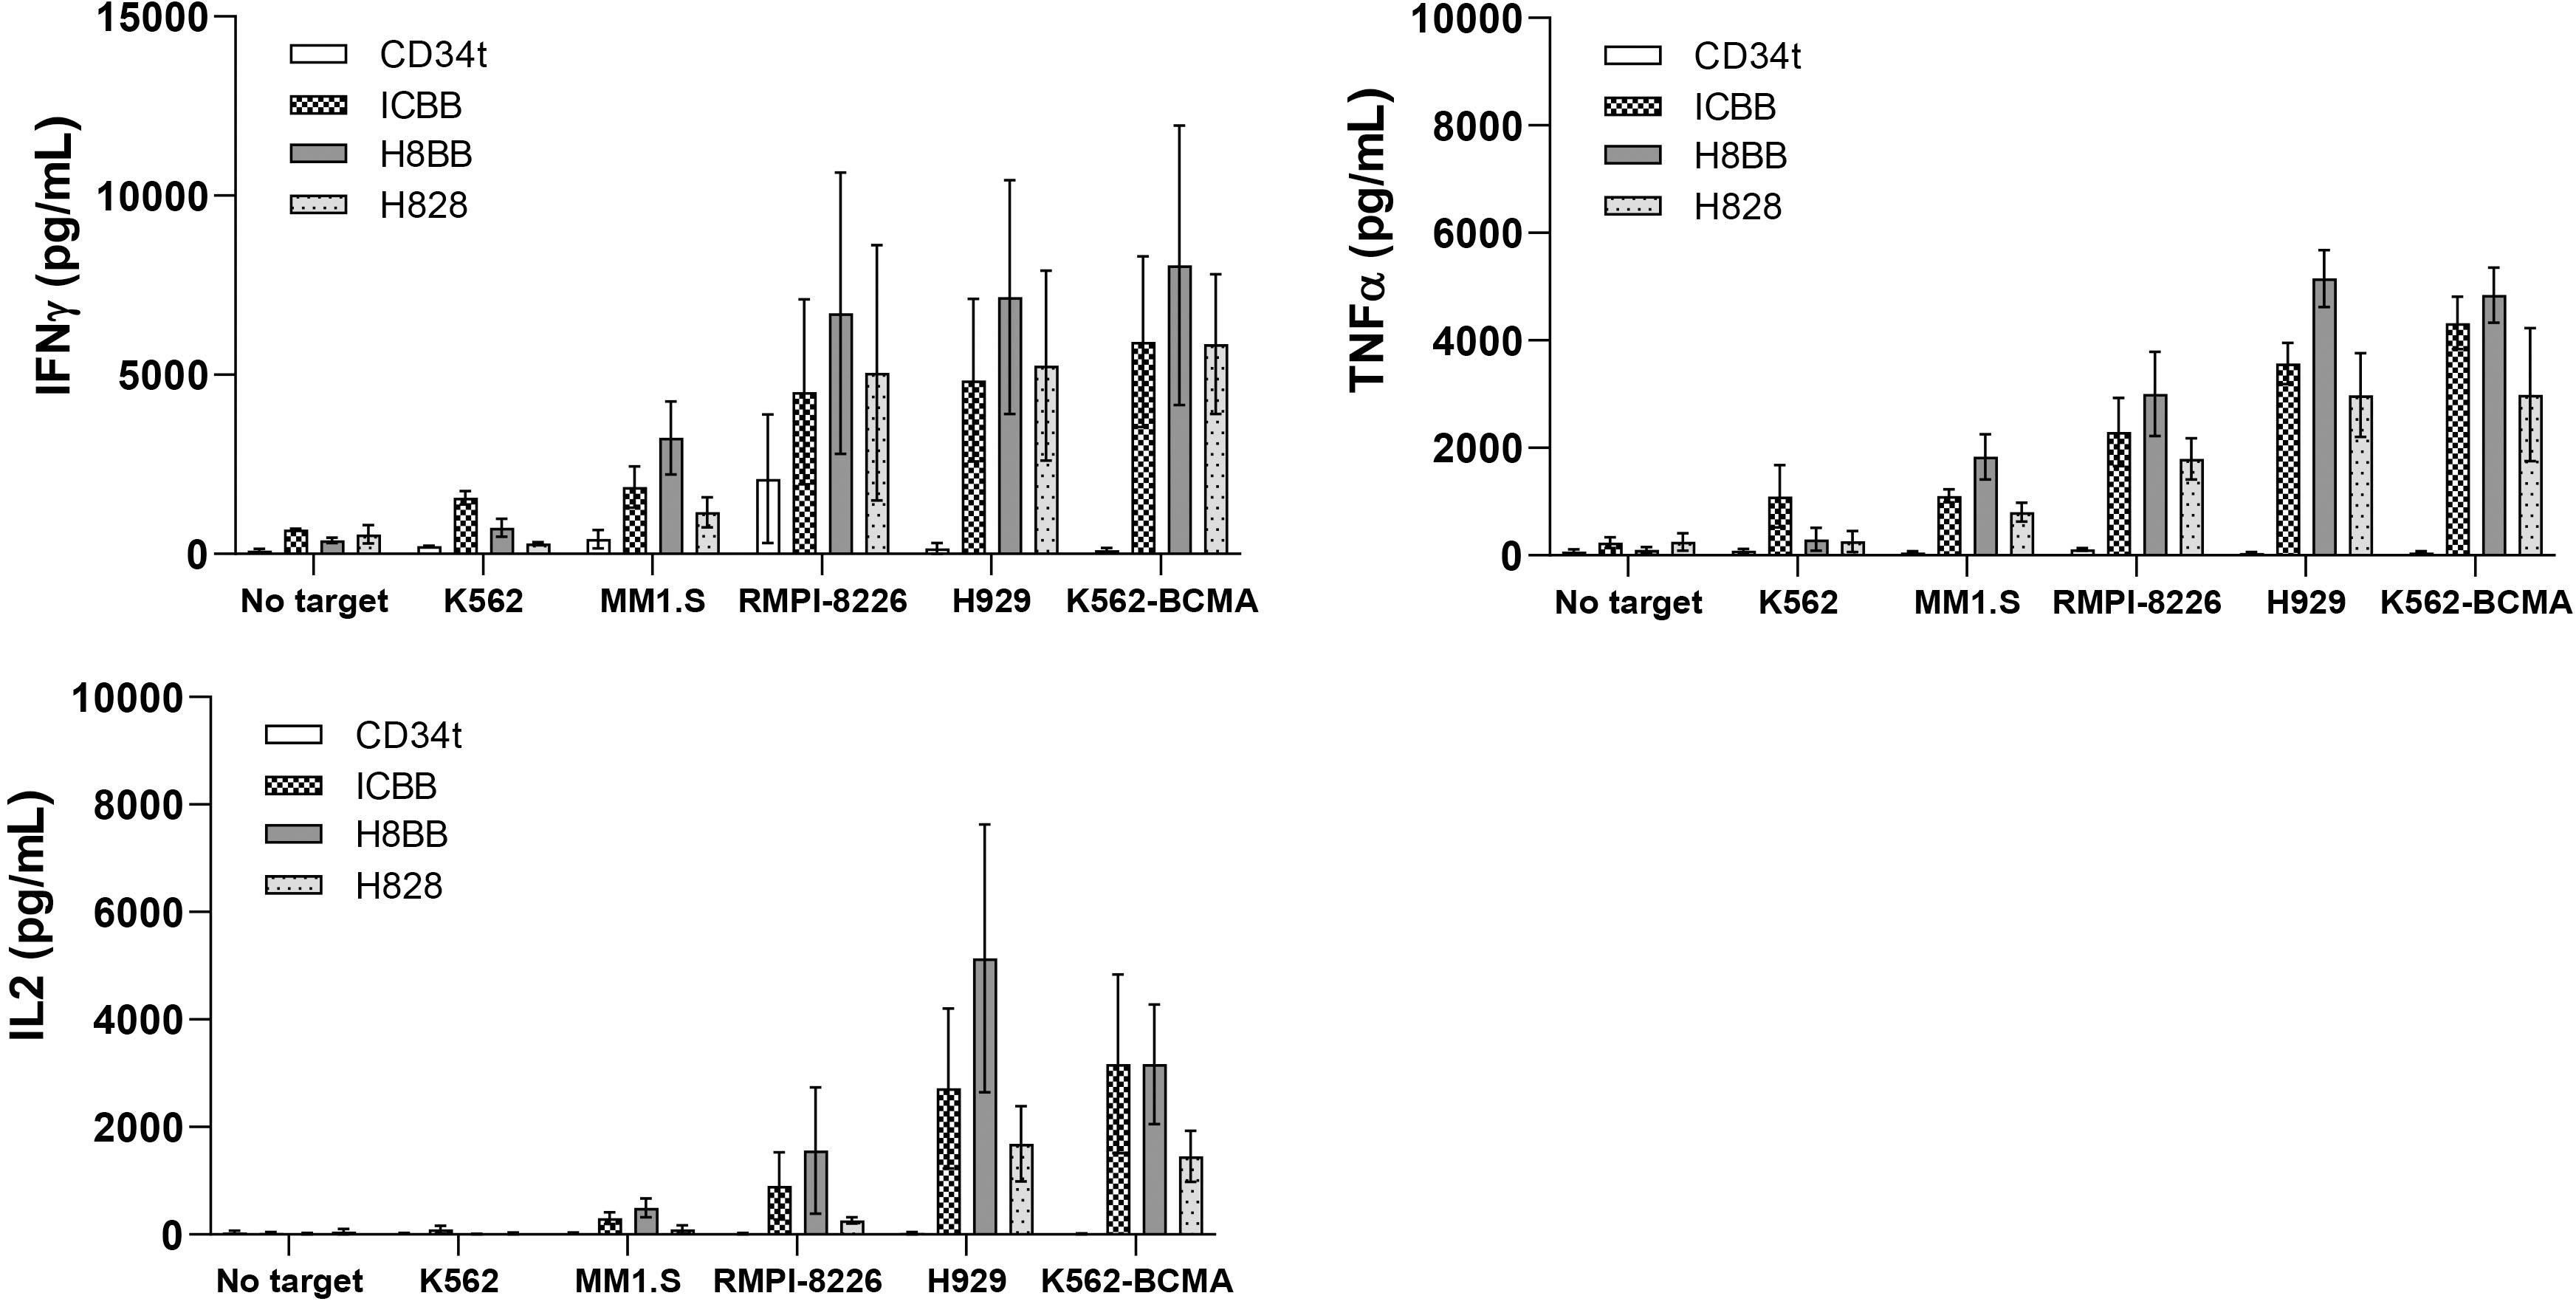
Cytokine secretion by BCMA-specific CAR
Next, we monitored the growth of the different BCMA CAR-transduced T cells over 18 days of culture. Figure 1D shows that ICBB CAR-T cells display the slowest expan sion profile (ICBB vs. H8BB/H828/CD34t, P<0.05). Addi tionally, we assessed BCMA-CAR T-cell viability with propidium iodide (PI) staining. Figure 1E indicates that a large proportion of ICBB-transduced cells were positive for PI (61.4±2.0%) compared to the other groups (5.3-9.1%; P<0.0001). This indicates that H8BB-transduced cells have a similar ability to expand in vitro over time as H828transduced cells, while ICBB-transduced cells exhibit an increased cell death (Figure 1E) and a subsequent reduced ability to expand (Figure 1D).
A B C Haematologica | 107 October 2022 2398 ARTICLE - BCMA-CAR optimization and evaluation O. Harush et al.
Following our initial evaluation of CAR functionality, we conducted wider cytokine secretion assays by co-cultur ing BCMA-CAR-transduced T cells with different plasma and MM cell lines. In general, BCMA CAR T-cells could specifically secrete high levels of cytokines (IFNγ, TNFα and IL-2) important for anti-tumor immunity,32 when com pared to CD34t negative control CAR-T cells (Figure 2; P<0.05). More precisely, in co-cultures with target
Figure 2. Anti-tumor function of BCMA-CAR-T cells. (A) OKT3-activated human primary B-cell maturation antigen (PBMC) were transduced with a retroviral vector encoding either ICBB-, H828-, H8BB-CAR, or truncated CD34 (CD34t control). Transduced T cells were co-cultured with different tumor lines as indicated. Interferon γ (IFNγ) secreted in the co-culture supernatant was measured by enzyme-linked immunosorbant assay (ELISA). These results are presented as mean+ standard error of the mean (SEM) (n=4, with 3 different donors). The difference between H8BB and H828 was found statistically significant (P=0.00098; cal culated using a paired Student’s t-test). (B and C) Similarly, these cells were co-cultured with the indicated target T cells and TNFα (B) and IL-2 (C) concentrations secreted in the culture supernatant were determined by ELISA. These results are presented as mean+SEM (n=3, with 3 different donors). P=0.01 for IL-2 and P=3.7x10⁻⁵ for TNFα; by paired Student’s t-test). BCMA: B-cell maturation antigen; CAR: chimeric antigen receptor.
Figure 3. Phenotypic characterization of BCMA-CAR transduced T cells. (A) CD4/CD8 ratio of different anti-BCMA chimeras. CARtransduced T cells or control T cells were stained with anti-CD4 and CD8 antibodies and analyzed by flow cytometry on day 7. These results are representative of 4 independent experiments with different donors. No significant difference was observed between the different groups. (B) Memory phenotype of T cells transduced with different BCMA chimeras. Three weeks following transduction, CAR-transduced T cells or control T cells were stained with anti-CD45RO and CCR7 antibodies and analyzed by flow cytometry. These results are representative of the mean of 4 independent experiments with different donors (n=4). (C) BCMA-CAR T cells in culture were monitored for the expression of exhaustion markers PD-1, LAG-3, TIM-3 and TIGIT over time (as indicated). BCMA: B-cell maturation antigen; CAR: chimeric antigen receptor.
A B C Haematologica | 107 October 2022 2399 ARTICLE - BCMA-CAR optimization and evaluation O. Harush et al.
Phenotypic analysis of BCMA-engineered CAR-T cells
We then sought to characterize the phenotype of BCMACAR-T cells, focusing on CD4/CD8 ratio and on memory dif ferentiation patterns. To this end, BCMA-CAR transduced T cells were sampled 3 weeks following PBMC activation and analyzed for marker expression by flow cytometry. As seen in Figure 3A, we did not notice any substantial differences between the different CAR-expressing populations as to the CD4/CD8 ratio which was approximately 1:2. Moreover, when analyzing the expression of the memory markers CD45RO
and CCR7, we observed a proportion of 44/40% of central memory (CM - CD45RO+/CCR7+) and 33/39% of effector memory (EM - CD45RO+/CCR7 ) T cells in the ICBB- and H8BB-CART cells, respectively (Figure 3B). However, H828transduced T cells displayed a higher proportion of effector memory T cells compared to 4-1BB-based CAR (57% vs. 36%; P=0.037) (Figure 3B). It has been reported that CAR-T cells displaying a “less differentiated profile” (namely, cen tral memory cells), persist and, thus, perform better in vivo 33 Exhausted T cells may become progressively dysfunc tional, and this loss of function is mediated by the up regulation of inhibitory receptors such as programmed death receptor-1 (PD-1), lymphocyte activation gene-3 (LAG-3), T-cell immunoglobulin-3 (TIM-3), and T-cell im munoreceptor with Ig and ITIM domains (TIGIT). 34 We therefore monitored the expression of these exhaustion markers over time in culture. Figure 3C shows a marked increase in the expression level of PD-1, LAG-3, TIM-3 and TIGIT on the surface of H828-transduced cell when compared to 4-1BB-based CAR over time (P<0.001). Im portantly, H828-transduced T cells exhibited significantly higher levels of exhaustion markers at very early stages. This elevation in the basal expression of exhaustion markers may be mediated by tonic signaling augmented by the CD28 co-stimulatory portion of the CAR,35 and no tably, may impede with CAR-T-cell function in vivo
RPMI8226, we observed an average secretion of 6,721 pg/mL of IFN γ mediated by the H8BB, 4,520 pg/mL by ICBB and 5,055 pg/mL by H828. Similar results were ob served when measuring TNFα and IL-2 secretion and the difference between H8BB and H828 was found statis tically significant (for IFNγ, P=0.00098; for IL-2, P=0.01 and for TNFα, P=3.7x10⁻⁵; using a paired Student’s t-test). As previously described herein (Figure 1B), it is noteworthy that H8BB- and H828- CAR-T cells displayed the lowest non-specific cytokine secretion in control co-cultures with an antigen-negative target (K562) or without any tar get (Figure 2A to C). This observation reinforces the idea that “off-target” (i.e., unspecific target) and tonic (i.e., without antigen stimulation) signaling may be influenced by the CAR configuration.
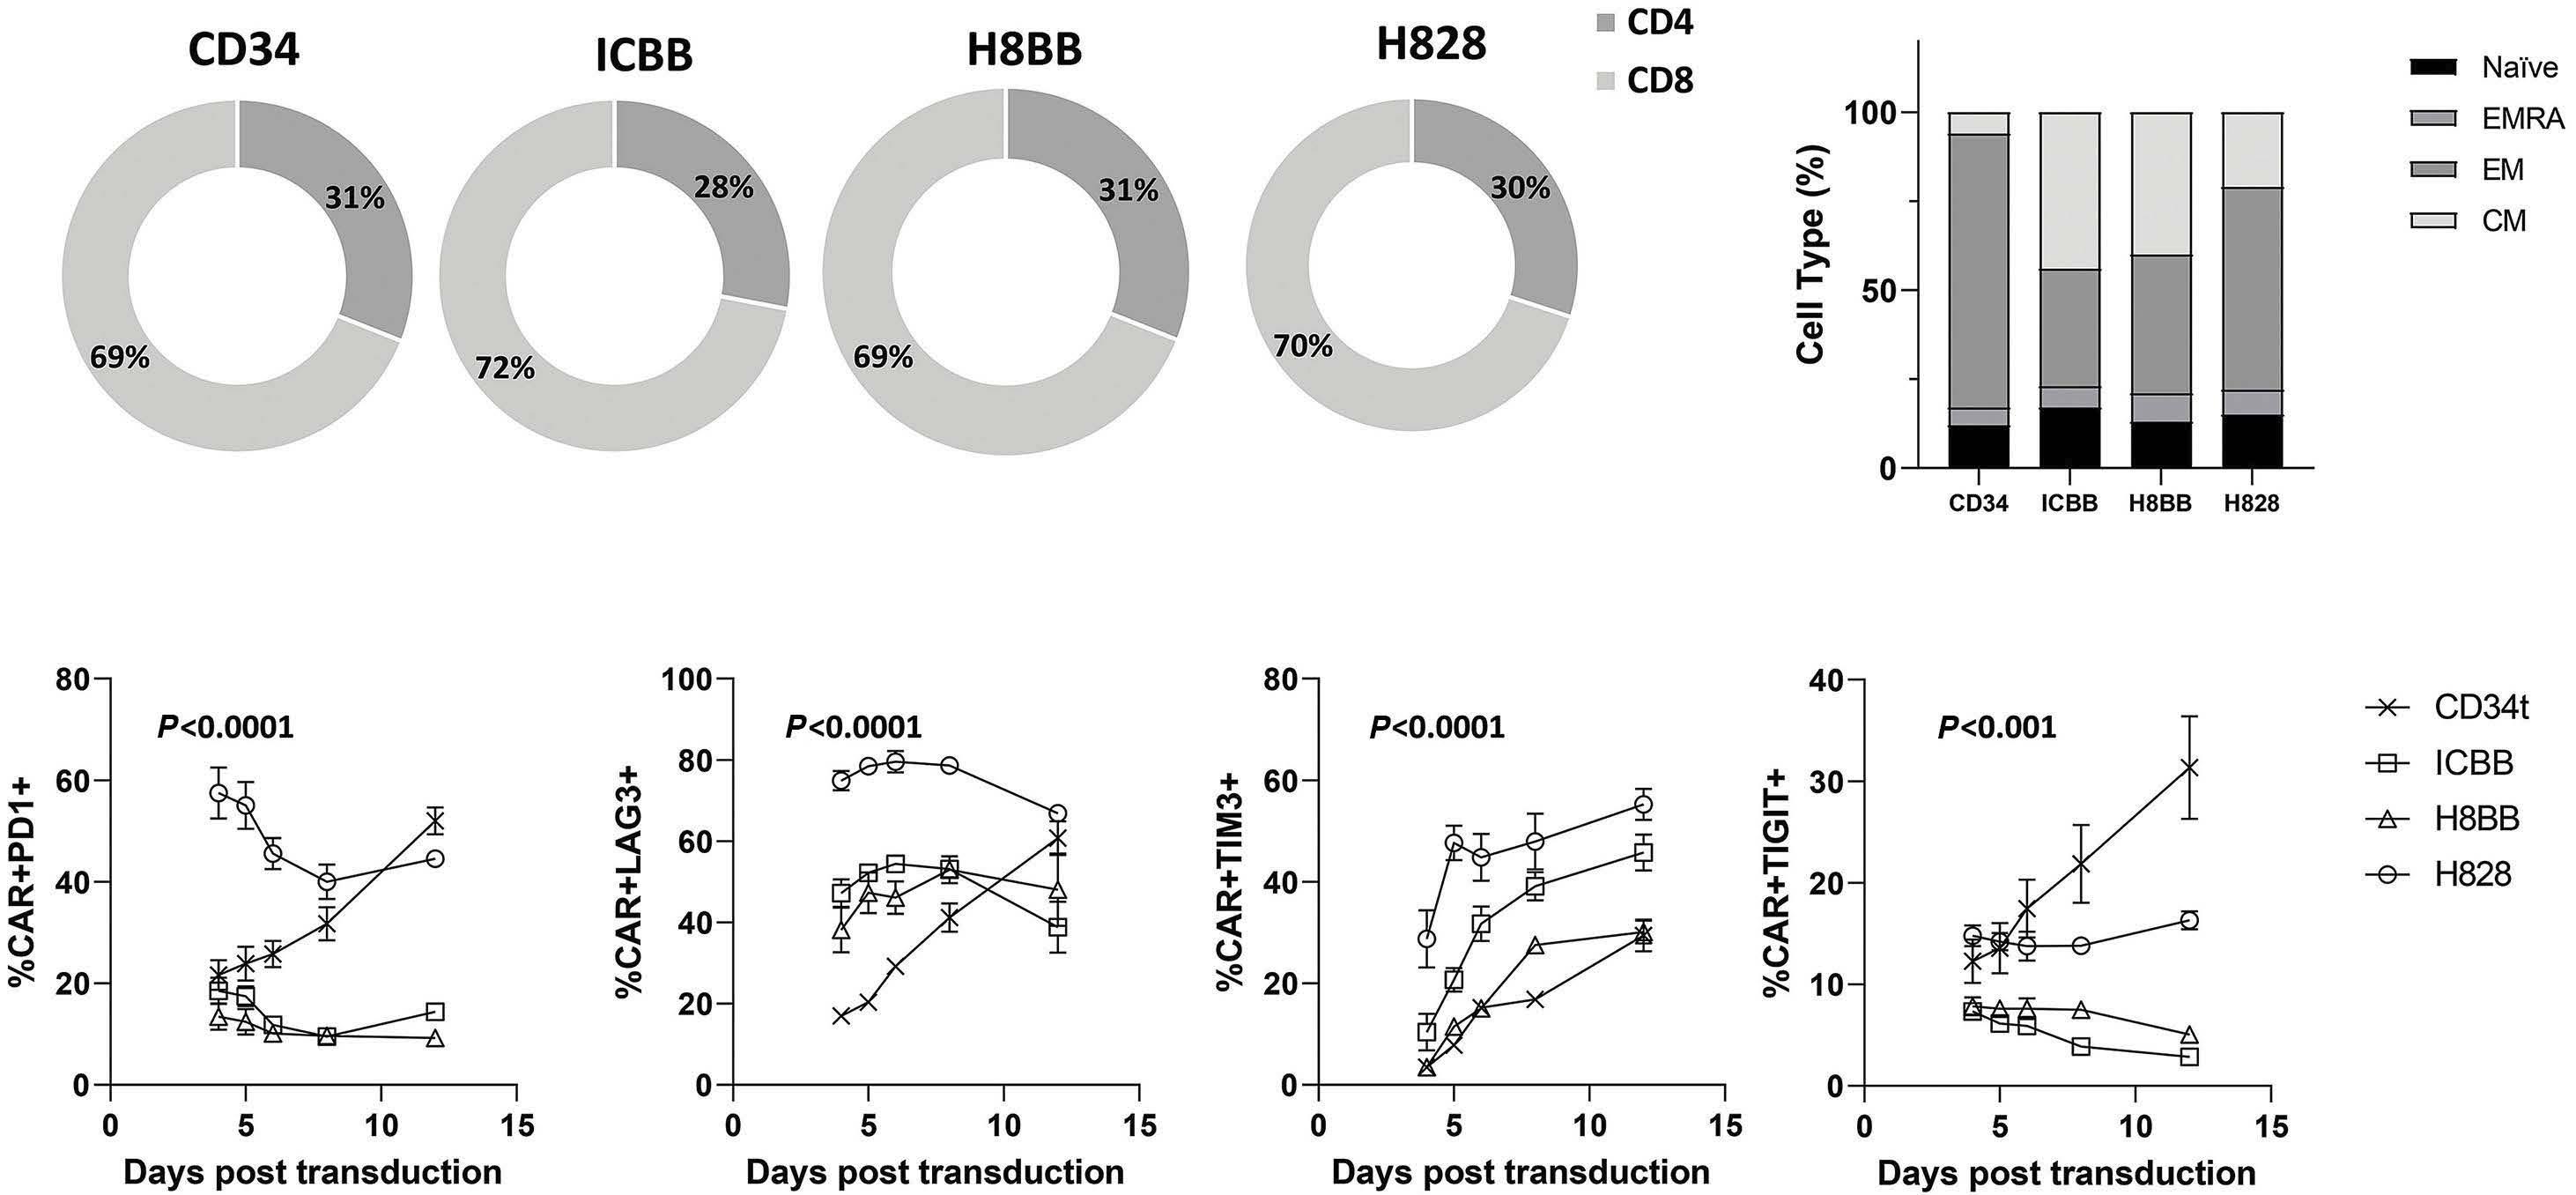
Figure 4. Exhaustion and activation profile of BCMA-CAR-T cells. (A) BCMA-CAR-T cells were co-cultured for 24 hours in the presence of the H929-MM cell line or BCMA-overexpressing K562 (K562-BCMA), or K562 cell line in T-cell medium without IL-2 at an effector to target (E:T) ratio of 10:1, in T-cell medium without IL-2, at 37°C. Following incubation, cells were washed, stained at 4°C for 20 minutes with a mixture of the fusion protein/antibodies (as indicated), to assess the expression of PD-1, LAG-3, TIM-3 and TIGIT by flow cytometry (gated on BCMA.CAR+). These results are representative of 3 different experiments with dif ferent donors. Data is represented as mean values ± standard error of the mean (SEM). (B) CAR-transduced T cells or CD34t cells were co-cultured with BCMA-positive targets, as indicated. Following an overnight or 4-hour co-culture (for CD69), cells were analyzed by flow cytometry for the expression of 4-1BB (right panel), CD69 (middle panel) and CD25 (left panel). Cells were gated on the CD8+ population for 4-1BB and CD69 expression, and on CAR+ cells for CD25 expression. The mean percentage of positive cells ± SEM is indicated on histograms overlay. Grey filled histograms represent CAR-T cells staining, and the dotted line histograms represent the staining of the CD34t control cells. These results are representative of 3 independent experiments with 3 different donors. BCMA: B-cell maturation antigen; CAR: chimeric antigen receptor.
BA Haematologica | 107 October 2022 2400 ARTICLE - BCMA-CAR optimization and evaluation O. Harush et al.
Upregulation of activation markers and exhaustion profile of anti-BCMA chimeras following antigen stimulation
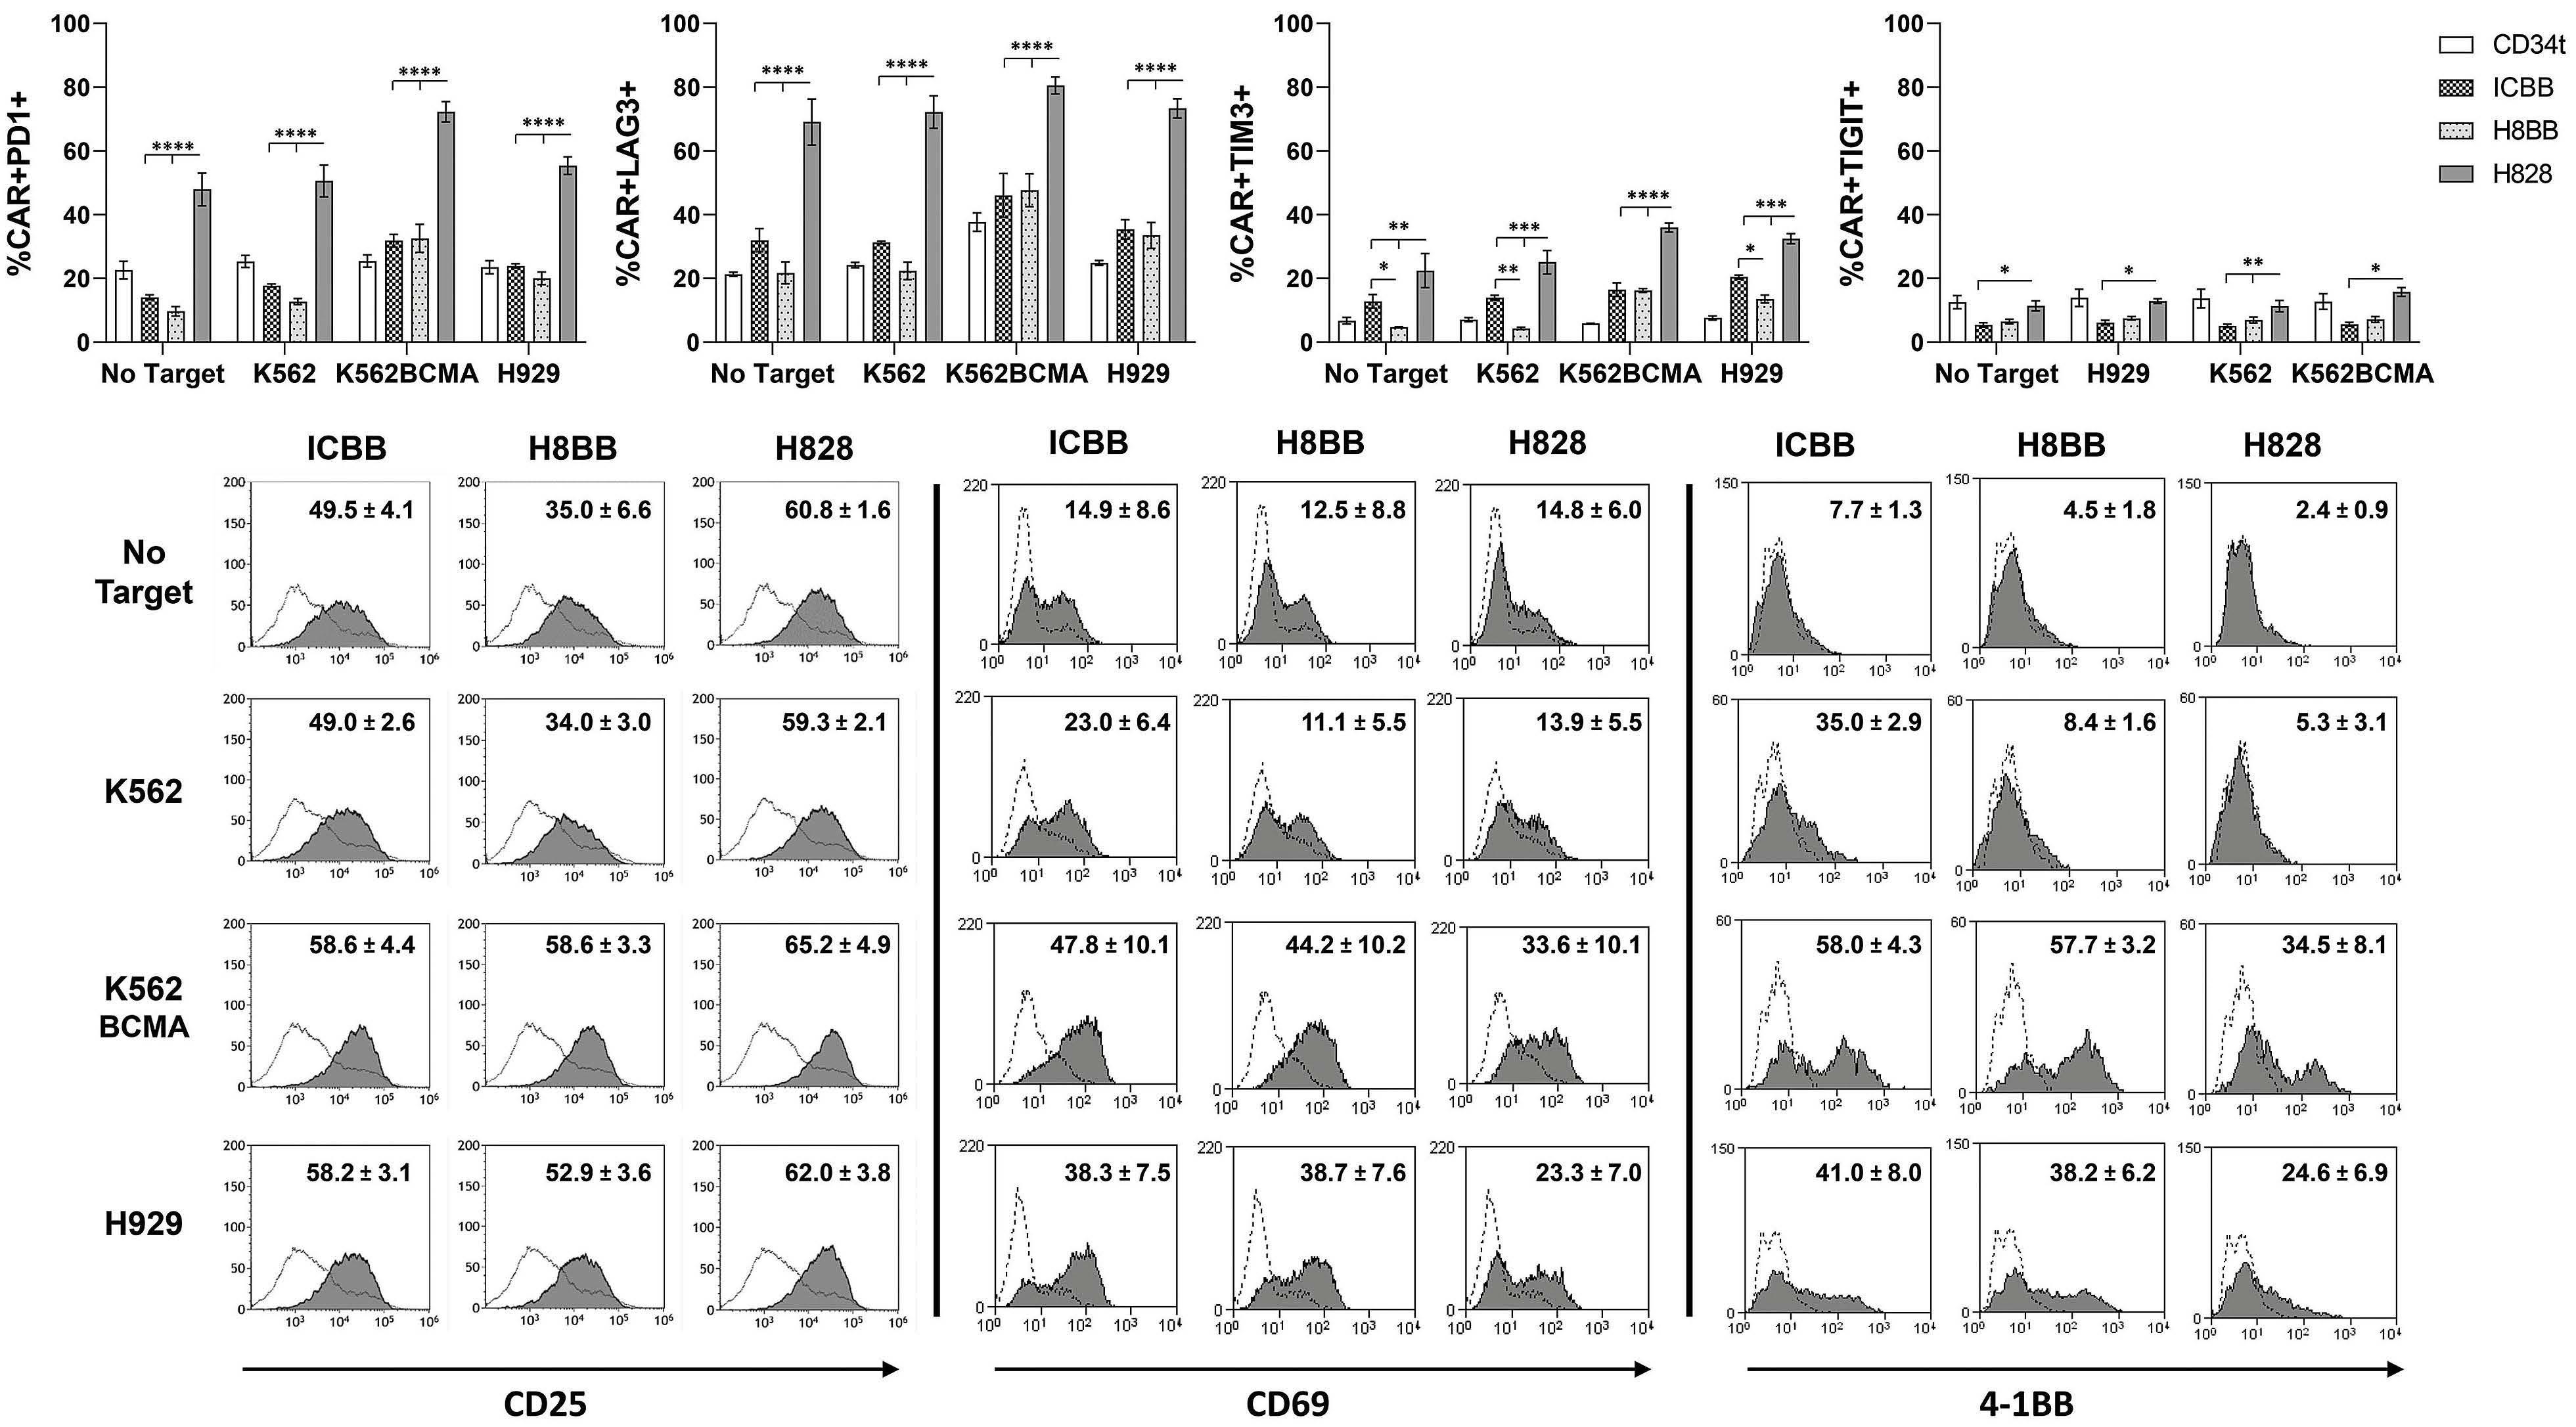
In order to test the hypothesis that basal expression of ex haustion markers may modulate CAR-T-cell activation state (Figure 3C), we next examined to what extent these CAR could mediate the upregulation of T-cell activation markers upon antigen stimulation. Following an overnight or a 4hour co-culture with BCMA-positive target cells, BCMACAR-T cells were analyzed for surface expression of activation markers including CD25, CD69 and 4-1BB (i.e., CD137). As anticipated, we found a correlation between the activation status and the exhaustion profile of CAR-T cells. Indeed, Figure 4B (right panel) indicates that although H828-CAR-T cells can upregulate 4-1BB following stimula tion with BCMA-expressing targets, they did so to a lesser extent than 4-1BB-based CAR-T cells (H828 vs. ICBB and H8BB, P<0.05). Similar results were achieved when measur ing CD69 expression following short co-cultures (4 hours) of myeloma target cells (Figure 4B, middle panel). Addi tionally, we noted that H8BB-CAR-T cells could significantly upregulate CD25 (P<0.01), while ICBB- and H828-CAR-T
In order to further investigate how the basal expression of exhaustion markers may be correlated with their func tionality, we analyze the expression of PD-1, LAG-3, TIM3 and TIGIT following an overnight co-culture with BCMA-positive targets. Figure 4A indicates that all the four exhaustion markers are highly expressed on the surface of H828-CAR-T cells, even in the absence of target, as previously hinted in Figure 3C. However, 4-1BB-based CAR-T cells responded specifically to the different stimu lations, by upregulating PD-1, LAG-3 and TIM-3 in a BCMAdependent manner as expected. Interestingly, we also noted the basal expression of TIM-3 in ICBB-CAR-T cells was significantly higher than in H8BB-CAR-T cells (P<0.05). Given the fact that TIM-3 expression can also be induced upon activation,36 this observation may account for the non-specific activity observed in cytokine release (Figure 1C; Figure 2A and B).
H8BB-CAR mediates improved in vitro cytotoxicity and in vivo biological activity
cells did not respond significantly to antigen stimulation (Figure 4B, left panel). For example, whereas CD25 ex pression levels were generally higher following co-culture with BCMA-positive targets in H828-CAR-T cells (between 62-65%) in comparison with H8BB-CAR-T cells (52.9-58.6% - H828 vs. H8BB, P<0.001), they did not increase signifi cantly from those observed for unstimulated cells or in coculture with BCMA-negative cells (59.3-60.8%). Thus, these results indicate that H8BB exhibited the lowest levels of exhaustion receptors and increased upregulation of acti vation markers which may facilitate a better specific and long-term in vivo activity.
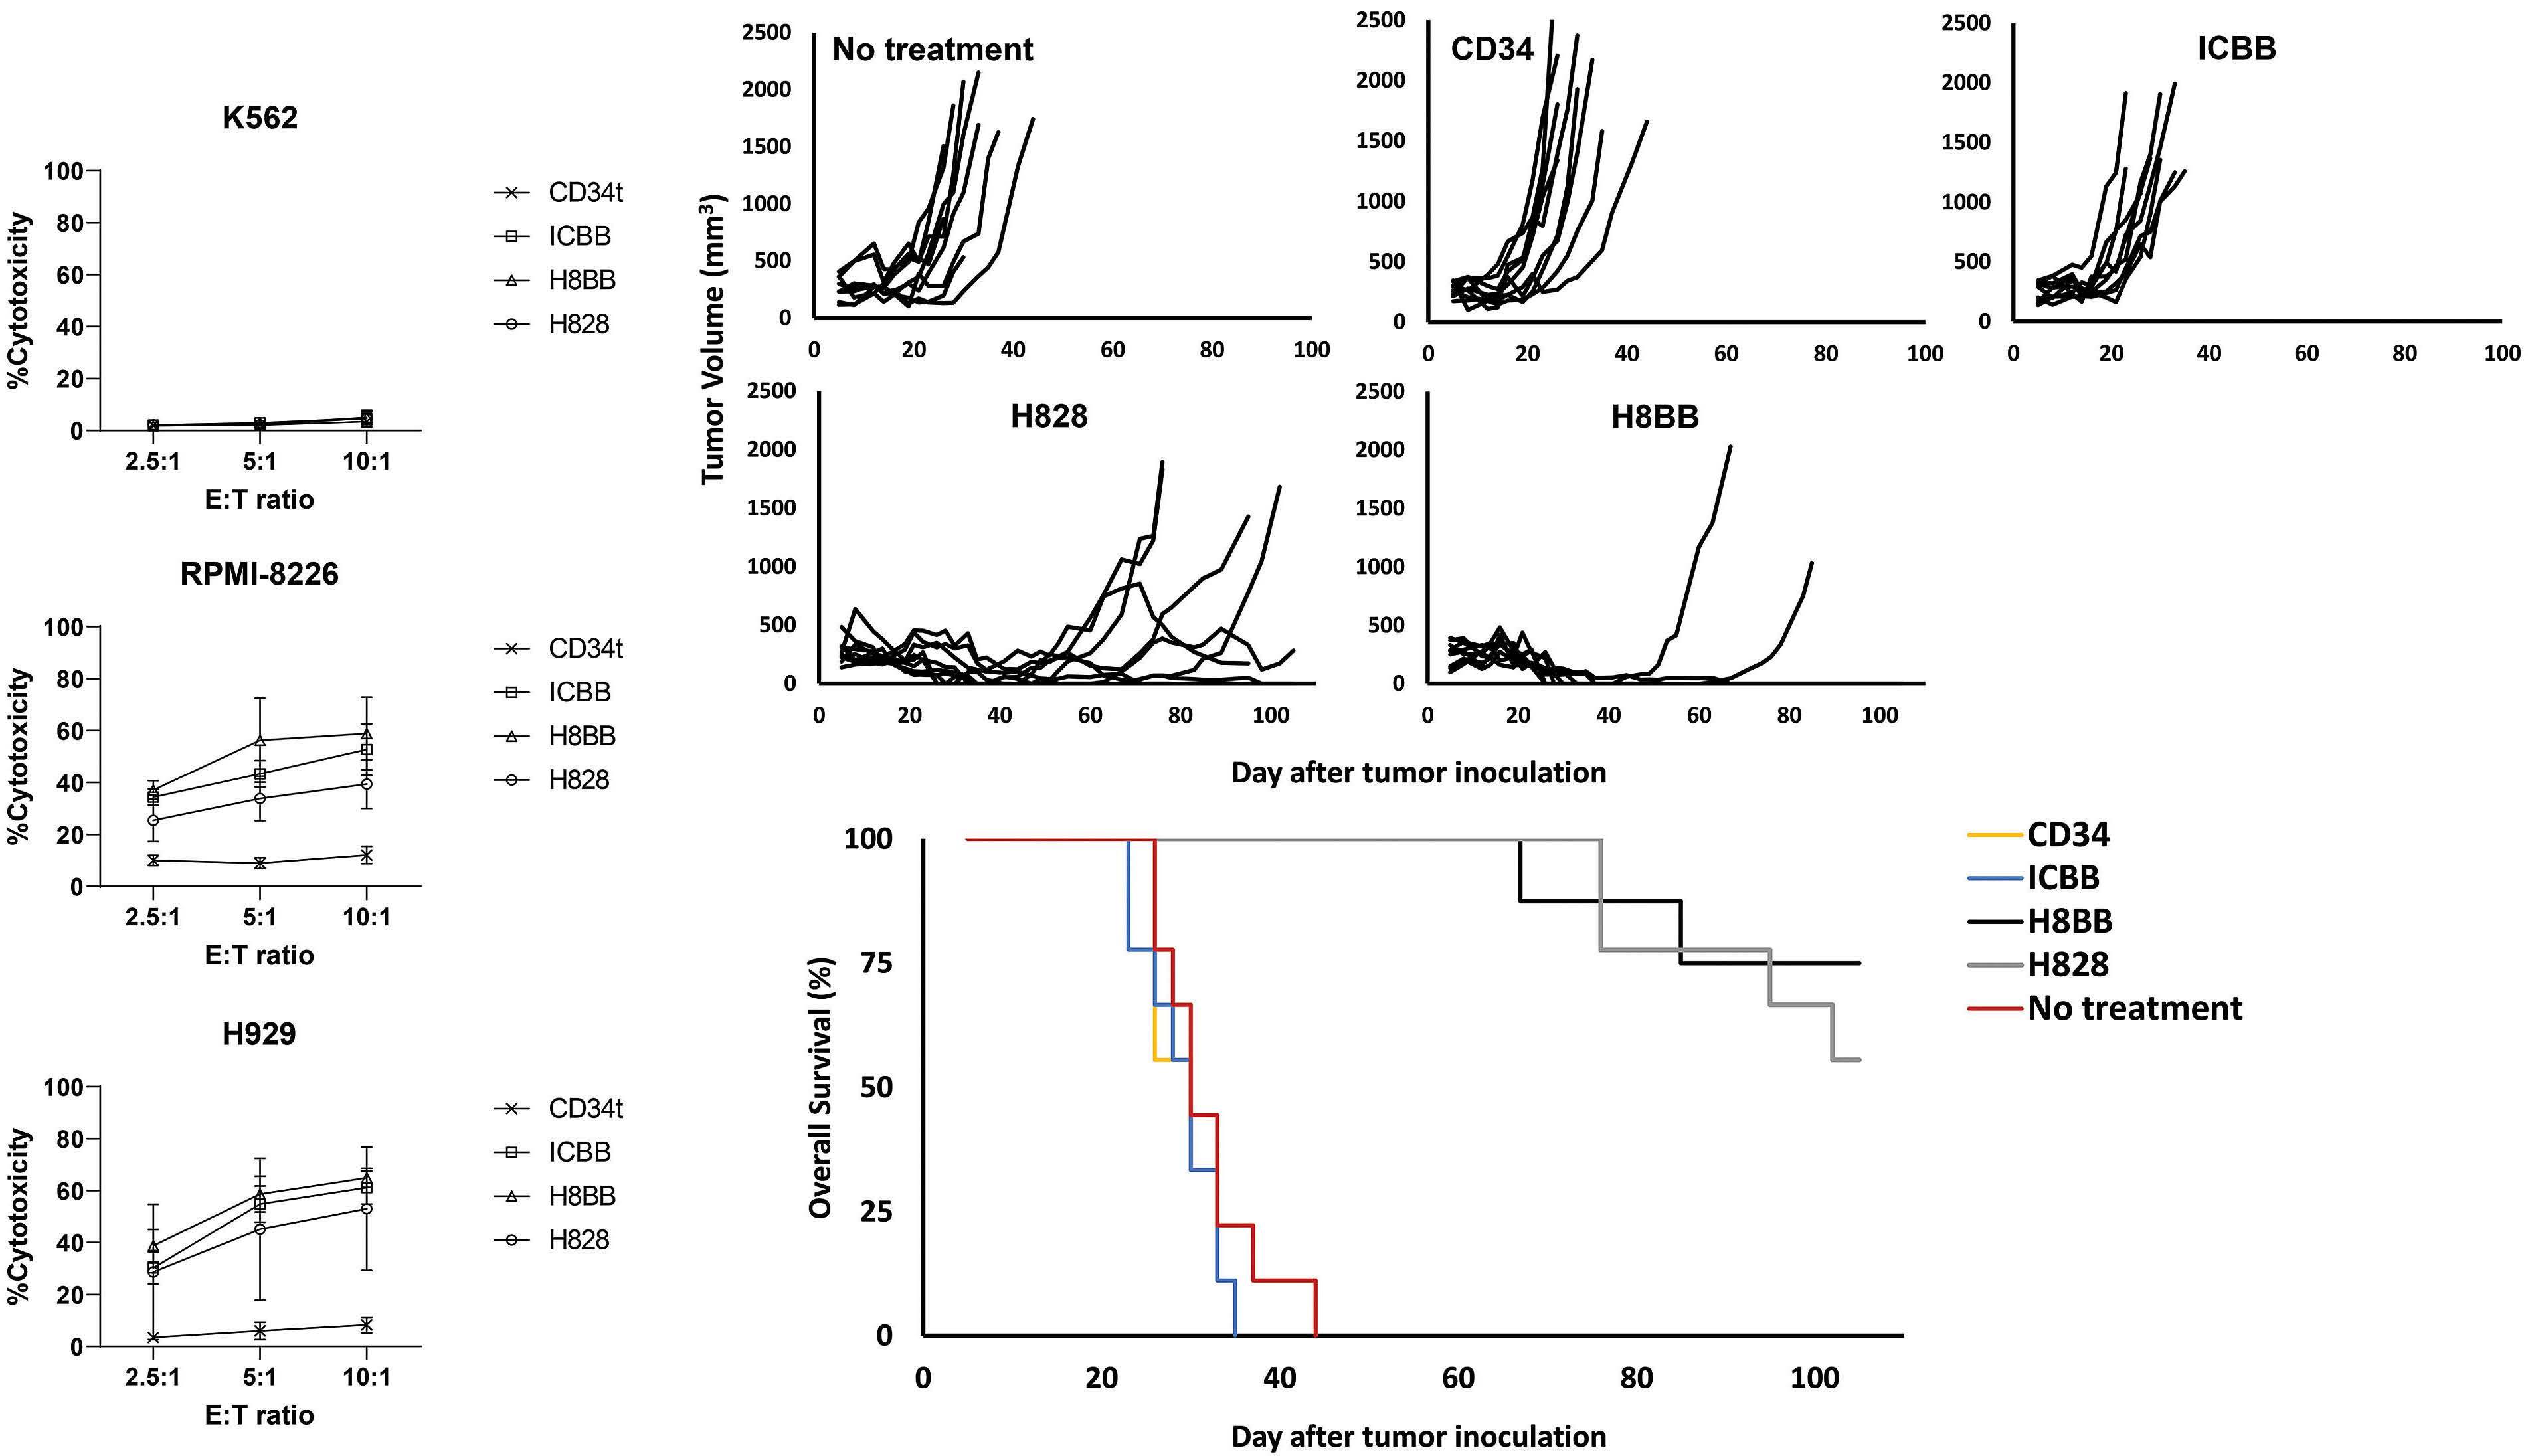
A CB
Figure 5. BCMA chimeras mediate anti-tumor cytotoxic activity in vitro and in vivo. (A) BCMA CAR or CD34t (control) transduced T cells were co-cultured with CFSE-labeled tumor cells at the indicated effector to target (E:T) ratios. After 4 hours, propidium iodide (PI) was added and the cells were analyzed by flow cytometry. Cytotoxicity was calculated based on the proportion of CFSE+/PI+ population out of the total CFSE+ population. These results are presented as mean ± standard error of the mean (SEM) of 3 independent experiments with 3 different donors and the difference between the BCMA-CARs and CD34t populations was found statistically significant (P<0.05, calculated using a Student’s paired t-test). (B) In vivo function of BCMA-CAR-T cells. NSG xenografts (n=8-9 per group) were inoculated H929 myeloma cells. One week following tumor inoculation, the mice were intra venously injected either with 15x106 BCMA-CAR+ or with CD34t-transduced control cells. Tumor volume was measured in a blinded fashion using a caliper and calculated using the following formula: (D×d2)×Π/6, where D is the largest tumor diameter and d its perpendicular one. (C) Overall survival analysis. The difference in the average survival of the H828 and H8BB groups compared to the no-treatment or control groups was found statistically significant (P<1e-4, using a logrank analysis). BCMA: Bcell maturation antigen; CAR: chimeric antigen.
In order to assess our assumption that H8BB would dis play an efficient and safe profile at mediating tumor eradi cation, we examined the cytotoxic activity of the T cells
Haematologica | 107 October 2022 2401 ARTICLE - BCMA-CAR optimization and evaluation O. Harush et al.
transduced with the different BCMA-CAR. Thus, tumor tar get cells, labeled with CFSE, were co-cultured with BCMA CAR- or CD34t control T cells for 4 hours. Then, CFSEpositive cells were analyzed for PI staining, as a surrogate for cytotoxic activity. As observed in Figure 5A, all CAR constructs mediated significant cytotoxicity against the H929 and RPMI-8226 myeloma cell lines, in comparison with CD34t control T cells (P<0.0001). Moreover, 4-1BBbased CAR-T cells demonstrated significantly higher cyto toxicity against RPMI-8226 myeloma cells even at the lowest ratio 2.5:1 (ICBB or H8BB vs. CD34t, P<0.001). Simi lar results were obtained when H8BB-CAR T cells were co-cultured with H929 (Figure 5A, bottom panel; H8BB vs. CD34t, P<0.05). Additionally, H8BB, but not ICBB, was more efficient than H828 at mediating cytotoxicity against RPMI-8226 at escalating E:T ratios (Figure 5A, middle panel; H8BB vs. H828 both at 5:1 and 10:1 ratio, P<0.05). As expected, CAR-T cells did not show any significant
(H8BB vs. control groups, P<0.0001 and H828 vs. control groups, P<0.001; Figure 5B), when compared to the control groups (”no treatment” and or CD34t groups) or the ICBB group. This observation is also reflected by the improved overall survival (Figure 5C; H8BB and H828 groups vs. con trol groups, P<0.0001; by log-rank analysis). Puzzlingly, ICBB CAR-T cells showed no significant anti-tumor activity compared to the control group. Furthermore, we found a significant reduction in the tumor volume of H8BB-treated mice in comparison with the tumor volume of H828treated cohort (H8BB vs. H828, P<0.05; by Kruskal-Wallis test, with Dunn's post hoc analysis). In this regard, we ob served that out of the nine mice that were administered either with H8BB or H828 CAR-T cells, four mice in the H828 group relapsed, and two additional mice showed fluctuations in their tumor volumes, while only two mice in the H8BB group experienced relapses (Figure 5B). Thus, we conclude that, while ICBB could not mediate myeloma eradication in vivo, H8BB was proven significantly more
Figure 6. Anti-myeloma effect of H8BB CAR-T cells. (A) NSG mice (4-5 animals per group) with an average of approximately 200 mm3 subcutaneous NCI-H929 tumors per treatment group received a single intravenous (i.v.) administration of 15x106 non-trans duced (NT) control cells, or 5, 10 or 15×106 H8BB-CAR+ T cells/mouse, respectively. Tumor size was measured by calipers twice weekly by personnel blinded to treatment conditions. (B) Serum B-cell maturation antigen (BCMA) protein levels assessed by enzyme-linked immunosorbant assay (grey dashed line) were plotted with corresponding tumor volume measurements (black line). Error bars show standard error of the mean (SEM). (C) Myeloma development was monitored by bioluminescence imaging (BLI). BLI measurement in photons per second per cm2 per steradian (p/s/cm2/sr) was translated to color to indicate disease ac tivity in the mice by the legend shown. The weight of the tumors that were excised from NSG xenografts in the NT group is in dicated in the table, to show that BLI reduction at this time was rather due to tumor necrosis than to a reduction in the tumor size. (D) Kaplan–Meier survival curves of study shown in (A and C); * represents NSG mouse that was found dead at day 60 post tumor inoculation, without any apparent relation to multiple myeloma.
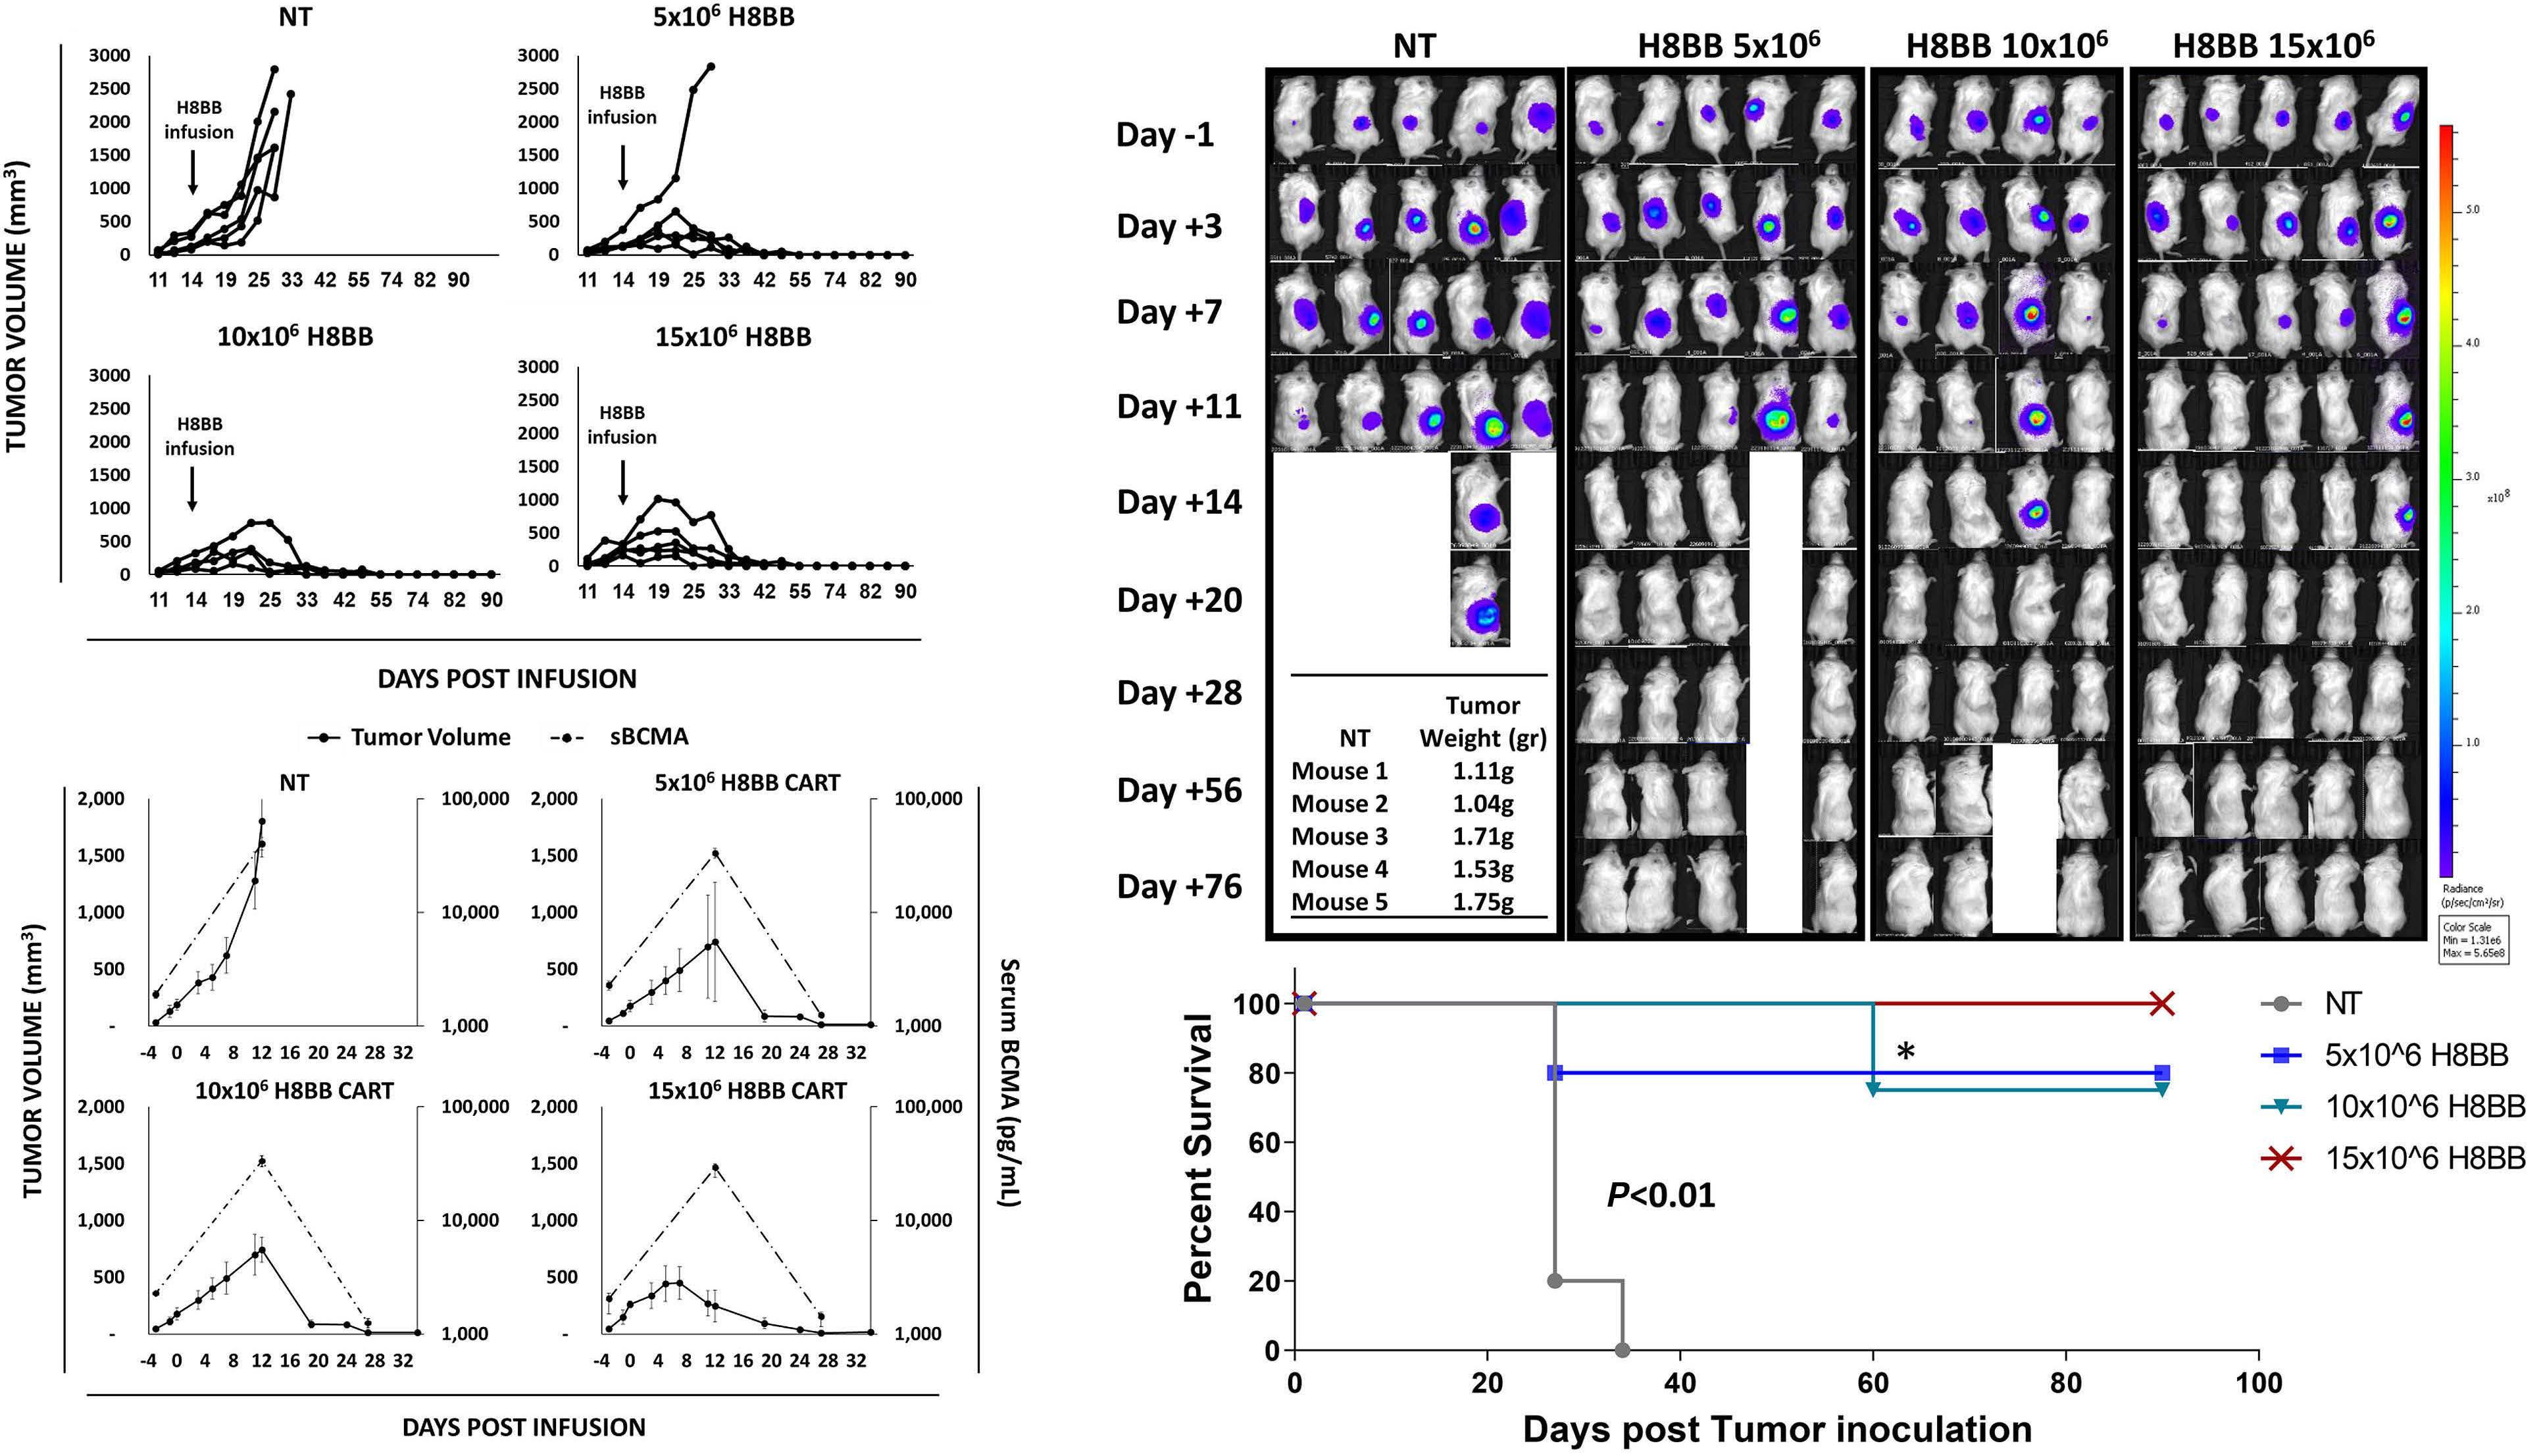
BA CD Haematologica | 107 October 2022 2402 ARTICLE - BCMA-CAR optimization and evaluation O. Harush et al.
cytotoxicity against the BCMA-negative cell line K562 (Fig ure 5A, top panel) when compared to corresponding con trol T cells. These results suggest that H8BB displays an advantage over H828 and ICBB at mediating myeloma cells elimination in vitro, even at low E:T ratio. Since cyto toxicity is mediated via the spatial recognition between the CAR molecule on the effector cells and cognate antigen at the surface of the target cells, we concluded that the configuration of H8BB is adequate to allow BCMA recognition and induce myeloma killing. Finally, we analyzed BCMA-CAR function in vivo, using a xenograft model of human tumors. Immunodeficient NSG mice were inoculated with 4x10⁶ NCI-H929 cells. Five days later, these mice were adoptively transferred intra venously either with BCMA-CAR or control T cells (CD34ttransduced T cells) or were left untreated ("no treatment"). Tumor volume was blindly evaluated every 23 days. H8BB- or H828-CAR-T cells display a significant delay and/or a marked regression in the tumor volume
lenged H8BB CAR-T cells by subjecting them to a higher tumor load than detailed above in Figure 5B and C. Only once the tumors were well-established (164±30 mm3, about 2 weeks following inoculation), the mice were in fused with escalating doses of H8BB CAR-T cells (5, 10 or 15x106 cells) or non-transduced (NT) cells as control. As shown in Figure 6, H8BB CAR-T cells exhibited a strong anti-myeloma effect. Specifically, the mice groups that re ceived a single injection of 10x106 or 15x106 H8BB CAR-T cells, showed an initial increase in tumor volume followed by a rapid and complete tumor regression by 2 to 3 weeks post infusion (Figures 6A to C). In the mice group that re ceived 5x10⁶ CAR-T cells, four of five mice showed com plete tumor regression. These results indicate that the minimal effective dose against NCI-H929 ranges between 5-10x106 cells. As for the control group, the mice were all sacrificed within a month post tumor inoculation for eth ical reasons. In parallel, we evaluated the concentration of soluble BCMA (sBCMA) in the serum as a biomarker for MM37 and evidence for tumor eradication. sBCMA levels rapidly declined in concomitance with tumor regression
efficient than H828 in mediating significant in vivo antitumor activity.
Further evaluation of the anti-tumor/off-target activity of H8BB CAR-T cells in vivo
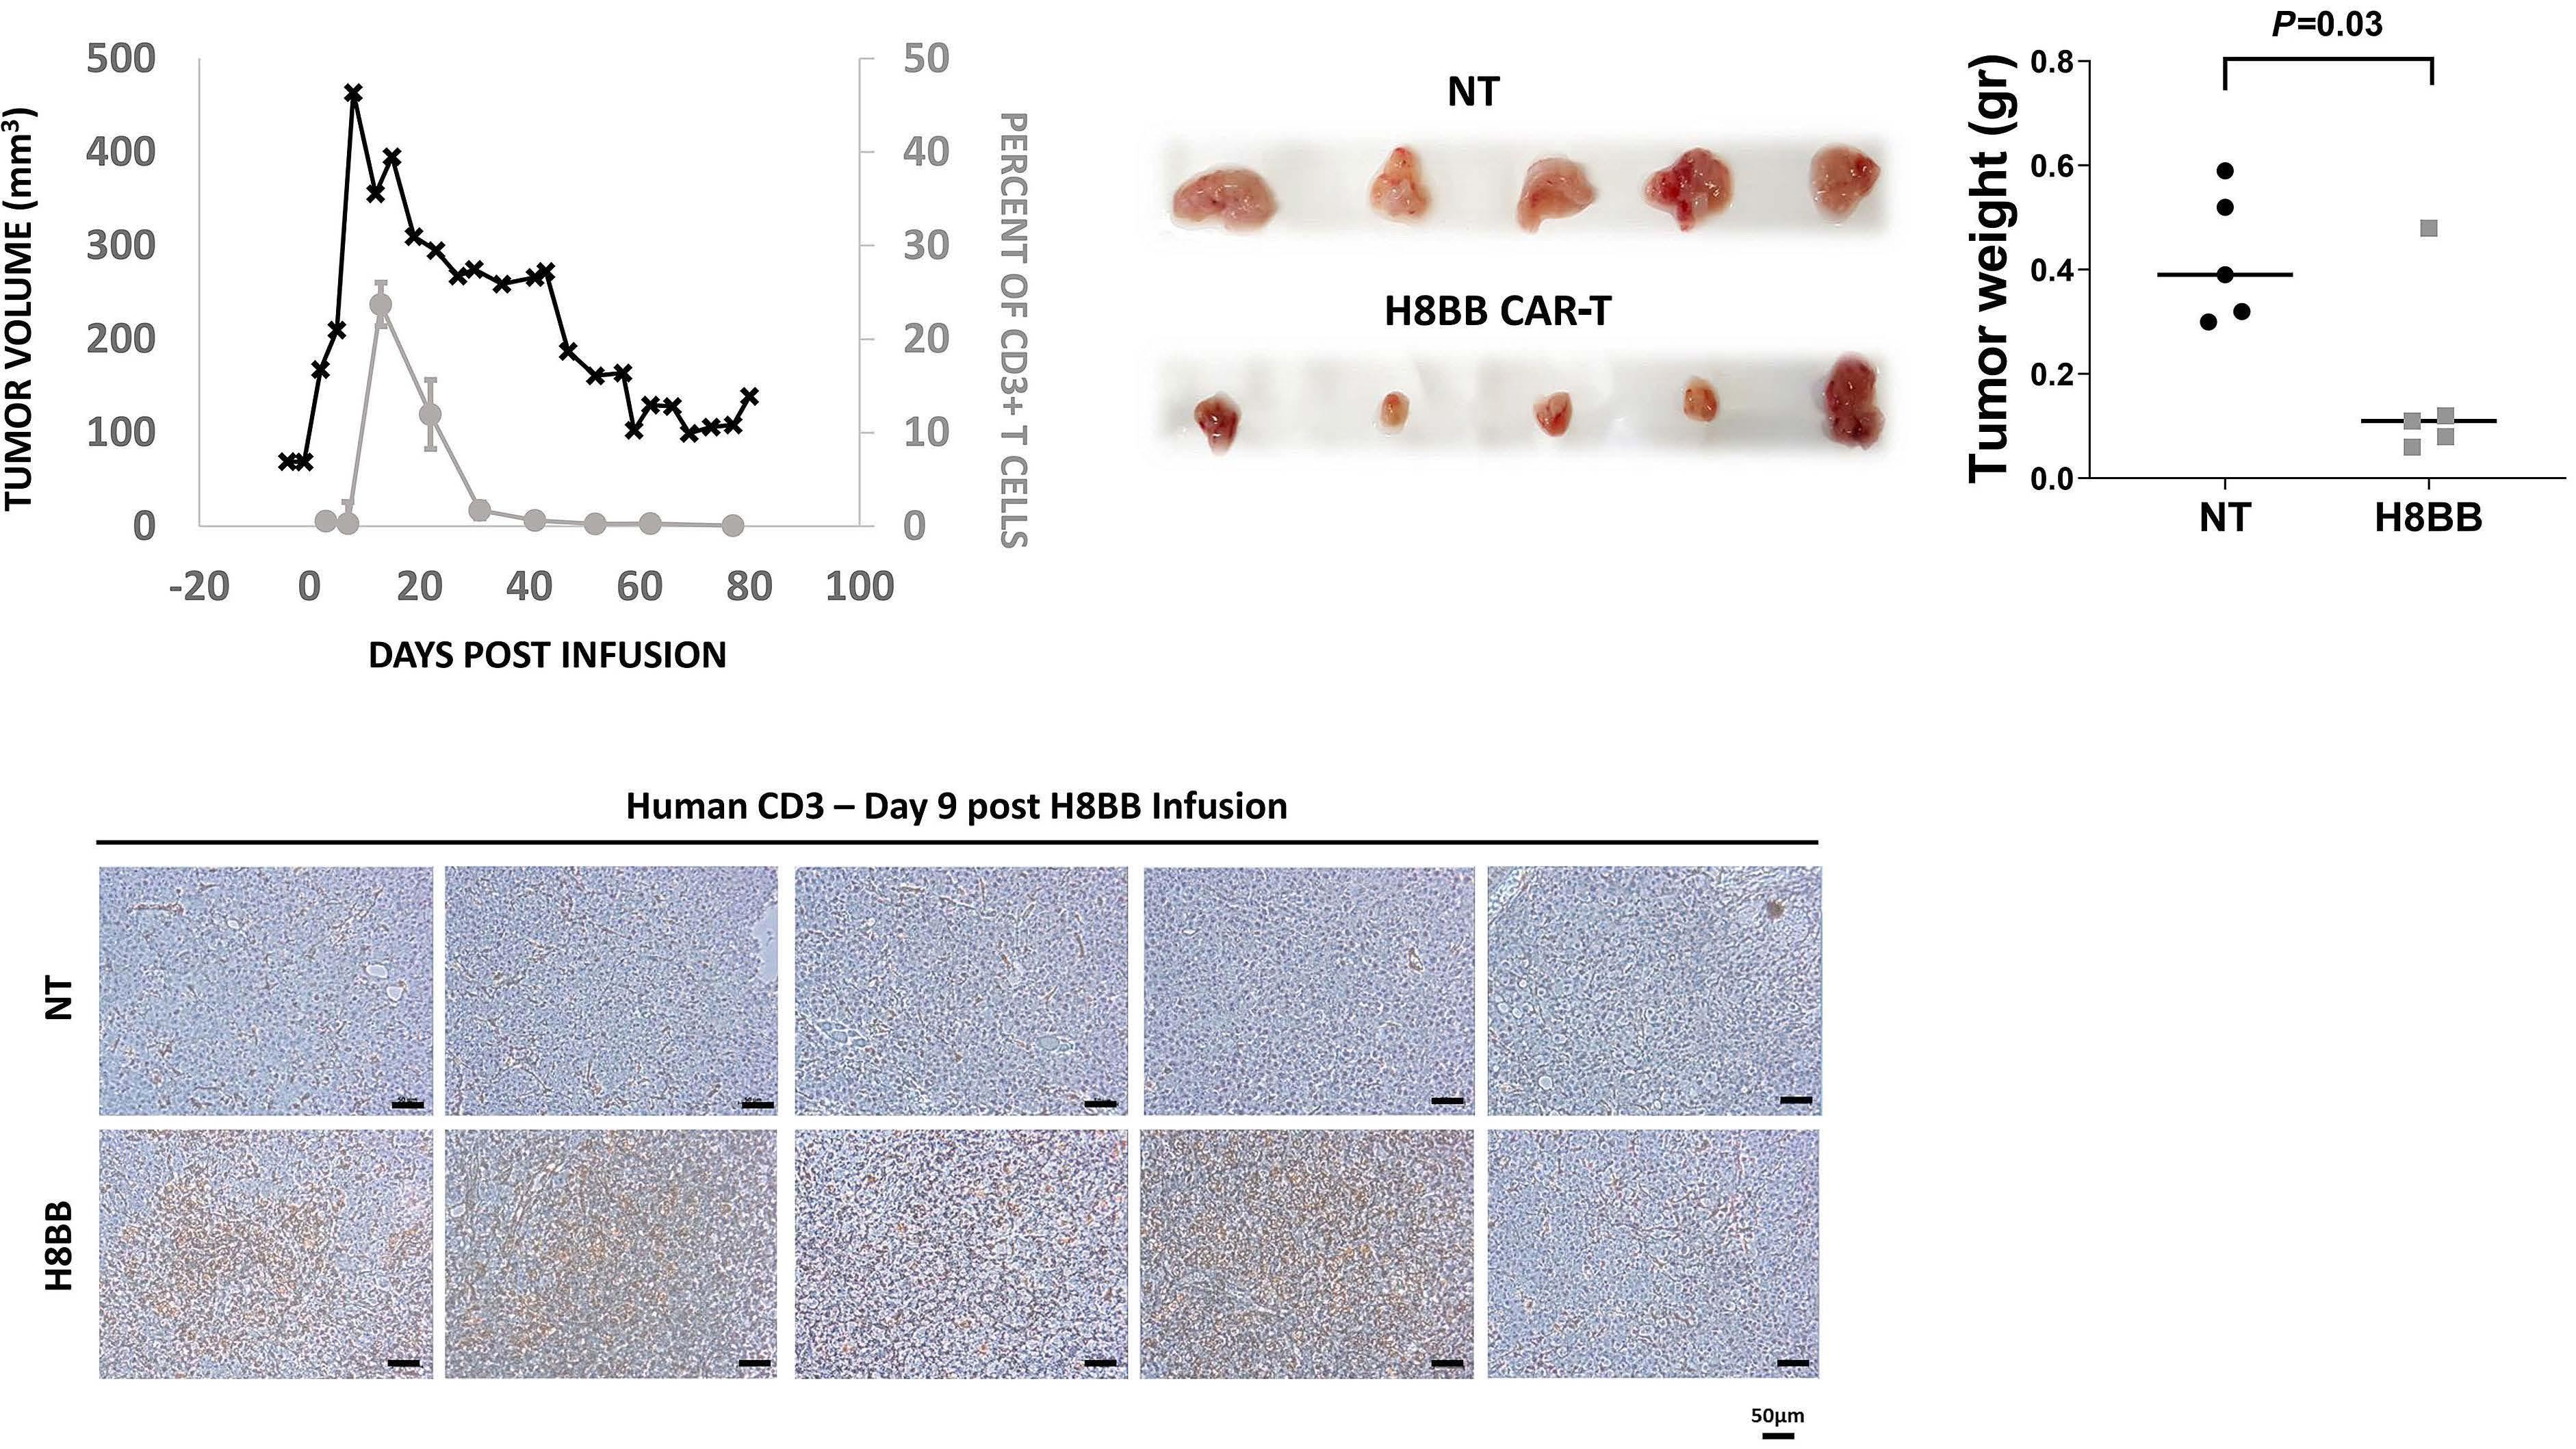
Figure 7. CAR+-T cells persistence in mice is associated with the elimination of NCI-H929 multiple myeloma tumor. (A) 25 µL of blood were collected from the tail vein was lysed with IOTEST 3 Lysing Solution (Beckman Coulter) for 10 minutes and stained with a mixture of fluorescent recombinant human B-cell maturation antigen (BCMA) protein, anti-CD3, anti-CD8 and anti-CD4. The percent of H8BB CAR-T cells in NSG blood (% of CD3+BCMA.CAR+ cells) was assessed by flow cytometry. (B) Average weight of the tumors excised from NCI-H929 multiple myeloma (MM) xenografts at day 9 post T-cell infusion. H8BB CAR-T xenograft tu mors are shown in the bottom panel; non-transduced (NT) xenograft control tumors are shown in the upper panel. (C) Infiltration of tumor tissue (depicted in B, upper panel) by CD3+ T cells was assessed by immunohistochemistry using anti-human CD3 anti body by day 9 post H8BB CAR or NT T-cell infusion. Marker bar represents 50 µm. Note: Figure 7A to C refer to experiments per formed on different cohorts of mice.
A B C Haematologica | 107 October 2022 2403 ARTICLE - BCMA-CAR optimization and evaluation O. Harush et al.
Given the optimal profile of H8BB compared to the other BCMA CAR assessed herein (i.e., appropriate optimal cell growth [Figure 1C], antitumor cytokines production with a minimal non-specific secretion [Figure 2A to C], reduced exhaustion profile [Figure 4A], reduced tonic signaling and non-specific activation [Figure 4B], high antitumoral cyto toxic activity both in vitro and in vivo [Figure 5A to C]), we decided to focus our efforts at evaluating H8BB potential therapeutic value to target BCMA in the treatment of plasma cell malignancies. In this attempt, we opted to study the anti-tumor function mediated by H8BB CAR-T cells and aimed at determining the optimal effective dose of H8BB CAR-T cells for infusion to achieve a desired therapeutic effect. To that end, we established an addi tional model in which NSG mice were injected with 4x10⁶ luciferase-expressing NCI-H929 myeloma cells. We chal
following CAR-T cell infusion (Figure 6B). Also, this data confirms that high concentrations of sBCMA in the blood of NSG xenografts did not seem to block the anti-mye loma activity of H8BB CAR-T cells in vivo. We investigated the persistence of H8BB CAR-T cells in mice xenografts both intratumorally and in the blood. CAR-T cells were detected in the periphery 3 days after T-cell injection, significantly increased 13-22 days after adoptive transfer and then declined over the next 3 weeks (Figure 7A). In a parallel cohort of NSG MM xenografts, mice were treated with 7.5x10⁶ H8BB-CAR-T cell or control and sacrificed at day 9 following T-cell administration. Figure 7B indicates that the average weight of tumors (fol lowing excision) from H8BB-CAR T-treated mice was sig nificantly lower than in the control group (P=0.03).
the control group (Figure 7C, upper panel). Altogether, these data demonstrate that H8BB CAR-T actively prolif erate, traffic to tumor sites and mediate tumor eradica tion.
Anti-myeloma efficacy of H8BB CAR-T cell against primary cells from multiple myeloma patients
As a preclinical evaluation step for the possible imple mentation of H8BB CAR-T cells treatment for myeloma patients, BCMA expression was assessed on plasma cells from the BM of patients suffering from different pathol ogies (e.g., MM, amyloidosis [AL], monoclonal gammopathy of undetermined significance [MGUS], plasmacytoma [PC] and Waldenström's macroglobulinemia [WDS]). In line with previous data,38 we observed a differential median expression of BCMA on plasma cells (gated on CD38++CD138++) derived from the BM of MM, AL, MGUS, PC and WDS patients, with a mean fluorescence intensity
Figure 8. H8BB CAR-T cells target plasma cells of multiple myeloma patients. (A) Bone marrow (BM) aspirates of multiple mye loma (MM), amyloidosis (AL), monoclonal gammopathy of undetermined significance (MGUS), plasmacytoma (PC) and Walden ström's macroglobulinemia (WDS) patients were assessed for B-cell maturation antigen (BCMA) expression by flow cytometry. The graph represents BCMA median expression in the bone marrow of patients, gated on CD38++CD138++ plasma cells. n=3 (AL, circles), n=16 (MM, squares), n=3 (MGUS, up triangles), n=3 (PC, down triangles), and n=2 (WDS, lozenges). Error bars show stan dard error of the mean (SEM). (B) Activation of CD3+ T cells was determined by assessing the expression of CD137 (4-1BB) by flow cytometry. H8BB CAR-T and non-transduced (NT) T cells were incubated in the presence of BM-derived mononuclear cells (BMMC) overnight. Statistical analysis was based on a Student’s paired t-test. (C) Mean fluorescence intensity (MFI) of BCMA ex pression on the targeted CD38++CD138++ plasma cell population of patients P1 to P4 (P=0.01, by Student's t-test). (D) The presence of CD38++CD138++ plasma cells of MM patients following co-culture with H8BB CAR-T cells or NT control cells was assessed by flow cytometry (P1 to P4).
Immunohistochemistry performed on tumor sections shows that human T cells were abundantly present in the H8BB sections (Figure 7C, bottom panel) while sparse in
A B C D Haematologica | 107 October 2022 2404 ARTICLE - BCMA-CAR optimization and evaluation O. Harush et al.
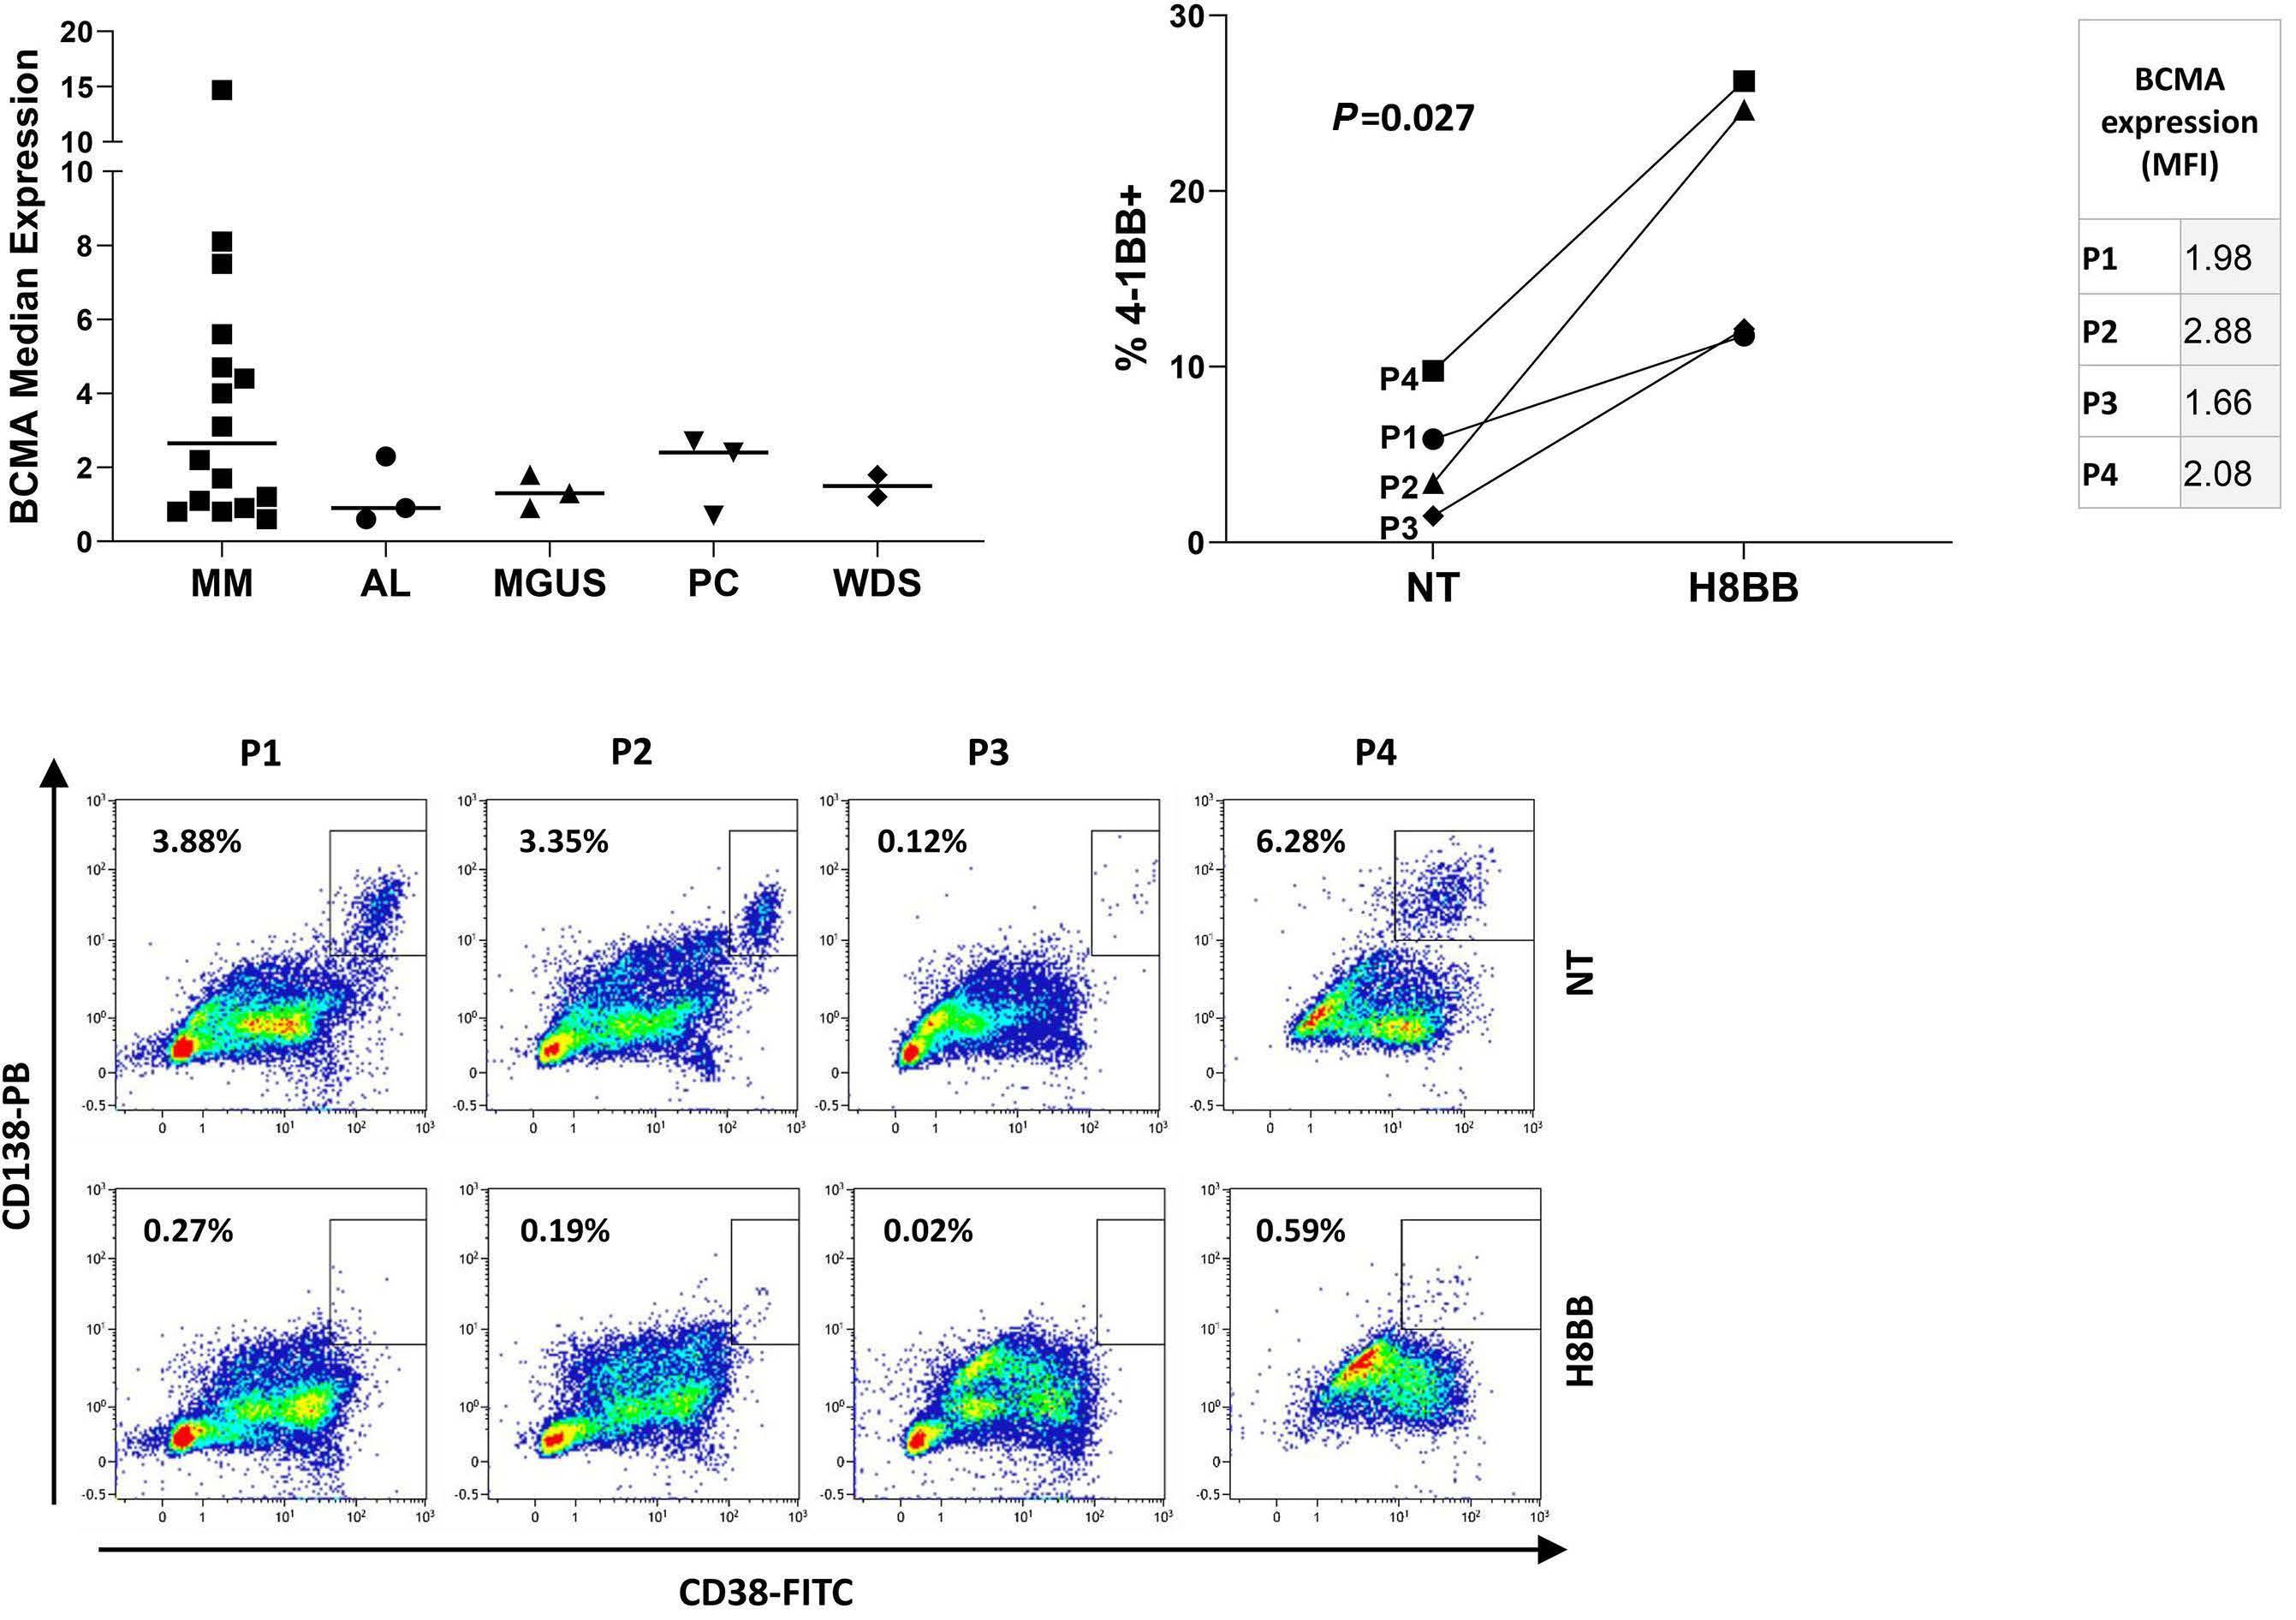
CAR-T-cell strategies revolutionized the treatment of CD19+ lymphoma and leukemia. The application of such approaches to other hematological malignancies such as MM requires the identification and design of suitable CAR targeting specific antigens. Herein, we designed and evaluated the theraputic function of several BCMA-spe cific CAR based on the same antibody chains forming the targeting moiety. Two of the assessed CAR incorporated a CD28 moiety (IC28 and H828) while the other two (ICBB and H8BB) were 4-1BB-based. Initial testing indicated the IC28 was the least functional (Figure 1B), prompting us to focus on the other constructs.
Discussion
expression in CAR-T cells and reduced cytokine secretion, along with retained cytotoxic function.42 ICBB poor in vivo performance might also be related to less expansion po tential (Figure 1D and E), tonic signaling and non-specific activity (Figure 2A and B), which could eventually lead to hypofunction.35Whencomparing H8BB and H828, we noted the former generally demonstrated superior activity with significantly lower exhaustion marker levels. Both demonstrated in vivo activity, with H8BB-CAR leading to better survival and a more pronounced effect on tumor regression. Thus, this seems to corroborate the previously described long term advantage manifested 4-1BB-based CAR over CD28-based receptors.17Wefurther explored the therapeutic potential of H8BB in preclinical studies. Importantly, we confirmed that BCMA can be expressed by plasma cells from the bone marrow of patients suffering from different plasma cells pathol ogies (Figure 8A). Considering the encouraging data col lected so far as to the functionality, specificity, and efficacy of H8BB, we aim to assess the therapeutic po tential of an H8BB CAR-T cell-based treatment in patients with different plasma cell pathologies including not only MM, but also other disorders such as light-chain amyloi dosis. To this end and following the approval from the Is raeli Ministry of Health, we initiated a clinical study, enrolling R/R malignant plasma cell patients to be treated with autologous H8BB CAR-T cells (clinicaltrails gov. Identifier: NCT04720313) in a dose escalation study first evaluating the safety, and then the efficacy of this ap proach. In conclusion, based on the results presented herein, we are confident that CAR-T therapy based on the optimized receptor H8BB holds promise for the treatment of MM and additional plasma cell-related pathologies.
We thank Ms. Riki Sabbag, Mrs. Zhanna Yekhtin and Dr. Lola Weiss for their technical help in executing in vivo ex periments work and Dr. Jennifer Israel-Cohen Benichou, head of the statistical unit in the Faculty of Life Sciences, Bar-Ilan University for her advice on statistical data pro cessing and presentation. We wish to thank Professor Zeev Rotstein, former Director of Hadassah Medical Center, for
Contributions
Acknowledgments
Compared to the evaluated CAR herein, H8BB demon strated generally the highest biological activity by means of cytokine secretion, cytotoxicity, and upregulation of ac tivation markers. Puzzlingly, while both the H8BB and H828 constructs mediated tumor regression in xenograft experiments, ICBB did not display significant in vivo activ ity (Figure 5). Several reasons could account for that: in deed, both H8BB and H828 share hinge and transmembrane regions derived from CD8 while the ICBB uses a shorter hinge (21 aa vs. 46 aa) and a CD28 TM re gion. Several studies demonstrated the need to customtailor the hinge nature and length to the targeted antigen.39,40 It was also shown that a longer hinge may in crease CAR potency and specificity41 and that CD8 hinge can lead to less activation-induced cell death.19 It was re cently demonstrated that modifications in CD8 α hinge and TM domains result in higher anti-apoptotic molecule
Disclosures
(MFI) of 3.8±3.8, 1.2±0.9, 1.3±0.4, 1.9±1.1 and 1.5±0.4 re spectively (Figure 8A). Although the average of BCMA-MFI in MM patients is markedly higher in comparison with other plasma cell disorders, P-values do not meet signifi cance. We investigated whether H8BB-CAR-T cells could efficiently target primary myeloma cell: BM-MNC from MM patients were co-cultured with either H8BB CAR-T cells or NT (control) in an allogeneic system (Figure 8B to D). Figure 8B indicates that H8BB T cells could significantly upregulate 4-1BB expression compared to NT (control) cells, when co-cultured with BM-MNC of MM patients (P=0.027). Figure 8C shows the level of BCMA expression on patients' BM-MNC (gated on CD38+CD138+). Overnight co-incubation of BM-MNC with H8BB CAR-T cells resulted in almost complete elimination of the plasma cells (gated on CD38++/CD138++; Figure 8D, right panel). In contrast, plasma cells were not affected by the presence of NT cells (Figure 8D, left panel), demonstrating the specificity of BCMA-CAR targeting. Altogether, these data confirm the potential efficacy of H8BB CAR-T-based therapy for the treatment of multiple myeloma.
No conflicts of interest to disclose.
OH, NA, SKE, TB and MA performed research, analyzed data and designed experiments; GA analyzed data; MEG analyzed data and designed experiments; PS and CJC supervised the study and designed experiments; OH, NA, SKE, PS and CJC wrote the manuscript. All the authors ap proved the manuscript.
Haematologica | 107 October 2022 2405 ARTICLE - BCMA-CAR optimization and evaluation O. Harush et al.
23. Davey AS, Call ME, Call MJ. The influence of chimeric antigen receptor structural domains on clinical outcomes and associated toxicities. Cancers (Basel) 2020;13(1):38.
We thank the Adelis Foundation for their generous support. This work was supported by the Israel Science Foundation
14. Mailankody S, Ghosh A, Staehr M, et al. Clinical responses and pharmacokinetics of MCARH171, a human-derived Bcma targeted CAR T cell therapy in relapsed/refractory multiple myeloma: final results of a phase I clinical trial. Blood. 2018;132(Suppl 1):S959.
12. Jiang S, Jin J, Hao S, et al. Low dose of human scFv-derived BCMA-targeted CAR-T cells achieved fast response and high complete remission in patients with relapsed/refractory multiple myeloma. Blood. 2018;132(Suppl 1):S960.
antigen receptor T-cell therapy in patients with relapsed or refractory multiple myeloma (CARTITUDE-1): a phase 1b/2 openlabel study. Lancet. 2021;398(10297):314-324.
20. Hudecek M, Sommermeyer D, Kosasih PL, et al. The nonsignaling extracellular spacer domain of chimeric antigen receptors is decisive for in vivo antitumor activity. Cancer Immunol Res. 2015;3(2):125-135.
26. Meril S, Harush O, Reboh Y, et al. Targeting glycosylated antigens on cancer cells using siglec-7/9-based CAR T-cells. Mol Carcinog. 2020;59(7):713-723.
25. Eisenberg V, Shamalov K, Meir S, et al. Targeting multiple tumors using T-cells engineered to express a natural cytotoxicity receptor 2-based chimeric receptor. Front Immunol. 2017;8:1212.
8. Ali SA, Shi V, Maric I, et al. T cells expressing an anti-B-cell maturation antigen chimeric antigen receptor cause remissions of multiple myeloma. Blood. 2016;128(13):1688-1700.
30. Tal Y, Yaakobi S, Horovitz-Fried M, et al. An NCR1-based chimeric receptor endows T-cells with multiple anti-tumor specificities. Oncotarget. 2014;5(21):10949-10958.
17. Kawalekar OU, O'Connor RS, Fraietta JA, et al. Distinct signaling of coreceptors regulates specific metabolism pathways and impacts memory development in CAR T cells. Immunity. 2016;44(2):380-390.
19. Alabanza L, Pegues M, Geldres C, et al. Function of novel antiCD19 chimeric antigen receptors with human variable regions is affected by hinge and transmembrane domains. Mol Ther. 2017;25(11):2452-2465.
5 Friedman KM, Garrett TE, Evans JW, et al. Effective targeting of multiple B-cell maturation antigen-expressing hematological malignances by anti-B-cell maturation antigen chimeric antigen receptor T cells. Hum Gene Ther. 2018;29(5):585-601.
References
27. Liu L, Sommermeyer D, Cabanov A, et al. Inclusion of Strep-tag II in design of antigen receptors for T-cell immunotherapy. Nat Biotechnol. 2016;34(4):430-434.
15. Munshi NC, Anderson LD, Jr., Shah N, et al. Idecabtagene vicleucel in relapsed and refractory multiple myeloma. N Engl J Med. 2021;384(8):705-716.
21. Hudecek M, Lupo-Stanghellini MT, Kosasih PL, et al. Receptor affinity and extracellular domain modifications affect tumor recognition by ROR1-specific chimeric antigen receptor T cells. Clin Cancer Res. 2013;19(12):3153-3164.
22. James SE, Greenberg PD, Jensen MC, et al. Antigen sensitivity of CD22-specific chimeric TCR is modulated by target epitope distance from the cell membrane. J Immunol. 2008;180(10):7028-7038.
16. Berdeja JG, Madduri D, Usmani SZ, et al. Ciltacabtagene autoleucel, a B-cell maturation antigen-directed chimeric
3. Cho SF, Anderson KC, Tai YT. Targeting B cell maturation antigen (BCMA) in multiple myeloma: potential uses of BCMA-based immunotherapy. Front Immunol. 2018;9:1821.
10. Raje N, Berdeja J, Lin Y, et al. Anti-BCMA CAR T-cell therapy bb2121 in relapsed or refractory multiple myeloma. N Engl J Med. 2019;380(18):1726-1737.
supporting this research and the clinical work involved in this project.
For original data, please contact the corresponding authors.
7. Carpenter RO, Evbuomwan MO, Pittaluga S, et al. B-cell maturation antigen is a promising target for adoptive T-cell therapy of multiple myeloma. Clin.Cancer Res. 2013;19(8):2048-2060.
2. Palumbo A, Anderson K. Multiple myeloma. N Engl J Med. 2011;364(119):1046-1060.
18. Fujiwara K, Tsunei A, Kusabuka H, et al. Hinge and transmembrane domains of chimeric antigen receptor regulate receptor expression and signaling threshold. Cells. 2020;9(5):1182.
4. Meinl E, Thaler FS, Lichtenthaler SF. Shedding of BAFF/APRIL receptors controls B cells. Trends Immunol. 2018;39(9):673-676.
24. Daniel-Meshulam I, Horovitz-Fried M, Cohen CJ. Enhanced antitumor activity mediated by human 4-1BB-engineered T cells. Int J Cancer. 2013;13(12):2903-2913.
28. Hoogi S, Eisenberg V, Mayer S, et al. A TIGIT-based chimeric costimulatory switch receptor improves T-cell anti-tumor function. J Immunother Cancer. 2019;7(1):243.
29. Shamalov K, Levy SN, Horovitz-Fried M, Cohen CJ. The mutational status of p53 can influence its recognition by human T-cells. Oncoimmunology. 2017;6(4):e1285990.
6. Ghosh A, Mailankody S, Giralt SA, et al. CAR T cell therapy for multiple myeloma: where are we now and where are we headed? Leuk Lymphoma. 2018;59(9):2056-2067.
9. Brudno JN, Maric I, Hartman SD, et al. T cells genetically modified to express an anti-B-cell maturation antigen chimeric antigen receptor cause remissions of poor-prognosis relapsed multiple myeloma. J Clin Oncol. 2018;36(22):2267-2280.
13. Liu Y, Chen Z, Fang H, et al. Durable remission achieved from Bcma-directed CAR-T therapy against relapsed or refractory multiple myeloma. Blood. 2018;132(Suppl 1):S956.
Funding
(1422/15, 646/20), and generous donation from the Manfred Steinfeld family.
1. Bu DX, Singh R, Choi EE, et al. Pre-clinical validation of B cell maturation antigen (BCMA) as a target for T cell immunotherapy of multiple myeloma. Oncotarget. 2018;9(40):25764-25780.
11. Cohen AD, Garfall AL, Stadtmauer EA, et al. B cell maturation antigen-specific CAR T cells are clinically active in multiple myeloma. J Clin Invest. 2019;129(6):2210-2221.
Haematologica | 107 October 2022 2406 ARTICLE - BCMA-CAR optimization and evaluation O. Harush et al.
Data-sharing statement
36. Han G, Chen G, Shen B, Li Y. Tim-3: an activation marker and activation limiter of innate immune cells. Front Immunol.
35. Long AH, Haso WM, Shern JF, et al. 4-1BB costimulation ameliorates T cell exhaustion induced by tonic signaling of chimeric antigen receptors. Nat Med. 2015;21(6):581-590.
32. Wilde S, Sommermeyer D, Leisegang M, et al. Human antitumor CD8+ T cells producing Th1 polycytokines show superior antigen sensitivity and tumor recognition. J Immunol. 2012;189(2):598-605.
34. Anderson AC, Joller N, Kuchroo VK. Lag-3, Tim-3, and TIGIT: coinhibitory receptors with specialized functions in immune regulation. Immunity. 2016;44(5):989-1004.
2013;4:449.
42. Ying Z, Huang XF, Xiang X, et al. A safe and potent anti-CD19 CAR T cell therapy. Nat Med. 2019;25(6):947-953.
33. Ren H, Cao K, Wang M. A correlation between differentiation phenotypes of infused T cells and anti-cancer immunotherapy. Front Immunol. 2021;12:745109.
Haematologica | 107 October 2022 2407 ARTICLE - BCMA-CAR optimization and evaluation O. Harush et al.
38. Bal S, Sigler A, Chan A, et al. First Description of B cell maturation antigen expression in light chain amyloidosis. Blood. 2019;134(Suppl 1):S5452.
41. Smith EL, Harrington K, Staehr M, et al. GPRC5D is a target for the immunotherapy of multiple myeloma with rationally designed CAR T cells. Sci Transl Med. 2019;11(485):eaau7746.
39. Guedan S, Calderon H, Posey AD, Jr., Maus MV. Engineering and design of chimeric antigen receptors. Mol Ther Methods Clin Dev. 2018;12:145-156.
37. Ghermezi M, Li M, Vardanyan S, et al. Serum B-cell maturation antigen: a novel biomarker to predict outcomes for multiple myeloma patients. Haematologica. 2017;102(4):785-795.
40. Lindner SE, Johnson SM, Brown CE, Wang LD. Chimeric antigen receptor signaling: functional consequences and design implications. Sci Adv. 2020;6(21):eaaz3223.
31. Eisenberg V, Hoogi S, Shamul A, Barliya T, Cohen CJ. T-cells "a la CAR-T(e)" - genetically engineering T-cell response against cancer. Adv Drug Deliv Rev. 2019;141:23-40.
Final analysis of the phase III non-inferiority COLUMBA study of subcutaneous versus intravenous daratumumab in patients with relapsed or refractory multiple myeloma
Received: June 25, 2021.
Accepted: March 23, 2022.
Abstract
Haematologica | 107 October 2022 2408 ARTICLE - Multiple Myeloma
©2022 Ferrata Storti Foundation
Saad Z. Usmani,1 Hareth Nahi,2 Wojciech Legiec,3 Sebastian Grosicki,4 Vladimir Vorobyev,5 Ivan Spicka,6 Vania Hungria,7 Sibirina Korenkova,8 Nizar J. Bahlis,9 Max Flogegard,10 Joan Bladé,11 Philippe Moreau,12 Martin Kaiser,13 Shinsuke Iida,14 Jacob Laubach,15 Hila Magen,16 Michele Cavo,17 Cyrille Hulin,18 Darrell White,19 Valerio De Stefano,20 Kristen Lantz,21 Lisa O’Rourke,21 Christoph Heuck,21 Maria Delioukina,21 Xiang Qin,22 Ivo Nnane,21 Ming Qi21 and Maria-Victoria Mateos23
In the primary analysis of the phase III COLUMBA study, daratumumab by subcutaneous administration (DARA SC) demon strated non-inferiority to intravenous administration (DARA IV) for relapsed or refractory multiple myeloma (RRMM). Here, we report the final analysis of efficacy and safety from COLUMBA after a median of 29.3 months follow-up (additional 21.8 months after the primary analysis). In total, 522 patients were randomized (DARA SC, n=263; DARA IV, n=259). With longer follow-up, DARA SC and DARA IV continued to show consistent efficacy and maximum trough daratumumab concentration as compared with the primary analysis. The overall response rate was 43.7% for DARA SC and 39.8% for DARA IV. The maxi mum mean (standard deviation [SD]) trough concentration (cycle 3, day 1 pre-dose) of serum DARA was 581 (SD, 315) µg/mL for DARA SC and 496 (SD, 231) µg/mL for DARA IV. Median progression-free survival was 5.6 months for DARA SC and 6.1 months for DARA IV; median overall survival was 28.2 months and 25.6 months, respectively. Grade 3/4 treatment-emergent adverse events occurred in 50.8% of patients in the DARA SC group and 52.7% in the DARA IV group; the most common (≥10%) were thrombocytopenia (DARA SC, 14.2%; DARA IV, 13.6%), anemia (13.8%; 15.1%), and neutropenia (13.1%; 7.8%). The safety profile remained consistent with the primary analysis after longer follow-up. In summary, DARA SC and DARA IV continue to demonstrate similar efficacy and safety, with a low rate of infusion-related reactions (12.7% vs. 34.5%, respect
1Memorial Sloan Kettering Cancer Center, New York, NY, USA; 2Karolinska Institute, Department of Medicine, Division of Hematology, Karolinska University Hospital at Huddinge, Stockholm, Sweden; 3Center of Oncology of the Lublin Region, St. Jana z Dukli, Lublin, Poland; 4Department of Hematology and Cancer Prevention, School of Public Health in Bytom, Medical University of Silesia in Katowice, Katowice, Poland; 5S. P. Botkin City Clinical Hospital, Moscow, Russian Federation; 61st Medical Department – Department of Hematology, First Faculty of Medicine, Charles University and General Hospital in Prague, Prague, Czech Republic; 7Clinica Medica São Germano, São Paulo, Brazil; 8Kyiv Center for Bone Marrow Transplantation, Kyiv, Ukraine; 9Arnie Charbonneau Cancer Research Institute, University of Calgary, Calgary, Alberta, Canada; 10Department of Internal Medicine, Falun General Hospital, Falun, Sweden; 11Hospital Clínic de Barcelona, Institut d’Investigacions Biomèdiques August Pi I Sunyer (IDIBAPS), University of Barcelona, Barcelona, Spain; 12Hematology Department, University Hospital Hôtel-Dieu, Nantes, France; 13Division of Genetics and Epidemiology, The Institute of Cancer Research and The Royal Marsden Hospital, London, UK; 14Department of Hematology and Oncology, Nagoya City University Graduate School of Medical Sciences, Nagoya, Japan; 15Department of Hematology and Oncology, Dana-Farber Cancer Institute, Harvard Medical School, Boston, MA, USA; 16Department of Hematology Chaim Sheba Medical Center, Ramat-Gan, Sackler Faculty of Medicine, Tel Aviv University, Tel Aviv, Israel; 17IRCCS Azienda Ospedaliero-Universitaria di Bologna, Istituto di Ematologia “Seràgnoli”, Dipartimento di Medicina Specialistica, Diagnostica, e Sperimentale, Università degli Studi, Bologna, Italy; 18Department of Hematology, Hôpital Haut Lévêque, Pessac, France; 19Dalhousie University and Queen Elizabeth II Health Science Centre, Halifax, Nova Scotia, Canada; 20Institute of Hematology, Catholic University, Fondazione Policlinico Universitario A. Gemelli IRCCS, Rome, Italy; 21Janssen Research & Development, LLC, Spring House, PA, USA; 22Janssen Research & Development, LLC, Raritan, NJ, USA and 23University Hospital of Salamanca/IBSAL/Cancer Research Center-IBMCC (USAL-CSIC), Salamanca, Spain.
Prepublished: March 31, 2022
Published under a CC BY-NC license
Correspondence: S. Z. Usmani usmanis@mskcc.org
https://doi.org/10.3324/haematol.2021.279459
Randomization and study treatment
the multi-center, open-label, non-inferiority, randomized phase III COLUMBA study (clinicaltrials gov. Identifier: NCT03277105) has been previously published with the prespecified co-primary endpoint analysis.10 Briefly, COLUMBA evaluated DARA SC or DARA IV in patients with RRMM. Pa tients had RRMM with a multiple myeloma diagnosis ac cording to International Myeloma Working Group criteria,13 had received ≥3 previous lines of therapy including a pro teasome inhibitor and an immunomodulatory drug, or were refractory to both a proteasome inhibitor and an immuno modulatory drug. All patients provided written informed consent. The study was approved by independent ethics committees/institutional review boards and was conducted in accordance with the Declaration of Helsinki and the In ternational Conference on Harmonization Good Clinical Practices guidelines.
Study design and participants
Eligible patients were randomly assigned in a 1:1 ratio to re ceive either DARA SC or DARA IV, stratified by baseline body weight (≤65 kg, 66-85 kg, >85 kg), previous lines of therapy(≤4 or >4), and myeloma type (immunoglobulin G vs. non–immunoglobulin G). Treatment groups were not masked to patients or investigators. Patients in the DARA SC group received a flat dose of 1,800 mg of daratumumab co-formulated with rHuPH20 at 2,000 U/mL, and patients in the DARA IV group received 16 mg/kg of daratumumab. Patients received daratumumab once weekly for cycles 12, once every 2 weeks for cycles 3-6 (all cycles, 28 days), and then once every 4 weeks thereafter until disease pro gression or toxicity.
Haematologica | 107 October 2022 2409 ARTICLE - Non-inferiority
The study design, including complete eligibility criteria, of
Introduction
ively) and shorter administration time (3-5 minutes vs. 3-7 hours) supporting DARA SC as a preferable therapeutic choice. (Clinicaltrials gov. Identifier: NCT03277105. of DARA IV
versus SC in RRMM S. Usmani et al.
The non-inferiority co-primary endpoints of the COLUMBA trial were overall response and the maximum Ctrough. Major secondary endpoints were tested sequentially in the fol lowing order: rate of IRR, progression-free survival (PFS), rate of very good partial response or better (≥VGPR), and overall survival (OS). Additional endpoints included rate of complete response or better (≥CR), time to next therapy, median PFS on the next line of therapy (PFS2; defined by time from randomization until disease progression or death on the next line of therapy), duration of response, and time to response. Disease assessments were conducted every 28 (±7) days until disease progression in accordance with International Myeloma Working Group response criteria14 and a validated computer algorithm. The primary and final analyses occurred approximately 6 and 22 months, re spectively, after the last patient was randomized.
A subcutaneous formulation of daratumumab (DARA SC; daratumumab 1,800 mg co-formulated with recombinant human hyaluronidase PH20 [rHuPH20; 2,000 U/mL; EN HANZE® drug delivery technology; Halozyme, Inc., San Diego, CA, USA]) was developed to reduce the duration of treatment administration (3-5 minutes for DARA SC vs. 37 hours for DARA IV) without compromising efficacy and safety. Based on the previously published primary analysis of the COLUMBA study,10 DARA SC was approved for use in the United States, European Union, and other countries globally as monotherapy for RRMM and combination ther apy for RRMM or newly diagnosed multiple myeloma.9,11 The primary analysis of the phase III COLUMBA study demonstrated that DARA SC was non-inferior to DARA IV in terms of the co-primary endpoints of efficacy (overall response rate [ORR]) and pharmacokinetics (maximum trough concentration measured pre-dose cycle 3, day 1 [Ctrough]). With a median follow-up time of 7.5 months, the ORR for DARA SC and DARA IV was 41% and 37%, respect ively (relative risk 1.11: 95% confidence interval [CI]: 0.891.37). Maximum Ctrough was chosen as a co-primary endpoint because this parameter was strongly correlated with efficacy.12 The maximum Ctrough in the DARA SC group was 593 (standard deviation [SD], 306) µg/mL and in the DARA IV group was 522 (SD, 226) µg/mL; the geometric means ratio was 107.93% (90% CI: 95.74-121.67). DARA SC was well tolerated with a safety profile comparable to that of DARA IV, and DARA SC had a lower rate of infu sion-related reactions (IRR) compared with DARA IV (13% vs. 34%; P<0.0001).10 Herein, we report the final analysis of the COLUMBA study, with a longer follow-up of 29.3 months (an additional 21.8 months after the primary analysis).
Endpoints and analyses
Daratumumab is a human immunoglobulin Gκ monoclonal antibody targeting CD38 with a direct on-tumor1-4 and im munomodulatory5-7 mechanism of action. Daratumumab by intravenous administration (DARA IV) is approved for use in many countries for the treatment of relapsed or re fractory multiple myeloma (RRMM) as a monotherapy or combined with standard of care for RRMM or for newly di agnosed multiple myeloma.8,9
Methods
Haematologica | 107 October 2022 2410 ARTICLE - Non-inferiority of DARA IV versus SC in RRMM S. Usmani et al.
Efficacy results at the final analysis were generally con sistent with those at the primary analysis. The ORR con tinued to improve in both treatment groups, from 41.1% to 43.7% in the DARA SC group and from 37.1% to 39.8% in
Results
the DARA IV group. In comparison to the primary analysis, the depth of response continued to deepen over time, as shown with rates of ≥VGPR based on the computerized algorithm increasing from 19% to 23.6% for the DARA SC group and from 17% to 21.6% for the DARA IV group (odds ratio, 1.13; 95% CI: 0.74-1.72; Figure 1) and the rates of ≥CR increasing from 1.9% to 4.6% for the DARA SC group and 2.7% to 5.4% for the DARA IV group. Median time to ≥VGPR was consistent with the primary analysis (DARA SC: 2.0 months [range, 1.0-19.4]; DARA IV: 1.9 months [range, 0.922.8]). Responses for DARA SC were generally similar across patients in each body weight subgroup (≤65 kg, >65-85 kg, and >85 kg; Online Supplementary Table S2).
Figure 1. Response rates over time. Response rates from the primary COLUMBA analysis10 (median follow-up, 7.5 months) and the final COLUMBA analysis (median follow-up, 29.3 months) for patients in the intent-to-treat population. Response rates are shown for the DARA SC and DARA IV groups. ORR: overall response rate; VGPR: very good partial response; PR: partial response; DARA SC: daratumumab by subcutaneous administration; DARA IV: daratumumab by intravenous administration; CR: complete response; sCR: stringent complete response.
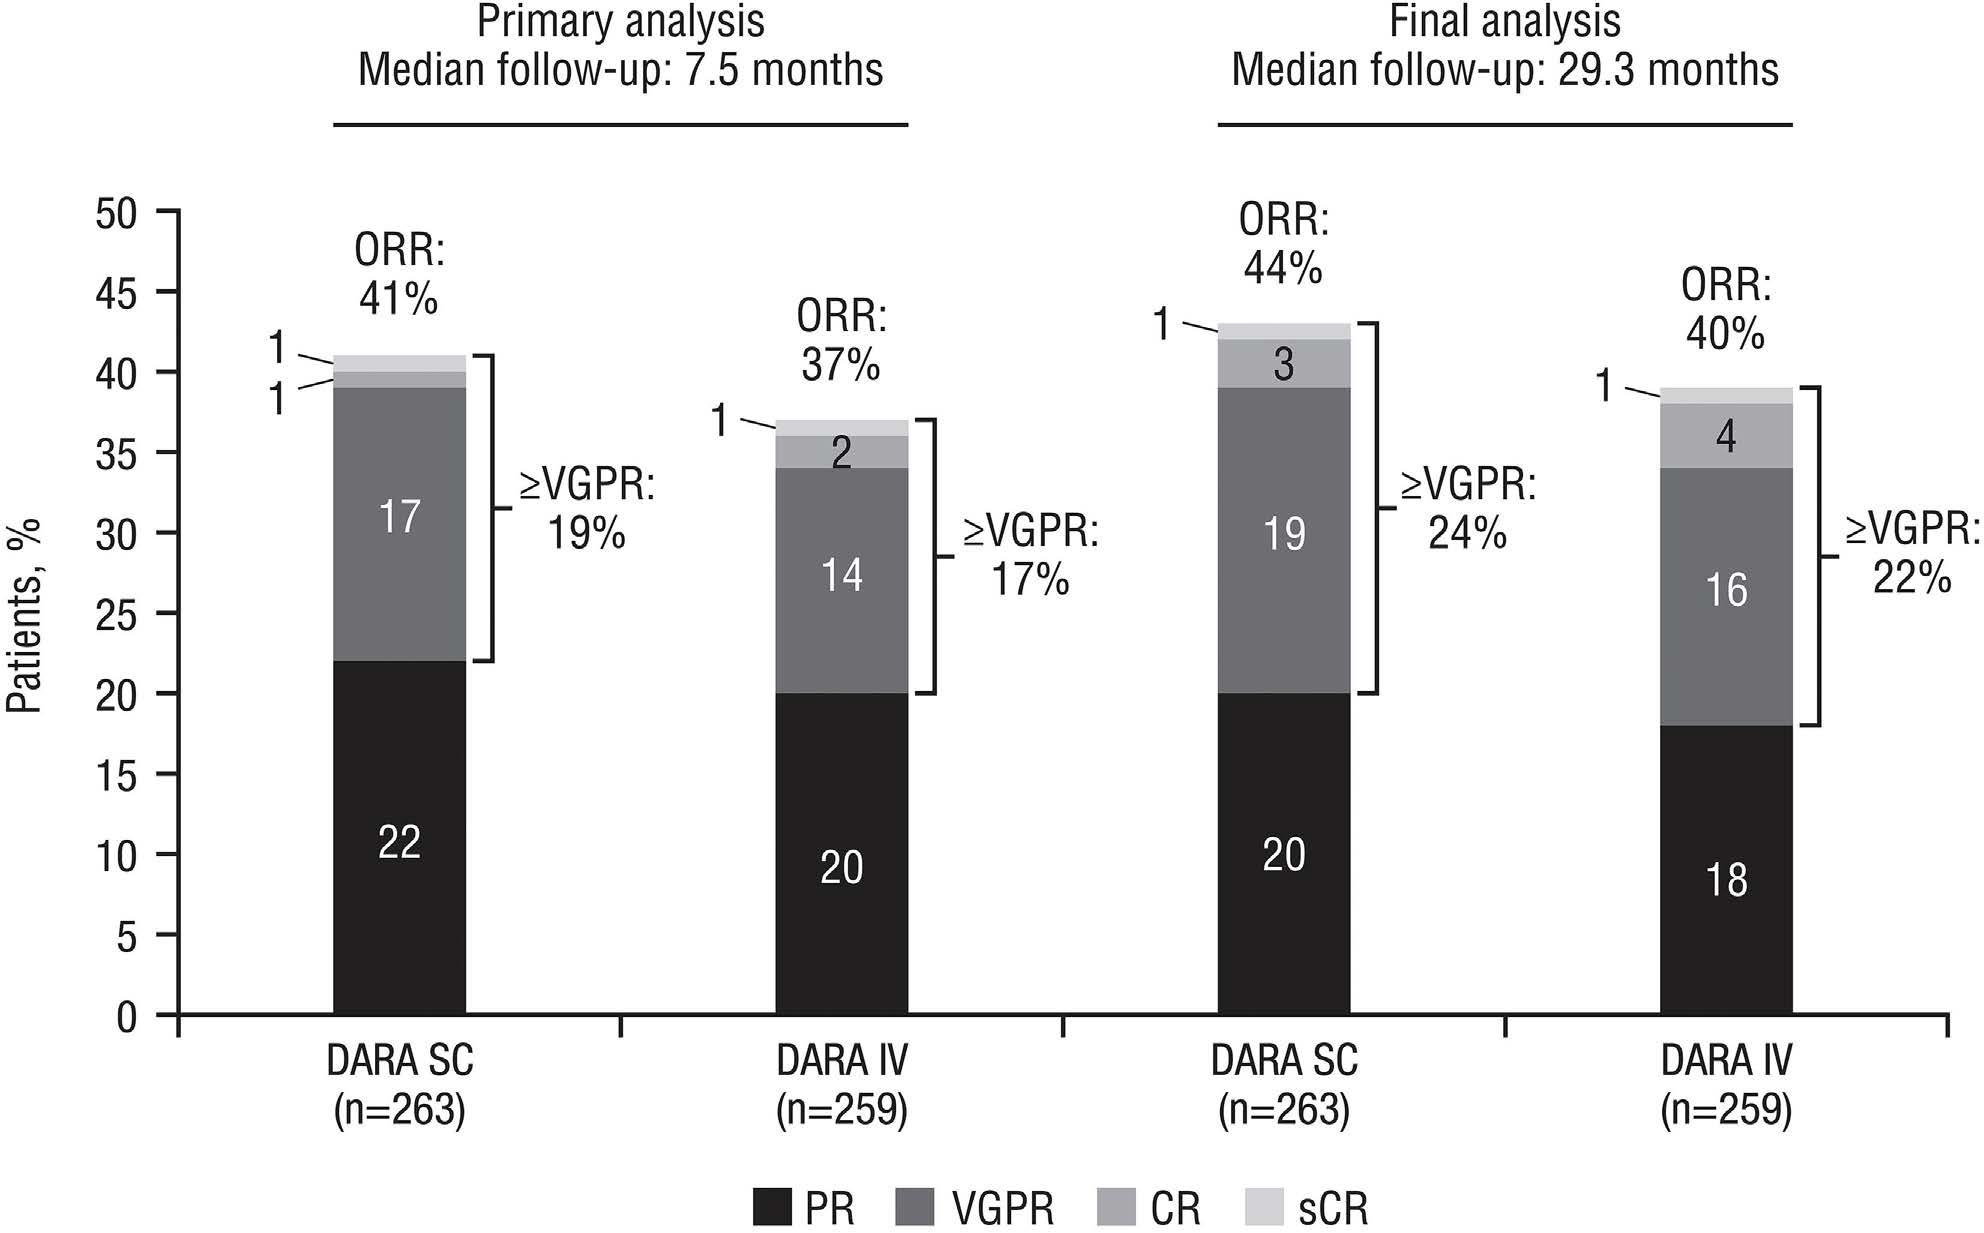
At the time of the final analysis, among patients who re ceived ≥1 treatment dose, a similar percentage in each group discontinued study treatment (DARA SC, 90.0% [n=234]; DARA IV, 91.1% [n=235]). Consistent with the pri mary analysis, progressive disease (75.4% [n=196]; 75.6% [n=195]) was the most common reason for treatment dis continuation in both groups. At the time of the clinical cutoff for the final analysis, 26 (10%) patients in the DARA SC group and 23 (8.9%) in the DARA IV group remained on study treatment. The median numbers of treatment cycles received were comparable for the DARA SC and DARA IV groups (7.0 [range, 1-38] and 7.5 [range, 1-37], respectively).
In total, 522 patients were randomized (DARA SC, n=263; DARA IV, n=259). Baseline and disease characteristics were generally well balanced and previously published.10
The median daratumumab relative dose intensities were similar for the DARA SC group at 100.0% (range, 25.0100.0) and for the DARA IV group at 99.9% (range, 1.3106.2), with a median duration of treatment of 5.6 months (range, 0.03-34.6) and 6.1 months (range, 0.03-33.4), re spectively.
Patients and treatment
Efficacy
The median time to ≥CR increased from 4.2 to 9.3 months for the DARA SC group, and from 3.8 to 7.2 months for the DARA IV group. The median duration of response was similar in both groups: 10.2 (range, 9.2-13.8) months for the DARA SC group and 10.6 (range, 9.2-15.6) months for the DARA IV group. With a median follow-up of 29.3 months, the median PFS was consistent with the primary analysis in both treat ment groups, with 5.6 (95% CI: 4.7-7.5) months and 6.1 (95% CI: 4.7-7.5) months for the DARA SC and DARA IV groups, respectively (hazard ratio [HR], 0.98; 95% CI: 0.811.19; Figure 2). The median OS was similar in both arms with 28.2 (95% CI: 22.8-not evaluable) months for the DARA SC group and 25.6 (95% CI: 22.1-not evaluable) months for the DARA IV group, (HR, 0.92; 95% CI: 0.721.18). The estimated 24-month OS rates were 55.8% (95% CI: 49.4-61.7) for DARA SC and 51.6% (95% CI: 45.1-57.6)
The final pharmacokinetic and immunogenicity results are consistent with those of the primary analysis.10 Among pa tients in the pharmacokinetic analysis set (DARA SC, n=259; DARA IV, n=257), serum trough concentrations of daratumumab following treatment with DARA SC were consistently higher or comparable with those from the DARA IV group for all visits at which concentrations were measured in both treatment groups (Figure 5). Following weekly dosing, trough serum concentrations of daratumu mab increased to the maximum Ctrough, which occurred im
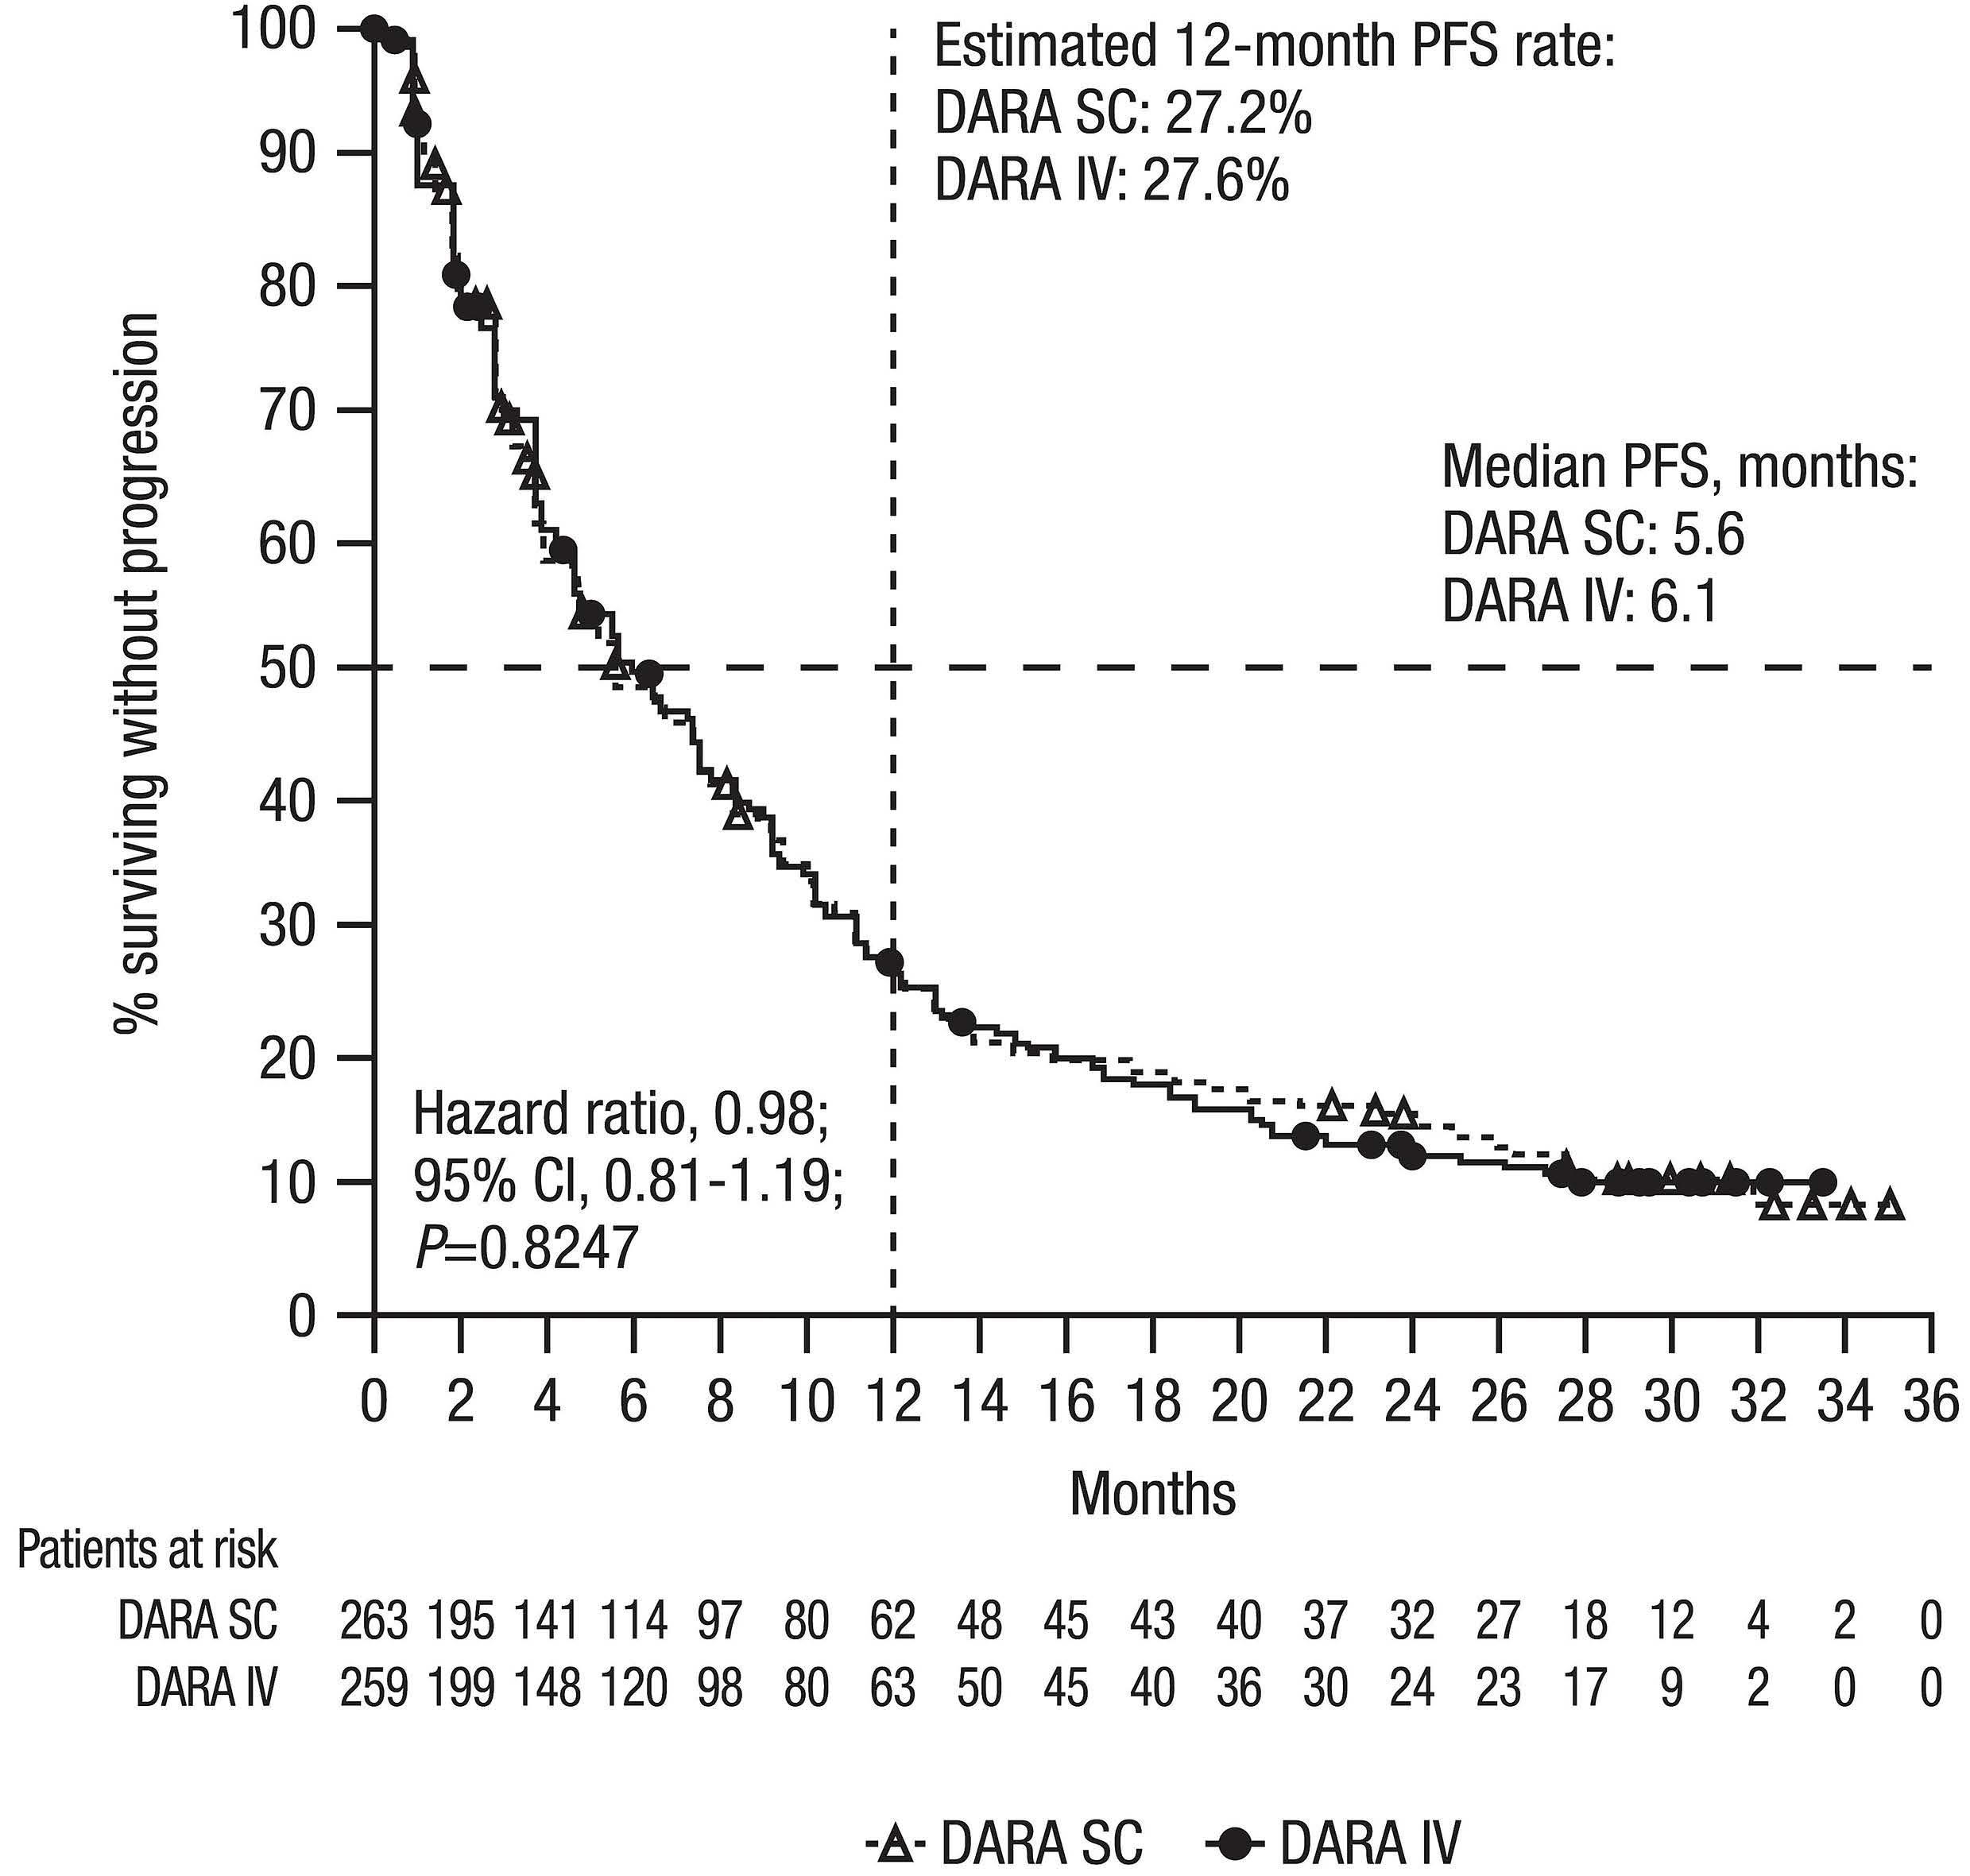
Two methods were used for detection of anti-daratumu mab antibodies for the final analysis: initial drug tolerance (DT) method and enhanced DT method. The enhanced DT method was developed to detect anti-daratumumab anti bodies in the presence of a high concentration of daratu mumab (4,000 µg/mL vs. 630 µg/mL in the initial DT assay). After the enhanced DT method became available, all samples were tested using the new enhanced DT
Pharmacokinetics and immunogenicity
The median times to next therapy were similar, with 8.8 (95% CI: 7.6-10.9) months for the DARA SC group and 9.4 (95% CI: 8.2-10.7) months for the DARA IV group (HR, 0.99; 95% CI: 0.81-1.21). PFS2 also remained similar with 19.0 (95% CI: 16.6-21.7) months for the DARA SC group and 18.1 (95% CI: 15.1-21.0) months for the DARA IV group (HR, 0.87; 95% CI: 0.70-1.10; Figure 4). The estimated 24-month PFS2 rates were 42.1% (95% CI: 35.8-48.4) and 37.1% (95% CI: 30.9-43.4) for the DARA SC and DARA IV groups, respect ively.
mediately prior to dosing on cycle 3 day 1 for both treat ment groups. The mean maximum Ctrough concentration was 581 (SD, 315) µg/mL for the DARA SC group and 496 (SD, 231) µg/mL for the DARA IV group. As expected for a monoclonal antibody administered SC as a flat dose and consistent with results in the primary analysis,10 higher serum daratumumab concentrations were observed in pa tients with lower body weight (≤65 kg) and lower serum daratumumab concentrations were observed in patients with higher body weight (>85 kg), compared with expo sures in the total pharmacokinetic analysis set in the DARA SC group. For patients treated with DARA IV, lower serum daratumumab concentrations were observed in pa tients with lower body weight (≤65 kg) and higher serum daratumumab concentrations were observed in patients with higher body weight (>85 kg), compared with expo sures in the total pharmacokinetic analysis set (Online Supplementary Table S1).
Haematologica | 107 October 2022 2411 ARTICLE - Non-inferiority of DARA IV versus SC in RRMM S. Usmani et al.
for DARA IV (Figure 3). Median OS outcomes were gen erally similar for the DARA SC and DARA IV groups across baseline body weight subgroups (≤65 kg, >65-85 kg, and >85 kg; Online Supplementary Table S2).
Figure 2. Kaplan-Meier estimates for progression-free survival in the intentto-treat population. Data included all patients who underwent randomization. Estimated 12-month progression-free survival (PFS) rates are shown. DARA SC: daratumumab by subcutaneous admin istration; DARA IV: daratumumab by in travenous administration; CI: confidence interval.
Figure 4. Kaplan-Meier estimates for progression-free survival in the intentto-treat population. Data included all patients who underwent randomiza tion. PFS2: time from randomization to progression on next line of therapy or death, based on investigator assess ment; DARA SC: daratumumab by sub cutaneous administration; DARA IV: daratumumab by intravenous adminis tration; CI: confidence interval.
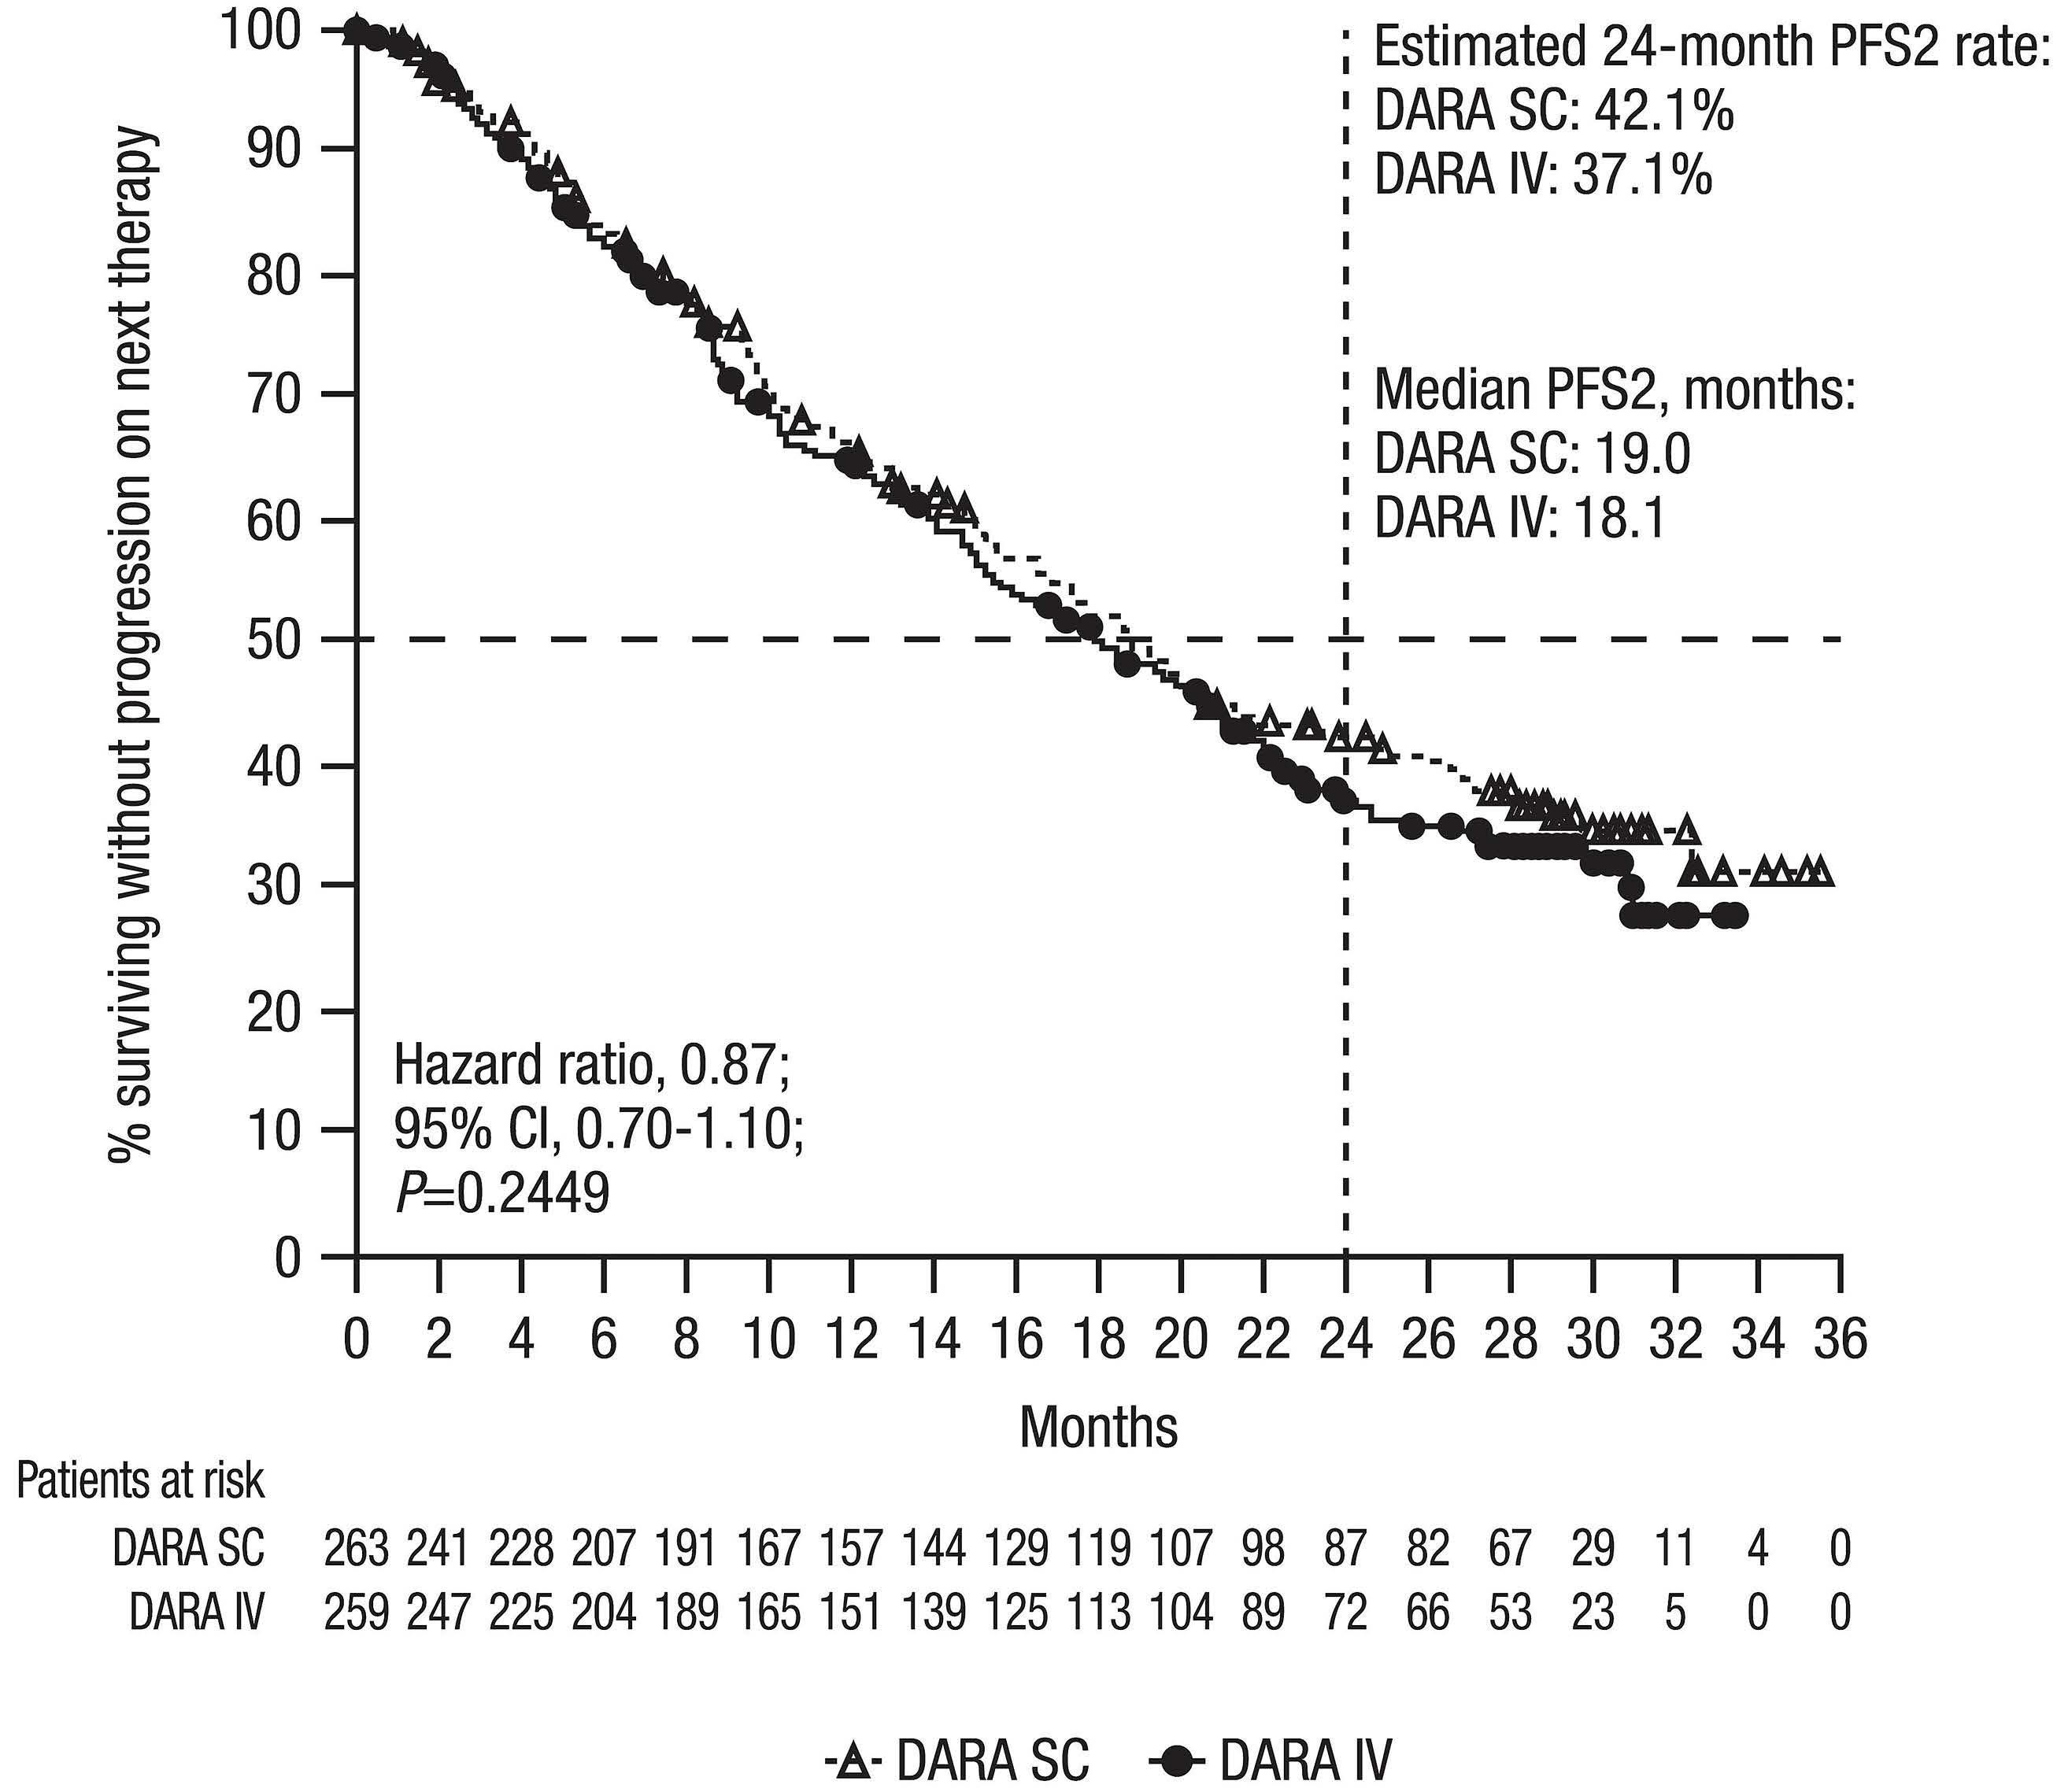
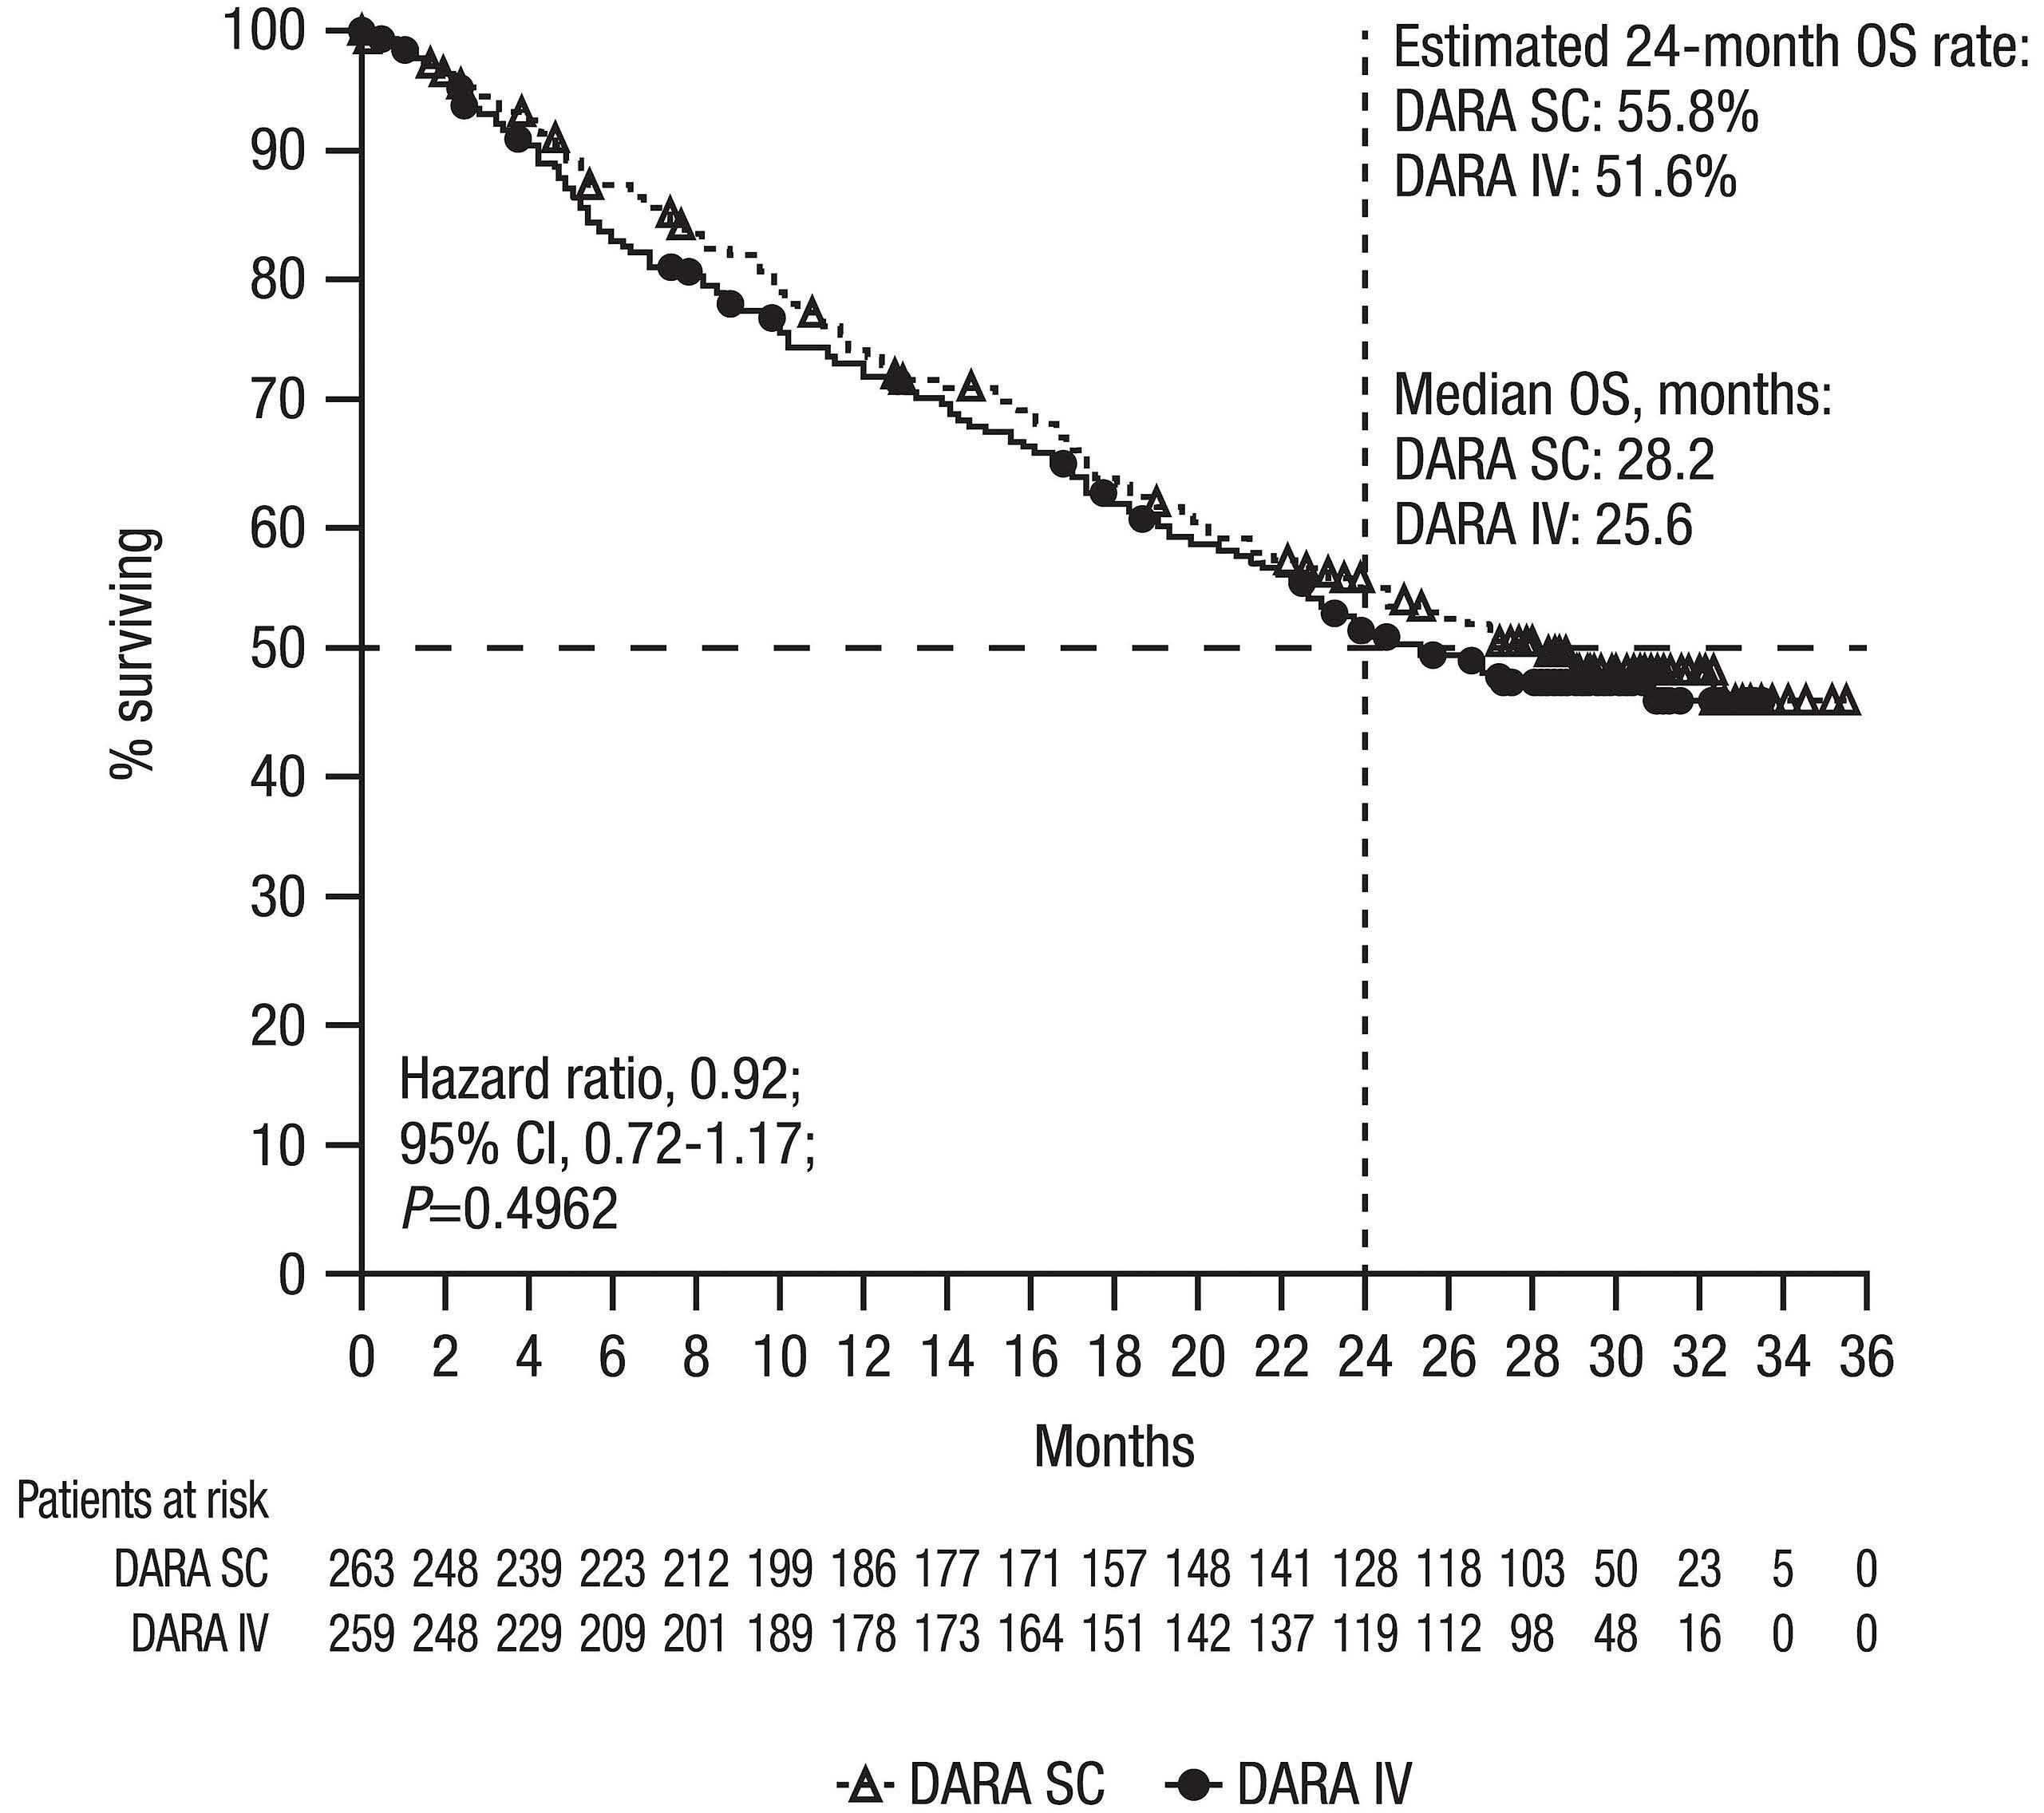
Haematologica | 107 October 2022 2412 ARTICLE - Non-inferiority of DARA IV versus SC in RRMM S. Usmani et al.
Figure 3. Kaplan-Meier estimates for overall survival in the intent-to-treat population. Data included all patients who underwent randomization. Esti mated 24-month overall survival (OS) rates are shown. DARA SC: daratumu mab by subcutaneous administration; DARA IV: daratumumab by intravenous administration; CI: confidence interval.
method (including samples that had been previously tested with the initial DT method during the primary analysis). Based on cumulative incidence in the daratumumab-im munogenicity-evaluable analysis set (n=228 for both DARA SC and DARA IV) of anti-daratumumab antibodies (i.e., pa tients positive for anti-daratumumab antibodies in either initial DT method or enhanced DT method), one (0.4%) pa tient tested positive for anti-daratumumab antibodies in the DARA SC group compared with six (2.6%) patients in the DARA IV group. The peak titer (based on enhanced DT method) was 1:192 in one patient who tested positive for treatment-emergent anti-daratumumab antibodies in the DARA SC group. For the six patients who tested positive for treatment-emergent anti-daratumumab antibodies in the DARA IV group, the peak titer was 1:6 in three patients, 1:24 in one patient, and 1:192 in one patient based on the en hanced DT method, and 1:20 in one patient based on the initial DT method. The one patient in the DARA SC group who tested positive for anti-daratumumab antibodies also tested positive for neutralizing antibodies, and five of six patients in the DARA IV group who tested positive for antidaratumumab antibodies also tested positive for neutral izing antibodies.
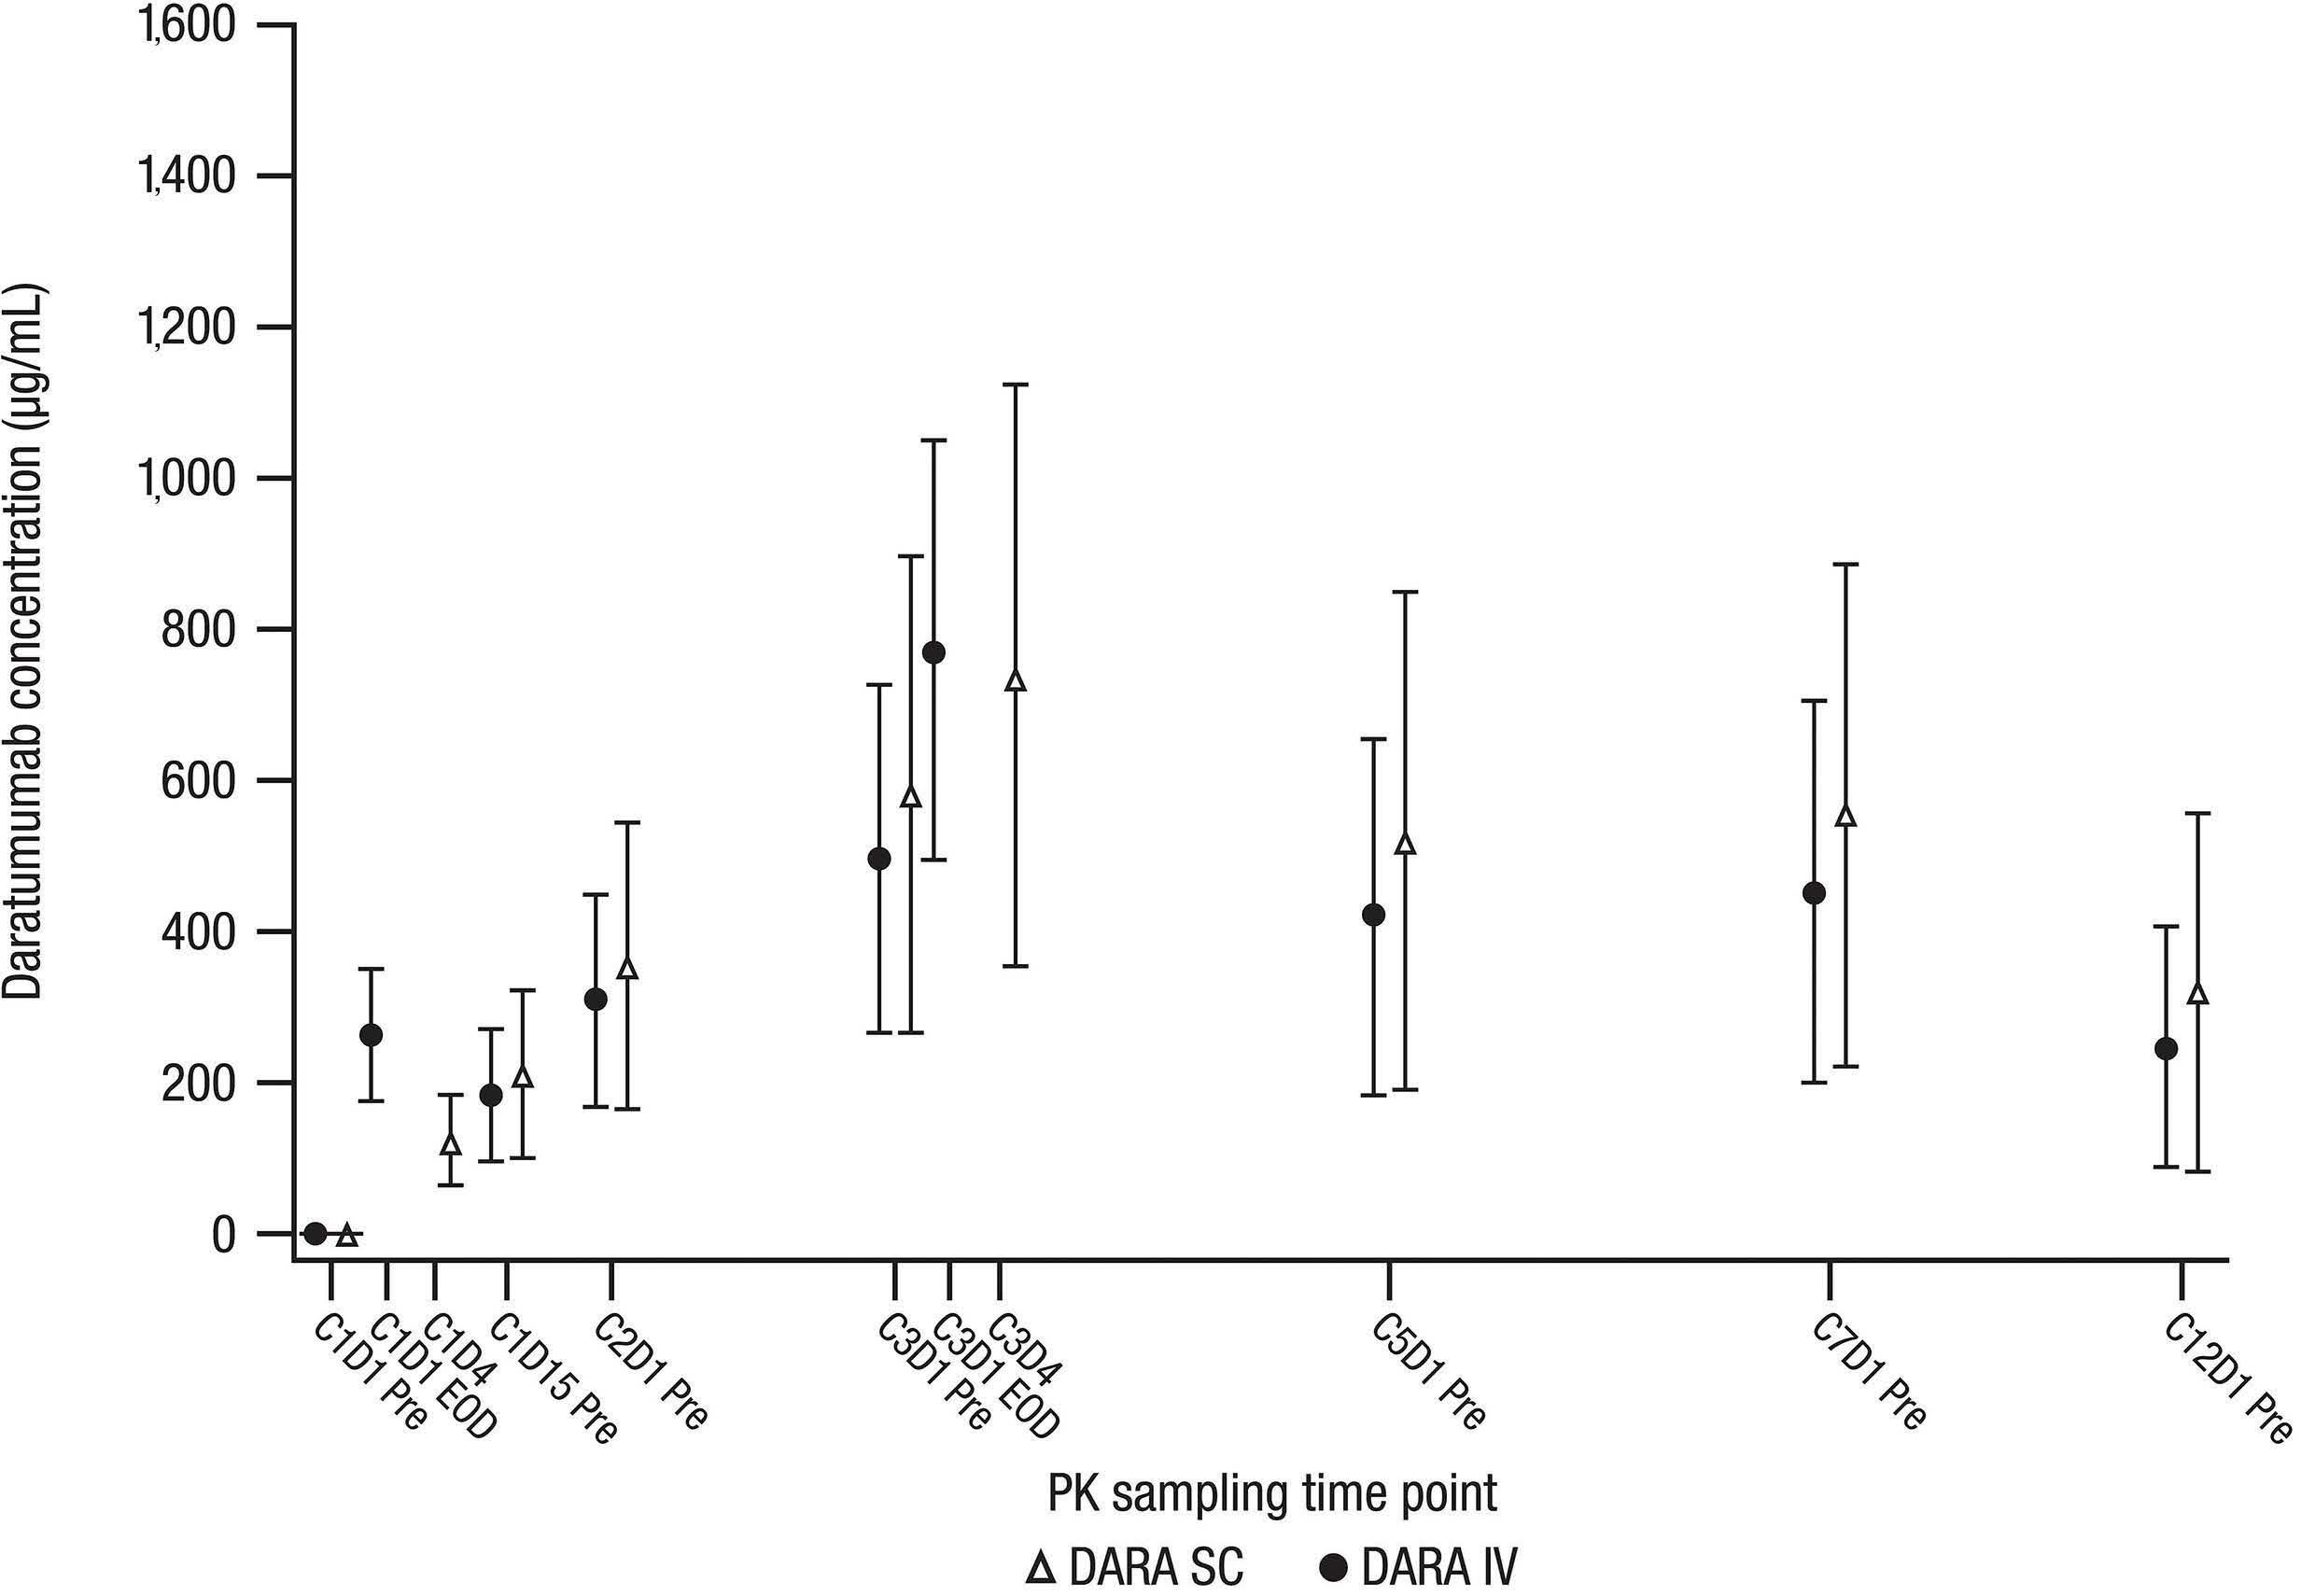
The overall safety profiles of the DARA SC and DARA IV groups were similar and consistent with the primary analy sis after longer follow-up, with 91.5% (n=238) and 93.0% (n=240) patients, respectively, experiencing treatmentemergent adverse events (TEAE) of any grade and the most common (>15%) in both groups being anemia, thrombo cytopenia, and pyrexia (Table 1). The incidence of grade 3 or 4 TEAE for both groups was similar to the data previously reported in the primary analysis, with the final analysis re porting 50.8% (n=132) of patients in the DARA SC group and
Figure 5. Plot of mean (standard deviation) daratumumab serum peak and trough concentrations over time. Data represented as mean with error bars denoting standard deviation for patients who received ≥1 administration of study therapy and had ≥1 pharmacokinetics sample concentration value after the first dose administration. C: cycle; D: day; Pre: pre-dose; EOD: end of dose; PK: pharmacokinetics; DARA SC: daratumumab by subcutaneous administration; DARA IV: daratumumab by intravenous administration.
Haematologica | 107 October 2022 2413 ARTICLE - Non-inferiority of DARA IV versus SC in RRMM S. Usmani et al.
Safety
Based on the updated rHuPH20 immunogenicity evaluable analysis set (including the primary and final analysis), 15 (6.7%) of 224 patients in the rHuPH20 immunogenicityevaluable analysis set had treatment-emergent antirHuPH20 antibodies post DARA SC administration. For patients who tested positive for treatment-emergent antirHuPH20 antibodies, the peak titer was 1:5 in ten patients, 1:10 in three patients, and 1:80 in two patients. None of the 15 patients with treatment-emergent anti-rHuPH20 antibodies tested positive for neutralizing antibodies to rHuPH20.
52.7% (n=136) of patients in the DARA IV group; the most common (≥10%) were thrombocytopenia, anemia, and neu tropenia (Table 1). The overall incidence of serious TEAE for both treatment groups also remained consistent with data previously reported in the primary analysis, with the final analysis reporting 31.9% (n=83) of patients in the DARA SC group and 34.5% (n=89) of patients in the DARA IV group; the most common SAE being pneumonia (4.6% [n=12]; 5.0% [n=13]). Second primary malignancies occurred at a low rate of 3.8% (n=10) of patients in the DARA SC group and 3.9% (n=10) patients in the DARA IV group. TEAE led to treatment discontinuation in 7.3% (n=19) pa tients in the DARA SC group and 8.5% (n=22) patients in the DARA IV group. TEAE resulting in death occurred in 6.2% (n=16) patients in the DARA SC group and 7.4% (n=19) patients in the DARA IV group. Treatment modifications due to any grade TEAE occurred in 30.0% (n=78) of DARA SC and 32.6% (n=84) of DARA IV patients.
With longer follow-up, no new IRR occurred, and the rate
TEAE resulting in death, N (%) 16 (6.2) 19 (7.4)
DARA SC (N=260) DARA IV (N=258)
Any TEAE, N (%) 238 (91.5) 240 (93.0)
Maximum toxicity grades of TEAE, N (%) Grade 1 Grade 2 Grade 3 Grade 4 Grade 5 13 (5.0) 92 (35.4) 931624(35.8)(9.2)(6.2) 19 (7.4) 85 (32.9) 88 (34.1) 29 (11.2) 19 (7.4)
There was no clinically meaningful difference in the overall tolerability and safety profiles between DARA SC and DARA IV in the ≤65 kg subgroup. Patients in each body weight subgroup (≤65 kg, >65-85 kg, and >85 kg) experienced any grade and grade 3/4 TEAE at frequencies similar to those of the overall population (Online Supplementary Table S3). Consistent with data previously reported in the primary analysis, a higher incidence of neutropenia in the ≤65 kg subgroup in the DARA SC group compared with the DARA IV group was reported, including neutropenia of all grades (DARA SC, 25.8%; DARA IV, 14.1%) and grade 3/4 neutrope nia (DARA SC, 20.4%; DARA IV, 8.7%) (Online Supplemen tary Table S3). In the ≤65 kg DARA SC subgroup there was no increase in the overall incidence of infections (DARA SC, 57.0%; DARA IV, 57.6%), grade 3 or 4 infections (10.8% and 17.4%, respectively), or serious infections (10.8% and 18.5%, respectively).
Table 1. Adverse event incidence and most common adverse events of any grade (≥10%) and grade 3/4 (≥5%) in the safetyevaluable population.a
TEAE leading to treatment discontinuation, N (%) 19 (7.3) 22 (8.5)
TEAE, N (%) Any grade Grade 3/4 Any grade Grade 3/4
HematologicAnemiaNeutropeniaThrombocytopeniaLymphopenia 72 (27.7) 52 (20.0) 5121(19.6)(8.1) 36 (13.8) 34 (13.1) 3714(14.2)(5.4) 66 (25.6) 35 (13.6) 5017(19.4)(6.6) 39 3520(15.1)(7.8)(13.6)16(6.2)
IRRsDyspneaChillsPneumoniaHypertensionNauseaCoughNasopharyngitisBackArthralgiaFatiguePyrexiaDiarrheapain 44 (16.9) 41 (15.8) 39 (15.0) 33 (12.7) 33 (12.7) 31 (11.9) 28 33151516162425(10.8)(9.6)(9.2)(6.2)(6.2)(5.8)(5.8)(12.7) 0 2 (0.8) 2 (0.8) 3 (1.2) 1 (0.4) 5 (1.9) 1 (0.4) 2 (0.8)0 11 (4.2) 13 (5.0) 1 (0.4) 2 (0.8) 4 (1.5)b 30 (11.6) 33 (12.8) 39 (15.1) 28 89283232363818(10.9)(7.0)(14.7)21(8.1)(14.0)(12.4)23(8.9)19(7.4)(12.4)(10.9)(34.5) 2 (0.8) 1 (0.4) 2 (0.8) 3 (1.2)0 7 (2.7)00 2 141315(0.8)(5.8)(5.0)2(0.8)2(0.8)(5.4)b
DARA SC: daratumumab by subcutaneous administration; DARA IV: daratumumab by intravenous administration; TEAE: treatment-emergent adverse event; IRR: infusion-related reactions. aThe safety-evaluable population includes all patients who underwent randomization and re ceived ≥1 dose of study treatment. bNo grade 4 IRR were reported for either DARA SC or DARA IV.
Haematologica | 107 October 2022 2414 ARTICLE - Non-inferiority of DARA IV versus SC in RRMM S. Usmani et al.
Non-hematologicUpperrespiratory infection
Serious TEAE, N (%) 83 (31.9) 89 (34.5)
In this final analysis of the non-inferiority phase III COLUMBA study, with 29.3 months of median follow-up (approximately 22 months after the primary analysis), DARA SC and DARA IV continued to demonstrate similar efficacy and trough da ratumumab concentrations, as measured by co-primary endpoints ORR and maximum Ctrough, and supported by depth and duration of response, PFS, and OS. With longer followup, no new safety concerns were identified, and DARA SC maintained a lower rate of IRR versus DARA IV. Together, these data are consistent with the primary analysis of COL UMBA.10Theresults from the final analysis of COLUMBA are con sistent with those seen for GEN501 and SIRIUS, which were two early-phase open-label studies that established the efficacy and safety of DARA IV monotherapy in RRMM patients.15,16 In a pooled, post hoc final analysis of GEN501 and SIRIUS, the combined ORR rate was 30.4%, median PFS was 4.0 months, and median OS was 20.5 months, with a combined median follow-up of 36.6 months.17 These data are similar to the final COLUMBA analysis: ORR rates were 43.7% and 39.8%, median PFS values were 5.6 months and 6.1 months, and median OS values were 28.2 months and 25.6 months for DARA SC and DARA IV, re Pharmacokineticspectively. analyses demonstrate that serum trough concentrations of daratumumab following treatment with DARA SC were consistently higher than or comparable with those from the DARA IV group, including the mean maximum Ctrough concentration (DARA SC, 581 µg/mL; DARA IV, 496 µg/mL); these values exceed the previously ident ified threshold (236 µg/mL) established for DARA IV to reach 99% target saturation for clinical effect.12 Analyses of pharmacokinetics by body weight subgroup were consist ent with body weight analyses from the primary COLUMBA analysis.18 Of note, there were only a small number of pa tients with body weight >120 kg who were treated with
SZU has received grants and personal fees from Amgen, Celgene, GlaxoSmithKline (GSK), Janssen, Merck, Sanofi, Seattle Genetics, SkylineDX, and Takeda; personal fees from Abbvie and MundiPharma; and grants from Bristol Myers Squibb (BMS) and Pharmacy clics. VV has received honoraria for lectures and advisory boards from Janssen, BMS, Celgene, Amgen, Takeda, AbbVie, Roche, and Astra Zeneca. IS has received honoraria and consulting and lec ture fees from Celgene, Amgen, Janssen-Cilag, Takeda, and Novartis; consulting and lecture fees from Sanofi; and lecture fees from BMS. VH has received fees for lectures and advisory boards from AbbVie, Amgen, BMS, Janssen, Sanofi, and Takeda. NB has received honoraria from and served as a consultant for AbbVie, Amgen, BMS, Celgene, Genentech, GSK, Janssen, Karyopharm, Sanofi, and Takeda; and received researching funding from Celgene. JB has re ceived personal fees from Janssen, Celgene, and Amgen. PM served as consultant for and received honoraria from Janssen, Celgene/BMS, Amgen, Sanofi, and AbbVie; and re ceived honoraria from Novartis and Takeda. AC served as a consultant for Janssen, Celgene, Novartis, Amgen, BMS,
Disclosures
The results from the modified-Cancer Therapy Satisfac tion Questionnaire (CTSQ) at the time of the final analysis confirmed, that with the longer follow-up, patients receiv ing DARA SC continued to have a more positive perception of their cancer therapy and greater satisfaction with ther apy compared with patients receiving DARA IV (Online Supplementary Table S3).
DARA SC in COLUMBA; therefore, the data should be inter preted with caution. Overall, DARA SC (1,800 mg) achieved adequate and consistent exposure across body weight subgroups (≤65 kg, 66-85 kg, and >85-120 kg), suggesting that dose adjustments are not required for DARA SC. With longer follow-up at the final COLUMBA analysis (median follow-up, 29.3 months), no new safety concerns were noted. There was no clinically meaningful difference in the overall tolerability and safety between DARA SC and DARA IV in the ≤65 kg subgroup. While a higher incidence of neutropenia in the ≤65 kg subgroup in the DARA SC group was reported, it did not result in an increased rate of any grade or grade 3 or 4 infections. These findings are consistent with those of the primary analysis. Overall, DARA SC was shown to be non-inferior to DARA IV through the primary analysis,10 a finding that was sup ported with an extended follow-up. In addition, DARA SC provides several advantages compared with DARA IV. DARA SC reduces the treatment burden for patients be cause of its considerably shorter duration of administra tion, while it confers a more positive perception and greater patient satisfaction with treatment compared with DARA IV.19 The final analysis of COLUMBA provides longterm efficacy and tolerability data on daratumumab monotherapy and strongly supports the use of DARA SC to achieve clinical outcomes comparable to those with DARA IV, with a low rate of IRR, short administration time, and without dose adjustment. Based on these results, DARA SC is considered a preferable treatment option relative to DARA IV for the patients with multiple mye loma.
of IRR remained significantly reduced with DARA SC com pared to DARA IV (12.7% [n=33] vs. 34.5% [n=89]; odds ratio, 0.28; 95% CI: 0.18-0.44; P<0.0001). For patients in the DARA SC group, one injection-site reaction occurred with longer follow-up. Among patients who switched from DARA IV to DARA SC (n = 13), none experienced IRR with DARA SC.
Discussion
Haematologica | 107 October 2022 2415 ARTICLE - Non-inferiority of DARA IV versus SC in RRMM S. Usmani et al.
The data sharing policy of Janssen Pharmaceutical Com panies of Johnson & Johnson is available at https:// www.janssen.com/clinical-trials/transparency. As noted on this site, requests for access to the study data can be sub mitted through Yale Open Data Access (YODA) Project site at http://yoda.yale.edu
7. Casneuf T, Adams HC III, van de Donk NWCJ, et al. Deep immune profiling of patients treated with lenalidomide and dexamethasone with or without daratumumab. Leukemia. 2020;35(2):573-584.
8. DARZALEX® (daratumumab) injection, for intravenous use [packet insert]. Horsham, PA: Janssen Biotech, Inc.; October 2021.
All authors contributed to the study design, study execu tion, data analysis, and manuscript writing. All authors pro vided a full review of the article and are fully responsible for all content and editorial decisions, were involved in all stages of manuscript development, and have approved the final version.
10. Mateos MV, Nahi H, Legiec W, et al. Subcutaneous versus intravenous daratumumab in patients with relapsed or refractory multiple myeloma (COLUMBA): a multicentre, openlabel, non-inferiority, randomised, phase 3 trial. Lancet Haematol. 2020;7(5):e370-e380.
11. DARZALEX FASPRO™ (daratumumab and hyaluronidase-fihj) [package insert]. Horsham, PA: Janssen Biotech, Inc; November 2021.
Karyopharm, Sanofi, Genzyme, Seattle Genetics, Oncopep tides, Millennium/Takeda, Antengene, GSK, and Secura Bio; and received research funding from Janssen, Celgene, No vartis, Amgen, Pharmacyclics, Seattle Genetics, and Millen nium/Takeda. MK has consulted for AbbVie, Amgen, BMS/Celgene, GSK, Janssen, Karyopharm, Seattle Genetics, and Takeda; received honoraria from BMS/Celgene, Janssen, and Takeda; received research funding from Janssen and BMS/Celgene; and travel support from BMS/Celgene, Janssen, and Takeda. SI has received honoraria and reserch grants from Celgene, Daiichi-Sankyo, Janssen, Ono, Sanofi, and Takeda; and also received research grants from AbbVie, BMS, Chugai, GSK, and Kyowa Kirin. MC has received hon oraria from AbbVie, GSK, BMS, Adaptive Biotechnologies, Takeda, Janssen, and Celgene. CHul has received honoraria from Celgene/BMS, GSK, Janssen Pharmaceuticals , and Takeda. DW has received honoraria from Amgen, Antengene, BMS/Celgene, GSK, Janssen, Karyopharm, Sanofi, and Takeda. VDS reports grants, personal fees, and non-financial support from Amgen, Celgene, and Novartis. KL is an em ployee of and owns equity in Janssen Research & Devel opment, LLC . LO is an employee of and owns equity in Janssen Research & Development, LLC. CHeu is an employee of and owns equity in Janssen Research & Development, LLC. MD was an employee of Janssen Research & Devel opment, LLC at the time of the analysis. XQ is an employee of and owns equity in Janssen Research & Development, LLC. IN is an employee of Janssen Research & Development, LLC. MQ an employee of and owns equity in Janssen Re search & Development, LLC. M-VM has received honoraria
This study (clinicaltrials.gov Identifier: NCT03277105) was sponsored by Janssen Research & Development, LLC.
12. Xu XS, Yan X, Puchalski T, et al. Clinical implications of complex
immune modulation as a novel mechanism of action. Cytometry A. 2019;95(3):279-289.
for lectures and advisory boards from AbbVie, Adaptive, Amgen, bluebird bio, BMS/Celgene, GSK, Janssen, Oncopep tides, Pfizer, Regeneron, Roche, Sanofi, Sea-Gen and Takeda. HN, WL, SG, SK, MF, JL and HM have no conflicts of interest to disclose.
9. European Medicines Agency. Darzalex 20 mg/mL concentrate for solution for infusion. Summary of product Accessed_-_Product_Information/human/004077/WC500207296.pdf.http://www.ema.europa.eu/docs/en_GB/document_library/EPARcharacteristics.11March2021.
Haematologica | 107 October 2022 2416 ARTICLE - Non-inferiority of DARA IV versus SC in RRMM S. Usmani et al.
6. Adams HC III, Stevenaert F, Krejcik J, et al. High-parameter mass cytometry evaluation of relapsed/refractory multiple myeloma patients treated with daratumumab demonstrates
3. Overdijk MB, Verploegen S, Bogels M, et al. Antibody-mediated phagocytosis contributes to the anti-tumor activity of the therapeutic antibody daratumumab in lymphoma and multiple myeloma. MAbs. 2015;7(2):311-321.
Contributions
Funding
2. Lammerts van Bueren J, Jakobs D, Kaldenhoven N, et al. Direct in vitro comparison of daratumumab with surrogate analogs of CD38 antibodies MOR03087, SAR650984 and Ab79. Blood. 2014;124(21):3474.
Acknowledgments
Data-sharing statement
References
4. Overdijk MB, Jansen JH, Nederend M, et al. The therapeutic CD38 monoclonal antibody daratumumab induces programmed cell death via Fcγ receptor-mediated cross-linking. J Immunol. 2016;197(3):807-813.
Medical writing and editorial support were provided by Aus tin Horton, PhD, of Cello Health Communications/MedErgy, and were funded by Janssen Global Services, LLC.
5. Krejcik J, Casneuf T, Nijhof IS, et al. Daratumumab depletes CD38+ immune-regulatory cells, promotes T-cell expansion, and skews T-cell repertoire in multiple myeloma. Blood. 2016;128(3):384-394.
1. de Weers M, Tai YT, van der Veer MS, et al. Daratumumab, a novel therapeutic human CD38 monoclonal antibody, induces killing of multiple myeloma and other hematological tumors. J Immunol. 2011;186(3):1840-1848.
Lancet. 2016;387(10027):1551-1560.
18. Mateos MV, Usmani SZ, Grosicki S, et al. Randomized, openlabel, non-inferiority, phase 3 study of subcutaneous (SC) versus intravenous (IV) daratumumab (DARA) administration in patients (Pts) with relapsed or refractory multiple myeloma (RRMM): body weight subgroup analysis of COLUMBA. Blood. 2019;134(Suppl 1):S1906.
15. Lokhorst HM, Plesner T, Laubach JP, et al. Targeting CD38 with daratumumab monotherapy in multiple myeloma. N Engl J Med. 2015;373(13):1207-1219.
pharmacokinetics for daratumumab dose regimen in patients with relapsed/refractory multiple myeloma. Clin Pharmacol Ther. 2017;101(6):721-724.
19. Usmani SZ, Mateos MV, Hungria V, et al. Greater treatment satisfaction in patients receiving daratumumab subcutaneous vs. intravenous for relapsed or refractory multiple myeloma: COLUMBA clinical trial results. J Cancer Res Clin Oncol. 2021;147(2):619-631.
13. Rajkumar SV, Dimopoulos MA, Palumbo A, et al. International Myeloma Working Group updated criteria for the diagnosis of multiple myeloma. Lancet Oncol. 2014;15(12):e538-e548.
14. Rajkumar SV, Harousseau JL, Durie B, et al. Consensus recommendations for the uniform reporting of clinical trials: report of the International Myeloma Workshop Consensus Panel 1. Blood. 2011;117(18):4691-4695.
16. Lonial S, Weiss BM, Usmani S, et al. Daratumumab monotherapy in patients with treatment-refractory multiple myeloma (SIRIUS): an open-label, randomised, phase 2 trial.
17. Usmani SZ, Nahi H, Plesner T, et al. Daratumumab monotherapy in patients with heavily pretreated relapsed or refractory multiple myeloma: final results from the phase 2 GEN501 and SIRIUS trials. Lancet Haematol. 2020;7(6):e447-e455.
Haematologica | 107 October 2022 2417 ARTICLE - Non-inferiority of DARA IV versus SC in RRMM S. Usmani et al.
type-1, and has a very poor prognosis.1,2 It is generally ac cepted that allogeneic hematopoietic stem cell transplan tation (HSCT) is the only curative treatment for ATL. Hence, it is recommended that younger patients (≤ nearly
Norio Tanaka,1* Seiichi Mori,1* Kazuma Kiyotani,2 Yuki Ota,1 Osamu Gotoh,1 Shigeru Kusumoto,3 Nobuaki Nakano,4 Youko Suehiro,5,6 Asahi Ito,3 Ilseung Choi,5 Eiichi Ohtsuka,7 Michihiro Hidaka,8 Kisato Nosaka,9 Makoto Yoshimitsu,10 Yoshitaka Imaizumi,11 Shinsuke Iida,3 Atae Utsunomiya,4 Tetsuo Noda,12 Hiroyoshi Nishikawa,13,14 Ryuzo Ueda13,15 and Takashi Ishida3,13
Published under a CC BY-NC license
https://doi.org/10.3324/haematol.2021.280352
©2022 Ferrata Storti Foundation
Abstract
Genomic determinants impacting the clinical outcome of mogamulizumab treatment for adult T-cell leukemia/lymphoma
Haematologica | 107 October 2022 2418 ARTICLE - Non-Hodgkin Lymphoma
*NT and SM contributed equally as co-first authors.
Correspondence: S. Mori itakashi@med.nagoya-u.ac.jpT.seiichi.mori@jfcr.or.jpIshida
Adult T-cell leukemia/lymphoma (ATL) is a peripheral Tcell neoplasm caused by human T-cell lymphotropic virus
1Project for Development of Innovative Research on Cancer Therapeutics, Cancer Precision Medicine Center, Japanese Foundation for Cancer Research, Tokyo; 2Project for Immunogenomics, Cancer Precision Medicine Center, Japanese Foundation for Cancer Research, Tokyo; 3Department of Hematology and Oncology, Nagoya City University Graduate School of Medical Sciences, Nagoya; 4Department of Hematology, Imamura General Hospital, Imamura; 5Department of Hematology, National Hospital Organization Kyushu Cancer Center, Kyushu; 6Department of Cell Therapy National Hospital Organization Kyushu Cancer Center, Kyushu; 7Department of Hematology, Oita Prefectural Hospital, Oita; 8Department of Hematology, National Hospital Organization Kumamoto Medical Center, Kumamoto; 9Department of Hematology, Kumamoto University Hospital, Kumamoto; 10Department of Hematology and Rheumatology, Kagoshima University Graduate School of Medical and Dental Sciences, Kagoshima; 11Department of Hematology, Nagasaki University Hospital, Nagasaki; 12Cancer Institute, Japanese Foundation for Cancer Research, Tokyo; 13Department of Immunology, Nagoya University Graduate School of Medicine, Nagoya; 14Division of Cancer Immunology, Research Institute/Exploratory Oncology Research and Clinical Trial Center, National Cancer Center, Tokyo and 15Department of Tumor Immunology, Aichi Medical University School of Medicine, Nagakute, Aichi, Japan
Received: November 16, 2021.
Introduction
Accepted: April 7, 2022.
In order to identify genomic biomarkers for the outcome of mogamulizumab-containing treatment, an integrated molecular analysis of adult T-cell leukemia/lymphoma (ATL) was conducted on 64 mogamulizumab-naïve patients. Among driver genes, CCR4 and CCR7 alterations were observed in 22% and 11% of the patients, respectively, both consisting of single nucleotide variants (SNV)/insertion-deletions (indels) in the C-terminus. Patients with CCR4 alterations or without CCR7 alterations exhibited a more favorable clinical response (complete response [CR] rate 93%, 13/14; P=0.024, and CR rate 71%, 40/56; P=0.036, respectively). Additionally, TP53, CD28, and CD274 alterations were identified in 35%, 16%, and 10% of the patients, respectively. TP53 alterations included SNV/indels or copy number variations (CNV) such as homozygous deletion; CD28 alterations included SNV, CNV such as amplification, or fusion; CD274 alterations included CNV such as amplification, or structural variants. Univariate analysis revealed that TP53, CD28 or CD274 alterations were associated with worse overall survival (OS) (hazard ratio [HR]: 2.330, 95% confidence interval [CI]: 1.183-4.589; HR: 3.191, 95% CI: 1.2877.911; HR: 3.301, 95% CI: 1.130-9.641, respectively) but that CCR4 alterations were associated with better OS (HR: 0.286, 95% CI: 0.087-0.933). Multivariate analysis indicated that in addition to performance status, TP53, CCR4 or CD274 alterations (HR: 2.467, 95% CI: 1.197-5.085; HR: 0.155, 95% CI: 0.031-0.778; HR: 14.393, 95% CI: 2.437-85.005, respectively) were inde pendently and significantly associated with OS. The present study contributes to the establishment of precision medicine using mogamulizumab in ATL patients.
Prepublished: April 14, 2022.
Study subjects were mogamulizumab-naïve ATL patients without prior allogeneic HSCT, who received mogamulizu mab-containing treatment. ATL diagnosis and clinical sub type assignment were according to the Japan Lymphoma Study Group recommendations.2 Therapeutic efficacy of mogamulizumab treatment was assessed according to the international consensus response criteria and classi fied as complete response (CR), partial response (PR), stable disease (SD) or progressive disease (PD).14 The cur rent genomic study was approved by the Institutional Re view Boards at all participating sites, and all patients
provided written informed consent before blood or tissue sampling. Exome sequencing was performed using paired tumor–derived and normal tissue DNA from the same pa tient, the latter almost always being peripheral blood mononuclear cells (PBMC) from the patient in hematologi cal remission after treatment. Details are available in the Online Supplementary Appendix
An entire landscape of genetic aberrations in ATL has been identified, and it is clear that diverse multistep oncogenic events, from infant to elderly adult, are involved in the de velopment of this disease.13 The next step would be indi vidualized treatments for ATL based on each patient’s genomic biomarkers, to tailor therapy to the specific dis ease entity. To this end, we performed an integrated mol ecular analysis for mogamulizumab-naïve ATL patients, in order to identify genomic biomarkers influencing the clini cal outcome of mogamulizumab-containing treatment. Our ultimate goal is to establish precision medicine for patients with ATL based on their genomic profiles.
Detection of structural variants in the 3’ UTR of the CD274 gene
Details are available in Online Supplementary Appendix.25-28
Adult T-cell leukemia/lymphoma patients and samples
Details are available in the Online Supplementary Appen dix 22,23
Details are available in the Online Supplementary Appen dix 24
Adult T-cell leukemia/lymphoma driver genes
Fusion gene detection with RNA sequencing
Methods
DNA/RNA preparation for genomic and epigenetic analysis
Somatic variant call
Details are available in the Online Supplementary Appen dix.16-21
Details are available in the Online Supplementary Appen dix.
Haematologica | 107 October 2022 2419 ARTICLE - Genomic determinants of clinical outcome in ATL N. Tanaka et al.
Details are available in the Online Supplementary Appen dix.15
A total of 81 genes was defined as ATL driver genes (Online Supplementary Table S1).13 Details are available in the On line Supplementary Appendix.
Human leukocyte antigen genotyping and alteration call
Exome library preparation and sequencing
Details are available in the Online Supplementary Appen dix
RNA sequencing
70 years of age) and those with relatively well-controlled ATL receive this treatment, aiming for long-term survival.3,4 However, treatment-related adverse events associated with allogeneic HSCT are generally severe compared to other treatments. In addition, many Japanese ATL patients are indeed older (median age at diagnosis, 68 years).5 Ac cordingly, ATL patients who are candidates for allogeneic HSCT by virtue of younger age are decreasing year by year. CC chemokine receptor 4 (CCR4) is expressed on the tumor cells of most patients with ATL, and it was there fore proposed as a molecular target for immunotherapy. The humanized anti-CCR4 monoclonal antibody moga mulizumab was developed for this purpose.6 This antibody has a defucosylated Fc region, which enhances antibodydependent cellular cytotoxicity (ADCC).7,8 It is approved in Japan both for patients with newly diagnosed or re lapsed/refractory ATL.9,10 Currently, most patients deemed unsuitable for allogeneic HSCT receive mogamulizumabcontaining treatment as first-line therapy.10,11 Moreover, most relapsed or refractory ATL patients receive moga mulizumab.9,12 However, some patients are initially refrac tory to mogamulizumab, or acquire resistance after treatment. The mechanisms responsible for this have not yet been determined.
Progression-free survival (PFS) was defined as the time from the first dose of mogamulizumab to progression, re lapse, or death resulting from any cause, whichever oc curred first. Overall survival (OS) was measured from the day of the first dose to death resulting from any cause. The survival estimate was calculated with all trans planted patients (n=9) censoring at the day of allogeneic HSCT. Details are available in Online Supplementary Ap pendix 29,30
Statistical analyses
lymphoma, or chronic) (Online Supplementary Figures S1G or S2G, respectively).
Sixty-four mogamulizumab-naïve ATL patients comprising 33 men and 31 women were included. Their median age was 68 years (mean, 66; range, 36-86), and disease clini cal subtypes included 46 acute, seven lymphoma, and 11 chronic ATL. The 11 chronic patients all had an unfavorable subtype.3,14 Twenty-six patients had not been previously treated, but the remaining 38 had previously received sys temic chemotherapy (Online Supplementary Table S2). Forty-five patients received mogamulizumab-containing combination therapies, such as a mogamulizumab plus VCAP-AMP-VECP (vincristine, cyclophosphamide, dox orubicin, prednisone; doxorubicin, ranimustine, predni sone; vindesine, etoposide, carboplatin, prednisone)-like regimen, or CHOP (cyclophosphamide, doxorubicin, vin cristine, prednisolone)-like regimens, whereas 19 received mogamulizumab monotherapy.31 Patients received a median of seven mogamulizumab infusions at 1 mg/kg, with a mean of eight (range, 1-42). Nine patients received allogeneic HSCT after mogamulizumab-containing treat ment.
PFS of patients with CR (median, 1.4 years) was signifi cantly better than of those with PR (median, 0.7 years, P=0.039), SD (median, 0.2 years, P<0.001), or PD (median, 0.1 years, P<0.001). Also, PFS of patients with PR was sig nificantly better than of those with SD (P=0.008) or PD (P<0.001). There were no significant differences of PFS be tween patients with SD and PD (Online Supplementary Figure S1H). OS of patients with CR (median, 4.6 years) was significantly better than of those with PR (median, 1.5 years, P=0.016), SD (median, 0.5 years, P<0.001), or PD (median, 0.5 years, P<0.001). Finally, the OS of patients with PR was significantly better than of those with SD (P=0.016), or PD (P=0.001). There were no significant dif ferences of OS between patients with SD and PD (Online Supplementary Figure S2H).
Clinical responses to mogamulizumab, and progressionfree survival and overall survival according to clinical parameters
There were no patients with both CCR4 and CCR7 alter ations (Figure 1A). No other driver gene alterations associ ated with clinical response to mogamulizumab were identified, according to these criteria (i.e., P<0.050,
Haematologica | 107 October 2022 2420 ARTICLE - Genomic determinants of clinical outcome in ATL N. Tanaka et al.
Patients’ characteristics
Results
Objective responses to mogamulizumab-containing treat ment were noted in 54 of the 64 patients, including 43 CR. Three patients had SD and seven PD. Median PFS and OS were 1.0 year (95% CI: 0.5-1.5) (Online Supplementary Figure S1A) and 1.6 years (95% CI: 1.1-2.2) (Online Supple mentary Figure S2A), respectively. There were no signifi cant differences in PFS and OS according to age (> or <70 years) (Online Supplementary Figures S1B and S2B, re spectively). PFS and OS of those patients with a perform ance status (PS) of 2-4 was significantly worse than of those with a PS of 0 or 1 (median PFS, 0.7 vs. 1.3 years, P=0.015, Online Supplementary Figure S1C, and median OS, 1.1 vs. 2.7 years, P=0.008, Online Supplementary Figure S2C, respectively). PFS and OS of patients with a higher serum LDH level (> upper limit of normal [ULN]) was significantly worse than in those with a lower level (< ULN) (median PFS, 0.6 vs. 1.4 years, P=0.009, Online Supplementary Fig ure S1D, and median OS, 1.3 vs. 5.1 years, P=0.020, Online Supplementary Figure S2D, respectively). There were no significant differences in PFS or OS according to sex (data not shown), between previously untreated or treated pa tients (Online Supplementary Figures S1E and S2E, re spectively), or between patients treated with mogamulizumab monotherapy or combination therapy (Online Supplementary Figures S1F and S2F, respectively). There were also no significant differences in PFS or OS among the patients with different clinical subtypes (acute,
Driver gene alterations associated with clinical response to mogamulizumab Sixty-three patients whose samples passed the quality assessments during exome analyses (n=64) and RNA se quencing (n=63) were evaluable for driver gene alterations. Frequencies, distributions and types of alterations in driver genes are shown in Figure 1A and B. The former in cluded hot spot truncations in the C-terminal position of CCR4, CCR7 and NOTCH1 genes, and hot spot missense SNV in PLCG1, PRKCB, VAV1, STAT3 and CARD11. The latter included homozygous deletion of 9p21.3 (CDKN2A), am plification of 2q33.2 (CD28) and 9p24.1 (CD274 [PD-L1]), 18q21.33, 6p25.3 (IRF4) and 14q32.2 (BCL11B) (the gene symbol in parenthesis indicates the presumed driver gene on the segment).32 In addition, a total of eight fusion genes was detected in six cases (1 each of ATXN1-GMPR, 1 CBLBGJC1, 1 CD58-SLC16A1, 3 ICOS-CD28, 1 CTLA4-CD28, and 1 SLC38A1-ARID2). Three structural variants were identified in the CD274 gene, including two deletions and one trans location of the 3' UTR. Analysis of combinations of driver SNV/indels, CNV, fusion, and structural variants revealed a comprehensive landscape of ATL driver alterations. In the current cohort, of the 81 driver genes (Online Supple mentary Table S1), alterations were detected in 66, at an average of 5.5 alterations per patient (Figure 2; Online Supplementary Table S3).
Next, we analyzed associations between clinical re sponses to mogamulizumab (CR vs. non-CR) and 30 driver gene alterations (presence or absence). The presence of CCR4 alterations or the absence of CCR7 alterations was associated with CR (CR 93%, 13/14; P=0.024; CR 71%, 41/56; P=0.036, respectively) (Online Supplementary Table S4).
Figure 1. Driver gene alterations in adult T-cell leukemia/lymphoma cells. (A) Truncating mutations, missense single nucleotide variant (SNV), in-frame insertion-deletions (indels), loss of heterozygosity (LOH) in wild-type allele by copy number (CN) loss, in the 64 adult T-cell leukemia/lymphoma (ATL) patients by exome sequencing are presented according to clinical response to mo gamulizumab using Oncoprint. Color code is as follows: truncating mutation, black; missense SNV, green; in-frame indels, brown; and LOH, light blue triangles. The altered gene name is indicated on the left, and their frequencies are indicated on the right The case outlined by the black square lacked RNA-sequencing data, and thus SNV or indels were not evaluable. (B) CN variations such as homozygous deletions and amplifications of the gene segment, in the 64 ATL patients are presented according to clinical response to mogamulizumab using Oncoprint. Color code is as follows: homozygous deletions, blue; and amplifications, red squares. CN gain (CN=3) or loss (CN=1) are not presented. The gene segments are shown in descending order of their altered frequency from top to bottom. The locations of the altered gene segments and the gene name in the segments are indicated on the left, and their frequencies are indicated on the right.
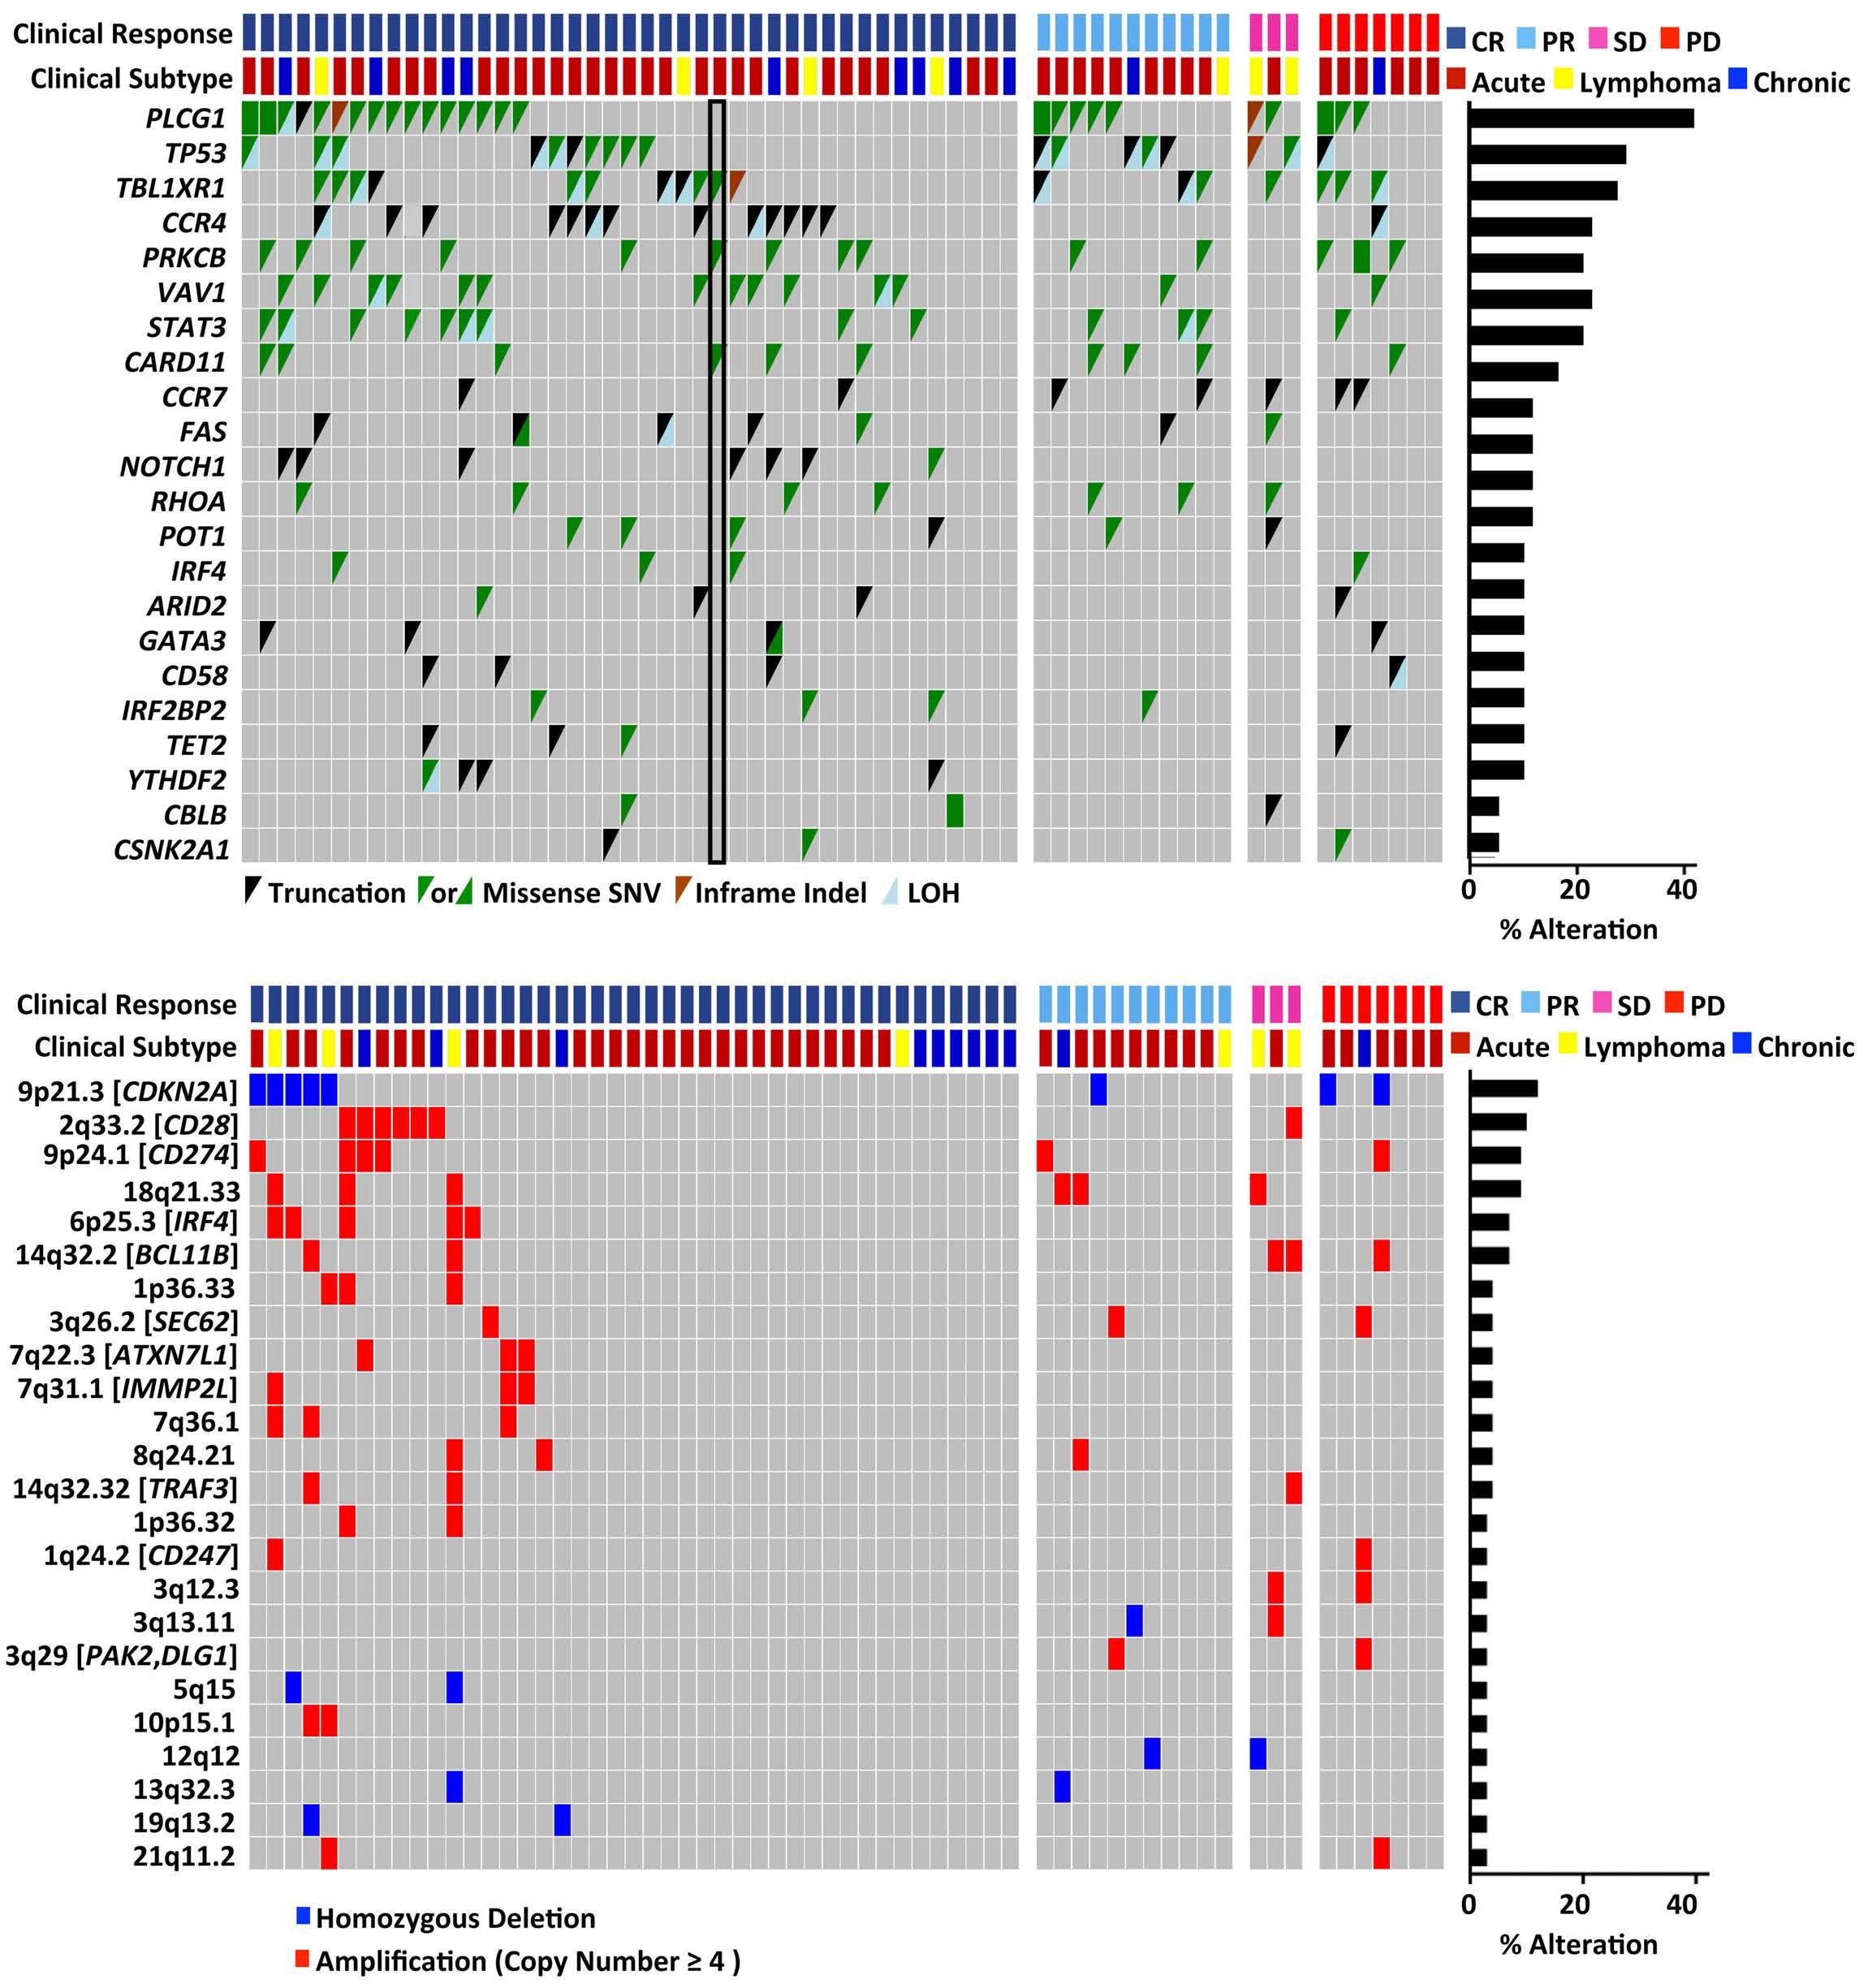
gene alterations (presence or absence) occurring in more than one patient. Of these TP53 and CD274 alterations were associated with worse PFS (HR: 2.001, 95% CI: 1.0583.784; HR: 2.924, 95% CI: 1.117-7.651, respectively). On the other hand, alterations in CCR4 were associated with better PFS (HR: 0.363, 95% CI: 0.142-0.928). DLG1 and PAK2 alterations were associated with worse PFS (HR: 5.427,
BA Haematologica | 107 October 2022 2421 ARTICLE - Genomic determinants of clinical outcome in ATL N. Tanaka et al.
number of cases with altered genes >3 in the cohort, and confirmation of altered allele expression by RNA sequenc ing).
Univariate analysis of PFS was performed for the 48 driver
Univariate analyses of progression-free and overall survival according to driver gene alterations
95% CI: 1.250 to 23.566; n=2 for both), but did not meet the present prognostic criteria (number of cases with al tered genes >3 in the cohort) (Figure 3).
Univariate analysis of OS was also performed. It was found that patients with TP53, CD28 or CD274 alterations had poorer OS (HR: 2.330, 95% CI: 1.183-4.589; HR: 3.191, 95% CI: 1.287-7.911; HR: 3.301, 95% CI: 1.130-9.641, re spectively). As with PFS, CCR4 alterations were associ ated with better OS (HR: 0.286, 95% CI. 0.087-0.933) (Figure 4).
Figure 2. Combinations of driver gene alter ations in adult T-cell leukemia/lymphoma cells. Combination of missense single nu cleotide variant (SNV), truncation, in-frame insertion-deletions (indels), loss of het erozygosity (LOH) by copy number (CN) loss, amplification, homozygous deletion, gene fusion, and mixed, of the driver genes in the 64 adult T-cell leukemia/lymphoma (ATL) patients. “Mixed” indicates overlapped de tection of more than two types of alter ations in a gene. Color code is as follows: missense SNV, green; truncation, black; inframe indels, brown; LOH, light blue; am plification, red; homozygous deletion, blue; fusion, purple; and mixed, gray. The altered gene name is indicated on the left, and they are shown in descending order of their combined altered frequency from top to bottom. X axis indicates the frequency of combined alterations.
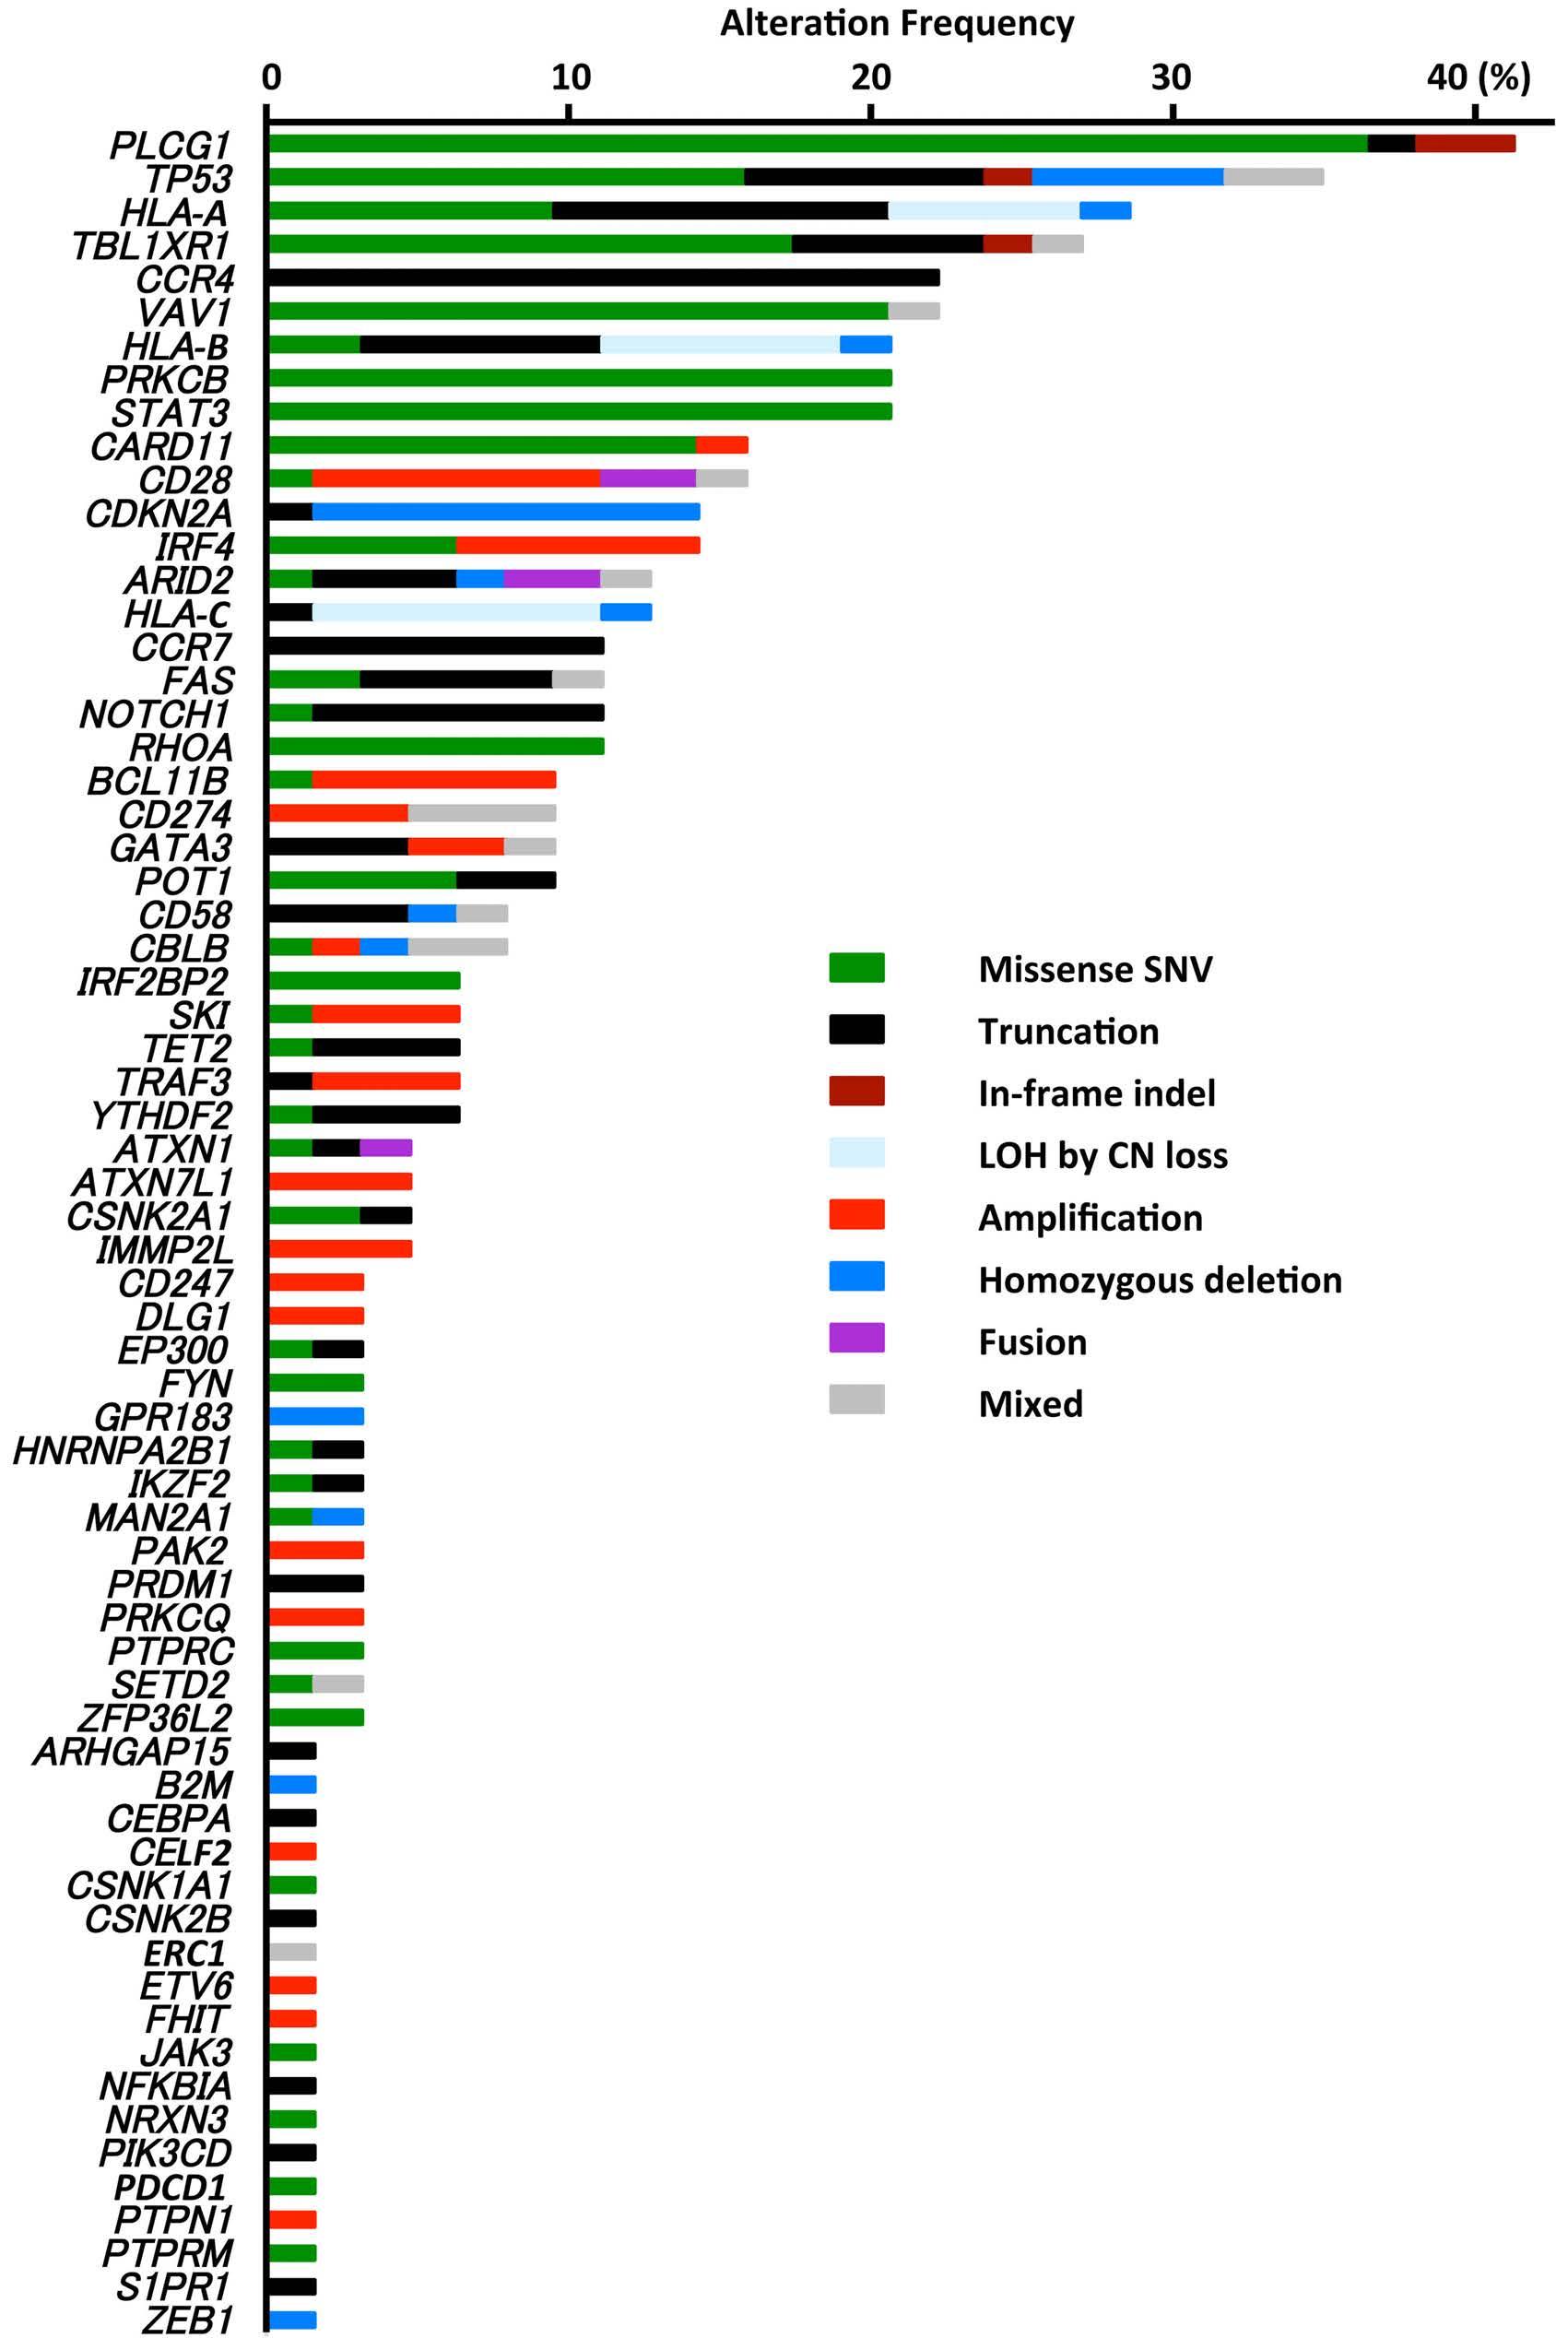
five variables: TP53, CCR4 and CD274 alterations, Eastern Cooperative Oncology Group (ECOG) PS, and serum lac tate dehydrogenase (LDH). Of these, four variables were significantly associated with PFS, namely, a worse PS (HR: 2.092, 95% CI: 1.024-4.277) and the presence of TP53 , CCR4 or CD274 alterations (HR: 2.074, 95% CI: 1.069-4.026; HR: 0.355, 95% CI: 0.127-0.991; HR: 5.846, 95% CI: 1.89018.081, respectively) (Table 1). The PFS of patients with or without TP53 , CCR4 or CD274 alterations is depicted in Figure 5A to C, respectively. Multivariate analysis of the OS of these 63 patients in cluded the six variables TP53, CCR4, CD28 and CD274 al terations, ECOG PS, and serum LDH. Of these, four were significantly associated with OS, namely, a worse PS (HR: 2.362, 95% CI: 1.078-5.175) and the presence of TP53 ,
Haematologica | 107 October 2022 2422 ARTICLE - Genomic determinants of clinical outcome in ATL N. Tanaka et al.
Multivariate analyses of progression-free and overall survival according to driver gene alterations
Multivariate analysis of PFS of the 63 ATL patients receiv ing mogamulizumab was performed using the following
KIR3DL1 allelic polymorphism and HLA-B epitopes
We classified patients into three groups, namely strong, weak, or non-interactors based on the extent of natural killer (NK) cell inhibition, according to killer cell immuno globulin-like receptor 3DL1 (KIR3DL1) and HLA-B subtyp ing.33 However, we found no significant differences in PFS or OS of patients in the strong (n=14), weak (n= 12), or non-interactor (n=38) groups (data not shown).
CCR4 or CD274 alterations (HR: 2.467, 95% CI: 1.197-5.085; HR: 0.155, 95% CI: 0.031-0.778; HR: 14.393, 95% CI: 2.43785.005, respectively) (Table 2). The OS of patients with or without TP53 , CCR4 , CD274 or CD28 alterations is de picted in Figure 5D to G, respectively.
Consensus clustering analysis using variably expressed genes across the samples (gene number =1,966 with vari ance >0.0865) revealed four transcriptome subtypes (TS)
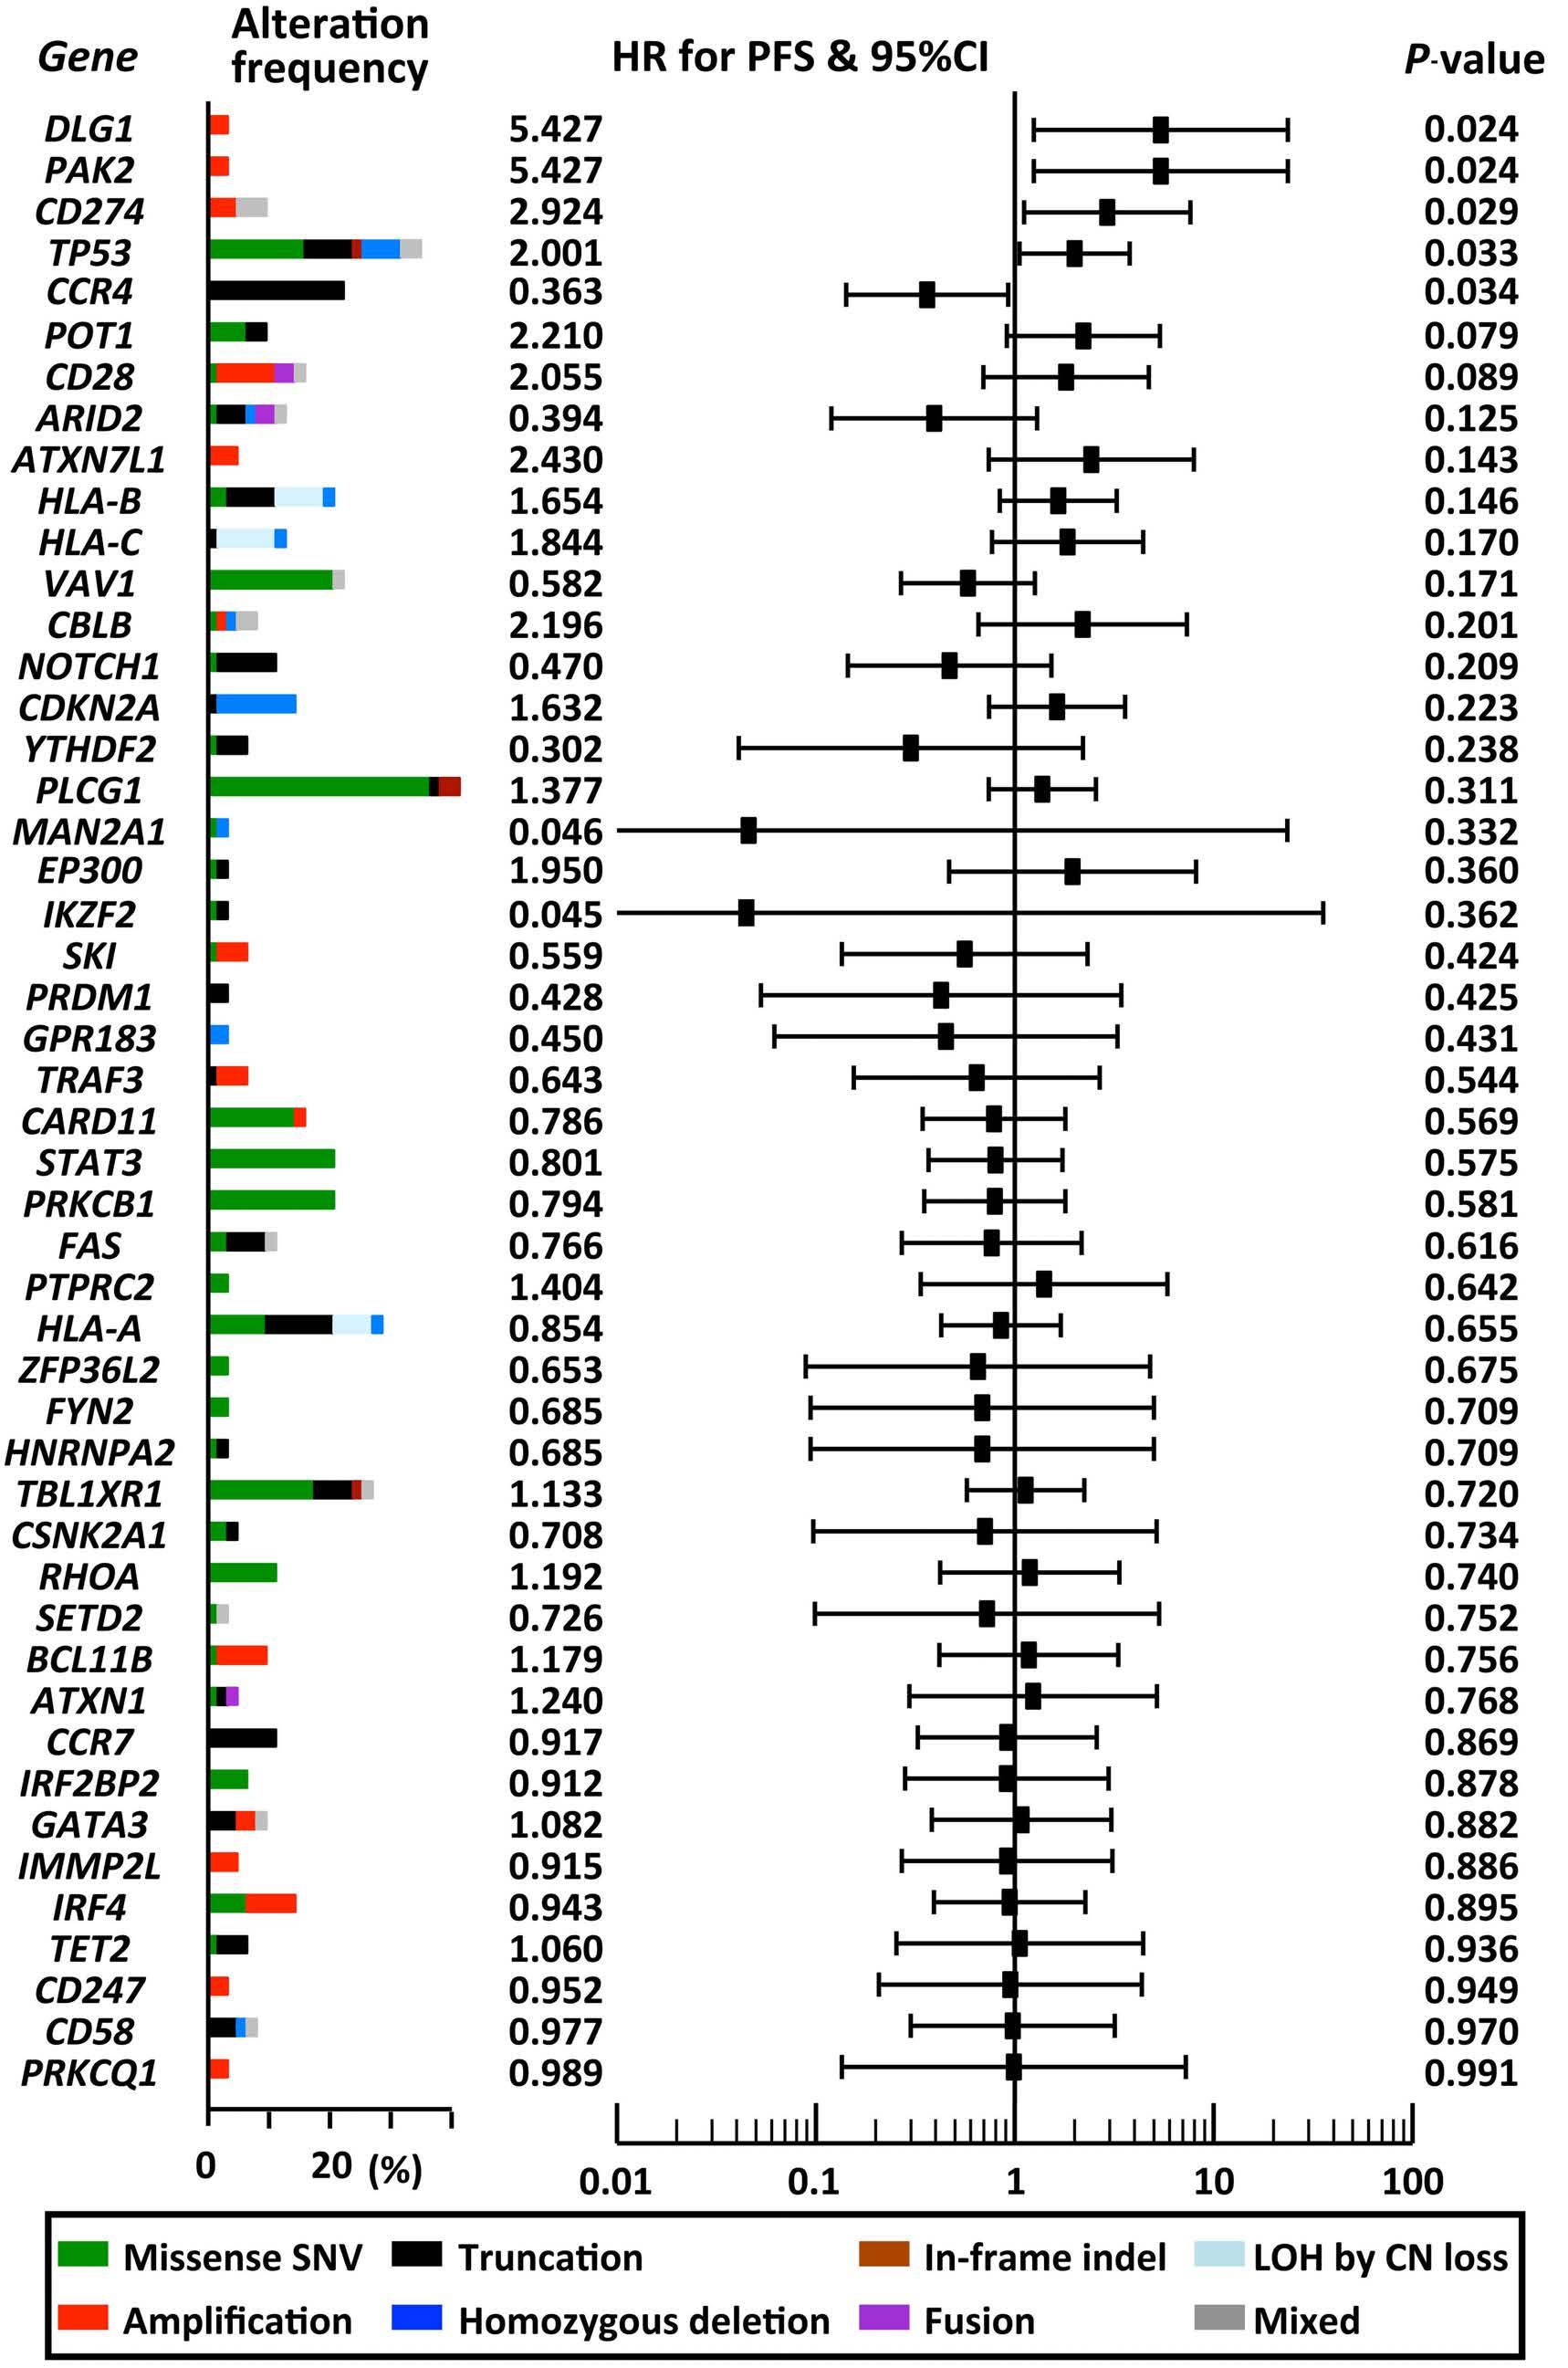
FCGR genotyping
Patients were stratified into three groups, according to FCGR3A genotype. However, also for this factor, there were no significant differences in OS between patients carrying FCGR3A 158V/V (n=5) versus FCGR3A 158V/F (n=21) or 158F/F (n=38), although the former (V/V) tended to have better PFS compared to the latter (V/F or F/F) (median PFS, 4.6 vs. 0.8 years, P=0.090) (data not shown).
Figure 3. Univariate analyses of progression-free survival according to driver gene alterations. Forest plot of hazard ratio (HR), and 95% confidence interval (CI) for progression-free survival (PFS), and P-value for patients with each driver gene alteration, obtained from univariate analysis for PFS by the Cox proportional hazards regression model. The altered gene is indicated on the left, and they are shown in ascending order of the P-value from top to bottom.
Haematologica | 107 October 2022 2423 ARTICLE - Genomic determinants of clinical outcome in ATL N. Tanaka et al.
Transcriptome subtypes of adult T-cell leukemia/lymphoma and clinical outcomes
Haematologica | 107 October 2022 2424 ARTICLE - Genomic determinants of clinical outcome in ATL N. Tanaka et al.
labeled A, B, C and D, which were distinguished by five gene modules (Figure 6A). TS-A was characterized by low tumor cell content and by the expression of “dendritic cell maturation”, “Triggering Receptor Expressed on Myeloid cells 1 (TREM1) signaling” and “neuroinflammation signal ing pathway” members. The genes of the “Th1 and Th2 ac tivation pathway” and “T-cell receptor signaling” were highly expressed in TS-B. TS-C was a cluster derived from lymph node samples, which prominently expressed “he patic fibrosis/hepatic stellate cell activation” genes. Ex pression of “IL-23 signaling pathway” and “TP53 signaling” genes were enriched in TS-D samples. Although clinical responses to mogamulizumab were not associated with these TS (data not shown), OS of patients with TS-D was significantly worse than of those with TSA (median OS, 0.9 years vs. 5.1 years, P=0.040) (Figure 6B), or the pooled TS-A, -B, and -C groups (median OS, 2.1
HLA-A, -B, -C, -DPB1, -DQB1 and -DRB1 genotypes were analyzed if carried by more than three patients, but no as sociations were found between any of the HLA genotypes and clinical responses to mogamulizumab (CR vs. non-CR). Nonetheless, of nine HLA-A genotypes, patients with HLAA*26:03 had a worse OS (HR: 2.926, 95% CI: 1.001-8.552)
years) (Figure 6C). We analyzed the association between TS and 30 driver gene alterations (presence or absence) found in more than three patients. Of these, TBL1XR1 al terations were not associated with TS-A, STAT3 alterations were associated with TS-D, and SKI and TRAF3 alterations were associated with TS-C (Online Supplementary Table S5). The other 26 gene alterations showed no positive or negative associations with TS (P≥0.050).
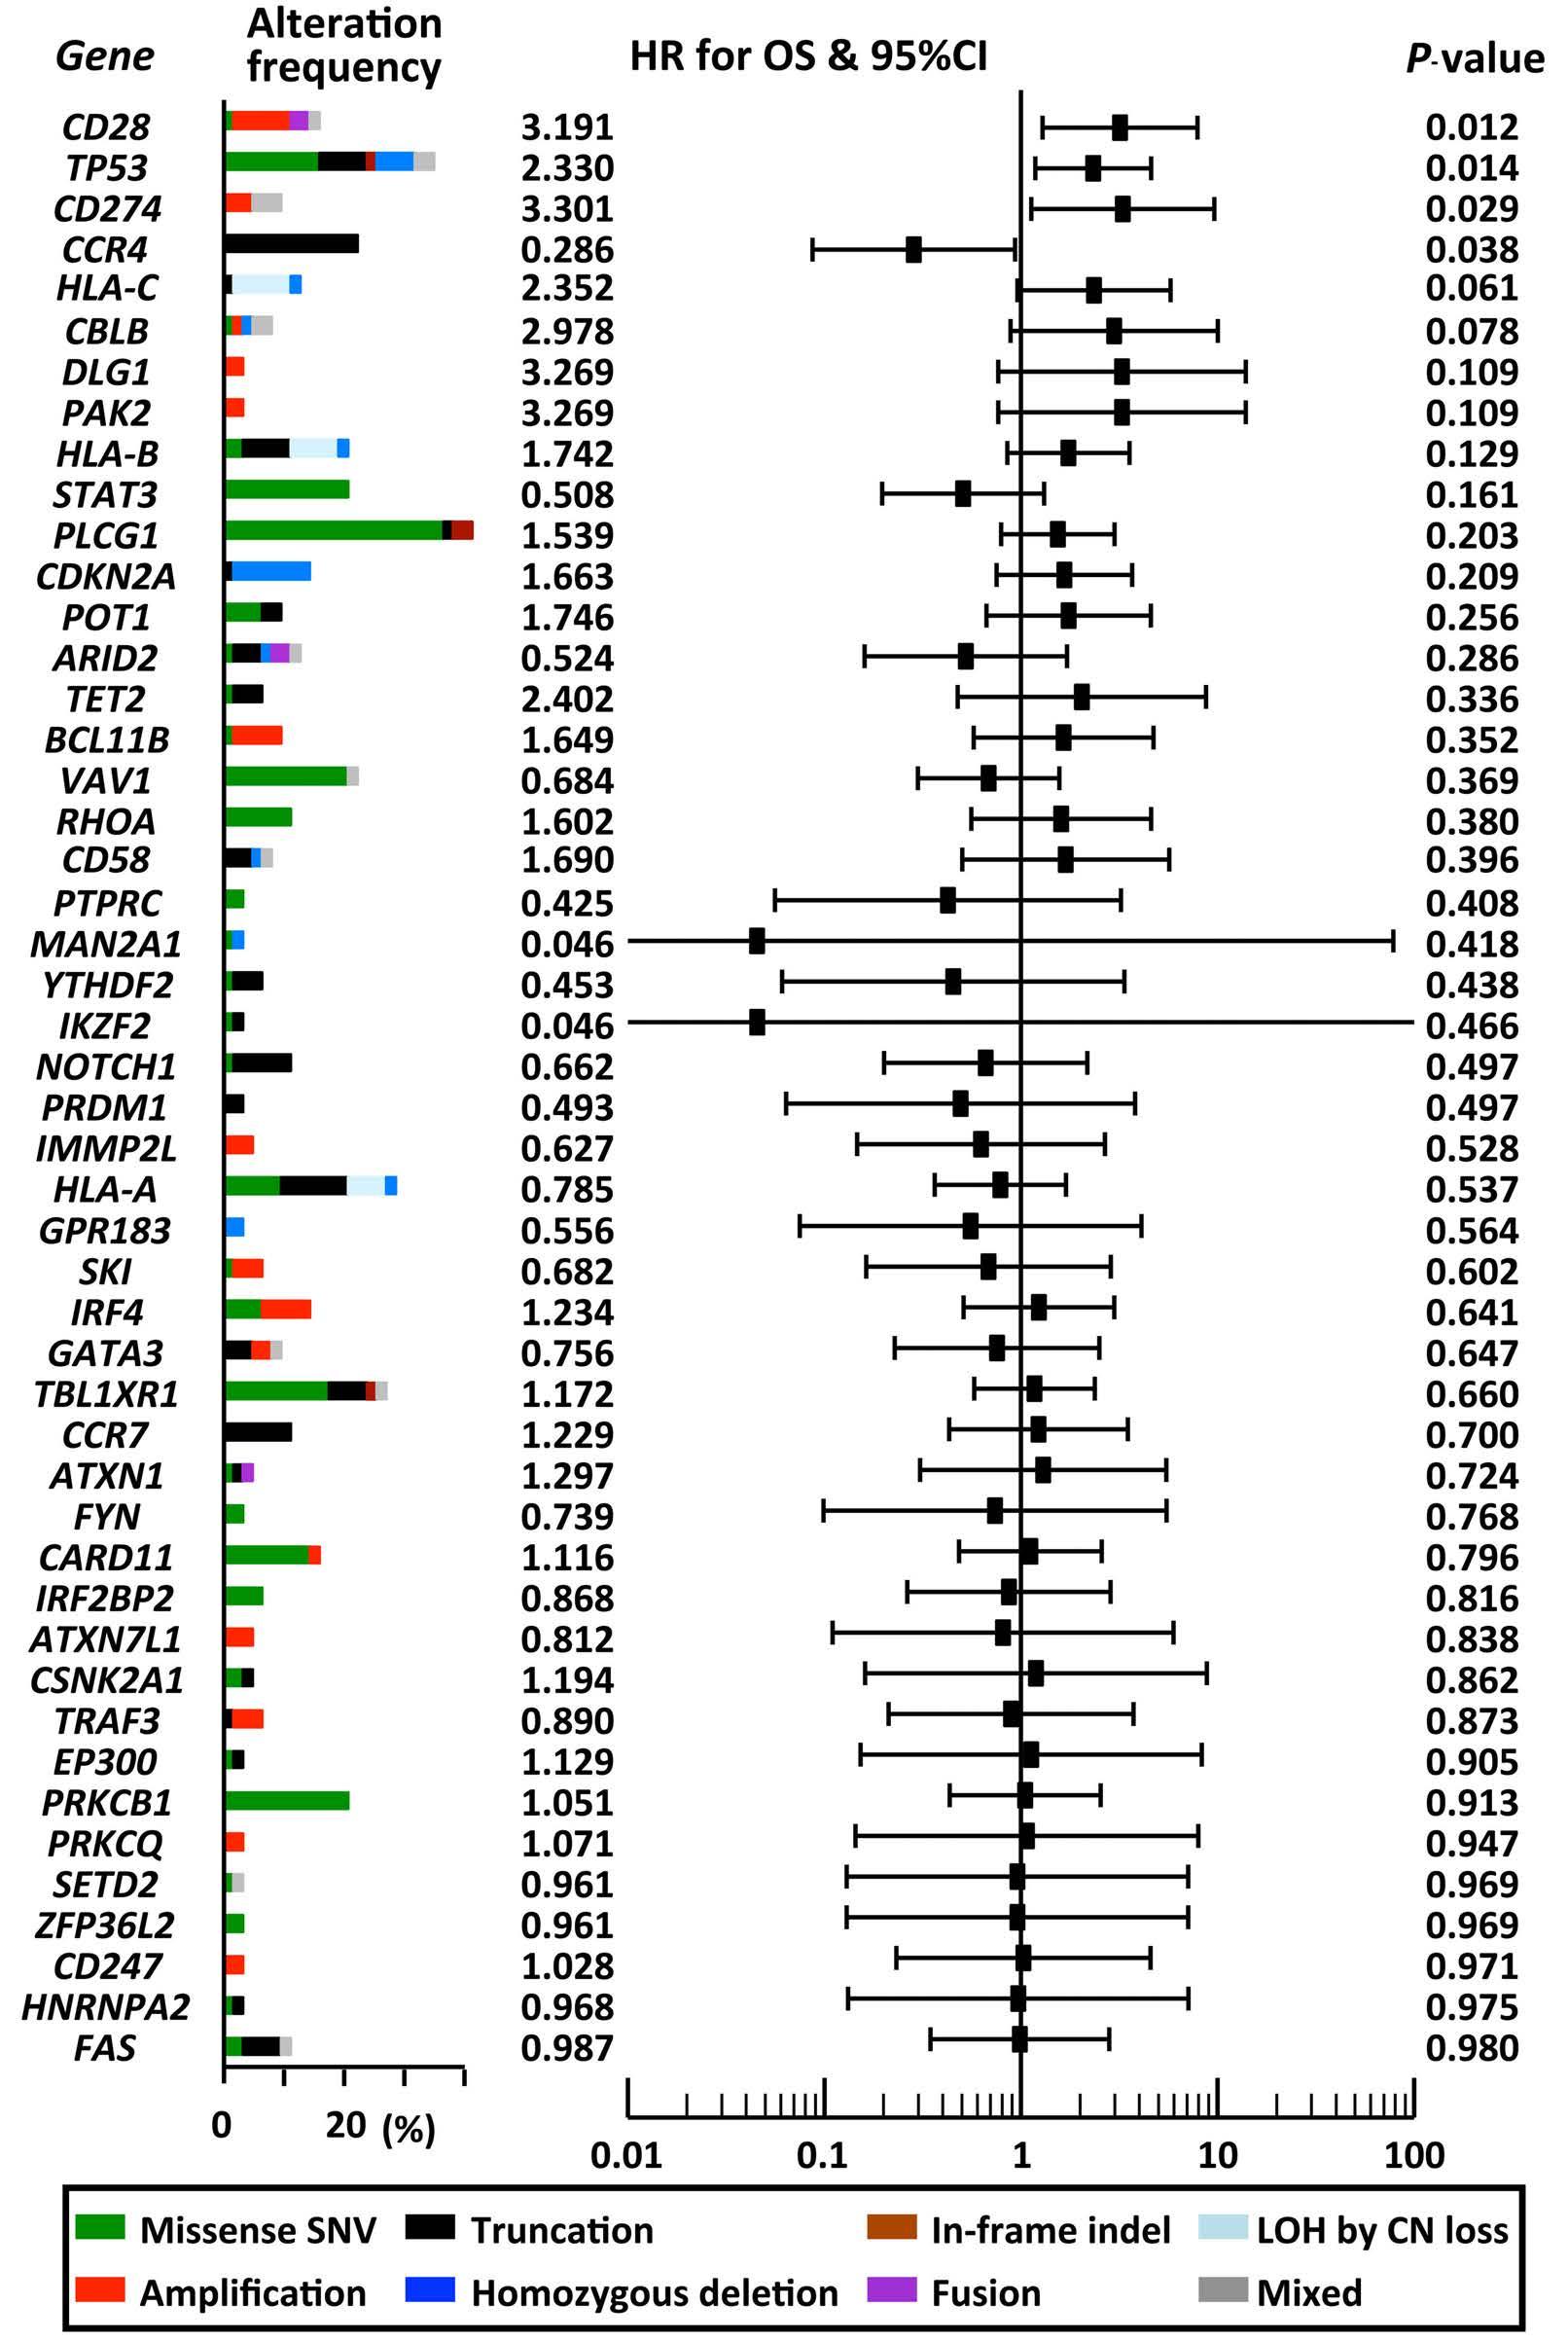
HLA genotypes, somatic alterations, and clinical outcomes
Figure 4. Univariate analyses of overall survival according to driver gene alterations. Forest plot of hazard ratio (HR) and 95% confidence interval (CI) for overall survival (OS) of patients with each driver gene alteration obtained from uni variate analysis for OS by the Cox propor tional hazards regression model. The altered gene is indicated on the left, and they are shown in ascending order of the P-value from top to bottom.
ECOG PS 0, 1 2, 3, 4 1647 2,0921,000 1.024-4.277 Reference0,043
ECOG PS 0, 1 2, 3, 4 1647 2,3621,000 1.078-5.175 Reference0,032
Table 1. Multivariate analysis including the gene alterations for progression-free survival in patients with adult T-cell leukemia/lymphoma.
CD274presenceabsencealterations 576 14,3931,000 2.437-85.005 Reference0,003
Variables N of patients HR 95% CI P-value
CI: confidence interval; HR: hazard ratio; ECOG PS: Eastern Cooperative oncology Group performance status; LDH: lactate dehydrogenase; ULN: upper limit of normal.
CD28presenceabsencealterations 1053 1,9411,000 0.648-5.813 Reference0,236
et al.
HLA-A, -B, -C, and -DPB1 genotypes, as well as the nine HLA-DQB1 and 13 HLA-DRB1 genotypes, were not associ ated with OS (P >0.050) (data not shown). HLA-A, -B, -C somatic alterations did not have any significant impact on PFS (Figure 3) or OS (Figure 4). A B2M gene somatic alter ation was observed in only one patient (Figure 2).
CD274absencealterationspresence 576 5,8461,000 1.890-18.081 Reference0,002
LDH<ULN>ULN 4221 1,7731,000 0.842-3.733 Reference0,131
TP53presenceabsencealterations 2241 2,4671,000 1.197-5.085 Reference0,014
and of eight HLA-B genotypes, those with HLA-B*40:02 had a worse OS (HR: 2.582, 95% CI: 1.246-5.348). Of eight HLA-C genotypes, a worse OS was associated with HLAC*03:04 (HR: 2.381, 95% CI: 1.222-4.638) and of seven HLADPB1 genotypes, patients with HLA-DPB1*05:01 had a better OS (HR: 0.458, 95% CI: 0.226-0.927). All the other
Table 2. Multivariate analysis including the gene alterations for overall survival in patients with adult T-cell leukemia/lymphoma.
Variables N of patients HR 95% CI P-value
CCR4presenceabsencealterations 1449 0,1551,000 0.031-0.778 Reference0,024
Reference0,031
LDH<ULN>ULN 4221 1,4401,000 0.600-3.456 Reference0,415
CI: confidence interval; HR: hazard ratio; ECOG PS: Eastern Cooperative Oncology Group performance status; LDH: lactate dehydrogenase; ULN: upper limit of normal.
ARTICLE - Genomic determinants of clinical outcome in ATL N. Tanaka
TP53presenceabsencealterations 2241 2,0741,000 1.069-4.026
CCR4presenceabsencealterations 1449 0,3551,000 0.127-0.991 Reference0,048
Haematologica | 107 October 2022 2425
A B C D E F G Haematologica | 107 October 2022 2426 ARTICLE - Genomic determinants of clinical outcome in ATL N. Tanaka et al.
This is the first integrated molecular analysis including exome sequencing, copy number variation assessment and RNA sequencing to evaluate genomic influences on clinical outcomes of mogamulizumab-naïve ATL patients receiving mogamulizumab-containing treatment. The critical inclusion criteria of the study were that patients had to be mogamulizumab-naïve, with no history of al
The frequency and types of alterations of the driver genes in ATL cells in the current cohort are almost identical to those in an earlier study.13 For example, PLCG1 (41%), TP53
Next, we performed multivariate analysis of factors in fluencing OS in the 64 ATL patients using the following six variables: HLA-A*26:03 (+ or -), HLA-B*40:02 (+ or -), HLA-C*03:04 (+ or -), HLA-DPB1*05:01 (+ or -), ECOG PS (0, 1 vs. 2-4) and serum LDH (> ULN vs. < ULN). Of these, two variables significantly affected OS, namely, the pres ence of HLA-DPB1*05:01 (HR: 0.409, 95% CI: 0.182-0.921), and a worse PS (HR: 2.454, 95% CI: 1.044-5.769) (Online Supplementary Table S6).
Discussion
logeneic HSCT. Although the present study included both previously-treated and untreated patients, there were no significant differences of PFS or OS between these two populations. In addition, the present study included pa tients who received mogamulizumab monotherapy or combination therapy, but there were also no significant differences of PFS or OS between these. These data are consistent with findings from our prospective clinical study of mogamulizumab-naïve ATL patients (the MIMOGA study, clinicaltrials go. Identifier: UMIN000008696).12 Ac cordingly, because the heterogeneity of these patients did not directly associate with PFS or OS, the cohort is con sidered appropriate for achieving the aim of the present study. The observed PFS or OS according to clinical re sponse to mogamulizumab-containing treatment (CR, PR, SD, or PD) thus indicates that this response directly in fluenced survival outcomes for these patients.
Figure 5. Survival of adult T-cell leukemia/lymphoma patients according to driver gene alterations. Progression-free survival (PFS) of adult T-cell leukemia/lymphoma (ATL) patients with and without (A) TP53 alterations, (B) CCR4 alterations, (C) CD274 alterations. OS of ATL patients with and without (D) TP53 al terations, (E) CCR4 alterations, (F) CD274 alterations, (G) CD28 alterations.
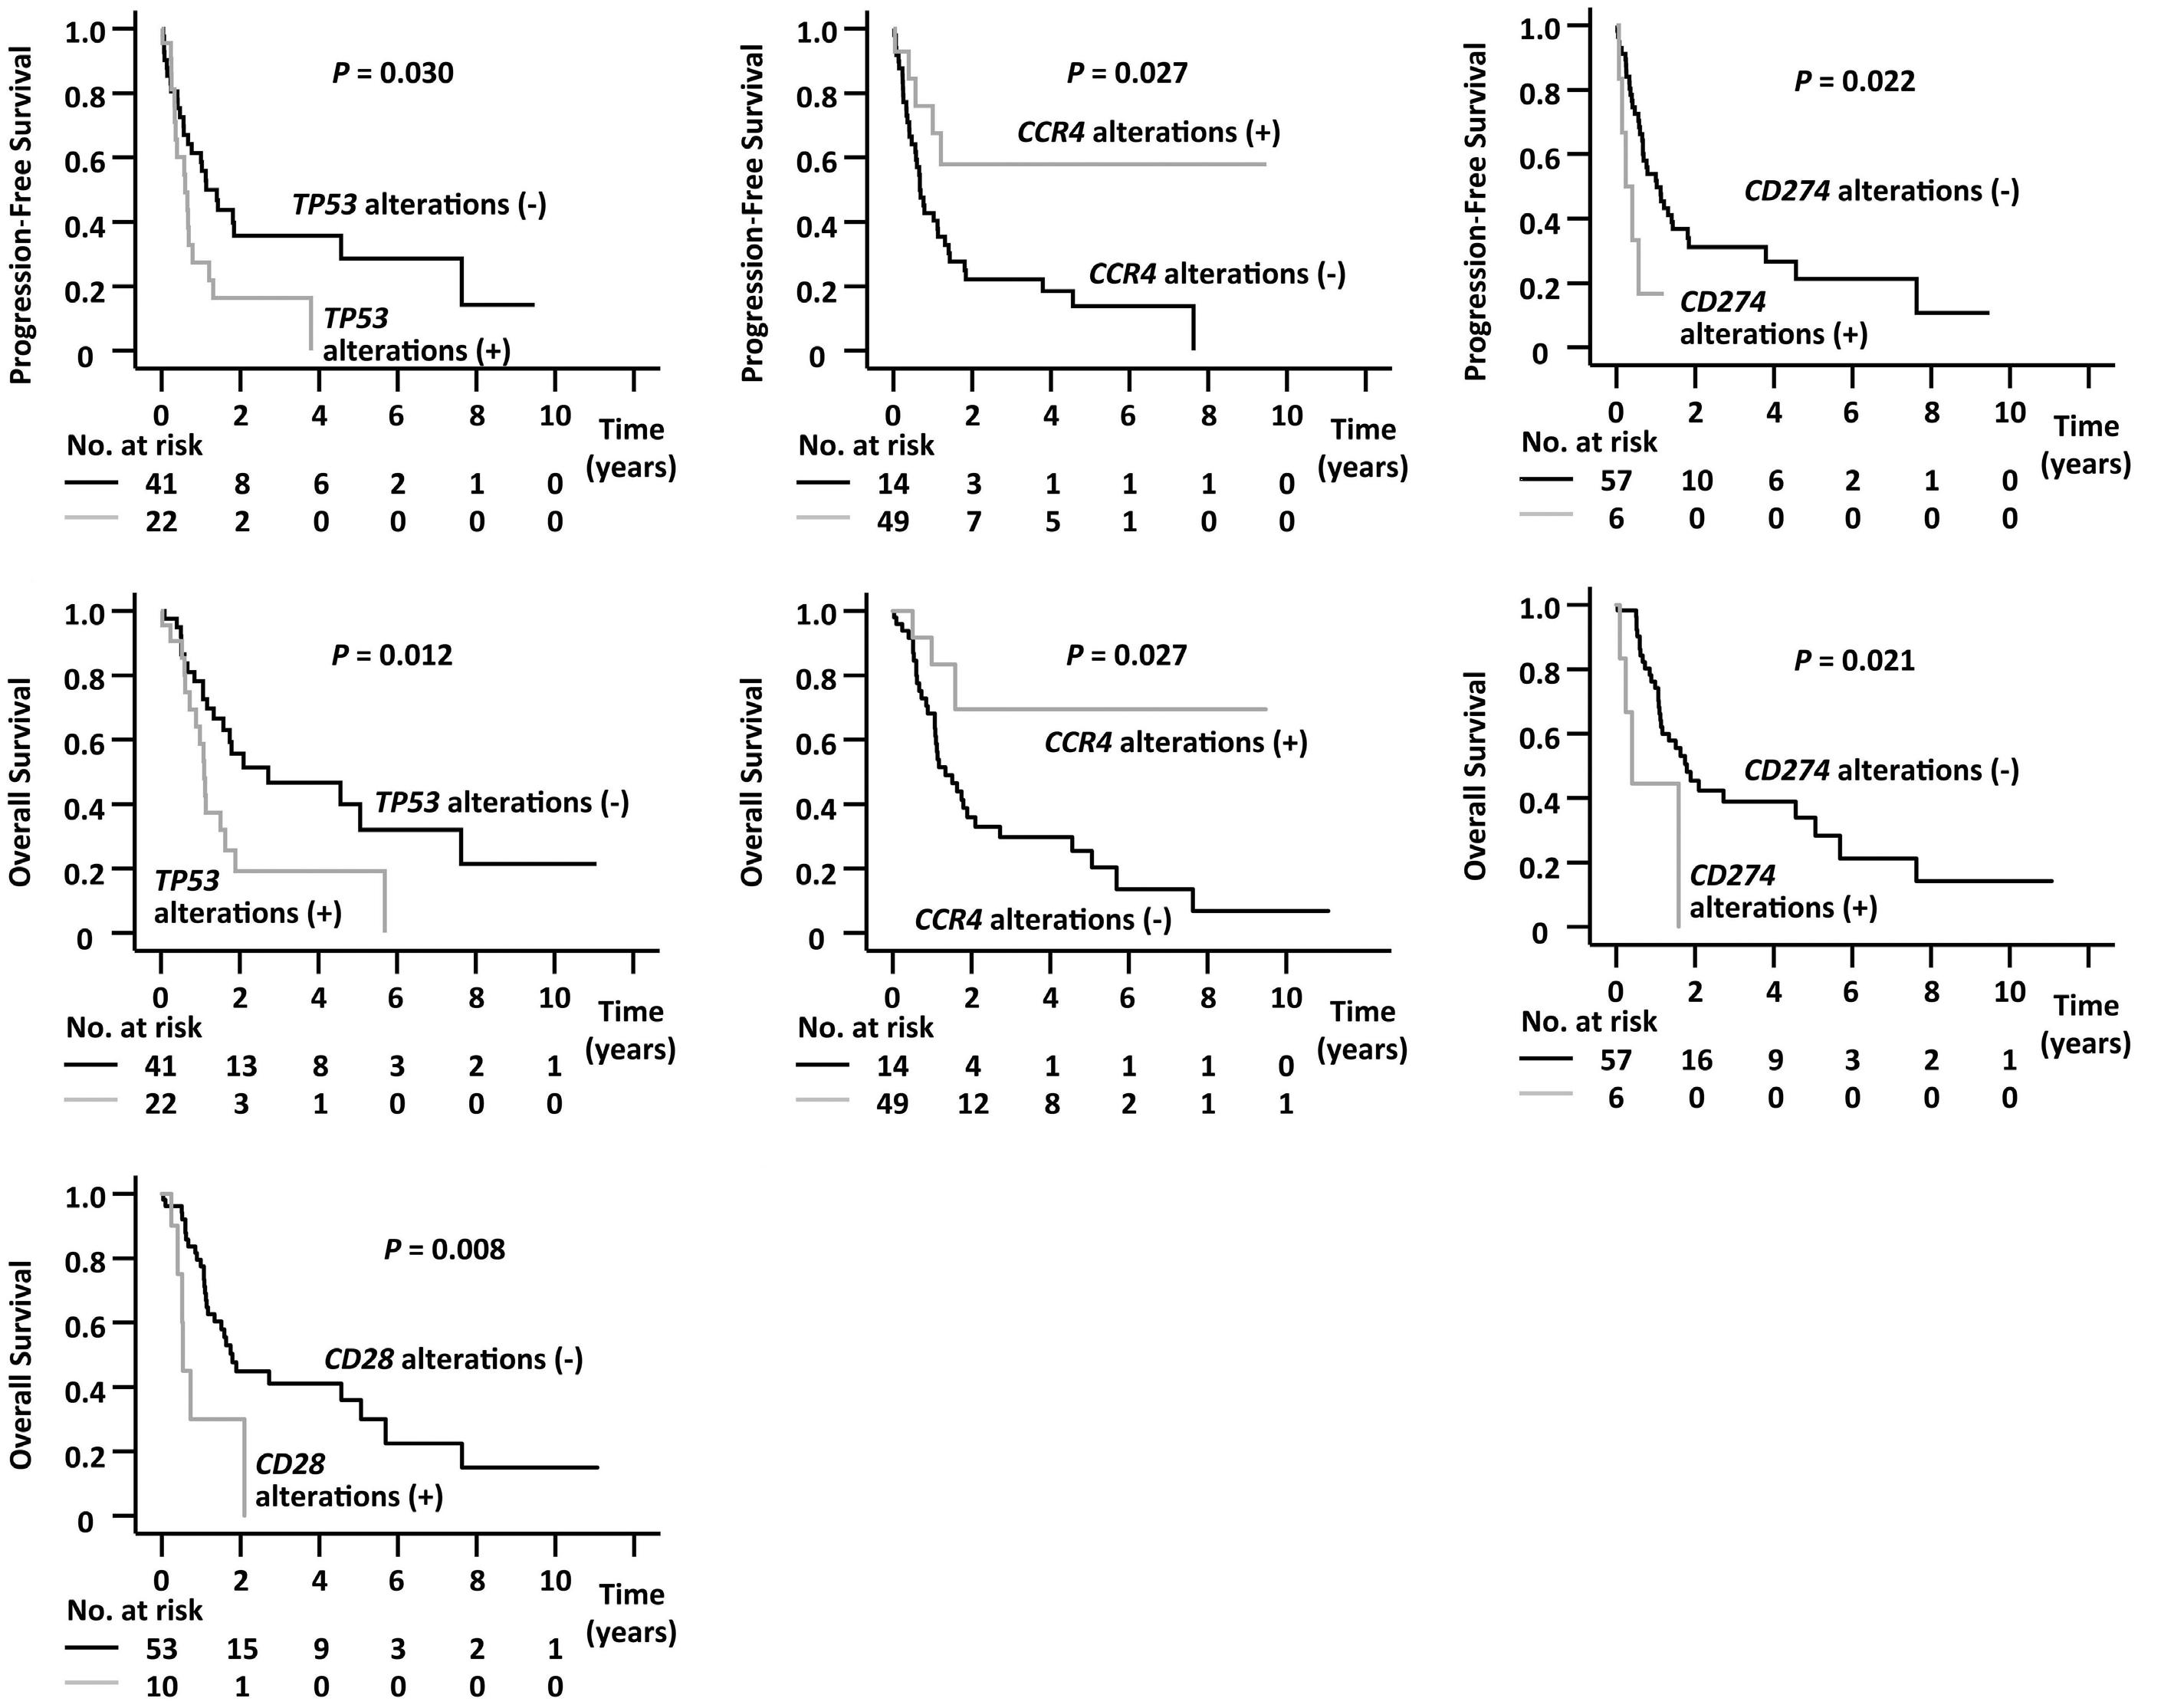
With respect to CD274, it was also reported that the am plification of this gene was an unfavorable prognostic fac tor in ATL, although the treatments received by patients in that study were different from the present study.36 The mechanism responsible for this may be that higher ex pression of CD274 by ATL cells results in the suppression of anti-tumor cytotoxic T lymphocytes (CTL) via enhanced CD274/PD-1 signaling.41 Thus, in general, higher expression of CD274 by gene amplification or structural variants seems to lead to ATL cells’ escape from host immune at tack by CTL, and thus to their survival advantage.24 These observations indicate the importance of the immune sys tem for clinical outcome in ATL, as previously re ported.12,42,43 However, we must take special note of the fact that rapid progression of ATL after CD274/PD-1 block ade has also been seen.44 In this context, a close relation ship between regulatory T (Treg) cells and ATL cells has been reported, and also that blockade of CD274/PD-1 sig naling leads to the activation and proliferation of PD-1positive Treg cells.45-48 Collectively, these data indicate that higher expression of CD274 in ATL cells might theor etically result in suppression of the activation or prolifer ation of PD-1-positive ATL cells themselves via enhanced CD274/PD-1 signaling between them. However, in fact, CD274 alterations leading to higher expression of the CD274 protein were significantly associated with worse PFS and OS in patients receiving mogamulizumab in the present study. These findings indicate that CD274/PD-1 signaling in ATL cells is very important, and we are there fore currently conducting further detailed investigations. With respect to the patients´ HLA genotypes or genetic polymorphisms, those with HLA-DPB1*05:01 had better OS in the present study. The biological mechanisms respon sible for this are unknown. Mogamulizumab mediates ADCC, but not complement-dependent cytotoxicity or di rect antitumor activities.7,8 In this context, NK cells are
presence of the ligand, and hence to an increased avail ability of target molecules for mogamulizumab.13,38 Thus far, a number of successful therapies targeting products of altered critical genes in cancer have been developed, such as those targeting bcr-abl fusion products in chronic myelogenous leukemia, mutated epidermal growth factor receptor in non-small-cell lung cancer (NSCLC), EML4-ALK fusion in NSCLC, or BRAF mutations in melanoma.40 In this context, based on the results presented here, mogamul izumab for patients with CCR4-altered ATL could repre sent a new addition to this group of successful targeted treatments. In addition, CCR7 is a seven-transmembrane G-protein-coupled chemokine receptor, alterations of which were associated with fewer CR, the opposite of CCR4 alterations. CCR7 and CCR4 alterations seem to be mutually exclusive in the present ATL cohort. The reasons for these paradoxical findings are unclear, and further in vestigations are warranted.
Haematologica | 107 October 2022 2427 ARTICLE - Genomic determinants of clinical outcome in ATL N. Tanaka et al.
(35%), HLA-A (29%), TBL1XR1 (27%), CCR4 (22%), VAV1 (22%), HLA-B (21%), PRKCB (21%), STAT3 (21%), CARD11 (16%), and CD28 (16%) were the 11 most frequently altered genes in the present study. Of these, eight genes other than HLA-A, HLA-B, and CD28 comprised the top eight most frequent genes with SNV/indels in the earlier study.13 It should also be noted that these alterations in ATL are similar to those in Sezary Syndrome, which is another ma ture CD4 T-cell neoplasm. It was reported that the six most frequently altered genes with SNV/indels in Sezary Syndrome are TP53 (24%), PLCG1 (18%), CARD11 (15%), ARID1A (10%), FAS (10%), and CCR4 (7%).34 Thus, four of these six (but not ARID1A and FAS) are included in the top 11 genes in the present ATL study. Together with the fact that the Food and Drug Administration and European Medicines Agenecy approved mogamulizumab for the treatment of patients with Sézary Syndrome in 2018, these genomic similarities are important for the estab lishment of appropriate therapeutic strategies for these difficult-to-treat diseases.
In the present study, TP53, CCR4, and CD274 alterations in addition to worse PS were independent and significant prognostic factors not only for PFS, but also for OS. Among them, worse PS is a generally accepted unfavor able prognostic factor already established by retrospec tive studies of ATL patients who did not receive mogamulizumab-containing treatment.35 In addition, our prospective study of mogamulizumab therapy also sup ports this finding.12 With respect to TP53, the most com monly altered gene in human cancer, an earlier study of ATL reported that SNV/indels and CNV of this gene were detected in 18% and 23% of patients, respectively.13 Al though the earlier study reported that neither SNV/indels nor CNV of the TP53 gene had prognostic impact on the OS of ATL patients, in that study, the majority of patients did not receive mogamulizumab-containing treatment.36 Therefore, this difference of the impact of TP53 alterations between the two studies may be due to differences in the treatment the patients received. On the other hand, the current adverse impact of TP53 alterations is consistent with our previous report.37 The establishment of alter native treatment strategies other than or in addition to mogamulizumab, which can overcome the refractoriness caused by TP53 alterations in ATL, is warranted. With respect to CCR4, alterations in 25-30% of patients with ATL were reported previously.13,38,39 Importantly, their association with superior outcomes of mogamulizumabcontaining treatment was also previously reported, and the present study is consistent with those findings.39 In addition, a higher CR rate in patients with CCR4 alterations was also observed in the present study. These findings are likely due to the fact that mutations in the C-terminus lead to impaired CCR4 internalization upon ligand binding, resulting in its increased surface expression even in the
influences the binding affinity of the FcγRIIIa on NK cells to the Fc portion of antibody, it is associated with the magnitude of ADCC.49 Nonetheless, the FCGR3A genotype was not found to be associated with PFS or OS in the present study. This finding might be consistent with an
considered to be the main effector cells of mogamulizu mab-induced ADCC. However, KIR3DL1 allelic polymor phism and HLA-B epitopes, which are associated with NK cell responses, were not associated with PFS or OS in the present study.33 In addition, because the FCGR3A genotype
Figure 6. Transcriptome subtypes and overall survival. (A) Heatmap of gene expression used for clustering analysis is shown with color code for clinical information (clinical response to mogamulizumab, clinical subtype, sample type) and heatmap for tumor contents in the sample. Consensus clustering identified four transcriptional subtypes (A, B, C and D) in the cohort. Rep resentative gene ontology annotations, identified by Ingenuity Pathway Analysis, for gene modules are shown on the right. (B) Overall survival (OS) of all adult T-cell leukemia/lymphoma (ATL) patients enrolled in the study, stratified according to transcrip tional subgroups. (C) OS of all ATL patients in transcriptional subgroup D compared to pooled TS-A, -B, and -C groups.
BA C Haematologica | 107 October 2022 2428 ARTICLE - Genomic determinants of clinical outcome in ATL N. Tanaka et al.
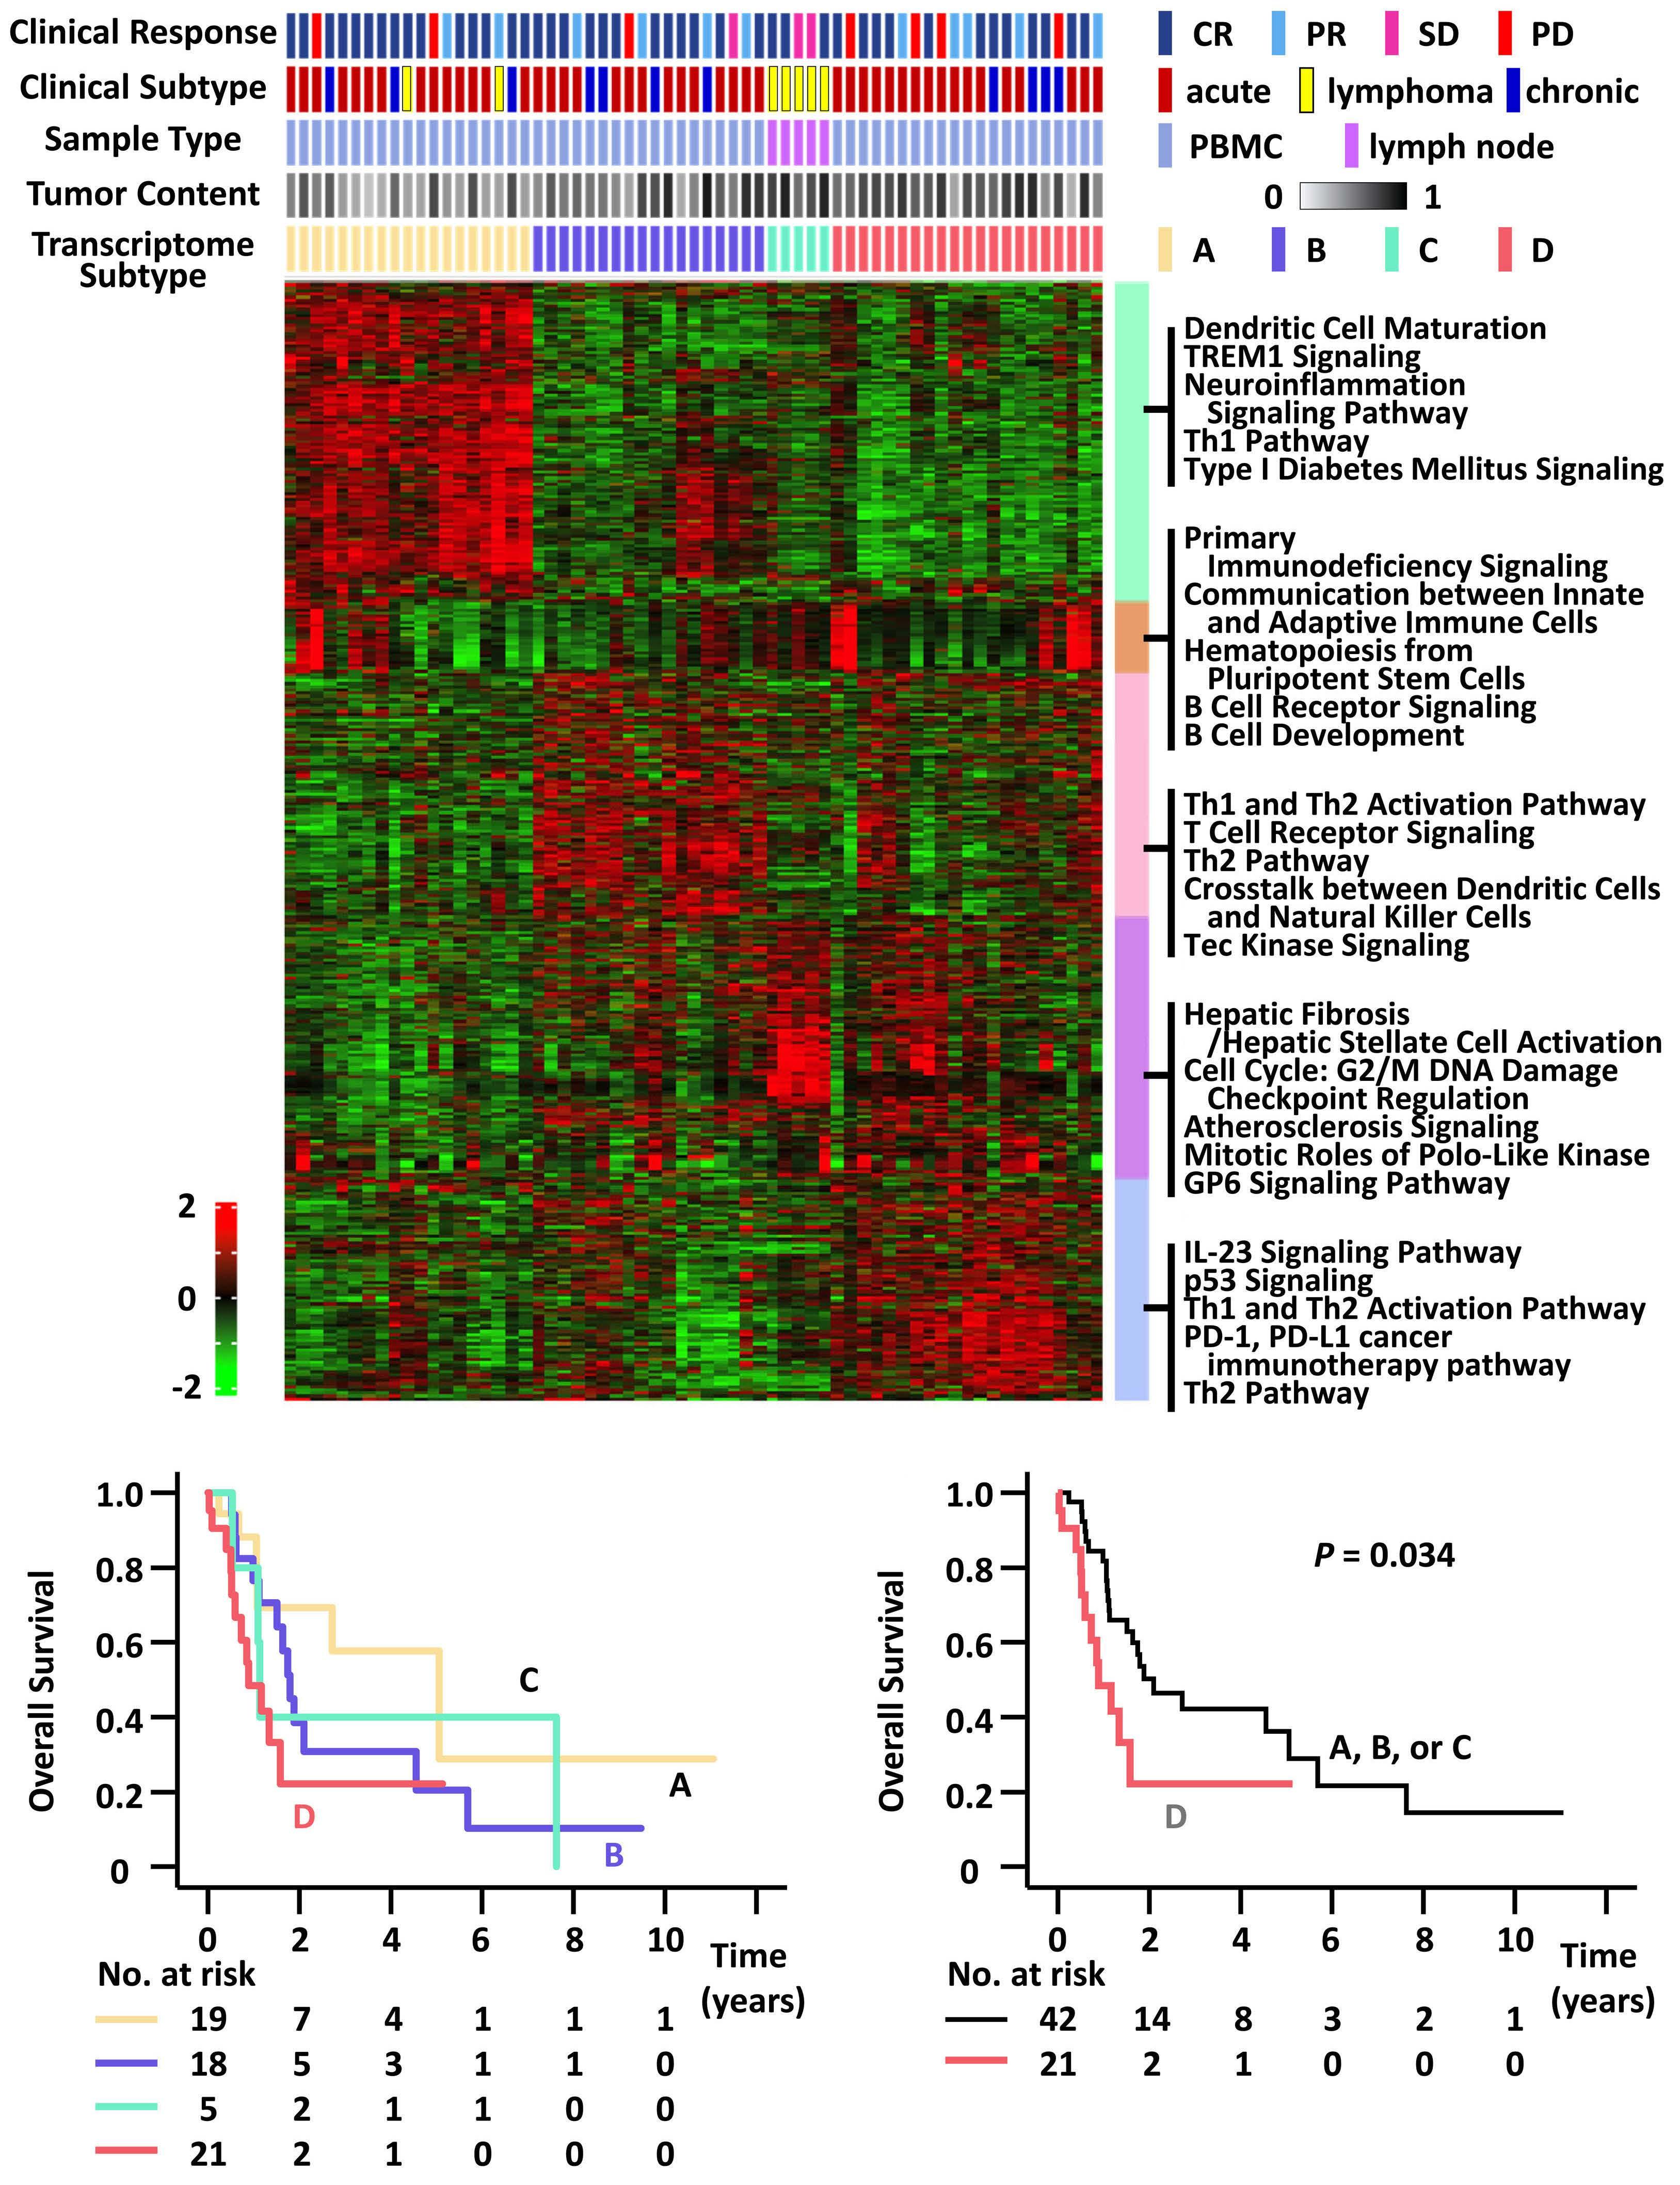
Incyte. MH received honoraria from Chugai, and consulting fee from Symbio. KN received research funding from Chugai, Kyowa Kirin, and honoraria from Meiji Seika, Celgene, Eisai, Novartis and Consultant or advisory role from Kyowa Kirin.MY received honoraria from Novartis, Takeda, and consulting fee from Takeda. YI received honoraria from Bristol-Myers, Celgene, CHUGAI, Eisai, Kyowa Kirin, Meiji Seika, Nippon Shinyaku, Sanofi, SymBio, Sumitomo Dainippon. SI received honoraria and reserch grants from Janssen, Sanofi, Takeda, Ono, Celgene and Daiichi-Sankyo, also received research grants from Bristol-Myers, Abbvie, Glaxo-Smithklein, Chugai and Kyowa Kirin. AU has received honoraria from Kyowa Kirin, Daiichi-Sankyo, Bristol-Myers, Celgene, and has received consulting fees from HUYA Japan, JIMRO, Meiji Seika and Otsuka Medical Devices. HN received research funding and honoraria from Ono, Bristol-Myers, MSD, Chugai, and research funding from Taiho, Daiichi-Sankyo, Kyowa Kirin, Zenyaku, Oncolys BioPharma, Debiopharma, Asahi-Kasei, Sysmex, Fujifilm, SRL, Astellas, Sumitomo Dainippon and BD Japan outside of this study. RU received research funding from Kyowa Kirin, Chugai Pharmaceutical, and Ono. All other authors have no conflicts of interest to disclose.
Contributions
SM, TN, HN, RU and TI developed the concept and design of the research; NT, SM, KK, YO, OG, SK, NN, YS, AI, IC, OM, MH, KN, MY, YI, SI, AU and TI acquired and analyzed data; NT, SM, KK, YO and TI interpreted data. All authors wrote and approved the final version of the manuscript.
Funding
study, ATL were divided into four transcrip tome subtypes. Patients with TS-D had a signi fi cantly worse prognosis than those in the other groups. Together with the present observations on somatic alterations, this is consistent with the findings that “TP53 signaling” and the “CD274/PD-1 cancer immunotherapy pathway” were enriched in TS-D. However, significant associations be tween TP53 alterations and TS-D or CD274 alterations and TS-D were not observed here. Again, more extensive in vestigations in larger patient cohorts are warranted in order to understand the clinical significance of TS in ATL. Although the present investigation offers significant ob servations regarding genomic biomarkers predicting clini cal outcomes of ATL patients on mogamulizumabcontaining treatment, some limitations of the study should be recognized. First, the number of patients en rolled was relatively low. Second, the study included both previously untreated and treated patients, and after en rollment, some patients received mogamulizumab mono therapy, whereas others received different combination therapies. Finally, the present exome-sequencing strategy required the patients’ own enriched non-tumor cells, which were in many cases their PBMC after treatment, as the reference. Thus, patients whose clinical responses to mogamulizumab-containing treatment were good, might be more likely to be enrolled in the study, even though the sensitivity of ATL disease to mogamulizumab was ex tremely good for ATL cells in the blood, compared to other disease sites.9,10 All of these considerations could affect the conclusions of the present study. In conclusion, the present integrated genomic analyses identified somatic alterations in ATL cells which influence the clinical outcome of patients treated with mogamul izumab. TP53 and CD274 alterations were independently and significantly associated with worse OS, and CCR4 al terations with better OS. The present study contributes to the establishment of precision medicine for patients with ATL. On the basis of these results, further genomic analyses in much larger cohorts are warranted.
The authors thank Professor Yusuke Nakamura for his helpful discussions, and Dr. Kentaro Yonekura, Dr. Tatsuro Jo, Dr. Hidenori Sasaki, Dr. Yukiyoshi Moriuchi, Dr. Masao Ogata, Dr. Hiro Tatetsu, Professor Kenji Ishitsuka, and Pro fessor Yasushi Miyazaki for their contributions to the MI MOGA study. The authors are grateful to Sayuri Amino, Noriko Yaguchi, Tomoko Kaneyasu, Miku Abe, Rika Nishiko, Mayuko Kosugi, and Chiori Fukuyama for their excellent technical assistance, and Minako Hoshida and Naomi Ochiai for their administrative assistance. The authors also thank the Japan Institute of Statistical Technology (Tokyo, Japan) for their critical review of the statistical analyses, and for providing a certificate attesting the validity of the statistical methods used for the data analyses in the pres ent manuscript.
This study was performed as a research program of AMED P-CREATE under the grant numbers of JP16cm0106301, JP17cm0106301, JP18cm0106301, JP19cm0106301, JP20cm0106301, and JP21cm0106301 (2016–2021).
earlier report that defucosylated antibodies mediate strong ADCC regardless of FCGR3A genotype.50 In any case, more detailed investigations of larger patient co horts are needed to identify the germline characteristics determining the clinical outcome of mogamulizumab Intreatment.thepresent
Disclosures
Acknowledgements
SK received research funding from Chugai, DaiichiSankyo, and honoraria from Chugai, Kyowa Kirin. NN received honoraria from Novartis, Takeda, Chugai, Celgene, Otsuka, Nippon Shinyaku, Kyowa Kirin, AsahiKasei, and consulting fee from JIMRO. YS received research funding from Chugai, Novartis, Bayer, Eisai, Ono, Otsuka, Pfizer, Amgen, Daiichi Sankyo, Celgene, and
Haematologica | 107 October 2022 2429 ARTICLE - Genomic determinants of clinical outcome in ATL N. Tanaka et al.
7. Ishida T, Iida S, Akatsuka Y, et al. The CC chemokine receptor 4 as a novel specific molecular target for immunotherapy in adult T-Cell leukemia/lymphoma. Clin Cancer Res. 2004;10(22):7529-7539.
31. Tsukasaki K, Utsunomiya A, Fukuda H, et al. VCAP-AMP-VECP compared with biweekly CHOP for adult T-cell leukemialymphoma: Japan Clinical Oncology Group Study JCOG9801. J Clin Oncol. 2007;25(34):5458-5464.
Dr. Takashi Ishida takes responsibility for the exome and RNA-sequencing data in the above manuscript, the data will
30. Wilkerson MD, Hayes DN. ConsensusClusterPlus: a class discovery tool with confidence assessments and item tracking. Bioinformatics. 2010;26(12):1572-1573.
18. McKenna A, Hanna M, Banks E, et al. The Genome Analysis Toolkit: a MapReduce framework for analyzing next-generation DNA sequencing data. Genome Res. 2010;20(9):1297-1303.
22. McPherson A, Hormozdiari F, Zayed A, et al. deFuse: an algorithm for gene fusion discovery in tumor RNA-Seq data. PLoS Comput Biol. 2011;7(5):e1001138.
be available on reasonable request by contacting him by email.
6. Ishida T, Utsunomiya A, Iida S, et al. Clinical significance of CCR4 expression in adult T-cell leukemia/lymphoma: its close association with skin involvement and unfavorable outcome. Clin Cancer Res. 2003;9(10Pt1):3625-3634.
10. Ishida T, Jo T, Takemoto S, et al. Dose-intensified chemotherapy alone or in combination with mogamulizumab in newly diagnosed aggressive adult T-cell leukaemia-lymphoma: a randomized phase II study. Br J Haematol. 2015;169(5):672-682.
23. Kim D, Salzberg SL. TopHat-Fusion: an algorithm for discovery of novel fusion transcripts. Genome Biol. 2011;12(8):R72.
28. McGranahan N, Rosenthal R, Hiley CT, et al. Allele-specific HLA loss and immune scape in lung cancer evolution. Cell. 2017;171(6):1259-1271.
1. Uchiyama T, Yodoi J, Sagawa K, Takatsuki K, Uchino H. Adult Tcell leukemia: clinical and hematologic features of 16 cases. Blood. 1977;50(3):481-492.
8. Ishii T, Ishida T, Utsunomiya A, et al. Defucosylated humanized anti-CCR4 monoclonal antibody KW-0761 as a novel immunotherapeutic agent for adult T-cell leukemia/lymphoma. Clin Cancer Res. 2010;16(5):1520-1531.
3. Cook LB, Fuji S, Hermine O, et al. Revised adult T-cell leukemialymphoma international consensus meeting report. J Clin Oncol. 2019;37(8):677-687.
27. Sachet AS, Rooney MS, Rajasagi M, et al. Comprehensive analysis of cancer-associated somatic mutations in class I HLA genes. Nat Biotechnol. 2015;33(11):1152-1158.
33. Forlenza CJ, Boudreau JE, Zheng J, et al. KIR3DL1 allelic
11. Fuji S, Inoue Y, Utsunomiya A, et al. Pretransplantation antiCCR4 antibody mogamulizumab against adult T-cell leukemia/lymphoma is associated with significantly increased risks of severe and corticosteroid-refractory graft-versus-host disease, nonrelapse mortality, and overall mortality. J Clin Oncol. 2016;34(28):3426-3433.
2. Shimoyama M. Diagnostic criteria and classification of clinical subtypes of adult T-cell leukemia-lymphoma. A report from the Lymphoma Study Group (1984–1987). Br J Haematol. 1991;79(3):428-437.
12. Yonekura K, Kusumoto S, Choi I, et al. Mogamulizumab for adult T-cell leukemia-lymphoma: a multicenter prospective observational study. Blood Adv. 2020;4(20):5133-5145.
17. Cibulskis K, Lawrence MS, Carter SL, et al. Sensitive detection of somatic point mutations in impure and heterogeneous cancer samples. Nat Biotechnol. 2013;31(3):213-219.
24. Kataoka K, Shiraishi Y, Takeda Y, et al. Aberrant PD-L1 expression through 3'-UTR disruption in multiple cancers. Nature. 2016;534(7607):402-406.
Haematologica | 107 October 2022 2430 ARTICLE - Genomic determinants of clinical outcome in ATL N. Tanaka et al.
26. Hayashi S, Yamaguchi R, Mizuno S, et al. ALPHLARD: a Bayesian method for analyzing HLA genes from whole genome sequence data. BMC Genomics. 2018;19(1):790.
14. Tsukasaki K, Hermine O, Bazarbachi A, et al. Definition, prognostic factors, treatment, and response criteria of adult Tcell leukemia-lymphoma: a proposal from an international consensus meeting. J Clin Oncol. 2009;27(3):453-459.
32. Sakamoto Y, Ishida T, Masaki A, et al. Clinical significance of CD28 gene-related activating alterations in adult T-cell leukaemia/lymphoma. Br J Haematol. 2021;192(2):281-291.
4. Utsunomiya A. Progress in allogeneic hematopoietic cell transplantation in adult T-cell leukemia-lymphoma. Front Microbiol. 2019;10:2235.
19. Patch AM, Christie EL, Etemadmoghadam D, et al. Wholegenome characterization of chemoresistant ovarian cancer. Nature. 2015;521(7553):489–494.
Data-sharing statement
25. Szolek A, Schubert B, Mohr C, Sturm M, Feldhahn M, Kohlbacher O. OptiType: precision HLA typing from next-generation sequencing data. Bioinformatics. 2014;30(23):3310-3316.
21. Mermel CH, Schumacher SE, Hill B, Meyerson ML, Beroukhim R, Getz G. GISTIC2.0 facilitates sensitive and confident localization of the targets of focal somatic copy-number alteration in human cancers. Genome Biol. 2011;12(4):R41.
13. Kataoka K, Nagata Y, Kitanaka A, et al. Integrated molecular analysis of adult T cell leukemia/lymphoma. Nat Genet. 2015;47(11):1304-1315.
16. Koboldt DC, Zhang Q, Larson DE, et al. VarScan 2: somatic mutation and copy number alteration discovery in cancer by exome sequencing. Genome Res. 2012;22(3):568-576.
9. Ishida T, Joh T, Uike N, et al. Defucosylated anti-CCR4 monoclonal antibody (KW-0761) for relapsed adult T-cell leukemia-lymphoma: a multicenter phase II study. J Clin Oncol. 2012;30(8):837-842.
5. Nosaka K, Iwanaga M, Imaizumi Y, et al. Epidemiological and clinical features of adult T-cell leukemia-lymphoma in Japan, 2010-2011: A nationwide survey. Cancer Sci. 2017;108(12):2478-2486.
Bioinformatics. 2011;12:323.
29. Monti S, Tamayo P, Mesirov J, Golub T. Consensus clustering: a resampling-based method for class discovery and visualization of gene expression microarray data. Machine Learning. 2003;52:91-118.
20. Magi A, Tattini L, Cifola I, et al. EXCAVATOR: detecting copy number variants from whole-exome sequencing data. Genome Biol. 2013;14(19):R120.
15. Li B, Dewey CN. RSEM: accurate transcript quantification from RNA-Seq data with or without a reference genome. BMC
References
45. Yano H, Ishida T, Inagaki A, et al. Regulatory T-cell function of adult T-cell leukemia/lymphoma cells. Int J Cancer. 2007;120(9):2052-2057.
44. Ratner L, Waldmann TA, Janakiram M, Brammer JE. Rapid progression of adult T-cell leukemia-lymphoma after PD-1 inhibitor therapy. N Engl J Med. 2018;378(20):1947-1948.
34. Wang L, Ni X, Covington KR, et al. Genomic profiling of Sézary syndrome identifies alterations of key T cell signaling and differentiation genes. Nat Genet. 2015;47(12):1426-1434.
42. Masaki A, Ishida T, Maeda Y, et al. Prognostic significance of tryptophan catabolism in adult T-cell leukemia/lymphoma. Clin Cancer Res. 2015;21(12):2830-2839.
Haematologica | 107 October 2022 2431 ARTICLE - Genomic determinants of clinical outcome in ATL N. Tanaka et al.
38. Nakagawa M, Schmitz R, Xiao W, et al. Gain-of-function CCR4 mutations in adult T cell leukemia/lymphoma. J Exp Med. 2014;211(13):2497-2505.
39. Sakamoto Y, Ishida T, Masaki A, et al. CCR4 mutations associated with superior outcome of adult T-cell leukemia/lymphoma under mogamulizumab treatment. Blood. 2018;132(7):758-761.
polymorphism and HLA-B epitopes modulate response to antiGD2 monoclonal antibody in patients with neuroblastoma. J Clin Oncol. 2016;34(21):2443-2451.
37. Sakamoto Y, Ishida T, Masaki A, et al. Clinical significance of TP53 mutations in adult T-cell leukemia/lymphoma. Br J Haematol. 2021;195(4):571-584.
41. Masaki A, Ishida T, Suzuki S, et al. Human T-cell lymphotropic/leukemia virus type 1 (HTLV-1) Tax-specific T-cell exhaustion in HTLV-1-infected individuals. Cancer Sci. 2018;109(8):2383-2390.
35. Katsuya H, Yamanaka T, Ishitsuka K, et al. Prognostic index for acute- and lymphoma-type adult T-cell leukemia/lymphoma. J Clin Oncol. 2012;30(14):1635-1640.
43. Nosaka K, Kusumoto S, Nakano N, et al. Clinical significance of the IgG heavy chain repertoire in PBMC of ATL patients receiving mogamulizumab. Br J Haematol. 2022;196(3):629-638.
46. Ishida T, Ueda R. Immunopathogenesis of lymphoma: focus on CCR4. Cancer Sci. 2011;102(1):44-50.
48. Kumagai S, Togashi Y, Kamada T, et al. The PD-1 expression balance between effector and regulatory T cells predicts the clinical efficacy of PD-1 blockade therapies. Nat Immunol. 2020;21(11):1346-1358.
40. Yesilkanal AE, Johnson GL, Ramos AF, Rosner MR. New strategies for targeting kinase networks in cancer. J Biol Chem. 2021;297(4):101128.
49. Hatjiharissi E, Xu L, Santos DD, et al. Increased natural killer cell expression of CD16, augmented binding and ADCC activity to rituximab among individuals expressing the Fc{gamma}RIIIa-158 V/V and V/F polymorphism. Blood. 2007;110(7):2561-2564.
50. Niwa R, Hatanaka S, Shoji-Hosaka E, et al. Enhancement of the antibody-dependent cellular cytotoxicity of low-fucose IgG1 Is independent of FcγRIIIa functional polymorphism.Clin Cancer Res. 2004;10(18Pt1):6248-6255.
47. Kamada T, Togashi Y, Tay C, et al. PD-1+ regulatory T cells amplified by PD-1 blockade promote hyperprogression of cancer. Proc Natl Acad Sci U S A. 2019;116(20):9999-10008.
36. Kataoka K, Iwanaga M, Yasunaga J, et al. Prognostic relevance of integrated genetic profiling in adult T-cell leukemia/lymphoma. Blood. 2018;131(2):215-225.
Thijs L.J. van Osch,1° Janita J. Oosterhoff,1° Arthur E. H. Bentlage,1° Jan Nouta,2° Carolien A. M. Koeleman,2° Dionne M. Geerdes,3 Juk Yee Mok,3 Sebastiaan Heidt,4 Arend Mulder,4 Wim J. E. van Esch,3 Rick Kapur,1 Leendert Porcelijn,5 C. Ellen van der Schoot,1 Masja de Haas,4,5° Manfred Wuhrer,2° Jan Voorberg6 and Gestur Vidarsson1°
Prepublished: March 31, 2022.
Correspondence: G. G.Vidarsson@sanquin.nlVidarsson
https://doi.org/10.3324/haematol.2021.280493
Abstract
°JN, CAMK and MW current address: Center for Proteomics and Metabolomics, Leiden University Medical Center, Leiden, The Netherlands
Received: December 13, 2021.
°MdH current addresses: Department of Clinical Transfusion Research, Sanquin Research, Amsterdam and Department of Hematology, Leiden University Medical Center, Leiden, The Netherlands
Approximately 20% of patients receiving multiple platelet transfusions develop platelet alloantibodies, which can be di rected against human leukocyte antigens (HLA) and, to a lesser extent, against human platelet antigens (HPA). These anti bodies can lead to the rapid clearance of donor platelets, presumably through IgG-Fc receptor (FcγR)-mediated phagocytosis or via complement activation, resulting in platelet refractoriness. Strikingly, not all patients with anti-HLA or -HPA antibodies develop platelet refractoriness upon unmatched platelet transfusions. Previously, we found that IgG Fc glycosylation of anti-HLA antibodies was highly variable between patients with platelet refractoriness, especially with respect to galacto sylation and sialylation of the Fc-bound sugar moiety. Here, we produced recombinant glycoengineered anti-HLA and antiHPA-1a monoclonal antibodies with varying Fc galactosylation and sialylation levels and studied their ability to activate the classical complement pathway. We observed that anti-HLA monoclonal antibodies with different specificities, binding sim ultaneously to the same HLA-molecules, or anti-HLA in combination with anti-HPA-1a monoclonal antibodies interacted synergistically with C1q, the first component of the classical pathway. Elevated Fc galactosylation and, to a lesser extent, sialylation significantly increased the complement-activating properties of anti-HLA and anti-HPA-1a monoclonal antibodies. We propose that both the breadth of the polyclonal immune response, with recognition of different HLA epitopes and in some cases HPA antigens, and the type of Fc glycosylation can provide an optimal stoichiometry for C1q binding and sub sequent complement activation. These factors can shift the effect of a platelet alloimmune response to a clinically relevant response, leading to complement-mediated clearance of donor platelets, as observed in platelet refractoriness.
Fc galactosylation of anti-platelet human IgG1 alloantibodies enhances complement activation on platelets
1Department of Experimental Immunohematology, Sanquin Research and Landsteiner Laboratory, Amsterdam University Medical Center, University of Amsterdam, Amsterdam; 2Center for Proteomics and Metabolomics, Leiden University Medical Center, Leiden; 3Sanquin Reagents, Amsterdam; 4Department of Immunology, Leiden University Medical Center, Leiden; 5Department of Immunohaematology Diagnostics, Sanquin Diagnostic Services, Amsterdam and 6Departement of Molecular Hematology, Sanquin Research and Landsteiner Laboratory, Amsterdam University Medical Center, University of Amsterdam, Amsterdam, the Netherlands
°TLJvO, JJO, AEHB and GV current addresses: Immunoglobulin Research laboratory, Department of Experimental Immunohematology, Sanquin Research, Amsterdam and Department of Biomolecular Mass Spectrometry and Proteomics, Utrecht Institute for Pharmaceutical Sciences and Bijvoet Center for Biomolecular Research, Utrecht University, Utrecht, The Netherlands
(onco-hematologic) patients with thrombocytopenia. However, in approximately 5-15% of patients receiving chronic platelet support rapid clearance of the transfused platelets is observed, known as platelet refractoriness
Introduction
Prophylactic and supportive platelet transfusions signifi cantly reduce mortality and hemorrhagic complications in
©2022 Ferrata Storti Foundation
Published under a CC BY-NC license
Haematologica | 107 October 2022 2432 ARTICLE - Platelet Biology & its Disorders
Accepted: March 22, 2022.
(PR). PR can be caused by either non-immune or immune factors.1–5 Immune PR occurs in approximately 20% of the cases of PR and is mainly attributable to the formation of antibodies against human leukocyte antigens (HLA) and occasionally human platelet antigens (HPA).6,7 Addi tionally, anti-ABO and drug-induced antibodies have also been described as potential causes of immune PR.8–10 Currently, the transfusion of HLA- and HPA-matched pla telets is the only treatment for alloimmunized patients,11–13 but finding compatible donors can be challenging. Un matched platelet transfusions can trigger an immune re sponse with a broad spectrum of HLA-epitope or HPA-recognizing antibodies and the binding of these antibodies to donor platelets may result in destruction of the platelets. It was originally assumed that this was mainly the result of IgG-Fc receptor (Fc γ R)-mediated phagocytosis but there is growing evidence that comple ment activation can also play a role.14 If platelet trans fusions are followed by an insufficient increment in platelet count, bleeding may not be prevented ad equately.15,16 For still unknown reasons, not all patients with anti-HLA or anti-HPA antibodies develop PR to un matched platelet transfusions. As of yet, no clear differ ential Fc γ R- or complement-activating potential of the antibodies present in these patients has emerged which might explain differences in platelet clearance rates. In the last decade, it has become clear that the initiation of the classical complement pathway by IgG antibodies, recognizing surface-bound antigens, requires a stepwise process. The first step, antigen-IgG binding, can precipi tate the assembly of hexameric complexes of IgG facili tated by lateral movement and Fc-Fc interactions.17 This depends on the target antigen not being rigidly anchored in the membrane and/or cellular cytoskeleton, and most likely can occur more efficiently if the antibody response is polyclonal. This leads to binding of antibodies to many different epitopes, with the result of higher levels of sen sitization and an increased likelihood of Fc-Fc inter actions.18 The ensuing hexameric assembly can then be further stabilized by interactions with C1q, followed by activation of C1 and the classical complement pathway. The need for hexamerization might also explain our pre vious observation that only a combination of anti-HLA monoclonal antibodies activated complement on the surface of platelets.14
viously, we described the glycosylation profile of antiHLA antibodies in patients with PR, which was highly variable with respect to galactose and sialic acid levels. Although Fc galactosylation was significantly increased in the majority of the patients, sialylation levels were more varied, with both decreased and increased sialyla tion being observed for anti-HLA IgG.19
Methods
Donor blood
Anti-HLA antibodies (SN230G6, SN607D8 and W6/32) were spotted, via random coupling, using a Continuous Flow Microspotter (Wasatch Microfluidics) onto a Sen sEye Easy2Spot G-type sensor (Senss). Spotting was done in 10 mM acetate buffer phosphate-buffered saline (PBS) + 0.075%-Tween 80 (Amresco), pH 4.5 in duplicate at a two-fold dilution ranging from 60 nM to 7.5 nM for 15 min. The sensor was deactivated with 100 mM etha nolamine (Merck), pH 8.8 for 7 min. Binding measure ments were carried out in an IBIS MX96 (IBIS Technologies). First, 100 nM HLA-A*02:01 was flowed over the sensor for 5 min, followed by a 5-min flow of 100 nM of each anti-HLA antibody separately. Regeneration was then performed with 10 mM Gly-HCl, pH 2.4. This was re peated for every possible antibody combination.
It has also become evident that complement activity of antigen-specific IgG can be controlled through IgG Fc glycosylation. All IgG subclasses contain a conserved Nlinked glycan at position N297 in the CH2 domain of the Fc-region of IgG antibodies which is highly variable. The glycan consists of a bi-antennary core structure composed of N-acetylglucosamines (GlcNAc) and man nose residues but can be further extended by a fucose, bisecting GlcNAc, galactose and sialic acid residues. Pre
Surface plasmon resonance
Haematologica | 107 October 2022 2433 ARTICLE - IgG glycans and complement activity on platelets T.L.J. van Osch et al.
Additional information on materials and methods used can be found in the Online Supplementary Data.
investigated the role of Fc glycosylation in antiplatelet alloantibodies and its effect on complement ac tivation, as well as the potential synergy in inducing complement activation if anti-HLA and anti-HPA-1a anti bodies are bound simultaneously.
Peripheral blood was obtained from anonymous, healthy volunteers with informed written consent, after approval from the Sanquin Ethical Advisory Board, in accordance with the Declaration of Helsinki.
The causal relation between the N-glycan structures and their influence on IgG effector functions is known; both at the level of Fc γ R- and complement-mediated effector functions.19–21 The different types of changes, primarily those of high levels of galactosylation, enhance comple ment activity through elevated C1q binding20,22 and can be found in patients with increased platelet clearance in fetal and neonatal alloimmune thrombocytopenia.19,23 High levels of galactosylation seem to have no effect on the intrinsic affinity of C1q to monomeric IgG, but stimu late hexamerization of IgG on IgG-opsonized surfaces, and enhance downstream complement activation of IgG.24,25Here,we
Flow cytometric complement assay
Platelet isolation
Citrated whole blood from healthy volunteers with known HLA and HPA-type, corresponding to the specificity of the anti-HLA antibodies (Online Supplementary Table S1), was centrifuged at 125 g for 20 min. The platelet-rich plasma was harvested and 10 vol% ACD (acid citrate dextrose, 85 mM Na3-citrate·2H2O, 71 mM citric acid·H2O and 111 mM Dglucose) was added. The platelet-rich plasma was centri fuged (850 g for 8 min) and washed twice with wash buffer (36 mM citric acid·H2O, 103 mM NaCl, 5 mM KCl, 5 mM EDTA, 5.6 mM D-glucose, pH 6.5). The platelets were fixed with 1% paraformaldehyde and washed and stored in PBS + 0.5% bovine serum albumin (BSA) at room tem perature.
Platelets (5x10⁶) were incubated with equal volumes of anti-platelet antibody (0.001-20 µg/mL) and pooled com plement-rich human serum, for 30 min. at 37°C while shaking. For the antibody combinations, the dilution series started with 10 µg/mL of both antibodies, resulting in a total antibody concentration of 20 µg/mL. The platelets were washed four times with PBS + 0.5% BSA + 5 mM EDTA and stained for 20 min. for flow cytometry with Goat F(ab')2 Anti-Human IgG-PE (1/250, Southern Biotech), anti-complement C3b/iC3b-APC Antibody Clone: 3E7/C3b (1/250, Biolegend) and C1q Polyclonal Antibody-FITC (1/25, Thermo Fisher Scientific). The samples were split and anti-C1q-FITC was measured separately due to the high
Figure 1. Production of glycoengineered anti-HLA and anti-HPA-1a human IgG1 monoclonal antibodies. (A) Schematic represen tation of the immunoglobulin G (IgG) Y-shaped structure; the Fc-N297 glycan and Fab- and Fc-regions are indicated. (B) Com position of the N297-glycan bi-antennary structure with the distinct sugar groups and their respective locations. (C) Antibody specificity of the anti-HLA and anti-HPA-1a monoclonal antibodies (mAbs). (D) Glycoengineering techniques to produce mAbs with increased Fc galactosylation and sialylation, via the addition of relevant substrates and constructs coding for enzymes prior/during transfection. (E) Fc-glycosylation profiles of the mAbs produced using different glycoengineering techniques to in crease Fc galactosylation and sialylation, analyzed by mass spectrometry.
AB EDC Haematologica | 107 October 2022 2434 ARTICLE - IgG glycans and complement activity on platelets T.L.J. van Osch et al.
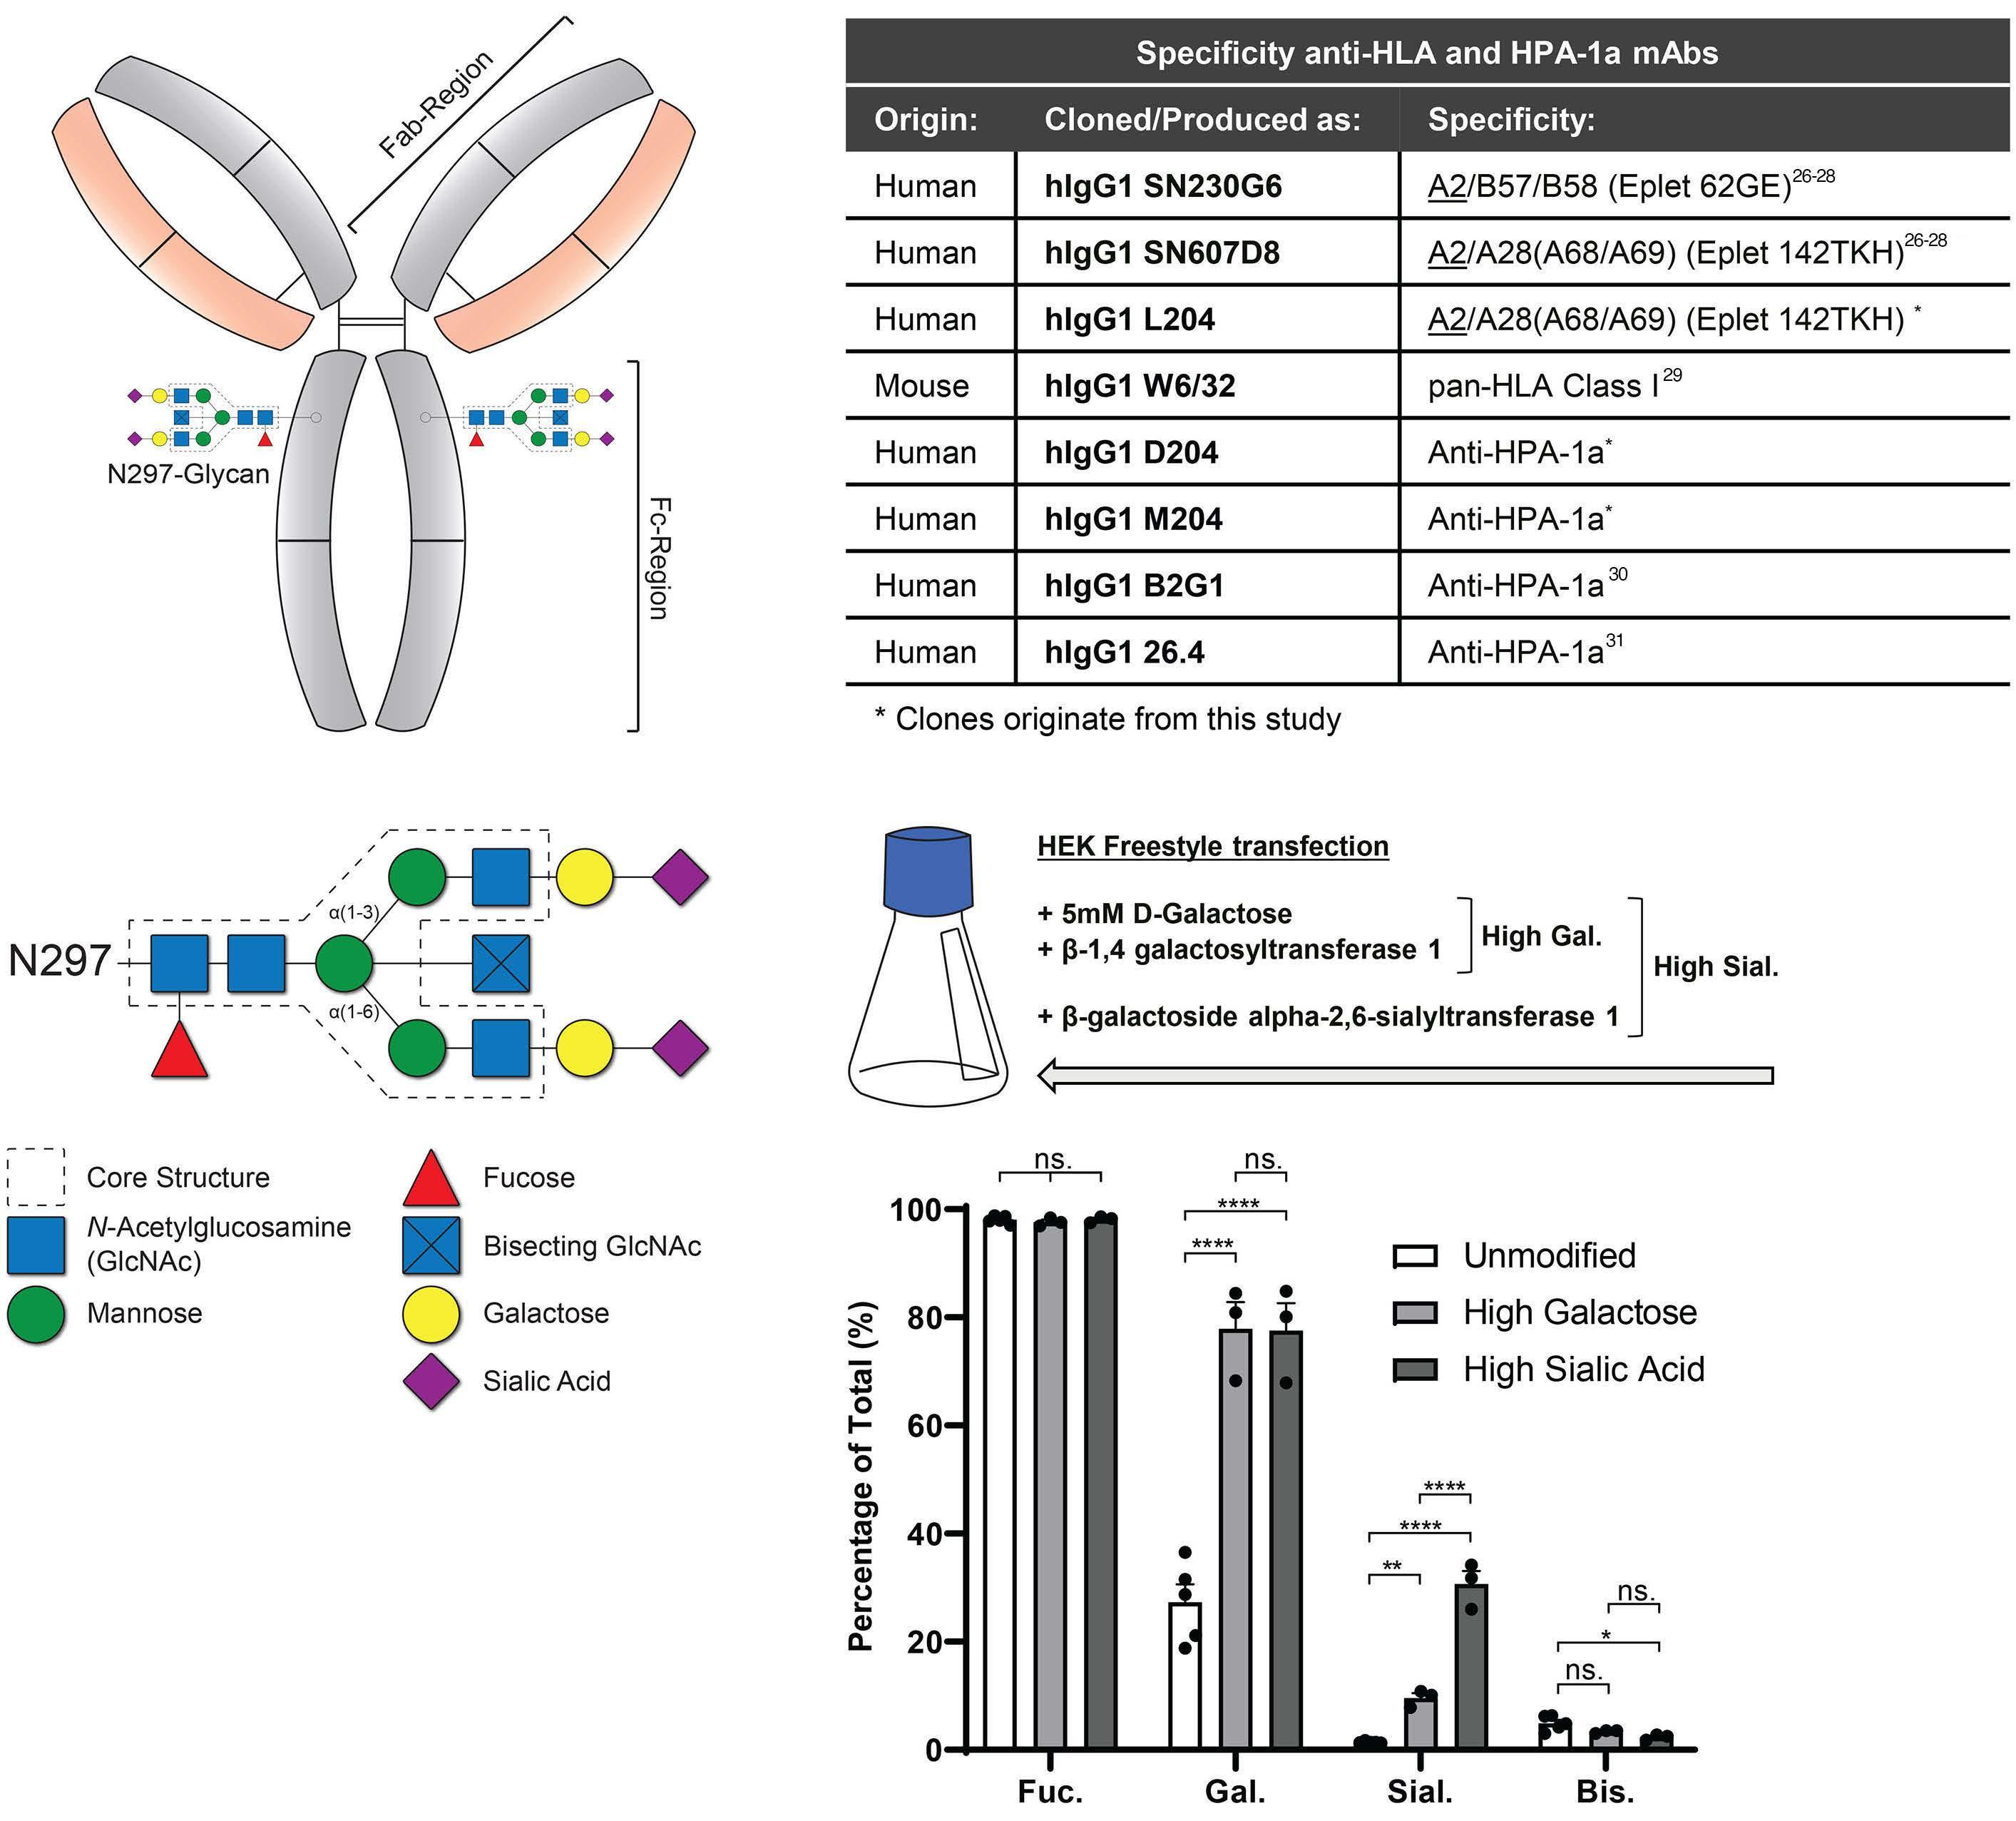
Figure 2. Surface plasmon resonance visualizes the co-binding and stabilization of multiple anti-HLA monoclonal antibodies to HLA-A*02:01. (A) Spotting of the sensor was performed with an array of unmodified or high galactosylated anti-HLA monoclonal antibodies with three different specificities. The color indicates the different spotted anti-HLA monoclonal antibodies (SN230G6 = green, SN607D8 = purple and W6/32 = red). HLA-A*02:01 monomers were flowed over the whole array (consisting of all anti bodies and controls), followed by each anti-HLA antibody in succession and in different orders, as indicated. An example is given of one of the spots under one specific flow condition using our surface plasmon resonance (SPR) set-up. The same glycovariants were used for all antibodies in the same run; when spotted with unmodified antibodies, all consecutive antibodies were also unmodified and when spotted with high galactosylated antibodies, all following antibodies were high galactosylated as well. (BG) Sensograms showing the co-binding and stabilization of multiple anti-HLA monoclonal antibodies to HLA-A*02:01. Runs with unmodified antibodies are indicated by solid lines and runs with high galactosylated antibodies are indicated by dotted lines. Each panel starts with the binding of HLA-A*02:01 to the spotted antibodies, but differs in the flow order of the three following anti-HLA monoclonal antibodies. Data represent two independent experiments, one for each set of glycovariants, SPR response units (RU) were normalized per experiment, in which the maximum response was set at 100%; the y-axis shows the relative RU in %. mAb: monoclonal antibody.
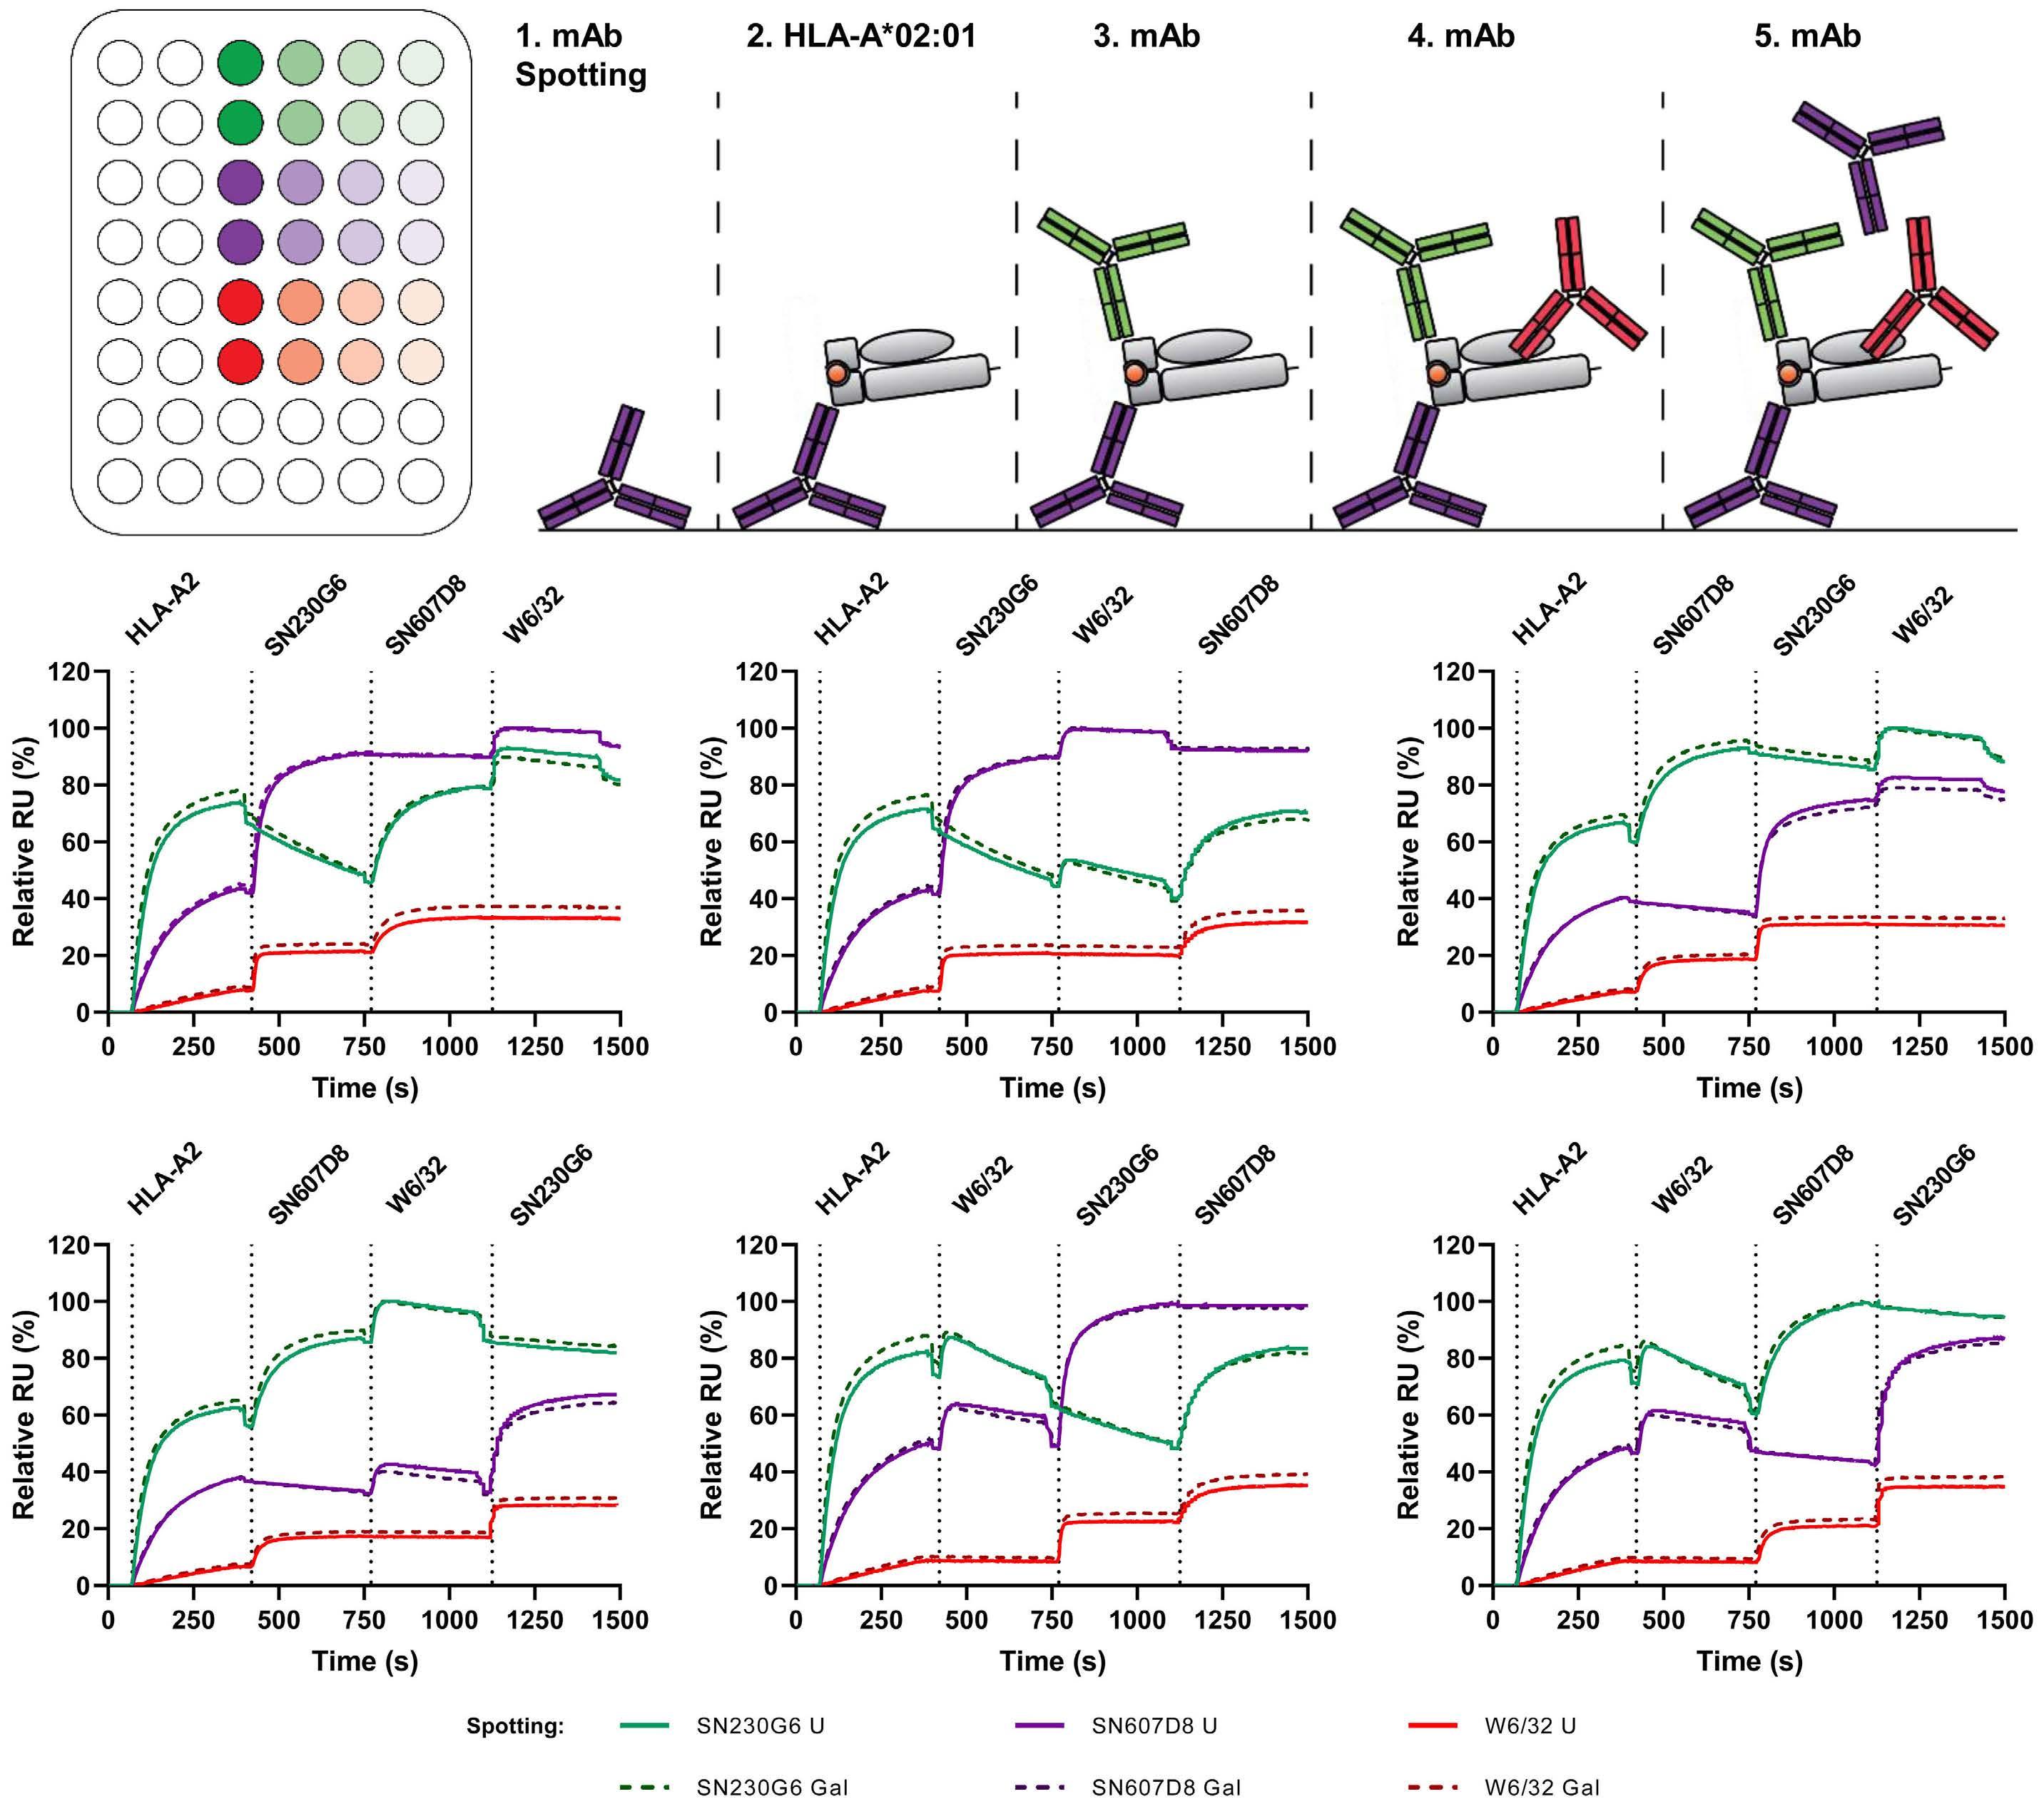
fluorescence intensity of the anti-IgG-PE. The flow cyto metry data were analyzed using FlowJo vX for Windows (BD Biosciences). The platelets were gated based on the
Haematologica | 107 October 2022 2435 ARTICLE - IgG glycans and complement activity on platelets T.L.J. van Osch et al.
FSC-A/SSC-A and single cells were selected (FSC-H/FSCA). The geometric-mean fluorescence intensities of all parameters were calculated.
BA C D E F G
Haematologica | 107 October 2022 2436 ARTICLE - IgG glycans and complement activity on platelets T.L.J. van Osch et al.
We then analyzed the recognition of HLA-A*02:01 monomers by the anti-HLA antibodies using surface plasmon resonance. We spotted an array of anti-HLA antibodies with different specificities (SN230G6, SN607D8 and W6/32) and their corresponding glycovari ants in parallel and then probed their binding to HLA, fol lowed by each of the antibodies in succession over time (Figure 2A). In our set-up, HLA-A*02:01 monomers were first flowed over the spotted antibodies on the sensor to visualize the initial binding of HLA-molecules by the spotted antibody. Thereafter, the same anti-HLA mono clonal antibodies were flowed in different orders over the sensor to visualize the subsequent binding of anti-HLA monoclonal antibodies to the same HLA molecules cap tured by the spotted antibody (Figure 2B-G). This allowed us to see potential overlap (blocking) in binding epitopes between the antibodies. SN230G6 showed the strongest capture of HLA from solution, followed by SN607D8 and then W6/32. After the initial binding of the HLA monomer to the spotted antibody, the remaining antibodies also bound successfully to the same molecule (e.g., purple line, Figure 2C). Although all antibodies were bound suc cessfully, the signal strengths varied depending on the order in which the complex was built, with an apparent dissociation of the antibody/HLA complex over time, rec ognizable as a decreasing slope. This dissociation was especially notable for the SN230G6 antibody where the antibody in solution showed strong competition with surface-immobilized SN230G6 (e.g., green line, Figure 2B, C). Remarkably, this dissociation did not occur after the sequential binding of soluble SN230G6 to spotted SN607D8 HLA-A2 complexes (e.g., purple line, Figure 2B) and soluble SN607D8 to spotted SN230G6 HLA-A2 com plexes (e.g., green line, Figure 2D), indicating the stabil izing interaction between the antibodies in the overall complex. This stabilizing interaction was not observed for combinations with the W6/32 antibody, probably be cause of low binding and rapid dissociation of the anti body. Furthermore, no differences were observed between the unmodified and high galactose variants.
IgG glycoengineering of anti-platelet monoclonal antibodies
Statistics
Investigating the effect of Fc glycosylation of anti-pla telet alloantibodies on complement activation is a dif ficult process. Various factors are known to affect complement activation, such as the binding epitope, af finity, iso/allo-type, titer and glycosylation profile of an antibody. In order to circumvent the large variety among PR patients and serum samples, caused by previous pregnancies, transfusions and transplants, a controlled experimental set-up is required. In this study, we pro duced unmodified and glycoengineered anti-HLA and anti-HPA-1a human IgG1 monoclonal antibodies with dif ferent specificities, and enhanced levels of galactosyl ation and sialylation (Figure 1A-C), as observed in patients with PR. Several specificities and epitopes have been described previously (SN230G6, 26–28 SN607D8, 26–28 W6/32, 29 B2G1 30 and 26.4 31 ). Two novel human mono clonal antibodies with HPA-1a specificity (D204 and M204) and one with HLA specificity (L204) were cloned from an alloimmunized individual by manipulation of the RNA of B cells that had secreted anti-platelet or antiHLA antibodies upon single-cell culture. All monoclonal antibodies were produced as human IgG1*03 kappa anti bodies using a HEK-freestyle based production sys tem. 20,24 After production (Figure 1D), the different glycoengineered antibodies were subjected to glyco analysis by liquid chromatography mass spectrometry (Figure 1E, Online Supplementary Figure S1A, B). The gly cosylation profiles of the unmodified antibodies showed nearly 100% fucosylation, ~25% galactosylation, 1% sialy lation and 5% bisection. By overexpressing B4GALT1 with elevated substrate availability, Fc galactosylation of IgG1 was increased to 80%. As observed previously, this was accompanied by a minor increase in sialylation and a de crease in bisection. 20,24 Increasing sialylation by over expressing ST6GALT increased sialylation to approximately 30%. Fucosylation was not affected by any of these glycoengineering techniques.
Statistical analyses were conducted within Graphpad Prism 8.02 (263) for Windows. Curve fitting was per formed using nonlinear regression dose-response curves with log(agonist) versus response – variable slope (four parameters). Bar graphs were analyzed using ordinary one-way analysis of variance with the Tukey multi-com parison test. P values ≤0.05 were defined as statistically significant, with the levels of significance being indicated by asterisks (* P ≤ 0.05, ** P ≤ 0.01, *** P ≤ 0.001 and ****P≤0.0001).
Anti-platelet monoclonal antibodies only activate the complement system when incubated simultaneously Next, we studied the possible synergistic effects of the anti-HLA and -HPA-1a monoclonal antibodies, for both antigen-binding and complement-activating properties on the surface of human platelets employing flow cyto metry. The gating strategy is shown in Online Supplemen tary Figure S2. All individual antibodies were capable of binding to the surface of platelets, to either HLA mol ecules or glycoprotein IIIa (GPIIIa), but differed in their maximum binding (Figure 3A) due to differences in bind
Multiple anti-HLA monoclonal antibodies bind and stabilize each other on a single HLA-monomer
Results
T.L.J. van Osch
A B C A B C D E F Haematologica | 107 October 2022 2437
Figure 4. Binding and complement-activating properties of combinations of unmodified anti-HLA or anti-HPA-1a monoclonal antibodies in the presence of complement-rich serum on the surface of matched platelets analyzed by flow cytometry. (A-C) Simultaneous incubation of different anti-HLA monoclonal antibody combinations. (D-F) Different combinations of anti-HPA-1a monoclonal antibodies. IgG binding is shown in (A, D), C3b deposition in (B, E), and the correlation between IgG binding and C3b deposition in (C, F). Data represent the mean and standard error of mean of three independent experiments using platelet donors with the following HLA-typing: HLA-A01/A02/B07/B08 and HLA-A02/A31/B40/B44. Curve fitting was performed using linear re gression and non-linear regression dose-response curves with log(agonist) versus response - variable slope (four parameters) in GraphPad Prism 8.0.2. gMFI: geometric-mean fluorescence intensity.
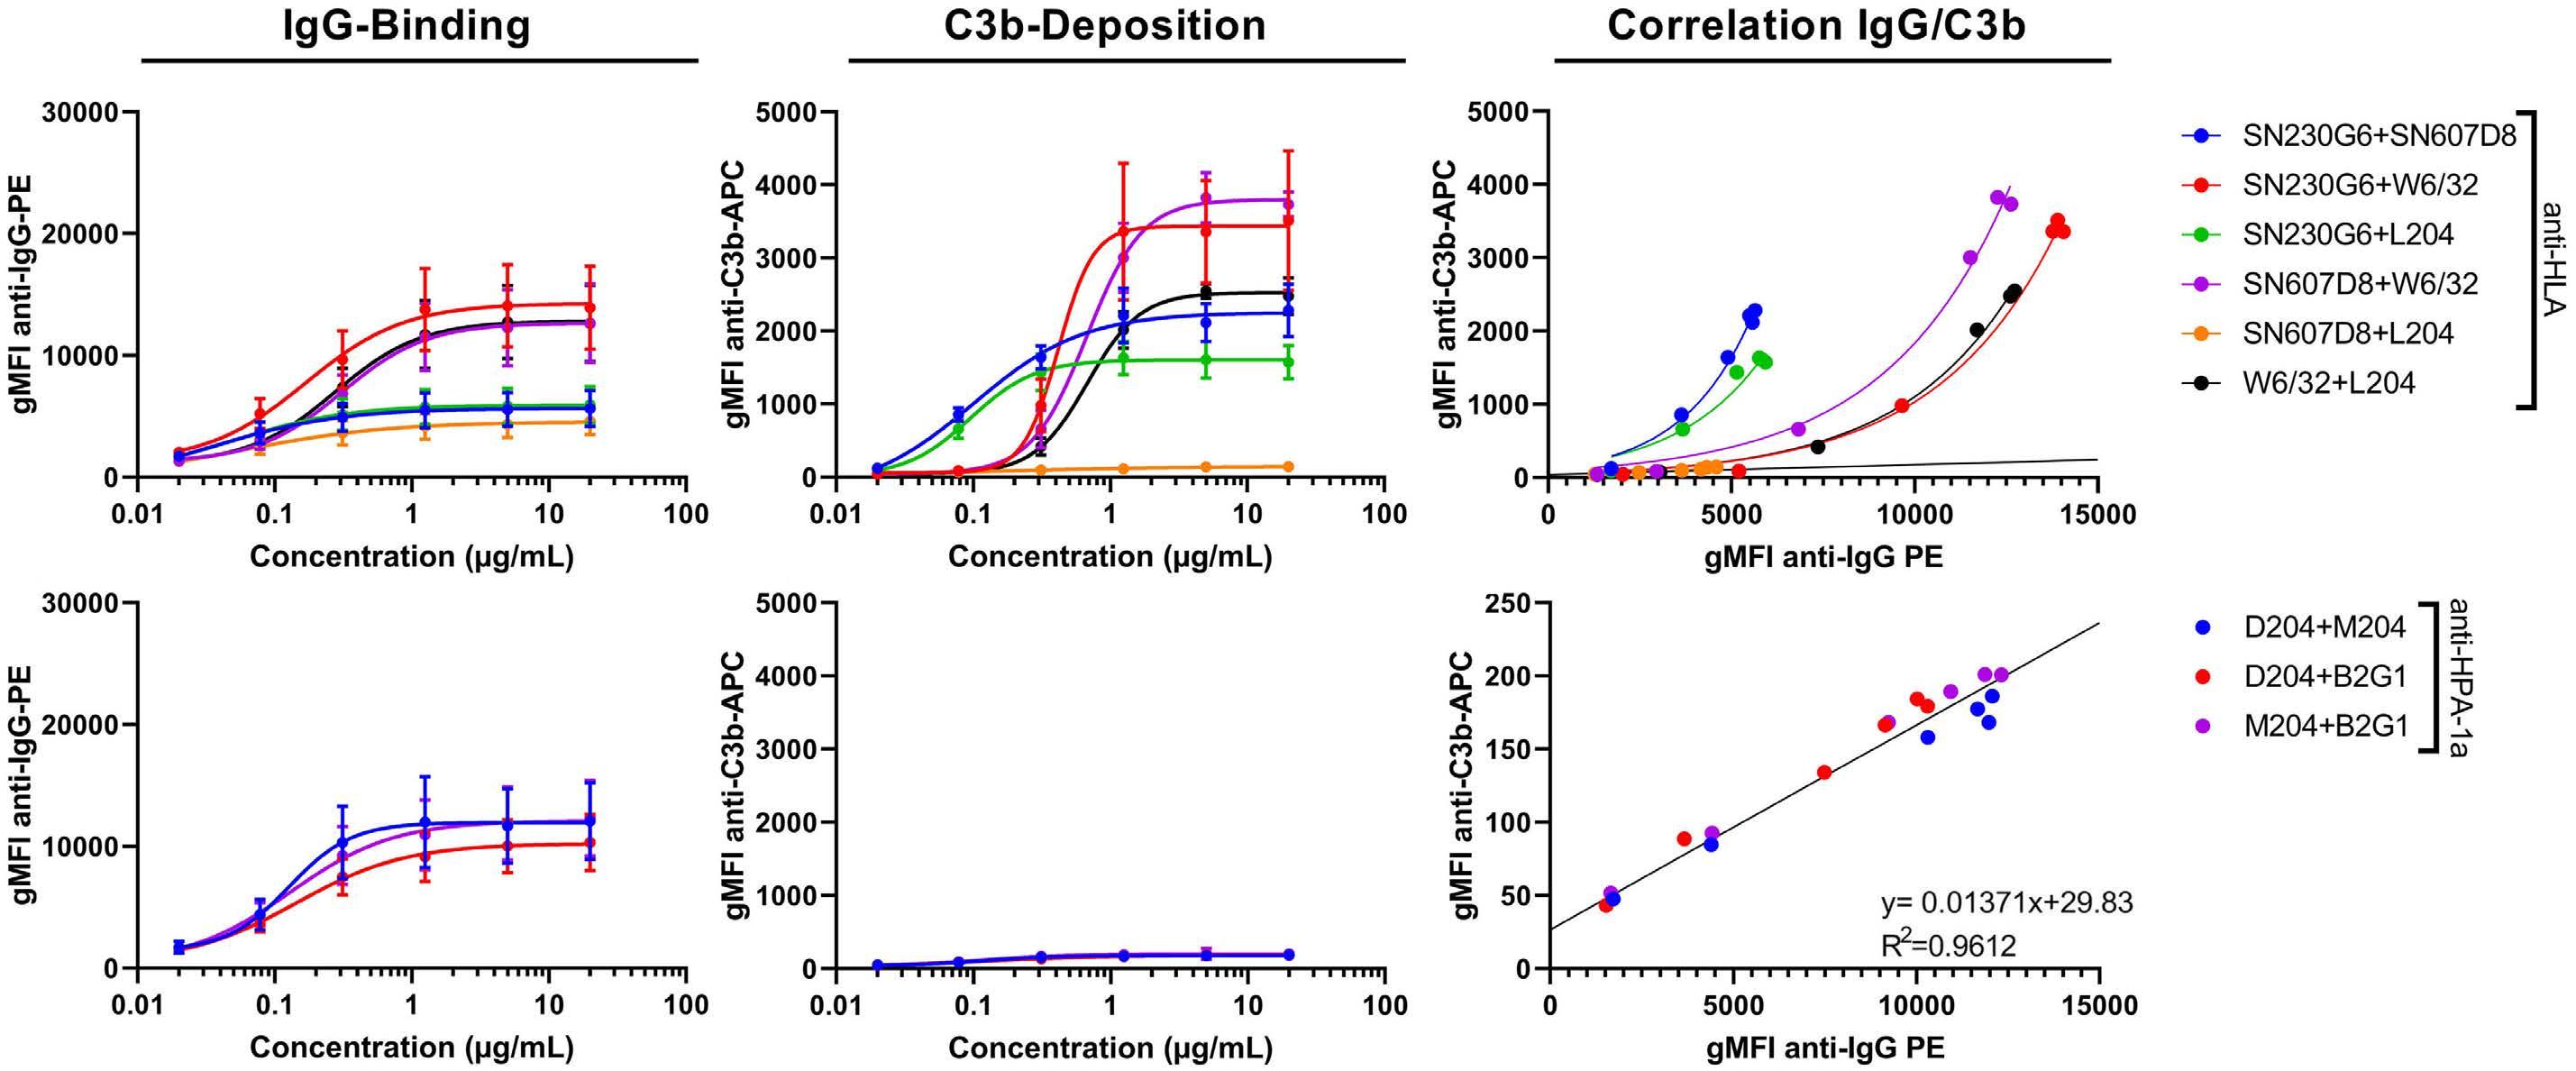
Figure 3. Binding and complement-activating properties of single unmodified anti-HLA or anti-HPA-1a monoclonal antibodies in the presence of complement-rich serum on the surface of matched platelets analyzed by flow cytometry. (A) IgG binding is shown, (B) C3b deposition, and (C) the correlation between IgG binding and C3b deposition. Data represent the mean and standard error of mean of three independent experiments using platelet donors with the following HLA-typing: HLA-A01/A02/B07/B08 and HLA-A02/A31/B40/B44. Curve fitting was performed using linear regression and non-linear regression dose-response curves with log(agonist) versus response - variable slope (four parameters) in GraphPad Prism 8.0.2. gMFI: geometric-mean fluorescence in tensity.
ARTICLE - IgG glycans and complement activity on platelets
et al.
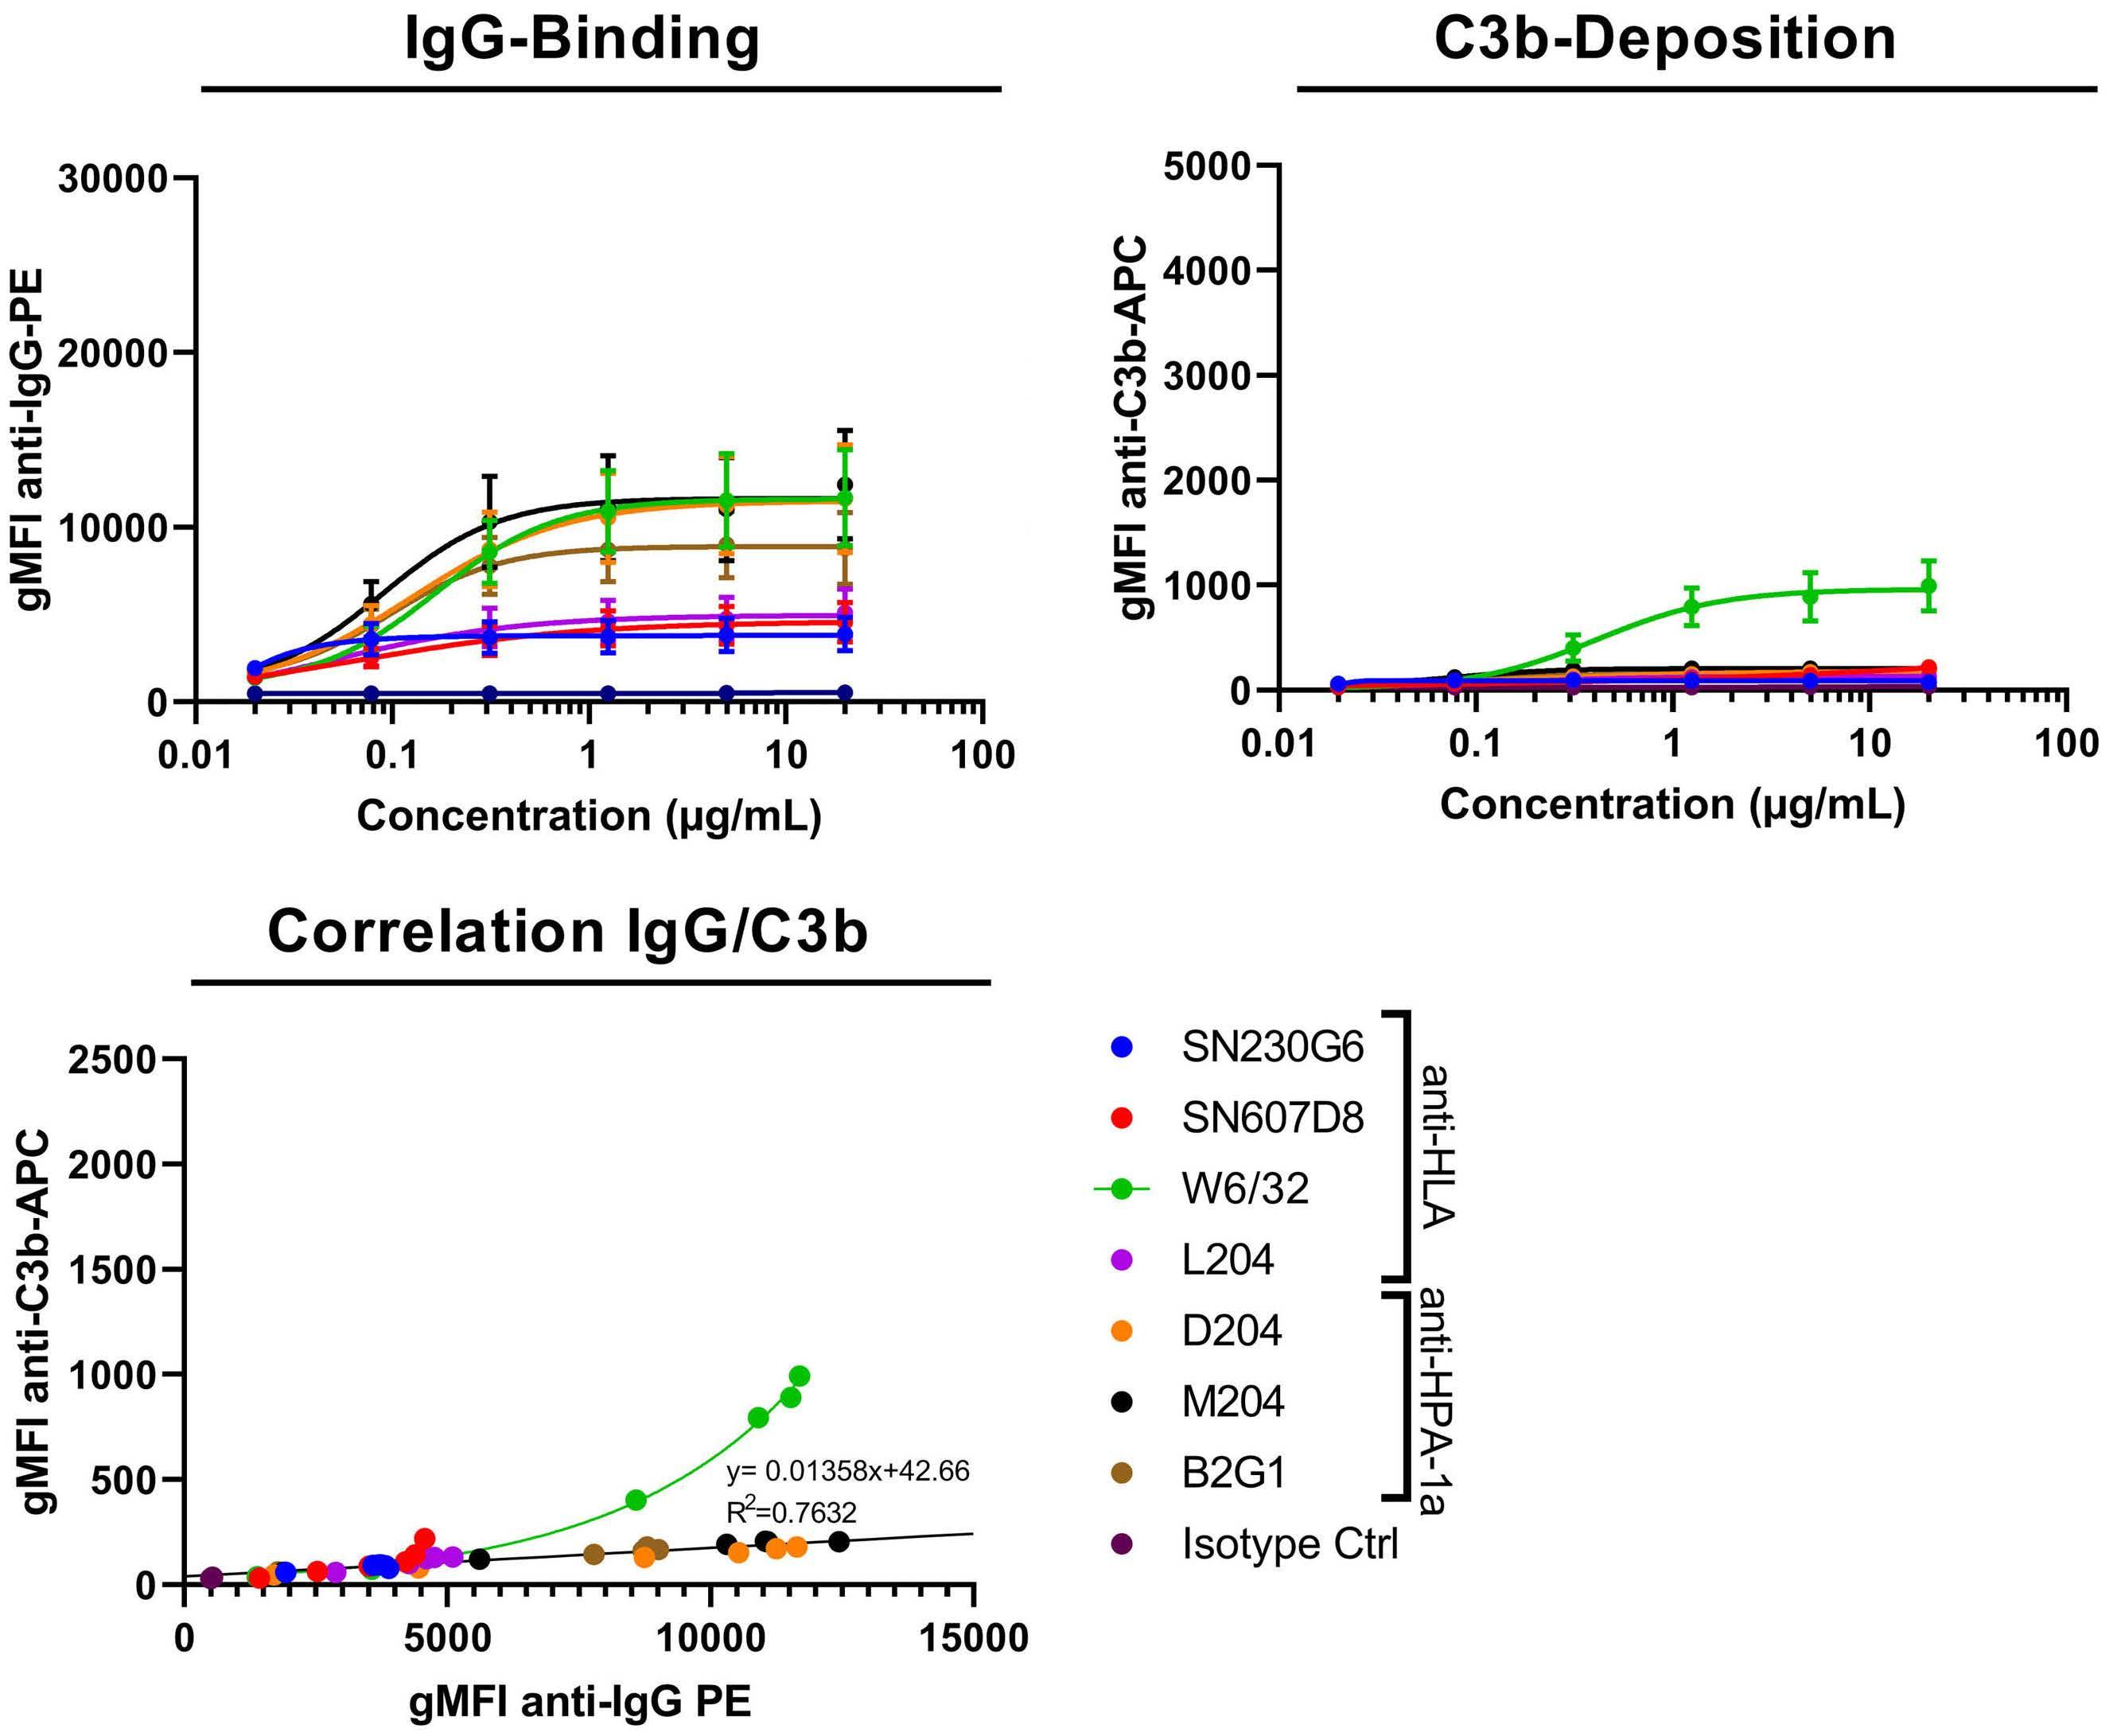
ing affinity27,32 and the surface expression of their targets. The monoclonal antibodies SN230G6, SN607D8 and L204 were only able to bind HLA-A2 molecules and therefore showed similar maximum binding. W6/32 binds all HLA class I molecules33 and showed a maximum binding ca pacity similar to that of the anti-HPA-1a antibodies. De spite significant binding of all antibodies, neither anti-HPA-1a nor anti-HLA antibodies provoked, by them selves, high levels of complement deposition on platelets, as determined by the amount of C3b deposition (Figure 3B), with the exception of W6/32. Nevertheless, the small amount of complement deposition correlated directly with IgG binding (Figure 3C). Again, W6/32 formed an ex ception, in line with its polymorphic HLA recognition. Complement activation was strongly enhanced when anti bodies with different specifi cities were combined. IgG binding was increased when multiple anti-HLA antibodies were incubated simultaneously (Figure 4A), to a similar
degree as seen in the surface plasmon resonance data (Figure 2). The combinations of anti-HLA antibodies gen erally increased C3b deposition (Figure 4B), suggesting enhanced classical complement activation. No synergy was observed for the combination of SN607D8 and L204 as these compete for the same binding epitope. Signifi cant synergistic effects were, however, seen for all other antibody combinations (Figure 4B, Online Supplementary Figure S3A), with C3b deposition surpassing a linear cor relation (Figure 4C). As expected, when using different combinations of anti-HPA-1a antibodies (all with identical single amino-acid epitopes), no synergistic effects were observed (Figure 4D-F, Online Supplementary Figure S3B). The strongest IgG binding was observed when combining anti-HLA and anti-HPA-1a IgG (Figure 5A). Interestingly, however, no synergistic complement activation was ob served between anti-HLA and anti-HPA-1a antibodies, ex cept for the combinations including W6/32 (Figure 5B, C
Figure 5. Binding and complement-activating properties of combinations of unmodified anti-HLA and anti-HPA-1a monoclonal antibodies in the presence of complement-rich serum on the surface of matched platelets analyzed by flow cytometry. (A-C) Different combinations of anti-HLA and anti-HPA-1a monoclonal antibodies. IgG binding is shown in (A), C3b deposition in (B), and the correlation between IgG binding and C3b deposition in (C). (D, E) Heatmaps of the amount of IgG binding and C3b de position when incubating with individual or combinations of anti-HLA and anti-HPA-1a monoclonal antibodies at 20 µg/mL, cal culated as the average geometric mean fluorescence intensity. Data represent the mean and standard error of mean of three independent experiments using platelet donors with the following HLA-typing: HLA-A01/A02/B07/B08 and HLA-A02/A31/B40/B44. Curve fitting was performed using linear regression and non-linear regression dose-response curves with log(agonist) versus re sponse - variable slope (four parameters) in GraphPad Prism 8.0.2. gMFI: geometric-mean fluorescence intensity.
A B C D E Haematologica | 107 October 2022 2438 ARTICLE - IgG glycans and complement activity on platelets T.L.J. van Osch et al.
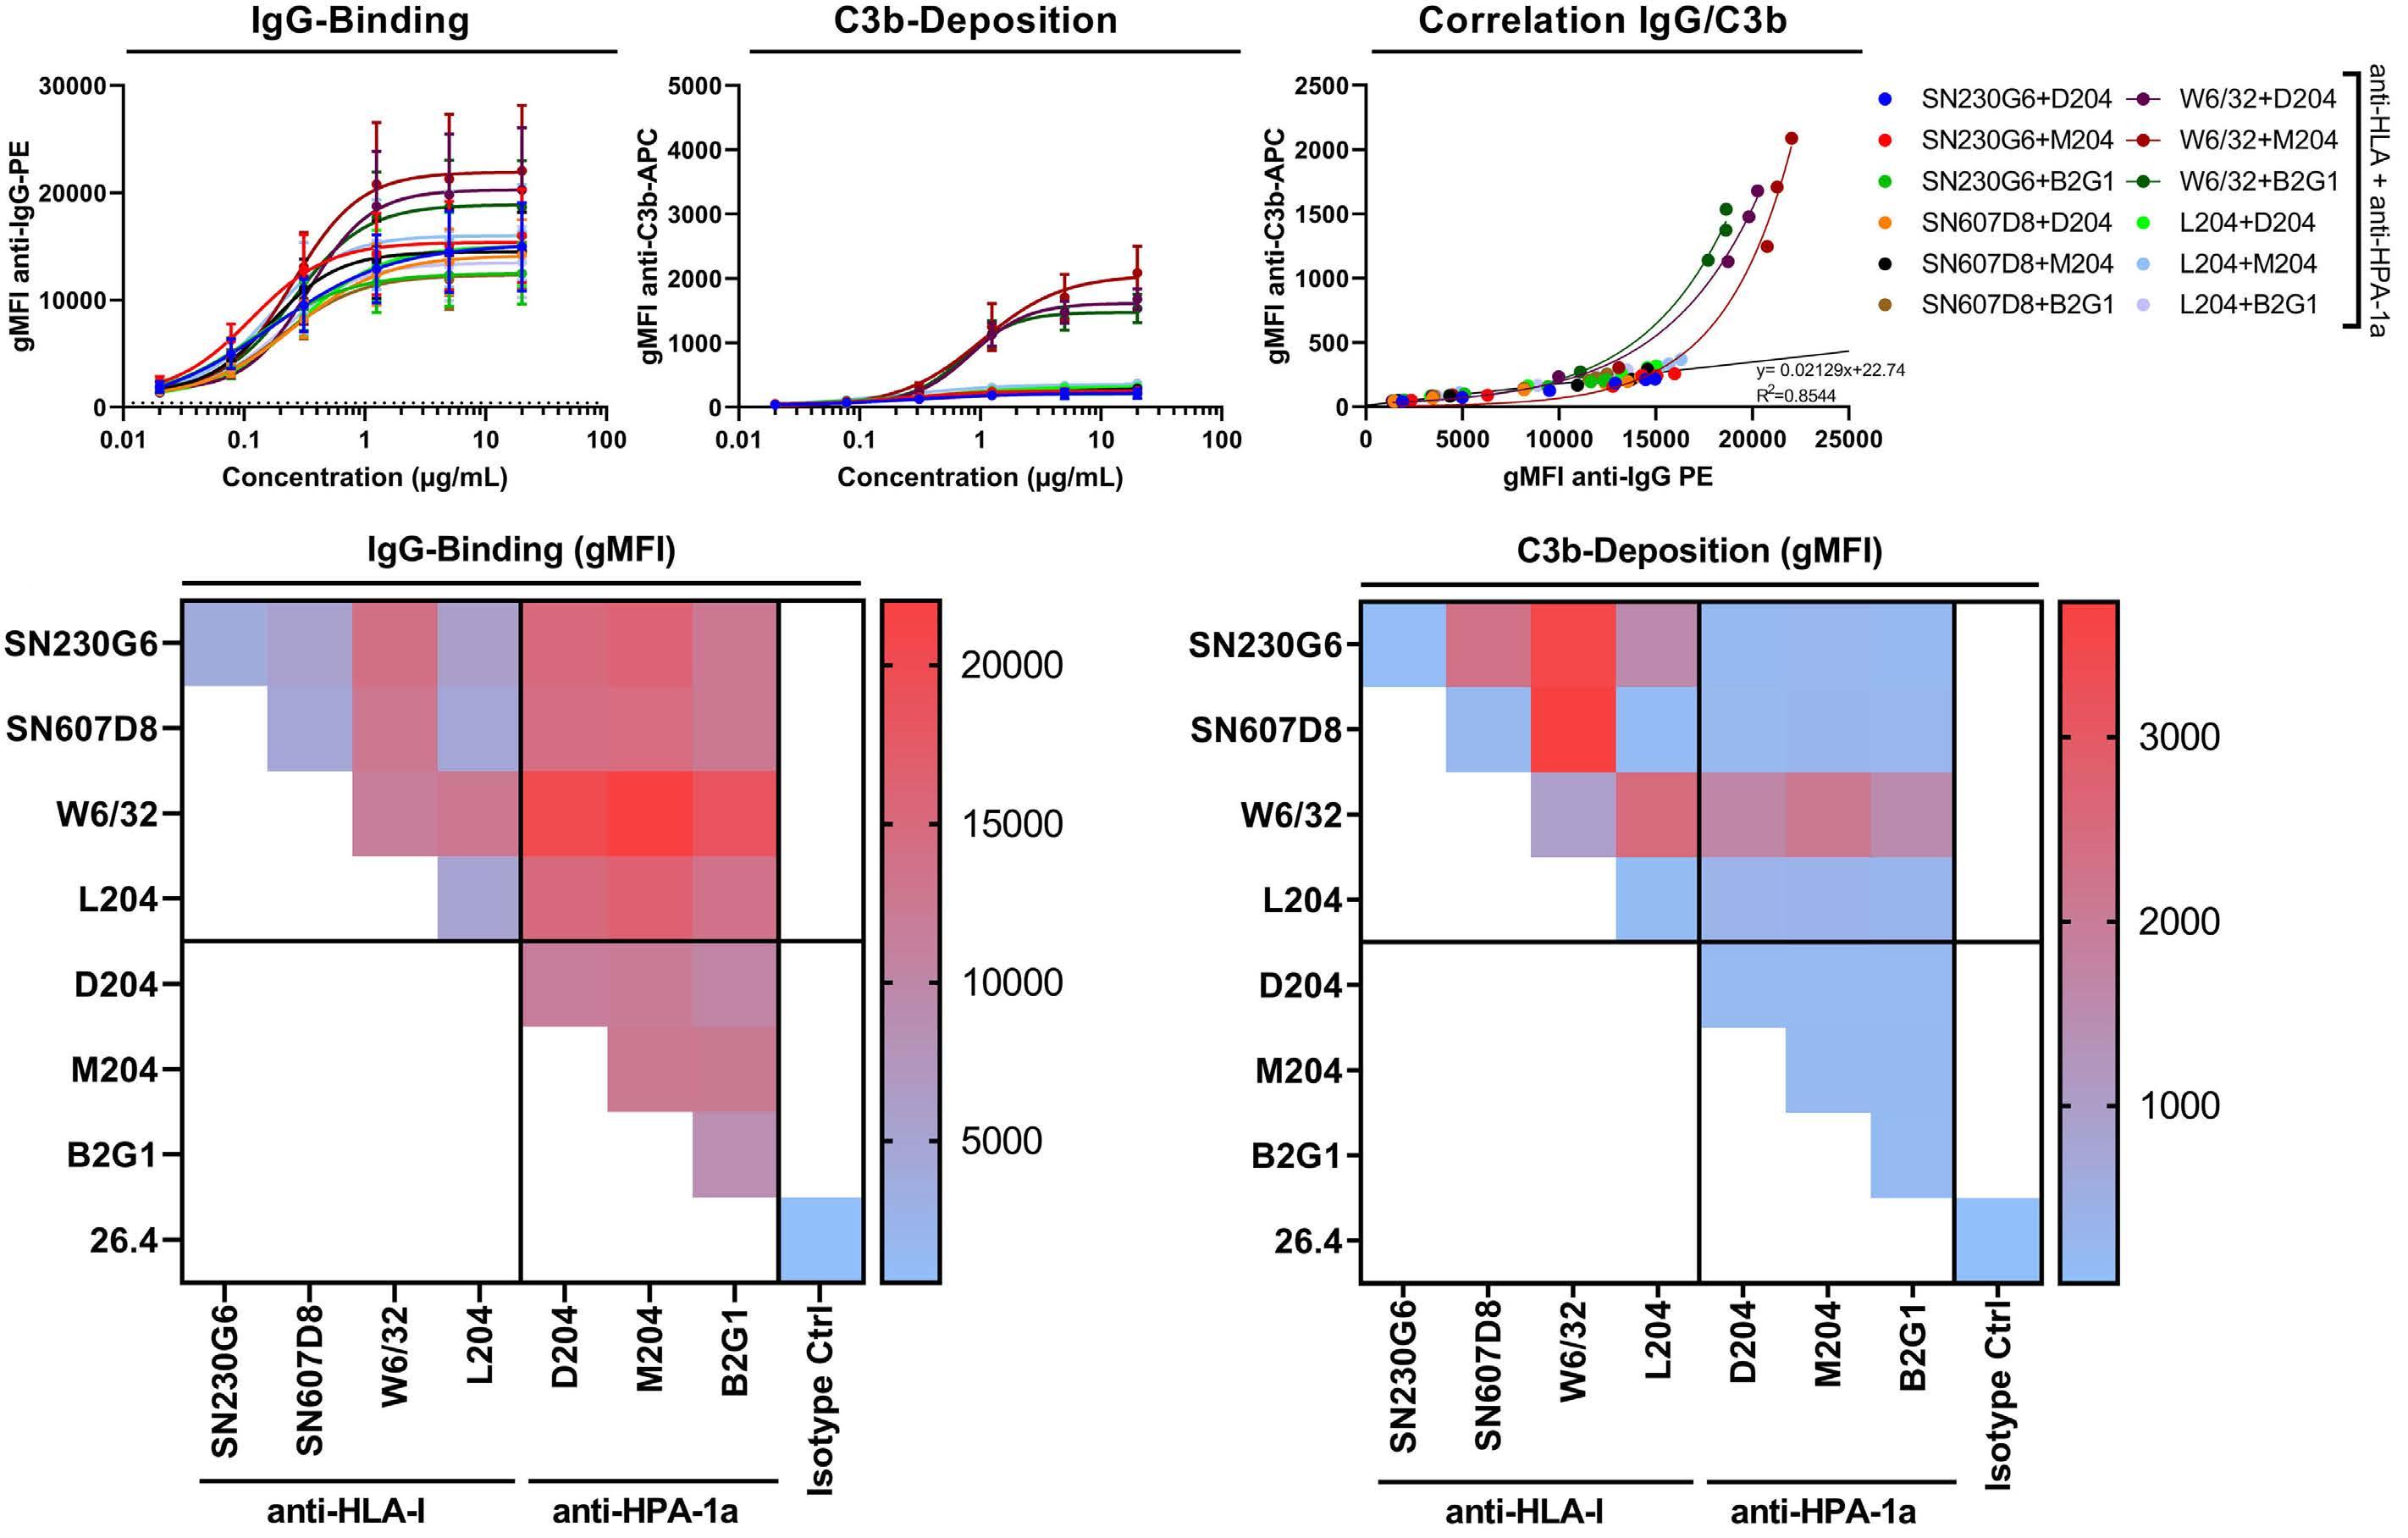
complement-richofpresencetheinantibodiesmonoclonalanti-HLAglycoengineeredofcombinationsofpropertiescomplement-activatingandBinding6.Figure serum. usingmeasuredweredepositionC3bandbindingC1qbinding,IgG fl theinbindingIgGshowingarrangedareDatacytometry.ow fi C1qG)),D,(A,columnrst eindependentthreerepresentdataTheI).F,(C,columnlasttheindepositionC3bandH),E,(B,columnsecondtheinbindingxperimentsusingaplateletdonorwith CurveHLA-A02/A26/B35/B44.HLA-typing:followingthe fi log(agonist)withcurvesdose-responseregressionnonlinearusingperformedwastingt versus –response geometric-meangMFI:8.0.2.PrismGraphpadinparameters)(fourslopevariable fl unmodiU:intensity;escenceuor fi acid.sialichighSial:galactose;highGal:ed;
BAC DEF GHI Haematologica | 107 October 2022 2439 ARTICLE - IgG glycans and complement activity on platelets T.L.J. van Osch et al.
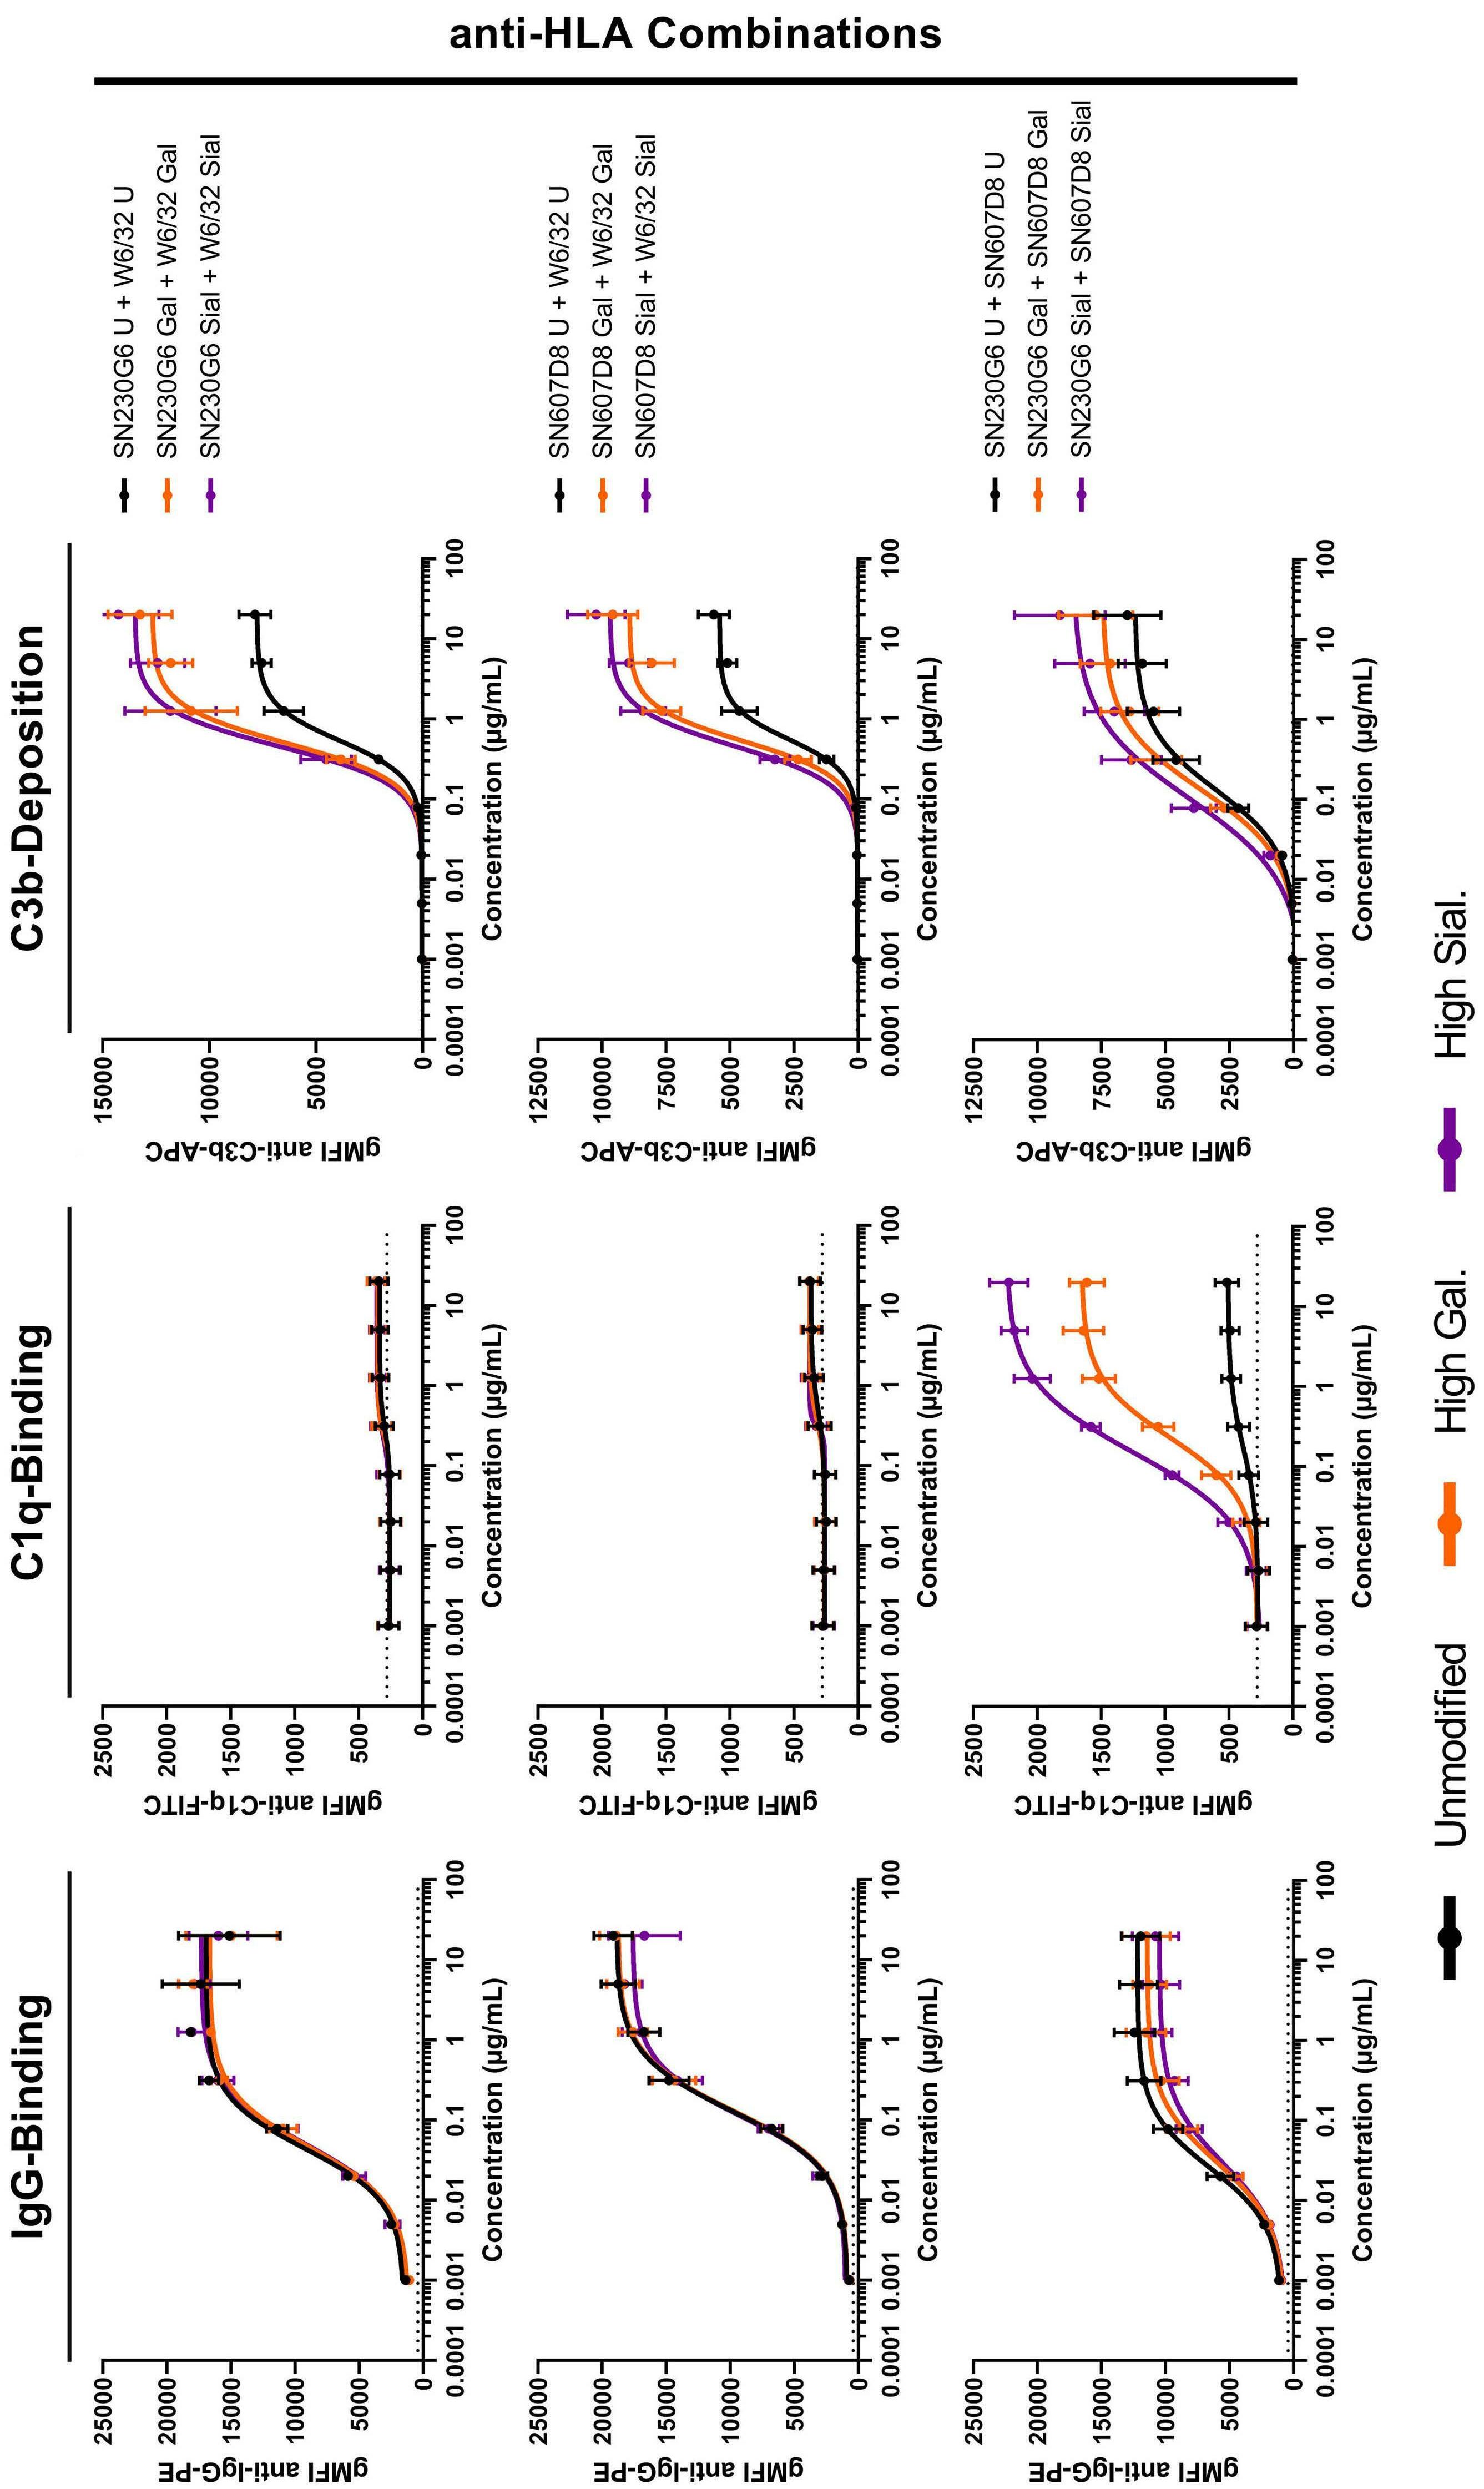
and Online Supplementary Figure S3C-F). An overview of the relative binding and complement deposition of all antibody combinations is depicted as heatmaps (Figure 5D, E), clearly illustrating the superior complement-acti vating potential of the anti-HLA antibodies, especially in combinations, and then particularly with the promiscuous W6/32, recognizing all HLA-I alleles.
We then investigated the IgG binding, C1q binding and C3b deposition of the same anti-HLA and anti-HPA-1a antibody combinations after glycoengineering, resulting in enhanced galactosylation and sialylation (Figures 6 and 7). As ex pected, no differences were observed for antigen-binding between IgG-glycovariants (Figure 6A, D, G and Figure 7A, D). C1q binding was particularly prominent for the com bination of SN230G6+SN607D8 and not for the combina tions with W6/32 (Figure 6B, E, H and Figure 7B, E). For the combination of SN230G6+SN607D8 a striking effect of elevated Fc galactosylation, and additionally of elevated sialylation, was observed, with a 4-fold increase in maxi mum C1q binding (Figure 6H, Online Supplementary Figure S4). Substantial effects of glycoengineering were also evi dent on C3b deposition for all antibody combinations (Fig
ure 6C, F, I and Figure 7C, F). Elevated Fc galactosylation increased C3b deposition 1.3- to 2-fold, compared to the unmodified antibody combinations (Online Supplementary Figure S4F-J), and the deposition was slightly further in creased, up to 2.5-fold, by elevated sialylation. These higher levels of complement deposition most likely translate into more complement-dependent lysis as more cell death was observed for these glycovariants, when performing the ex periments with non-fixed platelets (Online Supplementary Figure S5). When comparing the maximum responses of C1q binding and C3b deposition of all antibody combina tions, the differences between glycovariants were highly significant (Online Supplementary Figure S4). These results led to the conclusion that multiple anti-HLA antibodies, with different epitopes, are capable of binding to a single HLA-Class I molecule on the surface of pla telets in an allo-immune response (Figure 8A). The glycan composition of these antibodies, especially Fc galactosyl ation, affects Fc:Fc interactions (Figure 8B)24,25 and thereby promotes the formation of hetero-hexameric IgG com plexes between different anti-HLA antibodies but also be tween anti-HLA and anti-HPA-1a antibodies. These hexamers are the optimal platform for C1q to bind (Figure 8C), which subsequently activates the classical comple ment pathway, leading to the formation of the MAC-com plex and platelet lysis (Figure 8D).
Enhanced Fc galactosylation and sialyation of antiplatelet monoclonal antibodies enhance complement activation on platelets
Figure 7. Binding and complement-activating properties of combinations of glycoengineered anti-HPA-1a and anti-HLA mono clonal antibodies in the presence of complement-rich serum. IgG binding, C1q binding and C3b deposition were measured using flow cytometry. Data are arranged showing IgG binding in the first column (A, D), C1q binding in the second column (B, E), and C3b deposition in the last column (C, F). The data represent three independent experiments using different platelet donors with the following HLA-typing: HLA-A02/B35/B40 and HLA-A02/A24/B07/B35. Curve fitting was performed using nonlinear regression dose-response curves with log(agonist) versus response – variable slope (four parameters) in Graphpad Prism 8.0.2. gMFI: geo metric-mean fluorescence intensity; U: unmodified; Gal: high galactose; Sial: high sialic acid.
A B C D E F Haematologica | 107 October 2022 2440 ARTICLE - IgG glycans and complement activity on platelets T.L.J. van Osch et al.
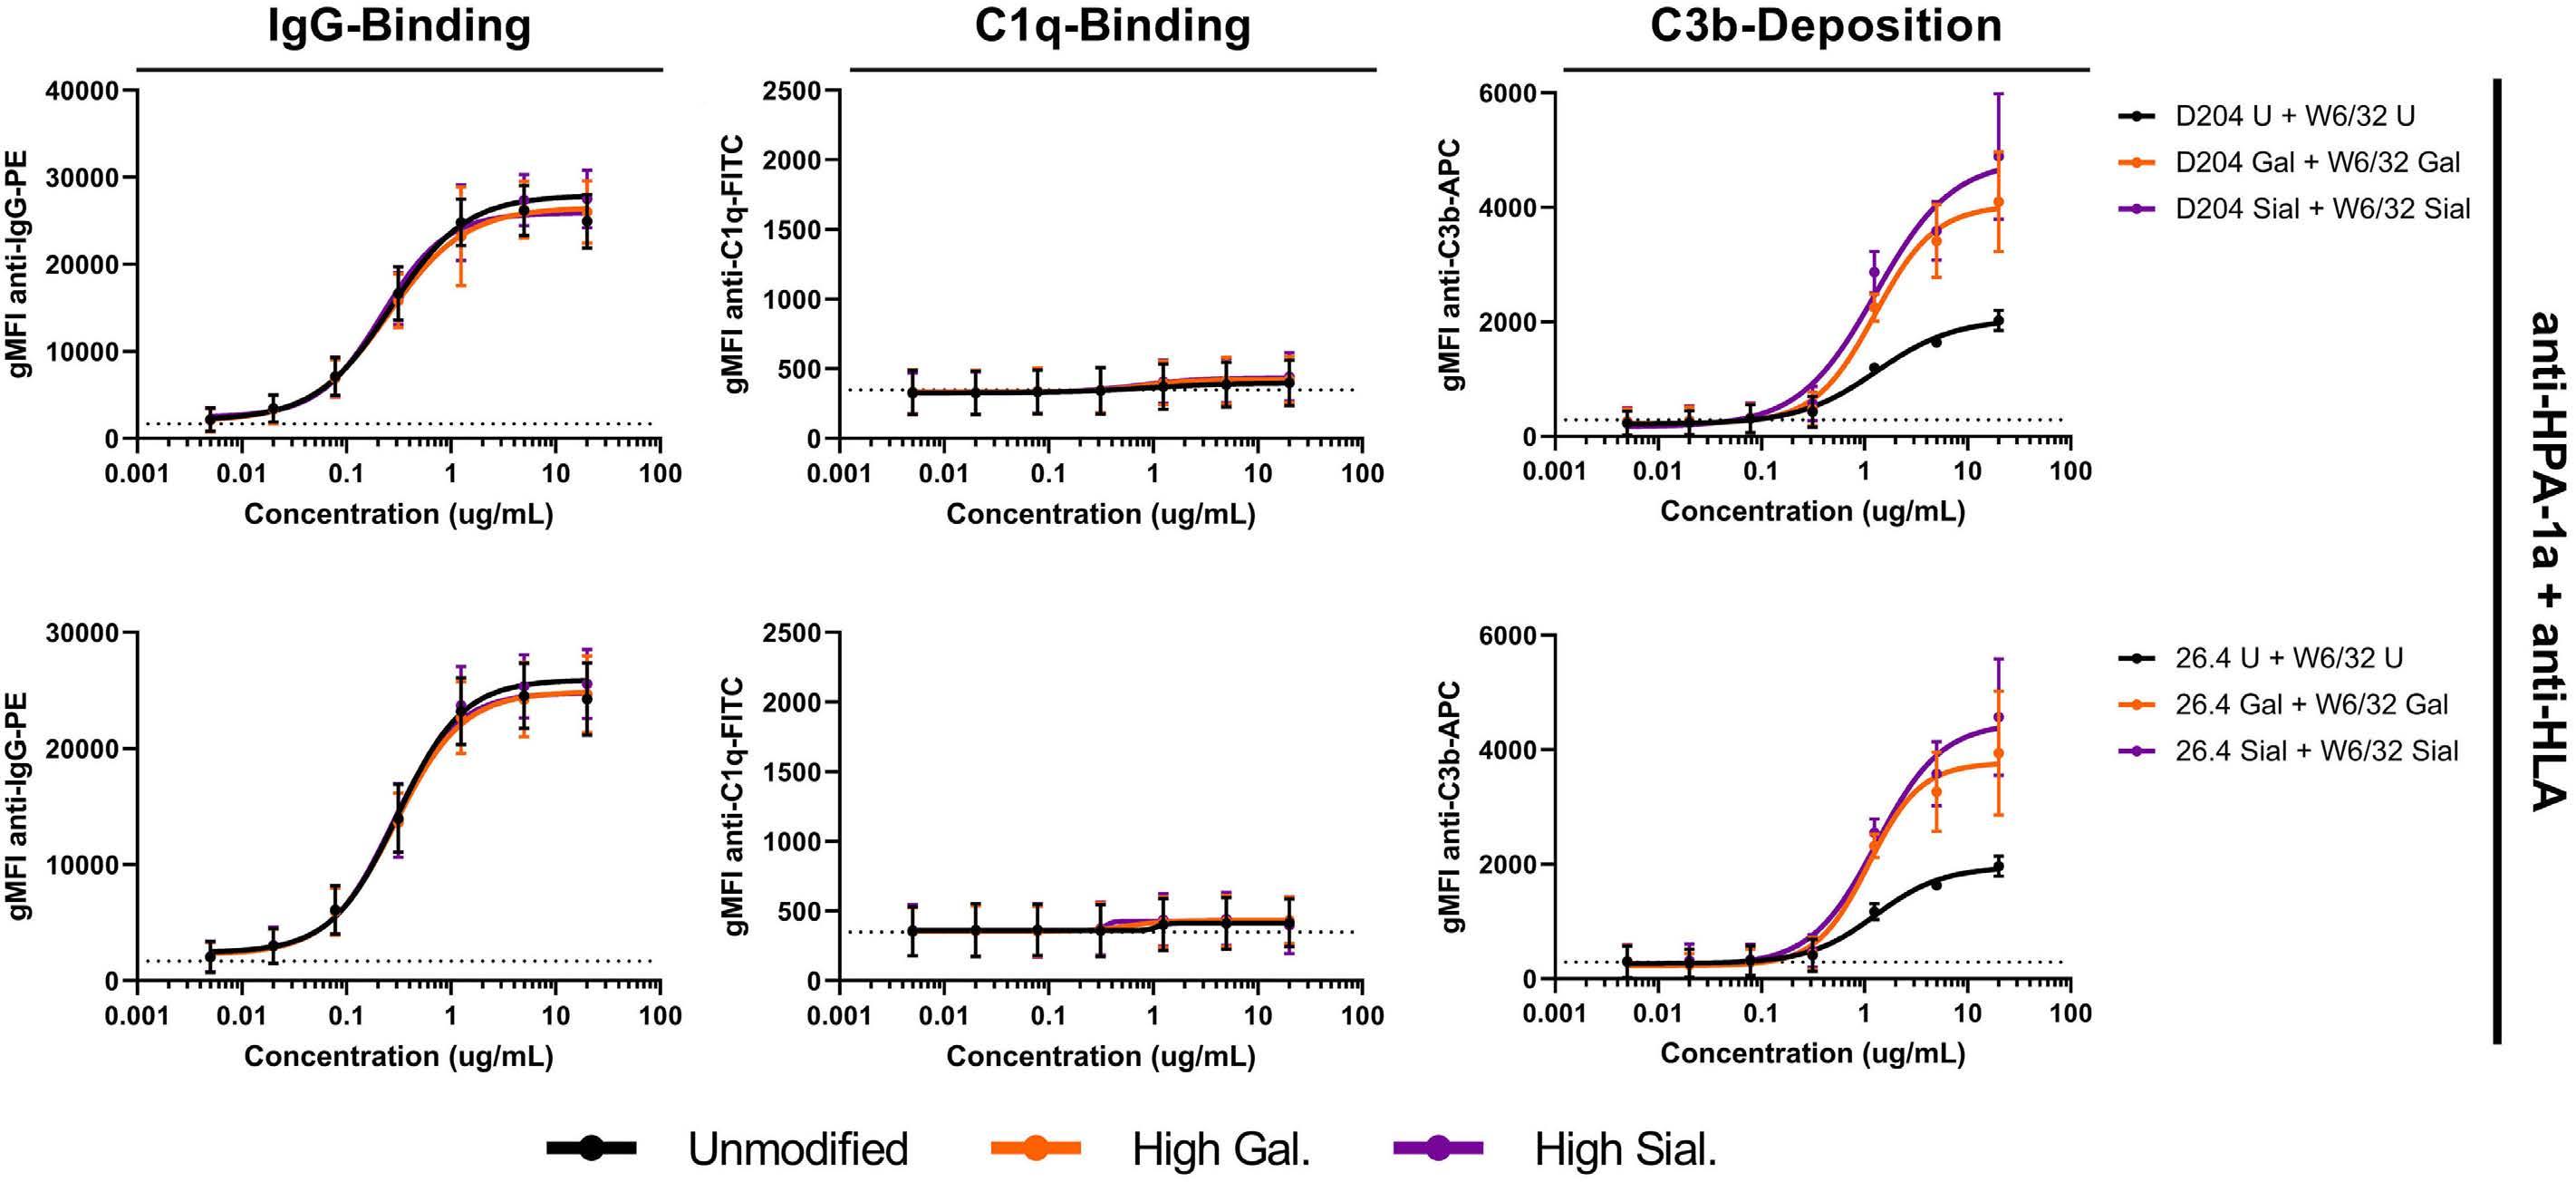
A B C D Haematologica | 107 October 2022 2441 ARTICLE - IgG glycans and complement activity on platelets T.L.J. van Osch et al.
Discussion
Anti-HLA and anti-HPA antibodies formed after preg nancies or incompatible platelet transfusions can play a devastating role in immune PR. They are responsible for the rapid clearance of donor platelets, theoretically via several immunological pathways, such as complementdependent cytotoxicity, antibody-dependent cellular cytotoxicity and antibody-dependent cellular phagocyto sis. The role of Fc γ R-mediated phagocytosis, in which opsonized platelets are phagocytosed by macrophages in the spleen, has been studied in detail and is an im portant clearance pathway.34–38 However, the role of the complement system, capable of both direct comple ment-dependent cytotoxicity and stimulation of myeloid antibody-dependent cellular phagocytosis through C3b opsonization, 39 in immune PR by anti-HLA or anti-HPA antibodies has been implied but inadequately investi gated in clinical studies.40 In contrast to solid organ
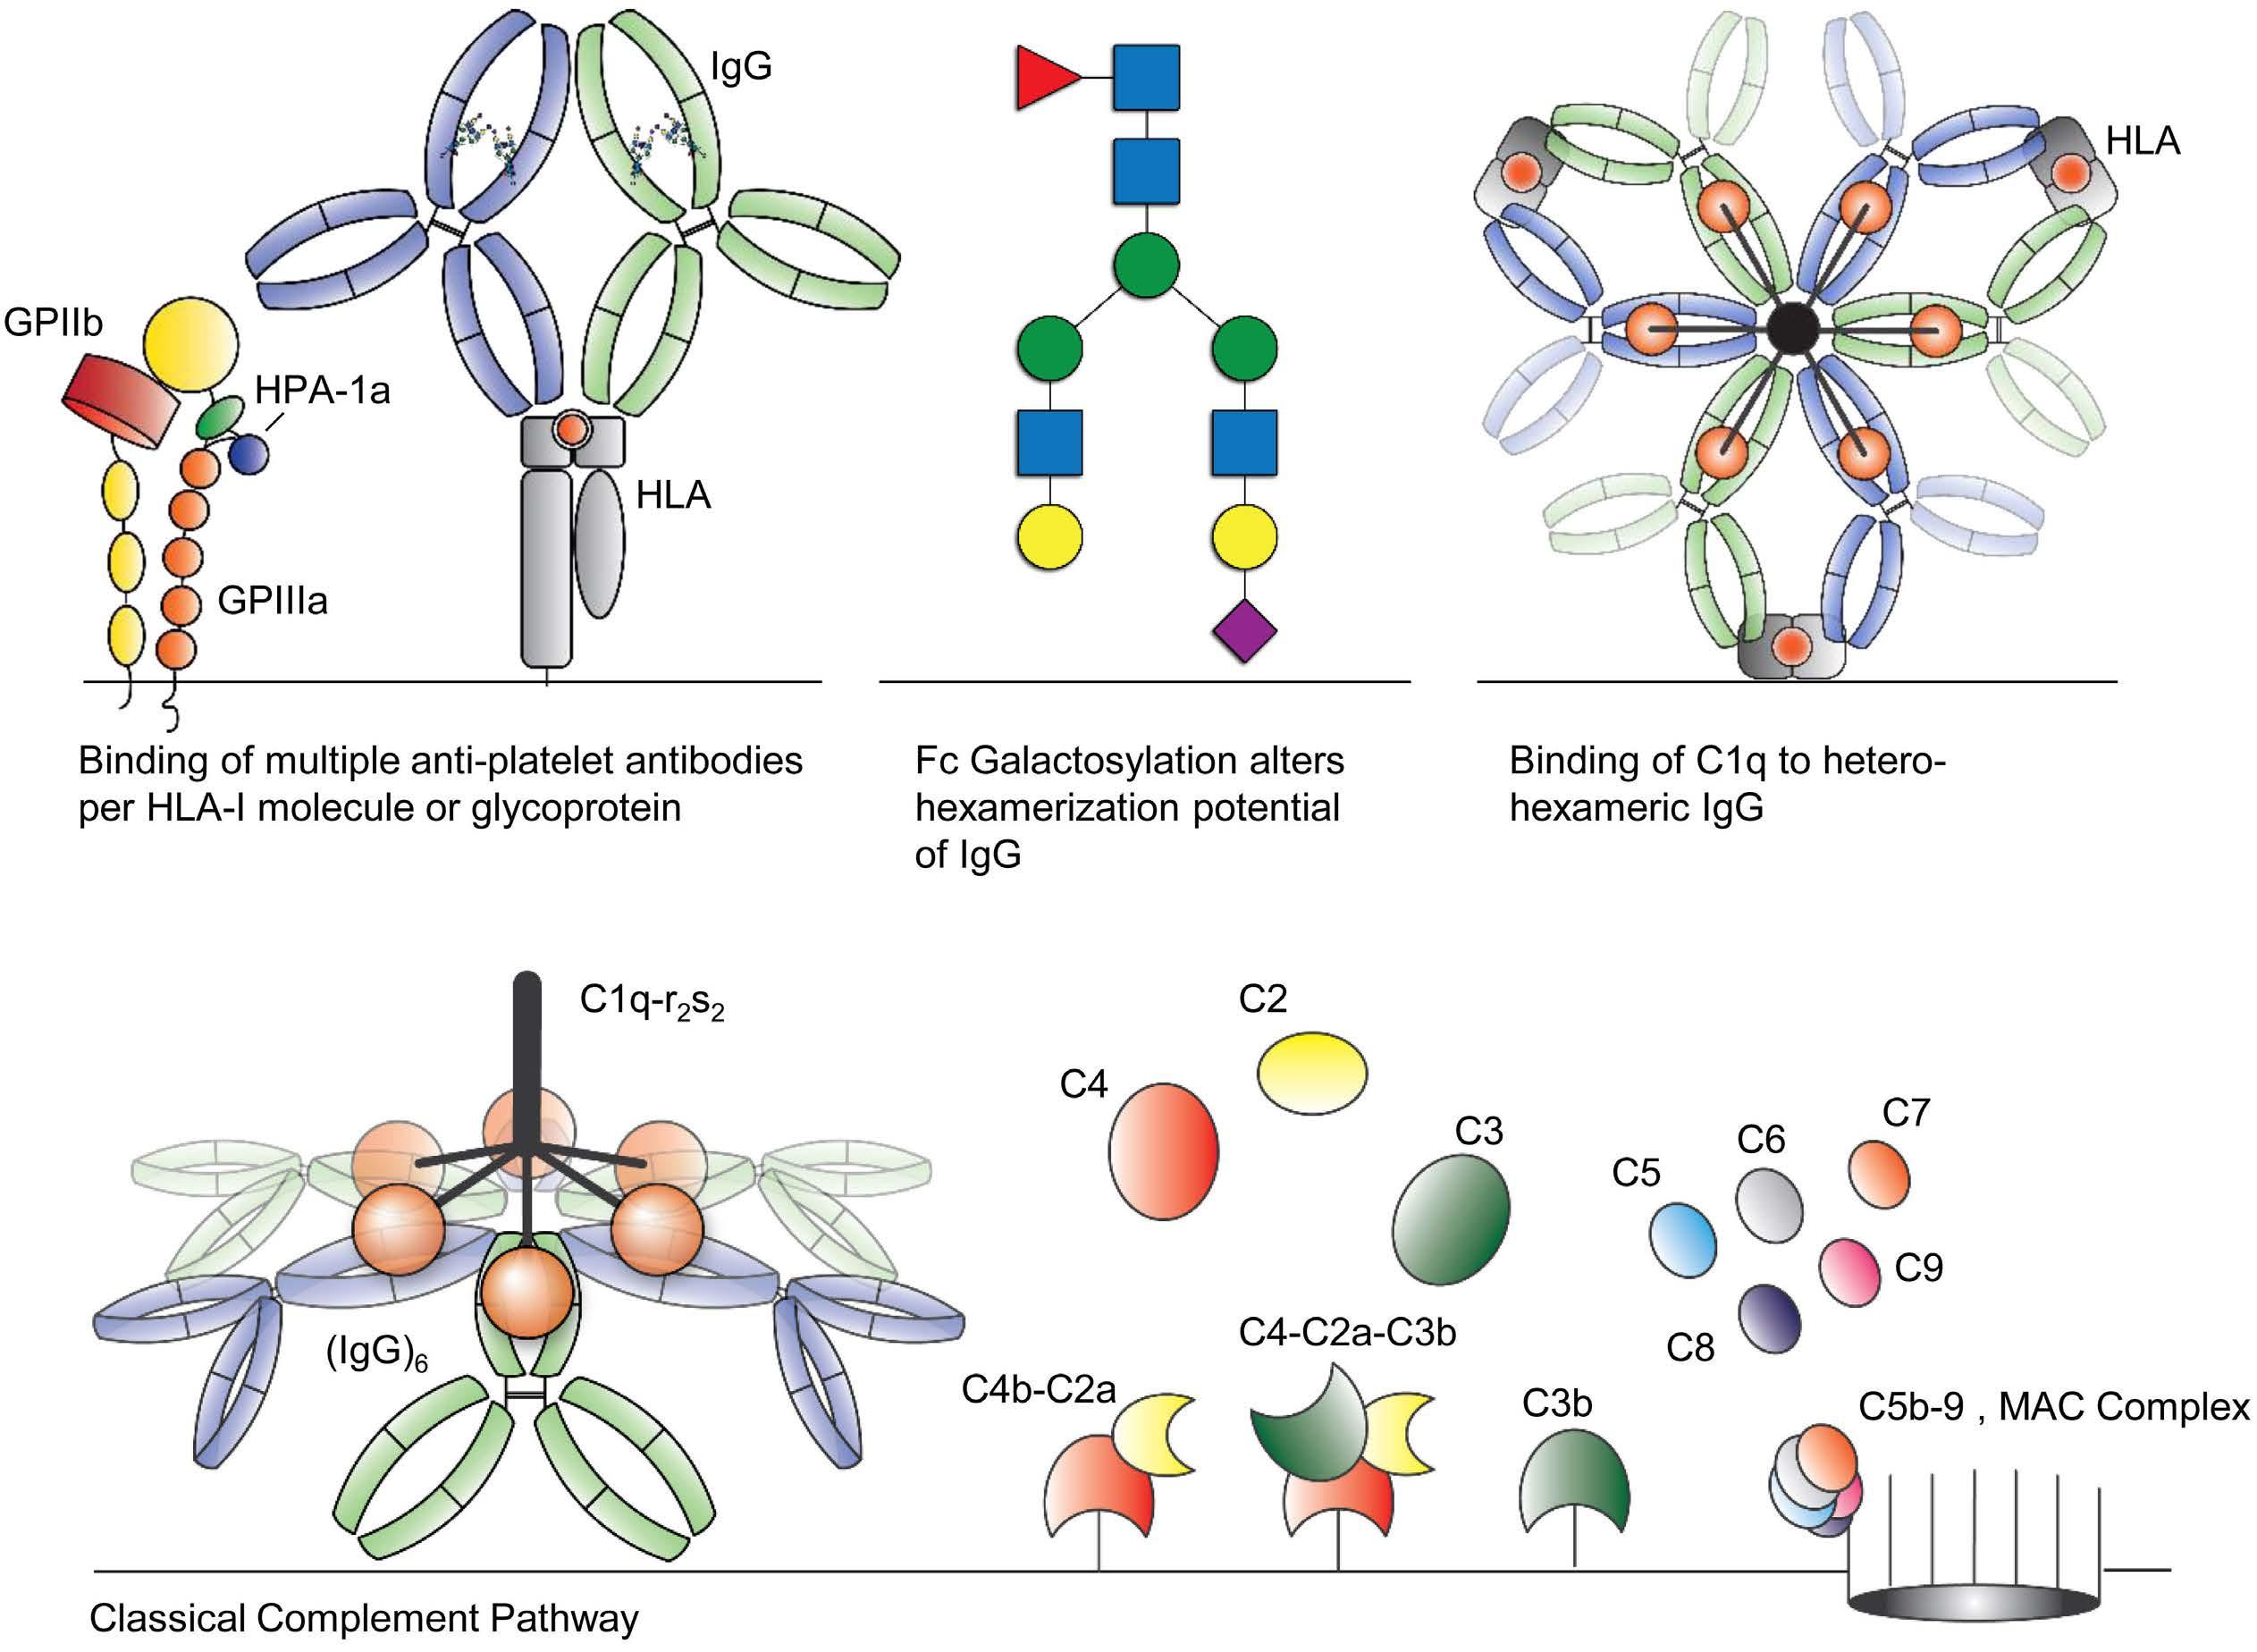
transplantation, in which C1q-binding anti-HLA anti bodies correlated with antibody-mediated rejection,41,42 Jackman et al. found no significant correlation between corrected platelet count increments and either C1q bind ing or low-level anti-HLA IgG antibodies.43,44 However, C1q-fixing solid-phase screening showed significantly better corrected count increments when compatible pla telets were selected for transfusion.45 Importantly, a pilot trial with the complement inhibitor eculizumab showed that a single injection resolved PR in four out of ten pa tients.46 Platelet activation is also known to induce com plement activation47–49 and prolonged storage of platelet concentrates could lead to increased levels of comple ment components (C4d, C3a, C5a and C5b-9), which can accelerate the complement cascade once they are trans fused into patients. 50 Furthermore, in vitro work has clearly shown the ability of anti-HLA and anti-HPA anti bodies to activate the complement system on the sur face of human platelets.14,51–54 Together, these results
Figure 8. The alloimmune response leading to platelet lysis following transfusion of incompatible platelets. (A-D) Incompatible platelet transfusions result in the formation of anti-platelet antibodies, which can be directed against HLA and/or HPA. A poly clonal antibody response will lead to the binding of multiple antibodies, recognizing different epitopes, to a single HLA-class I molecule or glycoprotein on the surface of platelets. Fc-glycosylation affects the potential of antibodies to form hetero-hexamers with neighboring Fc-tails. These hexamers are the optimal platform for C1q, leading to activation of the C1q-r2-s2 complex, starting the complement cascade by depositing C4b and C3b in the process, which ultimately leads to the formation of the membrane attack complex and lysis of platelets. MAC: membrane attack complex.
One of the factors that can affect the complement-acti vating properties of an antibody is its Fc glycosylation composition.20,22 We previously found that the Fc glyco sylation profile of anti-HLA antibodies in patients with PR showed varying levels of galactosylation (~40-80%), bisection (~5-30%) and sialylation (~3-30%).19 Interest ingly, fucosylation levels were comparable to those of the total IgG1 (~85-100%), whereas afucosylated IgG are specifically evoked in alloimmune responses, i.e., antiHPA-1a alloantibodies in fetal neonatal alloimmune thrombocytopenia,19,23 and against enveloped viruses. Afucosylated IgG increases the binding affinity to FcγRIIIa and FcγRIIIb by approximately 20- to 40-fold and directly translates into increased associated effector functions.19–21,23,55–57 Fc galactosylation and sialylation of antigen-spe cific IgG is often increased after recent or active immunization, as seen after COVID-19 infection,21 vacci nation 58,59 or alloimmunization.19,23 While bisection has been reported to have no effect on either complement or Fc-receptor binding or function, galactosylation has been found to enhance complement activity through in creased C1q binding.20,22,25 The effect of Fc sialylation on complement activity is less clear. On the one hand, Quast et al. showed that Fc sialylation impaired comple ment-dependent cytotoxicity,60 whereas Dekkers et al and Wada et al. found slightly increased C1q binding by sialylated IgG1.20,6 Here, we mimicked the Fc glycosylation profile of antiHLA monoclonal antibodies as observed in patients with PR, using glycoengineering. We have observed that antiHLA monoclonal antibodies with different epitopes are able to bind to the same HLA molecules and interact with each other to activate the complement system. This synergy was especially observed for anti-HLA antibodies and only between anti-HLA and anti-HPA-1a antibodies in combination with W6/32. Thus, despite significant IgG binding, not all antibody combinations were able to form hetero-hexamers and thereby initiate the classical com plement pathway. Overall, the more antibodies with noncompeting epitopes, the more antibodies will bind to the surface of platelets, resulting in more antibodies in close vicinity, enabling Fc:Fc interaction and hetero-hexamer formation, leading to complement activation. When only a single monoclonal antibody is present, either anti-HLA or anti-HPA-1a, the antibody density is too low or the distance between antibodies is too large to form hex amers. In this study, platelet donors were primarily se lected on the basis of expression of HLA-A2, which was the only HLA class I (A, B or C) matching the antibody specificity of SN230G6, SN607D8 and L204. W6/32 binds all HLA class I, 33 which possibly explains why it is the
Furthermore, elevated Fc galactosylation increased the complement-activating properties of anti-HLA and antiHPA-1a monoclonal antibody combinations and a minor contributing effect was observed for elevated Fc sialyla tion. These results are in agreement with reports de scribing increased complement activation by elevated Fc galactosylation,20,22,25,60 which enhances the Fc:Fc inter action and hexamerization of IgG and thereby improves C1q binding and downstream complement activation.24,25 We also noted slightly increased complement deposition after opsonization of platelets with antibodies engin eered to have elevated levels of sialylation, which is in line with our previous results using antibodies to model antigens (TNP and biotin).20,24
No conflicts of interest to disclose.
T.L.J. van
only anti-HLA monoclonal antibody for which synergy with anti-HPA-1a monoclonal antibodies was observed. We hypothesize that either its binding epitope or the overall antibody density is of importance.
strongly implicate complement in the pathogenesis lead ing to platelet clearance by anti-HLA or anti-HPA anti bodies in immune PR.
In conclusion, a single anti-HLA or anti-HPA-1a mono clonal antibody is an insufficient representation of the in vivo opsonization of donor platelets in a patient after a polyclonal alloantibody response, leading to immune PR. It is the interaction between antibodies that leads to ef ficient activation of the complement system, initiating complement-dependent lysis and/or opsonization for subsequent phagocytosis of platelets. Furthermore, the anti-HLA antibodies observed in PR patients are highly galactosylated and occasionally sialylated, which en hance the complement-activating properties of the anti bodies even further. Our work provides more insight into the mechanisms of classical complement activation by anti-platelet antibodies, which can be formed as a con sequence of alloimmunization in fetal-neonatal alloim mune thrombocytopenia and immune PR but also in auto-immune diseases, such as immune thrombo cytopenia. It especially highlights the importance of pretransfusion HLA and HPA-matching between donor and recipient or functional matching based on the comple ment-activating potential of patients’ antibodies. Fur thermore, our work also underscores the findings of the pilot trial by Vo et al.46 that inhibition of complement ac tivation could improve the effectiveness of platelet transfusions in HLA or HPA immunized patients. However, larger randomized trials are required to investigate this further.
Disclosures
Haematologica | 107 October 2022 2442 ARTICLE - IgG glycans and complement activity on platelets
Osch et al.
We also found that measurement of C1q binding to al loantibody opsonized platelets was a less suitable bio marker for complement activation on platelets compared to measurement of C3b deposition, most likely due to the low affinity of C1q to IgG as opposed to covalent binding of activated C3b to targets.
10. Bougie DW, Wilker PR, Aster RH. Patients with quinine-induced immune thrombocytopenia have both “drug-dependent” and “drug-specific” antibodies. Blood. 2006;108(3):922-927.
4. Hess JR, Trachtenberg FL, Assmann SF, et al. Clinical and laboratory correlates of platelet alloimmunization and refractoriness in the PLADO trial. Vox Sang. 2016;111(3):281-291.
TLJvO, RK, LP, CEvS, MdH, MW, JV and GV designed and supervised the experimental work. TLJvO, JJO, AEHB, CAMK and JN performed experiments and collected data. DMG, JYM, WJEvE, AM and SH developed vital reagents. TLJvO and GV wrote the manuscript, which was edited by all authors. All authors analyzed and interpreted data and approved the manuscript.
18. Ugurlar D, Howes SC, de Kreuk B-J, et al. Structures of C1-IgG1 provide insights into how danger pattern recognition activates complement. Science. 2018;359(6377):794-797.
Acknowledgments
2. Bub CB, Gonçalez AC, Barjas Castro ML, Castro V. Prospective evaluation of platelet refractoriness in haematological patients in a single Brazilian institution. ISBT Sci Ser. 2021;16(1):2-11.
11. Kekomäki S, Volin L, Koistinen P, et al. Successful treatment of platelet transfusion refractoriness: The use of platelet transfusions matched for both human leucocyte antigens (HLA) and human platelet alloantigens (HPA) in alloimmunized patients with leukaemia. Eur J Haematol. 1998;60(2):112-118.
27. Daga S, Moyse H, Briggs D, et al. Human immunology direct quantitative measurement of the kinetics of HLA-specific antibody interactions with isolated HLA proteins. Hum Immunol. 2017;:79(2):122-128.
8. Pavenski K, Warkentin TE, Shen H, Liu Y, Heddle NM. Posttransfusion platelet count increments after ABO compatible versus ABO incompatible platelet transfusions in noncancer patients: an observational study. Transfusion. 2010;50(7):1552-1560.
The authors would like to thank David E. Schmidt and Zoltan Szittner for sharing their knowledge during helpful dis cussions.
et al.
23. Sonneveld ME, Natunen S, Sainio S, et al. Glycosylation pattern of anti-platelet IgG is stable during pregnancy and predicts clinical outcome in alloimmune thrombocytopenia. Br J Haematol. 2016;174(2):310-320.
3. Hu X, Cai H, Zheng L, et al. Clinical and immunological features of platelet transfusion refractoriness in young patients with de novo acute myeloid leukemia. Cancer Med. 2020;9(14):49414948.
12. Garratty G, Heal JM, MacPherson BR, et al. Selection of platelets for refractory patients by HLA matching and prospective crossmatching. Transfusion. 1992;32(7):633-640.
21. Larsen MD, de Graaf EL, Sonneveld ME, et al. Afucosylated IgG characterizes enveloped viral responses and correlates with COVID-19 severity. Science. 2021;371(6532):eabc8378.
25. Wei B, Gao X, Cadang L, et al. Fc galactosylation follows consecutive reaction kinetics and enhances immunoglobulin G hexamerization for complement activation. MAbs. 2021;13(1):1893427.
20. Dekkers G, Treffers L, Plomp R, et al. Decoding the human immunoglobulin G-glycan repertoire reveals a spectrum of Fcreceptor- and complement-mediated-effector activities. Front Immunol. 2017;8:877.
Data can be requested by contacting Dr. Gestur Vidarsson (G.Vidarsson@sanquin.nl).
28. Duquesnoy RJ, Marrari M, Jelenik L, Zeevi A, Claas FHJ, Mulder A. Structural aspects of HLA class I epitopes reacting with human monoclonal antibodies in Ig-binding, C1q-binding and lymphocytotoxicity assays. Hum Immuno.l 2013;74(10):1271-1279.
26. Mulder A, Eijsink C, Kester MGD, et al. Impact of peptides on the recognition of HLA class I molecules by human HLA antibodies. J Immunol. 2005;175(9):5950-5957.
9. Aster RH, Bougie DW. Drug-induced immune thrombocytopenia. N Engl J Med. 2007;357(6):580-587.
T.L.J. van Osch
Haematologica | 107 October 2022 2443 ARTICLE - IgG glycans and complement activity on platelets
Data-sharing statement
17. Diebolder CA, Beurskens FJ, De Jong RN, et al. Complement is activated by IgG hexamers assembled at the cell surface. Science. 2014;343(6176):1260-1263.
transfusion refractoriness in patients with acute myelogenous leukemia who undergo autologous stem cell transplantation. Bone Marrow Transplant. 2000;26(3):315-320.
14. Rijkers M, Schmidt D, Lu N, et al. Anti-HLA antibodies with complementary and synergistic interaction geometries promote classical complement activation on platelets. Haematologica. 2018;104(2):403-416.
22. Peschke B, Keller CW, Weber P, Quast I, Lünemann JD. Fcgalactosylation of human immunoglobulin gamma isotypes improves C1q binding and enhances complement-dependent cytotoxicity. Front Immunol. 2017;8:646
1. Saris A, Pavenski K. Human leukocyte antigen alloimmunization and alloimmune platelet refractoriness. Transfus Med Rev. 2020;34(4):250-257.
References
5. Comont T, Tavitian S, Bardiaux L, et al. Platelet transfusion refractoriness in patients with acute myeloid leukemia treated by intensive chemotherapy. Leuk Res. 2017;61:62-67.
24. van Osch TLJ, Nouta J, Derksen NIL, et al. Fc galactosylation promotes hexamerization of human IgG1, leading to enhanced classical complement activation. J Immunol. 2021;207(6):1545-1554.
7. Vassallo RR. Recognition and management of antibodies to human platelet antigens in platelet transfusion-refractory patients. Immunohematology. 2009;25(3):119-124.
16. Kerkhoffs JLH, Eikenboom JCJ, Van De Watering LMG, Van Wordragen-Vlaswinkel RJ, Wijermans PW, Brand A. The clinical impact of platelet refractoriness: correlation with bleeding and survival. Transfusion. 2008;48(9):1959-1965.
13. Rioux-Massé B, Cohn C, Lindgren B, Pulkrabek S, McCullough J. Utilization of cross-matched or HLA-matched platelets for patients refractory to platelet transfusion. Transfusion. 2014;54(12):3080-3087.
Contributions
19. Kapur R, Kustiawan I, Vestrheim A, et al. A prominent lack of IgG1-Fc fucosylation of platelet alloantibodies in pregnancy. Blood. 2014;123(4):471-480.
15. Toor AA, Choo SY, Little JA. Bleeding risk and platelet
6. Pavenski K, Freedman J, Semple JW. HLA alloimmunization against platelet transfusions: Pathophysiology, significance, prevention and management. Tissue Antigens. 2012;79(4):237-245.
38. Audia S, Santegoets K, Laarhoven AG, et al. Fcγ receptor expression on splenic macrophages in adult immune thrombocytopenia. Clin Exp Immunol. 2017;188(2):275-282.
54. Peerschke EIB, Andemariam B, Yin W, Bussel JB. Complement activation on platelets correlates with a decrease in circulating immature platelets in patients with immune thrombocytopenic purpura. Br J Haematol. 2010;148(4):638-645.
40. Meinke S, Karlström C, Höglund P. Complement as an Immune Barrier in Platelet Transfusion Refractoriness. Transfus Med Rev. 2019;33(4):231-235.
46. Vo P, Purev E, West KA, et al. A pilot trial of complement inhibition using eculizumab to overcome platelet transfusion refractoriness in human leukocyte antigen allo-immunized patients. Br J Haematol. 2020;189(3):551-558.
55. Wuhrer M, Porcelijn L, Kapur R, et al. Regulated glycosylation patterns of IgG during alloimmune responses against human platelet antigens. J Proteome Res. 2009;8(2):450-456.
39. Vidarsson G, Van De Winkel JGJ. Fc receptor and complement receptor-mediated phagocytosis in host defence. Curr Opin Infect Dis. 1998;11(3):271-278.
48. Del Conde I, Crúz MA, Zhang H, López JA, Afshar-Kharghan V. Platelet activation leads to activation and propagation of the complement system. J Exp Med. 2005;201(6):871-879.
33. Barnstable CJ, Bodmer WF, Brown G, et al. Production of monoclonal antibodies to group A erythrocytes, HLA and other human cell surface antigens-new tools for genetic analysis. Cell. 1978;14(1):9-20.
42. Cohn CS. Platelet transfusion refractoriness: how do I diagnose and manage? Hematol Am Soc Hematol Educ Program. 2020;2020(1):527-532.
32. Visentin J, Leu DL, Mulder A, et al. Measuring anti-HLA antibody active concentration and affinity by surface plasmon resonance: comparison with the luminex single antigen flow beads and T-cell flow cytometry crossmatch results. Mol Immunol. 2019;108:34-44.
43. Jackman RP, Lee JH, Pei R, et al. C1q-binding anti-HLA antibodies do not predict platelet transfusion failure in Trial to Reduce Alloimmunization to Platelets study participants. Transfusion. 2016;56(6):1442-1450.
47. Hamad OA, Nilsson PH, Wouters D, Lambris JD, Ekdahl KN, Nilsson B. Complement component C3 binds to activated normal platelets without preceding proteolytic activation and promotes binding to complement receptor 1. J Immunol. 2010;184(5):2686-2692.
57. Temming AR, de Taeye SW, de Graaf EL, et al. Functional attributes of antibodies, effector cells, and target cells affecting NK cell–mediated antibody-dependent cellular cytotoxicity. J Immunol. 2019;203(12):3126-3135.
41. Chen G, Sequeira F, Tyan DB. Novel C1q assay reveals a clinically relevant subset of human leukocyte antigen antibodies independent of immunoglobulin G strength on single antigen beads. Hum Immunol. 2011;72(10):849-858.
52. Najaoui A, Bakchoul T, Stoy J, et al. Autoantibody-mediated complement activation on platelets is a common finding in patients with immune thrombocytopenic purpura (ITP). Eur J Haematol. 2012;88(2):167-174.
36. Rijkers M, Saris A, Heidt S, et al. A subset of anti-HLA antibodies induces FcγRIIa-dependent platelet activation. Haematologica. 2018;103(10):1741-1752.
58. Selman MHJ, De Jong SE, Soonawala D, et al. Changes in antigen-specific IgG1 Fc N-glycosylation upon influenza and tetanus vaccination. Mol Cell Proteomics. 2012;11(4):1-10.
30. Griffin HM, Ouwehand WH. A human monoclonal antibody specific for the leucine-33 (Ps(A1) HPA-1a) form of platelet glycoprotein IIIa from a V gene phage display library. Blood. 1995;86(12):4430-4436.
platelets
49. Peerschke EIB, Yin W, Grigg SE, Ghebrehiwet B. Blood platelets activate the classical pathway of human complement. J Thromb Haemost. 2006;4(9):2035-2042.
solid-phase screening for HLA antibodies increases the availability of compatible platelet components for refractory patients. Transfusion. 2011;51(12):2611-2618.
T.L.J.
van Osch et al.
50. Chen J, Losos M, Yang S, Li J, Wu H, Cataland S. Increased complement activation during platelet storage. Transfusion. 2017;57(9):2182-2188.
37. Aslam R, Kapur R, Segel GB, et al. The spleen dictates platelet destruction, anti-platelet antibody production, and lymphocyte distribution patterns in a murine model of immune thrombocytopenia. Exp Hematol. 2016;44(10):924-930.
59. Wang TT, Maamary J, Tan GS, et al. Anti-HA glycoforms drive B cell affinity selection and determine influenza vaccine efficacy. Cell. 2015;162(1):160-169.
45. Fontaine MJ, Kuo J, Chen G, et al. Complement (C1q) fixing
56. Vidarsson G, Dekkers G, Rispens T. IgG subclasses and allotypes: from structure to effector functions. Front Immunol. 2014;5:1-17.
29. Congy-Jolivet N, Drocourt D, Portet S, Tiraby G, Blancher A. Production and characterization of chimeric anti-HLA monoclonal antibodies targeting public epitopes as tools for standardizations of the anti-HLA antibody detection. J Immunol Methods. 2013;390(1-2):41-51.
44. Jackman RP, Deng X, Bolgiano D, et al. Low-level HLA antibodies do not predict platelet transfusion failure in TRAP study participants. Blood. 2013;121(16):3261-3266.
31. Eksteen M, Tiller H, Averina M, et al. Characterization of a human platelet antigen-1a–specific monoclonal antibody derived from a B cell from a woman alloimmunized in pregnancy. J Immunol. 2015;194(12):5751-5760.
35. Grozovsky R, Hoffmeister KM, Falet H. Novel clearance mechanisms of platelets. Curr Opin Hematol. 2010;17(6):585-589.
53. Tsubakio T, Tani P, Curd JG, Mcmillan R. Complement activation in vitro by antiplatelet antibodies in chronic immune thrombocytopenic purpura. Br J Haematol. 1986;63(2):293-300.
34. Badlou BA, Ya PW, Smid WM, Akkerman JWN. Platelet binding and phagocytosis by macrophages. Transfusion. 2006;46(8):1432-1443.
61. Wada R, Matsui M, Kawasaki N. Influence of N-glycosylation on effector functions and thermal stability of glycoengineered IgG1 monoclonal antibody with homogeneous glycoforms. MAbs. 2019;11(2):350-372. on
60. Quast I, Keller CW, Maurer MA, et al. Sialylation of IgG Fc domain impairs complement-dependent cytotoxicity. J Clin Invest. 2015;125(11):4160-4170.
Haematologica | 107 October 2022 2444 ARTICLE - IgG glycans and complement activity
51. Meinke S, Sandgren P, Mörtberg A, et al. Platelets made HLA deficient by acid treatment aggregate normally and escape destruction by complement and phagocytes in the presence of HLA antibodies. Transfusion. 2016;56(2):370-382.
Haematologica | 107 October 2022 2445 ARTICLE - Platelet Biology & its Disorders
Received: November 8, 2021.
1Regional University Hospital Center of Tours, Department of Hemostasis, Tours, France; 2University of Tours, EA7501 GICC, Tours, France; 3University Medicine Greifswald, Institute for Immunology and Transfusion Medicine, Greifswald, Germany and 4University of Lille, Inserm, Lille University Hospital Center, U1172-LilNCog-Lille Neuroscience and Cognition, Lille, France
Accepted: March 31, 2021.
Vaccine-induced immune thrombotic thrombocytopenia (VITT) is a rare but very serious complication of recom binant adenoviral vector vaccines used to prevent COVID19 induced by severe acute respiratory syndrome coronavirus 2 (SARS-CoV-2). VITT is associated with a high mortality rate, approaching 20-50% of affected patients,1-3 and due to multiple and atypical thrombotic events, par ticularly cerebral venous sinus thrombosis (CVST) and splanchnic thrombosis (SVT), sometimes accompanied by disseminated intravascular coagulation.1,3-8 Highly reactive anti-platelet factor 4 (PF4) immunoglobulin G (IgG) anti bodies were detected in almost all reported patients, al though they had not received heparin and likely play a central role in the pathogenesis of VITT.9,10 These anti bodies were found to activate platelets in the absence of
In order to improve the safety of COVID-19 vaccines, there is an urgent need to unravel the pathogenesis of vaccineinduced immune thrombotic thrombocytopenia (VITT), a severe complication of recombinant adenoviral vector vaccines used to prevent COVID-19, and likely due to anti-platelet factor 4 (PF4) IgG antibodies. In this study, we demonstrated that 1E12, a chimeric anti-PF4 antibody with a human Fc fragment, fully mimics the effects of human VITT antibodies, as it activates platelets to a similar level in the presence of platelet factor 4 (PF4). Incubated with neutrophils, platelets and PF4, 1E12 also strongly induces NETosis, and in a microfluidic model of whole blood thrombosis, it triggers the formation of large platelet/leukocyte thrombi containing fibrin(ogen). In addition, a deglycosylated form of 1E12 (DG-1E12), which still binds PF4 but no longer interacts with Fcγ receptors, inhibits platelet, granulocyte and clotting activation induced by human anti-PF4 VITT antibodies. This strongly supports that 1E12 and VITT antibodies recognize overlapping epitopes on PF4. In conclusion, 1E12 is a potentially important tool to study the pathophysiology of VITT, and for establishing mouse models. On the other hand, DG-1E12 may help the development of a new drug that specifically neutralizes the pathogenic effect of autoimmune anti-PF4 antibodies, such as those associated with VITT.
©2022 Ferrata Storti Foundation
heparin, by interacting with FcγRIIA receptors via their Fc part.1,6 Although their characteristics strikingly resemble those of antibodies in "autoimmune" HIT,11,12 they remain to be further investigated, especially to better understand the predisposition of VITT patients to cerebral and splanchnic vein thrombosis.
Introduction
https://doi.org/10.3324/haematol.2021.280251
Caroline Vayne,1,2 Raghavendra Palankar,3 Sandra Billy,2 Stefan Handtke,3 Thomas Thiele,3 Charlotte Cordonnier,4 Claire Pouplard,1,2 Andreas Greinacher,3 Yves Gruel1,2 and Jérôme Rollin1,2
TheAbstractdeglycosylated form of 1E12 inhibits platelet activation and prothrombotic effects induced by VITT antibodies
Correspondence:
Prepublished: April 7, 2022.
Published under a CC BY-NC license
On the other hand, VITT is an exceptional side effect of

Yves Jerome.rollin@univ-tours.frJérômegruel@univ-tours.frGruelRollin
Adenoviral vector-based vaccines are effective tools and were first used to fight the Ebola pandemic in Africa, and, unlike mRNA-based vaccines, they are currently affordable in many countries around the world.13,14 VITT emerged after vaccination with ChadOx1 nCoV19 (AstraZeneca) and Ad26.COV2-S (Janssen, Johnson & Johnson), and other adenoviral vector-based vaccines might therefore trigger similar adverse events in the future. Thus, understanding the mechanisms of VITT has major implications beyond the current pandemic.
The ability of 1E12 Fab’2 fragment to inhibit binding of VITT or HIT Ab to modified PF4 was performed by using PF4 IgG assay (Immucor). For more details, see the Online Supple mentary Appendix.
PF4-modified serotonin release assay (PF4-SRA) was per formed as previously described.6 Briefly, 14C-serotonin la beled platelets were incubated with PF4 (10 μ g/mL), plasma samples or 1E12 for 1 hour at room temperature. Then, the radioactivity was measured in supernatants. For competitive assays, washed platelets and PF4 (10 μg/mL) were pre-incubated for 10 minutes (min) with DG-1E12 or DG-Ctrl Ab before stimulation with either HIT or VITT plasma samples. For more details, see the Online Supple mentary Appendix.
COVID-19 vaccination, and patient samples are rare and limited to a few milliliters. This severely limits mechanistic studies or the provision of positive controls for laboratory assays. All these reasons explain the urgent need to pro vide the scientific community with a monoclonal antibody to study the pathophysiology of VITT and to standardize in vitro diagnostic tests.
VITT samples (plasma or serum) and HIT plasma samples were obtained from patients diagnosed in Tours or Greifs wald. The study of serum and plasma from patients was approved by the local Ethics Board and conducted in ac cordance with the Declaration of Helsinki.
In this regard, we have recently developed a chimeric IgG1 anti-PF4 antibody named 1E12 with a human Fc fragment, which exhibits strong similarities to autoimmune HIT anti bodies in terms of cellular effects.15 Here we show that this antibody mimics VITT antibodies by comparing cellu lar activation of platelets and granulocytes induced by 1E12 and human VITT antibodies. Then, we evaluated the capability of deglycosylated 1E12, an inactivated form of the antibody, which is unable to bind FcγR, to inhibit cel lular activation induced by VITT antibodies.
1E12 mimics vaccine-induced immune thrombotic thrombocytopenia antibody-induced platelet activation Using a PF4-SRA, we demonstrate that 1E12 strongly acti vates platelets, with a pattern very similar to that of human VITT plasma samples, i.e., in a PF4-dependent manner and without the addition of heparin (Figure 1). Moreover, platelet activation induced by 1E12 (5 and 10 µg/mL) was inhibited by a low heparin concentration (0.5 IU/mL), an effect we also observed with several VITT samples. Moreover, platelet activation induced by 1E12 was fully inhibited by IV.3, a monoclonal antibody blocking FcγRIIa receptors, and IdeS (IgG-degrading enzyme de rived from Streptococcus pyogenes), a bacterial protease that cleaves the hinge region of IgG and thus suppresses the binding of pathogenic IgG antibodies to FcγRIIa recep tors (Figure 1B). This inhibitory effect of IV.3 and IdeS,
PF4-modified serotonin release assay
Enzyme-linked immunosorbant competition assay
Whole blood (WB) collected on 0.129 M sodium citrate from healthy donors was incubated with VITT plasma, 1E12 or ALB6 Ab (Beckman Coulter). Then, blood samples were recalcified to 5 mM CaCl2 and perfused at a shear rate of 20 μL/min (500 s-1) in microfluidic channels (Vena8 Fluo1, Cellix) precoated overnight at 4°C with 160 μg/mL purified human von Willebrand factor (LFB). For competitive as says, WB was pre-incubated for 10 min with DG-1E12 or DG-Ctrl Ab before adding VITT plasma samples or ALB6. For more details, see the Online Supplementary Appendix
Microfluidic whole blood thrombosis model
Methods
Material and antibodies
Flow cytometry analysis
The flow cytometric assay was performed as a modified version of the PF4-induced flow cytometry-based pla telet activation test (PIFPA), which was recently de scribed.17 For more details, see the Online Supplementary Appendix
The formation of neutrophilic extracellular traps (NET) (“NETosis”) induced by VITT sera or 1E12 (10 μg/mL) was measured in a microplate assay in the presence of purified neutrophils, platelets and PF4 (10 μg/mL). In addition, the inhibitory effect of DG-1E12 and DG-Ctrl Ab (100 μg/mL) on NETosis was evaluated. For more details, see the Online Supplementary Appendix
Effect of antibodies on NETosis
Statistical analyses were performed with GraphPad Prism version 8.0.1 software. Mann-Whitney U test and Wilcoxon signed-rank test were performed to compare data ob tained after DG-1E12 or DG-Ctlr Ab treatment under dif ferent conditions. P<0.05 was considered statistically significant.
Statistical analysis
Results
Haematologica | 107 October 2022 2446 ARTICLE - DG-1E12 inhibits the effects of VITT antibodies C. Vayne et al.
The chimeric anti-PF4 monoclonal IgG1, 1E12, has been codeveloped with B-cell design (Limoges) as previously de scribed.15,16 The deglycosylated forms of 1E12 (DG-1E12) and cetuximab (Merck) tested as control antibody (DG-Ctrl Ab), were obtained after incubation overnight of each antibody (1 mg/mL) with 40 U of N-glycosidase F (Sigma-Aldrich), followed by removal of the enzyme using a Vivaspin 50 kDa column (Sartorius).
1. 1E12 mimics human vaccine-induced immune thrombotic thrombocytopenia antibodies to activate platelets. (A) Platelet activation induced by vaccine-induced immune thrombotic thrombocytopenia (VITT) plasma samples (n=7) and (B) 1E12 (5, 10, 50 μg/mL) in serotonin release assay performed in the presence of exogenous human PF4 (10 μg/mL) and increasing concentrations of heparin. The effects of the immunoglobulin G (IgG) cleaving protease IdeS and the monoclonal FcγRIIa blocking antibody IV.3 (10 μg/mL) on platelet activation induced by 1E12 (50 μg/mL) are also presented in (B). Data are the percentage of platelet activation, with mean (+/- standard error of the mean) of 4 independent experiments for (B). Optical density (OD) values measured in enzyme-linked immunsorbant assay (Immucor) and reflecting the levels of IgG antibodies to PF4 in all samples tested are indicated in brackets. effects of VITT
Based on the assumption that 1E12 and VITT antibodies rec ognize overlapping epitopes on PF4, we performed com petitive assays between VITT antibodies and an inactivated of 1E12 (DG-1E12) obtained after N-deglycosylation of its Fc fragment. We first confirmed that DG-1E12 was fully able to bind PF4 but no longer to activate platelets (Online Sup plementary Figure S3) since the removal of the Fc glycan abolishes IgG binding to FcγR.22 By incubating washed pla telets with DG-1E12 (50 μg/mL), platelet activation induced by VITT antibodies we strongly reduced in PF4-SRA, and fully abrogated with nine of the 13 VITT samples tested (maximal serotonin release < 20%; Figure 3A). In contrast, DG-1E12 could only partially inhibit HIT antibody-induced platelet activation, with an effect less pronounced than those obtained with VITT plasma samples, since the sero tonin release remained higher than 20% with all HIT plasma samples tested. In addition, the same inhibitory effect of DG-1E12 on VITT antibodies was demonstrated in whole blood using the recently described PF4-enhanced flow cytometry assay17 (Figure 3B). As expected, no inhibitory ef fect of deglycosylated control antibody (DG-Ctrl Ab) on VITT or HIT antibody-induced platelet activation could be evi denced (Figure 2A and B). We then investigated whether the competitive effect of DG-1E12 was dependent on its Fab part, by inhibiting the binding of VITT antibodies to PF4. This hypothesis is likely since pre-incubation of the Fab'2 frag
Haematologica | 107 October 2022 2447 ARTICLE - DG-1E12 inhibits the
The thrombotic complications of VITT probably result from complex multicellular activation processes involving pla telets and neutrophils. It has been recently shown that granulocytes produce large amounts of procoagulant NET in response to VITT antibodies.18,19 Similarly, 1E12, incubated with granulocytes and isolated platelets in the presence of PF4 (10 μ g/mL), induced NETosis with the release of elastase associated with DNA, at a level similar to that measured with VITT samples (Figure 2A to C). In addition, the presence of platelets was required for 1E12-induced NETosis (Online Supplementary Figure S1). When whole blood from healthy donors was incubated with 1E12 or VITT plasma and perfused it into capillaries coated with von Willebrand factor under shear stress (500 s-1) mimick ing venous conditions, numerous large fibrin(ogen)-con taining platelet/leukocyte aggregates were observed (Figure 2D and E). As expected, thrombus formation in duced by 1E12 was completely prevented by the addition of IdeS (0.1 U), IV.3 (10 μg/mL), or high concentrations of unfractionated heparin (UFH, 100 IU/mL) (Online Supple mentary Figure S2). This in vitro thrombus formation did not require exogenous UFH or PF4, in contrast to throm bus induction by HIT antibodies.20,21 These results strongly support that the specificity and affinity of VITT antibodies
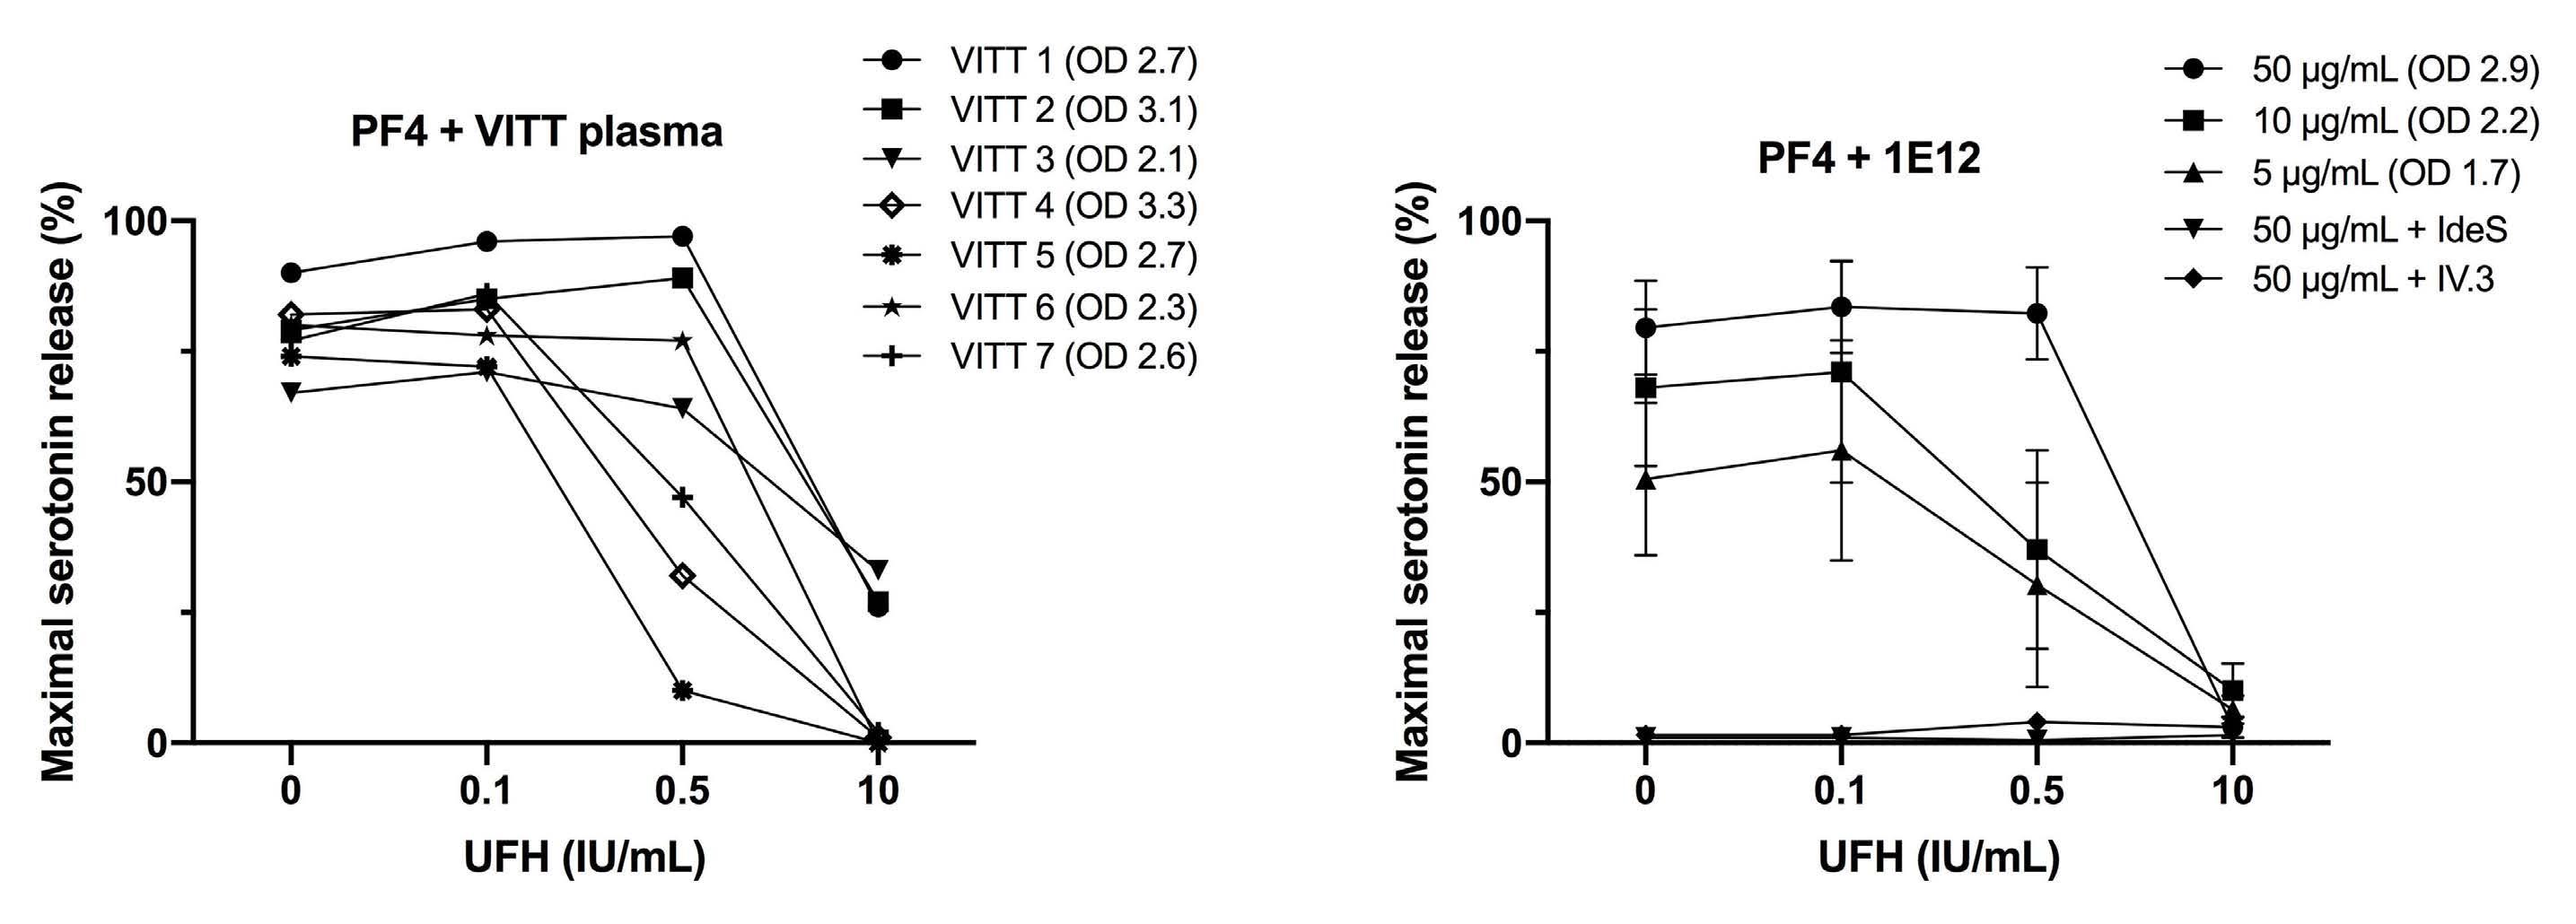
Deglycosylated 1E12 inhibits vaccine-induced immune thrombotic thrombocytopenia antibody-induced platelet activation
which we previously demonstrated with VITT samples,6 strongly supports that interaction between pathogenic anti-PF4 IgG and FcγRIIa plays a central role in the patho genesis of VITT.
1E12 mimics vaccine-induced immune thrombotic thrombocytopenia antibody-induced prothrombotic cellular effects
antibodies C. Vayne et al. B
are different from those of HIT antibodies since they rec ognize PF4 alone and activate cells without heparin.
FigureA
A CB ED Continued on following page. Haematologica | 107 October 2022 2448 ARTICLE - DG-1E12 inhibits the effects of VITT antibodies C. Vayne et al.
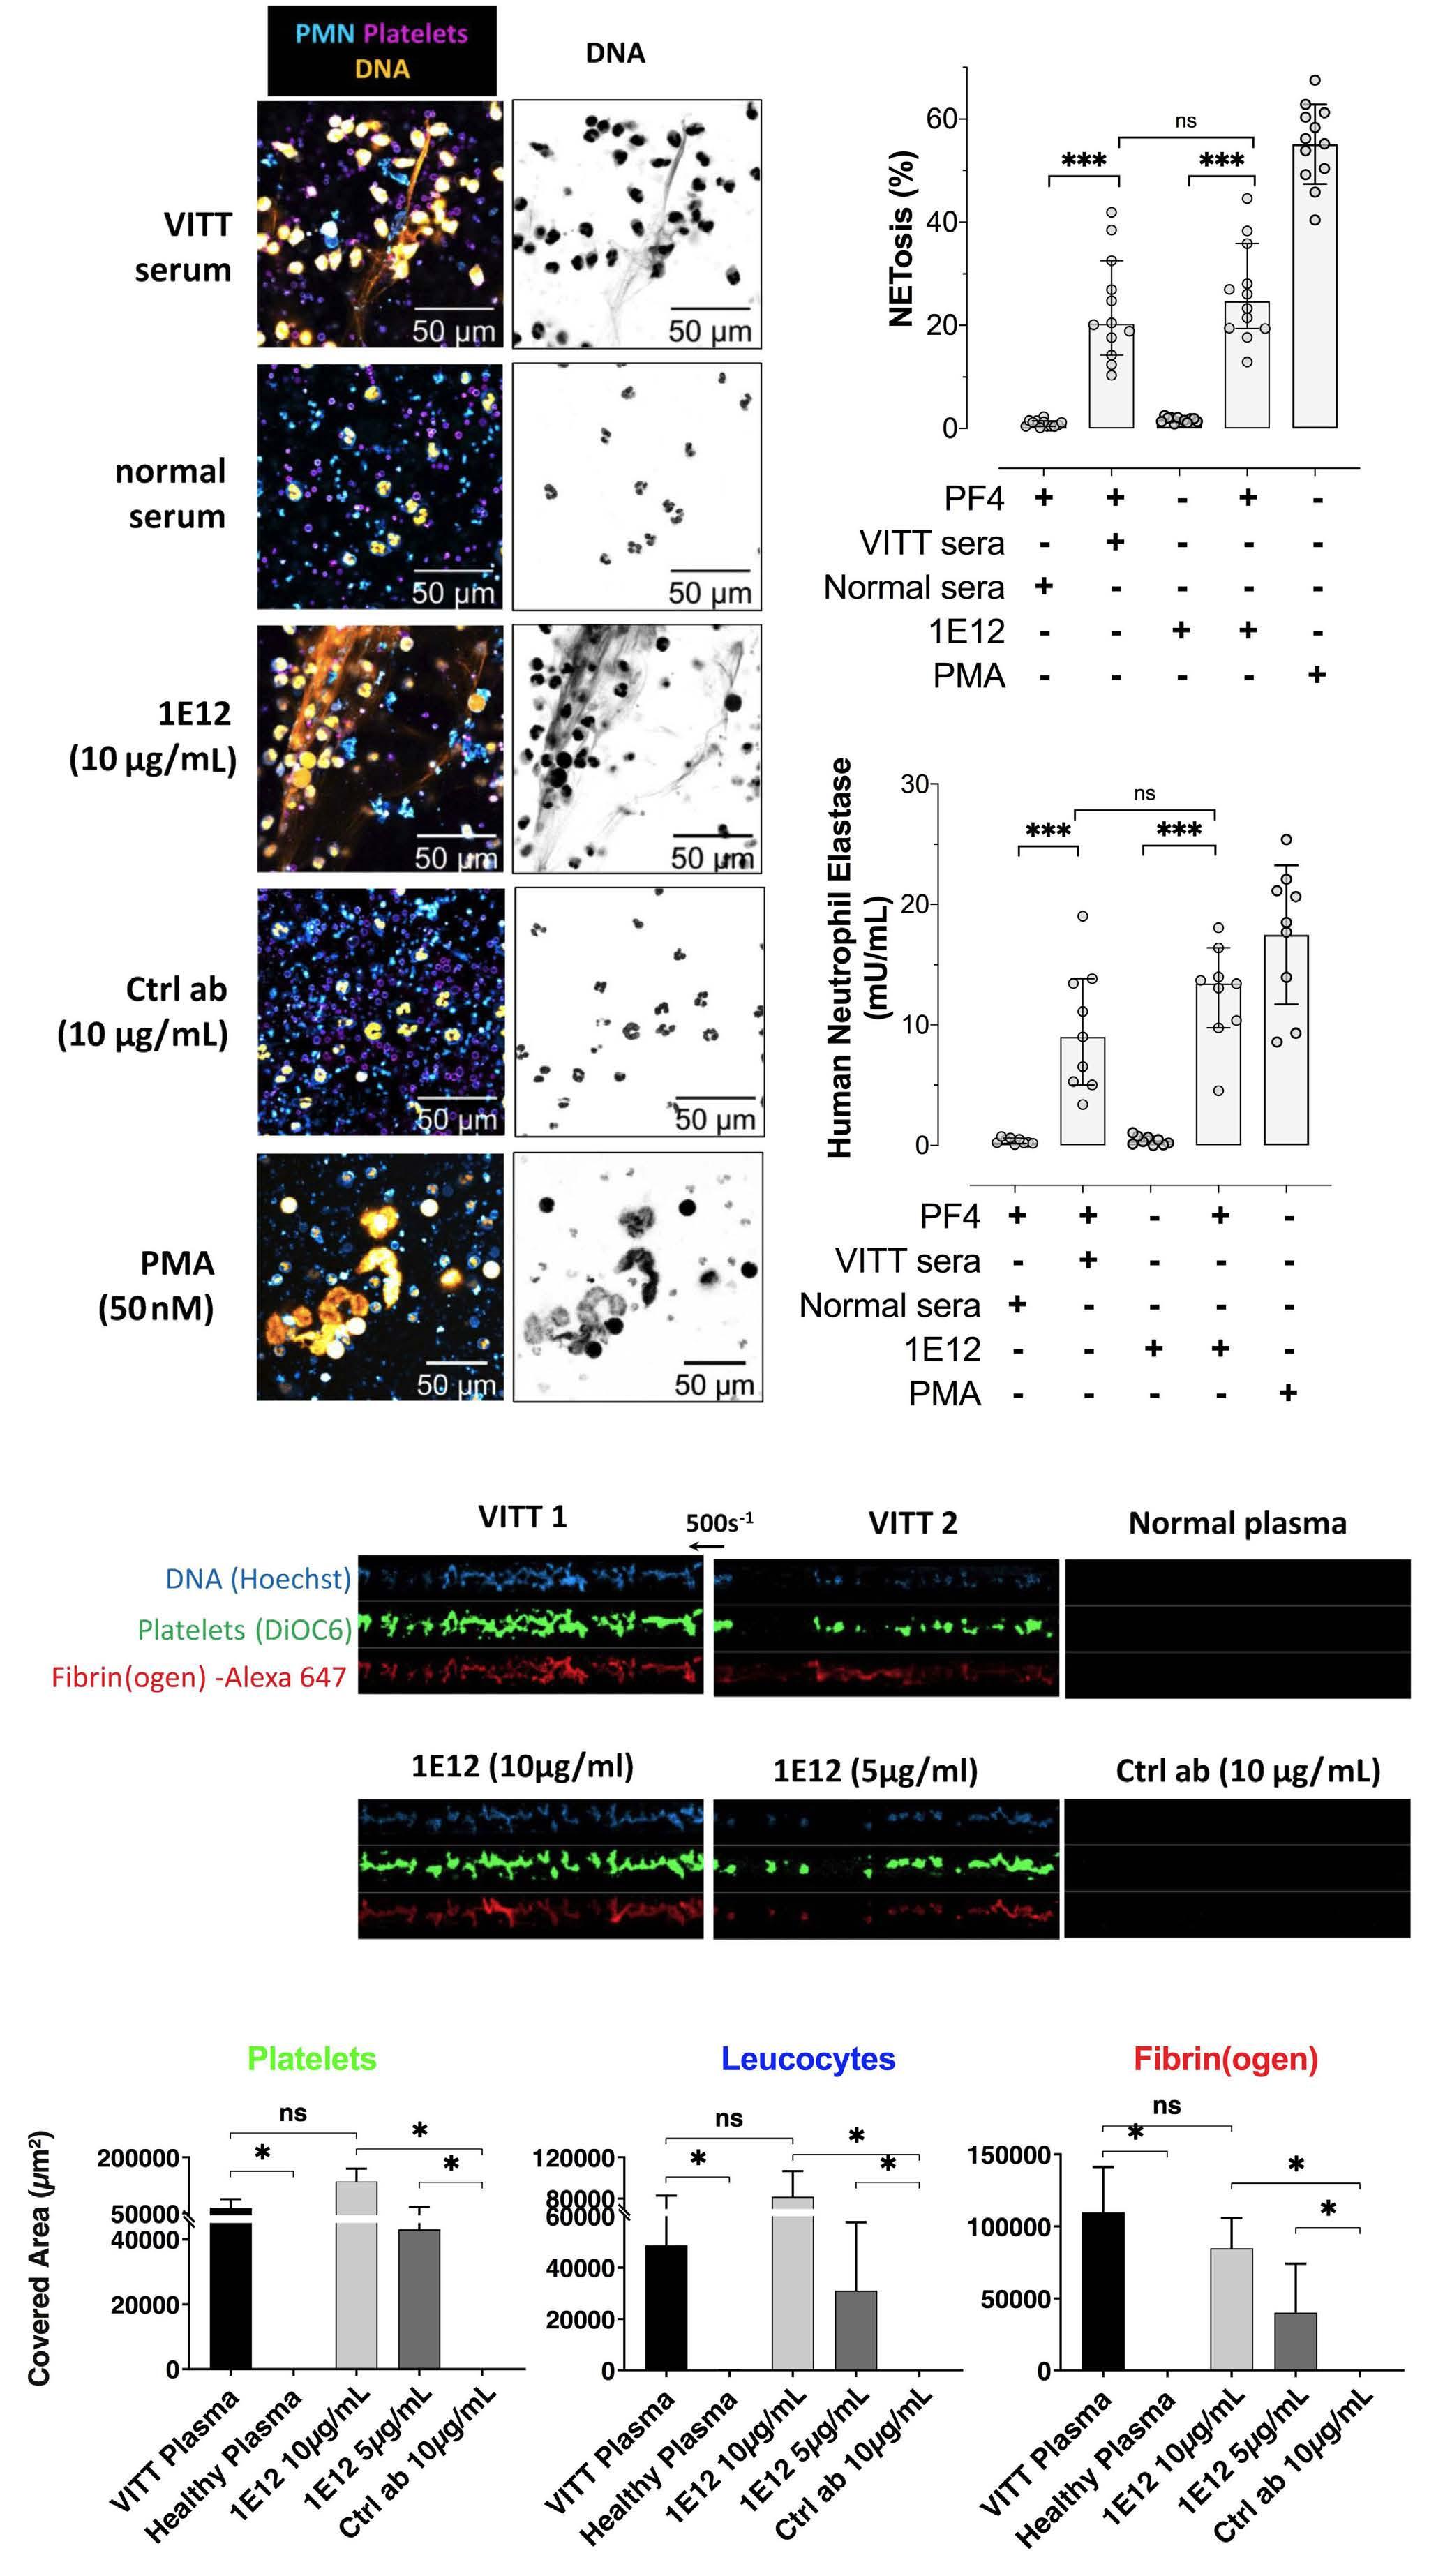
Deglycosylated 1E12 inhibits vaccine-induced immune thrombotic thrombocytopenia antibody-induced prothrombotic cellular effects
Discussion
fects of human VITT antibodies, as it activates platelets to a similar level in the presence of PF4. Incubated with neutro phils, platelets, and PF4, 1E12 also strongly induces NETosis, and in a microfluidic model of whole blood thrombosis, it triggers the formation of large platelet/leukocyte thrombi containing fibrin(ogen). In addition, a deglycosylated form of 1E12 (DG-1E12), which still binds PF4 but no longer interacts with Fcγ receptors, inhibits platelet, granulocyte and clotting activation induced by human anti-PF4 VITT antibodies.
In this study, we demonstrated that 1E12, a chimeric antiPF4 antibody with a human Fc fragment, fully mimics the ef
Using an alanine-scanning mutagenesis strategy, Huyhn et al. recently showed that amino acid residues involved in the epitopes recognized by VITT antibodies on PF4 are dif ferent from those required for HIT antibody binding to PF4/heparin complexes.23 In addition, it was recently dem onstrated that anti-PF4 antibodies in VITT are oligoclonal while those developed in HIT are polyclonal.24 Our results obtained with an enzyme-linked ummunsorbant competi tive assay strengthen this restricted specificity of VITT antibodies since the Fab’2 part of 1E12 strongly inhibits the binding of VITT IgG to PF4 without any significant effect on HIT antibody/PF4 interaction. Importantly, VITT anti body binding to PF4 was shown to be restricted to eight amino acids (R22, H23, E28, K46, N47, K50, K62, and K66), all of which are located in the heparin-binding site of PF4.23 In this regard, we also showed by using a predictive docking model that six of these eight residues likely par ticipate in the binding of 1E12 to PF4 (Online Supplemen tary Figure S5).15 These results likely explain why we could inhibit binding of VITT antibodies or 1E12 to PF4, as well as cellular activation, by adding relatively low concentra tions of heparin. In contrast, when low concentrations of heparin were added to HIT plasma samples or incubated with 5B9, a chimeric monoclonal IgG1 anti-PF4/H antibody mimicking human antibodies, HIT antibody binding and re lated cell activation were always enhanced.16 We had also previously provided evidence that 1E12 likely exhibits a much higher affinity for PF4 and PF4/H com plexes than the HIT monoclonal antibody 5B9.15 This also parallels the characteristics of VITT antibodies recently obtained by Huynh et al., who showed that VITT antibodies bind stronger to PF4 and PF4/H complexes than HIT anti
Figure 2. 1E12 activates neutrophils and induces thrombosis in vitro similarly to human vaccine-induced immune thrombotic thrombocytopenia antibodies. (A) Evaluation of in vitro NETosis by Confocal laser scanning microscopy following neutrophils stimulation by vaccine-induced immune thrombotic thrombocytopenia (VITT) patient serum, normal serum, 1E12 10 μg/mL or the control antibody (Ctlr Ab, 10 μg/mL), in the presence of platelets and human PF4 (10 μg/mL). Nuclear and extracellular DNA is shown in orange, platelets in purple, and polymorphonuclear neutrophils (PMN) in blue. (B and C) Quantification of NETosis by analysing 12 individual microscopy images (B) and by measuring levels of DNA-associated elastase activity in the supernatant after neutrophils stimulation (C). Four independent experiments were performed for each experimental condition. (D and E) Thrombus formation in von Willebrand factor (vWF)-coated microfluidic channels perfused with recalcified whole blood incubated for 10 minutes in the presence of VITT plasma samples (n=2), normal plasma, 1E12 (10 and 5 μg/mL) or control antibody (Ctrl Ab; 10 μg/mL). Images corresponding to areas of 0.1 mm2 are shown in (D) with platelets in green (DiOC6), fibrin(ogen) in red (Alexa Fluor 647–labeled fibrinogen), and leukocytes in blue (Hoechst 33342, DNA dye). The mean areas covered (E) by platelets (left, E), leukocytes (middle) or fibrin(ogen) (right) were calculated for each condition (n=4 independent experiments), by measuring using ImageJ software the surface covered by large aggregates (> 100 μm2) in 20 different areas. Wilcoxon signed-rank test and Mann-Whitney U test, respectively, were performed to compare the different conditions tested. *P<0.05, **P<0.01, ***P<0.001.
Haematologica | 107 October 2022 2449 ARTICLE - DG-1E12 inhibits the effects of VITT antibodies C. Vayne et al.
These data strongly suggested that DG-1E12 could prevent multicellular activation induced by VITT antibodies. This concept was reinforced by demonstrating that DG-1E12 fully abrogated VITT antibody-mediated thrombus forma tion in whole blood in vitro under vein flow conditions (Figure 4D and E). As expected and in accordance with the data obtained in NETosis experiments, DG-1E12 did not modify the size of platelet/leukocyte thrombi containing fibrin(ogen) induced by anti-CD9 antibodies. In addition, when the deglycosylated form of the irrelevant antibody (DG-Ctlr Ab) was tested in place of DG-1E12, no inhibitory effect on NETosis and thrombus formation induced by VITT antibody was observed (Figure 4B, C and E).
ment of 1E12 almost fully suppressed the binding of VITT antibodies to PF4/PVS (median A450 2.5 vs. 0.22). In contrast, it did not significantly modify the results obtained with all HIT samples tested (median A450 1.9 vs. 1.5) (Figure 3C). In addition, the Fab'2 fragment of 1E12 efficiently displaced all VITT IgG antibodies pre-bound to PF4/PVS complexes (On line Supplementary Figure S4).
When platelets and neutrophils were pre-incubated with DG-1E12, NETosis induced by VITT antibodies was com pletely inhibited (NETosis 3% vs. 23%, with or without DG1E12, respectively) as well as the release of DNA-associated elastase (activity level 0.7 vs. 9 mU/mL) (Figure 4A to C). Using similar experimental conditions, DG-1E12 did not inhibit NETosis induced by ALB6, a murine monoclonal anti-CD9 antibody that also strongly activates platelets in an FcγRIIa-dependent manner (NETosis 15% vs 14% and elastase activity 6.4 vs. 4 mU/mL, with or without DG-1E12, respectively) (Figure 4A to C).
A B C
Haematologica | 107 October 2022 2450 ARTICLE - DG-1E12 inhibits the effects of VITT antibodies C. Vayne et al.
bodies.23 Under our conditions, VITT antibody-induced thrombus formation in flow did not require the addition of exogenous PF4, suggesting that a sufficient amount of this chemokine was released and present on cell surfaces. However, VITT is a thromboinflammatory syndrome with high PF4 plasma levels, and our study model probably does not entirely replicate the complex pathophysiological conditions present in most VITT patients.
Our data also support that the beneficial impact of DG1E12 in preventing blood cell activation by VITT antibodies and thrombus formation likely depends on the competi tive effect of its Fab part on antibody binding to PF4, with out inhibiting FcγRIIa-mediated signaling. Hence, our results confirm that 1E12 has features very similar to those of human VITT regarding their specificity and cellular ef fects.
Figure 3. Deglycosylated 1E12 inhibits platelet activation induced by human vaccine-induced immune thrombotic thrombocytopenia antibodies. (A) Platelet activation induced by vaccine-induced immune thrombotic thrombocytopenia (VITT) (n=13) and HIT plasma samples (n=9) in PF4-modified serotonin release assay (PF4-SRA) with or without DG-1E12 or DG-Ctrl antibody (ab) (50 μg/mL). The maximal serotonin release values that were measured are expressed in percentages of (%), with means (horizontal lines). Experiments using DG-Ctrl ab (deglycosylated form of control antibody) was performed with all available VITT plasma samples (n=9) and HIT plasmas (n=9). All SRA experiments were performed in the presence of human PF4 (10 μg/mL). Platelet activation induced by VITT samples (n=5) added in whole blood with or without DG-1E12 or DG-Ctrl antibody (100 μg/mL), and measured by flow cytometry (B). CD62P expression is shown as the mean fluorescence intensity (MFI) of the gated events multiplied by the percentage of gated events. Each data point represents the averaged result from 3 different tests with 1 sample. Horizontal lines indicate the mean values obtained with the five VITT samples. Effects of Fab’2 fragment of 1E12 (10 μg/mL) on VITT (n=13) or HIT (n=11) antibody binding to PF4/PVS evaluated by competitive enzyme immunoassays (C).
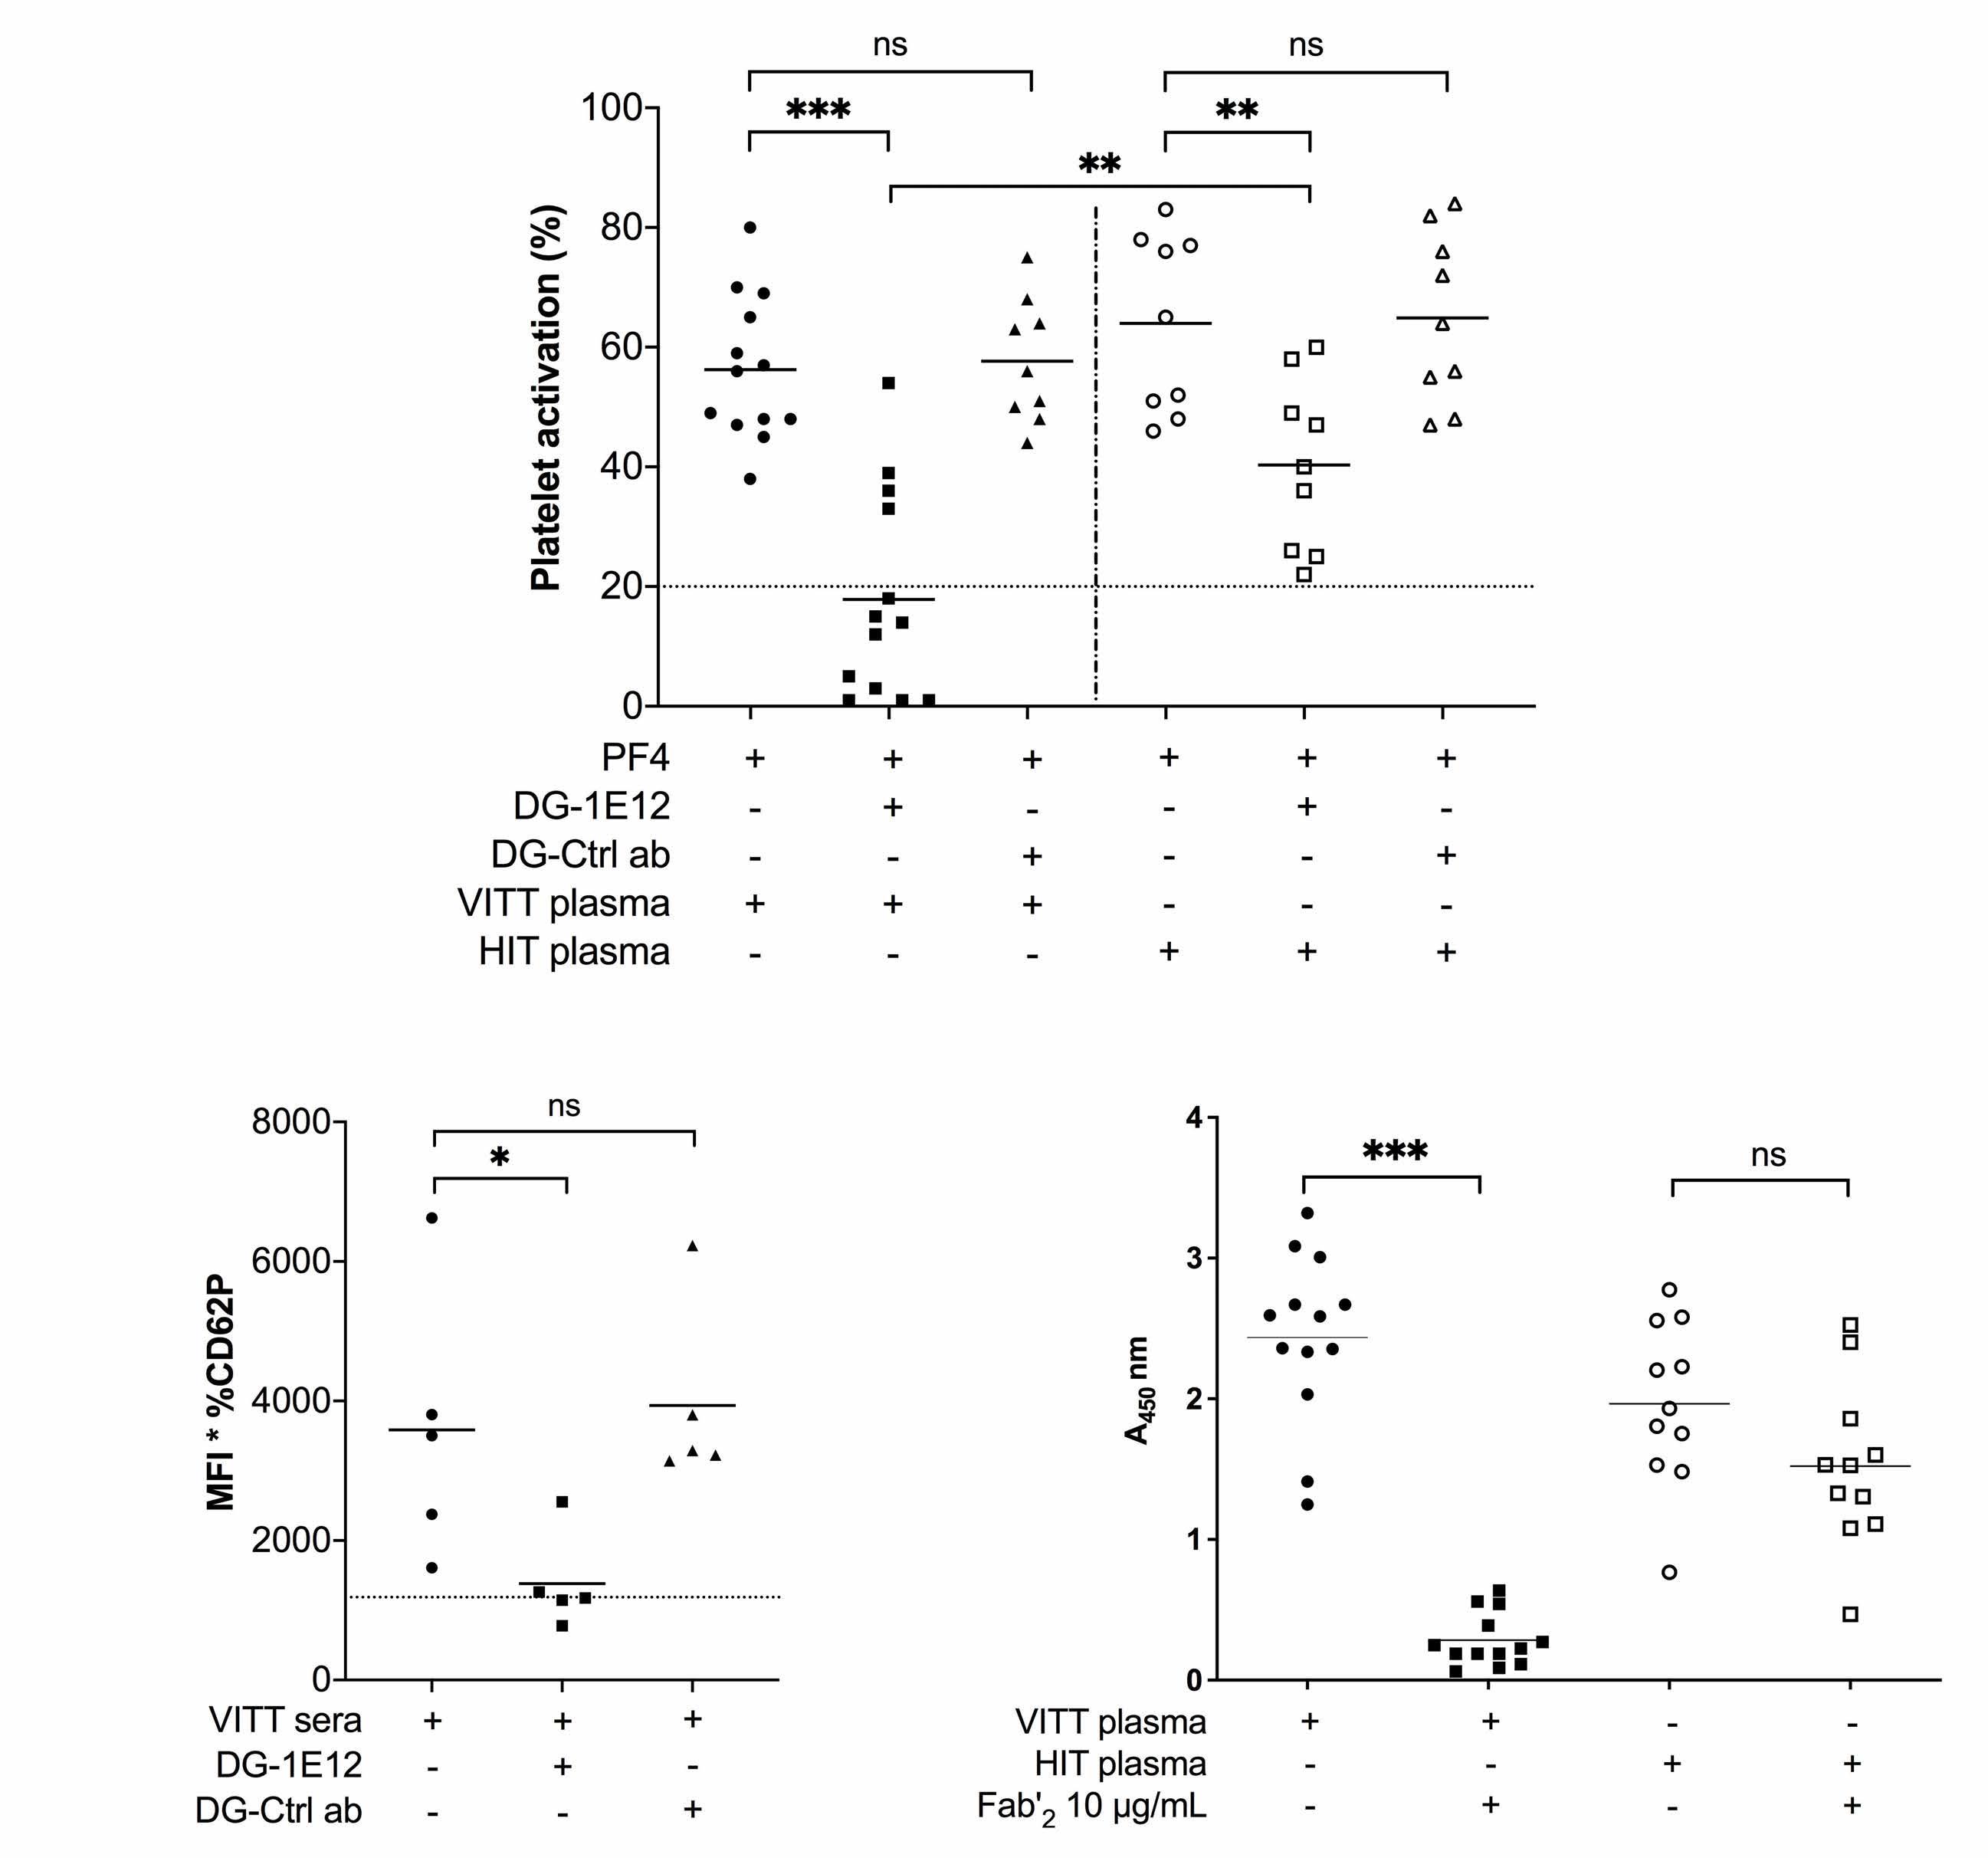
Haematologica | 107 October 2022 2451 ARTICLE -
Figure 4. Deglycosylated 1E12 inhibits NETosis and thrombus formation induced by human vaccine-induced immune thrombotic thrombocytopenia antibodies. (A) Evaluation of in vitro NETosis by confocal laser scanning microscopy following neutrophils stimulation by vaccine-induced immune thrombotic thrombocytopenia (VITT) serum or anti-CD9 antibody (20 μg/mL), with or without DG-1E12 (100 μg/mL). Nuclear and extracellular DNA is shown in orange, platelets in purple, and polymorphonuclear neutrophils (PMN) in blue. (B and C) Quantification of NETosis by analysing 12 individual microscopy images (B) and by measuring levels of DNA-associated elastase activity in the supernatant after neutrophils stimulation (C). Four independent experiments were performed for each experimental condition. (D and E) Thrombus formation in von Willebrand factor (vWF)-coated microfluidic channels perfused with recalcified whole blood incubated for 10 minutes with VITT plasma or ALB6 (20 μg/mL), with or without DG-1E12 (100 μg/mL). Images corresponding to areas of 0.1 mm2 are shown in (D) with platelets in green (DiOC6), fibrin(ogen) in red (Alexa Fluor 647–labeled fibrinogen), and leukocytes in blue (Hoechst 33342, DNA dye). The mean areas covered (E) by platelets (left), leukocytes (middle) or fibrin(ogen) (right) were calculated for each condition (n=5 independent experiments with 5 VITT plasmas), by measuring using ImageJ software the surface covered by large aggregates (>100 μm2) in 20 different areas. Deglycosylated form of cetuximab was used as control antibody (DG-Ctrl ab). Wilcoxon signed-rank test was performed to compare the different conditions tested. *P<0.05, **P< 0.01, ***P<0.001. DG-1E12 inhibits the effects of VITT antibodies
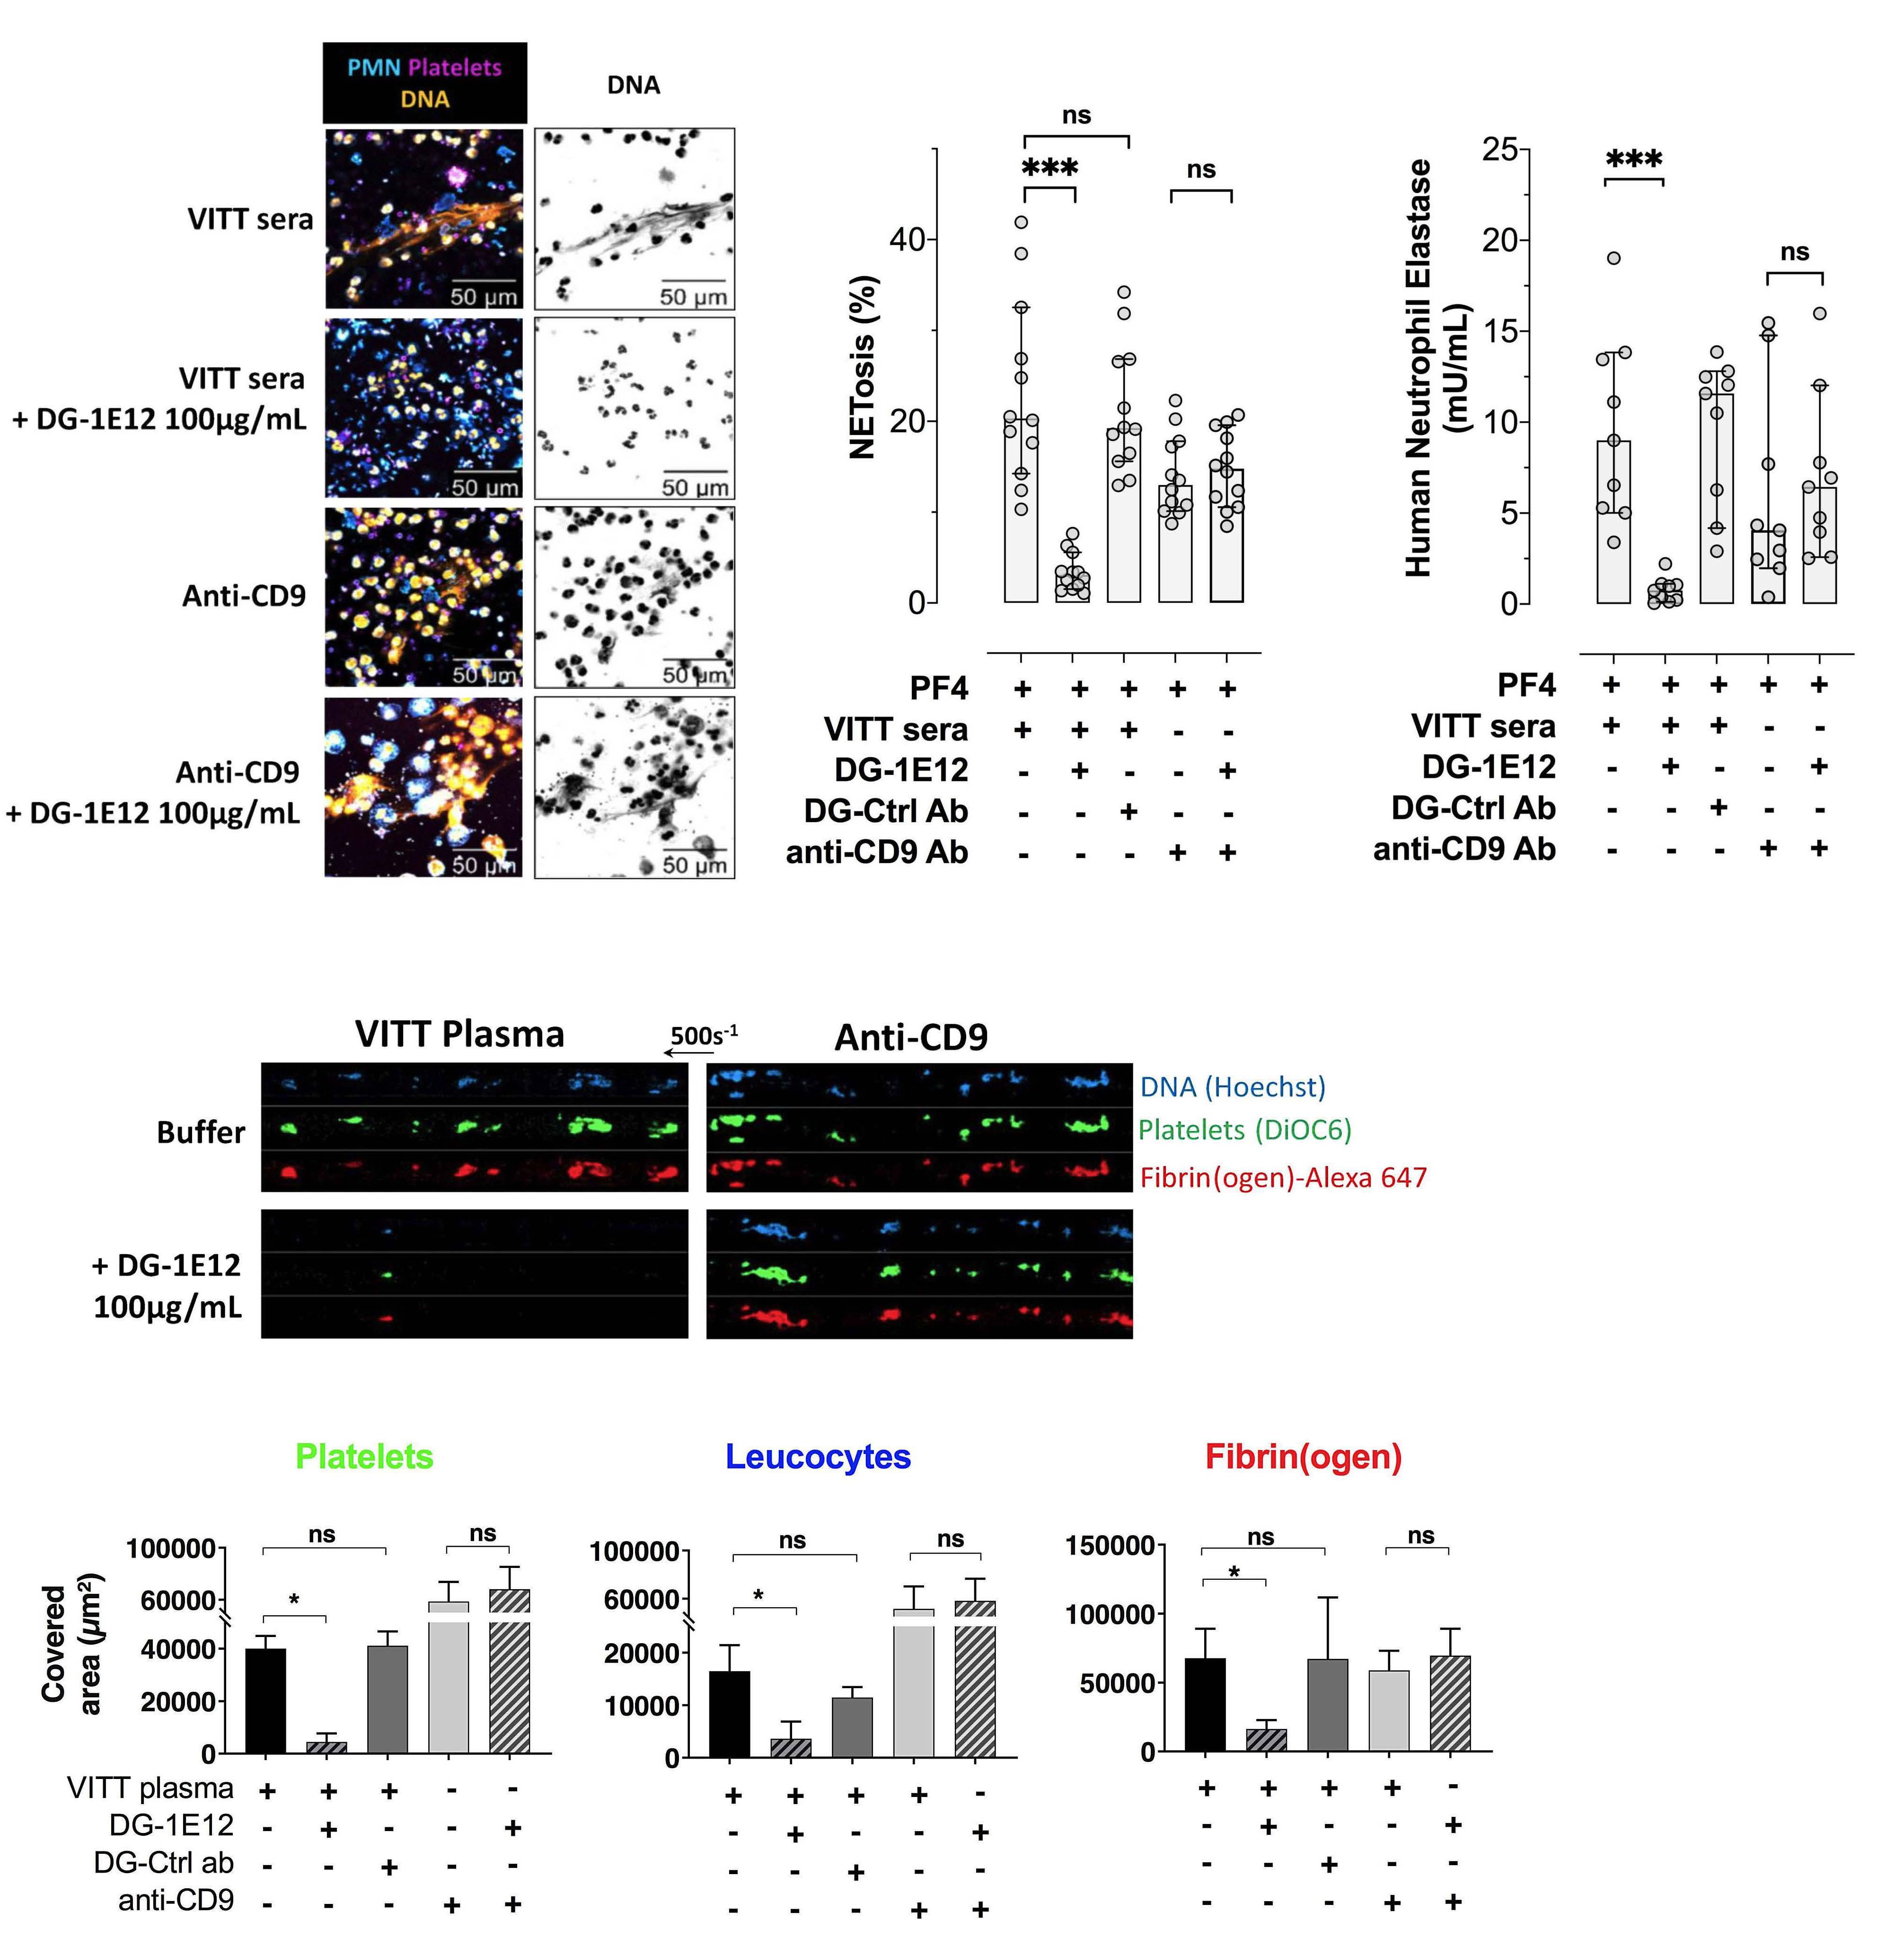
ADE B C
C. Vayne et al.
We are grateful to all biologists (Philippe Cauchie-Charle roi; Emmanuel De Maistre-Dijon; Dorothée Faille-Paris; Isa belle Gouin-Thibault-Rennes; Raphael Marlu-Grenoble; Guillaume Mourey-Besançon; François Mullier-Namur; Alain Stépanian-Paris; Marie Tuffigo-Angers; Sophie Voisin-Tou louse) who sent us the plasma samples analyzed in this study. We also thank the technical staff Mrs Séverine Auge reau and Mrs Merveille Atsouawe. The work of the technol ogists Ulrike Strobel, Carmen Freyer, Katrin Stein, Ines Warnig, Ricarda Raschke, Jessica Fuhrmann, Nicole Lembke, Transfusion Medicine Greifswald, is highly appreci ated. We thank B Cell design/ArkAb who generously pro vided the 1E12 antibody.
JR reports a research grant from Stago. YG reports a re search grant and symposium fees from Stago. CP reports a research grant from Stago. TT reports grants from Deut sche Forschungsgemeinschaft during the conduct of the study; personal fees and other from Bristol Myers Squibb, Pfizer, Bayer, Chugai Pharma, Novo Nordisk, Novartis, Dai chii Sankyo, outside the submitted work. CC reports per
Acknowledgements
This study was supported by the Institut pour la Recherche sur la Thrombose et l’Hémostase, the program “Investisse ments d'Avenir” (grant agreement no. LabEx MAbImprove ANR-10-LABX-53-01), the Région Centre-Val de Loire (APR IR 2020_DOMINO) and Force Hémato The study has been funded by the Deutsche Forschungsgemeinschaft (DFG, German Research Foundation) – project number 374031971 - TRR 240.
Contributions
Data-sharing statement
Data may be requested for academic collaboration from the corresponding author.
guidelines clearly recommended performing func tional assays for the diagnosis of VITT.30 SRA and HIPA must be done in the presence of exogenous PF4,1,6 but the diagnosis of VITT remains a challenge for many labora tories. In this context, the monoclonal antibody 1E12 could be useful as a positive control and external quality control to standardize the different functional assays usable for VITT diagnosis.
Haematologica | 107 October 2022 2452 ARTICLE - DG-1E12 inhibits the effects of VITT antibodies C. Vayne et al.
CV performed and designed the research, analyzed the data, and wrote the paper; JR and YG designed the re search, analyzed the data, and wrote the paper; RP, SH and SB performed research, analyzed the data; TT, CP, RP and AG designed the research and reviewed the paper; CC co ordinated the biological collection of the French patients included in this study. All authors have critically revised and approved the final version of the manuscript.
Funding
The therapeutic management of VITT patients is currently based on therapeutic dose anticoagulation with non-he parin anticoagulants, combined with high dose intra venous immunoglobulins (IVIG), which inhibit cell activation likely by competing with VITT antibodies.25 Apart from being expensive and limited, IVIG is also problematic for managing severe CVST with intracranial hypertension as it may induce intracranial pressure, and the efficacy of this therapy may be transient in some VITT patients with persistently high levels of activating anti-PF4 IgG anti bodies.26 In this context, DG-1E12 combined with a nonheparin antithrombotic drug could be a new therapeutic approach for efficiently and safely treating the more se vere cases of VITT. Interestingly, a similar strategy based on the use of an epitope-specific deglycosylated antibody was first successfully evaluated in a mouse model of fetal/neonatal alloimmune thrombocytopenia (FNAIT),27 and then more recently in HIT.28 In addition, we recently demonstrated that DG-1E12 completely inhibited cellular activation induced by a spontaneously synthesized antiPF4 IgG antibody from a patient with monoclonal gammo pathy whose paraprotein showed VITT-antibody-like activity and caused recurrend venous and arterial throm Recentbosis.29
Disclosures
In conclusion, we demonstrate that 1E12 and VITT anti bodies exhibit a similar capacity to activate platelets and neutrophils and to induce thrombus formation. Therefore, 1E12 is likely an excellent model antibody to further study the pathophysiology of VITT and in diagnostic assays. Our data also support that DG-1E12 may allow the devel opment of a new drug neutralizing the pathogenic effect of autoimmune anti-PF4 antibodies, such as those associ ated with VITT.
sonal fees and other from Biogen, BMS, Boehringer-Ingel heim, Astra-Zeneca outside the submitted work. AG reports grants and non-financial support from Aspen, Boehringer Ingelheim, MSD, Bristol Myers Squibb (BMS), Paringenix, Bayer Healthcare, Gore Inc., Rovi, Sagent, Biomarin/Pros ensa, personal fees from Aspen, Boehringer Ingelheim, MSD, Macopharma, BMS, Chromatec, Instrumentation Laboratory, non-financial support from Boehringer Ingel heim, Portola, Ergomed, GTH e.V. outside the submitted work. All other authors of this paper have no conflicts of interest.
17. Handtke S, Wolff M, Zaninetti C, et al. A flow cytometric assay to detect platelet-activating antibodies in VITT after ChAdOx1 nCov-19 vaccination. Blood. 2021;137(26):3656-3659.
27. Bakchoul T, Greinacher A, Sachs UJ, et al. Inhibition of HPA-1a alloantibody-mediated platelet destruction by a deglycosylated anti-HPA-1a monoclonal antibody in mice: toward targeted treatment of fetal-alloimmune thrombocytopenia. Blood. 2013;122(3):321-327.
10. Greinacher A, Selleng K, Palankar R, et al. Insights in ChAdOx1 nCov-19 vaccine-induced immune thrombotic thrombocytopenia (VITT). Blood. 2021;138(22):2256-2268.
4. Perry RJ, Tamborska A, Singh B, et al. Cerebral venous thrombosis after vaccination against COVID-19 in the UK: a multicentre cohort study. Lancet. 2021;398(10306):1147-1156.
12. Nguyen TH, Medvedev N, Delcea M, Greinacher A. Anti-platelet factor 4/polyanion antibodies mediate a new mechanism of autoimmunity. Nat Commun. 2017;8:14945.
16. Kizlik-Masson C, Vayne C, McKenzie SE, et al. 5B9, a monoclonal antiplatelet factor 4/heparin IgG with a human Fc fragment that mimics heparin-induced thrombocytopenia antibodies. J
25. Bourguignon A, Arnold DM, Warkentin TE, et al. Adjunct immune globulin for vaccine-induced immune thrombotic thrombocytopenia. N Engl J Med. 2021;385(8):720-728.
28. Sarkar A, Khandelwal S, Yarovoi S, et al. Fc-modified Kko: a novel therapeutic for heparin-induced thrombocytopenia (HIT), reversing both the thrombocytopenia and thrombosis. Blood. 2021;138(Suppl 1):S581.
Thromb Haemost. 2017;15(10):2065-2075.
19. Holm S, Kared H, Michelsen AE, et al. Immune complexes, innate immunity, and NETosis in ChAdOx1 vaccine-induced thrombocytopenia. Eur Heart J. 2021;42(39):4064-4072.
13. Kennedy SB, Bolay F, Kieh M, et al. Phase 2 placebo-controlled trial of two vaccines to prevent Ebola in Liberia. N Engl J Med. 2017;377(15):1438-1447.
7. Gresele P, Momi S, Marcucci R, Ramundo F, De Stefano V, Tripodi A. Interactions of adenoviruses with platelets and coagulation and the vaccine-induced immune thrombotic thrombocytopenia syndrome. Haematologica. 2021;106(12):3034-3045.
9. Althaus K, Möller P, Uzun G, et al. Antibody-mediated procoagulant platelets in SARS-CoV-2-vaccination associated immune thrombotic thrombocytopenia. Haematologica. 2021;106(8):2170-2179.
24. Singh B, Kanack A, Bayas A, et al. Anti-PF4 VITT antibodies are oligoclonal and variably inhibited by heparin. medRxiv. 2021 Sept 24. doi: 10.1101/2021.09.23.21263047. [preprint, not peer reviewed]
20. Gollomp K, Kim M, Johnston I, et al. Neutrophil accumulation and NET release contribute to thrombosis in HIT. JCI Insight. 2018;3(18):e99445.
29. Greinacher A, Langer F, Schonborn L, et al. Platelet-activating anti-PF4 antibodies mimicking VITT antibodies in an unvaccinated patient with monoclonal gammopathy. Haematologica. 2022;107(5):1219-1221.
15. Vayne C, Nguyen TH, Rollin J, et al. Characterization of new monoclonal PF4-specific antibodies as useful tools for studies on typical and autoimmune heparin-induced thrombocytopenia. Thromb Haemost. 2021;121(3):322-331.
26. Douxfils J, Vayne C, Pouplard C, et al. Fatal exacerbation of ChadOx1-nCoV-19-induced thrombotic thrombocytopenia syndrome after initial successful therapy with intravenous immunoglobulins - a rational for monitoring immunoglobulin G levels. Haematologica. 2021;106(12):3249-3252.
6. Vayne C, Rollin J, Gruel Y, et al. PF4 Immunoassays in vaccineinduced thrombotic thrombocytopenia. N Engl J Med. 2021;385(4):376-378.
22. Radaev S, Sun PD. Recognition of IgG by Fcgamma receptor. The role of Fc glycosylation and the binding of peptide inhibitors. J Biol Chem. 2001;276(19):16478-16483.
3. Schultz NH, Sørvoll IH, Michelsen AE, et al. Thrombosis and thrombocytopenia after ChAdOx1 nCoV-19 vaccination. N Engl J Med. 2021;384(22):2124-2130.
Haematologica | 107 October 2022 2453 ARTICLE - DG-1E12 inhibits the effects of VITT antibodies C. Vayne et al.
References
1. Greinacher A, Thiele T, Warkentin TE, Weisser K, Kyrle PA, Eichinger S. Thrombotic thrombocytopenia after ChAdOx1 nCov19 vaccination. N Engl J Med. 2021;384(22):2092-2101.
5. Scully M, Singh D, Lown R, et al. Pathologic antibodies to platelet factor 4 after ChAdOx1 nCoV-19 vaccination. N Engl J Med. 2021;384(23):2202-2211.
2. Pavord S, Scully M, Hunt BJ, et al. Clinical features of vaccineinduced immune thrombocytopenia and thrombosis. N Engl J Med. 2021;385(18):1680-1689.
18. Greinacher A, Selleng K, Palankar R, et al. Insights in ChAdOx1 nCoV-19 vaccine-induced immune thrombotic thrombocytopenia. Blood. 2021;138(22):2256-2268.
8. Pomara C, Sessa F, Ciaccio M, et al. Post-mortem findings in vaccine-induced thrombotic thombocytopenia. Haematologica. 2021;106(8):2291-2293.
30. Nazy I, Sachs UJ, Arnold DM, et al. Recommendations for the clinical and laboratory diagnosis of VITT against COVID-19: communication from the ISTH SSC Subcommittee on Platelet Immunology. J Thromb Haemost. 2021;19(6):1585-1588.
23. Huynh A, Kelton JG, Arnold DM, Daka M, Nazy I. Antibody epitopes in vaccine-induced immune thrombotic thrombocytopaenia. Nature. 2021;596(7873):565-569.
11. Greinacher A, Selleng K, Warkentin TE. Autoimmune heparininduced thrombocytopenia. J Thromb Haemost. 2017;15(11):2099-2114.
14. Milligan ID, Gibani MM, Sewell R, et al. Safety and immunogenicity of novel Adenovirus type 26- and modified Vaccinia Ankara-vectored Ebola vaccines: a randomized clinical trial. JAMA. 2016;315(15):1610-1623.
21. Kizlik-Masson C, Deveuve Q, Zhou Y, et al. Cleavage of antiPF4/heparin IgG by a bacterial protease and potential benefit in heparin-induced thrombocytopenia. Blood. 2019;133(22):2427-2435.
Anemia of cancer (AoC) is a common comorbidity1 and an independent poor prognostic factor in cancer patients.2 One of the most frequent types of AoC is caused by in flammation associated with cancer. Among the proinflam matory cytokines, interleukin 6 (IL-6) in particular can cause anemia by different mechanisms. IL-6 can either di rectly suppress erythropoiesis or inhibit erythropoiesis by interfering with iron homeostasis, the latter effect being well studied in models of anemia of inflammation. During
Iron- and erythropoietin-resistant anemia in a spontaneous breast cancer mouse model
©2022 Ferrata Storti Foundation
Nuria Fabregas Bregolat,1,2 Maja Ruetten,3 Milene Costa da Silva,4 Mostafa A. Aboouf,1,2,5 Hyrije Ademi,1,2 Nadine von Büren,1,2 Julia Armbruster,1,2 Martina Stirn,6 Sandro Altamura,4,7 Oriana Marques,4,7 Josep M. Monné Rodriguez,8 Victor J. Samillan,9 Rashim Pal Singh,10 Ben Wielockx,10 Martina U. Muckenthaler,4,7,11,12 Max Gassmann1,13 and Markus Thiersch1,2,13
Haematologica | 107 October 2022 2454 ARTICLE - Platelet Biology & its Disorders
Correspondence: Markus markus.thiersch@uzh.chThiersch
Anemia of cancer (AoC) with its multifactorial etiology and complex pathology is a poor prognostic indicator for cancer patients. One of the main causes of AoC is cancer-associated inflammation that activates mechanisms, commonly observed in anemia of inflammation, whereby functional iron deficiency and iron-restricted erythropoiesis are induced by increased hepcidin levels in response to raised levels of interleukin-6. So far only a few AoC mouse models have been described, and most of them did not fully recapitulate the interplay of anemia, increased hepcidin levels and functional iron deficiency in human patients. To test if the selection and the complexity of AoC mouse models dictates the pathology or if AoC in mice per se develops independently of iron deficiency, we characterized AoC in Trp53floxWapCre mice that spontaneously develop breast cancer. These mice developed AoC associated with high levels of interleukin-6 and iron deficiency. However, hepcidin levels were not increased and hypoferremia coincided with anemia rather than causing it. Instead, an early shift in the commitment of common myeloid progenitors from the erythroid to the myeloid lineage resulted in increased myelopoiesis and in the excessive production of neutrophils that accumulate in necrotic tumor regions. This process could not be prevented by either iron or erythropoietin treatment. Trp53floxWapCre mice are the first mouse model in which erythropoietin-resistant anemia is described and may serve as a disease model to test therapeutic approaches for a subpopulation of human cancer patients with normal or corrected iron levels who do not respond to erythropoietin.
1Institute of Veterinary Physiology, Vetsuisse Faculty, University of Zurich, Zurich, Switzerland; 2Center for Clinical Studies, Vetsuisse Faculty, University of Zurich, Zurich, Switzerland; 3PathoVet AG, Pathology Diagnostic Laboratory, Tagelswangen ZH, Switzerland 4Department of Pediatric Oncology, Hematology and Immunology, University of Heidelberg, Heidelberg, Germany; 5Department of Biochemistry, Faculty of Pharmacy, Ain Shams University, Cairo, Egypt; 6Clinical Laboratory, Department of Clinical Diagnostics and Services, Vetsuisse Faculty, University of Zurich, Zurich, Switzerland; 7Molecular Medicine Partnership Unit, Heidelberg, Germany; 8Laboratory for Animal Model Pathology, Institute of Veterinary Pathology, Vetsuisse Faculty, University of Zurich, Zurich, Switzerland 9Universidad Le Cordon Bleu, School of Human Nutrition, Lima, Peru; 10Institute of Clinical Chemistry and Laboratory Medicine, Carl Gustav Carus, TU Dresden, Germany; 11Translational Lung Research Center Heidelberg (TLRC), German Center for Lung Research (DZL), University of Heidelberg, Heidelberg, Germany; 12German Center for Cardiovascular Research, Partner Site, Heidelberg, Germany and 13Zurich Center for Integrative Human Physiology (ZIHP), University of Zurich, Zurich, Switzerland
IAbstractntroduction
Published under a CC-BY-NC license
Accepted: March 31, 2022.
inflammation, IL-6 induces the hepatic expression of hep cidin,3 the master regulator of iron metabolism.4,5 Under physiological conditions, hepcidin expression is induced by high iron levels via the BMP/HJV/SMAD pathway.6,7 In contrast, hepcidin is suppressed by the erythropoietin (EPO)-induced release of erythroferrone (ERFE) from red blood cell precursors.8-10 Hepcidin regulates iron trafficking by binding and degrading the cellular iron exporter ferro portin (FPN1)11,12 to prevent duodenal iron absorption and iron release from hepatocytes and macrophages.13 Thereby, hepcidin can cause functional iron deficiency by reducing
Received: January 24, 2022.
https://doi.org/10.3324/haematol.2022.280732
Prepublished: April 7, 2022.
AoC N.F. Bregolat et al.
serum iron levels and causing iron-restricted erythropoie sis even if tissue iron levels are normal or elevated. AoC in humans is associated with increased hepcidin levels.14,15 Mouse models with AoC displayed inconsistent hepcidin expression despite inflammation, and the abla tion of hepcidin did not change tissue and plasma iron levels.16 Mice with tumors overexpressing IL-6 showed in creased liver hepcidin expression associated with ane mia.17,18 However, inhibiting IL-6 prevented anemia without improving plasma iron levels,18 indicating that IL-6 may suppress erythropoiesis in a hepcidin- and iron-indepen dent manner in mice. A proportion (10-30%) of human cancer patients also do not respond to combination ther apies with iron and erythropoiesis-stimulating agents (ESA),19 indicating that a subpopulation of cancer patients may be resistant to ESA. Such resistance is better de scribed in anemic patients with kidney damage, in whom chronic inflammation and pro-inflammatory cytokines can directly suppress erythropoiesis.20 For example, IL-6 and interleukin-1 suppress erythropoiesis by inhibiting down stream signaling of the EPO receptor (EPOR) in erythroid precursors,20,21 for example, through activation of the sup pressor of cytokine signaling-3 (SOCS-3).22 Interferon gamma (INFγ) and tumor necrosis factor alpha (TNFα) in duce apoptosis of erythroid precursors23 or reduce their life span.24 Granulocyte colony-stimulating factor (G-CSF) and granulocyte-macrophage colony-stimulating factor (GM-CSF) also inhibit erythropoiesis in mice with AoC by interfering with red blood cell production, rather than by increasing hepcidin levels and dysregulating iron homeo stasis.25,26However, the chosen model may determine the AoC pa thology in mice. Because most mouse models analyzed so far were established by cancer cell injection, we character ized AoC in Trp53floxWapCre mice carrying a breast tissuespecific ablation of tumor suppressor p53 that gives rise to spontaneously occurring mammary carcinomas. In this study we investigated whether: (i) Trp53floxWapCre mice develop AoC due to functional iron deficiency or due to di rect inhibition of erythropoiesis; and (ii) Trp53floxWapCre mice mirror human pathology thereby representing an ad equate model to study AoC mechanisms and treatment options.
Animals
Methods describing hematology, plasma cytokine measurements, treatment with EPO and iron, and quanti tative polymerase chain reaction (qPCR) analyses including the list of primers (Online Supplementary Table S1) are de scribed in the Online Supplementary Information. Statis tical and flow cytometry analyses are also described there, including antibody cocktails for hematopoiesis (Online Supplementary Table S2), lineage-positive cell blocking (Online Supplementary Table S3) and erythroid maturation (Online Supplementary Table S4) as well as gating strat egies for hematopoietic (Online Supplementary Figure S1A) and late-stage erythroid cells (Online Supplementary Fig ure S1B).27,28
Female Trp53floxWapCre mice developed subcutaneous mammary tumors between 20 and 36 weeks of age and reached TS, as defined in the Methods section, 18 to 43 days following tumor onset (Table 1). TF Trp53floxWapCre female mice served as controls.
Hematocrit, hemoglobin levels and number of erythrocytes dropped from a mean of 41.1%, 13.3 g/dL, and 9.8x10⁶/μL in TF to 35.4% (P<0.001), 11.0 g/dL (P<0.001) and 7.7x10⁶/μL (P<0.001) in TS mice. While the proportion of overall circu lating reticulocytes tended to increase, the immature reti culocyte fraction increased from 51% in TF to 56.5% in TS mice (P<0.05), but the mature reticulocyte fraction de creased from 49% in TF to 43.5% in TS mice (P<0.05) (Fig ure 1A, Online Supplementary Figure S2A). The mean corpuscular hemoglobin did not differ between TF and TS mice. The mean corpuscular hemoglobin concentration decreased from 33.2 g/dL in TF to 31.3 g/dL in TS mice (P<0.01) and the mean corpuscular volume increased from 42.7 fL in TF to 45.2 fL in TS mice (P<0.01). The red cell dis tribution width decreased from 23.0% in TF to 22.1% in TS mice with
the murine whey acid promotor (WAP) to delete p53 spe cifically in mammary tissue giving rise to spontaneous breast tumors (Table 1). Housing conditions and tumor size measurements are described in the Online Supplementary Information. Mice were euthanized by CO2 at the indicated time points or when either one single tumor reached a size of 2 cm3 or multiple tumors reached a total volume of 3 cm3. We defined this time point as terminal stage (TS). As controls we used age-matched tumor-free female Trp53floxWapCre mice (TF), i.e., mice that had not devel oped tumors at that point. Tissue sampling is further de scribed in the Online Supplementary Data.
Methods
Results
Trp53floxWapCre mice develop breast cancer associated with anemia
Haematologica | 107 October 2022 2455 ARTICLE - Iron- and erythropoietin-resistant
Additional methods
Mouse experiments were performed in accordance with the Swiss animal law and with the approval of the ethical committee (license 128/2012 and 100/2018) of the local veterinary authorities. Trp53floxWapCre mice on a clean FVB background, obtained from Thomas Rülicke (University of Veterinary Medicine, Vienna, Austria), express Cre under
(P<0.001) (Figure 3A), respectively, the former due to in creased hepatocyte proliferation (Online Supplementary Figure S3) and the latter probably due to increased extramedullary erythropoiesis. Epo mRNA levels in the kid ney were 2 times higher in TS than in TF mice (P<0.05) and mean EPO plasma levels increased from 448 pg/mL in TF mice to 1109 pg/mL in TS mice (P=0.06) (Figure 3B), indi cating that renal EPO synthesis was increased in TS Trp53floxWapCre mice. We next tested if exogenous EPO ad ministration protects Trp53floxWapCre mice from anemia. EPO treatment did not alter tumor progression and in creased, as expected, the hematocrit in TF mice. However, EPO did not prevent most tumor-bearing Trp53floxWapCre mice from developing AoC (Figure 3C). Only two of 14 EPOtreated TS mice probably responded with increased ery thropoiesis (Figure 3C, red arrows).
Loss/gain of bodyweight at TS* [g] -1(loss) – +8 (gain) 0 +2.0 +4.0
Hemolysis not observed
Haematologica | 107 October 2022 2456
Further characteristics
Cervical mammary glands 21.1 %
Abdominal mammary glands 44.9 %
ARTICLE - Iron- and erythropoietin-resistant mice with AoC Bregolat et
Metastasis not observed
Liver mRNA levels of the inflammation marker serum amy loid A1 (Saa1) increased 100-fold (P<0.001) and plasma IL6 levels increased approximately 300-fold in TS mice (P<0.05), suggesting ongoing inflammation (Figure 2A). The number of circulating leukocytes in TS mice was 2.2 times higher than in TF mice (P<0.001). While the number of lym phocytes did not change, the number of monocytes in creased 9 times in TS mice (P<0.001). Basophils were detected in TF but not in TS mice and eosinophils did not differ between TF and TS mice. Neutrophils increased 9.5 times in TS mice (P<0.01) (Figure 2B, Online Supplementary Figure S2C) and accumulated, together with monocytes and other leukocytes, in suppuratively inflamed tumor re gions, probably contributing to tumor necrosis (Figure 2C).
Given that Trp53floxWapCre mice did not respond to EPO, we determined plasma iron levels, which can be limiting for erythropoiesis especially during inflammation. The mean iron concentration in blood plasma dropped from 240.5 μg/dL in TF to 186.7 μg/dL (P<0.01) in TS mice, the mean transferrin saturation decreased from 66% to 34% (P<0.001), and plasma ferritin was reduced by 54% (P<0.001) (Figure 3D, Online Supplementary Figure S4A). Tumor sections stained for iron as well as iron measure ments in tumor samples indicated that tumors were largely iron spared and that TS mice had less iron in bone marrow,
Thoracic mammary glands 19.7 %
N.F.
Trp53floxWapCre mice develop erythropoietin- and iron-resistant anemia of cancer
Number of tumors at TS* 1-6 2.0 3.0 4.0
Time until TS* [days] 18-43 21 24.5 29.25
Inguinal mammary glands 14.3 %
Trp53floxWapCre mice develop anemia of cancer associated with inflammation
al.
mice (P=0.06) (Figure 1B, Online Supplementary Figure S2B).
Overall, Trp53floxWapCre tumor mice developed hypo chromic, macrocytic anemia.
Trp53floxWapCre mice showed no evidence of metastasis (Table 1) or kidney, spleen, and liver damage (Online Sup plementary Table S5). However, the sizes of liver and spleen increased 1.5 times (P<0.001) and 2.5 times
Tumor onset [weeks of age] 21-36 25.6 27.0 30.2
Type of tumors 6 % solid carcinoma; 12.5 % adenocarcinoma, 81.5% carcinosarcoma Tumor location in mammary tissue
Bleeding/blood loss not observed
*TS: terminal stage, when either one tumor reached a size of 2 cm3 or multiple tumors reached a total volume of 3 cm3.
Parameter Range 25th Percentile Median 75th Percentile
Loss/gain of bodyweight at TS* [g] corrected for tumor weight -3 (loss) – +6 (gain) -2.0 0 +2.0
Table 1. Clinical characterization of terminal stage Trp53floxWpCre mice.
ever, the diet did not alter either hepcidin expression or the extent of anemia and iron deficiency in TS mice (Online Supplementary Figure S6). We concluded that TS mice developed iron deficiency and suppressed hepcidin expression through a mechanism that increases iron availability. We therefore tested if iron sup plementation prevents iron deficiency and anemia in Trp53floxWapCre tumor mice. Given that tumor growth and time points of reaching the TS varied between 18 and 43 days among mice with tumors, we performed two iron sup plementation experiments to control either the time after iron supplementation or tumor size. We injected mice in travenously with a single dose of iron or saline immediately after tumor onset and examined: (i) if anemia and iron levels changed 15 days after treatment independently of tumor size and (ii) if anemia and iron levels changed in TS mice. In both experiments, iron treatment did alter tumor prolifer ation, hematocrit (Figure 3E) or hemoglobin levels (Online Supplementary Figure S7A). While plasma iron levels were increased 15 days after iron supplementation, indicating that supplementary iron was available in the plasma at early time points, plasma iron levels in saline- or iron-treated TS mice were not altered (Online Supplementary Figure S7B). Ac cordingly, we concluded that hypoferremia coincided with, rather than caused, AoC in Trp53floxWapCre mice.
Haematologica | 107 October 2022 2457 ARTICLE - Iron- and erythropoietin-resistant
AoC N.F. Bregolat et al. A
Figure 1. Anemia of cancer in Trp53floxWapCre breast cancer mice. Blood from tumor-bearing Trp53floxWapCre mice (gray boxes) was taken when the tumor reached maximal permitted size (defined as terminal stage). Age-matched tumor-free Trp53floxWapCre mice (white boxes) served as controls. (A) Hematocrit (n=14-15) and hemoglobin (n=16-33) analyzed by microcentrifugation and by an ABL800, respectively, as well as erythrocyte count (n=6), proportion of overall circulating reticulocytes and proportion of immature and mature reticulocyte fractions (n=4) analyzed by a Sysmex XT-2000iV from whole blood. (B) Mean corpuscular hemoglobin, mean corpuscular hemoglobin concentration, mean corpuscular volume, and red cell distribution width (n=4-6), analyzed by a Sysmex XT-2000iV from whole blood. Data are shown as a box plot with minimum to maximum whiskers and were analyzed by a Student t-test (black symbols) or a Mann-Whitney test (red symbols or P-values) (*P<0.05, ** P<0.01, *** P<0.001). TF: tumor free; TS: terminal stage; MCH: mean corpuscular hemoglobin, MCHC: mean corpuscular hemoglobin concentration; MCV: mean corpuscular volume; RDW: red cell distribution width. mice with
spleen, liver, and kidney than TF mice (Online Supplemen tary Figure S4B, C). Despite the high IL-6 plasma levels, plasma hepcidin did not differ between TS and TF mice. In fact, hepcidin (Hamp1) mRNA levels in TS mice were even 2.9 times lower (P<0.05) than in TF mice (Figure 3D). Hep cidin expression at earlier stages of tumor development was also not altered. Among the genes that regulate hep cidin, we observed that Bmp6 RNA levels were reduced while Bmp2, Hfe and Hjv were not differentially regulated in the liver of TS mice (Online Supplementary Figure S4D). However, TS mice showed 1.7 times (P=0.07) and 5 times higher (P<0.05) mRNA levels of erythroferrone (Erfe), a sup pressor of hepcidin mRNA expression, in bone marrow and spleen, respectively, compared to TF mice (Figure 3D). No tably, expression of hepcidin-suppressing platelet-derived growth factor BB (PDGF-BB) and its downstream target Creb129 was not altered (Online Supplementary Figure S5). Unchanged ferroportin (Fpn1) mRNA and immunohisto chemically assessed FPN1 protein levels in the liver as well as increased FPN1 mRNA and protein levels in the spleen of TS mice (Online Supplementary Figure S4E) further indi cated that hepcidin was not activated in Trp53floxWapCre mice. Given that commercial diets exceed the daily iron demand of mice and may therefore blunt hepcidin ex pression,3 we fed mice with an iron-sufficient diet. How
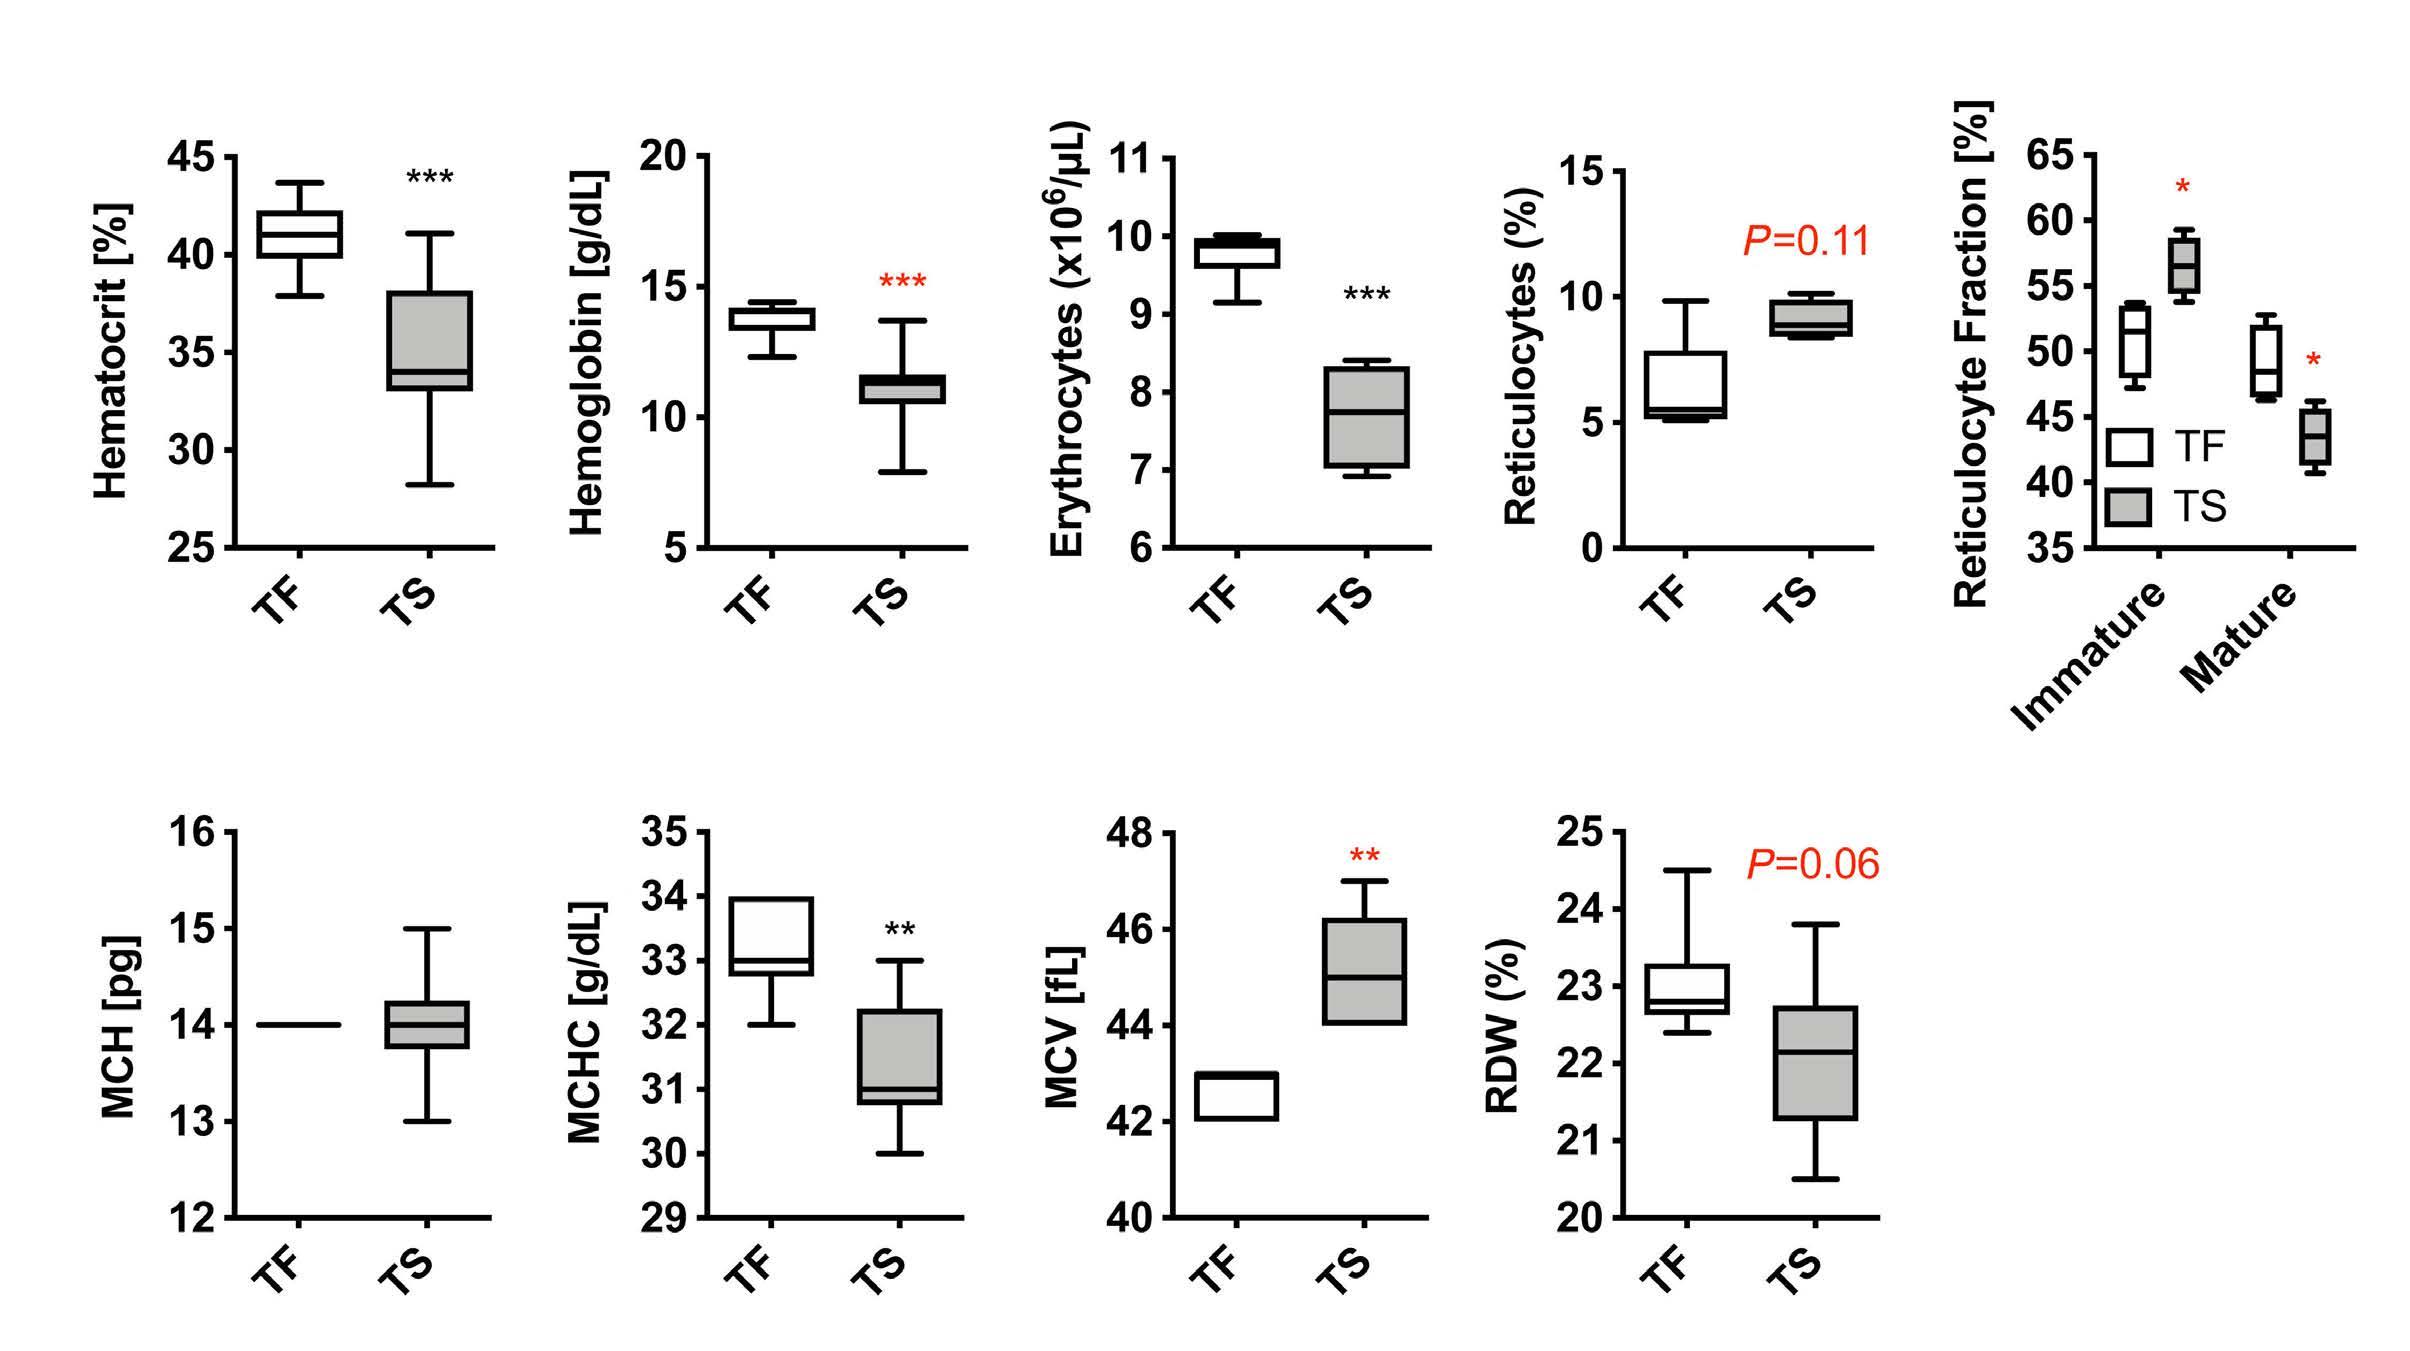
To assess erythropoiesis, we quantified five different ery throid maturation stages from proerythroblast to mature red blood cells of Ter119+ erythroid progenitors14 in bone marrow and spleen (Figure 4A, Online Supplementary Fig ure S8A). The bone marrow proportion of total Ter119+ ery throid progenitors decreased 2 times (P<0.05) in TS mice (Figure 4B, Online Supplementary Figure S8B). The relative proportion of the different erythroid maturation stages did not change significantly, although proerythroblasts showed an increasing trend (P=0.06) (Figure 4C, Online Supplemen tary Figure S8B). In contrast, the proportion of total Ter119+ cells in spleens of TS mice did not change but the relative proportion of the erythroid maturation stages increased from 0.8% to 3.2% in proerythroblasts, from 4.7% to 11.7% in basophilic erythroblasts, from 16.0% to 27.2% in poly chromatic erythroblasts, and from 6.0% to 14.9% in ortho
Figure 2. Inflammation in anemic Trp53floxWapCre breast cancer mice. Blood and liver tissue from tumor-bearing Trp53floxWapCre mice (gray boxes) were taken when the tumor reached maximal permitted size (defined as terminal stage, TS). Age-matched tumor-free Trp53floxWapCre mice (TF, white boxes) served as controls. (A) Liver mRNA levels of serum amyloid A 1 (Saa-1) (n=1415) determined by quantitative polymerase chain reaction analysis and normalized to β-actin (Actb) mRNA levels (left panel) as well as plasma interleukin-6 (IL-6) levels (n=4), determined by enzyme-linked immunosorbent assay (right panel). (B) Cell counts of leukocytes, lymphocytes, monocytes, neutrophils, eosinophil, and basophils in blood from TF (white boxes) and TS (grey boxes) Trp53floxWapCre mice, analyzed by a Sysmex XT-2000iV. (n.d. not detected) (C) Representative image of suppuratively inflamed tumor regions with massive neutrophil invasion (black arrows representative examples). Scale bar 250 μm. Data are shown as a box plot with minimum to maximum whiskers and were analyzed by a Student t-test (black symbols) or a MannWhitney test (red symbols) (*P<0.05, **P<0.01, ***P
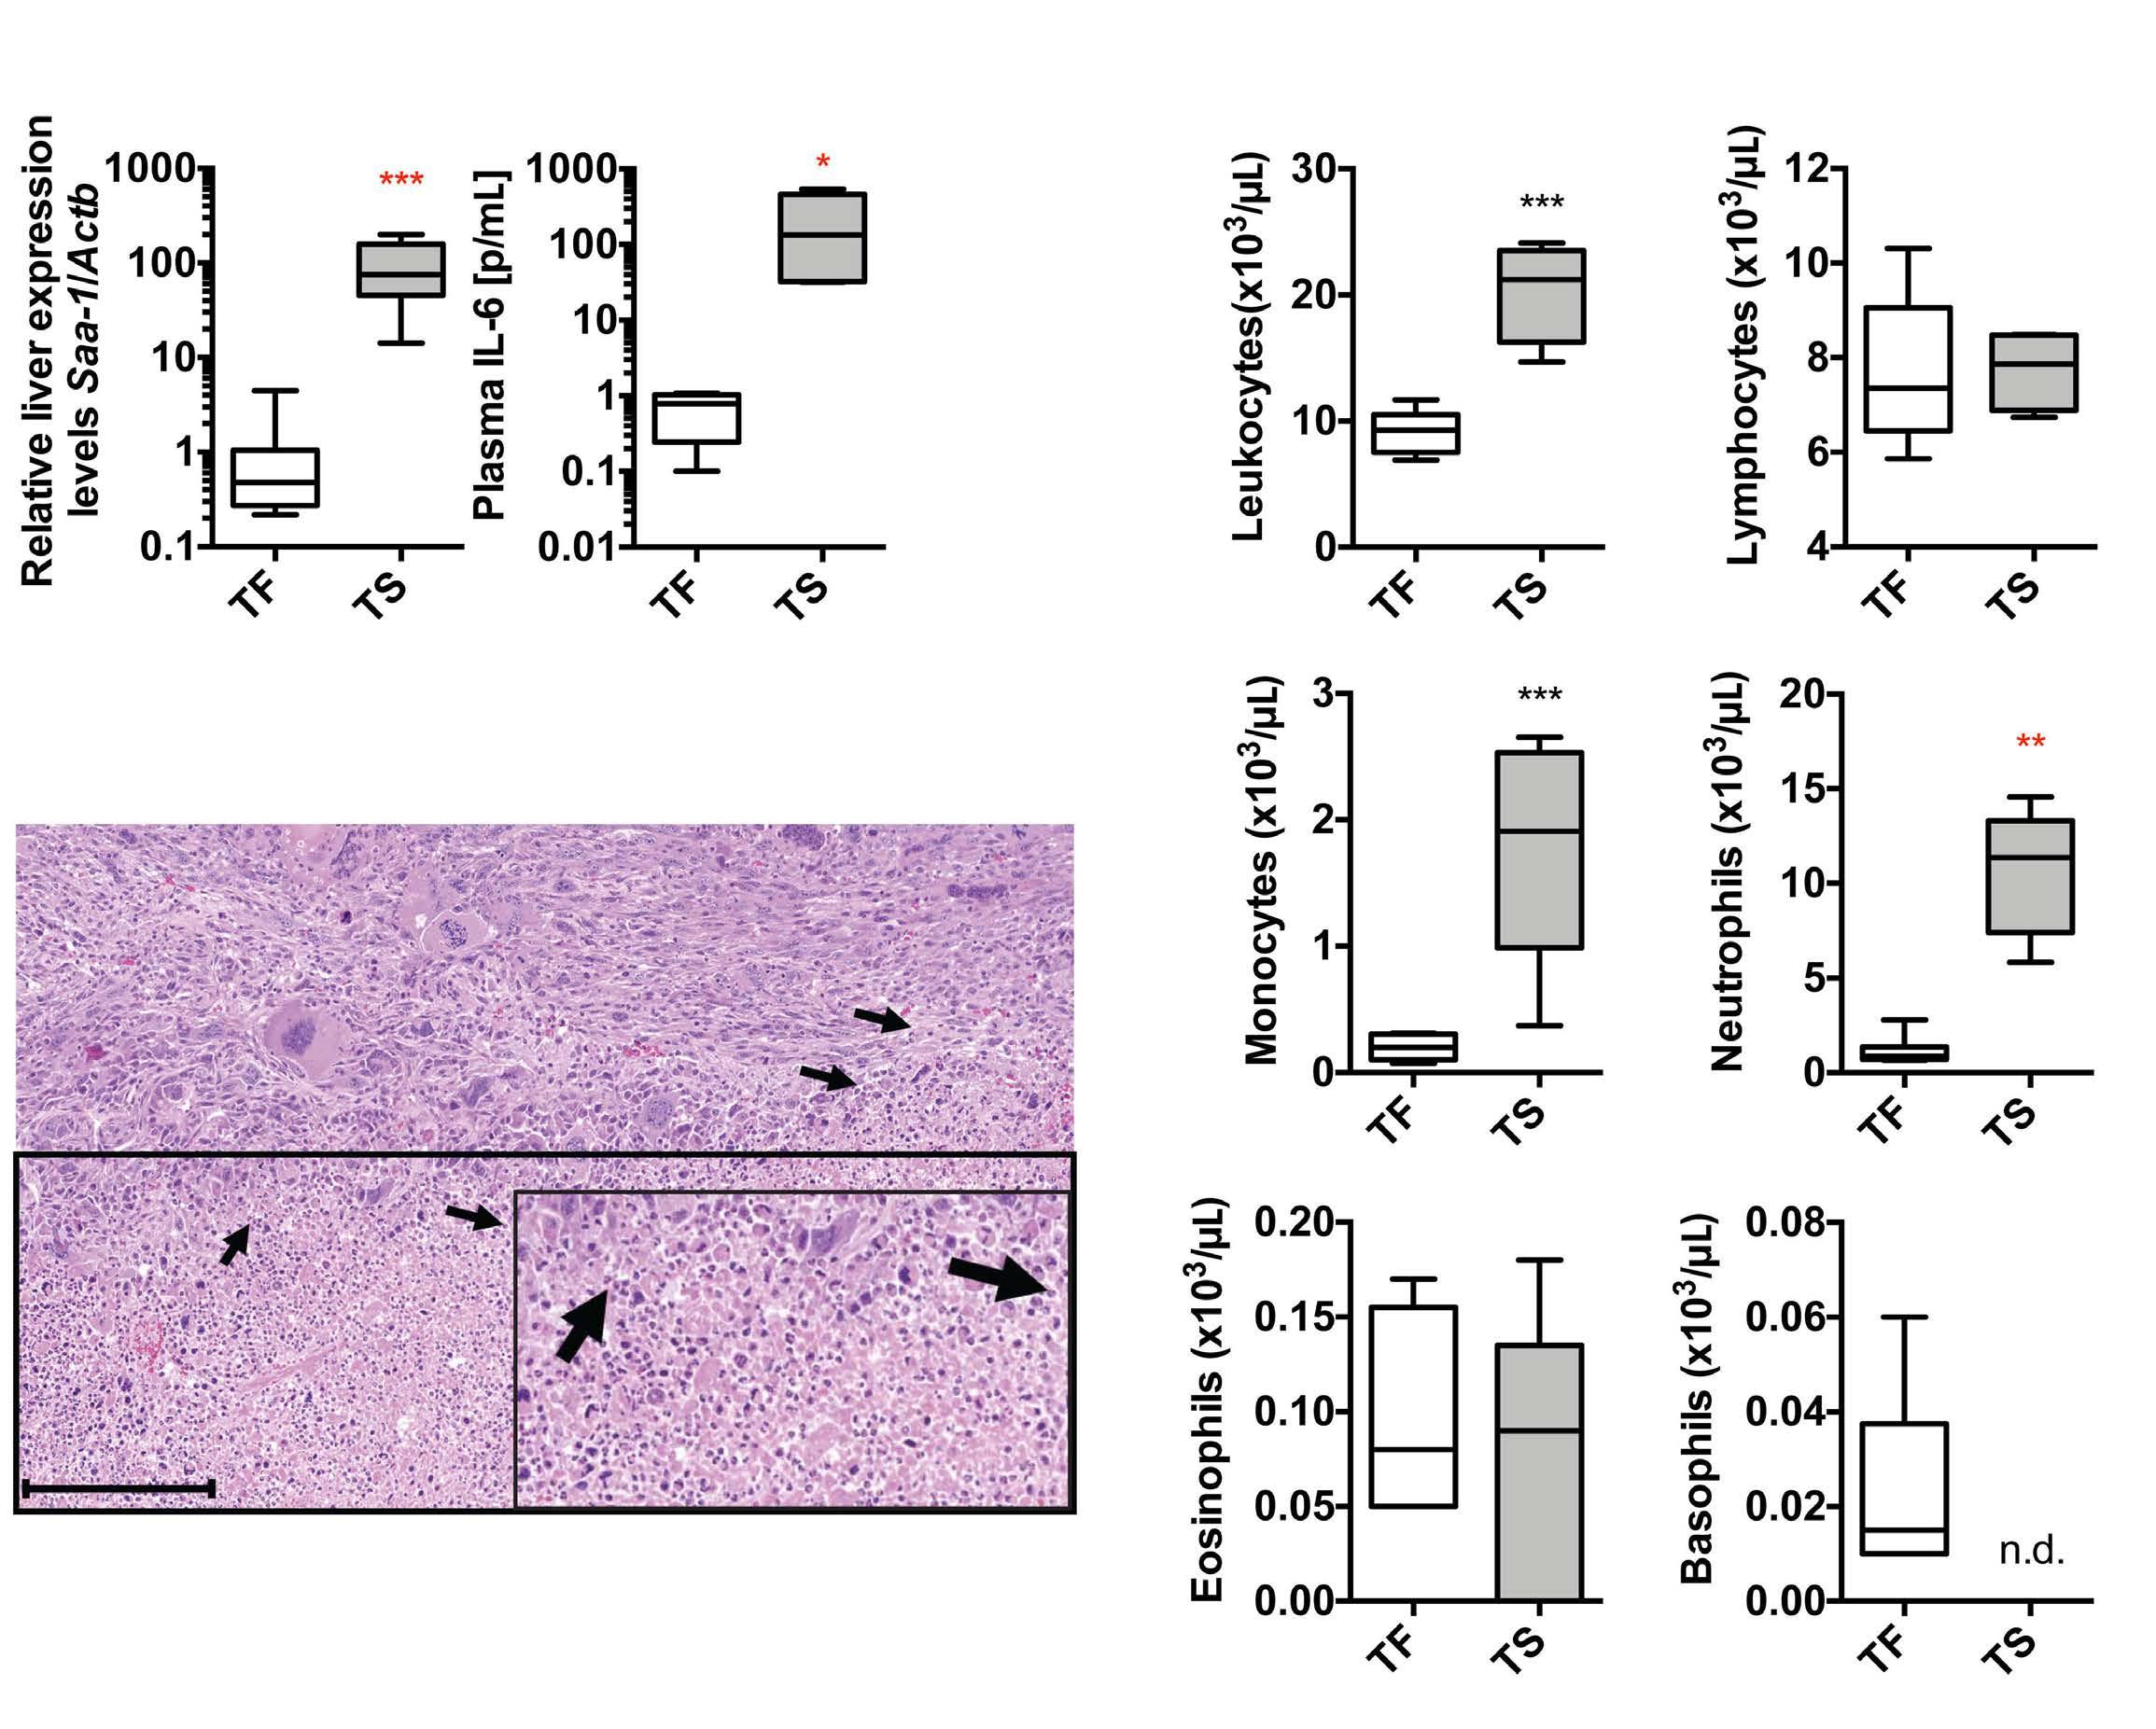
Haematologica<0.001). | 107 October 2022 2458 ARTICLE - Iron- and erythropoietin-resistant mice with AoC N.F. Bregolat et al.
Impaired erythropoiesis in bone marrow of Trp53floxWapCre mice
chromatic erythroblasts but decreased from 72.5% to 43.0% in mature red blood cells (P<0.05) (Figure 4C, Online Supplementary Figure S8B). In parallel mRNA levels of Tfrc, Trf2, and Dmt1 as well as of the erythroid progenitor genes Epor, Gypa, Hba, and Hbb increased in the spleens of TS mice, while their expression in bone marrow was reduced (Online Supplementary Figure S8C). To test whether ery thropoiesis can be boosted by acute iron supplementation during advanced tumor progression, we injected iron into mice harboring tumors larger than 1.5 cm3 and quantified bone marrow and spleen Ter119+ erythroid precursors 48 h later. While the Ter119+ bone marrow proportion of irontreated tumor mice was 2 times lower (P<0.05) than in iron-treated TF mice, the Ter119+ spleen proportion in creased from 41.6% (P<0.05) in TF to 53.8% (P<0.05) in tumor mice after iron treatment (Figure 4D). Thus, spleen but not bone marrow erythropoiesis profited from iron supplementation, implying that splenic stress erythropoie
A B C
Haematologica | 107 October 2022 2459 ARTICLE - Iron- and erythropoietin-resistant
Figure 3. Iron and erythropoietin resistance in hypoferremic Trp53floxWapCre breast cancer mice with anemia of cancer. (A, B and D) Tissue and blood from tumor-bearing Trp53floxWapCre mice (gray boxes) were taken when the tumor reached maximal permitted size (defined as terminal stage; TS). Age-matched tumor-free Trp53floxWapCre mice (TF, white boxes) served as controls. (A) Wet weight of spleen (left panel) and liver (right panel) normalized to the bodyweight. (B) Polymerase chain reaction (qPCR)-quantified erythropoietin (Epo) mRNA levels in the kidney normalized to β-actin (Actb) (n=9-10) (left panel) as well as EPO plasma levels determined by enzyme-linked immunosorbent assay (ELISA) (n=9-12) (right panel). (C) Immediately after tumor onset, Trp53floxWapCre mice were subcutaneously injected with either 1000 U/kg EPO (purple) or saline (light blue) thrice a week until tumors reached maximal size. The modified Kaplan-Meier curve shows the percentage of mice treated with saline (light blue) or 1000 U/kg EPO (purple) which reached maximal tumor size (n=11-13) (left panel). Hematocrit levels of saline-treated (light blue) or 1000 U/kg EPO-treated (purple) tumor mice (Tumor +) as well as TF controls (Tumor ) are also shown (n=6-14) (right panel). Red arrows indicate two EPO-treated mice that showed increased hematocrit values. (D) Plasma iron and transferrin saturation (n=19-20) analyzed by a bathophenanthroline assay (upper panels). Plasma ferritin (n=6) and plasma hepcidin levels (n=5-7) analyzed by ELISA (middle panels). Liver mRNA levels of hepcidin (Hamp1) (n=9-11) as well as erythroferrone (Erfe) (n=4-6) in bone marrow (BM) and spleen were determined by qPCR and normalized to β-actin (Actb) (lower panels). (E) Trp53floxWapCre mice were intravenously injected with a single dose of iron (dark blue boxes) or saline (light blue boxes) immediately after tumor onset. In experiment 1, mice received 20 mg/kg Ferinject® and blood as well as tissues were collected 15 days after treatment (15 DAT). In experiment 2, mice received 13.28 mg/kg Ferinject® or saline and blood as well as tissues were collected when the tumor reached maximal permitted size (TS). The modified Kaplan-Meier curve shows the percentage of saline-treated (light blue) and iron-treated (dark blue) mice, which reached maximal tumor size (n=9-10) (left panel) as well as hematocrit (n=8-10) (right panel). The black and red dotted lines in (E) indicate the average values of untreated TF (black dotted line) and untreated TS (red dotted line) mice. Data are shown as a box plot with minimum to maximum whiskers and were analyzed by a Student t-test (black symbols) or a Mann-Whitney test (red symbols) (*P<0.05, **P<0.01, ***P<0.001). Modified Kaplan-Meier curves were analyzed with a log-rank (Mantel-Cox) test. mice
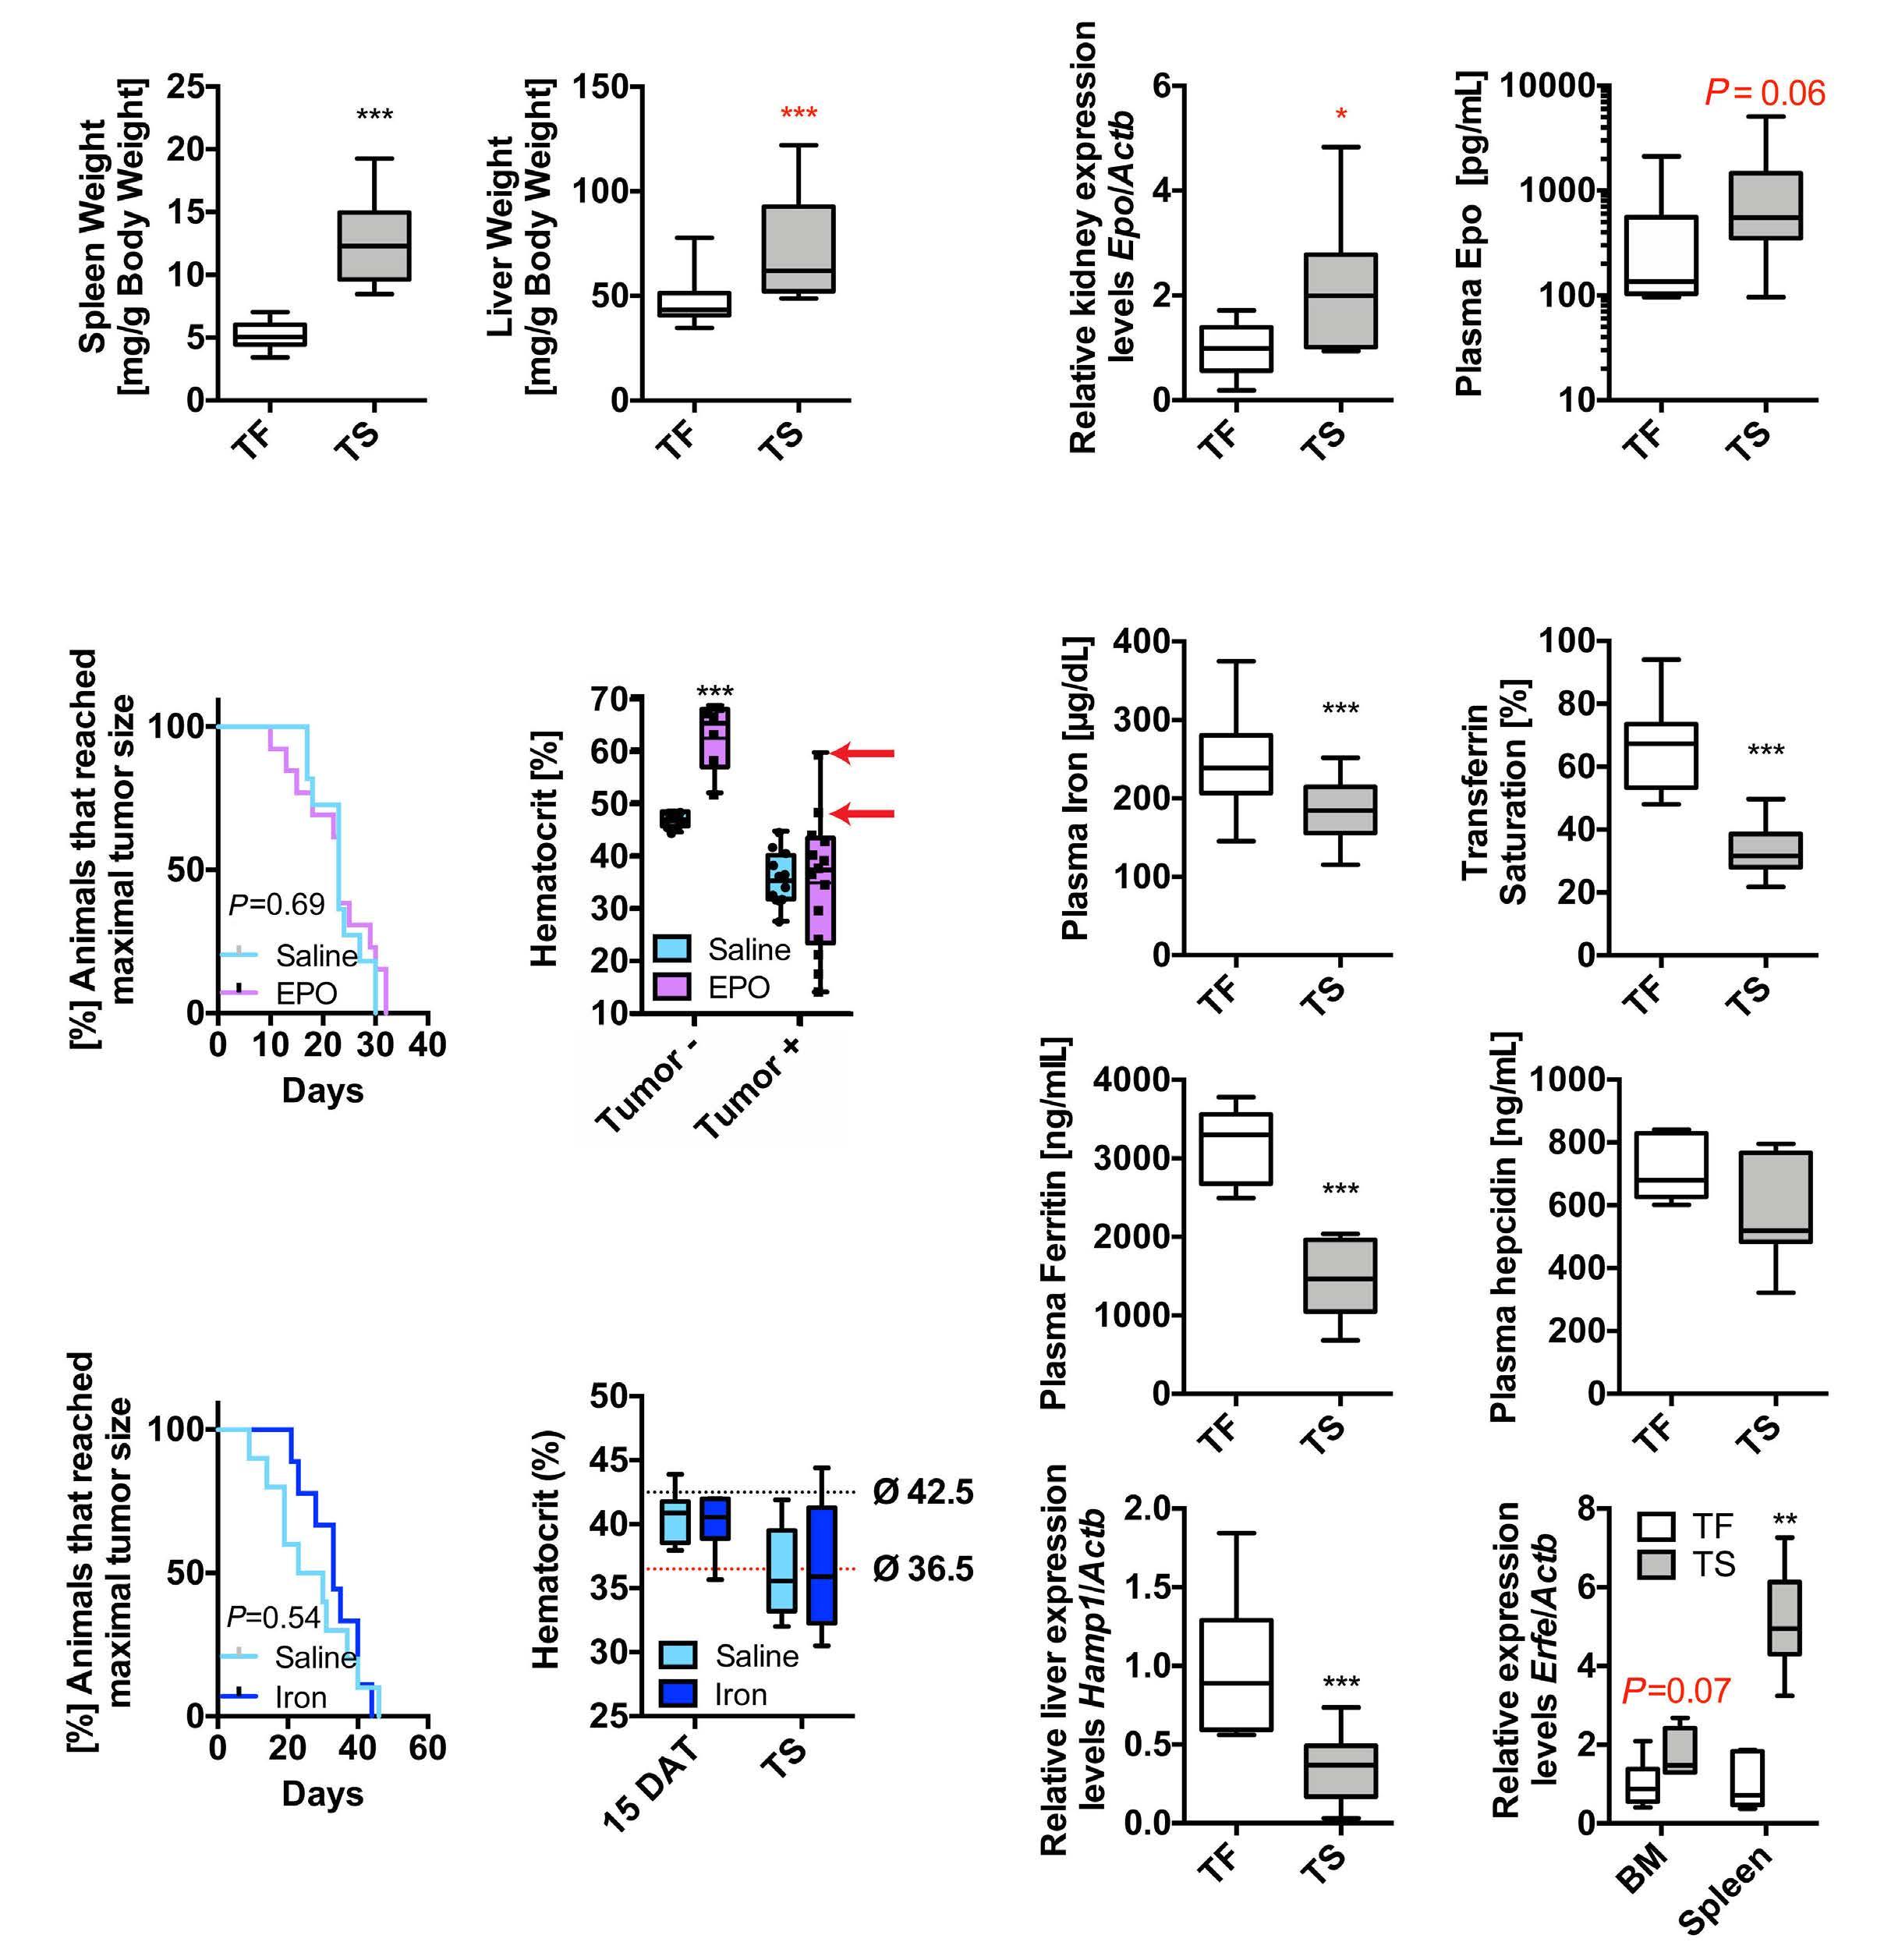
A B C D E
with AoC N.F. Bregolat et al.
sis was induced to compensate for the impaired bone marrow erythropoiesis.
Impaired hematopoiesis in bone marrow of Trp53floxWapCre mice
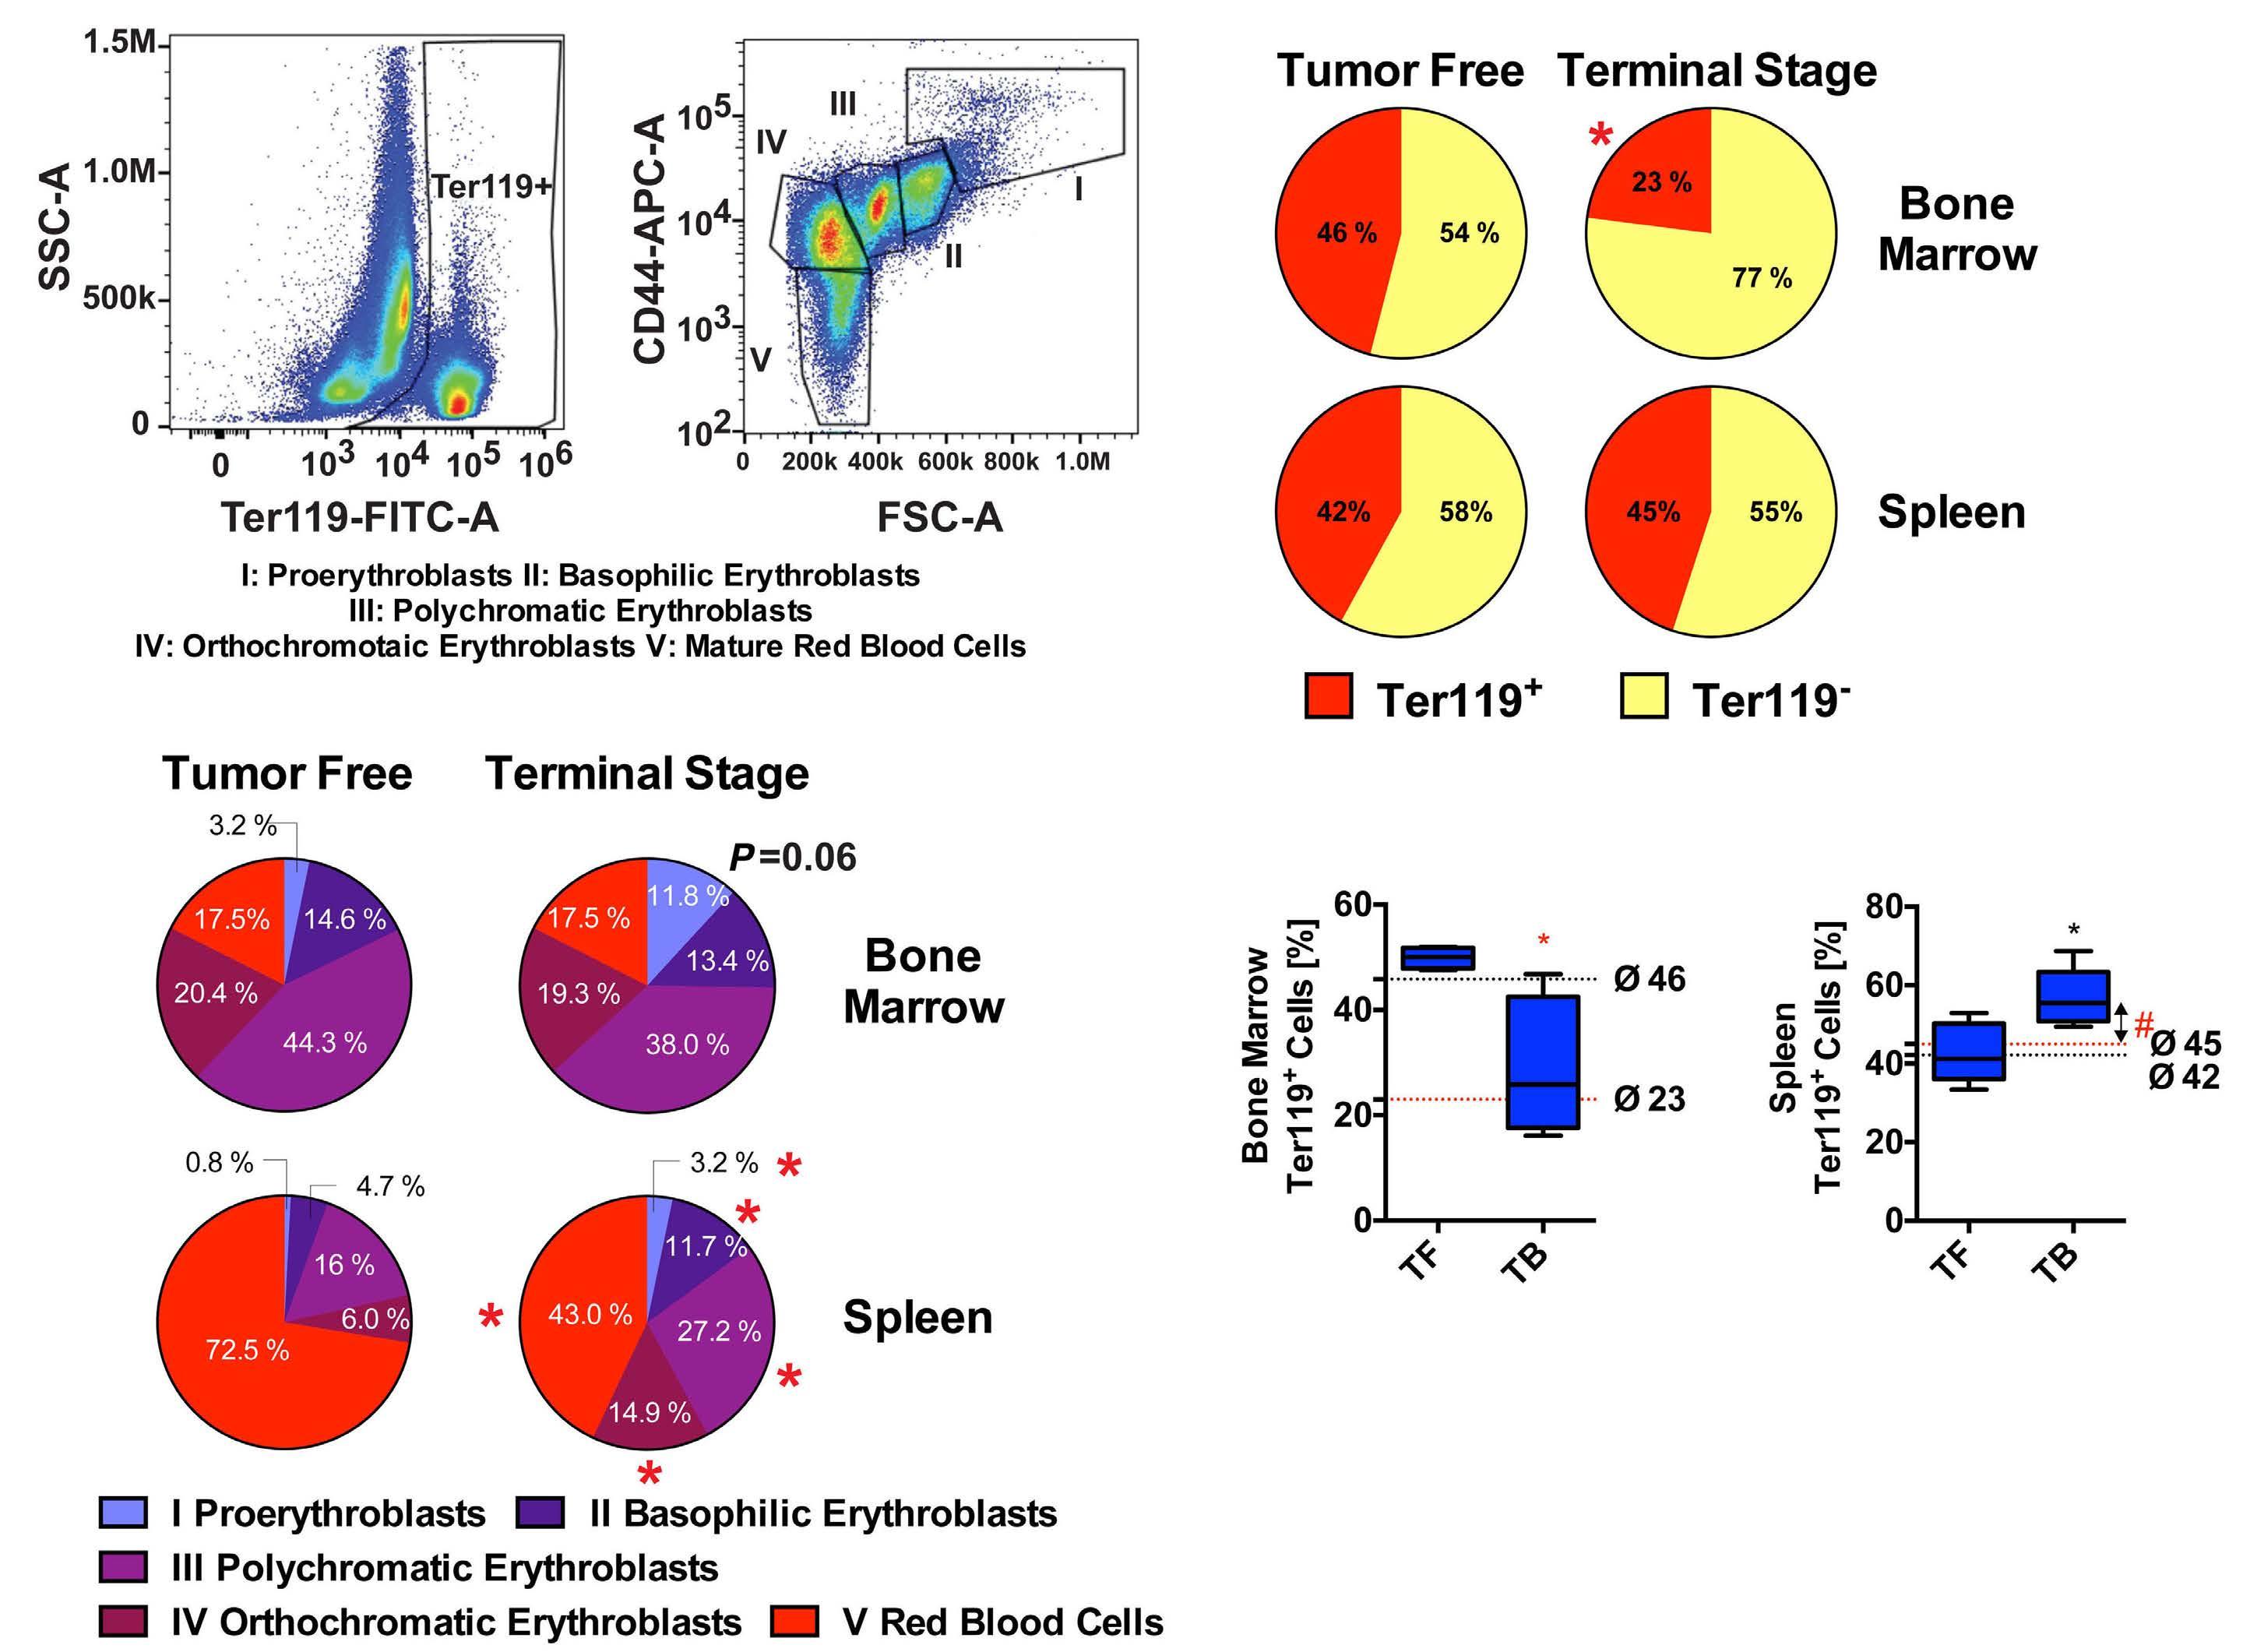
While bone marrow erythroid precursors decreased, the bone marrow cellular density did not differ between TF and TS mice (Online Supplementary Figure S9A) indicating that
Figure 4. Late-stage erythropoiesis in anemic Trp53floxWapCre mice. Bone marrow and spleen cells from age-matched tumor free (TF) and terminal stage (TS) Trp53floxWapCre mice were collected when the tumors reached maximal permitted size and analyzed by flow cytometry. (A) Representative image of Ter119+ cells (late erythroid precursors) gating in Ter119+ vs. SSC-Area plots (left panel). Different clusters of Ter119+ cells in an FSC-Area vs. CD44 plot (right panel) identified erythroid maturation stages (I: proerythroblasts; II: basophilic erythroblasts; III: polychromatic erythroblasts; IV: orthochromatic erythroblasts (including reticulocytes); and V: mature erythrocytes) based on cell size and CD44 expression levels. (B) Average proportions of Ter119+ (red) and Ter119 (yellow) cells in bone marrow (upper panels) and spleen (lower panels) from TF (left) and TS (right) Trp53floxWapCre mice analyzed by flow cytometry (n=4). (C) Average proportion of the five maturation stages of erythrocytes (I to V) identified by flow cytometry in an FSC-Area vs. CD44 plot in bone marrow (upper panels) and spleen (lower panels) from TF (left) and TS (right) Trp53floxWapCre mice analyzed by flow cytometry (n=4). (D) Age-matched TF and tumor-bearing (TB) mice received a single intravenous 20 mg/kg iron injection when tumors reached a size of 1.5 cm3. Bone marrow and spleen were harvested 48 h after injection and analyzed by flow cytometry. The proportions of bone marrow (left panel) and spleen Ter119+ cells (right panel) in iron-treated mice (n=4) are shown. Data in (B and C) are shown as average values in pie charts (n=4), data in (D) are shown as a box plot with minimum to maximum whiskers. Data were analyzed by a Student t-test (black symbols) or a Mann-Whitney test (red symbols, P-values) (***P<0.001; **P<0.01; *P<0.05). The black and red dotted lines in panel (D) indicate the average values of untreated TF (black dotted line) and untreated TS (red dotted line) mice. #in panel (D) indicates a difference (P<0.05) between iron-treated TS and untreated TS (red dotted line) mice.
other cells filled the bone marrow compartment. Indeed, myeloid precursors and mature myeloid cells were en riched in bone marrow smears of TS mice (Online Supple mentary Figure S9B). To assess hematopoiesis, we analyzed hematopoietic cells by flow cytometry.30 Our data show that neither CD48 /CD150+ hematopoietic stem cells (HSC) nor CD48+/CD150 multipotent progenitors (MMP) differed between TF and TS mice. However, while the bipotent
Haematologica | 107 October 2022 2460 ARTICLE - Iron- and erythropoietin-resistant mice with AoC N.F. Bregolat et al.
A B C D
ARTICLE Iron- and erythropoietin-resistant mice with AoC
CD105 /CD150+ pre-megakaryocyte-erythrocyte progen itors (Pre MgE) decreased from 0.25% in TF to 0.16% in TS mice (P=0.06), the CD105 /CD150 pre-granulocyte-mono cyte lineage cells (Pre-GM) increased from 0.8% in TF to 1.3% in TS mice (P<0.05) (Figure 5A). This suggests that the differentiation of common myeloid progenitors (CMP) was shifted from the erythroid lineage towards the granulo
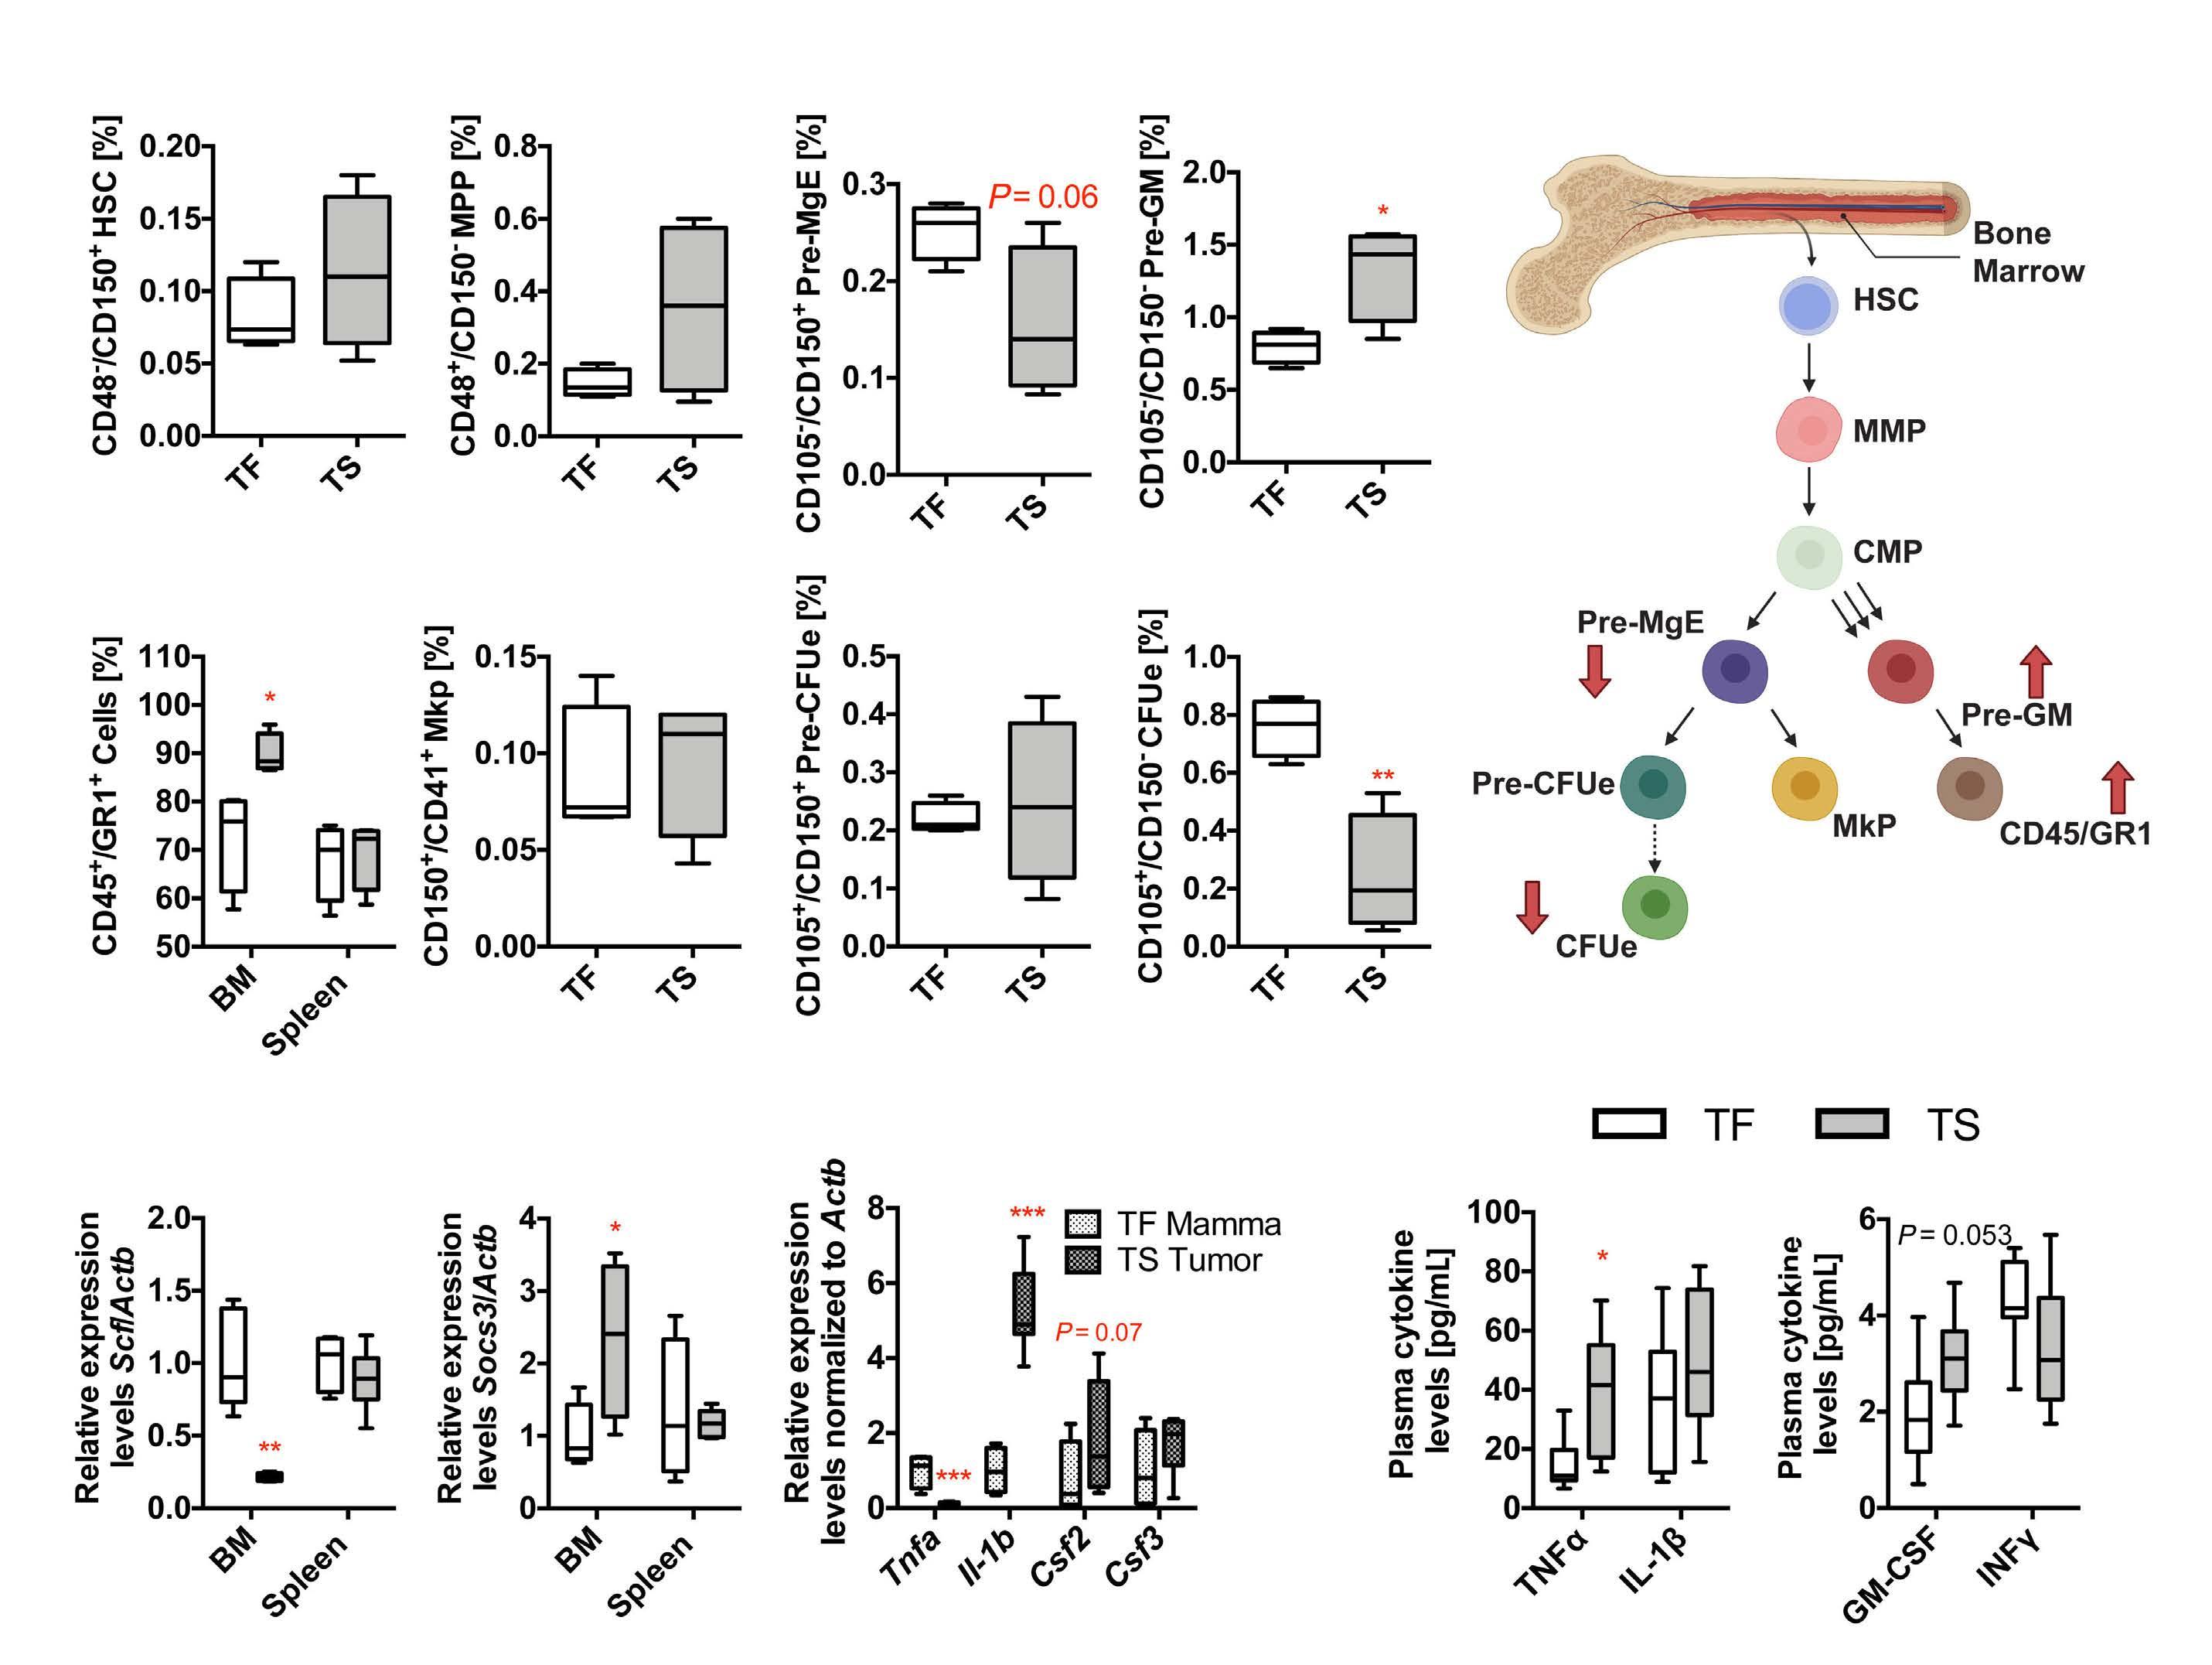
| 107 October 2022 2461
N.F. Bregolat et al.
cyte-monocyte lineage (Figure 5B). This was further sup ported by an elevated proportion of CD45+/GR1+ neutrophil progenitors in bone marrow which increased from 72.5% in TF to 86.5% in TS mice (P<0.05). Although the proportion of Pre-MgE was reduced in TS mice, we observed no dif ference in the proportion of CD150+/CD41+ megakaryocyte progenitors or CD105+/CD150+ pre-colony-forming units
-
Figure 5. Early-stage hematopoiesis in anemic Trp53floxWapCre mice. (A) Bone marrow and spleen from age-matched tumor free (TF, white boxes) and terminal stage (TS, gray boxes) Trp53floxWapCre mice were collected when the tumors reached maximal permitted size and analyzed by flow cytometry. Proportions of CD48 /CD150+ hematopoietic stem cells (HSC), CD48+/CD150 multipotent progenitors (MPP), CD105 /CD150+ pre-megakaryocyte erythrocyte progenitors (Pre-MgE), CD105 /CD150 pregranulocyte-monocyte lineage cells (Pre-GM) (n=4) are shown. The proportions of CD45+/GR1+ positive leukocyte precursors in bone marrow and spleen are also shown, as well as CD150+/CD41+ megakaryocyte precursors (Mkp), CD105+/CD150+ pre-colonyforming units erythrocyte (Pre-CFUe), and CD105+/CD150 colony-forming units erythrocyte (CFUe) in bone marrow (n=4). (B) Schematic illustration of the steps of hematopoiesis. The red arrows indicate an up- or down regulation of hematopoietic precursors and the triple black arrows indicate a shift in the maturation of common myeloid progenitors (CMP) towards Pre-GM in the bone marrow of TS Trp53floxWapCre mice. (C) mRNA levels of stem cell factor (Scf) (left panel) and suppressor of cytokine signaling 3 (Socs3) (right panel) in the bone marrow (BM) and spleen, determined by quantitative polymerase chain reaction (qPCR) and normalized to β-actin (Actb) mRNA levels (n=4-6). (D) mRNA levels of tumor necrosis factor alpha (Tnfα), interleukin 1 beta (Il-1b), granulocyte-macrophage colony-stimulating factor (Csf2) and granulocyte colony-stimulating factor (Csf3) in mammary tissue of tumor free (TF Mamma) and in tumor tissue of terminal stage Trp53floxWapCre mice (TS Tumor), determined by qPCR and normalized to β-actin (Actb) mRNA levels (n=4-8). (E) Plasma levels of tumor necrosis factor alpha (TNFα) and Interleukin 1 beta (IL-1β) (left panel) as well as granulocyte-macrophage colony-stimulating factor (GM-CSF) and interferon gamma (INFγ) (right panel) quantified by enzyme-linked immunosorbent assay (n=7-8). Data are shown as a box plot with minimum to maximum whiskers and were analyzed by a Student t-test (black P values, panel E) or a Mann-Whitney test (red symbols, P values) (***P<0.001; **P<0.01; *P<0.05).Haematologica
A B C D E
We examined if Trp53floxWapCre mice that spontaneously develop breast cancer mirror the human AoC pathology. TS Trp53floxWapCre mice developed hypochromic AoC together with a strong inflammation and iron deficiency. However, hepcidin levels were not induced and iron deficiency co incided with AoC rather than caused it. Treatment with iron as well as with EPO did not restore normal hemoglobin levels. During early hematopoiesis, the progenitor fate of CMP shifted from erythroid towards the myeloid lineage, re sulting in inadequate bone marrow production of red blood cells and excessive production of granulocytes and neutro phils. Pro-inflammatory cytokines such as TNFα and GMCSF as well as IL-6 may block erythropoiesis and stimulate myelopoiesis independently of hepcidin and iron levels.
Haematologica | 107 October 2022 2462
erythrocyte (pre-CFUe) between TF and TS mice. However, the CD105+/CD150 colony-forming units erythrocyte (CFUe) decreased from 0.76% in TF mice to 0.24% in TS mice (P<0.01) (Figure 5A). To investigate why erythropoiesis was inhibited in bone marrow but not spleen we analyzed gene expression levels of stem cell factor (Scf), which stimulates erythropoiesis,31 and suppressor of cytokine sig naling (Socs3), which inhibits erythropoiesis.22 While Scf mRNA levels in bone marrow of TS mice were 4.5 times lower (P<0.01) and Socs3 mRNA levels 2.3 times higher (P<0.05) than in TF mice, their mRNA levels in the spleen did not differ between TF and TS mice (Figure 5C). Addi tionally, autophagy genes, which play a critical role in cell organelle removal during erythroid maturation,32 were downregulated in the bone marrow of TS mice (Online Sup plementary Figure S9C). We also analyzed cytokine mRNA levels in tumors of TS and in healthy mammary tissue of TF mice. Tumor necrosis factor alpha (Tnfa) mRNA levels were 9.2 times lower (P<0.001), interleukin 1 beta (Il1b) levels were 5.3 times higher (P<0.001), and granulocytemacrophage colony-stimulating factor (Csf2) levels were 2.4 times higher (P=0.07) in tumor tissue, while granulocyte colony-stimulating factor (Csf3) levels did not differ be tween tumor tissue and mammary tissue (Figure 5D). How ever, the plasma cytokine levels of TNFα increased from 14.6 pg/mL in TF to 40.0 pg/mL in TS mice (P<0.05), the plasma IL-1β levels did not differ between TF and TS mice and the plasma levels of the myelocytic differentiation regulator GM-CSF increased from 2.0 pg/mL in TF mice to 3.1 pg/mL in TS mice (P=0.053). Additionally measured in terferon gamma (INFγ) plasma levels did not differ between TF and TS mice (Figure 5E). Our data suggest that while erythropoiesis may be actively suppressed (e.g., by TFNα), myelocytic differentiation regulators (e.g., GM-CSF) alter the fate of early hematopoietic precursors and prevent erythropoiesis by upregulating myelopoiesis.
ARTICLE
- Iron- and erythropoietin-resistant mice with AoC N.F. Bregolat et al.
Discussion
Trp53floxWapCre mice developed AoC associated with an increased number of monocytes and neutrophils in blood, which accumulated in suppuratively inflamed tumor re gions. Anemic mice showed slightly upregulated renal Epo mRNA as well as EPO plasma levels, probably in response to reduced blood oxygenation. Surprisingly, EPO treatment did not increase hematocrit and hemoglobin levels in TS mice. Non-responsiveness to ESA is also observed in up to 30-40% of human cancer patients33 either due to inhibited EPO signaling or due to reduced iron availability for ery thropoiesis caused by pro-inflammatory cytokines. Es pecially, IL-6 upregulates hepcidin in the liver, causing functional iron deficiency14,15 or it directly inhibits erythro poiesis in patients or mice.20,21,34 In anemic Trp53floxWapCre mice, IL-6 showed by far the highest upregulation of all cytokines assayed. However, while plasma iron levels were reduced, plasma hepcidin levels did not differ between TF and TS mice, and hepcidin mRNA levels in the liver were even reduced. We explain this discrepancy by the enlarged liver in TS mice with more hepcidin-producing cells that compensate the reduced cellular hepcidin synthesis rate. While hepcidin-inducing PDGF-BB29may not play a major role in our model, the reduced expression of BMP66,7 and the low iron levels per se35-37 may overwrite the hepcidininducing effect of IL-6 that is known from anemia of in flammation.3 Moreover, the increased bone marrow and spleen mRNA levels of Erfe8 and the increased renal Epo mRNA levels suggest that hepcidin may have also been suppressed by the HIF2-EPO-ERFE axis.38,39 Hepcidin downregulation in other murine models of AoC was sug gested to be a consequence of activated erythropoiesis at late tumor stages, while at early stages, hepcidin ex pression may be increased by inflammation.16 In our study, no increase of hepcidin mRNA levels at early or late stages of tumor progression was observed. Furthermore, feeding mice with an iron-sufficient diet (50 mg/kg iron), to ex clude the possibility that high iron levels in commercial diets blunt acute hepcidin expression,3 did not alter either hepcidin expression or anemia in our model. We conclude that hepcidin is not the main driver for AoC in Trp53flox WapCre mice. However, we cannot exclude that inappro priately high hepcidin plasma levels (i.e., no decrease in response to iron deficiency) may contribute to the devel opment of AoC in Trp53floxWapCre mice. When supplementing tumor mice with iron, hematocrit and hemoglobin values did not increase, although the iron plasma levels were elevated at least until 15 days after treatment. The majority of mice did not fully establish an anemic phenotype during the first 15 days of tumorigenesis and iron supplementation may not have had the desired effect at such early stages. We cannot exclude that higher iron dosages could have protected Trp53floxWapCre mice better from anemia, despite calculating iron supplemen tation so that normal hemoglobin values should have been
restored (Ganzoni formula40). Moreover, iron supplementa tion may also increase tumor proliferation41 but the calcu lated iron dosages did not cause tumor progression. When mice with advanced 1.5 cm3 large tumors were treated with iron, they had an acute increase in Ter119+ erythroid pro genitors in the spleen but not in the bone marrow. This suggested that red blood cell production was maintained by the spleen, while it was blocked in the bone marrow where hypoferremia was not a limiting factor for erythro poiesis and, thus, coincided with AoC in our model.
AoC N.F. Bregolat et al.
MG, MUM and MT initiated this project and MT developed it further. NFB contributed to designing experiments, per mice with
Contributions
Haematologica | 107 October 2022 2463 ARTICLE - Iron- and erythropoietin-resistant
WapCre mice were hardly higher than in healthy mammary tissue, plasma protein levels of myelopoiesis-stimulating GM-CSF were increased, probably contributing to excessive granulocytosis. Increased TNFα levels in Trp53floxWapCre mice suggest that, in addition to promoting myelopoiesis, erythropoiesis-suppressing mechanisms were activated.23 Indeed, Trp53floxWapCre mice showed increased expression of the EPOR signaling inhibitor SOCS322 in bone marrow but not in spleen. Additionally, we observed a decreased ex pression of erythropoiesis-stimulating SCF.51 However, the plasma levels of TNFα as well as GM-CSF increased less than 3 and less than 2 times, respectively, which challenges their significance in dysregulating bone marrow hemato poiesis in anemic Trp53floxWapCre mice. We speculate that a cocktail of several cytokines, potentially including GMCSF and TNFα, is required to cause iron- and EPO-resistant AoC. It is also possible that AoC in Trp53floxWapCre mice is predominantly caused by IL-6, which directly suppresses erythropoiesis without increasing hepcidin. Thus, AoC in Trp53floxWapCre mice differs from one of the most common forms of AoC in humans, in whom iron defi ciency plays a key role52 and increased hepcidin levels may serve as a serological biomarker for absolute or functional iron deficiency.53 Iron deficiency AoC is often associated with either normocytic (75%) or microcytic (21%) anemia.52 We observed macrocytic anemia in Trp53floxWapCre mice (corresponding to observations in 4% of human patients52), which may be a consequence of the severe leukocytosis.54 Thus, Trp53floxWapCre mice mimic a rare type of AoC in human patients, in whom bone marrow erythropoiesis is irreversibly suppressed while myelopoiesis is induced. In conclusion, we characterized AoC in breast cancer Trp53floxWapCre mice and show that hypoferremia does not cause AoC despite high IL-6 plasma levels, which are expected to activate hepcidin mRNA expression. While the IL-6-induced pathways during anemia of inflammation and AoC largely overlap in humans, IL-6 in mice may activate distinct pathways during anemia of inflammation and AoC. In fact, multiple mouse models, including the herein char acterized Trp53floxWapCre mice, develop AoC in response to excessive myelopoiesis suggesting that tumor-induced inflammation alters hematopoiesis prior to erythroid maturation. Trp53floxWapCre tumor mice are, to our knowl edge, the first mouse model in which AoC with excessive myelopoiesis cannot be prevented by iron or EPO treat ment. Thus, this model will be suitable to study mechan isms of and treatment options for EPO-resistant anemia.
Neither EPO nor iron treatment prevented AoC in Trp53flox WapCre mice. Therefore, our data suggest that bone mar row erythropoiesis was inhibited prior to iron-dependent maturation stages (erythroblast – reticulocyte) as well as prior to EPO-dependent maturation stages (CFUe – proerythroblast). At early hematopoiesis, bone marrow HSC, MPP and CMP did not differ between TF and TS mice. While HSC may be recruited from bone marrow to the spleen re sulting in a bone marrow depletion of HSC during AoC,26 the stem cell niche in our model did not appear to be affected. Instead, the commitment of CMP into either Pre-MgE or Pre-GM was shifted in mice. While the proportion of PreMgE, including downstream CFUe that give rise to the ery throid lineage, was reduced, the proportion of the myeloid precursors Pre-GM, which give rise to granulocytes,43 was increased, explaining the excessive neutrophil production in Trp53floxWapCre mice. Increased granulocytosis is also observed in human (breast44) cancer patients,45 in whom it associates with poor survival, as well as in transplanted tumor mouse models.46,47 Especially tumor-produced col ony-stimulating factors, G-CSF and GM-CSF,25,26 which block erythropoiesis by depleting erythroblastic island macrophages48 and increasing the number of granulocytes, can cause excessive myelopoiesis.25 Some tumors in cancer patients express G-CSF and GM-CSF associated with an in creased number, survival, and activation of neutrophils.49,50 While the mRNA levels of both factors in tumors of Trp53flox
At late-stage erythropoiesis, the proportion of Ter119+ ery throid precursors was reduced in the bone marrow of Trp53floxWapCre mice, while the composition of the ery throid maturation stages from pro-erythroblasts to red blood cells (stage I-V)27 were not significantly altered. In contrast, the proportion of erythroid precursors in the spleens of TF and TS mice did not differ, while the propor tion of stages I-IV (pro-erythroblasts to orthochromatic erythroblasts) were increased, and the proportion of the red blood cells (stage V) decreased. We interpret these re sults in the spleen and the associated splenomegaly as a consequence of stress erythropoiesis and the active re lease of red blood cells. Similar observations have been made in spleens of mice with abscess-induced inflamma tion. It was suggested that the accumulation of the matu ration stages I–IV results from a blockade of erythroid maturation stage V.42
Disclosures
No conflicts of interest to disclose.
10. Wang CY, Xu Y, Traeger L, et al. Erythroferrone lowers hepcidin by sequestering BMP2/6 heterodimer from binding to the BMP type I receptor ALK3. Blood. 2020;135(6):453-456.
4. Pigeon C, Ilyin G, Courselaud B, et al. A new mouse liver-specific gene, encoding a protein homologous to human antimicrobial peptide hepcidin, is overexpressed during iron overload. J Biol Chem. 2001;276(11):7811-7819.
References
5. Rivera S, Nemeth E, Gabayan V, et al. Synthetic hepcidin causes rapid dose-dependent hypoferremia and is concentrated in ferroportin-containing organs. Blood. 2005;106(6):2196-2199.
3. Nemeth E, Rivera S, Gabayan V, et al. IL-6 mediates hypoferremia of inflammation by inducing the synthesis of the iron regulatory hormone hepcidin. J Clin Invest. 2004;113(9):1271-1276.
Acknowledgments
13. Ganz T, Nemeth E. Hepcidin and iron homeostasis. Biochim Biophys Acta. 2012;1823(9):1434-1443.
12. Nemeth E, Tuttle MS, Powelson J, et al. Hepcidin regulates cellular iron efflux by binding to ferroportin and inducing its internalization. Science. 2004;306(5704):2090-2093.
7. Kautz L, Meynard D, Monnier A, et al. Iron regulates phosphorylation of Smad1/5/8 and gene expression of Bmp6, Smad7, Id1, and Atoh8 in the mouse liver. Blood. 2008;112(4):1503-1509.
14. Cheng Z, Yan M, Lu Y, et al. Expression of serum BMP6 and hepcidin in cancer-related anemia. Hematology. 2020;25(1):134-138.
Haematologica | 107 October 2022 2464 ARTICLE - Iron- and erythropoietin-resistant mice with AoC N.F. Bregolat et al.
formed mouse and wet laboratory experiments, analyzed and interpreted data, provided intellectual input, and helped to write the manuscript. MR prepared tissue samples, supported iron measurements and evaluated tumor sections. MCdS, OM and SA supported tissue iron measurements, iron staining in tissue sections, and immu nohistochemical staining of ferroportin. SA performed hep cidin measurements. MAA, HA, NvB, and JA supported animal experiments and molecular analyses. MS quantified bone marrow smears, JMMR performed Ki67 staining, and VS provided intellectual input. RPS and BW analyzed bone marrow hematopoiesis, and BW also contributed to writing the manuscript. MUM and MG provided intellectual input and helped to write the manuscript. MT designed experi ments, contributed to animal experiments, analyzed, and interpreted data, and wrote the manuscript.
All data generated or analyzed during this study are in cluded in this published article and its supplementary in formation files. Large images are stored on servers of the University of Zurich and are available upon request.
17. Mori K, Fujimoto-Ouchi K, Onuma E, et al. Novel models of cancer-related anemia in mice inoculated with IL-6-producing tumor cells. Biomed Res. 2009;30(1):47-51.
18. Noguchi-Sasaki M, Sasaki Y, Shimonaka Y, et al. Treatment with anti-IL-6 receptor antibody prevented increase in serum hepcidin levels and improved anemia in mice inoculated with IL-6producing lung carcinoma cells. BMC Cancer. 2016;16:270.
Data-sharing statement
MT acknowledges the Thoma Foundation and the MarieLouise von Muralt Foundation for financial support. MG ac knowledges the financial support of the Swiss National Science Foundation and the Humanities at the University of Zurich. MUM acknowledges SFB1036, SFB1118 and DFG (Fer rOs - FOR5146) for providing research funding. OM is sup ported by a Junior Research Grant from the European Hematology Association and an Olympia-Morata-Program fellowship provided by the Medical Faculty of the University of Heidelberg.
9. Muckenthaler MU, Rivella S, Hentze MW, et al. A red carpet for iron metabolism. Cell. 2017;168(3):344-361.
6. Andriopoulos B Jr, Corradini E, Xia Y, et al. BMP6 is a key endogenous regulator of hepcidin expression and iron metabolism. Nat Genet. 2009;41(4):482-487.
19. Rizzo JD, Brouwers M, Hurley P, et al. American Society of Clinical Oncology/American Society of Hematology clinical practice guideline update on the use of epoetin and darbepoetin in adult patients with cancer. J Oncol Pract. 2010;6(6):317-320.
2. Zhang Y, Chen Y, Chen D, et al. Impact of preoperative anemia on relapse and survival in breast cancer patients. BMC Cancer. 2014;14:844.
The authors thank Prof. Thomas Rülicke (University of Veterinary Medicine Vienna. Aus tria) for kindly providing the Trp53 flox WapCre mouse model and the Center for Clinical Studies of the Vetsuisse Faculty for technical
1. Gilreath JA, Stenehjem DD, Rodgers GM. Diagnosis and treatment of cancer-related anemia. Am J Hematol. 2014;89(2):203-212.
20. Akchurin O, Patino E, Dalal V, et al. Interleukin-6 contributes to the development of anemia in juvenile CKD. Kidney Int Rep. 2019;4(3):470-483.
22. Liu YX, Dong X, Gong F, et al. Promotion of erythropoietic differentiation in hematopoietic stem cells by SOCS3 knock-
16. Kim A, Rivera S, Shprung D, et al. Mouse models of anemia of cancer. PLoS One. 2014;9(3):e93283.
15. Maccio A, Madeddu C, Gramignano G, et al. The role of inflammation, iron, and nutritional status in cancer-related anemia: results of a large, prospective, observational study. Haematologica. 2015;100(1):124-132.
support. MT thanks Dr. Felix Funk and Dr. Susanna Burck hardt for their valuable scientific input and discussion as well as Vifor Pharma fo r supporting our independent study.
Funding
8. Kautz L, Jung G, Valore EV, et al. Identification of erythroferrone as an erythroid regulator of iron metabolism. Nat Genet. 2014;46(7):678-684.
21. McCranor BJ, Kim MJ, Cruz NM, et al. Interleukin-6 directly impairs the erythroid development of human TF-1 erythroleukemic cells. Blood Cells Mol Dis. 2014;52(2-3):126-133.
11. Gassmann M, Muckenthaler MU. Adaptation of iron requirement to hypoxic conditions at high altitude. J Appl Physiol (1985). 2015;119(12):1432-1440.
44. Tabuchi T, Ubukata H, Saniabadi AR, et al. Granulocyte apheresis as a possible new approach in cancer therapy: a pilot study involving two cases. Cancer Detect Prev. 1999;23(5):417-421.
35. Girelli D, Nemeth E, Swinkels DW. Hepcidin in the diagnosis of iron disorders. Blood. 2016;127(23):2809-2813.
51. Zsebo KM, Williams DA, Geissler EN, et al. Stem cell factor is encoded at the Sl locus of the mouse and is the ligand for the c-kit tyrosine kinase receptor. Cell. 1990;63(1):213-224.
54. Small T, Oski FA. The mean corpuscular volume (MCV) in children with acute lymphoblastic leukemia. Clin Pediatr (Phila). 1979;18(11):687-688, 690-691.
28. Pronk CJ, Rossi DJ, Mansson R, et al. Elucidation of the phenotypic, functional, and molecular topography of a myeloerythroid progenitor cell hierarchy. Cell Stem Cell. 2007;1(4):428-442.
40. Ganzoni AM. [Intravenous iron-dextran: therapeutic and experimental possibilities]. Schweiz Med Wochenschr. 1970;100(7):301-303.
38. Duarte TL, Talbot NP, Drakesmith H. NRF2 and hypoxia-inducible
37. Theurl I, Aigner E, Theurl M, et al. Regulation of iron homeostasis in anemia of chronic disease and iron deficiency anemia: diagnostic and therapeutic implications. Blood. 2009;113(21):5277-5286.
53. Shu T, Jing C, Lv Z, et al. Hepcidin in tumor-related iron deficiency anemia and tumor-related anemia of chronic disease: pathogenic mechanisms and diagnosis. Eur J Haematol. 2015;94(1):67-73.
41. Pfeifhofer-Obermair C, Tymoszuk P, Petzer V, et al. Iron in the tumor microenvironment - connecting the dots. Front Oncol. 2018;8:549.
49. Bahar B, Acedil Ayc Iota B, Coskun U, et al. Granulocyte colony stimulating factor (G-CSF) and macrophage colony stimulating factor (M-CSF) as potential tumor markers in non small cell lung cancer diagnosis. Asian Pac J Cancer Prev. 2010;11(3):709-712.
23. Rusten LS, Jacobsen SE. Tumor necrosis factor (TNF)-alpha directly inhibits human erythropoiesis in vitro: role of p55 and p75 TNF receptors. Blood. 1995;85(4):989-996.
25. DuPre SA, Hunter KW Jr. Murine mammary carcinoma 4T1 induces a leukemoid reaction with splenomegaly: association with tumor-derived growth factors. Exp Mol Pathol. 2007;82(1):12-24.
52. Park S, Jung CW, Kim K, et al. Iron deficient erythropoiesis might play key role in development of anemia in cancer patients. Oncotarget. 2015;6(40):42803-42812.
45. He H, Zhang Z, Ge J, et al. Leukemoid reaction associated with transitional cell carcinoma: a case report and literature review. Niger J Clin Pract. 2014;17(3):391-394.
47. Thomas E, Smith DC, Lee MY, et al. Induction of granulocytic hyperplasia, thymic atrophy, and hypercalcemia by a selected subpopulation of a murine mammary adenocarcinoma. Cancer Res. 1985;45(11 Pt 2):5840-5844.
33. Tonia T, Mettler A, Robert N, et al. Erythropoietin or darbepoetin for patients with cancer. Cochrane Database Syst Rev. 2012;12:CD003407.
32. Mortensen M, Ferguson DJ, Edelmann M, et al. Loss of autophagy in erythroid cells leads to defective removal of mitochondria and severe anemia in vivo. Proc Natl Acad Sci U S A. 2010;107(2):832-837.
27. Chen K, Liu J, Heck S, et al. Resolving the distinct stages in erythroid differentiation based on dynamic changes in membrane protein expression during erythropoiesis. Proc Natl Acad Sci U S A. 2009;106(41):17413-17418.
42. Prince OD, Langdon JM, Layman AJ, et al. Late stage erythroid precursor production is impaired in mice with chronic inflammation. Haematologica. 2012;97(11):1648-1656.
46. Lan S, Rettura G, Levenson SM, et al. Granulopoiesis associated with the C3HBA tumor in mice. J Natl Cancer Inst. 1981;67(5):1135-1138.
30. Singh RP, Grinenko T, Ramasz B, et al. Hematopoietic stem cells but not multipotent progenitors drive erythropoiesis during chronic rrythroid stress in EPO transgenic mice. Stem Cell Reports. 2018;10(6):1908-1919.
43. Akashi K, Traver D, Miyamoto T, et al. A clonogenic common myeloid progenitor that gives rise to all myeloid lineages. Nature. 2000;404(6774):193-197.
29. Sonnweber T, Nachbaur D, Schroll A, et al. Hypoxia induced downregulation of hepcidin is mediated by platelet derived growth factor BB. Gut. 2014;63(12):1951-1959.
Haematologica | 107 October 2022 2465 ARTICLE - Iron- and erythropoietin-resistant mice with AoC N.F. Bregolat et al.
31. Broudy VC, Lin NL, Priestley GV, et al. Interaction of stem cell factor and its receptor c-kit mediates lodgment and acute expansion of hematopoietic cells in the murine spleen. Blood. 1996;88(1):75-81.
factors: key players in the redox control of systemic iron homeostasis. Antioxid Redox Signal. 2021;35(6):433-452.
48. Jacobsen RN, Forristal CE, Raggatt LJ, et al. Mobilization with granulocyte colony-stimulating factor blocks medullar erythropoiesis by depleting F4/80(+)VCAM1(+)CD169(+)ERHR3(+)Ly6G(+) erythroid island macrophages in the mouse. Exp Hematol. 2014;42(7):547-561 e4.
39. Liu Q, Davidoff O, Niss K, et al. Hypoxia-inducible factor regulates hepcidin via erythropoietin-induced erythropoiesis. J Clin Invest. 2012;122(12):4635-4644.
24. Libregts SF, Gutierrez L, de Bruin AM, et al. Chronic IFN-gamma production in mice induces anemia by reducing erythrocyte life span and inhibiting erythropoiesis through an IRF-1/PU.1 axis. Blood. 2011;118(9):2578-2588.
36. Lasocki S, Millot S, Andrieu V, et al. Phlebotomies or erythropoietin injections allow mobilization of iron stores in a mouse model mimicking intensive care anemia. Crit Care Med. 2008;36(8):2388-2394.
34. Langdon JM, Yates SC, Femnou LK, et al. Hepcidin-dependent and hepcidin-independent regulation of erythropoiesis in a mouse model of anemia of chronic inflammation. Am J Hematol. 2014;89(5):470-479.
50. Curran CS, Evans MD, Bertics PJ. GM-CSF production by glioblastoma cells has a functional role in eosinophil survival, activation, and growth factor production for enhanced tumor cell proliferation. J Immunol. 2011;187(3):1254-1263.
26. Liu M, Jin X, He X, et al. Macrophages support splenic erythropoiesis in 4T1 tumor-bearing mice. PLoS One. 2015;10(3):e0121921.
down. PLoS One. 2015;10(8):e0135259.
#VH and JK contributed equally as co-senior authors.
Najibah A. Galadanci,1 Walter Johnson,2 April Carson,3 Gerhard Hellemann,4 Virginia Howard5# and Julie Kanter1#
Published under a CC BY-NC license
Correspondence: J. Kanter jkanter@uabmc.edu
Abstract
Improvements in healthcare and disease management have allowed more children with sickle cell disease (SCD) to reach adulthood, increasing the need to prevent dis ease-specific complications. Cardiopulmonary complica tions remain a leading cause of morbidity and mortality in SCD,1,2 particularly for people with sickle cell anemia (SCA) who have lower hemoglobin and higher baseline rate of Childrenhemolysis.3withSCAfrequently have severe anemia that re sults in increased cardiac output and cardiac dilatation corresponding to hemoglobin (Hb) level.4,5 The dilated left ventricle adapts partially by hypertrophy, initially preserv ing diastolic compliance and maintaining the filling press ure at normal levels. Ultimately, these adaptive responses
Factors associated with left ventricular hypertrophy in children with sickle cell disease: results from the DISPLACE study
1Division of Hematology and Oncology, Department of Medicine, University of Alabama at Birmingham, Birmingham, AL; 2Division of Pediatric Cardiology, Department of Pediatrics, University of Alabama at Birmingham, Birmingham, AL; 3Jackson Heart Study, University of Mississippi Medical Center, Jackson, MS; 4Department of Biostatistics, School of Public Health, University of Alabama at Birmingham, Birmingham, AL and 5Department of Epidemiology, School of Public Health, University of Alabama at Birmingham, Birmingham, AL, USA
Prepublished: April 14, 2022.
Received: December 8, 2021.
Introduction
may become maladaptive, resulting in left ventricular dia stolic and systolic dysfunction.6-9 Data suggest that left ventricular hypertrophy (LVH) may be the first step in the development of pulmonary hypertension in patients with SCA. However, the time course and mechanisms by which LVH may progress to pulmonary hypertension10,11 are not well understood.12,13 These previous studies found a sig nificant correlation between the use of hydroxyurea ther apy (HU) and subsequent increase in fetal hemoglobin with an improvement or decrease in high tricuspid regur gitant jet velocity (TRJV) associated with pulmonary hy pertension (in affected adults). Unfortunately, these studies were limited by small sample sizes and lacked long term follow-up.
Cardiopulmonary complications remain a leading cause of morbidity and mortality in sickle cell disease (SCD). The overall goals of this study were to evaluate the relationship between left ventricular hypertrophy (LVH) and laboratory markers of hemolysis and determine the association between LVH and SCD-specific therapies (hydroxyurea and chronic red cell transfusion). Data from the DISPLACE (Dissemination and Implementation of Stroke Prevention Looking at the Care En vironment) study cohort was used. LVH was defined based on the left ventricular mass indexed to the body surface area as left ventricular mass index >103.0 g/m2 for males and >84.2 g/m2 for females. There were 1,409 children included in the analysis and 20.3% had LVH. Results of multivariable analysis of LVH showed baseline hemoglobin levels were associ ated with the lower odds of having LVH (odds ratio [OR]: 0.71, 95% confidence interval [CI]: 0.60– 0.84). The odds of LVH increases for every 1-year increase in age (OR: 1.07, 95% CI: 1.02-1.13). Similarly, the odds of LVH were lower among males than females (OR: 0.59, 95% CI: 0.38-0.93). The odds of LVH were higher among those on hydroxyurea compared to no therapy (OR: 1.83, 95% CI: 1.41–2.37). Overall results of the study showed that LVH occurs early in children with SCD and the risk increases with increasing age and with lower hemoglobin. Further, we found higher use of hydroxyurea among those with LVH, suggesting that the need for hydroxyurea conveys a risk of cardiovascular remodeling.
In 2014, the American Thoracic Society recommended all adults with SCD receive screening echocardiography and
Haematologica | 107 October 2022 2466 ARTICLE - Red Cell Biology & its Disorders
https://doi.org/10.3324/haematol.2021.280480 ©2022 Ferrata Storti Foundation
Accepted: April 7, 2022.
Study population and design
that those with TRJV ≥2.5 m/sec receive HU or chronic red cell transfusion therapy (CRCT) for those patients who are not eligible for HU.14 However, the recommendations were solely based on the overall beneficial effects of HU and CRCT in individuals with SCD and not due to the di rect effect of these therapies on cardiopulmonary com plications. In contrast, the American Society of Hematology cardiopulmonary-renal guidelines published in 2020 recommended screening echocardiography only in those adults with SCD who presented with cardiopul monary symptoms such as dyspnea on exertion, chest pain, pedal edema, or other manifestations of complica Theretions.15are no current recommendations on cardiopulmon ary screening of children with SCD. Further, there are minimal data on which children with SCD will develop car diopulmonary complications and if there are early bio markers in these children that can be monitored for cardiac disease progression. Thus, while many children with SCD undergo echocardiography, there are no stan dard recommendations for initial or follow-up screening. The DISPLACE (Dissemination and Implementation of Stroke Prevention Looking at the Care Environment) study, is an NHLBI funded study to evaluate the real-world use of transcranial Doppler (TCD) screening and stroke pre vention in children with SCA from 28 clinical centers in the US.16 Data collected included laboratory assessments, echocardiography reports, TCD ultrasound reports, and brain magnetic resonance imaging (MRI) reports. Using data from the DISPLACE study, the overall goals of this analysis were to determine the prevalence of LVH in children with SCD, evaluate the relationship between LVH and laboratory markers of hemolysis, and determine the association between LVH and SCD-specific therapies (HU and CRCT).
Our primary outcome was LVH defined as left ventricular mass index >95th percentile. The left ventricular mass index was calculated by dividing the left ventricular mass by the body surface area and defined based on sex. LVH was therefore defined as left ventricular mass index > 103.0 g/m2 for males and >84.2 g/m2 for females.17 Our predictor variables included the available measure ments of hemolysis (hemoglobin and reticulocyte count) and the SCD medication use (ever use of HU or CRCT vs. never). Our covariates included age, sex (male or female), systolic blood pressure, diastolic blood pressure, heart rate, height, weight, history of overt ischemic stroke as defined by the MRI and clinical history. Selection of vari ables was based on previous literature.18,19 These variables were identified by chart review as part of the DISPLACE study, and adherence to HU or CRCT was not evaluated for this study.
Methods
Haematologica | 107 October 2022 2467 ARTICLE - LVH in sickle cell disease N. Galadanci et al.
Variables
For those children with multiple echocardiographs, we used only one assessment and the corresponding clinical and laboratory values from that same year. Additionally, all complete blood count (CBC) tests for the DISPLACE study were taken at steady state, free from transfusion
Institutional Review Board (IRB) approval and data use agreement for the DISPLACE study were obtained at and between each clinical institution and the sponsoring in stitution using a common protocol.16 All data were deidentified at time of entry and all data was retrospective; thus, consent was not required from individual patients or their families. For the current analysis, we further ob tained IRB approval from the University of Alabama at Bir mingham to evaluate the de-identified data.
This study was conducted as a crossectional study using data collected as part of the DISPLACE study.16 The DIS PLACE study collected data on 5,247 children with SCD aged 2-19 years from 28 centers in the US with multiple years of consecutive data.16 DISPLACE focused on obtain ing data of children between the ages of 2 and 16 years during the initial retrospective assessment to determine the frequency of TCD screening for stroke prevention. Data were collected from the clinical records of the children with a focus on clinical data from 2012-2016 but included all radiographic data (including echocardiograms and brain imaging) that were available throughout the child’s lifespan (including a range of 2000 to 2020). The echocardiograms were performed according to institu
tional standard of care (i.e., outside of DISPLACE) and in terpreted according to American Society of Echocardiog raphy guidelines. This study used echocardiogram reports only (i.e., images were not reviewed) and a statistical pro gram was used for data abstraction and entry to stan dardize echocardiogram data across all centers. Data collected included vital signs (heart rate, blood pressure, height and weight), laboratory tests including complete blood count and reticulocyte count, and use of SCD-related therapies (CRCT and HU). The inclusion crite ria for this study were (i) available echocardiographic re sults and (ii) available clinical and laboratory tests during the same year as the echocardiogram. Children who did not have at least one echocardiogram or at least one set of laboratory and clinical assessments were excluded. Ad ditionally, although the DISPLACE study included longi tudinal data on each patient (i.e., multiple records per patient); however, each patient’s data was only included once in the current analysis.
Institutional Review Board and Data Use Agreements
height, weight, and history of stroke. Using the no therapy group as the reference group, adjusted OR with their ac companying CI were calculated for CRCT and HU groups. We fitted two models, first model without Hb and reticu locyte (not included in the model since they are directly impacted by both HU and CRCT). In a second model, we forced hemoglobin into the model to see how it will am plify the effect of the treatment.
within the prior month. For children with more than one CBC test in a year, we used the results of CBC that was taken close to the date of the echocardiogram.
IQR: interquartile range *Variables are reported as the frequency and percent relative to the row attribute. **P-values from Row mean zero scores differ using Cochran-Mantel-Haenszel test for categorical and Wilcoxon rank sum test for continuous variables. #Left ventricular hy pertrophy (LVH): left ventricular mass index >103.0g/m2 for males, left ventricular mass index >84.2g/m2 for females. #No LVH: left ventricular mass index <=103g/ m2 for males, left ventricular mass index <= 84.2g/m2 for females.
Z-score for weight, median (IQR) 1,090 -0.29 (-1.13 to 0.43) -0.26 (-0.99 to 0.51) 0.2292
Hemoglobin, g/dL, median (IQR) 950 8.3 (7.6-9.2) 8.9 (8.0-9.9) <0.0001
Further, to determine the association between SCD ther apy and LVH, a logistic regression was fit and adjusted for age, sex, systolic and diastolic blood pressure, heart rate,
<0.0001
Number (%) 1,409 286 (20.3) 1,123 (79.7)
Therapy group, N (%)
Heart rate, beats/min, median (IQR) 842 86 (77-98) 92 (83-106) <0.0001
Of the 1,409 children, 20.3% had LVH (Table 1). There were no differences in sex, systolic blood pressure, z-score for weight, diastolic blood pressure and reticulocyte count
Sex, N (%)*
History of stroke, N (%) 1,409 25 (5.9) 77 (7.8) 0.2102
Statistical analysis
Chronic red cell transfusion
the association between the hemo lytic measurements-hemoglobin and reticulocyte count and LVH, logistic regression models were fit to obtain odds ratios (OR) and 95% confidence intervals (CI) for LVH. The first model was adjusted for age and sex. The second model included additional adjustment for blood pressure, heart rate, height, weight, and history of stroke.
Age in years 1,403 9.1 ± 4.4 8.2 ± 4.8 0.0006
Haematologica | 107 October 2022 2468 ARTICLE - LVH in sickle cell disease N. Galadanci et al.
Diastolic blood pressure, mmHg, median (IQR) 642 61 (56-67) 63 (56-68) 0.7182
Participants’ characteristics at baseline Demographic, laboratory, and clinical characteristics of children are shown in Table 1. A total of 1,409 children with SCD from the DISPLACE database were included in the analysis (Figure 1). All the children had SCA (HbSS or HbSB0). All children had at least one documented echoc ardiogram entered in the DISPLACE database.
Table 1. Demographics and clinical characteristics of children with sickle cell disease comparing those with left ventricular hypertrophy to those without.
Descriptive analysis was carried out to examine the as sociation between predictor variables with LVH. Median and interquartile range (IQR) were reported for age, he moglobin level, reticulocyte count, height, weight, heart rate, systolic blood pressure, and diastolic blood pressure, whereas frequencies and percentages were reported for sex, history of stroke, HU, and CRCT. In the bivariate analy sis, Kruskal-Wallis test and Cochran-Mantel-Haenszel test were conducted for continuous and categorical variables, Inrespectively.ordertodetermine
NoHydroxyureatherapy 1,250190494617 51 183(12.0)(43.1)150(35.4) 139 (14.0) 311 (31.4) 467 (47.2)
All reported P-values were 2-sided. Statistical significance was defined as P<0.05. All data analysis were performed using SAS 9.4, (SAS Institute, Cary, NC).
#Left hypertrophyventricular #No left hypertrophyventricular **P-value
FemaleMale 685725 209 215(50.1)(49.2) 516 (52.3) 470 (47.7) 0.2949
Reticulocyte x109/L, median (IQR) 637 290 (109-411) 280 (161-386) 0.9391
N of patientsinvestigated
Systolic blood pressure, mmHg, median (IQR) 642 110 (102-117) 108 (100-116) 0.0739
Z-score for height, median (IQR) 1,047 -0.43 (-1.14 to 0.33) -0.18 (-1.00 to 0.49) 0.0128
Results
For the analysis between SCD therapies and LVH, children who had not received any disease modifying therapy or those treated with either HU or CRCT were included (n=1,250). Assessments of adherence to disease-modifying therapy was beyond the scope of this analysis. We excluded children who were on both HU and CRCT (n=108). Compared to those not on either therapy, HU was significantly associ ated with LVH. The odds of LVH were higher among those on HU compared to no therapy (OR: 1.83, 95% CI: 1.41–2.37),
Hemoglobin was significantly associated with the odds of having LVH (OR: 0.71, 95% CI: 0.60–0.84). The odds of LVH were lower per 1 g increase in Hb. This association remained significant after multivariable adjustments in the sequential models (Table 2). The difference among the LVH group for reticulocyte was not statistically significant, (OR: 0.99, 95% CI: 0.99-1.00) and the association remained the same after adjustment. The odds of LVH increases for every 1-year in crease in age (OR: 1.07, 95% CI: 1.02-1.13). Similarly, the odds of LVH was lower among males than females (OR: 0.59, 95% CI: 0.38-0.93). There was no evidence that the odds of LVH was significantly associated with any of the other covariates (Table 2).
In this large retrospective analysis of children with SCD, the prevalence of LVH was 20% and was associated with lower Hb and HU use. Previous studies including a meta-analysis reviewing studies of left ventricular systolic dysfunction in SCD have shown that LVH is a common finding in individ uals with SCD.19-21 Most of these earlier analyses found an even higher prevalence of LVH of 25% to 40%. These find ings were likely due to the inclusion of older age groups which have an increased prevalence of LVH. Additionally, most of these studies included a comparison group of in dividuals without SCD.
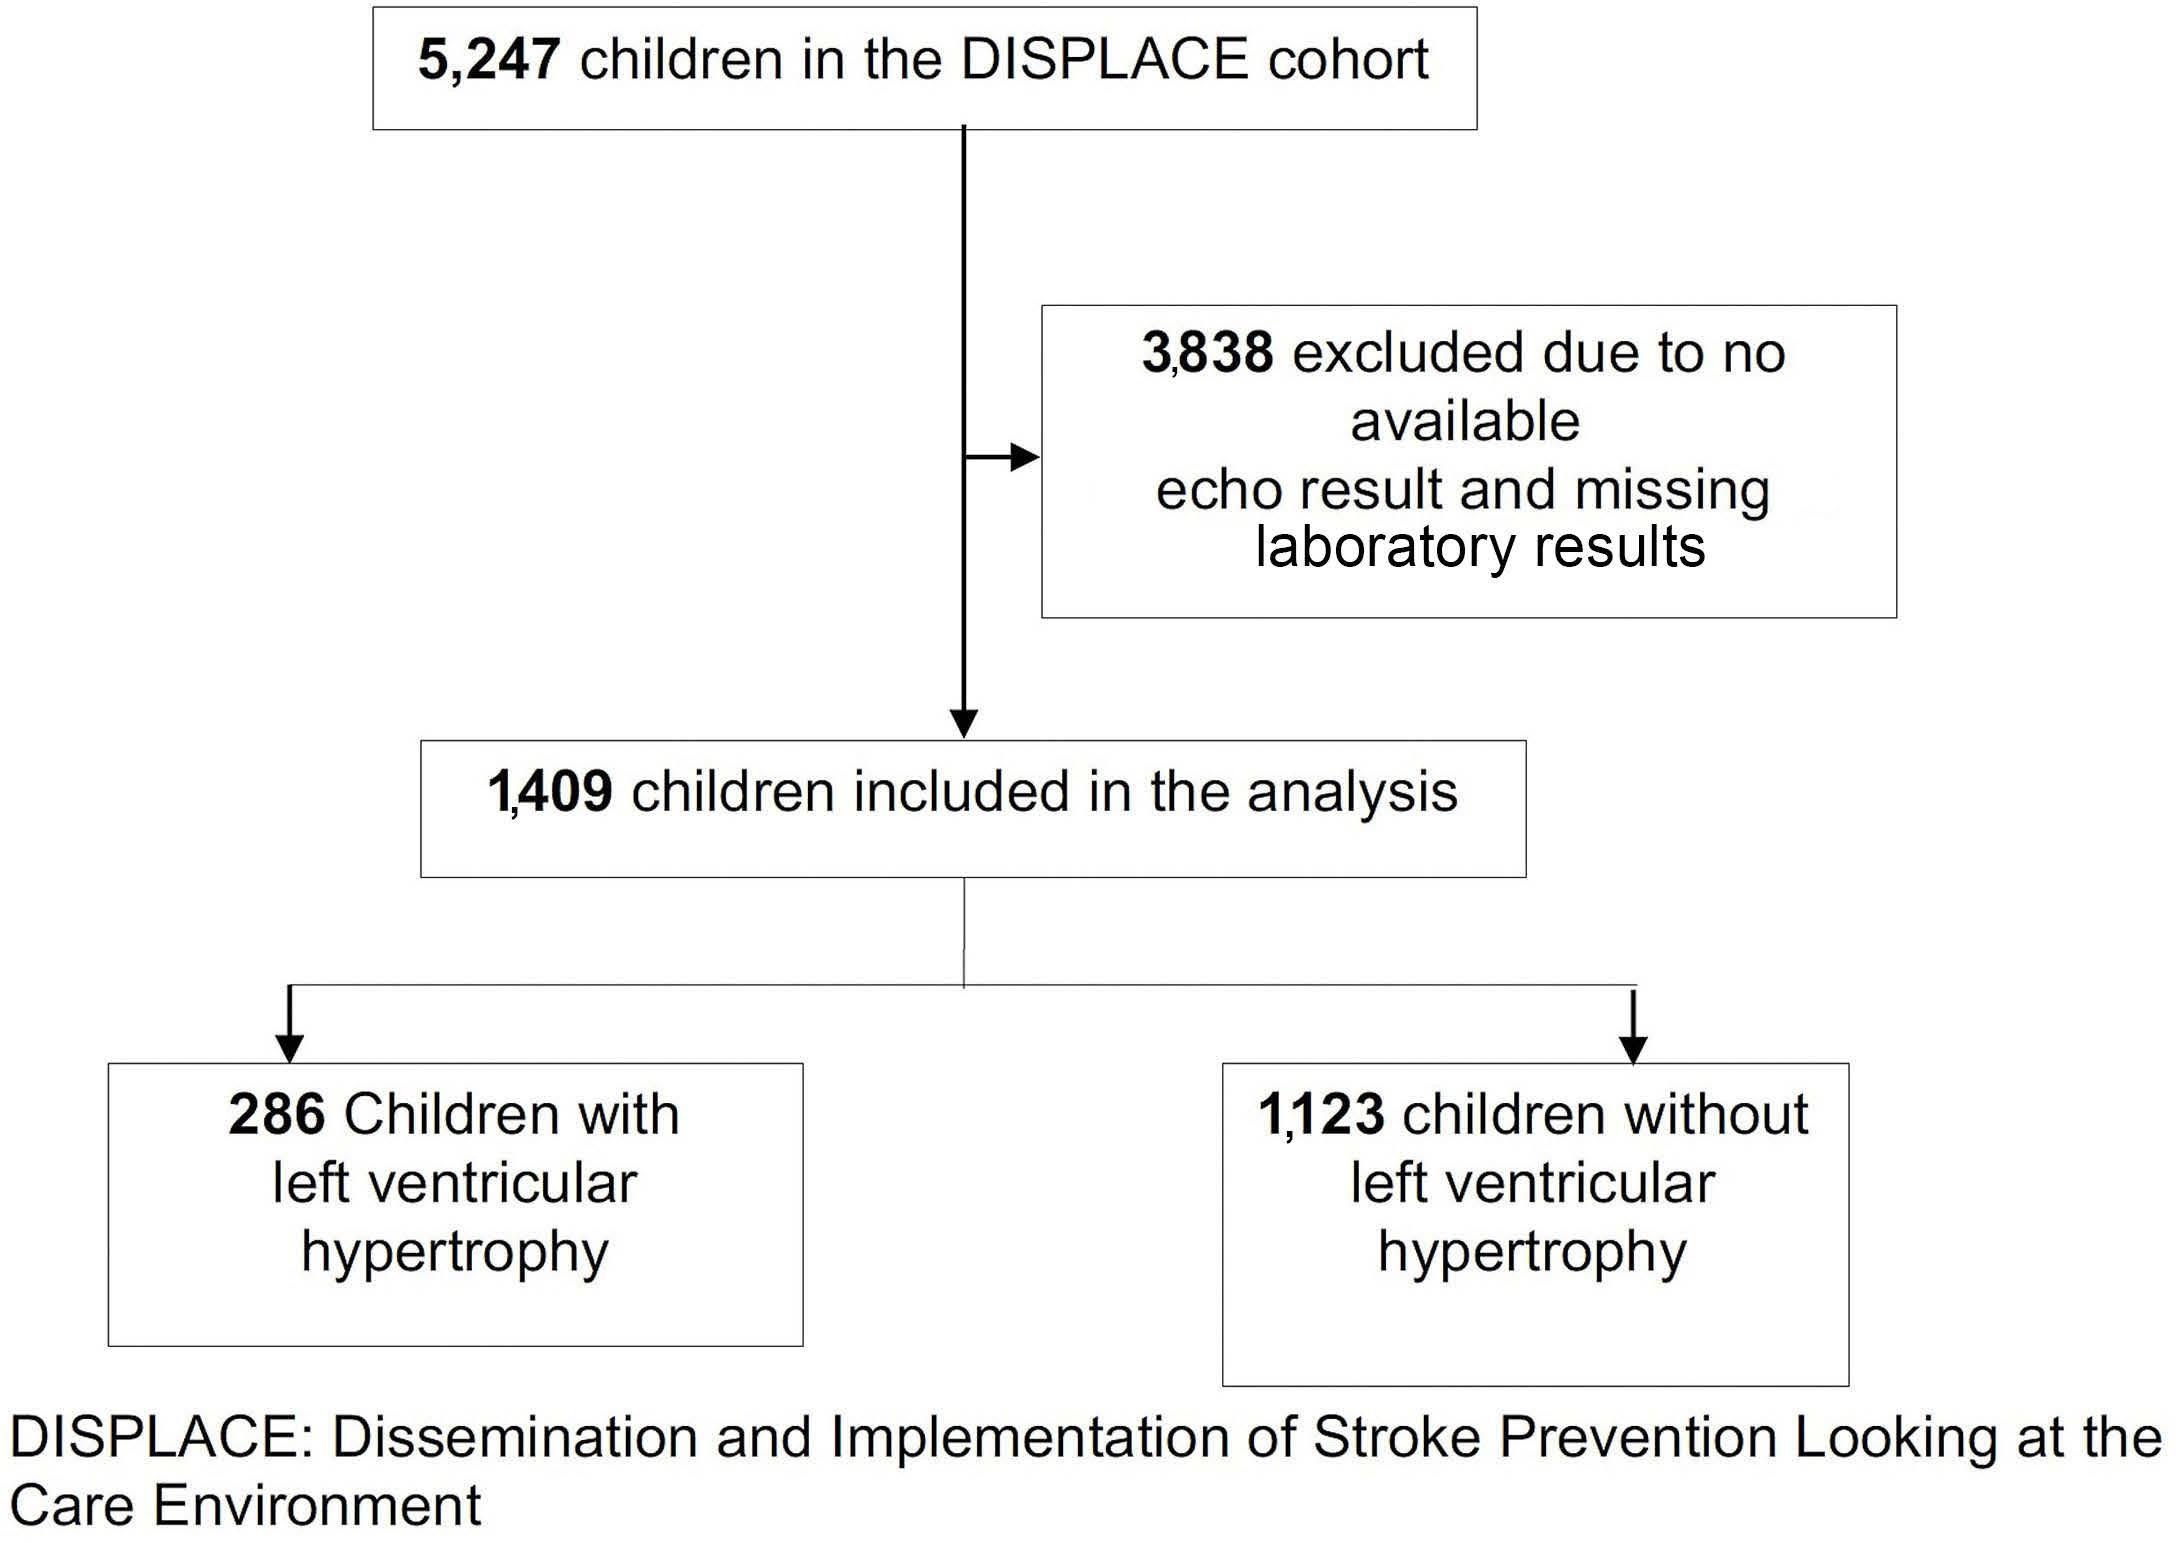
As shown in the multivariable adjusted model, the odds of having LVH was higher among those with lower Hb level. Our results are consistent with previous studies that also showed increased anemia (measured by Hb) was as sociated with increased cardiopulmonary complications including LVH.21 Even though we found no significant as sociation between LVH and reticulocyte count, there was more missing data on reticulocyte count in this limiting the investigation.
between those with and without LVH. (Table 1). Children who had LVH had a significantly lower Hb level (P<0.0001) compared to those without LVH. Similarly, children who had LVH were older (P=0.0006), had a lower z-score for height (P=0.0121) and lower heartrate (P<0.0001). A lower propor tion of children with LVH were on CRCT compared to children without LVH, while a higher proportion of children with LVH were on HU compared to no LVH (P<0.0001).
Figure 1. Flow chart depicting the number of DISPLACE study participants included in the analysis.
Discussion
Haematologica | 107 October 2022 2469 ARTICLE - LVH in sickle cell disease N. Galadanci et al.
and this association remained significant after multivariable adjustment. When we forced Hb into the model, we found the odds of LVH were higher among those on HU compared to no therapy, but the association was not statistically sig nificant. We found no significant association between CRCT and LVH (Table 3).
Predictors for left ventricular hypertrophy in children with sickle cell disease
As expected, age was significantly associated with LVH. This was consistent with findings from previous studies showing increasing left ventricular mass with increasing age.20 This study had a lower median age for LVH than re ported in previous studies, possibly due to the fact that most studies were conducted on samples including
Association between sickle cell disease therapies and left ventricular hypertrophy
Male sex 0.59 (0.38-0.93) 0.0214
Hemoglobin 0.79 (0.70-0.93) 0.0054 0.76 (0.64-0.90) 0.0020 0.78 (0.66-0.94) 0.0072
Table 2.Odds ratios and 95% confidence interval for the association between hemolytic factors and left ventricular hypertrophy in children with sickle cell disease.
which the left ventricular mass was corrected for body surface area as required in children.17 The results of their study showed that despite correcting for body surface area in children, the left ventricular mass still differs by sex and therefore recommended that left ventricular mass should be corrected for both body surface area and sex in children.17 Similarly, this same recommendation was made in recent studies.25,26 And as highlighted by Sethna and Leishman 2016, there is no clear consensus among specialists performing echocardiograms and clinicians on the definition of LVH in children including indexing method,27 and therefore we chose to use the most con servative approach within the limit of data available to us. In the current study, we found a significant association between LVH and HU but no association between LVH and CRT. Children on HU had a significantly higher odds of LVH compared to those on no therapy. This is in contrast to findings from previous studies in adults that showed HU was associated with a decreased risk of cardiopulmonary abnormalities and other comorbidities.12,19,23 Specifically, results from a small study of adults with SCD in Brazil, showed that patients taking HU were less likely to have LVH than those not taking the medication.19
Systolic blood pressure 1.00 (0.98-1.02) 0.8631
Stroke history 1.43 (0.51-4.03) 0.5013
Haematologica | 107 October 2022 2470 ARTICLE - LVH in sickle cell disease N. Galadanci et al.
Our results showed a significantly higher odds of LVH among females than males. We used sex-based defini tions of LVH as previously published by Daniels et al. in
Z score weight 1.03 (0.77-1.38) 0.1799
Previous studies in adults have shown no difference in tri cuspid regurgitation velocity in those receiving HU com pared with those not receiving HU,28,29 while others showed no evidence of protective effect of hydroxyurea on pulmonary hypertension.29,30 Although there is no direct evidence of a beneficial effect of HU on pulmonary hyper
children and adults while this study was solely focused on children <19 years. The youngest patient in this cohort with LVH was 9 years old. The likelihood of LVH was found to increase roughly about 10% for every year of age. It is unclear how the development of LVH relates to or predates other cardiovascular complications in SCD. The most prominent identified risk factor for death in adults with SCD is an elevated TRJV ≥ 2.5 m/sec.2 Other studies have shown that other cardiopulmonary complications in SCD are associated with death including myocardial in farction, chronic heart failure, arrhythmias and pulmonary hypertension.22-24 These studies also identified worsened anemia in SCD is associated with increased risk for early death. Although children may have an elevated TRJV, studies have not found an association between premature mortality and high TRJV in children. However, it will be important to identify whether other cardiac abnormalities seen in children can predict the development of pulmon ary hypertension. Other abnormalities/changes seen in the echocardiogram including LVH in children may be associ ated with progressive cardiopulmonary disease. A com prehensive prospective study is needed to determine which children with SCD are the greatest risk for cardio pulmonary complications in order to identify potential novel therapies that could be initiated in childhood for those individuals.
Z score height 0.81 (0.60-1.10) 0.8378
Age in years 1.07 (1.02-1.13) 0.0061
Model 1 Model 2 Model 3
Logistic regression was used to calculate odds ratio for the association between hemolytic factors and left ventricular hypertrophy. Model1 was unadjusted, model 2 was adjusted for age and sex, model 3 was adjusted for heart rate, history of stroke, systolic blood pressure, diastolic blood pressure, z score for weight and z score for height. OR: odds ratio, CI: confidence interval.
Heart rate 0.98 (0.97-1.00) 0.0468
Diastolic blood pressure 1.01 (0.98-1.04) 0.4920
Reticulocyte count 1.00 (0.99-1.00) 0.5080 1.00 (0.99-1.00) 0.7476 1.00 (1.00-1.00) 0.8223
Predictor OR (95% CI) P-value OR (95% CI) P value OR (95% CI) P-value
The strengths of our study include the use of a large na tional population sample of children with SCD from 28 sites across the US, which therefore improves the preci sion of our results and facilitates the generalizability of our findings. In addition, our study provides pertinent in formation to support initiating echocardiographic screen ing at an earlier age and the need to investigate for other cardiopulmonary markers of morbidity in children than currently practiced.
++No sickle cell disease therapy
Hydroxyurea
Haematologica | 107 October 2022 2471 ARTICLE - LVH in sickle cell disease N. Galadanci et al.
Table 3. Crude and adjusted odds ratios** and associated 95% confidence intervals for the association between sickle cell disease therapy and left ventricular hypertrophy.
tension, the American Thoracic Society guidelines recom mend that all adults with SCD and pulmonary hyperten sion receive HU, and for those in whom HU is contraindicated, that they should receive CRCT.14 This is solely based on the direct benefit of HU and CRCT on morbidities in SCD and studies were correlative. More recently the results of a retrospective longitudinal analysis of echocardiograms in patients with SCD, the authors found a high prevalence of LVH among patients on hydroxyurea, with higher prevalence among those treated for less than a year than those who had been treated longer.31 Further in the same study, analysis of ser ial echocardiogram reports showed that left ventricular dilation and hypertrophy improved significantly with hy droxyurea treatment, with a negative correlation between the treatment duration and left ventricular volume and mass.31Interestingly, our results differed from these expectations and findings, and did not support the initial hypothesis that HU would be protective against LVH. However, our study is limited as a crossectional analysis without the ability to evaluate children prospectively or to evaluate HU adherence. Considering HU may have been prescribed to children with more severe SCD including those with re current severe vaso-occlusive crises, chronic anemia, and severe acute chest syndrome, it may be that this finding was a marker of disease severity as opposed to a medi cation effect. In other words, our finding of higher HU use among those with LVH, may be strongly associated with the fact that incidentally, those children on HU are the same children that are more likely to have more severe disease and at risk of other sickle cell complications and therefore likely to develop LVH. Future prospective studies will be targeted at specifically following our cohort of children to determine if been on HU indeed protects against worsening LVH or the development of other car diopulmonary findings.
Number with LVH (%) 150 (35.4) 183 (43.1) 51 (12.0)
N (%): number (percent); percent represent percent of those in each therapy group among total with left ventricular hypertrophy (LVH); CI: confidence interval. **Logistic regression was used to calculate odds ratio for LVH comparing therapy groups. *Adjusted for age, sex, heart rate, history of stroke, systolic blood pressure, diastolic blood pressure, weight and height. ++The reference group is the group on no therapy.
Chronic red transfusioncell
Number 617 494 139
current practice in clinical centers in the US. Most of these centers were academic centers, which may bias the sample, but generally in the US, the majority of children with SCD attend clinics at academic institutions. Addi tionally, 3,000 children without an echocardiograph were excluded from the current analysis. Therefore, to ensure our study population did not differ from the original DIS PLACE study, we compared the baseline characteristics of the participants included in our analysis to the general DISPLACE participants and we found no significant differ ence in the baseline demographic and laboratory char acteristics between the two population. (Online Supplementary Table S1). Additionally, we used only avail able data and therefore were not able to include other important hemolytic factors like lactate dehydrogenase. Furthermore, we were not able to confirm the protective effect of HU on LVH as we didn’t prospectively follow the patients to determine if indeed HU protects against LVH. Additionally, we were not able to include data on α tha lassemia of our study participants despite its role in many cardiovascular complications of SCD. As mentioned in the methods section, our study design was a retrospective crossectional design and therefore we used only data that was available in the DISPLACE database. α thalassemia was not collected in this database.
As expected with a retrospective study design, this study has limitations. DISPLACE is a real-world evaluation of
Our study showed that LVH occurs at an early age in some children with SCD and the risk increases with increasing age and with lower Hb. Our results showed no indication of a causal relationship between HU and LVH. We found higher use of HU among those with LVH, suggesting that
*Adjusted odds ratio (95% CI) 1.0 (ref) 1.51 (1.02-2.22) 0.62 (0.25-1.53)
Crude odds ratio (95% CI) 1.0 (ref) 1.83 (1.41-2.37) 1.14 (0.79-1.65)
21. Ahmed S, Siddiqui AK, Sadiq A, Shahid RK, Patel DV, Russo LA. Echocardiographic abnormalities in sickle cell disease. Am J Hematol. 2004;76(3):195-198.
Contributions
12. Olnes M, Chi A, Haney C, et al. Improvement in hemolysis and pulmonary arterial systolic pressure in adult patients with sickle cell disease during treatment with hydroxyurea. Am J Hematol. 2009;84(8):530-532.
23. Steinberg MH, Barton F, Castro O, et al. Effect of hydroxyurea on mortality and morbidity in adult sickle cell anemia: risks and benefits up to 9 years of treatment. JAMA. 2003;289(13):1645-1651.
1. Rees DC, Williams TN, Gladwin MT. Sickle-cell disease. Lancet. 2010;376(9757):2018-2031.
The authors would like to thank the National Heart Blood and Lung Institute (NHLBI) of the National Institute for Health (NIH), USA and the American Heart Association (AHA).
Funding
10. Grossman W, Jones D, McLaurin LP. Wall stress and patterns of hypertrophy in the human left ventricle. J Clin Invest. 1975;56(1):56-64.
No conflicts of interest to disclose.
Data-sharing statement
Disclosures
16. Kanter J, Phillips S, Schlenz AM, et al. Transcranial Doppler screening in a current cohort of children with sickle cell anemia: results from the DISPLACE study. J Pediatr Hematol Oncol. 2021;43(8):e1062-e1068.
The data analyzed in this study is subject to the following
3. Gladwin MT, Vichinsky E. Pulmonary complications of sickle cell disease. N Engl J Med. 2008;359(21):2254-2265.
4. Varat MA, Adolph RJ, Fowler NO. Cardiovascular effects of anemia. Am Heart J. 1972;83(3):415-426.
14. Klings ES, Machado RF, Barst RJ, et al. An official American Thoracic Society clinical practice guideline: diagnosis, risk stratification, and management of pulmonary hypertension of
20. Poludasu S, Ramkissoon K, Salciccioli L, Kamran H, Lazar JM. Left ventricular systolic function in sickle cell anemia: a metaanalysis. J Card Fail. 2013;19(5):333-341.
22. Fitzhugh CD, Lauder N, Jonassaint JC, et al. Cardiopulmonary complications leading to premature deaths in adult patients with sickle cell disease. Am J Hematol. 2010;85(1):36-40.
Haematologica | 107 October 2022 2472 ARTICLE - LVH in sickle cell disease N. Galadanci et al.
2. Gladwin MT, Barst RJ, Gibbs JS, et al. Risk factors for death in 632 patients with sickle cell disease in the United States and United Kingdom. PLoS One. 2014;9(7):e99489.
7. Denenberg BS, Criner G, Jones R, Spann JF. Cardiac function in sickle cell anemia. Am J Cardiol. 1983;51(10):1674-1678.
15. Liem RI, Lanzkron S, T DC, et al. American Society of Hematology 2019 guidelines for sickle cell disease: cardiopulmonary and kidney disease. Blood Adv. 2019;3(23):3867-3897.
8. Martins Wde A, Mesquita ET, da Cunha DM, et al. [Cardiovascular changes in sickle cell anemia]. Arq Bras Cardiol. 1998;70(5):365-370.
18. Eddine AC, Alvarez O, Lipshultz SE, Kardon R, Arheart K, Swaminathan S. Ventricular structure and function in children with sickle cell disease using conventional and tissue Doppler echocardiography. Am J Cardiol. 2012;109(9):1358-1364.
References
This study was supported by the grant 5R01HL133896-04 to JK from NIH and pre-doctoral grant 20PRE35210531 to NAG from AHA.
13. Pashankar FD, Carbonella J, Bazzy-Asaad A, Friedman A. Longitudinal follow up of elevated pulmonary artery pressures in children with sickle cell disease. Br J Haematol. 2009;144(5):736-741.
lyzed the data. All authors drafted the initial manuscript, reviewed, and revised the manuscript and approved the submitted version.
6. Nagueh SF, Appleton CP, Gillebert TC, et al. Recommendations for the evaluation of left ventricular diastolic function by echocardiography. J Am Soc Echocardiogr. 2009;22(2):107-133.
sickle cell disease. Am J Respir Crit Care Med. 2014;189(6):727-740.
24. Powars DR, Chan LS, Hiti A, Ramicone E, Johnson C. Outcome of sickle cell anemia: a 4-decade observational study of 1056 patients. Medicine (Baltimore). 2005;84(6):363-376.
25. Foster BJ, Khoury PR, Kimball TR, Mackie AS, Mitsnefes M. New
NAG drafted the initial manuscript and reviewed and re vised the manuscript; NAG, WJ, VH and JK conceptualized and designed the study; NAG and GH collected and ana
9. Haywood LJ. Cardiovascular function and dysfunction in sickle cell anemia. J Natl Med Assoc. 2009;101(1):24-30.
11. Zilberman MV, Du W, Das S, Sarnaik SA. Evaluation of left ventricular diastolic function in pediatric sickle cell disease patients. Am J Hematol. 2007;82(6):433-438.
17. Daniels SR, Meyer RA, Liang YC, Bove KE. Echocardiographically determined left ventricular mass index in normal children, adolescents and young adults. J Am Coll Cardiol. 1988;12(3):703-708.
19. Faro GB, Menezes-Neto OA, Batista GS, Silva-Neto AP, Cipolotti R. Left ventricular hypertrophy in children, adolescents and young adults with sickle cell anemia. Rev Bras Hematol Hemoter. 2015;37(5):324-328.
Acknowledgement
5. Niss O, Quinn CT, Lane A, et al. Cardiomyopathy with restrictive physiology in sickle cell disease. JACC Cardiovasc Imaging. 2016;9(3):243-252.
children with severe form of the disease requiring HU are also at increased risk of cardiovascular remodelling. Our findings suggest that we need to identify whether LVH or other echocardiography findings could be used as a bio marker for long-term cardiovascular complications in SCD. Future studies should target identifying earlier car diopulmonary markers of morbidity and potential ther apies (including stem cell transplant) that could be initiated early in childhood for the most at-risk individuals.
28. Gordeuk VR, Campbell A, Rana S, et al. Relationship of erythropoietin, fetal hemoglobin, and hydroxyurea treatment to tricuspid regurgitation velocity in children with sickle cell disease. Blood. 2009;114(21):4639-4644.
Haematologica | 107 October 2022 2473 ARTICLE - RLVH in sickle cell disease N. Galadanci et al.
reference centiles for left ventricular mass relative to lean body mass in children. J Am Soc Echocardiogr. 2016;29(5):441-447.e2.
26. Khoury PR, Mitsnefes M, Daniels SR, Kimball TR. Age-specific reference intervals for indexed left ventricular mass in children. J Am Soc Echocardiogr. 2009;22(6):709-714.
31. Dhar A, Leung TM, Appiah-Kubi A, et al. Longitudinal analysis of cardiac abnormalities in pediatric patients with sickle cell anemia and effect of hydroxyurea therapy. Blood Adv. 2021;5(21):4406-4412.
29. Gladwin MT, Sachdev V, Jison ML, et al. Pulmonary hypertension as a risk factor for death in patients with sickle cell disease. N Engl J Med. 2004;350(9):886-895.
27. Sethna CB, Leisman DE. Left ventricular hypertrophy in children with hypertension: in search of a definition. Curr Hypertens Rep. 2016;18(8):65.
30.Voskaridou E, Tsetsos G, Tsoutsias A, Spyropoulou E, Christoulas D, Terpos E. Pulmonary hypertension in patients with sickle cell/beta thalassemia: incidence and correlation with serum Nterminal pro-brain natriuretic peptide concentrations. Haematologica. 2007;92(6):738-743.
Acute myeloid leukemia (AML) remains incurable in most cases, despite decades of clinical trials and new drug en tries.1,2 The standard induction chemotherapy in AML con sists of an anthracycline, including daunorubicin (DNR) or idarubicin (IDA), and cytarabine given together, typically for 3 and 7 consecutive days, respectively. However, the choice of anthracycline (DNR vs. IDA) and dose of DNR (45-90 mg/m2) are not standardized and have been the subject of multiple clinical trials and meta-analyses.3-5 The pivotal study regarding DNR dosing suggested the su periority of DNR 90 mg/m2 versus 45 mg/m2 for young (age <60 years) AML patients in terms of both complete re mission (CR) rate (71% vs. 57%) and overall survival (median 24 months vs. 16 months);6 follow-up information on the particular study suggested the advantage from DNR-90 to extend across younger age groups, cytogenetic and mutational risk categories, including NPM1, DNMT3A, and FLT3-ITD.7,8 These observations were confirmed in a similar study from South Korea.9 In another randomized trial of AML patients 60 years or older, DNR-90, compared to DNR-45, induced a higher CR rate but did not improve survival, except in those ages 60-65 years.10 On the other hand, comparison of DNR-90 to DNR-60 did not show dif ferences in CR or survival, save for a subset of FLT3-mu tated cases.11 Many other studies have also compared IDA to DNR;4 in one such study, IDA-12 was compared to DNR90 in AML patients age <60 years with no difference in CR rate, survival or toxicity; however, DNR-90 resulted in su perior overall and event-free survival in FLT3-mutated pa tients.12 Over the last several decades, we at the Mayo Clinic have serially utilized IDA and DNR at different doses for the treatment of AML based on information from exist ing literature at the time of diagnosis; the objective for the current study was to retrospectively review these cases and compare outcome in terms of CR and survival. The current study population was recruited from Mayo Clinic institutional databases, after Institutional Review Board approval and based on documentation of newly di agnosed AML and induction chemotherapy with DNR or IDA, in combination with cytarabine. Patients were typi cally prescribed “7+3” induction chemotherapy that in cluded 3 days of DNR at a daily dose of either 60 mg/m2 (DNR-60) or 90 mg/m2 (DNR-90), or IDA 12 mg/m2 (IDA-12). All patients were treated in the context of participation in
Daunorubicin-60 versus daunorubicin-90 versus idarubicin-12 for induction chemotherapy in acute myeloid leukemia: a retrospective analysis of the Mayo Clinic experience
The current study included 632 newly diagnosed AML pa tients (median age 60 years; range, 18-82 years; 56% males): 460 (73%) patients received IDA-12, 132 (21%) DNR-60, and 40 (6%) DNR-90. All patients in addition re ceived 7 days of continuous intravenous cytarabine (100200 mg/m2/day). Consolidation chemotherapy utilized high-dose cytarabine 3 gm/m2 days 1, 3, and 5 for patients age <60 years and 1.5 g/m2 days 1, 3, and 5 every 28 days for three to four cycles, for patients age ≥60 years. Table 1 outlines baseline disease features stratified by the three treatment groups and highlights significant differences only in age distribution (P<0.001); median (range) age was 60 (18-82), 63 (20-82), and 53 (22-70) years, for IDA-12, DNR-60, and DNR-90 treatment groups, respectively. Pri mary, secondary, and therapy-related AML accounted for 66%, 25% and 9% of all study patients: 64%, 26%, and 10% of IDA-12; 67%, 23% and 10% of DNR-60; and 75%, 23%, 3% of DNR-90 (P=0.4). The corresponding frequencies for adverse karyotype were 35%, 29% and 28% (P=0.5) whereas FLT3-ITD (P=0.9) and NPM1 (P=0.17) mutation fre quencies were similar between the treatment groups. CR/CRi was documented in 79% (498/632) of all evaluable patients: IDA-12 80% (370/460), DNR-60 70% (93/132), and
Haematologica | 107 October 2022 2474 LETTER TO THE EDITOR
clinical trials or routine clinical practice; for the purposes of the current study, patients receiving DNR at <60 mg/m2, those receiving a third drug (e.g., midostaurin) for induc tion, and patients with myeloid sarcoma were excluded. Treatment period spanned from January 2004 through May 2021 and follow-up information was updated as of March 2022. Conventional criteria were used to diagnose AML, assign cytogenetic risk category, and classify treat ment responses.13 CR was assessed after the completion of one or two induction courses, as indicated from day 14 bone marrow assessment, which might have required reinduction for presence of residual leukemic blasts. Pa tients receiving allogeneic hematopoietic stem cell transplant (AHSCT) were censored at time of AHSCT, dur ing survival analysis. The current study focused on treat ment efficacy and survival and details on treatment toxicity were not abstracted. Conventional methods were used for cytogenetic and molecular studies, including next- generation sequencing. Statistical analysis was per formed using JMP Pro 14.0.0 software package, SAS Insti tute, Cary, NC.
Hemoglobin <10 gr/dL, N in % [N=605] 67 66 69 73 0.6
DNR-90 88% (35/40) (P=0.01); there was no difference in the proportion of patients in each treatment group with documentation of a second induction course based on day 14 bone marrow assessment of residual disease (48% vs. 56% vs. 57%, respectively; P=0.38). In univariate analy sis (Table 2), significant predictors of CR/CRi were age <60 years (85% vs. 73%; P<0.001); absence of ELN adverse ka ryotype (96% in favorable and 85% in intermediate vs. 63% in adverse risk; P<0.001), primary (84%) versus secondary
In case not all patients have been examined for the parameter under evaluation, the number of subjects investigate for that aspect is reported in square brackets. ALL: Acute myeloid leukemia; IDA-12: idarubicin 12 mg/m2; DNR-60: daunorubicin 60 mg/m2; DNR-90: 90 mg/m2 ; ELN; European LeukemiaNet; CR: complete remission; Cri: CR with incomplete count recovery; AHSCT: allogeneic hematopoietic stem cell trans plantation.
Hemoglobin gr/dL, median (range) 9 (3-18) [N=441]9(5-18) [N=127] 9 (4.2-13.2) [N=37] 8.9 (3.1-13.2) 0.001
Platelets x 109/L, median (range) 56 (3-943) 55[N=438](3-943) 55[N=115](7-471) 62[N=37](12-361) 0.9
Documented re-induction based on day-14 marrow residual blasts, N (%) 227 (36) 159 (35) 52 (39) 16 (40) 0.4 Relapses, N (%) [N=465] 227/465 (49) 175/348 (50) 38/83 (46) 18/34 (42) 0.5 AHSCT, N (%) 209 (33) 143 (31) 38 (29) 28 (70) <0.0001 Deaths, N (%) 429 (68) 314 (68) 89 (67) 26 (65) 0.9
Males, N (%) 357 (56) 268 (75) 71 (20) 18 (5) 0.2 AML subtype, N (%)
Therapy-relatedSecondaryPrimary 414 (66) 159 (25) 59 (9) 296 (64) 119 (26) 45 (10) 88 (67) 31 (23) 13 (10) 30 (75) 91(23)(3) 0.4
Leukocytes x 109/L, median (range) 8.0 (0.2-350) 7.8[N=442](0.2-292) 7.6[N=126](0.4-350) 10.4[N=38](0.8-240) 0.5
FLT3-ITD, mutated/evaluated, N (%) 61/323 (18) 40/218 (18) 16/81 (20) 5/24 (21) 0.9 NPM1, mutated/evaluated, N (%) 86/280 (31) 63/187 (34) 20/74 (27) 3/19 (16) 0.17
Age at diagnosis in years, median (range) 60 (18-82) 60 (18-82) 63 (20-82) 53 (22-70) <0.001
(67%) versus therapy-related (75%) (P=0.01), presence of NPM1 mutation (93% vs. 79%; P=0.002), and treatment group other than DNR-60 (88% for DNR-90, 80% for IDA12 vs. 70% for DNR-60; P=0.01); no significant interaction was noted between FLT3-ITD mutation and CR/CRi (P=0.9). In multivariable analysis of CR/CRi prediction (Table 2), IDA-12 vs. DNR-60 (P=0.005), adverse versus fa vorable karyotype (P=0.03), adverse versus intermediaterisk karyotype (P=0.005), and NPM1 mutation (P=0.04)
Peripheral blood blast, N (%), median (range) 24 (0-99) 22[N=421](0-99) 26[N=127](0-98) 32[N=32](0-97) 0.8
Bone marrow blast, N (%), median (range) 55 (15-99) 55[N=422](1-99) 54[N=132](8-98) 50[N=36](10-97) 0.5
N=40DNR-90(6%) P value
Age group, N (%) <60 >=60yearsyears 307 (49) 325 (51) 224 (49) 236 (51) 49 (37) 83 (63) 34 (85) 6 (15) <0.001
ELN cytogenetic risk group, N (%) AdverseIntermediateFavorable 54 (8) 365 (58) 213 (34) 39 163258(56)(9)(35) 10 (8) 83 (63) 39 (29) 5 24(13)(60)11(28) 0.5
Response, N (%) NoCR/CRCR/CR 498 (79) 134 (21) 370 (80) 90 (20) 93 (70) 39 (30) 35 (88) 5 (12) 0.01
Table 1. Presenting features and response patterns among 632 consecutive Mayo Clinic patients with newly diagnosed acute myeloid leukemia (AML), stratified by anthracycline choice for induction chemotherapy: daunorubicin 60 mg/m2 (DNR-60) versus idarubicin 12 mg/m2 (IDA-12) versus daunorubicin 90 mg/m2 (DNR-90), each given for 3 days along with 7-day course of cytarabine.
Variables All N=632patients(100%) N=460IDA-12(73%) N=132DNR-60(21%)
Haematologica | 107 October 2022 2475 LETTER TO THE EDITOR
Table 2. Predictors of response and survival among 632 Mayo Clinic patients with newly diagnosed acute myeloid leukemia (AML), including the impact of anthracycline choice for induction chemotherapy: daunorubicin 60 mg/m2 (DNR-60) vs. idarubicin 12 mg/m2 (IDA-12) vs. daunorubicin 90 mg/m2 (DNR-90), each given for 3 days along with 7-day course of cytarabine.
Variables
Age, years
Among the 280 patients who were informative for FLT3 ITD/NPM1 co-mutation profile: 30 were FLT3-ITD+/NPM1+; 176 FLT3-ITD-/NPM1-; 18 FLT3-ITD+/NPM1-; and 56 FLT3ITD-/NPM1+; the respective CR/CRi rates were 97%, 91%, 81%, and 61%. Survival comparisons between the three an thracycline induction groups, analyzed separately in each FLT3-ITD/NPM1 profile did not reveal significant differences with respective P values of 0.83, 0.42, 0.28, and 0.64.
Mayo Clinic AML practice over the last two decades in cluded patients who participated in cooperative group trials and those managed according to institutional prac tice protocols that were influenced by changing views over time. Accordingly, the anthracycline component of our “7+3” induction regimens typically included DNR at 45-90
Favor<0.001primary
NPM1 0.002 Favor NPM1 mutated 0.04 0.01 Favor NPM1 mutated
Haematologica | 107 October 2022 2476 LETTER TO THE EDITOR
Favor<0.001primary
Favor<0.001<60
Karyotype <0.001 Favor non-adverse 0.002 <0.001 Favor non-adverse <0.001
CR: complete remission; Cri: CR with incomplete count recovery; AML: acute myeloid leukemia..
CR/CRiUnivariateprediction P CR/CRiMultivariateprediction P SurvivalUnivariateprediction P SurvivalMultivariateprediction P
AML subtype
After a median follow-up of 22 months (71 months for alive patients; range 3.6-212), 227 (49%) relapses among 465 evaluable cases were documented and similarly dis tributed among IDA-12 (n=175/348; 50%), DNR-60 (n=38/83; 46%), and DNR-90 (n=18/34; 42%) treatment groups (P=0.5). During the same period, AHSCT was docu mented in 209 (33%) patients, including 143 (31%), 38 (29%) and 28 (70%) patients, in the IDA-12, DNR-60 and DNR-90 treatment groups, respectively (P<0.001). At the time of this report, 429 (68%) deaths were documented and equally distributed among IDA-12 (68%), DNR-60 (67%), and DNR-90 (65%) treatment groups; median survivals for IDA-12, DNR-60 and DNR-90 treatment groups were 24, 15, and 86 months, respectively (P=0.05; Figure 1A with sur vival data that is censored for AHSCT); 36 early deaths (i.e., within 60 days of induction) were documented, including 21 (4.6%) in IDA-12, 15 (11.4%) in DNR-60, and zero in DNR90 groups (P=0.002); the difference remained significant after adjusting for age (P=0.007) but might have been in fluenced by the difference in level of fitness that was not systematically measured in the current retrospective study. The respective 3-year OS rates were 42%, 36%, and 55%; the apparent survival advantage favoring DNR-90 was no longer apparent during age-adjusted analysis (P=0.37), including individual comparisons of one treatment group with another (Figure 1A). Similar results were obtained dur ing analysis restricted to patients 60 years or younger (Fig ure 1B with survival data that is censored for AHSCT), or
FLT3-ITD 0.9 0.79 0.004 DNR-90 vs. IDA-12 vs. DNR-60 0.02 Favor DNR-90/IDA-12 0.01 0.09
Favor<0.001<60 <0.001
when survival analysis was performed without censoring patients undergoing AHSCT (all age groups P=0.17, age-ad justed P=0.8; for patients <60 years old P=0.14, age-ad justed P=0.2). We did note, however, the near-significant survival advantage for DNR-90 and IDA-12, in the younger age group, even after adjusting for age and karyotype (Fig ure 1B). In transplant-censored multivariable analysis that did not include mutations (n=632), independent risk fac tors for survival included younger age and non-adverse cytogenetic risk profile (Table 2); in the subset of patients in whom FLT3-ITD and NPM1 mutation information for both was available (n=280), FLT3-ITD (P=0.004), but not NPM1 (P=0.4) provided additional prognostic information (Table 2); the type or dose of anthracycline used during induction chemotherapy had no additional impact on survival, re gardless of mutational or cytogenetic status; specifically, there was no interaction between FLT3-ITD mutation status and the impact of anthracycline choice on survival (P=0.27 in FLT3-ITD-mutated and 0.69 in unmutated).
remained significant while DNR-90 versus DNR-60 be came borderline significant (P=0.09); there was no signifi cant difference in the rate of CR/CRi between IDA-12 and DNR-90 (P=0.64) or between favorable and intermediate risk karyotype (P=0.23).
mg/m2 doses or IDA at 12 mg/m2. Current information strongly supports the superiority of DNR-90 over DNR-45, in young patients with AML,6,9 but the choice between DNR-90, DNR-60 and IDA-12 remains in flux.11,12 In the cur rent study, we retrospectively reviewed CR/CRi rates and overall survival corresponding to adult patients, across all age groups, whose induction regimen included one of three anthracycline choices: DNR-90, DNR-60, and IDA-12. We documented significantly higher CR/CRi rates with both DNR-90 and IDA-12, compared to DNR-60, even after accounting for other independent predictors of CR/CRi, in
BA Haematologica | 107 October 2022 2477 LETTER TO THE EDITOR
(B) Overall survival of 307 Mayo Clinic pa tients age 60 years or younger with newly diagnosed acute myeloid leukemia strat ified by type and dose (mg/m2) of anthra cycline received during induction chemotherapy.
cluding younger age, non-adverse karyotype and NPM1 mutation. However, overall survival was not significantly different between the three treatment groups, especially after accounting for the younger age distribution in pa tients treated with DNR-90, although we cannot discard the favorable survival trend for DNR-90 and IDA-12, com pared to DNR-60. At the same time, it should be noted that patients treated on the higher potency anthracycline choices (i.e., DNR-90 or IDA-12) might have been not only younger but also fitter in their performance score, thus partly explaining their apparent survival advantage. We
Figure 1. Overall Survival of Mayo Clinic patients with newly diagnosed acute myeloid leukemia (A) Overall survival of 632 Mayo Clinic patients (median age 60 years; range 18-82) with newly diagnosed acute myeloid leukemia stratified by type and dose (mg/m2) of anthracycline re ceived during induction chemotherapy.
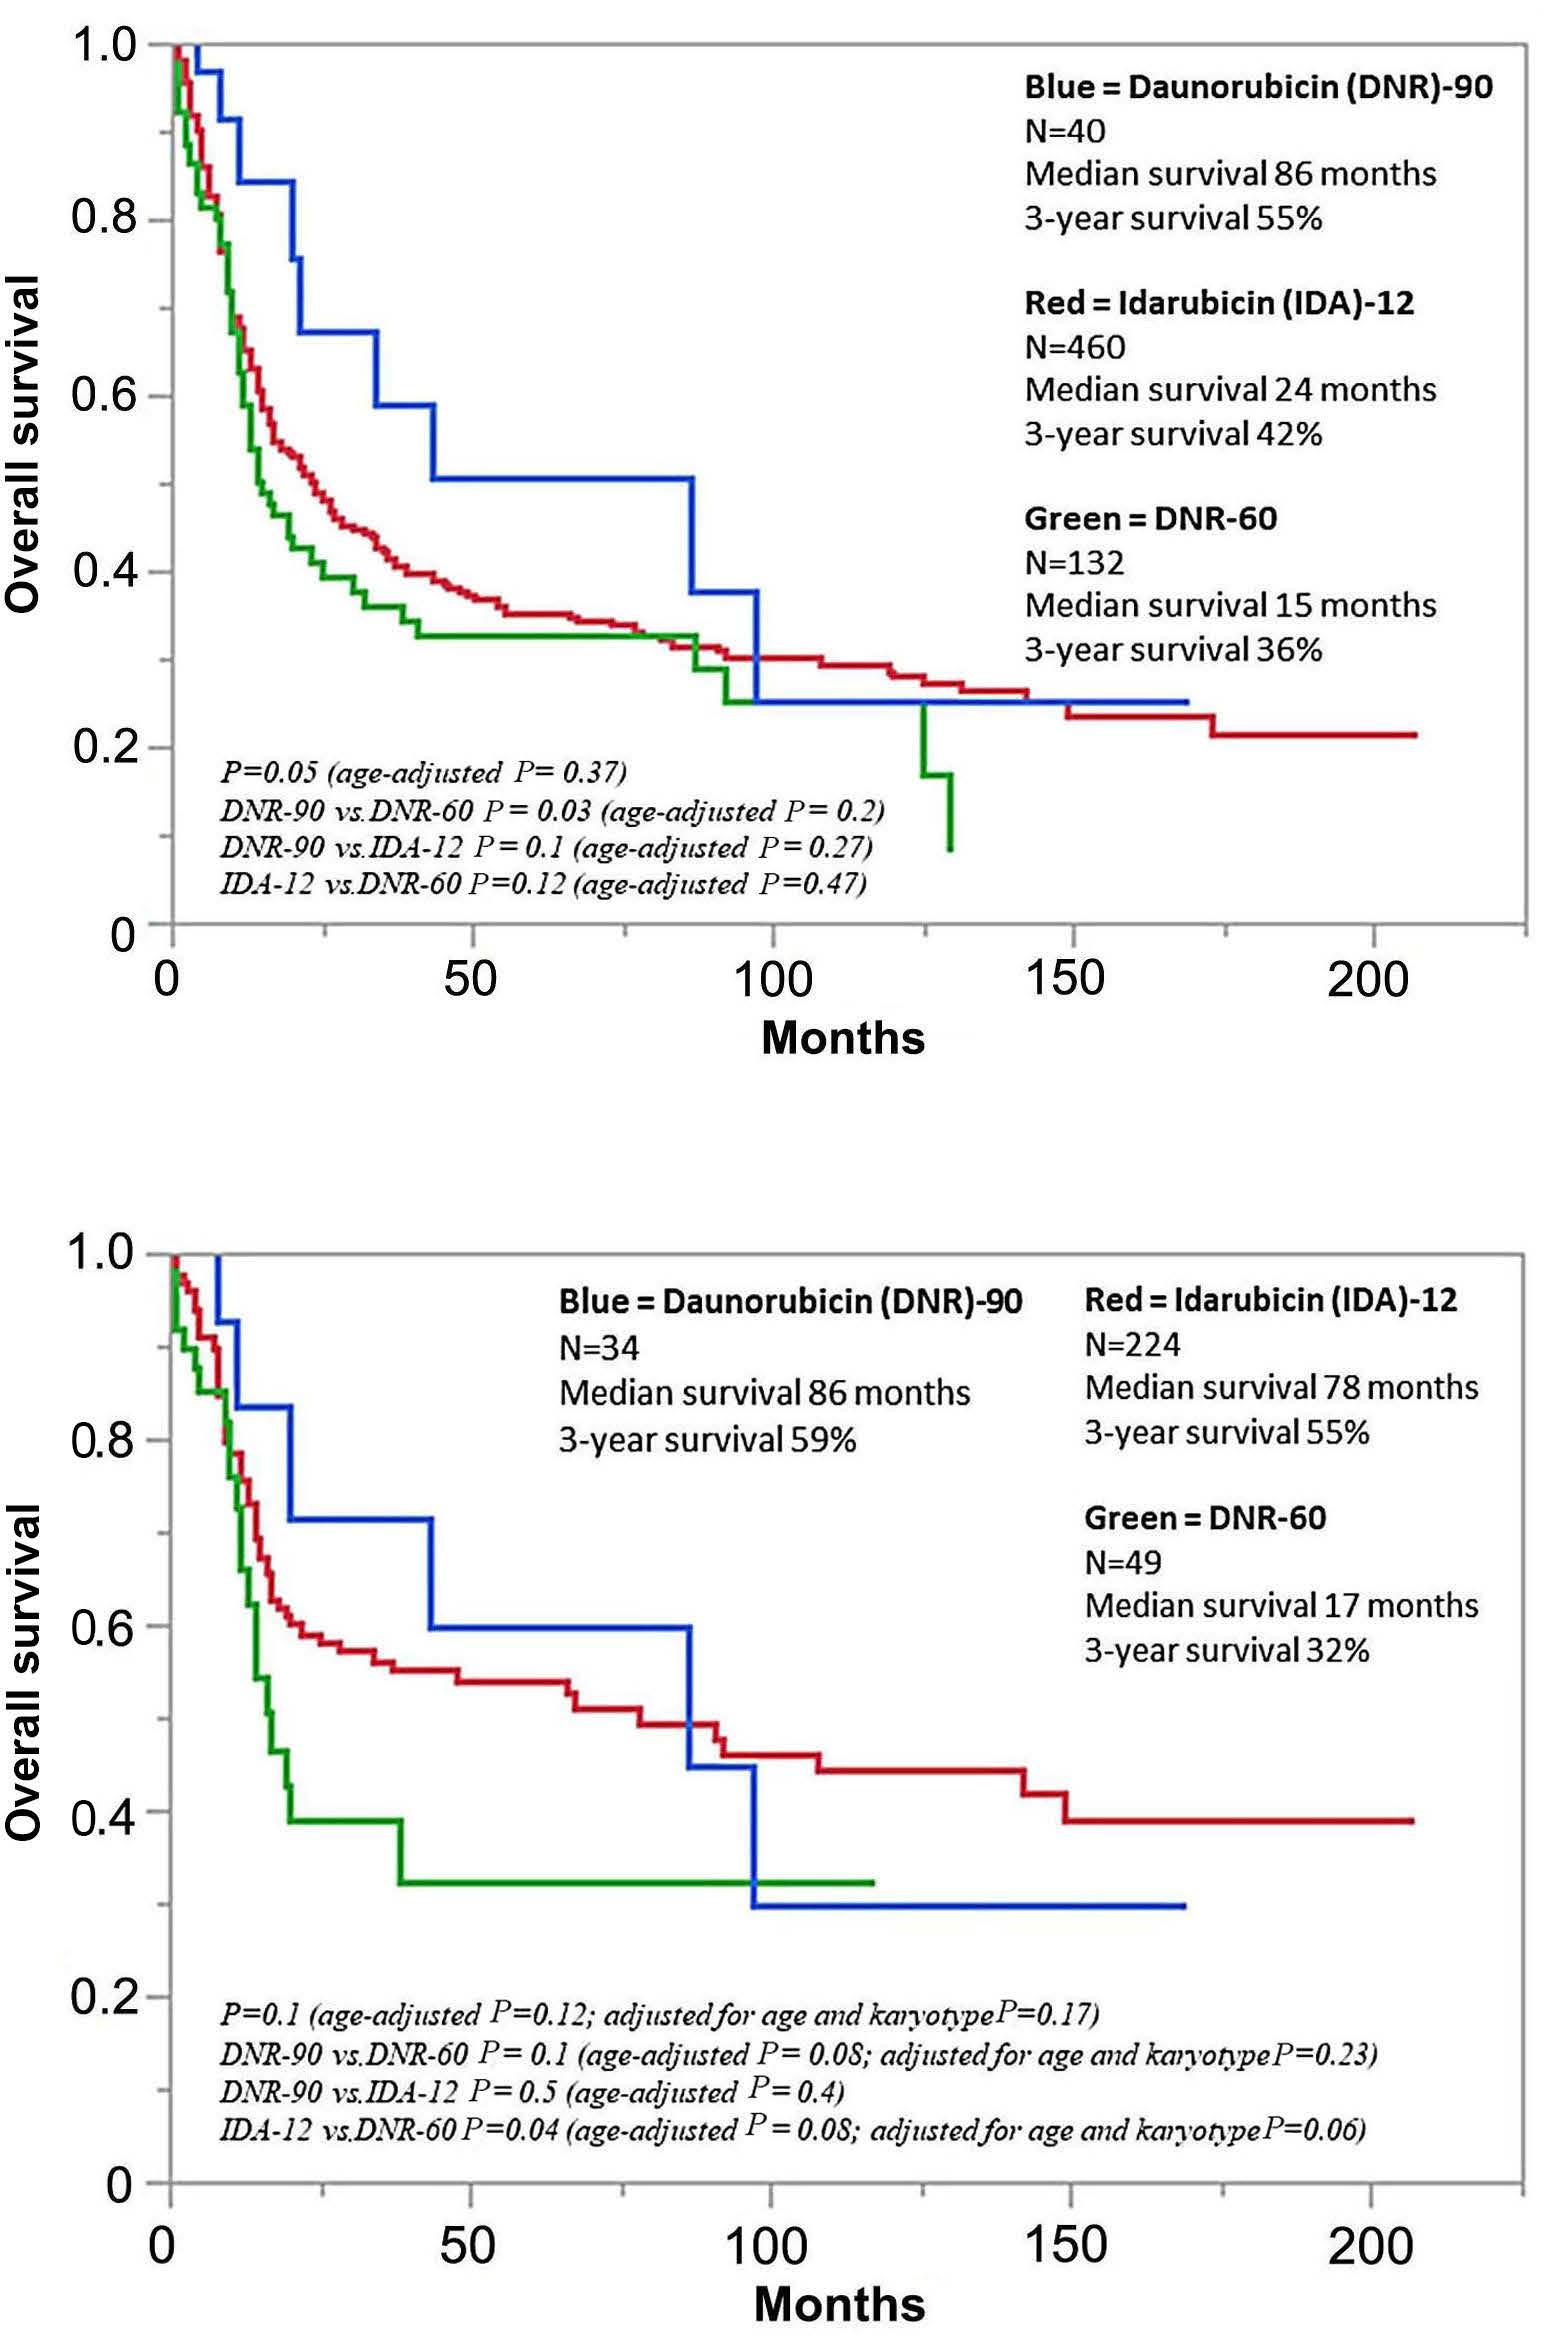
Authors
AT and KHB performed analysis and wrote the manuscript including preparation of tables and figures. AT, KHB, NG, MS, HA, MSP, AA, MAE, WJH, MRL, CCH, AM and AP participated in patient care. DV and DC contributed to pathology review. RPK contributed to cytogenetic review. All authors reviewed and approved the manuscript.
Data-sharing statement
2020;95(11):1368-1398.
Ayalew Tefferi,1 Naseema Gangat,1 Mithun Shah,1 Hassan Alkhateeb,1 Mrinal S. Patnaik,1 Aref Al-Kali,1 Michelle A. Elliott,1 William J. Hogan,1 Mark R. Litzow,1 Christopher C. Hook,1 Abhishek Mangaonkar,1 David Viswanatha,2 Dong Chen,2 Animesh Pardanani,1 Rhett P. Ketterling3 and Kebede H. Begna1
1. Kantarjian H, Kadia T, DiNardo C, et al. Acute myeloid leukemia: current progress and future directions. Blood Cancer J. 2021;11(2):41.
compared our findings with those of two other previously published clinical trials that employed similar induction regimens.11,12 In the study by Lee et al.,12 the authors com pared IDA-12 with DNR-90 in AML patients 65 years of age or younger and, as was the case in our study, reported similar CR/CRi rates and overall survival. Unlike the par ticular study,12 however, we did not find a survival advan tage for DNR-90, in FLT3-ITD-mutated cases. The second study by Burnett et al 11 compared DNR-90 with DNR-60 and reported similar CR/CRi rates and overall survival, and with inconclusive interaction between DNR dose and FLT3 ITD mutation; however, it should be noted that the par ticular study employed a different re-induction and consolidation schedule that might have had an impact on overall outcome.
1Department of Internal Medicine and Division of Hematology; 2Division of Hematopathology and 3Division of Cytogenetics, Department of Laboratory Medicine, Mayo Clinic, Rochester, MN, ©2022Prepublished:Accepted:Received:https://doi.org/10.3324/haematol.2022.281045K.H.Correspondence:USABEGNA-begna.kebede@mayo.eduMarch11,2022.June13,2022.June23,2022.FerrataStortiFoundationPublishedunderaCCBY-NClicense
2. Estey EH. Acute myeloid leukemia: 2021 update on riskstratification and management. Am J Hematol.
Contributions
3. McCurdy SR, Luger SM. Dose intensity for induction in acute myeloid leukemia: what, when, and for whom? Haematologica. 2021;106(10):2544-2554.
References
Disclosures
makes it that much harder to further clarify the optimal anthracycline choice or DNR dose for induction chemo therapy in AML.15,16
We are acutely aware of the substantial limitations to our retrospective study, including the lack of additional in formation that might have influenced treatment choices and thus indirectly impacted overall survival. The marked imbalance in the number of patients in each treatment group and the significant difference in age distribution should also be noted. The objective for our communication is simply to share experience and not influence current thinking on the subject matter, which is best inferred from properly designed controlled studies.6,11,12 Similarly, we ac knowledge the possibility of benefit from a specific an thracycline choice/dose for narrower molecular subsets that might not be accounted for by the ELN-2017 genetic risk stratification. Regardless, we are encouraged by the fact that the findings from the current study are mostly in line with those of previously published work and suggest equivalent value for DNR-60, DNR-90 and IDA-12, in terms of survival in older patients with AML, while confirming su perior performance for higher intensity anthracycline in in ducing CR/CRi, and possibly survival in younger patients. In our practice, individual treatment decision is often based on patient frailty and recognition of the higher gas trointestinal, but not necessarily cardiac, toxicity associ ated with DNR-90 and IDA-12;11,14 among the 40 cases that received DNR-90 in our patient cohort, we were able to document four cases (10%) with echocardiogram evidence for cardiomyopathy, all of which were late incidents oc curring at 12 months, 15 months, 19 months, and 7 years, after induction. Going forward, the ever-changing treat ment landscape in mutation-specified patient groups
Data is available on request.
No conflicts of interest to disclose.
4. Wang H, Xiao X, Xiao Q, Lu Y, Wu Y. The efficacy and safety of
Haematologica | 107 October 2022 2478 LETTER TO THE EDITOR
12. Lee JH, Kim H, Joo YD, et al. Prospective randomized comparison of idarubicin and high-dose daunorubicin in induction chemotherapy for newly diagnosed acute myeloid leukemia. J Clin Oncol. 2017;35(24):2754-2763.
5. Sekine L, Morais VD, Lima KM, Onsten TGH, Klarmann Ziegelmann P, Antonini Ribeiro R. Conventional and high-dose daunorubicin and idarubicin in acute myeloid leukaemia remission induction treatment: a mixed treatment comparison meta-analysis of 7258 patients. Hematol Oncol. 2015;33(4):212-219.
daunorubicin in older patients with acute myeloid leukemia. N Engl J Med. 2009;361(13):1235-1248.
7. Patel JP, Gonen M, Figueroa ME, et al. Prognostic relevance of integrated genetic profiling in acute myeloid leukemia. N Engl J Med. 2012;366(12):1079-1089.
6. Fernandez HF, Sun Z, Yao X, et al. Anthracycline dose intensification in acute myeloid leukemia. N Engl J Med. 2009;361(13):1249-1259.
daunorubicin versus idarubicin combined with cytarabine for induction therapy in acute myeloid leukemia: a meta-analysis of randomized clinical trials. Medicine (Baltimore). 2020;99(24):e20094.
15. Stone RM, Larson RA, Dohner H. Midostaurin in FLT3-mutated acute myeloid leukemia. N Engl J Med. 2017;377(19):1903.
16. Daver N, Venugopal S, Ravandi F. FLT3 mutated acute myeloid leukemia: 2021 treatment algorithm. Blood Cancer J. 2021;11(5):104.
11. Burnett AK, Russell NH, Hills RK, et al. A randomized comparison of daunorubicin 90 mg/m2 vs 60 mg/m2 in AML induction: results from the UK NCRI AML17 trial in 1206 patients. Blood. 2015;125(25):3878-3885.
9. Lee JH, Joo YD, Kim H, et al. A randomized trial comparing standard versus high-dose daunorubicin induction in patients with acute myeloid leukemia. Blood. 2011;118(14):3832-3841.
13. Dohner H, Estey EH, Amadori S, et al. Diagnosis and management of acute myeloid leukemia in adults: recommendations from an international expert panel, on behalf of the European LeukemiaNet. Blood. 2010;115(3):453-474.
14. Hogan WJ, Letendre L, Litzow MR, et al. Neutropenic colitis after treatment of acute myelogenous leukemia with idarubicin and cytosine arabinoside. Mayo Clin Proc. 2002;77(8):760-762.
Haematologica | 107 October 2022 2479 LETTER TO THE EDITOR
8. Luskin MR, Lee JW, Fernandez HF, et al. Benefit of high-dose daunorubicin in AML induction extends across cytogenetic and molecular groups. Blood. 2016;127(12):1551-1558.
10. Lowenberg B, Ossenkoppele GJ, van Putten W, et al. High-dose
samples of CLL registry (clinicaltrials gov. Identifier: NCT02863692) patients were evaluated after three COVID19 vaccinations. Six of the initially 21 patients3 were in cluded in the analyses, three with homologous and three with heterologous vaccination schedule (mean interval between vaccination 2 [V2] and V3 163 days; minimum 117 days and maximum 189 apart). Four vaccinated health care workers served as HC (mean interval between V2 and V3 266 days; range, 254-291 days). Both studies were ap proved by the local ethics committee. Patient and disease characteristics as well as vaccination schedules are sum marized in Table 1. SARS-CoV-2 spike receptor binding domain (RBD)-specific immunoglobulin G (IgG) antibodies, determined using the Alinity ci SARS-CoV-2 IgG II Quant assay (Abbott), were detectable in four of six (66.7%) CLL patients after com pared to two of six (33.3%) before booster vaccination (Figure 1A), cut-off ≥7.1 BAU/mL. In the one individual with detectable RBD-specific IgG after V2, V3 resulted in in creased levels. In another individual, the V3 raised the IgG titer to similar levels as seen shortly after V2 (Figure 1B and C). Detectable neutralizing serum activity, determined by a lentivirus-based pseudovirus neutralization assay against the Wu01 strain of SARS-CoV-2 was limited to the two individuals with the highest levels of RBD-binding IgG (Figure Peripheral1D).blood mononuclear cells (PBMC) were used for SARS-CoV-2 spike-specific T-cell analyses (Human IFNy ELISpotPLUS [ALP] kit [Mabtech]). Results are reported as spot-forming cells (SFC) per million PBMC. A SARS-CoV-2 peptide pool (15-mers overlapping by 11 amino acids which stimulate responses mediated by both CD4 + and CD8 + T cells) spanning the entire spike protein was used for measuring T-cell responses. The median number of SARSCoV-2 spike-specific T cells in the CLL cohort after V2
BNT162b was 31 SFC (interquartile range [IQR], 4.0-96.0) (Figure 2A). The response after V2 in the here described subgroup was significantly lower (1.7 SFC; IQR, 0.0-3.8 but increased to 8 SFC; IQR, 5.7-21.3) after booster vaccina tion. Overall, four of six (66.7%) showed a detectable in crease of T-cell activity and two a decrease (Figure 2B). In comparison, T-cell responses in HC remained above the cut-off in 100% (4/4), but did not increase further. Of the included patients, all received either B-cell-deplet ing (anti-CD20 monoclonal antibodies) or -directed (bru ton tyrosine kinase inhibitors) treatment within 6 months prior to V3. Despite B-cell-affecting treatment, the ma jority (4/6) showed an increase of serum IgG (Figure 1C).
We here report an increase of the humoral response in CLL patients after COVID-19 V3 despite B-cell-depleting treatment, as reported elsewhere,9 and in addition, an in crease of the cellular response in four of six patients. Our data show that V3 enhances IgG response in CLL pa tients, also in those that lacked detectable IgG after V2.
In conclusion, we report an increase of vaccine-induced cellular and humoral immune responses in CLL patients by a V3 COVID-19 vaccination.
Patients under B-cell-depleting treatment (2/6) mounted low levels of IgG antibodies after boost that did not result in detectable neutralizing serum activity (Table 1). Patients without detectable T cells prior to boost that received a heterologous booster immunization showed an increase in T-cell response. In contrast, homologous booster led to an increase in only one of three patients and did not show an effect on the remaining two patients (Figure 2B). A dis cordant immune response with T cell, but lacking humoral response was seen in two of six patients, indicating that cellular protection may be generated, probably in patients with lesser extent of CLL-associated T-cell exhaustion, whereas treatment-associated B-cell impairment may not be overcome.
Haematologica | 107 October 2022 2480 LETTER TO THE EDITOR
SARS-CoV-2-specific cellular response following third COVID-19 vaccination in patients with chronic lymphocytic leukemia
Recent data showed a significant increased humoral re sponse after COVID-19 vaccination, but less pronounced enhancement of the cellular response in healthy individ uals, likely to be dependent on the specific booster vac cine.4-6 Our data from the HC cohort – all vaccinated with a homologous BNT162b2 dose – confirm these findings and show a stable, but not relevantly increased T-cell re sponse. As already shown for rheumatologic and solid organ transplant patients, this may not generally be the case for immunocompromised patients.7,8
With great interest we read the study published by Blixt et al. showing that compared to healthy controls (HC), half as many of chronic lymphocytic leukemia (CLL) patients developed a T-cell response after two COVID-19 vaccine doses.1 Effects of a third vaccine dose on T cells in CLL patients is yet unknown, while approximately 20% fail achieving a humoral immune response.2 In this prospec tive cohort study we investigated the interplay of humoral and cellular response and report follow-up data of CLL patients 31 days (range, 19-94 days) after third vaccination Blood(V3).3
inAgePatientSex years Vaccine (Prime) Vaccine (Boost) ofDays sampling a ft er booster A ft V2erA ft V3erB-cell- depleting therapy B-cell- directed therapy ofState SerumSerumdiseaseIgG**ID50***Tcells*IgG**ID50***Tcells* PRYesNoBNTBNT/BNTM1781333<10442,94425 PRYesNoAZDBNT/BNTM27831neg.<100neg.<109 PRM376BNT/BNTBNT282.2251.206310.99919.2140NoYes CRYesADBNT/BNTM47163neg.<1008,3<107Yes CRYesADBNT/BNTF57336neg.<10011,8<1081No PDYesNoBNTBNT/BNTM67131neg.<1023neg.<105 Healthy VaccineinAgeSexcontrolyearsVaccine(Prime)(Boost) ofDays sampling a ft er booster A ft V2erA ft V3er **cellsTTcells BNTBNT/BNTF12528165.3202.7 BNTBNT/BNTM23028381.3404 BNTBNT/BNTF33837692428 BNTBNT/BNTF4492711677.31.Table controls.healthyversusoutcomesandcharacteristicsPatient *S-speci fi 6cells/10(spot-formingcellsTcperipheralbloodmononuclearcells);**RBD-speci fi secondV2:Pseudovirus).Wu01ID50(serumactivity***neutralization(BAU/mL);IgGc progressivePD:remission;completeCR:BNT162b2;BNT:AZD1222,AZ:Ad26.COV2,AD:dose;infectie:IDmale;M:female;F:G;immunoglobulinIgG:vaccination;thirdV3:vaccination;50 negative.neg:remission;partialPR:disease; Haematologica | 107 October 2022 2481 LETTER TO THE EDITOR
A B C D
Figure 2. T-cell immune responses after COVID-19 vaccination. (A) Interferon-y T-cell ELISpot response in chronic lymphocytic leukemia (CLL) patients and healthy controls (HC). Shown values are mean spots of duplicate wells, where background in negative control wells is subtracted from peptide-stimulated wells. The line displays the median response after second (V2) (left) and third (V3) vaccination (right). The limit of detection is 8 spot-forming cells/106 peripheral blood mononuclear cells. Samples were acquired 28 days after V3 in HC and at a median of 47 and 31 days (V2 and V3, respectively) in CLL patients. (B) Individual course of Interferon-γ T cell ELISpot response in HC (left) and CLL patients (right) after V2 and V3.
A B Haematologica | 107 October 2022 2482 LETTER TO THE EDITOR
We can confirm previous data from immunocompromised patients with rheumatological disease,7 solid organ trans plantation8 and solid malignancies12 within our CLL cohort revealing that T-cell responses are enhanced following V3. Further indepth analyses may provide insights into their (poly-)functionality, proliferation capacity, or epigenetic profile change after (booster) vaccination despite the low
Figure 1. Humoral immune responses after COVID-19 vaccination (A) Antibody response rate in chronic lymphocytic leukemia (CLL) patients after second (V2) and after third (V3) vaccination. (B) SARS-CoV-2 spike receptor binding domain (RBD)-specific immunoglobulin G (IgG) in CLL patients after V2 and V3 (median 10.05 BAU/ml, range 0.1-10,998.6) measured by chemiluminescent microparticle immunoassay. (C) Individual course of IgG anti-bodies in CLL patients after V2 and V3. (D) Serum neutralizing activity (50% inhibitory serum dilution) determined in a pseudovirus neutralizing assay against the Wu-01 pseudovirus strain. Bars indicating geometric mean ID50 with 95% confidence intervals. Dashed line indicates limit of detection (LOD, 10). Samples with no detectable neutralization (ID50 <10) were plotted with an ID50 of 5 (1/2 LOD) for graphical representation.
response-altitude and whether the response is biased to wards CD4+ or CD8+ T cells. Interestingly, all patients who received a heterologous boost (vector vaccine) showed an increased T cell re sponse compared to our previous analysis, while only one of three after homologous boost. This supports recently published data from randomized controlled as well as ob servational studies suggesting a benefit of a heterologous boost for eliciting stronger T-cell responses compared to homologous immunization.4,13 If this offers additional pro tection for patients with low or absent neutralizing anti bodies is yet unclear, particularly considering the low response levels with respect to quantity. Considering re cent data on SARS-CoV-2-specific T cells from patients with agammaglobulinaemia14,15 showing protection from severe disease and even in patients infected with variants
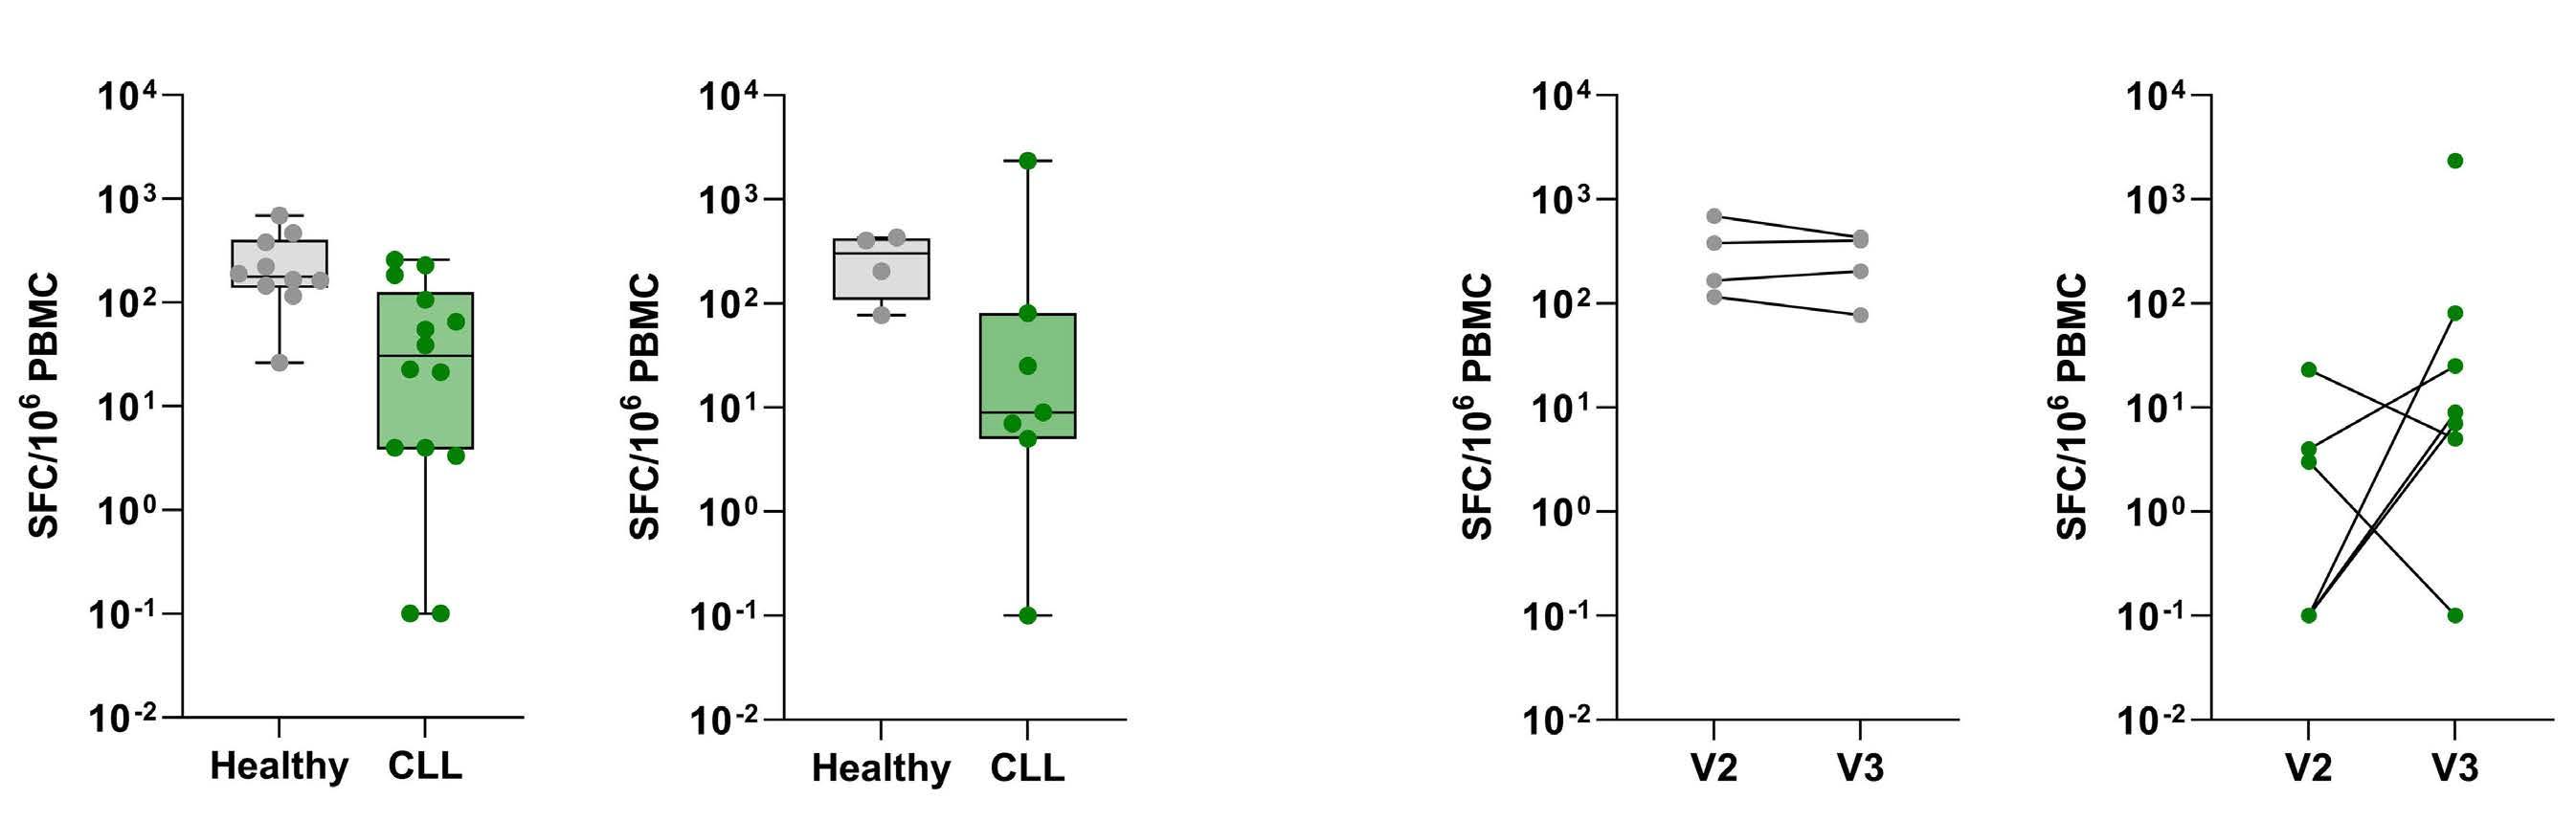
We found that anti-SARS CoV-2 antibodies were higher in patients who received three doses of BNT162b2 compared to two doses of BNT162b2 and a vector vaccine as booster, but that the latter vaccine combination was able to mount a serologic response in two of three previously negative patients. Yet, neutralizing serum activity was only partly detectable. In order to elicit a neutralizing serum re sponse, a fourth dose might be beneficial by further in creasing IgG levels.10,11
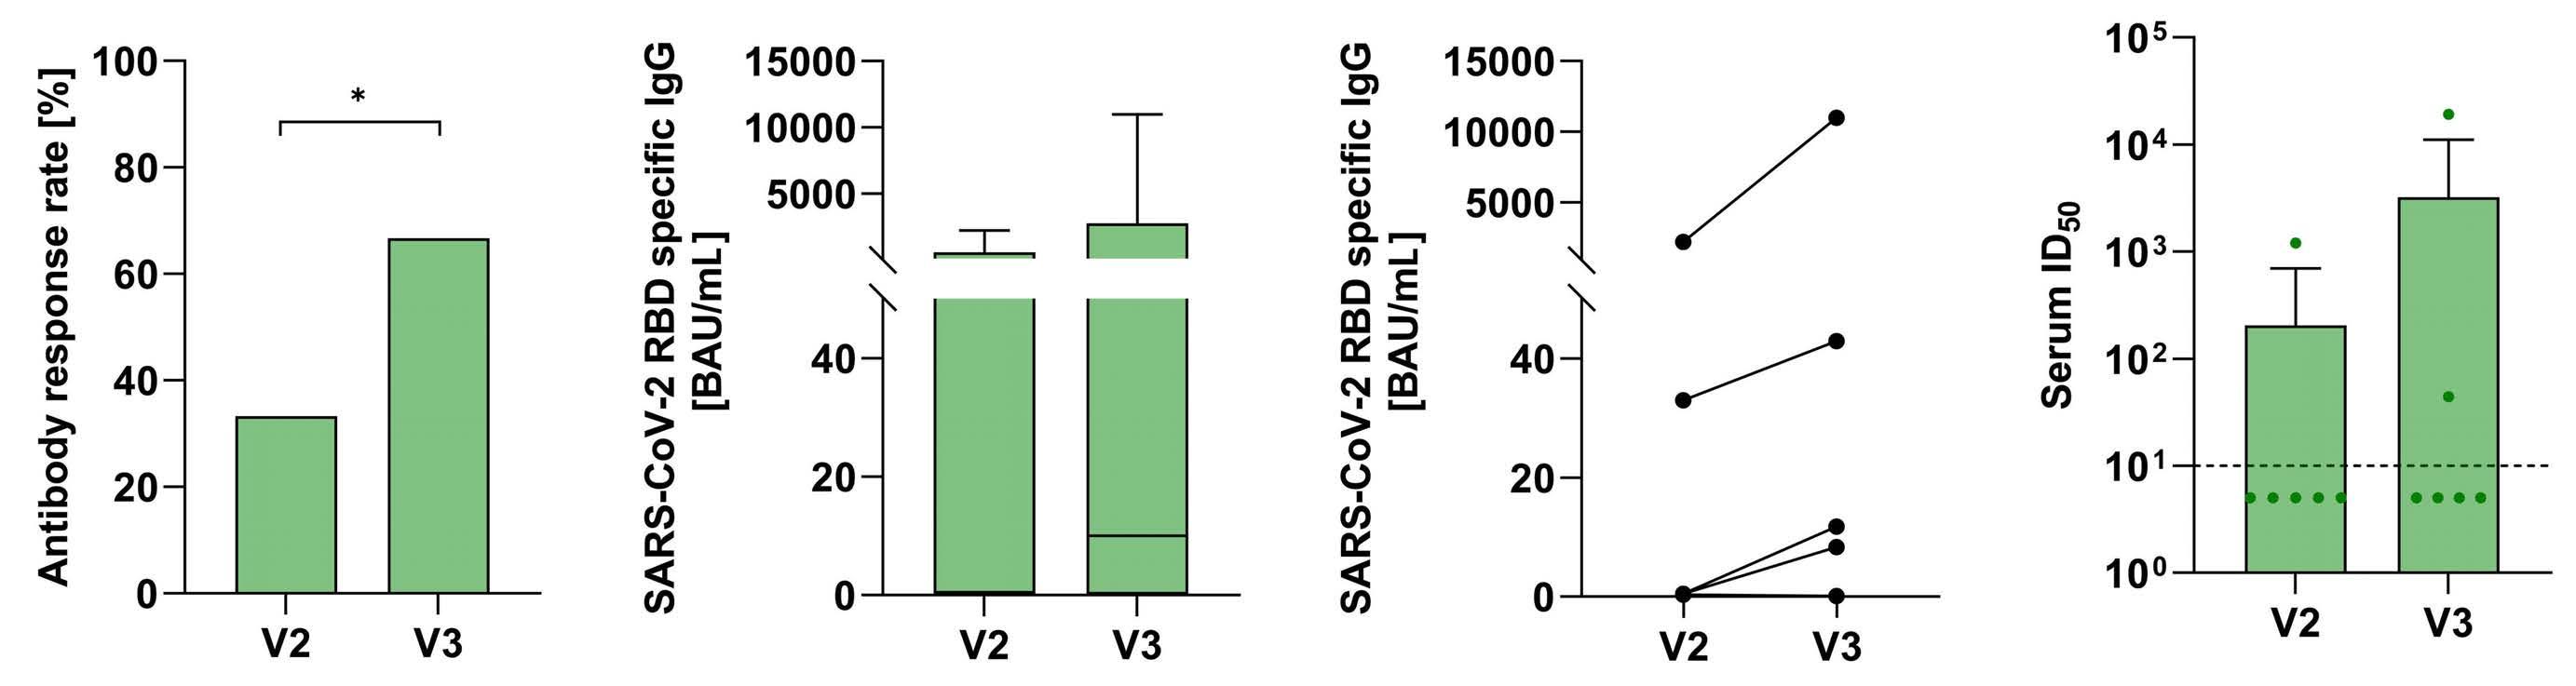
1Faculty of Medicine and University Hospital of Cologne, Department I of Internal Medicine, Center for Integrated Oncology Aachen Bonn Cologne Düsseldorf (CIO ABCD), University of Cologne, Cologne; 2German Center for Infection Research (DZIF), partner site BonnCologne, Cologne; 3Department of Clinical Immunology of Infectious Diseases, Bernhard Nocht Institute for Tropical Medicine, Hamburg; 4Division of Infectious Diseases, First Department of Medicine, University Medical Center Hamburg-Eppendorf, Hamburg; 5German Center for Infection Research (DZIF), Partner Site Hamburg-LübeckBorstel-Riems, Hamburg; 6Institute of Virology, Faculty of Medicine and University Hospital Cologne, University of Cologne, Cologne and 7Center for Molecular Medicine Cologne, University of Cologne, Faculty of Medicine and University Hospital Cologne, Cologne, Germany
Published©2022Prepublished:Accepted:Received:https://doi.org/10.3324/haematol.2022.280982March14,2022.June14,2022.June23,2022.FerrataStortiFoundationunderaCCBY-NClicense
Data-sharing statement
2022;107(4):1000-1003.
of concern,16 we hypothesize a potential benefit of in creased T-cell immunity. The impact of a fourth vaccine dose on altitude and functionality of T cells should be subject of forthcoming studies.
We thank the working groups of PD Dr. Hans-Anton Schlößer, Prof. Dr. Florian Klein and Prof. Dr. Marylyn M. Addo for all logistical and technical support. Especially, we thank Larisa Idrizovic, and Tatjana Lammertz for their continuous support.
Authors
References
Haematologica | 107 October 2022 2483 LETTER TO THE EDITOR
2. Herishanu Y, Rahav G, Levi S, et al. Efficacy of a third BNT162b2 mRNA COVID-19 vaccine dose in patients with CLL who failed standard 2-dose vaccination. Blood. 2022;139(5):678-685.
1. Blixt L, Wullimann D, Aleman S, et al. T cell immune responses following vaccination with mRNA BNT162b2 against SARS-CoV-2 in patients with chronic lymphocytic leukemia: results from a prospective open-label clinical trial. Haematologica.
SCM and PL implemented the research and design of the study. They were responsible for data assessment, coordination and conduct of the study and authored the manuscript. LM performed the T-cell vaccine response laboratory analyses and co-authored the manuscript. HG and KV performed the humoral vaccine response laboratory analyses and co-authored the manuscript. HAS, MS and MT performed blood sample processing and co-authored the manuscript. LMW, SR, CD, MMA, FK, AMF, KF, BE and MH supervised the conduct of the study, gave advice for study design and laboratory analyses and co-authored the manuscript.
Sibylle C. Mellinghoff,1,2,3* Leonie Mayer,3,4,5* Sandra Robrecht,1 Leonie M. Weskamm,3,4,5 Christine Dahlke,3,4,5 Henning Gruell,6 Maike Schlotz,6 Kanika Vanshylla,6 Hans A. Schlößer,7 Martin Thelen,7 AnnaMaria Fink,1 Kirsten Fischer,1 Florian Klein,2,6,7 Marylyn M. Addo,3,4,5 Barbara Eichhorst,1 Michael Hallek1 and Petra Langerbeins1
Acknowledgments
Data may be available upon request to the corresponding author.
In conclusion, we demonstrate an inferior T-cell response to COVID-19 vaccines in CLL patients as compared to HC, but possibly higher capacity in those patients to boost such response by V3 COVID-19. While the ideal primeboost regime is yet to determine, our data encourage to evaluate heterologous immunization by clinical trials in CLL pa tients.
*SCM and LM contributed equally as co-first authors.
A limitation of this study is the small sample size. In ad dition, our small cohort consists of mostly male and com parably old patients. Male sex and advanced age known as relevant factors for an impaired immune response which likely affect our results, but also reflect the CLL pa tient population well.
S.C.Correspondence:MELLINGHOFF - sibylle.mellinghoff@uk-koeln.de
Disclosures
SCM reports grants from DZIF (Clinical Leave Stipend). AMF reports research funding from Celgene/Bristol Myers Squibb (Inst), AstraZeneca (Inst), and travel expenses from AbbVie. KF reports other support from Roche and AbbVie. BE reports grants and personal fees from Janssen-Cilag, AbbVie, Roche and Gilead, personal fees from Novartis, Celgene, ArQule, AstraZeneca and Oxford Biomedica (UK), as well as grants from BeiGene, outside the submitted work. MH reports other support from AbbVie, F. HoffmanLaRoche, Gilead, Janssen-Cilag and Mundipharma, during the conduct of the study. PL reports grants and personal fees from Janssen-Cilag, personal fees from Abbvie and AstraZeneca, and other support from F. Hoffman-LaRoche. SR reports honoraria from AstraZeneca. All other authors have no conflicts of interest to disclose.
Contributions
16. Keeton R, Tincho MB, Ngomti A, et al. T cell responses to SARSCoV-2 spike cross-recognize Omicron. Nature. 2022;603(7901):488-492.
6. Flaxman A, Marchevsky NG, Jenkin D, et al. Reactogenicity and immunogenicity after a late second dose or a third dose of ChAdOx1 nCoV-19 in the UK: a substudy of two randomised controlled trials (COV001 and COV002). Lancet. 2021;398(10304):981-990.
15. Breathnach AS, Duncan CJA, Bouzidi KE, et al. Prior COVID-19 protects against reinfection, even in the absence of detectable antibodies. J Infect. 2021;83(2):237-279.
12. Fendler A, Au L, Shepherd STC, et al. Functional antibody and T cell immunity following SARS-CoV-2 infection, including by variants of concern, in patients with cancer: the CAPTURE study. Nat Cancer. 2021;2(12):1321-1337.
7. Bonelli M, Mrak D, Tobudic S, et al. Additional heterologous versus homologous booster vaccination in immunosuppressed patients without SARS-CoV-2 antibody seroconversion after primary mRNA vaccination: a randomised controlled trial. Ann Rheum Dis. 2022;81(5):687-694.
5. Liu X, Shaw RH, Stuart ASV, et al. Safety and immunogenicity of heterologous versus homologous prime-boost schedules with an adenoviral vectored and mRNA COVID-19 vaccine (ComCOV): a single-blind, randomised, non-inferiority trial. Lancet. 2021;398(10303):856-869.
4. Munro APS, Janani L, Cornelius V, et al. Safety and immunogenicity of seven COVID-19 vaccines as a third dose (booster) following two doses of ChAdOx1 nCov-19 or BNT162b2 in the UK (COV-BOOST): a blinded, multicentre, randomised, controlled, phase 2 trial. Lancet. 2021;398(10318):2258-2276.
Haematologica | 107 October 2022 2484 LETTER TO THE EDITOR
3. Mellinghoff SC, Robrecht S, Mayer L, et al. SARS-CoV-2 specific cellular response following COVID-19 vaccination in patients with chronic lymphocytic leukemia. Leukemia. 2022;36(2):562-565.
11. Earle KA, Ambrosino DM, Fiore-Gartland A, et al. Evidence for antibody as a protective correlate for COVID-19 vaccines. Vaccine. 2021;39(32):4423-4428.
13. Pozzetto B, Legros V, Djebali S, et al. Immunogenicity and efficacy of heterologous Cha-dOx1/BNT162b2 vaccination. Nature. 2021;600(7890):701-706.
9. Marlet J, Gatault P, Maakaroun Z, et al. Antibody responses after a third dose of COVID-19 vaccine in kidney transplant recipients and patients treated for chronic lymphocytic leukemia. Vaccines (Basel). 2021;9(10):1055.
10. Krammer F. A correlate of protection for SARS-CoV-2 vaccines is urgently needed. Nat Med. 2021;27(7):1147-1148.
8. Schrezenmeier E, Rincon-Arevalo H, Stefanski A-L, et al. B and T cell responses after a third dose of SARS-CoV-2 vaccine in kidney transplant recipients. J Am Soc Nephrol.
2021;32(12):3027-3033.
14. Soresina A, Moratto D, Chiarini M, et al. Two X-linked agammaglobulinemia patients develop pneumonia as COVID-19 manifestation but recover. Pediatr Allergy Immunol. 2020;31(5):565-569.
Gain/amplification of 1q21, referred to as 1q21+ in this letter, is one of the most common chromosomal abnor malities in multiple myeloma (MM),1 being detected in ap proximately 40% of patients at diagnosis.1-3 The number of MM cells with 1q21+ and the number of copies of 1q21+ in creases as the disease progresses.2 Furthermore, its negative impact on prognosis suggests that 1q21+ is in volved in the pathophysiology of disease progression and resistance to MM treatment.1 The 1q21+ abnormality is de fined as gain of 1q21 (gain[1q21], 3 copies) and amplification of 1q21 (amp[1q21], ≥4 copies).2,3 Co-existence of certain high-risk chromosomal abnormalities is common and further worsens the prognosis for patients with 1q21+.2 In the phase III studies ICARIA-MM and IKEMA, the addition of the anti-CD38 monoclonal antibody isatuximab (Isa) to the backbone of pomalidomide–dexamethasone (Pd) or carfilzomib–dexamethasone (Kd), respectively, improved progression-free survival (PFS) among patients with re lapsed/refractory MM,4,5 and subgroup analyses suggested benefit among patients with 1q21+.6,7 The current analyses examine four subgroups of patients from ICARIA-MM and IKEMA: 1q21+ (≥3 copies with or without high-risk chromo somal abnormalities), isolated 1q21+ (≥3 copies without high-risk chromosomal abnormalities), gain(1q21) (3 copies with or without high-risk chromosomal abnormalities), and amp(1q21) (≥4 copies with or without high-risk chromoso mal abnormalities). The analyses show a clear benefit of Isa-based combinations in 1q21+ disease.
Full methodological details of the randomized, open-label, phase III ICARIA-MM (ClinicalTrials.gov, identifier NCT02990338) and IKEMA (ClinicalTrials.gov, identifier NCT03275285) studies were previously described.4,5 The primary endpoint in both trials was PFS, as assessed by an independent response committee. Secondary end points included overall survival (OS) and overall response rate, assessed according to International Myeloma Work ing Group response criteria.8 For each study (Isa-Pd versus Pd or Isa-Kd versus Kd), within- and between-treatment group efficacy evaluations were conducted in the follow ing populations: patients with versus without 1q21+; pa tients with versus without isolated 1q21+; patients with versus without gain(1q21); and patients with versus with out amp(1q21). The presence of 1q21+ was evaluated using CD138+ plasma cells and a 30% cutoff. Cutoffs for highrisk chromosomal abnormalities were 50% for del(17p) and 30% for t(4;14) and t(14;16). For both PFS and OS, esti
Primary outcomes by 1q21+ status for isatuximab-treated patients with relapsed/refractory multiple myeloma: subgroup analyses from ICARIA-MM and IKEMA
mates of the median and corresponding confidence inter val (CI) were determined using the Kaplan-Meier method. Hazard ratios (HR) were determined using an unstratified Cox regression model, with terms for the factor, treat ment, and their interaction. The test for the interaction was performed at the 10% α level.
Of the 307 and 302 patients randomized in ICARIA-MM and IKEMA, respectively, cytogenetic risk was assessable by the central laboratory in 241 (78.5%) and 265 (87.7%) patients. Of the intention-to-treat populations, 49.4% (n=76/154; Isa-Pd) and 34.0% (n=52/153; Pd) had 1q21+ in ICARIA-MM, whereas 41.9% (n=75/179; Isa-Kd) and 42.3% (n=52/123; Kd) had 1q21+ in IKEMA. Patient-related and clinical characteristics at baseline were balanced across treatment arms with respect to 1q21+ status regardless of treatment arm (Online Supplementary Table S1).
The addition of Isa to Pd improved PFS and OS for pa tients with 1q21+ compared with the Pd groups (Figure 1). Patients with 1q21+ had a median PFS of 9.5 versus 3.8 months in the Isa-Pd versus Pd groups (HR=0.40, 95% CI: 0.25–0.63) (Figure 1A). The median OS for patients with 1q21+ was 21.3 versus 13.9 months in the Isa-Pd versus Pd groups (HR=0.72, 95% CI: 0.48–1.07) (Figure 1B). The median PFS for patients in the Isa-Pd group with versus without 1q21+ was 9.5 versus 11.6 months (Figure 1C) and the median OS for patients in the Isa-Pd group with versus without 1q21+ was 21.3 versus 21.2 months (Figure 1D). This compared with a median PFS of 3.8 months for those with 1q21+ versus 9.8 months for patients without 1q21+ in the Pd group (Figure 1E), and a median OS of 13.9 months for those with 1q21+ versus 28.3 months without 1q21+ in the Pd group (Figure 1F). The PFS and OS curves in the Isa-Pd group for patients with 1q21+ overlap with those for pa tients without 1q21+ (Figure 1C, D). In comparison, the PFS and OS curves in the Pd group for patients with 1q21+ ver sus those without 1q21+ clearly separate, with patients with 1q21+ having shorter PFS and OS (Figure 1E, F). We also performed outcome analyses for additional sub groups of patients from ICARIA-MM with isolated 1q21+, gain(1q21), and amp(1q21). A clear benefit of Isa addition was observed in all subgroups of patients, irrespective of high-risk chromosomal abnormalities. Results are avail able in Online Supplementary Figure S1 In patients with 1q21+ the addition of Isa to Kd improved PFS compared to that achieved with Kd alone (Figure 2). The median PFS in patients with 1q21+ who received Isa-
Haematologica | 107 October 2022 2485 LETTER TO THE EDITOR
A B C D E F Haematologica | 107 October 2022 2486 LETTER TO THE EDITOR
Figure 1. Survival outcomes in patients with relapsed/refractory multiple myeloma in the ICARIA-MM study according to treatment received and 1q21+ status. (A-F) Kaplan-Meier estimates of progression-free survival and overall survival from the ICARIAMM study in the subgroup of patients with 1q21+ treated with isatuximab (Isa) plus pomalidomide–dexamethasone (Pd) versus Pd (A, B), Isa-Pd with 1q21+ versus Isa-Pd without 1q21+ (C, D), and Pd with 1q21+ versus Pd without 1q21+ (E, F). Progression-free survival was defined as the time from randomization to first documentation of progressive disease before initiation of anti-mye loma therapy or death from any cause, whichever came first. Progression-free survival data were analyzed as per the ICARIA-MM primary analysis cutoff date (October 11, 2018). Overall survival data were analyzed at the second interim cutoff date (October 1, 2020). Efficacy analyses were performed on the intention-to-treat population and summarized by assigned treatment. Confidence intervals are 95% for all Kaplan-Meier plots. 1q21+ definition: ≥3 copies, 30% cutoff, with or without high-risk chromosomal ab normalities. PFS: progression-free survival; mPFS: median progression-free survival; mo: months; HR: hazard ratio; OS: overall survival; mOS: median overall survival.
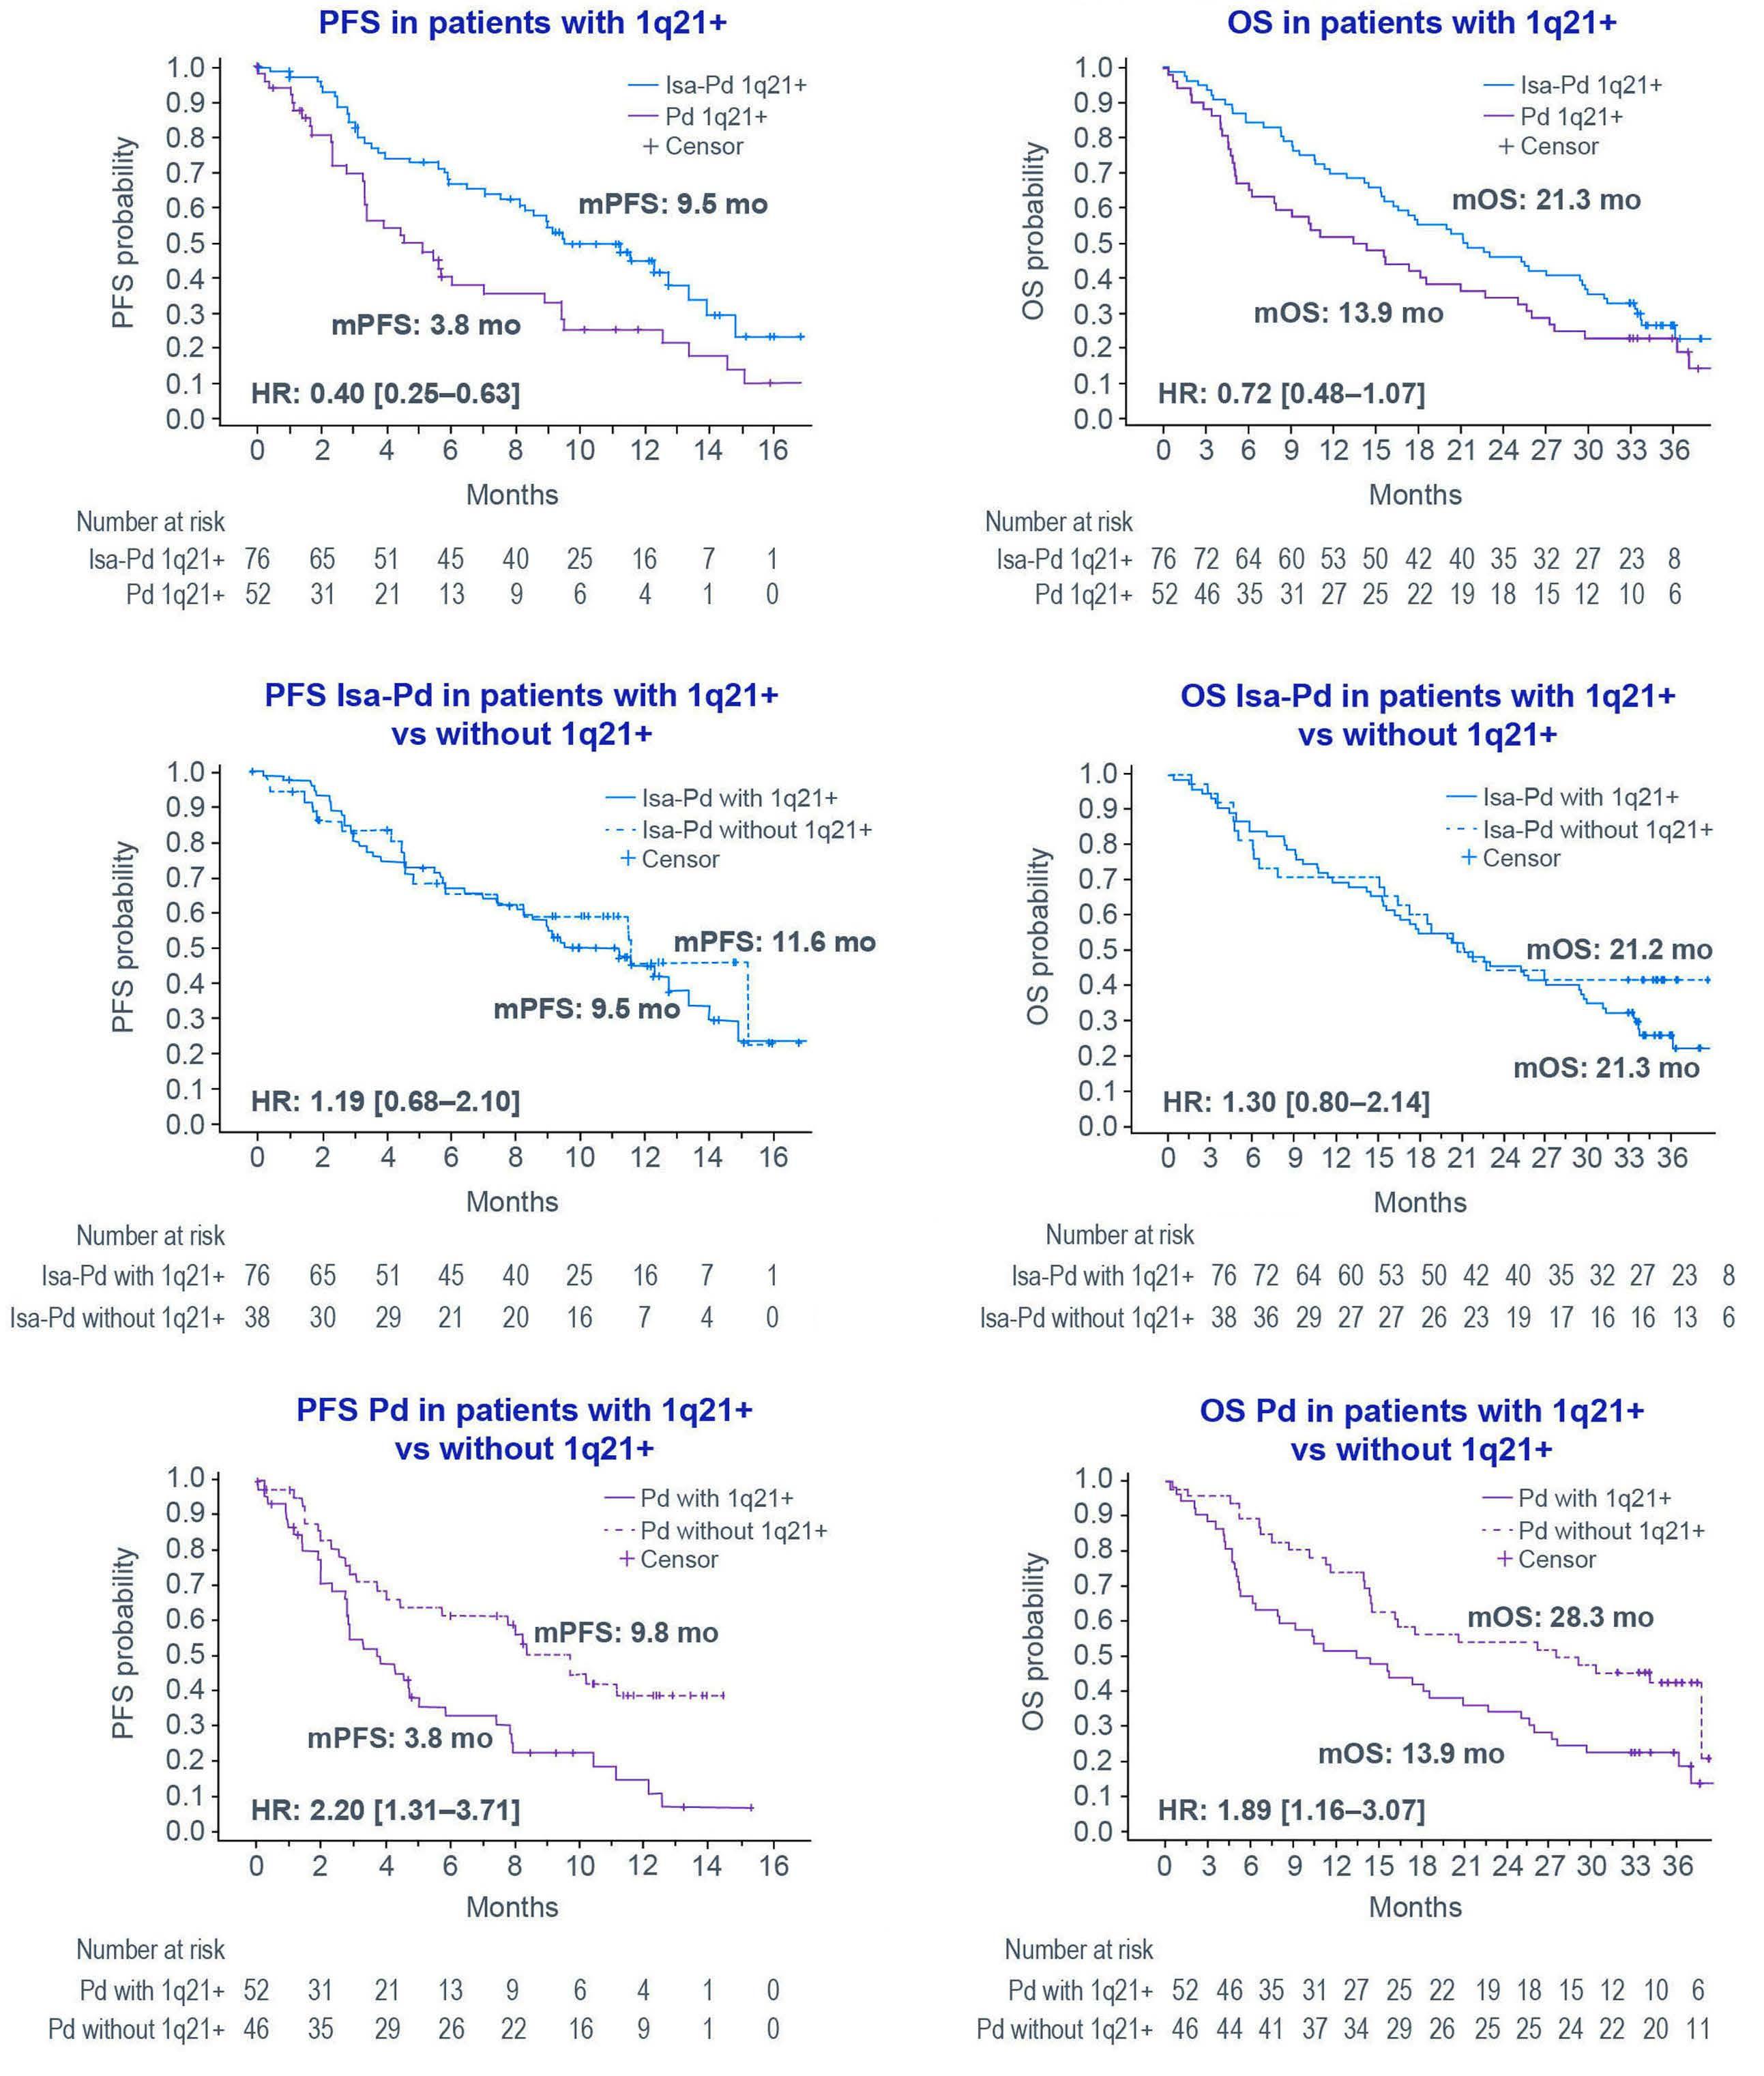
Continued on following page. A B C D Haematologica | 107 October 2022 2487 LETTER TO THE EDITOR
months for those with 1q21+ versus 20.3 months for pa tients without 1q21+, and the curves separated early fol lowing the initiation of treatment (Figure 2C). Additional outcomes for subgroups of patients from IKEMA with iso lated 1q21+, gain(1q21), and amp(1q21) are available in On line Supplementary Figure S2.
Kd was not reached versus 16.2 months in patients who received Kd (HR=0.57, 95% CI: 0.33–0.98) (Figure 2A). The median PFS was not reached by both the Isa-Kd patients with 1q21+ and the Isa-Kd patients without 1q21+, and the curves overlapped until approximately 11 months (Figure 2B). The median PFS of patients treated with Kd was 16.2
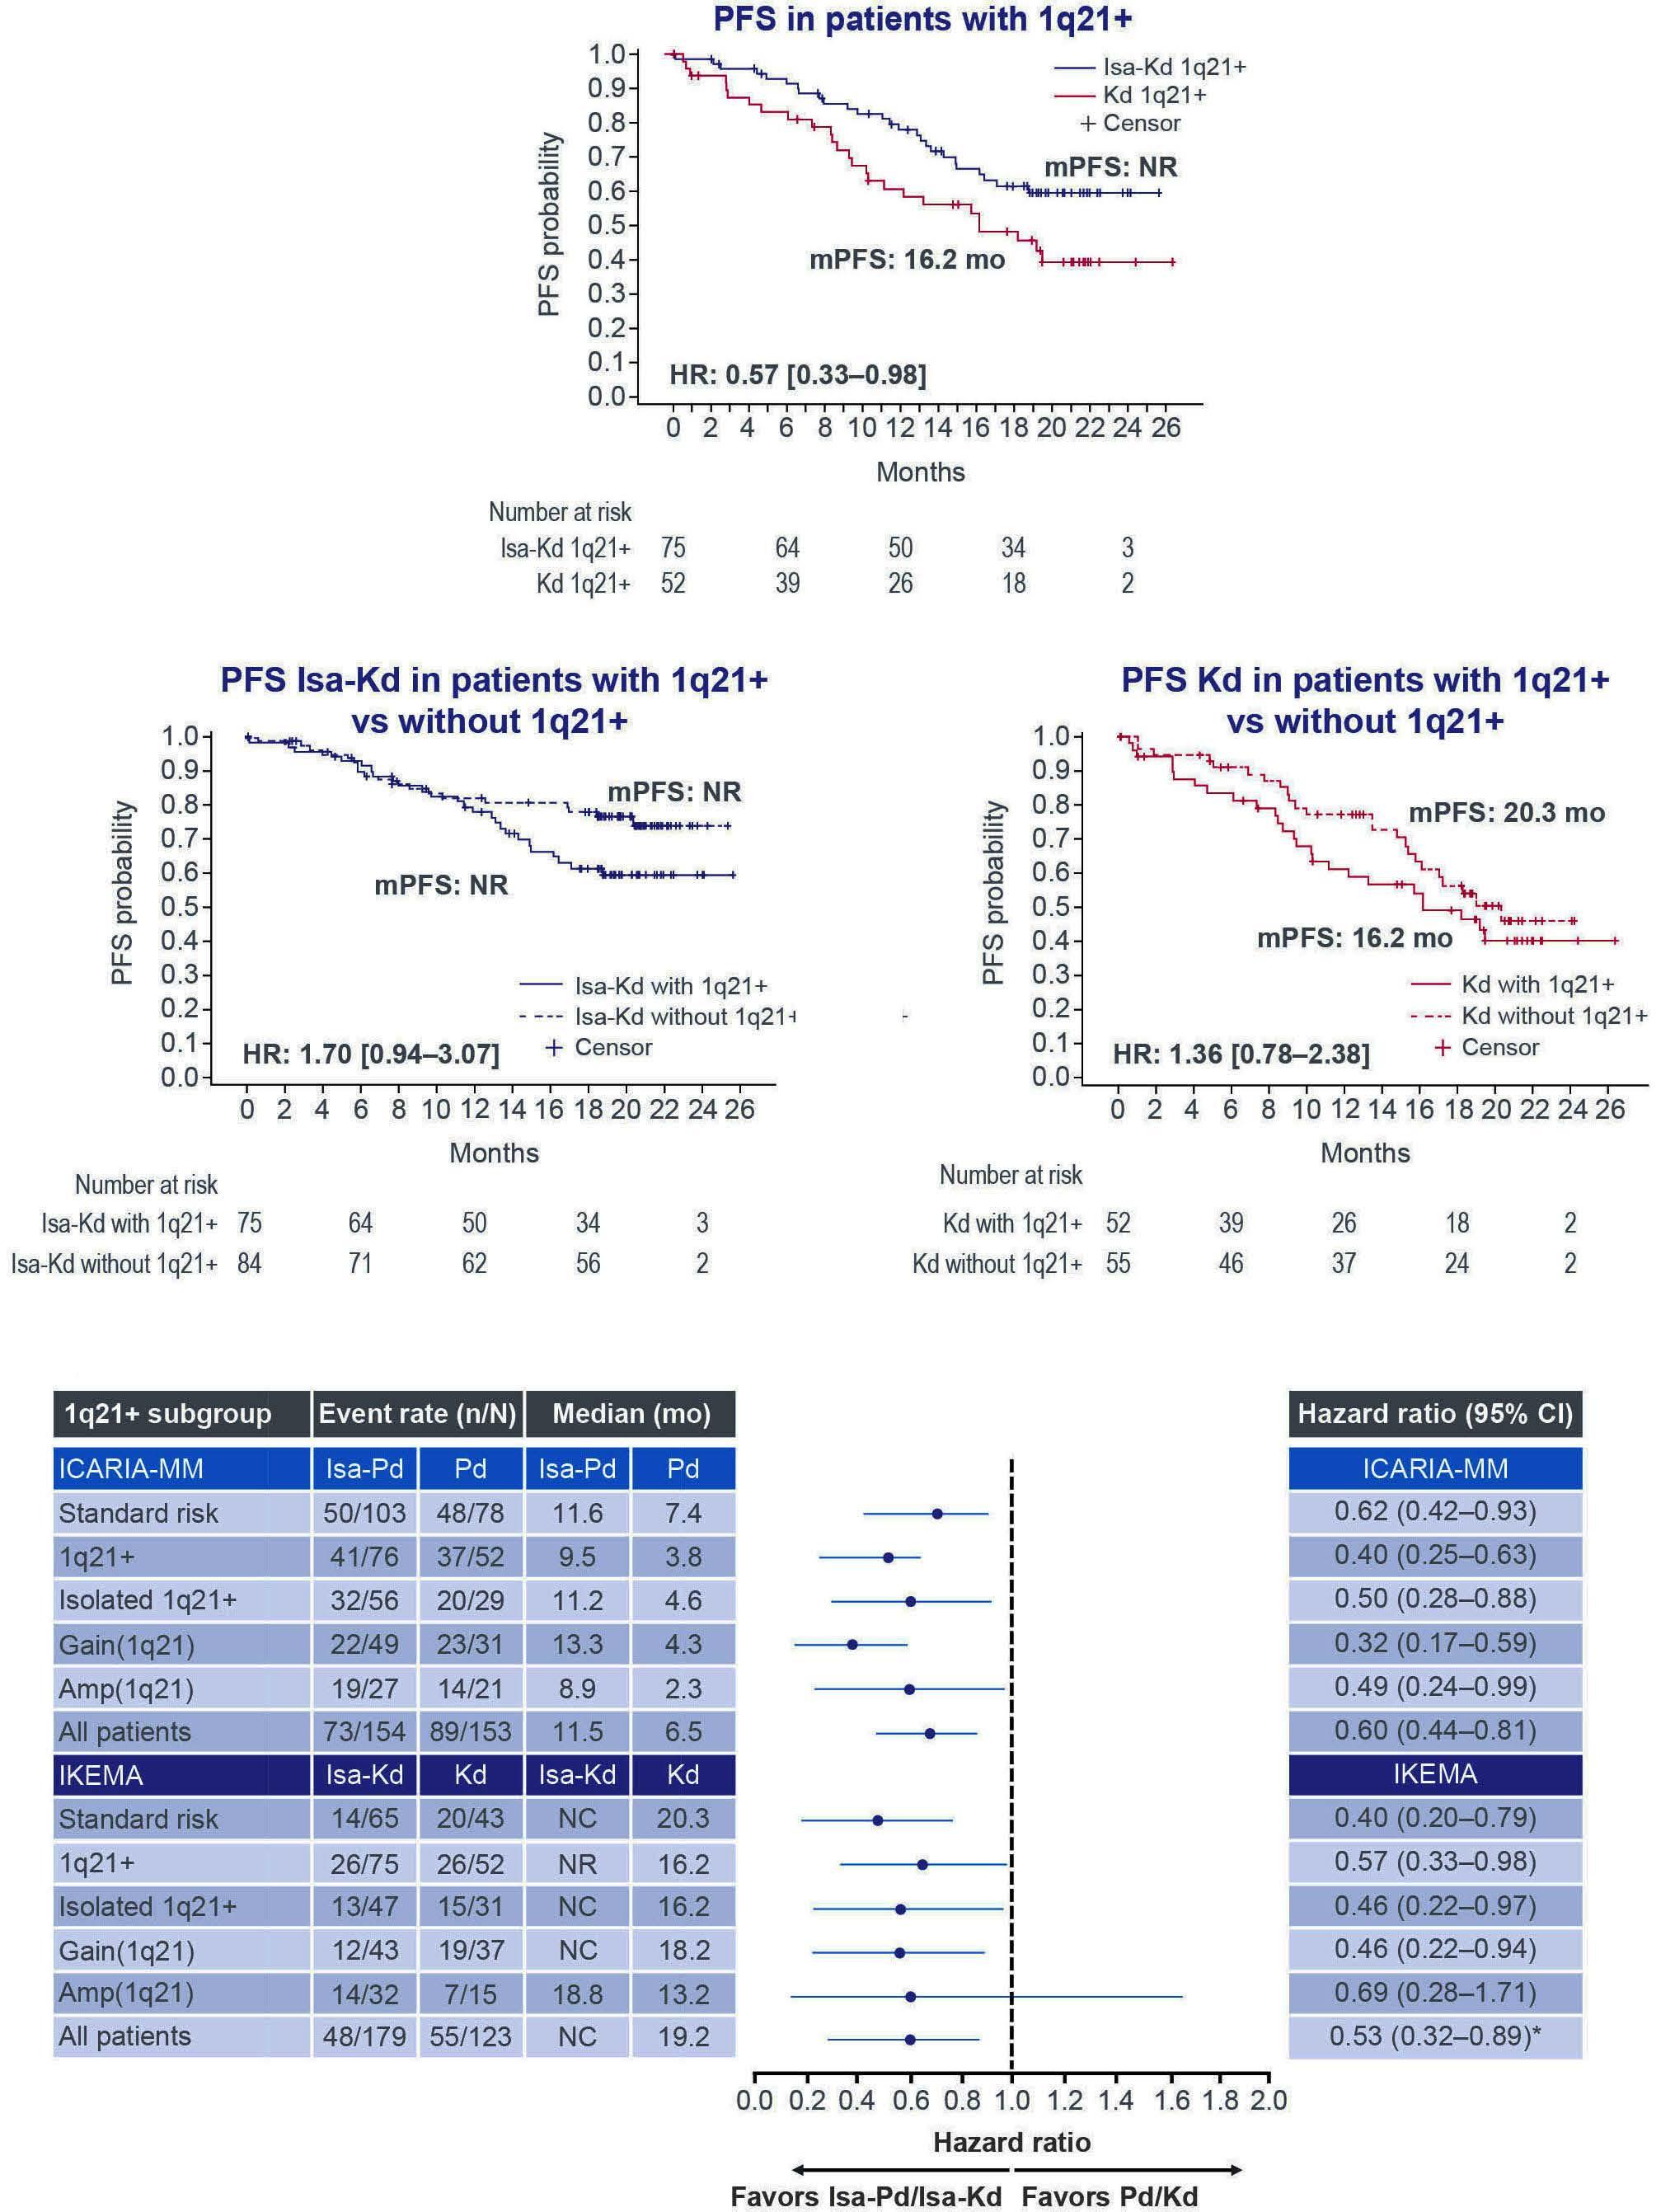
Figure 2D shows forest plots for PFS from both trials. Ha zard ratios for all subgroups related to 1q21+ favored IsaPd over Pd (range, 0.32–0.50) and Isa-Kd over Kd (range, 0.46–0.69). Apart from the Isa-Kd versus Kd subgroup with amp(1q21), the upper bounds of the 95% CI did not cross unity for the different subgroups related to 1q21+. In ICARIA-MM, the addition of Isa to Pd led to improved depth of response in the subgroups with 1q21+, isolated 1q21+, gain(1q21), and amp(1q21) (Figure 3A). In IKEMA, the depth of response in patients with 1q21+, isolated 1q21+, gain(1q21), and amp(1q21) was better in the Isa-Kd group than in the Kd group, with higher rates of response, very good partial response or better, and minimal residual dis ease negativity (Figure 3B). Safety data across subgroups were consistent with the overall treatment population from ICARIA-MM and IKEMA (data not shown).4,5
Figure 2. Progression-free survival in patients with relapsed/refractory multiple myeloma according to treatment received and 1q21+ status. (A-C) Kaplan-Meier estimates of progression-free survival from the IKEMA study in the subgroup of patients with 1q21+ in the group treated with isatuximab (Isa) plus carfilzomib–dexamethasone (Kd) versus Kd (A), Isa-Kd with 1q21+ versus Isa-Kd without 1q21+ (B), and Kd with 1q21+ versus Kd without 1q21+ (C). (D) Progression-free survival risk across treatment arms in the ICARIA-MM and IKEMA studies according to 1q21+ status. *99% confidence intervals were stratified on number of prior lines of therapy (1 versus >1) and Revised International Staging System stage (I or II versus III versus not classified) according to interactive response technology. Progression-free survival was defined as the time from randomization to first documentation of progressive disease before initiation of anti-myeloma therapy or death from any cause, whichever came first. Progressionfree survival was analyzed as per the IKEMA primary analysis cutoff date (February 7, 2020). Efficacy analyses were performed on the intention-to-treat population and summarized by assigned treatment. Confidence intervals are 95% for all Kaplan-Meier plots and forest plots, except where otherwise indicated. 1q21+ definition: ≥3 copies, 30% cutoff, with or without high-risk chro mosomal abnormalities. CI: confidence interval; HR: hazard ratio; Isa: isatuximab; mo: months; mPFS: median progression-free survival; NC: not calculable; NR: not reached; PFS: progression-free survival.
Two independent phase III studies have now shown that the addition of Isa to a standard-of-care backbone (Pd or Kd) improves PFS to the same extent in patients with 1q21+, gain(1q21), and amp(1q21). In ICARIA-MM, the PFS curves in the Isa arm appear to be overlapping for patients with and without 1q21+. In IKEMA, the PFS curves in the Isa arm appear to be overlapping in the first 11 months. Depth of response is consistently similar for patients with or without 1q21+. In both studies, the PFS curves in the standard-of-care arms were inferior for patients with 1q21+ compared to those without 1q21+. This was particu larly apparent in patients who received Pd, but less so for patients who received Kd; this confirms a recent obser vation that carfilzomib-based treatment (carfi lzomiblenalidomide-dexamethasone with or without stem cell transplantation) is beneficial for patients with 1q21+.9,10
Haematologica | 107 October 2022 2488 LETTER TO THE EDITOR
19.5% of patients. The median PFS was 0.5 years in the 1q21+ cohort (versus 2.1 years in patients without 1q21+), whereas the median OS was 0.9 years in the 1q21+ cohort (versus not reached in patients without 1q21+). Multivari ate analyses revealed that GEP70 score and 1q21+ status at initial presentation were independently associated with inferior PFS (P<0.05), whereas only GEP70 score was stat istically associated with poor OS (P<0.05); the presence of 1q21+ showed a tendency to be associated with poor OS (P=0.06). According to the authors, the poor outcome among patients with relapsed/refractory MM and 1q21+ receiving daratumumab-based therapy may be associated with daratumumab-mediated induction of complementdependent cytotoxicity, which could be mediated by up regulation of complement protein CD55, whose gene is localized to 1q32.2.11 A recent study found no prognostic benefit of daratumumab-based therapy on the outcome of newly diagnosed MM patients with 1q21+ in a real-world setting, although the study had limitations because of its relatively small sample size and its retrospective, singlecenter Overexpressionnature.12 of complement regulatory proteins CD55 and CD59 has been implicated in daratumumab resis tance.13 Interestingly, the gene encoding CD55 is localized to 1q32.2, and overexpression of CD55 has been sug gested to contribute to daratumumab resistance in 1q21+ patients.11 In contrast to daratumumab, the antitumor ac tivity of Isa relies more heavily on antibody-dependent cellular cytotoxicity than complement-dependent cyto toxicity.14,15 It is worth noting that the CD55 gene is lo cated outside of the 1q21 band, and how its upregulation could be associated with 1q21+ requires further investi Thegation.beneficial outcomes associated with Isa-based com bination therapy in patients with 1q21+, observed in ICA RIA-MM and IKEMA, suggest that such therapy can ease the negative prognostic impact of 1q21+ in patients with relapsed/refractory MM. In conclusion, Isa-Pd and Isa-Kd represent important treatment options for the difficultto-treat subgroup of patients with relapsed/refractory MM and 1q21+.
Compared to the benefits observed with Isa treatment in patients with 1q21+, limited information is available for daratumumab. In a single, prospective, observational study, the prognostic impact of 1q21+ and gene expression profiling (GEP70) risk score at initial presentation and prior to daratumumab therapy were assessed in 81 patients with relapsed/refractory MM.11 Daratumumab was given in combination therapy to 80.5% of patients (with pomalido mide in 58% of these patients) and as a single agent to
Figure 3. Response rates in patients with relapsed/refractory multiple myeloma according to treatment and 1q21+ status. (A) Overall response and very good partial response or better in each treatment arm of ICARIA-MM, and (B) overall response, very good partial response or better, and minimal residual disease negativity rate in each treatment arm of IKEMA, according to 1q21+ status. Minimal residual disease negativity was assessed by next-generation sequencing at 10-5 sensitivity. 1q21+ definition: ≥3 copies, 30% cutoff, with or without high-risk chromosomal abnormalities. Isolated 1q21+ definition: ≥3 copies, 30% cutoff, without high-risk chromosomal abnormalities. Gain(1q21) definition: 3 copies, 30% cutoff, with or without high-risk chromosomal abnor malities. Amp(1q21) definition: ≥4 copies, 30% cutoff, with or without high-risk chromosomal abnormalities. Amp: amplification; d: dexamethasone; Isa: isatuximab; K: carfilzomib; MRD: minimal residual disease; P: pomalidomide; VGPR: very good partial re sponse.
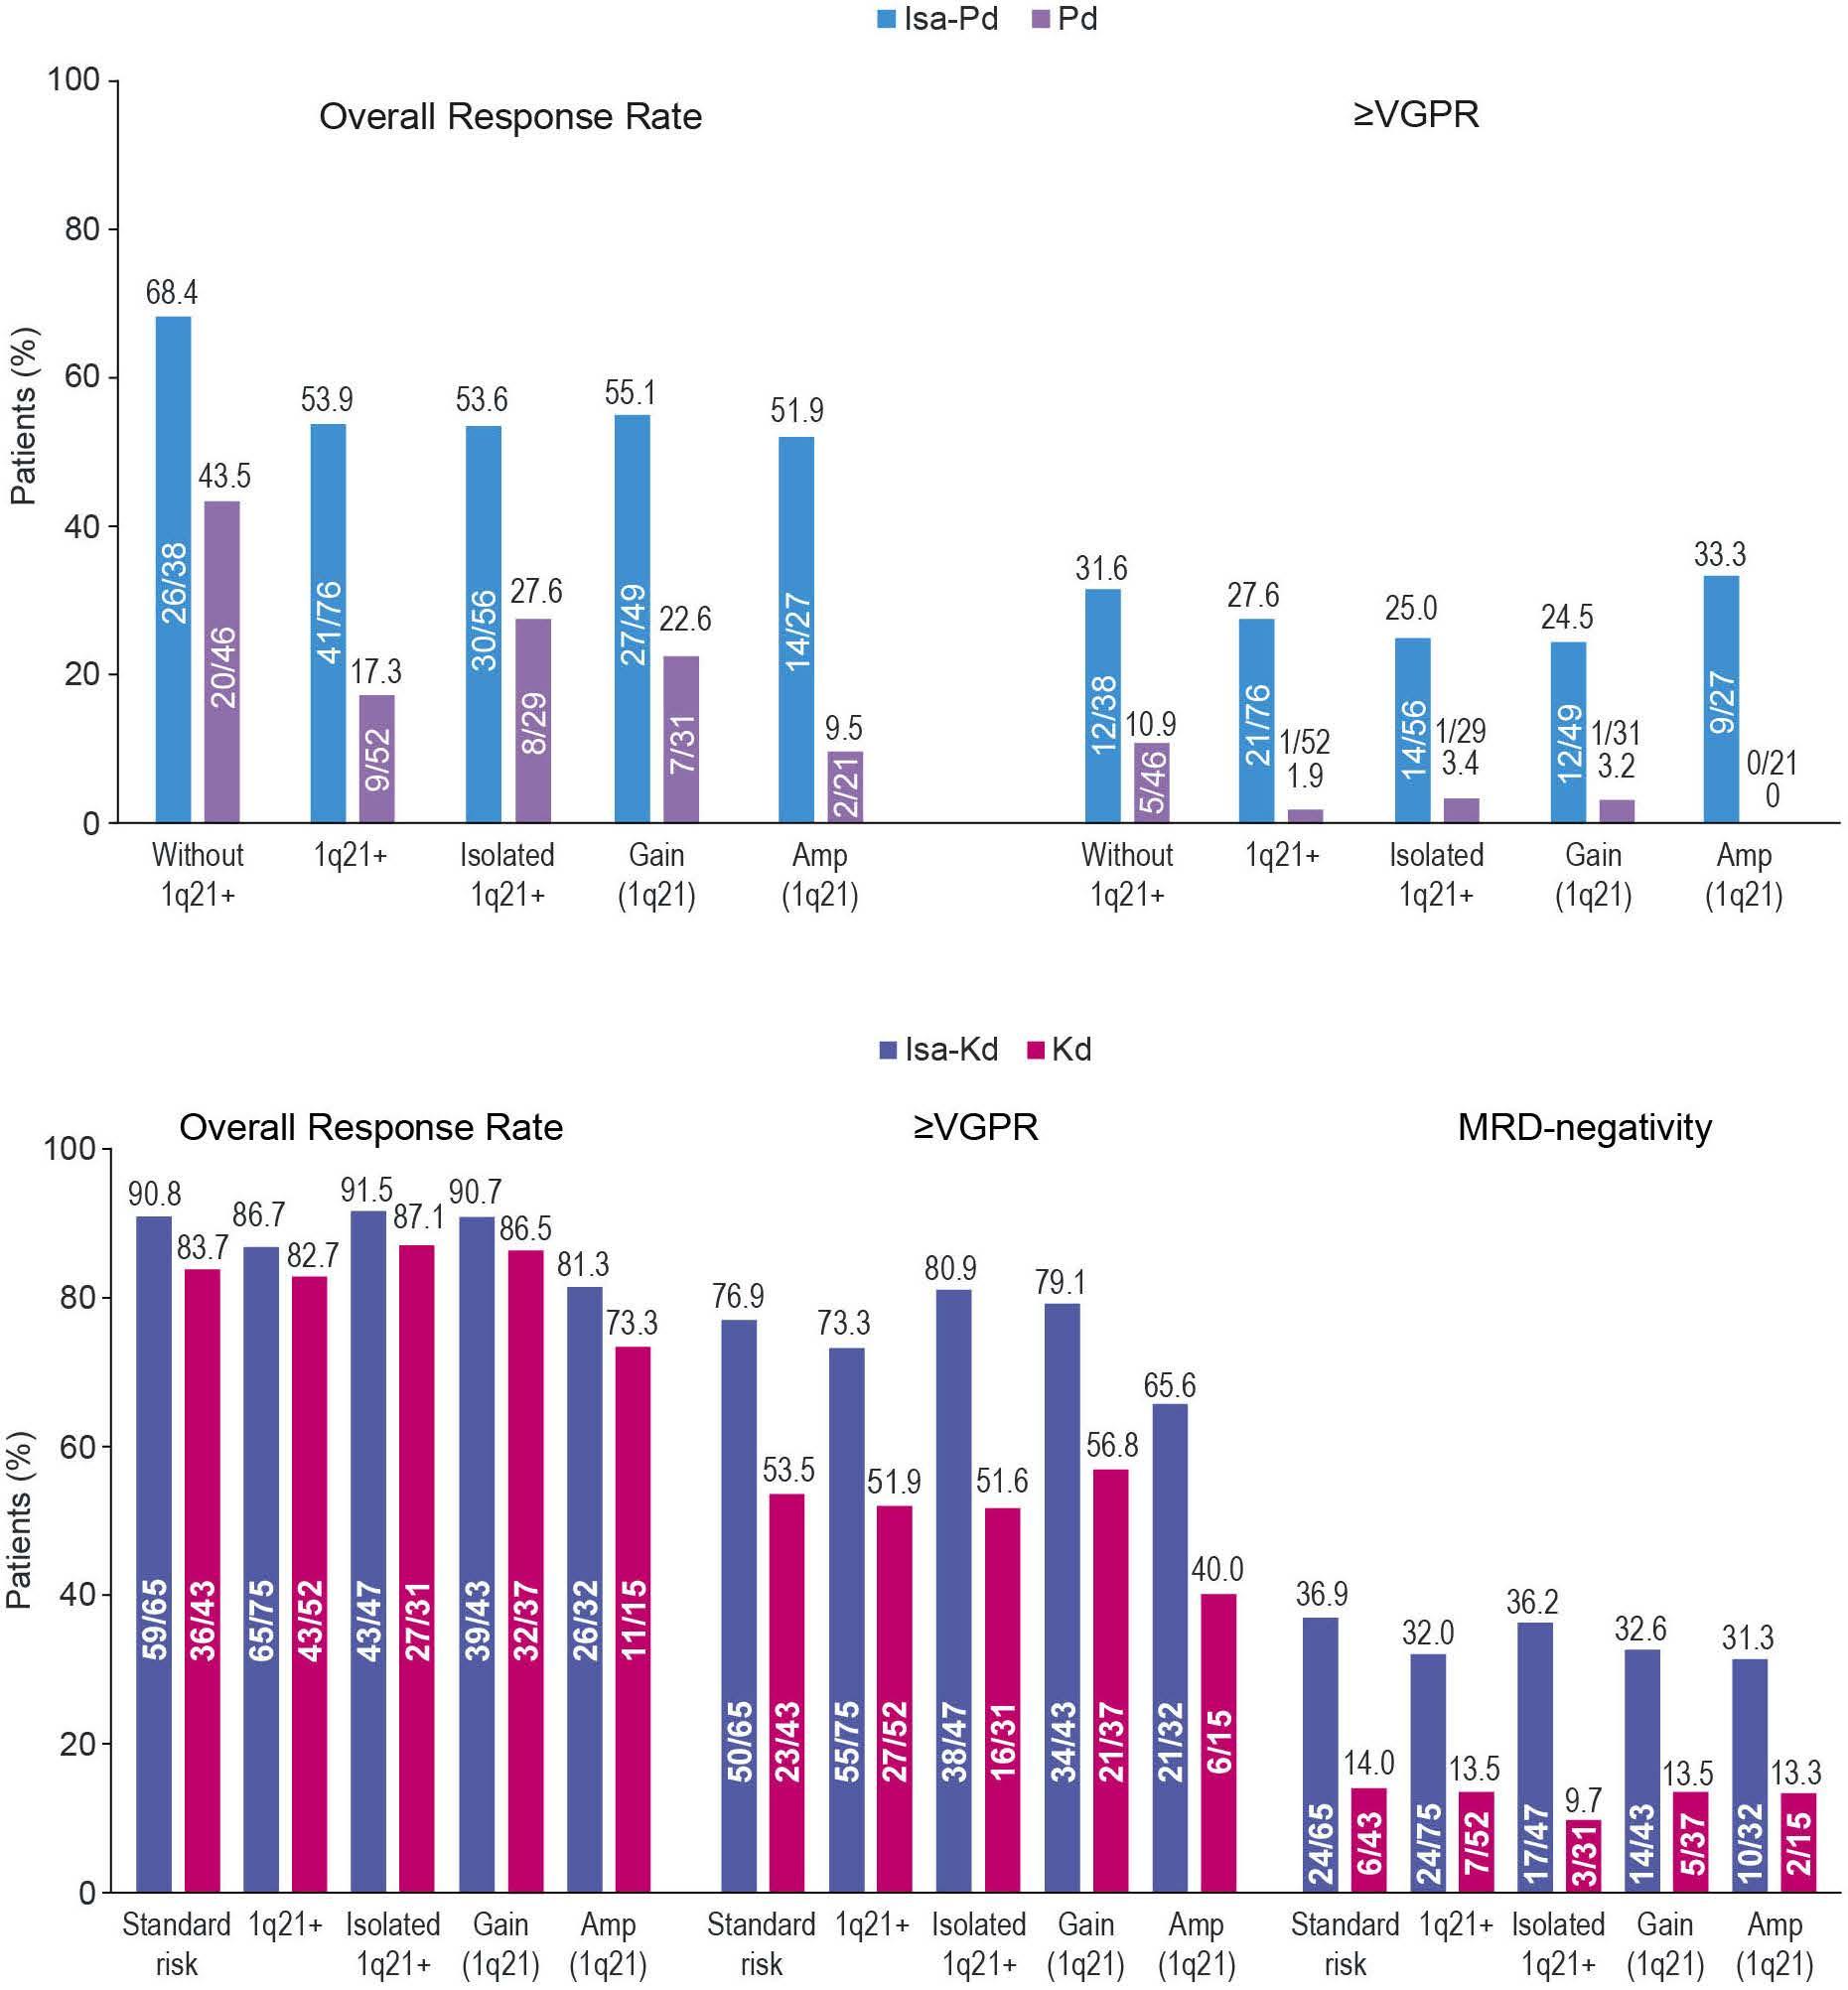
Institute, Boston, MA, USA; 3Department of Hematology, Lille University Hospital, Lille, France; 4Department of Hematology, University Hospital of Nantes, Nantes, France; 5Centre HospitaloUniversitaire (CHU) de Toulouse, Centre de Recherches en Cancérologie de Toulouse (CRCT), Institut Universitaire du Cancer de Toulouse-Oncopole (IUCT-O), Université de Toulouse, UPS, Toulouse, France; 6First Department of Medicine, Department of Hematology, First Faculty of Medicine, Charles University and General Hospital, Prague, Czech Republic; 7Sanofi, Research and
Tom Martin,1 Paul G. Richardson,2 Thierry Facon,3 Philippe Moreau,4 Aurore Perrot,5 Ivan Spicka,6 Kamlesh Bisht,7 Marlene Inchauspé,8 France Casca,9 Sandrine Macé,10 Helgi van de Velde7 and Kenshi
1Suzuki11UCSFMedical
Authors
BA Haematologica | 107 October 2022 2489 LETTER TO THE EDITOR
Center, San Francisco, CA, USA; 2Dana-Farber Cancer
6. Harrison SJ, Perrot A, Alegre A, et al. Subgroup analysis of ICARIA-MM study in relapsed/refractory multiple myeloma patients with high-risk cytogenetics. Br J Haematol. 2021;194(1):120-131.
Qualified researchers can request access to patient-level data and related study documents including the clinical study report, study protocol with any amendments, blank case report forms, statistical analysis plan, and dataset specifications. Patient-level data will be anonymized, and study documents will be redacted to protect the privacy of trial participants. Further details on Sanofi’s data sharing criteria, eligible studies, and process for requesting access are available at: https://www.vivli.org.
4. Attal M, Richardson PG, Rajkumar SV, et al. Isatuximab plus pomalidomide and low-dose dexamethasone versus pomalidomide and low-dose dexamethasone in patients with relapsed and refractory multiple myeloma (ICARIA-MM): a randomised, multicentre, open-label, phase 3 study. Lancet. 2019;394(10214):2096-2107.
Disclosures
8. Rajkumar SV, Harousseau JL, Durie B, et al. Consensus recommendations for the uniform reporting of clinical trials: report of the International Myeloma Workshop Consensus Panel 1. Blood. 2011;117(18):4691-4695.
1. Bisht K, Walker B, Kumar SK, et al. Chromosomal 1q21 abnormalities in multiple myeloma: a review of translational, clinical research, and therapeutic strategies. Expert Rev Hematol. 2021;14(12):1099-1114.
9. D'Agostino M, Ruggeri M, Aquino S, et al. Impact of gain and amplification of 1q in newly diagnosed multiple myeloma patients receiving carfilzomib-based treatment in the Forte trial. Blood. 2020;136(Suppl 1):38-40.
Haematologica | 107 October 2022 2490 LETTER TO THE EDITOR
Development, Cambridge, MA, USA; 8IT&M Statistics for Sanofi, Neuilly sur-Seine, France; 9IVIdata for Sanofi, Levallois-Perret, France; 10Sanofi, Research and Development, Vitry-Sur-Seine, France and 11Department of Hematology, Japanese Red Cross Medical Center, Tokyo, Prepublished:Accepted:Received:https://doi.org/10.3324/haematol.2022.280660T.Correspondence:Japan.MARTIN-Tom.Martin@ucsf.eduJanuary10,2022.June14,2022.June23,2022.©2022FerrataStortiFoundationPublishedunderaCCBY-NClicense
TM reports receiving research funding from Sanofi, Amgen, Seattle Genetics, JNJ and Janssen as well as consultancy fees from Legend Biotech. PM reports grants from BMS, grants and honoraria (advisory committee member) from Oncopeptides, Celgene, Takeda, and Karyopharm, and honoraria (advisory committee member) from Janssen and Sanofi TF reports being a member of a data monitoring board for Sanofi and an advisory board member for Celgene, Janssen, Roche, Oncopeptides, Karyopharm and Amgen. IS reports receiving personal fees, advisory board and speakers bureau work for Amgen, Celgene, Janssen, Sanofi, BMS and Takeda. PM has received consultancy fees and honoraria from Janssen, BMS, Celgene, Amgen, Sanofi and AbbVie. AP has received honoraria from
Contributions
3. Hanamura I, Stewart JP, Huang Y, et al. Frequent gain of chromosome band 1q21 in plasma-cell dyscrasias detected by fluorescence in situ hybridization: incidence increases from MGUS to relapsed myeloma and is related to prognosis and disease progression following tandem stem-cell transplantation. Blood. 2006;108(5):1724-1732.
5. Moreau P, Dimopoulos MA, Mikhael J, et al. Isatuximab, carfilzomib, and dexamethasone in relapsed multiple myeloma (IKEMA): a multicentre, open-label, randomised phase 3 trial. Lancet. 2021;397(10292):2361-2371.
Funding
Data-sharing statement
2. Hanamura I. Gain/amplification of chromosome arm 1q21 in multiple myeloma. Cancers (Basel). 2021;13(2):256.
7. Spicka I, Moreau P, Martin TG, et al. Isatuximab plus carfilzomib and dexamethasone in relapsed multiple myeloma patients with high-risk cytogenetics: IKEMA subgroup analysis. J Clin Oncol. 2021;39(s15):8042.
10. Mina R, Zamagni E, Fazio F, et al. Efficacy of carfilzomib-based induction/consolidation with or without autologous transplant and lenalidomide or carfilzomib-lenalidomide maintenance in high-risk patients in the Forte trial. HemaSphere. 2021;5(S2):46-47 (abstract S182).
References
11. Mohan M, Weinhold N, Schinke C, et al. Daratumumab in high-
TM, PGR, TF, PM, AP, IS, KB, MI, FC, SM, HvdV, and KS were involved in the validation, formal analysis, writing, review, and editing of the manuscript. KB, MI, FC, SM and HvdV were involved in the conceptualization, project administration, and supervision of the studies. All authors approved the final version of the manuscript and take responsibility for the accuracy of the data.
Amgen, Bristol-Myers Squibb/Celgene, Janssen, Sanofi and Takeda. HvdV, KB, and SM are employees of Sanofi and may hold shares and/or stock options in the company. MI and FC are contracted to work for Sanofi. KS has received honoraria from Takeda, Celgene, ONO, Amgen, Novartis, Sanofi, BMS, AbbVie and Janssen, consultancy fees from Takeda, Amgen, Janssen and Celgene and research funding from BMS, Celgene and Amgen.
Sanofi funded this sub-analysis of the ICARIA-MM and IKEMA studies. Medical writing support was provided by John Clarke, PhD, and Camile Semighini Grubor, PhD, on behalf of Elevate Medical Affairs, contracted by Sanofi for publication support services.
15. Zhu C, Song Z, Wang A, et al. Isatuximab acts through Fcdependent, independent, and direct pathways to kill multiple myeloma cells. Front Immunol. 2020;11:1771.
12. Hu X, Wu CH, Cowan JM, Comenzo RL, Varga C. Outcomes of patients with multiple myeloma harboring chromosome 1q gain/amplification in the era of modern therapy. Ann Hematol. 2022;101(2):369-378.
risk relapsed/refractory multiple myeloma patients: adverse effect of chromosome 1q21 gain/amplification and GEP70 status on outcome. Br J Haematol. 2020;189(1):67-71.
Haematologica | 107 October 2022 2491 LETTER TO THE EDITOR
14. van de Donk N, Richardson PG, Malavasi F. CD38 antibodies in multiple myeloma: back to the future. Blood. 2018;131(1):13-29.
complement inhibitors affect response and resistance to daratumumab therapy in myeloma. Blood. 2016;128(7):959-970.
13. Nijhof IS, Casneuf T, van Velzen J, et al. CD38 expression and
COVID-19 vaccine-induced adverse events predict immunogenicity among recipients of allogeneic hematopoietic stem cell transplantation
egorized per the Common Terminology Criteria for Ad verse Events standards. Adverse events, including oc currence of GVHD, were also retrieved from review of medical records. Thirty-six of 48 (75%) of allo-HCT re cipients experienced adverse reactions following the first vaccination and 26 of 49 (53%) following the second vaccine dose. No serious adverse events were recorded. Adverse events were mostly mild and only three patients reported moderate adverse reactions. In the prioritized third-dose cohort 15 of 33 (45%) experienced adverse reactions (2 moderate, 13 mild). The lower frequency of adverse events likely reflects the more pronounced de gree of immunodeficiency within cohort 2, with shorter time elapsed since transplantation and higher frequency of patients receiving immunosuppressive treatment. In both cohorts, local reaction at the injection site was the most common adverse event followed by fatigue, mal aise, myalgia, and headache (Table 1). Three patients re ported worsening of GVHD and two experienced de novo onset GVHD. These reactions resolved following topical skin therapy, modest augmentation of the prednisone dose, or spontaneously. The frequency of adverse reac tions was similar or slightly higher than that reported in a previous trial in mRNA COVID-19-vaccinated allo-HCT recipients,10 but lower than reported in the BNT162b2 and mRNA-1273 registration trials enrolling participants from the general population.11,12 However, larger cohorts of vaccinated allo-HCT recipients and a similar reporting system for adverse reactions as for the registration trials would be needed to elucidate if adverse reactions are less common among allo-HCT.
Haematologica | 107 October 2022 2492 LETTER TO THE EDITOR
Peripheral blood was collected immediately before the first and third vaccine doses, 4 weeks (median 28; range, 16-38 days) after the first, second and third doses and at 5.5 months (median; range, 3.8-5.6 months) after the second dose. In order to quantify vaccine-specific cel lular responses, the whole blood samples were stimu lated ex vivo with multimer peptides spanning the S1 portion of the spike protein to induce the release of Tcell-derived IFN-γ from SARS-CoV-2 specific T cells. This assay captures virus-specific T cells (CD4 + and CD8 + ) with high sensitivity and specificity.13 In brief, 1 mL of pe ripheral blood, collected in lithium-heparin tubes, was stimulated with 1 μ g/mL/peptide of 170 15-mer peptides with 11-amino acid overlap spanning the N-terminal SARS-CoV-2 spike 1 (S1) domain (product number: 130-
Recipients of allogeneic hematopoietic stem cell trans plantation (allo-HCT) are at elevated risk for severe dis ease and death from COVID-191,2 and mount suboptimal immune responses following COVID-19 vaccination, in particular during the first years after transplantation. 3-7 Previous studies in healthy individuals support an associ ation between adverse reactions after COVID-19 vacci nation and induced humoral immunity 8,9 but whether adverse vaccine reactions also are associated with T-cell reactivity remains to be elucidated. Here we report that adverse reactions to COVID-19 vaccination predict the evolvement of virus-specific T cells among recipients of Thisallo-HCT.study is part of the DurIRVac study (EudraCT no. 2021 000349 42) that was approved by the Swedish Eth ical Review Authority (permit no. 2021 00539) and by the Swedish Medical Products Agency (permit no. 5.1 2021 11118), and followed the European Society for Blood and Marrow transplantation (EBMT) guidelines for COVID-19 vaccination (www.ebmt.org; Version 6.0, May 31, 2021). The study was performed in accordance with the Dec laration of Helsinki and all participants gave written in formed consent before enrollment. The first cohort constituted 50 patients having undergone allo-HCT 92 months (median; range, 7-340 months) prior to the first COVID-19 vaccine dose. Patients were immunized with two doses of the mRNA-based COVID-19 vaccines BNT162b2 (Pfizer-BioBTech Comirnaty; n=32) or mRNA1273 (Moderna Spikevax; n=18) with 41 days (median; range, 40-50 days) between doses. Patients with pre vious polymerase chain reaction (PCR)-confirmed COVID-19 infection or antibodies against SARS-CoV-2 in baseline samples were excluded. A second cohort comprised 37 COVID-19-naïve allo-HCT recipients who fulfilled the criteria from the Public Health Agency of Sweden for receiving an early third dose of COVID-19 vaccine, i.e., to have undergone transplan tation within 3 years, or to currently receive immunosup pressive treatment for graft-versus-host disease (GVHD). Patients in this cohort received a third mRNA vaccination (BNT162b2, n=24 or mRNA-1273, n=13) at 127 days (median; range, 56-174 days) after the second dose. Eight patients were included in both cohorts. Further baseline characteristics of these cohorts are provided in 6,7 Two weeks after each vaccination, patients completed a questionnaire regarding possible adverse events cat
Nausea 1 (2) 0 (0) 1 (3)
GVHD3-related 5 (10) 0 (0) 0 (0)
1Patients completing the questionnaire regarding adverse events. 2Any adverse event other than local reactions. 3Graft-versus-host disease (GVHD).
Systemic reaction,2 N (%) 23 (48) 17 (35) 7 (21)
No adverse events, N (%) 12 (25) 22 (46) 18 (55)
A B C D E F G H
Fatigue 10 (21) 13 (27) 3 (9)
Headache 7 (15) 7 (14) 3 (9)
Dose 2
Table 1. Adverse reactions after COVID-19 vaccination.
Haematologica | 107 October 2022 2493 LETTER TO THE EDITOR
Dose 1
Cohort 2 (N=37)
Local reaction at injection site, N (%) 30 (62) 17 (35) 14 (42)
Cohort 1 (N=50)
Myalgia 9 (19) 7 (14) 3 (9)
Malaise 7 (15) 13 (27) 3 (9)
Fever 3 (6) 2 (4) 3 (9)
Evaluable patients,1 N (%) 48 (96) 48 (96) 33 (90)
Dose 3
Figure 1. Adverse events following COVID-19 vaccination predict evolving vaccine-specific T-cell and antibody responses. Samples from allogeneic hematopoietic stem cell transplantation (allo-HCT) patients who experienced (Yes) or did not experience (No) adverse events to COVID-19 vaccination were analyzed for vaccine-specific T-cell and antibody responses. (A, C, E, and G) Whole blood was stimulated with S1 peptides for 48 hours and analyzed for T-cell-induced interferon-γ (IFN-γ). (B, D, F and H) IgG serum antibody levels of the receptor-binding domain (RBD) within S1 were measured. (A and B) Immunogenicity in samples from allo-HCT cohort 1, retrieved 1 month after the first and second vaccine dose. (C and D) Immunogenicity in samples from allo-HCT cohort 2, retrieved 1 month after the third vaccine dose. (E to H) Patients in cohort 1 are separated as experiencing local adverse events (local), or at least 1 systemic adverse event (systemic) to any of the 2 first vaccine doses. (E and F) Results 1 month after the second vaccine dose. (G and H) Results 5-6 months after the second vaccine dose. The number of samples above the cut-off for each assay ( >5 pg/mL IFN-γ detected by enzyme-linked immunosorbent assay (A, C and E), >18 pg/mL IFNγ detected by Fireplex (G) and >14 BAU/mL IgG), are shown in brackets below the number of observations (n). Statistics by MannWhitney test. Dashed lines show the limit of detection (LOD) for each assay.
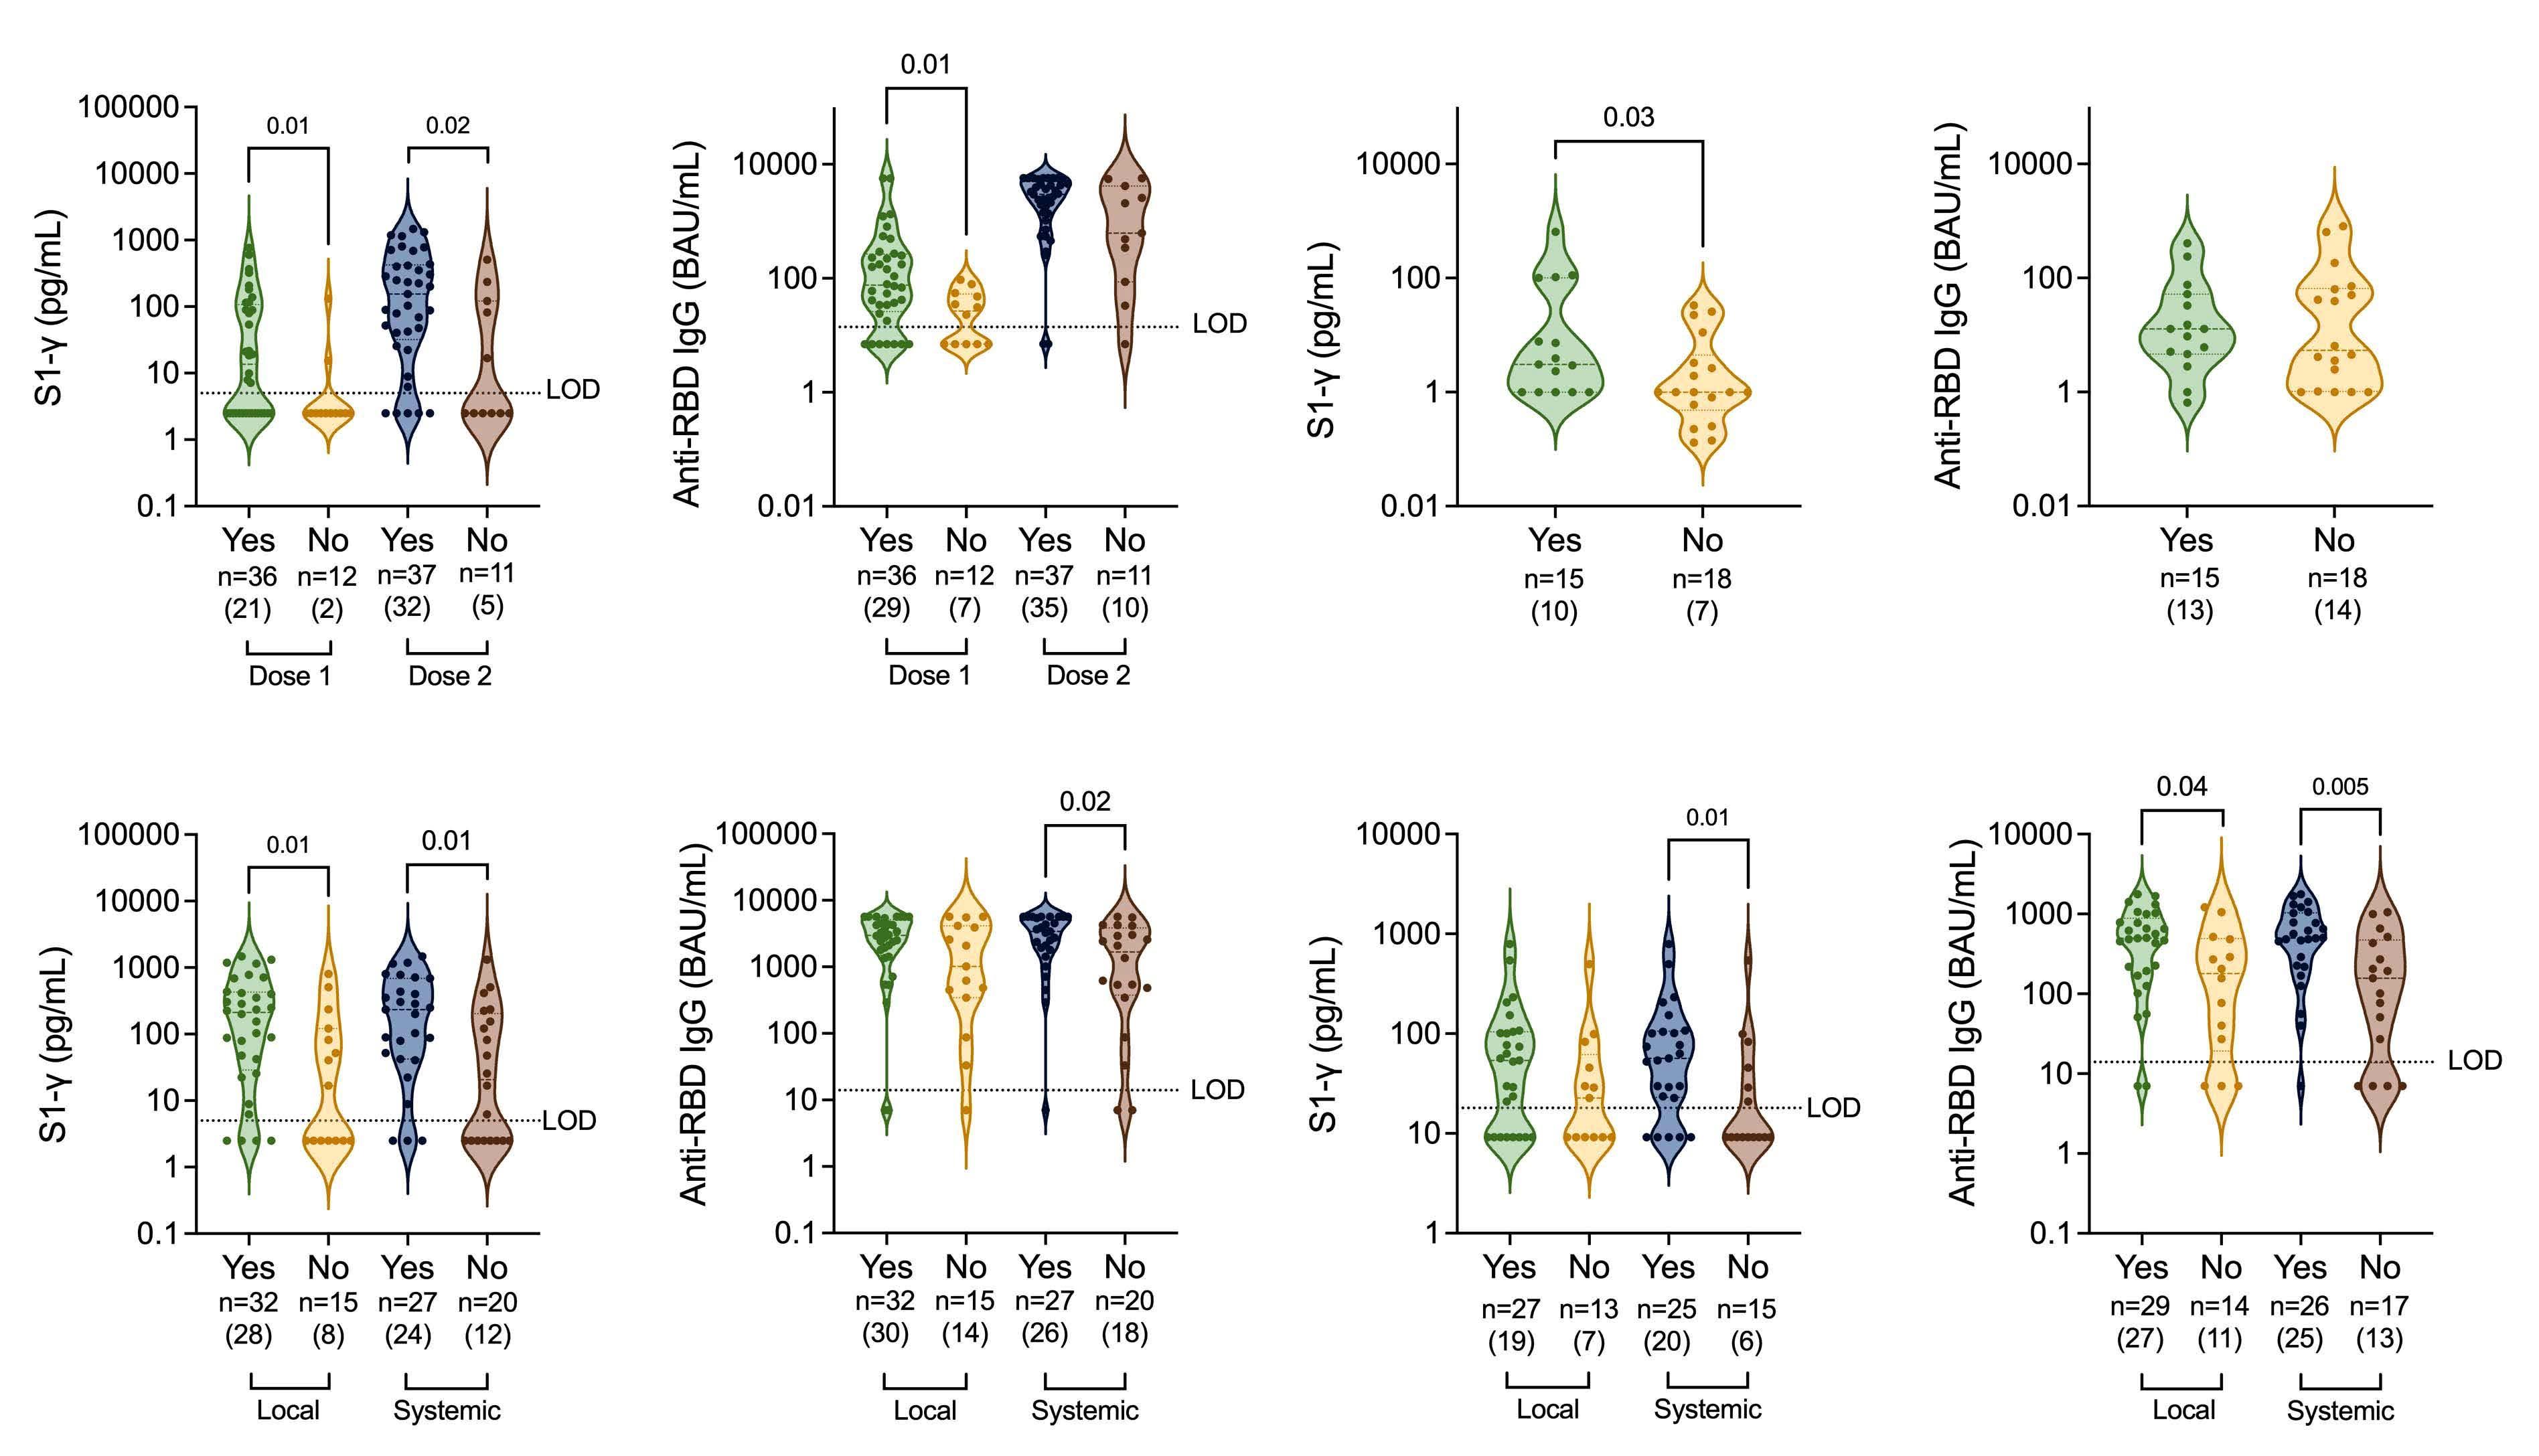
Cohort 1
Patients in cohort 1 experiencing adverse reactions to the first vaccination showed significantly higher levels of virus-specific T cells as reflected by increased S1-in duced IFN- γ in plasma supernatants. The enhanced Tcell response among patients experiencing adverse events to at least one vaccine dose remained significant also after the second vaccination (Figure 1A). Adverse re actions to the first vaccine dose were also associated with significantly higher anti-RBD IgG levels with a simi lar non-significant trend after two vaccine doses (Figure 1B). Among the third dose-prioritized patients (cohort 2) induction of SARS-CoV-2 specific T cells was superior in patients experiencing adverse reactions to third dose vaccination (Figure 1C) with a similar trend for induced anti-RBD-IgG (Figure 1D).
Haematologica | 107 October 2022 2494 LETTER TO THE EDITOR
Median age in years (range) 65 50 0.03d 65 48 <0.01d 61 64 0.67d (40-75) (29-78) (41-75) (29-78) (32-70) (31-78) <24 months since allo-HCT3, N (%) 4 (33) 2 (6) 0.03e 4 (36) 2 (5) 0.02e 11 (61) 5 (33) 0.17e Female sex, N (%) 2 (17) 21 (58) 0.02e 1 (9) 22 (59) <0.01e 6 (33) 9 (60) 0.17e Received Pfizer4 vaccine, N (%) 4 (33) 26 (72) 0.04e 3 (27) 27 (73) 0.01e 12 (67) 9 (60) 0.73e cGVHD5, N (%) 2 (17) 15 (42) 0.17e 2 (18) 15 (41) 0.28e 8 (44) 12 (80) 0.07e Ongoing IST6, N (%) 4 (33) 5 (14) 0.20e 4 (36) 5 (14) 0.18e 10 (56) 12 (80) 0.27e
1Any adverse reaction to (a) the first vaccine dose, (b) at least 1 of the first 2 doses, (c) the third vaccine dose. 2Statistics by (d) Mann-Whitney test or (e) Fisher’s exact test, 3Allogenic hematopoietic cell transplantation, 4BNT162b2 (Pfizer-BioNTech), 5chronic graft-versus-host disease (GVHD), 6immunosupressive treatment (IST).
the small sample size. Also, no significant association between systemic adverse events and immunogenicity was seen in the third dose cohort, in which only seven patients experienced systemic reactions.
In accordance with previous studies of mRNA COVID19-vaccinated healthy subjects, 8,9 female sex and low age was associated with enhanced frequency of adverse reactions also among vaccinated allo-HCT recipients (Table 2). In cohort 1, patients receiving the BNT162b2 vaccine reported more adverse reactions compared with patients receiving the mRNA-1273 vaccine (Table 2). This was unexpected, but likely explained by the higher age of patients receiving the mRNA-1273 vaccine in this cohort (median age 63 years; range, 46-71 vs . 35 years; range, 18-58 years for BNT162b2-vaccinated pa tients). Patients transplanted within the last 2 years showed reduced frequency of adverse reactions, and patients with chronic GVHD tended to report more ad verse events (Table 2).
127-041, Miltenyi Biotec). After 2 days of incubation at 37°C, samples were centrifuged and IFN- γ content of re covered plasma was determined by enzyme-linked im munosorbent assay (DY285B, R&D systems) or by FirePlex (Abcam, ab285173) according to the manufacturer’s in structions. Humoral responses were assessed by quan tification of serum anti-RBD IgG (SARS-CoV-2 IgG II Quant, Abbott, Illinois, USA) using a chemiluminescent microparticle immunoassay in an automated Alinity sys tem, as described 13.
The association between adverse vaccine reactions and T-cell immunogenicity remained significant in multivari ate linear regression analysis when taking potential con founders (age, sex, vaccine type, immunosuppressive therapy and chronic GVHD) into account. Thus, the pres ence of adverse reactions independently predicted T-cell responses in cohort 1 following the first immunization (P=0.019) and following the third vaccine dose (P=0.032) in cohort 2.
Cohort 2 Dose 1 Dose 2 Dose 3
Adverse reaction1 (N=12)No (N=36)YesaP2 P2 (N=11)No (N=37)Yesb P (N=18)No (N=15)Yesc P
Systemic adverse events, referring to any event other than local reactions, appeared particularly predictive of vaccine immunogenicity. Hence, patients experiencing at least one systemic adverse reaction to the first or sec ond immunization showed significantly higher levels of virus-specific T cells as well as anti-RBD IgG at 1 month and 5.5 months after the second vaccine dose (Figure 1E to H). Concordantly, vaccine-induced fever has been linked to robust antibody responses towards human pa pillomavirus (HPV) and COVID-19.8,14 None of the systemic side effects significantly predicted evolving immune re sponses when analyzed separately, likely explained by
To conclude, this study shows that recipients of allo-HCT who experience adverse reaction to mRNA COVID-19 vac cination were more likely to mount durable SARS-CoV2-specific immune responses. Systemic adverse reactions appeared more predictive of immunoreactivity compared with local adverse reactions, but further studies are needed to learn which side effects are pre dictive of adaptive immune responses for improved vac cine formulations.
Table 2. Patient characteristics versus adverse reactions after COVID-19 vaccination.
ANNACorrespondence:MARTNERPrepublished:Accepted:Received:https://doi.org/10.3324/anna.martner@gu.sehaematol.2022.280813February23,2022.June15,2022.June23,2022.
8. Kontou E, Ranellou K, Zoulas D, et al. Antibody response following a two-dose mRNA vaccination regimen, in health care workers of a tertiary hospital in Athens, Greece. J Pers Med. 2021;11(6):576.
12. Polack FP, Thomas SJ, Kitchin N, et al. Safety and efficacy of the BNT162b2 mRNA Covid-19 Vaccine. N Engl J Med. 2020;383(27):2603-2615.
Inquiries regarding sharing of de-identified data shall be addressed to the corresponding author.
13. Tornell A, Grauers Wiktorin H, Ringlander J, et al. Rapid cytokine release assays for analysis of SARS-CoV-2-specific T cells in whole blood. J Infect Dis. 2022 Jan 12. [Epub ahead of print]
2. Sharma A, Bhatt NS, St Martin A, et al. Clinical characteristics and outcomes of COVID-19 in haematopoietic stem-cell transplantation recipients: an observational cohort study. Lancet Haematol. 2021;8(3):e185-e193.
This work was supported by the Swedish Medical Research Council (Vetenskapsrådet; 2021-04779), the Swedish Cancer Society (Cancerfonden; 19 0033 Pj and 19 0030 SIA) and ALF Funds at Sahlgrenska University Hospital (ALFGBG-438371).
Hanna Grauers Wiktorin,1 Sigrun Einarsdottir,2 Andreas Törnell,1 Mohammad Arabpour,1,3 Nuttida Issdisai,1 Jesper Waldenström,4,5 Johan Ringlander,3,4 Magnus Lindh,3,4 Martin Lagging,3,4 Kristoffer Hellstrand1,3 and Anna Martner1
No conflicts of interest to disclose.
5. Redjoul R, Le Bouter A, Beckerich F, Fourati S, Maury S. Antibody response after second BNT162b2 dose in allogeneic HSCT recipients. Lancet. 2021;398(10297):298-299.
Funding
9. Lo Sasso B, Giglio RV, Vidali M, et al. Evaluation of anti-SARSCov-2 S-RBD IgG antibodies after COVID-19 mRNA BNT162b2 vaccine. Diagnostics (Basel). 2021;11(7):1135.
4. Dhakal B, Abedin S, Fenske T, et al. Response to SARS-CoV-2 vaccination in patients after hematopoietic cell transplantation and CAR T-cell therapy. Blood. 2021;138(14):1278-1281.
7. Einarsdottir S, Martner A, Waldenström J, et al. Deficiency of SARS-CoV-2 T-cell responses after vaccination in long-term
allo-HSCT survivors translates into abated humoral immunity. Blood Adv. 2022;6(9):2723-2730.
Haematologica | 107 October 2022 2495 LETTER TO THE EDITOR
14. Zhuang CL, Lin ZJ, Bi ZF, et al. Inflammation-related adverse reactions following vaccination potentially indicate a stronger immune response. Emerg Microbes Infect. 2021;10(1):365-375.
1. Ljungman P, de la Camara R, Mikulska M, et al. COVID-19 and stem cell transplantation; results from an EBMT and GETH multicenter prospective survey. Leukemia. 2021;35(10):2885-2894.
References
1TIMM Laboratory, Sahlgrenska Center for Cancer Research, Department of Infectious Diseases, Institute of Biomedicine, Sahlgrenska Academy, University of Gothenburg; 2Department of Hematology and Coagulation, Institute of Medicine, Sahlgrenska Academy, University of Gothenburg; 3Region Västra Götaland, Sahlgrenska University Hospital, Department of Clinical Microbiology; 4Department of Infectious Diseases, Institute of Biomedicine, Sahlgrenska Academy, University of Gothenburg and 5Region Västra Götaland, Sahlgrenska University Hospital, Department of Infectious Diseases, Gothenburg, Sweden
3. Bergman P, Blennow O, Hansson L, et al. Safety and efficacy of the mRNA BNT162b2 vaccine against SARS-CoV-2 in five groups of immunocompromised patients and healthy controls in a prospective open-label clinical trial. EBioMedicine. 2021;74:103705.
©2022 Ferrata Storti Foundation
Disclosures
HGW conducted experiments, analyzed data, made figures and wrote the manuscript. SE designed and conducted the clinical trial. AT, MA and NI conducted experiments. JW analyzed data. JR conducted experiments and analyzed data. MLi designed the clinical trial. MLa and KH designed the clinical trial and wrote the manuscript. AM designed the clinical trial, conducted experiments, analyzed data and wrote the manuscript. All authors have edited and approved the manuscript.
Published under a CC-BY-NC license
Data-sharing statement
11. Baden LR, El Sahly HM, Essink B, et al. Efficacy and safety of the mRNA-1273 SARS-CoV-2 vaccine. N Engl J Med. 2021;384(5):403-416.
10. Ali H, Ngo D, Aribi A, et al. Safety and Tolerability of SARS-CoV2 emergency-use authorized vaccines for allogeneic hematopoietic stem cell transplant recipients. Transplant Cell Ther. 2021;27(11):938.e1-938.e6.
Authors
6. Einarsdottir S, Martner A, Nicklasson M, et al. Reduced immunogenicity of a third COVID-19 vaccination among recipients of allogeneic haematopoietic stem cell transplantation. Haematologica. 2022;107(6):1479-1482.
Contributions
Forty-seven patients (87%) experienced at least one grade 3 or 4 adverse event within 100 days. The most common adverse event was culture-negative grade 3 neutropenic fever (n=32, 58.2%) that occurred at a median of 3 days post-HCT (interquartile range [IQR] 2-4.5). Many of these early events were likely related to cytokine release syn drome. Twenty-five infection events occurred, which were bacterial (n=13, 23.6%) or viral (n=12, 21.8%). Other common grade 3 or 4 adverse events were pulmonary (n=10, 18.2%) and gastrointestinal, including mucositis (n=14, 25.4%), nausea (n=5, 9.1%), and diarrhea (n=4, 7.3%). There were four (7.3%) cases of sinusoidal obstructive syndrome, one of which was fatal. In addition, nine (16.3%) patients had asymptomatic grade 3 or 4 hyperbilirubinemia. Hemor rhagic cystitis of any grade occurred in 31 (56%) patients at a median of 32 days post-HCT (range, 1-71; IQR 11-42). Of these, 29 (53%) were related to BK virus (grade 1 [n=11, 20%], grade 2 [n=14, 25%], and grade 3 [n=4, 7%]).
Haematologica | 107 October 2022 2496 LETTER TO THE EDITOR
By the end of the study period, 34 patients were alive, in cluding 14 in the haploidentical and 20 in the HLAmatched group. With a median follow-up of 37.6 months (range, 25.3-47.8 months), the estimated 2-year overall survival was 65.5% (95% confidence interval [95% CI]: 5479.3%) in the entire cohort, 53.8% (95% CI: 37.7-76.9%) in the haploidentical group, and 75.9% (95% CI: 61.8-93.2%) in the HLA-matched group (Figure 2A). Twenty-eight pa tients were alive without disease progression, including
A myeloablative fractionated busulfan conditioning regimen with post-transplant cyclophosphamide in HLA-matched and haploidentical transplantation: results of a phase II study
12 in the haploidentical and 16 in the HLA-matched group. The overall 2-year progression-free survival rate was 54.5% (95% CI: 42.9-69.4%); 46.2% (95% CI: 30.5-69.9) in the haploidentical and 62.1% (95% CI: 46.7-82.5%) in the HLA-matched group.
Myeloablative conditioning (MAC) is associated with su perior outcomes than reduced-intensity conditioning in patients undergoing allogeneic hematopoietic stem cell transplantation (HCT).1,2 MAC is associated with a higher risk of non-relapse mortality (NRM) and is often avoided in older patients and those with comorbidities. Therefore, we studied a novel schedule of delivering pretransplant conditioning chemotherapy in a fractionated manner, in which busulfan is administered over a period of 2 weeks, rather than the traditional dosing on 4 consecutive days in recipients of grafts from matched donors. We showed that this fractionated myeloablative busulfan and fluda rabine (Bu-Flu) regimen was safe in patients up to 75 years of age,3-7 whose NRM was 4-6% at day 100.3 How ever, the NRM increased to 20-24% at 1 year,3 most of which was attributed to graft-versus-host disease (GvHD)related deaths.3,8 The GvHD prophylaxis in that study in cluded tacrolimus and methotrexate. Thus, we questioned whether outcomes could be improved with post-trans plantation cyclophosphamide (PTCy). It was also unknown whether this strategy could be employed in the haplo identical HCT setting. We therefore added PTCy to our myeloablative fractionated Bu-Flu regimen and included patients with haploidentical donors in addition to HLAmatched donors.
Overall, there were 21 deaths, of which eight were due to recurrence or persistence of the underlying malignancy, four from acute GvHD, six from infections (2 bacterial, 3 viral, and 1 protozoal), and one each from idiopathic pneu monia syndrome, sinusoidal obstruction syndrome, and an unidentified cause. Of note, all infection-related deaths occurred in the haploidentical group. The cumulative inci dence of NRM for the entire cohort at 2 years post-HCT was 21.8% (95% CI: 10.8-32.9%). Most of these events oc curred in the haploidentical group, with a resultant NRM of 34.6% at 2 years, versus 10.3% in the HLA-matched group (Figure 2C).
Fourteen patients (5 in the haploidentical group, 9 in the HLA-matched group) experienced a relapse of the under lying malignancy. The cumulative incidence of relapse at 2 years was 23.6% (95% CI: 12.3-35%); 19.2% (95% CI: 3.634.9%) in the haploidentical and 27.6% (95% CI: 10.944.2%) in the HLA-matched group (Figure 2B). Among the 39 patients with myeloid malignancies, 1/16 patients (6.25%) in the haploidentical group relapsed, compared to 6/23 patients (26%) in the matched group.
This was an open-label, non-randomized, phase II clinical trial (ClinicalTrials.gov identifier NCT02861417) that as sessed the safety and efficacy of fractionated Bu-Flu con ditioning with PTCy-based GvHD prophylaxis (Figure 1). The eligibility criteria included patients 12-65 years of age with any hematologic malignancy who had an HLAmatched (unrelated or sibling) or haploidentical donor and had adequate organ function. Fifty-five patients were en rolled in the first three groups of this study between Au gust 2016 and June 2018 and are reported here (Table 1).
N of patients 55
Intermediate 36 (65.5) High 14 (25.4)
Median (range) 47 (15-65)
Black 8 (14.6) Other 15 (27.2)
Donor, N Haploidentical(%) 26 (47.3)
HLA-matched unrelated 18 (32.7)
Diagnosis, N (%)
Chronic myeloid leukemia/myeloproliferative disorder 9 (16.4)
White 32 (58.2)
<50 years 30 (54.5)
≥50 years 25 (45.5) Sex, N (%)
Lymphoma 5 (9.1)
GvHD prophylaxis, N (%)
PTCy + tacrolimus + MMF * 30 (54.5)
Multiple myeloma 5 (9.1)
Disease Risk Index, N (%) Low 5 (9.1)
Haematologica | 107 October 2022 2497 LETTER TO THE EDITOR
Figure 1. Study schema. Patients received the first two doses of busulfan 80 mg/m2 intravenously each as an outpatient either on days -13 and -12 (haplo donor n=16 group 1; matched donor n=29 group 2) or on days -20 and -13 (haplo donor n=10 group 3). Inpatient conditioning included busulfan intravenously immediately following each dose of fludarabine 40 mg/m2 intravenously on day -6 through day -3. Pharmacokinetic analyses were conducted after the first dose of busulfan (day -13 or day -20) and the third dose (day -6), based on which the last two doses of busulfan (days -4 and -3) were adjusted as needed to achieve the total target area under the curve of 20,000 (including outpatient doses). The median total dose of busulfan was 11.29 mg/kg (interquartile range: 9.75-13.37; range, 4.05-20.07). The haploidentical group also received thiotepa 5 mg/kg intravenously on day -7. Day 0 was the day on which the graft was infused. All patients received post-transplant cyclophosphamide 50 mg/kg intravenously on days +3 and +4 and tacrolimus from day +5 for prophylaxis of graft-versus-host disease; recipients of haploidentical grafts and later also recipients of grafts from matched unrelated donors also received mycophenolate mofetil from day +5. Bu: busulfan; PK: pharmacokinetics; AUC: area under the curve; PTCy: post-transplant cyclophosphamide; Tac: tacrolimus; MMF: mycophenolate mofetil.
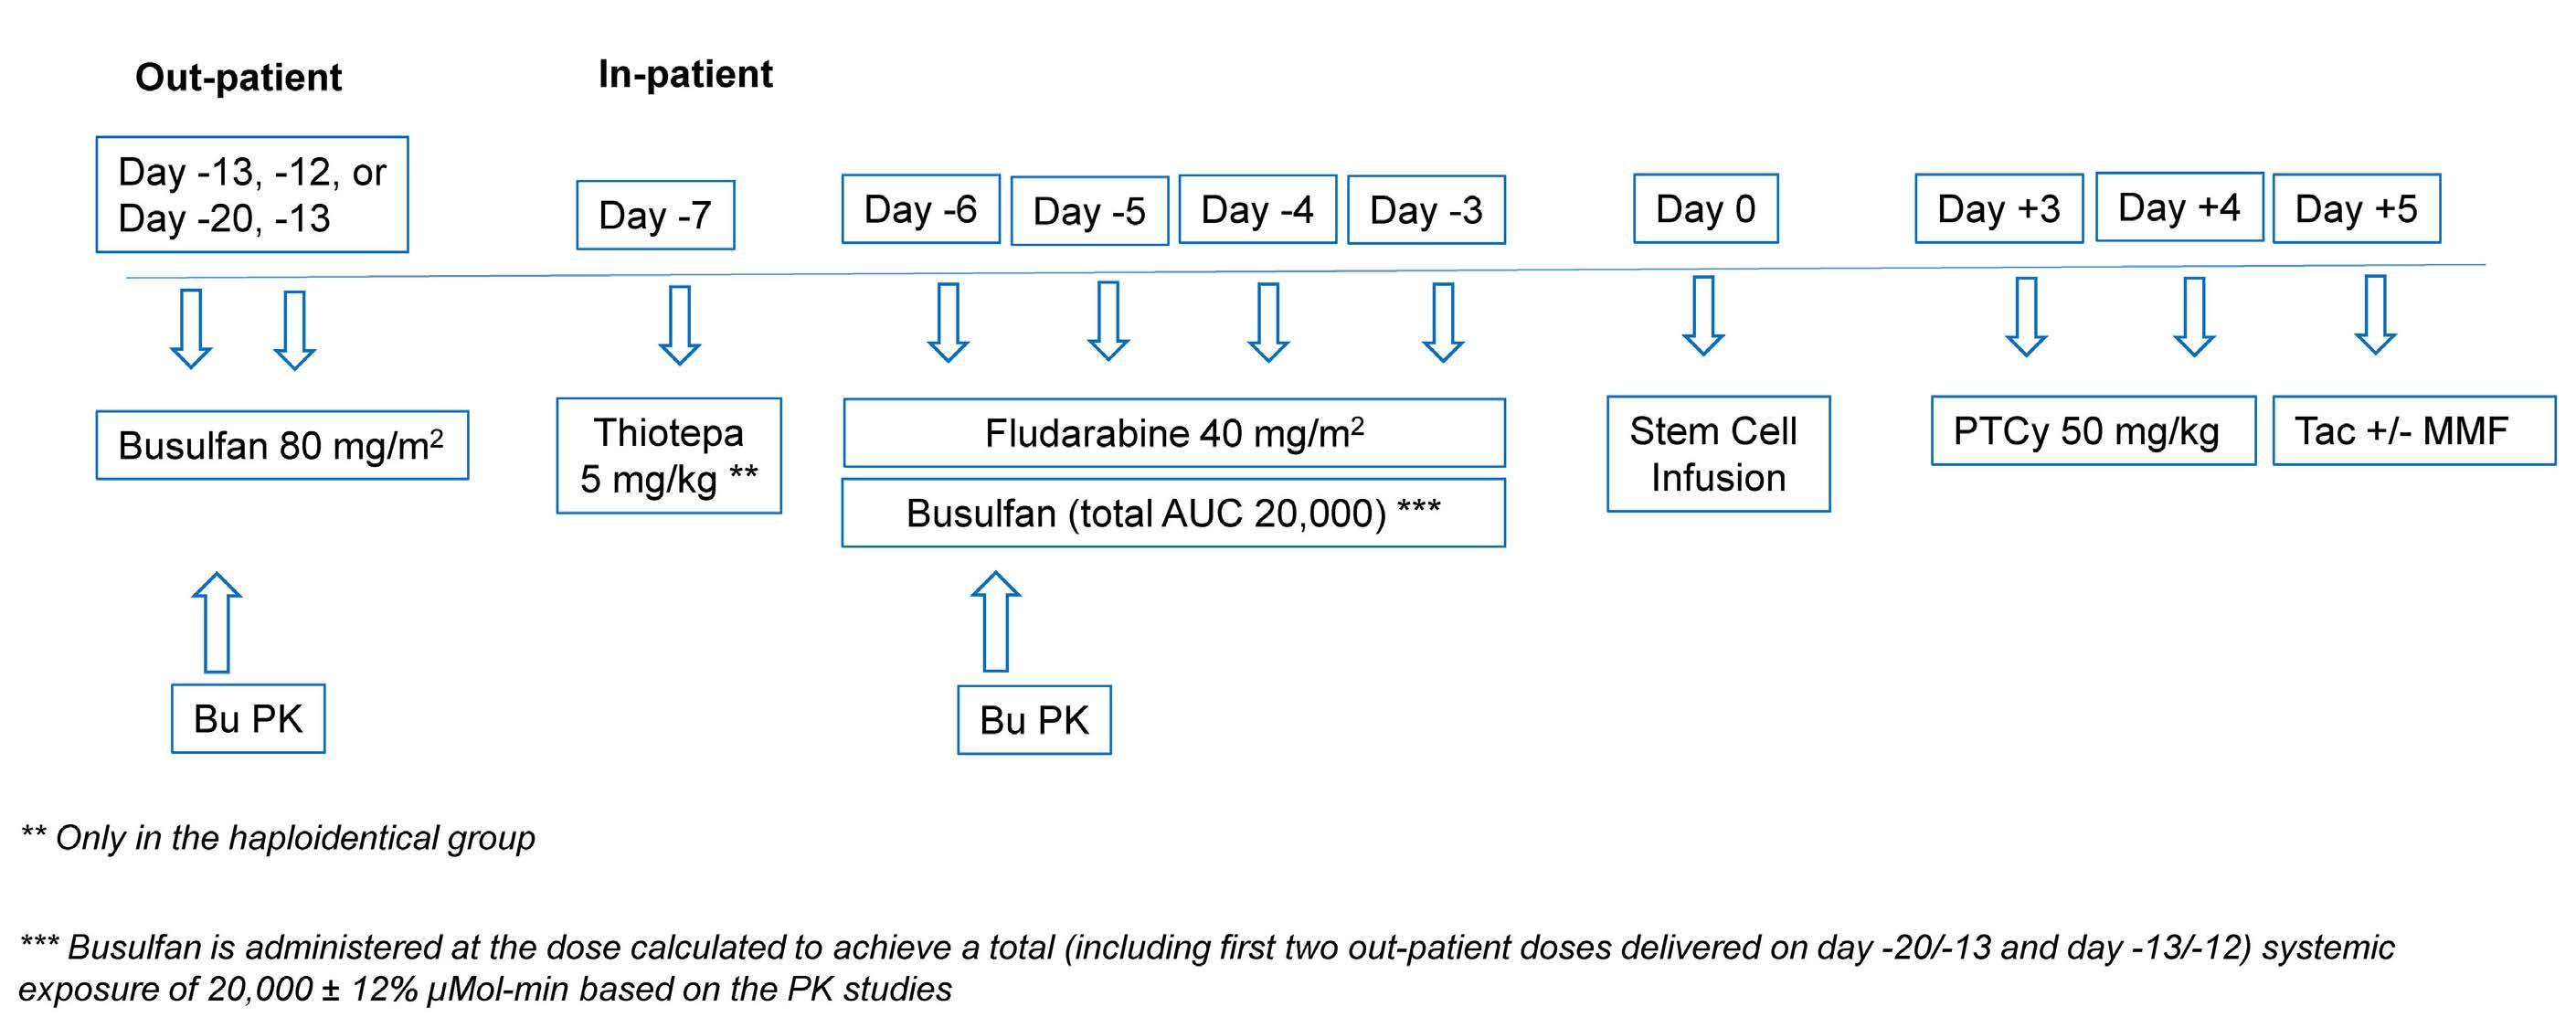
HCT-CI, N (%)
0-2 33 (60) ≥3 22 (40)
Interquartile range 40-57 Patients in age group, N (%)
Follow-up in months, median (range) 37.6 (25.3-47.8)
Acute myeloid leukemia/myelodysplastic syndrome 30 (54.5)
Acute lymphoblastic leukemia 6 (10.9)
90-100 29 (52.7)
<90 26 (47.3)
Characteristic
Male 34 (61.8)
* 25/26 recipients of haploidentical grafts and 4 recipients of grafts from matched unrelated grafts. HCT: hematopoietic cell transplan tation; HCT-CI: Hematopoietic Cell Transplantation-Specific Comor bidity Index; HLA: human leukocyte antigen; MMF: mycophenolate mofetil; PTCy: post-transplant cyclophosphamide.
Characteristic
Table 1. Patients’ baseline characteristics.
HLA-matched sibling 11 (20) Graft source, N (%)
Female 21 (38.2) Race, N (%)
PTCy + tacrolimus 25 (45.5)
Karnofsky performance score, N (%)
Age at HCT in years
Peripheral blood progenitor cells 33 (60) Bone marrow 22 (40)
Haematologica | 107 October 2022 2498 LETTER TO THE EDITORAC
Figure 2. Study outcomes. (A) Overall survival, (B) relapse, (C) non-relapse mortality. OS: overall survival; NRM: non-relapse mortality.
B
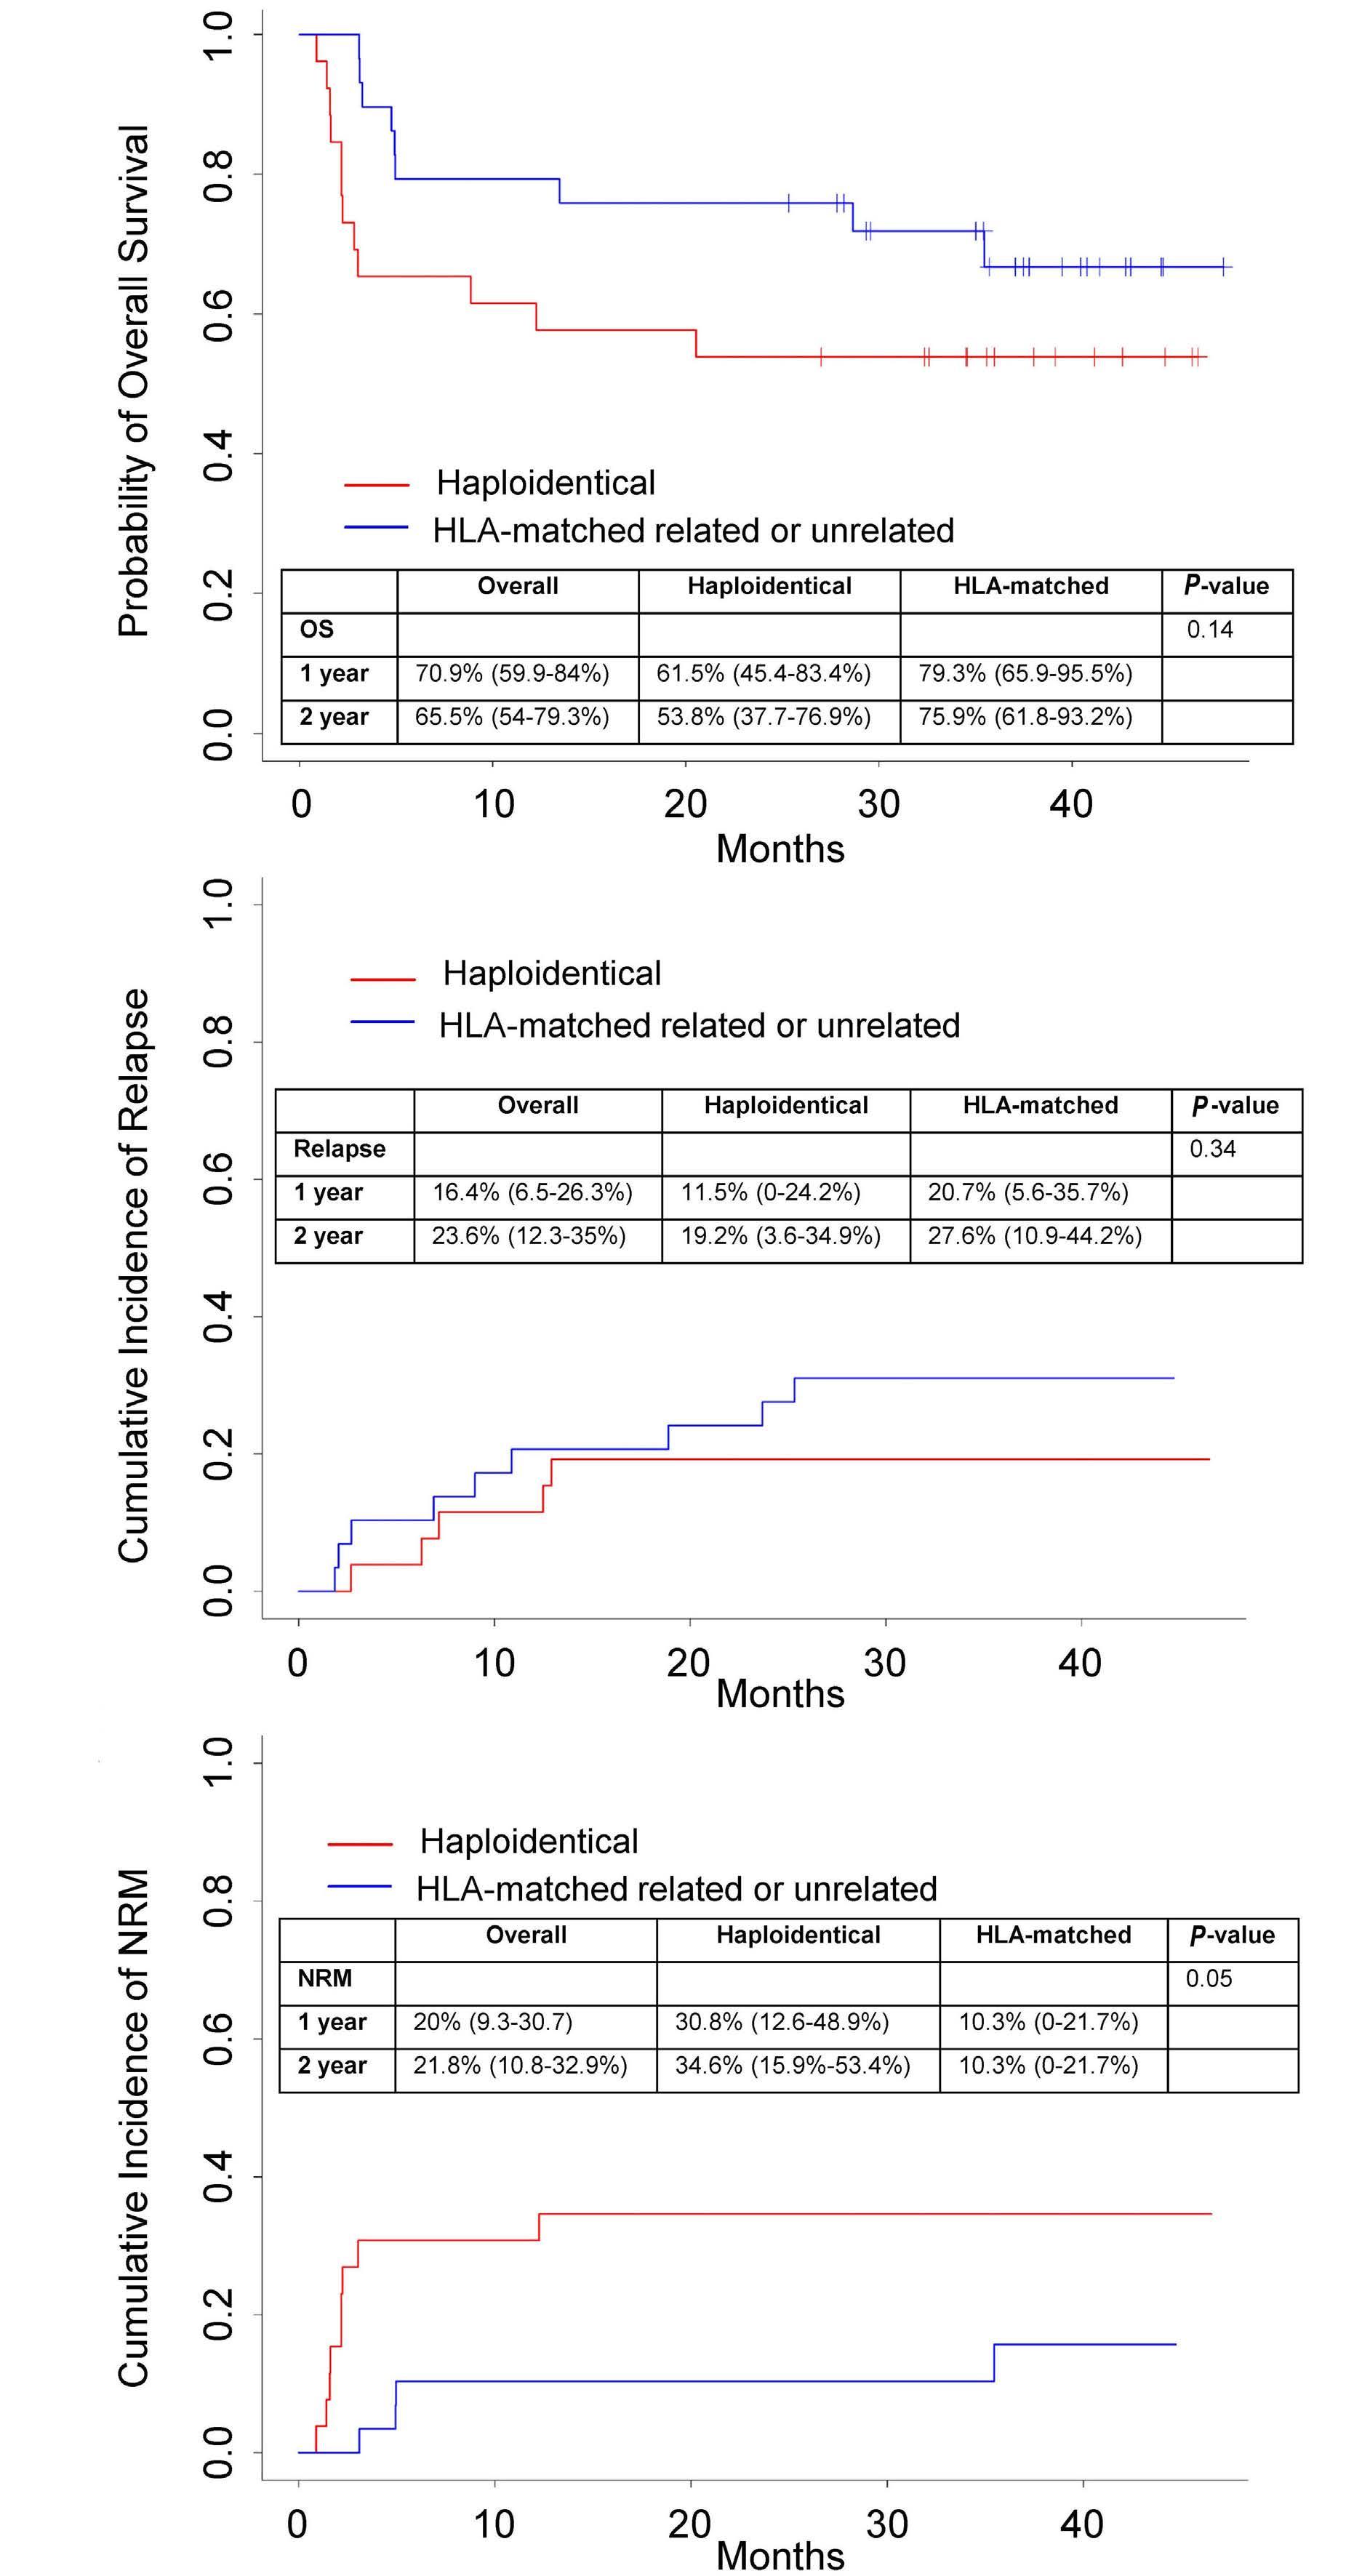
from previous studies provide benchmarks to assess baseline risk without PTCy, as the conditioning regimen was identical, and the current study was constructed on the foundation laid by the previous studies with a frac tionated Bu-Flu regimen. In this study, the overall survival of the patients with matched donors was 76% at 2 years, which is comparable to that reported with myeloablative regimens in patients with myelodysplastic syndrome or acute myeloid leukemia in complete remission.1 Whether additional fractionation and lengthening of this regimen with pharmacokinetic monitoring9 could further reduce toxicity and NRM, and improve survival is being studied in older patients. If successful, it may offer a safe myeloab lative alternative for older patients undergoing matched donor transplantation.
No graft failure occurred. The median time to neutrophil engraftment was 17 days (range, 13-39; IQR 15-19); among bone marrow graft recipients it was 18 days (range, 14-39; IQR 16-20) and among recipients of peripheral blood pro genitor cell grafts it was 15 days (range, 13-28; IQR 14-18).
Microsatellite polymorphism analysis on day 30 showed a median of 100% myeloid cells (range, 97-100%; IQR 100100%) and 100% T cells (range, 0-100%; IQR 98-100%) of donor origin. The median remained unchanged in both myeloid and T-cell compartments at all subsequent time points analyzed (day 100, 6 months, and 1-year post-HCT).
As GvHD is the leading cause of NRM that occurs beyond day 100,3,8 any reduction in GvHD may result in lower NRM and better survival. As expected, we found a lower risk of NRM than in previous studies in the HLA-matched group, with a resultant NRM of about 10% at 2 years versus 22% at 1 year with fractionated Bu-Flu MAC and tacrolimus/methotrexate prophylaxis.3 It was not the in tent of the current study to compare these results to those of our previous studies without PTCy prophylaxis in which older patients were also treated,3-6 so no formal comparisons can be made. Nevertheless, the outcomes
Thus, the fractionated myeloablative Bu-Flu conditioning regimen with PTCy is tolerated well and leads to a low risk of severe acute and chronic GvHD and NRM, with encour aging survival, especially in those with HLA-matched do nors. Further modifications are needed in the haploidentical group to improve outcomes.
Haematologica | 107 October 2022 2499 LETTER TO THE EDITOR
Uday R. Popat,1 Borje S. Andersson,1 Roland Bassett,2 Jitesh Kawedia,1 Ben C. Valdez,1 Amin M. Alousi,1 Gheath Al-Atrash,1 Qaiser Bashir,1 Chitra M. Hosing,1 Jin S. Im,1 Partow Kebriaei,1 David Marin,1
The median time to platelet engraftment (platelets ≥20x109/L, n=49) was 25 days (range, 11-167; IQR 19-38), while the median time to a platelet count ≥50x109/L (n=42) was 32 days (range, 15-296; IQR 24-48).
Twenty-one patients (7 in the haploidentical group, 13 in the HLA-matched group) developed grade II-IV acute GvHD by day 100, with a cumulative incidence of 38.2% (95% CI: 25.2-51.2%) and five patients (3 in the haplo identical group, 2 in the HLA-matched group) developed grade III-IV acute GvHD, with a cumulative incidence of 9.1% (95% CI: 1.4-16.8%) at day 100. Eight patients devel oped chronic GvHD (all extensive; 3 in the haploidentical group, 5 in the HLA-matched group), with a cumulative incidence of 10.9% (95% CI: 2.5-19.3%) at 2 years. Among 22 patients who were alive in remission, the median time to discontinuation of tacrolimus was 254 days (range, 144742; IQR 178-335).
Our results also provide another option for a MAC regimen for recipients of haploidentical transplantation, with a 2year overall survival of 54%. These results appear to be comparable to those of published studies with MAC and are better than those achieved with reduced intensity conditioning.10 In our study, thiotepa was added in the ha ploidentical group to intensify immunosuppression and reduce the risk of graft failure. With that, no graft failures occurred. Moreover, thiotepa appeared to be associated with a reduction in relapse risk,11 especially in patients with myeloid malignancies in our study. The alloreactive immune effects of a haploidentical graft may also be re sponsible for a lower relapse rate. Both thiotepa and poor immune reconstitution after a haploidentical transplant may have resulted in a higher NRM than that occurring in recipients of transplants from matched donors (35% ver sus 10%, respectively, at 2 years). Reducing the condition ing intensity may reduce NRM and thus improve outcomes further in the haploidentical group. Our ongoing studies are assessing this by examining lower doses of busulfan and/or thiotepa. For instance, we are evaluating the use of a lower dose of busulfan (area under the curve 16,000) with the same dose of thiotepa (5 mg/kg) versus the same dose of busulfan (area under the curve 20,000) with a lower dose of thiotepa (2.5 mg/kg).
Authors
We demonstrated the safety of adding PTCy for GvHD pro phylaxis to the fractionated myeloablative Bu-Flu regimen in recipients of haploidentical, as well as HLA-matched grafts. The addition of PTCy was tolerated well and re sulted in lower than expected severe acute and chronic GvHD, with a severe grade III-IV acute GvHD rate of about 9% at day 100, and chronic GvHD rate of about 11% at 2 years. Without directly comparing results across studies, the risk of chronic GvHD appeared to be remarkably lower than in our previous fractionated Bu-Flu MAC study with tacrolimus/methotrexate prophylaxis (55% overall, 36% extensive).3 These results are even more encouraging, as about half of the patients in the current study had a mis matched haploidentical donor, while in a previous study all patients had a matched donor.
7. Mehta RS, Bassett R, Chen J, et al. Myeloablative fractionated busulfan with fludarabine in older patients: long term diseasespecific outcomes of a prospective phase II clinical trial. Tran splant Cell Ther. 2021;27(11):913.e911-913.
References
8. Ramdial JL, Mehta RS, Saliba RM, et al. Acute graft-versus-host disease is the foremost cause of late nonrelapse mortality. Bone Marrow Transplant. 2021;56(8):2005-2012.
9. Andersson BS, Thall PF, Valdez BC, et al. Fludarabine with phar macokinetically guided IV busulfan is superior to fixed-dose de livery in pretransplant conditioning of AML/MDS patients. Bone Marrow Transplant. 2017;52(4):580-587.
consulting for Affimed and has received research funding from Affimed, Novartis, Astra-Zeneca, and Secura Bio. None of the other authors has any conflicts of interest to disclose.
Correspondence: UDAY R. POPATPublished©2022Prepublished:Accepted:Received:https://doi.org/10.3324/haematol.2022.280778upopat@mdanderson.orgFebruary2,2022.June16,2022.June30,2022.FerrataStortiFoundationunderaCCBY-NClicense
10. Solomon SR, St Martin A, Shah NN, et al. Myeloablative vs redu ced intensity T-cell-replete haploidentical transplantation for hematologic malignancy. Blood Adv. 2019;3(19):2836-2844.
1. Scott BL, Pasquini MC, Logan BR, et al. Myeloablative versus re duced-intensity hematopoietic cell transplantation for acute myeloid leukemia and myelodysplastic syndromes. J Clin Oncol. 2017;35(11):1154-1161.
3. Popat UR, Mehta RS, Bassett R, et al. Fludarabine with a higher versus lower dose of myeloablative timed-sequential busulfan in older patients and patients with comorbidities: an openlabel, non-stratified, randomised phase 2 trial. Lancet Haema tol. 2018;5(11):e532-e542.
Haematologica | 107 October 2022 2500 LETTER TO THE EDITOR
2. Scott BL. Long-term follow up of BMT CTN 0901, a randomized phase III trial comparing myeloablative (MAC) to reduced inten sity conditioning (RIC) prior to hematopoietic cell transplanta tion (HCT) for acute myeloid leukemia (AML) or myelodysplasia (MDS) (MAvRIC Trial). Biol Blood Marrow Transplant. 2020;26(3):S11.
1Department of Stem Cell Transplantation and Cellular Therapy; 2Department of Biostatistics, The University of Texas MD Anderson Cancer Center, Houston, TX, USA
Funding
Disclosures
UP conceptualized the study design, helped with interpreting the data, and ensured compliance with regulatory requirements for the clinical trial; RB contributed to the data analysis and figures and wrote the statistical section of the manuscript; JK performed the busulfan pharmacokinetic analysis; AMA, GA, QB, CMH, JSI, PK, DM, YN, AO, BO, SS, MHQ, and EJS enrolled patients in the study and monitored clinical responses; BCV helped with laboratory data; REC and BSA enrolled patients in the study and monitored clinical responses and conceptualized the study design; RSM contributed to interpreting the data and wrote the manuscript.
Data-sharing statement
11. Bramanti S, De Philippis C, Bartoli A, et al. Feasibility and effi cacy of a pharmacokinetics-guided busulfan conditioning regi men for allogeneic stem cell transplantation with post-transplantation cyclophosphamide as graft-versus-host disease prophylaxis in adult patients with hematologic mali gnancies. Transplant Cell Ther. 2021;27(11):912.e911-912.
Contributions
This work was supported in part by a Cancer Center Support grant (NCI grant P30 CA016672).
The data presented in this study are available upon reasonable request to the corresponding author by e-mail.
4. Oran B, Saliba RM, Mehta RS, et al. Fractionated busulfan mye loablative conditioning improves survival in older patients with acute myeloid leukemia and myelodysplastic syndrome. Cancer. 2021;127(10):1598-1605.
Yago Nieto,1 Betul Oran,1 Amanda Olson,1 Muzaffar H. Qazilbash,1 Samer A. Srour,1 Elizabeth J. Shpall,1 Richard E. Champlin1 and Rohtesh S. Mehta1
RSM has received research funding from Incyte, Kadmon, CSL Behring and Syndax Pharmaceuticals Inc. URP has received research funding from Novartis, Abbvie, Incyte, and Bayer. YN declares
5. Mehta RS, Bassett R, Olson A, et al. Myeloablative conditioning using timed-sequential busulfan plus fludarabine in older pa tients with acute myeloid leukemia: long term results of a pro spective phase II clinical trial. Haematologica. 2019;104(12):e555-e557.
6. Popat U, Mehta RS, Bassett R, et al. Optimizing the conditioning regimen for hematopoietic cell transplant in myelofibrosis: long-term results of a prospective phase II clinical trial. Biol Blood Marrow Transplant. 2020;26(8):1439-1445.
miaNet (ELN) criteria.5 Minimal/measurable residual dis ease (MRD) assessment by multiparametric flow cyto metry with a sensitivity of 0.01% was performed at the time of achieving CR, or CRi in a subset of patients. Fol low-up was updated in February 2022. Determinants of treatment response were assessed by Chi-square or Fisher’s exact test for nominal data and Wilcoxon ranksum test for continuous variables. OS was evaluated by the Kaplan–Meier method with differences compared by the log-rank test. Analyses were performed using JMP Pro 16.0.0 software package, SAS Institute, Cary, NC.
Venetoclax (Ven) in combination with hypomethylating agents (HMA) is Food and Drug Administration-approved therapy for elderly/unfit acute myeloid leukemia (AML) patients. The phase 3 randomized VIALE-A study demon strated superior efficacy and prolonged survival with Ven+HMA compared to HMA alone in previously untreated patients with AML.1 Moreover, in the particular study, su perior responses with Ven+HMA were observed across the mutational spectrum including in patients with IDH1/2, FLT3, NPM1 and TP53 mutations.1 In contrast, in another study which included elderly AML patients treated with Ven-based combination therapy in the upfront setting, re sponse was found to be favorable (complete response or compete response with incomplete count recovery [CR/CRi] >80%) with NPM1, IDH1/2, and DNMT3A muta tions, and inferior with TP53, RUNX1, FLT3/ITD, and RAS mutations.2 Furthermore, survival was prolonged in the presence of NPM1 and IDH2 mutations with 2-year overall survival (OS) of 71.8% and 79.5%, respectively.2 A recent pooled analysis of IDH1/2-mutated AML patients enrolled in Ven+ azacitidine clinical trials confirmed favorable re sponse rates and OS in the presence of IDH1/2 mutations.3 The aforementioned observations were based on clinical trial results and require systematic validation. Accordingly, the objective of the current study was to determine the impact of mutations on response and survival in treat ment-naïve AML patients receiving Ven+HMA in routine clinical Treatment-naïvepractice.
Molecular predictors of response to venetoclax plus hypomethylating agent in treatment-naïve acute myeloid leukemia
Haematologica | 107 October 2022 2501 LETTER TO THE EDITOR
One hundred and three AML patients (median age 74 years, 67% male, 62% de novo) received upfront Ven+HMA. ELN cytogenetic risk included favorable (5%, n=5), inter mediate (50%, n=52) or adverse (45%, n=46). Mutations in volved TP53 in 25 patients (25%), TET2 in 24 (23%), IDH1/IDH2 in 20 (19%), RUNX1 in 19 (19%), ASXL1 in 18 (18%), SRSF2 in 18 (18%), K/NRAS in 15 (15%), NPM1 in 13 (13%), DNMT3A in 13 (13%), and FLT3-ITD in ten (10%) patients. Sixty-four (62%) patients received decitabine and the re mainder azacitidine with a median Ven dose of 200 mg (range, 50-400 mg). Fourty-seven (46%) patients experi enced cycle delays/interruptions; moreover, Ven and HMA dose adjustments were instituted after cycle 1 in 89 (86%) and 29 (29%) patients, respectively. Venetoclax duration was reduced in eighty patients (range; 7 to 21 days) while azacitidine duration was reduced in ten patients (range, 3 to 5 days) and dose reduced to 50 mg/m2 in five patients; decitabine duration reduced to 3 days in 11 patients and dose reduction to 15 mg/m2 in five patients. Pancytopenia related to therapy was noted in 35 (34%) patients and was complicated by neutropenic fever in 22 cases (21%) sec ondary to gram-negative bacteremia (n=3), Staphylococcal bacteremia (n=2), Clostridium difficile colitis (n=2), in fluenza A (n=2), respiratory syncytial virus (n=1), COVID19 (n=1), coccidiomycosis (n=1), Aspergillus pneumonia (n=1), Fusarium fungemia (n=1). Renal toxicity was noted in three patients which included tumor lysis syndrome in one case. 30-day mortality was 5% (n=5). Table 1 provides in formation regarding patient characteristics at the time of initiation of Ven+HMA, response rates, and overall out Fourtycome. (39%) patients achieved CR, 20 (19%) CRi, resulting in CR/CRi in 60 (58%) patients with median time to best response of 1.4 months (range, 1.0-10.4 months) and median duration of response of 6.6 months (range, 1.0-32
AML patients receiving Ven+HMA outside a clinical trial at the Mayo Clinic were retrospectively re cruited after obtaining Institutional Review Board appro val. At our institution, Ven+HMA regimen was selected by the treating physician primarily based on patient age and fitness. Cytogenetic and molecular studies were per formed by conventional karyotype, and next-generation sequencing (NGS) of a 42-gene panel, respectively. Addi tionally, FLT3 and NPM1 reverse transcription polymerase chain reaction (RT-PCR) was obtained. All patients re ceived at least one cycle of Ven+HMA, with the Ven dose adjusted based on drug interactions particularly with azole antifungal prophylaxis.4 Azacitidine 75 mg/m2 days 1 to 7 or decitabine 20 mg/m2 days 1 to 5 was administered as part of the combination therapy. Bone marrow biopsy was obtained after either cycle 1 or 2 in the majority of cases based on treating physician discretion with re sponse assessed according to the 2017 European Leuke
Circulating blasts %, median (range) 14 (0-93) 15 (0-93) 11 (0-92) 0.6
Variables
Patients not in CR/CRi N=43 P Multivariatevalue/P value
Secondary or therapy-related 64 (62) 39 (38) 42 (70) 19 (32) 22 (51) 20 (47) 0.09/0.75
In univariate analysis, presence of ASXL1 mutation was as sociated with favorable response (CR/CRi 83% vs. 53%, P=0.01), while secondary AML (CR/CRi 49% vs. 65%, P=0.09), adverse karyotype (50% vs. 65%, P=0.11), presence of TP53 (32% vs. 67%, P=0.002) and FLT3-ITD mutations (30% vs. 61%; P=0.06) predicted inferior response. In multivariable analysis, including the aforementioned vari ables of significance/borderline significance, presence of ASXL1 mutation (83% vs. 53%; overall response [OR] 4.5) and absence of TP53 (67% vs. 32%; OR 3.3) and FLT3-ITD mutations predicted favorable response (61% vs. 30%; OR
Leukocyte count x 109/L, median (range) 3.6 (0.1-116) 3.65 (0.1-116) 3.95 (0.5-107) 0.45
Platelet count x 109/L, median (range) 59.5 (7-444) 61.5 (9-444) 51 (7-239) 0.54
Male, N (%) 69 (67) 39 (65) 30 (70) 0.42 AML type, N (%)
Bone marrow blasts %, median (range) 48 (2-97) 47 (2-97) 48 (2-91) 0.4
2017 ELN cytogenetic risk stratification, N (%)
Mutations on NGS, N (%)
Table 1. Clinical characteristics at time of treatment with venetoclax and hypomethylating agent for 103 patients with treatmentnaïve acute myeloid leukemia stratified by achievement of complete response or compete response with incomplete count recovery.
Patients in N=60CR/CRi
FLT3-ITDK/NRASNPM1IDH1/IDH2SRSF2DNMT3ATET2RUNX1ASXL1TP53 25 (25) 18 (18) 19 (19) 24 (23) 13 (13) 18 (18) 20 (19) 13 (13) 15 (15) 10 (10) 8 14121515(13)(25)11(18)(25)7(12)(20)(23)9(15)9(15)3(5) 17 (40) 3 (7) 8 (19) 9 (21) 6 (14) 6 (14) 6 764(14)(9)(14)(16)
AllN=103patients
months). MRD by multiparametric flow cytometry was as sessed in a subset of patients achieving CR/CRi (n=20) and was negative in 15 (75%) of patients. The remainder of the responses included morphological leukemia-free state in five (5%), partial remission in one (1%), and stable disease in 19 (18%) patients while progressive disease was noted in four (4%) cases. Follow-up molecular studies were per formed in three of eight TP53-mutated patients that achieved CR/CRi; TP53 variant allele frequency pre- and post-therapy were 81%/39%, 52%/24% and 42%/6%, re spectively.
Hemoglobin, g/dL, median (range) 8.6 (4.8-14) 8.6 (4.8-14) 8.5 (5.1-12.9) 0.98
De novo
AdverseIntermediateFavorable 5 (5) 52 (50) 46 (45) 4 (7) 33 (55) 23 (38) 1 (2) 19 (44) 23 (53) 0.11/0.93
0.002/0.010.01/0.02 0.880.450.270.480.680.710.9 0.06/0.01
HMA used, N (%) DecitabineAzacitidine 39 (38) 64 (62) 20 (33) 41 (68) 19 (44) 23 (53) 0.20
Final dose of venetoclax, mg, (median, range) 200 (50-400) 200 (100-400) 200 (50-400) 0.47
Cycle delays, N (%) 47 (46) 32 (53) 15 (35) 0.09
HMA: hypomethylating agent; NGS: next-generation sequencing; ELN: European LeukemiaNet; CR: complete response; CRi: CR with incomplete count recovery.
Haematologica | 107 October 2022 2502 LETTER TO THE EDITOR
Venetoclax dose adjustment, N (%) 89 (86) 56 (93) 33 (77) 0.05
HMA dose adjustment, N (%) 29 (28) 20 (33) 9 (21) 0.23 Allogeneic transplant, N (%) 9 (9) 8 (13) 1 (2) 0.04
Age in years, median (range), Age > 60 years, N (%) 7493(36-92)(90) 7456(36-88)(93) 7456(36-88)(93) 0.530.90
ASXL1-mutatedpatientsN=18
HMA used, N (%)
HMA: hypomethylating agent; AML: acute myeloid leukemia; CR: complete response; CRi: CR with incomplete count recovery; ELN: European LeukemiaNet; NGS: next generation sequencing.
Table 2. Patient characteristics at time of treatment with venetoclax and hypomethylating agent for 103 patients with treatmentnaïve acute myeloid leukemia stratified by ASXL-1 mutation status.
AdverseIntermediateFavorable 5 (5) 52 (50) 46 (45) 1 (6) 11 (61) 6 (33) 4 (5) 41 (48) 40 (47) 0.56
Variables AllN=103patients
FLT3-ITDNPM1IDH1/IDH2DNMT3ATET2RUNX1TP53 25 (25) 19 (19) 24 (23) 13 (13) 20 (19) 13 (13) 10 (10) 2 (11) 6 (33) 6 220(33)(0)(11)1(6)(11) 23 (27) 13 (15) 18 (21) 13 (15) 18 (21) 12 (14) 8 (9) 0.830.310.300.020.280.090.13
HMA dose adjustment, N (%) 29 (28) 4 (22) 25 (29) 0.51
Male, N (%) 69 (67) 15 (83) 54 (64) 0.09 AML type, N (%)
Circulating blasts %, median (range) 14 (0-93) 9 (0-86) 14 (0-93) 0.58
Hemoglobin, g/dL, median (range) 8.6 (4.8-14) 8.9 (6.7-12.3) 8.6 (4.8-14) 0.24
6.4). Moreover, in ASXL1-mutated patients, CR/CRi was not impacted by the presence of TP53 mutation (100% vs. 81%) whereas in ASXL1-unmutated patients, the presence of TP53 mutation predicted inferior response (26% vs. 63%; P=0.001). TP53 mutations clustered with absence of ASXL1 mutations; 23 of 85 (27%) ASXL1-unmutated pa tients harbored TP53 mutations versus two of 18 (11%) of ASXL1-mutated patients (Table 2). ASXL1 and TP53 are typically mutually exclusively,6 however presence of TP53 mutation in two patients with ASXL1 mutation was not detrimental to achievement of response.
DecitabineAzacitidine 39 (38) 64 (62) 3 15(17)(83) 36 (42) 49 (58) 0.03
Final dose of venetoclax, mg, (median, range) 200 (50-400) 200 (100-400) 200 (50-400) 0.68
Allogeneic transplant, N (%) 9 (9) 1 (6) 8 (9) 0.58
ASXL1-unmutatedpatientsN=85 P value
(70% vs. 55%; P=0.23), DNMT3A (54% vs. 59%; P=0.73), RUNX1 (58% vs. 58%; P=0.1), TET2 (63% vs. 57%; P=0.63), SRSF2 (67% vs. 56%; P=0.42) and K/NRAS mutations (60% vs. 58%, P=0.88) did not impact response. In addition, the likelihood of response was not impacted by prior HMA use (n=7); CR/CRi was 43% vs. 59% with or without prior HMA therapy, (P=0.40). Similar responses were noted with aza citidine and decitabine with CR/CRi rates of 51% and 64%, respectively (P=0.20).
Mutations on NGS, N (%)
Venetoclax dose adjustment, N (%) 89 (88) 18 (100) 72 (85) 0.03
Haematologica | 107 October 2022 2503 LETTER TO THE EDITOR
Platelet count x 109/L, median (range) 61 (7-444) 62 (9-444) 59 (7-239) 0.06
Age in years, median (range), Age > 60 years, N (%) 7493(36-92)(90) 7317(56-88)(94) 7476(36-92)(89) 0.490.50
2017 ELN cytogenetic risk stratification, N (%)
Cycle delays, N (%) 47 (46) 6 (33) 41 (48) 0.24
De novo Secondary or therapy-related 64 (62) 39 (38) 10 (56) 8 (44) 54 (64) 31 (36) 0.53
Presence of NPM1 (CR/CRi; 69% vs. 57%, P=0.41), IDH1/2
Furthermore, ASXL1-mutated patients were compared to their unmutated counterparts and were more likely to be males (83% vs. 63%; P=0.09), RUNX1-mutated (33% vs.
Bone marrow blasts %, median (range) 48 (2-97) 40 (4-92) 48 (2-97) 0.20
Leukocyte count x 109/L, median (range) 3.6 (0.1-116) 8 (1.1-98.7) 3.1 (0.1-116.7) 0.18
CR/CRi, N (%) 60 (58) 15 (83) 3 (17) 0.01
15%, P=0.09), DNMT3A-unmutated (100% vs. 85%, P=0.02), have received decitabine (83% vs. 58%; P=0.03) (Table 2). CR/CRi rates were conspicuously higher in ASXL1-mutated patients but accompanied by higher rates of MRD positiv ity; 60% vs. 13% in ASXL1-unmutated (P=0.04). Therefore, relapses after achieving CR/CRi were frequent in 11 of 15 (73%) ASXL1-mutated patients versus 16 of 45 (35%) of un mutated cases (P=0.02).
6 months) and low risk (0–1 point, n=47; mOS, 16 months) categories (P<0.001) (Figure 1).
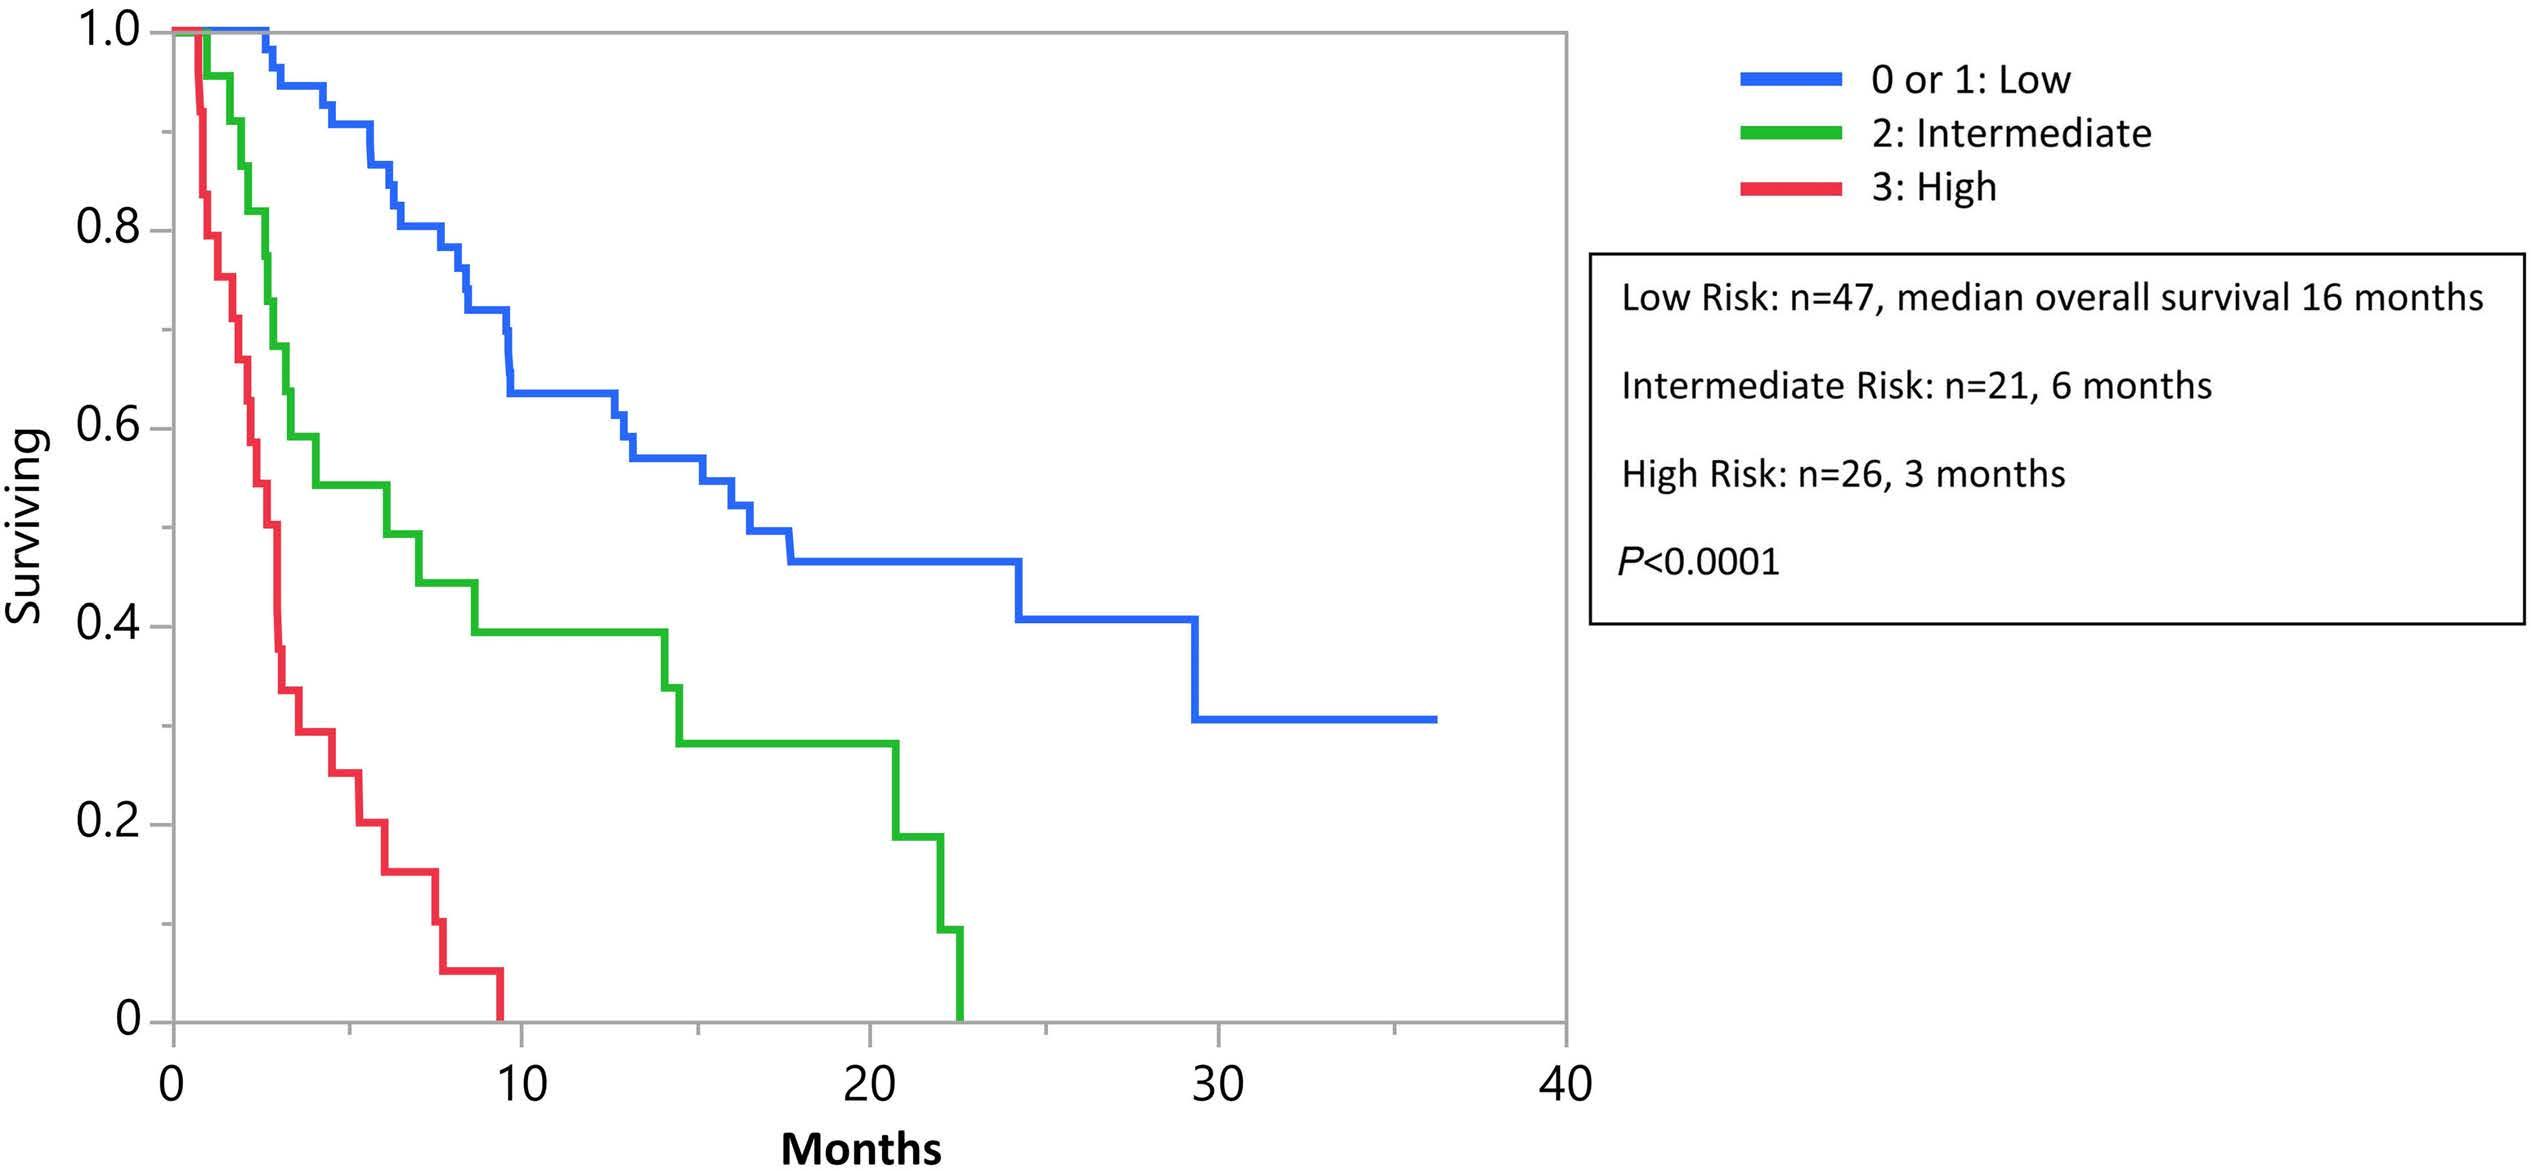
Figure 1. Survival according to risk groups. Survival of 94 treatment-naïve, non-transplanted acute myeloid leukemia (AML) pa tients receiving venetoclax and hypomethylating agent (Ven+HMA), stratified by hazard ration (HR)-weighted scoring system, HR in the absence of complete response or compete response with incomplete count recovery (CR/CRi), 5.9 (95% confidence interval [CI]: 3.3-10.6), ASXL1 mutation, 2.9 (95% CI: 1.5-5.5), and adverse karyotype, 1.8 (95% CI: 1.1-3.0), allocating 2 adverse points for not achieving CR/CRi, 1 adverse point for adverse karyotype, and 1 adverse point for ASXL1 mutation. Median overall survival stratified by low risk (0-1 points), intermediate risk (2 points) and high risk (3 points) is shown.
After a median follow-up of 6.6 months (16.5 months for alive patients; range, 0.6-36.3), 68 patients (66%) have died and nine (9%) underwent allogeneic stem cell trans plant. Median OS (mOS) was 8.5 months (range, 0.6-36 months) and longer in transplanted patients (not reached vs. 8.4 months, P=0.08).
In the current study, the presence of ASXL1 mutation was associated with initial favorable response to Ven+HMA; however, relapses were common resulting in a negative impact on survival due to higher rates of MRD positivity. The importance of MRD response and OS was recently highlighted in an analysis of AML patients treated with Ven+azacitidine that achieved CR/CRi; patients who achieved CR/CRi and MRD <10–3 had longer OS than re sponding patients with MRD ≥10–3.7 Additional predictors of inferior survival included inability to achieve CR/CRi and adverse karyotype. The association of ASXL1 mutation and achieving CR/CRi following Ven+HMA is supported by preclinical investigations demonstrating enhanced sensitivity to Ven and azacitidine through alterations in DNA methyl ation and BCL 2 upregulation.8,9 Similarly, a single institu tion retrospective study including relapsed/refractory AML patients treated with Ven+HMA confirmed superior re sponses with ASXL1 mutation.10 Our observations differ from those reported by DiNardo et al. in regard to durable remission and prolonged survival with NPM1 and IDH2 mu tations while the association of TP53 and FLT3-ITD muta tions with adaptive resistance was consistent with our findings.2 In another study on relapsed/refractory AML pa tients treated with Ven combination therapy, responses were superior with NPM1 mutation and survival shortened with TP53, K/NRAS and SF3B1 mutations.11 The discrepant observations across studies are likely a result of differ ences in co-occurrence of mutations, and treatment
Haematologica | 107 October 2022 2504 LETTER TO THE EDITOR
Age-adjusted survival analysis limited to 94 patients that did not receive transplant, identified CR/CRi (P<0.0001), NPM1 (P=0.009), and IDH1/2 mutations (P=0.02) as favor able, and TP53 (P=0.01), ASXL1 mutations (P=0.17) and ad verse karyotype (P=0.05) as unfavorable risk factors for survival. Multivariable analysis confirmed the negative survival impact of not achieving CR/CRi, presence of ASXL1 mutation and adverse karyotype; hazard ratio [HR] of 5.9 (95% confidence Interval [CI]: 3.3-10.6) for absence of CR/CRi, 2.9 (95% CI: 1.5-5.5) for presence of ASXL1 muta tion and 1.8 (95% CI: 1.1-3.0) adverse karyotype. Accord ingly, a practical three-tiered survival model was generated by using HR-weighted risk point assignment; 2 points for absence of CR/CRi, 1 point each for ASXL1 mu tation and adverse karyotype, resulting in high (3 points, n=26; mOS, 3 months), intermediate (2 points, n=21; mOS,
Data-sharing statement
Correspondence:
4. Agarwal SK, DiNardo CD, Potluri J, et al. Management of venetoclax-posaconazole interaction in acute myeloid leukemia patients: evaluation of dose adjustments. Clin Ther. 2017;39(2):359-367.
Disclosures
References
Please email the corresponding author.
12. Garciaz S, Hospital MA, Alary AS, et al. Azacitidine plus venetoclax for the treatment of relapsed and newly diagnosed acute myeloid leukemia patients. Cancers (Basel). 2022;14(8):2025.
2. DiNardo CD, Tiong IS, Quaglieri A, et al. Molecular patterns of response and treatment failure after frontline venetoclax combinations in older patients with AML. Blood. 2020;135(11):791-803.
5. Dohner H, Estey E, Grimwade D, et al. Diagnosis and management of AML in adults: 2017 ELN recommendations from an international expert panel. Blood. 2017;129(4):424-447.
disease response and prognosis in treatment-naive acute myeloid leukemia with venetoclax and azacitidine. J Clin Oncol. 2022;40(8):855-865.
Division of Hematology, Mayo Clinic, Rochester, MN, USA
Authors
Prepublished:Accepted:Received:https://doi.org/10.3324/haematol.2022.281214gangat.naseema@mayo.eduApril7,2022.June21,2022.June30,2022.©2022FerrataStortiFoundationPublishedunderaCCBY-NClicense
6. Devillier R, Mansat-De Mas V, Gelsi-Boyer V, et al. Role of ASXL1 and TP53 mutations in the molecular classification and prognosis of acute myeloid leukemias with myelodysplasiarelated changes. Oncotarget. 2015;6(10):8388-8396.
regimens utilized coupled with the limited number of pa tients studied. It is to be noted that OS in our cohort was inferior compared with the VIALE-A study1 but akin to a real world analyses of newly diagnosed AML patients treated with Ven+ azacitidine due to enrichment with sec ondary AML.1,12 Taken together, our findings which require further validation suggest an independent prognostic im pact of ASXL1 mutation in treatment-naïve AML patients receiving Ven+HMA.
*NG and IJ contributed equally as co-first authors.
9. Rahmani NE, Ramachandra N, Sahu S, et al. ASXL1 mutations are associated with distinct epigenomic alterations that lead to sensitivity to venetoclax and azacytidine. Blood Cancer J. 2021;11(9):157.
1. DiNardo CD, Jonas BA, Pullarkat V, et al. Azacitidine and venetoclax in previously untreated acute myeloid leukemia. N Engl J Med. 2020;383(7):617-629.
N. GANGAT -
8. Bogenberger JM, Kornblau SM, Pierceall WE, et al. BCL-2 family proteins as 5-Azacytidine-sensitizing targets and determinants of response in myeloid malignancies. Leukemia. 2014;28(8):1657-1665.
Contributions
10. Aldoss I, Yang D, Pillai R, et al. Association of leukemia genetics with response to venetoclax and hypomethylating agents in relapsed/refractory acute myeloid leukemia. Am J Hematol. 2019;94(10):E253-E255.
11. Ball BJ, Famulare CA, Stein EM, et al. Venetoclax and hypomethylating agents (HMAs) induce high response rates in MDS, including patients after HMA therapy failure. Blood Adv. 2020;4(13):2866-2870.
NG, IJ and AT designed the study, collected data, performed analysis and co-wrote the paper. KM, FF, AA, HA, KHB, AM, MRL, WH, MS, MMP, AP contributed patients. All authors reviewed and approved the final draft of the manuscript.
3. Pollyea DA, DiNardo CD, Arellano ML, et al. Impact of venetoclax and azacitidine in treatment-naive patients with acute myeloid leukemia and IDH1/2 mutations. Clin Cancer Res. 2022;28(13):2753-2761.
MRL has receieved research funding from AbbVie. All other authors have no conflicts of interest to disclose.
Naseema Gangat,* Isla Johnson,* Kristen McCullough, Faiqa Farrukh, Aref Al-Kali, Hassan Alkhateeb, Kebede Begna, Abhishek Mangaonkar, Mark Litzow, William Hogan, Mithun Shah, Mrinal Patnaik, Animesh Pardanani and Ayalew Tefferi
Haematologica | 107 October 2022 2505 LETTER TO THE EDITOR
7. Pratz KW, Jonas BA, Pullarkat V, et al. Measurable residual
Haematologica | 107 October 2022 2506 LETTER TO THE EDITOR
Association of FLT3-internal tandem duplication length with overall survival in acute myeloid leukemia: a systematic review and meta-analysis
short and long FLT3 -ITD length, cut-off determination method, unadjusted hazard ratio (HR) for death and 95% confidence interval (CI). In seven of 18 studies, HR for death and 95% CI were reported in the publication or raw data were available. If the HR and 95% CI were not re ported, we contacted the authors up to three times to retrieve these values. If we did not receive these data, we reconstructed individual patient data from published Kaplan-Meier plots to estimate OS and the correspond ing HR and 95% CI via univariable Cox regression, as pre viously described.8–10 We then performed a meta-analysis of HR for death, using a random effects model with re stricted maximum likelihood. We provide the pooled HR for death for adult and pediatric patients separately and combined, and the corresponding 95% CI, depicted in a forest plot. Heterogeneity between studies was evalu ated using the I2 statistic. Analyses were performed in R (version 3.6.0) with packages survival, metafor and ThesurvHE.eighteen studies, comprising fourteen adult and four pediatric studies, included 2,098 patients for metaanalysis. Table 1 presents the characteristics of the indi vidual studies. Full references to each study and the risk of bias for each study are presented in the Online Sup plementary Table S1. All but one study included FLT3-ITD length as binary variable to predict OS, with cut-offs for short and long FLT3-ITD lengths ranging from 39 to 178 base pairs (bp). The most commonly (9/18) used cut-off value was 48 bp. For the one study that included FLT3 ITD length as ordinal variable based on quartiles, we used the median as cut-off.11 Six studies determined the cut-off point based on the literature, seven used the median of their study population and five studies used an ‘optimal’ cut-off value. We reconstructed individual patient data from Kaplan-Meier curves for seven studies. The pooled HR for death calculated within the random effects model for patients with a long FLT3-ITD length, compared with patients with short FLT3-ITD length, was 1.50 (95% CI: 1.28–1.75; I2=26.2%) (Figure 1). Stratified for adult and pediatric AML patients, the pooled HR for death were 1.43 (95% CI: 1.23–1.67; I 2 =17.5%) and 1.97 (95% CI: 1.14–3.43; I2=57.4%), respectively. Our results indicate that AML patients with a long FLT3 ITD length have a moderately but statistically signifi cantly higher risk of death, compared with patients with a short FLT3-ITD length. Long FLT3-ITD length might be associated with a higher degree of constitutive kinase
The most common genetic aberration in acute myeloid leukemia (AML) is the internal tandem duplication (ITD) of the FMS-like tyrosine kinase 3 (FLT3)-gene, leading to a variable elongation of the juxta-membrane or tyrosine kinase-1 domain of the FLT3 protein.1 The presence of FLT3 -ITD – especially with a high allelic ratio (AR) – is associated with poor overall survival (OS).2 The impact of the longer length of the FLT3 -ITD is controversial, but may be associated with more auto-phosphorylation and thereby poor survival outcomes. 3 In contrast to FLT3 ITD-AR measurement, FLT3-ITD length is independent of AML blast percentage or sampling error, and therefore is an objective and constant diagnostic variable.4 To date, FLT3-ITD length has not been included as a risk factor for AML patient survival. In order to address the hetero geneous data on FLT3-ITD length and its association with OS, we present a systematic review and meta-analysis of adult and pediatric AML studies reporting the associ ation between FLT3 -ITD length and OS consisting of 2,098 FLT3-ITD-positive AML patients. We performed this review according to PRISMA.5 All rel evant databases were searched for peer-reviewed studies (no conference abstracts) published from Janu ary 1, 1996 through December 31, 2021 using all possible spellings of “ FLT3 -ITD” and “Acute Myeloid Leukemia”. After deduplication, two independent reviewers (DGJC and SD) screened 2,118 articles for inclusion using Rayyan (https://www.rayyan.ai/) and assessed 137 full texts for eligibility. Non–English-language articles, reviews, studies that focused on APL and studies that did not in vestigate the association of FLT3 -ITD length with OS were excluded. We also excluded studies that utilized ty rosine kinase inhibitors (TKI) in treatment protocols, as these likely affect the prognostic impact of FLT3 -ITD.6 Disagreement was resolved through discussion between the authors. These processes yielded a total of 16 studies. Upon request, we received data of FLT3- ITDpositive patients from two collaborative study groups that initially did not report analyses of association of OS and FLT3-ITD length. This provided a total of 18 studies (Online Supplementary Figure S1). Selected studies were screened for bias using Quality In Prognosis Studies (QUIPS).7Weextracted the following data if available: number of FLT3-ITD patients, median age and range, number of pa tients with NPM1 and DNMT3A mutations, white blood cell count, median FLT3-ITD length and range, cut-off for
≥48 vs. <48 literature 1.32 c
≥40 vs. <40 median 1.65 a Kusec et al. 2006 86 70 (30-100)
≥48 vs. <48 Literature 1.20 a
≥70 vs. <70 ‘minimum P value’ 2.19 a
Adult
≥48 vs. <48 median 0.84 c
Cucchi et al. 2018 21 39 (6-103)
≥70 vs. <70 median 0.31 b
Gale et al. 2007 260 48 (15-231)
Schlenk et al. 2014 323 NA (15-195)
Koszarska et al. 2014 68 39 (6-210)
≥39 vs. <39 median 2.45 b
Meshinchi et al. 2008 77 52 (15-174)
≥48 vs. <48 ‘minimum P value’ 4.70 d
2006 47 39 (15-153)
≥48 vs. <48 Literature 1.34 d Manara et al. 2017 54 NA (18-126)
Schlenk et al. 2020 99 48 (18-240)
≥48 vs. <48 median 1.39 a Schiller et al. 2012 39 45 (3-144)
≥48 vs. <48 literature 1.08 b
≥49 vs. <49 ‘minimum P value’ 2.29 c Gamis et al. 2014 190 48 (3-210)
Table 1. Characteristics of individual studies included in the meta-analysis.
Liu et al. 2019 89 39 (6-90)
≥48 vs. <48 literature 1.66 b Cucchi et al. 2021f 126 46 (-3-178)
>61 vs. <61 median 0.86 a
≥48 vs. <48 literature 1.92 a
Stirewalt et al.
≥50 vs. <50 ‘minimum P value’ 1.9 c Castaño-Bonilla et al. 2021 161 48 (3-201)
≥48 vs. <48 literature 1.15 d Cucchi et al. 2021e 133 43 (3-186)
aHazard ratio (HR) and 95% confidence interval (CI) based on reconstructed individual patient data from Kaplan-Meier curves. bHR and 95% CI provided in published manuscript. cHR and 95% CI provided on request. dHR and 95% CI based on individual patient data (provided by the authors). eResults provided separately for the Dutch-Belgian Cooperative Trial Group for Hematology-Oncology (HOVON)/Swiss Group for Clinical Cancer Research (SAKK) HOVON 102 AML/SAKK 30/09 trial. fResults provided separately for the HOVON 132 AML/SAKK 30/13 trial. ITD: internal tandem duplication; NA: not available; OS: overall survival; bp: base pair; N: number of FLT3-ITD-positive acute myeloid leukemia (AML) patients in study.
activation leading to a more aggressive phenotype.3 Al ternatively, long FLT3-ITD length may be a surrogate for ITD localization in the tyrosine kinase domain rather than in the juxta-membrane domain,1 which is associated with drug resistance and inferior OS. However, Liu et al.3 sug gest an association independent of ITD localization, since the authors observed poor OS in AML patients with long FLT3 -ITD within the juxta-membrane domain. We explored other explanatory variables that correlate with survival in the Online Supplementary Table S2 . These variables were spread evenly across ‘short’ and ‘long’ FLT3-ITD patients – only white blood cell count appeared to be elevated in patients with long FLT3-ITD. The heterogeneous dichotomization among the included studies makes it arduous to decide what ‘short’ and ‘long’ FLT3 -ITDs are. This variation may be a source of
Zhang et al. 2020 81 51 (18-207) >69 vs. <69 ‘minimum P value’ 1.58 b
≥45 vs. <45 median 2.60 a
Kim et al. 2015 73 50 (16-150)
Pediatric
bias, introduced by approaches to select cut-offs for short and long FLT3-ITD lengths to achieve a ‘minimum P value.12 We therefore performed a sensitivity analysis to assess the potential impact of this bias. Restricting our analysis to studies with the most commonly used cut-off point of 48 bp, the pooled HR for death was 1.35 (95% CI: 1.16–1.57; I2=0.61%). When we included studies with a cut-off of 43–51 bp, this was 1.47 (95% CI: 1.24–1.75; I2=30.85%). This indicates that our results are con sistent regardless of the exact definition of ‘long’ and ‘short’. Meta-regression analysis including the cut-off value as continuous explanatory variable did not show a significant effect estimate (HR [per bp] -0.01; 95% CI:0.03 to 0.02; P=0.63), indicating that varying cut-offs do not explain data heterogeneity. Although we caution against merely dichotomizing FLT3-ITD length and would
Blau et al. 2012 60 61 (21-203)
Author Year FLT3 patients,-ITD+N bpMedian(range)
Engen et al. 2021 111 51 (15-132)
Haematologica | 107 October 2022 2507 LETTER TO THE EDITOR
Cut-off, bp selectionCut-off HRdeathfor sourceData
specifically improve survival in patients with high FLT3 ITD-AR.6 Therefore, numerical variation of FLT3-ITD may remain important to inform selection of patients most benefitting from TKI. We suggest analyses of numerical variation of FLT3-ITD in the context of other prognostic factors using data from studies such as the RATIFY, QuAN TUM-First, ADMIRAL and QuANTUM-R trials.17 Finally, our study may be subject to publication bias since re searchers are less likely to report or publish a lack in prognostic value, an issue inherent to any such metaanalysis. However, our extensive personal enquiries for ad ditional data and advanced techniques to reconstruct individual patient data when only graphical data were available, allowed for inclusion of additional studies and patients. Altogether, this minimized the risk of publication bias and this was confirmed in a funnel plot.
Figure 1. Meta-analysis of studies reporting FLT3-internal tandem duplication length and overall survival in acute myeloid leukemia patients. For Cucchi et al.4 results are provided separately for (a) the Dutch-Belgian Cooperative Trial Group for Hematol ogy-Oncology (HOVON)/Swiss Group for Clinical Cancer Research (SAKK) HOVON 102 AML/SAKK 30/09 trial and (b) the HOVON 132 AML/SAKK 30/13 trial. N: number of FLT3-ITD-positive acute myeloid leukemia (AML) patients in study; HR; hazard ratio for death; 95% CI: 95% confidence interval; ITD: internal tandem duplication; Cut-off: cut-off value used for group comparison of short and long FLT3-ITD lengths, reported in base pairs
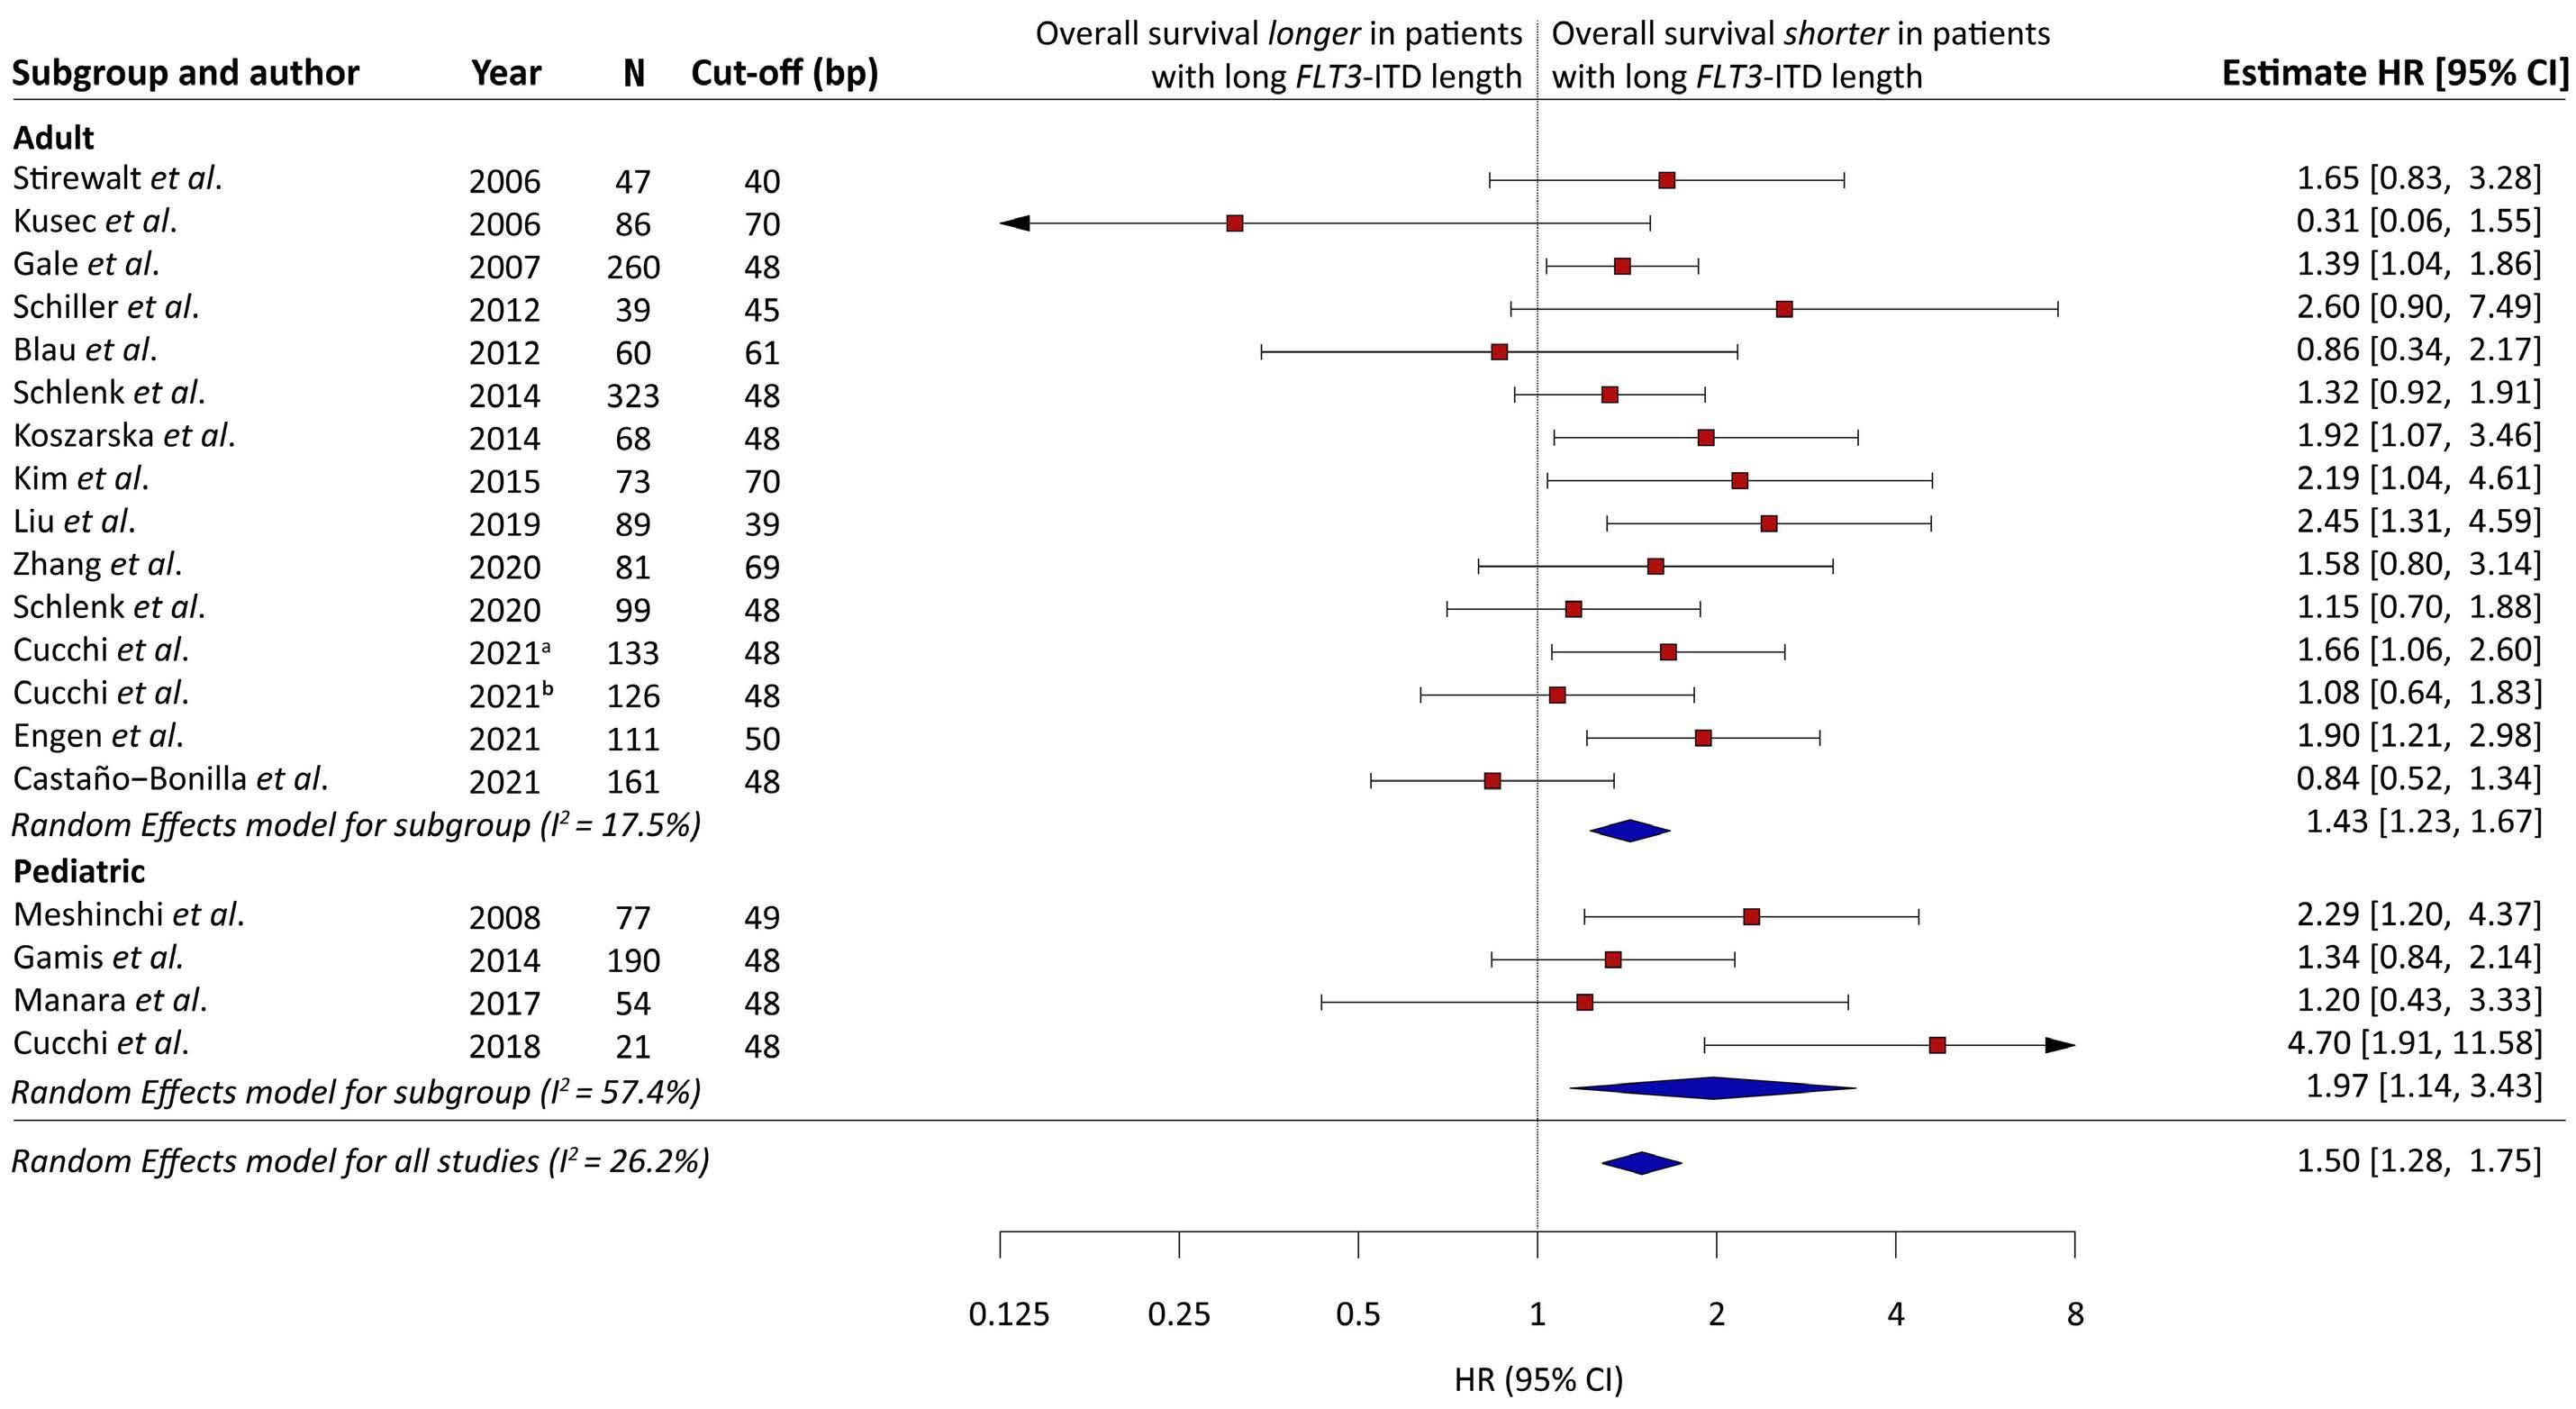
recommend exploring various functional relations (e.g., linear, splines) between FLT3-ITD length and OS, a cutoff of 48 bp appears useful in clinical practice. Our study has several limitations. First, we could only sys tematically investigate the univariable effect of FLT3-ITD length, since multivariable analyses were provided in only four of the 18 included reports.3,4,13,14 In three of these four reports, FLT3-ITD length remained a relevant prognostic factor in multivariable analysis with FLT3-ITD-AR,13 FLT3 ITD-AR, sex and cytogenetic risk3 and FLT3-ITD-AR, NPM1, TP53 and CEBPa mutations and cytogenetic risk.4 How ever, due to the limited, heterogenous, and potentially preferential reporting of association analyses, it remains unclear whether FLT3-ITD length has additional prog nostic value over the FLT3-ITD-AR, and whether this also depends on the presence of other prognostic factors, such as the FLT3-ITD insertion site.1 We therefore call for broader and homogeneous reporting of statistical tests to reproduce and facilitate further research. Second, our re sults may only apply to patients treated in regimens with out FLT3-TKI. Few studies report a lack of association of numerical variation of FLT3-ITD with survival outcomes in regimens containing FLT3-TKI, suggesting that FLT3-TKI overcome its adverse impact.6,15,16 FLT3-TKI might, however,
In conclusion, in this meta-analysis, long FLT3-ITD length was associated with a moderately but statistically sig nificantly higher HR for death compared with short FLT3 ITD length. Prospective analysis of its prognostic value in the context of contemporary treatment protocols,17 the FLT3-ITD-AR, insertion site and other molecular aberra tions,18 is essential to refine risk stratification protocols for AML in the years to come.
Haematologica(bp). | 107 October 2022 2508 LETTER TO THE EDITOR
9. Fu C, Zhou S, Short N, Huang X, Berry D, Ravandi-Kashani F. 90552 Evidence synthesis with reconstructed survival data. J Clin Transl Sci. 2021;5(s1):44-45.
10. Guyot P, Ades AE, Ouwens MJNM, Welton NJ. Enhanced secondary analysis of survival data: reconstructing the data from published Kaplan-Meier survival curves. BMC Med Res Methodol. 2012;12:9.
DGJC conceived and supervised the research. JC and JJWMJ provided critical feedback on the research methodology. SD and DGJC performed the search and collected data. JKH, SM and KD provided additional clinical data. DGJC, TBP and JvR performed statistical analysis. TBP and DGJC wrote the manuscript. All authors reviewed and approved the final version of the manuscript.
Data-sharing statement
1Erasmus School of Health Policy and Management, Erasmus University Rotterdam, Rotterdam, the Netherlands; 2Department of Biostatistics, Erasmus MC, Rotterdam, the Netherlands; 3Department of Epidemiology, Erasmus MC, Rotterdam, the Netherlands; 4Real-World Data Department, myTomorrows, Amsterdam, the Netherlands; 5Department of Hematology, Cancer Center Amsterdam, Amsterdam University Medical Centers, location VUmc, Amsterdam, the Netherlands; 6Department of Internal Medicine III, University Hospital of Ulm, Ulm, Germany and 7Clinical Research Division, Fred Hutchinson Cancer Research Center, Seattle, WA, Correspondence:USAD.G.J.CUCCHI.Email: https://doi.org/10.3324/haematol.2022.281218d.cucchi@amsterdamumc.nlReceived:April8,2022.Accepted:June27,2022Prepublished:July7,2022.©2022FerrataStortiFoundationPublishedunderaCCBY-NClicense
Contributions
Tobias B. Polak,1,2,3,4 Joost van Rosmalen,2,3 Stijn Dirven,5 Julia K. Herzig,6 Jacqueline Cloos,5 Soheil Meshinchi,7 Konstanze Döhner,6 Jeroen J.W.M. Janssen5 and David G.J. Cucchi5
We thank Prof Dr HCM de Vet for advice regarding bias assessment.
References
2. Döhner H, Estey E, Grimwade D, et al. Diagnosis and management of AML in adults: 2017 ELN recommendations from an international expert panel. Blood. 2017;129(4):424-447.
Most data are derived from publicly available sources. Aggregated and analyzed data will be made available on reasonable request.
1. Rücker FG, Du L, Luck TJ, et al. Molecular landscape and prognostic impact of FLT3-ITD insertion site in acute myeloid leukemia: RATIFY study results. Leukemia. 2022;36(1):90-99.
7. Hayden JA, van der Windt DA, Cartwright JL, Côté P, Bombardier C. Assessing bias in studies of prognostic factors. Ann Intern Med. 2013;158(4):280-286.
8. Short NJ, Zhou S, Fu C, et al. Association of measurable residual disease with survival outcomes in patients with acute myeloid leukemia: a systematic review and meta-analysis. JAMA Oncol. 2020;6(12):1890-1899.
11. Gale RE, Green C, Allen C, et al. The impact of FLT3 internal tandem duplication mutant level, number, size, and interaction with NPM1 mutations in a large cohort of young adult patients with acute myeloid leukemia. Blood. 2008;111(5):2776-2784.
12. Altman DG, Lausen B, Sauerbrei W, Schumacher M. Dangers of
Adboards, Pfizer and Abbvie; is president of Apps for Care and Science Foundation. This foundation has received unrestricted educational grants from Abbvie, Alexion, Beigene, Astellas, EUSApharma, Novartis, Amgen, Sanofi Genzyme, Takeda, Jazz, Pfizer, Roche, Servier, Daiichi-Sankyo, Janssen, Incyte and BMS for development of the HematologyApp. DGJC has received speaker fees from Takeda. TBP works part-time for expanded access service provider myTomorrows, in which he holds stock and stock options. TBP is contractually free to publish, and the service provider is not involved in any of his past or ongoing research, nor this Letter. JC has an advisory role for Novartis; has received research grant for institution Novartis, Merus, Takeda, Genentech, BD Biosciences, and holds royalty/license from Navigate and BD Biosciences. KD has acted as a consultant and advisor for Astellas, Celgene, Daiichi Sankyo, Janssen, Novartis, and Roche and has received clinical research support from Astex, Celgene, and Novartis. The remaining authors have no conflicts of interest to disclose.
4. Cucchi DGJ, Vonk CM, Rijken M, et al. DNA vs cDNA FLT3 -ITD allelic ratio and length measurements in adult acute myeloid leukemia. Blood Adv. 2021;5(21):4476-4479.
3. Liu S-B, Dong H-J, Bao X-B, et al. Impact of FLT3 -ITD length on prognosis of acute myeloid leukemia. Haematologica. 2019;104(1):e9-e12.
Disclosures
Haematologica | 107 October 2022 2509 LETTER TO THE EDITOR
Authors
JJWMJ has received research funding from Novartis, BMS,
5. Moher D, Liberati A, Tetzlaff J, et al. Preferred reporting items for systematic reviews and meta-analyses: the PRISMA statement. PLoS Med. 2009;6(7):e1000097.
Acknowledgments
6. Abou Dalle I, Ghorab A, Patel K, et al. Impact of numerical variation, allele burden, mutation length and co-occurring mutations on the efficacy of tyrosine kinase inhibitors in newly diagnosed FLT3- mutant acute myeloid leukemia. Blood Cancer J. 2020;10(5):48.
using “optimal” cutpoints in the evaluation of prognostic factors. J Natl Cancer Inst. 1994;86(11):829-835.
17. Cucchi DGJ, Polak TB, Ossenkoppele GJ, et al. Two decades of targeted therapies in acute myeloid leukemia. Leukemia. 2021;35(3):651-660.
15. Schlenk RF, Weber D, Fiedler W, et al. Midostaurin added to chemotherapy and continued single-agent maintenance therapy in acute myeloid leukemia with FLT3-ITD. Blood.
13. Stirewalt DL, Kopecky KJ, Meshinchi S, et al. Size of FLT3 internal tandem duplication has prognostic significance in patients with acute myeloid leukemia. Blood. 2006;107(9):3724-3726.
16. Chen F, Sun J, Yin C, et al. Impact of FLT3-ITD allele ratio and ITD length on therapeutic outcome in cytogenetically normal AML patients without NPM1 mutation. Bone Marrow Transplant. 2020;55(4):740-748.
Haematologica | 107 October 2022 2510 LETTER TO THE EDITOR
18. Cucchi DGJ, Van Alphen C, Zweegman S, et al. Phosphoproteomic characterization of primary AML samples and relevance for response toward FLT3-inhibitors. Hemasphere. 2021;5(7):e606.
2019;133(8):840-851.
14. Engen C, Hellesøy M, Grob T, et al. FLT3-ITD mutations in acute myeloid leukaemia – molecular characteristics, distribution and numerical variation. Mol Oncol. 2021;15(9):2300-2317.
Platelet functional abnormalities and clinical presentation in pediatric patients with germline RUNX1
The mechanisms of platelet dysfunction in FPD/AML, ANKRD26-RT and ETV6-RT require further investigation. The risk of clonal evolution in inherited thrombocytopenias is another unresolved problem. This manuscript describes the clinical and hematologic phenotypes and platelet functional characteristics of 24 children with FPD/AML, ANKRD26-RT and ETV6-RT.
We performed a retrospective analysis of pediatric pa tients referred to our Center between 2013 and 2020. Pe ripheral blood samples from patients, their family members, and age-matched healthy controls were ob tained with written informed consent. The study was ap proved by the local ethics committee (approval number 12э/4-21, 21.12.21) and conducted in accordance with the Declaration of Helsinki.
We used the International Society on Thrombosis and Hemostasis Bleeding Assessment Tool (ISTH BAT) scale4 and Pediatric Bleeding Questionnaire (PBQ)5 to assess bleeding tendency. Genetic studies were performed by Sanger sequencing or next-generation sequencing with MiSeq/NextSeq (Illumina, USA) using a custom target panel “Hemostasis”. Multiplex ligation-dependent probe amplifi cation analysis was used to detect gross deletions and du plications in RUNX1 and ETV6 genes. Light transmission aggregometry,6 as well as endpoint (platelet functional ac tivity assay7-10) and continuous (platelet signaling study9,11) flow cytometry were performed as described previously. Fourteen children from 12 families were found to have RUNX1 mutations (Table 1). Seven mutations were novel variants. In eight cases from five families, mutations were detected in the ANKRD26 5’ untranslated region domain (Table 1). Two children had ETV6 mutations. The new vari ants were considered to be causative according to Ameri can College of Medical Genetics criteria, segregation of the identified variants in the pedigrees and clinical data. Our patients had isolated mild-to-moderate thrombo
cytopenia with mild bleeding phenotypes, consistent with previously published findings.2,12 Twelve of 14 patients with FPD/AML had a family history of thrombocytopenia. There were four cases of acute myelogenous leukemia, one case of acute lymphoblastic leukemia and five cases of acute leukemia of unknown phenotype in the patients’ pedigrees. In our pediatric co hort, there was one case of acute myelogenous leukemia. Patient 5 was a girl with a c.388delG variant in exon 5 of RUNX1. At the age of 10 years, she developed acute mye logenous leukemia with BCR-ABL1 and co-expression of CD19, CD22 and an additional somatic FLT3 mutation. She received chemotherapy and achieved complete remission. After an early relapse, she underwent hematopoietic stem cell transplantation, but died from the second relapse.
Aggregometry data were available for seven patients with FPD/AML and revealed diminished platelet aggregation upon stimulation with collagen (Figure 1A), protease-ac tivated receptor 1 activating peptide (PAR1-AP), with no second wave (Figure 1B), and adrenaline (Figure 1C), pre dominantly decreased aggregation upon stimulation with adenosine diphosphate (ADP) (Figure 1D), and variably nor mal aggregation upon stimulation with ristocetin (Figure 1E). Aggregometry was performed in four patients with ANKRD26-RT and revealed decreased maximum aggre gation in response to both PAR1-AP (Figure 1B) and adren aline (Figure 1C), while aggregation upon stimulation with collagen (Figure 1A) was predominantly normal. A signifi
Haematologica | 107 October 2022 2511 LETTER TO THE EDITOR
,
Familial platelet disorder with propensity to acute myelo genous leukemia (FPD/AML) associated with mutations in the RUNX1 gene, ANKRD26-related thrombocytopenia (ANKRD26-RT), and ETV6-related thrombocytopenia (ETV6-RT) are inherited thrombocytopenias characterized by a moderate decrease in platelet number, normal mean platelet size and the predisposition to hematologic malig nancies.1-3 The assessment of bleeding risk in inherited thrombocytopenias is sometimes controversial because these conditions are associated not only with low platelet counts, but also with platelet functional abnormalities.1
ANKRD26, and ETV6 mutations
One of the patients with ETV6-RT had a family history of thrombocytopenia without known cases of acute leuke mia. The second patient had several features of immuno deficiency (2 episodes of pneumonia before the age of 1 year, IgA <0.15 g/L, IgG 1.74 g/L). His mother had a con firmed ETV6 mutation with adequate platelet count. This patient developed B-cell acute lymphoblastic leukemia at the age of 2 years. He responded to chemotherapy and achieved complete remission. While a germline ETV6 mu tation was revealed after completion of chemotherapy, this patient received the standard treatment regime. At the time of writing, he is still in complete remission for more than 5 years without having undergone allogeneic hematopoietic stem cell transplantation.
In four of the five families with ANKRD26-RT, relatives with thrombocytopenia were known. In these pedigrees throm bocytopenia was observed in two (1 family), three (2 families), and four (1 family) generations. There were no cases of acute leukemia in these families.
9 M Exon c.520A>C6 174Р Birth (80-160)116 1/1
Grandmother (thrombocytopenia, AL); motherALL,(thrombocytopenia,HSCT) 7.9 Alive
5 F Exon 5 c.388delG p.V130Sfs*3 Birth (50-70)63 1/1
с
3
Patients with germline ANKRD26 mutations F Exon 1 (5' 4 (46-173)56 5/5 Sibling (Pt #2), father, grandmother (thrombocytopenia) 8.8 Alive M 1 (5' (30-71)52 3/3 Sibling (Pt #1) 4.7 Alive M Exon 1 (5' Birth (53-226)69 0/0 Mother grandfather(thrombocytopenia),(thrombocytopenia) 3.3 Alive
Patients with germline RUNX1 mutations
10 M Exon 5–Intron c.497_508+10del5p.? Birth (36-128)64 1/1 Father (thrombocytopenia) 2.1 Alive
1 M Exon c.1087_1088dup9p.I364Afs*231 Birth (20-210)128 0/0 (thrombocytopenia,Father AML) 4.8 Alive
14
c.-118C>AUTR)regulatory 1.5
4 F Gross duplication of exons 4–6 Birth (100-150)106 4/4
on
Sibling (Pt #9); mother and grandfatherunclegreat-grandfather(thrombocytopenia),(AL),(AMLatage5years,died),aunt(AMLatage19years,HSCT,CR) 13.1 Alive
Family history
Continued following
Sibling (Pt #8) 3.7 Alive
с
At last follow-up Age, years Status
р Т
7 F Gross deletion of exons 1–6 Birth (50-113)89 1/1 2.6 Alive
12 M Exon 6 .601С p.R201*>T Birth (50-151)62 2/2 Sibling (Pt #11)b 3.3 Alive 13 M Exon 8 Birth (76-200)98 2/2 Father (thrombocytopenia) 9.6 Alive M Exon 5 .497 2 (60-140)106 0/0 Father, aunt, (thrombocytopenia)grandmother 14.7 Alive
2 F Exon 5 c.496C>G p.R166G 0.5 (113-159)139 4/4 Fathermutation(asymptomaticcarrier) 4.0 Alive
1
3 F Exon c.292C>T4p.L98F 2 (53-140)107 0/0 Father(thrombocytopenia,(thrombocytopenia),grandfatherAL) 13.5 Alive
Exon
c.-119C>AUTR)regulatory
Pt# Sex Mutation yearsAge,a Platelet count x109/L,(range)median BAT/PBQISTH
Sibling (Pt #12),b mother and father (mutation not detected) 3.3 Alive
6 F Intron c.613+1delG6 p.? Birth (81-170)121 1/1 3.7 Alive
с p.S308Afs*3.921delC
page. Haematologica | 107 October 2022 2512 LETTER TO THE EDITOR
8 M Exon c.520A>C6 174Р 3.5 (80-180)142 0/0
р Т
Table 1. Characteristics of patients with RUNX1 (n=14), ANKRD26 (n=8) and ETV6 (n=2) mutations.
Mother (thrombocytopenia, cervical cancer), great-grandfather(thrombocytopenia),grandmothergreat-uncle(thrombocytopenia,AL),(thrombocytopenia),great-great-grandmother(thrombocytopenia,AL) 11.1 Deadc
11 M Exon 6 .601С p.R201*>T Birth (45-192)67 2/2
с
2
c.-118C>AUTR)regulatory
p.R166QG>A
side scatter (SSC) was within normal ranges (Figure 2B). Flow cytometry revealed significantly impaired annexin V-positive (procoagulant) platelet formation (Figure 2C) upon dual stimulation with collagen-related peptide and PAR1-AP in comparison with that of age-matched, healthy controls. While platelet P-selectin expression in both resting and stimulated states was within normal
Haematologica | 107 October 2022 2513 LETTER TO THE EDITOR
Platelet count x109/L,(range)median BAT/ISTHPBQ
2 M Exon 5 Gross deletion 0.5 (100-140)115 2/2 Father (thrombocytopenia) 8.7 Alived
Patients with germline ETV6 mutations
Sibling (Pt #4) 1.1 Alive
yearsAge,a
1 M Exon p.His383Argc.1148A>G6(p.H383R) 1.3 (40-120)106 2/2 Mother (asymptomatic carrier) 9.3 Alive
6 F Exon 1 (5' UTR) c.-134G>A regulatory 13 (18-57)24 6/6 15.3 Alive
A B C D E
Figure 1. Light transmission aggregometry in patients with RUNX1, ANKRD26, or ETV6 mutations upon stimulation with different agonists. (A) Platelet aggregation upon stimulation with 2 mg/mL collagen was predominantly decreased in patients with RUNX1 mutations. (B, C) Platelet aggregation upon stimulation with 32 μM protease-activated receptor 1 activating peptide (B) and 5 μM adrenaline (C) was diminished in patients with RUNX1 and ANKRD26 mutations. (D) Platelet aggregation upon stimulation with 5 μM adenosine diphosphate was decreased in patients with ANKRD26 mutations. (E) Platelet aggregation upon stimulation with 15 mg/mL ristocetin was within the normal range. The data points are the circle symbols, horizontal lines are medians, boxes show 25th-75th percentiles, error bars show 5-95% intervals, gray color indicates normal ranges. ADP: adenosine diphosphate; PAR1-AP: protease-activated receptor 1 activating peptide.
Pt Sex Mutation
Patients with germline ANKRD26 mutations
Platelet functional activity flow cytometry was per formed in all 14 patients with FPD/AML. Platelet forward scatter was predominantly diminished (Figure 2A), while
#
At last follow-up Age, years Status
8 M Exon 1 (5' UTR) c.-126T>C regulatory 0.2 (18-94)42 1/1 Sibling (Pt #7), (thrombocytopenia)father 9.0 Alive
7 M Exon 1 (5' UTR) c.-126T>C regulatory 2 (25-76)28 3/3 Sibling (Pt #8), (thrombocytopenia)father 15.1 Alive
cantly diminished aggregation to weak stimulation with ADP was also observed in these patients (Figure 1D). In the patient with ETV6-RT, platelet aggregation was within normal ranges (Figure 1).
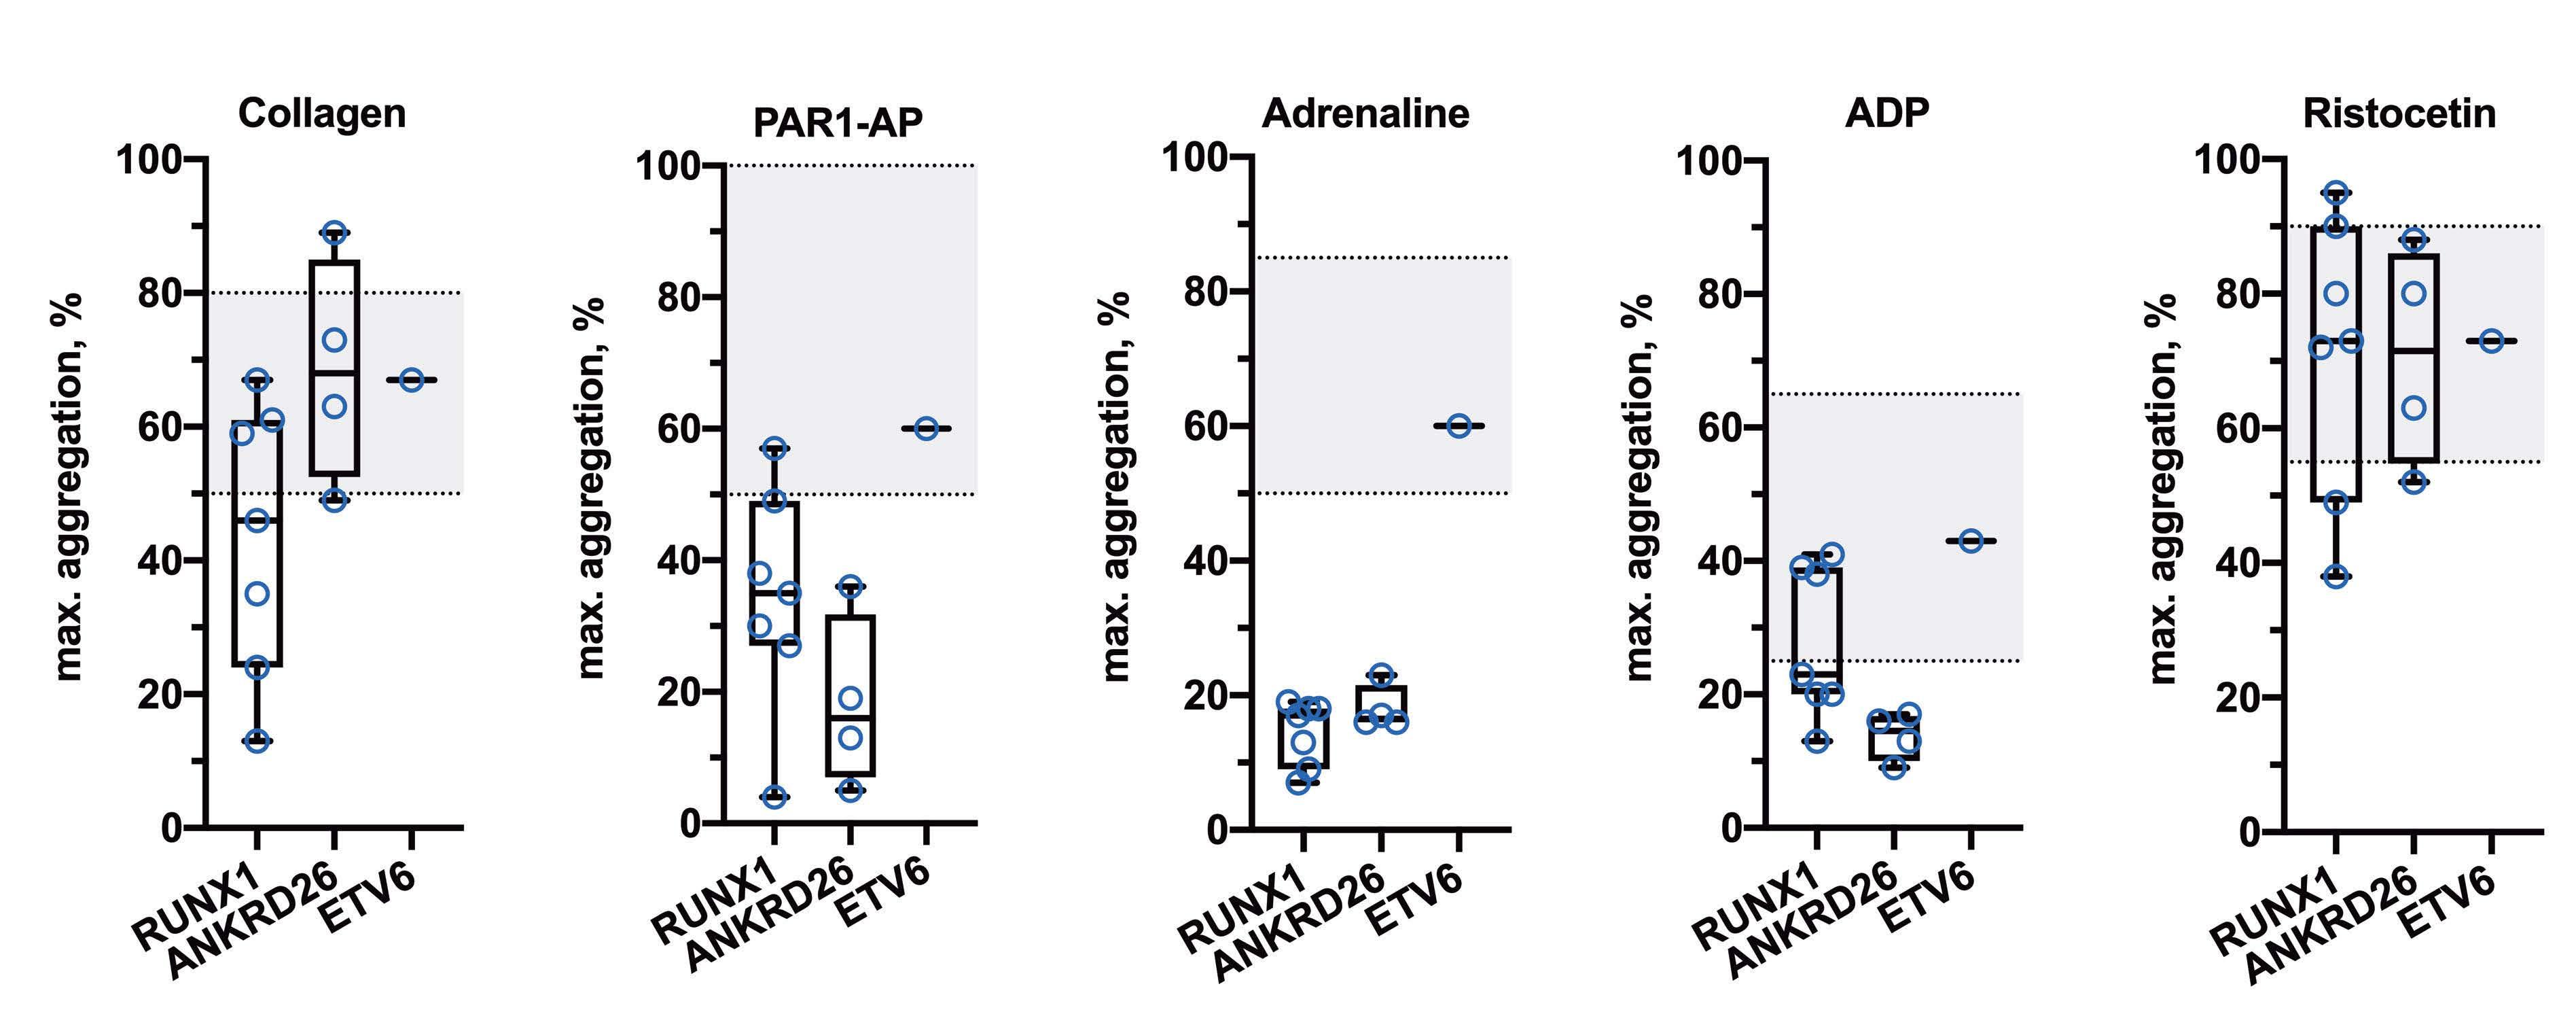
5 F Exon 1 (5' UTR) c.-128G>A regulatory 0.1 (60-152)77 2/1
4 F Exon 1 (5' UTR) c.-128G>A regulatory 0.9 (58-100)68 0/0 Sibling (Pt #5), father, grandmother (thrombocytopenia) 5.6 Alive
Family history
RefSeq transcript: RUNX1 - NM_001754.5, ANKRD26 - NM_014915.3, ETV6 - NM_001987.5. aAt first time of documented thrombocytopenia. bMo nozygotic twins. cAcute myeloblastic leukemia, co-expression of CD19, CD22, FLT3 mutation (at the age of 10 years). dB-cell acute lymphoblastic leukemia at the age of 2 years; in complete remission for more than 5 years after standard treatment without allogeneic hematopoietic stem cell transplantation. M: male; F: female; ISTH BAT: International Society on Thrombosis and Haemostasis Bleeding Assessment Tool; PBQ: Pediatric Bleeding Questionnaire; AL: acute leukemia; ALL: acute lymphoblastic leukemia; AML: acute myeloblastic leukemia; HSCT: hema topoietic stem cell transplantation; CR: complete remission.
GPIIb/IIIa (Figure 2H) and its active form (assessed by PAC1 binding) (Figure 2I) was comparable to that of the control cohort.
ranges (Figure 2D), reduced mepacrine loading (Figure 2E) and decreased dense granule secretion (Figure 2F) indicated defects of the platelet dense granule storage pool in these patients. Flow cytometry also revealed in creased platelet GPIb expression (Figure 2G) in both resting and stimulated states. The expression of platelet
Platelet functional activity was assayed in seven patients with ANKRD26-RT. In resting platelets, no differences were observed in forward scatter (Figure 2A) or side scatter
Figure 2. Platelet flow cytometry (platelet functional activity assay) in patients with RUNX1, ANKRD26, or ETV6 mutations, and healthy children (in resting state and upon dual stimulation with 20 ? g/? L collagen-related peptide plus 12.5 ? M protease-activated receptor 1 agonist peptide. (A) Diminished forward scatter in patients with RUNX1 and ETV6 mutations. (B) Increased side scatter upon platelet stimulation in patients with ANKRD26 mutations, decreased side scatter of platelets in the resting state in the patient with an ETV6 mutation. (C) Decreased annexin V-positive (procoagulant) platelet percentage upon stimulation in patients with RUNX1 mutations. (D) Normal platelet Pselectin expression in both resting and stimulated states. (E) Decreased mepacrine loading of resting platelets in patients with RUNX1 mutations. (F) Decreased dense granule release upon platelet stimulation in patients with RUNX1 and ETV6 mutations. (G) Increased platelet CD42b ex pression in the resting state in patients with RUNX1 mutations, increased platelet CD42b expression upon stimulation in patients with RUNX1 and ANKRD26 mutations. (H) Increased CD61 expression upon platelet stimulation in patients with ANKRD26 mutations. (I) Decreased PAC1 binding upon activation in the patient with an ETV6 mutation. The data points are the circle symbols, horizontal lines are medians, boxes show 25th-75th percentiles, error bars show 5-95% intervals. Blue color represents resting platelets, red color represents stimulated platelets. Statistical significance is shown by asterisks: *P<0.05, **P<0.01, ***P<0.001, no marking corresponds to non-significant differences. The Mann-Whitney U test was used to compare two independent samples and the Wilcoxon signed-rank test was used to conduct a paired difference test of repeated measurements. act: activated platelets; FSC: forward scatter; HD: healthy donors; rst: resting platelets; SSC: side scatter.
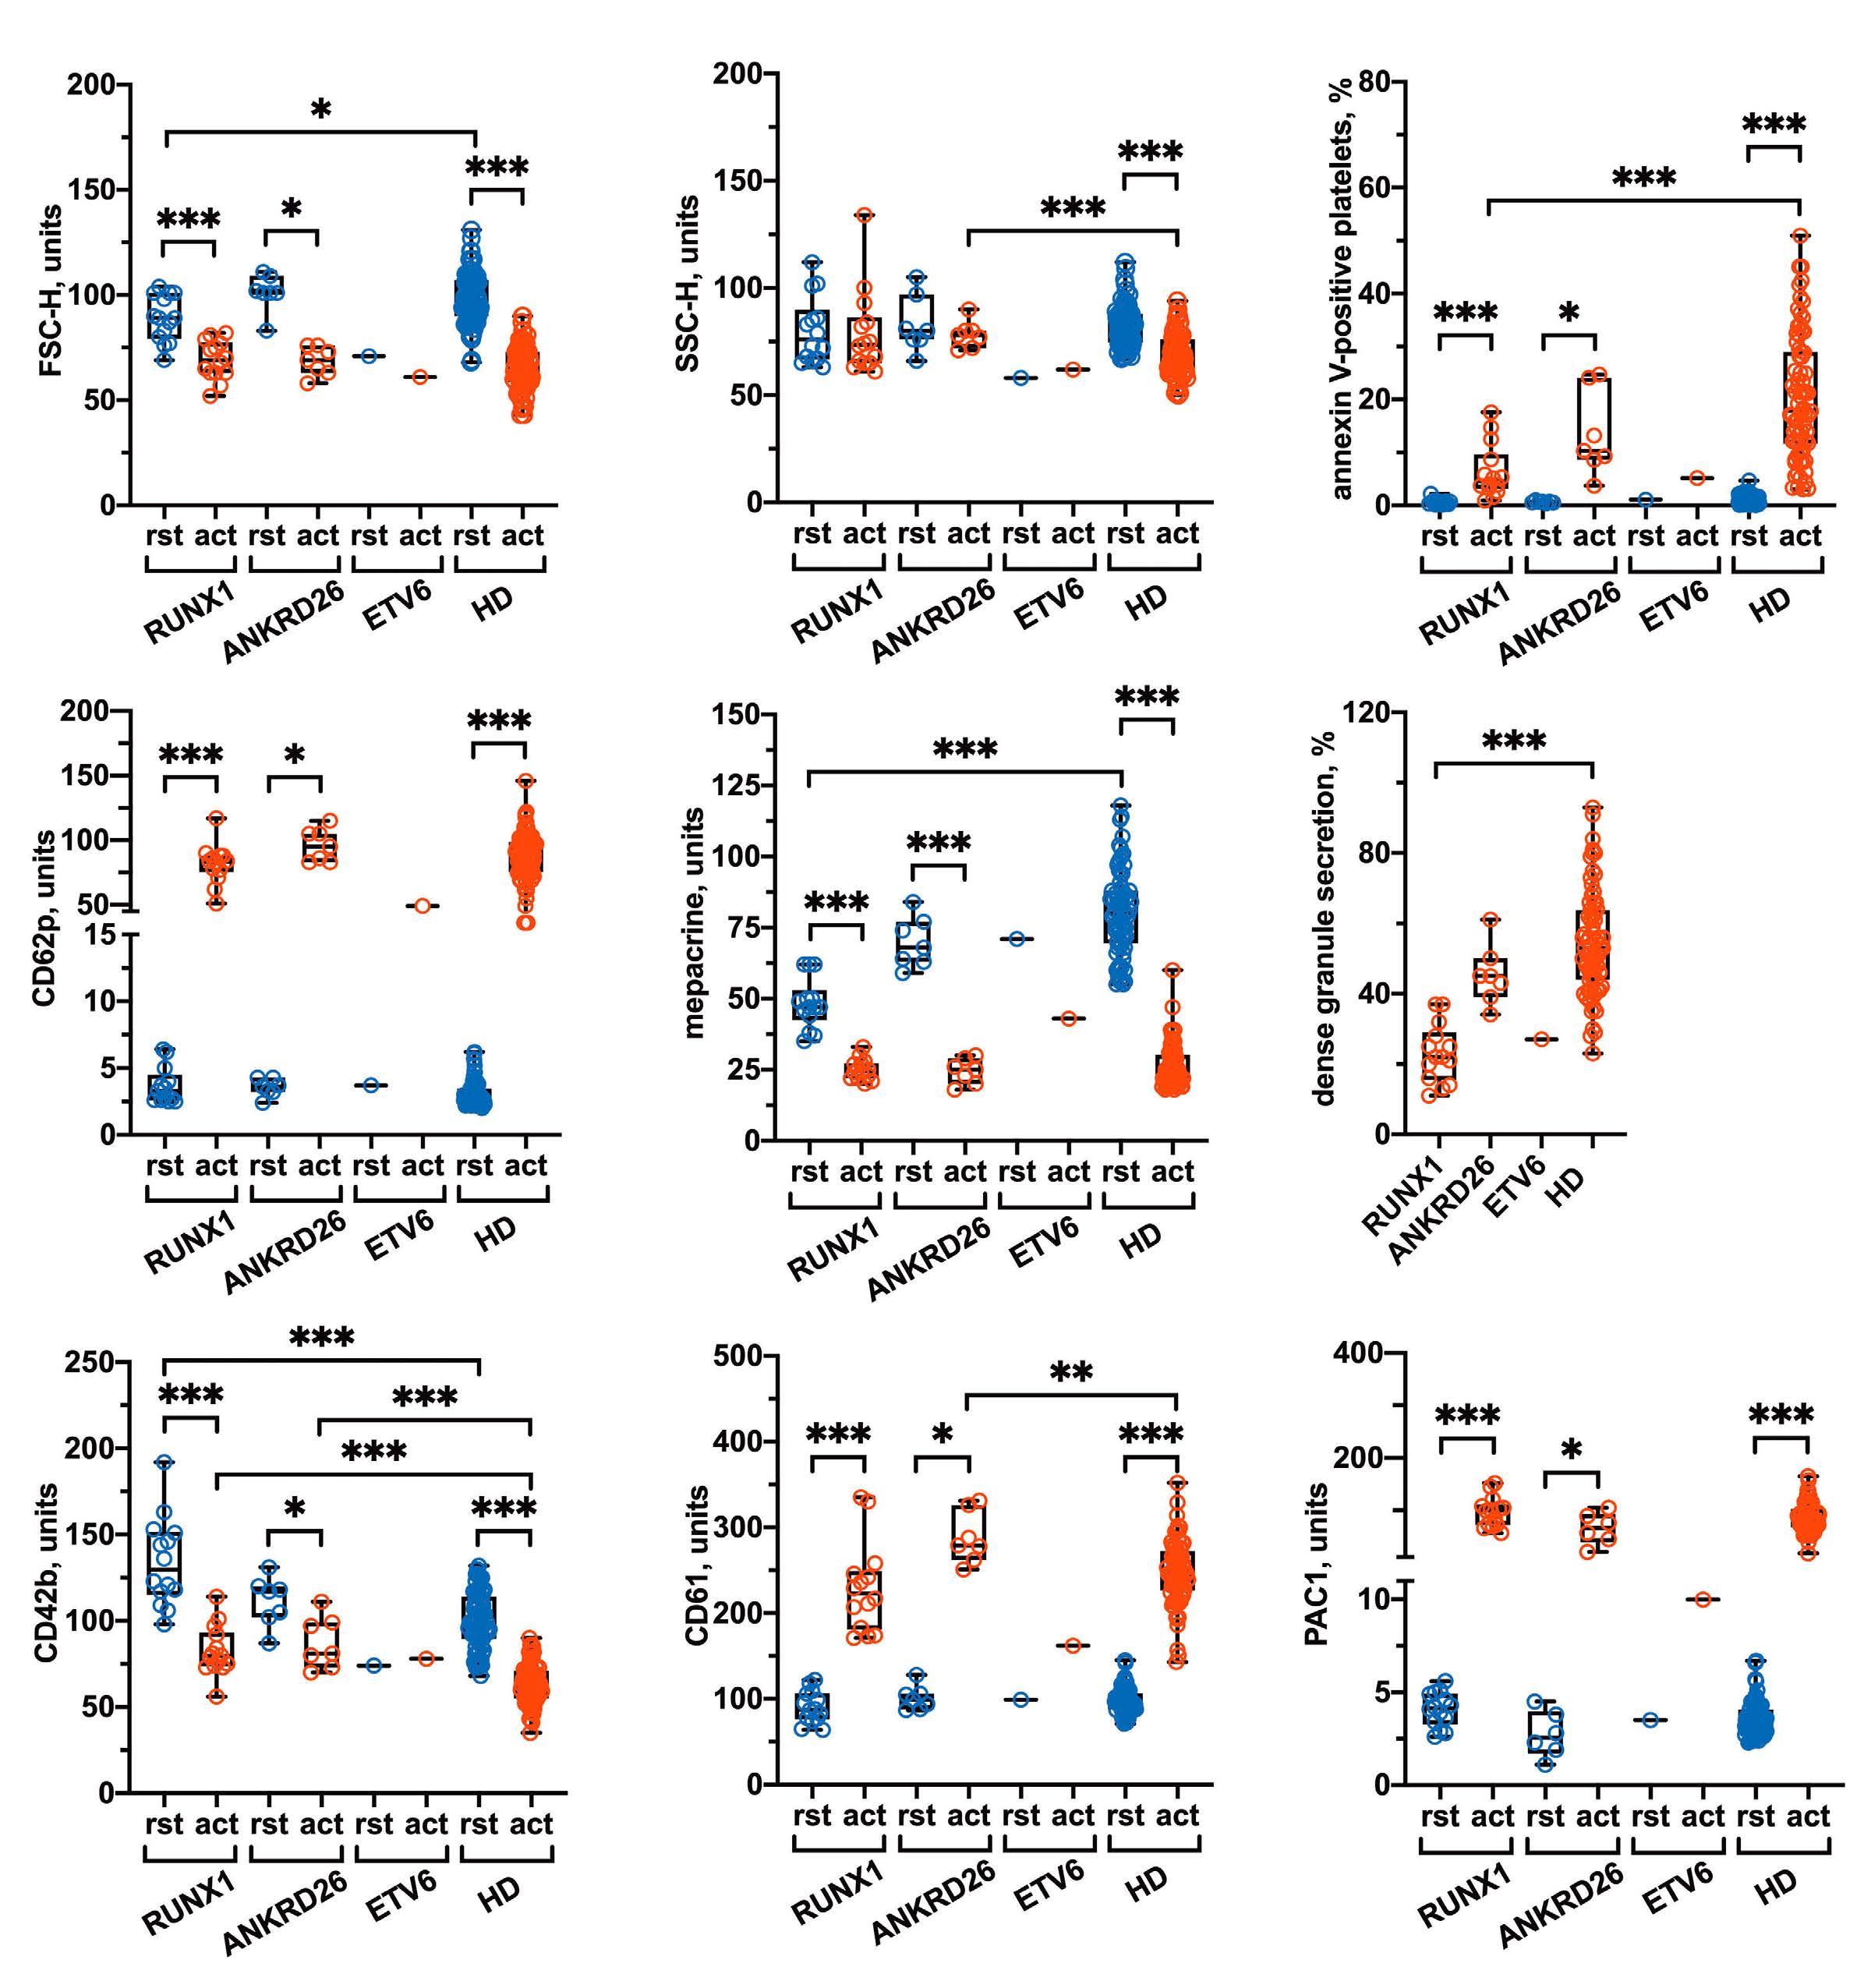
D E F
A B C
G H I
Haematologica | 107 October 2022 2514 LETTER TO THE EDITOR
we did not observe significant correlations between bleeding (ISTH BAT and PBQ scores) and platelet count in patients with germline RUNX1 (Spearman r=0.01, P=0.98) (Online Supplementary Figure S2) or ANKRD26 (r=0.71, P=0.09) (Online Supplementary Figure S3) mutations. Moreover, we found no correlations between bleeding and
(Figure 2B) between patients and healthy controls, while side scatter upon platelet activation was significantly higher in patients (Figure 2B). These results indicate poss ible impairment in platelet shape changes upon activation. We observed normal GPIb expression in resting platelets and significantly increased GPIb expression upon platelet activation (Figure 2G). This may indicate impaired platelet GPIb shedding upon activation. We also observed that total GPIIb/IIIa density upon stimulation was significantly higher in patients than in healthy controls (Figure 2H), while the difference in active GPIIb/IIIa (Figure 2I) was insignificant. Procoagulant platelet formation (Figure 2C), dense-granule secretion (Figure 2F) and α-granule secretion (Figure 2D) upon platelet activation seem to be unimpaired in patients with ANKRD26-RT.
Authors
Platelet signaling studies were performed in only two pa tients with ANKRD26-RT and revealed diminished calcium responses to both ADP (Online Supplementary Figure S1B) and PAR1-AP (Online Supplementary Figure S1D) as well as a decreased fibrinogen response to PAR1-AP (Online Sup plementary Figure S1E). In the patient with ETV6-RT, we observed normal platelet calcium signaling (Online Sup plementary Figure S1A, B) and a diminished fibrinogen re sponse upon stimulation with ADP (Online Supplementary Figure S1C Interestingly,).
Here we have described the clinical and hematologic phe notypes, history of neoplastic progression, and the results of platelet functional studies in pediatric patients with FPD/AML, ANKRD26-RT, and ETV6-RT. Our observations provide some new data on the pathogenesis of platelet dysfunction in inherited thrombocytopenias. While the re sults require validation in a larger number of patients, our findings indicate correlations between the severity of pla telet function abnormalities and bleeding tendency in these patients. The development of protocols for bleeding risk assessment and management is a promising direction for further studies.
1Dmitry Rogachev National Medical Research Center of Pediatric Hematology, Oncology and Immunology; 2Center for Theoretical Problems of Physicochemical Pharmacology, Russian Academy of Sciences; 3Lomonosov Moscow State University and 4Sechenov First Moscow State Medical University, Moscow, Russian D.Correspondence:Federation.V.FEDOROVAhttps://doi.org/10.3324/haematol.2022.281340daria.fedorova@fccho-moscow.ru
Haematologica | 107 October 2022 2515 LETTER TO THE EDITOR
In the patient with ETV6-RT, for whom data were available, flow cytometry revealed decreased forward scatter (Figure 2A) and side scatter (Figure 2B) in resting platelets, dimin ished GPIIb/IIIa activation (Figure 2I), decreased dense granule secretion (Figure 2F), and impaired GPIb shedding (Figure 2G) upon platelet stimulation.
maximum aggregation in response to any of the studied agonists (data not shown). However, several platelet func tional characteristics assessed by flow cytometry cor related with bleeding. In patients with FPD/AML, we observed strong negative correlations between the per centage of procoagulant platelets upon stimulation and both the bleeding scores (r=-0.64, P=0.02), strong negative correlations between GPIb expression upon platelet acti vation and both the scores (r=-0.63, P=0.02), and moderate negative correlations between GPIIb/IIIa activation as sessed by PAC1 binding and both the scores (r=-0.59, P=0.03). Strong negative correlations between the severity of thrombocytopenia and platelet side scatter, both in a resting state (r=-0.86, P<0.01) and upon stimulation (r=0.74, P<0.01), were also found. In patients with ANKRD26 RT, we observed strong positive correlations between platelet side scatter in an activated state and both the scores (r=0.83, P=0.03). Statistical analysis was not per formed in patients with ETV6-RT because of the small sample size.
Platelet signaling studies (continuous flow cytometry) were performed in seven patients with FPD/AML. Cytosolic calcium concentration in resting platelets was increased in three patients, while it was normal in four others (Online Supplementary Figure S1A). Platelet cytosolic calcium mobilization (Online Supplementary Figure S1B) and fibri nogen binding (Online Supplementary Figure S1C) in re sponse to ADP were significantly diminished. Impaired calcium mobilization and fibrinogen binding upon stimu lation with PAR1-AP were less pronounced, yet clearly de tectable (Online Supplementary Figure S1D, E, respectively). Increased cytosolic calcium concentration may indicate platelet pre-activation in these patients. Moreover, platelet pre-activation may explain dense granule storage pool deficiency (Figure 2E) due to premature dense granule re lease and overall platelet refractoriness in response to both weak (ADP) and strong (PAR1-AP) stimuli.
Galina S. Ovsyannikova,1* Daria V. Fedorova,1* Ivan P. Tesakov,1* Alexey A. Martyanov,1,2 Anastasia A. Ignatova,1 Evgeniya A. Ponomarenko,1 Pavel A. Zharkov,1 Anna V. Pavlova,1 Elena V. Raykina,1 Michael A. Maschan,1 Mikhail A. Panteleev,1,2,3 Galina A. Novichkova,1 Anastasia N. Sveshnikova1,2,3,4# and Nataliya S. Smetanina1#
This work was supported by a grant from the Charitable Foundation “Science for Children” in the Russian Federation.
8. Ignatova AA, Ponomarenko EA, Polokhov DM, et al. Flow cytometry for pediatric platelets. Platelets. 2019;30(4):428-437.
GSO concieved and designed the study, GSO, DVF and IPT wrote and revised the manuscript. DVF and PAZ evaluated and followed up the patients. IPT, AAM, AAI and EAP performed platelet function testing. IPT and AAM analyzed and interpreted data. AVP and EVR provided genetic testing. MAP, NSS and ANS reviewed the manuscript and contributed to study conception. MAM and GAN provided administrative, technical, and material support.
Published under a CC BY-NC license
Disclosures
The authors would like to thank the patients and their families for making this work possible. The authors cordially thank Alexander Poletaev and Elena Seregina for performing platelet light transmission aggregometry, Charlotte M. Niemeyer (Children‘s Hospital University Medical Center Freiburg, Germany) for useful comments and help with preparing the manuscript.
Raw data supporting the findings of this study are available from the author for correspondence (DVF) on request.
7. Ignatova AA, Karpova OV, Trakhtman PE, Rumiantsev SA, Panteleev MA. Functional characteristics and clinical effectiveness of platelet concentrates treated with riboflavin and ultraviolet light in plasma and in platelet additive solution. Vox Sang. 2016;110(3):244-252.
No conflicts of interest to disclose.
12. Balduini CL, Savoia A, Seri M. Inherited thrombocytopenias frequently diagnosed in adults. J Thromb Haemost. 2013;11(6):1006-1019.
Prepublished: July 7, 2022
Data-sharing statement
Received: May 3, 2022.
10. Suntsova EV, Demina IM, Ignatova AA, et al. Bleeding tendency and platelet function during treatment with romiplostim in children with severe immune thrombocytopenic purpura. Int J Hematol. 2017;105(6):841-848.
3. Noris P, Pecci A. Hereditary thrombocytopenias: a growing list of disorders. Hematology Am Soc Hematol Educ Program. 2017;2017(1):385-399.
2. Galera P, Dulau-Florea A, Calvo KR. Inherited thrombocytopenia and platelet disorders with germline predisposition to myeloid neoplasia. Int J Lab Hematol. 2019;41(Suppl 1):131-141.
11. Martyanov AA, Morozova DS, Sorokina MA, et al. Heterogeneity of integrin alphaIIbbeta3 function in pediatric immune thrombocytopenia revealed by continuous flow cytometry analysis. Int J Mol Sci. 2020;21(9):3035.
©2022 Ferrata Storti Foundation
Contributions
5. Bowman M, Riddel J, Rand ML, Tosetto A, Silva M, James PD. Evaluation of the diagnostic utility for von Willebrand disease of a pediatric bleeding questionnaire. J Thromb Haemost. 2009;7(8):1418-1421.
4. Rodeghiero F, Tosetto A, Abshire T, et al. ISTH/SSC bleeding assessment tool: a standardized questionnaire and a proposal for a new bleeding score for inherited bleeding disorders. J Thromb Haemost. 2010;8(9):2063-2065.
Accepted: June 28, 2022
Funding
Haematologica | 107 October 2022 2516 LETTER TO THE EDITOR
References
6. Poletaev AV, Koltsova EM, Ignatova AA, et al. Alterations in the parameters of classic, global, and innovative assays of hemostasis caused by sample transportation via pneumatic tube system. Thromb Res. 2018;170:156-164.
9. Ignatova AA, Suntsova EV, Pshonkin AV, et al. Platelet function and bleeding at different phases of childhood immune thrombocytopenia. Sci Rep. 2021;11(1):9401.
Acknowledgments
1. Pecci A, Balduini CL. Inherited thrombocytopenias: an updated guide for clinicians. Blood Rev. 2021;48:100784.
Patient 2 (Figure 1B) is a 2-year-old Black female with sickle cell (Hb SC) disease who presented with 1 day of fever and vaso-occlusive crisis. She had no respiratory symptoms or known history of COVID-19. After hospital admission, she was persistently febrile with rising inflam matory markers despite antibiotic therapy. Infectious dis ease work-up was negative including blood cultures, urine cultures, and chest X-ray (CXR) were negative for pathol ogy, but revealed anti-SARS-CoV-2 antibodies in blood with a negative SARS-CoV-2 PCR. Further evaluation dem onstrated elevated CRP (19.9 mg/dL), ferritin (2,913 ng/mL), B-type natriuretic peptide (NT-proBNP; 39,972 pg/mL), and D-dimer (14.59 µg/mL) with a normal troponin T. TTE revealed mildly reduced left ventricle ejection frac tion (LVEF) of 50-55%, diastolic dysfunction, and a mod erate pericardial effusion. Based on these findings and presence of thrombocytopenia, a diagnosis of MIS-C was made. IVIG (2 g/kg), methylprednisolone (1 mg/kg every 12 hours) and enoxaparin were initiated. Though she initially had no evidence of renal dysfunction, her creatinine grad ually increased during her hospitalization (peak HD 5), and she developed severe hypertension requiring initiation of five antihypertensives. Repeat CXR demonstrated bilateral pleural effusions. Given the concern for uncontrolled in
The successful use of eculizumab for treatment of thrombotic microangiopathy in pediatric acute SARSCoV2 infection and multisystem inflammatory syndrome in children
Patient 1 (Figure 1A) is an 11-year-old Black female with sickle cell disease (HbS β thalassemia) who was initially hospitalized with positive SARS-CoV-2 PCR and acute chest syndrome. While hospitalized, she developed warm autoimmune hemolytic anemia (AIHA) with initial re sponse to IVIG and methylprednisolone. She was dis charged on prednisone (1 mg/kg every 12 hours). Five days after discharge she presented in status epilepticus and was notably hypertensive and intermittently febrile. Schis tocytes and an elevated LDH were noted. Brain magnetic resonance imaging with angiography (MRI/MRA) was most consistent with posterior reversible encephalopathy syn drome (PRES). Despite continuation of prednisone for AIHA, she developed worsening anemia and thrombo cytopenia, both requiring transfusions, and worsening re fractory hypertension requiring five antihypertensive medications. Elevated temperature, C-reactive protein (CRP; peak 27.3 mg/dL), ferritin (peak 34,053 ng/mL), and D-Dimer (peak >20.0 µg/mL) also suggested a hyper inflammatory state (Figure 1A). This prompted, on hospital day (HD) 7-8, initiation of high-dose methylprednisolone (1 g/day divided every 6 hours), rituximab (560 mg), and
Evidence of complement activation, endothelial injury, and thrombotic microangiopathy (TMA) is becoming increas ingly recognized in patients with acute SARS-CoV-2 infec tion and multisystem inflammatory syndrome in children (MIS-C) and adults (MIS-A). Recently, Diorio et al. found elevated lactate dehydrogenase (LDH) and soluble C5b-9 (sC5b-9), anemia, thrombocytopenia, schistocytes, renal damage, and hypertension in a subset of pediatric pa tients with active SARS-CoV-2 infection and MIS-C, con sistent with complement-mediated TMA (CM-TMA).1 Eculizumab, an anti-C5 monoclonal antibody that inhibits terminal complement activation, has been used to treat hematopoietic cell transplant-associated TMA (TA-TMA), with a response rate of up to 66%.2 Given reported find ings consistent with TMA in both acute SARS-CoV-2 in fection and MIS-C, eculizumab may provide therapeutic benefit in this setting. However, there is a paucity of data describing its use. Here we present three patients diag nosed with TMA during acute COVID-19/MIS-C who were treated with eculizumab and propose a “multiple-hit” hy pothesis for pediatric patients with an increased risk of SARS-CoV-2 associated TMA.
IVIG (1 g/kg) for aggressive AIHA treatment, and anakinra (150 mg every 6 hours) and tocilizumab (400 mg twice) for treatment of hyperinflammation (Figure 1A). Despite these therapies, on HD 9 she developed new hypoxic respiratory failure and bronchoscopy revealed diffuse alveolar hemor rhage (DAH). She also demonstrated pulmonary hyperten sion on transthoracic echocardiogram (TEE), proteinuria (peak 5.15 mg/mg creatinine), elevated LDH (peak 2,905 units/L), elevated sC5b-9 (peak 1,254 ng/mL), thrombo cytopenia refractory to platelet transfusions, schistocytes, and a low C4, consistent with CM-TMA (Table 1). Following the diagnosis of CM-TMA, she received her first dose of eculizumab (HD 9), after which both her CH50 and sC5b9 levels normalized, and her DAH and pulmonary hyperten sion all rapidly improved. Prior to eculizumab she required platelets and blood almost daily. Following her second dose of eculizumab (HD 12) she did not require any trans fusions for 3 weeks. Following her third dose of eculizu mab (HD 14), she was transferred out of the intensive care unit. She was able to be discharged on HD 36.
Haematologica | 107 October 2022 2517 CASE REPORT
flammation and serositis, anakinra (10 mg/kg/day, divided every 6 hours) and ibuprofen were started on HD 10. Based on lack of improvement of severe LDH elevation (peak 885 units/L), anemia (nadir 6.3 g/dL), thrombocytopenia, pres ence of schistocytes, proteinuria (2+), severe hyperten
sion, serositis, and elevated soluble C5b-9 (396 ng/mL) despite intensification of MIS-C therapy, the patient was diagnosed with CM-TMA and was treated with eculizumab 600 mg (Table 1). Two days following the first dose of eculizumab, her blood pressure improved and three of her
A B C Haematologica | 107 October 2022 2518 CASE REPORT
Figure 1. Temporal association of clinical and laboratory improvement with eculizumab dosing. (A) In patient 1, lactate dehydro genase (LDH) drastically decreased after the first dose of eculizumab. Terminal complement (C5b-9) and total complement (CH50) notably decreased after the first dose of eculizumab illustrating adequate inhibition of the complement cascade. Hemo globin and platelets count stabilized after 2 doses of eculizumab with significant reduction in need for platelet transfusions. Systemic hypertension fluctuated during the hospital course with no temporal association with eculizumab. (B) In patient 2, initial improvement in LDH and hemoglobin as hemolysis related to improvement of underlying vaso-occlusive crisis can be seen; however, thrombocytopenia persists despite use of steroids, anakinra and IVIG for treatment of multisystem inflammatory syndrome in children (MIS-C). Peak creatinine occurred on hopital day (HD) 5 with improvement to baseline by HD 8. There was continued improvement of LDH and hemoglobin and resolution of thrombocytopenia after the initiation of eculizumab. Adequate complement inhibition was achieved based on decreased C5b-9 and CH50 levels. Systolic and diastolic blood pressure increased on HD 6. Hypertension was progressive and refractory to multiple antihypertensives. After the second dose of eculizumab, blood pressure improved, and antihypertensive agents were aggressively weaned, and steroids were titrated down with the improve ment of inflammation. (C) In patient 3, there was improvement in hemoglobin and C5b-9 with cyclosporine discontinuation. Ad equate complement inhibition was achieved based on decreased CH50 levels. LDH showed rapid and progressive reduction after initiation of eculizumab. PCT: pericardiocentesis; PLT: platelet transfusion; ECZ: eculizumab; AHT: hypertensive medications.
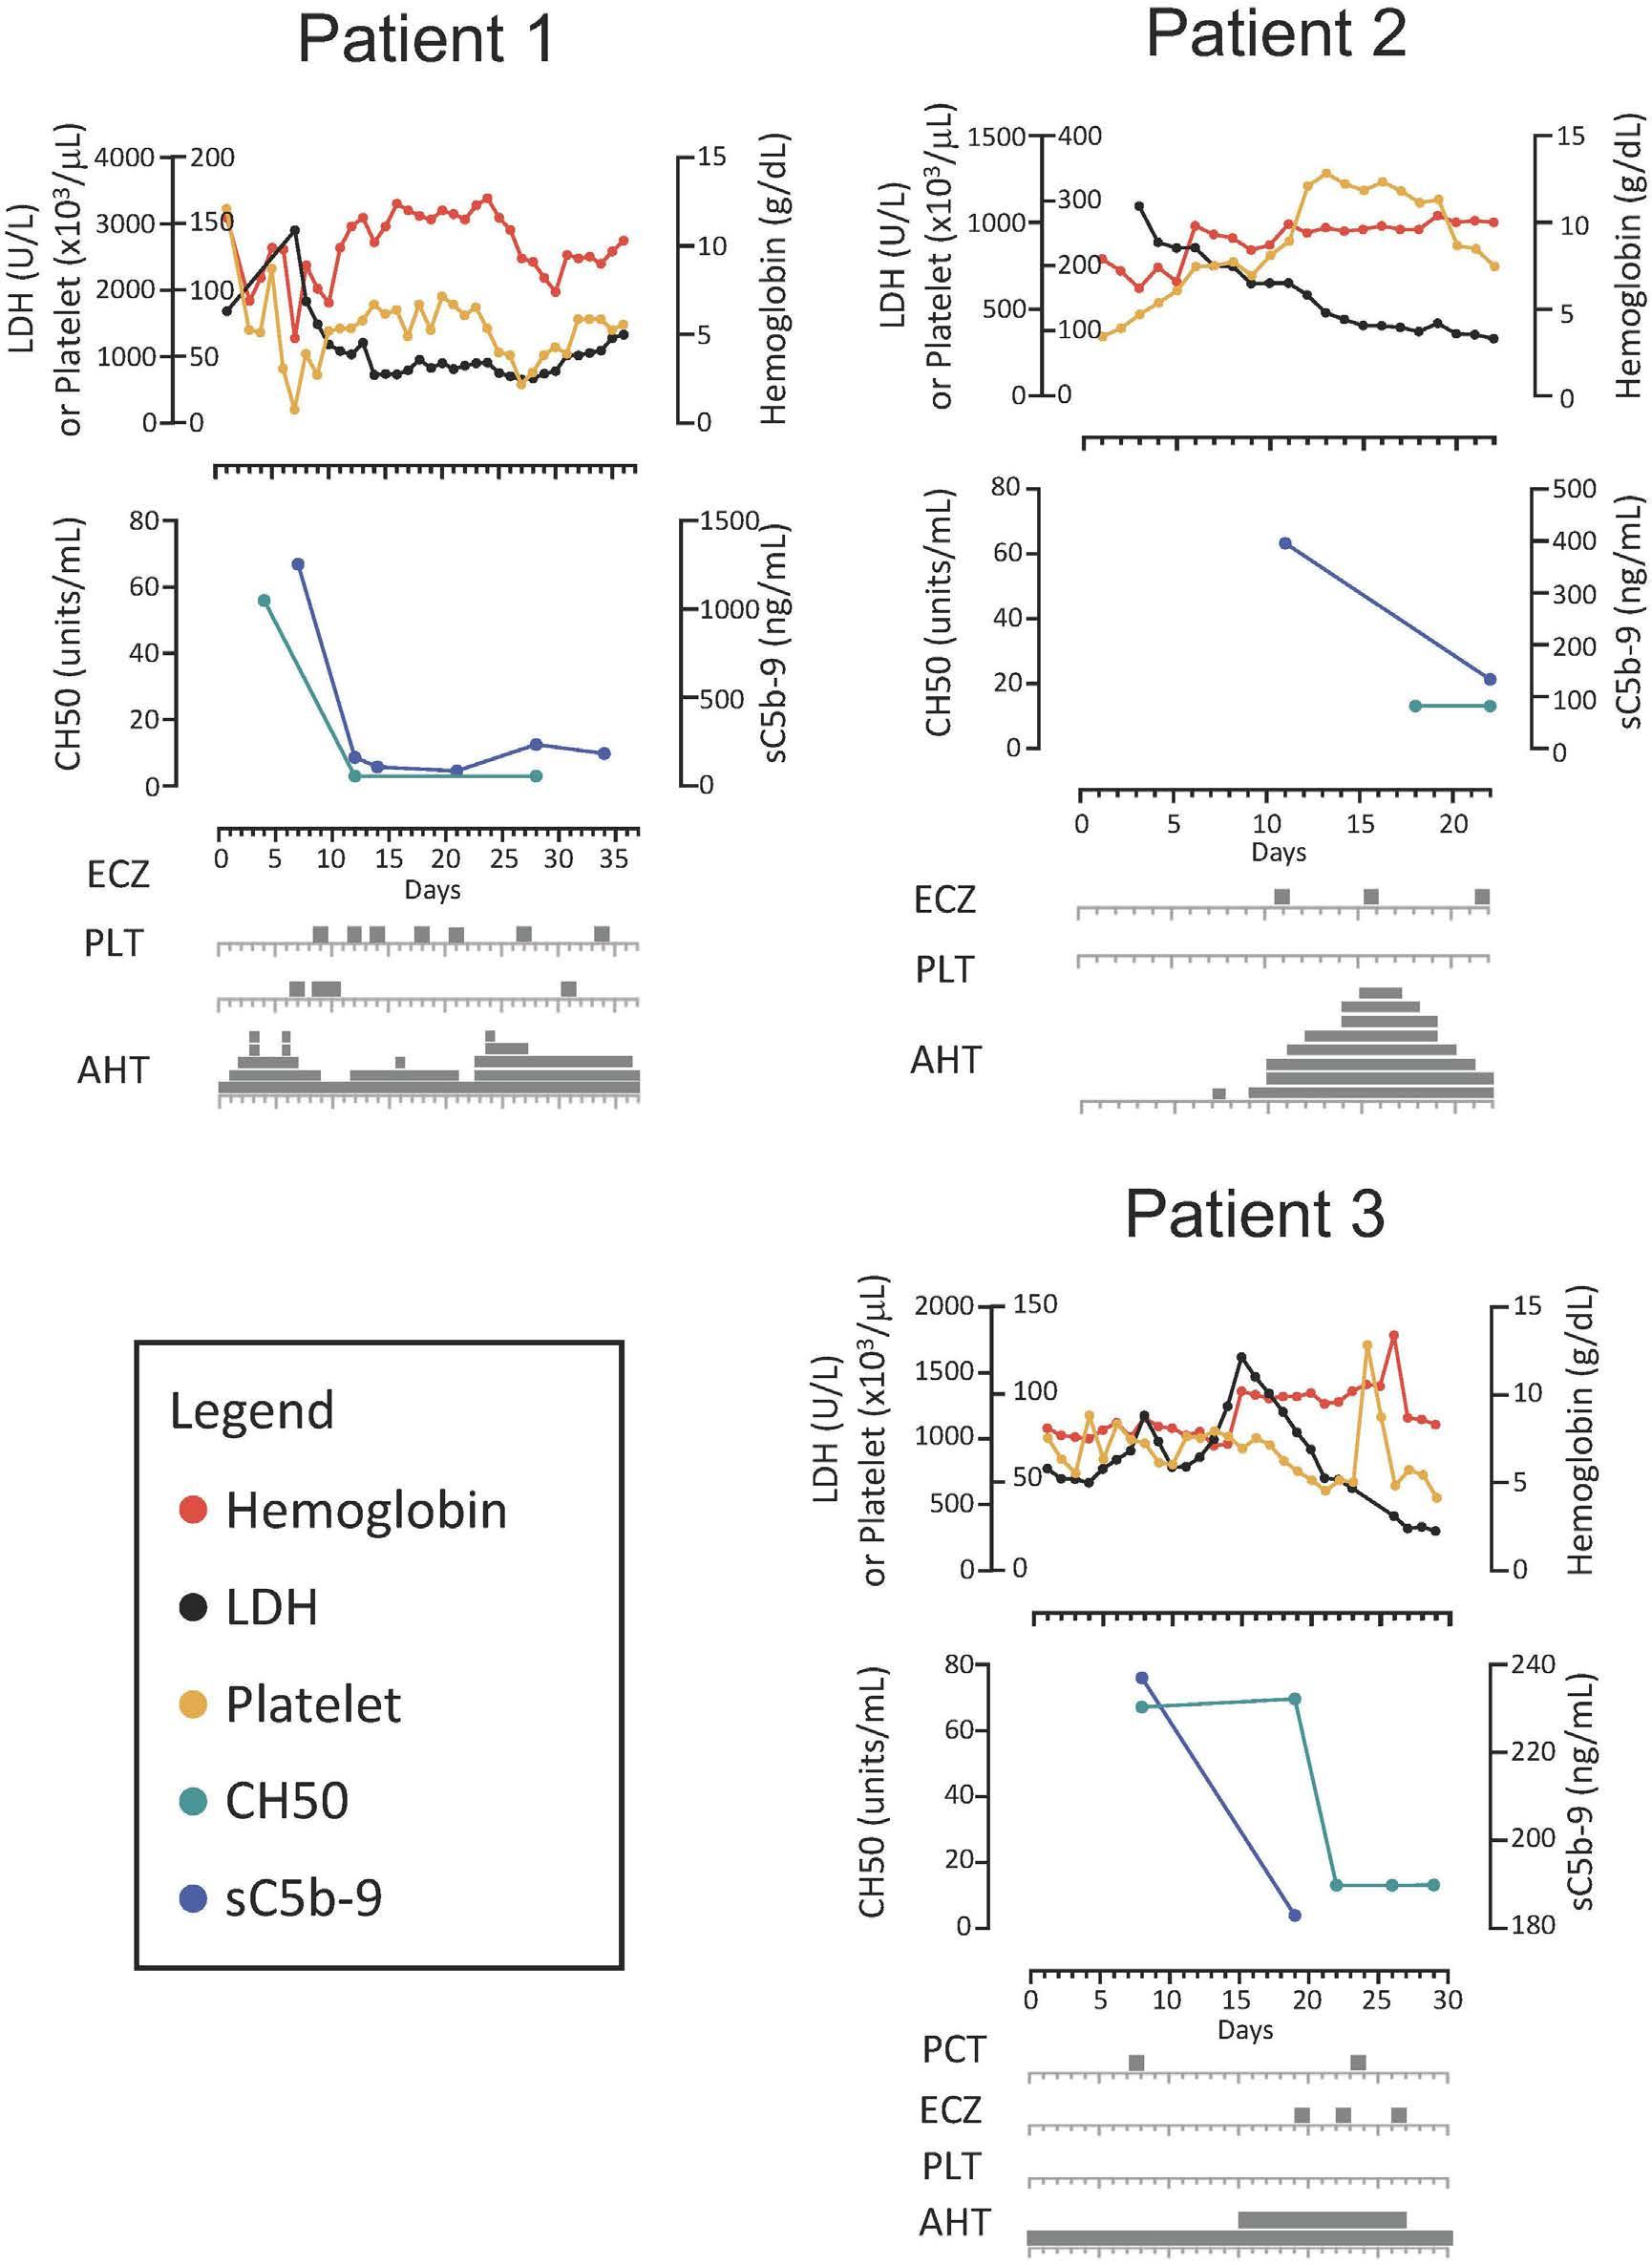
Elevated LDH + + +
New thrombocytopenia for age + + +***
Other symptoms consistent with TMA Serositis + +
Renal dysfunction* + + PRES +
showed a pericardial effusion without tamponade physi ology and preserved biventricular function. Remdesivir (125 mg daily for 10 days) and a single infusion of con valescent plasma were given with improvement of respir atory status. However, on HD 12 repeat CXR and TTE demonstrated worsening serositis with bilateral pleural effusions and enlargement of the pericardial effusion with tamponade physiology. Emergent pericardial drainage was performed, and dexamethasone (0.15 mg/kg/day for 10 days) was started. Additionally, the patient was noted to have rising LDH, schistocytes, thrombocytopenia, protei nuria (4.51 mg/mg creatinine), and hypertension which was suggestive of evolving TMA (Table 1; Figure 1C). On HD 15, cyclosporine for graft-versus-host disease (GVHD) prophy laxis was discontinued with some improvement in anemia and sCb-9 but without resolution of serositis or signifi cant improvement in other laboratory findings (proteinuria [11.45 mg/mg creatinine], LDH, schistocyte count [7.1 OIF
Presence of hypertension (>99th percentile for age, sex and height) + + +
Pulmonary hemorrhage + Eculizumab details
Dose, mg 900 300 600
Weight, kg 51 13.5 23.9
Duration of therapy, weeks 3 2 12
TMA: thrombotic microangiopathy; LDH: lactate dehydrogenase; PRES: posterior reversible encephalopathy; *renal dysfunction was determined based on the Kidney Disease: Improving Global Outcomes (KDIGO) criteria; **patient also had AIHA; ***platelet count after engraftment was 212x10x103/µL with baseline platelet count at admission138x103 cells/µL.
Haematologica | 107 October 2022 2519 CASE REPORT
Number of doses required 5 3 7
Elevated sC5b-9 + +
five antihypertensives were discontinued. After her sec ond dose of eculizumab 600 mg, she was transferred out of the intensive care unit and only required one antihy pertensive agent. Her inflammatory markers, renal func tion, and thrombocytopenia all returned to baseline following her second dose. Subsequent TTE showed im provement in LVEF and resolution of the pericardial effu sion. By the end of her hospital stay, her sC5b-9 level normalized, and she was discharged on one cardioprotec tive antihypertensive medication.
Presence of schistocytes + + + New anemia for age +**
TMA criteria (number met) (2, 7, 11) 7 6 5
Patient 3 (Figure 1C) is a 6-year-old Hispanic male with relapsed B-cell acute lymphoblastic leukemia admitted with fever and hypoxemia on day +45 following a matched sibling donor hematopoietic cell transplant. Work-up re vealed a positive SARS-CoV-2 PCR on HD 1. Elevated Creactive protein (CRP) (3.9 mg/dL), ferritin (680 ng/mL), D-dimer (0.83 µg/mL) and NT-proBNP; 1,740 pg/mL were noted without elevation of troponin-T. A TTE on HD 1
Patient 1 Patient 2 Patient 3
Presence of proteinuria (>/=1+ proteinuria [30 mg/dL] on urinalysis or random urine protein/ creatinine ratio >/=2 mg/mg + + +
Table 1. Signs and symptoms of complement-mediated thrombotic microangiopathy in patient series.
Figure 2. Multiple-hit hypothesis of complement activation. SARS-CoV-2 infection leads to activation of the complement cascade through all three known pathways - classical, lectin, and alternative. The classical pathway is activated by binding of the C1 complex with antigen-antibody (Ag-Ab) complexes. The robust formation and continued presence of Ag-Ab complexes may act as a driver of complement activation in the setting of patient with multisystem inflammatory syndrome in children (MIS-C). SARS-CoV-2 N protein is thought to interact with the MASP2-MBL complex leading to activation of the lectin pathway.8 SARSCoV-2 S protein interacts and activates the C3 within the alternative pathway.10,12 All 3 pathways converge with the production of C3 and C5 convertases and ultimately the cleavage and production of both C3a and C5a, which are anaphylatoxins, and C5b, leading to the development of the membrane attach complex (MAC). C3a and C5a propagate inflammation by recruiting neutro phils and monocytes/macrophages, which release proinflammatory cytokines, leading to damage to surrounding tissue and en dothelium. Additionally, in the setting of complement-mediated thrombotic microangiopathy (CM-TMA), the MAC is thought to lead to endothelial damage by forming in the membrane of endothelial cells, endotheliitis, and the formation of microthrombi.2,7 In our patient series, there was likely additional activation of the complement system in the setting of sickle cell disease (patients 1 and 2) or autoimmune hemolytic anemia due to free heme that is known to interact with C3 (alternative pathway), which lead to increased due to free heme that is known to cause C3 (alternative pathway) hydrolysis with production of downstream com plement (C3a, C3b, C5a, C5b).9 Patient 3 was day +45 after hematopoietic cell transplant and on a calcineurin inhibitor for graftversus-host disease prophylaxis that is known to lead to increased complement activation through the alternative pathway.2,7 An additional risk factor that was unknown in our patients could be the presence of complement mutations leading to issues with homeostatic balance of complement activity. The mechanism of action of eculizumab is the binding of C5, thereby preventing the formation of C5a and the MAC preventing downstream effects. All patients in this series either showed evidence of or had presumed increased level of MAC with clinical response with initiation of eculizumab.
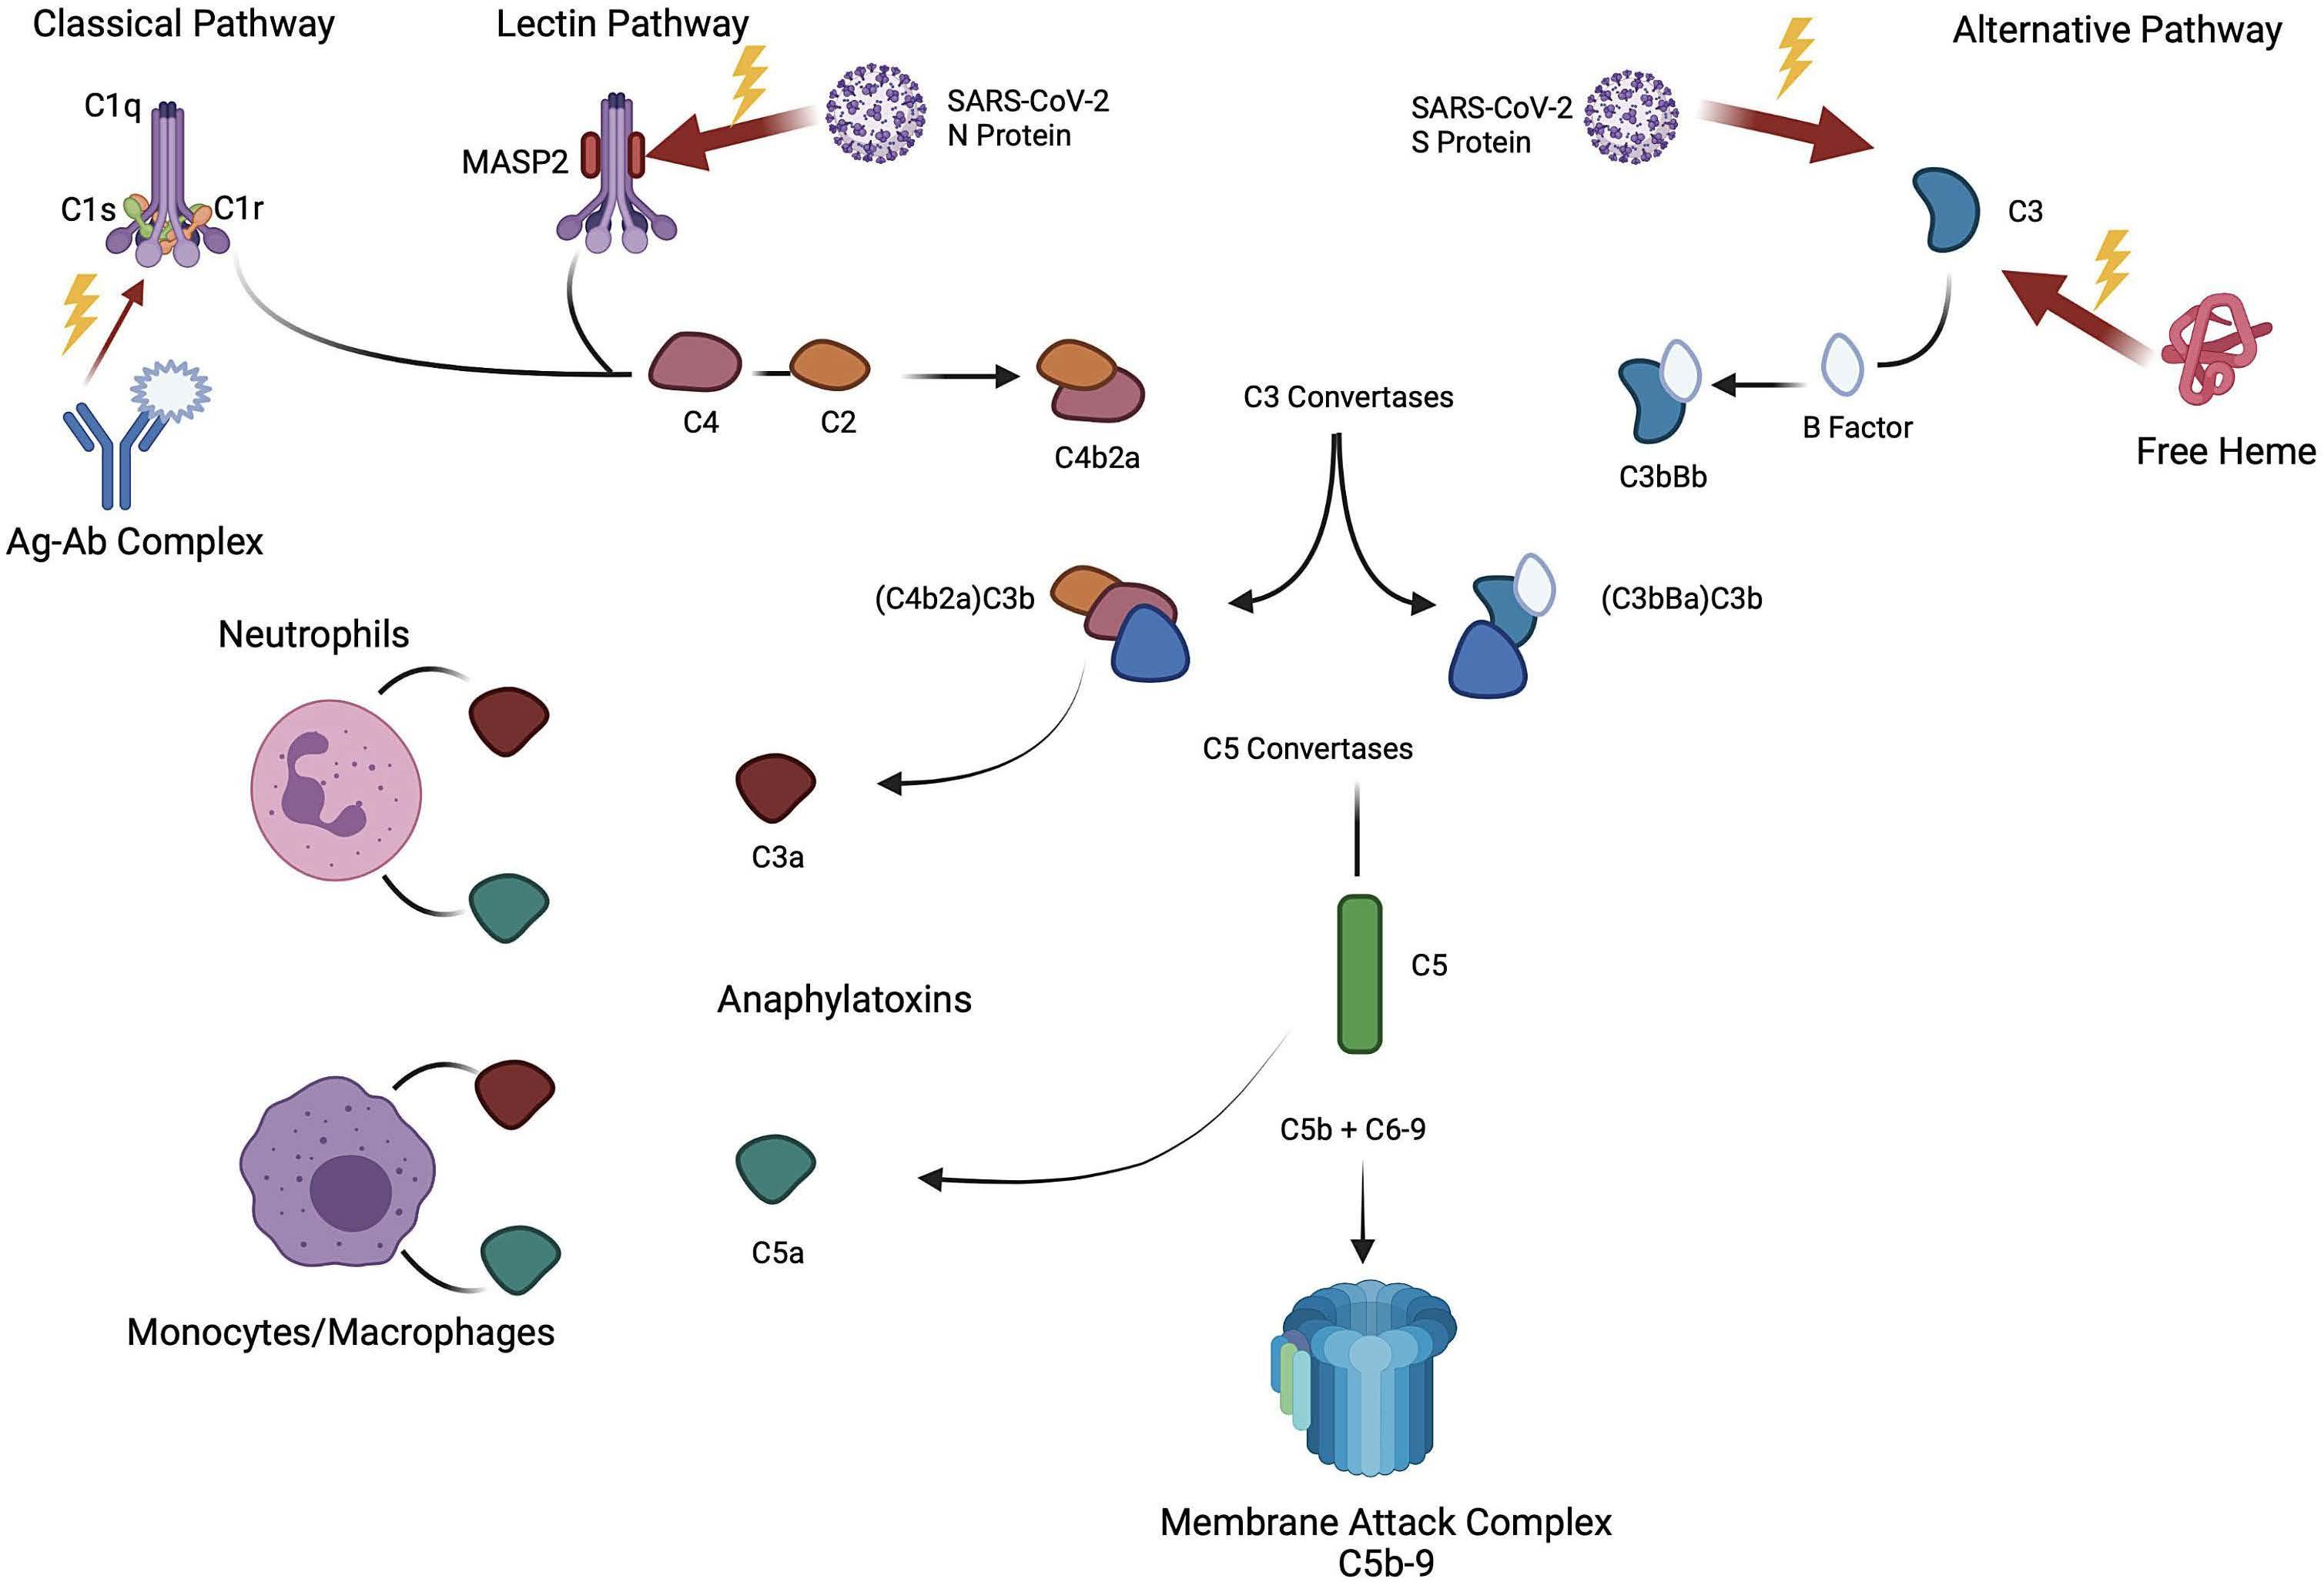
Haematologica | 107 October 2022 2520 CASE REPORT
There has been increasing attention given to the contribu tion of complement pathway activation in the pathogen esis of SARS-CoV-2 infection (Figure 2). Indeed, elevated soluble C5b-9 has been found to correlate with SARSCoV-2 disease severity.1,3,4 Reported efficacy of terminal complement inhibition for treatment of severe acute COVID-19 has been mixed. Initially, there was evidence of improved outcomes in a proof-of-concept study;5 how ever, a phase III trial of ravulizumab (mAb for C5a; clini caltrials gov. Identifier: NCT 04369469) was stopped early due to a lack of efficacy. However, these studies did not
schistocytes/100 X objective]). The patient underwent a pericardial window procedure for persistent pericardial ef fusion and eculizumab was started on HD 19 for TA-TMA (Table 1). After initiation of eculizumab, LDH and schisto cyte count improved (3.2 OIF) and hemoglobin stabilized (Figure 1C). After the second dose of eculizumab, protei nuria resolved, and antihypertensive therapy was weaned. He was discharged after a 4-week hospitalization and eculizumab was continued 8 weeks after discharge. His platelet count, creatinine, and hemoglobin normalized with this therapy.
Here we discuss three patients with diagnoses of acute COVID-19/MIS-C and complement-mediated TMA with progressive end organ dysfunction, refractory hyperten sion, acute kidney injury, and serositis and/or DAH, despite appropriate COVID-19/MIS-C directed therapies (Table 1). Interestingly, all patients had a biphasic clinical course with initial improvement upon starting COVID-19/MIS-C directed therapies followed by clinical worsening (median 9 days after admission). After treatment with eculizumab, all patients had appropriate laboratory response and im provement in serositis, hypertension, and organ function. The diagnosis of TMA in these patients was difficult due to possible alternative etiologies for the corresponding ab normal findings, such as elevated LDH in a patient with sickle cell disease. However, the presence of multiple spe cific TMA-related findings along with clinical response to eculizumab are suggestive of CM-TMA. All three patients had known causes of underlying endothelial injury and complement activation, including AIHA, TA-TMA, and sickle cell disease.6 We hypothesize that the additional comple ment activation associated with SARS-CoV-2 infection contributed to a multiple-hit pathogenesis that resulted in uncontrolled complement activation and severe organ dysfunction in these at-risk patients (Figure 2).2,6-10 None of these patients experienced recurrent TMA, consistent with previous reports of resolution of increased terminal complement levels by 30 days after initial SARS-CoV-2 in CM-TMAfection.3
should be considered in patients with acute COVID-19/MIS-C who have known underlying endothelial injury and evidence of worsening end organ dysfunction, particularly if previously showing improvement or failing standard therapy. In these situations, terminal comple ment inhibition with eculizumab may offer therapeutic benefit. Further investigation is warranted to determine ef ficacy and length of therapy of eculizumab in patients with evidence of TMA and end organ dysfunction in the setting of acute COVID-19/MIS-C.
1Department of Clinical Education, St Jude Children’s Research
Funding
Tarun Aurora,1 Noel Joseph,2 Senthil Velan Bhoopalan,3 Miguela A Caniza,4,5 Tim Flerlage,4 Saad Ghafoor,6 Jane Hankins,3 Diego R Hijano,4 Rohith Jesudas,3 Justin Kirkham,1 Hugo Martinez,7 Gabriela Maron Alfaro,4 Akshay Sharma8 and Melissa Hines6
Contributions
AS is the site principal investigator of clinical trials for genome editing of sickle cell disease sponsored by Vertex Pharmaceuticals/CRISPR Therapeutics (clinicaltrials gov. Identifier: NCT03745287) and Novartis (clinicaltrials gov. Identifier: NCT04443907). The industry sponsors provide funding for the clinical trial, which includes salary support paid to AS institution.
Disclosures
AS has received consultant fee from Spotlight Therapeutics, Medexus Inc. and Vertex Pharmaceuticals. AS has also received research funding from CRISPR Therapeutics and honoraria from Vindico Medical Education. JH receives research funding from Global Blood Therapeutics and consultancy fees from Global Blood Therapeutics, Forma Therapeutics and bluebird bio. SB receives grant support from the American Society of Hematology.
Data-sharing statement
Published©2022Prepublished:Accepted:Received:https://doi.org/10.3324/haematol.2021.280603M.Correspondence:HINES-melissa.hines@stjude.orgJanuary20,2022.May18,2022.May26,2022.FerrataStortiFoundationunderaCCBY-NClicense
No conflicts of interest to disclose.
Original data is available to other investigators after obtaining the appropriate data agreement. Please contact the corresponding author.
Haematologica | 107 October 2022 2521 CASE REPORT
All authors provided clinical care (except TF) to the patients presented in this case series; TA, NJ, SVB, JK, and MH authored the manuscript; SVB and MH (with Biorender) developed the figures. All authors were involved with the case analyses, and reviewed, edited, and refined the manuscript.
Hospital; 2Department of Pediatrics, Clinical Education, University of Tennessee Health Science Center; 3Department of Hematology, St Jude Children’s Research Hospital; 4Department of Infectious Diseases, St Jude Children’s Research Hospital; 5Department of Global Pediatric Medicine, St Jude Children’s Research Hospital; 6Department of Pediatric Medicine, Division of Critical Care, St Jude Children’s Research Hospital; 7Department of Pediatrics, Division of Cardiology, University of Tennessee Health Science Center and 8Department of Bone Marrow Transplantation and Cellular Therapy, St Jude Children’s Research Hospital, Memphis, TN, USA
GM receives research funding from Astellas Inc and SymBio Pharmaceuticals Limited. MH receives research funding from Incyte.
select for patients with clear evidence of TMA or endothe lial dysfunction, which leaves open the possibility of effi cacy for the subset of patients with these findings in the setting of COVID-19.
Authors
6. Frimat M, Tabarin F, Dimitrov JD, et al. Complement activation by heme as a secondary hit for atypical hemolytic uremic syndrome. Blood. 2013;122(2):282-292.
5. Annane D, Heming N, Grimaldi-Bensouda L, et al. Eculizumab as an emergency treatment for adult patients with severe COVID19 in the intensive care unit: a proof-of-concept study. EClinicalMedicine. 2020;28:100590.
Haematologica | 107 October 2022 2522 CASE REPORT
4. de Nooijer AH, Grondman I, Janssen NAF, et al. Complement activation in the disease course of coronavirus disease 2019 and its effects on clinical outcomes. J Infect Dis. 2021;223(2):214-224.
8. Chouaki Benmansour N, Carvelli J, Vivier E. Complement cascade in severe forms of COVID-19: recent advances in therapy. Eur J Immunol. 2021;51(7):1652-1659.
9. Merle NS, Grunenwald A, Rajaratnam H, et al. Intravascular hemolysis activates complement via cell-free heme and hemeloaded microvesicles. JCI Insight. 2018;3(12):e96910.
11. Gloude NJ, Dandoy CE, Davies SM, et al. Thinking beyond HLH: clinical features of patients with concurrent presentation of hemophagocytic lymphohistiocytosis and thrombotic microangiopathy. J Clin Immunol. 2020;40(5):699-707.
12. Yan B, Freiwald T, Chauss D, et al. SARS-CoV-2 drives JAK1/2dependent local complement hyperactivation. Sci Immunol. 2021;6(58):eabg0833.
10. Yu J, Yuan X, Chen H, et al. Direct activation of the alternative complement pathway by SARS-CoV-2 spike proteins is blocked by factor D inhibition. Blood. 2020;136(18):2080-2089.
2. Jodele S, Dandoy CE, Lane A, et al. Complement blockade for TA-TMA: lessons learned from a large pediatric cohort treated with eculizumab. Blood. 2020;135(13):1049-1057.
References
3. Cugno M, Meroni PL, Gualtierotti R, et al. Complement activation and endothelial perturbation parallel COVID-19 severity and activity. J Autoimmun. 2021;116:102560.
1. Diorio C, Henrickson SE, Vella LA, et al. Multisystem inflammatory syndrome in children and COVID-19 are distinct presentations of SARS-CoV-2. J Clin Invest. 2020;130(11):5967-5975.
7. Jodele S, Laskin BL, Dandoy CE, et al. A new paradigm: diagnosis and management of HSCT-associated thrombotic microangiopathy as multi-system endothelial injury. Blood Rev. 2015;29(3):191-204.
Acquired pure red cell aplasia (PRCA) is a heterogenous entity, which may present in association with autoimmune diseases, lymphoproliferative disorders including large granular lymphocytic leukemia (LGL) or chronic lympho cytic leukemia (CLL), monoclonal gammopathy of unde termined significance (MGUS), thymoma, viral infections (parvovirus B19), drugs (recombinant erythropoietin), or ABO-incompatible stem cell transplantation.1 An immune basis involving antibody and cell-mediated responses which inhibit red cell erythropoiesis is considered a com mon pathogenetic mechanism. Accordingly, immunosup pressive agents are utilized as first line therapy and cyclosporine in combination with corticosteroids yields high response rates (66-95%).2 Treatment considerations in refractory cases, include cyclophosphamide, alemtu zumab, antithymocyte globulin, bortezomib, rituximab, and intravenous immunoglobulin (IVIG).1 Herein, we de scribe a 74-year-old female with a 10-year history of treat ment-refractory idiopathic acquired PRCA with rapid and sustained response to daratumumab. At initial presentation, she developed symptomatic ane mia (hemoglobin 5 g/dL, mean coruscular volume [MCV] 98% fL) requiring hospitalization. Anemia workup revealed severe reticulocytopenia, with reticulocyte percentage <0.28 and an absolute reticulocyte count of 2,800. Serol ogy for parvovirus B19, cytomegalovirus, hepatitis B, C, and human immunodeficiency virus were negative. Mono clonal protein studies identified an IgG κ, 0.5 g/dL with a normal immunoglobulin free light chain ratio. Computed tomography scan of the chest showed no evidence of thy moma. Bone marrow (BM) examination revealed matura tion arrest in erythroid precursors, few pro-normoblasts were seen, granulopoiesis and megakaryocytes appeared normal, and an increase in plasma cells (5%) was noted. There was neither evidence of a lymphoproliferative dis order nor myelodysplastic syndrome. Chromosome analy sis and T-cell gene rearrangement studies were within normal limits. A diagnosis of idiopathic PRCA was estab lished and the patient was initiated on cyclosporine and prednisone 60 mg daily with a 3-month taper. After 6 months of cyclosporine, given the ongoing transfusion needs, she received rituximab 375 mg/m2 weekly for four doses without clinical response. Thereafter, a combination of anti-thymocyte globulin (ATG), cyclosporine and pred nisone were administered, and 3 months later treatment was switched to alemtuzumab, followed by cyclophos phamide orally for 6 months which was discontinued due to treatment emergent neutropenia. Next, a trial of bor
Daratumumab for treatment-refractory acquired
Weretention.elected to observe off active therapy for 3 and a half years with continued red cell transfusion support every 3 weeks, and iron overload with peak ferritin of 1,194 ng/mL was managed with deferasirox. Monoclonal protein studies were monitored annually; IgG κ remained stable at 0.5 g/dL. A repeat BM biopsy was obtained which con tinued to show decreased erythropoiesis and 5-9% CD138-positive plasma cells (Figure 1A). Cytogenetic studies were without clonal abnormality. At that time, treatment with daratumumab, a human IgG1 k monoclonal antibody targeting plasma cells, at a dose of 16 mg/kg weekly was initiated. At baseline, the patient was trans fusion-dependent every 3 weeks and the reticulocyte per centage was <0.28. A week after initiation of therapy, hemoglobin was above 8 g/dL and 1 and 2-month post therapy, hemoglobin values were 9.4 g/dL and 11 g/dL, re spectively. Similarly, the reticulocyte % peaked at month 1, at 3.33 (Figure 2). Daratumumab was administered weekly for 8 weeks and given the peak hemoglobin of 11 g/dL, the treatment schedule was changed to bimonthly with hemoglobin consistently remaining above 10 g/dL without transfusion support. Ferritin decreased to 79 ng/mL by 2 months following initiation of therapy, hence deferasirox was discontinued. At 9 months post therapy, a repeat BM was obtained which demonstrated a normo cellular BM with morphologically unremarkable trilineage hematopoiesis, including an adequate number of erythroid precursors, however, clonal plasma cells (up to 10%) re mained unchanged (Figure 1B). Daratumumab did not re sult in any adverse effects and no infusion-related reactions were noted. Given the sustained hemoglobin >10 g/dL, but downtrending reticulocytes, she continues to receive daratumumab on a monthly basis. IgG κ mono clonal gammopathy is still present and measures 0.3 g/dL on last measure. Immunoglobin levels have been closely monitored without major infectious complications other than an upper respiratory tract infection.
The above case highlights the challenges encountered in management of PRCA, specifically in cases without a clear etiology. Treatment recommendations are based on case series and expert opinion.1 The association of MGUS with
Haematologica | 107 October 2022 2523 CASE REPORT
tezomib 2 mg subcutaneously once weekly, 2 weeks on and 1 week off for a total of eight cycles was pursued. Given the lack of clinical benefit with bortezomib, eltrom bopag with dose uptitrated to 125 mg daily was prescribed for a total of 1 year without efficacy, followed by danazol for 5 months which resulted in masculinization and fluid
idiopathic pure red cell aplasia
Figure 1. Bone marrow biopsy findings pre- and post-treatment with daratumumab. (A) Bone marrow biopsy pre-treatment with daratumumab. Bone marrow (BM) aspirate (500x magnification), core biopsy (100x magnification) and immunohistochemical stains (100x magnification) performed on the core biopsy. The findings show decreased erythropoiesis with left shift as demon strated by scattered E-cadherin-positive pronormoblasts and very rare hemoglobin-positive maturing erythroids, a normal number of myelomonocytic elements (positive for myeloperoxidase) and 5-9% CD138-positive plasma cells. (B) BM biopsy posttreatment with daratumumab. BM aspirate (500x magnification), core biopsy (100x magnification) and clot section (100x magnifi cation). The findings show a normocellular BM for age, with morphologically unremarkable trilineage hematopoiesis, including an adequate number of erythroid precursors. CD138 immunohistochemical stain demonstrates increased plasma cells (up to 10%). κ and λ light chain in situ hybridization demonstrates κ light chain restriction within the plasma cells.
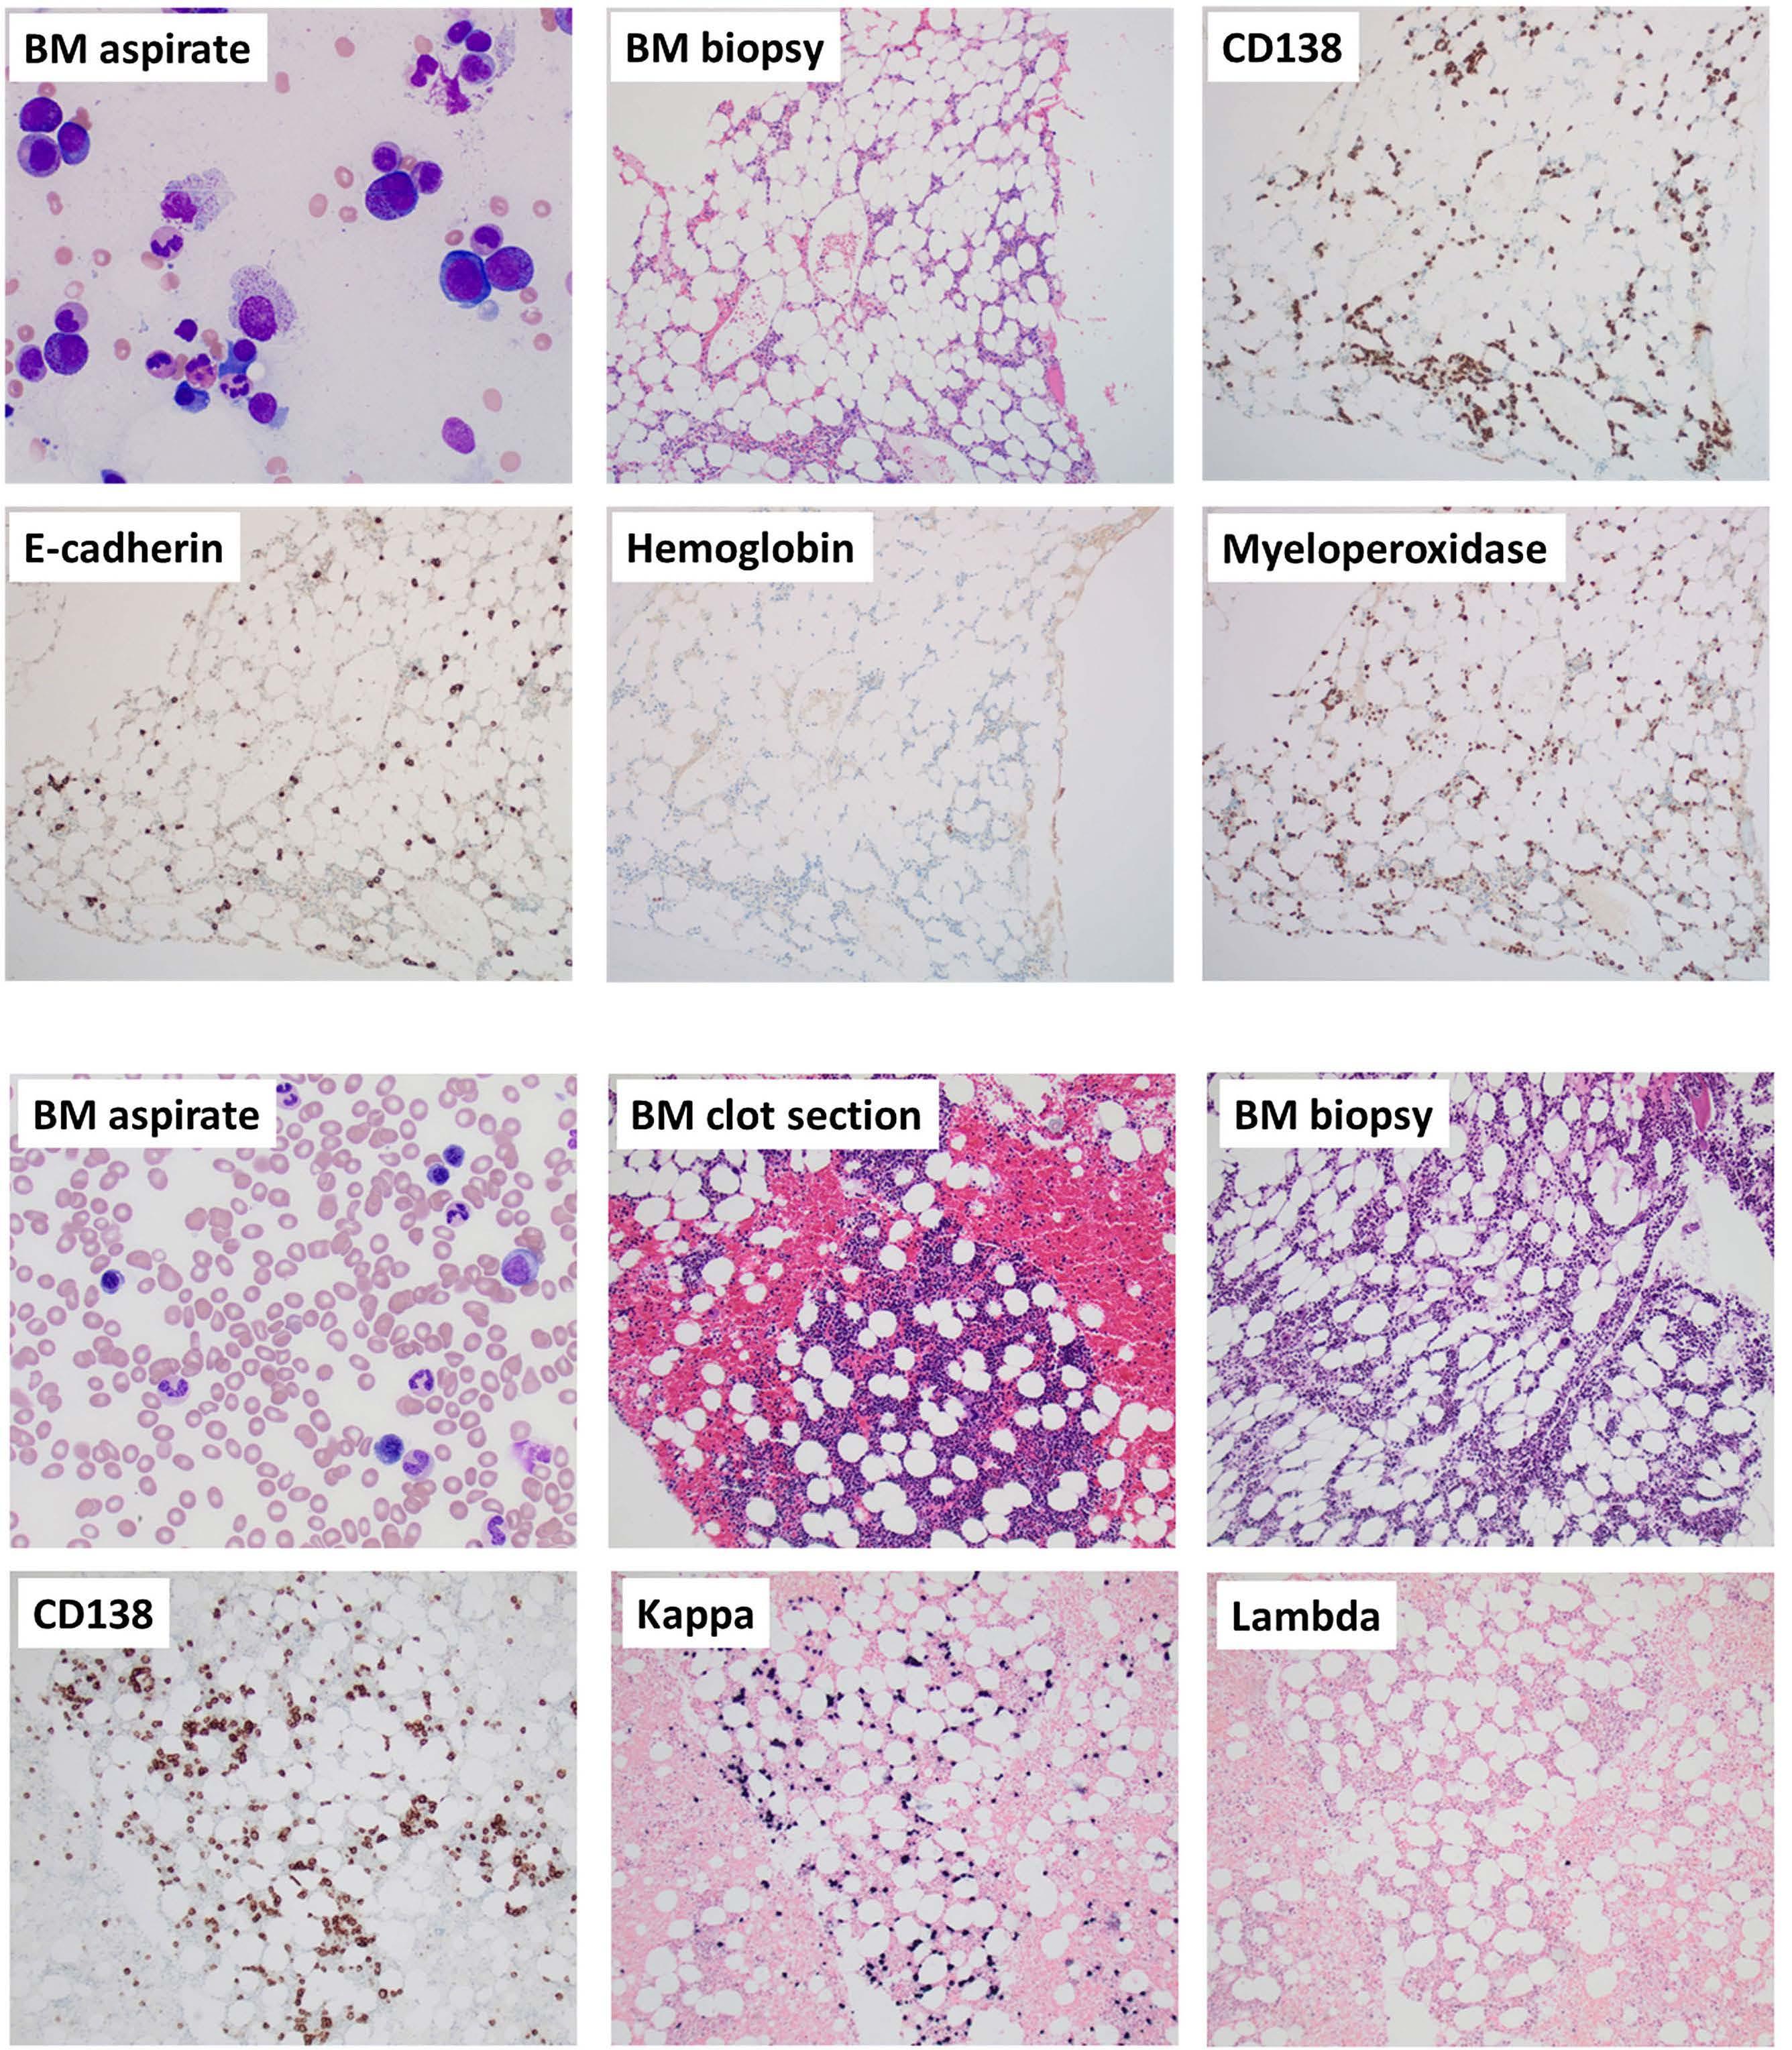
PRCA has been previously described and was observed in a quarter, 12 of 51 patients with PRCA that were evaluated at the National Institute of Health (NIH).3 In addition, three patients were successfully treated with anti-myeloma-di
rected therapy consisting of bortezomib or lenalidomide in combination with dexamethasone.3 It is to be noted that our patient had previously received bortezomib and rituximab, targeting plasma cells and B cells, respectively.
BA Haematologica | 107 October 2022 2524 CASE REPORT
Authors
Published©2022Prepublished:Accepted:Received:https://doi.org/10.3324/haematol.2022.281398N.GANGATCorrespondence:-gangat.naseema@mayo.eduMay11,2022.June1,2022.June9,2022.FerrataStortiFoundationunderaCCBY-NClicense
Naseema Gangat,1 Jonathan Bleeker,2 Douglas Lynch,2 Horatiu Olteanu,3 Louis Letendre1 and Ayalew Tefferi1
Contributions
Disclosures
References
Haematologica | 107 October 2022 2525 CASE REPORT
Although, daratumumab primarily targets high CD38-ex pressing plasma cells, it is known to have myriad immu nomodulatory effects, on CD38-positive T and B cells, including regulatory T cells (Tregs). In addition, an increase in cytotoxic T-cell number, activation, and clonality has been observed following daratumumab in multiple mye loma.7,8 A similar effect of daratumumab in modulating CD4 and CD8 T-cell responses with reduction in type 1 in terferon activity has also been reported in connection with treatment of refractory systemic lupus erythemato sus.9 Based on the above observations, we hypothesize that modulation of T-cell-mediated immune responses, although not confirmed by immune profiling, resulted in clinical improvement in our patient. In summary, we de scribe a patient with idiopathic PRCA refractory to eight prior therapies including rituximab and bortezomib, that achieved a rapid response following daratumumab, sug gesting an efficacy signal, which is worthy of further pros pective investigation.
NG wrote the paper; NG, JB, LL, and AT participated in patient care; DL and HO performed the review of bone marrow biopsies. All authors reviewed and approved the final draft of the paper.
No conflicts of interest to disclose.
Most recently, successful treatment of PRCA following ABO-incompatible stem cell transplant with daratumu mab has been described in a total of ten cases with rapid and prolonged remission achieved after two to four doses of therapy.4-6 In the aforementioned situation, clinical re sponse was attributed to elimination of the residual re cipient plasma cells and reduction in isohemagglutinin titers. In our patient, PRCA was not necessarily associated with MGUS given the lack of therapeutic benefit with bor tezomib. Moreover, follow-up BM examination after 9 months of daratumumab therapy did not demonstrate an appreciable change in the plasma cell clone, in spite of improvements in hemoglobin levels and elimination of transfusion needs.
1Division of Hematology, Mayo Clinic, Rochester, MN; 2Division of Hematology and Hematopathology, Sanford Health, Sioux Falls, SD and 3Division of Hematopathology, Mayo Clinic, Rochester, MN, USA
Data-sharing statement
1. Gurnari C, Maciejewski JP. How I manage acquired pure red cell aplasia in adults. Blood. 2021;137(15):2001-2009.
Figure 2. Pre- and post-daratumumab changes in hemoglobin levels, reticulocyte percentage and monoclonal protein studies.
Please email the corresponding author.
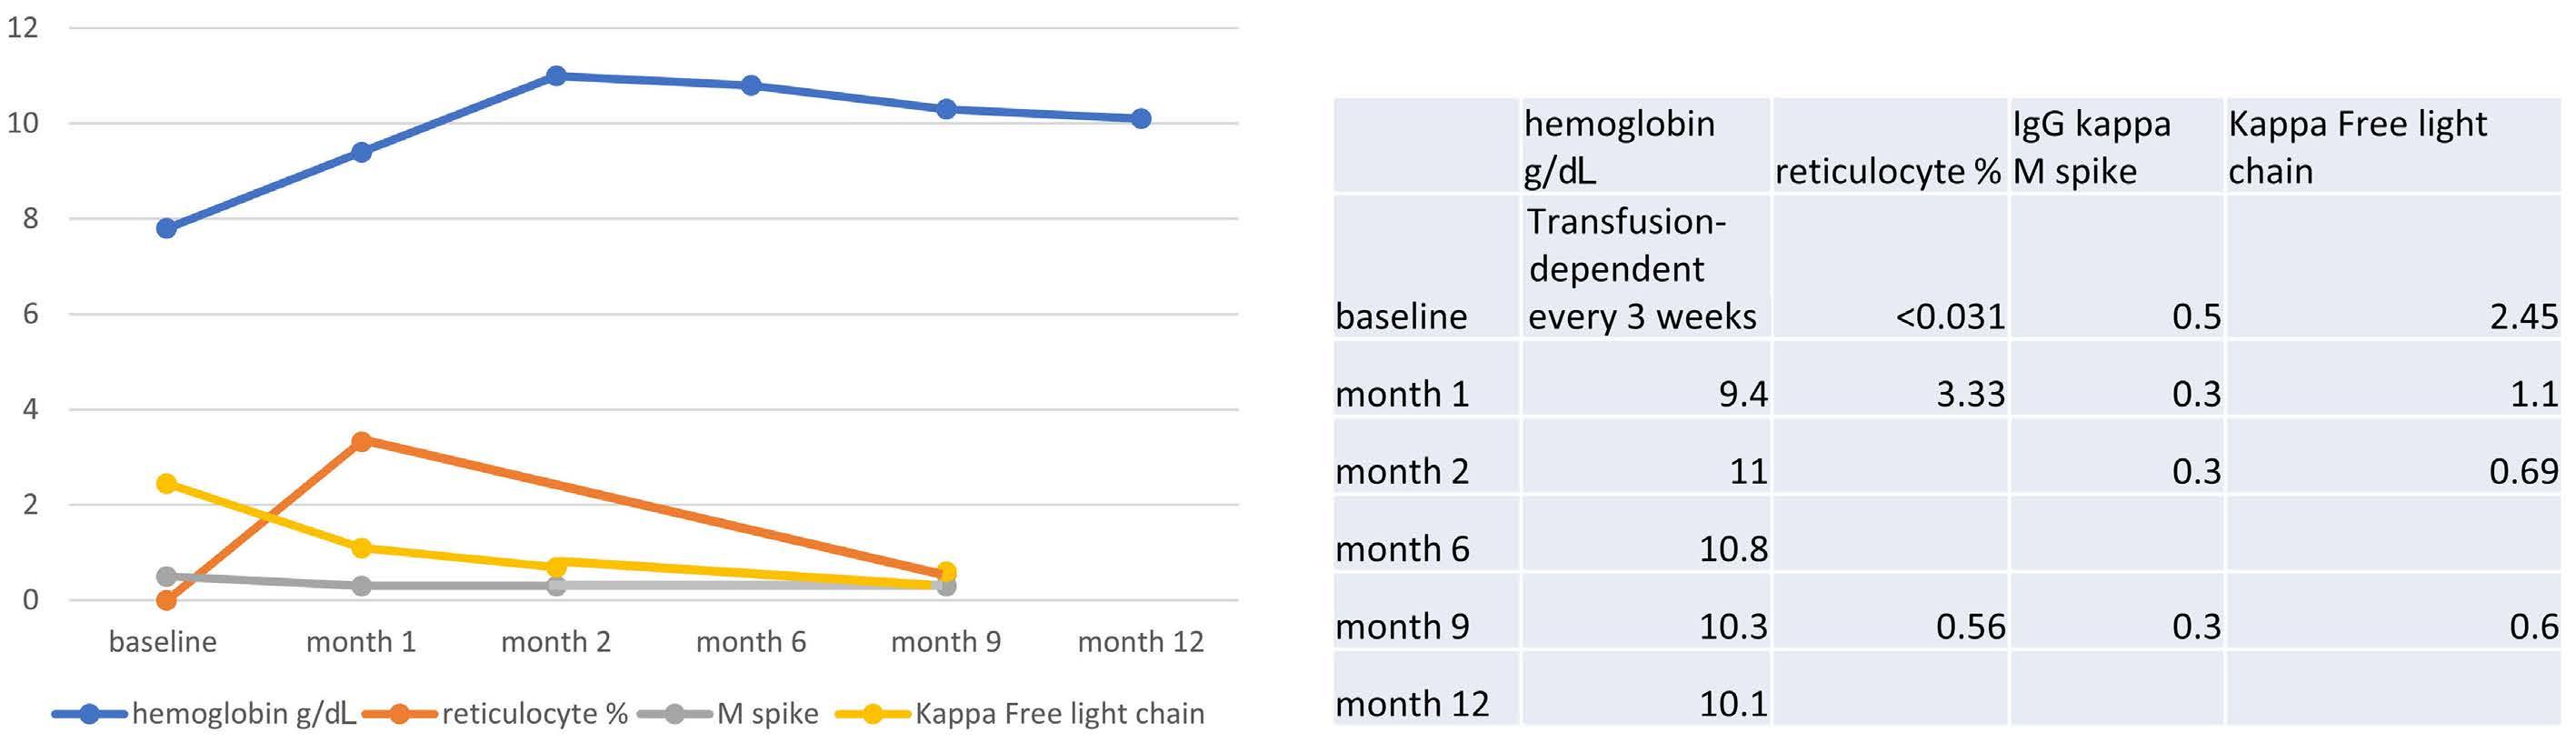
7. Krejcik J, Casneuf T, Nijhof IS, et al. Daratumumab depletes CD38+ immune regulatory cells, promotes T-cell expansion, and skews T-cell repertoire in multiple myeloma. Blood. 2016;128(3):384-394.
9. Ostendorf L, Burns M, Durek P, et al. Targeting CD38 with daratumumab in refractory systemic lupus erythematosus. N Engl J Med. 2020;383(12):1149-1155.
refractory red cell aplasia after allogeneic hematopoietic cell transplantation with daratumumab. Eur J Haematol. 2020;104(2):145-147.
8. Kitadate A, Kobayashi H, Abe Y, et al. Pre-treatment CD38positive regulatory T cells affect the durable response to daratumumab in relapsed/refractory multiple myeloma patients. Haematologica. 2020;105(1):e37-e40.
4. Martino R, García-Cadenas I, Esquirol A. Daratumumab may be the most effective treatment for post-engraftment pure red cell aplasia due to persistent anti-donor isohemagglutinins after major ABO-mismatched allogeneic transplantation. Bone Marrow Transplant. 2022;57(2):282-285.
Haematologica | 107 October 2022 2526 CASE REPORT
3. Korde N, Zhang Y, Loeliger K, et al. Monoclonal gammopathyassociated pure red cell aplasia. Br J Haematol. 2016;173(6):876-883.
2. Balasubramanian SK, Sadaps M, Thota S, et al. Rational management approach to pure red cell aplasia. Haematologica. 2018;103(2):221-230.
5. Chapuy CI, Kaufman RM, Alyea EP, Connors JM. Daratumumab for delayed red-cell engraftment after allogeneic transplantation. N Engl J Med. 2018;379(19):1846-1850.
6. Salas MQ, Alahmari A, Lipton JH. Successful treatment of
