


OWNER : FirstSource Energy India Private Limited PLACE OF PUBLICATION : 95-C, Sampat Farms, 7th Cross Road, Bicholi Mardana Distt-Indore 452016, Madhya Pradesh, INDIA Tel. + 91 96441 22268 www.EQMagPro.com EDITOR & CEO : ANAND GUPTA anand.gupta@EQmag.net PUBLISHER : ANAND GUPTA PRINTER : ANAND GUPTA TRENDS & ANALYSIS MOHAN GUPTA isearch@EQmag.net PUBLISHING COMPANY DIRECTORS: ANIL ANITAGUPTAGUPTA CONSULTING EDITOR : SURENDRA BAJPAI SR. GRAPHICS & LAYOUT DESIGNER : RATNESH JOSHI GRAPHICS DESIGNER : ABHISHEK SARAI JOURNALIST MISHIKA MEHTA Disclaimer,Limitations of Liability While every efforts has been made to ensure the high quality and accuracy of EQ international and all our authors research articles with the greatest of care and attention ,we make no warranty concerning its content,and the magazine is provided on an>> as is <<basis.EQ international contains advertising and third –party contents.EQ International is not liable for any third- party content or error,omission or inaccuracy in any advertising material ,nor is it responsible for the availability of external web sites or their contents The data and information presented in this magazine is provided for informational purpose only.neither EQ INTERNATINAL ,Its affiliates,Information providers nor content providers shall have any liability for investment decisions based up on or the results obtained from the information provided. Nothing contained in this magazine should be construed as a recommendation to buy or sale any securities. The facts and opinions stated in this magazine do not constitute an offer on the part of EQ International for the sale or purchase of any securities, nor any such offer intended or implied Restriction on use The material in this magazine is protected by international copyright and trademark laws. You may not modify,copy,reproduce,republish,post,transmit,or distribute any part of the magazine in any way.you may only use material for your personall,NonCommercial use, provided you keep intact all copyright and other proprietary notices. want to use material for any non-personel,non commercial purpose,you need written permission from EQ International. SUBSCRIPTIONS : AVADESH PATEL admin@eqmag.net VOLUME 14 Issue 09(A) CONTENT 241412INTERNATIONAL HEAD SALES & MARKETING : GAZALA KHAN hayat@EQmag.net MARKETING MANAGER: MUKUL HARODE sales@EQmag.net INTERVIEWINTERVIEWTECHNOLOGY

MR. Michael Chen EMMVEE- LEADING THE SOLAR JOURNEY THEN, NOW AND AHEAD

MR. MANISH NARULA


16 18 38 INTERVIEW TECHNOLOGY Pg. 12-16 Pg. 38-77 Interviews EQ iSearch Reports & Analysis MR. DARSHAN PANDYA ETI-SOL® – IOT SOLAR PV MONITORING SCADA SOLUTION FROM ENERMAN INDIA SOLAR AND RENEWABLE ENERGY Q2 REPORT- 2022


Emmvee Group is one of the leading manufacturers and suppliers of solar photovoltaic modules and solar water heating systems in India. Emmvee is the only company with more than 30 years of expertise in solar systems, known for its quality, reliability and distinctiveness. Headquartered in Bangalore, Emmvee has 2 advanced manufacturing facilities in Karnataka with 1.25GW Mod ule production capacity, active sales offices across India and Germany and dedicated dealer network across Mid dle East, Africa and US markets.


EQ: What is the total quantity you supplied to India in Last 1 Year and What is the Expectation from coming one year?
MN: Several Global Manufacturers are launching their new technologies. At Jinko Solar, we’ve already launched the Tiger Neo Solar Modules, which are based on N Type Technology. These products have been accepted very well by the Industry due to its High Efficiency, Low Degradation as well as High Bi-faciality. All these advantages make this product a low LCOE product, which makes Investors happy as this means better ROIs on their projects.
EQ: What kind of Pricing and Technology RoadMap do you see coming through in the Industry?
EQ: How does the Dynamics of Price - Demand - Supply Looks Like for this and the next Year?
EQ: What are your views on the ALMM / BIS etc…?
MN: We did great business in India last year. We were leading all charts every quarter across all analysis from Bridge to India, JMK, etc. From Q1 2021 to Q1 2022, we supplied almost 5 GW capacity to India. We also completed a 8GW cumulative shipment milestone this year.
MN: The industry is gearing up to invest more in Local Manufacturing. Also, some of the players are finding loopholes in the system to bring Duty free products from other routes. Overall, a reduced demand due to heavy Duty imposition.
EQ: What kind of changes do you see in the Industry after the BCD Implementation on Solar Panels?

MN: India is a booming market. 3rd largest in the Globe. Its one of the most preferred investment des tinations as well. The present Projects demand is also great. However, if we see the expected installation targets going up to 2030, this annual demand could be made higher. In terms of manufacturing, we see a big demand due to PLI scheme and push for local manufacturing. However, let’s not rely on domestic manufacturing only due to its very limited supply chain control within the country.
MR. MANISH NARULA Executive Vice President - South Asia JinkoSolar Holding Co. Ltd. EQ in Exclusive talk with...

MN: It looks like that due to global disturbances, the prices are going to stay on a higher side briefly before it settles down. Demand-supply situation will improve after seeing many new manufacturing capacities getting commissioned. Next year, if no further disturbance is there, the prices shall stay lower than what it is this year.
12 EQ SEPTEMBER 2022 (A) www.EQMagPro.com INTERVIEW
EQ: What Kind of Products and New Technologies you are going to launch in in this or next Year?
EQ: What is the Opportunity in India Currently…in Terms of Projects in Tender, Pipeline etc…Opportunities in Manufacturing etc…?
MN: Pricing and Technology go hand in hand. We’re making all efforts to support the industry by offering our Latest Technology products to reduce overall lifetime investment by Solar Power Developers. At present, as you see, the price trend of Solar Modules is stable, only the landed price is higher due to BCD. It is likely to go down as we see more Manufacturing capacity getting commissioned across the Globe. Also due to high demand during certain peak times, say Q4, we may see a spike in the prices.
MN: It’s a must for any country to get its own Qual ity Standards and other regulations. However, these standards and regulations should be constantly up graded to match with Global Standards. At present, as we understand, these standards are not up to the mark and need improvements. Another key factor is that such standards should act as enablers for Indus try’s growth rather than act as hurdles. We strongly believe that MNRE will find ways to help Industry and allow level playing field for all global players till the times sufficient capacity is not developed in India.
MN: These types of installations could be key supporters of plain Vanilla Solar Installations that country has witnessed till date. However, India which has always been a price sensitive market, may not have total reliance on such high-cost installations. At present India needs to complete its main RE target at reasonable tariff. Energy Storage and other kind of projects will only make the installation targets slower and costlier at the same time. Let’s stick to the base load from Conventional Energy while adding more RE power within the country. In all, such additional installations may be there in low percentage in order to find its own way towards several new Technologies.
MN: If all factors are considered, the tariffs should remain range bound.
EQ: Visible Changes in RE Industry w.r.t. Energy Storage, RTC, Hybrid RE Projects, Floating, etc and their likely impact.
EQ: What is your expectations from the Government, Policy Makers and Regulators?
www.EQMagPro.com 13EQ SEPTEMBER 2022 (A) INTERVIEW
EQ: How has the rupee devaluation affected the Solar Industry and your business?
EQ: Rise of Role of PSU’s in the RE Sector and your views on the same?
EQ: India couldn’t achieve the RE Capacity Targets Set for 2022 and now has set up another ambitious target for 2030….What are your views on the same. Key Learnings, Expectations?
EQ: What kind of Solar Tariff Trends do you see coming?
MN: Not major implications our business as such.
MN: We expect Govt to support all Industry segments towards meeting RE goals of the country. The key stakeholders, So lar Power Developers, who invest for 25-30 years in a project, needs to be heard first before anyone else.
MN: We should allow level playing field to meet the high demand first. Later we may develop local industry to sustain the growth. If we get influenced by just one segment, it is likely to create stress on overall economy of RE installations.
MN: It is great to see all major PSUs in India being so enthusiastic about RE with the likes of NTPC leading the way. We believe these companies have huge potential and can contribute significantly to solar capacity addition by way of tenders and self-consumption. They are serious competitors with private player in all solar auctions. We hope that the new policies will allow Jinko and other foreign brands to cater to the huge demand of PSUs directly which hasn’t been the case till now.

EQ: How is the latest backsheet of Jolywood coping up with the higher wattage panels of saying above 500Wp or above 600 WP?
EQ: How is the changing policy in India such as BCD, ALMM, BIS certification, influencing the solar business in India?
MN:ability.For
MN: Til 2022 Q4, Jolywood backsheet production capacity will be 250 million square meters(appro.50GW), and each year this will be expanded by 50 million square meters in the next five years.
In view of the existing module manufacturers in the Asia-Pacific region: (1) the certification process is complicated. (2) the certification cycle is time-consuming (3) the certification progress is not transparent.
EQ: What is the latest product launched or going to launch and when?
EQ: Tell us something about the future projections of Jolywood in terms of the manufacturing expansion capacity of the backsheet.
MR. Michael Chen Sales Department Sunwatt Co., Ltd.

For Indian local module manufacturers, due to favorable local policies and strong global demand, the number of Indian local companies under construction and expansion in India is increasing. Jolywood backsheet is widely applied in the Indian market, and white fluorine-based backsheet has obtained the lowest anti-dumping duty rate. The transparent backsheet has been im muned from anti-dumping duty.
Jolywood (Suzhou)
transparent backsheet covers 85% of the market, with stable shipments and reliable performance, No.1 ranking in India and also the same in the world. (Detailed introduction to Hauberk Technology.) TECHNOLOGY
14 EQ SEPTEMBER 2022 (A) www.EQMagPro.com INTERVIEW
EQ in Exclusive talk with...
MN: According to the third party forecast, In 2022, the global solar installation is estimated to reach 250GW -300GW, and the worldwide PV market demand shows an increasing ten dency in future. Due to trade restrictions and special incen tives for solar energy in India, the Indian market is expected to reach 40-50GW in the year of 2023. Therefore, Jolywood team keeps focusing special attention to Indian PV market.
MN: 1. In this year, Jolywood backsheet becomes No.1 in terms of worldwide market share, and Jolywood transparent backsheet become No.1 in terms of market share in India. 2. Jolywood backsheet have been running stably outdoors for more than 15 years, with stable performance, high reliability, and zero end-user complaints.
Overseas
JOLYWOOD: PIONEER IN BACKSHEET
MN: Jolywood R&D team has invented brand-new Hauberk Technology's transparent backsheet. Until now, Jolywood
EQ: What is the market you are focusing on?
EQ: What is the global/India share of the Jolywood backsheet in terms of market share?
MN: Almost all the world's leading solar module manufacturers are cooperating with Jolywood. Moreover, Jolywood team started to provide backsheet to 500Wp / 600Wp power solar module starting from one year ago. All the customers confirms that Jolywood backsheet have stable outdoor performance and high reli-
module manufacturers in China, due to the above-mentioned certification and tariff barriers, Indian solar project investors are more inclined to choose module manufacturers in the Asia-Pacific regions other than China.
SETTING THE PACE OF INNOVATION IN METALLIZATION Asia Americas BUILT FROM 200+ YEARS OF INNOVATION DNA AND 30+ YEARS OF METALLIZATION PRACTICE, SOLAMET ELEC TRONIC MATERIALS CO., LTD. WAS LAUNCHED IN JULY 2021 AS AN INDEPENDENT COMPANY FOR A FRESH START FOLLOWING THE ACQUISITION OF DUPONT SOLAMET® PHOTOVOLTAIC METALLIZATION PASTE BUSINESS. WE ARE THE GLOBAL INNOVATION LEADER IN PHOTOVOLTAIC METALLIZATION. Solamet Electronic Materials Co., Ltd. | www.solamet.com | info@solamet.com Headquarter ‒ Shanghai office China sales director ‒ Elvis Li Mail: tianjiao.li@solamet.com Tel. +86-13120722661 US R&D team Chief technology officer ‒ Qijie Guo Mail: qijie.guo@solamet.com Tel. +1-6462493189 Malaysia sales & service team - Kuala Lumpur/Penang International sales director ‒ Kok-Fye Wong Mail: kokfye.wong@solamet.com Tel. +60-176698289 Shanghai R&D center China technical director - Jackie Zhang Mail: zinan.zhang@solamet.com Tel. +86-17717487778 Taiwan R&D center Oversea vice president of technology ‒ Kaien Chang Mail: kaien.chang@solamet.com Tel. Account+886-920305050manager‒Michael Chen Mail: michael.chen@solamet.com Tel. +886-958031186 India sales & service team Account manager -Bhargav Chaitanya Mail: chaitanya.bhargav@solamet.com Tel. +91-9717344475

So,the current trend of big size panels over 500 W needs compatible inverters with higher AMP rating. All Foxess inverters come with a high amp rating starting from 1kw to 25k .which can be used with most Domestic and Inter national panels over 500w.
We have shipped almost 150 MW of inverters in the Indian market. Thanks to our business partners,EPC who always supports us with pros and cons from time to time and we have taken all feedback in a positive manner. Foxess factory is located in Wenzhou spread in area of 110000 sq meters having current capacity of 11 GW and we believe that good Quality and after sales service focus will help us achieve good market share in this and next few years FOXESS became a top 5 Brand of inverter choice of EPC in Residen tial segment in India in this short span of time.
We have already made significant improvements in the areas of inverter efficiency and lifespan thanks to pioneering design fea tures including a unique star-fin heatsink design which is most suitable for countries like India where temperature is very high. This design gives more cooling to the inverter.
DP: For Incomplete targets for 2022 I think it is because of Pandemic and post pandemic effect. 2030 Targets are achievable. But the Government should make policies to encourage them. Like a sudden change in policy affecting the target. I believe a good long term policy will be a key factor for any ambitious target.
We are a manufacturer of lithium battery material, bat tery cell, battery pack and solar inverter and Energy Stor age System. So customers get all their needs from one place only.
EQ: What Kind of Products and New Technologies you are going to launch in in this or next Year?
We believe that for long term business, the market needs reliable and cost-effective products.
DP: Last 2 years were very difficult for all of us. Pandemic, shortage of chips,Russia-Ukraine war and uncertainty of economy in the world. In this situation company like us who got established in 2019 and faced many challenges but as say challenges make you stronger. We as a company became stronger and worked hard to overcome challenges like this.
DP: India is a priority market for us and constant R & D, we are offering good technology products which are Value for Money. And now the trend is changing in India as well and the industry is accepting Technology Quality against the price for industry benefit , every individual should think towards the technology and quality and most important after sales service.
MR. DARSHAN PANDYA Managing Director (INDIA), FoxEss

DP: Foxess is vertical of Tsingshan group, fortune 500 company no.1 stainless steel manufacturer,no.1 nickel production and no.4 nickel ore resources having 55.7 billion USD revenue last year. Foxess was established in 2019 but its not new in the market with experienced management R & D and sales. Company is well aware of the market and their needs and constantly working towards fulfilling that. The Company Focuses on Providing Advanced Distributed Energy,ESS products,smart Energy Management solutions,on grid solar inverter to households and C & I.
EQ: How does the Dynamics of Price - Demand - Supply Looks Like for this and the next year?
EQ: India couldnt achieve the RE Capacity Targets Set for 2022 and now has set up another ambitious target for 2030….Whats are your views on the same. Key Learnings, Expectations
DP: As we all know, technology changes are happening in the world very fast. So,As a inverter manufacturing company and having an excellent R & D team we are always ready for technology change.
EQ in Exclusive talk with...
EQ: What kind of Pricing and Technology RoadMap do you see coming through in the Industry?
16 EQ SEPTEMBER 2022 (A) www.EQMagPro.com
EQ: What's the total quantity you supplied to India in Last 1 Year and Whats the Expectation from coming one year?
As mentioned due to this global crisis, Prices is increased globally. India is always a big market so demand is not a problem at all. And also, opening of national portals has given a boost to the Market especially Residential. As an Inverter Manufacturing Company we are ready to serve this opportunity in the Indian market.
ONE OF INDIA’S FASTEST GROWING SOLAR PV &MANUFACTURERMODULESOLUTIONPROVIDERS ge on f a M R on w o e / N M g o in n c o u P d E o R tr C In Grid-TiedInverter CO ŵO A E OFFICE d fl a a e E e ce N a Ma c e ce C ad A edabad G a a MANŝFAC ŝ ING ŝNI A ŵ a NH a ŵ a D aba a a G a a INDIA Inviting Inquiries for FRANCHISEE PARTNERS for all States of India TOLL 1800-313-5052FREE e de a a I d a C e c a a SERVICES Over a Decade of Experience + ea a d E e e ce a I d + MƟ I a ed G a a + H e a ed G a a www.australianpremiumsolar.co.in ca e e b I


Single Line Diagrams (SLD): The SLD diagrams are very important for an electrical engineer or technician to do live monitoring and take quick action if a device turns red due to a fault. This page is custom built for each plant based on how the plant is designed by referring to its schematic diagrams.
ETI-SOL® – IOT SOLAR PV MONITORING SCADA SOLUTION FROM ENERMAN
The Device dashboards: All major devices like Inverter, SCB, Weather Station, MFM of a plant have their own dash boards and can be accessed from this page.
The Map view page: This displays all Inverters and SCBs on a Google Map with exact geo coordinates of the plant and the co lour of Inverters and SCBs become red if there is a device fault. Geo-tagging helps locating and fast identification of faulty Invert ers/SCB’s in larger power plants reducing down-time and thereby minimizing generation loss.
18 EQ SEPTEMBER 2022 (A) www.EQMagPro.com TECHNOLOGY
The Plant-Overview page: This dashboard is designed to get complete knowledge about how his plant is operating. Some of the performance metrics are generation, insolation, peak power, total power, PR, CUF, yield etc. Some of the components in this page are customizable to the specific needs of a customer. If a key performance indicator is outside the expected range, there is a provision for the technician to share the incident knowledge to the managers at HQ by adding Bulletin message.
EnerMAN is a global leading provider of innovative, IoT based AI & ML driven, Energy Management solutions at affordable price to Renewable Energy Industry. EnerMAN has successfully deployed ETi-SOL® - Remote Monitoring SCADA solution to 1.3GW+ (1300MW+) of Solar Assets, 300+ sites, across the world. ETi-SOL® is an end-to-end solution, made in India product to cater to global market at an affordable price by inhouse developed Hardware, Firmware and Software products. We are proud to endorse “Vocal for Local to go Global”. Our IoT SCADA success prove that there is always demand for good product, which is reliable, easy to use dashboards, useful alerts on breakdowns, and backed by quick customer service support from professional team. Some of the salient features of our ETi-SOL® Solar PV Monitoring & Control Solutions: The Home page: This dashboard provides plant and portfolio level KPIs like Generation, PR, Plant Status etc. Multi Plant View Homepage gives a comprehensive view of the health of complete portfolio. This data is very useful for the plant owner as well as O&M Manager to know how their plants are performing on every day. The SCADA transforms generation data into carbon footprint knowledge that owner can take the pride in how he is contributing to healthier planet.
The Inverter dashboard displays hourly, daily, and monthly generation and insolation in a Graph. The users of SCADA can drill down from Plant->Block-> Inverter Room ->Inverter level to get the generation information. As part of EnerMAN technology efforts to deliver Knowledge not just data, Inverter dashboard has a unique feature called “Dip Reason”. The Dip Reason window automatically displays if there is a dip in energy generation due to Grid Outage and/ or Inverter faults. There is also a provision for technician to manually enter any other reason which is not automati cally inferred by the SCADA system. The SCB dashboard displays any underperforming strings so that the technician can take actions just by looking at color coded information.

‘Daily Generation Report in your Inbox’ feature relieving the load of O&M engineer to download & email DGRs.
ETi-PPC (Power plant controller): Power plant controller is a reliable and flexible solution that can control different param eters
The Alarm Page: Alert module plays pivotal role in any SCADA. The ETi-SOL® works closely with edge device (ETi-LOG) to pro vide real-time, robust, and accurate alarms and events. It has two levels of Alarms detection logics, the primary logic de ployed in the edge device (ETi-LOG) and the secondary logic deployed in the SCADA (ETi-SOL®). This extra layer of alert logic ensures that the user will not miss an Alarm.
ETi-LMS: Load Management System: An IoT Solution for DG-Sync which is a universal Solution for all Inverter brands (Supports Heterogenous Make) Controls Active Power of In verter’s.
The Analytics Page: The user can pick and choose any pri mary parameters across different devices and analyze trends and performances in a graph or table view. ETI-SOL® ana lytics tab enables user to choose the parameters to be com pared across the plants in different geographic locations in couple of clicks. In addition to primary data, the user can also analyze and download computed KPIs like PR, Yield, Insola tion, and Daily Generation Reports (DGR). We have released much awaited feature to our customers "INVERTER PERFOR MANCE RANKING", an advanced ML based analytics mod ule which throws actionable insights about top performing and least performing Inverters of Solar PV plant for any selected period. Another feature we are offering is DOWNTIME LOSS ANALYSIS, which analyses grid/equipment downtime and pro vide meaningful generation loss analysis reports to improve plant performance at a click of button.
Apart from Remote monitoring solution, we have developed a series of products to cater to various customer solar PV plant requirements.
ETi-ZES (Zero Export System): We have developed another software product, ETi-ZES, which will ensure Zero Export from Solar PV plants / Rooftops to electricity Grid, as per DISCOM policy guidelines, to avoid penalty. This product collects the data from Solar PV plants' end-equipment and controls/limits the out-power of Solar Inverters based on Power load / con sumption at factory/manufacturing unit.
ETi-SLDC: A software product, which can be installed in local PC/Server to collect data from the Solar PV plant’s equipment and can send the required data to SLDC in an interval of few seconds as per SLDC guidelines.

ETi-CAST: Energy Generation & Forecasting solution which is a cloud-based forecasting tool for solar power plants.
The Report page: The user can download pre-defined daily, monthly, and yearly reports by click of a button. The user can configure his report module & save it as a template after which with few clicks, one can download Plant level, Block level or Device level reports. ETi-SOL® supports Customizable
present in Solar PV plants to achieve Utility grid require ments at POI (Point of interconnection). PPC is a combina tion of Software Logic and Hardware which continuously monitor the healthiness of grid and automatically acts in case of any abnormality. EnerMAN’s Power Plant Controller (ETi PPC) is a control system that can manage active power, reactive power, and power factor from Solar Inverter (Solar Plant, Solar Hybrid Plants).
www.EQMagPro.com 19EQ SEPTEMBER 2022 (A) TECHNOLOGY
ETi-SOL® Edge: For the customers who do not want to pay an nual cloud server charges to view their plant data, EnerMAN has introduced ETi-SOL® Edge which is a local monitoring solu tion. One time investment to the system which does not require internet & cloud storage.
ETi-SOL® Android/iOS App: Introducing the new mobile app version of our SCADA. Now the home page in the app is similar to web version i.e. all the plants in one with with its pirority status list. The much awaited in-app alert notification feature is now up and going. Both, Android and iOS are now available.
EnerMAN has proven track record in providing solution for Remote Monitoring, Local Monitoring, and Integration with third party Scada using REST APIs or FTP server or OPC interface.
CEOASHOKAUTHORDMandManaging Director EnerMAN Technologies

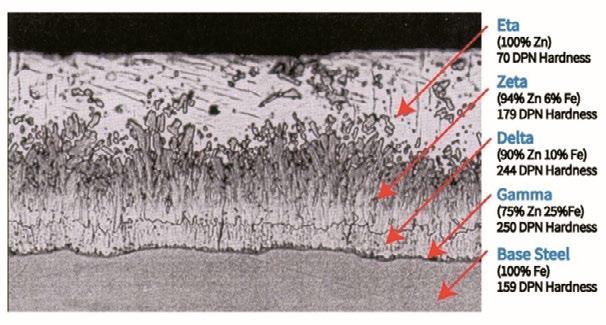
cross-section of the galvanized steel coating, showing a typical microstructure comprised of three alloy layers and a layer of pure metallic zinc
PREFACE
Zinc is mostly used as an anti-corrosion agent and being used from very early ages i.e., from 200BC to obtain brass which is alloy of copper and zinc. It has inherent natural capacity to protect steel against corrosion.
20 EQ SEPTEMBER 2022 (A) www.EQMagPro.com OPINION
HOT DIPPED GALVANIZED VS DEVELOPER’SPRE-GALVANIZED:PERSPECTIVE
In 1742, a chemist known as Melouin found that a zinc coating could be applied to iron by dipping it into molten zinc which indeed laid the founda tion for galvanizing. In 1780, an Italian physicist, Luigi Galvani, observed that the contact between two dissimilar metals resulted in the flow of an electrical current. He worked in field of galvaniza tion and on the name of this physicist, the process is named as Galvanization. Subsequently in year 1836, a French civil engineer, inventor cum chem ist, named as Stanislas Sorel patented a method of galvanization by cleaning steel and then coating it with zinc by dipping it into molten zinc. This was the beginning of modern hot-dip galvanizing.
Steel is the most common material used in almost all products i.e., from households to Industrial applica tion. Significant part of the economy is steel sector based; however, steel have one large disadvantage – its high corrosion rate. Hence protection of steel structures and components is of great economic im portance. In Indian subcontinents, the rate of corro sion is quite high considering hot and humid envi ronmental conditions.
In the HDG process, the base material is getting three level protection.
REASONS FOR OPTING HOT DIPPED GALVANIZATION OVER PRE-GALVANIZATION FROM DEVELOPERS PERSPECTIVE
ii. Cathodic Protection where in zinc acts as an ode and sacrifices itself protecting the steel from corrosion
Pre galvanized material does not provide the requisite thickness of galvanization and service life guarantee comparable with HDG and paint ing
BENEFITS OF GALVANIZATION
However, this cost effectiveness is achievable in HDG only. Corresponding thickness of galvanization compared to 325micron painting is 60 to 80 microns. These 60 to 80 microns of galvanization thickness provide minimum 25 to 30 years of life expectancy under worst condition like corrosion condition greater than C4.
iii. Zinc Patine where in zinc oxidizes and builds a protective layer over steel

i. Zinc Layer Barrier Protection which protects steel by insulating direct contact with air and moisture.
Formationsystem.ofZinc
i. Galvanization is the process of applying a protective zinc coating to steel or iron to prevent corrosion. There may be various other ways of corrosion protection; however galva nized coating is one of the most durable forms of corrosion protection. In an ideal condition i.e., without any operation loads on the steel structure i.e., if the galvanized steel is kept, with average coating thickness of 85 microns, it will protect the base material for almost 100 years. It means, the galvanization is very durable. Hot dipped galvanization is proven and well-established method. HDG members comes with guarantee of service life; however, Pre galvanized steel supplier do not provide performance guarantee beyond 5 to 10 years. Scientific literature is present in case of HDG stat ing the year-on-year degradation of the coating in various corrosive environments, whereas no such data is available for Pre-Gal material and the life of the asset is at risk beyond 10 years.
www.EQMagPro.com 21EQ SEPTEMBER 2022 (A) OPINION
ii. Hot Dipped Galvanization is almost maintenance free. Once it is done, there is no requirement of reapplication or recoating. Hot dipped Galvanization is very much sustain able. In case of pre galvanized material, after some service life the pre-galvanized material needs replacement and / or maintenance.
patina – which itself acts as a protective layer for the active zinc metal
Hot-dip galvanizing has been in use over 100 years to protect steel corrosion worldwide; how ever, over the decades, many new material and process has been evolved. Comparing all the use of hot-dipped galvanization remained most trusted based on their superb performance and till date experience as user.
iii. Indian solar developers are trying to in crease the solar project life to 35-40 years instead of present standard of 25 years, and as most of the upcoming solar projects in India will be at C3-C4 corrosion zones, it is important to design the BOP systems for 40-50 years as well. Galvanization is techno – economically, cost effective so lution when compared with grit blasted equivalent painting system. PU or alike painting systems must be applied in mul tiple layers over grit blasted steel surfaces. Usually painting scheme shall have 275 to 325micron thickness as per manufacturer prescription.
i. As India is accelerating towards its goal of 300 GW solar capacity by 2030 from 58 GW at present, do we need to change our engi neering designs for making a long-term & sustainable solution or should we continue focusing on the designs developed by West ern countries, for totally different environ mental conditions.
OPINION
vii. Typically, in Pre-Galvanized material, the claimed 80-micron thickness of galvani zation represents 40micron on inner face + 40 micron on outer face of steel; however, in Hot Dipped Galvanization 80 microns it is a coating thickness on each side.
POINTS TO PONDER
iv. Hot Dipped Galvanizing ensures complete coverage over steel surface, irrespective of it’s shape, geometry. As a process point of view, in case of hot dipped galvani zation, once the structural member is completely fabri cated including welding, punching, drilling, cutting etc. all operation, it is immersed into molten zinc and kept for requisite time duration. This ensures complete zinc coverage all over steel members. However, in case of pre galvanized steel members, this is not possible. The steel members which are fabricated using pre galvanized are highly susceptible to corrosion. In manufacturing process of the pre-galvanized sheet (or similar products), a bare steel plate of thickness is passed galvanization process. As a result, zinc coating is applied (of 20/30micron) only on the exposed surfaces. While fabricating the structural member to requisite shape and size it is subjected welding, punching, drilling, cutting i.e., all activities involved in fabrication work exposes and damages the existing pre galvanized layer., so corrosion starts and life of the steel structure member comprises.
vi. Hot Dipped Galvanized is fast activity. Once the steel members are fabricated, it simply required just few min utes of immersion time into molten zinc tank post cleaning of the members. The molten zinc reaches to all exposed surfaces and do provide complete protection. However, such all protection in such short time is not possible in case of pre galvanized material, as the punched, drilled, cut surfaces remains unprotected or it need special treat ment in special case requirements.
Mr.AUTHORShankar Sengupta Head – Energy Engineering Group, Adani Corporate House Ahmedabad

ii. Which all components should be inno vated to increase the plant life to 50 years & beyond.
22 EQ SEPTEMBER 2022 (A) www.EQMagPro.com
viii. In Renewable Power sector, all the struc tures which are comprising of thin structural members and cost is worked out on basis of weight of the structural members; in such cases owner or project developer leverage benefit of steel weight from Hot Dipped Gal vanized members, this tonnage benefit is not available in pre-gal structures. In Hot Dipped Galvanized process, the bond between steel and protective zinc coating is metallurgical bond. This bond is very strong, in some cas es, the strength of this interface layer i.e. zinc + steel is stronger than bare steel, hence it is possible to optimize the base material thick ness. However, this advantage of weight re duction is not possible in pre galvanized or PosMAC like materials.
v. Hot Dipped Galvanizations provide superior abrasion resistance. In hot dip galvanization process, a zinc coating which is formed is firmly bonded metallurgically to the steel surface. Due to its unique metallurgical bond, a galvanized coating is incredibly tough, offering excep tional performance for all kind of abrasion and shocks. An initial outer layer of galvanization provides reliabil ity by acting as a buffer zone, helping to absorb any type of initial shock, impacts, abrasions etc. to the galvanized coating and metal surface. Also, the underlying zinc-iron alloys is harder than steel itself and will further reduce any potential penetration of the coating or the exposure of bare steel. This means that a galvanized coating is highly shock, wear, and tear resistant which particularly suited to areas of high frequency industrial application. A Hot Dipped Galvanization coating can also help prevent dam age during construction, transport, erection, and the other mechanical activities. This type of protection is not pos sible in pre-galvanized steel as the galvanized thickness is itself very thin compared to HDG.

Emmvee gears into the future to set up a 3 GW facilityCellmanufacturingmoduleand1.5GWmanufacturinginBangalore
Emmvee has footprints all over the globe. Starting with India, there is not one state that they haven't touched includ ing even the Andaman and Nicobar Islands. They have also supplied a large number of PV modules to Europe. In 2006 when Emmvee started PV module production, there was minimal domestic demand; hence 100% of their manufac turing went to the European market. They have managed to build a good brand reputation in the European market, with their PV modules having performed for over 15 years in the European Market. A zero claim rate has allowed them to build immense credibility and trust in the European Market. Additionally, they have also supplied their PV Modules to the Middle East, Africa and North America, including the United States. They have reached their planned capacity of 1.25 GW manufacturing capacity in Bangalore and have signed an MOU with the government for expansion of manufacturing in Karnataka. They have currently reached their planned ca pacity of 1.25GW and plan to increase their capacity to 3GW and get into cell manufacturing by the end of 2023.
Emmvee PV Modules are performing for over 15 years in the European Market. A zero claim rate has allowed them to build immense credibility and trust in the Global Market.
FEATURED
24 EQ SEPTEMBER 2022 (A) www.EQMagPro.com
EMMVEE- LEADING THE SOLAR JOURNEY THEN, NOW AND AHEAD
Over its 30 year duration, Emmvee has grown tremendously, thanks to its dynamic, inspiring and innovative management. Their journey until now has been filled with a myriad of ups and downs. In 1992, when the solar electricity industry was non-existent in India, they set up shop as Solar Water Manufacturers and began their solar journey by selling their Solarizer Water Heaters. After over 15 years of establishing themselves as a leader in manufacturing dependable solar water heaters, they set up their PV Module Manufacturing Business. While sales in the initial few years were driven by demand from the European Market, demand for solar electricity soon started to pick up domestically, as India started to move towards a cleaner future. While this journey of beginning with solar water heaters to now being a market leader in solar electricity as well has been full of challenges, this company has managed to keep pushing forward thanks to the grit and determination of its senior leadership. For the future, Emmvee plans to increase its manufacturing capacity to 3GW and get into cell manufacturing by the end of 2023. In recent years, as India has pushed for increased self-reliance and for the use of renewable energy, Emmvee’s tough journey has started to bear fruit in recent years. However, while there has been a constant internal push for use of more and more advanced technology to stay up to date with the industry, there has been one thing which has remained constant within the company - Transparency with its customers, vendors and all of its stakeholders. That is why developers, EPCs and retail consumers choose Emmvee.
Mr. Manjunatha DV, Managing Director and Founder, Emmvee Group, first started his venture with Solar water heaters in 1992. Power production during these times was very limited and as a result, power cuts were frequent. Mr. Manjunatha dreamt of starting up a business that could eradicate this problem. Since the solar electricity industry was not established in 1992, Mr Manjunatha started with solar water heater production at a small scale to supply in and around Bangalore. Since then, Em mvee has ventured into Photovoltaic Module production as well and has made progress towards Mr. Manjunatha’s vision of making every individual energy independent. Mr Manjunatha says, “We carry a dream to make the world completely powered by clean energy and a better place for future genera tions. Our philosophy, Power for Good, is an effort of our employees, stakeholders and customers to be more responsible and use their power for good in green initiatives.”
Mr. Suhas Donthi, Director at Emmvee says, “Our Products are performing across the globe by producing clean energy and clean hot water. Emmvee PV products have produced more than 15 billion units of clean energy and our water heaters have helped reduce more than 76 lakh tonnes of carbon footprint.” Emmvee is the first integrated solar company in India and celebrates 30 years of presence in the solar industry. They have always been the front runner in embracing new technologies in PV and Thermal energy manufacturing. Emmvee has been leading the way in the industry by being the first ones to implement automatic stringers, multi stack laminators and the first ones to introduce Mono PERC in India. It has pushed the advancement of production lines with the implementation of cutting-edge automation technologies, artificial intelligence and machine learning to increase efficiency. Em mvee has 2 high quality manufacturing facilities and is capable of producing up to 680 Wp mono facial and bifacial modules includ ing glass to glass with cell sizes of up to 220mm.According to the current industry scenario, most of the manufacturing plants in India produce Mono PERC panels, hence pricing is more or less similar irrespective of the production capacity of the company. Mono PERC is a matured technology and will continue to be the industry’s backbone, across the entire globe. In India, most of the plants are less than a decade old and would continue to be operational with Mono PERC technology for at least another decade.
FEATURED
Prices of cells and modules have gone up, not only because of the basic customs duty, but also because of a variety of other reasons. This increment in prices and variable availability has made the players think twice. These players cannot see aggressive growth after BCD implementation. If you observe the year 2020-21, there was a lot of aggressive competition among the develop ers while bidding for these projects. A lot of investors realized there is an amazing amount of potential that this country has to offer in terms of solar energy. Then what went wrong you ask? While everyone was aware of the fact that BCD was about to be implemented, no one was aware of exactly how high the prices would jump.
As of June 2022, India’s installed solar ca pacity is 50.6 GW. In just two quarters, India has installed 8.4GW, which is a remarkable achievement. We expect that more than 15GW of capacity will be added this year. India plans to add 10GW by 2023 and another 15GW by 2025, ultimately hoping to reach its ambi tious target of 300GW of solar by 2030. Mr Manjunatha says, “Based on our 30 years of experience in the solar industry, the sector is currently undergoing a radical change and in dustry consolidation. This sector will grow in India, just like the IT and Pharma sectors have grown. The PLI scheme and BCD implemen tation are welcome moves by the government. However, the industry is looking forward to policies which are released with better clarity and which last for a longer term, so that the business models are aligned with said poli cies and don’t have to experience shocks.” As per Solar Tariff Trends, the present prices that you see, 2.5 to 3.00 Rs/Wp, and this will be consistent. The developers have accepted the changes in price since they understand that the corrections they were expecting will not mate rialize.” According to Mr Suhas Donthi, anoth er issue that developers see in Solar’s growth is that there are a lot of other opportunities for developers in the form of Green hydrogen, Hybrid etc, all of whom have potential in the Indian market. He feels that for now, there has been minimal backlash to BCD since developers have been able to diversify to some of the above-mentioned alternatives.”
www.EQMagPro.com 25EQ SEPTEMBER 2022 (A)
The next big technology will be TOPCon, as PERC based manufacturing plants can be upgraded to it and this offers lifecycle extensions for PERC production lines. The new production lines coming up in India would also lean more towards TOPCon, due to its low set up cost per gigawatt plant. TOPCon based plants require tech nology and opex cost refinement for mass adaptability.
HJT Technology is a new technology in the block with fewer processes, developed to reduce the module cost and on the other hand offers higher achievable efficien cy. The Investment and opex cost of this technology are very high. The technology needs to mature further to cre ate a greater value to the industry and become one of the mainstream technologies. This would take a few more years of operation and outcome. “The new emerging technology of TOPCon Rear Emitter (TOPCoRE) offers equivalent efficiency compared to HJT. It is also upgrad able from the TOPCon technology. The clear advantage over capex optimization and continuous innovation in technology, TOPCon would be a leading manufacturing technology for a longer time. All new Emmvee lines are compatible for producing TOPCon modules.” adds Mr. Suhas
Mr. Suhas Donthi, Group Director, EMMVEE Group of Companies is a young and dynamic entrepreneur. He has graduated from Drexel University, USA with a degree in Business and Engineering. He has vast experience in solar thermal and PV systems and foresight vision towards the industry and company. He drives sales and operations at EMMVEE. He strategizes new market development, international business and strategic alli ances. He also drives the organization in new business development, pipeline building, business acceleration, etc. Mr. Suhas heads operations and manages production, de mand and supply planning. He develops and implements new business processes to improve operations and achieve high efficiency. With his fresh thoughts and futuristic approach, he is actively involved in the company's transformation in terms of culture, marketing and brand building.

He further says, “The developers’ expectations from the Government, Policy Makers and Regulators are that while the government had a clear idea when the BCD was announced, they now need to fix the loop holes. It is not a fixed platform for manufacturers as developers are also in confusion. Uncertainty still exists. What they’re expecting is very simple: They have been in the industry for the last 30 years; there fore, what they need is clarity about all these policies. BCD and the uncertainty revolving around it needs to be addressed. Some immediate action is required.”
from optimizing, to managing and to storing. Encouraging Hybrid energy and energy storage projects will address the need for continuous and round the clock power from renewable energy. Hybrid RE projects are on the rise. Along with rooftop solar, Mini wind projects have attracted Commercial establishments and institutions ex tensively. Due to their advantages like effective space utilization, continuous power and various other power requirements in commercial estab lishments, developers are opting for this combi nation. However for the utility scale projects, there is still a long way to go. With the growing electricity demand, the current renewable energy production, including all renewable and clean en ergy stands at 114GW, accounting only around 40% of the nation’s demand. However, India is planning well ahead with a foresighted vision on the HES projects and a parallel focus on using re newable energy to address the immediate power supply needs.
ARTICLE
Mr. D.V. Manjunatha He is a dynamic business leader & the key driving force of EMMVEE with over 30 years of management and entrepreneurial experience. Under his leadership, the company has established itself as an internationally acclaimed Solar water heater, Photovoltaic module manufacturer and a comprehensive EPC & Rooftop solutions provider. Under his leadership the company has received global recognition and various accolades. In the 1990’s, the frequent power outages made the lives miserable. Since then, D.V. Manjunatha dreamed of starting up a business that would eradicate this problem. His inspiration behind the foundation of EMMVEE bloomed from this idea. Very soon, EMMVEE was inaugurated as a manufacturing industry, inspired to find a solution to the power problems with an ecofriendly and greener approach. It also enabled his motive of making this world a better place to live. With his strong values inculcated in the EMMVEE under his leadership, the company has developed and innovated various expertise in Renewable energy products and solutions worldwide. With over 900 employees and various suppliers placed in locations across the world, EMMVEE can stand out through excellent customer service and commitment.

In a similar manner if they don't see any changes, they might fail to attend the good part. The population of India is huge, and they have a lot of potential. This is leverage for them. The policy about manufacturing should be implied along with in-house manufacturing also.
26 EQ SEPTEMBER 2022 (A) www.EQMagPro.com
Non-Renewable energy cannot continue to be the main source of power forever. Government is taking all the needed steps to make renewable energy a main and continuous source of power,
MANUFACTURINGROADMAPPLANTS
www.EQMagPro.com 27EQ SEPTEMBER 2022 (A)
Manufacturing Plant Unit - 2: 750MW Located at Dabaspet, Bengaluru Manufacturing Plant Unit - 1: 500MW Located at Airport road, Bengaluru ARTICLE


EXPLORER OF FUTURE PV n-type DeepBlue
Best Research-cell Efficiencies
of cells with different technologies have rapidly in creased. The efficiency of single crystal silicon cell has reached a laboratory efficiency of 26.7%. An other promising emerging technology is Perovskite and Si tandem cell technology, which has reached a laboratory efficiency of 29.8%.
The production capacity of n-type cell is ex pected to expand in the next 1-2 years, as maturity of technology and equipment increases and cost decreases. The n-type PV module is expected to become the mainstream product in the market in 5 years, as shown in Figure 2.
28 EQ SEPTEMBER 2022 (A) www.EQMagPro.com
4.0 XPARTTECHNOLOGY1BACKGROUND
In the past decade, the growth of the global photo voltaics (PV) industry has been impressive. Great technological developments have been made in both laboratory and industrial mass production. As shown in Figure 1, emerging technologies have appeared in the past decade or so, meanwhile, the efficiencies
However, the mainstream technology in the indus try is still single crystal silicon solar cell technol ogy. With the development and maturity of p-type PERC technology, there is limited space for further improvement of cell efficiency. On the other hand, the efficiency of n-type silicon cell has been improv ing rapidly in recent years.

www.EQMagPro.com 29EQ SEPTEMBER 2022 (A) TECHNOLOGY
PART 2 INTRODUCTION OF DEEPBLUE 4.0 X
On May 18th 2020, JA Solar launched the Deep Blue 3.0 series products, starting a new chapter of 182 modules. DeepBlue 3.0 has now become one of the mainstream products in the market. JA Solar has never stopped innovating and surpassing itself, and is committed to creating PV products with real core technical competitiveness. Now, two years later af ter DeepBlue 3.0 was born, we are once again wit nessing the birth of a new product - DeepBlue 4.0 X. It is a product that inherits the value of "customercentric" of the DeepBlue series; it is a top product based on the latest n- type high-efficiency cell and module technologies; it is a product that leads the industry in the era of high efficiency and opens an infinite future; it is a breakthrough product born at the right time.

DeepBlue 4.0 X is JA Solar's first official n-type product, but JA Solar has been developing the ntype solar cell for 13 years and have gone through multiple iterations. The cell efficiency has been continuously improved. The core technologies of high-efficiency n-type Bycium+ solar cell cover wafer, cell and process.
B. Surface passivation structure: for many years, the efficient way for improving cell efficacy is better surface passivation.
1. BYCIUM+ n-type high-efficiency bifacial cells
A. Wafer for BYCIUM+ cell: the wafers are JA Solar's self-developed phosphorus-doped n-type wafers. The minority carrier lifetime is much higher, at the millisecond level (over 50 times of p-type wafer). The n-type cell needs to go through an ultra-high temperature process. In or der to eliminate the negative effects of oxygen in the high temperature environment, we effectively reduce the oxygen content in the silicon wafer to less than 12 ppm, and this can make the wafer meet the requirements of n-type cells which is highly sensitive to oxygen. In terms of wafer size, JA Solar will continue with the proven M10 wafer size which has been adopted for our p-type products. This ensures that the module size is ex actly the same as the P-type module, so it is con venient for module installation and application.

Now, along with the progress of the whole industry chain, we have come to the first year of industrial ization of n-type products. What kind of PV module are customers seeking in the n-type era?
Core features and advantages of DeepBlue 4.0 X are shown below.
2. Gapless Flexible Interconnection (GFI) Tech nology....The advanced n-type cell technology contributes greatly to improving the efficiency of the final module product. In order to achieve higher module efficiency, DeepBlue 4.0 X also employs a new-generation high-density module technology - Gapless Flexible Interconnection (GFI) technology. As shown in Figure 5, the GFI technology eliminates the micro crack problem
for high-density module by adopting regular round ribbon together with a special buffer design which deals with mechanical stress at the cell connections. It ensures stable and reliable long-term power genera tion performance. Besides, GFI is totally compatible with both monofacial and bifacial modules. Through GFI technology, module power can be increased by more than 5 watts and module efficiency increased by at least 0.2%.


30 EQ SEPTEMBER 2022 (A) www.EQMagPro.com
Gapless Flexible Interconnection (GFI) Module
TECHNOLOGY
Structure of BYCIUM+ n-type high-efficiency bifacial cell
Power Comparison of Module
4.0
4. Higher power and efficiency
www.EQMagPro.com 31EQ SEPTEMBER 2022 (A)
With the advanced cell and module technologies, DeepBlue 4.0 X has higher power density. Com pared

with p-type module, the power of DeepBlue 4.0 X is about 25W higher and module efficiency is about 1% higher (Figure 7).
TECHNOLOGY
n-type and p-type
Excellent Reliability of DeepBlue X
5. Lower Degradation...When we evaluate a module product, in addition to power and effi ciency, the module's power generation perfor mance is also critical, because this affects the customer's benefits from the PV power station. Power generation performance is mainly af fected by some factors, including degradation, temperature effect, bifaciality, low light perfor mance and so on.
6. Lower Temperature Influence...As known, higher temperature brings down the power output of PV modules. For the BYCIUM+ cell, because its open circuit voltage can be as high as about 715 mV, so finally the DeepBlue 4.0 X has a better temperature coefficient. The temperature coefficient of power is -0.30%/°C, while it is -0.35%/°C for p-type module.
TECHNOLOGY
Effect of Temperature on Power Output
Power Degradation of n-type and p-type Module
32 EQ SEPTEMBER 2022 (A) www.EQMagPro.com
JA Solar provides a 30-year power output warranty (Figure 8), with a first-year degradation of 1%, and linear degradation rate of 0.4% every year. After 30 years, the power of DeepBlue 4.0 X module can still be at least 87.4% of the initial value, which is 2.4% higher than conventional p-type module. Because of this lower degradation rate, the n-type module gen erates 1.8% more electricity in 30 years, compared with p-type module.

This excellent temperature coefficient allows the DeepBlue 4.0 X to generate more power in high temperature environments. As can be seen from Figure 9, thanks to the excellent temperature co efficient, the DeepBlue 4.0 X generates about 2% more electricity than p-type module in one year, if we suppose that the operating temperature is 65°C.

7. Higher Bifacial Benefits...Under standard il lumination of 1000 W/m2, DeepBlue 4.0 X has a higher bifaciality of 80%, while the typical value for p-type module is only 70%. If we sup pose that the irradiation at the back side is 10% of the front side, the extra bifacial gain is about 0.9% for DeepBlue 4.0 X compared with p-type module.

www.EQMagPro.com 33EQ SEPTEMBER 2022 (A) TECHNOLOGY
8. Better Low Light Performance...Because of lower internal resistance and higher minority carrier lifetime of n-type cells, DeepBlue 4.0 X has a better perfor mance under low irradiation. The test result shows (Figure 10) when the irradiation is below 600 W/m², ntype module obviously produces more electricity than p-type. So, the energy gain in the morning or evening would be about 0.2%.
The following picture (Figure 11) summarizes the features and benefits of the DeepBlue 4.0 X module. Low-light Relative Power Gain and Benefits of DeepBlue 4.0 X

n/p
Features
PART 3 DATA FROM DEMONSTRATION PROJECT AND SIMULATION
Power Generation Performance (n-type vs p-type)

34 EQ SEPTEMBER 2022 (A) www.EQMagPro.com
"Maximizing customer value" is the core design con cept of DeepBlue 4.0 X. The excellent power gen eration performance of n-type module perfectly im proves the customer value. JA Solar and TÜV NORD launched a one-year (February 2021-February 2022) energy yield test at China Photovoltaic Test Center,
Yinchuan base (North west China). The results (Figure 12) from this demonstration project show that the power generation of n-type modules is 3.9% higher than that of p-type modules. Excellent power generation performance is essential for ex cellent module products.
Comparison of BOS and LCOE
TECHNOLOGY
BOS and LCOE are the core indicators to assess the customer value for PV power plant. We made simulations of a 100MW project in Dubai to compare the BOS and LCOE of DeepBlue 4.0 X and p-type mod ule.
The results show the BOS for DeepBlue 4.0 X is 2.1% lower, and LCOE is 4.6% lower than p-type module (Figure 13). The DeepBlue 4.0 X module will bring significant gain of the PV system.

In addition, for different regions, we also did corresponding simulations (Figure 14). LCOE of n-type module is better than that of p-type, and the average difference is about 2.3%.

"High quality, high efficiency, low cost" is the eternal theme of the PV industry. The cost will directly af fect the large-scale commercial applications. The cell manufacturing cost of DeepBlue 4.0 X is still a little higher than p-type product. However, with further improvement of technology and production capacity,
www.EQMagPro.com 35EQ SEPTEMBER 2022 (A) TECHNOLOGY
we believe that, the cost of DeepBlue 4.0 X will be more competitive in the next 1-2 years. In the future, JA Solar will continue to provide customers with PV products with the best LCOE and high est customer value, and contribute to facilitate the achievement of carbon neutrality goals.
PART 4 CLOSING

OUR HISTORY SPEAKS FOR ITSELF…


For more details Call: 1860 266 3911 Followwww.mahindrateqo.comus: Creating Delighted Asset Owners


Q2 REPORT- 2022
38 EQ SEPTEMBER 2022 (A) www.EQMagPro.com
INDIA SOLAR AND RENEWABLE ENERGY


Recent Solar Auction ………………………………………………………………………………………………………………..60
www.EQMagPro.com 39EQ SEPTEMBER 2022 (A)

Solar PV Installation by State ……………………………………………………………….…………………………………..54
Solar Water Pump ……………………………………………………………………………………………………………………69
Installed Power Capacity from Different Sources ………………………………………………………………….….46
Recent Solar Tender ………………………………………………………………………………………………………………...61
Hydrogen …………………………………………………………………………………………………………………75
Updates
ALMM Approved List of Models and Module manufacturers ASP Average Selling Price BCD Basic Custom Duty BOM Balance of Material BU Billion Unit CEA Central Electricity Authority CERC Central Electricity Regulatory Commission CFA Central Finance Assistance cKM Circuit kilometre CPSU Central Public Sector Unit CY Calendar Year DISCOM Distribution Company EV Electric Vehicle GW Gigawatt GWh Gigawatt Hour IREDA Indian Renewable Energy Development Agency ISTS Inter-State Transmission System JNNSM Jawaharlal Nehru National Solar Mission KV Kilo volt kW Kilowatt kWh Kilowatt Hour LC Letter of Credit M&A Merger and Acquisition MNRE Ministry of New and Renewable Energy MoU Memorandum of Understanding MSME Ministry of Micro, Small and Medium Enterprise MU Million Unit MVA Mega Volt Amp MW Megawatt PM- Pradhan Mantri Kisan Urja Suraksha evem Utthan KUSUM Mahabhiyan PPA Power Purchase Agreement PV Photovoltaic RE Renewable Energy REC Renewable Energy Certificate RPO Renewable Purchase Obligation RTS Rooftop Solar System T&D Transmission and Distribution
in
Updates
Discom Dues to Power Generator ………………………………………………………………………………….………..…48
State-Wise Solar Energy Generation ………………………………………………………………………………………..52
Utility-scale Solar Installations …………………………………………………………………………….……………..………43
List of Models and Manufacturers (ALMM)
Annual Growth in Power Generation …………………………………………….………………………………………….52
RE Generation in India ………………………………………………………………………………………………….…….……..49
Funds Release ………………………………………………………………………………………………….67
Approved …………………………………………………………..71
Tariff ………………………………………………………………………………………….75
EV ………………………………………………………………………………………………………………………………75 ……………………………………………………………………………………………………77
Conclusion and Suggestions
in
Quarterly Results ……………………………………………………………………………………………………………………..63
Market Scenario ……………………………………………………………………………………………………………………………44
Solar Parks India ………………………………………………………………………………………………………………….68
Installed Capacity ……………………………………………………………………………………………………….70
Policy & Regulatory ……………………………………………………………………………………………………66
Solar Rooftop Installation …………………………………………………………………….……………………………….……44
India achieves 100 GW Milestone ……………………………………………….…………………………………………….55
Transmission and Distribution Losses ……………………………………………………………………………………..58
for Renewable
TABLE OF
Trends
Introduction …………………………………………………………………………………………………………….……………………40
Trend in India (Wind/Solar)
Updates
SECI Monthly Payment ………………………………………………………………………………………….………………….56
Solar Energy Electricity Potential and Achievements by State ……………………………………………….57
ABBREVIATIONSCONTENT
IREDA Voyage Renewable Sector ………………………………………………………………………………………..67
Solar Power Generation by State …………………………………………………….………………………………….………50
Electricity Market ……………………………………………………………………………………………………………………..59
Solar Installations in India by Year ……………………………………………………………….………………………………41
Funding and M&A Updates ……………………………………………………………………………………………………..65
India installed Solar PV capacity has crossed the 57 GW line with the installed capacity of 55.9 GW (utility & rooftop) as of 30th June 2022. Of the total Solar PV installed capacity, most of the installation comes from utility-scale projects of more than 48.9 GW, while the rest comes from rooftop Solar. In Q2 2022, the pace of Solar rooftop installations was normal and increased by 13 percent but the installations on a utility-scale have decreased by 25 percent over the previous quarter of 2022. Many of the industrial and commercial customers are coming forward to go for Solar installations which were not available a few months back, especially in the second wave restriction. The year has started on a good note for the Indian Solar industry and will end with maximum installations, as 2022 is the last year for the JNNSM target of 100 GW Solar by December 2022.
The share of utility-scale in the total Solar PV installations as of June 2022 was around 87 percent, while in CY Q2 2022, it exponentially increased to 88 percent. While the share of rooftop Solar as of June 2022 was around 13 percent of the country's total Solar PV installations, it has gained a 6.63 percent share in the second quarter of CY 2022 over the previous quarter's cumulative capacity. The share of the rooftop especially in the commercial and industrial space will grow substantially as the net-metering policy which was pending been approved by the Ministry of Power where the new amendment allows the net metering users to go for loads up to 500 kW or up to the sanctioned load, which ever is lower.
I
Rooftop Solar installations accounted for around 438 MW installed in Q2 2022, an increase of 13 percent compared to 388 MW installed in Q1 2022. In a Y-o-Y comparison, rooftop Solar installations increased by just 7 percent, with around 408 MW added in Q2 2021.
In Q2 2022, large-scale installations totaled around 3.13 GW compared to around 4.16 GW installed in the previous quarter. Y-o-Y, large-scale installations increased by over 96 percent compared to 1.59 GW installed in Q2 2021. The large-scale Solar PV project installation figures wereslow due to BCD (basic customs duty) on Solar PV modules & cells which resumed from April 2022. In the first half of CY 2022, more than 8.1 GW of SolarPV projects got commissioned (utility & rooftop).
The market has substantially improved since 2020 due to which the Solar PV installations crossed 3 GW in the second quarter of 2022 but were lower than the first quarter. The government had set a target for setting up 100 GW of Solar power capacity by December 2022 in the country. Against this, a total of around 57.7 GW (utility, rooftop, off-grid) of Solar power capacity has been installed, as of 30th June2022, 60.66 GW capacity is at various stages of implementation and 23.14 GW capacity is under bidding stage as per the Lok Sabha update. The market has recovered from a pandemic, and projects are getting commissioned which were stuck in 2021 but one issue of rising in the Solar PV modules pulling back the Indian Solar industry, along with BCD on Solar Cells & Module, and the upcoming ALMM.

In Q2 2022, the PV supply chain saw substantial price fluctuations. Polysilicon shortages affect production output across the supply chain, whilst energy intensity and consumption control, and power rationing imposed in China since September 2021 affected overall raw material supply. Also, there is an out break of COVID-19 in the country again in 2022 which are affecting transport, as there is a lockdown in a few of the important province of the country, due to which there is a halt in the movement of goods inside the country, which create shortage from the bubble demand of Solar PV modules and the price of the panels got an increase.
ndia’s quarterly Solar capacity additions declined by 22 percent in Q2 2022 over the previous quarter with around 3.56 GW installed in the second quarter of 2022 (utility & rooftop), a decent decrease compared to around 4.5 GW installed in Q1 2022. Installations were up by 78 percent year over year compared to Q2 2021.
Even the installations might be more in the third quarter of the calendar year 2022 as this is the last year for the JNNSM target of 100 GW Solar by December 2022, but there was a supply chain disruption in China due to which the prices in the domestic country in China were itself high, it’s a wait and watch the situation as to how developers are reacting in the Q3 2022 and commissioned the projects to get the benefit of the extra cost of duty on modules if they would have procured the panels on/before 31st March 2022.
INTRODUCTION
40 EQ SEPTEMBER 2022 (A) www.EQMagPro.com
In overseas markets, Polysilicon prices and shipping costs remained high and volatile during the quarter. Epidemic prevention and containment policies in China since March 2022 have resulted in logistics congestion and sharp reductions in transport capacity, which further increased cost pressures. To overcome these difficulties, the industry has taken early action to ensure ample reserves of raw materials as well as close cooperation and coordination of production, supply chain,
After the Paris agreement, there is a positive growth in Solar PV installations in the country, and India became one of the top Solar markets globally after China & the USA. The total renewable energy capacity (excluding Hydro Power) already crossed the 114 GW mark in June 2022. The 175 GW installed RE capacity by 2022 announced in 2015 by the Hon’ble Prime Minister of India surpassed the 114 GW milestone (excluding large hydro) in 2022. India has only tapped a fraction of the vast potential for renewable energy and, therefore, India has raised the target to 450 GW RE installed capacity by 2030 with 280 GW of Solar. India will install the maximum capacity of yearly Solar PV installation in the Calendar year 2022, which already started with more than 8.1 GW of installations inthe first half of CY 2022, the developers have procured the modules before the imposition of BCD, and commissioned the projects with the duty-free module in the second quarter except rooftop installers who might have paid duty for the import of foreign modules.


India has tier-1 panel manufacturers who can provide quality panels at an affordable rate, also many huge announcements from top domestic manufacturers are announcing an expansion, and trying to match the capacity of Chinese module manufacturers so that they can get the benefit of economies of scale and supply the modules at a competitive rate.
www.EQMagPro.com 41EQ SEPTEMBER 2022 (A)

47,889
There was tremendous growth in the Indian Solar PV installations from 2016 to 2019, but due to COVID-19, the installations have slowed down. In CY 2021, the installations have taken a U-turnand shown a growth of 279 percent over 2020, but India needs more projects to be commissioned in the coming quarters as the target is huge, and left with only two quarters where the country has to achieve 100 GW of Solar PV installations by December 2022. Utility-scale installations were on track and left with just 11 GW to achieve the 60 GW of JNNSM target for ground-mount Solar PV installations.
SOLAR INSTALLATIONS IN INDIA BY YEAR
The growth rate of Solar PV installations inthe second quarter of 2022 had slowed down, as India's capacity addition in the quarter was around 3.56 GW (utility & rooftop) compared to the installations in Q1 2022 were 4.54 GW.
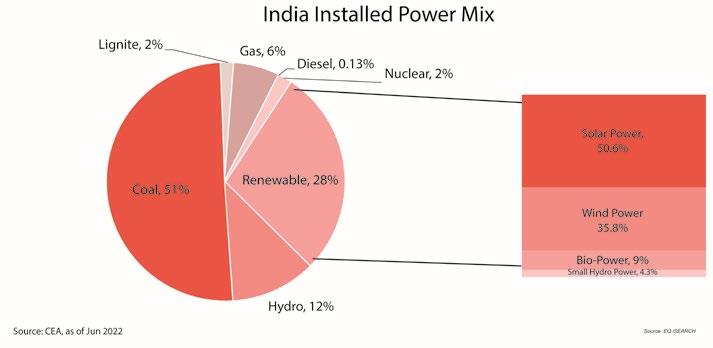
India’s renewable capacity (excluding Hydro Power) has crossed the 114 GW mark, of which Wind and Solar Power contribute most of the installation with a market share of 35.8 percent and 50.6 percent as per June 2022 CEA (Central Electricity Authority) updates.
42 EQ SEPTEMBER 2022 (A) www.EQMagPro.com
Installations in Indian Solar Industry might be slow in the coming quarter due to BCD on modules and cells, in the second quarter of 2022 installations were down compared with the previous quarter due to the imposition of BCD. The raw materials price is high due to supply disruptions in China, also the new COVID outbreak is going to further affect the prices of the module.


EQ isearch
www.EQMagPro.com 43EQ SEPTEMBER 2022 (A)
In Q2 2022, utility-scale projects accounted for 88 percent of the total Solar PV installed capacity, which was down by 25 percent over Q1 2022, where the installations were around 4.16 GW.

In CY Q22022, around3.13 GW of Solar PV has been installed in the country under utility-scale installations. This quarter's installations have reduced compared to Q1 2022 with 4.16 GW. The developers commissioned the maximum projects in March 2022 before the implementation of BCD on the Solar PV module & cell.
UTILITY-SCALE SOLAR INSTALLATIONS

The installations in CY Q2 2022would have been more but due to an increase in the raw materials, the price of the modules has increased many folds, also the availability of modules in the short-term is difficult due to global demand. Many Chinese suppliers were not able to supply the panels due to a shortage of raw materials in China. Even Q3 2022 is going to be a difficult quarter due to the recent outbreak of COVID-19, there was a fresh lockdown in a few of the major provinces due to which many containers were floating idle in the coastal region. This will result in inflation in the Solar PV upstream segment. Also, there is a BCD on Solar Cells & Modules which will indirectly increase the project cost.
Ever since tariff barriers went up on solar cells (25%) and modules (40%) starting in April 2022, Indian Solar manufacturers and developers have been exploring various ways of bypassing these tariff barriers. One such avenue is the use of the Free Trade Agreement (FTA) that India has with ASEAN countries (Vietnam, Singapore, Thailand, Malaysia, Cambodia among others).
Rooftop Solar installations increasedby 13 percentin Q2 2022 reaching around 438 MW compared to Q1 2022. There was a year-over-year growth of 7 percent compared to Q2 2021. Rooftop Solar contributes just 12 percent of the total Solar PV installations in the second quarter of 2022. The installations in the quarter were slow due to a BCD, one of the major reasons for the decline in the overall installations of rooftops in the second quarter was the lack of panels availability, as C&I consumers don’t want to install the projects with higher panels price, which went down to the lowest a few quarters back. The good days were gone for the C&I consumers as they have to pay extra costs for the procurement of moduleson the imposition of BCD.
The installations for Solar PV in the second quarter of 2022 were around 3.56 GW (utility-scale & rooftop), there was a decline of 22 percent compared to the previous quarter's installations, due to the increase in the module price as BCD has been implemented from the start of a quarter second, it becomes a difficult task for the developers to execute the projects at the pre-determined price. Lots of negotiations are happening between the project developers and module suppliers.

India should roll back the duty hikes for at least 2 years, press on with incentives and grants to Indian manufacturers, and hold the non-tariff barriers (like the ALMM) for an equal period of 2 years to put the country's Solar target on a path which has diverted a lot.
MARKET SCENARIO
The record of steep tariffs incentivizing domestic manufacturing in solar has been very patchy. The recent experiences of the US and Europe manifest this. Be that as it may, a fragment of a tariff barrier would be needed to reduce dependency and foster energy security. But if India does not want the sacrifice and pausesthe energy transition goals, it pays to be realistic, and roll back activities that take further steps to hamper the momentum of our energy transition. There is a slowdown in the import of BCD cells & modules, as suppliers and developers are still negotiat ing it find out the ways of this extra burden duty which is shattering the margin of the solar PV project. The rise in solar module prices is an ab erration, and long-term average prices should revert to sub-$0.20/Wp (before duties and taxes) levels from the current $0.28/Wp in June 2022.
SOLAR ROOFTOP INSTALLATION
44 EQ SEPTEMBER 2022 (A) www.EQMagPro.com
India bought into the “Atma Nirbhar” narrative and announced across the board tariff walls on Solar cells and modules. Simultaneously a Production linked incentive scheme was announced for manufacturers. The Covid has driven supply chain disruption increased module prices and combined with the steep hike in duties which push the modules prices to another level. The new Capacity addition has all but paused. Meanwhile, domestic production is struggling to catch up and it will take new capacities at least 2-3 years to come on flow (if they do). Unless the government act soon, this has the potential to set us back by 2-3 years.
www.EQMagPro.com 45EQ SEPTEMBER 2022 (A)
Cumulative rooftop Solar installations have reached 7 GW as per MNRE monthly updates and still makeup just 13 percent of the total Solar PV installations in the country, the target for Solar rooftops by December 2022 is 40 GW, still,a long way to go to reach the target, it is impos sible to install 40 GW of Solar rooftop projects. We can estimate that India can achieve below 10 GW of rooftop Solar installations by 2022. The rooftop consumer’s major objective for a Solar system is to reduce their electricity bills as installing a Solar system for large consumers is beneficial, but due to BCD, their payback period will increase.

Rooftop Solar installations will grow exponentially in 2022 as the demand in commercial and industrial are increasing every year. Also, the recent update on the Coal shortage will kick up the Solar rooftop installation in the coming quarters as the C&I consumer's dependence on distribution companies (discoms) will reduce, this will help them smooth the flow of their day-to-day operation which is getting disrupted due to load shedding. In the first half of 2022, around 825 MW of Solar Rooftop being installed as per MNRE monthly update.
Renewable capacity additions continue to increase at a rapid pace in India, accounting for approximately 28.3 percent of India’s power capacity mix at the end of June 2022. India’s total installed power capacity stood at over 403.8 GW at the end of the second quarter of 2022 from all the sources, with renewables accounting for 114.064 GW making up 28.3 percent, compared to cumulative renewable energy installations of 109.88 GW at the end of March 2022, which represented a 3.8 percent growth quarter-over-quarter.

46 EQ SEPTEMBER 2022 (A) www.EQMagPro.com
India installed around 438 MW of Solar rooftop projects in the quarter second of 2022. But the good days are already over as BCD on Solar modules and cellsis being imposed, the installations might start falling again as rooftop installations always go for higher wattage imported panels from Chinese companies such as Mono Perc, Bifacial, now these panels cost 40 percent extra, the installers will suffer a huge loss as the cost of projects for rooftop Solar become very competitive from the past few quarters and negotiation for the higher price will be very difficult for the installers.
INSTALLED POWER CAPACITY FROM DIFFERENT SOURCES
Annual Solar Rooftop Installations in India 2015-2022
www.EQMagPro.com 47EQ SEPTEMBER 2022 (A)
Thermal power (which includes coal, lignite, gas, and diesel) is still the significant source of energy in the country - with its cumulative instal lations reaching 236 GW, representing 58.5 percent of the total installed power capacity. Coal accounted for a dominant share of the mix, with 50.5 percent of the total installed power capacity, followed by natural gas at 6.2 percent, lignite at 1.6 percent, and diesel with a 0.13 percent share. However, thermal power’s share in the overall power mix is gradually declining as the government is shutting down old thermal plants, especially coal, and moving toward a non-conventional source of energy. Butin the recent past, the country suffers outages across the country due to a shortage of coal in the thermal power coal unit, it’s a long way when renewable power generation will be able to dominate the country's electricity demand as mainstream renewable energy is intermittent.

Solar power accounted for approximately 57.7 GW of installations, which is 14.29 percent of the total installed power capacity. The share of Solar power in the installation mix grew by 6.9 percent quarter over quarter, with a 14.3 percent share in June 2022. Among the renewables (ex cluding Hydro), Solar accounted for approximately 50.6 percent of the installed capacity. Wind accounted for 10.1 percent of the total installed capacity and 35.8 percent of the renewable mix capacity as of June 2022. As the restrictions across the country have been uplifted, the overall installed capacity in the country has been increased by 1.07 percent which is 403.75 GW quarter over quarter from Q2 2022 over Q1 2022. Among the renewable, Solar Power has shown the highest growth quarter-over-quarter at 6.9 percent, while Wind Power has grown by 1.07 percent, Hydro power’s cumulative installations stood at 46.85 GW, making up 11.6 percent of India’s total installed power capacity.
Small hydro had installed over 4.88 GW and represented 1.2 percent of the overall power mix capacity at the end of June 2022. The share of nuclear remains constant during the second quarter of 2022 which represents 1.7 percent of the total power mix installed capacity by June 2021, with no capacity added since the second quarter of 2021. Nuclear power is not only clean and environmentally friendly, but it is also a source of base load power available 24x7 like thermal power.

There was an overdue amount that needs to be paid by discoms at the start of June 2022 was ₹ 107,420 crore ($13.6194 billion), which was ₹4,747 crore ($601.853 million) higher than March 2022and ₹22,621crore ($2.868 billion) higher by June 2021. In June 2022, the total amount billed to discoms was ₹30,232crore ($3.832billion). Discom paid around ₹79,092crore($10.0278 billion) in Q2 2022 for both current and overdue. The Power System Operation Corporation (Posoco) instructed the three power exchanges in the country to restrict 27 distribution companies across 13 States from trading on their platforms on account of non-payment of outstanding dues. DUES TO GENERATOR

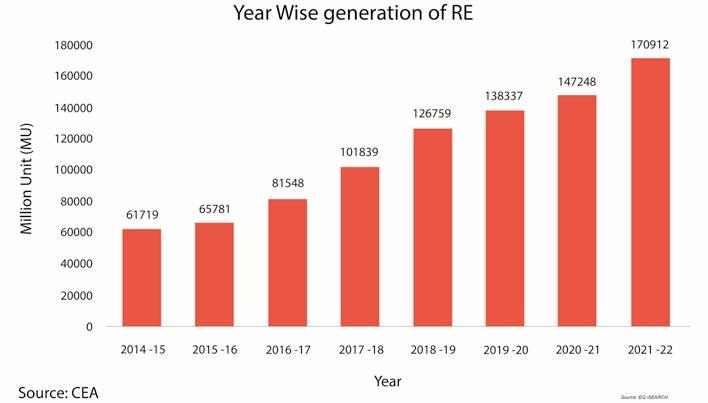
48 EQ SEPTEMBER 2022 (A) www.EQMagPro.com
DISCOM
POWER
www.EQMagPro.com 49EQ SEPTEMBER 2022 (A)
RE GENERATION IN INDIA

Total renewable energy generations in June 2022 reach 19,496.96 million units, there is an increase of RE generators by 24.6 percent over March 2022, where the RE generations were 15,643.06 million units, also there is an increase of over 31.7 percent quarter over quarter from Q1 2022 to Q2 2022 where the generation from RE was 42.12 billion units in Q1 2022 to 55.48 billion units in Q2 2022.

Rajasthan overtake Gujarat and shows the largest Solar Power installed capacity among the top Solar PV installed states by June 2022, While Rajasthan also overtook Karnataka to become the largest Solar PV generation state and shows a tremendous growth rate of 152 percent year over year comparison for Solar generation as the state has installed a huge amount of Solar power projects since March 2021, also many Solar parks in Rajasthan got commissioned such as Bhadla, Phalodi-Pokaran, Fatehgarh with a total capacity of 2.901 GW as per Lok Sabha update.
Gujarat 838.77 529.38 58%
39.36
Name of State/UT Solar Power Generation June’2022
Source CEA iSearch

Solar Power generation is having the largest percentage in terms of the generation behind Wind Power with 8,259.91 million units and contrib utes 42.37 percent of the total renewable generation share in June 2022, Wind Power with 49.8 percent market by generating 9,708.52 million units in June 2022. Other sources such as Bagasse, small Hydro, and Biomass contribute 1.7 percent, 3.58 percent, and 1.55 percent respec tively. Solar and Wind Power together contributed 92.16 percent of the total renewable energy generation in June 2022.
SOLAR POWER GENERATION BY STATE
(MU)
Tamil Nadu 728.6 609.73 19%
Andhra Pradesh 710.95 731.04 -3% Telangana 559.28 522.44 7%
Uttar Pradesh 307.57 195.61 57%
Solar Power Generation (MU) June’2021
Karnataka 1133.93 1170.75 -3%
Maharashtra 314.57 420.51 -25%
There is a growth of around 14.1 percent in the total renewable generation from June 2021 to June 2022. While there is an exponential growth of 37.5 percent in Solar power generation from June 2021, Wind Power has declined by 0.17 percent in generation in the same period due to the monsoon season.
Rajasthan has crossed over 2,800 million units of Solar power generation as the state has installed 14.06 GW followed by Karnataka crossed 1,100 million units with 7.59 GW of Solar PV installation as of June 2022 as per MNRE monthly updates.
Madhya Pradesh 340.79 336.52 1%
Haryana 63.04 33.66 87% Odisha 51.5 41.48 24% Kerala 43.32 43.02 1% Chhattisgarh 29.12 35% Uttarakhand 24.63 12%
Punjab 198.87 137.92 44%
Growth (%)
27.65
Rajasthan 2822.97 1119.77 152%
50 EQ SEPTEMBER 2022 (A) www.EQMagPro.com
www.EQMagPro.com 51EQ SEPTEMBER 2022 (A)
Even though Gujarat has installed more than Karnataka, butby generation through Solar projects, Karnataka has more generations in terms of million units which shows the quality of generations and the irradiation level in southern states, as per the June 2022 data, Tamil Nadu and Andhra Pradesh were in the fourth and fifth position interms of Solar power generation as of June 2022.


YEAR
Solar, Wind & Other RES Increased by 7.96 %
Nuclear Increased by 9.49 %
2013-14 4.2 10 9.05 5.23
2018-19 3.4 14.3 12.09 5.19
2011-12 6.6 17.5 18.3 9.14
52 EQ SEPTEMBER 2022 (A) www.EQMagPro.com
North Eastern Region has improved in recent years as the growth of Solar installations is increasing year after year due to the imposition of Solar RPO in those states which was not there earlier, from 2019-20 to 2020-22, this region had shown a growth of 176 percent, which is quite positive for the country as a whole.
Thermal Increased by 7.96 %
The Overall generation (Including generation from grid-connected renewable sources) in the country has increased from 1,110.458 BU dur ing 2014-15 to 1,173.603 BU during the year 2015-16, 1,241.689 BU during 2016-17, 1,308.146 BU during 2017-18, 1,376.095 BU during 2018-19, 1389.121 BU during 2019-20, 1,381.855 BU during 2020-21 and 1,491.859 BU during 2021-22. The performance of Category wise generation during the years 2021-22 was as follows:-
Solar energy production has increased from 39.27 BU (billion units) in 2018-19 to 73.48 BU in 2021-22 registering an increase of 87 percent or 34.21 BU. There is tremendous growth in different regions of the country from 2018-19 to 2021-22, such as the North Eastern Region showed a growth of 479 percent, followed Northern Region by 176 percent, Western by 82 percent, Southern by 56 percent, and Eastern Region by 75 percent in the same period.
2017-18 4.3 11.1 9.55 5.35
2019-20 -2.7 12.7 13.99 0.95 2020-21 -1 2.1 0.86 -0.52 2021-21 7.96 7.74 7.96 7.96 2021-22* 17.17 16.47 14.04 16.79
2016-17 5.3 8.9 7.68 5.8
STATE-WISE SOLAR ENERGY GENERATION
2012-13 7.3 -5.9 -4.78 4.46
2014-15 10.8 1.3 1.91 8.84
In 2021-22, Northern Region has gained market share in terms of power generation of the country which shows 31 percent, while the Western Region has 20 percent, but the maximum shares still come from the Southern region which has more than 48 percent of the total Solar power generation in the country in 2021-22. Eastern Region is still the neglected region in the country where the share of power generation was just 1 percent followed by the North Eastern Region by 0.13 percent share.
Source: Ministry of Power (*Provisional (upto June 2022))
Bhutan Import Reduced by 14.51 %
Hydro Increased by 0.88 %
2015-16 7.5 -1.8 0.97 5.69
Growth in Fossil Fuel Generation Renewable Gen erationHydro)(Including Non-Fossil Fuel (RE + GenerationNuclear) Total Generation
GROWTH (%)
ANNUAL GROWTH IN POWER GENERATION
Uttarakhand 318.29 341.51 329.64 301.6 55.3
State-Wise and Year-Wise Solar Energy Generation Installed (in MU)
Dadra and Nagar Haveli 5.76 6.19 11.96 49.16 6.72
Kerala 110.84 143.59 275.44 496.93 103.63
Puducherry 2.58 4.15 6.39 12.24 2.04
Rajasthan 5109.35 7776.56 10384.24 17219.88 5509.88
Orissa 263.03 362.29 476.26 603.71 129.01 Sikkim 0 0 0 0 0
Eastern Region 516.58 615.81 752.78 904.75 192.35
Meghalaya 0 0 0 0.47 0
Name of State/UT 2018-19 2019-20 2020-21 2021-22 2022-23 May-2022)(upto
Gujarat 2410.32 3631.86 4633.81 6774.5 1767.58
Tripura 7.14 3.43 6.04 6.18 1.12
Goa 0 0.82 1.46 15.93 0.84
Ladakh 0 0 0 0 0
Northern Region 8252.45 11209.77 14335.59 22754.17 6766.28
Karnataka 7575.83 11221.2 13238.86 13169.43 2551.03
Chhattisgarh 335.15 326.42 370.8 436.56 89.6
Tamil Nadu 3554.5 4946.63 6115.48 7172.88 1431.92
Uttar Pradesh 1235.08 1447.05 1856.19 2900.41 663.99
Andaman Nicobar 13.86 11.6 24.82 21.51 5.38 Bihar 179.89 160.16 160.63 163.08 32.28
Chandigarh 13.51 13.33 10.16 14.19 3.04
Lakshadweep 1.11 0.66 0.45 0.3 0.03
Delhi 10.83 136.3 189.99 225.84 42.68
North Eastern Region 17 14.24 31.11 98.41 37.6
Maharashtra 2206.62 2372.68 3089.46 3187.18 665.26
www.EQMagPro.com 53EQ SEPTEMBER 2022 (A)
Telangana 6312.26 6263.92 6351.04 6536.94 1229.99
Southern Region 22523.09 28435.26 32943.75 35221.23 6778.54
isearch
J&K 0 0 9.42 1.71 0
West Bengal 40.65 64.29 73.89 98.24 21.96
Arunachal Pradesh 1.2 1.6 1.54 1.72 8.38
Assam 6.67 6.14 13.37 81.64 26.09
Manipur 1.88 2.63 7.71 6.72 1.35
Mizoram 0.12 0.44 2.45 1.68 0.66
Source: Lok Sabha Update, CEA, iSearch
Nagaland 0 0 0 0 0
Haryana 72.47 125.14 162.95 572.85 126.08
Daman & Diu 18.94 21.83 29.52 35.35 4.87
HP 0 11.66 36.52 44.29 11.66
Andhra Pradesh 4965.96 5855.11 6956.1 7832.51 1459.91
EQ
Jharkhand 19.15 17.47 17.16 18.21 3.73
All India Total 39268.2 50131.1 60402.25 73483.94 17151.49
Western Region 7959.08 9856.02 12339.03 14505.37 3376.72
Madhya Pradesh 2982.29 3496.23 4202.03 4006.7 841.85
Punjab 1492.9 1358.22 1356.48 1473.41 353.64
www.EQMagPro.com 55EQ SEPTEMBER 2022 (A)
India has also enhanced its ambition to install 450 GW of Renewable Energy capacity by 2030 of that 280 GW comes from Solar. If large hydro is included the installed RE capacity increases to 160.9 GW by the end of June 2022.
ICRA estimates the outlook for the capacity addition in the renewable energy sector remains strong with a large project pipeline of over 55 GW and the highly competitive tariffs offered by these projects. The commitment to climate change goals announced by the Prime Minister at the recent COP26 summit, including increasing the non-fossil power capacity to 500 GW and meeting 50% of energy requirement from renewable sources by 2030, further strengthens the investment prospects in the renewable energy sector.
India had committed to achieving 40.1% of its installed electricity capacity from non-fossil energy sources by 2030. The country has achieved around 39.85 percent of the total installed power capacity. The country’s installed Renewable Energy capacity stands over 160 GW while its nuclear energy-based installed electricity capacity stands at 6.78 GW. The Government is committed to achieving 500 GW of installed power capacity from non-fossil fuel sources by the year 2030.
The total installed renewable energy capacity in India, excluding large hydro, has crossed the mile-stone of 114.064 GW by the end of June 2022. India has set an ambitious target for itself in the area of Renewable Energy, which the Ministry of New and Renewable Energy is com mitted to achieving.

INDIA ACHIEVES 100 GW MILESTONE

SECI MONTHLY PAYMENT
Solar Energy Corporation of India (SECI) paid ₹22.691 billion (~$287.69 million) for Solar and Wind power purchased in the second quarter of 2022 from ₹16.491 billion (~218.005 million) in Q1 2022, there is an increase of over 38 percent over the previous quarter. The disbursed amount was highest in the second quarter of 2022 since the quarter third of 2021. There were many ups and down in the payment to generators from July2021 to June 2022.

During the first half of 2022, SECI made a payment of around ₹39.182 billion ($496.77 Million). The payment to Solar and wind generators started increasing in 2022, as lots many projects are coming online in the coming quarters. SECI is the major power purchaser for Solar in the country, and monthly payments to power generators are increasing year on year basis.

56 EQ SEPTEMBER 2022 (A) www.EQMagPro.com
Recently, Posoco, in a letter to the Indian Energy Exchange (IEX), Power Exchange India Limited (PXIL), and Hindustan Power Exchange (HPX), said buy and sell transactions in all products of the power market for discoms shall be entirely restricted till further notice from the power delivery date of August 19. The action is likely under the Electricity (late payment surcharge and related matters) Rules, 2022, notified in June. The total dues are around ₹5,085 crores ($644.71 million), of which those from Telangana, Tamil Nadu, Rajasthan, Jammu, and Kashmir, Andhra Pradesh, Maharashtra, and Karnataka total upto ₹4,761 crores ($603.63 million).
www.EQMagPro.com 57EQ SEPTEMBER 2022 (A)
SOLAR ENERGY ELECTRICITY POTENTIAL AND ACHIEVEMENTS BY STATE

Since2022.thesigning of the Paris Agreement, Solar installations in the country have increased exponentially, many schemes such as Ultra Mega Solar Power Park, PM-KUSUM, and Grid Connected Solar Rooftop Programme have been launched to promote Solar PV, the results of which Solar became the highest growing sector among the power. The share of Solar PV installed capacity among the total power installed capacity was around 14.29 percent. The Solar PV installed capacity was around 5 GW by 2015, now India has installed around 58 GW as per the MNRE update. India is set to achieve 450 GW renewable energy installed capacity by 2030 of that 280 GW comes from Solar.
58 EQ SEPTEMBER 2022 (A) www.EQMagPro.com
Of all the renewable energy, Solar power has the potential of over 700 GW across the country. India has tapped just 8.23 percent of the actual potential for the Solar PV project, as per the available data. Punjab achieved the maximum potential capacity of 40 percent, out of the total potential of Solar power followed by Tamil Nadu with 32 percent and Karnataka with 31 percent. JNNSM's target of Solar power by 2022 is 100 GW of this around 57.7 GW has already been achieved by the second quarter of the calendar year

Region Availability GWh Consumption GWh T&D Losses GWh T&D Losses NER 16069 11475 4594 28.59% ER 146615 110339 36276 24.74% WR 407581 320056 87525 21.47% NR 385100 303565 81535 21.17% SR 352320 292083 60237 17.10% Source: Niti Aayog Dashboard (2019)
www.EQMagPro.com 59EQ SEPTEMBER 2022 (A)
ELECTRICITY MARKET

The second quarter of 2022 saw significant growth in industrial and economic activities, leading to an increase in the overall power demandand subsequent - consumption. The entities showing aggressiveness in buying Renewable Energy Certificates (REC) to meet their renewable purchase obligation (RPO), there is a decline of 13 percent quarter over quarter from Q2 2022over Q1 2022. In June 2022, Power Market trades the highest monthly volume of 8,267 MU in the second quarter of 2022. In Q2 2022 of the calendar year, the electricity market achieved 23,437 MU volume resulting in 9.8 percent YoY growth across market segments.

60 EQ SEPTEMBER 2022 (A) www.EQMagPro.com EQ isearch RECENT SOLAR AUCTION Winner Capacity (MW) Tariff (₹/kWh) Solar PV Auctions in Q2 2022 Tata Power Renewable 600 2.53 SECI – V Hybrid Auc tion. AMP Energy 120 2.53 SECI – V Hybrid Auc tion. NTPC 450 2.53 SECI – V Hybrid Auc tion. Narmada DevelopmentHydroelectricCorporation 100 3.22 RUMSL Floating Solar (Omkareshwar Water Park), 300 MW AMP Energy 100 3.21 RUMSL Floating Solar (Omkareshwar Water Park), 300 MW SJVN 90 3.26 RUMSL Floating Solar (Omkareshwar Water Park), 300 MW Aditya Birla Renewables 300 2.3 GUVNL T-XIV, 500 MW Hinduja Renewables 120 2.3 GUVNL T-XIV, 500 MW SJVN 80 2.31 GUVNL T-XIV, 500 MW Source: iSearch

Selection of Hybrid Power Developers for Setting up of 750 MW Intra-State Wind Solar Hybrid Power Projects in Madhya Pradesh under Tariff-based Competitive Bidding
MSEDC 500 Utility RfS Document for Purchase of Power on Long Term Basis Through Competitive Bidding Process (Fol lowed by Reverse E-Auction) From 500 MW Grid Connected Solar Power Projects
PSPCL has issued a RfS to procure power from 1 GW of solar projects with a minimum capacity of 5 MW located in Punjab through a long-term tariffbased competitive bidding process
SECI 1,200 Wind RfS for setting up of 1200 MW ISTS-Connected Wind Power Projects (Tranche-XIII)
EoI for development of grid-connected solar PV power project in 1,200 MW ultra-mega renewable energy power park, Jalaun (Uttar Pradesh)
PSPCL floats tenders to buy 2000 MW solar power from Punjab and outside
NTPC REL 1,255 Utility BoS package for 1,255 MW solar PV projects at Khavda re-power park, Rann of Kutch, Gujarat
GUVNL 500 Utility Storagewith
RECENT SOLAR TENDER
Hindustan Salts Limited 1,000 Utility Online bids are invited for the development of 1,000 MW solar PV project at kharaghoda, surendranagar, Gujarat
Bundelkhand Saur Urja Limited 1,200 Utility
NTPC REL 600 Utility EPC Package with Land for Development of ISTS connected Solar PV Projects (Upto 600 Mw) Any where in India.
RfS for purchase of power through competitive bidding process followed by reverse e-auction] from 500 MW grid connected re projects with assured peak power supply along with energy storage system located in the state of Gujarat
PSPCL/Punjab 1,000 Utility
GUVNL 500 Utility RfS Document for purchase of power through a competitive bidding process (followed by reverse e-auction) from 500 MW grid-connected solar photovoltaic power projects to be setup in Gujarat (Phase XIV) with green shoe option of additional upto 500 MW
Rewa Ultra Mega Solar Limited 750 (Wind-Solar)Utility
www.EQMagPro.com 61EQ SEPTEMBER 2022 (A) EQ isearch
MPUVNL 1,250 Utility RFP for Selection of RPGs for Implementation of 1,250 MW Grid Connected Solar based power plants connected to selected 33/ 11 kV substation for Sale of Power to MPPMCL at various locations in MP under feeder solarization component of PM KUSUM-C
PSPCL 2,000 Utility
MSEDCL 1,000 Utility RfS Document for procurement of 1000 MW Solar power from projects to be developed in Maharashtra through a competitive bidding process
SECI 500 ageUtility/Stor
RfS Document for setting up of Pilot Projects of 500 MW/1000MWh Standalone Battery Energy Storage Systems in India under Tariff-Based Global Com petitive Bidding (ESS-I)
Issuer Capacity(MW) Project Type
Solar PV Tenders in Q2 2022
MSEDCL Issue Tender for Supply of 500 MW (AC) solar power from decentralized solar projects under component-c of PM KUSUM scheme to be devel oped in the state of Maharashtra
HPGCL (Haryana) 121 Utility Design, Engineering, Supply & Procurement, Con struction, Erection, Testing, and Commissioning of 121 MW Grid Connected Ground Mounted Solar Power Plant at HPGCL Land (Faridabad, Panipat, and Yamuna Nagar) including Comprehensive Op eration and Maintenance (O&M) For 15 Years
NHPC 75 Utility EPC contract for Development of 75 MW capacity ISTS connected Solar Power Project anywhere in In dia for sale of energy through Power Exchange along with Comprehensive O&M of 05 years
NTPC REL 100 Wind NTPC REL invites online bids from eligible bid ders on Single Stage Two Envelope (i.e., Envelope-I: Techno-Commercial Bid and Envelope-II: Price Bid) for 100 MW STU-Connected Wind Energy Project(s) in Madhya Pradesh
MSEDCL 431 Rooftop For procurement of cumulative 431 MW solar power from decentralised solar projects of minimum 0.5 MW to maximum 2 MW capacity under com ponent-a of PM KUSUM scheme to be developed in the state of Maharashtra
NTPC REL 200 Utility EPC package with land for STU grid-connected solar PV projects (upto 200mw) in MP
GSECL/Gujarat 100 Wind Engineering, Supply, Procurement, Installation, Commissioning, Comprehensive O&M of 100 MW (+5%) Wind Power Project at the suitable site(s) in the state of Gujarat (2 sites max.) on turnkey basis with its Comprehensive Operation & Maintenance for 25 Years
62 EQ SEPTEMBER 2022 (A) www.EQMagPro.com MSEDCL 500 Utility/Rooftop
BHEL 100 Utility Design supply I&C and O&M 3 Months of Module Cleaning System for 100MW Solar PV power plant for GSECL at Raghanesda
NTPC REL 250 Utility Development of ISTS Connected 250 MW/500 MWh Standalone BESS
NLC 100 Utility Setting up of 100 MW ISTS connected Solar Power Project on PAN India basis with O&M for 3 years
UPNEDA 98 Utility RFS of Solar Power Generator for Setting up of Grid Connected Solar Power Plants on Barren uncul tivable or agriculture land, under PM KUSUM A Scheme
BHEL 300 Floating Entering into Pre-Bid Tie up for Supply and Installa tion of PV Modules, Floaters, anchoring and moor ing system and AMC for 3x100 MW Floating Solar PV Power Plant, Omkareshwar Reservoir
MSPGCL (Maha Genco) 105 Utility RfP for Selection of Solar Power Developer for Set ting up of 105 MW Grid Connected Floating Solar PV Power Project at Erai Dam Solar Park
NHDC 88 Floating Design, EPC Contract for development of 88 MW (UNIT-D) FSPV plant at Omkareshwar Reservoir, dist. Khandwa (MP) along with 5 years Comprehen sive O&M of Plant in the solar park developed by RUMSL invited through RFP phase-I
Total shipments in the first quarter of 2022 were 8,390 MW, including 8,031 MW for solar module shipments and 359 MW for cell and wafer shipments. The overall impact of the COVID-19 outbreak on production and operations should be short-term and controllable. We heightened cooperation and coordination between our production, supply chain, and sales teams to ensure production and delivery. In light of the growing demand for higher efficiency N-type products, and the smooth ramping up of our first phase of 16 GW N-type cells production capacity, we plan to invest in the second phase of N-type cells with a total production capacity of approximately 16 GW. Our in-house integrated capacity structure will be further improved. Leveraging an in-depth global marketing structure and localized service network, we are committed to bring ing high-quality and efficient products to serve global customers.
Bhopal Municipal Cor poration 50 Wind BMC Issue Tender for Supply of 15 MW wind power proj ect in Madhya Pradesh
SECI 20 Floating SECI Issue Tender for setting up of grid-connected 30 MW Floating Solar PV (FSPV) Plants on Raw Water Reservoirs of DVC Thermal Power Plants at West Bengal
DAQO NEW ENERGY
MPUVNL 20 RooftopUtility/ RfP for Discovery of Tariff and Selection of Solar Power Developers for Implementation of Aggregate Capacity of Thirty-Five 35MWGrid Connected Roof Top Solar PV Projects, for Sale of Solar Power under RESCO Model, at various locations.
GSECL/Gujarat 20 Utility Design, Engineering, Supply, Procurement, Installation, Commissioning, Operation, and Maintenance Of 45 MW Solar Photovoltaic Grid Connected Power Plant at Badeli of Bhavnagar District Around Substation of GETCO In the State of Gujarat. P&P DEPT.
UPNEDA 74 Utility Selection of SPDs for Setting Up of 75 MW Grid Con nected Solar PV Power Projects in UP Solar Park, Uttar Pradesh
SECI 20 Floating Tender for setting up of grid-connected 30 MW Floating Solar PV (FSPV) Plants on Raw Water Reservoirs of DVC Thermal Power Plants at Koderma, Mejia, and Raghunath pur Thermal Power stations.
In the first quarter of 2022, 8,390 MW (8,031 MW for solar modules, 359 MW for cells and wafers), total shipments were down 13.4% sequen tially, and up 56.7% year over year.RMB14.76 billion (US$2.33 billion), down 9.9% sequentially and up 85.9% year over year. The sequential decrease was mainly attributable to a decrease in the shipment of solar modules. The year-over-year increase was mainly attributable to an increase in the shipment of solar modules. While, net income was RMB28.9 million (US$4.6 million), compared with RMB239.5 million se quentially and RMB221.1 million year over year.
JINKO SOLAR
www.EQMagPro.com 63EQ SEPTEMBER 2022 (A)
TSREDCO 70 Rooftop Design, supply, installation, and commissioning of the aggregated capacity of 70 MW on-grid SPV power plants with 5 years CMC at various buildings of Mahatma Gandhi University, Nalgonda District, Telangana state
KSEB (Kerala) 65 Wind KSEB Issue Tender for Supply of Selection of Wind Power Developers for Setting up of 65 MW Grid-connected Wind Power Projects in Kerala
In the second quarter of 2022, Daqo produced 35,326 MT (metric tons) in Q2 2022, compared to 31,383 MT in Q1 2022. Polysilicon's average total production cost was $7.26/kg in Q2 2022, compared to $10.09/kg in Q1 2022, while Polysilicon's average selling price (ASP) was $33.08/ kg in Q2 2022, compared to $32.76/kg in Q1 2022. Revenue was $1,244.1 million in Q2 2022, compared to $1,280.3 million in Q1 2022. Poly silicon's average cash cost was $6.51/kg in Q2 2022, compared to $9.19/kg in Q1 2022. Net income attributable to Daqo New Energy Corp. shareholders was $627.8 million in Q2 2022, compared to $535.8 million in Q1 2022.
QUARTERLY RESULTS
Source: iSearch
The company now has a record backlog of over 44 GWs, extending the horizon for future expected deliveries to 2026. The 10.4 GWs of new bookings since our prior earnings call in April brings our total year-to-date bookings to 27.1 GWs. Second quarter operating income increased primarily due to increased module sales volume and a gain on the sale of the Company’s Japan project development platform, partially offset by an impairment associated with a legacy systems business asset in Chile.This results in company earnings guidance being lowered due to legacy systems business asset impairment in Chile and the Japanese Yen devaluation.
Daqo's second-quarter polysilicon ASP was $33.08/kg in Q2 2022, compared to $32.76/kg in Q1 2022. For the quarter, Daqo achieved a poly silicon sales volume of 37,545 MT in Q2 2022, compared to 38,839 MT in Q1 2022. Revenue reached $1.24 billion, gross profit was $947 mil lion with a gross margin of 76%. Net income attributable to Daqo share holders was $628 million, an increase of 17.2% from $535.8 million in the first quarter of 2022 and an increase of 170% from $232 million in Q2 2021. Our cash position at the end of the quarter was $3.3 billion, an increase of approximately $2.2 billion from $1.1 billion at the end of Q1 2022, reflecting our strong cash flow generation. Cash and bank note receivable combined balances reached $4.6 billion. Operating cash flow was $1.1 billion for the first six months of this year
The company expectsits polysilicon production volume in the third quarter of 2022 to be in the range of 31,000 – 32,000MT. With its betterthan-expected operational performance in the first half of 2022, the companyis increasing its guidance on annual production volume to 129,000 – 132,000MT for the full year 2022, up from the previous guidance of 120,000-125,000MT
CANADIANFIRSTSOLARSOLAR
In the second quarter of 2022, Net sales were $621 million, an increase of $254 million from the prior quarter, primarily due to increased mod ule sales.The Company reported a second quarter income per diluted share of $0.52, compared to a loss per diluted share of $0.41 in the prior quarter.
Total debt was $2.7 billion as of June 30, 2022, unchanged from March 31, 2022. Non-recourse debt used to finance solar power projects decreased to $264 million as of June 30, 2022, from $550 million as of March 31, 2022, mainly due to the monetization of project assets. The gross margin in the second quarter of 2022 was 16.0%, above prior guidance, and compared to 14.5% in the first quarter of 2022. The sequential gross margin increase was mainly driven by higher module pricing, lower manufacturing costs from the depreciation of the Renminbi relative to the U.S. Dollar, and scale benefits from higher volume. Net foreign exchange and derivative gain in the second quarter of 2022 was $6 million, compared to a net gain of $3 million in the first quarter of 2022 and a net loss of $3 million in the second quarter of 2021. Net income attributable to Canadian Solar in the second quarter of 2022 was $74 million, or $1.07 per diluted share ("diluted EPS"), compared to net income of $9 million, or $0.14 per diluted share, in the first quarter of 2022, and net income of $11 million, or $0.18 per diluted share, in the second quarter of 2021.On May 27, 2022, Canadian Solar announced that its wholly-owned subsidiary Recurrent Energy completed the construction of the 100 MW Sunflower solar power plant in Mississippi. Recur rent Energy developed and built the solar power plant under a Build Transfer Agreement for Entergy Mississippi which owns the plant for the life of the facility after the completion of construction.
Solar module shipments of 5.06 GW, at the high end of 4.9 GW to 5.1 GW guidance range.62% increase in revenue year-over-year ("yoy") to $2.31 billion, above the high end of the $2.2 billion to $2.3 billion guidance range. Canadian Solar global energy Solar project pipeline expands to 26 GWp and the storage pipeline expands to over 31 GWh, as of June 30, 2022. Sequentially, the company grew its module shipments by nearly 40% and battery storage solutions revenues by 2.8 times, while significantly expanding our profitability and completing a large volume of project sales.
64 EQ SEPTEMBER 2022 (A) www.EQMagPro.com
GE Energy Financial Services, an arm of GE, has acquired a 49% stake in Continuum Green Energy’s 148.5 MW Morjar onshore wind project in Gujarat. The deal size is estimated to be around $30 million, officials aware of ELECTRICALS BUSINESS
TATA POWER RAISING ₹4,000 CRORE TO FUND GROWTH OF ITS RENEWABLE ENERGY BUSINESS IREDA SANCTIONED ₹14,000 CRORE LOANS FORRENEWABLE ENERGY PROJECTS IN MAHARASHTRA SBI, 15 OTHERS SELL OVER ₹8,000-CRORE SUZLON LOANS TO REC AND IREDA CABINET GO-AHEAD TO ₹1,600CROREPOWER INFRA UPGRADATION GE ARM BUYS 49% STAKE IN CONTINUUM’S MORJAR PROJECT
RR Kabel announced the acquisition of Luminous Home Electrical business from Schneider. This acquisition will further strengthen RR Ka bel’s consumer electricals business which has a diversified portfolio of fans, lights & appliances. The transaction is expected to close in May’22. As a major player and innovation leader in the wire and cable industry, this acquisition will help us to be in the leading position in India’s fastgrowing home electrical industry.
Tata Power and BlackRock Real Assets-led consortium, including Mubadala Investment Company, have entered into a binding agreement to invest in Tata Power’s renewable energy subsidiary, Tata Power Renewable Energy Limited. BlackRock Real Assets, together with Mubadala, shall invest ₹4,000 crore($525 million) by way of equity/compulsorily convertible instruments for a 10.53% stake in Tata Power Renewables, translating to a base equity valuation of ₹34,000 crore. The final shareholding will range from 9.76% to 11.43% on final conversion. This newly created platform will consist of five distinct businesses delivering long-term, customer-oriented solutions. It will house all re newable energy businesses of Tata Power including those in Utility Scale Solar, Wind & Hybrid Generation assets; Solar Cell & Module Manufacturing; Engineering, Procurement and Construction (EPC) contracting; Rooftop Solar infrastructure; Solar Pumps and Electric Vehicle Charging infrastructure. The broad-based portfolio of assets ensures diversified yet stable revenue sources including 25-year fixed-price PPAs for grid-connected utility-scale projects.
To reduce power loss and boost Goa’s power infrastructure, the state cabinet approvedthe spending of over ₹1,600 crore ($206.42 million), including the central fund. Of this, the state government will spend over ₹700 crore ($90.31 million) for power loss reduction, over ₹400 crore ($51.6 million) for modernization, and over ₹450 crore ($58.05 million) for installing 7 lakh smart meters.The state cabinet approved the elec tricity department’s action plan and detailed project report (DPR) for availing funds under the revamped distribution sector scheme initiated by the ministry of power for various projects proposed under loss reduction, modernization, and smart metering infrastructure with anticipatory budgetary support of over ₹750 crore ($96.76 million) from the central government
FUNDING AND M&A UPDATES
the development mentioned. Continuum, majority-owned by a global infrastructure fund managed by Morgan Stanley Infrastructure Inc, continues to own 51% of the project. RR KABEL ACQUIRES LUMINOUS HOME
www.EQMagPro.com 65EQ SEPTEMBER 2022 (A)
A group of 16 banks led by SBI has sold more than ₹8,000 crore ($1.032 billion) in loans to the Rural Electrification Corporation and the stateowned Renewable Energy Development Agency of India (IREDA), clearing his books of an account that has been a drag for nearly a decade and a half.The loan sale concluded even as the wind power company was in the midst of its second bank-led restructuring beginning in 2020. The REC- and IREDA-led refinancing would extend the life of Suzlon’s loans and also carry a lower interest rate. lower than paying the banks, said several people familiar with the outlines of the deal.
IREDA (Indian Renewable Energy Development Agency Limited) in association with the Mahratta Chamber of Commerce Industries and Ag riculture (MCCAI) conducted a workshop on ‘Greening India through renewables’ on May 20, 2022, in Pune, Maharashtra. The company has disbursed ₹10,018 crore ($1.2867 Billion) in Maharashtra alone out of its total loan disbursement of ₹79,446 crore ($10.2044 billion). IREDA’s commitment to the development of renewable energy projects in all states, including Maharashtra, notes that out of a total loan of ₹1,20,946 crore ($15.5348 billion) sanctioned by IREDA, ₹14,445 crore ($1.85537 billion) was sanctioned for 422 RE project accounts in Maharashtra CMD said. During FY22, IREDA sanctioned a loan of ₹2,564 crore ($329.33 million) for 12 RE project accounts and disbursed ₹1,362 crore ($174.94 million) in Maharashtra.
The Karnataka Electricity Regulatory Commission (KERC) approved an increase in energy charges by five paise per unit and raised fixed charges ranging between ₹10 and ₹30 per kW. The overall average increase accounts for 35 paise per unit for the financial year 2022-23, which is up by 4.33 percent KERC chairperson said. The ESCOMs (Electricity Supply Corporation of Malawi) had sought an average raise of ₹1.85 per unit accounting for 23.83 percent increase for a proposed revenue deficit of ₹11,320 crore ($1.4168 billion). The power purchase cost in 2020-21 has also increased by 31 paise per unit due to payment of fixed charges without drawing energy from thermal stations.
MNRE has removed the clause of providing a performance bank guarantee (PBG) of ₹5 lakh per MW for Solar power generators under the PM-KUSUM scheme. The ministry has also done away with the requirement of submitting a bank guarantee for the solarisation of agriculture feeders under component C. PM-KUSUM New Scheme aims to provide water and energy security to farmers and enhance their income. Under this, 30.8 GW solar power capacity is targeted by 2022 with a CFA of ₹34,035 cror0 ($4.2598 billion).
the government has approved an additional budget provision of ₹40 crore (~$5 million) for the reimbursement of state goods and services tax (SGST) on such vehicle purchases.Rajasthan Chief Minister has approved this policy, and its execution will minimize pollution generated by diesel and gasoline vehicles in the state.According to the battery capacity of the vehicle, the state government will repay ₹5,000 to ₹10,000 in SGST for two-wheelers and ₹10,000 to ₹20,000 for three-wheelers.E-vehicles have been exempted from the state’s Motor Vehicle Tax.
ALMM TO ENLISTS ELIGIBLE MODELS AND MANUFACTURERS OF SOLAR MODULES COMPLYING WITH THE BIS STANDARDS
The Jammu and Kashmir Administrative Council (AC), which met under the chairmanship of Lieutenant Governor Manoj Sinha, approved the installation of 200 MW of grid-tied rooftop solar power plants under the ‘Solar City Mission’ in Jammu. Under the project, 200 MW grid-tied rooftop solar power plants will be installed on 50,000 residential buildings in Jammu by the J&K Energy Development Agency (JAKEDA) under its ‘Solar City Mission’ at an estimated cost of ₹1,040 crore ($130.17 million). The project will be completed by March 2024 and will have a shelf-life of 25 years. The rooftop solar program will provide subsidized installation of solar power panels on residential houses at the cost of ₹58,739, ₹53,995, ₹52,594, and ₹51,309 for Category-A (Up to 1 kW), Category-B (1 kW to 2 kW), Category-C (2kW up to 3 kW), and Category-D (3 kW up to 10 kW), respectively.
POLICY & REGULATORY UPDATES
Only the models and manufacturers included in this list are eligible for use in Government Projects/ Government assisted Projects/Projects under Government Schemes & Programmes/Open Access/Net-Metering Projects, installed in the country, including Projects set up for the sale of electricity to Government under the Guidelines issued by Central Government under section 63 of Electricity Act, 2003 and amendment thereof. The word “Government” includes Central Government, State Governments, Central Public Sector Enterprises, State Public Sector En terprises, and, Central and State Organisations/ Autonomous bodies.” For Open Access/Net-Metering Projects, mandatory use of ALMM listed solar modules is applicable on such renewable energy projects which apply for open access or net-metering facility, on or after 1stOctober 2022.
The notified Rules enable a simplified procedure for open access to green power. It will enable faster approval of Green OA, Uniform Banking, Voluntary purchase of RE power by commercial & industrial consumers, Applicability of OA charges, etc. Commercial and Industrial consum ers are allowed to purchase green power voluntarily.Captive Consumers can take power under Green Open Access with no minimum limit. Discom Consumers can demand a supply of green power to them. The Green Open access is allowed to any consumer and the limit of Open Access Transaction has been reduced from 1 MW to 100 kW for green energy, to enable small consumers also to purchase renewable power through open access.
KERC APPROVES INCREASE OF ENERGY CHARGES BY 5 PAISE PER UNIT
RAJASTHAN GOVERNMENT APPROVED THE RAJASTHAN ELECTRIC VEHICLE POLICY (REVP) TO ENCOURAGE EVS IN THE STATE
ANOTHER MAJOR REFORM TO PROMOTE RENEWABLE ENERGY THROUGH GREEN ENERGY OPEN ACCESS
ROOFTOP SOLAR PROGRAMME APPROVED IN J&K UNDER SOLAR CITY MISSION
66 EQ SEPTEMBER 2022 (A) www.EQMagPro.com
AMENDMENT IN PROVISIONS OF BANK GUARANTEES IN PM-KUSUM SCHEME GUIDELINES
IREDA has posted a Profit Before Tax (PBT) of ₹ 339.86 crores ($0.043 million) in the Q1 FY 2022-23, which is 72% higher compared to ₹197.20 crores ($0.025 million) in the Q1 of the previous FY. IREDA's Net Non-Performing Assets (NPAs) have been reduced to 2.92% in Q1, FY 2022-23 from 4.77% in Q1, FY 2021-22, a significant reduction of 39% YoY.
www.EQMagPro.com 67EQ SEPTEMBER 2022 (A)
IREDA VOYAGE IN RENEWABLE SECTOR
State-wise details of Central Financial Assistance (CFA) were released for the implementation of various renewable energy schemes/programs by the Ministry from 2019-20 to 2021-22 (till 30thJune2022).
IREDA LOAN PORTFOLIO AS ON MARCH 2022
FUNDS RELEASE FOR RENEWABLE

IREDA dashboard of loan portfolio show, Solar Energy contributed the maximum percentage of the total renewable energy financed across the loan portfolio, followed by Short-term Loan. As of March 2022, the IREDA loan portfolio includes Solar Energy with ₹8,678.05 crore ($1.1 billion), Wind Energy with ₹ 6,242.53 crore ($791.47 million), Small Hydro with ₹4,058.6 crore ($514.574 million), Short-Term Loan with ₹ 11,792.62crore ($1.49514 billion), Biomass & Cogen with₹ 1,565.89crore ($198.53 million) & Other (Mfg.,WTE,EEC) ₹1,592.91crore ($201.96 million).

68 EQ SEPTEMBER 2022 (A) www.EQMagPro.com
Puduchchery 0.79 0 0
Meghalaya 3.47 1.13 0
Source: Lok Sabha Update
Delhi 0.6 23.29 26.17
STATE-WISE DETAILS OF FUNDS RELEASED UNDER VARIOUS SOLAR SCHEMES OF MNRE DURING LAST THREE YEARS (in ₹Crores)
Ladakh 0 0 12.41
Manipur 16.86 23.06 14.89
State 2019-20 2020-21 2021-22
SOLAR PARKS IN INDIA
Jharkhand 29.79 31.28 15.16
Goa 0.5 0 3.59
Mizoram 15.33 19.73 2.35
Andhra Pradesh 194.04 51.49 10.48
iSearch
Jammu & Kashmir 16.68 4.89 42.26
Haryana 22.44 65.89 175.08
Karnataka 219.51 160.64 141.91
Bihar 1.38 2.93 0
Lakshadweep 0 0 0
Nagaland 13.55 10.69 5.86
Kerala 0 18.46 36.34
Odisha 30.17 4.01 33.47
Gujarat 81.19 101.3 1242.71
Himachal Pradesh 8.09 23.43 33.44
Madhya Pradesh 159.33 93.69 64.95 Maharashtra 117.32 114.48 95.16
Chhattisgarh 13.45 0 7.1
Government has sanctioned 61 Solar Parks in 16 States including Jharkhand under the Scheme for “Development of Solar Parks and UltraMega Solar Power Projects”. State-wise details of the Solar Parks with their sanctioned capacity and commissioned capacity, and also of the fully commissioned Solar Parks are given below
Andaman & Nicobar 6.77 0.35 37.97
The Government is implementing a scheme for the development of Solar Parks for setting up 50 Solar Parks with 40,000 MW capacity in the country. So far, 61 Solar Parks, with an aggregate capacity of 40 GW have been sanctioned in 16 States across the country under the scheme. Solar Parks are meant to provide developed infrastructure to facilitate the installation of Solar power projects in a plug-and-play model. Central Financial Assistance of upto ₹25 Lakhs ($32,800) for the preparation of the Detailed Project Report and ₹20 Lakhs ($26,240) per MW for the development of the Solar Park is provided under the scheme.
Assam 33.07 0 9.19
Arunachal Pradesh 17.01 19.76 10.54
Chandigarh 5.13 0.85 0
For Component-B and Component-C, Government is providing central financial assistance (CFA) of 30% of the benchmark cost or cost discov ered through tender, whichever is lower. In the case of North-Eastern States including Sikkim, hilly States of Himachal and Uttarakhand, UTs of Jammu and Kashmir, Ladakh, Andaman & Nicobar Island, and Lakshadweep a higher CFA of 50% of benchmark cost or cost discovered through tender, whichever is lower, is provided.
SOLAR WATER PUMP

As PM-KUSUM is a demand-driven scheme, targets are not fixed by the Central Government. Allocations under the Scheme are made to states based on demands received. State-wise and component-wise capacities sanctioned and capacity achieved under Component-B and ComponentC, including for the State of Rajasthan, are placed in the below table. Lok Sabha
Update iSearch
www.EQMagPro.com 69EQ SEPTEMBER 2022 (A)
S.No. State Number of Solar Parks Sanctioned Sanctioned Capac ity (MW) CapacityCommissioned(MW) 1 Andhra Pradesh 5 4200 3050 2 Chhattisgarh 1 100 0 3 Gujarat 7 12025 785 4 Himachal Pradesh 2 1280 0 5 Jharkhand 5 180 0 6 BengalJharkhand/West 2 989 0 7 Karnataka 2 2500 2000 8 Kerala 2 155 100 9 Madhya Pradesh 9 6080 1000 10 Maharashtra 3 1250 0 11 Manipur 1 20 0 12 Meghalaya 1 20 0 13 Mizoram 1 20 0 14 Odisha 3 340 0 15 Rajasthan 10 7036 2901 16 Uttar Pradesh 7 3805 165 Total 61 40000 10001 Source:
10314 314 0 250000 0 Kerala 100 0
16717 6717 208 10000 0
2000
Maharashtra 100000 0 250000 0 0 0 0 Meghalaya 35 0 10000 0
Jammu
35
Nagaland 0 0 0 0 5741 997 8310 0 0 12000 10131 38111 0
Tamil
Chhattisgarh 0
Total 359461 123180 75650
Karnataka 9448 21^ 0 0 0
50 0 0 0 0
PradeshHimachal
50
0
PradeshArunachal
of
feed ers,
25000
Source:
70 EQ SEPTEMBER 2022 (A) www.EQMagPro.com State Component-B (Nos) Component-C (Nos) Sanctioned Installed (IPS)*Sanctioned (FLS)#Sanctioned Installed
Manipur 78 28
Assam
PradeshMadhya 187455 0
Goa 0 0
Installed under Individual Pump Solarization (IPS)
Sabha Update,iSearch * IPS:
57000 7234 0
200 0 11000
Rajasthan 76210 10764 1026^ Nadu 0
Haryana
& Kash mir 5000 323 0 0 0
Ladakh 600 0
39
6200 1766 20000 1311
1180 359 0 0 0
Tripura 0 Pradesh 0 0 Bengal 0 0 0 925427 1047 Lok Solarization # FLS: Solarization agriculture ^
21842 6842 0 30000
Uttarakhand 338 73 200 0
0 0 0 43265 0 Gujarat 2459 459 7000 39832
39326 36793 0 37142 0
Uttar
Punjab
of individual grid-connected agriculture pumps,
INSTALLED CAPACITY TRENDS
West
Jharkhand
The share of Wind Power has increased by 1.76 percent in Q2 2022 compared to Q1 2022 installation, as it has a market share of 29 percent by the end of 2021, of the total installed capacity among Hydro (excluding pumped storage), Wind and Solar. In Q2 2022, Solar Power installed ca pacity grow by 16.94 percent over the previous quarter. Total Renewable capacity (Solar, Wind, Hydro) increased by 6.92 percent quarter over quarter by the end of June 2022. The share of Solar and Hydro increased, while Wind installed capacity in the second quarter of 2022 was slow.
1000 0 603 0 0
5822
Odisha
44340
3021 947 2600 0
5478
Many large Solar PV tenders are mentioning the requirement of ALMM registered panels, also to decide the tariff based on that, but the Indian Solar Market is being dominated by Chinese players who are not able to get their capacity under ALMM to be supplied to this project. As of Q2 2022, around 16,850 MW of manufacturing installed capacity has been enlisted with 66 companies, compared to Q1 2022 where 58 companies were listed with 12,847 MW of capacity.
INSTALLED CAPACITY TRENDS
Since 2016, there was a continuous decrease in the wind share of the total installed renewable capacity as mentioned above, even the focus on Hydropower plants has been reduced, the major contributors among the renewable were Solar which shows a gradual increase in the capacity addition since the announcement of JNNSM target for 2022.


The Ministry of New & Renewable Energy has issued an Approved List of Models and Manufacturers (ALMM) order dated 2nd January 2019. Due to the pandemic and outbreak in China again, government officials were not able to inspect the Chinese production unit, and even a few domestic players are facing issues to enlist their capacity. Below are the only Indian manufacturers who can get their registration under the ALMM list-l by August 2022.
APPROVED LIST OF MODELS AND MANUFACTURERS (ALMM)
www.EQMagPro.com 71EQ SEPTEMBER 2022 (A)
72 EQ SEPTEMBER 2022 (A) www.EQMagPro.com

The Solar PV module manufacturers from Gujarat got the maximum capacity of approved capacity under the ALMM List-l, having a capacity of 8,660 MW with 27 manufacturers, followed by Telangana with 8 manufacturers of 2,381 MW capacity. Karnataka, Maharashtra, and Uttar Pradesh got six manufacturers each listed with 1.1 GW, 979 MW, and 480 MW of production capacity. West Bengal, Rajasthan,and Haryana got three manufacturers each with 1.54 GW, 163 MW, and 320 MW of production capacity. Chhattisgarh, Odisha, Tamil Nadu, and Uttarakhand with just a single manufacturer listed under ALMM List-l.


www.EQMagPro.com 73EQ SEPTEMBER 2022 (A)
Tamil Nadu has an upcoming Solar Panel manufacturing unit of 4 GW from Tata Power Solar, the state has announced the inauguration of 1.2 GW of Solar PV Module manufacturing unit of Vikram Solar in 2021. Even, First Solar also announced 3.3 GW of manufacturing units in Tamil Nadu, soon going to be online. The MNRE has extended the deadline for implementing ALMM on panels from 01 April 2022 to 31stOctober 2022. All open access, net metering, and government Solar development projects were required to use modules only approved under ALMM.
74 EQ SEPTEMBER 2022 (A) www.EQMagPro.com


ACME Cleantech Solutions Private Limited Signed MoU with the Karnataka government proposing to invest ₹51,865 crore ($6.49148 billion) in the state within five years for setting up a green hydrogen and ammonia plant with an associated solar power unit in Mangalore.According to the MoU, in the first phase, the company proposes to invest ₹5,300 crore ($663.35 million),and in the second phase ₹46,565 crore ($5.828 million). It has proposed to generate 1,800 jobs.The MoU said the Karnataka government would facilitate ACME to obtain all necessary per missions, registrations, approvals, clearances, and incentives from the department concerned of the state government according to its prevailing policies, rules, and regulations.
CESL DISCOVERS
PTC India Ltd signed a pact with Greenstat Hydrogen India Pvt Ltd to jointly develop green hydrogen solutions for Indian power market beneficiaries. PTC India and Greenstat Hydrogen India have entered into MoU with the purpose of joint development of green hydrogen solu tions for Indian power market beneficiaries. Under this MoU, both will jointly work towards the development of green hydrogen projects in India. The areas of development shall include feasibility studies and/or project management services for green hydrogen solutions to potential beneficiaries in India. “Green hydrogen has huge potential to meet the future energy demand sustainably and also support the transition to net zero economies. Under this association, PTC and Greenstat would play an important role in the adoption of green hydrogen in India,” Rajib K Mishra, CMD, PTC India, said.
www.EQMagPro.com 75EQ SEPTEMBER 2022 (A)
EV UPDATES
HYDROGEN UPDATES
Oil India Ltd has signed an initial agreement with Homi Hydrogen to work together in the green hydrogen value chain.The memorandum of understanding (MoU) signed with HomiHydrogen Pvt Ltd is to boost India’s efforts towards energy transition for achieving net-zero by 2070 and support the development of indigenous technology and manufacturing under Aatmanirbhar Bharat in the field of hydrogen and green energy technology.Homi Hydrogen is a joint venture company established by electrolyzer experts from Germany, Switzerland, Italy, and Norway to manufacture all four types of electrolyzers under one roof. It is promoted by well-established companies like h2e Power Systems NSE 2.31 % Pvt Ltd, Bluebasic Ama Engineering Pvt Ltd, and Greenstat Hydrogen India Pvt Ltd.
OIL INDIA SIGNS MOU WITH HOMIHYDROGEN FOR GREEN HYDROGEN
ACMESOLUTIONSGROUP TO
PTC INDIA, GREENSTAT HYDROGEN INDIA SIGN PACT TO DEVELOP GREEN HYDROGEN INVEST $6.7 BILLION IN GREEN HYDROGEN PROJECT IN KARNATAKA COMMISSIONED INDIA’S FIRST PURE HYDROGEN PLANT IN ASSAM THE LOWEST EVER PRICES FOR 5,450 BUSES UNDER THE FAME II SCHEME
Convergence Energy Services Limited (CESL) announced prices discovered for the biggest ever demand electric buses.The Grand Challenge tender comprises demand for 5,450 buses across five major Indian cities – Kolkata, Delhi, Bangalore, Hyderabad, and Surat. Prices discovered are the lowest ever and more importantly, at par with or very close to the operational cost of diesel buses. The lowest price discovered for a 12-meter bus is Rs. 43.49 ($0.5682)/km, and a 9-m bus is ₹39.21 (₹51.23)/km. This includes the cost of electricity for charging the buses.The value of the tender is over ₹5000 crore ($653.28 million). The buses are expected to operate around 4.71 billion kilometers over twelve years saving 1.88 billion liters of fossil fuel. This will result in 3.31 million tonnes of CO2e from tailpipe emissions, a major step towards mitigating climate change.
GREEN
Oil India Limited (OIL) has taken the first significant step towards Green Hydrogen Economy in India with the commissioning of India’s First 99.999% pure Green Hydrogen pilot plant, with an installed capacity of 10 kg per day at its Jorhat Pump Station in Assam. The plant was com missioned in a record time of 3 months.The plant produces Green Hydrogen from the electricity generated by the existing 500kW Solar plant using a 100 kW Anion Exchange Membrane (AEM) Electrolyser array. The use of AEM technology is being used for the first time in India.This plant is expected to increase its production of green hydrogen from 10 kg per day to 30 kg per day in future. The company has initiated a detailed study in collaboration with IIT Guwahati on blending of Green Hydrogen with Natural Gas and its effect on the existing infrastructure of OIL.
TARIFF TREND IN INDIA (WIND/SOLAR)
OIL INDIA
Electric bus manufacturer Olectra Greentech, part of Megha Engineering and Infrastructures Ltd, has announced securing the biggest ever order in its history for 2,100 electric buses from Bhrihanmumbai Electric Supply and Transport (BEST) worth ₹3,675 crore ($473.76 million). Evey Trans Private Ltd (EVEY), an arm of Olectra, has obtained the letter of award from BEST after being declared as an L1 (least quoted) bidder. EVEY shall procure these 2,100 electric buses either directly by itself or through its special purpose vehicle from Olectra Greentech to be delivered over 12 months.

BPCL TO INVEST ₹200 CRORE TO SET UP 100 FAST EV CHARGING CORRIDORS WITH 2,000 STATIONS
OLECTRA BAGS BIGGEST EVER ORDER OF ELECTRIC BUSES WORTH ₹3,675 CRORE AND VOLKSWAGEN EXPLORE STRATEGIC ALLIANCE TO ACCELERATE ELECTRIFICATION OF INDIAN AUTOMOTIVE MARKET
Bharat Petroleum will invest around ₹200 crores($26.13 million) this fiscal to set up 100 fast electric vehicle charging corridors having 2,000 stations along the busiest 100 national highways.The company has recently opened its first EV charging corridor along the Chennai-TrichiMadurai highway with one charging unit. The second corridor will come up on the Kochi-Salem section of the National Highway 47 within the next two months, BPCL executive director for retail
76 EQ SEPTEMBER 2022 (A) www.EQMagPro.com
EV POLICY, ANNOUNCES SOPS TO MANUFACTURERS
Tata Power has collaborated with the National Real Estate Development Council (NAREDCO), Maharashtra to install up to 5,000 EV charging points across its member developer properties. The MoU was signed at The Real Estate Forum, 2022 in Mumbai. The move will give a boost to EV adoption in the state. Tata Power will provide a comprehensive EV charging solution across member developers of NAREDCO. This will include installation, maintenance, and upgradation of the chargers as and when required. EV owners across NAREDCO's member developers' properties will have access to 24x7 vehicle charging, monitoring, and e-payments facilities through Tata Power’s EZ Charge mobile app.
Mahindra & Mahindra Ltd. (M&M) and The Volkswagen Group signed a Term Sheet on the supply of MEB electric components for Mahindra’s new, purpose-built electric platform INGLO, deepening the Partnering Agreement from earlier this year. The cooperation intends to have a volume of more than one million units over a lifetime and includes the equipment of five all-electric SUVs with MEB components. In addition, the two companies will explore further opportunities for collaboration, opening the perspective toward a broader strategic alliance to accelerate the electrification of the Indian automotive market.
The Haryana Government on approved the State Electric Vehicle (EV) Policy 2022 offering several financial incentives to EV manufacturers. A decision in this regard was taken at a meeting of the state cabinet. The EV policy offers various financial incentives to EV manufacturers by giving incentives on Fixed Capital Investment (FCI), net SGST, stamp duty, employment generation, etc, an official statement said.There is a 100 percent reimbursement of stamp duty along with an exemption in electricity duty for 20 years.Under this policy, units setting up batteries disposal units will get 15 percent of FCI up to ₹1 crore ($128,914).
TATA POWER SIGNS MOU WITH NAREDCO TO INSTALL 5,000 EV CHARGING POINTS ACROSS
MAHINDRA
HARYANAAPPROVESMAHARASHTRASTATE
www.EQMagPro.com 77EQ SEPTEMBER 2022 (A)
The installations in the second quarter of CY 2022 werelower than the Q1 CY 2022. There is a decline in Solar installation during this quarter. BCD force the developers to commission their projects during this period as they would have procured the panels at the start of 2022.
The installations on Utility-scale were low compared to the first quarter of 2022, there is a downfall of around 25 percent quarter over quarter. But there is a wait and watch the situation in 2022 as BCD imposed on Solar PV modules, the domestic developers, as well as Chinese suppliers’ negotiations, are going on. Even though the government has extended the ALMM date till October 2022, none of the Chinese manufacturers were there on the list-l as per the latest update. Around 16,850 MW of domestic production capacity of Solar PV modules has been registered.
CONCLUSION AND SUGGESTIONS
The installation in 2022 will be the highest among the previous yearly installation which already crossed 8.1 GW in the first half of CY 2022, as this is going to be the crucial year for India as the JNNSM target of 100 GW of Solar capacity, will end in the next two quarters. There is a Covid outbreak in China at the start of 2022 due to which the movements of goods were at a halt, which will again affect the yearly installations in India as well as the JNNSM target, as India installed around 57.7 GW of Solar PV installations by the end of Q2 2022. As per the analysis, the JNNSM target for a Utility-scale of 60 GW might be achieved. As of 30thJune 2022, 60.66 GW capacity is at various stages of implementation and 23.14 GW capacity is under bidding stage as per the latest Lok Sabha update. The government should postpone the duty hikes for at least two years, provides incentives and grants to the domestic manufacturer, and also hold the ALMM for another couple of year till the market stabilizes and foreign companies especially Chinese can get their panels listed under ALMM List-l. Also, the module prices in the Chinese market are touching 30 cents per watt, which is a difficult situation for the whole Solar industry. Indian manufacturers will be facing a hard time.
The distributed sector was moving in an upward direction, and Commercial and Industrial (C&I) segment installations were high compared to the previous quarter. C&I consumers have huge demand as the manufacturing sector is doing well and festive seasons are on their way, so they want to install the projects on their premises so that they can get the benefit of their power bill.
78 EQ SEPTEMBER 2022 (A) ADVERTISERS INDEXSUBSCRIBE Subscribe “EQ International” at www.EQMagPro.com or fill your complete address and Email to :rishabh.eqmag.net@gmail.com or Call +91-7692973898 Yes! I would like to Subscribe to EQ International Magazine For 1 Issue: o Indian citizens Rs. 200 o International $ 25 / € 20 For 1 Year (12 issues): o Indian citizens Rs. 2400 o International $ 300 / € 240 Please Mail the coupon to: DescriptionCompany:Department:JobName:Title:of the Company: City/State/ZipAdress: Code: WebE-Mail.Fax:Phone:Country:site: PAYMENT 1.- My Cheque/DD in favour of “FirstSource Energy India Private Limited” for Date/Signature:with.DrawnRs……………………………………………………………………on………………………………………isenclosedhere 2.- I will pay by Credit Card Type: .......................................................................... Name on Card: SecurityNumber: ExpirationCode:Date: Mail this coup on to: First Source Energy India Pvt. Ltd. Subscription Department. 95 C, Sampat Farms, Bicholi Mardana Distt-Indore 452016 Tel. + 91 96441 22268 " ADANI SOLAR..............................................FRONT GATEFOLD- 02 AUSTRALIAN PREMIER SOLAR SOLEX...........................................................................BACKSOLAMET..........................................................................................15SOFARORIANO...........................................................INSIDEJOLYWOOD..........................................INSIDEGROWATT.....................................................FRONTFOX-ESS..............................................INSIDEEN-ICON..........................................................................................13EMMVEE.....................................................................FRONT(APS).........................................17COVERFRONTCOVERRHSGATEFOLD-01FRONTCOVERLHSBACKCOVERSOLAR...................................................................................11COVER


R.N.I. NO. MPBIL/2013/50966 | POSTAL REGD. NO. MP/IDC/1435/2022-2024

