 We are working with Cambridge Assessment International Education towards endorsement of this title.
Original material © Cambridge University Press 2022. This material is not final and is subject to further changes prior to publication.
We are working with Cambridge Assessment International Education towards endorsement of this title.
Original material © Cambridge University Press 2022. This material is not final and is subject to further changes prior to publication.
SAMPLE
We are working with Cambridge Assessment International Education towards endorsement of this title.
Original material © Cambridge University Press 2022. This material is not final and is subject to further changes prior to publication.
SAMPLE
We are working with Cambridge Assessment International Education towards endorsement of this title.
Marine Science for Cambridge IGCSE™
COURSEBOOK
Matthew Parkin & Paul Roobottom
Original material © Cambridge University Press 2022. This material is not final and is subject to further changes prior to publication.
SAMPLE
University Printing House, Cambridge CB2 8BS, United Kingdom
One Liberty Plaza, 20th Floor, New York, NY 10006, USA
477 Williamstown Road, Port Melbourne, VIC 3207, Australia
314–321, 3rd Floor, Plot 3, Splendor Forum, Jasola District Centre, New Delhi – 110025, India
103 Penang Road, #05–06/07, Visioncrest Commercial, Singapore 238467
Cambridge University Press is part of the University of Cambridge.
It furthers the University’s mission by disseminating knowledge in the pursuit of education, learning and research at the highest international levels of excellence.
Information on this title: www.cambridge.org/9781009089760
© Cambridge University Press & Assessment 2022
This publication is in copyright. Subject to statutory exception and to the provisions of relevant collective licensing agreements, no reproduction of any part may take place without the written permission of Cambridge University Press.
First published 2022
20 19 18 17 16 15 14 13 12 11 10 9 8 7 6 5 4 3 2 1
Printed in Italy by Rotolito
A catalogue record for this publication is available from the British Library
ISBN 978-1-009-08976-0 Coursebook Paperback with Digital Access (2 Years)
ISBN 978-1-009-09638-6 Digital Coursebook (2 Years)
ISBN 978-1-009-09639-3 Coursebook eBook
Additional resources for this publication at www.cambridge.org/go
Cambridge University Press has no responsibility for the persistence or accuracy of URLs for external or third-party internet websites referred to in this publication, and does not guarantee that any content on such websites is, or will remain, accurate or appropriate. Information regarding prices, travel timetables, and other factual information given in this work is correct at the time of first printing but Cambridge University Press does not guarantee the accuracy of such information thereafter.
NOTICE TO TEACHERS IN THE UK
It is illegal to reproduce any part of this work in material form (including photocopying and electronic storage) except under the following circumstances:
(i) where you are abiding by a licence granted to your school or institution by the Copyright Licensing Agency; (ii) where no such licence exists, or where you wish to exceed the terms of a licence, and you have gained the written permission of Cambridge University Press;
(iii) where you are allowed to reproduce without permission under the provisions of Chapter 3 of the Copyright, Designs and Patents Act 1988, which covers, for example, the reproduction of short passages within certain types of educational anthology and reproduction for the purposes of setting examination questions.
Original material © Cambridge University Press 2022. This material is not final and is subject to further changes prior to publication.
We are working with Cambridge Assessment International Education towards endorsement of this title.
SAMPLE
Endorsement indicates that a resource has passed Cambridge International’s rigorous quality-assurance process and is suitable to support the delivery of a Cambridge International syllabus. However, endorsed resources are not the only suitable materials available to support teaching and learning, and are not essential to be used to achieve the qualification. Resource lists found on the Cambridge International website will include this resource and other endorsed resources.
Any example answers to questions taken from past question papers, practice questions, accompanying marks and mark schemes included in this resource have been written by the authors and are for guidance only. They do not replicate examination papers. In examinations the way marks are awarded may be different. Any references to assessment and/or assessment preparation are the publisher’s interpretation of the syllabus requirements. Examiners will not use endorsed resources as a source of material for any assessment set by Cambridge International.
While the publishers have made every attempt to ensure that advice on the qualification and its assessment is accurate, the official syllabus, specimen assessment materials and any associated assessment guidance materials produced by the awarding body are the only authoritative source of information and should always be referred to for definitive guidance. Cambridge International recommends that teachers consider using a range of teaching and learning resources based on their own professional judgement of their students’ needs.
Cambridge International has not paid for the production of this resource, nor does Cambridge International receive any royalties from its sale. For more information about the endorsement process, please visit www.cambridgeinternational.org/endorsed-resources.
We are working with Cambridge Assessment International Education towards endorsement of this title.
Original material © Cambridge University Press 2022. This material is not final and is subject to further changes prior to publication. SAMPLE
Original material © Cambridge University Press 2022. This material is not final and is subject to further changes prior to publication.
 We are working with Cambridge Assessment International Education towards endorsement of this title.
SAMPLE
How to use this book vi Introduction viii
Key skills for Cambridge IGCSE™ Marine Science 1
1 The Earth and its oceans 53
1.1 Structure of the Earth 55
1.2 Plate tectonics 59
1.3 Oceans and seas 66
1.4 Tides and currents 70
2 Seawater 81
2.1 The water cycle 83 2.2 pH and salinity 92 2.3 Dissolved gases 104 2.4 Density 107
2.5 Effects of increasing depth 111 2.6 Upwelling 117
3 Marine organisms 126
3.1 Cell structure and function 128
3.2 Reproduction 131
3.3 Classification 133 3.4 The animal kingdom 136 3.5 Plant and protoctist kingdoms 155 3.6 Animal life cycles 161 3.7 Migration 164
4 Nutrients and energy 177
5 Marine ecology 212
5.1
The components of ecosystems 214 5.2 Investigating ecosystems 220 5.3 Open ocean ecosystems 232 5.4 Rocky shores 238 5.5 Sedimentary shores 243 5.6 Mangrove forests 246 5.7 Tropical coral reefs 251
6 Human influences on the marine environment 263
6.1 Human interactions with marine ecosystems 265 6.2 Tourism 275 6.3 Fisheries 284 6.4 Aquaculture 303 6.5 Energy from the seas 310 6.6 Plastic pollution 320 6.7 Eutrophication 324 6.8 Understanding climate change 326 6.9 Conservation strategies 334
Glossary 349
Acknowledgements 362
Index 363
Nutrients 179 4.2 Respiration 190 4.3 Photosynthesis 193 4.4 Feeding relationships 199
4.1
Original material ©
University Press
v Contents Contents
We are working with Cambridge Assessment International Education towards endorsement of this title.
Cambridge
2022. This material is not final and is subject to further changes prior to publication. SAMPLE
We are working with Cambridge Assessment International Education towards endorsement of this title.
How to use this book
Throughout this book, you will notice lots of different features that will help your learning. These are explained below.
LEARNING INTENTIONS
These are found at the start of each chapter, help with navigation through the coursebook and indicate the important concepts in each topic.
GETTING STARTED
This feature contains questions and activities on subject knowledge you will need before starting the chapter.
MARINE SCIENCE IN CONTEXT
This feature presents real-world examples and applications of the content in a chapter, encouraging you to look further into topics. There are discussion questions at the end which look at some of the benefits and problems of these applications. The feature also provides the opportunity to extend your learning beyond the syllabus.
KEY WORDS
Key vocabulary for the syllabus is highlighted in the text when it is first introduced. Definitions are given in the key words boxes throughout and can also be found in the Glossary at the back of this book. Any key words marked with an asterisk (*) do not appear in the syllabus and are therefore not required knowledge but are useful terms for the subject.
Questions
Appearing throughout the text, questions give you a chance to check that you have understood the topic you have just read about.
COMMAND WORDS
Command words that appear in the syllabus and might be used in the exams are highlighted in the exam-style questions. In the marginal boxes, you will find the syllabus definition. You will also find these definitions in the Glossary at the back of the book with some further explanation on the meaning of these words.
ACTIVITY
Activities give you an opportunity to check your understanding throughout the text in a more active way, for example, by creating presentations, posters or role plays. They also provide the opportunity to extend your learning beyond the syllabus.
PRACTICAL TASK
Practical tasks focus on developing your practical skills and cover the essential practicals that are listed in the syllabus. They include lists of necessary equipment, safety considerations, step-by-step instructions so you can carry out the experiment and questions to help you think about what you have learnt.
Original material © Cambridge University Press 2022. This material is not final and is subject to further changes prior to publication.
CAMBRIDGE IGCSE™ MARINE SCIENCE: COURSEBOOK vi
SAMPLE
We are working with Cambridge Assessment International Education towards endorsement of this title.
How to use this book
WORKED EXAMPLES
The Key Skills chapter has Worked examples which show you the practical application of key data handling and practical skills.
REFLECTION
These activities ask you to think about the approach that you take to your work and how you might improve this in the future.
This design tells you where information in the book is extension content and is not part of the syllabus.
SUMMARY
There is a summary of key points at the end of each chapter.
SKILLS TIP
These tips help you with key data handling and practical skills in the Key Skills chapter. You will find references back to them in the Practical tasks throughout the rest of the book.
SELF/PEER ASSESSMENT
At the end of some Activities and Practical tasks, you will find opportunities to help you assess your own work, or that of other students, and consider how you can improve the way you learn.
CASE STUDY PROJECT
Case study projects allow you to apply your learning from the whole chapter to pair or group activities, such as preparing posters or presentations. They provide the opportunity to extend your learning beyond the syllabus.
EXAM-STYLE QUESTIONS
Questions at the end of each chapter provide more demanding exam-style questions, some of which may require use of knowledge from previous chapters.
SELF-EVALUATION CHECKLIST
The self-evaluation checklists are followed by ‘I can’ statements which match the Learning intentions at the beginning of the chapter. You might find it helpful to rate how confident you are for each of these statements when you are revising. You should revisit any topics that you rated ‘Needs more work’ or ‘Getting there’.
I can Needs more work Getting there
Confident to move on See Section
Original material © Cambridge University Press 2022. This material is not final and is subject to further changes prior to publication.
vii
SAMPLE
Introduction
Studying marine science
Marine science is the study of our oceans and seas. It is a subject that has elements of biology, chemistry, physics, geography, and geology. Marine scientists learn all about the different forms of life that live in the marine world and how they interact with each other. They discover the chemical and physical properties of the oceans and how these affect life. They study the different forms of coastlines, the seabed, and how geological processes shape our world. Importantly, they learn how humans interact with the marine world, how we rely on it for food, and how we can reduce the damage that we are doing.
Why should you study marine science? There are many reasons. Some people study marine science to help them to progress onto a career involved with the marine world, but many people study the subject for interest. The organisms that live in our oceans are fascinating and marine science allows people to study them in more depth.
About this coursebook
This is the first edition of our Cambridge IGCSE™ Marine Science Coursebook, which provides full coverage of the Cambridge IGCSE Marine Science (0697) syllabus for examinations from 2024 onwards.
The chapter order generally follows the same sequence as the topics in the syllabus. The various features that you will find in these chapters are explained in the previous two pages.
Many of the questions you will meet in this coursebook test if you have a deep understanding of the facts and concepts you have learnt. It is therefore not enough just to learn words and diagrams that you can repeat in answer to questions; you need to really understand each concept fully. Trying to answer the questions within each chapter, and at the end of each chapter, should help you to do this.
Although you will study marine science as a series of different topics, all these topics in fact link up with each other. You will therefore need to make links between different areas of the syllabus to answer some questions.
As you work through your course, keep reflecting on the work you did earlier and how it relates to the topic that you are now studying. The Reflection boxes ask you to think about ‘how you learn’ to help you make the very best use of your time and abilities as your course progresses. You can also use the Self-evaluation checklists at the end of each chapter to decide how well you have understood each topic, and whether you need to do more work on each one.
Practical skills are an important part of your marine science course. You will develop these skills as you do experiments and other practical work related to the topics you are studying.
Original material © Cambridge University Press 2022. This material is not final and is subject to further changes prior to publication.
We are working with Cambridge Assessment International Education towards endorsement of this title.
CAMBRIDGE IGCSE™ MARINE SCIENCE: COURSEBOOK viii
SAMPLE
Careers in marine science
We hope that you will find this marine science course and reading this coursebook interesting, and that it will inspire you to pursue your interest in the marine world to a higher level. The world needs inspiring, enthusiastic people to educate others on the issues that face our oceans. Studying marine science can offer many career opportunities. Some people choose to work in industries such as tourism and fishing, others choose to work in environmental research and conservation.
Tourism
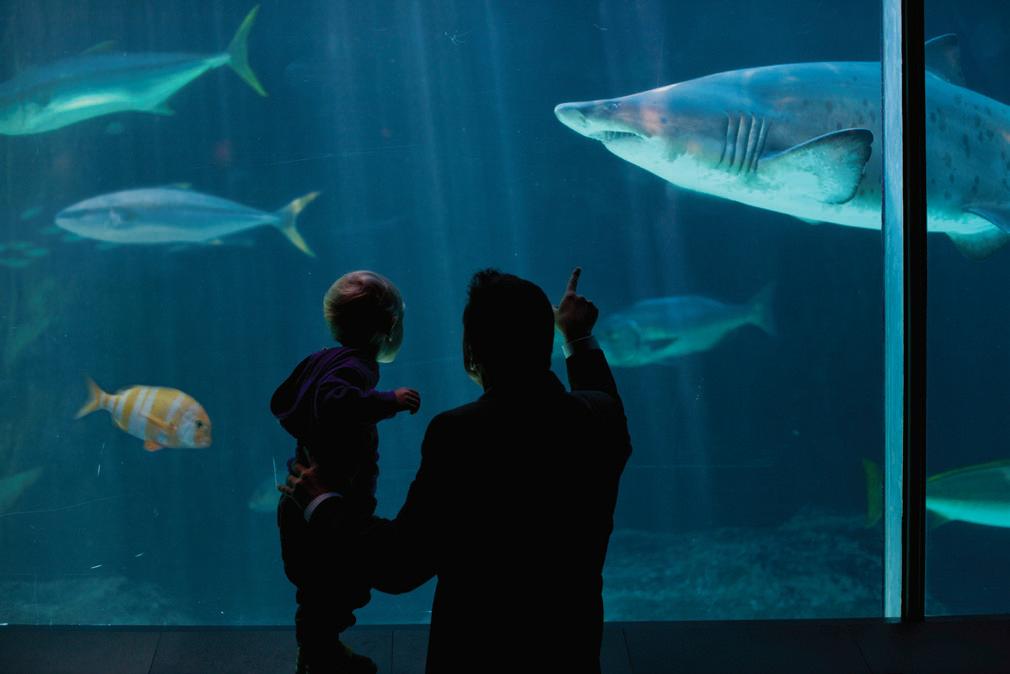
Marine tourism brings many employment opportunities. One of the aims of ecotourism is to educate visitors. Marine scientists may give talks to visitors, act as guides, and produce information leaflets. Employers in tourist resorts need staff in hotels who can understand the natural world, and explain the ecology of the area to visitors. Marine scientists are also involved in the development of resorts to assess the impacts on ecosystems. Many tourist resorts are close to areas of scientific interest, and to support these areas there are often conservation projects and aquaria. These need people to work on research projects and captive breeding programmes.
Fishing industry and aquaculture
Visitors can learn about marine organisms at an aquarium.
The fishing industry offers many career opportunities. Employers include government agencies, university departments or private industry. Marine scientists research the health of fish stocks and help set fishing quotas. They are also involved in the development of sustainable fishing methods. The crews of fishing vessels also need to understand the best methods of fishing and how to ensure that fishing is not harming the environment. Aquaculture is a worldwide industry that is growing to meet the demand for seafood. Aquaculture enterprises need staff who understand the process, can investigate ways of improving it, and assess whether pollution from aquaculture is harming local ecosystems.
Energy industry
The worldwide demand for energy increases every year, offering jobs to marine scientists. Fossil fuel companies need people with an understanding of the geology of the Earth to help extract oil safely. As renewable fuels become more important, there is a need for scientists and engineers who can design, install, and operate renewable energy systems. Journalists with an understanding of marine science can raise public awareness about environmental issues and the energy industry.
Conservation
Marine scientists are often employed in conservation, both in research and in the running of projects. People with a knowledge of marine science are needed to assess the ecological health of habitats and the sustainability of species. Active conservation workers who manage areas and run breeding programmes are an essential part of any conservation project. Teachers and guides may be employed as education workers at conservation sites. Sometimes marine scientists are employed to raise awareness of conservation issues, and fund raise through social media.
Original material © Cambridge University Press 2022. This material is not final and is subject to further changes prior to publication.
We are working with Cambridge Assessment International Education towards endorsement of this title.
ix Introduction
SAMPLE
We are working with Cambridge Assessment International Education towards endorsement of this title.
Original material © Cambridge University Press 2022. This material is not final and is subject to further changes prior to publication.
SAMPLE
We
Chapter 1
The Earth and its oceans
IN THIS CHAPTER YOU WILL:
• describe the motion of the Earth, the Moon and the Sun relative to each other and state what keeps them in regular motion
• describe the internal structure of the Earth and explain how this structure creates features that shape our oceans
• identify the five oceans and describe how water flows around and between them
• describe and explain the regular changes in tides
• describe tsunamis and rip currents and explain how they form.
Original material ©
is
to
are working with Cambridge Assessment International Education towards endorsement of this title.
Cambridge University Press 2022. This material
not final and is subject
further changes prior to publication. SAMPLE
CAMBRIDGE
GETTING STARTED
Spend two minutes thinking about each of these questions before comparing notes with another learner for a further two minutes, adding to or correcting your own work. Be prepared to share your thoughts with the class.
• Why do the Sun and the Moon rise and fall in the sky each day?
• What causes earthquakes and volcanoes?
• How are oceans different to seas?
• What are the differences between tides and currents?
MARINE SCIENCE IN CONTEXT
Do migrating turtles have a compass?
Year by year, sea turtles around the world return to the beaches they hatched on to lay their eggs (Figure 1.1). How do they know how to get there?
Scientists have known for a long time that turtles, like many other animals, find their way using the invisible lines of the Earth’s magnetic field. Turtles contain a magnetic material called magnetite in their heads, and scientists think they use this as an internal compass to find their way using the Earth’s magnetic field. But how are the turtles able to find their way to the exact beach where they hatched?
We now know that each coastline has its own unique magnetic field based on the rocks and the shape of the coast. This helps the turtles, who remember and use this magnetic field to find their way home. However, this magnetic field is not as fixed and permanent as we might think.
The internal structure of the Earth offers clues to changes that have taken place through time. The Earth’s magnetic field is created by the Earth’s core, and this magnetic field has changed throughout the history of the Earth. Some of these changes in the magnetic field have been measured. The changes in the magnetic field affect the location of turtle nesting sites along beaches.
Discussion questions
1 If the Earth acts as a big magnet, what might be happening to the magnetic material inside the Earth to cause the magnetic field to change direction?
2 What might be the advantages to turtles of returning to the same beach to lay their eggs?
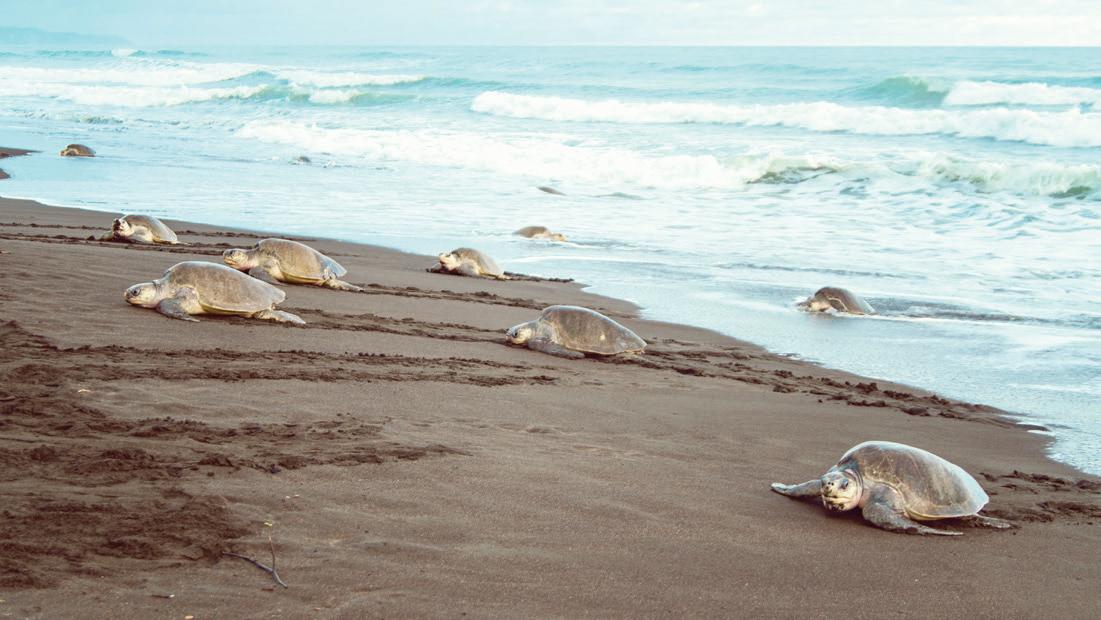 Figure 1.1: Olive ridley sea turtles returning to a beach in Costa Rica
We are working with Cambridge Assessment International Education towards endorsement of this title.
Figure 1.1: Olive ridley sea turtles returning to a beach in Costa Rica
We are working with Cambridge Assessment International Education towards endorsement of this title.
IGCSE™ MARINE SCIENCE: COURSEBOOK 54
Original material © Cambridge University Press 2022. This material is not final and is subject to further changes prior to publication. SAMPLE
1.1 Structure of the Earth
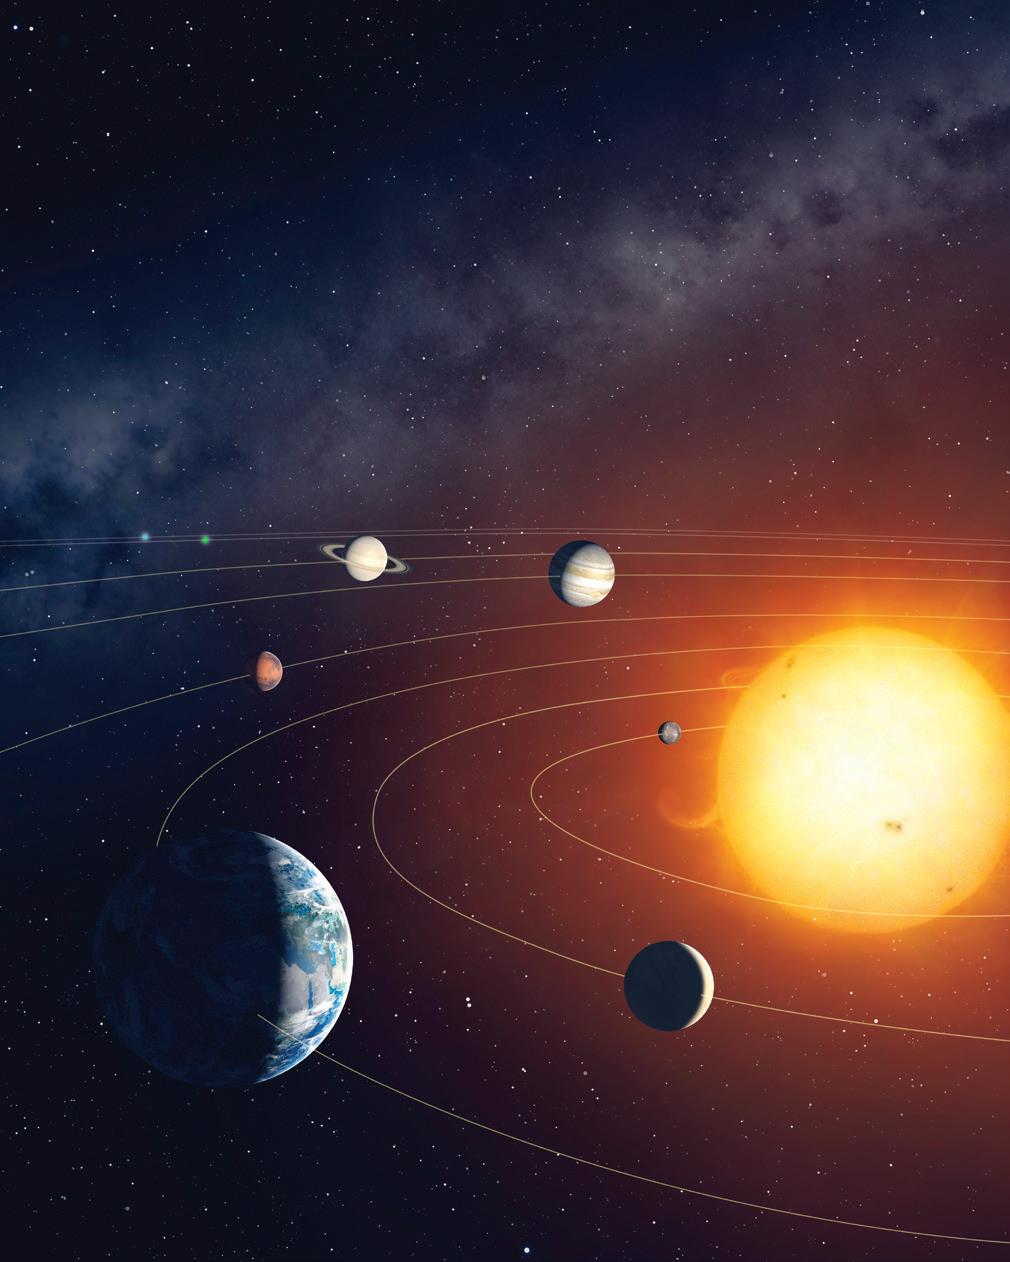
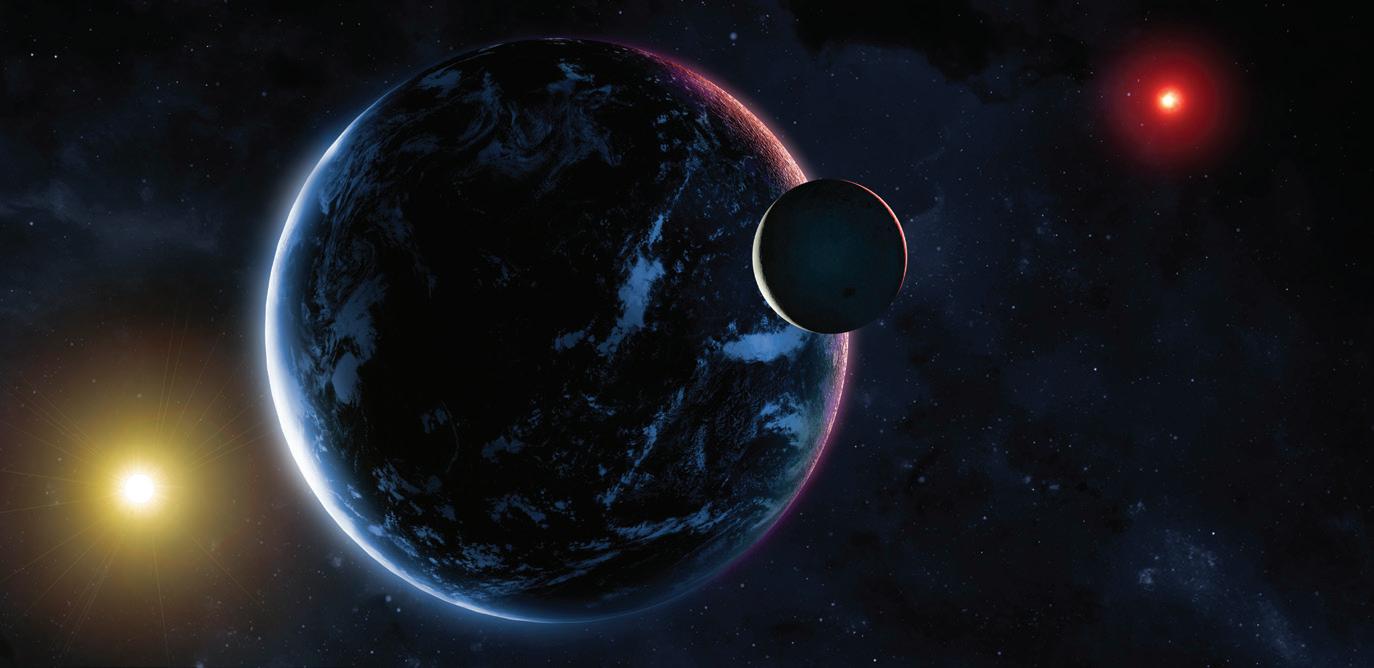
The Earth is one of eight planets orbiting the Sun in the Solar System (Figure 1.2). The Sun is the largest object in the Solar System and it has the greatest gravitational pull (gravity)
Solar System. Gravitational pull keeps the Earth in around the Sun. The Earth’s position as the third planet from the Sun helps to create the ideal temperatures for life to exist on the Earth.
As the Earth orbits the Sun, the Earth is also spinning on its
KEY WORDS
Solar System*: eight planets and their moons in orbit around the Sun gravity / gravitational pull: the force that exists between any two objects with mass orbit: the path of an object as it moves around a larger object axis*: the imaginary line between the Earth’s North Pole and South Pole hemisphere*: half of a sphere; the Earth can be considered to be made of two hemispheres divided by the Equator Equator: an imaginary line drawn round the Earth, halfway between the North Pole and the South Pole tropics / tropical zones: the region between the Tropic of Cancer and the Tropic of Capricorn, between which the Sun moves directly overhead during a year
Figure 1.3 shows how the Earth spins on its axis at an angle of 23.5 degrees, so for most of the year there is unequal exposure to light and heat from the Sun on the surface of the Earth. In Figure 1.3 you can see that the Southern Hemisphere is exposed to more heat and light than the Northern Hemisphere during summer in the Southern Hemisphere.
The intensity of the Sun is greatest near to the Equator and between the Tropics of Cancer and Capricorn. The more intense heating in these regions continues throughout the year. In Figure 1.3 the Sun is directly over the Tropic of Capricorn in the Southern Hemisphere, causing this part of the Earth to experience the most intense light.
Figure 1.3: How the Earth’s axis is tilted at 23.5° causing uneven heating in the Northern and Southern hemispheres
Original material © Cambridge University Press 2022.
material is not final and is subject to further changes prior to
Earth and its
Earth the Sun
Figure 1.2: The Sun and the eight planets we now know orbit the Sun.
Arctic Circle
23.5º Earth’s axis N S
Earth’s rotation
Antarctic Circle Tropic of Cancer Tropic of Capricorn the Equator
We are working with Cambridge Assessment International Education towards endorsement of this title.
1 The
oceans 55
This
publication. SAMPLE
b c d
CAMBRIDGE
Position of Earth Month
December summer S S NN winter March autumn (fall) spring
Southern Hemisphere Northern Hemisphere
season
June winter summer
September spring autumn (fall)
Figure 1.4: How the Earth experiences seasons as it orbits the Sun
Light from the Sun only reaches the southern limit of the Arctic Circle, resulting in no light on any of the Earth’s land or ocean north of this line. The Antarctic Circle, near to the South Pole, is completely exposed to light from the Sun. This results in daylight that lasts for weeks or months, but the light intensity is very low compared to near the equator. At the poles, there is very limited heating from light from the Sun. This means that the polar regions are the coldest on the Earth.
The Earth takes 3651 4 days to complete one full orbit of the Sun. As the Earth moves around the Sun, the Earth’s axis continues to point in the same direction. This causes the Northern Hemisphere and the Southern Hemisphere to experience seasons because the number of hours of daylight changes during the year. Longer days, by which we mean longer periods of daylight, and greater exposure to more energy from the Sun, cause more warming of the Earth’s surface in summer months. Shorter days, with less exposure to energy from the Sun, cause cooler weather in winter months. You can see this in Figure 1.4.
The Moon is a natural satellite that orbits the Earth every 27.5 days (Figure 1.5). The closeness of the Moon to the Earth, and relatively large size of the Moon compared to the Earth, causes a strong gravitational pull between them. This keeps the Moon in orbit around the Earth. This gravitational pull between the Earth and the Moon also has a large effect on the water in seas and oceans, causing tides (see Section 1.4).
KEY WORDS
satellite: any object that orbits a planet
Original material © Cambridge University Press 2022. This material is not final and is subject to further changes prior to publication.
We are working with Cambridge Assessment International Education towards endorsement of this title.
IGCSE™ MARINE SCIENCE: COURSEBOOK 56
a
SAMPLE
ACTIVITY 1.1
Modelling day and night
You will need:
• a lamp
• a globe of the Earth.
For this whole-class activity, use a lamp to represent the Sun. This activity will work best in a darkened room.
• If you have a globe, use that to represent the Earth (Figure 1.6).
• You could use an orange with a pencil sticking through it instead, but make sure that the pencil is at an angle (around 23.5°) to the vertical.
CONTINUED
• Begin by turning the ‘Earth’ anticlockwise on its axis, assuming you are looking downward over the North Pole. This demonstrates why we experience day and night.
• Move the ‘Earth’ slowly around the ‘Sun’ in a large circle; this models a complete year. Rotate the ‘Earth’ on its axis at different positions in its journey round the ‘Sun’; this models day / night at different positions around the Sun.
• Observe how the light reaches the North Pole or South Pole only when that pole is pointing towards the Sun.
• Investigate the difference in the length of the day in both hemispheres as the Earth moves around the Sun.
• Discuss how the length of day changes near to the poles.
• Discuss the intensity of light near the poles compared with the intensity of light near the equator.
The Earth is a rocky planet, but the rock is only solid at and near to the surface. Figure 1.7 shows a cross-section of the Earth, showing how the solid rocks at the surface form a thin layer called the crust. The crust beneath the ocean has a greater density and varies in thickness from 3 to 10 km. Continental crust has a lower density and usually varies in thickness from 35 to 40 km, though continental crust can be as much as 100 km in thickness.
Beneath the crust is a much thicker layer (the mantle), which is made of viscous molten rock called magma.
KEY WORDS
crust: outermost solid layer of the Earth
mantle: the region of the Earth found between the crust and the core
viscous: describes a liquid that flows slowly
magma: hot semi-liquid rock found below or within the crust
The Earth and its oceans
Moon
Figure 1.5: The Earth and Moon with the Sun in the distance.
Figure 1.6: Modelling changes each day, month and year
We are working with Cambridge Assessment International Education towards endorsement of this title.
1
57
Original material © Cambridge University Press 2022. This material is not final and is subject to further changes prior to publication. SAMPLE
CAMBRIDGE
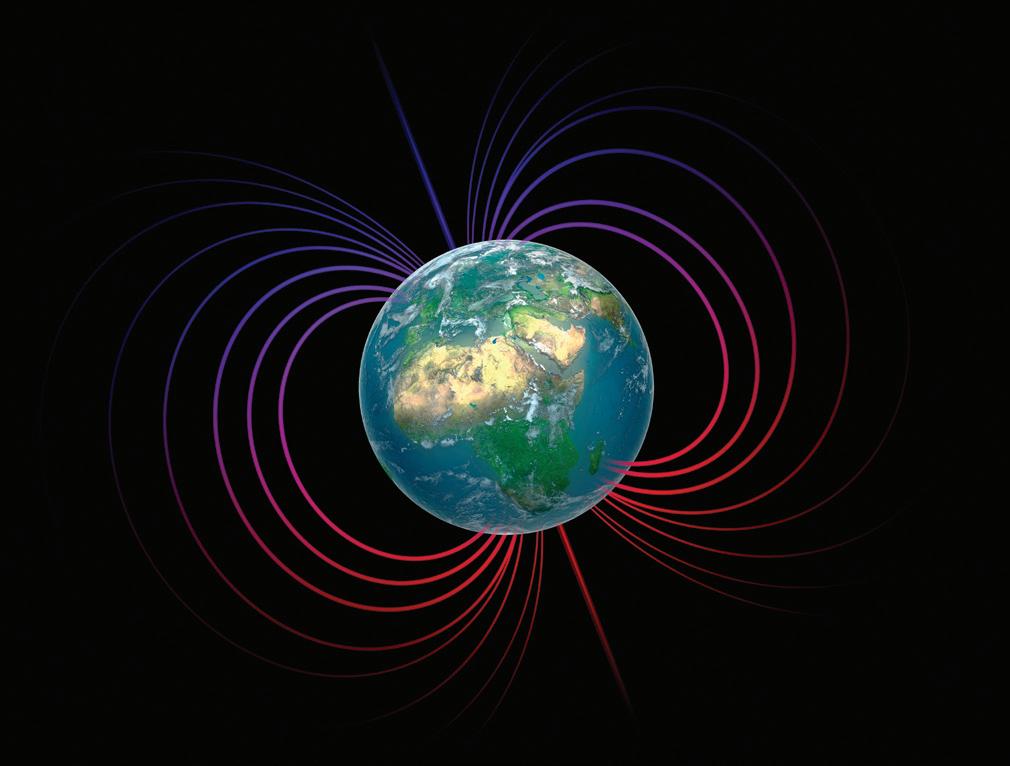
Beneath the mantle is the core, made almost entirely of metal, particularly iron. The core is solid in the centre and molten around this.
An important effect of the iron in the Earth’s core is that this creates a magnetic field around the Earth (Figure 1.8). We use the Earth’s magnetic field for navigation. A compass uses a magnet that can freely rotate to align with the Earth’s magnetic field and point to the magnetic North Pole. The Earth’s magnetic field is important in helping some species to navigate during migration , as we saw at the beginning of the chapter.
KEY WORDS
core: the very hot, dense centre of the Earth
iron: a metallic element with magnetic properties
navigate: the process of plotting a course from one place to another
species: organisms that are able to breed and produce fertile offspring


migration: movement of animals from one region to another, usually in response to changes in the seasons
Questions
1 Name the force that keeps the Earth in orbit around the Sun.
2 Draw a cross-section of the Earth and label the layers found inside.
3 What produces the magnetic field around the Earth?
Figure 1.8: Earth’s magnetic field.
 kmcrust mantle
core
core
land oceanic crust continental crust mantle
Figure 1.7: Cross-section of Earth showing relative depths of crust, including oceanic and continental, mantle and core
We are working with Cambridge Assessment International Education towards endorsement of this title.
kmcrust mantle
core
core
land oceanic crust continental crust mantle
Figure 1.7: Cross-section of Earth showing relative depths of crust, including oceanic and continental, mantle and core
We are working with Cambridge Assessment International Education towards endorsement of this title.
IGCSE™ MARINE SCIENCE: COURSEBOOK 58
0–100
outer
inner
6370 km 5100 km 2900 km
Original material © Cambridge University Press 2022. This material is not final and is subject to further changes prior to publication. SAMPLE
1.2 Plate tectonics
Volcanoes and major earthquakes only occur in some regions of the Earth, and these regions often form patterns around the Earth (Figure 1.9).
It was only in the 1960s that the theory of plate tectonics was developed to help explain the distribution of earthquakes and volcanoes, and why these features exist.
In Section 1.1 we saw that the Earth’s structure consisted of a core, surrounded by semi-molten rock called the mantle, covered with a relatively thin solid layer of rock called the crust that floats on top of the mantle.
Tectonic plate theory describes how radioactive decay of atoms in the Earth’s core heats the mantle, creating convection currents in the mantle (Figure 1.10).
The convection currents create tension in the crust as the mantle moves in different directions beneath the crust, causing the crust to break into large pieces called tectonic plates (Figure 1.11).
KEY WORDS
theory of plate tectonics: a theory developed in the 1960s that helps explain the formation of some of the important features on the Earth’s surface and how the continents move
convection current: the transfer of thermal energy (heat energy) by the motion of a fluid tectonic plates: large sections of crust
Original material © Cambridge University Press 2022. This material is not final and is subject to further changes prior to
Earth and its oceans
volcanoes earthquakes
Figure 1.9: Earthquakes and volcanoes around the Earth
We are working with Cambridge Assessment International Education towards endorsement of this title.
1 The
59
publication. SAMPLE
CAMBRIDGE IGCSE™ MARINE SCIENCE: COURSEBOOK 60 continental crust oceanic crust continental crust mantle convection current convection current trench outer core inner core ocean oceanic crust subduction mid-oceanic ridge Figure 1.10: Convection currents in the Earth’s mantle causing the crust to move. 30°60°0°30°90°120°150° 60°90°120°150° Eurasian Plate Philippine Plate Pacific Plate Caroline Plate Fiji Plate Bismarck Plate Indo-Australian Plate Arabian Plate African Plate Antarctic Plate Scotia Plate South American Plate Nazca Plate Cocos Plate Pacific Plate Juan de Fuca plate Caribbean Plate North American Plate30º 30º 60º 0º 60º subduction zones divergent boundaries plate movement Figure 1.11: Main tectonic plates on Earth and their movement We are working with Cambridge Assessment International Education towards endorsement of this title. Original material © Cambridge University Press 2022. This material is not final and is subject to further changes prior to publication. SAMPLE
We are working with Cambridge Assessment International Education towards endorsement of this title.
1 The Earth and its oceans
ACTIVITY 1.2
Modelling convection currents
You will need:
• a tripod and gauze
• a Bunsen burner
• a glass beaker
• water
• coffee granules
Use the equipment shown in Figure 1.12 to see convection currents occur. If you do not have this equipment, you could use a different container of water (e.g. a saucepan) over a different heat source (e.g. a cooker hob). Any soluble solid with a dark colour can be used to show the convection currents.
Safety: take care when heating and when using flames – hot liquids and equipment can cause burns. Follow all safety instructions from your teacher.
Self-assessment
How well did you complete this activity? Rate your work according to the following scheme for each of the points listed: if you did it really well if you made a good attempt at it and partly succeeded if you did not try to do it or did not succeed.
The theory of plate tectonics describes how this movement of tectonic plates has occurred over hundreds of millions of years. Using computer models, we can trace the movements of the plates back in time. Figure 1.13 shows how all the continents were once joined to form a giant supercontinent called Pangea As you can see from the diagrams in Figure 1.13, most of the continents have slowly drifted apart from each other over time.
coffee granules
Figure 1.12: Equipment to demonstrate convection currents.
When you heat the water, observe the direction in which the colour from the granules moves, both in the water and at the surface. What happens if you add small floating objects to the surface in the middle of the water? Compare what you have seen with what you have learned about convection currents in the Earth’s mantle. Discuss what you observe with the rest of the class.
• I set up the equipment correctly.
• I created a convection current and observed this using the coloured substance.
• I carried out the activity safely.
KEY WORDS
supercontinent: a large landmass thought to have broken up into several of the current continents
Pangea*: a large landmass thought to have broken up to create all the current continents
Original material © Cambridge University Press 2022. This material is not final and is subject to further changes prior to publication.
61
SAMPLE
225 million years ago
200 million years ago
150 million years ago
65 million years ago present day
Figure 1.13: How the continents have moved over time
Plate boundaries
Where two tectonic plates meet, one of three types of plate boundary can occur:
• divergent plate boundaries – plates move away from each other
• convergent plate boundaries – plates move towards each other
• transform plate boundaries – plates slide against each other.
KEY WORDS
divergent plate boundary: two tectonic plates move apart, forming new land between them
convergent plate boundary: two tectonic plates move towards each other
transform plate boundary*: two tectonic plates try to slide past each other
Divergent plate boundaries
When two tectonic plates move away from each other, a gap is created between the two plates. As the layer beneath the crust is molten, this causes magma from the mantle to rise and fill the gap. The molten rock is called lava once it gets to the upper surface of the crust. The lava cools when it is exposed to cool air or water above it, and solidifies to produce new solid rock.
The movement of the tectonic plates is not smooth and constant. The plates often move suddenly, causing earthquakes, and can suddenly release molten lava to the surface, which cools to form new rock. As a result, the new rock forms uneven mountain ranges either side of
KEY WORDS
lava*: molten rock that erupts from the Earth’s crust
earthquake: a sudden shaking of the ground, usually caused when two plates suddenly slip against each other
Original material © Cambridge University Press 2022. This material is not final and is subject to further changes prior to
Laurasia
Gondwana
Pangea
North America South America Asia Antarctica Australia Africa Europe
We are working with Cambridge Assessment International Education towards endorsement of this title.
CAMBRIDGE IGCSE™ MARINE SCIENCE: COURSEBOOK 62
publication. SAMPLE
1 The Earth and its oceans
the divergent plate boundary as the plates slowly move apart over time.
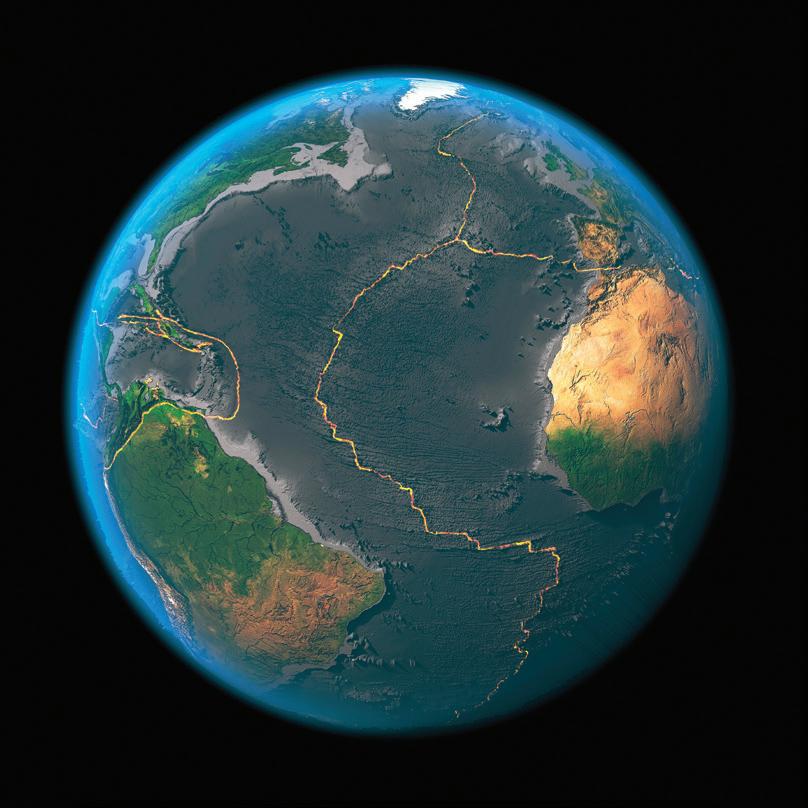
Most divergent boundaries occur in the oceans between continents. Figure 1.14 shows the Mid-Atlantic Ridge, which runs from Iceland in the North Atlantic, down the Atlantic Ocean to the Southern Ocean near Antarctica. This forms one of the longest mountain ranges in the world. Most of this mountain range is underwater, though some parts break above the ocean to form Iceland and other islands in the Atlantic, including the Azores, which is a group of volcanic islands in the Atlantic.
Mid-Atlantic Ridge
KEY WORDS
volcanic islands: islands formed when volcanic eruptions result in the formation of an island or group of islands
volcanoes: part of the Earth’s crust from which lava erupts
mid-ocean ridge*: mountain ranges formed deep in the ocean that extend for hundreds of miles either side of the parting plates
hydrothermal vent*: cold ocean water seeps into the Earth’s crust and is superheated by underlying magma; this heated water is forced through vents (gaps) in the ocean floor and as it cools dissolved minerals solidify and form a chimney-like structure minerals: nutrients that are needed by living organisms; examples include calcium and iron subduction*: the downwards movement of one plate beneath another
Figure 1.14: The Mid-Atlantic Ridge
Features associated with divergent plate boundaries include:
• earthquakes, due to sudden movements of the tectonic plates
• volcanoes, both underwater and on land, formed as the plates move apart, allowing magma to rise up and escape as lava
• mid-ocean ridges, which are extensive mountain ranges formed deep in the ocean that extend for hundreds of miles either side of the parting plates
hydrothermal vents, formed where cold seawater seeps into cracks (or faults) in the sea floor and is superheated by the magma beneath, allowing minerals to dissolve in the water. The hot water is forced back into the sea, where it rapidly cools. The dissolved minerals solidify and create a chimney-like structure, a hydrothermal vent.
Convergent plate boundaries
When two tectonic plates move towards each other, the plates collide. What happens at the boundary depends on what type of crust is colliding.
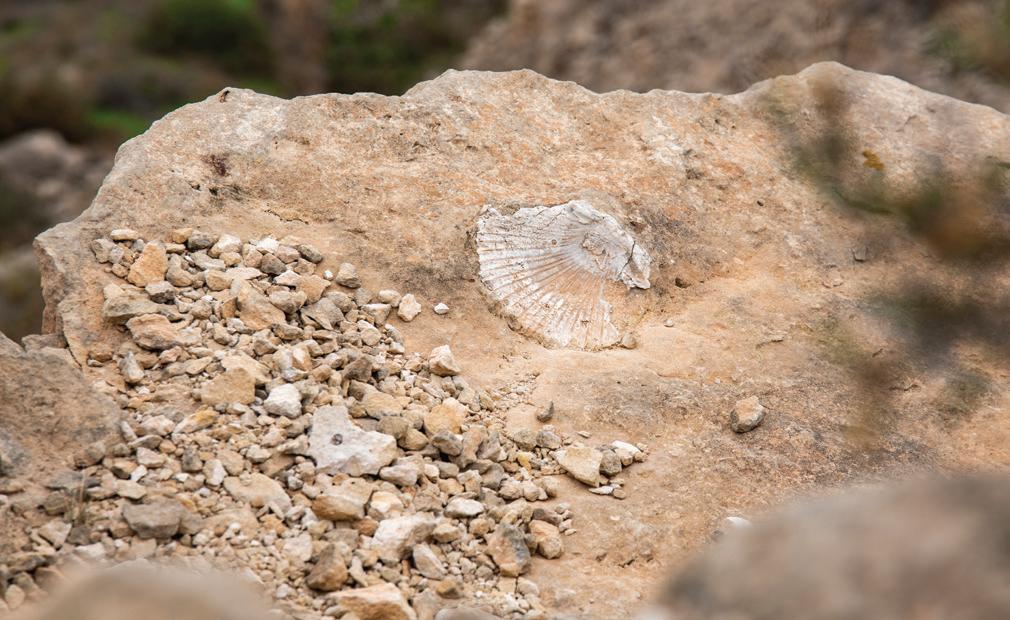
If both sections of crust converging are continental crust, this results in fold mountains. While fold mountains are not directly linked to the oceans, they do provide evidence supporting the theory of plate tectonics. The Himalayan mountain range is an example of fold mountains created by the convergence of the IndoAustralian Plate into the Eurasian Plate. Fossils of sea creatures can be found on mountains in the Himalaya, such as the shell shown in Figure 1.15. These fossils support the idea of plate movement and uplifting of land over time as the Himalaya are far too high to ever have been covered by ocean in their current position.
If a section of continental crust converges with a section of oceanic crust, the denser oceanic crust undergoes subduction beneath the continental crust (Figure 1.16).
Original material © Cambridge University Press 2022. This material is not final and is subject to further changes prior to publication.
Figure 1.15: Fossilised shell found on a mountain
We are working with Cambridge Assessment International Education towards endorsement of this title.
63
SAMPLE
CAMBRIDGE
Features associated with convergent plate boundaries include:
• earthquakes, due to sudden movements of the tectonic plates
• tsunamis, caused by sudden violent earthquakes
• volcanoes on land formed as the plates converge, causing the oceanic crust to subduct and melt allowing magma to rise through the continental crust and escape as lava
• ocean trenches, which are deep underwater valleys running along the plate boundary; the Mariana Trench is the deepest part of the world’s oceans, and is found between Japan and Papua New Guinea.
KEY WORDS
tsunami: a fast-moving wave with a long wavelength, created by ocean floor displacement or landslide
melt: the change of a solid into a liquid; during this process heat is taken in from the surroundings
ocean trench: a deep underwater valley formed when oceanic crust slides below continental crust
Transform plate boundaries
When two tectonic plates slide against each other, the movement of the plates is not smooth and constant. The plates build up tension until the forces pushing on them become so great that they slip suddenly, causing earthquakes. These earthquakes are less likely than earthquakes along convergent boundaries to cause a tsunami. This is because the movement of the plates does not usually cause a large displacement of seawater.
Most transform boundaries beneath the ocean occur near to mid-ocean ridges linking sections of divergent plates (Figure 1.17).
mid-ocean ridges separate two tectonic plates transform fault oceanic crust
Original material © Cambridge University Press 2022. This material is not final and is subject to further changes prior to publication.
plate direction mantle
Figure 1.17: Transform fault beneath the ocean
subductingoceaniccrust oceanic crust continental crust mantle melting ocean trench volcanoes
Figure 1.16: Subduction of oceanic crust at a convergent boundary with continental crust
We are working with Cambridge Assessment International Education towards endorsement of this title.
IGCSE™ MARINE SCIENCE: COURSEBOOK 64
SAMPLE
The Earth and its oceans
The features most associated with transform plate boundaries are earthquakes, due to sudden movements of the tectonic plates.
Tsunamis
Tsunamis occur when an extremely large volume of seawater is displaced, such as when two plates move suddenly. Figure 1.18 shows how a tsunami can be created by plate movements at a convergent boundary.
When a tsunami forms, the wave travels very quickly through deep ocean – this can be up to 800 km per hour, allowing tsunamis to cross oceans in less than a day.
A tsunami wave may be as little as a few cm high in the middle of the ocean, but the wavelength (the distance between the tops of two successive waves) can be over 500 km long. As a tsunami wave nears the coast on the continental shelf, the ocean is much less deep. This causes the wave to increase in height as the wavelength decreases. The shallower depth also slows down the wave, causing the wave to gain even more height. As a tsunami wave reaches
the coast it may slow to as little as 30 km per hour, but the wave can be as high as 30 m, resulting in the wave flooding the coast and spreading as far as 16 km inland.
Tsunamis can also be caused by other events that displace huge volumes of seawater, such as a huge landslide underwater, a powerful volcanic eruption, or the impact of a large meteorite hitting an ocean. Whichever way they form, a tsunami wave always travels in the same way.
When a tsunami occurs, a huge amount of energy is transferred through the moving water in the tsunami wave. This energy moves rocks and sediments on the sea
KEY WORDS
continental shelf: part of the continental plate extending from the coast/shore in shallow waters with little or no slope
sediments: small fragments of rock, such as gravel, sand and silt
overriding plate slow distortionstuck
subducting plate
a The continental plate gets stuck over the subducting oceanic plate.
earthquake starts tsunami
stuck plate slips, releasing energy in an earthquake
c The plates suddenly slip, causing an earthquake and displacing a huge volume of water in the ocean above.
b The continental plate distorts as tension continues to build.
tsunami waves spread
d The displaced water sinks back down and spreads, creating a tsunami.
Figure 1.18: How earthquakes at convergent boundaries can cause a tsunami.
Original material © Cambridge University Press 2022. This material is not final and is subject to further changes prior to publication.
We are working with Cambridge Assessment International Education towards endorsement of this title.
1
65
SAMPLE
Original
CAMBRIDGE
floor, destroying habitats and organisms on the seabed. The tsunami off the coast of Japan in March 2011 moved ocean sediments and deposited them over other habitats as huge sea-floor sand dunes.
Coral reefs act as natural breakwaters and coastal defences against tidal action and tsunamis. These important marine ecosystems face the full force of tsunamis and can suffer great damage, taking many years to recover from a tsunami. Other important marine habitats affected by tsunamis include coastal seagrass beds and mangrove forests.
Due to the great height of tsunami waves and the large amount of energy they transfer, tsunamis can do great damage to human communities along coastlines. The speed with which a tsunami wave floods a shore gives very little time for people to evacuate. A tsunami in the Indian Ocean on 26 December 2004 killed over 200 000 people in 14 countries around the Indian Ocean.
In addition to loss of life, the impact on coastal economies can be devastating, with fishing boats and gear destroyed and tourism disrupted. Farmland may be flooded with salt water, leading to the loss of crops and difficulties in farming the flooded land for many years after the tsunami.
KEY WORDS
breakwater*: a barrier which reduces the energy in waves before waves reach the coast
ecosystem: all the organisms in the area along with their environment
tourism: recreational visits to an area that brings money into local economies
Questions
4 Describe what is meant by tectonic plate theory.
5 Describe the movement of plates for each of these boundaries, using diagrams to help you:
a convergent
b divergent
c transform.
6 State the types of plate boundary at which the following features occur, and describe how they form:
a volcanoes
b earthquakes.
7 What is a tsunami? How does a tsunami form?
1.3 Oceans and seas
Oceans and seas cover 71% of the Earth’s surface, with areas of land only covering 29%. The oceans are interconnected to encircle the Earth as a World Ocean –while water flows between the oceans and seas through currents. This is described in detail in Section 1.4.
Most of the water on the Earth (97%) is found in oceans and seas as salt water, with just 3% of the world’s water as freshwater.
Oceans separate most of the continents and are generally much deeper than seas. Seas are smaller areas of water.
Seas are sometimes found within oceans, such as the Bering Sea in the Pacific Ocean. Seas are often partially enclosed by land. The Mediterranean Sea is almost entirely enclosed by land, except for a very narrow strait past Gibraltar (south of Spain) to the Atlantic Ocean. The Earth’s five oceans and many of the seas are shown in Figure 1.19. The Pacific Ocean is the largest ocean, with an area of over 160 million km2 and a volume of 660 million km3
We use a system of coordinates to form a grid enclosing the Earth. These coordinates help us identify and locate places on the Earth. Just like axes on a graph, this system has reference lines that act as zero for the coordinate scales (Figure 1.20).
The horizontal reference line is the Equator, around the middle of the Earth. As you move north or south from the Equator the latitude increases, from zero at the Equator to 90° N at the North Pole, or 90° S at the South Pole.
The vertical reference line is the Prime Meridian, which runs from the North Pole to the South Pole through the
KEY WORDS
World Ocean: all the oceans, which are interconnected to encircle the world
freshwater: water that has very low concentrations of salts; it is used for drinking water
coordinates: a pair of numbers used to identify a point
latitude: the distance from the Equator to the North Pole or South Pole, on a scale where 0° is at the Equator and 90° is at the pole
Prime Meridian*: a line from the North Pole to the South Pole through the Royal Observatory in Greenwich, England
We are working with Cambridge Assessment International Education towards endorsement of this title.
IGCSE™ MARINE SCIENCE: COURSEBOOK 66
material © Cambridge University Press 2022. This material is not final and is subject to further changes prior to publication. SAMPLE
1 The Earth and its oceans 67 Gulf of Alaska Tropic of Cancer Tropic of Capricorn Arctic Circle Antarctic Circle Bering Sea Chukchi Sea Beaufort Sea Lincoln Sea Baffin Bay Labrador Sea Sargasso Sea Caribbean Sea Pacific Ocean Atlantic Ocean Indian Ocean Pacific Ocean Arctic Ocean Chilean Sea Scotia Sea Arabian Sea Red Sea Bay of Bengal Timor Sea Arafura Sea South China Sea East China Sea Sea of Japan Sea of Okhotsk East Siberian Sea Laptev Sea Kara SeaBarents Sea Greenland Sea Norwegian Sea Baltic Sea North Sea Mediterranean Sea Black Sea Caspian Sea Coral Sea Tasman Sea Ross Sea Weddell Sea Southern Ocean Gulf of Guinea Amundsen Sea Figure 1.19: Earth’s oceans and seas 90 180 Latitude Tropic of Cancer Arctic Circle Antarctic Circle Tropic of Capricorn Equator Longitude Prime Meridian 0 North (+) 60 150 150 120120 9090 6060 3030 East (+) West (–) South (–) 60 30 30 60 30 30 60 90 0 Figure 1.20: Latitude and longitude We are working with Cambridge Assessment International Education towards endorsement of this title. Original material © Cambridge University Press 2022. This material is not final and is subject to further changes prior to publication. SAMPLE
Royal Observatory in Greenwich, England. As you move east or west from this line the longitude increases, from zero at the Prime Meridian to 180° on the opposite side of the globe.
In Section 1.1 we learned how the Earth’s axis is tilted, causing uneven heating of the Earth’s surface. The tropical zones are the areas of the Earth’s surface between the Tropic of Cancer at 23.5° N of the Equator, and the Tropic of Capricorn at 23.5° S of the Equator.
This is the warmest region of the Earth, resulting in warmer oceans and seas.
The Arctic Circle is at a latitude of 66.5° N and the Antarctic Circle is at a latitude of 66.5° S. These polar zones are the coldest on the Earth. Water often freezes at the surface of seas and oceans in these areas.
The zones between the tropics and Arctic Circle or Antarctic Circle are described as temperate zones These areas experience more variation in temperatures during a year, with warmer temperatures in summer and colder temperatures in winter. Figure 1.21 summarises the different zones around the Earth.
KEY WORDS

longitude: the distance east or west from the Prime Meridian on a scale where 0° is at the Prime Meridian and 180° is on the opposite side of the Earth from the Prime Meridian
polar zones: the area north of the Arctic Circle or south of the Antarctic Circle
Tropic
temperate zones: the area between the Tropic of Cancer and the Arctic Circle, and the area between the Tropic of Capricorn and the Antarctic Circle
Figure
CAMBRIDGE IGCSE™ MARINE SCIENCE: COURSEBOOK 68
of Capricorn (23.5° S) Antarctic Circle (66.5° S) temperate zone polar zone temperate zone tropical zone tropical zone Tropic of Cancer (23.5° N) Equator (0° Latitude)
1.21: Tropical, temperate and polar zones continental shelf continental slope ocean trenchmid-ocean ridge continental shelf abyssal plain volcanic island continental slope abyssal plain Figure 1.22: Geomorphology of the oceans.
We are working with Cambridge Assessment International Education towards endorsement of this title. Original material © Cambridge University Press 2022. This material is not final and is subject to further changes prior to publication. SAMPLE
We are working with Cambridge Assessment International Education towards endorsement of this title.
The Earth and its oceans
In Section 1.2 we learned how the movement of tectonic plates has shaped the Earth, including the oceans, and how movements of plates create different features in and around the oceans. This link between geological processes and the physical features of the Earth’s surface (both on land and below the seas and oceans) is referred to as geomorphology.
Feature Description
Figure 1.22 shows a simple cross-section of the ocean which illustrates some of the key features that shape the ocean floor. You can see a summary of each of these features and how they form in Table 1.1.
How feature forms
continental shelf part of the continental plate extending from the coast/shore in shallow waters with little or no slope; generally no more than 100–200 m deep
continental slope the steeper slope from the continental shelf to near the abyssal plain, the edge of continental crust, where this meets oceanic crust
mid-ocean ridge underwater mountain ranges found either side of diverging tectonic plates
Continental crust that is below sea level: the sea covering it is often shallow due to sediments accumulating following erosion from the coast.
Oceanic crust is much thinner than the continental crust, causing steep slopes as the thickness of crust and the depth of ocean changes.
Sea floor spreading causes tectonic plates to move apart. As magma rises to fill the gap this magma cools and solidifies. New rock is formed, creating ridges in the form of vast mountain ranges under the ocean.
abyssal plain generally flat ocean floor usually at depths of 3000–6000 m
ocean trench very long deep depressions in the ocean floor; an example is the Mariana Trench, which is the deepest point in the oceans, with a maximum depth of about 11 000 m
volcanic islands volcanoes that continued to erupt to break above sea level and create islands
Sea floor spreading causes tectonic plates to move apart. The peaks of ridges created by new rock gradually erode and the gaps fill with sediment to create large flat areas.
Ocean trenches occur at convergent plate boundaries where oceanic crust is subducted beneath continental crust, creating a deep trench along the plate boundary.
Volcanic activity causes lava to erupt and solidify, gradually adding more height until they create islands above sea level.
KEY WORDS
erosion: the wearing away of rock along the coastline
geomorphology: the study of the physical features of the surface of the Earth and their relation to its geological structures and processes
continental slope: the steeper slope from the continental shelf to near the abyssal plain
abyssal plain: the generally flat ocean floor, usually at depths of 3000–6000 m
Original material © Cambridge University Press 2022. This material is not final and is subject to further changes prior to
Table 1.1: Summary of geomorphological features found in oceans.
1
69
publication. SAMPLE
Questions
8 Figure 1.23 shows a photograph of the Earth taken from space.
Greece. He noticed that the tides matched the movement of the Moon around the Earth, and also that the height of the tides depended on the phase of the Moon
KEY WORDS
tides: the rising and falling of the sea in regular cycles, caused by the gravitational attraction between the Earth, the Moon and the Sun phases of the Moon*: the changes in the observed shape of the Moon caused by changes in the proportion of the visible surface of the Moon
We learned in Section 1.1 how gravity keeps the Earth in orbit around the Sun, and also keeps the Moon in orbit around the Earth. The gravitational force of the Moon pulls water in the oceans towards the Moon. Water is a liquid and able to flow, unlike solid land. This creates a bulge in the oceans on the side of the Earth nearest to the Moon. The centrifugal force caused by the Earth spinning also creates a slightly smaller bulge in oceans on the opposite side of the Earth from the Moon (Figure 1.24).
Figure 1.23: The Earth seen from space.
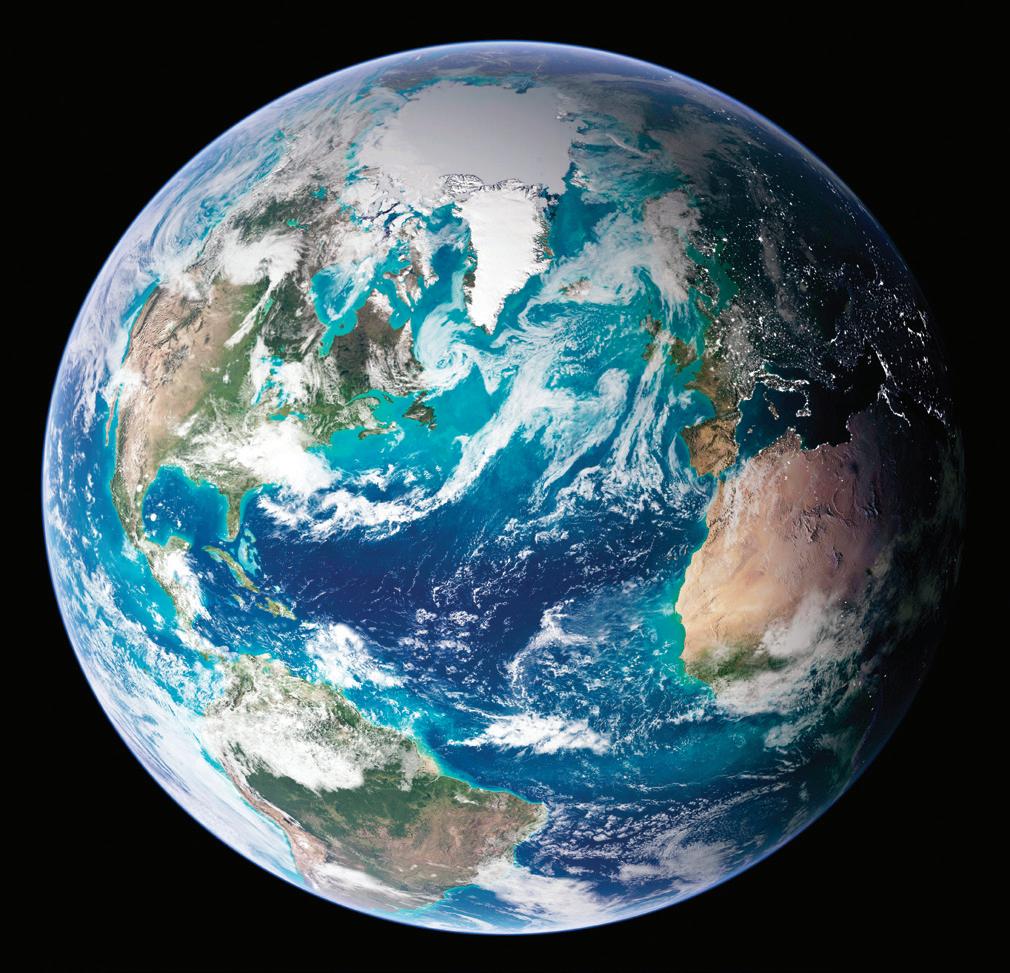
a The Arctic Ocean, at the top of the image, is mostly covered in ice. Explain why.
b Which ocean is shown in the middle of the photo?
9 Why is it difficult to describe where one ocean ends and another starts?
10 Which ocean is: a the deepest b the largest?
11 Explain the differences between a mid-ocean ridge and an ocean trench.
1.4 Tides and currents
Tides
Throughout history, humans have observed the regular rising and falling of sea level along the coastline. The first record of a suggested explanation was given by the Greek astronomer, Pytheas, who sailed to the British Isles in about 325 BC and observed that the tides experienced round Britain were greater than in his native
The bulge of water in the oceans caused by the gravitational pull of the Moon on the Earth moves around the oceans as the Earth rotates once on its axis every 24 hours. This causes the height of the sea level at any location on the Earth to rise and fall as it moves into and out of these bulges. It is this regular rising and falling of sea level each day that we call the tides. The time between each high tide and following low tide is actually a little over six hours due to the Moon slowly orbiting around the Earth. This adds about 25 minutes to each change in tide, or a total of 12 hours 50 minutes between each high tide.
But why does the height of the tides change during each month? The answer is that the Sun also has a gravitational pull on the water in the oceans. Although the Sun is much larger than the Moon, the gravitational pull of the Sun on the oceans is much less than the gravitational pull from the Moon. This is due to the distance between the Sun and the Earth being much greater than the distance between the Moon and the Earth. The Sun therefore causes a second set of bulges in the ocean. These are much smaller than the bulges caused by the Moon, but they do increase or decrease the height of the tides as the Moon orbits the Earth during each month.
We are working with Cambridge Assessment International Education towards endorsement of this title.
CAMBRIDGE IGCSE™ MARINE SCIENCE: COURSEBOOK 70
Original material © Cambridge University Press 2022. This material is not final and is subject to further changes prior to publication. SAMPLE
We are working with Cambridge Assessment International Education towards endorsement of this title.


low tide
high tide high tide
low tide
high tide
height high tide high tidehigh tide
0 0
low tide low tide 6 12 18 24
Hours

Figure 1.24: How the Moon causes tides each day
When the Moon, the Earth and the Sun are lined up with each other in a straight line, the gravitational forces of the Moon and the Sun combine to create higher high tides and lower low tides. These are called spring tides. The spring tides are greatest when the Moon is between the Sun and the Earth, with the gravitational pull of both the Sun and the Moon acting in the same direction. When the Sun and the Moon are on opposite sides of the Earth the tides are still spring tides, but not quite as high or low.
When the Moon, the Earth and the Sun are at right angles to each other, the gravitational pull of the Moon and the Sun on the Earth are in different directions. This causes lower high tides and higher low tides. These are called neap tides. These effects are shown in Figure 1.25.
Two important terms relating to measuring tides are tidal range and tidal amplitude. The tidal range is the difference between the height of the sea at high tide, and the height at the following low tide. Tidal amplitude is exactly half of the tidal range. Spring tides are when the tidal range and tidal amplitude are greatest. These occur when the lunar tide (the bulge of water caused by gravitational attraction towards the Moon) adds to the
Solar tide (the bulge of water caused by gravitational attraction towards the Sun) to create the highest and lowest tides. Neap tides are when the tidal range and tidal amplitude are least. These occur when the lunar tide is separated from the Solar tide to create the lowest high tides and highest low tides.
KEY WORDS
spring tides: tides experienced during a new Moon and full Moon with higher high tides and lower low tides than usual
neap tides: tides experienced during the first and last quarters of the Moon with lower high tides and higher low tides than usual

tidal range*: difference in height between high tide and the following low tide


tidal amplitude: half the difference in height between high tide and the following low tide
71
Tidal
Original material © Cambridge University Press 2022. This material is not final and is subject to further changes prior to publication. SAMPLE
Third Quarter
spring tide
Sun solar tidesolar tide solar tide
lunar tide
high tide Moon
solar tide
lunar tide lunar tide
spring tide low tide
Measuring tidal amplitude
Look up some tide information for a location near to you. You can find this information by searching for ‘tide times’ on the internet. Identify the height of the next high tide and the following low tide. Calculate the difference between these two heights – this is the tidal range. To find the tidal amplitude, divide the tidal range by two.
Example:
The next high tide on the Maldives is 0.89 m
The following low tide is 0.15 m
The tidal range is 0.89 m − 0.15 m = 0.74 m
The tidal amplitude is 0.74 m ÷ 2 = 0.37 m
Calculate the tidal amplitude at the same location for the next two tides and compare this to the first value you calculated. Discuss why the tidal amplitude has increased or decreased.
Original material © Cambridge University Press 2022.
Currents
low tide
high tide neap tide lunar tide
An oceanic or sea current is a continuous flow of seawater in a particular direction. Currents at the surface are generally caused by the direction of prevailing winds For example, at the Equator the prevailing winds blow from east to west. This movement of the air above the sea surface pushes water at the surface in the same direction as the wind, from east to west. Since the winds are often blowing in the same direction for much of the time this creates currents at the surface of the ocean, with the water moving in the same direction.
As these surface currents flow towards land, the direction of the current changes to move along the coast away from the Equator. This, combined with the spinning of the Earth on its axis, creates currents that flow in opposite directions in the Northern Hemisphere compared to
KEY WORDS
(sea or ocean) current: continuous flow of seawater in a particular direction
prevailing winds: the direction from which winds usually blow at a particular location
material is
final and is subject to further changes
New Moon spring tide
Full Moon neap tide First Quarter neap tide
Figure 1.25: How the alignment of the Sun, Earth and Moon affect tides
ACTIVITY 1.3
We are working with Cambridge Assessment International Education towards endorsement of this title.
CAMBRIDGE IGCSE™ MARINE SCIENCE: COURSEBOOK 72
This
not
prior to publication. SAMPLE
the Southern Hemisphere. In the Northern Hemisphere currents move in a clockwise direction. In the Southern Hemisphere currents move in an anticlockwise direction. Figure 1.26 shows the main surface currents in the oceans.
Surface currents circulating in the oceans form gyres in most of the oceans. These gyres, shown in Figure 1.27, circulate clockwise in the Northern Hemisphere (in
the North Atlantic and North Pacific). Gyres circulate anticlockwise in the Southern Hemisphere (in the South Atlantic, South Pacific and Indian Ocean).
Original material © Cambridge University Press 2022.
is


 The Earth and its oceans
Indian Ocean Atlantic Ocean the Equator
Pacific Ocean
Pacific Ocean
Figure 1.26: Major surface currents around the world.
KEY WORD gyre: a large system of rotating ocean currents
North Pacific Gyre
Indian Ocean Gyre
South Pacific Gyre South Atlantic Gyre North Atlantic Gyre
Figure 1.27: The five ocean gyres.
We are working with Cambridge Assessment International Education towards endorsement of this title.
The Earth and its oceans
Indian Ocean Atlantic Ocean the Equator
Pacific Ocean
Pacific Ocean
Figure 1.26: Major surface currents around the world.
KEY WORD gyre: a large system of rotating ocean currents
North Pacific Gyre
Indian Ocean Gyre
South Pacific Gyre South Atlantic Gyre North Atlantic Gyre
Figure 1.27: The five ocean gyres.
We are working with Cambridge Assessment International Education towards endorsement of this title.
1
73
This material
not final and is subject to further changes prior to publication. SAMPLE
CAMBRIDGE
Tides can also cause currents, which reverse direction with each change in tide. You most often see tidal currents in areas where the coastline is funnel-shaped. As the sea level rises with a rising tide, the water moves up a narrowing funnel-shaped channel, creating strong currents. These currents also create much higher tides further up the enclosed channel. When the sea level starts to decrease again after high tide, the current reverses direction and flows out of the channel. This creates much lower tides at the narrowest part of the bay. As a result of these tidal currents the tidal range in funnel-shaped channels is much greater than in other parts of the world. The tidal range in the Bay of Fundy in Canada can be over 16 m.
Some currents cause seawater to move vertically (upwards and downwards) in the ocean. These currents are caused by changes in density of the seawater (see Section 2.4). Cooler or saltier water is denser than warmer or less salty water. When seawater cools it sinks deeper into the ocean, creating downward currents. These currents move down into the deep ocean and
then flow along the ocean floor at much slower speeds than surface currents. Eventually, the currents are pushed up to the surface again, often many thousands of miles from where the water went down into the deep ocean. Winds can also cause water to move to the surface from the deep ocean. This is called an upwelling (see Section 2.6).
KEY WORD
upwelling: the movement of cold, nutrient-rich water from deep in the ocean to the surface
Many surface currents are linked to vertical currents and the slow currents moving in the deep ocean. This linkage creates a ‘global conveyor belt’ of moving water around the entire globe (Figure 1.28). The water in the global conveyor belt takes around 1000 years to complete one circulation. This global circulation, combined with the movement of water in ocean gyres, helps to circulate water around the World Ocean.
warm surface currents cold deep-water currents
Indian Ocean
Pacific Ocean
Atlantic Ocean
Figure 1.28: Global conveyor belt of surface and deep ocean currents
We are working with Cambridge Assessment International Education towards endorsement of this title.
IGCSE™ MARINE SCIENCE: COURSEBOOK 74
Original material © Cambridge University Press 2022. This material is not final and is subject to further changes prior to publication. SAMPLE
Rip currents
A rip current (Figure 1.29) is a dangerous narrow current that can form on beaches; many people get into difficulties in these currents each year. Usually, when waves push water against a beach the water moves back to the ocean evenly across the width of the beach. This does not normally cause rip currents. Sometimes, sand or sediment in the sea near to the beach creates a sand bar. Waves moving water towards the beach flow over the bar easily. As water from the wave begins to flow back out to sea the water level over the sand bar falls, and water tries to get through where the sand bar is already lowest. Over time, the lower sections in the sand bar form gaps or channels. These channels get deeper as more water flows back to the ocean through them. This creates powerful rip currents flowing out to sea from the beach, and these rip currents can extend over 500 m into the ocean. Swimmers caught in rip currents are pulled far out to sea and then struggle to swim back to shore. Any swimmer who finds themselves in a rip current should remember that rip currents are very narrow. If swimmers try to swim at right angles to the current, they may escape the current and so be able then to swim back to the shore.
KEY WORD
rip current: a narrow powerful current moving from a beach out to the ocean
ACTIVITY 1.4
Danger – rip currents
Every year many swimmers get into trouble after being caught in rip currents. Working in a pair or small group, make a poster to warn swimmers at a beach. Your poster should clearly explain what rip currents are and describe how swimmers can escape from them.
Peer assessment
Rate the poster of another learner according to the following scheme for each of the points listed:
if they did it really well
if they made a good attempt at it and partly succeeded
if they did not try to do it or did not succeed.
The poster should:
• identify what a rip current is
• describe the danger to swimmers caused by rip currents
• explain how to swim out of a rip current
• have a clear layout that is quick and easy to understand.
Original material © Cambridge University Press 2022. This material is not final and is subject to further changes prior to publication.
The Earth and its oceans
beach breaking waves rip current sand bar
Formation of rip currents
We are working with Cambridge Assessment International Education towards endorsement of this title.
1
75
Figure 1.29:
SAMPLE
CAMBRIDGE
Measuring currents
Measurements of currents involve two separate pieces of information: speed and direction. We can measure the speed of currents in several ways. The simplest involves floating an object on the surface of a current and recording the time it takes to travel a known distance. This can be done with any floating object alongside a boat, using a compass to measure the direction the object moves in. Modern equipment often uses Global Positioning System (GPS) sensors to record speeds using locations and times. These devices may contain a compass to record the direction moved by the sensor in the current, although the direction can also be determined from the GPS data.
KEY WORD
Global Positioning System (GPS): a network of artificial satellites forming a navigation and location system
Questions
12 Describe the differences between spring tides and neap tides.
13 State what is meant by an ocean current.
14 State four factors that can cause ocean currents.
15 Compare the similarities and differences between tides, ocean currents and ocean gyres.
SUMMARY
The Earth is a planet and the Moon is a natural satellite of the Earth. Gravity keeps the Earth in orbit around the Sun, and the Moon in orbit around the Earth.
The Earth is a rocky planet, with a thin solid outer crust, and semi-molten mantle beneath. The planet has a core made mostly of iron, which creates a magnetic field around the Earth.
The Earth’s crust is broken into large tectonic plates that float and slowly move around the Earth. This movement is caused by convection currents in the mantle.
The movement of tectonic plates caused giant supercontinents to break up and separate over hundreds of millions of years.
Tectonic plates move against each other in different directions, causing convergent, divergent and transform plate boundaries. These can cause earthquakes and create features that shape the Earth and oceans, including volcanoes, mid-ocean ridges and ocean trenches.
Tsunamis are caused by a sudden displacement of very large volumes of seawater. Tsunamis can have a devastating effect on marine life and human coastal communities.
The Earth has five distinct oceans which are interconnected to form a World Ocean. Oceans and seas contain most of the world’s water and cover more than two thirds of the planet.
The gravitational effects of the Moon and the Sun on water in oceans and seas create tides. The tidal amplitude changes as the Moon orbits the Earth, causing spring tides and neap tides.
Oceanic currents are the continuous flow of seawater in a particular direction. These currents are caused by prevailing winds, the spinning of the Earth, tides and changes in the density of seawater.
Gyres are large systems of circular oceanic currents. There are five main gyres found in some of the largest oceans. Ocean currents and gyres circulate water around the World Ocean.
Rip currents can form along beaches and coastlines. These currents are dangerous to swimmers.
Original material © Cambridge University Press 2022. This material is not final and is subject to further changes prior to publication.
We are working with Cambridge Assessment International Education towards endorsement of this title.
IGCSE™ MARINE SCIENCE: COURSEBOOK 76
SAMPLE
CASE STUDY PROJECT
Evidence for tectonic plate theory
Our understanding of plate tectonics has developed quite recently. It is only since the 1960s that we have begun to understand how plates move around the Earth. But what is the evidence to support the theory?
In 1912, the German scientist Alfred Wegener developed a theory called continental drift.
He noticed that fossilised remains of several species were found on different continents. He also saw that the coastlines of some continents appeared to fit together, and that the regions where fossils were found on each continent also matched, as shown in Figure 1.30. But the theory of continental drift was not accepted by most scientists for nearly 50 years as there was no explanation of how the plates were able to move.
fossilised remains of Lystrosaurus, a reptile that lived on land
fossilised remains of Cynognathus, a reptile that lived on land
Original material ©
Press 2022.
fossilised remains of Mesosaurus, a reptile that lived in fresh water
fossilised remains of Glossopteris, a fern that lived on land across many of the continents
is not final and is subject to further changes
Earth and its
Africa India South America
Australia Antarctica
Figure 1.30: Distribution of fossilised remains of species across continents.
We are working with Cambridge Assessment International Education towards endorsement of this title.
1 The
oceans 77
Cambridge University
This material
prior to publication. SAMPLE
CONTINUED
In a pair or small group, produce a five-minute presentation to deliver to other learners in the class showing evidence to support tectonic plate theory.
Try to include a range of evidence, which could include:
• what you have learned about convection currents
• types of plate boundary and the features they create
Peer assessment
Give feedback to another group. Look at their evidence:
• How much evidence is included?
• How clearly is the evidence presented?
• where fossilised remains have been found, and how this helps us to know that there used to be supercontinents in the past.
You could even research to see if the Earth’s magnetic field has changed over time, and how this provides further evidence to support tectonic plate theory.
You should include diagrams to support your explanations. Try to include as many relevant key words from the chapter as you can.
• Have they made good use of diagrams and key words?
Provide written or verbal feedback in the form of ‘two stars and a wish’. Describe two things about the work that you liked, and give one suggestion for improvement: ‘It could be even better if …’
REFLECTION
What do you think helps you understand theories such as tectonic plate theory?
• Do demonstrations and models help?
• What about diagrams?
• Has it helped you to try and explain the theory to others by creating your presentation?
Discuss with a partner how using different methods of learning and reviewing information can help to improve your understanding.
Original material © Cambridge University Press 2022. This material is not final and is subject to further changes
We are working with Cambridge Assessment International Education towards endorsement of this title.
CAMBRIDGE IGCSE™ MARINE SCIENCE: COURSEBOOK 78
prior to publication. SAMPLE
We are working with Cambridge Assessment International Education towards endorsement of this title.
1 The Earth and its oceans
EXAM-STYLE QUESTIONS
1 The Moon orbits the Earth every 27.5 days.
a State the name of the force that keeps the Moon in orbit around [1]
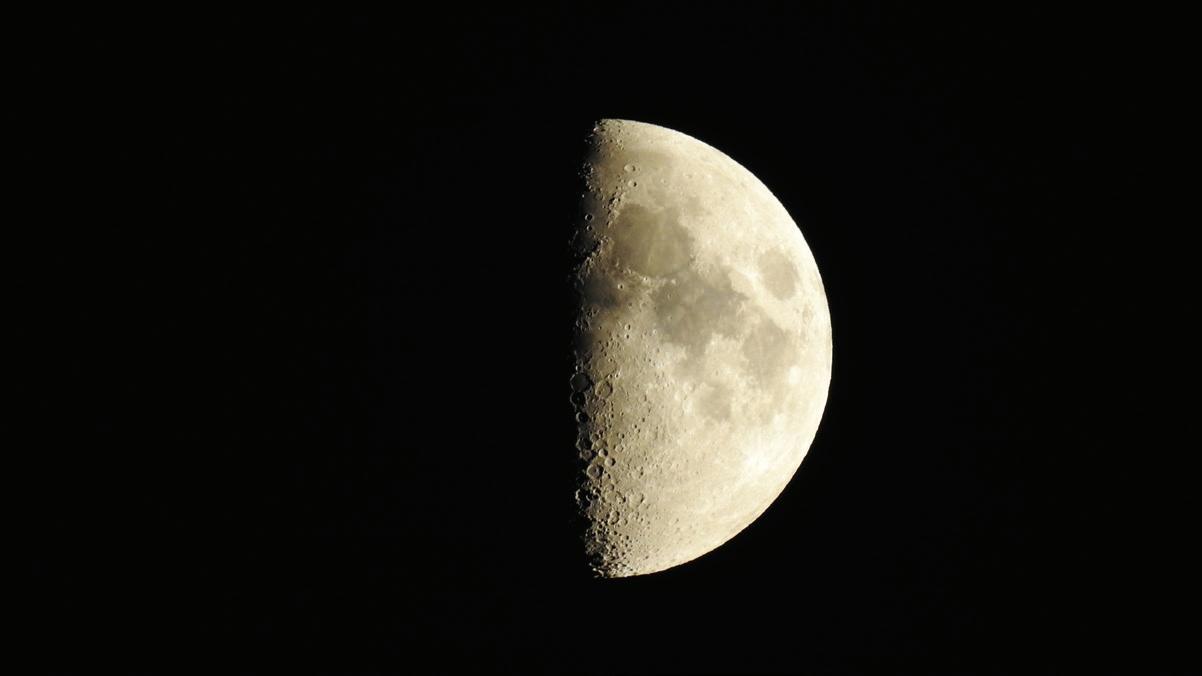
COMMAND WORD
state: express in clear terms
Figure 1
b Figure 1 shows the Moon at one point in its orbit around the Earth.
i Describe the alignment of the Moon with the Earth and the Sun causing the image shown in Figure 1. [1]
ii Explain how this alignment affects tidal amplitude. [2] [Total: 4]
2 An earthquake occurs at a convergent plate boundary and creates a tsunami.
a Describe how an earthquake forms at a convergent plate boundary. [3]
b Describe a tsunami. [3]
c Explain how a tsunami is formed. [2]
d Describe the impacts of tsunamis on human coastal communities. [2] [Total: 10]
3 Figure 2 shows some features on the ocean floor. C A B underwater volcano
Figure 2
a Identify features A, B and C. [3]
b Describe how the underwater volcano shown may one day form an island. [2] [Total: 5]
4 The Atlantic Ocean contains two ocean gyres. Describe how oceanic currents form to create ocean gyres. [Total: 5]
COMMAND WORDS
describe: state the points of a topic / give characteristics and main features
explain: set out purposes or reasons / make the relationships between things clear / say why and / or how and support with relevant evidence
COMMAND WORD
identify: name / select / recognise
Original material © Cambridge University Press 2022. This material is not final and is subject to further changes
79
prior to publication. SAMPLE
We are working with Cambridge Assessment International Education towards endorsement of this title.
SELF-EVALUATION CHECKLIST
After studying this chapter, think about how confident you are with the different topics. This will help you to see any gaps in your knowledge and help you to learn more effectively.
I can Needs more work Getting there Confident to move on See Section
describe the motion of the Earth relative to the Sun, and the Moon relative to the Earth 1.1 state the force that keeps the Earth and the Moon in their orbits 1.1
describe the layers and types of material that make up the structure of the Earth 1.1
state why the Earth has a magnetic field 1.1 explain what tectonic plates are, and outline tectonic plate theory and how supercontinents once existed 1.2 describe the three types of plate boundary 1.2 explain how plate boundaries give rise to earthquakes and volcanoes 1.2
describe how tsunamis form and outline their effects on marine ecosystems and human coastal communities 1.2 identify and describe the location of the Earth’s oceans 1.3 describe the extent of the oceans and explain how they are interconnected 1.3
describe seas in comparison to oceans 1.3 describe and identify the geomorphology of the oceans 1.3 outline how the gravitational effects of the Sun and the Moon cause tides 1.4
describe how to measure tidal amplitude 1.4 describe ocean currents, and how to measure their speed and direction 1.4 state reasons why ocean currents form 1.4 describe gyres and identify the locations of the five main oceanic gyres 1.4 state how water circulates in the World Ocean 1.4 describe how rip currents form and why they are dangerous to swimmers 1.4
Original material © Cambridge University Press 2022. This material is not final and is subject to further changes prior to publication.
CAMBRIDGE IGCSE™ MARINE SCIENCE: COURSEBOOK 80
SAMPLE
Chapter 2 Seawater
IN THIS CHAPTER YOU WILL:
• describe and explain changes of state and diffusion using particle theory
• describe the water cycle and relate the water cycle to changes in state
• describe and investigate the pH of solutions
IN THIS CHAPTER YOU WILL:
• describe the composition of seawater
In this chapter you will learn how to:
• investigate the units of measurement used in microscopy, e.g. millimetres, micrometres and nanometres
• describe and explain how solubility affects the salinity of the oceans and the concentration of dissolved gases in the oceans
• carry out conversions between the different units
• explain the salinity of different bodies of water in terms of the water cycle and Earth processes
• calculate magnifications of photographs or images
• describe and explain changes in density in seawater caused by temperature and salinity differences
• calculate magnifications from a scale bar
• describe how physical and chemical conditions in water change with increasing depth
• describe how upwelling occurs and discuss the formation and local effects of El Niño.
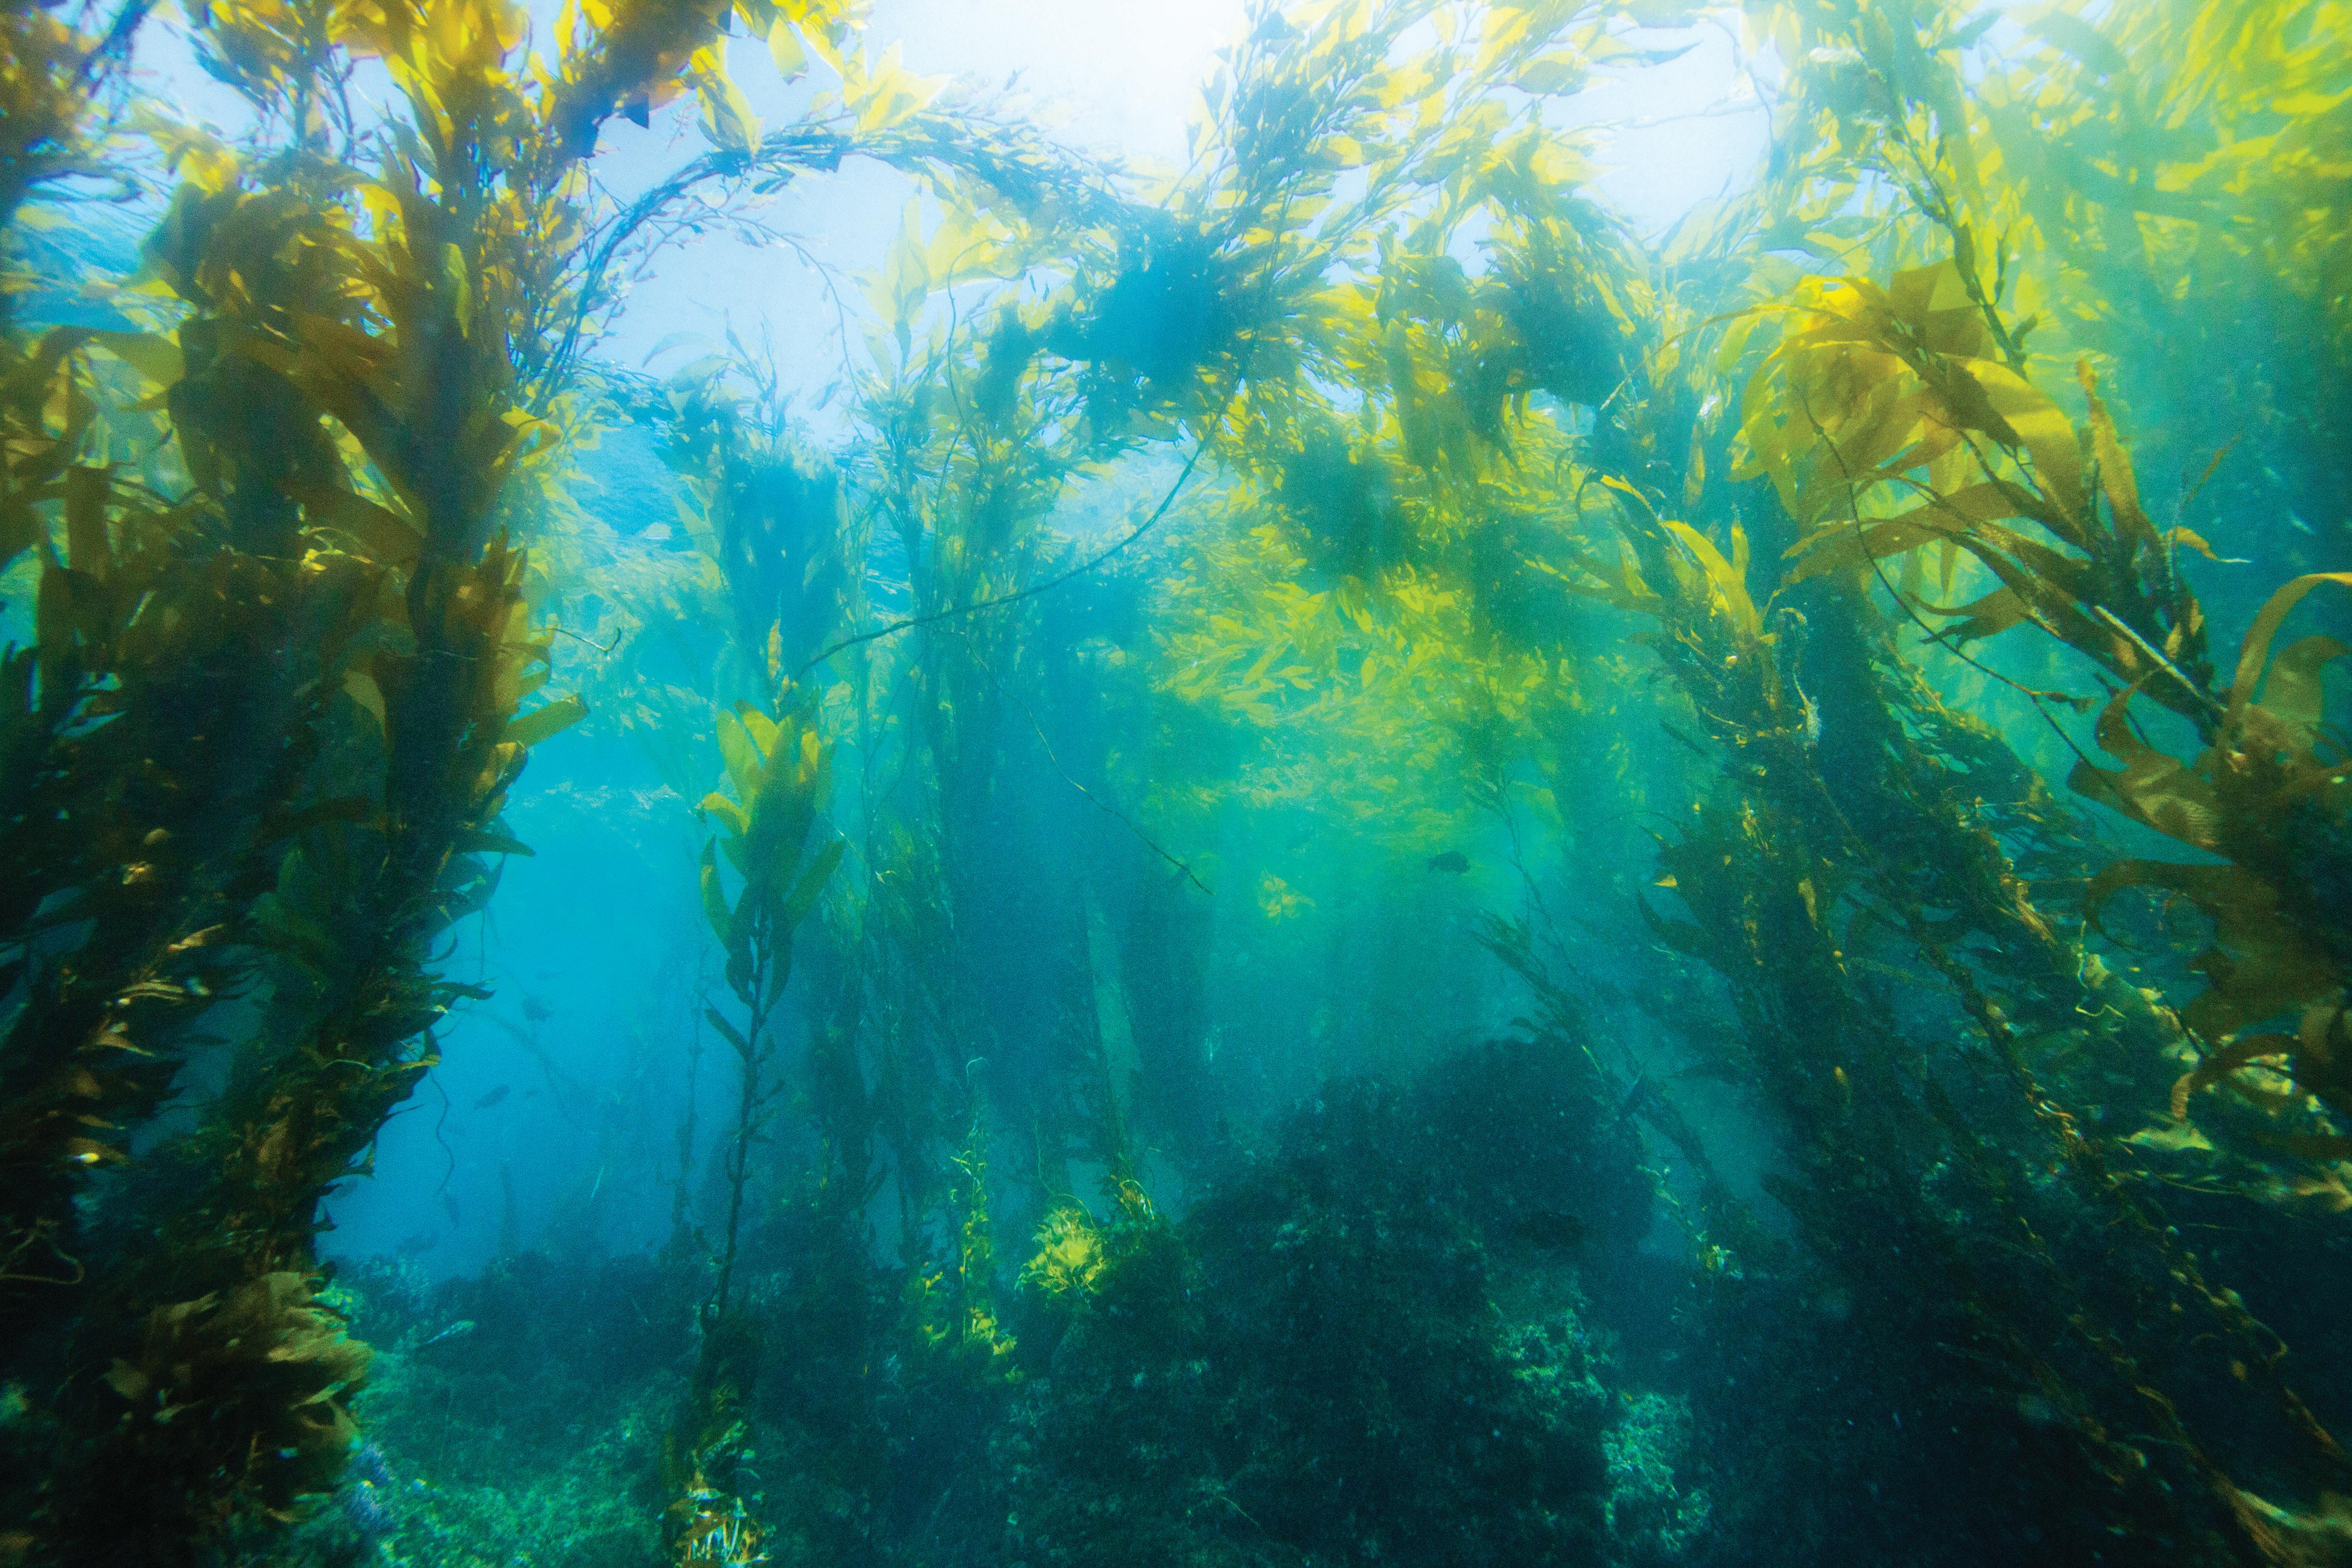
• calculate the real size of objects from a given magnification.
Original material © Cambridge University Press 2022. This material is not final and is subject to further changes prior to publication.
We are working with Cambridge Assessment International Education towards endorsement of this title.
SAMPLE
GETTING STARTED
Particle theory helps us to explain how matter behaves.
• Here are five statements about the three physical states of matter: solids, liquids and gases. Which statements relate to each of these states of matter? Some statements can apply to more than one state.
• The substance has a fixed shape in any container.
• The substance takes the shape of the container it is in.
• The substance has a fixed volume.
• The substance can be compressed into a smaller space.
• The substance can flow.
• If all substances are made of particles, can you explain any of the five statements using the idea of particles?
Be ready to share your ideas.
MARINE SCIENCE IN CONTEXT
A pioneering diver
Dr Sylvia Earle (born 1935) is a scientist who studies the oceans and an explorer from the United States. Her work includes the development of modern self-contained underwater breathing apparatus (SCUBA) gear and the development of deep-sea submersibles. At the age of 16, before the creation of SCUBA equipment, she attempted her first dive using a diving helmet. In 1979 she set the world record for the deepest untethered dive using SCUBA equipment, reaching a depth of 381 m. She achieved this by using an armoured diving suit while attached to the front of a small submersible vessel to reach the sea floor. When on the sea floor, she detached herself from the vessel and explored the sea floor for more than two hours. No one has repeated or exceeded this achievement in the past 42 years.
SCUBA diving equipment allows divers to stay below the surface of the sea for much longer periods of time (Figure 2.1). It consists of a tank containing compressed air and a regulator that reduces the
Original material © Cambridge University Press 2022. This material is not final and is subject to further changes prior to publication.
pressure of the air from the tanks before the diver breathes this in. Reducing the pressure in this way
Figure 2.1: Dr. Sylvia Earle next to a small submarine.
We are working with Cambridge Assessment International Education towards endorsement of this title.
CAMBRIDGE IGCSE™ MARINE SCIENCE: COURSEBOOK 82
SAMPLE
CONTINUED
A few years after her deep dive, Sylvia Earle helped to design a submersible called Deep Rover, a submarine vehicle capable of reaching depths of 914 m.
These developments enabled other scientists to build on her work and create diving equipment capable of reaching even greater depths.
2.1 The water cycle
Particle theory
All materials are made up of tiny particles called atoms. We can think of atoms as tiny balls or spheres. These atoms can form larger particles called molecules and other larger structures (Figure 2.2).
Discussion questions
1 What challenges do you think Dr Sylvia Earle had to overcome to set the world record for the deepest untethered dive?
2 Suggest why it is important that scientists record exactly how they carry out their investigations when they record and publish their findings.
KEY WORDS
atoms of helium molecules of oxygen larger structure of sodium chloride
Figure 2.2: Arrangement of particles as separate atoms, molecules and larger structures
Particle theory is the idea that we can describe all materials as a collection of very many tiny particles that are constantly moving. The more energy the particles have, the more they move relative to each other. An increase in the energy of a substance causes all the particles to move faster, so the particles have more kinetic energy. As a material is heated, the particles gain more kinetic energy and move faster, and the temperature of the material increases. The temperature of a material is measured in degrees Celsius (°C) – this is a measure of the kinetic energy of the particles in the material.
Materials exist in three different physical states: solid, liquid and gas. Figure 2.3 shows how the particles are moving in each state. Table 2.1 compares the properties of each state of matter.
atom*: the smallest particle of a substance that can take part in a chemical reaction
molecule: a group of atoms held together by sharing electrons between atoms in the molecule particle theory: a theory which describes the bulk properties of the different states of matter in terms of the movement of particles (atoms or molecules) – the theory explains what happens during changes in physical state
kinetic energy: the energy possessed by objects or particles due to movement
physical state*: solid, liquid and gas are the three states of matter in which any substance can exist, depending on the conditions of temperature and pressure
Original material © Cambridge University Press 2022. This material is not final and is subject to further changes prior to
solid liquid gas
Figure 2.3: The arrangement and motion of particles in solids, liquids and gases
We are working with Cambridge Assessment International Education towards endorsement of this title.
2 Seawater 83
publication. SAMPLE
Original
Physical state Solid Liquid Gas arrangement of particles
particles closely packed together; not enough space for particles to move past each other
motion of particles particles vibrating against each other in fixed positions
shape of material fixed shape; particles are in a fixed position so the material keeps its shape
particles closely packed together; just enough space for particles to move past each other
particles vibrating against each other and flowing past each other
takes the shape of the container – liquids can be poured and will fill the bottom of a container, having the same shape as the container
particles far apart from each other; lots of space for particles to move past each other
particles moving fast, colliding with each other
takes the shape of the container – gases spread out to fill all the space available
volume of material fixed volume (though solids can expand predictably when heated)
cannot be compressed as particles are already very close together
Table 2.1: Properties of solids, liquids and gases.
fixed volume (though liquids can expand predictably when heated)
cannot be compressed easily as particles are too close together
fill the volume of the space available – gases spread out in larger volumes
can be compressed into smaller volumes as there are large spaces between the particles
When a solid is heated, the particles gain more kinetic energy and move faster, as shown in Figure 2.4. These faster vibrations cause solids to expand slightly, so the solid takes up more space, and this reduces the density of the solid. Density is explained in more detail in Section 2.4.
2022.
Figure 2.4: Atoms vibrating in a solid at two temperatures
We are working with Cambridge Assessment International Education towards endorsement of this title.
CAMBRIDGE IGCSE™ MARINE SCIENCE: COURSEBOOK 84
material © Cambridge University Press
This material is not final and is subject to further changes prior to publication. SAMPLE
When the particles in a solid have enough energy, their vibrations create enough space between the particles so that the particles can move past each other. This is when a solid melts to form a liquid. The temperature at which this happens is called the melting point While a substance is melting the temperature stops increasing. The energy transferred to separate the particles enough to move past each other is called the latent heat energy – the particles gain latent heat during melting. The levelling off of temperature that occurs as a solid is melting gives many materials a well-defined melting point (for example, pure water melts at 0 °C). When all the solid has melted, the particles then begin to move faster again as they gain more kinetic energy. The temperature of the liquid then begins to rise (Figure 2.5).
Temperature (°C)
meltingsolid liquid
Time (minutes)
Figure 2.5: Change in the arrangement of particles in a solid melting into a liquid over time
KEY WORDS
melting point: the temperature at which a solid turns into a liquid; it has the same value as the freezing point
latent heat energy*: energy absorbed or released by a substance during a change in its physical state
When a liquid is heated, the temperature continues to rise as the particles gain more kinetic energy. The temperature represents the average kinetic energy of all the particles in a substance, and some of the liquid particles have more energy than others. Particles at the surface of the liquid with more kinetic energy may have enough energy to completely escape from the liquid – this is called evaporation. Evaporation explains why water escapes from the surface of liquids that are not boiling, such as from seas or oceans or rock pools (Figure 2.6). Evaporation also explains why wet surfaces dry out. The warmer a liquid is the faster the rate of evaporation.
material ©
University Press 2022.
is not final and is subject to further changes prior
Figure 2.6: During hot weather water evaporates rapidly from a rock pool
We are working with Cambridge Assessment International Education towards endorsement of this title.
2 Seawater 85
Original
Cambridge
This material
to publication. SAMPLE
We are working with Cambridge Assessment International Education towards endorsement of this title.
CAMBRIDGE
When a liquid reaches its boiling point, all of the particles have enough energy to evaporate. The temperature stops increasing again as the particles of liquid gain latent heat energy to evaporate from the surface, until all the liquid has evaporated (Figure 2.7). Pure water boils at 100 °C. Water in the ocean rarely reaches such high temperatures, but water is constantly evaporating from the surface of seas and oceans to create water vapour in the air. The evaporation of water is an important part of the water cycle that transfers water into the atmosphere.
When substances cool down, the opposite changes happen. As the substance gets cooler the particles lose kinetic energy and start to move closer together. When a gas cools to the temperature of its boiling point, the particles release latent heat energy and move closer together to form a liquid. The loss of latent heat energy causes the temperature to remain constant until all the gas has turned to a liquid. This change in state is called condensation.
When a liquid cools, the temperature will drop as the particles lose kinetic energy. When the liquid reaches the melting point, the particles release latent heat energy and freeze (or solidify). The melting point of a substance is the same temperature that a liquid becomes a solid When all the liquid has become solid the temperature can begin to fall again. These changes in state are summarised in Figure 2.7.
KEY WORDS
boiling point*: the temperature at which a liquid boils
water vapour*: gaseous water in the air that has evaporated
water cycle: the cycle of processes by which water circulates between the Earth’s oceans, atmosphere, and land; it involves precipitation, drainage and run-off into streams and rivers, and return to the atmosphere by evaporation
atmosphere: layer of gases surrounding the surface of the Earth
freeze: the change of a liquid into a solid; during this process heat is given out to the surroundings
Temperature (°C)
Temperature (°C)
melting freezing boiling condensing
solid solid
gas gas Time Time liquid liquid
Figure 2.7: Heating and cooling curves showing changes in state and the arrangement of particles at each state
IGCSE™ MARINE SCIENCE: COURSEBOOK 86
Original material © Cambridge University Press 2022. This material is not final and is subject to further changes prior to publication. SAMPLE
ACTIVITY 2.1
Modelling changes in state
In a pair or small group, plan how a group of people can help to explain the movement of the particles in solids, liquids and gases. Think about:
• How would the people be arranged to represent the particles in a solid?
• How could you represent the movement of the particles?
• What would change as the solid melts to become a liquid?
• What would change as the liquid boils to become a gas?
Your plan should answer the following questions:
1 Why does it take time for a solid to melt, and for a liquid to boil?
2 Different substances also have different melting and boiling points. Suggest why this is.
3 Why is it that you can feel a liquid cooling your skin when it evaporates from your hand?
After you have answered these questions, share your ideas with the rest of the class.
Peer assessment
Give feedback to another group. Look at their plan and think about:
• How does the model help to explain particle theory?
• How clear is the explanation?
• Have they made good use of the model to support their explanation?
Provide written feedback in the form of ‘two stars and a wish’: describe two things about the work that you liked, and give one suggestion for improvement: ‘It could be even better if…’. Alternatively, you could say what you think about their model, based on the questions above. This type of feedback is called verbal feedback.
After all the groups have shared their ideas, agree on one or more plans to use as a class.
Diffusion
We can use particle theory to help explain how different substances mix with each other. Particles in liquids and gases are able to move, so when other substances are added to a liquid or a gas, their particles can mix together.
When a soluble solid is placed into a liquid (such as water), the liquid particles allow the solid particles to mix (dissolve) with them. This process is called dissolving (Figure 2.8). The solid particles are in a high concentration where the liquid meets the solid. These solid particles slowly move further from the solid, mixing more with the liquid they are dissolving in. This is called diffusion
KEY WORDS
soluble: the description of a substance that dissolves in a particular solvent
diffusion: the random movement of particles (or molecules) from an area of higher concentration to an area of lower concentration (down a concentration gradient); it is a passive process, not requiring the input of energy
Original material © Cambridge University Press 2022. This material is not final and is subject to further changes prior to publication.
Figure 2.8: Particles in a solid dissolving and diffusing into water.
We are working with Cambridge Assessment International Education towards endorsement of this title.
2 Seawater 87
SAMPLE
At the surface of a liquid, gases can also dissolve into the liquid. Oxygen and carbon dioxide both dissolve in water. These gases will dissolve into the water from the surface, and then diffuse further down into the water (Figure 2.9).
high concentration of particles
concentration gradient
low concentration of particles
Figure 2.10: This diagram shows how we can use the analogy of a slope to think about a concentration gradient. We can imagine particles moving down the slope, from a high concentration to a low concentration
Figure 2.9: Oxygen molecules dissolving and starting to diffuse into water
When diffusion happens, particles move from a region where they are in a high concentration to a region where the particles are in a lower concentration. This movement is due to the random movement of the particles. This can also be described as diffusing down a concentration gradient (Figure 2.10).
Questions
1 a Sketch the arrangement of particles in a solid, a liquid and a gas.
b Describe the motion of particles in a solid, a liquid and a gas.
2 a State the name of the unit used to measure temperature.
b What does the temperature of a substance measure?
where ice melts has an impact on sea levels. You will compare ice melting on land to the melting of floating ice. You will use models to represent land and the sea.
You will need:
• two identical, clear containers (at least 10 cm width or diameter)
• modelling clay or play dough, or small rocks (enough to create a 3–5 cm high surface that half fills each container)
• a tray of ice cubes
• cold water
• a ruler
Introduction
Ice can either form on land or in the sea (Figure 2.11). In this investigation you will try to find out if the place
• a marker (to write on the side of the containers).
Original material © Cambridge University Press 2022. This material is not final and is subject to further changes prior to publication.
PRACTICAL TASK 2.1
Figure 2.11: Floating iceberg in the sea and land-based ice on mountains in Greenland
We are working with Cambridge Assessment International Education towards endorsement of this title.
CAMBRIDGE IGCSE™ MARINE SCIENCE: COURSEBOOK 88
SAMPLE
