Physics for the IB Diploma


COURSEBOOK
 Together with IB teachers
Seventhedition Digital Access SAMPLE Original material © Cambridge University Press & Assessment 2023. This material is not final and is subject to further changes prior to publication.
How to use this series


This suite of resources supports students and teachers of the IB Physics Diploma course. All of the books in the series work together to help students develop the necessary knowledge and scientific skills required for this subject.


Physics for the IB Diploma
The coursebook with digital access provides full coverage of the latest IB Physics Diploma course.


It clearly explains facts, concepts and practical techniques, and uses real world examples of scientific principles. A wealth of formative questions within each chapter help students develop their understanding, and own their learning. A dedicated chapter in the digital coursebook helps teachers and students unpack the new assessment, while exam-style questions provide essential practice and self-assessment. Answers are provided on Cambridge GO, supporting self-study and home-schooling.
The workbook with digital access builds upon the coursebook with digital access with further exercises and exam-style questions, carefully constructed to help students develop the skills that they need as they progress through their IB Physics Diploma course. The exercises also help students develop understanding of the meaning of various command words used in questions, and provide practice in responding appropriately to these.
Physics for the IB Diploma
Physics for the IB Diploma
The Teacher’s resource supports and enhances the coursebook with digital access and the workbook with digital access. This resource includes teaching plans, overviews of required background knowledge, learning objectives and success criteria, common misconceptions, and a wealth of ideas to support lesson planning and delivery, assessment and differentiation. It also includes editable worksheets for vocabulary support and exam practice (with answers) and exemplar PowerPoint presentations, to help plan and deliver the best teaching.

PHYSICS FOR THE IB DIPLOMA: COURSEBOOK vi
COURSEBOOK Together Seventhedition Digital Access
Together with IB teachers Secondedition Digital Access Second edition
WORKBOOK
Together with IB teachers Digital Teacher’s Resource
SAMPLE
Original material © Cambridge University Press & Assessment 2023. This material is not final and is subject to further changes prior to publication.
How to use this book
Throughout this book, you will find lots of different features that will help your learning. These are explained below.
UNIT INTRODUCTION
A unit is made up of a number of chapters. The key concepts for each unit are covered throughout the chapters.
LEARNING OBJECTIVES
Each chapter in the book begins with a list of learning objectives. These set the scene for each chapter, help with navigation through the coursebook and indicate the important concepts in each topic.
• A bulleted list at the beginning of each section clearly shows the learning objectives for the section.
GUIDING QUESTIONS
This feature contains questions and activities on subject knowledge you will need before starting this chapter.
Links
These are a mix of questions and explanation that refer to other chapters or sections of the book.
The content in this book is divided into Standard and Higher Level material. A vertical line runs down the margin of all Higher Level material, allowing you to easily identify Higher Level from Standard material.
Key terms are highlighted in orange bold font at their first appearance in the book so you can immediately recognise them. At the end of the book, there is a glossary that defines all the key terms.
KEY POINTS
This feature contains important key learning points (facts) and/or equations to reinforce your understanding and engagement.
EXAM TIPS
These short hints contain useful information that will help you tackle the tasks in the exam.
SCIENCE IN CONTEXT
This feature presents real-world examples and applications of the content in a chapter, encouraging you to look further into topics. You will note that some of these features end with questions intended to stimulate further thinking, prompting you to consider some of the benefits and problems of these applications.
NATURE OF SCIENCE
Nature of Science is an overarching theme of the IB Physics Diploma course. The theme examines the processes and concepts that are central to scientific endeavour, and how science serves and connects with the wider community. Throughout the book, there are ‘Nature of Science’ features that discuss particular concepts or discoveries from the point of view of one or more aspects of Nature of Science.
How to use this book
vii SAMPLE Original material © Cambridge University Press & Assessment 2023. This material is not final and is subject to further changes prior to publication.
THEORY OF KNOWLEDGE
This section stimulates thought about critical thinking and how we can say we know what we claim to know. You will note that some of these features end with questions intended to get you thinking and discussing these important Theory of Knowledge issues.
INTERNATIONAL MINDEDNESS
Throughout this Physics for the IB Diploma course, the international mindedness feature highlights international concerns. Science is a truly international endeavour, being practised across all continents, frequently in international or even global partnerships. Many problems that science aims to solve are international and will require globally implemented solutions.
CHECK YOURSELF
These appear throughout the text so you can check your progress and become familiar with the important points of a section. Answers can be found at the back of the book.
EXAM-STYLE QUESTIONS
TEST YOUR UNDERSTANDING
These questions appear within each chapter and help you develop your understanding. The questions can be used as the basis for class discussions or homework assignments. If you can answer these questions, it means you have understood the important points of a section.
WORKED EXAMPLE
Many worked examples appear throughout the text to help you understand how to tackle different types of questions.
REFLECTION
These questions appear at the end of each chapter. The purpose is for you as a learner to reflect on the development of your skills proficiency and your progress against the objectives. The reflection questions are intended to encourage your critical thinking and inquirybased learning.
Exam-style questions at the end of each chapter provide essential practice and self-assessment. These are signposted in the print coursebook and can be found in the digital version of the coursebook.
SELF-EVALUATION CHECKLIST
These appear at the end of each chapter/section as a series of statements. You might find it helpful to rate how confident you are for each of these statements when you are revising. You should revisit any topics that you rated ‘Needs more work’ or ‘Almost there’.
Free online material
Additional material to support the Physics for the IB Diploma course is available online.
This includes Assessment guidance—a dedicated chapter in the digital coursebook helps teachers and
students unpack the new assessment and model exam specimen papers. Additionally, answers to the Exam-style question and Test your understanding are also available. Visit Cambridge GO and register to access these resources.
PHYSICS FOR THE IB DIPLOMA: COURSEBOOK viii
SAMPLE
Original material © Cambridge University Press & Assessment 2023. This material is not final and is subject to further changes prior to publication.
Space, time and motion
INTRODUCTION
Unit A SAMPLE
This unit deals with Classical Mechanics. The basic concepts that we will use include position in space, displacement (change in position), mass, velocity, acceleration, force, momentum, energy and of course time. These concepts, the relations between them and the laws they give rise to are discussed in the first five chapters. This incredible structure that began with Newton's work detailed in his Principia is also called Newtonian Mechanics. The Newtonian view of the world has passed every conceivable experimental test both on a local terrestrial scale as well as on a much larger scale when it is applied to the motion of celestial bodies. It is the theory upon which much of engineering is based with daily practical applications. Of course, no theory of Physics can be considered “correct” no matter how many experimental tests it passes. The possibility always exists, that new phenomena, new observations and new experiments may lead to discrepancies with the theory. In that case it may be necessary to modify the theory or even abandon it completely in favour of a new theory that explains the old as well as the new phenomena. This is the case, too, with Newtonian Mechanics. In chapter 6 of this unit we will see that the Newtonian concepts of space and time need to be revised in situations where the speeds involved approach the speed of light. This is not to say that Newtonian Mechanics is useless; the theory of relativity that replaces it, does becomes Newtonian Mechanics in the limit of speeds that are small compared to that of light. Laws that have been derived with Newtonian Mechanics such as the conservation of energy, the conservation of momentum and the conservation of angular momentum also hold in the theories that replace Newtonian Mechanics. There is another limit in which Newtonian Mechanics is unable to describe observed phenomena. This is the physics on a very small, atomic and nuclear scale. At these scales Newtonian Mechanics fails completely to describe the observed phenomena and needs to be replaced by a new theory, Quantum Mechanics.
Original material © Cambridge University Press & Assessment 2023. This material is not final and is subject to further changes prior to publication.
Chapter 1 Kinematics
LEARNING OBJECTIVES
In this chapter you will:
• learn the difference between displacement and distance,
• learn the difference between speed and velocity,

• learn the concept of acceleration,
• learn how to analyse graphs describing motion,
• learn how to solve motion problems using the equations for constant acceleration,
• learn how to describe the motion of a projectile,
• gain a qualitative understanding of the effects of a fluid resistance force on motion,
gain an understanding of the concept of terminal speed.

•
SAMPLE Original material © Cambridge University Press & Assessment 2023. This material is not final and is subject to further changes prior to publication.
GUIDING QUESTIONS
• Which equations are used to describe the motion of an object?
If the line is horizontal, we use the symbol x to represent the coordinate and position. If the line is vertical, we use the symbol y. In general, for an arbitrary line, we use a generic symbol, s, for position. So, in Figure 1.1, x = 6 m, y = −4 m, s = 0 and y = 4 m. It is up to us to decide which side of zero we call positive and which side of zero we call negative; the decision is arbitrary.
Introduction
This chapter introduces the basic concepts used to describe motion.
First, we consider motion in a straight line with constant velocity. We then discuss motion with constant acceleration. Knowledge of uniformly accelerated motion allows us to analyse more complicated motions, such as the motion of projectiles.
• How does graphical analysis help us to describe motion? –4–3–2–1012
We use graphical analysis when acceleration is not constant.
1.1 Displacement, distance, speed and velocity
Straight line motion in one dimension means that the particle that moves is constrained to move along a straight line. The position of the particle is then given by its coordinate on the straight line (Figure 1.1). Position is a vector quantity—this is important when discussing projectile motion but, while discussing motion on a straight line, we can just express position as a positive or a negative number since here the vector can only point in one direction or the opposite.
a c
0 1 –1–2–3–4 2 3 4
b 345678 x /m
y /m s /m
–1 –2 –3 –4 2 3 4 d y /m 0 –1
0 1
1 2 3 4 –2 –3 –4
Figure 1.1: The position of a particle is determined by the coordinate on the number line.
The change in position is called displacement, Δs = sfinal − sinitial. Displacement is a vector.
1 Kinematics 3
SAMPLE Original material © Cambridge University Press & Assessment 2023. This material is not final and is subject to further changes prior to publication.
Table 1.1 shows four different motions. Make sure you understand how to calculate the displacement and that you understand the direction of motion.
Initial position Final position
DisplacementDirection of motion
12 m28m+16 mTowards increasing s
−6 m−14 m−8 mTowards decreasing s
10 m−5 m−15 mTowards decreasing s
−20 m−15+5 mTowards increasing s
Table 1.1: Four different motions.
Consider the two motions shown in Figure 1.2. In the first motion, the particle leaves its initial position at −4 m and continues to its final position at 16 m. The displacement is:
Δs = sfinal sinitial = 16 (− 4) = 20 m
The distance travelled is the actual length of the path followed (20 m).
In the second motion, the particle leaves its initial position at 12 m, arrives at position 20 m and then comes back to its final position at 4 m.
–4–202468101214161820 s /m –4–202468101214161820 s /m
Figure 1.2
The second motion is an example of motion with changing direction. The change in the position of this particle (its displacement) is:
Δs = sfinal sinitial = 4 − 12 = − 8 m
But the distance travelled by the particle (the length of the path) is 8 m in the outward trip and 16 m on the return trip, making a total distance of 24 m. So, we must be careful to distinguish distance from displacement:
Distance is a scalar quantity but displacement is a vector quantity.
Numerically, they are different if there is a change of direction, as in Figure 1.2.
As the particle moves on the straight line its position changes. In uniform motion in equal intervals of time, the position changes by the same amount.
For uniform motion the velocity, v, of the particle is the displacement divided by the time to achieve that displacement: v = Δs Δt .
The average speed is the total distance travelled divided by the time taken.
Assume that the first motion in Figure 1.2 took 4.0 s to complete. The velocity is 20 4.0 = 5.0 m s −1. The average speed is the same since the distance travelled is also 20 m.
Assume the second motion took 6.0 s to complete. The velocity is 8.0 6.0 = − 1.3 m s −1 and the average speed is 24 6.0 = 4.0 m s −1. So, in uniform motion, average speed and velocity are not the same when there is change in direction.
This implies that for uniform motion: v = s − sinitial t − 0 which can be re-arranged to give: s = sinitial + vt
(Notice how we use s for final position, rather than sf or sfinal, and we will write si for sinitial for simplicity). So for motion with constant velocity: s = si + vt
EXAM TIP
This for mula gives, in uniform motion, the position s of the moving object t seconds after time zero, given that the constant velocity is v and the initial position is si.
4 PHYSICS FOR THE IB DIPLOMA: COURSEBOOK
This formula can only be used when the velocity is constant. SAMPLE Original material © Cambridge University Press & Assessment 2023. This material is not final and is subject to further changes prior to publication.
This means that a graph of position against time is a straight line and the graph of velocity against time is a horizontal straight line (Figure 1.3).
s ∆ t 0
Velocity 0
∆ s ∆ t
WORKED EXAMPLE 1.1
Two cyclists, A and B, start moving at the same time. The initial position of A is 0 km and her velocity is +20 km h−1. The initial position of B is 150 km away from A and he cycles at a velocity of −30 km h−1
a Determine the time and position at which they will meet.
b What is the displacement of each cyclist when they meet?
c On another occasion the same experiment is performed but this time B starts 1 h after A. When will they meet?
t
∆ s Time
Figure 1.3: In uniform motion the graph of position against time is a straight line with non-zero gradient. The graph of velocity against time is a horizontal straight line.
Positive velocity means that the position s is increasing. Negative velocity means that s is decreasing. Observe that the area under the v versus t graph from t = 0 to time t is vt.
From s = si + vt we deduce that s si = vt and so the area in a velocity-against-time graph is the displacement.
CHECK YOURSELF 1
An object moves from A to B at speed 15 m s−1 and returns from B to A at speed 30 m s−1
What is the average speed for the round trip?
Answer
a The position of A is given by the formula sA = 0 + 20t.
The position of B is given by the formula sB = 150 − 30t.
They will meet when they are at the same position, i.e. when sA = sB. This implies: 20t = 150 − 30t 50t = 150 t = 3.0 h
The common position is found from either sA = 20 × 3.0 = 60 km or sB = 150 − 30 × 3.0 = 60 km.
b The displacement of A is 60 km − 0 = 60 km. That of B is 60 km − 150 km = −90 km.
c sA = 0 + 20t as before. When t h go by, B will have been moving for only t − 1 h.
Hence sB = 150 − 30(t − 1).
They will meet when sA = sB: 20t = 150 – 30(t − 1) 50t = 180 t = 3.6 h
1 Kinematics 5
SAMPLE Original material © Cambridge University Press & Assessment 2023. This material is not final and is subject to further changes prior to publication.
TEST YOUR UNDERSTANDING
1 A car must be driven a distance of 120 km in 2.5 h. During the first 1.5 h the average speed was 70 km h−1. Calculate the average speed for the remainder of the journey.
10
s /m 10 2345 t /s 0 5 10 15 20 25 s /m 15 10 5 0 5 25 20
s /m 10 2345 t /s 0 5 10 15 20 25 s /m 15 10 5 0 5 25 20
10
s /m 10 2345 0 5 10 15 20 25 1234 t /s 5
s /m 15 10 5 0 5 25 30
20
t / s
1234 5
s /m 10 2345 0 5 10 15 20 25 1234 t /s 5
s /m 15 10 5 0 5 25 30
t / s
1234 5
t / s
20
4
3
2
1
4
Figure 1.4 Figure 1.5
v/m/s 1 10 2345 t /s 0
3
2
1
5 12345 t / s 0
v/m/s 1 10 2345 t /s 0
1
1
5 12345 t / s 0
1
1
2
2
t / s 3
v/m/s 1 2 3
v/m/s 1 2 SAMPLE Original material © Cambridge University Press & Assessment 2023. This material is not final and is subject to further changes prior to publication.
6 PHYSICS FOR THE IB DIPLOMA: COURSEBOOK
2 Find the constant velocity for each motion whose position–time graphs are shown in Figure 1.4. 3 a Draw the position–time graphs for an object moving in a straight line with velocity–time graphs as shown in Figure 1.5. The initial position is zero. b In each case, state the displacement at 4 s.
4 Two cyclists, A and B, have displacements 0 km and 70 km, respectively.
At t = 0 they begin to cycle towards each other with velocities 15 km h−1 and 20 km h−1, respectively.
At the same time, a fly that was sitting on cyclist A starts flying towards cyclist B with a velocity of 30 km h−1
1.2 Uniformly accelerated motion: the equations of kinematics
Defining velocity in non-uniform motion
How is velocity defined when it is not constant? We have to refine what we did in Section 1.1. We now define the average velocity as: v = Δs Δt
where Δs is the total displacement for the motion and Δt the total time taken. We would like to have a concept of velocity at an instant of time, the (instantaneous) velocity. We need to make the time interval Δt very, very small. The instantaneous velocity is defined as:
v = lim Δt→0 Δs Δt
In other words, instantaneous velocity is the rate of change of position. This definition implies that velocity is the gradient of a position-against-time graph.
Consider Figure 1.6a. Choose a point on this curve. Draw a tangent to the curve at the point. The gradient of the tangent line is the meaning of v = lim Δt→0 Δs Δt and, therefore, also of velocity.
As soon as the fly reaches cyclist B it immediately turns around and flies towards cyclist A, and so on until cyclist A and cyclist B meet.
a Find the position of the two cyclists and the fly when all three meet.
b Determine the distance travelled by the fly.
30
25
20
15
10
5
0
s /m 1 02
a 345 t /s
30
25
20
15
10
5
0
s /m 1 02
b 345 t /s
Figure 1.6: a In uniformly accelerated motion the graph of position against time is a curve. b The gradient (slope) of the tangent at a particular point gives the velocity at that point.
1 Kinematics 7
CONTINUED
SAMPLE Original material © Cambridge University Press & Assessment 2023. This material is not final and is subject to further changes prior to publication.
In Figure 1.6b the tangent is drawn at t = 3.0 s. We can use this to find the instantaneous velocity at t = 3.0 s. The gradient of this tangent line is: 25 1.0 5.0 1.0 = 6.0 m s −1
To find the instantaneous velocity at some other instant of time we must take another tangent and we will find a different instantaneous velocity. At the point at t = 0 it is particularly easy to find the velocity: the tangent is horizontal and so the velocity is zero.
From now on we drop the word instantaneous and refer just to velocity. The magnitude of the velocity is known as the (instantaneous) speed
When the velocity changes we say that we have acceleration. The average acceleration is defined as a = Δv Δt . So for a body that accelerates from a velocity of 2.0 m s −1 to a velocity of 8.0 m s −1 in a time of 3.0 s the average acceleration is a = 8.0 2.0 3.0 = 2.0 m s −2.
To define instantaneous acceleration or just simply acceleration, we use the same idea as for velocity. We let the time interval Δt get very small and define acceleration as:
Acceleration is the rate of change of velocity. a = lim Δt→0 Δv Δt . It is the gradient of a velocity-against-time graph. Acceleration is a vector.
Uniformly accelerated motion means that the acceleration is constant: the graph of velocity against time is a non-horizontal straight line (Figure 1.7). In equal intervals of time the velocity changes by the same amount.
Figure 1.8: This fighter jet is accelerating.

When the acceleration is positive, the velocity is increasing (Figure 1.8). Negative acceleration means that v is decreasing.
For constant acceleration there is no difference between instantaneous acceleration and average acceleration. Suppose we choose a time interval from t = 0 to some arbitrary time t later. Let the velocity at t = 0 (the initial velocity) be u and the velocity at time t be v. Then: a = Δv Δt = v u t 0 which can be re-arranged to: v = u + at
For uniformly accelerated motion, this formula gives the velocity v of the moving object t seconds after time zero, given that the initial velocity is u and the acceleration is a
WORKED EXAMPLE 1.2
A particle has an initial velocity 12 m s−1 and moves with a constant acceleration of −3.0 m s−2. Determine the time at which the particle stops instantaneously.
Answer
Figure 1.7: In uniformly accelerated motion the graph of velocity against time is a straight line with non-zero slope.
At some point it will stop instantaneously; that is, its velocity v will be zero. We know that v = u + at Substituting values gives: 0 = 12 + (−3.0) × t 3.0t = 12 Hence t = 4.0 s.
8 PHYSICS FOR THE IB DIPLOMA: COURSEBOOK
∆
0 ∆
SAMPLE Original material © Cambridge University Press & Assessment 2023. This material is not final and is subject to further changes prior to publication.
t v
t
v ∆ t ∆ v
Consider the graph of velocity against time in Figure 1.9. Imagine approximating the straight line with a staircase. The area under the staircase is the change in position since at each step the velocity is constant. If we make the steps of the staircase smaller and smaller, the area under the line and the area under the staircase will be indistinguishable and so we have the general result that:
We get a final formula if we combine s = si + ut + 1 2 at 2 with v = u + at
From the second equation, we find t = v u a . Substituting in the first equation we get:
s si = u v u a + 1 2 ( v u a ) 2 = uv a u 2 a + 1 2 v 2 a uv a + 1 2 u 2 a = v 2 u 2 2a
KEY POINT
The area under the curve in a velocity against time graph is the change in position; in other words, the displacement.
From Figure 1.9 this area is (the shape is a trapezoid):
Δs = ( u + v 2 )t
This becomes: v 2 = u 2 + 2a(s si) or v 2 = u 2 + 2aΔs
Usually si = 0 so this last equation is usually written as v 2 = u 2 + 2as
This formula is useful to solve problems in which no information about time is available.
In summary, for motion along a straight line with constant acceleration:
v = u + at Δs = ( u + v 2 )t Δs = ut + 1 2 at 2 v 2 = u 2 + 2aΔs
Graphs of position against time for uniformly accelerated motion are parabolas (Figure 1.10). If the parabola ‘holds water’ (concave up) the acceleration is positive. If its concave down, the acceleration is negative.
s s ab
Figure 1.9: The straight-line graph may be approximated by a staircase.
But v = u + at, so this becomes:
Velocity v u t 0 t 0
Δs = ( u + u + at 2 )t = ut + 1 2 at 2
So we have two formulas for position in the case of uniformly accelerated motion (recall that Δs = s si ):
s = si + ( u + v 2 )t or Δs = ( u + v 2 )t
s = si + ut + 1 2 at 2 or Δs = ut + 1 2 at 2
Figure 1.10: Graphs of position s against time t for uniformly accelerated motion. a Positive acceleration. b Negative acceleration.
0 t SAMPLE Original material © Cambridge University Press & Assessment 2023. This material is not final and is subject to further changes prior to publication.
1 Kinematics 9
Time
EXAM TIP
Table 1.2 summarises the meaning of the gradient and area for the different motion graphs.
Graph of …GradientArea position against time velocity velocity against time accelerationchange in position, i.e. displacement acceleration against time change in velocity
Table 1.2: Information that can be derived from motion graphs
The equations of kinematics can be used only for motion on a straight line with constant acceleration. (If the initial position is zero, Δs may be replaced by just s.)
CHECK YOURSELF 2
The graph in Figure 1.11 shows the variation of position with time.
WORKED EXAMPLE 1.3
A particle has an initial velocity 2.00 m s−1 Its acceleration is a = 4.00 m s−2. Find its displacement after 10.0 s.
Answer
Displacement is the change of position, i.e. Δs = s si. We use the equation: Δs = ut + 1 2 at 2 = 2.00 × 10.0 + 1/2 × 4.00 × 10. 0 2 = 220 m
WORKED EXAMPLE 1.4
A car has an initial velocity of u = 5.0 m s−1 After a displacement of 20 m, its velocity becomes 7.0 m s−1. Find the acceleration of the car.
Answer
Here, Δs = s si = 20 m. So, use v2 = u2 + 2aΔs to find a. 7.02 = 5.02 + 2a × 20 24 = 40a Therefore, a = 0.60 m s−2
s /m 0.5
1.0 1.0
WORKED EXAMPLE 1.5
0.5
0 t /s
1.5 2.5 0.5 1.0 2.0
A body has an initial velocity of 4.0 m s−1. After 6.0 s the velocity is 12 m s−1. Determine the displacement of the body in the 6.0 s.
Answer
Figure 1.11
Indicate the intervals of times for which the acceleration is: a positive b negative c zero.
We know u, v and t. We can use: Δs = ( v + u 2 )t to get: Δs = ( 12 + 4.0 2 ) × 6.0 Δs = 48 m
10 PHYSICS FOR THE IB DIPLOMA: COURSEBOOK
SAMPLE
This
is
and is subject to
changes prior to publication.
Original material © Cambridge University Press & Assessment 2023.
material
not final
further
CONTINUED
A slower method would be to use v = u + at to find the acceleration:
12 = 4.0 + 6.0a
⇒ a = 1.333 m s −2
Then use the value of a to find Δs:
Δs = ut + 1 2 at 2
= 4.0 × 6.0 + 1 2 × 1.333 × 36 = 48 m
WORKED EXAMPLE 1.6
A ball, X, starts moving to the right from rest with a constant acceleration of 2.0 m s−2 2.0 s later, a second ball, Y, starts moving to the right with a constant velocity of 9.0 m s−1. Both balls start from the same position.
Determine the position of the balls when they meet. Describe what is going on.
Answer
Let the two balls meet t s after X starts moving.
The position of X is:
sX = 1 2 at 2 = 1 2 × 2.0 × t 2 = t 2
The position of Y is:
sY = 9(t − 2)
(The factor t – 2 must be considered because, after t s, Y has actually been moving for only t 2 seconds.)
These two positions are equal when the two balls meet, and so: t 2 = 9(t 2)
Solving the quadratic equation we find t = 3.0 s and 6.0 s. At these times the positions are 9.0 m and 36 m.
At 3.0 s Y caught up with X and passed it. At 6.0 s X caught up with Y and passed it. (Making position–time graphs here is instructive.)
1 Kinematics 11
SAMPLE Original material © Cambridge University Press & Assessment 2023. This material is not final and is subject to further changes prior to publication.
WORKED EXAMPLE 1.7
A particle starts out from the origin with velocity 10 m s−1 and continues moving at this velocity for 5 s. The velocity is then abruptly reversed to 5 m s−1 and the object moves at this velocity for 10 s.
For this motion find:
a the change in position, i.e. the displacement b the total distance travelled c the average speed d the average velocity Answer
The problem is best solved using the velocity–time graph, which is shown in Figure 1.12.
10 v /ms–1 5
1015 t 0/s –5 –10
Figure 1.12
a The initial position is zero. So, after 5.0 s, the position is 10 × 5.0 m = 50 m (the area under the first part of the graph). In the next 10 s, the displacement changes by 5.0 × 10 = 50 m (the area under the second part of the graph). So the change in position (the displacement) = 50 50 = 0 m.
b Take the initial velocity as moving to the right. The object moved towards the right, stopped and returned to its starting position. (We know this because the displacement was 0.) The distance travelled is 50 m moving to the right and 50 m coming back, giving a total distance travelled of 100 m.
c The average speed is 100 15 = 6.7 m s −1
5 SAMPLE Original material © Cambridge University Press & Assessment 2023. This material is not final and is subject to further changes prior to publication.
12
FOR THE IB DIPLOMA: COURSEBOOK
PHYSICS
d The average velocity is zero, since the displacement is zero.
WORKED EXAMPLE 1.8
An object with an initial velocity 20 m s−1 and initial position of 75 m experiences a constant acceleration of 2 m s−2. Sketch the position–time graph for this motion for the first 20 s.
WORKED EXAMPLE 1.9
Answer
Use the equation s = si + ut + 1 2 at 2. Substituting the values we know, the position is given by s = 75 + 20t t2. This is the function we must graph. The result is shown in Figure 1.13.
40 s /m
An object is thrown vertically upwards with an initial velocity of 20 m s−1 from the edge of a cliff that is 25 m from the sea below, as shown in Figure 1.14. Determine: a the ball’s maximum height b the time taken for the ball to reach its maximum height c the time to hit the sea d the speed with which it hits the sea (You may approximate g to 10 m s−2.)
5101520 t 0/s –20 –40
–60
20ms–1 30m –80
Figure 1.13
At 5 s the object reaches the origin and overshoots it. It returns to the origin 10 s later (t = 15 s). The furthest it gets from the origin is 25 m. The velocity at 5 s is 10 m s−1 and at 15 s it is 10 m s−1. At 10 s the velocity is zero.
A special acceleration
Assuming that we can neglect air resistance and other frictional forces, an object thrown into the air will experience the acceleration of free fall while in the air. This is an acceleration caused by the attraction between the Earth and the body. The magnitude of this acceleration is denoted by g. Near the surface of the Earth g = 9.8 m s−2. The direction of this acceleration is always vertically downwards. (We will sometimes approximate g to 10 m s−2.)
Figure 1.14: A ball is thrown upwards from the edge of a cliff.
Answer
20 SAMPLE Original material © Cambridge University Press & Assessment 2023. This material is not final and is subject to further changes prior to publication.
1 Kinematics 13
We have motion on a vertical line so we will use the symbol y for position (Figure 1.15a). We take the direction up to be positive. The zero for position is the ball’s initial position.
CONTINUED 20ms–1 a b
y /m 30m 0
0 y /m
50m
Figure 1.15: Diagrams for solving the ball’s motion.
a Displacement upwards is positive. b The highest point is the zero of position. Here we take displacement downwards to be positive.
a The quickest way to get the answer to this part is to use v2 = u2 2gy. (The acceleration is a = g.) At the highest point v = 0, and so: 0 = 20 2 2 × 10y ⇒ y = 20 m
b At the highest point the object’s velocity is zero. Using v = 0 in v = u gt gives: 0 = 20 10 × t t = 20 10 = 2.0 s
c There are many ways to do this. One is to use the displacement arrow shown in blue in Figure 1.15a. Then, when the ball hits the sea, y = 25 m. Now use the formula y = ut 1 2 gt 2 to find an equation that only has the variable t: − 25 = 20 × t 5 × t 2 t 2 4t 5 = 0
This is a quadratic equation. Using your calculator you can find the two roots as 1.0 s and 5.0 s. Choose the positive root to find the answer t = 5.0 s.
Another way of looking at this is shown in Figure 1.15b. Here we start at the highest point and take the direction down to be positive. Then, at the top y = 0, at the sea y = +45 m and a = +10 m s−2. Now, the initial velocity is zero because we take our initial point to be at the top. Using y = ut + 1 2 gt 2 with u = 0, we find: 45 = 5 t 2 ⇒ t = 3.0 s
This is the time to fall to the sea. It took 2.0 s to reach the highest point, so the total time from launch to hitting the sea is: 2.0 + 3.0 = 5.0 s.
d Use v = u gt and t = 5.0 s to get v = 20 10 × 5.0 = 30 m s−1. The speed is then 30 m s−1
(If you prefer the diagram in Figure 1.15b for working out part c and you want to continue this method for part d, then you would write v = u + gt with t = 3.0 s and u = 0 to get v = 10 × 3.0 = +30 m s−1.)
CHECK YOURSELF 3
A ball is thrown vertically upwards with a speed of 20 m s−1 and another vertically downwards with the same speed and from the same height. What interval separates the landing times of the two balls? (Take g = 10 m s−2.)
14 PHYSICS FOR THE IB DIPLOMA: COURSEBOOK
CONTINUED
©
to publication.
SAMPLE Original material
Cambridge University Press & Assessment 2023. This material is not final and is subject to further changes prior
TEST YOUR UNDERSTANDING
5 The initial velocity of a car moving on a straight road is 2.0 m s−1. It becomes 8.0 m s−1 after travelling for 2.0 s under constant acceleration. Find the acceleration.
12 Two balls are dropped from rest from the same height. One of the balls is dropped 1.00 s after the other. Air resistance is ignored.
6 A car accelerates from rest to 28 m s−1 in 9.0 s. Find the distance it travels.
7 A particle has an initial velocity of 12 m s−1 and is brought to rest over a distance of 45 m. Find the acceleration of the particle.
8 A particle at the origin has an initial velocity of −6.0 m s−1 and moves with an acceleration of 2.0 m s−2. Determine when its position will become 16 m.
9 A plane starting from rest takes 15.0 s to take off after speeding over a distance of 450 m on the runway with constant acceleration. Find the take-off velocity.
10 A particle starts from rest with constant acceleration. After travelling a distance d the speed is v. What was the speed when the particle had travelled a distance d 2 ?
11 A car is travelling at 40.0 m s−1. The driver sees an emergency ahead and 0.50 s later slams on the brakes. The deceleration of the car is 4.0 m s−2.
a Find the distance travelled before the car stops.
b Calculate the stopping distance if the driver could apply the brakes instantaneously without a reaction time.
c Calculate the difference in your answers to a and b.
d Assume now that the car was travelling at 30.0 m s−1 instead. Without performing any calculations, state whether the answer to c would now be less than, equal to or larger than before. Explain your answer.
a Find the distance that separates the two balls 2.00 s after the second ball is dropped.
b Explain what happens to the distance separating the balls as time goes on.
13 A particle moves in a straight line with an acceleration that varies with time as shown in Figure 1.16. Initially the velocity of the object is 2.00 m s−1
3
0 0246
9 6 t /s
Figure 1.16
a Find the maximum velocity reached in the first 6.00 s of this motion.
b Draw a graph of the velocity against time.
14 The graph in Figure 1.17 shows the variation of velocity with time of an object. Find the acceleration at 2.0 s.
v /ms–1
6
4
2
8 0123 t /s SAMPLE Original material © Cambridge University Press & Assessment 2023. This material is not final and is subject to further changes prior to publication.
a /ms–2 4 0
1 Kinematics 15
Figure 1.17
CONTINUED
15 Your brand-new convertible is parked 15 m from its garage when it begins to rain. You do not have time to get the keys, so you begin to push the car towards the garage. The maximum acceleration you can give the car is 2.0 m s−2 by pushing and 3.0 m s−2 by pulling back on the car. Find the least time it takes to put the car in the garage. (Assume that the car and the garage are point objects.)
16 A stone is thrown vertically up from the edge of a cliff 35.0 m from the sea (Figure 1.18). The initial velocity of the stone is 8.00 m s−1
v =8.00ms–1 35.0m
Figure 1.18
Determine: a the maximum height of the stone b the time when it hits the sea
1.3 Graphs of motion
If the acceleration is constant the equations derived in Section 1.2 hold and we can use them to analyse a motion problem. But if acceleration is not constant
c the velocity just before hitting the sea d the distance the stone covers e the average speed and the average velocity for this motion
17 A ball is thrown upwards from the edge of a cliff with velocity 20.0 m s−1. It reaches the bottom of the cliff 6.0 s later. Take g = 10 m s−2.
a Determine the height of the cliff. b Calculate the speed of the ball as it hits the ground.
18 A toy rocket is launched vertically upwards with acceleration 3.0 m s−2. The fuel runs out when the rocket reaches a height of 85 m.
a Calculate the velocity of the rocket when the fuel runs out.
b Determine the maximum height reached by the rocket.
c Draw a graph to show the variation of i the velocity of the rocket ii the position of the rocket from launch until it reaches its maximum height
d Calculate the time the rocket takes to fall to the ground from its maximum height.
these equations do not apply and cannot be used. But we can still analyse a motion using graphs. Our main tools will be those provided in Table 1.1.
16 PHYSICS FOR THE IB DIPLOMA: COURSEBOOK
SAMPLE Original material © Cambridge University Press & Assessment 2023. This material is not final and is subject to further changes prior to publication.
Consider the graph of position against time shown in Figure 1.19.
s /m 0.5
Working in exactly the same way we can find the shape of the acceleration-against-time graph by examining the gradient of the velocity graph we just obtained. The result is Figure 1.21.
0.5
1.0 1.0
0 t /s
0.2 0.4 0.6 0.8 1.0
Figure 1.19: Position against time for accelerated motion.
We would like to predict the shape of the graph of velocity against time. We use the fact that velocity is the gradient of the position-against-time graph. We see that at t = 0 the gradient is positive. As time increases the gradient is still positive but gets smaller and smaller and at t = 0.25 s it becomes zero. It then becomes negative. It gets more and more negative, reaching its most negative value at t = 0.5 s. It remains negative past 0.5 s but the curve gets less steep and the gradient becomes zero again at 0.75 s. From then it becomes positive and increases until 1.0 s. These observations lead us to the velocity-against-time graph shown in Figure 1.20. Note that it is the shape we are after, not detailed numerical values of velocity; hence there is no need to put numbers on the vertical axis.
v
t /s
Figure 1.20: The velocity graph corresponding to the graph of Figure 1.19.
Figure 1.21: Acceleration graph corresponding to the velocity graph of Figure 1.20.
CHECK YOURSELF 4
Look at the motion in Figure 1.22.
velocity 0.2 0.2 0.4
0.4 0.6 0.8 1.0 1.5 2.5 0.5 1.0 2.0
0 t / s
Figure 1.22
a 0.2 0.4 0.6 0.8 1.0 t /s 0.2 0.4 0.6 0.8 1.0
a State the time(s) at which the acceleration is zero.
b State the time(s) at which the acceleration is negative.
c At what time is the acceleration most negative?
d At 2.3 s, do you expect the displacement to be positive or negative and why?
1 Kinematics 17
SAMPLE
Original material © Cambridge University Press & Assessment 2023. This material is not final and is subject to further changes prior to publication.
TEST YOUR UNDERSTANDING
19 The graph in Figure 1.23 shows the variation of the position of a moving object with time. Draw the graph showing the variation of the velocity of the object with time.
21 The graph in Figure 1.25 shows the variation of the position of a moving object with time. Draw the graph showing the variation of the velocity of the object with time.
0.50 t /s 11.522.53
Figure 1.23
20 The graph in Figure 1.24 shows the variation of the position of a moving object with time. Draw the graph showing the variation of the velocity of the object with time.
s
s 0123456 t /s 7
Figure 1.24
0.5 011.52 t /s
Figure 1.25
22 The graph in Figure 1.26 shows the variation of the velocity of a moving object with time. Draw the graph showing the variation of the position of the object with time. The initial position is zero.
v
s 0.5 011.52 t /s SAMPLE Original material © Cambridge University Press & Assessment 2023. This material is not final and is subject to further changes prior to publication.
18 PHYSICS FOR THE IB DIPLOMA: COURSEBOOK
Figure 1.26
23 The graph in Figure 1.27 shows the variation of the velocity of a moving object with time. Draw the graph showing the variation of the position of the object with time (assuming the initial position to be zero).
Draw a graph to show how velocity varies with time. The initial velocity is zero.
26 The graph in Figure 1.30 shows how acceleration varies with time.
Time
Figure 1.30
1 0234 t /s
Figure 1.27
24 The graph in Figure 1.28 shows the variation of the velocity of a moving object with time. Draw the graph showing the variation of the acceleration of the object with time.
v 0.5 011.52 t /s
Draw a graph to show how velocity varies with time. The initial velocity is zero.
27 The graph in Figure 1.31 shows the position against time of an object moving in a straight line. Four points on this graph have been selected.
Figure 1.28
25 The graph in Figure 1.29 shows how acceleration varies with time.
Acceleration
v Time
Figure 1.29
Figure 1.31
a Is the velocity between A and B positive, zero or negative?
b What can you say about the velocity between B and C?
c Is the acceleration between A and B positive, zero or negative?
d Is the acceleration between C and D positive, zero or negative?
1 Kinematics 19
CONTINUED
SAMPLE Original material © Cambridge University Press & Assessment 2023. This material is not final and is subject to further changes prior to publication.
Acceleration A BC D x t 0
28 Sketch velocity–time plots (no numbers are necessary on the axes) for the following motions.
a A ball is dropped from a certain height and bounces off a hard floor. The speed just before each impact with the floor is the same as the speed just after impact. Assume that the time of contact with the floor is negligibly small.
1.4 Projectile motion
Figure 1.32 shows the positions of two objects every 0.2 s: the first was simply allowed to drop vertically from rest; the other was launched horizontally with no vertical component of velocity. We see that in the vertical direction, both objects fall the same distance in the same time and so will hit the ground at the same time.
b A cart slides with negligible friction along a horizontal air track. When the cart hits the ends of the air track it reverses direction with the same speed it had right before impact. Assume the time of contact of the cart and the ends of the air track are negligibly small.
c A person jumps from a hovering helicopter. After a few seconds she opens a parachute. Eventually she will reach a terminal speed and will then land.
THEORY OF KNOWLEDGE
How do we understand this fact? Consider Figure 1.33, in which a black ball is projected horizontally with velocity v. A blue ball is allowed to drop vertically from the same height.
Figure 1.33a shows the situation when the balls are released as seen by an observer X at rest on the ground. But suppose there is an observer Y, who moves to the right with velocity v 2 with respect to the ground. What does Y see? Observer Y sees the black ball moving to the right with velocity v 2 and the blue ball approaching with velocity − v 2 Figure 1.18b). The motions of the two balls are therefore identical (except for direction). So this observer will determine that the two bodies reach the ground at the same time. Since time is absolute in Newtonian physics, the two bodies must reach the ground at the same time as far as any other observer is concerned as well.
Figure 1.32: A body dropped from rest and one launched horizontally cover the same vertical distance in the same time.
20 PHYSICS FOR THE IB DIPLOMA: COURSEBOOK
CONTINUED
y /m x /m 020406080100 –5 –4 –3 –2 –1 0
SAMPLE Original material © Cambridge University Press & Assessment 2023. This material is not final and is subject to further changes prior to publication.
The green vector in Figure 1.35a shows the position of the projectile t seconds after launch. The red arrows in Figure 1.35b show the velocity vectors and their components. Here the true vector nature of what we have been calling position comes into its own.
–v v 2 v 2 –v 2 v 2
Figure 1.33: a A ball projected horizontally and one simply dropped from rest from the point of view of observer X. Observer Y is moving to the right with velocity v 2 with respect to the ground.
b From the point of view of observer Y, the black and the blue balls have identical motions.
The motion of a ball that is projected at some angle can be analysed by separately looking at the horizontal and the vertical directions. All we have to do is consider two motions, one in the horizontal direction in which there is no acceleration and another in the vertical direction in which we have an acceleration, g
Consider Figure 1.34, where a projectile is launched at an angle θ to the horizontal with speed u The components of the initial velocity vector are u x = u cos θ and u y = u sin θ
At some later time t the components of velocity are v x and v y . In the x-direction there is zero acceleration and in the y-direction, the acceleration is g and so:
The position of the projectile is determined by the position vector → r , a vector from the origin to the position of the projectile. The components of this vector are x and y
uy
Horizontal
direction v x = u cos θ v y = u sin θ − gt
θ
u ux
Figure 1.34: A projectile is launched at an angle θ to the horizontal with speed u
15
10
5
y
20 y /m x
a 1.52.0 x 0/m –5
20 y /m
15
10
0.51.0
5
P 0.51.0
b 1.52.0 x 0/m –5
Figure 1.35: a The position of the particle is determined if we know the x- and y-components of the position vector. b The velocity vectors for projectile motion are tangents to the parabolic path.
EXAM TIP
All that we are doing is using the formulas from the previous section for velocity and position –v = u + at and s = ut + 1 2 at 2 – and rewriting them separately for each direction x and y. In the x-direction there is zero acceleration, and in the y-direction there is an acceleration –g
We would like to know the x- and y-components of the position vector. We now use the formula for position. In the x-direction: x = u x t and so x = ut cos θ In the y-direction:y = u y t 1 2 gt 2 and so y = ut sin θ 1 2 gt 2
ab XY SAMPLE Original material © Cambridge University Press & Assessment 2023. This material is not final and is subject to further changes prior to publication.
1 Kinematics 21
directionVertical
CONTINUED
XY
In summary:
Horizontal directionVertical direction
v x = u cos θ v y = u sin θ gt
x = ut cos θ y = ut sin θ 1 2 gt 2
The equation with ‘squares of speeds’ is a bit trickier (carefully review the following steps). It is:
v2 = u2 2gy
Since v2 = v x 2 + v y 2 and u2 = u x 2 + u y2, and in addition v x 2 = u x2, this is also equivalent to: v y 2 = u y 2 2gy
EXAM TIP
Always choose your x- and y-axes so that the origin is the point where the launch takes place.
TEST YOURSELF 5
A projectile is launched with kinetic energy K at 60° to the horizontal. What is the kinetic energy of the projectile at the highest point of its path? (Kinetic energy is equal to 1 2 mv 2.)
WORKED EXAMPLE 1.10
A body is launched with a speed of 18.0 m s−1 at the following angles: a 30° to the horizontal b 0° to the horizontal c 90° to the horizontal Find the x- and y-components of the initial velocity in each case.
Answer
a v x = u cos θ v y = u sin θ
v x = 18.0 × cos 30° v y = 18.0 × sin 30° v x = 15.6 m s−1 v y = 9.00 m s−1 b v x = 18.0 m s−1 v y = 0 m s−1 c v x = 0 v y = 18.0 m s−1
WORKED EXAMPLE 1.11
For a projectile launched at some angle above the horizontal, sketch graphs to show the variation with time of:
a the horizontal component of velocity b the vertical component of velocity Answer
The graphs are shown in Figure 1.36.
Time
vy
vx 0 Time 0
Figure 1.36: Answer to worked example 1.11
WORKED EXAMPLE 1.12
An object is launched horizontally from a height of 20 m above the ground with speed 15 m s−1. Determine: a the time at which it will hit the ground b the horizontal distance travelled c the speed with which it hits the ground (Take g = 10 m s−2.)
Answer
a The launch is horizontal, i.e. θ = 0°, and so the formula for vertical position is just y = 1 2 gt 2 The object will hit the ground when y = 20 m.
22 PHYSICS FOR THE IB DIPLOMA: COURSEBOOK
SAMPLE Original material © Cambridge University Press & Assessment 2023. This material is not final and is subject to further changes prior to publication.
CONTINUED
Substituting the values, we find:
− 20 = − 5t 2 ⇒ t = 2.0s
b The horizontal position is found from x = ut Substituting values: x = 15 × 2.0 = 30 m (Remember that θ = 0°.)
c Use v2 = u2 2gy to get: v2 = 152 2 × 10 × ( 20) v = 25 m s−1
WORKED EXAMPLE 1.13
An object is launched horizontally with a velocity of 12 m s−1. Determine:
a the vertical component of velocity after 4.0 s b the x- and y-components of the position vector of the object after 4.0 s.
Answer
a The launch is again horizontal, i.e. θ = 0°, so substitute this value in the formulas. The horizontal component of velocity is 12 m s−1 at all times.
From v y = gt, the vertical component after 4.0 s is v y = 40 m s−1.
b The coordinates after time t are: x = ut y = 1 2 gt 2 x = 12 . 0 × 4 . 0 y = − 5 × 16 x = 48 m and y = − 80 m
EXAM TIP
Worked example 1.13 is a basic problem— you must know how to do this!
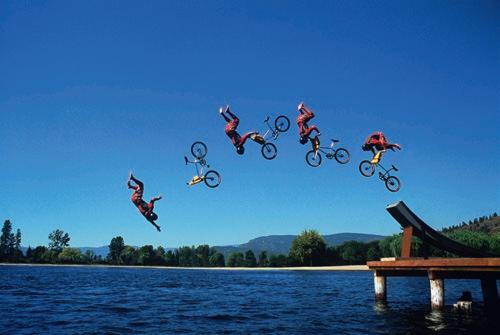
Figure 1.37 shows an object thrown at an angle of θ = 30° to the horizontal with initial speed 20 m s−1. The position of the object is shown every 0.2 s. Note how the dots get closer together as the object rises (the speed is decreasing) and how they move apart on the way down (the speed is increasing). It reaches a maximum height of 5.1 m and travels a horizontal distance of 35 m. The photo in Figure 1.38 shows an example of projectile motion.
y
u0
4
3
2
y /m x
1
0
5 05101520253035 x/m
Figure 1.37: A launch at of θ = 30° to the horizontal with initial speed 20 m s−1
At what point in time does the vertical velocity component become zero? Setting v y = 0 we find: 0 = u sin θ gt ⇒ t = u sin θ g
Figure 1.38: A real example of projectile motion.
1 Kinematics 23
SAMPLE Original material © Cambridge University Press & Assessment 2023. This material is not final and is subject to further changes prior to publication.
The time when the vertical velocity becomes zero is, of course, the time when the object attains its maximum height. What is this height? Going back to the equation for the vertical component of position, we find that when:
t = u sin θ g y is given by: ymax = u u sin θ g sin θ − 1 2 g ( u sin θ g )2 ymax = u 2 sin 2 θ 2g
What about the maximum displacement in the horizontal direction (called the range)? At this point y is zero. We can find the time by setting y = 0 in the formula for y but it is easier to notice that since the path is symmetrical the time to cover the range is double the time to get to the top, so t = 2u sin θ g
EXAM TIP
You should not remember these formulas by heart. You should be able to derive them quickly.
Therefore the range is: x = 2 u 2 sin θ cos θ g
A bit of trigonometry allows us to rewrite this as: x = u 2 sin 2θ g
One of the identities in trigonometry is 2 sin θ cos θ = sin 2θ.
The maximum value of sin 2θ is 1, and this happens when 2θ = 90° (θ = 45°). In other words, we obtain the maximum range with a launch angle of 45°. This equation also says that there are two different angles of launch that give the same range for the same initial speed. These two angles add up to a right angle. (Can you see why?)
CHECK YOURSELF 6
On Earth the maximum height and range of a projectile are H and R, respectively. The projectile is launched with the same velocity on a planet where the acceleration of free fall is 2g. What are the maximum height and range of the projectile on the planet?
WORKED EXAMPLE 1.14
A projectile is launched at 32.0° to the horizontal with initial speed 25.0 m s−1. Determine the maximum height reached. (Take g = 9.81 m s−2.)
Answer
The vertical velocity is given by v y = u sin θ gt and becomes zero at the highest point. Thus:
t = u sin θ g
t = 25.0 × sin 32.0° 9.81 t = 1.35 s
Substituting in the for mula for y, y = ut sin θ 1 2 gt 2 , we get:
y = 25 × sin 32.0° × 1.35 − 1 2 × 9.81 × 1.35 2 y = 8.95 m
Equivalently, 0 = (u sin θ) 2 − 2gy ⇒ y = (25.0 × sin 32.0°) 2 2 × 9.81 = 8.95 m
WORKED EXAMPLE 1.15
A projectile is launched horizontally from a height of 42 m above the ground. As it hits the ground, the velocity makes an angle of 55° to the horizontal. Find the initial velocity of launch. (Take g = 9.8 m s−2.)
Answer
The time it takes to hit the ground is found from y = − 1 2 gt 2. (Here θ = 0° since the launch is horizontal.)
The ground is at y = 42 m and so: 42 = 1 2 × 9.8 t 2 ⇒ t = 2.928 s
Using v y = u sin θ gt, when the projectile hits the ground:
v y = 0 9.8 × 2.928 v y = 28.69 m s−1
24 PHYSICS FOR THE IB DIPLOMA: COURSEBOOK
Original material © Cambridge University Press & Assessment 2023. This material is not final and is subject to further changes prior to publication.
SAMPLE
CONTINUED
We know the angle the final velocity makes with the ground (Figure 1.39). Hence: tan 55° = | v y v x | ⇒ v x = 28.69 tan 55° v x = 20.09 ≈ 20 m s −1
which accelerates it downwards. As the speed increases, the force of air resistance also increases. Eventually, this force will become equal to the weight and so the acceleration will become zero: the body will then move at constant speed, called terminal speed, vT. This speed can be found from: mg = kvT which leads to: vT = mg k
vx vy vy vx
Figure 1.39
Links
In projectile motion we have a single constant force whose direction is always vertical. This force is the weight of the body. When the body is projected at an angle to the vertical the result is motion along a path that is parabolic. There is one other instance where again a force that is constant in magnitude and direction acts on a body. This is the case of motion of an electric charge in a uniform electric field. So we expect that a charge projected at an angle in a region of uniform electric field will also result in motion along a parabolic path and what we have learned in this chapter will apply to that case as well. See Chapter 19
tan=
Fluid resistance
The discussion of the previous sections has neglected air resistance forces. In general, whenever a body moves through a fluid (gas or liquid) it experiences a fluid resistance force that is directed opposite to the velocity. Typically F = kv for low speeds and F = kv2 for high speeds (where k is a constant). The magnitude of this force increases with increasing speed.
Imagine dropping a body of mass m from some height. Assume that the force of air resistance on this body is F = kv. Initially, the only force on the body is its weight,
Figure 1.40 shows how the speed and acceleration vary for motion with an air resistance force that is proportional to speed. The speed eventually becomes the terminal speed, and the acceleration becomes zero. The initial acceleration is g
θ θ 0
20
10
30 0510
a 1520 t /s
a /ms–2 8 6
10
v /ms–1 0
b 1520 t /s
2
4 0510
Figure 1.40: a The variation with time of a speed. b Acceleration in motion with an air resistance force proportional to speed.
The effect of air resistance forces on projectiles is very pronounced. Figure 1.41 shows the positions of a projectile with (red) and without (blue) air resistance forces. With air resistance forces the range and maximum height are smaller and the shape is no longer symmetrical.
1 Kinematics 25
SAMPLE Original material © Cambridge University Press & Assessment 2023. This material is not final and is subject to further changes prior to publication.
The projectile hits the ground at a steeper angle.
y /m
WORKED EXAMPLE 1.16
The force of air resistance in the motion described by Figure 1.40 is given by F = 0.653v
1000
500
0
1500 0500100015002000250030003500 x /m
Figure 1.41: The effect of air resistance on projectile motion.
NATURE OF SCIENCE
The simple and the complex Careful observation of motion in the natural world led to the equations for motion with uniform acceleration along a straight line that we have used in this section. Thinking about what causes an object to move links to the idea of forces. However, although the material in this section is perhaps some of the ‘easiest’ material in your physics course, it does not enable you to understand the falling of a leaf off a tree. The falling leaf is complicated
TEST YOUR UNDERSTANDING
29 A ball rolls off a table with a horizontal speed of 2.0 m s−1. The table is 1.3 m high. Calculate how far from the table the ball will land.
30 Two particles are on the same vertical line. They are thrown horizontally with the same speed, 4.0 m s−1, from heights of 4.0 m and 8.0 m.
a Calculate the distance that will separate the two objects when both land on the ground.
b The particle at the 4.0 m height is now launched with horizontal speed u such that it lands at the same place as the particle launched from 8.0 m. Calculate u.
Determine the mass of the projectile. Answer
The terminal speed is 30 m s−1 and is given by vT = mg k . Hence: m = 0.653 × 30 9.8 m ≈ 2 . 0 kg
because it is acted upon by several forces: its weight, but also air resistance forces that constantly vary as the orientation and speed of the leaf change. In addition, there is wind to consider as well as the fact that turbulence in air greatly affects the motion of the leaf. So the physics of the falling leaf is far away from the physics of motion along a straight line at constant acceleration. But learning the principles of physics in a simpler context allows its application in more involved situations.
31 For an object thrown at an angle of 40° to the horizontal at a speed of 20 m s−1, draw graphs of: a horizontal velocity against time b vertical velocity against time c acceleration against time
32 Determine the maximum height reached by an object thrown with speed 24 m s−1 at 40° to the horizontal.
33 An object is thrown with speed 20.0 m s−1 at an angle of 50° to the horizontal. Draw graphs to show the variation with time of: a the horizontal position b the vertical position
26 PHYSICS FOR THE IB DIPLOMA: COURSEBOOK
SAMPLE Original material © Cambridge University Press & Assessment 2023. This material is not final and is subject to further changes prior to publication.
34 A cruel man takes aim horizontally at a chimp that is hanging from the branch of a tree, as shown in Figure 1.42.
The chimp lets go of the branch as soon as the hunter pulls the trigger. Treating the chimp and the bullet as point particles, determine if the bullet will hit the chimp.
ii the angle to the horizontal the ball was launched at,
iii the acceleration of free fall on this planet.
b Make a copy of the graph and draw two arrows to represent the velocity and the acceleration vectors of the ball at t = 1.0 s.
c The ball is now launched under identical conditions from the surface of a different planet where the acceleration due to gravity is twice as large. Draw the path of the ball on your graph.
36 A stone is thrown with a speed of 20.0 m s−1 at an angle of 48° to the horizontal from the edge of a cliff 60.0 m above the surface of the sea.
a Calculate the velocity with which the stone hits the sea.
Figure 1.42
35 A ball is launched from the surface of a planet. Air resistance and other frictional forces are neglected. The graph in Figure 1.43 shows the position of the ball every 0.20 s.
b Discuss qualitatively the effect of air resistance on your answer to a
37 a State what is meant by ter minal speed
b A ball is dropped from rest. The force of air resistance on the ball is proportional to the ball’s speed. Explain why the ball will reach terminal speed.
38 A projectile is launched with speed u at 45° to the horizontal. The projectile is at height h at two different times.
a Show that the horizontal distance separating those points is u g √ u 2 4gh
b Deduce, using the result in part a, the maximum height reached by this projectile.
Figure 1.43
a Use this graph to determine:
i the components of the initial velocity of the ball,
39 A projectile is launched with some speed at some angle to the horizontal. At 1.0 s and at 5.0 s the height of the projectile from the ground is the same. What is the maximum height reached by this projectile?
(Take g = 10 m s–2.)
1 Kinematics 27
CONTINUED
0 2 4 6 8 10 0102030405060 x /m y /m SAMPLE Original material © Cambridge University Press & Assessment 2023. This material is not final and is subject to further changes prior to publication.
SELF-ASSESSMENT CHECKLIST
I am able to ... Section Not yet Nearly there Ready to move on define and distinguish between the concepts of position, displacement, average and instantaneous velocity and average and instantaneous acceleration 1.1 solve problems using the equations of kinematics 1.2 analyse motion through graphs 1.3 solve problems with projectile motion 1.4 describe the effect of air resistance force on projectile motion 1.4
REFLECTION
Do you understand the difference between distance and displacement? Do you understand the difference between speed and velocity? Are you confident using the equations of kinematics? Do you know what information a graph of position versus time gives? Do you know what information a graph of velocity versus time gives? Can you explain why a body reaches terminal speed if it is acted upon by a speed dependent resistance force? Do you understand how to solve problems with projectile motion? Can you describe the effect of air resistance on the path of a projectile?
28 PHYSICS FOR THE IB DIPLOMA: COURSEBOOK
QUESTIONS 1 Two cyclists X and Y are separated by a distance of 68 km. At t = 0, X starts cycling with speed 8.0 km hr −1 and one hour later Y starts cycling with speed 12 km hr −1 . What is the displacement of Y when X and Y meet? a 32 km b −32 km c 36 km d −36 km SAMPLE Original material © Cambridge University Press & Assessment 2023. This material is not final and is subject to further changes prior to publication.
EXAM-STYLE
CHECK YOURSELF ANSWERS
1 Let d be the distance between A and B and t1, t2 the travel times back and forth. Then d = 15 t1 = 30 t2, i.e. t1 = 2 t2. The average speed is then v = 2d t1 + t2 = 2 × 30 t2 3 t2 = 20 m s −1
2 Positive for 1.0 s on, because curve is concave up, negative for 0 s to 1.0 s and zero at 1.0 s.
3 It takes 2 s to get to the maximum height and 2 to retur n so the required time is 4 s.
4 a Zero at about 0.4 s and 1.6 s. b Negative from 0.4 s to 1.6 s.
c Most negative at 1.0 s.
d The displacement from 0 s to 1.0 s is about the same in magnitude as that from 1.0 s to 2.0 s so the displacement at 2.3 s will be positive.
5 K = 1 2 mu 2. At the highest point, KE = 1 2 mu 2 x = 1 2 mu 2 cos 2 60 ° = 1 2 mu 2 × 1 4 = K 4
6 Both H and R are inversely proportional to the acceleration of free fall and so both are halved.
1 Kinematics 29
SAMPLE Original material © Cambridge University Press & Assessment 2023. This material is not final and is subject to further changes prior to publication.
