


Digital access .. .. .. . ....
Original material © Cambridge University Press 2023. This material is not final and is subject to further changes prior to publication.
DRAFT
Original material © Cambridge University Press 2023. This material is not final and is subject to further changes prior to publication.
DRAFT
Cambridge Lower Secondary Computing
Victoria Ellis & Sarah Lawrey
LEARNER’S
DRAFT Original material © Cambridge University Press 2023. This material is not final and is subject to further changes prior to publication.
BOOK 7
University Printing House, Cambridge CB2 8BS, United Kingdom
One Liberty Plaza, 20th Floor, New York, NY 10006, USA
477 Williamstown Road, Port Melbourne, VIC 3207, Australia
314–321, 3rd Floor, Plot 3, Splendor Forum, Jasola District Centre, New Delhi – 110025, India
103 Penang Road, #05–06/07, Visioncrest Commercial, Singapore 238467
Cambridge University Press is part of the University of Cambridge. It furthers the University’s mission by disseminating knowledge in the pursuit of education, learning and research at the highest international levels of excellence.
www.cambridge.org
Information on this title: www.cambridge.org/9781009297059
© Cambridge University Press & Assessment 2023
This publication is in copyright. Subject to statutory exception and to the provisions of relevant collective licensing agreements, no reproduction of any part may take place without the written permission of Cambridge University Press.
20 19 18 17 16 15 14 13 12 11 10 9 8 7 6 5 4 3 2 1
Printed in Malaysia by Vivar Printing
A catalogue record for this publication is available from the British Library
ISBN 978-1-009-29705-9 Paperback with Digital Access (1 Year)
ISBN 978-1-009-29703-5 Digital Learner's Book (1 Year)
ISBN 978-1-009-29702-8 eBook
Additional resources for this publication at www.cambridge.org/go
Cambridge University Press has no responsibility for the persistence or accuracy of URLs for external or third-party internet websites referred to in this publication, and does not guarantee that any content on such websites is, or will remain, accurate or appropriate. Information regarding prices, travel timetables, and other factual information given in this work is correct at the time of first printing but Cambridge University Press does not guarantee the accuracy of such information thereafter.
NOTICE TO TEACHERS IN THE UK
It is illegal to reproduce any part of this work in material form (including photocopying and electronic storage) except under the following circumstances:
(i) where you are abiding by a licence granted to your school or institution by the Copyright Licensing Agency;
(ii) where no such licence exists, or where you wish to exceed the terms of a licence, and you have gained the written permission of Cambridge University Press;
(iii) where you are allowed to reproduce without permission under the provisions of Chapter 3 of the Copyright, Designs and Patents Act 1988, which covers, for example, the reproduction of short passages within certain types of educational anthology and reproduction for the purposes of setting examination questions.
Original material © Cambridge University Press 2023. This material is not final and is subject to further changes prior to publication.
DRAFT
Endorsement indicates that a resource has passed Cambridge International’s rigorous quality-assurance process and is suitable to support the delivery of a Cambridge International curriculum framework. However, endorsed resources are not the only suitable materials available to support teaching and learning, and are not essential to be used to achieve the qualification. Resource lists found on the Cambridge International website will include this resource and other endorsed resources.
Any example answers to questions taken from past question papers, practice questions, accompanying marks and mark schemes included in this resource have been written by the authors and are for guidance only. They do not replicate examination papers. In examinations the way marks are awarded may be different. Any references to assessment and/or assessment preparation are the publisher’s interpretation of the curriculum framework requirements. Examiners will not use endorsed resources as a source of material for any assessment set by Cambridge International.
While the publishers have made every attempt to ensure that advice on the qualification and its assessment is accurate, the official curriculum framework, specimen assessment materials and any associated assessment guidance materials produced by the awarding body are the only authoritative source of information and should always be referred to for definitive guidance. Cambridge International recommends that teachers consider using a range of teaching and learning resources based on their own professional judgement of their students’ needs.
Cambridge International has not paid for the production of this resource, nor does Cambridge International receive any royalties from its sale. For more information about the endorsement process, please visit www.cambridgeinternational.org/endorsed-resources
Cambridge International copyright material in this publication is reproduced under licence and remains the intellectual property of Cambridge Assessment International Education.
Third party websites and resources referred to in this publication have not been endorsed by Cambridge Assessment International Education.
DRAFT Original material © Cambridge University Press 2023. This material is not final and is subject to further changes prior to publication.
Welcome to Stage 7 of Cambridge Lower Secondary Computing!
Computers and technology play an important role in our lives and are all around us. Learning about technology will help you understand the world you live in.
In this book, you will:
• develop your computational thinking skills and create programs in Python
• discover how data can be used to plan and help us in real-life situations
• learn all about different types of networks and how data allows us to access websites
• think critically about devices and systems and how useful they are for a certain purpose, such as asking yourself, ‘What does the internet allow us to do?’
…and much more!
Computer scientists work with lots of different people when developing computer programs. Like a computer scientist, you will have lots of opportunities to work with a partner or a group in the activities throughout this book. Sharing your ideas with other people helps you learn more about how computers and technology are used. You can always learn new skills from working with others!
Some of the activities will be done away from a computer. These activities will develop your computing knowledge, and activities on the computer will develop your computing skills. There is also a project for you to complete at the end of each unit. These give you the chance to be creative and will help you develop your understanding.
We hope you find learning more about computers and technology exciting, and that you enjoy discovering how the modern world works.
Victoria Ellis and Sarah Lawrey
Introduction 4
Original material © Cambridge University Press 2023. This material is not final and is subject to further changes prior to publication.
Introduction DRAFT
1.3
1.4
Throughout the resource there is a symbol to indicate where additional digital only content is required. This content can be accessed through the Digital Learner’s Book on Cambridge GO. It can be launched either from the Media tab or directly from the page.
The symbol that denotes additional digital content is:
The source files can also be downloaded from the Source files tab on Cambridge GO. In addition, this tab contains a teacher guidance document which supports the delivery of digital activities and programming tasks in this Learner’s Book.
Contents 5
Contents
Page Unit 6–8 How to use this book
1 Computational thinking and programming
Flowcharts
Selection and logic in flowcharts
9–145
1.1
1.2
Pattern
and sub-routines in flowcharts
recognition
Introduction to text-based programming
Python programming
Software development and testing
Physical computing 146–201 2 Managing data
Spreadsheets
Modelling
Databases
Data collection 202–234 3 Networks and digital communication 3.1 Accessing websites 3.2 Types of network 3.3 Data transmission 235–283 4 Computer systems 4.1 Computer design 4.2 Types of software 4.3 Data representation 4.4 Logic gates 4.5 Automation and artificial intelligence 284–289 Glossary and Index 290 Acknowledgements DRAFT Original material © Cambridge University Press 2023. This material is not final and is subject to further changes prior to publication.
1.5
1.6
1.7
2.1
2.2
2.3
2.4
How to use this book
This book contains lots of different features that will help your learning. These are explained below.
This list sets out what you will learn in each topic. You can use these points to identify the important topics for the lesson. This contains questions or activities to help find out what you know already about this topic.
Important words are highlighted in the text when they first appear in the book. You will find an explanation of the meaning of these words in the text. You will also find definitions of all these words in the Glossary and Index at the back of this book.
You will have the opportunity to practise and develop the new skills and knowledge that you learn in each topic. Activities will involve answering questions or completing tasks by using a computer. Some activities don't require a computer. These are called unplugged activities, and they help you understand important ideas about computing.
How to use this book 6
DRAFT Original material © Cambridge University Press 2023. This material is not final and is subject to further changes prior to publication.
Peer-assessment questions help you evaluate the work of your peers.
These tasks help you to practise what you have learnt in a topic.
Programming tasks are in Unit 1
Practical tasks are in Unit 2
Self-assessment questions help you think about your work and how you learn.
When you see this icon, you are going to do a digital activity using a source file or website link. This content can be found on Cambridge GO. Your teacher will help you to get started.
How to use this book 7
DRAFT Original material © Cambridge University Press 2023. This material is not final and is subject to further changes prior to publication.
These questions help you to practise what you have just learnt.
Important safety tips to remember when using a computer and going online.

These tell you interesting facts connected to the topic.
This contains questions that ask you to look back at what you have covered and encourages you to think about your learning.
This list summarises the important material that you have learnt in the topic.
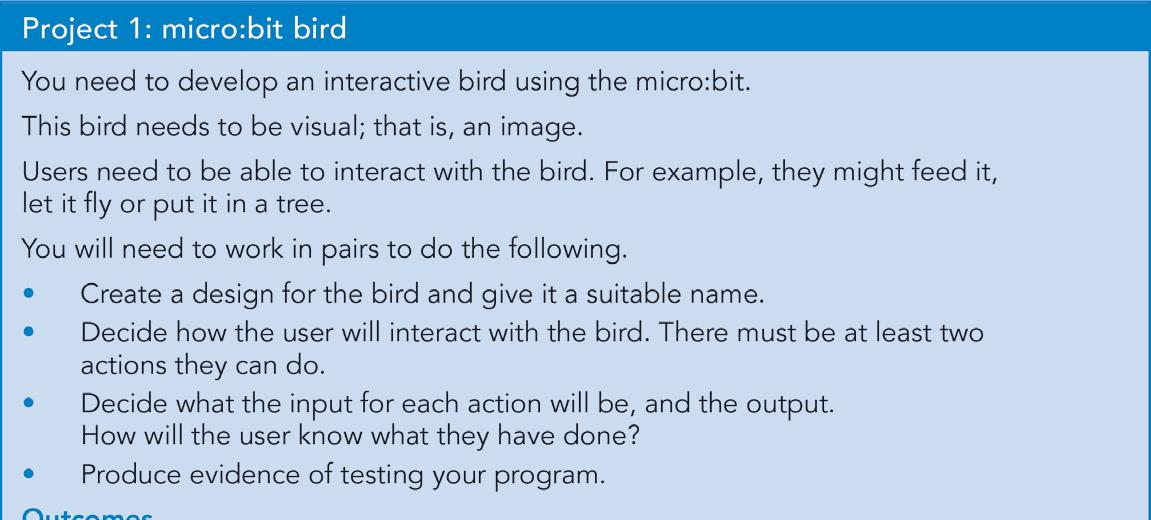
At the end of each unit, there is a project that you might carry out by yourself or with other learners. This will involve using some of the knowledge that you developed during the unit. Your project might involve creating or producing something, or you might solve a problem.
These questions look back at some of the content you learnt in each unit. If you can answer these, you are ready to move on to the next unit.
How to use this book 8
DRAFT Original material © Cambridge University Press 2023. This material is not final and is subject to further changes prior to publication.
1.1 Flowcharts
In this topic you will:
• understand the structure of a flowchart
• know how to follow a flowchart
• learn how to edit a flowchart
• learn how to correct a flowchart
• create a flowchart to solve a problem.
Getting started
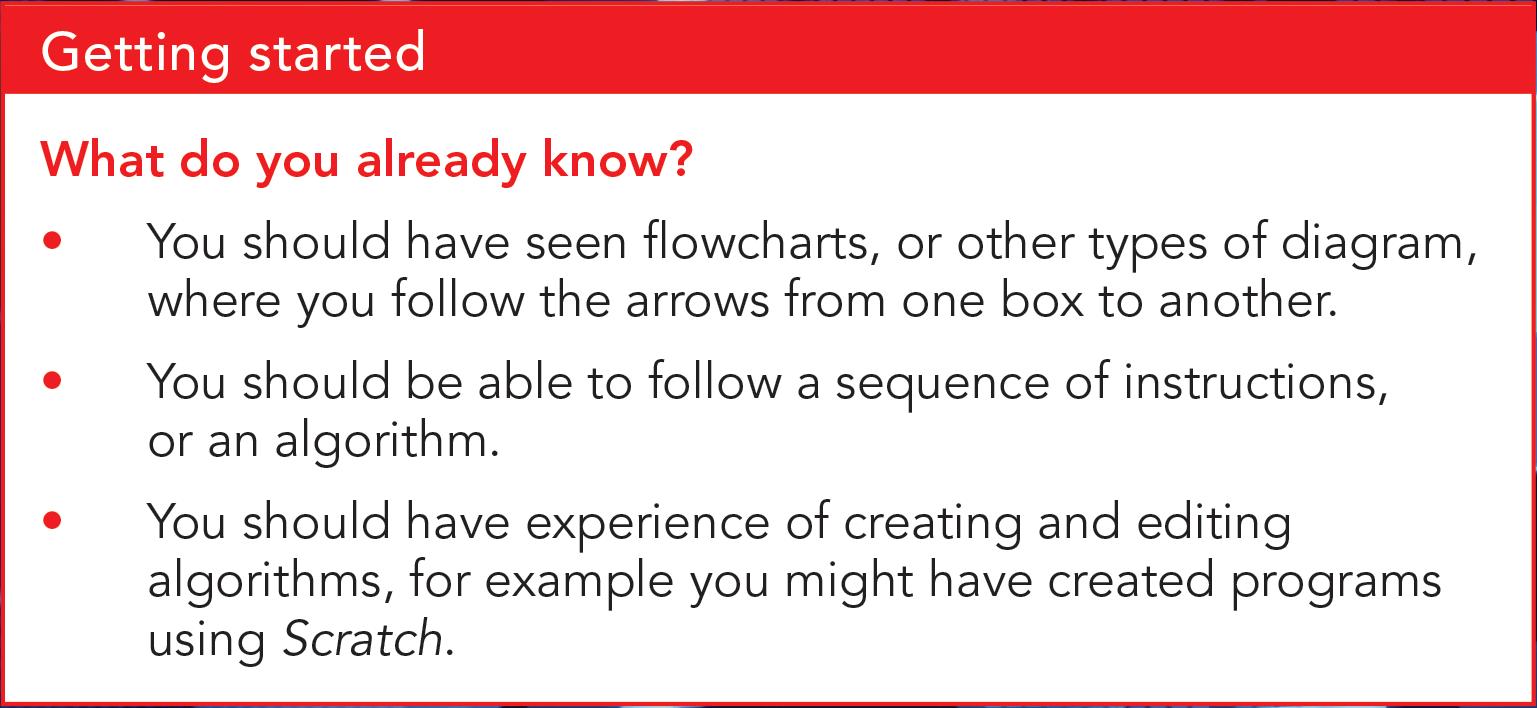
What do you already know?
• You should have seen flowcharts, or other types of diagram, where you follow the arrows from one box to another.
• You should be able to follow a sequence of instructions, or an algorithm.
• You should have experience of creating and editing algorithms. For example, you might have created programs using Scratch.
Key words
data flow


flowchart
input output
process
variable
1 Computational thinking and programmingDRAFT
Original material © Cambridge University Press 2023. This material is not final and is subject to further changes prior to publication.
Now try this!
Follow this flowchart. What actions did you perform?
Look at the flowchart. What features does it have? What do the boxes look like? What joins the boxes?
Following flowcharts
Put
Cross
A flowchart is a diagram that shows a sequence of steps that should be followed. The diagram could ask you to do practical activities, like the one in the Now try this! task, or it could represent the steps that a computer program will follow.
Both types of flowchart will have the same features, so we will look at both. A flowchart has to follow set rules. These rules include:
• specific shapes for different purposes:
• input – for the user to enter data
• process – to do a calculation or action
• output – to display words and numbers to the user
• a start and a stop (sometimes these might be labelled ‘begin’ and ‘end’)
• data flows (the arrows that show you how to move through the flowchart).
10 1 Computational thinking and programming Continued
Start Stop
your hands on your head
your arms
up
around
on one leg 10 times
on the floor
up DRAFT Original material © Cambridge University Press 2023. This material is not final and is subject to further changes prior to publication.
Stand
Turn
Hop
Sit
Stand
This table shows the flowchart shapes and their purpose.
Shape Description Example
Start or stop
Start: this is the first box in a flowchart. It has an arrow to the first box to run.
Stop: this is the last box in a flowchart. It has an arrow from the last box to run.
Input or output
Input: this takes a value from the user and stores it somewhere.
Output: this displays a message, or makes a sound.
Process
Data flow
Start Stop
Shout "Hello" OUTPUT "Hello"
This is an action. It tells something to change. Stand up
Number = number + 1
A data flow is an arrow. The arrows show you which box to move to next.
The start box does not have any arrows going into it, but it must have one (and only one) arrow coming from it.
The stop box has one (and only one) arrow going into it, and no arrows coming from it.
The input/output box has one (and only one) arrow going into it, and one (and only one) arrow coming from it.
The process box has one (and only one) arrow going into it, and one (and only one) arrow coming from it.
11 1.1 Flowcharts
Table 1.1: Shapes used in flowcharts and their meanings
Stand up INPUT colour
Stop Start
DRAFT Original material © Cambridge University Press 2023. This material is not final and is subject to further changes prior to publication.
Figure 1.1: Data flow
Questions 1.1
1 What is the shape of the output box?
2 What is the shape of the process box?
3 How many data flows go into a start box?
4 How many data flows go into a stop box?
Following a flowchart
To follow a flowchart:
• find the start box
• follow the arrow from start to the next shape
• perform the action in each shape
• continue until you reach the stop box.
Unplugged activity 1.1
Follow this flowchart and perform each of the actions. Compare what you did with a classmate. Did you do anything differently?
Shout "Boo!"
Clap twice
Shout "NO!"
Shout "Yes!"
Wave with both hands
Flowchart actions should be performed one at a time.
12 1 Computational thinking and programming
Start
Stop
Figure 1.2: Flowchart for activity
DRAFT Original material © Cambridge University Press 2023. This material is not final and is subject to further changes prior to publication.
Storing data
Read this flowchart: Start
OUTPUT "How old are you?"
INPUT age
age = age + 10
OUTPUT "in 10 years you will be"
OUTPUT age Stop
Figure 1.3:
This flowchart uses a variable. A variable is a named storage location where you can store data. The data value can change in a variable. In this flowchart, the variable is age. The flowchart can put data into age, for example:
INPUT age
The data the user enters will be stored in age. The flowchart can change the data in age, for example:
age = age + 10
Figure
This adds 10 to age and then stores the result.
You might remember variables from primary school!
13 1.1 Flowcharts
Flowchart
Figure 1.4: Input box
1.5: Process box changing data
DRAFT Original material © Cambridge University Press 2023. This material is not final and is subject to further changes prior to publication.
The flowchart can access the data in age, for example: This will output the contents of age.
Unplugged activity 1.2
OUTPUT age
You will need: an empty box, a sticker, pieces of paper and some pens
Get into groups of three and number yourselves 1, 2 and 3. Someone in the group should write 'number' on a sticker and put it on the box. The box is going to act as the variable.
number
Put a value into number:
• Person 1 writes 23 on a piece of paper
• That person then opens the box and puts the piece of paper in the box
number now stores 23.
23
number
14 1 Computational thinking and programming
Figure 1.7: The ‘variable’
Figure 1.8: Storing a number in the ‘variable’
DRAFT Original material © Cambridge University Press 2023. This material is not final and is subject to further changes prior to publication.
Figure 1.6: Output box
Add 10 to number. Person 2 performs these actions.
• Open the box and take the piece of paper out.
• Add 10 to the number on the paper.
• Write this value on a new piece of paper.
• Put the new piece of paper in the box. number should now store 33.
23 +10 = 33
23 33
Outputting number
• Person 3 should open the box and take the piece of paper out.
• Read out what is on the piece of paper.
• Put the same piece of paper back in the box.
33 should have been output.
Take it in turns to give the other members of your group instructions to either put a value into number, change the content of number or output the content of number.
Everyone should follow the instructions to make sure they are run correctly.
15 1.1 Flowcharts
Continued
number number
Figure 1.9: Changing the number in the ‘variable’
33 number
DRAFT Original material © Cambridge University Press 2023. This material is not final and is subject to further changes prior to publication.
Figure 1.10: The output
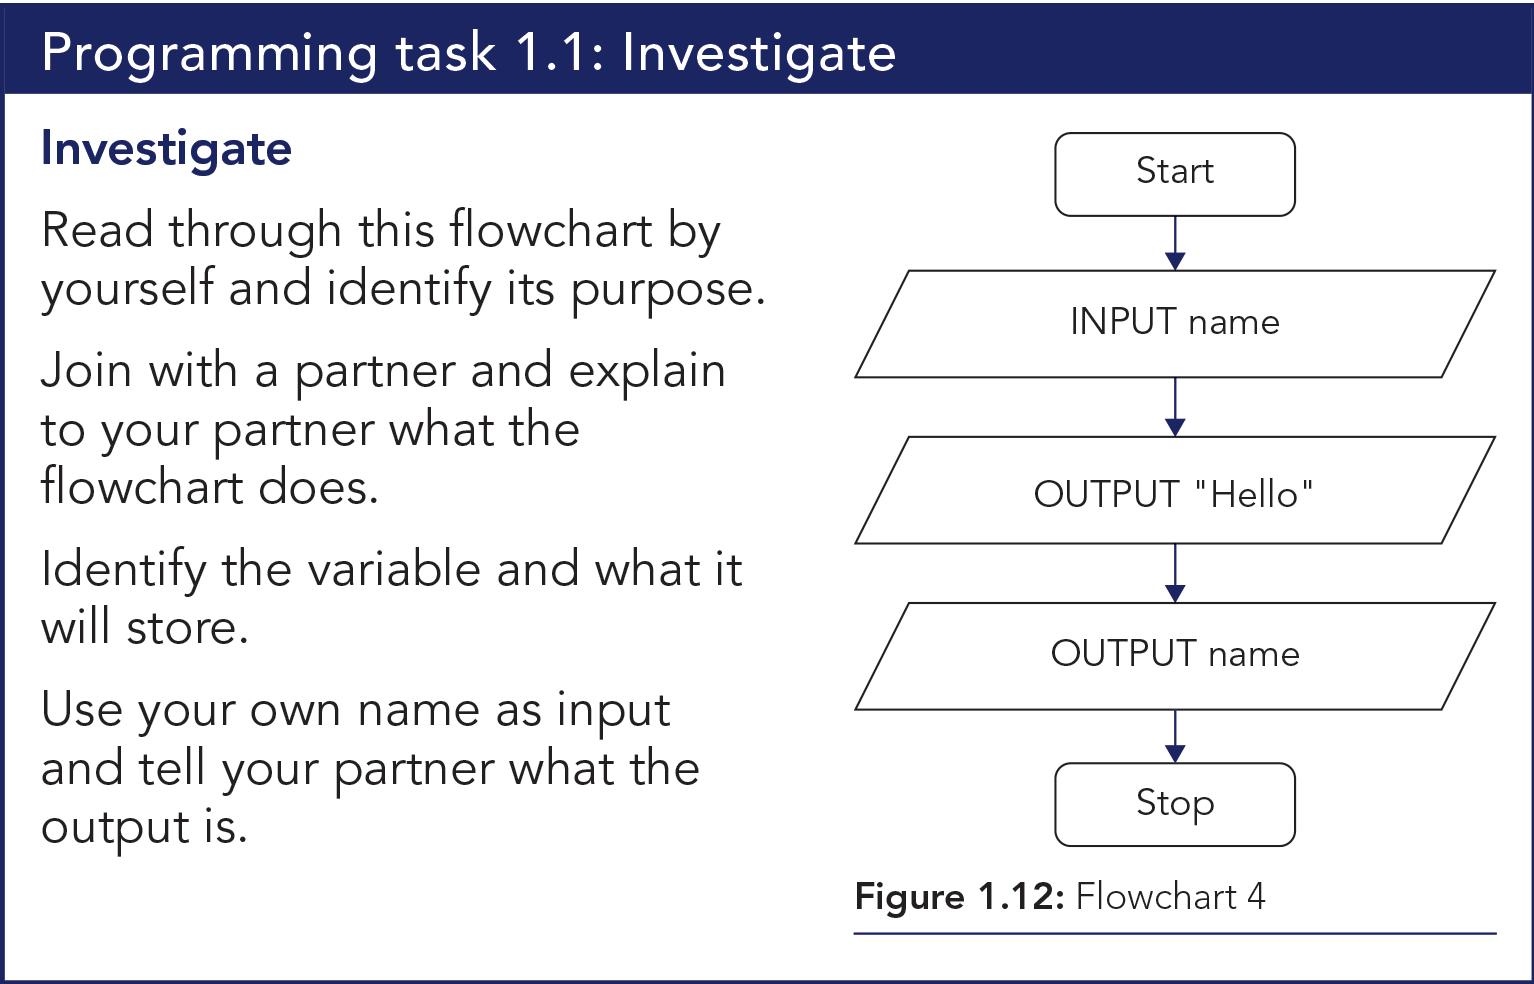
Programming task 1.1: Investigate
Investigate: Read through this flowchart by yourself and identify its purpose.
Join with a partner and explain to your partner what the flowchart does. Identify the variable and what it will store.
Use your own name as input and tell your partner what the output is.
Programming task 1.2: Predict and Run
Predict: Discuss the purpose of this flowchart with a partner. Explain to each other what the flowchart will do.
Run: Test your program. The first time, input the number 10. The second time, input the number 20.
• What is the total?
• Were you correct?
Did you know?
Flowcharts are used in all sorts of industries and professions, not just computer science. You are just as likely to see a flowchart in science, geography, history or even philosophy.
16 1 Computational thinking and programming
Start INPUT name OUTPUT "Hello" OUTPUT name Stop
Figure 1.11: Flowchart for programming task
Start OUTPUT "Enter a number" INPUT first OUTPUT "Enter another number" Stop INPUT second total = first + second OUTPUT total
DRAFT Original material © Cambridge University Press 2023. This material is not final and is subject to further changes prior to publication.
Figure 1.12: Flowchart for programming task
Editing and correcting flowcharts
You may be given a flowchart that does not work – it doesn’t do what it is supposed to do. Or you could be given a flowchart that needs to be changed to do something new, or to do something extra.
Before you do either of these, you first need to trace the algorithm yourself. You need to walk through the flowchart one step at a time to find out what it does.
Correcting errors
If you need to correct an error, compare what the flowchart does to what it should do. For example, the number 20 is output instead of the number 10. You need to find out why and then make the change.
Common errors may include:
• using the wrong mathematical operator (+, -, *, /)
• using the wrong values in a calculation
• not taking the correct value as input from the user
• outputting an incorrect value.
You need to test the flowchart before you look for the error, and then test it again with the same data after to make sure it now works.
Unplugged activity 1.3
This flowchart should add together three numbers that are input by the user and output the result. There is an error in the flowchart. Work in pairs to walk through the flowchart and find out what it does.
Input some numbers – for example, 1, 2, 3 – and see whether it outputs the correct value (6).
Did the flowchart give the correct result?
Discuss with your partner where the error is and change the flowchart. Test your flowchart with the same data and see if it gives the correct result.
17 1.1 Flowcharts
Start INPUT first Stop INPUT second INPUT third total = first + second OUTPUT total
DRAFT Original material © Cambridge University Press 2023. This material is not final and is subject to further changes prior to publication.
Figure 1.13: Flowchart for activity
Programming task 1.3: Predict, Run and Investigate
You will need: a pen and paper
This flowchart should:
• take a number from the user
• multiply the number by 2 and output it in a message
• multiply the number by 4 and output it in a message.
Predict: Identify a number to be input. Write down what the output should be.
Run: Test the flowchart with the number you have identified and write down the output.
Investigate:
1 Identify where there is a difference between what you predicted, and the result.
2 Identify the error, or multiple errors, and change the flowchart.
3 Re-test the flowchart with the same number. Write down the output. Repeat until the flowchart works.
Changes
If you are changing a flowchart, you first need to work out what the flowchart does now. Then identify what it needs to do, and the difference between these. Change the flowchart and test it to see if it now works. Common changes may include:
• performing a different mathematical calculation
• changing the output
• including an additional input or output
• inserting an extra calculation.
18 1 Computational thinking and programming
Start OUTPUT "Enter a number" OUTPUT number & " * 2 = " & first OUTPUT number & " * 4 = " & first INPUT number Stop first = number * 2 second = number * 4
Figure 1.14: Flowchart for programming task
DRAFT Original material © Cambridge University Press 2023. This material is not final and is subject to further changes prior to publication.
Unplugged activity 1.4
You will need: a pen and paper
This flowchart calculates the number of years (approximately) that someone has been alive.
Test the flowchart with a partner. Take it in turns to input the data and calculate the result.
The flowchart needs to be changed to also output the number of months in that many years. For example, in 10 years there are 120 months. There are four different additions below but only one will perform the change required. Work out with your partner which is the correct addition.
months = currentYear * 12
OUTPUT "This is" & months & "months"
age = currentYear - birthYear
OUTPUT "You have been alive" & age & "years"
months = birthYear / 12
OUTPUT "This is" & months & "months"
months = age / 12
OUTPUT "This is" & months & "months"
months = age * 12
OUTPUT "This is" & months & "months"
Redraw the flowchart with your selected addition. Test your flowchart and make sure it works.
19 1.1 Flowcharts
Figure 1.16: Additional parts for the flowchart
Start
INPUT birthYear
Stop
INPUT currentYear
DRAFT Original material © Cambridge University Press 2023. This material is not final and is subject to further changes prior to publication.
Figure 1.15: Flowchart for activity
Programming task 1.4: Predict, Run and Modify
You will need: a pen and paper
Read this flowchart: Start
INPUT number
OUTPUT number + 10
OUTPUT number + 20
OUTPUT number + 30 Stop
Predict: Identify a number to input and write down what you think will be output.
Run: Test the flowchart by inputting your number and writing down the output. Compare the output to your prediction.
Modify 1: The flowchart needs to also output the result of the number input + 40:
• Identify the flowchart shape that this calculation will be put into.
• Identify the position in the flowchart for this to be put.
• Redraw the flowchart with your addition.
Swap your flowchart with a partner. Predict and run your partner’s flowchart. Did it give the correct answer? If not, tell your partner what the difference was, so they can find and correct the error.
20 1 Computational thinking and programming
Figure 1.17: Flowchart for programming task
DRAFT Original material © Cambridge University Press 2023. This material is not final and is subject to further changes prior to publication.
Modify 2: The flowchart needs to output a message with each value, for example, "10 + 10 = 20".
• Identify how a message can also be output.
• Identify the places in the flowchart that this change will be placed.
• Redraw the flowchart with your addition.
Swap your flowchart with a partner. Predict and run your partner’s flowchart. Did it give the correct answer? If not, tell your partner what the difference was, so they can find and correct the error.
Modify 3: The flowchart needs to ask the user to input their name at the start, and then a message that says "Goodbye" followed by their name.
• Identify how the name will be input, and how the message will be output.
• Identify the place in the flowchart where the input will go.
• Identify the place in the flowchart where the output will go.
• Redraw the flowchart with your addition.
Swap your flowchart with a partner. Predict and run your partner’s flowchart. Did it give the correct answer? If not, tell your partner what the difference was, so they can find and correct the error.
Create a flowchart
You have learnt the symbols for flowcharts, you have followed flowcharts, and you have changed and corrected flowcharts. Now it is time to create your own flowcharts.
When you create a flowchart for an algorithm, it is a good idea to start by writing down the steps of the algorithm.
Example:
A flowchart needs to take a user’s name and their favourite food as input, and then output a message telling them that you don’t like the food they have chosen.
Split this long sentence into short statements, each statement should only do one action:
1 Take user’s name as input.
2 Take favourite food as input.
3 Output message saying "I don’t like" food entered.

21 1.1 Flowcharts Continued
DRAFT Original material © Cambridge University Press 2023. This material is not final and is subject to further changes prior to publication.
From this you can start to draw your flowchart.
1 Always start with start! Start
Figure 1.18: Start box
2 The first action is 'Take user’s name as input'. Draw an input box. Write a statement to input the name. Because the name will be stored, it needs a variable. Start INPUT name
Figure 1.19: Input 'Take user’s name as input'
3 The second action is 'Take favourite food as input'. Draw an input box and write the statement to input the favourite food. It will need a variable. Start
INPUT name
INPUT food
Figure 1.20: Input 'Take favourite food as input'
4 The third action is 'Output message saying "I don’t like" food entered'. The food entered will be stored in the variable food. Start INPUT name
INPUT food
OUTPUT "I don’t like" & food
Figure 1.21: Output message ‘I don’t like food'
22 1 Computational thinking and programming
DRAFT Original material © Cambridge University Press 2023. This material is not final and is subject to further changes prior to publication.
5 Always end with a stop.
When you have drawn your flowchart, use this checklist to make sure you have met flowchart requirements:
Requirements checklist ✓
Is there a start and a stop?
Are all inputs and outputs in the correct shape?
Are all processes in the correct shape?
Does each input, output and process have one data flow arrow going in, and one data flow arrow going out?
Do all the boxes lead to another box?
If you have used a variable, have you used the same name consistently?
Have you used the correct mathematical symbols (+, -, *, /)?
If these are all met, then it’s time to test your flowchart. Predict what the output should be, then Run the flowchart to see if it works correctly.
If it does, then great!
If it doesn’t, that’s OK. Look at the output you got and the output you expected. What is the difference? Then find the error.
Did you know?
It is OK for your algorithms to not work first time. All programmers make errors, even professionals who write programs all day. Have you heard of patches being downloaded for software? This is where an error is found and it needs to be fixed.
23 1.1 Flowcharts
Start Stop INPUT name INPUT food OUTPUT "I don’t like" & food
Figure 1.22: Flowchart with stop box
Table 1.2: Flowchart requirements checklist
DRAFT Original material © Cambridge University Press 2023. This material is not final and is subject to further changes prior to publication.
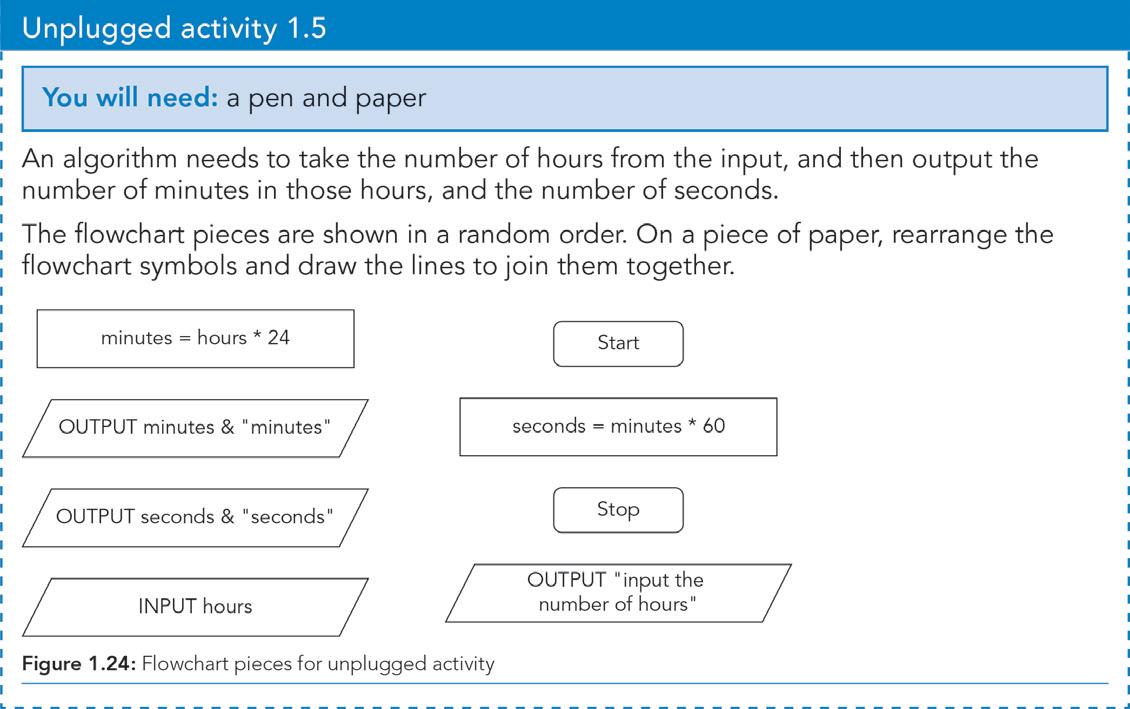
Unplugged activity 1.5
You will need: a pen and paper
An algorithm needs to take the number of hours from the input, and then output the number of minutes in those hours, and the number of seconds.
The flowchart pieces are shown in a random order. On a piece of paper, rearrange the flowchart symbols and draw the lines to join them together.
Programming task 1.5: Make and Predict
You will need: a pen and paper
Make: The perimeter (the length of all the sides added together) of a square is the length of one side multiplied by 4.
The area of a square is the length of one side squared. Draw a flowchart to take the length of one side of a square as input, and then output the perimeter and area.
When you have drawn your flowchart, compare it to the flowchart checklist.
Predict and Modify: Predict the outcome and run your flowchart to make sure it works. If it doesn’t, then modify it until it does.
Swap your flowchart with a partner. Predict and run their flowchart to make sure it works.
24 1 Computational thinking and programming
Start Stop minutes = hours * 24 seconds = minutes * 60 OUTPUT seconds & "seconds" INPUT hours OUTPUT "input the number of hours" OUTPUT minutes & "minutes"
Figure 1.23: Flowchart pieces for unplugged activity
DRAFT Original material © Cambridge University Press 2023. This material is not final and is subject to further changes prior to publication.
Peer-assessment
Compare the two flowcharts: yours and your partner’s.
• Are they exactly the same?
• What are the differences?
• Do the differences change how the algorithm works?
Questions 1.2
1 Create a flowchart to output the chorus of a song, one line at a time.
2 Create a flowchart to take a number as input, divide the number by 2 and output the result.
3 Create a flowchart to take a distance in miles, convert it to kilometres and output the result.
4 Create a flowchart to take a number as input, then output the first 12 multiples for that number. For example, if 2 is input, then the flowchart should output:
2 × 1 = 2
2 × 2 = 4
2 × 3 = 6
2 × 4 = 8
2 × 11 = 22
2 × 12 = 24
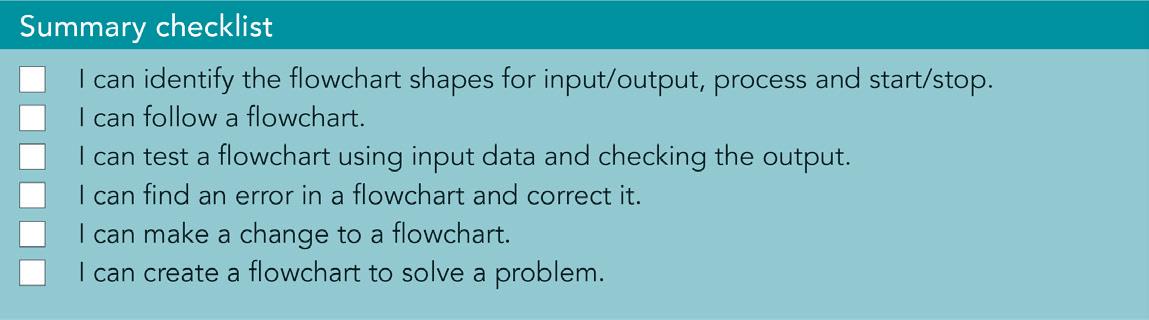
Summary checklist
I can identify the flowchart shapes for input/output, process and start/stop. I can follow a flowchart.
I can test a flowchart using input data and checking the output. I can find an error in a flowchart and correct it. I can make a change to a flowchart.
I can create a flowchart to solve a problem.
25 1.1 Flowcharts
Continued
DRAFT Original material © Cambridge University Press 2023. This material is not final and is subject to further changes prior to publication.
1.2 Selection and logic in flowcharts
In this topic you will:
• understand how to use selection statements in a flowchart

• follow flowcharts that use selection and predict the result
• follow flowcharts and algorithms that use IF THEN ELSE
• select and use <, >, <=, >=, == and !=
• use the Boolean operators AND, OR and NOT in selection.
Getting started
What do you already know?
• What you do next will depend on what your decision is:
• If I have toast, then I need to put the bread in the toaster.
Shall I have toast or fruit for breakfast?
• If I have fruit, I need to cut it into smaller pieces.
The same thing happens when you are designing a computer program.
• You have probably used branching algorithms, most likely in Scratch. A branching statement has a condition –this is a question that only has two possible answers, true (yes) or false (no).
Key words
AND
Boolean condition
Boolean logic comparison operator condition
IF, THEN, ELSE NOT OR selection statement
1 Computational thinking and programming
DRAFT Original material © Cambridge University Press 2023. This material is not final and is subject to further changes prior to publication.
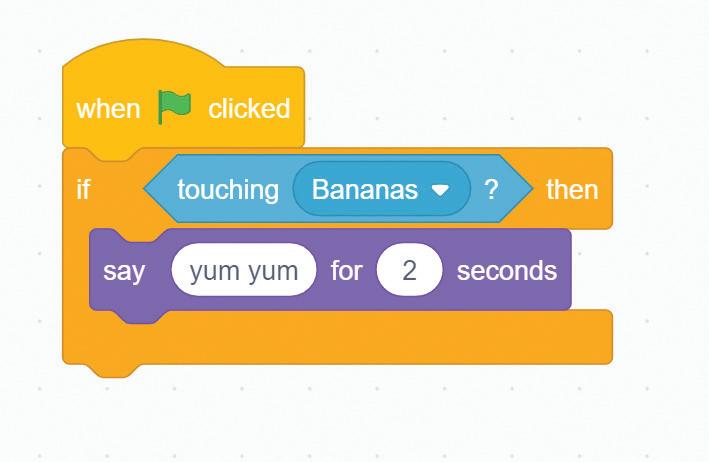
Here’s an example:
When the cat touches the Bananas sprite, it will say ‘yum yum’.
• You might have used comparison operators in your mathematics lessons. You might have even used them in Scratch.
Comparison operators are: = > < >= <=
You use a comparison operator to compare the numbers on either side of it. For example, are two numbers the same? Is one number greater than another number? Is one number less than another number? Check what you already know by answering these questions:
Is 10 > 3?
Is 20 = 19?
Is 100 < 50?
Now try this!
Read these statements and perform each action. You can do this on your own or with a partner.
• If you like the colour red better than the colour blue, stand up, otherwise sit on the floor.
• If you like fruit better than pizza, put your right hand on your head, otherwise put your left hand on your head.
• If you like maths better than science, laugh, otherwise say ‘shhhhhh’.
Now look around at everyone else. Is anyone doing the same actions as you? Why are people doing different things? Why are some people sitting down?
You have just been running selection statements.
27 1.2 Selection and logic in flowcharts
Continued
DRAFT Original material © Cambridge University Press 2023. This material is not final and is subject to further changes prior to publication.
Selection statements
A selection statement is used when a decision needs to be made in an algorithm. It has a condition. This is a statement that will be either true or false.
• If the result is true, then one action will take place.
• If the result is false, then a different action will take place. Selection statements often have the key commands IF, THEN and ELSE. Selection statements have three parts:
1 condition: The condition (can only be true or false).
2 true: The action that happens if the condition is true.
3 false: The action that happens if the condition is false. This statement can then be written as IF (condition) THEN (true) ELSE (false)
Unplugged activity 1.6
You will need: a paper, pen and scissors
In pairs, take a piece of paper and cut it into 10 different pieces. Write a different number on each piece of paper. Write any numbers you like, not just 1 to 10.
Put all the pieces of paper face down on the table, so that you cannot see the numbers.
Each of you pick a number, then follow this statement:
IF you have a higher number than your friend THEN you win a point, ELSE you lose a point.
Keep playing until one of you reaches 10 points.
Congratulations, you just ran a selection statement! You executed the three parts of a selection statement:
• The condition (is your number higher than your friend’s number?)
• The action if it is true (you win a point)
• The action if it is false (you lose a point)
Did you know?
Computers cannot make decisions without being told to. Almost all of the decisions that computers make are programmed using selection statements.
28 1 Computational thinking and programming
DRAFT Original material © Cambridge University Press 2023. This material is not final and is subject to further changes prior to publication.
Selection in flowcharts
Selection uses the diamond symbol in a flowchart:
Inside the diamond, you write the condition. For example, IF colour chosen = blue
Note: In a flowchart the ‘equals to’ symbol can be = or ==. Keep in mind that the word IS can be used instead of IF in a flowchart. The diamond then has two arrows that come from it. One arrow is followed when the condition is True (or yes). The second is followed when the condition is False (or no). True and False need to be written on the arrows so we know which is which. Here’s an example of both ways this can be shown:
IF colour == blue True
This format matches the selection statement format IF, THEN, ELSE we looked at earlier. It has the three parts:
• IF: The condition (that can only be true or false) within the diamond.
• THEN: The action that happens if the condition is true, follow the True or Yes arrow.
• ELSE: The action that happens if the condition is false, follow the False or No arrow.
29 1.2
Selection and logic in flowcharts
Figure 1.24: The selection symbol
False
Figure 1.25: Examples of a selection statement
IS colour == blue? Yes No DRAFT Original material © Cambridge University Press 2023. This material is not final and is subject to further changes prior to publication.
Programming task 1.6: Investigate
You will need: a pen and paper
Read this flowchart with a partner. Investigate: Discuss these questions with a partner. Point to the different parts of the flowchart and write your answers to the questions.
1 Where is the selection box in the flowchart?
2 What is the condition in the flowchart?
3 What happens if the condition is true?
4 What happens if the condition is false?
Self-assessment
How did you follow the flowchart? Did you miss out some of the boxes, or did you read each box one at a time in order?
Did you help your partner? Or did your partner help you? How did you decide on the correct answer to each question between you?
30 1 Computational thinking and programming IF colour = blue ELSE THEN True False
Figure 1.26: Examples of a selection statement using IF, THEN, ELSE
Start INPUT colour Stop OUTPUT "That colour is ok, but purple is better" IF colour == "purple" True False OUTPUT "I like purple too"
DRAFT Original material © Cambridge University Press 2023. This material is not final and is subject to further changes prior to publication.
Figure 1.27: Flowchart for programming task
Programming task 1.7: Predict
Predict: Work with a partner and follow this algorithm. Predict what will happen if:
• the number 4 is input into the algorithm?
• the contents of the two output boxes are swapped around (although the arrows stay in the same place)?
• there is no INPUT answer box?
• the decision changes to IF answer >= 4?
• the ‘True’ and ‘False’ are removed from above the data flow arrows?
Questions
1.3
1 What is a selection statement?
2 What shape is selection in a flowchart?
3 How many arrows come from a selection box in a flowchart, and what is written on each?
4 What are the three parts of a selection statement?
Comparison operators
Do these symbols look familiar from mathematics?
These are called comparison operators and we include them in statements in algorithms. We use them to perform comparisons between different values.
31
1.2 Selection and logic in flowcharts
> < >= <=
INPUT answer Stop OUTPUT "Sorry, no it’s 4" IF answer = 4 OUTPUT "Correct" Start OUTPUT "What is 2 + 2?" True False
DRAFT Original material © Cambridge University Press 2023. This material is not final and is subject to further changes prior to publication.
Figure 1.28: Flowchart for programming task
The different operators are shown in this table:
Operator Description Examples
> greater than 10 > 2
20 > 19 200 > 0
< less than 100 < 200
1 < 2
0 < 10
>= greater than or equal to 100 >= 100
120 >= 99
22 >= 1
<= less than or equal to 100 <= 100
82 <= 99
1 <= 3
== equal to 100 == 100
20 == 20
1 == 1
!= not equal to 2 != 1
100 != 99
0 != 10
These are the symbols that are used in the programming language Python, which you will be using later in this unit. You can put one of these operators in a selection condition, and the result will be either True or False.
Let’s look at an example: Is 10 > 2?
This is asking whether the number 10 is greater than 2.
• If 10 is greater than 2, the result is True.
• If 10 is not greater than 2, the result is False. What is the result? True.
Did you know?
These operators might be different depending on the language you use. Especially the symbols for ‘equal to’ and ‘not equal to’. For example, in the language Visual Basic, ‘equal to’ is = and ‘not equal to’ is <>.
32 1 Computational thinking and programming
Table 1.3: Comparison operators
DRAFT Original material © Cambridge University Press 2023. This material is not final and is subject to further changes prior to publication.
Unplugged activity 1.7
You will need: a pen and paper
Write a list of questions that make use of the comparison operators – for example, ‘Is 2 < 1’? Make sure that you have at least one question for each operator. Swap your questions with a partner.
Write an answer to each of your partner’s questions.
Swap the answers back.
Peer-assessment
Check your partner’s answers. Give them a tick if they are correct. Add the number of ticks and give your partner a final mark.
If your partner has any incorrect answers, explain to them why their answer was incorrect, and make sure they understand the reasons.
Boolean logic
The conditions in the flowcharts above can only be answered by True or False. These are called Boolean conditions. Boolean means that there are only two options. These could be:
• True / False
• Yes / No
• 1 / 0
• Positive / Negative
There is no ‘maybe’ answer.
Unplugged activity 1.8
You will need: a pen and paper
Work with a partner. Write down three questions that can only have two possible answers: true or false. Ask your partner your questions, and they will ask you their questions. When answering, try and work out if there is a possible third answer. For example, do you prefer apples or kiwi? Your partner might not like either!
33
1.2 Selection and logic in flowcharts
DRAFT Original material © Cambridge University Press 2023. This material is not final and is subject to further changes prior to publication.
Self-assessment
How many of your questions only had two possible answers?
Were you able to find more answers to your partner’s questions?
How did you change your questions to try and make them have only two answers?
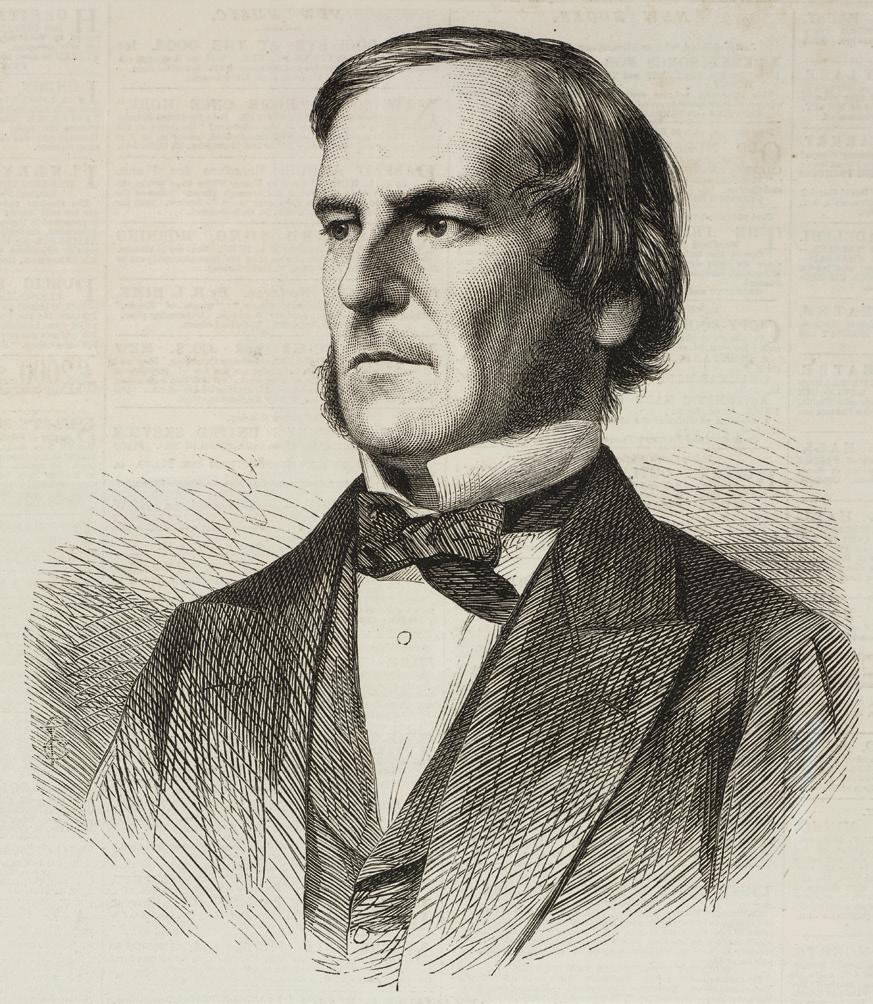
Did you know?
George Boole was a mathematician who lived in the 1800s. He developed Boolean logic, which computers (and humans) still use today. Boolean logic is named after him.
There are different Boolean operators. The three basic operators are AND, OR and NOT. The operators are used when you need to check more than one condition.
AND
This statement has one condition on either side. If both conditions are true, the result is true. Otherwise, the result is false. Is Condition 1 true AND Condition 2 true?
Condition 1 will give True or False Boolean operator AND Condition 2 will give True or False
34 1 Computational thinking and programming
Figure 1.29: George Boole
Continued
DRAFT Original material © Cambridge University Press 2023. This material is not final and is subject to further changes prior to publication.
Condition 1 result Condition 2 result AND result
Let’s look at an example: Is 10 > 2 AND 20 > 5?
• Condition 1: is 10 > 2? This is true
• Condition 2: is 20 > 5? This is true
• Boolean operator: AND Both are true so the result is true.
Let’s look at another example: Is 2 > 10 AND 1 > 0?
• Condition 1: is 2 > 10? This is false
• Condition 2: is 1 > 0? This is true
• Boolean operator: AND One is false so the result is false.
This statement has one condition on either side. If one or both conditions are true, the result is true. It is false only when both conditions are false.
Is Condition 1 true OR Condition 2 true?
Condition 1 will give True or False Boolean operator OR
Condition 2 will give True or False
35 1.2
Selection and logic in flowcharts
true
false
true true true
false false false true false
false false
Table 1.4: All outcomes for the AND operator
OR
DRAFT Original material © Cambridge University Press 2023. This material is not final and is subject to further changes prior to publication.
Condition 1 result Condition 2 result OR result
Let’s look at an example: Is 10 > 2 OR 20 > 5?
• Condition 1: is 10 > 2? This is true
• Condition 2: is 20 > 5? This is true
• Boolean operator: OR
Both are true so the result is true.
Let’s look at another example: Is 2 > 10 OR 1 > 0?
• Condition 1: is 2 > 10? This is false
• Condition 2: is 1 > 0? This is true
• Boolean operator: OR
One is true so the result is true.
The Not statement has only one condition. If the condition is true, it makes it false. If the condition is false, it makes it true.
Is NOT Condition 1?
Boolean operator NOT Condition 1 will give True or False
When you use NOT, the outcome is the opposite to the condition. If the condition is TRUE, the outcome will be FALSE.
36 1 Computational thinking and programming
true true true true false true false true true false false false
Table 1.5: All outcomes for the OR operator
NOT
NOT result true false false true
Condition result
Table 1.6: All outcomes for the NOT operator
DRAFT Original material © Cambridge University Press 2023. This material is not final and is subject to further changes prior to publication.
Let’s look at an example: Is NOT 10 > 2?
• Condition: is 10 > 2? This is true
• Boolean operator: NOT NOT reverses the true to give false. Let’s look at another example: Is NOT 2 > 10?
• Condition: is 2 > 10? This is false
• Boolean operator: NOT NOT reverses the false to give true.
Unplugged activity 1.9
You will need: a pen, paper and scissors
In groups, cut out 15 pieces of paper. On each piece of paper write a number from 1 to 5, and a colour from purple, red, green, yellow, orange. Each piece of paper should have a number and a colour written on it. For example:
3, green
Place these pieces of paper face down on the table.
Each person in your group then writes a selection statement that uses Boolean AND, OR or NOT on another piece of paper. For example:
• If your card is orange AND is less than 2, sing a song.
• If your card is 1 OR 5, sit on the floor, otherwise put your hands on your head.
Fold these statements in half and put them in the middle of the table.
Pick one statement from the middle of the table and read it out. Each person in the group then picks a card and tests the statement, performing the required action.
Peer-assessment
Check which action each person in your group is performing. Say ‘yes’ if they are doing the correct action. If they are not, give them a hint such as ‘your card is orange’ to help them.
37
1.2 Selection and logic in flowcharts
DRAFT Original material © Cambridge University Press 2023. This material is not final and is subject to further changes prior to publication.
Did you know?
Not everything related to computers relies on Boolean values. Some mathematics and computer science looks at something called fuzzy logic. This allows values between 0 (false) and 1 (true).
Fuzzy logic is used when a result has more possibilities. For example, the temperature can be hot or cold, but it can also be:
very hot
warm OK
chilly
quite cold
very cold
There are not just two possibilities.
38 1 Computational thinking and programming
Programming task 1.8: Run and Modify
will need: a card from Unplugged activity 1.9 INPUT number Stop OUTPUT "Sorry" IF colour = "red" AND number > 5 OUTPUT "Yes!" Start INPUT colour True False
DRAFT Original material © Cambridge University Press 2023. This material is not final and is subject to further changes prior to publication.
You
Figure 1.30: Flowchart for programming task
Continued
Run: Pick a card with a number and colour from the Unplugged activity and run the flowchart. What will your card output?
Put your card back and pick another. Run the flowchart again. Was the result different? Keep picking cards until you have output both ‘Yes!’ and ‘Sorry’.
Modify: The flowchart needs to be changed. If the colour is red or blue then ‘Yes!’ should be output. Discuss with a partner how you would change the flowchart.
Questions 1.4
1 What are the two Boolean values?
2 What is the result of True AND True?
3 When will a Boolean OR condition give False?
4 What does a Boolean NOT do?
5 When will a Boolean AND condition not give True?
Summary checklist
I can describe the purpose of a selection statement. I can identify the three parts of a selection statement. I can follow selection statements in a flowchart.

I can predict the outcome of a flowchart that uses selection. I can identify that Boolean value can only be True or False.
I can describe the function of AND, OR and NOT.
I can follow algorithms that use AND, OR and NOT.
1.2
Selection and logic in flowcharts
DRAFT Original material © Cambridge University Press 2023. This material is not final and is subject to further changes prior to publication.
1.3 Pattern recognition and sub-routines in flowcharts
In this topic you will:
• understand what is meant by pattern recognition
• understand the reasons why pattern recognition is used when designing solutions to tasks

• understand how sub-routines are designed in flowcharts
• understand how to follow flowcharts that use sub-routines
• understand how to change flowcharts that use sub-routines.
Getting started
What do you already know?
• Patterns are everywhere in our everyday life. You will have seen them at home, in the park and in school subjects. Patterns you come across in school could be:
• What is the pattern in these numbers?
1, 2, 3, 4, 5, 6
• What is the pattern in these shapes?
Key words call (a sub-routine) efficient identifier pattern pattern recognition return (from a sub-routine) sub-routine
1 Computational thinking and programming
DRAFT Original material © Cambridge University Press 2023. This material is not final and is subject to further changes prior to publication.
• The symbol for a sub-routine in a flowchart is:
• A sub-routine is a program that can be used multiple times in an algorithm. It can also be used by different algorithms.
Now try this!
Read this list of colours.
violet purple blue red green orange
green yellow blue violet violet purple
blue red green orange green yellow
blue violet violet violet purple blue
red green orange green yellow blue
violet purple blue red green orange
green yellow blue violet purple blue
Can you identify any patterns in this list of colours?

How many different patterns can you find?
Compare your patterns with a partner’s. Did you both find the same patterns? Or different patterns?
Is there a right answer to how many patterns there are?
1.3
Continued
Pattern recognition and sub-routines in flowcharts
DRAFT Original material © Cambridge University Press 2023. This material is not final and is subject to further changes prior to publication.
Did you know?
Patterns occur naturally in plants and animals. People can find mathematical rules that describe these patterns. Next time you walk past a plant look for a pattern in its flowers or leaves.

Patterns can be identified when developing computer programs. The patterns could be:
• features in a program that will appear several times
• the same action being performed several times
• the same background or images used
• the same decisions being made
• the same inputs and outputs being made
• the same calculations being performed. And many others.
42 1 Computational thinking and programming
DRAFT Original material © Cambridge University Press 2023. This material is not final and is subject to further changes prior to publication.
Activity 1.1
You will need: a computer game with patterns in it
Find the patterns in the game.
Open a computer game, for example Pac-Man or Tetris, or another game that your teacher tells you to use. Play the game on your own.

In a group of three, write down any patterns (or repeated elements) in the game.
As a hint, in Pac-Man, each level has the same layout. In Tetris, each shape can move left or right.
Share the patterns you have identified with the rest of the class. How many different patterns did you identify?
Self-assessment
Give yourself a rating based on the number of patterns you identified. Were they all about the design, or were some about the data, processes and outputs?
Orange = I identified at least one pattern.
Blue = I identified more than one pattern but they were all the same type. Purple = I identified more than two patterns and there were at least two different types of patterns.
Pattern recognition is important when writing algorithms and programs for many reasons.
• Instead of writing the same piece of code several times, you could write it just once and then use it several times.
• Patterns can save you time when writing the program. If you use the same code several times then you only need to test it once. If it works once, it will (hopefully) work every time.
• Patterns can also make your program more efficient. This means that it could run faster or use less memory, because instead of having a lot of individual elements all working on their own, you could just have one that appears several times.
Which would you prefer to do?
1 Write the same piece of code 20 times. Or
2 Write the code once and then copy it 19 times.
43
1.3 Pattern recognition and sub-routines in flowcharts
DRAFT Original material © Cambridge University Press 2023. This material is not final and is subject to further changes prior to publication.
1 Computational thinking and programming
Questions 1.5
1 What is a pattern?
2 What is an example pattern in a computer program?
3 Why is it important to identify patterns when designing an algorithm?
Sub-routines
A sub-routine is a self-contained algorithm. It has an identifier, which is the name of the sub-routine. By using this identifier you can call the sub-routine from other code. Calling the sub-routine means that:
• the algorithm in the main code stops where it is
• the sub-routine runs
• at the end of the sub-routine, the algorithm stopped in the main code.
Unplugged activity 1.10
You will need: a pen and paper
Here is a sub-routine:
Identifier: Dance
Stand up
Turn around once
Wave hands in air twice
Turn around once
Sit down
Each time Dance is written, the steps in the sub-routine are run. Run this algorithm by yourself and perform the actions:
Dance
Dance
Dance

How many times did you stand up? How many times did you turn around?
Compare your answers with a partner’s. Did you both stand up the same number of times? If not, run the algorithm again and see who was correct.
44
DRAFT Original material © Cambridge University Press 2023. This material is not final and is subject to further changes prior to publication.
Continued
Write your own sub-routine with the identifier Dance2. Include a series of actions for a partner to perform. Make sure that these are safe in your classroom environment. If you are not sure, check with your teacher.
Write an algorithm that calls both Dance and Dance2 multiple times. Swap your algorithm with a partner and run each other’s algorithms.
Sub-routines in flowcharts
The symbol for a sub-routine in a flowchart is:
Sub-routine identifier
This is used to start the sub-routine and to call it from another flowchart. The identifier (name) of the sub-routine is written in the shape. The sub-routine has one arrow coming from it in the actual sub-routine. Where it is used to call the sub-routine, it will have one arrow going in and one arrow going out.
Sub-routine call
45
1.3 Pattern recognition and sub-routines in flowcharts
Figure 1.31: Symbol for a sub-routine in a flowchart
Figure 1.32: Symbol to call the sub-routine in a flowchart
DRAFT Original material © Cambridge University Press 2023. This material is not final and is subject to further changes prior to publication.
‘Pick up food’ might be part of a sub-routine for ‘Eat’!
A sub-routine needs an identifier (name). This could be anything! However, identifiers should be appropriate and meaningful. For example, a bad name for a sub-routine that outputs a story is mathsQuestions
The identifier can be two words in a flowchart, but in these examples, we will use programming-style identifiers. These will be one word ('addNumbers' instead of 'add numbers'). They will also have brackets () after the name: addNumbers(). This is because these brackets will be needed when programming sub-routines, and it makes it clear that the identifier refers to a sub-routine instead of anything else. Here’s an example of a sub-routine declaration.
Sometimes the STOP in the flowchart might say RETURN instead.
Questions 1.6
1 What is the identifier of this sub-routine?
2 What data is input into this sub-routine?
3 What process takes place in this sub-routine?
4 What is output in this sub-routine?
5 What happens when STOP is reached in this sub-routine?
46 1 Computational thinking and programming
STOP
number1
number2
= number1 + number2 OUTPUT total addNumbers()
INPUT
INPUT
total
Figure 1.33: Example of a sub-routine declaration
DRAFT Original material © Cambridge University Press 2023. This material is not final and is subject to further changes prior to publication.
