THE ARCHITECTURE OF DIAGRAMS A Taxonomy of Architectural Diagrams Compiled by Andrew Chaplin
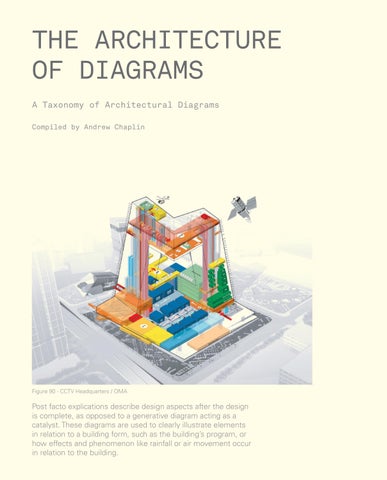
Figure 90 - CCTV Headquarters / OMA
Post facto explications describe design aspects after the design is complete, as opposed to a generative diagram acting as a catalyst. These diagrams are used to clearly illustrate elements in relation to a building form, such as the building’s program, or how effects and phenomenon like rainfall or air movement occur in relation to the building.
TABLE OF CONTENTS i ii iii 1 5 9 13 17 21 25 29 32 36 40 44 48 52 56 60 64 68 72 74
Table of Contents Introduction Descriptor Map 1 - Planimetric 2 - Sectional 3 - Axonometric 4 - Programmatic 5 - Contextual 6 - Circulation 7 - Structural 8 - Scaled 9 - Sequential 10 - Generative 11 - Topological 12 - Euclidean 13 - Pertaining to a Visual Field 14 - Pertaining to Sensation 15 - Diagrammatic Buildings 16 - Parti 17 - Relating Equipment and Effects 18 - Post Facto Explications Endnotes Image References
i
INTRODUCTION There are multiple understandings of diagrams and their uses in architecture. The overarching purpose of any architectural drawing is to act as a ‘visual language’ - a medium between thoughts and reality. In the visual language of architecture, diagrams are the ‘dot points’ compared to the prose of detailed drawings and renders. The description and comparison of diagrams can be aided by the use of secondary descriptors or categories. This taxonomy aims to exhibit a framework of different types of diagrams categorised using descriptors, many of which overlap. Not all of these images might be considered as diagrams in the purest sense, however they are selected due to a percieved diagrammatic intent or nature. Rather than to provide an exhaustive catalogue, this project aims to complement existing discourse on architectural diagrams so that a general understanding can be approached through critique and comparison.
ii
CATEGORY MAP PLANIMETRIC
SECTIONAL
AXONOMETRIC
1
2
3
STRUCTURAL
SCALED
SEQUENTIAL
7
8
9
VISUAL FIELD
SENSATION
DIAGRAMMATIC BUILDINGS
13
14
15
This map shows the overlaps of the diagram descriptors by connecting them with a line when there is a connection.
iii
PROGRAMMATIC
CONTEXTUAL
CIRCULATION
4
5
6
GENERATIVE
TOPOLOGICAL
EUCLIDEAN
10
11
12
PARTI
EQUIPMENT & EFFECTS
POST FACTO
16
17
18
For example, Figure 2 (next page) could be categorised as planimetric, programmatic or circulation, so a line is drawn between each of these categories to visualise the connection.
iv
1
PLANIMETRIC Planimetric diagrams represent concepts and spatial elements from above. Planimetric diagrams often relate the architectural form with program, spatial composition and layout. For example, figure 1 illustrates a scheme for a social housing project showing different room types and their floor areas. Figure 2 describes the entrance and circulation routes of the Rolex Learning Centre, and vaguely describes the programmatic layout of the interior. Figure 3 illustrates a large ‘swarm’ of building forms, which are related to different programs using colour coding and a legend. Figure 4 uses a planimetric diagram to illustrate different patterns and textures used for a canopy structure, which is better understood in combination with a perspective sketch (figure 5).
1
Figure 1 - Collage Paris Social Housing / ECDM
Figure 2 - Rolex Learning Centre / SANAA
2
Figure 3 - Swarm Town / R&Sie(n)
3
Figure 4 - Grand Canopy Proposal / SO-IL
Figure 5 - Grand Canopy Proposal / SO-IL
4
2
SECTIONAL Sectional diagrams relate to architectural or spatial concepts using a vertical plane cut through an object to show the interiority and verticality of a design. These diagrams often relate architectural form with program, invisible phenomenon such as light and wind, and relate elements to the human scale. Figure 6 uses a combination of sectional diagrams to illustrate the programmatic layout of the Linked Hybrid structures in relation to the overall building form, using colour coding. Figure 7 is a sectional diagram of Anh House, illustrating the way phenomenon such as sunlight and wind interact with the building form. Figure 8 shows a building form in relation to texture and scale using a collage of images. Figure 9 describes different types of sectional shapes used in the Vitrahaus design. Figure 10 is a diagrammatic section of The Seed Cathedral, showing the sculpted exterior landscape elements and the interior space of the pavilion in relation to human figures.
5
Figure 6 - Linked Hybrid / Steven Holl Architects
Figure 7 - Anh House / Sanuki Nishizawa
6
Figure 8 - Times+Life / Petar Mitev
Figure 10 - The Seed Cathedral / Heatherwick Studios
7
Figure 9 - Vitrahaus / Herzog & de Meuron
8
3
AXONOMETRIC Axonometric diagrams relate to architectural or spatial concepts as seen from an exterior viewpoint in parallel projection. These diagrams are often used as descriptive tools to illustrate a design concept as a whole, whether it is an exploded view of individual elements or as a unified body representing the intended final outcome, although they can also be used as part of a sequence in a design process. Figure 11 illustrates elements of a design in an exploded axonometric view so as to gain insight into the interior space and the relationship to the exterior. Figure 12 is a descriptive diagram, which illustrates elements using icons and colour coding. Figure 13 shows elements both as a unified whole and as an exploded view of individual components. Figure 14 shows a design process where modular elements are stacked and shaped to form a certain form. Figure 15 illustrates a concept for a MoMA P.S.1 installation in an abstract manner.
9
Figure 11 - VIII Hispalyt Competition / Studio Icono
Figure 12 - Waste-to-Engery Plant / BIG
10
Figure 13 - Labratory of Light / R&Sie(n)
11
Figure 14 - Sky Village / MVRDV
Figure 15 - Pole Dance / SO-IL
12
4
PROGRAMMATIC Programmatic diagrams relate to the layout of a building in terms of program and use, and are used to visualise how the programs relate to the building form. These diagrams are usually planimetric, sectional and axonometric diagrams, and relate the building form to the intended function of each area. Figure 16 illustrates the programmatic layout of Linked Hybrid as a planimetric diagram, which allows greater understanding in conjunction to the sectional diagram (figure 6). Figure 17 shows the programmatic layout of Mobiüs House using written categories in relation to the building form. Figure 18 shows the programmatic layout of the Cooper Union building using minimal relationship to the overall building form. Figures 19-21 illustrate programmatic layout using sectional diagrams and words to describe the function of each area. Figure 22 illustrates the programs of the Seattle Central Library, and visually represents the scale of each program through size and colour.
13
Figure 16 - Linked Hybrid / Steven Holl Architects
Figure 17 - Mobius House / UNStudio
14
Figure 18 - The Cooper Union for The Advancement of Science and Arts / Morphosis Architects
Figure 19 - Milstein Hall / OMA
15
Figure 20 - Seattle Central Library / OMA
Figure 21 - Seattle Central Library / OMA
Figure 22 - Seattle Central Library / OMA
16
5
CONTEXTUAL Contextual diagrams relate a design concept to larger contextual aspects beyond itself. These diagrams frequently represent abstract notions, and so often contain less fine detail than other types of diagrams. Contextual diagrams range in scale from immediate surroundings to global conditions and activities. Figure 23 illustrates an abstract interpretation of the context of the Museum de Cantabria proposal and shows the integration of this concept into the building form, which is complemented by an elevation diagram (figure 24). Figure 25 describes the context of a site in Greenland and the greater global contexts relating to the design, which is then simplified and implemented as a plus shaped building form. Figure 26 illustrates the Rolex Learning Centre and the landscaping within the surrounding university campus. Figure 27 uses a combination of planimetric and axonometric view to describe the context of the Cooper Union building form.
17
Figure 23 - Museum de Cantabria / Mansilla+Tuñón
Figure 24 - Museum de Cantabria / Mansilla+Tuñón
18
Figure 25 - Air+Port / BIG
19
Figure 26 - Rolex Learning Centre / SANAA
Figure 27 - The Cooper Union for The Advancement of Science and Arts / Morphosis Architects
20
6
CIRCULATION Circulation diagrams relate building form to the circulation aspects of a design concept. Circulation is often included as an aspect in programmatic diagrams, though can often be represented in a more detailed manner when presented in diagrams focusing purely on circulation. Figure 28 shows the circulation elements of the Cooper Union building and uses colour coding to reference different levels. Figure 29 illustrates the circulation paths on different levels of Vitrahaus. Figure 30 relates an axonometric and a planimetric diagram to show the interior public path in relation to the building form of the Vanke Centre Shenzen and immediate context. Figure 31 shows an abstract presentation of the circulation concept used in the Yokohama Ferry Terminal, which is aided by an exploded axonometric diagram showing the actual circulation layout (figure 32).
21
Figure 28 - The Cooper Union for The Advancement of Science and Arts / Morphosis Architects
Figure 29 - Vitrahaus / Herzog & de Meuron
22
Figure 30 - Vanke Centre Shenzen / Steven Holl Architects
23
Figure 31 - Yokohama Ferry Terminal / Foreign Office Architects
Figure 32 - Yokohama Ferry Terminal / Foreign Office Architects
24
7
STRUCTURAL Structural diagrams relate to structural aspects of a design concept. Usually this is a planimetric, sectional or axonometric diagram of the structural elements of a building illustrated in relation to the overall building form. Sometimes these diagrams also describe invisible phenomenon such as compression and tension through use of a scale and colour range. Figure 33 illustrates the structural elements of an ‘Air Tree’1 from the Ecoboulevard de Vallecas project. Figure 34 shows the reaction of a building façade to sunlight over time. Figure 35 describes the structural districts of the Vanke Centre Shenzen and the major structural elements within them. Figure 36 describes the structural elements of the Soumaya Museum in an axonometric diagram. Figure 37 describes the compression, tension, and reaction forces affecting the Infinity Loop Bridge design.
25
Figure 33 - Ecoboulevard de Vallecas / Ecosystema Urbano
26
Figure 34 - Unplug / R&Sie(n)
Figure 35 - Vanke Center Shenzen / Steven Holl Architects
27
Figure 36 - Soumaya Museum / FR-EE
Figure 37 - Infinity Loop Bridge / 10 Design
28
8
SCALED Scaled diagrams relate to the scale of a design concept. These diagrams often relate a building form to the human scale, or illustrate the scale of a building form compared to a commonly known reference. Figure 38 describes the building form of the Vanke Centre Shenzen in plan compared to an elevation diagram Empire State building. Figure 39 illustrates the relationship of MahaNakhon to the human scale using an axonometric diagram.
29
Figure 38 - Vanke Center Shenzen / Steven Holl Architects
Figure 39 - MahaNakhon / OMA
30
9
SEQUENTIAL Diagrams pertaining to a derivative sequence in a design process describe a sequence of steps in a design process. This is often presented as an equation of sorts, or as a numbered process ranging from two steps, to ten or more. These diagrams often make use of a background or setting that remains constant throughout the process, only changing one or two variables so as to be able to communicate the process more clearly. Figure 40 illustrates an additive process, where two programs are combined to create a new program type. Figure 41 shows a sequential process where existing elements (city buildings) are reconfigured to create a new building type. Figure 42 describes a sequence of concepts of phenomenon that shape a building form within its context.
31
Figure 40 - Hybrid Office / Edward Ogosta Architecture
Figure 41 - Museum Plaza / REX
32
Figure 42 - West 57th Street / BIG
33
34
10
GENERATIVE Diagrams pertaining to a generative design process relate to a series of outcomes in a design process that are not necessarily sequential, and are formed using a range of parameters set by the designer. In many cases these diagrams are produced as a series of experiments, in which parameters are changed until a satisfactory outcome is achieved, although a sequence is sometimes used in relation to the overall design process. Figure 43 illustrates a non-sequential series of form diagrams created by a generative design process. Figure 44 illustrates the evolution of the form generation process of Trabeculae. Figures 45-47 describe the generative process used to design and create Packed Pavilion, showing the overall design process, as well as the form generative aspects such as the packing concept and the cone optimisation.
35
Figure 43 - Variants / Spatial Pixel
36
Figure 44 - Trabeculae / Dave Pigram, Iain Maxwell, Brad Rothenberg, and Ezio Blasetti
Figure 45 - Packed Pavilion / Min‐Chieh Chen, Dominik Zausinger and Michele Leidi
37
Figure 46 - Packed Pavilion / Min‐Chieh Chen, Dominik Zausinger and Michele Leidi
Figure 47 - Packed Pavilion / Min‐Chieh Chen, Dominik Zausinger and Michele Leidi
38
11
TOPOLOGICAL Topological diagrams describe relationships between elements of a design concept in a flexible way. These diagrams often illustrate spaces or elements as nodes, which are usually described using a vague relation to the building form, and connected by a conceptual ‘link’ (an arrow or a line). Figure 48 describes a conceptual spatial layout using links and area sizes, and uses a vague relation to the overall building form. Figure 49 illustrates the relationship of different types of spaces through colour coding, as well as written program types. Figure 50 illustrates the spatial elements of Casa da Musica in a fluid relationship to the building form. Figure 51 shows the parameters created in a generative design process within the Grasshopper program.
39
Figure 48 - Open Office Planning / John Pile
40
Figure 49 - Ascot Residence / OMA
41
Figure 50 - Casa da Musica / OMA
Figure 51 - Lace-r Cut Lace / Adinaroth
42
12
EUCLIDEAN Euclidean diagrams represent a Euclidean relationship of elements, usually forming a grid so that each element cannot be moved without affecting the elements surrounding it. The mathematical definition of a Euclidean relation is that “a relation R on a set X is Euclidean if it satisfies that for every a,b,c in X, if a is related to b and c, then b is related to c”2. Figure 52 illustrates the Euclidean layout of Sighvasston House and its relation to program and the overall building form and exterior. Figures 53-54 illustrate the development of the Euclidean layout of the Glass Pavilion in the Toledo Mueseum of Art and the translation into the final building plan layout.
43
Figure 52 - Sighvatsson House / OMA
44
Figure 53 - Glass Pavilion, Toledo Museum of Art / SANAA
45
Figure 54 - Glass Pavilion, Toledo Museum of Art / SANAA
46
13
PERTAINING TO A VISUAL FIELD Diagrams pertaining to a visual field relate to elements of a design concept, as a user would visually perceive them. These diagrams often use arrows or lines arranged in a cone to represent a field of vision in relation to a building form, most commonly using planimetric or sectional diagrams in addition to axonometric diagrams. Figure 55 illustrates the field of vision of a building form and relates it to sectional diagrams. Figure 56 uses cone shaped lines to represent the intended field of vision from within the Ascot Residence and compares it to an axonometric and perspective diagram. Figure 57 describes the intended view types and angles from the Vanke Centre Shenzen. Figures 58-60 show the angles and viewpoints that were considered in the design of Slow House, and the view both to and from the building form.
47
Figure 55 - Diagram of the Field of Vision / Herbert Bayer
Figure 56 - Ascot Residence / OMA
48
Figure 57 - Vanke Center Shenzen / Steven Holl Architects
49
Figure 58 - Slow House / Diller + Scofidio
Figure 59 - Slow House / Diller + Scofidio
Figure 60 - Slow House / Diller + Scofidio
50
14
PERTAINING TO SENSATION Diagrams pertaining to sensation relate to sensorial or experiential aspects of a design concept, as perceived through all human senses. These diagrams might also illustrate visual aspects, however this is distinct from diagrams pertaining to a visual field, as they are not focused on the scope of vision or sensation, but rather the desired effects of aspects of a design concept. As their subject is primarily related to feeling, there is often an intangible element to these diagrams, where sensation is illustrated through light and texture. Figure 61 illustrates the sensation of the intended effect of the interior of a structure, by diagramming the concept of coloured and reflected light as perceived by a human figure. Figure 62 illustrates the desired sensation of inhabiting Therme Vals - the impression of being within cave-like voids carved from a solid, as opposed to the comparatively thin wall structures in the actual building plan and section diagrams (figure 63-64). Figure 65 diagrams an abstract layout of spaces and alludes to a textural quality. Figure 66 is an image of the built outcome.
51
Figure 61 - Project / Wabisabimade
52
Figure 62 - Therme Vals / Peter Zumthor
Figure 63 - Therme Vals / Peter Zumthor
Figure 64 - Therme Vals / Peter Zumthor
53
Figure 65 - Therme Vals /Peter Zumthor
Figure 66 - Therme Vals / Peter Zumthor
54
15
DIAGRAMMATIC BUILDINGS Diagrammatic buildings are buildings where a diagram is directly translated physically and visually into the built outcome. These diagrams and their intended built outcomes are often geometrically simple forms, as the process diagrams are often produced at a small scale, which are then scaled up usually without further detail being added. Figure 67 illustrates the nature of the Bubble installation in a section diagram. The nature of the thin material used to create the form of the ‘Bubble’ mean that its diagram is visually similar to the intended build outcome shown in figures 68-69. Figure 69 shows the conceptual process of the Glass Farm. This diagram is directly translated to the final built outcome in the fact that the bricks, windows and doors are all a façade treatment, shown in figures 71-72. Figure 73 describes the layout of SANAA’s design as a plan diagram. Figure 74 shows how the plan diagram is extruded to create the final building form.
55
Figure 67 - Bubble by Diller, Scofidio + Renfro
Figure 68 - Bubble by Diller, Scofidio + Renfro
Figure 69 - Bubble by Diller, Scofidio + Renfro
56
Figure 70 - Glass Farm by MVRDV
Figure 71 - Glass Farm by MVRDV
Figure 72 - Glass Farm by MVRDV
57
Figure 73 - 21st Century Museum of Contemporary Art, Kanazawa by SANAA
Figure 74 - 21st Century Museum of Contemporary Art, Kanazawa by SANAA
58
16
PARTI Parti diagrams relate to initial conceptual aspects of a design, which are not necessarily directly visible in the built outcome. As these diagrams are often the first step of a design process, they are usually hand drawn and relate the concept vaguely to a building form, which is more referential than descriptive. Parti diagrams could be described as ‘one-liners’, which illustrate a single idea or concept. Figure 75 illustrates the concept of wrapping a restaurant in canvas as a sketch diagram. Figure 76 shows how this concept was translated into the built outcome, though not literally by scaling up the diagram. Figure 77 shows the intended evolution of the Ecoboulevard de Vallecas project over a period of twenty years. Figure 78 shows the concept of “bottles of light in a stone box” for the Chapel of St Ignatius. Figure 79 shows the sketch concept of Drawer House, which is expressed in built outcome in figures 80-81.
59
Figure 75 - Canvas by Nendo
Figure 76 - Canvas by Nendo
60
Figure 77 - Ecoboulevard de Vallecas by Ecosystema Urbano
Figure 78 - Chapel of St Ignatius by Steven Holl Architects
61
Figure 79 - Drawer House by Nendo
Figure 80 - Drawer House by Nendo
Figure 81 - Drawer House by Nendo
62
17
RELATING EQUIPMENT AND EFFECTS Diagrams relating equipment and effects describe elements of a design that could be classified as ‘equipment’ (most likely separate to the building form), and illustrate the desired effects of the use of the equipment. These diagrams usually relate to a level of interaction with a building form that is enhanced or changed through the use of the equipment. Figures 82-85 describe the use of “braincoats” devised as an experiential element of the ‘Blur’ project. They described the intended use and outcomes of the equipment and effects. Figures 86-87 show the interactive software used in conjunction with the ‘Pole Dance’ MoMA P.S.1 installation. They show a phone and computer application which allows the users to modify the space through sound and physical elements. Figures 88-89 show the physical built outcome.
63
Figure 83 - Blur by Diller + Scofidio
Figure 82- Blur by Diller + Scofidio
Figure 84 - Blur by Diller + Scofidio
Figure 85 - Blur by Diller + Scofidio
64
Figure 86 - Pole Dance by SO-IL
Figure 87 - Pole Dance by SO-IL
65
Figure 88 - Pole Dance by SO-IL
Figure 89 - Pole Dance by SO-IL
66
18
POST FACTO EXPLICATIONS Post facto explications describe design aspects after the design is complete, as opposed to a generative diagram acting as a catalyst. These diagrams are used to clearly illustrate elements in relation to a building form, such as the building’s program, or how effects and phenomenon like rainfall or air movement occur in relation to the building. Figure 90 illustrates the separate building elements of the CCTV Headquarters within an outlined building form. These elements are shown in an exploded axonometric in figure 91 to describe the individual components. Figure 92 diagrams ‘Logplug’ and explains how to use the fictional object. Figure 93 illustrates invisible concepts and phenomenon such as rainfall and sunlight and its interaction with a building form. Figure 94 shows the intended environmental aspects of The Eden Project and the relation to the building form.
67
Figure 90 - CCTV Headquarters / OMA
Figure 91 - CCTV Headquarters / OMA
68
Figure 92 - Logplug / Archigram
69
Figure 93 - Salt Building / Acton Ostry Architects
Figure 94 - The Eden Project / Grimshaw Architects
70
ENDNOTES
1 - Eco Boulevard in Vallecas / Ecosystema Urbano, ArchDaily, viewed 28 October 2013, <http://www.archdaily.com/6303/>. 2 - Fagin, R 2003, Reasoning About Knowledge, MIT Press, p. 60.
71
72
IMAGE REFERENCES Figure 1: <http://www.architecture-buildings.com/collage-paris-social-housing-in-france-by-emmanuel-combarel-domini que-marrec/view-collage-paris-zap-typo-diagram-plan/>, viewed 28 October 2013. Figure 2: SANAA 2011, Rolex Learning Center, El Croquis 155: SANAA 2008-2011 (English and Spanish Edition), Idea Books, Amsterdam. Figure 3: <http://www.new-territories.com/korea%202.htm>, viewed 28 October 2013. Figure 4: <http://so-il.org/artifact/1690>, viewed 28 October 2013. Figure 5: <http://so-il.org/artifact/1690>, viewed 28 October 2013. Figure 6: <http://www.archdaily.com/34302/linked-hybrid-steven-holl-architects/1252355356-sect-2/>, viewed 28 October 2013. Figure 7: <http://www.dezeen.com/2013/08/28/anh-house-by-sanuki-nishizawa/>, viewed 28 October 2013. Figure 8: <http://drawingarchitecture.tumblr.com/image/44297638303>, viewed 28 October 2013. Figure 9: <http://www.archdaily.com/50533/vitrahaus-herzog-de-meuron/294_ci_0703_006/>, viewed 28 October 2013. Figure 10: <http://4.bp.blogspot.com/_apFpwnMI2hs/THsUY9O7iAI/AAAAAAAADBw/nCVZdtI3QOo/s1600/UK_Section.j pg>, viewed 28 October 2013. Figure 11: <http://drawingarchitecture.tumblr.com/image/57524196546>, viewed 28 October 2013. Figure 12: <http://3.bp.blogspot.com/-Md1TESxRBu4/TV75FW5zC7I/AAAAAAAAANE/SjnjLwux-qI/s1600/BIG_Hedonisti cSustainablePlantDiagram.jpg>, viewed 28 October 2013. Figure 13: <http://www.new-territories.com/laboratoryoflight.htm>, viewed 28 October 2013. Figure 14: <http://3.bp.blogspot.com/_8Lufw3c2g4I/TSOJHwDemLI/AAAAAAAAYgk/Co9RFr2FGRA/s1600/MVRDV+.+A DEPT+.+Sky+Village+.+R%25C3%25B8dovre+%25283%2529.jpg>, viewed 28 October 2013. Figure 15: <http://so-il.org/wp-content/uploads/2010/12/so-il-poledance-diagram.jpg>, viewed 28 October 2013. Figure 16: <http://www.archdaily.com/34302/linked-hybrid-steven-holl-architects/program_plan-converted/>, viewed 28 October 2013. Figure 17: <http://architizer.com/projects/mobius-house/media/189764/>, viewed 28 October 2013.
73
Figure 18: <http://www.archdaily.com/40471/the-cooper-union-for-the-advancement-of-science-and-art-morphosis-archite cts/program-sustainable-strategies-diagram/>, viewed 28 October 2013. Figure 19: <http://europaconcorsi.com/projects/181492-Milstein-Hall/images/2848494>, viewed 28 October 2013. Figure 20: <http://www.archdaily.com/11651/seattle-central-library-oma-lmn/1376179271_spl-platform-diagram-rex/>, viewed 28 October 2013. Figure 21: <http://www.archdaily.com/11651/seattle-central-library-oma-lmn/2138020950_spl-inbetweens-diagram-rex/>, viewed 28 October 2013. Figure 22: <http://www.archdaily.com/11651/seattle-central-library-oma-lmn/887383014_spl-program-diagram-i-rex/>, viewed 28 October 2013. Figure 23: Mansilla+Tuñón 2012, Museum de Cantabria, El Croquis 161: Mansilla+Tuñón 1992-2012 (English and Spanish Edition), Idea Books, Amsterdam. Figure 24: Mansilla+Tuñón 2012, Museum de Cantabria, El Croquis 161: Mansilla+Tuñón 1992-2012 (English and Spanish Edition), Idea Books, Amsterdam. Figure 25: <http://www.big.dk/#projects-fgl>, viewed 28 October 2013. Figure 26: Della Casa, F & Eugène 2010, Rolex Learning Center, EPFL Press, Lausanne. Figure 27: <http://www.archdaily.com/40471/the-cooper-union-for-the-advancement-of-science-and-art-morphosis-archite cts/diagram-site-plan-and-axon-rendered-1-l/>, viewed 28 October 2013. Figure 28: <http://www.archdaily.com/40471/the-cooper-union-for-the-advancement-of-science-and-art-morphosis-archite cts/circulation-diagram/>, viewed 28 October 2013. Figure 29: <http://www.archdaily.com/50533/vitrahaus-herzog-de-meuron/294_ci_0703_011/>, viewed 28 October 2013. Figure 30: Holl Architects, S 2011, Horizontal Skyscraper, William Stout Publishers, Richmond. Figure 31: <http://c1038.r38.cf3.rackcdn.com/group1/building1231/media/4c235b890d9c80.24433383.jpg>, viewed 28 October 2013. Figure 32: <http://openbuildings.com/buildings/yokohama-international-port-terminal-profile-1231/media#!buildings-medi a/9>, viewed 28 October 2013.
74
Figure 33: <http://ad009cdnb.archdaily.net/wp-content/uploads/2008/09/268273586_structure-axo.jpg>, viewed 28 October 2013. Figure 34: <http://www.new-territories.com/unplug.htm>, viewed 28 October 2013. Figure 35: Holl Architects, S 2011, Horizontal Skyscraper, William Stout Publishers, Richmond. Figure 36: <http://fr-ee.org/projects/soumaya-museum-mexico-city-mexico/>, viewed 28 October 2013. Figure 37: <http://www.morfae.com/data/1437/05.jpg>, viewed 28 October 2013. Figure 38: Holl Architects, S 2011, Horizontal Skyscraper, William Stout Publishers, Richmond. Figure 39: <http://www.designboom.com/weblog/images/images_2/lauren/mahanahkhon/mah12.jpg>, viewed 28 October 2013. Figure 40: <http://www.archdaily.com/229636/hybrid-office-edward-ogosta-architecture/diagram-01-41/>, viewed 28 October 2013. Figure 41: <http://www.architecture-buildings.com/images/2011/12/rex-museum-zap-diagram-concept.jpg>, viewed 28 October 2013. Figure 42: <http://plusmood.com/wp-content/uploads/2011/02/W57_BIG_plusMOOD_diagram.jpg>, viewed 28 October 2013. Figure 43: <http://www.spatialpixel.com/blog/2012/10/img/variant-results.jpg>, viewed 28 October 2013. Figure 44: <http://www.evolo.us/wp-content/uploads/2010/05/trabeculae-5.jpg>, viewed 28 October 2013. Figure 45: <http://uemfab.blog.com/files/2012/05/sketch_01.jpg>, viewed 28 October 2013. Figure 46: <http://1.bp.blogspot.com/_YksPD4GXvMo/TRXC5v-AFiI/AAAAAAAAAJE/wv52t3vV19Q/s1600/sketch_02.jpg >, viewed 28 October 2013. Figure 47: <http://4.bp.blogspot.com/_YksPD4GXvMo/TRXC7BquF0I/AAAAAAAAAJI/MjCykr1iu60/s1600/sketch_03.jpg >, viewed 28 October 2013. Figure 48: <https://ksacommunity.osu.edu/image/diagrammatic-seminar/office-area-diagram>, viewed 28 October 2013. Figure 49: <http://www.oma.eu/contentimages/projects/2003-ASCOT-RESIDENCE/Ascot-Residence-organigram4_big.jp g>, viewed 28 October 2013.
75
Figure 50: Curry, J 2013, ‘CHP_DIAGRAMS + DEFINITONS’, University of Adelaide, viewed 3 Novermber 2013. Figure 51: <http://newtextiles.media.mit.edu/wp-content/uploads/sites/12/2013/05/image-2.png>, viewed 28 October 2013. Figure 52: OMA 2007, Sighvatsson House, El Croquis 134/135: OMA 1996-2007 (English and Spanish Edition), Idea Books, Amsterdam. Figure 53: SANAA 2008, Toledo Museum of Art, El Croquis 139: SANAA 2004-2008 (English and Spanish Edition), Idea Books, Amsterdam. Figure 54: <https://ksacommunity.osu.edu/system/files/imagecache/12col_700px/glass_pavilion_plan.gif>, viewed 28 October 2013. Figure 55: <http://25.media.tumblr.com/tumblr_mb1ua59p1W1rr1oxso1_1280.jpg>, viewed 28 October 2013. Figure 56: <http://www.oma.eu/contentimages/projects/2003-ASCOT-RESIDENCE/Ascot-Residence-page-42-copy_big.j pg>, viewed 28 October 2013. Figure 57: Holl Architects, S 2011, Horizontal Skyscraper, William Stout Publishers, Richmond. Figure 58: <http://www.public.iastate.edu/~shayang/Slow%20House2.html>, viewed 28 October 2013. Figure 59: <http://1.bp.blogspot.com/-Th4UjHo4pe4/UNiYTl0-gjI/AAAAAAAAA0M/7kYyzVbQ10M/s1600/CRI_5891.jpg>, viewed 28 October 2013. Figure 60: <http://4.bp.blogspot.com/-a4b_I8AbtrU/UNiW95EGIgI/AAAAAAAAAzs/7GD1pV2j7fM/s1600/tumblr_m3qa5b Hv9a1qcbkj5o3_400.jpg>, viewed 28 October 2013. Figure 61: <http://drawingarchitecture.tumblr.com/post/49261977141/section-by-wabisabimade>, viewed 28 October 2013. Figure 62: Hauser, S 2007, Peter Zumthor Therme Vals, Verlag, Scheidegger and Spiess. Figure 63: <http://ideasgn.com/wp-content/uploads/2013/04/Therme-Vals-Switzerland-by-Peter-Zumthor-ideasgn-plan.jpg >, viewed 28 October 2013. Figure 64: <http://ideasgn.com/wp-content/uploads/2013/04/Therme-Vals-Switzerland-by-Peter-Zumthor-ideasgn-section.j pg>, viewed 28 October 2013. Figure 65: <http://www.flickr.com/photos/archiparlance/3454264718/sizes/o/>, viewed 28 October 2013.
76
Figure 66: <http://www.garretcordwerner.com/blog/gcw-inspiration-3/the-therme-vals-by-peter-zumthor-24/>, viewed 28 October 2013. Figure 67: <http://1.bp.blogspot.com/-Ph5EW9VWmbs/USEQWXKAzBI/AAAAAAAAI68/cH8qMFEUxGI/s1600/hirshhorn 4.png>, viewed 28 October 2013. Figure 68: <http://www.designboom.com/wp-content/uploads/2009/12/diller-scofidio-renfro-hirshhorn-museum-bubble-d esignboom02.jpg>, viewed 28 October 2013. Figure 69: <http://www.designboom.com/wp-content/uploads/2009/12/diller-scofidio-renfro-hirshhorn-museum-bubble-d esignboom00.jpg>, viewed 28 October 2013. Figure 70: <http://www.archdaily.com/321503/glass-farm-mvrdv-2/50fb70e1b3fc4b068c000012_glass-farm-mvrdv_tp25 4_110215_concept_diagram_en_300dpi-png/>, viewed 28 October 2013. Figure 71: <http://www.archdaily.com/321503/glass-farm-mvrdv-2/50fb706ab3fc4b068c000011_glass-farm-mvrdv_11011 3_11_pvenews-com-jpg/>, viewed 28 October 2013. Figure 72: <http://www.archdaily.com/321503/glass-farm-mvrdv-2/50fb6f25b3fc4b068c000002_glass-farm-mvrdv_mvrd vm001-jpg/>, viewed 28 October 2013. Figure 73: <http://3.bp.blogspot.com/-28akjhPeE0s/T7c82ZSA2BI/AAAAAAAARYk/D686FtokUdw/s1600/sanaa-kanazaw a-plan.jpeg>, viewed 28 October 2013. Figure 74: <http://2.bp.blogspot.com/-S0oZW1fXxqo/T7c8wqTkGgI/AAAAAAAARXs/dc-ktXtkjk8/s1600/1044-08.jpg>, viewed 28 October 2013. Figure 75: <http://www.nendo.jp/en/works/canvas-2/?egenre>, viewed 28 October 2013. Figure 76: <http://www.nendo.jp/en/works/canvas-2/?egenre>, viewed 28 October 2013. Figure 77: <http://ad009cdnb.archdaily.net/wp-content/uploads/2008/09/125614499_diagrama-tiempo.jpg>, viewed 28 October 2013. Figure 78: <http://www.archdaily.com/115855/ad-classics-chapel-of-st-ignatius-steven-holl-architects/bottles-of-light-2/>, viewed 28 October 2013. Figure 79 <http://www.nendo.jp/en/works/drawer-house/?egenre>, viewed 28 October 2013. Figure 80: <http://www.nendo.jp/en/works/drawer-house/?egenre>, viewed 28 October 2013.
77
Figure 81: <http://www.nendo.jp/en/works/drawer-house/?egenre>, viewed 28 October 2013. Figure 82: <http://dsrny.com/projects/BlurBraincoat/18--transmission-zones-copy.jpg>, viewed 28 October 2013. Figure 83: <http://dsrny.com/projects/BlurBraincoat/openimage.jpg>, viewed 28 October 2013. Figure 84: <http://dsrny.com/projects/BlurBraincoat/BLUR-BRAINCOAT-SYSTEM-DIAG.jpg>, viewed 28 October 2013. Figure 85: <http://dsrny.com/projects/BlurBraincoat/J%2010a%20-%20Questionnaire%20options%20copy.jpg>, viewed 28 October 2013. Figure 86: <http://2x4.org/directus/media/thumbnails/39779ef065b3e5f6ba46085c248841ed.jpg?w=540&h=5000&c=fa lse>, viewed 28 October 2013. Figure 87: <http://www.morfae.com/data/0361/14.jpg>, viewed 28 October 2013. Figure 88: <http://www.morfae.com/data/0361/14.jpg>, viewed 28 October 2013. Figure 89: <http://www.morfae.com/data/0361/09.jpg>, viewed 28 October 2013. Figure 90: <http://www.archdaily.com/236175/cctv-headquarters-oma/exploded-axon-13/>, viewed 28 October 2013. Figure 91: <http://www.archdaily.com/236175/cctv-headquarters-oma/diagram-97/>, viewed 28 October 2013. Figure 92: <http://www.remixtheschoolhouse.com/sites/default/files/archigram%20logplug.jpg>, viewed 28 October 2013. Figure 93: <http://www.archdaily.com/194397/salt-building-acton-ostry-architects/sustainability-diagram-5/>, viewed 28 October 2013. Figure 94: Grimshaw, N 2011, ‘The Eden Project’, Architecture and Urbanism, no. 487.
78