Transport Global Practice


© 2023 International Bank for Reconstruction and Development / International Development Association or The World Bank
1818 H Street NW
Washington, DC 20433
Telephone: 202-473-1000
Internet: www.worldbank.org
This work is a product of the staff of The World Bank, together with external contributions from S&P Global Market Intelligence. The findings, interpretations, and conclusions expressed in this work do not necessarily reflect the views of The World Bank, its Board of Executive Directors, or the governments they represent. The World Bank does not guarantee the accuracy of the data included in this work. The boundaries, colors, denominations, and other information shown on any map in this work do not imply any judgment on the part of The World Bank concerning the legal status of any territory or the endorsement or acceptance of such boundaries.
Nothing herein shall constitute or be considered to be a limitation upon or waiver of the privileges and immunities of The World Bank, all of which are specifically reserved.
This work is available under the Creative Commons Attribution 3.0 IGO license (CC BY 3.0 IGO) http://creativecommons.org/licenses/by/3.0/igo.+ Under the Creative Commons Attribution license, you are free to copy, distribute, transmit, and adapt this work, including for commercial purposes, under the following conditions:
Attribution—Please cite the work as follows: The World Bank, 2023. “The Container Port Performance Index 2022: A Comparable Assessment of Performance based on Vessel Time in Port (Fine).” World Bank, Washington, DC. License: Creative Commons Attribution CC BY 3.0 IGO.
Translations—If you create a translation of this work, please add the following disclaimer along with the attribution: This translation was not created by The World Bank and should not be considered an official World Bank translation. The World Bank shall not be liable for any content or error in this translation.
Adaptations—If you create an adaptation of this work, please add the following disclaimer along with the attribution: This is an adaptation of an original work by The World Bank. Views and opinions expressed in the adaptation are the sole responsibility of the author or authors of the adaptation and are not endorsed by The World Bank.
Third-party content—The World Bank does not necessarily own each component of the content contained within the work. The World Bank, therefore, does not warrant that the use of any third-party-owned individual component or part contained in the work will not infringe on the rights of those third parties. The risk of claims resulting from such infringement rests solely with you. If you wish to reuse a component of the work, it is your responsibility to determine whether permission is needed for that reuse and to obtain permission from the copyright owner. Examples of components can include, but are not limited to, tables, figures, or images.
All queries on rights and licenses should be addressed to World Bank Publications, The World Bank Group, 1818 H Street NW, Washington, DC 20433, USA; fax: 202-522-2625; e-mail: pubrights@worldbank.org.
This technical report was prepared jointly by the teams from the Transport Global Practice of the Infrastructure Vice-Presidency at the World Bank and the Maritime, Trade and Supply Chain division of S&P Global Market Intelligence.
The World Bank team was led by Richard Martin Humphreys (Global Lead for Connectivity and Logistics and Lead Transport Economist, ITRGK), Grace Naa Merley Ashley (Transport Specialist, ITRGK), and Dominique Guillot (Associate Professor, University of Delaware), under the guidance of Binyam Reja (Global Practice Manager Transport, ITRGK) and Nicolas Peltier-Thiberge (Global Practice Director Transport, ITRGK).
The S&P Global Market Intelligence team was led by Turloch Mooney (Director, Global Intelligence & Analytics), Andy Lane (Partner, CTI Consultancy), and Michelle Wong (Senior Research Analyst, GTI Product Management), under the guidance of Jenny Paurys (Head of Global Intelligence & Analytics) and Guy Sear (Managing Director, Global Risk & Maritime Global Intelligence & Analytics).
The joint team would like to extend special thanks to the following experts for their comments on the draft of the technical report: Jan Hoffmann (Chief, Trade Logistics Branch, Division on Technology and Logistics, United Nations Conference on Trade and Development, Geneva), Gylfi Palsson (Lead Transport Specialist, ILTC1), and Ninan Biju Oommen (Senior Transport Specialist, IEAT1).
AIS Automatic Identification System
CI Crane Intensity
COVID-19 Coronavirus Disease 2019
CPPI Container Port Performance Index
EEZ Exclusive Economic Zone
FA Factor Analysis
GCI Global Competitiveness Index
GCMPH Moves per Gross Crane Hour
GDP Gross Domestic Product
GRT Gross Registered Tonnage
ITU International Telecommunication Union
LLDC Landlocked Developing Country
LPI Logistics Performance Index
SIDS Small Island Developing States
TEU Twenty-foot Equivalent Unit
UNCTAD United Nations Conference on Trade and Development
All fast: The point when the vessel is fully secured at berth and all mooring lines are fast
Arrival time/hours: The total elapsed time between the vessel’s automatic identification system (AIS) recorded arrival at the actual port limit or anchorage (whichever recorded time is the earlier) and its all lines fast at the berth
Berth hours: The time between all lines fast and all lines released
Berth idle: The time spent on berth without ongoing cargo operations. The accumulated time between all fast to first move plus last move to all lines released
Call size: The number of container moves per call, inclusive of discharge, load, and restowage
Cargo operations: When cargo is being exchanged, the time between first and last container moves
Crane intensity (CI): The quantity of cranes deployed to a ship’s berth call. Calculated as total accumulated gross crane hours divided by operating (first to last move) hours
Factor analysis (FA): A statistical method used to describe variability among observed, correlated variables in terms of a potentially lower number of unobserved variables called factors
Finish: Total elapsed time between last container move and all lines released
Gross crane hours: Aggregated total working time for all cranes deployed to a vessel call without any deductions. Time includes breakdowns, inclement weather, vessel inspired delays, un/lashing, gantry, boom down/up plus hatch cover and gear-box handling.
Gross crane productivity (GCMPH): Call size or total moves divided by total gross crane hours.
Hub port: A port which is called at by deep-sea mainline container ships and serves as a transshipment point for smaller outlying, or feeder, ports within its geographical region. Typically, more than 35 percent of its total throughput would be hub and spoke or relay transshipment container activity.
Moves: Total container moves. Discharge + restowage moves + load. Excluding hatch covers, gearboxes, and other non-container related crane work. Breakbulk cargo lifts are excluded, however empty platform (tweendeck or flat-rack) handling moves are included.
Moves per crane: Total Moves for a call divided by the crane intensity.
Port call: A call to a container port/terminal by a container vessel where at least one container was discharged or loaded.
Port hours: The number of hours a ship spends at/ in port, from arrival at the port limits to sailing from the berth.
Port limits: Either an anchorage zone or the location where pilot embarkation or disembarkation occurs and recorded as whichever activity is the earliest.
Port to berth hours: The time from when a ship first arrived at the port limits or anchorage zone (whichever activity occurs first) until it is all fast alongside the berth.
Relay transhipment: Containers transhipped between ocean going container ships.
Ship size: Nominal capacity in twenty foot equivalent units (“TEU’s”).
Start: The time elapsed from berthing (all lines fast) to first container move.
Steam in time: The time required to steam-in from the port limits and until all fast alongside the berth.
Twenty foot equivalent unit or TEU: A standard metric for container throughput, and the physical capacity of a container terminal. A 20-foot container is equal to 1 TEU, and a 40-foot or 45-foot container is equal to 2 TEUs. Regardless of container size (10 feet, 15 feet, 20 feet, 30 feet, 40 feet, or 45 feet), each is recorded as one move when being loaded or discharged from the vessel.
Vessel capacity: Nominal capacity in twenty foot equivalent Units (“TEU’s”).
Waiting time: Total elapsed time from when vessel enters anchorage zone to when vessel departs anchorage zone (vessel speed must have dropped below 0.5 knots for at least 15 mins within the zone).
The challenges caused by the COVID-19 pandemic and its aftermath on the sector eased in 2022, an easing that has continued into early 2023. This has resulted in an improvement in both port congestion and a reduction in logistical disruption. The improvement in 2022 has had a positive impact on the performance and ranking of some ports; where the problem was systemic, as opposed to location specific, the inherent inefficiency remains. One of the ‘silver linings’ of the pandemic was greater awareness and focus on the resilience and efficiency of the maritime gateways, where any friction will result in tangible impacts on consumer choice, price and ultimately economic development.
However, one of the major challenges to stimulating improvement in the efficiency of ports has been the lack of a reliable, consistent, and comparable basis on which to compare operational performance across different ports. While modern ports collect data for performance purposes, the Quality, consistency, and availability of data, the definitions employed, and the capacity and willingness of the organizations to collect and transmit data to a collating body have all precluded the development of a robust comparable measure(s) to assess performance across ports and time.
The introduction of new technologies, increased digitalization, and the willingness on the part of industry stakeholders to work collectively toward systemwide improvements have now provided the opportunity to measure and compare container port performance in a robust and reliable manner. A partnership has resulted in this technical report, which is the third iteration of the Container Port Performance Index (CPPI), produced by the Transport Global Practice of the World Bank in collaboration with the Global Intelligence & Analytics division of S&P Global Market Intelligence.
The CPPI is intended, as in its earlier iterations, to serve as a reference point for improvement for key stakeholders in the global economy, including national governments, port authorities and operators, development agencies, supranational organizations, various maritime interests, and other public and private stakeholders in trade, logistics, and supply chain services. The performance of a port may be assessed based on a myriad of measurements, such as: terminal capacity or space utilization, cost, landside connectivity & services, or ship to shore interchange. The CPPI is based on available empirical objective data pertaining exclusively to time expended in a vessel stay in a port and should be interpreted as an indicative measure of container port performance, but not a definitive one.
Head of Global Intelligence & Analytics
 S&P Global Market Intelligence
Maritime transport forms the foundation of global trade and the manufacturing supply chain. The maritime industry provides the most cost-effective, energy-efficient, and dependable mode of transportation for long distances. More than 80 percent of global merchandise trade (by volume) is transported via sea routes. A considerable and increasing proportion of this volume, accounting for about 35 percent of total volumes and over 60 percent of commercial value, is carried in containers.
The emergence of containerization brought about significant changes in how and where goods are manufactured and processed, a trend that is likely to continue with digitalization. Container ports are critical nodes in global supply chains and essential to the growth strategies of many emerging economies. In numerous cases, the development of high-quality container port infrastructure operating efficiently has been a prerequisite for successful export-led growth strategies. Countries that follow such a strategy will have higher levels of economic growth than those that do not. Efficient, high quality port infrastructure can facilitate investment in production and distribution systems, engender expansion of manufacturing and logistics, create employment opportunities, and raise income levels.
However, ports and terminals, especially container terminals, can cause shipment delays, disruptions in supply chain, additional expenses, and reduced competitiveness. The negative effect of poor performance in a port can extend beyond the that port’s hinterland to others as container shipping services follow a fixed schedule with specific berth windows at each port of call on the route. Therefore, poor performance at one port could disrupt the entire schedule. This, in turn, increases the cost of imports and exports, reduces the competitiveness of the country and its hinterland, and hinders economic growth and poverty reduction. The consequences are particularly significant for landlocked developing countries (LLDCs) and small island developing states (SIDS).
Comparing operational performance across ports has been a major challenge for improving global value chains due to the lack of a reliable, consistent, and comparable basis. Despite the data collected by modern ports for performance purposes, the quality, consistency, and availability of data, as well as the definitions used and the capacity and willingness of organizations to transmit data to a collating body, have hindered the development of a comparable measure(s) for assessing performance across ports and time. However, new technologies, increased digitalization, and industry interests’ willingness to work collectively toward systemwide improvements now provide an opportunity to measure and compare container port performance in a robust and reliable manner. The World Bank’s Transport Global Practice and the Global Intelligence & Analytics division of S&P Global Market Intelligence have collaborated to produce the third edition of the Container Port Performance Index (CPPI), presented in this technical paper.
The aim of the CPPI is to pinpoint areas for enhancement that can ultimately benefit all parties involved, ranging from shipping lines to national governments and consumers. It is designed to act as a point of reference for important stakeholders in the global economy, including port authorities and operators, national governments, supranational organizations, development agencies, various maritime interests, and other public and private stakeholders in trade, logistics, and supply chain services. The development of the CPPI rests on total container ship in port time in the manner explained in subsequent sections of the report, and as in earlier
iterations of the CPPI. This third iteration utilizes data for the full calendar year of 2022. One slight change in this iteration is that the CPPI 2022 only includes ports that had a minimum of 24 valid port calls within the 12-month period of the study, compared to 20 in earlier iterations. The number of ports included in the CPPI 2022 is 348.
In earlier iterations of the CPPI, the calculation of the ranking of the index employed two different methodological approaches, an administrative, or technical, approach, a pragmatic methodology reflecting expert knowledge and judgment; and a statistical approach, using factor analysis (FA). The rationale for using two approaches was to try and ensure that the ranking of container port performance reflects as closely as possible actual port performance, whilst also being statistically robust. And there has been a marked improvement in consistency between the rankings that result from the two approaches since the inaugural CPPI 2020, but some minor inconsistencies remained.
Accordingly, for CPPI 2022, the same methodological approaches are used and then a rank aggregation method applied to combine the results from the two different approaches and return one aggregate ranking. The aggregation methodology and the resulting ranking is detailed in the report, while the statistical and administrative approaches and their respective rankings are detailed in Appendix A. Table E.1 presents the resulting CPPI 2022.
The two top-ranked container ports in the CPPI 2022 are Yangshan Port (China) in first place, followed by the Port of Salalah (Oman) in second place. These two ports occupy the same positions in the rankings generated by both approaches. Port of Salalah was ranked second in both approaches in CPPI 2021. Yangshan Port ranked third and fourth in the statistical and administrative approaches, respectively, for CPPI 2021. Three ports in the Middle East are ranked in the top ten (Salalah, Kahlifa, Hamad), as are three of the large Chinese gateways (Yangshan, Ningbo and Guangzhou).
Of the top 10 ranked ports, 9 have either maintained or improved their position since CPPI 2021. The exception is Hamad Port, which moved down 5 and 3 places in the administrative and statistical rankings, respectively. Yokohama fell from 10th and 12th in CPPI 2021 to 15th place in CPPI 2022, and Jeddah fell from 8th place in CPPI 2021 to 29th place in CPPI 2022.
Source: Original table produced for this publication, based on CPPI 2022 data.
There are 14 new entrants to the CPPI 2022, and several significant movers since the CPPI 2021. Over one hundred and ten ports improved their rankings in CPPI 2022 compared to CPPI 2021, with some of the largest improvers increasing their ranking by more than 200 positions.
Since the start of maritime trade, ports have played a central role in the economic and social development of countries. The innovation of containerization by Malcom McLean in 1958 changed the course of the shipping industry and engendered significant changes to where and how goods are manufactured. Container ports remain vital nodes in global supply chains and are crucial to the growth strategies of many emerging economies. The development of high-quality port infrastructure, operated efficiently, has often been a prerequisite for successful growth strategies, particularly those driven by exports. When done correctly, it can attract investment in production and distribution systems and eventually, support the growth of manufacturing and logistics, create employment, and increase income levels.
In contrast, a poorly functioning or inefficient port can hinder trade growth, with a profound impact on LLDCs and SIDS. The port, along with the access infrastructure (inland waterways, railways, roads) to the hinterland, is a vital link to the global marketplace and needs to operate efficiently. Efficient performance encompasses several factors, such as the port’s efficiency itself, the availability of sufficient draught, quay, and dock facilities, the quality of road and rail connections, the competitiveness of these services, and the effectiveness of the procedures utilized by public agencies for container clearance. Any inefficiencies or non-tariff barriers among these actors will result in higher costs, reduced competitiveness, and lower trade volumes (Kathuria 2018).
More specifically, the efficiency of port infrastructure has been identified as a key contributor to the overall port competitiveness and international trade costs. Micco et al. (2003) identified a link between port efficiency and the cost of international trade. Clark, Dollar, and Micco (2004) found a reduction in country inefficiency, specifically transport cost, from the 25th to 75th percentile, resulting in an increase in bilateral trade of around 25 percent. Wilmsmeier, Hoffmann, and Sanchez (2006) confirmed the impact of port performance
on international trade costs, finding that doubling port efficiency in a pair of ports had the same impact on trade costs as halving the physical distance between the ports. Hoffmann, Saeed, and Sødal (2020) analyzed the short- and long-term impacts of liner shipping bilateral connectivity on South Africa’s trade flows, and showed that gross domestic product (GDP), the number of common direct connections, and the level of competition have a positive and significant effect on trade flows.
However, ports and terminals, particularly for containers, can often be the main sources of shipment delays, supply chain disruptions, additional costs, and reduced competitiveness. Poorly performing ports are characterized by limited spatial and operating efficiency, maritime and landside access, oversight, and coordination among the public agencies involved, which lower predictability and reliability. The result is that instead of facilitating trade, the port increases the cost of imports and exports, reduces competitiveness, and inhibits economic growth and poverty reduction. The effect on national and regional economies can be severe [see inter alia World Bank (2013)] and has driven numerous efforts to improve performance to strengthen competitiveness.
Port performance is also a key consideration for container shipping lines that operate liner services on fixed schedules, based on agreed pro-forma berth windows. Delays at any of the scheduled ports of call on the route served by the vessel would have to be made good before the vessel arrives at the next port of call, to avoid an adverse impact on the efficient operations of the service. As such, port efficiency and port turnaround time at all the ports of call are important subjects for operators, and monitoring port performance has become an increasingly important undertaking in the competitive landscape.
One of the major challenges to improving efficiency has been the lack of reliable measures to compare operational performance across different ports. The old management idiom, ‘you cannot manage what you cannot measure,’ is reflective of the historical challenge of both managing and overseeing the sector. While modern ports collect data for performance purposes, it is difficult to benchmark the outcomes against leading ports or ports with similar profiles due to the lack of comparative data.
Unsurprisingly, there is a long history of attempts to identify a comparative set of indicators to measure port or terminal performance. A brief review of the literature was provided in The Container Port Performance Index 2020: A Comparable Assessment of Container Port Performance (World Bank 2021), CPPI 2020, which illustrated the broad approaches identified and commented on the merits and demerits of each. The measures fell into three broad categories: Firstly, measures of operational and financial performance; secondly, measures of economic efficiency; and thirdly, measures that rely, predominately, on data from sources exogenous to the port. This review is not replicated in CPPI 2021, and interested readers are directed to CPPI 2020 (World Bank 2021), or the extant literature. One of the general challenges of nearly all the approaches has been the quality, consistency, and availability of data; the standardization of definitions employed; and the capacity and willingness of organizations to collect and transmit the data to a collating body.
At a slightly higher level, there are several aggregate indicators that provide an indication of the comparative quality and performance of maritime gateways. The World Bank Logistics Performance Index (LPI) (Arvis et al. 2018) and the World Economic Forum’s Global Competitiveness Index (GCI) 4.0 both report on the perceived efficiency of seaport services and border clearance processes and indicate the extent to which inefficiencies at a nation’s sea borders can impact international trade competitiveness. But the aggregate nature of the indicators, and the fact that they are perception based, means that they offer at best an indication of comparative performance and offer little to guide
spatial or operating performance improvements at the level of the individual port. The United Nations Conference on Trade and Development’s (UNCTAD’s) Liner Shipping Connectivity Index (LSCI) provides an indicator of a port’s position within the liner shipping network, which is partly a result of the port’s performance, but does not directly measure it. Like the CPPI, the LSCI is limited to container ports.
Digitalization offers an opportunity to measure and compare container port performance in a robust and reliable manner. New technologies, increased digitalization and digitization, and growing willingness on the part of industry stakeholders to work collectively toward system-wide improvements have created the capacity and opportunity to measure and compare container port performance. The data used to compile the CPPI 2022 is from S&P’s Global Port Performance Program, which commenced in 2009 to drive efficiency improvements in container port operations and supporting programs to optimize port calls. It includes 10 of the world’s largest liner shipping companies, which collectively operate close to 80 percent of the global container ship fleet capacity.
The liner shipping companies provide the program with a series of operational time stamps for each individual port call. The data are provided monthly and cover the full global networks of each liner shipping company and their subsidiaries. In 2022, performance time stamp data and other information for the 348 ports comprising the main index were captured for 156,813 port calls involving 243.9 million container moves. The nature, source, and scope of the data are discussed in the subsequent chapter.
The aim of CPPI was to utilize the existing empirical data to establish an unbiased metric for comparing container port performance among different ports, over time. The performance of container ports is most relevant in terms of customer experience, specifically the speed and efficiency with which customer assets are handled. In this third edition of CPPI, the focus remains exclusively on quayside performance, which reflects the experience of a container ship operator - the port’s primary customer - and its fundamental value stream. The operational efficiency of how ports receive, and handle container ships is critically important in a carrier’s decision to choose a port over other options.
This year, we have streamlined the computation of the CPPI using an additional method that aggregates the two methodologies used in the former editions. This will catalyze and stimulate improvements as the ranking is now more reliable, consistent, and comparable across different ports. The three methodologies employed in this study, and the justification for their use, are presented in the subsequent chapters. The results are presented in chapter 3, with further details provided in appendixes A and B.
The purpose of the CPPI is to help identify opportunities to improve a terminal or a port that will ultimately benefit all public and private stakeholders. The CPPI is intended to serve as a benchmark for important stakeholders in the global economy, including national governments, port authorities and operators, development agencies, supranational organizations, various maritime interests, and other public and private stakeholders engaged in trade, logistics, and supply chain services. The joint team from the World Bank and S&P Global Market Intelligence intends to enhance the methodology, scope, and data in future annual iterations, reflecting refinement, stakeholder feedback, and improvements in data scope and quality.
• Arvis, Jean-François, Lauri Ojala, Christina Wiederer, Ben Shepherd, Anasuya Raj, Karlygash Dairabayeva, and Tuomas Kiiski. 2018. Connecting to Compete 2018: Trade Logistics in the Global Economy. Washington DC: World Bank. https://openknowledge.worldbank.org/bitstream/ handle/10986/29971/LPI2018.pdf
• Clark, Ximena, David Dollar, and Alejandro Micco. 2004. “Port Efficiency, Maritime Transport Costs, and Bilateral Trade.” Journal of Development Economics 75 (2): 417–450. https://doi.org/10.1016/j. jdeveco.2004.06.005
• Hoffmann, Jan, Naima Saeed, and Sigbjørn Sødal. 2020. “Liner Shipping Bilateral Connectivity and Its Impact on South Africa’s Bilateral Trade Flows.” Maritime Economics & Logistics 2020, 22 (3): 473–499. DOI: 10.1057/s41278-019-00124-8.
• Kathuria, Sanjay. 2018. A Glass Half Full: The Promise of Regional Trade in South Asia. Washington DC: World Bank. https://openknowledge.worldbank.org/handle/10986/30246
• Levinson, Marc. 2006. The Box: How the Shipping Container Made the World Smaller and the World Economy Bigger. Princeton, New Jersey, United States: Princeton University Press.
• Micco, Alejandro, Ricardo J. Sanchez, Georgina Pizzolitto, Jan Hoffmann, Gordon Wilmsmeier, and Martin Sgut. 2003. “Port Efficiency and International Trade: Port Efficiency as a Determinant of Maritime Transport Costs.” Maritime Economics & Logistics, 5 (2): 199–218. DOI:10.1057/palgrave. mel.9100073.
• UNCTAD (United Nations Conference on Trade and Development). 2021. Review of Maritime Transport 2021. Geneva: UNCTAD. https://unctad.org/webflyer/review-maritime-transport-2021
• Wilmsmeier, Gordon, Jan Hoffmann, and Ricardo J. Sanchez. 2006. “The Impact of Port Characteristics on International Maritime Trade Costs.” Research in Transportation Economics, 16 (1): 117–140. DOI:10.1016/S0739-8859(06)16006-0.
• World Bank. 2013. “Opening the Gates: How the Port of Dar es Salaam Can Transform Tanzania.” Tanzania Economic Update 3, May 21, 2013. https://www.worldbank.org/en/country/tanzania/ publication/opening-the-gates-how-the-port-of-dar-es-salaam-can-transform-tanzaniabackup#:~:text=US%241%2C759%20million%20%E2%80%93%20the%20total,port%20of%20Dar%20 es%20Salaam
• World Bank. 2022. The Container Port Performance Index 2021: A Comparable Assessment of Container Port Performance. Washington, DC: World Bank.
Introduction
Container (liner) shipping services are generally highly structured service rotations. They are typically set up with weekly departure frequencies, a fixed sequence of port calls, and standard pro forma day and time-specific berthing windows. Once a service has been defined or adjusted, it will usually remain intact for many months, or even years. The berthing windows are pre-agreed with the terminal and port operators, usually based on a slightly higher than expected average quantity of container exchange moves, and ideally modest buffers in the sea legs between ports.
The clear advantages of this model are that shippers can make long-term supply decisions and ports and terminals schedule and balance their resources to meet expected demand. With a well-planned and well-executed pro forma schedule, they can achieve higher levels of reliability and predictability. This, in turn, can lead to more effective supply chain operations and planning as container ships spend around 15 percent to 20 percent of their total full rotation time in ports, with the balance being spent at sea. Reduced port time can allow ship operators to reduce vessel speed between port calls, thereby conserving fuel, reducing emissions, and lowering costs in the process.
Conversely, for every unplanned additional hour in port or at anchorage, the ships need to increase speed to maintain the schedule, resulting in increased fuel consumption, costs, and emissions. In extreme cases, ships that fall many hours behind their pro forma schedule will start to arrive at ports outside of their agreed windows, causing berth availability challenges for ports and terminals, particularly those with high berth utilization rates. This, in turn, causes delay to shipments and disruption to supply chains. A service recovery can involve significantly higher sailing speeds, and therefore, higher fuel consumption, emissions, and costs, or the omission of a port or ports from the service rotation.
Time is valuable for stakeholders, and so it is logical to measure port performance based on the total amount of time ships are required to spend in port. The CPPI 2022 has been developed based on the total port time in the manner explained in subsequent sections. This iteration has utilized data from the full calendar year of 2022 and has employed the same two approaches as the earlier editions, an administrative approach and a statistical approach. The resulting ranking of container port performance reflects as closely as possible actual port performance, while being statistically robust. The approaches are discussed in this chapter, with further details on the statistical methodology provided in Appendix B. The results are presented in chapter 3, and in more details in Appendix A.
The data used to compile the CPPI is from S&P Global’s Port Performance Program. The program was started in 2009 with the goal of supporting efficiency improvements in container port operations and to support projects to optimize container port calls. The program includes 10 of the world’s largest liner shipping companies that collectively operate close to 80 percent of global fleet capacity.
The liner shipping companies provide the program with a series of data points comprising operational time stamps and other bits of information such as move counts for each individual port call undertaken globally. The data are provided monthly and cover the full global networks of each liner shipping company and their subsidiaries. In 2022, performance time stamp data were captured for 157,704 port calls involving 243.9 million container moves at 765 container terminals in 434 ports worldwide.
Following receipt from the shipping lines, the port call data undergo several validation and quality checks before mapping to historical AIS vessel movement data, which enables tracking and verification of the shipping line data. The geo-fencing of port and terminal zones within the AIS system supports the creation of several of the performance metrics tracked in the program. Most of the port performance metrics are constructed from the combined AIS and liner shipping data. The combination of empirical shipping line data and AIS movement data enables the construction of more accurate and granular metrics to measure container port performance. Many of the metrics consist of a time component cross-referenced with workload achieved in that time, either in the form of move counts or a specific task within the container port call process. Time stamps, definitions, and methods to calculate metrics are fully standardized in collaboration with the shipping line partners in the program.
AIS technology is used to track and monitor vessels in near real time. It sends information on a vessel’s movement, speed, direction, and other particulars via satellite and terrestrial stations. The system’s function as a localized service, and indeed global tracking, was initially considered secondary. The AIS primarily functions as a navigational safety aid, to ensure the safety and efficiency of navigation, safety of life at sea, and maritime environmental protection.1 AIS was designed for the avoidance of vessel collision, as outlined in the Safety of Life at Sea (SOLAS) Convention.2
All ships of net tonnage of at least 300 gross register tonnage (GRT) performing international voyages, all cargo ships of at least 500 GRT not performing international voyages, and all passenger ships, regardless of size, should be equipped with AIS. This allows vessels to automatically transfer data and a plethora of navigational and identification information to other nearby ships and relevant port authorities in the form of structured messages.3 The technical requirements for AIS are specified by the International Telecommunication Union (ITU) Recommendation ITU-R M.1371-5(02/2014).4
For maritime domain awareness and safety purposes, the use of continuous 24/7, near-real-time online AIS data makes it possible to monitor areas, vessels, and routes; generate shore-based alerts; and provide useful positional and navigational information in general (IALA 2005). Satellite-based AIS receivers offer coverage outside the land-based antennas’ range by covering the whole globe from pole to pole. Satellite AIS coverage can extend to the entire exclusive economic zone (EEZ) or globally, including remote coastal areas (IALA 2016).
In the case of ports5, the usage of ‘zones’ helps in recording a vessel’s navigational status and positioning. AIS zones offer different indicators activated automatically by the vessel’s signal reporting its position. Every port has at least one zone created in a way that captures the arrivals and sailings of vessels at cargo-handling facilities but avoids spurious reports being recorded from passing traffic. Where a subject port is geographically spread out with terminals located remotely, it is likely that there will be more than one zone, with all zones linked by a standard port identification number.
Ports that straddle a river or another similar body of water will often have zones along opposing shorelines with a track separating them, thus avoiding the capture of AIS reports from traffic navigating through a fairway or channel. Once again, the individual zones will be linked to their common port using the port’s unique identification number.
Zones also cover anchorages to record vessels arriving at a port but awaiting authority to enter, or vessels laid up awaiting orders. Additional zones cover the arrival of vessels at repair yards or those navigating locks. Anchorage zones may be created on an ad hoc basis. Not all ports have anchorage areas and among those that do, not all are shown in nautical charts. Whenever possible, S&P Global uses its own tracking and observation tools to determine where vessels anchor and create zones accordingly. Each anchorage zone is linked to the relevant port using the subject port’s unique identification number.
AIS is generally reliable, but it also has limitations that can impact the transmission and quality of the data captured. Some factors that may affect the signal could be the AIS transponder being turned off deliberately, problematic reception, high traffic density areas, weather conditions, or anomalous positions.
Every container ship port call can be broken down into six distinct steps. These individual steps are illustrated in Figure 2.1. ‘Total port hours’ is defined as the total time elapsed between when a ship reaches a port (either port limits, pilot station, or anchorage zone, whichever event occurs first) to when it departs from the berth after having completed its cargo exchange.
The time spent from berth departure (All Lines Up) to the departure from the port limits is excluded. This is because any port performance loss that pertains to departure delays, such as pilot or tug availability, readiness of the mooring gang, channel access and water depths, forecasting completion time, communication, and ship readiness will be incurred while the ship is still alongside the berth. Additional time resulting from these causes will, therefore, be captured during the period between 4. Last Lift and 5. All Lines Up (“berth departure).
Gangway down, authority clearence, abour available, position crenes, unlash, load approval, etc

All cargo operations, driven by Crane Intesity and Gross Crane Performance
Lashing and checks, authority clearence, crew onboard, engine ready, repairs completed, bunkers, channel clear, tugs & pilot
Source: Original figure produced for this publication


Ships may spend extra time in a port after the departure from a berth, but the time associated with these additional activities is excluded from the CPPI, as they are not influenced by the operational performance of the terminal or port. Ships may dwell within a port’s limits for bunkering, repairs, or simply waiting in a safe area if they are unable to berth on arrival at their next port. Apart from bunkering being performed simultaneously with cargo operations, these causes of additional port time are not necessarily reflective of poor performance and hence, are excluded from the CPPI.


Although none of these factors necessarily indicate port inefficiency, they can contribute to additional time spent in the port. For instance, clearance authorities’ delays can result in delays in the first lift and idle time after cargo operations have concluded. However, the data available do not provide enough detail to identify the root causes of such delays. It is assumed that only a small percentage of ships idle at the berth after cargo operations due to factors unrelated to port performance, and their inclusion does not significantly affect the CPPI rankings.
The other four components of the port call can logically be grouped into two distinct blocks of time. The first comprises elapsed time between Arrival Port Limits and All Lines Fast (steps 1 and 2 in Figure 2.1); the second comprises time elapsed between All Lines Fast and All Lines Up (steps 2 to 5, also commonly referred to as ‘berth time’ or ‘berth hours’). The logic behind this division is that while there will always need to be time consumed between steps 2 and 5, the bulk of time between steps 1 and 2, excluding actual sailing in time, is waiting time, which can be eliminated.
The time stamps in the source data allow us to break down and summarize total port time into three categories: Arrival Time, Berth Idle, and Cargo Operations. Expressed as a percentage of total port hours recorded, the distribution of port time per ship size range and globally aggregated is shown in Figure 2.2.
As there is naturally some correlation between ship size and call size, a higher percentage of time is required for cargo operations for the larger ships, and this will be explored in detail later in this report. What is interesting, and surprising at the same time is that only 60 percent of the total port time is attributable to cargo operations, meaning there is potentially a lot of ‘wastage’ in terms of excess time in the system.
The average duration of a port call in 2022 was 36.8 hours, which was a slight increase over the global average of 36.3 hours in 2021. About 10.8 percent (or 3.96 hours) was consumed at the berth immediately before and after cargo operations. Also known as the ‘Start-Up’ and ‘Finish’ sub-processes of a port call, each activity does not necessarily need to take more than 30 minutes to complete safely. There are 33,787 examples of Start-Up recorded as 30 minutes or less and a further 29,367 actual cases of the Finish consuming 30 minutes or less. There were 12,784 port calls in 2022 where both the Start-Up and Finish took 30 minutes or less. There is, therefore, an opportunity to eliminate almost three hours per call of port time globally simply through better planning, preparation, communication, and process streamlining. This time saved equates to more hours at sea, leading to slower sailing speeds, lower GHG emissions, and cost savings for the ship operator, which would be significant for each port call.
Figure 2.2 • In-Port Time Consumption Source: Original figure produced for this publication, based on CPPI 2022 dataIn the second half of 2020, there was a rebound in the global sales of durable goods, most prominently in the US, and a sharp increase in the overall container volume demand. This coincided with continued COVID-19 restrictions and resulted in the emergence of severe port congestion. In 2021, this port congestion was still manifesting itself, reaching a peak in the third quarter of 2021 and the average arrival time per port call globally remained above 11 hours until the third quarter of 2022. The fourth quarter of 2022 saw reducing volumes and many ports were able to clear backlogs and reduce average arrival times to close to 10 hours per port call. The expectation is that the average port arrival time globally in 2023 will continue to decline to levels prior to the start of 2021. (see Figure 2.3)
At a regional level and broken down by ship size groups, the change in average arrival time per region and per ship size group over the 2021-2022 period is illustrated in Table 2.1. The column ‘All’ shows the aggregate change in quantity of hours from arrival at port limits or start of anchorage time, to berthing for cargo operations to commence for each region, across all ship size groups.
Figure 2.3 • Global Average Arrival Time DevelopmentAt a global level, on average each port arrival increased by 0.4 hours, as illustrated in Figure 2.3 where there were two peak quarters in 2021 compared with three in 2022. The largest increase in average arrival time was witnessed in North America (USA and Canada) with an average increase in time of 6.0 hours over all vessel sizes. By contrast, performance improved in Africa (Sub-Sahara) with an average 8.0-hour reduction in arrival time across all vessel sizes. Improvements in East Asia and Southeast Asia were also recorded.
At the ship size level, ships within the 1,501 TEU-5,000 TEU range consumed less time entering ports in 2022 compared to 2021, but the opposite was true for ships in the 5,001 TEU-8,500 TEU range where an average additional time per call of 2.4 hours was recorded.
At a port level, the top 20 most improving or deteriorating average arrival time developments are reflected in the following tables. The numbers per port and ship size range are the actual average arrival hours recorded in 2022. The comparison with 2021 is made for the average arrival hours for all ship sizes combined.
Source: Original table produced for this publication, based on CPPI 2022 data.
Both Los Angeles and Long Beach dramatically reduced their average arrival times. This might have been at the expense of six of the seven ports with the highest quantity of additional hours incurred and could potentially be the result of cargo and ship re-routings.
The overall improvements and reductions in average arrival hours in African ports has been driven by Dar Es Salaam, Monrovia, Douala, Pointe-Noire, Tema, Luanda, Lomé, Lagos, Port Victoria, Dakar, and Ngqura. The increase is slightly offset by increased average arrival time in Cape Town, San Pedro, Abidjan, and Mombasa. In East Asia, improvements were seen in Yantian and Yangshan but countered by increased time in Manila and Qingdao. There are no European ports in the top 20 improvers. Poti, La Spezia, Mersin, Trieste, Hamburg, and Koper all experienced longer average arrival times.
Waiting time, defined as the period between ‘Arrival Port Limits’ or when the ship enters an anchorage zone, and ‘All Lines Fast’ can generally be regarded as wasted time. As such, in the construction of the CPPI, one possibility was to apply a penalty to waiting time. The decision was taken not to do so, as the introduction of a penalty of this type would be a normative judgement inconsistent with the overall aim of the study to create bean objective quantitative index.
There was consideration as to whether to apply a discount to waiting time for the smallest segment of ships. Smaller ships generally suffer less priority than larger ones, and in some hub ports might be purposely idled at anchorage waiting to load cargo which is arriving from off-schedule ocean going ships. However, after reviewing average arrival time for the various ship size segments on a regional basis, the data did not support applying a discount to waiting time for the smallest segment of ships. (see Table 2.4).
Source: Original table produced for this publication, based on CPPI 2022 data.
Regions that host major hub ports, and where smaller sized ships expended more time to arrive than the average of all ships, are the Mediterranean, the Middle East, India, and Southeast Asia. Further study reveals that the following hub ports in these regions did record significantly higher average arrival times for smaller ships versus the average for all vessel sizes.
Source: Original table produced for this publication, based on CPPI 2022 data.
To test the significance of purposely delayed smaller feeder vessels on the overall ranking, we conducted a simulation within the overall CPPI model. For all ports (not only the focus ports), we reduced the quantity of arrival hours by 50 percent for all ship calls where the capacity of the ship is 1,500 TEU or less in size. The quantity of berth hours for all ships was maintained at 100 percent, as was the average arrival hours for all other ship size groups.
Table 2.5 displays the original overall rank without any adjustment to feeder ship arrival hours. The last column presents what the overall rank would have been with 50 percent of arrival hours for ships of 1,500 TEU or less capacity eliminated. The conclusion from the simulation is that such an adjustment does not materially alter the overall CPPI 2022 rankings, and four of the six focus ports dropped in rankings during the simulation (Khalifa Port, Singapore, Marsaxlokk, and Tanger-Mediterranean), although only by one place.
Since it is not possible to see from the data whether waiting time is voluntary or forced, it is difficult to find a suitable level at which to discount waiting time in this scenario. The port calls of ships with less than 1,500 TEUs of capacity comprise just 10 percent of the total calls in the CPPI. Therefore, the disparity in waiting times between ships with less than 1,500 TEUs of nominal capacity and other segments, as simulated, has only a small impact to the overall CPPI. To keep the data pure and avoid normative judgment that is inconsistent with an objective quantitative index, the rankings published in this iteration are not influenced by adjustments made to empirically recorded port hours.
As illustrated in Figure 2.2, over 60 percent of a port call is consumed through cargo operations, for the handling of containers. In this aspect of the call, call size is of great significance. Call size is far less significant when it comes to arrival time, which is more likely to be influenced by ship size.
There have been several earlier studies, in which ships are grouped into size segments (ranges) based upon their size or capacity and port calls are ranked based on the time elapsed in port or on the berth. While these studies provide an indication, the optimum outcome requires the workload for each call to be taken into consideration. In this index, workload is represented by ‘Call Size,’ defined as the total quantity of containers (regardless of size), which were physically discharged, loaded, or restowed during a port call.
Source: Original figure produced for this publication, based on CPPI 2022 data
Although there will be some level of correlation between the ship and call size, it is not a perfect correlation. For example, an 18,000 TEU capacity ship calling at a port in Thailand or southern Vietnam might exchange 1,000-2,000 containers per call, but that same ship in Yangshan or Singapore might exchange more than 4,000 containers. Similarly, in the Thai or southern Vietnamese ports, a 3,000 TEU (‘feeder’ ship) might exchange more than 3,000 containers, potentially twice that of an 18,000 TEU mainline ship at the same port.
The 60 percent of a port call, during which containers are exchanged, is influenced by two sub-factors:
1. The quantity of cranes deployed
2. The speed at which the cranes, especially the long crane (the crane with the highest workload in terms of cycles), operate
Source: Original figure produced for this publication, based on CPPI 2022 data
The variation in containers handled per gross crane hour across all ship sizes is statistically minor. The global average for all ships is 23.5 moves per hour, so the smallest ships are 9.4 percent less efficient than the average, whereas ships in the 8,501 TEU-13,500 TEU range are 3.6 percent more efficient than the average. It is often implied that larger ships are more difficult to work, but the data says otherwise. On the larger ships, the crane operator has higher hoists and longer trolley distances, which increases cycle time, but this is offset by more moves per bay and hatch, resulting in more containers handled per gantry or hatch-cover move. The smaller ships can often encounter list or trim issues, making it harder for the operator to hit the cell-guides and the hatch-cover and lashing systems.
A review of gross crane productivity versus call size and crane intensity reveals no strong increases or decreases through the ranges. Assessed on call size ranges, there is a -5.2 percent to 3.8 percent variation to the average. Meanwhile, an assessment of crane intensity reveals that the first and last segments have extremely high and low performances, respectively, but in the mid-range, there is little difference in crane productivity across the seven ranges. This implies that crane speed (productivity) does not gradually increase (or decrease) as ship size, call size, or crane intensity increases. It is therefore statistically not a key determinant of operating hours. The far more significant influencer of operating time is the quantity of cranes deployed (crane intensity).
Figure 2.8 • Call Size versus Crane IntensityAs might be expected, the more container moves are to be handled, the more cranes must be deployed. However, crane intensity lags call size growth, which means that as the call size grows, each crane is required to handle more containers. Theoretically, if a call with 1,000 moves was assigned 2 cranes, then one with 5,000 moves would require 10 cranes for a status quo, and that does not happen often, if at all. Since the exchange rate per crane does not increase progressively with ship size, call size, or crane intensity growth, the overall operating time increases. This makes call size differentiation the critical factor to consider when attempting port performance benchmarking and ranking.
Moving on to the construction of the CPPI, for a port to qualify for inclusion in the CPPI it must have registered at least 24 valid port calls where port hours can be calculated within the full calendar year. Of the 434 ports for which S&P Global received port call information, 348 are included in the main index of CPPI 2022. There were 156,813 distinct port calls recorded in the data over the period at those 348 main ports. A further 86 ports registered less than 24 calls each, accumulatively accounting for 891 port calls (0.6 percent of the total), these ports are excluded from the CPPI 2022.
The CPPI is based solely on the average port hours per port call, with port hours being the total time elapsed from when a ship first entered a port to when it departed from the berth. Due to the large volume of data, it was possible and prudent to break it down into ship size and call size groups or ranges. However, too much fragmentation would have diluted the data to the extent that more assumptions than actual empirical data would be present in the index. Therefore, the data was grouped into five distinct ship sizes, and then within each ship size group by call size group, as reflected in Figure 2.10 below.
Source: Original figure produced for this publicationThe number of ship size groups was limited to five, and the number of call size groups to 10. That results in a 50 (5 x 10) matrix for the qualifying ports for the main index of CPPI 2022. However, there were insufficient port calls in the larger five call size groups for the less than 1,500 TEU ship size group and similarly for the two larger call size groups for the 1,501 TEU-5,000 TEU ship size group. In total, the data was distributed into 43 ship-call size groups.
Source: Original table produced for this publication, based on CPPI 2022 data.
The five ship size groups were based on where they might be deployed and the similarities of ships within each group. Although a sixth group for ships more than 18,000 TEU or 24,000 TEU could have been added, it would have highly diluted the data in the two larger ship size groups.
Less than 1,500
1,500 to 5,000
5,000 to 8,500
8,500 to 13,500
Greater than 13,500
Almost exclusively feeder vessels, often connecting small outlying ports with regional hub ports. Some intra-regional services will also have ships in this size range.
A vast quantity of these classic Panamax ships are deployed on intra-regional trades. They are found on North-South trades to and from Africa, Latin America, and Oceania, as well as Transatlantic services.
Vessels within this size group are mainly deployed on the North-South trade lanes. Vessel cascading and improving port capabilities has seen them start to emerge as stock vessels for Africa, Latin America, and Oceania trades. There is some presence on Transatlantic and Asia–Middle East trades as well.
These Neo-Panamax vessels are largely deployed on East-West trades, particularly Trans-Pacific, both to North America’s west coast as well as via either the Panama or Suez Canals to North America’s east coast. They also feature on Asia–Middle East trades, with some deployed on Asia–Mediterranean rotations.
These ultra-large container ships (ULCS) are mainly deployed on Asia–Europe (serving both North Europe and the Mediterranean) and Asia–United States trades, especially on Trans-Pacific services calling at North America’s west coast ports.
Source: Original table produced for this publication, based on CPPI 2022 data.
The application of ship size groups is less important than call size groups, particularly since the call data is already split into 10 call size groups. However, the objective of the CPPI is to highlight through comparison the performance gaps and opportunities to save fuel and reduce emissions. The analysis should, therefore, consider that the larger the ship, the more fuel it consumes, and the higher the potential to save fuel and reduce emissions.
Source: Original figure produced for this publication, based on CPPI 2022 data
Almost 50 percent of all ship port calls in 2022 were from the Panamax (1,501-5,000 TEU) size of ships. With just 10 percent of port calls made by ships more than 13,500 TEU, it was decided not to disaggregate these further. As the main participants of the Port Performance Program are primarily deep-sea operators, there was a relatively small number of calls in the feeder segment (less than 1,500 TEU capacity).
An attempt has been made to make the 10 call size groups as narrow as possible by grouping together calls in instances where they are most likely to have received similar crane intensity provisions. The analysis then compares all qualifying ports on how close (or far) the individual call size is to the average call size within each call size group.
Source: Original table produced for this publication, based on CPPI 2022 data
To assess the sensitivity within each call size group across all 348 qualifying ports, the median call size between all ports within a call size group was taken and a tolerance range of 15 percent above and below the median created (see Table 2. 8). In the six call size groups from the 1,001–1,500 to 4,001–6,000 moves groups, more than 96.9 percent of ports have an average call size well within this tolerance range.
Beyond the threshold of 6,000 moves per call, the call size has a much lower impact on crane intensity. This is because the number of cranes that can be deployed is limited by the overall number of cranes available or stowage splits. The quantity of ports with an average call size within the tolerance range in the three smallest call size groups is not as high as the quantity in the six call size groups from the 1,001–1,500 to 4,001–6,000 moves groups. However, for ports with an average call size above the tolerance range, it would be possible to increase crane intensity to match the slightly higher call sizes, and, therefore, the conclusion is that objective comparisons can be made within all 10 call size groups.
The handicap of missing values can be addressed in two different ways in the administrative approach and the statistical approach. The former involves assigning values to empty categories based on data that are available when a port has registered a data point within a specific ship size range.
Source: Original table produced for this publication, based on CPPI 2022 data
For each ship size group, the call size group that has the largest quantity of data representation is selected (see Table 2.9) as the Base Call Size group. Ideally, this is a mid-range call size group because the lowest and highest groups can demonstrate some uniqueness. In cases where there is no actual data for the base call size group, the next highest group is examined to find an actual data set. If none is found, then the approach involves looking at the immediately lower call size band. At the end of this exercise, every port has a value assigned for the base call size group.
Imputing vessel arrival values. Where a call size group does not have an arrival hours value, it is populated using the overall average arrival time for all vessels registered at that port across all call size groups within each specific ship size group. This is logical as call size is a less important determinant of waiting time than ship size.
Imputing berth hours. From the base call size group, moving left toward the lowest group and right toward the highest group, in groups where no value exists, a value is determined on a pro rata basis given the adjacent call size group value, actual data or imputed. The rationale is that if within one call size group a port has either higher or lower berth hours than the average, the adjacent call size group too is likely to show similar trends.
Table 2.10 provides an example. In this case, port A had a higher quantity of hours in the base call size group than the group average. It is assumed that would also have been the case had the port registered actual calls in the 501–1,000 and 1,501–2,000 call size groups. The opposite is true for port B, which achieved a lower quantity of hours in the base call size group. The calculation for port A in the 501–1,000 call size group is actual hours within the group 1,001–1,500 (12.0) multiplied by the group average factor (0.9) for a prorated quantity of average berth hours of (10.8).
Source: Original table produced for this publication, based on CPPI 2022 data
Note: The numbers in the green highlighted cells have been imputed by multiplying the base cells by the factor multiplier determined by the overall group average.
The inherent risk with this approach is that poor or good performance within just one group will cascade across all call size groups. It also assumes that a port can add cranes to larger call size groups, which might not be true in all cases. On the other hand, it would be illogical to assume that any port would simply achieve the average of the entire group or that a port performing below average in one call size group would perform much better than average in others where it did not record any actual calls.
A more rigorous approach is used for the statistical approach through the use of a likelihood-based method to impute those missing values. With respect of the current data set, the expectationmaximization (EM) algorithm can be utilized to provide a maximum-likelihood estimator for each missing value. This approach relies on two critical assumptions: The first one is that the missing values are random, that is, it is not due to some bias in the sample selection; and the second one is that the variables under consideration are all normally distributed. These assumptions are not considered unrealistic in the context of the data set. EM then computes the maximum likelihood estimator for the mean and variance of the normal distribution given the observed data. Knowing the distribution that generates the missing data, one can then sample from it to impute the missing values.6
The CPPI has in previous iterations utilized two distinct methodologies: the administrative, or technical approach that employs expert knowledge and judgment to produce a practical methodology, and a statistical approach that utilizes factor analysis (FA). CPPI 2022 goes a step further to aggregate the two rankings to produce one index that to present the performance of ports via both methodologies.
Rank aggregation, that is the process of combining multiple rankings into a single ranking, is an important problem arising in many areas (Langville and Meyer 2012). For example, in a ranked voting system, citizens rank candidates in their order of preference and a single winner needs to be determined. Similarly, recommender systems and search engines can produce many different rankings of items that are likely to be of interest to a given user. Such rankings can naturally be aggregated to produce a more robust list of items (Pappa et al. 2020).
Many strategies were proposed in the literature to combine several rankings into one that is as consistent as possible with the individual rankings (Langville and Meyer 2012, Fagin et al. 2003, Dwork et al. 2001, Dwork et al. 2012, Oliveira et al. 2020) and references therein. The Borda count (Langville and Meyer 2012, Chapter 14) provides a simple and effective approach for aggregating rankings, wherein each item to rank is given points according to the number of items it outranks in its segment. These points are added and then used to produce a new ranking. Our approach to combine the administrative and the statistical rankings is inspired by the Borda count, but also considers the index values for attributing the number of points.
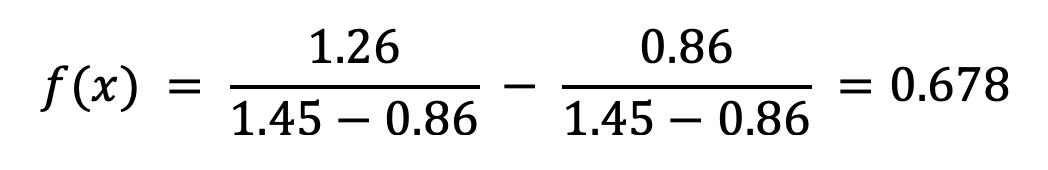
The process is as follows: First, each index is scaled to take values into the interval [0,1]. This is accomplished by applying the following linear transformation: where m is the minimum value of the index and M the maximum value. Observe that the port with the smallest index is always given a scaled value of 0 and the port with largest index a scaled value of 1. The other ports get a scaled value between 0 and 1. Once the indices are scaled, they are added to produce a combined index. Finally, a ranking is obtained by sorting the ports according to the combined index in decreasing order. Thus, the port with the largest combined index is ranked first and the port with the smallest combined index is ranked last.

Source: Original table produced for this publication, based on CPPI 2022 data.
For example, the scaled administrative index value of Port 2 (x = 1.26) is computed as follows: the minimum and maximum values of the administrative index are m = 0.86 and M = 1.45. Thus, the scaled value is
• Langville, Amy N., and Carl D. Meyer. Who’s# 1?: the Science of Rating and Ranking. Princeton University Press, 2012.
• Fagin, Ronald, Ravi Kumar, and Dakshinamurthi Sivakumar. Comparing Top k lists. SIAM Journal on Discrete Mathematics 17, no. 1 (2003): 134-160.
• Dwork, Cynthia, Ravi Kumar, Moni Naor, and D. Sivakumar. Rank Aggregation Revisited. (2001): 613-622.
• Dwork, Cynthia, Ravi Kumar, Moni Naor, and Dandapani Sivakumar. Rank Aggregation Methods for the Web. In Proceedings of the 10th International Conference on World Wide Web, pp. 613-622. 2001.
• Ali, Alnur, and Marina Meilă. Experiments with Kemeny Ranking: What Works When? Mathematical Social Sciences 64, no. 1 (2012): 28-40.
• Oliveira, Samuel EL, Victor Diniz, Anisio Lacerda, Luiz Merschmanm, and Gisele L. Pappa. Is Rank Aggregation Effective in Recommender Systems? An Experimental Analysis. ACM Transactions on Intelligent Systems and Technology (TIST) 11, no. 2 (2020): 1-26.
Introduction
The rankings of container port performance, based on the ranking aggregation approach, are presented in this chapter. The following section presents the rankings for the top 100 best performing container ports, with the full rankings of all ports by both approaches presented in Appendix A. The subsequent sections present a summary by region and port throughput (large, medium, small), so ports in the same region, or with the same throughput within broad categories, can be easily compared.
Table 3.1 presents the rankings of container port performance in the CPPI 2022. It reflects the aggregation of the scores from the results from the administrative approach and the statistical approach in the manner described in the previous section.
In the aggregate index, the two top-ranked container ports in the CPPI 2022 are Yangshan Port (China) in first place, followed by the Port of Salalah (Oman) in second place. These two ports occupy the same positions in the rankings generated by the constituent approaches. The Port of Salalah was ranked second in both approaches in CPPI 2021, while the Yangshan Port ranked third and fourth in the statistical and administrative approaches, respectively, in CPPI 2021.
Three ports in the Middle East have secured positions among the top 10 spots. Three of the large Chinese gateways–Shanghai (Yangshan), Ningbo, and the southern port of Guangzhou–maintained places in the top 10. Of the top 10 ranked ports, nine have either maintained or improved their position since CPPI 2021. The exception is Hamad Port, which moved down five and three places (provide the rankings, sincethey’re specified for Yokohama and Jeddah) in the administrative and statistical rankings, respectively. Yokohama fell from the 10th and 12th ranks in CPPI 2021 to the 15th in CPPI 2022, and Jeddah fell from the 8th (provide both administrative and statistical rankings) to 29th.
There are 14 new entrants to the CPPI 2022, and several significant gainers in terms of ranking. Over 110 ports improved their rankings in CPPI 2022 over CPPI 2021, with some of the largest gainers moving up more than 200 positions. In contrast, 200 ports fell in the CPPI 2022 rankings, some falling nearly 260 positions, which is 40 positions fewer than the biggest fall in the previous CPPI edition.
The CPPI 2022 shows reduced discrepancies between the two approaches compared to its previous edition. In CPPI 2022, 40 percent of all ports (140 ports) are ranked within three places or less from themselves in the dual rankings (a 2 percent improvement). In CPPI 2021, 38 percent of all ports (139 ports) are ranked within three places or less from themselves in the dual rankings (a 20 percent improvement). In CPPI 2020, just under 18 percent of all ports (61 ports) were ranked within three places or less from themselves in the dual rankings. The reduction in discrepancies contributes significantly to having a well-balanced aggregated index.
This section presents an overview of the outcomes from the CPPI 2022 report. The first edition of CPPI was modified based on requests for the presentation of results and rankings by region and throughput for an improved comparison of ports within the same region and those with similar throughput. The subsequent sections include a concise tabulation of the results and ranking (from Table 3.2) for the designated regions.
• North America (United States and Canada)
• Central America, South America, and the Caribbean Region
• West, Central, and South Asia (Saudi Arabia to Bangladesh)
• East Asia (Myanmar to Japan)
• Oceania (Australia, New Zealand, and the Pacific Islands)
• Sub-Saharan Africa
• Europe and North Africa
Table 3.2Source: Original table produced for this publication, based on CPPI 2022 data
Source: Original table produced for this publication, based on CPPI 2022 data
Source: Original table produced for this publication, based on CPPI 2022 data
Source: Original table produced for this publication, based on CPPI 2022 data
Source: Original table produced for this publication, based on CPPI 2022 data
Source: Original table produced for this publication, based on CPPI 2022 data
Source: Original table produced for this publication, based on CPPI 2022 data
This section presents the CPPI 2022 by throughput. It offers a summary tabulation (from Table 3.9) by throughput using the following defined ranges:
• Large: more than 4 million TEUs per year
• Medium: between 0.5 million and 4 million TEUs per year
• Small: less than 0.5 million TEUs per year
Source: Original table produced for this publication, based on CPPI 2022 data
Table 3.11 • The CPPI by Throughput: Small Ports (Less than 0.5 million TEUs per Year)
The primary objective of developing the CPPI by utilizing existing empirical data was to create an impartial benchmark to assess and compare container port performance across different ports, over time. This was done to facilitate the identification of gaps and opportunities for improvement in a standardized manner, which could ultimately benefit all stakeholders, including shipping lines, national governments, and consumers. The CPPI was intended to serve as a crucial point of reference for various stakeholders in the global economy, such as port authorities and operators, national governments, development agencies, supranational organizations, and other public and private entities involved in trade, logistics, and supply chain services.
In the future, the CPPI is expected to undergo further refinement in subsequent editions, incorporating stakeholder feedback, advancements in data scope and quality, and additional trend analysis. The World Bank-S&P Global Market Intelligence team will continue to improve the methodologies, expand the scope by potentially including more ports, and enhance the data. The next version, CPPI 2023, will be comparable to the current edition, facilitating trend analysis of container port performance across the aggregate index. Specifically, subsequent releases will also contain indices aggregated from the statistical and administrative approaches. CPPI 2022 considers the dissimilarities between the two approaches while simultaneously gaining a deeper understanding of the vital factors that affect container port performance. The goal remains to identify opportunities for improvement to benefit all stakeholders, including ports, shipping lines, governments, line agencies, businesses, and consumers.
Source: Original table produced for this publication, based on CPPI 2022 data.
Source: Original table produced for this publication, based on CPPI 2022 data.
The administrative and statistical approaches are explained in detail in this section.
Before discussing the methodology employed in constructing the CPPI with matrix factorization, it is helpful to first summarize the structure of available data. The data set is segmented by the following five categories of ship sizes:
• Feeders: <1,500 TEUs
• Intra-regional: 1,500 TEUs –5,000 TEUs
• Intermediate: 5,000 TEUs –8,500 TEUs
• Neo-Panamax: 8,500 TEUs –13,500 TEUs
• Ultra-large container carriers: >13,500 TEUs
For each category, there are 10 different bands for call size. The port productivity is captured by average idle hour, which consists of two parts: port-to-berth (PB) and on-berth (B). In the previous CPPI iteration, total variables used = 5 x 10 x 2. Of course, many of them have missing values. The objective is to build a model to summarize these variables and then construct a port productivity index for all ports under consideration. The average waiting time and average berth time is calculated for each call size. The resulting data is a table/matrix whose rows represent ports and whose columns contain the average waiting and berth times of each call size.
A major practical problem is that most idle hour variables have a significant number of missing values. For instance, in the port performance data set, the two smaller ship sizes contain little data for the larger call sizes. Consequently, as in the administrative approach, the call size groups with more than 2,000 moves were removed from the <1,500 TEU ship category, and the call size groups with more than 4,000 moves were removed from the 1,501 TEU–5,000 TEU ship category.
A more sophisticated approach is to use likelihood-based methods to impute those missing values. For the current data set, expectation–maximization (EM) algorithm can be utilized to provide a maximum-likelihood estimator for each missing value. It relies on two critical assumptions. The first assumption is that gaps are random, or more specifically, the gaps are not caused by sample selection bias. The second assumption is that all variables under consideration follow a normal distribution. Given the data set, these two assumptions are plausible. EM computes the maximum likelihood estimator for the mean and variance of the normal distribution given the observed data. Knowing the distribution that generates the missing data, we can then sample from it to impute the missing values. Matrix factorization can then be performed on the resulting data set, instead of the original one filled with missing values.
Missing values in the resulting table/matrix are reconstructed using the EM algorithm (Dempster, Laird, and Rubin 1977). A non-negativity constraint is added to make sure the reconstructed times are nonnegative. Assuming the data has a multivariate Gaussian distribution with mean vector µ and covariance matrix ∑, the EM algorithm provides an estimate of the two parameters µ and ∑ via maximum likelihood.
Missing values are imputed using their conditional expectation. In this approach, given a row with available values x_a and missing values x_m, the missing values are imputed by their conditional expectation E(x_m 1_(x_m )≥|x_a ) given the available data, where the expected value is computed only over the non-negative values of x_m to ensure the imputed values are non-negative.
In this iteration, arrival and berth hours are aggregated into total port hours, just like in the administrative approach. The data structure after this aggregation for a particular category k (k = 1, 2, 3, 4, 5) can be summarized as shown in Table B.1.
Source: Original table produced for this publication
Table B.1Essentially, for each port, quite a few variables contain information about its efficiency. These include average time cost under various categories: (1) different call size bands, and (2) berth/port-to-berth. The reason matrix factorization can be helpful is that these variables are in fact determined by a small number of unobserved factors, which might include quality of infrastructure, expertise of staff, and so on. Depending on the data, very few of such factors can summarize almost all useful information. The challenge lies in the inability to observe those latent factors; however, a simple example could be helpful: Imagine three ports, each with four different types of time cost, as shown in table B.2.
As one can observe, costs 2 to 4 are just some multiples of cost 1. Although we have four variables, to rank the efficiency of these three ports, just one variable is enough (A>B>C). This is an extreme case, but the idea can be generalized if these variables are somehow correlated, but to a less extreme extent. In that case, the factors are computed as some linear combination of costs 1 to 4. Of course, if costs 1 to 4 are completely independent of each other, then this method makes no sense. Fortunately, this is not the case for our data set. Thus, for each port, we can compute its score on all factors and then combine those scores together to reach a final efficiency score.
Note that in the statistical approach using matrix factorization, the scores are not calculated for each call size range. On the contrary, the whole data set, including the smaller ports, is used simultaneously to obtain latent factors. This is in sharp contrast to the administrative approach. The statistical approach factors in all the correlations among hours for various call size bands, which purely from a statistical perspective is more efficient.
There is no right or wrong methodology, but the two different approaches that are considered complementary. Hence, the decision in this iteration of the CPPI to maintain both approaches, to try and ensure that the resulting ranking(s) of container port performance reflects as closely as possible actual port performance, whilst also being statistically robust.
The data are scaled and weighted as in the administrative approach.
• Let p_ij denote average port time of port i in call size j.
• Let p_(avg,j ) denote the average of the average port time of all ports in the given call size.

• Let w_j denote the ratio of port calls that are in the call size group j
• The data are scaled by replacing p_ij by.
A positive value of x_(ij ) means the port is doing better than average, whereas a negative value means it is doing worse than average.
Let X = (x_(ij )) denote the resulting matrix of scaled port time. Assume X has n rows (n ports) and p columns (p call size bands). Instead of using factor analysis as in the previous iteration, the matrix X is decomposed as X ≈ WH where W is a n×k matrix and H is an entrywise non-negative k ×p matrix. The integer k (the number of columns of W) is chosen to be a small number to compress the data. The matrix W represents factors and the matrix H factor loadings that are used to explain the data X. A number of k = 3 factors was found to be adequate to approximate the data matrix X.
Note: In the previous iteration, a factor analysis (FA) approach was used. The FA produces a matrix factorization X ≈ WH as above, except that the matrix H does not need to be non-negative. This is a problem since a large positive factor does not necessarily represent a small port time if the corresponding loading is negative. The new approach fixes that problem by enforcing non-negativity in the loadings matrix H. This approach produces results that are consistent with the administrative approach.
The CPPI index is a weighted sum of these indices: Let CPPIi denote the CPPI index for ship size i (i = 1, . . . ,5).
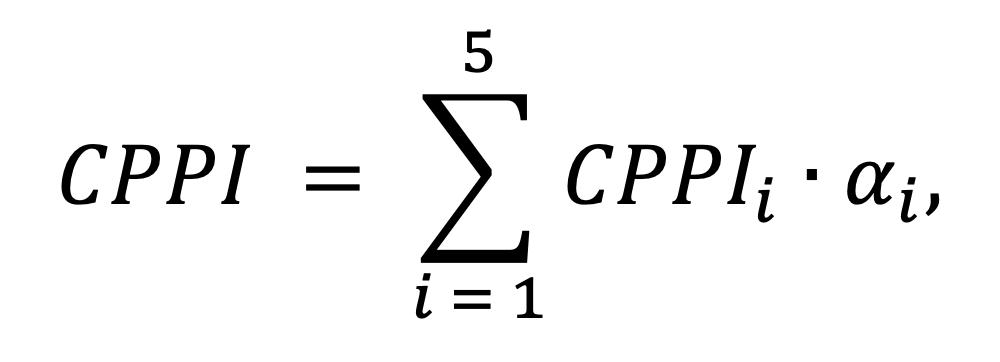
Aggregating arrival and berth hours into total port hours. This report indicated earlier that a case could be made for penalizing waiting time which is regarded as pure waste. However, as expressed earlier, this would be a normative judgment, accordingly both arrival and berth hours are weighted as 1.0 and the two time segments are summed to form total port hours in CPPI 2022.
Appraising port hours performance. Average port hours are naturally higher in the larger than smaller call size groups. This can magnify the difference in hours between a subject port and the average port hours of the overall group. So, appraising on the difference between a port’s average hours and average hours of the group may skew the scoring unduly toward the larger call size calls. There are also far fewer calls within the larger than smaller call size groups, and this also needs to be reflected in the construction of the CPPI to retain maximum objectivity.
The method applied to each call size group individually is that the port’s average port hours is compared with the group’s average port hours as a negative or positive quantity of hours. The result of that comparison is weighted by the ratio of port calls in each call size group for the entire group of ports Table B.3 provides an illustration as to how it is done.
Source: Original table produced for this publication, based on CPPI 2021 data
In this illustrative example, the subject port used 12.09 fewer hours than the average of the entire group (22.56 versus 34.65). Since 16.0 percent of all port calls in this ship size group were in the subject call size group, the difference in hours (12.09) is multiplied by ratio 0.160 for an overall index points result of 1.9344. Where a port uses more port time than the average for all ports, the index points become negative.
Aggregation to a score and rank per ship size group. The “results” achieved per port within each of the 10 call size groups are then summed together to calculate a score within the overall ship size group (it is five and eight groups rather than 10 groups in the case of the two smaller ship size groups, respectively). Based upon these scores, there is a sub-ranking performed within each ship size group that can be reviewed in the final CPPI rankings.
No allowance was made for ports that did not handle ships within specific ship size groups during the period under consideration. The primary reason is many of the smaller ports are not capable of handling some of the larger ship sizes and so would in effect be awarded positive (or negative) results for scenarios that are physically impossible. The omission of scores within some ship size groups would only be an issue if an attempt was made to compare the performance of major mainline ports with those of far smaller ports. But this is a comparison that is neither fair nor valuable.
For the comparison between similarly sized ports, this factor will not contribute, or at least not significantly. In aggregating the scores from the various ship size groups into the overall CPPI in the administrative approach, a factor was built in to differentiate the importance and significance of better performance of larger ships over smaller ones. This was constructed based on the relative fuel consumption (and, therefore, emissions and cost) of different ship sizes in the form of an index (see table B.4). For each ship size group, a typical mid-range example ship was selected. Based upon the expected deployment of such ships, a range of sea legs were defined (and weighted), at a typical pro forma service speed, and the impact on fuel consumption that one hour longer (or shorter) in port would be likely to yield.
The index weight then suggests that it is 2.57 times more costly to recover an additional hour of port time at sea for a ship with a capacity of more than 13,500 TEUs than it would be for a ship in the 1,500 TEU–5,000 TEU capacity range. The total aggregated index points per port within each ship size group are then weighted by this cost/environmental factor. The sum of the weighted index points for each port across all five ship size groups are then summed and the final CPPI ranking is based on those weighted values.
The primary focus was micro-delays and it was assumed that these would be recovered on long-haul ocean legs, and not between coastal ports, which would be more costly. Through simulation, if the index values are tweaked up or down by up to 10 percent, the overall ranking is unaffected. If they are adjusted so that larger ship size groups have lower indices than smaller ones, it results in radical changes to the overall ranking. The resulting index for main and secondary ports using the administrative approach is presented in chapter 3 and appendix A.
1International Maritime Organization (IMO) Resolution MSC.74(69) Annex 3.
2See the International Maritime Organization’s website on “International Convention for the Safety of Life at Sea (SOLAS), 1974,” (accessed March 2022), at https://www.imo.org/en/About/Conventions/ Pages/ International-Convention-for-the-Safety-of-Life-at-Sea-(SOLAS),-1974.aspx.
3International Convention for the Safety of Life at Sea (SOLAS), under the revised SOLAS 1974 Chapter V (as amended)—Safety of Navigation, section 19.2.415, carriage requirements for shipborne navigational systems and equipment.
4See ITU’s website on “Technical Characteristics for an Automatic Identification System Using Time Division Multiple Access in the VHF Maritime Mobile Frequency Band,” (accessed November 2021), at https://www.itu.int/dms_pubrec/itu-r/rec/m/R-REC-M.1371-5-201402-I!!PDF-E.pdf
5It may be a conventional land-based port or a stretch of water designated as an area for transferring cargo or passengers from ship to ship.
6The precise approach to produce a robust data set is detailed in appendix B.
7The actual equation is: (Group Average Port Hours/Example Port Hours) x Call Size Group Weight.
• Dempster, A. P., N. M. Laird, and D. B. Rubin. 1977. “Maximum Likelihood from Incomplete Data via the EM Algorithm.” Journal of the Royal Statistical Society: Series B (Methodological), 39 (1): 1–22. https://doi.org/10.1111/j.2517-6161.1977.tb01600.x.
• IALA (International Association of Marine Aids to Navigation and Lighthouse Authorities). 2005.
IALA Guideline 1050: The Management and Monitoring of AIS information. Edition 1.0. Saint Germain: IALA. https://www.iala-aism.org/product/management-and-monitoring-of-ais-information1050/?download=true.
• IALA (International Association of Marine Aids to Navigation and Lighthouse Authorities). 2016.
IALA Guideline 1082: An Overview of AIS. Edition 2.0. Saint Germain: IALA. 19. https://www.iala-aism. org/product/an-overview-of-ais-1082/?download=true.