Final Report
the SWEDISH MASS EXPERIMENT 2019 A CITIZEN SCIENCE PROJECT AS PART OF EUROPEAN RESEARCHERS’ NIGHT
VA-report 2020:3 Published by: VA (Public & Science), Nov 2020 P.O. Box 5073, SE-102 42 Stockholm E-mail: info@v-a.se Website: www.v-a.se Authors: Martin Bergman Urban Eriksson, Hanna Mellin, Tanja Kramer Nymark, Lena Sรถderstrรถm and Lotta W Tomasson Translation: Helen Garrison Graphic design: Lotta Waesterberg Tomasson, VA Photographs front and back cover: Anna Olsson More information about the project at www.forskarfredag.se/star-spotting You are welcome to quote from this report provided that VA is cited as the source.
CONTENTS SUMMARY.............................................................................................4 BACKGROUND AND OBJECTIVES...........................................................6 LIGHT POLLUTION - A GROWING PROBLEM ...................................................................6 OBJECTIVES.................................................................................................................8
WHAT DID WE DO? ..............................................................................9 CITIZEN SCIENCE....................................................................................................................9 METHODOLOGY........................................................................................................................9 IMPLEMENTATION...................................................................................................................10 HOW THE CALCULATIONS WORK............................................................................................12
RESULTS............................................................................................15 SWEDEN................................................................................................................................15 UNITED KINGDOM..................................................................................................................16 IRELAND................................................................................................................................16 SPAIN....................................................................................................................................17 WHAT DID WE DISCOVER?......................................................................................................20 An overview of the results in Spain, Ireland and the UK..............................................20 An overview of the results in Sweden..........................................................................21 FUN BUT TRICKY - FEEDBACK FROM PARTICIPANTS..............................................................24
DISCUSSION & CONCLUSIONS...............................................................25 HOW RELIABLE IS THE METHOD?...........................................................................................25 SIMPLICITY - IMPORTANT FOR THE FUTURE...........................................................................26 UNCERTAINTIES.....................................................................................................................27
WHAT CAN WE DO?...............................................................................28 MORE INFORMATION.............................................................................29
3
Summary THE STAR-SPOTTING EXPERIMENT 2019-2020 During 2019 and into early 2020, school pupils, scout groups, astronomers and interested members of the public went out to count stars in the night sky. The objective was to test a new method for measuring light pollution, based on the principle that the more stars you see in the night sky, the less light pollution. The project started in Sweden in February 2019 coordinated by the non-profit organisation Vetenskap & Allmänhet (Public & Science), VA, as a part of the research festival European Researchers’ Night in Sweden, ForskarFredag. In September of the same year, the project was also launched in Ireland, the UK and Spain. A total of 1,912 observations were reported into the project. There was a great response to the project, which resulted in the problems associated with light pollution being talked about in schools and scout huts in all four countries. The project was also promoted during astronomy events and European Researchers’ Night activities. Light pollution is a growing problem that has negative effects on people, animals and nature. In order to learn more about its effects, we need precise, reliable and common methods of measuring it. Through this project, we wanted to increase awareness of the issue as well as test a new measurement method, which could contribute new knowledge about light pollution. This new measurement method has been tested by comparing our findings with those obtained using different measurement methods. The method used was simple and did not require any prior knowledge. All that was needed was a compass and a measuring instrument consisting of a cardboard tube with a protractor attached to it. Each participant counted the number of stars they could see through the tube, in nine predetermined directions. The observations were then reported in the Star-Spotting app or via the web and the observer was instantly told how light-polluted it was at that particular observation location. This report covers the background, objectives, methodology of the project. The analysis of the results has focused mainly on the Swedish observations, therefore, the Swedish results are the most prominent in this report. Image 1. Participants in the Star-Spotting Experiment in Umeå, winter 2019. Photo: Mattias Pettersson, Umeå University
4
Some of the results: * A total of 1,921 observations were recorded in Ireland, Spain, the UK and Sweden, around 900 of which were in Sweden. * In Sweden, 252 school classes, 29 scout groups and 176 individuals registered their interest in participating in the Star-Spotting Experiment. * For 17 percent of all observations in Sweden, no stars could be seen in the sky at all. For observations where stars could be seen in the sky, the app calculated that on average 454 stars were visible across the whole sky. This corresponds to a limiting magnitude1 of 4.5. The number varied greatly, from no visible stars to several thousand. * A comparison shows that the Star-Spotting Experiment achieved more or less the same results as other methods of measuring light pollution. This means that the method we developed during the Star-Spotting Experiment works well as a way of measuring light pollution! The results indicate that the method used in the Star-Spotting Experiment can be used as a simple and reliable way of monitoring how light pollution changes over time and varies locally. If we can all help to measure light pollution by looking through a cardboard tube and counting how many stars we can see, this would be a simple and cheap method to complement other methods of measuring light pollution, such as by sending satellites into space. The scientific leader of the project was Dr Urban Eriksson, a researcher and university lecturer in physics at Lund University and Kristianstad University. Dr Tanja Nymark, Head of Physics at House of Science, also helped with the analysis of the results. The Project Managers were Lena Sรถderstrรถm and Dr Martin Bergman at the Swedish non-profit organisation VA (Public & Science). The Star-Spotting Experiment is the result of a collaboration between VA (Public & Science), the National Resource Center for Physics Education (NRCF), Lund University, Kristianstad University, the Swedish National Space Agency, the Swedish Astronomical Society, and the two science centres Umevatorium and House of Science (Vetenskapens Hus) with funding from the research council Formas. The project is also funded by the European Commission under HORIZON 2020 in the framework of the Marie Sklodowska-Curie actions, GA 818421. Internationally, the project was run in collaboration with Fundaciรณn Descubre, Esciencia, La Palma Centre and Fundaciรณn Madri+d in Spain, University College Cork and Trinity College in Ireland and the Natural History Museum, London, UK. We would like to thank everyone who participated in the project!
port!
ng the re i d a e r y o Enj
1
The maximum brightness of a star that can be seen with the naked eye under optimal conditions (see page 10).
5
Background and objectives LIGHT POLLUTION - A GROWING PROBLEM A growing number of people around the world live in cities or towns with lots of nighttime light in the form of street lighting, shop windows, fluorescent signs and illuminated buildings. This artificial light illuminates the sky making it difficult for us to see the stars. The phenomenon is called light pollution. Light pollution is a growing problem: Towns and cities are expanding, and more are being lit up. LED lights are becoming increasingly common, which reduces electricity consumpImage 2. Illustration: Hanna Mellin/VA tion, but makes the problem of light pollution worse. Darkness at night is becoming a scarcity in the world and is an environmental problem that needs to be taken seriously2. The effects of illumination at night on humans, plants, animal behaviour, ecology and biodiversity, are largely unknown, but it is something researchers are trying to learn more about. Studies undertaken by researchers show that both animals and plants are adversely affected by too much light at night3. Artificial lighting affects the biological clock of animals, their circadian rhythms, sense of direction and behaviour. Image 3. A moth attracted to outdoor lighting. Photo: Fir0002 from Wikipedia / CC BY-SA (http://creativecommons.org/licenses/by-sa/3.0/)
2 3
Kyba et al. 2017 Longcore & Rich 2004; Chepesiuk 2009; Gaston et al. 2013
6
One example is how nocturnal insects are often drawn to light sources such as lamps and streetlamps. Flying insects usually navigate using the moon, stars and the light of the horizon. A streetlamp distracts the insects, which start to swarm around the lamp instead of searching for food or a partner. Bats are another example. They are active during the dark hours of the day and choose their roosting spots with care to avoid light. Studies show that buildings illuminated with facade lighting can have devastating effects on bats4. Image 4. Illustration: Hanna Mellin/VA
Image 5. A church in Amsterdam with facade lighting. Photo: https://www.publicdomainpictures.net/
During the day, the bats sit hidden under facades and roofs waiting for it to get dark so they can go out and hunt. When façade lights are used on the outside of buildings, it never gets dark and the bats never go out hunting, which causes them to die of starvation. However, there is a simple solution to the problem; lighting up one side of the building and leaving the other sides dark.
In recent years, researchers have begun to notice that humans are also being adversely affected by light pollution. Exposure to too much light during the dark hours of the day can disrupt our internal biological clock and as a result affect the body’s hormones and important functions, such as the immune system5.
4 5
EklĂśf & Rydell 2018 Chepesiuk 2009
7
OBJECTIVES There is currently no common and effective way of measuring light pollution. This is a problem that researchers are working to find a solution to. A reliable way of measuring light pollution is needed in order to be able to improve our knowledge about the problem. It is only when we understand how light pollution works that we, and politicians, can take the right measures to reduce it. What is unique about the Star-Spotting Experiment method is that it measures light pollution at a very local level (from your street, school playground or garden) compared to other methods, often satellite-based, where observations are made from above. The objectives of the Star-Spotting Experiment were: * * * * *
To test a new, simple method for measuring light pollution. To investigate whether this method is as good as other methods or perhaps better. To map light pollution in the participating countries. To raise awareness of the problems associated with light pollution. To demonstrate how research is done and how researchers carry out their work.
Image 6. The constellation Orion against a dark sky compared with a city sky in an urban area with 500,000 inhabitants. Photo: Jeremy Stanley [CC BY 2.0 (https://creativecommons.org/licenses/by/2.0)], Wikimedia Commons
8
What did we do? CITIZEN SCIENCE The Star-Spotting Experiment is an example of citizen science, a research method whereby members of the public help researchers in a scientific study. Thanks to the help of teachers, pupils, scouts, amateur astronomers and others, we were able to collect data from all over Sweden as well as in Spain, Ireland and the United Kingdom.
METHODOLOGY If the sky was pitch black and we were in space, we would be able to see around 9,096 stars around us in all directions6. These 9,096 stars are therefore lighter than magnitude7 6.5 (see fact box 1 on the magnitude scale), which is roughly the limit of the eye’s ability to see bright stars. However, in reality, we can see significantly fewer stars than that when we look up at the night sky. Half of the stars are below the horizon (i.e. below the ground we are standing on), which reduces the number of stars we are able to see to half: 4,548. In addition, here on earth we have an atmosphere that both diffuses and absorbs light. This makes it difficult to see more than 4,000 stars, even without any light pollution at all. The Star-Spotting Experiment is based on the simple principle that the more stars you can see in the night sky, the less light pollution there is. The aim was to count how many stars the participant could see with the naked eye in the place where they made the observation. Participants made their observations of the night sky following the same systematic method. No expensive equipment or prior knowledge about astronomy or light pollution was needed, just a compass, the Star-Spotting Experiment app and a measuring instrument consisting of a cardboard tube with a protractor attached to it. The measuring tube could easily be constructed by the participants on their own (see image 9).
6 7
Image 7. The Star-Spotting Experiment had its own app that was used for reporting observations. The app was developed with the help of SPOTTERON GmbH - Citizen Science Platform Image: www. spotteron.net
According to the Yale Bright Star Catalogue, which contains a list of all the stars with magnitude brighter than 6.5. Magnitude is a measure of the brightness of a star or other astronomical object.
9
FACTBOX 1 Magnitude – What is it? When astronomers want to describe how bright a star is, they use the term magnitude. The concept of magnitude was already introduced prior to the Middle Ages when visible stars were divided into Image 8: Illustration of the Greek astronomer 6 different categories of size, Hipparchus observing the sky from Alexandria. He introduced the magnitude scale (Woodcut from 1876) magnitudes. The brightest stars were called �First class stars�, or magnitude 1, while fainter stars had a higher magnitude, with the faintest having a magnitude of 6. The magnitude scale was redefined in the 19th century, when more accurate measurements of brightness could be made. So now a star of magnitude 0 is 100 times brighter than a star of magnitude 5. The limit of what you can see with the naked eye under the best conditions (the limiting magnitude) is around 6.5. The magnitude scale therefore works in reverse - a higher figure means that the star is fainter, while the brightest stars have a negative magnitude ( - ). Sirius has the magnitude -1.5. The North Star varies between magnitude 1.86 and 2.13.
IMPLEMENTATION After testing the method with a few school classes during the autumn of 2018 and receiving useful feedback and suggestions from teachers and pupils, the Star-Spotting Experiment was launched in February 2019. In order to be able to compare the observations made around the country, it was important that everyone did it in the same way. In all research, it is important to carefully plan how the data is collected. The challenge in the Star-Spotting Experiment was to make the observation process as simple as possible (so that as many people as possible could participate), while ensuring that the observations were carefully undertaken. This was achieved by having detailed instructions.
10
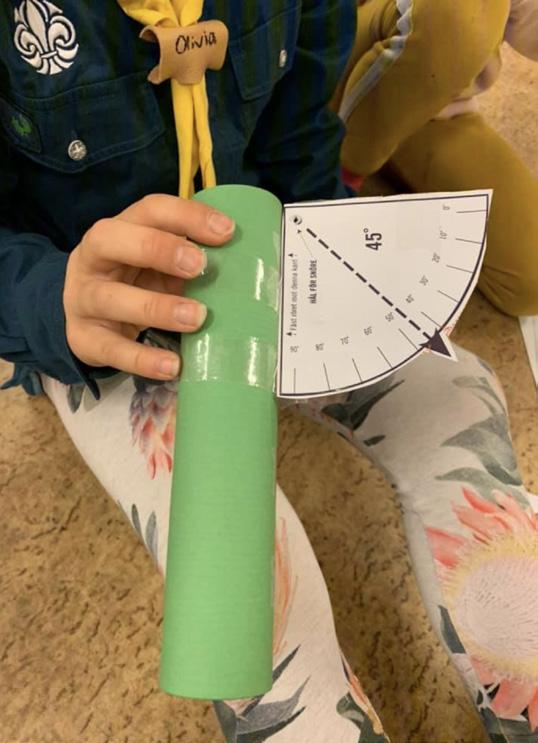
Image 9. Steps to make a measuring tube for the Star-Spotting Experiment. (1) Cut out a protractor, (2) Attach the protractor to the tube, (3) Attach some string with a weight tied onto it to the protractor. (4) This is used to show when the tube is at a 45-degree angle. Illustration: Lotta W Tomasson/VA.
Instructions:
North
1. Go out an hour after sunset, or alternatively an hour before sunrise to ensure it is sufficiently dark. Wait 10 minutes without looking at another light source. Look at the sky instead and allow your eyes to get used to the darkness. 2. Point the tube towards the sky at a 45° angle straight towards North (N). Use a compass to find the right direction. Use the protractor to get the right angle. It’s easiest if two people help each other.
Northwest
West
Northeast
East
Zenith
Southwest
Southeast South
Image 10. Observations had to be made in different compass directions. Illustration: Lotta W Tomasson / VA.
3. Hold the tube still to your eye and count the number of stars you can see through the tube. Record the number in the app or on paper so you can submit the data later. 4. Turn to the Northeast (NE) and repeat. 5. Continue with observations towards East (E) Southeast (SE), South (S), Southwest (SW), West (W) and Northwest (NW). 6. Finish by pointing the tube straight up in the air at the zenith and count the number of stars there as well. (The string with the weight will hang straight down from the tube).
11
7. If you can’t see the sky in one of the directions (i.e. if a house, wall, or a tree is in the way) simply leave the box empty. Make a note of why a direction has not been recorded. 8. Write zero (0) if you can see the sky but do not observe any stars. 9. Fill in information about the weather, the moon phase, the diameter and length of the tube in millimeters (mm), as well as the date and time of the observation in the app. 10. Allow your mobile to access your location. Check that the observation is in the right place on the map. Participants could report their observations directly in the app when they were outside or choose to record their observations on paper and submit them via a web page on a computer. On the Star-Spotting Experiment’s website were instructions, video clips, background material, a protractor template and a data collection template to print out on paper. https://forskarfredag.se/ star-spotting
Image 11. Observations were made at a 45-degree angle in different compass directions. Illustration: Hanna Mellin/VA
Based on the number of stars each participant could see, a calculation was then made of how many visible stars were in the entire night sky at that particular time at that particular location. The more stars you could count through the tube, the more visible stars in the sky in total. The app did the calculation automatically and the participant was immediately informed how light-polluted it was at that location. A detailed explanation of how the calculations were made can be found below. N
S
V
NV
N
NÖ
SV
S
SÖ
Ö
HOW THE CALCULATIONS WORK This is how the Star-Spotting Experiment app calculates how many visible stars there are in the whole sky at the time the observation is made: When we have counted the number of stars in (a maximum of ) nine different directions, the number of stars seen in each direction are labelled N1, N2 … up to N9. The average number of stars (Navg) is calculated using the formula: Navg = (NI + N2 + ... +N9) / 9.
12
The calculation of the number of visible stars in the entire sky is based on the assumption that the stars are evenly distributed across the sky. The larger the area of the sky we observe, the more stars we see. We can use this assumption to calculate how many stars are visible. Let’s start from the beginning: The length of the tube is L and its diameter is D. The area of the open end (A) is then:
D L
A = π (D/2)2 = π D2/4
P
H
Image 12. If you look at the sky through a tube, the rays of light entering the tube come from a much larger circular area in the sky. If the tube is pointed in every direction, it would eventually cover the surface of an ‘imaginary’ hemisphere above your head (H). Illustration: Lotta W Tomasson/VA
If you point the tube in lots of different directions up towards the sky, it would create an imaginary hemisphere (H) around where you are standing (see image 12).The radius of the hemisphere would then be the length of your tube, L. The area of the imaginary hemisphere H with a radius L is therefore: H = 2 π L2 The area of the end of the tube can be projected and extended up into the night sky. Let’s call the projected image P, see image 12. The imaginary hemisphere can also be projected up into the sky into the earth’s hemisphere. This gives us the relationship: Area of the hemisphere in the night sky P
=
Area of H
=
(2 π L2)
A
or Area of the hemisphere in the night sky
Number of stars in H (π D2) 4
13
=
8L2 D2
Finally, we go back to the assumption that we made at the beginning, that the number of stars is evenly distributed across the night sky. If this is true, it gives us the formula: The total number of stars in the sky (Ntot) The number of stars in P
=
Area of the hemisphere in the sky Area of P
=
8L2 D2
Which gives: Ntot =
8L2 D2
* the number of stars you can see in the tube
How many stars is it even possible to see in the sky? According to the Yale Bright Star Catalogue8, there are 9,096 stars that are brighter than magnitude 6.5, which is considered to be the limit of what is visible to the naked eye. But we can only see half of space, because we can’t see what is on the other side of the earth. This reduces the number of stars we can see to 4,548. So, if the calculation ends up being a number greater than 4,548, it has either been calculated incorrectly in some way or something has gone wrong with the observation. Using the calculation and the information about how many stars it is theoretically possible to see, you can calculate the level of light pollution. This is done by taking 1 minus the observed number of stars (Ntot) and dividing by 4,548: Level of light pollution = 1 - Ntot / 4,548 where the degree of light pollution ranges from 1 (maximum light pollution) to 0 (no light pollution). Or as a percentage: Level of light pollution = (1 - Ntot / 4,548) * 100 where the degree of light pollution ranges from 100 % (maximum light pollution) to 0 % (no light pollution).
Image 13. The degree of light pollution from 0% (no light pollution) to 100% (maximum light pollution). Illustration: Hanna Mellin / VA
8
A star catalogue published by the Yale University Observatory that lists and contains data about stars with a brightness greater than magnitude 6.5.
14
RESULTS During the autumn and winter 2019/2020, the Star-Spotting Experiment was carried out in Sweden, Ireland, Spain and the United Kingdom. A total of 1,921 observations were recorded across the four countries.
SWEDEN In Sweden, anyone interested in participating could sign up via the website forskarfredag.se. 252 schools from all over Sweden signed up, ranging from nursery schools to high schools and adult education institutions. In addition, eight astronomy societies, 29 scout groups and 176 individuals registered their interest. The Star-Spotting Experiment was promoted during the Swedish research festival ForskarFredag (part of European Researchers’ Night) held on 27-28 September 2019, Image 14. Results of the Swedish observations. You can find an interacwhich had the overall tive map of the Swedish results at forskarfredag.se/stjarnforsoket/karta. theme “Space & Me”. llustration: Hanna Mellin/VA and GoogleMyMaps The date also coincided with the Day and Night of Astronomy (a themed day to celebrate astronomy, founded by the Swedish Astronomical Society,) which ForskarFredag was able to collaborate with. At local events around Sweden, families and other members of the public could construct their own star-spotting tubes and learn more about light pollution.
15
UNITED KINGDOM In the UK the Star-Spotting Experiment was promoted during European Researchers’ Night on 27 September 2019, attended by 200 visitors. The National History Museum in London promoted the event on its website and to its 2.3 million followers on Twitter.
Image 15. A tweet during European Researchers’ Night about #starspottingexperiment. Photo: Natural History Museum in London
IRELAND In Ireland, PhD students visited schools to explain about the project to pupils and help them construct the measuring tubes. Information about the project and the teacher’s guide was widely circulated to schools, engaging over 400 schools.
Image 16. Results of observations made in Cork, Ireland. You can find an interactive map of the international results at forskarfredag.se/starspotting/map. llustration: Hanna Mellin/VA and GoogleMyMaps
During the Cork Discovers science festival, which ran as part of European Researchers’ Night, families could learn more about the project and construct their own tubes at a Star-Spotting booth. The project was also highlighted during an astronomy talk during Cork City Culture Night. Image 17. A tweet from Cork Discovers in Ireland about #starspottingexperiment. Photo: St. Multose National School in Cork
16
SPAIN Cuenta Estrellas was promoted throughout Spain, where light pollution is a particular problem. Light from the major cities is visible hundreds of kilometers away1. Hundreds of schools were sent information about the project as well as local and regional astronomical associations. On and around European Researchers’ Night on 27 September 2019, activities were run for families, schools and amateur astronomers in over ten cities in Andalusia, the Canaries, Azores, Madrid and Zaragoza. Over 1,700 participants were engaged and a total of 433 observations were reported in the Star-Spotting Experiment app.
Image 18. Results of observations made in Spain. You can find an interactive map of the international results at forskarfredag.se/star-spotting/map. llustration: Hanna Mellin/VA and GoogleMyMaps
In central Madrid, the organisation FundaciĂłn para el Conocimiento Madri+d worked together with the National Institute of Aerospace Technology. About 70 people participated in the activities and made observations. Image 19. A close-up view of observations made in the Bay of Gibraltar. llustration: Hanna Mellin/VA and GoogleMyMaps
1
seatitan.eu/light-pollution-in-spanish-cities (10/04/2019)
17
In the Canary Islands, La Palma Research Centre organised activities where visitors could observe the night sky and participate in the Star-Spotting Experiment. Almost 100 of the Spanish observations were reported in the Canary Islands (see image 20).
Image 20. Observations made on the Canary Islands. You can find an interactive map of the international results at forskarfredag.se/star-spotting/map. llustration: Hanna Mellin/VA and GoogleMyMaps
Image 21. A close-up view of observations made in Santa Cruz de Tenerife. llustration: Hanna Mellin/VA and GoogleMyMaps
Did you know that‌ In the Canary Islands the night sky is protected by law. Located here are some of the largest and most important observatories in the world and both researchers and amateur astronomers come here to study the night sky.
18
The project was featured in newspapers, on the radio and television, including an article in El País, Spain’s largest daily newspaper, (see image 23).
Image 22. Cuenta Estrellas activity in Zaragoza. Photo: Cuenta Estrellas - The Star-Spotting Experiment.
Image 23. Article in El País about .Cuenta Estrellas, 17 September 2019.
Image 24. Pupils making observations after school in Algeciras, Spanien. Photo: Cuenta Estrellas - The Star-Spotting Experiment.
19
WHAT DID WE DISCOVER? Although the Star-Spotting Experiment was carried out in several different countries, in this report, the analyses of the results focus mainly on those reported in Sweden. Therefore, the analysis of the Swedish results is also more detailed. When the analyses of the data were done, some observations had to be removed, observations that were either incorrect, e.g. more stars were reported than there actually were in the night sky (see page 9 under methodology), or those that were done at the wrong time (e.g. before it was completely dark). Removing certain data points is something that has to be done. In research, there is always the risk that certain data is incorrect. Mistakes can occur at every stage of the process when you are doing experiments and studies. For example, there may be something wrong with a measuring instrument or you may accidentally record data incorrectly. As a researcher, it is important that you are very thorough as the data you collect is the basis upon which you draw your conclusions. If there are inaccuracies in the data, you risk drawing incorrect conclusions. Even when data is collected through citizen science, such as in the Star-Spotting Experiment, where many different people are making the observations and reporting data via an app, some incorrect values ​​will be reported. Observations had to be made at least one hour after the sun sets or at least one hour before the sun rises. Some observations were made too close to sunrise or sunset, when the sky was too bright to be able to draw conclusions about the number of stars that were visible. Once these observations had been removed, 874 usable observations were left from all across Sweden. Most observations were made in southern Sweden and areas where lots of people live. NB: When we here talk about the number of visible stars reported in the app, we do not mean the number that you saw through your tube, but the number that the app calculated that you could see across the whole sky, based on the observations you made through the tube. An overview of the results in Spain, Ireland and the UK: In total, 413 observations were used in the analyses for Spain, 332 on the mainland and 81 on the Canary Islands. On average 529 stars were visible across the whole of the sky, 523 on the mainland and 553 on the Canary Islands. The mean value9 corresponds to a limiting magnitude of 4.6 over Spain, with a slightly higher limiting magnitude for the Canary Islands, 4.7 compared to 4.6 on the mainland (see Table 1).
9
The mean and average are the same. The sum of all observations is divided by the number of observations.
20
In Ireland and the UK only 23 observations were included in the analyses. This limits the conclusions that can be made based on the data, but the observations that were made correspond to a limiting magnitude of 4.3 (see Table 1).
TABLE 1 Observations made in Spain, Ireland and the UK. Number of observations
Average number of stars
Median number of stars
Limiting magnitude
Spain (total)
413
529
271
4,6
Spain - mainland
332
523
267
4,6
Spain - Canary Islands
81
554
303
4,7
Ireland & UK
23
371
161
4,3
Location
An overview of the results in Sweden: The sky with the most stars, which one participant stood under, was on a cloudless and moonless evening in Västerhejde on the island of Gotland on 4 October 2019 at 18.33. The Star-Spotting Experiment app calculated that there were 3,872 visible stars across the whole sky at this time. For 146 observations, no stars could be seen at all, which accounts for 17% of all of the observations made in Sweden. For 25 other observations, the app calculated that anyone standing outside could see fewer than ten stars across the whole of the sky. This means that for around 20% of all the observations, a maximum of ten could be seen. For observations where you could see stars in the sky, on average 454 stars were visible across the whole of the sky. The mean therefore corresponds to a limiting magnitude of 4.5 over Sweden. The median10 for these observations is 300 stars, which corresponds to a limiting magnitude of 4.1 (see Table 2).
10
The median value is the middle value after you sort by order of magnitude. The median can be a better measure if the observations have a skewed distribution with many high or low values. As opposed to the mean, the median is not affected by extreme values.
21
In this case, the median can be a better measure than the mean as the variation in how many stars were visible across the sky according to the app’s calculations is large, ranging from 0 to almost 4,000 stars.
TABLE 2 Observations made in Sweden
Location
Number of observations
Number of observations where stars are visible
Number of observations where NO stars are visible
Average number of stars
Median number of stars
Limiting magnitude
Whole of Sweden
874
728
146
454
300
4,51
Gotland
68
40
28
464
337
4,52
Gävle
36
34
2
486
446
4,57
Karlstad
10
7
3
534
441
4,65
Skåne + Blekinge
83
74
9
601
319
4,76
Skövde + Mariestad
50
42
8
268
266
4,09
Central Stockholm
53
39
14
268
196
4,03
Greater Stockholm area
147
106
41
316
218
4,18
Uddevalla
19
14
5
215
142
3,84
Umeå
15
15
0
325
156
4,21
Visingsö
7
7
0
783
780
4,99
Örnsköldsvik
10
8
2
389
441
4,37
Östergötland
19
19
0
439
346
4,48
Rest of Sweden
357
323
34
516
346
4,62
22
One of the central research questions in the project was to investigate how comparable the measurements of light pollution made in the Star-Spotting Experiment are to those made using other methods. Our results have therefore also been compared with results in other databases. This comparison shows that the degree of light pollution we measured is very similar to the degree of light pollution measured using other methods, both from the ground and from space, using satellites (see image 26). Other methods of measuring light pollution from the ground separate into two different types; either they involve people e.g. counting how many stars they can see within a certain constellation (see another international citizen science project called Globe at Night, www.globeatnight.org) or a special camera is used aimed at the sky that measures how bright it is (see image 25).
Image 25. A sky quality meter (SQM) is an instrument used to measure light pollution from the ground. Image: Lamiot / CC BY-SA (https://creativecommons.org/licenses/by-sa/3.0)
Image 26. The map shows what light pollution looks like measured using a satellite (on the left) compared with our method (on the right). There is good similarity between them, plus using our method we are able to obtain more localised detail than is possible using the satellite-based method. Illustrations: Left: lightpollutionmap.info, Right: Hanna Mellin/VA with GoogleMyMaps
23
The collated results for Sweden show, in line with what we expected, that the degree of light pollution is high in and around the largest cities. But the effects of light pollution are also noticeable in more sparsely populated parts of the country. In the village of Karesuando, for example, in the far north of Sweden, far away from any large cities, the degree of light pollution reported is 89 %, which corresponds to 471 visible stars. However, this is based on a single observation, so it is difficult to draw any conclusions. The observation may, for example, have been made in the vicinity of a street lamp. This is also a good example of why researchers often take multiple measurements in the same location. The more measurements that show the same thing, the more certain you can be that the measurements actually represent the truth, and the more certain you can be in your conclusions. The situation appears to be a lot better on Visingsö, an island in the middle of Lake Vättern in south-central Sweden, where observations show that you can see an average of 782 stars, corresponding to a limiting magnitude of 5.0. Although this is significantly more stars than the average across the country, it is still quite low, which indicates that the degree of light pollution is quite high here too.
FUN BUT TRICKY - FEEDBACK FROM PARTICIPANTS As a result of participating in the experiment, participants became more aware of the consequences of light pollution for society and the environment. We can see this in comments from participants in Sweden, which were left in the app during the observations. A few examples:
”
”
MY NEIGHBOUR’S OUTDOOR LIGHTING, STREET LAMP AND OUR KITCHEN WINDOW GOT IN THE WAY.
THE DARKNESS WAS BROKEN BY AN EXTERIOR LIGHT AND LIGHTING INSIDE THE HOUSE.
Participants also seem to have enjoyed the task, although it was somewhat difficult to complete:
” ” ””
IT WAS FUN. AN AMAZING NIGHT SKY.
... IT WAS A LITTLE DIFFICULT TO WORK OUT THE ANGLES.
DIFFICULT TO SEE THE SMALL STARS THROUGH THE LITTLE TUBE.
The comments show that the participants are now a lot more aware about the phenomenon of light pollution and at the same time gained an insight into how scientific research is conducted.
24
DISCUSSION & CONCLUSIONS HOW RELIABLE IS THE METHOD? The results from the Star-Spotting Experiment show that the method we used, whereby you use a cardboard tube to count the stars you can see with your naked eye, worked very well. When we compare our data on light pollution with data based on images taken from satellites, we see that they are pretty much similar to each other. In the Star-Spotting Experiment, our results show a limiting magnitude of 4.5 in Sweden. This largely matches the results of other studies. One difference from other methods is also that the Star-Spotting Experiment’s data is more localised. While with satellite images, for example, you can get a good appreciation of the light pollution over a large urban area11, with the Star-Spotting Experiment method we can see variations within urban areas and get a more detailed picture of how light pollution varies in a specific area (see images 26 and 27).
Image 27. Two different maps over Santa Cruz de Tenerife show what light pollution looks like measured using a satellite (on the left) compared with our method (on the right). Satellite observations are used to create an average value over a region, but our observations show the level of light pollution at a very local level. Illustrations: Left: lightpollutionmap.info, Right: Hanna Mellin/VA with GoogleMyMaps.
We have also compared the results with data from other smaller projects, where light pollution has been measured from the ground, e.g. Globe at Night12 and the International Dark Sky Association13. The results obtained in the Star-Spotting Experiment are comparable with results from these initiatives, even though the number of observations made in Sweden within these projects is relatively low.
www.lightpollutionmap.info www.globeatnight.org 13 www.darksky.org 11 12
25
One explanation for why the Star-Spotting Experiment’s method worked well is that no special equipment is needed to participate - everything you need can be found home or at school. This means that lots of people can participate. The more observations you have upon which to base your analyses and conclusions, the greater the accuracy and the more confident you can be that the data you have collected shows the real picture. Collecting lots of observations proved difficult. Going out in the evening when it is dark (and perhaps cold) is not always so fun. Pupils who were given the task as homework may not have been so motivated. However, Image 28. Scouts with their selfin some places, particularly in the far north of Sweden constructed star-spotting tubes. Photo: Sollentuna North Scout where it gets dark early, observations could be made Group’s Facebook group. by a class during school time. In scout groups, on the other hand, the project was much appreciated, as groups normally meet after school, and outdoor activities are something they are used to doing. In addition, it provided an opportunity to talk about points of the compass and how to use one.
Image 29. Photo taken at European Researchers’ Night 2019 in Borlänge, Sweden, where visitors could construct their own star-spotting tubes. Photo: Henrik Hansson
If the method had been simpler, with fewer steps to follow, more people would probably have taken part. We would have received more observations and had more data to use in our analysis. But because everyone followed the same steps and did exactly the same, the data was sufficiently reliable to allow comparisons and conclusions to be made. When doing research, the process needs to be a little tricky in order to get reliable results.
SIMPLICITY - IMPORTANT FOR THE FUTURE The method used to measure light pollution in the Star-Spotting Experiment was deliberately developed to ensure that anyone could participate and measure light pollution. Simplicity was a key focus of the research project. By using scientific methods, we could test whether such a simple method (using a cardboard tube to count how many stars you can see with the naked eye in the night sky) is a reliable way to measure light pollution. The results show that this is the case.
26
One of the difficulties in reducing light pollution, and, as a result, the harmful effects of light pollution, is that there is no uniform and common method to measure it. The Star-Spotting Experiment shows that light pollution can be measured effectively using a simple method. If we could all together help to measure light pollution by looking through a cardboard tube, it would be much easier and cheaper and a good complement to sending satellites into space.
UNCERTAINTIES In order for it to be done correctly, it is important that the instructions for carrying out the observations are clear and that they are followed carefully. In addition to the information in the app, participants in the Star-Spotting Experiment could read information on the website, download written information and watch videos which described the process. We have analysed the data very carefully and checked observations that seem strange or stand out in different ways from other observations. We can see two main errors in the data that has been reported: 1. The most common mistake was where the dimensions of the tube were entered in centimeters (cm) instead of millimeters (mm). In order to be able to compare all observations with each other, it is important that observers report the dimensions of their tubes in the same unit. In some cases, it is obvious that the observer has written mm instead of cm, but in some cases we do not know, which has resulted in these observations having to be removed. It is of course sad, but it is important that incorrect numbers do not affect the results. 2. In the instructions we asked observers to report a zero (0) if they could see the sky through the tube, but no stars. If, on the other hand, they did not see the sky because something was in the way (a house wall, a tree or something else), they were to leave the field completely blank. There is a big difference between these two options. If a zero was reported, it means that the sky could clearly be seen, but that it was so light polluted that not even a single star could be seen in that direction. If, on the other hand, the field was left empty, it means that an obstacle was in the way, for example a large tree or a house wall, and therefore the night sky could not be seen. Both of these errors affect the calculation of the total number of stars and the degree of light pollution.
27
WHAT CAN WE DO? One of the difficulties in reducing light pollution, and, as a result, the harmful effects of light pollution, is that there is no uniform and common method to measure it. The Star-Spotting Experiment shows that light pollution can be measured effectively using a simple method. If we could all together help to measure light pollution by looking through a cardboard tube, it would be much easier and cheaper and a good complement to sending satellites into space. But what can we personally do to reduce light pollution? What should you as an individual think about? What we can do is actually the same thing that a city planner needs to keep in mind when building a new neighbourhood. It can be summarised as: “Right light in the right place at the right time!”. Things to think about are: •
Avoid illuminating your surroundings. Do you have to put up that light on the back of your house? Do you really need facade lighting?
•
Reduce the time you light up your surroundings. Set up a motion detector so that the light on the back of the house only comes on when you are there. Or put a post-it note on the light switch to remind you to turn it off when you get in.
•
Use lamps that direct the light to where you want it. If you really want a light on the back of your house so that you can see where you are going when it is dark, ensure that the light only lights up the ground and does not light up the sky (see image 30).
VERY BAD
BAD
BETTER
BEST
Image 30. Examples of different types of street lighting and the effect on light pollution. llustration: Lotta Waesterberg Tomasson/VA CC BY-NC 2.0 (https://creativecommons.org/licenses/by-nc/2.0/)
28
MORE INFORMATION SCIENTIFIC LITERATURE : Chepesiuk, R. (2009). Missing the Dark: Health Effects of Light Pollution. Environmental Health Perspectives, 117, A20-A27. Eklรถf & Rydell (2018) Forskning & Framsteg 8, 26-33. Gaston, K. J. et al. (2013). The ecological impacts of nighttime light pollution: a mechanistic appraisal. Biological reviews, 88, 912-927. Kyba, C. C. M. et al. (2017). Artificially lit surface of Earth at night increasing in radiance and extent. Science Advances 3, 1-8. Longcore, T., & Rich, C. (2004). Ecological light pollution. Frontiers in Ecology and the Environment 2, 191-198.
WEB RESOURCES ABOUT LIGHT POLLUTION: www.darksky.org www.globeatnight.org www.darkskiesawareness.org www.lightpollutionmap.info
29
FORSKARFREDAG’S MASS EXPERIMENT – CITIZEN SCIENCE RELEVANT TO YOUR EVERYDAY LIFE Every autumn since 2009, thousands of Swedish pupils and members of the public have been helping researchers to develop new knowledge as part of ForskarFredag’s mass experiment. The experiments establish valuable contacts between researchers and schools and give pupils insights into research methods. The mass experiments are an example of citizen science, a rapidly growing global phenomenon. ABOUT FORSKARFREDAG The last weekend in September is designated as European Researchers’ Night by the European Commission. Activities are organised all across Europe, where the public can meet researchers and discover how exciting and relevant research is to our everyday lives. Known as ForskarFredag in Sweden, it is the country’s most widespread science festival. ForskarFredag is coordinated by the Swedish non-profit organisation VA (Public & Science). Read more about ForskarFredag and the mass experiment at forskarfredag.se