SAIMM-YPC Mentoring Programme 'Potential Meets Opportunity'


VOLUME 123 NO. 1 JANUARY 2023


‘Unlock Your Potential: Join the SAIMM YPC Mentoring Programme and get the cheat code to take your career to the next level!’

Are you a young professional in the mining industry in South Africa struggling to find employment or take your career to the next level? Mentoring programmes can help bridge the gap between your skills and the skills required by employers in the mining and minerals industry.
For unemployed young professionals, being part of a mentoring programme provides the opportunity to gain valuable hands-on experience, develop industry-specific skills, and build a network of contacts that can help secure employment in the future. For employed young professionals, mentoring programmes can provide the opportunity to gain experience and skills needed to take on more responsibilities and advance -your career. In both cases, protégés (‘mentees’) have the opportunity to learn from experienced professionals in the field and understand how the industry works.
Mentoring programmes can also benefit the mining industry as a whole. By investing in the development of new talent, the industry can ensure that it has a pipeline of skilled professionals to meet its future needs. Additionally, mentoring programmes can help to promote diversity and inclusion within the industry, by providing opportunities for underrepresented groups to gain the skills and experience they need to succeed.
So, if you're a young professional in the mining industry in South Africa, whether you are unemployed or employed, and looking to progress your career, consider applying for the 2023 SAIMM YPC mentoring programme. Not only will you gain valuable skills and experience, but you'll also have the opportunity to network and make connections that can help you secure employment or advance in your career. The SAIMM is committed to the development of young professionals, so take advantage of this opportunity and apply.


Sign up to participate in our Mentoring Programme
Are you a protégé looking for a mentor?
Are you a protégé looking for a mentor?
Are you a mentor willing to support a protégé?
For more information on the Mentoring Programme
We are looking for members to participate to be mentors or protégés.
“ Mentoring is a brain to pick, an ear to listen, and a push in the right direction.”
“ Mentoring is a brain to pick, an ear to listen, and a push in the right direction.”
Honorary President
Nolitha Fakude
President, Minerals Council South Africa
Honorary Vice Presidents
Gwede Mantashe
Minister of Mineral Resources and Energy, South Africa
Ebrahim Patel
Minister of Trade, Industry and Competition, South Africa
Blade Nzimande
Minister of Higher Education, Science and Technology, South Africa
President
Z. Botha
President Elect
W.C. Joughin
Senior Vice President
E. Matinde
Junior Vice President
G.R. Lane
Incoming Junior Vice President
T.M. Mmola
Immediate Past President
I.J. Geldenhuys
Honorary Treasurer
W.C. Joughin
Ordinary Members on Council
W. Broodryk G. Njowa
Z. Fakhraei S.J. Ntsoelengoe
R.M.S. Falcon (by invitation) S.M. Rupprecht
B. Genc M.H. Solomon
K.M. Letsoalo A.J.S. Spearing
S.B. Madolo A.T. van Zyl
F.T. Manyanga E.J. Walls
M.C. Munroe
Co-opted to Members
K. Mosebi
A.S. Nhleko
Past Presidents Serving on Council
N.A. Barcza C. Musingwini
R.D. Beck S. Ndlovu
J.R. Dixon J.L. Porter
V.G. Duke M.H. Rogers
R.T. Jones D.A.J. Ross-Watt
A.S. Macfarlane G.L. Smith
M.I. Mthenjane W.H. van Niekerk
G.R. Lane–TPC Mining Chairperson
Z. Botha–TPC Metallurgy Chairperson
M.A. Mello–YPC Chairperson
K.W. Banda–YPC Vice Chairperson
Branch Chairpersons
Botswana Being established
DRC Not active
Johannesburg N. Rampersad
Namibia Vacant
Northern Cape I. Tlhapi
North West I. Tshabalala
Pretoria Vacant
Western Cape A.B. Nesbitt
Zambia J.P.C. Mutambo (Interim Chairperson)
Zimbabwe A.T. Chinhava
Zululand C.W. Mienie
* W. Bettel (1894–1895)
* A.F. Crosse (1895–1896)
* W.R. Feldtmann (1896–1897)
* C. Butters (1897–1898)
* J. Loevy (1898–1899)
* J.R. Williams (1899–1903)
* S.H. Pearce (1903–1904)
* W.A. Caldecott (1904–1905)
* W. Cullen (1905–1906)
* E.H. Johnson (1906–1907)
* J. Yates (1907–1908)
* R.G. Bevington (1908–1909)
* A. McA. Johnston (1909–1910)
* J. Moir (1910–1911)
* C.B. Saner (1911–1912)
* W.R. Dowling (1912–1913)
* A. Richardson (1913–1914)
* G.H. Stanley (1914–1915)
* J.E. Thomas (1915–1916)
* J.A. Wilkinson (1916–1917)
* G. Hildick-Smith (1917–1918)
* H.S. Meyer (1918–1919)
* J. Gray (1919–1920)
* J. Chilton (1920–1921)
* F. Wartenweiler (1921–1922)
* G.A. Watermeyer (1922–1923)
* F.W. Watson (1923–1924)
* C.J. Gray (1924–1925)
* H.A. White (1925–1926)
* H.R. Adam (1926–1927)
* Sir Robert Kotze (1927–1928)
* J.A. Woodburn (1928–1929)
* H. Pirow (1929–1930)
* J. Henderson (1930–1931)
* A. King (1931–1932)
* V. Nimmo-Dewar (1932–1933)
* P.N. Lategan (1933–1934)
* E.C. Ranson (1934–1935)
* R.A. Flugge-De-Smidt (1935–1936)
* T.K. Prentice (1936–1937)
* R.S.G. Stokes (1937–1938)
* P.E. Hall (1938–1939)
* E.H.A. Joseph (1939–1940)
* J.H. Dobson (1940–1941)
* Theo Meyer (1941–1942)
* John V. Muller (1942–1943)
* C. Biccard Jeppe (1943–1944)
* P.J. Louis Bok (1944–1945)
* J.T. McIntyre (1945–1946)
* M. Falcon (1946–1947)
* A. Clemens (1947–1948)
* F.G. Hill (1948–1949)
* O.A.E. Jackson (1949–1950)
* W.E. Gooday (1950–1951)
* C.J. Irving (1951–1952)
* D.D. Stitt (1952–1953)
* M.C.G. Meyer (1953–1954)
* L.A. Bushell (1954–1955)
* H. Britten (1955–1956)
* Wm. Bleloch (1956–1957)
* H. Simon (1957–1958)
* M. Barcza (1958–1959)
* R.J. Adamson (1959–1960)
* W.S. Findlay (1960–1961)
* D.G. Maxwell (1961–1962)
* J. de V. Lambrechts (1962–1963)
* J.F. Reid (1963–1964)
* D.M. Jamieson (1964–1965)
* H.E. Cross (1965–1966)
* D. Gordon Jones (1966–1967)
* P. Lambooy (1967–1968)
* R.C.J. Goode (1968–1969)
* J.K.E. Douglas (1969–1970)
* V.C. Robinson (1970–1971)
* D.D. Howat (1971–1972)
* J.P. Hugo (1972–1973)
* P.W.J. van Rensburg (1973–1974)
* R.P. Plewman (1974–1975)
* R.E. Robinson (1975–1976)
* M.D.G. Salamon (1976–1977)
* P.A. Von Wielligh (1977–1978)
* M.G. Atmore (1978–1979)
* D.A. Viljoen (1979–1980)
* P.R. Jochens (1980–1981)
* G.Y. Nisbet (1981–1982)
A.N. Brown (1982–1983)
* R.P. King (1983–1984)
J.D. Austin (1984–1985)
* H.E. James (1985–1986)
H. Wagner (1986–1987)
* B.C. Alberts (1987–1988)
* C.E. Fivaz (1988–1989)
* O.K.H. Steffen (1989–1990)
* H.G. Mosenthal (1990–1991)
R.D. Beck (1991–1992)
* J.P. Hoffman (1992–1993)
* H. Scott-Russell (1993–1994)
J.A. Cruise (1994–1995)
D.A.J. Ross-Watt (1995–1996)
N.A. Barcza (1996–1997)
* R.P. Mohring (1997–1998)
J.R. Dixon (1998–1999)
M.H. Rogers (1999–2000)
L.A. Cramer (2000–2001)
* A.A.B. Douglas (2001–2002)
S.J. Ramokgopa (2002-2003)
T.R. Stacey (2003–2004)
F.M.G. Egerton (2004–2005)
W.H. van Niekerk (2005–2006)
R.P.H. Willis (2006–2007)
R.G.B. Pickering (2007–2008)
A.M. Garbers-Craig (2008–2009)
J.C. Ngoma (2009–2010)
G.V.R. Landman (2010–2011)
J.N. van der Merwe (2011–2012)
G.L. Smith (2012–2013)
M. Dworzanowski (2013–2014)
J.L. Porter (2014–2015)
R.T. Jones (2015–2016)
C. Musingwini (2016–2017)
S. Ndlovu (2017–2018)
A.S. Macfarlane (2018–2019)
M.I. Mthenjane (2019–2020)
V.G. Duke (2020–2021)
I.J. Geldenhuys (2021–2022)
Editorial Board
S.O. Bada
R.D. Beck
P. den Hoed
I.M. Dikgwatlhe
R. Dimitrakopolous*
M. Dworzanowski*
L. Falcon
B. Genc
R.T. Jones
W.C. Joughin
A.J. Kinghorn
D.E.P. Klenam
H.M. Lodewijks
D.F. Malan
R. Mitra*
H. Möller
C. Musingwini
S. Ndlovu
P.N. Neingo
M. Nicol*
S.S. Nyoni
M. Phasha
P. Pistorius
P. Radcliffe
N. Rampersad
Q.G. Reynolds
I. Robinson
S.M. Rupprecht
K.C. Sole
A.J.S. Spearing*
T.R. Stacey
E. Topal*
D. Tudor*
F.D.L. Uahengo
D. Vogt*
*International Advisory Board members
Editor /Chairman of the Editorial Board
R.M.S. Falcon
Typeset and Published by
The Southern African Institute of Mining and Metallurgy


PostNet Suite #212
Private Bag X31
Saxonwold, 2132
E-mail: journal@saimm.co.za
Printed by Camera Press, Johannesburg
Advertising Representative
Barbara Spence
Avenue Advertising
Telephone (011) 463-7940
E-mail: barbara@avenue.co.za

ISSN 2225-6253 (print)
ISSN 2411-9717 (online)
Directory of Open Access Journals

Journal Comment: The value of clear communication in an increasingly complex world by Q.G. Reynolds iv
President’s Corner: The Burning Question: Where is the grass greener? by Z.
BothaAn improved methodology is presented for assessing the economic feasibility and effectiveness of recycling of industrial waste. The methodology provides for the introduction of new evaluation criteria, which leads to a significant expansion of the secondary raw material base. The potential for recycling manganese-containing waste materials from the Chiatura mining enterprise in Georgia is used as an example.
Hand-held XRF sorting of spent refractory bricks to aid recycling by N.P. Mabasa, N. Naudé, and A.M. Garbers-Craig
Approximately 28 Mt of MgO-C and Al₂O₃-MgO-C refractory bricks are discarded each year. When furnaces and ladles are relined, the spent refractory bricks become mixed and need to be sorted. In this study we examined the use of a hand-held X-ray fluorescence analyser (HH-XRF) to distinguish the various spent refractory materials. The HH-XRF was successful in distinguishing between the different oxide-carbon-based refractory bricks before cleaning and after cleaning.
THE INSTITUTE, AS A BODY, IS NOT RESPONSIBLE FOR THE STATEMENTS AND OPINIONS ADVANCED IN ANY OF ITS PUBLICATIONS.
Copyright© 2023 by The Southern African Institute of Mining and Metallurgy. All rights reserved. Multiple copying of the contents of this publication or parts thereof without permission is in breach of copyright, but permission is hereby given for the copying of titles and abstracts of papers and names of authors. Permission to copy illustrations and short extracts from the text of individual contributions is usually given upon written application to the Institute, provided that the source (and where appropriate, the copyright) is acknowledged. Apart from any fair dealing for the purposes of review or criticism under The Copyright Act no. 98, 1978, Section 12, of the Republic of South Africa, a single copy of an article may be supplied by a library for the purposes of research or private study. No part of this publication may be reproduced, stored in a retrieval system, or transmitted in any form or by any means without the prior permission of the publishers. Multiple copying of the contents of the publication without permission is always illegal.
U.S. Copyright Law applicable to users In the U.S.A. The appearance of the statement of copyright at the bottom of the first page of an article appearing in this journal indicates that the copyright holder consents to the making of copies of the article for personal or internal use. This consent is given on condition that the copier pays the stated fee for each copy of a paper beyond that permitted by Section 107 or 108 of the U.S. Copyright Law. The fee is to be paid through the Copyright Clearance Center, Inc., Operations Center, P.O. Box 765, Schenectady, New York 12301, U.S.A. This consent does not extend to other kinds of copying, such as copying for general distribution, for advertising or promotional purposes, for creating new collective works, or for resale.
1
9
Chinese coal mining is facing the transition from output to quality. Based on the total mining capacity and average production, the current situation of coal mining is analysed. The average capacity of coal mines in China is 1.05 Mt/a, with 1181 mines of capacity less than 0.3 Mt/a (35% of the mines) contributing only 4.51% to output, which seriously restricts green coal mining. The coal industry should speed up the closure of small coal mines, eliminate outdated production capacity, increase the speed and proportion of coal resources moving westward, and promote high-quality development of coal mining.
Elastic damage characterization of an ilmenite smelter freeze lining
by A. Mabentsela ..........................................................................A furnace freeze lining is necessary for safety and economic reasons in several smelting operations. The integrity of the freeze lining is put at risk by furnace power imbalances, but no model exists for thermomechanical damage to the freeze lining. This study provides an initial pathway for modelling freeze lining thermomechanical damage in ilmenite smelters. The modified power law proved to be the best predictor of softening response of drill core samples of solidified slag ingots used to represent the freeze lining. Damage driving parameters were extracted from the raw data, and governing equations of the damage driving parameters with respect to temperature were derived for use in a finite element method (FEM) code.
Real-time underground route identification and route progress using simple on-board sensing and processing
by R.F. Meeser and N. Theron ...............................................................Optimally applied hybrid power systems in vehicles can save up to 40% on fuel costs. To optimally manage a hybrid vehicle’s energy flow, it is necessary to know, in real time, all the energy requirements to complete a given route. In this study the topographic and heading profiles are used to identify routes which are easily measured by means of digital barometric pressure and compass sensors. The system proved to function correctly in underground tests and it finds direct practical application where route identification is required and where using GPS is not feasible.
19
29
41


As a reader of the SAIMM Journal, you might well know that the mining and metallurgical engineering industry is one of the most complex and intricate of human endeavours. This edition’s excellent set of papers particularly demonstrates that successful enterprises routinely collaborate across disciplines. Advanced technical research and development stakeholders need to interact with economic and business entities while also considering environmental sustainability, social ethics, and corporate governance. In addition to this, the industry has become truly global, with experts from a broad array of cultural and social backgrounds, sharing knowledge via the written word.
Therefore, one of the most critical skills in our industry is the ability to clearly communicate difficult concepts between different fields of expertise. When communication is done well, it can be agile and effective with minimal oversight, even in challenging time-critical workflows; without it, misunderstandings and wasted effort are the order of the day. One way to ensure that this communication is done well, is through the use of plain language principles.
The drive to adopt plain language principles is gathering momentum in many areas where large and diverse teams execute highly cross-disciplinary projects (one example is https://www. plainlanguage.gov/guidelines/). Plain language aims to improve clarity and reduce ambiguity. In particular, it can aid with the communication of information out of pockets of expertise where domain-specific jargon and terminology often obscure the core ideas. Perhaps it’s time we looked at it for our world?
During the festive season of 2022, I came face to face with the question: to stay or not to stay? Given the context of a skilled engineer, working in the South African minerals industry, how does an individual make this decision?
The question around the security of our own infrastructure still hangs in the air. How will this impact our minerals industry’s growth prospects? Reports are conflicting, some saying the minerals industry is in a downward spiral with its ninth consecutive month of decline in October 2022. Three top challenges always mentioned are erratic power supply and Transnet woes, both port and rail.
Other reports show that the industry’s financial performance exceeded expectations: distributions to shareholders more than doubled, capital expenditure grew by more than 30%, taxes paid increased by more than 10%, and record commodity prices reached for the platinum group metals basket, iron ore, and coal.
Again, given the conflicting reports and the uncertainty around South African infrastructure, how do highly skilled individuals in the South African minerals industry make the decision: to stay or not to stay?
According to the United Nations’ Department of Economic and Social Affairs, more than 914 ,000 South African citizens emigrated between 2015 and 2020, which is basically three times as many than in previous years. New World Immigration (Pty) Ltd statistics show that almost three quarters of enquiries come from highly skilled and qualified professionals, while 30% of applicants were tradesmen.
Data from across the globe shows more than 201 000 South Africans living in Australia at the end of 2021 (2 230 more than in 2020); Canada welcomed 25 000 South African citizens between 2015 and 2020; in just the first half of 2022, 11 300 South Africans had their New Zealand residency applications approved; the UK Home Office shows that between Q1 2020 and Q3 2021, more than 5 800 citizenship grants were awarded to South Africans; and in the USA, more than 650 South Africans obtained resident status in 2022 (more than 2 300 passing in 2021). According to a study commissioned by the Inclusive Society Institute during 2021, 11.13% of South Africans with higher education indicated that they were seriously considering emigrating within the next two years.

What is the impact of this ‘brain drain’ on the minerals industry?
During April 2022, the South African government announced plans to change its data collection systems to get a better idea of how many skilled South Africans are leaving the country. The proposal noted that the country has seen an outflow of valuable skills in several sectors. It added that the emigration of skilled South Africans has not been addressed efficiently through any specific policy and constitutes a growing problem in certain sectors. Various society leaders have expressed concern about the fact that those who emigrate make up a large part of South Africa’s skilled labour.
Life-changing decisions are never easy and one might even believe that freedom lies in the absence of choice. Nonetheless, I want to make a plea for South Africa. Acknowledging that all is relative and highly dependent on the comparison made (for example: emerging countries or markets vs mature, established, first-world economies), South Africa is one of the countries with the lowest cost of living, For example: our consumer prices are 40% lower than in London, rent is 60%

lower, dining out will cost you 50% less, and groceries prices are 30% lower than in London. Although our stringent labour law policies may challenge South African employers, they do give employees a high level of job security, ensuring fair treatment. South Africa also has lower costs of tertiary ducation and child care. Given the crippling health care challenges Britain faces (due to surging inflation coupled with almost 10 years of stagnant wage growth), I am thankful for our health care system. On the UHC index developed by the World Health Organization, comprising 14 tracer indicators, South Africa’s score has almost doubled in the past 20 years, reaching 67 (on a scale of 0–100) in 2019.
Above and beyond all of this, I am thankful to be part of the SAIMM and for the support we give to our young professionals, entering our minerals industry, through our SAIMM-YPC. We focus on supporting scholars through career guidance, supporting them in mathematics, science, and tutoring in life skills. We also focus on our graduates, supporting them in selection processes and bridging the gap between theory (getting the degree) and practical execution in the industry. We continue our support with conferences on best practices, training, mentoring, and development programmes. The SAIMM is committed to influencing other bodies (for example ECSA) to the benefit of all stakeholders, especially our young professionals. Maybe most important of all, we support entrepreneurial activities that will serve the requirements of our young professionals.
Social comparison has its roots in evolution, it is a human condition, and I will continue comparing grass to determine where it is greener; therefore, I will come face to face again with the question: to stay or not to stay? I wish everyone wisdom in answering this question and wherever you might find yourself during 2023, I wish everyone a year of collaboration, growth, and development.
Z. Botha President, SAIMMThis year’s biennial symposium of the South African National Committee on Tunnelling (SANCOT) was hosted in November in the university town of Stellenbosch at the Wallenberg Conference Centre @STIAS (Stellenbosch Institute for Advanced Study). Needless to say, the setting in itself presented its own attraction, and soon enough we’ll have new tunnelling developments in the region to draw a second occasion!
There is yet another, more specific reason to couple the beauty of the Western Cape winelands, and the richly concentrated resources of a world class university and research instution to that of exploring tunnelling advancements. Aside from the obvious burgeoning and burning need for urban infrastructure development, this is additionally juxtaposed on that of global consciousness on sustainable development and protection of the environment. Sustainable solutions to the exploding problems associated with those indelible effects of our human footprint on this precious planet mean that not only are we bound to seek short-term results to accommodate ourselves, but an imperative to find long-term results that future generations can live with.
At the risk of expanding on a cliché, it is through tunnelling that this will be achieved – is already being achieved, and has been largely entrenched into urban development strategies globally. Underground infrastructure development provides a means through which we foresee a lasting offset to environmental impacts as a result of urbanisation And for the SubSaharan region, this SANCOT symposium held special significance. In the near future, water shortages, roads, rail, urban networks, access to raw materials through mining, the establishment of storage facilities to hold grain, for underground cultivation or waste disposal, will become imperative to accommodate the approximately 2.5 billion people projected to occupy
the African continent by 2050, less than 30 years from now.
The theme of the conference ‘Tunnel boring in civil engineering & mining’ therefore spoke directly to these challenges. The pressure not only to deliver the results, but to do so safely, fast and effiiciently informs those technological advancements so desperately required
Many tens of thousands of kilometres of underground tunnels have historically been developed, by conventional drill and blast methods, but this is changing; slowly, but ever more steadily and rapidly, as technological advances for mechanised tunnelling and tunnel boring in mining are gaining traction –literally and strategically
The SANCOT 2022 Symposium was attended by a selection of globally representative delegates from Europe and the Americas, as well as a significant contingent of South African delegates.


Photo courtesy: Du Toit Carstens et al, WSP Group Africa, CSV Construction and City of Cape Town

Affiliation:
1Metallurgical Engineering and Consulting LTD, Georgia.
Correspondence to: G. Jandieri
Email: gigo.jandieri@gmail.com
Dates:
Received: 12 Jan. 2020
Revised: 25 Sept. 2022
Accepted: 4 Nov. 2022

Published: January 2023
How to cite:
Janieri, G. 2023
Increasing the efficiency of secondary resources in the mining and metallurgical industry.
Journal of the Southern African Institute of Mining and Metallurgy, vol. 123, no. 1, pp. 1–8
DOI ID: http://dx.doi.org/10.17159/24119717/1092/2023
ORCID: G. Jandieri http://orcid.org/0000-00032976-1201
Synopsis
An improved methodology is presented for assessing the economic feasibility and effectiveness of recycling industrial waste. The methodology is based on the break-even control mechanism, but at the same time provides for the introduction of new evaluation criteria such as the threshold of conditionality and the degree of ore substitution. Based on an improved analysis, it becomes possible to more precisely predict recycling efficiency. A more refined determination of the lower limit of concentration of recoverable metals, at which technogenic waste can be assigned the status of secondary raw materials and processed profitably, leads to a significant expansion of the secondary raw material base suitable for recycling. The potential for recycling manganese-containing dust from the production of ferrosilicomanganese, dehydrated sludge from the hydro separation of slags, and cake from the production of electrolytic manganese dioxide at the Chiatura mining enterprise is used as an example. It is shown that with a threshold of –24% Mn content, the highest recycling efficiency can be achieved by the production of low-phosphorus manganese slag and conversion to ferrosilicomanganese using the above waste to replace 40-60% grade III and IV manganese concentrates in the feed.
Keywords
industrial waste, secondary raw materials, efficiency of recycling, coefficient of conditionality, ore substitution index.
Introduction
Mining and metallurgy are major sources of industrial waste accumulation (BRGM, 2001). In this industry, on average, no more than 25% of the mined mineral resources, ends up in the final product. The remaining 75% constitutes industrial waste (Butorina, and Butorina, 2018).
According to Reuter and Kojo (2012), iron and lead undergo the highest degree of recycling – 47% each – followed by aluminum, copper, zinc, and nickel with indices of 40, 38, 36, and 34%, respectively. It is obvious that most metal-containing wastes are not included in the recycling stream and are stored indefinitely, which increases the risk of environmental pollution and other disasters (Bagrov, and Murtazov, 2010; Bolshina, 2012). Despite this, the appropriate management of metal-containing waste is still not given due attention, neither from the point of view of nature conservation, rational use of energy and natural resources, nor from the economic perspective. Global demand for metals is growing and will continue to grow due to the high rate of industrialization in developing countries (UNEP, 2013; Kaza et al., 2018). Accordingly, in the short term, the rate of production of metal-containing industrial wastes will increase. Based on the current situation, the effective management of industrial wastes and secondary resources of the steel industry will remain relevant and of practical importance, both for environmental and economic reasons.
A survey of the literature shows that in the modern world there is already a consensus on the importance of solving problems of optimizing the use of primary (natural) resources and increasing the efficiency of recycling of wastes and secondary resources in the mining and metallurgical industry (Hogland et al., 2014; NEA, 2019; Chernousov, 2011; Jishkariani et al., 2012; Chernousov et al., 2016; Sausheva, 2017; Allesch, and Brunner, 2015; Reuter, and Schaik, 2016; Brunner et al., 2017; Ndlovu, Simate, and Matinde, 2017; Matinde, Simate, and Ndlovu, 2018). Modern technologies for recycling and processing secondary resources create new opportunities for sustainable development. However, the focus to date has been mainly on technological solutions. Less emphasis has been placed on improving the organizational and economic aspects of waste management, which is also important or increasing recycling efficiency (Abramov, 2009; van Schaik, and Reuter, 2016).
The need to improve the management of the waste in the mining and metallurgical industry is especially apparent when considering the problems involved in the efficient processing of resources with a relatively low content of valuable elements, such as tailings and metal oxide by-products (dust from electric furnaces, dehydrated sludge, slag). These materials are currently used mainly in the construction industry (Berdzenishvili, 2008; Tang et al., 2019; Romanova, and Begunov, 2016; Bolshakov et al., 2016; Needomskiy, Chernishev, and Chernishov, 2017), but this practice is irrational since they can be more effectively used as metallurgical raw materials (Rao, 2006; Norval, and Oberholster, 2011; Jandieri, 2012; Jandieri et al., 2012, 2015; Kojamuratov et al., 2017; Corte, Bergmann, and Woollacott, 2019).
According to the United Nations Environment Programme and International Solid Waste Association (UNEP/ISWA, 2015), one of the main priorities is to establish an effective, integrated system of management for recycling, utilizing, and neutralizing metal-containing wastes. This will include improving the tools for assessing the resource potential of industrial waste.
An analysis of improvement opportunities shows that a new approach should be based on the break-even concept (Cherniy, Kudriavskiy, and Golev, 2007), with the addition of fundamentally new evaluation criteria such as the concentration thresholds (allowable lower limits) of the recoverable elements and the degree of ore substitution. According to the break-even concept, a conditional resource will be understood to mean a technogenic resource with a metal content equal to or greater than the breakeven point of the selected processing route. By establishing the concentration threshold of conditionality and the ore substitution index, it will be possible to predict the effectiveness of metallurgical processing of the secondary resource, which in turn will lead to a more accurate assessment of the feasibility of recycling and the scale at which it can be done. This can significantly expand the secondary resource base suitable for processing in the mining and metallurgical industry. As a result, the usage of expensive primary ore resources will decrease, harmful anthropogenic impacts on the environment will be reduced, and the inefficient and unsafe use of resources suitable for ferrous metallurgy in the construction industry will decrease.
Based on the above analysis, the development and practical implementation of the selected approach to improving the organizational-economic management system, an indicator for assessing the recycling efficiency can be derived (Abramov, 2009):
where
Er - is an indicator of the economic efficiency of recycling
Ec - an indicator of the environmental significance of recycling
Qj - an indicator of the scale of recycling.
In order to solve the problem, we adapt the economic-mathematical model of breakeven (Cherniy, Kudriavskiy, and Golev, 2007) to the organizational-economic features of the system of industrial recycling, after which we obtain the model of break-even of recycling:
Ep - is the expected income from the processing of technogenic resources ($).
Imj - the content of the j-th target component in the resource (%)
Mj - the total mass of the recycled resource (t)
Krj - the coefficient of extraction of this component
Pmj - the market value of the j-th component ($ per tont)
Сmj - costs of recovery and extraction ($ per ton)
Cej1 and Cej2 - specific environmental costs before and after recycling ($ per tont)
n - the number of extracted components.
In our case, the break-even point of recycling is the lower critical boundary of the content of the extracted component, Imin, at which the selected process does not violate the margin threshold condition. Based on this, determination of the concentration threshold of conditionality of the resource can be determined from the following expression: [3]
where Imin is the permissible lower limit of the content of the target component in the resource (%), and Kvpm is the coefficient of variation of the market price.
The ratio of the actual content of the target component, Iac, to the calculated threshold content of that component, Imin, will be called the coefficient of conditionality of the technogenic resource, Kk: [4]

The resource will considered as secondary raw material if Kk ≥ 1.
To estimate the amount of primary concentrate that can be substituted by the raw materials, we introduce the ore substitution index, Ios: [5]
where
Iac is the concentration of the target component in the secondary resource (%)
Ioc - the concentration of the target component in the primary concentrate (%)
Kr1 - the coefficient of extraction of the target component from primary concentrate
Kr2 - the coefficient of extraction of the same component from the secondary resource (established experimentally).

The norm of consumption of secondary raw materials of threshold conditionality (Imin) in the production of a product with a given content of the extracted component (Imet) is equal to: [6]
In turn, the consumption norm of secondary raw materials differing in content from the calculated concentration threshold will be equal to: [7]


It is noteworthy that although the profitability of the production of the target product when using secondary raw materials with an extremely low content of the recoverable component may be zero, the total profitability of the enterprise itself, R, will still increase due to the decrease in consumption of expensive primary raw materials, i.e. reducing the cost of normalized working capital: [8]
where
where
R is the profitability of the enterprise (%)
Vp - annual production output ($)
Pcfa - the cost of fixed assets ($)
Pvnwc - the average annual value of normalized working capital ($).
Since the average annual cost of normalized working capital is a function of the saving indicator of the main ore raw materials
Pvnwc=f(E), it can be determined by calculating the reduction in the consumption norm of this raw material, NΔq:

where
Nqi - is the norm of consumption of the ore raw materials per unit of finished product (t)
Nqj - the norm of consumption of secondary raw materials approved by the technological regulations, (at Nqj=N(Iac) Nqi=0) (t)
W1 - the norm of waste generation during the processing of the raw materials (kg/t)
W2 - the norm of formation of waste during recycling (kg/t).
In this case, taking into account the quantitative saving of the main raw materials ΔQi = QiNΔq and its purchase price Pi, the expected cost savings Еp on the purchase of ore raw materials can be calculated:
As a result, the known functional dependence (Equation [1]) for evaluating the recycling efficiency index takes the following form:


where
K1, K2, K3 - are the weighting factors that determine the importance of the economic, environmental, and scale components of the recycling process, which are determined experimentally
Es - revenues from the sale of secondary by-product silicate waste, as a suitable material for the construction industry.
For an accurate quantitative assessment of the reserves of target components contained in the secondary resource, we use the expression:
where
S - is the area of the accumulated secondary resource (km2)
h - the thickness of this accumulation (m)
Iacj - the content of the j-th target component in the recycled secondary resource (%)
γ
mj - the specific gravity of the j-th component (t/m3)

Iosj - ore substitution index of the j-th resource
Kkj - the coefficient of conditionality of the j-th resource


n - the amount of target components.
Based on the calculated indicator of the recycling efficiency index, provided that Ier ≤ 0.5, the feasibility of further intensification of recycling processes and the maximum possible extraction of valuable components can be investigated by encouraging innovative developments and the introduction of high-performance energysaving technologies. If this involves significant investments, the expected effectiveness of these investments needs to be assessed. For this we use the forecast indicator of the profitability index Ii:
where
Min and Mout - are the expected cash inflow and outflow
Kt - project investment capital
T - project implementation period (months, years).
In turn, as an indicator of the expected effectiveness of developed or implemented innovative technologies, we can to apply the integrated efficiency coefficient of the use of technogenic resources, Ki, which is used to determine the ratio between the volumes of recycling before and after applying innovative technologies to the total amount of secondary raw materials in need of processing:
where
Ki - is the coefficient of useful use of secondary material
Vri - consumption of secondary raw materials after the application of innovative technology (t)
Vrj - consumption of raw materials before the application of innovative technologies (t)
Wnj, Wni - inevitable repeated technological losses before and after the application of innovative technology (t)
Qrj - the total quantity of accumulated secondary resources (t).
Taking into account the predicted indicators of the useful use of secondary raw materials and the investments required for this, the mathematical expression (Equation [11]) for a comprehensive assessment of the recycling efficiency can be written as:
If internal recycling is not possible or expedient, which may be due to poor technical and economic indicators of the main production process and, accordingly, to a high concentration threshold of conditionality and ore substitution, it may be possible to market the accumulated secondary resource to other, more technologically flexible enterprises. In this case, the outcome is given by the following expression:
where
Pp - is the sale price of the base ton of secondary raw materials ($ per ton)
Ccdj - costs of collecting the j-th type of recyclable materials ($ per ton)
Сcpj - preparation costs for the sale of this raw material ($ per ton)
Qr - the volume of raw materials sold (t)
Ios - ore substitution index
Kwj - correction coefficient of the degree of external clogging En - the normative coefficient of comparative economic efficiency of capital investments (En = 0.16)

Isp - specific capital investment for the processing of 1 t. of secondary raw materials ($).
If necessary, for a separate assessment of the expected environmental effect of recycling, Equation [17] can be used to calculate the savings on environmental costs, depending on the reduction of the negative environmental impact:
where
Mv - is market value of land adjacent to the enterprise ($ per km2)
Sa - the land area saved from pollution (km2)
Ke - the coefficient of ecological and social significance of this area
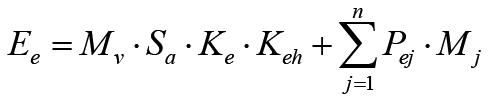
Keh - coefficient of environmental hazard of a polluting metal
Pej - state duty for the accumulation and landfill of metal pollutant ($ per ton)
Mj - the mass of metal recovered during recycling (t).
The technical-economic indicators of different enterprises, even those producing the same product, differ significantly, depending on numerous technical, technological, and organizational-economic factors, including differences in mineralogical characteristics, physicochemical properties, and the cost of basic and auxiliary raw materials. Therefore, calculations for each specific enterprise must be carried out individually, for local conditions of industrial recycling. As an example, we investigated the possibility of recycling manganese-containing secondary resources at Georgian Manganese LLC, which comprised the Chiatura mining enterprise, Zestafoni ferroalloy plant, and Varcikhe hydroelectric power station.
Figures 1 and 2 give details of the types of manganese ore beneficiation wastes in the Chiatura mining enterprise, their qualitative and quantitative characteristics, and the annual amounts
of oxidic waste generated from ferrosilicomanganese smelting at the Zestafoni ferroalloy plant. Each year an additional 500 000 t of slime (10-11% Mn), 250 000 t of so-called agglomeration grade (14-16% Mn), and 350 000 t of intermediate product (15-16% Mn) are generated (Jandieri, Sakhvadze, and Raphava, 2020; Sasmaz, Sasmaz, and Hein, 2021).
It is possible to process waste (hydrometallurgical sludge, -30±3% Mn) from the production of electrolytic manganese dioxide together with the indicated technogenic resources to produce either low-phosphorus manganese slag suitable for the production of standard ferrosilicomanganese (FeMnSi18, ISO 5447, 1980) or ferrosilicomanganese (FeMnSi28, ISO 5447, 1980) for smelting medium- and low-carbon ferromanganese (FeMn90C20, ISO 5446, 2017).
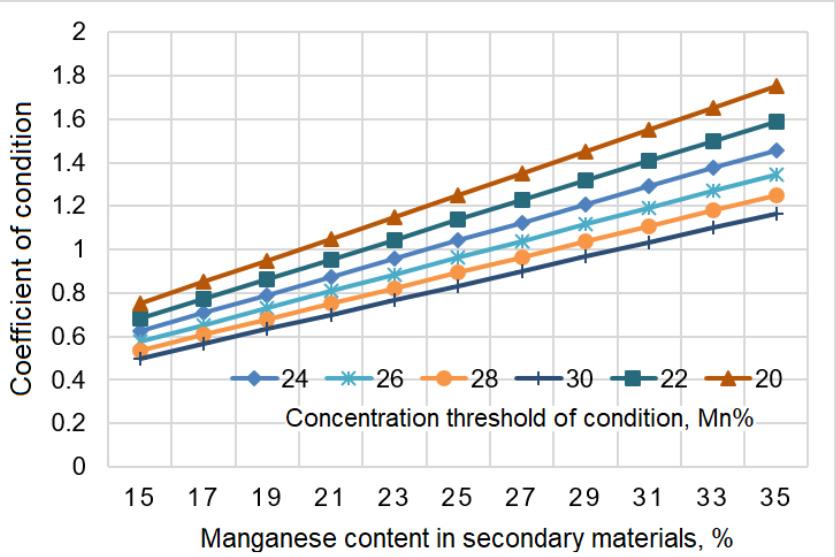
Figure 3 illustrates the dependence of the coefficient of conditionality, Kk, on the calculated concentration threshold of conditioalityn Imin and the actual manganese content in secondary manganese-containing raw materials. Figure 4 shows the change in the quantitative indicator of ore substitution, Ios, depending on the manganese content in the secondary manganese-containing raw material, when substituting manganese concentrates of grades I, II, III, IV. Figure 5 illustrates the dependence of the norm of consumption of secondary raw materials on the concentration of manganese in the final product.
As regards the practical application of the results, it is especially important to consider the trends in Figures 4 and 5. From Figure 4 it is seen that a secondary resource that contains 24-27% manganese (for example, electric furnace dust, dehydrated sludge) can replace manganese ore concentrate grade I (48% Mn) by 28-40% grade II (42% Mn) by 35-45%, grade III (36% Mn) by


42-60%, and grade IV (28% Mn) by 62-90%. Secondary raw materials that contain 27-30% Mn (for example, sludge from the production of electrolytic manganese dioxide, slag from the production of carbon ferromanganese) can replace grade I manganese concentrate by 40-58%, grade II by 50-65%, grade III by 60-82%, and grade IV by >90% (i.e., 800-1100 kg of the secondary material can be substituted for 1 t of grade IV concentrate).
At the Zestafoni ferroalloy plant, when smelting special lowphosphorus slag (38-40% Mn), the concentration threshold for conditionality of manganese-containing secondary raw materials is 24% Mn, for which the consumption of manganese secondary raw materials is 2.6-2.8 t per base ton of product. At a manganese content of 26% in secondary raw materials, the consumption decreases to 2.2-2.4 t per base ton product. For the production of ferrosilicomanganese (FeMnSi28, 57-60% Mn), secondary raw
materials with a manganese content of 28% can be used – the consumption of such secondary material will be 2.9-3.1 t per base ton. Recycled materials containing 30% manganese and with an acceptable phosphorus level can be used in the production of ferrosilicomanganese (FeMnSi18, 65-70% Mn) or ferromanganese (FeMn75C80, 75-80% Mn), with a consumption of 2.8-3.2 t. and 3.4-3.6 t per base ton respectively (data from Figure 5).
An analysis of the results shows that the highest recycling efficiency index can be achieved by maximizing the environmental and large-scale components, i.e. The purpose of combining resources of various types is to obtain secondary raw materials with a threshold content of the target component. For example, mixing relatively Mn-rich sludge from the production of electrolytic manganese dioxide (27-30% Mn) with sludge (slag sand) from the hydro separation of ferrosilicomanganese slag (18% Mn) in a ratio


of 1:0.5 yields an intermediate product with a threshold manganese content of 24-25%. According to Figure 4, such secondary material can reduce consumption of grade IV manganese concentrate by 60-70%, and that of grade III by 40-50%, in the smelting of lowphosphorus slag (40% Mn) or ferrosilicomanganese (57% Mn) respectively. If it is necessary to completely omit the use of grade III and IV manganese concentrates, it will be necessary to utilize 2.8 t and 3.6 t of these combined raw materials, respectively (Figure 5). An additional benefit in the processing of these secondary raw materials is the high content of silicon dioxide (SiO2 45 ± 5%). This can also lead to a decrease in the consumption of quartzite (96% SiO2) by an average of 30%.
It should be noted that the above approach to improving recycling efficiency can be especially effective for recycling metalcontaining secondary resources, with the stability of internal and external economic factors that significantly affect production indicators. For example, recycling efficiencies, from an economic point of view, can be significantly affected by fluctuations in the market prices of the main and auxiliary raw materials (manganese concentrate, coke, electrode materials etc.), for energy resources (electricity, natural gas), or for the products. The significance of this problem is quite clearly emphasized in the generalized study (Carrera, Bastourre, and Ibarlucia, 2010). Recycling efficiencies may also fluctuate due to unplanned downtime of main production furnaces and auxiliary units. According to Equation [3], in such cases there will be a consequent deviation in the value of the conditionality threshold of the recyclable resource (the break-even point of the recycling process will change). This, in turn, will affect the coefficient of conditionality (Equation [4]), ore substitution index (Equation [5]), and the norm of consumption of secondary raw materials (Equations [6] and [7]).
It is also important to note that with an increase in the cost of ore concentrates and other charge materials, or a decrease in the price of manufactured products, enterprises that are dependent on imported raw materials, by developing their own system of internal recycling/processing of accumulated production waste (replacing expensive purchased ore with cheaper secondary resources) will be more competitive, economically more stable, and less sensitive to external economic factors. In the case of external recycling (transfer or sale of secondary resources to other processing enterprises, recycling efficiency will decrease due to margins on logistics services (Equation [16]). According to Equation [15], the maximum recycling effect is achieved by maximizing the efficiency index Iermax = 1.
The algorithm for the practical implementation of the developed methodology for increasing recycling efficiency can be graphically illustrated in the form of a functional flow chart (Figure 6). The particulars of the functioning of the proposed algorithm are as follows: In the first instance, after determining the initial data on the metal content in the waste (Iac) according to Equations [2] and [3], the break-even point and the corresponding threshold of conditionality of the waste (Imin) are determined. If the metal content is greater than the minimum permissible (Iac > Imin), the resource is classified as a conditional secondary raw material and its technological characteristics (Kk), (Ioc), (N (Imin)) and (N (Iac)) are determined according to Equations [4]-[7]. If the metal content in the waste is below the threshold concentration, then in-house recycling will be inefficient. Provided that the waste is a conditional secondary raw material (Iac > Imin), then the consumption savings (Ep) for the main ore raw materials are calculated according to Equation [10]. Equation [12] is used to estimate the total resource
(reserve) of secondary raw materials (Qj), while the savings on environmental taxes (Ee) are determined by Equation [17]. Using the data obtained, Equation [11] provides for the preliminary assessment of the recycling efficiency (Ier). If the calculated efficiency is higher than 50% (Ier ≥ 0.5), then recycling is efficient and can be carried out without any additional investment and/or using existing production capacities and infrastructure.
Alternatively, if the estimated efficiency is below 50%, then the recycling efficiency is considered to be low and an additional investment is required to increase it to Ier ≥ 0.5. In this case, after determining the object or technology of additional investment, according to Equations [13] and [14], a forecast of the effectiveness of the planned investment (Ii) and (Ki) is made, after which the waste recycling efficiency (Ier) Equation [15]) is then re-evaluated. If the total recycling efficiency has increased to 0.5 or higher, then the metal-bearing secondary resource can be subjected to target processing after additional investments. Should the total recycling efficiency after possible additional investment still remain below 0.5, then in-house processing is uneconomic and not worth pursuing. It is thus recommended to consider the recycling and re-use of the metal-bearing wastes in alternative industries. In this case, Equation [16] is used to calculate the expected economic return from the direct sale of secondary raw materials (Er). The improvement of the abovementioned technical, technological, economic and environmental performance indicators leads to an overall sustainable increase in recycling efficiency.
Based on the results of the study, it can be concluded that by applying the proposed recycling efficiency improvement technique, the following practical problems can be solved:
➤ A qualitative and quantitative assessment of the appropriateness and scale of internal recycling of a secondary technogenic resource
➤ Calculation of the total conditional reserves of valuable components in the accumulated secondary resource
➤ Identification of the appropriate proportions for combining secondary resources of different types and conditionalities. This will lead to a significant increase in the secondary raw material base suitable for profitable recycling and extraction of valuable components.
In particular, the recycling of manganese-bearing secondary resources at the Chiatura mining enterprise using the proposed algorithm will:
➤ Increase total manganese recovery from the current 50-55% to 75-80%
➤ Reduce manganese concentrate consumption by 25-30% with a corresponding increase in the service life of operating mines
➤ Reduce the cost of ferroalloy production by 10-15%.
The present solution to the problem of increasing recycling efficiency is universally applicable and can be particularly successfully used to improve the processing efficiency of secondary resources in the production of metal semi-finished products such as manganese, chromium and silicon ferroalloys, ligatures, and modifiers that are produced in bulk. References
the efficiency of recycling of secondary resources in the mining and metallurgical industry
Allesch, A. and Brunner P. 2015. Material flow analysis as a decision support tool for waste management: A literature review. Journal of Industrial Ecology, vol.19, no. 5. pp. 753–764

Bagrov, A.I. and Murtazov, A.K. 2010. Technogenic systems and theory of risk. S.A. Yesenin Ryazan State University, Ryazan, Russia. 207 с. https://www. rsu.edu.ru/wp-content/uploads/users/m.mahmudov/Bagrov_Murtazov.pdf [in Russian]
Berdzenishvili, I.G. 2008. Utilization of electrolytic manganese dioxide production waste in silicate industry. Proceedings of the 5th International Conference on Cooperation to Solve the Problem of Waste, Kharkov, Ukraine. https://waste.ua/cooperation/2008/theses/berdzenishvili.html
Bolahsakov, V.I., Eliseeva, М.А., Nevedomskij, B.А., and Shcherbак, S.А. 2016. Building materials and products based on silicomanganese slags. Bulletin of the Dnieper State Academy of Civil Engineering and Architecture, vol. 5, no. 218. pp. 54. http://nbuv.gov.ua/UJRN/Vpabia_2016_5_9 [in Russian].
Bolshina, E.P. 2012. Ecology of metallurgical production. Novotroitsk, Russia, NB NUST MISiS. 155 pp. https://nmetau.edu.ua/file/ktemp_15502.pdf [in Russia].
BRGM. 2001. Management of mining, quarrying and ore-processing waste in the EU. 79 pp. https://ec.europa.eu/environment/waste/studies/ mining/0204finalreportbrgm.pdf
Brunner, Ch., Schwelberger, J., Fleischanderl, A., and Ropke, A. 2017. Practice of recycling operations in iron direct reduction units. Chernye Metally. Journal of Ore and Metals, vol. 8. pp. 59–63. https://www.rudmet.ru/ journal/1652/article/28375/
Butorina, I.V. and Butorina, M.V. 2018. Review of wastes utilization technologies in mining and metallurgical industry. Chernye Metally, Journal of Ore and Metals Publishing House, vol. 12. pp. 44–49. http://www.rudmet.ru/ journal/1781/article/30433/
Carrera, J., Bastourre, D., and Ibarlucia, J. 2010. Commodity prices: Structural factors, financial markets and non-linear dynamics. Banco Central de la República Argentina, Investigaciones Económicas.
Cherniy, S.А., Kudriavskiy, Ju.P., and Golev, А.V. 2007. Complex criteria of break-even for industrial waste recycling technologies. Advances in Current Natural Sciences, vol. 11. pp. 72–76. http://www.naturalsciences.ru/ pdf/2007/11/38.pdf [in Russian]
Chernousov, P., Saiadova, U., and Golubev, O. 2016. Econometric forecast of ferrous metal -recycling. LAP Lambert Academic Publishing. Saarbrucken, Germany. 93 pp. https://www.morebooks.de/store/gb/book/ Эконометрический-прогноз-рециклинга-чёрных-металлов/isbn/978-3659-95589-1 [in Russian]
Chernousov, P.I. 2011. Рециклинг. Recycling. Technologies for processing and utilization of technogenic formations and wastes in the ferrous metallurgy. NUST MISiS. 428 pp. https://www.twirpx.com/file/1005553/ [in Russian]
Corte C. da, Bergmann, C., and Woollacott, L. 2019. Improving the separation efficiency of Southern African haematite from slimes through selective flocculation coupled with financial markets and non-linear dynamics. Journal of the Southern African Institute of Mining and Metallurgy, vol.119. pp. 963–972.
Increasing the efficiency of recycling of secondary resources in the mining and metallurgical industryFigure 6—Functional algorithm to increase the efficiency of recycling of secondary resources of the mining and metallurgical industry
Hogland, W., Kaczala F., Jani Y., Hogland M., and Bhatnagar A. 2014. Beyond the zero waste concept. Proceedings of Linnaeus ECO-TECH´14, At Kalmar, Sweden. Department of Biology and Environmental Science, Linnaeus University, pp. 2–10.
ISO 5446:2017. Ferromanganese - Specification and conditions of delivery. https:// www.iso.org/standard/65346.html
ISO 5447:1980. Ferrosilicomanganese - Specification and conditions of delivery. https://www.iso.org/standard/11492.html
Jandieri, G. 2012. Electrothermal alloying of grey cast iron from iron-containing fine-dispersive technogenic waste. Proceedings of the IX International Congress ‘Machines, Technologies, Materials’, Varna, Bulgaria. vol. 1. pp. 5–8. https://mech-ing.com/journal/Archive/2013/1/3_Dzhandieri_ENG.pdf
Jandieri, G. and Sakhvadze D. 2013. Smelting of alumosilicomanganese from technogenic and secondary resources mining-metallurgical industry of Georgia. Proceedings of the X International Congress Machines, Technologies, Materials, Varna, Bulgaria. vol. 1. pp. 107–110.
Jandieri, G., Jishkariani, G., Sakhvadze, D., and Tavadze, G. 2012. Technologies of rendering harmless and regenerating solid and liquid inorganic industrial wastes. Proceedings of Modern Technologies and Methods of Inorganic Materials Science, Tbilisi, Georgia. pp. 304–319.
Jandieri, G., Sakhvadze, D., and Raphava, A. 2020. Manganese biomining from manganese-bearing industrial wastes of Georgia. Journal of the Institution of Engineers (India): Series D, vol. 102. https://doi.org/10.1007/s40033-02000235-0
Jishkariani, G., Jandieri, G., Sakhvadze, D., Tavadze, G., Oniashvili, G., and Aslamazishvili, Z. 2012. Ecological problems related to mining-metallurgical industries and innovatory, energy-efficient ways of solving them. Engineering, vol.4, no.2. pp. 83–89. https://doi.org/10.4236/eng.2012.42011
Kaza, S., Yao, L.C., Bhada-Tata, P., and van Woerden, F. 2018. What a Waste 2.0: A Global Snapshot of Solid Waste Management to 2050. World Bank, Washington, DC: https://elibrary.worldbank.org/doi/epdf/10.1596/978-1-46481329-0
Kojamuratov, R.U., Safarov, R.Z., Shomanova, J.K., and Nosenko, Yu.G. 2017. Utilization of ferroalloy wastes. Proceedings of Global Science and Innovations 2017, Bursa, Turkey. Bursa Technical University. pp. 201–213.
Matinde, E., Simate, G.S., and Ndlovu, S. 2018. Mining and metallurgical wastes: a review of recycling and re-use practices. Journal of the Southern African Institute of Mining and Metallurgy, vol. 118. pp. 825–844.
Ndlovu, S., Simate, G.S., and Matinde, E. 2017. Waste Production and Utilization in the Metal Extraction Industry. CRC Press: Portland, OR. 512 pp. –http://library.sadjad.ac.ir/opac//temp/18652.pdf
NEA. 2019. 3R guidebook for industrial developments. National Environment Agency. Singapore. 52 pp. https://www.nea.gov.sg/¬docs/default-source/ resource/3r-guidebook-for-industrial-developments.pdf
Nevedomskij, V.А., Chernoshov, А.V., and Chernishov, А.А. 2017. Nanotechnology for the production of stone material from fiery liquid technogenic waste to produce products. Journal of ZSTU/Engineering, vol. 2, no. 80. pp. 60–67. https://doi.org/10.26642/tn-2017-2(80)-60-67
Norval, D. and Oberholster, R.E. 2011. Further processing and granulation of slags with entrained metal and high metal compound content, with specific reference to present manganese slag dumps as well as additions due to daily
production. Proceedings of Southern African Pyrometallurgy. Jones, R.T and den Hoed, P. (eds.). Southern African Institute of Mining and Metallurgy, Johannesburg. pp. 129–143.
ao, S.R. 2006. Resource Recovery and Recycling from Metallurgical Wastes. Waste Management, vol. 7. Elsevier Science & Technology, UK. 580 pp.
Reuter, M.A. and Schaik, van A. 2016. Strategic metal recycling: adaptive metallurgical processing infrastructure and technology are essential for a circular economy. Responsabilité & Environnement, vol. 2, no. 82. pp. 62–66.
Reuter, M.A. and Kojo, I.V. 2012. Challenges of metal recycling. Materia, no. pр. 52–57.
Romanova, I.P. and Begunov, O.B. 2016. Use of metallurgical waste in the construction industry as a way to save natural resources and reduce environmental tensions. Territory of Science. Journal of Voronezh institute of Economics and Lawl, vol. 2. pp. 53–57 [in Russian].
Sarukhanishvili, A.V., Shashek, L., Shapakidze, E.V., and Sarukhvanishvili, I.A. 1992. Waste materials from the production of electrolytic manganese dioxide in the glass-container industry. Glass and Ceramics, vol. 49. pp. 161–163. https://doi.org/10.1007/BF00676989
Sasmaz, A., Sasmaz, B., and Hein, J.R. 2021. Geochemical approach to the genesis of the Oligocene-stratiform manganese-oxide deposit, Chiatura (Georgia). Ore Geology Reviews, vol. 128. 103910. https://doi.org/10.1016/j. oregeorev.2020.103910
Sausheva O.S. 2017. Monitoring of the effectiveness of recycling: tasks and organization. Journal of ITMO University, Series Economics and Environmental Management, vol 4. pp. 102–109. https://cyberleninka.ru/article/n/ monitoring-effektivnosti-retsiklinga-zadachi-i-organizatsiya/viewer [in Russian]
Suman Lata. 2018. Industrial Economics. Alagappa University, India. 286 pp. https://alagappauniversity.ac.in/uploads/files/MAEconomic-362%2014_ Industrial%20Economics.pdf
Tang,C., Li, K., Ni, W.,and Fan, D. 2019. Recovering iron from iron ore tailings and preparing concrete composite admixtures. Minerals, vol. 9, no. 4. https://doi. org/10.3390/min9040232
UNEP. 2013. Metal Recycling: Opportunities, Limits, Infrastructure. А Report of the Working Group on the Global Metal Flows to the International Resource Panel. Reuter, M.A., Hudson, C., van Schaik, A., Heiskanen, K., Meskers, C., and Hagelüken C. (eds).Paris, France. 316 pp. https://wedocs.unep.org/ handle/20.500.11822/8423
UNEP/ISWA. 2015. Global Waste Management Outlook. Osaka, Japan. 333 pp. https://www.uncclearn.org/sites/default/files/inventory/unep23092015.pdf
Van Schaik, A. and Reuter, M.A. 2016. Recycling indices Visualizing the performance of the circular economy. World of Metallurgy – ErzmetallI, vol. 69, no, 4. pp. 201–216.
Zhdanov, A.V., Zhuchkov, V.I., Dashevskiy, V.Ya, and Leontyev, L.I. 2015. Wastes generation and use in ferroalloy production. Proceedings of the Fourteenth International Ferroalloys Congress: Energy Efficiency and Environmental Friendliness are the Future of the Global Ferroalloy Industry. Proceedings of INFACON XIV. Kiev, Ukraine. pp. 754–758. https://www. pyrometallurgy.co.za/InfaconXIV/754-Zhdanov.pdf u
Affiliation:
1Department of Materials Science and Metallurgical Engineering, University of Pretoria, Pretoria, South Africa.
2BEng(Metallurgy) Final Year Project Student.
Correspondence to: A.M. Garbers-Craig
Email:
Andrie.Garbers-Craig@up.ac.za
Dates:
Received: 30 Nov. 2021
Revised: 20 Sept. 2022
Accepted: 10 Oct. 2022
Published: January 2023
How to cite:
Mabasa, N.P., Naudé, N., and Garbers-Craig, A.M. 2023 Hand-held XRF sorting of spent refractory bricks to aid recycling. Journal of the Southern African Institute of Mining and Metallurgy, vol. 123, no. 1, pp. 9–18
DOI ID: http://dx.doi.org/10.17159/24119717/1928/2023
ORCID:
N. Naudé http://orcid.org/ 0000-00029615-0243
A.M. Garbers -Craig http://orcid.org/0000-00020298-8097
Synopsis
An improved methodology is presented for assessing the economic feasibility and effectiveness of recycling MgO-C and Al2O3-MgO-C refractory bricks, which are widely used in the steelmaking industry. Since approximately 28 Mt of refractory bricks are discarded each year, it is logical to recycle them. When furnaces and ladles are relined, the spent refractory bricks become mixed up, and need to be sorted before recycling. This study examined the use of a hand-held X-ray fluorescence analyser (HH-XRF) to distinguish between spent oxide-based and oxide-carbon-based refractory materials, with special emphasis on spent MgO-C (MC) and Al2O3-MgO-C (AMC) bricks. HH-XRF analysis was conducted on 18 oxide-carbon refractory bricks as well as on MgO-chromite and bauxite-based refractories. X-ray diffraction, reflected light optical microscopy, and scanning electron microscopy with energy dispersive spectroscopy were used to characterize the MgO-C and Al2O3-MgO-C bricks to confirm the accuracy of the HH-XRF analyses.
This study also underlined the importance of calibrating the HH-XRF analyser for the refractory bricks to be sorted. The HH-XRF was successful in distinguishing between the different oxide-carbon-based refractory bricks both before and after cleaning. This result is important as it proves that HH-XRF provides a method whereby spent MC and AMC bricks can be sorted quickly and reliably.
Keywords
hand-held XRF (HH-XRF), recycling, MgO-C, Al2O3-MgO-C, refractory bricks.
Introduction
Fang, Smith, and Peaslee (1999) define refractories as ‘ceramic materials that are designed to withstand a variety of severe service conditions including high temperatures, corrosive liquids and gases, abrasion, mechanical and thermal induced stress’. According to a study conducted by Horckmans et al. (2019), approximately 35-40 Mt/a of refractories are produced worldwide, of which 70% goes to the iron and steel industry. It was also estimated that 28 Mt of spent refractories are generated every year. Due to factors such as increasing landfilling costs and environmental concerns (Gokce et al., 2008), the need for recycling of refractory materials has increased over the years.
MgO-C (MC) bricks are of utmost importance in the steel industry where they are used in the working lining of basic oxygen furnaces, electric arc furnaces, ladle furnaces, and secondary steelmaking ladles where their high resistance to thermal spalling and corrosion is exploited (Kangal, Forssberg, and Hammergren, 2006). Al2O3-MgO-C (AMC) bricks, however, make up a small portion of the working lining of the electric arc furnace (EAF), where they are used in the hearth, as well as in steelmaking ladles. Since the iron and steel industry is the main consumer of refractory materials, it is understandable that this sector is the main focus of refractory recycling efforts.
Recycled MC bricks can be used as a slag conditioner, whereby the required fluxes are reduced and foaming conditions are improved, or they can be used to produce magnesia refractories (Arianpour, Kazemi, and Fard, 2009). However impurities such as slag, metal, and other foreign materials penetrate and react with the bricks during service. Spent MC bricks cannot therefore be recycled directly into fluxes or new bricks but must first be separated from other types of oxide-carbon bricks (such as AMC bricks) and cleaned (Viklund-White, Johansson, and Ponkala, 2000). Since MC and AMC bricks look similar to the naked eye, the first challenge is to separate them from each other.
For many years, manual sorting, which depends on visual identification and expertise, has been used to distinguish between refractories. There is, however, a demand for using more scientific and automated methods to improve the accuracy and speed of sorting (Horckmans et al., 2019). The methods that have been investigated include a charge-coupled device (CCD) camera and laser induced breakdown spectroscopy (LIBS). This paper focuses on the use of a hand-held X-ray fluorescence analyser (HH-XRF) to distinguish between different types of oxide and oxide-carbon refractory bricks.
Background
MgO-C vs. Al2O3-MgO-C refractory bricks
MC bricks are unfired refractories, generally constituted from high-purity MgO aggregate (sintered or fused), graphite, a carbon binder, and powdered antioxidants such as aluminium (Al), silicon (Si), silicon carbide (SiC), boron carbide (B4C), and Al-Si and AlMg alloys, which are added to protect the carbon against oxidation. Carbon is added to these bricks as a bonding phase and as graphite flakes to improve thermal shock resistance and to prevent wetting of the brick by slag, thus improving corrosion resistance.
AMC refractories are constituted from the same raw materials as the MC bricks, but also contain alumina aggregate (bauxite and corundum). They also have a continuous matrix which contains the resin binder, graphite flakes, and antioxidant additives (Munoz and Tomba Martinez, 2012). Wear is reduced due to controlled residual expansion by in-situ spinel (MgAl2O4) formation, which improves resistance to thermal shock and spalling (Munoz, Pena, and Tomba Martinez, 2014).
Chemical properties
The chemical composition ranges of typical synthetic resin-bonded MC and AMC bricks, without antioxidant additions, are shown in Tables I and II. The magnesia grains are of high purity (fused and/ or sintered) with small amounts of impurity oxides such as alumina (Al2O3), haematite (Fe2O3), lime (CaO), and silica (SiO2). The
Table I
Chemical composition ranges of synthetic resin-bonded MC bricks without antioxidants, (mass%) (Routschka and Wuthnow, 2012)
Table II
Chemical composition ranges of AMC bricks without antioxidants, (mass%) (Routschka and Wuthnow, 2012)
carbon is usually added as graphite, with carbon contents ranging from 7 to 25%. Steelmaking ladles can contain up to 12% carbon (Kujur et al., 2018). AMC bricks with varying Al2O3: MgO ratios are produced. The impurity oxides present are governed by the amounts and types of alumina and magnesia raw materials used. Natural graphite also contributes oxide-based impurities to these bricks. Effect of antioxidants on microstructure
Antioxidants protect carbon against oxidation by reacting with the carbon or the gaseous atmosphere to form carbides, oxides, and nitrides. These compounds crystallize as plates or whiskers and fill the pores or react with Al2O3 or MgO to form new solid phases such as spinel (MgAl2O4) or forsterite (Mg2SiO4), depending on the antioxidant(s) added (Munoz, Pena, and Tomba Martinez, 2014). Al and Si powders are mostly used due to their low cost and effective protection (Bag, 2011).
Zhang, Marriott, and Lee (2001) examined reactions at 1200°C for 3 hours in an MC brick in which aluminium was used as an antioxidant (Figure 1). Aluminium remained as angular, unreacted metallic particles, while it also reacted with carbon to form spheroidal Al4C3 and in certain areas it oxidized to form spheroidal Al2O3 grains. Cubic MA spinel subsequently formed through the reaction of the oxidized Al antioxidant (Al2O3) and MgO at approximately 1200°C. AlN formed as 10 µm diameter whiskers between graphite flakes and on the Al4C3 grain surfaces (Figure 1).
When Si was added as an antioxidant it also formed an oxide, a carbide, and a nitride during reaction, similar to the Al antioxidant. Forsterite was observed (Figure 2a), a SiO2 shell surrounding the unreacted Si particle (Figure 2b), spheroidal SiC (Figure 2a-c); as well as Si3N4 as 10 µm black whiskers within the SiC grains (Figure 2c) (Zhang, Marriott, and Lee, 2001).
Munoz, Pena, and Tomba Martinez (2014) investigated the physical, chemical, and thermal characterization of different AMC refractories using several techniques such as XRF, XRD, reflected light optical microscopy, SEM, and gravimetry. The microstructures of the used AMC brick obtained by optical microscopy contained a large amount of alumina, with smaller proportions of antioxidant particles, and impurities such as mullite (3Al2O3.2SiO2), tielite (Al2O3.TiO2), and rutile (TiO2), (Figure 3).

One of the most important refractory raw materials is magnesia, which accounts for 25–30% of the total refractory mineral demand. China is one of the largest suppliers of dead-burnt and fused magnesia and controls 71.3% of of the global supply of natural graphite, 65% of the synthetic graphite, and 100% of the spherical graphite (IMFORMED, 2021). Over 82.4 Mt of bauxite was exported by Guinea in 2020, making it one of the world’s single largest exporters (Artacho, 2021).

China’s exports of dead-burnt and fused magnesia were 131 kt, fused alumina 44 kt, and graphite 21 kt in February 2021 (Shaw, 2021). Graphite had the highest average economic value, followed by fused alumina (Figure 4). Magnesia had the lowest average economic value; however it is important to note that the demand for magnesia is the highest, therefore making it one of the most valuable raw materials. Recycling of MgO-containing refractories therefore has, apart from environmental benefits, great economic potential.

Oxide-carbon bricks of different colours were sampled from a heap of mixed oxide-carbon bricks at Philmar Consulting in Meyerton (Figure 5). A sample of 36 bricks was chosen at random from different positions in the heap, i.e., 8 from the top, 12 from the middle, and 16 from the bottom. When sampling the bricks, it was observed that the bricks were of different sizes, shapes, and appearances (Figure 6).
Each of the bricks was numbered (including the various faces of the bricks) in order to keep track of where each individual brick (or brick face) was analysed with the HH-XRF and sampled for XRD and SEM-EDS analyses.


A HH-XRF is a portable device that can be used to determine the elemental composition of materials. The HH-XRF is typically used in material science, research, and exploration geology. It can also be used in the food industry for foreign body identification and quality

analysis of food, art conservation and authentication, as well as in archaeological studies for analysis of objects (Berg Engineering, 2020).
The HH-XRF is mostly used for field-testing, allowing the operator to remain mobile in the area of interest for maximum efficiency. Its features include a pistol grip and trigger-style switch, full colour displays, and it is battery operated (Drake, 2015). The main benefit of the HH-XRF is that it does not require sample preparation, and the analysis can be done rapidly (Desroches et al., 2018). The size of the spot to be analysed can be varied between 1 mm and 8 mm depending on the collimators used. Additional advantages of the HH-XRF device is that it gives quick results, there are no restrictions on the number of tests that can be run, procedures can be changed without any preparation, and the device is cost-effective for most applications (Bosco, 2013).
A HH-XRF can analyse elements as light as magnesiuim and as heavy as uranium, which provides researchers with a powerful tool (Berg Engineering, 2020). It is supplied as a ready-to-use analytical instrument as it is factory-calibrated, using specific standards based on customer needs. A shortcoming of the HH-XRF is that its calibration is limited to matrices of packed powders, therefore when measuring samples that are more metallic, the increase in density results in poor calibration.
HH-XRF instruments are safe to use if used correctly. Safety precautions associated with using HH-XRF devices are mainly related to the prevention of radiation exposure (Liddle, 2012). These include holding the instrument by its handle during operation, never aiming the device at a person, never holding samples or placing samples against any body part during analysis, being aware that the primary beam can be transmitted through a work surface onto the operator’s body, and ensuring that the instrument is placed against a flat surface during analysis to prevent scatter radiation from escaping.
A 4W Bruker Tracer5i HH-XRF, with a Rh anode, a SDD detector and 8mm collimator was used to analyse the bricks. The GeoMining Oxide Concentrates factory calibration was used in all cases. This factory calibration analyses for all elements between Mg and U, using three different sets of conditions to cover the entire range between Mg and U – 15 kV with no filter for the light elements, 30 kV with an AlTi filter for transition elements, and 50 kV with an AlTiCu filter for heavy elements. Carbon does not provide enough fluorescence yield to be analysed. In the oxide calibrations, no normalizations are done, so the carbon content does not affect the analyses but only causes low analytical totals. Since an initial round of analyses showed large discrepancies, the factory calibration was optimized by doing a type standardization. This was done using pressed pellets of certified refractory reference materials to compensate for the fact that the factory calibration was performed on packed powders while the analyses were directly on bricks with very different densities. The HH-XRF analyses were repeated three times on two faces that were identified as either the hot face or the cold face of the brick. The analyses were conducted on the spots and faces shown in Figure 7. The as-received bricks were analysed and after observing the effect that dust had on brick 9 (especially as regards to the light elements), the bricks were cleaned by dusting with a brush on each of the faces (hot face and cold face) prior to analysis. Each spot was analysed once.
A characterization study was conducted to determine the validity of the HH-XRF results, i.e., if the HH-XRF can undeniably distinguish between MC and AMC bricks. The purpose of the XRD and SEM/ EDS analyses was to obtain a basic understanding of the phases present in the bricks, as this information is important when interpreting the HH-XRF data. For example, when a discard MC brick, which contained aluminium as anti-oxidant, is analysed
with XRF, the reported aluminium concentration will be low (< 5 mass%), while the aluminium concentration of a discard AMC brick (with aluminium anti-oxidant) will be high (> 50 mass%). XRD and SEM/EDS analyses give supplementary information on whether the reported aluminium is present in metallic, carbide, or oxide forms, or in combinations thereof.
The bricks were cut using a diamond blade circular saw close to one of the spots that were analysed by the HH-XRF. The sectioned part was cut into two, one half was prepared for XRD and the other was prepared for SEM/EDS analysis (Figure 8). Each brick sample cut for XRD analysis was hammered and then pulverized to –75 µm (Figure 9). XRD analysis was performed using a PANalytical X’Pert Pro powder diffractometer.

To prepare the brick samples for SEM/EDS and light optical microscopy, 10 parts of epoxy resin to 6 parts hardener were mixed and poured into a mould containing the brick samples. The mounted samples were then put under vacuum for 10 minutes to eliminate trapped air in the mixture and left to dry overnight in an oven at 40°C. The samples were polished and then gold coated before SEM/EDS analysis using a Jeol JSM–IT300LV scanning electron microscope coupled with an Oxford X–Max 50 energy–dispersive X–ray spectrometer.
The relative phase amounts (weight%) of the crystalline portions of bricks 14, 26, and 29 were estimated from the hot and cold faces of each of the bricks using the Rietveld method (X’Pert Highscore Plus software) (Table III). The major crystalline phase in brick 14 was periclase (MgO), while forsterite (Mg2SiO4) and monticellite (CaMgSiO4) were identified as minor phases. Monticellite is an impurity phase associated with MgO aggregate originating from magnesite (MgCO3). In brick 29, periclase was also identified as a major phase. The minor phases were monticellite, magnetite (Fe3O4), and forsterite. Graphite was absent in both bricks 14 and 29. This was confirmed by the light brown colour of the pulverized samples, which indicated that these were magnesia bricks that ended up on the oxide-carbon brick dump. Two major phases were identified in brick 26 – periclase and graphite.
SEM/EDS
Typical microstructures of the MC and AMC bricks are shown in Figure 10. MgO aggregates were identified in the MC bricks whereas alumina and MgO aggregates were identified in AMC bricks, as expected. Monticellite, merwinite, and forsterite were observed in the MC brick, while phases such as tielite and alumina-silicates were observed in the AMC brick. Forsterite presumably formed after the Si antioxidant and / or formed SiC oxidized to silica (SiO2) and reacted with MgO according to Equations [1]-[4]:
Si(s) + 2CO(g) →SiO2(s) +2C(s) [1]
XRD and SEM-EDS analyses confirmed that the majority of elements detected in the bricks were present as oxides. The HH-XRF data was therefore expressed as oxides, i.e MgO, Al2O3, SiO2, CaO, Fe2O3 / Fe3O4, Cr2O3, and TiO2.


Effect of dusting of the bricks before HH-XRF analysis
Brick 9 was used to investigate the effect of dusting of the bricks on the HH-XRF results (Figure 11, Table IV). The SiO2 content (probably originating from dust) decreased, whereas the MgO content and total chemical composition increased after the brick was cleaned with a brush. This was an indication that the amount of dust on the brick adversely affects the accuracy of the MgO analysis (an element with a low atomic mass).
The repeatability of the HH-XRF analyses was determined by analysing a single spot (spot 1) ten times and the reproducibility of analysis i.e. homogeneity of the brick was evaluated by analysing 10 different spots on brick 6 (Figure 12). Figure 13 shows the results. The chemical composition of the brick seemed homogeneous with the naked eye (Figure 14), but the HH-XRF results showed a significant variation in MgO content (standard deviation of 6% when 10 different spots were analysed). This presumably is due to a large MgO aggregate grain (3 mm in diameter) sometimes

falling within (or partially within) the collimated spot analysed. In contrast, when the same spot was analysed 10 times the compositional variation was insignificant. For this scenario, the MgO content had the highest variation of all the oxides, but with a standard deviation of only 1%, which is well within the analytical uncertainty associated with Mg analyses by HH-XRF.
The factory-calibrated HH-XRF was used to analyse 15 clean oxidecarbon bricks (Figure 15). High percentages of MgO were recorded, as expected from an MC brick. Although significant variations were observed, as indicated by the error bars, the HH-XRF was able to identify MC bricks.

The oxide composition of brick 14 was estimated through a mass balance calculation of the crystalline phases identified using quantitative XRD and compared with the HH-XRF results (Table V). A significant difference was observed in the MgO, SiO2, and CaO contents determined by the two methods.
It is assumed that the accuracy of the HH-XRF data could have been affected by sample preparation (samples were analysed as received and not pulverized), the fact that characteristic X-ray photons are emitted from only the top few micrometres of the sample, especially in the case of light elements, the fact that the HH-XRF cannot analyse for carbon, and that the HH-XRF was not calibrated for the types of refractory bricks used in this study.

After it was realized that all the oxide-carbon brick samples from the stockpile were MC bricks, which again highlights the difficulty of distinguishing between the MC and AMC bricks, a test was conducted on previously characterized virgin refractory bricks (magnesia-chromite, bauxite-based bricks). These tests were aimed at determining if the HH-XRF was able to distinguish between different oxide-based refractory bricks, i.e bricks that do not contain any carbon. The macrostructures of these bricks, as can be seen with the naked eye, are shown in Figure 16.
Magnesia-chromite brick compositions reported by the HHXRF were similar to the expected MgO and Cr2O3 compositions of 52% and 26% respectively. The alumina content of the bauxite brick was close to the expected 83%; however, the SiO2 content was too high (Table VI).


The MC and AMC refractory bricks that were characterized using
XRD and SEM-EDS were also analysed with the HH-XRF. The HHXRF reported 100% alumina (Table VII), which was much higher than the expected 67% (Table VIII) and completely unrealistic.

HH-XRF analyses vs. calculated chemical compositions of bricks 14, 26 and 29 (mass%)

The MgO concentration reported by the HH-XRF in the MC brick (Table VII) was higher than the expected 88% (Table IX).
Due to the high alumina reported in the previous tests, it was clear that the factory-calibrated HH-XRF was not suitable for analysis of the refractory bricks, as it was calibrated for a maximum of 69% Al2O3. Pressed powders of refractory brick reference materials were therefore prepared (Figure 17) and analysed in order to carry out a ‘type standardization’ (an empirical correction method used to optimize HH-XRF equipment for specific matrices) to improve accuracy. The AMC brick was analysed again, and values close to the data sheet values in Table VIII were obtained (Table X), indicating that a type standardization can be used to improve quantitative HH-XRF results.
Apart from accuracy, the speed of sorting through the spent refractories is important, hence the effect of reducing the analysis time on a single brick was investigated (Table XI). The measurement time was reduced from 90 seconds to 50 seconds. Although the measured magnesia content decreased, the type of brick could still be identified. Therefore, a HH-XRF can also be used at measurement times of 50 seconds, thus permitting the sorting of refractory bricks at a faster pace.
➤ HH-XRF technology can successfully distinguish between different types of oxide-based and oxide-carbon-based refractory bricks.
➤ It is important to calibrate the HH-XRF using refractory brick reference materials before analysis (sorting) is started, as the factory calibration is not sufficient.
HH-XRF test results for oxide-based refractories
HH-XRF test results for the virgin MC and AMC bricks
Table VIII
Composition of the AMC brick, as reported in the data sheet
IX
Composition of the MC brick, as reported in the data sheet
Table X
HH-XRF analysis of an AMC refractory brick before and after type standard calibration
Table XI
HH-XRF results for an MC brick analysed for 90 seconds and 50 seconds
Drake, L. 2015. User guide: Tracer series. https://www.xrf.guru/WorkshopVI/ TracerDocumentation/Manuals/files/Tracer%20User%20Guide.pdf [accessed 26 September 2021]
Fang, H., Smith, J.D., and Peaslee, K.D. 1999. Study of spent refractory waste recycling from metal manufacturers in Missouri. Resources, Conservation and Recycling, vol. 25. pp. 111–124.
Gokce, A.S., Gurcan, C., Ozgen, S., and Aydin, S. 2008. The effect of antioxidants on the oxidation behaviour of magnesia-carbon refractory bricks. Ceramics International, vol. 34. pp. 323–330. https://doi.org/10.1016/j. ceramint.2006.10.004
➤ The spot size analysed with the HH-XRF should be as large as possible relative to the largest size fraction of aggregate material used in the brick formulation.
➤ Although dusting of the bricks increases quantitative accuracy, it was shown that even without cleaning one can still distinguish between different types of oxide-carbon refractories.
➤ HH-XRF is a reliable and quick technique by which MC and AMC bricks can be sorted before their different raw materials are recovered and recycled.
The authors gratefully acknowledge Vesuvius South Africa and Philmar Consulting for providing the oxide-carbon refractory bricks. Special thanks are also due to Maggi Loubser from the School of Arts at the University of Pretoria for the use of the Bruker Tracer5i HH-XRF analyser as well as for technical support.
References
Arianpour, F., Kazemi, F., and Fard, F.G. 2009. An outlook of refractory recycling experience in Iran. Proceedings of the 11th Unified International Technical Conference UNITECR 2009, Salvador, Brazil. https://www. researchgate.net/profile/Faramarz-Kazemi/publication/324860711_AN_ OUTLOOK_OF_REFRACTORY_RECYCLING_EXPERIENCE_IN_IRAN/ links/5ae7f2be0f7e9b837d393c25/AN-OUTLOOK-OF-REFRACTORYRECYCLING-EXPERIENCE-IN-IRAN.pdf
Artacho, M. 2021. Guinea-Bissau plays a crucial role in global bauxite supply chain. Africa News. https://www.topafricanews.com/2021/09/08/guinea-bissauplays-a-crucial-role-in-global-bauxite-supply-chain-by-miguel-artacho/ [accessed 26 September 2021].
Bag, M. 2011. Development of environmental friendly new generation MgO-C brick using nano carbon. MTech thesis, Rourkela National Institute of Technology, India.
Berg Engineering. 2020. Bruker TRACER 5i handheld XRF analyzer (TRACER5I). https://www.bergeng.com/product/TRACER5I.html [accessed 26 September 2021]
Desroches, D., Bedard, L.P., Lemieux, S., and Esbensen, K.H. 2018. Suitability of using handheld XRF for quality control of quartz in an industrial setting. Minerals Engineering, vol. 126. pp. 36–43. https://doi.org/10.1016/j. mineng.2018.06.016
Horckmans, L., Nielsen, P., Dierckx, P., and Ducastel, A. 2019. Recycling of refractory bricks used in basic steelmaking: A review. Resources, Conservation and Recycling, vol. 140. pp. 297–304. https://doi.org/10.1016/j. resconrec.2018.09.025
IMFORMED. 2021. Refractory minerals market: facing up to the future. http://imformed.com/refractory-minerals-market-facing-up-to-the-future/ [accessed 20 September 2021]
Kangal, O., Forssberg, E., and Hammergren, P. 2006. Evaluation of MgO-C bricks for recovering graphite and magnesite. Proceedings of the XXIII International Mineral Processing Congress, Istanbul, Turkey. Önal, G. (ed.). International Minerals Processing Council. pp. 2236–2244.
Kujur, M.K., Roy, I., Kumar, K., Chintaiah, P., Ghosh, S., and Ghosh, N.K. 2018. Raw materials for manufacturing of superior quality MgO-C bricks. Materials Today: Proceedings, vol. 5. pp. 2359–2366. https://doi.org/10.1016/j. matpr.2017.09.242
Liddle, S.A. 2012. Guidance on the safe use of handheld XRF analysers. Society for Radiological Protection. https://www.rp-alba.com/resources/Guidance_on_ the_safe_use_of_Handheld_XRF.pdf
Muñoz, V., Galliano, P.G., Brandaleze, E., and Tomba Martinez, A.G. 2015. Chemical wear of Al2O3-MgO-C bricks by air and basic slag. Journal of the European Ceramic Society, vol. 35. pp. 1621–1635. https://doi.org/10.1016/j. jeurceramsoc.2014.11.024

Munoz, V., Pena, P., and Tomba Martinez, A.G. 2014. Physical, chemical an thermal characterization of alumina-magnesia-carbon refractories. Ceramics International, vol. 40, no. 7A. pp. 9133–9149. https://doi.org/10.1016/j. ceramint.2014.01.128
Routschka, G. and Wuthnow, H. 2012. Handbook of Refractory MaterialsDesign - Properties - Testing. 4th edn. Vulkan Verlag GmbH, Esseh, Germany.
Shaw, S. 2021. Refractories: Chinese trade data for Jan/Feb highlight raw material disruption. https://roskill.com/news/refractories-chinese-trade-data-for-janfeb-highlight-raw-material-disruption/ [accessed 28 June 2021]
Viklund-White, C., Johansson, H., and Ponkala, R. 2000. Utilization of spent refractories as slag formers in steelmaking. Proceedings of the 6th International Conference on Molten Slags, Fluxes and Salts, Stockholm, Sweden and Helsinki, Finland. https://www.pyrometallurgy.co.za/MoltenSlags2000/pdfs/212.pdf
Zhang, S., Marriott, N.J., and Lee, W.E. 2001. Thermochemistry and microstructures of MgO-C refractories containing various antioxidants. Journal of the European Ceramic Society, vol. 21, no. 8. pp. 1037–1047. https://doi.org/10.1016/S0955-2219(00)00308-3 u
Please Note: We will consider only those candidates who meet the requirements listed below.
VACANCY: Publications Co-ordinator
The Southern African Institute of Mining and Metallurgy is a professional membership organisation serving the minerals industry. We offer membership to all professionals working in the industry. One of the benefits associated with being a member is to receive a monthly, internationally recognised technical journal.

We wish to appoint a publications co-ordinator for the co-ordination and administration of the entire publications process for Journal papers and books within the SAIMM. including sourcing and managing relationships with external stakeholders and vendors (authors, reviewers, editors, copyeditors, designers, translators, printers, The Academy of Science of South Africa (ASSAf), ISBN and ISSN numbers as well as the National Copyright Library, etc).
Position: Publications Co-ordinator
The successful incumbent will be responsible for all the direct day-to-day activities, while reporting to the Manager. Consistent feedback and meetings with the editor, the publications committee, the editorial board, and authors of books are an integral part of the role. The publications team includes the DTP operator, the proof reader and the advertising agent. The position offers considerable autonomy in the way that the publications department operates.
Main responsibilities
Co-ordination and administration of the Journal
• Managing communication between authors, reviewers and the editor.
• Managing the paper reviewing process from submission to publication.
• Managing the registration of authors and reviewers on the Online Journal System and providing support.
• Managing the electronic distribution of the Journal.
Administration for the Publications Committees
• Preparing documentation for monthly Publications Committees’ meetings.
• Arrange meeting logistics, including venues, or virtual platform to be used.
Co-ordination and administration of Book Publications
• Arrange meetings with the author(s).
• Co-ordinate the entire process for publishing the book.
Requirements
• Relevant diploma or degree.
• 5 - 8 years’ experience in co-ordination and administration of publications
• A high level of quality control, attention to detail and time management
• Be able to take and transcribe minutes
• An understanding of budgets and financial reporting
• Computer literate - proven competence in Microsoft Office applications
• Proficiency in English
Terms: This is a permanent, fulltime position. The SAIMM has a hybrid model of working, i.e., working at the office and from home. We offer a salary package of R300 000 CTC, which includes a contribution to a pension scheme and an annual bonus plus 20 days annual leave.
Applications: Download and complete the application form using this link: https://www.saimm.co.za/about-saimm/ vacancies
Submit the form together with your CV and a letter of application by email only to vacancies@saimm.co.za
Closing date: 10 February 2023
Only shortlisted candidates will be contacted and if you have not heard from us by 24 February 2023, you can assume that your application has been unsuccessful.
To find out more about the SAIMM click here: https://www.saimm.co.za
Affiliation:
1State Key Laboratory of Water Resource Protection and Utilization in Coal Mining, China Energy Investment Corporation, Beijing.
2School of Energy and Mining Engineering, China University of Mining and Technology-Beijing, Beijing 100083, China.
Correspondence to: X. Liu
Email: liuxinjie@pku.edu.cn
Dates:
Received: 6 Feb. 2021
Revised: 27 Jul. 2022
Accepted: 17 Oct. 2022
Published: January 2023
How to cite:
Liu, X., Li, L., and Yang, Y. 2023
Development status of coal mining in China.
Journal of the Southern African Institute of Mining and Metallurgy, vol. 123, no. 1, pp. 19–28
DOI ID: http://dx.doi.org/10.17159/24119717/1506/2023
ORCID: X. Liu http://orcid.org/0000-00034339-7207
Synopsis
Coal mining in China is facing the transition from output to quality. Based on the total mining capacity and average production, the current situation of coal mining at mine, city, and province levels is analysed, and data in support for the layout of sustainable mining development and the optimization of output provided. The results show that 87% of China's coal is mined by underground methods, with an average production capacity of 0.93 Mt/a per mine. Open pit mining accounts for 13%, with an average mine production capacity of 5.73 Mt/a. The average mining capacity of coal mines in China is 1.05 Mt/a, with 1181 coal mines with an average capacity less than 0.3 Mt/a, accounting for 35% of the total coal mines but contributing only 4.51% to output. They are distributed in about 48 cities in six provinces, seriously restricting the transition to green coal mining. The coal industry should speed up the closure of small coal mines in key provinces and cities, eliminate outdated production capacity in the central region, increase the speed and proportion of coal resources moving westward, and promote high-quality development of coal mining.
Keywords
coal mining, production capacity, sustainable mining, price indices.
Introduction
Coal is the lifeblood of industry. The world’s annual output is nearly 8 Gt/a. Ten countries – China, India, Indonesia, the USA, Australia, Russia, South Africa, Germany, Poland, and Kazakhstan – produce more than 100 Mt/a and account for 95% of the world’s total output. China, the largest producer, accounts for half of world production, (Figure 1).
The large amount of coal production in China is related to national conditions. China's resource endowment is rich in coal, but lacking in oil and gas, and coal resources account for more than 68% of primary energy production in the long term. Until 2020, coal accounted for 67.2% of China’s total energy, while oil and gas supplied only 6.8% and 6% respectively, as shown in Figure 2.

China has always emphasized food and energy security. Coal is the mainstay of China's energy security, and coal guarantees stable domestic prices and smooth operation of the economy. The active and controllable role of coal is reflected in two main aspects. Firstly, capacity can be increased or decreased according to the national demand. For example, during the 2016 energy surplus, the state required coal mines to organize production according to 276 working days, resulting in a 16% drop in production to 3.41 Gt/a. Secondly, China’s coal-to-liquids (CTL) industry uses coal as a raw material to produce oil and petrochemical products by either a direct or an indirect coal liquefaction process, with capacities of 1 Mt/a
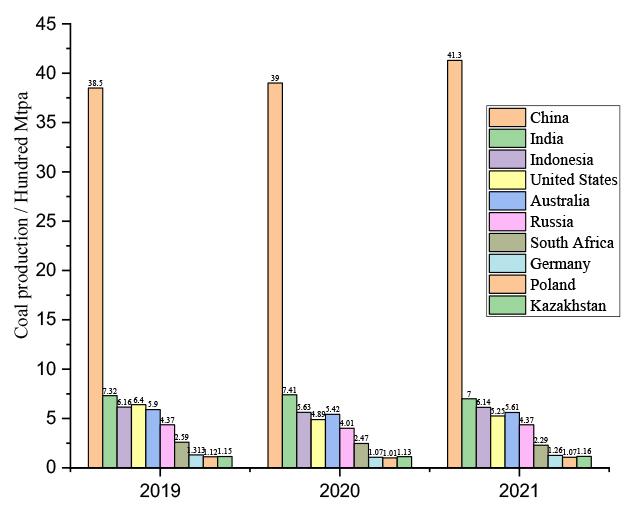
and 4 Mt/a respectively. The current international and regional situation is profoundly complex and changeable, and various challenges and uncertainties have increased significantly. In the first half of 2022, coal production reached 2.19 Gt. Variations in production over the last decade are shown in Figure 3.

By the end of December 2018, China had 3373 fully-licensed coal mines with a total output of 3.53 Gt/a, with an average production capacity of 1.045 Mt/a /mine, comprising 0.93 Mt/a per
mine for underground mining and 5.73 Mt/a per mine for openpit mining (National Energy Administration, 2019. Coal mining is carried out in about 25 provinces, mainly concentrated in 176 urban areas, the details of which are shown in Table I, and the mining level distribution is shown in Figure 4. It is worth stating that the history of Taiwan's coal mines spans about 125 years, from the first officially operated coal mine by the Chinese Qing Dynasty government in Baduzi, Keelung, in 1876, to the closing of the last coal mine around 2000.
At present, the regional distribution and technology level of coal mines in China vary greatly, and advanced and outdated coal mining technology coexist. There are 41 working faces of 10 Mtp/a in China, including 25 underground and 16 open pit. However, there are also 1181 mines with an annual output of less than 0.3 Mt/a (1176 underground and five open pits), accounting for 35% of the total number of coal mines but only 4.51% of the total output. This shows a serious imbalance between quantity and output. In order to advance the national three-year action plan for the special rectification of work safety, in the next three years, small coal mines with an output of less than 0.3 Mt/a will be disposed of by category and more efforts will be made to close them. By 2022, the proportion of large coal mines in China will reach more than 70%. At the same time, the level of mechanization, information, automation, and intelligence of coal mines will be improved. There are 41 coal mines with an output of 10 Mt/a or more in China,
with a combined production of 666.4 Mt/a (Ministry of Emergency Management, 2020).
In this paper we consider coal mining from three levels: mine, city, and province, which provides data support for the proactive strategic layout of coal resources in China.

Mining type
Due to national conditions and geographical differences, coal mining is dominated by underground mines, accounting for 87%of the total output. The production capacity of underground and open pit mines is shown in Figure 5 and Table II.

Underground mining
China has 3292 underground coal mines with a total output of
3063 Mt/a and an average production capacity of 0.93 -Mt/a. The distribution by capacity is shown in Figure 6.

One quarter of the underground mines are classified as highyielding (>1 Mt/a). Production capacity is mainly concentrated in those mines with an annual output of 1 Mt/a or less, and the contribution to output is low, which seriously drags down the coal mining level. The greatest number of mines (1288, 39%) are in the category 0.3–1 Mt/a, contributing 24% of the underground output. There are 1176 mines with a production capacity of less than 0.3 Mt/a, accounting for 36% of the total number of underground mines, and the output contribution is only 4.5%. The mainstay of China's coal output is the mines with an annual output of over 1 Mt/a, among which 803 have an annual output of 1 to 10 Mt/a, accounting for 24% of the total, and the output contribution is as high as 59.9%. There are 25 mines (less than 1% of the total) with an annual output of 10 Mt/a or more, the output contribution of which is 11.6%.
The smaller mines (<0.3 Mt/a) are concentrated mainly in the- southern and eastern regions. Mining at this small scale causes serious safety, economic and ecological problems. The current focus of production capacity reform is therefore to close mines of less than 0.3 Mt/a capacity, reduce the number of mines in the 0.3–1 Mt/a category, and increase the number of mines with production capacity of more than 1 Mt/a.
There are 81 open pit mines, with a total output of 463 Mt/a and an average production capacity of 5.73 Mt/a. Open pit mines are concentrated in nine provinces, with Inner Mongolia, Xinjiang. and Shanxi accounting for 95% of the open-pit output. Production varies widely, with Inner Mongolia producing 290 Mt/a, while Guangxi produces only 200 kt/a. The number of medium-capacity open pit mines (0.3–10 Mt/a) is large, but the number of high- and low-capacity mines is small.Nevertheless, open pit mines with a capacity of over 10 Mt/a make a substantial contribution to the total output, as shown in Figure 7.
There are 36 open pit mines in the 1–10 Mt/a category, accounting for 44.4% of the total number of mines but only 30.08%


of the output contribution, which is lower than the average level. There are 24 mines (29.6% of the total) with a production capacity of 0.3–1 Mt/a, contributing only 2.78% to the output, which is much lower than the average level. Five mines (6.2% of the total) have a capacity of less than 0.3 Mt/a, with an output contribution of less than 0.1%. There are 16 open pit mines with positive output contributions, all of which have a production capacity of more than 10 Mt/a, and for which the output contribution is as high as 67.06%. Based on the comprehensive comparison, it can be seen that the production capacity level of open pit mines is seriously polarized. The low contribution rate of mines with a production capacity of less than 10 Mt/a affects the average mining level. The lower the production capacity, the more obvious it is. Therefore, it is necessary to speed up the closure of open pit mines with a production capacity of less than 1 Mt/a.
There are about 176 cities in China engaged in coal mining, and due to regional differences, the output varies greatly. There are about 63 cities with coal production capacities of more than 10 Mtp/a, with a combined capacity of 3248 Mt/a, accounting for 92% of total production. The distribution of mining by city is shown in Table III. Based on the national average coal production capacity of 1.045 Mt/a, the urban mining levels are shown in Figure 8.

Ordos, Yulin, Shuozhou, Changzhi, and Jincheng are among the cities that produce more than 100 Mt of coal annually. With a combined output of 1314.5 Mt/a, about 25% of total coal production, these five cities are the ‘capitals’ of modern coal mining. Among them, Shuozhou has the highest annual coal output and Jincheng the lowest, but all of them are better than the national average capacity. There are 14 cities with an annual coal output of 50–100 Mt/a, with a combined output of 1039.4 Mt/a, which can be regarded as the core cities for coal mining. The average capacity in this group varies widely. Xilingol has the highest annual coal output and Liupanshui the lowest. There are 26 cities with a coal production capacity of 15–50 Mt/a, with a combined output of
674.9 Mt/a, which can be regarded as the reserve force of modern coal mining cities. There are still 113 cities with less than 10 Mt/a capacity, and their combined capacity is 278.29 Mt/a.
The level of urban coal mining depends not only on the output of coal, but also on the number of coal mines. Fuyang has the highest annual coal output, while Dazhou has the lowest, with 34% of the cities in this echelon below the national average. Ordos, the city with the largest coal output, has a large number of coal mines (237). However, after calculating the average value, its production capacity is lower than that of Fuyang. The reason is that Fuyang has only three coal mines (annual output 11.4, 9.6, and 5 Mt/a), and its production capacity is higher after calculating the average value. Secondly, Xilingol, Hulun Buir, Huainan, and Baoji have higher average coal production capacities. Xilingol has 16 coal mines, including four open-pit mines with an output of 10 Mt/a and three open-pit mines with an output of more than 5 Mt/a, raising the average coal production capacity in the region. Hulunbuir has 19 coal mines, and its average production capacity is high because it has two open-pit mines of more than 20 Mt/a. The average production capacity of 16 coal mines in Huainan was increased after the elimination of two low-yielding mines. Baoji has only two coal mines (annual output 5 and 4 Mt/a) and its average coal production capacity is relatively high.
Dazhou (Sichuan), Southwest Guizhou Autonomous Prefecture (Guizhou), Zunyi (Guizhou), Qujing (Yunnan), Jixi (Heilongjiang), and Qitaihe (Heilongjiang) are cities with annual coal output of 10 Mt, but the average production capacity is less than 0.3 Mt/a. Their common characteristics are low total coal output, a large number of mines, and low average coal production capacity, which are the key points for optimization and reform. In general, there are 44 coal mines with an average production capacity of more than 1.045 Mt/a, accounting for about 70% of the major coal-mining cities.
Generally speaking, in China, the greater the capacity, the more stringent environmental and ecological protection requirements, and the higher the overall efficiency. It can be seen that there is still much room for improvement in both the number and average coal production capacity of coal mines.
China's economy is mainly concentrated in the south, and coal mining is mainly in the north. The areas of coal production and consumption are adversely distributed, and since the transportation cost is high, the low-capacity coal mines in the south have remained in production. With advances in technology and the construction of west-east power transmission lines, five clean energy bases have been established in the north to transport coal south, and the small mines are about to be closed.
Provincial coal output and capacity
China has 25 provinces and municipalities directly under the Central Government engaged in coal mining, and their output and capacities vary greatly due to their wide geographical distribution. The output status and average coal production capacities are shown in Figure 9.
Eight of China's major coal-producing provinces (Shanxi, Inner Mongolia, Shaanxi, Xinjiang, Guizhou, Shandong, Henan and Anhui) produce more than 100 Mt/a of coal, and can be regarded as the first echelon of coal production. Among them, the production capacities of Guizhou and Henan are lower than the national average.
There are 11 provinces in the second echelon of coal production, with outputs between 10 and 100 Mt/a. These are Heilongjiang, Ningxia, Hebei, Sichuan, Gansu, Yunnan, Liaoning, Jilin, Chongqing, Jiangsu, and Hunan, among which Hunan, Sichuan, Heilongjiang, Yunnan, Chongqing, and Jilin have significantly lower outputs than the national average. The coal output of the third echelon is relatively low, and is concentrated mainly in six provinces, namely Jiangxi, Guangxi, Qinghai, Fujian, Beijing, and Hubei. Except for Beijing, the coal outputs of these provinces are all lower than the national average. From the perspective of coal output and average production capacity, the six provinces in urgent need of reform are Jiangxi, Hubei, Hunan, Sichuan, Fujian, and Heilongjiang. The mines account for 27% of capacity, but the coal output contribution is only 5% and the average coal production capacity is less than 0.3 Mt/a.
Similarly, taking the average coal production capacity of 1.045 Mt/a as the baseline, the provinces at the higher level are Shanxi, Inner Mongolia, Shaanxi, Xinjiang, Shandong, Anhui, Ningxia, Hebei, Gansu, Liaoning, Jiangsu, Qinghai, and Beijing. The main reason for the high average coal production capacity of these provinces is that they have geographical advantages, good coal storage conditions. and large reserves, which are the main areas that the coal mining strategy is concerned with. Another reason is that outdated production capacity is constantly eliminated and the mining level is improved, such as in Shandong, Beijing, Jiangsu, and other regions.
The provinces with low average coal production capacity are mainly located in southern China, with complex geographical conditions, low total production, and many coal mines, which should be paid close attention in the future coal production capacity reform. In order to implement this reform, the country put forward the requirement of classification management of coal mines with an annual output of less than 0.3 Mt/a. Jiangxi Provincial Administration of Coal Mine Safety has developed an implementation plan for classified disposal of coal mines less than 0.3 Mt/a in the province. The implementation plan clarifies the overall requirements, main tasks, and safeguard measures, and calls for the accelerated closure of coal mines with an annual output
of 0.9 Mt/a or less in Pingxiang city, and the resolute elimination of mines with an annual coal output of 0.9 Mt/a or less that do not meet the standards of industrial policy, safety, environmental management, and amount and quality of resources (National Coal Industry Network, 2020a).
Although Guizhou and Henan are major coal-producing provinces, their mining capacities are lower than the national average, so outdated coal mines should be eliminated as quickly as possible. In April, Guizhou province closed 254 legal coal mining operations with a capacity totalling 135 Mt/a as of end 2020 (Guizhou Province, 2020). In 2020, Henan province will eliminate coal overcapacity, close six coal, and promote high-quality development of coal mining (Henan Province, 2020).
Output and production capacity of open pit coal mines

There are 81 open pit coal mines, mainly located in nine provinces. China's opencast coal mining is concentrated in the three provinces of Inner Mongolia, Xinjiang, and Shanxi, with Inner Mongolia accounting for 64% of the country's output. The production capacity of open pit coal mines in China varies greatly, as shown in Figure 10.
Ha'erwusu open pit coal mine and Shenhua Baorixile Energy Co., both have a coal production capacity of 35 Mt/a, while that of No. 9 of No. 5 panel of Gulianhe mine and No. 3 of the Gulianhe mine, both of which are in the Greater Khingan Range, is only 50 kt/a and 40 kt/a, showing a serious polarization. Taking 5.73 Mt/a as the average production capacity of open pit coal mines in China, only Inner Mongolia and Shanxi are above this level, which shows the uneven distribution of output and production capacity of open pit coal mines. In order to improve the level of open-pit coal mining in China, urgent attention should be given to the reform of open pit coal mining in Guangxi, Heilongjiang, and Qinghai provinces.
The price of thermal coal in China is closely related to coal production capacity, which indirectly reflects the balance between supply and demand. Northwest China is rich in coal resources and mining costs are low, but the local economy is underdeveloped and the coal supply is greater than the demand; Central China has a poor coal resource endowment, high mining costs, and a more
developed economy, and the supply exceeds demand. Thus the price difference between these regions is large, which is why electricity is supplied to the east from the west.
The National Development and Reform Commission made it clear in its memorandum on curbing abnormal price fluctuations in the coal market that from 2016 to 2020, in order to prevent abnormal price fluctuations in coal, the state has established an early warning mechanism that classifies thermal coal prices into green, blue, and red categories. The green category (normal price) is 500~570 CHY per ton; the blue is 570 ~600 or 470~500 CHY per ton; and the red category is above 600 CHY per ton or below 470 CHY per ton. The CTCI of each province is an indicator of the competitiveness of coal mining to a certain extent. The distribution of CTCIs for provinces with large coal production capacities in the past six years is shown in Figure 11.
It can be seen that in the past six years, the national average thermal coal price was within a reasonable range only in 2017 and 2018, while in the other four years the price was relatively low, mainly due to oversupply. Due to geographical and regional economic development differences, Shandong, Henan, and Anhui have seen high coal prices, while prices in Xinjiang, Inner Mongolia, Shanxi, and Shaanxi have long been low, and the price advantage represents the potential of coal mining in the future. At the end of April 2020, China National Coal Group, China Huaneng Group,

and State Power Investment Group formally signed the 2020 coal medium- and long-term contract, with the benchmark coal price of 535 CHY per ton. Coal power enterprises will successively complete the contract signing before 10 May 2020. Large coal enterprises should play a leading role in stabilizing the market and take effective measures to keep the price within the green range and prevent excessive price fluctuations (State Coal Industry Network,2020; National Coal Industry Network, 2020b).
In China, the greater the coal production capacity the higher the mining level, the lower the cost, and the better the benefit. Usually, this kind of coal mine is a nationally owned enterprise and guides the development of the coal market. Since 2016, China has promoted the supply of coal on a medium- and long-term contract basis and implemented the pricing mechanism of ‘benchmark price plus floating price’. The benchmark price of 5500 large trucks of thermal coal was CNY 535 per ton from 2017 to 2021, and was adjusted to CNY 700 per ton in 2021.
In China, with increasing investment in coal mine safety, the safety level has improved dramatically and the fatality rate per million tons of coal mined has decreased year by year, as shown in Tables IV and V.
During the 18 years from 2004 to 2021, the safety production cost standards of coal production enterprises were adjusted twice, in 2004 and 2012, and a new revision is in progress starting in 2022. The investments in safety measures and corresponding drop in fatality rates are shown in Figure 12.

China is geographically diverse and has a variety of coal mining conditions. A large number (1181) of small mines with an annual production of less than 0.3 Mt account for 35% of the total production. The contributing rate of output is only 4%, which seriously restricts the sustainability. Jiangxi, Hubei, Hunan, Sichuan, Fujian, and Heilongjiang provinces are the main areas in which underground mining should be reduced, while Guangxi, Heilongjiang, and Qinghai provinces are the main areas to reform and optimize open pit mines.
China's average coal production capacity is 1.045 Mt/a per mine. The average coal production capacity of underground mines, which comprise 75% of the total number of mines, is 0.93 Mt/a, lower than the average level. The average coal production capacity of open pit coal mines is 5.73 Mt/a, and these mines account for 68% of production. The average coal production capacity of both underground and open pit mines has great potential for optimization.
China will transition from a major country to a leading country in coal mining, and switch the emphasis from output to quality. China should accelerate the strategic shift of coal in the west region, optimize the central region, and promote coal as a sustainable resource with an output that can be adjusted proactively.
The research work was supported by the CHN ENERGY Science
and Technology Innovation Project (SHJT-17-38) and the National Natural Science Foundation of China (52004012).
Guizhou Province. 2020. Guizhou Provincial Administration of Resource. Announcement on the lawful production capacity of coal mines in the whole province in April 2020 [EB/OL]. 2020-04-03 [2020-04-30]. http://nyj.guizhou.gov.cn/xwzx/gsgg/202004/t20200403_55774909.html
Han Province. 2020. Provincial People's Government. Office of Henan leading group on eliminating overcapacity [EB/OL]. 2020-03-20 [2020-04-30]. https://www.henan.gov.cn/2020/03-20/1307488.html
Ministry of Emergency Management. 2020. Three-year Action Plan for Special Rectification of National Production Safety [EB/OL]. 2020-04-28 [2020-04-30]. https://www.mem.gov.cn/xw/bndt/202004/t20200428_350572.shtml
National Energy Administration. 2019. Notice no. 2 of 2019 [EB/OL]. 2019-315 [2019-04-30]. http://zfxxgk.nea.gov.cn/auto85/201903/t20190326_363a7.htm
National Coal Industry Network. 2020a. Jiangxi formulated a work plan for classified disposal of coal mines with an annual output of less than 0.3 million tonnes [EB/OL]. 2020-04-14 [2020-04-30]. http://www.coalchina.org.cn/index. php?a=show&c=index&catid=15&id=117072&m=content
National Development and Reform Commission. 2020. Price Monitoring Center of the National Development and Reform Commission, PRC. China thermal coal price index (CTCI) [EB/OL]. 2020-02-20 [2020-04-30]. http://jgjc.ndrc.gov.cn/dmzs.aspx?clmId=741
State Coal Industry Network. 2020. China Coal Group, Huaneng, Guodian formally signed the 2020 Coal Medium and Long Term Contract [EB/ OL]. 2020-04-30 [2020-04-30]. http://www.coalchina.org.cn/index. php?m=content&c=index&a=show&catid=16&id=118422.[8] National Coal Industry Network. 2020b. It is expected that the basic balance of supply and demand in the coal market will be slightly loose this year. [EB/OL]. 2020-05-07 [2020-05-09]. http://www.coalchina.org.cn/index.php?m=content&T u


Through GIW® Slurry Pumps, KSB is an innovative partner that provides you with the best and longest wearing slurry solutions. We are your partner over the entire lifecycle of your GIW® slurry pump.

KSB Pumps South Africa is a globally recognized pump solutions provider that manufactures globally recognized products locally to the highest quality standards both internationally and locally.

We not only manufacture and service your slurry pumps, we offer total slurry solutions to your industry.
One team - one goal.
KSB Pumps and Valves (Pty) Ltd

Tel: +27-11-876-5600
www.ksb.com/en-za
Level 1 B-BBEE Supplier

Affiliation:
1University of Botswana, Minerals Engineering, Department of Civil Engineering, Gaborone
Correspondence to: A. Mabentsela
Email: arthurmabentsela@gmail.com
Dates:
Received: 9 Jun. 2020
Revised: 10 Oct. 2022
Accepted: 11 Nov. 2022
Published: January 2023
How to cite: Mabentsela, A. 2023
Elastic damage characterization of an ilmenite smelter freeze lining.
Journal of the Southern African Institute of Mining and Metallurgy, vol. 123, no. 1, pp. 29–40
DOI ID: http://dx.doi.org/10.17159/24119717/1248/2023
Synopsis
A furnace freeze lining is necessary for safety and economic reasons in several smelting operations. The integrity of the freeze lining is put at risk by furnace power imbalances. Although numerous models have been derived to model the growth and depletion of the freeze lining due to power imbalances, no model exists for thermomechanical damage to the freeze lining.
This study provides an initial pathway for modelling thermomechanical damage to the freeze lining in an ilmenite smelting furnace using information from the literature and experimental work.
A methodology under the framework of continuum damage mechanics is proposed to model mechanical damage to the freeze lining due to phase changes, thermophysical changes, and constrained thermal expansion. Drill cores of solidified slag ingots were used to represent the freeze lining. The modified power law proved to be the best predictor of the softening response of the drill cores. Damage driving parameters were extracted from the raw data, and governing equations of the parameters with respect to temperature were derived for use in a finite element method (FEM) code.
Keywords
ilmenite smelting, freeze lining damage, elastic damage, thermal damage.
Introduction
Freeze lining technology has made it possible for high-temperature, high-agitation, and unstable refractoryslag systems to be usEd with minimal impact on the refractory integrity. A furnace freeze lining is the term given to frozen furnace material which accumulates on the hot side of the refractory face due to cooling on the refractory cold face. The presence of a freeze lining limits the interaction between molten slag and the refractory hot face by providing a barrier to molten slag-refractory contact. The freeze lining therefore protects the refractory and thereby prolongs the furnace life.
A freeze lining is a necessity for safety and economic reasons in some smelting operations. Operations that have been made viable by freeze lining technology include the Hall-Héroult process, in which without the freeze lining the refractory would fail in six months (Crivits 2016), ilmenite smelting, which targets a refractory lifespan of ten years through the freeze lining application (Zietsman, 2004), and the ISASMELT process, which aims to increase refractory lifespan which otherwise is challenged by the high temperatures of the process (Verscheure et al., 2005).
Much has been published about the thermal aspects of growth and depletion of the freeze lining. These works have been summarized by Crivits (2016). Similarly, attention has been given to thermochemical models for freeze lining growth and depletion. Zietsman (2004) derived a finite difference method (FDM) model coupled with FactSage® to calculate freeze lining thickness and composition variations in response to changes in furnace power, the slag bath, and feed. Thermal mass transfer models have also been produced for various smelting industries (Crivits, 2016). Attention has been given to the physical aspects of freeze lining growth through the use of a cold probe technique. Fallah-Mehrjardi, Hayes, and Jak (2014) studied the effect of bath chemistry on the freeze lining microstructure of a copper smelting slag at the laboratory scale using the cold probe technique and found that the freeze lining formed depended on the viscosity of the slag bath. Kalliala et al. (2015) also used the cold probe technique in a refractory sleeve to show that the freeze lining composition depends on the cooling rate of the freeze lining during formation.
Little work has been done to model the thermomechanical aspects of freeze linings, despite several comments on aspects that mechanically challenge the freeze line integrity (Kalliala et al., 2015; Crivits, 2016; Zietsman, 2004). A thermomechanical model was produced by Campbell, Pericleous, and Gross (2002) that made use of a computational fluid mechanics (CFD) model coupled with a thermomechanical module to model the penetration, corrosion, and erosion of the refractory in a HIsmelt process. However, this model is for the refractory, not for the freeze lining.

The purpose of this paper is to provide an initial pathway through a literature search and experimental methods for thermomechanical modelling of furnace freeze linings, and to extract from the experimental results the relationship between important parameters as a function of temperature needed for finite element method (FEM) modelling of freeze lining fracture due to thermomechanical effects. The work is applied to the ilmenite smelting process.

Ilmenite smelting involves the carbothemic reduction of ilmenite to give a titanium dioxide-rich slag (the primary product) and a pig iron by-product. The reduction takes place in the liquid phase at a slag temperature of approximately 1650°C (Pistorius, 2008).
Ilmenite smelters operate with stringent limitations on the amount of impurities present in the titania-rich slag product. Such limitations include less than 1.5% (mass percentage) Al2O3 and less than 1.2% MgO in the slag (Pistorius, 2008). These requirements cause challenges for the integrity of the furnace structure as far as the furnace refractory is concerned. Due to the low alumina and magnesia concentrations in the slag, the activity of these two species is low, thus making magnesia and high-alumina refractory bricks highly soluble in molten ilmenite slags. Alumina refractories are even more challenged because they form a liquid at the operating temperature of the furnace. Magnesia bricks are therefore the only viable refractory (Garbers-Graig and Pistorius, 2006). To protect the magnesia refractory bricks from molten slag, ilmenite furnaces must operate with a freeze lining.
Ilmenite slag baths typically contains TiO2, Ti2O3, and FeO with minor impurities, mainly SiO2, MnO, Al2O3, MgO, V2O3, CaO, and Cr2O3 (Garbers-Graig and Pistorius, 2006). Figure 1 shows acrosssection through a TiO2-FeO-Ti2O3 ternary phase diagram at10% FeO, a typical FeO content in ilmenite slags, as predicted by the thermochemical package FactSage 5.2. Figure 1 serves to show that the TiO2-FeO-Ti2O3 system has a eutectic point; point (A). Slags with a TiO2 content higher than the eutectic composition deposit rutile as the main freeze lining constituent, while slags with a TiO2 content lower than the eutectic point composition but higher than the M3O5 composition deposit pseudobrookite as the main freeze lining constituent (Zietsman, 2004).
A typical ilmenite slag consists of 54% TiO2, 34% Ti2O3, and 10% FeO, the balance being minor impurities (Garbers-Graig and Pistorius, 2006). This composition lies on the eutectic point therefore the expected freeze lining composition is pseudobrookite and rutile (see Figure 1). Moreover, at temperatures lower that 1300°C; near the refractory hot face, the freeze lining is expected to contain iron as a standalone phase. Pseudobrookite is a solid solution consisting of M2+(Ti⁴+)2O5 and (M3+)2Ti⁴+O5, where M2+ is Fe2+, Mg2+, and Mn2+ while M3+ is Ti3+, Cr3+, Al3+, and V3+ (Garbers-Graig and Pistorius, 2006).
While the bulk of the freeze lining consists of pseudobrookite, rutile, and iron globules, the freeze lining attached to the refractory has a different composition; that of the reaction products of the refractory and slag. The products consist of (Mg,Fe,Mn)TiO3 needles embedded in a high-TiO2-MgO matrix with composition 56% TiO2 and 41% MgO, with the remainder being (Mn,Fe)O (Garbers-Graig and Pistorius 2006). Importantly, the (Mg,Fe,Mn) TiO3 needle phase does not have any preferential orientation (see Figure 2), hence the freeze lining at the micro-level does not have any directional weakness and may be treated as an isotropic material.
It is known that solid ilmenite slags undergo significant compositional changes during temperature changes and in oxygenrich environments such as air. Importantly, these compositional changes affect the mechanical behaviour of the solid slags, rendering them mechanically weak. Furthermore, the pseudobrookite crystals undergo irregular expansion during temperature changes (de Villiers, Göske, and Tuling, 2005). These changes may also apply to the freeze lining during furnace cooling cycles when the freeze lining is exposed to oxidizing conditions in the furnace freeboard space due to ingress of air when the furnace pressure control is off and the slag has been drained below the freeze lining height. No numerical approach has been used to capture the mechanical consequence of these changes.
Modelling work by the author, based on a finite element method (FEM), on a 5 m radius DC ilmenite furnace at steady state in idle mode showed that the steady-state temperature of the freeze lining directly in contact with the refractory is approximately 760°C. The
solidus temperature of the slag which forms the freeze lining is approximately 1458°C, depending on the iron content (Kotzé and Pistorius, 2010). Thus the highest temperature that the freeze lining experiences is approximately 1458°C, while the lowest temperature is dictated by the length of the stoppage and position in relation to the refractory wall.
Irregular expansion of pseudobrookite crystals during temperature changes
De Villiers, Göske, and Tuling (2005) studied the thermal straining of M3O5 crystals during temperature changes and oxidation. They found that the pseudobrookite unit cell undergoes irregular strains during temperature changes; on heating the a-axis contracts slightly, the b-axis expands slightly, while the c-axis expands significantly over a temperature range of 50-220°C. The authors noted cracking of the pseudobrookite crystals upon heating due to lattice strain.
From work by Stana (2016) the coefficient of thermal expansion of titanium dioxide slags is approximately 40 ×10-6 °C-1 for a temperature range of 125-525°C, and 30 × 10-6 °C-1 for 625-700°C. In comparison, the coefficient of thermal expansion of MgO refractory is in the region of 13.6 × 10⁻⁶ -14.7 × 10 °C-1 for the temperature range of 20-1765°C (Heindl, 1933). The coefficient of thermal expansion of titania-rich slag is thus close to 2.7 times that of the magnesium oxide refractory. The coefficient of thermal expansion of an ilmenite freeze lining is expected to be close to that of titania-rich slags. The difference in thermal expansion between the refractory brick and freeze lining is bound to cause a mechanical load at the freeze lining-refractory interface, especially if the temperature change at the interface is significant, e.g., during a long stoppage and subsequent recovery of power.
Rutile undergoes a transition to form anatase at temperatures between 400 and 1000°C (Bessinger, 2000). This results in a molar volume increase of 8.47% (Bessinger, 2000). This volume increase can add a localized compressive stress to the already present thermal compressive stresses experienced by the freeze lining during transient temperature conditions.
It is known that the pseudobrookite phase is not stable in nearambient and oxygen-rich environments similar to those that exist when the furnace is off. Pseudobrookite decomposes in two ways; disproportionation reaction and oxidation reaction (Pistorius, 2008). The oxidation reaction is accompanied by spontaneous crumbling of slag ingots and possibly furnace freeze linings.
Disproportionation reaction involves FeO and Ti2O3 in the pseudobrookite phase (Equation [1]). This reaction is possible at temperatures lower than 1100°C and is triggered by oxidation (Pistorius, 2008):
Equation [1] results in a 0.75% molar volume increase (Bessinger, 2000), which could add to the compressive stress that the freeze lining experiences during transient conditions.
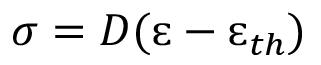
The oxidation reaction is linked to the oxidation of pseudobrookite to form M6O11 in oxygen-rich environments at temperatures close to 400°C (Bessinger, 2000). Importantly, this change from M3O5 to M6O11 leads to spontaneous crumbling of slag blocks (Bessinger, 2000) and furnace freeze linings when air is allowed to enter the furnace freeboard space (Zietsman, 2004).
This spontaneous crumbling is known as decrepitation. It has been commented that decrepitation is a surface effect requiring the continuous flaking and exposure of new surfaces to air to proceed to a significant extent (Bessinger, Geldenhuis, and Pistorius, 2005). Inside the furnace, this constant flaking of the freeze lining is not possible if the slag level is kept at the freeze lining level, thus shielding the freeze lining from oxidation. However, in some instances, furnace operators may choose to lower the slag level before a shutdown. This is done to reduce the impact of a furnace runout and lower the furnace hill (solidified slag and pig iron left inside the furnace) that has to be melted during startup. This would leave the freeze lining exposed to oxidation.
The numerical model to be produced would have to account for changes in mechanical strength of the freeze lining due to pseudobrookite irregular straining during temperature cycles, rutile/anatase phase changes at 400–1000°C, oxidation of pseudobrookite near 400°C, and mechanical loading of the freeze lining due to constrained thermal expansion by the refractory.
Given the progressive and localized nature of cracks in pseudobrookite crystals in response to temperature changes and the localized straining at high temperatures (possibly due to anatase/ rutile phase changes), the ilmenite furnace freeze lining can be treated as a quasi-brittle material. Quasi-brittle materials are those which are not characterized by a large plastic flow but still require a more-than-needed energy to cause fracture (Peerlings, 1999).
Failure in quasi-brittle materials is characterized by a progressive damage process which starts with the growth and coalescence of micro-defaults (micro-cracks) leading to localization of damage in narrow zones (Carmeliet, 1999). These micro-defaults in localized damage zones lead to progressive softening of the quasibrittle material as the micro-cracks coalesce, causing the material’s ability to resist stress to gradually decrease. When the micro-cracks have sufficiently coalesced to form a macro-crack, the local ability of the material to resist stress is completely lost (Peerlings, 1999). Micro-cracking in ilmenite freeze linings can be a result of irregular straining of the pseudobrookite crystals due to temperature changes. Coalescence of the micro-cracks can be brought about by constrained thermal expansion of the freeze lining by the refractory bricks to which the freeze lining it is intimately attached.
The method by which micro-cracks present themselves and coalesce is called damage. Two types of damage arise in furnaces during transient temperature conditions; elastic damage and thermal damage.
The ilmenite freeze lining is intimately attached to a magnesium oxide refractory. The difference in thermal expansion of the two materials is in the order of 27 × 10-6 °C-1 in the temperature range 125–525°C with the freeze lining expanding more than refractory, thus leading to a case of constrained thermal expansion and contraction of the freeze lining during transient temperature conditions.
Elastic damage in quasi-brittle material under thermal load arises from macro-scale hindered thermal expansion. This leads to the evolution of elastic stress due to constrained expansion or contraction. The magnitude of stress due to hindered thermal strain in the elastic region is given by Hooke’s Law:
where s is the stress tensor and D is the elasticity matrix, a function of Young’s modulus and Poisson ratio. ε is the total strain tensor given by Equation [3], and εth is the thermal strain tensor given by Equation [4].
where εel is the elastic strain tensor resulting from constrained macro-scale thermal expansion (Damhof, Brekelmans, and Geers, 2011a).
where α is the coefficient of thermal expansion of the isotropic freeze lining, θ is the temperature at the point of interest, and θ0 is the reference temperature of the unstrained material. I is an identity tensor.

The mechanical weakening of a quasi-brittle material due to elastic damage in a continuum damage-based model is described by Equation [5] (Damhof, Brekelmans, and Geers, 2011b, 2009; Peerlings 1999). [5]
where the elastic damage (del) is a scalar isotropic function of the highest attained scalar representation of the elastic strain tensor (κel). del serves to reduce the Young’s modulus of the material being modelled in accordance with the softening behaviour of quasi-brittle material post damage initialization deformation (κel,i). Physically, del is a representation of the abundance of microstructural defects (cracks, voids) in the material caused by mechanical load in comparison to the undamaged material.
Numerous models for the elastic damage exist; ‘linear’ law, power law, Mazars’s law, modified Mazars’ law, and Oliver’s law to mention a few (Polanco-Loria and Sørensen 1995). These are based on the stress-strain behaviour of the material after it has reached its damage initialization point (κel,i).
A linear softening law is applied for theoretical developments of damage (Equation [6]) (Figure 3).


In a real material, however, softening is nonlinear and can be modelled by an exponential softening law (Peerlings 1999):
where κel is a scalar representation of the highest locally attained elastic stain tensor, κel,i is a scalar representation of the minimum elastic strain at which damage starts to take place, and κel,c is a scalar representation of the strain tensor which leads to complete damage. Values for κel,i, and κel,c are experimentally determined from uniaxial stress tests.
In this instance the material loses stiffness exponentially post damage initialization strain (Figure 4). The parameter b is a temperature-dependent constant which controls the rate of softening. A higher value of b means faster damage growth and thus a more brittle material (Peerlings, 1999). It is important to note that damage when using Equation [7] asymptotically approaches (1 − a)Eκel,i (Peerlings. 1999) i.e. a point of zero stress (del = 1) is not reached. Equation [7]. has been used by Damhof, Brekelmans, and Geers (2008) to model thermomechanical damage of refractory material.


Another elastic damage law proposed by Geers (in Peerlings, 1999) models damage to completion. This model was originally developed for short glass-fibre-reinforced polymers. The so-called modified power law is given by (Figure 5):
The exact law which governs elastic damage of ilmenite freeze linings is not known. However, the values of κel,i), κel,c and α, β have to be determined experimentally in the case of exponential softening, or κel,i, κel,c, and γ, β in the case that the modified power law should apply. Values of α, β or γ, β are the same in tension and compression provided that the loading does not change sign, i.e. no change from compression and tension on the same domain. This is because change from tension to compression or vice versa closes


or opens micro-cracks and coalesced micro-cracks respectively. A material which has micro-cracks induced in it behaves differently compared to the virgin material. In the case of reversal from compression to tensile, the material damages more readily in tension compared to the virgin material because of existing microcracks or coalesced micro-cracks caused by the compressional load.
Thermal damage
Thermal damage is linked to phase changes and thermophysical changes at low temperatures when the furnace is cooling down and the lining is exposed to air during a stoppage. Such phase changes and thermophysical changes lead to modifications to the mechanical properties of the freeze lining. Phase changes in an ilmenite freeze lining are linked to the anatase/rutile transformation at 400-1000°C, while thermophysical changes are linked to irregular straining of the pseudobrookite due to temperature change.
In similar studies (Damhof, Brekelmans, and Geers, 2009, 2008, 2011a, 2011b) a separation was possible between elastic damage and thermal damage, owing to the slow, gradual progress of thermal damage. In the case of ilmenite freeze linings, however, such a separation is thought to be impossible as the anatase/rutile phase change and irregular straining of the pseudobrookite are held to be fast-acting changes and therefore cannot be separated from elastic damage characterization. As such, only elastic damage will be characterized, with the thermal damage incorporated in the results.
Sample acquisition
Any attempt to reconstruct the freeze lining would involve crushing slag ingot pieces followed by remoulding to form suitable core sizes. In this study, it was decided to use drill core samples from cooled 25 t bell-shaped slag ingots to represent the freeze lining. The cores were 24 mm in diameter with varying lengths and were taken at Tronox Namakwa Sands in Saldanha, South Africa.


Due to safety concerns around drilling through unsolidified portions of the ingot, the drill cores were not taken directly from the ingots but rather from pieces that had been broken off with a hydraulic hammer. Figure 6 shows a collection of slag ingot pieces from which the drill cores were taken. The sampled ingots followed the Tronox Namakwa Sands cooling process, which involves a primary air-cooling in a 25 t ladle followed by removal of the ingot and secondary cooling with a water spray.
It was anticipated that since the slag ingots are from a production line with tightly controlled chemistry there would not be a significant variability in the ingot compositions. Therefore
only four different ingot pieces were sampled. One of the sampled ingot pieces (ingot 4) was slow-cooled in a 25 t ladle for the entire cooling cycle as opposed to being tipped over and spray-cooled after air cooling. This slow cooling process allows the higher-melting components such as pseudobrookite to solidify first on the outer rim of the ingot while the lower-melting components such as silicates solidify last in the centre of the ingot (Pistorius and Kotzé, 2009). However, the slag solidifies to a thickness of 300 to 320 mm during the primary air-cooling stage in the ladle (Kotzé and Pistorius 2010), therefore for the depth of drill cores taken in this study (approximately 40 mm) all cores ought to be same as regards cooling patterns.
A 24 mm inside diameter diamond tip core bit was used to take the samples. Wet drilling was done to avoid wearing of the bit and oxidizing the cores due to the high temperature caused by the drill bit. The same process water used to spray-cool the ingots was used to during wet drilling. Thirty-two drill cores 24 mm Ø by approximately 40 mm were recovered from each ingot.
Drilling was done in the direction of heat flow radially in, i.e from the outside of the ingot where the ingot face interfaced with the ladle towards the centre of the ingot. Care was also taken to drill in the centre of the ingot and not the bottom of the inverted ingot, as iron tended to collect at the bottom of the inverted ingot during spray-cooling (Figure 7). Figure 8 shows a picture of a drilled slag ingot piece in the direction of heat flow and at the centre of the ingot.
The chemistry of each ingot was determined from crushed unprocessed drill cores. The cores were pulverized using a planetary mill at 500 r/min for 15 minutes and analysed using X-ray fluorescence (XRF) for chemical analysis and X-ray diffraction (XRD) for mineralogical analysis.
To determine the elastic damage equation parameters (κel,i, κel,c, α, β or β and γ ) and elastic properties (E and ν) of the freeze lining, uniaxial compression tests were carried out on drill core samples. The tests were conducted in air at temperatures of 25, 125, 350, 550, 750, 950, and 1200°C using an MTS Criterion model 43 machine. Samples were heated in muffle furnace in air for an hour and then quickly placed in the MTS Criterion for compression, a total of 1 minute was taken from the time the sample was removed from the furnace to complete the compression load tests. During this time it is envisaged that no significant temperature change would have taken place in the sample due to the low thermal conductivity of ilmenite slags of 0.5-3.2 W.m-1.°C-1 for a temperature range of 1251500°C (Kotzé and Pistorius 2010).
A low strain rate of 0.04 s-1 was used. Three repeats at each temperature were done. The Young’s modulus of each sample was determined by computing the gradient of the stress vs. strain plot before any damage. An estimate of 0.160 was used for Poison’s ratio based on results by Boukendakji (2014) for 70% slag slag-concrete mixtures. The values of β, γ, κel,c, κel,i or α and β were determined by model fitting (Equations [6]-[8] to uniaxial compression stress vs strain curves at different temperatures.
The values of κel,i and κel,c are normally determined from tensile load tests (Pearce, Nielsen, and Bicanic, 2004). However, it was thought that the drill cores would not be able to withstand the pressure applied by the clamps of a tensile device. As such, values for κel,i and κel,c were first determined in compression and then corrected for tension by dividing by the ratio of compressive strength and tensile strength at the various temperatures. Values for β, γ, and α, β are the same in tension and compression (Peerlings et al. 1998; Damhof, Brekelmans, and Geers, 2011a).
The XRF results for the four ingots are shown in Table I. The table shows the eight main constituents together with some species which form part of a silicate phase in solid ingots as opposed to being part of the pseudobrookite phase (SiO2, Al2O3, CaO, and K2O).
As expected, there is no significant variation in the chemistry of the ingots, but this cannot be interpreted to mean the ingots can be expected to display the same mechanical behaviour as cooling patterns may differ and thus affect the mechanical properties.

XRD analyses showed that the ingots consist mostly of a single phase. Ingot 1 is 100% Fe0.33Mn0.05Ti2.52O5 (kennedyite); ingot 2 97.2% kennedyite, 0.4 % rutile, and 2.3% quartz; ingot 3 98.7% Mg0.45Ti2.55O5 (magnesium titanium oxide) and 1.3 % rutile;. and ingot 4 98.1% magnesium titanium oxide and 1.9% rutile. Essentially, the ingots were mostly pseudobrookite.
Figures 9–12 show the stress-strain responses of the samples from the four ingots.
Surprisingly the Young’s modulus does not simply decrease with temperature even for temperatures greater than 550°C. Another

Elastic damage characterization of an ilmenite smelter freeze liningFigure 8—Drilled piece of ingot showing cores mostly taken from the centre of the core radially inward in the direction of heat flow. Arrow points to the top of the ingot
To derive an appropriate damage law for ilmenite freeze linings, Equations [7] and [8] were model-fitted to the results in Figure 9. Microsoft Excel was used to minimize the squared difference between model predictions and raw data by changing the initial damage parameters (κel,i κel,c, α, β or β and γ). The linear softening law was judged unlikely to be a good predictor of damage given the curved nature of the stress-strain response post damage initialization strain. Figure 13 shows the raw data and stress-strain response as predicted by the exponential softening law for ingot 1 to compression at 25°C.
Figure 14 shows the raw data and stress-strain response as predicted by the modified power law for ingot 1 to compression at 25°C.


The exponential softening law fails to capture the curvature of the stress-strain response post the damage initialization strain. This is not the case with the modified power law. Thus, the modified power law is deemed appropriate for modelling freeze lining elastic damage during furnace power cycles.
Surprisingly the stress-strain curve post damage initialization strain is convex and not concave as shown in Figures 4 and 5. However, the modified power law can accommodate this change in shape well.
interesting point is the restoration of the Young’s modulus at 750°C to almost the same value as it was at 350°C for ingots 1 and 2 while for ingots 3 and 4 the Young’s modulus assumes almost the same value it had at 25°C and 750°C. It was interesting to see that the drill cores behaved in a brittle manner even at 950°C, where one would expect a more ductile response. At 550°C the Young’s modulus is lowest for all ingots.
Air pocket closure points can be seen in Figure 9 by the slips in the stress-strain response in the linear region.
Further examples of how the modified power law fitted the raw data can be seen in Figure 15.
Elastic damage law parameters for ilmenite freeze linings
The method of model-fitting the modified power law to the stress-strain response of the four ingots to compression was followed for temperatures 25, 125, 350, 550, 750, 950, and 1200°C. Tables II–V show the extracted damage parameters at the indicated temperatures. The data is an average of three runs for each temperature. The damage initialization points κel,i are for compression.

The value of the data in Tables II–V is better appreciated in the form of equations which can be used in finite element method (FEM) codes for a range of inter-experimentally determined temperatures. Figures 16–35 show the extracted damage driving parameters as a function of temperature for the four ingots.

Table II
Damage driving parameters for ingot 1
Damage driving parameters for ingot 3
Table III
Damage driving parameters for ingot 2
For ingot 1:


For γ care should be taken when using the trend line equations that the value of γ does not turn negative. A criterion should be used to keep the value of γ to a minimum of 0.0005 to preserve the integrity of Equation [8] even when ĸei reaches the critical damage point. The value of β should also be kept to a minimum of zero despite trend line equations.


For ingot 2:


For
For
4:
The Young’s modulus and critical damage strain are similar in their response to temperature and model fit for all ingots (see Figures 36 and 38). For the other damage parameters, different models predict the response of the damage parameters to temperature for all four ingots. These differences cannot be attributed to chemistry because the chemical makeup of the ingots is similar. The differences are perhaps associated with microstructural detail of the ingots, which is driven by a combination of cooling rates and chemistry of the slag forming the ingots. From this study, one can therefore differentiate between four types of slags forming the freeze lining: slags 1, 2, 3, and 4. These four slags are not the only grouping possible. It is possible that if more ingots were sampled, more slag groupings would be identified due to the ‘complex’ interaction of slag chemistry and thermal history that affects the mechanical properties of slag ingots and by extension, freeze linings. For the immediate thermomechanical work, however, one can use the four identified slag groupings identified in this study.


It is of concern that the mechanical response of the slags cannot be linked to the chemistry because this means that the furnace operator cannot control the slag chemistry to influence the mechanical response of the freeze lining within the constraints of meeting production targets (slag quality and quantity).
A furnace freeze lining is used to protect furnace refractories from molten slag attack. Numerous models exist for the growth and depletion of the freeze lining due to thermal imbalances. Knowledge of the freeze lining microstructure under different slag bath conditions also exits. However, no modelling work has been done to date on thermomechanical damage to freeze linings.
A methodology under the framework of continuum damage mechanics is proposed to model mechanical damage to the
Figure 37—Model-fitted damage initialization strain response to temperature freeze lining due to phase changes, thermophysical changes, and constrained thermal expansion. Drill cores of solidified slag ingots were used to represent the freeze lining.
The modified power law proved to be a better predictor of the softening behaviour of the drill cores used to represent the freeze lining. Damage driving parameters were extracted from the uniaxial compression raw data at varying temperatures. Governing equations of the damage driving parameters with respect to temperature were derived. No link could be established between the slag chemistry and damage driving parameters. This was due to the tight chemical control practiced by the commercial plant producing the titaniarich slag from which the samples were taken. Despite this, four slag groupings were observed from the model fitting exercise. It is these slag groupings that future investigations will have to model. The damage driving parameters as a function of temperature presented in the study are suitable for use in a finite element method (FEM) code.


A special thank you to the staff of University of Botswana’s Civil and Mechanical department for the equipment which allowed for this research to take place. Mr John Kennedy for his efforts in organizing the equipment. Mr Bennet Stofberg and the team at Tronox Namakwa Sands for allowing me to take samples of their ingots.
References
Bessinger, D. 2000. MSc thesis, Cooling characteristics of high titania slags. MSc thesis, University of Pretoria.
Bessinger, D., Geldenhuis, J.M.A., and Pistorius, P.C. 2005. Phase changes in the decrepitation of solidified high titania slags. Proceedings of Heavy Minerals 2005. Society for Mining, Metallurgy, and Exploration, Littleton, CO. pp. 213–219. Boukendakji, M. 2014. Stress-strain behaviour of slag cement concrete. International Journal of Geometallurgy, vol. 7, no. 1. pp. 974–978.
Campbell, A.P., Pericleous, K.A., and Gross, M. 2002. Modelling of freeze layers and refractory wear in direct smelting processes. Iron and Steel Maker, vol. 9, no. 29. pp. 41–45.
Carmeliet, J. 1999. Optimal estimation of gradient Damage Parameters from Localization Phenomena in Quasi-brittle Materials. Mechanics of CohesiveFrictional Materials, vol. 4. pp. 1–16.
Crivits, T. 2016. Fundamental studies on the chemical aspects of freeze linings. MSc thesis, University of Queensland.
Damhof, F., Brekelmans, W.A.M., and Geers, M.G.D. 2011a. Non-local modelling of cyclic thermal shock damage including parameter estimation. Engineering Fracture Mechanics, vol. 78. pp. 1846–1861.
Damhof, F., Brekelmans, W.A.M., and Geers, M.G.D. 2011b. Predictive FEM simulation of thermal shock damage in the refractory lining of steelmaking installations. Journal of Materials Processing Technology, vol. 211, no. 12. pp. 2091–2105.
Damhof, F., Brekelmans, W.A.M., and Geers, M.G.D. 2009. Experimental analysis of the evolution of thermal shock damage using transit time measurement of ultrasonic waves. Journal of the European Ceramic Society, vol. 29. pp. 1309–1322.
Damhof, F., Brekelmans, W.A.M., and Geers, M.G.D. 2008. Non-local modelling of thermal shock damage in refractory materials. Engineering Fracture Mechanics, vol. 75. 470064720.
De Villiers, J.P.R., Göske, J., and Tuling, A. 2005. Disintegration in high grade titania slags: low temperature oxidation reactions and associated fracture mechanics of pseudobrookite. Mineral Processing and Extractive Metallurgy, vol. 114. pp. 73–79.
Fallah-Mehrjardi, A., Hayes, P.C., and Jak, E. 2014. Further experimental investigation of freeze-lining-bath interface at steady-state conditions. Metallurgical and Materials Transactions B, vol. 45B. pp. 2040–2049.
Garbers-Graig, A.M. and Pistorius, P.C. 2006. Slag-refractory interactions during the smelting of ilmenite. South African Journal of Science, vol. 102. pp. 575–580.
Heindl, R.A. 1933. The thermal expansion of refractories to 1800°C. Bureau of Standards Journal of Research, vol. 10, no. 6. pp. 715–733.
Kalliala, O., Kaskiala, M., Suorttu, T., and Taskinen, P. 2015. Freeze lining formation on water cooled refractory wall. Transactions of the Institution of Mining and Metallurgy: Section C, vol. 124, no. 4. pp. 224–232.
Kotzé, H. and Pistorius, P.C. 2010. A heat transfer model for high titania slag blocks. Journal of the Southern African Institute of Mining and Metallurgy, vol. 110. pp. 57–66.
Pearce, C.J., Nielsen, C.V., and Bicanic, N. 2004. Gradient enhances thermomechanical damage model for concrete at high temperatures including transient thermal creep. International Journal for Numerical and Analytical Methods in Geo-mechanics, vol. 28. pp. 715–735.


Peerlings, R.H.J. 1999. Enhanced damage modelling for fracture and fatigue. PhD thesis, Technical University of Eindhoven.
Peerlings, R.H.J., de Borst, R., Geers, M.G.D., and Geers, M.G.D. 1998. Gradient enhanced damage modelling of concrete fracture. Mechanics of Cohesive-Frictional Materials, vol. 3. pp. 323–342.
Pistorius, P.C. 2008. Ilmenite smelting: The basics. Journal of the Southern African Institute of Mining and Metallurgy, vol. 108. pp. 35–43.
Pistorius, P.C. and Kotzé, H. 2009. Role of silicates phases during comminution of titania slag. Mineral Engineering, vol. 22. pp. 182–189.
Polanco-Loria, M. and Sørensen, S.I. 1995. Damage evolution laws for concrete - A comparative study. Fracture Mechanics of Concrete Structures. Wittmann, H. (ed.). Aedificatio, Freiburg. pp. 1027–1036.
Stana, R.H. 2016. Solidification of titanium slags and influence on post processing. Master’s thesis, Norwegian University of Science and Technology.
Verscheure, K., van Camp, M., Blanpain, B., Wollants, P., Hayes, P.C., and Jak, E. 2005. Investigation of zinc fuming processes for the treatment of zinc-containing residues. Proceedings of the John Floyd International Symposium on Sustainable Developments in Metals Processing, Melbourne, Australia, 3-6 July 2005. Nilmani, M. and Rankin, J. (eds). Australasian Institute of Mining and Metallurgy, Melbourne. Zietsman, J.H. 2004. Interaction between freeze lining and slag bath in ilmenite smelting. PhD thesis, University of Pretoria.
Affiliation:
1University of Pretoria, Pretoria, South Africa
Correspondence to: R.F. Meeser
Email: riaan.meeser@up.ac.za
Dates:
Received: 4 Nov. 2021
Revised: 21 Oct. 2022
Accepted: 15 Nov. 2022
Published: January 2023
How to cite: Meeser, R.F. and Theron, N. 2023
Real-time underground route identification and route progress using simple on-board sensing and processing.
Journal of the Southern African Institute of Mining and Metallurgy, vol. 123, no. 1, pp. 41–52
DOI ID: http://dx.doi.org/10.17159/24119717/1893/2023
ORCID:
R.F. Meeser http://orcid.org/0000-00015546-883X
Synopsis
The global emphasis on conserving energy resources has led to the adoption of hybrid power systems in vehicles. Optimally applied, hybrid systems can save up to 40% on fuel costs. To optimally manage a hybrid vehicle's energy flow it is necessary to know, in real time, all the energy requirements to complete a given route. The energy consumption depends mainly on the vehicle mass, speed profile, and route topography. Of these, the topographic profile is the one factor that is only route-dependent and not influenced by the vehicle or driving styles. The heading vs. distance profile is also an example of a route characteristic not influenced by the vehicle or driving style. In this study the topographic and heading profiles are used to identify routes, and are easily measured by means of digital barometric pressure and compass sensors. Correlations between the current route and previously travelled/stored routes are performed based on their topographic and heading profiles in a point-by-point manner. Above-ground tests were first performed using a road vehicle and six routes to evaluate the system. The system consistently and correctly identified a 20 km route within the first 4 km. It also proved to function correctly in underground tests through the implementation of an instrumented hand-held surveyor's wheel. This system finds direct practical application in optimizing the energy management of an underground hybrid locomotive used by the mining industry in South Africa, but can also be of benefit in applications where route identification is required and using GPS is not feasible.
Keywords
real-time route identification, underground navigation, topographic profile.
Introduction
Recently an increasing emphasis has been placed on improving vehicle efficiency and reducing waste in all forms (Taghavipour et al., 2016). One such improvement is the use of hybrid drivetrains in vehicles. Many hybrid electric vehicles (HEVs) comprise a combination of a fossil fuel internal combustion engine (ICE), electric motor (EM), electric motor driver (power electronics that control the power to and from the electric motor), energy storage systems (ESSs), inverters (to facilitate the energy flow), and a vehicle control system to manage all of these. Hybrid vehicles are equipped with sophisticated control strategies that are applied to achieve higher efficiencies than normal ICE-driven vehicles by allowing the use of the electrical systems to store or recover energy that would otherwise be wasted as well as enabling the ICE to operate in a more efficient region of its operating range (Huang et al., 2017). When correctly applyied, hybrid technology can decrease fuel consumption by up to 40% (Tie and Tan, 2013). The vehicle that this project focuses on is an underground hybrid electric locomotive that is used in the mining sector in South Africa. The locomotive has a 30 kVA tier 4 diesel generator set that is used to charge a 460 V, 160 Ah lithium iron phosphate (LiFePo4) battery pack. The battery pack provides the electrical energy that is used to power the locomotive's two 17 kW direct current (DC) motors, which in turn are connected to the wheels via a chain drive (CMTi Group, 2021).
Successful optimization of the energy system of an HEV relies on knowing not only the current state of the onboard energy systems, including fuel level, battery state of charge etc., but also the future demands that the locomotive will encounter on its route. These demands depend on variables such as the vehicle, drivetrain, route speed profile, route topography, and vehicle mass, all as a function of the route's distance to completion. The topography of a route has a direct effect on the instantaneous energy requirements, as fuel consumption on a flat route can be 15–20% less than that on hilly terrain (Boriboonsomsin and Barth, 2009). The advantage of a hybrid system is also increased on hilly terrain as energy when going downhill can be regenerated by means of electric braking systems (Wang and Lukic, 2011; Lajunen, 2014; Johannesson et al., 2015). It can thus be of great benefit if the route being travelled can be identified in real time and its topography known to allow the vehicle control system to make better management decisions regarding energy usage. The energy usage can be altered in terms of the power source, power levels, speed profiles, and efficiency profiles to name a few.
Vehicle location above ground can be easily and accurately pinpointed by means of a GPS, and route identification can then also easily be performed, but the vehicle used as the focal point for this study mainly operates underground, in the hostile environment of a mine. The objective of this paper is to present a method by which routes may be easily and cheaply identified undergound with sufficient accuracy, making use of easily obtainable environmental data and not requiring any transmitters or beacons to be placed on the routes in the mine.
The novelty of this project lies in the use of magnetic heading and barometric altitude data, which are easily measureable environmental attributes that do not change as a function of driving style or the vehicle used. A three-axis magnetic heading sensor and a digital barometric pressure sensor were used together with a wheel rotation encoder to record patterns in the heading and altitudechange data, both as a function of distance. A simplistic statistical comparison model was implemented that compares these values, measured in real time over standard distance increments, to those of saved routes, then sequential patterns in the results are evaluated to perform route identification.
The route identification strategy (RIS) proposed was first evaluated above ground using a normal road vehicle and six different routes of comparable length. The results showed that the RIS was able to correctly identify a route, usually within less than 20% (4 km) of the route total length, with no prior knowledge of the location of the vehicle. The algorithm was set up such that the start point of the route is also not crucial, with a practical limitation that a route won't be identified if more than half of the route is already passed, as little optimization benefit will be achievable past that point.
A compact hand-held test instrument was constructed and used to perform similar tests underground to verify whether the RIS was capable of functioning correctly when traversing underground. The first underground tests were performed in a basement parking lot, and after the system performed satisfactorily more tests were conducted inside a small decomissioned gold mine, where the strategy proved successful in identifying patterns in a route's data sampled there as well.
In summary, the project set out to develop a system that is able to identify a route that an undergound locomotive is travelling on as well as the position on that route. By using simple and low-cost sensing equipment, route attributes rather than vehicle and/or driver attributes were stored and patterns in this data were evaluated and compared to previously recorded data. Routes were succesfully identified, proving the usability of this system.
With the global energy crises it is of great importance to reduce all energy wastage as well as achieve the highest possible efficiencies for energy converters. One means of decreasing resource consumption is by applying hybrid drive systems to vehicles. Some hybrid vehicles are also able to be plugged into and charged off of mains grid power systems, potentially yielding even lower costs in vehicle operation. These vehicles are called plug-in hybrid electric vehicles (PHEVs). Hybrid systems are able to run at power levels higher than those that an IC engine can deliver on its own. They are also capable of allowing the IC engine to run on average closer to its peak efficiency. A hybrid system allows operation of the vehicle with the IC engine turned off for short periods if becessary. It facilitates regenerative
braking to recover some of the kinetic/potential energy and store it for later use by operating the electric motor as a generator to slow the vehicle on downgrades. Though beneficial on a flat road, simply running the engine in its peak efficiency still does not guarantee the most efficient operation (Phillips, Jankovic, and Bailey, 2000; Boyd and Nelson, 2008). Tie and Tan (2013) state that a fully hybrid electric vehicle with a high-capacity energy storage system can achieve a fuel saving of up to 40% without compromising performance. The true benefits of hybrid systems, however, can be realized only if the energy flow is optimized for the vehicle in real time. Hu et al. (2017) proposed a novel unified cost-optimal control scheme that considers all the contributing factors in HEV cost, able to yield a 28–40% cost reduction. They considered mains grid charging cost, power management during driving, fuel cost, and battery life models using rapid and efficient convex programming (CP).
To optimally manage the energy usage of a hybrid vehicle it is necessary to account not just for the instantaneous power usage, but also strategize a plan for future consumption based on the route travelled, as this can yield significant advantages (Back et al., 2002; Yokoi et al., 2004; Taghavipour et al., 2016). This can only be done if detailed information is available about the route parameters, like topography, required speed profiles, vehicle mass, distances, charging station locations etc.
The most general way of determining the location of an above-ground vehicle on a specific route is by making use of a global positioning system (GPS). A GPS in ideal conditions is able to state the absolute location of an object to within a couple of metres (<5 m), though this is not good enough for road grade/ incline measurement. In less than ideal conditions the GPS data may be substantially less reliable and sometimes even corrupted (Vahidi, Stefanopoulou, and Peng, 2005). Many of the current route identification studies make use of GPS data for their algorithm (Rezaei and Sengupta, 2007; Johannesson et al., 2015; Chen et al., 2016). Some authors supplement GPS data by feeding additional information into the RIS. These additional parameters include inertial information obtained from accelerometers and gyroscopes, wheel speed sensors, steering angle, power demand levels, stop times, standard deviations for power demand, road slope, GPRS communication, laser displacement sensors to scan distances to objects, and magnetometers to measure heading for an indoor tour robot (Jeon et al., 2002; Lin et al., 2004; Rezaei and Sengupta, 2007; Alvarez-Santos et al., 2015; Chen et al., 2016; Song et al., 2018). Yokoi et al. (2004) found that velocity profiles vs. time are not very useful in route identification as there are too many factors that influence the time. Bender, Kaszynski, and Sawodny (2013) noted that the quality of the route prediction has a great effect on the fuel consumption of the vehicle.
GPS is, however, not able to work underground, so a RIS making use of other sense-able data is required. From the references studied it was found that there are two route-specific variables that can be measured with relative ease and which are not dependent on the vehicle, driving style, or time. These are the magnetic heading and barometric altitude, both as a function of travel distance. To date no references have been found of route identification systems that make use of only this data.
The real benefit of hybrid systems is realized when the vehicle is travelling over hilly terrain, where uphill and downhill sections are
frequent, or when accelerating and decelerating regularly (Wang and Lukic, 2011; Lajunen, 2014; Johannesson et al., 2015). Fuel consumption on flat routes can be 15–20% lower than on hilly routes for non-hybrid vehicles, showing that road grade plays a significant role in vehicle fuel consumption and emissions. There are, however, some optimization strategies that do not even take topography into account, in which case the solution to the problem is oversimplified. (Rogers and Trayford, 1984; Boriboonsomsin and Barth, 2009; Hellström, Åslund and Nielsen, 2010; Liu, Rodgers, and Guensker et al., 2018; Basso et al., 2019). Road grade data with a high enough resolution to be used in simulations is hard to find. Liu, Rodgers, and Guensker(2018) state that a barometric pressure sensor works better for incline estimation than accelerometers and other types of sensors, the data from which is overwhelmed by the noise caused by vibrations during driving, though they do note that barometric altitude is sensitive to weather. Boroujeni, Frey, and Sandhu (2013) showed that a distance increment of approximately 0.1 mile (160 m) is an appropriate segment length for quantifying road grades as individual runs.
A barometric pressure sensor was used in this study to obtain an estimate for the altitude, then using this data the topographic profile and inclines for sections of the route were determined. An inexpensive open-source GY87 module sensor board and software was implemented. The GY87 consists of a BMP085 barometric pressure sensor, a MPU6050 three-axis accelerometer, three-axis gyro, and a HMC5883L three-axis magnetometer. These module boards retail for about US$10 (R200).
The BMP085 sensor is capable of measuring pressures ranging to a maximum of 10 000 hPa (1000 kPa, 10 bar), which equates to approximately 24 km below sea level, far more than any currently existing mines. In ultra-high resolution mode the barometric pressure sensor is capable of detecting a 0.03 hPa pressure change, equating to a 0.25 m altitude change, with the RMS noise of the signal being able to go down to 0.1 m (Sensortec, 2009). The barometric sensor's pressure reading is converted to an effective altitude by means of the international barometric formula (Equation [1]).
Test 2: Barometric altitude during an elevator ride (to verify the sensor's ability to smoothly detect small altitude changes)
The altitude was recorded when riding in an elevator from floor 9 up to floor 15, down to floor 3, and back to 9 again (Figure 1, bottom left). The red line is the raw data and the black line is a digital low-pass filter applied to the data afterwards. It is noted that the noise in short time-frames for the low-pass filtered data amounts to less than 0.75 m. For a 100 m stretch the noise equates to an incline angle error of less than 0.5°. This shows that the barometric data is sufficiently sensitive to determine an approximate topographic profile for a route, as the ranges typically experienced are significantly larger than the sensor's resolution on barometric altitude. It is, however, noted that this sensor's minimum detectable height does place a limitation on the shortest distance increment for which it can be used to effectively determine incline.
Test 3: Maximum simulated depth (to verify that the sensor can work in a deep underground mine)
The whole testing device was installed in a sealed container and incrementally pressurized up to a maximum absolute pressure of 1.5 bar. A pressure of 1.35 bar absolute equates to the pressure at the bottom of the deepest mine in the world at the time of this study, 2500 m below sea level, therefore slightly exceeding this deepest effective pressure would suffice to prove the device's ability to function as required (Mining Technology, 2019). The results for test 3 are shown in Figure 1, bottom right. It is seen that the sensor behaved in a predictable manner and gave the effective depth values as expected, returning back to the test location altitude again after the test, showing that no sensor damage occurred. This is a simple overpressure test to determine if the sensor can still yield sensible data at elevated pressures and is not intended as a detailed calibration test.
where P is the measured pressure, P0 is the pressure at sea level, and the altitude is then given in metres. In this equation, a pressure change of 1 hPa equates to a change in altitude of approximately 8.4 m at sea level.

To confirm the accuracy and suitability of the sensor for obtaining usable data for incline and topographic profile, three simple indoor tests were performed.
For test 1 the sensor was left stationary on a table and the data was recorded over a period of 24 hours. The resulting plot can be seen in Figure 1, top left. It is noticed that the absolute altitude varied by as much as 60 m over a 24 hour period. This means that the absolute value for barometric altitude is not suitable for determining inclines of normal road profiles. When viewing the barometric pressure over a shorter time-frame (Figure 1, top right) one can see that the effect of the drift is much less (typically around 0.1 m per minute). From this result it was decided to use the relative altitude between two adjacent points rather than the absolute altitude value.
The barometric pressure sensor could now be implemented on a roadgoing vehicle that has an optical encoder to measure wheel displacement. This data can be used to obtain an estimation for the topographic plot for a route and to perform route identification. To have an above-ground comparison for the barometric altitude topographic plot and verify its usability, a GPS sensor was used to log the GPS coordinates (latitude, longitude, and altitude) as well. It was, however, noted that the barometric altitude shows jumps of tens of metres in the data when the sensor is exposed to direct sunlight, so special care should be taken to avoid these sudden changes in sensor temperature.
Alvarez-Santos et al. (2015) obtained an estimate for heading from a three-axis magnetic sensor. A magnetic sensor is a low-cost sensor that can give the orientation of a device. The drawback is that it is easily affected by external magnetic field disturbances like electric motors and metallic objects. Gallant and Marshall (2016) propose a wheel rotation encoder to enable the heading data to be recorded as a function of distance.
The HMC5883L included on the GY-89 module board is a highresolution three-axis magneto resistive sensor that can determine heading accurately within 1° to 2° using its built-in 12-bit analog-todigital converter. The sensor has a maximum sampling rate of 160 Hz, which allows for multiple samples to be taken consecutively to average/filter out higher frequency noise in the sensor. The sensor can also be used in a strong magnetic field environment and still yield good heading accuracy as long as compensation is performed
for the constant offsets (Honeywell International Inc., 2013). The heading noise of the raw data recorded by this sensor was found during testing to be approximately 0.5°.
Initial testing was carried out using an instrumented road vehicle above ground and an instrumented handheld surveyor's wheel underground. These test platforms were both fitted with an optical encoder to obtain displacements over the routes in real time. As the odometer processor is fitted with a high-speed clock it is able to yield velocity as a function of distance and time, which is useful in calculations relating to the route energy, but that is outside the scope of this paper.
To demonstate that the barometric pressure sensor is able to obtain an accurate topographic plot for a route and to be able to calibrate the odometer, the results must be verified using a good reference. As all of the initial tests of the RIS were performed above ground it was possible to use a GPS. The GPS module used is capable of obtaining a horizontal position accurately to less than 2.5 m and velocity with an error of less than 0.1 m/s. Boroujeni, Frey, and Sandhu (2013) found that GPS data is unreliable under bridges and overpasses, which was also found to be true during road tests in this study, especially when driving into a multi-level parking garage.
It was now possible to gather the topographic data for a route travelled by a road vehicle and compare the results to a GPS reference. The patterns in this data could be used in conjunction with patterns in heading data for various routes to implement the proposed RIS.
A pair of open-source Arduino prototyping boards were used to read and scale the data streamed from the sensors and in turn stream these values to a laptop that processed these values as input to the RIS (Arduino, 2005). One Arduino board was used as the master to facilitate serial communication between the sensors
and the laptop, and the other was set up as a slave to serve as the odometer. Once the preset distance increment for sampling of the heading and altitude is reached it transmits the total recorded distance to the main Arduino board. It was found that a distance increment of 100 m yields good overall results. Upon receiving the distance value from the odometer board the main Arduino board requests the heading and barometric altitude 20 times consecutively in a very short time-frame from each of the sensors to form a more stable averaged value for each parameter respectively. It then streams the averaged heading, averaged barometric altitude, and distance to the laptop via serial communication as a string. The 20 samples were found to yield stable enough data for use in subsequent processing. The sampling rates for these two sensors are high enough to allow multiple samples to be taken consecutively without a significant calculation time penalty or distance travelled over the sampling time. Figure 2 shows a schematic layout of the operation of the data acquisition system. Operating the stream in this way has the advantage that the amount of data that needs to be processed is low enough for the route identification program to be run in real-time.
Figure 3a shows the GPS -altitude vs. -distance and the barometric altitude vs. optical encoder distance. It should be noted that the barometric altitude and the GPS altitude were zeroed at the start of the run to align with each other; the barometric drift was explained in the section on topography. The barometric data lines up very well with the GPS data. Figure 3b shows the zeroed barometric altitude vs. distance for the same route driven on three separate days, demonstrating very good consistency between the three tests.

The GPS data signal is not without fault, as there is a large jump at the end of the data, and many times missing data was observed when travelling underneath a bridge/overpass. The jump at the end of the data was caused by the vehicle entering a covered parking building, thus degrading the GPS signal.
To alleviate the issue of zeroing the barometric altitude, which varies with weather conditions, and thus the absolute altitude accuracy, it makes sense to rather use the derivative of the function, i.e. the change in altitude over a predefined relatively short distance/ time increment. Altitude gain/loss over a small distance in a relatively short time will not noticeably suffer from weather and
other environmental effects, as was shown in Figure1. Figure 4a shows the raw incremental change in barometric altitude, which is termed the altitude gain, for three passes of the same route. The altitude gain also allows direct calculation of the incline of the route, which is beneficial for energy calculations performed in further studies.

The heading was also recorded for the three passes to demonstate good correlation between the data for the same route on different passes; this is shown in Figure 4b. It is noted that the heading data shows very good consistency for the three passes. Headings near magnetic north are the cause for the abrupt jumps in the data from 15 000 m to the end. As an example a heading of 1°

is only 2° away from a heading of 359°, and though it isn't intuitive from observing the figure it is easily accounted for in a later step when the comparisons between routes are done in the Results section.

The aim was to develop a system capable of identifying the route that is being travelled based on patterns in heading and altitude change data. Once these parameters had been recorded above ground and found successful in route identification the system could be tested for underground use. An distance increment of 100 m reduces the amount of data that requires processing

compared to higher sampling rates and also reduces noise in the altitude gain data. The low sampling rate has one drawback; when the heading or altitude changes sharply, like on a residential winding road, it will degrade the ability to perform route identification as the exact location of the sample point around a bend is not the same from one pass of the route to the next, which will lead to significant differences in heading data.
If the topographic plot of a certain route and the vehicle's location on that route are known, the hybrid vehicle control system is able to make better decisions regarding total energy management, a topic that is still under investigation by the authors. This study is based on an underground railway vehicle, so the route options are fairly limited compared to normal road vehicles which can do u-turns and take -side roads, thus greatly reducing the number of possible routes to search for. This limits the number of routes possible during route identification, and this will facilitate the development of an optimization system in future research. Figure 5 shows a schematic diagram of how the route identification program works. The program is excecuted in real time on a standard laptop. The software used is open-source GNU Octave v.4.2.1. (GNU Octave, 2017). These steps are explained in the paragraphs to follow.
A real-time route comparison can be performed only if there is information available for, at the very least, one route previously travelled. The first route was saved from the data recorded for the feasibility study of the heading and altitude change data. This data was saved in two text files, one containing the heading and the other the altitude gain information. With the distance increment being constant at 100 m it allows the heading and altitude data to be saved without their distance reference, as each new line of saved data is by design stored at the corresponding distance increment for comparison to the real-time data streaming in.
With each new heading and altitude data-point streamed in, the laptop in the vehicle is able to compare these new values to the recorded set of values for routes previously travelled and saved. The program makes use of a normal distribution function to yield a high value for good correlation and very low value for bad correlation. Each new data-point is compared to the data-points for all the previously saved routes on a point-by-point basis. Although this is a
tedious process, computationally speaking it is easily accomplished before the next data-points are streamed in a couple of seconds later. There is an advantage of always comparing all of the points of all of the routes as this allows the route identification program to identify a route even if the starting points do not line up, or to distinguish between routes that may have the same or very similar portions. Points are compared by calculating the value of the probability density function at point X of the normal distribution with a mean of μ and a standard deviation of σ. The variable X is the incoming data-point, μ is the saved data-point's value, and σ is the standard deviation. The value for the standard deviation, σ, was assumed to be constant, which was demonstrated to work well during simulations of the RIS. The OCTAVE/MATLAB function that is used for this is normpdf(X,μ,σ). This is not a purely statistical method; however, the normpdf function is a very convenient method of comparing the correlation between data-points. It is normalized for each data-point to ensure that the maximum probability density function value given by the function cannot exceed 1.0 for an exact match. A sensitivity analysis was performed to determine the best values for σ based on route identification success rates. A low value for σ will make the route identification program stricter, up to a point where no routes are ever identified as very few points will have exactly the same heading and altitude gain values, and a high value has the opposite effect where routes would be identified incorrectly. For the simulations performed a value of σ = 8° was found to perform well for heading and a height change of σ = 3 m per 100 m performed well for the altitude gain.
The altitude gain correlation value for a point streamed in is compared directly to all of the points in all of the saved routes. This will yield a N × M matrix which contains the correlation values, with N being in the direction of the data for the saved routes and M the data in the streamed-in route direction. The same point-forpoint method is performed for the heading data, but additional computations need to be carried out. For the heading correlation it is necessary to specifically account for headings close to north, as was shown earlier (Figure 4b). This correlation matrix is generated by taking the probability for each heading point streamed in to the saved routes' values, and then doing the same again but this time
using a heading value of (heading – 360°). This will allow a 358° incoming point to also be calculated as –2°. A third scenario is also applied where (heading + 360°) is used so that a streamed heading value of 1° can be compared to a saved value close to, but less than, 360°. The largest of these three heading correlation values for each point is stored in the heading correlation matrix and used in further calculation steps.
Now that a correlation value is determined for both the heading and altitude gain, point-for-point for all of the saved data-points, a resultant correlation matrix accounting for both heading and altitude gain at the same time is determined by simply multiplying the two correlation matrices, point-for-point. Thus, only if both the heading and the altitude gain data-points correspond well to the saved data-point does it register as a high correlation. These correlation values are recorded and saved in a 3D matrix, where one axis represents the number of routes evaluated, the second represents the streamed data, and the third axis the saved data.
If the route being travelled correlates to one of the saved routes, there will be a high band in the route's plane in the 3D matrix. The streamed data and saved data will have to be in phase with each other and yield consistently high correlation values for a route to be identified. The route planes in the 3D matrix are evaluated by taking the averages of bands in these matrices, where the bands are identified as Matrix(a+X,a). The value for ‘a’ ranges from unity up to the shortest length of the plane and ‘X’ is varied from the negative of half of the shortest length to the positive of half of that length. This in effect determines the averages for lines parallel to the diagonal of the matrix. The reason for not going all the way to the end of the matrix will be explained in more detail later.
Figure 6a shows the resultant correlation matrix plotted for a case when the data of the route travelled is compared to itself. Figure 6b shows the travelled route compared to a different route stored. No pattern is apparent for the mismatched route, which is exactly what we expected. The bands are only evaluated in a positive direction in both the saved and streamed data axis as we are not evaluating travelling the route backwards at this stage. A band that has a consistently high correlation indicates a good chance of travelling on the specific saved route to which it is being compared. Not only the central band, but also bands parallel to that, need to be evaluated as the exact start points for the saved and streamed routes do not have to match. tt is importand to evaluate the parallel bands as this will allow route identification even when the starting points of the routes are not the same, or when there are slight distance discrepancies between the saved and current test streams. There is, however, a limit to the minimum distance that a route needs to correlate with before it is claimed as identified. This restriction is necessary to neglect the false positive route identifications that arise if only a couple of consecutive points line up close to the start or end. If the program was not able to establish a good correlation between the travelled route and any of the saved routes, it was set up to then save this route as a new route, the data for which will be used in the route identification steps in future passes.

It is of benefit if the RIS is somewhat lenient in terms of the exact band that correlates to a route. For example, if a set of data is offset by 50 m relative to the saved route it might cause the high band values to float between two adjacent bands, depending on the exact point being considered, which will cause the band's average value to drop drastically, even though the same route is being travelled. This situation can occur due to wheel slippage, or slight offsets in the starting points. The strategy implemented to make route identification more forgiving and robust is to make use of a
smoothing filter on the route's correlation matrix, which means that a route can be identified even if there does not exist a single band with high correlation values. A Gaussian filter was implemented for this purpose. This filter will also pull up local low points that might have been caused by a local error, for example when travelling around a sharp corner and the two data-points which are being compared don't line up perfectly around the corner, yielding almost zero correlation for that local point due to the heading correlation value being far off.
The smoothed data is shown in Figures 6c and 6d, for the same and another route respectively. This smoothing strategy reduces the effect of starting value differences, small amounts of wheel slip, and other factors that cause the exact distance correlations to deviate from the single high band. A point to note, however, is that this smoothing filter also reduces the maximum probability value for a route point which correspond 100%, due to the neighbouring ones that draw it down slightly. Figures 6e and 6f shows plan views of the smoothed probabilities for the same route (e) and another route (f). A high correlation band is clear for the similar route (e) and no high bands are visible for the other route (f). A potential issue with evaluating the bands based only on the highest average value could be that a band with a consistent medium probability might be outweighed by a diagonal with generally low probability and
some local high probabilities, or some consistently low route may even end up being the highest average probability and incorrectly identified as a route, simply because it happened to be the highest probability of the data available. To avoid this potential error in averaging of correlation values a threshold value to the probabilistic matrix was applied, causing the probability for a point to simply be considered as either zero (no correlation) or unity (sufficient match), based on some experimentally determined constant threshold cut-off value. This process is illustrated in Figures 6g and 6h. Now the band values can be compared and if found to exceed a preset value it can be assumed a positively identified route.
To avoid erroneous route identifications based on the average band approach it is important to stay in the central region of the matrix, and not to calculate the averages for the extreme end points. For example, if a distance travelled equal to the final point of the route is considered, in the real-time program no further information regarding the route will be available yet, and thus the diagonal average value for the end point of the matrix, with a length of one cell, might have an average = 1, which is the maximum value and thus the route will be ‘confidently’ identified based on a single data-point. This will lead to many incorrect route identifications and make the whole system unstable. To alleviate this problem not all of the bands are considered, but only those in the central region. For the purpose of the tests it was found that using half of the matrix width in either direction for the bands mostly solved this problem of incorrect/erratic route identification. In general, route identification more than halfway through the route would not be very beneficial in an optimization strategy in any way. If, by the end of a route no routes were identified the system automatically saves this route as a new route that will be used in future passes to perform route identification.
Eight routes were used to evaluate the effectiveness of the RIS. Most of the routes were back and forth between points A and B (Figure 7). These routes were plotted from the GPS data recorded during testing. It should be noted that the routes overlap close to the start and end points, so initial identification of a route may be incorrect as it is impossible to tell where you are going to turn off and continue with the planned route. It is important to remember this when the route optimization is performed later on as it directly influences the route optimization that needs to be performed and can be detrimental to optimizing if the incorrect route is optimized for initially. Most of these routes are tarmac public roads. Route

R5 is a table-top test, where the distance travelled is theoretically simulated, although no real movement took place. The advantage of using the constant valued route R5 is that it facilitated fault-finding and refinement of the program during tests/simulations performed without physical testing on the road. The trip distances of the routes between A to B are stated in Table I. Route 2 was an around-theblock route to verify sensor data and was not travelled for route identification purposes.
A sensitivity analysis was performed through simulations and the most usable and safe values for accurate route identification are as follows: σAltitude gain = 3 m per 100 m, σHeading = 8°, and threshold cut-off value = 0.2. These values were then used to perform aboveground real-time route identification for the eight routes. The results are presented in the Results and discussion section.
Gathering of vehicular test data in an operating underground mine was not possible due to security and safety concerns. The best alternative was to build a small handheld device that could be used to record heading vs. distance and altitude vs. distance data in an underground environment to prove that these parameters can be effectively measured underground and form patterns that yield the same RIS success as was obtained above ground. The handheld device used for the underground tests was an instrumented surveyor's wheel fitted with an optical encoder, magnetometer, and barometric pressure sensor, but in this case the real-time data was recorded on a SD card and processing afterwards due to space and practical reasons. Figure 8 shows the handheld device. At the bottom of the device, just above the wheel, is the battery. The battery needed to be placed far away from the magnetometer as it was found that close proximity causes a catastrophic offset in the heading data, rendering the whole test unusable unless the magnetometer was specifically recalibrated for this offset. The magnetometer/barometer were mounted on top of a skeletonized soft foam suspension block to reduce accelerations on the sensor, which were found to increase data noise in the barometric pressure sensor. The surveyor's wheel has a factory-calibrated distance readout, which made calibration and quality checking of the recorded data much easier. For the above-ground tests the distance increment was set to 100 m, but in the tests with the handheld device the distance increment was reduced to 5 m, as walking many kilometers underground is not very practical. It was recognized that the altitude data will now yield noisy incline data due to the minimum elevation accuracy mentioned in the topography section.
It had already been proven that the heading and altitude gain strategy works above ground, so in-detail underground tests were not deemed essential, rather, simply to prove the device’s ability to detect appropriate heading and barometric values underground so that route identification can be performed.

The first underground tests were performed in the basement parking of the Engineering 3 building, at the University of Pretoria's main campus, on level P1, two levels below ground level. The building is a steel-reinforced concrete structure with no external steel structural members. Mentioning this is important as it could have an effect on the magnetic data. A circuit on level 1 was walked four times with the device reset at approximately the same point on each pass. The circuit started on a flat section, proceded down a slope, back up the slope again and on the flat to the start point of the route. The results for route identification in the basement tests are included in the Results and discussion section.
The testing of the device to determine if it functions in an actual gold mine was performed at Gold Reef City, an amusement park located in Johannesburg, South Africa. There is a decommissioned small gold mine on site, which is now only used for tourist and educational visits. The purpose of performing a test in a real mine, though it is very small compared to the commercially active mines, was to verify that the sensors yield information that can be used to successfully perform route identification. The same surveyor's wheel set-up that was used for the basement test was used for the underground mine test. The mine's tourist level is located approximately 76 m below the surface. Only two passes were granted for testing purposes. The results for the route identification performed in the Gold Reef City mine are presented in the next section.
Eight different routes were evaluated. Route 2 was just a short test route to evaluate sensor function and the data being streamed. Route 5 was a theoretically generated constant route to allow finer testing of the system. In Figure 9 the route correlation values are plotted against distance for all of the saved routes when travelling on route 1. It is noted from Figure 7 that routes 1, 3, and 6 all have the same initial portions, which is why it makes sense that routes 3 and 6 both also had increasing correlations up to the point where they deviate from route 1. This proves that the RIS was able to correctly identify the route travelled with high confidence by 4.6 km, equating to less than 20% of the total route length, and with moderate confidence by 2.5km.
Route identification tests were performed multiple times for every real route to evaluate the ability of the RIS to perform satisfactorily. Table II summarizes the results, showing the route travelled, the route identified, along with the distance where it was identified and the number of times each route was tested.
From the test results shown in Table II it is seen that the RIS was able to identify the correct route in every test performed, in real time, with small errors occationally found in the initial parts of the routes. In the case of route 7, route 5 was twice identified initially for short parts of the route due to similarities between the routes' data, though this error was corrected within 400 m and the correct route was maintained until the end.
The reason why the identification correlation value starts at zero is due to the program being set up such that it starts at zero for all routes so as not to favour any route above another without proper knowledge of the route being travelled. With it using an averaging program the initial zero correlation gradually grows as the correlation of the route with a stored one increases over distance. The routes are usually more winding at the start and towards the destination due to parking lot driving and sharp corners followed in residential areas, where the under-sampling of the route data at 100 mr increments reduces the ability of the RIS to lock onto a route. The ability of this system to run in real -time allows the RIS to not only identify the route being travelled but also to know the location of the vehicle on that route (route progress), which will be essential when optimizing the energy management of a hybrid locomotive in further studies.
The heading and altitude data for these passes can be seen in Figures 10a and 10b respectively. Good consistency is seen in the data for the four passes. It should be noted that, being obtaines by hand, this data will not be as consistent as that obtained by a vehicle driving on a public road with lane directions clearly indicated and closely adhered to, and even less than what a rail-bound locomotive will see.
Four passes of the same route were used for the test. The first one was saved as the reference, with all four routes compared to this stored route. Comparing the route to itself is handy for consistency checking. Figure 12a shows the correlation as a function of the distance (5 m increment). It is seen that the route that was walked four times yields data that is usable for the RIS proposed. The noise introduced due to manual operation did reduce the smoothness of the correlation graphs, as is expected. The reason why a 100% probability is not achieved with route 1 compared to itself is due to the Gaussian filter, as was explained in the above-ground tests section.

Route no. Route identified and distance to successful identification
1 R3@800 m, R1@8.5 km R1@800 m R1@4.2 km
3 R6@4.4 km, R3@8.5 km, R1@4.6 km, 6.8 km R3, R3@700 m, R6@4.3 km, R1@4.4 km, R3@8.4 km to the end
4 R4@500 m R4@500 m R4@800 m R4@1.1 km
6 R6@4.6 km R6@3.4 km
7 R5@4.0 km, R7@4.1 km R7@3.5 km R7@3.5 km R7@1.7km (R5 from 2.8 km - 3.2 km), R7@ 3.3km to end R5@3.0 km, R7@3.4 km to end
8 R8@500 m R8@3.1 km R8@800 m
of hits
It could now be concluded that the RIS yields satisfactory results for an underground basement test using the handheld data logging device. The next step was to perform tests in a mine, located at greater depths and in the typical rocks that mines are excavated in to confirm applicability of this system in underground environments.
Only two passes were granted in a small underground gold mine on the tourist level to determine whether the heading and altitude data can be used to identify a route being travelled. In the top of Figure 11 the sensor data can be seen for a trip from the surface, twice through the mine's underground visitor's loop, and back to the surface. It is noted that the initial change in heading was as we approached the elevator shaft, and the jump on the vertical black line is due to us walking out of the elevator in the opposite direction with the test data for the first pass starting directly after that. There is also a jump in the altitude data as the elevator descended . The data is then split into the two individual passes plotted over each other. The progress stages are indicated by the three vertical lines
in the top of figure. The altitude is shown in this case instead of the altitude gain as the noise is too great on the small distance increments used, making it difficulte to see any patterns.
In the bottom left of Figure 11 it can be seen that the heading data is very closely correlated between the two passes. The altitude data shows good correlation as well, although the data is much more noisy when one zooms into the local values. The noise in the data amounted to around 0.5 m, which corresponds to the accuracy stated previously. The route identification algorithm can be set up to allow for higher noise in the barometric data by using less strict statistical parameters (larger σ value). Though it is noisy this does still enable comparison of patterns in the data.
The correlation vs. distance plots for the underground gold mine tests are given in Figure 12b. Pass 1 is compared to itself and then to the second pass. The correlation is not 100% all the way through due to the Gaussian filter, as discussed previously. It can be seen that the RIS very quickly identifies pass 2 as the same route as pass 1, taking only around four samples, which equates to a distance of 20 m, or less than 10% of the loop distance, and consistently identifyes the route from there onwards with high confidence.

A novel method of identifying routes underground and finding the location on a route has been presented. This method makes use of easily and affordably obtained magnetic heading and barometric altitude values measured as a function of distance while driving the route. This automatically also yields a topographic profile for the route, which can be used in later processing for route optimization. A pattern recognition program was developed that is able to compare patterns in data for a route being driven to a set of routes that were driven previously and which is stored into a simple small text file in memory. This strategy was able to successfully identify a route being travelled by a vehicle, as well as the location of the vehicle on that route, for a total of six real-life route options investigated. The location on the route is known simply by the most recent data-point streamed in, once the route is identified If the route is not known to the system it is automatically saved as a new route to the small text file, which will then be used for route identification comparisons in future driving cycles. The system proved to function both above ground and underground, where GPS signals are not available. A sensitivity analysis was able to

identify the optimal parameters for which the route identification strategy yielded the best results. The route identification strategy was able to always converge to the correct route within a short distance, typically within the first 20% of the route travelled. For future work the standard deviation value for each point of the route can be updated based on the stability of the streamed data for that that portion of the route, and through averaging the data for many passes of the same section. This has the potential to improve the route identification accuracy and responsiveness. If the system is implemented in an actual deep underground mine the absolute pressure obtained by the barometric pressure sensor can also be used to rule out certain routes from the stored set for that mine, as mine levels are usually many metres apart, which will lead to reduced calculation times. When using a route identification strategy to optimize route energy management it is crucial to take into account the fact that the initial parts of some routes are similar and thus optimizing for a specific route can be detremental to the efficient completion of another which the vehicle could potentially be travelling at that time, and one can only fully optimize when enough certainty on route uniqueness is obtained.

The author would like to thank Gold Reef City theme park for their kind assistance in allowing undergound testing at their facility.
References
Alvarez-Santos, V., Canedo-Rodriguez, A., Iglesias, R., Pardo, X.M., and Regueiro, C.V. 2015. Route learning and reproduction in a tour-guide robot. Robotics and Autonomous Systems, vol. 63. pp. 206–213. https://doi. org/10.1016/j.robot.2014.07.013
Arduino, I.I.D.I. 2005. Arduino IDE. GitHub. https://www.arduin.cc/en/software
Back, M., Simons, M., Kirshaum, F., and Krebs, V. 2002. Predictive control of drivetrains. IFAC Proceedings Volumes, vol. 35, no. 1. pp. 241–246. https://doi.org/10.3182/20020721-6-ES-1901.01508
Basso, R., Kulczár, B., Ehardt, B., Lindroth, P., and Sanchez-Diaz, I. 2019. Energy consumption estimation integrated into the Electric Vehicle Routing Problem. Transportation Research Part D: Transport and Environment, vol. 69. pp. 141–167. https://doi.org/10.1016/j.trd.2019.01.006
Bender, F.A., Kaszynski, M., and Sawodny, O. 2013. Drive cycle prediction and energy management optimization for hybrid hydraulic vehicles. IEEE Transactions on Vehicular Technology, vol. 62, no. 8. pp. 3581–3592. https://doi.org/10.1109/TVT.2013.2259645
Boriboonsomsin, K. and Barth, M. 2009. Impacts of road grade on fuel consumption and carbon dioxide emissions evidenced by use of advanced navigation systems. Transportation Research Record: Journal of the Transportation Research Board, vol. 2139, no. 1. pp. 21–30. https://doi. org/10.3141/2139-03
Boroujeni, B.Y., Frey, H.C., and Sandhu, G.S. 2013. Road grade measurement using in-vehicle, stand-alone GPS with barometric altimeter. Journal of Transportation Engineering, vol. 139, no. 6. pp. 605–611. https://doi. org/10.1061/(ASCE)TE.1943-5436.0000545
Boyd, S. and Nelson, D.J. 2008. Hybrid electric vehicle control strategy based on power loss calculations. Proceedings of the SAE World Congress & Exhibition https://doi.org/10.4271/2008-01-0084
Chen, Z., Li, L., Yan, B., Yang, C., Ma, C.M., and Cao, D. 2016. Multimode energy management for plug-in hybrid electric buses based on driving cycles prediction. IEEE Transactions on Intelligent Transportation Systems, vol . 17, no. 10., pp. 2811–2821. https://doi.org/10.1109/TITS.2016.2527244
CMTi Group. 2021. LOCO1000 Series. http://cmtigroup.co.za/LOCO1000-Series/ [accessed 7 September 2021.
Gallant, M.J. and Marshall, J.A. 2016. The LiDAR compass: Extremely lightweight heading estimation with axis maps. Robotics and Autonomous Systems, vol. 82. pp. 35–45. https://doi.org/10.1016/j.robot.2016.04.005
GNU Octave. 2017. GNU Octave. https://www.gnu.org/software/octave/ [accessed: 19 November 2019].
Hellström, E., Åslund, J., and Nielsen, L. 2010. Design of an efficient algorithm for fuel-optimal look-ahead control. Control Engineering Practice, vol. 18, no. 11. pp. 1318–1327. https://doi.org/10.1016/j.conengprac.2009.12.008
Honeywell International Inc. 2013. HMC5883L_3-Axis_Digital_Compass_ IC.pdf
Hu, X., Martinez, C.M., and Yang, Y. 2017. Charging, power management, and battery degradation mitigation in plug-in hybrid electric vehicles: A unified costoptimal approach. Mechanical Systems and Signal Processing, vol. 87. pp. 4–16. https://doi.org/10.1016/j.ymssp.2016.03.004
Huang, Y., Wang, H., Khajepour, A., He, H., and Ji, J. 2017. Model predictive control power management strategies for HEVs: A review. Journal of Power Sources, vol. 341. pp. 91–106. https://doi.org/10.1016/j.jpowsour.2016.11.106
Jeon, S., Jo, S., Park, Y., and Lee, J. 2002. Multi-mode driving control of a parallel hybrid electric vehicle using driving pattern recognition. Journal of Dynamic Systems, Measurement, and Control, vol. 124, no. 1. p. 141. https://doi. org/10.1115/1.1434264
Johannesson, L., Murgovski, N., Jonasson, E., Hellgren, J., and Egardt, B. 2015. Predictive energy management of hybrid long-haul trucks. Control Engineering Practice, vol. 41. pp. 83–97. https://doi.org/10.1016/j. conengprac.2015.04.014
Lajunen, A. 2014. Fuel economy analysis of conventional and hybrid heavy vehicle combinations over real-world operating routes. Transportation Research Part D: Transport and Environment, vol. 31. pp. 70–84. https://doi.org/10.1016/j. trd.2014.05.023
Lin, C.-C., Jeon, S., Pemg, H., and Lee, J.M. 2004. Driving pattern recognition for control of hybrid electric trucks. Vehicle System Dynamics, vol. 42, no. 1–2. pp. 41–58. https://doi.org/10.1080/00423110412331291553
Liu, H., Li, H., Rodgers, M.O., and Guensler, R. 2018. Development of road grade data using the United States geological survey digital elevation model. Transportation Research Part C: Emerging Technologies, vol. 92. pp. 243–257. https://doi.org/10.1016/j.trc.2018.05.004
Mining Technology. 2019. Top ten deepest mines in the world. https://www. mining-technology.com/features/feature-top-ten-deepest-mines-world-southafrica/ [accessed: 19 November 2019].
Phillips, A.M., Jankovic, M., and Bailey, K.E. 2000. ‘Vehicle system controller design for a hybrid electric vehicle. Proceedings of the 2000. IEEE International Conference on Control Applications. Conference Proceedings (Cat. No.00CH37162). 2000 IEEE International Conference on Control Applications, Anchorage, AK: IEEE. pp. 297–302. https://doi.org/10.1109/CCA.2000.897440
Rezaei, S. and Sengupta, R. 2007. Kalman filter-based integration of DGPS and vehicle sensors for localization. IEEE Transactions on Control Systems Technology, vol. 15, no. 6. pp. 1080–1088. https://doi.org/10.1109/ TCST.2006.886439
Rogers, K.J. and Trayford, R.S. 1984. Grade measurement with an instrumented car. Transportation Research Part B: Methodological, vol. 18, no. 3. pp. 247–254. https://doi.org/10.1016/0191-2615(84)90035-3
Sensortec. 2009. BMP085 Digital pressure sensor. p. 27.
Song, K., Li, F., Hu, X., He, L., Niu, W., Lu, S., and Zhang, T. 2018. Multi-mode energy management strategy for fuel cell electric vehicles based on driving pattern identification using learning vector quantization neural network algorithm. Journal of Power Sources, vol. 389. pp. 230–239. https://doi. org/10.1016/j.jpowsour.2018.04.024
Taghavipour, A., Vajedi, M., Azad, N.L., and McPhee, J. 2016. A comparative analysis of route-based energy management systems for Phevs: Asian Journal of Control, vol. 18, no. 1. pp. 29–39. https://doi.org/10.1002/asjc.1191
Tie, S.F. and Tan, C.W. 2013. A review of energy sources and energy management system in electric vehicles. Renewable and Sustainable Energy Reviews, vol. 20. pp. 82–102. https://doi.org/10.1016/j.rser.2012.11.077
Vahidi, A., Stefanopoulou, A., and Peng, H. 2005. Recursive least squares with forgetting for online estimation of vehicle mass and road grade: theory and experiments. Vehicle System Dynamics, vol. 43, no. 1. pp. 31–55. https://doi.org/10.1080/00423110412331290446
Wang, R. and Lukic, S.M. 2011. Review of driving conditions prediction and driving style recognition based control algorithms for hybrid electric vehicles. Proceedings of the IEEE Vehicle Power and Propulsion Conference, Chicago, IL, USA. pp. 1–7. https://doi.org/10.1109/VPPC.2011.6043061
Yokoi, Y., Ichikawa, S., Doki, S., Okuma, S., Naitou, T., Shilmado, T., and Miki, N. 2004. Driving pattern prediction for an energy management system of hybrid electric vehicles in a specific driving course. Proceedings of the 30th Annual Conference of IEEE Industrial Electronics Society, IECON 2004, Busan, South Korea: IEEE. pp. 1727–1732. https://doi.org/10.1109/ IECON.2004.1431842 u
13-17 February 2023 — Principles of diamond processing University of the Witwatersrand, Johannesburg, South Africa
Website: https://wits-enterprise.co.za/c/principles-ofdiamond-processing/contact
22-23 February 2023 — Drilling and Blasting Online Short Course 2023
Contact: Camielah Jardine
Tel: 011 538-0237
E-mail: camielah@saimm.co.za
Website: http://www.saimm.co.za
13-16 March 2023 — 8TH Sulphur and Sulphuric Acid Conference 2023
The Vineyard Hotel, Newlands, Cape Town, South Africa
Contact: Gugu Charlie
Tel: 011 538-0238
E-mail: gugu@saimm.co.za
Website: http://www.saimm.co.za
24-25 April 2023 — Southern African Hydrogen and Fuel Cell Conference 2023
From fundamentals to accelerated integration Hazendal Wine Estate, Stellenbosch, Cape Town
Contact: Camielah Jardine
Tel: 011 538-0237
E-mail: camielah@saimm.co.za
Website: http://www.saimm.co.za
11-14 June 2023 — European Metallurgical Conference
2023
Abstracts are to be completed online on https://bit.ly/ Enter2021YPLCfinals
13-15 June 2023 — Copper Cobalt Africa in association with the 10TH Southern African Base Metals Conference 2023
Avani Victoria Falls Resort, Livingstone, Zambia
Contact: Camielah Jardine
Tel: 011 538-0237
E-mail: camielah@saimm.co.za
Website: http://www.saimm.co.za
19-22 June 2023 — Introduction to Multiple-Point Statistics Online Course
Contact: Camielah Jardine
Tel: 011 538-0237
E-mail: camielah@saimm.co.za
Website: http://www.saimm.co.za
25-28 June 2023 — SME APCOM 2023
Intelligent Mining: Innovation, Vision, and Value Rapid City, South Dakota, USA
E-mail: Andrea.Brickey@sdsmt.edu
Website: https://www.smenet.org/Conferences/SMEAPCOM
26-29 June 2023 — 26th World Mining Congress 2023
Brisbane Australia
Website: https://www.wmc2023.org/
28-29 June 2023 — Digital Transformation in Mining
2023
Putting digital technologies to work
The Canvas, Riversands, Fourways
Contact: Gugu Charlie
Tel: 011 538-0238
E-mail: gugu@saimm.co.za
Website: http://www.saimm.co.za
July 2023 — 10th World Gold Conference
Xiamen, China
E-mail: world@china-gold.org
Website: http://world.china-gold.org/#
25-26 July 2023 — Diamonds Source to Use 2023 Conference
New Beginnings A brave new (diamond) world
Birchwood Hotel and OR Tambo Conference Centre, Boksburg, Johannesburg
Contact: Camielah Jardine
Tel: 011 538-0237
E-mail: camielah@saimm.co.za
Website: http://www.saimm.co.za
21-22 August 2023 — HMC 2023 Twelth International Heavy Minerals Conference 2023
The Capital Zimbali, Ballito, KwaZulu-Natal
Contact: Gugu Charlie
Tel: 011 538-0238
E-mail: gugu@saimm.co.za
Website: http://www.saimm.co.za
4-7 September 2023 — Geometallurgy Conference 2023 Geomet meets Big Data
Hazendal Wine Estate, Stellenbosch, Western Cape
Contact: Gugu Charlie
Tel: 011 538-0238
E-mail: gugu@saimm.co.za
Website: http://www.saimm.co.za
12-14 September 2023 — 10th International Conference on Ground Support in Mining and Underground
Construction
Perth, Western Australia
Website: https://www.acggroundsupport.com/
26-27 September 2023 — SAIMM Diversity and Inclusion Dialogue 2023 (DIMI)
Intersectionality in the Minerals Industry From Awareness to Action
Avianto, Muldersdrift, Johannesburg
Contact: Camielah Jardine
Tel: 011 538-0237
E-mail: camielah@saimm.co.za
Website: http://www.saimm.co.za
11-13 October 2023 — 11th International Ground Freezing Symposium
London
E-mail: events@iom3.org
Website: https://www.iom3.org/events-awards/11thinternational-symposium-on-ground-freezing.html
24-26 October 2023 — Next generation tailingsopportunities or risk? Conference 2023
Emperors Palace, Johannesburg
Contact: Camielah Jardine
Tel: 011 538-0237
E-mail: camielah@saimm.co.za
Website: http://www.saimm.co.za
The following organizations have been admitted to the Institute as Company Affiliates
3M South Africa (Pty) Limited
acQuire Technology Solutions
AECOM SA (Pty) Ltd
AEL Mining Services Limited
African Pegmatite (Pty) Ltd
Air Liquide (Pty) Ltd
Alexander Proudfoot Africa (Pty) Ltd
Allied Furnace Consultants
AMEC Foster Wheeler
AMIRA International Africa (Pty) Ltd
ANDRITZ Delkor (Pty) Ltd
ANGLO Operations Proprietary
Anglogold Ashanti Ltd
Arcus Gibb (Pty) Ltd
ASPASA
Aurecon South Africa (Pty) Ltd
Aveng Engineering
Aveng Mining Shafts and Underground
Axiom Chemlab Supplies (Pty) Ltd
Axis House Pty Ltd
Bafokeng Rasimone Platinum Mine
Barloworld Equipment -Mining
BASF Holdings SA (Pty) Ltd
BCL Limited
Becker Mining (Pty) Ltd
BedRock Mining Support Pty Ltd
BHP Billiton Energy Coal SA Ltd
Blue Cube Systems (Pty) Ltd
Bluhm Burton Engineering Pty Ltd
Bond Equipment (Pty) Ltd
BOUYGUES Travaux Publics
Caledonia Mining South Africa Plc
Castle Lead Works
CDM Group
CGG Services SA
Coalmin Process Technologies CC
Concor Opencast Mining
Concor Technicrete
Council for Geoscience Library
CRONIMET Mining Processing SA Pty Ltd
CSIR Natural Resources and the Environment (NRE)
Data Mine SA
Digby Wells and Associates
DRA Mineral Projects (Pty) Ltd
DTP Mining - Bouygues Construction
Duraset
EHL Consulting Engineers (Pty) Ltd
Elbroc Mining Products (Pty) Ltd
eThekwini Municipality
Ex Mente Technologies (Pty) Ltd
Expectra 2004 (Pty) Ltd
Exxaro Coal (Pty) Ltd
Exxaro Resources Limited
Filtaquip (Pty) Ltd
FLSmidth Minerals (Pty) Ltd
Fluor Daniel SA (Pty) Ltd
Franki Africa (Pty) Ltd-JHB
Fraser Alexander (Pty) Ltd
G H H Mining Machines (Pty) Ltd
Geobrugg Southern Africa (Pty) Ltd
Glencore
Gravitas Minerals (Pty) Ltd
Hall Core Drilling (Pty) Ltd
Hatch (Pty) Ltd
Herrenknecht AG
HPE Hydro Power Equipment (Pty) Ltd
Huawei Technologies Africa (Pty) Ltd
Immersive Technologies
IMS Engineering (Pty) Ltd
Ingwenya Mineral Processing (Pty) Ltd
Ivanhoe Mines SA
Kudumane Manganese Resources
Leica Geosystems (Pty) Ltd
Loesche South Africa (Pty) Ltd
Longyear South Africa (Pty) Ltd
Lull Storm Trading (Pty) Ltd
Maccaferri SA (Pty) Ltd
Magnetech (Pty) Ltd
MAGOTTEAUX (Pty) LTD
Malvern Panalytical (Pty) Ltd
Maptek (Pty) Ltd
Maxam Dantex (Pty) Ltd
MBE Minerals SA Pty Ltd
MCC Contracts (Pty) Ltd
MD Mineral Technologies SA (Pty) Ltd
MDM Technical Africa (Pty) Ltd
Metalock Engineering RSA (Pty)Ltd
Metorex Limited
Metso Minerals (South Africa) Pty Ltd
Micromine Africa (Pty) Ltd
MineARC South Africa (Pty) Ltd
Minerals Council of South Africa
Minerals Operations Executive (Pty) Ltd
MineRP Holding (Pty) Ltd
Mining Projections Concepts
Mintek
MIP Process Technologies (Pty) Limited
MLB Investment CC
Modular Mining Systems Africa (Pty) Ltd
MSA Group (Pty) Ltd
Multotec (Pty) Ltd
Murray and Roberts Cementation
Nalco Africa (Pty) Ltd
Namakwa Sands(Pty) Ltd
Ncamiso Trading (Pty) Ltd
Northam Platinum Ltd - Zondereinde
Opermin Operational Excellence
OPTRON (Pty) Ltd
Paterson & Cooke Consulting Engineers (Pty) Ltd
Perkinelmer
Polysius A Division Of Thyssenkrupp
Industrial Sol
Precious Metals Refiners
Rams Mining Technologies
Rand Refinery Limited
Redpath Mining (South Africa) (Pty) Ltd
Rocbolt Technologies
Rosond (Pty) Ltd
Royal Bafokeng Platinum
Roytec Global (Pty) Ltd
RungePincockMinarco Limited
Rustenburg Platinum Mines Limited
Salene Mining (Pty) Ltd
Sandvik Mining and Construction
Delmas (Pty) Ltd
Sandvik Mining and Construction
RSA(Pty) Ltd
SANIRE
Schauenburg (Pty) Ltd
Sebilo Resources (Pty) Ltd
SENET (Pty) Ltd
Senmin International (Pty) Ltd
SISA Inspection (Pty) Ltd
Smec South Africa
Sound Mining Solution (Pty) Ltd
SRK Consulting SA (Pty) Ltd
Time Mining and Processing (Pty) Ltd
Timrite Pty Ltd
Tomra (Pty) Ltd
Traka Africa (Pty) Ltd
Ukwazi Mining Solutions (Pty) Ltd
Umgeni Water
Webber Wentzel
Weir Minerals Africa
Welding Alloys South Africa
Worley

Date: 27-28 September 2023
Venue: Avianto, Muldersdrift
Johannesburg
The SAIMM through its committee for Diversity and Inclusion in the Minerals Industry (DIMI) and in collaboration with Women in Mining South Africa (WiMSA) is excited to announce its DIMI Dialogue 2023 focusing on the issues of diversity and inclusion in the mining and minerals industry.


The Southern African minerals industry, just like the global minerals industry, still faces challenges when it comes to diversity and inclusivity in the workplace. While landscape might be changing due to various of companies embracing the need for a more representative and diverse workforce, there is still a lot to be done. Beside issues of gender disparity in the industry, safe spaces in the workplace, protective equipment, sanitation facilities,
pregnancy and childcare facilities are some of the challenges that continue to plague the sector. The industry also needs to go beyond workforce diversity to inclusion, by identifying individuals from different geographic, gender, economic and cultural groups, creating safe spaces for them, providing support for them to grow into their roles. Creating conditions that promote inclusion on a daily basis can go a long way in retaining and advancing the careers of workforce and hence contribute to the long term growth of the minerals industry. DIMI provides a platform for discussion that can lead to the development of strategies for advancing and encouraging decisions that are in the best interest of a diverse workforce.
FOR FURTHER INFORMATION, CONTACT:
Camielah Jardine
E-mail: camielah@saimm.co.za
Head of Conferencing Tel: +27 11 538-0238
SAIMM Web: www.saimm.co.za
The Southern African Institute of Mining and Metallurgy in collaboration with the Zululand Branch are organising:
2023
INTERNATIONAL HEAVY MINERALS CONFERENCE
21-22 AUGUST 2023
THE CAPITAL ZIMBALI, BALLITO, KWAZULU-NATAL


The HMC series of conferences has previously been focused on mining and processing of heavy minerals. Whilst this conference will still focus on these important issues, there is a shift in focus to include some of the more strategic risks affecting this industry. With the recent global changes such as climate change and its effect on operations close to sea level, the energy crisis and its effect on the economics of smelting and geopolitical risk and its effect on supply chains dependent on unfriendly countries. The future of the industry is now at risk from such changes which are outside of its immediate control. Failure to recognise these significant risks could impact the entire future of the heavy minerals industry. There are also time constraints on finding solutions to such issues. This conference will attempt to high light some of those risks and to suggest possible mitigation measures.
This series of conferences was started in 1997 and has run since that date. The Conference alternates between South Africa and other heavy mineral producing countries. It provides a forum for an exchange of knowledge in all aspects of heavy minerals, from exploration through processing and product applications. This is a strictly technical conference, and efforts by the Organizing Committee are aimed at preserving its technical nature. The benefit of this focus is that it allows the operators of businesses within this sector to discuss topics not normally covered in such forums. The focus on heavy minerals includes the more obvious minerals such as ilmenite, rutile and zircon; and also other heavy minerals such as garnet, andalusite, and sillimanite.
Located in a luxury eco estate with insanely beautiful Indian Ocean views, less than 15 minutes from King Shaka International Airport. SET IN A TROPICAL FOREST that unfurls into the ocean, the resort blends organically into a lush natural landscape. A magnet for fun seekers, families, couples, solo explorers and business travellers; the resort is far enough removed to allow you to step back and take time to enjoy the tranquil surroundings.
FOR FURTHER INFORMATION, CONTACT:
Professionals specialising or working in the areas of:
• Renewable energy
• Water purification
• Infrastructure
• Desalination plants
As well as the following industry professionals are invited to participate:
• Academics
• Business development managers
• Concentrator managers
• Consultants
• Engineers
• Exploration managers
• Geologists
• Hydrogeologists
• Innovation managers
• Mechanical engineers
• Metallurgical managers
• Metallurgical consultants
• Metallurgists

• Mine managers
• Mining engineers
• New business development managers
• Planning managers
• Process engineers
• Product developers
• Production managers
• Project managers
• Pyrometallurgists
• Researchers
• Scientists
Prospective authors are invited to submit abstracts of not more 500 words, in English. Please email abstracts and requests to be added to the conference mailing list to Gugu Charlie: Conference Co-ordinator, SAIMM at gugu@saimm.co.za
27 March 2023 – Submission of abstracts
10 April 2023 – Acceptance of abstracts
15 May 2023 – Submission of papers
21-22 August 2023 – Conference
Gugu
Charlie, Conference co-ordinatorE-mail: gugu@saimm.co.za Tel: +27 11 538-0237, Web: www.saimm.co.za