Wear Resistant, High PerformanceGlobal Quality Mining Pumps.

KSB South Africa is based in Johannesburg with modern manufacturing and sales facilities. With Sales & Service facilities in Southern Africa, West, Central and East Africa. KSB is represented throughout the whole country.

KSB South Africa, manufactures our globally recognised pump solutions locally to the most stringent international and local quality standards. Our innovative solutions provide for the most demanding and corrosive slurry applications with superior abrasion resistance.
At KSB South Africa, we manufacture and service your slurry systems. We work with you one on one to find the best solution for your slurry and process pumping applications. Partner with KSB to help you meet your production goals. One team - one goal.
KSB Pumps and Valves (Pty) Ltd • www.ksb.com/en-za • Your Level 1 B-BBEE Partner
KSB MINING Kseb...
Wear Resistant, High PerformanceGlobal Quality Mining Pumps.

KSB South Africa is based in Johannesburg with modern manufacturing and sales facilities. With Sales & Service facilities in Southern Africa, West, Central and East Africa. KSB is represented throughout the whole country.
KSB South Africa, manufactures our globally recognised pump solutions locally to the most stringent international and local quality standards. Our innovative solutions provide for the most demanding and corrosive slurry applications with superior abrasion resistance.
At KSB South Africa, we manufacture and service your slurry systems. We work with you one on one to find the best solution for your slurry and process pumping applications. Partner with KSB to help you meet your production goals. One team - one goal.
KSB MINING Kseb...
KSB Pumps and Valves (Pty) Ltd • www.ksb.com/en-za • Your Level 1 B-BBEE Partner
The Southern African Institute of Mining and Metallurgy
OFFICE BEARERS AND COUNCIL FOR THE 2022/2023 SESSION
Honorary President
Nolitha Fakude
President, Minerals Council South Africa
Honorary Vice Presidents
Gwede Mantashe
Minister of Mineral Resources and Energy, South Africa
Ebrahim Patel
Minister of Trade, Industry and Competition, South Africa Blade Nzimande
Minister of Higher Education, Science and Technology, South Africa
President Z. Botha
President Elect W.C. Joughin
Senior Vice President E. Matinde
Junior Vice President G.R. Lane
Incoming Junior Vice President T.M. Mmola
Immediate Past President I.J. Geldenhuys
Honorary Treasurer W.C. Joughin
Ordinary Members on Council
W. Broodryk G. Njowa
Z. Fakhraei S.J. Ntsoelengoe
R.M.S. Falcon (by invitation) S.M. Rupprecht B. Genc M.H. Solomon
K.M. Letsoalo A.J.S. Spearing
S.B. Madolo A.T. van Zyl
F.T. Manyanga E.J. Walls M.C. Munroe
Co-opted to Members
K. Mosebi A.S. Nhleko
Past Presidents Serving on Council
N.A. Barcza C. Musingwini
R.D. Beck S. Ndlovu
J.R. Dixon J.L. Porter
V.G. Duke M.H. Rogers
R.T. Jones D.A.J. Ross-Watt
A.S. Macfarlane G.L. Smith
M.I. Mthenjane W.H. van Niekerk
G.R. Lane–TPC Mining Chairperson
Z. Botha–TPC Metallurgy Chairperson
M.A. Mello–YPC Chairperson
K.W. Banda–YPC Vice Chairperson
Branch Chairpersons
Botswana Being established
DRC Not active
Johannesburg N. Rampersad
Namibia Vacant
Northern Cape I. Tlhapi
North West I. Tshabalala
Pretoria Vacant
Western Cape A.B. Nesbitt
Zambia J.P.C. Mutambo (Interim Chairperson)
Zimbabwe A.T. Chinhava
Zululand C.W. Mienie
PAST PRESIDENTS
* W. Bettel (1894–1895)
* A.F. Crosse (1895–1896)
* W.R. Feldtmann (1896–1897)
* C. Butters (1897–1898)
* J. Loevy (1898–1899)
* J.R. Williams (1899–1903)
* S.H. Pearce (1903–1904)
* W.A. Caldecott (1904–1905)
* W. Cullen (1905–1906)
* E.H. Johnson (1906–1907)
* J. Yates (1907–1908)
* R.G. Bevington (1908–1909)
* A. McA. Johnston (1909–1910)
* J. Moir (1910–1911)
* C.B. Saner (1911–1912)
* W.R. Dowling (1912–1913)
* A. Richardson (1913–1914)
* G.H. Stanley (1914–1915)
* J.E. Thomas (1915–1916)
* J.A. Wilkinson (1916–1917)
* G. Hildick-Smith (1917–1918)
* H.S. Meyer (1918–1919)
* J. Gray (1919–1920)
* J. Chilton (1920–1921)
* F. Wartenweiler (1921–1922)
* G.A. Watermeyer (1922–1923)
* F.W. Watson (1923–1924)
* C.J. Gray (1924–1925)
* H.A. White (1925–1926)
* H.R. Adam (1926–1927)
* Sir Robert Kotze (1927–1928)
* J.A. Woodburn (1928–1929)
* H. Pirow (1929–1930)
* J. Henderson (1930–1931)
* A. King (1931–1932)
* V. Nimmo-Dewar (1932–1933)
* P.N. Lategan (1933–1934)
* E.C. Ranson (1934–1935)
* R.A. Flugge-De-Smidt (1935–1936)
* T.K. Prentice (1936–1937)
* R.S.G. Stokes (1937–1938)
* P.E. Hall (1938–1939)
* E.H.A. Joseph (1939–1940)
* J.H. Dobson (1940–1941)
* Theo Meyer (1941–1942)
* John V. Muller (1942–1943)
* C. Biccard Jeppe (1943–1944)
* P.J. Louis Bok (1944–1945)
* J.T. McIntyre (1945–1946)
* M. Falcon (1946–1947)
* A. Clemens (1947–1948)
* F.G. Hill (1948–1949)
* O.A.E. Jackson (1949–1950)
* W.E. Gooday (1950–1951)
* C.J. Irving (1951–1952)
* D.D. Stitt (1952–1953)
* M.C.G. Meyer (1953–1954)
* L.A. Bushell (1954–1955)
* H. Britten (1955–1956)
* Wm. Bleloch (1956–1957)
* H. Simon (1957–1958)
* M. Barcza (1958–1959)
* R.J. Adamson (1959–1960)
* W.S. Findlay (1960–1961)
* D.G. Maxwell (1961–1962)
* J. de V. Lambrechts (1962–1963)
* J.F. Reid (1963–1964)
* D.M. Jamieson (1964–1965)
* H.E. Cross (1965–1966)
* D. Gordon Jones (1966–1967)
* P. Lambooy (1967–1968)
* R.C.J. Goode (1968–1969)
* J.K.E. Douglas (1969–1970)
* V.C. Robinson (1970–1971)
* D.D. Howat (1971–1972)
* J.P. Hugo (1972–1973)
* P.W.J. van Rensburg (1973–1974)
* R.P. Plewman (1974–1975)
* R.E. Robinson (1975–1976)
* M.D.G. Salamon (1976–1977)
* P.A. Von Wielligh (1977–1978)
* M.G. Atmore (1978–1979)
* D.A. Viljoen (1979–1980)
* P.R. Jochens (1980–1981)
* G.Y. Nisbet (1981–1982)
A.N. Brown (1982–1983)
* R.P. King (1983–1984)
J.D. Austin (1984–1985)
* H.E. James (1985–1986)
H. Wagner (1986–1987)
* B.C. Alberts (1987–1988)
* C.E. Fivaz (1988–1989)
* O.K.H. Steffen (1989–1990)
* H.G. Mosenthal (1990–1991)
R.D. Beck (1991–1992)
* J.P. Hoffman (1992–1993)
* H. Scott-Russell (1993–1994)
J.A. Cruise (1994–1995)
D.A.J. Ross-Watt (1995–1996)
N.A. Barcza (1996–1997)
* R.P. Mohring (1997–1998) J.R. Dixon (1998–1999) M.H. Rogers (1999–2000)
L.A. Cramer (2000–2001)
* A.A.B. Douglas (2001–2002) S.J. Ramokgopa (2002-2003)
T.R. Stacey (2003–2004)
F.M.G. Egerton (2004–2005)
W.H. van Niekerk (2005–2006)
R.P.H. Willis (2006–2007)
R.G.B. Pickering (2007–2008)
A.M. Garbers-Craig (2008–2009)
J.C. Ngoma (2009–2010)
G.V.R. Landman (2010–2011)
J.N. van der Merwe (2011–2012)
G.L. Smith (2012–2013)
M. Dworzanowski (2013–2014)
J.L. Porter (2014–2015)
R.T. Jones (2015–2016)
C. Musingwini (2016–2017)
S. Ndlovu (2017–2018)
A.S. Macfarlane (2018–2019)
M.I. Mthenjane (2019–2020)
V.G. Duke (2020–2021)
I.J. Geldenhuys (2021–2022)
Honorary Legal Advisers M H Attorneys Auditors Genesis Chartered Accountants Secretaries The Southern African Institute of Mining and Metallurgy 7th Floor, Rosebank Towers, 19 Biermann Avenue, Rosebank, 2196 PostNet Suite #212, Private Bag X31, Saxonwold, 2132 E-mail: journal@saimm.co.za
*Deceased
Editorial Board
S.O. Bada
R.D. Beck
P. den Hoed
I.M. Dikgwatlhe
R. Dimitrakopolous* M. Dworzanowski* L. Falcon B. Genc
R.T. Jones
W.C. Joughin
A.J. Kinghorn
D.E.P. Klenam
H.M. Lodewijks D.F. Malan R. Mitra* H. Möller
C. Musingwini S. Ndlovu
P.N. Neingo M. Nicol*
S.S. Nyoni M. Phasha P. Pistorius P. Radcliffe N. Rampersad Q.G. Reynolds I. Robinson
S.M. Rupprecht K.C. Sole A.J.S. Spearing* T.R. Stacey E. Topal* D. Tudor* F.D.L. Uahengo D. Vogt*
*International Advisory Board members
Editor /Chairman of the Editorial Board R.M.S. Falcon
Typeset and Published by The Southern African Institute of Mining and Metallurgy PostNet Suite #212 Private Bag X31 Saxonwold, 2132 E-mail: journal@saimm.co.za

Printed by Camera Press, Johannesburg
Advertising Representative
Barbara Spence Avenue Advertising
Telephone (011) 463-7940 E-mail: barbara@avenue.co.za ISSN 2225-6253 (print) ISSN 2411-9717 (online)
Directory of Open Access Journals


Contents
Journal Comment: Synergy between computational and empirical methods in the mining and metallurgy by D. Klenam iv
President’s Corner: The Mining Industry and the Energy Crisis
What is the role we are playing? by Z. Botha v-vi
NEWS OF INTEREST
SAIMM members honoured as Top Scholars in South Africa . . . . . . . . . . . . . . 628
The Just Transition and the Coal Mining Sector in South Africa by M. Cole, M. Mthenjane, and A. van Zyl 637
PROFESSIONAL TECHNICAL AND SCIENTIFIC PAPERS
The effect of overburden and confined stress state on cave mining propagation by N.K. Schoeman, S.W. Jacobsz, and E.P. Kearsley 617
A physical modelling approach is adopted in an investigation to simulate the process of cave mining propagation at various horizontal to vertical stress state ratios. Image data was captured and used to observe resulting failure mechanisms. The study exhibited a scale factor magnitude of 119 using a calculated critical extensional strain value of 0.014 % for the modelling material used. It was perceived that cave propagation occurred through successive parallel extensional ‘fracture bands’ in all cases as noticed in models of prior studies.
THE INSTITUTE, AS A BODY, IS NOT RESPONSIBLE FOR THE STATEMENTS AND OPINIONS ADVANCED IN ANY OF ITS PUBLICATIONS.
Copyright© 2022 by The Southern African Institute of Mining and Metallurgy. All rights reserved. Multiple copying of the contents of this publication or parts thereof without permission is in breach of copyright, but permission is hereby given for the copying of titles and abstracts of papers and names of authors. Permission to copy illustrations and short extracts from the text of individual contributions is usually given upon written application to the Institute, provided that the source (and where appropriate, the copyright) is acknowledged. Apart from any fair dealing for the purposes of review or criticism under The Copyright Act no. 98, 1978, Section 12, of the Republic of South Africa, a single copy of an article may be supplied by a library for the purposes of research or private study. No part of this publication may be reproduced, stored in a retrieval system, or transmitted in any form or by any means without the prior permission of the publishers. Multiple copying of the contents of the publication without permission is always illegal.
U.S. Copyright Law applicable to users In the U.S.A. The appearance of the statement of copyright at the bottom of the first page of an article appearing in this journal indicates that the copyright holder consents to the making of copies of the article for personal or internal use. This consent is given on condition that the copier pays the stated fee for each copy of a paper beyond that permitted by Section 107 or 108 of the U.S. Copyright Law. The fee is to be paid through the Copyright Clearance Center, Inc., Operations Center, P.O. Box 765, Schenectady, New York 12301, U.S.A. This consent does not extend to other kinds of copying, such as copying for general distribution, for advertising or promotional purposes, for creating new collective works, or for resale.
The Journal of the Southern African Institute of Mining and Metallurgy

▶ ii NOVEMBER 2022 VOLUME 122
VOLUME 122
NOVEMBER 2022
NO. 11
Fines generation from South African manganese ores during preheating in a rotary kiln by M.S. Moholwa, J.D. Steenkamp, and H.L. Rutto 629
Decrepitation behaviour of manganese ores presents a problem in the operations of smelters. The purpose of this investigation was to determine the extent to which South African manganese ores will decrepitate during preheating in a rotary kiln. It was established that the Decrepitation Index (DI) for all the ores used was proportional to temperature and rotational speed, and inversely proportional to particle size range, with temperature being the most important parameter of all.
Drawpoint loading optimization strategies in block caving: A case study of Palabora Mining Company by M.S. Nyarela, R.B. Khumalo, and R.C. Nemathithi 639 Palabora Mining Company uses the block caving mining method for the extraction of its copper minerals from the Palabora Orebody. This paper enumerates the drawpoint loading strategies for the overall head grade improvements, particularly for a block that nears depletion. From this study, an optimised draw control strategy is presented.
Effect of zinc process water recycling on galena flotation from a complex sulphide ore by K. Boujounoui, A. Abidi, A. BaÇaoui, K. El Amari, D. He, and A. Yaacoubi 647
The effects of the recycled tailings pond water from the flotation plant at the Mining Company of Guemassa (MCG) were studied at bench scale to maximize the recyclability. The results showed that recycling the tailings pond water in the lead circuit without mixing in fresh water gave a good flotation performance in terms of lead recovery and in terms of its selectivity towards the other metals. However, increasing the d80 from 100 μm to the 160 μm had a negative effect on the flotation performance of the lead.
Review of machine learning-based Mineral Resource estimation by M.A. Mahboob, T. Celik, and B. Genc 655
Conventional geostatistical methods used for grade estimation require expertise, understanding and knowledge. However, such models are sensitive to change in data and would have to be rebuilt on newly acquired data. In this paper, a systematic literature review of machine learning methods is presented using data during the period 1990 to 2019. The results based on 31 research studies show that machine learning based methods have outperformed conventional grade estimation modelling methods.
A new method for determining muckpile fragmentation formed by blasting by A. Tosun 665
Muck pile fragmentation that is formed because of blasting depends on the specific charge factor, the discontinuity values of the blasting surface, and the rock strength. Determination of the discontinuity characteristics and rock strength is a long and difficult process. A correlation was developed predicting muck pile fragmentation according to the specific charge factor and the drilling speed of the drill machine.
Applicability of the risk ranking methodology designed for water reservoirs to tailings storage facilities D. Nišić, D. Knežević, A. Cvjetić1, N. Nišić, and V. Jovanović ............................................. 673
It often happens that Water Reservoirs and Tailings Storage Facilities are put in the same category when it comes to risk assessment and the application of relevant methodologies. This paper analyses whether it is possible to apply the risk ranking methodology designed for water reservoirs to tailings storage facilities. It was concluded that a more realistic evaluation of risk levels can be provided by adopting a systematic approach to risk assessment.
The Journal of the
VOLUME 122 NOVEMBER 2022 iii ◀
Southern African Institute of Mining and Metallurgy
Journal Comment

Synergy between computational and empirical methods in the mining and metallurgy
The importance of the mining and metallurgical disciplines to the collective future of humanity cannot be overemphasized. These fields are the fulcrum for engineering, information technology, and biotechnology. The efficacious interplay between these areas will drive a green future, a circular economy, and technologies of the future. This future must enable innovation for prosperity and reduction of carbon footprints for human survival.
The mining, geology, and metallurgical industries have undergone four major paradigm shifts. The first shift is based on empiricism sparking the curiosity of humans through a hands-on approach; experiments are carried out to allow interaction with the environment in ways that link theory to practice. The second focused on model-based theoretical science, where the laws of thermodynamics became apparent in the 1950s. The third paradigm shift is deeply embedded in computational modelling and simulations. This is underpinned by design and systems, thinking which was popularized in the early 2000s. In this era of overwhelming complexities, tremendous competition, and accelerated change, the fourth paradigm shift is mainly concerned with Big Data. This involves the application of statistical and probability theory for predictive analytics, relationship mining, and materials informatics. The characteristics of Big Data revolved around the ‘six Vs’: volume, value, variety, velocity, veracity, and variability. The mining and metallurgical industries will in the future thrive on the synergies between artificial intelligence and empirical research.
Geological materials are heterogenous. The concept of geometallurgy is critical for the optimization of mining and exploration operations. Advanced computation and simulation are tools for predicting operational scenarios and performance. These approaches are essential to metallurgical and mineral recovery in addressing circularity for a green economy and innovation for all. Computational approaches provide the opportunities to test a great many assumptions and then finally optimize the parameters required to execute a few experiments in a cost-effective and timeous manner. Irrespective of advanced techniques and high throughput, simulation and computation methods are available and more are being constantly developed. Experimentation is the final arbiter where theory aligns with practice.
In this edition of the Journal, the main themes of the papers focused on empiricism and Big Datadriven approaches for mineral resource optimization. These multidisciplinary and transdisciplinary approaches are expected to contribute to and deepen our understanding of current research hotspots in mining and metallurgy.
In summary, rational approaches to exploratory, basic, and applied research are essential in this knowledge economy. Hence, computation and experimentation, with their complementary approaches, are the right tools for a resource-constrained world and the future. This is essential for the metallurgy and mining industries. We hope readers will glean insights from these papers in ways that contribute to further intellectual discourse.
D. Klenam University of the Witwatersrand

▶ iv NOVEMBER 2022 VOLUME 122
The Journal of the Southern African Institute of Mining and Metallurgy
President’s Corner
The Mining Industry and the Energy Crisis
What is the role we are playing?

Ifind myself confronted with my own ignorance after a few months (if not years) of an overwhelming information onslaught about the state of South Africa’s infrastructure. More specifically, our country’s energy crisis. I realized that with this torrent of information, I still cannot say what the future of our energy infrastructure and supply will look like. More importantly, if the future indicates an ongoing energy gap, what will be the impact on the mining industry?
A report from the Centre for Sustainability Transitions at Stellenbosch University has estimated that $250 billion will be required over the next 30 years to support South Africa’s transition away from coal. The Just Energy Transition Partnership Investment Plan (JETP-IP), currently in its first draft, seeks to unlock $8.5 billion in finance over 3 to 5 years to assist South Africa’s transition away from fossil fuels. Commentary indicates that this will not be sufficient to address the current energy gap.

South Africa relies heavily on electricity generation by an ageing fleet of coal-fired power stations. Eskom plans to remove approximately 3.5 GW of supply by decommissioning five coalfired stations, which will have reached the end of their 50-year lifespan between 2021 and 2025. Approximately 60% of the nominal capacity of 37.4 GW is generated by power stations between 35 and 59 years old. With this imminent threat, it is estimated that without additional capacity there will be an electricity gap of around 5 GW over the next four years. Since electricity generation from fossil fuels retains a monopoly in South Africa, plans had to be put in place to manage the energy gap through the Integrated Resources Plan (IRP), which focuses on pursuing an energy mix, including renewables, hydrogen, and nuclear to meet the country’s energy demand. Should there be any further slippage in executing the installation of renewable energy sources and the completion of the transition development plan (TDP), the supply gap will balloon to 9.1 GW by 2030. This would be disastrous for South Africa and the mining industry.
Mining is one of the biggest contributors to South Africa’s gross domestic product, accounting for almost 9% of the GDP in 2021, and according to Statistics South Africa at the end of March 2022 the mining industry marked the second most significant quarter-on-quarter increase of 2% in employment. Statistics vary, but 14% to 30% of South Africa’s total energy is supplied to the mining industry, around 40% of which is consumed by the platinum mining industry. Platinum is one of the key materials for batteries and hydrogen technologies. South Africa produces 72% of the world’s platinum and in layman’s terms, a growing energy gap would mean that underground operations would cease, causing major PGM supply disruptions. Apart from the risk to PGM supply, an ongoing and increasing energy gap could cost the country billions of rands in lost tax revenue from the mining industry as production slows. In April 2022, Stats SA showed a slump of 14% in mining production, which was far worse than market forecasts of a 5% decline at the time.
Is there a role for the mining industry to play within this energy crisis?
South Africa’s President announced that the licence-exemption cap on self- or distributedgeneration plants would be raised from 1 MW to 100 MW. The implication of this is that mining companies can now build power generation units of up to 100 MW without applying for a licence through the National Energy Regulator of South Africa (Nersa). Keeping in mind that the mining industry is one of South Africa’s largest energy consumers, the mining industry aims to reduce its own consumption by approximately 30% with 73 self-generation projects, from 24 mining companies, which could generate up to 5.1 GW of electricity (technology analyst Christian Teffo from the Minerals Council South Africa). According to the Minerals Council, gold producer
The Journal of the Southern
Institute of Mining and Metallurgy VOLUME 122 NOVEMBER 2022 v ◀
African
President’s Corner (continued)
Pan African Resources is already producing 10 MW, Gold Fields is set to add a further 50 MW, and Harmony Gold is aiming to produce 38 MW. This year alone, Nersa has registered 295 MW of projects for mining companies. Sibanye-Stillwater is preparing feasibility studies for prospective 50 MW and 85 MW solar PV projects; Anglo Platinum is looking at building a 75 MW to 100 MW solar PV plant and in May 2022, at the annual African Mining Indaba held in Cape Town, unveiled a prototype of the world’s largest hydrogen-powered mine haul truck. Northam Platinum is looking at modules of 10 MW. According to Gold Fields CEO Chris Griffith, their solar PV plant will generate more than 20% of the mines’ electricity and will save Gold Fields R120 million a year in power costs.
All these initiatives will go a long way towards achieving a net-zero carbon emissions target set for 2050. South African miners commit to playing their part to support the new energy plan, protecting economic growth and the production of key minerals for batteries and hydrogen technologies. However, the possible solutions for closing the energy gap are complex and the role that the South African mining industry can play to support the national energy plan is not without risks and barriers.
Risks that enjoy media attention reach across social, economic (especially capital costs), technological, and regulatory barriers. The dialogue around fossil fuels cannot happen without acknowledging political influence. National plans to install alternative energy slipped mainly because of a failure to implement policy between 2015 and 2018 and the consequent breakdown in procurement. The missed opportunity is immense, considering that new IPP renewable energy sources can potentially come on-line quite quickly and smaller projects can be implemented rapidly (compared to coal-fired power stations). Moreover, there is still debate around structural reforms, including unbundling of the national power supplier, the option of independent transmission operators, and independent energy trade, which has explicitly been mentioned by Jevon Martin, the chairperson of the Energy Intensive Users Group (EIUG). Although there is a risk in affordable energy storage options for renewable power, it seems that the barrier that is most often discussed is regulatory challenges. Have we truly addressed our regulatory barriers? Nikisi Lesufi, the Minerals Council’s senior executive for environment, health, and legacies, said there was still a ‘plethora of red tape’ which is stopping individual mining companies from fast-tracking power projects. He mentions that the lack of coordination between different authorities and long lead times in obtaining authorization are unnecessarily increasing the project timelines of mining companies. It is evident that the South African energy policy and legal regulations are highly complicated and dynamic, with obvious institutional fragmentation.
Is there a role for the mining industry to play in addressing these regulatory barriers? The SAIMM continues to create a platform for our stakeholders to discuss these challenges. One example was the Just Transition ESGS Webinar in October 2022, where Andrew van Zyl, who is currently managing the SRK team that is part of the EU Re-sourcing Project, Dr Megan Cole, sustainable development researcher from the University of Cape Town, and Mzila Mthenjane, executive head, strategy and stakeholder engagement at Exxaro Resources, gave an excellent perspective on our coal mining, the associated communities, and the just transition in South Africa. I urge our stakeholders to join us and continue having this conversation
Z. Botha President, SAIMM
▶ vi NOVEMBER 2022 VOLUME 122 The Journal
the
of Mining and Metallurgy
of
Southern African Institute
Affiliation: 1Department of Civil Engineering, University of Pretoria, Pretoria, South Africa.

Correspondence to: N.K. Schoeman Email: u14074428@tuks.co.za
Dates: Received: 20 Nov. 2021 Revised: 28 Jul. 2022 Accepted: 1 Aug. 2022 Published: November 2022
How to cite: Schoeman, N.K., Jacobsz, S.W., and Kearsley, E.P. 2022
The effect of overburden and confined stress state on cave mining propagation. Journal of the Southern African Institute of Mining and Metallurgy, vol. 122, no. 11, pp. 617–628
DOI ID: http://dx.doi.org/10.17159/24119717/1910/2022
ORCID: N.K. Schoeman http://orcid.org/0000-00031544-8476
S.W. Jacobsz http://orcid.org/0000-00027439-2276
E. Kearsley http://orcid.org/0000-00030458-8908
J. Wesseloo http://orcid.org/0000-00017124-2267
The effect of overburden and confined stress state on cave mining propagation
by N.K. Schoeman1, S.W. Jacobsz1, and E.P. Kearsley1
Synopsis
A physical modelling approach was adopted to simulate the process of cave mining propagation at various horizontal to vertical stress state ratios, and image data was captured and used to characterize the resulting failure mechanisms. Image processing was integrated into the study to determine minor principal strains in models to identify where critical extensional strains had been exceeded relative to crack propagation. The study exhibited a scale factor magnitude of 119 using a calculated critical extensional strain value of 0.014% for the modelling material used. It was perceived that cave propagation occurred through successive parallel extensional ‘fracture bands’ in all cases, as noticed in models of prior studies, deviating from that described by the Duplancic model. Cracks tended to bisect regions of minor principal strain equal to the critical extensional strain, which suggests ‘fracture banding’ is an acceptable failure mode for brittle, rock-like materials. Moreover, it was found that models with lower horizontal to vertical stress ratios (K ratios) showed a greater degree of vertical development of the caving mechanism (at similar vertical stresses), while the vertical extent of the cave was suppressed in models with higher K ratios. Models subjected to larger vertical stresses experienced slower cave formation in latter time-steps. These models exhibited larger two-dimensional caved perimeters and areas, respectively.
Keywords
physical modelling, cave mining propagation, particle image velocimetry, critical extensional strain, model material.
Introduction
Cave mining involves the mass mining of an orebody by means of an undercutting process in the form of drilling and blasting of horizontal in-situ rock sections. This broken rock is removed at underground drawpoints after the undercutting phase. When an undercutting footprint of sufficient extent has been reached, a self-sustaining propagating cave will advance, provided the caved material is removed. Block and panel cave mining are efficient mass mining methods since, after initial establishment of the infrastructure, no drilling and blasting is necessary to mine the ore.
In-situ stress states
The World Stress Map (WSM) provides a database of lithospheric stresses resulting from tectonic plate movement in the upper part (2-5 km), as well as the lower part (5-20 km) of the Earth's crust. Zoback and Zoback (2002) claim that in-situ stresses at depths exceeding 100 m are caused purely by tectonic stress fields. According to Stacey and Wesseloo (1998), the horizontal secondary principal stresses in South Africa’s mines are found to take on an approximate NW-SE orientation in most cases, with some NE-SW directions in fewer instances. The general trend found in South Africa’s mines is that horizontal stress values are typically equal to or greater than the vertical stress This is commonly the case in mines around the world except for Australia and Canada (Brady and Brown, 2006; Arjang, 2004; Yong and Maloney, 2015; Lee et al., 2010). Stacey and Wesseloo (1998) pointed out that the approach of using a horizontal to vertical stress ratio of 0.5 for mining layout analyses is normally invalid. It is commonly known that the Northern Cape Province is an area of high horizontal stress (Nieuwoudt and Rozendaal, 1990). At shallow depths, it is significant to note that horizontal stresses generally exceed the overburden stresses (Stacey and Wesseloo, 1998). It is hypothesised that the in-situ horizontal to vertical stress ratio (in the earth’s crust) would affect the mode of cave propagation, where larger ratios could lead to less steep caving, and even causing cave stalling.
617 The Journal of the Southern African Institute of Mining and Metallurgy VOLUME 122 NOVEMBER 2022
The Duplancic model
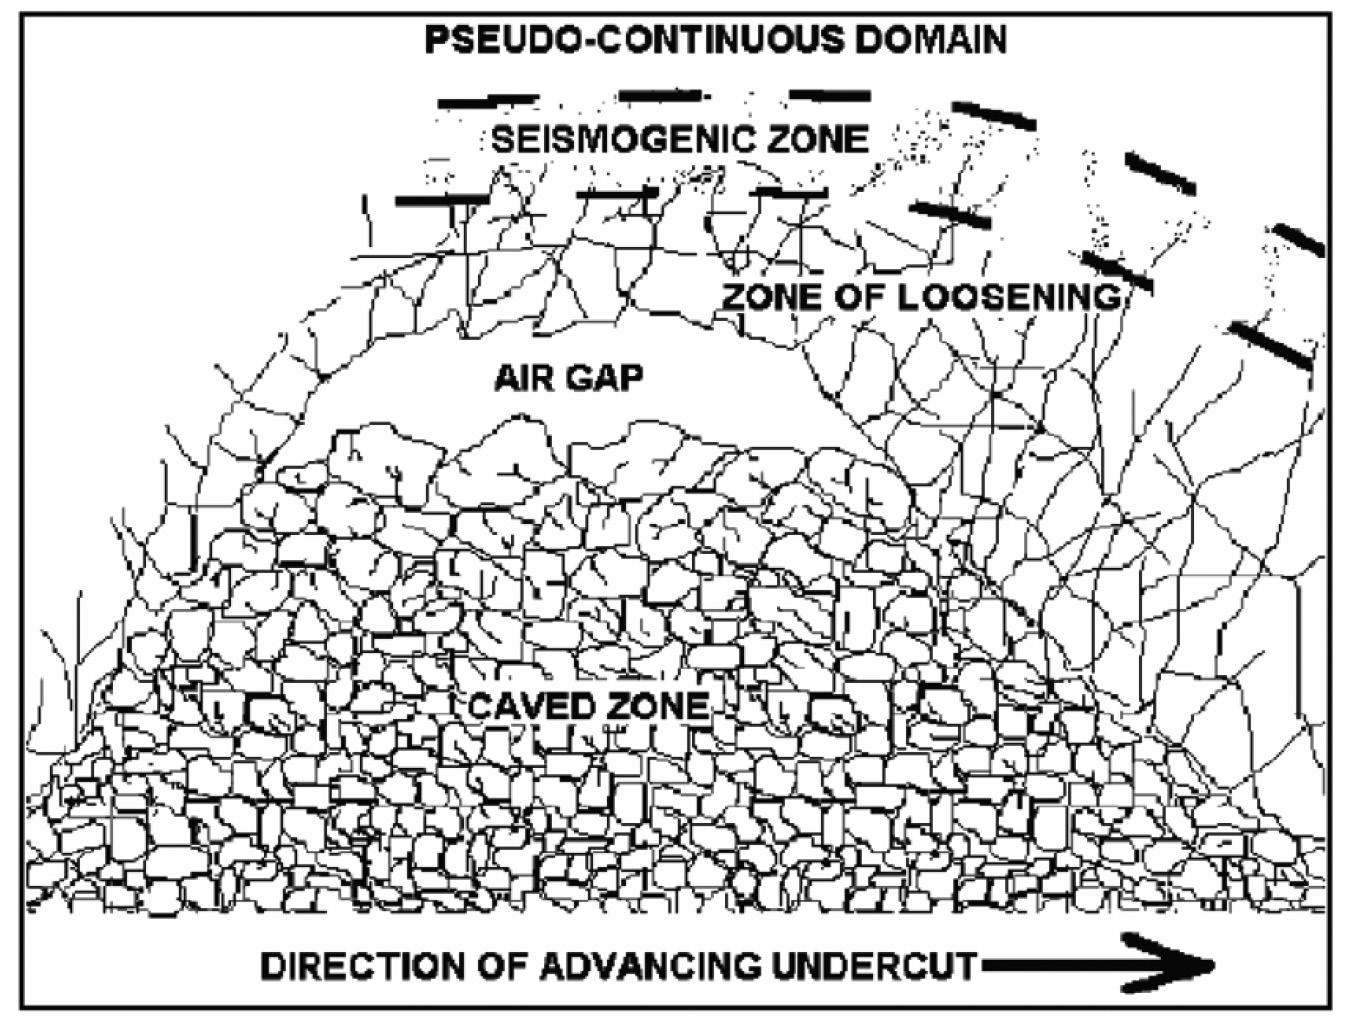
The failure mechanism that is most accepted in industry is the Duplancic model (Duplancic, 2001). The principal assumption of this model is that the damage profile of rock material decreases with distance above the cave back and that caving takes place primarily due to slip along pre-existing rock fractures (Duplancic, 2001). The model describes several zones of influence affected by cave mining. There are five sub-zones which categorize the Duplancic model, as shown in Figure 1:
➤
Caved zone – which comprises a zone of caved material that has collapsed from the cave back capable of providing – to some extent – support to the flanks of the cave back
➤ The air gap between the cave back and the caved zone
➤ The zone of loosening, consisting of rock that is in a loosened state which does not provide any support to the overlying rock mass. Also known as the zone of disintegration
➤ The seismogenic zone, above the zone of loosening. Seismic fracture, as the name suggests, occurs in the part of the rock mass which causes slip along pre-existing discontinuities
➤ The last zone is referred to as the pseudo-continuous domain This zone is above the seismogenic zone, where the rock mass damage is limited and deformation is generally assumed to be elastic.
Caving mechanics
Cumming-Potvin et al. (2016a) conducted geotechnical centrifuge modelling of the caving process on physical artificial rock models produced from fly ash and weakly cemented sand into which a network of pre-cut joints was randomly distributed during the curing process. In these model tests, the horizontal confining stresses in cave mines were simulated using water-filled bladders on the sides of samples. The undercutting procedure was induced by withdrawal of five hydraulically-supported pistons. Approximately 50 mm thick artificial rock slabs (samples) were tested under near-plane strain conditions, with confinement in the third dimension provided by a glass panel to allow the models to be photographed using a digital single lens reflex (DSLR) camera. Samples were tested at an acceleration of 80 g.
The results obtained from the physical modelling did not agree with the behaviour of the Duplancic model. Cumming-Potvin et al (2016) observed an extensional type of failure mechanism whereby
the cave advanced upwards in successive parallel fractures (referred to as ‘fracture bands’) from the cave back. From these results it appeared that the damage profile did not monotonically decrease with distance above the cave back as advocated by the Duplancic model, but followed a discontinuous profile. The failure was characterized as extensional because of the direction of movement and the lack of damage to the edges of the ‘fracture bands’ as referred to by Cumming-Potvin et al. (2016a). The authors noted that their evidence was not definitive, but indicative that these fractures formed in extension. All samples tested in the physical modelling programme were reported to have failed by the extensional-type failure described previously. The spacings of fractures were consistent within each test, but not from one test to another, indicating that the spacing of the fractures might be a function of material properties and/or stress state. Some of the fractures terminated at the edges of the piston-retractable platforms, creating the impression that fracture banding is a byproduct of the undercutting performed with comparatively wide platforms. It is clear that close to the undercut, the discrete piston width affects the fracture behaviour. This is, however, not the case with cave propagation after the original cave initiation (CummingPotvin et al., 2016a). Wesseloo et al. (2020) showed that the fracture generally occurs in the crown of the cave and propagates outwards and downward to terminate at the piston edge.
It was reported that no tests of brittleness had been performed and further research was yet to be conducted to determine the influence of brittleness on physical modelling tests (Cumming-Potvin et al., 2016a). Cumming-Potvin et al. (2016b) recommended that a better model material needed to be developed for follow-up physical model studies investigating cave propagation. In supplementation of Wesseloo et al. (2020), the research described in this paper extends the physical modelling by Cumming-Potvin et al. (2016a, 2016b) and attempts to investigate cave mining propagation mechanisms under different horizontal to vertical stress ratios. The current study also proposes an improvement to the model material that incorporates better rock-like features such as fragmentation, overall brittleness, and stiffness.
Methodology
Materials and properties
The material used to simulate the cave mining process in physical models was developed by trial and error to produce a weak, relatively hard, brittle medium, capable of representing a rock mass that would fracture at the test acceleration of 80 g. Table I indicates the proportioned constituents used in fabricating the model material, with their corresponding relative densities.
Constituents were blended using a high-shear mixer at a moderate setting (855 r/min). Fly ash and water were mixed first, followed by equal quantities of kaolin in 5-minute time
Table I
Mix design of kaolin-fly ash material
Constituent Specific gravity Proportion (kg/m³) Mass %
Kaolin 2.70 269.6 16.40
Fly ash 2.22 875.0 53.24
Water 1.00 499.0 30.36
Total 1644 100.0
618 NOVEMBER 2022 VOLUME 122
The effect of overburden and confined stress state on cave mining propagation
The Journal of the Southern African Institute of Mining and Metallurgy
Figure 1—the influential zones of the Duplancic model (Duplancic and Brady, 1999)
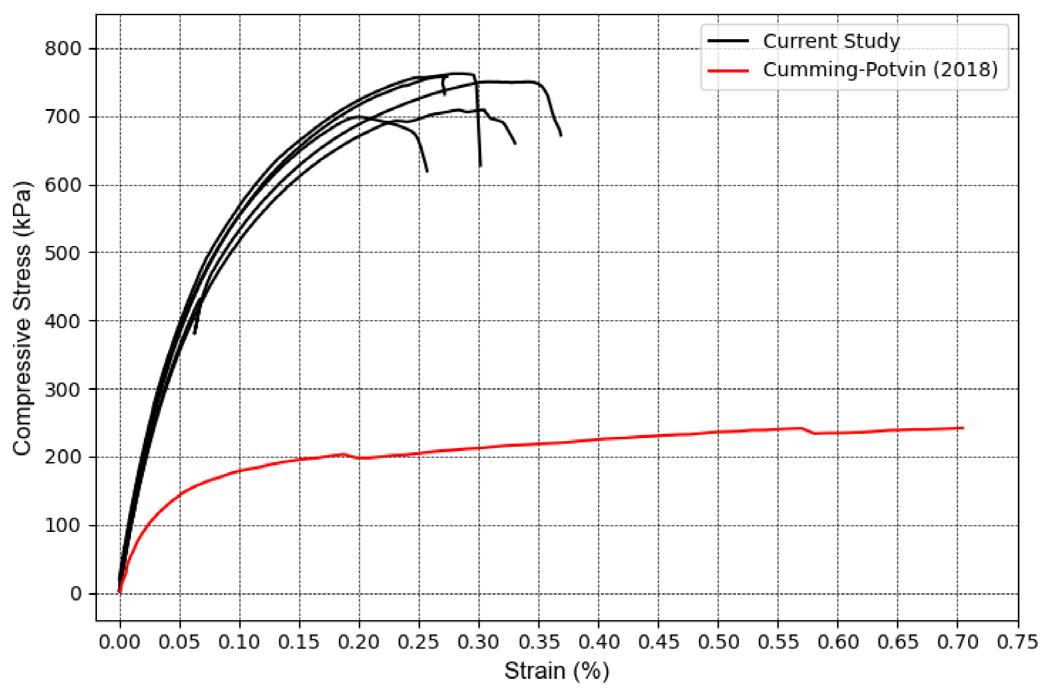
Figure 2— UCS repeatability tests for the model material
increments. The constituents were mixed for a further 5 minutes and cast into oiled slab moulds (500 mm by 450 mm by 55 mm) and cylinder moulds (100 mm long by 50 mm diameter) before being vibrated for 7 minutes to remove air. Samples were initially cured uncovered at 24°C for 13 days, after which they were strong enough to be handled. Samples were finally oven-dried at 70°C for 48 hours before they were used in centrifuge testing.
Uniaxial compressive strength (UCS) tests were conducted on cylindrical samples to gain an indication of the stiffness, brittleness, and unconfined compression strength of the model material. Figure 2 exhibits the response in the UCS tests of the model material, also showing the truncated UCS curve of 48hour cured material as used by Cumming-Potvin (2018). In the current study, the average UCS value was recorded as 735 kPa, with the material failing at an axial strain of 0.25–0.35 %, the latter correlating well with rock and other brittle materials such as concrete.
Triaxial testing was carried out at confining pressures ranging from 100 to 700 kPa on specimens to establish an average Young’s modulus and Poisson’s ratio. Triaxial results were then used to determine the Mohr-Coulomb strength parameters of the material. Numerous Brazilian indirect tensile disc tests (BDTs) were performed on the material with curved loading arcs to alleviate premature failure at the points of load application (Gaspar and Jacobsz, 2020). A tensile strength of around 86 kPa was calculated using the relationship from ASTM 2008 (and ISRM 1981) for the splitting tensile strength (σt): [1]
where:
σ
t = Tensile strength (Pa)
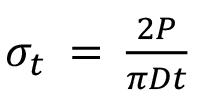
P = Compressive load at failure (N)
D = Diameter of disc specimen (m)
t = Thickness of disc specimen (m)
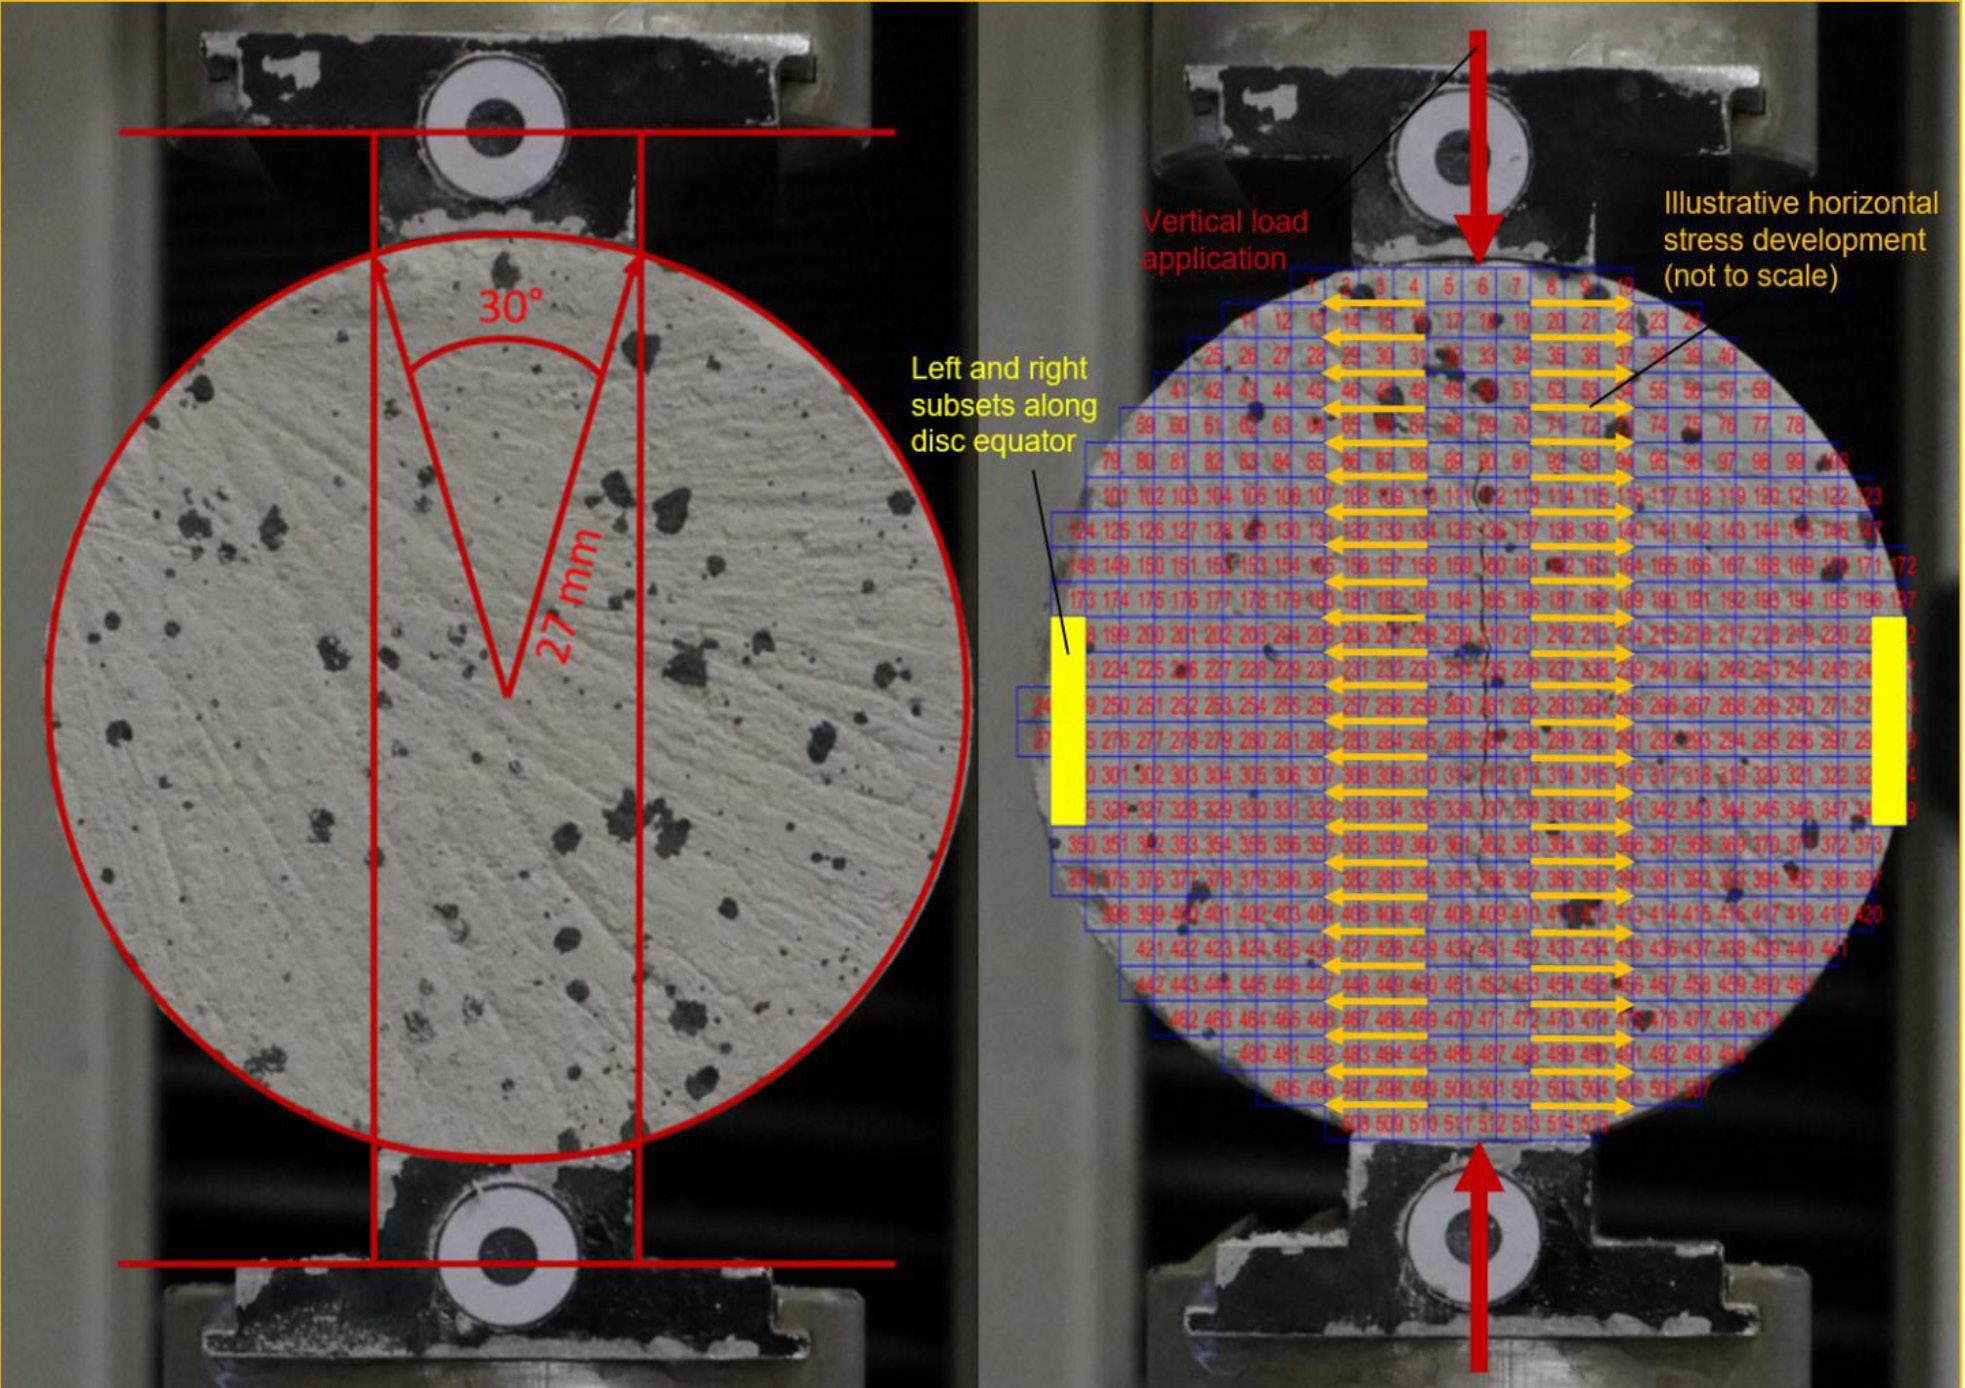
The average tensile stress was determined from the tensile splitting tests. Images taken at 5-second intervals during BDTs were corrected for lens distortion using the GIMP GNU image manipulation programme (Kimball and Mattis, 2019). Images were processed via PIV (particle image velocimetry) analysis through GeoPIV-RG software (Stanier et al., 2016) to determine the tensile sample strains during testing. The input for the PIV analysis involved generating a mesh to populate the subsets over the
reference image with a patch size of 50 pixels. Images used in the analysis had adequate texture to allow for particle tracking. The diameter of the disc specimens was typically 1250 pixels (imagebased distance).
The Young’s modulus of the model material was determined as 778 MPa (on average), and the average unit weight was 1 453 kg/m3, based on laboratory-tested specimens. The shear modulus was calculated as 365 MPa and the Poisson’s ratio was estimated as 0.22 from the triaxial tests conducted at a cell pressure of 100 kPa. The Poisson’s ratio of the model material correlates well with the range exhibited by most rocks (Vutukuri, Lama, and Saluja., 1974; Hatheway and Kiersch, 1986; Gercek, 2007). The porosity of specimens and panels used in centrifuge testing was calculated as 37.3% on average, which correlates well with sedimentary rocks. According to Sheorey (1997), the compressive to tensile strength ratio of rock covers a range of 2.7 to 39, depending on the rock type. The average ratio of compressive to tensile strength for the model material in the current study was approximately 8.54. The average values for the cohesion and friction angle for specimens were calculated as 240 kPa and 16.5° respectively at peak principal stresses. At residual principal stresses, values of 112 kPa and 21.8° were reported for the cohesion and friction angle respectively. This revealed that the cohesive strength was mobilized first, followed by the onset of the frictional component, which requires higher degrees of strain to mobilize (Schmertmann and Osterburg, 1960).
Critical extensional strain
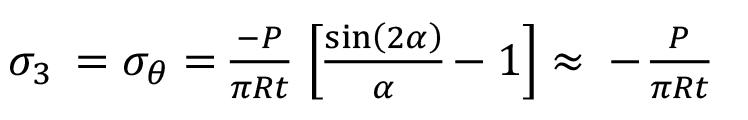
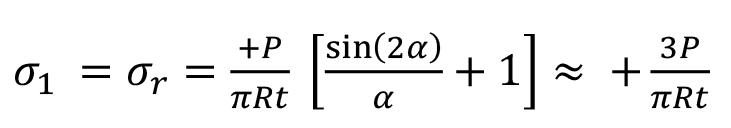
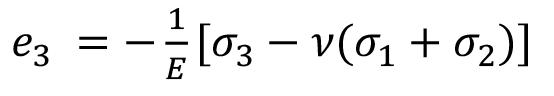
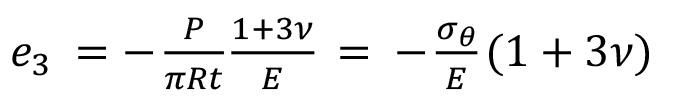
According to Li and Wong (2013), tensile cracks may initiate at strains equal to the critical extensional strain even before the required stress has reached the material’s tensile strength. It is also worth noting that these cracks caused by extensional strains can be generated in environments where all three principal stresses are compressive (Stacey, 1981). Following the procedure of obtaining the tensile strength and horizontal strains from load and image data respectively, a lower and upper bound were defined to assess the critical extensional strain for the model material. The stress at the elastic limit on the tensile extreme was divided by the Young’s modulus, which yielded a lower bound strain absolute value of 0.011%. The calculation of the upper bound necessitated the modification of Equation [2], with the substitution of Equation [1] at the centre of the disc sample as per Li and Wong (2013) – shown by Equations [3], [4] and [5], where σ2 is considered negligible. In this way, the added component of Poisson’s ratio is used to determine a more refined value for critical extensional strain. Thus, utilizing the resulting Equation [6] to calculate extensional strains using the circumferential stresses in Brazilian disc specimens, anticipates an over-estimation of the value for critical extensional strain. In the following equations, which are valid in plane-strain environments, compression is taken as positive. [2] with [3] [4] [5]
619 The Journal of the
VOLUME 122 NOVEMBER 2022
The effect of overburden and confined stress state on cave mining propagation
Southern African Institute of Mining and Metallurgy
Finally, substituting Equations [3], [4] and [5] into Equation [2]: [6]
where e₃ = Extensional strain / minor principal strain
E = Elastic modulus of the material (kPa) ν = Poisson’s ratio σ₁ = σr, Major principal stress or radial stress (kPa) σ₂ = Intermediate principal stress (kPa) σ₃ = σθ, Minor principal stress or circumferential stress (kPa) R = Disc radius of the specimen (m) 2 α = Angular distance over which P is assumed to distributed radially (usually ≤15°).
The origin of Equations [3] and [5] is from the assumptions of Griffith criterion where the exact centre of the disc is the only crack initiation point at which the conditions for tensile failure at a value equal to the uniaxial strength are met.
Making use of Equation [6] and the load data from the BDT tests, the extensional strain (e3) experienced normal to the cracks
forming during Brazilian disc testing can be plotted against the vertical displacement applied to the sample. The extensional strain curves for six tests, which were found to have split through their centres (in tension failure), are shown in Figure 3.
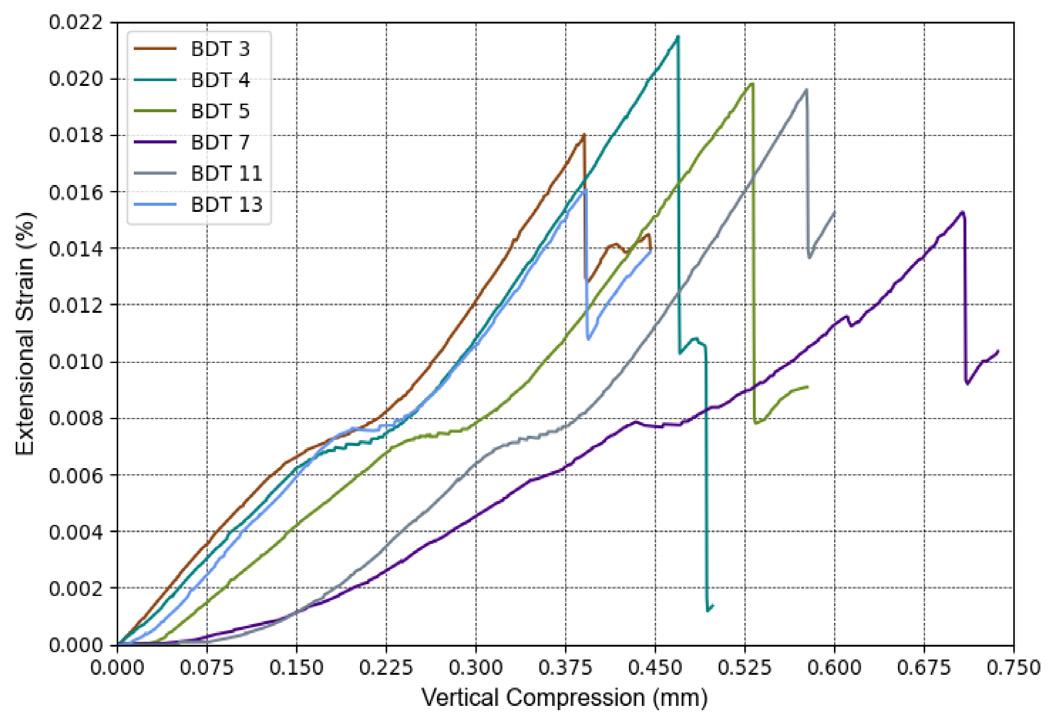
From Figure 3, an average value of 0.018% for the upper bound of tensile strain was evaluated. Note that values were taken from the peaks of the curves, which correspond to the tensile strength of the material. If the average value of 0.018% was regarded as a candidate value for critical extensional strain, it would be an overestimation as tensile cracks might have initiated where the tensile strain equals the critical extensional strain for the particular material (Li and Wong, 2013). According to Li and Wong (2013), this extensional strain value, when translated to a stress, is lower than the tensile strength of the material in most cases. This shows that strains could potentially govern failure in brittle materials.
Considering the lower and upper bound values, strains were also determined from the horizontal displacements (i.e. ‘bulging’) of BDT specimens using PIV analysis. The horizontal displacements that were exported from the PIV data were for the left and right subsets near either end of the 'disk equator' as illustrated by the yellow columns in Figure 4. Other subsets tracked during the PIV analysis are indicated by outlined blue squares. Upon determining the horizontal tensile strains from the displacements tracked along the sides of each specimen, the absolute extensional strain was plotted for each progressive image taken during the indirect tensile tests. Values of strains recorded outside the limits, as defined by the lower and upper bounds, were discarded to select a representative estimate of the critical extensional strain for the chosen material. The representative critical extensional strain value was approximated by 0.014%, checked against the previously defined bound values.
Centrifuge model and test procedure
Due to settlement and shrinkage during the curing process, sample dimensions decreased by 25 mm in width, 20 mm in height, and 8 mm in thickness, resulting in final sample dimensions of approximately 475 mm in width, 430 mm in height and 47 mm in thickness. The physical modelling of the cave Figure 3—Tensile
620 NOVEMBER 2022 VOLUME 122
The effect of overburden and confined stress state on cave mining propagation
The Journal of the Southern African Institute of Mining and Metallurgy
strain-displacement curves for the model material
Figure 4—BDT test set-up (left) and failed specimen indicating subsets (right)
mining process was performed at an acceleration of 80 g using the geotechnical centrifuge at the University of Pretoria (Jacobsz, Kearsley, and Kock., 2014). Five 50 mm wide retractable platforms, positioned next to each other, supported the centre 250 mm of
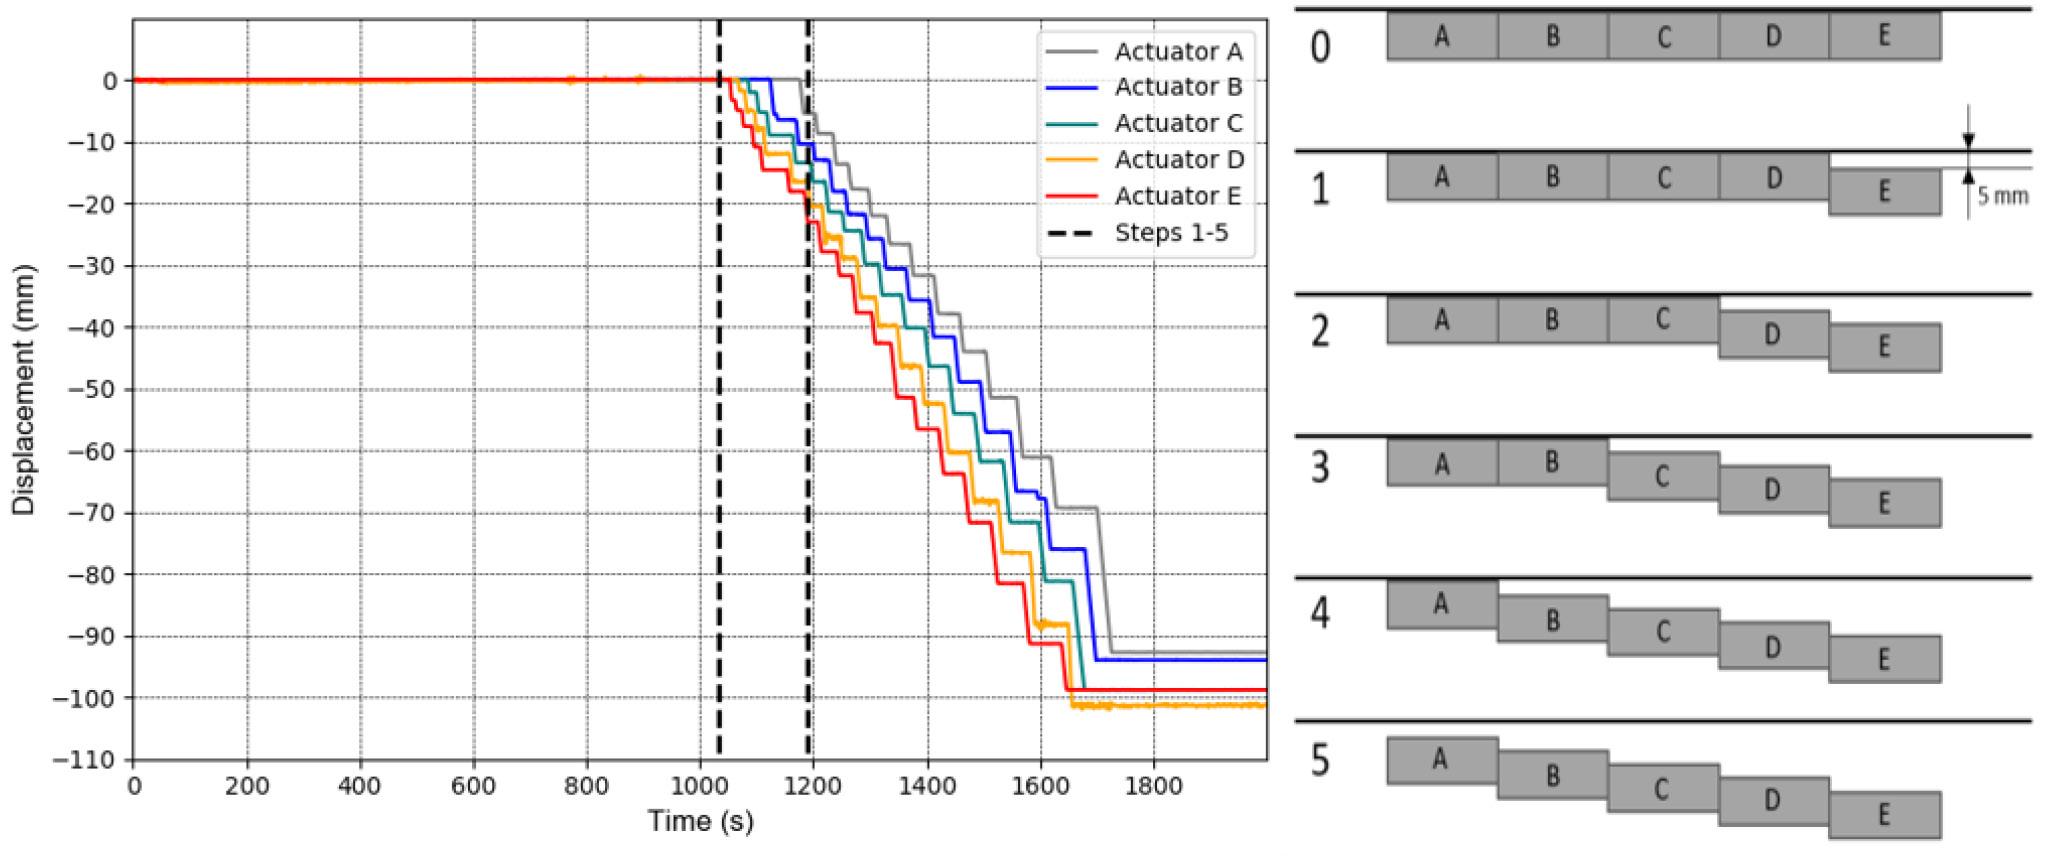
each sample panel of model material, with the sides of the panel resting on rigid supports. The centrifuge model is illustrated schematically in Figure 5. Figure 6 displays photographs of the test frame itself, as well as the sample residing within the test frame before and after the window is fastened for centrifuge testing. The retractable platforms (or trapdoors) were controlled using linear electric actuators, each driven by a 24 V DC motor and gearbox and enabled the undercutting associated with the cave mining process to be simulated. Undercutting of the model orebody was done in a sequence illustrated in Figure 7. The linear actuators were controlled using a high-current motor driver with a variableduty cycle which was operated using a closed-loop control system developed specifically for centrifuge applications, termed Fly-byPi (Broekman et al., 2020).
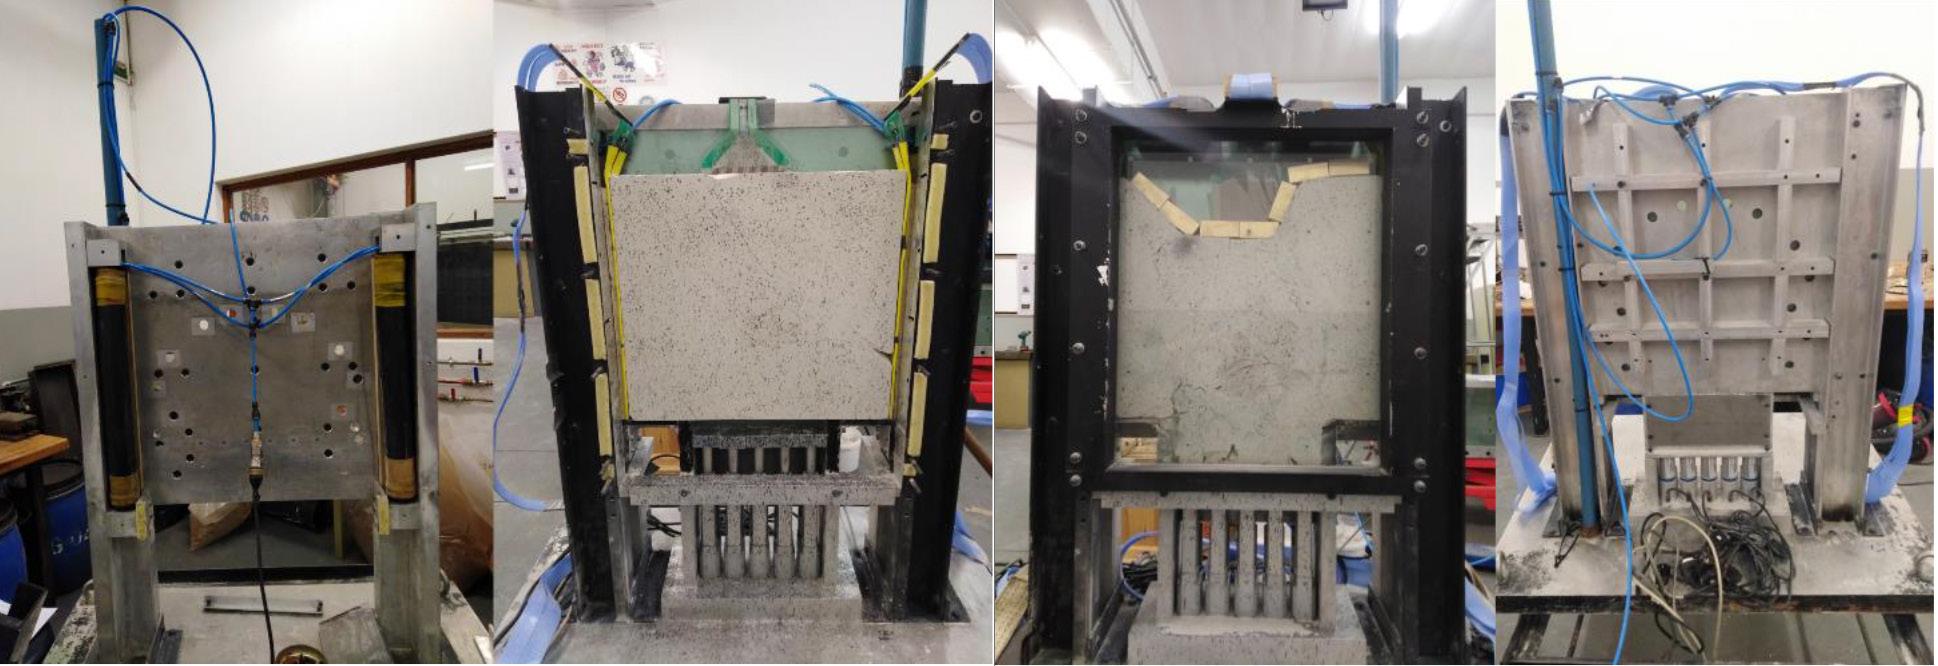
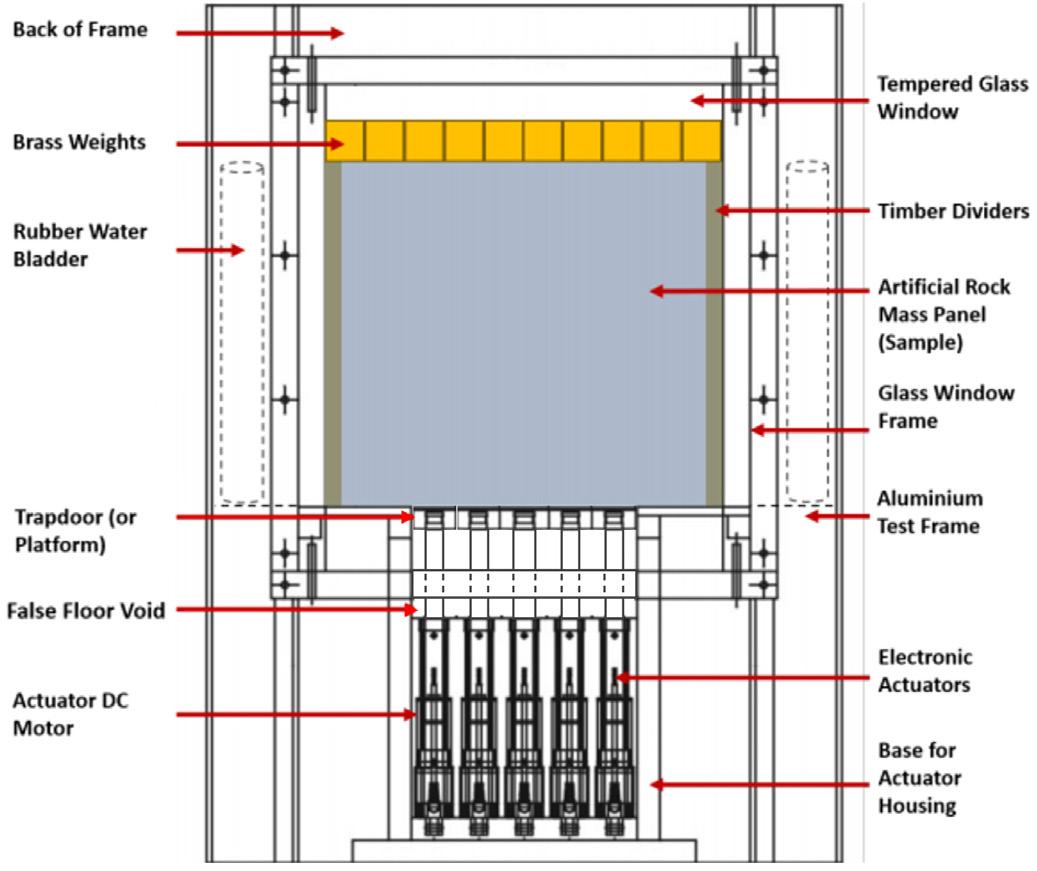
Various components, required for simulating external loads representing different cave mining conditions underground, were integrated within the test frame. These included water-filled bladders adjacent to the caving material that were pressureregulated by a test-specific static head in a standpipe. Adjustable brass weights were placed on top of the caving material to provide overburden pressures for each specific test. Both components allowed for a certain combination of horizontal and vertical stresses to be applied to enable a number of different stress states to be achieved.
The front of the test frame comprised a 30 mm thick tempered glass panel to retain the slab of caving material and to allow
621 The Journal of the
VOLUME 122 NOVEMBER 2022
The effect of overburden and confined stress state on cave mining propagation
Southern African Institute of Mining
and
Metallurgy
Figure 5—Schematic of the test frame used during centrifuge tests
Figure 6—Front and back of the test frame with and without the sample model material
Figure 7—Actuator head displacements during a typical test (left) and undercutting procedure illustrating undercutting sequence (right)
photography. A 10 mm thick glass panel provided low-friction confinement at the back of the caving material and was kept in position by an aluminium panel at the back of the test frame. It was intended to maintain the caving material in near plane-strain conditions. The back panel of the test frame was also stiffened by aluminium ribs for increased bending stiffness. Movable timber dividers were placed between the sample and the water bladders to ensure consistent and uniform pressure was exerted on the sample during testing. Silicone and rubber strips were used to cushion sections of the frame that possibly could make contact with the glass components during the tests, to prevent the glass panes from cracking. With the exception of first centrifuge test, where lateral confinement of the sample was achieved using sand, water-filled bladders were placed into the side pockets of the frame. These were linked to a standpipe, fastened to the frame, which was used to control the water pressure in the bladders. After preparation, a panel of model material was abraded to the correct tolerances in order to eliminate any lack of fit in the frame. The panel was then carefully placed in the frame where the actuator heads were positioned below the sample, out of contact. The actuator heads (platforms) were then carefully extended to their maximum limit to ensure that the panel rested firmly on all the platforms. Once the panel had been centred over the five actuator platforms (leaving equal spaces on the sides of the panel), the timber dividers were positioned on the sides of the sample. The panel was marked with black spray paint spots to provide texture in the photos captured for PIV analysis. Care was taken to bolt the 30 mm thick front glass panel in place to avoid the sample cracking due to local stress concentrations. Brass weights were added to the top surface of the sample to achieve the desired overburden stress. The centrifuge model was positioned on the centrifuge swing. The centrifuge lights were switched on, actuators connected, cameras configured, and the data acquisition system initialized. The water bladders were ‘bled’ to purge the system of any air. Image capturing using the Canon DSLR camera and a high-speed Basler camera was started before the actuators were withdrawn to simulate caving. The undercutting commenced as shown in Figure 7 (right) to initiate cave propagation once an acceleration of 80 g was reached. This was continued until all the actuators were fully withdrawn.
Table II
Scaling law parameters for the prototype and model Prototype property*** Value Unit Model property Value Unit σ p 188 MPa σm 0.736 MPa L p *x m L m 0.250 m ρp 2.65 kN/m³ ρm 1.450 kN/m³ E p 50.0 GPa E m 0.778 GPa e3p 0.0001 % e3m **0.014 % *x is calculated using equations listed in Table III **Critical extensional strain value for material in current study *** Properties of quartzite taken from Jacobsz et al. (2018)
Scaling relationships
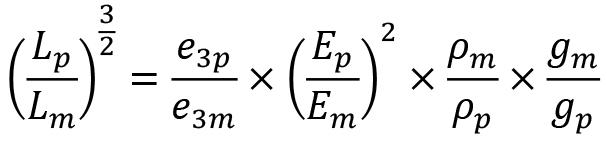
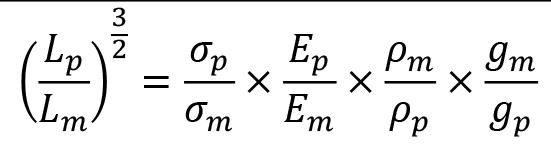
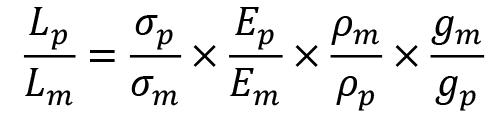
For the physical modelling in this investigation to be representative of the conditions applicable in the field it was necessary to satisfy the requirements of similitude. Buckingham (1914) postulated that the similitude of systems is based on dimensional analysis used extensively in the Buckingham π theorem. This theorem utilizes independent parameters that characterize a system and uses them to determine equations that must be satisfied for achieving similitude between the scale model and the prototype. According to Jacobsz et al. (2018), using the same material for both the prototype and modelling material to simulate deep mining problems is not feasible due to the limitations of most centrifuges. Utilizing the model material described in the current study, ranges of scale factors were calculated using typical rock values (prototype) and the corresponding values for the model material, applying the modified equation from the relevant reference. The values for these parameters are given in Table II compared to quartzite, while the scale factors achieved for the relevant equation used are shown in Table III. Note that subscripts m and p refer to the model and prototype respectively, where σ denotes stress, L is the characteristic length dimension, ρ is the relative density of the material, E is the Young’s modulus, and e₃ denotes critical extensional strain.
622 NOVEMBER 2022 VOLUME 122
The effect of overburden and confined stress state on cave mining propagation
The Journal of the Southern African Institute of Mining and Metallurgy
Comparison of the range of scale factors for various scaling relationships Equation Scaling relationship Reference Scale factor [7]* Hoek (1965b) 720 079 [8]** Hoek (1965a) 8 034 [9]*** Jacobsz et al. (2018) 119 *Based on elastic similitude **Based on bulk material strength scale effects ***Based on critical extensional strain similitude
Table III
Table IV
Summary of horizontal and vertical stresses (kPa) and K ratios for centrifuge models
Parameter Model 1 Model 2 Model 3 Model 4 Cumming-Potvin (2018)
σh (top) 0 120.9 128.3 419.1 324.4 σh (bottom) 234.8 458.3 465.7 756.6 658.6 σh (1/3 height) 158.3 348.5 355.9 646.7 546.7
It should be noted for clarity that the model material, and hence the physical models, were not specifically representative of a certain type of rock (or of a certain block cave mine); however, the material and models of this study were aimed at satisfying the scaling laws for a range of rock types and therefore catering for cave mining in multiple rock types. Typically, σm is taken at the base of models since the model material would first fail in this position when undercut. Scaling laws were derived from the basis of Jacobsz et al. (2018).
Results and discussion
Centrifuge tests
Four cave mining simulations were conducted in the geotechnical centrifuge under different applied stress states. Test 1, with in-situ horizontal to vertical stress ratio of 0.50 (K = 0.50), had negligible horizontal confinement, using sand with zero overburden pressure. This was deemed to represent cave mining cases where low horizontal stresses and minimal overburden stresses exist.
Test 2 (K = 0.94) had a minimal horizontal confinement applied to the sample with zero overburden pressure. It should be noted that, although the in-situ stress ratio at the base of the sample was recorded at 0.94, it did vary to 1.40 at two-thirds the height from the sample base. This test was aimed at representing conditions where there are large horizontal stresses in areas that are not deep underground. This test of the current study compares the closest to those of Cumming-Potvin (2018).
Test 3 (K = 0.69) had a minimal overburden pressure applied to the sample, with the same horizontal confinement as test 2.
Finally, test 4 (K = 0.69) had a maximum overburden pressure applied to the top of the sample, with the highest horizontal confinement given by the water bladders. Theoretical stresses experienced, particularly at the bottom of the sample, exceeded the material’s UCS value.
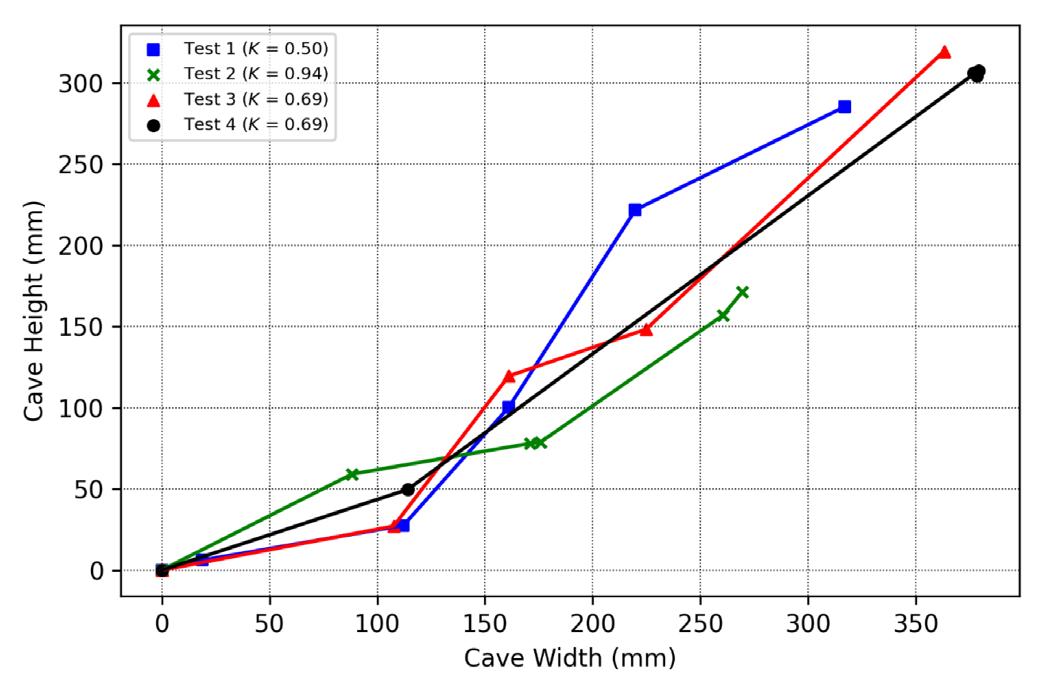
Figure 10—Cavity height (H) vs. width (B) plot during cave mining propagation through steps 1-5
Table IV shows the models of the current study compared to that of Cumming-Potvin (2018), where σh and σv refer to the horizontal and vertical stress, respectively.
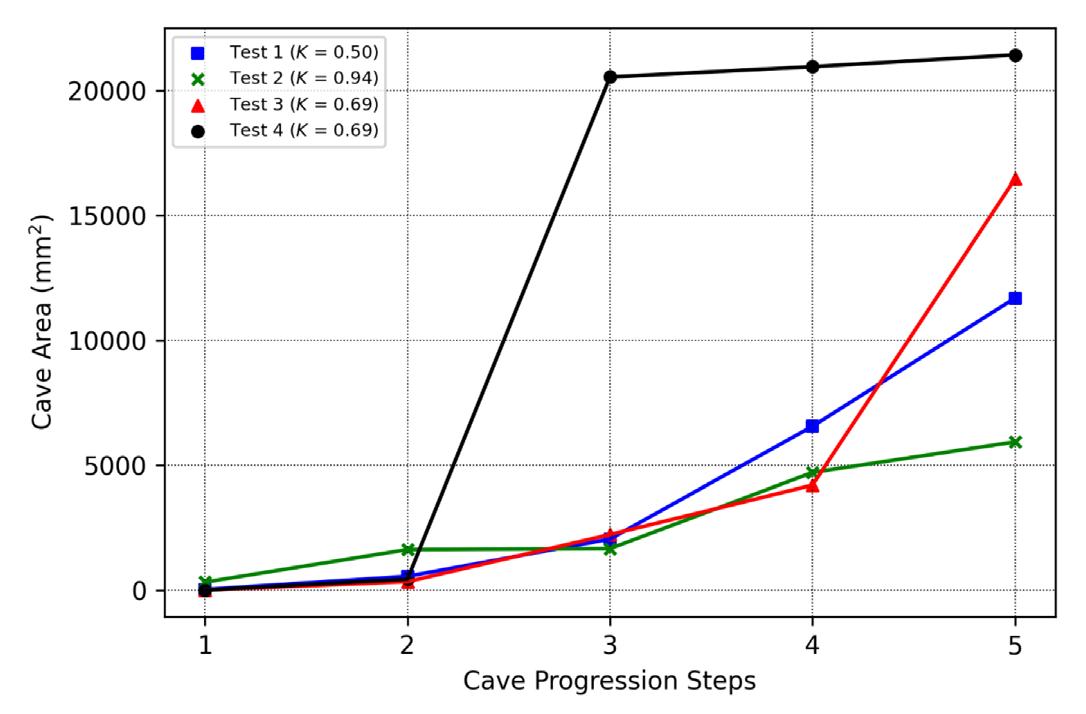
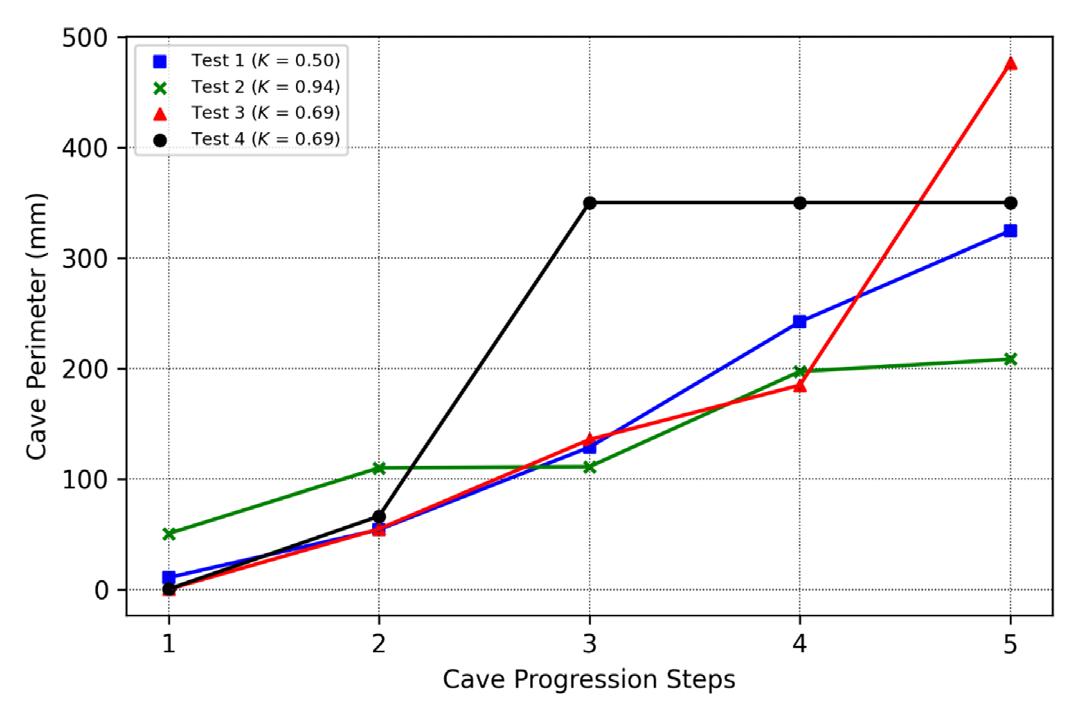
Figures 8 and 9 display the calculated caved perimeter and caved area over the cave progression steps, respectively. Figure 10 plots the measured cavity height against the cave width over cave progression steps (i.e. time intervals when each of the platforms were initially withdrawn).
1-5
From the trends observed in the plots of the geometric parameters against the cave progression steps 1 to 5, it was concluded that tests of higher K ratios resulted in gradients that were initially steep and tended to flatten off when the cave back advanced. Tests of smaller K ratios resulted in slopes that were initially flat, possibly due to the lack of horizontal confinement; however, trends steepened upon the cave back reaching a certain height. When the cave back reached this particular height, the
623 The Journal of the
VOLUME 122 NOVEMBER 2022
The effect of overburden and confined stress state on cave mining propagation
Southern African Institute of Mining and Metallurgy
Figure 8—Caved perimeter length during cave mining propagation through steps
Figure 9—Caved area during cave mining propagation through steps 1-5
horizontal stress arched across, above the cave back, increasing the horizontal stress in the model. This behaviour is exhibited across tests 1, 2, and 3 with a K ratio of 0.50, 0.94, and 0.69, respectively. The same trend is identified when plotting the ratios of cavity height to width at different cave progression steps against the K ratios of tests.
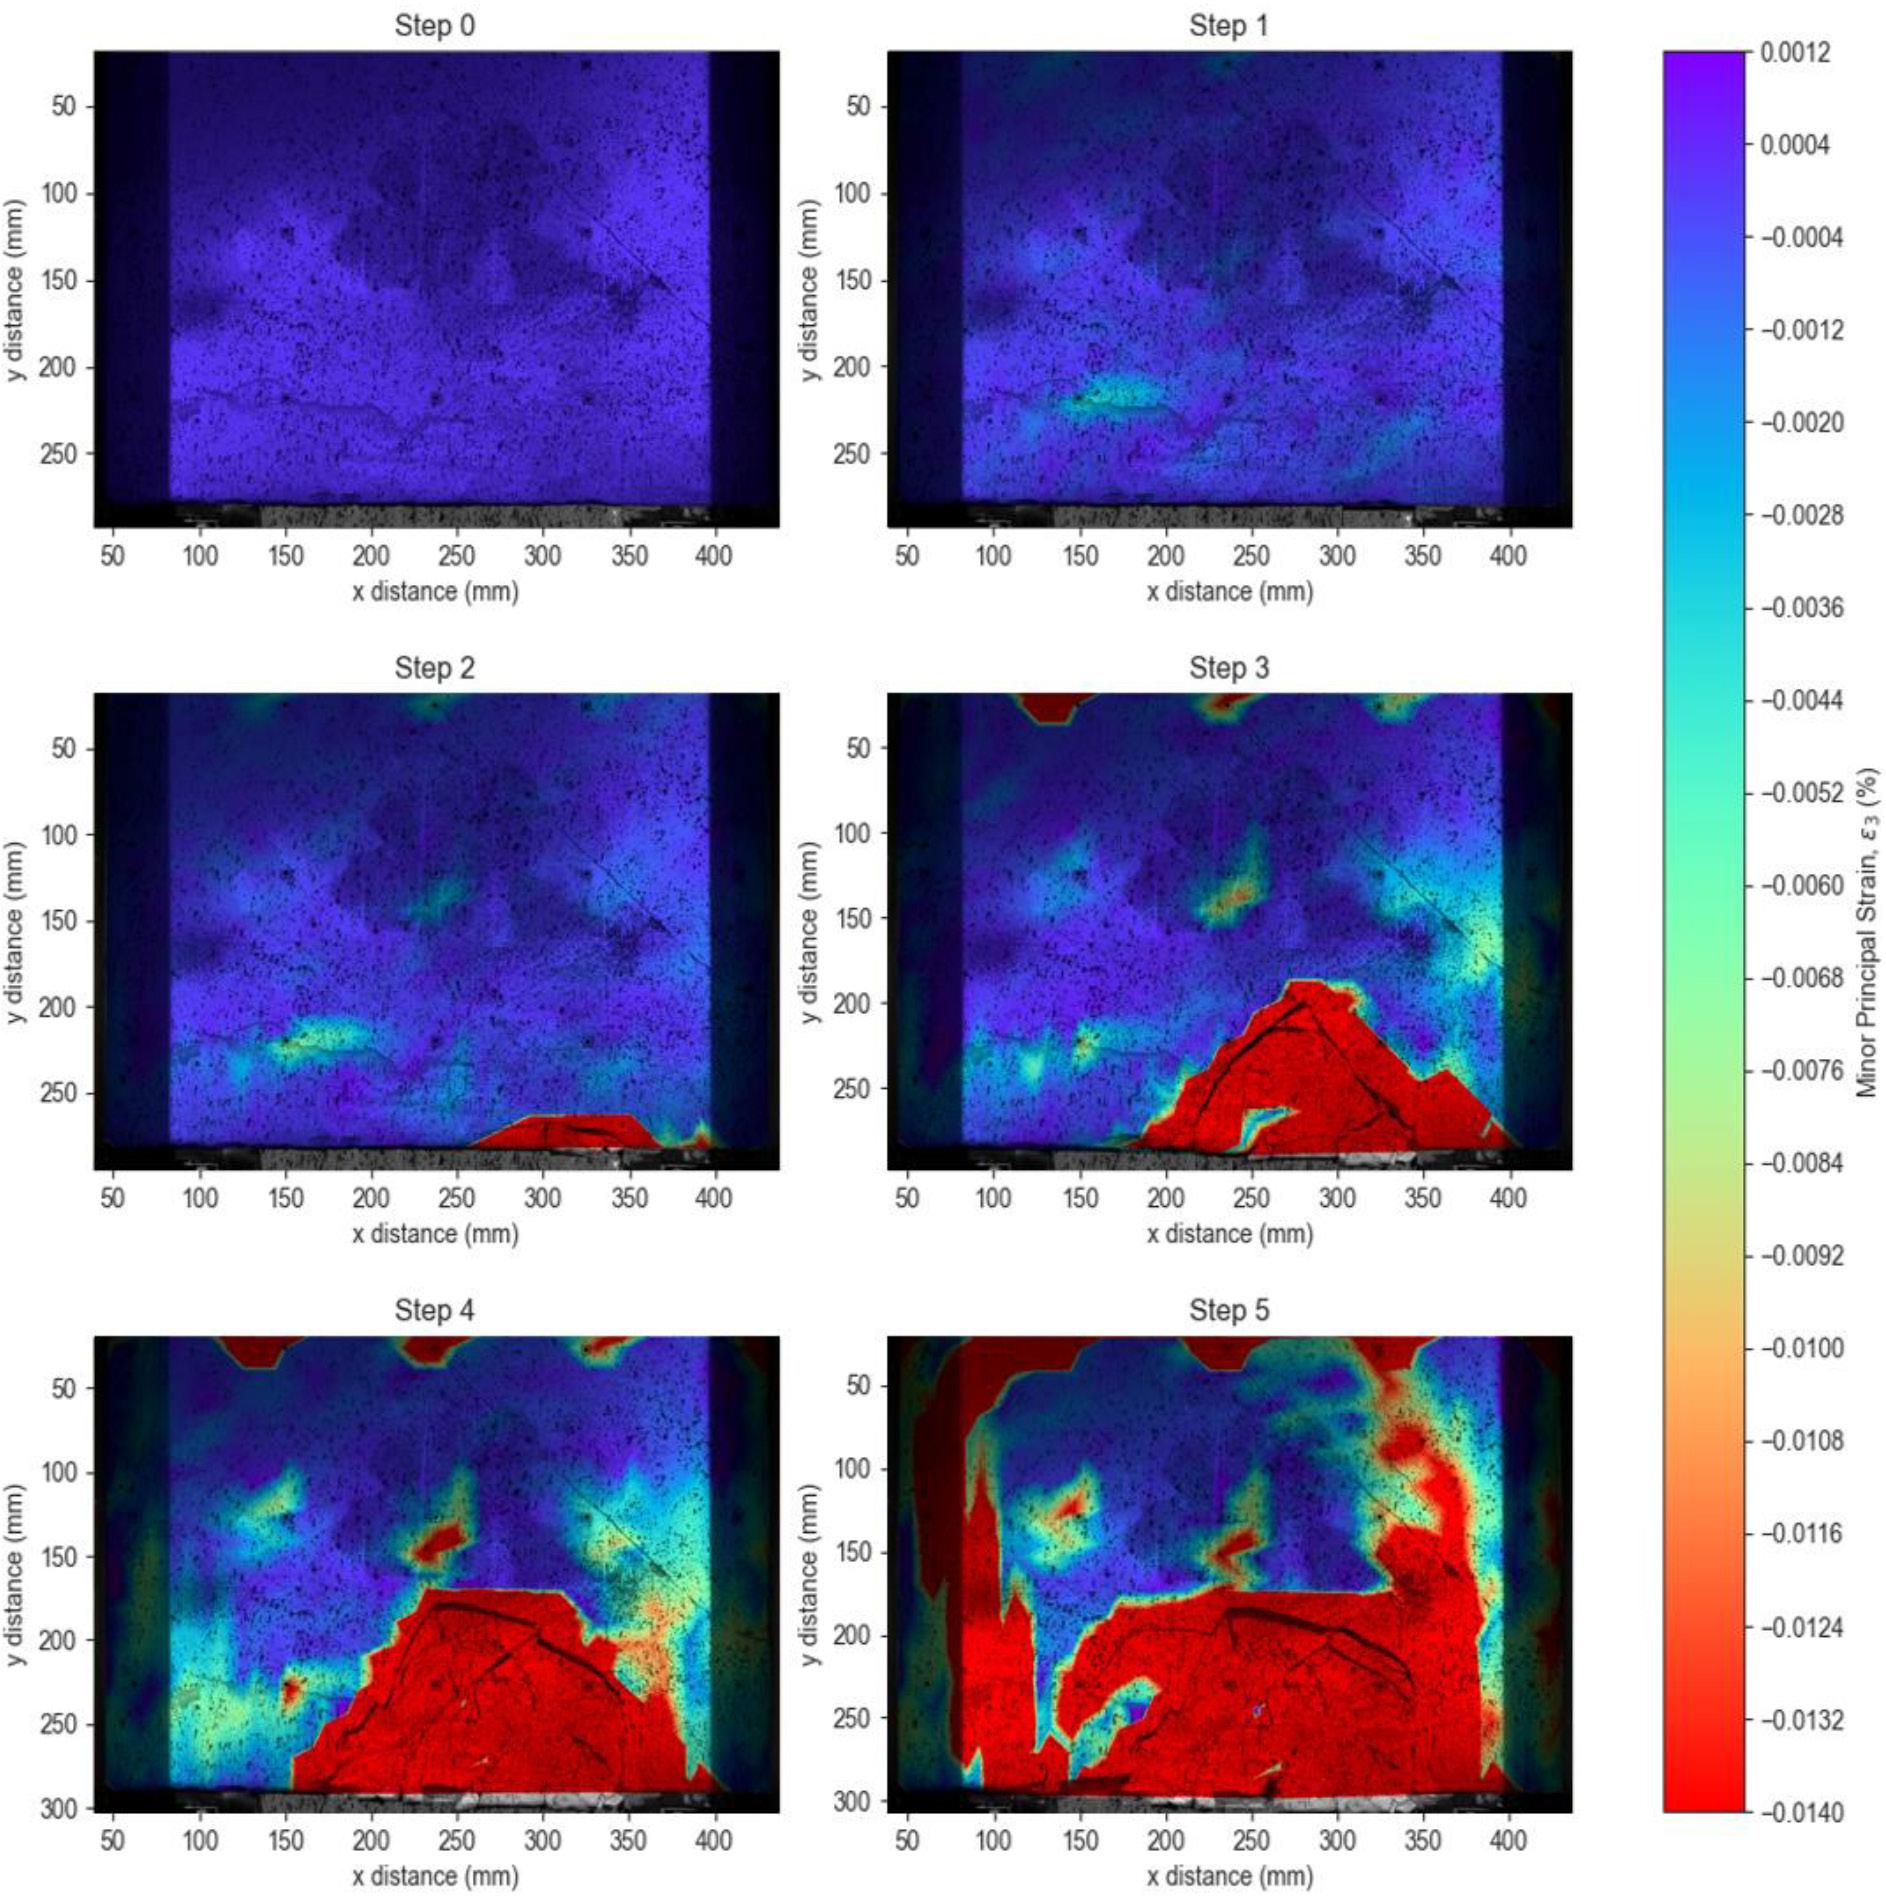
Minor principal strain and crack propagation mapping
In this section, strain surface plots are superimposed on images that show crack propagation for the relevant time steps 1 to 5. Minor principal strains were presented in an attempt to capture magnitudes of tensile strain in models.
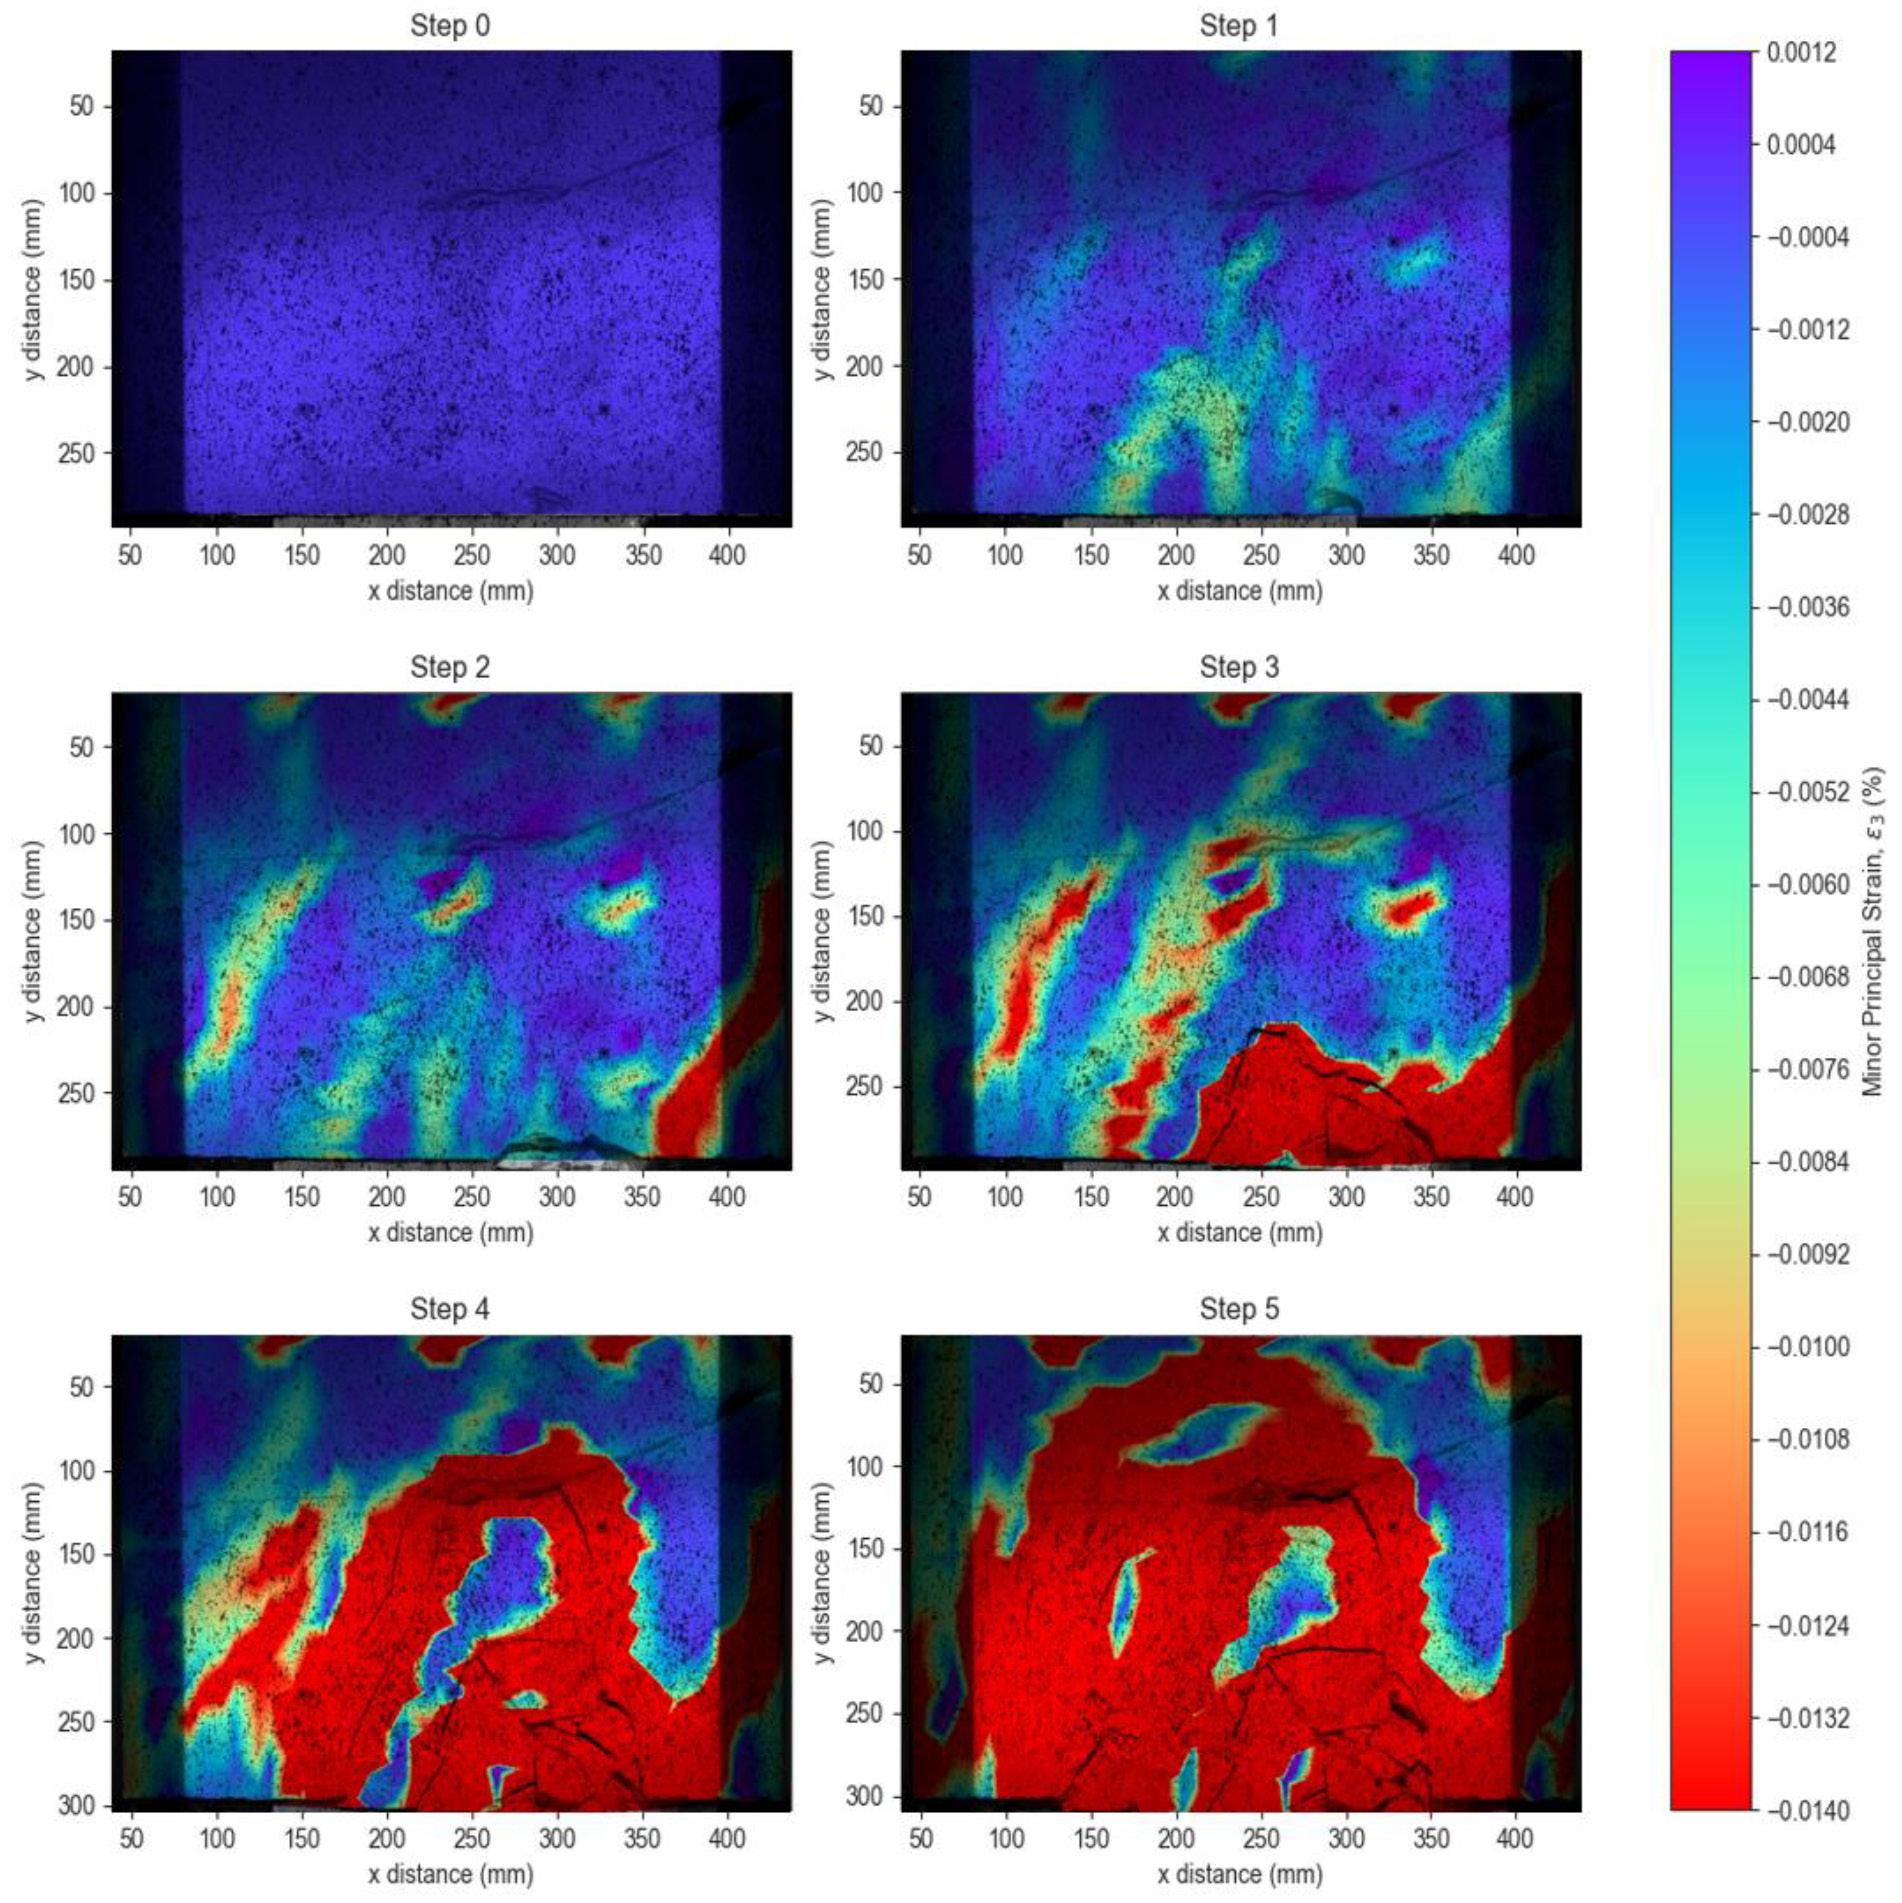
The critical extensional strain model from Stacey (1981) is applied to the events of cave progression in models and used to map cave mining propagation. Surface plots, superimposed on images showing crack development, are helpful in discerning whether strains coincide with or are bisected by cracks – which is notable in most cases. Referring to Figures 11, 12, and 13, it is interesting to take note of the fact that the minor principal strains follow the direction of crack propagation. Where the cracks formed in an advancing cave back around material which has not yet failed (for example tests 1 and 2), the strains are mapped out such that the zones of non-critical strains are surrounded by zones of critical strains. When crack propagation has occurred around an area of caved (failed) material, critical strains show up above the failed material, indicating the cave back relative to the region of caved material (this is evident from test 3). Strain mapping also indicated zones where shearing started to take place (in the cases of test 3 and test 4). Overviews of minor principal strains are shown in all time steps of tests in Figures 11 through to Figure 14.
From what was observed in test 1 (K = 0.5), the critical extensional strains were mapped around the perimeter of the cave back, clearly defining the area of cracks where the absolute critical value was exceeded, as shown in Figure 11. From step 2 onwards, strains are observed to exceed the critical value at the point where crack propagation takes places — providing evidence that the chosen strain criterion is valuable for detecting cracks within the model, thereby highlighting the tensile failure of the model material.
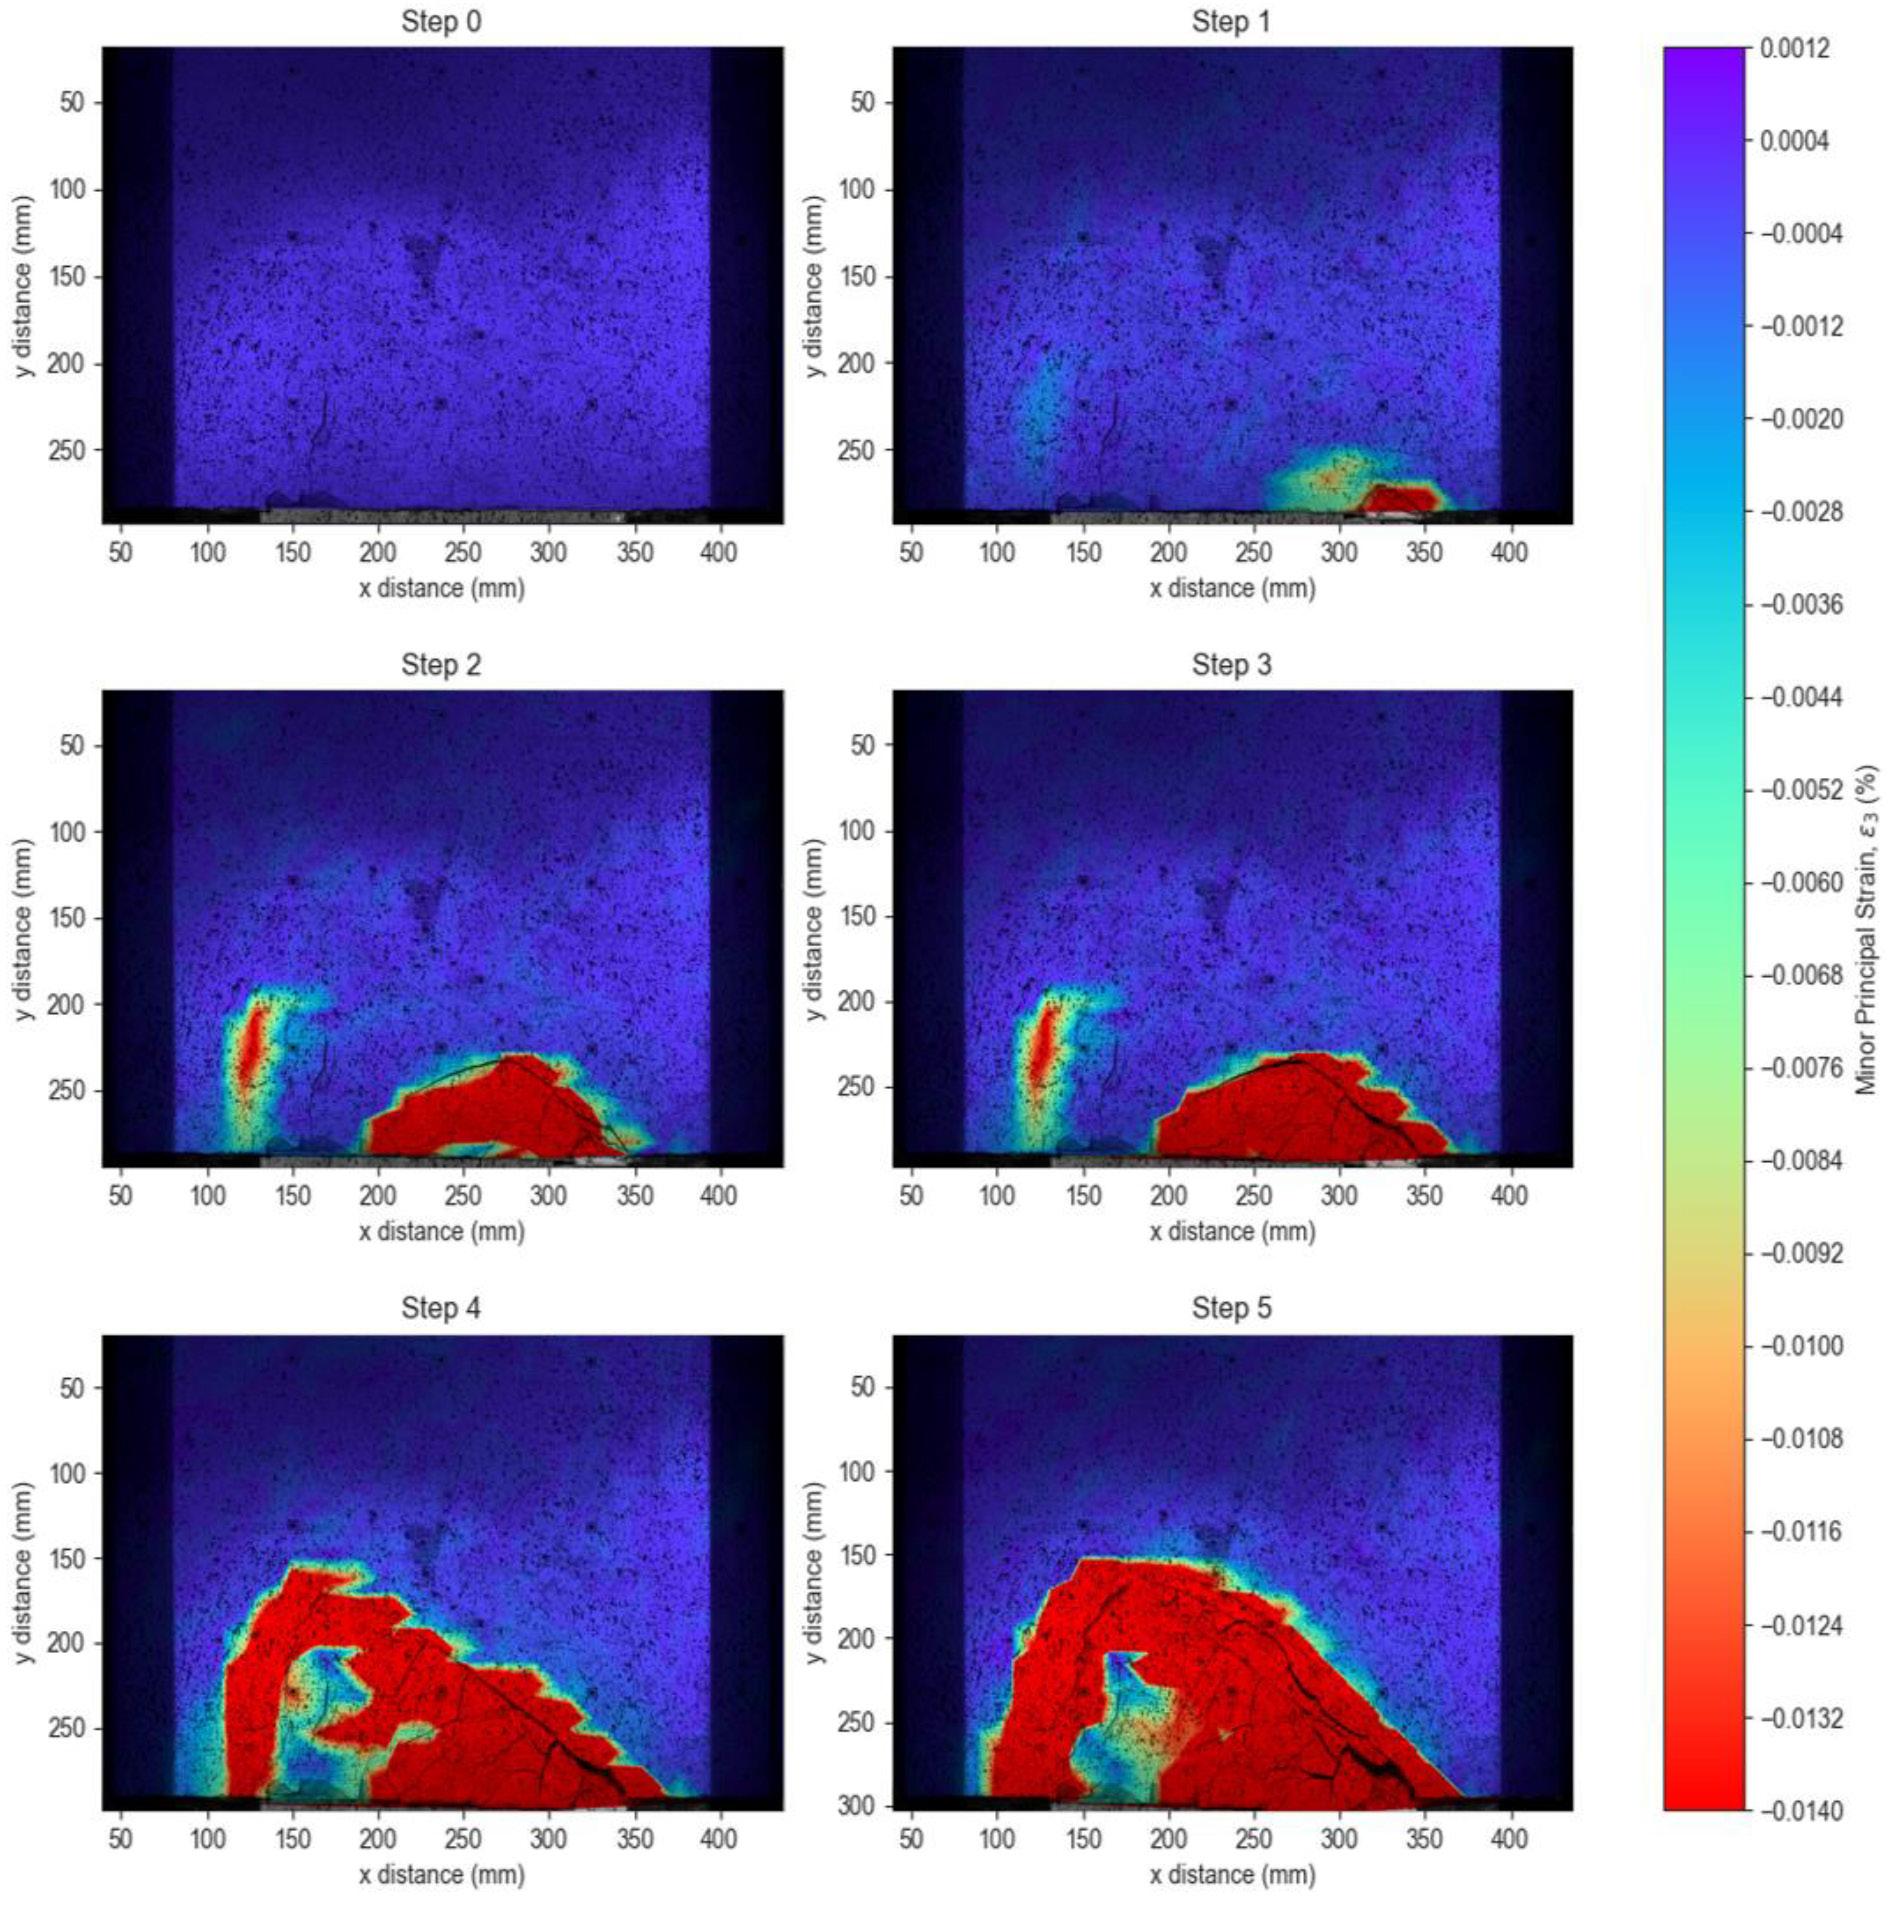
In test 2 (K = 0.94) (Figure 12), cracks propagated as tensile strains reached the critical value and, on closer inspection, seemed to have reached pre-existing fractures within the model. Strains were once again mapped around clearly defined fractures with red zones rendered where cracks had formed.
In steps 2 and 3, the outermost critical strains were seen to overlap with the cave back in certain positions. In step 4 the red zone of critically exceeded strain followed the cave back around an area which had not yet formed part of the cave back. This could suggest that the minor principal strains tended to follow the advancing cave back around since unfractured material is rendered non-critical.
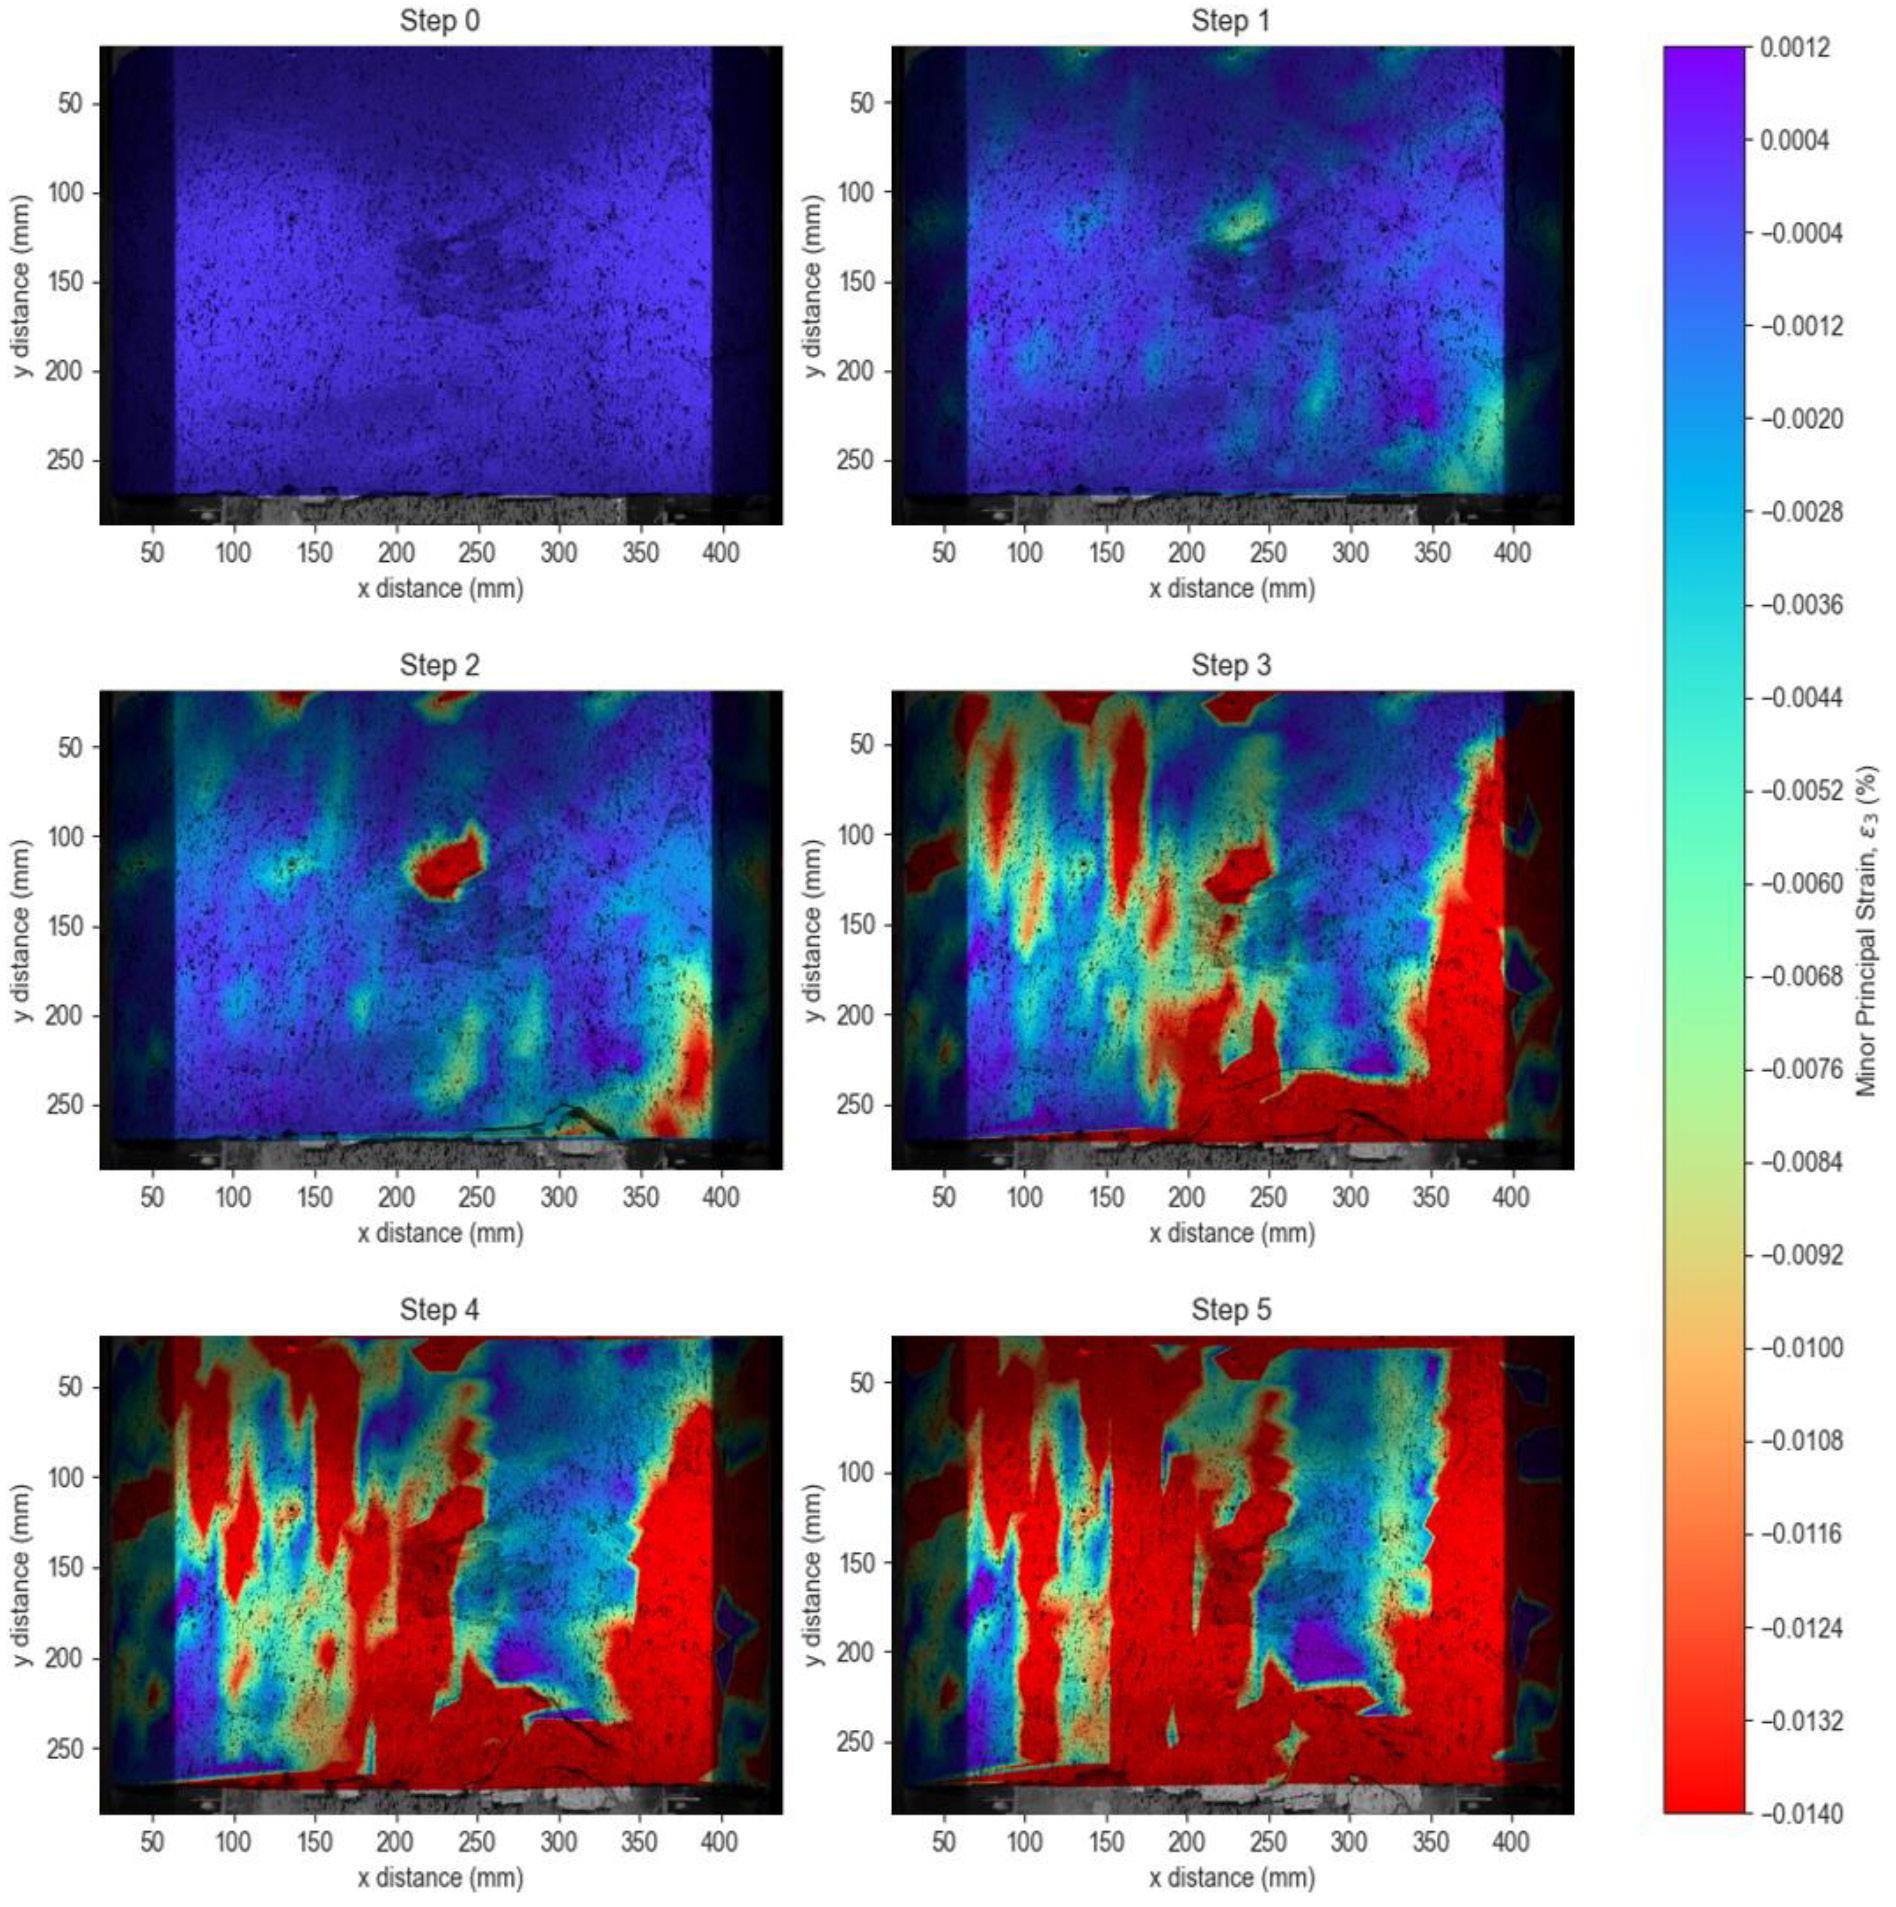
Test 3 (K = 0.96) revealed strains exceeding their critical values from the start of crack propagation in large zones which were bisected by these fractures. Figure 13 shows no gaps of noncritical strain contours that were observed, which was different from tests 1 and 2. Transition lines formed to allow for subsidence in step 5 where strains outside of these lines were also clearly detected as critical.
In test 4 (K = 0.96), shown in Figure 14, fractures propagated to pre-existing ones when critical values were reached very early
624 NOVEMBER 2022 VOLUME 122
The effect of overburden and confined stress state on cave mining propagation
The Journal of the Southern African Institute of Mining and Metallurgy
Figure 11—Minor principal strain surface plots superimposed on images (test 1, steps 0-5)
The effect of overburden and confined stress state on cave mining propagation
625 The Journal
VOLUME 122 NOVEMBER 2022
of
the Southern African Institute of Mining and Metallurgy
Figure 12—Minor principal strain surface plots superimposed on images (test 2, steps 0-5)
Figure 13—Minor principal strain surface plots superimposed on images (test 3 steps 0-5)
(in step 2) due to crushed material at the bottom of the sample caused by excessive overburden stresses.
Subsidence appears to start on the bottom right-hand side of the sample and rapidly formed in step 3 of the caving progression test. The superposition of minor principal strain contours on identified cracks using image analysis allowed for the identification of tensile failure within the experimental models. In all tests, the observations seem to correspond well with the mode of cave mining failure identified by Cumming-Potvin (2018).
The notion of ‘parallel fracturing’ seems to be notable in the four cases of centrifuge test results; and the identified tensile strains exceeding the critical extensional strain value for artificial material used seemed adequate in estimating when and where crack propagation would occur.
Both extreme cases of tests 1 and 2 with K ratios 0.50 and 0.94, respectively, demonstrated a failure mechanism of parallel fracturing as a cave propagation concept. Both tests 3 and 4, despite having a K ratio within the extremes, also demonstrated parallel fracturing (extensional failure) at steps before and after the event of subsidence.
Generally, experimental models were proposed to have failed in a stress caving mechanism with the mobilization of extensional failure within the sample. Despite some scatter in the results, as can be expected in brittle fracture processes of this nature, evidence of extensional fracturing is visible when superimposing images (from which fractures can be identified) with surface plots where zones of tensile strains are present. Utilizing the simple model of critical extensional strain (Stacey, 1981), it was possible to identify areas from where cracks originated, as well as the point from which propagation took place. The critical extensional strain value chosen and used in minor principal strain surface plots was estimated using a lower and upper bound approach. The
propagation of the tensile strains could be tracked conveniently from the source, and it could be ascertained that strained zones coincided with cracks which propagated upwards toward the top of the model, ultimately resulting in the occurrence of surface subsidence.
In all test cases, cracks propagated from the points where the material exceeded the absolute critical strain value of 0.014%. This occurred in either new fractures formed via cave back progression or from pre-existing fractures. In most cases, the regions of extensional strain were observed to have been bisected by visual fractures in samples, and the results indicate that extensional strains were exceeded upon formation of the cracks. This suggests that the cave material failure was extensional. The mapping of minor principal strains in the models also demonstrated, in some cases, that the outermost tensile strain contours approximately coincided with the advancing cave back. Lastly, subsidence through ‘chimney’ formation was detected and identified through the critical strain contours.
Conclusions
The results of centrifuge tests allowing the observation of cave propagation in models subjected to four different stress states have been presented. This work is a continuation of research by Cumming-Potvin et al. (2016a, 2016b), with more brittle material being developed and utilized which allowed for modelling actual rock behaviour more realistically. In UCS testing, the model material failed in a strain range of 0.25% to 0.35%, which compares well to that of concrete, rock, and other brittle materials. The Poisson’s ratio, compression to tensile strength ratio, and fracturing characteristics are similar to most rocks. For this reason, the material can be seen to exhibit sufficient brittleness to be suitable for centrifugal cave mining progression tests.
626 NOVEMBER 2022 VOLUME 122
The effect of overburden and confined stress state on cave mining propagation
The Journal of the Southern African Institute of Mining and Metallurgy
Figure 14—Minor principal strain surface plots superimposed on images (test 4 steps 0-5)
All tested caving models, having been initially exposed to different stress states, were noted to have failed in a manner conforming to the extensional-type failure mechanism proposed by Cumming-Potvin (2018a). Although there was some uncertainty before about the fracturing mode in the centrifuge tests due to the relatively ductile nature of the material tested by Cumming-Potvin et al. (2016a, 2016b), this study also shows that the mechanism of cave propagation is indeed extensional fracturing.
The application of an improved scaling law utilizing critical extensional strain similitude resulted in a scale factor of the order of 1:119 compared to typical properties of quartzite. This scale factor offers an improvement on that determined from the elastic law of similitude by Hoek (1965) which gave a scale factor of 1:720 079, as well as to that based on bulk material strength scale effects, which gave a scale factor of 1:8 034.
Acknowledgements
The authors gratefully acknowledge the financial and technical support of Newcrest Mining Limited which made this work possible.
Author contributions
Mr N.K. Schoeman carried out the investigation with the practical assistance of Professor S.W. Jacobsz, under the supervision of Professor E.P. Kearsley and co-supervision of Professor S.W. Jacobsz. The manuscript was written by Mr. N.K. Schoeman and proof-read by Professor E.P. Kearsley, Professor S.W. Jacobsz and Professor J. Wesseloo.
References
Arjang, B. 2004. Database on Canadian in situ ground stresses. Division Report MMSL 01-029, March 2001 (revised 2004). CANMET Mining and Mineral Sciences Laboratories, Sudbury.
ASTM. 2008. Standard test method for splitting tensile strength of intact rock core specimens. D 3967-08. ASTM International, West Conshohocken, PA.
Bieniawski, Z.T. 1974. Estimating the strength of rock materials. Journal of the Southern African Institute of Mining and Metallurgy, March 1974. pp. 312–320.
Brady, B.H.G. and Brown, E.T. 2006. Rock Mechanics for Underground Mining. 3rd Edn (reprint): Kluwer Academic Publishers, Netherlands.
Broekman, A., Jacobsz, S.W., Louw, H., Kearsley, E.P., Gaspar, T.A.V., and da Silva Burke, T.S. 2020. Fly-by-Pi: Open source closed-loop control for geotechnical centrifuge testing applications. HardwareX, vol. 8. e00151.
Buckingham, E. 1914. On physically similar systems; illustrations of the use of dimensional equations. Physical Review, vol. 4.4. p. 345.
Cumming-Potvin, D. 2018. An extended conceptual model of caving mechanics. PhD thesis. University of Western Australia, Perth.
Cumming-Potvin, D., Wesseloo, J., Jacobsz, S.W., and Kearsley, E.P. 2016a. Fracture banding in caving mines, vol. 116, no. 8. pp. 753–761.
Cumming-Potvin, D., Wesseloo, J., Jacobsz, S.W. and Kearsley, E.P. 2016b. Results from physical models of block caving. Proceedings of the 7th International Conference & Exhibition on Mass Mining (MassMin 2016), 9-11 May 2016, Sydney, New South Wales, Australia. Australasian Institute of Mining and Metallurgy, Perth. pp. 329–340.
Duplancic, P. and Brady, B. 1999. Characterisation of caving mechanisms by analysis of seismicity and rock stress. Proceedings of the 9th ISRM Congress International Society for Rock Mechanics and Rock Engineering. Lisbon.
Duplancic, P. 2001. Characterisation of caving mechanisms through analysis of stress and seismicity. PhD thesis, University of Western Australia, Perth.
Southern African Institute of Mining and Metallurgy
Gaspar, T.A.V. and Jacobsz, S.W. 2020. Brazilian tensile strength test conducted on ductile unsaturated soil samples. Geotechnical Testing Journal, vol. 44, no. 3. pp. 799–810. https://doi.org/10.1520/GTJ20190078
Gercek, H. 2007. Poisson's ratio values for rocks. International Journal of Rock Mechanics and Mining Sciences, vol. 44, no. 1. pp. 1–13.
Hatheway, A.W. and Kiersch, G.A. 1986. Engineering properties of rocks. Handbook of Physical Properties of Rocks and Minerals. Vol. 2. Carmichael R.S. (ed.). CRC Press. pp. 289–331.
Hoek, E. 1965a. Rock fracture under static stress conditions. PhD thesis, University of Cape Town. 237 pp.
Hoek, E. 1965b. The design of a centrifuge for the simulation of gravitational force fields in mine models. Journal of the South African Institute of Mining and Metallurgy, vol. 65, no. 9. pp. 455–487.
ISRM: 1981. Rock Characterization, Testing and Monitoring - ISRM Suggested Methods Pergamon, Oxford.
Jacobsz, S.W., Kearsley, E.P., and Kock, J.H.L. 2014. The geotechnical centrifuge facility at the University of Pretoria. Proceedings of the 8th International Conference on Physical Modelling in Geotechnics, Perth. CRC Press. pp. 169–174.
Jacobsz, S.W., Kearsley, E.P., Cumming-Potvin, D., and Wesseloo, J. 2018. Modelling cave mining in the geotechnical centrifuge. Physical Modelling in Geotechnics, vol. 2. CRC Press. pp. 809–814.
Lee, M.F., Mollison, L., Campbell, A., and Litterbach, J. 2010. Rock stresses in the Australian continental tectonic plate. Proceedings of the 11th IAEG Congress CRC Press, Boca Raton, FL.
Li, D. and Wong, L. 2013. The Brazilian disc test for rock mechanics applications: Review and new insights. Rock Mechanics and Rock Engineering, vol. 46, no. 2. pp. 269–287.
Nieuwoudt, A.P.C. and Rozendaal, A. 1990. In situ stress determinations in mines located in two major structural domains in South Africa. Proceedings of the ISRM International Symposium. International Society for Rock Mechanics and Rock Engineering, Lisbon. Paper no. ISRM-15-1990-023.
Schmertmann, J. and Osterberg, J. 1960. An experimental study of the development of cohesion and friction with axial strain in saturated cohesive soils. Proceedings of the Research Conference on Shear Strength of Cohesive Soils ASCE. pp. 643–694.
Sheorey, P.R . 1997. Empirical Rock Failure Criteria. A.A. Balkema, Rotterdam, The Netherlands.
Stacey, T.R . 1981. A simple extension strain criterion for fracture of brittle rock. International Journal of Rock Mechanics and Mining Sciences & Geomechanics Abstracts, vol. 18, no. 6. pp. 469–474.
Stacey, T.R. and Wesseloo, J. 1998. In situ stresses in mining areas in South Africa. Journal of the South African Institute of Mining and Metallurgy, vol. 98, no. 7. pp. 365–368.
Stanier, S.A., Blaber, J., Take, W.A ., and White, D.J. 2016. Improved imagebased deformation measurement for geotechnical applications. Canadian Geotechnical Journal, vol. 53, no. 5. pp. 727–739.
Tang, G.X. and Graham, J. 2000. A method for testing tensile strength in unsaturated soils. pp. 377–382. doi: 10.1520/GTJ11059J. Geotechnical Testing Journal, vol. 23, no.3.
Vutukuri, V.S., Lama, R.D., and Saluja, S.S. 1974. Handbook on Mechanical Properties of Rocks, Volume 1. Trans Tech Publications, Clausthal. 280 pp.
Wesseloo, J., Cumming-Potvin, D., Potvin, Y., Jacobsz, S.W., and Kearsley, E.P. 2020. Physical modelling to provide data-rich case studies for verification and validation of numerical modelling of cave mechanics problems. Proceedings of the 8th International Conference & Exhibition on Mass Mining (MassMin 2020). Santiago, Chile. 4–7 October 2020. pp. 462–477.
Yong, S. and Maloney, S. 2015. An update to the Canadian Shield stress database. NWMO-TR-2015-18. Nuclear Waste Management Organization, Toronto.
Zoback, M.L. and Zoback, M.D. 2002. State of stress in the Earth’s lithosphere. International Handbook of Earthquake and Engineering Seismology, vol. 81A. Elsevier. pp. 559–568. u
627 The Journal of the
VOLUME 122 NOVEMBER 2022
The effect of overburden and confined stress state on cave mining propagation
SAIMM members honoured as Top Scholars in South Africa

Twenty-nine of the country’s leading scholars and scientists were inaugurated as Members of the Academy of Science of South Africa (ASSAf) at the annual Awards Ceremony on 19 October 2022.

As the official Academy of South Africa, ASSAf has as core function to honour the country’s most outstanding scholars by electing them to Membership of the Academy. ASSAf Members are drawn from the full spectrum of disciplines.
New Members are elected each year by the full existing Membership. Membership of the Academy is a great honour and is in recognition of scholarly achievement. Members are the core asset of the Academy and give of their time and expertise voluntarily in the service of society.
The 29 new ASSAf Members bring the total Membership of ASSAf to 659. The SAIMM is proud to announce that two of the new members are Prof Rodney Jones, a Past President (2015-2016) and a Fellow of the SAIMM, and Prof Aubrey Mainza, a Member of the SAIMM.
Their
628 NOVEMBER 2022 VOLUME 122
The effect of overburden and confined stress state on cave mining propagation
The Journal of the Southern African Institute of Mining and Metallurgy
membership certificates were presented to them by the President of ASSAf, Prof Jonathan Jansen.
Prof Jonathan Jansen (left) with Prof Rodney Jones, a Past President (2015-2016) and a Fellow of the SAIMM
Prof Jonathan Jansen (left) with Prof Aubrey Mainza, a Member of the SAIMM
Affiliation:
1 Mintek, Randburg, South Africa.
2 Vaal University of Technology, Vanderbijlpark, South Africa.
3 University of the Witwatersrand, Johannesburg, South Africa.
Correspondence to: M. Moholwa
Email: sammo@mintek.co.za
Dates: Received: 30 Aug. 2021 Revised: 22 July 2022 Accepted: 30 July 2022 Published: November 2022
How to cite:
Moholwa, M.S., Steenkamp, J.D., and Rutto, H.L. 2022
Fines generation from South African manganese ores during preheating in a rotary kiln. Journal of the Southern African Institute of Mining and Metallurgy, vol. 122, no. 11, pp. 629–638
DOI ID: http://dx.doi.org/10.17159/24119717/1724/2022
Fines generation from South African manganese ores during preheating in a rotary kiln
by M.S. Moholwa1,2, J.D. Steenkamp1,3, and H.L. Rutto2
Synopsis
Manganese ores are the major source of manganese for the production of manganese ferroalloys. There is a gap in the knowledge of the decrepitation behaviour of manganese ores, which presents a problem in the operation of smelters. Decrepitation, which is the breakage of the ore particles upon heating, is an important quality parameter for these ores. The purpose of this investigation was to determine the extent to which South African manganese ores decrepitate during preheating in a rotary kiln. The effects of temperature, rotational speed, and particle size decrepitation were investigated. Manganese ores were heated in a laboratory-scale rotary kiln at temperatures of 600, 800, and 1000°C, and rotational speeds of 3, 6, and 12 r/min. The size ranges were +6-20, +20-40, and +40-75 mm and the residence time was constant at 30 minutes. The decrepitation index (DI) is quantified as the ratio of the mass of <6 mm particles after pre-heating to the total mass of the sample. It was found that the DIs for all ores used were proportional to the temperature and the rotational speed and inversely proportional to the particle size range with temperature being the most important parameter. Ore A was the most susceptible to decrepitation followed by ore C and ore B; this was mainly to the decomposition of kutnohorite, the content of which was the highest in ore A and the lowest in ore B.
Keywords
decrepitation, manganese ores, rotary kiln, temperature, rotational speed, size range.
Introduction
Manganese ores are mostly used as a raw material in the production of manganese ferroalloys (Faria, Jannoti, and da Silva AraÚjo, 2012). Due to the desirable properties that manganese imparts to steel, the bulk of the ferromanganese alloys produced is consumed by the steel industry (Olsen, Tangstad, and Lindstad, 2007). There are 810 mt of total manganese reserves worldwide, and 83% of it is found in South Africa, the Ukraine, Australia, Brazil, and India (Sangine, 2020). The production of highcarbon ferromanganese (HCFeMn) is carried out mainly in submerged arc furnaces (SAFs) through the carbothermic reduction of manganese ores (Olsen, Tangstad, and Lindstad, 2007). The SAFs used in the production of HCFeMn are in general circular and have three graphite electrodes spaced equilaterally (Olsen, Tangstad, and Lindstad, 2007). The electrodes are submerged in the burden with an electric current running through the area below the electrode tips (Olsen, Tangstad, and Lindstad, 2007). The metal and slag are tapped either from the same tap-hole or separately from different slag and metal tapholes (Olsen, Tangstad, and Lindstad, 2007). A cross-sectional view of the SAF is displayed in Figure 1. The production of manganese in a submerged arc furnace is a highly energy-intensive process and releases large amounts of CO₂ gas (Olsen, Tangstad, and Lindstad, 2007). Emissions of CO₂ gas and shortage of energy are global problems, therefore there is a need to reduce energy consumption and CO₂ emissions from industrial processes (Pegels, 2010). PREMA is project that aims to demonstrate a suite of innovative technologies that involve the use of industrial off-gas and solar thermal energy
Figure 1—Cross-sectional view of a submerged arc furnace
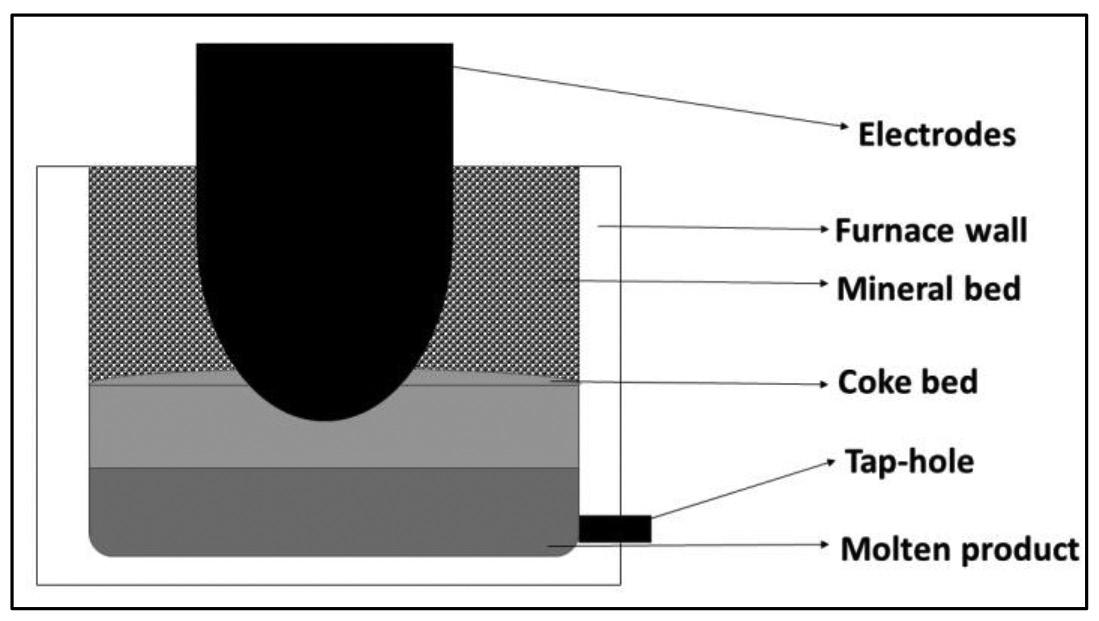
629 The Journal of the Southern African Institute of Mining and Metallurgy VOLUME 122 NOVEMBER 2022
to reduce energy consumption and emissions of CO₂ from the manganese production process (PREMA, 2019). PREMA proposed the incorporation of a pre-heating unit in the existing process of manganese production. The effect of preheating on the smelter is being investigated by Mintek in South Africa. A pilot-scale facility is being developed which includes a rotary kiln coupled to an alternating current (AC) submerged arc furnace. The use of a rotary kiln as a preheating unit necessitates the consideration of ore decrepitation during the rotation and heating of the of the ore in the kiln.
Decrepitation is the breakage of ore particles upon heating to produce fines (Faria et al., 2013). The decrepitation index (DI) is used to evaluate the behaviour of lump ores when subject to heating and is defined by Equation [1]. The potential for decrepitation necessitated an investigation to determine to what extent South African manganese ores decrepitate during preheating. Fine particles resulting from decrepitation reduce the permeability of the burden, which will affect safety and efficiency of the SAF, and could lead to an eruption or explosion (Faria, Jannoti, and da Silva AraÚjo, 2012). [1]
DI = Decrepitation index.
M1 = Mass of particles < 6 mm after heating (g).
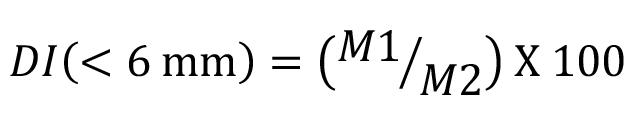
M2 = Total mass of the sample after heating (g).
Decrepitation of manganese ores
Faria et al. (2012, 2013) have shown that the rate of decrepitation of Mn ores is influenced by a variety of factors. Mineralogical composition and physical properties are two such factors. The study by Faria, Jannoti, and da Silva AraÚjo, (2012) utilized four ores with different mineralogical compositions (Table I). The Azul and Urucum ores were mainly composed of oxides with a prevalence of cryptomelane. The Morro da Mina ore composed mainly of carbonates and silicates, while Wessels ore is comprised of braunite and carbonates. The study found that manganese oxides decrepitate mainly due to cryptomelane and pyrolusite decomposition during heating. Cryptomelane decomposes between 500°C and 900°C, while pyrolusite undergoes a phase transformation to bixbyite at 700°C (Biswas, Das, and Singh, 2016). Pyrolusite has a tetragonal crystal structure while bixbyite is isometric (Faria, Jannoti, and da Silva AraÚjo, 2012). The volumetric change associated with the phase change contributed to the decrepitation of Azul and Urucum ore.
The moisture content of the ores and the geometry of the crucibles used in the test affect the decrepitation of manganese ore (Biswas, Das, and Singh, 2016). The removal of structural water from the hydrated phases such as goethite (FeO(OH)) and
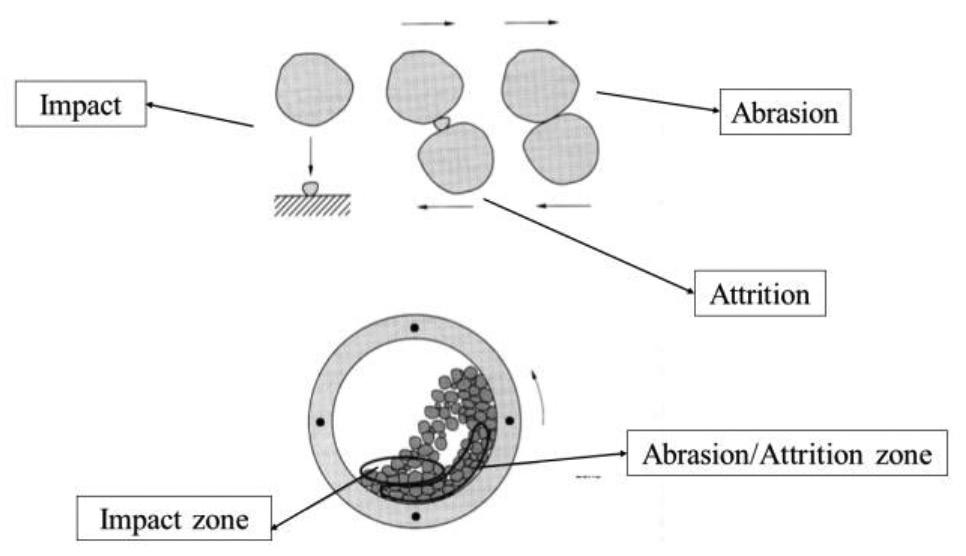
Table I
clay minerals during heating contribute towards decrepitation (Biswas, Das, and Singh, 2016; Faria, Jannoti, and da Silva AraÚjo, 2012). Gradual heating eliminates thermal shock which in turn reduces the decrepitation intensity (Faria, Jannoti, and da Silva AraÚjo, 2012).
Decrepitation in rotary kilns
Rotary kilns are industrial or laboratory-scale furnaces which are long and cylindrical and slightly tilted during operation (Pisaroni, Sadi, and Lahaye, 2012). Rotary kilns have a wide range of material processing applications, including cement production and sponge iron production. The tilting angle differs for different applications. The material being processed is fed into the upper end of the cylinder, leaving a considerable amount of freeboard or empty space. The material bed gradually moves down towards the lower end as the kiln rotates about its axis. This rotation and downward movement promote a certain amount of stirring and mixing (Pisaroni, Sadi, and Lahaye, 2012). A tumbler is basically a rotary kiln without the heating elements, hence the factors that cause fines generation in the tumbler will represent fines generation in rotary kilns (Kingman et al., 2008).
There are two factors that affect the DI of ores in rotary kilns: the tumbling action and the tumbling time. The tumbling effect is associated with three breakage mechanisms: abrasion, attrition, and impact. Abrasion occurs when two particles rub against each other and attrition occurs when two particles (of almost similar size) both rub against one small particle. During tumbling, particles are lifted to the top of the mill and subsequently move perpendicular to the plane of contact, impacting on the other particles and particle-wall contacts; this is therefore referred to as the impact mechanism. These mechanisms are the main causes of fines generation (decrepitation) in rotary kilns. Figure 2 depicts the breakage mechanisms and the zones at which they primarily occur in a rotary kiln. The effect of tumbling time on the amount
Mineral composition Urucum Morro da mina Azul Wessels
Cryptomelane: K(Mn4+Mn2+)8O16
>50 % >50%
Pyrolusite: MnO2 <20 %
Braunite: Mn2+Mn3+6SiO12 <10 % >50 %
Rhodochrosite:(Mn,Fe,Mg,Ca)CO3 >50 %
Spessartine: Mn2+3Al2(SiO4)3 <50 % <3 %
630 NOVEMBER 2022 VOLUME 122
Fines generation from South African manganese ores during preheating in a rotary kiln
The Journal of the Southern African Institute of Mining and Metallurgy
Mineralogy of four types of ores studied by (Faria, Janotti, and da Silva AraÚjo, 2012)
Figure 2—The tumbling action and associated breakage mechanisms (Kingman et al., 2008
of fines generated was studied by Kingman et al. (2008) using limestone rock samples. The investigation was done for the size fractions of 2.36-3.35 mm, 1.7-1.18 mm, 1.18-1.7 mm, and 0.85-1.18 mm for tumbling durations of 1, 2, 3, 4, 5, 7, 9, and 15 minutes. It was found that increasing the tumbling time increased the mass of fines generated.
The main aim of the research presented here was to determine whether manganese lump ore will decrepitate during preheating in a rotary kiln. The objectives were to determine the effect of temperature, rotational speed, and particle size range on the DIs of three different manganese ores sourced from the Kalahari Manganese Field (KMF) in South Africa.
Methods
A custom-made rotary kiln with a 316 stainless steel rotating tube 78 cm long and inside diameter of 23 cm was used. The kiln is equipped with a REX-P200 temperature controller. The kiln can provide a maximum heating rate of 10°C/min and can reach a maximum temperature of 1 200°C. The kiln is also equipped with a direct current (DC) motor and a variable speed drive which can give a maximum output of 12 r/min. The rotating tube and DC motor are connected by means of gears and chains. For the purpose of these experiments the kiln was kept in a horizontal position.
The ores were supplied by a South African producer of silicomanganese and designated A, B, and C. About 200 kg of each type of ore was utilized for the investigation. The samples were first screened to obtain +6-20 mm, +20-40 mm, and +40-75 mm particle size fractions. Each size fraction was coned and quartered to produce 10 kg samples representative of the batch. The 10 kg samples were then split into 1 kg samples using a rotating splitter.
The 1 kg samples were used for the decrepitation tests or chemical and phase chemical analyses. Inductively coupled plasma optical emission spectrometry (ICP-OES) was used to determine the bulk chemistry and the analyses were done in triplicate. Quantitative X-ray diffraction (QXRD) was applied to determine the bulk modal mineral compositions. A Bruker D8 diffractometer with an acceleration voltage of 35 kV was utilized. A cobalt tube with Fe-low beta filter was used with 2ø angle ranging from 2 to 80 degrees and step size of 0.02°2ø. The samples were then taken for quantitative analysis, using the D-500 diffractometer with Cu Kἀ radiation and a graphite monochromator. The microstructure and the quantitative elemental analysis of the ores were determined using scanning electron microscope with energy dispersive X-ray spectroscopy (SEM-EDS). This technique utilized a Zeiss Evo MA15 at an acceleration voltage of 20 kV.
The porosity was determined using a He-pycnometer. The pycnometer measures the specific volume of sample placed in the test cup. This value was then used together with the expected volume a particle of unit mass with zero porosity should occupy using Equation [2]. Loss on ignition (LOI) was determined by the ASTM D7348 standard method. Moisture content was determined by the ASTM D2216-19 standard method and bulk density by a modified volumetric method. The modified volumetric method involves filling a hopper of a known mass (with a volume of 4 293 cm3) with ore particles and weighing it. The mass of the empty hopper was subtracted from the mass of the hopper and ore to obtain the mass of the ore. The method was repeated three times. The bulk density was calculated according to Equation [3].
where
X = porosity %
A = measured specific volume (g/cm³)
B = expected specific volume (g/cm³)
where
ρ = bulk density (g/cm3)
M = mass of the particles (g)
V = volume of the hopper (cm3)
Temperature (600, 800, or 1000°C) and rotational speed (3, 6 or 12 r/min) setpoints were selected on the controller. The heating rate was kept constant at 2.5 ⁰C/ min. Once the kiln reached the selected temperature, 1 kg of the ore sample of either the +6-20 mm, +20-40 mm or +40-75 mm size fraction was fed into the kiln using a shovel while it was rotating and held at temperature for 30 minutes. After 30 minutes the sample was allowed to cool and subsequently screened to separate particles <6 mm. The experimental plan for each type of ore is shown in Table II. Parameters marked with (*) are kept constant when investigating the effect of other parameters. For example, when the effect of temperature was investigated rotational speed and size range were kept constant at 6 r/min and +6-20 mm respectively, and temperature was varied from 600 to 1000 ⁰C.
Results
Characterization of samples prior to heating
The moisture content, porosity, and loss on ignition (LOI) results for the three ores are tabulated in Table III.
The calculated averages of the bulk density measurements of the ore samples, obtained at different size ranges, are presented in Table IV together with the standard deviations calculated. Ore C is denser than the other ores in the study, and the bulk density decreases with increasing size range for all three ores
Table V summarizes the chemical compositions of the ores as determined by ICP-OES. Ore B has the highest manganese (Mn) content followed by ore C and finally ore A. The totals do not sum to 100 because manganese and iron are reported in their metallic forms.
Table II
Experimental conditions which were used for each type of ore
Temperature (°C) Rotational speed (r/min) Size range (mm) 600 3 +6-20* 800* 6* +20-40 1000 12 +40-75
Table III
Moisture content, porosity and LOI for the ores used in the study
Ore type Moisture content (%) Porosity (%) LOI (%)
Ore A 0,83 0,75 6,01
Ore B 0,44 0,71 3,49 Ore C 0,62 0,74 3,61
631 The Journal of the
VOLUME 122 NOVEMBER 2022
Fines generation from South African manganese ores during preheating in a rotary kiln
Southern African Institute of Mining and Metallurgy
[2]
[3]
Table IV
Bulk densities of ores
Bulk density (g/cm³)
Ore +6-20 mm +20-40 mm +40-75 mm
A Average 1.60 1.57 1.53 Std. dev 0.005 0.002 0.001
B Average 1.69 1.65 1.63 Std. dev 0.004 0.001 0.002
C Average 1.78 1.75 1.72 Std. dev 0.004 0.003 0.002
The bulk phase chemical compositions of the samples are presented in Table VI. From the table it can be observed that braunite is the main source of manganese in all three ores and that ore A has the highest carbonate content (indicated by kutnohorite, calcite, and dolomite), followed by ore B and then ore C
Figure 3 displays the diffraction patterns for the ore samples. The charts are attached to complement the QXRD iresults in Table VI.
Characterization of samples after heating
The phase chemistry of thermally treated samples of ore A was determined using QXRD analysis, Figure 4 presents the trends for minerals that underwent a change during thermal treatment. It can be observe that heating the sample at 600°C decreased the
Table V
Chemical compositions of Mn ores determined by IPC-OES
percentage of braunite from 30% to 24.7%. The braunite content decreases further to 25.7% at 800°C, and then to 6.6% at 1000°C. The hausmannite content was not affected by heating at 600°C, but it then increased from 7.4% to 24.9% at 800°C and to 38.2% at 1000°C. The trials for kutnohorite and dolomite at 600°C are similar to that of hausmannite. These two minerals disappear when the samples are treated at 800°C and 1000°C. The calcite content increases from 20% to 29.3% when treated at 600°C and to 41.4% at 800°C, then drops to 1.5% at 1000°C. The marokite content is zero for untreated material and samples treated at 600°C and 800°C, but then increases to 25% at 1000°C. The content of haematite and bixbyite drops from the initial content when treated at 600°C and then increases to 800°C. But when the samples are treated at 1000°C, the content of bixbyite drops to zero while the content of haematite increases to 11%.
The minerals of ore B that changed during thermal treatment are displayed in Figure 5. There is no difference in braunite content between the untreated sample and the sample treated at 600°C. The braunite content drops from 40% to 35.1% when treated at 800°C and drops further to 12.1% at 1000°C. Hausmannite dropped from 12.3% to 0.8% when treated at 600°C, increased from 0.8% to 23.9% at 800°C and then increased further from 23.9% to 35.7% at 1000°C. The kutnohorite content increased from 10% to 30.7% at 800°C and then dropped to zero at 1000°C. The calcite content drops from the initial 24.4% to 14.7% when treated at 600°C, increases to 32% at 800°C, and then drops again to 2.3% at 1000°C. The trend of haematite drops from 5.5% to 4.4% at 600°C, increases slightly to 4.8% at 800°C, and then increases
Ore Mn Fe Al₂O₃ CaO MgO SiO₂ P₂O₅ Total
A Average 29.24 5.5 0.25 21.51 3.22 4.84 0.06 64.62 Std. dev 0.23 0.05 0.04 0.15 0.03 0.05 0
B Average 38.87 5.16 0.21 15.42 2.01 4.7 0.04 66.41 Std. dev 0.11 0.04 0.01 0.26 0.01 0.04 0
C Average 35.17 4.57 0.21 16.52 2.99 6.01 0.04 65.49 Std. dev 0.07 0.02 0.01 0.19 0.01 0.04 0
Table VI
Mineralogical compositions of ores determined by QXRD (mass%)
Mineral Ideal chemical composition A B C
Haematite Fe₂O₃ 4.5 5.2
Jacobsite (Fe2+)(Mn3+)₂O₄ 6.5
Bixbyite (MnFe)₂O₃ 5.4 5.5
Braunite Mn2+Mn3+₆SiO12 30.2 40.0 29.8
Hausmannite Mn₃O₄ 6.0 12.3 21.3
Kutnohorite CaMn(CO₃)₂ 23.2 10.0 14.4
Calcite CaCO₃ 20.0 24.6 24.6
Dolomite CaMg(CO₃)₂ 9.8 <1
Clinopyroxene (NaCa)(Mg.Fe.Al)(Al.Si)₂O₆ 2.7
Jianshuiite (Mg.Mn2+)Mn4+₃O₇.3H₂O <1 Total 99.1 97.6 99.3
632 NOVEMBER 2022 VOLUME 122
Fines generation from South African manganese ores during preheating in a rotary kiln
The Journal of the Southern African Institute of Mining and
Metallurgy
Fines generation from South African manganese ores during preheating in a rotary kiln
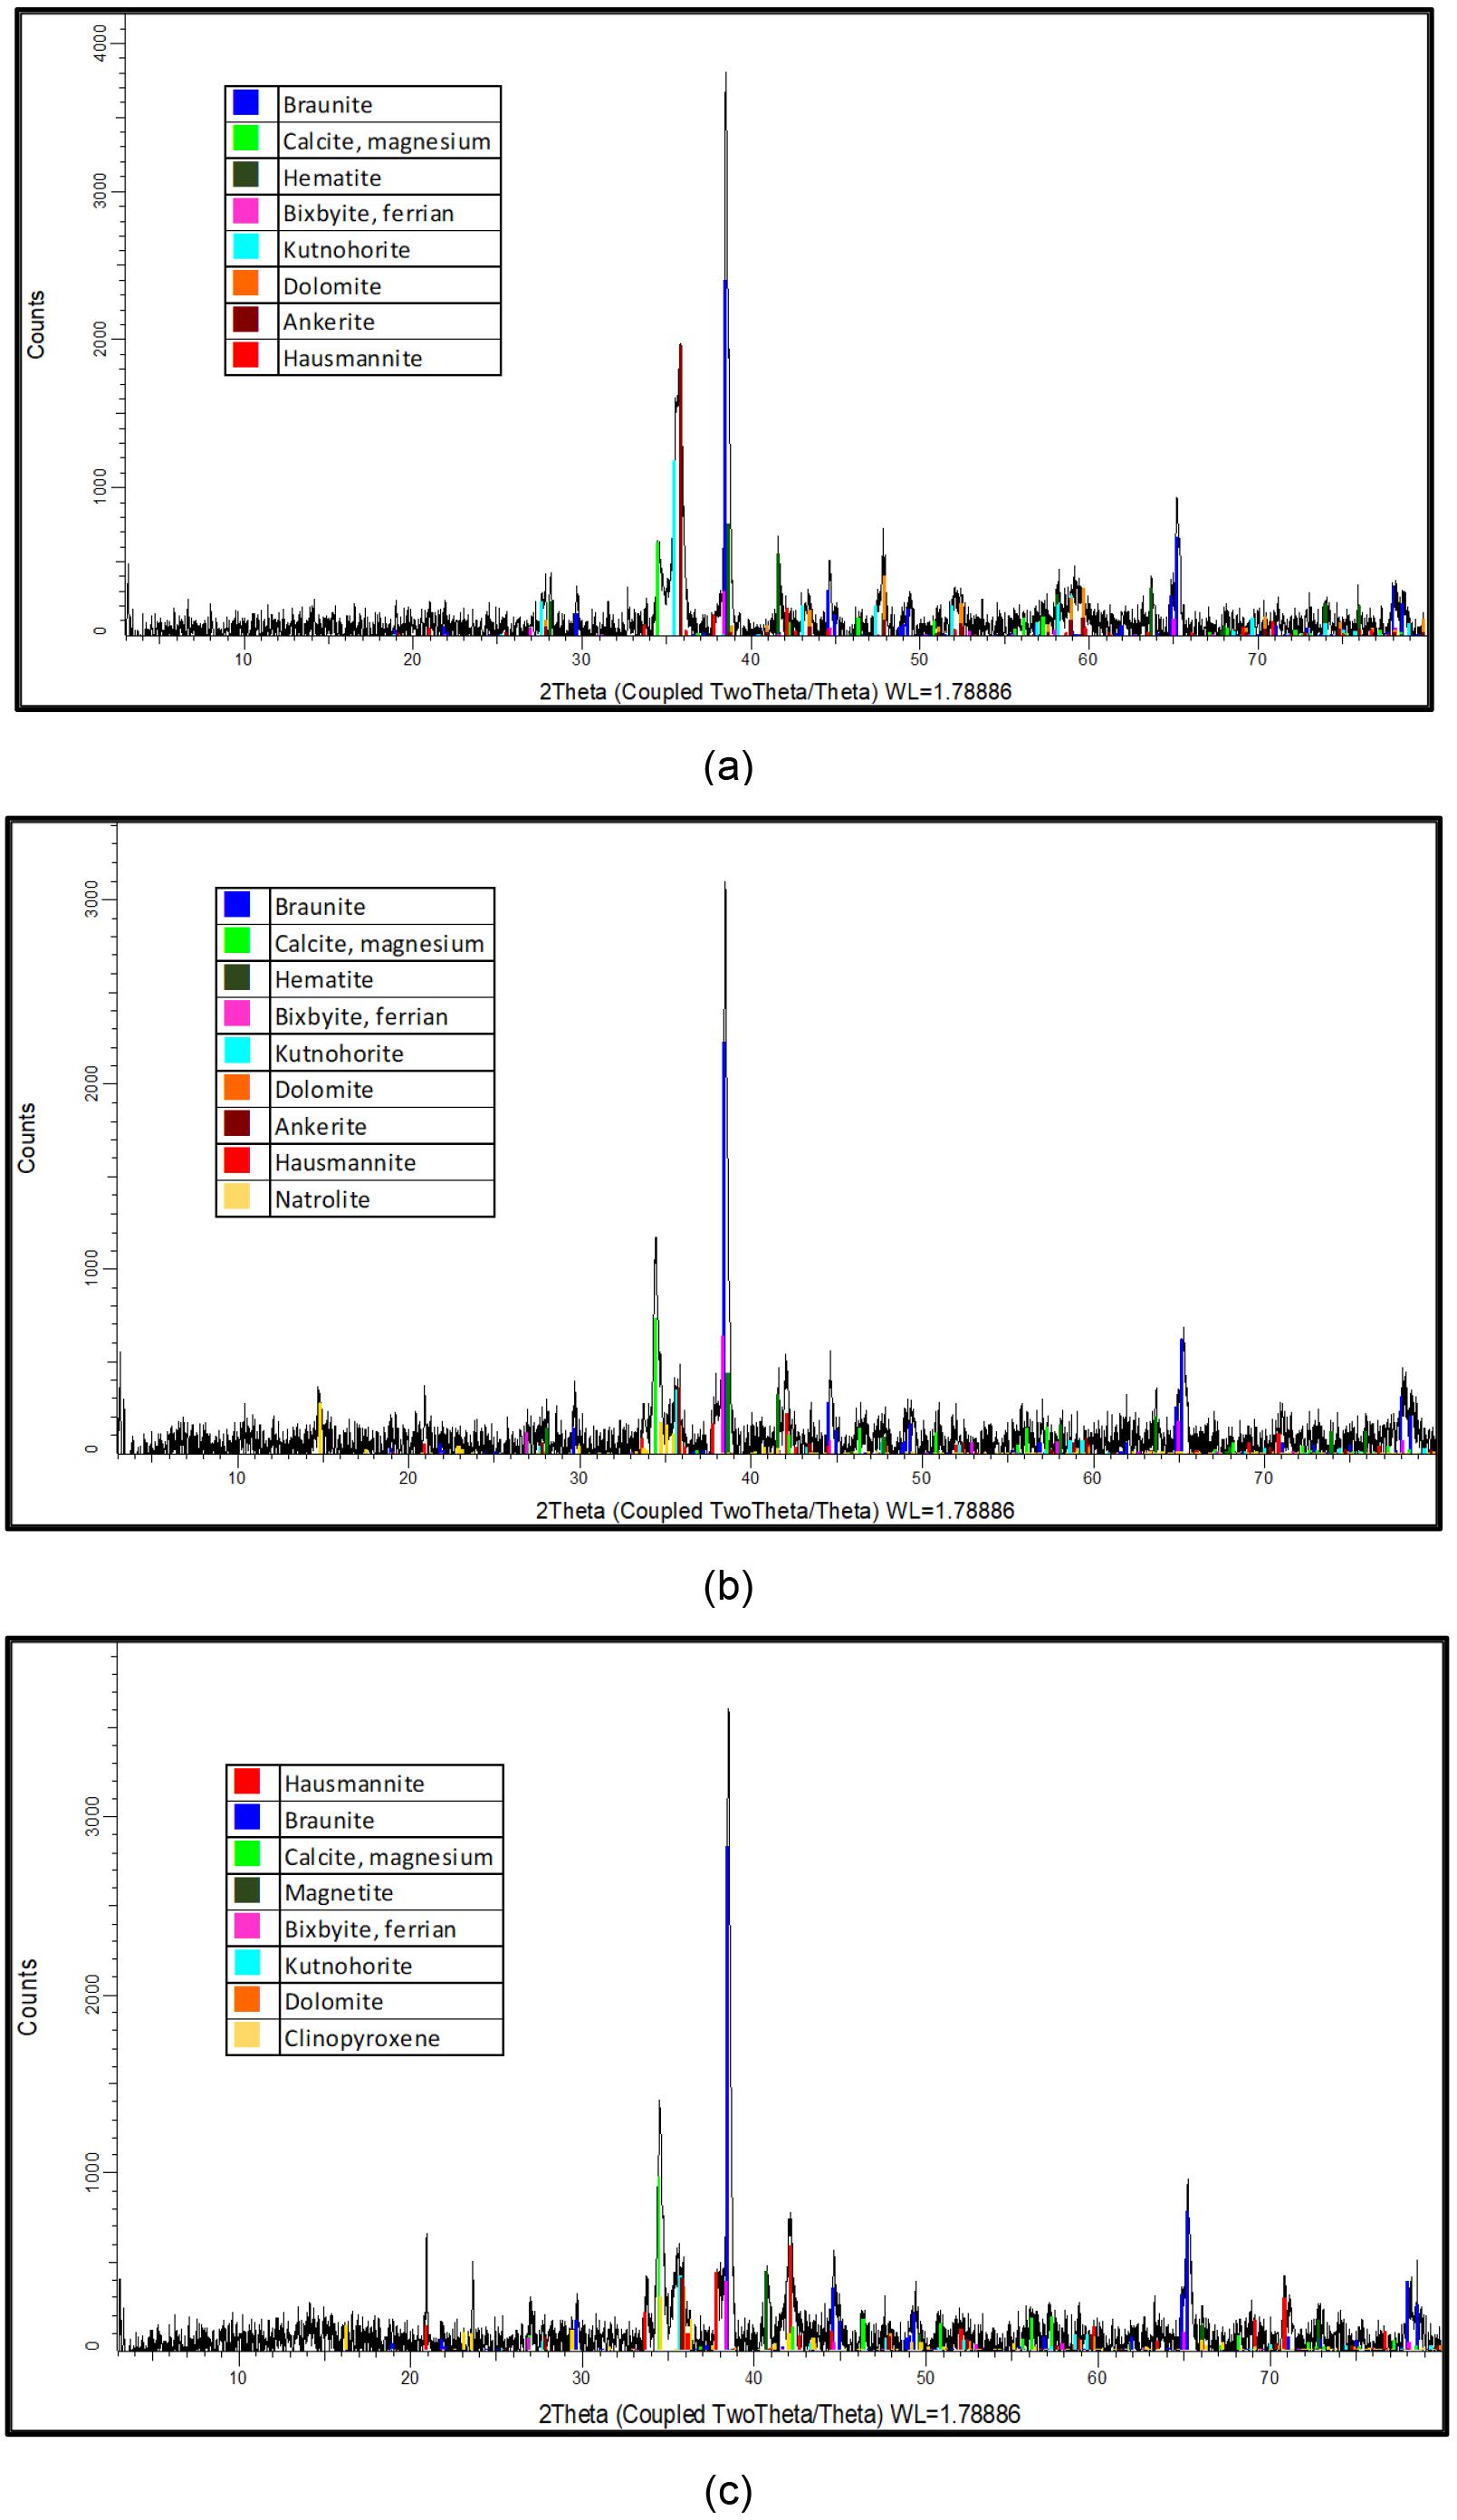
Figure 3—Diffraction patterns for (a) ore A, (b) ore B, and (c) ore C
Southern African Institute of Mining and Metallurgy
633 The Journal of
VOLUME 122 NOVEMBER 2022
the
from to 7.7% at 1000°C. Bixbyite showed similar trends in ores B and A, starting at 5.5% for untreated samples and dropping to 1.5% at 600°C. The content then increased from 1.5% to 2.8% at 800°C, and dropped tozero at 1000°C.
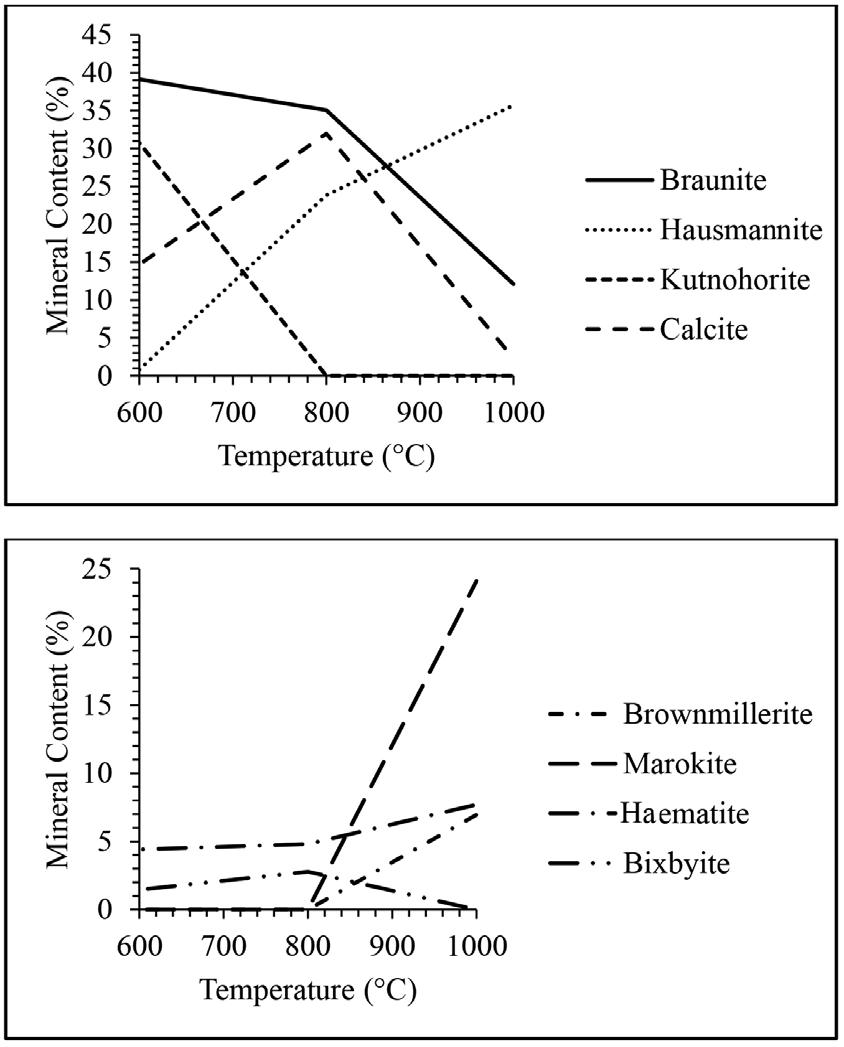
The change in mineral contents with temperature for Ore C are plotted in Figure 6. Braunite in Ore C and Ore A follows a similar trend: the contents start at 18.3% and increases to 26% when treated at 600°C. The content further increases to 30.4% when treated at 800°C and then drops to 26.8% when treated at 1000°C. The hausmannite content makes a parabolic shape between the temperatures of 600°C and 1000°C, the contents start at 42.9% and drops to 19.3% when treated at 600°C. The percentage then increases from 19.3% to 30.1% when treated
at 800°C and then further increases to 42.5% when treated at 1000°C. The content starts at 2% and increases to 37.8% when treated at 600°C and then dropped to 29.9% and 11.4% when treated at 800°C and 1000°C respectively. The kutnohorite content starts at 0% and increases to 10% when treated at 600°C and then drops to 0% when treated at 800°C and 1000°C. Dolomite and kutnohorite follow a similar trend: the content starts at 0% and increases to 5.1% when treated at 600°C and then drops to 0% when treated at 800°C and 1000°C. The hematite content starts at 6% and decreases to 2.7% when treated at 600°C and increases to 7.4% and drops to 4.3% when treated at 800°C and 1000°C respectively. Marokite is only observed when the sample is treated at 1000°C and then at low concentration (1.5%). Decrepitation index
Figure 7 presents the effect of temperature on the DI of the three ores. Temperature has a significant effect on the DI of all three ores, increasing with temperature. Ore A has the highest DI and ore B the lowest. At 600°C the DI of ore A is 3.6 times that of ore B, while at 1000°C the DI of ore A is 1.3 times that of ore B. However, at 800°C the DI of ore B is 1.21 times that of ore C, while at 1000°C the DI of ore C is 1.08 times that of ore B.
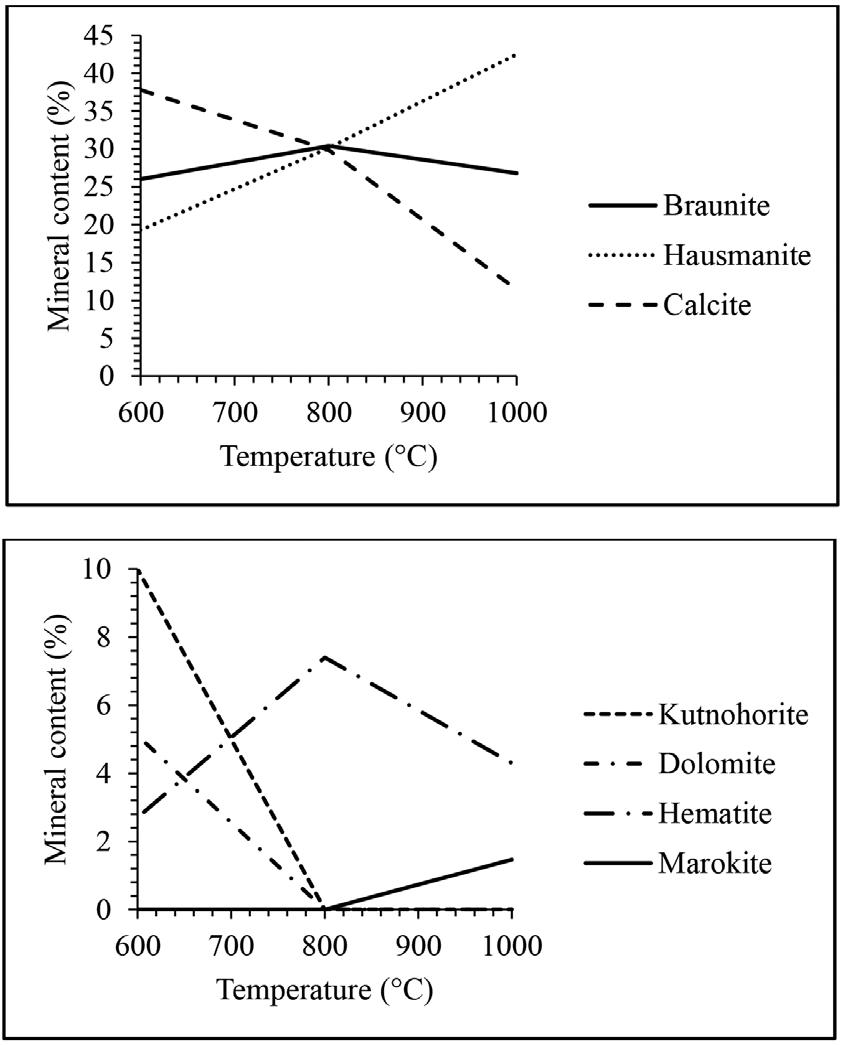
The effect of the rotational speed of the kiln on the DI of all ores is depicted in Figure 8. For ore B and ore C the change in DI is very small when increasing the rotational speed, while for ore A the change is noticeable when moving from 3 r/min to 6 r/min. The effect of rotational speed on the DI is not as significant as the effect of temperature. For this parameter generally ore A has the highest DI followed by ore B and then ore C. At 3 r/min the DI of ore A is only 0.9 times when compared to the DI of ore B, while at 12 r/min the DI of ore A is 1.3 times that of ore B. That is, DI increases with increasing rotational speed although the increase is less pronounced with ore C. The rotational speed has a very little effect on the DI, there being an increase of only 0.85% and 1.22% as the rotational speed increases from 3 to 6 r/min and from 6 to 12 r/min respectively for ore C, while ores A and B increase only slightly more than 2% each time.
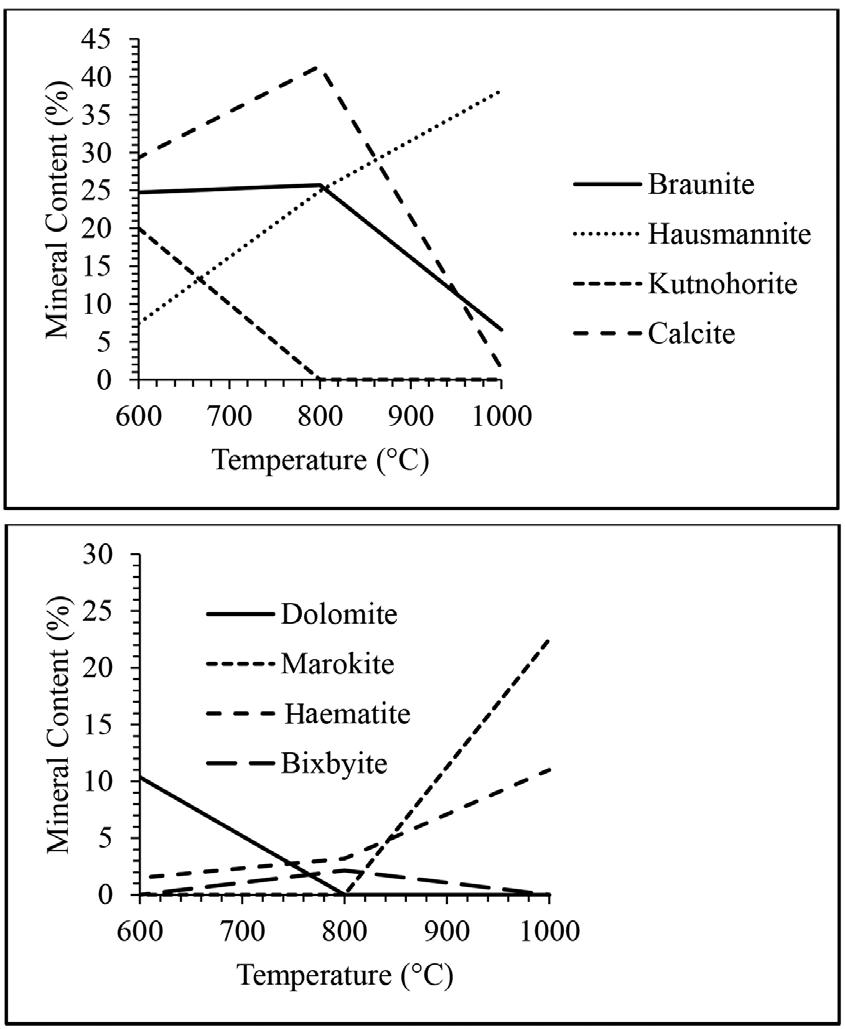
634 NOVEMBER 2022 VOLUME 122
Fines generation from South African manganese ores during preheating in a rotary kiln
The Journal of the Southern African Institute of Mining and Metallurgy
Figure 4—Changes in mineral content of ore A with temperature
Figure 5—Changes in mineral content of ore B with temperature
Figure 6—Changes in mineral content of ore C with temperature
Figure 7—DI of ore A-C at different temperatures (rotational speed 6 r/min size range +6-20 mm)
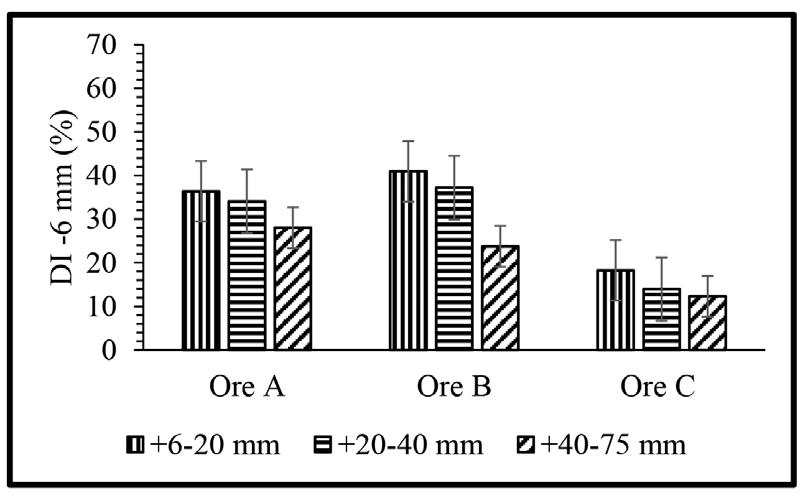
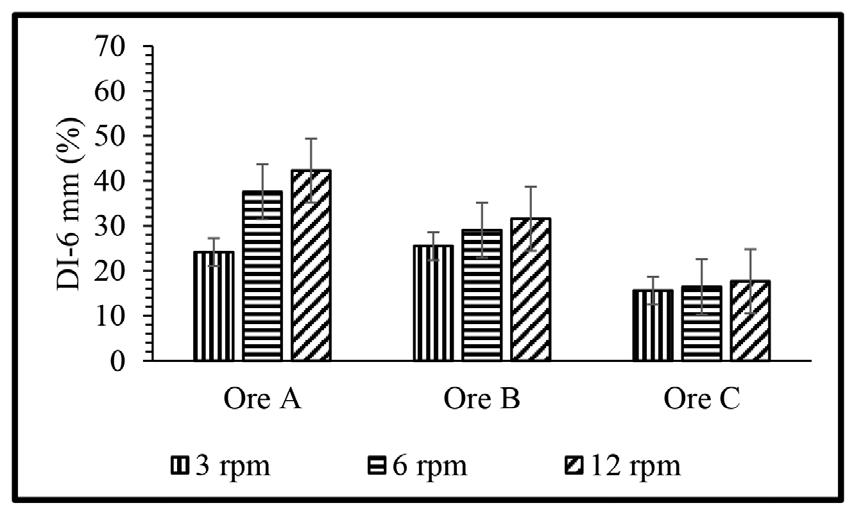
Figure 9—DI of ores A-C at different size ranges (temperature at 800°C, rotational speed 6 r/min)
crystallite structure, hausmannite has a tetragonal distorted spinel structure (Benardini et al., 2020; Bevan and Martin., 2008). Because hausmannite has a distorted structure and braunite does not, the stress induced during phase transformation caused cracking and contributed to an increase in DI. The chemical composition of the dark and light areas in the SEM images are displayed in Table VII. [4] [5]
Figure 8—DI of ores A-C at different rotational speed (temperature 800°C, size range +6-20mm)

Figure 9 presents the effect of size range on the DI. This parameter gives rise to opposite trends compared to the effects of temperature and rotational speed. For this parameter ore B has the highest DI followed by ore A and then ore C. The DI decreases with increasing size range. The effect is the greatest for ore B and small for the other ores. For a size range of +6-20 mm the DI of ore B is 1.1 times that of ore A, while for a size range of +40-75 mm the DI of ore B is only 0.8 times that of ore A.
Discussion
Effect of temperature
Figure 7 shows the effect of temperature on the decrepitation index of manganese ores. As shown by the changes in mineral content for ore A in (Figure 4), kutnohorite decreased during thermal treatment and dropped to zero at 800°C. This drop is due to the decomposition of kutnohorite, at 500°C as shown in Equations [3] and [4] (Faria et al, 2010, 2012, 2013). This decomposition process explains why the trend of DI for these three ores followed the kutnohorite content in the untreated samples. Braunite transforms into hausmannite (Mn₂O₄) at a temperature of 700°C or higher (Faria, Jannoti, and da Silva AraÚjo, 2012). This transformation of braunite to hausmannite also contributes to increasing the DI in the ores treated at 800°C and 1000°C. Faria et al., (2010) concluded that phase transformation is one of the reasons decrepitation occurs, therefore this finding is in agreement with the literature. It was mentioned in the literature review that a change in crystalline structure induces stress that causes cracks during phase transformation and contributes to decrepitation (Faria, Jannoti, and da Silva AraÚjo, 2012). As shown in Figure 10, the sample treated at elevated temperature (1000°C) has more cracks per unit area than the sample treated at low temperature (600°C). Although braunite and hausmannite both have a tetragonal
Moisture content and LOI of the ores also play a role in decrepitation (Dollimore et al., 1994; Faria et al., 2013). From Table III the trends for moisture content and LOI are similar to the trends for DI. Ore A has the highest moisture content and LOI as well as DI, followed by ore C and finally ore B. From the literature it is seen that ores with a higher moisture content decrepitate more, because heating water raises its vapour pressure (Faria et al., 2013, 2012, 2010). Should the moisture be trapped in the inner pores, the vapour pressure can rise high enough to cause rupture and breaking of the ore particle. Fracture of ore particles with closed pores is possible when heated to high temperatures. (Faria, Jannoti, and da Silva AraÚjo, 2012). This is also one of the reasons why the samples treated at a higher temperature (1000°C) have a higher DI than those treated at lower temperature (600°C). This finding is also in agreement with the literature (Faria et al.,2013). LOI is typically seen as the amount of volatile material available in a soil or ore sample. As seen from the experiments conducted at higher temperatures and the changes in bulk phase chemical compositions observed, LOI is a useful standardized test to conduct to give an indication of the carbonate content of the ore. Studies by Faria et al. (2010, 2012, and 2013) indicated that manganese-bearing carbonate minerals such as kutnohorite start to decompose at a temperature of 500°C, which explains why kutnohorite decreased during heat treatment. The ore that has the highest kutnohorite content (ore A) also had the highest decrepitation index. This indicates that the presence of kutnohorite greatly influences decrepitation. Braunite transforms into hausmannite at a temperature of 700°C and higher and this explains the increase of hausmannite content found in this study (Faria, Jannoti, and da Silva AraÚjo, 2012). Since 600°C is below the transformation temperature of 700°C, this also explains why the increase in hausmannite at 600°C is small compared to the increase when the sample is treated at 800°C. The phase change of these minerals is one of the reasons we have a DI of 26.97% (ore A at 600°C and 6 r/min). Faria et al., (2010) concluded that phase transformation is one of the reasons decrepitation occurs, therefore this finding is in agreement with literature.
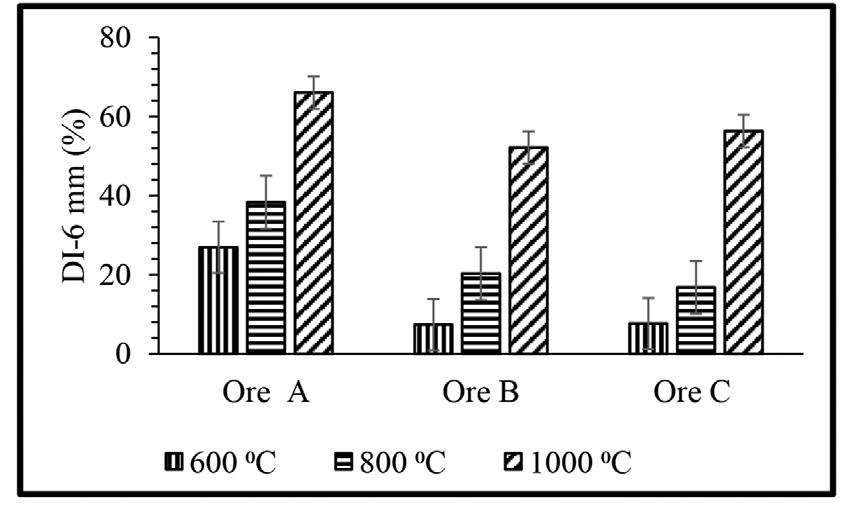
635 The Journal of the
VOLUME 122 NOVEMBER 2022
Fines generation from South African manganese ores during preheating in a rotary kiln
Southern African Institute of Mining and Metallurgy
Effect of rotational speed
The effect of rotational speed on the decrepitation index of manganese ores is shown in Figure 8. From the literature, it has already been established that decrepitation in a rotary kiln is also influenced by the mechanical breakage which is brought about by the rotation (Kingman et al., 2008). This breakage involves three mechanisms attrition, abrasion, and impact (Figure 2). Increasing the rotational speed increases the intensity of these breakage mechanism, resulting in an increase in DI. The kiln had a critical speed of approximately 85.6 r/min, which is seven times more than the highest rotational speed used in the tests. In addition, Faria and co-worker showed that the porosity of the ore may affect the DI, such that an increase in ore porosity increases the DI. The understanding is that an ore with high porosity is much more likely to break under impact. This further explains the higher DI for ore A, and lower DI for ore B and ore C. The other factor that affects the DI of the ores when the rotational speed is adjusted, is the frequency at which the ore particles collide with each other and with the walls of the kiln. Interparticle collisions cause, the particles to break due either to attrition or abrasion (Kingman et al., 2008). When the particles collide with the walls of the kiln tube, they break due to impact damage (Kingman et al., 2008). When the kiln rotates at a higher speed, the particles in the kiln also move at a higher speed, which increases the frequency of collision between the particles and the walls of the tube. Hence the DI increased when the rotational speed was increased from 3 to 6 and then to 12 r/min.
Effect of size range
The effect of size range on the DI of manganese ores is shown in Figure 9. Since for all the experiments 1 kg of sample was used, it can be assumed that the number of particles decreases with increasing size range. This decreases the probability of interparticle collision, which in turn reduces the DI. Another factor that affects the DI of the ores is the area of contact between the particles when the abrasion breakage mechanism applies. Therefore, when the ore particles are large, the voidage between them is greater which results in small area of contact between particles. Lower bulk density essentially means more total space between the particles (voidage) and a smaller area of contact between the particles of the same ore type. This leads to a reduced formation of fines and ultimately a lower DI at larger size ranges.
Conclusion
The aim of the research was to investigate the of decrepitation of three South African manganese ores in a rotary kiln preheating
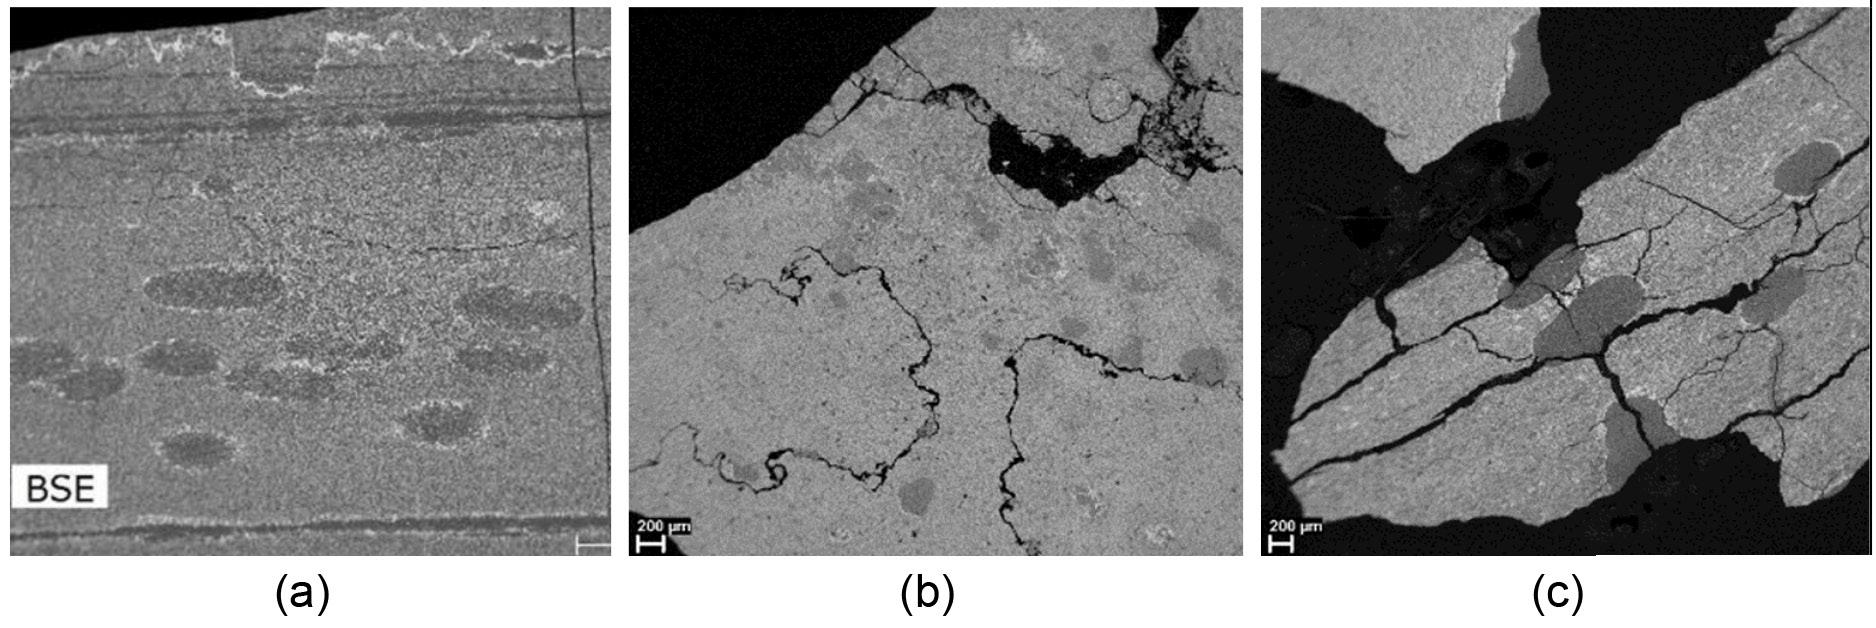
unit. The decrepitation index (DI) of each ore was measured based on three process parameters, namely temperature, rotational speed, and ore size range. The following conclusions were drawn from the results of the study.
➤ Increasing temperature increased the DI for all three ores. Ore A was found to have a higher DI than the other two ores. Ore B was the least susceptible to decrepitation. The DI of ore A increased from 26.97% to 38.36% and from 38.36% to 65.99% when the temperature was increased from 600°C to 800°C and from 800°C to 1000°C. The DI of ore B increased from 7.41% to 20.31% and from 20.31% to 52.15% when the temperature was increased as above, and the DI of ore C increased from 7.68% to 16.80% and then to 56.34%.
➤ Increasing rotational speed increased the DI for all three ores, although the effect was not as significant as that of temperature. Ore A was the most affected by rotational speed, and Ore C the least. The DI of ore A increased from 24.15% to 37.57% and from 37.57% to 42.31% when the speed was increased from 3 r/min to 6 r/min and from 6 r/min to 12 r/min respectively. The DI for ore B increased from 25.48% to 29.02% and from 29.02% to 31.58%, and the DI of ore C from 15.62% to 16.47% and from 16.47% to 17.69%.
➤ Increasing the size range of the sample decreased the DI. The effect of size range on DI was also not as significant as the effect of temperature. Ore B was the most susceptible in this regard, followed by ore A and finally ore C. The DI of ore A decreased from 36.41% to 34.11% and from 34.11% to 28.03% when the size range was increased from +6-20 mm to +20-40 mm and from +20-40 mm to +40-75 mm respectively. The DI for ore B decreased from 40.99% to 37.23% and from 37.23% to 23.77%, and that of ore C from 18.27% to 13.95% and from 13.95% to 12.30%.
In summary, increasing the temperature and the rotational speed of the kiln increases the DI for all three ores. Increasing the size range of the sample used for the test decreases the DI for all three ores. For further study it is recommended that the effects of heating rate and heating time as well as the gas atmosphere on the DI be investigated.
Acknowledgements
The PREMA project is thanked for providing funds that made the execution of the project possible. The PREMA project is funded by the European Union’s Horizon 2020 Research and Innovation Programme under Grant Agreement No. 820561 and industry partners Transalloys, Eramet, Ferroglobe, OFZ, and Outotec.
636 NOVEMBER 2022 VOLUME 122
Fines generation from South African manganese ores during preheating in a rotary kiln
The Journal of the Southern African Institute of Mining
and Metallurgy
Figure 10—SEM images showing formation of cracks in ore A samples treated at (a) 600°C, (b) 800°C, and (c) 1000°C at 6 r/min and size range of +6-20 mm
Mintek and Transalloys provided equipment and the raw material used throughout the project. The paper is published with permission of Mintek.
References
ASTM D2216. 2014. Standard Test Methods for Laboratory Determination of Water (Moisture) Content of Soil and Rock by Mass. ASTM International, West Conshohodcen, PA.
ASTM D4892. 2008. Standard Test Method for Density of Solid Pitch (Helium Pycnometer Method). ASTM International, West Conshohodcen, PA.
ASTM D7348. 2008. Standard Test Methods for Loss on Ignition (LOI) of Solid Combustion Residues. ASTM International, West Conshohodcen, PA.
Benardini, S., Bellatreccia, F., Della Vetura, G., Ballirano, P., and Sodo, A 2020. Raman spectroscopy and laser-induced degradation of groutellite and ramsdellite, two cathode materials of technological interest. RSC Advances, vol. 10. 923 p.
Bevan, D.J.M. and Martin, R.L. 2008. The role of the coordination defect: A new structural description of four fluorite-related sesquioxide minerals, bixbyite, braunite, braunite II, parwelite, and their structural relationships. Journal of Solid State Chemistry, vol. 181. pp. 2250–2259.
Biswas, A., Das, P.K., and Singh, V. 2016. Investigation of the decrepitation phenomenon of polymorphic materials: A theoretical and experimental study. Powder Technology, vol. 294. https://doi.org/10.1016/j.powtec.2016.02.020
Dollimore, D., Dunn, J.G., Lee, Y.F., and Penrod, B.M. 1994. Decrepitation of dolomite and limestone. Thermochimca Acta, vol. 273. https://doi.org/10.1021/ a1960006p
Faria, G.L., Jannoti, N., and da Silva Araujo, F.G. 2012. Decrepitation behavior of manganese lump ores. International Journal of Mineral Processing, vol. 102. https://doi.org/10.1016/j.minpro.2011.10.004
Faria, G.L., Tenório, J.A.S., Jannotti Jr, N., and da Silva AraÚjo, F.G 2013. Disintegration on heating of a Brazilian manganese lump ore. International Journal of Mineral Processing, vol. 121. https://doi.org/10.1016/j. minpro.2013.06.008
Faria, G.L., Vianna, N.C.S., Jannoti, N., Vieira, C.B., and Da Silva Araujo, F.G. 2010. Decrepitation of Brazilian manganese lump ores. Proceedings of the International Ferroalloys Congress, Helenski, Finland, 6–9 June 2010. pp. 449–455.
Kingman, S.W., Lowndes, I.S., Petavratzi, E., and Whittles, N. 2008. An investigation into the mechanism of dust deneration in a tumbling mill. Journal of Rock Mechanics and Tunnelling Technology, vol. 14, no. 26. pp. 77–102.
Olsen, S.E., Tangstad, M., and Lindstad, T. 2007. Production of Manganese Ferroalloys. Tapir Academic Press, Trondheim, Norway.
Pegels, A. 2010. Renewable energy in South Africa: Potentials, barriers and options for support. Energy Policy, vol. 38, no. 9. pp. 4945–4954. https://doi. org/10.1016/j.enpol.2010.03.077
Pisaroni, M., Sadi, R., and Lahaye, D. 2012. Counteracting ring formation in rotary kilns. Journal of Mathematics in Industry, vol. 19. https://doi.org/10.1186/21905983-2-3
PREMA . 2019. https://www.spire2030.eu/PREMA [accessed 20 February 2019].
Sangine, E. 2020. Mineral commodity summaries 2020. US Geological Survey. https://doi.org/10.3133/mcs2020 u
The Just Transition and the Coal Mining Sector in South Africa
Megan Cole, Mzila Mthenjane, and Andrew van Zyl
Growing concern over the impacts of climate change across the world has led to the widely-shared goal of a ‘just transition’ to cleaner energy sources and reduced dependence on coal. Different definitions are used for the just transition, but a key feature is that no-one is left behind when changes are made to energy and economic systems to mitigate climate change. That involves sharing the costs and benefits of the changes fairly, supporting workers with new jobs or retraining, and supporting communities through broader economic changes. Crucial to the just transition is preventing further societal fragmentation along wealth, race, age, and gender lines. Internationally, there has been a transition away from coal mining, particularly in Europe, and a growing awareness of the need for new policies to address job losses, skills shortages and changing value chains and supply chains. South Africa is under pressure to do the same, as the world’s seventh largest coal producer and the fourteenth biggest CO2 emitter. In addition, South Africa is going to experience greater temperature increases than the global average and adaptation to climate change is a growing concern. There are 72 operating coal mines in South Africa, largely in Mpumalanga Province, supplying the domestic and export markets. They are owned by 32 mining companies who directly employ over 92 000 people and support approximately 170 000 jobs indirectly. According to available life-of-mine data, at least 17 of these mines could close by 2030 (total production of 33 Mt/a), a further 22 mines by 2040 (100 Mt/a), and 13 mines (47 Mt/a) by 2050 (Figure 1). They supply coal to 15 Eskom power stations, which employ over 12 000 people. Most of these power stations are pushing the limits of their design life, and six of them will be decommissioned by 2030 (9.3 GW), a further four by 2040 (14 GW), and three more by 2050 (12.3 GW). New coal-based power projects, when considered in the light of the cost and time overruns of Kusile and Medupi, would not come on stream fast enough to prevent severe energy shortages even if financing was available and there were no climate considerations in play. This indicates a clear path to decarbonization and means that the transition away from coal to renewable energy is already planned and will likely occur without premature closure implied by the ‘just transition’. In fact, mining companies are contributing to the transition by installing their own renewable energy solutions at mine sites, with a commitment of 6.5 GW by 29 companies across various commodities planned to date. This approach is a shared and responsible pathway to the energy transition given our domestic energy and economic challenges. Despite ambitious commitments to low carbon growth, political and governance factors have hindered the rollout of renewable energy. However, renewable projects that have proceeded have performed well and there is some cause for optimism now that regulatory progress has been made. Further research may also show that employment in the energy sector in a renewable energy dominant economy may be higher.
Southern African Institute of Mining and Metallurgy

637 The Journal of the
VOLUME 122 NOVEMBER 2022
Fines generation from South African manganese ores during preheating in a rotary kiln
The Just Transition and the Coal Mining Sector in South Africa (continued)
The impact of mine closure on host communities is significant, disruptive, and should not be underestimated. Coal mines currently operate in two metros and 21 local municipalities, home to over 10 million people. Specifically, there are at least 50 coal mining host communities (4 cities, 24 towns, 14 townships, and 8 rural villages) that are home to 2.5 million people. These communities already have low levels of employment (39% unemployed), income (37% below the poverty line), education (45% of adults have Grade 12/ NQF4), and internet access (Figure 2) and thus are vulnerable to a changing energy system and local economy. The level of basic services varies significantly but is lowest in rural areas with the lowest income levels and fewest job opportunities. Importantly, many of the local municipalities are under financial stress and will struggle to cope with mine closure and the resultant loss of revenue and support.
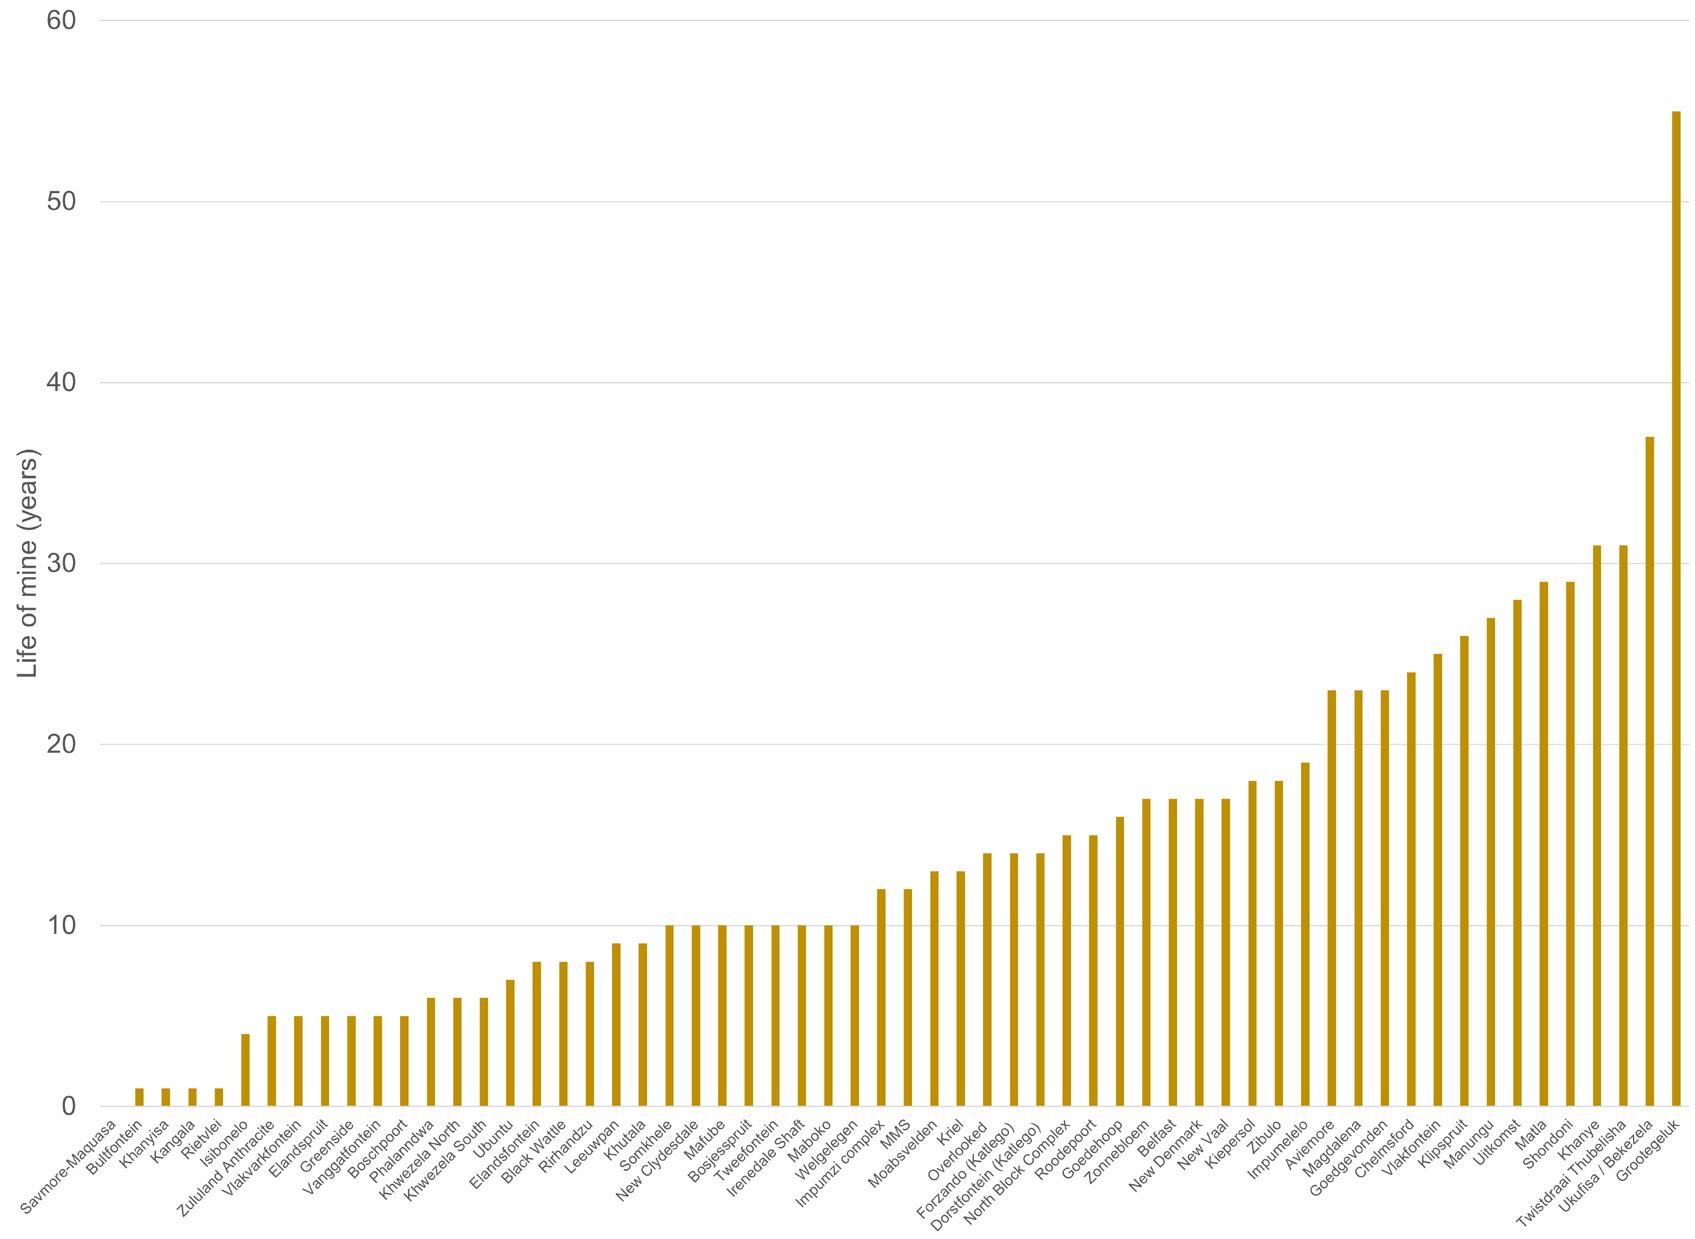
The South African approach to the ‘just transition’ needs to take into account these local realities and the narrative needs to support an effective transition that does not undermine the economy or the social licence to operate of the coal mines that are currently an essential part of the energy system. Much work has already been done on stakeholder engagement, but clarity is needed on the drivers and nature of the transition, which in reality is a planned socio-economic transition to closure, in addition to environmental considerations.
Figure 1 – Life-of-mine of coal mines in South Africa
Figure 2 – Social wellbeing barometer for coal mining host communities in South Africa
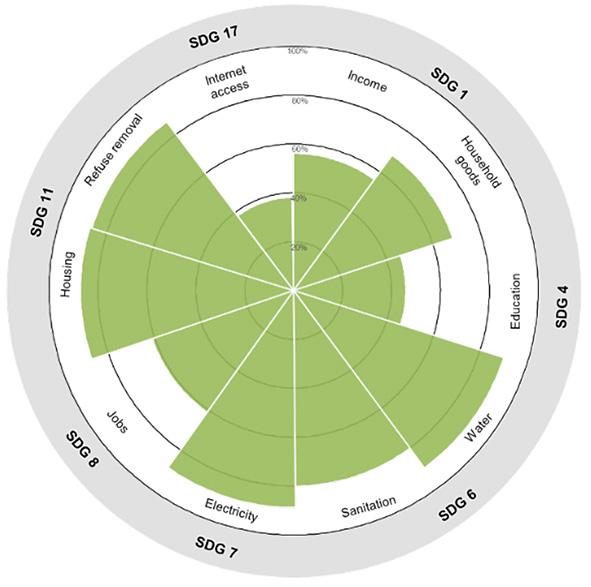
638 NOVEMBER 2022 VOLUME 122
Fines generation from South African manganese ores during preheating in a rotary kiln
The Journal of the Southern African Institute of Mining
and Metallurgy
Drawpoint loading optimization strategies in block caving: A case study of Palabora Mining Company
by M.S. Nyarela1, R.B. Khumalo1, and R.C. Nemathithi1
Affiliation:
1Palabora Mining Company, Limpopo, South Africa.
Correspondence to: M.S. Nyarela
Email: m.nyarela@gmail.com
Dates:
Received: 29 Jun. 2021 Revised: 7 Nov. 2021 Accepted: 10 Aug. 2022 Published: November 2022
How to cite: Nyarela, M.S., Khumalo, R.B., and Nemathithi, R.C. 2022
Drawpoint loading optimization strategies in block caving: A case study of Palabora Mining Company. Journal of the Southern African Institute of Mining and Metallurgy, vol. 122, no. 11, pp. 639–646
DOI ID: http://dx.doi.org/10.17159/24119717/1664/2022
Synopsis
Palabora Mining Company is one of the largest low-grade copper mines globally. The mine uses block caving for the extraction of the orebody. This paper enumerates the drawpoint loading strategies for the overall head grade improvements, particularly for a block that is nearing depletion. A comprehensive literature review of various considerations relating to improving productivity in block caving is presented to contextualize the draw control in caving. From this study, an optimized draw control strategy is presented, which focuses on three parameters that include grade distribution, loading compliance, and tonnage splits per sector. An empirical method based on the relational study between various parameters is used to outline the key criteria to be used in the optimization of drawpoint loading in block caving.
Keywords
caving, draw control, drawpoint, tonnage split.
Introduction
Generally, when a mining block nears depletion, it becomes more challenging to effectively extract the mineralization from the block, particularly in the case of high-grade deposits (Duffy et al. 2015; Jang, Topal, and Kawamura, 2015). This leads to lower recoveries, with more fines and dilution. The study by Diering et al., (2018) suggest various factors that contribute to such a high content of dolerite, which leads to fines accumulating in the drawpoint much quicker. This challenge requires selective mining, which is difficult to accomplish in block caving. Causes of dilution include the integration of lower-grade material in the block, as well as the ingress of external sources that further dilute the existing high-grade blocks (Jang, Topal, and Kawamura, 2015). Although waste sorting is practical in narrow vein reefs, it poses a challenge in massive mines, except with proper application of draw control strategies. (Shekhar et al., 2018).
Several massive mining methods are often trialled when mining companies transition from the open pit to the underground setting (Moss, Diachenko, and Townsend, 2006). Among the underground massive mining methods, the one that has gained the most popularity is block caving (Shelswell, Labrecque, and Morrison, 2018; Khodayari and Pourrahimian 2017). The preference for this method is based on its low operating cost, and high production output (Firouz and Yashar, 2017). This method is also applicable in the extraction of low-grade orebodies (Shelswell, Labrecque, and Morrison, 2018).
Although block caving offers various benefits, all these require correct timing, sequencing, and diligence in abiding with the required leads and lags, and drilling and blasting during the undercutting phase, which must be rigorously enforced. Once all these parameters are in place, and the hydraulic radius has been reached, then the benefits of this method are realized. Apart from the challenges with waste and high capital cost, block-caving is still profitable as very high production rates can be achieved (Khodayari and Pourrahimian, 2017).Other advantages are realized with minimal blasting once the block has caved with emphasis on constant monitoring by means of draw control (Shekhar et al., 2018).
Draw control entails the allocation of the load haul dump (LHD) vehicles in the correct areas, and ensuring that the correct quantities of ore are extracted. This approach becomes crucial to achieving waste control and life-of-mine production targets (Nezhadshahmohammad, Khodayari, and Pourrahimian, 2017). According to Rehal et al. 2003 (as cited in Shelswell, Labrecque, and Morrison, 2018), drawpoint loading requires effective maintenance and operations to attain the required rates. The maintenance of the drawpoint includes drawpoint rehabilitation and secondary breaking activities.
639 The Journal of the Southern African Institute of Mining and Metallurgy VOLUME 122 NOVEMBER 2022
Drawpoint loading optimization strategies in block caving: A case study of Palabora Mining Company
Various studies have been conducted, particularly relating to secondary breaking to increase production rates (Ngidi and Boshoff, 2011). However, there is inadequate literature regarding strategies to employ for optimal drawpoint loading as the block nears depletion. Such strategies are pivotal for understanding the factors to consider for optimizing loading, thus improving production performance. Grade performance is one of the key factors to consider in improving production.
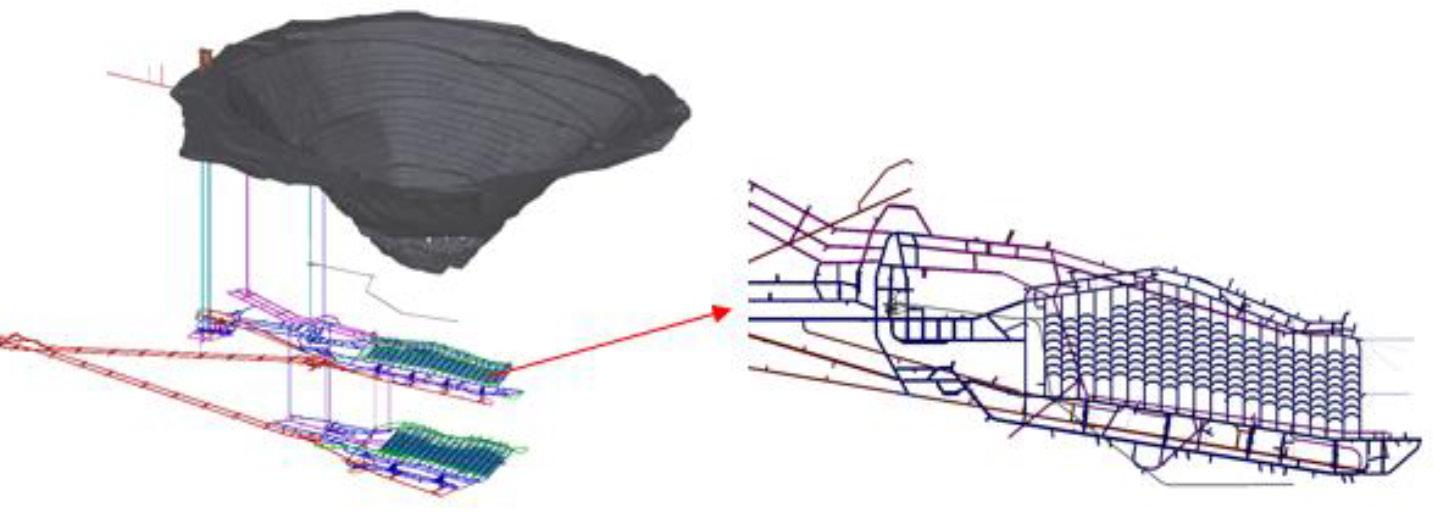
Grade performance is influenced by various factors, which may range from the underground block size, plant recoveries, loading strategies and market conditions dictating the drawing rates, as well as the size and distribution of the drawpoints, and waste or dolerite content (Diering et al., 2018). In this research study we intend to highlight some of the strategies to employ to optimize drawpoint loading. In addressing the main objective of the study, we seek to answer the following questions:
➤ What is the influence of loading compliance on copper grade performance?
➤ Does an increase in tonnage split correlate with an improvement in grade performance?
➤ What strategies should the mine employ when prioritizing drawpoints in the cave?
Background of the study area
The study was conducted at Palabora Mining Company (PMC), which is a subsidiary of the HBIS group, situated in the Limpopo Province, South Africa, (Figure 1). The mine commenced operations in 1956, and produces copper, vermiculite, and magnetite and other by products from the Palabora Igneous Complex (van der Spuy 1982; Killick et al., 2016). The chief mineral produced is copper, which is found in the copper-bearing rocks such as carbonatite and foskorite (Southwood and Cairncross, 2017). Copper- and magnetite-bearing rocks are all enclosed in the Palabora Igneous Complex, which is complex in formation with dimensions extending 6.5 km by 2.5 km (Southwood and Cairncross 2017; Letts et al., 2011).
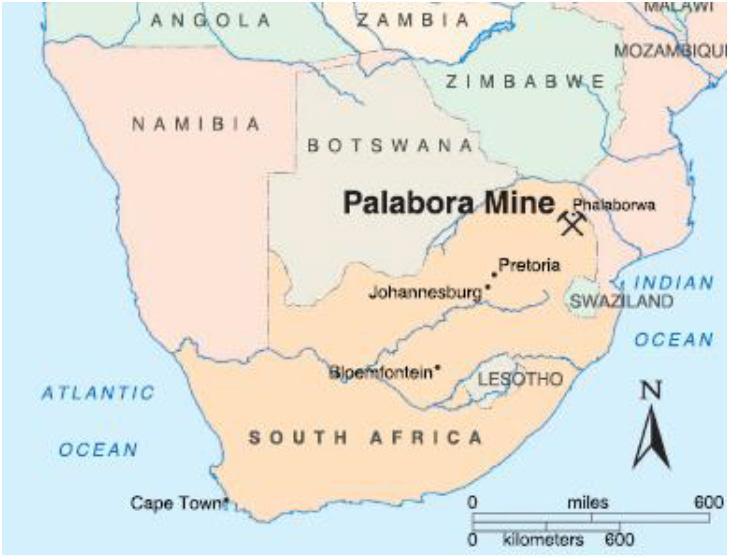
In the initial stages, the mine was an open pit operation, and traditional to underground operations using block caving (Moss, Diachenko, and Townsend, 2006). Access to underground mining was planned to mine the crown pillar using block caving mining method, which commenced in 2001 (Sainsbury et al., 2016).
Block caving encompasses various stages, which include the horizontal development, undercutting, and production mining, with the ore being drawn through drawbells. PMC comprises two lifts or mining blocks, which are named Lift 1 and two blocks. Lift 1 commenced in 2001, with a capacity to produce more than 30 000 t/d from 20 crosscuts, with 332 drawpoints. Each crosscut
forms part of a sector. There are four sectors each with five crosscuts.
Undercutting commenced centrally and extended outward towards the eastern and western regions. This strategy resulted in the quicker maturity of the cave, particularly in sector 2 (Nyarela, 2019). The categorization of each sector is for ease of ore tipping as well as the minimization of traffic in the cave. Figure 2 presents the PMC block cave outline.
Various equipment is used for the block cave operation at PMC, including LHD machines, medium reach rigs (MRRs), mobile rock breaker (MRBs), lube trucks, conveyors, and winders. The structure of the block cave requires the LHD to load material from the drawpoints until there is hang-up or blockage in the drawpoint. Such blockages require the function of a secondary breaking facility that aids in creating free-flowing material, facilitating loading, conveying, and transport out to surface by means of winders (Figure 3).
Problem statement
Various research studies have been conducted to resolve challenges related to block cave mining (Dirkx, Kazakidis, and Dimitrakopoulos 2018; Ngidi and Boshoff, 2007; Castro, Trueman, and Halim, 2007). The present investigation seeks to outline strategies to improve drawpoint loading when a mining block nears depletion, thus improving the overall production performance.
640 NOVEMBER 2022 VOLUME 122
The Journal of the Southern African Institute of Mining and Metallurgy
Figure 1—Palabora Mining Company locality plan (Southwood and Cairncross, 2017)
Figure 2—Schematic representation of the Palabora block cave
Drawpoint loading optimization strategies in block caving: A case study of Palabora Mining Company
Literature review
Block caving is an underground mining method that is gaining popularity due to its safety, cost, and higher production outputs compared to other methods (Rashidi-Nejad, Suorineni, and Asi, 2014). This is an underground massive mining method where the rock mass caves naturally under the influence of gravity (Vergugo and Ubilla, 2004). Several benefits are realized, such as the ability to effectively extract lower-grade orebodies and reduced employee risk compared to conventional mining methods. Cave initiation is by means of creating a horizontal slice by drilling and blasting the level above the production level, known as an undercutting level, to fragment the rock mass and allow gravity to further reduce the ore into smaller particles that will be drawn from the drawpoints (Vergugo and Ubilla 2004; Khodayari and Pourrahimian 2017). This process relates to cave propagation, which influences the rock mass by causing mobilization and fragmentation of the ore (Sainsbury, et al., 2016). Drilling and blasting creates a zone of weak overburden to allow collapse of the rock and movement of material (Oosthuizen and Esterhuizen 1997; Rashidi-Nejad, Suorineni, and Asi, 2014). Figure 4 illustrates a schematic of a block cave mine.
The point at which caving occurs is determined by using a chart, which predicts the hydraulic radius (HR) as a function of the mining rock mass rating (MRMR) in order to determine the stable, transitional, and caving zones, as indicated in the Figure 5 (Laubscher 1990; Butcher 1999). The stability diagram enables a mine to determine at which point the cave will propagate as well as understand different rock types and zones which are classified based on the diagram.
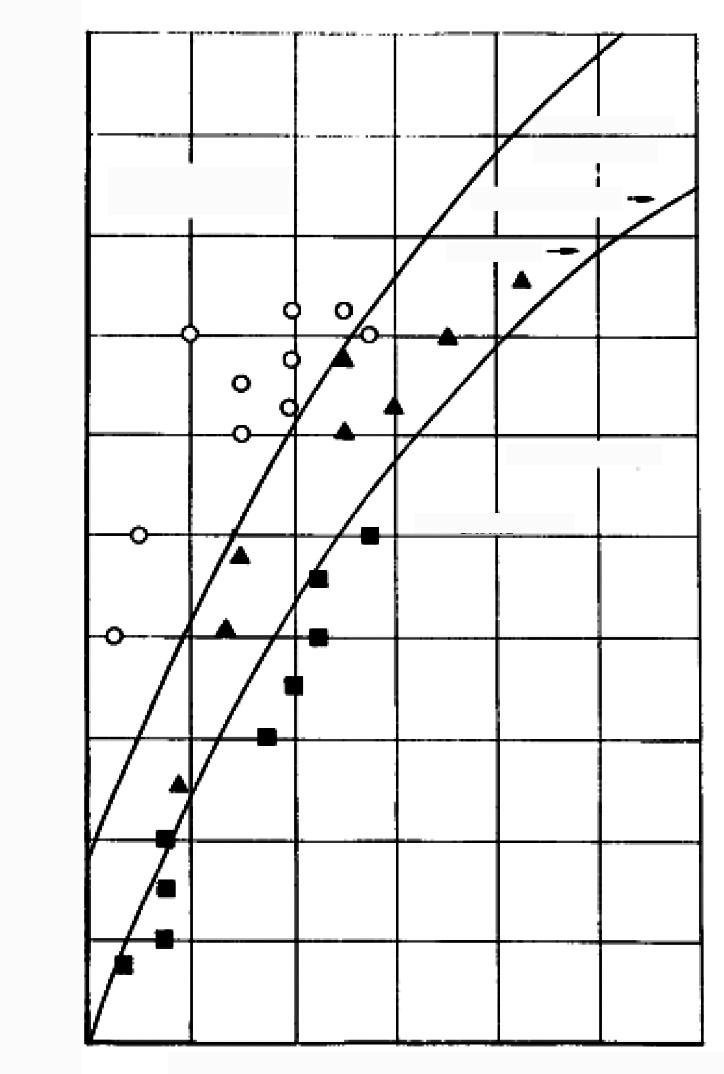
Once caved, the material is drawn from the production level through drawbells, which connect in the form of drawpoints. Each drawpoint is loaded and maintained to ensure the maximum tonnage is are extracted from each and to ensure sustainability of the cave. Ensuring the sustainability of the cave requires the loading of ore to be controlled by means of effective draw control, which reduces the likelihood of running short of material as well as minimizing environmental challenges related to block caving. Such challenges include the risk of airblasts, early dilution, and drawpoints from which no ore is extracted for long periods (Nyarela, 2019).
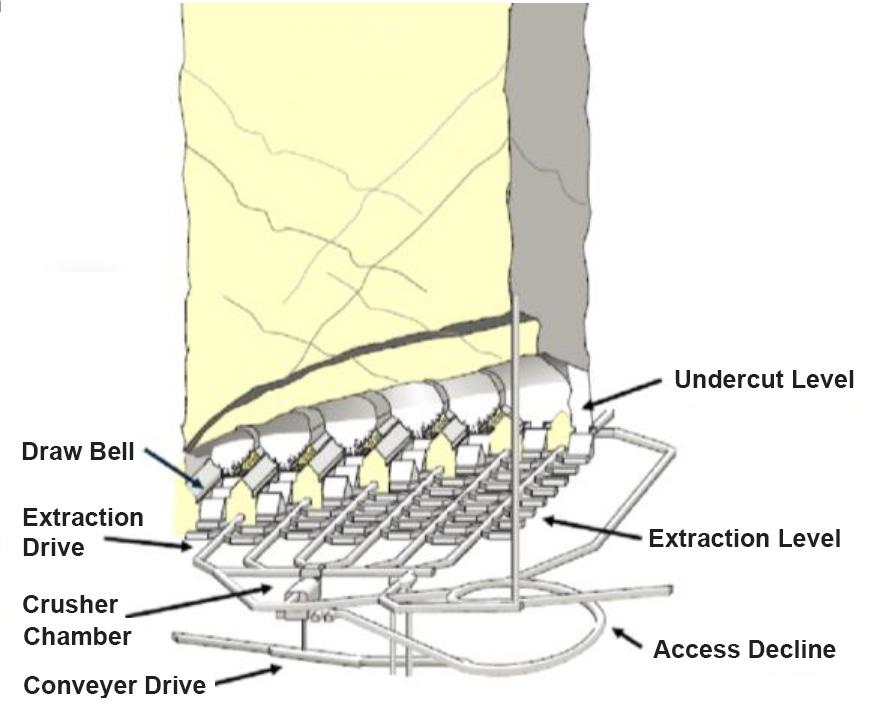
Ensuring cave sustainability through draw control also entails measures to monitor and control the overall grade in the cave (Booth et al. 2004) (as cited in Shekhar et al., 2018). Unlike in conventional mines, rock separation is a challenge, thus the optimal loading and scheduling of a block is critical in achieving the desired grade performance. This involves measures to control and reduce loading waste and low-grade drawpoints, correct assigning of LHDs, and the combination of strict adherence to optimal production schedules factoring inputs from various supporting departments such as geology and rock mechanics (Nezhadshahmohammad, Khodayari, and Pourrahimian, 2017).
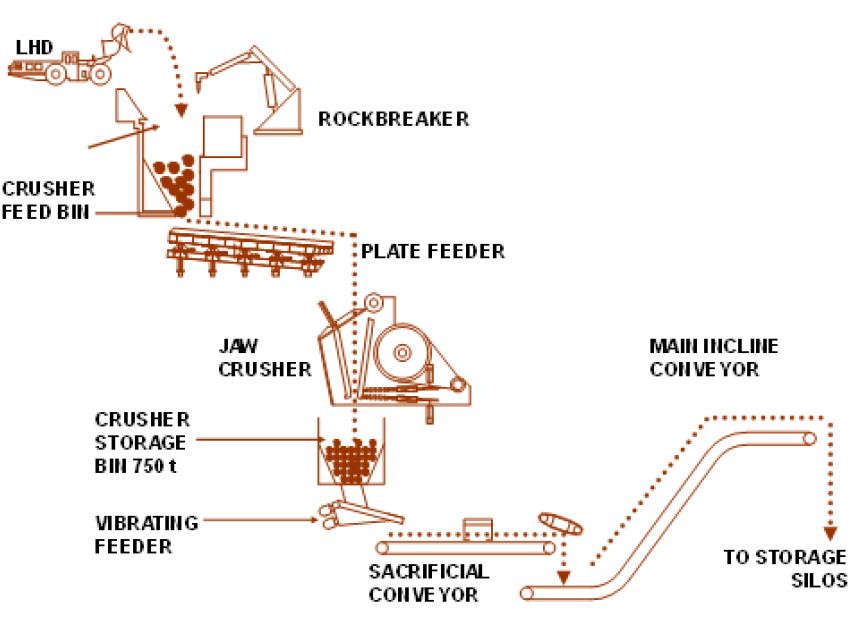
641 The Journal of the
and
VOLUME 122 NOVEMBER 2022
Southern African Institute of Mining
Metallurgy
3—Palabora
ore-flow schematic
4—Block cave mine schematic (Duffy
2015) Figure 5—Stability diagram (Laubscher, 1990) Ore Body 10 20 30 40 50 60 100 90 0 80 70 60 50 40 30 20 10 ADJUSTED ROCK MASS RATINGS STABLE (LOCAL SUPPORT) TRANSITION DILUTION ZONE LARGER PILLARS SUBSIDENCE CAVING
Figure
Mining Company
Figure
et al.,
Figure 6—Lift 1 grade performance
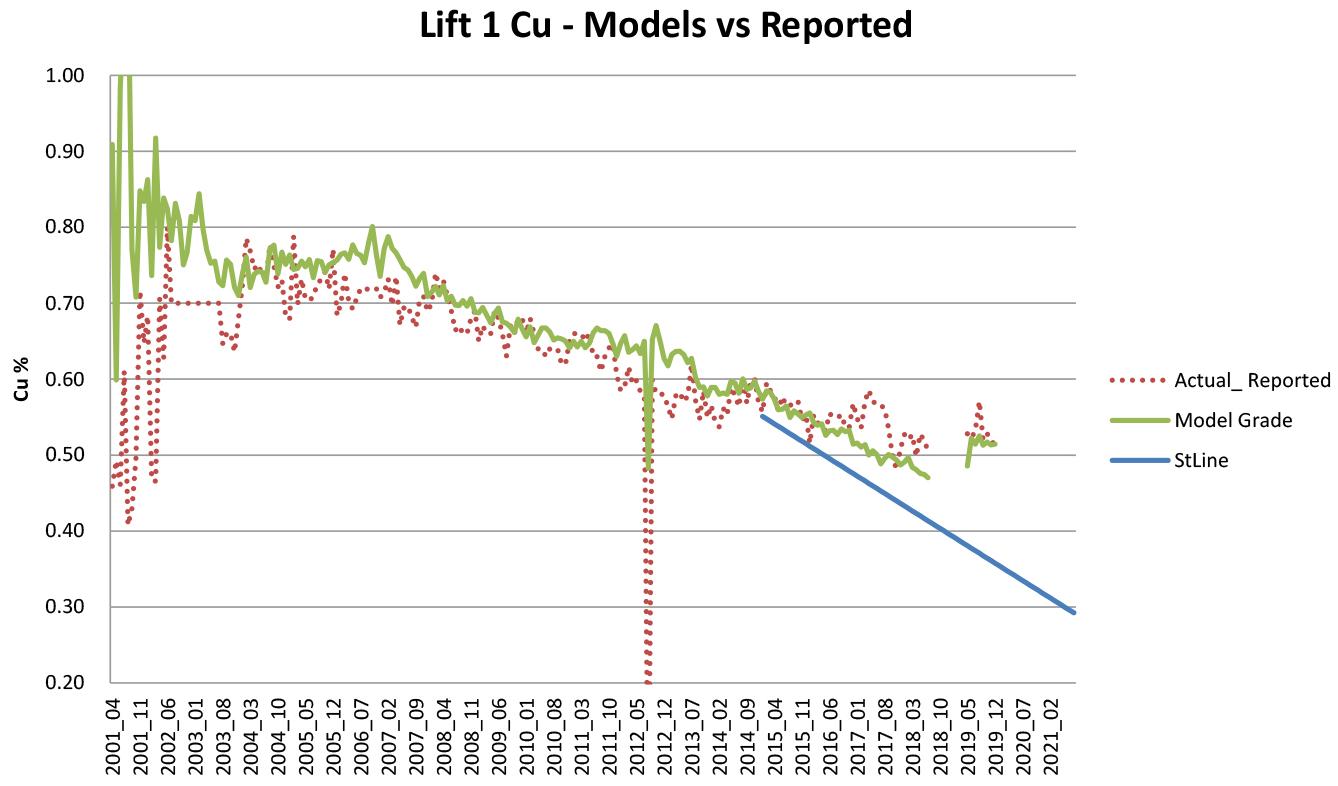
Research methodology
We conducted an empirical study based on the actual data extracted from the mine’s daily records. This study investigates 261 drawpoints, which encompass 19 crosscuts, categorized into four sectors. Each sector is categorized into crosscuts of five, with the exception of sector 2. The data covers the period between January 2017 and June 2018. The justification for this period is based on the need to acquire consistent data for a period longer than twelve months continuously, whereby the monthly tonnages, compliance, and grade distribution are available.
Correlational analysis is adopted to determine the relationship between different variables in order to determine the impact that one variable has on the other (Kumar and Chong 2018; Miot 2018). The key focus is on improving the overall head grade, which plays a significant role in the recovery of the metal from underground. For this reason, this study intends to determine factors that influence the improvements in the head grade, by focusing on the loading compliance, tonnage splits, and grade distribution. The reliability of the data-set is determined using both the SigmaXL® tool and Microsoft Excel®
Results and discussion
Research question 1
In addressing the research question: ‘what is the influence of loading compliance on copper grade performance?’, the key interest is due to the observed decline of the head grade, with emphasis on in seeking to understand the underlying factors that influence the decline. Figure 6 presents historical data of the mine’s grade performance. Since the inception of block caving at PMC, the grade has fallen from above 0.7% to around 0.5% as the reserves were depleted. The projected straight-line average grade demonstrates that there is still a decline anticipated to below 0.4% copper grade.
The results in Figure 6 also present a positive grade trend between 2017 and 2019, as denoted by the red-dotted line (actual head grade). The Gems PCBC® model indicates that in the same period there would be a decline to below the 0.5% mark; however, the actual grade recorded between 2017-2019 is still
above the model value. Various factors led to the positive grade performance, and it is the intent of this study to outline some of those factors in order use them as strategies for the remaining years of mining.
The first objective is based on the need to analyse the influence of the loading compliance on the head grade. This includes ensuring the incorporation of an effective draw control by focusing mainly on high-grade drawpoints. In this analysis, the intent is to determine whether the improved compliance is proportional to an improved grade. The results, presented in Figure 7, indicate a correlational analysis of the two variablesgrade and compliance.
According to Miot (2018), a correlational analysis evaluates ‘two quantitative variables’ using the Pearson’s or the Spearman’s correlation coefficient, which makes use of scatter plots to graphically analyse the interrelatedness between the variables. The Pearson’s correlation coefficient, denoted, rp, is categorized as positive weak or positive strong and negative weak or negative strong. Values between zero and 0.5, and zero and -0.5, are considered weak, whereas the values between 0.5 and 1 and -0.5 and -1 are considered moderate to strong, which could be used to justify the relevance of the variables to one another (Kumar and Chong 2018; Miot 2018). The degree of variability between the two factors is represented by the coefficient of determination (R²) value, which measures how far the values are from the fitness line. The values for the R2 value range between zero and 1.
Figure 7—Relationship between loading compliance and grade
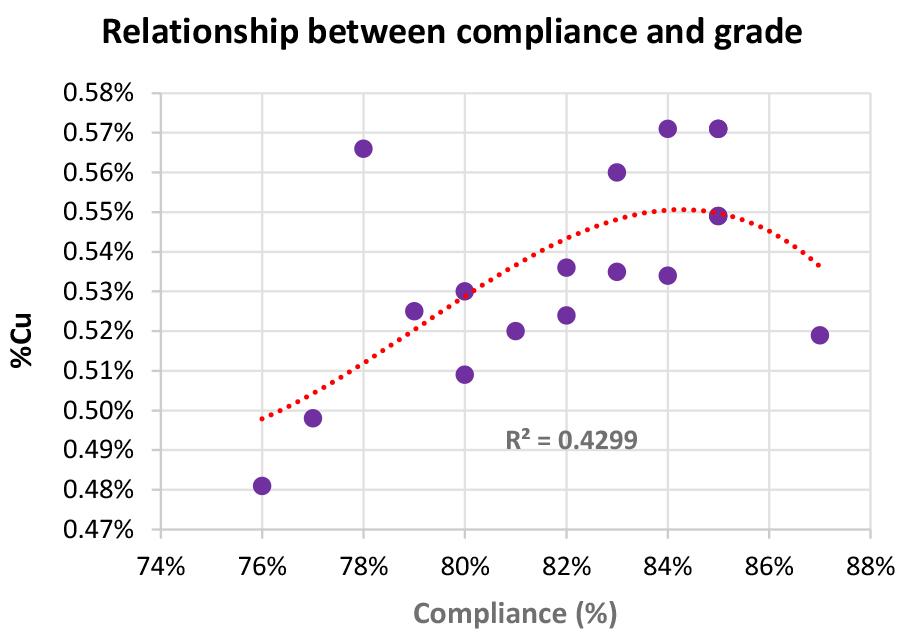
642 NOVEMBER 2022 VOLUME 122
and
Drawpoint loading optimization strategies in block caving: A case study of Palabora Mining Company
The Journal of the Southern African Institute of Mining
Metallurgy
Drawpoint loading optimization strategies in block caving: A case study of Palabora Mining Company
The results presented in Figure 7 indicate a correlation coefficient of 0.583 and coefficient of determination (R²) value of 0.4299. In this instance, the variability can be explained by the R-squared value of 43%. Although the correlation coefficient (rp) is moderate, it is not significant enough to indicate that an improvement in loading compliance is a sole determinant influence on the head grade proportionally. Loading compliance is a factor of the overdrawn and underdrawn drawpoints and does not necessarily influence the improvements in head grade. It factors whether the LHD loaded where it was assigned to load. The schedule should be designed in such a manner that it factors other variables, and does not focus on only one aspect (compliance).
Research question 2
In addressing the research question, ‘Does an increase in tonnage split correlate with the improvement in grade performance?’, the data relating to the tonnage split is collected and analysed. According to Butcher (1999), block caving is a preferred option due to its ability to meet a high production target. However, loading should be conducted as per a set schedule, which forms part of draw control (Shekhar, et al., 2018; Duffy, et al, 2015). Figure 8 presents the mean tonnage distribution across the cave that covers the study period. The figure shows that sectors 1 and 2 have been allocated higher tonnage splits for the period of study. Considering the tonnage split in isolation provides a distorted view; as such, the data is further interrogated to determine whether improvements in head grade are a result of an increase in the daily loaded tons.
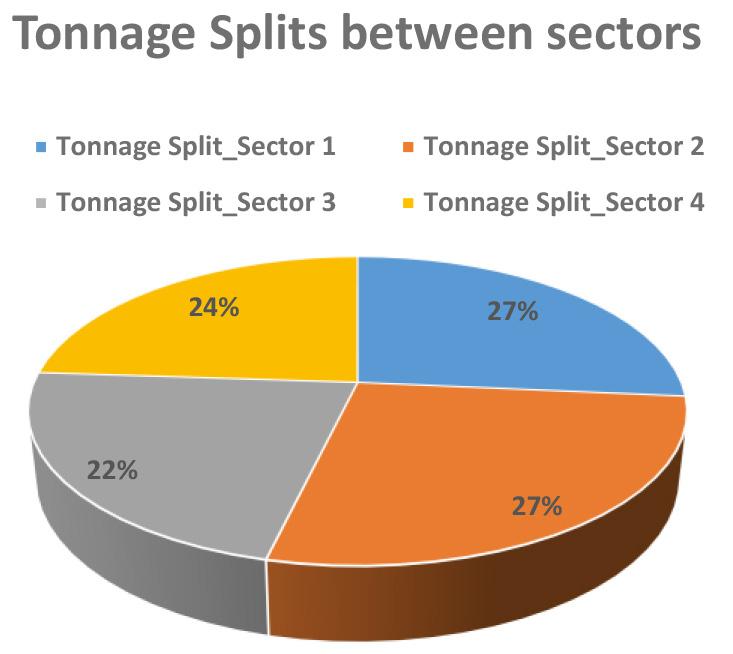
A further analysis is presented in Figure 9 and indicates the relationship between loaded tons and grade performance. The relationship is negative. This means that an increase in tonnage does not improve grade performance. The results also indicate that when intending to optimize loading in block caving, the approach should not be to increase the number of loading splits in various sectors, as this does not necessarily influence the overall head grade. The degree of variability between the two variables can be explained by the R-squared value of 19%, which is negligible and cannot be used to justify increasing tonnage split to increase head grade.
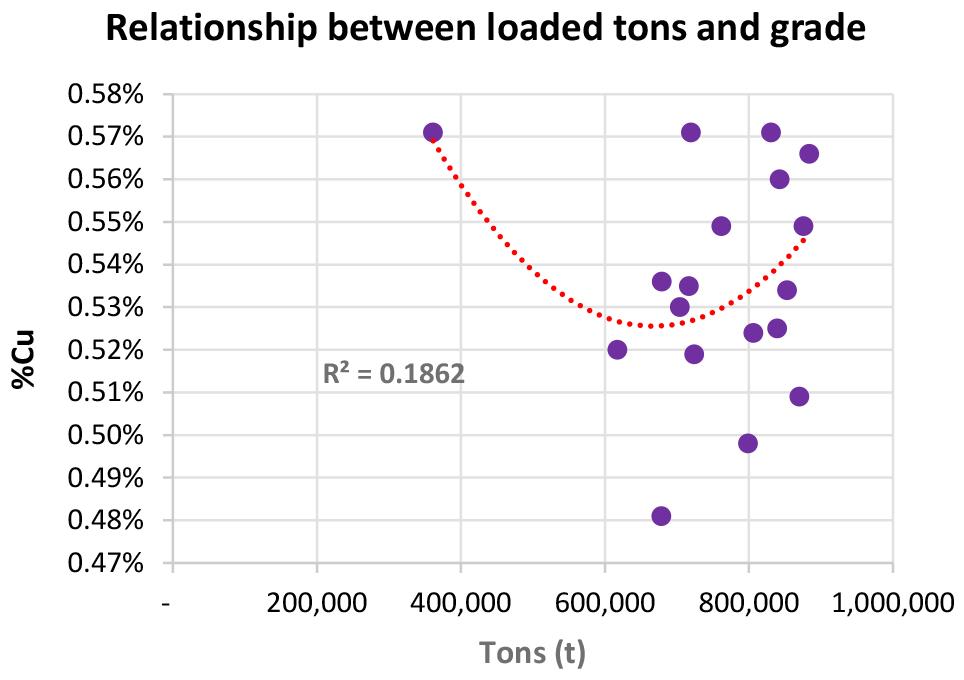
Research question 3
In addressing the research question, ‘What strategies should the mine employ when prioritising drawpoints in the cave?’, this section presents various strategies to employ in order to improve the overall head grade. The results in both Figures 7 and 8 indicated that improvements in loading compliance and increased tonnage have a minimal effect on the head grade if carried out as sole determinants. This section highlights elements to consider to, improve the head grade.
Strategy 1: Drawpoint loading strategies in block caving
The first strategy entails incorporating the prioritization of medium- to high-grade drawpoints in the drawpoint loading scheduling. This strategy does not negate other considerations, but rather ensures that there are minimal blockages and stoppages on the priority drawpoints. Figure 10 highlights the grade distribution across the cave. The Figure depicts assay grades - not based on the geological model but sampled from the drawpoints.
The red blocks represent high-grade drawpoints, those above 0.61% copper grade, and the orange blocks indicate the medium-grade drawpoints, whereas the green blocks indicate the
low-grade drawpoints. To be optimal, the schedule should not only allocate loading of all the high-grade drawpoints, but should incorporate various considerations that include the geology, rock mass behaviour, production requirements, and drawpoint history. This strategy does not ignore geotechnical consideration such as stress distribution and minimization of stress buildup by constant loading and reducing of idling drawpoints.
This strategy focuses on ensuring that priority is given to the medium to high-grade drawpoints to optimize metal recovery. As with any strategy, the intent is to make the mine productive. By prioritization, the focus should not be on one specific sector. Although sectors 1 and 4 have a high concentration of highgrade drawpoints, these should not be treated in isolation while neglecting loading from other sectors. If prioritization is given to a specific sector due to the increased number of high-grade drawpoints, the objective to optimize will not be realized, as presented in Figure 11.
Figure 11 analyses the relationship between sector allocation and the grade. The analysis presents a weak positive relationship, with a correlation coefficient (rp) of 0.452 and coefficient of determination (R²) value of 0.1733. According to Brown (2003), the R² determines the ‘degree to which the two sets of numbers vary together’. In this regard, the data presented demonstrates a low degree of variance, thus indicating a poor justification that an increase in loading allocation in Sector 4, which has high-grade drawpoints (Figure 10), would improve grade performance. The results indicate that there is no positive relationship between the increment in the sector allocation and overall head grade.
A drawpoint is not productive if only one factor is highly prioritized, such as loading of high-grade drawpoints, but it should be a combination of other factors, which include improved
643 The Journal of the
VOLUME 122 NOVEMBER 2022
Southern African Institute of Mining and Metallurgy
Figure 8—Tonnage split between sectors
Figure 9—Relationship between loaded tons and grade
Figure 10—Lift 1 grade distribution
Figure 11—Relationship between sector 4 and grade
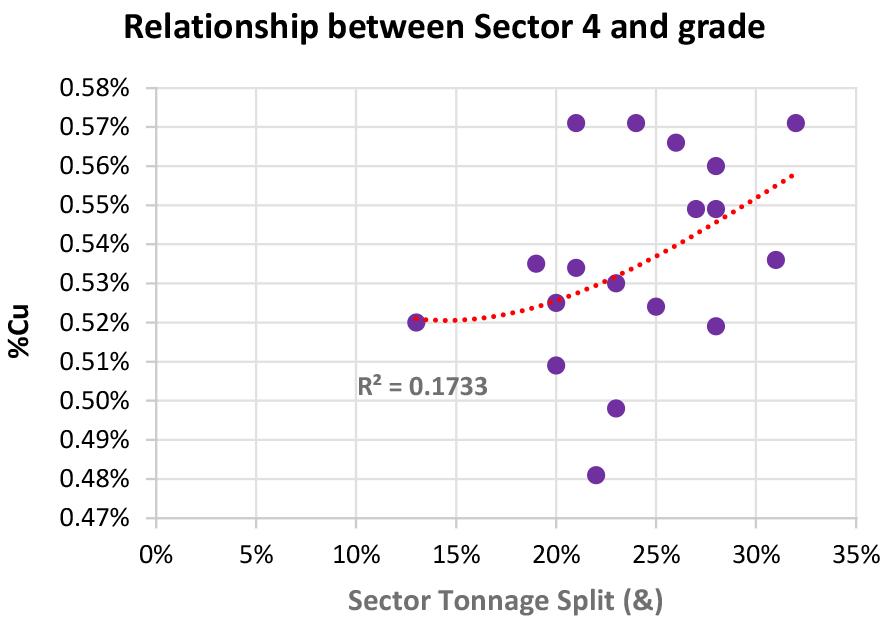
tonnages, loading compliance, and correct sector allocation. This strategy enables the organization to holistically consider the underground factors that influence the head grade. Other factors, such as the concentrator recoveries, play a pivotal role; however, those that the mining operations can influence include the factors indicated in Table I.
Data for grade, tons, compliance, and tonnage split shows that there is a significant differences between the variables when considered as improvement factors if treated in isolation as the, p-value was less than 0.05, when using ANOVA statistical analysis method as reflected in Table II. This difference is very large as the p-value came to the figure of 0.0000. Increasing the confidence level of 95% will probably not assist in this case. The null hypothesis (Ho), which states that there is no difference, must be rejected for this data-set comparison.
Strategy 2: Drawpoint loading management — defining the optimal point
An effective way to manage drawpoint loading is by ensuring an effective draw control (Bull and Page 2000, (cited in Shekhar et al., 2018). This involves finding the optimized balance between compliance, grade distribution, and tonnage split, as presented in Figure 12. This optimized loading point enables the scheduling of the blocks to be carried out by taking into cognizance various
factors, which on their own may not have a positive influence on the grade, but combined, may improve the overall head grade and the production performance of the cave. Optimized loading involves finding an overlapping point between tonnage splits, grade distribution and loading compliance, as presented in Figure 12. Note that the larger influences are those of loading compliance and grade distribution. Understanding the grade distribution in the cave enables proper planning and scheduling, which also influences loading compliance, as critical drawpoints are prioritized.
The significance of the strategy is further analysed by the following proposed splits, based on the sector grade distribution, as presented in Figure 13. The proposal is to allocate a minimum daily target of 20% loading splits for sectors 1, 2, and 3 and 40% for sector 4, which equates to 5 000 t for sectors 1 through 3 and 10 000 t for sector 4.
The application of this strategy demonstrates the positive influence that the tonnage split can have on the overall head grade, provided the loading compliance is maintained at 75% minimum across the cave. In comparing the proposed splits and grade, the degree of variability is 0.872, also expressed at 87.2%, which is sufficiently significant to justify the strength of the relationship between two variables (Figure 14). The significance in the correlation is based on considering other factors, and not treated in isolation.
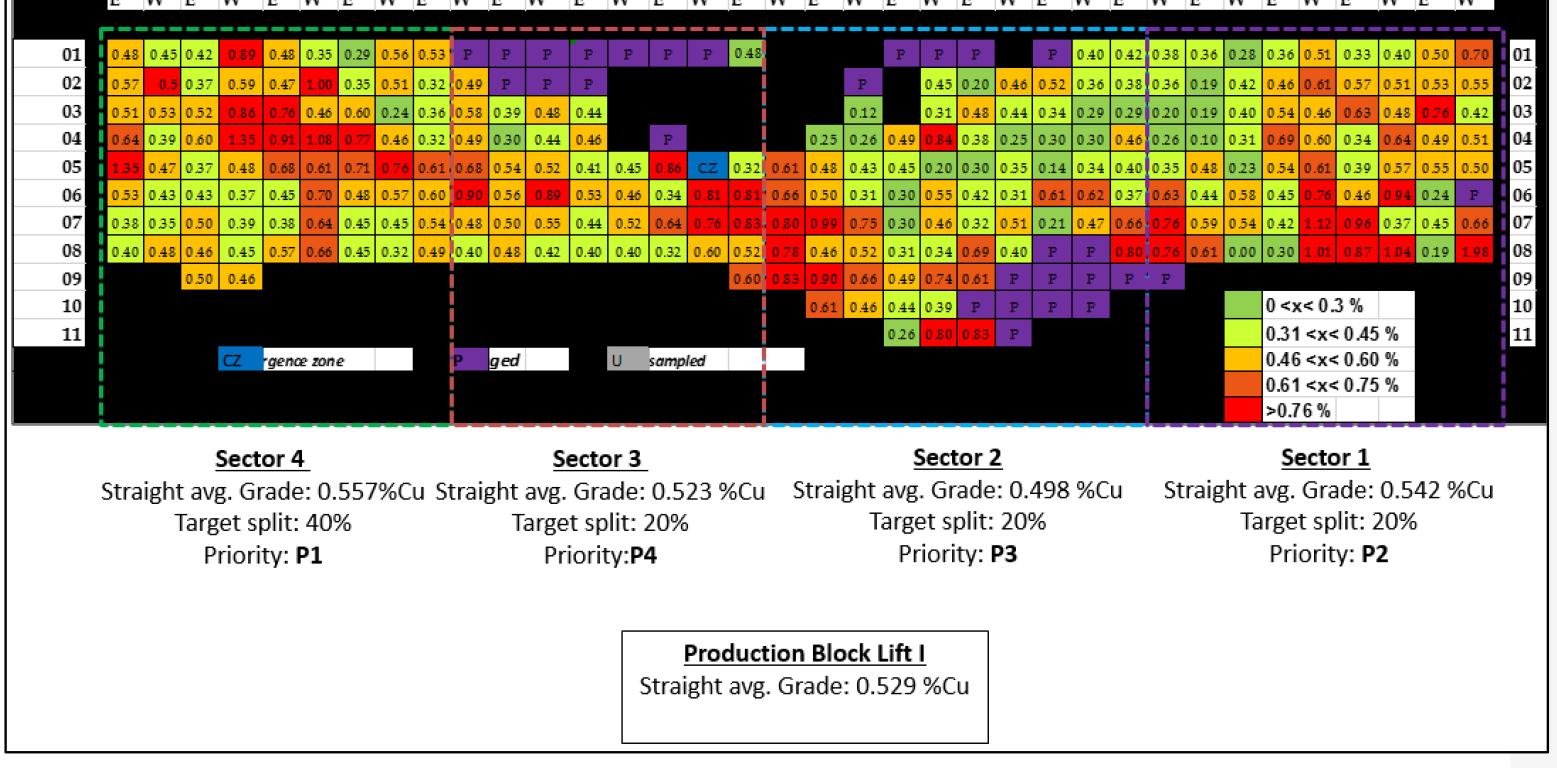
Conclusion
This study sought to outline strategies to optimize a block cave mine that is nearing depletion, particularly as relates to grade performance. The first approach was determining whether loading compliance influences grade performance. The results indicate that loading compliance is an insignificant factor if treated in isolation, thus it cannot be used to justify any significant improvement to grade performance. The second factor was on determining whether an increase in tonnage split correlates with an improvement in grade performance. The condition is minimal, and thus does not justify that increasing loading in high-grade drawpoints
644 NOVEMBER 2022 VOLUME 122
Drawpoint loading optimization strategies in block caving: A case study of Palabora Mining Company
The Journal of the Southern African Institute of Mining
and Metallurgy
Drawpoint loading optimization strategies in block caving: A case study of Palabora Mining Company
Table I
Loading optimization factors in block caving
Overall drawpoint grade optimization factors
Grade Tons Compliance
Tonnage split Sector 1 Tonnage split Sector 2 Tonnage split Sector 3 Tonnage split Sector 4
Jan-17 0.549% 761 825 85% 30% 19% 24% 27%
Feb-17 0.536% 679 011 82% 32% 19% 18% 31%
Mar-17 0.571% 830 667 85% 30% 24% 22% 24%
Apr-17 0.571% 719 476 84% 9% 31% 28% 32%
May-17 0.571% 361 256 85% 29% 28% 22% 21%
Jun-17 0.566% 884 012 78% 27% 29% 18% 26%
Jul-17 0.549% 875 652 85% 27% 31% 14% 28%
Aug-17 0.560% 842 658 83% 25% 28% 19% 28%
Sep-17 0.535% 716 774 83% 24% 33% 24% 19%
Oct-17 0.498% 798 853 77% 24% 28% 25% 23%
Nov-17 0.481% 678 617 76% 29% 27% 22% 22% Dec-17 0.509% 870 305 80% 25% 30% 25% 20% Jan-18 0.525% 839 379 79% 27% 33% 20% 20% Feb-18 0.520% 617 299 81% 29% 35% 23% 13%
Mar-18 0.534% 852 763 84% 27% 31% 21% 21% Apr-18 0.530% 703 939 80% 15% 35% 27% 23% May-18 0.524% 806 305 82% 32% 23% 20% 25% Jun-18 0.519% 723 921 87% 35% 7% 30% 28% Mean 0.536% 753 484 82% 26% 27% 22% 24%
Table II
Statistical analysis results from ANOVA
H₀: Mean 1 = Mean 2 = … = Mean k Ha: At least one pair Mean i ≠ Mean j
One-Way ANOVA & Means Matrix
Summary Information Grade Tons Compliance Tonnage split sector 1 Tonnage split sector 2 Tonnage split sector 3 Tonnage split sector 4 Count 18 18 18 18 18 18 18
Mean 0.005 753 484 0.820 0.264 0.273 0.223 0.239 Standard deviation 0.000 126 269 0.031 0.061 0.069 0.039 0.047 UC (2-sided, 95%, pooled) 22274 775 758 22275 22274 22274 22274 22274 LC (2-sided, 95%, pooled) -22274 731 210 -22273 -22274 -22274 -22274 -22274
ANOVA Table
Source SS DF MS F p-value
Between 8.759E+12 6 1.460E+12 640.96 0.0000 Within 2.710E+11 119 2.278E+09 Total 9.030E+12 125 Pooled standard deviation = 47725 R-Sq = 97.00% DF = 119 R-Sq adj. = 96.85%
Metallurgy
645 The Journal of the
VOLUME 122 NOVEMBER 2022
Southern African Institute of Mining and
Drawpoint loading optimization strategies in block caving: A case study of Palabora Mining Company
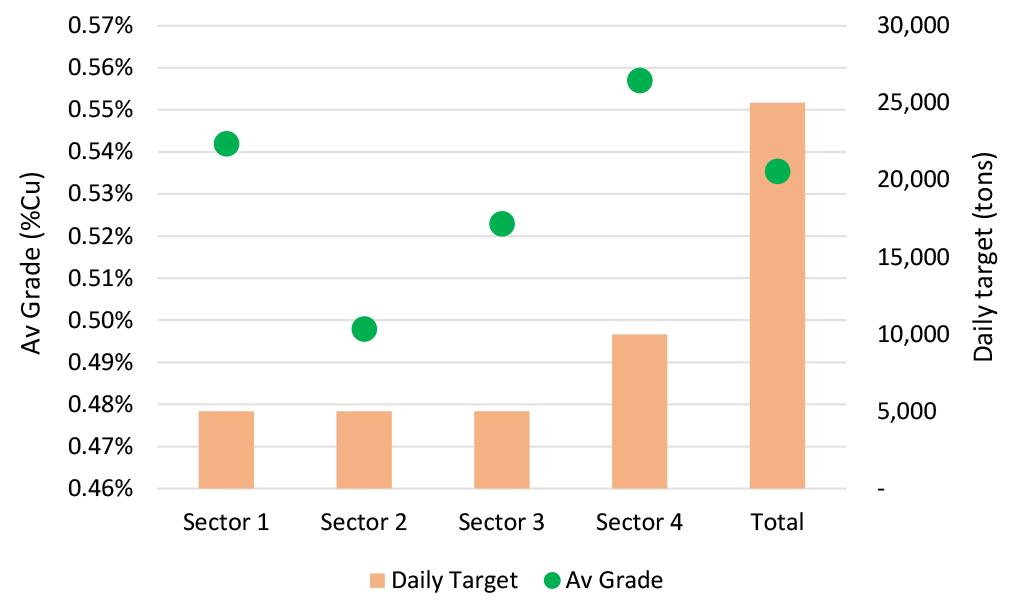
References
Brown, J.D. 2003. The coefficient of determination (Statistics Corner: Questions and answers about language testing statistics). Shiken: JALT Testing & Evaluation SIG Newsletter, vol. 7. pp. 14–16.
Butcher, R. 1999. Design rules for avoiding draw horizon damage in deep level block caves. Journal of the South African Institute of Mining and Metallurgy, vol. 99, no. 3. pp. 151–155.
Castro, R., Gómez, R., and Hekmat, A. 2016. Experimental quantification of hangup for block caving applications. International Journal of Rock Mechanics & Mining Sciences, vol. 85. pp. 1–9.
Diering, T., Ngidi, S.N., Bezuidenhout, J.J., and Paetzold, H.D. 2018. Palabora Lift 1 block cave: Understanding the grade behaviour. Australian Centre for Geomechanics, Perth. pp. 91–106.
Duffy, K., Valery, W., Jankovic, A., and Holtham, P. 2015. Integrationg bulk ore sorting into a mining operation to maximise profitability. Proceedings of Matallurgical Plant Design and Operating Stategies, Perth. Australasion Institut of Mining and Metallurgy, Melbourne.
Figure 14—Optimized drawpoint loading point
Figure 12—Optimized drawpoint loading point
Figure 13—Optimized drawpoint loading point
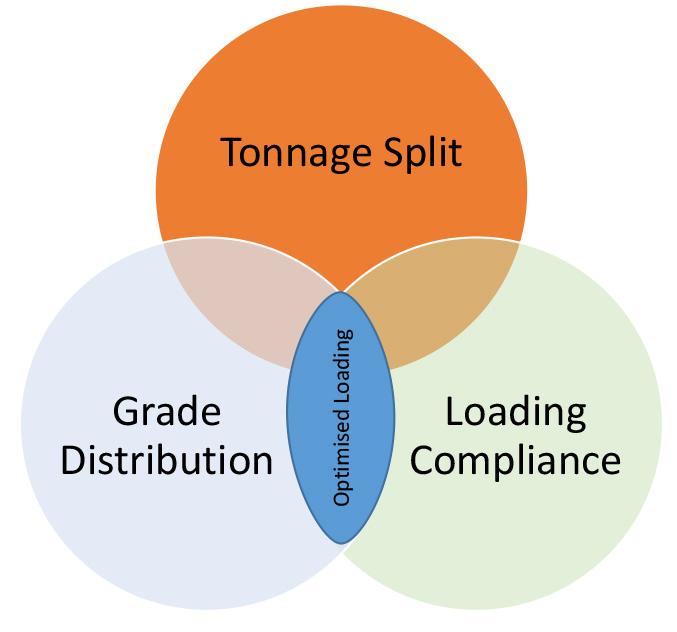
Achieving optimized head grade for a mine that is nearing depletion could be challenging. An organization needs to find a balance between the production requirements and as ascertaining that maximum metal is extracted from the block cave. To achieve this, the study outlined three parameters, which should not be applied in isolation. The focus should not be on one aspect, but rather a collective effort to ensure maximum benefit to the overall production performance. To this effect, the study emphasizes that by maintaining the loading compliance above 75% and increasing the tonnage split for the high-grade sector could potentially improve the overall head grade. The correlational analysis demonstrates a strong positive relationship between these three variables, thus justifying the need for an optimized loading strategy.
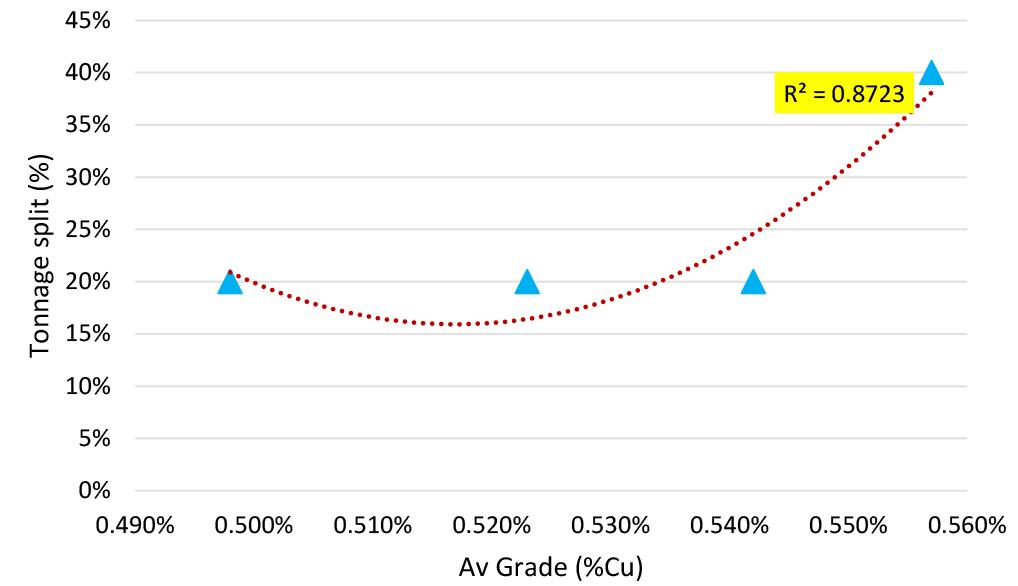
Acknowledgements
The authors would like to extend their appreciation to PMC management for the opportunity to conduct and publish this research study.
Jang, H., Topal, E., and Kawamura, Y. 2015. Unplanned dilution and ore loss prediction in longhole stoping mines via multiple regression and artificial neural network analyses. Journal of The Southern African Institute of Mining and Metallurgy, vol. 115, no. 05. pp. 449–456.
Khodayari, F. and Pourrahimian, Y. 2017. Production scheduling in block caving with consideration of material flow. Aspects in Mining and Mineral Science vol. 1, no. 1. pp. 1–8.
Killick, D., Miller, D., Thondhlana, T. P., and Martinón-Torres, M. 2016. Copper mining and smelting technology in the northern Lowveld, South Africa, ca. 1000 CE to ca. 1880 CE. Journal of Archaeological Science. pp. 10–26.
Kumar, S. and Chong, I. 2018. Correlation analysis to identify the effective data in machine learning: Prediction of depressive disorder and emotion states. International Journal of Environmental Research and Public Health, vol. 15, no. 12. pp. 1–24.
Laubscher, D. H. 1990. A geomechanics classification system for the rating of rock mass in mine design. Journal of The Southern African Institute of Mining and Metallurgy, vol. 90, no. 10. pp. 257–273.
Letts, S., Torsvik, T.H., Webb, S.J., and Ashwal, L.D. 2011. New Palaeoproterozoic palaeomagnetic data from the Kaapvaal Craton, South Africa. Special Publication, Geological Society, London.
Miot, H.A . 2018. Correlation analysis in clinical and experimental studies. Journal Vascular Brasileiro, vol. 17, no. 4. pp. 275–279.
Moss, A., Diachenko, S., and Townsend, P. 2006. Interaction between the block cave and the pit slopes at Palabora Mine. Proceedings of the International Symposium on Stability of Rock Slopes in Open pit Mining and Civil Engineering. Southern African Institute of Mining and Metallurgy, Johannesburg. pp. 399–410.
Nezhadshahmohammad, F., Khodayari, F., and Pourrahimian, Y. 2017. Draw rate optimisation in block cave production scheduling using mathematical programming. Proceedings of Underground Mining Technology 2017, Sudbury, Canada. Australian Centre for Geomechanics, Perth.
Ngidi, S. and Boshoff, P. 2011. Cave management and secondary breaking practices at Palabora Mining Company. Journal of The Southern African Institute of Mining and Metallurgy, vol. 111. pp. 209–220.
Nyarela, M. S. 2019. Strategies to improve cave availability at a South African block cave mine Master’s Dissertation. University of Johannesburg.
Oosthuizen, J.B. and Esterhuizen, G.S. 1997. Evaluation of three rock breaker layouts for mechanized block cave mining. Journal of The South African Institute of Mining and Metallurgy, vol. 97, no. 6. pp. 269–273.
Rashidi-Nejad, F., Suorineni, F.T., and Asi, B. 2014. Open pit or block caving? A numerical ranking method for selection. Journal of The South African Institute of Mining and Metallurgy, vol. 114. pp. 183–199.
Sainsbury, D.P., Sainsbury, B.L., Partzald, H-D., Lourens, P., and Valeili, A. 2016. Caving-induced Subsidence Behaviour of Lift 1 at the Palabora Block Cave Mine. Sydney, NSW. Proceedings of the Seventh International Conference & Exhibition on Mass Mining (MassMin, 2016), Australasion Institute of Mining and Metallurgy, Melbourne.
Shekhar, G., Gustafson, A., Boeg-Jensen, P., Malingson., and Schunnesson, H 2018. Draw control strategies in sublevel caving mines - A baseline mapping of LKAB's Malmberget and Kiirunavaara mines. Journal of The South African Institute of Mining and Metallurgy, no. 118, no. 7. pp. 723–733.
Shelswell, K.J., Labrecque, P.O., and Morrison, D.M. 2018. Increasing productive capacity in block caving mines. Proceedings of the Fourth International Symposium on Block and Sublevel Caving. Vancouver, Potvin, Y. and Jakubec, J (eds). Australian Centre for Geomechanics, Perth. pp. 107–118.
Southwood, M. and Cairncross, B. 2017. The minerals of Palabora, Limpopo Province, South Africa. Rocks and Minerals, vol. 92, no. 5. pp. 426–453.
Van der Spuy, R. C. 1982. The heavy-minerals plant at Palabora Mining Company - A low-grade, high-tonnage gravity concentator. Journal of The South African Institute of Mining and Metallurgy, vol. 82, no. 02. pp. 17–29.
Verdugo, R. and Ubilla, J. 2004. Geotechnical analysis of gravity flow during block caving. Proceedings of MasMin, 2014, Santiago, Chile. pp. 195–200. u
646 NOVEMBER 2022 VOLUME 122
The Journal of the Southern African Institute of Mining
and Metallurgy
Affiliation:
1Faculty of Sciences Semlalia, Department of Chemistry, Marrakech, Morocco.
2Mining Institute of Marrakech (IMM), Marrakech, Morocco.
3Georesources Laboratory, Faculty of Sciences and Technologies Marrakech, Marrakech, Morocco.
4School of Resources & Safety Engineering, Wuhan Institute of Technology, Wuhan, P.R. China.
Correspondence to: K. Boujounoui
Email: boujounoui.kh@gmail.com
Dates: Received: 28 Nov. 2019 Revised: 2 Dec. 2019 Accepted: 1 July 2022 Published: November 2022
How to cite: Boujounoui, K., Abidi, A., Baçaoui, A., El Amari, K., He, D., and Yaacoubi, A. 2022
Effect of zinc process water recycling on galena flotation from a comlex sulphide ore. Journal of the Southern African Institute of Mining and Metallurgy, vol. 122, no. 11, pp. 647–654
DOI ID: http://dx.doi.org/10.17159/24119717/241/2022
ORCID: A. BaÇaoui
https://orcid.org/0000-00023867-2836
D. He https://orcid.org/0000-00026810-9171
Effect of zinc process water recycling on galena flotation from a complex sulphide ore
by K. Boujounoui1, A. Abidi2, A. BaÇaoui1, K. El Amari3, D. He4, and A. Yaacoubi1 Synopsis
The effects of utilizing recycled tailings pond water from the flotation plant at the Mining Company of Guemassa (MCG) on galena recovery and selectivity towards chalcopyrite (RPb-Cu) , sphalerite (RPbZn), and pyrrhotite (RPb-Fe) were studied at bench scale. The results showed that recycling the tailings pond water in the lead circuit without addition of fresh water gave a good flotation performance in terms of lead recovery (Rpb) (75%) and selectivity towards the other metals: RPb-Cu (54%), RPb-Zn (60%) and RPb-Fe(65%). This allows the water to be recycled at least four times. However, increasing the d80 from 100 μm to 160 μm currently used at the MCG plant had a negative effect on the lead flotation performance.
Keywords
flotation, complex sulphide ore, process water recycling.
Introduction
In countries like Morocco that have a semi-arid climate, maximizing the recycling of process water, which could be both economically and environmentally beneficial, is a major challenge. Water recycling is an important aspect of sustainable management of the environment and water resources (Zeman, /Rich, and Rose, 2006; Orona et al. 2007; Hochstrat, Wintgens, and Melin, 2008; Mudd 2008). Especially as regards froth flotation, the mining industry is one of the most water-intensive industries, and this encourages greater use of recycled water in place of fresh water (McIntyre 2006; van der Bruggen 2010; Liu, Moran, and Fink, 2013; Molina et al. 2013). Recycling tailings pond water will clearly have a positive impact on the economics of industrial processes, because it reduces water cost and at the same time facilitates the recovery of unconsumed reagents retained in the tailings (Nedved and Jansz 2006; Slatter et al. 2009; Liu, Moran, and Fink, 2013; Molina et al. 2013). However, due to the accumulation of impurities in the pulp, suspended solids, the occurrence of adverse side reactions, bacterial oxidation of sulphide minerals, and decreased pH, recycling the water has an effect on its quality and disrupts flotation performance (Rao and Finch, 1989; Levay, Smart, and Skinner, 2001; N’gandu, 2001; Seke and Pistorius, 2006; Slatter et al., 2009; Muzenda 2010; Ikumapayi et al., 2012; Jing Xu et al., 2012; Deng, Liu, and Xu, 2013; Molina et al., 2013; Wang and Peng, 2014; Boujounoui et al., 2015, 2018, 2019; Wang et al., 2015. Some impurities present in the recycled water cause uncontrolled variations in the redox potential of the pulp, which has an adverse effect on the chemistry of the reagents and the flotation performance (Chadwick, 2007). These impurities also induce undesirable variations in the pulp properties, leading to alterations to the surface of the minerals and their floatability (Biçak et al., 2012; Dávila-Pulido et al., 2015).
The Mining Company of Guemassa (MCG) concentrator, located 30 km southwest of Marrakech (Morocco), uses selective flotation to successively produce concentrates of galena (using Aerophine A3418 at pH 11.3), chalcopyrite (using Aerophine A3418 at pH 8.9), and sphalerite (using potassium amyl xanthate, at pH about 12). The process water used consists mainly of fresh water from the mine site and the Lalla Takerkoust dam, which is located a few kilometres away from the plant. Owing to the complexity of ore processing, the only possible way to maintain the flotation plant performance is to re-use part of the zinc process water in the zinc circuit, the lead process water in the lead circuit, and the copper process water in the copper circuit. Production of zinc, lead, and copper concentrates at the MCG flotation plant in 2014 was 72 970, 13 812 and 16 755 t respectively (Managem Annual Report, 2014).
Previous work on sulphide ore flotation at MCG (Boujounoui et al., 2015, 2018) showed the need to control Cu2+, Zn2+, Mg2+, Ca2+, SO₄2-, and potassium amyl xanthate concentrations in the process water to maintain acceptable galena recovery in the presence of chalcopyrite, sphalerite, and pyrrhotite. These results, considering the scarcity of water in and around Marrakech, make process water recycling an alternative way of overcoming the problems of water management at the MCG plant. Some mining plants recycle up to 80% of their water (Atmacaand Kuyumcu, 2003), although the recycle rate does not exceed 34% for MCG.
647 The Journal of the Southern African Institute of Mining and Metallurgy VOLUME 122 NOVEMBER 2022
Effect of zinc process water recycling on galena flotation from a complex sulphide ore
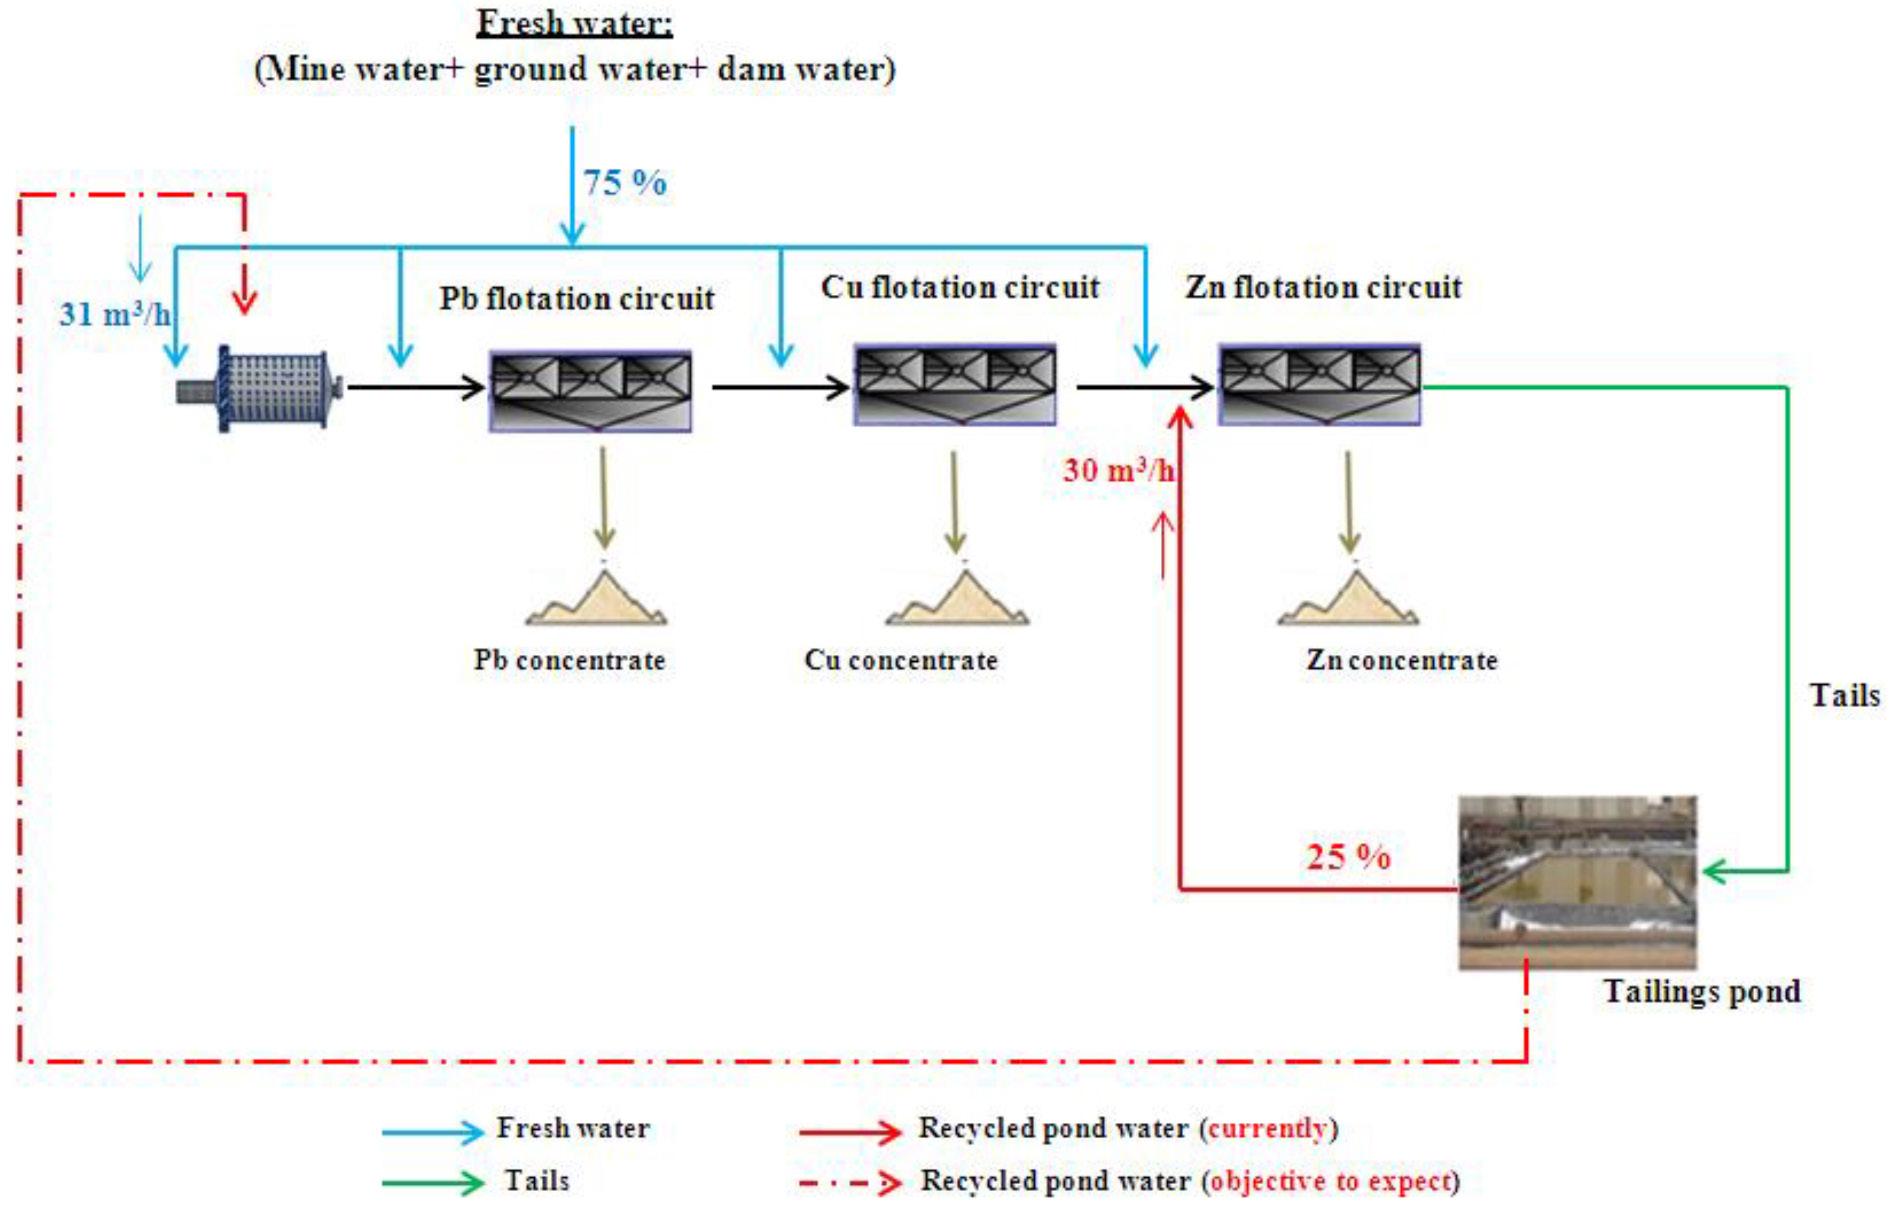
1—Flow
Three water sources were used to supply 4 900 m3daily for this production; 25% from the dam at Lalla Takerkouste, located a few kilometers from the plant, 50% from mine dewatering and groundwater, and 25% from tailings pond water (TPW) recycled in the zinc circuit (Figures 1 and 2) (Boujounoui, 2017).
The aim of this study was to assess the effects of using recycled TPW on galena recovery in the MCG flotation plant and the selectivity towards chalcopyrite, sphalerite, and pyrrhotite. Tests were carried out according to the results of Boujounoui et al., (2018), who used a synthetic solution to simulate the industrial process water at MCG. These results showed a water quality limit to not exceed the specification in Table IV.
Flotation tests were performed using mixtures of fresh water and TPW produced by the flotation plant. Further flotation experiments were performed on the optimal water mixture
obtained by increasing the d80 particle size to 160 μm, the size currently used in the lead circuit at the plant.
Climatology of the site
According to the Agency of Basin Haouz Tensift (ABHT), the data on climatic parameters collected at the meteorological station at the Lalla Takerkoust dam from 1962 to 2009, particularly the data on pluviometry, temperature, and evaporation, highlights the need to recycle industrial water at the MCG plant. The Lalla Takerkoust dam is mainly filled by snowmelt from the High Atlas Mountains of Morocco. Snowfall correlates positively with rainfall in the area, and therefore the use of dam water and underground water in the flotation process at the MCG plant has to be carefully managed to preserve water resources in the area. The climatological data (Figure 3) reveals the following.
Figure 2—Flow sheet of tailings pond water recycling rate in the MCG plant
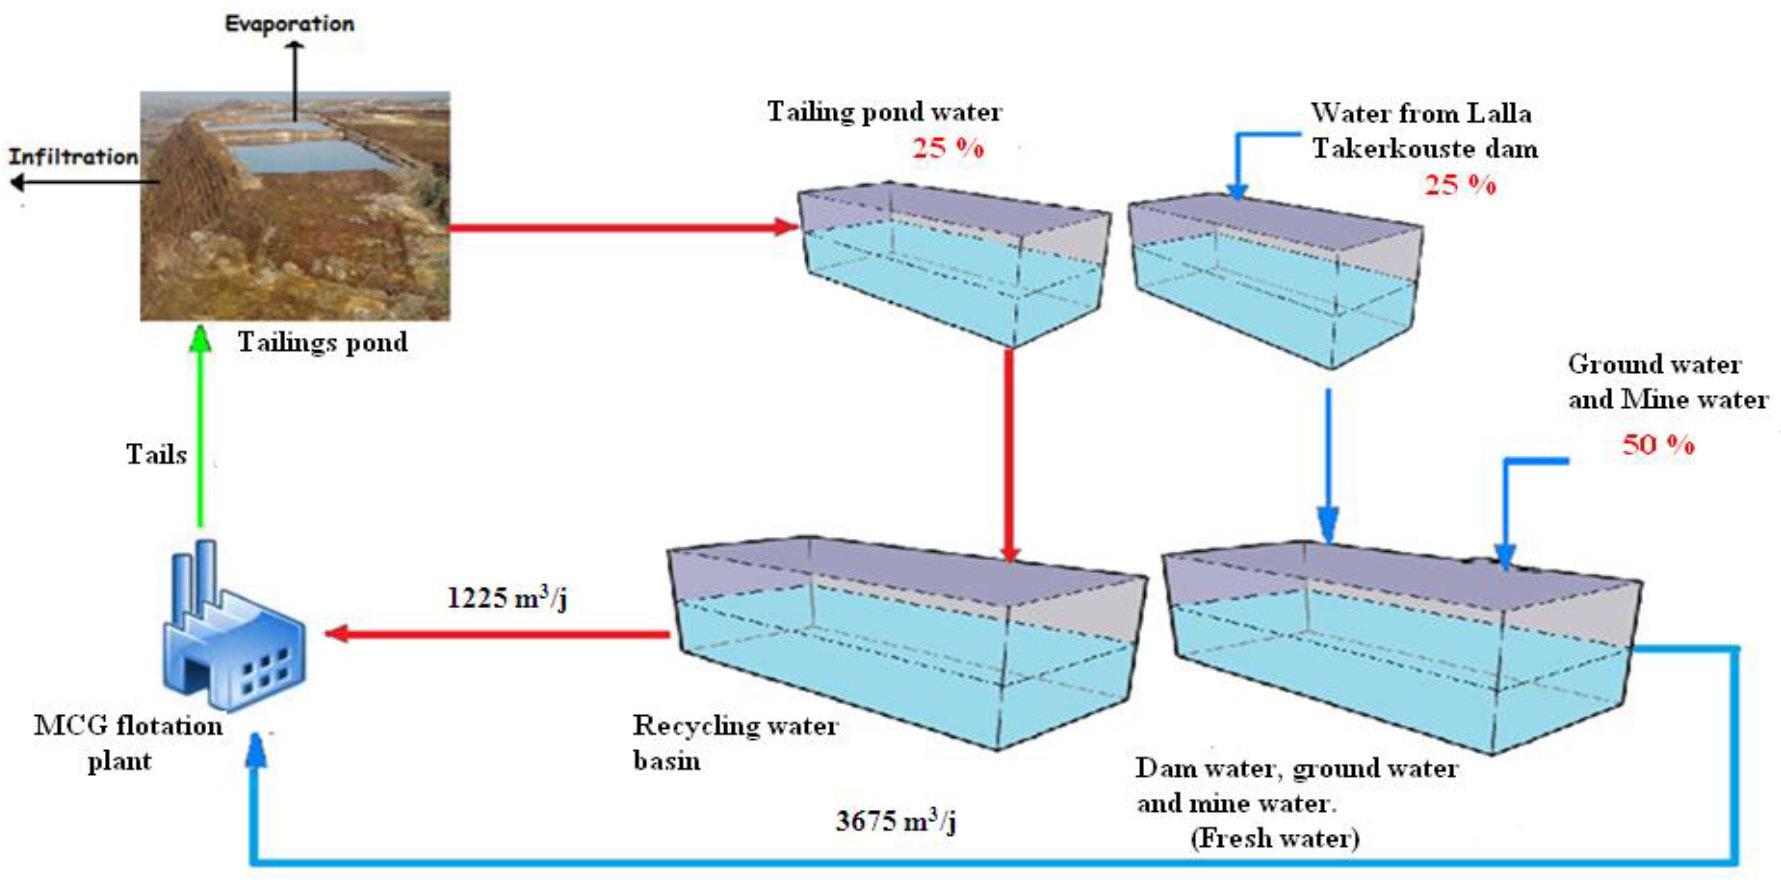
648 NOVEMBER 2022 VOLUME 122
The Journal of the Southern African Institute of Mining and Metallurgy
Figure
sheet of different water resources supplying the MCG plant
Effect of zinc process water recycling on galena flotation from a complex sulphide ore
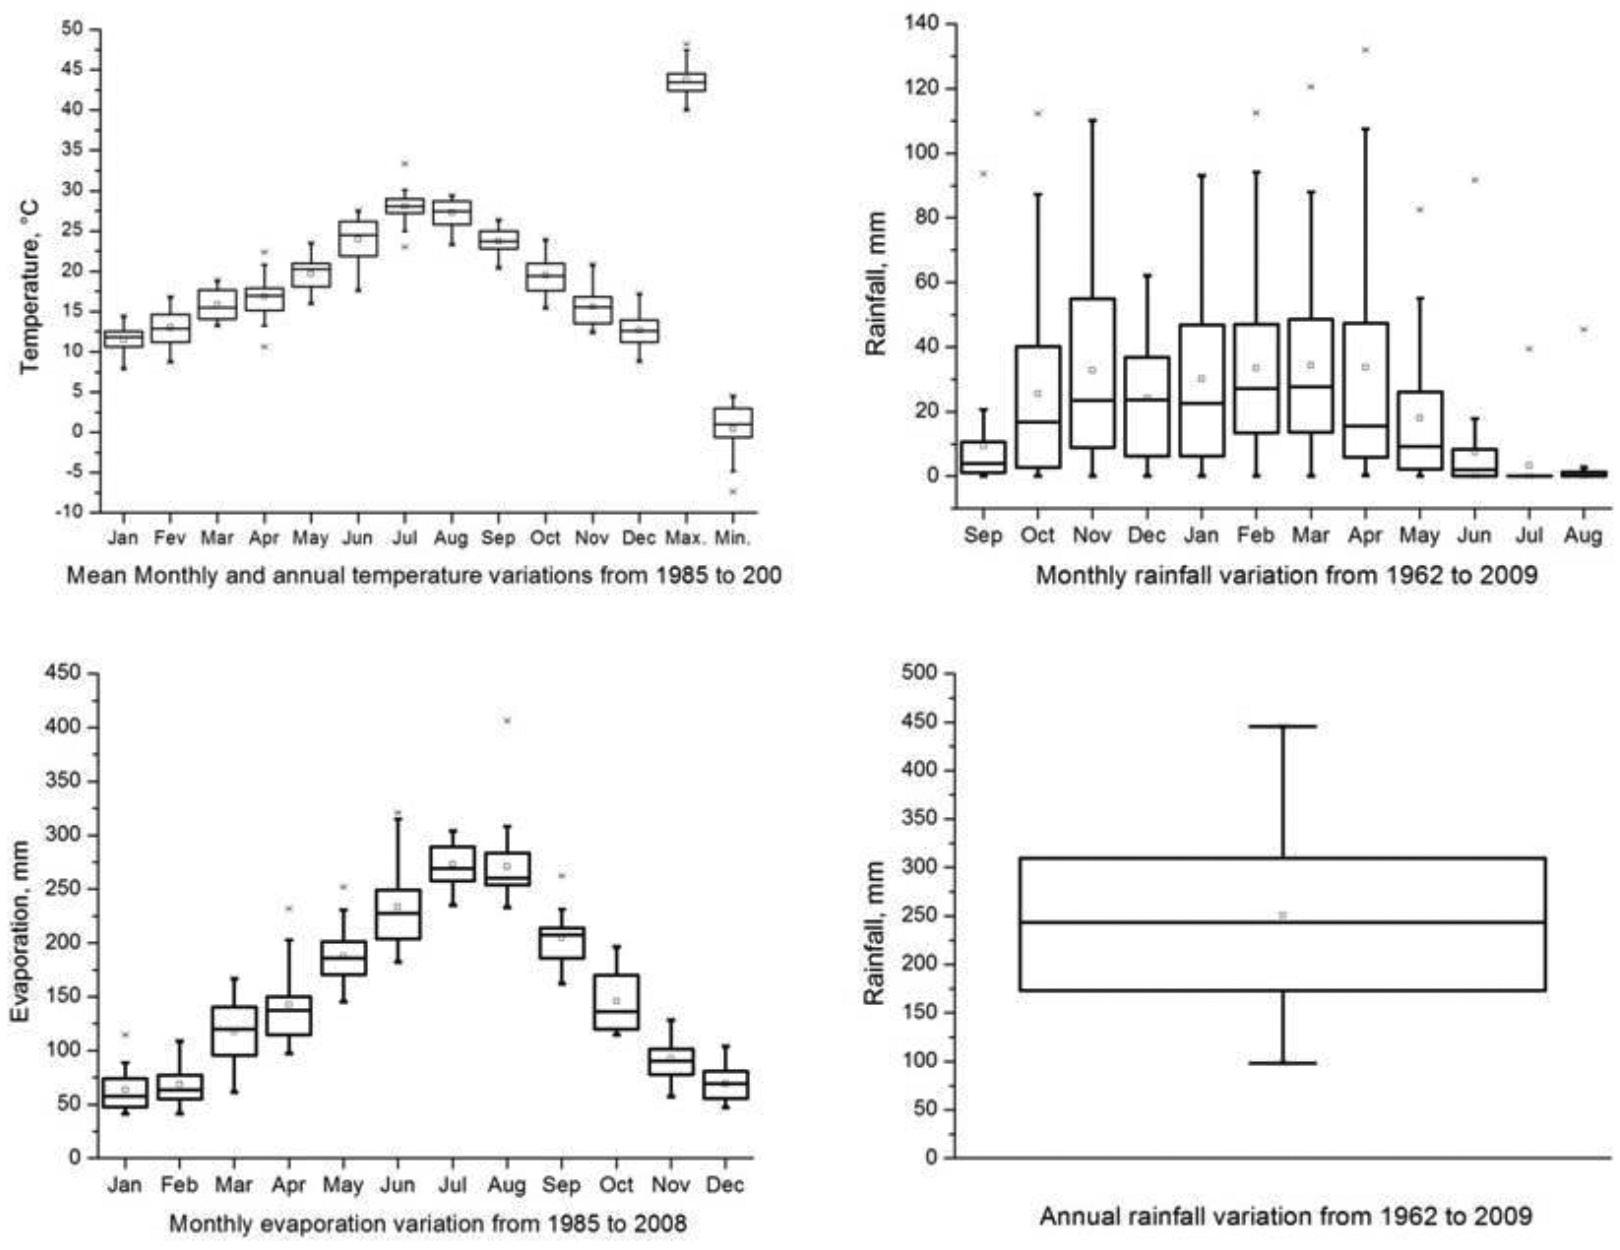
➤ Generally, rainfall is low and irregular (about 250 mm/a). Inter-annual rainfall is also irregular, with a maximum of 424 mm in 1970 and a minimum of 106 mm in 1982. The mean monthly rainfall variation over the same period shows two distinct seasons: a rainy season (November to April) and a dry season (May to October), with average total rainfalls of 187 and 67 mm respectively.
➤ The variation in the average monthly temperature recorded from 1985 to 2008 show three distinct periods: a very hot period (June to September), a temperate period (October to May), and a relatively cold period (December to February). The temperature can reach 48°C in August and fall below zero in December.
➤ The trend in evaporation correlates with the temperature: the highest evaporation rates are linked to the hottest season of the year, and consequently both water from the Lalla Takerkoust dam and the rainfall during the hot season are drastically affected by evaporation.
Experimental Materials
Bench-scale flotation tests were carried out on a representative sample of the complex sulphide ore from the Draa Sfar mine (Morocco) processed by MCG. The sulphide ore used was composed of 6.43% sphalerite (ZnS), 2.22% galena (PbS), 0.95% chalcopyrite (CuFeS₂), 41.57% pyrrhotite (Fe9S10), and 48.82% gangue, consisting mainly of quartz, talc, chlorite, calcite, siderite, and ankerite (Abidi et al., 2014; Boujounoui et al., 2015, 2018, and 2020).
The industrial process water used in these tests consisted of tailings pond water (TPW) mixed with fresh water (Table I). TPW and the flotation reagents (sodium cyanide, Aerophine 3418A, and methyl isobutyl carbinol) were provided by MCG.
Methods
Solid sample preparation
A representative sample of 128 kg was taken from the feed belt to the primary ball mill at the MCG flotation plant and crushed down to 2 mm using a laboratory roll crusher. The sample was then divided into 1 kg batch samples for the flotation experiments. These batch samples were stored in vacuum-sealed bags to prevent the sulphide minerals from oxidizing.
Prior to each flotation test, a sample of 500 g was milled in 250 ml of process water using a Denver carbon steel ball mill with an internal volume of 9.5 l for 6 to 10 minutes, depending on whether the d80 target grain size was 160 μm or 100 μm.
Water sample preparation
Four-litre samples of industrial water were prepared by mixing TPW with fresh water in proportions of 100, 90, 75, 65, 50, 40, 25, 15, and 0% TPW. Each test was repeated three times. The quality of the different mixtures was calculated from the individual analyses of the fresh water and TPW given in Tables I and II.
Flotation experiments
Flotation tests of galena were carried out in a Denver flotation cell of 1.5 l capacity. Solid concentration was about 27% by weight, using mixtures of TPW and fresh water at different proportions.
649 The Journal of the
VOLUME 122 NOVEMBER 2022
Southern African Institute of Mining and Metallurgy
Figure 3—Climatological data for Marrakech area from LallaTakerkoust meteorological station
Table II
Table I
Characteristics of waters used in MCG flotation plant (d.l.: below detection limit)
Parameters TPW Fresh water pH 9 7.6
Conductivity, μS/cm 5810 578
Cu2+ (mg/L) 0.509 0.0036
Zn2+ (mg/L) 0.0072 0.003
Ca2+ (mg/L) 785.09 35.18 Mg2+ (mg/L) 8.1 12.12 SO₄2- (mg/L) 2406 34.6 CN (mg/L) d. l. d. l. PAX (mg/L) 0.83 0.05
Qualities of TPW-fresh water mixtures
Water quality
Constituents (mg/L)
Cu2+ Zn2+ Ca2+ Mg2+ SO42- PAX TDS
Limit to not exceed 5 13 1390 140 4130 13 5691
TPW (%) 100 0.509 0.0072 785.088 8.1 2406 0.83 3201 90 0.46 0.0068 710.1 8.5 2168.86 0.752 2889 75 0.38 0.0062 597.61 9.11 1813.15 0.635 2421 65 0.33 0.0057 522.62 9.51 1576.01 0.557 2109 50 0.26 0.0051 410.13 10.11 1220.3 0.44 1641 40 0.21 0.0047 335.14 10.51 983.16 0.362 1329 25 0.13 0.0041 222.66 11.12 627.45 0.245 862 15 0.08 0.0036 147.67 11.52 390.31 0.167 550 0 0.0036 0.003 35.18 12.12 34.6 0.05 82
The natural pH was about 7. NaOH was used in all tests to adjust the PH value to 11.3. Sodium cyanide (NaCN) was used as a depressant for sphalerite, chalcopyrite, and pyrrhotite for all tests at a specific dosage of 350 g/t. Diisobutyl phosphinate (Aerophine 3418A) (40 g/t) and methyl isobutyl carbinol (MIBC) (40 g/t) were used as galena collector and frother respectively. The impeller rotation speed was a constant 1000 r/min. The level of the pulp was constantly adjusted by the addition of water at the required quality. The flotation time was 10 minutes for each test, and the concentrates were recovered by automatic scraping every 30 seconds
All concentrates and tails were filtered, dried, weighed and then analysed by atomic absorption spectroscopy (AGILENT 280FS) for Cu, Pb, Zn, and Feat in the laboratory at the Reminex Center (Morocco). Metal recoveries to the concentrates were calculated from the following equation: [1]
where R (%) is the metal recovery, tc (%) is the grade of the concentrate metal, tf (%) is the grade of the feed metal, C is the concentrate weight, and A is the feed weight. The proportions of iron combined with chalcopyrite were taken into account in the calculations of iron sulphide recoveries. Lead selectivity was calculated as the difference between lead recovery and the recoveries of the other metals.
Results and discussion
The optimal results of water quality, for galena recovery, were obtained with a synthesized water simulating industrial TPW (Boujounoui et al., 2018). These results indicate that fresh water usage could be reduced in the lead circuit at the MCG plant by substitution with water from the tailings pond.
Prior to considering these results as a reference (limit of water quality to not exceed) for the lead flotation circuit, in which the process water contained 5 mg/L Cu2+, 13 mg/L Zn2+, 1390 mg/L Ca2+, 140 mg/L Mg2+, 4130 mg/L SO₄2-, and 13 mg/L PAX, three validation tests were performed using these optimal operating conditions. The results given in Table III verified the mathematical model proposed for lead recovery by Boujounoui et al., (2018) and showed that as long as the process water quality is close to the reference, the lead flotation performance was maintained.
Flotation tests using tailings pond water
Bench-scale flotation tests were conducted on galena with various proportion of TPW from zero to 100% to optimize its proportion in the lead circuit. The results would help in assessing the recycling ratio without affecting the lead flotation performance. Table II presents the water qualities used and their relationship with the reference water quality obtained by Boujounoui et al., (2018). It can be deduced from the data that 100% TPW is below the maximum limits for all constituents and could be successfully used as process water.
650 NOVEMBER 2022 VOLUME 122
Effect of zinc process water recycling on galena flotation from a complex sulphide ore
The Journal of the Southern African Institute of Mining and Metallurgy
Effect of zinc process water recycling on galena flotation from a complex sulphide ore
Table III
Validation tests according to lead flotation model given by Boujounoui et al. (2018) (pH = 11.3, 350 g/t NaCN, 40 g/t Aerophine 3418A, 40 g/t MIBC, flotation time 10 min, d80= 100 μm)
Recovery (%)
Response Theoretical Experimental Relative error (%)
Y1, RPb 85.67 82.35 3.9
Y2, RPb-Cu 58.21 52.57 9.7
Y3, RPb-Zn 62.6 64.09 2.4 Y4, RPb-Fe 67.66 69.04 2
R= recovery; RA-B = recovery of A minus recovery of B, A being Pb and B, Cu, Zn, or Fe
The results presented in Table IV show that the variation in water quality had no significant effect on the recovery of Pb and selectivity over Zn and Fe. However, the selectivity towards copper was adversely affected due to chalcopyrite activation by copper ions (Deng et al., 2014) and their interactions with calcium and PAX (Boujounoui et al., 2018). The best recovery of lead was
82% obtained at 15% TPW and the best selectivities towards copper (54%), zinc (61%) and iron (70%) were obtained at 100%, 90%, and 75% TPW respectively. Nonetheless, according to the objective of best flotation performance and maximum water process recyclability, the optimal proportion of TPW that can be recycled to the lead circuit is 100%.This proportion allowed 75% of Pb to be recovered, with galena retaining good selectivity over the other minerals: RPb-Cu (54%), RPb-Zn (60%) and RPb-Fe (65%). This result confirmed the robustness of the mathematical model used, which states that the closer the water process to the reference quality (limit to not exceed), the better the performance.
Table IV
Effect of TPW proportions in the flotation water process on metal recoveries (pH = 11.3, 350 g/t of NaCN, 40 g/t of Aerophine 3418A, 40 g/t of MIBC, and flotation time of 10 min, d80= 100 μm)
(%)
Water quality
Limit to not exceed (%) 85.67 58.21 62.6 67.66 TPW
100 75.35 53.58 59.54 64.94 90 79.82 22.54 60.80 69.71 75 81.74 10.01 57.32 69.78 65 77.14 20.39 58.47 67.20 50 77.04 16.15 57.61 66.11 40 76.18 39.51 58.47 65.58 25 78.56 34.72 59.95 67.80 15 82.04 8.40 55.45 68.73 0 79.55 14.66 52.56 62.51
Based on the robustness of this model, four successive recycling stages using 100% TPW were performed, with the focus on the evolution of the process water quality after each stage with no need to determine the flotation performances. The results given in Table V show that most of the process water was recycled; the best performance was for galena flotation, except for selectivity over chalcopyrite which remained relatively constant. After four recycling stages with 100% TPW, the water quality was still within the quality limits required for the lead circuit (water quality reference). This means that tailings pond water can be recycled at least four times, as long as chalcopyrite activation is controlled. Table V
Southern African Institute of Mining and Metallurgy
651 The Journal of the
VOLUME 122 NOVEMBER 2022
Recovery
RPb RPb-Cu RPb-Zn RPb-Fe
Evolution of TPW quality with recycling stages compared to the reference for lead recovery (pH = 11.3, 350 g/t NaCN, 40 g/t Aerophine 3418A, 40 g/t MIBC, flotation time 10 min, d80= 100 μm), (Rec. st.= recycling stage) Water Quality Parameters (mg/L) Recoveries (%) Cu Zn Ca Mg SO42- PAX RPb RPb-Cu RPb-Zn RPb-Fe
to not exceed 5 13 1390 140 4130 13 85.67 58.21 62.6 67.66
0.509 0.0072 785.088 8.1 2406 0.83 75.35 53.6
st.
1
Limit
TPW
59.54 65 Rec.
1 3.8
773 1.6 2563 0.24 71.3 50.9 63.5 61.1 Rec. st. 2 7 1 715.9 1 3609 0.65 77.8 50.7 70.4 70.8 Rec. st. 3 5.7 1 698 2.5 3980 1.44 76.4 46.6 68.7 70.5 Rec. st. 4 5.5 1.4 589.1 6.6 4121 1.52 82.8 48.9 74.2 79.1
Table VI
Metal recoveries using TPW at d80 of 160 μm (pH = 11.3, 350 g/t NaCN, 40 g/t Aerophine 3418A, 40 g/t of MIBC, and flotation time 10 min)
Recovery (%)
TPW (%)
RPb RPb-Cu RPb-Zn RPb-Fe 100 67.56 35.59 48.32 46.09 90 63.64 33.38 44.45 41.53 40 68.69 37.41 47.66 45.00
Lead flotation using industrial grain size
Because a d80 grain size of 160 μm is currently used in the lead circuit at the MCG flotation plant, further tests were carried out to assess the effect of increasing the particle-size from 100 to 160 μm on the lead flotation performance. Experiments were then carried out under MCG plant operating conditions using 100, 90 and 40% TPW. The results presented in Table VI and Figure 4 show that the flotation performance in terms of galena recovery and selectivity was not affected by the process water quality. However, comparison with the results in Table IV shows that, the increase in the ore grain size adversely affected the lead flotation performance. The lead recovery decreased from 75% to 68%, and its selectivity over Cu, Zn, and Fe, decreased from 54% to 36%, 60% to 48% and 65% to 46% respectively. These results confirmed those of Boujounoui et al., (2015) in which particle-size adversely affected galena selectivity.
Conclusion
Our study on the effects of recirculating MCG tailings pond water on galena recovery and its selectivity towards Cu, Zn, and Fe revealed the following.
➤ The variation in water quality had no significant effect on the lead recovery and its selectivity over zinc and iron, but adversely affected the Pb-Cu selectivity.
➤ Recycling tailings pond water without mixing with any fresh water is possible. At least four recycling stages can be used if a d80 particle size of 100 μm is adopted.
➤ Increasing the particle size from 100 to 160 μm had a negative effect on the performance of Pb flotation. Supplementary work needs to be performed to compare the cost savings gained by the reduced use of fresh water with the increase in energy consumption on an industrial scale from reducing the particle size from 160 to 100 μm. Environmental concerns and water scarcity in the region of the MCG plant must also be considered.
Acknowledgments
The authors thank the Mining Company of Guemassa for providing the sulphide ore sample, flotation reagents, and tailings pond water, and Reminex Society for the chemical analyses.
References
Atmaca, T. and Kuyumcu, H.Z. 2003. Investigations on water consumption in mineral processing plants. Erzmetall, vol. 56, no. 9. pp. 558–562.
Abidi, A., Elamari, K., Bacaoui, A ., and Yacoubi, A . 2014. Entrainment and true flotation of a natural complex ore sulphide. Journal of Mining Sciences, vol. 50. pp. 1061–1068.
Abidi, A., Boujounoui, K., Bacaoui, A., El Amari, and K., Yaacoubi, A. 2019. Contribution to improve water process recycling in the flotation plant of a complex Zn-Pb-Cu sulphide ore. Journal of Mining Sciences, vol. 55, no. 4. pp. 658–667.
Bıcak, O., Ekmekci, Z., Can, M., and Ozturk, Y. 2012. The effect of water chemistry on froth stability and surface chemistry of the flotation of a Cu–Zn sulfide ore. International Journal of Mineral Processing, vol. 102–103. pp. 32–37.
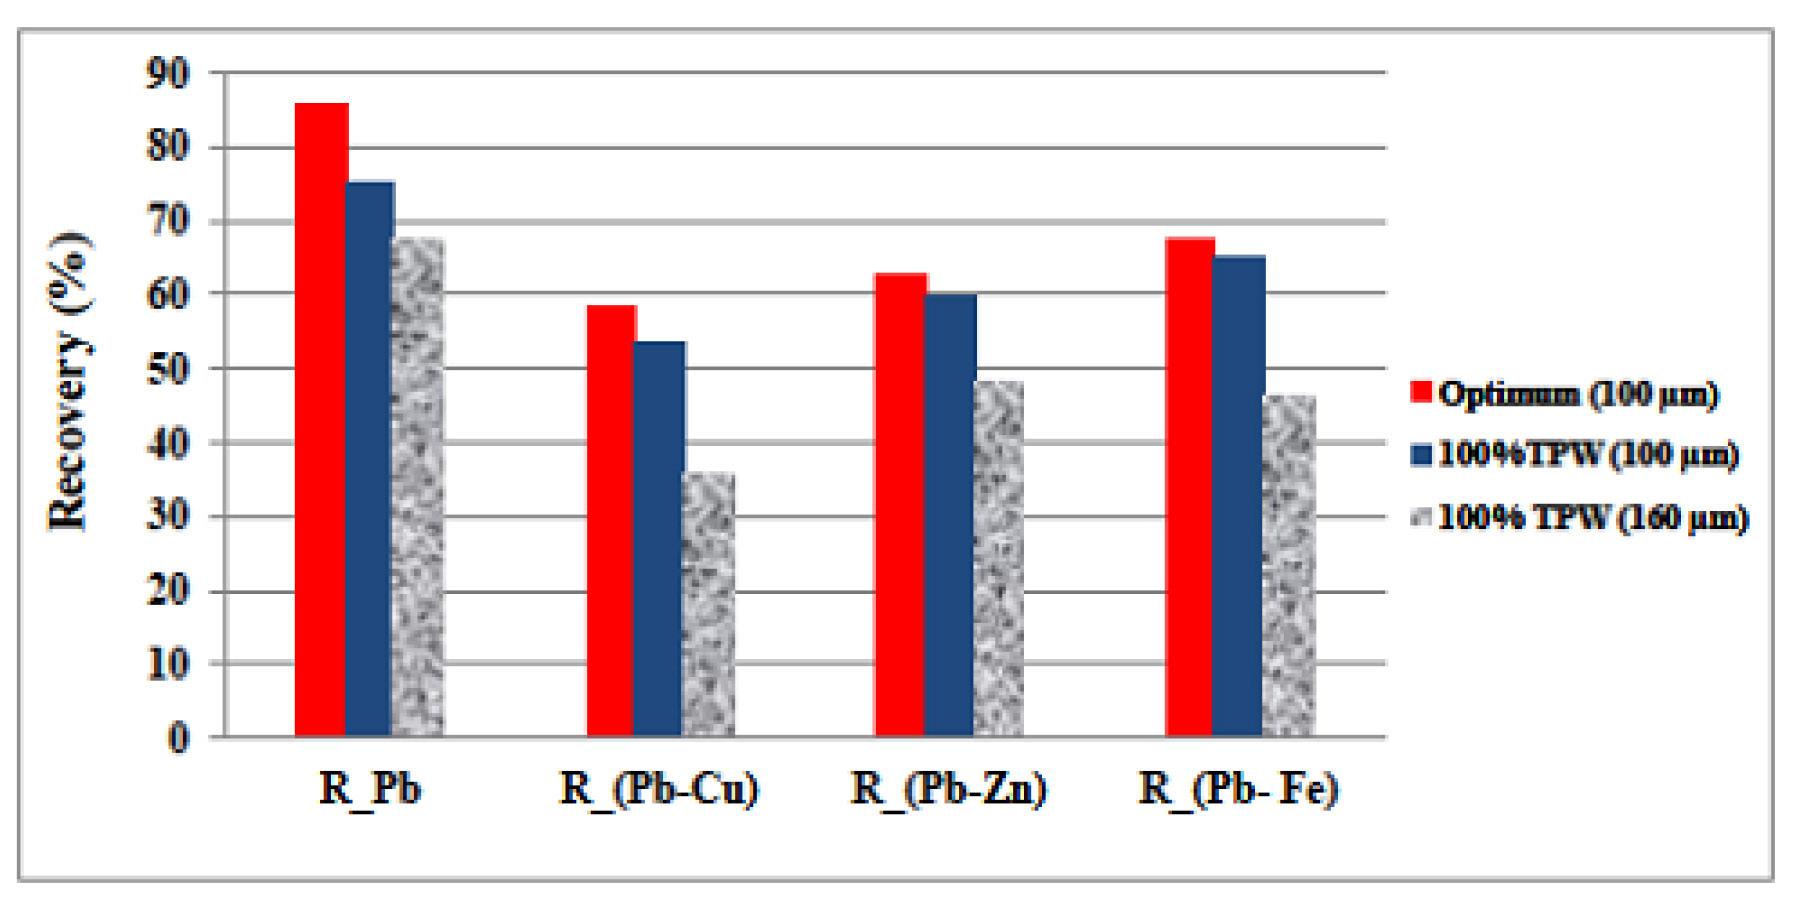
Figure 4—Comparison of the galena
performances using
particle sizes of d80 =160 and 100 μm
652 NOVEMBER 2022 VOLUME 122
and
Effect of zinc process water recycling on galena flotation from a complex sulphide ore
The Journal of the Southern African Institute of Mining
Metallurgy
flotation
100% TPW for
Effect of zinc process water recycling on galena flotation from a complex sulphide ore
Boujounoui, K., Abidi, A., Bacaoui, A., El Amari, K., and Yaacoubi, A. 2015. The influence of water quality on the flotation performance of complex sulphide ores: case study at Hajar Mine. Morocco. Journal of the Southern African Institute of Mining and Metallurgy, vol. 115. pp. 1243–1251.
Boujounoui, K. 2017. Optimisation du potentiel de recyclage de l’eau de procédé dans les circuits de flottation des minerais sulfurés complexes : Cas de Draa Lasfar Sud (Maroc). Thesis, Université Caddi Ayyad, Faculté des Sciences Semlalia, Maroc.
Boujounoui, K., Abidi, A., Bacaoui, A., El Amari, K., and Yaacoubi, A. 2018. Flotation process water recycling investigation for the complex Draa Sfar sulphide ore, Morocco. Mine Water and the Environment, vol. 37, no. 1. pp. 75–87. https://doi.org/10.1007/s10230-017-0471-3
Boujounoui, K., Abidi, A., Bacaoui, A., El Amari, K., and Yaacoubi, A. 2019. Effect of water quality on the performance of the galena and blend flotation: Case of Draa Sfar complex sulphide ore. Moroccan Journal of Chemistry, vol. 7, no. 2. pp. 337–345.
Boujounoui, K., Abidi, A., Bacaoui, A., El Amari, K., and Yaacoubi, A. 2020. Optimization of chlorite and talc flotation using experimental design methodology: Case study of the MCG plant, Morocco. Journal of the Southern African Institute of Mining and Metallurgy, vol. 120, no. 12. pp. 693–700.
Chadwick, J. 2007. Water management: Minimizing water use and its pollution, International Mining. pp. 38–47.
Chandra, A.P. and Gerson, A.R. 2009. A review of the fundamental studies of the copper activation mechanisms for selective flotation of the sulfide minerals, sphalerite and pyrite. Advances in Colloid and Interface Science, vol. 145. pp. 97–110.
Deng, M., Liu, Q., and Xu, Z. 2013. Impact of gypsum supersaturated water on the uptake of copper and xanthate on sphalerite. Minerals Engineering, vol. 49. pp. 165–171.
Deng, J., Wen, S., Liu, J., Wu, D., and Feng, Q. 2014. Adsorption and activation of copper ions on chalcopyrite surfaces: A new viewpoint of self-activation. Transactions of Nonferrous Metals Society of China, vol. 24. pp. 3955−3963.
Dávila-Pulido, G.I., Uribe-Salas, A., Álvarez-Silva, M., and López-Saucedo, F. 2015. The role of calcium in xanthate adsorption onto sphalerite. Minerals Engineering, vol. 71. pp. 113–119.
Hochstrat, R., Wintgens, T., and Melin, T. 2008. Development of integrated water reuse Strategies. Desalination, vol. 218. pp. 208–217.
Ikumapayi, F., Makitalo, M., Johansson, B., and Rao, K.H. 2012. Recycling of process water in sulphide flotation: Effect of calcium and sulphate ions on flotation of galena. Minerals Engineering, vol. 9. pp. 77–88.
Jing, X., Runqing, L., Wei, S., Yuehua, H., and Jingping, D. 2012. Effect of mineral processing wastewater on electrochemistry of galena. Journal of Environmental Science and Engineering, vol. A1. pp. 279–285.
Liu, W., Moran, C.J., and Vink, S. 2013. A review of the effect of water quality on flotation. Minerals Engineering, vol. 53. pp. 91–100.
Levay, G., Smart, R.S.C., and Skinner, W.M. 2001. The impact of water quality on flotation performance. Journal of the Southern African Institute of Mining and Metallurgy, vol. 101. pp. 69–76.
McIntyre, J.P. 2006. Industrial water reuse and wastewater minimization, GE Water and process technologies technical report, General Electric Company, pp. 1–7.
Mudd, G.M. 2008. Sustainability reporting and water resources: A preliminary assessment of embodied water and sustainable mining. Mine water and environment, vol. 27. pp. 136–144.
Muzenda, E. 2010. An investigation into the effect of water quality on flotation performance. World Academy of Science, Engineering and Technology, vol. 69. pp. 237–241.
Molina, G.C., Cayo, C.H., Radrigues, M.A.S., and Bernades, A.M. 2013. Sodium isopropylxanthate degradation by advanced oxidation processes. Minerals Engineering, vol. 45. pp.88–93.
Managem Group, 2014. Annual Report. Casablanca, Morocco.
N’gandu, D.E. 2001. The effect of underground mine water on performance of the Mufulira flotation process. Journal of the Southern African Institute of Mining and Metallurgy, vol. 101. pp. 367–380.
Nedved, M. and Jansz, J. 2006,. Waste water pollution control in the Australian mining Industry. Journal of Cleaner Production, vol. 14. pp. 1118–1120.
Orona, G., Gillermana, L., Bickd, A., Mnaore, Y., Buriakovskya, N., and Haginc, J. 2007. Advanced low quality waters treatment for unrestricted use purposes: Imminent challenges. Desalination, vol. 213. pp.189–198.
Rao, S.R. and Finch, J.A. 1989. A review of water re-use in flotation. Minerals Engineering, vol. 2. pp. 65–85.
Seke, M.D. and Pistorius, P.C. 2006. Effect of cuprous cyanide. dry and wet milling on the selective flotation of galena and sphalerite. Minerals Engineering, vol. 19. pp. 1–11.
Slatter, K.A., Plint, N.D., Cole, M., Dilsook, V., de Vaux, D., Palm, N., and Oostendorp, B. 2009. Water management in Anglo Platinum process operations: Effects of water quality on process operations, [Abstract] Proceedings of the International Mine Water Conference, Pretoria, South Africa, 19–23 October. International Mine Water Association. pp. 46–55.
Van der Bruggen, B. 2010. The global water recycling situation. Sustainability Science and Engineering, vol. 2. pp. 41–61.
Wang, B. and Peng, Y. 2014. The effect of saline water on mineral flotation – A critical review. Minerals Engineering, vol. 66–68. pp. 13–24.
Wang, L., Peng, Y., Runge, K., and Bradshaw, D. 2015. A review of entrainment: Mechanisms. contributing factors and modelling in flotation, Minerals Engineering, vol. 70. pp. 77–91.
Zeman, C., Rich, M., and Rose, J. 2006. World water resources: Trends challenges and Solutions. Reviews in Environmental Science and Bio/Technology, vol. 5. pp. 333–346. u
Southern African Institute of Mining and Metallurgy
653 The Journal of the
VOLUME 122 NOVEMBER 2022
SOUTHERN AFRICAN HYDROGEN AND FUEL CELL CONFERENCE
ABOUT THE CONFERENCE
The primary purpose of the 1st Hydrogen and Fuel Cells conference is the advancement of green hydrogen technologies in Southern Africa and the global community, by highlighting the power of renewable and sustainable technologies and addressing the emerging challenges— through the exploration of fuel cells, hydrogen storage, and hydrogen generation by way of engagement with industry, academia and government. The conference will provide a platform for high level exchange and networking opportunities with various experts in the field. The two-day conference will feature high-level scientific talks and posters, complemented with keynote and plenary presentations on country overviews, status of leading and major players in the Southern African and global arena.
BENEFITS OF ATTENDING
Will include both inspiring technical talks as well as social networking events
Participants will have the opportunity to directly engage with conference participants to discuss their research
Fuel cell technologies & applications
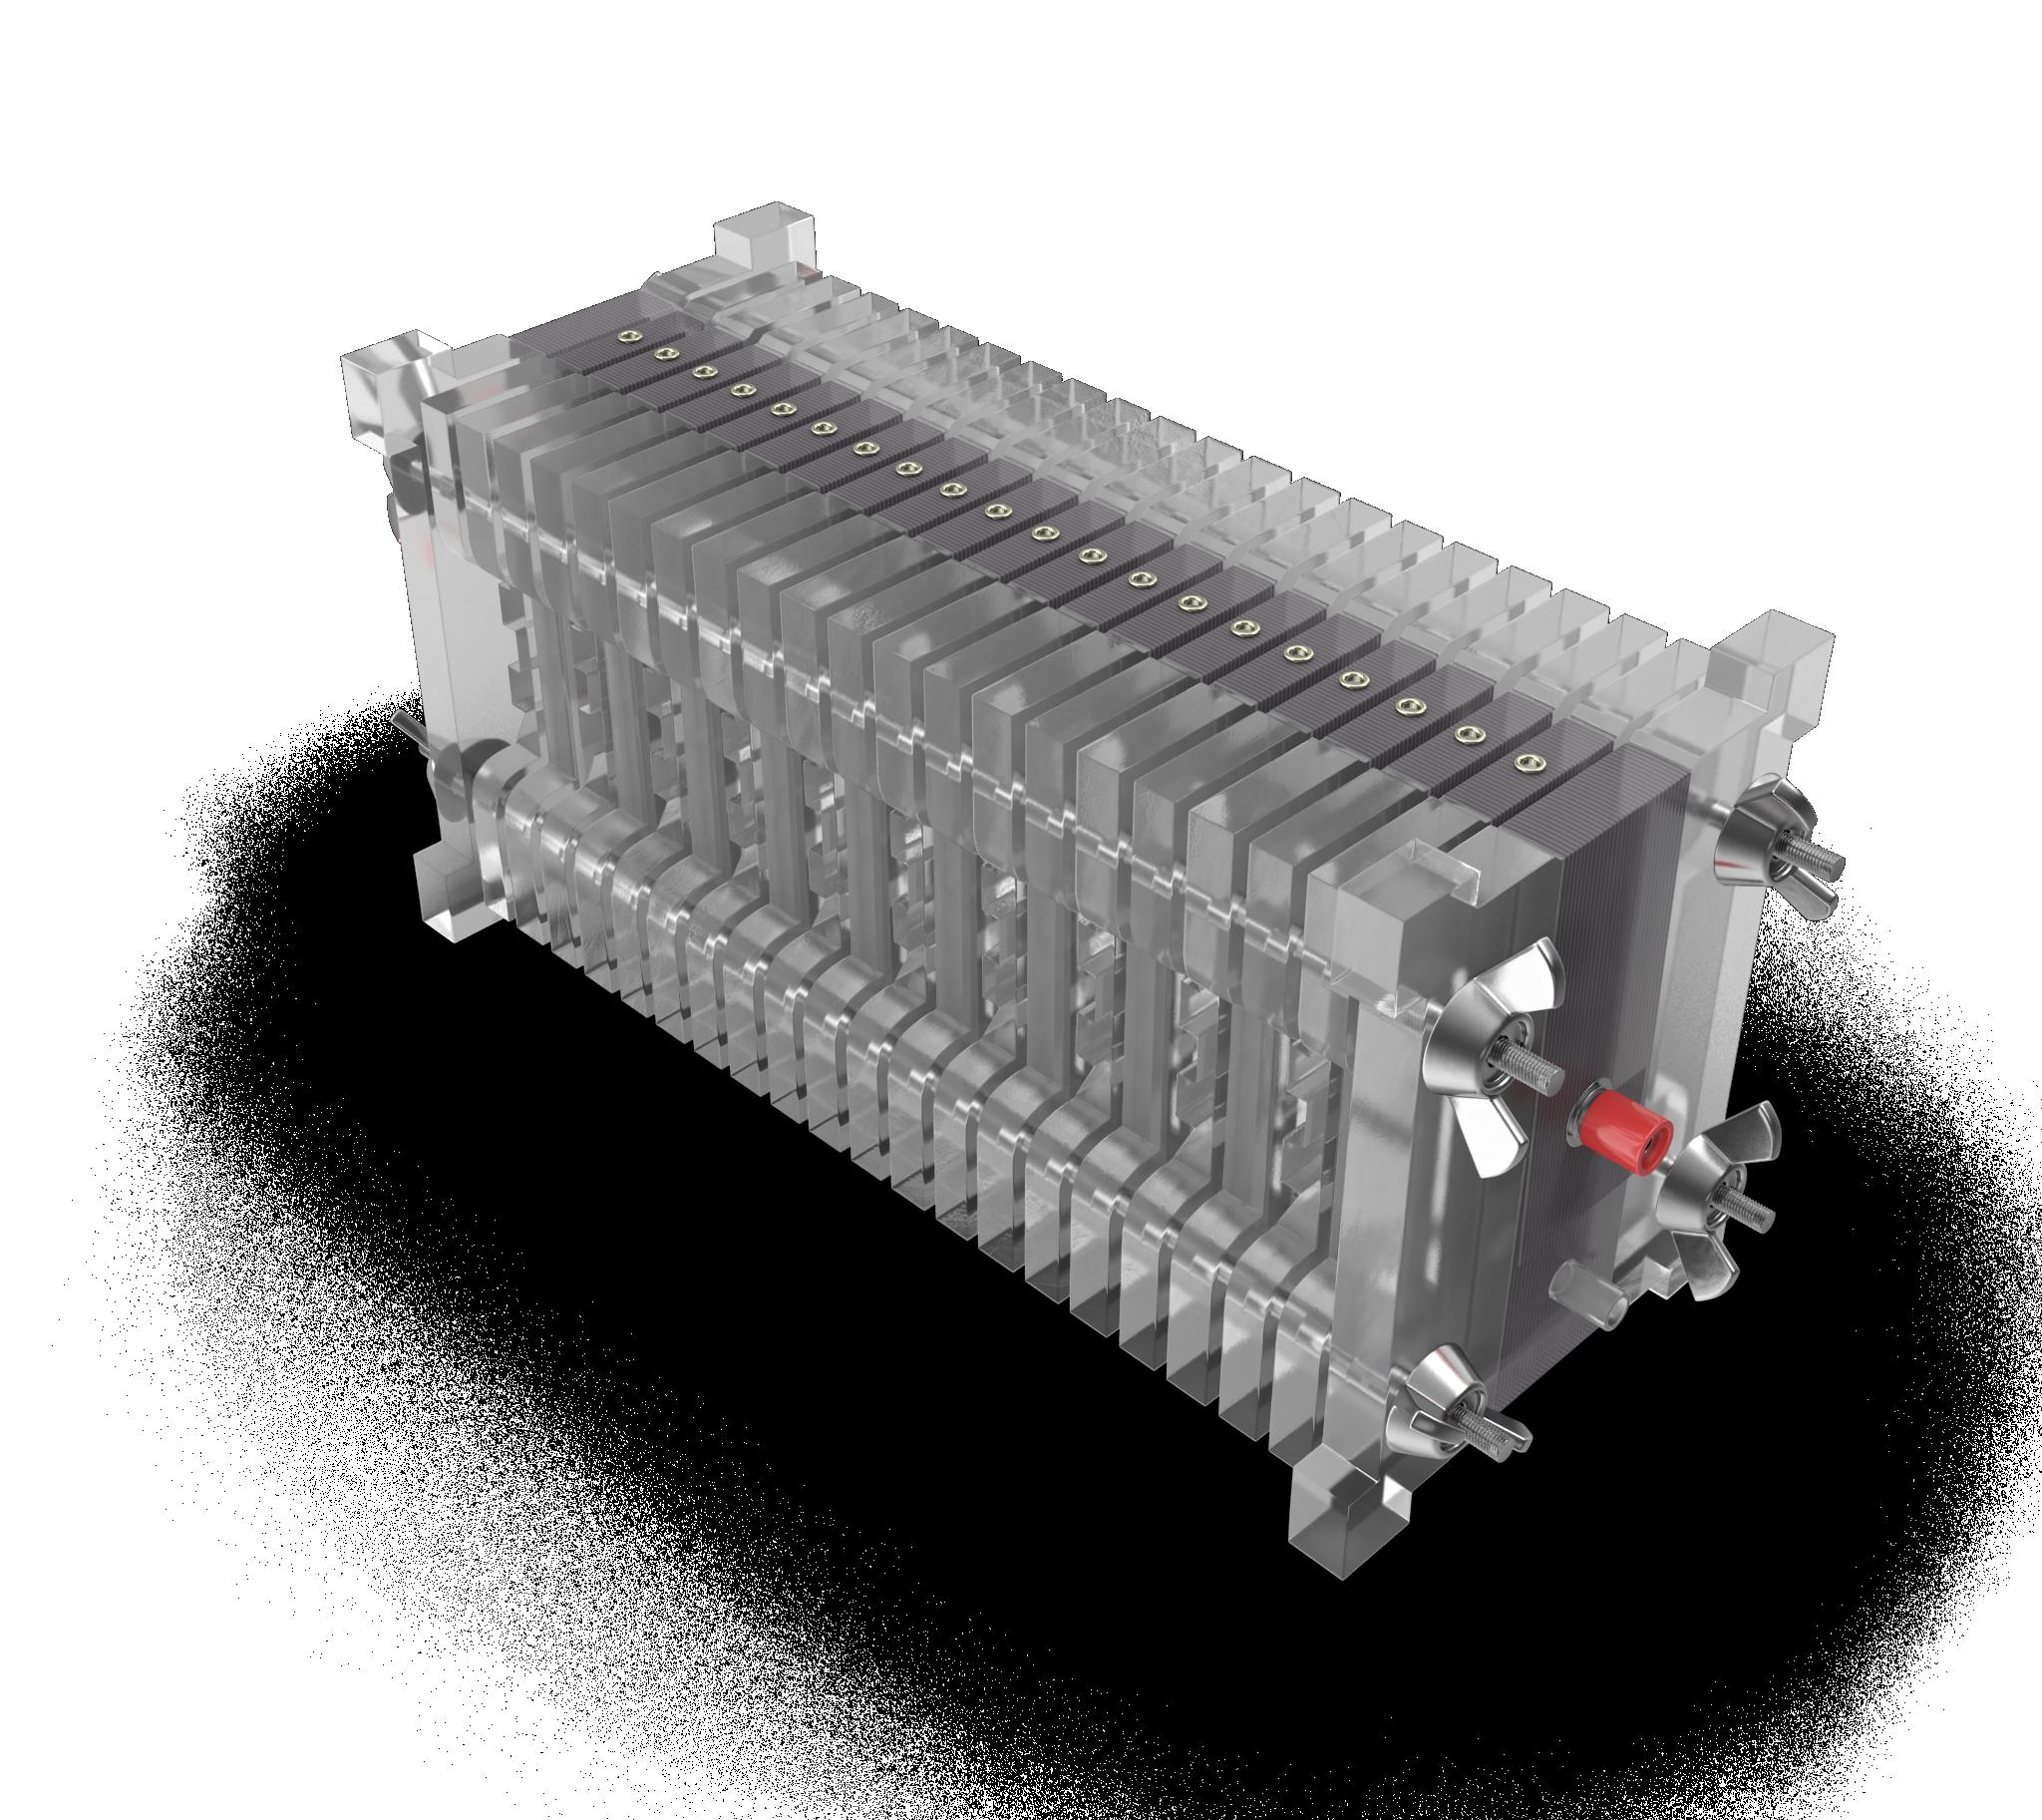
Performance, durability, design, and manufacturing (from components to systems)
- Hydrogen storage technologies
- Hydrogen generation technologies
Hydrogen mobility –strategies, safety, roadmaps, transitioning to hydrogen refueling stations (HRS)
Technology status in industry.
WHO SHOULD ATTEND
The conference presents an attractive programme for researchers, industry players, academic institutions, government, investors, policy makers and potential users of fuel cell and hydrogen technologies. The focus is on building collective know-how and fostering engagement between business, government, science and academic institutions. Participants from all countries are invited and welcome to attend the event.
FOR FURTHER INFORMATION, CONTACT:
654 NOVEMBER 2022
Camielah Jardine, Head of Conferencing
E-mail: camielah@saimm.co.za Tel: +27 11 538-0237 Web: www.saimm.co.za
14 November 2022
• Notification of acceptance of abstracts: 31 November 2022
• Deadline of submission of papers: 30 December 2022
The Conference is being organized by the Southern African Institute of Mining and Metallurgy, and individuals are invited to submit papers or presentations or posters for the Conference. Titles and short abstracts (no more than 500 words) on any relevant subject should be submitted in English to:
Head of Conferencing, Camielah Jardine
Enquiries may be made at: Tel: +27 011 538-0237 E-mail: camielah@saimm.co.za website: www.saimm.co.za
Effect of zinc process water recycling on galena flotation from a complex sulphide ore
VOLUME 122 The Journal of the Southern African Institute of Mining and Metallurgy
From fundamentals to accelerated integration
ECSA AND SACNASP CPD POINTS WILL BE ALLOCATED PER HOUR ATTENDED
24-25 APRIL 2023 HAZENDAL WINE ESTATE, STELLENBOSCH, CAPE TOWN
2023
Affiliation:
1School of Mining Engineering, Faculty of Engineering and the Built Environment (FEBE). University of the Witwatersrand, Johannesburg, South Africa.
2Sibanye-Stillwater Digital Mining Laboratory (DigiMine), Wits Mining Institute (WMI), Faculty of Engineering and the Built Environment (FEBE), University of the Witwatersrand, Johannesburg, South Africa.
3School of Electrical and Information Engineering, University of the Witwatersrand, Johannesburg South Africa.
Correspondence to: M.A. Mahboob
Email: mahsan.mahboob@wits.ac.za ahsan.igis@gmail.com
Dates: Received: 11 Jun. 2020 Revised: 2 Aug. 2022 Accepted: 11 Aug. 2022 Published: November 2022
How to cite: Mahboob, M.A., Celik, T., and Genc, B. 2022
Review of machine learning-based Mineral Resource estimation.
Journal of the Southern African Institute of Mining and Metallurgy, vol. 122, no. 11, pp. 655–664
DOI ID: http://dx.doi.org/10.17159/24119717/1250/2022
Review of machine learning-based Mineral Resource estimation
by M.A. Mahboob1,2, T. Celik3, and B. Genc1
Synopsis
Mineral Resources estimation plays a crucial role in the profitability of the future of mining operations. The conventional geostatistical methods used for grade estimation require expertise, understanding and knowledge of the spatial statistics, resource modelling, geology, mining engineering as well as clean validated data to build accurate block models. However, the geostatistical models are sensitive to changes in data and would have to be rebuilt on newly acquired data with different characteristics, which has proved to be a time-consuming process. Machine learning methods have in recent years been proposed as an alternative to the geostatistical methods to alleviate the problems these might suffer from in Mineral Resource estimation. In this paper, a systematic literature review of machine learning methods used in Mineral Resource estimation is presented. This has been conducted on such studies published during the period 1990 to 2019. The types, performances, and capabilities, of several machine learning methods have been evaluated and compared against each other, and against the conventional geostatistical methods. The results, based on 31 research studies, show that the machine learningbased methods have outperformed the conventional grade estimation modelling methods. The review also shows there is active research on applying machine learning to grade estimation from exploration through to exploitation. Further improvements can be expected if advanced machine learning techniques are to be used.
Keywords
machine learning, artificial intelligence, Mineral Resources, grade estimation.
Introduction
Mineral Resources estimation (MRE) is one of the most important and critical stages in the mining value chain. The whole mining project depends on the reliable estimation of the grade of the mineralization. The spatial distribution of Mineral Resources (MR) depends on several known and unknown factors that cannot be incorporated in the traditional/conventional geostatistical models (Rossi and Deutsch, 2013; Hosseini, Asghari, and Emery, 2017). The basic assumption made by most of the mineral grade estimation models is that a spatial relationship exists between the grades at any two locations and that this relationship is a function of the distance between the two locations. Since the 1950s, many Mineral Resource Estimation (MRE) models have been proposed based on statistical methods, and later by incorporating the spatial dimensions in the estimations, which improved the results significantly. However, even the spatial estimation techniques are based on several assumptions and predict the MR values with some uncertainty levels. Many MRE models based on spatial statistics only incorporate the three-dimensional location of the measured value (X, Y, Z) along with the grade and thickness information. However, several other parameters like topographical variations, directions of geological structures, type of geology etc. are also very important for reliable MRE. These parameters are often neglected or not incorporated in the conventional statistical and spatial statistical methods. In the last 10 years, machine learning (ML)-based methods have become more popular in Resource estimation research. Several researchers (Samanta, Banopadhyay, and Ganduli, 2006; Chatterjee, 2010, Tahmasebi and Hezarkhani 2010, Zhang, 2017) have reported that ML-based methods have emerged as prediction models and as major alternatives to geostatistics for MRE.
Despite the huge number of research studies that used ML-based methods, inconsistent results have been reported regarding the accuracy of the methods, the comparison between ML and non-ML methods, and comparisons among several different ML-based methods. For example, in a comparison of ML and non-ML methods for MRE, Dutta, et al., (2010) concluded that the ML methods produced more accurate results; however, Samanta, Ganguli, and Banopadhyay, (2005) showed that non-ML methods outperform the ML-based methods in producing reliable MREs. In a comparison among the ML-based methods,
655 The Journal of the Southern African Institute of Mining and Metallurgy VOLUME 122 NOVEMBER 2022
Review of machine learning-based Mineral Resource estimation
Tahmasebi and Hezarkhani, (2010), showed that artificial neural networks perform better than regression models. Chatterjee and Bandopadhyay (2011) however, reported opposing results. Due to the discrepancies in the research studies which applied ML methods for MRE, practitioners in the fields of mining and geosciences may be hesitant to use ML models more practically and confidently. As opposed to other fields of study where the ML methods have been well tested and applied successfully, the applications of these methods in MRE face several challenges, like limited training data-sets, the uncertainty in existing data-sets and geological conditions, as well as the human factor. Although there is an increasing trend in academic research towards the applications of ML methods, most of the experts choose non-ML methods for MRE.
To facilitate the applications of ML methods in the mining industry, it is very important to systematically summarize the empirical evidence on ML methods in current research and practice. The applications of ML methods are novel in the field of MRE, hence very little literature is available on the subject. There is no existing systematic literature review on the applications of ML methods in the field of mining related to MRE. In this paper, the literature review was performed on articles published from January 1 1990 to June 30 2019, related to ML methods applications in the field of MRE. The main purpose is to summarize the published work regarding the types of ML methods used in MRE, the comparisons between ML and non-ML methods, the performance evaluation of ML and non-ML methods, and the factors mainly considered in the application of ML methods.
Methodology
The systematic literature review methodology proposed by Kitchenham and Charters (2007) was used to conduct and report the review. The main steps include the definition of research questions, design of search strategy, selection criteria for studies, quality assessment, extraction of relevant data, and analysis, as given in Figure 1.
Research questions
Four research questions were defined based on the objective of summarizing the published work regarding the types of ML models used in MRE.
1. Which ML methods/models have been used for MRE? The aim was to identify the ML methods/models that have been used in MRE to provide MRE researchers and practitioners with a range of possible methodologies to consider.
2. Does any publication on the comparison of ML against non-ML methods exist?
This question is concerned with the comparison of ML with non-ML methods in terms of accuracy, if performed in the studies.
3. Do ML methods outperform non-ML methods? The aim is to compare the accuracy of the ML methods against non-ML methods.
4. Are there any ML methods that distinctly outperform other ML methods?
The comparison of different ML methods in order to identify these ML methods which perform better than others.
Search approach
The search strategy was based on the search terms, sources of publications, and process of search as explained below.
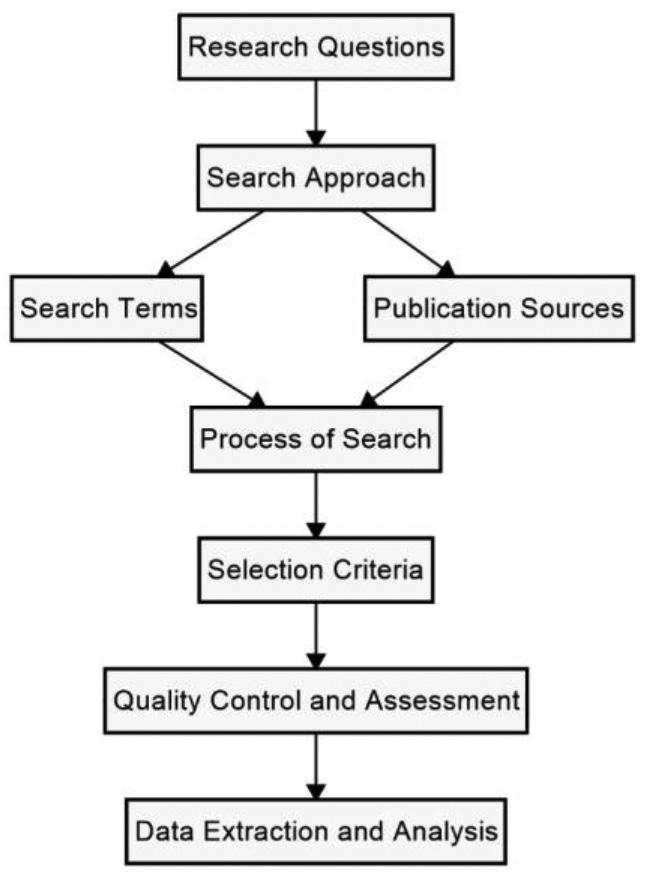
Search terms
The following steps were applied in order to search the terms for MRE, Wen, 2012:
(a) Selection of major keywords based on the research questions (b) Identify possible different spellings and synonyms for major keywords (c) Check the major keywords given in the relevant books and papers (d) Usage of Boolean operator or to combine the different spellings and synonyms (e) Usage of and operator to link the major keywords.
The following are the main keywords identified from the published work on machine learning models and techniques used for MRE.
Mineral AND (grade OR ore OR reserve OR resources) AND (estimation OR prediction) AND (machine learning OR artificial intelligence OR mining OR data mining) AND (geochemical OR exploration OR boreholes) AND (neural networks OR support vector machine OR support vector machine OR regression tree OR random forest OR Kriging OR nearest neighbour) AND (modelling OR spatial OR analysis).
Although significant research has been done on the application of ML techniques in the oil and gas or petroleum industry, that was not considered in this literature review, being outside the scope of the paper.
Publication sources
Figure 1—The methodology used for the systematic literature review (conceptualised from Wen, et al, 2012)
Five reliable and widely searched electronic databases (IEEE Xplore, ScienceDirect, Springer Nature, Web of Science, and Google Scholar) were used to search the most relevant literature. All the other databases are largely covered by these five primary databases, and hence have also been used by many literature reviews studies in several fields. The main keywords developed
656 NOVEMBER 2022 VOLUME 122
The Journal of the Southern African Institute of Mining and Metallurgy
Review of machine learning-based Mineral Resource estimation
previously were used to search for journal and conference papers in the five databases. Except for Google Scholar, the search was conducted on the title, abstract, and keywords. Google Scholar returned several millions of irrelevant records when terms were searched on full text, hence the search was limited to the titles of the publications. The searches were restricted to the time period from January 1 1990 to June 30 2019, as publications on the application of ML methods to MRE begin to appear in the early 1990s; for example, Wu and Zhou (1993) used neural networks for reserve estimation in 1993.
Search process
A comprehensive search of the relevant keywords among all the databases is very important. Therefore, the search process was designed and divided into two phases to identify relevant published papers.
Phase A: Search the five databases individually and list all the papers that resulted from the searches.
Phase B: The references in each resulting paper were scanned to identify additional relevant papers, which were added to the original. The inclusion and exclusion criteria set for the papers were as follows:
Inclusion criteria
1. ML methods used to pre-process the data
3. Applied more than one ML method and/or combined with nonML methods
4. Comparative studies that compare different ML methods and/ or with non-ML methods
5. Studies which contain both conference and journal publications; only journal papers were selected for inclusion
6. Studies which have multiple versions or duplications; only the most recent and complete study was included in the list.
Exclusion criteria
1. Qualitative studies without proper ML methodsdetails and used with other than borehole or geochemical data.
2. Review papers.
Quality control and assessment
The quality control process assists with the selection of the most relevant research papers. A series of research questions was formulated in order to assess the rigorousness, reliability, and relevance of the papers. The questions are given in Table I, based on the methodology developed by Wen et al. (2012). The
three options were assigned to each question, i.e. yes, partially, and no. These options were scored as 1, 0.5, and 0 respectively as in by Wen et al. (2012). The quality was assessed by summing the scores for answers against each question. The studies with a minimum score of 3.0 (50% of a perfect score) were selected for data extraction and analysis to ensure the quality of this literature research.
By applying the selection criteria, 50 papers were identified. After scanning the references in these papers, eight additional relevant papers were found. Hence, a total of 58 relevant papers were initially considered. However, after applying the quality control criteria, only 31 papers were selected for data extraction. The quality assessment is discussed in detail in the following sections. The complete list of the 31 selected papers can be found in Appendix A.
Data extraction and analysis
The selected research studies were exploited in order to collect the data that can answer the specific research questions of this exercise. All the reliable and relevant research papers were divided into specific sections, as given in Table II.
These sections were analysed combinedly to provide more meaningful information and to enhance the understandings. The extracted data was both quantitative (number. of boreholes or data-sets) and qualitative (data type, publisher, publication type). Different visualization techniques such as bar charts, pie charts, etc. were also used to enhance the data extracted from the research studies.
The vote counting method was used in order to compare the accuracy and application of different ML models (Malhotra, 2015). The vote counting method counts the number of times a model i.e., Model A outperformed Model B, or vice versa. With this method, a general idea of whether an estimation ML model outperforms another model in the estimation of mineral grades emerged.
QA1 Are the aims of the research clearly defined?
QA2 Are the estimation methods well defined and deliberate?
QA3 Is the estimation accuracy measured and reported?
QA4 Is the proposed estimation method compared with other methods?
QA5 Are the findings of the study clearly stated and supported by the results?
QA6 Are the limitations of the study analysed thoroughly?
657 The Journal of the
VOLUME 122 NOVEMBER 2022
Southern African Institute of Mining and Metallurgy
the
of the published
Table I Research Questions defined for
quality assessment
research studies Code Question
Table II Information extracted from the research studies for the analysis Sr. no Extracted sections 1 Title of paper 2 Title of journal/conference 3 Publisher 4 Link 5 Year of publication 6 Type
7
10 Error
11
12
13
14
15
16
(journal/conference)
Data-set type (borehole/image)
assessment technique
Research question 1
Research question 2
Research question 3
Research question 4
Relevant to research
Publication domain
Review of machine learning-based Mineral Resource estimation
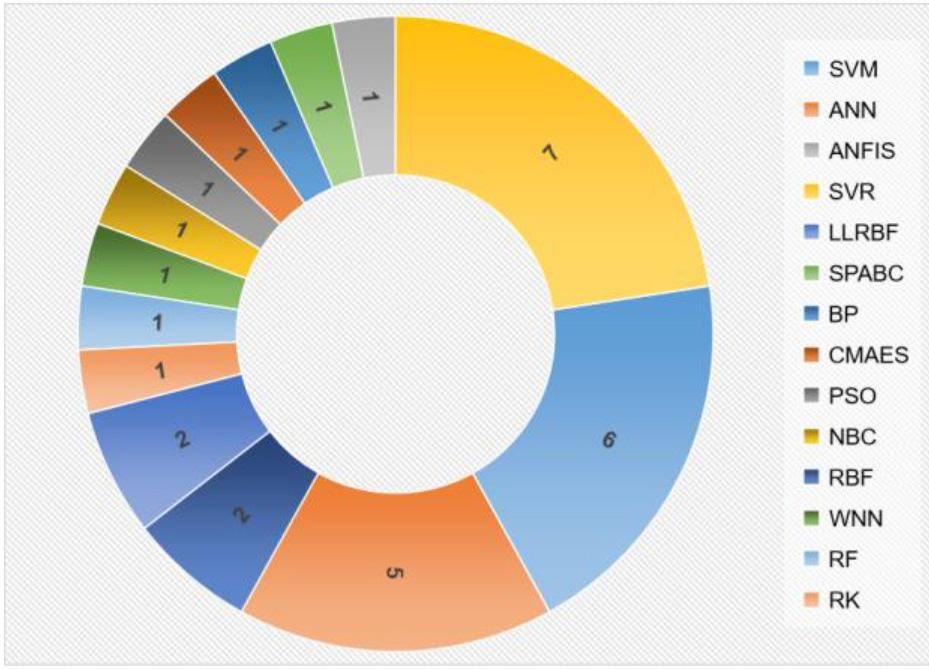
Results and discussion
A total of 31 research studies were identified that dealt with the application of ML methods in the field of MRE. These studies were published between 1990 and 2019 in journals and conference proceedings. Of these, 30 (approx. 97%) papers were published in journals, only one (approx. 3%) was published in conference proceedings, and none were found as book chapters. The places of publication are given in Appendix B. The publishers were mainly Elsevier, Springer, the IEEE, and Taylor & Francis. All of the research studies were experimental and none of them were survey research. In terms of quality control, only those studies were selected with a minimum quality score of 50%, hence all the studies were of a high-quality level.
The publication history is summarized in Figure 2 and shows that the oldest paper found was in the year 1993, followed by eight years wherein the selected publishers did not publish any paper until 2002. A significant increase in ML-based mineral grade estimation papers was found in 2010, with five papers published in that year. In both 2013 and 2017, four papers were published. However, only one paper was found to be published in 2018 and 2019. These statistics show that limited research has been conducted on the application, testing and validation ofML techniques in the field of mineral grade estimation.
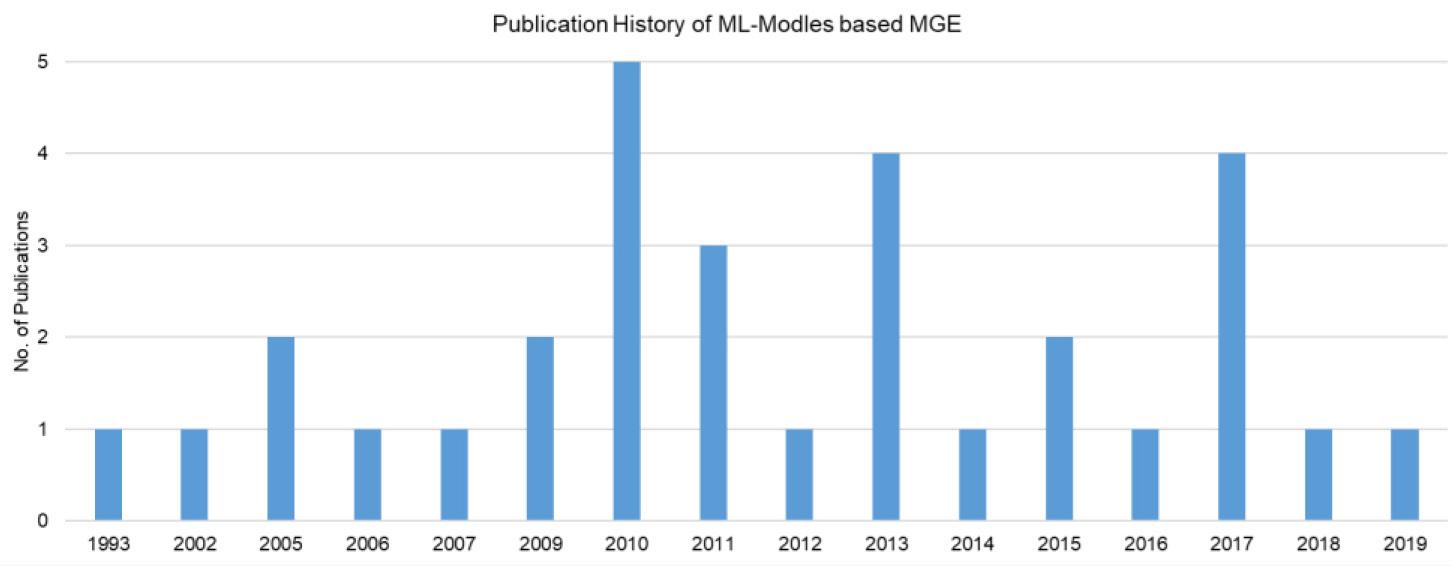
Through this exercise, thirteen types of ML-based methods and techniques were identified that have been used for mineral resource exploration and estimation as listed below:
➤ Support vector machine (SVM)
➤ Support vector regression (SVR) – This is the order of discussion below
• Artificial neural networks (ANN)
• Adaptive neuro-fuzzy inference system (ANFIS)
• Support victor regression (SVR)
➤ Local linear radial basis function (LLRBF) neural network
➤ Simultaneous perturbation artificial bee colony algorithm (SPABC)
➤ Back propagation (BP)
➤ Covariance matrix adaptation evolution strategy (CMAES)
➤ Particle swarm optimization (PSO)
➤ Naïve Bayes classifier (NBC)
➤ Radial basis function (RBF)
➤ Wavelet neural network (WNN)
➤ Random forest (RF)
➤ Regression kriging (RK)
Among all these models and techniques, SVM, SVR, and ANN are the most commonly used and applied for MRE. Together they were found in 60% of the selected studies, as shown in Figure 3. Detailed information about which techniques were used in which study are given in Appendix C.
On the other hand, the non-ML methods mostly used in MRE are kriging, ordinary kriging, and inverse distance weight (IDW). Only 41% of studies (13 papers) compared the results of ML with non-ML methods in terms of mineral grade estimation. All of these studies concluded that ML models outperformed the nonML methods except S-04, which concluded that ordinary kriging performed better than artificial neural networks. The ML methods which most frequently outperformed the other ML methods were SVM and SVR. A brief description of most the common ML techniques, including SVM, SVR, and ANN, are given in following sections.
The support vector machine is a supervised empirical machine-learning algorithm, based on statistical learning theory (Vapnik 1999). (SVM has recently been introduced in the field of mining and mineralization. The SVM is usually used for data classification and prediction; however, multi-class SVM can also be generated by combining multiple binary classifiers. It showed several unique advantages in a small data sample with nonlinear
658 NOVEMBER 2022 VOLUME 122
The Journal of the Southern African Institute of Mining
and Metallurgy
Figure 2—Annual ML research publications from 1990 to 2019
Figure 3— Frequency of use of ML models by the selected research studies
Review of machine learning-based Mineral Resource estimation
and multi-dimensional patterns recognition. The main objective of SVM is to locate a hyperplane that can separates data-points of one type from another. The best hyperplane is the one with the largest margin between two classes, and hence can separate the classes distinctively as shown in Figure 4.
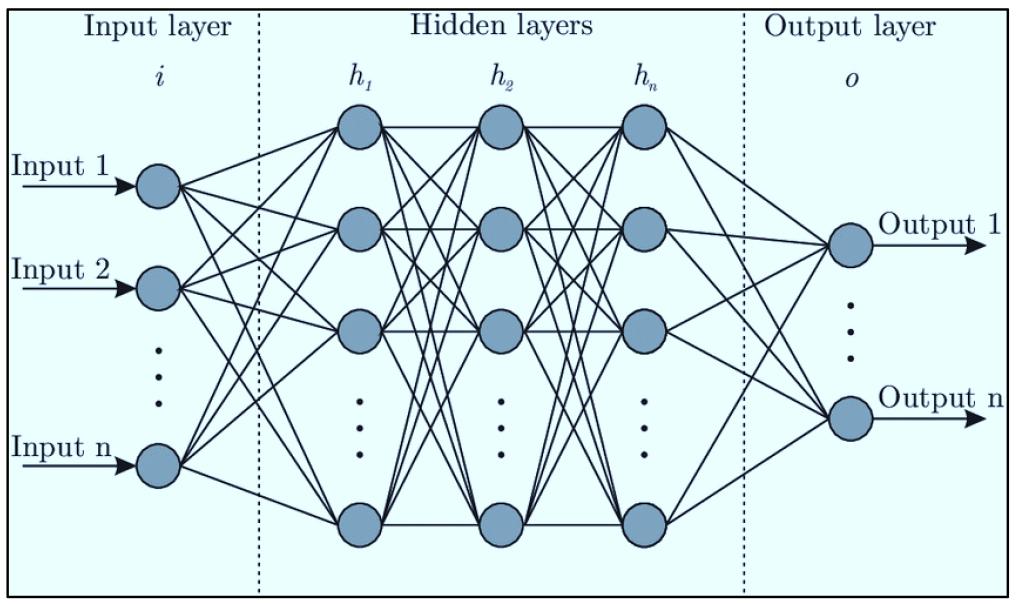
The maximum distance between two parallel hyperplanes results in the minimum classification error. SVM has been extensively used in several field of engineering, science, and natural languages. In the mining industry, it has recently been used for mineral classification (Patel, Chatterjee, and Gorgi, 2017), mineral prospectivity (Abedi, Norouzi, and Bahroudi, 2012), and automatic lithological classifications (Yu et al. 2012).
Support vector regression differs greatly from other regression models. Whereas the other linear regression models try to minimize the difference between the estimated and the true value, SVR tries to fit the best line within a threshold value. In MRE, SVR tries to categorize all the estimation lines in two forms, those that pass through the threshold boundary and those that don’t. The lines that do not pass the threshold boundary are not considered as the difference between the estimated grade value and the true grade value has exceeded the error threshold defined by ε (epsilon) as shown in Figure 5. On the other hand, the lines that pass are considered for a possible support vector to estimate the grade value at an unknown location.
Artificial neural networks is another strong machine-learning approach. This biologically inspired computational technique has wide applications in several science and engineering fields. A
Figure 6—General architecture of an ANN network (Bre, Gimenez, and Fachinnoti, 2018)
unique quality of ANNs is that they are able to create empirical relations between independent and dependent variables and extract the hidden variability and complex knowledge from training data-sets. The relations lies between independent and dependent variables can be built without assumptions about any mathematical depiction of the phenomena. ANN models have several benefits over regression-based ML methods, including their ability to deal with noisy data. An ANN model has thousands of interconnected artificial neurons made up of inputs and outputs. The input nodes receive the actual mineral grade values at known locations based on the internal weighting system and the neural network tries to learn the hidden patterns and produces the output, as shown in Figure 6.
An ANN model compares the actual output with what it was meant to produce, i.e., the desired output. The difference between both is corrected using back-propagation so the ANN works regressive, going from the final output node to the input nodes in order to fine-tune the weight of its connections until the variation between the actual grade value and estimated grade value produces the lowest possible error.
The types of data used for MRE estimation, regardless of technique, can be divided into three general categories: ➤ Exploratory boreholes ➤ Images ➤ Stream sediments.
4—Hyperplane separating the support vectors during the classification by SVM (MATLAB, 2020)
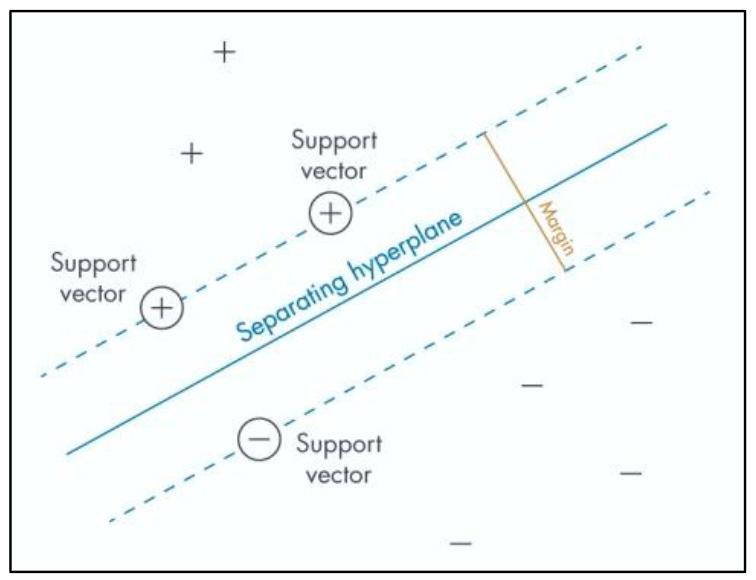
Twenty-three studies used exploratory borehole data, six used images photographs, and only one study utilized stream sediment data for the mineral grade estimation. The study S-13 used 3,500 exploratory boreholes and concluded that ML-based SVR is he most accurate technique for mineral grade estimation compared to the non-ML based ordinary kriging. Similarly, research study S-08, in which the authors used stream sediments, also concluded that ANN, which is another ML method, outperformed kriging, a non-ML method, when used for mineral grade estimation. The studies in which images were used did not compare the results of ML models with non-ML models.
In terms of publication domains, the studies were divided into the following three main categories: ➤ Minerals/mining ➤ Computer science ➤ Geoscience
Figure 5—Illustration of an SVR regression function separated by the ξ band for data-sets (Rosenbaum et al., 2013)
A total of seven studies were published in the field of minerals/mining, 12 in computer sciences, and 12 in the field of geosciences. This reveals that most of the publications fall into
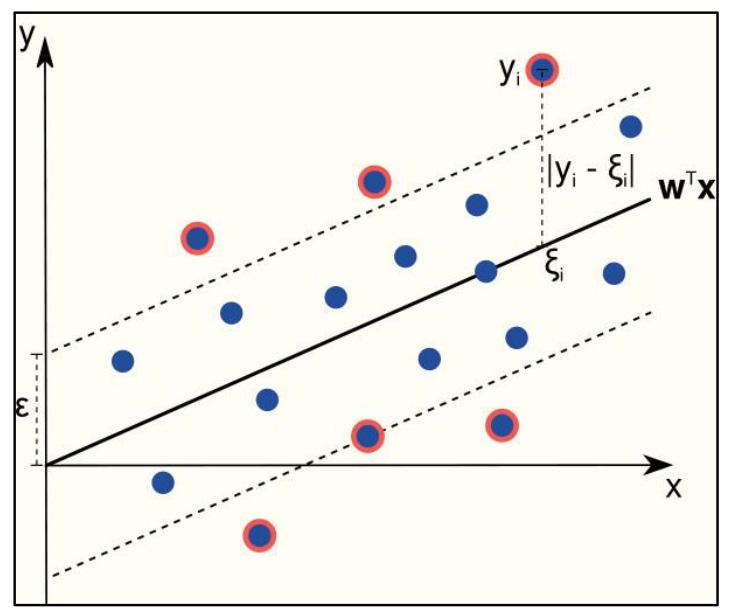
659 The Journal of the
VOLUME 122 NOVEMBER 2022
Southern African Institute of Mining and Metallurgy
Figure
Review of machine learning-based Mineral Resource estimation
multidisciplinary applied domains. Another important aspect of this SLR is to identify the most applicable statistical/geostatistical technique used for the error assessment of the predicted mineral grades. More than 73% of the research studies used mean square error (MSE) and root mean square error (RMSE) as error assessment techniques, followed by the standard error (SE), and mean absolute error (MSE) with a total of 16%. The remaining 11% of the error assessment techniques include mainly generalization error, percentage of accuracy, co-efficient of determination, and out-of-bag error.
This review has found that most of the recent and advance ML methods and techniques such as deep convolution neural network, hierarchical convolutional deep maxout network, and hidden trajectory (generative) models, are seldom used within the field of mineral grade estimation. Therefore, researchers/ practitioners are encouraged to apply these techniques and test their applicability for mineral grade estimation.
In addition, researchers/practitioners are also encouraged to explore the other, non-tested, ML methods for mineral grade estimation. In order to become acquainted with the unexplored ML methods and to apply them in a more efficient way, researchers/practitioners should keep a close watch on the related disciplines like machine learning, deep learning, data science, and artificial intelligence, as these disciplines may provide ideas for new ML methods and techniques (Wen et al., 2012). Even though this investigation has found that the ML models are more accurate and perform better than the non-ML methods, the results of error assessment between ML and non-ML methods, and between different ML methods, are still inconclusive. Hence, it is strongly recommended that the scientific community to develop a common framework for evaluating the performance of different ML techniques, as well as against non-ML methods. The results of the studies may vary because of different data-sets and/ or different experimental designs.
Conclusion
This systematic literature review examined machine learning (ML)-based MRE models in terms of the type of ML methods or techniques, the error estimation of applied ML methods, comparison between different ML and non-ML methods, as well as ML methods with other ML methods. The extensive systematic literature review was based on research studies published in the period 1990-2019, with a total of 31 studies meeting the requirements of five research questions.
The key findings of the litrature review are that the significant ML methods applied for the MRE are, in order of application, SVM, ANN and SVR. Few studies actually compared the results of ML methods with non-ML methods for MRE. Those studies concluded that ML methods outperformed the non-ML methods in general. SVM and SVR are the most applied and tested ML methods, which yield much better results than other ML methods. Very few papers have been published in the fields of mineral and mining, whereas most of them were published in the computer and geosciences fields.
This review provides recommendations for researchers for future work as well as guidelines for practitioners. More research should be conducted detailing studies on the application of ML methods and drawing of conclusions in terms of their applicability, validation, and accuracy. Researchers should also develop a framework in terms of data usage and accuracy assessment against non-ML methods used for mineral grade estimation.
From this review, it is very clear that the application of ML methods in the industry for MRE are limited, and hence more studies should be conducted and analysis done in order to find the possible barriers to ML method applications. It is strongly recommended that ML models be used in parallel with non-ML (conventional statistical) models in the early stages of mineral grade estimations. After the error assessment and quality check, the validated ML methods can then be used for estimation of Mineral Resources. Moreover, it is advisable to consult researchers/experts from the fields of machine learning and/or data science in order to check the strengths and weaknesses of the potential ML methods and interpretation of results before and after application accordingly.
Acknowledgment
The work presented here is based on the PhD research study of the first author in the School of Mining Engineering at the University of the Witwatersrand, Johannesburg, South Africa. The authors would also like to acknowledge the valuable feedback provided by the reviewers, which has improve the presentation and quality of work.
References
Abbaszadeh, M., Hezarkhani, A., and Soltani-Mohammadi, S. 2013. An SVM-based machine learning method for the separation of alteration zones in Sungun porphyry copper deposit. Geochemistry, vol. 73, no. 4. pp. 545–554.
Abedi, M., Norouzi, G.-H., and Bahroudi, A . 2012. Support vector machine for multi-classification of mineral prospectivity areas. Computers & Geosciences, vol. 46. pp. 272–283.
Bre, F., Gimenez, J.M., and Fachinotti, V.D. 2018. Prediction of wind pressure coefficients on building surfaces using artificial neural networks. Energy and Buildings, vol. 158. pp. 1429–1441.
Chatterjee, S. and Bandopadhyay, S. 2011. Goodnews Bay platinum resource estimation using least squares support vector regression with selection of input space dimension and hyperparameters. Natural Resources Research, vol. 20, no. 2. pp. 117–129. not referenced in this version
Chatterjee, S., Bandopadhyay, S., and Machuca, D. 2010. Ore grade prediction using a genetic algorithm and clustering based ensemble neural network model. Mathematical Geosciences, vol. 42, no. 3. pp. 309–326.
Chatterjee, S., Bandopadhyay, S., and Rai, P. 2008. Genetic algorithm-based neural network learning parameter selection for ore grade evaluation of limestone deposit. Mining Technology, vol. 117, no. 4. pp. 178–190.
Chatterjee, S., Bhattacherjee, A., Samanta, B., and Pal, S.K. 2010. Image-based quality monitoring system of limestone ore grades. Computers in Industry, vol. 61, no. 5. pp. 391–408.
Das Goswami, A., Mishra, M., and Patra, D. 2017. Investigation of general regression neural network architecture for grade estimation of an Indian iron ore deposit. Arabian Journal of Geosciences, vol. 10, no. 4. pp. Article no. 80.
Dutta, S., Bandopadhyay, S., Ganguli, R., and Misra, D. 2010. Machine learning algorithms and their application to ore reserve estimation of sparse and imprecise data. Journal of Intelligent Learning Systems and Applications, vol. 2, no. 02. pp. doi:104236/j/lsa.2010.22012.
Horrocks, T., Wedge, D., Holden, E.-J., Kovesi, P., Clarke, N., and Vann, J. 2015. Classification of gold-bearing particles using visual cues and cost-sensitive machine learning. Mathematical Geosciences, vol. 47, no. 5. pp. 521–545.
Hosseini, S., Asghari, O., and Emery, X. 2017. Direct block-support simulation of grades in multi-element deposits: application to recoverable mineral resource estimation at Sungun porphyry copper-molybdenum deposit. Journal of the Southern African Institute of Mining and Metallurgy, vol. 117, no. 6. pp. 577–585.
Jafrasteh, B. and Fathianpour, N. 2017. A hybrid simultaneous perturbation artificial bee colony and back-propagation algorithm for training a local linear radial basis neural network on ore grade estimation. Neurocomputing, vol. 235. pp. 217–227.
Jafrasteh, B., Fathianpour, N., and Suárez, A. 2018. Comparison of machine learning methods for copper ore grade estimation. Computational Geosciences, vol. 22, no. 5. pp. 1371–1388.
Jalloh, A.B., Kyuro, S., Jalloh, Y., and Barrie, A.K. 2016. Integrating artificial neural networks and geostatistics for optimum 3D geological block modeling
660 NOVEMBER 2022 VOLUME 122
The Journal of the Southern African Institute of Mining and Metallurgy
Review of machine learning-based Mineral Resource estimation
in mineral reserve estimation: A case study. International Journal of Mining Science and Technology, vol. 26, no. 4. pp. 581–585.
Kitchenham, B. and Charters, S. 2007. Guidelines for performing systematic literature reviews in software engineering. EBSE Technical Report. EBSE2007-01.
Li, X.-L., Li, L.-h., Zhang, B.-l., and Guo, Q.-j. 2013. Hybrid self-adaptive learning based particle swarm optimization and support vector regression model for grade estimation. Neurocomputing, vol. 118. pp. 179–190.
Li, X.-l., Xie, Y.-l., Guo, Q.-j., and Li, L.-h. 2010. Adaptive ore grade estimation method for the mineral deposit evaluation. Mathematical and Computer Modelling, vol. 52, no. 11–12. pp. 1947–1956.
Li, X., Ao, Y., Guo, S., and Zhum, L. 2019. Combining regression kriging with machine learning mapping for spatial variable estimation. IEEE Geoscience and Remote Sensing Letters, vol. 17, no. 1. pp. 27–31.
Malhotra, R . 2015. A systematic review of machine learning techniques for software fault prediction. Applied Soft Computing, vol. 27. pp. 504–518.
MATLAB. 2020. Support Vector Machine SVM. https://www.mathworks.com/ discovery/support-vector-machine.html, [accessed 10 January 2021].
Patel, A.K., Chatterjee, S., and Gorai, A.K. 2017. Development of machine visionbased ore classification model using support vector machine (SVM) algorithm. Arabian Journal of Geosciences, vol. 10, no. 5. p. 107.
Patel, A.K., Chatterjee, S., and Gorai, A.K. 2017. Development of online machine vision system using support vector regression (SVR) algorithm for grade prediction of iron ores. Fifteenth IAPR International Conference on Machine Vision Applications (MVA), IEEE, New York. doi:10.23919/MVA.2017.1986823
Perez, C.A., Estévez, P.A., Vera, P.A., Castillo, L.E., Aravena, C.M., Schulz, D.A., and Medina, L.E. 2011. Ore grade estimation by feature selection and voting using boundary detection in digital image analysis. International Journal of Mineral Processing, vol. 101, no. 1-4. pp. 28–36.
Rosenbaum, L., Dörr, A., Bauer, M.R., Boeckler, F.M., and Zell, A . 2013. Inferring multi-target QSAR models with taxonomy-based multi-task learning. Journal of Cheminformatics, vol. 5, no. 1. p. 33.
Rossi, M E. and Deutsch, C.V. 2013. Mineral Resource Estimation. Springer Science & Business Media.
Samanta, B. 2010. Radial basis function network for ore grade estimation. Natural Resources Research, vol. 19, no. 2. pp. 91–102.
Samanta, B. and Bandopadhyay, S. 2009. Construction of a radial basis function network using an evolutionary algorithm for grade estimation in a placer gold deposit. Computers & Geosciences, vol. 35, no. 8. pp. 1592–1602.
Samanta, B., Bandopadhyay, S., and Ganguli, R . 2002. Data segmentation and genetic algorithms for sparse data division in Nome placer gold grade estimation using neural network and geostatistics. Exploration and Mining Geology, vol. 11, no. 1–4. pp. 69–76.
Samanta, B., Bandopadhyay, S., and Ganguli, R. 2006. Comparative evaluation of neural network learning algorithms for ore grade estimation. Mathematical Geology, vol. 38, no. 2. pp. 175–197.
Samanta, B., Banopadhyay, S., Ganguli, R., and Dutta, S. 2005. A comparative study of the performance of single neural network vs. Adaboost algorithm based combination of multiple neural networks for mineral resource estimation. Journal of the Southern African Institute of Mining and Metallurgy, vol. 105, no. 4. pp. 237–246.
Samanta, B., Ganguli, R., and Bandopadhyay, S. 2005. Comparing the predictive performance of neural networks with ordinary kriging in a bauxite deposit. Mining Technology, vol. 114, no. 3. pp. 129–139.
Savu-Krohn, C., Rantitsch, G., Auer, P., Melcher, F., and Graupner, T. 2011. Geochemical fingerprinting of coltan ores by machine learning on uneven datasets. Natural Resources Research, vol. 20, no. 3. pp. 177–191.
Sheng, L., Zhang, T., Niu, G., Wang, K., Tang, H., Duan, Y., and Li, H. 2015. Classification of iron ores by laser-induced breakdown spectroscopy (LIBS) combined with random forest (RF). Journal of Analytical Atomic Spectrometry, vol. 30, no. 2. pp. 453–458.
Tahmasebi, P. and Hezarkhani, A . 2010. Application of adaptive neuro-fuzzy inference system for grade estimation; case study, Sarcheshmeh porphyry copper deposit, Kerman, Iran. Journal of Basic and Applied Sciences, vol. 40, no. 3. pp. 408–420.
Tahmasebi, P. and Hezarkhani, A . 2012. A hybrid neural networks-fuzzy logicgenetic algorithm for grade estimation. Computers & Geosciences, vol. 42. pp. 18–27.
Tessier, J., Duchesne, C., and Bartolacci, G. 2007. A machine vision approach to on-line estimation of run-of-mine ore composition on conveyor belts. Minerals Engineering, vol. 20, no. 12. pp. 1129–1144.
Vapnik, V.N. 1999. An overview of statistical learning theory. IEEE Transactions on Neural Networks, vol. 10, no. 5. pp. 988–999.
Wen, J., Li, S., Lin, Z., Hu, Y., and Huang, C. 2012. Systematic literature review of machine learning based software development effort estimation models. Information and Software Technology, vol. 54, no. 1. pp. 41–59.
Wu, X. and Zhou, Y. 1993. Reserve estimation using neural network techniques. Computers & Geosciences, vol. 19, no. 4. pp. 567–575.
Yu, L., Porwal, A., Holden, E.-J., and Dentith, M.C. 2012. Towards automatic lithological classification from remote sensing data using support vector machines. Computers & Geosciences, vol. 45. pp. 229–239.
Zhang, X., Song, S., Li, J., and Wu, C. 2013. Robust LS-SVM regression for ore grade estimation in a seafloor hydrothermal sulphide deposit. Acta Oceanologica Sinica, vol. 32, no. 8. pp. 16–25.
Zhang, Y., Song, S., You, K., Zhang, X., and Wu, C. 2017. Relevance vector machines using weighted expected squared distance for ore grade estimation with incomplete data. International Journal of Machine Learning and Cybernetics, vol. 8, no. 5. pp. 1655–1666.
Zhang, Z., Yang, J., Wang, Y., Dou, D., and Xia, W. 2014. Ash content prediction of coarse coal by image analysis and GA-SVM. Powder Technology, vol. 268. pp. 429–435. u
List of research publications used in the systematic literature review after quality control and assessment
Study ID Title Reference
S-01 Reserve estimation using neural network techniques. Wu and Zhou, 1993
S-02 Data segmentation and genetic algorithms for sparse data division in nome placer gold grade estimation using neural network and geostatistics.
S-03 A comparative study of the performance of single neural network vs. adaboost algorithm based combination of multiple neural networks for mineral resource estimation.
S-04 Comparing the predictive performance of neural networks with ordinary kriging in a bauxite deposit.
S-05 Comparative evaluation of neural network learning algorithms for ore grade estimation.
Samanta, Bandopadhyay, and Ganguli, 2002
Samanta, Bandopadhyay, Ganguli, and Dutta, 2005
Samanta, Ganguli, and Bandopadhyay, 2005
Samanta, Bandopadhyay, and Ganguli, 2006
S-06 A machine vision approach to on-line estimation of run-of-mine ore composition on conveyor belts. Tessier, Duchesne, and Bartolocci, 2007
S-07 Genetic algorithm-based neural network learning parameter selection for ore grade evaluation of a limestone deposit.
Southern African Institute of Mining and Metallurgy
Chatterjee, Bandopadhyay, and Rai, 2008
661 The Journal of
VOLUME 122 NOVEMBER 2022
the
APPENDIX A
Review of machine learning-based Mineral Resource estimation
List of research publications used in the systematic literature review after quality control and assessment
Study ID Title Reference
S-08 Ore grade prediction using a genetic algorithm and clustering based ensemble neural network model. Chatterjee, Bandopadhyay, and Machuca, 2010
S-09 construction of a radial basis function network using an evolutionary algorithm for grade estimation in a placer gold deposit.
S-10 Application of adaptive neuro-fuzzy inference system for grade estimation; case study, sarcheshmeh porphyry copper deposit, Kerman, Iran.
Samanta and Bandopadhyay, 2009
Tahmasebi and Hezarkhani, 2010
S-11 Image-based quality monitoring system of limestone ore grades. Chatterjee, Bhattacherjee, Samata, and Pal, 2010
S-12 Radial basis function network for ore grade estimation. Samanta, 2010
S-13 Machine learning algorithms and their application to ore reserve estimation of sparse and imprecise data. Dutta, Bandopadhyay, Ganguli, and Misra, 2010
S-14 Adaptive ore grade estimation method for the mineral deposit evaluation. Li, Xie, Guo, and Li, 2010
S-15 Ore grade estimation by feature selection and voting using boundary detection in digital image analysis. Perez, Estévez, Vera, Castillo, Aravena, Schultz, and Medina, 2011
S-16 geochemical fingerprinting of coltan ores by machine learning on uneven datasets. Savu-Krohn, Rantitsch, Auer, Melcher, and Graupner, 2011
S-17 Goodnews Bay platinum resource estimation using least squares support vector regression with selection of input space dimension and hyperparameters. Chatterjee and Bandopadhyay, 2011
S-18 A hybrid neural networks-fuzzy logic-genetic algorithm for grade estimation. Tahmasebi and Hezarkhani, 2012
S-19 Hybrid self-adaptive learning based particle swarm optimization and support vector regression model for grade estimation.
S-20 An SVM-based machine learning method for the separation of alteration zones in sungun porphyry copper deposit.
S-21 Robust LS-SVM regression for ore grade estimation in a seafloor hydrothermal sulphide deposit.
Li, Li, Zhang, and Guo, 2013
Abbaszadeh, Hezarkhani , and Soltani-Mohammadi, 2013
Zhang, Song, You, Zhang, and Wu, 2013
S-22 Ash content prediction of coarse coal by image analysis and GA-SVM. Zhang, Yang et al. 2014
S-23 Classification of iron ores by laser-induced breakdown spectroscopy (libs) combined with random forest (RF).
S-24 Classification of gold-bearing particles using visual cues and cost-sensitive machine learning.
S-25 Integrating artificial neural networks and geostatistics for optimum 3d geological block modeling in mineral reserve estimation: A case study.
S-26 A hybrid simultaneous perturbation artificial bee colony and back-propagation algorithm for training a local linear radial basis neural network on ore grade estimation.
S-27 Investigation of general regression neural network architecture for grade estimation of an indian iron ore deposit.
S-28 Development of online machine vision system using support vector regression (svr) algorithm for grade prediction of iron ores.
Sheng, Zhang, Niu, Wang, Tang, Duan, and Li, 2015
Horrocks, Wedge, Holden, Kovesi, Clarke, and Vann, 2015
Jalloh, Kyuro, Jalloh, and Barrie, 2016
Jafrasteh and Fathianpour, 2017
Das Goswami, Mishra, and Patra, 2017
Patel, Chatterjee, and Gorai, 2017
S-29 Relevance vector machines using weighted expected squared distance for ore grade estimation with incomplete data Zhang, Song, You, Zhang, and Wu, 2017
S-30 Comparison of machine learning methods for copper ore grade estimation. Jafrasteh, Fathianpour, and Suárez, 2018
S-31 Combining regression kriging with machine learning mapping for spatial variable estimation Li, Ao, Guo, and Zhu, 2019
APPENDIX B
Publication domains of the selected research studies used for SLR
Study ID Title of journal/cConference
S-01 Computers & Geosciences
S-02 Exploration and Mining Geology
S-03 Journal of The Southern African Institute of Mining and Metallurgy
Publisher
Elsevier
Canadian Institute of Mining, Metallurgy and Petroleum
Southern African Institute of Mining and Metallurgy
S-04 Transactions of the Institutions of Mining and Metallurgy: Section A: Mining Technology Taylor & Francis
S-05 Mathematical Geology Springer
S-06 Minerals Engineering Elsevier
S-07 Transactions of the Institutions of Mining and Metallurgy: Section A: Mining Technology Taylor & Francis
S-08 Mathematical Geosciences Springer
662 NOVEMBER 2022 VOLUME 122
The Journal of the Southern African Institute of Mining and Metallurgy
APPENDIX A (continued)
Review of machine learning-based Mineral Resource estimation
APPENDIX B (continued)
Publication domains of the selected research studies used for SLR Study ID Title of journal/cConference
Publisher
S-09 Computers & Geosciences Elsevier
S-10 Australian Journal of Basic and Applied Sciences Australian Journal of Basic and Applied Sciences
S-11 Computers in Industry Elsevier
S-12 Natural Resources Research Springer
S-13 Journal of Intelligent Learning Systems and Applications Scientific Research Publishing Inc
S-14 Mathematical and Computer Modelling Elsevier
S-15 International Journal of Mineral Processing Elsevier
S-16 Natural Resources Research Springer
S-17 Natural Resources Research Springer
S-18 Computers & Geosciences Elsevier
S-19 Neurocomputing Elsevier
S-20 Geochemistry Elsevier
S-21 Acta Oceanologica Sinica Springer
S-22 Powder Technology Elsevier
S-23 Journal of Analytical Atomic Spectrometry Royal Society of Chemistry
S-24 Mathematical Geosciences Springer
S-25 International Journal of Mining Science and Technology Elsevier
S-26 Neurocomputing Elsevier
S-27 Arabian Journal of Geosciences Springer
S-28 Fifteenth IAPR International Conference on Machine Vision Applications (MVA) IEEE Xplore
S-29 International Journal of Machine Learning and Cybernetics Springer
S-30 Computational Geosciences Springer
S-31 IEEE Geoscience and Remote Sensing Letters IEEE Xplore
APPENDIX C
The type of ML models applied in the research studies for MRE Study ID ML model applied for MRE
S-01 Support vector machine (SVM)
S-02 Coactive neuro-fuzzy inference system based on artificial neural networks adaptive neuro-fuzzy inference system (ANFIS)
S-03 Adaptive neuro-fuzzy inference system (ANFIS) artificial neural networks (ANN) kriging
S-04 Support vector regression (SVR)
S-05 Support vector machine (SVM) Neural network kriging
S-06
Local linear radial basis function (LLRBF) neural network LLRBF network with skewed Gaussian activation function Simultaneous perturbation artificial bee colony (SPABC) algorithm Back propagation (BP) Standard artificial bee colony Covariance matrix adaptation evolution strategy (CMAES) Particle swarm optimization (PSO) Support vector machine (SVM)
663 The Journal of the
VOLUME 122 NOVEMBER 2022
Southern African Institute of Mining and Metallurgy
Review of machine learning-based Mineral Resource estimation
The type of ML models applied in the research studies for MRE
Study ID ML model applied for MRE
S-07 Support vector machine (SVM Random forest (RF)
S-08
Multi-layer perceptron neural network
S-09 Support vector machine (SVM)
S-10 Support vector machine (SVM) A naive Bayes classifier A majority decision table
S-11
S-12
S-13
S-14
S-15
S-16
S-17
S-18
S-19
Least square support vector machine regression Inverse distance weight Ordinary kriging Back propagation neural network
Support vector machine (SVM)
Multi-layer feed forward neural network Simple kriging Ordinary kriging Kriging with linear drift function Kriging with a quadratic drift function Lognormal kriging
Support vector machines (SVM) Linear programming boosting
General regression neural network Multilayer perceptron neural network Ordinary kriging
Radial basis function (RBF)
Radial basis function network Ordinary kriging
Support vector machine (SVM) Regression
Single neural network Multiple neural network
S-20 Support vector machine (SVM)
S-21 Layered feedforward artificial neural network
S-22 Support vector regression (SVR)
S-23
S-24
S-25
S-26
S-27
Artificial neural networks (ANN) Geostatistics
Artificial neural networks (ANN) Ordinary kriging
Relevance vector machine Expected squared distance Weighted expected squared distance Inverse distance weighted
Neural networks Support vector regression (SVR) Ordinary kriging)
Neural networks
S-28 Wavelet neural network
S-29
Multilayer feedforward neural network
S-30 Neural networks Random forests (RF ) Gaussian processes
S-31
Ordinary kriging Regression kriging Machine learning mapping Hybrid method
664 NOVEMBER 2022 VOLUME 122
The Journal of the Southern African Institute of Mining and Metallurgy
APPENDIX
C (continued)
A new method for determining muckpile fragmentation formed by blasting
by A. Tosun1
Affiliation: 1Dokuz Eylul University, Department of Mining Engineering and Bergama Vocational School Buca-Begama-Izmir/Turkey.
Correspondence to: A. Tosun
Email: abdurrahman.tosun@deu.edu.tr
Dates:
Received: 1 Feb. 2020 Revised: 21 Apr. 2022 Accepted: 15 Aug. 2022 Published: November 2022
How to cite: Tosun, A. 2022
A new method for determining muckpile fragmentation formed by blasting.
Journal of the Southern African Institute of Mining and Metallurgy, vol. 122, no. 11, pp. 665–672
DOI ID: http://dx.doi.org/10.17159/24119717/1104/2022
Synopsis
Muckpile fragmentation formed by blasting depends on the specific charge factor, the discontinuities in the rock mass, and the rock strength. Determination of the discontinuity characteristics and rock strength is a long and difficult process. These two parameters are directly associated with the rock drilling speed. Therefore, it is the drilling speed of the machine used for the blast-hole, rather than the blasthole discontinuity characteristics and rock strength parameters, that is used in the prediction of muckpile fragmentation before blasting. Primarily, it has been suggested that the muckpile fragmentation values can be correctly determined by establishing correlations between the efficiency of the loader and muck pile fragmentation, since fragmentation is directly correlated with the former parameter. Subsequently, a correlation predicting the drilling speed of the drill machine was developed according to the discontinuity characteristics of the blasting surface and the rock strength. Finally, a correlation was developed predicting muckpile fragmentation according to the specific charge factor and the drilling speed of the drill machine The data was obtained by conducting blasting tests in two different limestone quarries.
Keywords
muckpile fragmentation, rock-drilling yield, specific charge factor.
Introduction
Muckpile fragmentation by blasting in open quarries determines the efficiency of the loading, transportation, and crushing processes that constitute the subsequent phases. Therefore, it is important to properly predict muckpile fragmentation before blasting. Many researchers have conducted studies related to the subject (Langefors and Kilhström, 1963; Bergmann, Riggie, and Wu, 1973; Rustan, 1981; Grady and Kipp, 1987; Persson,Holmberg, and Lee, 1994; Cunningham, 1983, 1987; Chung and Katsabanis, 2000). In all of these studies, the parameters determining the specific charge factor, rock strength, and blasting surface discontinuity characteristics were used.
While calculating the specific charge factor values in the blasting operations is easy, it is difficult to determine the rock strength and the blasting surface discontinuity characteristics in site conditions. The values of rock strength are determined by applying certain tests in a rock mechanics laboratory to samples from the site. However, the measurement of the discontinuity values using a measuring tape and compass can be a long and tiresome process.
The discontinuity characteristics of the blasting surfaces are found according to the method developed by Lilly, (1986). In this method, the vertical discontinuity interval and the discontinuity plane angle are defined as the discontinuity characteristics. The vertical discontinuity range is defined by the length of the blasting surface per fissure, while the discontinuity plane angle is the difference between the dip direction of the blasting surface and that of the crack surfaces. This difference determines whether the planar angle remains inside the surface or not.
There is a direct correlation between the rock drilling speed and the rock mass characteristics (the rock strength and discontinuity characteristics) (Hoseinie, Aghababaei, and Pourrahimian, 2008; Teale, 1965; Selim and Bruce, 1970; Wilbur et al., 1982; Howarth, Adamson, and Berndt, 1986; Jimeno Jimeno, and Carcedo, 1995; Kahraman, 1999).
Therefore, before blasting, the value of the blast-hole drilling speed can be used instead of the rock strength and the discontinuity characteristics of the blast-hole surface in the correlations predicting muckpile fragmentation. Thus, the effect of the rock strength and blasting surface discontinuity characteristics on fragmentation can be determined both faster and easier.
In this study, blasting tests were conducted in two limestone quarries. In all the tests, the rock strength, blasting surface discontinuity characteristics, speed of drilling, specific charge factor values, muckpile fragmentation, and efficiency of the loader were measured. Primarily, it was assumed that the muckpile fragmentation values could be determined correctly by establishing correlations between the
665 The Journal of the Southern African Institute of Mining and Metallurgy VOLUME 122 NOVEMBER 2022
A new method for determining muckpile fragmentation formed by blasting
efficiency of the loader and muckpile fragmentation. This relates to the fact that even if the loader is burdened by the increase of muckpile during loading, the loader operates more easily, and this is emphasized also by many researchers (Singh and Yalcın, 2002; Osanloo and Hekmat, 2005; Sarı and Lever, 2007; Segarra et al., 2010). In addition, a correlation between the drilling speed, strength and blasting surface discontinuity characteristics was established. In the final phase, a correlation between the muckpile fragmentation due to blasting, the specific charge factor, and the drilling speed was determined.
Field and laboratory studies
Blast tests were conducted in two limestone quarries in Izmir, Turkey. Eighteen blasting tests in total were conducted: eight in the first quarry and 10 in the second. The locations of the sites are shown in Figure 1.

The discontinuity characteristics, speed of drilling the blastholes, specific charge factor, size distribution of the muckpile, and oil pressure in the hydraulic pistons of the loader (which indicate the efficiency of the loader) were precisely measured. The density and uniaxial compressive strength of the rock of both limestone quarries were determined in the laboratory.
Discontinuity range of the blasting characteristics
The vertical discontinuity range of the blasting surfaces, and dip direction and angles of the joints, layering, and the blasting surfaces were Measured. A tape was used to measure the vertical discontinuity ranges, while a compass was used to determine the dips and dip directions. It was observed that the layering has more influence on the blasting surfaces than the joints. Therefore, the difference between the dip direction of the blasting surface and that of the stratification surfaces was calculated. The results are given in Table I.
Drilling speed
Blasting operations in both quarries were conducted by drilling blast-holes 89 mm in diameter. The total length of holes drilled for each blast test and the working hours of the driller were recorded. These values were averaged in a very precise manner by conducting observations until the end of the process in each test. The drilling speed was also obtained by dividing the total length of the holes by the working hours (Table II).
Specific charge factor
The weight of the fragmented material from each blast was measured using a weighbridge and the total material volume calculated using this value and the unit volumetric weight. The specific charge factor values were determined by dividing the total amount of explosive used by the total material volume (Table III). ANFO was used as the explosive in the blasting operations and nitroglycerin-based dynamite was used to trigger the ANFO.
Determination of muckpile fragmentation
The pile from each blast was divided into sections and photographs of the sections, separated in a manner representing the entire pile, were taken. The size distributions were determined by the image analysis using WipFrag programme. Finally, the size distribution values representing the entire pile were determined on average for all blasting tests by combining the size distribution values from each photograph. The size distribution values were determined for each blasting test using the new model developed
in order to ensure that very fine fragments were used in the calculation (Tosun, 2018). The results are presented in Table IV. The size values related to the eighth blast test conducted in the second quarry could not be determined due to a data storage problem.
Figure 1—The study areas
Table I
Discontinuity properties at the study sites
Test no. vs c l b b
Quarry no. 1
1 62.31 137/72-219/76 323/44 150/85 -173
2 45.67 115/68-221/77 323/13 158/80 -165
3 34.21 215/85-165/63 280/23 144/82 -136
4 42.97 50/75-158/76 340/29 160/80 -180
5 26.65 151/73-77/79 276/26 117/85 -159
6 22.34 198/82-58/83 302/28 130/85 -172
7 40.16 213/78-107/70 309/40 130/84 -179
8 25.62 179/84-85/79 293/23 120/85 -173
Quarry no. 2
1 35.00 129/60 254/30 65/82 -189
2 39.72 126/65 260/30 66/83 -194
3 51.90 145/65 247/30 40/82 -207
4 48.43 158/73 247/30 45/83 -202
5 47.89 124/54 238/30 45/82 -193
6 38.60 129/55 240/30 51/81 -189
7 49.53 129/55 231/30 48/81 -183
8 37.62 152/68 190/44 330/82 140
9 44.78 335/88-129/63 218/31 35/82 -183
10 47.06 144/56 215/31 35/83 -180
vs: Discontinuities range (cm/crack)
c: Inclination direction / inclination angles of the joints
l: Inclination direction / inclination angles of the layering
b: Inclination direction / inclination angles of the blast surfaces
sa: Difference of inclination direction angles of blast surfaces and layering
666 NOVEMBER 2022 VOLUME 122
The Journal of the Southern African Institute of Mining and Metallurgy
A new method for determining muckpile fragmentation
Table II
Drilling speeds
Test no. h t m dv
Quarry no. 1
1 30 342.0 10.318 0.552
2 20 212.0 6.879 0.514
3 20 192.0 6.316 0.507
4 12 122.4 3.790 0.538
5 18 167.4 5.684 0.491
6 18 248.4 7.710 0.537
7 20 338.0 10.631 0.530
8 12 127.2 3.940 0.538
Quarry no. 2
1 6 78.0 1.533 0.848
2 7 86.1 1.651 0.869
3 20 284.0 5.384 0.879
4 18 255.6 4.952 0.860
5 4 56.4 1.100 0.855 6 7 96.6 1.857 0.867 7 18 252.0 4.881 0.860 8 6 85.2 1.651 0.860 9 7 98.0 1.926 0.848 10 7 98.7 1.926 0.854 h: Number of blast-hole t: Total blast hole length drilled (m) m: Operating time of the drilling machine (h) dv: The drilling speed of the drilling machine (m/min)
Hydraulic pressure in the loader
With increasing muckpile fragmentation, the forces on the loader will increase. The pressure in the hydraulic cylinders of the loader will vary according to the size distribution of the material during loading, and these variations indicate the efficiency of the loader. The pressure values were recorded using the image processing technique of (Tosun et al., 2012). This data could not be measured in the first test in the first quarry due to some field problems. The hydraulic pressure values were recorded until the entire pile had been loaded. The results are shown in Table V.
Laboratory studies
Uniaxial compressive strength tests were carried out on the core samples from the sites where the blasting tests were conducted. Unit volumetric weights of the core drilling samples were determined with a precision balance and digital calipers and their densities measured with a helium pycnometer. The results from the laboratory studies are given in Table VI. The table also shows the number of tests performed and the standard deviation values.
Assessment
A relationship, was established between the three pressure variations that occur in the hydraulic pistons of the loader during loading and the average size distribution of the pile (Table VII, Figures 2 and 3). Because the loading work is performed by
Southern African Institute of Mining and Metallurgy
formed by blasting
Table III
Specific charge factors
Test no.
Specific charge factor (kg/m3)
Quarry no. 1 1 0.502 2 0.422 3 0.454 4 0.401 5 0.469 6 0.598 7 0.603 8 0.475 Quarry no. 2 1 0.372 2 0.287 3 0.318 4 0.406 5 0.466 6 0.387 7 0.344 8 0.362 9 0.329 10 0.379
Table IV
Muckpile fragmentation values calculated using Wipfrag software (X50) (Tosun, 2018)
Test no. Fragmentation (X50, cm)
Quarry no. 1 1 16.73 2 18.23 3 18.19 4 18.80 5 16.34 6 15.15 7 15.73 8 16.40 Quarry no. 2 1 18.60 2 19.70 3 19.20 4 17.35 5 16.70 6 17.10 7 19.10 8 9 18.90 10 17.80
667 The Journal of
VOLUME 122 NOVEMBER 2022
the
A new method for determining muckpile fragmentation formed by blasting
Table V
Data determining loader efficiency
Test no. Loader hydraulic pressure (kg/cm2) nd ma fp bp ac bc Total Quarry no. 1
1 5512.33
2 192.46 185.83 12.09 14.67 405.04 138712 4156.98
3 181.20 183.83 5.56 23.42 394.02 13812 3721.76
4 189.24 193.02 9.74 8.09 400.10 12060 2447.66
5 172.72 177.19 7.80 10.83 368.54 91048 3167.98
6 161.10 160.85 4.83 9.42 336.21 146380 3814.88
7 165.56 169.85 7.31 10.69 353.41 85828 5987.43
8 169.82 176.69 5.53 8.10 360.14 59060 2272.54
Quarry no. 2
1 149.39 152.43 7.21 6.44 315.47 162804 2343.94
2 152.27 156.58 10.00 14.90 333.70 240232 2350.10
3 149.11 161.90 8.13 6.72 325.90 241640 7816.74
4 128.13 140.73 6.69 6.53 282.09 447308 4965.16
5 116.60 119.19 5.08 4.26 245.12 188868 995.80
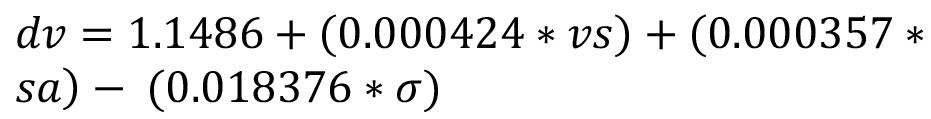
6 137.76 139.52 7.86 5.35 290.49 149328 2084.94
7 147.60 151.61 7.53 15.23 321.97 85172 5861.80
8 146.34 150.66 8.62 6.58 312.20 146652 1673.46
9 147.99 160.10 7.39 8.65 324.10 197844 2653.40
10 140.05 148.13 6.79 5.91 300.88 234232 2305.12 fp: Front pump, bp: Back pump, ac: Arm closure, bc: Bucket closure, nd: Total number of data, ma: Amount of loaded material (t)
Table VI
Physical and mechanical properties of the samples
Quarry no. 1 Quarry no.2 Density (gr/cm³)
Average 2.74 ± 0.002 2.70 ± 0.0025 No. of tests 18 21
Unit weight (gr/cm³)
Average 2.65± 0.07 2.64± 0.004 No. of tests 17 24
Uniaxial compressive strength (MPa)
Average 38.004± 1.75 20.3325± 2.07 No. of tests 15 20
different loaders, the relationships were established separately for each site.
Figures 2 and 3, show strong relationships between total pressure values in the hydraulic pistons of the loader and the average size distribution of the pile. This indicates shows that the values of muckpile fragmentation that occurs because of blasting are determined correctly.
Table VII
Values measured for determining loader hydraulic pressure and average muckpile fragmentation (X50)
Test no.
Total of loader hydraulic pressures (kg/cm²)
Muckpile fragmentation values calculated according to Wipfrag software(X50, cm)
Quarry no. 1 1 16.73 2 405.04 18.23 3 394.02 18.19 4 400.10 18.80 5 368.54 16.34 6 336.21 15.15 7 353.41 15.73 8 360.14 16.40
Quarry no. 2 1 315.47 18.60 2 333.70 19.70 3 325.90 19.20 4 282.09 17.35 5 245.12 16.70 6 290.49 17.10 7 321.97 19.10 8 312.20 9 324.10 18.90 10 300.88 17.80
In the second part of the assessment, a correlation predicting the drilling speed values was developed by conducting a multiple regression analysis between the discontinuity values of the blasting surfaces and the uniaxial compressive strength values of the rock (Table VIII, Equation [1]). The discontinuity characteristics of the blasting surfaces, the vertical discontinuity range, the blasting surface, and the difference in slope direction angle between the layers were used. It was determined that the layers are denser on all blasting surfaces compared to the joints. [1]
dv = Drilling speed of the drilling machine (m/minute) vs = Vertical discontinuities range (cm/crack) sa = Difference between inclination direction angles of blast surfaces and layers σ = Average uniaxial compressive strength of the rock (MPa).
Drilling speeds were measured and calculated according to Equation [I]; the percentage errors are given in Table IX. The proximity of the said data-sets to each other is shown in Figure 4. The slope of the linear vector in this case is 45°.
As understood from Table IX and Figure 4, very small errors were determined between the drilling speed values measured and those that were calculated according to Equation [1]. This shows that the drilling speed parameter is directly associated with the discontinuity characteristics of the blasting surfaces and the uniaxial compressive strength values of the rock.
668 NOVEMBER 2022 VOLUME 122
The Journal of the Southern African Institute of Mining and Metallurgy
A new method for determining muckpile fragmentation formed by blasting
410 400 390 380 370 360 350 340 330
y = 18.085x + 66.895 R2 = 0.9524
15 16 17 18 19 20
Muck pile fragmentation (X50, cm)
Figure 2—Relationship between total loader hydraulic pressure values and average muckpile fragmentation values (X50) for quarry no. 1
Total of loader hydraulic pressure values (kg/cm 2 ) 250 240
340 330 320 310 300 290 280 270 260
Muck pile fragmentation (X50, cm)
y = 24.881x - 150.21 R2 = 0.8769
Total of loader hydraulic pressure values (kg/cm 2 ) 16 16.5 17 17.5 18 18.5 19 19.5 20
Figure 3—Relationship between total of loader hydraulic pressure values and average muckpile fragmentation values (X50) for quarry no. 2
In the last phase of the assessment, a correlation predicting the average size distribution value of the pile was determined using the drilling speed and the specific charge factor (Table X and Equation [2]).
[2]
literature, the determination of the discontinuity characteristics of the blasting surfaces is both difficult and time-consuming. Therefore, the correlations predicting the size distribution may give wrong results. This study tried to eliminate the misprediction of muckpile fragmentation.
X 50 : Muckpile fragmentation (cm)
dv : The drilling speed of the drilling machine (m/minute)
q : Specific charge factor (kg/m3)
The measured and calculated values of the average size distribution of the pile according to Equation [2] and the percentage errors between them are given in Table XI. The proximity of the data-sets to each other is shown in Figure 5. The slope of the linear vector in this case is 45°.
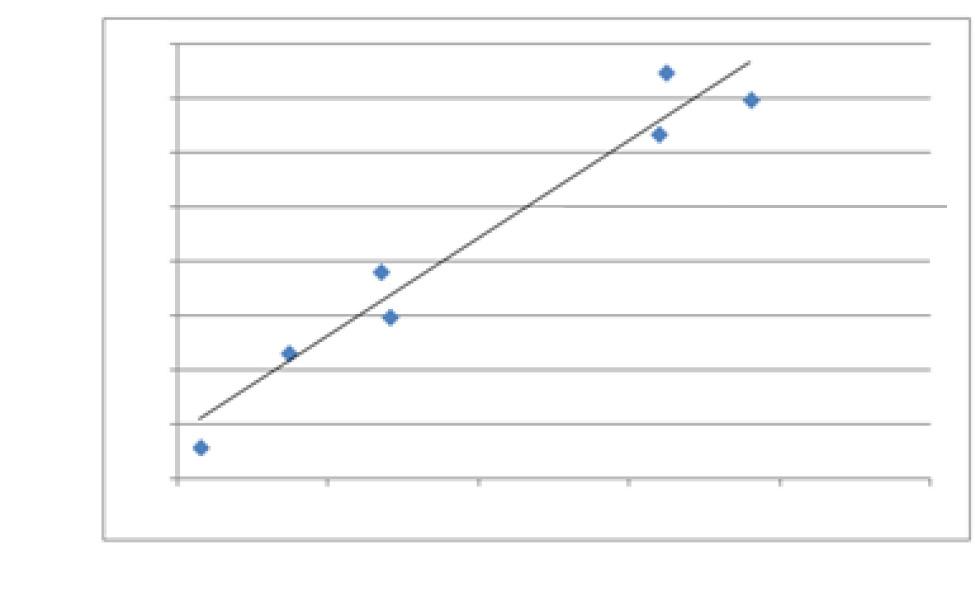
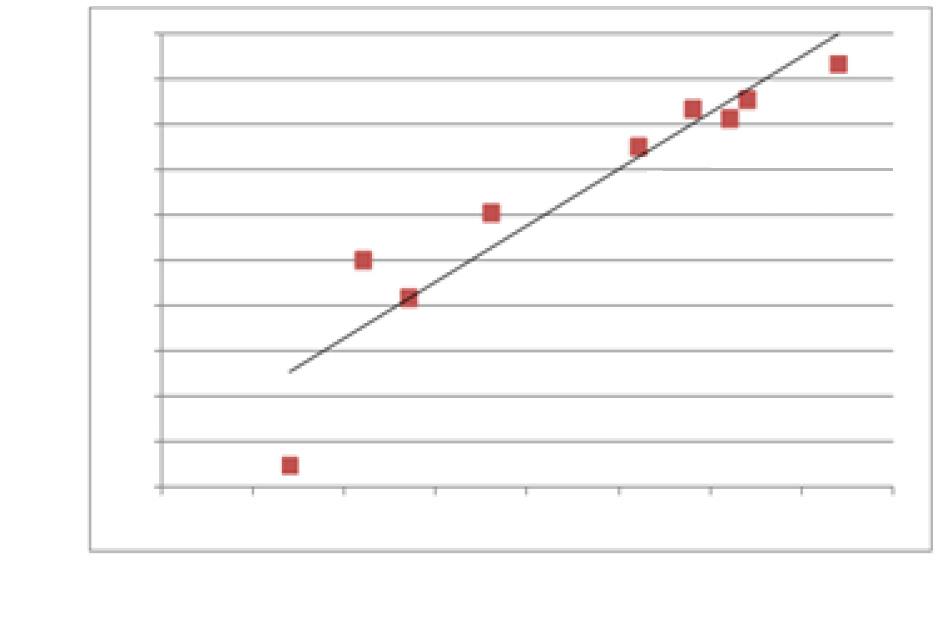
As understood from Table XI and Figure 5, very small errors were determined between the measured values of the average size distribution of the pile and those calculated according to Equation [2]. This condition shows that the average size distribution values of the pile are directly associated with the drilling speed and the specific charge factor.
In this study, the drilling speed values were used to determine the average size distribution after blasting rather than the discontinuity characteristics of the blasting surfaces and the uniaxial compressive strength of the rock. As is known from the
Southern African Institute of Mining and Metallurgy
The drilling speed values were measured as the values close to each other in the tests performed. It is important to carry out the study with rock and field characteristics that are different from each other.
Conclusion
In this study, 18 blasting tests in total were conducted: 8 tests in the first limestone quarry and 10 in the second limestone quarry. The rock strength, blasting surface discontinuity characteristics, speed values of the blast-hole driller, specific charge factor values, muckpile fragmentation, and efficiency of the loader were measured.
Primarily, for ascertaining whether the muckpile fragmentation values are determined correctly, correlations were established between the efficiency of the loader and muckpile fragmentation separately for both work sites since the material loading was conducted in both quarries by loaders of different characteristics. The correlation was determined to be 95.24 for the first and 87.69 for the second limestone quarry.
669 The Journal of the
VOLUME 122 NOVEMBER 2022
A new method for determining muckpile fragmentation formed by blasting
Table VIII
Discontinuity properties, average uniaxial compressive strength of the rock, and the drilling speed of the study sites
Test no. vs sa σ dv
Quarry no. 1
Table IX
Drilling speed values measured and calculated according to the proposed equation
Test no.
1 62.31 173 38.00
0.552
2 45.67 165 0.514
3 34.21 136 0.507 4 42.97 180 0.538 5 26.65 159 0.491 6 22.34 172 0.537
7 40.16 179 0.530 8 25.62 173 0.538
Quarry no. 2
Drilling speed measured (m/min.)
Drilling speed calculated according to the proposed equation (m/min.) Error (%)
Quarry no. 1
1 0.552 0.538 2.523
2 0.514 0.529 2.909 3 0.507 0.513 1.326
4 0.538 0.533 1.016
5 0.491 0.518 5.607 6 0.537 0.521 2.938
0.848 2 39.72 194 0.869 3 51.90 207 0.879 4 48.43 202 0.860 5 47.89 193 0.855 6 38.60 189 0.867 7 49.53 183 0.860 8 37.62 140 0.860 9 44.78 183 0.848 10 47.06 180 0.854 vs: The discontinuities range (cm/crack) σ: Average uniaxial compressive strength of the rock (MPa) sa: Difference between inclination direction angles of blast surfaces and layers dv: Drilling speed (m/min)
1 35.00 189 20.33
7 0.530 0.531 0.254 8 0.538 0.523 2.813
Quarry no. 2
1 0.848 0.857 1.099 2 0.869 0.861 0.927 3 0.879 0.871 0.936
4 0.860 0.868 0.861 5 0.855 0.864 1.132 6 0.867 0.859 0.938
7 0.860 0.861 0.101 8 0.860 0.841 2.225 9 0.848 0.859 1.331 10 0.854 0.859 0.600
The drilling measured (m/minute) 0.450
0.900 0.850 0.800 0.750 0.700 0.650 0.600 0.550 0.500
The first limestone quarry
The second limestone quarry
y = 1x R2 = 0.9946
0.450 0.550 0.650 0.750 0.850
The drilling speed calculated according to proposed equation (m/minute)
Figure 4—Relationship between the drilling speeds measured and calculated according to the proposed equation
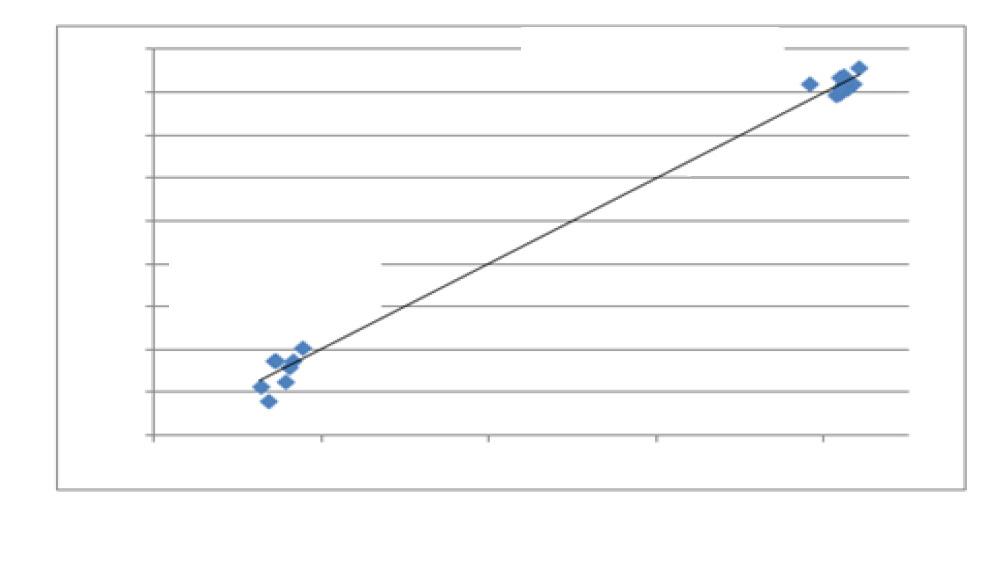
A correlation predicting the drilling speed of the driller according to the rock strength and the blasting surface discontinuity characteristics was then established. It was shown that the correlation obtained gave correct results with a value of 99.46%.
In the final phase, a correlation determining muckpile fragmentation due to blasting according to the specific charge
factor and the drilling speed was established. It was shown that this correlation has given realistic results on a scale of 86.42%.
References
Bergmann, O.R., Riggle, J.W., and Wu, F.C. 1973. Model rock blasting – Effect of explosives properties and other variables on blasting results. International Journal of Rock Mechanics and Mining Sciences, vol. 10. pp. 585–612.
670 NOVEMBER 2022 VOLUME 122
The Journal of the Southern African Institute of Mining and Metallurgy
A new method for determining muckpile fragmentation formed by blasting
Table X
The field data measured
Test no. dv q Muckpile fragmentation (X50, cm)
Quarry no. 1
1 0.552 0.502 16.73 2 0.514 0.422 18.23 3 0.507 0.454 18.19 4 0.538 0.401 18.80 5 0.491 0.469 16.34 6 0.537 0.598 15.15 7 0.530 0.603 15.73 8 0.538 0.475 16.40
Quarry no. 2
1 0.848 0.372 18.60 2 0.869 0.287 19.70 3 0.879 0.318 19.20 4 0.860 0.406 17.35 5 0.855 0.466 16.70 6 0.867 0.387 17.10 7 0.860 0.344 19.10 8 0.860 0.362 9 0.848 0.329 18.90 10 0.854 0.379 17.80
Table XI
Muckpile fragmentation values measured and calculated according to the proposed equation
Test no. Measured (X50, cm.) (X50, cm.) Error (%)
Quarry no. 1 1 16.73 16.692 0.230 2 18.23 18.102 0.704 3 18.19 17.587 3.314 4 18.8 18.395 2.153 5 16.34 17.373 6.325 6 15.15 15.136 0.094 7 15.73 15.069 4.205 8 16.4 17.170 4.697
Quarry no. 2 1 18.6 18.194 2.182 2 19.7 19.555 0.736 3 19.2 19.020 0.939 4 17.35 17.604 1.464 5 16.7 16.623 0.461 6 17.1 17.904 4.701 7 19.1 18.630 2.459 8 9 18.9 18.906 0.032 10 17.8 18.065 1.487
Muck pile fragmentation values measured (X50, cm) y = 1x R2 = 0.8642
Muck pile fragmentation values calculated according to the proposed equation (X50, cm)
Figure 5—Relationship between muckpile fragmentation values measured and calculated according to the proposed equation
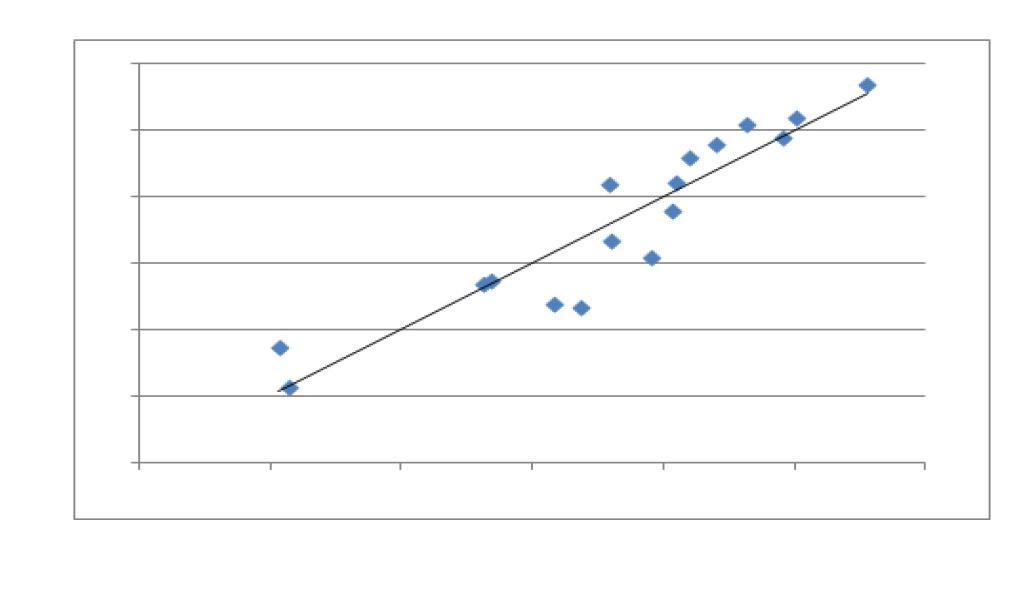
Chung, S.H. and Katsabanis, P.D. 2000. Fragmentation prediction using improved engineering formulas. International Journal of Fragmentation by Blasting, vol. 4. pp. 198–207.
Cunningham, C.V.B. 1983. The Kuz-Ram model for prediction of fragmentation from blasting. Proceedings of the First International on Rock Fragmentation by Blasting. pp. 439–453.
Cunningham, C.V.B. 1987. Fragmentation estimations and the Kuz-Ram model –four years on. Proceedings of the Second International on Rock Fragmentation by Blasting. Society for Experimental Mechanics, Bethel, CT. pp. 475–487.
The Journal of the Southern African Institute of Mining and Metallurgy
Grady, D.E. and Kipp, M.E. 1987. Dynamic rock fragmentation. Fracture Mechanics of Rock. Academic Press, London, Atkinson, B.K. (ed). pp. 429–475.
Hoseinie, S.H., Aghababaei, H., and Pourrahimian, Y. 2008. Development of a new classification system for assessing of rock mass drillability index (RDi). International Journal of Rock Mechanics and Mining Sciences, vol. 45. 110 p.
Howarth, D.F., Adamson, W.R., and Berndt, J.R . 1986. Correlation of modeltunnel boring and drilling machine performances with rock properties. International Journal of Rock Mechanics and Mining Sciences, vol. 23. pp. 171–175.
Jimeno, C.L., Jimeno, E.L, and Carcedo, F.J.A . 1995. Drilling and Blasting of Rocks. Balkema, Rotterdam.
671
VOLUME 122 NOVEMBER 2022
14.000 15.000 16.000 17.000
20 19 18 17 16 14 15
18.000 19.000 20.00
A new method for determining muckpile fragmentation formed by blasting
Kahraman, S. 1999. Rotary and percussive drilling prediction using regression analysis. Journal of Rock Mechanics and Mining Sciences, vol. 36. pp. 981–989.
Langefors, U. and Kihlström, B. 1963. The modern Technique of Rock Blasting. Almqvist and Wicksell, Uppsala, Sweden.
Osanloo, M. and Hekmat, A. 2005. Prediction of shovel productivity in the Gol-EGohar mine. Journal of Mining Science, vol. 41, no 2. pp. 177–184.
Persson, P.A., Holmberg, R., and Lee J. 1994. Rock Blasting and Explosives Engineering. CRC Press, Boca Raton, FL.
Rustan, A. 1981. Fragmentation influencing factors in rock blasting. Technical rapport, Lulea University of Technology, Lulea, Sweden. 38T.
Sarı, M. and Lever, P.J.A . 2007. Effect of blasted rock particle size on excavation machine loading performance. Proceedings of the 20th Intenational Mining Congress and Exhibition of Turkey
Segarra, P., Sanchidrián, J.A., López, L.M., and Querol, E. 2010. On the prediction of mucking rates in metal ore blasting. Journal of Mining Science, vol. 46, no. 2. pp. 167–176
Selim, A.A. and Bruce, W.E. 1970. Prediction of penetration rate for percussive drilling. Report of Investigations. 7396. US Bureau of Mines
Singh, S.P. and Yalcin, T. 2002. Effects of muck size distribution on scooping operations. Proceedings of the 28th Annual Conference on Explosives and Blasting Techniques. International Society of Explosives Engineers. pp 315–325.
Teale, R. 1965. The concept of specific energy in rock drilling. International Journal of Rock Mechanics and Mining Sciences, vol. 2. pp. 57–71.
Tosun, A., Konak, G., Karakuş, D., and Onur, A.H. 2012. Determination of loader efficiency with hydraulic pressure values. Proceedings of the International Multidisciplinary Scientific GeoConference SGEM, Bulgaria. pp. 531–538.
Tosun, A . 2018. A modified Wipfrag programme for determining muckpile fragmentation. Journal of the Southern African Institute of Mining and Metallurgy, vol. 118. pp. 1113-1119.
Wilbur, L., Kuesel, T.R, King, E.H., and Bickel, J.O. 1982. Tunnel Engineering Handbook. Springs, New York. u
The Journal of the Southern African Institute of Mining and Metallurgy

672 NOVEMBER 2022 VOLUME 122
Applicability of the risk ranking methodology designed for water reservoirs to tailings storage facilities
by D. Nišić1, D. Knežević1, A. Cvjetić1, N. Nišić1, and V. Jovanović2
Affiliation:
1University of Belgrade, Faculty of Mining and Geology, Belgrade, Serbia.
2Institute for Technology of Nuclear and Other Mineral Raw Materials, Serbia.
Correspondence to: D. Nišic ’
Email: dragana.nisic@rgf.bg.ac.rs
Dates: Received: 19 Jan. 2021 Revised: 16 Dec. 2021 Accepted: 26 Aug. 2022 Published: November 2022
How to cite: Nišic’, D., Kneževic’, D., Cvjetic’, A., Nišic’, N., and Jovanovic ’ V. 2022
Applicability of the risk ranking methodology designed for water reservoirs to tailings storage facilities.
Journal of the Southern African Institute of Mining and Metallurgy, vol. 122, no. 11, pp. 673–680
DOI ID: http://dx.doi.org/10.17159/24119717/1492/2022
ORCID: D. Nišić
ORCID: https://orcid.org/00000002-6470-9567
Synopsis
The risks associated with operating water reservoirs and tailings storage facilities (TSFs) are different because of their different purposes, methods of construction and operation, and characteristics of the materials impounded and their flow behaviour. Regardless of the differences, these two types of structures are often put in the same category when it comes to risk assessment and the application of relevant methodologies, which may result in unrealistic outcomes. In this paper we investigate whether it is possible to apply the risk ranking methodology designed for water reservoirs to TDFs and overview the key differences between these two types of structures. We also provide a comparative analysis of the results obtained by conducting a risk assessment of the operation of a TSF, applying the method recommended by the International Commission on Large Dams (ICOLD), and analyse the results using the failure mode and effects analysis (FMEA) technique. It is concluded that a more realistic evaluation of risk levels can be obtained by adopting a systematic approach to risk assessment in accordance with the traditional risk definition on which the FMEA technique is based.
Keywords
risk assessment, water reservoir, tailings storage facility, TSF, ICOLD, FMEA.
Introduction
The International Commission on Large Dams (ICOLD) is an international professional organization founded in 1928 to develop standards, and provide technical education for engineers in the field of design, construction, and maintenance of hydraulic structures. Since the 1980s ICOLD has extended its scope of activities to include tailings storage facilities (TSFs). Over this period, many rules that applied to water reservoirs were also put into effect for dealing with TSFs. The lack of motivation and responsibility, and the lack of applicable legislation on TSF risk assessment, led to a situation in which the existing risk assessment methods for water reservoirs were unofficially assumed to be valid for TSFs. Such practice completely ignores the obvious physical, geomechanical, hydraulic, rheological, and other differences between reservoirs for water storage and TSFs. The justification for such practice was found wanting in statistical surveys of accidents that have occurred over time. A new risk standard was developed for the management and design of tailings dams and was incorporated in 2020, The Global Industry Standard of Tailing Management (GISTM, 2020).
In the 21st century a total of 33 accidents have been recorded on water reservoirs, while in the same period 45 failures have occurred at TSFs (WMTF, 2018). In this period, 739 people died in accidents at water reservoirs, while 437 deaths were the direct result of accidents at TSFs (ICOLD, 2001). Historically the largest number of casualties at a water reservoir was recorded in 1889 at the South Fork Dam in the USA, when 2200 people were killed due to dam crest overtopping (Lempérière, 2017).
The severest accident that occurred at a TSF took place in 1966 at the Plakalnica lead and zinc TSF in Bulgaria, when due to several days of intense rainfall a massive slurry spill took place covering a distance of 8 km and killing 488 people (WMTF, 2018).
This paper lays down a basic hypothesis, according to which water-retention dams and the embankments at TSFs cannot be put in the same category and therefore it is not possible to apply the same methodology for risk ranking to both cases. Accordingly, the aim of this paper is to point out the differences between these two types of structures and the materials stored in them, and in line with this, to analyse the applicability of one of the most frequently used approaches for the risk ranking of such structures, i.e., the ICOLD methodology for large dam risk rankings.
673 The Journal of the Southern African Institute of Mining and Metallurgy VOLUME 122 NOVEMBER 2022
Differences between water reservoirs and TSFs
Purpose and method of construction
A comparison of water reservoirs and TSFs reveals that there are more differences than similarities between them. The basic difference is due to their purpose.
A water reservoir is a major infrastructure facility and has multiple important functions: irrigation, electricity production, water supply, flood prevention, recreation, waterway regulation, fish farming, etc. (ICOLD, n.d.). These multiple purposes are crucial for economic and social development, and ensure that there is a high yield of water from the dam
On the other hand, a TSF, while being also a major structure, is used to store mine residue from a mineral processing plant.
So, in the case of a water reservoir it is of general interest to maintain adequate safety levels over the full operational cycle, to provide constant water quality, and to maintain the operation of all the facilities within necessary limits. In case of a TSF the main purpose is to safely store mine residues and to minimize impacts to downstream water resources and communities.
In the first case, the objective implies maintaining the water reservoir at the highest level of safety, which as a rule, exceeds the statutory minimum requirements while maintaining profitability, while in the second case the objective in the past was to maintain the TSF at a level that just basically meets the statutory minimum standards, which implies lower costs and ultimately higher profits. Today, goals have changed, and the safety of downstream communities is considered an extremely high priority because of frequent accidents.
The construction of a dam and other reservoir structures, considering their use and purpose, will last for several years, while the construction of a TSF will be completed within a maximum time-frame and in parallel with its operation (McLeod and Murray, 2003).
In the case of water reservoirs, it is essential to finalize the construction of all the necessary structures before the operation starts.
➤ The characteristics of dam construction materials (concrete, rock, earth) must be known, predetermined, and controlled.
➤ The overflow spillways must be designed to pass the design basis flood, which is a function of the hazard class of the dam, constructed from certified materials, and located where easily accessible.
➤ In addition to the service spillway, it is necessary to construct auxiliary spillways that protect the dam from extremely high water inflows. The capacity of these spillways must cater for PMF conditions.
➤ Dam foundations are usually built on soil and/or rock, the properties of which are well defined. Construction must meet strict standards, and quality control testing must be conducted to provide assurance that the technical specifications have been met.
➤ In Serbia the dam freeboard should not be less than 1.5 m for dams less than 15 m high and not less than 2 m for dams over 20 m in height (Standard SRPS, 1980). Similar standards apply in other countries.
➤ Continuous, and in most cases automated, monitoring of the dam and all surrounding facilities is conducted during the entire period of construction and operation.
As regards to TSFs the following features are characteristic. The properties of the materials used to construct the initial
dam are known and controlled. However, for upstream raised facilities, subsequent embankment lifts are usually constructed with the coarser fractions of the available tailings material; the grain-size composition of this material is not always adapted to the requirements of embankment construction, and priority is usually given to the maximum utilization of the useful component. As a result, the quality of the material from which embankments are built largely varies, depending on the construction stage (in terms of size, chemical and mineral composition, porosity, permeability, etc.). The authors are of the view that the main problem with upstream construction is that the upstream lifts are built on previously deposited tailings, which may be weak and the composition of which is often different to that assumed during the dam design. A second significant problem is that upstream dams are difficult to drain adequately, so that tailings saturation is more difficult to control and becomes a critical factor for long-term stability.
In the case of TSFs built on flat terrain, where possible, the decant systems are sized for the probable maximum precipitation (PMP) conditions: they are centrally located, and their performance depends on the size and the location of the settling pond. In other words, at certain periods during operation, if TSFs are not well operated, the position of the tailings pond may be inadequate and lead to incomplete or deficient use of the spillways, particularly in events of extremely high water inflows due to heavy rainfall.
In TSFs, situated in mountainous terrain, free water is usually discharged through floating pump stations, which are sized to meet the needs of the plant that uses this water. The floating pump station is usually placed against the topography opposite to the embankment where the pond is located. This often impedes easy access to the floating pump station. During operation, certain disturbances or unforeseen and sudden inflows of water can occur, due to which the tailings settling pond may encroach too close to the embankment, thereby endangering the stability of the embankment and of the entire TSF.
Auxiliary spillways are built only at large TSF on hill sides in mountainous terrain, while TSFs build on flat ground do not usually have open spillways.
Initial dam foundations are built in compliance with the rules that are applied to reservoir dam foundations and considering the final height of the dam.
In Serbia, the freeboard at the perimeter embankment is increased by 1 m according to local regulations (Kneževic' et al., 2014).
The dam and surrounding facilities are regularly monitored, but in most cases, this operation is not automated.
A particular feature of some TSFs is the disposal of the tailings into a series of specially engineered, discrete cell impoundments. The entire surface is divided into a series of cells and tailings deposition is cycled between the cells to provide staged filling of the impoundment and to facilitate partial consolidation and stabilization of the tailings layers deposited during previous stages. This sequence of operations can bring about a significantly different level of risk (for example, if an accident happens at a currently inactive cell which is not receiving deposits of fresh tailings, environmental impacts will not necessarily occur). The total storage capacity represents the sum of the capacities of each cell.
Also, the existence of tailings beaches that serve as buffer zones between the embankment and the settling pond is a significant difference compared to water reservoirs where free
674 NOVEMBER 2022 VOLUME 122
Applicability of the risk ranking methodology designed for water reservoirs to tailings storage facilites
The Journal of the Southern African Institute of Mining
and Metallurgy
Table I
Change in the geotechnical properties of the deposited material due to segregation during disposal (Bjelkevik, 2005)
Property Beach zone Sludge zone
Particle size, [mm] d10 0.02 <<0.001 d60 0.1 0.005 d90 0.25 0.03
Moisture content (%) 10 x 30 45 x 96 Density (t/m3) 2.76 2.78
Bulk density (t/m3) 1.95 1.64 x 1.78 Void ratio, e 0.55 x 1.0 1.5 x 3.0 Permeability, [m/s] 1·10-4 x 5·10-7 1·10-9 x 2·10-8
Shear strength, [kN/m2] 20 x >50 <5 (on the surface) 5-20 (with depth)
Atterberg limits Plastic limit (ωP) 15 21 Liquid limit (ωL) 28 54 Plasticity index (IP) 14 32
water is in direct contact with the dam. These beaches can provide additional strength and resistance to failure, which is not the case in water dams.
Characteristics of stored materials
Reservoirs store water, the characteristics of which have been well studied, understood, and proven. Layers of sludge accumulate at the bottom of the reservoir. These sediment loads are derived from the watershed and transported via watercourses that supply the reservoir.
TSFs always contain liquid and solids in different proportions. Variations are illustrated in Table I (Bjelkevik, 2005).
➤ The embankment consists predominantly of large frictional or non-cohesive grain material with limited moisture content.
➤ Segregation of solid grains by size and density occurs on the tailings beach, where larger and heavier grains are deposited closer to the embankment while the finer and lighter grains are closer to the tailings pond. The material between the embankment and the pond ranges from frictional to cohesive with variable saturation.
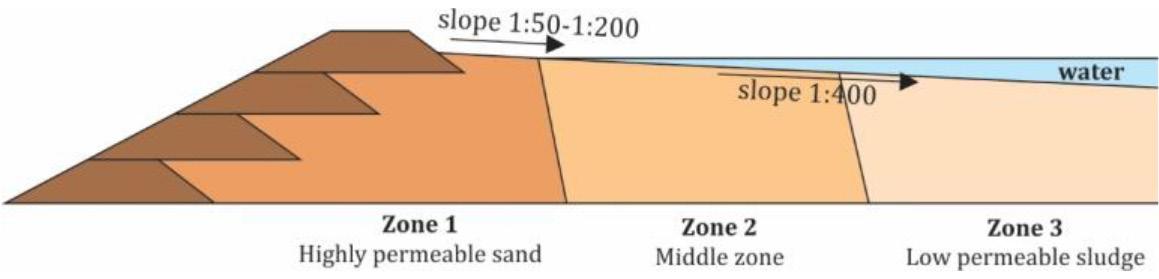
➤ The water in the pond has a low concentration of the finest particles that settle slowly.
➤ In the embankment the tailings densifies by natural consolidation as the height of the facility increases, and in this way the properties of the embankment change slowly but continuously, (Table II) (MDT, 2016).
Table II
The properties of the embankment at the TSF of a copper mine, consistent with the depth (Study IRM, 2009)
Depth, m <10 10-20 20-30 > 30 Gravimetric water content (%) 18 28 34 30
Density (kg/m3) 2780 2750 2750 2820
Bulk density, moist (kg/m3) 1820 1910 1910 1820 Bulk density, dry (kg/m3) 1570 1480 1450 1390 Angle of internal friction (o) 28 27 27 27 Cohesion (kN/m2) 20 25 27 20 Porosity (%) 43 46 46 50
➤ The segregation of material by size occurs on the tailings beach. The tailings is partly or completely saturated and slopes towards the pond. The beach slope is variable, from as steep as 1:50 (vertical to horizontal) down to 1:200. The beach is defined as the distance between the edge of the free water in the pond and the embankment. This distance is variable.
➤ The clarified water is collected at the lowest point in the beach. The base of the pond may comprise of fine solids sludge, which is completely saturated and has poor geotechnical properties. The material that lies between the clear water and the settled tailings may comprise a suspension of solids. The depth of the water varies, and the slope of the subaqueous beach may be as low as 1:400 but may vary substantially.
Figure 1 shows an idealized two-dimensional section which illustrates how segregation of the tailings brings about a gradation of properties(modified after Witt, 2004).
While the water characteristics are relatively stable and predictable, the characteristics of the deposited mixture of water and tailings are variable, particularly in terms of their rheological and soil mechanics properties.
Water such as contained in water dams and in tailings ponds exhibits Newtonian behaviour, while the behaviour of the mixture of water and tailings is non-Newtonian, being very complex with yield stress and viscosity depending on the solid-to-liquid ratio. If the mass fraction of solids in the slurry is less than 10% it is considered a Newtonian fluid, but if the density of waste slurry increases it is regarded as non-Newtonian fluid (Jovanovic ' et al., 2003).
Wastes of mineral origin when mixed with water to form a slurry are usually considered as ideal plastic systems, i.e., Bingham fluids. This cannot be applied to the waste generated during phosphate ore processing since its flow behaviour has all the characteristics of a turbulent flow and the parameters of viscosity and strength are lower than for other waste materials (Boger,
675 The Journal of the
VOLUME 122 NOVEMBER 2022
Applicability of the risk ranking methodology designed for water reservoirs to tailings storage facilites
Southern African Institute of Mining and Metallurgy
Figure 1—Material segregation at a TSF by size (modified after Witt, 2004
Parameters considered in the risk ranking of large dams (ICOLD, 1989; 2010)
Parameter Extreme High Moderate Low
Capacity Mm³ >120 1-120 0.1-1 <0.1
Risk factor (6) (4) (2) (0) Height (m) > 45 30-45 15-30 <15 Risk factor (6) (4) (2) (0)
Evacuation requirements (no. of persons) Number > 1000 100-1000 1-100 0 Risk factor (12) (8) (4) (0)
Potential downstream damage High Moderate Low None Risk factor (12) (8) (4) (0)
Scales, and Sofra, 2006; Wasp, Kenny, and Gandhi, 1977; Bain and Bonnington, 1970). The plastic systems do not undergo yielding at stresses that are below the flow stresses typical for such systems. When these stresses are achieved, the plastic systems start behaving as fluids. The cause of this phenomenon is the constant interaction between slurry particles (Kneževic', 1996).
In the event of a slurry breach, the flood wave is considerably higher than in cases of water inflow (by 1-6 m), but the velocity of slurry flow is considerably lower, due to increased resistance brought about by the viscosity effects (Komatina and Jovanovic ' , 1997). Since the liquefied tailings will not flow as far as water would, the damage to structures caused by liquefied tailings will be more localized, while at greater distances only environmental damage occurs. The damage caused by the release of water is associated with high flow velocity, and depending on terrain configuration, it can affect areas at great distances. On the other hand, the flow of slurry will be significantly slowed down by obstacles such as bridges, structures, narrow passages, and ravines, and will increase the height of the flood wave upstream, in contrast to the situation in which there is a release of water.
Therefore, the flow of water waves and slurry waves cannot be identical, and neither are the amounts of material released, the distances that the material will travel, the height and the velocity of the waves, or many other properties. Accordingly, the consequences cannot be identical, and since the risk is a function of the likelihood of a breach and the consequences arising from that breach, the level of risk for water reservoirs and TSFs will be considerably different.
Based on all the foregoing, it can be concluded that TSFs and water reservoirs should not be placed in the same category when it comes to risk assessment, since it may lead to either underestimation or overestimation of the risk associated with their operation.
Risk ranking methodology designed for water reservoirs
ICOLD methodology
In 1989 ICOLD implemented, and then in 2010 revised, the methodology for risk ranking of large water dams. This system has been also widely applied for TSFs because of its simple concept that provides for quick application and easy interpretation of results.
According to ICOLD a large dam is one with a height of 15 m or more. Dams that are 5–15 m high and have a reservoir volume of more than 3 Mm³, they are also classified as large dams (ICOLD, 2011).
The risk ranking for large water dams, according to the ICOLD methodology, involves consideration of the parameters in Table III, which provides in parentheses the weighting factors for each parameter, whereby after the quantification and weighting, the risk classes are determined according to Table IV (ICOLD, 1989; 2010).
Analysing the parameters considered in the risk ranking of large dams (Table III), it may be noted that the adoption of the first three parameters is based on an objective judgment, while the evaluation of the fourth parameter is subjective, and its magnitude depends on the opinion of the assessor. ICOLD provides very limited guidelines on how to quantify this parameter. Also, the first two parameters represent the physical dimensions of the dam (capacity and height), and the other two are related to its environment or setting, being the endangered population and material damage. The weighting ratio between these two groups of parameters is 1:2 (0.33:0.67). The increase of the weighting factor for the first group of parameters, from low to extreme, is 2, while for the second group it is 4. The total weight that can be assigned thus ranges from zero (where the capacity is below 0.1 Mm3, the height is below 15 m, the evacuation of people is not necessary, and there is no damage) to 36 (where capacity is above 120 Mm3, height above 45 m, evacuation of more than 1000 persons is required, and damage is high).
Risk ranking includes the evaluation of each of the four factors assigned to every dam and all the factors will be added to obtain the total value that places each dam into one of the four risk classes given in Table IV.
Table IV shows that the weighting factors are not evenly distributed (9 points for each class would define equal weighting). Namely, the first class (low) and the fourth class (extreme) are reduced to a range of 5 to 6 points, while the two middle classes are extended to a range of 12 points. This immediately suggests that the fewest number of dams belong to the categories low or extreme classes. The largest number of dams should be classified within the range of moderate to high-risk classes. Experience
Table IV
Risk class (ICOLD, 1989, 2010)
Total risk factor 0 – 6 7 – 18 19 - 30 31 - 36
Risk class I (Low) II (Moderate) III (High) IV (Extreme)
676 NOVEMBER 2022 VOLUME 122
Applicability of the risk ranking methodology designed for water reservoirs to tailings storage facilites
The Journal of the Southern African Institute of Mining
and Metallurgy
Table
III
shows that the biggest problem is when a dam is close to the marginal values between moderate and high-risk categories (15-22 points) and in many cases it seems to be the consequence of the application of weighting factors.
Applicability of ICOLD methodology to TSFs
Some uncertainties concerning the application of this methodology to TSFs appear even when adopting the weighting factor for storage capacity. As this system is initially intended for water reservoirs, where in case of a dam breach, all the water stored in the reservoir will flow out, it is reasonable to perceive the actual volume of the water stored within the reservoir as a potential environmental threat. However, this is not the case for TSFs since in the event of a dam breach it is most likely that all free water from the tailings pond would flow out together with a variable proportion of the tailings. In some rare cases as much as 100% of the deposited tailings can flow out, e.g., the failure at the El Cobre New Dam, Chile in 1965 (WMTF, 2018). Accordingly, the question arises as to whether the weighting factor of the capacity parameter should be adopted based on the volume of the storage space or on the actual potential quantity of the material that will be released in the event of a breach. The assumptions that are made regarding the volume of water and tailings that will be released influence the number of persons to be evacuated and the damage to the environment caused by the peak flood wave, hence the overall risk factor varies considerably depending on the approach followed to calculate the volume of tailings that will be released. A more realistic tailings release scenario will certainly reduce potential exposures.
In addition, the ICOLD methodology fails to provide a clear definition of the damage caused by the release of tailings contained in the TSF. In the event of a failure and the uncontrolled release of tailings, the environmental damage will not have the same extent or severity in the area surrounding the storage facility and cannot be regarded as a simple addition of impacts. ICOLD defines that the damage should be considered downstream of the embankment, and in the case of tailings facilities in mountainous terrain it is not difficult to determine the direction in which the flood wave will move. If the facility is located on flat land this is not the case. In such situations it is necessary to carry out a segment analysis or to consider the worst-case scenario of flood wave movement, so it is impossible to obtain an unambiguous assessment of the damage.
Risk is not a constant and it varies depending on the stage of TSF operation, the level of management, environmental conditions, and many other factors. If it is hypothetically assumed that the height of the water retention dam is over 45 m, its storage capacity is less than 120 Mm3, with an expected need to evacuate more than 100 persons and a moderate damage expectancy, this reservoir would be categorized as risk class III, from the outset once filled with water. Over a longer period, it is possible that its risk class will increase, decrease, or remain unchanged, depending on changes in population density or on construction or removal of structures and installations in the downstream area.
On the other hand, if this dam is compared to a TSF initially divided into three cell impoundments with a 3 m high initial embankment and a storage capacity less than 1 Mm3 per cell, considering its low height and small storage capacity initially, this facility may represent a threat to only a small number of people and may cause minor damage. Hence in the beginning of its lifecycle this cell-type TSF would be assigned a risk class I or II. For some years this TSF will, according to ICOLD, remain in class I or
Figure 2—Changes in the degree of risk at a water reservoir and a TSF over their operating life
II, and may never be categorized as class III, which is the starting position for the water reservoir.
So, in the case of water reservoirs, the risk class is not likely to vary much over time. On the other hand, the risk class for a similar sized TSF can vary significantly.
The possible changes in the classification for the previously considered comparison of a dam and TSF over time are shown graphically in Figure 2.
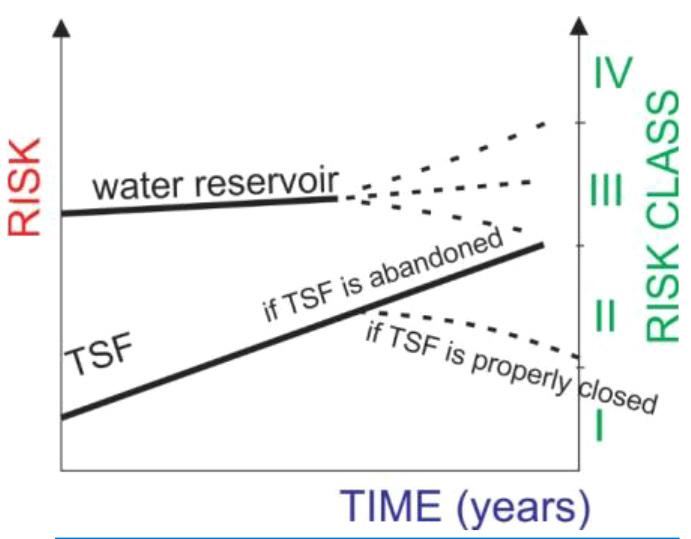
Accordingly, in terms of the level of risk, as per ICOLD, the TSF is in a far more favourable position and over many years it will be assigned a lower risk class than the water reservoir. The ICOLD methodology does not recognize the actual risk associated with each structure such as may be associated with the effectiveness of dam lifts and the level of maintenance of built structures. The assumption is that the execution of lifts and level of maintenance is in accordance with the specifications and is thus representative of the best-case scenario. For TSFs, the assumption of the best-case scenario cannot be a priori accepted, and because of the long period of construction, the difficulties with the choice of materials, and applied machinery/equipment, it must always be analysed in conjunction with the actual structure condition and the condition of the TSF itself. Therefore, risk ranking will not show a continuously increasing trend but rather a fluctuating tendency. In TSFs the risk is variable, and it may increase or decrease with the length of its operation life since the maintenance level is constantly changing, depending on mine performance, on the management policy, and the skill of the workers involved in its construction and operation, or whether the dam is closed properly or abandoned.
It can therefore be concluded that the assessment of risk ranks associated with operating TSFs should be approached differently and should take into consideration the large number of parameters that affect the level of risk. This is now done commonly across the world with the Global Industry Standard on Tailings Management (GISTM), Canadian Dam Association (CDA), Australian National Committee on Large Dams (ANCOLD), and South Africa National Standard (SANS) classification systems, which are based on consequence classes only. For these systems, risk is considered to be site-specific and is a function of the actual condition of each TSF at a point in time (GISTM, 2020; CDA, 2016; ANCOLD, 2012; SANS, 1998).
Comparative risk ranking according to the ICOLD methodology and FMEA technique
One of the most frequently used qualitative risk assessment techniques is the failure modes and effects analysis (FMEA), which involves a systematic analysis of all failure modes, a detailed assessment of their effects and a breakdown of events
677 The Journal of the
and
VOLUME 122 NOVEMBER 2022
Applicability of the risk ranking methodology designed for water reservoirs to tailings storage facilites
Southern African Institute of Mining
Metallurgy
leading to those that can be isolated and mitigated (Pamukcu, 2015; Joshi and Joshi, 2014). The FMEA risk assessment technique for TSFs specifically involves a detailed analysis of all probable failure scenarios, their mechanisms, and the consequences that follow (Valis and Koucky, 2009). This approach makes the FMEA technique more reliable and more realistic than the ICOLD methodology for risk ranking.
To verify this claim, a comparative risk ranking was performed using both the ICOLD methodology and the FMEA technique. As the subject of assessment, one of the most hazardous TSFs in Serbia is singled out, the TSF Veliki Krivelj in Bor. The risks associated with operating this facility have been discussed and studied on several occasions, providing an informed basis for a comparative analysis (Lekovski, Mikic, and Krzanovic, 2013; Zivković et al., 2014; NiŠić, Kneževic', and Lilic, 2018; NiŠić and Kneževic', 2018).
To assess the risks with the FMEA technique the research results that were previously obtained applying the same technique are used. These results were based on three potential accident scenarios: seismic, hydrological and hydro-technical (defects associated with the structure). For the sake of comparability, the consequences that are used in both approaches are equal, such as the number of persons to be evacuated and the damage downstream. Table V shows the data relevant for this comparative analysis.
The data provided in Table V was used for a comparative analysis of risk ranking results, (Table VI).
Table V
Basic data on the TSF Veliki Krivelj (NiŠic ', Knezevic, and Lilic, 2018)
Data
Type Valley Status Active
Height 100 m
Volume of storage space 101 Mm3
Quantity of material to be released in the event of an accident ~30 Mm3
Evacuation requirements (no. of persons) ~300
Number of potential casualties 1
Total downstream damage in the event of an accident Moderate
Table VI
Based on the results given in Table VI, it is possible to observe some crucial differences between these two approaches. According to the ICOLD approach, the class of risk is a constant value and is rated as high, while according to the FMEA approach, risk ranges from negligible to high, depending on the failure mode. It is obvious that the ICOLD approach is blind to the nature, mechanism (failure mode), and timing of the failure at the TSF. Also, it may be noted that FMEA is based on a traditional risk definition, according to which the risk is the product of probability of occurrence of a hazardous event and the consequences of the event, while ICOLD has an unambiguous approach to damage, and considers it as a constant category, so consequently the risk class of the TSF is constant. In addition, the concept of damage is not clearly defined and the person trying to assess the risks using the ICOLD approach may have a dilemma whether to include potential human casualties, or merely consider the material damage caused. This, however, can however be clearly defined in the FMEA approach and each consequence category is separately analysed, which has decisive influence on their final ranking.
Moreover, when using ICOLD methodology for ranking TSF risk, there is also a dilemma whether the storage capacity should be considered as the total amount of the deposited tailings or just the amount of the material discharged due to TSF failure. In the case of the TSF Veliki Krivelj, the weighting factor of both quantity indicators places capacity in the high category, so there is no difference in the final risk class, regardless of the initial capacity. With the FMEA technique this is not the case and the consequence ranking depends exclusively on the actual quantity of discharged material and subsequently also on the other characteristics of the flood wave, such as the distance that the tailings will travel after failure.
Conclusion
Superficially, water reservoirs and TSFs appear to be similar structures, but only at first glance. However, their different purposes, principles of construction and operation, flow behaviour of the impounded material, and ultimately, failure rates make them remarkably dissimilar. Putting these facilities in the same category for risk classification purposes (as per ICOLD) would suggest the presence of a long-term superficiality of assessment by responsible and qualified professionals, and as a result the actual risk is either overestimated or underestimated. Fortunately, this practice has now been changed and TSFs are now classified according to their potential to do harm. The ICOLD classification that has been referenced in this paper is now no longer in use.
Comparative analysis of the operation of risks for the TSF Veliki Krivelj ICOLD methodology
Parameter
Capacity,(Mm3)
Height (m)
FMEA (NiŠic ', Knezevic, and Lilic, 2018)
Rank Failure scenario Probability Consequences Risk rank
High (4) Seismic 1 1 1 (negligible)
Extreme (6) Hydrological 2 2 4 (low)
Evacuation requirements (no. of persons) Moderate (4) Hydrotechnical 1-3 1-2 12 (high)
Potential downstream damage Moderate (8)
Total risk factor 22 1–12
Risk class High III Negligible-high
678 NOVEMBER 2022 VOLUME 122
Applicability of the risk ranking methodology designed for water reservoirs to tailings storage facilites
The Journal of the Southern African Institute of Mining and Metallurgy
This paper, consistent with the established research objectives, presents the key differences between these two types of facilities to prove the hypothesis that there can be no grounds for reverting to the practice of classifying TSFs in the same category as water dams. The analysis of one of the most used methodologies for rating the risk associated with water retention dams, provided by ICOLD, points out all the deficiencies of such an approach, which are particularly obvious when applied to TSFs. This analysis is additionally sustained by providing a comparative risk assessment and ranking of one of the most hazardous TSFs in Serbia, the TSF Veliki Krivelj, using the ICOLD methodology and the FMEA risk assessment technique, which is based on a traditional risk definition and allows a systematic risk analysis. It may be noted that the risk assessment with the FMEA technique gives more realistic results, and that risk assessment cannot be conducted without considering the actual condition of the TSF, different scenarios and impact mechanisms of potential failures, as well as the actual quantities of the material that might be discharged, which will have a decisive influence on the final consequences. In order to reduce the responsibility of TSF users, these facilities were most often identified with water dams. This bad practice has become common and caused a lot of conflicts in the risk for evaluation.
The ICOLD methodology for risk ranking that has been compared to the FMEA approach in this paper is clearly not suitable for tailings storage facilities. It is therefore recommended that its use be terminated and that the GISTM classification system be adopted for tailings storage facilities in future. This paper illustrates very well how a classification system that has been developed for one type of structure cannot always be used for another, although the structures are seemingly similar.
References
ANCOLD. 2012. Guidelines on the consequence categories for dams.
Australian National Committee on Large Dams. https://www.ancold.org. au/?product=guidelines-on-the-consequence-categories-for-dams-october2012
Bain, A.G. and Bonnington, S.T. 1970. The Hydraulic Transport of Solids by Pipeline. Pergamon Press.
Bjelkevik, A . and Knutsson, S. 2005. Swedish tailings: Comparison of mechanical properties between tailings and natural geological materials. Proceedings of the International Conference on Mining and the Environment, Metals and Energy Recovery, Stockholm, 27 June–1 July. pp. 117-129. SveMin. urn: urn:nbn:se:ltu:diva-28132
Boger, D.V., Scales, P.J., and Sofra, F. 2006. Rheological Concepts. Paste and Thickened Tailings - A Guide (2nd Edn). Jewell, R.J. and Fourie, A.B. (eds). Australian Centre for Geomechanics, Perth, Australia. https://doi.org/10.36487/ ACG_repo/863_21
CDA. 2016. Canadian Dam Association consequence classification ratings for dams. https://open.alberta.ca/dataset/e598d71f-9baa-4f33-98d1-2417f9bf7d93/ resource/08db72bd-6fef-48d4-8c62-72c33c44d9a3/download/cdaclassificationratingsdams-apr2016.pdf
GISTM. 2020. Global Industry Standard on Tailings Management, Consequence Classification Tables (Annex 2). https://globaltailingsreview.org/wp-content/ uploads/2020/08/global-industry-standard_EN.pdf
MDT. 2016. Mining Technical Design for the Elevation of VK Tailings Storage Facility at Field 1 to 390 meters a.s.l. Institute of Mining and Metallurgy Bor, Bor.
ICOLD. 1989. Bulletin 72, Revision. Selecting seismic parameters for large dams, Guidelines. International Committee on Large Dams. Paris.
ICOLD. 2001. Tailings dams: Risk of dangerous occurrences: Lessons learnt from practical experiences (vol. 121). United Nations Publications, International Committee on Large Dams, Paris.
ICOLD. 2009. Bulletin 72, Selecting seismic parameters for large dams, Guidelines. International Committee on Large Dams, Paris.
ICOLD. 2011. Small dams, design, surveillance and rehabilitation. International Committee on Large Dams, Paris.
ICOLD. n.d. Role of dams. https://www.icold-cigb.org/GB/dams/role_of_dams.asp
Joshi, G. and Joshi, H. 2014. FMEA and alternatives v/s enhanced risk assessment mechanism. International Journal of Computer Applications, vol. 93, no. 14. pp. 33–37.
Jovanovic', M., Kapor, R., Komatina, D., Djordjevic, D., Stefanovic, N., and Jancic, V. 2003. Numerical simulation of hydraulic consequences of dam failures on coal ash disposal sites. Water Management Industry.
Kneževic', D., Torbica S., Rajkovic Z., and Nedic M. 2014. Industrial waste disposal. Faculty of Mining and Geology, Belgrade [in Serbian].
Kneževic', D. Kolonja, B., and Stankovic, R. 1996. Hydraulic transport of mineral raw materials. Faculty of Mining and Geology, University of Belgrade, Belgrade [in Serbian].
Komatina, D. and Jovanovic', M. 1997. Experimental study of steady and unsteady free surface flows with water-clay mixtures. Journal of Hydraulic Research, vol. 35, no. 5. pp. 579–590.
Lekovski, R., Mikic, M., and Krzanovic, D. 2013. Impact of the tailing dumps on the living environment of Bor and protective measures. Mining and Metallurgy Engineering Bor, vol. 2. pp. 97–116.
Lempérière, F. 2017. Dams and floods. Engineering, vol. 3, no. 1. pp. 144–149.
McLeod, H., Murray, L., and Berger, K.C. 2003. Tailings dam versus a water dam, What is the design difference. Proceedings of the ICOLD Symposium on Major Challenges in Tailings Dams. 15. p. 12.
NiŠic', D. and Kneževic', D. 2018. Risk-based classification of industrial waste storage facilities. Inżynieria Mineralna, vol. 20.
NiŠic', D., Kneževic', D., and Lilic, N. 2018. Assessment of risks associated with the operation of the tailings storage facility Veliki Krivelj, Bor (Serbia). Archives of Mining Sciences, vol. 63, no. 1. pp. 165–181.
Pamukcu, C. 2015. Analysis and management of risks experienced in tunnel construction. Acta Montanistica Slovaca, vol. 20, no. 4. pp. 271–281.
SANS. 1998. The Code of Practice for Mine Residue Deposits - SANS 10286 (Ed.1.00). The South African Bureau of Standards, South Africa
Institute for Standardisation of Serbia. 1980. Standard SRPS U.C5.020. Design of embankment dams and hydraulic embankments, Technical conditions.
Valis, D. and Koucky, M. 2009. Selected overview of risk assessment techniques. Problemy Eksploatacji, no. 4. pp. 19–32.
Wasp, E.J., Kenny, J.P., and Gandhi, R.L. 1977. Solid-liquid flow: Slurry pipeline transportation. [Pumps, valves, mechanical equipment, economics]. Series on Bulk Material Handling. Gulf Publishing. 224 pp.
Witt, K.J. and Schönhardt, M. (eds.). 2004. Tailings Management Facilities –Risks and Reliability. Report of the European RTD project TAILSAFE. http://www.tailsafe.com/
WTMF, 2018. World mining tailings failures database. https://worldminetailingsfailures.org/
Zivkovic, N., Mihajlovic, E., Zivkovic, L., and Bozilov, A. 2014. Risk management of disastrous events on tailings in 'RTB Bor', Serbia, Annual of the University of Mining and Geology St. Ivan Rilski. Mining and Mineral Processing, vol. 57. no. 2.
Author Contributions
Conceptualization: [Dragana Nišić and Dinko Knežević]; Methodology: [Dragana Nišić]; Data curation: [Neda Nišić and Aleksandar Cvjetić]; Writing—original draft preparation: [Dragana Nišić and Dinko Knežević]; Writing—review and editing: [Aleksandar Cvjetić and Vladimir Jovanović]; Visualization: [Neda Nišić and Vladimir Jovanović]; Project administration: [Neda Nišić]. u
679 The Journal of the
VOLUME 122 NOVEMBER 2022
Applicability of the risk ranking methodology designed for water reservoirs to tailings storage facilites
Southern African Institute of Mining and Metallurgy


Applicability of the risk ranking methodology designed for water reservoirs to tailings storage facilites 680 NOVEMBER 2022 VOLUME 122 The Journal of the Southern African Institute of Mining and Metallurgy Distribution information ABC Accredited SAIMM 2023 MARKETING OPPORTUNITIES The
offers businesses wanting to
and key opinion-formers
different opportunities
commercial
It
CLICK THROUGHS Advertising Home Page Banner click throughs between 126 and 204 per month WEBSITE VIEWING 24/7 CONFERENCES 4-6 Well attended conferences per annum JOURNAL Journal referred to again and again by professionals and students due to informative accredited and peer reviewed papers covering all aspects of mining and metallurgy in Southern Africa DIGITAL EDITIONS 12 Digital Editions per annum MAILERS 12 Mailers per annum READERS 3 Readers per copy SOCIAL MEDIA Active Social Media engagement with members and followers INTERNATIONAL ALLIANCES 7 International Alliances PACKAGES AVAILABLE Cost efficient advertising rates with unique and cross media advertising packages available ADVERTISING PLATFORMS 4 Advertising platforms available (Website, Journal, Mailer and Conferences) ADVERTISEMENT BOOKINGS Barbara Spence · Avenue Advertising PO Box 71308, Bryanston, 2021 Tel: 011 463 7940 X Cell: 082 881 3454 X E-mail: barbara@avenue.co.za X Website: http://www.avenue.co.za
SAIMM
reach decision makers, thought-leaders
in the mining environment
and essential platforms to do so. Include the SAIMM in your marketing plan if you want to get noticed, grow your market share and assure your existing client base that they are dealing with the right service provider. The SAIMM’s monthly, highly regarded Journal, website and monthly Journal mailer are distinctly differentiated from other available
mining publications, and online digital avenues.
all starts with circulation, and works best when marketers use omni-channel integration to synergise the effectiveness of all the media paths to persuasion and purchase. Innovative and different advertising opportunities, company profiles and sponsored content marketing are all available to you to match your marketing message best.
NATIONAL & INTERNATIONAL ACTIVITIES
11-13 January 2023 — GSSA Geocongress
University of Stellenbosch Campus, Stellenbosch, South Africa
Tel: 021 910 1913
E-mail: geocongress@allevents.co.za Website: https://allevents.eventsair.com/geocongress/ 13-17 February 2023 — Principles of diamond processing
University of the Witwatersrand, Johannesburg, South Africa Website: https://wits-enterprise.co.za/c/principles-ofdiamond-processing/contact
22-23 February 2023 — Drilling and Blasting Online Short Course 2023
Contact: Camielah Jardine Tel: 011 538-0237
E-mail: camielah@saimm.co.za Website: http://www.saimm.co.za
13-16 March 2023 — 8TH Sulphur and Sulphuric Acid Conference 2023
The Vineyard Hotel, Newlands, Cape Town, South Africa
Contact: Gugu Charlie Tel: 011 538-0238
E-mail: gugu@saimm.co.za Website: http://www.saimm.co.za
24 25 April 2023 — Southern African Hydrogen and Fuel Cell Conference 2023 From fundamentals to accelerated integration Hazendal Wine Estate, Stellenbosch, Cape Town
Contact: Camielah Jardine Tel: 011 538-0237
E-mail: camielah@saimm.co.za Website: http://www.saimm.co.za
11 14 June 2023 — European Metallurgical Conference 2023
Abstracts are to be completed online on https://bit.ly/ Enter2021YPLCfinals
13 15 June 2023 — Copper Cobalt Africa in association with the 10TH Southern African Base Metals Conference 2023
Avani Victoria Falls Resort, Livingstone, Zambia
Contact: Camielah Jardine Tel: 011 538-0237
E-mail: camielah@saimm.co.za Website: http://www.saimm.co.za
19 22 June 2023 — Introduction to Multiple-Point Statistics Online Course
Contact: Camielah Jardine Tel: 011 538-0237
E-mail: camielah@saimm.co.za Website: http://www.saimm.co.za
25 28 June 2023 — SME APCOM 2023
Intelligent Mining: Innovation, Vision, and Value Rapid City, South Dakota, USA E-mail: Andrea.Brickey@sdsmt.edu
Website: https://www.smenet.org/Conferences/SMEAPCOM
26 29 June 2023 — 26th World Mining Congress 2023 Brisbane Australia Website: https://www.wmc2023.org/ 28 29 June 2023 — Digital Transformation in Mining 2023
Putting digital technologies to work The Canvas, Riversands, Fourways
Contact: Gugu Charlie Tel: 011 538-0238
E-mail: gugu@saimm.co.za Website: http://www.saimm.co.za
July 2023 — 10th World Gold Conference Xiamen, China
E-mail: world@china-gold.org Website: http://world.china-gold.org/# 25 26 July 2023 — Diamonds Source to Use 2023 Conference
New Beginnings A brave new (diamond) world Birchwood Hotel and OR Tambo Conference Centre, Boksburg, Johannesburg
Contact: Camielah Jardine Tel: 011 538-0237
E-mail: camielah@saimm.co.za Website: http://www.saimm.co.za
4 7 September 2023 — Geometallurgy Conference 2023
Geomet meets Big Data Hazendal Wine Estate, Stellenbosch, Western Cape Contact: Gugu Charlie Tel: 011 538-0238
E-mail: gugu@saimm.co.za Website: http://www.saimm.co.za
12 14 September 2023 — 10th International Conference on Ground Support in Mining and Underground Construction Perth, Western Australia Website: https://www.acggroundsupport.com/ 27 28 September 2023 — SAIMM Diversity and Inclusion Dialogue 2023 (DIMI)
Intersectionality in the Minerals Industry From Awareness to Action Avianto, Muldersdrift, Johannesburg
Contact: Camielah Jardine Tel: 011 538-0237
E-mail: camielah@saimm.co.za Website: http://www.saimm.co.za
11 13 October 2023 — 11th International Ground Freezing Symposium
London E-mail: events@iom3.org Website: https://www.iom3.org/events-awards/11thinternational-symposium-on-ground-freezing.html
2023 The Journal of the Southern African Institute of Mining and Metallurgy VOLUME 122 NOVEMBER 2022 vii ◀
Company affiliates
The following organizations have been admitted to the Institute as Company Affiliates
3M South Africa (Pty) Limited
acQuire Technology Solutions
AECOM SA (Pty) Ltd
AEL Mining Services Limited
African Pegmatite (Pty) Ltd
Air Liquide (Pty) Ltd
Alexander Proudfoot Africa (Pty) Ltd
Allied Furnace Consultants
AMEC Foster Wheeler
AMIRA International Africa (Pty) Ltd
ANDRITZ Delkor (Pty) Ltd
ANGLO Operations Proprietary
Anglogold Ashanti Ltd
Arcus Gibb (Pty) Ltd
ASPASA
Aurecon South Africa (Pty) Ltd
Aveng Engineering
Aveng Mining Shafts and Underground
Axiom Chemlab Supplies (Pty) Ltd
Axis House Pty Ltd
Bafokeng Rasimone Platinum Mine
Barloworld Equipment -Mining
BASF Holdings SA (Pty) Ltd
BCL Limited
Becker Mining (Pty) Ltd
BedRock Mining Support Pty Ltd
BHP Billiton Energy Coal SA Ltd
Blue Cube Systems (Pty) Ltd
Bluhm Burton Engineering Pty Ltd
Bond Equipment (Pty) Ltd
BOUYGUES Travaux Publics
Caledonia Mining South Africa Plc
Castle Lead Works
CDM Group
CGG Services SA
Coalmin Process Technologies CC
Concor Opencast Mining
Concor Technicrete
Council for Geoscience Library
CRONIMET Mining Processing SA Pty Ltd
CSIR Natural Resources and the Environment (NRE)
Data Mine SA
Digby Wells and Associates
DRA Mineral Projects (Pty) Ltd
DTP Mining - Bouygues Construction
Duraset
EHL Consulting Engineers (Pty) Ltd
Elbroc Mining Products (Pty) Ltd
eThekwini Municipality
Ex Mente Technologies (Pty) Ltd
Expectra 2004 (Pty) Ltd
Exxaro Coal (Pty) Ltd
Exxaro Resources Limited
Filtaquip (Pty) Ltd
FLSmidth Minerals (Pty) Ltd
Fluor Daniel SA (Pty) Ltd
Franki Africa (Pty) Ltd-JHB Fraser Alexander (Pty) Ltd
G H H Mining Machines (Pty) Ltd
Geobrugg Southern Africa (Pty) Ltd
Glencore
Gravitas Minerals (Pty) Ltd
Hall Core Drilling (Pty) Ltd Hatch (Pty) Ltd
Herrenknecht AG
HPE Hydro Power Equipment (Pty) Ltd
Huawei Technologies Africa (Pty) Ltd
Immersive Technologies
IMS Engineering (Pty) Ltd
Ingwenya Mineral Processing (Pty) Ltd
Ivanhoe Mines SA
Kudumane Manganese Resources Leica Geosystems (Pty) Ltd
Loesche South Africa (Pty) Ltd
Longyear South Africa (Pty) Ltd
Lull Storm Trading (Pty) Ltd Maccaferri SA (Pty) Ltd Magnetech (Pty) Ltd
MAGOTTEAUX (Pty) LTD
Malvern Panalytical (Pty) Ltd Maptek (Pty) Ltd
Maxam Dantex (Pty) Ltd
MBE Minerals SA Pty Ltd
MCC Contracts (Pty) Ltd
MD Mineral Technologies SA (Pty) Ltd
MDM Technical Africa (Pty) Ltd
Metalock Engineering RSA (Pty)Ltd
Metorex Limited
Metso Minerals (South Africa) Pty Ltd
Micromine Africa (Pty) Ltd MineARC South Africa (Pty) Ltd
Minerals Council of South Africa
Minerals Operations Executive (Pty) Ltd MineRP Holding (Pty) Ltd Mining Projections Concepts Mintek
MIP Process Technologies (Pty) Limited
MLB Investment CC
Modular Mining Systems Africa (Pty) Ltd
MSA Group (Pty) Ltd
Multotec (Pty) Ltd
Murray and Roberts Cementation
Nalco Africa (Pty) Ltd
Namakwa Sands(Pty) Ltd
Ncamiso Trading (Pty) Ltd
Northam Platinum Ltd - Zondereinde Opermin Operational Excellence
OPTRON (Pty) Ltd
Paterson & Cooke Consulting Engineers (Pty) Ltd
Perkinelmer
Polysius A Division Of Thyssenkrupp Industrial Sol
Precious Metals Refiners
Rams Mining Technologies Rand Refinery Limited
Redpath Mining (South Africa) (Pty) Ltd
Rocbolt Technologies
Rosond (Pty) Ltd
Royal Bafokeng Platinum
Roytec Global (Pty) Ltd
RungePincockMinarco Limited
Rustenburg Platinum Mines Limited Salene Mining (Pty) Ltd
Sandvik Mining and Construction Delmas (Pty) Ltd
Sandvik Mining and Construction RSA(Pty) Ltd
SANIRE
Schauenburg (Pty) Ltd
Sebilo Resources (Pty) Ltd
SENET (Pty) Ltd
Senmin International (Pty) Ltd
SISA Inspection (Pty) Ltd
Smec South Africa
Sound Mining Solution (Pty) Ltd
SRK Consulting SA (Pty) Ltd
Time Mining and Processing (Pty) Ltd
Timrite Pty Ltd
Tomra (Pty) Ltd
Traka Africa (Pty) Ltd
Ukwazi Mining Solutions (Pty) Ltd
Umgeni Water
Webber Wentzel
Weir Minerals Africa
Welding Alloys South Africa Worley
▶ viii NOVEMBER 2022 VOLUME 122 The Journal of the Southern African Institute of Mining and Metallurgy
SAIMM FORTHCOMING CONFERENCES/WEBINARS/ SHORT COURSES

February 2023
22-23 February 2023
March 2023
Drill and Blast Short Course Online
Sulphuric Acid Conference 2023 Cape Town April 2023 24-25 April 2023 Hydrogen Fuel Cells Conference 2023 Cape Town May 2023
13-16 March 2023
June 2023
13-15 June 2023
19-22 June 2023
27-28 June 2023
July 2023
Copper Cobalt Conference 2023 Hybrid/Zambia
Multiple Points Statistics Short Course Online
Digitalisation/New Technology/Future Mining Hybrid/ Johannesburg Conference 2023
Diamonds Conference 2023 Hybrid/ Johannesburg August 2023
25-26 July 2023
August 2023
Pyro Conference 2023 Hybrid
August 2023 HMC Conference 2023 Hybrid/ KZN August 2023 Tailings Conference 2023 Hybrid/ Johannesburg
September 2023
4-7 September 2023
Geometallugy Conference 2023
Hybrid/ Cape Town
September 2023 Young Professionals 2023 Hybrid/ Johannesburg
27-28 September 2023
October 2023
October 2023
October 2023
DIMI Conference 2023 Hybird/Johannesburg
Rare Earths 2023 Hybrid
ESG Conference 2023 Hybrid
October 2023 MineSafe 2023 Hybrid
November 2023
November 2023 Student Colloquium 2023 Hybrid
For more information on upcoming SAIMM events, please visit www.saimm.co.za or contact camielah@saimm.co.za
DIGITAL
IN MINING
Putting digital technologies to work

Whatever terminology you wish to use, it is obvious the world of work is changing rapidly.
The Mining Industry, along the Mining Value Chain, is a part of this; seeking to take advantage of digital opportunities in the quest for competitiveness, sustainability and Zero Harm.


Mining businesses in Africa, as globally, are on this journey purposefully or by default. This event adds to purpose by being a showcase and learning experience for everyone associated with the Mining Industry. We will learn about Global Best Practices, network with global leaders in mining and other businesses, and do so in an exciting and interactive format.
Be prepared to be challenged and informed and to leave excited and better equipped for today’s digital journey.
FOR FURTHER INFORMATION, CONTACT:
Gugu Charlie, Conference co-ordinator
E-mail: gugu@saimm.co.za Tel: +27 11 538-0237, Web: www.saimm.co.za
2023 28-29 JUNE 2023 THE CANVAS, RIVERSANDS, FOURWAYS
TRANSFORMATION
