


ENHANCED PILLAR DESIGN METHODOLOGIES FOR METALLIFEROUS MINES
Mechanization of the shallow tabular orebodies in South Africa is routinely done using bord and pillar layouts. These layouts can be found in the platinum, chrome, and manganese mines. A difficulty with the design of the pillars is that their sizes need to increase substantially with depth and this decreases the extraction ratio. This will become a major hurdle in terms of future mechanization at greater depths. Pillar designs are typically based on the popular Hedley and Grant power-law strength formula developed for Canadian uranium mines. Improved pillar design methodologies, or at the very least improved calibrations of the formula, need to be developed for South African conditions. Furthermore, it is not clear if a power law or a linear strength formula is best suited for the South African reef types.
Special Themed Edition
Papers are therefore invited that cover all aspects of pillar design in bord and pillar layouts. This includes both empirical methods and numerical modelling analysis of pillar strength. Underground case studies, laboratory experiments related to pillars, and work on secondary pillar extraction can also be submitted.
Call for Papers
Papers should be submitted to: Kelly Matthee | Journal Coordinator SAIMM | Email: kelly@saimm.co.za | Tel: +27 11 538-0238 www.saimm.co.za The deadline for paper submissions will be on the 31st of October 2022

W.H. van Niekerk (2005–2006)
J.A. Cruise (1994–1995)
* J. Gray (1919–1920)
* C. Butters (1897–1898)
M.A ziz
W.C. Joughin
A.S. Macfarlane (2018–2019)
Nolitha President,FakudeMinerals Council South Africa
Honorary Vice Presidents
Blade MinisterNzimandeofHigher Education, Science and Technology, South Africa
* J.P. Hoffman (1992–1993)
Z.Botha
* C.E. Fivaz (1988–1989)
Johannesburg D.F. Jensen Namibia N.M. Namate Northern Cape Jaco Mans Pretoria Vacant Western Cape A.B. Nesbitt
* F.W. Watson (1923–1924)
* A.F. Crosse (1895–1896)
* J.A. Woodburn (1928–1929)
* C.B. Saner (1911–1912)
* P. Lambooy (1967–1968)
* H.E. Cross (1965–1966)
N.A. Barcza (1996–1997)
Past Presidents Serving on Council N.A. Barcza S.Ndlovu R.D. Beck J.L. Porter
* J.E. Thomas (1915–1916)
* D.A. Viljoen (1979–1980)
Z.Botha–TPC Metallurgy Chairperson
Junior Vice President E.Matinde
* S.H. Pearce (1903–1904)
* V. Nimmo-Dewar (1932–1933)
* F. Wartenweiler (1921–1922)
A.N. Brown (1982–1983)
The Southern African Institute of Mining and Metallurgy
Ebrahim Patel
* R.E. Robinson (1975–1976)
R.D. Beck (1991–1992)
* W.S. Findlay (1960–1961)
*(1973–1974)R.P.Plewman (1974–1975)
* P.N. Lategan (1933–1934)
J.N. van der Merwe (2011–2012)
* G. Hildick-Smith (1917–1918)
S. Ndlovu (2017–2018)
* D.M. Jamieson (1964–1965)
Incoming Junior Vice President
* W.R. Feldtmann (1896–1897)
D.A.J. Ross-Watt (1995–1996)
* A.A.B. Douglas (2001–2002)
* A. McA. Johnston (1909–1910)
C. Musingwini (2016–2017)
M.I. Mthenjane (2019–2020)
Immediate Past President V.G. Duke
* W. Bettel (1894–1895)
G.V.R. Landman (2010–2011)
Honorary Legal Advisers M H Attorneys Auditors Genesis Chartered Accountants Secretaries The Southern African Institute of Mining and Metallurgy 7th Floor, Rosebank Towers, 15 Biermann Avenue, Rosebank, 2196 PostNet Suite #212, Private Bag X31, Saxonwold, 2132 E-mail: journal@saimm.co.za
OFFICE BEARERS AND COUNCIL FOR THE 2020/2021 SESSION
H. Wagner (1986–1987)
M.A. Mello––YPC Vice Chairperson
* H.G. Mosenthal (1990–1991)
*Deceased
* J. Chilton (1920–1921)
Z.Fakhraei S.J. Ntsoelengoe B.Genc S.M. Rupprecht
* Sir Robert Kotze (1927–1928)
Minister of Trade, Industry and Competition, South Africa
* M.G. Atmore (1978–1979)
Honorary Treasurer
* W. Cullen (1905–1906)
* M.D.G. Salamon (1976–1977)
V.G. Duke (2020–2021)
* R.C.J. Goode (1968–1969)
* R.A.
Co-opted to Members
* O.K.H. Steffen (1989–1990)
* W.R. Dowling (1912–1913)
President Elect
***********************(1935–1936)Flugge-De-SmidtT.K.Prentice(1936–1937)R.S.G.Stokes(1937–1938)P.E.Hall(1938–1939)E.H.A.Joseph(1939–1940)J.H.Dobson(1940–1941)TheoMeyer(1941–1942)JohnV.Muller(1942–1943)C.BiccardJeppe(1943–1944)P.J.LouisBok(1944–1945)J.T.McIntyre(1945–1946)M.Falcon(1946–1947)A.Clemens(1947–1948)F.G.Hill(1948–1949)O.A.E.Jackson(1949–1950)W.E.Gooday(1950–1951)C.J.Irving(1951–1952)D.D.Stitt(1952–1953)M.C.G.Meyer(1953–1954)L.A.Bushell(1954–1955)H.Britten(1955–1956)Wm.Bleloch(1956–1957)H.Simon(1957–1958)M.Barcza(1958–1959)
* D.D. Howat (1971–1972)
F.T. Manyanga S.J. Tose
* P.R. Jochens (1980–1981)
* E.C. Ranson (1934–1935)
* A. Richardson (1913–1914)
Zambia Vacant Zimbabwe C.P. Sadomba Zululand C.W. Mienie
* P.A. Von Wielligh (1977–1978)
M.H. Rogers (1999–2000)
A.T. Chinhava–YPC Chairperson
M.I. van der Bank
Branch Chairpersons
* W.A. Caldecott (1904–1905)
* J. Henderson (1930–1931)
* H.E. James (1985–1986)
* H. Scott-Russell (1993–1994)
R.G.B. Pickering (2007–2008)
F.M.G. Egerton (2004–2005)
* E.H. Johnson (1906–1907)
G.R. Lane
G.R. Lane–TPC Mining Chairperson
* J.A. Wilkinson (1916–1917)
* C.J. Gray (1924–1925)
* J. Yates (1907–1908)
* H.S. Meyer (1918–1919)
W.C. Joughin
* H.A. White (1925–1926)
* J. de V. Lambrechts (1962–1963)
S.J. Ramokgopa (2002-2003)
PAST PRESIDENTS
* G.Y. Nisbet (1981–1982)
J.R. Dixon (1998–1999)
A.M. Garbers-Craig (2008–2009)
T.M. Mmola A.T. van Zyl G.Njowa E.J. Walls
J.L. Porter (2014–2015)
* H.R. Adam (1926–1927)
* R.P. Mohring (1997–1998)
R.P.H. Willis (2006–2007)
Honorary President
President I.J. Geldenhuys
* V.C. Robinson (1970–1971)
* R.J. Adamson (1959–1960)
* H. Pirow (1929–1930)
* G.A. Watermeyer (1922–1923)
* J.R. Williams (1899–1903)
Gwede MinisterMantasheofMineral Resources, South Africa
K.M. Letsoalo A.J.S. Spearing S.B. Madolo M.H. Solomon
* G.H. Stanley (1914–1915)
* D. Gordon Jones (1966–1967)
A.S. Macfarlane D.A.J. Ross-Watt M.I. Mthenjane G.L. Smith C.Musingwini W.H. van Niekerk
R.T. Jones (2015–2016)
J.C. Ngoma (2009–2010)
* P.W.J. van Rensburg
* R.G. Bevington (1908–1909)
* J.P. Hugo (1972–1973)
* R.P. King (1983–1984)
T.R. Stacey (2003–2004)
Ordinary Members on Council
* B.C. Alberts (1987–1988)
* J. Moir (1910–1911)
* J. Loevy (1898–1899)
L.A. Cramer (2000–2001)
G.L. Smith (2012–2013)
J.D. Austin (1984–1985)
M. Dworzanowski (2013–2014)
* J.K.E. Douglas (1969–1970)
* D.G. Maxwell (1961–1962)
J.R. Dixon S.J. Ramokgopa R.T. Jones M.H. Rogers
Senior Vice President
* J.F. Reid (1963–1964)
* A. King (1931–1932)
Journal Comment: The Future of Coal by H. Lodewijks
Fully automated coal quality control using digital twin material tracking and statistical model predictive control for yield optimization during production of semi soft coking- and power station coal by B.J. Coetzee and P.W. Sonnendecker.

VOLUME 122 NO. 8 AUGUST 2022
Avenue E-mail:TelephoneAdvertising(011)463-7940barbara@avenue.co.za ISSN 2225-6253 (print) ISSN 2411-9717 (online) Directory of Open Access Journals THE INSTITUTE, AS A BODY, IS NOT RESPONSIBLE FOR THE STATEMENTS AND OPINIONS ADVANCED IN ANY OF ITS PUBLICATIONS. Copyright© 2022 by The Southern African Institute of Mining and Metallurgy. All rights reserved. Multiple copying of the contents of this publication or parts thereof without permission is in breach of copyright, but permission is hereby

Printed by Camera Press, Spence given for the copying of titles and abstracts of papers and names of authors. Permission to copy illustrations and short extracts from the text of individual contributions is usually given upon written application to the Institute, provided that the source (and where appropriate, the copyright) is acknowledged. Apart from any fair dealing for the purposes of review or criticism under The Copyright Act no. 98, 1978, Section 12, of the Republic of South Africa, a single copy of an article may be supplied by a library for the purposes of research or private study. No part of this publication may be reproduced, stored in a retrieval system, or transmitted in any form or by any means without the prior permission of the publishers. Multiple copying of the contents of the publication without permission is always illegal.
Contents
. . . . . . . . . . . . . . . . . . . . . . . . . . . . . . . . . . . . . . . . . . . . . . v
Ceramic composites produced from three different coal discards and polysiloxane pre-ceramic polymer resin was studied for their potential as building material. The thermal stability of the synthesized composite materials exceeded that of conventional roofing materials. The excellent chemical resistance of composites (94.43−99.98%) eliminates the need for external coatings, and the composites can be shaped into bricks, shingles, roofing tiles, etc. This new technique for recycling coal discards into ceramic composites of structural interest offers an excellent opportunity to eliminate the enormous volumes of coal discard and to advance the circular coal economy.
COAL NEWSEDITIONOFINTEREST
PostNet Suite #212 Private Bag X31 Saxonwold, 2132 journal@saimm.co.za
President’s Corner: The final word with a little help from Whitman by I.J. Geldenhuys
▶ ii AUGUST 2022 VOLUME 122 The Journal of the Southern African Institute of Mining and Metallurgy


E-mail:
. . . . . . . . . . . . . . . . . . . . . . . . . . . 429
Editorial Board
Johannesburg Advertising Representative Barbara
I.M.
R.M.S. Falcon
vi-vii
Typeset and by The Southern African Institute
of Mining and Metallurgy
iv
R.D. Beck
P.N.S.NdloC.MusingwiniH.MölR.MitrD.F.H.M.D.E.P.A.J.W.C.R.T.B.GencL.FM.DwR.DimitrDikgwatlheakopolous*orzanowski*alconJonesJoughinKinghornKlenamLodewijksMalana*lervuNeingoM.Nicol*S.S.NyoniM.PhashaP.PistoriusP.RadcliffeN.RampersadQ.G.ReynoldsI.RobinsonS.M.RupprechtK.C.SoleA.J.S.Spearing*T.R.StaceyE.Topal*D.Tudor*F.D.L.UahengoD.Vogt**InternationalAdvisory
Board members
S.O. Bada
Quality control of a two-stage coal washing process involves several complex components that need to be modelled accurately in order to enable autonomous control of the process. The primary objective was to develop a method to track the material through the washing process. This was achieved through a digital twin model of the Grootegeluk 1 coal processing plant, which has been successfully implemented. This information is used to control and set the processing medium densities for all 15 modules on the plant.
Novel ceramic composites produced from coal discards with potential application in the building and construction sectors by O. Eterigho-Ikelegbe, R. Trammell, and S.O. Bada 421
U.S. Copyright Law applicable to users In the U.S.A. The appearance of the statement of copyright at the bottom of the first page of an article appearing in this journal indicates that the copyright holder consents to the making of copies of the article for personal or internal use. This consent is given on condition that the copier pays the stated fee for each copy of a paper beyond that permitted by Section 107 or 108 of the U.S. Copyright Law. The fee is to be paid through the Copyright Clearance Center, Inc., Operations Center, P.O. Box 765, Schenectady, New York 12301, U.S.A. This consent does not extend to other kinds of copying, such as copying for general distribution, for advertising or promotional purposes, for creating new collective works, or for resale.
P.den Hoed
Editor /Chairman of the Editorial Board
The Green, The Bad and The Ugly: The Risks of Greenwashing
Published
PROFESSIONAL TECHNICAL AND SCIENTIFIC PAPERS
..............................................................................
The Journal of the Southern African Institute of Mining and Metallurgy VOLUME 122 AUGUST 2022 iii ◀
Co-firing of high-ash discard coal and refuse-derived fuel – ash and gaseous emissions by K. Isaac and S.O. Bada 451
Estimation of coal density using a 3D imaging system: RhoVol by F. Nakhaei, Q.P. Campbell, M. le Roux, and S. Botlhoko 443
Petrographic and geochemical characteristics of beneficiated metallurgical coal from the No.6 Seam, Tshipise sub-basin, Soutpansberg coalfield, South Africa by M.J.T. Sebola, G.R. Drennan, and N.J. Wagner 461
A technique based on 3D imaging system, called RhoVo, is introduced to determine coal washability curves. The main factors influencing the errors were identified and investigated. The results showed that this method fails to capture hidden concavities in the sample, leading to an overestimation of the coal particle volume. The difference between the RhoVol measurement and sink and float test results has led to several attempts to apply neural network (NN) and linear regression techniques to produce a fully reliable model for correction and estimation of coal density. The NN approach offers superior predictive capability over linear regression model and the estimated density distribution is in line with the sink and float analysis.
..............................................................
The petrographic and geochemical characteristics of beneficiated -1+0.25 mm samples from the Makhado Project are presented. The samples show strong caking properties, but further beneficiation is necessary to reduce the sulphur, alkali, and phosphorus contents to acceptable industry standards for hard coking Ccoal. Trace element and rare earth element concentrations on a coal ash basis are highly enriched relative to the crustal abundances showing them to be a promising source of rare earth elements.
Flotation of weathered coal discards using a HIP W/O emulsion binder and kerosene by P.M. Mashaba and S.O. Bada 437
The co-firing of discard coal with refuse-derived fuel (RDF) will utilize this abundant resource in South Africa and reduce the volume of waste dumped in landfill sites. The gaseous emissions and ash residues from the combustion and co-combustion of coal, two different RDFs, and coal/RDF blends were analysed. The propensity for slagging was found to be very low for the co-fired blends; the propensity for fouling decreased from high to medium range, and the co-combustion of RDF with coal showed a decrease in SO₂ emissions.
Production of Al(III)-K(I)-Ti(IV)-sulphate-containing leach liquor from metakaolinite-containing ash derived from South African coal fines by A.C. Collins, C.A. Strydom, R.H. Matjie, J.R. Bunt, and J.C. van Dyk ........................................... 473 South African discard coal fines K2 CO 3 blends were heated to produce ashes for H2 SO 4 leaching tests. The objective was to determine if the Al present in metakaolinite (Al2 O 3 .2SiO 2), the Al, K, and Ti in the aluminosilicate glasses, and the Ti in rutile (TiO2) could be selectively dissolved in H 2 SO 4. Based on the high dissolution efficiencies of Al and K, coal fines and its K2 CO 3 blends can possibly be utilized as feedstocks in the production of aluminium(III), potassium(I), titanium(IV), and sulphate-containing leach liquor. Environmental issues and high costs and coal fine volumes associated with the material handling and disposal will also be resolved.
This study was carried out to beneficiate weathered South African coal obtained from a discard dump. The calorific values of the as-received discard coal range from 8.48 MJ/kg to 20.94 MJ/kg. High internal phase water-in-oil HIW/OP emulsion was compared to kerosene in terms of the physico-chemical properties of the clean coal products. The highest increase in calorific value achieved was from 8.48 MJ/kg to 18.16 MJ/kg. Overall, it has been established that emulsion binders can upgrade discard coal dumped for many decades.
Coal has recently gone through a revival, with demand and prices internationally at levels not seen in years. It is obviously uncertain for how long this trend will persist, but it does illustrate the pitfalls of trying to forecast demand for fossil energy in times of uncertainty. It seems clear that coal as an energy source will be largely phased out in the medium to long term, but it is clearly in demand in the short term. In the meantime, a lot of work needs to be done to complete the transition to renewable energy, and this Journal issue addresses some of the impacts of coal mining that need to be addressed in the decarbonization journey. You will find several papers dealing with coal mine wastes. This is indeed a problem that has been building for years. Tens of millions of tons of coal discard and ultrafine coal are generated each year and stored in discard facilities that require long-term care. Re-purposing and recycling are potential solutions to this ever-growing problem and perhaps the investigations described in this Journal issue will lead to progress in this field. Some of these projects have been or are being funded by Coaltech in the realization by Coaltech members that a just transition requires innovative and sustainable solutions to mining impacts that have been generated over decades.
The Future of CoalJournalComment

▶ iv AUGUST 2022 VOLUME 122 The Journal of the Southern African Institute of Mining and Metallurgy
H.Lodewijks Coaltech Research Association

Powerful stuff! Set against the Whitman poem this scene really impacted me back in 1989 when I saw this movie for the first time. Whitman’s poem and the eloquent presentation thereof stayed with me throughout my life. I’ve always visualized my life as a verse in the ‘powerful play’ as evinced by the Whitman poem. When I researched the scene for this article, I found the movie clip on YouTube, and as I watched the scene start, I experienced a profound and incontrovertible truth - words and ideas still matter. As a young adult/teenager the question posed at the end of the scene, impacted my thinking and life profoundly. Yet, this time around the powerful opening words to the scene made me pause: ‘No matter what anybody tells you, words and ideas can change the world.’
Whitman a renowned American poet, essayist, and journalist, wrote the remarkable poem ‘O Me! O Life!’ in which he talks about the purpose of life. This famous poem was first published in 1867 during a time of quite dramatic technological change in the world. The poem speaks about the struggle of humanity and spotlights our struggle to understand the purpose of life. One could easily feel hopeless if you stop reading after the first verse. Whitman chooses a powerful metaphor in the concluding lines that follow the enigmatic second stanza, that merely reads: ‘Answer.’ Without hesitation Whitman chose not to leave the reader without hope. He chooses to tell us that we all matter. We all matter because we are here.
I.J. Geldenhuys President, SAIMM

The final word with a little help from WhitmanPresident’sCorner
‘That you are here—that life exists and identity, That the powerful play goes on, and you may contribute a verse.’ Whitman equates life and existence to a ‘powerful play,’ and that each person may contribute to this play. The 1989 movie Dead Poets Society features Robin Williams in the role of an enigmatic and passionate teacher. In one of the most memorable scenes, the character played by Williams, delivers the same Whitman poem to his students. And he concludes, in a near whisper: ‘What will your verse be? What will your verse be?’
Walt
From me, my final words in this role: Thank you!
The Journal of the Southern African Institute of Mining and Metallurgy VOLUME 122 AUGUST 2022 v ◀
It is coming full circle. As the President, I’ve shared many thoughts and ideas over the past year. It has been a privilege to write this article every month, despite the pressures of a monthly deadline amid a hectic schedule. The process was incredibly rewarding, allowing me to share ideas and words with readers. But more importantly, many, many people shared their ideas and words with me. I experienced the power of words and ideas first-hand and was frequently left in awe of the amazing volunteers that creates life within the Institute. The SAIMM has travelled a tough and challenging road over the past two years. But I see the green shoots emanating from the hard work of the SAIMM team, the volunteers, and the committees starting to appear. In-person events are back on the calendar, and it is with excitement that I look forward to going to a conference again. I think we all look forward to appreciating the things we took for granted before the pandemic.
Members continue to support the Institute with their time and talent, their words and ideas, and it is through these efforts that the Institute stands as a beacon of knowledge and professionalism. Through the power of words and ideas we change the world. I conclude this year with a deep appreciation and gratitude to all who contributed and continue to contribute to the SAIMM’s verse. Thank you for the support and feedback from all corners of the world, helping, guiding, and sometimes just supporting. It was an amazing privilege to serve the Membership over the past year and I know I can pass the torch to Zelmia with confidence and excitement as we celebrate the transition.
In June 2022 it was reported that Japan’s financial regulator intends to introduce measures, such as disclosure requirements, to oversee ESG products and curb greenwashing.
Ziyanda Sibeko Senior Associate


Pooja Dela Partner


Tobia Serongoane Associate from Webber Wentzel
The Green, The Bad and The Ugly: The Risks of Greenwashing
Greenwashing is the act of misleading the public about an organization’s environmental or sustainability practices or deceiving the public about how eco- (and ESG-) friendly a product or practice is Environmental or sustainability claims have been ‘greenwashed’ if they are vague, false, omit important information, or are misleading or deceptive. Greenwashing is a way to convince the public, such as customers, investors, or regulators, that an organization, whether a juristic person or the government, is making positive environmental or sustainability choices when this is not the case. This is often done through the use of ecoconscious buzzwords such as ‘environmentally friendly’, ‘reduced footprint’, ‘green’, and ‘sustainable’ in an effort to convince the public that the relevant product or practice is more natural, wholesome, or free of toxins than that of competitors, or that the organization involved is doing more for the environment or sustainability than it actually is.
Jared Ishmael Associate
In January 2022, the UK Advertising Standards Authority banned adverts by Oatly, the Swedish oat milk company, after it was found to have overstated claims about its environmental impact.
In early July 2022, it was reported that litigation has been instituted against Dutch airline KLM for alleged greenwashing in that the adverts promoting its sustainability initiatives are misleading.
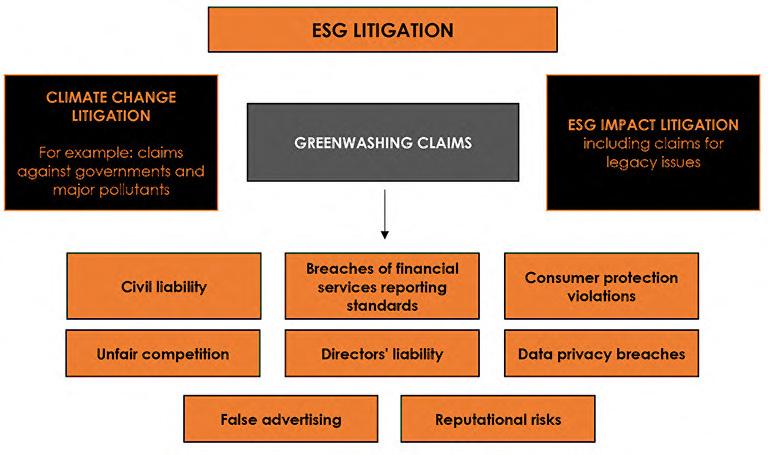
The need to combat greenwashing came under the spotlight at the United Nations COP26 Summit in November 2021, when it was highlighted that countries around the world are likely to see an increase in action being taken against organizations who greenwash. This is an additional area of potential risk that organizations are exposed to as they undertake their sustainability journeys (Figure 1).
Perhaps the best-known example of greenwashing is ‘Dieselgate’, the 2015 emissions scandal which resulted in action being taken against Volkswagen in several countries after it installed emissions-cheating devices in its vehicles. In 2022, several greenwashing cases have come to light which emphasize that organizations are increasingly facing risks because of greenwashing. These risks do not only arise in the environmental context. Companies may face claims as a result of greenwashing social and governance practices, too. For instance:
Merlita Kennedy Partner
Bernadette Lötter Senior Associate

On 31 May 2022, German prosecutors raided asset manager DWS and its majority shareholder Deutsche Bank following allegations of greenwashing. A whistleblower had claimed that DWS misled investors about ESG investments.
▶ vi AUGUST 2022 VOLUME 122 The Journal of the Southern African Institute of Mining and Metallurgy
Over the course of the next few months, we will be unpacking greenwashing risks in these contexts and highlighting the trends we are seeing in different sectors of the economy.
In early July 2022, HSBC’s global head of responsible investing, Stuart Kirk, resigned. He had been suspended in May 2022 after giving a presentation where he said that climate change was not a financial risk that should concern investors.
The South African public, like the rest of the world, has become hyper-vigilant about sustainability. Most of us have refused a plastic straw or swiftly placed an animal-tested product back on the shelf. As sustainability concerns grow, so does our desire to hold organizations to account, particularly if they are dishonest about their own sustainability practices.
Greenwashing may lead South African companies to face civil liability claims before the courts, criminal complaints, or a wide range of other regulatory complaints if their greenwashing is considered, for example, to amount to a breach of reporting standards, constitute false advertising, violate consumer protection laws, amount to unfair competition or constitute a breached of data privacy laws. The risks do not end there. It is possible that directors of companies will face personal consequences for failing to act in good faith or in the best interests of the company concerned. In the age of social media, it is probable that any allegations of greenwashing will receive local (and even international) airtime, also creating reputational risks for the organization involved.
◆ Figure 1
The message is clear: people are watching, and they demand accountability. The only way to avoid landing in hot water is to ensure that ESG reporting, and any environmental or sustainability-related statements made by an organization, are accurate and supported by objective and verifiable evidence.
South Africa currently has no laws or guidelines in force against greenwashing. Recent events have shown, however, that a shift in accountability standards is under way. For example, the JSE released its Sustainability and Disclosure Guidance in June 2022. Its aim is to assist listed companies with their ESG reporting by enabling more useful, consistent, and comparable sustainability disclosure to inform better decision-making and action. The guideline draws from and is aligned with international initiatives on sustainability and climate change disclosure. It guides organizations on what and how they should be reporting in line with international trends. Although the guideline states that it does not constitute disclosure or reporting obligations pursuant to that of the JSE Listings Requirements – and therefore noncompliance does not amount to a breach – its release is an indication of what the public expects from organizations in terms of environmental and sustainability reporting. It is in this context that the risk of greenwashing becomes apparent. The public wants organizations to do more for the environment and sustainability, but to do so honestly.
The Journal of the Southern African Institute of Mining and Metallurgy VOLUME 122 AUGUST 2022 vii ◀
School of Chemical and Metallurgical Engineering Upcoming short courses Foundry Methods: Design and Simulation: 24-25 October 2022 Engineering Failure Analysis: 31 October-4 November 2022 Coal courses Contact: Prof Josias van der Merwe 083 651 Josias.vandermerwe@wits.ac.za8238


Email: eterighoo@gmail.com
Dates: Received: 25 Jan. 2022 Revised: 19 May 2022
Journal of the Southern African Institute of Mining and Metallurgy, vol. 122, no. 8, pp. 421 428
utilization, composites, chemical resistance, circular economy.
421The Journal of the Southern African Institute of Mining and Metallurgy VOLUME 122 AUGUST 2022
by O. Eterigho-Ikelegbe1, R. Trammell2, and S.O. Bada1
Coal is a relatively low-cost source of energy that has contributed enormously to global economic development. The mining and processing of coal in the industrialized and developing countries has led to the production of billions of tons of coal discard. With coal meeting about 77% (http://www.energy. gov.za) of the energy needs in South Africa, coal production will likely remain significant, at least for the foreseeable future. According to the website, about 60 Mt coal waste are produced each year, adding to an already accumulated surplus of 1 Gt. These coal discards heaped on arable land or retention ponds could pose enormous environmental hazards such as spontaneous combustion if not properly managed. Most of these dumps are known to contain low- to high-quality rich inorganic-organic compounds, depending on the source. Although some coal discard dumps can be beneficiated to yield clean coal, the process could be somewhat unattractive when the age of the coal is taken into consideration. Other factors that are considered are the degree of oxidation or weathering of the coal, the potentially high cost of treatment, and the subsequent generation of discard after beneficiation.
Affiliation:
Correspondence to: O. Eterigho-Ikelegbe
Accepted: 22 Jun. 2022 Published: August 2022
DOI
How to cite: Eterigho-Ikelegbe, O., Trammel, R., and Bada, S.O. 2022
Novel ceramic composites produced from coal discards with potential application in the building and construction sectors
coalKeywordsindustry.discard,waste
Introduction
A panoply of innovative research on the beneficiation of South Africa´s coal discard into alternative products exists in the literature. Tambwe, Kotsiopoulos, and Harrison. (2020) demonstrated the laboratory-scale heap leaching potential of pyrite from sulphidic coal discard to reduce its risk of disposal. Nevertheless, the process still leaves behind desulphurized coal discard as waste. The combustion of SA coal discard in a circulating fluidized bed (CFB) boiler was demonstrated and reported by Belaid et al (2013). Due to the similar combustion profile of the co-combustion of 70% coal discard and 30% refusederived fuel compared to 100% coal, Isaac and Bada (2020) proposed that the blend could be considered an alternative fuel for use in existing pulverized boilers. The use of different South African coal discards to produce activated carbon as porous adsorbents for natural gas storage was reported by Abdulsalam et al. (2019; 2020). Amaral Filho et al. (2020) demonstrated that low-sulphur ultrafine coal discard fabricated topsoil outperformed native soil for rehabilitating coal mine sites. Despite the numerous
InSynopsisresponse
to the enormous amounts of coal discard generated during coal mining and preparation, the development of an efficient and sustainable strategic use of this resource is essential. Furthermore, the rising urban population over the next decades is confronted with the depletion of quality raw materials for building components. To this end, this study reports new information on the morphology, water absorption, and flexural strength properties of ceramic composites produced from three different coal discards and polysiloxane pre-ceramic polymer (PCP) resin. In addition, test results relating to the continuous operating temperature, chemical resistance, and efflorescence potential of the composites are presented. The results show that the water absorption and flexural strength of the coal composites, up to 1.94% and 36.46 MPa respectively, exceed the requirements for ceramic and clay roof tiles. The continuous operating temperature of composites is found to be more thermally stable than conventional roofing tiles (concrete and ceramic) between ambient temperature and 600°C. In addition, the excellent chemical resistance of the composites (94.43%−99.98%) compared to conventional roofing tiles (67.82%−99.97%) eliminates the need for additional external coatings. The interesting results documented so far suggest that this technique could be used to produce low-temperature application building products such as bricks, panels, roofing tiles, etc. This new recycling technique offers an excellent opportunity to eliminate enormous volumes of coal discard and to advance the circular economy in the coal
Novel ceramic composites produced from coal discards with potential application in the building and construction sectors
1DSI-NRF SARChI Clean Coal Technology Research Group, School of Chemical & Metallurgy, Faculty of Engineering and the Built Environment, University of the Witwatersrand, South Africa. 2Semplastics, United States.
SecundaConference,Society,SouthernThis6384-7741https://orcid.org/0000-0001-O.1079-3492https://orcid.org/0000-0002-S.O.ORCID:9717/2001/2022http://dx.doi.org/10.17159/2411-ID:BadaEterigho-IkelegbepaperwasfirstpresentedattheAfricanCoalProcessingBiannualInternationalCoal12-14thOctober2021,

Novel ceramic composites produced from coal discards
An article by Haywood et al. (2019) calls for the introduction and use of mineral waste into the South African economy. The author reported that the secondary utilization of mining waste is a preferred choice over waste disposal. In a sense, it opens the door to value creation, sustainable development, and reducing the responsibilities associated with the waste stream. Globally, the repurposing of coal discard aligns with the concepts of waste valorization, the circular economy, and sustainability. In this context, it could be considered a practical solution to pollution problems caused by coal discard dumps. To this end, among the potential re-use strategies of South African coal discard, for the first time, Eterigho-Ikelegbe, Trammell, and Bada. (2021) reported on the density, porosity, compression strength, pyrolysis shrinkage, etc. of coal composites produced from South African coal discard and a polysiloxane preceramic polymer (PCP) resin. PCPs are known to convert into thermoset polymers and Sibased ceramics upon crosslinking and pyrolysis, respectively. The polysiloxanes (R1R2SiO)n, contains –Si–O– as the basic backbone or inorganic network with various side reactive and/or inert groups on the Si atom site. These polymers are ideal precursors for producing SiCO bulk ceramic, coatings, foams, energy storage materials, ceramic fibres, and ceramic matrix composites (Bernardo et al., 2014; Wen et al., 2022; Wen, Yu, and Riedel 2020).
ongoing investigations on coal discard utilization, it is worth mentioning that these approaches would not fully utilize the over 1Gt of coal discard in South Africa.
422 AUGUST 2022 VOLUME 122 The Journal of the Southern African Institute of Mining and Metallurgy
Experimental Materials and method
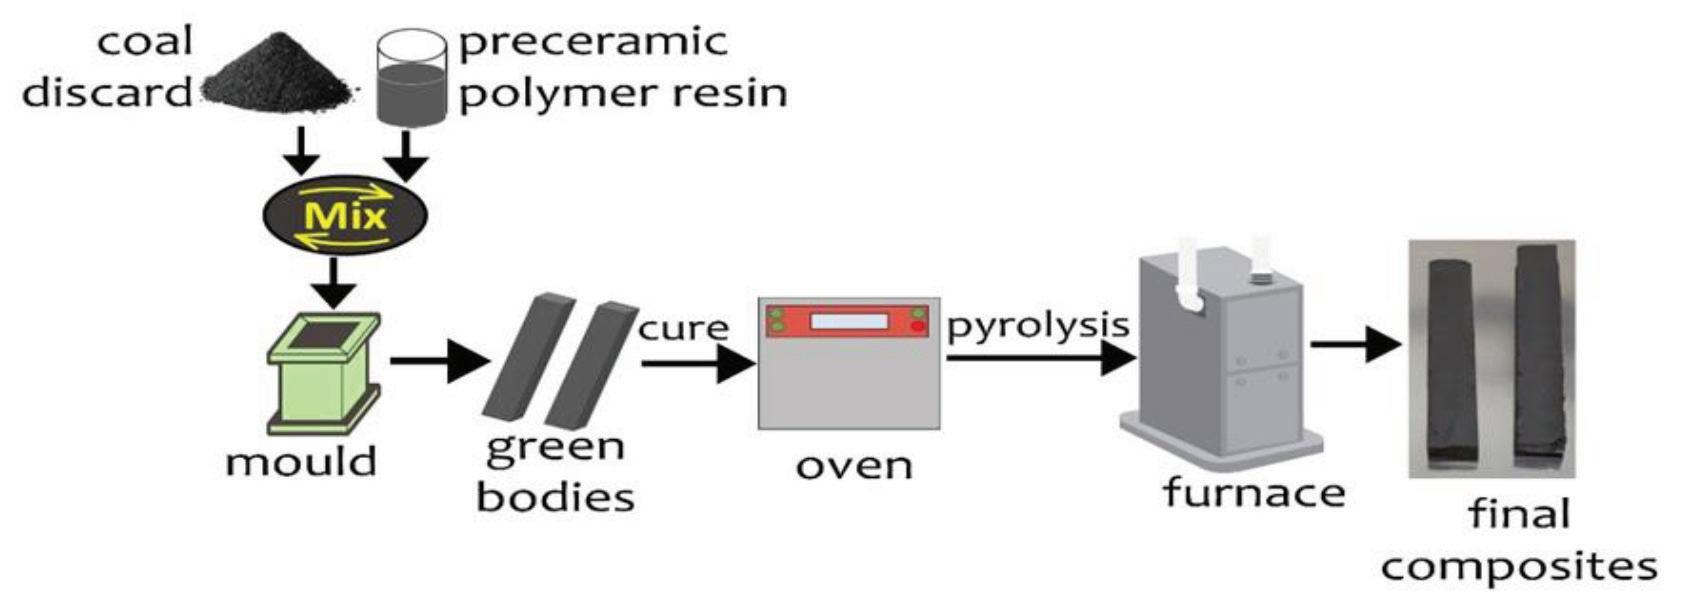
Three coal discards were selected which were sourced from the Witbank coalfield and the KwaZulu-Natal coal area. The coal discards are denoted GTS (Greenside tailing slurry), PCD (Proteas coal discard), and LCS (Likeflow coal slurry). A specially formulated PCP resin by XMAT®, the Advanced Materials Division of Semplastics, Florida, USA was used as a binder to develop the coal composites. The as-received coal discard lumps were crushed and pulverized to about 80% passing 45 μm. The coal particles were thoroughly mixed with the PCP resin, after which the mixture was pressed to 6.89 MPa in low-cost rectangular moulds. The moulds are machined steel with a smooth matte finish, and a PTFE release film used to line the mould was in direct contact with the material being pressed. The processing of the coal composites occurred in two stages – curing and pyrolysis. The moulded bodies were cured to about 120°C in an oven to harden and fuse the resin and the coal particles. During cross-linking, the functional groups in the PCP and coal particles presumably undergo a series of reactions – condensation and combination reactions. After curing, the cured bodies were pyrolysed in a furnace under a nitrogen flow at 236 mL/min up to 1000°C for 10 hours. The pyrolysis step facilitates the molecular and chemical interactions between the PCP and the coal constituents. In parallel, the elimination of some volatile and hydrogen species occurs during pyrolysis, thereby converting the cured bodies to ceramic-like composites. A schematic of the production process of the coal composites is depicted in Figure 1.
Characterization of coal discard and coal/ceramic composite
➤ Proximate analysis was conducted using approximately 1 g of each sample in a thermogravimetric analyser (TGA701, LECO Corp., USA) according to ASTM D5142.
➤ Carbon and sulphur contents were obtained using a LECO SC-132 analyser (LECO Corp., USA) following the ASTM D4239 standard.
The following techniques were used to characterize the coal discard and the produced coal composites.
➤ The morphology of the composites was observed under a Zeiss Sigma 300 VP scanning electron microscope (CarlZeiss, Germany).
Figure 1—Schematic of coal/ceramic composites production
➤ A bench-top energy-dispersive X-ray fluorescence (EDXRF) elemental analyser (NEX QC+ QuantEZ) was used to semiquantitatively determine the major and minor elements of the coal discard.
By blending a suitable coal discard dump of about 1Mt with a known quantity of PCP resin, following heat treatment, structural coal composites could be produced without generating secondary waste. Whereas with the washing of this discard dump and cofiring with biomass, additional wastes like flyash and discard are generated.Inthis article, we report new scientific information on the morphology, water absorption, and flexural strength of the produced coal composites. Furthermore, the continuous operating temperature, chemical resistance, and efflorescence potential of the coal discard composites are presented. Some of the results obtained are then compared with those of standard building materials (concrete and ceramic roof tiles). The performance of the coal composites produced in this study in terms of their temperature resistance up to 600°C and chemical resistance equivalent to ´thermal stability and durability´, respectively, would be of great interest to the building/construction and coal industries. These results suggest the prospect of repurposing South African coal discard to produce ceramic composites for building/construction purposes.
Hydrogen 3.24 1.64 3.67
P 0.31 0.00 0.43
The coal discards differ widely and exhibit different chemical compositions due to the diversity of the coal sources (Table I).
• Lactic acid solution (5 % V/V)
S 3.95 3.94 8.07
Novel ceramic composites produced from coal discards
Total carbon 56.7 51.40 68.55 40 42.70 44.05
➤ The X-ray diffraction patterns of the powdered coal composites were recorded using a Bruker D2 phaser diffractometer (Bruker Corp., Germany). X-ray source Cu K radiation ( =1.54184 Å) operating at 30 kV and 10 mA was used to scan the sample through a range of 2q angles from 10° to 70°.
Results and discussion
V 0.29 0.15 0.52
Zr 0.08 0.07 0.14
Table II
➤ The efflorescence potential of the coal composites was evaluated according to the ASTM C67 standard test method for structural clay tiles.
Parameters GTS PCD LCS GTS PCD LCS (wt.%, a.d.) composite composite composite
LOI 45.56 47.78 42.46
Ca 5.21 3.51 7.89
Sr 0.23 0.18 0.61
423The Journal of the Southern African Institute of Mining and Metallurgy VOLUME 122 AUGUST 2022
N)].Table
Al 10.02 10.01 9.08
Pd 0.41 n.d. 0.64
Ba 0.12 0.10 0.11
• Hydrochloric acid (18 % V/V)

Ti 1.72 1.18 2.89
• Citric acid solution (100 g/L)
➤ Measurement of water absorption and flexural strength of the composites is described in Eterigho-Ikelegbe, Trammell, and Bada (2021).
• Ammonium chloride solution (100 g/L)
Fe 9.92 6.96 9.32
by S and Ca in varying quantities. Although the coal discards have similar contents of Al, they differ widely in Si content. This variance is the first evidence of potential differences in the curing and pyrolysis activity of the three coal/PCP blends. Of the coal discards, PCD possesses the highest amount of Si and Al combined (33.57%), followed by GTS (29.67%) and LCS (24.76%). The abundance of Si and Al, especially for PCD2, depends largely on the silica minerals (mostly quartz) and aluminosilicates (especially kaolinite) associated with coal (Huggins, 2002; Mishra et al., 2016). Due to the refractory nature of quartz PCD, with the highest content of Si (23.56%) will degrade at relatively high temperatures compared with GTS and LCS, which contain less Si. The alkali and alkaline earth (K + Ca) metal content in the coal discard average 7.27%, 5.68%, and 9.37% for GTS, PCD, and LCS respectively, and are related to the feldspar species in the discard. Feldspar-containing coal discard could promote the formation of the glassy or vitreous phase (Nicolas et al., 2020) with the PCP resin during pyrolysis of the mixture. This reaction is important for the densification of coal composites during pyrolysis. Table II presents a summary of the physicochemical properties of the coal discard and coal composites. The ash content of PCD (39.76%) compared with GTS (30.69%) and LCS (15.57%) infers that PCD contains a significant amount of refractory and incombustible minerals. It is anticipated that this property might cause PCD to be weakly reactive and thus lead
Fixed carbon 43.42 45.31 56.74 41.04 45.23 54.87
Ash content 30.69 39.76 15.57 56.22 52.67 42.41
[1]
The major and minor element content of the coal discards Element GTS PCD LCS (wt.%, a.d.)
K 2.05 2.17 1.48
Others 0.38 0.25 0.49
a.d.: air-dried; n.d.: not detected; LOI: loss on ignition
Volatile matter 22.57 10.67 23.72 1.78 1.50 2.03
The data presented in Table I shows in quantitative terms that the coal discards contain predominantly Si, Al, and Fe followed
Oxygen 6.46 2.99 7.22
Properties of the coal discard samples
where W1 and W2 are the weights of the composites before immersion and after drying, respectively.
➤ The thermogravimetric analyser was used to estimate the continuous operating temperature of the composites. For the analysis, 1 g of chunk composites were heated in an air atmosphere from room temperature to 950°C at a ramp rate of 10°C/min.
➤ The resistance of the coal composites to different analytical reagent grade chemicals was evaluated according to ISO 10545-13 for ceramic tiles. The dried composites were immersed in glass bottles containing the chemical for 17 days at ambient temperature and kept covered to minimize evaporation. The chemicals used were
After immersion, the composites were washed with running water and dried in an oven at 105°C to a constant weight until the difference between two successive weighings was less than 0.1 g. The chemical resistance of all the composites was measured in terms of weight loss (WL) using Equation [1].
• Potassium hydroxide solution (100 g/L and 30 g/L)
Physicochemical properties of the coal discard and coal composites
Total sulphur 0.94 0.65 0.97 0.61 0.33 0.26 a.d.: air-dried; H: Hydrogen; C: Total carbon; O: Oxygen by difference [100 - (M + Ash + S + H + C + I
Si 19.65 23.56 15.68
Cr 0.10 0.15 0.20
to a weak bonding interaction between PCD and the PCP resin during pyrolysis. The volatile matter of PCD (10.67%) and LCS (23.72%) infers that PCD and LCS might originate from lean anthracite coal and medium-volatile bituminous coal, respectively (Eterigho-Ikelegbe, Trammell, and Bada 2021). Compared to PCD, higher volatile matter coal discards (GTS and LCS) could have a positive influence on the reactivity of the mixture during pyrolysis and ultimately on the final properties of the composites. From an environmental, scalability, and cost perspective, this straightforward technique is attractive because the coal discard does not require beneficiation before utilization to produce the composites. In addition, the carbon within the coal discard is retained in the composites, as seen in Table II.
424 AUGUST 2022 VOLUME 122 The Journal of the Southern African Institute of Mining and Metallurgy
Visualization of the surface morphology of the composites (Figure 2) shows that there is a relationship between the physiochemical properties of the coal discards presented in Table II and the surface smoothness of the coal composites.
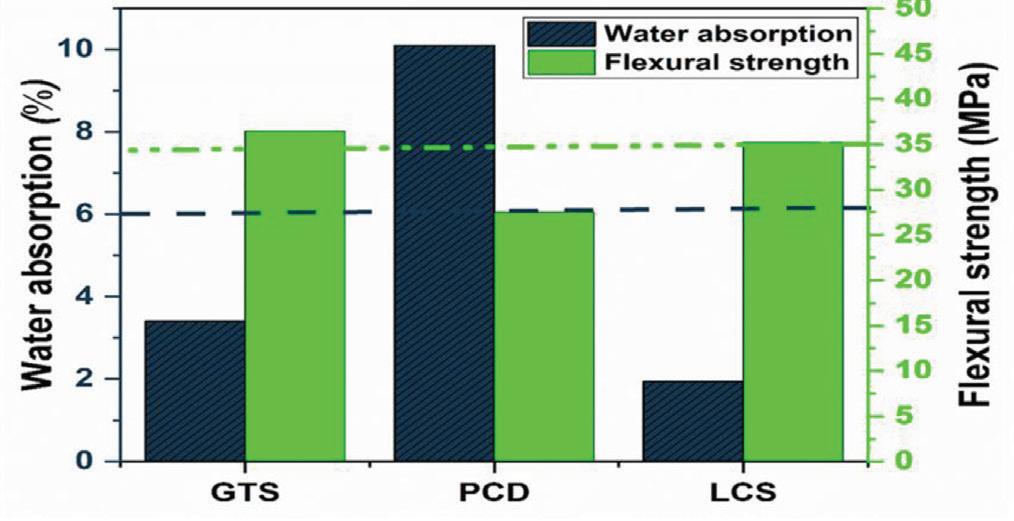
Figure 3—Water absorption and Flexural strength properties of the com posites. (Dotted lines represent the standard cut-off)
Morphological characterization of the coal composites
Flexural strength and water absorption properties High-quality coal composites proposed for use as building materials must be able to satisfy specifications for flexural strength and water absorption. Flexural strength is a parameter used to determine the strength requirement for building materials. For example, ISO 15045-4 specifies that the minimum average flexural strength for ceramic tiles should be 35 MPa. Three flexural tests were performed on each composite and the mean values are presented in Figure 3. It can be seen from the figure that PCD composites failed to meet the ISO requirement. However, the flexural strength of GTS and LCS composites, 36.46 MPa and 35.23 MPa respectively, exceeding the 35 MPA requirement for ceramic tiles.A water absorption test provided valuable information on the degree of compactness of the composites. Based on the standard for clay roof tile, the water absorption must not exceed 6% (ASTM C1167; ASTM C373; Taha et al., 2017). Figure 3 shows that the GTS (3.4%) and LCS (1.94%) composites recorded lower water absorption compared to PCD composites (10.1%). In general terms, the GTS and LCS composites with water absorption that meets the ASTM C1167 standard displayed higher strength. This trend is similar to observations by other researchers (Phonphuak and Thiansem, 2011; Rahman et al., 2015; Yagüe et al., 2018).
Figure 2—Scanning electron microscopy images of (a) GTS composites (b) PCD composites (c) LCS composites
Novel ceramic composites produced from coal discards
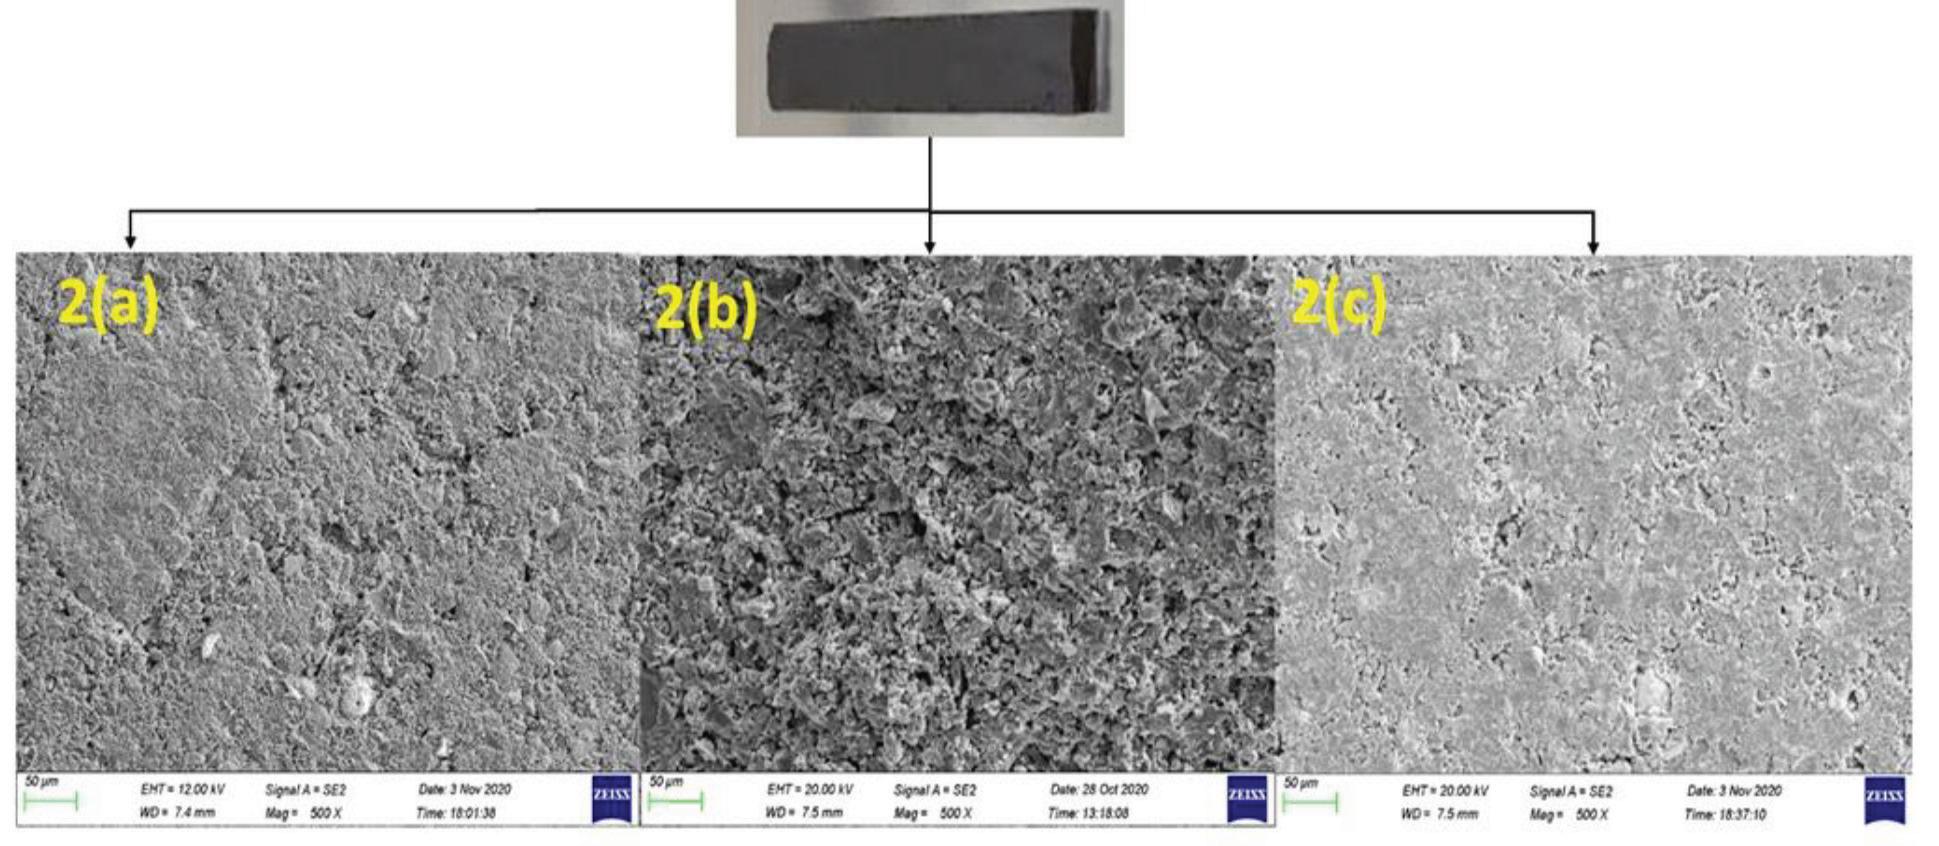
From Figure 2 it appears that the surface of GTS and LCS composites is smoother than that of PCD composites. The surface unevenness and lack of fusibility of PCD composite might be related to the physicochemical properties of the coal discard, in particular the oxygen content. As stated in (Table II), GTS and LCS discards recorded higher oxygen contents compared to PCD. Based on this, it is likely that GTS and LCS are weathered coals and contain a significant amount of oxygen functional groups (Gao et al., 2017; Jian et al., 2019; Nicolas et al., 2020). It could also suggest that GTS and LCS discards likely contain more vitrinite (reactive macerals) whose chemical structure is generally characterized by a relatively high oxygen content compared to other maceral groups (Whitehurst, 1978; ICCP, 1998; van Niekerk, 2008; Roberts, 2015). Based on this, it is possible that coal discard with significant vitrinite maceral and oxygen functional groups, especially if the groups are polar such as -OH and -COOH, could have enhanced reactivity (Jian et al., 2019; Ahamed et al., 2019) with the PCP during the curing and pyrolysis stages of the blend. This phenomenon might be responsible for the good fusibility and smooth surfaces of these composites (GTS and LCS). In summary, since the major raw material of the blend is coal discard, to produce composites of satisfactory fusibility and low surface
roughness it is deemed necessary to select coal discard with a significant oxygen content for this process.
The weight loss data for the composites at 900°C and the temperature at 5% weight loss (T5%) extracted from the thermograms are presented in Table III. The T5% values of the coal/ceramic composites are slightly higher than for the conventional roofing tiles, confirming their superiority, and that thermally stable structures were indeed formed. Furthermore, the percentage weight loss of the composites is comparable with that for the conventional materials after being subjected to thermal degradation up to 900°C, with PCD displaying the highest degradation of 13%.
Figure 5—(a) Weight loss curves (b) DTG curves of coal discard composites and conventional roof materials
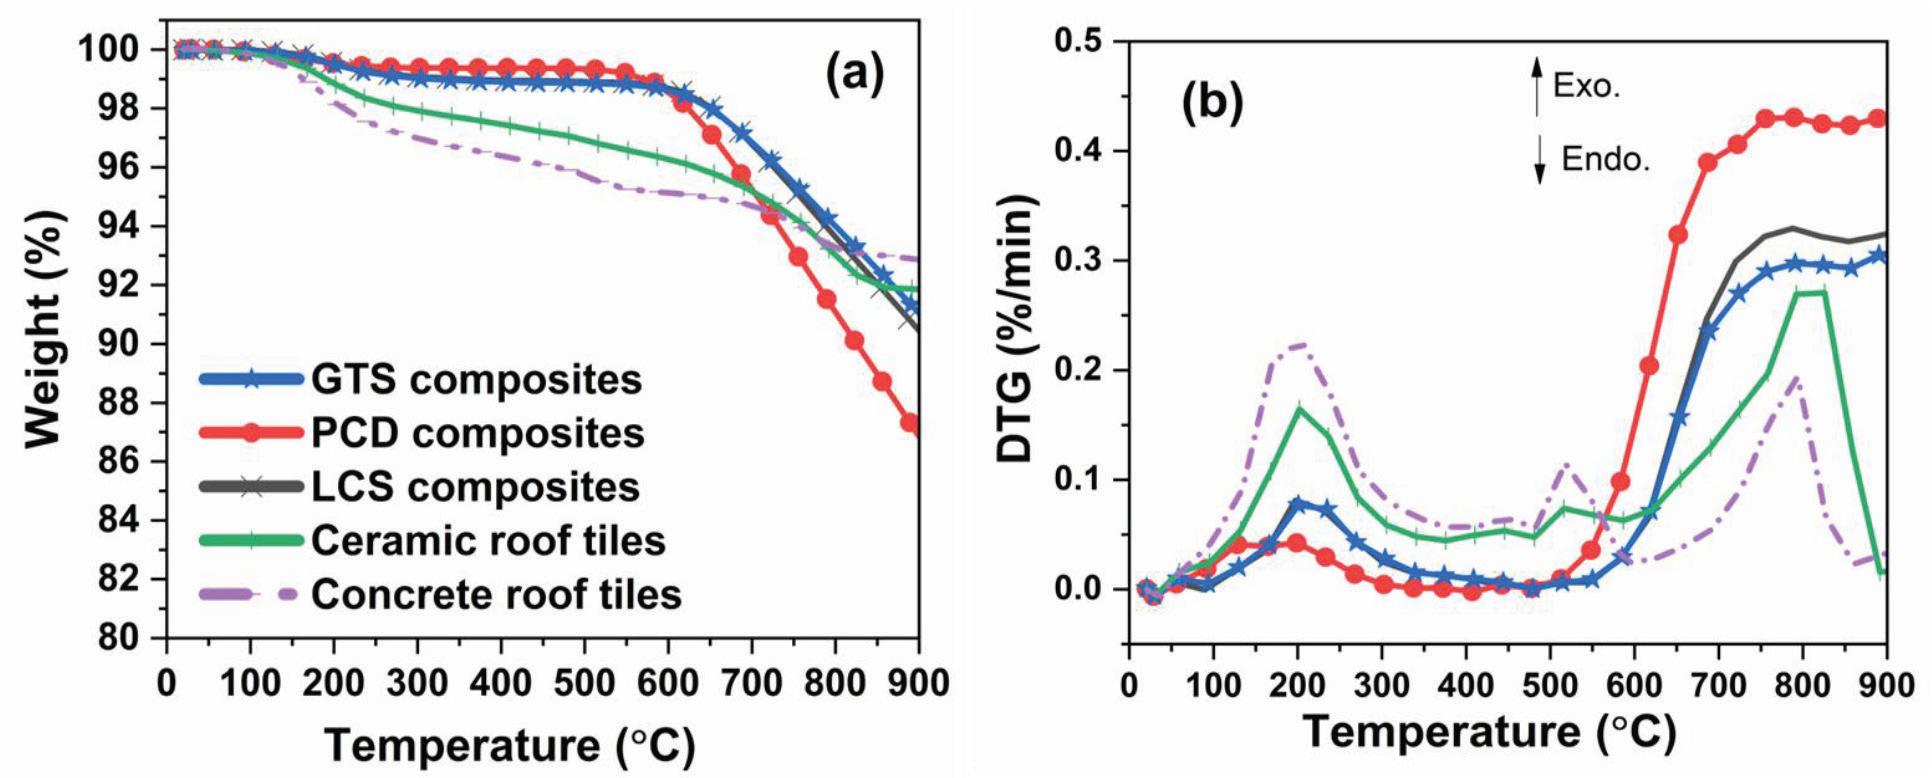
Weight loss in all the samples occurred in two separate stages. No significant change in weight was noted between 25 °C and 125°C, whereas above 125°C a pronounced degradation in the molecular structure of the conventional roof tiles is observed compared to the coal composites. The peaks at 200°C (Figure 5b) indicate that the coal composites contain fewer volatile compounds then the conventional materials. This observation agrees with the data presented in Table II. Of the three composites, PCD composites possessed the lowest volatile matter after devolatilization. The coal composites are also noted to be more stable up to 600°C, with about 99% of the original mass of the composites remaining (Figure 5a). It can be deduced that the compact structure of GTS and LCS composites, as confirmed by their low water absorption values, might be responsible. In addition, the ceramic phases formed during pyrolysis could also have contributed to the heat-resistant nature of the composites up to 600°C. The dramatic weight loss experienced by the PCD composites above 600°C (Figure 5a) could be a result of a loosely compacted structure/bonding as explained under the morphological characterization section.
425The Journal of the Southern African Institute of Mining and Metallurgy VOLUME 122 AUGUST 2022
Overall, the results demonstrate that the coal composites are superior to conventional roof tiles at temperatures up to 600 °C. The thermal degradation in this range indicates the suitability of the composite as building materials such as roof
Novel ceramic composites produced from coal discards
Continuous operating temperature
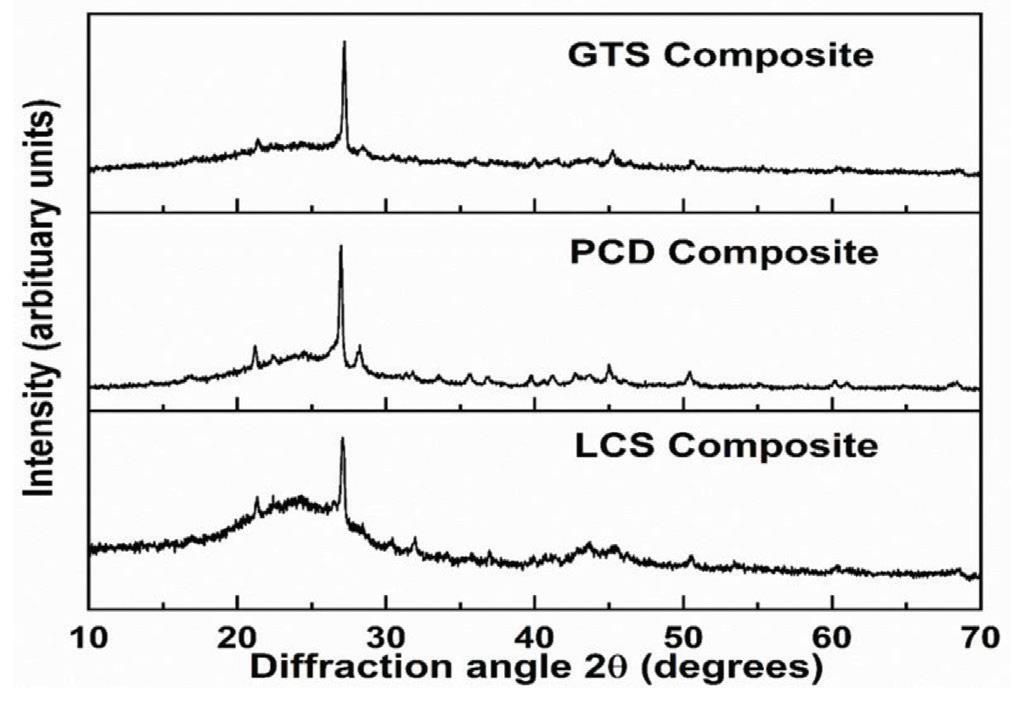
Composites GTS and LCS, which meet the required ASTM C1167 standard for water absorption, may have more compact structures. This could be used as a good indicator for predicting the durability of the composites in terms of efflorescence and frost resistance (Eliche-Quesada et al., 2011; Makarov, Suvorova, and Masloboev, 2019). The superior water absorption and flexural strength properties of GTS and LCS composites over PCD composites can be explained based on the studies by Hu et al. (2017) and Hill and Easter (2019). These authors reported that the molecules of low-ranked or weathered coals are rich in hydrogen bonds that could easily be broken to form hydrogen bonds with other materials. As stated previously, the hydrogen content of the PCD (1.64%) reflects that this coal discard might contain a low amount of hydrogen-bonded structures required to form adequate interactions with the PCP resin during pyrolysis. Furthermore, it has also been reported that hydrogen bonding probably accounts for the glassy properties of coal (Painter, Sobkowiak, and Youtcheff, 1987, Painter 2010). Therefore, the ability to generate a glassy phase during pyrolysis would enhance the fusibility and compaction of the mixture. Hence, LCS composites conforming well with the ASTM C1167 standard specification might be a result of the glassy phase formed during the pyrolysis of LCS coal discard and the PCP resin. This is evidenced in the broad hump around 2q = 24° of the XRD patterns of the composites (Figure 4). Taha et al. (2017) reported that the formation of the glassy phase had a positive effect on the mechanical strength of ceramic composites produced from coal.
The extent of the degradation of 1 g chunk coal composites heated in a thermogravimetric analyser under an air atmosphere from 25°C to 900°C until constant weight loss is depicted in Figures 5a and 5b. As with sintered ceramic, polymer-derived ceramic or ceramic composites produced from PCP resins are notable for displaying high heat resistance (Ionescu et al., 2010; Ding et al., 2012; Fonblanc et al., 2018; Shen, Barrios, and Zhai, 2018). Therefore, it was anticipated that the composites produced in this study would display appreciable heat resistance.
Figure 4—XRD patterns of the composites
Table III
426 AUGUST 2022 VOLUME 122 The Journal of the Southern African Institute of Mining and Metallurgy
tiles, bricks, or panels. In addition, the impressive resistance of the composites to degredation at temperatures up to 600°C could be considered a desirable property for fire-resistant construction materials.
Table IV provides valuable information on the compatibility of the coal composites in different chemical environments. The results show that the composites were moderately affected by base solutions and least affected by acid solutions. This indicates that the bonds of the coal composite structure are more resistant to attack or diffusion of Cl and H+ ions than OH ions. In contrast, conventional roofing materials displayed limited resistance to acidic solutions, as indicated by high level of deterioration in terms of weight loss.
Lactic acid (5 % V/V) 98.02 97.46 99.26 79.83 82.84
Chemical resistance (%)
KOH (100 g/L) 94.43 94.57 97.95 99.97 99.54
HCl (18 % v/v) 97.76 97.22 99.21 71.05 67.82
Table IV
GTS PCD LCS Ceramic roof tile Concrete roof tile
Summary of data extracted from the weight loss curves (Figure 5a)
Data/ GTS PCD LCS Ceramic Concrete Composites roof tiles roof tiles T5% (°C) 765.0 706.3 757.0 704.6 671.0 Weight loss at 900°C (%) 8.9 13.0 9.4 8.1 7.1
Novel ceramic composites produced from coal discards
Citric acid (100 g/L) 99.74 98.44 99.41 72.88 77.68
The ability of the coal composites to resist degradation or physical corrosion caused by chemical media attacks is of paramount importance. To confirm this, the composites were exposed to different chemical reagents for 17 days to evaluate their chemical resistance (Figure 6).
NH₄Cl (100 g/L) 99.92 98.77 99.38 96.83 90.65
Chemical resistance performance of coal composites and conventional roof tiles Medium/Composites
Figure 6—Coal composites and conventional roof tiles (CC = Concrete; CE = Ceramic) exposed to different chemicals. (a) citric acid (b) potassium hydroxide (c) ammonium chloride (d) lactic acid solution
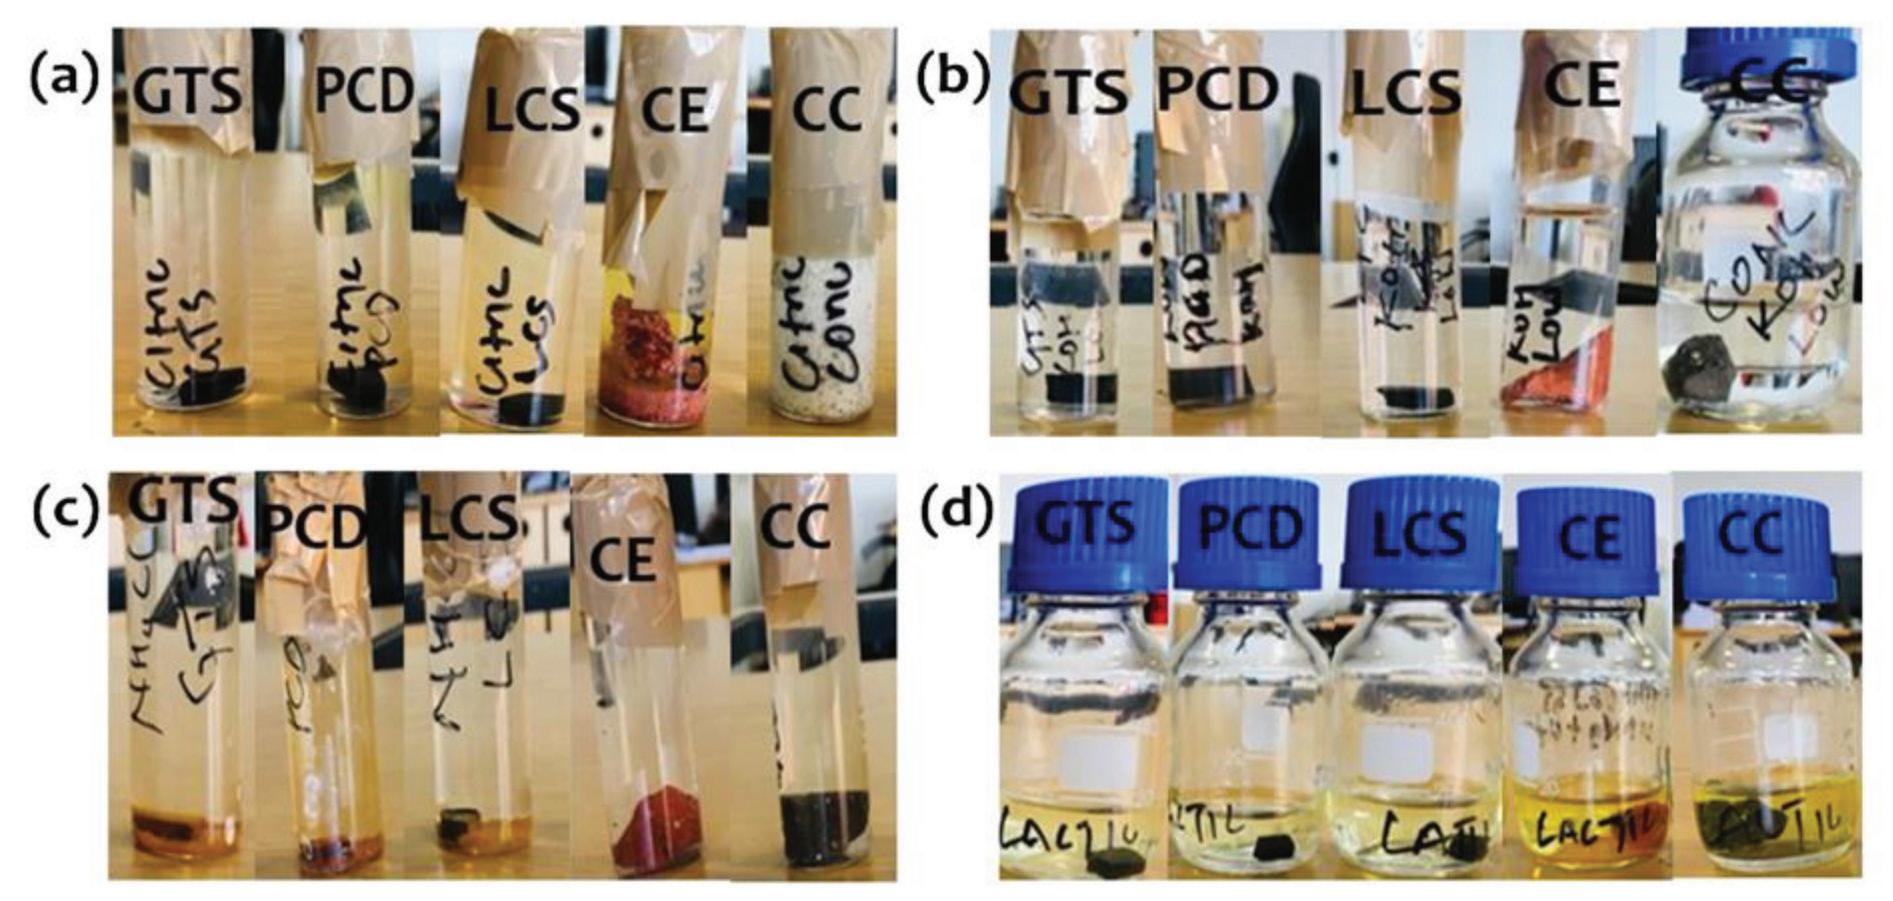
Interestingly, the chemical resistance of the coal composites can be correlated with the amorphous nature of the composites (XRD spectra in Figure 4). This amorphous peak, which was attributed to the presence of glassy-like structures (EterighoIkelegbe, Trammell, and Bada, 2021), is more noticeable in LCS composites. The amorphous nature of LCS composites could have been responsible for the unprecedented chemical stability (99.21% –99.98%) compared to GTS and PCD composites. Furthermore, we recorded the porosity of GTS, PCD, and LCS composites to be 7.22%,17.08%, and 3.44%, respectively (Eterigho-Ikelegbe, Trammell, and Bada, 2021). Therefore, composites with porosities that meet the ASTM C1167 standard may have restricted chemical absorption. Thus, in addition to the porosities of GTS and LCS composites that meet the ASTM C1167 standard, the stabilized bond network of these composites (as mentioned earlier) possibly serves as a protective mechanism against weight loss caused by chemical attack. The results mean that little to no chemical activity took place at the material-solution interface during immersion in the solutions, making the composites ideal for longlastingEquallyperformance.important, the physical appearance and colour changes of the reagents at the end of the test validated the superiority of the coal discard composites to chemical attack. It was observed that the colourless chemical solutions remained unchanged after testing. In terms of the physical appearance of the composites, we observed no surface damage or visual corrosion effects. In contrast, the conventional roof materials formed solid sediments, and the appearance of the clear, colourless chemical solution altered, especially the acid solutions. Admittedly, the composites must be checked to see whether they retained their mechanical strength, water resistance absorption, and thermal
Chemical resistance
KOH (30 g/L) 95.79 96.55 99.98 99.45 99.39
Bernardo, E., Fiocco, L., Parcianello, G., Storti, E., and Colombo, P. 2014. Advanced ceramics from preceramic polymers modified at the nano-scale: A review. Materials, vol. 7. pp.1927–1956. https://doi.org/10.3390/ma7031927
The authors wish to thank the Advanced Materials Division of Semplastics, X-MAT®, for developing the coal composite specimens. This research was funded by the Department of Science and Innovation National Research Foundation (DSI-NRF) South African Research Chairs Initiative (SARChI) Clean Coal Technology Grant (Grant Number: 86421).
Eterigho-Ikelegbe,clay.2011.03.003 O., Trammell, R ., and Bada, S. 2021. Preparation and characterization of ceramic composites from South Africa coal discard. Construction and Building Materials, vol. 302. p. 124164. https://doi.org/10.1016/j.
Acknowledgments
Eliche-Quesada, D., Martínez-García, C., Martínez-Cartas, M.L., CotesPalomino, M.T., Pérez-Villarejo, L., Cruz-Pérez, N., and Corpas-Iglesias, F.A. 2011. The use of different forms of waste in the manufacture of ceramic bricks. Applied Clay Science, vol. 52, no. 3. pp.270–276. https://doi.org/10.1016/j.
This study provides additional information on the properties of coal ceramic composites produced using South African coal discard and a polysiloxane PCP resin. The composites displayed excellent resistance to different chemical solutions, are stable at operating temperatures up to 600°C and contained no soluble salts. As regards suitability for blending with polysiloxane PCP resin, high-ash and quartz-rich coal discard (PCD) was deduced to be only weakly reactive until a relatively high temperature is achieved. This resulted in composites with weak molecular bonding. On the other hand, GTS and LCS coal discard formed composites of good quality that meet building material standards. Coal/ceramic composites that meet or/and exceed building material requirements may also be obtained by investigating other coal discard stockpiles in South Africa and PCP resins. The interesting properties of the coal composites reported in this study indicate that this innovative approach could bode well for avoiding the environmental impact of coal discard and for producing environmentally friendly composite materials for construction applications.
Experimental evaluation of activated carbon derived from South Africa discard coal for natural gas storage. International Journal of Coal Science & Technology, vol. 6, no. 3. pp. 459–477. https://doi.org/10.1007/s40789-019-
test methods for determination of water absorption and associated properties by vacuum method for pressed ceramic tiles and glass tiles and boil method for extruded ceramic tiles and non-tile fired ceramic whiteware products. https://www.astm.org/c0373-18.html [accessed 24 January 2022].
South African coal discards. ACS Omega, vol. 5, no. 50. pp.32530–32539. https:// Abdulsalam,doi.org/10.1021/acsomega.0c04744J.,Mulopo,J.,Oboirien,B., Bada, S. and Falcon, R. 2019.
Ding, D., Zhou, W., Zhou, X., Luo, F., and Zhu, D. 2012. Influence of pyrolysis temperature on structure and dielectric properties of polycarbosilane derived silicon carbide ceramic. Transactions of Nonferrous Metals Society of China, vol. 22, no. 11. pp.2726–2729. https://doi.org/10.1016/S1003-6326(11)61524-0
Fonblanc,conbuildmat.2021.124164D.,Lopez-Ferber, D., Wynn, M., Lale, A., Soleilhavoup, A., Leriche, A., Iwamoto, Y., Rossignol, F., Gervais, C., and Bernard, S. 2018. Crosslinking chemistry of poly (vinylmethyl- co -methyl) silazanes toward low-temperature formable preceramic polymers as precursors of functional aluminium-modified Si–C–N ceramics. Dalton Transactions, vol. 47, no. 41. pp. 14580–14593. https://doi.org/10.1039/C8DT03076F
Ahamed,0262-5M.A.A., Perera, M.S.A., Matthai, S.K., Ranjith, P.G., and Dong-yin, L. 2019. Coal composition and structural variation with rank and its influence on the coal-moisture interactions under coal seam temperature conditions – A review article. Journal of Petroleum Science and Engineering, vol. 180. pp.901–917.
Construction products are constantly exposed to water for long periods of time, and this can result in functional or aesthetic deterioration. Therefore, the efflorescence potential of asproduced coal composites was analysed according to the method of ASTM C67. This test was performed to assess the potential for migration of water-soluble salts to the surfaces of composites. To simulate realistic conditions, the composites were partially immersed in distilled water for 7 days at ambient temperature, and then dried in an oven for 24 hours. Based on visual inspection of the faces of the tested composites compared to freshly produced composites, there was no deposition of white deposits (crystal line salts) on the surface. The absence of crystalline salts suggests that the composites contain no soluble salts. This indicates that calcium compounds such as Ca(OH)₂ and/or CaO that cause efflorescence are not present in the composites. According to Ibraeva, Tarasevskii, and Zhuravlev, (2017), the migration of soluble salts could weaken the binding network of structural bodies and deteriorate the technical and aesthetic performance of building materials. Furthermore, it should be noted that there was no significant change in the weight and dimension of the coal composites after the efflorescence experiment. This indicates that they are of good quality and can be classified as ´not efflorescent´.
427The Journal of the Southern African Institute of Mining and Metallurgy VOLUME 122 AUGUST 2022
resistance properties. In conclusion, the results so far present the first evidence that coal discard composites would perform well in aggressive environments. They may not require additional surface protective coating, additives, or inhibitors to prevent degradation.
Conlusions
Amaralhttps://doi.org/10.1016/j.petrol.2019.06.007Filho,J.R.,Firpo,B.A.,Broadhurst,J.L., and Harrison, S.T.L., 2020. On the feasibility of South African coal waste for production of ‘FabSoil’, a Technosol. Minerals Engineering, vol. 146. p. 106059. https://doi.org/10.1016/j.
Novel ceramic composites produced from coal discards
ASTMmineng.2019.106059C373-18.2018.Standard
ASTM C67. Standard test methods for sampling and testing brick and structural clay tile. https://www.astm.org/c0067-07.html [accessed 24 January 2022].
Gao, Z., Ding, Y., Yang, W., and Han, W. 2017. DFT study of water adsorption on lignite molecule surface. Journal of Molecular Modeling, vol. 23, no. 1. p. 27.
Haywood,https://doi.org/10.1007/s00894-016-3194-7L.K.,deWet,B.,deLange,W.,andOelofse, S., 2019. Legislative challenges hindering mine waste being reused and repurposed in South Africa. The Extractive Industries and Society, vol. 6, no. 4. pp. 1079–1085. https://doi. org/10.1016/j.exis.2019.10.008
ASTM C1167-11. 2017. Standard specification for clay roof tiles. https://www.astm. org/c1167-11r17.html [accessed 24 January 2022].
References
Abdulsalam, J., Mulopo, J., Bada, S.O., and Oboirien, B., 2020. Equilibria and isosteric heat of adsorption of methane on activated carbons derived from
Efflorescence
Belaid, M., Falcon, R., Vainikka, P., and Patsa, K.V. 2013. Potential and technical basis for utilising coal beneficiation discards in power generation by applying circulating fluidised bed boilers. Proceedings of the 2nd International Conference on Chemical, Ecology and Environmental Sciences. pp.17–18.
Wen, Q., Qu, F., Yu, Z., Graczyk-Zajac, M., Xiong, X., and Riedel, R. 2022. Sibased polymer-derived ceramics for energy conversion and storage. Journal of Advanced Ceramics, vol. 11. pp. 197–246. https://doi.org/10.1007/s40145-021Wen,0562-2Q.,Yu, Z. and Riedel, R. 2020. The fate and role of in situ formed carbon in polymer-derived ceramics. Progress in Materials Science, vol. 109. pp. 100623. Whitehursthttps://doi.org/10.1016/j.pmatsci.2019.100623,D.D.1978.Aprimeronthechemistry and constitution of coal. Organic Chemistry of Coal, ACS Symposium Series. American Chemical Society pp. 1–35. https://doi.org/10.1021/bk-1978-0071.ch001
Yagüe, S., Sánchez, I., Vigil de la Villa, R., García-Giménez, R., Zapardiel, A., and Frías, M. 2018. Coal-mining tailings as a pozzolanic material in cements industry. Minerals, vol. 8, no. 2. p. 46. https://doi.org/10.3390/min8020046 u
Painter, P., Pulati, N., Cetiner, R., Sobkowiak, M., Mitchell, G., and Mathews, J., 2010. Dissolution and dispersion of coal in ionic liquids. Energy & Fuels, vol. 24, no. 3. pp. 1848–1853. https://doi.org/10.1021/ef9013955
Shen, C., Barrios, E., and Zhai, L. 2018. Bulk polymer-derived ceramic composites of graphene oxide. ACS Omega, vol. 3, no. 4. pp. 4006–4016. https://doi. Taha,org/10.1021/acsomega.8b00492Y.,Benzaazoua,M.,Hakkou, R ., and Mansori, M. 2017. Coal mine wastes recycling for coal recovery and eco-friendly bricks production. Minerals Engineering, vol. 107. pp. 123–138. https://doi.org/10.1016/j.mineng.2016.09.001
Nicolas,fuel.2016.08.092M.F.,Vlasova, M., Aguilar, P.A.M., Kakazey, M., Cano, M.M.C., Matus, R.A ., and Puig, T.P. 2020. Development of an energy-saving technology for sintering of bricks from high-siliceous clay by the plastic molding method. Construction and Building Materials, vol. 242. p. 118142. https://doi.org/10.1016/j. conbuildmat.2020.118142
Painter, P.C., Sobkowiak, M., and Youtcheff, J. 1987. FT-i.r. study of hydrogen bonding in coal. Fuel, vol. 66, no. 7. pp. 973–978. https://doi.org/10.1016/0016Phonphuak,2361(87)90338-3N.andThiansem, S. 2011. Effects of charcoal on physical and mechanical properties of fired test briquettes. ScienceAsia, vol. 37, no. 2. p. 120. Rahman,https://doi.org/10.2306/scienceasia1513-1874.2011.37.120M.H.,Islam,M.T.,Minhaj,T.I.,Azad,M.A.K.,Hasan, M.M., and Haque, A.M.R. 2015. Study of thermal conductivity and mechanical property of insulating firebrick produced by local clay and petroleum coal dust as raw materials. Procedia Engineering, vol. 105. pp. 121–128. https://doi.org/10.1016/j. Robertsproeng.2015.05.019,M.J.2015.The molecular structure of selected South African coal-chars to elucidate fundamental principles of coal gasification. PhD thesis, North-West University, South Africa. https://repository.nwu.ac.za/handle/10394/16014 [accessed 24 January 2022].
Novel ceramic composites produced from coal discards
ISO 10545-4. 2019. Ceramic tiles – Part 4: Determination of modulus of rupture and breaking strength. https://www.iso.org/obp/ui/#iso:std:iso:10545:-4:ed-4:v1:en [accessed 24 January 2022].
ISO 10545-13. 2016. Ceramic tiles – Part 13: Determination of chemical resistance. https://www.iso.org/standard/60975.html [accessed 24 January 2022].
428 AUGUST 2022 VOLUME 122 The Journal of the Southern African Institute of Mining and Metallurgy
Van Niekerk, D. 2008. Structural elucidation, molecular representation and solvent interactions of vitrinite-rich and inertinite-rich South African coals. PhD thesis, Pennsylvania State University.
Makarov, D.V., Suvorova, O.V., and Masloboev, V.A. 2019. Prospects of processing the mining and mineral processing waste in Murmansk Region into ceramic building materials. https://inep.ksc.ru/documents/27_prosp_19%20(1).pdf [accessed 24 January 2022].
Mishra, V., Bhowmick, T., Chakravarty, S., Varma, A.K., and Sharma, M. 2016. Influence of coal quality on combustion behaviour and mineral phases transformations. Fuel, vol. 186. pp. 443–455. https://doi.org/10.1016/j.
Coal and Organic Petrology (ICCP). 1998. The new vitrinite classification (ICCP System 1994). Fuel, vol. 77, no. 5. pp. 349–358. Ionescu,https://doi.org/10.1016/S0016-2361(98)80024-0E.,Papendorf,B.,Kleebe,H.-J.,Poli,F.,Müller, K., and Riedel, R. 2010. Polymer-derived silicon oxycarbide/hafnia ceramic nanocomposites. Part I: Phase and microstructure evolution during the ceramization process. Journal of the American Ceramic Society, vol. 93, no. 6. pp. 1774–1782. https://doi. Isaacorg/10.1111/j.1551-2916.2010.03765.x,K.andBada,S.O.2020.Theco-combustion performance and reaction kinetics of refuse derived fuels with South African high ash coal. Heliyon, vol. 6, no. 1. p. e03309. https://doi.org/10.1016/j.heliyon.2020.e03309
Hill, A. and Easter, W. 2019. Carbon ceramic composites and methods. US Patents. 20190292441A1. http://www.energy.gov.za/files/coal_frame.html [accessed 4 May 2022].
Jian, K., Chen, G., Guo, C., Ma, G., and Ru, Z. 2019. Biogenic gas simulation of low-rank coal and its structure evolution. Journal of Petroleum Science and Engineering, vol. 173. pp. 1284–1288. https://doi.org/10.1016/j.petrol.2018.11.005
Tambwe, O., Kotsiopoulos, A., and Harrison, S.T.L. 2020. Desulphurising high sulphur coal discards using an accelerated heap leach approach. Hydrometallurgy, vol. 197. p. 105472. https://doi.org/10.1016/j. hydromet.2020.105472
Hu, G., Bian, Z., Xue, R., Huang, W., and Komarneni, S. 2017. Polymer-coal composite as a novel plastic material. Materials Letters, vol. 197,. pp. 31–34. Hugginshttps://doi.org/10.1016/j.matlet.2017.03.148,F.E.,2002.Overviewofanalyticalmethods for inorganic constituents in coal. International Journal of Coal Geology, vol. 50. pp. 169–214. https://doi. Ibraeva,org/10.1016/S0166-5162(02)00118-0Y.,Tarasevskii,P.,andZhuravlev, A. 2017. Salt corrosion of brick walls. MATEC Web of Conferences, vol. 106. p. 03003. https://doi.org/10.1051/ Internationalmatecconf/201710603003Committeefor
1]University of Pretoria, South Africa.
coalKeywordsquality, quality control, digital twin.
429The Journal of the Southern African Institute of Mining and Metallurgy VOLUME 122 AUGUST 2022
by B.J. Coetzee1,2 and P.W. Sonnendecker1
TheSynopsisquality control of a two-stage coal washing process involves several complex components that need to be modelled accurately, to enable autonomous control of the process. The first objective is to develop a method to track the material through the washing process, while ensuring accurate washing prediction models are used. This was achieved through a digital twin model of the Grootegeluk 1 coal processing plant. The model is the amalgamation of manipulating and combining of data-sets from the plant historian, geological wash tables, and mining dispatch servers. This information is then used to control and set the processing medium densities of all 15 modules on the plant, 10 modules in the primary wash and 5 modules in the secondary wash. This controller has been successfully implemented and controlled the plant for 10 days.
Correspondence to: B.J. Coetzee
Published: August 2022
Fully automated coal quality control using digital twin material tracking and statistical model predictive control for yield optimization during production of semi soft coking- and power station
Fully automated coal quality control using digital twin material tracking and statistical model predictive control for yield optimization during production of semi soft coking- and power station coal
Received: 25 Jan. 2022
Introduction
Due to the high waste fraction of the ROM processed at GG1, the first washing cuts the waste and the second wash cuts the remaining product stream between PSC and SSCC. The exact fraction of each stream is controlled by manipulating the relative density (RD) which directly affects the ash content of the coal (Osborne, 2013).
Problem statement
Accepted: 8 Jul. 2022
Dates:
2Exxaro Resources Limited, South Africa.
Affiliation:
Email: bjcoetzee@yahoo.com
How to cite: Coetzee, B.J. Sonnendecker,andP.W. 2022
Journalcoal.ofthe Southern African Institute of Mining and Metallurgy, vol. 122, no. 8, pp. 429–436
The controller developed in this paper was implemented on the Grootegeluk 1 (GG1) coal processing plant. GG1 forms part of the Exxaro Grootegeluk Coal Complex, which is one of the largest opencast coal mines in the southern hemisphere. Given the vast size of the operation, GG1 is not fed from a single source in the pit, but from several coal blocks. The mixing of the run-of-mine (ROM) material introduces additional complexity since coal from each block reacts different to the washing conditions encountered duringTwoprocessing.coalproducts are produced at GG1, coal used for electricity generation or power station coal (PSC) with an ash content of 35% and semi-soft coking coal (SSCC) used in the production of steel. SSCC is a higher value product when compared to PSC and has an ash content of 10.3%. The sequence in which these two products are produced depends on the mass fraction of each stream. In a conventional circuit, the higher value product is removed first, followed by the second and finally discarding the waste (Wills, and Finch, 2015).
A time delay of 3–4 hours is observed between the time that the secondary wash products are sampled, and the coal quality results are reported. This implies that by the time the results are reported to the process controllers, the material that has similar properties has long since been through the washing process and thus renders the information outdated to a large extent. Results and discussion
DOI
SecundaConference,Society,SouthernThis9717/2002/2022http://dx.doi.org/10.17159/2411-ID:paperwasfirstpresentedattheAfricanCoalProcessingBiannualInternationalCoal12-14thOctober2021,
Revised: 30 Jun. 2022
5 Secondary silos Secondary wash 2:10 8:20
To test the entire mass tracking of the model, the predicted values will be compared to the product conveyor belt scales. This will be done for both product streams, PSC and SSCC. It should be noted that each section, for example ROM to A02/A03, will not be validated individually but as a combined total mass balance for PSC and SSCC
321
• Coal product qualities resulting from the selected cutPerformancepoint tracking to evaluate the performance of the controller. This will also assist with the identification of potential future improvements
• Compare the calculated output to the output from the current geological models for the material in all 15 silos.
• Pre- and post-implementation analysis of the product streams’ qualities
Figure 1a is an aerial view indicating the layout of the various areas within GG1. Figure 1b is a schematic diagram of the coal material flow. Area 02 contains 5 dense medium cyclones; Area 03 contains 5 dense medium drums; Area 04 contains 5 dense medium cyclones. The additional fine material of the spirals in Area 05 should also be considered and modelled.
The controller was developed and programmed in the Python version 3.7.6 programming language. The program was sectioned into several main functions with defined inputs and outputs. This will facilitate the updating of an improved algorithm for future revisions of the controller. The main functions of interest are discussed in the following sections. A detailed report containing the explanation of each component is available upon request.
3 Primary silos Primary wash 5:00 5:55
Solution objectives
Fully automated coal quality control using digital twin material tracking
Table I
6 Secondary wash Laboratory 2:00 10:20
1 Truck loading Tipping bin 0:25 0:25
7 Laboratory Preparation 1:00 11:20
• Yield resulting from the selected cut point based on the geological information
• From pit to primary silos (ROM to A02/A03)
Method of validation
Objective
2 Tipping bin Primary silos 0:30 0:55
9 Analysis Results 0:30 12:50
Cumulative Time (hh:mm)
• Compare the predicted qualities when using the current plant cut-points and with the quality results reported by the laboratory
The controller must react on the combined input data-set containing the material properties and location. This will then be used to calculate and set the optimal plant conditions for each of the 15 modules. The controller output will provide the medium density set-point for each module. These outputs will update the
This delay challenge, along with the varying material origins, lead to the fact that the only reasonable way to circumvent these issues is to implement a solution that will have a sufficient granularity along with the ability to track the material through the entire process (Solution objective Table below).
Step Origin Destination Time (hh:mm)
• From secondary silos to stock yard (A04 to stockpiles)
Real-time and accurate material tracking through all the different areas within the plant (Figure 1):
Combining wash tables (geological coal characteristics) to ensure that mixing and movement of the material within the silo is modelled and accounted for. Eeach module's silo will contain material with different characteristics, depending on the selected silo at the time of material tipping. This will also have the following sub-objectives:
current PID controller set-point to that of each module, which is typically adjusted by the plant operator.
To test the wash table combination of the model, the predicted values will be validated by using both of the following methods:
Method
• From primary silos to secondary silos (A02/A03 to A04)
The following procedures will be employed to validate the efficiency and effective functioning of the controller:
Time delay between various points in the washing process
• Percentage utilization. Operators and management’s acceptance of the controller and the resulting qualities
4 Primary wash Secondary silos 0:15 6:10
430 AUGUST 2022 VOLUME 122 The Journal of the Southern African Institute of Mining and Metallurgy
A similar effect is seen when evaluating the time delay between the tipping point to the first wash and from the first wash to the second wash. When combining all the time delays in Table I, a total time delay of approximately 12 hours 50 minutes can be determined. This implies that the material tipped during the current shift will likely be washed only during the next shift, voiding any attempt by the process controllers to wash according to the tipped material’s geological properties.
8 Preparation Analysis 1:00 12:20
431The Journal of the Southern African Institute of Mining and Metallurgy VOLUME 122 AUGUST 2022
Figure 1—GG1 (a) Aerial view and (b) schematic diagram of coal material flow
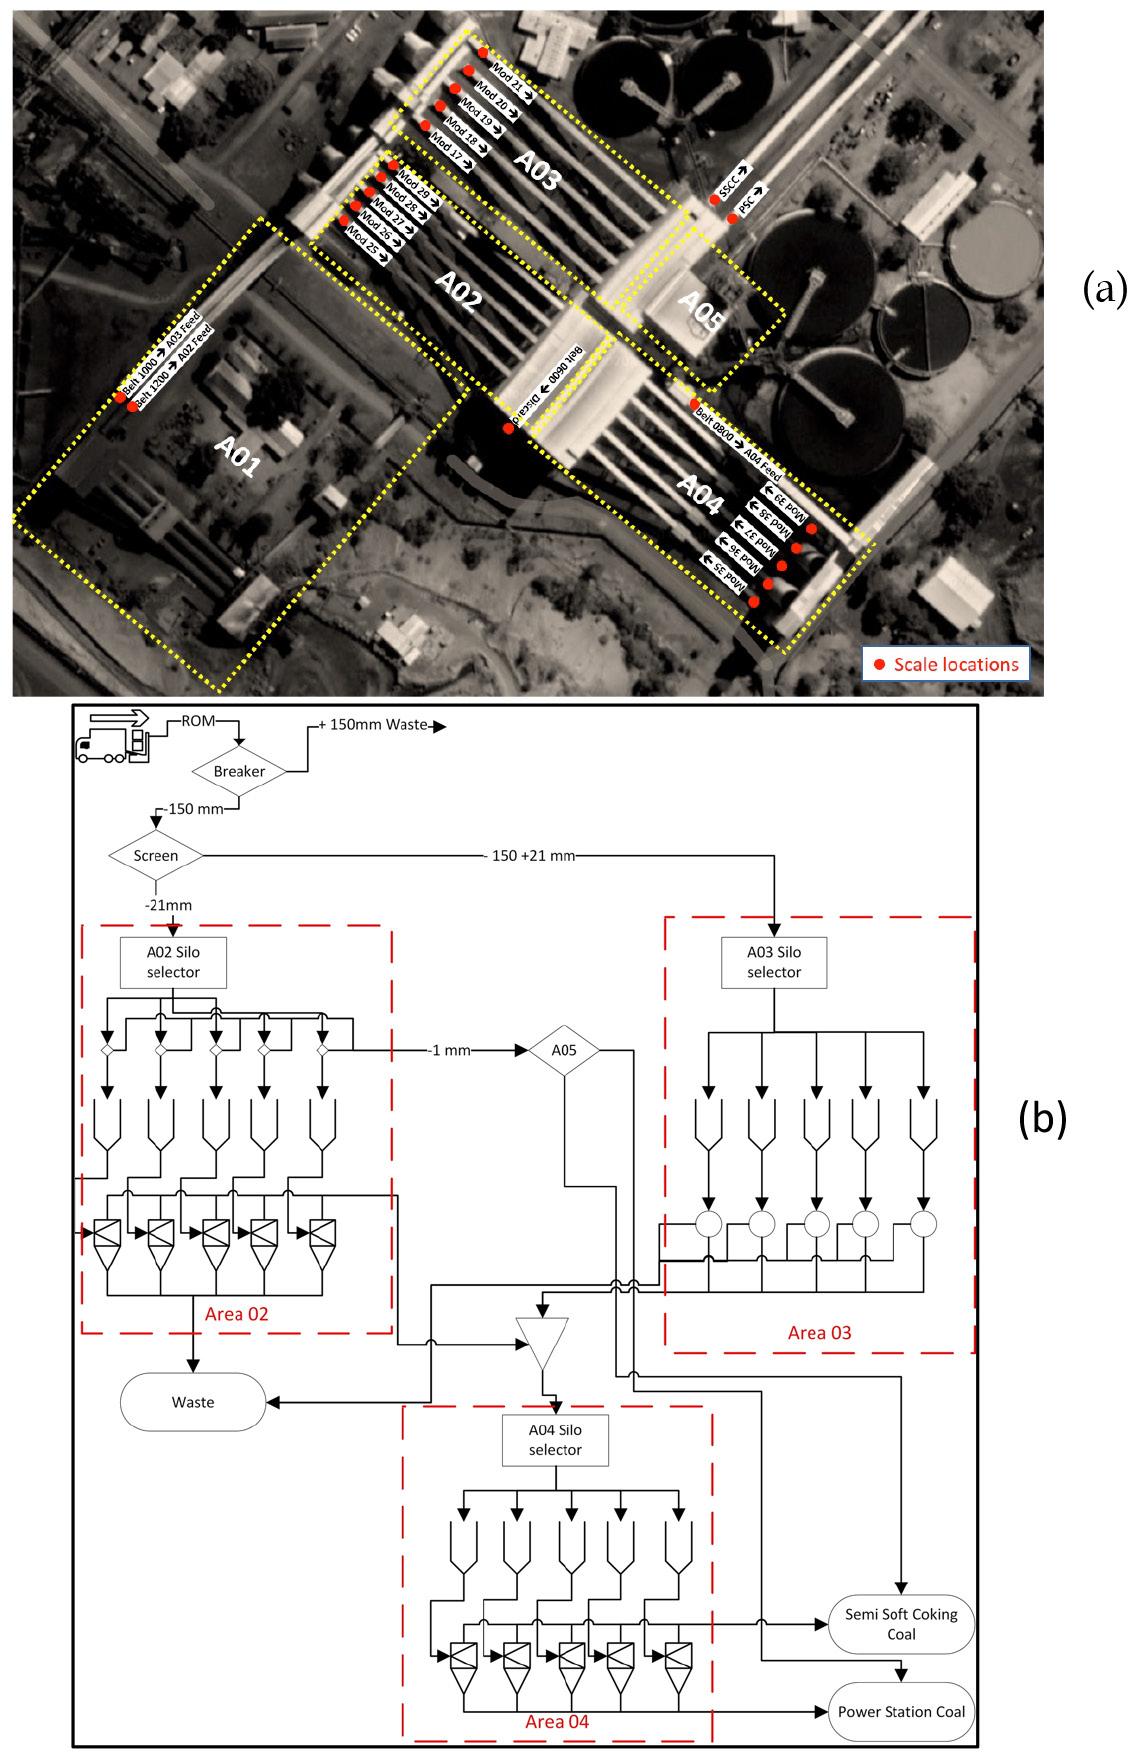
Fully automated coal quality control using digital twin material tracking
Controller execution logic
Upon start up the controller runs through an initialization algorithm to bring the plant digital twin model (PDTM) in line with the current material quality and quantity within the plant. It was seen that it could take several hours for the material to exit as product once it was tipped at the plant's bin. It was decided that the PDTM would have to access data from a week prior to initialization. The extended timeframe was selected to accommodate events where a module was taken out of production for several days with no material movement.
The programming logic of the main execution loop is seen in Figure 2. The main execution loop is executed on an hourly basis due to the analysis results being released on an hourly basis. An increased execution rate will therefore not introduce any benefit to the controller accuracy. The longer duration is also required for the plant to respond to the adjustments in RD set-points.
Figure 2—Main controller programming logic flow
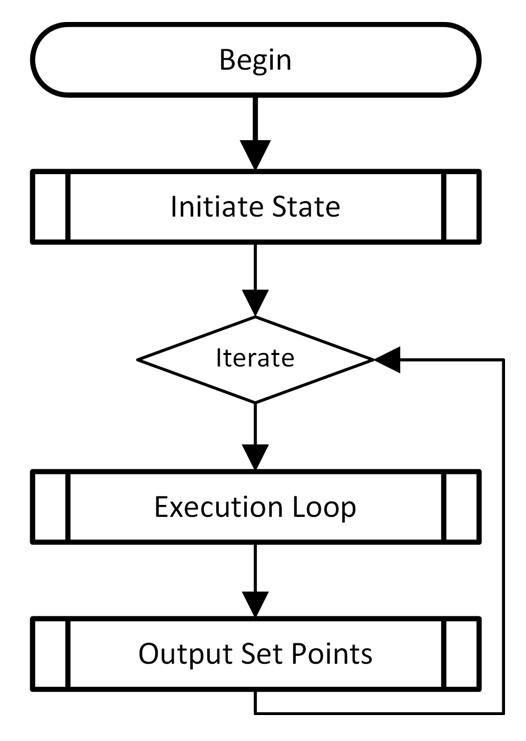
Figure 3—Loop execution containing the sub programming logic flow
This information is then prepared and used to update the PDTM material locations within the various sections. The additional material that has been tipped to the plant is moved to the primary silos and the material that was in the primary silos is washed and moved to the secondary silos. Lastly, the material in the secondary silos is allocated to the stockpiles by the PDTM.
Figure 4—Data retrieval logic flow

The next step is the interaction with the process operators (Figure 7). It is verified that the controller is switched ON and is operated on SCADA. If the process is not controlled in automatic mode, the controller is not allowed to interact with the plant. This is to ensure that the operator is still able to provide oversight and retain control over the plant. If the controller is switched OFF, the set-points are not written to the PID controllers and the program halts until the next iteration.
These 15 RD values are then used and written out to the plant's PLC system. The optimized RD values thus become the set-point values for the PID control loops in each individual module. A final communications check is also performed right before the values are written out.
The next step Figures 5 and 6, is to calculate the primary RD set-points of the modules in Area 02 and Area 03. Each module is evaluated individually and the combined material properties within each module is considered to determine the optimum RD. These RDs are then used to determine the fraction of waste removed and the remaining material is moved to the secondary silos.Similarly,
each module in Area 04 is then considered individually and the combined material properties are considered. This is then used in combination with the RDs used in the primary area to determine the optimum RD for the secondary wash.
plant historian, which contains the historical values of the plant sensors. These three data-sets are then cleaned and transformed such that the datasets can be combined.
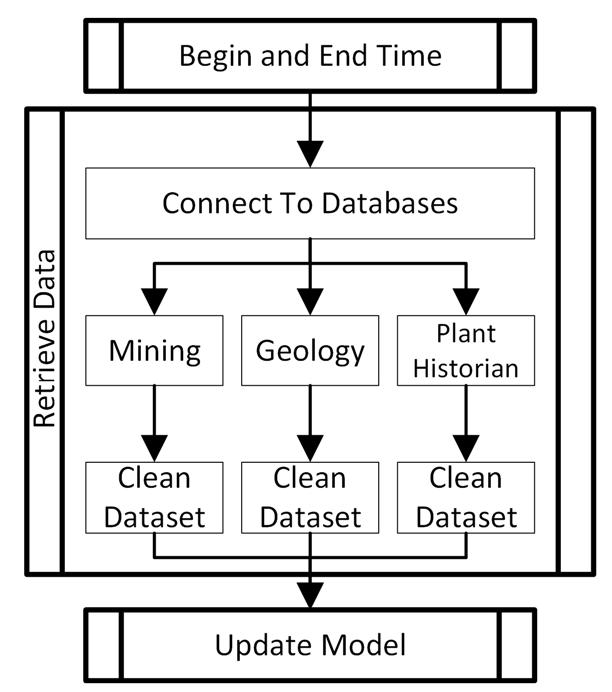
The two time intervals are then used to retrieve the data from the three databases, seen in Figures 3 and 4. These databases are the: mining database containing the information of the truck tips, which in turn contains the tipped mass and material origins within the pit; the geological database, which contains the complete proximate analysis of each block in the reserve; and lastly the
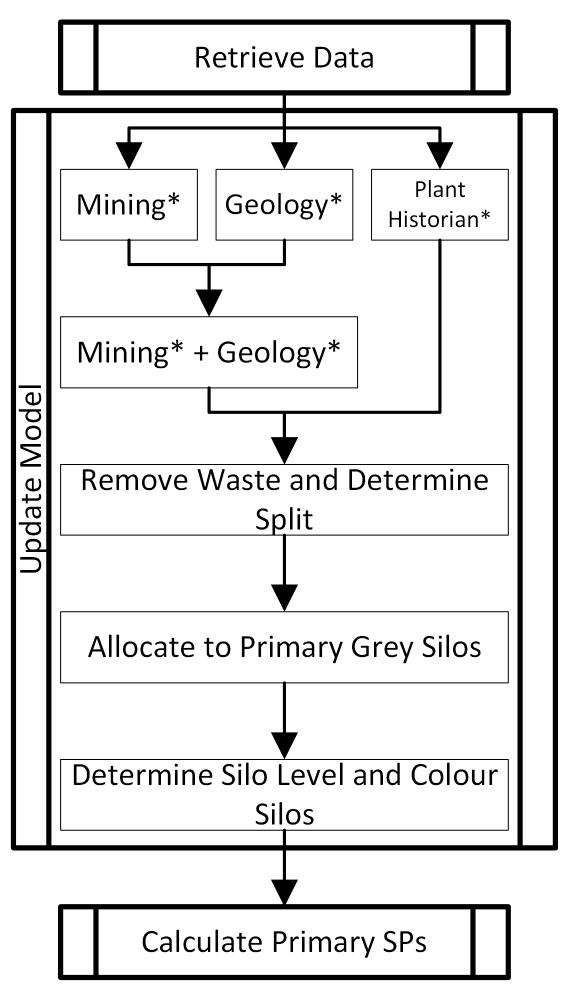
Fully automated coal quality control using digital twin material tracking
Once an hour has lapsed and this logic has been started, the first step is to determine the beginning and end times of the interval to be used. The end time will be the current time; whereas the beginning will be the hour prior. One exception is with the beginning time, when an iteration does not see any new information the beginning time is not updated. In these exceptions the beginning time will therefore be the end time of the last successful iteration.
432 AUGUST 2022 VOLUME 122 The Journal of the Southern African Institute of Mining and Metallurgy
Figure 5—PDTM Update logic flow
The method used to calculate the yields, the split between the product and waste fractions after each washing stage, evolved through the duration of the project, in an attempt to improve the accuracy of the calculations. The addition and inclusion of several factors greatly increased the complexity of the algorithms used. The algorithms used were applied to the geological wash tables of each block in the pit. An example of this can be seen in Table II. Each method was given the target to reach a final product ash content of 35% and 10.3% for PSC and SSCC respectively. These RDs were then used in a Whitten model with an Ecart probable (Ep) of 0.025 to evaluate the performance (De Korte, 2008; Wills, and Finch, 2015).
1.8
Comparison of yield calculation methods Method Cut-point Resulting quality (ash content)
Primary Secondary PSC SSCC
433The Journal of the Southern African Institute of Mining and Metallurgy VOLUME 122 AUGUST 2022
Figure 6—Primary set-points calculation logic flow Figure 7—Procedure for writting new SPs to actual plant logic flow
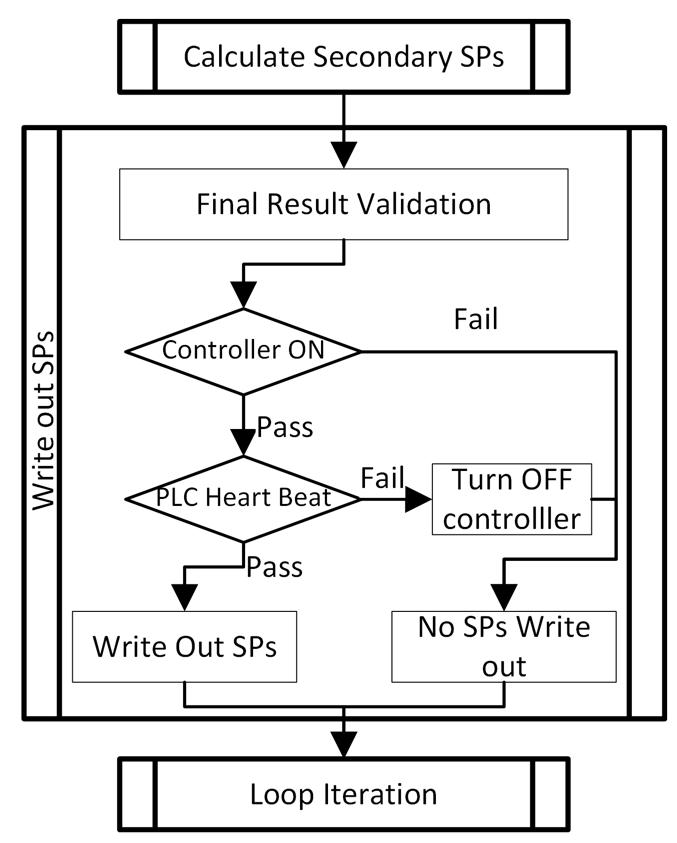
Method A: Interpolation for primary and secondary wash Method A was the first attempt at reaching a solution. This method interpolates between the data-poins to find the predicted RD based on the cumulative ash column. Both primary and secondary RDs are calculated in the same way, where a perfect separation is assumed with no effect on the near dense material (NDM) incorporated. This method does not consider the interplay effect between the washes. As seen in Table III, this method makes a reasonable attempt at finding the correct solution, but still leaves a lot of room for improvement.
2.2
1.35
Method A 2.104 1.421 37.6% 10.35% Method B 2.123 1.425 36.6% 10.35% Method C 2.106 1.427 36.7% 10.44% Method D 2.056 1.417 35.00% 10.300%
2.0
1.5
Table II
Fully automated coal quality control using digital twin material tracking
Example of a combined wash table within a silo RD Yield (%) Ash (%) Calorific(MJ/kg)value 7.595 5.998 30.994 12.426 9.163 30.005 1.45 16.645 11.244 29.288 20.716 13.260 28.595 25.379 15.656 27.762 28.213 17.164 27.233 33.292 20.131 26.198 37.086 22.615 25.312 40.797 25.233 24.383 45.1039 28.335 23.270 50.1559 31.826 22.022 60.1692 38.123 19.768 2.5 100 54.918 14.119
1.6
Table III
1.55
1.4
Method B: Single iteration of whitten model for primary and interpolation for secondary wash Method B is the accepted method to calculate the mine's monthly reconciliation and performance reports. It works on a combination of the interpolation method, used for the secondary wash, and the Whitten model, used for the secondary wash. This
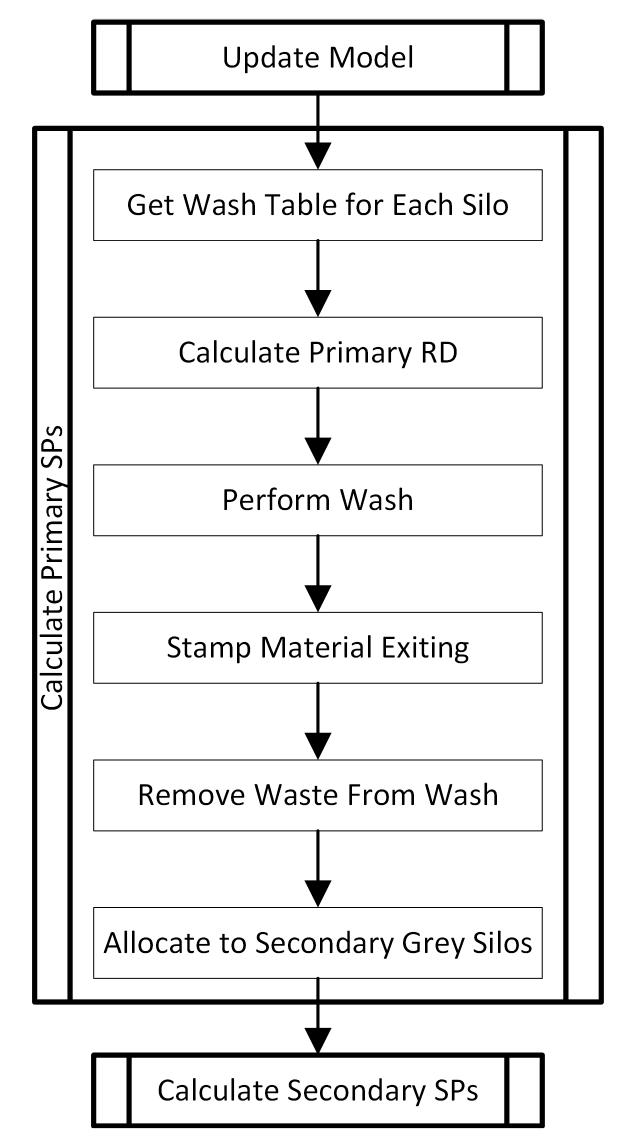
1.9
2.1
If the plant is operated in automatic mode, the controller checks communication with the three PLCs, one for each respective area in the plant. This is done by using a PLC heartbeat, which is implemented by the controller writing out a value of e.g. 58 and the PLC subtracting one each second. This means that if the controller loses connection for a minute, the controller will switch off automatically. If the PLC communication check is successful, the next step takes place and the set-points are written to the PID controllers.
1.7
Yield calculation methods
products are at the desired specification. This iterative approach is used to calculate both washes simultaneously, accounting for the interplay between the two washes.
Figure 9—Quality Results
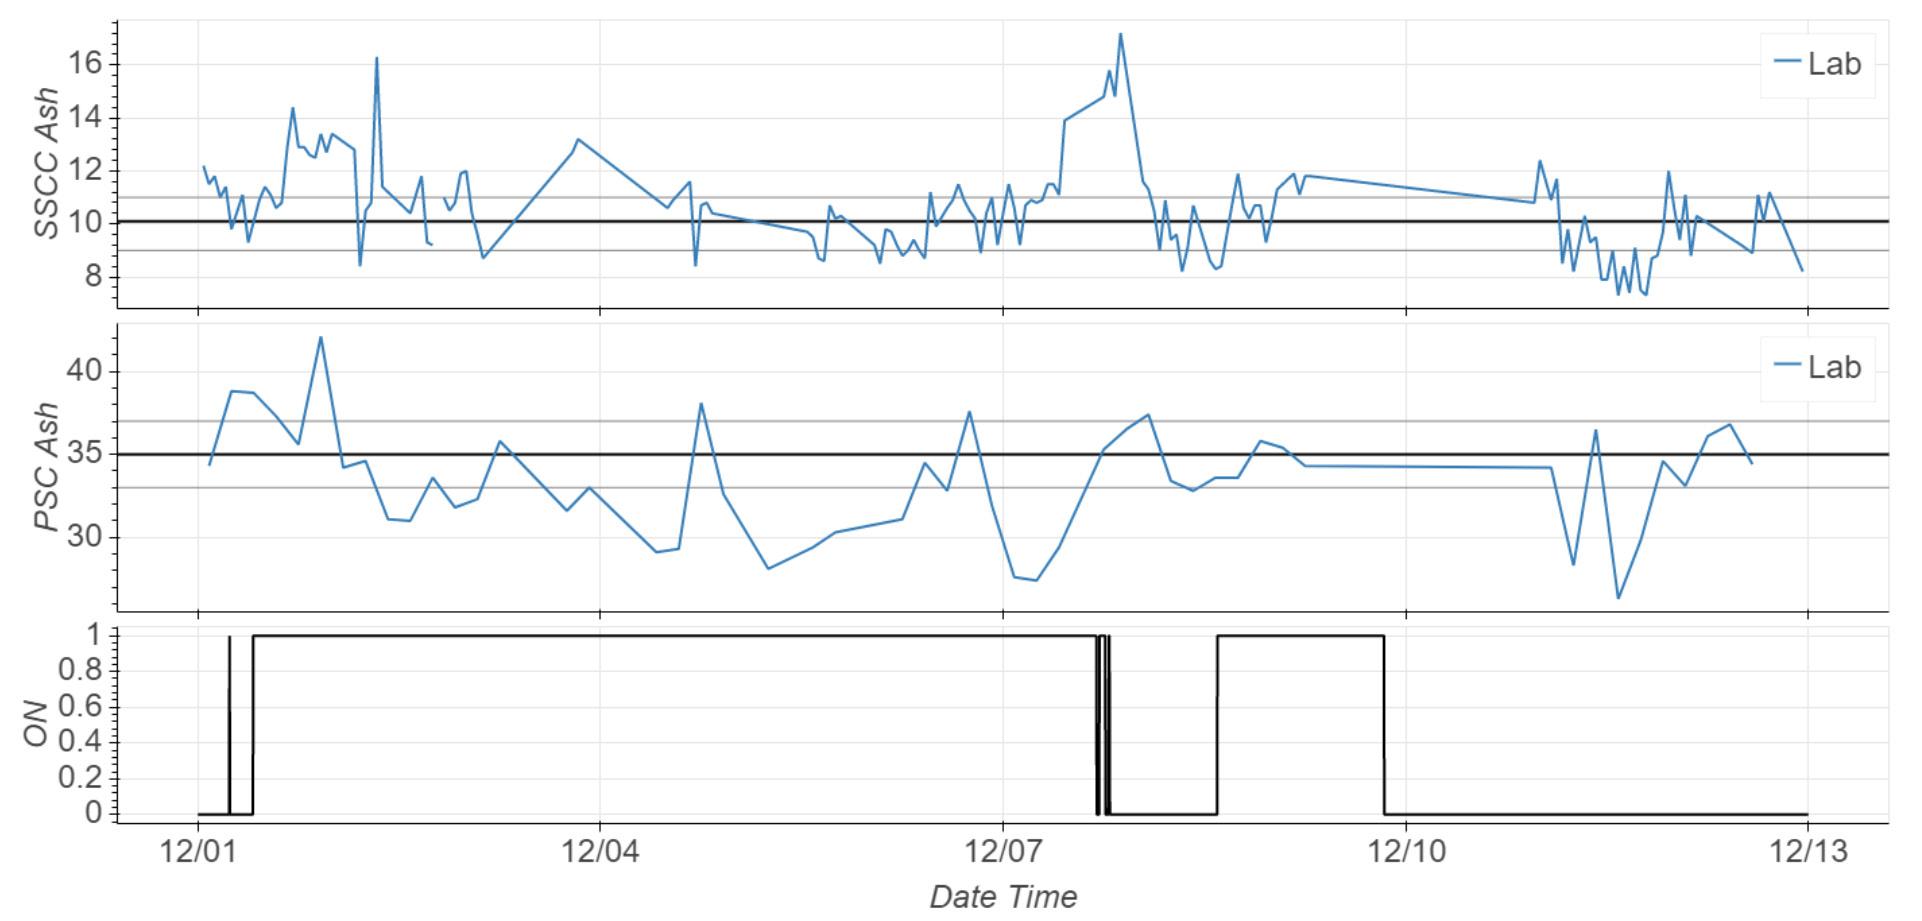
This was the natural progression Method B, where the adapted Whitten model is used for both washes. It is still, however, only a single iteration and therefore does not fully incorporate the interplay effect between the two washes. Since an Ep is used in both stages, it also allows the difference in separation performance of the different areas to be incorporated.
Since this calculation will be performed for each of the 15 modules in each execution step it was optimized to reach a solution as fast as possible. The function was also developed to incorporate the physical constraints as well as a convergence time limit. The final solution implemented was able to reach an optimized value in roughly 20 milliseconds.
Method D: Optimized whitten model for primary and secondary wash
Method C: Single iteration of whitten model for primary and secondary wash
This process results in the output SPs for all 15 modules, which in turn are send to the OPC server through the OPC connection component. The process operator remains the gatekeeper of the instructions. This is to ensure the process operator still retains ultimate control of the process.
8—Schematic data architecture
Fully automated coal quality control using digital twin material tracking
This method makes use of the sample calculation used in Method B, however the functions were developed to iterate until both
Method C is the most metallurgicaly sound, since it considers the fractional yield at each RD fraction. This results in accounting for the NDM present close to the cut RD. It can be seen that this method produces a final result that is much closer to the desired value, although it is not yet the optimized value.
Figure 9 depicts a schematic diagram of the controller configuration on the plant. It can be seen how the various sources are connected to the controller, namely the plant historian, geological database, and mining data-sets. These data-sets are combined to update the internal models and the updated models are used to calculate new controller set-points.
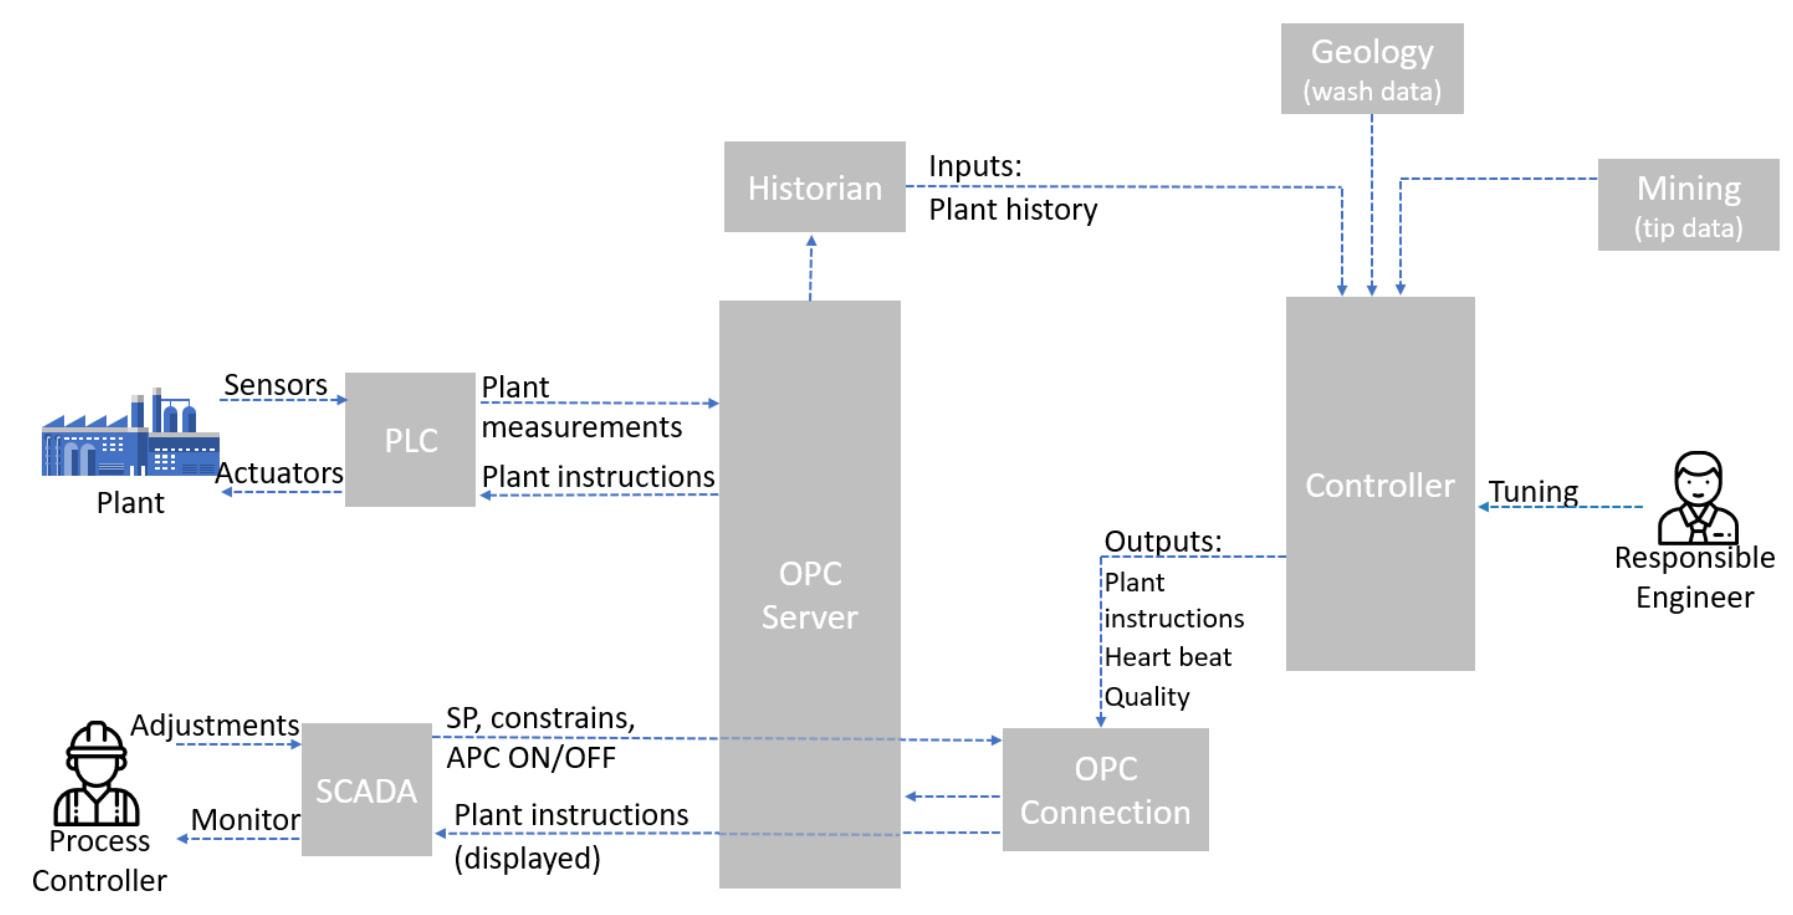
method only performs a single iteration of the calculation. Since this method incorporates the NDM in the primary wash it is already an improvement on Method A.
Data structure architecture
Figure
434 AUGUST 2022 VOLUME 122 The Journal of the Southern African Institute of Mining and Metallurgy
435The Journal of the Southern African Institute of Mining and Metallurgy VOLUME 122 AUGUST 2022
Zhao, L. and Lin, Y. 2011. Operation and maintenance of coal handling system in thermal power plant. Procedia Engineering, vol. 26. pp.2032 2037. u
Table IV
Controller performance results
Results and discussion
The controller can be switched ON and OFF from the plant SCADA screen. Several other key parameters are also shown on the same screen, for example the heartbeat check.
Acknowledgements
Osborne, D. (ed.) 2013. The Coal Handbook: Towards Cleaner Production: Volume: Coal Utilisation. Elsevier.
Wills, B.A. and Finch, J. 2015. Wills' Mineral Processing Technology: An Introduction to the Practical Aspects of Ore Treatment and Mineral Recovery. Yüksel,Butterworth-Heinemann.C.,Thielemann,T.,Wambeke, T., and Benndorf, J. 2016. Real-time resource model updating for improved coal quality control using online data. International Journal of Coal Geology, vol. 162. pp. 61–73.
Figure 10—Module 439 SP changes and PV tracking
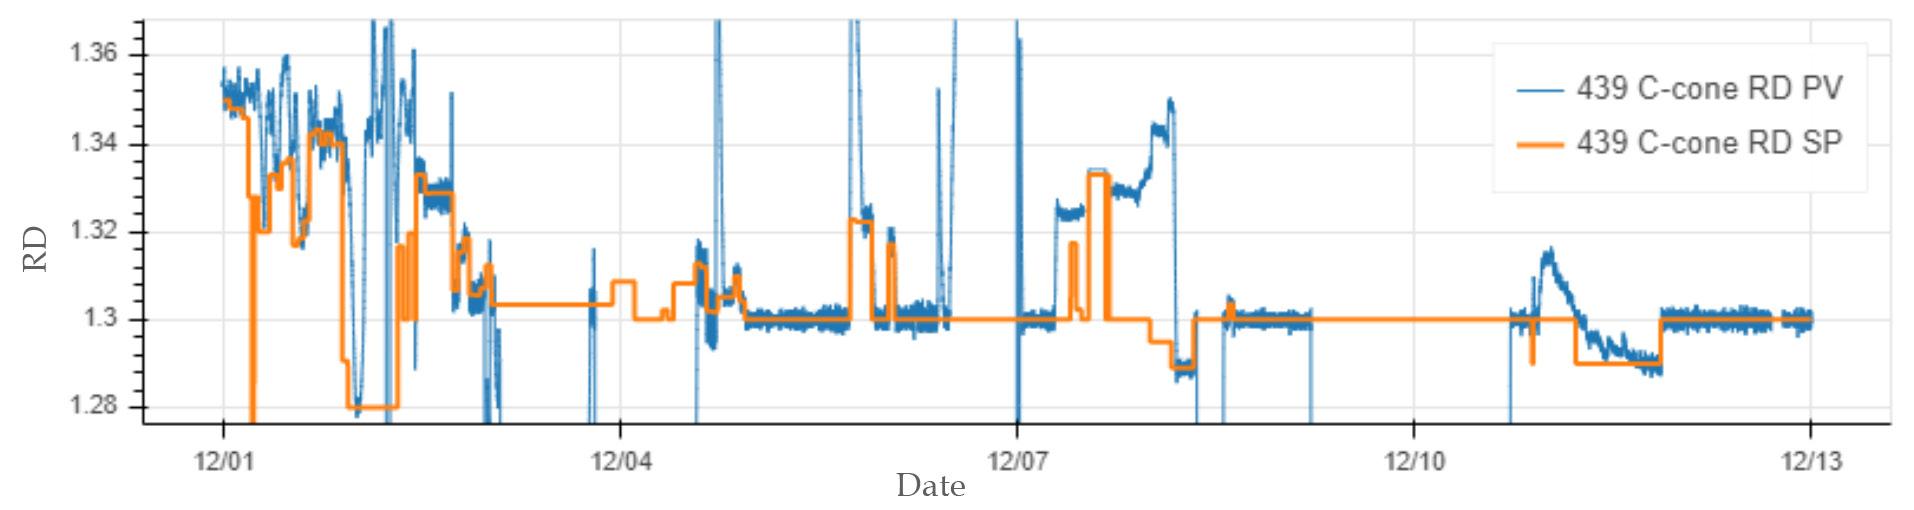
The process response and controller set-points are indicated in Figure 10. The controller is implemented in a cascaded manner where the SP instruction to the PID loop controlling the water valve is updated.
This paper is published with permission from Exxaro. The authors would like to acknowledge the trust and support given by the GG1 production teams to allow the controller to prove itself and their willingness to test this new technology as well as the support from management and personnel of the Process Development team at GG.
With the exclusion of these two cases, a clear improvement is seen in the minimum and maximum values as well as a reduction in standard deviation of 1.39 % to 1.24 % ash for the SSCC.
De Korte, G.J. 2008. The influence of near-dense material on the separation efficiency of dense-medium processes. International Journal of Coal Preparation and Utilization, vol. 28, no. 2. pp. 69–93.
The water valve supplies additional water which in turn regulates the RD of the dense medium. The process value did not always follow the RD set-point. This was another lesson learned since failure to do so will result in the inability to effectively judge the performance of the controller, i.e., when the clarified water lines are blocked or the medium tank is at full capacity. This issue was identified on several modules in each area, indicating areas for furtherDuringimprovement.thistesting phase the SSCC target value was set to 10.1% ash. The reason for this was twofold. Firstly, a conservative value was selected to ensure no product rejections were obtained. Secondly, the production team requested a lower value to be used since the average bed qualities were already above the required 10.3% ash, and thus be brought back down.
SSCC Pre 10.31 14.7 5.1 1.39 SSCC Post 10.13 13.2 7.3 1.24 PSC Pre 32.25 40.4 28.2 2.41 PSC Post 32.88 38.1 28.1 2.52
This can lead to a marginal deviation between the observed and actual RD values, since the actual RD is not considered but only the relative difference while still producing coal with qualities that are acceptable. Luckily this was a simple fix where the SCADA RD values were calibrated more frequently. Once this was accomplished the controller was able to successfully control the plant.When the controller was initialized, there was a spike caused by the RD difference discussed in the paragraph above. There is also a second spike where the controller is switched OFF. This was the result of a communication failure caused by a power failure, which led to the controller handing control back to the operators. Several of the plant's sensors were affected, which led to the large deviation. Once the plant was in stable operation the controller was switched on again.
The controller was commissioned and implemented on 2 December, 2020. The controller operated for ten days until the author was reassigned to a sister mine. Thereafter, the mine expressed interest in upskilling the onsite personnel to receive a handover of the project. The controller’s performance can be seen in Figure 9 and Table IV. The implementation of this controller made GG1 the first fully automated quality control plant within Exxaro.The light grey lines indicate the acceptable range in which the qualities should be maintained. It should be noted that the SSCC was sampled once an hour whereas the PSC was only sampled once every four hours, leading to the fewer data-points.
References
Fully automated coal quality control using digital twin material tracking
During the initial activation there were several lessons learned, one of which was with regard to the RD values observed on SCADA and the actual RDs sampled on the plant. When the plant is controlled manually by the process operator, very little to no attention is paid to the wash tables during operation. The quality control philosophy centres around the operators reacting on the produced qualities; when the ash values are lower than the target value, the operators must increase the RD set point values, and the extent of the adjustment is based on each operator's experience. The same is true for the opposite case when the ash values are higher than expected.
Period Average Max Min Std dev
There has been a significant change in the explosives and initiating systems used in the mining, quarrying and civil blasting applications both on surface and underground. This course will provide and align the delegates with some basic principles, tools, examples and understanding of the leverage of these products. Whether you are new to the industry or a seasoned user or find yourself in the position of an explosive manager or supervisor to a regulator, the course will enable some debate, rules and questions you should be asking of your explosive OEM.

Simon Tose
Simon Tose is an expert in Blast Design from AEL and will be sharing his expertise on this subject.

DATE: 22-23 FEBRUARY 2023
VENUE ONLINE
Simon Tose is an established industry recognized consultant, registered professional engineer and leader in technology, mining, explosives and blasting science. Holding a BSC Hons Mining Engineering degree, management and explosive qualifications. Extensive experience in mining methods, education and management of projects and blast investigations. He has written papers, articles and presented at a number of International and Local conferences. Current board member of the IOQSA & ISEE and regular contributions to the SAIMM & AusIMM. With a strength in project design he leads the Blast Consult team with a strong passion for the development of environmental and blast monitoring, measurement and investigation, consulting, management and financial analysis for AEL.
Drilling and Blasting Short Course 2023
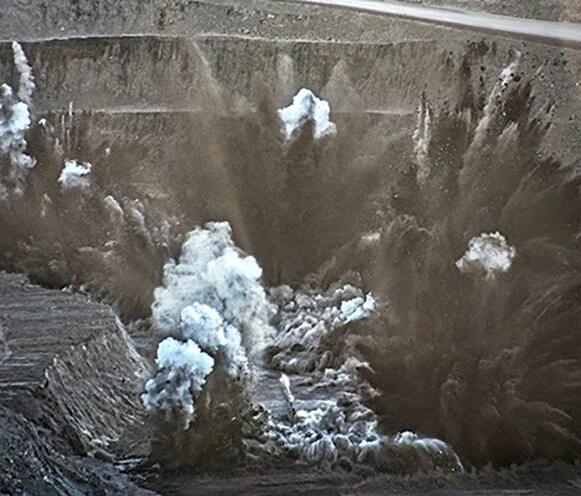
Fully
PRESENTER
0.1 CPD points for every 1 hour event attended
The importance of improved safety standards, cost effectivenessand productivity has driven mining management and operators to examine all facets of their operations. Increasingly it has been realized that an efficient drilling and blasting program can impact positively throughout the mining operation from loading to maintenance, hauling to crushing, ground support to scaling and grade control to recovery. We will also test the concepts and increasing challenges of blasting in the vicinity of local communities.
For further information contact:
BACKGROUND
automated coal quality control using digital twin material tracking 436 AUGUST 2022 VOLUME 122 The Journal of the Southern African Institute of Mining and Metallurgy

Camielah Jardine, Head of Conferencing E-mail: camielah@saimm.co.za Tel: +27 11 538-0237, Web: www.saimm.co.za
SHORT COURSE
calorificKeywordsvalue, discard coal, rapid beneficiation, W/O emulsion technique, weathered coal.
Flotation of weathered coal discards using a HIP W/O emulsion binder and kerosene Journal of the Southern African Institute of Mining and Metallurgy, vol. 122, no. 8, pp. 437–442
Run of mine (ROM) coal is processed to separate the valuable carbonaceous component from the inorganic minerals. However, gravity beneficiation processes are restricted to certain particle size fractions and are ineffective for coals of less than 150 μm, generated through mechanized mining (Horsfall, Zitron, and de Korte., 1986; Liao et al., 2017; Barma, 2018). In South Africa, about 1.5 Gt of discard coal have been produced, and a further 60 Mt are generated annually (Department of Energy, 2001). The South African Coal Roadmap indicated that fines and ultra-fines account for 11% of the annual coal discard (Fossil Fuel Foundation, 2011). Almost 100% of these fines are regarded as waste and stored in tailings dams (Bada, Falcon, and Bergmann, 2016).
AnSynopsisadvanced high internal phase water-in-oil (HIP W/O) emulsion binder and flotation with an internal dispersed water phase of 95 vol% was used to beneficiate South African weathered coal from discard dumps. Five coal samples with calorific values ranged from 8.48 MJ/kg to 20.94 MJ/kg were utilized. The performance of the HIP W/O emulsion was compared to that of kerosene in terms of the physicochemical properties of the clean coal products. A 5 kg/t emulsion binder addition produced a high-quality coal concentrate with 11.76% ash and a heating value of 28.61 MJ/kg from a sample containing 29.34% ash. Using the same dose and coal sample, kerosene resulted in a clean coal concentrate with 17.47% ash and a calorific value of 26.42 MJ/kg. Further samples were also beneficiated using 5 kg/t of W/O emulsion. The highest increase in calorific value was achieved from the beneficiation of a sample containing 48.71% ash, from 8.48 MJ/kg to 18.16 MJ/kg. It has been established that emulsion binders can upgrade coal samples dumped many decades ago.
Flotation of weathered coal discards using a HIP W/O emulsion binder and kerosene
Email: poitahmashaba@gmail.com
Revised: 28 Jul. 2022
Accepted: 4 Aug. 2022 Published: August 2022
437The Journal of the Southern African Institute of Mining and Metallurgy VOLUME 122 AUGUST 2022
Affiliation: 1DSI-NRF SARChI Clean Coal Technology Research Group, School of Chemical & Metallurgy, Faculty of Engineering and the Built Environment, University of the Witwatersrand, South Africa.
Dates: Received: 25 Jan. 2022
by P.M. Mashaba1 and S.O. Bada1
How to cite: Mashaba, P.M. and Bada, S.O. 2022
DOI SecundaConference,Society,SouthernThis5454-9301https://orcid.org/0000-0002-P.M.1079-3492https://orcid.org/0000-0002-S.O.ORCID:9717/2003/2022http://dx.doi.org/10.17159/2411-ID:BadaMashabapaperwasfirstpresentedattheAfricanCoalProcessingBiannualInternationalCoal12-14thOctober2021,
Introduction
Exposure of the waste coal to the atmosphere causes the production of hydrophilic oxygenated groups such as the hydroxyl (C–OH), carbonyl (–C=O), and carboxyl (O=C–OH) groups on the surface of the coal. As a result, the flotation of the coal using traditional reagents like kerosene or diesel becomes less effective with the application of physico-chemical processes such as froth flotation and selective agglomeration, and greater amounts of these organic liquids are required for successful beneficiation (Xia, Yang, and Liang, 2013; Li et al., 2018; Wang et al., 2018). Previous research has shown that for effective separation, an oil dosage of 10 to 20 weight per cent (wt%) is required to form a continuous oil layer on the coal surface and to fill the void spaces within the agglomerates in the traditional agglomeration process (Garcia, Vega, and Martinez-Tarazona, 1995; Dickinson, Jiang, and Galvin, 2015; Netten, MorenoAtanasio, and Galvin, 2016). With the high internal phase water-in-oil (HIP W/O) emulsion technique, most of the void spaces between the coal particles are filled with dispersed water droplets, rather than oil as in traditional agglomeration. Using this approach, it has been found that the same quality product as that obtained by traditional agglomeration and flotation can be achieved with on-tenth the amount of organic liquid (Netten, Moreno-Atanasio, and Galvin, 2016; Netten and Galvin, 2018; and Lu et al., 2019).
Correspondence to: P.M. Mashaba
The present investigation, the HIP W/O emulsion binder was used to beneficiate some weathered coals of 20 to 30 years old from various dumps. The use of HIP W/O emulsion binder with flotation is very similar to the selective agglomeration process. The binder acts as a hydrophilic and hydrophobic reagent
Figure 3 illustrates the laboratory beneficiation flow sheet. A mechanical flotation cell was used to beneficiate the coal samples. The clean coal products from the rougher and scavenger stages were subjected to two cleaning stages. The coal slurry (25 wt% coal) was agitated in a 1.5 L flotation cell for two minutes at a speed of 1 000 r/min. The same process conditions were applied for two minutes in the scavenger, cleaner, and re-cleaner stages for both reagents (emulsion binder and kerosene).
Five samples with various ash contents were collected from mines in the Witbank Basin (Figure 1). Greyish samples 2 and 4 were
[1]
for selecting, wetting, and bonding hydrophobic and hydrophilic carbonaceous particles, thereby leaving the inorganic minerals unwetted (Netten, Borrow, and Galvin et al., 2017; Netten and Galvin, 2018; Lu et al., 2019). The viscosity of the emulsion binder is also known to influence the recovery rate in this process. Traditional reagents such as pure kerosene have a low viscosity of 0.0016 Pa, whereas HIP emulsion, depending on its composition, has a viscosity of around 100 Pa (Galvin et al., 2001). A high-viscosity solution or binder is expected to adhere to a particle after a collision with greater effectiveness than a low-viscosity binder. In addition, based on the composition of the emulsion and its stability, most of the void spaces between the coal particles are filled with dispersed water droplets rather than oil as in traditional agglomeration (Garcia, Vega, and Martinez-Tarazona, 1995; Dickinson, Jiang, and Galvin, 2015; Netten, Moreno-Atanasio, and Galvin,According2016). to the literature, over 80% of the volume of the dispersed phase comprises NaCl and water, leading to the reduction in the amount of organic liquids used in the preparation of the HIP W/O emulsion binder (Netten, Borrow, and Galvin, 2017; Netten and Galvin, 2018; Lu et al., 2019). Using an emulsion binder with 95% by volume of the dispersed phase, Netten and Galvin (2018) beneficiated coal feed that had been stored in water to limit surface oxidation. A clean coal product with an ash content of 15 to 17% and combustible recovery of 70 to 80% was obtained from feed coal with an ash content of 42%. Lu et al (2019) beneficiated a laboratory-oxidized coal (−74 +38 μm) using an emulsion binder composed of 85% internal dispersed water phase by volume. The new collector improved the flotation of the oxidized coal. This highlighted the need for further study on the use of the HIP W/O emulsion binder can be used to beneficiate weathered coal fines from discard dumps or slurry ponds. In this study, five coal fines samples aged between two and three decades with different degrees of oxidation were studied by flotation. The performance of the HIP W/O emulsion with an internal dispersed water phase of 95% by volume was compared with that of kerosene, and the quality of the clean coal products recovered from the five coals were compared.
The coal concentrate was scraped off after 30 seconds of aeration. The products obtained, including the clean concentrate and tailings (inorganic minerals), were oven-dried for 15 hours at a temperature of 50°C. The ash content, combustible recovery, yield and ash rejection of the dried products were then determined using Equations [1−4].
Figure 2 shows the reagents used to beneficiate the coal samples. The emulsion binder comprised 5% organic liquid by volume, with the remainder being the dispersed phase (Figure 2a). Kerosene was used at 100% by volume (Figure 2b).
collected from the outside of a stockpile where they have been severely exposed to atmospheric conditions. Sample 1, 3, and 5 were taken from within a stockpile. Total sulphur and total carbon analyses were performed according to ASTM D 4239-14:2015 using a LECO CHN 628 instrument with an add-on 628 S module. Proximate analysis, the calorific value (heating value), and FTIR analysis were also conducted on the samples in accordance with ASTM D-5142, ASTM D5865-04, and ASTM E168, respectively.
Figure 1—Different discard coal samples taken
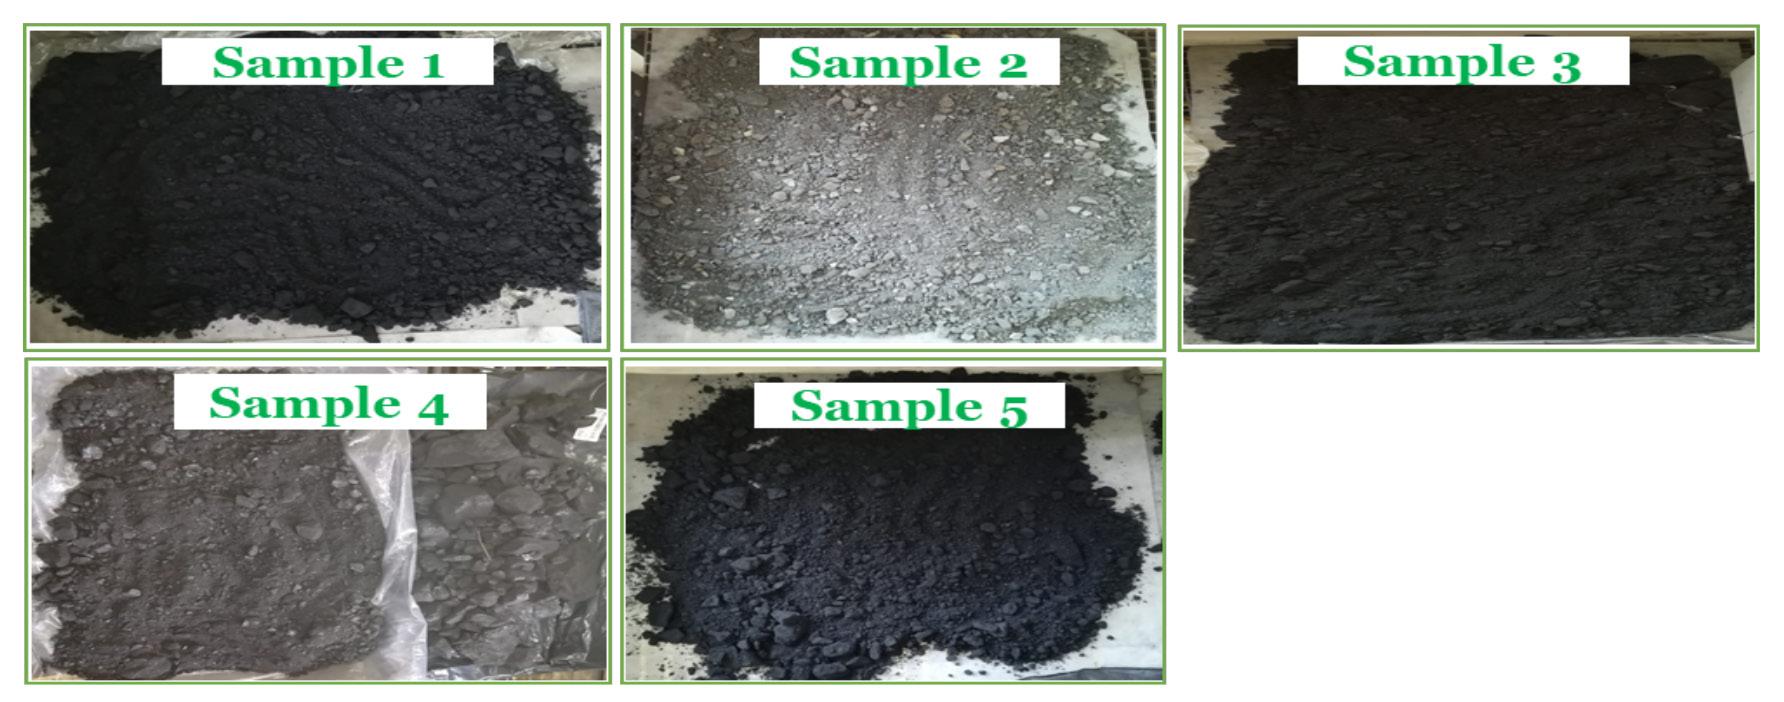
Reagents
Beneficiation test
Flotation of weathered coal discards using a HIP W/O emulsion binder and kerosene
Experimental Coal preparation and characterization
438 AUGUST 2022 VOLUME 122 The Journal of the Southern African Institute of Mining and Metallurgy
Emulsion binder preparation
The organic liquids, kerosene, and Span 80, also known as Sorbitan monooleate (SMO), were mixed in equal proportions (7.5 ml each) in a standard domestic food mixer. An aqueous NaCl dispersion phase solution was formed by dissolving 8.55 g of NaCl in 285 ml of tap water. Subsequently, the NaCl solution was added while mixing to the organic liquid mixture in small increments of 7.5 ml every 15 seconds to prevent deterioration of the emulsion binder (Netten, Moreno-Atanasio, and Galvin, 2016). A viscous and opaque emulsion binder was produced (Figure 2a).
Figure 4—The particle
Figure 2—HIP W/O emulsion binder (a) and kerosene (b)
where Mc is the mass of the floated clean coal (g) (dried basis), MF is the mass of the dry feed coal sample (g) (dried basis), AC is the ash content of the dry floats (%), and AF is the ash content of the dry coal feed (%).
Reagent dosages
Table I Results of KC tests on CFA sample HIP emulsion and kerosene Organic
Results and discussion
Organic liquids within the emulsion (kg/ton)= binder (kg/ton)× (5 vol%) [6]
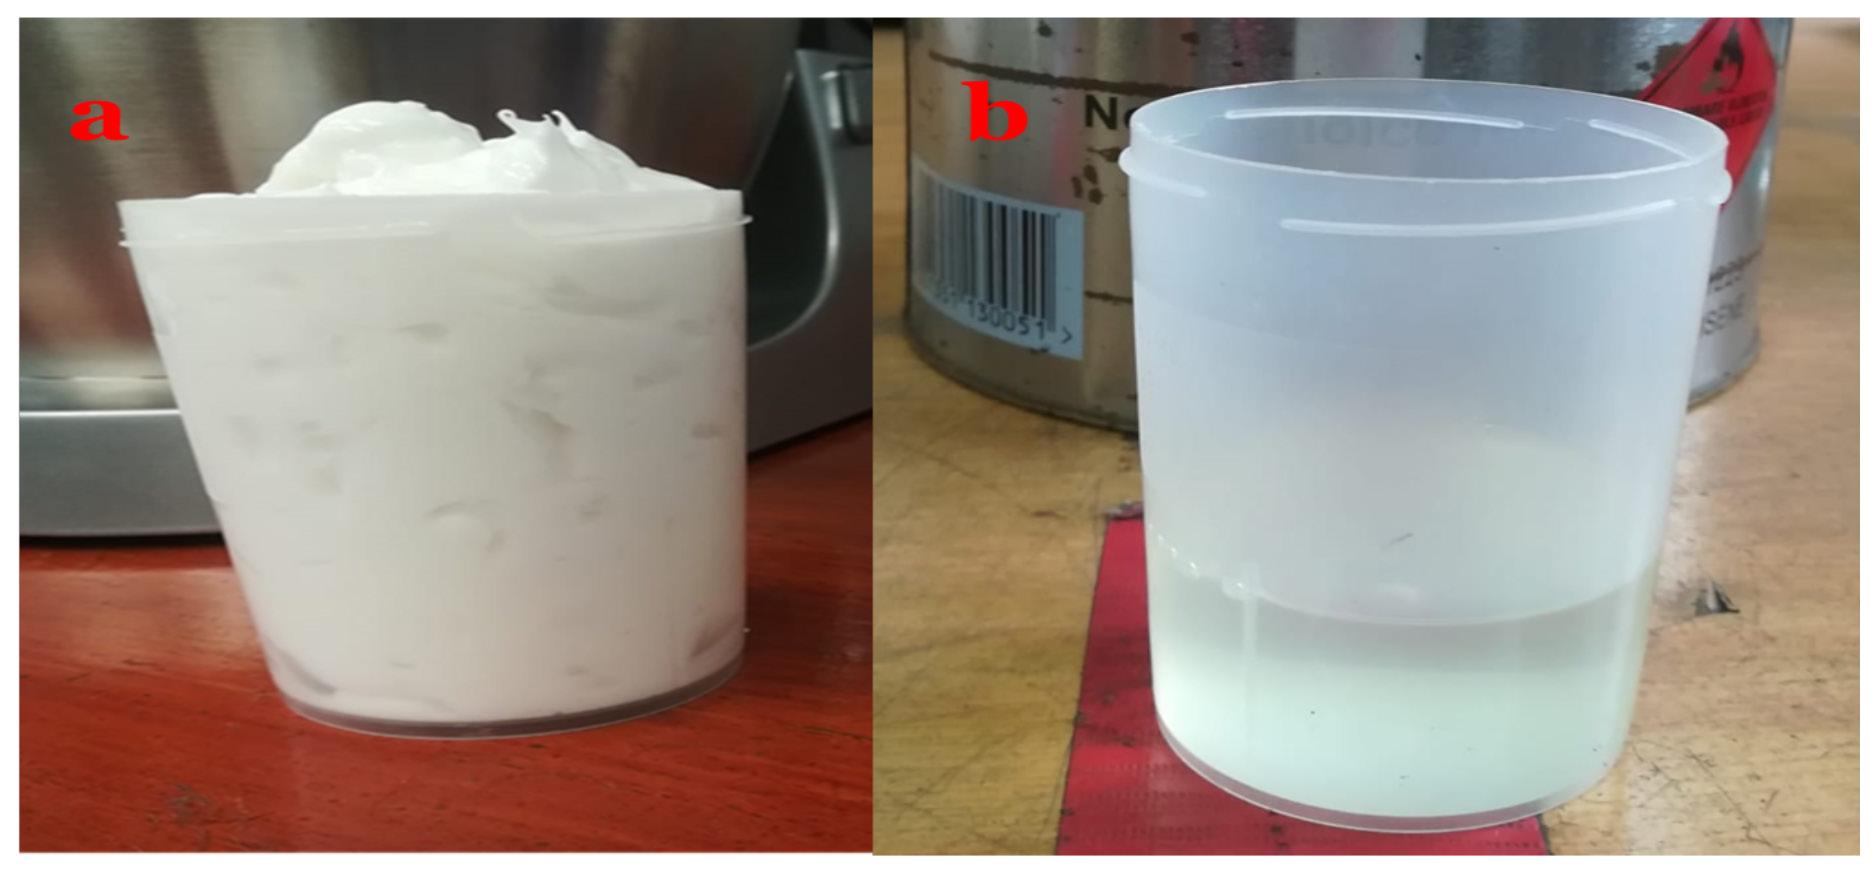
439The Journal of the Southern African Institute of Mining and Metallurgy VOLUME 122 AUGUST 2022 [2][3][4]
Figure 3—W/O emulsion technique beneficiation stages
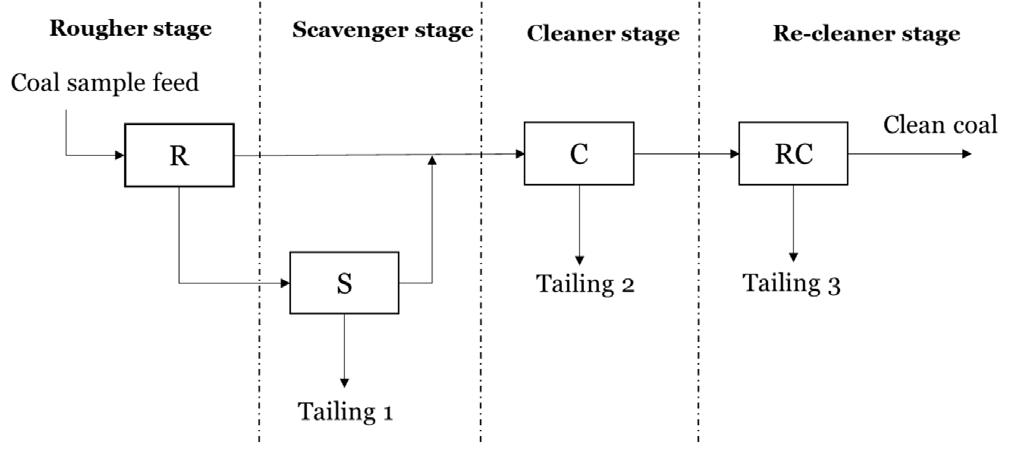
Flotation of weathered coal discards using a HIP W/O emulsion binder and kerosene
Doses g kg/t HIP W/O emulsion Kerosene vol% kg/t vol% kg/ton 1 1.5 5 0.25 5 2 2.0 7 5 0.35 100 7 3 2.5 9 0.45 9
size distribution of the coal samples
The particle size distributions of the coal samples are presented in Figure 4. The percentage coal passing 150 μm was 96% for sample 1, and 84%, 93%, 78% and 92% for samples 2, 3, 4 and 5, respectively. The difference in the size distribution curves can be attributed to the difference in hardness and friability of the coals (Isaac, 2019). Sample 2 had the highest ash content of 48.71%, followed by sample 3 (41.71%), and sample 4 with the lowest ash
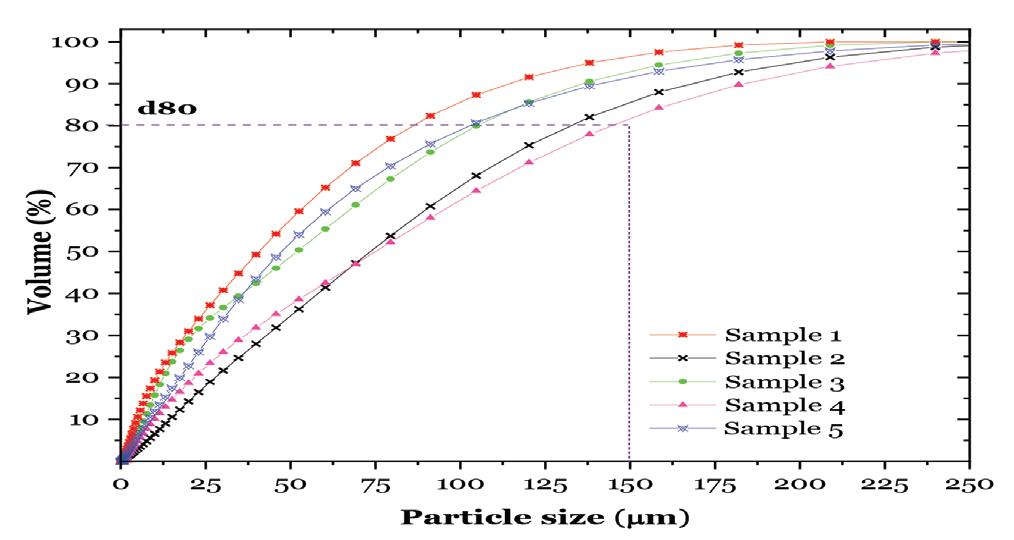
Organic liquid within kerosene (kg/ton)= kerosene (kg/ton)× (100 vol%) [7]
Table I presents the reagent doses. The doses were determined using Equation [5−7]. [5]
R - rougher cell, S - scavenger cell, C – cleaner, RC - re-cleaner cell liquids used
Coal characteristics
The clean coal product yield, ash content and combustible recovery increase with increasing in kerosene and W/O emulsion binder dosage (Figures 7 and Figure 8). The observed trend corresponds to the findings of Netten, Moreno-Atanasio, and Galvin. (2016) and Lu et al. (2019). Netten and Galvin (2018) also showed that product ash content increased with combustible recovery due to an increase in emulsion binder dosage. According to Netten and Galvin (2018) the increase might be because of the binder sufficiency, which enhanced the floatability and pulling of semi-hydrophobic carbonaceous particles to the clean coal product. This therefore leads to a lower-grade carbonaceous product.Inthis study, clean coal products with low ash contents of 17.47% and 11.76% ash were obtained using 5 kg/t kerosene and HIP W/O emulsion binder, respectively. A yield of 12.50% and combustible recovery of 15.61% was obtained using 5 kg/t emulsion (Figure 7). This was lower than the clean coal yield of 18.47% and recovery of 21.59% using 5 kg/t kerosene (Figure 8). Nevertheless, an abundance of pure kerosene was required to enhance the floatability of the carbonaceous particles the coal discard. This
Figure 7—Effect of W/O emulsion dosages on clean coal 1 yield and ash
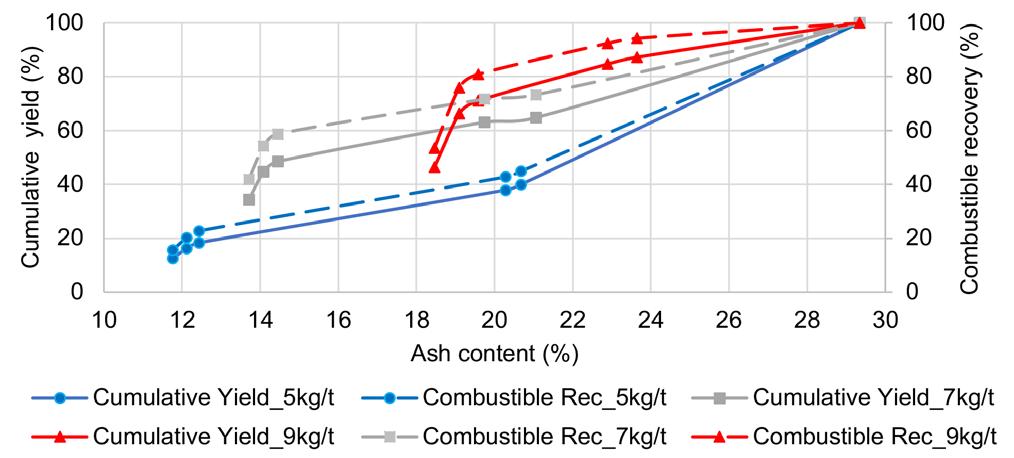
Ash content Fixed carbon Volatile matter Volatile matter Total carbon Total sulphur (%) (%) (%) (%) (%) (%)
FTIR spectra for the five coal samples, W/O emulsion, and kerosene
Proximate analysis (air-dry basis)
4 28.63 43.83 22.88 5.71 55.95 1.00 20.61
content
Total sulphur and carbon Calorific value analysis (dry basis) (MJ/kg)
The physico-chemical properties of the coal feeds
Table II
440 AUGUST 2022 VOLUME 122 The Journal of the Southern African Institute of Mining and Metallurgy
for the reagents used to beneficiate the coal feeds
1 29.34 43.29 23.40 3.02 54.50 0.87 20.9
content of 28.63% (Table II). The as-received coal samples are of low quality (grade D III) as indicated by the calorific values which range from 8 to 21 MJ/kg. Based on the proximate analysis results, the samples had fixed carbon contents ranging between 17.79% and 43.83%. Sample 2 had the highest total suphur content of 3.04%.
Figure 6—Spectra – cm-1)
Flotation of weathered coal discards using a HIP W/O emulsion binder and kerosene
The FTIR spectra of the five coal samples are shown in Figure 5. This was undertaken to determine the degree of weathering of the coal surfaces. Coal oxidation is denoted by the intensity of the oxygenated functional groups such as the hydroxyl (O-H) and carbonyl (C=O) (Wang et al., 2012). A distinct and intense peak of O-H groups is present for sample 2, suggesting that the coal is highly weathered. Although samples 4 and 5 show evidence of intense C=O groups, sample 3 contained the second-highest amount of the O-H groups.
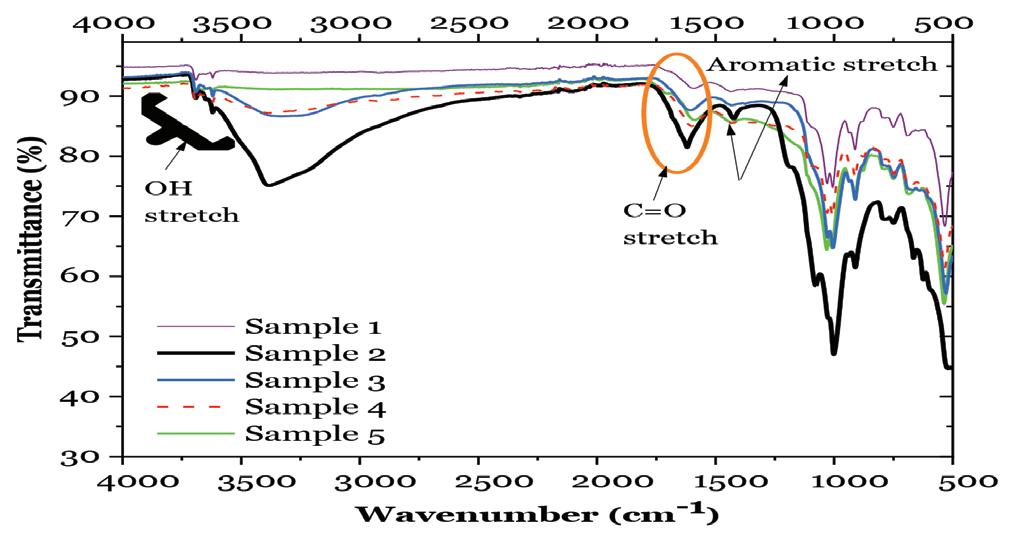
FTIR was also used to characterize the reagents to determine the functional group compositions (Figure 6). As indicated, the presence of O-H stretch and C=O stretch on the surface of HIP W/O emulsion binder are evident whereas none was observed on the surface of kerosene. The only groups present on the surface of kerosene are aliphatic groups 2837-2967 cm-1. This group is also available on the emulsion binder, suggesting that the emulsion is an emulsifier, i.e. comprises both oxygenated and aliphatic groups and can therefore be expected to bind to weathered coal.
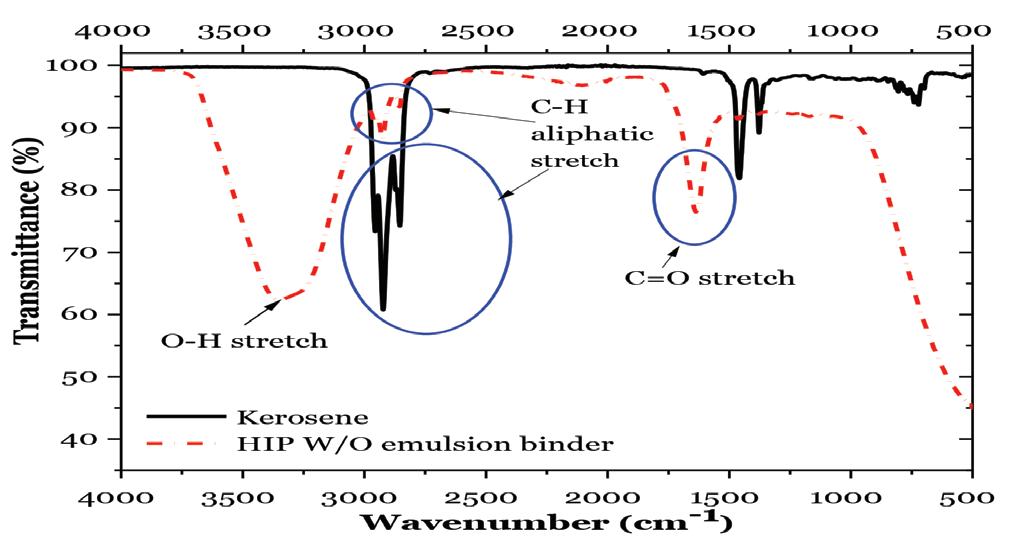
(4000
500
Figure 5—Fourier
transformation infrared spectra of the coal feeds
Washability, ash rejection, and physico-chemical properties of coal sample 1
Influence of reagent dosage
2 48.71 17.79 28.69 5.80 24.9 3.04 8.48
Coal sample
3 41.71 35.58 20.79 7.36 43.7 1.29 16.29
5 33.32 40.68 22.63 5.51 51.45 0.43 18.55
The highest ash rejection of 94.99% was achieved using 5 kg/t emulsion (Figure 9A). At 5 kg/t kerosene, 89.03% of the ash was rejected. The corresponding lowest ash content of 11.76%, achieved using 5 kg/t emulsion, indicates a high percentage rejection of inorganic minerals, including (but not limited to) silica (SiO₂), kaolinite [Al₂Si₂O₅(OH₄)], calcite (CaCO₃), and dolomite [CaMg(CO₃)₂]. This is because the emulsion has both hydrophobic and hydrophilic characteristics, leading to the possibility of hydrogen bonds forming between the carbon present in the coal sample and the HIP W/O emulsion binder (Lu et al., 2019).
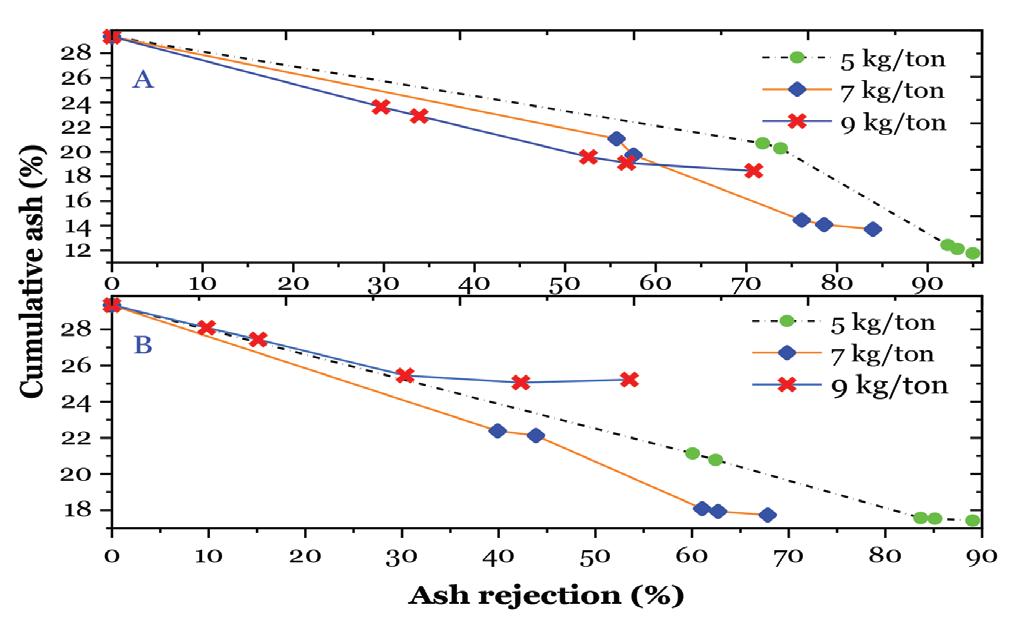
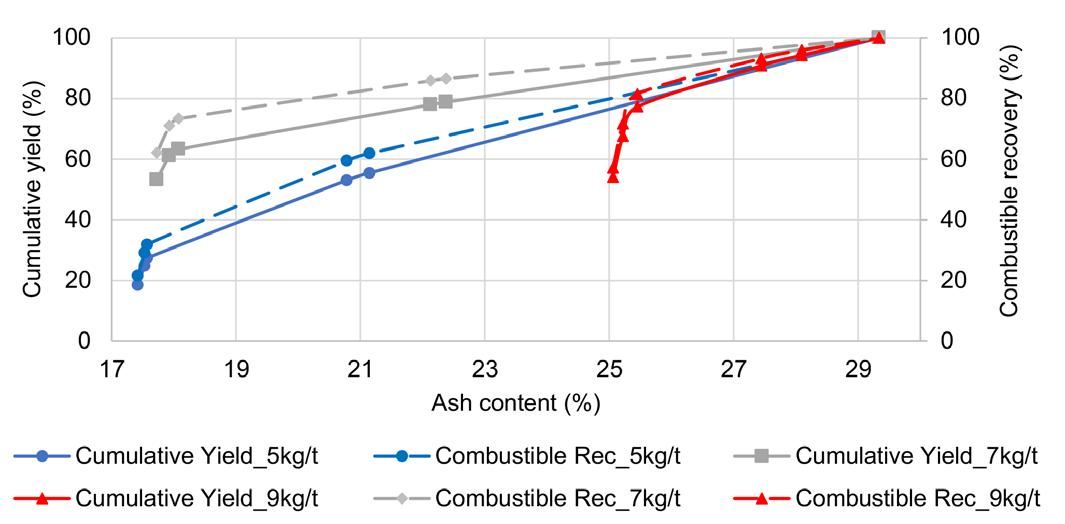
Flotation of weathered coal discards using a HIP W/O emulsion binder and kerosene
Figuredosages10—The
The recovery curves for the beneficiation of coals 2, 3, 4, and 5 at the same emulsion concentration (5 kg/t) to which coal 1 was subjected are depicted in Figure 11. The results were obtained by means of Equations [2] and [3]. Floated clean coal products with a combustible recovery of 2.5% and 6.14% and ash content of 31.16% and 17.23% were obtained for coals 2 and 3, respectively. The combustible recoveries for sample 4 and 5 were 3.08% and 4.02%, with ash contents of 12.12% and 12.70% respectively. For coal sample 1, a clean coal product with a recovery of 15.61% and 11.76% ash was achieved. The nature and degree of weathering of the coal could be responsible for the differences in clean coal product yield and ash content.
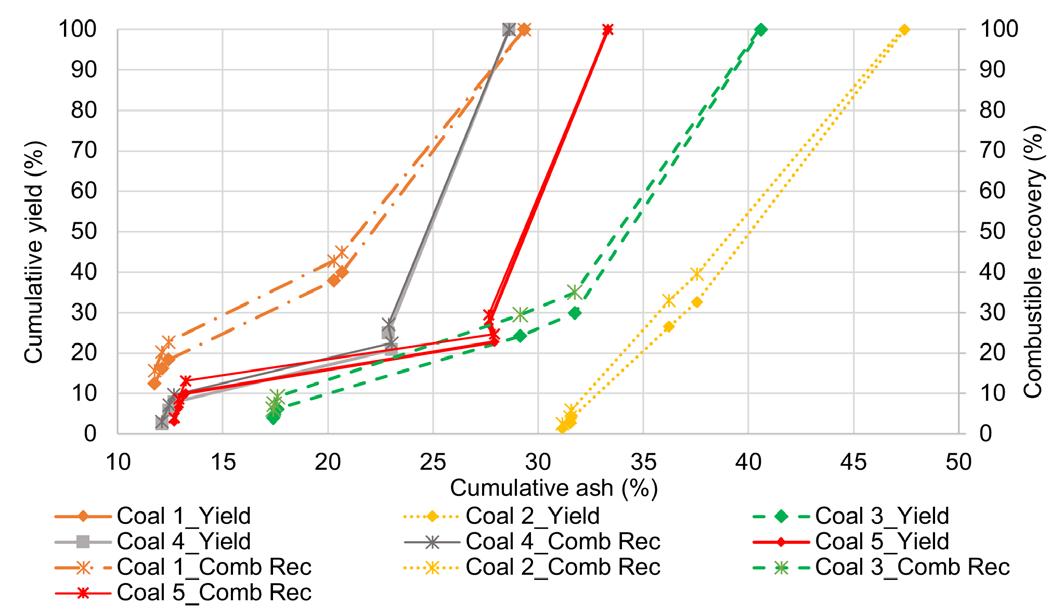
Recovery of coal sample 2, 3, 4, and 5 and with 5 kg/t of the emulsion
Clean coal yield and combustible recovery
agrees with the literature that for an effective separation using pure oil (diesel, kerosene etc), a higher oil dosage is essential (Garcia, Vega, and Matnines-Tarazona, 1995; Dickinson, Jiang, and Galvin, 2015; Netten, Moreno-Atanasio, and Galvin, 2016). The low recovery for sample 1 may be due of the presence of carbonyl groups (C=O), which enhance the potential of the air bubbles to repel the carbonaceous particles in the coal and lower the attachment rate (Sarikaya and Ozbayoglu, 1990; Li et al., 2018). In comparison, the W/O HIP emulsion binder required only 0.25 kg/t organic oil, while 5 kg/t pure kerosene was required to beneficiate the same coal.
441The Journal of the Southern African Institute of Mining and Metallurgy VOLUME 122 AUGUST 2022
Selectivity is the ability to differentiate hydrophobic and hydrophilic carbonaceous particles from inorganic mineral matter prior to advanced agglomeration and froth flotation (Netten and Galvin, 2018; Lu et al., 2019). The extent to which the W/O emulsion binder and kerosene were able to select clean coal from the inorganic minerals in the coal sample was evaluated using ash rejection percentage (Equation [4]). As seen in Figure 9A, the emulsion binder has high level of selectivity.
Figure 11—Effect of HIP W/O emulsion concentration (5 kg/ton) on the cumulative yield, combustible recovery (Comb Rec) and ash content of the clean coal products
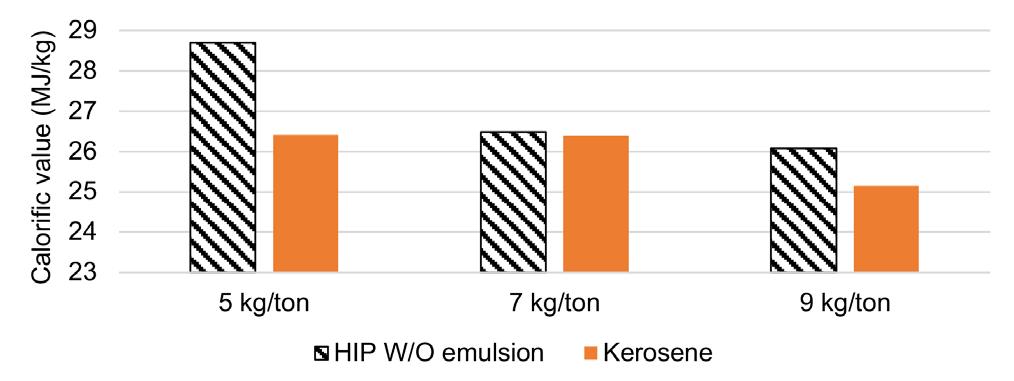
calorific values of the clean coal products
Figure 9—The rejection of inorganic minerals from reporting to the floated carbonaceous product at different HIP W/O (A) and kerosene (B)
Figure 8—Impact of kerosene concentration on clean coal 1 product yield and ash content
Selectivity
Calorific value of the clean coal
The calorific value, also known as the heating value, was evaluated to determine the grade of the clean coal products obtained from the weathered coals, as well as their market potential. As a result of the rejection of the inorganic minerals of the clean coal produced at 5 kg/t W/O emulsion (Figures 7 and 9A), the feed coal calorific value increased from 20.94 MJ/kg to 28.61 MJ/kg (Figure 10). On the other hand, kerosene produced a clean product with a calorific value of 26.42 MJ/kg using the same dosage of 5 kg/t. As the optimal dosage of 5 kg/t (W/O emulsion binder) provided the best recovery from sample 1, the other coal samples (2, 3, 4, and 5) were then beneficiated at this condition.
Wang,SACRM-Value-Chain-Overview.pdf.http://www.fossilfuel.co.za/initiatives/2013/[accessed20April2021].Q.,Niida,H.,Apar,P.,Chen,Q.,Gui,L.,Qian,Q.,Mitsumura,N.,Kurokawa,H.,Sekiguchi,K.,andSugiyama,K.2012.Influentialfactorsontheoilagglomerationprocessforrecoveryfromdifferentgradecoals.Itoh, H., Brebbia, C.A., and Popov, V. (eds). Waste Management and the Environment VI. WIT Press, Southampton. pp. 1−448.
Garcia, A.B., Vega, J.M.G., and Martinez-Tarazona, M.R. 1995. Effects of oil concentration and particle size on the cleaning of Spanish high-rank coals by agglomeration with n-heptane. Fuel, vol. 74, no. 11. pp. 1692−1697.
Netten, K. and Galvin, K.P. 2018. Rapid beneficiation of fine coal tailings using a novel agglomeration. Fuel Processing Technology, vol. 176. pp. 205−210.
Xia, W., Yang, J., and Liang, C. 2013. A short review of improvement in flotation of low rank/oxidised coals by pretreatments. Powder Technology, vol. 237. pp. 1−8. u
Chemical Engineering Research and Design, vol. 101. pp. 74−84.
Barma, S.D. 2018. Ultrasonic-assisted coal beneficiation: A review. UltrasonicsSonochemistry
Clean coal 28.61 18.16 25.77 27.62 26.28
CV= calorific value
Compared to pure kerosene, requiring 5 kg/t to produce clean coal products, the HIP W/O emulsion binder used only 0.25 kg/t of the organic liquids (kerosene and Span 80) to produce a clean coal concentrate of 11.76% ash content and heating value of 28.61 MJ/ kg. In contrast, 17.47% ash and a calorific value of 26.42 MJ/kg were achieved using 5 kg/t of kerosene. This research has established that weathered coal samples from South African coalfields dumped for decades can be upgraded to a high-quality product.
Eskom. n.d. Eskom Holdings SOC Ltd - Lethabo Power Station.
Liao, Y., Cao, Y., Liu, C., Zhao, Y., and Zhu, G. 2017. Comparison of the effect of particle size on the flotation kinetics of a low-rank coal using air bubbles and oily bubbles. The Journal of the Southern African Institute of Mining and Metallurgy, vol. 117. pp. 561−566.
Calorific values (MJ/kg) of the clean coal products using 5 kg/t emulsion binder
Horsfall, D.W., Zitron, Z., and de Korte, G.J. 1986. The treatment of ultrafine, especially by froth flotation. The Journal of South African Mining and Metallurgy, vol. 86, no. 10. pp. 401−407.
References
Nicol, S.K., Smitham, J.B., and Hinkley, J.T. 1994. Measurement of coal flotation efficiency using the tree flotation technique. Cracow, Poland. Proceedings of the 12th International Coal Preparation Congress. pp. 1159−1166.
Department of Energy. 2001. National inventory discard and duff coal – 2001. http://www.energy.gov.za/files/esources/coal/coal discards.html [accessed 20 February 2022].
Coal samples 20.34 8.48 16.29 20.61 18.55
Conclusions
Li, E., Lu, Y., Cheng, F., Wang, X., and Miller, J.D. 2018. Effect of oxidation on the wetting of coal surfaces by water: experimental and molecular dynamics silumation studies. Physiochemical Problems Mineral Processing, vol. 54, no. 4. pp. 1039−1051.
Value (MJ/kg) 1 2 3 4 5
Lu, Y., Wang, X., Liu, W., Li, E., Cheng, F., and Miller, J.D. 2019. Dispersion behaviour and attachment of high internal phase water-in-oil emulsion droplets during fine coal flotation. Fuel, vol. 253. pp. 273−282.
Impact of HIP W/O emulsion binder functional groups on selectivity
Flotation of weathered coal discards using a HIP W/O emulsion binder and kerosene
Galvin, K.P., Pratten, S J., Shankar, N.G., Evans, G.M., Biggs, S.R ., and Tunaley, D. 2001. Production of high internal phase emulsions using rising air bubbles. Chemical Engineering Science, vol. 56, no. 21-22. pp. 6285−6293.
Netten, K., Moreno-Atanasio, R., and Galvin, K.P. 2016. Selective agglomeration of fine coal using a water-in-oil emulsion. Chemical Engineering Research and Design, vol. 110. pp. 54−61.
Fossil Fuel Foundation. 2011. The South African Coal Roadmap. Overview of the South African Coal value chain.
Table III
CV increment 7.67 9.68 9.48 7.01 7.73
Dickinson,Power_Station.aspxco.za/Whatweredoing/ElectricityGeneration/PowerStations/Pages/Lethabo_https://www.eskom.[accessed23September2021].J.E.,Jiang,K.,andGalvin,K.P.2015.FastflotationofcoalatlowpulpdensityusingtheRefluxFlotationCell.
Coal discards
Netten, K., Borrow, D.J., and Galvin, K.P. 2017. Fast agglomeration of ultra-fine hydrophobic particles using a high-internal-phase emulsion binder comprising permeable hydrophobic films. Industrial and Engineering Chemistry Research, vol. 56, no. 38. pp. 10658−10666.
In summary, the HIP W/O emulsion binder has the capacity to beneficiate weathered coal samples from tailings dams.
442 AUGUST 2022 VOLUME 122 The Journal of the Southern African Institute of Mining and Metallurgy
Acknowledgements
Wang, G., Bai, X., Wu, C., Li, W., Liu, K., and Kiani. 2018. Recent advances in the beneficiation of ultrafine coal particles. Fuel Processing Technology, vol. 178. pp. 104−125.
Table III presents the calorific values of the floated clean coal products with an emulsion concentration of 5 kg/t. As indicated, a higher calorific value increase was achieved for samples 2 and 3. The increase in the grade of both coals might be due to the high abundance of the OH groups found on their surfaces. According to Lu et al. (2019), HIP W/O emulsion is noted to prevent the entrainment of inorganic minerals in the floated clean coal product, and in addition, leads to the formation of strong bonds with the oxygenated functional groups in the weathered coal. The highest calorific value improvement was achieved for sample 2, from 8.48 MJ/kg to 18.26 MJ/kg after beneficiation. This calorific value surpasses the heating value requirements for some Eskom power plants such as Lethabo power station, which requires a calorific value of 16 MJ/kg and ash content of between 35% and 42% ash (Eskom, n.d.). On the other hand, the clean coal obtained from coals 1 and coal 4 had a calorific value of 28.61 MJ/kg, and 27.62 MJ/kg and can be classified as Grade A and Grade B, respectively. As shown in Table III, the products obtained from samples 3 and 5 have heating values of 25.77 MJ/kg and 26.28 MJ/kg, respectively.
Bada, S.O., Falcon, R.M.S., and Bergmann, C.P. 2016. Co-firing potential of raw and thermally treated Phyllostachys aurea bamboo with coal. Energy Sources, Part A: Recovery, Utilization, and Environmental Effects, vol. 38, no. 10. pp. 1345−1354.
Isaac, K. 2019. The co-combustion Pperformance of South African coal and refuse derived fuel. MEng thesis, University of the Witwatersrand. https://hdl.handle. net/10539/29052 [Accessed 05 May 2021].
Financial support from Coaltech Research Association (Project Number: P2020-1) and the National Research Foundation of South Africa's SARChI Clean Coal Technology Grant (Grant Number: 86421) is highly appreciated. The authors also gratefully acknowledge the University of the Witwatersrand for access to research facilities.
Email: 36598704@nwu.ac.za
Coal is a major fossil energy source for production of electrical power, which plays an important role in the economic development of many countries (Campbell, le Roux, and Nakhaei, 2021a,b). Coal requires to be processed to remove gangue minerals in order to increase its quality. Coal particles have different densities, affected by the maceral and mineral compositions, rank, volatile matter, and ash and moisture contents (Roux, 2021). Most coal cleaning processes are based on gravity separation. Coal washability data is vital for assessing the performance of coal preparation plants. The washability curves are expressed under optimal conditions in sink and float experiments in a graphic format (Korkmaz and Bentli, 2017; Botlhoko et al., 2021; 2022).
error, linear regression, neural network, RhoVol, sink and float, washability.
Revised: 21 Jun. 2022
Estimation of coal density using a 3D imaging system: RhoVol.
Estimation of coal density using a 3D imaging system: RhoVol
1School of Chemical and Minerals Engineering, North-West University, South Africa.
443The Journal of the Southern African Institute of Mining and Metallurgy VOLUME 122 AUGUST 2022
How to cite:
Dates:
Affiliation:
Received: 26 Jan. 2022
Some alternative methods, including magnetized fluids, dual energy X-ray transmission (DEXRT) systems, dense medium suspensions, gas pycnometry, and replacing organic liquids with salt solutions such as zinc chloride, have been reported in the literature (Forbes et al., 2003; Fofana and Steyn, 2019).
Accepted: 13 Jun. 2022
DOI SecundaConference,Society,SouthernThis9330-426Xhttps://orcid.org/0000-0002-M.0510-6018https://orcid.org/0000-0003-Q.P.8840-9772https://orcid.org/0000-0001-F.ORCID:9717/2004/2022http://dx.doi.org/10.17159/2411-ID:NakhaeiCampbellleRouxpaperwasfirstpresentedattheAfricanCoalProcessingBiannualInternationalCoal12-14thOctober2021,
Journal of the Southern African Institute of Mining and Metallurgy, vol. 122, no. 8, pp. 443–450
by F. Nakhaei1, Q.P. Campbell1, M. le Roux1, and S. Botlhoko1
coal,Keywordsdensity,
TheSynopsisresults
Sink and float tests are expensive and time-consuming. Coal washing plants usually perform a comprehensive sink and float experiment once a month. In daily operation, operators often conduct a rapid test every hour to optimize the processing conditions. Typically, results take a few hours to be returned, so it is not possible to accurately optimize the plant operation. Moreover, sink and float tests rely strongly on the expertise and experience of the operator, and the repeatability of the process can be poor. The rapid calculation of coal washability curves has therefore become a vital topic of investigation (Ze-Lin et al., 2011; Fofana and Steyn, 2019).
Published: August 2022
of coal sink and float tests are plotted as washability curves. Analysis of these curves indicates the most effective method by which the coal can be cleaned. Sink and float experiments are samplingdependent, destructive, and use toxic chemicals. The present research introduces an alternative method based on a 3D imaging system called RhoVol, in which the density of individual particles is determined from mass and volume measurements. A quantitative error analysis was conducted on coal sample density measurements obtained by RhoVol, and the main factors influencing the errors identified and investigated. The results show that the drawback of this technique is related to its not being able to detect hidden concavities in the particle, resulting in an overestimation of particle volume. Furthermore, it is difficult to capture the impact of porosity and cracks on the volume of coal particles obtained from 3D silhouette images. This mismatch between the RhoVol data and sink and float test results has led to attempts to apply neural network (NN) and linear regression techniques to produce a fully reliable model for correction and estimation of coal density. The NN approach offers superior predictive capability over linear regression, and the estimated density distribution is in line with the sink and float analysis. The root mean square error in estimation of density using the NN model was less than 0.05 g/cm³.
Nakhaei, F., Campbell, Q.P., le Roux, M., and Botlhoko, S. 2022

Introduction
Correspondence to: F. Nakhaei
The sink and float method separates coal and gangue particles based on density by allowing particles to sink or float in dense liquid solutions of known density (Zhang et al., 2011). The particles of higher density sink in the liquid medium and are transferred to a solution of greater density, whereas the lighter ones float on the liquid surface (Callen et al., 2008). These dense liquids pose health and environmental hazards. Increasing concerns over the risks of heavy liquids have resulted in an alternative method of determining coal washability curves.
The goal of this study is to ascertain if RhoVol is able to sort coal particles based on density to determine the washability curve, as obtained by the sink and float method. The purpose is to understand the fundamentals of the RhoVol process, especially the errors associated with density measurement and the approaches known to minimize errors.
In order to investigate the repeatability of the measurement system, each particle was passed through the machine seven times and the volume and density values compared. To assess the RhoVol accuracy, the average of seven replications is compared with the volume or density obtained through a sink and float test. In plain words, any calibration procedure is meant to fix the RhoVol parameters such that the results are as close as possible to the sink and float results.
Sink and float testwork
Although salt solutions are preferable to heavy organic liquids, they commonly need to be washed from the coal after the test. Furthermore, they are costly and hazardous in high concentration.
444 AUGUST 2022 VOLUME 122 The Journal of the Southern African Institute of Mining and Metallurgy
size limitation) with significant shape variations were prepared and used in the experiments. The particles had ash contents ranging from 8% to 52%. These particles were chosen from coal samples obtained from mines in the Witbank and Molteno-Indwe coalfields (South Africa). Highveld is a low-rank bituminous coal while Molteno-Indwe is lean coal bordering on anthracite. These coal particles were individually sorted by float-sink testing and the Rhovol machine.
Digital image processing is a fast, non-invasive, and low-cost technology for obtaining process-related information and is widely accepted in mineral processing (Nakhaei et al., 2018; 2019; Nakhaei, 2021). RhoVol is an image-processing-based measurement system that determines the size, shape and volume of particles. It is also equipped with a high-speed load cell to accurately measure the mass of particles. Figure 1 shows a schematic diagram of the RhoVol system. RhoVol is able to produce a density distribution of particles in a speedy and safe way. The system uses seven cameras at various angles to record seven silhouettes of a particle at a time. A 3D model of the sample is calculated as the intersection of silhouette cones obtained by back-projecting the silhouettes from the different viewpoints, so that any size and shape properties can be obtained, such as minimum circle diameter (MCD), minimum square sieve size (MSSS), roller gap size (RGS), compactness, elongation, and flatness. The 3D model produced in this way is termed the visual hull and is the maximal approximation of the object that is consistent with a given set of silhouette views (Laurentini, 1994; Mangera, Morrison, and Voigt, 2016).
Fifty-seven coal particles in the size fraction –8+2.8 mm (RhoVol’s
Reliable density measurement is essential for characterizing raw coal and predicting the performance of a coal washing plant. A good measurement system allows for rapid processing and repeatability and produces reliable results. One concern for the RhoVol is that the volume calculation is based on apparent measurement, not a real measurement; therefore its accuracy depends on how well particle volume represents the true volume.
The RhoVol is also equipped with a sorting functionality in which samples are detected and sorted into twelve discrete bins based on any of the particle characteristics such as density, mass, size, or Theshape.accuracy of the density measurement would affect the sorting results and therefore it is essential to understand the errors associated with the RhoVol system. In this study, two main sources of error, termed the instrumental error or repeatability and heterogeneity error or accuracy, are investigated. Repeatability includes independent experimentaly results which are acquired the same way, using identical test parameters, for the same sample (Polakowski et al., 2021). Hence, repeatability represents the best accessible internal precision. The accuracy is the gap between a measured value and a true value.
Experimental Materials
The repeatability and accuracy of the measured density or volume rely greatly on the physical features and the orientation of a particle at the moment when the images are recorded (Forbes et al., 2006; Forbes, 2007).
In this paper, the validity and reliability of a camera-based 3D imaging system for coal density measurement are investigated to improve the accuracy of RhoVol. Moreover, error correction methods for coal density obtained by RhoVol are proposed. We apply linear regression and neural network (NN) techniques as powerful functional approximators to correct the coal density obtained from RhoVol parameters so as to be close to sink and float test results. A model that decreases the errors is suggested and the applicability of RhoVol in coal sorting applications is verified.
Particle density is the ratio of the mass to volume. Since 3D imaging systems can analyse on a particle -by -particle basis, it is possible to estimate the volume and density of a certain particle, which can be applied to the washability analysis of a given coal sample. The RhoVol system, commercialized by De Beers Technologies (South Africa), calculates the density of particles by determining the mass and volume. The 3D model generated using the integrated seven-camera system enables an estimation of the volume of the particle. This technique provides a good estimation of the visual hull of a particle (Mangera, Morrison, and Voigt, 2016; Botlhoko et al., 2021).
Estimation of coal density using a 3D imaging system: RhoVol
RhoVol measurements
Lu (1996) studied the relationship between coal ash and its float and sink behaviour and presented a model to estimate the float and sink response of the raw coal. Liu and Lu (1998) estimated the washability of raw coal from the total ash content. Wang and Lu (1999) established a model to estimate the washability curve on the basis of the relationship between the ash content and density of the raw coal. Prediction of floating and sinking ratios from the ash content of the raw coal has been shown to resulting in a big difference between the estimated and the real values. Considerable work has been done by different investigators using advanced techniques, such as the DEXRT system (Zhang et al., 2021) to estimate coal sortability and washability. These systems are able to analyse the ash content and specific gravity of a given particle by measuring the X-ray attenuation for each sample.
Coal density differs from seam to seam, based on the coal rank and purity. Sink and float experiments are used to sort coal samples according to their densities. In this work, coal density was determined using a series of solutions of different
Mangera, Morrison, Voigt (2016) proposed a technique for correction of particle volume estimation by applying a shapedependent scaling factor. They used a k-means algorithm to identify the shape classes and applied a class scale factor to each sample. This method reduces the volume error from 20% to 6%. This approach has proved successful in kimberlite analysis.
Apart from the input nodes, each node uses a nonlinear activation function. A three-layer NN was considered in this
Fundamentals of NNs can be found in Nakhaei et al., (2010; 2012). The multi-layer perception (MLP) is a type of feed forward NN that includes an input layer, one or more hidden layers, and an output layer. The structure of NNs comprise a set of processing elements, typically organized in layers, known as neurons. These neurons are connected to each other by synaptic weights. Connection weights are the coefficients of the NN and have to be adjusted in order to minimize the prediction errors.
Estimation of coal density using a 3D imaging system: RhoVol
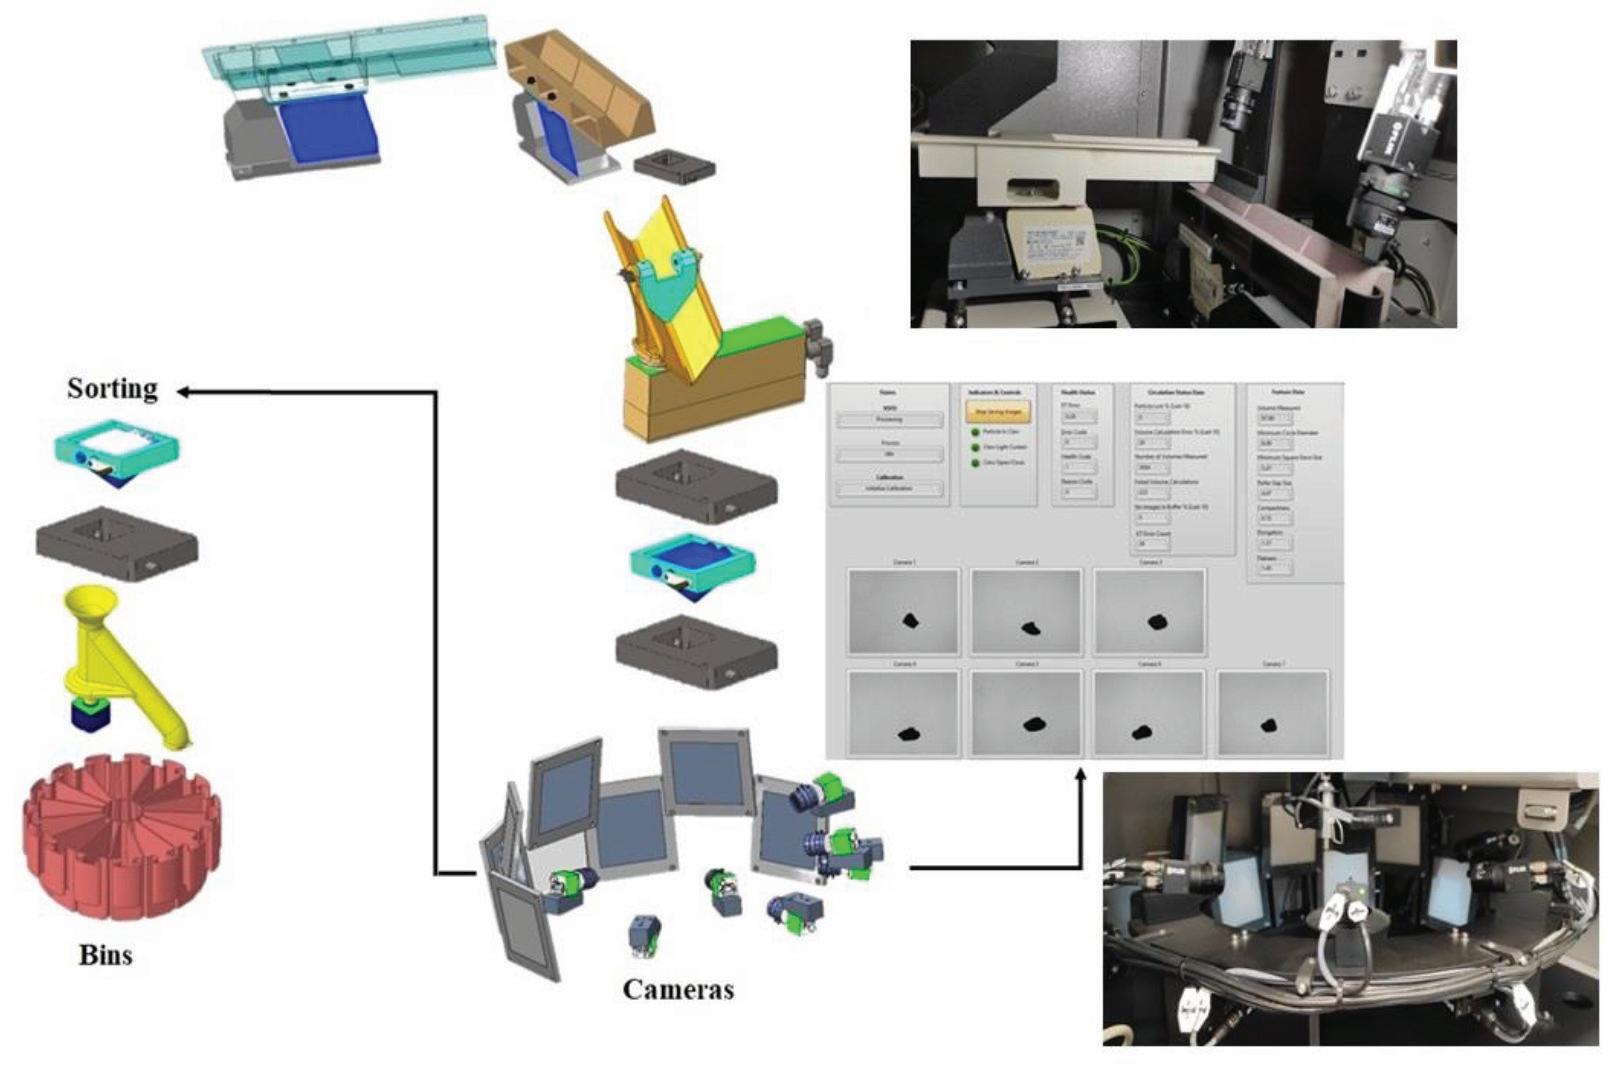
The neural network (NN) is considered one of the most robust and practical methods for modelling of nonlinear systems in many fields of engineering. The NN is a nonlinear statistical data modelling tool that is used to establish the relationship between independent variables and the dependent variables of a process (Nakhaei, Irannajad, M., and Yousefikhoshbakht, 2016; Nakhaei, Irannajad, and Mohammadnejad, 2019).
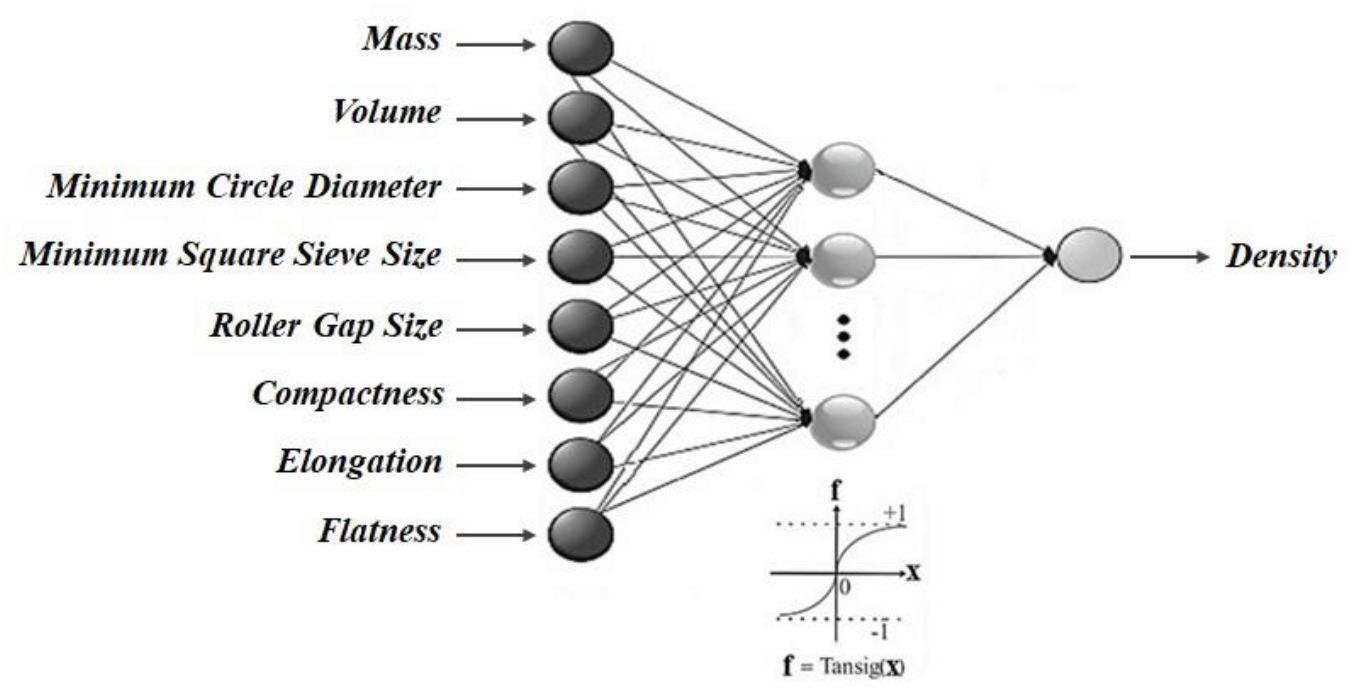
Methodology
Figure 1—Schematic diagram of the RhoVol system
RhoVol repeatability and accuracy
Initially, the input variables were inserted into the NN, and the proposed NN was trained based on the inputs and output data using a portion of the data called a training set. Then, to reveal the authenticity and practicality of the model, a comparison of the estimated values and desired values was performed on a test set. Seventy-five per cent of the data-set was used in the model training and the rest of the data-set was used in the testing stage for evaluating the model. The testing phase was conducted using the data that was not used in the training process.
study for the density estimation, as shown in Figure 2. The aim of NN algorithm is to find the best density in terms of accuracy, authenticity, and expedition.
The accuracy and repeatability of the calculated coal density rely on the physical features of particle and the orientation of the particle within the RhoVol at the moment when the images are captured (Mangera, Morrison, and Voigt, 2016). Figure 3 shows seven distinct viewpoints of a coal particle captured by seven cameras in five replications. Measurements of the first to fifth runs are given in Table I. Repeatability indicates the error in successive measurements of a variable under identical operating
Multi-layer perceptron (MLP)
Results and discussion
Figure 2—Feed-forward neural network model
densities (ranging from 1.20 to 2.1 g/cm3 in incremental steps of 0.05 g/cm³). Nineteen consecutive vessels were used in these experiments. The densities of the solutions were measured using a hydrometer. After preparing the solutions, each particle was loaded into the solution of lowest density first. Then, the sink particle was collected and washed before being placed in the vessel with the next higher density, and so forth. Based on the sink and float experiments, the density of coal particles can be measured with probable error ±0.05 g/cm³. These tests helped to evaluate the feasibility of the successful application of RhoVol on the coal samples.
445The Journal of the Southern African Institute of Mining and Metallurgy VOLUME 122 AUGUST 2022
The neurons in the MLP are trained using a backpropagation (BP) learning algorithm. In the forward stage the random weights are fixed as the signal is transmitted layer-by-layer through the network. In the backward stage, if the output layer cannot obtain the expected value, the connection weights of the hidden layer are modified before the output layer (Lorencin et al., 2020).
5 479.4 302.64 1.58 9.12 8.12 6.319 0.72 1.34 1.46
The results show that the repeatability of the density (volume) estimation does not depend on the shape of the coal particle. For example, the volumes and densities of coals (c) and (d) with similar shape characteristics show different repeatabilities. However, for most of the coal particles, instrumental error (standard deviation) for density was less than 0.06 g/cm₃. Since the sink and float tests were carried out in incremental steps of 0.05 g/cm₃, the instrumental error can be considered small. In conclusion, instrumental error would not significantly affect the accuracy of the density measurement and it can be ignored.
446 AUGUST 2022 VOLUME 122 The Journal of the Southern African Institute of Mining and Metallurgy
The results of the RhoVol repeatability experiment
The heterogeneity errors (accuracy) for all 57 coal samples are shown in Figure 5. It can be observed that for most of the particles, the error accounted for over 20% of the measured value, indicating that the heterogeneity error has a significant impact on density measurement. The most important reason why the reliability of RhoVol in coal sorting application has been questioned is that the particle volume is estimated from the visual hull of the object. The shape measurements from the silhouette technique do not take into account hidden concavities
1 480.3 310.83 1.54 9.21 8.01 6.34 0.73 1.31 1.49
3 479.3 307.12 1.56 9.60 7.94 6.3 0.73 1.29 1.55
2 479.4 292.95 1.64 9.22 7.89 6.291 0.71 1.32 1.58
S.T.D 0.49 6.68 0.03 0.19 0.08 0.02 0.01 0.02 0.05
Figure 3—An example of images of a coal particle captured by RhoVol in five replications. The particle is visualized from seven distinct viewpoints
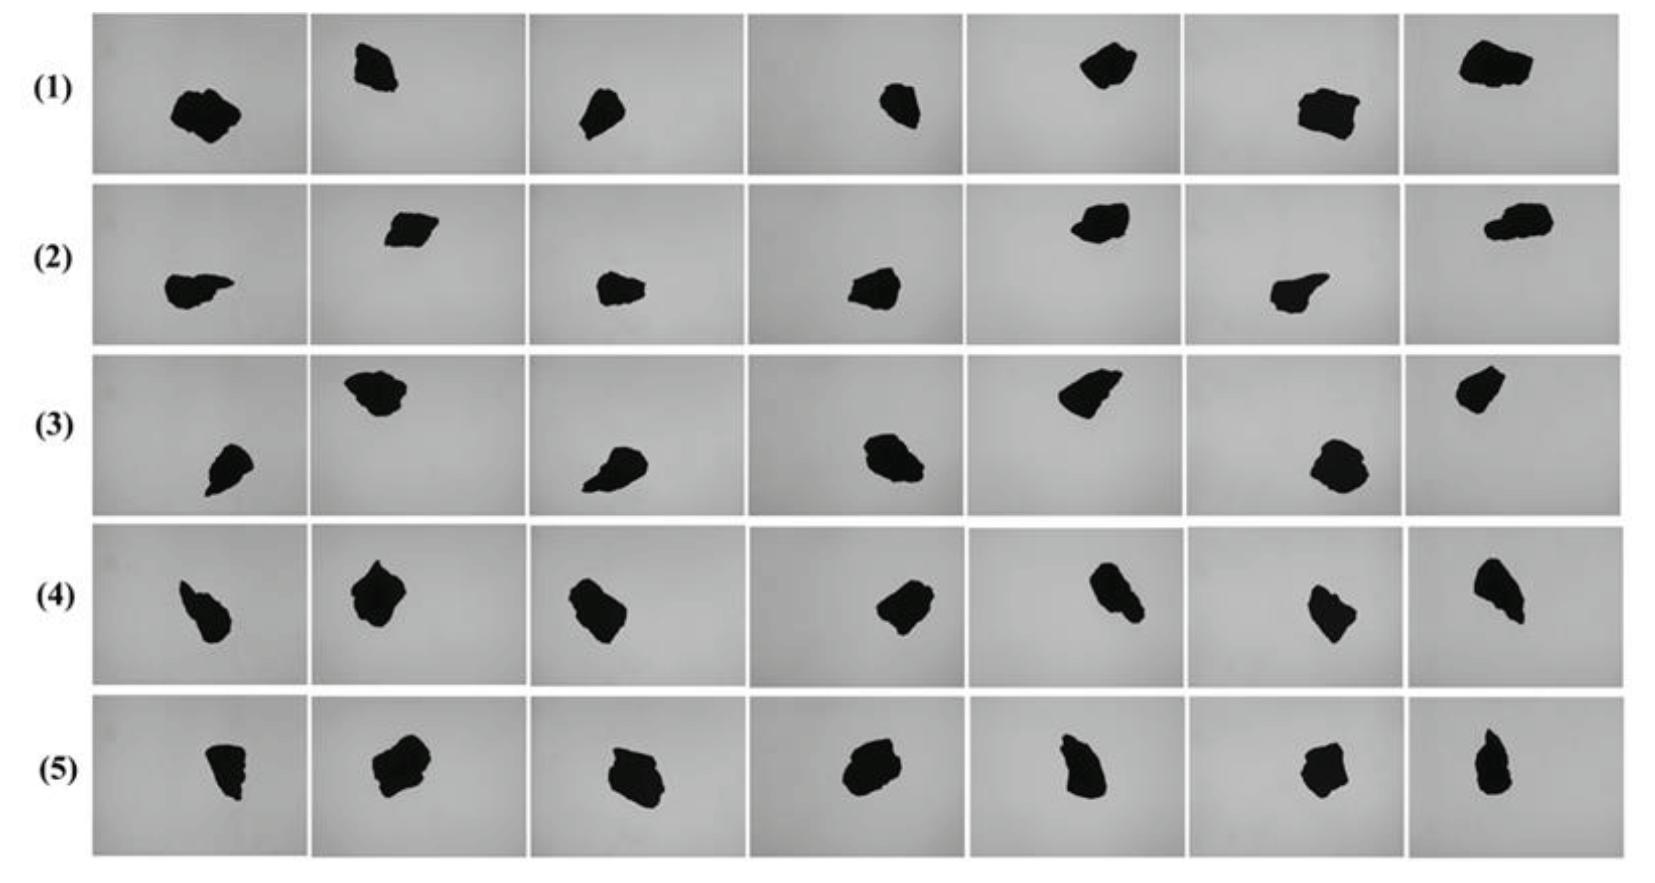
Error correction models
of a particle, resulting in an overestimation of the particle volume. Moreover, it is impossible to capture the impact of porosity and cracks on the volume of coal samples obtained from 3D images. The difference between the RhoVol measurements and sink and float data is not necessarily constant over all particles (Botlhoko et al., 2021; 2022). This mismatch is termed the heterogeneity error in this paper. Thus, the calculation of accurate density values on the basis of 3D imaging systems requires a correction factor (CF) or other techniques that produce fully reliable models.
Linear regression
conditions, and beyond certain limits the error is unacceptable. Repeatability is usually manifest as the standard deviation of the measured values. In this study, it is considered as instrumental error.As a result, the appearance of the coal particle changes slightly depending on its orientation and position relative to the camera when the images are captured. All particles were imaged in the RhoVol seven times. The results for four types of coal particles are presented in Figure 4 and Table II.
Repeat Mass Volume Density MCD MSSS RGS Compactness Elongation Flatness (mg) (mm³) (g/cm³) (mm) (mm²) (mm)
Although the RhoVol method is repeatable, it has been shown that there is a considerable difference between coal density measured by the RhoVol and the sink and float test results. A linear regression model for correction and estimation of the coal density is proposed here.
Average 479.5 303.41 1.58 9.26 7.99 6.31 0.72 1.31 1.52
Figure 6 displays the correlation between the RhoVol densities (average of seven observations) and the densities by sink and float tests for coal particles. The high correlation coefficient of the model equation (R² = 0.89) indicates the strong correlation between RhoVol and sink and float densities of the coal particles.
Estimation of coal density using a 3D imaging system: RhoVol
In practice, a linear regression model is applied to convert the RhoVol measurements to values close to the sink and float tests. The model is y = ax+b, where y is the true density of the target particle; x is the measured density by RhoVol; and a and b are model-fitted slope and intercept coefficients.
Table I
4 479.1 303.54 1.58 9.15 7.97 6.31 0.72 1.31 1.53
b Average 505.15 361.28 1.40 10.55 8.47 5.99 0.78 1.12 1.71
[1]
d Average 529.68 396.77 1.34 9.86 8.21 7.08 0.73 1.46 1.2 S.T.D 0.17 17.66 0.06 0.11 0.15 0.19 0.01 0.03 0.06
A linear correction factor was fitted using this data. For coal particles the correction function can be expressed as follows:

Figure 4—Distribution of mass and volume of four particles recorded seven times in the RhoVol
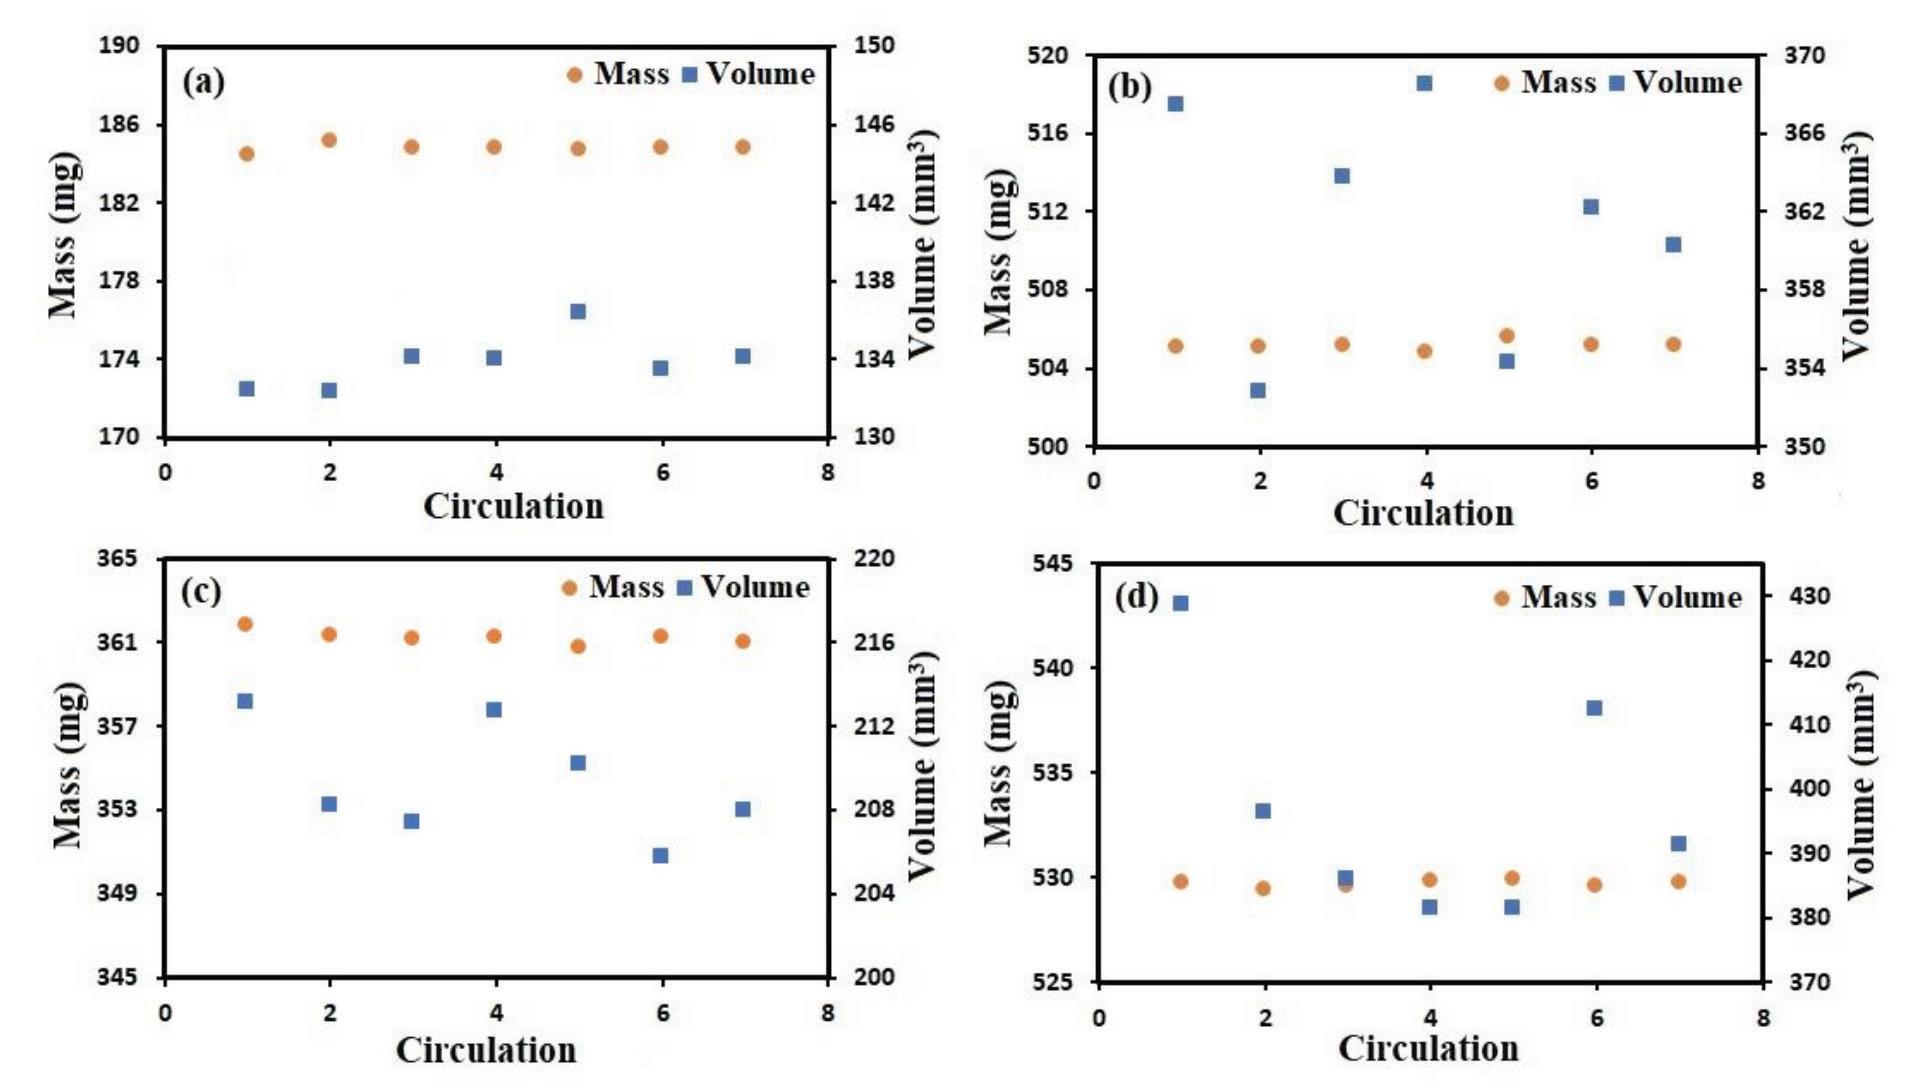
S.T.D 0.22 6.04 0.02 0.04 0.10 0.05 0.01 0.01 0.04
c Average 361.19 209.30 1.72 6.67 6.32 5.37 0.69 1.59 1.20 S.T.D 0.33 2.79 0.02 0.06 0.04 0.04 0.00 0.01 0.01
Figure 5—Comparison of the density measurements obtained from RhoVol and sink and float test for each particle
447The Journal of the Southern African Institute of Mining and Metallurgy VOLUME 122 AUGUST 2022
Particle Index Mass Volume Density MCD MSSS RGS Compactness Elongation Flatness (mg) (mm³) (g/cm³) (mm) (mm2) (mm)
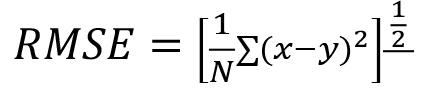
S.T.D 0.21 1.37 0.02 0.04 0.03 0.03 0.00 0.02 0.05
Estimation of coal density using a 3D imaging system: RhoVol
2011). The RMS error for the density estimate was computed using the equation:
a Average 184.77 133.83 1.38 6.89 6.22 4.93 0.80 1.18 1.40
[2]
This equation was applied to the RhoVol results to estimate the density closeness to the sink and float test and to ensure that the output data is not erroneous.
The results of the RhoVol measurements on four coal particles (Figure 4) extracted from the 3D model
The root mean square error (RMSE) is a standard index to compute the error of a model in forecasting data (Nakhaei et al.,
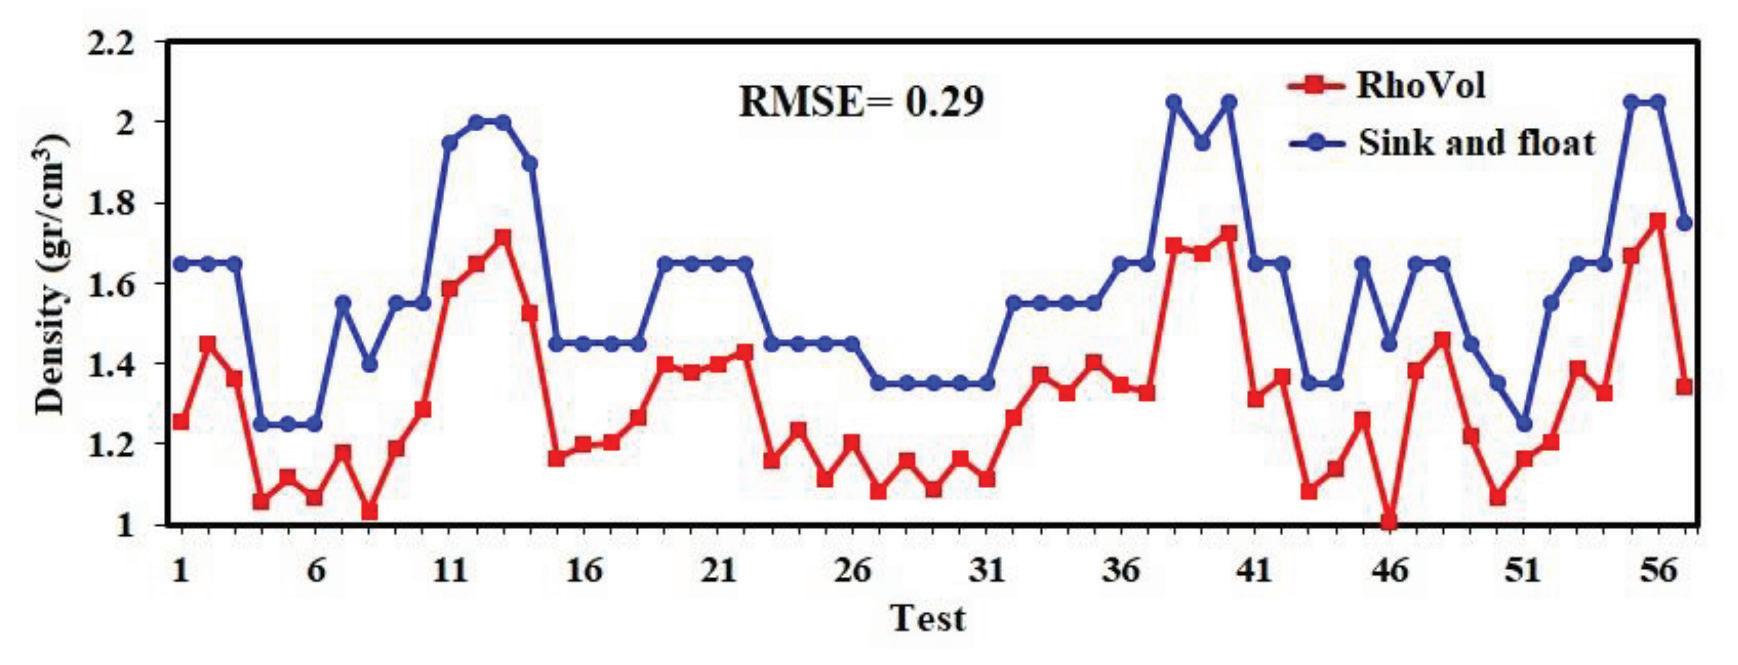
where x is the estimated density and y is the density on the basis of sink and float tests. The comparison between sink and float density and estimated density of the linear model is presented in Figure 7. The proposed model provides density estimates
Table II
Figure 9—Comparison of measured densities from sink and float tests with estimated data by NN in testing phase
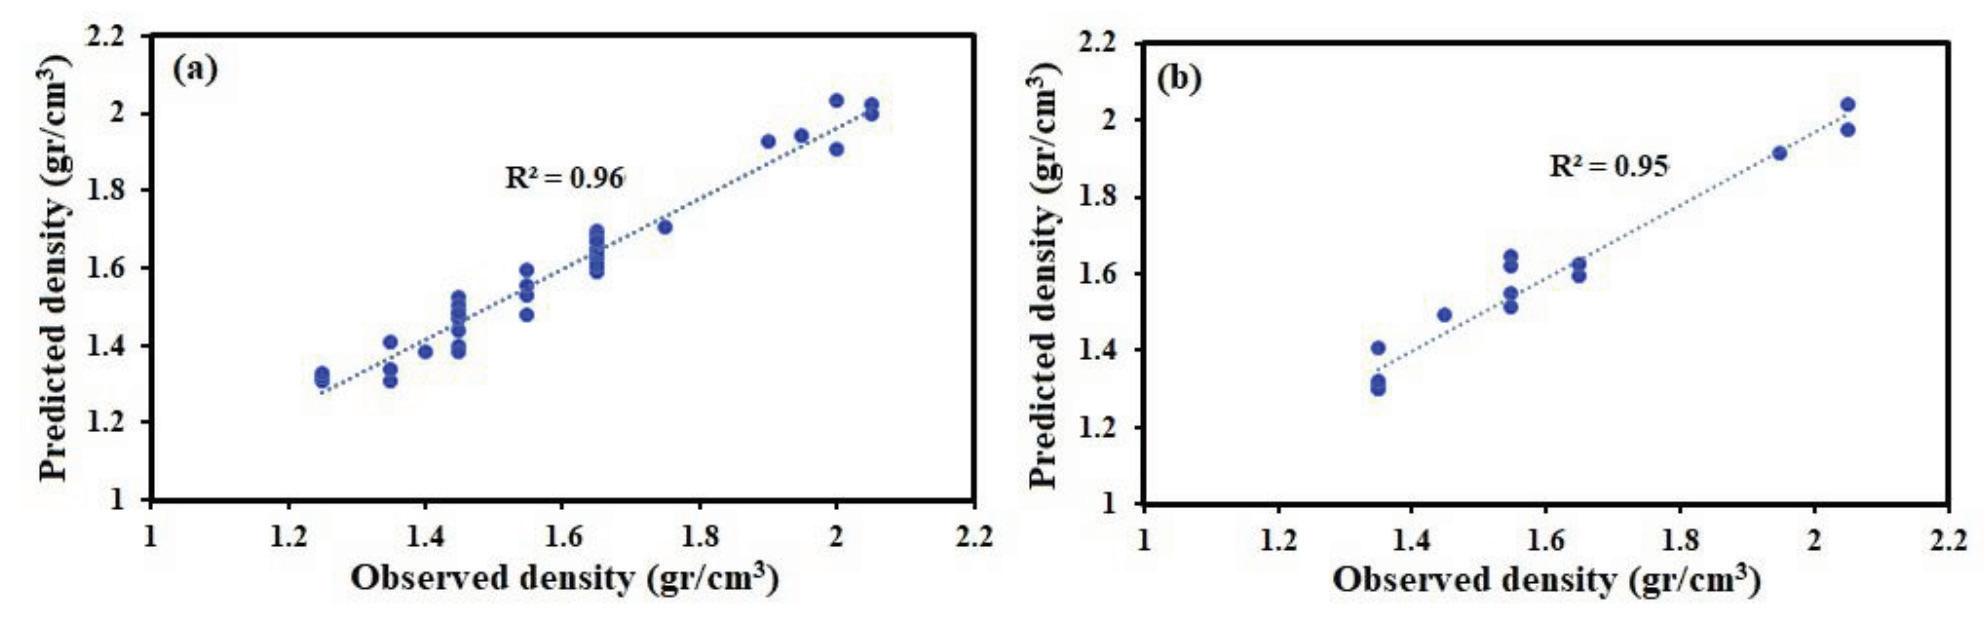
Since minor improvements did not justify increasing the complexity of the NN, the structure with NHL = 11 was selected. Figures 8 and 9 indicate the results of the NN training and testing processes.Figure 8 shows sink and float and predicted densities obtained in the NN testing stage on 15 data-sets that were not used for the training stage. Results of the testing process showed that the NN model provides a quite satisfactory approximation of density.
The coal particles (-8 +3 mm) were individually subjected to sink and float (1.2-2.1 g/cm3) and RhoVol experiments. The results showed that there are differences between sink and float test data and the RhoVol measurements. The shape-from-silhouette technique fails to record hidden concavities in a particle, resulting in a particle volume overestimation. Besides, it is impossible to consider the impact of porosity and cracks on the volume of coal particles obtained from 3D images. Therefore, linear regression
Estimation of coal density using a 3D imaging system: RhoVol
Neural network
The density predictions made using an NN model seem to be more reliable than those made by the linear equation. Practically speaking, the RMSE value in the prediction by the regression model was greater than that in the NN model; therefore, the NN for predicting coal density is more effective than the regression method. The proposed NN model can be used to estimate the coal density with a reasonable error (RMSE = 0.05). The results of this study can be used as a soft sensor in RhoVol for estimation of coal density and washability curves.
448 AUGUST 2022 VOLUME 122 The Journal of the Southern African Institute of Mining and Metallurgy
As mentioned earlier, seven parameters, namely mass, volume, minimum circle diameter, minimum square sieve size, roller gap size, compactness, elongation, and flatness were considered as input parameters. The MLP was trained according to these parameters.Tofindthe best structure and parameters of the NN, numerous combinations of network geometry with different numbers of neurons in the hidden layer (NHL) and different values of learning coefficients during the training phase were analysed. The selected model was validated using 15 sets of experimental data.
Conclusion
Figure 7—Comparison of estimated density by linear regression vs. sink and float values
Figure 6—Correlation between the RhoVol and the sink and float data
close to those obtained by the sink and float experiments (RMSE =0.08). Results show that the linear regression model provided improvements in the accuracy of density measurement and the estimated densities are sufficiently close to those from the sink and float test.
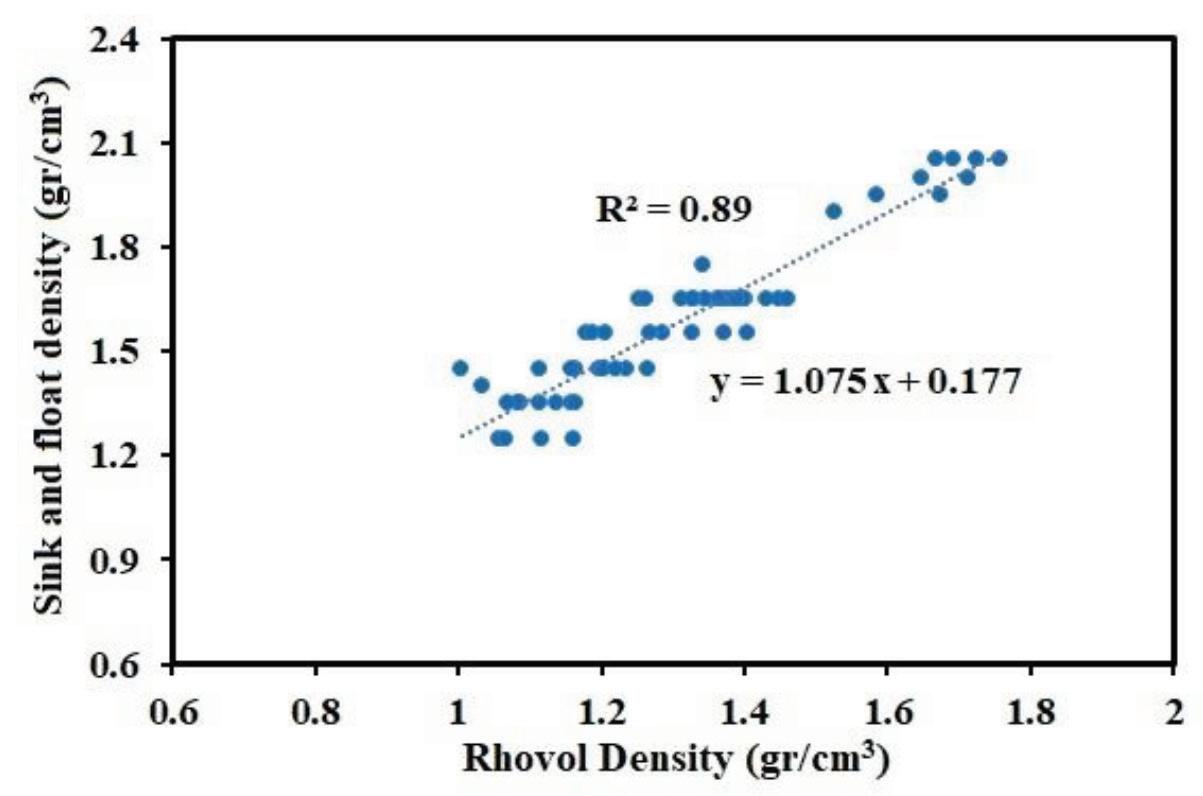
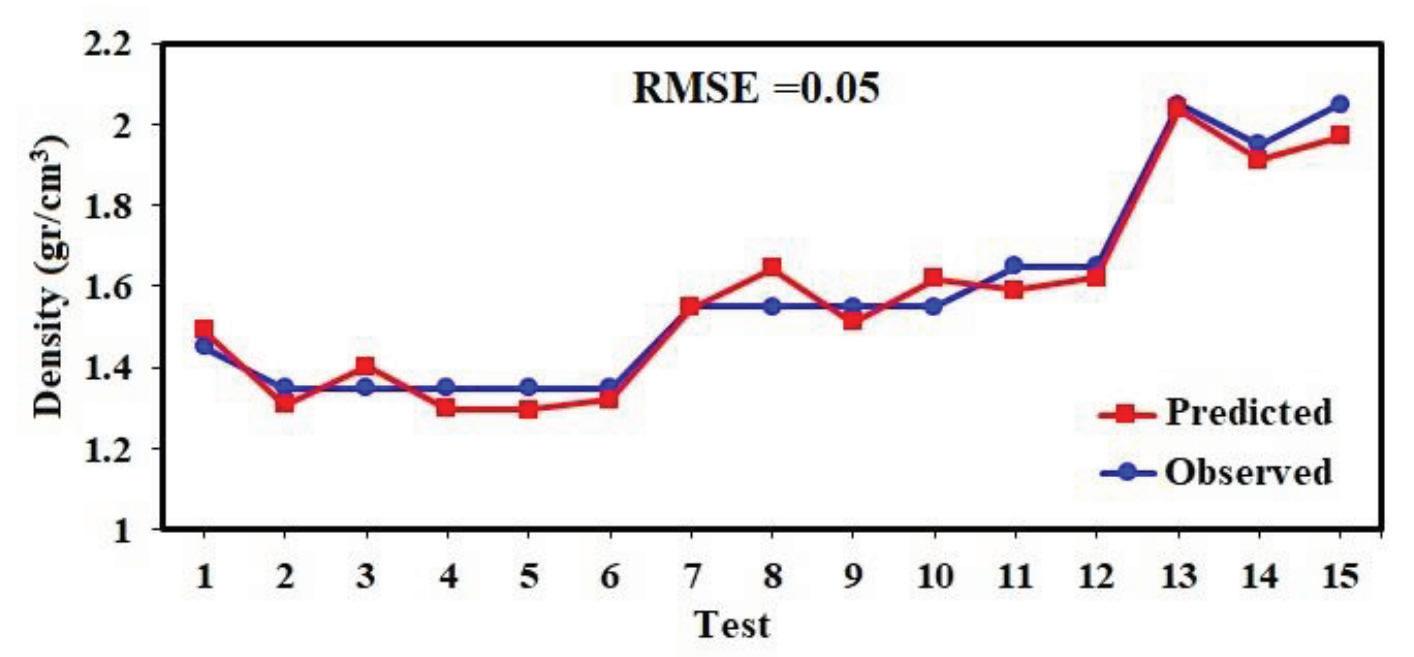
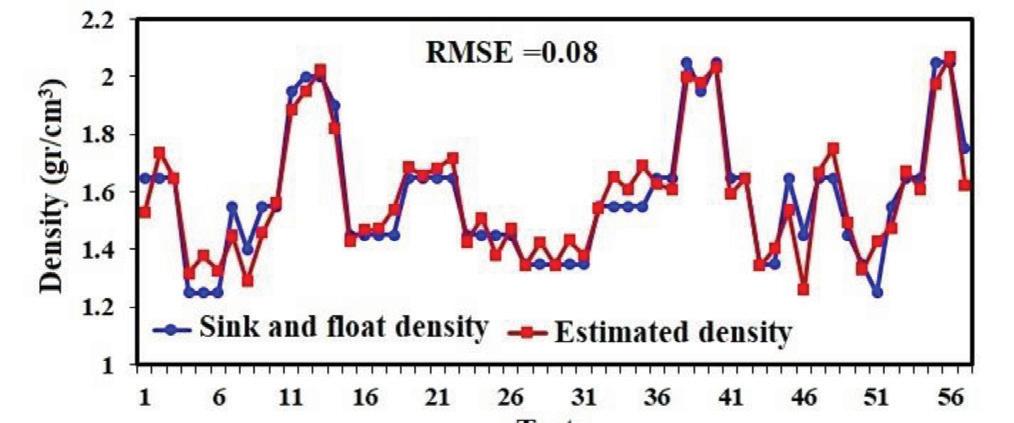
Figure 8—NN outputs vs. targets, (a) training, (b) testing
The coal washability curves are usually determined using laboratory sink and float tests. The motivation of this study was to assess an alternative technique to sink and float tests due to the time-consuming process as well as the costly and toxic heavy liquids used. We presented a novel 3D imaging system (RhoVol) for measuring density of individual coal particles.
Roux, L. 2021. Density – A contentious issue in the evaluation and determination of Resources and Reserves in coal deposits. Journal of the Southern African Institute of Mining and Metallurgy, vol. 121, no. 5. pp. 227–250.
Nakhaei, F., Irannajad, M., and Yousefikhoshbakht, M. 2016. Flotation column performance optimisation based on imperialist competitive algorithm. International Journal of Mining and Mineral Engineering, vol. 7, no. 1. pp. 1–17.
Fofana M. and Steyn, T. 2019. Monitoring the performance of DMS circuits using RhoVol technology. Journal of the Southern African Institute of Mining and Metallurgy, vol. 119. no. 2. pp. 133-125.
It has been demonstrated that RhoVol, a non-destructive and non-toxic method, has the potential to be an alternative to traditional sink and float tests, provided that it is integrated with a NN model.
Botlhoko, S., Campbell, Q.P., le Roux, M., and Nakhaei, F. 2021. Application of RhoVol information for coal washability analysis. Proceedings of the Coal Processing Conference 2021, Secunda, South Africa.
Mangera, R., Morrison, G., and Voigt, A.P. 2016. Particle volume correction using shape features. Proceedings of the Pattern Recognition Association of South Africa and Robotics and Mechatronics International Conference (PRASA-RobMech). pp.
Campbell, Q.P., le Roux, M., and Nakhaei, F. 2021a. Coal moisture variations in response to rainfall event in mines and coal-fired power plant stockpiles— Part 1: Runoff, infiltration, and drainage. Minerals, vol. 11. p. 1365.
Forbes, K., Nicolls, F., Dejager, G., and Voigt, A. 2006. Shape-from-silhouette with two mirrors and an uncalibrated camera. Proceedings of the 9th European Conference on Computer Vision (ECCV 2006), Graz, Austria, 7-13 May, 2006. Springer. pp. 165–178.
and neural network models were used to correct the densities obtained by RhoVolso that they corrosponded to the sink and float test data. The results indicated that for prediction of coal densities, a BPNN model with RMSE of 0.05 g/cm3 perform better than the regression method.
Korkmaz, A. and Bentli, A. 2017. Determination of washability characteristics of Arguvan- Malatya lignite by different washability index methods. Energy Sources, Part A: Recovery, Utilization, and Environmental Effects, vol. 39, no. 14. pp.
Ze-Lin, Z., Jian-guo, Y., Yu-ling, W., Wen-Cheng, X., and Xiang-yang, L. 2011. A study on fast predicting the washability curve of coal. Procedia Environmental Sciences, Part C, no. 11. pp. 1580–1584.
Zhang, Q., Tian, Y.Z., Qiu, Y.Q., Cao, J.X., and Xiao, T.C. 2011. Study on the washability of the Kaitai coal, Guizhou province China. Fuel Processing Technology, vol. 92. pp. 692–698.
Nakhaei, F., Irannajad, M., and Mohammadnejad, S. 2019. A comprehensive review of froth surface monitoring as an aid for grade and recovery prediction of flotation process. Part A: structural features. Energy Sources, Part A: Recovery, Utilization, and Environmental Effects https://doi: Nakhaei10.1080/15567036.2019.1663313,F.2021.Performancerecognition of column flotation process using K-means clustering algorithm based on froth image analysis. Proceedings of the 5th Young Professionals Online Conference, 20-22 September 2021. Southern African Institute of Mining and Metallurgy, Johannesburg.
Galvin, K.P. 2008. Development of waterbased methods for determining coal washability data. International Journal of Coal Preparation and Utilization, vol. 28. no. 1. pp. 33–50.
Sam, A., Mohammadi, M.A ., and Mosavi, M.R. 2011. Application of neural network technique for metallurgical performance prediction of flotation column (case study: Sarcheshmeh Copper Pilot Plant). Proceedings of the 1st Copper World Congress, Tehran, Iran, October 2011.
Nakhaei,1–6.F.,
Campbell, Q.P., le Roux, M., and Nakhaei, F. 2021b. Influence of rainfall events on coal moisture content in mine stockpiles. International Journal of Coal Preparation and Utilization, 2021. https://doi: 10.1080/19392699.2021.2011724
449The Journal of the Southern African Institute of Mining and Metallurgy VOLUME 122 AUGUST 2022
Lorencin, I., Anđelić, N., Španjol, J., and Car, Z. 2020. Using multi-layer perceptron with Laplacian edge detector for bladder cancer diagnosis. Artificial Intelligence in Medicine, vol. 102. 101746.
Nakhaei, F. and Irannajad, M. 2012. Design of neural network using genetic algorithm for recovery and grade prediction of pilot plant flotation column concentrate. Proceedings of the 2th Mining Industries Conference, Shahid Bahonar Kerman University, Iran.
Laurentini1572–1580.,A.1994.
Wang, Z.C. and Lu, M.X. 2002. On-line forecast of raw coal washability curves. Mining Science and Technology, vol. 99. pp. 485–488.
Estimation of coal density using a 3D imaging system: RhoVol
Zhang, Y.R., Yoon, N., and Holuszko, M.E. 2021. Assessment of coal sortability and washability using dual energy X-ray transmission system. International Journal of Coal Preparation and Utilization. https://doi: 10.1080/19392699.2021. 1914024 u
Nakhaei, F., Mosavi, M.R., Sam, A., and Vaghei, Y. 2012. Recovery and grade accurate prediction of pilot plant flotation column concentrate: Neural network and statistical techniques. International Journal of Mineral Processing, vol. 110–111. pp. 140–154.
Nakhaei, F., Hajizadehomran, A. Irannajad, M., and Mohammadnejad, S. 2018. Relationship between froth behavior and operating parameters of flotation column. Proceedings of the XXIX International Mineral Processing Congress (IMPC 2018), Moscow, Russia.
References
Proceedings of the IEEE 10th International Conference on Signal Processing, IEEE, New York. pp. 1421–1424.
Nakhaei, F., Irannajad, M., and Mohammadnejad, S. 2019. Column flotation performance prediction: PCA, ANN and image analysis-based approaches. Physicochemical Problems of Mineral Processing, vol. 55, vol. 5. pp. 1298–1310.
Botlhoko, S., Campbell, Q.P., le Roux, M., and Nakhaei, F. 2022. Washability analysis of coal using RhoVol: a novel 3d image-based method. Mineral Processing and Extractive Metallurgy Review https://doi: Callen,10.1080/08827508.2022.2027769A.M.,Patel,B.,Zhou,J.,and
Liu, J. and Lu, M.X. 1998. Predicting the washability of raw coal from its total ash content. Proceedings of the XIII International Coal Preparation Congress. Brisbane, Australia. Volume II. Australian Coal Preparation Society.
Nakhaei, F., Sam, A., Mosavi, M.R ., and Zeidabadi, S. 2010. Prediction of copper grade at flotation column concentrate using artificial neural network.
Lu, M.X. 1990. Computer application in coal preparation industry in China. Proceedings of the XXII International APCOM Symposium. Technische Universität Berlin, Berlin.
The visual hull concept for silhouette-based image understanding. IEEE Transactions on Pattern Analysis and Machine Intelligence, vol. 16, no. 2. pp. 150–162.
Polakowski, C., Ryzak, M., Sochan, A., Beczek, M., Mazur, R ., and Bieganowski, A. 2021. Particle size distribution of various soil materials measured by laser diffraction. The problem of reproducibility. Minerals, vol. 11. p. 465.
Forbes, K. 2007. Calibration, recognition, and shape from silhouettes of stones, PhD dissertation, University of Cape Town, South Africa.
Forbes, K., Voigt, A ., and Bodika, N. 2003. Using silhouette consistency constraints to build 3D models. Proceedings of the Fourteenth Annual Symposium of the Pattern Recognition Association of South Africa (PRASA 2003). South African Institute of Electrical Engineering. pp. 33–38.
FOR FURTHER INFORMATION, CONTACT:
of coal
2023
Camielah Jardine, Head of Conferencing E-mail: camielah@saimm.co.za Tel: +27 11 538-0237 Web: www.saimm.co.za
Participants from all countries are invited and welcome to attend the event.
• Deadline of submission of papers: 28 November 2022
Estimation density using imaging system: RhoVol
• Notification of acceptance of abstracts: 26 September 2022
The Conference is being organized by the Southern African Institute of Mining and Metallurgy, and individuals are invited to submit papers or presentations or posters for the Conference. Titles and short abstracts (no more than 500 words) on any relevant subject should be submitted in English
From
fundamentals to accelerated integration
The primary purpose of the 1st Hydrogen and Fuel Cells conference is the advancement of green hydrogen technologies in Southern Africa and the global community, by highlighting the power of renewable and sustainable technologies and addressing the emerging challenges— through the exploration of fuel cells, hydrogen storage, and hydrogen generation by way of engagement with industry, academia and government. The conference will provide a platform for high level exchange and networking opportunities with various experts in the field. The two-day conference will feature high-level scientific talks and posters, complemented with keynote and plenary presentations on country overviews, status of leading and major players in the Southern African and global arena.
ABOUT CONFERENCETHE
a 3D
The conference presents an attractive programme for researchers, industry players, academic institutions, government, investors, policy makers and potential users of fuel cell and hydrogen technologies. The focus is on building collective know-how and fostering engagement between business, government, science and academic institutions.
19 September 2022
24-25 APRIL 2023 HAZENDAL WINE ESTATE, STELLENBOSCH,
Fuel cell technologies & applications Performance, durability, design, and manufacturing (from components to systems)-Hydrogentechnologiesstorage - Hydrogen technologiesgeneration
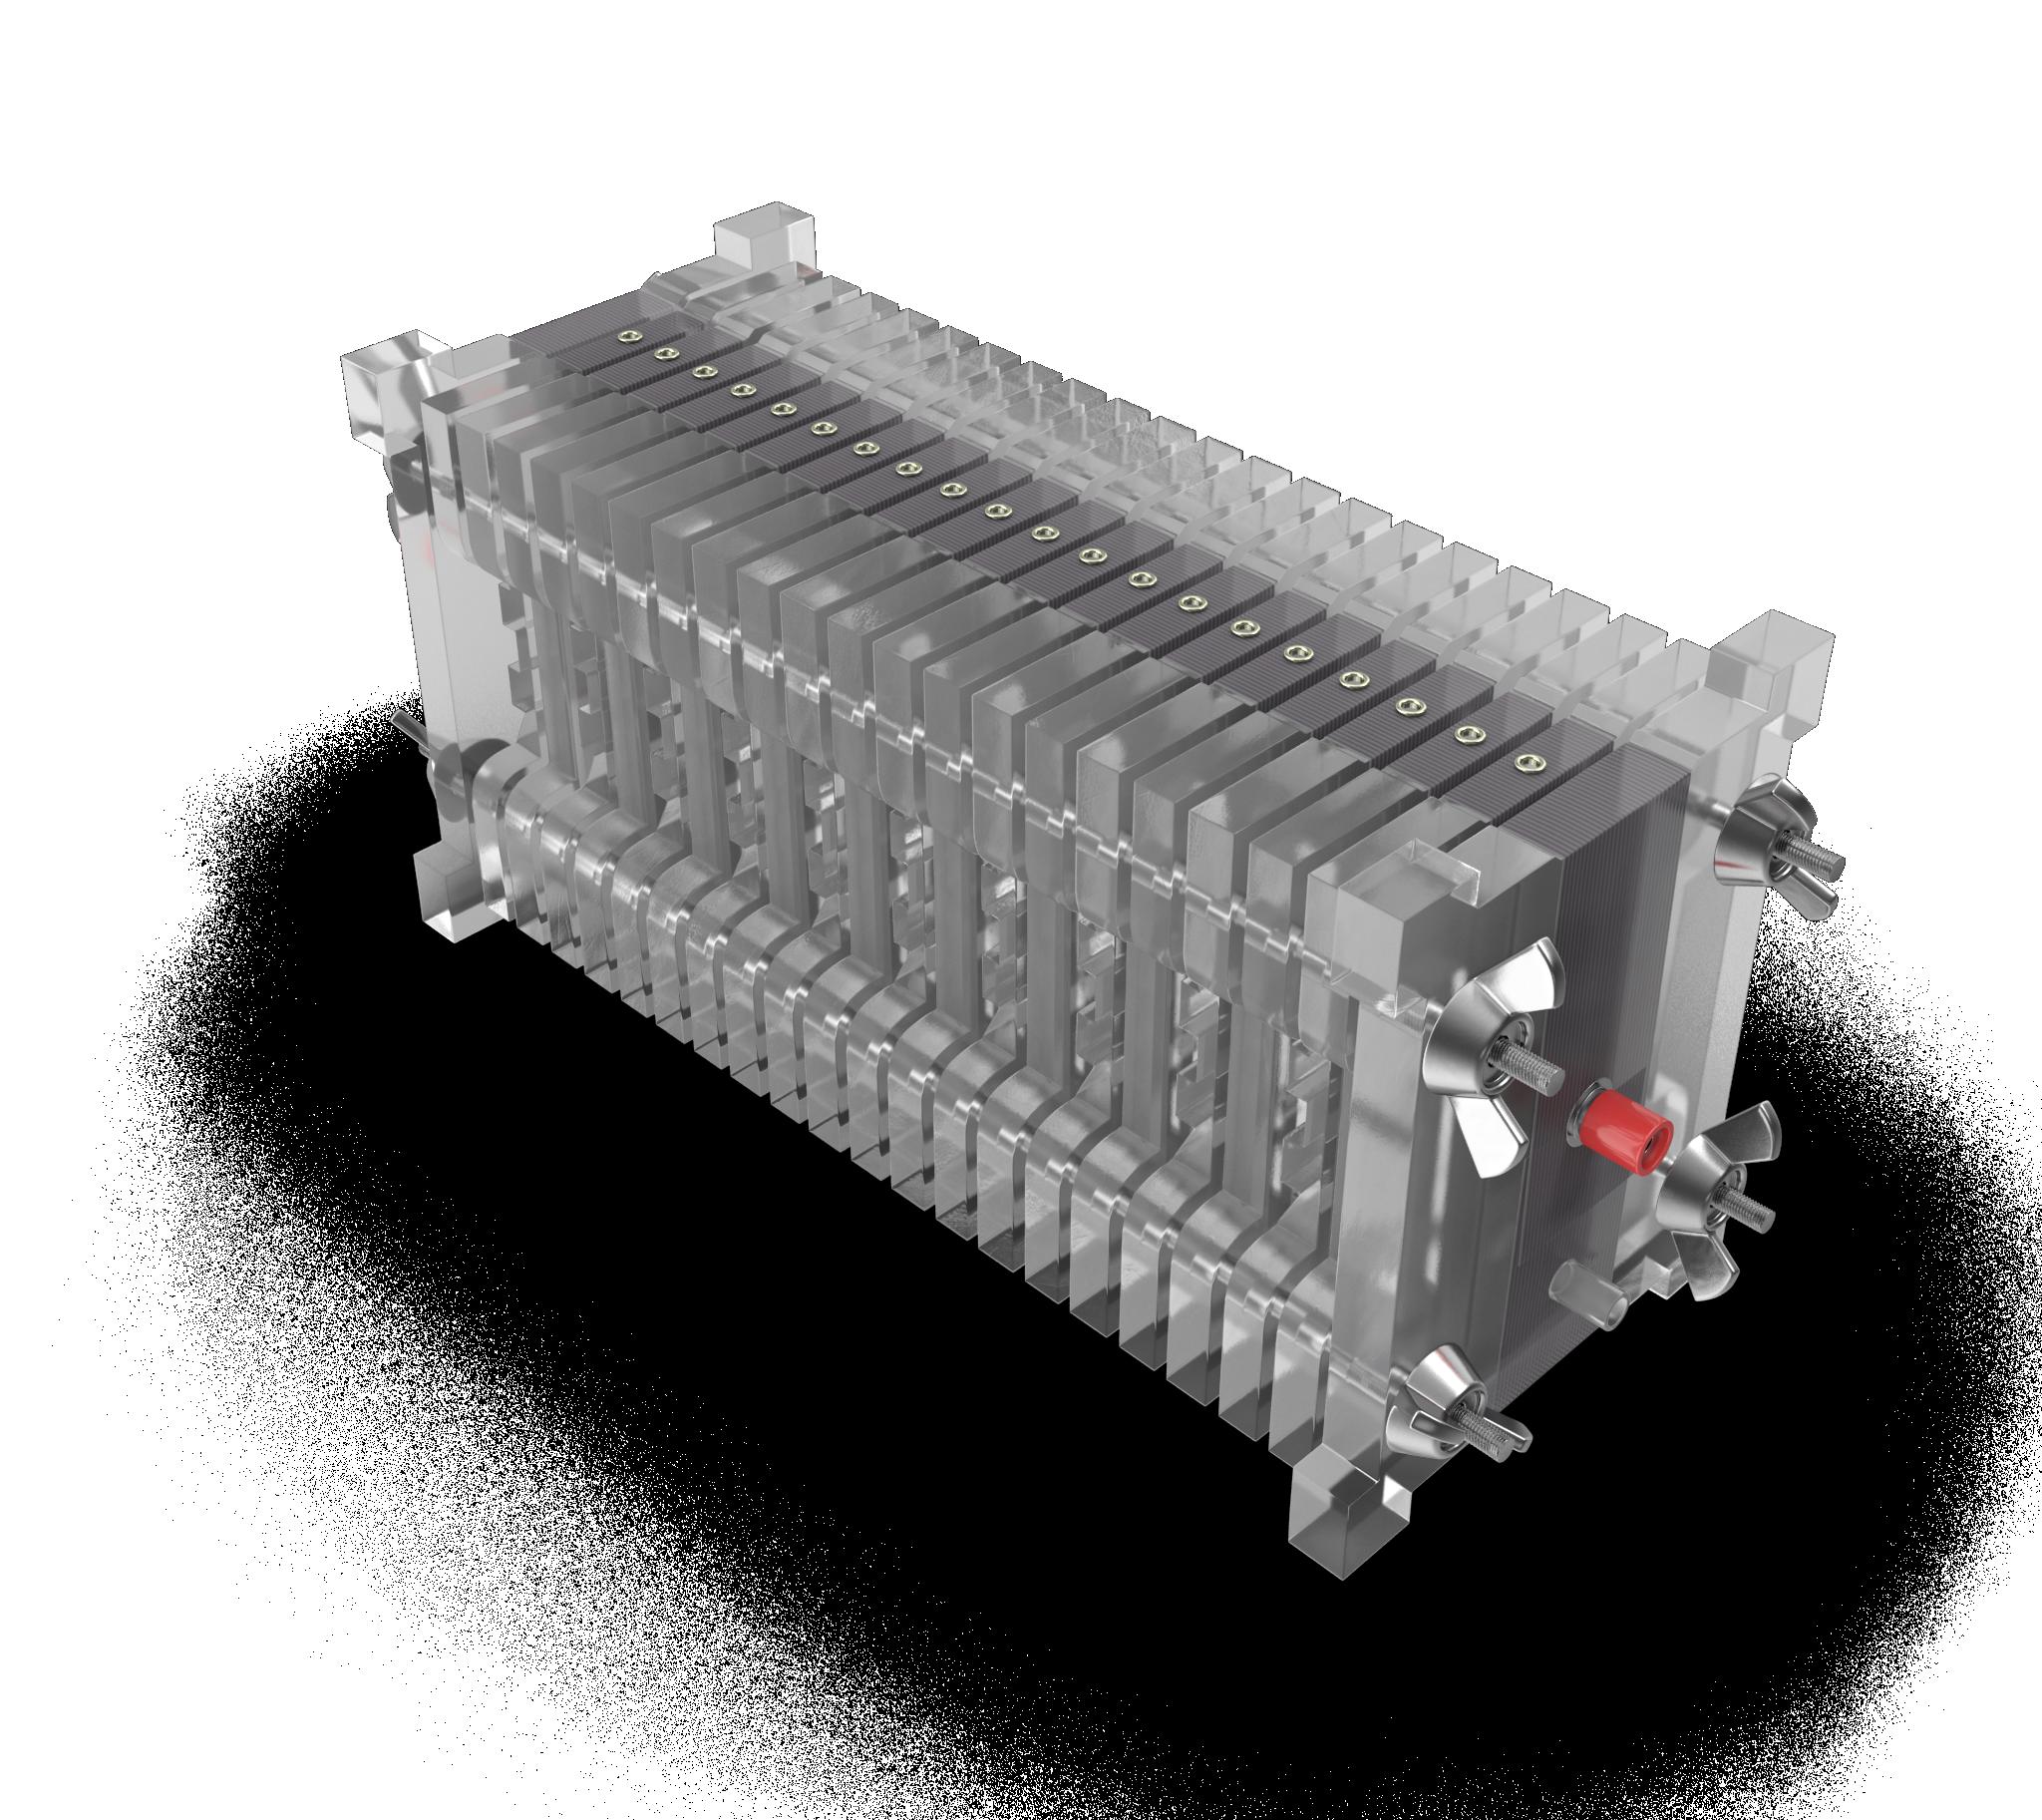
450 AUGUST 2022 VOLUME 122 The Journal of the Southern African Institute of Mining and Metallurgy
Hydrogen mobility –strategies, safety, roadmaps, transitioning to hydrogen refueling stations (HRS) Technology status in industry.
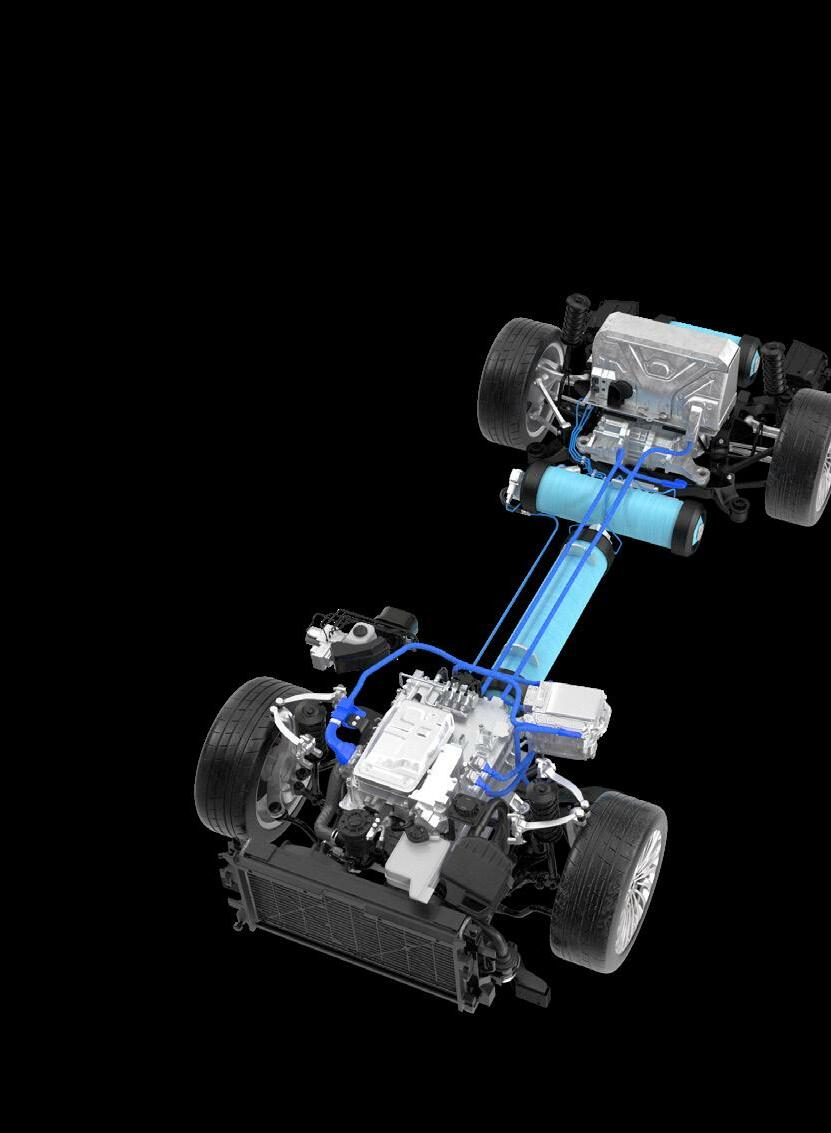
ECSA
BENEFITS ATTENDINGOF Will include both inspiring technical talks as well as social networking events Participants will have the opportunity to directly engage with conference participants to discuss their research
AND SACNASP CPD POINTS WILL BE ALLOCATED PER HOUR ATTENDED
Headto: of EnquiriesCamielahConferencing,Jardinemaybemade at: Tel: +27 011 538-0237 E-mail: website:camielah@saimm.co.zawww.saimm.co.za CAPE TOWN
SOUTHERN HYDROGENAFRICANANDFUEL CELL CONFERENCE
WHO ATTENDSHOULD
451The Journal of the Southern African Institute of Mining and Metallurgy VOLUME 122 AUGUST 2022
Dates: Received: 9 Feb. 2022 Revised: 31 Mar. 2022
Journal of the Southern African Institute of Mining and Metallurgy, vol. 122, no. 8, pp. 451–460
by K. Isaac1 and S.O. Bada1
DOI 5934-9280https://orcid.org/0000-0001-K.1079-3492https://orcid.org/0000-0002-S.O.ORCID:9717/2015/2022http://dx.doi.org/10.17159/2411-ID:BadaIsaac
Introduction
Isaac, K. and Bada, S.O. 2022
Co-firing of high-ash discard coal and refuse-derived fuel – ash and gaseous emissions.
How to cite:
Co-firing of high-ash discard coal and refuse-derived fuel – ash and gaseous emissions
discard coal, emissions, refuse-derived fuel.
The adverse effect of air pollutants from coal-fired power plants on the environment and human health has resulted in many regulations being put in place to reduce the use of fossil fuels for energy generation. These emissions could be reduced by co-firing refuse-derived fuel (RDF) and other types of biomass with coal, because of their lower sulphur content (Vekemans and Chaouki, 2016; Makwarela, Bada, and Falcon, 2017; Malat’ák, Velebil, Bradna, 2018; Ndou et al., 2020). With significant coal deposits in South Africa, coal will continue to play a part in the countries's energy mix over the coming decades. However, coal combustion contributes to CO2 and SOx emissions, and has been deemed harmful to the environment (Cheng and Zhang, 2018). The co-combustion of coal with municipal solid waste (MSW) is one of the promising clean coal technologies that can limit the emissions of greenhouse gases. This is a popular and direct means of reducing the CO2 intensity of newly designed and existing or older coal-fired power plants.
Affiliation:
Accepted: 5 Apr. 2022 Published: August 2022
Coal is the predominant fuel for used electricity and power generation in South Africa. Nearly all the country’s carbon reductants in the metallurgical industry, and heat and power for up to 6 000 industrial users such as pulp and paper, cement, sugar, mining, and agriculture, are produced from coal (FFF, 2017). Most of the remaining coal deposits in South Africa are of low quality and need to be beneficiated before they can be used locally or as high-quality marketable products. Locally available low-quality middling is used in Eskom's (South Africa´s power utility) pulverized fuel boilers to generate electricity. A power plant like Lethabo uses coal with an average calorific value of 16 MJ/kg and an ash content between 35% and 42% (Eskom, n.d.). The combustion of such coal with a high inherent mineral content leads to air pollution, with emissions of particulate matter, carbon dioxide, sulphur dioxide and oxides of nitrogen (Iacovidou et al., 2018).
Email: Samson.Bada@wits.ac.za
ThisSynopsisresearch focuses on the co-firing of discard coal with refuse-derived fuel (RDF) to utilize this abundant resource in South Africa for energy generation and reduce the volume of waste disposed of at landfills. The potential of a coal with a high ash content (> 40%), which is a grade used in some power stations in South Africa, and its combustion compatibility with two different RDFs in terms of emission reductions has been established. Gaseous emissions and ash residues from the combustion and cocombustion of the coal, two different RDFs and coal/RDF blends of different proportion were analysed. One of the RDF samples contained mostly paper (PB) and the other mostly plastic (PL). Co-combustion ash from the discard coal and RDFs showed a decrease in chloride and alkali metal contents as the coal ratio in the blend increased. The slagging propensity of the co-fired blends was found to be very low, while the propensity for fouling decreased from high to medium for all the blends with < 75% RDF. Cocombustion of RDF with coal showed a decrease in SO2 emissions from 387 ppm (discard coal) to 50 ppm for the sample containing 25% coal discard plus 75% PL. A 15% PL to 85% coal blend also reduced NOx emissions from 145 ppm (100% PL) to 88 ppm. The lowest CO2 emission observed was 6000 ppm for the blend of 85% discard coal plus 15% PB. It was established that the most favourable fuel blend that can produce the lowest sulphur emissions if used for power generation is the 25% coal discard plus 75% PL ash,Keywordssample.co-combustion,
1DSI-NRF SARChI Clean Coal Technology Research Group, School of Chemical & Metallurgy, Faculty of Engineering and the Built Environment, University of the Witwatersrand, South Africa.
Correspondence to: S.O. Bada
One of the major concerns with RDF combustion is the adverse effect of the fly ash produced on the boiler. The ash from RDF incineration has a high slagging and fouling tendency due to the large proportions of alkaline elements and volatile inorganic oxides such as Na2O and K2O in the ash (Akdag, Atimtay, and Sanin 2016). The alkali metals in the RDF are released at lower temperatures, and once vaporized can react to form alkali silicates, sulphates, and chlorides (Vekemans and Chaouki, 2016). RDF contains higher chlorine levels than coal. Biomass combustion, depending on type and age, is known to form HCl vapour or chlorides that condense on the walls of the furnace, causing corrosion (Vekemans and Chaouki 2016). The formation of chloride in the furnace reduces the softening temperature of the furnace deposits and damages the protective oxide layer on the furnace surface (Vekemans and Chaouki 2016). It is important that preliminary experimental studies are conducted on the ash produced from the co-combustion of the RDFs utilized in this study with discard coal before recommending RDF as a co-fired fuel. This information is important to the local energy sector, as the majority of the sorted RDFs in the country are exported rather than utilized for power generation. According to Brew (2021) RDF has contributed up to a 50% reduction in MSW landfill in the UK, and the majority of this waste is used in the waste-to-energy facilities.There is little information on the use of high-ash coal (> 40%) co-fired with RDFs and its impact on the reduction of chlorine and gas emissions. Therefore, in this study, coal with a high ash content, which is of lower quality than the coal used in the
In South Africa, land filling used to be the dominant choice for both general and hazardous waste management. However, in 2012 South Africa updated its waste management strategy to minimize landfilling and use the waste rather than collect and dispose of it (DEA, 2012). Given this approach, it is very important to investigate the use of the combustible fraction of this resource for power generation, either alone or co-fired with coal. In this research, the energy potential of different batches of sorted waste streams collected from an environmental waste management establishment in South Africa was investigated. The reactivity of these RDFs and their effect where co-combustion with South African inertinite high-ash coal is discussed.
Over 2.01 Gt of waste were produced worldwide in 2016, and this is expected to increase to 3.4 Gt by 2050 (World Bank, 2019).
Materials and methods
pulverized fuel boilers in the Northern Hemisphere, was tested. Its influence on the elemental composition, i.e., chemistry of the ash produced during co-combustion with different types of RDF (30 % plastic blend, 75% plastic blend, 30% paper blend, and 75% paper blend) was studied.
Materials
452 AUGUST 2022 VOLUME 122 The Journal of the Southern African Institute of Mining and Metallurgy
Of the 54.2 Mt of waste generated in South Africa per year, only 38.6% is recycled and 61.4% is dumped in landfills (DEA, 2018).
The discard coal (C2) used in this study was sourced from the Witbank Coalfield in Mpumalanga Province, South Africa. The RDF samples were sourced from Interwaste, an environmental solution, company based in Johannesburg. The waste included cardboard, paper, plastics, and textiles from a range of different product packages. The waste was shredded on site in a primary and secondary shredder to reduce the particle size of the composites. The RDF sample PB (paper blend) contained 53% brown paper and cardboard, 32% yellow coated paper, 10% plastic, and 5% textiles, while the RDF PL (plastic) sample contained 85% plastic, 10% paper, and 5% textiles. The RDF samples were milled in a Retsch SM 200 cutting mill to -212 μm. The discard coal was crushed in a hammer mill and then pulverized to -212 μm. Cocombustion blends of 85% discard coal plus 15% RDF, 70% discard coal plus 30% RDF, 50% discard coal plus 50% RDF, and 25% discard coal plus 75% RDF were used.
A diagram of the horizontal tube combustion reactor used for these tests can be seen in Figure 1. The reactor temperature was set to 850°C and 100 mg samples of each blend were combusted in air, at a flow rate of 23 ml/s. The concentration of the gases emitted during combustion was measured with the a Födisch MGA 11 online analyser at a rate of one scan per second over a tenminute period. Each test was repeated three times and the mean concentrations of each emitted gas used to plot the emission profiles.
The samples were ashed in a furnace in an air atmosphere in accordance with the CEN/TS 14775:2009 standard for 'Solid biofuels - Determination of ash content' and 1171:2010 for 'Solid mineral fuels - Determination of ash'. The ash samples were prepared for SEM/EDX analysis by mounting on stainless steel stubs, and coated with one coat of carbon and two coats of Au/Pd. The samples were then analysed using a Carl Zeiss Sigma FE-SEM. The XRF analysis was conducted using an Ametek SPECTRO XEPOS HE analyser. Approximately 3 g of each sample was used for chloride analysis using a Mertohm Eco ion chromatography analyser with an aqueous multi-element standard.
[1]
Several investigations have been carried out on the cocombustion of biomass, sewage sludge, and RDF with the sole purpose of reducing emissions. Akdag, Atimtay, and Sanin 2016 studied the co-combustion of RDF and coal, and reported a decrease in SO2 emissions as the RDF in the blend increased, with no marked change in NOx emission. They also noted a rapid formation of CO that corresponded to a large reduction in oxygen, and attributed this to the high volatile matter content of the RDF. A similar study on SO2 emissions was carried out by Zhang et al. 2018, where a decrease in SO2 emissions was achieved as the MSW in the coal/MSW blend increased. The authors suggested that this could be due to the adsorption of SO2 by the pores of the fly ash produced from the coal. In the same study a decrease in NOx emissions was noted as the percentage of MSW in the blend increased. This was contrary to the observation made by Akdag, Atimtay, and Sanin 2016 and therefore it is essential that boiler design takes the fuel characteristics into account.
Co-firing of high-ash discard coal and refuse-derived fuel – ash and gaseous emissions
Analytical techniques
Gaseous emissions analysis
Ash analyses
The propensity of the fuel to slagging and fouling was predicted using the weight percentage of each compound in the base-to-acid ratio in Equation [i] (James et al., 2012). Where the Rb/a value is between 0.4 and 0.7, the slagging potential of the ash is considered high or severe, whereas when the value is less than 0.4 or greater than 0.7 the slagging propensity is low to medium (Miller, 2011).
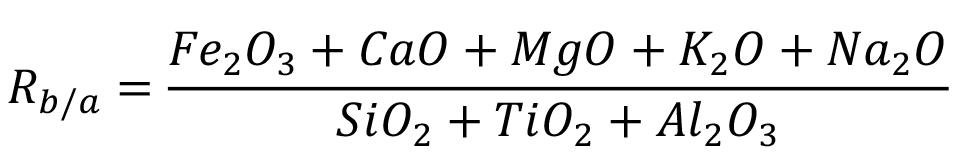
Proximate and ultimate analysis of the discard coal and RDF Parameterssamples
Hydrogen 9.26 8.35 2.67
Figure 1—Horizontal tube combustion reactor set-up for gaseous emissions tests
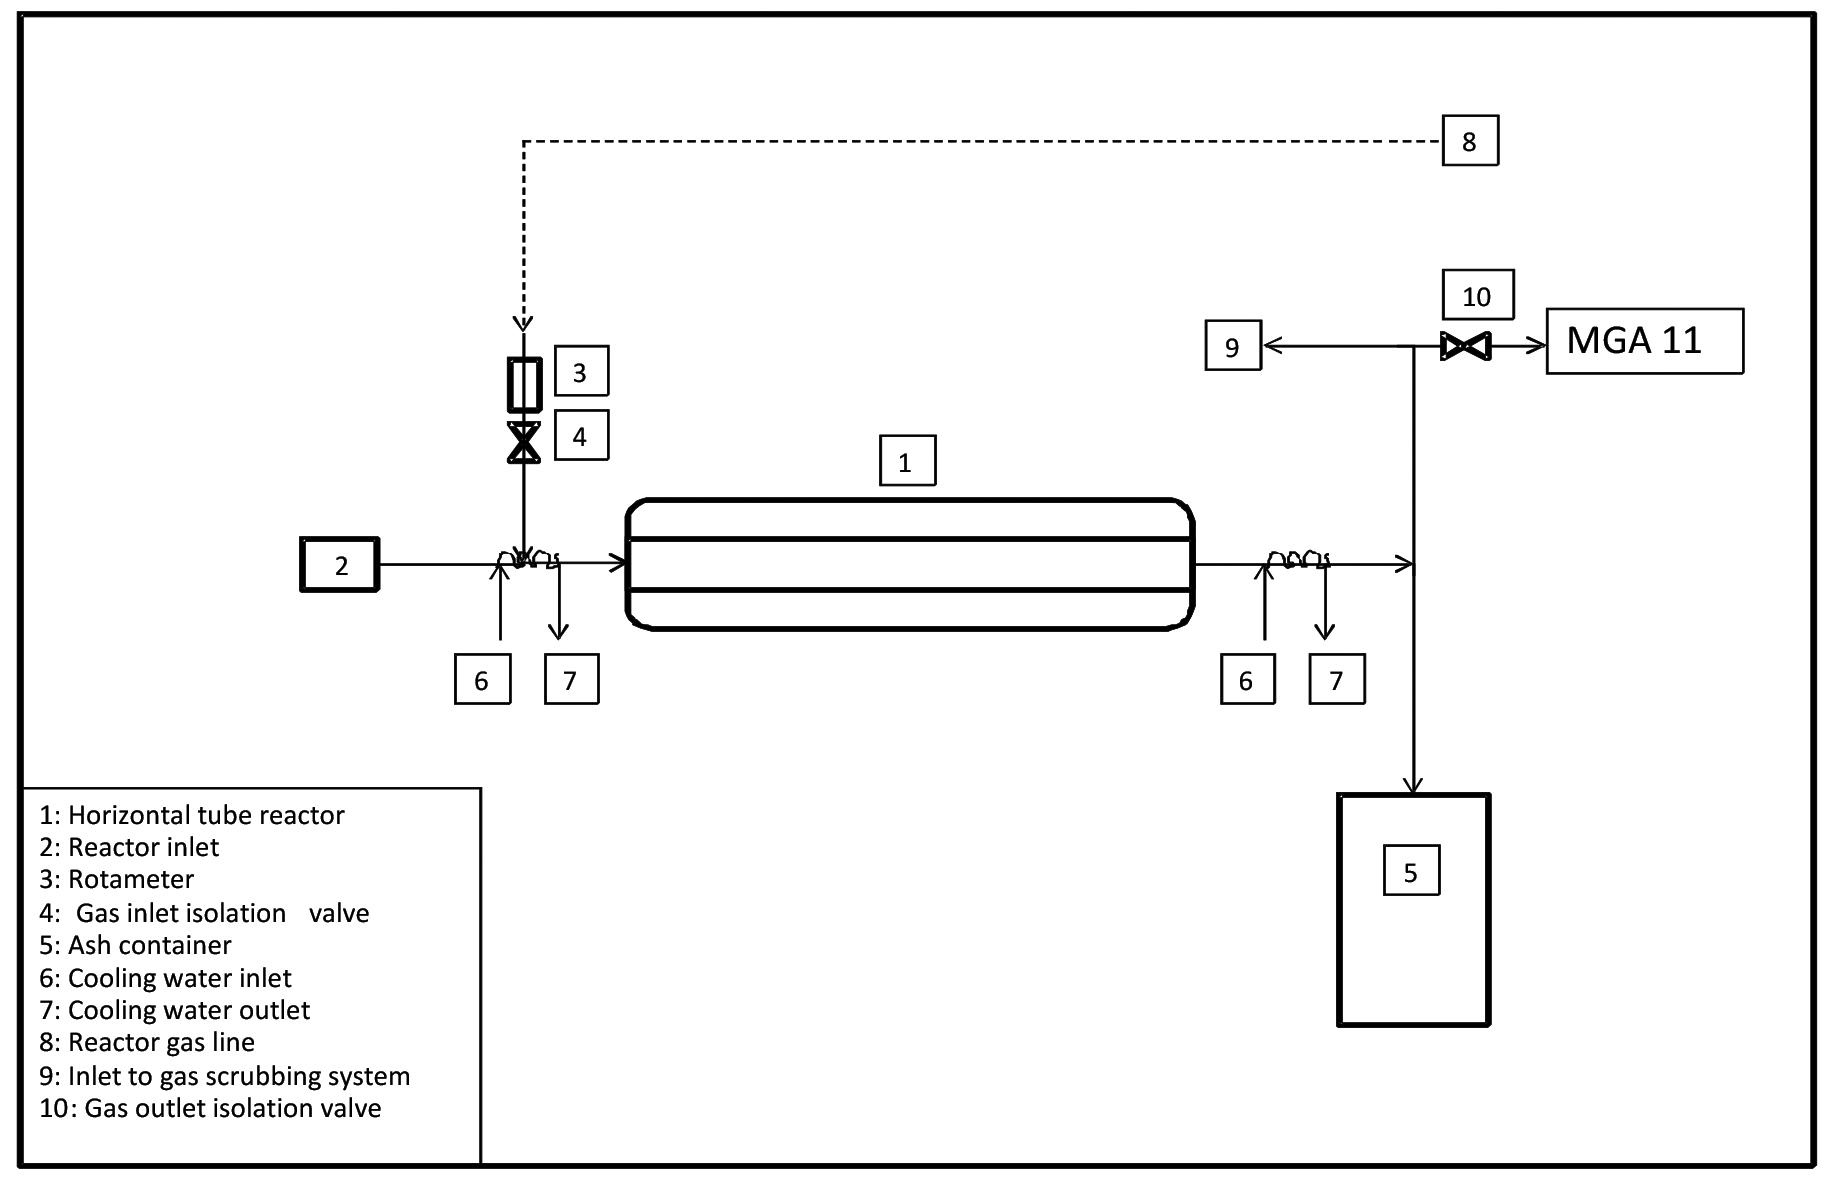
Physiochemical analysis
CV: (MJ/kg) 31.23 22.4 16.73
Ash content 11.10 6.66 41.95
The fouling index is presented in Equation [2]. The fouling potential is low when F u is less than 0.6, medium when F u is between 0.6 and 1.6, high when F u is between 1.6 and 40, and extremely high when the index is above 40 (James et al., 2012). = RB/A Na2O + O
SO2 emissions
Table I presents the physiochemical properties of the discard coal, paper blend, and plastic RDF used in this study. The discard coal possesses the lowest volatile matter content of 20.17%, with the RDFs ranging from 81.15 – 81.67%. With a volatile matter content of 22.88%, the coal is expected to have a higher ignition temperature and lower flame stability than the two RDFs. The three samples had a low moisture content, ranging from 1.23 to 3.19% (inherent moisture). The RDFs had a low fixed carbon (69%) and ash (6.66%−11.11%) content, while the coal discard had an ash content of 41.95%. The coal discard used in this study can be categorized as a commercial low-grade (grade D III) coal due to its calorific value of 16.73 MJ/kg (Setsepu, Abdulsalam, and Bada, 2021). Furthermore, the fixed carbon content (35.83%) is close to that of coals sampled from three commercial South African coalfired plants (40.3−46.8%) reported by Rautenbach et al. (2019).
Total carbon 57.38 57.16 48.90
Results and discussion
Nitrogen 0.35 0.29 1.15
Proximate analysis (wt%, Ar)
The RDF samples had a total carbon content of 57.16% for PB and 57.38% for PL (Table I). The discard coal had a total carbon content of 48.90%, which was expected because it also has the lowest fixed carbon content of all the fuels. The hydrogen content of the RDFs was found to be higher than that of the discard coal, which is in line with the higher volatile matter content of the RDFs. From the same table, it can be seen that the nitrogen content is much lower in the RDF samples (0.29% for PB and 0.35% for PL) compared to the coal sample (1.15% ). It is well known that the nitrogen and sulphur content of fuels contributes to the formation of NOx and SOx during combustion. Therefore, it could be expected that the co-combustion of these RDFs with this coal might lead to a reduction in NOx and SO₂ emissions.
ar: As received; db: dry basis; O: Oxygen by difference [100-(Ash+H+C+N+S)]; UT: untraceable
× (
Oxygen 20.67 24.35 1.93
) [2]
Co-firing of high-ash discard coal and refuse-derived fuel – ash and gaseous emissions
Plastic Paper Discard RDF (PL) blend (PB) coal (C2)
Volatile matter 81.67 81.15 20.17
Fixed carbon 6.00 9.00 35.83
453The Journal of the Southern African Institute of Mining and Metallurgy VOLUME 122 AUGUST 2022
K₂
Ultimate analysis (wt%, db)
The concentrations of SO2 emitted from the co-combustion of discard coal with plastic (PL) and paper blend (PB) RDF are depicted in Figures 2 and 3, respectively. The discard coal (C2) sample emitted the highest SO2 concentration, with a peak of 387 ppm at 61 seconds. This shows that the volatile combustion stage was the dominant stage for the SO2 emissions from the coal discardd. This SO2 concentration is above the current legislated maximum of 191 ppm for new power plant (IEA, 2015). In the case of the plastic sample (PL) the maximum SO2 emission occured at 26 seconds with a concentration of 107 ppm. A reduction in the gradient of the curve indicates that less SO2 was emitted during the volatile matter combustion stage for this sample. The low SO2 emitted might be because of the regular total sulphur content of the fuel, which was reported undetected in the ultimate analysis (Figure 2). Both Figures 2 and 3 show that co-combustion of coal discard with RDF reduces SO2 emissions and changes the sample
Total sulphur UT UT 1.34
F u
Table I
Moisture 1.23 3.19 2.05
With co-combustion of discard coal and PL, the 85% C2 plus 15% PL sample exhibits a similar emission profile to that of C2. NOx emissions from this sample occurred earlier at 42 seconds and a concentration of 88 ppm, which is slightly higher than the emission from 100% discard coal. The blending of PL and C2 results in a higher concentration of NOx during the volatile combustion phase and a decrease in the duration of the emissions. This is similar to the observations of Chyang, Han, Wu, Wan,
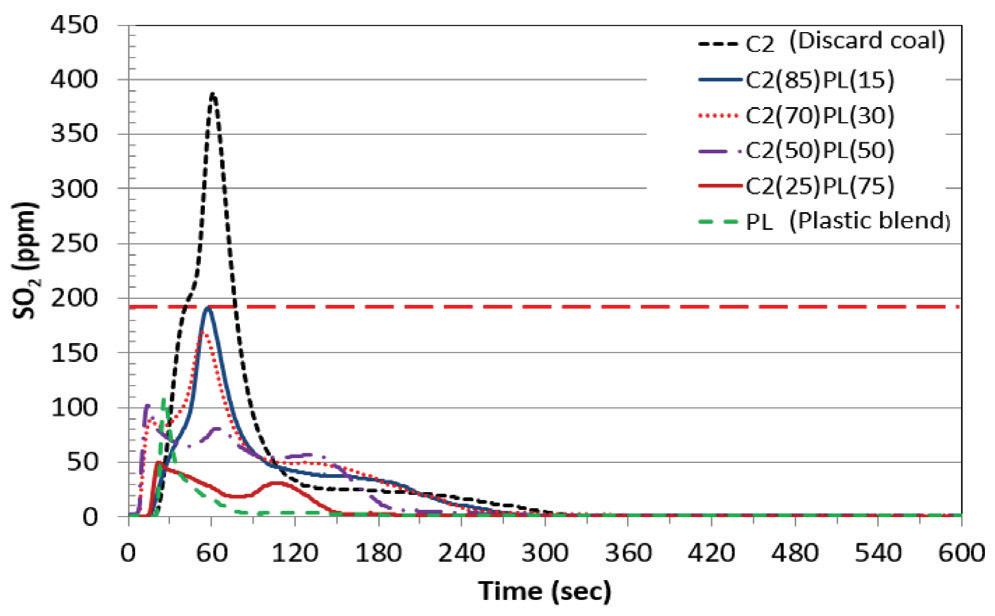
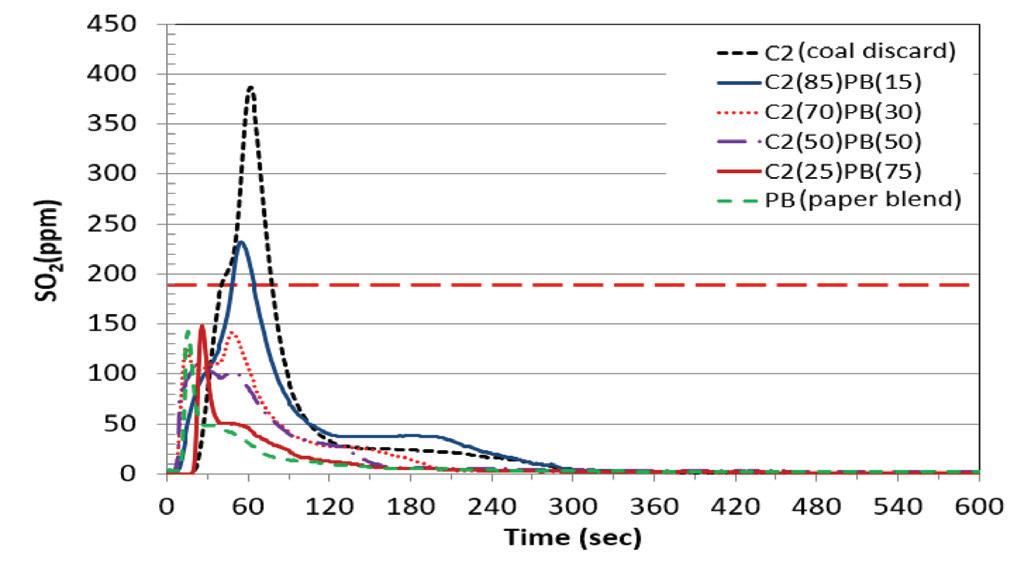
Na₂O 1.38 13.65 8.24 1.91 4.41 2.16 4.27 SiO₂ 50.87 32.15 21.22 46.04 35.67 47.77 40.47
SO₃ 3.26 8.62 4.29 5.22 9.57 4.49 11.68 Cl⁻ UT 0.90 2.84 0.05 0.73 UT 0.16
Slagging and fouling indices
Rb/a 0.22 0.43 0.37 0.24 0.28 0.24 0.31 6.31 3.42 0.73 1.55 0.79 1.65
The NOx emissions from the co-combustion of discard coal with both RDFs (PL and PB) are presented in Figure 4 and Figure 5, respectively. The plastic sample (PL, Figure 4) presents the highest peak, with two peaks displayed in its emission profile, at 17 seconds (143 ppm) and 32 seconds (119 ppm). The different volatiles associated with the fuel nitrogen and char nitrogen may be responsible for the two peaks. The dominant stage of NOx release occurred during the combustion of volatile matter for both PL and PB. For the discard coal, NOx emission peaks at 58 seconds (80 ppm), which represents the volatile combustion stage. As the reaction time increases, NOx continues to be released as the char
454 AUGUST 2022 VOLUME 122 The Journal of the Southern African Institute of Mining and Metallurgy
NO x emissions
TiO₂ 2.51 9.04 16.71 3.98 9.18 2.83 4.82
The 85% C2 plus 15% PL and 85% C2 plus 15% PB blends (Figures 2 and 3) have an emission pattern similar to that of coal discard, but at much lower concentrations. This is due to the higher coal content in this blend relative to other blends. The maximum SO2 emission for 85% C2 plus 15% PL occurs at 57 seconds at a concentration of 191 ppm equal to the SO2 emission limit for a new coal-fired power station in South Africa. This is a significant reduction compared to the 387- ppm produced by combustion of C2 coal alone. However, for the 85% C2 plus 15% PB blend (Figure 3), the SO2 emissions exceeded the South African standard. As RDF content in the blends increased, there was a reduction in emissions with two or three peaks for some samples. For the 50% C2 plus 50% PL sample (Figure 2), three peaks were noted, with the first representing the SO2 released during combustion of the PL volatile component. The second peak denotes the release of SO2 during the volatile combustion of C2 and the third indicates the release of SO2 from char combustion of C2. Sample 50% C2 plus 50% PB (Figure 3) displays two emission peaks at 20 seconds (110 ppm) and 49 seconds (102 ppm), which correspond to the SO2 released from the combustion of the volatile matter in the blend. The alkali and alkaline-earth metal oxide contents in the two RDFs are higher than in the discard coal (Table II). These oxides might be responsible for the reduction in SO2 emissions by reacting with SO2 to form sulphates (Guo and Zhong, 2018).
combusts similar to the observation by Chen et al. (2018) during the combustion of anthracite.
FigureRDF2—SO2
Co-firing of high-ash discard coal and refuse-derived fuel – ash and gaseous emissions
Al₂O₃ 34.49 73.55 45.19 34.57 43.11 34.33 41.41
Figure 3—SO2 emissions from the co-combustion of discard coal and paper blend
concentration profiles. This observation agrees with the findings of other authors (Akdag, Atimtay, and Sanin., 2016, Teixeira et al., 2012, Wan, 2008).
Fu 0.55
D – discard coal, PB – Paper blend RDF, PL – plastic RDF, UT – untraceable, RB/A - base-to-acid ratio, Fu - fouling index
Table II Major elemental composition of the ash samples (wt%) 100 % C2 100 % PB 100 % PL 70% C2 + 25% C2 + 70% C2 + 25% C2 + 30 % PL 75% PL 30% PB 75% PB Fe₂O₃
emissions from the co-combustion of discard coal and plastic blend RDFs 9.42 1.44 1.10 8.49 5.75 8.47 6.55 CaO 6.47 29.66 18.83 7.76 12.51 7.29 13.88 MgO 1.01 3.35 1.55 1.00 1.17 1.06 1.42 K₂O 1.09 1.08 1.01 1.14 1.05 1.16 1.01
Figure 4—NOx emissions from the co-combustion of discard coal and plastic blend RDFs
Figure 6—CO2 emissions from the co-combustion of discard coal and plastic blend RDF
The surface morphologies of the ashes obtained from all the samples were determined using scanning electron microscopy (SEM). The micrographs of the 100% RDF samples show a
The CO2 emission profiles the co-combustion of discard coal C2 and different paper blends are presented in Figure 7. The paper blend emitted the highest CO2 concentration of all fuels, and the emissions increased as the ratio of BP in the blend increased. All paper and coal blends appeared to release CO2 in a single step, indicating the combustion of volatile matter. This occurred at t<60 seconds for all the blends. The 85% C2 plus 15% PB sample emitted the lowest concentration of CO2 at 25 seconds and 6000 ppm. This might be due to the large proportion of discard coal in this sample. As discussed previously, the discard coal showed very low CO2 emissions, which indicates incomplete combustion of the fuel.
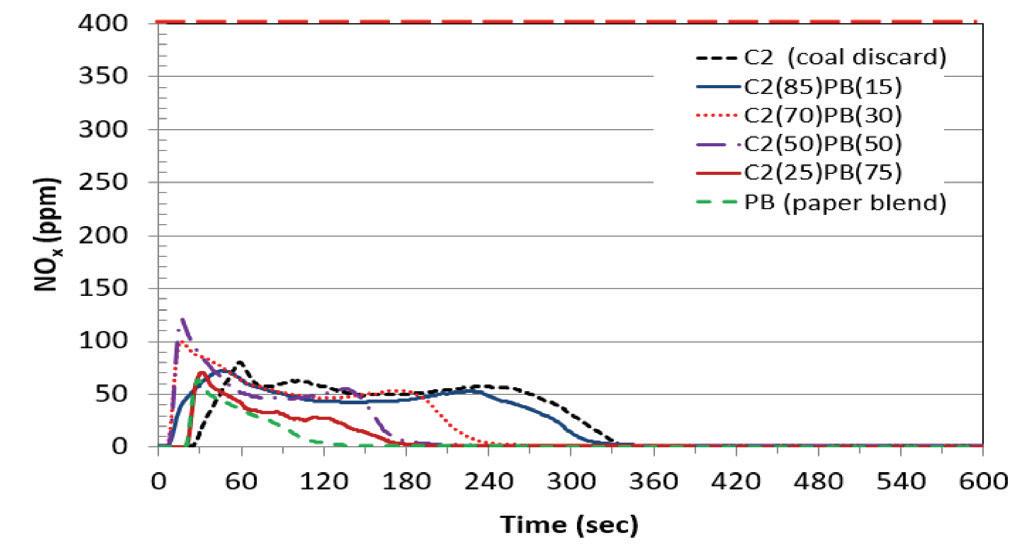
Ash surface morphology
C2 plus 15% PL sample displays a single-stage profile with a peak in the range of the char combustion for sample PL (the third peak) and the volatile combustion for C2, at 39 seconds and 16 000 ppm (Figure 6). The emission profile of this sample is shorter than that of 100% C2, which shows that an increase in volatile matter or PL proportion influences the CO2 emission of the fuel. Volatile combustion of samples blended with 75% and 50% PL occurred at 25 seconds and 55 000 ppm, and 14 seconds and 41 000 ppm, respectively. As PL is added to the blend, the amphitude of the first peak of the emission profile increases, and that of the second peak decreases.
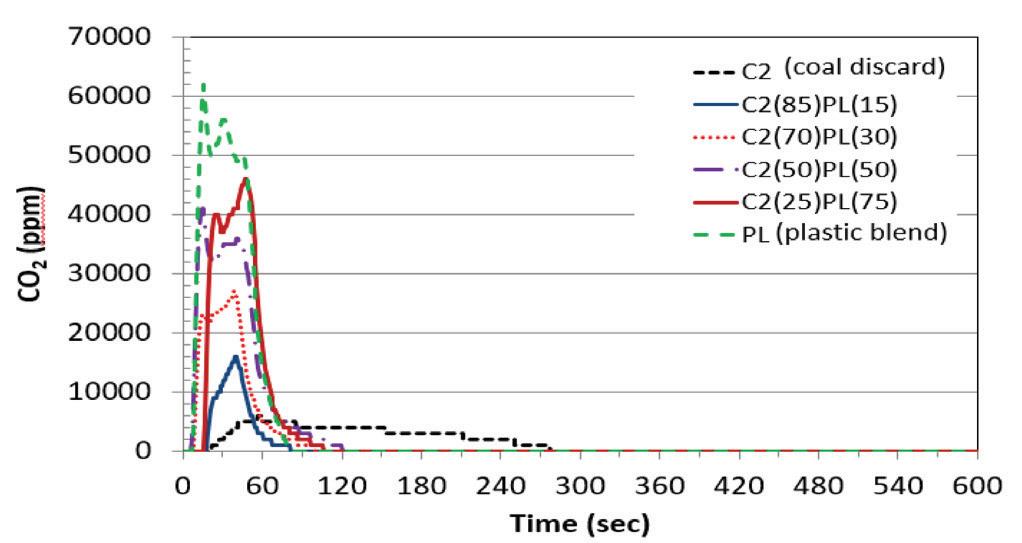
Figure 7—CO2 emissions from the co-combustion of discard coal and paper blend RDF

Co-firing of high-ash discard coal and refuse-derived fuel – ash and gaseous emissions
455The Journal of the Southern African Institute of Mining and Metallurgy VOLUME 122 AUGUST 2022
The two peaks could relate to the two initial peaks observed in the 100% LP sample, from the combustion of its light and heavy volatile components. The second peak observed is due to the combustion of char, which gave rise to the third peak in the 100% PL sample.The85%
CO2 emissions
Figure 5—NOx emissions from the co-combustion of discard coal and paper blend RDF
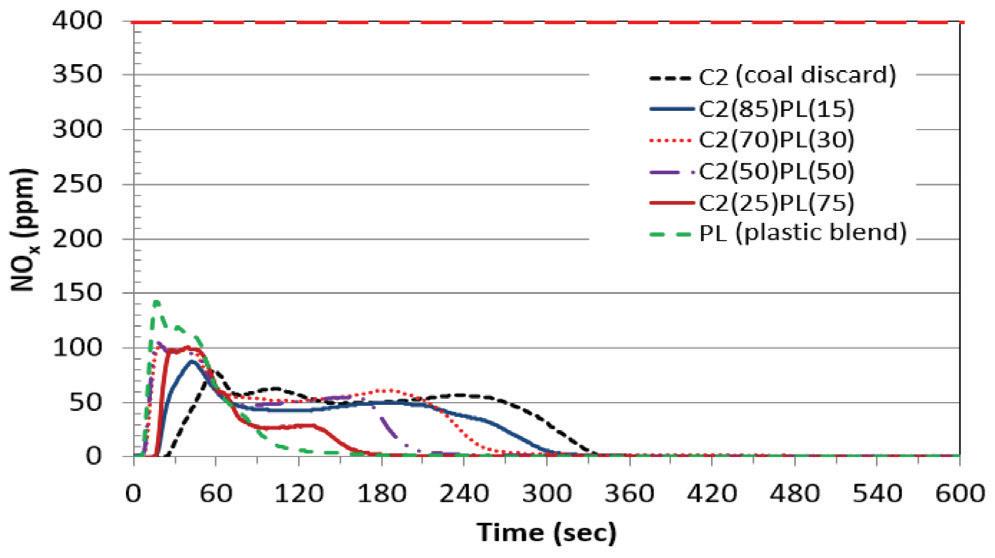
Lee, and Chang, (2010) and Wan, Chang, Chien, Lee, and Huang, (2008) when a low coal-char component is present in a fuel. It can also be seen (Figure 4), that as the amount of coal in the blend decreases, the complete release of the NOx (char combustion) occurs earlier. The 85% C2 plus 15% PB sample displays a similar profile to that of 100% discard coal (Figure 5); however, the emission duration was shorter due to the addition of PB. The samples containing 30% and 50% PB display an emission profile with two peaks. The first peak indicates the release of NOx from the combustion of volatiles in PB. Both samples show a maximum concentration above 100% PB, indicating that there may be an interaction between the two fuels. The emission profile for the sample containing the most PB (75%) was very similar to that for 100% PB, with a maximum concentration slightly higher than 70 ppm. The NOx concentrations for most of the blends co-fired in this study are consistent with those from Wan, Chang, Chien, Lee, and Huang, (2008), who found that the emissions from co-firing of coal and RDFs remained below 100 ppm. An increase in NOx emissions was also observed by Zhang et al. (2018) in the co-firing of MSW with coal when the MSW content was increased above 15%. All samples conformed to the South African emission standard of 750 mg/m3 (399 ppm) for NOx in new coal-fired power plants (IEA, 2015).
The emissions of CO2 from the co-combustion of discard coal with RDF (Figures 6 and Figure 7) show an increasing trend as the quantity of RDF is increased. The discard coal sample shows the lowest CO2 emission concentration of about 5000 ppm. CO2 emissions increase as the proportion of LP in the blend increases. Samples containing 75%, 50%, and 30% LP have a two-step profile, in which the first peak is due to combustion of volatile matter.
Figure 8—´Shredded sponge´ and ´paint chip´ morphologies of RDF ash samples
Figure 9—SEM images from the discard coal and paper blend co-combustion ash
sparsely distributed, in the ash from co-combustion of the coal and PL in comparison to the ash from the paper blend PB (Figure 9). The large clusters and agglomerates noted in these blends are due to the presence of low-melting- point alkaline earth metal such as Mg in the RDFs, which causes deposits within the ash, as observed by Fuller et al. (2018) and Wu et al. (2011).
The predominant oxides found in the 100% discard coal ash are SiO₂, Al₂O₃, Fe₂O₃ and CaO. Silica and alumina are the most common oxide constituents found in South African coals, and are indicative of quartz (SiO₂) and clay (Si, Al compounds) minerals. Together, these minerals generally comprise over 70% of the mineral-ash contents in South African coals (Wagner, Malumbazo, and Falcon, 2018). This result agrees with the findings of other
456 AUGUST 2022 VOLUME 122 The Journal of the Southern African Institute of Mining and Metallurgy
Ash elemental composition
The SEM image of 100% discard coal ash in Figure 9 shows that the ash contained mostly fine particles and some coarse particles consisting of Al and Si. The micrographs in Figures 9 and 10 show that as the discard coal content in the blend increases there are fewer coarse particles and more fine particles are introduced. This is consistent with the findings by Fuller et al. (2018). Figure 10 also shows that there are more coarse particles
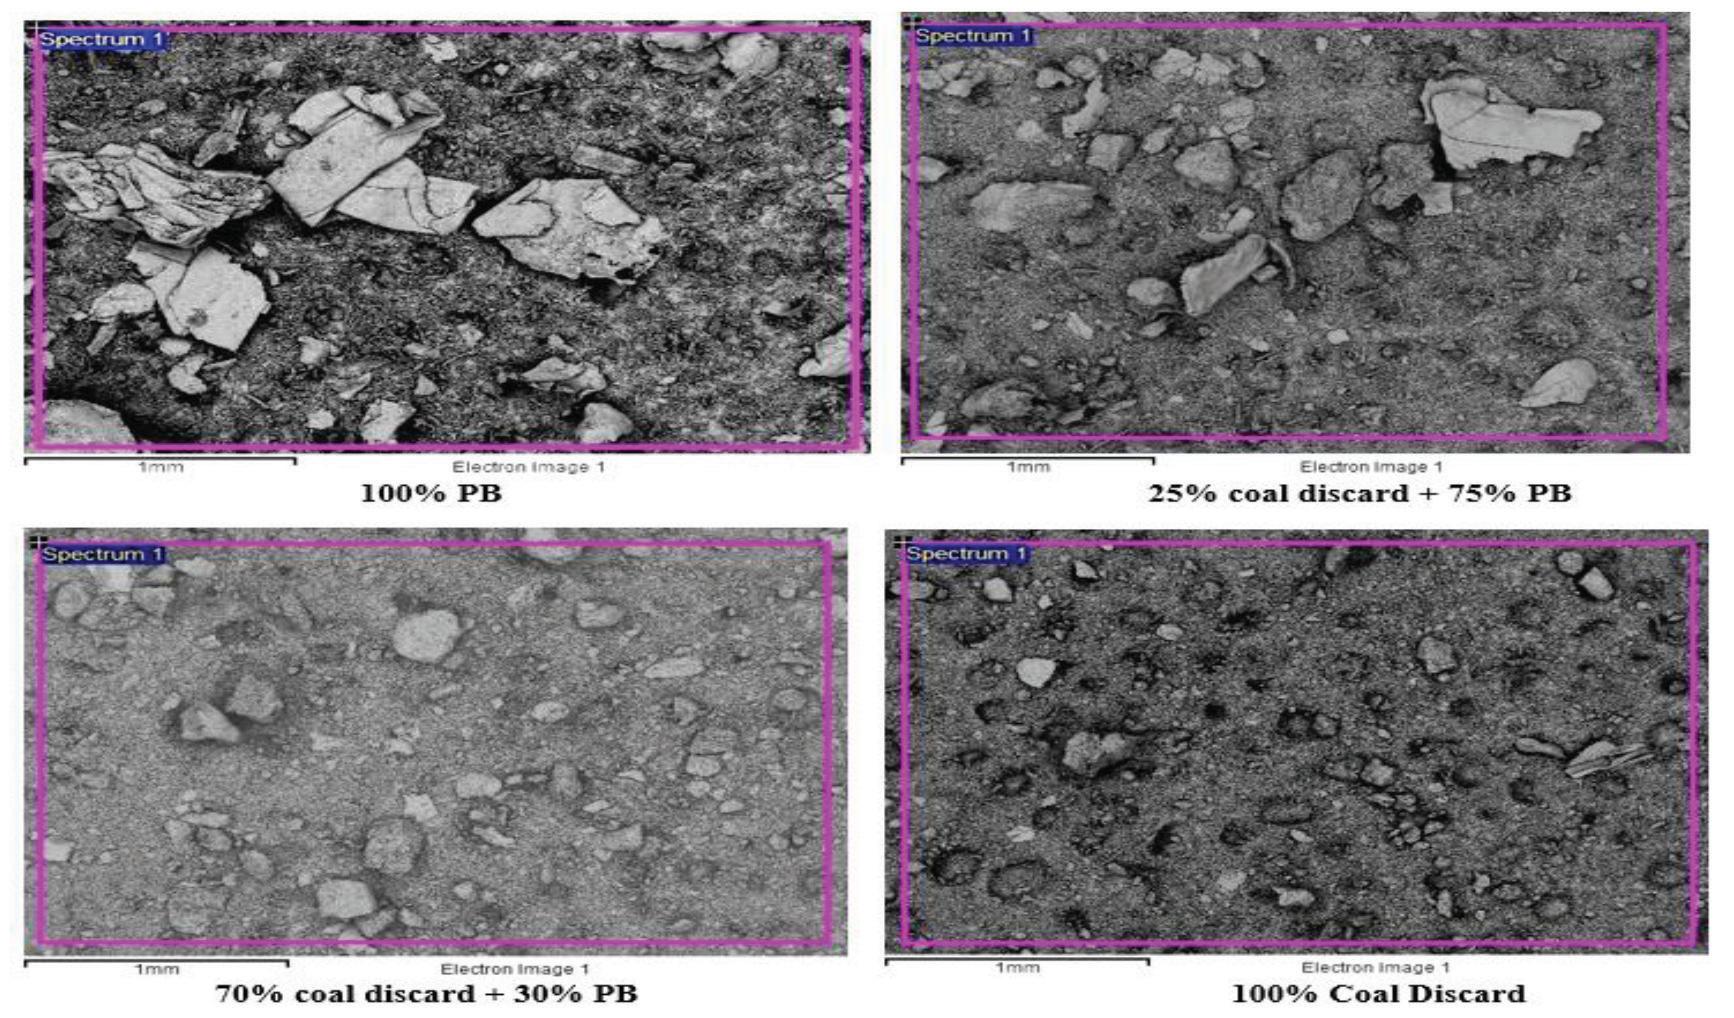
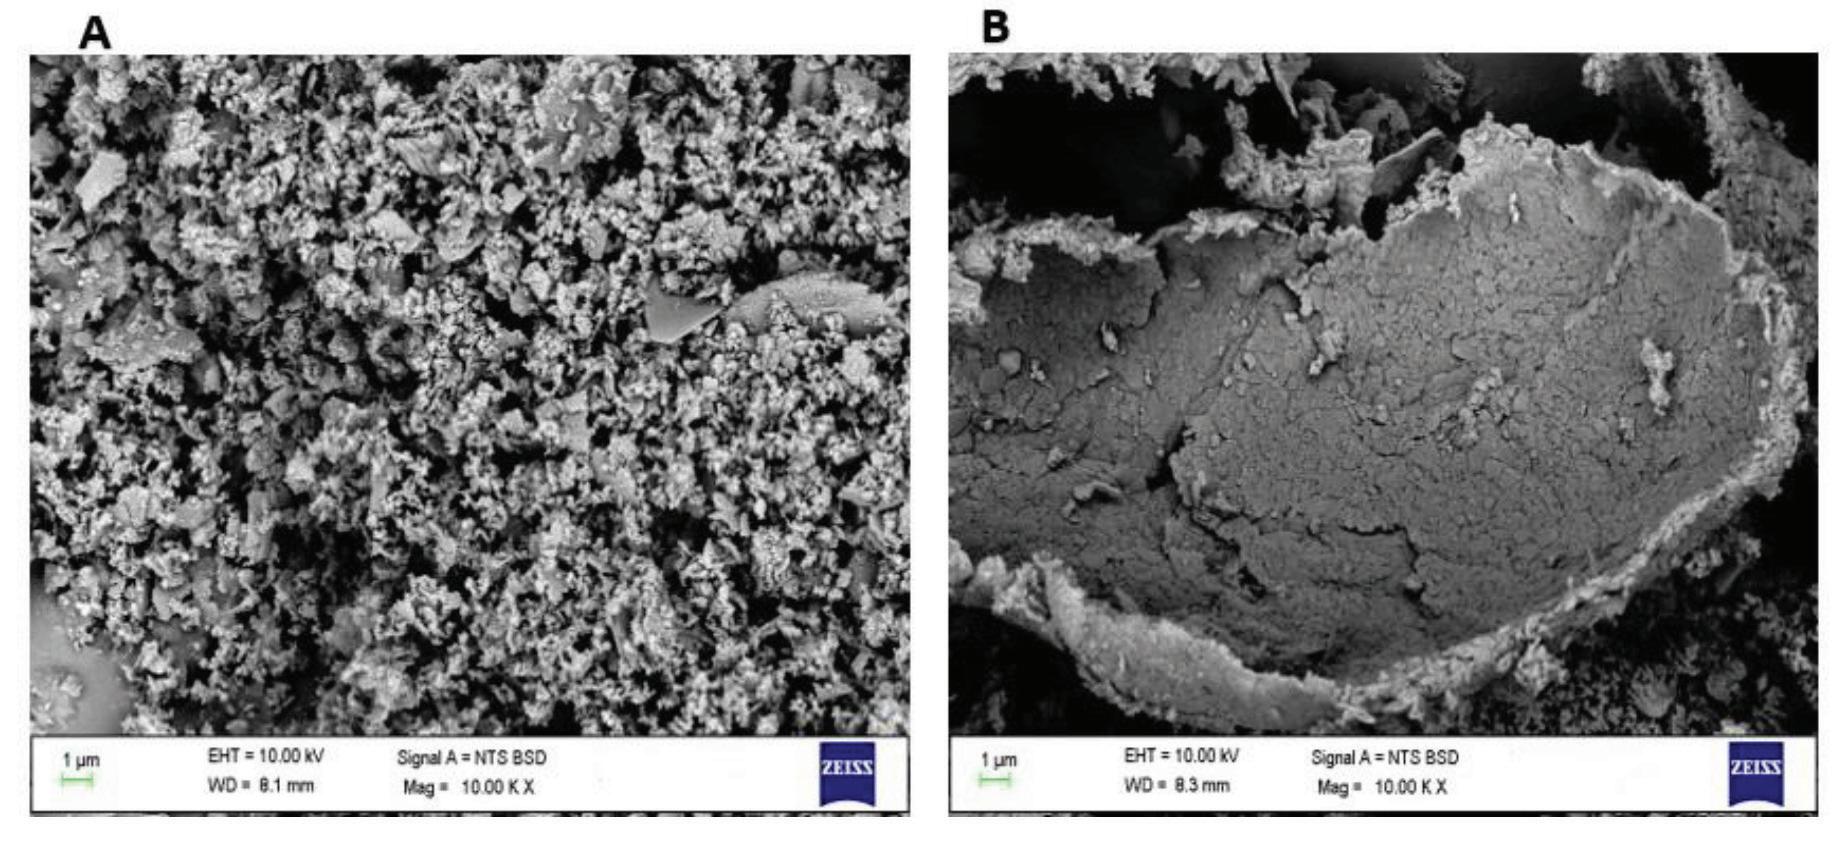
The major elemental compositions of the ash from the PB, PL, coal discard, and their blends using XRF analysis and ion chromatography (for water-soluble chlorides) are depicted in Table II. These analyses were replicated three times to ensure reliability and an average of the results is reported.
Co-firing of high-ash discard coal and refuse-derived fuel – ash and gaseous emissions
´shredded sponge´ and ´paint chip´ texture (Figures 8A and 8B. These morphologies are similar to those obtained by Taylor et al. (1982). The micrographs of 100% PB ash and coal blends at different proportion are seen in Figure 9. The material is heterogenous in nature and consists of very large irregular agglomerated aluminium deposits (88.92%). This could be from packaging components containing aluminium foil in the PB blend. The ash from the 100% LP (Figure 10) sample contained significantly more fine particulate matter than that from the 100% PB sample. The fine particles seen in these micrographs contain several elements, including alkali and alkaline-earth metals, which are known to form low-melting-point deposits, as well as chlorine, which causes corrosion to boiler surfaces.
Figure 10—SEM images from the discard coal and plastic co-combustion ash
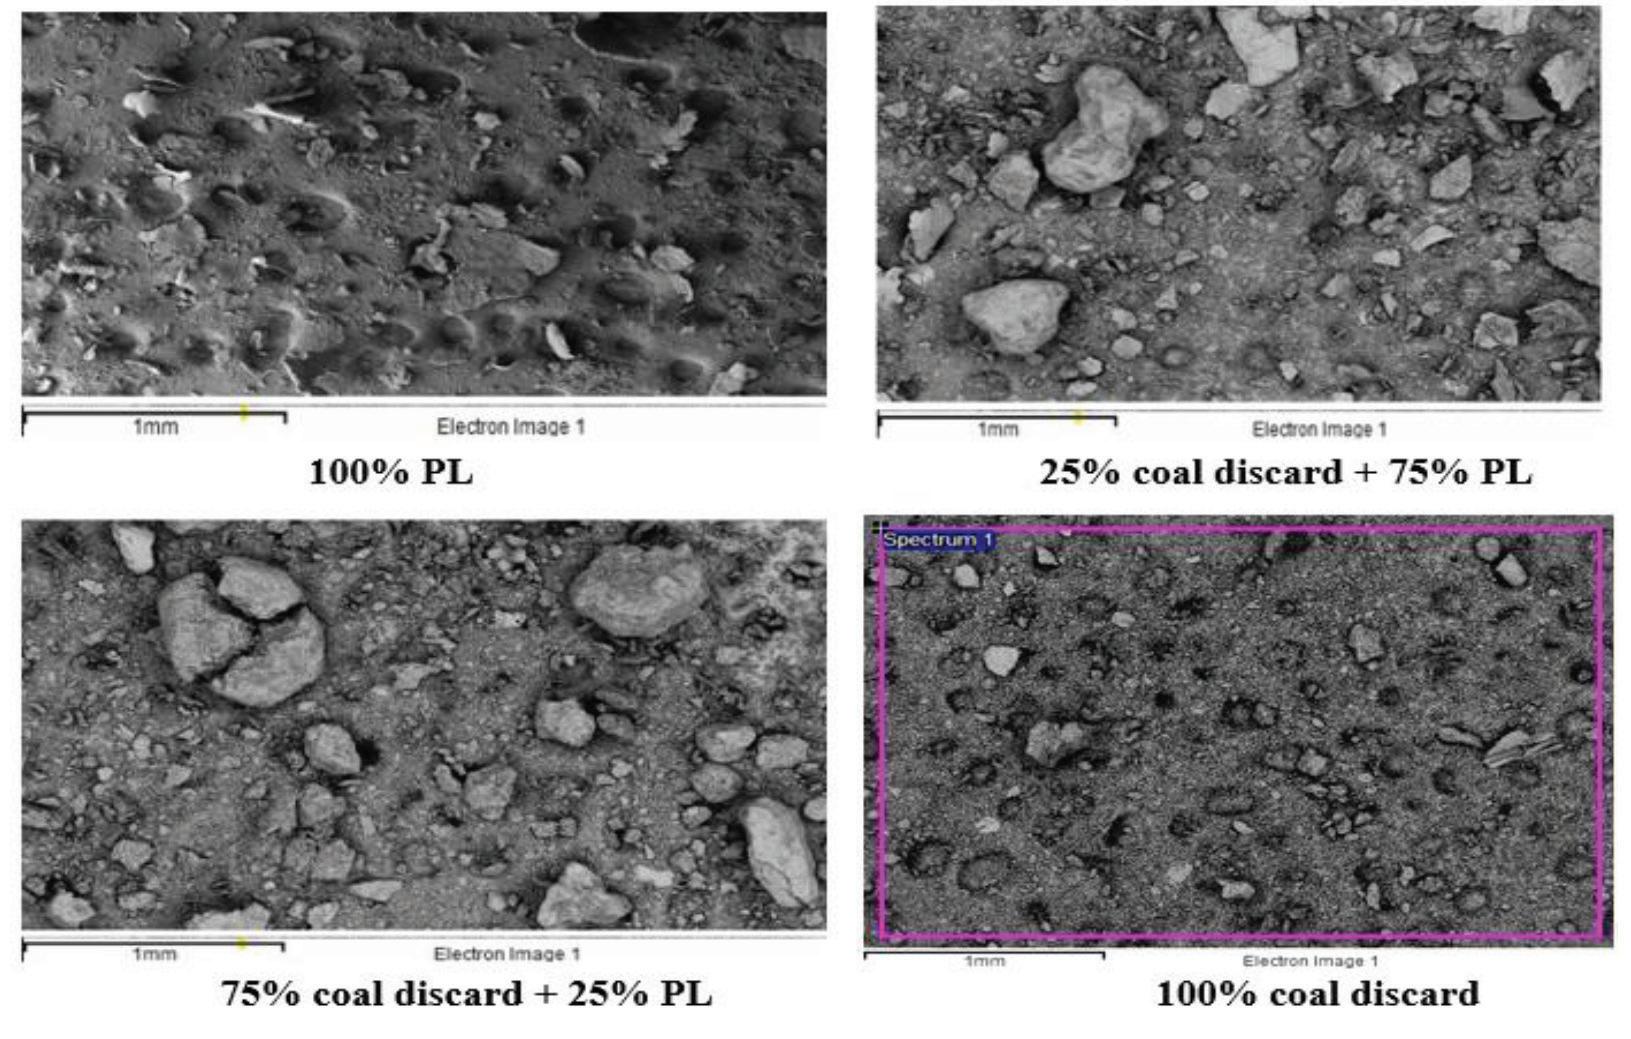
457The Journal of the Southern African Institute of Mining and Metallurgy VOLUME 122 AUGUST 2022
Table II shows that the most abundant oxide in the RDF (PB and PL) ash composition was Al₂O₃, followed by SiO₂. The alkali and the alkaline-earth metal oxides are more predominant in the RDF ash than in the coal ash, indicating that these elements are present in an ionic or organic form in the RDF (Iacovidou et al., 2017). Table II shows that the SiO₂ content in the ash decreased with increasing RDF content in the blend, which agrees with the findings of Zhang et al. (2018). Table II also shows that the Al₂O₃ content in the ash increased while the content of Fe₂O₃ decreased as RDF is increased in the fuel blend; the same trend was observed by Wu et al. (2011). An increase in the CaO and Na2O content in the ash was also noted as the proportion of RDF in the coal/RDF blend increased, with no significant change in the concentrations of MgO and K2O. This is again consistent with the findings of Wu et al. (2011). The chloride content in the ash of 100% RDFs, coal discard, and their blends was determined using ion chromatography, and the results are also depicted in Table II. The plastic sample (PL) had the highest chloride concentration at 2.84%, followed by the 100% paper blend with a concentration of 0.9%. The chloride content of the coal discard sample was untraceable, which led to a decrease in the chloride content of the blend as the proportion increases. This agrees with the findings of Wan et al. (2008).
Co-firing of high-ash discard coal and refuse-derived fuel – ash and gaseous emissions
coal proportion in the coal-RDF blends, the fouling and slagging potential is significantly reduced. Sample 25% discard coal plus 75% PL was reduced to 1.55 which is in the range for medium fouling propensity. The samples containing 30% RDF plus 70% discard coal were both close to the lower boundary for medium fouling propensity, at 0.73 and 0.79 for PL and PB, respectively.
Table II shows that the most abundant oxide in the RDF (PB and PL) ash composition was Al₂O₃, followed by SiO₂. The alkali and the alkali-earth metal oxides are more predominant in the RDF ash compared to the coal ash, indicating that these elements are present in an ionic or organic form in the RDF (Iacovidou et al., 2017). Table II shows that the SiO₂ content in the ash decreased with increasing RDF content in the blend, which agrees with the findings of Zhang et al. (2018). Table II also shows that the Al₂O₃ content in the ash increased while the content of Fe₂O₃ decreased as RDF is increased in the fuel blend; the same trend was observed by Wu et al. (2011). An increase in the CaO and Na₂O content in the ash was also noted as the proportion of RDF in the coal/RDF blend increased, with no significant change in the concentrations of MgO and K₂O. This is again consistent with the findings of Wu et al. (2011). The chloride content in the ash of 100% RDFs, coal discard, and their blends was determined using ion chromatography, and the results are also depicted in Table II. The plastic sample (PL) had the highest chloride concentration of 2.84%, followed by the 100% paper blend with a concentration of 0.9%. The chloride content of the coal discard sample was untraceable, which led to a decrease in the chloride content of the blend as the proportion increases. This agrees with the findings of Wan et al. (2008).
authors with regard to South African coal ash (Akinyeye et al., 2016, Waanders et al., 2003). The discard coal ash was found to contain 9.42% Fe₂O₃ (Table II), which is higher than most of the values reported for bituminous to sub-bituminous coals in the literature. However, it can be expected that this high-ash inertinite discard coal will contain a oxide suite of minerals (CaO and MgO) and iron sulphide (pyrite, chalcopyrite etc.) minerals, since they are beneficiated from the organic content of the coal, leading to an increase in Fe₂O₃ content.
From the slagging and fouling indices (Table II) the 100% PB sample had the highest slagging propensity with a value of 0.43. This can be attributed to the high content of CaO and Na₂O in the fuel. The burning of this sample alone in the boiler could have a negative impact, as the alkali metal salts and alkaline-earth metals form low-viscosity deposits with low melting points. The 100% PB and PL samples showed a high propensity for fouling, with an Fu index of 6.31 and 3.42, respectively. Table II shows that the 25% discard coal plus 75% PB sample is also within the high range, due to the large quantity of PB in this sample. With an increase in the coal proportion in the coal-RDF blends, the fouling and slagging potential is significantly reduced. Sample 25% discard coal plus 75% PL was reduced to 1.55 which is in the range for medium
From the slagging and fouling indices (Table II) the 100% PB sample had the highest slagging propensity with a value of 0.43. This can be attributed to the high content of CaO and Na₂O in the fuel. The burning of this sample alone in the boiler could have a negative impact, as the alkali metal salts and alkaline-earth metals form low-viscosity deposits with low melting points. The 100% PB and PL samples showed a high propensity for fouling, with an Fu index of 6.31 and 3.42, respectively. Table II shows that the 25% discard coal plus 75% PB sample is also within the high range, due to the large quantity of PB in this sample. With an increase in the
Cu 67 353 746 135 375 79
Zr 476 79 145 451 331
Mn 437 930 188 439 340
Ash elemental concentration limits (ppm) for utilization in forestry and agriculture (Lanzerstorfer, 2015)
As 30−40 Cr 100−300 Cu 400−700
Sr 50 17 13 46 36
1. The discard coal was found to have the highest SO₂ and NOx emissions. With increasing RDF content in the fuel blend, a decrease in SO₂ and NOx emissions was observed.
Cr 254 221 164 254 230
Co 14 19 53 30
3. The ash obtained from the co-combustion of the discard coal and RDF showed a decrease in the alkali and alkaline-earth metal contents. This is a consequence of the increase in the proportion of coal in the blend. The water-soluble chloride content of the ash also decreased with the addition of coal to the fuel blend. 1 6 2531 21 248 244 170 62 2 3 442 620 11 10 28 86 93 215 205 181 62 74 36 48 39 69 49 37 2 1 4 105 56 34 48 39 43 35 184 127 61 47 182 848 447 322
Zn 48 2424 3910 427 1788
Co-firing of high-ash discard coal and refuse-derived fuel – ash and gaseous emissions
Ce 71 - 17 34 42
Pb 57 104 51 56 57
Table III Trace elements concentrations in the co-combustion ash (ppm) 100 % C2 100 % PB 100 % PL 70% C2 + 25% C2 + 70% C2 + 25% C2 + 30 % PL 75% PL 30% PB 75% PB As 13 3 - 11 5 10 7 Ba 713 895 2695 958 1522 912 682 Br 1 34 11 1 4
Ga 52 75 79 53 65 51
Trace element Concentration (ppm)
Hg 2 1 4 2 4
Sb 4 79 155 22
Conlusions
Sn 18 46 205 47
Rb 50 17 13 46
fouling propensity. The samples containing 30% RDF plus 70% discard coal were both close to the lower boundary for medium fouling propensity, at 0.73 and 0.79 for PL and PB, respectively.
Nb 39 13 37 39 39 37
Table IV
Hg 1−3 Ni 70−150 Pb 150−300 Zn 700−7000
V 192 - - 163 34
Nd 200 74 124 222
Y 65 9 8 61 44
458 AUGUST 2022 VOLUME 122 The Journal of the Southern African Institute of Mining and Metallurgy
2. CO₂ emissions increased with the addition of RDF to the blends, which could be caused by the high volatile matter content of RDF.
Th 47 10 10 43 34
Se 1 1 1 1
It was established in this study that the most favourable fuel blend that could be used for power generation is that of discard coal (25%) and PL (75%). This was based on the lowest S02 emissions attained during the volatile and char combustion of the blend. In addition to the earlier time to complete the release of the NOx (char combustion). Hence in this study, the following conclusions were made.
Ni 95 111 90 84 85
Trace element concentrations
The concentrations of potentially toxic elements (PTE), such as As, Co, Cr, Cu, Mn, Ni, Sb, and V, was also investigated, and the results are reported in Table III. Concentrations of As, Co, Cr, Nd, Rb, Sr, Th, V, Y, and Zr increase as the amount of coal discard increases in the blend. As the RDF content in the blend increases the concentrations of Cu, Ga, and Zn are increased in the ash for both PL and PB. The paper blend (PB) specifically increases the concentrations of Mn, Pb, and Ni in the ash, while the plastic RDF increases the concentrations of Ba, Sn, and Sb. This agrees with the ash analyses from other RDFs and coal co-combustion studies in the literature (Taylor et al., 1982, Norton, Malaby, and DeKalb, 1988).The concentration limits of some heavy metals in ashes from Lithuania, Sweden, and Finland are depicted in Table IV (Lanzerstorfer, 2015). The ash obtained from the co-combustion of the RDF and coal used in this study conformed to the concentration limits required for most of the elements. However, the Hg concentration (Table III) in the 100% PL and blend of 25% discard coal plus 75% PL (4 ppm) was found to be above the limit. Apart from these two samples, all other ash samples could be used as a soil conditioner in forestry and agriculture in some countries, based on their stipulated heavy metal limit. The EN 450-1 (2012) standard for fly ash used in the construction industry (concrete) requires the chloride concentration in the ash to be less than or equal to 0.1%. From the results obtained in this study, both ashes produced from 100% RDFs are unsuitable for use in concrete, while the samples containing up to 70% discard coal were within the chloride limit for concrete (Table II).
Mo 10 12 12 11 11
Lanzerstorfer, C. 2015. Chemical composition and physical properties of filter fly ashes from eight grate-fired biomass combustion plants. Journal of Environmental Science (China), vol. 30. pp. 191–197. https://doi.org/10.1016/j. Makwarela,jes.2014.08.021M.O.,Bada, S.O., and Falcon R.M.S. 2017. Co-firing combustion characteristics of different ages of Bambusa balcooa relative to a high ash coal. Renewable Energy, vol 105. pp. 656–664.
4. The slagging and fouling indices showed that as the percentage of coal in the blend increases, the propensity of the fuel blend to slagging and fouling decreases.
459The Journal of the Southern African Institute of Mining and Metallurgy VOLUME 122 AUGUST 2022
Akinyeye, R., Omoniyi, P., Leslie, P., and Olorunfemi, O. 2016. Comparative chemical and trace element composition of coal samples from Nigeria and South Africa. American Journal of Innovative Research & Applied Sciences pp. 391–404.
Co-firing of high-ash discard coal and refuse-derived fuel – ash and gaseous emissions
Acknowledgements
MillerAR.18.045,B.2011.
Bunt, J.R, Matjie, R.H., Campbell, Q.P., and Van Alphen, C. 2019. Mineralogical, chemical, and petrographic properties of selected South African power stations’ feed coals and their corresponding density separated fractions using float-sink and reflux classification methods. International Journal of Coal Preparation and Utilization, vol. 39, no. 8. pp. 421–446.
DEA. 2018. South Africa State of Waste Report. Department of Environmental Affairs, Pretoria.
Akdag, A., Atimtay, A., and Sanin, F. 2016. Comparison of fuel value and combustion characteristics of two different RDF samples. Waste Management, vol. 47. pp. 217−224.
Brew, M. What’s on the horizon for refuse-derived fuel as Brexit looms and production evolves.
Clean Coal Engineering Technology. 2nd edn.
Rautenbach,org/10.1021/es00176a005R.Strydom,C.A.
Cheng, G. and Zhang, C. 2018. Desulfurization and denitrification technologies of coal-fired flue gas. Polish Journal of Environmental Studies, vol. 27, no. 2. pp. Chyang,481−89.C.S.,Han, Y.L., Wu, L.W., Wan, H.P., Lee, H.T., and Chang, Y.H. 2010. An investigation on pollutant emissions from co-firing of RDF and coal. Waste Management, vol. 30. pp. 1334−1340.
DEA. 2012. Municipal Solid Waste Tariff Strategy. Department of Environmental Affairs, Pretoria.
World Bank. 2019. Solid Waste Management. urbandevelopment/brief/solid-waste-managementhttp://www.worldbank-.org/en/topic/[accessed23October2021].
Eskom, n.d. Eskom Holdings SOC Ltd - Lethabo Power Station. php?Item_ID=179archive.org/web/20090713043507/http://www.eskom.co.za/live/content.https://web.[accessed25March2022].
Waanders, F., Vinken, E., Mans, A ., and Mulaba-Bafubiandi, A. 2003. Iron minerals in coal, weathered coal and coal ash – SEM and Mössbauer results. Hyperfine Interact, vol. pp. 35–7. https://doi.org/10.1023/ Wagner,B:HYPE.0000003760.89706.f6N.,Malumbazo,andFalcon, R.M.S. 2018. Southern African Coal and Carbon Petrographic Atlas: Definitions and Applications of Organic Petrology. Wan,Penguin.H.P.,Chang, Y.H., Chien, W.C., Lee, H.T., and Huang, C.C. 2008. Emissions during co-firing of RDF-5 with bituminous coal paper sludge and waste tires in a commercial circulating fluidized bed co-generation boiler. Fuel, vol. 87. pp. 761–767. https://doi.org/10.1016/j.fuel.2007.06.004
Ndou, N.R., Bada, S.O., Falcon, R.M.S., and Weiersbye, I.M. 2020. Co-combustion of Searsia lancea and Tamarix usneoides with high ash coal. Fuel, vol. 267. 117282. Norton, G.A., Malaby, K.L., and DeKalb, E.L. 1988. Chemical characterization of ash produced during combustion of refuse-derived fuel with coal. Environmental Science and Technology, vol. 22. pp. 1279–83. https://doi.
The authors gratefully acknowledge the financial support of National Research Foundation of South Africa's SARChI Clean Coal Technology Grant (Grant Number: 86421). Opinions, findings, and conclusions expressed are those of the authors and NRF accepts no liability whatsoever in this regard. In addition, the authors express their appreciation to Interwaste, South Africa for providing the refuse-derived waste used in this study.
Energies vol. 11. https://doi.org/10.3390/en11020337
Guo, F. and Zhong, Z. 2018. Co-combustion of anthracite coal and wood pellets: Thermodynamic analysis, combustion efficiency, pollutant emissions and ash slagging. Environmental Pollution, vol. 239. pp. 21–9. https://doi.org/10.1016/j. Iacovidou,envpol.2018.04.004E.,Hahladakis, J., Deans, I., Velis, C., and Purnell, P. 2018. Technical properties of biomass and solid recovered fuel (SRF) co-fired with coal: Impact on multi-dimensional resource recovery value. Waste Management, vol. 73. pp. 535–45. https://doi.org/10.1016/j.wasman.2017.07.001
Fuller, A., Maier, J., Karampinis, E., Kalivodova, J., Grammelis, P., and Kakaras, E., 2018. Fly ash formation and characteristics from (co-)combustion of an herbaceous biomass and a Greek lignite (low-rank coal) in a pulverized fuel pilot-scale test facility. Energies, vol. 11, no. 6. https://doi.org/10.3390/ en11061581
Setsepu, R.L., Abdulsalam, J., and Bada, S.O. 2021. Effects of Searsia lancea hydrochar inclusion on the mechanical properties of hydrochar/discard coal pellets. Journal of the Southern African Institute of Mining and Metallurgy 2021, vol. 121. pp. 617–621.
Teixeira, P., Lopes, H., Gulyurtlu, I., Lapa, N., and Abelha, P. 2012. Evaluation of slagging and fouling tendency during biomass co-firing with coal in a fluidized bed. Biomass and Bioenergy, vol. 39. pp. 192–203. https://doi.org/10.1016/j. Vekemansbiombioe.2012.01.010,O.andChaouki, J. 2016. Municipal solid waste co-firing in coal power plants: Combustion Performance. Developments in Combustion Technology pp. 118–42. https://doi.org/http://dx.doi.org/10.5772/63940
Wu, H., Glarborg, P., Frandsen, F.J., Dam-Johansen, K., Jensen, P.A ., and Sander, B. 2011. Co-combustion of pulverized coal and solid recovered fuel in an entrained flow reactor - General combustion and ash behaviour. Fuel, vol. 90. pp. 1980–91. https://doi.org/10.1016/j.fuel.2011.01.037
FFF. 2017. Fossil Fuel Foundation of Africa. Submission to the Department of Energy RE. South African Integrated Resource Plan 2016 (unpublished).
References
Chen,derived-fuel/172555/as-brexit-looms-and-production-evolves-whats-on-the-horizonfor-refuse-https://www.recyclingwasteworld.co.uk/in-depth-article/(accessed25March2022).X.,Xie,J.,Mei,S.,andHe,F.NOxandSO₂2018.emissionsduringco-combustionofrdfandanthraciteintheenvironmentofprecalciner.
Malat’ák, J., Velebil, J., and Bradna, J. 2018. Specialty types of waste paper as an energetic commodity. Agron Res, vol. 16. pp. 534–42. https://doi.org/10.15159/
IEA. 2015. Emission Standards: South Africa, London. James, A.K., Thring, R.W., Helle, S., and Ghuman, H.S. 2012. Ash management review-applications of biomass bottom ash. Energies , vol. 5. pp. 3856–7383. https://doi.org/10.3390/en5103856
Zhang, S., Lin, X., Chen, Z., Li, X., Jiang, X., and Yan, J. 2018. Influence on gaseous pollutants emissions and fly ash characteristics from co-combustion of municipal solid waste and coal by a drop tube furnace. Waste Management, vol. 81. pp. 33–40. https://doi.org/10.1016/j.wasman.2018.09.048. u
Taylor, D.R., Tompkins, M.A., Kirton, S.E., Mauney, T., Natusch. D.F.S., and Hopke P.K. 1982. Analysis of fly ash produced from combustion of refusederived fuel and coal mixtures. Environmental Science and Technology, vol. 16. pp. 148–54. https://doi.org/10.1021/es00097a006
• Mineralogy
The burgeoning global lithium-ion battery market has, however, opened up numerous opportunities in the region for expanded cobalt production and interest in producing high-purity base-metal salts for cathode material applications, as well as consideration of recycling efforts for end-of-life Thisproducts.conference provides a platform for discussion of new and more agile ways of operating and remaining relevant and innovative in a world that has changed considerably since the global COVID-19 pandemic.
• Hydrometallurgy
CONFERENCE TOPICS

• Minerals processing
• Slag treatment
Technical topics span the value chain from mineralogy and geometallurgy, through project development, operations and processing, to highpurity value-added products, recycling, and sustainability issues. Selected
Co-firing of high-ash discard coal and refuse-derived fuel – ash and gaseous emissions 460 AUGUST 2022 VOLUME 122 The Journal of the Southern African Institute of Mining and Metallurgy IN ASSOCIATION WITH THE 10th SOUTHERN AFRICAN BASE METALS CONFERENCEBASE2023METALS AFRICACOBALTCOPPER 13–15 JUNE 2023 AVANI VICTORIA FALLS RESORT, LIVINGSTONE, ZAMBIA
To be held in Livingstone, Zambia, this anticipated and prestigious event provides a unique forum for discussion, sharing of experience and knowledge, and networking for all those interested in the processing of copper, cobalt, and base metals in an African context, in one of the world’s most spectacular settings - the Victoria Falls.

• Pyrometallurgy and roasting
• Encourage participation and build capacity amongst young and emerging professionals from the Copper Belt region.
• Operational practices and improvements
The Organizing Committee looks forward to your participation.
• Novel technologies
• Project development and execution
• Geometallurgy
• Environmental issues
• Sulfide and oxide flotation
• Waste treatment and minimization
• Enhance understanding of new and existing technologies that can lead to safe and optimal resource utilization;
TYPE OF EVENT
The event is currently planned as an inperson conference only. As necessary, this decision may be revisited should country or international travel requirements change.
FOR FURTHER INFORMATION, CONTACT: Camielah Jardine, Head of Conferencing E-mail: camielah@saimm.co.za Tel: +27 11 538-0238 | Web: www.saimm.co.za
• Recycling and urban mining
The African Copper Belt has experienced a period of some difficulty since the last conference, held in 2018. Owing to the global slowdown in commodity demand during the early stages of the pandemic, many operations scaled down production or were placed on care and maintenance. For those continuing in business, this resulted in considerable focus on process and operating cost optimization, productivity improvements, product quality enhancements, skills development and capacity building, and consolidation of best practice within the industry. Ongoing projects are required to be well-defined and -motivated, and subject to greater technical and financial scrutiny, to ensure that they can rapidly ramp up and deliver immediate value.
SAIMM is proud to host the Third Copper Cobalt Africa Conference.

papers on relevant economic issues will also be considered. Industry operators will be able to share technical experience and practices, meet vendors, and learn about new technologies and processes that can add value to their operations. Worldclass plenary speakers will offer a unique opportunity to hear first-hand opinions on the status and overview of the Twoindustry.Continuing Professional Development short courses are planned. Hydrometallurgy of Cobalt will focus on the various unit operations in cobalt processing, with relevance to the Copperbelt operations. As a new technology now being implemented in the region, Sulfide Flotation will provide an introduction to this topic for metallurgists, covering both fundamental and practical techniques. Both courses will be presented by leading engineers and accredited by the Engineering Council of South ForAfrica.international participants, this conference offers an ideal opportunity to gain in-depth knowledge of and exposure to the African copper–cobalt industry, as well as other base-metal operations and projects in the region, and to better understand the various facets of minerals processing and extraction in this part of the world. Hosted by the Metallurgy Technical Programme Committee of the Southern African Institute of Mining and Metallurgy (SAIMM), this conference aims to:
• Promote dialogue between operators, vendors and service providers on common metallurgical challenges facing the industry;
coal,Keywordsdensity
461The Journal of the Southern African Institute of Mining and Metallurgy VOLUME 122 AUGUST 2022
TheSynopsisSoutpansberg
Introduction
South African coalfields predominantly host coals of thermal quality, which are used to generate over 70% of the country’s energy (Minerals Council, 2022 https://www.mineralscouncil.org.za/). In contrast, approximately 1% of the coal mined in South Africa is of metallurgical/coking quality ((IEA, 2017; Peatfield, 2003; Prévost, 2013). The quality of metallurgical coals that are mined in South Africa are largely limited to semi-soft coking coal (SSCC) and pulverized coal for injection (PCI) coal (Hancox and Götz, 2014; Jeffrey, 2005). Metallurgical coal is extracted from the Grootegeluk Coal Mine (approx. 2.5 Mt/a) in the Waterberg Coalfield, and to a smaller extent from selected seams in the Main Karoo Basin (MKB): Witbank, Ermelo, Klip River, Vryheid, and Utrecht coalfields, as well as the Nongoma, Sonkhele and Kangwane coalfields (Figure 1). Due to the limited local supply, South Africa imports metallurgical coal to the value of R4 billion to meet annual demand for its iron and steel industry (Chamber of Mines, 2018; Prévost,Significant2013).
How to cite: Sebola, M.J.T., Drennan, G.R., and Wagner, N.J. 2022
Petrographic and geochemical characteristics of beneficiated metallurgical coal from the No. 6 Seam, Tshipise sub-basin, Soutpansberg coalfield, South JournalAfrica of the Southern African Institute of Mining and Metallurgy, vol. 122, no. 8, pp. 461–472
DOI 4046-4788https://orcid.org/0000-0002-N.J.8715-1597https://orcid.org/0000-0001-G.R.0213-4390https://orcid.org/0000-0002-M.J.T.ORCID:9717/2061/2022http://dx.doi.org/10.17159/2411-ID:SebolaDrennanWagner
Affiliation: 1School of Geosciences, University of the Witwatersrand, South 2Africa.DSI-NRF CIMERA, University of Johannesburg, South Africa.
deposits of hard coking coal (HCC) in South Africa are known to occur in the Soutpansberg coalfield. Here prime HCC was exploited from the eastern sector of the coalfield, at Tshikondeni Coal Mine between 1984 and 2014 (Hancox and Götz, 2014; Jeffrey, 2005; Prévost, 2017). However, published studies detailing the coal characteristics in this coalfield are limited despite the miningMetallurgicalactivity. coal (coking coal) and graphite are recognized as critical raw materials for the development of clean technology and clean energy (Duda and Fidalgo Valverde, 2021; European Commission, 2020; York and Bell, 2019). In addition, hard coal and coal ash are increasingly being studied for the concentration and potential extraction of other critical raw materials, specifically rare earth elements (REEs) (Dai, Graham, and Ward, 2016; Dai et al., 2017; Dai and Finkelman, 2018; Franus, Wiatros-Motyka, 2015; Fu et al, 2022; Scott and Kolker, 2019; Seredin and Dai, 2012; Peiravi et al., 2017; Predeanu et al., 2021, among many others). China`s dominance in REE reserves, coupled with its restrictions on REE trade, as well as the high global demand for REEs, has ignited significant efforts into exploration and research to identify alternative unconventional REE sources (Eterigho-Ikelegbe, Harrar, and Bada, 2021; Huang, Fan, and Tiand, 2018; van Gosen et al., 2014; Zhang et al., 2020). Investigation into
Coalfield hosts South Africa's hard coking coal reserves. However, coals in this region are understudied compared to other coalfields in the country.
by M.J.T. Sebola1, G.R. Drennan1, and N.J. Wagner2
This study characterizes the properties of fine-float fraction samples extracted from a wide diameter borehole core in the Makhado Project, Tshipise sub-basin, Soutpansberg coalfield. Conventional analyses were used to determine the coal quality, petrographic composition, mineralogy, geochemistry (including trace element and rare earth element composition), and free swelling index of samples from six coal horizons and three partings from the economic No.6 Seam.
Petrographic and geochemical characteristics of beneficiated metallurgical coal from the No. 6 Seam, Tshipise sub-basin, Soutpansberg coalfield, South Africa
fractionation, vitrinite, rare earth elements, trace elements in coal.
Email: mjtsebola@yahoo.co.uk
Dates: Received: 22 Mar. 2022 Revised: 4 Jul. 2021 Accepted: 12 Jul. 2021 Published: August 2022
The coal samples are classified as medium rank bituminous C coals (0.88 %RoVmr, 0.92 %Rmax) and are highly vitrinitic in composition (97 vol% mineral matter free (mmf)). The samples show strong caking potential (FSI of 9). The total rare earth concentrations range between 570 and 3193 ppm in the ash samples. Preliminary analysis show all but two samples are promising sources of rare earth elements as the total concentrations exceeded the 1000 ppm cut-off grade. Further research is required to confirm these preliminary findings.
Correspondence to: M.J.T. Sebola
climate (Cadle et al., 1993; Cairncross, 2001). The Karoo-age strata in the Soutpansberg coalfield were deposited in horst and graben structures, in thinner sedimentary units compared to the MKB coal-bearing strata (Catuneanu et al., 2005; Johnson et al., 2006). Coal seams occur in the Madzaringwe Formation and the overlying Mikambeni Formation, seven economically viable seams being found in the former (Figure 2) within the Tshipise sub-basin (Sparrow, 2012). The Madzaringwe Formation is the equivalent of the coal-bearing sediments of the Ecca Group in the MKB (Hancox and Götz, 2014). Of the seven coal seams identified, the sixth seam (herein referred to as the No. 6 Seam) is the primary economic target and is further divided into six distinct horizons or plies: Seam Bottom Lower (SBL), Seam Bottom Middle (SBM), Seam Bottom Upper (SBU), Seam Middle Lower (SML), Seam Middle Upper (SMU), and Seam Upper (SU) (de Klerk and Sparrow, 2015; Sparrow, 2012). These horizons are characterized by relatively thin vitrinitic bands that are interbedded with carbonaceous mudstone and shale (Hancox and Götz, 2014).
The Soutpansberg Coalfield is an intracratonic rift basin of Karoo age located in the Limpopo Province of South Africa (Figure 1). It is divided into three sub-basins, namely the western (Mopane sub-basin), central (Tshipise sub-basin), and eastern (Pafuri subbasin) (Malaza, 2013). Deposition of the stratigraphic units of the Soutpansberg coalfield was concurrent with those of the Karoo Supergroup in the MKB, which occurred from the end of the Carboniferous period (300 Ma) to the mid-Jurassic (183 Ma) and shows evidence of transition from a glacial to arid
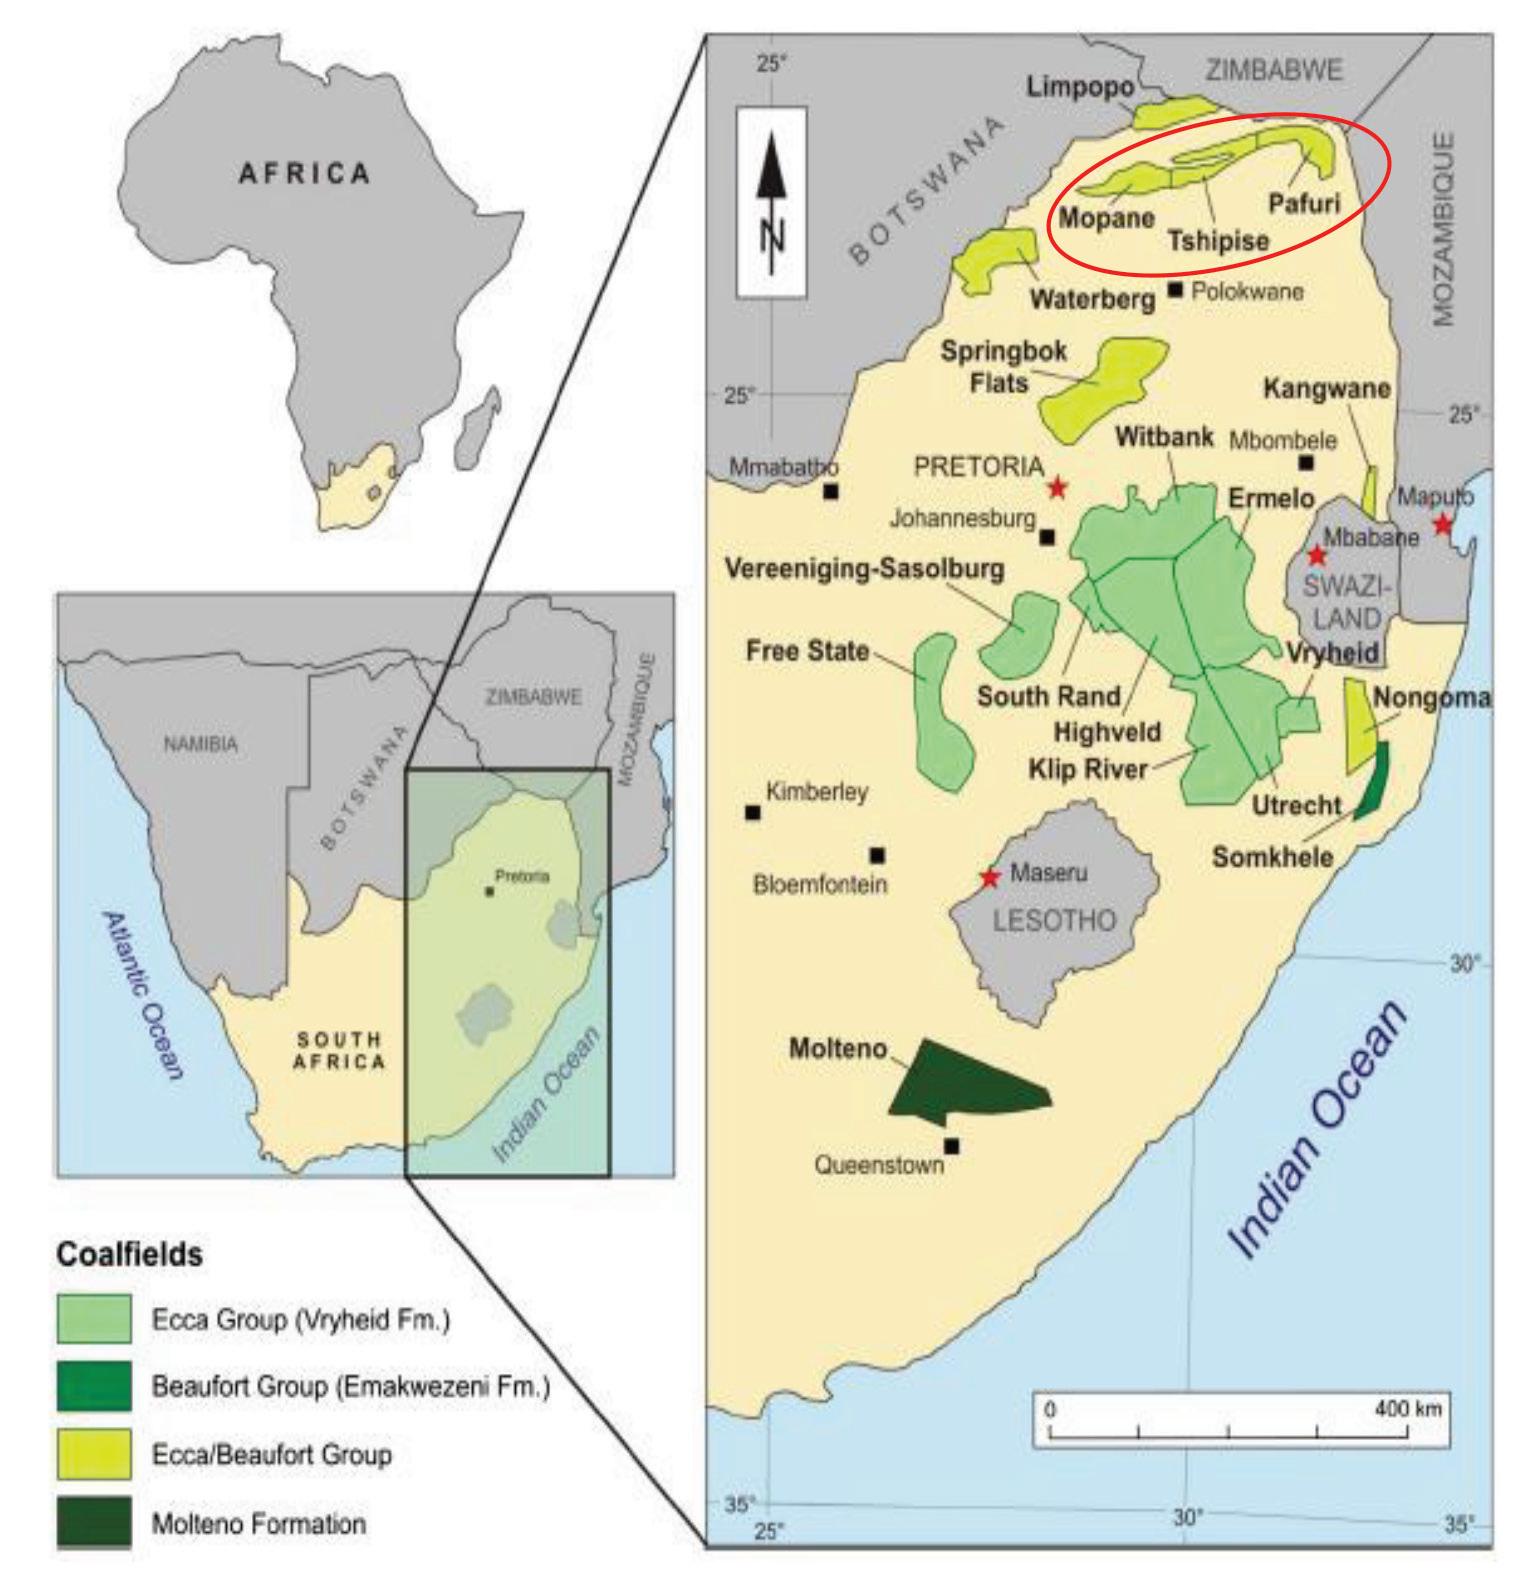
the potential extraction of REEs from South African coals and ash has received some attention, with published studies limited to coal and ash from the MKB (Akdogan et al., 2019; Akinyemi et al., 2012; Cornelius et al., 2021; Eze et al., 2013; Hart, Leahy, and Falcon, 1982; Wagner and Matiane, 2018).
Materials and methods
Petrographic and geochemical characteristics of beneficiated metallurgical coal
462 AUGUST 2022 VOLUME 122 The Journal of the Southern African Institute of Mining and Metallurgy
Samples and sample preparation
Figure 1—Distribution of South African coalfields (Hancox and Götz, 2014). Circled in red: the Mopane, Tshipise and Pafuri sub-basins constitute the Soutpansberg coalfield
Considering the limited literature available on Soutpansberg coals, as well as the high value placed on metallurgical coal, and the need to seek alternative REE resources, the aim of this paper is to present the petrographic and geochemical characterization of beneficiated metallurgical coal product from the No. 6 seam horizons of the Tshipise sub-basin of the Soutpansberg coalfield. The significance of this research is the contribution towards understanding the properties of metallurgical coal from the Soutpansberg coalfield. Moreover, the geochemical data presented is a preliminary evaluation of the occurrence of REE in the beneficiated coal ash product.
Geological setting
The samples originate from a large diameter drill core obtained from the Makhado Project in the Tshipise sub-basin of the Soutpansberg coalfield. The drill core intercepts the No. 6 coal seam of the Madzarinwge Formation (Figure 2), and six coal horizons (SU, SMU, SML, SBU, SBM, and SBL) and three partings
The coking properties of the samples were inferred by FSI, conducted according to ISO 501, at the Council for Geoscience laboratory. The FSI allowed for rapid, and cost-effective determination of the coking properties. Detailed assessment of the plasticity and cokability of the samples was beyond the scope of theThestudy.mineral composition was determined using XRD. Diffractograms were obtained using a Malvern Panalytical Aeris diffractometer with PIXcel detector and fixed slits with Fe-
Sample characterization
analyses were conducted at the coal laboratory in the Council for Geoscience,PetrographicPretoria.blocks were prepared according to SANS/ISO 7404-2, ensuring smooth, scratch-free surfaces for analysis. Coal petrography was conducted using a Zeiss Axio Imager M2M petrographic microscope equipped with a Hilgers Fossil system housed at the University of Johannesburg, at a total magnification of 500x using a 50x oil immersion lens. Macerals and mineral groups were determined following SANS/ISO 7404-3 in nonpolarized white reflected light; UV light was used to confirm liptiniteRandommacerals.(%RoVmr) and maximum (%Rmax) vitrinite reflectance measurements were taken broadly following SANS/ ISO 7404-5. The monochrome camera was used to measure the %RoVmr and %Rmax on a minimum of 100 points of collotelinite in each sample. Measurements were taken under green reflected light using a 50x oil objective in non-polarized (RoVmr) and polarized (RoVmax) light. The microscope was calibrated using an yttrium-aluminium-garnet (YAG) 0.900%.
Figure 2—Stratigraphic correlation of the Karoo Supergroup in the Main Karoo Basin and the Tshipise sub-basin, Soutpansberg Coalfield (Modified after Luyt, 2017; Sparrow 2012). Samples in this study originate from the upper seams (SU, SMU, and SML), bottom seams (SBU, SBM, and SBL), and partings (P1, P2, and P3)
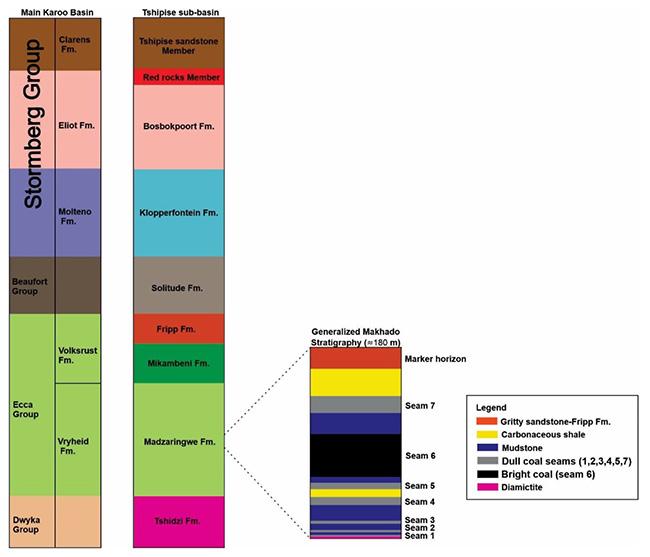
The proximate analyses entailed the determination of ash (ISO 1171), inherent moisture (SANS 5925), volatile matter (ISO 562), and fixed carbon by difference. Total sulphur was determined using the Leco CHN 628 based on ASTM standard D4239. The
Coal quality determination
(P1, P2, and P3) were sampled. Nine samples were subjected to drop shatter, dry tumble and wet tumble tests to estimate the particle size distribution expected during the transportation, handling, and processing of the coals (data not reported herein; refer to Sebola, 2022). Float-sink testing was conducted on the resultant daughter particles to determine suitable washability conditions for the production of a 10% ash metallurgical product. The test procedures are detailed by Sebola (2022). Washability analyses indicated that the fine size fraction (-1+0.25 mm) at a density of 1.30-1.70 g/cm3 was suitable for a 10% ash product. The fine-sized float fractions are discussed in this paper.
463The Journal of the Southern African Institute of Mining and Metallurgy VOLUME 122 AUGUST 2022
Petrographic and geochemical characteristics of beneficiated metallurgical coal
The -1+0.25 mm samples were coned and quartered and the first quarter was reserved for coal petrography. Two quarters were milled to -212 μm and split further for coal quality determination: proximate analyses, total sulphur, free swelling index (FSI) and X-ray diffraction (XRD). The remaining quarter of the sample material was ashed for geochemical analyses: major oxide, trace element, and REE+yttrium and scandium content. Ashing was carried out by gradually heating the coal to a maximum temperature of 815°C over a three-hour period (following Dai et al, 2017) at MAK Analytical Laboratory, Johannesburg.
The ICP-MS method was utilized for the identification and quantification of trace elements and REY+Sc using the Thermo Scientific iCAP RQ instrument at the Earth Lab, University of the Witwatersrand. The ashed samples were digested in a microwave digester (MARS from CEM) using ultra-high purity 2:1 HF:HNO₃. The instrument is optimized for maximum counts on oxide levels set to less than 2% as well as doubly charged ions set to less than 2%. Three replicate measurements were recorded and averaged for each sample. Replicates deviating by more than 2% were flagged.
filtered Co-K radiation. The phases were identified using X’Pert Highscore Plus software. The relative phase amounts (weight %) were estimated using the Rietveld method. The samples were analysed at XRD Analytical and Consulting cc, based in Pretoria.
Samples from the bottom seams reported higher %P (0.0390.065%) compared to the upper seams (0.001-0.004%) and partings (0.005-0.008%). Moreover, the %P exceeded the limit (%P ≤ 0.010%) for coking coals used in the South African steel industry (Xaba, 2004). Likewise, samples from the bottom seams, as well as P1, SML, and P3 exceeded the limit (%P ≤ 0.006%) for coking coals used in the South African ferro-alloy industry (Xaba, 2004). There is a need to further explore the occurrence of P-bearing minerals in these coal samples; further processing will be necessary to reduce the alkali and P contents to acceptable industry levels.
Precision is taken as 1% for elements having abundances of greater than 5% by weight, and 5% for elements with abundances less than 5%.
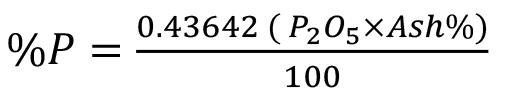
464 AUGUST 2022 VOLUME 122 The Journal of the Southern African Institute of Mining and Metallurgy
It is of interest to determine the leves of trace elements and REEs, including yttrium (REY) and scandium (REY+Sc) of the Makhado No. 6 seam ashed samples . Assessment of these elements is important to determine the level of potentially harmful elements, as well as their economic potential as a secondary source of critical REE (Huang, Fan, and Tiand, 2018; Kumar and Kumar, 2018; Dai et al., 2017).
The XRF analysis was carried out at the Earth Lab, University of the Witwatersrand. Major elements were determined by the Norrish Fusion 1 technique using in-house correction procedures. The instrument used was the Panalytical Axios X-ray spectrometer and samples were analysed at 50 kV and 50 mA. Major elements were fused using Johnson Matthey Spectrolflux 105 at 1000°C into a glass bead and raw data corrected using in-house software. Standard calibrations were made up using synthetic oxide mixtures and international standard rocks as well as in-house controls. Sample weight used was 0.35 g and flux weight 2.0 g. Calibration standards include primary International Reference Materials USGS series (USA) and NIM series (South Africa).
Results and discussion
The major oxides occurring in the samples are silica (SiO₂, 42-67%), aluminium oxide (Al₂O₃, 14-27%), titanium dioxide (TiO₂, 5-14%), ferric oxide (Fe₂O₃, 2-7%), calcium oxide (CaO, 2-4%), and magnesium oxide (MgO, 1-2%). The remaining oxides are generally present in quantities less than 1%. Samples from the bottom seams had higher amounts of Al₂O₃, CaO, Na₂O, K₂O, and P₂O₅ compared to the upper seams and partings. Samples from the upper seams and partings showed higher amounts of SiO₂, Fe2O₃, and TheNiO.alkali content (Na₂O+ K₂O) varied from 1.21-1.95% and therefore exceeded the recommended 1.5% limit set for coking coals (Xaba, 2004) in all samples excluding SU and P1. The percentage phosphorus (%P) present in the ash of the samples was calculated from the P₂O₅ values (Table I) using the formula from Schernikau (2017):
[1]
Table I Coal quality of the -1+0.25mm samples
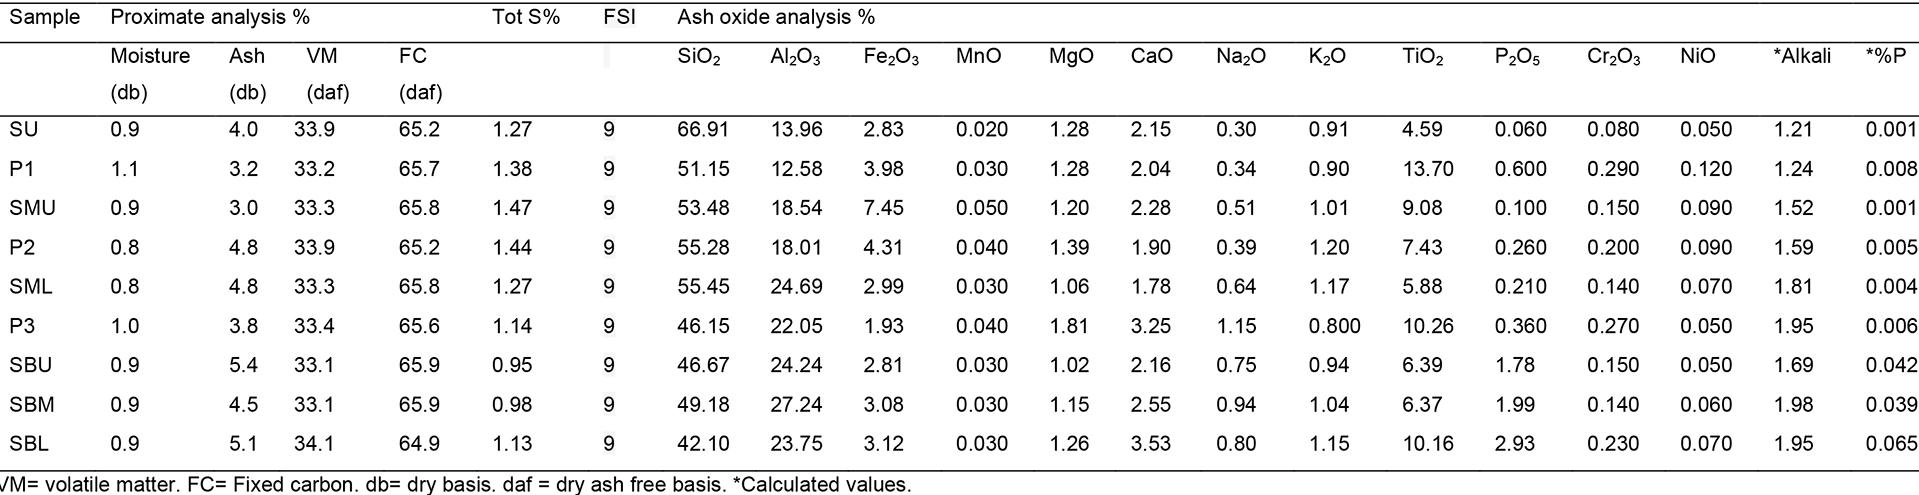
Coal quality characterization
Trace element and REY+Sc determination
The trace element and REY+Sc data for the ashed samples was compared to values determined for the upper continental crust (UCC) by Taylor and McLennan (1985), as well as the Clarke values for world hard coals on ash-basis determined by Ketris and Yudovich (2009). Comparison to the UCC and Clarke values allowed the best comparison to trace element concentrations in conventional rock sources and global coal ash.
Petrographic and geochemical characteristics of beneficiated metallurgical coal
The coal quality data for the fine density fractionated float samples is reported in Table I.
The samples are characterized by low ash (3-5%, db) and high fixed carbon, as expected in this beneficiated product range. The volatile matter (daf) showed minor variation through the sequence and averaged 33%. The total sulphur content varied between 0.98 and 1.47%, with samples from the bottom horizons containing the least sulphur. All samples are strongly caking (FSI of 9) and suggest excellent coking properties pending specialized coking tests such as the Roga test (ISO 335) and Giseler plastometer test (ASTM D-2639) which are necessary to confirm the carbonization properties of the fine samples.
P1 0.89 0.068 0.65 1.10 Medium rank C 0.92 0.70 1.10 0.068 V9
fusinite, semifusinite (inert and reactive), and secretinite (Figure 3C-E). Overall, the reactive component of the samples is mainly vitrinite and minor reactive semifusinite.
The trace element concentrations for the fine-sized samples (ash) are comparable to the Clarke coal ash values (Figure 4 and Table V). The trace elements occur in concentrations up to 47 412 ppm (Ti, Zr, V, Sr, P), 1200 ppm (Ga, Ni, Nb, Cu, Pb, Co, Hf), and 146ppm (Li, U, Th, Rb, Sb, W, Sn, Cs, Ta), respectively. Only Tl occurs in concentrations below 1.5 ppm. Samples from the bottom seams show higher concentrations of Ba, Sr, P, Cu, U, Th, Cs, and Tl. Overall, samples P3 (89 745 ppm), SBL (77 905 ppm) and P1 (77 041 ppm) contain the highest total trace element concentrations. Trace elements considered to be of environmental and health concern include As, B, Cd, Hg, Mo, Pb, Se, Cr, F, Cl, Cu, Ni, V, Zn, Ba, Co, Ge, Li, Mn, Sb, Sr, Rn, Th, U, Be, I, Ra, Sn, Te and Tl (Finkelman, 1999; Swaine, 2000; Vejahati, Xu, and Gupta, 2010.). In the present study, hazardous trace elements determined were limited to Pb, Cr, Cu, Ni, V, Zn, Ba, Co, Li, Sb, Th, U, Sn, and Tl due to instrument limitations. The aforementioned elements are listed in order of decreasing environmental concern, and range in concentration between 0.274 and 9650 ppm (Figure 4 and Table V).
SU 3.20 0.70 0.40 95.70 96.55
Petrographic characterization
SML 0.91 0.061 0.70 1.05 Medium rank C 0.94 0.75 1.10 0.063 V9
REY+Sc in coal ash
Maceral reflectance and rank determination for the -1+0.25 mm samples
SMU 1.60 1.20 0.40 96.80 97.25
Petrographic and geochemical characteristics of beneficiated metallurgical coal
From a utilization point of view, the ratio of fusinite and other inertinites relative to vitrinite is favourable as low amounts of inertinite in act to improve coke strength during carbonization (Suárez-Ruiz and Crelling, 2008). This is consistent with the high reactive versus inert maceral ratios for South African coking coals (Jordan, 2008; Powell, 2016).
The petrographically observable minerals occupy less than 3 vol% on average and consist predominantly of clay minerals and quartz (Table IV). Siderite, calcite and pyrite were rarely observed. The minerals are finely disseminated within the macerals and are indicative of syngenetic origins (Figure 3FL). Syngenetic minerals are difficult to liberate by physical beneficiation due to their intimate association with the macerals (Bhattacharya, Maheshwari, and Panda, 2016; Subba-Rao and Gouricharan, 2016).
SBL 2.00 1.80 0.80 95.30 95.35
Mineral species in the -1+0.25 mm samples (wt%)
P3 1.30 1.30 0.60 96.80 95.56
Trace elements in coal ash
Table III
Table II
P2 0.88 0.065 0.65 1.05 Medium rank C 0.92 0.75 1.10 0.066 V9
SBU 0.89 0.067 0.70 1.05 Medium rank C 0.93 0.75 1.10 0.069 V9
465The Journal of the Southern African Institute of Mining and Metallurgy VOLUME 122 AUGUST 2022
The REY+Sc concentrations (Table VI) for the Makhado fine-size samples (ash) generally follow a similar distribution pattern to the crustal abundance (UCC) and Clarke coal ash trend (Figure
Sample %RoVmr St.dev. Min. Max. Rank %Rmax Min. Max. St.dev. Vitrinoidtype(v-type)
P2 2.60 1.20 0.50 95.80 95.25
Sample Quartz Kaolinite Tridymite Organic LOI (SiO₂) (Al₂Si₂O₅ (SiO₂) carbon (C) (OH)₄)
SBU 2.50 2.30 0.90 94.30 94.82
SU 0.87 0.077 0.60 1.10 Medium rank C 0.90 0.60 1.15 0.079 V9
P3 0.87 0.079 0.60 1.10 Medium rank C 0.90 0.65 1.10 0.081 V9
SBL 0.87 0.078 0.60 1.10 Medium rank C 0.91 0.65 1.15 0.080 V9
Maximum reflectance %Rmax
SMU 0.87 0.065 0.65 1.05 Medium rank C 0.90 0.70 1.05 0.064 V9
The samples are classified as medium rank C bituminous coals (ECE-UN, 1998), showing average %RoVmr values of 0.88% (Table III). The %Rmax readings show average values of 0.92% (v9). The petrographic composition (Table IV) is highly vitrinitic consisting of collotelinite up to 89 vol% (mmf). The collotelinite occur predominantly as smooth homogeneous particles, typically ≥ 150 μm in diameter (Figure 3A). Pseudovitrinite was detected in all samples, on average 8 vol% (mmf); sample SML contains very high (20 vol% mmf) pseudovitrinite. The pseudovitrinite particles are characterized by desiccation slits orientated perpendicular to bedding or sometimes randomly oriented (Figure 3B). Although pseudovitrinite is known to have a deleterious effect on the coking properties of metallurgical coal, studies have shown pseudovitrinite to be reactive under certain coking conditions (Kruszewska, 1998; Sahajwalla, 2012). Furthermore, the adverse effects of pseudovitrinite in the Makhado fines may be negligible due to the very high collotelinite content and FSI values. Inertinite constitutes up to 6 vol% (mmf), and includes
P1 2.00 1.00 0.40 96.60 97.14
SBM 0.89 0.064 0.75 1.10 Medium rank C 0.92 0.75 1.10 0.066 V9
The mineral content determined by XRD (Table II) is low, predominantly consisting of quartz (1.30-3.20%) and kaolinite (0.70-2.30%). Minor tridymite (≤ 0.90%), a high-temperature polymorph of quartz, was also detected in the samples, possibly due to elevated temperature during XRD analysis. Additional minerals such as pyrite and siderite were below the detection limit of 0.5-3 wt%. The XRD and XRF data are in agreement as the measured high silica (SiO₂) and aluminium (Al₂O₃) correspond to the dominance of quartz and kaolinite reported in the samples.
SBM 2.00 1.90 0.70 95.40 95.59
SML 2.20 1.50 0.80 95.50 96.16
[2]
Overall,concentrations.thetotalREY+Sc (REY+ Sc) concentrations are highest in the bottom seams (2521-3193 ppm) compared to the upper seams (570-1342 ppm). Sample P3 contains comparable REY+Sc concentrations (2604 ppm) to the bottom seams. The total LREE+Sc (LREE+Sc) concentrations (300-2618 ppm) are higher compared to 213-1454 ppm for the total MREE+Y (MREE+Y), 57-178 ppm for total HREE (HREE) concentration. The order of decreasing abundance observed in the samples for the LREE+Sc follows the general trend Ce>La>Nd>Sc>Pr>Sm, while the MREE+Y trend generally follows Y>Dy>Gd>Eu>Tb. The HREE generally follow a trend of Yb>Er>Ho>Tm>Lu.
5). Although the REY+Sc concentrations of the fine-size samples greatly exceed the UCC values, they are comparable to the Clarke coal ash
466 AUGUST 2022 VOLUME 122 The Journal of the Southern African Institute of Mining and Metallurgy
The UCC-normalized graph (Figure 6A) shows that samples from the upper seams and partings exhibit enrichment from 2 to 20 times, compared to 9 to 33 times in sample P3. Enrichment in the bottom seams is in the range 10 to 23 times. Notably, Sc and Y show enrichment factors of 32 and 24 respectively in sample P3. Enrichment levels relative to the Clarke hard coal ash values are 5 times higher in samples from the upper seams, 8 times higher in the bottom seams, and 10 times higher in the partings (Figure 6B). The LREE/HREE ratios show that LREEs are slightly more enriched in the bottom seams, while the upper seams show higher HREE enrichment. The UCC- and Clarke- normalized curves are generally smooth. However, a zig-zag pattern is observed between Nd and Dy on the UCC-normalized curves (Figure 6A). The zigzag pattern is also apparent for the HREEs (Ho-Lu) on the Clarkenormalized curves (Figure 6B). These anomalies likely arise due
Seredin (2010) proposed the outlook coefficient (Koutl) as a rapid method for the preliminary evaluation of economic REE deposits. Dai et al (2017) provided a revised criterion for the preliminary assessment of the REY in coal ash as economic raw materials. The revised outlook coefficient (Coutl) is defined as 'the ratio of the relative amount of critical REY metals in the total REY to the relative amount of excessive REY' (Dai et al., 2017, p. 15), and is calculated as:
Table IV
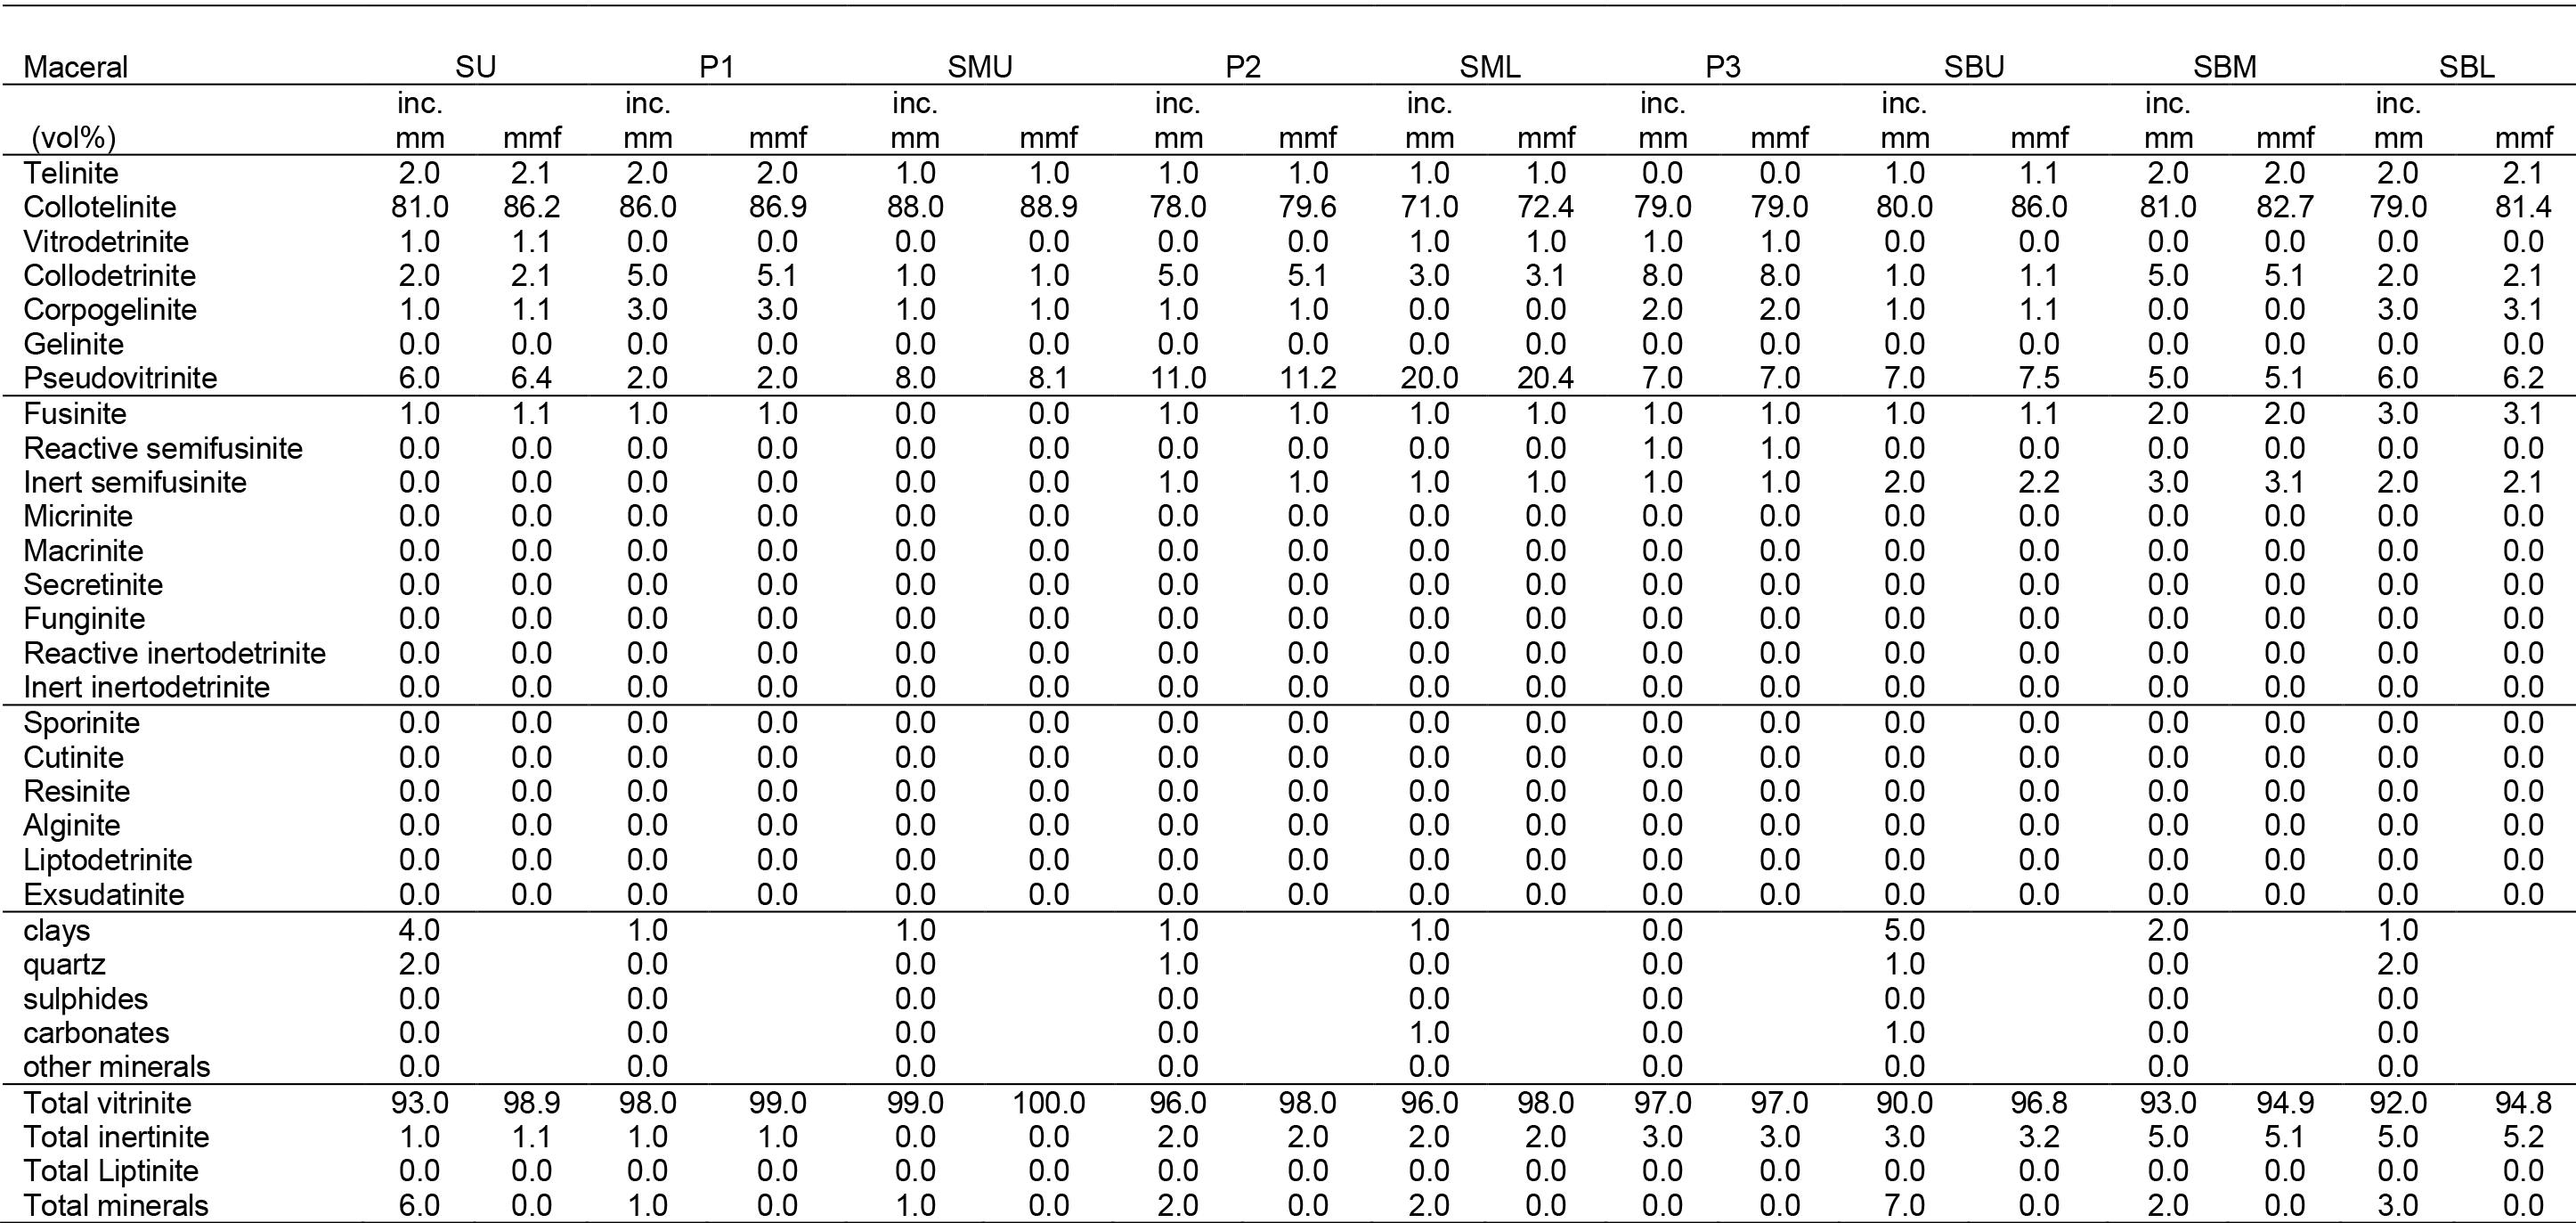
to incomplete digestion during sample preparation, or spectral interferences. However, the overall smoothness of the graphs gives confidence in the REY+Sc data (Dai et al., 2017).
Overall, the concentration of trace elements and REY+Sc in the fine-sized Makhado samples is considered to be abnormally
Petrographic and geochemical characteristics of beneficiated metallurgical coal
The REY considered as critical to the economy due to their undersupply (Y, Nd, Dy, Er, Eu, and Tb) are in the range 268-979 ppm, generally reaching their maximum in sample P3 and samples from the lower seams. Pr, which is also in high demand occurs above 100 ppm only in the lowermost seams.
Maceral group analyses (vol%) of the -1+0.25 mm samples (vol %)
The outlook coefficients are then classified as follows: ➤ Unpromising REY source: Coutl < 0.7 ➤ Promising REY source: 0.7 ≤ Coutl ≤ 1.9 ➤ Highly promising REY source: Coutl > 2.4
The Coutl value for the Makhado fine-size samples vary from 0.8 to 2.0 and thus indicate promising REY sources (Table VII). The REY for the lower seams as well as P2, SML and P3 exceeds 2000 ppm and therefore meets the cut-off grade (Figure 7). In contrast, samples SU and SMU do not qualify as promising REY sources due to their REY concentrations being less than the required 1000 ppm cut-off grade. South African coal ash samples obtained from power stations in the MKB were similarly disregarded as potential sources of REY due to their REY content falling below 1000 ppm, despite meeting the Coutl criteria (Wagner and Matiane, 2018).
In addition to the above Coutl criteria, the REY must be ≥ 1000 ppm in order to meet the minimum cut-off grade required for economic recovery (Dai et al., 2017).
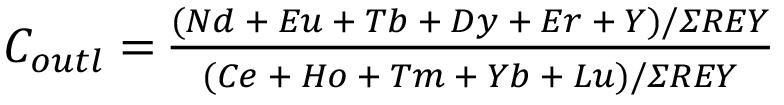
Petrographic and geochemical characteristics of beneficiated metallurgical coal
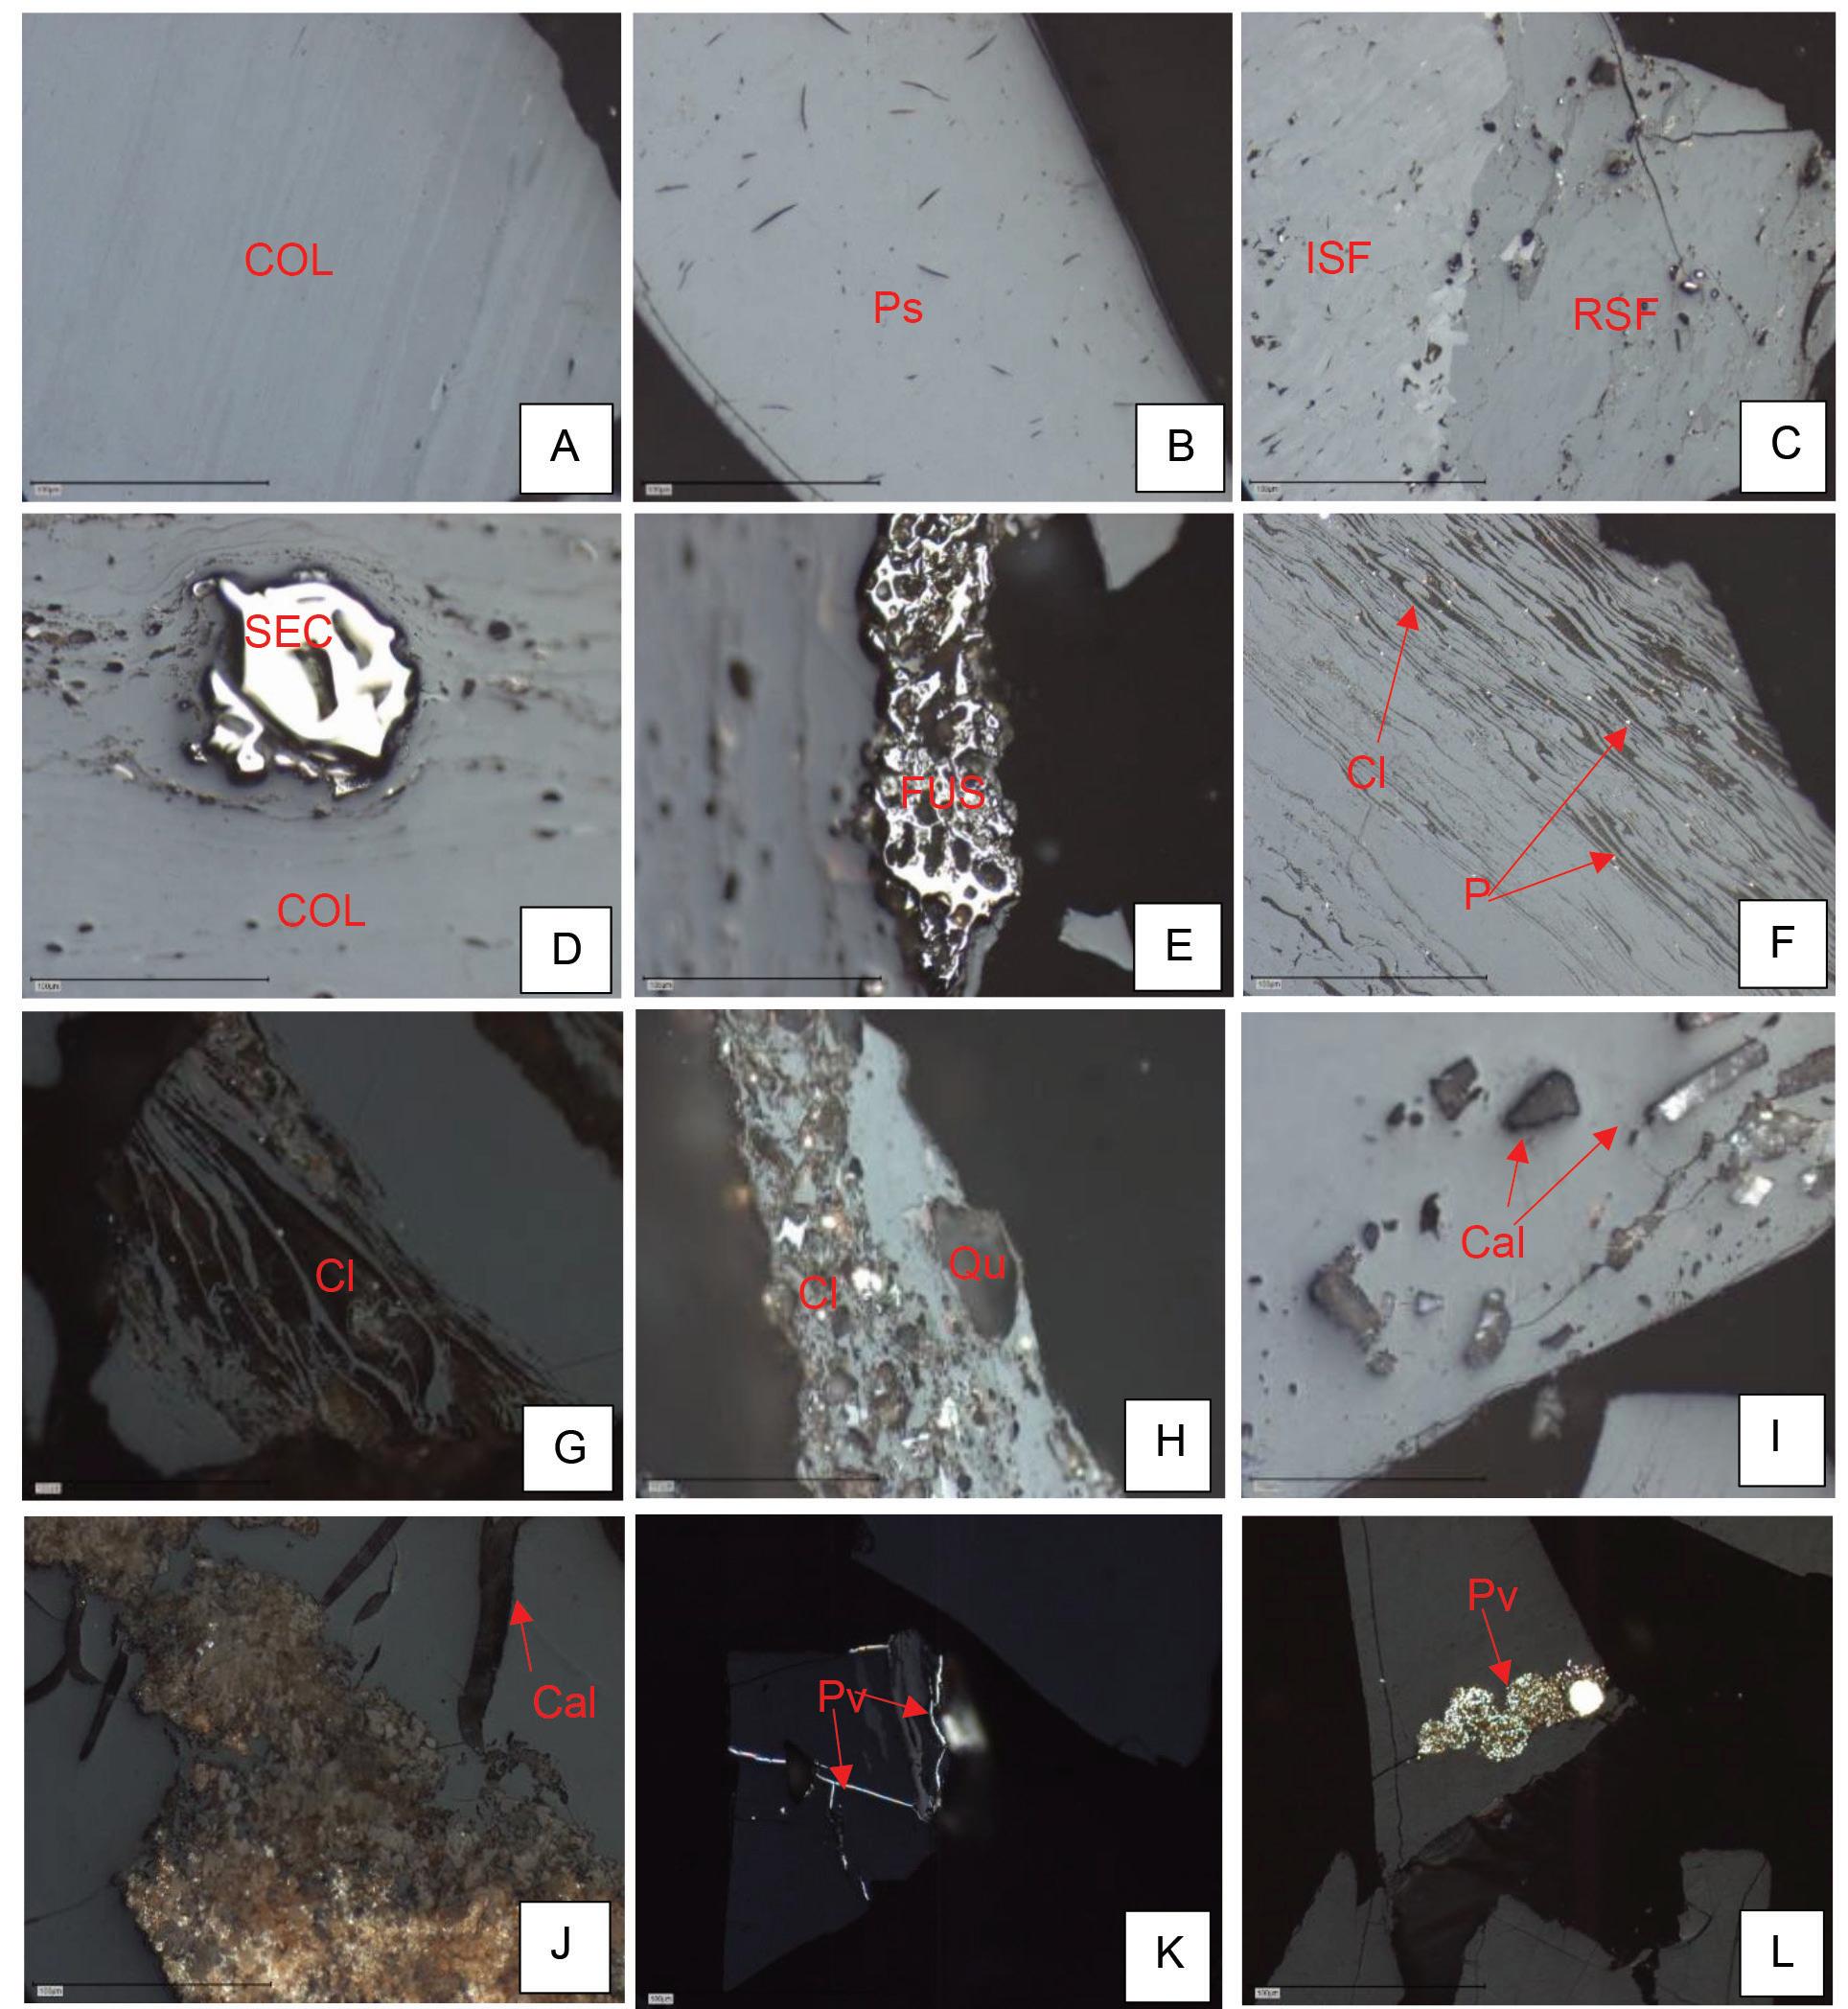
467The Journal of the Southern African Institute of Mining and Metallurgy VOLUME 122 AUGUST 2022
for a better understanding of the partitioning behaviour of trace elements and REY+Sc in clean and discard coals during beneficiation.
Conlusions
This study characterized the petrographic and geochemical properties of fine-sized beneficiated metallurgical coals from the Soutpansberg coalfield, South Africa. The samples were selected based on the suitability of their washability characteristics for the production of metallurgical coal. The coal samples were found to show strong caking properties on the basis of FSI and petrographic analyses; however, further testing is required to confirm their carbonization properties. The coal samples as well the partings are medium rank C bituminous coals, vitrinite-rich and very low ash.
Figure 3—Dominant macerals and minerals occurring in the -1+0.25 mm samples. (A) Dark and lighter bands of collotelinite. (B) Massive pseudovitrinite particle showing randomly oriented slits. (C) Inert semifusinite and reactive semifusinite. D) Secretinite embedded in collotelinite. Note collotelinite wrapped around secretinite. (E) Fusinite char embedded in collotelinite. (F and G) Flocculated clay minerals infilling cell lumens in vitrinite particles. (H) Quartz particles of varying sizes associated with clay minerals. (I) Calcite within collotelinite. (J) Calcite cleats cross-cutting siderite nodule. (K) Pyrite-infilled fractures (L) Clusters of framboidal pyrite occurring within clay minerals. COL = collotelinite. Ps = Pseudovitrinite. ISF = Inert semifusinite. RSF = reactive semifusinite. FUS = Fusinite. SEC = Secretinite. Py = Pyrite. Cl = clay minerals. Qu = Quartz. Cal = calcite. Si = Siderite. Reflected light, oil immersion at 500x magnification. Scale bar = 100 μm
high given the fact that they are beneficiated coals containing of very low ash. Studies show that high concentrations of trace elements and REY+Sc are generally expected in coal sink/discard fractions because they contain high amounts of mineral matter which host the trace elements and REY+Sc (Daim, Graham, and Ward, 2016; Duan et al., 2019; Finkelman, Palmer, and Wang, 2018; Huggins et al., 2009; Kolker et al., 2021; Lin et al., 2017; Wang et al., 2006; Ward, 2016; Wen-feng et al., 2009; Zhang, Honaker, and Groppo, 2017). The trace elements and REY+Sc in the Makhado fine ash samples are likely hosted in the finely disseminated clay minerals i.e., kaolinite which are intricately bound to the vitrinite macerals.Itisrecommended that further studies into the modes of occurrence and associations of trace elements and REY+Sc be conducted on corresponding sink fractions to the finefloat samples analysed in this study. This approach will allow
and Ta ≤ 146
(D)
468 AUGUST 2022 VOLUME 122 The Journal of the Southern African Institute of Mining and Metallurgy
Petrographic and geochemical characteristics of beneficiated metallurgical coal
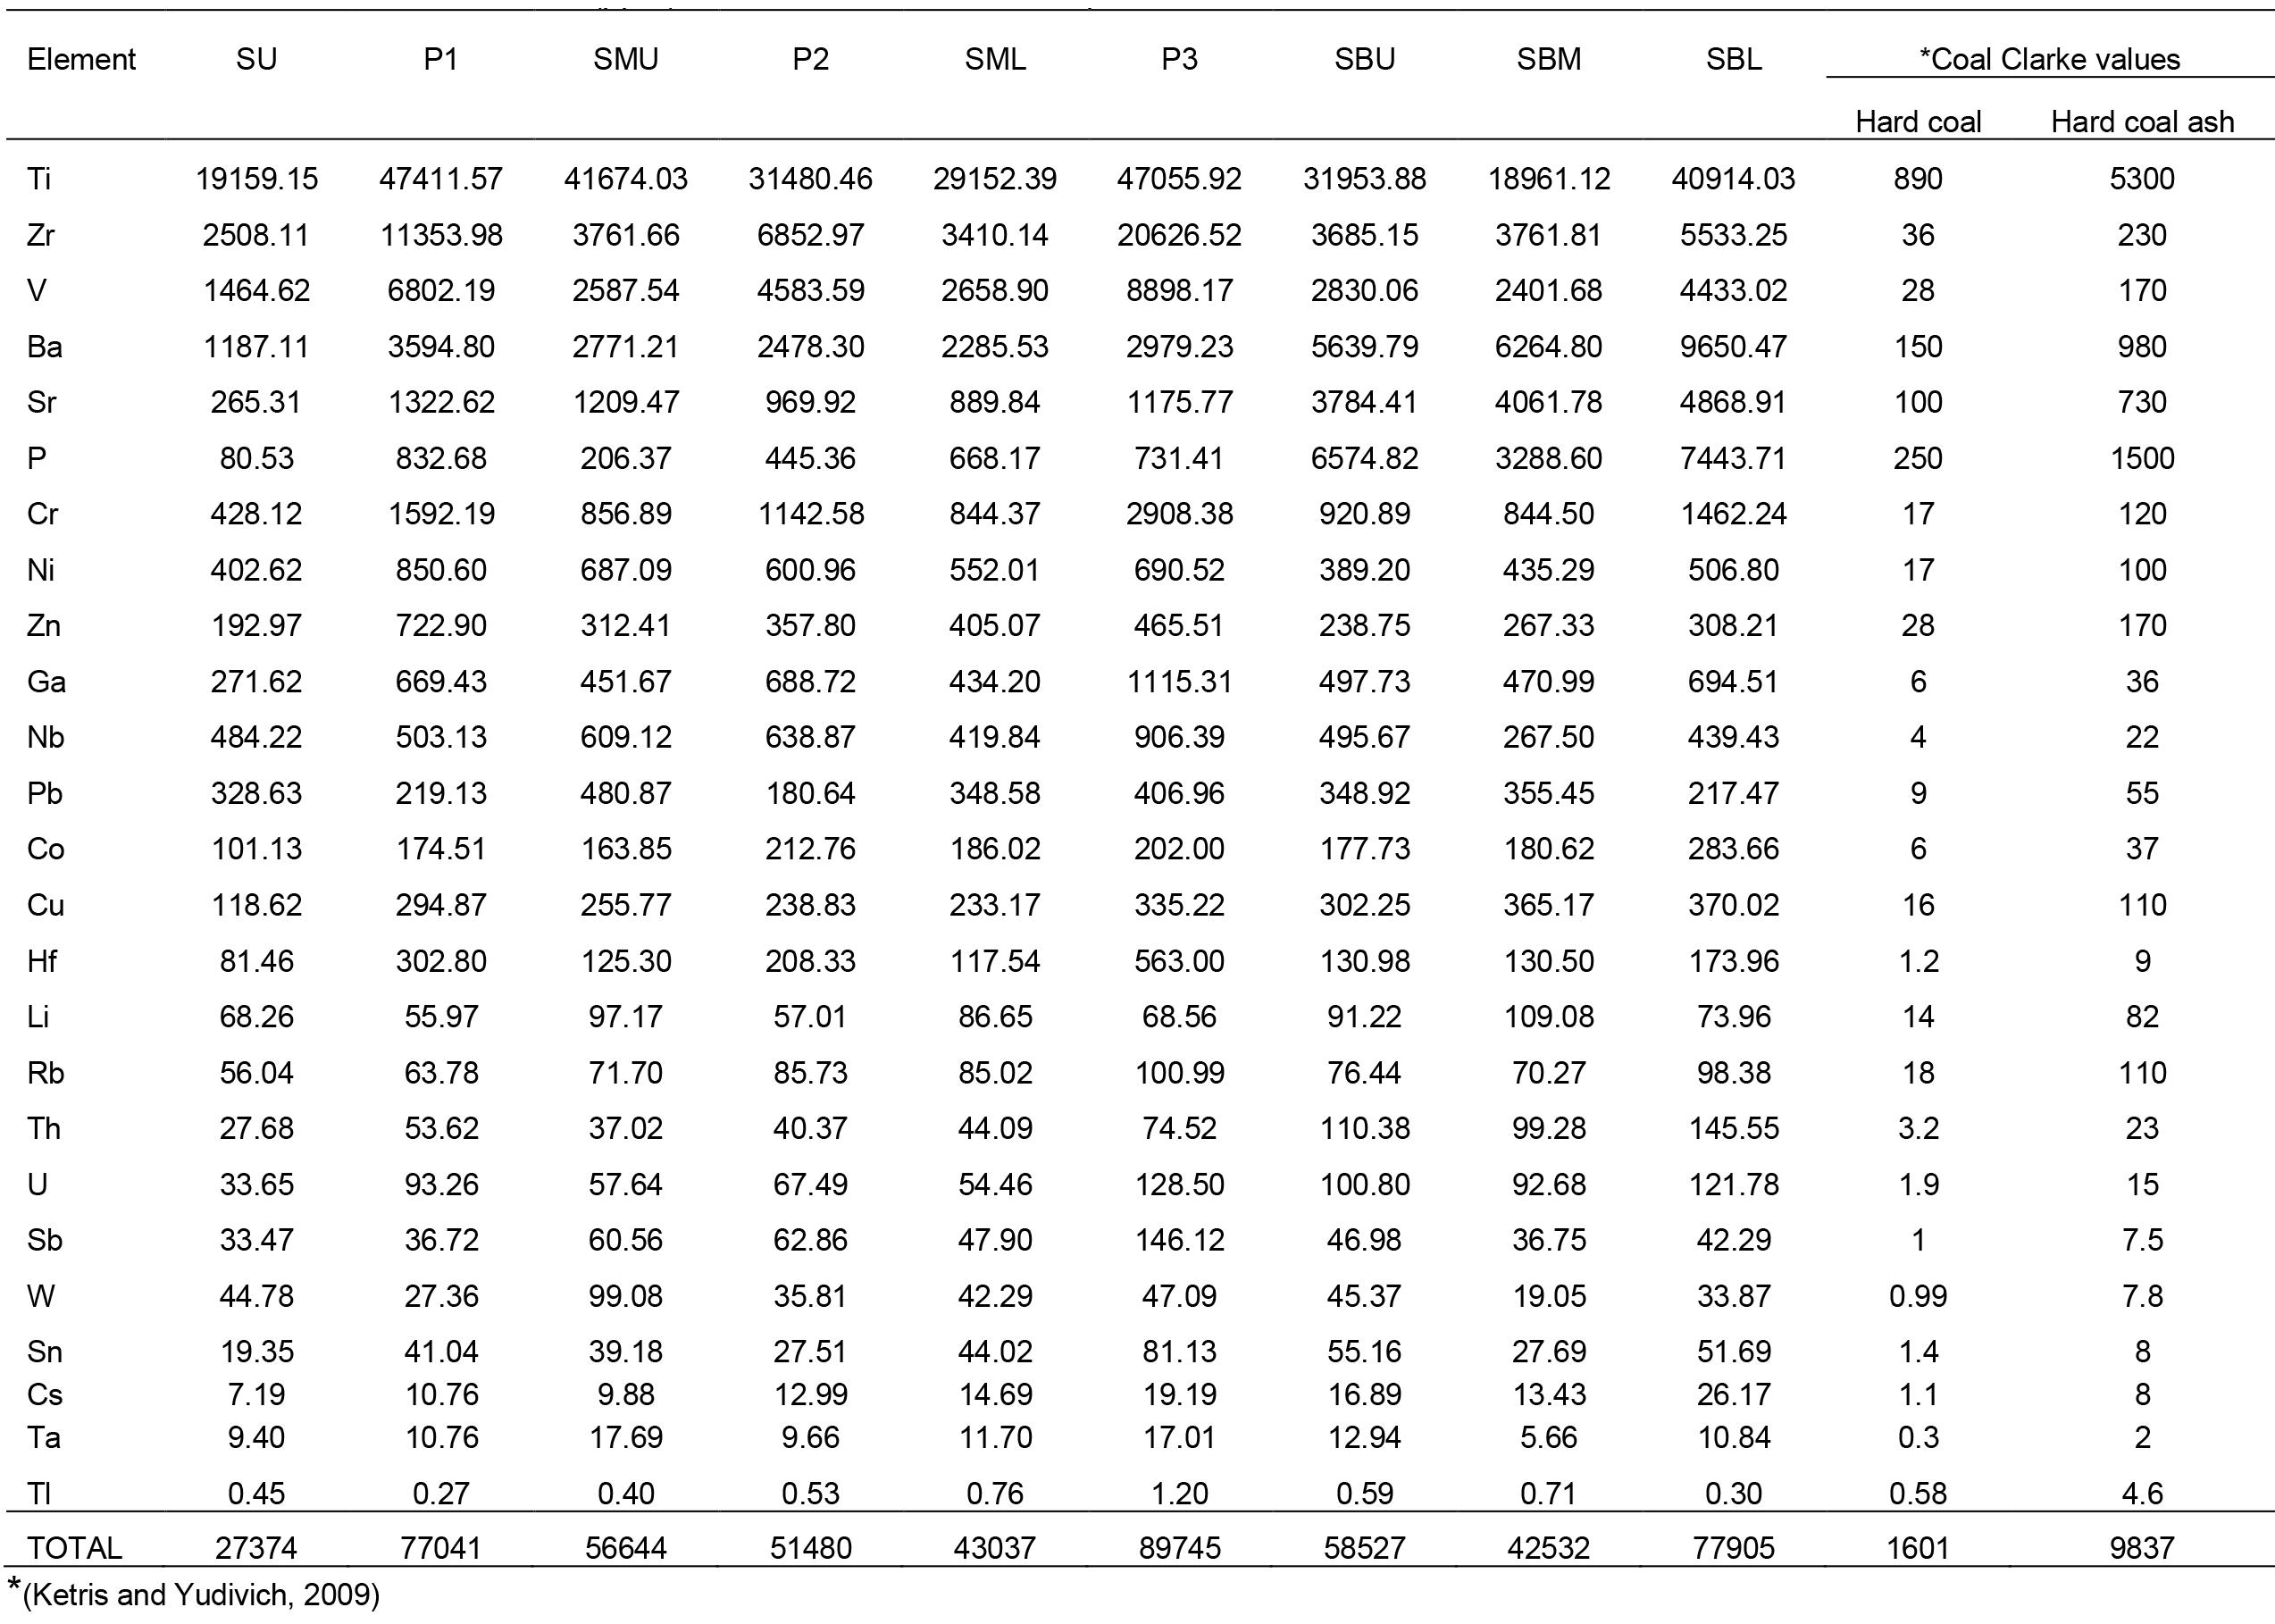
Figure 4—Trace elements concentrations in the -1+0.25 mm ash samples relative to the Clarke hard coal ash values are grouped as (A) Ti, Zr, and Rb, Cs, ppm, Tl
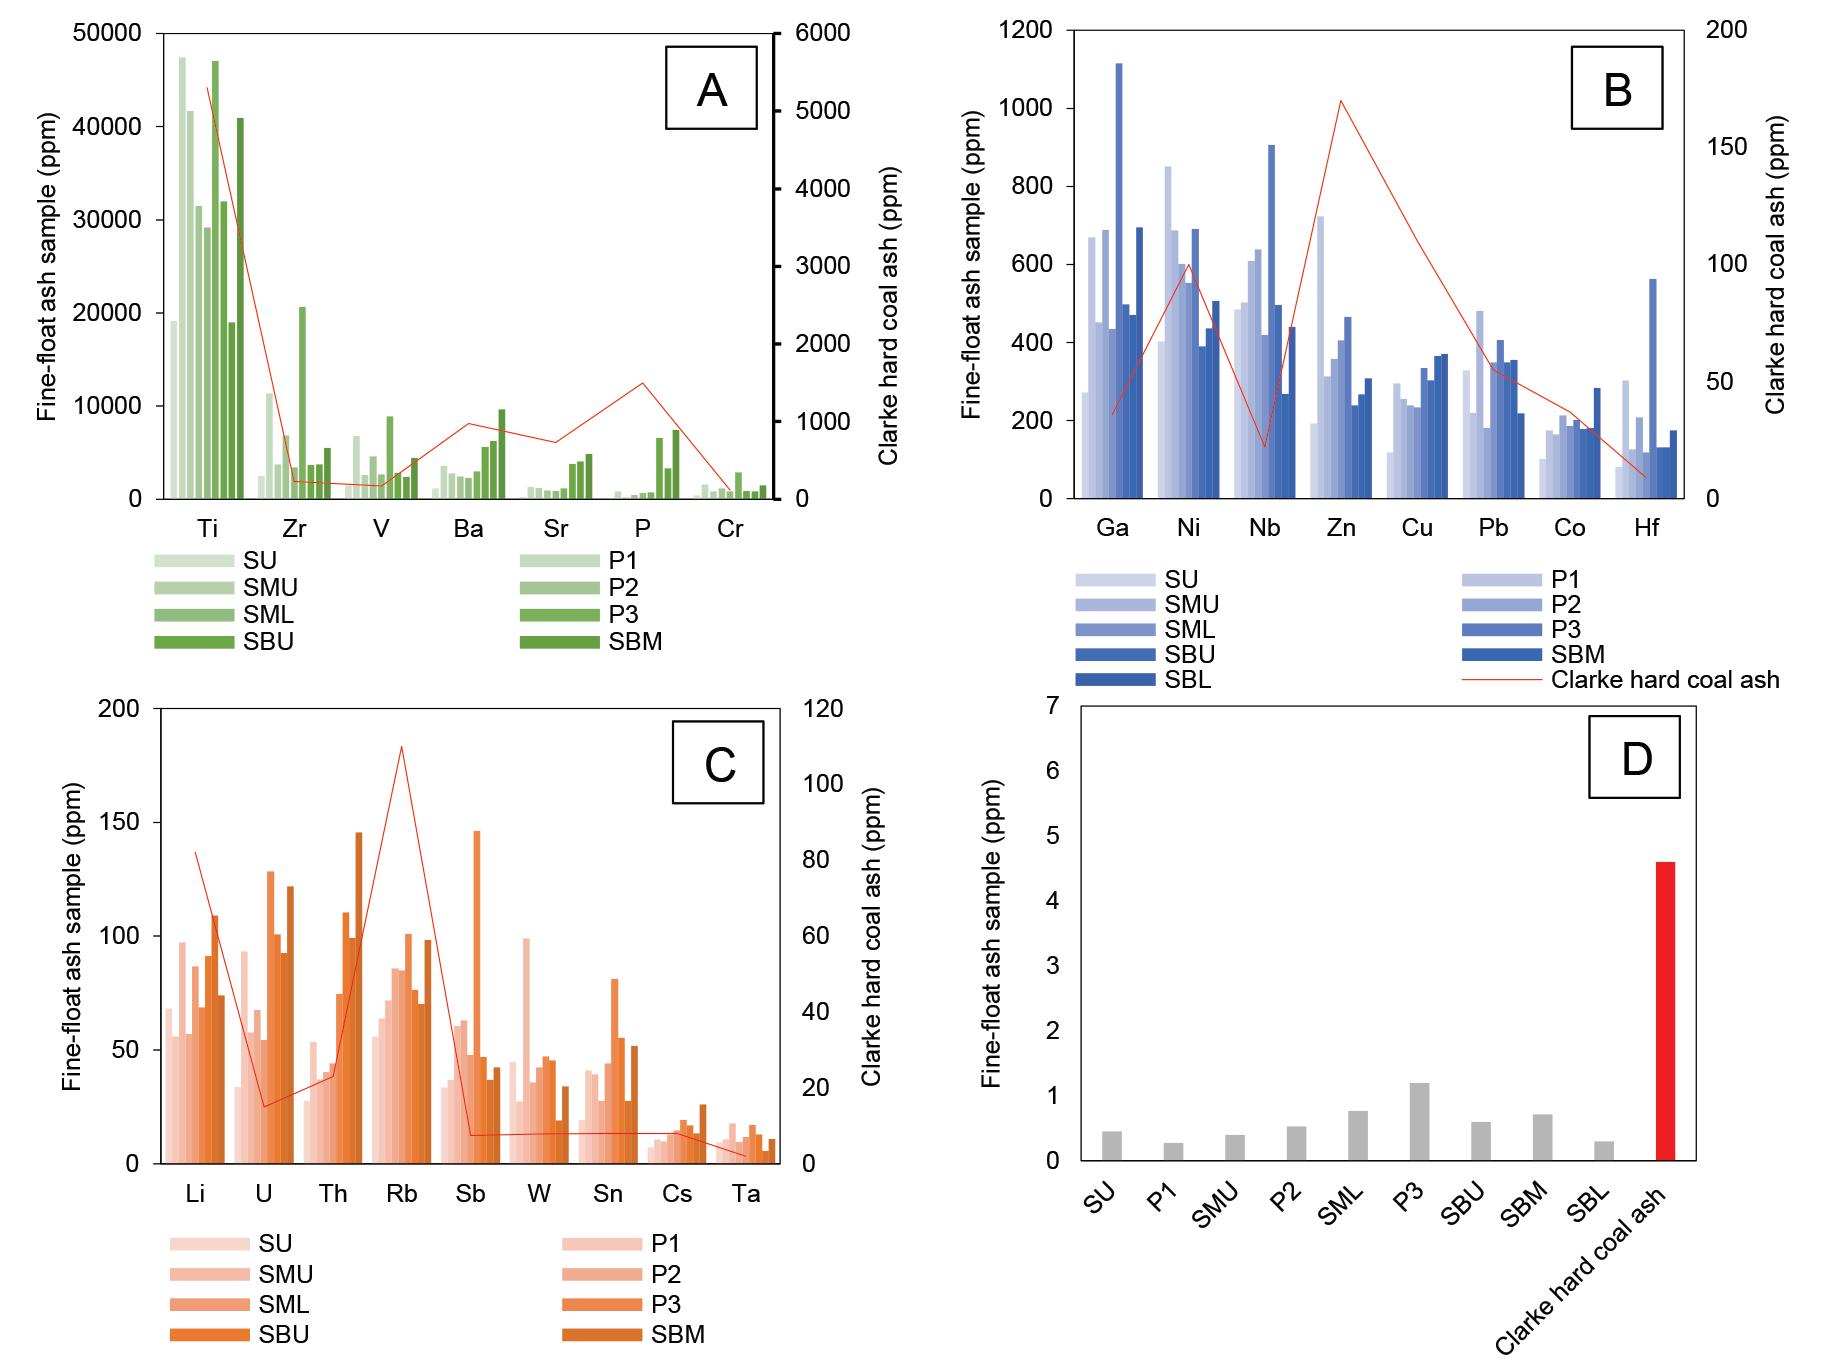
Table V
Sb, W, Sn,
V, Ba, Sr, P and Cr ≤ 47 412 ppm, (B) Ga, Ni, Zn, Nb, Cu, Pb, Co,
≤ 1ppm
Trace element concentrations (ppm) in the -1+0.25 mm ash samples
Hf ≤ 1200 ppm, (C) Li, U, Th,
and Metallurgy VOLUME 122 AUGUST 2022
Table VI
Figure 5—Rare earth concentrations in the -1+0.25 mm samples relative to the UCC (Taylor and McLennan, 1985) and the Clarke values on coal ash basis (Ketris and Yudovich, 2009)
Petrographic and geochemical characteristics of beneficiated metallurgical coal Mining
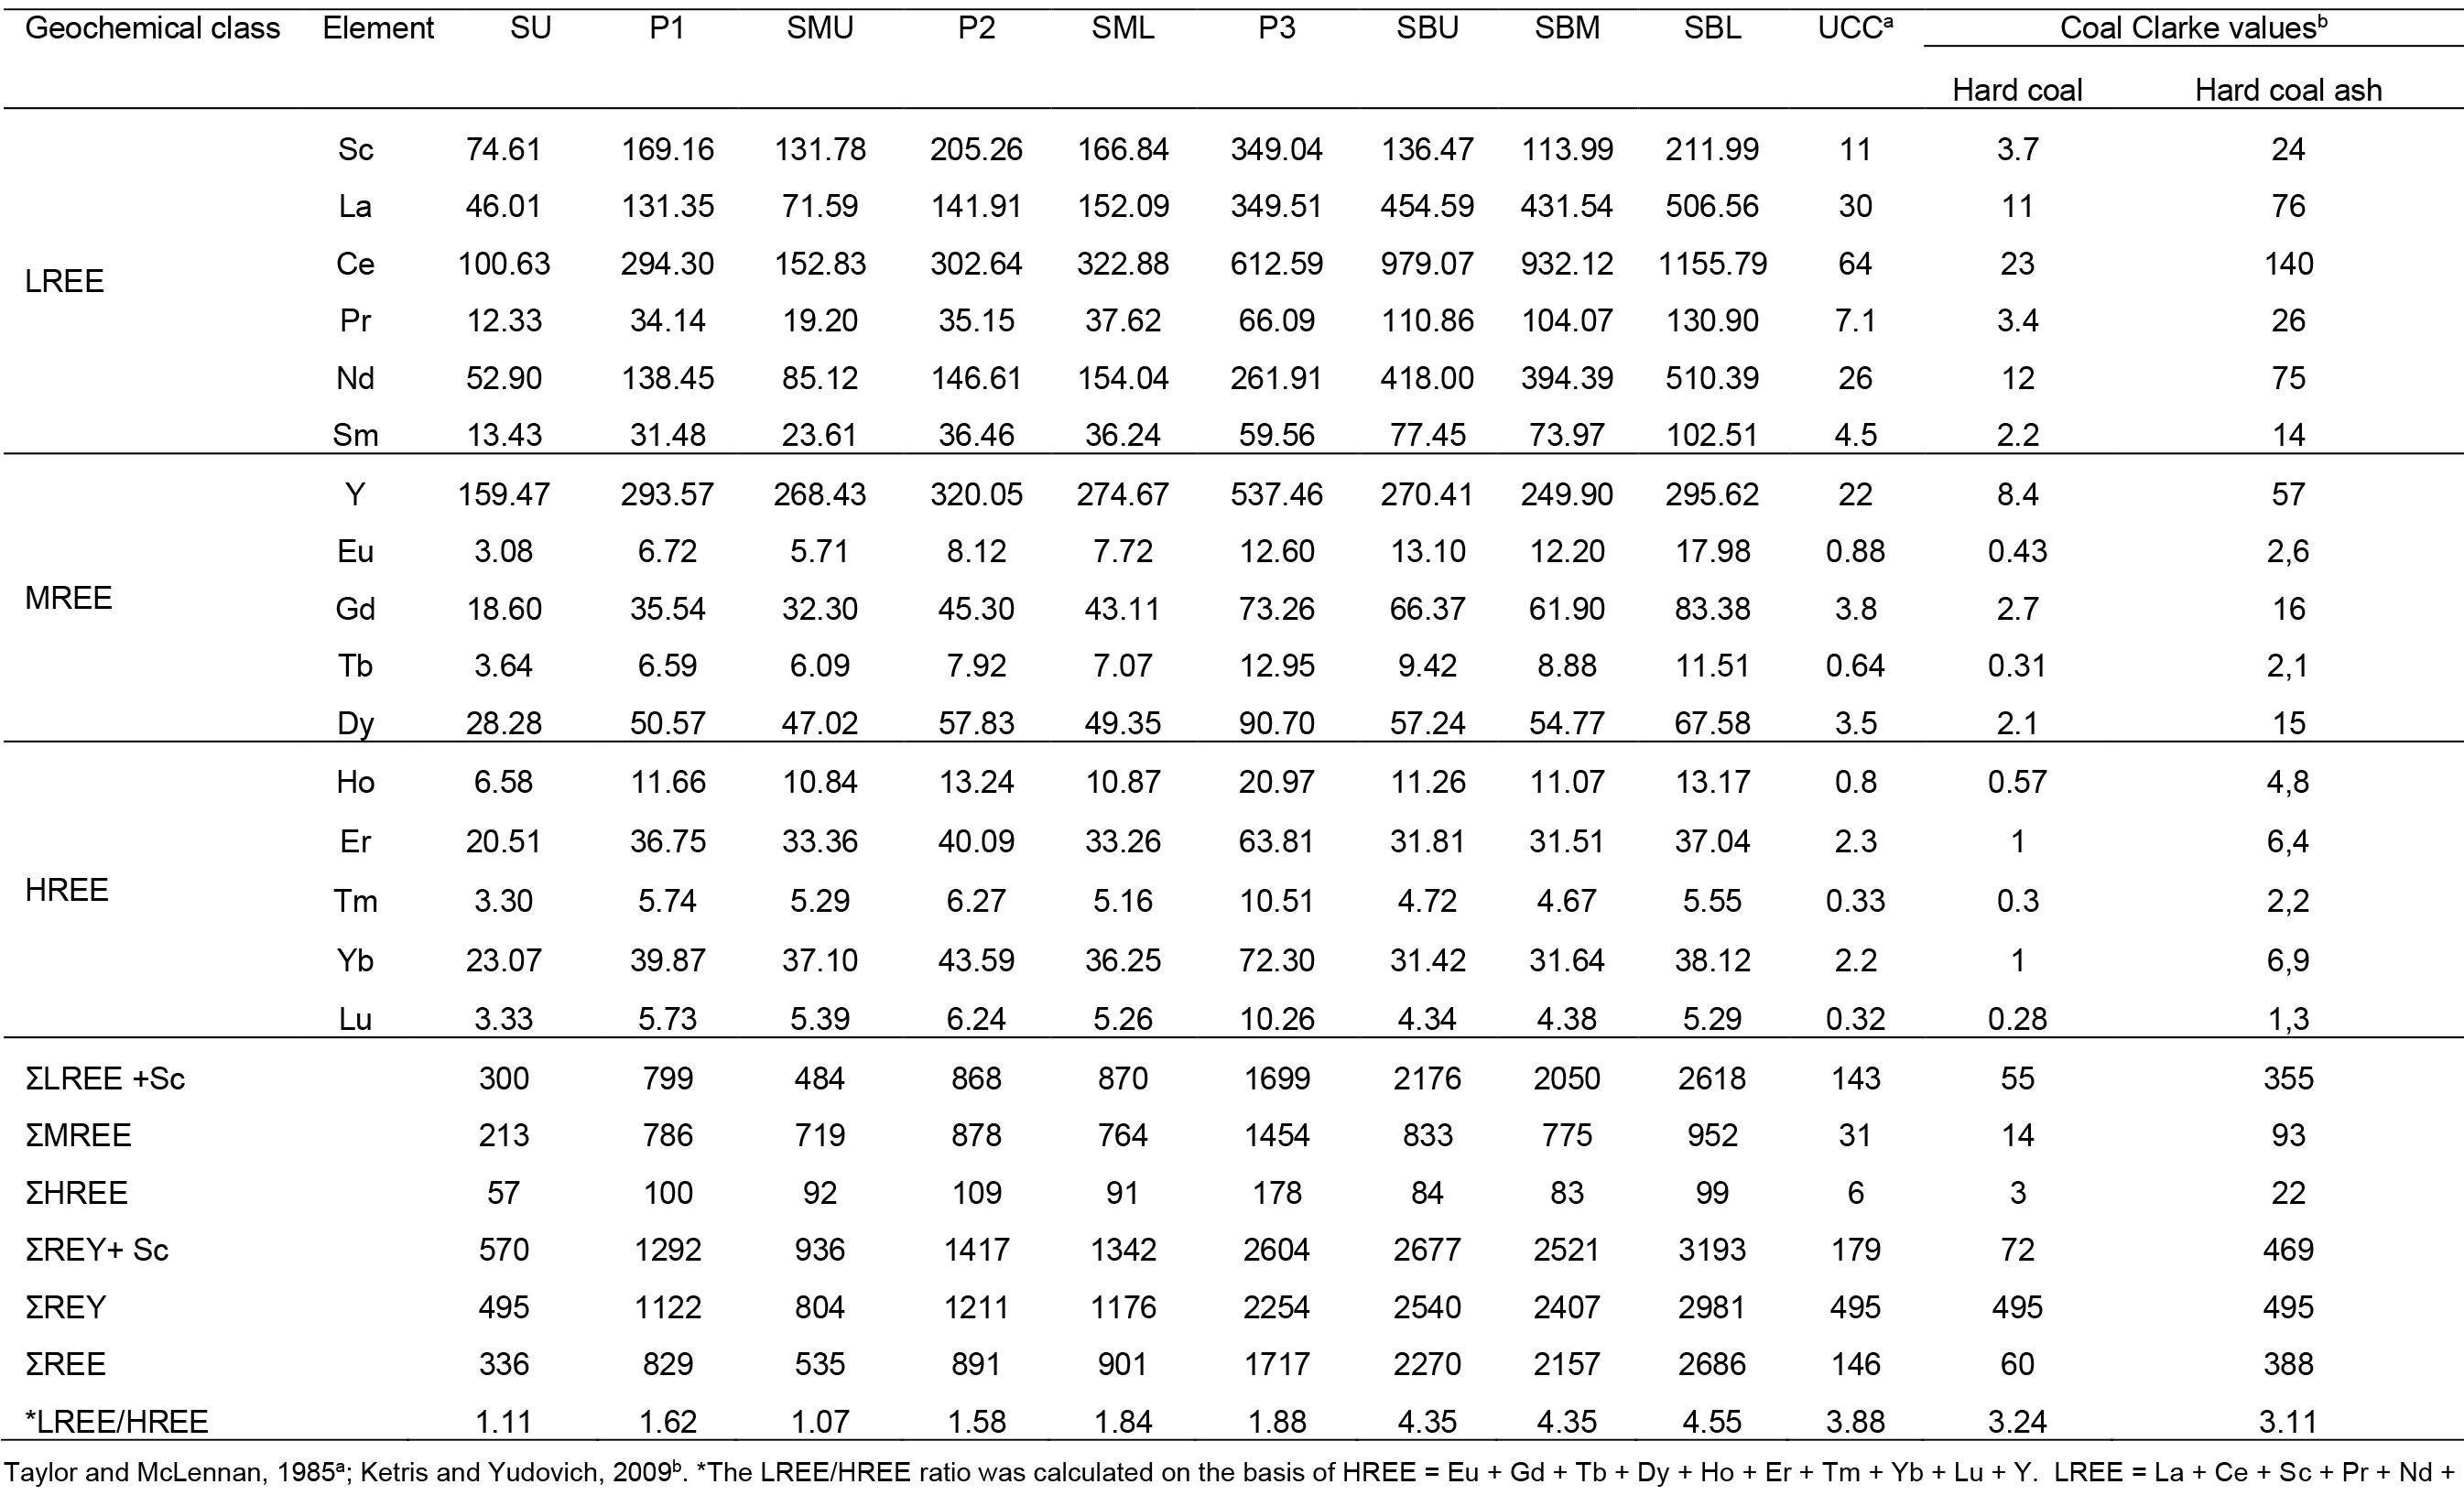
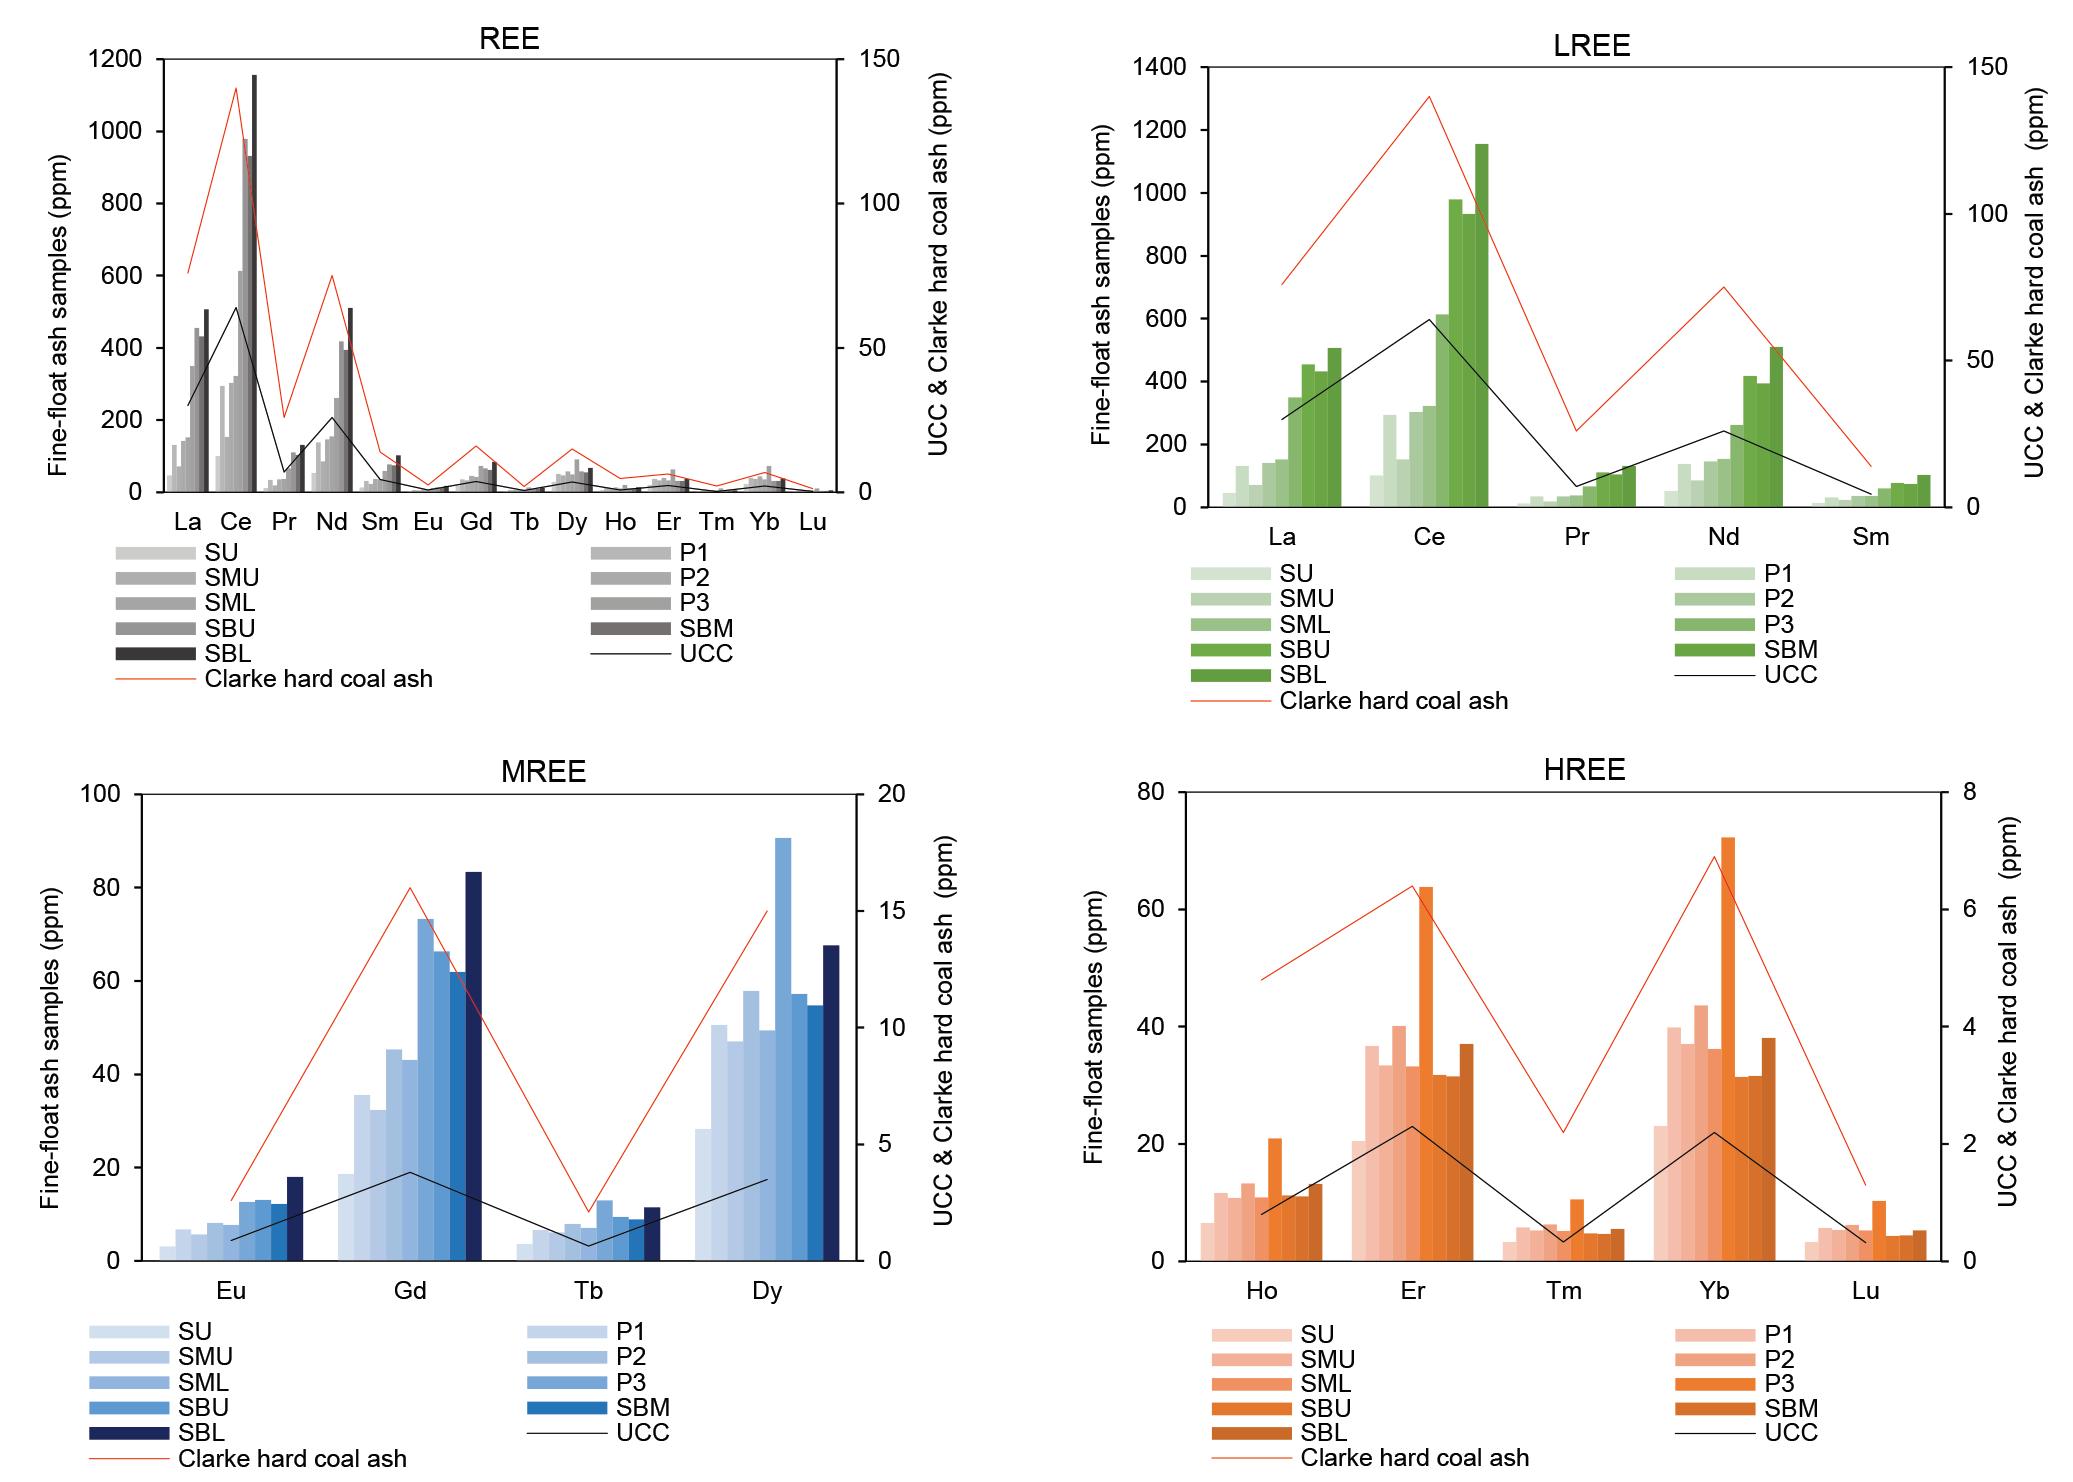
REY+ Sc concentrations (ppm) in the -1+0.25 mm ash samples
469The Journal of the Southern African Institute of
SBL 2981 0.8 Promising REY source
Table VII
The findings of this study highlight the properties of metallurgical coals from the Soutpansberg coalfield, as well as their potential as unconventional REE source pending further investigation into their viability.
CrediT author statement
References
Outlook coefficient (Coutl) for the -1+0.25mm ashed Samplesamples
P1 1122 1.5 Promising REY source
SBM 2407 0.8 Promising REY source
P2 1211 1.6 Promising REY source
Acknowledgements
SML 1176 1.4 Promising REY source
Figure 7—Revised Coutl graph following Dai et al. (2017). All samples apart from SU and SMU fall in the `promising` area. Total REY concentrations in samples SU and SMU are < 1000 ppm
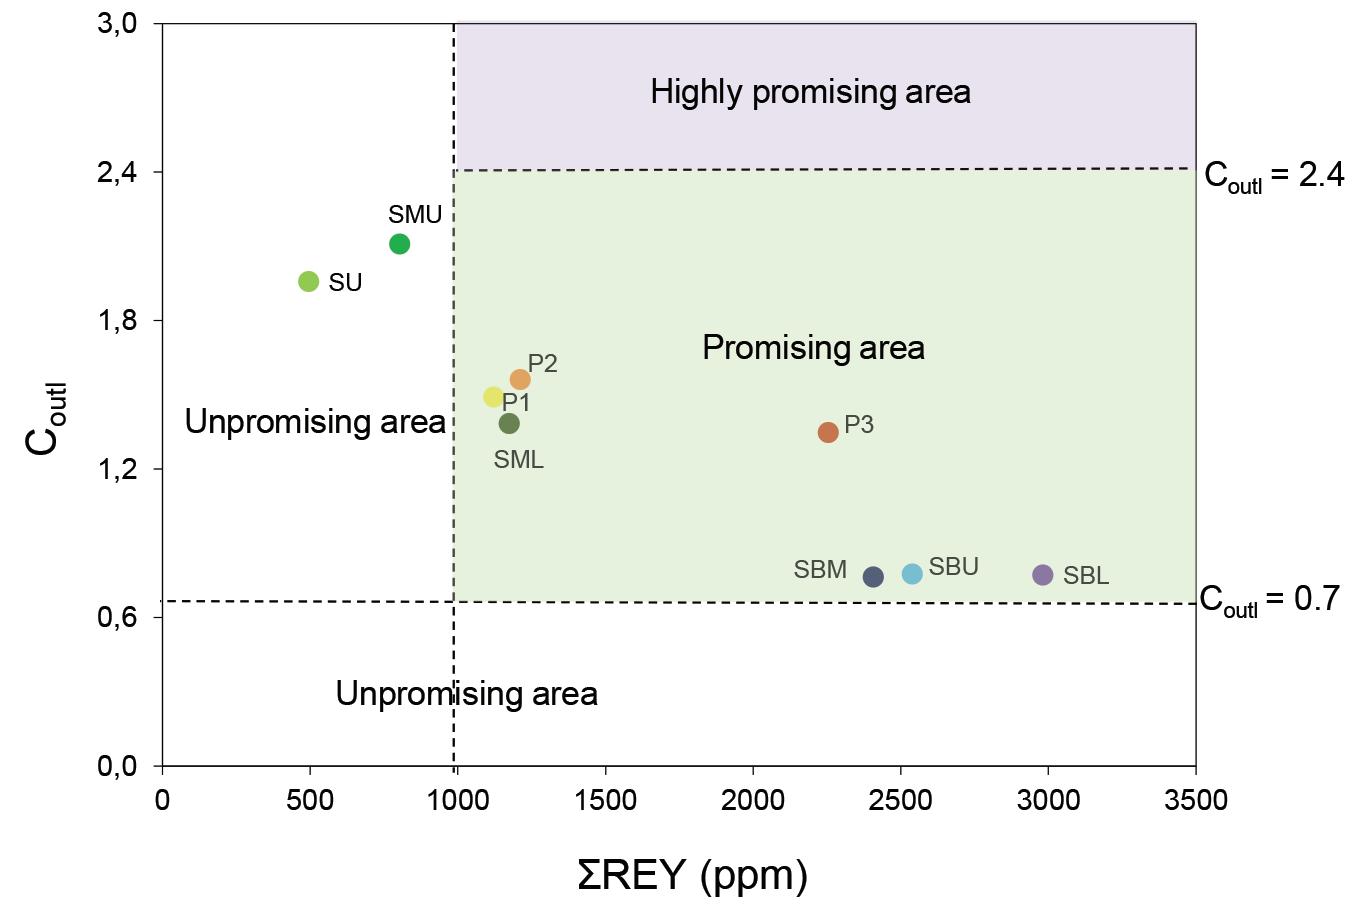
The Council for Geoscience, South Africa is acknowledged for funding this research project. The management of the MC Mining (Makhado Project) is thanked for providing the sample material and access to test work data. The DSI-NRF CIMERA grant awarded to N.J. Wagner provided support for the petrographic analyses.
Bhattacharya, S., Maheshwari, A ., and Panda, M. 2016. Coal cleaning operations: The question of near gravity material. Transactions of the Indian Institute of Metals, vol. 69, no. 1. pp.157–172. http://doi:10.1007/s12666-015-0737-z
Preliminary assessment of the REY+Sc showed all but two of the ashed coal samples are promising for economic development as their REY exceed the 1000 ppm cut-off grade, albeit at laboratory level.
Cadle, A.B., Cairncross, B., Christie, A.D.M., and Roberts, D.L. 1993. The Karoo Basin of South Africa: type basin for coal-bearing deposits of southern Africa. International Journal of Coal Geology, vol. 23, no. 1-4. pp. 117–157. https://doi. Cairncrossorg/10.1016/0166-5162(93)90046-D,B.2001.Anoverviewofthe Permian (Karoo) coal deposits of southern Africa. Journal of African Earth Sciences, vol 33, no. 3-4. pp. 529–562. https://doi.org/10.1016/S0899-5362(01)00088-4
REY Coutl Revised Coutl classification
SBU 2540 0.8 Promising REY source
Petrographic and geochemical characteristics of beneficiated metallurgical coal
Akinyemi, S.A., Gitari, W.M., Akinlua, A., and Petrik, L.F. 2012. Mineralogy and geochemistry of sub-bituminous coal and its combustion products from Mpumalanga Province, South Africa. Analytical Chemistry. Krull I.S. (ed.) Chapter 2. InTechOpen. https://doi:10.5772/50692
SMU 804 2.1 Promising REY source
MJT: Conceptualization, methodology, project administration, formal analysis, Investigation, data curation, validation, writing original draft, writing-reviewing and editing, visualization, funding acquisition; N.J.: PhD supervision, funding, resources, validation, writing-reviewing and editing, conceptualization, methodology G.R: PhD supervision, funding, resources, validation, writingreviewing and editing, conceptualization, methodology.
470 AUGUST 2022 VOLUME 122 The Journal of the Southern African Institute of Mining and Metallurgy
SU 495 2.0 Promising REY source
Figure 6—REY+Sc concentration in the -1+0.25 mm samples normalized to (A) the Earth´s UCC values (Taylor and McLennan, 1985), (B) Clarke values on ash-basis (Ketris and Yudovich, 2009)
P3 2254 1.3 Promising REY source
Akdogan, G., Bradshaw, S., Dorfling, C., Bergmann, C., Ghosh, T., and Campbell, Q. 2019. Characterization of rare earth elements by XRT sorting products of a South African coal seam. International Journal of Coal Preparation and Utilization. pp. 1–17. https://doi.org/10.1080/19392699.2019.1685506
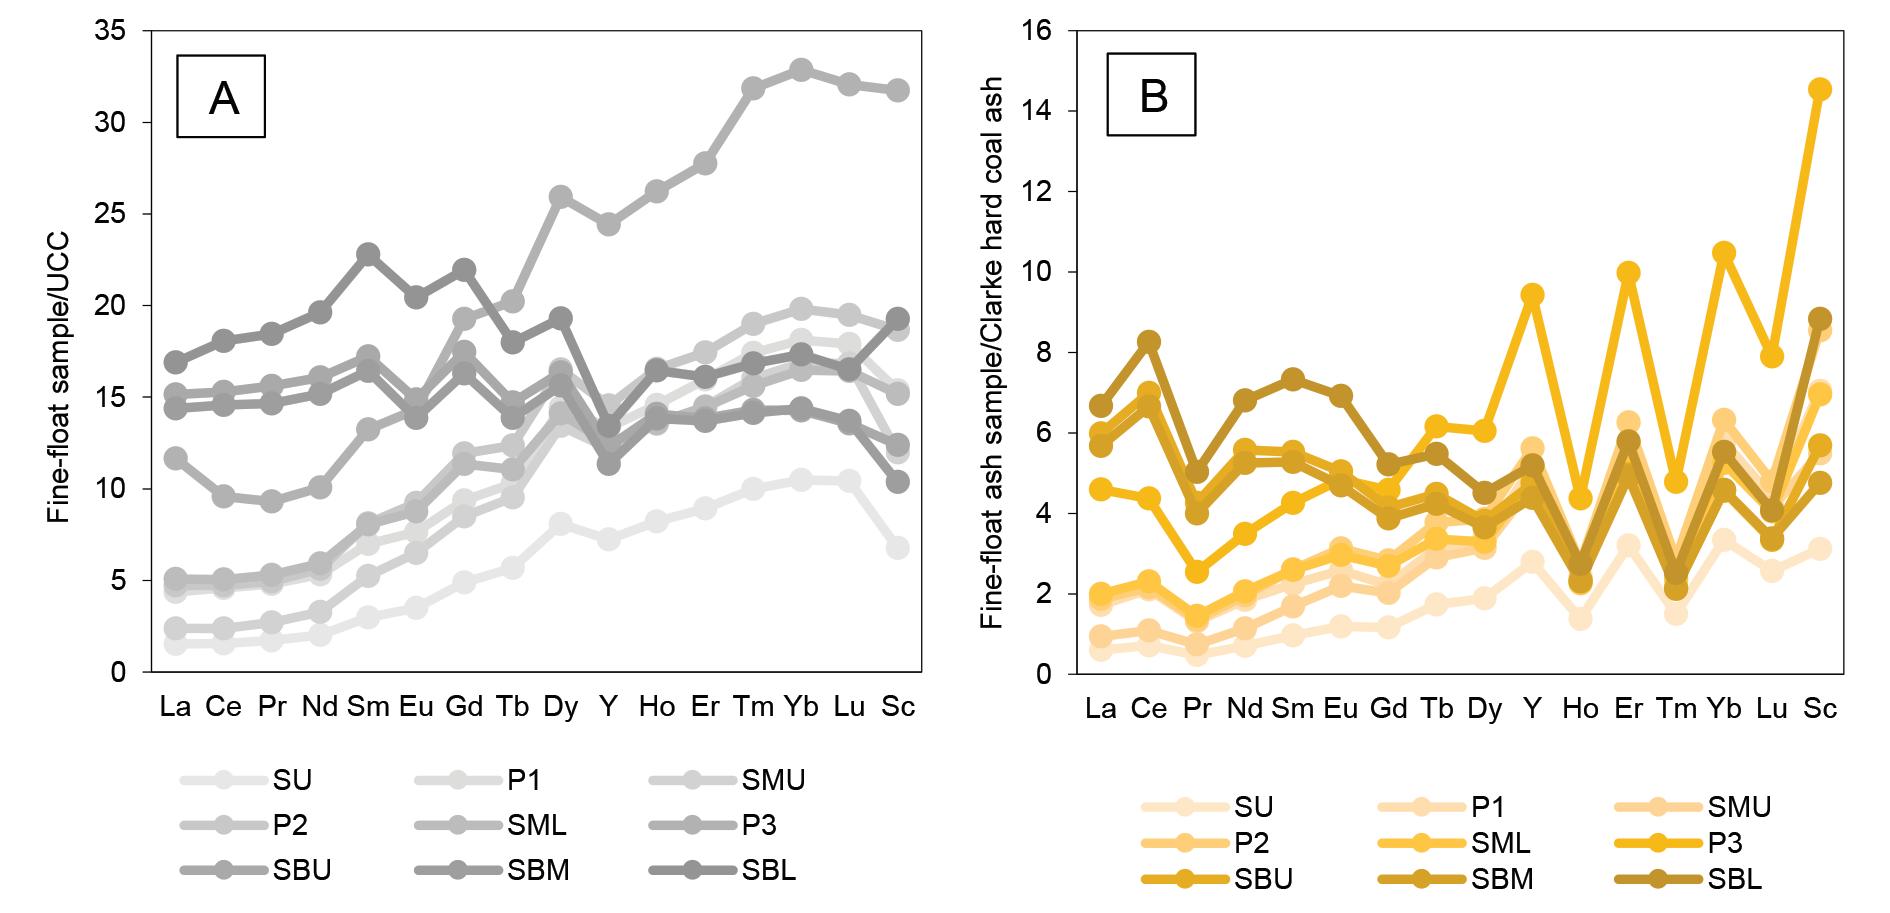
Kruger, H. 2013. Coking coal. ArcelorMittal presentation for Fossil Fuel Foundation Coal Coke and Carbon in the Metallurgical Industry. 32 pp. Kruszewskastudylib.net/doc/8896225/coking-coal---the-fossil-fuel-foundation-of-africahttps://,K.J.1998.Thereactivityofpseudovitriniteinsomecoals. Fuel, vol. 77, no. 14. pp. 1655–1661. https://doi.org/10.1016/S0016-2361(98)00088-X
Dai, S., Graham, I.T., and Ward, C.R. 2016. A review of anomalous rare earth elements and yttrium in coal. International Journal of Coal Geology, vol. 159, no.1. pp. 82–95. https://doi.org/10.1016/j.coal.2016.04.005
Dai, S. and Finkelman, R.B. 2018. Coal as a promising source of critical elements: Progress and future prospects. International Journal of Coal Geology, vol. 186. no.1. pp. 155–164. https://doi.org/10.1016/j.coal.2017.06.005
Minerals Engineering, vol. 173, no. 1. pp. 107187. Europeanhttps://doi.org/10.1016/j.mineng.2021.107187Commission.2020.StudyontheEU's list of Critical Raw MaterialsFinal Report 2020. http://www.europa.eu
Duda, A., and Fidalgo Valverde, G. 2021. The Economics of Coking Coal Mining: A Fossil Fuel Still Needed for Steel Production. Energies, vol. 14, no. 22. pp. 7682. https://doi.org/10.3390/en14227682
Johnson, M.R., van Vuuren, C.J., Visser, J.N.J., Cole, D.I., Wickens, H., de, V., Christie, A.D.M., Roberts, D.L., and Brandl, G. 2006. Sedimentary rocks of the Karoo Supergroup. The Geology of South Africa. Johnson, M.R., Anhaeusser, C.R., and Thomas, R.J. (eds.). Geological Society of South Africa, Johannesburg/Council for Geoscience, Pretoria. pp. 461–499.
Dai, S., Xie, P., Jia, S., Ward, C.R., Hower, J.C, Yan, X., and French, D. 2017. Enrichment of U-Re-V-Cr-Se and rare earth elements in the Late Permian coals of the Moxinpo Coalfield, Chongqing, China: Genetic implications from geochemical and mineralogical data. Ore Geology Reviews, vol. 80, no. 1. pp. 1–17. https://doi.org/10.1016/j.oregeorev.2016.06.015
Eze, C.P., Fatoba, O., Madzivire, G., Ostrovnaya, T.M., Petrik L.F., Frontasyeva, M.V., and Nechaev, A.N. 2013. Elemental composition of fly ash: a comparative study using nuclear and related analytical techniques. Journal of ChemistryDidactics-Ecology-Metrology, vol. 18, no. 1-2. pp.19–29. https://doi:10.2478/cdem-
Petrographic and geochemical characteristics of beneficiated metallurgical coal
Catuneanu, O., Wopfner, H., Eriksson, P.G., Cairncross, B., Rubidge, B.S., Smith, R.M.H., and Hancox, P.J. 2005. The Karoo basins of south-central Africa. Journal of African Earth Sciences, vol. 43, no. 1-3. pp. 211-253. https://doi. Chamberorg/10.1016/j.jafrearsci.2005.07.007ofMines.2018.Nationalcoal strategy for South Africa. 30 pp. Cornelius,south-africawww.mineralscouncil.org.za/special-features/604-national-coal-strategy-for-https://M.L.U.,Ameh,A.E.,Eze,C.P.,Fatoba,O.,Sartbaeva,A.,andPetrik,L.F.2021.ThebehaviourofrareearthelementsfromSouthAfricancoalflyashduringenrichmentprocesses:Wet,magneticseparationandzeolitisation. Minerals, vol. 11. no. 9. pp. 950. https://doi.org/10.3390/ min11090950
Eterigho-Ikelegbe,In-Seam_Coals_-January_1998.pdforg/fileadmin/DAM/energy/se/pdfs/coal/1998_International_Classification_of_https://unece.O.,Harrar,H.,andBada,S.2021.Rareearthelementsfromcoalandcoaldiscard–Areview.
Finkelman, R.B., Palmer, C.A., and Wang, P.P. 2018. Quantification of the modes of occurrence of 42 elements in coal. International Journal of Coal Geology. vol. 185, pp. 138–160. https://doi.org/10.1016/j.coal.2017.09.005
ECE-UN (Economic Commission for Europe – United Nations). 1998. International classification of in-seam coals. (Energy/1998/19).
IEA. 2017. Coal 2017-Analysis and forecast to 2022, IEA, Paris. https://www.iea.org/ reports/coal-2017. 13 August 2022.
471The Journal of the Southern African Institute of Mining and Metallurgy VOLUME 122 AUGUST 2022
Fu, B., Hower, J.C., Zhang, W., Luo, G., Hu, H., and Yao, H. 2022. A review of rare earth elements and yttrium in coal ash: Content, modes of occurrences, combustion behaviour, and extraction methods. Progress in Energy and Combustion Science, vol. 88, no. 1. pp. 100954. https://doi.org/10.1016/j. Hancox,pecs.2021.100954P.J.andGötz, A.E. 2014. South Africa’s coalfields-A 2014 perspective. International Journal of Coal Geology, vol. 132, no.1. pp.170–254. https://doi. Hart,org/10.1016/j.coal.2014.06.019R.J.,Leahy,R.,andFalcon, R.M. 1982. Geochemical investigation of the Witbank Coalfield using Instrumental Neutron Activation Analysis. Journal of Radioanalytical Chemistry, vol. 71, no.1-2. pp. 285–297. https://doi.org/10.1007/ bf02516156
Huang, Z., Fan, M., and Tiand, H. 2018. Coal and coal byproducts: A large and developable unconventional resource for critical materials-Rare earth elements. Journal of Rare Earths, vol. 36, no.4. pp. 337–338. https://doi. Huggins,org/10.1016/j.jre.2018.01.002F.E.,Seidu,L.B.A.,Shah, N., Huffman, G.P., Honaker, R.Q., Kyger, J.R ., and Seehra, M.S. 2009. Elemental modes of occurrence in an Illinois# 6 coal and fractions prepared by physical separation techniques at a coal preparation plant. International Journal of Coal Geology, vol. 78, no.1. pp. 65–76. https://doi. Jeffreyorg/10.1016/j.coal.2008.10.002,L.S.2005.Characterization of the coal resources of South Africa. Journal of the Southern African Institute of Mining and Metallurgy, vol.105, no. 2. pp. 95–102. https://hdl.handle.net/10520/AJA0038223X_3050
Kumar, D. and Kumar, D. 2018. Sustainable management of coal preparation. Woodhead, New York, USA. https://doi.org/10.1016/C2016-0-01854-5
Luytfuel.2017.03.096,J.P.2017.Thetectono-sedimentary history of the coal-bearing Tshipise Karoo basin. MSc dissertation, University of Pretoria, South Africa. http://hdl.handle. net/2263/63290
De Klerk, E. and Sparrow, J. 2015. Independent Competent Persons Report on Coal of Africa Limited’s Greater Soutpansberg Projects Prepared for Coal of Africa Limited and Peel Hunt LL. Unpublished Report by Venmyn Deloitte for Coal of Africa Limited. 290 pp.
Franus W., Wiatros-Motyka M.M., and Wdowin, M. 2015. Coal fly ash as a resource for rare earth elements. Environmental Science and Pollution Research vol. 22, no. 12. pp. 9464–9474. https://doi.org/10.1007/s11356-015-4111-9
Jordan, P. 2008. Characterising coals for coke production and assessing coke: predicting coke quality based on coal petrography, rheology and coke petrography. MSc dissertation. University of the Witwatersrand, South Africa. Ketrishttps://core.ac.uk/download/pdf/39664974.pdf,M.andYudovich,Y.2009.EstimationsofClarkes for carbonaceous biolithes: world averages for trace element contents in black shales and coals. International Journal of Coal Geology, vol. 78, no. 2. pp.135–148. https://doi. Kolker,org/10.1016/j.coal.2009.01.002A.,Scott,C.,Lefticariu,L., Mastalerz, M., Drobniak, A., and Scott, A. 2021. Trace element partitioning during coal preparation: Insights from US Illinois Basin coals. International Journal of Coal Geology, vol. 243, no. 1. pp. 103781. https://doi.org/10.1016/j.coal.2021.103781
Finkelman2013-0014,R.B. 1999. Trace elements in coal. Biological Trace Element Research, vol. 67, no. 3. pp. 197–204. https://doi.org/10.1007/BF02784420
Duan, P., Wang, W., Liu, X., Sang, S., Ma, M., and Zhang, W. 2019. Differentiation of rare earth elements and yttrium in different size and density fractions of the Reshuihe coal, Yunnan Province, China. International Journal of Coal Geology, vol. 207, no.1. pp. 1–11. https://doi.org/10.1016/j.coal.2019.03.014
Lin, R., Howard, B.H., Roth, E.A., Bank, T.L., Granite, E.J., and Soong, Y. 2017. Enrichment of rare earth elements from coal and coal by-products by physical separations. Fuel, vol. 200. pp. 506–520. https://doi.org/10.1016/j.
Seredin V.V and Dai, S. 2012. Coal deposits as potential alternative sources for lanthanides and yttrium. International Journal of Coal Geology, vol. 94, no. 1. pp. 67–93. https://doi.org/10.1016/j.coal.2011.11.001
Taylor, S.R. and McLennan, S.M. 1985. The continental crust: Its composition and evolution. Blackwell, Oxford. https://www.osti.gov/biblio/6582885
Zhang, W., Noble, A., Yang, X., and Honaker, R. 2020. A comprehensive review of rare earth elements recovery from coal-related materials. Minerals, vol. 10, no 5. pp. 451. https://doi.org/10.3390/min10050451. u
Coal - Key facts and figures. https://www. mineralscouncil.org.za/sa-mining/coal [accessed 20 March 2022].
472 AUGUST 2022 VOLUME 122 The Journal of the Southern African Institute of Mining and Metallurgy
Van Gosen, B.S., Verplanck, P.L., Long, K.R., Gambogi, J., and Seal II, R.R. 2014. The rare-earth elements-Vital to modern technologies and lifestyles. USGS Mineral Resources Program, Fact Sheet 2014-3078. https://doi.org/10.3133/ Wagnerfs20143078,N.J.and
Seredin, V.V. 2010. A new method for primary evaluation of the outlook for rare earth element ores. Geology of Ore Deposits, vol. 52. pp. 428–433. https://doi. Sparroworg/10.1134/S1075701510050077,J.2012.TheSoutpansberg Coalfield `he Forgotten Basin`. Presentation at the Inaugural FFF Limpopo Conference, October 2012. 45 pp. https://
Ward, C.R. 2016. Analysis, origin and significance of mineral matter in coal: An updated review. International Journal of Coal Geology, vol. 165. pp. 1-27. Wen-feng,https://doi.org/10.1016/j.coal.2016.07.014W.,Yong,Q.,Jun-yi,W.,andJian, L. 2009. Partitioning of hazardous trace elements during coal preparation. Procedia Earth and Planetary Science, vol. 1. pp. 838–844. https://doi:10.1016/j.pro .2009.09.131
Peatfield, D. 2003. Coal and coal preparation in South Africa - A 2002 review. Journal of the Southern African Institute of Mining and Metallurgy, vol. 103. pp. 355–372. https://hdl.handle.net/10520/AJA0038223X_2807
Powell, D.M. 2016. A techno-economic evaluation of the production of hard coking coal from Tshikondeni coal discards. MSc dissertation, North-West University, South Africa. http://hdl.handle.net/10394/20453
Sebola, M.J.T. 2022. The influence of beneficiation on the petrographic, geochemical & physical properties of metallurgical coal from the Soutpansberg Coalfield, South Africa. PhD thesis, University of the Witwatersrand, Johannesburg.
Swaine, D.J. 2000. Why trace elements are important. Fuel Processing Technology, vol. 65. pp. 21-33. https://doi.org/10.1016/S0378-3820(99)00073-9
Peiravi, M., Ackah, L., Guru, R., Mohanty, M., Liu, J., Xu, B., Zhu, X., and Chen, L. 2017. Chemical extraction of rare earth elements from coal ash. Minerals & Metallurgical Processing, vol. 34. pp. 170–177. https://doi.org/10.19150/mmp.7856
Predeanu, G., Slăvescu, V., Bălănescu, M., Mihalache, R.D., Mihaly, M., Marin, A.C., Meghea, A., Valentim, B., Guedes, A., Abagiu, T.A., Popescu,A.M., Manea-Saghin, A.M., Vasile, B.S., and Drăgoescu, M.F. 2021. Coal bottom ash processing for capitalization according to circular economy concept. Minerals Engineering, vol. 170. pp.107055. https://doi.org/10.1016/j.mineng.2021.107055
Prévost, X. 2013. Review of the South African coal mining industry. 12 pp. https:// Prévostcer.org.za/wp-content/uploads/2017/12/Annexure-P.pdf,X.2017.Coal’spowerfulrole.
Matiane, A. 2018. Rare earth elements in select Main Karoo Basin (South Africa) coal and coal ash samples. International Journal of Coal Geology, vol. 196. pp. 82–92. https://doi.org/10.1016/j.coal.2018.06.020
Xaba, D.S. 2004. Evaluate the remaining resources of low phosphorus coal in Mpumalanga Province. Coaltech 2020 Task 1.2.1 report. CSIR Miningtek, Johannesburg.
Petrographic and geochemical characteristics of beneficiated metallurgical coal
Schernikau, L. 2017. Economics of the international coal trade: Why coal continues to power the World. 2nd edn. Springer, Berlin. https://doi. Scottorg/10.1007/978-3-319-46557-9,C.andKolker,A.2019.Rare earth elements in coal and coal fly ash. US Geological Survey Fact Sheet 2019-3048. 4 p. https://doi.org/10.3133/fs20193048
Yorkresources-of-low-phosphorus-coal-in-mpumalanga-provincehttps://coaltech.co.za/mining/evaluate-the-remaining-,R.andBell,S.E.2019.Energytransitionsoradditions?:Whyatransitionfromfossilfuelsrequiresmorethanthegrowthofrenewableenergy.
Energy Research & Social Science, vol. 51, no. 1. pp. 40–43. https://doi.org/10.1016/j. Zhang,erss.2019.01.008W.,Honaker, R ., and Groppo, J. 2017. Concentration of rare earth minerals from coal by froth flotation. Mining, Metallurgy & Exploration, vol. 34, no. 3. pp. 132–137. https://doi.org/10.19150/mmp.7613
Wang, W., Qin, Y., Sang, S., Jiang, B., Guo, Y., Zhu, Y., and Fu, X. 2006. Partitioning of minerals and elements during preparation of Taixi coal, China. Fuel, vol. 85. pp. 57–67. https://doi.org/10.1016/j.fuel.2005.05.017
Malaza, N. 2013. Basin analysis of the Soutpansberg and Tuli Coalfields, Limpopo Province of South Africa. PhD thesis, University of Fort Hare. 270 pp. http:// Mineralshdl.handle.net/20.500.11837/311CouncilSouthAfrica.2022.
Inside Mining, vol. 10. pp. 12–13. https://hdl. Sahajwallahandle.net/10520/EJC-6e951428f,V.2012.Theeffectofcoal properties on carbonization behaviour and strength of coke blends. Masters dissertation, University of New South Wales.
Suárez-Ruiz,fffcarbon.co.za/conferences/2012/John_Sparrow.pdfI.,andCrelling,J.C.2008.Appliedcoalpetrology: the role of petrology in coal utilization. Academic Press. 301pp. https://doi.org/10.1016/ Subba-Rao,B978-0-08-045051-3.X0001-2D.V.andGouricharan, T. 2016. Constituents of coal. Coal Processing and Utilization, CRS Press. 536 pp. https://doi.org/10.1201/b21459
Vejahati, F., Xu, Z., and Gupta, R. 2010. Trace elements in coal: Associations with coal and minerals and their behavior during coal utilization–A review. Fuel, vol. 89. pp. 904–911. https://www.doi:10.1016/j.fuel.2009.06.013
Correspondence to: R.H. Matjie
How to cite: Collins, A.C., Strydom, C.A., Matjie, R.H., Bunt, J.R., and van Dyk, J.C. 2022
leaching, aluminium, titanium, potassium, coal ash, XRD, XRF.
by A.C. Collins1, C.A. Strydom2, R.H. Matjie3, J.R. Bunt3, and J.C. van Dyk1,4
1Chemical Resource Beneficiation, North-West 432Potchefstroom,University,SouthAfrica.CentreofExcellenceinCarbon-basedFuels,SchoolofPhysicalandChemicalSciences,North-WestUniversity,Potchefstroom,SouthAfrica.CentreofExcellenceinCarbon-basedFuels,SchoolofChemicalandMineralEngineering,North-WestUniversity,Potchefstroom,SouthAfrica.AfricanCarbonEnergy,SouthAfrica.
Email: matjie4@gmail.com
473The Journal of the Southern African Institute of Mining and Metallurgy VOLUME 122 AUGUST 2022
Production of sulphate-containingAl(III)-K(I)-Ti(IV)-leachliquor from metakaolinite-containing ash derived from South African coal fines
SouthSynopsisAfrican discard coal fines and K₂CO₃ blends were heated in a laboratory-scale rotary kiln to produce ashes for H₂SO₄ leaching tests. The optimized H₂SO₄ leaching conditions of 6.12 mol.dm³ (M) H₂SO₄, solid to liquid ratios 1:5 and 1:10, and 80°C for 8 hours were used. K₂CO₃ was added to increase the dissolution efficiency of K. The objective was to determine if the Al present in metakaolinite (Al₂O₃.2SiO₂), the Al, K, and Ti in the alumino-silicate glasses, and the Ti in rutile (TiO₂) in the ashes could be selectively dissolved in H₂SO₄. XRF results show that the ashes formed at 700°C dissolved more efficiently (87% Al, 89% K and 23% Ti) compared to the ashes formed at 1050°C. This can be attributed to the presence of Al₂O₃.2SiO₂, K₂CO₃ melt, K₂CO₃ remnants, KAl(SO₄)₂, and K-aluminosilicate glass in these ashes. XRD results indicate that the ashes prepared at 1050°C contained anorthite (CaAl₂Si₂O₈), microcline (KAlSi₃O₈), pseudomullite (Al₂O₃.SiO₂), and silicon spinel (2Al₂O₃.3SiO₂), which are either insoluble or only sparingly soluble in H₂SO₄. These minerals resulted in the lower dissolution efficiencies of Al and K. Based on the high dissolution efficiencies of Al and K for the ashes produced at 700°C, coal fines blended with K₂CO₃ could possibly be utilized as feedstocks for the production of aluminium(III), potassium(I), and titanium(IV) and a sulphate-containing leach liquor. Furthermore, the environmental issues and costs associated with the handling and disposal of large volumes of coal fines will also be sulphuricKeywordsresolved.acid
Affiliation:
Dates: Received: 10 Mar. 2020 Revised: 13 Jun. 2021 Accepted: 3 Aug. 2022 Published: August 2022
Industrial and population growth in developing countries has necessitated the generation of more power to meet increasing energy demands. Coal-based power generation is still one of the most important and effective processes (Izquierdo and Querol, 2012). The increase in power generation results in energy demands being met (Nayak and Panda, 2010), but at the cost of an increase in waste generation (coal fines, coal ash, and gaseous emissions) which give rise to associated environmental and health risks.
South African collieries and gasification and combustion plants dispose of more than 60 Mt of coal fines (>75<1000 μm) per annum that are unavoidable by-products (Reddick, von Blottnitz, and Kothuis, 2007; Matjie et al., 2018). Furthermore, other sources of coal fines (>1 mm < 5 mm coal particles) produced from carbon conversion plants using Highveld coal are pulverized to <75 μm and blown into pulverized fuel boilers to generate electricity and high-pressure steam for the fixed-bed gasification process.
Introduction
Production of 3051-2528https://orcid.org/0000-0003-J.R.ORCID:2839-3729https://orcid.org/0000-0002-R.H.ORCID:5295-2095https://orcid.org/0000-0001-C.A.ORCID:5134-9638https://orcid.org/0000-0002-A.C.ORCID:9717/1154/2022http://dx.doi.org/10.17159/2411-DOIvol.InstituteJournalcoalashfromsulphate-containingAl(III)-K(I)-Ti(IV)-leachliquormetakaolinite-containingderivedfromSouthAfricanfinesoftheSouthernAfricanofMiningandMetallurgy,122,no.8,pp.473–486ID:CollinsStrydomMatjieBunt
In addition, Sangita, Nayak, and Panda (2017) used sulphuric acid solution to solubilize aluminium from coal fly ash from Chinese power stations, which contained 62% reactive amorphous aluminosilicate glasses, to form pure aluminium sulphate crystals. Furthermore, van der Merwe et al. (2017) heated a blend of South African ultrafine fly ash containing cenospheres and either ammonium sulphate or ammonium bisulphide to 400°C and 600°C to produce a solid sample. A conventional hydrometallurgical water method was subsequently applied to selectively solubilize aluminium (47% Al solubilized) from the heated cenosphere blends. These cenospheres are ultrafine particles and roughly 8−1000 μm in diameter with a density lower than 1 g/cm3 (Kolay, 2001; Vassilev, 2004). Cenospheres, which comprise approximately 1-2% of the fly ash produced during pulverized fuel combustion, comprise a mixture of aluminosilicate glasses with mullite and quartz (SiO₂) (Kolay, 2001; Vassilev, 2004). Sulphuric acid is mostly used for recovering high-value metals due to its effectiveness, availability, and affordability as a leaching solution (Seidel, 1999). However, the high energy input required to break the bonds between alumina and silica in mullite and K-feldspar crystals, the gas and alkali emissions, as well as the cost of the chemicals, make the proposed H₂SO₄ leaching process economically unviable as well as environmentally.
Since aluminium, titanium, and potassium species in coal ashes produced from the combustion and gasification processes cannot directly react with sulphuric acid, coal fine waste and a blend of coal fine waste and potassium carbonate were heated at either 700°C or 1050°C in air to produce lower temperature combustion coal ash samples. These temperatures are more typical of what can be expected in a fluidized-bed combustion unit. The low-temperature ashes contain metakaolinite, and amorphous glasses of illite (K, H₃O)(Al,Mg,Fe)₂(Si,Al) and microcline. Soluble potassium melt and K₂CO₃ remnants were produced at either 700°C or 1050°C via combustion of the coal fines, and blends of coal fines and K₂CO₃. The Al₂O₃ from metakaolinite and aluminosilicate glasses, and titanium, and potassium compounds contained in the low-temperature combustion ash samples were dissolved during the sulphuric acid leaching experiments. The possible chemical reactions of Al₂O₃ from metakaolinite, TiO₂, K₂O, and H₂SO₄ to form the aluminium(III), titanium(IV), potassium(I), and sulphatecontaining leach liquor are as follows:
K₂O +H₂SO₄ K₂SO₄ + H₂O [4]
474 AUGUST 2022 VOLUME 122 The Journal of the Southern African Institute of Mining and Metallurgy
Sangita, Nayak, and Panda, (2017) and Torma (1983) leached a blend of fly ash from an overseas power station and CaO which was heated to between 1000°C and 1200°C with sulphuric acid solution and achieved an aluminium extraction of 80-99%. This implies that CaO reacted with the alumina that is associated with mullite in the coal ash to form calcium aluminate (CaAl₂O₄), which is soluble in sulphuric acid solution (Torma, 1983; Matjie, Bunt, and van Heerden, 2005).
Ash samples derived from kaolinite-containing coal fines, blends of coal fines and K₂CO₃ have not previously been utilized as an alternative feedstock to heated kaolinite-bearing clays in the production of technical-grade aluminium sulphate salts using sulphuric acid solution (Altiokka et al., 2010; Alquacil, Amer, and
Production of Al(III)-K(I)-Ti(IV)-sulphate-containing leach liquor from metakaolinite
TiO₂ + 2H₂SO₄ Ti(SO₄)₂ + 2H₂O [2]
Studies have shown that approximately 80% of the aluminium which is present in South African coal fly ash produced during the pulverized fuel combustion process at approximately 1600°C is associated with mullite (Al₆O13Si₂), which is not soluble in the sulphuric acid (Matjie, Bunt, and van Heerden, 2005; Freeman, 1993). The balance of the aluminium (20%) is reported to be present in the amorphous aluminosilicate glasses (Freeman, 1993; Matjie, Bunt, and van Heerden, 2005). The leachability of aluminium from the glassy phase will be influenced by the form in which the amorphous materials are present (Seferinoglu, 2003) and surface associated elements which have been found to be more susceptible to leaching (Izquierdo and Querol, 2012).
4H₂SO₄ + K₂O + Al₂O₃ + 20H₂O 2KAl(SO₄)2.12H₂O [3]
South African commercial power stations produce more than 50 Mt of coal ash per annum, which comprises both bottom ash and coal fly ash (Department of Environmental Affairs, 2018). These ashes contain significant amounts of aluminium (>7.9 Mt), potassium (>0.2 Mt), silicon (>13 Mt), and titanium (>0.5 Mt) (Badenhorst, 2019). According to Ginster and Matjie (2005) and Reynolds-Clause and Singh, (2019) approximately 7.5 Mt of coal ash are re-used in cement applications as extender, wastes treatment, concrete applications, road construction, brickmaking, rubber, paint, geopolymer, soil amelioration, mine backfilling, landfill, and mine drainage treatment. However, more than 43 Mt of coal ash is still being dumped at the disposal sites of South African power stations every year.
Al₂O₃.2SiO₂ + ₃H₂SO₄ Al₂(SO₄)₃ +2SiO₂ +3H₂O [1]
Current disposal methods for coal fine discards are associated with environmental and health problems, i.e. the spontaneous combustion and dust particle emissions to the environment (Moyo et al., 2018; Department of Environmental Affairs, 2012; Muzenda, 2014). Spontaneous combustion is caused by the oxidation of pyrite (FeS2) present in the coal, and can result in fires and pyrite oxidation products being released during handling and storage. In addition, high costs are incurred by the disposal of coal fine wastes into slimes dames or disposal areas.
All inorganic elements that are associated with inactive or non-reactive minerals formed at elevated temperatures are sparingly soluble or insoluble in all mineral acid solutions apart from hydrofluoric acid solution (Paul et al., 2006). These minerals are formed in coal ashes through partial or complete mineral transformation during the coarse coal gasification (1400°C) process and high-temperature (1600°C) combustion (Matjie, Bunt, and van Heerden, 2005; Torma, 1983; Neupane and Donahoe, 2013). All of South Africa´s bottom ash and coal fly ash, as well as gasification coal ash containing mullite and anorthite (CaAl₂Si₂O₈), formed at elevated temperatures during the pulverized fuel combustion and gasification processes respectively, are unsuitable leaching using sulphuric acid solution (Matjie, Bunt, and van Heerden, 2005; Torma, 1983). However, it has been shown that the leaching of a heated blend of South African fly ash and quicklime (CaO) with 6.12 M H₂SO₄ at 80°C and 1:3½ or 1:5 solid to liquid ratios for 4 hours results in high aluminium and titanium extractions of 80-85% and 50% respectively in (Matjie, Bunt, and van Heerden, 2005). Moreover
Furthermore, coal ash from overseas power stations is utilized in small amounts in industrial applications, i.e., brick manufacturing, building materials, road construction, and ceramics (Nayak and Panda, 2010). The ash by-products, containing significant amounts of Al and smaller amount of Ti (a higher-value inorganic element), also have potential for the recovery of these elements by leaching (Barry et al., 2018; Matjie, Bunt, and van Heerden, 2005; Wu, Yu, and Zang, 2012).
Potential uses of the liquid products
beneficiation at the South African coal preparation plants. The prepared coal samples were subjected to oxidation in air, using specific conditions to produce the desired ash samples. These ashes have not been used for the commercial production of aluminium sulphate salts although, as stated in the introduction they are thought to be suitable for utilization in the commercial process to produce aluminium sulphate leach liquor from heated kaolinite-bearing clay.
Luis, 1987; Numluk and Chaisena, 2012). In addition, Phillips and Wills (1982) used the nitric acid leaching route to dissolve alumina from the micaceous residues from smelter grade China clay.
Coal sampling, preparation, and composition of coals
Ash samples
Due to the similarities in the chemical and mineralogical properties of coal samples SA1 and SA2, sample SA2 was blended with K₂CO₃. SA1, SA2 blend, and SA3 were subjected to lowtemperature combustion tests to produce samples for the leaching experiments, XRD and XRF analyses. In addition, SA2, SA1, SA2 blend, and SA3 were submitted for XRD analyses. The characterization analytical methods including proximate, ultimate, and XRF analyses used to determine the chemical composition of coals and the results obtained are also published in Collins et al. (2018). The reagents (H₂SO₄ and K₂CO₃) used in this investigation are also described in Collins et al. (2018).
The coal samples used in this investigation have similar properties to those of discarded coal fines produced during coal mining and
The aluminium(III), potassium(I), titanium(IV), and sulphatecontaining leach liquor produced during the acid leaching tests of these coal ashes can possibly be utilized in other chemical industries, i.e. technical aluminium sulphate or potassium aluminium sulphate in the form of either liquid or solid can be used as coagulants in water treatment plants. Furthermore, the aluminium(III), potassium(I), titanium(IV), and sulphatecontaining leach liquor could be purified through solvent extraction for the production of pure aluminium chemicals, including iron-free aluminium sulphate or iron-free potassium aluminium sulphate. The potassium sulphate solution could be used in potassium chemicals, or in the fertilizer industry, whereas a pure titanium dioxide could be used in the paint/paper industry. The ash residues obtained after leaching could possibly be used as an aggregate in brick manufacturing and masonry concrete.
475The Journal of the Southern African Institute of Mining and Metallurgy VOLUME 122 AUGUST 2022
The commercial leaching methods and conditions used during this investigation are applied in the recovery of aluminium from deactivated clay minerals (non-bauxite ores) with Al dissolution efficiencies reaching up to 90% (Ibrahim, Moumani, and Mohammad, 2018; Mark et al., 2019; Numluk and Chaisena, 2012). High-temperature pulverized fuel combustion conditions (approximately 1600°C) (van Alphen, 2005) are used in the commercial power stations to produce fly ash and bottom ash samples. These conditions were not followed in this study as they are not suitable for the production of low-temperature combustion ashes (containing soluble Al, K, and Ti species) of coal fines and blends of coal fines and K₂CO₃, which can be leaching using H₂SO₄ leaching experiments.
The sampling of coals from the collieries as well as the preparation methods are reported in Collins et al. (2018).
The commercial plants that produce aluminium sulphate by H₂SO₄ leaching of clay-containing kaolinite is employing temperatures of 600-800°C. Heller-Kallai (1978) and Heller-Kallai and Lapides (2003) heated a mixture of clay containing kaolinite and potassium compounds at 600-700°C to produce synthetic potassium feldspars via the solid state reaction of metakaolinite and potassium cations. Therefore, the temperatures of either 700°C or 1050°C were finally selected for this study, based on the contents of metakaolinite, silicon spinel, and pseudomullite in the coalCoalashes.samples of approximately 5 kg were placed to clay fired sample trays and loaded into the hot zone of a rotary kiln. The temperature of the kiln was increased to 700°C at a heating rate of 10°C/min. All sub-samples were heated to 700°C for a residence time of 3 hours under air flow of 80 ml/min to facilitate coal combustion and transformation of the mineral matter and the evolution of volatiles. The furnace was then switched off and allowed to cool for 8 hours and the ash samples were removed once the samples reached ambient temperature. Four representative ash samples were blended to form one homogenous sample. The sample preparation methods set out in ISO 18283 and ISO 13909-4) (Rautenbach et al., 2019) were followed to take representative samples from the bulk ashes prepared at 700°C for the H₂SO₄ leaching tests and for further heating in a muffle furnace. After placing the representative sample of ash produced at 700°C in the muffle furnace, the
Materials and methods
According to Collins (2019), the ash samples prepared at 700°C contain a higher proportion of metakaolinite (alumina associated with metakaolinite is soluble in either H₂SO₄, or HCl or HNO₃) and a small proportion of amorphous glasses of illite and microcline. These ashes are also characterized by a small proportion or zero per cent of Al₂O₃.SiO₂ pseudomullite, silicon spinel 2Al₂O₃.3SiO₂, and <1% organic carbon, which are only sparingly soluble or insoluble in these mineral acids. A temperature of 700°C was therefore used in this study to produce ashes which can possibly contain a higher proportion of metakaoilinite, which may be associated with a higher dissolution efficiency of alumina during sulphuric acid leaching. The ash samples produced at 1050°C are characterized by higher proportions of pseudomullite and silicon spinel, a small proportion (or zero per cent) of metakaolinite, and zero organic carbon. Higher proportions of pseudomullite and silicon spinel, which are sparingly soluble in H₂SO₄, could be formed at this temperature. Lower dissolution efficiencies of Al, K, and Ti during sulphuric acid leaching could be expected from these ashes. In addition, Bryers (1986) and Yanti and Pratiwi (2018) found that metakaolinite transformed to silicon spinel at 925°C, which further formed pseudomullite at 1100°C. At 1200-1400°C, pseudomullite transformed to mullite, which is insoluble in mineral acid solutions apart from hydrofluoric acid (Teklay et al., 2014; Bryers, 1986). According to Osawa and Bertan, (2005) pseudomullite and silicon spinel prepared at pH 4 and pH 8 are formed from mixtures of alumina and silica sols at 1050°C and transform to mullite at 1200°C.
X-ray fluorescence (XRF) and X-ray diffraction (XRD) techniques were used to characterize the coal fines and blends of coal fines and K₂CO₃, the ash samples, and leached ash residues produced from the experiments. The XRF results and the masses of ash samples before and after the H₂SO₄ leaching tests were utilized in calculating the dissolution efficiencies of inorganic elements after acid leaching of the ash samples prepared at either 700°C or 1050°C.
Production of Al(III)-K(I)-Ti(IV)-sulphate-containing leach liquor from metakaolinite
Equation [5] was used to calculate the percentage dissolution
leaching experiments. A 500 cm³ round-bottomed container, with sealing lid and cooler, was used as the leaching vessel. An automatic overhead stirrer with base plate (model 720), coupled with a temperature controller with a sensor probe, was used as the heat source. The leaching conditions used in the experiments are stated below.
Figure diagram of the experimental procedure and analytical methods
1—Schematic
A schematic diagram of the process and analytical methods used in this study for dissolving Al, K, and Ti from coal ash and blend ash samples, is presented in Figure 1.
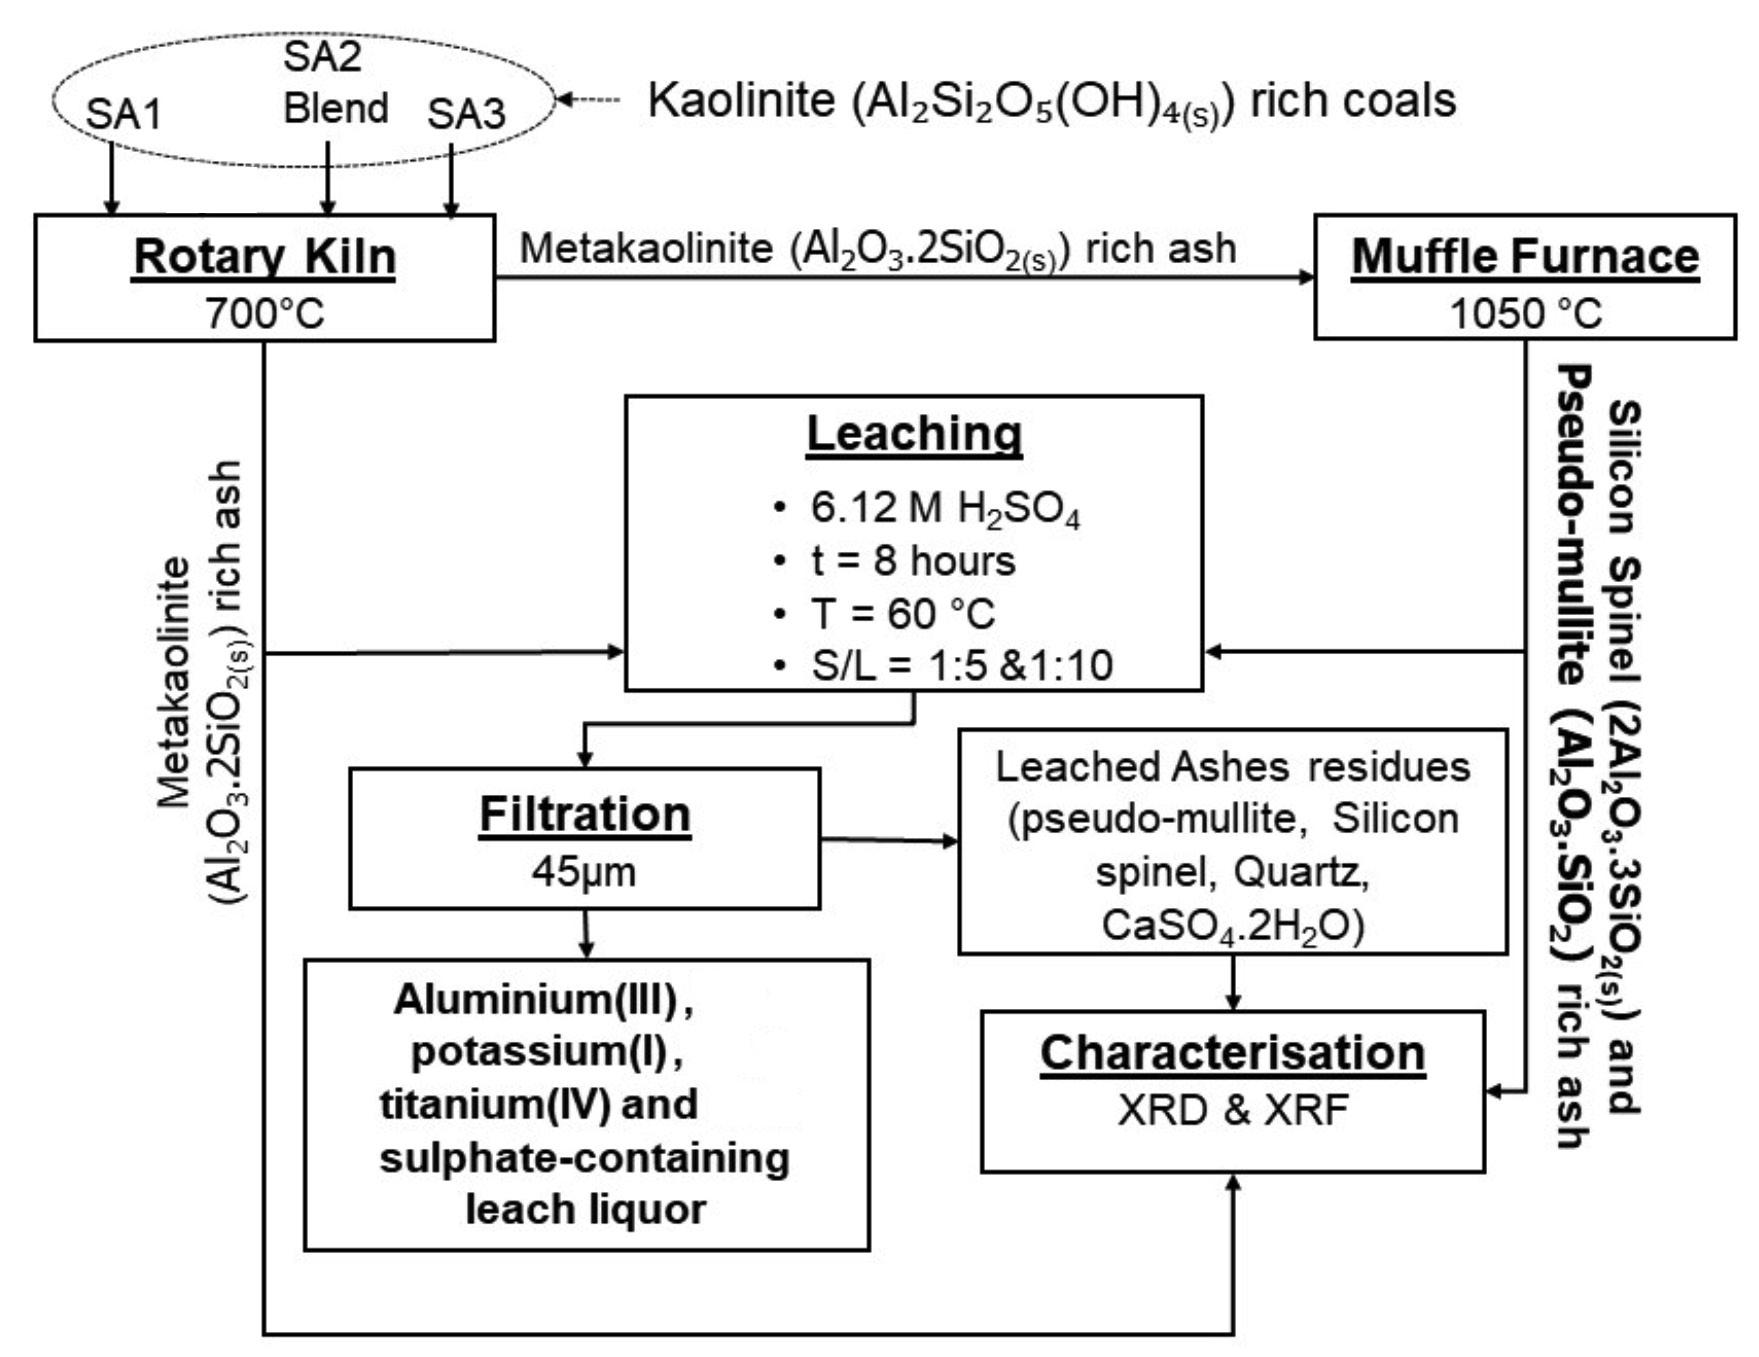
temperature was increased to 1050°C at a heating rate of 10°C/ min. This experimental procedure to produce low temperature combustion ashes at either 700°C or 1050°C was repeated for all the coal samples used in this study.
Experimental procedure
The influence of solid to liquid ratio on the dissolution of the inorganic elements contained in the ash samples was investigated during the acid leaching experiments. The solid to liquid ratios used were 1:5 and 1:10. A 10 g ash sample was accurately weighed out and added into the leaching vessel. The optimized H₂SO₄ leaching conditions for sintered pellets of a mixture of South African fly ash, coal, and CaO − a solid to liquid ratio of 1:5, temperature of 80°C, time of 8 hours and (6.12 M) H₂SO₄ (Matjie, Bunt, and van Heerden, 2005)− which achieved the highest leaching efficiency of Al and Ti, were used in this study. A known 6.12 M H₂SO₄ was transferred into the vessel containing value of coal ash to maintain the solid to liquid ratio of the specific experiment. The slurry was stirred at 200 r/min with an automatic overhead stirrer at 80°C for 8 hours. The hot slurry sample was filtered to produce the leached wet ash residue and leach liquor (filtrate). The ash residue was washed with deionized water to ensure that all dissolved inorganic species were recovered. The leached ash residue was placed in a vacuum furnace and dried at 60°C for 24 hours. The wash solution was combined with the original leach liquor to form the final leach liquor sample. In this investigation, only coal ash and leached ash residue samples were submitted for XRD and XRF analyses. Due to the cost constraints associated with the inductively coupled plasma atomic emission spectrometry (ICP-AES) analysis of the liquid samples, all the leach liquor samples were not submitted for this analysis but were kept for the other purification steps.
Acid leaching
476 AUGUST 2022 VOLUME 122 The Journal of the Southern African Institute of Mining and Metallurgy
Technical grade sulphuric acid (10 M H₂SO₄ or 98% H₂SO₄, a stable or less reactive and viscous mineral acid) with small proportions of ions (H₃O+, SO₄2-) was used to prepare a 6.12 M H₂SO₄ or 60% H₂SO₄, which is very reactive with significant amounts of ions (H₃O+, SO₄2-), using deionized water, for the
6.12 M H₂SO₄ leaching
XRD analysis
Production of Al(III)-K(I)-Ti(IV)-sulphate-containing leach liquor from metakaolinite
Calculation of dissolution efficiencies
XRF analysis
XRF analysis of coal ash samples (SA1, SA2 blend, and SA3) prepared at either 700°C or 1050°C to determine the proportions of inorganic elements in these samples was conducted according to the methods proposed by other researchers (Norrish and Hutton, 1969; Matjie et al., 2018).
Analytical methods
XRD analysis of coal (SA1, SA2, SA2 blend and SA3) and ash (SA1, SA2 blend and SA3) samples was carried out to qualify and quantify the proportions of crystalline and amorphous phases in these samples using the methods suggested by other researchers (Rietveld, 1969; Speukman, 2012; Matjie et al., 2018). The percentage XRD error is 0.2-0.3 and the detection limit is between 0.5 and 5 weight per cent. This implies that XRD results for the trace minerals with smaller crystallite sizes (<1 nm crystallites) in the solid samples which are above this detection limit may not be accurate (Chinchón et al., 1993).
XRD results for the coal samples (wt.%)
%E is the percentage of the inorganic element in the coal ash or leached ash residue, as calculated by Equation [7] msample is the mass of the ash sample or leached ash residue sample.
Illite 0.8 1.4 0.7
Total 100.0 100.0 100.0 100.0
The occurance of extraneous calcite and extraneous dolomite discrete particles indicates that these minerals could transform at temperatures of 700°C and 1000°C to CaO (quicklime) and a mixture of MgO (periclase) and CaO respectively (Matjie et al., 2018; van Dyk, Waanders, and Hack, 2008). The inherent calcite or dolomite associated with clays (kaolinite, illite, muscovite) and microcline and carbon matrix in the coals can transform at 12001400°C to form a molten solution or partial melt (Rautenbach et al., 2021). Furthermore, either the extraneous calcite and dolomite react with each other at 1200-1400°C to form melts during heat treatment. The high-temperature minerals (mullite, anorthite, K-feldspar) formed, which are insoluble in sulphuric acid solution, crystallized at low temperatures from the molten solutions. These minerals can also be formed at elevated temperatures via solidstateThereactions.high-temperature products (CaO and MgO) derived from transformation of either extraneous calcite or dolomite have been found to be responsible for the in-situ capturing of sulphur dioxide to form calcium sulphate (Rautenbach et al., 2021). These oxides account for the reduction of gas emissions during coal combustion. In addition, the carbonation reaction will form either calcite or dolomite in the ashes, resulting in the minimization of CO₂ emissions.
Graphite 1.9 0.8 0.4 0.5
MEO is the molecular weight of the elemental oxide.
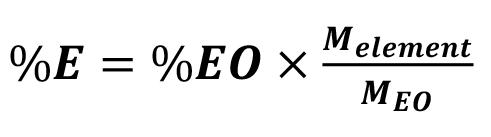
Calcite 2.1 1.9 0.7
%EO is the percentage elemental oxide in the sample (provided through XRF analysis)
The percentage (%E) of inorganic element present in each of the ash and leached ash residue samples was calculated using Equation [7].
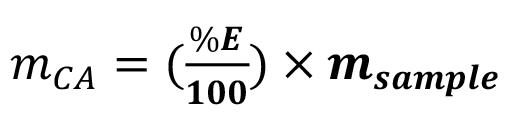
where
Results and discussion
Amorphous (organic carbon) 66.2 71.6 69.6 73.2
The mass of the specific inorganic element in the coal ash and leached ash residue samples can be calculated by using Equation [6].
mCA is the mass (g) of inorganic element (Al, K, or Ti) in the coal ash or leached ash residues

Sample SA1 SA2 SA2 blend SA3
Pyrite 0.1 0.2
mCA is the mass of the specific inorganic element in the coal ash and leached ash residues samples mRES is the mass of ash residue (after leaching).
Melement is the molecular weight of the element in the oxide
efficiency for Al, K, and Ti using the XRF results for the ash samples and the leached ash residues as well as the masses of ashes. In this study the aluminium in the form of the alumina is expected to be selectively dissolved from metakaolinite during sulphuric acid leaching of the coal ash. Al, Ti, and K contained in the aluminosilicate glasses of illite and microcline and Ti in either rutile or anatase, as well as the K in the potassium melt and K₂CO₃ remnants, are also expected to be solubilized. The dissolution efficiency was calculated using Equation [5]:
Table I
K₂CO₃ 0.0 0.0 6.2 0.0
Production of Al(III)-K(I)-Ti(IV)-sulphate-containing leach liquor from metakaolinite
[7]
Coal mineralogy
Kaolinite 18.0 13.4 12.3 13.7
Microcline 0.7 0.1
[6]
The XRD results of the coal samples are presented in Table I. The results indicate that all the coal samples consist mainly of amorphous (non-crystalline) organic carbon. The SA1 sample contains a higher proportion of kaolinite than the other coals tested, while the SA2 coal and SA2 blend samples contain less quartz than SA1 and SA3. Minor proportions of other minerals (microcline, illite, calcite (CaCO₃), pyrite (FeS₂), and anatase (TiO₂)) and a high proportion of dolomite (CaMgCO₃), were found in all the coal samples evaluated in this study. Other minerals are present in trace quantities. As expected, the SA₂ blend also contained a low proportion of K₂CO₃ compared to the percentage of potash added to this coal). This can be attributed to the hydration of K2CO3 by the 4% moisture contained in this coal. Also, these XRD results, excluding the SA2 blend, match previous XRD data for other South African coals (van Dyk et al., 2009; van Dyk, Waanders, and Hack, 2008).
477The Journal of the Southern African Institute of Mining and Metallurgy VOLUME 122 AUGUST 2022
Dolomite 1.3 6.4 5.3 4.4
[5] where (MO) is the dissolution efficiency of the specific inorganic element (Al, K, or Ti)
Quartz 10.6 4.0 3.6 7.3
%Ewhere is the percentage of the element in the coal ash or ash residue sample
BaO
The SA1 ash sample prepared at 1050°C contains a lower or zero percent of metakaolinite, and a higher percentage of silicon spinel and pseudomullite (sparingly soluble in mineral acid solution, apart from HF) compared to the SA1 ash samples prepared at 700°C (Tables III and IV). Rautenbach et al. (2021) found that mullite crystallizes from the molten aluminosilicate solution formed at 1200-1400°C during the combustion of coals in a laboratory and gasification study of other South African coals. Furthermore, mullite, which is associated with the transformation of the extraneous kaolinite, can also be formed at elevated temperatures of 1200-1400°C via the solid-state reaction (Rautenbach et al., 2021). Fe₂O₃ 2.7 2.7 4.1 4.2 3.8 3.8 TiO₂ 2.1 1.7 1.7 1.6 1.5 1.5 MgO 0.9 0.8 2.3 2.3 2.0 1.8 K₂O 0.8 0.8 18.4 18.6 0.4 0.7 SO₃ 0.2 0.2 4.4 4.9 0.8 2.1
Na₂O
Mn₃O₄ 0.1 0.1
Coal ash mineralogy
Table II Chemical composition of ash samples prepared at 700°C and 1050°C from SA1, SA2 blend and SA3 (wt. %) Sample SA1 SA2 Blend SA3 Ash temp 700°C 1050°C 700°C 1050°C 700°C 1050°C SiO₂ 62.1 62.6 36.3 36.1 57.7 56.9 Al₂O₃ 28.3 28.3 22.6 22.2 27.5 27.1 CaO 2.7 2.3 8.9 8.6 5.4 5.2
SrO
478 AUGUST 2022 VOLUME 122 The Journal of the Southern African Institute of Mining and Metallurgy
P₂O₅ 0.1
Production of Al(III)-K(I)-Ti(IV)-sulphate-containing leach liquor from metakaolinite
Note: K-kaolinite, Q-quartz, Ka-kalsilite, Mic-microcline, An-anorthite, SS-silicon spinel, An-anorthite, pM-pseudomullite. Intensity - intensity of diffracted radiation and q - diffraction angle
The XRD results show a lower proportion of total amorphous phases in the ashes after heating either SA1 coal, SA2 blend, or SA3 coal at 1050°C compared the ashes prepared at 700°C (Tables III and IV). The XRD results of the ash samples reveal that kaolinite in the selected coals transformed at 700°C to form metakaolinite in the ashes (Tables III and IV). The total amorphous material contents of these ashes decrease with increasing temperature. Pseudomullite (transformation product of metakaolinite and
XRF analysis
The XRF results of the ash samples prepared from coals at elevated temperatures are presented in Table II. The dominant constituents in the SA1, SA2 blend, and SA3 ashes prepared at either 700°C or 1050°C under air are SiO₂, and Al₂O₃, with lesser but still significant proportions of CaO, Fe₂O₃, MgO, TiO₂, MgO, and in some cases K₂O (>18%) and SO₃ (>4%) (Table II). Other oxides, including Cr₂O₃, Mn₃O₄, P₂O₅, BaO, Na₂O, and SrO, each make up less than 1% of the ashes. These XRF results, with the exception of the ash of the coal sample spiked with K₂CO₃, are in good agreement with those of the ash samples prepared from other South African coals using thermochemical processes (Hattingh et al., 2011; van Alphen, 2005; van Dyk et al., 2009).
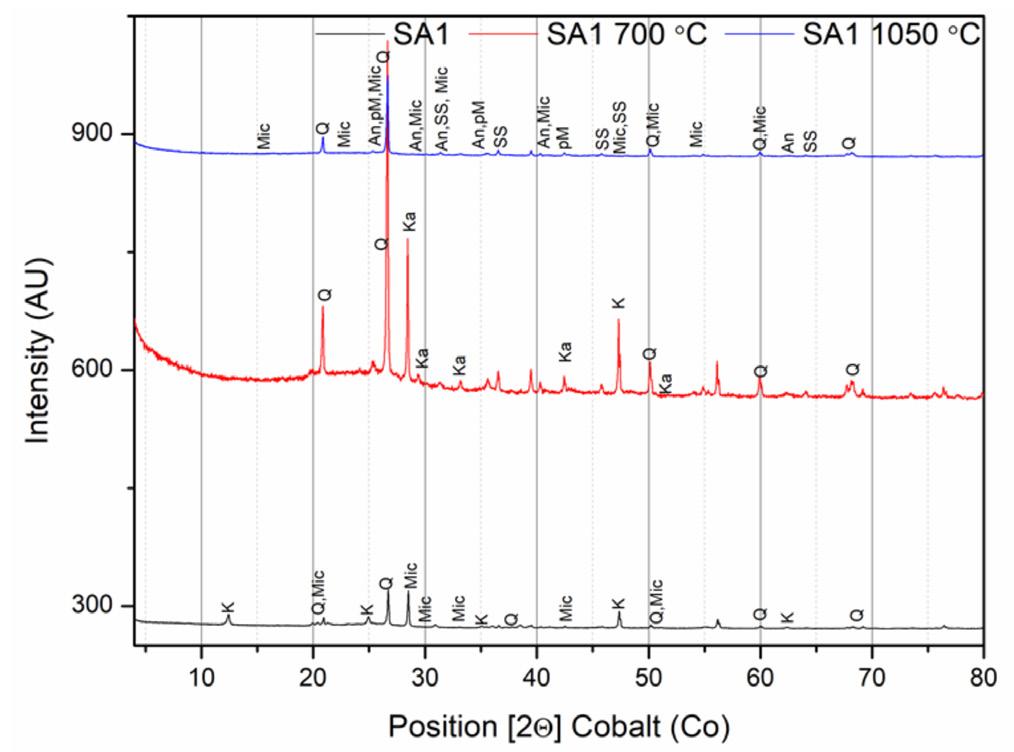
XRD results of the selected ashes of SA1, SA2 blend, and SA3 samples prepared at 700°C and 1050°C are presented in Figures 2-4 and Tables III and IV. These results indicate that the SA2 blend and SA3 ash samples prepared at 700°C, consisted of higher proportions of total amorphous phases (metakaolinite and amorphous glasses of illite and microcline) than the SA1 ash. Higher proportions of total amorphous materials formed at elevated temperatures in the ashes are associated with the mode of occurrence of the fluxing minerals (calcite, dolomite, and pyrite), clays (kaolinite, illite etc.) - and microcline in the coals (Rautenbach et al., 2021). The fluxing minerals lower the ash fusion temperature (AFT) values of clays, promoting the formation of melts during heat treatment of coals. The SA1 ash contains a higher concentration of quartz than the other ash samples. Based on the kaolinite and illite/microcline contents in the coals (Table I), metakaolinite could contribute to 95% of the total amorphous content in the coal ashes produced at 700°C.
Cr₂O₃ 0.1 0.1 0.1 0.1 0.1 0.1 0.2 0.2 0.1 0.1 0.2 0.4 0.4 0.3 0.4 − 0.1 0.0 0.3 0.3 0.1 SrO = 0.1 Total 100.0 100.0 100.0 100.0 100.0 100.0
silicon spinel at elevated temperatures) increase with increasing temperature during heat treatment (Tables III and IV). The presence of metakaolinite in the ashes of South African coals can be attributed to the transformation of kaolinite at elevated temperatures (600 - 850°C) (Matjie, van Alphen, and Pistorius, 2006; Matjie et al., 2018, Uwaoma et al., 2020).
Figure 2—Stacked diffractograms of SA1 (kaolinite-rich) and ashes obtained at 700°C (SA1 700°C (metakaolinite-rich)) and 1050°C (SA1 1050°C (pseudomullite- rich)
0.1
Muscovite 0.3
K₂CO₃ 0.9
Dolomite 0.1
Haematite 1.4 1.3 1.0 Kalsilite 1.2 8.4
Calcite 4.2
Figure 3—Stacked diffractograms of SA2 (kaolinite-rich) and ashes ob tained at 700°C (SA2 700°C, metakaolinite-rich and 1050°C SA2 1050°C pseudomullite) K-kaolinite, Q-quartz, Ka- kalsilite, Mic-microcline, An-an orthite, SS -silicon spinel, An-anorthite, pM- pseudomullite. Intensityintensity of diffracted radiation, q - diffraction angle
Khan et al. (2017) and Heller-Kallai (1978) studied the transformation of kaolinite in pure kaolinite-containing clay to form metakaolinite at elevated temperatures using XRD analysis, thermogravimetric analysis (TGA), and Fourier transform infrared (FTIR) techniques under oxidizing and inert conditions. They found that almost all of the kaolinite particles in the kaolinitecontaining clay samples transformed to metakaolinite at 600850°C.The presence of trace periclase in some of the SA1, and SA2 blend ash samples (Table IV) is due to the transformation of the extraneous dolomite at 700°C to form a mixture of CaO and MgO. Hlatshwayo et al. (2009) and Matjie, van Alphen, and Pistorius, (2006) used XRD analysis to detect periclase in ash samples from South African carbon conversion plants that utilize thermochemical processes. The surface temperature and the peak temperature in the combustion zone and ash bed of South African carbon conversion gasifiers are 1200°C and 1400°C respectively (Glover et al., 1995; Bunt, 2006). CaO (the transformation product
Anorthite 1.2 9.0 1.4 Portlandite 0.2 0.2 Magnetite 0.3 0.7 Cristobalite 0.4 0.5 Muscovite 0.7 Anatase 0.1
Production of Al(III)-K(I)-Ti(IV)-sulphate-containing leach liquor from metakaolinite
Diopside 0.5 0.3
K₂CO3 14.1
Kaolinite 0.2 Periclase 0.8 0.2 Pyrrhotite 0.3 Rutile 0.8
Diopside 4.6
Quartz 43.9 37.1
Microcline 9.0 Dolomite 1.2 Calcite 0.1 Gypsum 7.6 0.4 Graphite 6.4
Mineralogical composition of the ash samples prepared at 700°C Sample(wt.%)
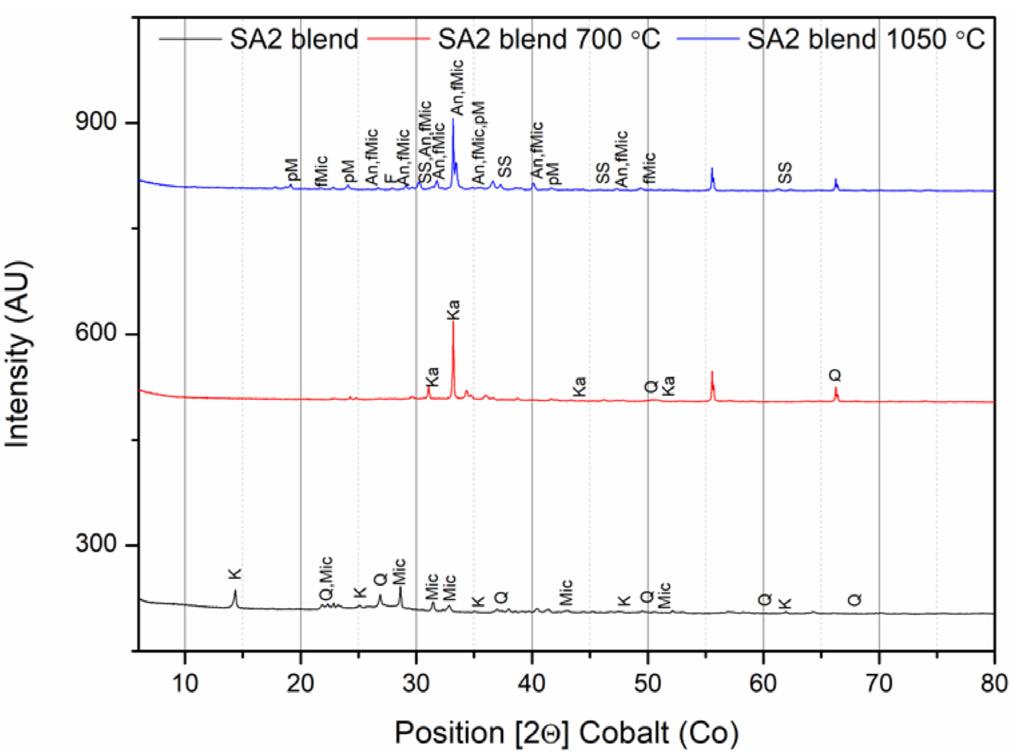
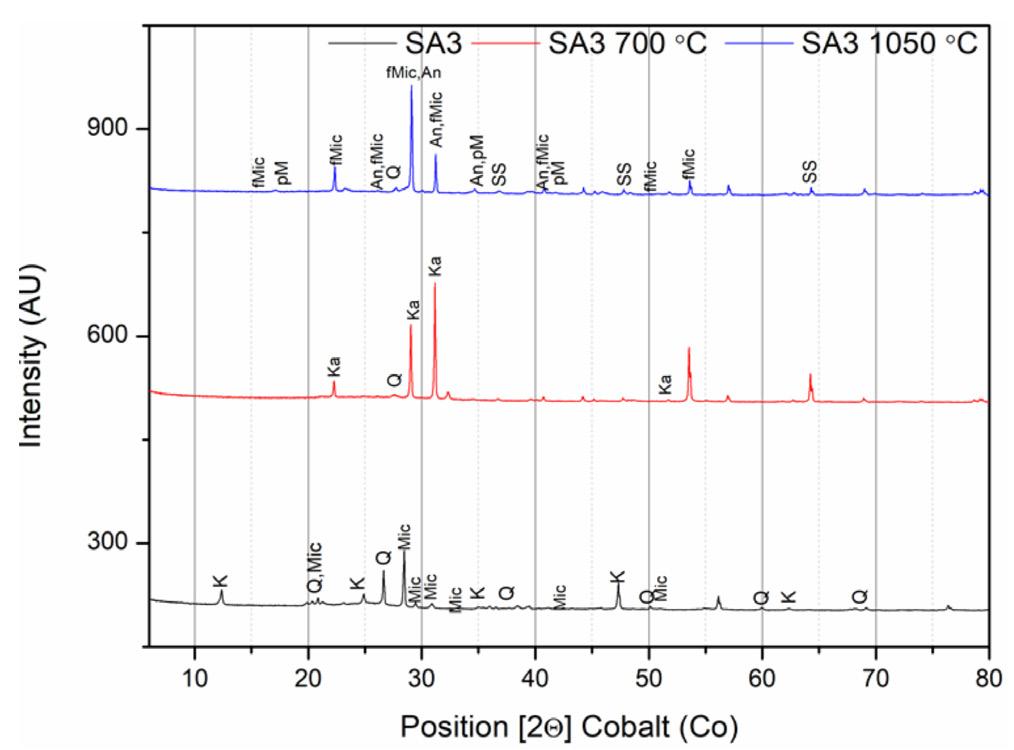
479The Journal of the Southern African Institute of Mining and Metallurgy VOLUME 122 AUGUST 2022
Pyrrhotite 0.3 0.1
SA1 SA2 Blend SA3
Mineralogical composition of the ash samples prepared at 1050°C (wt.%)
Anhydrite 1.5 0.9 2.7 Pseudomullite 14.2 13.3 3.3 Haematite 0.4 2.2
Silicon spinel 1.4 0.7 2.0 Total amorphous 35.8 44.3 39.6 Total 100.0 100.0 100.0
Table III
Figure 4—Stacked diffractograms of SA3 (kaolinite-rich) and ashes ob tained at 700°C (SA3 700°C, Metakaolinite-rich) and 1050°C (SA3 1050°C (pseudomullite) K-kaolinite, Q-quartz, Ka- kalsilite, Mic-microcline, An-anorthite, SS -silicon spinel, An-anorthite, pM- pseudomullite). Inten sity - intensity of diffracted radiation, q - diffraction angle
Gypsum 0.6 0.2
Graphite 2.0 3.2
Magnetite 0.2 0.3 Cristobalite 0.1 0.1 0.1
*Total amorphous content: metakaolinite plus aluminosilicate glasses of illite and microcline plus amorphous K2CO3
Kaolinite 0.6
Portlandite 0.4 0.2 0.1
of either calcite or dolomite associated with kaolinite) can react with metakaolinite at 1400°C to form anorthite either via a solidstate reaction or crystallization from the molten aluminosilicate phase containing Ca, Mg, K, Fe, Ti, and Na impurities (Hlatshwayo et al., 2009). Anorthite is insoluble in sulphuric acid solution. The low content of haematite (Fe₂O₃) (Tables III and IV) in the ashes of SA1, SA2 blend, and SA3 prepared at either 700°C or 1050°C was formed by the transformation of pyrite. Anhydrite (CaSO₄) (Tables III and IV) was formed via the interaction of organic sulphur and organic calcium. Also, free CaO from the
Quartz 45.1 4.0 20.4 Anhydrite 1.6 1.3 1.0
Table IV
Sample SA1 SA2 blend SA3
Total amorphous content* 50.0 75.7 68.8
Total 100.0 100.0 100.0
Periclase 0.2
480 AUGUST 2022 VOLUME 122 The Journal of the Southern African Institute of Mining and Metallurgy
As expected, the total amorphous content of the ash samples decreases with increasing ashing temperature due to the transformation of metakaolinite in the amorphous phases to silicon spinel during combustion. Silicon spinel subsequently transforms at 1100°C to pseudomullite (Bryers, 1986; Yanti and Pratiwi, 2018). This is supported by the observed decrease in the total amorphous content, which is accompanied by an increase in the content of gypsum (CaSO₄.2H₂O), K₂CO₃, microcline originally detected in the coals, and synthetic microcline and pseudomullite in the ashes (Tables III and IV). An increase in the proportion of insoluble microcline in the SA2 blend ash samples prepared at 1050°C can be attributed to the reaction between potassium ions from the K₂CO₃ melt or K₂O reacting with metakaolinite, at elevated temperatures (Tables III and IV) (Rautenbach et al., 2021, Matjie et al., 2018).
1:5 1:10 1:5 1:10 1:5
The XRF results for the ash samples prepared at 700°C and 1050°C which were leached with the 6.12 M H₂SO₄ at 80°C and solid to liquid ratios of 1:5 and 1:10 for 8 hours are presented in Tables V and VI. The leached SA1 and SA3 ash samples prepared at 1050°C contain a lower proportion of SiO₂ and a higher proportion of Al₂O₃ (Table VI) than the leached SA1 and SA3 ash samples prepared at 700°C (Table V). On the other hand, the leached SA2 blend ash contain a lower proportion of Al₂O₃ and a higher proportion of SiO₂ than the other ash samples (Tables V and VI). Furthermore, the leached SA2 blend ash is characterized by a higher content of CaO in relation to the other leached ash samples prepared at either 700°C or 1050°C. The presence of SiO₂, Al₂O₃, and CaO in the leached ash samples prepared at both 700°C and 1050°C is consistent with those of the original SA1, SA2 blend, and SA3 ash samples (Table II) before H₂SO₄ leaching at 80°C for 8 hours.
Total 100.0 100.0 100.0 100.0
Production of Al(III)-K(I)-Ti(IV)-sulphate-containing leach liquor from metakaolinite
Matjie et al. (2021) studied the reaction between metakaolinite and potassium cations to form synthetic K-feldspars by heating a blend of 10% K₂CO₃ and coal at 700°C and 1050°C in air. In addition, Collins et al. (2018) used FACTSAGE™ modelling to predict microcline and kalsilite crystallization at temperatures between 1050°C and 1250°C from the melt of the SA2 blend.
XRF analysis of the leached ash samples
SiO₂ 77.2 79.9 66.8 70.5 77.7 77.0 Al₂O₃ 12.5 13.7 4.2 5.4
Furthermore, potassium cations from K₂CO₃ react with metakaolinite derived from kaolinite-containing clay at 600700°C to form synthetic potassium feldspars (kalsilite (KAlSiO₄), kaliophilite (KAlSiO₄), nepheline ((Na, K)AlSiO₄), and microcline
It can be concluded that all selected ash samples from SA1, SA2 blend, and SA3 coal samples produced at elevated temperatures of 1050°C contain a lower proportion of total amorphous material and higher proportions of silicon spinel, pseudomullite, and anorthite than those produced at 700°C. The mineralogical composition of the coal ash samples thus changed as the ashing temperature increased.
via solid-state reactions (Heller-Kallai and Lapides, 2003; HellerKallai, 1978).
CaO 5.3 2.1 14.9
Fe₂O₃ 1.1 1.3 2.6 3.7
Cr₂O₃ 0.2 0.1
Silica associated with metakaolinite is insoluble in the sulphuric acid solution and remained in the leached ash residues (Matjie, Bunt, and van Heerden, 2005; Altıokka et al., 2010). M H₂SO₄, Ratio 1:10 13.5 12.6 14.5 5.3 6.4 1.9 1.7 0.8 1.1 2.2 0.4 0.4 0.1 0.1 0.1 0.2 0.1 0.1 0.3 0.3 0.1 0.1 100.0 100.0
K₂O 0.4 0.5 2.8
using 1:5 and 1:10 S/L ratios (normalized inorganic oxides – based on the loss on ignition and trace elements (LOI)) (wt.%) Sample SA1 SA2 blend SA3 S/L
Table V Chemical composition of the leached coal and blend ash samples produced at 700°C with 6.12
The SA2 blend and SA3 ash samples leached with 6.12 M H₂SO₄ contained less Al₂O₃, K₂O, Fe₂O₃, and TiO₂ compared to the original ashes prepared at either 700°C or 1050°C (Tables V and VI). The proportions of these inorganic elements decreased significantly after H₂SO₄ leaching. This can be attributed to the reaction between alumina in the metakaolinite and sulphuric acid (Altıokka et al., 2010; Kyriakogona, Giannopoulou, and Panias, 2017; Equations [1] and [3]). This sulphuric acid solution selectively dissolved alumina from metakaolinite to form aluminium sulphate in the leach liquor.
TiO² 2.0 1.8 1.8 1.9
MgO 0.2 0.3 0.2 0.2
P₂O₅ 0.1 0.2 BaO 0.3 0.2
Na₂O 0.1 SO₃ 0.9 0.1 6.0 0.9
transformation of extraneous calcite at elevated temperatures can capture sulphur dioxide from the reaction of pyrite in the presence of oxygen or air. Furthermore, CaO in these ashes reacts with water to form portlandite (Ca(OH)₂). A lower cristobalite (SiO₂) content (product of a reaction between silica and alumina) (Tables III and IV) in SA1, SA2 blend, and SA3 ashes prepared at either 700°C or 1050°C, was formed during the transformation of the extraneous kaolinite and illite to metakaolinite, reactive silica, and amorphous glasses of illite. Diopside (CaMgSi₂O₆) in these ashes (Tables III and IV) was formed by silica reacting with CaO and MgO derived from the transformation of dolomite at elevated temperatures. These XRD results are consistent with those obtained during characterization studies of South African coal ashes produced from thermochemical processes (Hlatshwayo et al., 2009; Rautenbach et al., 2021; Uwaoma et al., 2020).
SrO − 0.4
Chemical composition of the leached coal and blend ash samples prepared at 1050°C with 6.12 M H₂SO₄, using 1:5 and 1:10 S/L ratios (normalized inorganic oxides – based on the LO.I) (wt.%)
Na₂O 0.1
SiO₂ 66.3 65.9 46.2 56.4 57.7 61.0
K₂O 0.7 0.7 5.4 5.8 0.8 0.6
SO₃ 0.4 0.6 26.9 11.2 7.3 3.8
Production of Al(III)-K(I)-Ti(IV)-sulphate-containing leach liquor from metakaolinite
BaO 0.1 0.3 0.3 0.3 0.1 0.2
Soluble potassium, iron, and titanium species from the ash reacted with sulphuric acid to form potassium sulphate, iron sulphate, and titanium sulphate respectively. In addition, the dissolution of Al₂O₃ and K₂O from the ash samples contributed to the SiO₂ content in the leached ash samples (Equations [1], [3], and [4]).
CaO + H₂SO₄ + H₂O CaSO₄ + 2H₂O
CaO 2.0 1.6 11.1 11.5 5.9 5.0
Al₂O₃ 27.2 27.8 5.3 8.0 24.9 26.3
481The Journal of the Southern African Institute of Mining and Metallurgy VOLUME 122 AUGUST 2022
Total 100.0 100.0 100.0 100.0 100.0 100.0
The proportion of Al₂O₃ in the leached SA1 ash produced at 1050°C and leached SA3 ash samples prepared at 1050°C is consistent with that of SA1 and SA3 ash samples prepared at 1050°C (Table VI). This can be ascribed to the significant amounts of the sparingly soluble silicon spinel, and pseudomullite that were formed in these materials. The XRF results of the coal ash samples and leached ash samples are consistent with those for other coal ash samples and their corresponding leached ash samples (Torma, 1983; Nayak and Panda, 2010; Matjie, Bunt, and van Heerden, 2005; Sangita, Nayak, and Panda, 2017; van der Merwe et al., 2017; Burnet, Murtha, and Dunker, 1984).
The decrease in the proportions of aluminium, potassium, titanium, and iron in the original ash samples can be attributed to the selective dissolution of alumina from metakaolinite and aluminosilicate glasses, and K from either amorphous K₂CO₃, K₂CO₃ remnants, or potassium aluminosilicate glass (Tables V and VI) in the sulphuric acid solution. Fe can be dissolved from haematite, magnetite, and aluminosilicate glasses , while Ti as TiO₂ can be dissolved from rutile/anatase (Equation [2]) and aluminosilicate glasses.
Mineralogy leached ash samples mineralogy
XRD results of the ash samples leached with 6.12 M H₂SO₄ using 1:5 and 1:10 S/L ratios are shown in Table VII. These samples, apart from the leached SA2 blend ash prepared at 1050°C, contain major quartz, anhydrite, and amorphous materials which are insoluble in sulphuric acid. Minor minerals (dolomite, calcite, gypsum, portlandite, and pseudomullite) along with trace minerals (kaolinite, graphite, illite, muscovite, cristobalite) are insoluble in sulphuric acid. In addition, other minor minerals (pyrrhotite, haematite, K₂CO₃, rutile, periclase, and anatase) are soluble in the sulphuric acid solution. Furthermore, microcline and muscovite are only sparingly soluble or insoluble soluble in H₂SO₄ (Table VII).The presence of dolomite, calcite, kaolinite, and graphite in the other leached ash samples could be associated with the small proportion of unburnt coal particles. In addition, the presence of coal char could be due to the encapsulation of coal particles by the molten ash formed during combustion of the coals. Dolomite and calcite in the other leached ash samples are associated with the reactions of CaO/MgO and CO₂ during sulphuric acid leaching. The leached SA2 blend ash produced at 1050°C using 1:10 S/L ratio is characterized by high concentrations of the microcline and anhydrite, and low proportions of quartz and amorphous materials (Table VIII) compared to other samples. Anhydrite crystallizes out from the gelatinous calcium sulphate precipitate and gypsum during drying of leached ashes at 80°C (Freeman, 1993; Matjie, Bunt, and van Heerden, 2005). Furthermore, the XRD results of the leached ash samples (SA1 ash, SA3 ash, and SA2 blend ash) show that the proportion of quartz (Table VIII) in the SA1 ash sample produced at 700°C decreased after leaching, due to the formation of the gelatinous calcium sulphate precipitate. The microcline in the unburnt coal char is insoluble in sulphuric acid. The synthetic potassium feldspar minerals, including microcline, form when potassium species react with metakaolinite at 600-700°C (Heller-Kallai, 1978; Heller-Kallai and Lapides, 2003, Matjie, et al., 2021). Other potassium feldspars present in the coals begin to transform at temperatures of >1050°C (Matjie et al., 2021).
[8]
Table VI
SrO 0.3 0.3 0.1
Finally, the XRF results of the leached ash samples are in good agreement with the XRD results (Tables III − VI). The chemical properties of the ash samples and their corresponding leached ash samples varied substantially after H₂SO₄ leaching.
Fe₂O₃ 1.4 1.2 3.0 4.8 1.3 1.4
Cr₂O₃ 0.1 0.1 0.1 0.1
TiO₂ 1.5 1.5 1.1 1.0 1.5 1.4
The leached SA1 ash prepared at 1050°C contains a lower proportion of CaO (Table VI) than that of the original SA1 ash produced at 1050°C. However, the proportion of CaO (Table V) increased in the leached SA1 ash produced at 700°C, leached SA2 blend ash, and leached SA3 ash samples prepared at 1050°C. This can be attributed to the insolubility of CaO in the sulphuric acid solution. However, other researchers found that Ca2+ reacts with SO₄2- to form gelatinous calcium sulphate, which precipitates during the leaching of the coal ash samples (Nayak and Panda, 2010; Matjie, Bunt, and van Heerden, 2005; Sangita, Nayak, and Panda, 2017; Freeman, 1993; Torma, 1983 (Equation [5]). The chemical reaction between CaO and H₂SO₄ to form gelatinous calcium sulphate (gypsum) which occurred during the sulphuric acid leaching of coal ash samples is as follows:
Sample SA1 SA2 Blend SA3
MgO 0.2 0.2 0.4 0.6 0.3 0.2
S/L ratio 1:5 1:10 1:5 1:10 1:5 1:10
Periclase 0.2 0.1 0.2 Kaolinite 0.1 0.2 0.1 Hematite 0.1 Anorthite 1.8
Illite 0.1 0.5 0.4 Graphite 0.7 0.2 Kaolinite 0.1
Sample SA1 SA2 blend SA3
Pyrrhotite 0.1
Quartz 26.8 26.7 7.9 7.4 16.1 23.9
Anhydrite 7.1 6.0 34.0 29.4 15.5 16.9
Calcite 0.5 0.8 0.7 Dolomite 0.4 0.5 5.8 0.6 1.2 0.7 Portlandite 0.2 0.3 0.1 0.4
Rutile 0.8 0.4 0.1 Silicon spinel 1.0 0.5 1.5 0.8 1.7 1.0 Amorphous 48.1 48.1 51.0 48.0 48.0 43.1 Total 100.0 100.0 100.0 100.0 100.0 100.0
Table VIII
482 AUGUST 2022 VOLUME 122 The Journal of the Southern African Institute of Mining and Metallurgy
Muscovite 0.1 0.1 0.1
Mineralogical composition of the leached coal and blend ash samples prepared at 700°C with 6.12 M H₂SO₄ solution, using 1:5 and 1:10 S/L ratios (wt.%)
Mineralogical composition of the coal and blend ash samples produced at 1050°C leached with 6.12 M H₂SO₄ solution, using 1:5 and 1:10 S/L ratios (wt.%)
Calcite 0.4 0.3 0.4 0.1 0.3 Dolomite 0.3 0.3 0.2 0.8 0.1 Portlandite 0.1 0.1 Muscovite 0.1 0.1 0.5 0.1 0.3 0.2 Microcline 0.3 Anatase 0.3
Microcline 0.8 0.9 17.0 0.9 Pseudomullite 0.9 1.3 0.5 1.8 7.4 2.2
S/L ratio 1:5 1:10 1:5 1:10 1:5 1:10
Dissolution efficiencies of Al, K, and Ti as calculated from XRF results
Gypsum 0.7 0.6 0.8 0.1 0.8 K₂CO₃ 0.5 1.3 0.5
Table VII
S/L ratio 1:5 1:10 1:5 1:10 1:5 1:10
Sample temp SA1 SA2 blend SA3
The dissolution efficiencies for Al, K, and Ti as calculated from the XRF results after H₂SO₄ leaching of the coal ash samples are presented in Figure 5. Sulphuric acid leaching of the SA1 ash, produced at 700°C with the 6.12 M H₂SO₄ using a 1:5 S/L ratio, achieved higher dissolution efficiencies of Al, K, and Ti compared
Quartz 40.0 40.1 0.5 0.6 25.4 32.0
Illite 0.7 0.3 Cristobalite 0.1 0.4 Anatase 1.3 Graphite 0.9
Total 100.0 100.0 100.0 100.0 100.0 100.0
Pyrrhotite 0.1 Rutile 0.1 0.2 Amorphous 66.4 66.7 64.5 63.5 73.6 63.5
linked to the carbonation of calcium and magnesium oxides, as well as the in-situ capturing of sulphur dioxide to form calcium sulphates during leaching.
Anhydrite 4.1 3.3 23.1 25.0 7.6 9.9 Gypsum 1.0 1.5 1.9 1.1 0.8 1.0
K₂CO₃ 0.8 1.2 0.8 1.0 0.5 0.7
Production of Al(III)-K(I)-Ti(IV)-sulphate-containing leach liquor from metakaolinite
In addition, quartz and metakaolinite could dissolve in the potassium carbonate melt during heating of the SA2 blend at 1050°C, and microcline/anorthite could crystallize during the cooling of the ash melt (Table VIII). As expected, the mineralogical properties of the leached ash samples differ significantly from those of the original ash samples (Tables III, IV, VII, and VIII). This can be ascribed to the dissolution of soluble minerals in the H₂SO₄ solution and alumina associated with metakaolinite and Al, Ti, K, Mg and Fe from other aluminosilicate glasses of illite, muscovite and microcline. Furthermore, the significant difference in the mineralogical properties could be
The low dissolution efficiencies of Al and K for the SA1 ash samples produced at 1050°C are due to the presence of springly soluble and insoluble minerals (pseudomullite, silicon spinel, and Ca-anorthite/K-microcline in the ash samples. The interactions of association minerals (calcite/dolomite/K₂CO₃ associated with kaolinite) at temperatures of >1000°C resulted in the formation of aluminosilicate melts with K, Fe, and Ca impurities (Klopper, Strydom, and Bunt, 2012). Pseudomullite, anorthite, and synthetic potassium feldspars can subsequently crystallize from this molten solution or partially melted particles. These minerals, which are sparely soluble or insoluble in the sulphuric acid solution, can also be formed at 600-700°C via solid-state reactions (Heller-Kallai, 1978; Heller-Kallai and Lapides, 2003, Matjie et al., 2021).
483The Journal of the Southern African Institute of Mining and Metallurgy VOLUME 122 AUGUST 2022
Leaching experiments of the SA3 ash sample prepared at 700°C, with 6.12 M H₂SO₄ using a 1:5 S/L ratio, yielded higher dissolution efficiencies of Al and K (Figure 5) compared to those of the SA3 ash produced at 700°C using a solid to liquid ratio of 1:10. Lower or zero dissolution efficiency of Ti was achieved by H₂SO₄ leaching of SA3 ashes using solid to liquid ratios of either 1:5 or 1.10. The lower dissolution efficiency of Ti from the SA3 ash, could be due to either a lower Ti content in the original coal sample or the association of Ti with minerals and glassy phases in these ashes which are insoluble in sulphuric acid. The SA3 ash sample prepared at 1050°C achieved the lowest dissolution efficiency of Al, K, and Ti (Figure 5) when leached with the 6.12 M H₂SO₄ at either 1:5 S/L or 1:10 S/L.
to the SA1 ash prepared at 1050°C (Figure 5). The 1:10 S/L ratio attained higher dissolution efficiencies of Al, K, and Ti compared to the SA1 ashes prepared at 1050°C (Figure 5). Also, as the volume/concentration of sulphuric acid solution is increased, precipitation of gelatinous calcium sulphate increases. This can subsequently result in lower dissolution efficiencies of Al and K species during H₂SO₄ leaching of the ash samples with higher proportions of CaO. This gelatinous calcium sulphate lost water when heated at 80°C to form anhydrite (Tables VII and VIII).
The low Ti dissolution efficiencies could be due to Ti being captured in the insoluble crystalline phases in ashes formed during combustion. Also, insufficient free sulphuric acid in the leach liquor could contribute to the lower dissolution efficiency of Ti from rutile and anatase.
Low dissolution efficiencies of these elements are attributed to the formation of significant amounts of gelatinous calcium sulphate precipitate and the presence of pseudomullite, silicon spinel, microcline, and anorthite in the ash samples. An Al dissolution efficiency of 85% was obtained by Matjie, Bunt, and van Heerden (2005) when sintered pellets of another South African fly ash, and quicklime (CaO) were leached with 6.12 M H₂SO₄ at a temperature of 80°C for 8 hours. Torma (1983) obtained a maximum Al dissolution efficiency of 99% after the H₂SO₄ leaching of calcined pellets, which comprise fly ash from
ash prepared at 1050°C with a S/L ratio of 1:10 achieved higher dissolution efficiencies of Al and K than those of SA3 ashes samples prepared at 1050°C. The high dissolution efficiencies for Al and K (Figure 5) from the SA2 blend ash samples prepared at 700°C are due to the dissolution of Al and K from metakaolinite, the aluminosilicates of illite and microcline, K₂CO₃ remnants, and soluble K melt present in these ash samples. These soluble potassium-containing species in the ash could react with sulphuric acid to form potassium sulphate, which in turn could prevent the formation of gelatinous calcium sulphate precipitate (Klopper, Strydom, and Bunt, 2012).
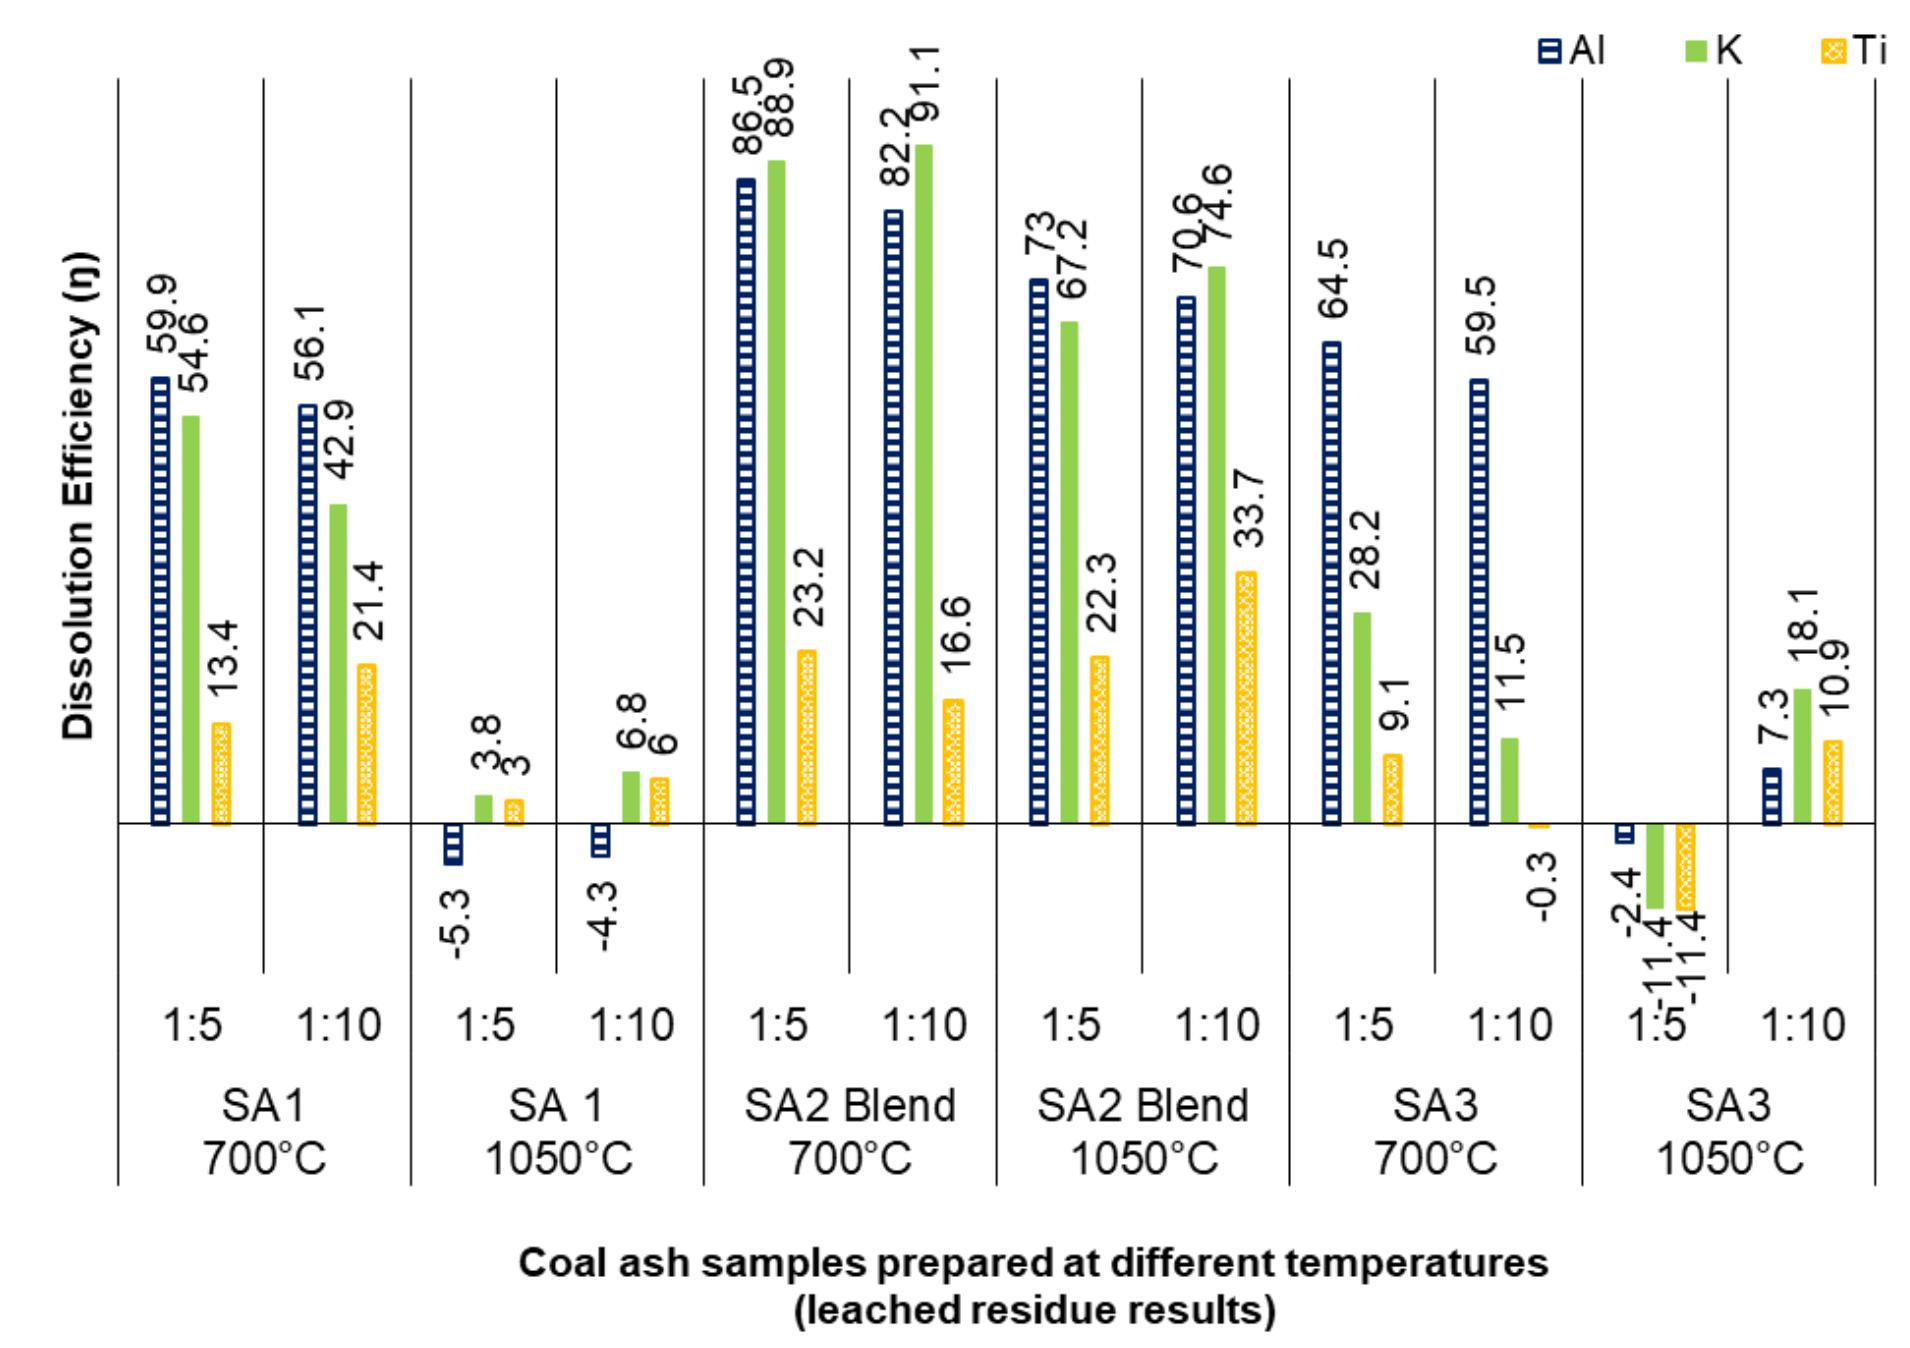
The SA2 blend ash samples prepared at 700°C achieved the highest dissolution efficiency of Al, and K (Figure 5) when leached with the 6.12 M H₂SO₄ using S/L ratios of either 1:5 or 1:10 compared to those of SA2 blend ashes produced at 1050°C. A similar dissolution efficiency of Ti was attained after leaching SA2 blend ashes produced at either 700°C or 1050°C with 6.12 M H₂SO₄ using S/L ratios of 1:5 and 1:10. The leaching of SA1
Figure 5—Dissolution efficiencies () for Al, K, and Ti as determined from XRF analysis of leached and original ash samples (leaching conditions 6.12 M H₂SO₄, 80°C, 8 hours, S/L ratio 1:5 and 1:10) Note: Negative dissolution efficiencies of Al and K imply that either Al or K in potassium feldspar, pseudomullite, silicon spinel and microcline, formed at 1050°C which are insoluble in the sulphuric acid solution, resulted in extrapolation errors. Also, a negative dissolution effi ciency of Ti implies Ti in Ti-containing minerals formed at 1050°C during the combustion of coal samples polymerized to form insoluble agglomerates in the sulphuric acid solution
Production of Al(III)-K(I)-Ti(IV)-sulphate-containing leach liquor from metakaolinite
In this study, the Al as alumina from metakaolinite, K from potassium carbonate melt and potassium carbonate/sulphate, and Ti from rutile/anatase contained in the coal ash samples were selectively dissolved in concentrated sulphuric acid solution.
As expected, the mineralogical and chemical properties of the ashes leached with sulphuric acid are significantly different to those of the original ash samples (Tables II-IV). This can be attributed to the dissolution of K₂CO₃ remnants and K ions contained in the potassium melt, Al associated with metakaolinite, and soluble Al, K, and Ti species contained in the aluminosilicate glasses in sulphuric acid. Low carbonation of calcium oxide and magnesium oxide to form calcite and dolomite (estimated to be <20% CO₂ in-situ captured) respectively, as well as the in-situ capturing of sulphur dioxide with free CaO to form calcium sulphates (estimated to be >90% SO₂ in-situ captured) in the leaching tests and are associated with the significant differences in mineralogical and chemical properties of the leached ashes. Also, the gelatinous calcium sulphate precipitation that forms during the sulphuric acid leaching of coal ashes can contribute to different mineralogical properties of the leached ashes.
The proposed process for recovery of Al, Ti, and K from metakaolinite-rich coal ashes and ashes of coal fines blended with 10% K₂CO₃ additive using the H₂SO₄ leaching should be subjected to an economic evaluation.
All ash samples containing H₂SO₄ -soluble species of Al associated with metakaolinite, soluble K associated with the
potassium melt, and the added K₂CO₃ remnants formed at 700°C achieved higher dissolution efficiencies of aluminium and potassium compared to the ash samples containing pseudomullite, silicon spinel, microcline and anorthite prepared at 1050°C. The SA2 blend ash prepared at 700°C achieve the highest Al dissolution efficiencies of 87% and 82%, and highest K dissolution efficiencies of 89% and 91% during leaching with 6.12 M H₂SO₄ using 1:5 ratios of and 1:10, respectively. The higher dissolution efficiencies can be attributed to the presence of metakaolinite containing acid-soluble Al₂O₃ and aluminosilicate glasses with soluble species of Al, K, Ti and potassium carbonate remnants in these ash samples, which are soluble in the sulphuric acid solution.Theresults indicate that the leaching efficiency of certain metallic and non metallic species from metakaolinite-rich coal ash containing soluble K, Al, and Ti species in the aluminosilicate glasses produced at 'lower' temperatures can be improved by the addition of K₂CO₃. This is particularly applicable to fluidized-bed combustion ashes.
Recommendations
Production of Al(III)-K(I)-Ti(IV)-sulphate-containing leach liquor from metakaolinite
The recovery of soluble aluminium and potassium species from coal ash and ash with a potassium additive prepared under conditions used in this study may be possible with 6.12 M H₂SO₄ leaching step. The aluminium(III), potassium(I), titanium(IV) and sulphate-containing leach liquor could be utilized as coagulant in water treatment. The leach liquor could also be subjected to solvent extraction produce pure iron-free aluminium sulphate solution for utilization in paper mills and dye manufacturing. Titanium sulphate solution is used as a mordant in dyeing, and TiO₂ in paint, coatings, paper, pigments, and chemical industries and water treatment; and potassium sulphate liquid as fertilizer. In addition, the leached residues, neutralized with quicklime, could be utilized as aggregate in the road and building industries, brick manufacturing, and masonry concrete applications. Furthermore, the ashes derived from the existing low-temperature combustion of coal via fluidized-bed combustion or gasification technologies could be an excellent feedstock for mineral recovery.
Based on the results the following conclusions can be drawn: Ashes of kaolinite-rich coals (SA1 and SA3) have comparable chemical and mineralogical properties. The corresponding metakaolinite-rich ash samples from kaolinite-rich coals that were produced at either 700°C or 1050°C have similar chemical properties but different mineralogical properties, apart from the ash of coal SA2 blend with 10% K₂CO₃ additive.
Acknowledgements
The information presented in this paper is based on research financially supported by the South African Research Chairs Initiative (SARChI) of the Department of Science and Technology and National Research Foundation of South Africa (Coal Research Chair Grant No. 86880). Any opinion, finding, or conclusion or recommendation expressed is that of the authors and the NRF does not accept any liability in this regard. The authors would also like to acknowledge Mrs B. Venter for the XRF and XRD analyses. We also would like to acknowledge Mintek researchers for providing the laboratory rotary kiln and muffle furnace for the preparation of coal ashes at lower temperatures for the H₂SO₄ leaching experiments. Mr Katlego Mphahlele is thanked for preparing the figures and tables, as well as the preparation of coal and K₂CO₃ blends for XRD and XRF analysis.
Conclusions
All ash samples produced at 1050°C contain lower proportions of amorphous phase (metakaolinite and aluminosilicate glasses of illite, muscovite, and microcline), higher proportions of pseudomullite, silicon spinel, K-feldspar, and anorthite than all ash samples prepared at 700°C, except for the SA2 blend ash. The metakaolinite in coal ash samples transformed at 1050°C to silicon spinel and pseudomullite as the ashing temperatures increased during combustion of the coals.
an overseas power station and calcium carbonate. Van der Merwe et al. (2017) showed a low dissolution efficiency of 47% for Al using conventional hydrometallurgical methods to selectively solubilize Al from an ultrafine South African coal fly ash using ammonium sulphate/sulphite solution. All ash samples containing metakaolinite (alumina soluble in H₂SO₄ and silica insoluble in H₂SO₄), amorphous glasses of illite and microcline, and potassium carbonate remnants prepared at 700°C achieved the highest dissolution efficiencies of aluminium and potassium compared to the 1050°C ash samples containing pseudomullite, silicon spinel, microcline, and anorthite. Microcline and potassium feldspar, which are insoluble in H₂SO₄, are associated with the calculated negative dissolution efficiencies of Al and K and resulted in the extrapolation errors. Furthermore, the calculated negative dissolution efficiency of titanium could be attributed to the polymerization or hydrolysis of titanium species to produce agglomerates that are insoluble in sulphuric acid. According to Han, Rubcumintara, and Fuerstenau (1987) and Lasheen (2009) titanium polymerizes to produce hydrolysed titanium agglomerates which are insoluble in sulphuric acid.
484 AUGUST 2022 VOLUME 122 The Journal of the Southern African Institute of Mining and Metallurgy
Chinchón, J.S.E., Va’zquez, A., Alastuey, A ., and López-Soler, A. 1993. X-ray diffraction analysis of oxidisable sulphides in aggregates used in concrete. Materials and Structures, vol. 26. pp. 24–29.
Altiokka, M.R., Akalin, H., Melek, N., and Akyalcin, S. 2010. Investigation of the dissolution kinetics of meta-kaolin in H₂SO₄ solution. Industrial and Engineering Chemistry Research. vol. 49. pp. 12379–12382.
Bryers, R.W. 1986. Influence of segregated mineral matter in coal. Mineral Matter and Ash in Coal. Vorres, K., (ed). American Chemical Society. pp. 351–374
Heller-Kallai, L. and Lapides, I. 2003. Thermal reactions of kaolinite with potassium carbonate. Journal of Thermal Analysis and Calorimetry, vol. 71. pp. 689–698.
Lasheen, T.A. 2009. Sulphate digestion process for high purity TiO2 from titania slag. Front. Chem. Eng. China, vol. 3. pp. 155–160.
Ginster, M. and Matjie, R.H. 2005. Beneficial utilisation of Sasol coal gasification ash. Proceedings of World of Coal Ash (WOCA) Conference. Center for Applied Energy Research, Lexington, University of Kentucky, KY. http://www.flyash.
Glover,info/G.,
Muzenda, E. 2014. Potential uses of South African coal fines: A review. Proceeidngs of the 3rd International Conference on Mechanical, Electronics and Mechatronics Engineering. pp. 37–39.
van Der Walt, T.J., Glasser, D., Prinsloo, N.M., and Hildebrandt, D. 1995. DRIFT spectroscopy and optimal reflectance of heat-treated coal from a quenched gasifier. Fuel, vol. 74. pp. 1216−1219.
Ibrahim, K.M., Moumani, M.K., and Mohammad, S.K. 2018. Extraction of -alumina from low-cost kaolin. Resources, vol. 7, no. 63. pp. 2−12.
Mark, U., Anyakwao, C.N., Onyemaobi, O., and Nwobodo, C.S. 2019. The thermal activation of Nsu clay for enhanced alumina leaching response. International Journal of Engineering and Technologies, vol. 16. pp. 34−46.
Moyo, A., Filho, J.A., Harrison, S., and Broadhurst, J. 2018. Characterising the environmental risks of coal preparation wastes: A study of fine coal slurry waste and discards from South African collieries. Proceedings of the11th ICARD | IMWA | MWD Conference – 'Risk to Opportunity'. pp. 417–423.
Khan, M. I., Ullah, K.H., Khairun Azizi, A., Sufian, S., Man, Z., Siyal, A., Muhammad, N., and Rehman, M. 2017. The pyrolysis kinetics of the conversion of Malaysian kaolin to metakaolin. Applied Clay Science, vol. 146. pp. 152–161.
Matjie, R.H., van Alphen, C., and Pistorius, P.C. 2006. Mineralogical characterisation of Secunda gasifier feedstock and coarse ash. Minerals Engineering, vol. 19. pp. 256−261.
Neupane, G. and Donahoe, R.J. 2013. Leachability of elements in alkaline and acidic coal fly ash samples during batch and column leaching tests. Fuel, vol. 104. pp. 758−770.
Collins, A. C. 2019. Extraction of K, AI and Ti containing compounds from ash produced by low temperature combustion. PhD thesis, North-West University: Potchefstroom, South Africa.
485The Journal of the Southern African Institute of Mining and Metallurgy VOLUME 122 AUGUST 2022
Freeman, M.J. 1993. The manufacture of alumina in South Africa Mintek, Randburg, South Africa.
Bunt, J.R. 2006. A new dissection methodology and investigation into coal property transformational behaviour impacting on a commercial-scale Sasol-Lurgi MK IV fixed-bed gasifier. PhD thesis, North-West University: Potchefstroom, South Africa.
Hattingh, B.B., Everson, R.C., Neomagus, H.W.J.P., and Bunt, J.R. 2011. Assessing the catalytic effect of coal ash constituents on the CO₂ gasification rate of high ash, South African coal. Fuel Processing Technology, vol. 92. pp. 2048−2054.
Production of Al(III)-K(I)-Ti(IV)-sulphate-containing leach liquor from metakaolinite
Matjie, R.H., Bunt, J.R., and van Heerden, J.H.P. 2005. Extraction of alumina from coal fly ash generated from a selected low rank bituminous South African coal. Minerals Engineering, vol. 18. pp. 299−310.
Collins, A.C., Strydom, C.A., van Dyk, J.C., and Bunt, J.R. 2018. FACTSAGE™ thermo-equilibrium simulations of mineral transformations in coal combustion ash. Journal of Southern African Institute of Mining and Metallurgy, vol. 218. pp. 1059–1066.
Department of Environmental Affairs. 2018. South Africa – State of waste report. 2nd draft report. Government Printer, Pretoria.
Kolay, P.K. 2001. Physical, chemical, mineralogical, and thermal properties of cenospheres from an ash lagoon. Cement and Concrete Research, vol. 31. pp. Kyriakogona,539−542.K., Giannopoulou, I., and Panias, D. 2017. Extraction of aluminium from kaolin: A comparative study of hydrometallurgical processes. Proceedings of the 3rd World Congress on Mechanical, Chemical, and Material Engineering (MCM'17), Paper no. MMME 133. https://doi: 10.11159/mmme17.133
Izquierdo, M. and Querol, X. 2012. Leaching behaviour of elements from coal combustion fly ash: An overview. International Journal of Coal Geology, vol. 94. pp. 54−66.
Hlatshwayo, T.B., Matjie, R.H., Li, Z., and Ward, C.R. 2009. Mineralogical characterisation of Sasol feed coals and corresponding gasification ash constituents. Energy & Fuels, vol. 23. pp. 2867−2873.
References
Burnet, G., Murtha, M.J., and Dunker, J.W. 1984. Recovery of metals from coal ash. DOE Iowas State University Ames: Ames Laboratory
Department of Environmental Affairs. 2012. National waste information baseline. Pretoria.
Heller-Kalla, L. 1978. Reactions of salts with kaolinite at elevated temperatures. Clay Miner, vol. 13. pp. 221.
Matjie, R., Bunt, J., Stokes, W., Bijzet, H., Mphahlele, K., Uwaoma, R ., and Strydom, C. 2021. Interactions between kaolinite, organic matter, and potassium compounds at elevated temperatures during pyrolysis of caking coal and its density-separated fractions. 2021. Energy Fuels, vol. 35. pp. 13268−13280.
Matjie, R.H., Lesufi, J. M., Bunt, J.R., Strydom, C.A., Schobert, H.H., and Uwaoma, R. 2018. In situ capturing and absorption of sulfur gases formed during thermal treatment of South African coals. ACS Omega, vol. 3. pp. 14201−14212.
Barry, T.S., Uysal, T., Birinci, M., and Erdemoglu, M. 2018. Thermal and mechanical activation in acid leaching processes of non-bauxite ores available for alumina production—A review. The Society for Mining, Metallurgy and Exploration
Klopper, L., Strydom, C.A., and Bunt, J.R. 2012. Influence of added potassium and sodium carbonates on CO₂ reactivity of the char from a demineralised inertinite rich bituminous coal. Journal of Analytical and Applied Pyrolysis, vol. 96. pp. 188−195.
Han, K.N., Rubcumintara, T., and Fuerstenau, M.C. 1987. Leaching behavior of ilmenite with sulphuric acid. Metallurgical Transaction B, vol. 18. pp. 325–330.
Badenhorst, C. 2019. Char extracted from coal ash as a replacement for natural graphite – 'Charphite'. PhD thesis University of Johannesburg, South Africa. pp. 21–31
Alguacil, F.J., Amer, S., and Luis, A. 1987. The application of Primene 81R for the purification of concentrated aluminium sulphate solutions from leaching of clay minerals. Hydrometallurgy, vol. 18. pp. 75−92.
Phillips, C.V. and Wills, K.J. 1982. A laboratory study of the extraction of alumina of smelter grade from China clay micaceous residues by nitric acid route. Hydrometallurgy, vol. 9. pp. 15−28.
Seferinoglu, M. 2003. Acid leaching of coal and coal-ashes. Fuel, vol. 82. pp. 1721−1734.
Speukman, S.A. 2012. Basics of X-ray powder diffraction. http://prism.mit.edu/xray [accessed 14 February 2019].
Teklay, A., Yin, C., Rosendahl, L., and Bøjer, M. 2014. Calcination of kaolinite clay particles for cement production: A modelling study. Cement and Concrete. Research, vol. 61-62. pp. 11–19.
Van Dyk, J.R., Benson, S.A., Laumb, M.L., and Waanders, B. 2009. Coal and coal ash characteristics to understand mineral transformations and slag formation. Fuel, vol. 88. pp. 1057−1063.
Vassilev, S.T. 2004. Phase-mineral and chemical composition of coal fly ashes as a basis for their multicomponent utilisation. 2. Characterisation of ceramic cenosphere and salt concentrates. Fuel, vol. 83. pp. 585−603.
Van Dyk, J.C., Waanders, F.B., and Hack, K. 2008. Behaviour of calcium-containing minerals in the mechanism towards in situ CO₂ capture during gasification. Fuel, vol. 87. pp. 2388−2393.
Osawa, C.C. and Bertran, C.A. 2005. Mullite formation from mixtures of alumina and silica sols: Mechanism and pH Effect. Journal of the Brazilian Chemical Society, vol. 16. pp. 251−258.
Seidel, A. 1999. Self-inhibition of aluminium leaching from coal fly ash by sulfuric acid. Chemical Engineering Journal, vol. 72. pp. 195−207.
Uwaoma, R.C., Strydom, C.A., Matjie, R.H., Bunt, J.R., and Van Dyk, J.C. 2020. The influence of the roof and floor geological structures on the ash composition produced from coal at UCG temperatures. International Journal of Coal Preparation and Utilisation, vol. 40. pp. 247−265.
Wu, C., Yu, H., and Zang, H. 2012. Extraction of aluminium by pressure acidleaching method from coal fly ash. Transaction of the Nonferrous Metals Society of China, vol. 22. pp. 2282−2288.
Yanti, E.D., and Pratiwi, I. 2018. Correlation between thermal behaviour of clays and their chemical and mineralogical composition: a review. Earth and Environmental Science, vol. 118. pp. 1−4. u
Reynolds-Clause, K. and Singh, N. 2019. South Africa’s power producer’s revised coal ash strategy and implementation progress. Coal Combustion and Gasification Products, vol. 11. pp. 10−17. http://www.flyash.info/
Van der Merwe, E.M., Gray, C.L., Castleman, B.A., Mohamed, S., Kruger, R.A., and Doucet, F.J. 2017. Ammonium sulphate and/or ammonium bisulphate as extracting agents for the recovery of aluminium from ultrafine coal fly ash. Hydrometallurgy, vol. 171. pp. 185−190.
Rautenbach, R., Matjie, R., Strydom, C., and Bunt, J. 2021. Transformation of inherent and extraneous minerals in feed coals of commercial power stations and their density-separated fractions. Energy Geoscience, vol. 2. pp. 136−147.
Paul, M., Seferinoglu, M., Aycik, G.A., Sandstrom, Å., Smith, M.L., and Paul, J. 2006. Acid leaching of ash and coal: Time dependence and trace element occurrences. International Journal of Mineral Processing, vol. 79. pp. 27−41.
Norrish, K. and Hutton, J.T. 1969. An accurate X-ray spectrographic method for the analysis of a wide range of geological samples. Geochimica et Cosmochimica Acta, vol. 33. pp. 431−453.
Reddick, J.F., von Blottnitz, H., and Kothuis, B. 2007. A cleaner production assessment of the ultra-fine coal waste generated in South Africa. Journal of the Southern African Institute of Mining and Metallurgy, vol. 107. pp. 55−60.
Sangita, S., Nayak, N., and Panda, C.R. 2017. Extraction of aluminium as aluminium sulphate from thermal power plant ashes. Transaction of the Nonferrous Metals Society of China, vol. 27. pp. 2082−2089.
Torma, A.E. 1983. Extraction of Aluminium from fly ash. Metals, vol. 37. pp. 589−592.
Van Alphen, C. 2005. Factors influencing fly ash formation and slag deposit formation (slagging) on combusting a South African pulverised fuel in a 200MWe boiler. PhD thesis, University of the Witwatersrand.
Production of Al(III)-K(I)-Ti(IV)-sulphate-containing leach liquor from metakaolinite
Numluk, P. and Chaisena, A. 2012. Sulfuric acid and ammonium sulphate leaching of alumina from Lampang clay. E-Journal of Chemistry, vol. 9. pp. 1364−1372.
486 AUGUST 2022 VOLUME 122 The Journal of the Southern African Institute of Mining and Metallurgy
Rautenbach, R., Strydom, C. A., Bunt, J. R., Matjie, R. H., Campell, Q. P., and van Alphen, C. 2019. Mineralogical, chemical, and petrographic properties of selected South African power stations' feed coals and their corresponding density separated fractions using float-sink and reflux classification methods. International Journal of Coal Preparation and Utilization, vol. 39. pp. 421−446.
Rietveld, H.M. 1969. A profile refinement method for nuclear and magnetic structures. Journal of Applied Crystallography, vol. 2. pp. 65−71.
E-mail: Website:camielah@saimm.co.zahttp://www.saimm.co.za
2023 — 8TH Sulphur and Sulphuric Acid Conference 2023
13–17 November 2022 — Copper 2022 Santiago, Chile Website: https://copper2022.cl/
12–13 October 2022 — Mine-Impacted Water Hybrid Conference 2022 ´Impacting the Circular Economy´ Mintek Randburg, South Africa
´Environment/Energy - CO2 Emissions´ Fédération Nationale Des Travaux Publics (FNTP), Paris
15–20 September 2022 — Sustainable Development in the Minerals Industry 2022 10TH Internationl Hybrid Conference (SDIMI) ´Making economies great through sustainable mineral development´ Windhoek Country Club & Resort, Windhoek, Namibia
Fifth International Conference on Block and Sublevel Caving Hilton Adelaide, South Australia Website: https://www.acgcaving.com/
31 August–1 September 2022 — Caving 2022
8-14 September 2022 — 32ND Society of Mining Professors Annual Meeting and Conference 2022 (SOMP) Windhoek Country Club & Resort, Windhoek, Namibia
Contact: Camielah Jardine Tel: 011 538-0238
E-mail: Website:camielah@saimm.co.zahttp://www.saimm.co.za
4–6 October 2022 — 18TH MINEX Russia Mining and Exploration Forum Website:Moscow organisers/https://2021.minexrussia.com/en/contact-forum-
Contact: Camielah Jardine
26 October 2022 — 18TH Annual Student Colloquium 2022 Mintek Randburg, South Africa Contact: Gugu Charlie Tel: 011 538-0238 E-mail: Website:gugu@saimm.co.zahttp://www.saimm.co.za
13-16 December 2022 — 4TH International Conference on Science and Technology of Ironmaking and Steelmaking Indian Institute of Technology Bombay (IIT Bombay) Website: http://stis2022.org/
13–15 June 2023 — Copper Cobalt Africa in association with the 10th Southern African Base Metals Conference Avani Victoria Falls Resort, Livingstone, Zambia Contact: Camielah Jardine E-mail: Website:camielah@saimm.co.zahttp://www.saimm.co.za
13-162023March
Contact: Lileen.Lee@wits.ac.za Website: https://www.wits.ac.za/wmi/
11 November 2022 — 17TH Annual Student Colloquium 2022 Online Contact: Gugu Charlie Tel: 011 538-0238 E-mail: Website:gugu@saimm.co.zahttp://www.saimm.co.za
Contact: Camielah Jardine Tel: 011 538-0238
2–4 November 2022 — PGM The 8TH International Conference 2022 Sun City, Rustenburg, South Africa Contact: Camielah Jardine Tel: 011 538-0238 E-mail: Website:camielah@saimm.co.zahttp://www.saimm.co.za
Contact: Camielah Jardine Tel: 011 538-0238
E-mail: Website:camielah@saimm.co.zahttp://www.saimm.co.za
2022 The Journal of the Southern African Institute of Mining and Metallurgy VOLUME 122 AUGUST 2022 ix ◀
20–21 September 2022 — 4TH Manganese School
5–6 September 2022 — Implications of S-K1300 regulations and disclosures for dual-listed companies on the JSE and NYSE Online Webinar
E-mail: Website:camielah@saimm.co.zahttp://www.saimm.co.za
27-28 September 2022 — Wits Mining Institute Seminar
Contact: Gugu Charlie Tel: 011 538-0238
E-mail: Website:gugu@saimm.co.zahttp://www.saimm.co.za
7–8 November 2022 — SANCOT Symposium 2022 ´Tunnel boring in civil engineering and mining´ Wallenberg Conference Centre @ STIAS, Stellenbosch, Western Cape, South Africa Contact: Gugu Charlie Tel: 011 538-0238 E-mail: Website:gugu@saimm.co.zahttp://www.saimm.co.za
Contact: Camielah Jardine Tel: 011 538-0238
NATIONAL & INTERNATIONAL ACTIVITIES
Tel: 011 538-0238 E-mail: Website:camielah@saimm.co.zahttp://www.saimm.co.za
28 November –1 December 2022 — South African Geophysical Association’s 17TH Biennial Conference & Exhibition 2022 Sun City, South Africa Website: https://sagaconference.co.za/
The Vineyard Hotel, Newlands, Cape Town, South Africa Contact: Gugu Charlie E-mail: Website:gugu@saimm.co.zahttp://www.saimm.co.za
28–29 September 2022 — Thermodynamic from Nanoscale to Operational Scale (THANOS) International Hybrid Conference 2022 on Enhanced use of Thermodynamic Data in Pyrometallurgy Teaching and Research Mintek, Randburg, South Africa
ANDRITZ Delkor(Pty) Ltd
MDM Technical Africa (Pty) Ltd Metalock Engineering RSA (Pty)Ltd Metorex Limited
Allied Furnace Consultants
Bafokeng Rasimone Platinum Mine Barloworld Equipment -Mining
Aveng Mining Shafts and Underground Axiom Chemlab Supplies (Pty) Ltd
AECOM SA (Pty) Ltd
CSIR Natural Resources and the Environment (NRE)
AureconASPASA South Africa (Pty) Ltd
DTP Mining - Bouygues Construction
EHLDurasetConsulting Engineers (Pty) Ltd
Digby Wells and Associates
MD Mineral Technologies SA (Pty) Ltd
▶ x AUGUST 2022 VOLUME 122 The Journal of the Southern African Institute of Mining and Metallurgy
Ex Mente Technologies (Pty) Ltd
Geobrugg Southern Africa (Pty) Ltd
MIPMintekProcess Technologies (Pty) Limited
Expectra 2004 (Pty) Ltd
Immersive Technologies
Equipment (Pty) Ltd
AMIRA International Africa (Pty) Ltd
Axis House (Pty) Ltd
Ingwenya Mineral Processing (Pty) Ltd
Loesche South Africa (Pty) Ltd Longyear South Africa (Pty) Ltd Lull Storm Trading (Pty) Ltd Maccaferri SA (Pty) Ltd Magnetech (Pty) Ltd Magotteaux (Pty) Ltd
Huawei Technologies Africa (Pty) Ltd
Micromine Africa (Pty) Ltd MineARC South Africa (Pty) Ltd Minerals Council of South Africa Minerals Operations Executive (Pty) Ltd
The following organizations have been admitted to the Institute as Company Affiliates
Ivanhoe Mines SA
Bouygues Travaux Publics
Royal Bafokeng Platinum Roytec Global (Pty)
Murray and Roberts Cementation Nalco Africa (Pty) Ltd Namakwa Sands(Pty) Ltd Ncamiso Trading (Pty) Ltd
Caledonia Mining South Africa Plc Castle Lead Works
DRA Mineral Projects (Pty) Ltd
Hatch (Pty)
CDM Group
Paterson & Cooke Consulting Engineers (Pty) Ltd
Filtaquip (Pty) Ltd
G H H Mining Machines (Pty) Ltd
MineRP Holding (Pty) Ltd Mining Projections Concepts
eThekwini Municipality
Fluor Daniel SA (Pty) Ltd
3M South Africa (Pty) Limited
Air Liquide (Pty) Ltd
GravitasGlencoreMinerals (Pty) Ltd
Malvern Panalytical (Pty) Ltd Maptek (Pty) Ltd
Joy Global Inc.(Africa)
Coalmin Process Technologies CC Concor Opencast Mining
AMEC Foster Wheeler
Company affiliates
Data Mine SA
CGG Services SA
Elbroc Mining Products (Pty) Ltd
Alexander Proudfoot Africa (Pty) Ltd
Concor Technicrete Council for Geoscience Library
Bond Equipment (Pty) Ltd
BCL BeckerLimitedMining (Pty) Ltd
PolysiusPerkinelmerADivision of Thyssenkrupp Industrial Sol Precious Metals Refiners Rams Mining Technologies Rand Refinery Limited
Maxam Dantex (Pty) Ltd MBE Minerals SA Pty Ltd MCC Contracts (Pty) Ltd
Hall Core Drilling (Pty) Ltd
Metso Minerals (South Africa) (Pty) Ltd
WorleyWeldingWeirWebberUmgeniUkwaziTrakaTomraTimriteTimeSRKSoundSmecSISASenminSENETSebiloSchauenburgSANIRERSASandvikDelmasSandvikSaleneRustenburgRungePincockMinarcoLtdLimitedPlatinumMinesLimitedMining(Pty)LtdMiningandConstruction(Pty)LtdMiningandConstruction(Pty)Ltd(Pty)LtdResources(Pty)Ltd(Pty)LtdInternational(Pty)LtdInspection(Pty)LtdSouthAfricaMiningSolution(Pty)LtdConsultingSA(Pty)LtdMiningandProcessing(Pty)Ltd(Pty)Ltd(Pty)LtdAfrica(Pty)LtdMiningSolutions(Pty)LtdWaterWentzelMineralsAfricaAlloysSouthAfrica
BedRock Mining Support (Pty) Ltd
CRONIMET Mining Processing SA (Pty) Ltd
BHP Billiton Energy Coal SA Ltd Blue Cube Systems (Pty) Ltd
Bluhm Burton Engineering (Pty) Ltd
Exxaro Coal (Pty) Ltd
FLSmidth Minerals (Pty) Ltd
MLB Investment CC Modular Mining Systems Africa (Pty) Ltd MSA Group (Pty) Ltd Multotec (Pty) Ltd
BASF Holdings SA (Pty) Ltd
Aveng Engineering
Kudumane Manganese Resources Leica Geosystems (Pty) Ltd
Arcus Gibb (Pty) Ltd
Franki Africa (Pty) Ltd-JHB Fraser Alexander (Pty) Ltd
Anglo Operations Proprietary Limited Anglogold Ashanti Ltd
Exxaro Resources Limited
HPEHerrenknechtLtdAGHydroPower
IMS Engineering (Pty) Ltd
Northam Platinum Ltd - Zondereinde Opermin Operational Excellence OPTRON (Pty) Ltd
AEL Mining Services Limited African Pegmatite (Pty) Ltd
Redpath Mining (South Africa) (Pty) Ltd Rocbolt Technologies Rosond (Pty) Ltd
In person presentations will be preferred, although virtual presentations may be streamed live or preProspectiverecorded. authors are invited to submit titles and abstracts of their papers and/or presentations in English.•Authors must note whether they wish to submit a peer reviewed paper or a standalone presentation.
WHO SHOULD ATTEND Geologists Mineral (diamond) resource managers Mining engineers Process engineers Consultants Suppliers Sales/marketing Diamantaires Mine managers Mining companies Students
Abstract acceptance 6 March 2023
DATE: 25-26 JULY 2023
OBJECTIVE
The objective of the conference is to provide a forum for the dissemination of information relating to the latest tools and techniques applicable to all stages of the diamond industry, from exploration through mine design, processing, to cutting, marketing, and sales.

TOPICS COVID-19 and impact on diamond sales Geology and exploration Mine expansion projects Mining, metallurgy, and processing technology Rough diamond sales and marketing Cutting, polishing, and retail Project Management Financial services and industry analysis Industry governance, beneficiation, and legislation Mine-specific case-studies.
Paper submission (if applicable) 3 April 2023
VENUE BIRCHWOOD HOTEL AND OR TAMBO CONFERENCE CENTRE, BOKSBURG, JOHANNESBURG
For further information contact: Camielah Jardine, Head of Conferencing E-mail: camielah@saimm.co.za Tel: +27 11 538-0237, Web: www.saimm.co.za
Abstract submission 20 February 2023
The complete Proceedings volume will be made available on the internet for public access after the Limitedconference.sponsorship (registration only) may be available to students presenting full, refereed papers. Applications for such sponsorship will be considered only on the acceptance of a full paper.
• Authors must note whether they plan to attend in person or whether they would deliver a livestreamed or recorded virtual presentation.
• Abstracts should be no longer than 500 words and should be submitted to: Camielah Jardine, Head of Conferencing, E-mail: camielah@saimm.co.za
ECSA, GSSA, and SACNASP CPD points will be allocated to all attending delegates
CALL FOR PAPERS/PRESENTATIONS
Diamonds Source to Use 2023 Conference

CONFERENCE
Prospective authors may choose to submit full (peer-reviewed) papers/presentations or standalone presentations only.
New Beginnings A brave new (diamond) world
THEME
Furthermore, the fast, efficient and safe abstraction of raw mineral reserves is of strategic importance for leading mining companies. The South African mining sector needs to mechanize at a faster pace in order to remain globally competitive.
Tunnel boring in civil engineering and mining SANCOTSYMPOSIUM
2022 7-8 NOVEMBER 2022 WALLENBERG CONFERENCE CENTRE @ STIAS, STELLENBOSCH, WESTERN CAPE SOUTH AFRICA

BACKGROUND
Gugu E-mail:ConferenceCharlieCo-ordinatorgugu@saimm.co.zaFORFURTHERINFORMATION CONTACT:Tel:+2711538-0238Web:www.saimm.co.za CPD Points: 0.1 points per hour
This results in further development of road, rail and metro infrastructure. However, the availability of space for this necessary infrastructure in the urban environment is becoming a major challenge. In order to keep up with this increasing demand, Civil Contractors are having to resort to tunnelling more than ever before and, in order to deliver these services timeously, tunnel boring and mechanized underground excavation and support installation is proving to be cost effective.

This conference is in response to the Civil and Mining industry being under immense pressure to deliver projects fast, efficiently and as safely as possible. Tunnel boring and mechanized underground excavation and support installation is proving to be an invaluable and cost effective tool in the execution of a project. Technology exists for mechanized excavation where tunnels can be excavated from as small as 300 mm to in excess of 18 metres in order to access ore bodies, build road or railway tunnels, mining access and excavations, facilitate the installation of utilities, construct storage caverns for gas and oil, etc
Due to the global increase in urbanization, pressure is being placed on governments and the public sector to provide expanded services such as safe and reliable public transport, electricity, gas, water and sewage facilities.