PESTICIDE USE IN THE UK – A SNAPSHOT OF CHANGES SINCE 2016
May 2023
Introduction
In 2018 PAN UK published “The Hidden Rise of UK Pesticide Use”, a report looking at the facts behind industry claims that pesticide use had halved in the UK since 1990. The report debunked this claim and showed that, by most internationally accepted measures, pesticide use was actually rising, as was the exposure of humans and wildlife to their harmful impacts. More specifically, the report revealed that, while the overall weight of pesticides being used had indeed halved between 1990 and 2016, the toxicity of the chemicals, the area of land treated with pesticides and the number of times key crops were treated had all increased.
Five years on, PAN UK is taking a fresh look at UK Government pesticide usage data, this time covering the period from 2016 to 2020 (the most recent data available at time of writing). It has been impossible to conduct this analysis before now, because the UK Government failed to update pesticide usage data beyond 2016 until 2022.
A few things to note about the findings in this briefing:
6 Unless otherwise stated, all figures in this briefing are taken from publicly available, official UK Government data. The Pesticide Usage Survey Statistics (PUS STATS) are hosted on the website of Fera Science Ltd (Fera) on behalf of the Department for Environment, Farming and Rural Affairs (Defra) and can be accessed at: https://pusstats.fera.co.uk/data
6 The data only refers to pesticides used in agriculture. It does not include figures for any other kind of pesticide use and so excludes the amenities sector, urban areas (such as parks, playgrounds and pavements), fish farming, forestry, conservation and amateur use by gardeners.
6 Throughout this briefing we have chosen to focus on a limited number of the UK’s most dominant crops, namely potatoes, cereals (primarily wheat and barley) and oilseeds (such as rapeseed and linseed).
1
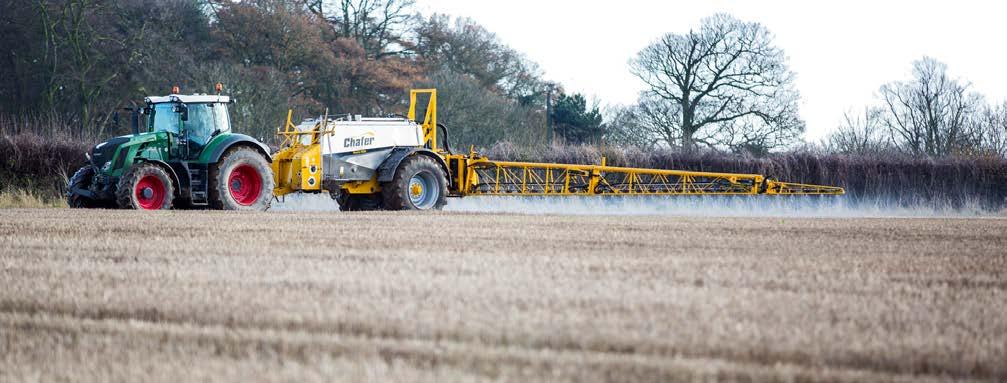
Chafer Sentry applying glyphosate to stubbles in North Yorkshire. © Chafer Machinery, flickr.com, CC BY 2.0
A summary of key findings
UK Government pesticide usage data covering 2016 to 2020 reveals the following:
6 There have generally been small decreases in the weight of pesticides being applied, the area of land being treated with pesticides and the average number of times key crops are treated in a growing season. However, the rate or intensity at which pesticides are being applied (i.e. the average kilogram of pesticide used per hectare of land) has largely remained the same.
6 Glyphosate use has increased, both in terms of weight applied and land area treated.
6 The use of a number of other Highly Hazardous Pesticides (HHPs) has also increased, including:
® Cyantraniliprole (highly toxic to bees)
® 2,4-D (carcinogen and suspected endocrine disruptor)
® Imazalil (carcinogen and developmental or reproductive toxin)
6 The three neonicotinoids that were banned in 2018 have not been replaced by a return to pyrethroids (their predecessor). The use of an alternative neonicotinoid, acetamiprid, has increased considerably. Acetamiprid is moderately toxic to bees.
2 Pesticide use in the UK – a snapshot of changes since 2016
Year Crop Type of pesticide Weight applied (kg) Percentage change in weight since 2016 Area treated (ha) Percentage change in area since 2016 Kilogram applied per hectare (kg/ha) Change in grams per hectare since 2016 (g) 2020 All All 13,018,559 -25% 38,893,631 -24% 0.335 -4 2016 All All 17,277,459 50,937,385 0.339 2020 All Fungicides 4,869,399 -24% 17,877,238 -22% 0.272 -4 2016 All Fungicides 6,357,709 23,007,493 0.276 2020 All Herbicides 6,101,878 -22% 13,464,073 -17% 0.453 -31 2016 All Herbicides 7,810,947 16,136,135 0.484 2020 All Insecticides 147,752 -26% 2,801,049 -31% 0.053 +4 2016 All Insecticides 199,951 4,048,700 0.049 © davidpwhelan, morguefile.com
Table 1: Changes in weight of pesticides used, area of land treated, and kilograms per hectare applied between 2016 and 2020 (by type of pesticide)
Weight, land area and intensity of pesticide use
As shown in Table 1 above, UK Government data shows a downwards trend in overall pesticide use across all classifications of insecticide, herbicide and fungicide when both kilograms applied and hectares treated are looked at separately. This is, on the face of it, a positive as fewer tonnes of pesticides are being applied and less land area is being treated. However, when looking at these figures in terms of kilogram of active substance applied per hectare of land then the picture is less optimistic:
6 The largest decrease has been for herbicides which have, on average, reduced by 31 grams per hectare since 2016, despite significant increases in the use of certain herbicides such as glyphosate and 2,4-D. However, herbicides are still being applied, on average, at a rate of almost half a kilogram per hectare, which is significantly higher than other types of pesticides.
6 Meanwhile, the data shows that there has been a slight downward trend in the rates applied for fungicides as well as the overall category of ‘all pesticides’, both of which have experienced a decrease of 4 grams per hectare.
6 During the same time period, the average rate of insecticide use has increased by 4 grams per hectare. This means that while fewer pesticides are being applied, they are often being used at the same or similar intensity in the areas that are treated. As a result, wildlife and humans in those areas are likely to be exposed to a similar toxic load.
There are numerous factors at play that could account for the apparent decreases in weight applied and area treated. Possible reasons include (but are not
limited to) changes in the way in which pesticide use is being reported, changes in the area of cultivation of particular crops being grown, conversion of land to livestock farming, withdrawal of certain active substances, the impact of the weather on pest and disease levels and the adoption of non-chemical alternatives by farmers.
A closer look at the area of land being treated
According to 2020 data, the UK has an area of approximately 17.3 million hectares (ha) under agricultural production. This includes arable, horticulture and grazing land. Table 2 below shows clearly that the actual area treated with pesticides is greater than the amount of physical land available. In fact, for some specific crops there are huge discrepancies between the area of land being treated and the actual area of land that exists. The reason for this is simple, multiple treatments on the same piece of land result in the anomalous situation whereby we are treating more land than we actually have.
It is worth noting that, between 2016 and 2020, the overall agricultural area of the UK fell by 60,000 hectares, while the cereal area decreased by 94,000 hectares and the oilseed area by 193,000 hectares. The area of potatoes grew by 3,000 hectares during the same time period.
While the data shows small reductions in the average number of times that an area of land has been treated with pesticides, the figures remain high. It has been postulated that recent increases in the purchasing price of pesticides could account for a decrease in the number of times crops are being treated.
3 Pesticide use in the UK – a snapshot of changes since 2016
2016 2020 Total area (ha) Area treated (ha) Average number of times each hectare treated Total area (ha) Area treated (ha) Average number of times each hectare treated UK agricultural area 17,360,000 50,937,385 X 2.93 17,300,000 38,893,631 X 2.25 UK cereal area 3,132,000 37,037,570 X 11.83 3,038,000 27,937,725 X 9.20 UK oilseed area 608,000 6,708,944 X 11.03 415,000 3,894,807 X 9.39 UK potato area 139,000 3,419,315 X 24.60 142,000 3,135,467 X 22.08
Table 2: Changes in total area planted, total area treated and average number of times each hectare is treated with pesticides between 2016 and 2020 (by crop)
DISCREPANCIES IN GOVERNMENT PESTICIDE USAGE DATA
UK pesticide usage data, which is hosted on the Fera website, has always been inadequate for a range of reasons, most notably that it does not provide the information in anywhere near enough detail and is extremely slow to publish data and so tends to be at least two years behind.
In addition to these ongoing issues, PAN UK came across discrepancies in the data while conducting the research for this report. As an example, the following table shows in the left-hand column the figures for area of land treated as reported in 2018. The figures in the right-hand column are those that are currently available (at time of writing in March 2023). There are some significant differences.
* Note that, for the sake of clarity, PAN UK used these current figures for all analysis included in this report.
Another area of concern are differences in figures reported in the bi-annual reports and those available in the data section of the usage statistics. As far as the authors of this research are aware, these figures are supposed to be identical. As an example, the figures for oilseeds in the bi-annual arable report for 2016* state that 6,874,932 hectares were treated, whereas the data gives a figure of 6,708,944 hectares –a difference of 165,988 hectares.
These discrepancies lead to a number of questions for the UK Government – why have some pesticide usage figures been changed retroactively? Is it a mistake or intentional? Why don’t the figures in the biannual reports match those in the data section? Do these discrepancies point to a new way of recording pesticide use?
The only information potentially pertaining to these discrepancies is a statement from Fera on the pesticide usage statistics pages saying – “The data held in this application is presented using new crop and chemical groups, therefore figures are not directly comparable to the Pesticide Usage Survey reports.” But this far from clarifies the matter, meaning that it has become impossible to analyse current UK usage data against previous figures or cross-check different government sources of usage data with any degree of certainty. As a result, the picture of UK pesticide use is extremely confusing, making it much harder to identify trends upon which to base policy.
The UK Government has commitments under the Aarhus Convention to provide citizens with access to environmental information and has also promised to reduce domestic pesticide use. However, the inadequacies of pesticide usage data are a major obstacle to the achievement of both of these goals. See page 11 for our recommendations on how to improved pesticide monitoring data.
4 Pesticide use in the UK – a snapshot of changes since 2016 title
2016 Area treated (ha) as shown in 2018
Discrepancy All pesticides 73,172,193 50,937,385 -30.39% Fungicides 36,369,847 36,079,197 -0.80% Herbicides 23,099,598 23,149,219 +0.21% Insecticides 5,126,906 4,072,747 -20.56%
2016 Area treated (ha) as shown in 2023*
* Pesticide Usage Survey Report 271, Arable Crops in the United Kingdom (2016), pp. 29 & 33: https://pusstats.fera.co.uk/api/report-download/22
A closer look at the number of times key crops are treated with pesticides
Table 3 shows a mixed picture in terms of changes in treatment frequency between 2016 and 2020, making it difficult to establish a definitive trend. The percentage of crops being treated once or twice in a growing season has risen, which would appear to be a positive in terms of pesticide reduction. Meanwhile, the figures for crops treated more than four times have fallen, although they do remain high. This is particularly true in the case of potatoes, 94% of which were treated four or more times in 2020.
A closer look at active substances and pesticide products approved for use in the UK
Historical data on the number of active substances (the chemically active part of a manufactured pesticide product) and pesticide products approved in 2016 is no longer available, so researchers compared current figures with those from 2018 (the oldest available). As shown in Table 4, between 2018 and 2022, the number of approved active substances permitted for use on potatoes, oilseed rape (OSR) and wheat increased fairly significantly. Meanwhile, during the same time period, the number of approved pesticide products that can be used on these crops fell. This indicates that a smaller selection of pesticide products containing a wider range of active substance is now available for use in
the UK. The two most likely reasons for this are a) a decrease in the efficacy of certain pesticide products and/or active substances and b) the need to diversify active substances in order to combat resistance issues.
5 Pesticide use in the UK – a snapshot of changes since 2016
Treated 1x Treated 2x Treated 3x Treated 4x Treated 4+x 2016 2020 2016 2020 2016 2020 2016 2020 2016 2020 Cereals 3.41% 7.32% 10.87% 16.07% 13.65% 20.29% 14.27% 17.81% 57.79% 38.51% Oilseed 0.61% 4.09% 2.79% 3.31% 5.33% 6.32% 9.37% 8.94% 81.9% 77.33% Potatoes 0% 0% 0% 1.73% 0.54% 2.66% 0.18% 1.13% 99.28% 94.48%
Table 3: Frequency of treatment (shown by crop)
2018 2022 Active Substances Pesticide products Active substances Pesticide products Potatoes 62 633 84 586 Oilseed rape (OSR) 52 737 67 720 Wheat 93 1432 169 1326
Table 4: Number of UK approved active substances and pesticide products for key crops*
* This is taken from the CRD products database and the approved products register.
Wheat field. © Pixbay, CC0
“ In 2020, Potatoes received on average 10 fungicide, 3 herbicide, 2 insecticide and 1 growth regulator spray per growing cycle “
Pesticide Usage Survey Report 295, Arable Crops in the United Kingdom (2020), p. 43: https://pusstats.fera.co.uk/api/report-download/9
Increases in use of particular Highly Hazardous Pesticides
While overall weights and treated areas have gone down for all classes of pesticide there have been increases in the use of certain Highly Hazardous Pesticides (HHPs). The concept of HHPs originates from the UN’s Food and Agriculture Organization and World Health Organization and is used to identify pesticides that pose a particularly high risk to human health, operator health or the environment.
It should be noted that the UK approves more than 400 active substances so PAN UK has not examined usage data for them all while conducting the analysis for this report. Instead, researchers focussed on a number of HHPs which are a) widely used in the UK and b) of particular concern in terms of their impacts on health and/or environment.
Active substance 1: Glyphosate – Herbicide – 115 products approved for professional use – approved until 2025 (see Table 5 below)
6 A probable human carcinogen
6 Harmful to bees and aquatic organisms
6 Approved for use in a wide range of situations including; all edible crops, arable, grassland and pasture and amenity use
Despite the ongoing controversy surrounding glyphosate and its impact on human health and the environment, use between 2016 and 2020 has generally increased in terms of weight, area treated and application rate per hectare. The exact reasons for these increases are unclear but could include a rise in pre-harvest desiccation (where crops are artificially dried using glyphosate) and/or an increase in ‘notill’ agriculture which tends to rely upon glyphosate and other herbicides to deal with weeds without releasing carbon from the soil via ploughing. Given that glyphosate makes up at least three-quarters of all active substances applied in the amenity sector, the figures in Table 5 below (which relate only to agriculture) are an underestimation of the amount of glyphosate used in the UK.
Active substance 2: Cyantraniliprole – Insecticide – three products approved – approved until 2029 (see Table 6 on next page)
6 Highly toxic to bees
® Honeybees contact acute LD50 0.093
® Honeybees oral acute LD50 0.105
For an explanation of LD50, see page 8.
6 Approved for use on broccoli/calabrese (outdoor), brussels sprout, brussels sprout (outdoor), bulb onion (outdoor), cabbage, cabbage (outdoor), carrot, carrot (outdoor), cauliflower, cauliflower (outdoor)
6 Pesticide use in the UK – a snapshot of changes since 2016
Year Crop Weight applied (kg) Percentage change in weight since 2016 Area treated (ha) Percentage change in area since 2016 Kilogram applied per hectare (kg/ ha) Change in grams per hectare since 2016 (g) 2020 All 2,601,811 +16% 2,876,906 +9% 0.90 +50 2016 All 2,239,476 2,646,836 0.85 2020 Cereals 1,753,237 +27% 2,041,588 +17% 0.86 +70 2016 Cereals 1,381,416 1,752,144 0.79 2020 Oilseeds 485,846 -11% 444,627 -16% 1.09 +60 2016 Oilseeds 543,368 528,349 1.03 2020 Potatoes 66,170 +5% 70,191 +4% 0.94 +10 2016 Potatoes 63,071 67,540 0.93
Table 5: Changes in UK use of glyphosate between 2016 and 2020 (by crop)
Cyantraniliprole is a broad-spectrum insecticide used to control a range of insect pests including aphids, whitefly and thrips. One of the driving factors for its increased usage is its effectiveness against pests that have developed resistance to other insecticides.
Active substance 3: 2,4-D – Herbicide – 75 products approved for use – approved until 2025 (see Table 7 above)
6 Carcinogen and suspected endocrine disruptor (EDC)
6 Approved for use on amenity grassland, barley (spring), barley (undersown with clover, undersown with grass), barley (winter), grassland, managed amenity turf, oats (undersown with clover, undersown with grass), oats (winter), rye
2,4-D is widely used for the control of broad leaf weed species in grassland and arable crops. It has the potential to harm human health and is also toxic to
aquatic species, earthworms and bees. It is one of the oldest herbicides currently in use, having first come onto the market in 1945.
Active substance 4: Imazalil – Fungicide – five products approved for use – approved until 2027 (see Table 8 above)
6 Carcinogenic and developmental toxin
6 Approved for use in the UK on barley (seed treatment), wheat (seed treatment) and for stored potatoes
6 Used on imported citrus and vegetables
Imazalil is a systemic fungicide used to protect stored fruit and vegetables from fungal infection and also used as a seed treatment on certain grains. Due to concerns over its impact on human health, there have long-been discussions in the EU about banning its use.
7 Pesticide use in the UK – a snapshot of changes since 2016
Year Crop Active substance Weight applied (kg) Percentage change in weight since 2016 Area treated (ha) Percentage change in area since 2016 Kilogram applied per hectare (kg/ ha) Change in grams per hectare since 2016 (g) 2020 All Cyantraniliprole 321 +241% 4,666 +345% 0.07 -20 2016 All Cyantraniliprole 94 1,047 0.09
Table 6: Changes in UK use of cyantraniliprole between 2016 and 2020
Year Crop Active substance Weight applied (kg) Percentage change in weight since 2016 Area treated (ha) Percentage change in area since 2016 Kilogram applied per hectare (kg/ ha) Change in grams per hectare since 2016 (g) 2020 All 2,4-D 26,357 +117% 28,373 +67% 0.93 +210 2016 All 2,4-D 12,113 16,896 0.72
Table 7: Changes in UK use of 2,4-D between 2016 and 2020
Year Crop Active substance Weight applied (kg) Percentage change in weight since 2016 Area treated (ha) Percentage change in area since 2016 Kilogram applied per hectare (kg/ ha) Change in grams per hectare since 2016 (g) 2020 All Imazalil 2,018 +53% 81,021 +63% 0.025 -2 2016 All Imazalil 1,315 49,533 0.027
Table 8: Changes in UK use of imazalil between 2016 and 2020
Increasing pesticide toxicity: insecticides
A key point to understand when looking at reducing pesticide-related harms is that the toxicity of pesticides has increased since they were created in the 1940s. This is particularly true of insecticides, which not only have a direct impact on insect life, particularly on bees and other non-target pollinator species, but also have a huge knock-on effect on biodiversity more widely.
In fact, by volume, modern neonicotinoid insecticides (the world’s most widely used insecticides) are 10,000 times more potent than DDT1 (history’s most notorious pesticide which was banned globally in 2001 due to concerns about harm to the environment and human health). Because they are more potent, smaller amounts are required of newer pesticides than their older equivalents. Therefore, while the weight of pesticides used in UK agriculture may have decreased, the rise in toxicity means that we are not necessarily any less exposed to their harmful impacts.
In order to illustrate this point, Table 9 charts some of the changes and developments in the types of insecticides that have been used in the UK and globally since 1945. The table gives the figures, where available, of the LD50 (lethal dose 50%) for acute and dermal absorption by honey bees. The value of LD50 for a substance is the dose required to kill half the members of a tested population after a specified test duration. LD50 figures are frequently used as a general indicator of a substance’s acute toxicity. A lower LD50 is
indicative of increased toxicity as it shows that it takes less of a substance to kill half the population.
Table 9 below provides a simple snap shot of toxicity showing that the acute toxicity of commonlyused insecticides to honey bees has increased tenfold from Lindane in 1945 to neonicotinoids in the 1990s.
A closer look at the UK’s use of neonicotinoids and other insecticides
Driven by dramatic declines in populations, there has been much attention paid in recent years to the impact of pesticides on bee and other pollinator species, as well as on insect populations in general. Neonicotinoids – a class of insecticides which includes seven active substances, five of which have been approved for use in the UK at some point – have been the subject of huge controversy for over a decade. Their links to pollinator and insect declines have been well documented and, in 2018, following the EU’s lead, the UK Government banned the use of the three neonicotinoids most toxic to bees – clothianidin, imidacloprid and thiamethoxam – on any crop grown outdoors.
However, while the ban was a huge step forward, it suffers a number of deficiencies. Firstly, it is applied inconsistently. For example, while prohibited for use in agriculture the banned neonicotinoid – imidacloprid – continues to be used widely in veterinary medicines, especially flea treatments.
8 Pesticide use in the UK – a snapshot of changes since 2016
Lindane Organochlorine 1945 Diazinon Organophosphate 1953 Dicofol Organochlorine 1956 Chlopyrifos Organophosphate 1965 Deltamethrin Pyrethroid 1974 Cypermethrin Pyrethroid 1975 LambdaCyhalothrin Pyrethroid 1984 Thiamethoxam Neonicotinoid 1991 Contact acute 48 hour LD50 0.23 0.13 Data unavailable 0.068 0.0015 0.023 0.038 0.024 Oral acute 48 hour LD50 0.011 0.09 >50 0.15 0.079 0.172 0.91 0.005
Table 9: Changing toxicity of commonly used insecticides*
* University of Hertfordshire Pesticide Properties Database, https://sitem.herts.ac.uk/aeru/ppdb/en/atoz.htm
1 An overview of the environmental risks posed by neonicotinoid insecticides, Dave Goulson, Journal of Applied Ecology 2013, page 1 - https://www.sussex.ac.uk/webteam/gateway/file.php?name=goulson-2013-jae.pdf&site=411
As a result, it has been found to still be contaminating the UK’s natural environment and rivers in particular, and there is a growing body of evidence that points to a potential problem. The 2018 ban has also not been strictly enforced. The UK Government granted emergency derogations for the use of the banned neonicotinoid – thiamethoxam – on sugar beet crops in 2021, 2022 and 2023.
In addition to these issues around implementation and enforcement, UK pesticide usage data points to the following:
i) Ban on the most bee-toxic neonicotinoids has not led to a return to more toxic, older pesticides
One of the key arguments made by the pesticide industry and other vested interests during the debate on banning neonicotinoids was that it would usher in a return to previously used, more harmful, pesticides such as pyrethroids. However, it appears from the data that this has not been the case and that the use of pyrethroids has also decreased to some extent. This raises the question of how effective neonicotinoids actually were, and whether they were even necessary to protect crops.
Table 10 shows that there have been decreases in weight applied and area treated for both neonicotinoids and pyrethroids since 2016. However, as with the overall picture of pesticide use as shown in Table 1, it also reveals that application rates in terms of kilogram of active substance used per hectare have generally remained the same
over that same time period. Therefore, while fewer pesticides are being applied, they are being used at the same or similar intensity in the areas that are treated. Once again, the reduction in weight and area treated could be accounted for by reductions in planting areas for particular crops.
ii) Ban has driven major increase in use of approved neonicotinoid
Instead of a return to more harmful, older chemistry, the data reveals that the use of the one remaining approved neonicotinoid – acetamiprid – has risen sharply since 2016. See Table 11 on next page. While considerably less harmful to bees than the three banned neonicotinoids, acetamiprid is, nonetheless, still moderately toxic to bees. Specifically; 6 Honeybees contact acute LD50 8.09 (compared to 0.081 for imidacloprid and 0.024 for thiamethoxam)
6 Honeybees oral acute LD50 14.53 (compared to 0.0037 for imidacloprid and 0.005 for thiamethoxam)
For an explanation of LD50, see page 8.
Acetamiprid is approved in the UK until 2033. There are currently 27 products containing acetamiprid approved for use on a handful of crops, namely potato (excluding seed), potato (seed), sugar beet and oilseed rape (which is particularly attractive to pollinators).
9 Pesticide use in the UK – a snapshot of changes since 2016
Year Crop Class of pesticide Weight applied (kg) Percentage change in weight since 2016 Area treated (ha) Percentage change in area since 2016 Kilogram applied per hectare (kg/ha) 2020 All Pyrethroid 20,140 -57% 2,252,957 -37% 0.01 2016 All Pyrethroid 47,137 3,599,016 0.01 2020 All Neonicotinoids 21,266 -76% 271,092 -57% 0.08 2016 All Neonicotinoids 87,704 633,269 0.14
Table 10: Changes in weight of neonicotinoids and pyrethroids used, area of land treated, and kilograms per hectare applied between 2016 and 2020
iii) Despite the ban, insecticides that are highly-toxic to bees remain in use
Neonicotinoids are not the only bee-toxic pesticides currently in use in the UK. For example:
Cyantraniliprole, a diamide insecticide, was first put forward for UK approval in 2011. While not as toxic to bees as some of the now banned neonicotinoids, it is still highly toxic to bees. Specifically;
6 Honeybees contact acute LD50 0.093 (compared to 0.081 for imidacloprid and 0.024 for thiamethoxam)
6 Honeybees oral acute LD50 0.105 (compared to 0.0037 for imidacloprid and 0.005 for thiamethoxam)
As revealed by Table 6, the use of cyantraniliprole increased in the UK between 2016 and 2020. The number of kilograms used increased by 241% (albeit from a very low baseline) while the area of land treated rose by 345%.
Lambda-Cyhalothrin, a pyrethroid insecticide, is approved in the UK until 2026. It is highy toxic to bees. Specifically;
6 Honeybees contact acute - LD50 0.038 (compared to 0.081 for imidacloprid and 0.024 for thiamethoxam)
6 Honeybees oral acute - LD50 0.91 (compared to 0.0037 for imidacloprid and 0.005 for thiamethoxam)
There are currently 44 products containing lambdacyhalothrin that are approved for use on a very wide range of crops including cereals, brassicas, oilseed rape, potatoes and sugar beet.
Between 2016 and 2020, the weight of lambdacyhalothrin used fell by 6.5%, from 11,329kg to 10,589kg. Over the same time period, the area of land treated with lambda-cyhalothrin decreased by 11%, from 1.95 million hectares to 1.75 million hectares. Despite these reductions, the rate at which lambda-cyhalothrin is applied remained the same (0.01kg per ha).
10 Pesticide use in the UK – a snapshot of changes since 2016
Year Crop Active substance Weight applied (kg) Percentage change in weight since 2016 Area treated (ha) Percentage change in area since 2016 Kilogram applied per hectare (kg/ha) 2020 All Acetamiprid 1,506 +258% 30,258 +244% 0.05 2019 All Acetamiprid 290 6,627 0.04 2018 All Acetamiprid 248 5,087 0.05 2017 All Acetamiprid 162 3,403 0.05 2016 All Acetamiprid 421 8,786 0.05
Table 11: Changes in weight of acetamiprid used, area of land treated, and kilograms per hectare applied between 2016 and 2020
Oilseed rape. © David Bartus, CC0
Recommendations for the UK Government
1. Improve pesticide usage monitoring and data
In order to reduce both the use and impacts of pesticides, it is vital that accurate and timely data is made available for all areas and sectors in which pesticides are used. This data needs to be presented in a transparent and clear manner that is freely available to all interested parties including the public, researchers, academics, journalists and civil society organisations.
PAN UK is calling on the Government to;
6 Make reporting of and public access to farm spray records mandatory.
6 Make reporting of and public access to amenity use pesticide data mandatory.
6 Provide information on pesticide sales data for all categories including agricultural, amenity and home & garden.
6 Provide information on pesticide efficacy postapproval.
6 Overhaul the PUSSTATS database so that it includes the following:
® Greater frequency of reporting with a shorter lag (ideally no more than a year) between surveys and publishing the results.
® More detailed geographical information –ideally down to field level but, as a minimum, this should be county level rather than the current regional approach.
® Presentation and dissemination of the raw data should be made available to users and the tables and graphs should be downloadable to enable analysis.
® An annual report of findings should be published, as is the case with reports from the Expert Committee on Pesticide Residues in Food (PRiF).
® Addition of data on treatment frequency.
® Addition of data on the variety of pesticides being used, including how many different active substances.
® Information on active / crop combinations rather than the current class / crop combination.
2. Introduce pesticide reduction targets for both use and toxicity
Setting clearly defined targets is recognised as a useful policy tool for establishing aspirations and driving action. National targets have already been laid down in other policy areas to help tackle important environmental issues such as carbon emissions and landfill waste
The Government should follow through on its commitments made in the draft revised UK National Action Plan for the Sustainable Use of Pesticides (NAP) to introduce pesticide risk reduction targets. The targets should be ambitious and time bound and lead to a reduction in both overall pesticide use and toxicity. Including a focus on cutting overall use is particularly important to ensure that indirect and poorly understood impacts (such as combinatory effects) are reduced. Meanwhile, including a measure of toxicity to humans and wildlife will ensure that pesticides known to be most directly harmful are reduced first and fastest.
3. End the use of pesticides that harm bees and other pollinators
If we are to halt and reverse the current declines in biodiversity, and protect the pollinators we rely upon for food production, then there must be a significant shift away from the use of pesticides that pose a high risk to bees, pollinators and other insect species. This must include:
6 Maintaining and enforcing the ban on the three most bee-toxic neonicotinoids.
6 Phasing out and ultimately banning the use of other bee-toxic pesticides, such as cyantraniliprole, lambda-cyhalothrin and acetamiprid.
6 Ending the use of bee-toxic insecticides in veterinary medicines, with an immediate focus on imidacloprid.
6 Incorporating into the UK pesticide approval system mandatory testing of impacts on pollinators for all pesticides, including herbicides and fungicides. This must include direct and indirect impacts and lethal and sub-lethal effects on a range of pollinator species, not limited solely to the honey bee.
11 Pesticide use in the UK – a snapshot of changes since 2016
Recommendations for the UK Government continued
4. Increase support for farmers to reduce pesticide use and utilise non-chemical alternatives
The Government should introduce a strong package of support designed to help farmers reduce their pesticide use and adopt comprehensive Integrated Pest Management (IPM) systems in which chemical pesticides are used only as a last resort, if at all. The package of support should include but not be limited to:
6 Payments for farmers via the Environment Land Management Scheme (ELMS) for reducing pesticide usage and adopting IPM techniques.
The current proposal to pay farmers to not use insecticides should be promoted as one of the key actions farmers can take, rather than just one of a number of options.
6 Provide farmers with training and crop-specific guidance on IPM and pesticide reduction and facilitate knowledge-sharing by creating peer-topeer learning opportunities for farmers.
6 Ensure that all farmers can access independent agronomic advice not tied to the pesticide industry.
Pesticide Action Network UK
PAN UK is based in Brighton. We are the only UK charity focused solely on addressing the harm caused by chemical pesticides.
We work tirelessly to apply pressure to governments, regulators, policy makers, industry and retailers to reduce the impact of harmful pesticides. Find out more about our work at: www.pan-uk.org
The Green Hub
The Brighthelm Centre North Road
Brighton BN1 1YD
Telephone: 01273 964230
Email: admin@pan-uk.org
Pesticide use in the UK – a snapshot of changes since 2016
Nature Friendly Farmers Network © Kirsty Tait
