
MAGAZINE | SPRING 2023

ENERGY GL BAL Sign up to receive a digital copy of the magazine www.energyglobal.com/magazine Generating renewable energy from natural resources
30 Cut The Confusion Out Of Completions
Mojtaba Moradi, Tendeka, UK, outlines how the completion and performance of injection operations, particularly in carbonate reservoirs, can be improved and suggests how common challenges in the area can be overcome.
10 US Gulf Of Mexico: The Basin With Nine Lives

Mfon Usoro and R. Scott Nance, Wood Mackenzie, USA, provide an overview of the upstream industry in the US Gulf of Mexico, and delve into the outlook for the region in terms of supply, capital investment, cost inflation, technology, and the energy transition.
16
A Cause For Collaboration
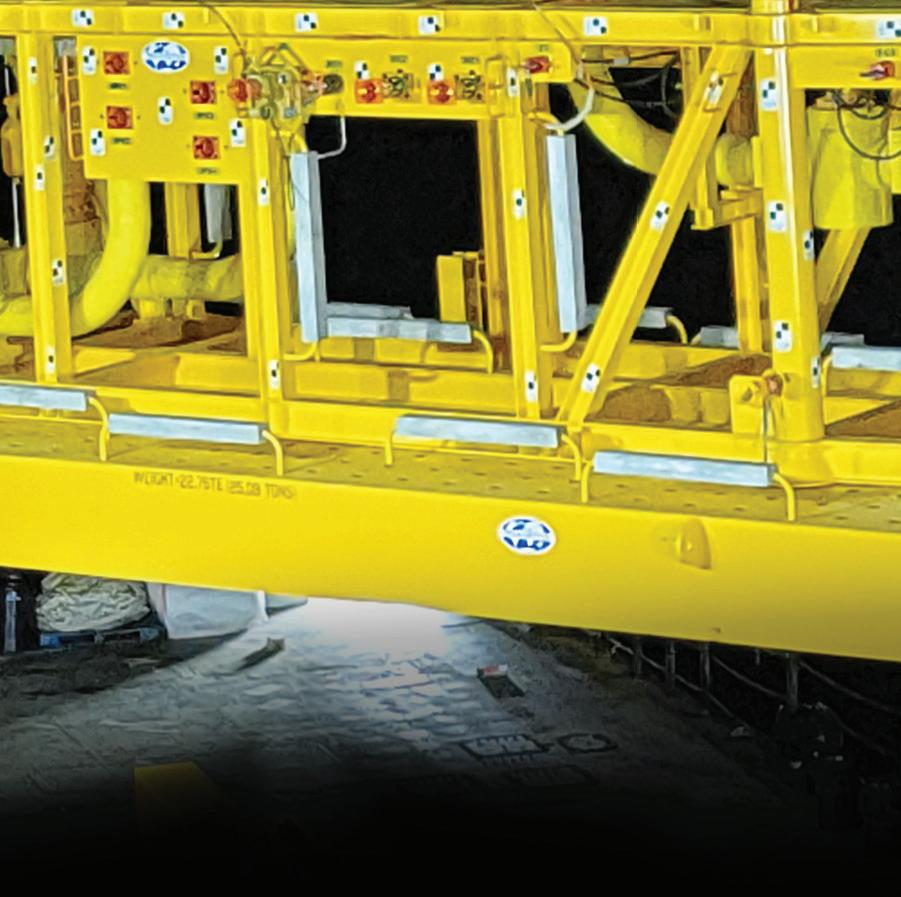
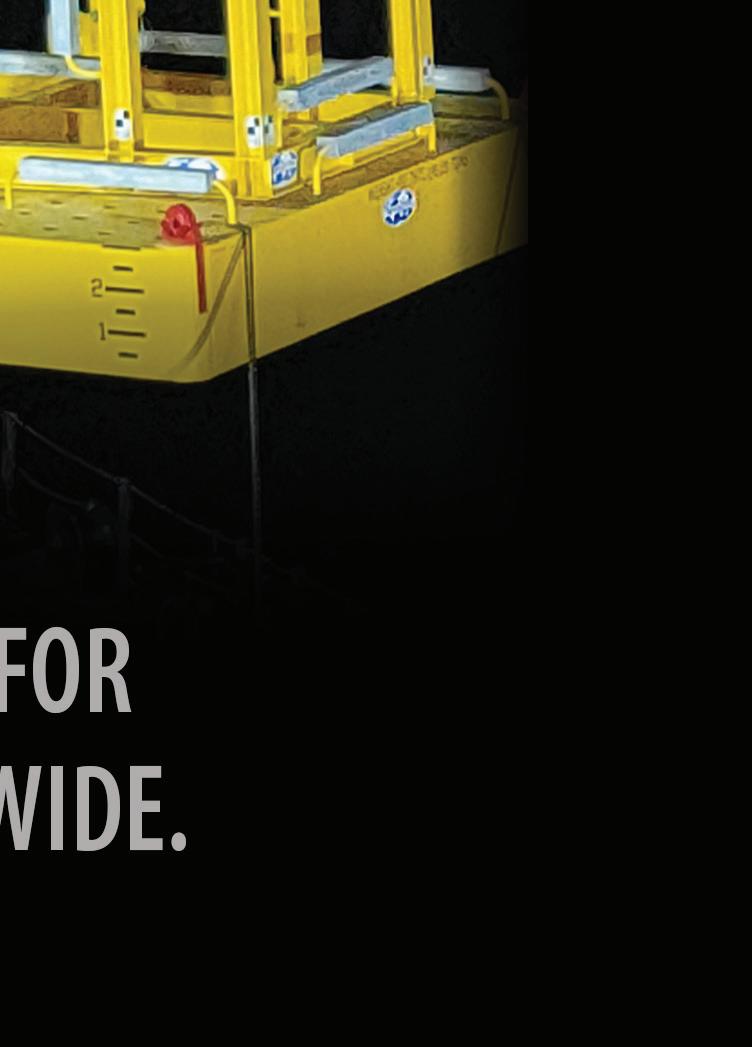
Danny Constantinis, EM&I Group, Malta, discusses the importance of continued industry collaboration in finding technical solutions to offshore challenges and improving the safety of operations.
20
Trusting In Tracer Technology
Carlos Pedroso, Enauta, Brazil, and Zaque Araujo and Paul Hewitt, Tracerco, Brazil and USA, consider the use of tracer and AICD technologies as a method of quantitative oil inflow and water cut measurement in subsea wells.
25 Thinking Outside The Box
Paul Hazel, Welltec, UK, considers how a combination of well barrier elements of varying materials and delivery mechanisms, as opposed to the traditional stand-alone cement, could help meet challenging life-of-well requirements.
Front cover
Varel Energy Solutions is designed around accelerated growth through organic and acquisitive initiatives – ultimately committed to becoming the ‘industry’s maker’ in consumable downhole products to the energy sector. VES focuses on improving customer economics through reducing logistical costs, strengthening the continuity of supply and delivering predictable product performance.
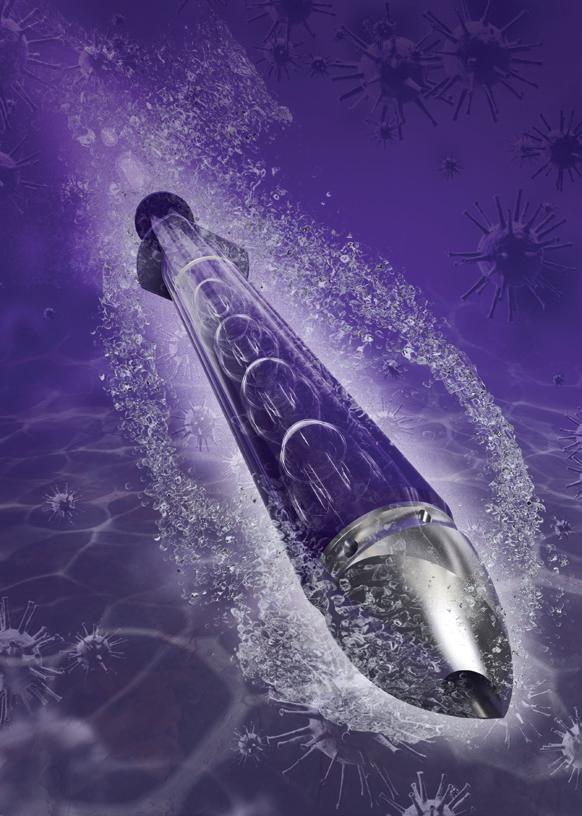
Varel Energy Solutions’ drilling and well construction solutions are widely recognised for their ingenuity, performance and reliability.
34 The Answer Is In Real-time Analysis
Thomas Fenderson, Kemira Chemicals Inc., USA, explains how time-resolved fluorescence for real-time assessment could be the answer for oil and gas operators using high molecular weight polyacrylamide polymers.
38 Change Is On The Horizon
F. Morris Hoagland, Jade Dragon LLC, USA, explores the options for beneficial reuse of produced water generated during oil and gas production.
41 Testing The Waters
Dr Ming Yang, TÜV SÜD National Engineering Laboratory, UK, outlines the factors to consider when selecting a fit-for-purpose online oil-in-water analyser for oilfield produced water applications.
44 Dissolving Problems And Developing Fracking Operations

Nine Energy Service, USA, explains how the upstream oil and gas industry can leverage dissolvable technologies in order to reduce its carbon footprint.
47 A Spotlight On CUI-fighting Technologies
Sara Crighton, Net Zero Technology Centre, UK, explains why CUI is an ongoing problem for operators in the upstream sector, and describes the technologies that are being investigated to mitigate it.

ISSN 1757-2134 Copyright © Palladian Publications Ltd 2023. All rights reserved. No part of this publication may be reproduced, stored in a retrieval system, or transmitted in any form or by any means, electronic, mechanical, photocopying, recording or otherwise, without the prior permission of the copyright owner. All views expressed in this journal are those of the respective contributors and are not necessarily the opinions of the publisher, neither do the publishers endorse any of the claims made in the articles or the advertisements. More from Like us on Facebook Oilfield Technology Join us on LinkedIn Oilfield Technology Follow us on Twitter @OilfieldTechMag Spring 2023 Volume 16 Number 01 Contents 03 Comment 05 World News
210x297mm VES Aqueous The Cure Oilfield Technology Cover Apr 2023 648774-02.indd MAGAZINE SPRING 2023 A s reservoir production declines over time, the injection of fluids is needed to enhance oil recovery and/or to maintain the reservoir pressure. To overcome the common challenges associated with injection wells, such as loss of injectivity, premature injector failure, and fluid injection conformance, the industry has applied multitude of methods in the field to enhance the efficiency An interventionless, injection rate-limiting, autonomous outflow control device (AOCD) called FloFuse was recently developed by Tendeka, which can mitigate the conformance issues for fluid injection operations for both fluid injection and/or acid stimulation operations, particularly in carbonate reservoirs. The technology was recently applied in a water injection well totalling 2963 in the Middle East which was accumulating excessive water across some sections due to faults and fractures. This was subsequently Completed as a dual completion, consisted of nine joints of AOCDs, five joints of bypass high-pressure resistance ICDs and five swell packers installed via workover. The injection rate was 3000 bpd. By restricting flow into the thief zones and ensuring proportional distribution of injection fluids along the full length of the wellbore, improving the performance of injection operations. Conformance control issues The effective conformance of an injection well in carbonate reservoir is related to the continuously changing well injectivity profile. This change could be attributed to several factors, including: � Dilating fractures The evolution of filter cakes Mojtaba Moradi, Tendeka, UK, outlines how the completion and performance of injection operations, particularly in carbonate reservoirs, can be improved, and suggests how common challenges in the area can be overcome. Cut the confusion out of completions 30 31 30
THE WORD IS OUT
TETRA Technologies Recognized as Top Performing Service Provider of Completion Fluids With Highest Customer Loyalty
An independent survey of Gulf of Mexico oil and gas operators recognizes TETRA Technologies as the top performing service provider of completion fluids with the highest customer loyalty rating.
With our PhD innovators, customized chemistries, vertical integration, robust manufacturing capabilities, and service capacity, TETRA develops and delivers fluid solutions that help make operations more efficient, cost-effective, productive, and sustainable.
Visit tetratec.com/completionfluids to learn more or email us at completion-fluids@tetratec.com.
03/2023 © TETRA Technologies, Inc. All Rights Reserved. COMPLETION FLUIDS • ADDITIVES • FILTRATION • WELLBORE CLEANUP & DISPLACEMENT • LABORATORY SERVICES
Comment
Aspotlight is currently shining on the offshore oil and gas industry. While fossil fuels remain high in demand, offshore production represents one of the less carbon-intensive means of extracting hydrocarbons, extending an opportunity to oil and gas giants to advance towards the energy transition. According to Rystad Energy, the sector has an estimated US$214 billion of new project investments lined up, and over the next two years, will be set to achieve the highest growth in a decade.1
Up from 40% between 2015 – 2018, activity in the sector has been said to account for 68% of sanctioned conventional hydrocarbons in 2023. Increased activity in the sector is being seen across the Middle East, South America, the UK, and Brazil. In North America, spending has been forecast to reach US$17.5 billion. According to the regional report from Wood Mackenzie in this issue of OilfieldTechnology,production in the US Gulf of Mexico is also set to reach an all-time high by 2025, with 2.3 million boe produced each day and a number of greenfield projects in the works. An increased demand for oil has been a huge driver behind the boom in offshore activity; 2019 saw crude oil production hit 95 million bpd, and by 2021, demand swung to 96.5 million bpd.
Yet, growth in demand and production requires a full and skilled workforce, and the oil and gas industry in particular is currently suffering labour shortages, as workers migrate towards the renewable energy space, grow older and retire from the industry, or are discouraged from the sector due to arduous conditions, and remote locations. A recent report from McKinsey & Company has revealed that industry costs could increase between 6 – 10% in 2023, in part due to labour uncertainties.2
Arguably therefore, more needs to be done to incentivise workers. According to the Global Energy Talent Index, 44% of oil and gas workers saw salary increases last year, and more generous pay packets have increased job satisfaction for some.3 Yet for others, this may not be enough. Despite having seen significant improvements in the health and safety sphere over the last few years, the dangers involved with confined spaces, and working at height, as well as potential fire and explosion risks, could deter workers from a career in the industry. In its ‘2022 Health, Safety & Environment Report,’ OEUK noted an increased over-seven-day injury rate compared to the previous year, demonstrating a need for a continual focus on improving safety in the industry.4
In an article from EM&I in this issue of OilfieldTechnology, collaboration and technical innovation are discussed as key drivers to create a safer working environment. Diverless technologies and innovations reducing the need for perilous confined space entry for example are at the forefront of risk mitigation for offshore workers, and these advances can only increase the appeal of offshore work moving forward. Whilst improving safety, technology and digitalisation could also be used to attract workers and bridge the gap during the labour shortage by inviting in a new digitally-minded workforce; with the use of cloud-based tools and platforms that can boost productivity, more can be achieved with reduced labour. Perhaps, therefore, a technology-driven and digitally enhanced oilfield is the key to a smarter, safer workplace.

References
1. www.rystadenergy.com/news/offshore-is-back-more-than-200-billion-of-greenfield-investmentsexpected-by-2025

2. www.mckinsey.com/industries/oil-and-gas/our-insights/how-oil-and-gas-companies-can-secure-supplychain-resilience
3. www.getireport.com/oil-and-gas/
4. OEUK HS&E REPORT 2022: https://oeuk.org.uk/wp-content/uploads/2022/12/HSE-report-2022Offshore-Energies-UK-OEUK.pdf
Contact us
Editorial
Managing Editor: James Little james.little@palladianpublications.com
Senior Editor: Callum O’Reilly callum.oreilly@palladianpublications.com
Deputy Editor: Emily Thomas emily.thomas@palladianpublications.com
Editorial Assistant: Isabelle Keltie isabelle.Keltie@palladianpublications.com
Design
Production: Kate Wilkerson kate.wilkerson@palladianpublications.com
Sales
Sales Director: Rod Hardy rod.hardy@palladianpublications.com
Sales Manager: Ben Macleod ben.macleod@palladianpublications.com
Website
Digital Administrator: Leah Jones leah.jones@palladianpublications.com

Digital Content Assistant: Merili Jurivete merili.jurivete@palladianpublications.com
Events
Events Manager: Louise Cameron louise.cameron@palladianpublications.com
Digital Events Coordinator: Stirling Viljoen stirling.viljoen@palladianpublications.com
Marketing Administration Manager: Laura White laura.white@palladianpublications.com
Reprints: reprints@palladianpublications.com
Palladian Publications Ltd, 15 South Street, Farnham, Surrey GU9 7QU, UK Tel: +44 (0) 1252 718 999 Website: www.oilfieldtechnology.com
Spring 2023 Oilfield Technology | 3
Emily Thomas, Deputy Editor emily.thomas@palladianpublications.com


World news
UK North Sea flaring halves in four years
North Sea flaring has been cut in half following four consecutive years of reductions driven by tough measures to make UK oil and gas production cleaner, new analysis shows.
Offshore flaring fell again in 2022 by 13% to 22 billion ft3 (bcf) of gas, contributing to a total decrease of 50% since 2018, when volumes totalled 44 bcf. Last year’s reduction alone was equivalent to the gas demand of 80 000 UK homes, a boost for the UK’s energy security and net zero ambitions.
About a fifth of emissions from North Sea oil and gas production activities come from flaring, which is when excess gas is burned off, mainly resulting in carbon dioxide emissions.
Some flaring is unavoidable for safety and operational reasons, but the North Sea Transition Authority (NSTA) has been consistently clear that more can be done to prevent the waste of gas needed to heat and power homes and businesses.
The NSTA started benchmarking flaring performance in 2020 and the following year issued tougher guidance, stating all new developments should have no routine flaring and venting, with zero routine flaring across all North Sea platforms, whether new or existing, by 2030 at the latest.
In addition to tracking, monitoring and reporting performance, the NSTA closely scrutinises operators’ applications for flaring consents, pushes back against requests to increase flaring and has ordered operators to temporarily restrict production to stay within agreed limits. The NSTA has also used sanctions powers for consents breaches, with £215 000 worth of fines issued in late-2022.
Hedvig Ljungerud, NSTA Director of Strategy, said: “It is hugely encouraging to see North Sea flaring cut in half in just four years, something the NSTA has made a priority, and which supports both the UK’s energy security and net zero ambition. Industry also deserves credit for making this progress.”
“The NSTA expects reductions to continue and remains firmly focused on both supporting and challenging industry on emissions, including from flaring and venting.”
Backed up by its stewardship expectations, the NSTA regularly engages with industry to highlight best practices and has, for example, worked with operators to improve procedures to reduce flaring associated with platform restarts. These approaches reflect the NSTA’s strategy, revised in early 2021 to oblige industry to support the UK government’s net zero 2050 target.
Industry has shown it is committed to cleaner operations, having pledged to halve overall production emissions by 2030 in the North Sea Transition Deal.
Operators have made substantial investments in equipment designed to minimise flaring, namely flare gas recovery units, each estimated to save up to 22 t of flared gas per day.
Production operations coming to an end on older platforms with higher emissions has also contributed to the drop in flaring in recent years, though last year’s reduction in flaring was still against a backdrop of a 17% rise in gas production.
Meanwhile, venting, when gas is released without being burnt, went up by 5% to 2.9 bcf in 2022, having been at particularly low levels in mid-2021 due to prolonged maintenance shutdowns across multiple platforms, timed to coincide with work to upgrade major pipelines. Venting represents about 0.15% of total UK greenhouse gas emissions and less than 5% of North Sea production emissions.
Fugro and Petrobras introduce remote subsea inspection survey in Brazil
Fugro and Petrobras have achieved a major milestone in Brazil’s offshore energy sector by successfully completing the country’s first ever remote subsea inspection survey. This technology trial was carried out by Fugro in collaboration with Petrobras under an existing multiyear contract with the aim of minimising risk and improving sustainability during inspection, repair and maintenance (IRM) projects.
Fugro utilised a remotely operated vehicle (ROV) deployed from the Fugro Aquarius to conduct the survey. Office-based personnel piloted the ROV from an operations centre in Aberdeen, Scotland, instead of from the vessel itself. The approach was informed by Fugro’s remote ROV piloting experience in other parts of the world, and was accomplished using a high-speed datalink provided by Petrobras. For future projects, remote ROV piloting may help Petrobras limit the number of crew deployed to the field, resulting in safer operations with a reduced carbon footprint.
Spring 2023
Türkiye
Trillion Energy International Inc. has announced the preliminary gas indications from the West Akcakoca 1 well, the fourth well in the company’s multi-well programme at the SASB gas field, Black Sea, Türkiye.
On 10 March, West Akcakoca 1 reached 3839 m total measured depth and true vertical depth of 1677 m. During the drilling, an abundance of gas pay was discovered. An analysis of logging while drilling data suggests 55 m of potential natural gas pay within six sands in the Akcakoca member (SASB production zone). The logging while drilling data is consistent with the initial mud show results. The 7 in. production casing will be run in and cemented. The initial perforation intervals are currently being selected to bring the well into production. Completion and flow testing will occur once the well is perforated, with revenue being generated prior to the end of March.
After completion of the West Akcakoca 1 well, the rig will be skidded back to the Guluc-2 well for completion. The Guluc-2 well is scheduled to be put onto production by the end of March.
China
China National Offshore Oil Corporation has announced that it has discovered an oilfield in the Bohai Sea.

The Bozhong 26-6 oilfield has an average water depth of about 22 m. The main oil-bearing formations are Archean buried hills, and the oil product is light crude oil. The discovery well Bozhong 26-6-2 encountered a total of 321.3 m of oil and gas layers, and the drilling depth was 4480 m. After testing, the average daily output of the well was determined to be around 2040 boe/d and 11.45 million ft3 of natural gas.
Mr. Xu Changgui, Deputy Chief Engineer of the company’s exploration, said: “This discovery shows the broad prospects for exploration of hidden buried hill oil and gas reservoirs in the Bohai Sea, and has important guiding significance for the exploration of similar basins.”
In brief Spring 2023 Oilfield Technology | 5
World news
Diary dates
01 – 04 May 2023
Offshore Technology Conference 2023 Texas, United States 2023 otcnet.org
Spring 2023
Equinor strikes oil and gas near the Troll field in the North Sea
Equinor has again struck oil and gas near the Troll field in the North Sea. This is Equinor’s eighth discovery in the area since 2019.
The volumes are estimated at between 24 and 84 million boe, with slightly more oil than gas. Named Heisenberg, the discovery well was drilled by the Deepsea Stavanger drilling rig. Equinor is the operator, and DNO is a partner.
The discovery is considered commercially interesting, partly because it can utilise existing infrastructure connected to the Troll B platform. However, an appraisal well is needed to get a more precise estimate of the size before it can be concluded whether the volumes can be recovered. The parties are considering drilling the appraisal well in 2024.
05 – 08 September 2023
Gastech Exhibition & Conference Tampines, Singapore gastechevent.com
02 - 05 October 2023
ADIPEC 2023
Abu Dhabi, United Arab Emirates adipec.com
Web news highlights
Ì Neptune Energy provides record levels of support for European economies
Ì OEUK: Official stats confirm risks of shutting down Scottish oil and gas industry
Ì Rystad Energy: More than US$200 billion of offshore greenfield investments expected by 2025
Ì Wood Mackenzie: Willow project in National Petroleum Reserve-Alaska receives approval from US Interior Department
To read more about these articles and for more event listings go to:
www.oilfieldtechnology.com
“Our Troll exploration play keeps delivering. With discoveries in eight out of nine exploration wells, we are approaching a success rate of 90%. We plan to further explore the area, while looking at possible development solutions for the discoveries that have been made. We have a good infrastructure in the area and can quickly bring competitive barrels from here to the market at low cost and with low CO2 emissions,” says Geir Sørtveit, Equinor’s Senior Vice President for exploration and production.
Five of the eight discoveries have been made in licences awarded through APA rounds. It is just over a month since Equinor together with partners made the Røver South discovery in the same area. Through acquisitions two weeks ago, Equinor increased its ownership interests in four of the discoveries made in the area. The seven previous discoveries are: Echino South, Swisher, Røver North, Blasto, Toppand, Kveikje and Røver South.
Aker BP confirms that the Frosk field development has been completed

Aker BP has announced that the Frosk field development in the Alvheim area has been completed and production has started on schedule and within budget, only 18 months after the Plan for Development and Operation (PDO) was submitted. Frosk is operated by Aker BP, with Vår Energi as partner.
“The Frosk project has been delivered with high quality, on time and within budget by Aker BP’s project team in close cooperation with our suppliers. This is a great example of what we can achieve with the alliance model, working as one team with our suppliers towards a common goal with shared incentives. Frosk is also an excellent illustration of how we can increase the value of our existing fields through higher production and lifetime extensions as well as reduced unit costs and emissions intensity,” says CEO of Aker BP, Karl Johnny Hersvik.
The Frosk field is tied back to Alvheim FPSO in the North Sea via existing subsea infrastructure and utilises existing capacity in the processing facilities with only a marginal increase in power consumption and CO2 emissions.
The Frosk project has been delivered within the initial investment estimate of around NOK 2 billion (approximately US$230 million). Recoverable reserves in Frosk are estimated at around 10 million boe.
The Alvheim area is among the most efficient assets on the Norwegian continental shelf, and the resource base has multiplied since start-up. This is the result of targeted exploration and reservoir development, technological innovation and not least the unique collaboration with key suppliers under Aker BP’s alliance model.
Through the alliance model, Alvheim benefits from continuity on rigs, vessels, facilities and personnel. This is a key success factor which allows for transfer of learnings and continuous improvement in methods and technology from one project to the next.
Frosk is the first of three new subsea tie-back projects to the Alvheim FPSO, with Kobra East & Gekko planned to come on stream early 2024 and Tyrving expected on stream in 2025.
6 | Oilfield Technology Spring 2023
We know POWER sections.
We know what the oil and gas industry demands – to go faster, deeper and farther.


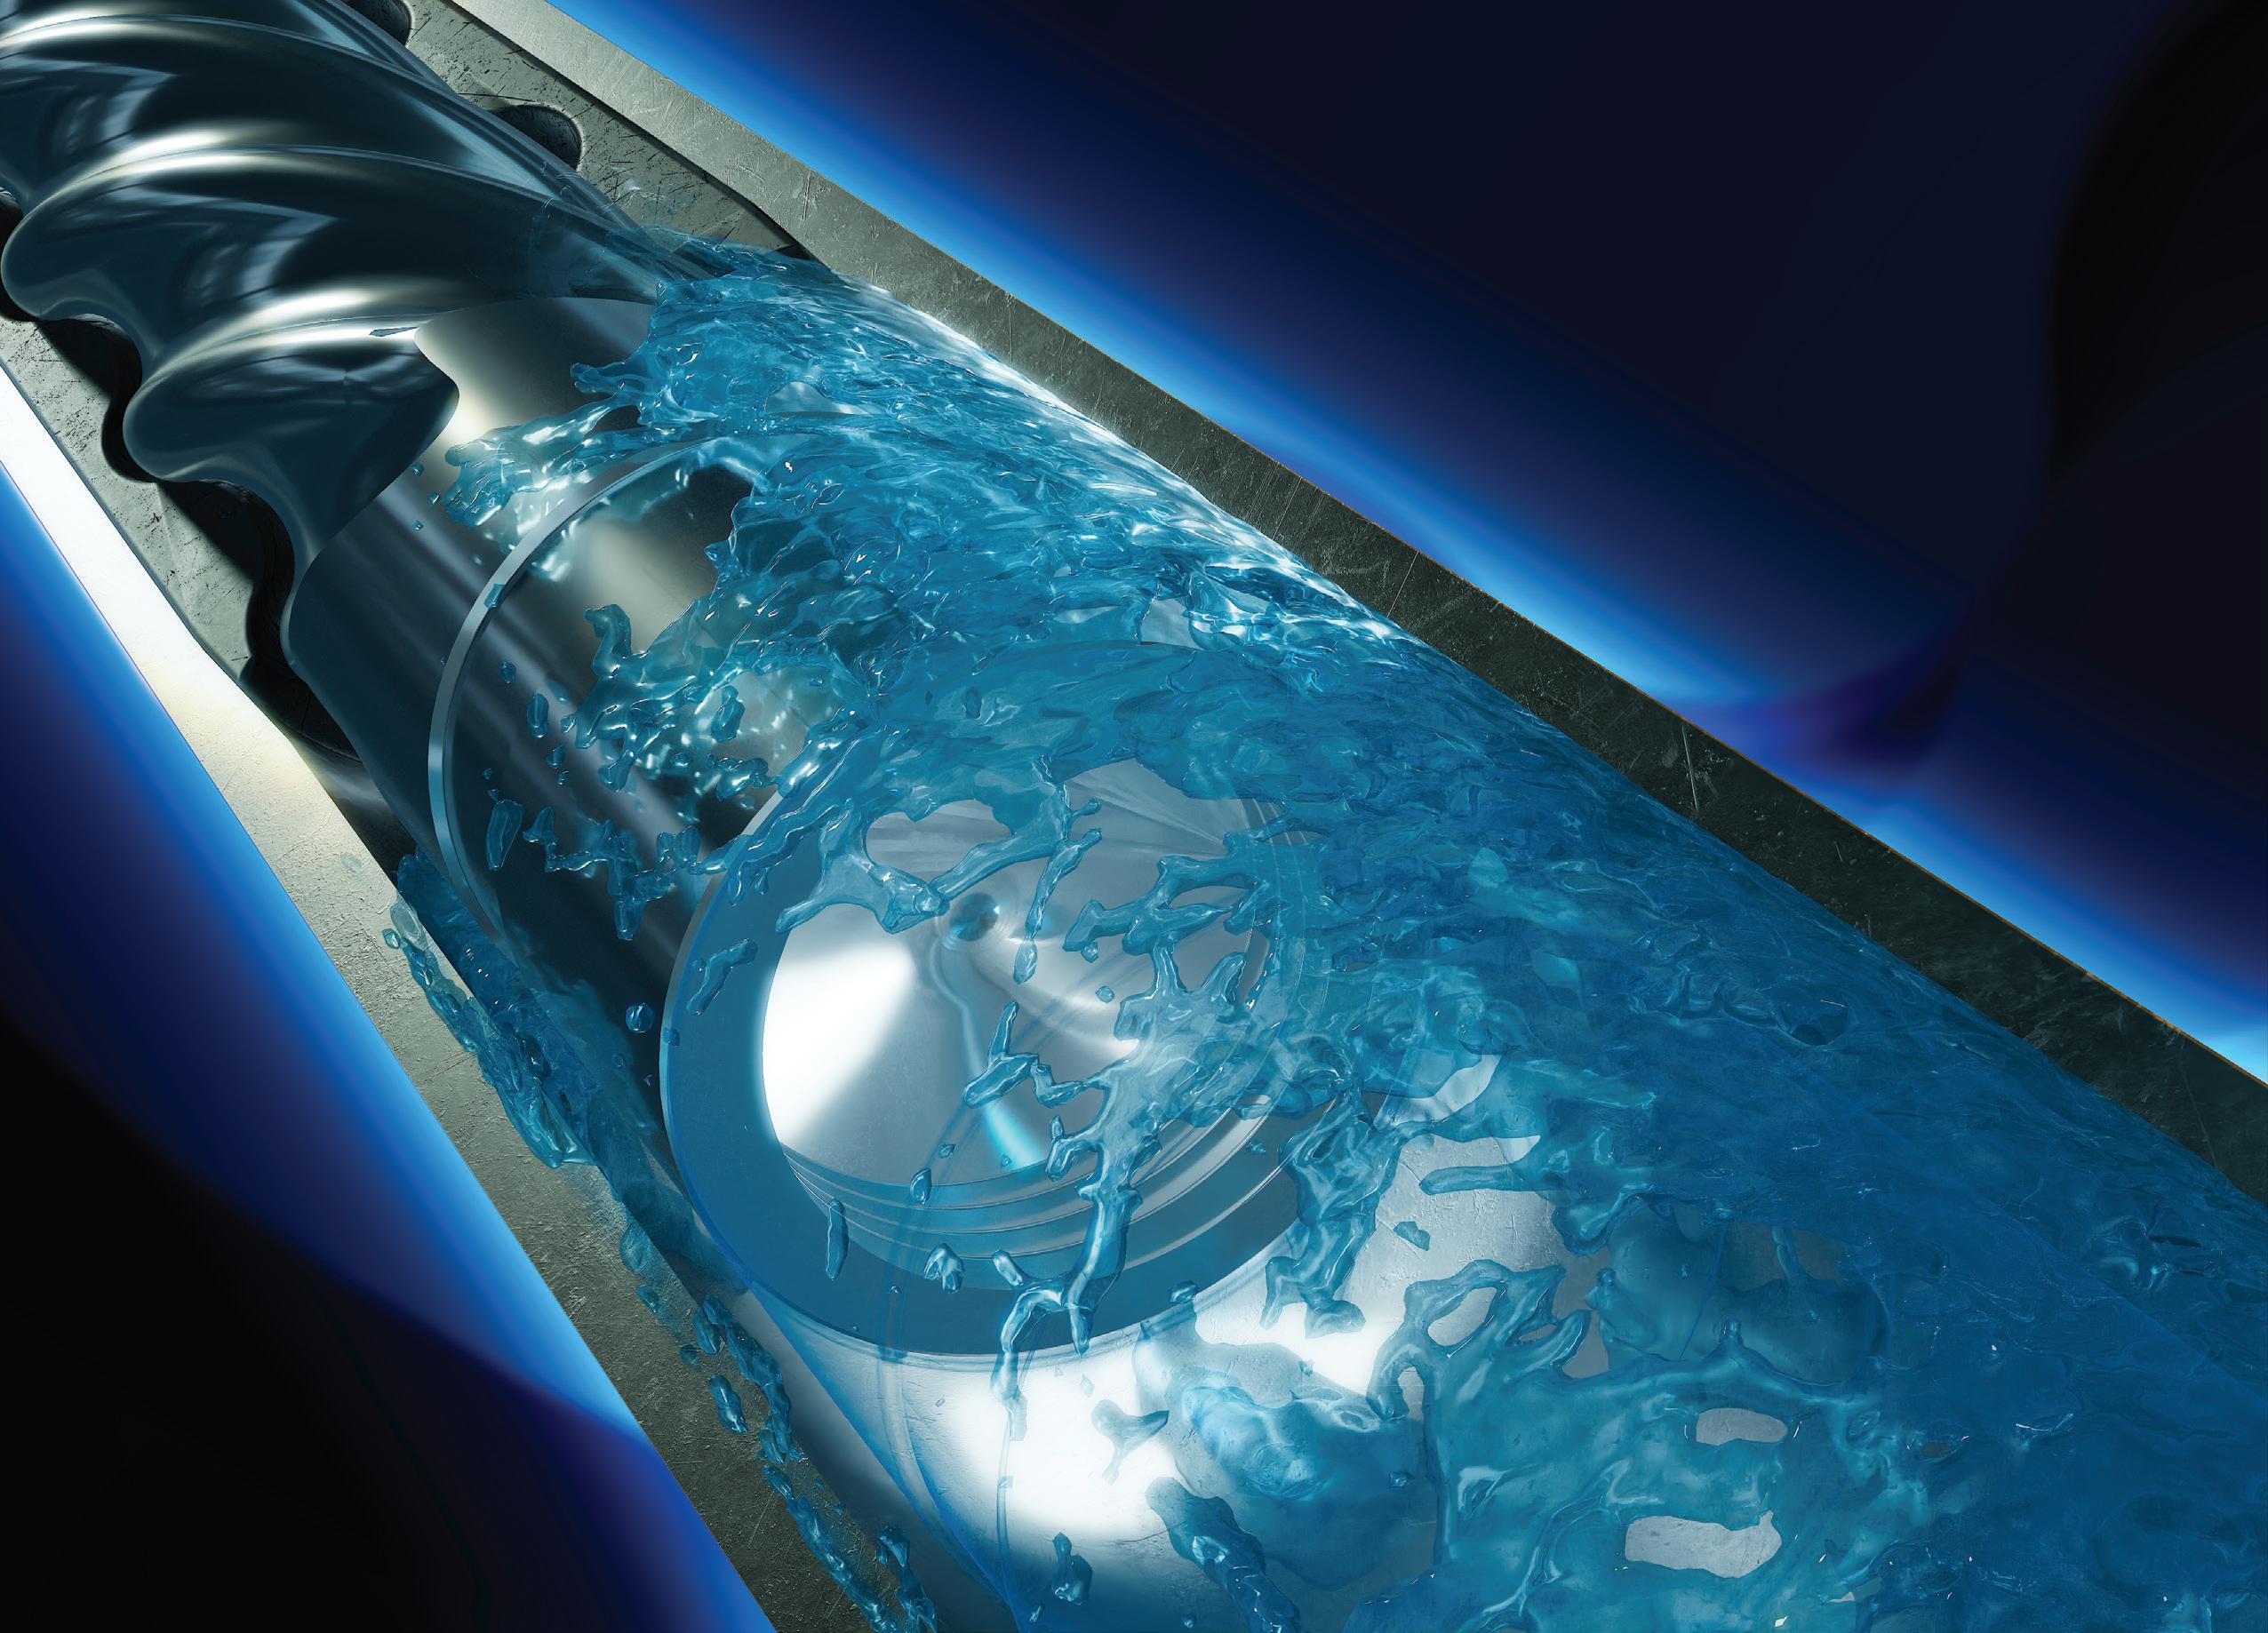
It takes leading edge technologies. Meticulously designed power sections that are precisely engineered, manufactured and calibrated to deliver maximum drilling and thru-tubing performance. Elastomer technologies researched and developed to ensure reliability downhole in corrosive, high temperature, high torque or high wear applications. An elite line of power sections ranging from 1-11/16” - 11-3/4”.


We set the industry benchmark for power section innovation, quality and performance – because we know what it takes to power your downhole drilling operations around the globe.


Learn more at Abacodrilling.com

Stator
Elastomer
Rotor
© 2022 Abaco Drilling Technologies. All rights reserved.
LEADING POWER SECTION TECHNOLOGY
World news
Halliburton and Siguler Guff announce joint venture for emissions management software
Halliburton Company and Siguler Guff & Company, LP have announced the launch of Envana Software Partners, LLC. The new venture provides critical emissions management software-as-a-service (SaaS) solutions to track greenhouse gas emissions in the oil and gas industry and beyond.
The Envana™ digital emissions management solution provides a smarter and more accurate picture of emissions, which gives companies actionable information to manage and reduce their total carbon footprint.
The Halliburton-created software incorporates the company’s operational expertise and oilfield best practices. Future Envana products that are now in active development will support methane detection and quantification management.
The venture’s first offering, Envana Catalyst, is a SaaS solution that helps increase transparency of the environmental impact of drilling, completions, and production operations.
It can improve the visibility of greenhouse gas emissions tracking and forecasting companywide and can provide support for actionable recommendations throughout upstream asset life, from planning and design through to execution.
Envana Catalyst allows customers to choose the methodologies used to estimate emissions from a library of emissions sources tailored to the oil and gas industry, update them as needed, and track any changes.
With its documented API, Envana Catalyst can integrate with existing customer software to automate emissions forecasting and tracking, or users can model emissions manually using the Envana Catalyst interface. Halliburton currently uses Envana Catalyst to help monitor and manage the emissions footprint of its products and services.
“Envana provides breakthrough SaaS emissions management solutions and is the latest example of how innovation adds to sustainability in the oil and gas industry,” said Rami Yassine, Senior Vice President, Halliburton Drilling and Evaluation division. “Envana Catalyst provides digital solutions to generate actionable recommendations for emissions improvement throughout the asset lifecycle.”
Halliburton Landmark will serve as the channel partner for the new venture by providing sales support through its global relationships and reach.
Built on the flexibility and operational fidelity of iEnergy® hybrid cloud, the Halliburton Landmark secure cloud environment, Envana Catalyst delivers emissions data from planning and operations to users.

Envana Catalyst is available both as a standalone solution and, as additional functionality, integrated into E&P workflows within the Halliburton DecisionSpace® 365 suite of products.
Landmark’s integration of Envana Catalyst to enhance existing workflows and help mitigate emissions is an industry first,” said Nagaraj Srinivasan, Senior Vice President of Landmark, Halliburton Digital Solutions, and Consulting. “I’m excited about the impact Envana can have in the rapidly evolving emissions management market.”
Spring 2023
Well-Safe Solutions supports decommissioning of BP Kate wells in North Sea
Well-Safe Solutions is supporting the decommissioning of two suspended wells in BP’s Kate field in the North Sea, 220 km from Aberdeen.
The programme of work, expected to be executed from the Noble Innovator jack up vessel during Q2 2023, will see Well-Safe Solutions carry out well engineering support services using its bespoke Well Decommissioning Delivery Process (WDDP).
Ruth Thomas, Subsurface Team Lead at Well-Safe Solutions, said: “We are very much looking forward to supporting BP with this work scope, which involves detailed subsurface and well engineering basis of design studies ideally suited to our specialist capabilities.”
“Well-Safe Solutions will be instrumental in establishing and evaluating key subsurface isolation criteria including identifying and quantifying zones of flow potential and risks associated with redevelopment.”
“In addition, we will also examine existing barriers and optimise the barrier strategy, taking into account the attributes of the region to safely and efficiently deliver this project.”
Well-Safe Solutions personnel will work alongside BP staff throughout, realising the decommissioning company’s promise to provide safe, smart, and efficient well decommissioning through collaboration.
James Richards, Well Abandonment Director at Well-Safe Solutions, added: “The Well Decommissioning Delivery Process (WDDP) guides operators through the well plug and abandonment process efficiently and effectively, without the extended commitments and high costs historically associated with engineering resources over long periods.”
“The WDDP is built to realise the benefits of capturing, retaining and sharing of knowledge between our personnel, clients and stakeholders.”
This announcement is the latest in a busy year for Well-Safe Solutions, as it prepares for the mobilisation of the Well-Safe Defender and the fitting out of the Well-Safe Guardian with a bespoke dive spread system by summer 2023.
ADNOC Drilling awards new build contract for ten hybrid power land rigs
ADNOC Drilling Company has announced that it has signed an agreement to purchase ten newbuild hybrid power land drilling rigs for a total of US$252 million.
The use of hybrid power solutions is an essential element of ADNOC Drilling’s rigorous decarbonisation strategy as the company contributes to ADNOC’s commitment to reduce greenhouse gas intensity by 25% by 2030, as well as the UAE Net Zero by 2050 strategic initiative.
The rigs use a high capacity battery and engine automation in parallel with the rigs’ traditional diesel generators. The hybrid power technology system stores energy in its batteries to use when there is a need for continuous power or to provide instant extra power when there is an increase in demand, reducing a rig’s greenhouse gas emissions intensity by 10% – 15%.
Each of the rigs will have the provision to be connected to the electrical grid with minimum adjustment, depending on rig location and the availability of grid power, further reducing emissions.
8 | Oilfield Technology Spring 2023

feel the need, the need for speed!” A VAREL PRODUCT(ion)
Bit Body Geometry Customized for Air Drilling Balanced Cutting Structure for Better Tool Life DIG-IT™ Bit to Rock Contact Analysis Software Design
“We
VES DESIGN TEAM VES FIELD TEAM VES MANUFACTURING VES APPS ENGINEERING
US Gulf of Mexico: The basin with nine lives

10 |
Mfon Usoro and R. Scott Nance, Wood Mackenzie, USA, provide an overview of the upstream industry in the US Gulf of Mexico, and delve into the outlook for the region in terms of supply, capital investment, cost inflation, technology, and the energy transition.
The US Gulf of Mexico (US GoM) has remained resilient through fluctuating oil prices. In 2014, an industry-wide shift in philosophy from maximising reserve recovery to maximising returns helped to improve the US GoM’s profitability. The region has moved from the era of mega-hub projects to

| 11
simplified, standardised and nimble projects. As a result, capital efficiency has been achieved. Project CAPEX per boe has reduced by 50% since 2015 and nearly converged with some US tight oil projects.
Energy transition goals have been added to investment decision criteria and caused companies to re-evaluate their upstream portfolios, but US GoM operators have affirmed commitment to the region. Deepwater projects have a lower emissions footprint than other resource themes, and the US GoM is even more advantaged as flaring in the region is limited to operational purposes. The higher EUR per well and robust network of infrastructure also allows for reduced absolute emissions and emissions intensity.
The US GoM remains an attractive destination for investment and a strategic asset for the United States’
energy security. However, there are different themes that could impact its growth trajectory. In this article, Wood Mackenzie delves into the outlook for the region, including supply, capital investment, cost inflation, technology, and the energy transition.
Supply outlook: Peak production expected by the middle of the decade
The US GoM deepwater production is set to reach an all-time high by 2025 of 2.3 million boe/d. Large greenfield projects including the Shell-operated Vito, BP-operated Mad Dog Phase II, Chevron-operated Anchor, Shell-operated Whale, Beacon-operated Shenandoah, and LLOG-operated Salamanca are set to start up over the next two years.
Infrastructure expansion projects are underway to support the near-term production growth. Four additional floating production units (FPU) will arrive at the US GoM by 2025. In addition, new export pipelines and the expansion of existing pipelines are ongoing projects.
Genesis Energy announced capital commitment of US$500 million to fund the construction of a new 105-mile oil pipeline (SYNC) to service the Walker Ridge area, and an expansion of the Cameron Highway Oil Pipeline System (CHOPS).
Production by year of discovery
Capacity is also expanding in the Perdido corridor in the Western GoM. The only export line that services the Perdido corridor is the Hoover Offshore Oil Pipeline System (HOOPS), but Williams has announced plans to build a new 125-mile oil export line that will transport oil from the future Whale FPU to shore.
While the near-term supply outlook is strong, the region will experience steep declines post 2026. The momentum in large project sanctions seen in 2022 is not expected to continue in 2023. The Shell-operated Sparta is currently the only greenfield project on the FID queue.
Another reason for the bleak long-term outlook is that discovered volumes have not kept up with the pace of production.
Fields discovered before
12 | Oilfield Technology Spring 2023
0% 10% 20% 30% 40% 50% 60% 70% 80% 90% 100% 2015201620172018201920202021202220232024202520262027202820292030 % of annual GoM deepwater production
Figure 1. Project CAPEX/boe. CAPEX per boe is the total CAPEX committed from the first year of project spend, divided by total 2P + 2C resources. Source: Wood Mackenzie.
Pre-2001 discoveries Discovered 2001-2010 Discovered 2011-2020 Post-2020 discoveries
0 5 10 15 20 25 30 35 40 45 50 2012 2013 2014 2015 2016 2017 2018 2019 2020 2021 2022 US$ (real terms)
Source: Wood Mackenzie. Fields onstream, approved for development, and justified for development are included. Figure 2. Production by year of discovery: Fields onstream, approved for development, and justified for development are included. Source: Wood Mackenzie.
Source: Wood Mackenzie. Capex per boe is the total capex committed from first year of project spend, divided by total 2P + 2C resources.

For more information, please contact: ben.macleod@oilfieldtechnology.com Advertising with us Learn more about our advertising opportunities • Brand exposure • Lead generation • Premium packages
2001 are still responsible for almost half of the production in the region. Fields discovered post 2010 account for 12% of current production and will only reach 28% by the year 2030.
The key to improving the production outlook in the region will be increased exploration and commercialisation of Paleogene discoveries. Commercial Paleogene fields are characterised by strong initial production (IP) rates, shallow decline rates, and significant resource potential. More operators have begun to recognise the importance of the Paleogene to GoM supply, and exploration wells targeting the play have increased moderately for 2023.
Capital investment: Continued capital discipline
Investment could reach US$10 billion in 2023, an increase of US$2 billion from its 2020 low. Cost inflation plays a role as increases in rig rates will impact recently greenlit developments.
The US GoM experienced steeper rig rate inflation compared to other offshore regions in 2022. The average fixture rate in the US GoM increased by 45% between 2021 and 2022, compared to 30% and 36% in Africa and Latin America, respectively. Wood Mackenzie anticipates that leading-edge day rates for US GoM rigs could reach US$500 000/day in 2023.
The near-term increase in capital investment is also activity-driven. Greenfield and large subsea tie-back projects including Anchor, Whale, Shenandoah, Leon/Castile, Ballymore, and Rydberg have been greenlit over the last three years. Development activity for these projects will be in full swing in 2023 with spend totalling US$3.2 billion.
Similar to production, capital investment is set to decline by the middle of the decade. The cost discipline exerted over the last decade, particularly in exploration activity, has resulted in a limited project inventory. Only three projects – Winterfell, Sparta, and Puma West – will reach FID in the near-term. Although Shell has begun appraising its recent discoveries in the Perdido corridor, (Blacktip, Blacktip North, and Leopard) these projects are not expected to reach FID in 2023. Chevron’s departure from Blacktip and Leopard also signals a less optimistic view of the discoveries.
Technology remains a driving force behind extending the basin’s life
The US GoM continues to retain its position as a hub of innovation in deepwater technology, from pioneering FPUs that can operate in deeper waters, to the use of Ocean Bottom Node (OBN) seismic. The region is once again expected to deploy a new drilling subsea technology in 2023, which is a result of a decade-long research and development stage.
The first-ever floating rig capable of handling 20 000 psi in completion operations has arrived in the US GoM. The Deepwater Atlas rig made its way to the Shenandoah blocks in Walker Ridge in Q4 2022, and the Deepwater Titan is expected to arrive in 2023. Both rigs are also the first eighth generation rigs to reach the market.
The Deepwater Titan and Atlas are part of the technology that is exclusive — for now — to the US GoM, which will allow for the safe development of ultra-high-pressure reservoirs. These reservoirs are located in Paleogene sands and require 20 000 psi-rated subsea and drilling equipment to extract their hydrocarbons.
The delivery of the 20 000 psi technology will unlock the next frontier of oil and gas resources in the US GoM. The barrier to commercialising ultra-high-pressure Paleogene discoveries has been lifted. The Chevron-operated Anchor and Beacon-operated
Shenandoah will be the first ever fields to produce from the ‘Inboard Paleogene’ reservoirs and are set to come onstream in 2024. The Shell-operated Sparta will benefit from this technology and could be sanctioned in 2023.
Wood Mackenzie expects to see an uptick in exploration activity targeting the Inboard Paleogene reservoirs if Anchor and Shenandoah deliver exceptional production rates. Exploration prospects such as Crown, Sea Wall and Casterly Rock in the Walker Ridge and Green Canyon area have been identified as potentials to be drilled over the next three years.
Regulatory environment
One of the Biden administration’s first interactions with the oil and gas sector was a battle over federal lease sales, but the Inflation Reduction Act (IRA) brought back stability to leasing. The Bureau of Ocean Energy Management (BOEM) is required to hold the two final GoM lease sales in the current five-year programme by the end of 2023. In addition, federal offshore wind lease sales must be preceded by an offshore oil and gas lease sale for the next ten years.
Two oil and gas lease sales are scheduled in 2023. Wood Mackenzie does not expect bid amounts to increase substantially. Cost inflation and capital discipline remain the dominant counterforce to lease spend.
Although government regulations have eased off on lease sales, there are some operational areas that are facing restrictions. Over the past three years, a 14-times increase in seismic permit approval time by BOEM has been seen. Some roadblocks have been put in place recently, including the required approval of the National OcEanic and Atmospheric Administration (NOAA) Fisheries permit before BOEM will evaluate it. In addition, litigation over the interpretation of the MMPA is causing application decision delays from NOAA.
How does the US GoM fit into the energy transition?
In addition to capital discipline, investors have begun expecting progress on emissions reduction and a commitment to the energy transition. The US GoM has a significant advantage. Its emissions intensity, measured in tons of CO2 equivalent emitted per boe produced, is in the bottom quartile of global deepwater basins. This provides companies the ability to continue GoM investment while still making progress towards net-zero goals.
The US GoM will host its first wind lease sale in 2023. BOEM has identified two offshore wind energy areas nearby and Lake Charles, Los Angeles. Entergy and Mitsubishi have an agreement to bid together in the upcoming sale. US GoM players BP, Equinor, TotalEnergies, and Shell could be candidates based on participation in US GoM wind feasibility studies and past Atlantic wind lease sales. Carbon capture will gain momentum in the region. BOEM is expected to release guidance for regulations around offshore sequestration this year. Once released, it will be the catalyst that could increase activity in 2023. At least one carbon capture lease sale is expected.
Wood Mackenzie expects carbon capture to become more mainstream in 2023. Boosted by 45Q credits in the US, emerging emission trading schemes elsewhere and new supportive regulations, more CCUS projects will gain traction. Hub developments and the capability to offer ‘carbon capture as a service’ will be a major goal for those with net-zero targets. More operators will look to join this exclusive club as commercial models develop in 2023.
14 | Oilfield Technology Spring 2023


Book your delegate pass and hear from the energy experts Co-Host Book your delegate pass at the loyalty rate to hear from more than 600 expert speakers, including policy makers from the world’s leading energy economies, the industry’s pre-eminent leaders, and technical experts from the global natural gas, LNG, hydrogen, low-carbon solutions, and climate technologies industries. SCAN TO REGISTER AS A DELEGATE delegates@gastechevent.com gastechevent.com @gastechevent #Gastech Save up to $1,630 by registering now 4,000+
600+ technical and
40,000+
Held in Gold Sponsors Partner Sponsors Supported by Organised by
delegates 300+ CEOs, Ministers, and business leaders speaking
commercial speakers
international attendees 100+ countries represented
Danny Constantinis, EM&I Group, Malta, discusses the importance of continued industry collaboration in finding technical solutions to offshore challenges and improving the safety of operations.
16 |
An engineer recently addressed a major conference on technology and innovation in the energy sector. He made the point that any major technical revolution, innovation or breakthrough often arises from a crisis or a shock; a natural crisis, such as an earthquake or a nuclear disaster, might accelerate the development of robotics. A financial crisis might lead to technical innovations to ‘make do’ with less. War and global conflict have been seen to accelerate the adoption of new technologies in diverse fields such as medicine and artificial intelligence.
The ‘energy shock’ of 2022, and the resultant global chaos leading to unstable oil and gas markets, has led to redoubling of the world’s governments’ efforts to address the challenges of creating a clean, more secure, and cheaper energy system. These challenges extend offshore, as governments seek diverse supplies and increasingly invest to secure their energy needs.
We have been here before… so what is new?
The ‘energy transition’ has been a significant and welcome point of focus in the offshore sector for fossil fuel and renewables production. It has added pace and urgency to the development of technical solutions to the range of problems besetting the industry,
| 17
whether that be ‘sweating’ elderly production assets, improving safety, or simply struggling with the inevitable resistance to change that adds so powerful a brake to progress. It has also added complexity, not least in the area of regulation, which continues to lag behind the relentless
pace of technical solutions in the energy sector in general, and specifically, to managing the integrity of offshore production assets.
What has been the response of industry to offshore challenges?
EM&I recently commissioned a report to understand and mitigate the risks of offshore work being faced by its staff. In it, the author, Professor Andy Woods of the University of Cambridge, stressed the inherent dangers associated with offshore production, most notably in the area of confined space entry (CSE) and working at height.1
The report describes in detail the safety risks, using historic data of confined space working in the context of both trading and floating offshore vessels. The report quantifies empirically the risk, and the associated monetary cost of a fatality before drawing an important observation that “the current level of risk of a fatality is higher than industry guidelines would wish,” and that “the consequences of these incidents, although relatively rare, are very substantial in terms of both the fatality and also collateral impacts of lost production and corporate reputation.”
The bottom line is that people are still being killed or injured in the industry; it is in many ways preventable – and it is simply unacceptable to continue, at every level, and not least, at the ethical level.
Are improved procedural methodologies the panacea?
The offshore floating production industry, while concerned, is alert to these dangers and accepts that improved procedural methodology alone will not mitigate the risk in full. EM&I believes that the industry, including its regulators, accepts this, and there is encouraging evidence of the change afoot to prove it.
The work of the global FPSO Forum and the HITS (Hull Inspection Techniques and Strategy) Joint Industry Programme (JIP) provides an important signpost to the future in which owner, operator, classification society, service provider, and academic bodies collaborate to seek technical solutions to offshore challenges.
Technological innovations and lifting the barriers that ‘prevent safety’
It is EM&I’s view that the key to the effective ‘industrialisation’ (getting ideas for technological innovations into operation on assets quickly and safely) is through continued collaboration in meaningful and effective JIPs such as HITS, and its floating gas and floating offshore wind equivalent JIPs (FloGas, FloWind) in which the innovator collaborates with the regulator, and asset owners and operators, to deliver successful outcomes quickly, noting that ‘just in time’ is frequently ‘just too late’. Identifying and focusing on the industry’s needs are also central tenets. In the case of HITS, as an example, the focus has been on reducing and removing the need for diver interventions offshore, and for reducing or removing the need for perilous confined space entry. A focus has also
18 | Oilfield Technology Spring 2023
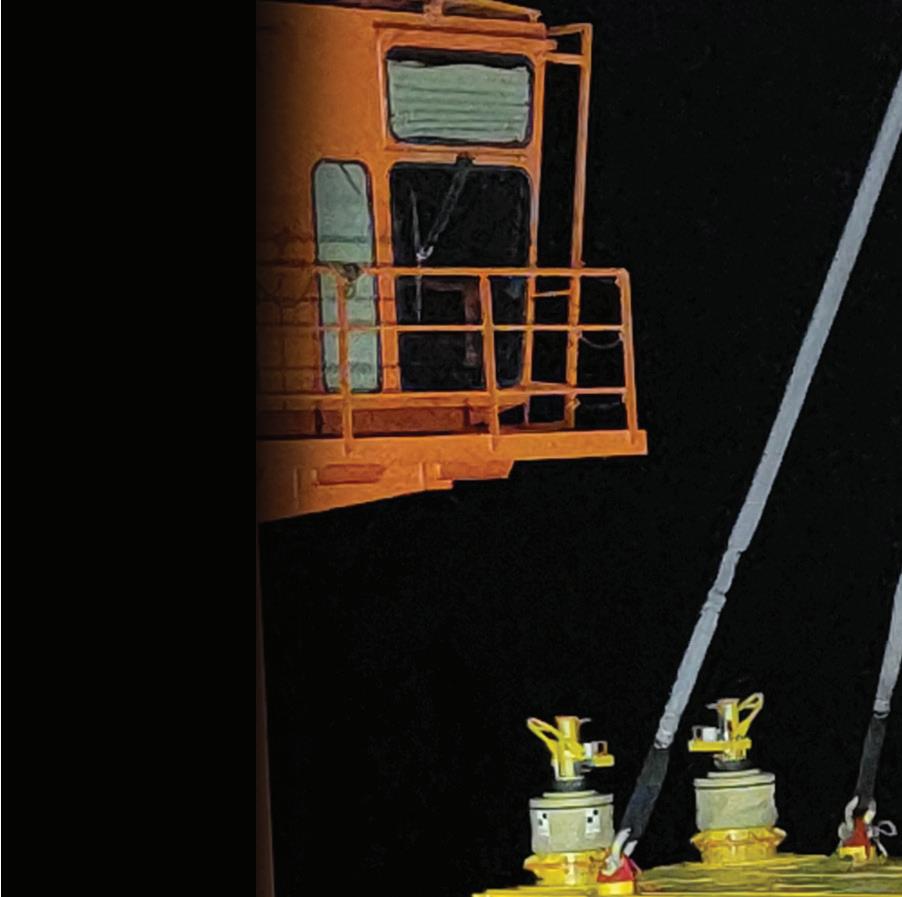
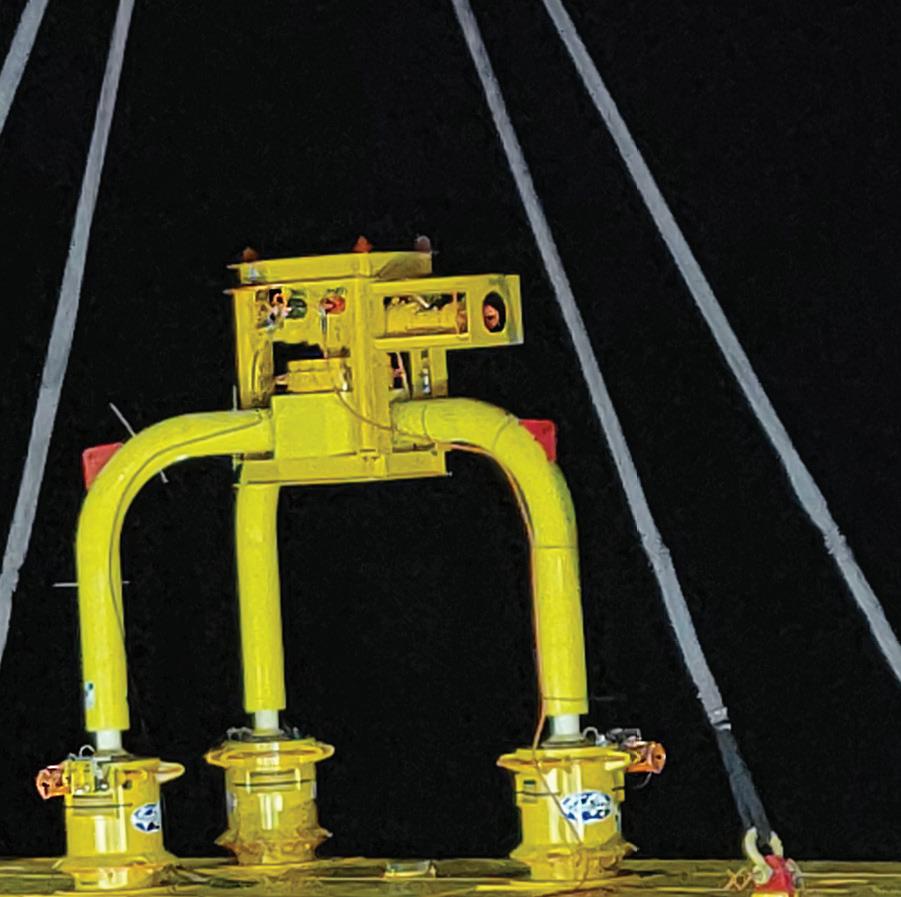
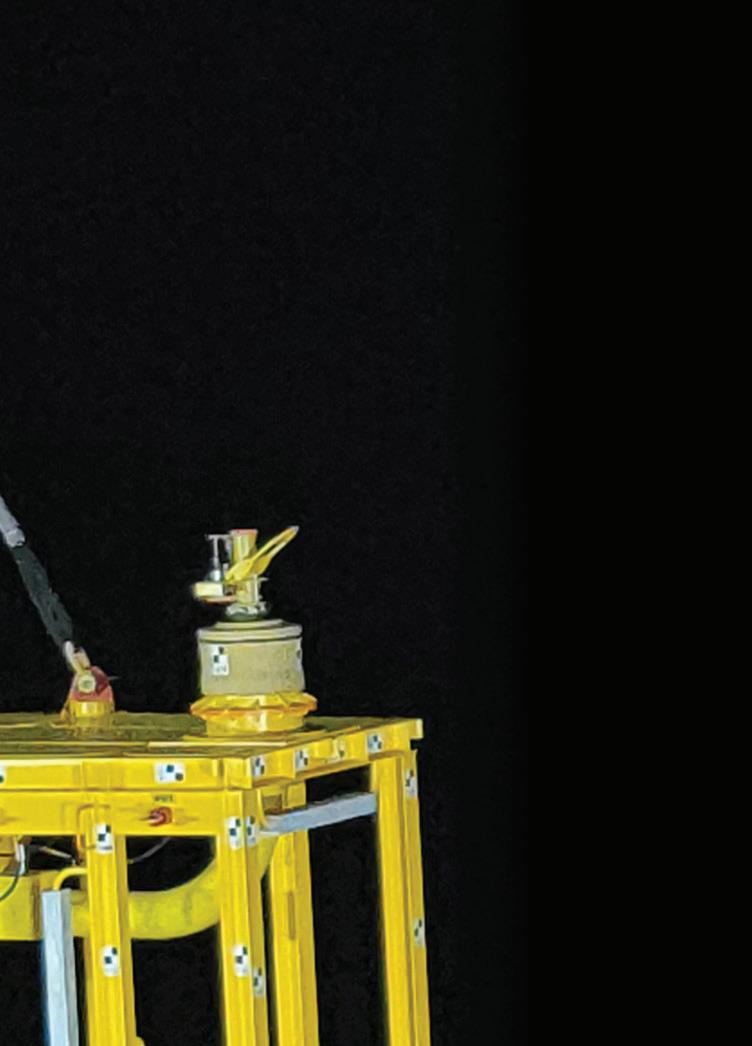
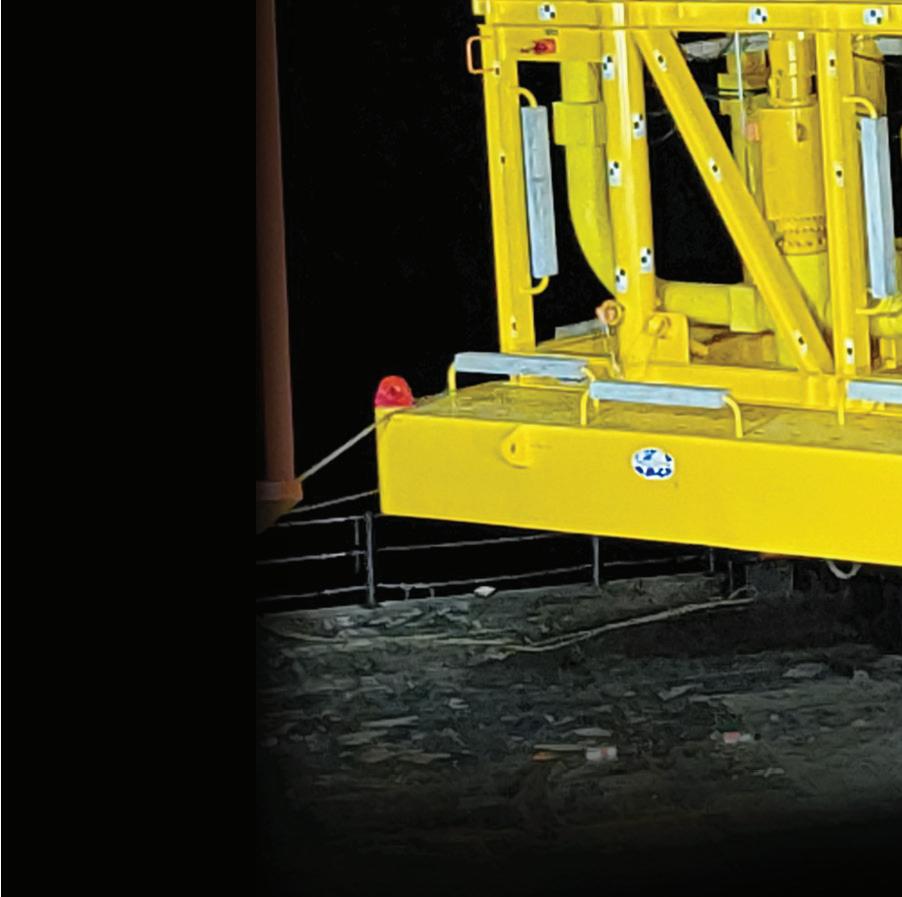
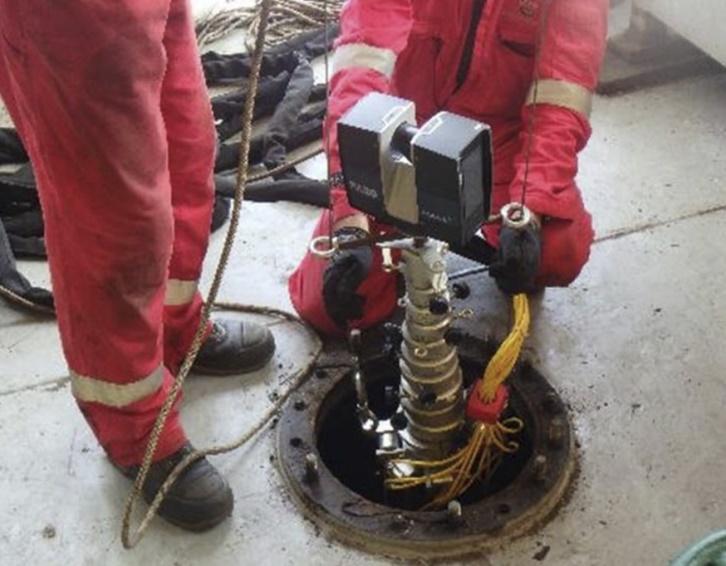
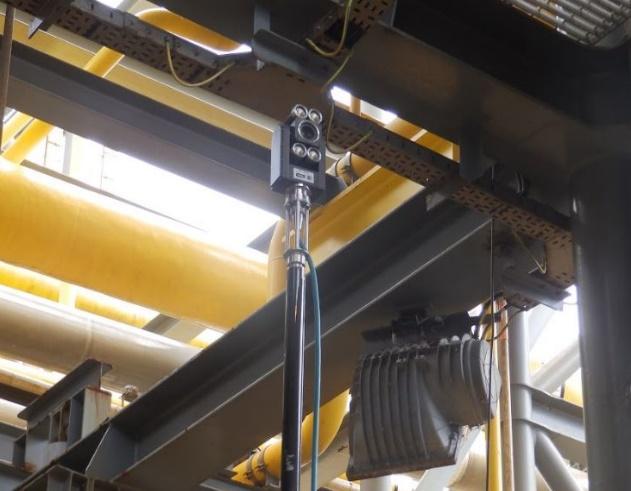
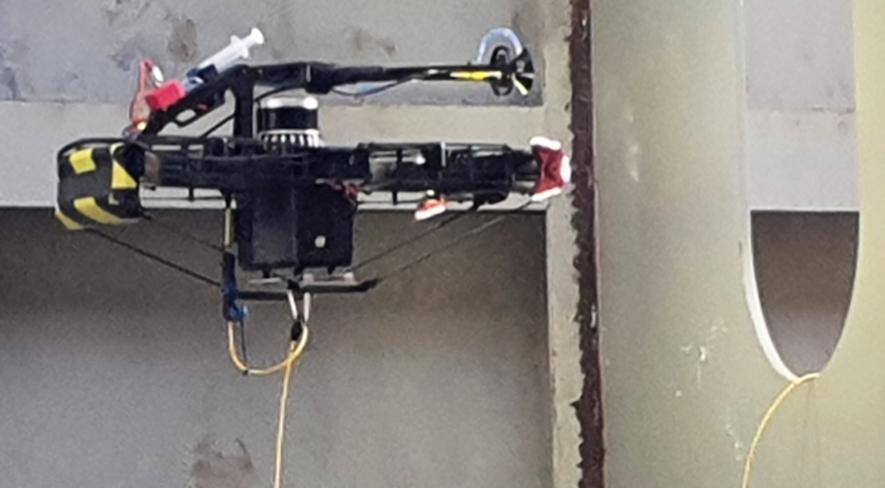
Figure 1. Laser measurement for measuring thickness and distortion and a tethered BVLOS advanced inspection drone equipped with a UT probe.
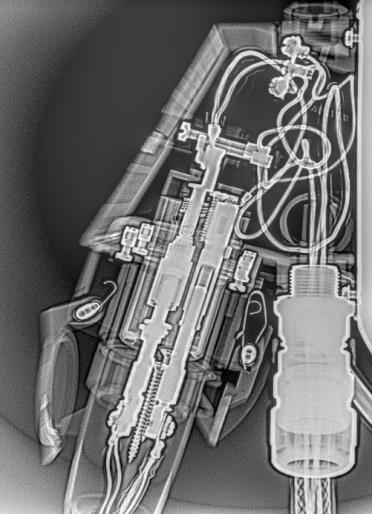
Figure 2. EM&I has developed a system that utilises specialised digital radiography for non-intrusive detailed inspections of critical Ex equipment in accordance with IEC 60079, and high level, remote close visual external inspections using the NoMan camera.
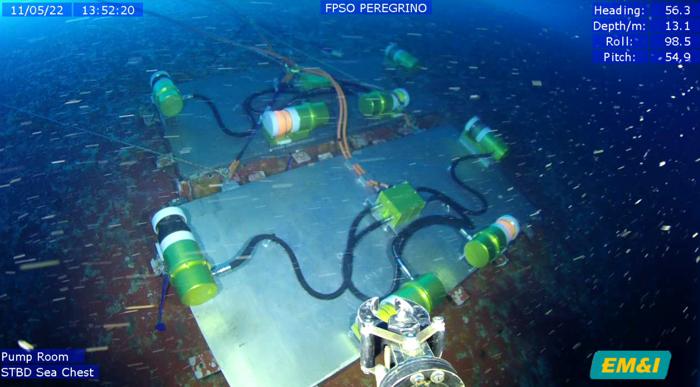
been on enhancing the increasingly large volumes of complex data that is available in order to assure and meet the regulatory requirements. This laser-like focus has enabled the rapid development of technologies. EM&I’s diverless sea chest blanking to enable valve isolation for replacement and/or repair, as well as sea chest repairs without diver intervention, was delivered and approved for operational use within one year. The NoMan Plus suite of services for assessing the condition of cargo oil tanks – without having to place a human in the tank – has now received its first classification society approval with more to follow – all within two years of inception.
None of this might have been achieved without collaboration and a commitment by all JIP participants to improve safety offshore, minimise the impact on production operations, and contribute to the reduction of carbon.
Global crises will continue to emerge and change the face of the offshore industry, as will the associated challenges that will tax those charged to mitigate them. The key will be to adapt quickly to the tempo and pace of change, to maintain a sharp focus on what really matters to the industry, and to collaborate effectively. In this way, change will be meaningful and we might finally settle in an environment where the challenges no longer contribute to ‘the prevention of safety’.
References
1. “Safety in Confined Spaces with Reference to Floating Production Storage and Offloading Units (FPSOs) and other Marine Vessels”, Professor Andy Woods, Institute of Energy and Environmental Flows, University of Cambridge, February 2022. Copy available on request.
Omnetics specializes in application-specific connector to cable systems. Our expert designers have experience designing harnesses for complex and harsh environment applications. Omnetics designers have the necessary experience needed to meet the Quality and Performance specifications required by the US Military, NASA and ESA.
We design and manufacture a wide range of custom cable solutions to support all of our various product lines, while allowing your team to guide the design.
Omnetics Connector Corporation follows IPC/WHMA-A-620 for all cable assembly, test and inspection practices.
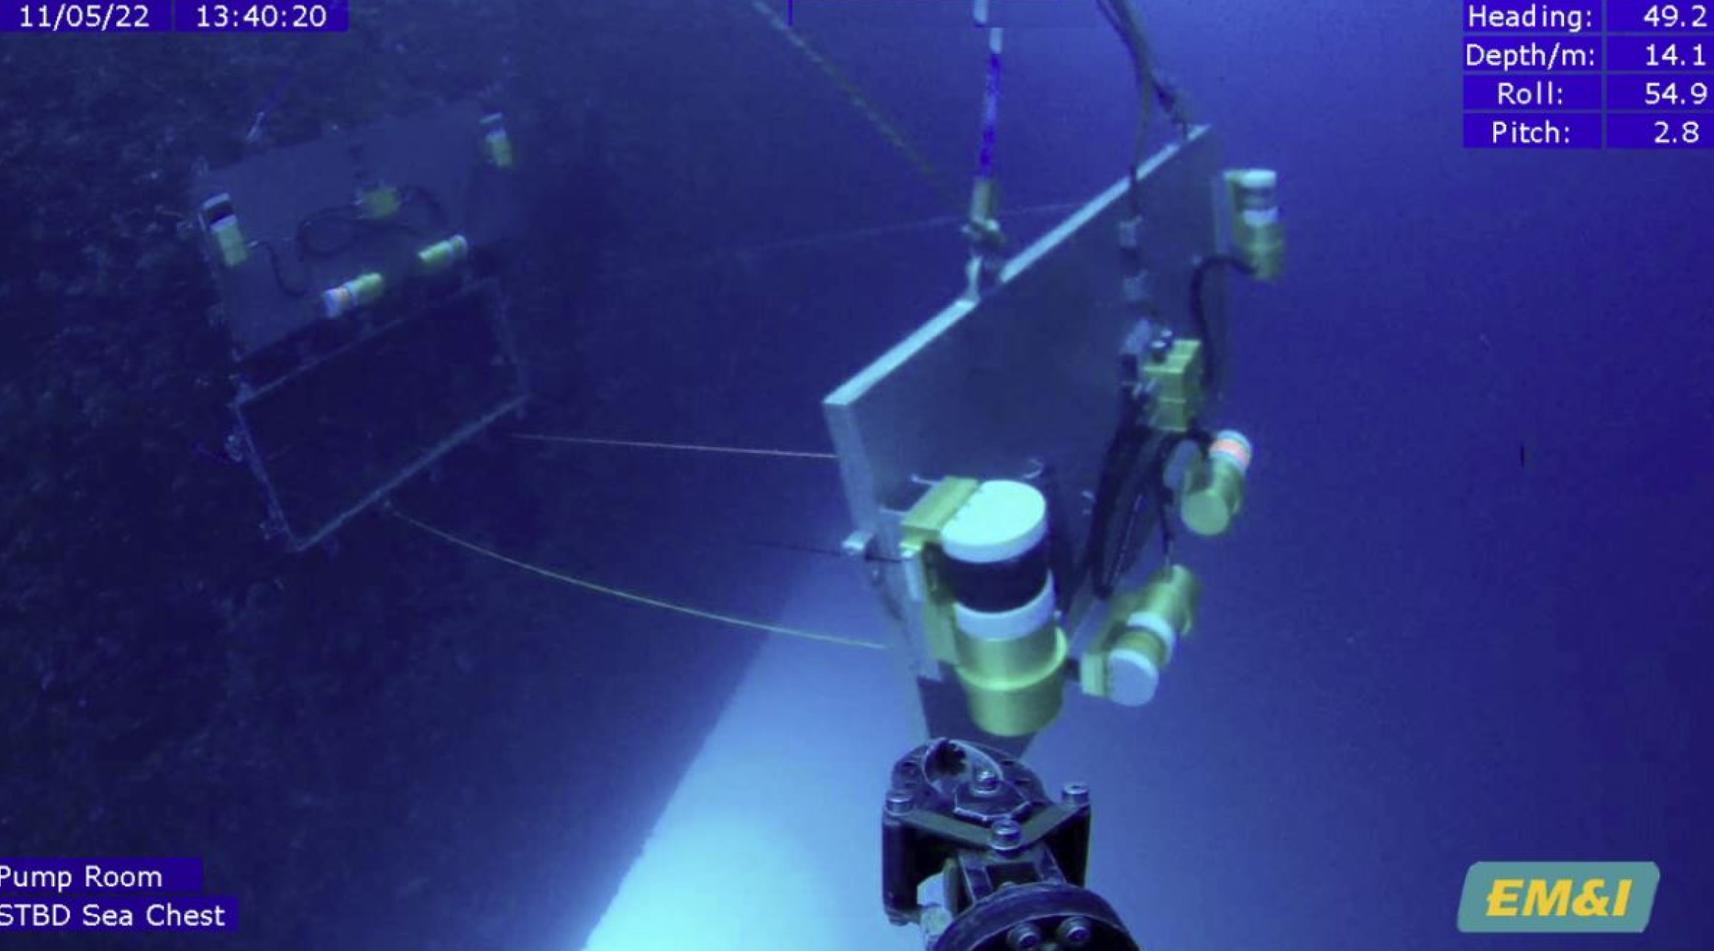
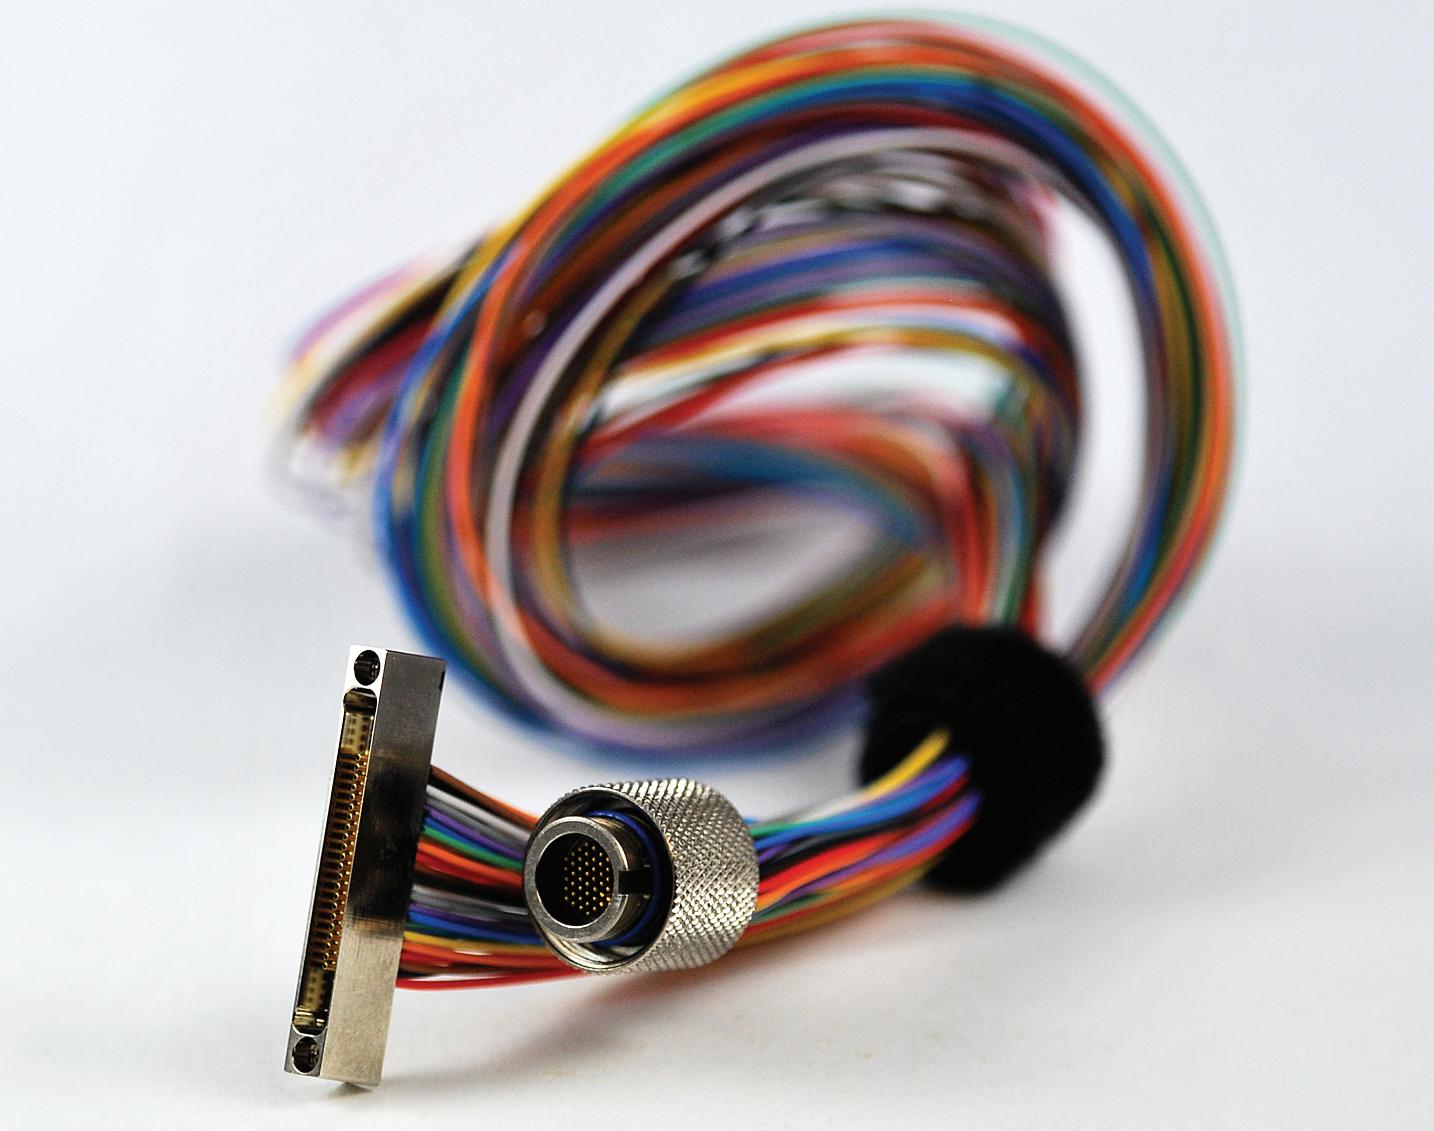 Figure 3. A diverless method for blanking sea chests without the use of divers, using an ‘intelligent’ motorised wire-guided blanking plate.
www.omnetics.com | sales@omnetics.com
Trusting
tracer
Carlos Pedroso, Enauta, Brazil, and Zaque Araujo and Paul Hewitt, Tracerco, Brazil and USA, consider the use of tracer and AICD technologies as a method of quantitative oil inflow and water cut measurement in subsea wells.
At a water depth of over 1000 m, an offshore field was experiencing all the challenges of a deep-water oilfield. Despite a large aquifer below the oil reservoir, the expectation was that only a small amount of water would be produced. At the onset of the planning phase, it was determined that the use of some form of flow equalising technology would be beneficial to delay water breakthrough. However, this concept was discarded for the first two wells due to a low frac gradient associated with the long horizontal sections that could have caused issues during gravel pack pumping.
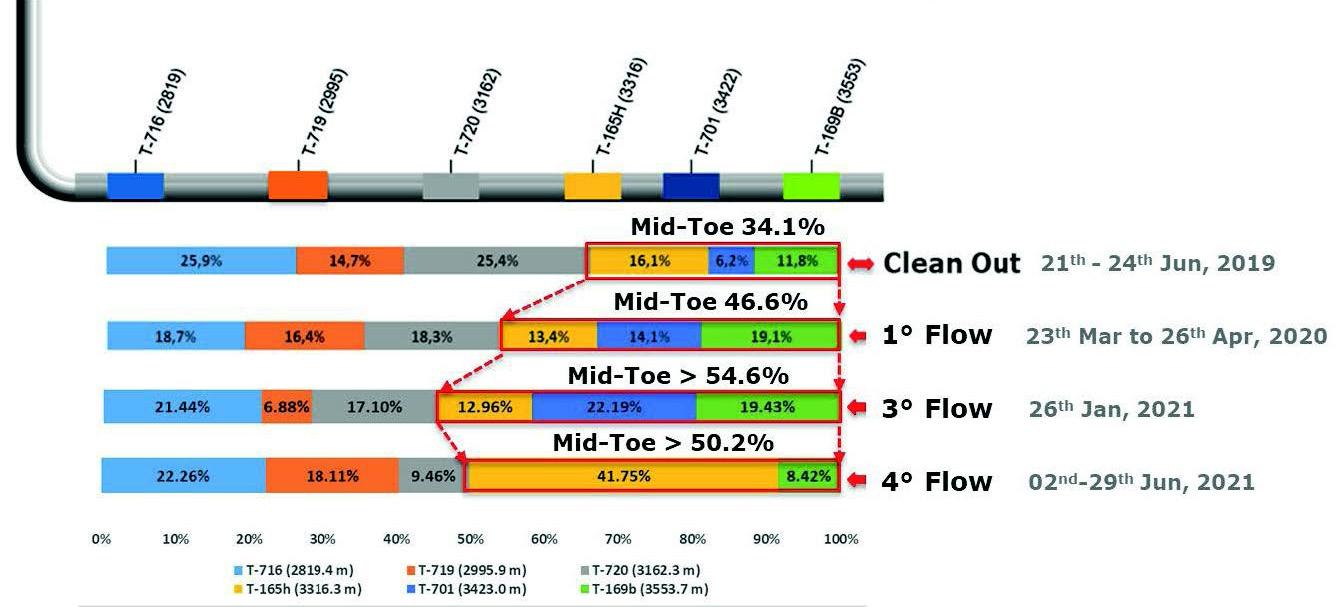
Following the completion and flow of the first two wells in the field, analysis of water tracer data from solid polymer tracers integrated into sand screens and placed along the length of each of the two wells showed a dominant water flow towards the heel of each well (Figure 1).
During completion of the first two wells, a better evaluation of the minimum horizontal stress was obtained.

Therefore, the operational window was enlarged, and it was determined that it would be possible to apply flow equalising technology together with gravel packing in future wells to try to mitigate water breakthrough.
The well design was completed after a comprehensive reservoir simulation to identify key reservoir characteristics in order to apply autonomous inflow control device (AICD) technology effectively. It demonstrated that water production would again be predominant from the heel to middle section of the well and the AICD configuration was selected based on the reservoir permeability and the oil/water saturation profile.
Computer simulated results using common solutions, such as reduced carrier fluid density, progressive pump rate reduction and use of friction reducer, to extend the operational window, showed that 94% of the open hole would be packed at the end of pumping operations.
20 |
technology in

| 21
To increase coverage targeting 100% pack, the following enhanced design strategy was simulated and adopted after showing promising results:
Ì Use of a toe end sacrificial screen, to allow the gravel pack alpha wave to be pumped with normal pump rates and conventional density proppants.
Ì A change to low density proppants after covering the sacrificial screen to allow transportation into position at lower pump rates.
Ì Low proppant concentration at the beginning of the job.
Ì Decreasing the pump rate to the minimum limit.
Ì Use of a 4 in. wash pipe inside the 6 5/8 in. screens.
Ì Use of three AICD screens up into the casing in a none-producing zone, instead of blank pipe. These contained eight inserts to give an additional 24 holes in the screens, allowing some degree of continued fluid return while packing the open hole until screen out.
As part of well surveillance activities, the operator wanted to carry out a well evaluation to determine the benefits of the design strategy in balancing and ultimately reducing aquifer water production.

The solution
The most cost-effective method to carry out well evaluation to establish oil and water positional inflow was through use of solid polymer tracers integrated into sand screens prior to running in hole. The technology is environmentally safe, and a low-cost way to quantitatively measure water production profile over time.
The solid polymer tracers are chemical compounds tailored to mark only the oil or water phase under investigation. Non-radioactive, non-adsorbing, non-degrading, and compatible with common oilfield chemicals, tracer measurement technology provides advantages over traditional inflow measurement methods. Unlike a production logging tool (PLT), tracers do not require intervention of any kind, or for the well to be shut-in. They can be used in wells with electrical submersible pump access restrictions, provide insight over time rather than a mere snapshot of production, and can be used at a fraction of the cost of a PLT, without constraints on wellbore length.
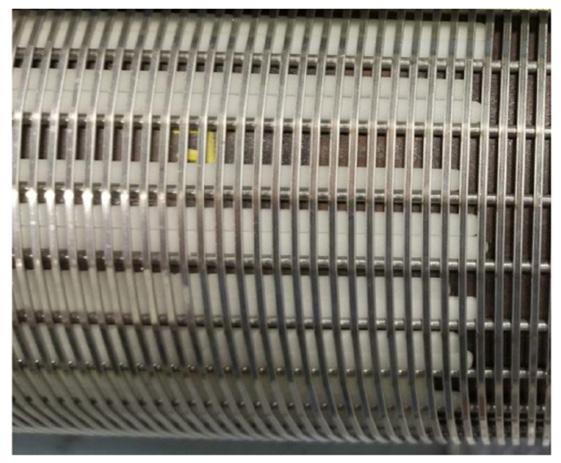
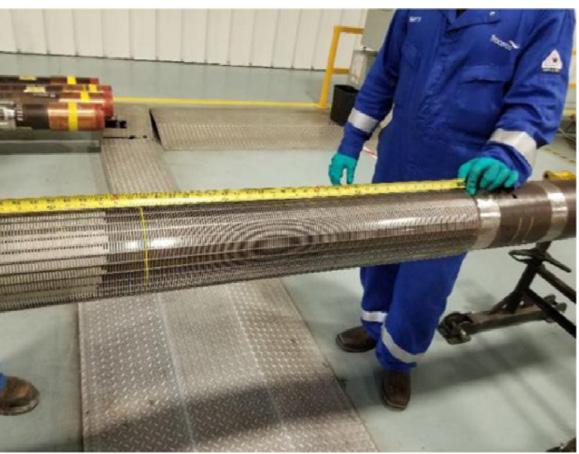
Solid polymer tracers were integrated into the AICD sand screens (Figure 2) during manufacture and placed at specific areas of interest downhole during run in hole (RIH) of the lower completion.
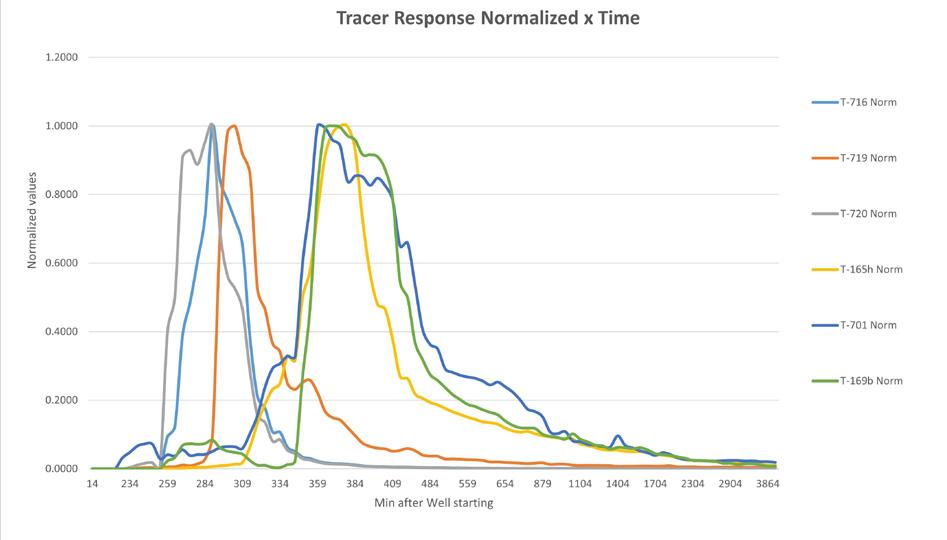
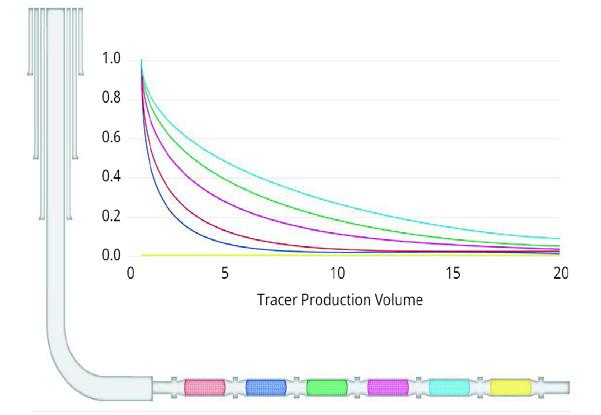
Flow of fluids from a well using AICD systems enters the main production tubing at discrete points. It is possible to use tracer concentration decay curve analysis from this type of well to gain information on the amount of fluid flowing into the wellbore at each of the positions traced. Tracer decay curve analysis is completed by sampling the well at a high frequency, following well clean-up or a brief shut in. During the shut in, concentrated clouds of tracer accumulate in the fluids at their respective locations. During well flow, each cloud disperses and flows to the surface, and their timing and shape are measured using captured samples and tracer analysis.
shape
individual
22 | Oilfield Technology Spring 2023
The
of the
Figure 1. Water cut measurement showing relative water cut taken three months apart with heel flow dominance.
Figure 2. Solid polymer tracer within the drainage layer of the sand screen during manufacture.
Figures 3 & 4. Tracer decay curve interpretation (left). Water cut measurement is based upon the surface area in contact with water being directly related to the amount of water tracer released (right).
Figure 5. Decay curve analysis used to determine the amount of oil flowing into the well at specific locations.

Visit our website today: www.globalhydrogenreview.com The home for the latest hydrogen news, analysis and events
tracer concentration over time is compared and used to calculate the zonal flow rates using mathematical models. The faster the flow, the faster the decay of the tracer from the well. An example of decay
curve analysis can be seen in Figure 3 where the dark blue position shows the highest flow, followed by red, pink, green and light blue, with yellow showing zero flow into the well.
In addition, proprietary software enables data interpretation relating to water cut within the wellbore and uses water tracer concentrations linked to surface area contacted by producing water, where the tracers are located to provide a relative water cut assessment to be made. An example of water cut interpretation can be seen in Figure 4 where 90% of the water is in contact with a large surface area of the yellow tracer when compared to the red. This results in more tracer being released than in the red position. A comparison of tracer concentration in a surface water sample allows the relative water cut to be measured.
The results
The oil tracer responses from the well during a transient test are shown in Figure 5. The analysis of each tracer decay curve allowed for a comparison of speed of flush out to be measured. An assessment could also be made regarding where the dominant oil flow was occurring from within the well.
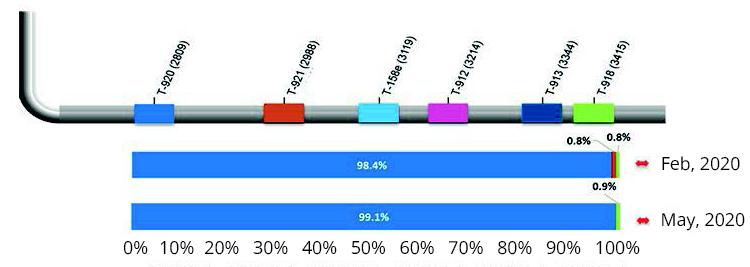
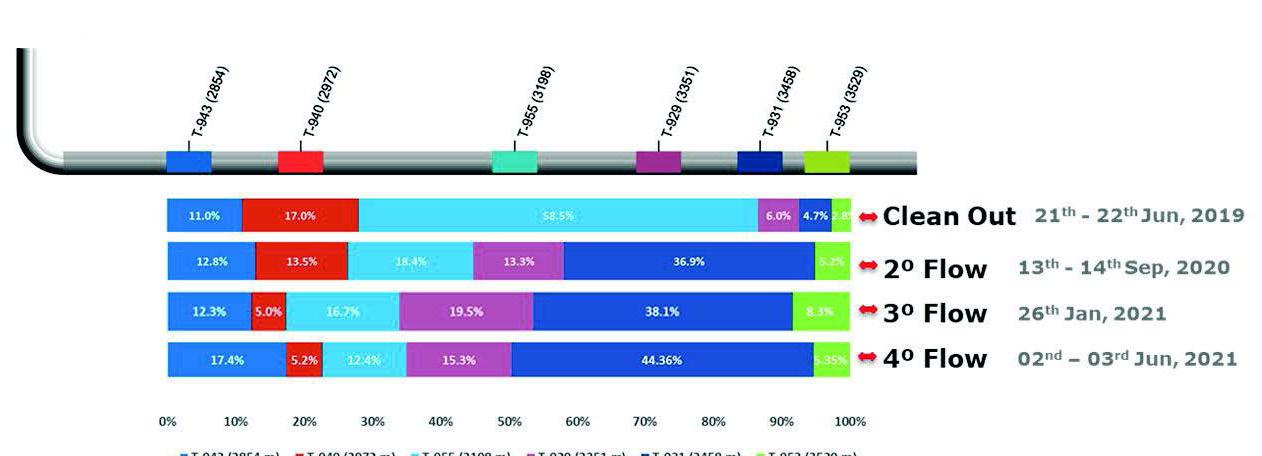
Figure 6 shows how the well started with dominant water flow of primarily water-based completion fluids from the mid-section of the well. Over the next two years, the water distribution balanced a little better, and importantly was not showing dominance from the heel of the well, with an average of 40:60 flowing from the upper half versus the lower half. In addition, following the initial clean out flow from the well, the distribution of oil flowing from the well was balanced with an average of 50:50 flowing from the upper and lower halves (Figure 7). The lack of oil tracer presence during the last testing round matches where the dominant water flow was originating. This was indicative of a lack of oil contact with the tracer during the shut-in period, as tracer clouds build and confirms the water tracer data.
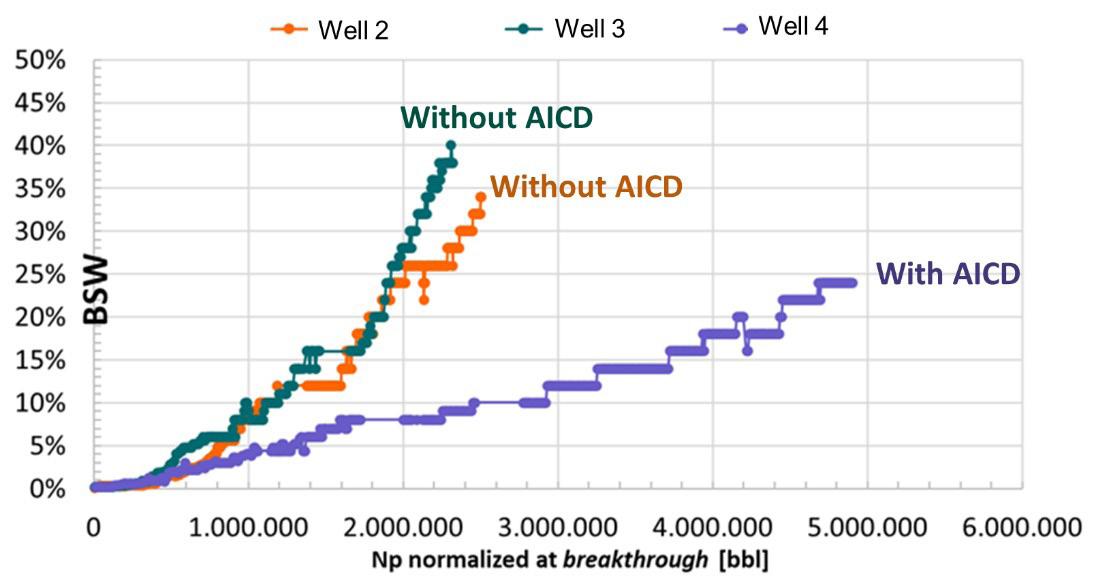
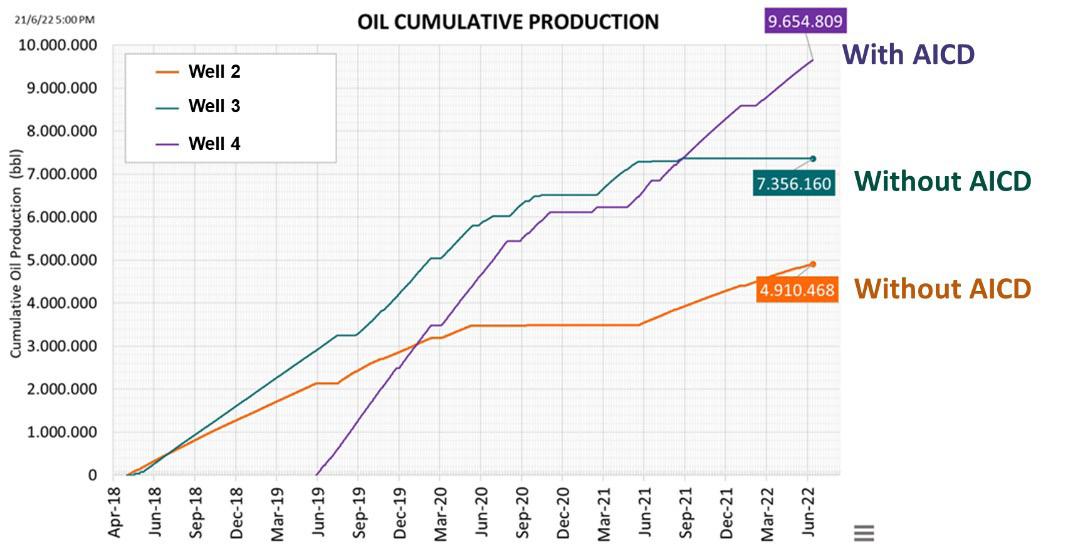
A comparison of the cumulative oil produced from the three wells (with two containing no AICDs and one using AICDs) clearly showed benefits of AICD use with significantly more oil production in a shorter period of time as presented in Figure 8. When reviewing water production from each of the three wells, the data also showed a significant benefit in AICD use with water cut increasing much more slowly in the well with the AICDs, than in the two wells that did not have any water control capabilities (Figure 9).
Conclusions
Tracers allowed a low-cost evaluation method of quantitative oil inflow and water cut measurement in subsea wells without any intervention. They were shown to be compatible with open hole horizontal gravel packing (OHHGP) and AICD use, and in this case, established that some equalisation was achieved, restricting water inflow from the heel and balancing oil inflow.
This resulted in lower cumulative water production and enhanced oil production from the well using AICDs when compared to the other two wells that did not use AICD technology.
24 | Oilfield Technology Spring 2023
Figure 6. Oil tracers in Well 4 using tracer technology over a two-year time period.
Figure 7. Water cut results in Well 4 using tracer technology over a two-year time period.
Figure 8. Cumulative oil production comparison between wells with and without AICD systems.
Figure 9. BSW comparison between wells with AICD and without AICD.
Thinking outside the box

Paul Hazel, Welltec, UK, considers how a combination of well barrier elements of varying materials and delivery mechanisms, as opposed to the traditional stand-alone cement, could help meet challenging life-of-well requirements.
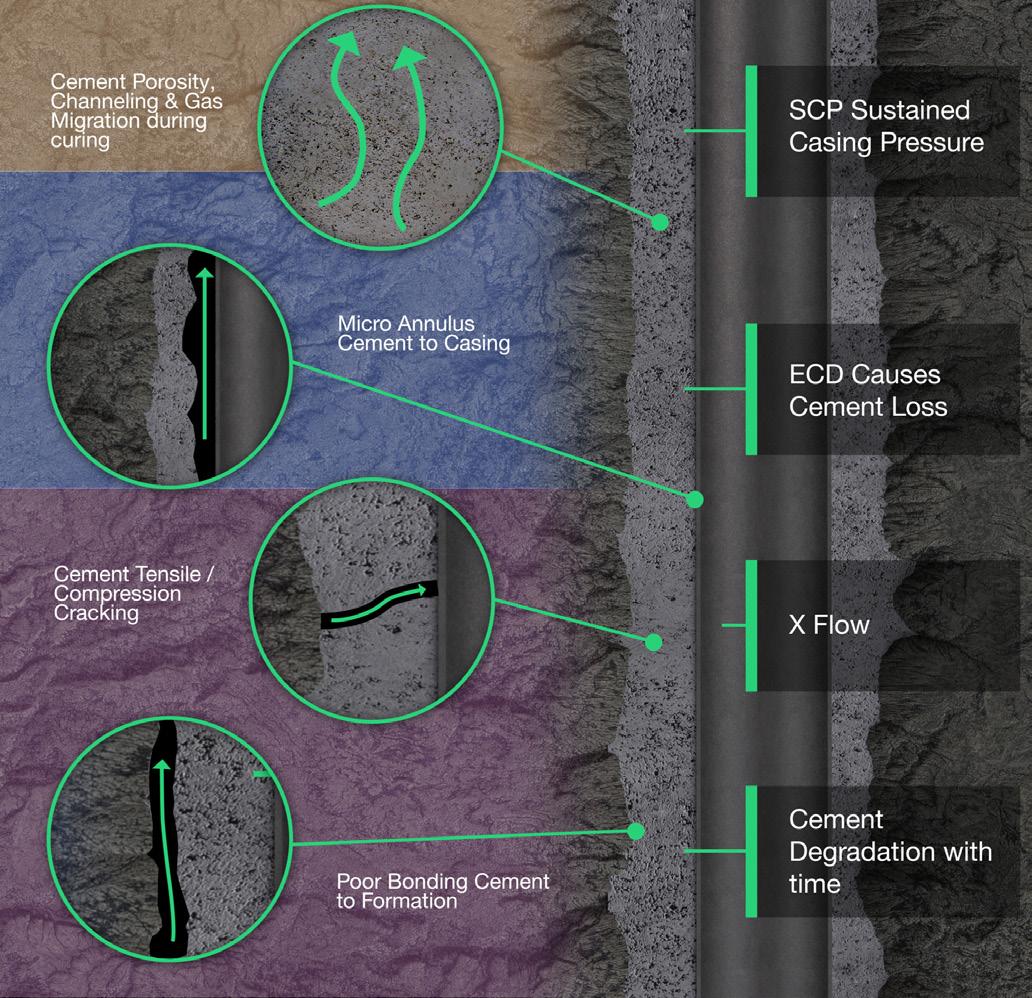
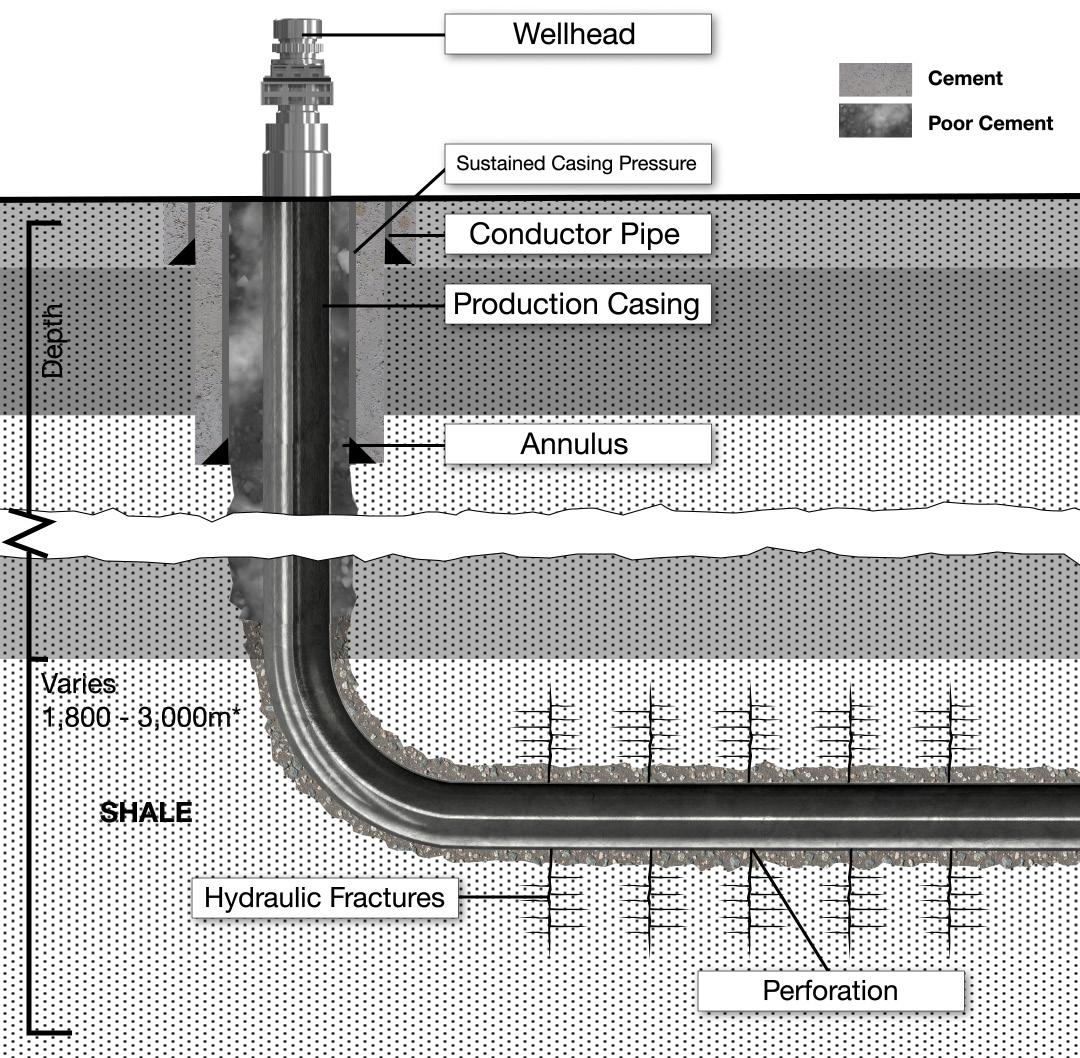
For over a century, the oil and gas industry has relied on cement to isolate pressurised reservoirs and prevent unintentional release of fluid or gas to the surface. Cement typically forms part of the primary and/or secondary well barrier (Norsok D10, UK Oil and Gas, API, and ISO) in most wells drilled. The primary objective of the well barrier element (WBE) is to prevent crossflow between reservoirs and prevent flow to the surface. When cement forms part of the WBE, its function is to maintain a pressure-tight seal to preserve well integrity (WI) for life-of-well. In particular, when cement failure occurs, this will often impact the overall integrity of the well. In particular, when cement failure occurs around the production casing, this often leads to sustained casing pressure (SCP) which raises the potential for the release of methane into the atmosphere.
Unfortunately, a large proportion of wells across the globe exhibit SCP (estimates are more than 30%), which is a clear indication that cement is proving to be insufficient as a sole WBE in both the short and long term. Cement failure may also go undetected, and therefore wells may be suffering from crossflow subsurface between reservoirs, leading to potential aquifer contamination, salt erosion, pressure charging of non-pressured reservoirs etc. If cement failure occurs across the pay zone, this may reduce productivity, and the ability to isolate water, and have a significant impact on the overall economics and the total recoverable hydrocarbons.
The complexity of well construction has increased, as wells are deeper and hotter, with higher differential pressure regimes, which in turn has heightened the challenge for
| 25
cement to provide a WBE. As a result, the chemistry of cement has had to evolve, along with pumping and placement techniques, mechanical properties, etc.
The challenge for cement to deliver a reliable WBE comes from a deluge of sources in varying environments, created by the diverse nature of oil and gas, and new energy reservoirs (conventional, unconventional, EOR etc.) and further extends to cover geothermal and CCUS environments.
However, for conventional and unconventional reservoirs, there are numerous examples of cement’s shortcomings, from minor leaks to catastrophic failures, the worst of which cause loss of life with consequential impact on the finances and reputation of the corporation. It is reasonable to expect that this trend of cement failing to provide life-of-well sealing and an effective WBE will persist within new energy developments, possibly increasing in frequency due to the new operating environment.
Failure of cement is caused by many factors such as micro-annulus, cracks, channels, poor mud-removal, geo-tectonic movements, subsidence, changes in temperature and pressure, poor pipe centralisation, operator error, etc. Evaluating a cement operation is not simple, and a cement bond log does not measure seal integrity. There are often contingencies in place for cement remediation, but these do not guarantee repair to the extent of providing a pressure-tight fluid or gas seal. Remedial work is costly, often complex, and comes with risks. On occasion, poor cement quality may lead to shut-in production, the need to sidetrack the well, or even carry out plug and abandonment.
Regime change for true well integrity
Given the large number of wells with known cement failure and the shift towards drilling and completing wells within the new energy segment, is now the time to consider alternative methods to create a long-term WBE?
Rather than create and rely on a WBE formed from a single material or product (cement), there is the option of deploying varying qualified WBEs that have different capabilities associated with mechanical strength, chemical stability, environmental compatibility, and operational efficiency to meet the challenging life-of-well requirements. Well integrity can be enhanced by combining several independent and co-dependent well barrier elements of varying materials and delivery mechanisms.
What is holding back a more widespread introduction of alternative well barriers? Is it regulation, policy and procedures, or is it a lack of knowledge-sharing (communications, training etc.) with well engineering teams not empowered or encouraged to keep pace with technology?
Could there be an element of fear to address the ‘elephant in the room’ (sustained casing pressure) or the challenge of accepting/adopting alternative methods? Is the industry holding back to protect assets that are already deployed? An analogy could be made to ocean-going vessels; they do not change direction easily.
Is it time for a paradigm shift to meet the demands of all wells and illustrate that the energy industry truly is working towards meeting its environmental targets?
There are already several technologies available with proven
26 | Oilfield Technology Spring 2023
Figure 1. Cement as a lone WBE (top) vs the addition of an MEP for cement assurance (bottom).
Figure 2. Case study 1 – the challenge.


Subscribe online at: www.oilfieldtechnology.com/subscribe Global Publication A global industry requires a global publication
track records (each having associated case examples), which often provide standalone barrier elements or work in combination with cement (cement assurance) to enhance the well integrity.
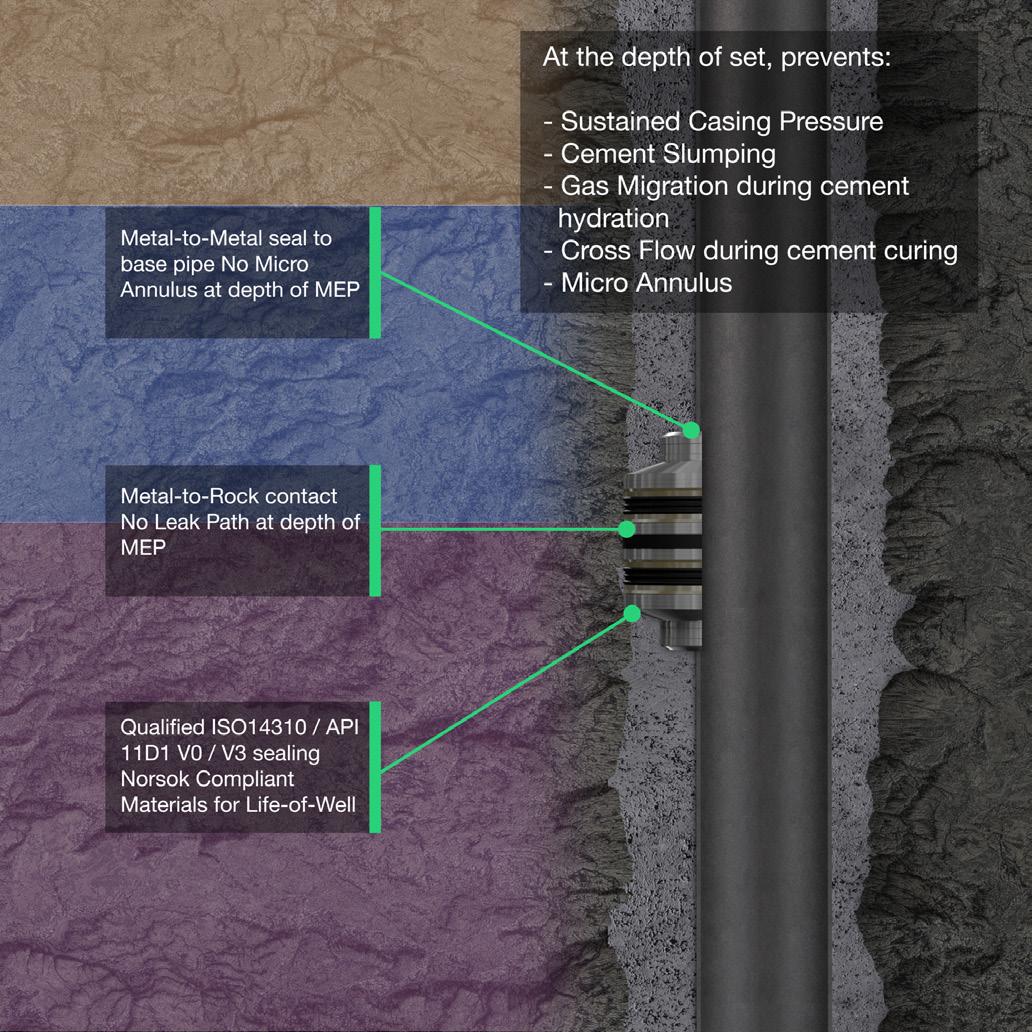
One such technology that has gained use as a WBE is the metal expandable packer (MEP) provided by Welltec A/S. A range of qualified MEP products are available, with over a thousand products deployed globally. Approximately 50% of the deployments are related to providing a WBE, either as cement assurance (CA) or as a standalone solution (no cement) to provide life-of-well integrity.
The MEP is a surface-controlled, metal expandable, open hole or cased hole packer that delivers robust, qualified, and reliable annular sealing (isolation) over the life of the well. The MEP is qualified in accordance with ISO14310 V3/V0 and manufactured in accordance with ISO9001 API 11D1. When expanded, the MEP conforms to the well bore geometry (OH or CH) with primary sealing delivered via multiple, and independent elastomeric seal elements. The seals are backed-up by a series of metal fins that provide metal-to-metal or metal-to-rock contact, preventing seal extrusion and delivering high anchoring load capability.
Case study 1: Cement replacement providing a WBE for conventional oil and gas
The challenge
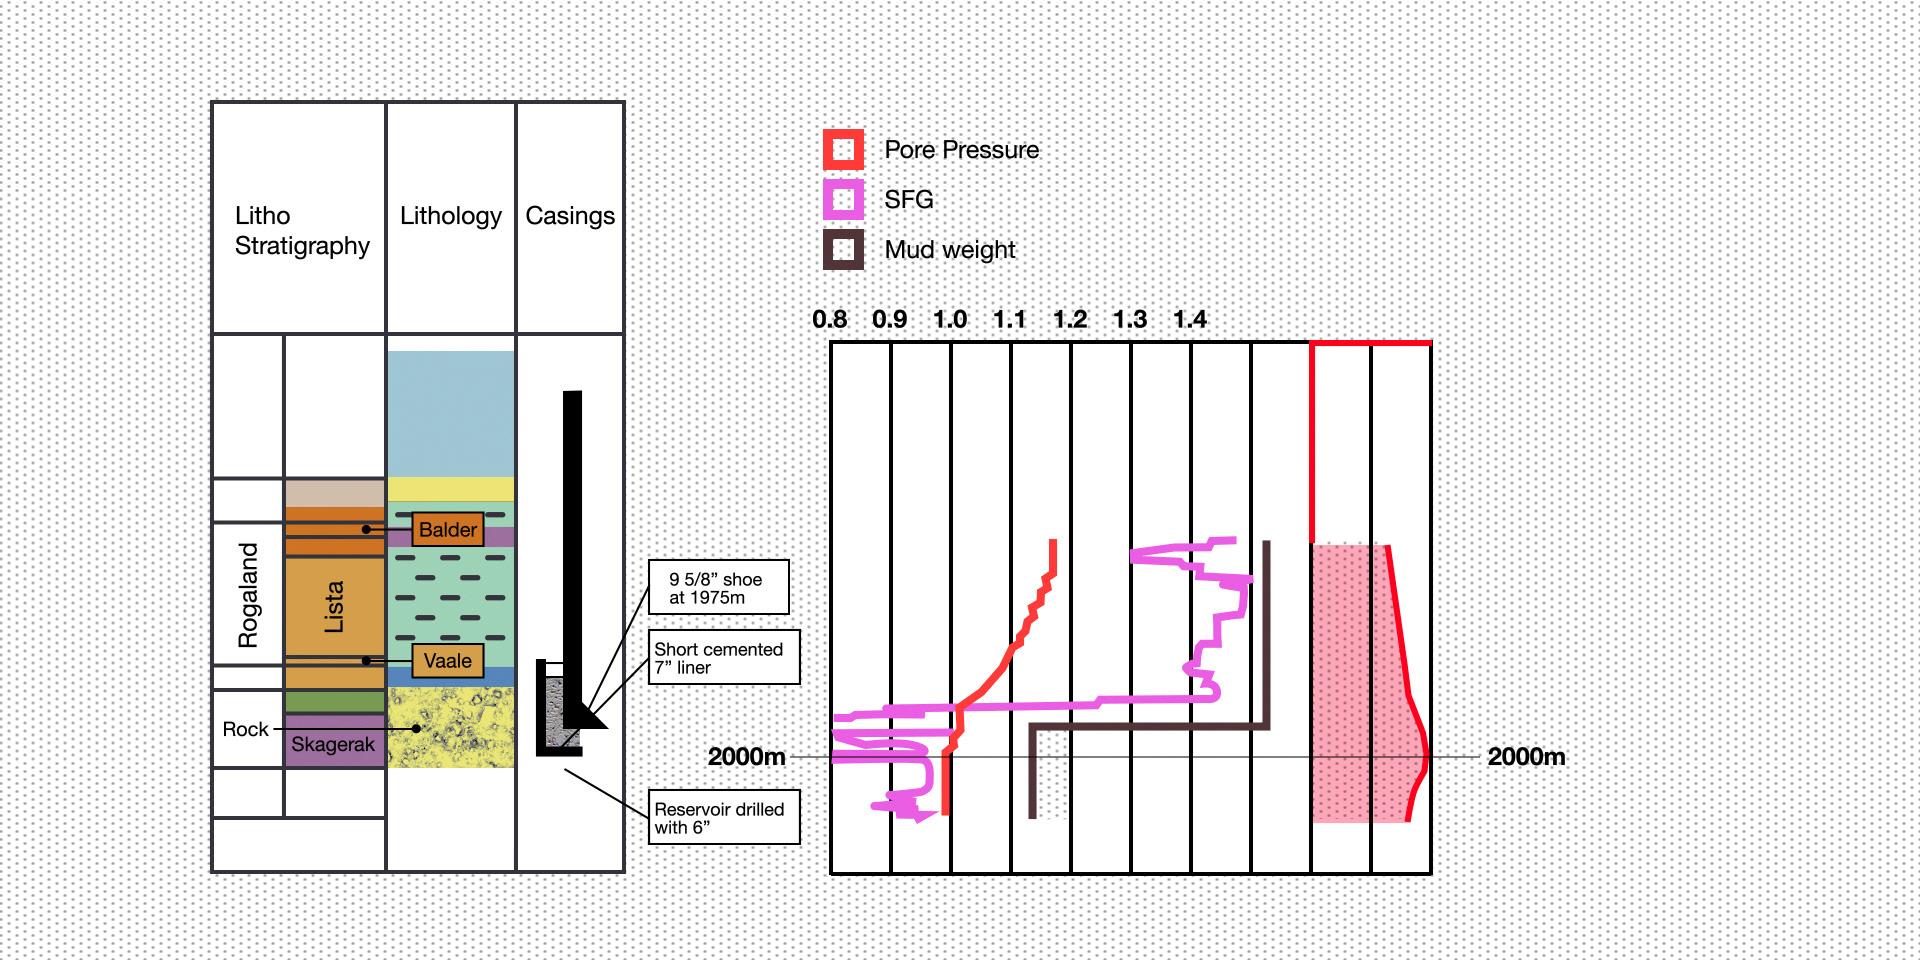
An operator was challenged with a reduction in pore pressure and safe fracture gradient below the planned 9 5/8 in. shoe. One option considered was a short 8.5 in. drilled hole section with a 7 in. liner. The reservoir section was drilled using a 6 in. bit and subsequently completed with a 4.5 in. screen assembly. The well inclination (horizontal) and the small cement volume between the 8.5 in. open hole and the 7 in. liner made this a very challenging cement operation with a high risk of a pressure-tight seal not being achieved.
The solution
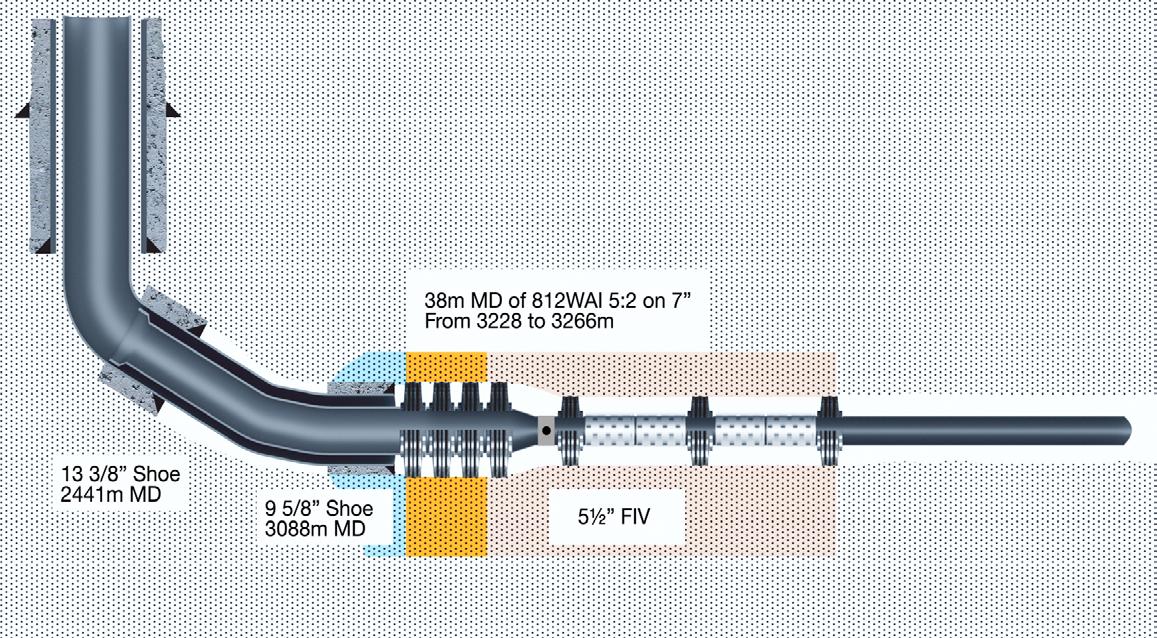
Welltec proposed maintaining the 9 5/8 in. shoe depth, drilling to target depth with an 8.5 in. bit, and deploying a 7 in. x 5.5 in. liner incorporating 38 m of MEP 812WAI (Welltec annular isolation)1 and screen assembly. The MEP 812WAI expanded quickly within open hole, under full surface control, replacing cement. The MEP 812WAI provided a sealing element between the top of the reservoir and the 9 5/8 in. shoe for life-of-well. This solution saved approximately 14 rig days per well with additional cost savings associated with the reduction in cement service costs. A secondary major benefit was the increase in liner ID and hole OD that delivers improvements in PI on the producers, and higher injectivity capacity on the injectors, both improving NPV. Three wells were drilled and successfully completed.
Case study 2: Cement assurance preventing SCP on shale gas (unconventional)
The challenge
An operator in the USA was experiencing sustained casing pressure (bradenhead pressure) on approximately 30% of the wells drilled within unconventional shale gas (Figure 4). A cemented 5.5 in. long string casing with an attempted top of cement inside the 9 5/8 in. production casing was not delivering the WBE to prevent shallow gas from entering the A annulus and migrating to surface. The maximum observed pressure at surface was 1200 psi, this pressure being present prior to the multistage frac operations.
28 | Oilfield Technology Spring 2023
Figure 3. Case study 1 – the solution.
Figure 4. Case study 2 – the challenge. * Depths will vary based on local geology and can vary outside of this range.
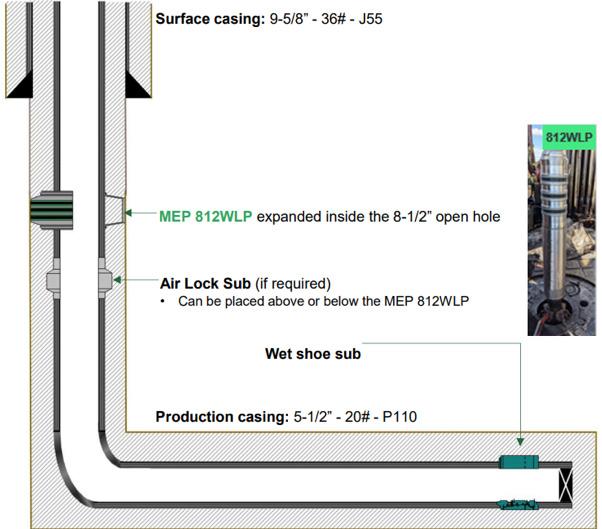
Figure 5. Case study 2 – the solution.
Many logistical and technical challenges make cement remediation very difficult and problematic. Legislation prevents wells with SCP from being completed or produced.
The solution
The proposed solution incorporated an MEP 812WLP and expanded within the 8.5 in. drilled open hole above the shallow gas to provide cement assurance and form part of the WBE (Figure 5). The 5.5 in. air filled liner was floated to TD (rotation as required) and the cement operation performed as normal (casing reciprocation if needed). The cement was pumped, plug bumped and the MEP 812WLP expanded quickly under full surface control. At the setting depth, the MEP 812WLP ensures no micro annulus, no channelling, and provides an ISO 14310 qualified seal. During 2022, several pads and in excess of 170 wells were completed with no sustained casing pressure recorded post multi-stage frac through the incorporation of the MEP 812WLP. Further alternate technologies to cement that have been utilised successfully as either cement assurance or as a WBE are:
Ì Swelling shales and salts: A mechanism that has been exploited to establish well barriers is to use in-situ shale or salt formations.2 Large-scale laboratory results illustrate that shale can form competent low permeability annular barriers, confirmed using pressure-pulse decay measurements. They also show that experimental conditions influence the rate of barrier formation; higher effective stress, higher temperature, and beneficial manipulation of the annular fluid chemistry all have a significant effect. This creates the possibility of activating shale to form well barriers, even when these barriers might not normally be created naturally (e.g. by exposing them to low annular pressure, elevated temperature, different annular fluid chemistry, or a combination of these).
Ì Flopetrol QuartzPackTM: QuartzPack consists of 70 – 80% by volume of solids and 20 – 30% of fluidising additives.3 Its rheology
can be characterised as bingham plastic (material that behaves as a rigid body at low stresses but flows as a viscous fluid at high stress). Quartzpack will adhere to changing downhole environments and geometrics. Oil and gas wells will experience shear stresses caused by subsidence, temperature fluctuations, and mechanical actions. Quartzpack when exposed to such changes will liquify, morph, and re-establish sealing.

Ì Isol8TM: Isol8 uses alloys, bismuth, and non-bismuth-based materials that are melted in the well using a thermite heating system to create a metallurgical bond with the steel, expanding against the in-situ cement and/or geological rock at the desired setting depth.4 The bismuth-based alloy expands when cooled and is able to fill gaps within cement or wellbore rock. Isol8 can also utilise other non-bismuth alloys to bond with the steel tubing/casing.

Ì BiSNTM: BiSN utilises thermite to melt bismuth-based alloys into plugs.5 When molten, the alloy has a viscosity similar to water which allows it to flow and fill voids that it is intended to seal. As it cools, it provides downhole sealing for a variety of applications. This technology can be applied in the drilling, completions, interventions, or abandonment stages of a well.
Ì WellcemTM: Wellcem provides a resin-based sealing solution for leaking wells; the material is permanent and will last for life-of-well.6 The sealing material will withstand all normal well fluids and can only be removed by mechanical means. The material is robust and to some degree flexible, enabling it to withstand mechanical shock, temperature and pressure changes in the well.
References
1. Cement Replacement with Metal Expandable Annular Sealing on a Laminated, Deep-Water Injector SPE 199682
2. Simplifying Well Abandonments using Shale as a Barrier SPE 199654-PA
3. www.flopetrol-wb.com
4. www.isol8.com
5. www.BiSN.com
6. www.wellcem.com
TRUST RESPONSIBILITY INTEREST MOTIVATION OBJECTIVITY STABILITY Your partner in OIL & GAS / Geothermal Industry www.trimos-sro.eu ISO 9001:2015 Mrs. Lenka Sîrghi Lenka@trimos-sro.cz Mr. Petru Sîrghi trimos@trimos-sro.cz TRIMOS, s.r.o. Prosečská 4541 468 04 Jablonec nad Nisou Czech Republic EUROPE
Cut the confusion out of completions
30 |
As reservoir production declines over time, the injection of fluids is needed to enhance oil recovery and/or to maintain the reservoir pressure. To overcome the common challenges associated with injection wells, such as loss of injectivity, premature injector failure, and fluid injection conformance, the industry has applied a multitude of methods in the field to enhance the efficiency of water/polymer flooding and ultimately, boost performance.
An interventionless, injection rate-limiting, autonomous outflow control device (AOCD) called FloFuse was recently developed by Tendeka, which can mitigate the conformance issues for both fluid injection and/or acid stimulation operations, particularly in carbonate reservoirs. The technology was
recently applied in a water injection well totalling 2963 ft in the Middle East, which was accumulating excessive water across some sections due to faults and fractures. This was subsequently affecting the injection performance and production of nearby wells. Completed as a dual completion, it consisted of nine joints of AOCDs, five joints of bypass high-pressure resistance ICDs and five swell packers installed via workover. The injection rate was 3000 bpd.
By restricting flow into the thief zones and ensuring proportional distribution of injection fluids along the full length of the wellbore, the project demonstrated how the completion could be used to improve the performance of injection operations.
| 31
Mojtaba Moradi, Tendeka, UK, outlines how the completion and performance of injection operations, particularly in carbonate reservoirs, can be improved and suggests how common challenges in the area can be overcome.
Conformance control issues
The effective conformance of an injection well in a carbonate reservoir is related to the continuously changing well injectivity profile. This change could be attributed to several factors, including:
Ì Dilating fractures.
Ì The evolution of filter cakes.
Ì Chemical reactions.
Ì Continuous solid deposition inside the reservoir.
Ì (Re)connecting vuggy spaces in the reservoir especially near wellbore conditions.
Amongst all these factors, the dilation/growth of natural fractures is proven to have a significant impact on the conformance of the injected fluid. This can cause a variety of problems ranging from insufficient voidage replacement and undesired reservoir pressure profile, to the production of unwanted fluids and oil left untapped in the reservoir.
To remediate this issue, costly and often challenging interventions and re-drills were traditionally used to restore optimum injection performance. Many operators have more recently used passive flow control devices, normally known as ICDs (with or without sliding sleeves) and/or more complex interval control valves (ICV) completion systems to manage the conformance of injected fluids.1 The ICDs are installed as a segmented lower completion string in horizontal/vertical injection wells to balance water outflux from the well to the reservoir.
While these completions have been used successfully to improve the fluid conformance from injection wells in sandstone reservoirs, their functionality is limited in reacting to dynamic changes in reservoir/well properties associated with carbonated reservoirs which inherently have more complex pore and dilating fracture systems.
Optimising injection operations
There are several considerations when planning the completion of an injection well, particularly around rock and fluid properties and the credible risks that could occur, such as uneven displacement of hydrocarbons, fracture growth short-circuiting injectant
proximal wells, fracture growth breaching cap rock/basement seal, crossflow, plugging and solids fill and injectant conformance.
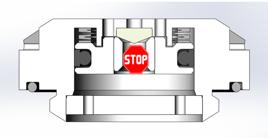
FloFuse was developed to autonomously provide a rate limit to prevent excessive fluid injection into the thief/fracture zones, thereby enabling distributed or matrix injection flow. Like other flow control devices, this device (Figure 1) is installed in several zones in the wells. It has two operating conditions, firstly, as a conventional flow control device, and secondly, as a barrier when the flowrate through the valve exceeds a designed limit.
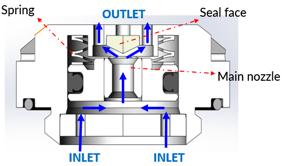
When the pressure drop in the formation decreases as a result of increased injectivity of a fracture or high permeability streak, the injection rate into that compartment will rise. The resultant increased pressure drop through the nozzle at that section of the well acts against the return spring until the flow area between the seal face and the nozzle becomes restricted. The device will then autonomously trigger the closed position, restricting the outflow into that zone.
Here, the denied fluid to that specific zone will be distributed among the neighbouring zones, preventing excessive fluid injection into the thief/fracture zones, and thereby maintaining a balanced or prescribed injection distribution.
Figure 2 shows how injection outflow passes through the normal operating nozzle into the housing and through the screen. By being fully reversible, the device will re-set if the rate becomes sufficiently distributed again. The target operating rates and degree of outflow control and trigger rates can be varied by application.
The single biased open valve has undergone full-scale laboratory tests as well as numerous single-phase injection experiments including gas, water and polymer to define the characteristics of the device with different sizes. The characteristics are described by the differential pressure across the device against flowrate. For example, the plotted data in Figure 3 represents the pressure drop across the device as a function of flow rate for single-phase water across the varying nozzle sizes. The results show that after reaching a certain flow rate, FloFuse shuts off water flow. This trigger rate is dependent on the nozzle size and spring constant. They are 105 psi (or 80 bwpd), 130 psi (or 135 bwpd) and 200 psi (or 280 bwpd) for 2.2 mm, 3 mm and 4.5 mm standard nozzle sizes, respectively.
Middle East case study
The AOCDs were recently installed as a retrofit solution in an injection well in a carbonate reservoir in the Middle East. Initially finalised as a dual completion in 2012, the short string (completed as a cased and perforated completion) injected water into the upper layer of reservoir B while the long string (kept as a 6 in. open hole) injected water into the lower formation with a total length of 2983 ft.
The well was characterised by low to moderate reservoir properties with an average matrix permeability
32 | Oilfield Technology Spring 2023
Figure 1. The AOCD design with two operational positions: Position 1 – open to flow position (left), and position 2 – tripped, close position (right).
Figure 2. The AOCD mounted in the screen housing and flow path.
of 4.8 mD with an average injection rate of around 3000 bwpd. The main objective of this well, plus three other neighbouring wells, was to maintain the reservoir pressure of reservoir B.
After two years, the well was taking a greater volume of water than expected at some sections due to its location, intersecting two interpreted faults as well as ant-tracks or potential fractures or faults; the behaviour and properties were uncertain and could not be identified from available data. Approximately 36% of the total water injection was expected to be received by these low injectivity sections. Few other sections were taking a higher portion (64%) of injected flow rates, confirmed by PLT.
Through timely surveillance and integrated technical evaluation, the well was reviewed in detail to identify possible solutions. All the available information including seismic data, open hole logs, PLT, well injection and modelling data was analysed. FloFuse was selected as it automatically responds to dynamic changes in intake rates and unexpected variations in fluid displacement if the valves are realised to be open, active, or dilating, and thus intaking fluids excessively. The device restricts the injection of excessive fluid into fractures and faults. Importantly, the use of this technology mitigates the disproportional injection of fluid into the thief zones without the need for any intervention. After performing an extensive modelling workflow, the completion consisted of nine joints of AOCDs, five joints of bypass high-pressure resistance ICDs, and five swell packers, installed via workover.
The well was then put on injection in November 2020 with a rate of 3000 bpd. Four months later, a PLT showed that the flow control devices were successful in delivering the target injection rate and the desired water distribution along the wellbore. Based on the comparison between old and new PLTs, it was determined that the injection rate into the zones with fault and ant-tracker features was reduced by 42%, while water injection in the other zones increased by 20 – 25%, with no suspected faults and very low injectivity.
As a result, the overall sweep efficiency in this section significantly improved. Moreover, water injection contribution along the horizontal section of the hole was improved.
As this type of completion can function as a mechanical diverter, an acid stimulation operation is planned in the well in the near future to help improve the injectivity of zones with low permeability and remove any skin accumulated over years of injection. This would further improve the water injection conformance of the zones.
Device performance
As the device can react to changes in reservoir conditions autonomously, the results of this case study as well as other field applications, demonstrate how this device could manage uncertainties in static and dynamic reservoir properties, while delivering optimised well performance. With this enhanced conformance, it is expected to realise an improved sweep in the sector of the reservoir, resulting in improved oil production in the supported producers nearby.
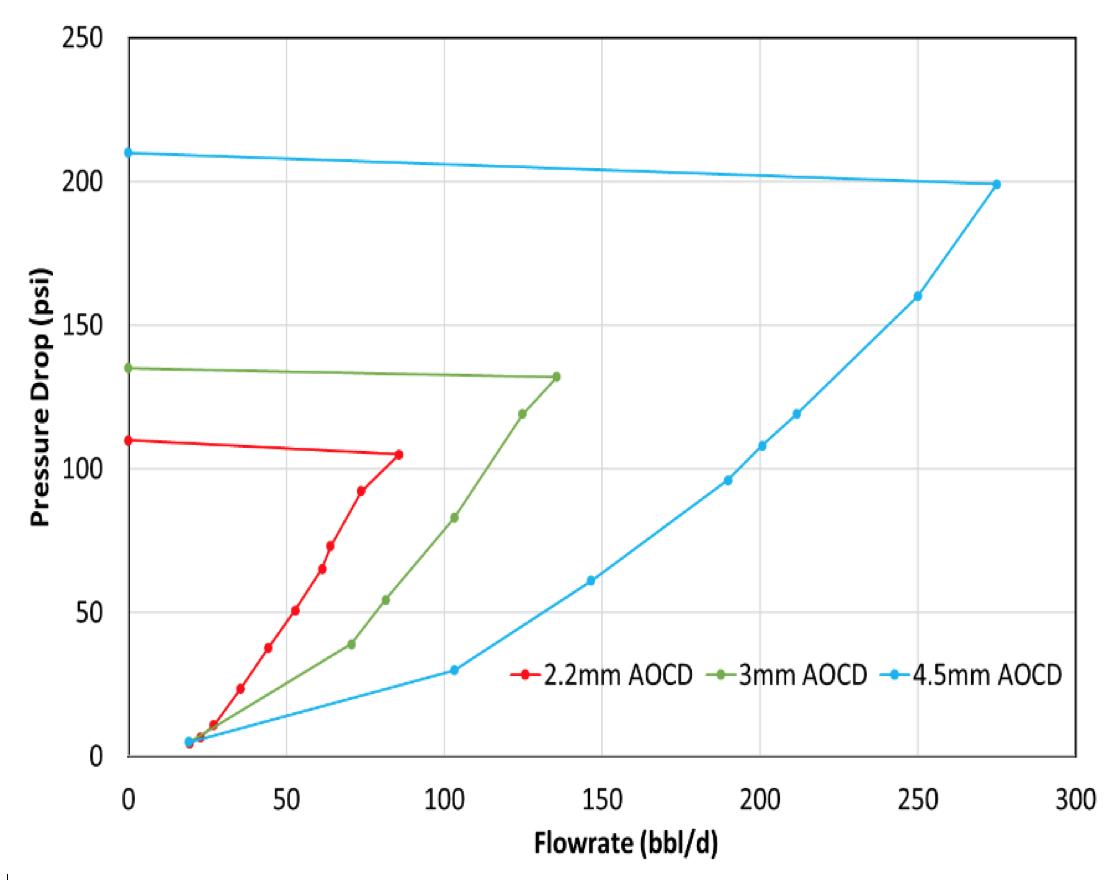
Since its introduction in 2019, the outcomes of several simulation modelling studies, supported with results from a dozen field applications of the devices worldwide, have shown that the AOCD reduces the injection cost, improves field NPV, and assures reliability of injection well systems. It can also lower the risk of poor conformance due to complex structures and any sort of exacerbated outflow balance, minimising the risk of out-of-formation fracturing.
The technology’s attributes make it an ideal completion for many injection operations including water injection wells,1,2 polymer injection wells,3 acid injection stimulation operations,4 as well as water alternating (WAG) operations and as a mechanical diverter to manage and optimise matrix acid stimulation operations for an improved injectivity profile. Its use in CO2 injection wells and for storage applications in particular, is crucial to ensure injection conformance and/or minimise the risks around compromised caprock integrity over time and losing containment to above zones in CO2 wells.
References
1. ISMAIL, I.M., KONOPCZYNSKI, M., AND MORADI, M.,“A Game Changer for Injection Wells Outflow Control Devices to Efficiently Control the Injection Fluid Conformance ” Paper presented at the Abu Dhabi International Petroleum Exhibition & Conference, Abu Dhabi, UAE, Nov 2019.
https://doi.org/10.2118/197612-MS
2. AL SHEMAILI, S. I., FAWZY, A. M., ASSRETI, E., EL MAGHRABY, M , MORADI, M., CHAUBE, P., AND TAWHEED, M., “The New Generation of Outflow Control Devices Autonomously Controlling the Conformance of Water Injection Well - A Case Study with ADNOC Onshore ” Paper presented at the Abu Dhabi International Petroleum Exhibition & Conference, Abu Dhabi, UAE, Nov 2021. https://doi.org/10.2118/207647-MS
3. AL HARRASI, A., MASKARI, M., GERARDO, U., AL-JUMAH, A., BADI, S., BUSAIDI, I., HARTHY, K., ABAZEED, O., AND MORADI, M., “Autonomous Outflow Control Technology AOCD in New Water/Polymer Injectors in Heavy Oil Fields from South Sultanate of Oman ” Paper presented at the Abu Dhabi International Petroleum Exhibition & Conference, Abu Dhabi, UAE, November 2021. https://doi.org/10.2118/207361-MS
4. MORADI, M., KONOPCZYNSKI, M. R., “The New Flow Control Devices Autonomously Controlling the Performance of Matrix Acid Stimulation Operations in Carbonate Reservoirs ” Paper presented at the SPE Annual Technical Conference and Exhibition, Dubai, UAE, September 2021. https://doi.org/10.2118/205975-MS
Spring 2023 Oilfield Technology | 33
Figure 3. The performance of AOCDs with water.
THE ANSWER IS IN REAL
TIME ANALYSIS
Oil and gas operators that use high molecular weight polyacrylamide polymers for chemical enhanced oil recovery (cEOR) or oil sands tailings treatment can spend anywhere between US$5 – US$50 million a year on polymer. Knowing the accurate concentration of polymer in water is required to deliver optimal performance, as incorrect concentrations can impact the sustainability of an operation. There are several challenges with current monitoring tools, such as unreliable results and time-consuming methods, which limit an operator’s ability to respond quickly to changing conditions. The interest remains high for a rapid, reliable, and accurate technique that provides the scope for real-time assessment. The use of time-resolved fluorescence (TRF) has been successfully deployed in oil and gas applications and has shown to be an effective method to detect chemicals like polyacrylamide polymers. This technology can help improve the
stability of an operation, optimise the volume of chemical used, and prevent unnecessary chemical spend.
Time-resolved fluorescence
Time-resolved fluorescence (TRF) is an analytical approach that can be used to detect the concentration of polyacrylamide-based polymers in liquid samples. The TRF approach is more sensitive than normal fluorescence measurements because it works on a delayed signal measurement, which helps to eliminate interference from other materials such as hydrocarbons. To utilise TRF, a fluorophore needs to be complexed to the compound of interest (e.g. the polymer). A fluorophore is a substance that emits light after absorbing energy from an external excitation source. A fluorophore molecule can be radiated at a specific wavelength to absorb light energy and excite the electrons to a higher energy state. As the electrons
-
34 |
return to the ground state, the emitted energy has a specific wavelength that can be detected.
In this case, TRF is utilised by forming a lanthanide-chelate complex, where a lanthanide such as europium is coupled with the polymer. After forming the lanthanide complex, the solution is excited at a particular wavelength. The lanthanide exhibits long-lasting luminescence, and the resulting TRF signal is measured within a selected time window. This TRF signal is proportional to the concentration of the polyacrylamide polymer in a solution. This approach has been found to provide rapid, accurate, and repeatable results for measuring polymer
concentrations down to parts per million (ppm) levels. The basic principles of the TRF approach are shown in Figure 1.
The KemConnect EOR instrument utilises TRF to detect polymers in a solution. The test setup (shown in Figure 2) consists of fully prepared test kits, a laptop containing the user interface, a small workstation to prepare samples, and a reader which measures the test kits. The operation is simple enough that no prior analytical testing experience is required by the technician, and the unit is easily transported between field locations. The procedure involves taking a sample of water containing polymer and moving through a few brief
Thomas Fenderson, Kemira Chemicals Inc., USA, explains how time-resolved fluorescence for real-time assessment could be the answer for oil and gas operators using high molecular weight polyacrylamide polymers.
| 35
pre-treatment steps to remove interfering compounds, form the lanthanide complex, and filter out contaminants. Once the sample is prepared, it is inserted into the reader and the polymer concentration is immediately reported. The laptop contains built-in calibrations for each polymer at a given worksite, as each requires a unique calibration. The procedure is rapid, and results are obtained in approximately 15 minutes.
Maximising oil production for chemical enhanced oil recovery
One example where rapid and accurate monitoring tools are required is the use of polymer flooding for chemical enhanced oil recovery (cEOR), which is a widely used method to extract

a higher percentage of oil from a reservoir and extend the life of an asset. The process involves injecting water containing high molecular weight polyacrylamide polymers to improve the sweep efficiency. The polymer increases the viscosity of the injection water, improving the mobility ratio between the water and the hydrocarbon trapped in the reservoir.
There are multiple times during a cEOR polymer flood where confirming the amount of polymer in water is valuable to the operation. On the injection side of the process where the polymer is first introduced to water, a target viscosity is required. This viscosity is achieved by adding a certain concentration of polymer to the water (typically 500 – 3000 ppm). The desired polymer concentration is dependent on factors such as the polymer charge and molecular weight, the salinity and divalent ion content of the water, and the reservoir temperature. From an operational standpoint, confirming that the correct amount of polymer has been added to the water is crucial to ensuring that the correct viscosity is pumped in order to improve the sweep efficiency and preserve the integrity of the reservoir. From an environmental standpoint, confirming the polymer concentration prevents an overuse of a chemical that could lead to a larger environmental footprint from its unnecessary production and transportation.
On the production side of a cEOR polymer flood, detecting when the polymer begins reporting with the produced fluid (i.e. polymer breakthrough) can have several advantages. The presence of polymers in produced fluids entering battery or water treatment facilities has the potential to impact separation efficiency due to interactions with production chemicals used for phase separation. Early detection of polymers can help minimise process impacts before they become problematic by guiding decisions on produced fluid management strategies. Another benefit of detecting polymers in the produced fluid is to help an operator understand how fluids are flowing through the reservoir. If polymers are detected in certain producing wells but not others, this presents an opportunity for strategic control of the polymer flood to maximise oil production. In the produced fluid, polymers may only be present at low concentrations of less than 100 ppm, so a sensitive technique is required.
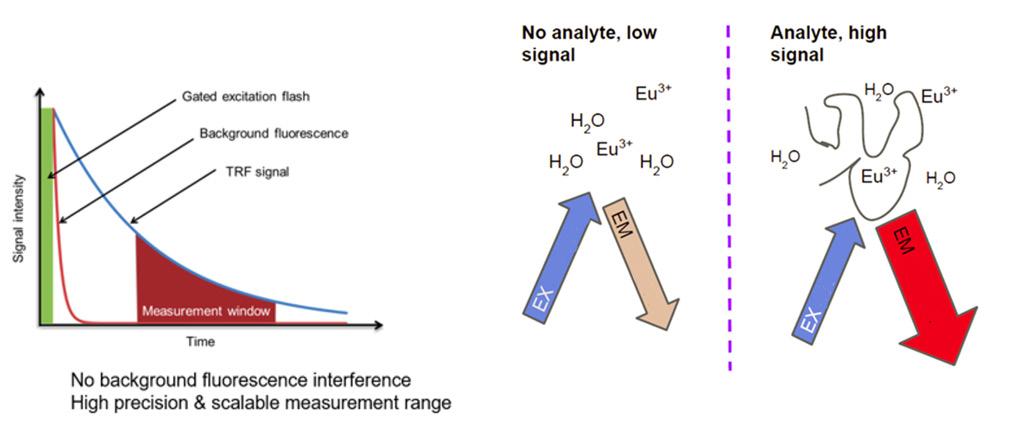
High-accuracy techniques to confirm polymer concentration, especially at low ppm levels, require specialised instruments and analytical testing experience. These methods, which include titrations or size exclusion chromatography (SEC), need to be performed at a separate location from where the injection or production fluids are sampled, and may need to be shipped offsite for measurement. In these instances, obtaining results can take days or sometimes weeks for remote locations, so the data cannot be used for real-time decision making and process adjustments. Some of these techniques can also be prone to error, caused by the presence of oil or other production chemicals such as scale and corrosion inhibitors.

36 | Oilfield Technology Spring 2023
Figure 1. The principles of time-resolved fluorescence.
Figure 2. KemConnect TRF instrument and test kits.
More rapid techniques, such as onsite viscosity measurements, obtain data quickly but often provide misleading conclusions as the data can be impacted by temperature changes, dissolved gas in the solution, or shearing of the polymer solution when fluid sampling is performed incorrectly. It can be challenging to identify when these impacts are creating false data, as opposed to actual changes in the process.
The use of the TRF technology can provide rapid and accurate data on the concentration of polymers in solution for both injection and production samples. Figure 3 shows an example of data generated with the KemConnectEOR and TRF technology vs SEC, which is a high-accuracy analytical method for measuring concentrations of polymers in solution. The KemConnect EOR, which can be used onsite near the point of sampling, produced very similar data to the SEC analysis performed in an offsite laboratory. The data was consistent for low concentrations less than 100 ppm. The results from TRF are also not impacted by the presence of oil or other production chemicals.
Achieving sustainability goals for oil sands tailings treatment
The technology has also proven to be beneficial in other oilfield applications where detection of polymer concentration is critical. In the surface mining of oil sands in Alberta, Canada, the extraction of heavy oil bitumen is a water-intensive process which results in large volumes of fluid tailings, composed of water, fine clays, sand, and residual bitumen. At the end of 2021, there were approximately 1.34 billion m 3 of fluid tailings in inventory throughout the Alberta oil sands industry. Regulatory requirements set out in the Alberta Energy Regulator Directive 085 mandate that oil sands operators must remediate the fine tailings and return the land to a reclaimed state. Operators are actively focused on this goal, using various chemical and mechanical techniques, but each requires treatment at high throughput to maintain compliance with Directive 085. One of the most common chemical approaches to provide separation of water and solids in the fluid tailings is the use of polyacrylamide polymer flocculants.
During the treatment of fluid tailings, the efficiency of solid-liquid separation is dependent on accurate dosing of the polymer flocculant. With optimal dosing, an operator can maximise the separation of phases, resulting in water that is free of suspended solids, and a solid deposit which continues to dewater and gain strength over time. Underdosing the polymer will lead to inadequate solid-liquid separation and reduce the quantity of water recovered. Overdosing the polymer is an unnecessary chemical spend which can also be detrimental to the quality of the recovered water by stabilising and dispersing fine clays.
Providing an accurate dose of the polymer to the tailings requires that the concentration of the polymer in solution is well understood. Confirming the concentration in the field is a challenge using traditional techniques. Changing water quality and temperature makes
it difficult to use viscosity to estimate the polymer concentration. Accurate gravimetric approaches, such as oven-drying of polymer solutions to determine the amount of active polymer, can take several hours to obtain data and do not provide an opportunity for real-time adjustments.
Figure 4 shows an example of data generated with the KemConnectTRF vs SEC in a dose range that is more common in oil sands tailings treatment. The TRF technology can provide the same level of accuracy as SEC, providing data within 15 minutes of sampling that is less prone to discrepancies caused by changing water quality.
Conclusion
The use of time-resolved fluorescence and the KemConnect technology offers a measurement tool that can provide rapid and reliable data for the concentration of high molecular weight polyacrylamide polymers in solution down to ppm levels. The method is user-friendly and portable, preventing the need to send samples to offsite laboratories for analysis. The data is not impacted by the presence of oil or other production chemicals in the fluid. Frequent and accurate assessments on the polymer concentration can enable operators to make real-time assessments on the status of their application and adjust accordingly to maximise production and reduce chemical costs and storage.
Spring 2023 Oilfield Technology | 37
Figure 3. Comparison of TRF and SEC for low polymer concentrations.
20 40 60 80 100 1 2 3 4 5 Active polymer on ppm Sample reference ACTIVE POLYMER (PPM), LOW CONCENTRATION KemConnect EOR Size exclusion chromatography 200 400 600 800 1000 1200 1400 1600 1800 1 2 3 4 5 6 7 8 Active polymer on ppm Sample reference ACTIVE POLYMER (PPM), HIGH CONCENTRATION KemConnect TRF Size exclusion chromatography
Figure 4. Comparison of TRF and SEC for high polymer concentrations.
Change is on
Huge quantities of produced water are generated during oil and gas production; a projected 23 billion bbl were produced through onshore operations in 2022. 1 While the oilfield has been generating large volumes of produced water for decades, excess volumes are a

38 |
the horizon

F. Morris Hoagland, Jade Dragon LLC, USA, explores the options for beneficial reuse of produced water generated during oil and gas production.
more recent problem due to the production from shale plays. Conventional oil and gas production from porous formations generates a lot of produced water. However, most of this water is used to maintain formation pressure, and to push more oil to producing wells. This is not an option in shale plays, because of
| 39
the low permeability of the formations; the production water coming out of shale wells therefore needs somewhere to go.
Technological developments during the first decade of this century allowed the hydraulic fracturing of horizontal shale wells to take off. Large quantities of water are required to fracture these tight formations in order to recover hydrocarbons. Initially, all the flowback water from the fracturing process and produced connate water from the formation were combined and injected into Class II UIC Salt Water Disposal (SDW) wells. Eventually, the hydraulic chemistry formulators developed packages that could tolerate high salinity waters. This development allowed salty produced water to replace fresh water in hydraulic fracturing operations. Now, close to 20% of produced water from shale wells is being recycled back into hydraulic fracturing operations for new wells. While this is a positive trend, recycling this water back into new well completions cannot solve the water imbalance. Even if every new well was fractured using recycled produced water, more than half of the water generated from shale wells would still need to go to SWD wells.
Seismic events result from high volumes of produced water going to SWDs in several shale plays. The greatest impact has been seen in Oklahoma and the Permian Basin in Texas and New Mexico. This has led to regulators forcing SWD facilities to reduce volumes or to close wells completely. When this happens, the operators must transport water further for disposal, generating higher costs. SWD facilities bordering active seismic zones then receive all the water they can handle, and increase their disposal prices. The combination of higher water transport costs and higher disposal costs are creating an opportunity for alternate uses of produced water to become more cost effective.
Beneficial reuse of produced water outside of the oilfield has never been an economically attractive option. Using produced water in agriculture or industry requires desalination of the water, resulting in unacceptably high treatment costs. New Mexico has taken a leading position in finding disposal options. The New Mexico Produced Water Research Consortium (NMPWRC) started up in 2017 with the goal of researching technologies that could cost effectively treat produced water for beneficial reuse outside of the oilfield. 2 Since then, the Texas Produced Water Consortium (TXPWC) and the Colorado Produced Water Consortium (COPWC) have started up. These three groups are comprised of technology developers, academics, oil and gas operators, regulators, and subject matter experts. The consortiums are working together to identify and field test emerging technologies that may reduce the cost of treatment to allow beneficial reuse to become competitive with disposal in SWDs. The NMPWRC also has a comprehensive toxicological research programme to reduce the risk of using produced water by identifying additives and byproducts that might express toxicity in the environment.
An interesting development of this research is the identification of technologies that may generate a positive cash flow by recovering high value minerals from produced water. Lithium is obviously an attractive element with high value to supply the electric vehicle market. Other valuable minerals that can be recovered from produced water include strontium, magnesium hydroxide, calcium chloride, iodine, bromine, caustic soda, and sodium hypochlorite. Generating cash from produced water turns this waste stream into a potential resource. Furthermore, during the mineral recovery process,
most of the produced water is desalinated, to the point that it can be used in some agricultural or industrial applications – an important benefit in arid regions. Recovery of the mineral value will require working with economies of scale in large centralised plants.
The development of a midstream water industry is also contributing to the cost effectiveness of treating and reusing produced water. Over the past five years, there has been huge investment into produced water pipeline infrastructure and large-scale treatment facilities. The pipelines move water around the oilfield at a much lower cost, while taking countless water trucks off the highways. The produced water is collected at large facilities that treat water for reuse into oilfield operations at a fraction of the cost of years past. This has allowed much more recycling of produced water for the hydraulic fracturing of new wells. The centralised handling of these waters makes the availability of feed water for mineral recovery convenient. Recent consolidation of midstream operators has improved the efficiency of the sector and further reduced operating costs.
The Department of Energy (DOE) is sponsoring a programme to develop new tools for the oilfield to manage produced water more effectively. The National Energy Technology Laboratory (NETL), in cooperation with the Lawrence Berkeley National Laboratory (LBNL), has launched a produced water optimisation initiative. The Produced Water Application for Beneficial Reuse, Environmental Impact and Treatment Optimization (PARETO) 3 is specifically designed for produced water management and beneficial reuse. The major deliverable of this project will be an open-source, optimisation-based, downloadable and executable produced water decision-support application. PARETO can be run by upstream operators, midstream companies, technology providers, water end users, research organisations and regulators.
Produced water treatment technology continues to improve and best practices are constantly evolving. Recent improvements to membrane technology are reducing the cost to pretreat complex produced water for feed in desalination processes.
Produced water volumes are projected to continue growing in the decades ahead, and the oil and gas industry must look more closely at planning to manage it. Seismic activity in several shale plays creates risks for the continued use of SWD as the primary option for managing produced water. Costs to move and dispose of it will continue to increase the attractiveness of disposal alternatives.
Shareholders are pressuring boards to become more responsive to ESG issues. This is especially true for the oil and gas industry. Turning a produced water waste stream into a resource is good business. Generating significant volumes of fresh water for arid regions where companies are operating is good for local communities. Oil and gas production has been the economic driver for many communities in the shale plays. Investments into mineral recovery creates good jobs, while diversifying from hydrocarbon production. The old paradigm for managing produced water through deep well disposal may be coming to an end; change is on the horizon.
40 | Oilfield Technology Spring 2023
References 1. HASLER, R., Bracing for a Flood, US Shale Set To Treat Less Produced Water Despite Earthquake Boom, 06 January 2022, Journal of Petroleum Technology. 2. https://nmpwrc.nmsu.edu/ 3. www.project-pareto.org
Testing the waters Testing the waters Testing the waters
Dr Ming Yang, TÜV SÜD National Engineering Laboratory, UK, outlines the factors to consider when selecting a fit-for-purpose online oil-in-water analyser for oilfield produced water applications.

Produced water is an inevitable byproduct of oil and gas production. Globally, on average, it is estimated that for every barrel of oil produced there are roughly 5 bbls of water co-produced. How to best manage produced water therefore has significant implications economically, socially, and environmentally for the oil and gas industry.
One of the important aspects of produced water management is the measurement and monitoring of oil in produced water, regardless of whether the treated water is for discharge, re-injection, or reuse.
Online oil-in-water (OiW) monitors play an
increasingly important role in relation to produced water treatment process optimisation and control, as well as for reporting the discharge of oil in produced water overboard for manned, unmanned, remote, and subsea operations.
Selecting a fit-for-purpose online OiW analyser for a specific oilfield application can be a challenge, even for the most experienced of engineers. This is due to the wide range of measurement principles and instruments that are commercially available, the complex nature of produced water properties and characteristics, and the hazardous environment within which the analysers will be installed.
When selecting an online OiW analyser, the following aspects need be carefully considered:
| 41
Ì The purpose of application.
Ì Produced water characteristics.
Ì Measurement range.
Ì Accuracy.
Ì Process conditions.
Ì Operational environment.
Ì Installation requirements.
Ì Previous applications/experiences with similar produced water characteristics.
Ì Field trial/laboratory flow loop testing.
Ì Costs.
Ì After-sales service s.
It is important to realise that OiW is a method-defined parameter and, as a result, different online techniques will measure OiW differently and produce different values. Calibration and correlation to an existing approved laboratory method therefore becomes important, especially if the results from the online OiW analyser will be used for regulatory compliance monitoring purposes.
Considerations for selecting an online OiW analyser
Measurement purposes
There are two main purposes of measuring OiW. One is for production operations, such as process optimisation, and the other is for oil-in-produced-water discharge reporting. For regulatory compliance monitoring and reporting, accuracy is more important. For process optimisation, measurement range and repeatability becomes more important.
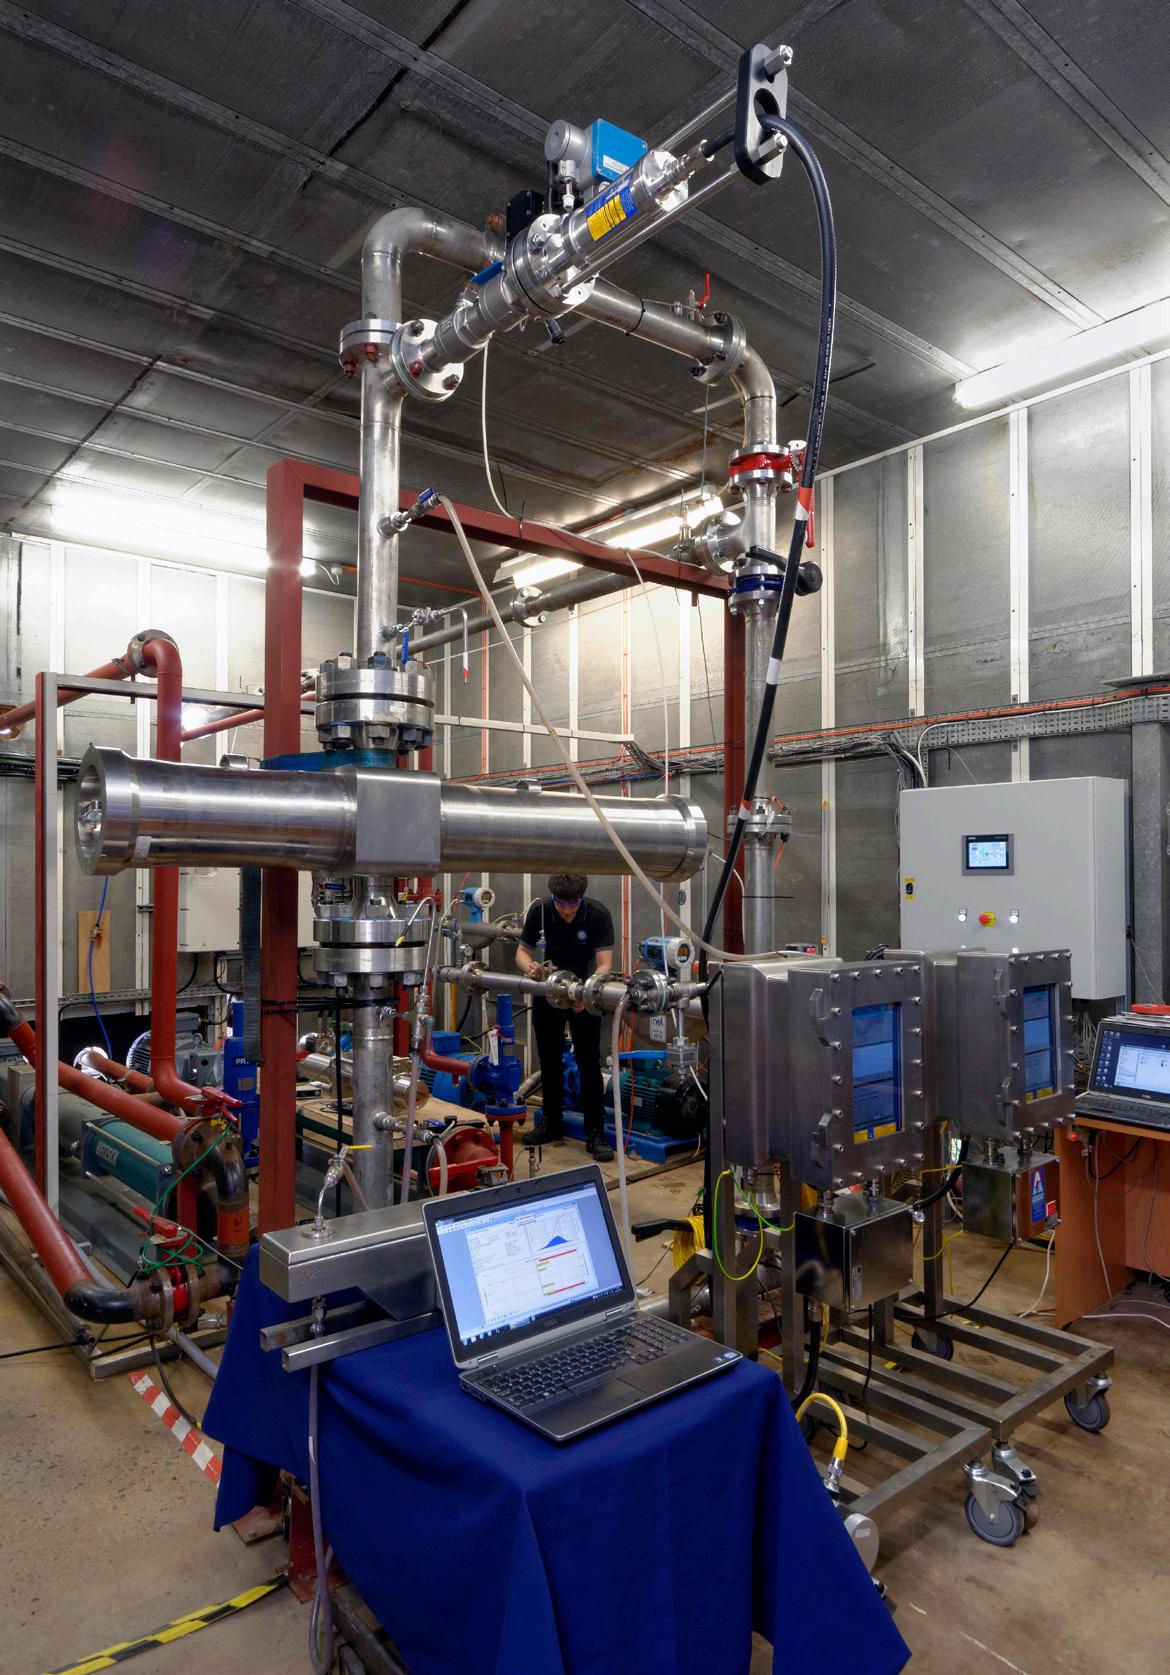
Produced water characteristics
Produced water is a complex mixture. Whilst it is mainly water, it also contains dispersed oil, dissolved oil, particulates, production chemicals, heavy metals, dissolved gas, and radioactive materials.
Different measurement techniques will respond to the produced water characteristics differently and therefore measure and generate OiW results differently. Fluorescence and laser induced fluorescence (LIF) are based on measuring aromatics in the produced water, while microscopy image analysis, light scattering and ultrasonic acoustics are based on measuring the sizes of oil droplets and particles.
Types of oils, presence of solids particles and gas bubbles, as well as production chemicals in the produced water, can also impact on measurement. Some measurement techniques are more affected by the presence of these than others.
Measurement range and accuracy level
For discharge reporting, a narrower measurement range but a higher accuracy is required, while for process optimisation, a bigger range is more important. Whilst suppliers’ brochures are useful, other references should also be sought to check the claims made by the vendors. Experiences gained from applications with similar produced water characteristics can be invaluable.
42 | Oilfield Technology Spring 2023
PRODUCED WATER SOLIDS DISSOLVED GASES HEAVY METALS BTEX NPDs PAHs ORGANIC ACIDS ALKYL PHENOLS RADIOISOTOPES DISPERSED HYDROCARBONS SALTS PRODUCED WATER COMPOSITIONS
Figure 1. Online oil-in-water analyser research.
Figure 2. Produced water compositions.
Process conditions and operating environment
Process conditions may include OiW concentration range, operating pressure, temperature, flow rate, and their variations. The operating environment may be subject to humidity, high and low ambient environmental temperatures, exposure to electromagnetic interference, etc.
Installation requirements
OiW analysers may be fitted directly inline or on a bypass line. If fitted inline, it must be considered whether the retrieval of the instrument sensor would require the production process to be stopped. Some OiW analysers are equipped with retrievable sensors. If an analyser is fitted on a bypass line, it must be ensured that oily water in the line will be representative of the oily water in the main pipeline. Points to consider will include how the bypass line is arranged (i.e. connection to the main pipeline, sample point, use of quill, etc.) and the piping size, as well as the length.
Single point measurement or multiple point measurement
Some analysers have the capability of multiple point measurements. These analysers usually have a single process unit that is connected to a number of sensors that can be installed at different locations of the produced water treatment process. Installation requirements will obviously be different for single or multiple point measurement arrangements. Also, the concentration range at different locations will likely be different.
Utility requirements
These may include power consumption, voltage, use of compressed air, etc.
Sample conditioning/upstream installation effect
Sample conditioning can be useful in terms of creating an oily water mixture with a consistent oil droplet size. The use of sample conditioning systems is often associated with an analyser fitted on a bypass line. UV or light scattering-based technologies often come with such a conditioning unit. However, the inclusion of a sample conditioning unit adds to the complexity of the overall online OiW analyser system. These sample conditioning units will also need regular maintenance.
Pipe fittings are well known to provide mixing, which is good for creating an oily water with a more consistent oil droplet size. However, they can also result in swirl and the distribution of oil droplets/particulate across the pipe cross section. Installing analysers or taking samples from a vertical pipe is usually a better choice than from a horizontal pipe. This is due to a more homogenous condition likely being achieved on a vertical pipe.
Signal output and analyser remote access
There are various output signals available from a particular online OiW analyser. Choosing what signal to use will depend upon individual applications. Remote access is becoming increasingly important for diagnostics, checking the status of the online analyser, maintenance, and data downloading. Therefore, it is important to get the requirement right for remote access of the instrument.
Previous applications/experiences
Previous applications and experiences obtained (both good and bad) from fields with similar produced water characteristics
are invaluable. Both vendors and operators should be approached to provide information on these. It is good practice to check internally first to see if there have been any similar applications previously. Vendors would usually keep a record of customers and applications, and it should be easy for them to shortlist similar applications. Literature is the other place to find online OiW analyser applications and experiences.
If field applications are hard to find, then results from previous laboratory-based flow loop testing can also be helpful. There have been a good number of flow loop tests on online OiW analysers that have been carried out on behalf of individual operators, or a group of operators. Not all the test results/information will be available in the public domain, but it is worth checking.
Field trial/laboratory flow loop testing
Before an online OiW analyser is purchased, a field trial may be arranged. A field trial is the ultimate way of finding out if the technology can work well. Some vendors may also offer good terms for such a trial before a purchase. However, field trials can be logistically difficult to arrange and are usually expensive. Independent laboratory-based flow loop testing offers an alternative option. Whist a complete replication of field produced water conditions is not possible, these flow loop tests offer a way to assess the performance and suitability of an online analyser. In a laboratory-based flow loop setup, various process conditions can be easily simulated. Using flow loop testing, one can also look into the correlation between the online analyser and an approved (reference) method, as well as calibration and maintenance requirements.
Costs/after-sales services
The costs of having an online OiW analyser supplied/fitted can vary. The difference in cost between different vendors and technologies can run into tens of thousands of pounds. In addition to the capital costs, there are also running costs, i.e. for spare parts and maintenance, which should also be taken into consideration.
After-sales service is another important aspect for consideration, which may include repair work, routine maintenance, periodical calibration and validation, etc. As an online OiW analyser is not a ‘fit-and-forget’ type of instrument, understanding what after-sales services are available from the vendors and included in the purchase, and making a good use of them, will become important.
Conclusion
Selecting a fit-for-purpose online OiW analyser is not an easy task, even for an experienced engineer. As it is usually costly and logistically complex, one should always ask if an alternative method, such as a field bench-top method, may be used.
If the decision is to go for an online OiW analyser because of the benefits that it can offer, then one needs to fully understand the different types of technologies, how they work and what advantages and disadvantages they have. In addition, there are many other aspects that need to be considered and understood. These may include the characteristics of the produced water, the purpose of the applications, costs, whether to have a field trial or laboratory-based flow loop test, installation, after-sales service, etc. If the application is critically important, e.g. subsea, unmanned, and for regulatory compliance monitoring, one may also need to consider the use of multiple analysers/sensors to offer contingency.
Spring 2023 Oilfield Technology | 43
Nine Energy Service, USA, explains how the upstream oil and gas industry can leverage dissolvable technologies in order to reduce its carbon footprint.

Time is ticking for the oil and gas industry. By 2050, the sector must cut its yearly emissions by at least 3.4 gigatons of carbon dioxide equivalent (GtCO2e), or 90% of present emissions. What is more, all major emitting nations have pledged under the 2015 Paris Climate Agreement to reduce their greenhouse gas emissions and to make those pledges stronger over time to address climate change. The global pact intends to collectively put forth the effort to keep the rise in global temperature this generation to 2°C over preindustrial levels, while also exploring methods to keep the rise to 1.5°C. Oil and gas companies must keep up with the industry-wide shift towards low carbon emissions or risk falling short of implementing adequate tools and technologies to meet the demands of this global sustainability initiative. While 2050 may seem far off, time is of the essence for climate solutions.
DISSOLVING
and developing
44 |
A key advancement for oil and gas
Location, asset mix (offshore vs onshore, gas vs oil, upstream vs downstream), and local laws and practices (regulations, carbon pricing, availability of renewables, and proximity to the central grid) all have a role in the emissions reduction strategies a company chooses to implement. The good news is that several technologies and services have been created that give operators several options to reduce carbon emissions, while simultaneously maintaining, or even improving efficiencies and reducing costs.
Dissolvable technology is a key advancement in oil and gas production, generating tremendous demand from operators, especially as technology and material science has improved over the last several years, and with good reason. Dissolvable technology reduces emissions while simultaneously speeding up the time it takes

P ROBLEMS
to get to production, reducing risk at the well site with less equipment and people at the surface. Dissolvable plugs are especially useful in long laterals with higher stage densities and complex laterals in general. Since dissolvable frac plugs’ first introduction to the market in 2012, they have become a much more common part of well completions, regardless of the wellbore or downhole environment. Today, dissolvable technology is proving its impact on the future of sustainability in the oil and gas sector.
Significant and scalable emissions reduction in the Permian Basin
Environmental Resources Management (ERM) and Nine Energy Service found that dissolvable plugs reduce carbon emission intensity in a scalable way that can be used on a per-well basis. The analytical study
fracking operations
| 45
compared the cradle-to-grave emissions reduction of a dissolvable vs a composite plug completion. The study’s key findings included the following:
Ì There is a significant and immediate reduction in greenhouse gas emissions when using a dissolvable plug vs a composite plug.
Ì By eliminating coil intervention, dissolvable plugs show a 91% carbon footprint reduction, or ~67.3 t of CO2e compared to a traditional composite plug completion.
Ì Dissolvable plugs have shown a carbon footprint reduction of 18% or around 13.3 t of CO2e, assuming a three-day coil tubing cleanout run.
Ì In practical application, utilising dissolvable frac plugs on a six-well pad is equivalent to taking 84 cars off the road or approximately 404 t of CO2e.
The method(ology) behind the madness
Carbon footprint is “the sum of greenhouse gas emissions and removals in a product system, expressed in CO2e and based on life cycle assessment, considering a single impact category – climate change."1 The standard sets out four phases for the development of a carbon footprint study (in accordance with life cycle assessment studies), which include the life cycle inventory (LCI), life cycle impact assessment (AICV), interpretation, goal, and scope definition.
Study scope and boundaries
Additionally, the scope and boundaries of the Permian Basin-based study included a functional unit of one typical deployment and extraction or clean-out process of 70 plugs and a cradle-to-grave approach. With transport taking place between each step, the following process was implemented:
Ì Pre-Nine Energy manufacturing.
Ì Nine Energy manufacturing.
Ì Deployment.
Ì Clean-out.
Ì Disposal.
A coil clean-out run (assuming three days of clean-out and four days for a conventional drill-out) defined scenario one, while the elimination of coil usage (assuming four days for a conventional drill-out) defined scenario two of the study.
Comparative emissions reduction: Clean-out vs elimination of coiled tubing
The clean-out results for the conventional drill-out resulted in 74 146 kg CO2e per wellbore compared to only 6873 kg CO2e per wellbore for the dissolvable, with no clean-outs. Regarding the elimination of coiled tubing, the life-cycle carbon footprint of the dissolvable plug would be 91% smaller per wellbore than the conventional composite plug.2 This equates to ~67.3 t of CO2e or 14 passenger cars driving per year.
Conversely, the life-cycle carbon footprint of the dissolvable plug with clean-out is 18% smaller per wellbore than the conventional composite plug — or 60 843 kg CO2eq per wellbore (dissolvable with clean-outs) vs 74 146 kg CO2eq per wellbore (conventional drill-out). This equates to ~13.3 t of CO2e or three passenger cars driving per year.
Performance in the Woodford
In addition to carbon footprint reduction, leveraging dissolvable frac plug technology provides other valuable returns for operators, such as cost savings and improved efficiency. Nine’s Stinger™ dissolvable frac plug recently helped Charter Oak Production Company in the Woodford Basin complete its first-ever three-mile lateral, which included a vertical depth of only ~6000 ft. This brought about a significant challenge of limited weight with coiled tubing that would be costly and time-consuming. The operator decided to run the Nine Dissolvable Stinger for the entire wellbore.
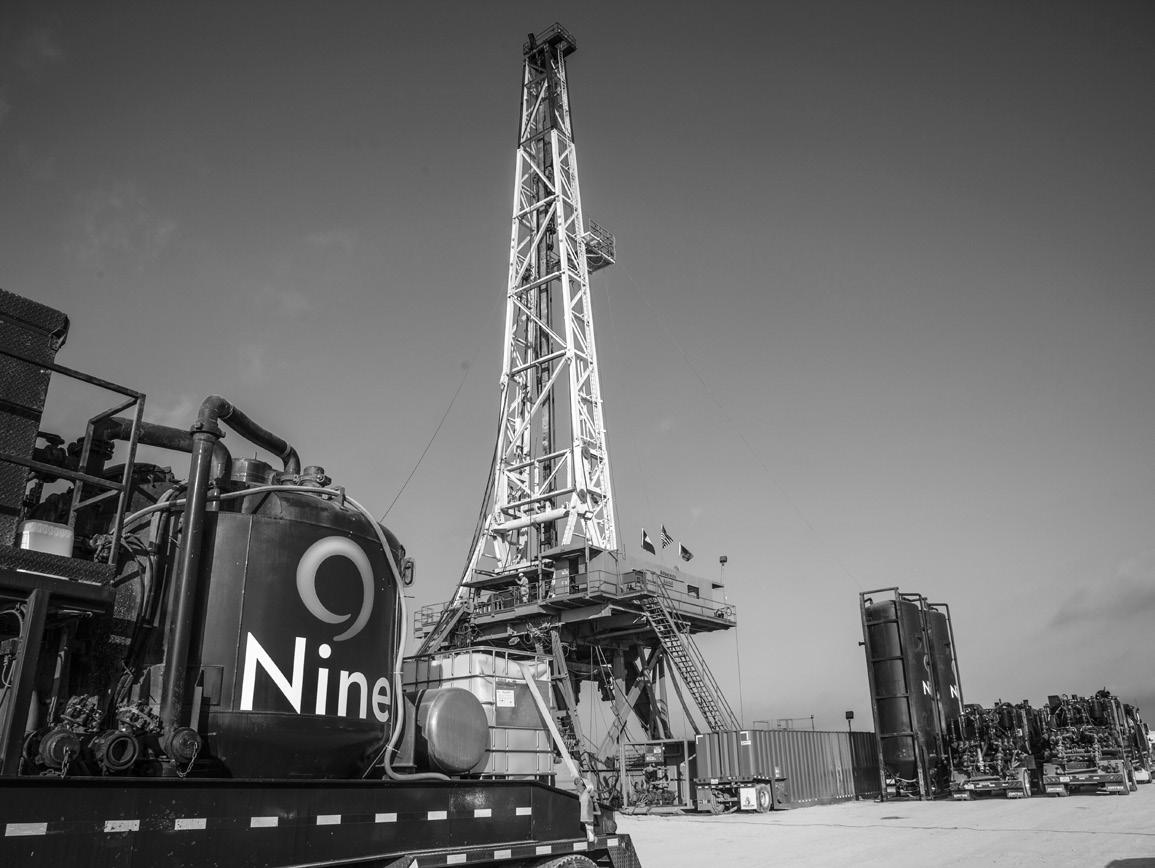
The scenario called for zonal isolation utilising 114 freshwater Stinger dissolvable frac plugs with a dissolvable pump down ring, and had the following factors in place:
Ì 5.5-in. 20# casing.
Ì BHT: 135°F.
Ì TVD: ~6000 ft.
Ì TD: ~21 000 ft.
Ì Frac fluid: Freshwater.
Ì Cleanout run: Five days after completion of the final phase.
As a result, all plugs were successfully deployed, and zonal isolation was achieved, saving the operator an estimated US$200 000 on coiled tubing costs.
Moving forward with the future: Dissolvable frac plug technology
How the oil and gas sector adapts to the global energy shift will be critical. As such, leaders in the industry will be differentiated from the slow starters by customers, employees, and investors. Today, dissolvable frac plug technology is designed to perform with increased efficiency and precision in the most extreme conditions. These dissolvable frac plugs are created for high-temperature formations whose wellbore temperatures often reach or surpass 250°F, as well as low-temperature environments, often found in the Permian Basin.
Fortunately, investing in and implementing innovative dissolvable frac plug technology that can withstand the full spectrum of geographical temperatures and wellbore environments can offer oil and gas companies a solid start. Those who make a strategic and active effort to adapt to the resolute standards of the global 'great energy transition' will find themselves in a more favourable circumstance as the industry evolves.
46 | Oilfield Technology Spring 2023
Notes
1. (ISO 14067: Quantifying and reporting the carbon footprint of products)
2. Carbon footprint of 70-plug deployment in metric ton CO2 equivalents.
Figure 1. Reduced emissions and faster production advantages have led to a significant increase in operator demand for dissolvable technology during the past decade.
Sara Crighton, Net Zero Technology Centre, UK, explains why CUI is an ongoing problem for operators in the upstream sector, and describes the technologies that are being investigated to mitigate it.
A SPOT L IGHT ON
Asignificant contributor to fugitive emissions is corrosion under insulation (CUI) which poses a major operational, safety and economic challenge for operators in the upstream oil and gas industry. Over 20% of the major oil and gas accidents reported within the EU since 1984 were associated with CUI. Many assets on the UK Continental Shelf (UKCS) are operating beyond their expected design life, and 60% of pipe failures are attributed to CUI.
The IEA estimates that, for net zero to be achieved, fugitive methane emissions need to reduce by 75% by 2030. In addition, early detection and repair of failing pipework will reduce associated fugitive emissions of methane by 14%.1
What is CUI?
Regardless of how secure the insulation is, there will inevitably be areas where water can seep in, thereby creating conditions that cause corrosion. Corrosion, especially left undetected, can cause critical damage
to production facilities, which can result in the release of harmful chemicals and pollutants into the environment. This can increase emissions and reduce equipment efficiency, leading to increased energy consumption and higher emissions levels.
Evolving methods of monitoring and mitigation
The energy industry has historically relied on manual practices of visual inspection and spot measurement techniques to identify areas prone to CUI. This approach involves periodically removing insulation in selected areas for visual inspection, which is labour-intensive, time-consuming, and costly, especially if scaffolding is required. This technique also heavily depends on operator knowledge, which can add risk, as moisture can travel within insulation, leading to unexpected CUI occurrences.
To overcome these limitations and risks, implementing predictive maintenance enabled by continuous
automated monitoring offers significant advantages. Continuous monitoring reduces the need for insulation removal and provides remote data over a long period, leading to reduced costs and increased safety for the industry. By using predictive maintenance techniques, the industry can reduce the risks and costs associated with manual inspection and improve overall efficiency in identifying and mitigating CUI.
NZTC is working on the development and deployment of several technologies that focus on CUI prevention and monitoring.
Technology under the spotlight
High-resolution monitoring technologies
CorrosionRADAR’s system uses a high-resolution monitoring technology called Electro-Magnetic Guided Radar (EMGR) mounted on the external surface
| 47
of pipes and vessels to detect, locate, and monitor key indicators that may lead to CUI, such as corrosion on a sensor and moisture in the insulation. It can be retrofitted to existing and ageing assets and installed during the construction phase of new assets.
The key technical innovation behind the system is a long, thin, and flexible sensor that acts as a corrosion coupon to the corrosive environment near it. Specially coded electromagnetic signals are sent through the sensor, and the reflected signals are interpreted using proprietary algorithms to locate corrosion. The sensor is permanently installed alongside a pipe or any other complex structure.
The system identifies corrosion-prone locations, corrosion rate, and future projections using historical moisture profiling along a pipe’s axis. The data can be accessed through a cloud dashboard or reside in a local server at the client’s premises.
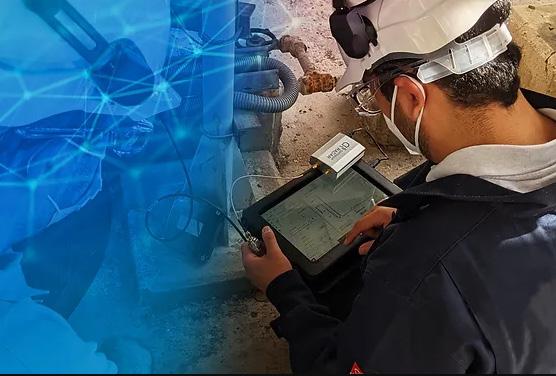
The solution can be applied in different configurations depending on the asset and the coverage needed, and can also be applied to cold pressure vessels and pipes insulated with cellular glass.
Once installed, the sensor becomes a representative sample of the pipe corrosion before catastrophic corrosion levels occur, providing more data-driven risk-based inspections. The system locates corrosion-prone sites, and inspectors can interpret this data to evaluate any risk to the pipe based on field conditions, such as pipe protection, reliability and age.
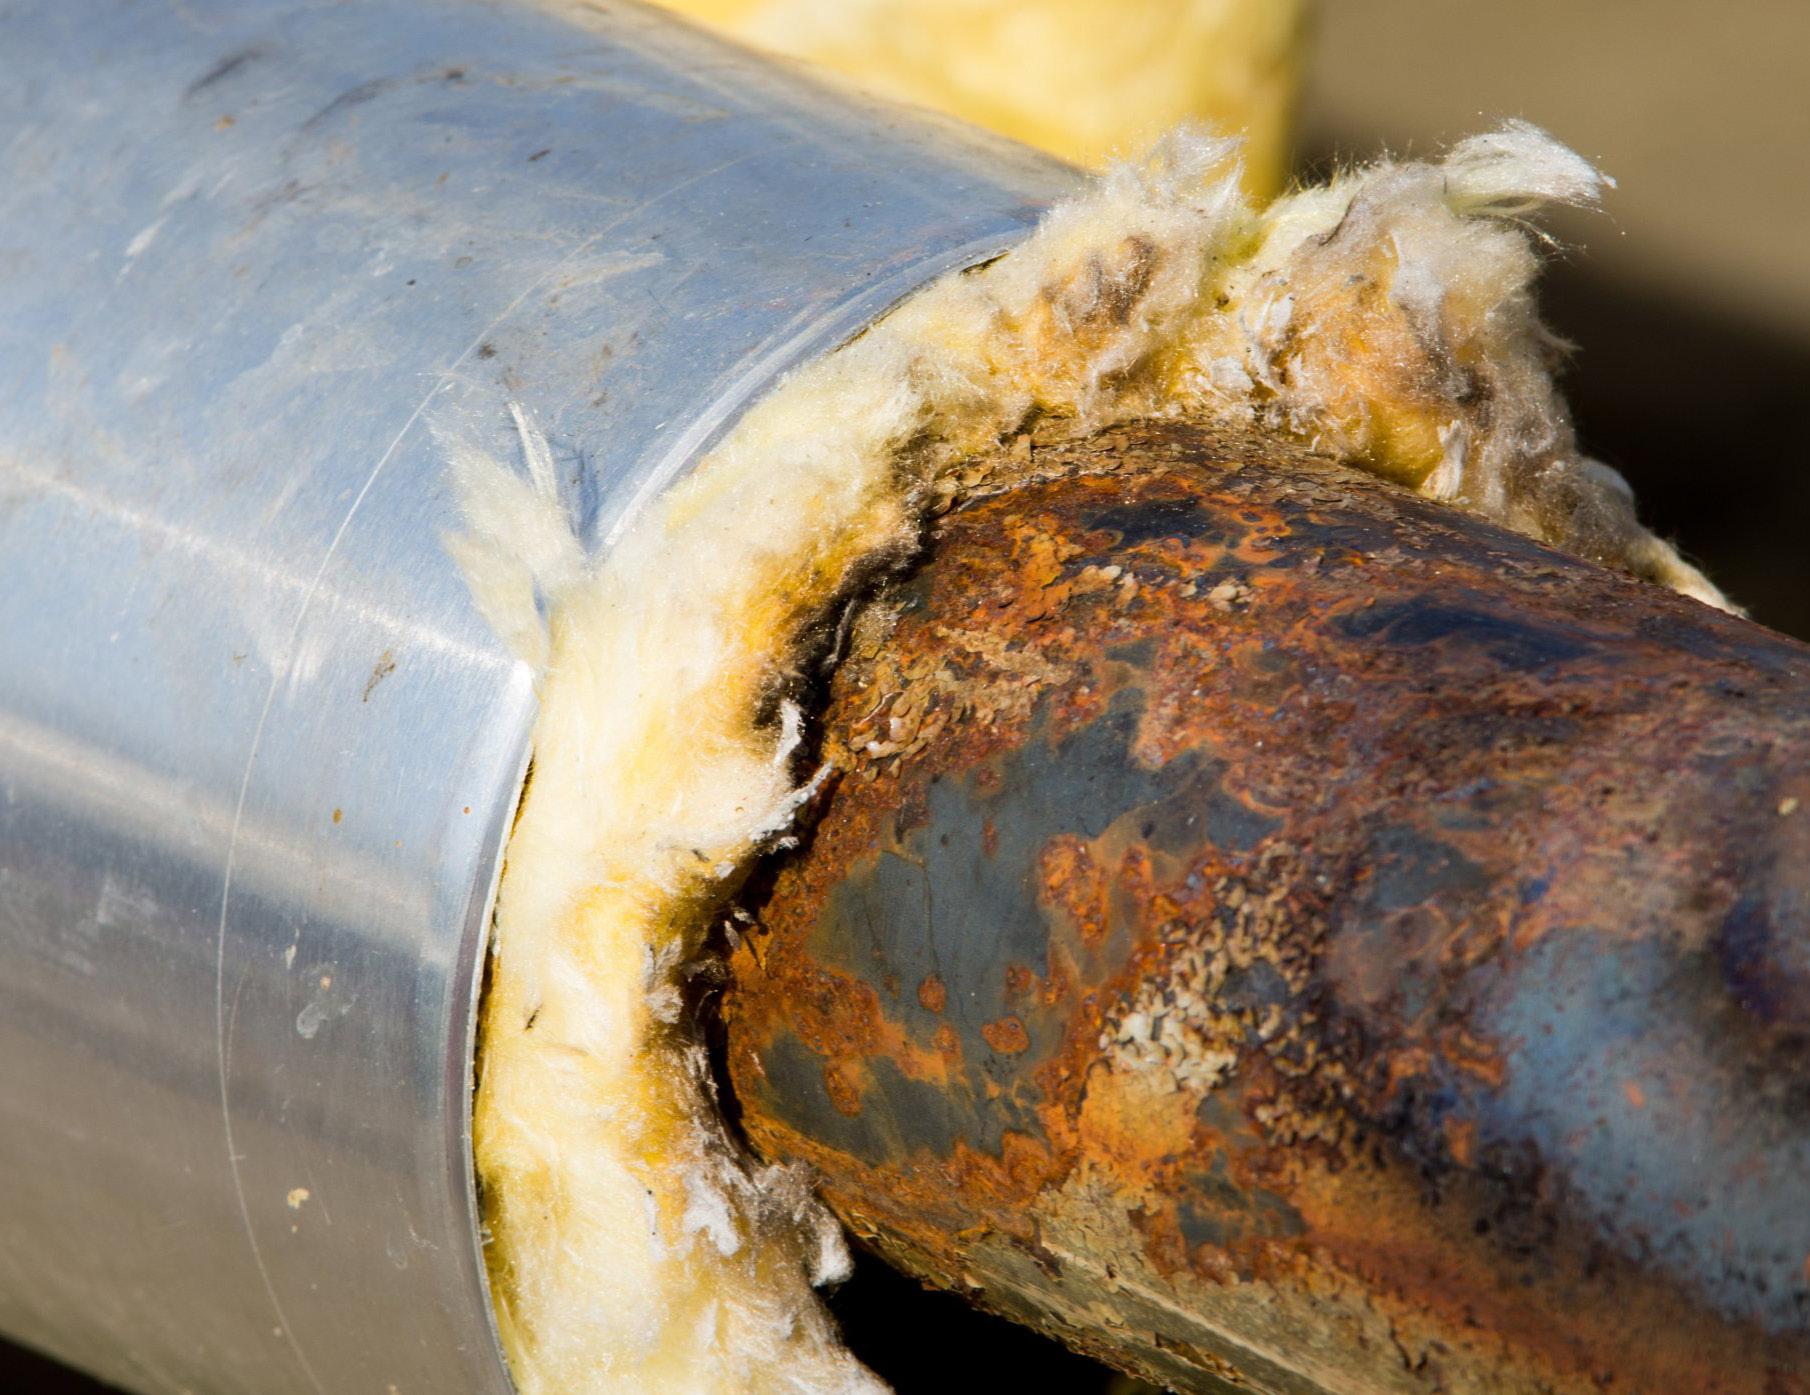
Current risk-based inspection (RBI) approaches require vast amounts of time and money to ensure safe operation, particularly when inspecting insulated columns, where significant scaffolding and safety measures are needed to gain access and inspect for CUI.
For example, a partial strip of installation for spot checks and non-destructive testing is required every five years, with a full asset strip required every 10. Any test that finds as little as 5% damage may result in full insulation stripping, costing up to £1 million, depending on column height and complexity. Remote monitoring of CUI risk is suited for this type of application.
The monitoring system’s long, thin, flexible sensors are installed adjacent to the asset, underneath the insulation.
The data from the sensors enables early detection and localisation of areas of CUI, allowing time for careful planning of repairs. This vastly reduces maintenance costs while increasing asset uptime. System installation is fast and may be carried out during planned asset turnarounds, significantly reducing the cost of adoption.
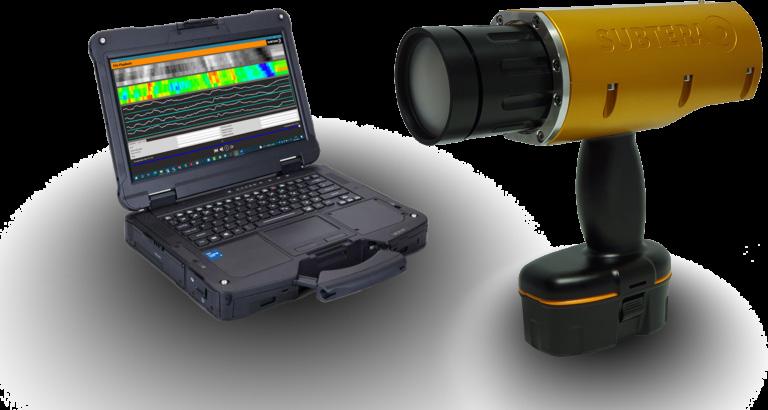
CorrosionRADAR has demonstrated the technology, having detected a CUI-prone location with medium corrosivity levels below a nozzle on a column for a client. The system detected localised water ingress and corrosivity rates inside the insulation which seemed perfectly good upon visual inspection. The result led to a very targeted inspection using rope access during the next inspection cycle. The estimated return on investment is 55%; more importantly, this assures the client of the healthy condition of insulation on most of the column and avoids future unnecessary inspections.
CorrosionRADAR is currently undertaking further field trials with a UKCS operator.
CUI and moisture detection sensors
SubTera’s Pi technology was selected for support as part of NZTC’s 2022 Open Innovation Programme, which awarded over £8 million to develop and deploy technologies that will reduce offshore emissions,
48 | Oilfield Technology Spring 2023
Figure 1. Corrosion under insulated pipework.
Figure 2. Electro-magnetic guided radar technology from CorrosionRADAR.
Figure 3. CUI and moisture detection sensor from SubTera.
accelerate clean energy production, and enable the delivery of the UK’s net zero ambitions. The project has secured support from five UKCS operators for on-and-offshore field trials.
Pi, SubTera’s CUI and moisture detection sensor, is a passive inspection tool that measures sub-terahertz photons naturally emitted by concealed corrosion and moisture. It enables the inspection of assets fitted with non-metallic cladding while operational. Pi can be used in a freehand mode to inspect prone areas or locations with complex geometries. Pipework can be fully inspected by combining multiple real-time linear scans into a single inspection dataset; this is managed efficiently through operator software workflows.
The data can be exported in standalone documents or as data files for integration within external reports. As part of an independent blind trial of Pi, a corrosion scab was developed from first principles. An accelerated corrosion process was used, whereby a corrosive solution was dripped directly onto an uncoated area of an insulated pipe heated to 80°C. Pi was used to inspect the pipe at regular intervals during the project, and analysis of the sensor data enabled SubTera to correctly identify the location of the CUI while the insulation and cladding were fitted.
During the project, with the pipe temperature being maintained at 80°C, SubTera witnessed a small volume of water (50 ml) being injected into the mineral wool insulation, after which the cladding was reapplied. The following day, Pi was used to inspect the pipe section, and the sensor data showed significant changes in the area around the water injection point, again without requiring the cladding to be removed.
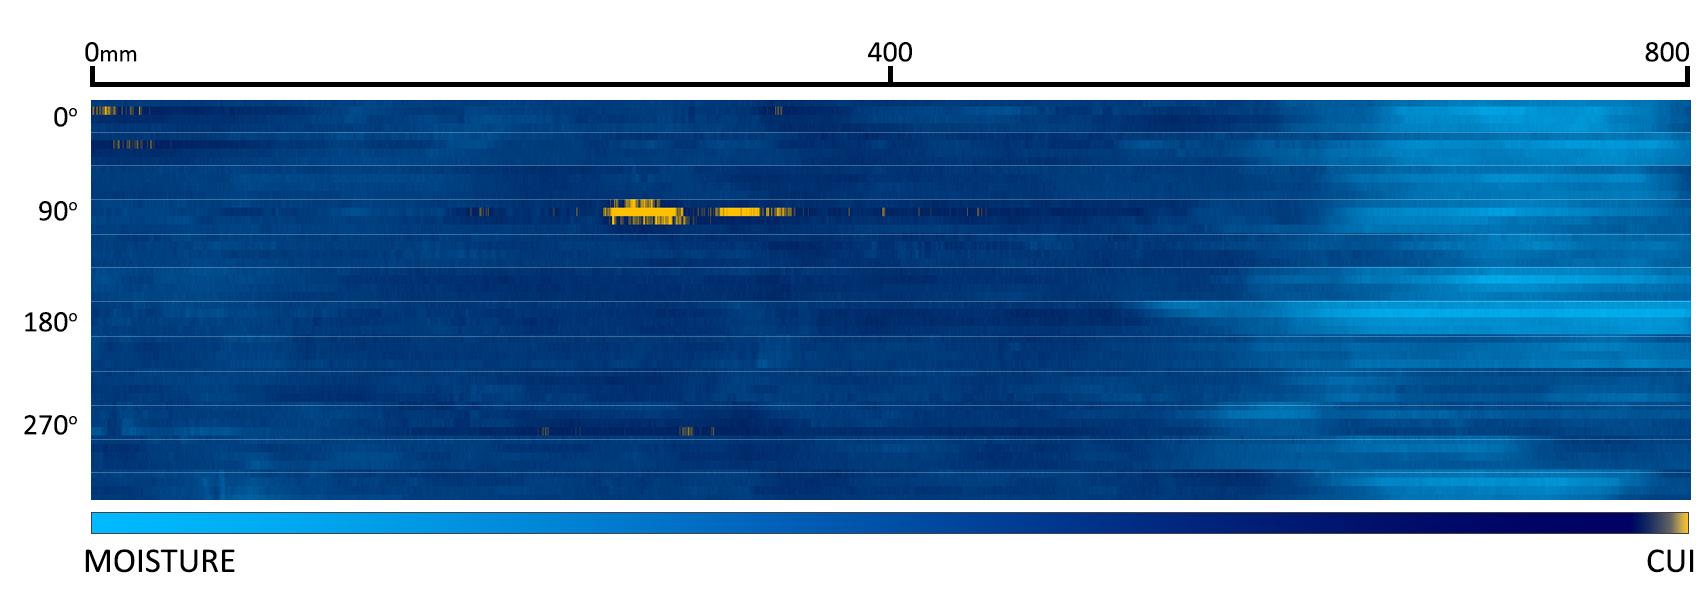
The pipe section used during the project was fitted with mineral wool insulation and non-metallic cladding, which are commonly found on pipework and vessels used throughout the chemical, energy, and process industries.
Advances in coating systems
The Copsys Intelligent Digital Skin is another technology selected through NZTC’s 2022 Open Innovation Programme. It is a unique coating system that can be used for several applications, including mitigating and managing CUI.
Once installed, the technology can detect and locate coating barrier damage or CUI hotspots in real time before corrosion damage can occur. The integrated impressed current cathodic protection within the coating creates an entirely new category of continuous sensor technology. Consisting of an epoxy resin with Copsys’ proprietary additives and proprietary polyamine hardener, the Copsys Intelligent Digital Skin detects and locates coating damage digitally.
When the skin is damaged, a signal is sent to an electronic controller, which processes it to locate the damage. The digital skin coating then provides additional protection to the pipework. The technology has received interest from industry, and field trials with four UKCS operators are scheduled to take place in 2023.
Conclusion
Reducing CUI is essential for the offshore industry to achieve net zero emissions and maintain high levels of safety. Technology has significantly advanced over the last decade from predictive maintenance implementation to automated monitoring techniques. Industry has come a long way and we now do not need to remove insulation thanks to remote data collection, analytics over extended periods and moisture and corrosion detection tools that offer real-time results, bringing long-term cost savings and increased safety. Achieving a sustainable net-zero future requires a tailored approach, as there is no universal solution for reducing the risk of catastrophic failures. A combination of various technologies can be employed to mitigate the risk and promote a more sustainable future.
References
1. www.iea.org/reports/curtailing-methane-emissions-from-fossil-fueloperations/executive-summary
Spring 2023 Oilfield Technology | 49
Figure 4. Sensor measurement data.
Figure 5. Intelligent digital paint demonstration from Copsys.


Never miss an issue! Go to: www.oilfieldtechnology.com/magazine Advertiser Index ABACO DRILLING TECHNOLOGIES ENERGY GLOBAL GASTECH EXHIBITION & CONFERENCE 2023 GLOBAL HYDROGEN REVIEW HYDROCARBON ENGINEERING OILFIELD TECHNOLOGY 07 IFC 15 23 IBC 13, 27, 50, OBC OMNETICS CONNECTOR CORPORATION TETRA TECHNOLOGIES TRENDSETTER ENGINEERING TRIMOS, S.R.O. VAREL ENERGY SOLUTIONS 19 02 04 29 OFC, 09 with us to hear the latest in upstream oil and gas news Stay informed www.oilfieldtechnology.com


Worldwide Coverage Subscribe online at: www.hydrocarbonengineering.com/subscribe Global coverage of the downstream oil and gas sector

We hope you enjoyed the latest issue of Oilfield Technology magazine. For more information on advertising opportunities please contact: For any editorial enquiries please contact: www.oilfieldtechnology.com/magazine ben.macleod@oilfieldtechnology.com emily.thomas@oilfieldtechnology.com
