8 minute read
Painting a clear picture

Next Article

or water bodies. In addition, turbine SCADA and event data are misaligned by design.
However, it is now possible to process data and analyse how different streams interact in a matter of minutes, allowing underperformance to be recognised and loss of revenue to be limited. Clir’s platform utilises an advanced data model to structure available data in a way that enables performance analytics to be conducted quickly and accurately at scale.
Finding the needle in a haystack
While major mechanical failures such as a broken gearbox are easily detectible in traditional data analysis, subtle underperformance can often be missed unless the owners dedicate a significant amount of time looking for ‘needles in a haystack.’
If the owner assesses turbine SCADA data alone to try to identify the source of underperformance, smaller faults are often indistinguishable from dips in output due to a low wind resource. These smaller faults tend to reduce annual energy production (AEP) by 1 - 2% on their own, but if they are consistently missed and allowed to accumulate, asset owners can lose out on hundreds of MWh each year.
However, if SCADA data is analysed correctly, it is possible to easily separate out whether a dip in output is a part of the natural variation in resource or if it is a technical issue. Automating this process using advanced digital tools such as machine learning allows owners to fix small but significant issues before the lost production becomes a burden on their balance sheet.
Spotting the slightest misalignment
Poor pitch strategies and yaw misalignment are common causes of turbine underperformance. Angling of the blades or yaw away from the wind direction by as little as 4˚ can reduce AEP by up to 1%. If turbine data is put into the right context, owners can quickly identify whether the nacelle is facing ever so slightly away from the wind direction.
Clir worked with a wind farm owner who had identified lower than expected performance across its project but was unsure of the exact cause. After onboarding not only data from every turbine on the wind farm, but also data detailing resource conditions and the surrounding environment, Clir found that one of the turbines had much higher output compared to its neighbours when its nacelle was angled 8˚ away from the direction of the wind. From this, the owner was able to confirm that turbines across the project had been misaligned by 8˚ due to a sensor error. Once repaired, the overall output of the wind farm increased.
Figure 1. Clir’s interface shows that, for this hypothetical scenario, the wind resource has boosted AEP by 20.2%, while turbine underperformance reduced AEP by 4.5%. Underperformance has prevented the wind farm from taking full advantage of unexpectedly favourable weather conditions.
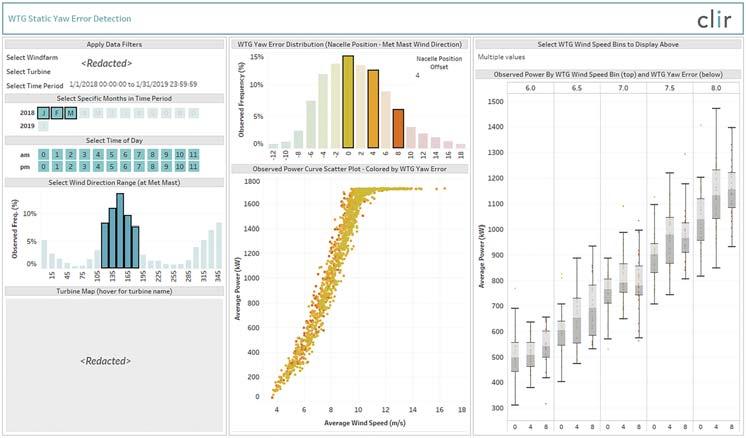
Figure 2. Static yaw error detected from a client’s turbine data. Power production is maximised when the turbine appears to be 8˚ misaligned with the recorded met mast wind direction, i.e. true wind direction.
Tracing unnecessary derating
Unreported derating is another cause of underperformance that can be missed and mistaken for low winds by traditional data analysis methods. While turbines should only be derated under conditions previously agreed by the asset owner, the turbine manufacturer, the grid operator, and the permitting authority, there can be times when derating occurs outside of these parameters and without the owner’s knowledge.
This can see the turbine run below rated power despite optimal generating conditions, leaving potential revenue on the table. However, if the owner does not analyse turbine data in the context of its environment, the distinction between a drop in winds and a drop in turbine performance can be lost.
For example, Clir analysed the data from a turbine with consistently low output, and after placing it in context of peer turbine data and environmental data, was able to pinpoint that despite optimal conditions, at specific time intervals the turbine’s output would plummet by up to 10%. This pattern of underperformance indicated that the turbine was being derated outside of the terms of the derating agreement.
Armed with evidence of misapplied derating, owners can renegotiate derating strategies to ensure that the turbine is only curtailed when absolutely necessary.
Rectifying errors in data collection
Ironically, malfunctioning sensors used for data collection can actually be a cause of underperformance themselves. For example, wind turbines are often programmed to
automatically derate in response to severe weather conditions to protect components. As such, high wind speed can cause low output from wind farms.
In some cases, however, these turbines derate despite ideal conditions due to improperly calibrated sensors. For example, if air density sensors are programmed to be too sensitive, the turbine will collect data that triggers derating well below the proper wind speed threshold and see the project miss out on optimal generating conditions.
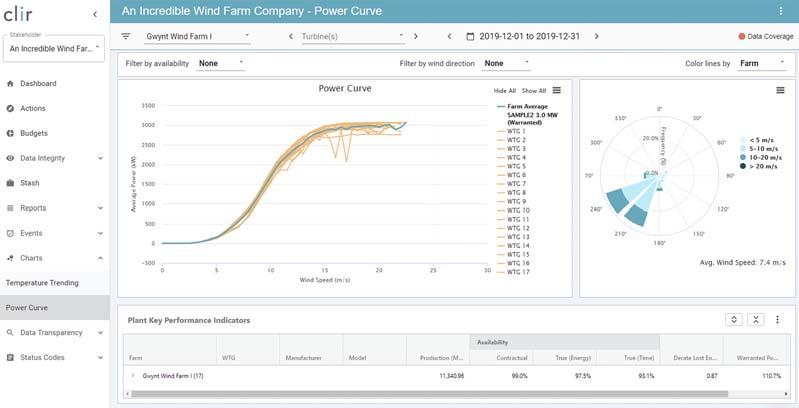
However, by having a true understanding of turbine performance within the context of environmental data, these miscalibrations can be Figure 3. The power curve for this scenario indicates that while the wind farm’s easily spotted and the consequences of incorrect average power production is 3.0 MW, one turbine is being consistently derated to derating due to the miscalibrations can be quantified. under 2.5 MW.
Clir worked with a wind farm owner to identify why more than 650 MWh had been lost from the project’s potential output, discovering that this was the result can move past this, asset owners remain at risk of lost revenue of incorrectly calibrated air density sensors. The owner was due to persistent technical underperformance going under the then able to prevent the loss of further output by recalibrating radar. the sensors. However, by applying the latest technology to analyse and interpret not just turbine or panel data, but the environmental Generating a holistic understanding of context in which the asset operates, owners can gain a true asset performance understanding of asset performance. Specifically, whether The wind industry has long struggled with ensuring that output issues are really a result of low resource. is maximised despite the uncontrollable nature of the resource Machine learning allows owners to rapidly analyse realit relies on. The key to this is debunking the assumption that world information, and ultimately can help drive the insights low output is generally down to resource. Unless the industry necessary to manage risk to the full extent .

A global industry requires a global publication
Register for free at www.energyglobal.com
Anya Nova, Power Ledger, Australia, considers renewable energy certificates and how implementing blockchain technology could assist with their trade.


Have you heard that if you count every 100% orange juice packet on every supermarket shelf in the world, and then derive the size of the orange grove, you would find that there simply is not enough space on Earth for that many orange trees?
The same question can be asked about renewable energy certificates (RECs). RECs are one of the ways that societies and governments incentivise investment in renewable energy sources. Through compliance programmes, electricity utilities, environmental firms, and aggregators purchase these certificates to reduce their net emissions. These RECs help fuel the growth of the renewable energy sector.
It should be the case that the purchase of one REC by a fossil fuel user means that somewhere 1 MWh of clean energy was generated. However, until the introduction of blockchain technology, there was no simple way to verify this.
REC schemes are often criticised for being too opaque, difficult to understand and navigate, with too many complexities governing how RECs are verified and trades made.


RECs become a verified digital asset
What if every REC could be tokenised using blockchain technology and transparently traded on a 24/7 exchange? Or in other words, how do we support the emerging market for RECs with a robust accounting system?
Blockchain technology can clean up the haze and fog to facilitate a clean and transparent market that is driven by verified supply and transparent pricing.
With blockchain technology deployed to create unique fingerprints, RECs can be minted, bought and sold with supreme confidence – eliminating costly and time-consuming auditing processes.
By checking and guaranteeing the authenticity of an REC, blockchain technology allows renewable energy to be priced securely in real-time. In short, blockchain technology unlocks a new marketplace for trading renewable energy assets in a way that benefits both sides of the trade.

Getting a share of the market for RECs
Aside from their conventional use as a compliance tool, RECs are gaining the interest of investors as another way of ‘owning’ renewable energy. Growing numbers of energy (and cryptocurrency) traders are attracted to tokenised RECs to experiment with alternative investments and profit from the sale of energy produced by a wind farm, for example, for the duration of its useful life.
While RECs have been around and traded since the early 2000s, it has previously been cost prohibitive (and somewhat unnecessary) to track individual transactions. Regulators are concerned that an REC is retired as a compliance obligation, but not necessarily who bought the REC or where it is from.


