

Introduction


Dr. Ronald P. D’Amelia and Evan H. Kreth Chemistry Department, Hofstra University, Hempstead, NY 11549-0151

Poly(2-vinylpyridine) (P 2VP) is a versatile polymer that holding numerous industrial applications, particularly within the textile and automotive industries Most notably, P 2VP monomer 2-vinylpyrdine is copolymerized with styrene and butadiene, monomers for poly(styrene) and polybutadiene rubber respectively, to form vinylpyridine latex the copolymer providing the adhesion between the fabric and rubber of vehicle tires Adhesive applications extend beyond vehicle tires, as P 2VP has also found industrial purpose in machinery involving fabric to rubber friction such as belts, hoses, and conveyor systems
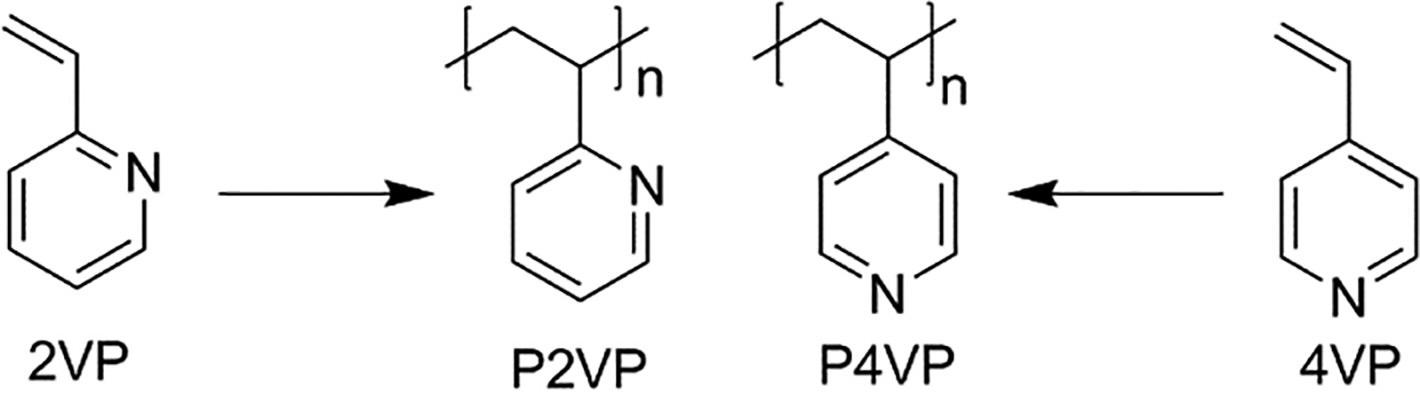
Figure 1. Polymerization of 2 -vinylpyridine monomer to form P2VP
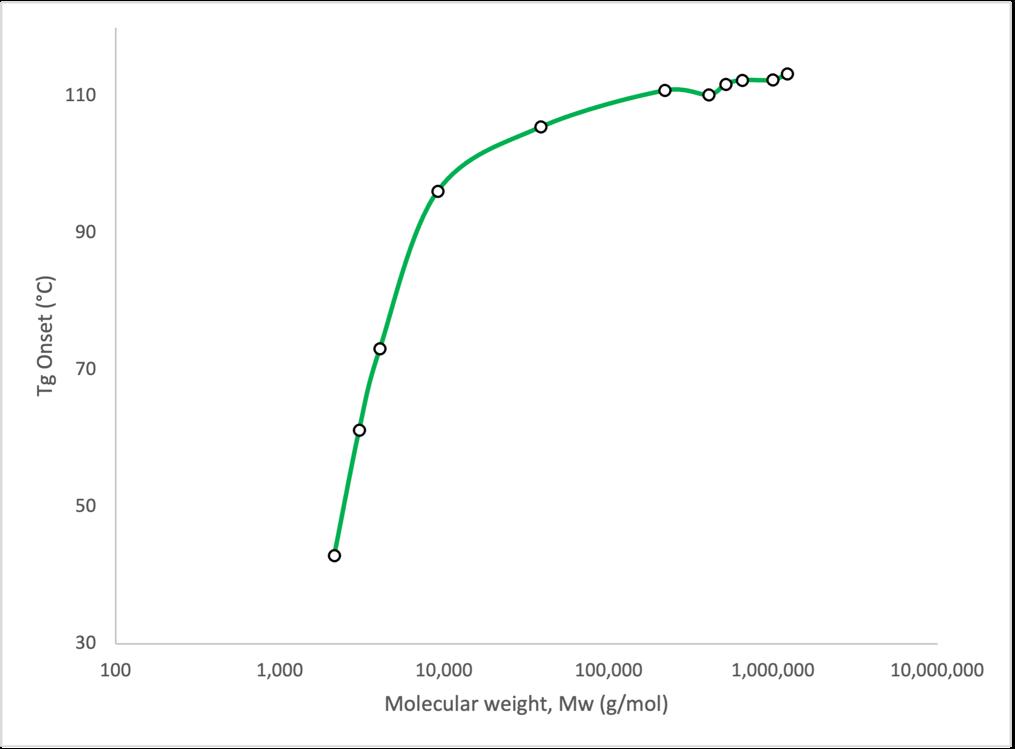
Glass transition temperature (Tg ), termed the “melting point of amorphous materials” is the temperature at which an amorphous polymer changes from a hard, glassy state to a soft, rubbery one As the number-average molecular weight (Mn ) of the amorphous polymer increases, its Tg also increases but ultimately levels off at a maximum value labeled Tg ∞ The Flory-Fox equation relates these parameters for amorphous polymers and is given below
�! = �! # � �$
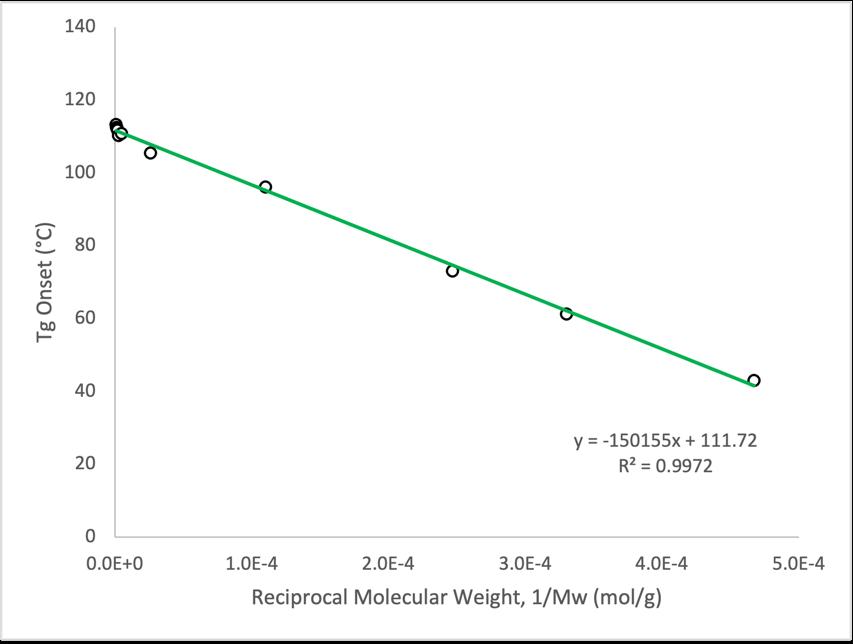
The Flory-Fox equation can be rearranged so that the Flory-Fox parameters Tg ∞ and K can be solved graphically This rearrangement is shown below where the final equation parallels the general equation given for a straight line Through this manipulation the slope of a plot examining onset Tg versus reciprocal molecular weight Mw -1 represents K for the particular amorphous polymer, while the y-intercept of the same plot denotes Tg ¥
�! = � �$ + �!#
�! = � 1 �$ + �!#
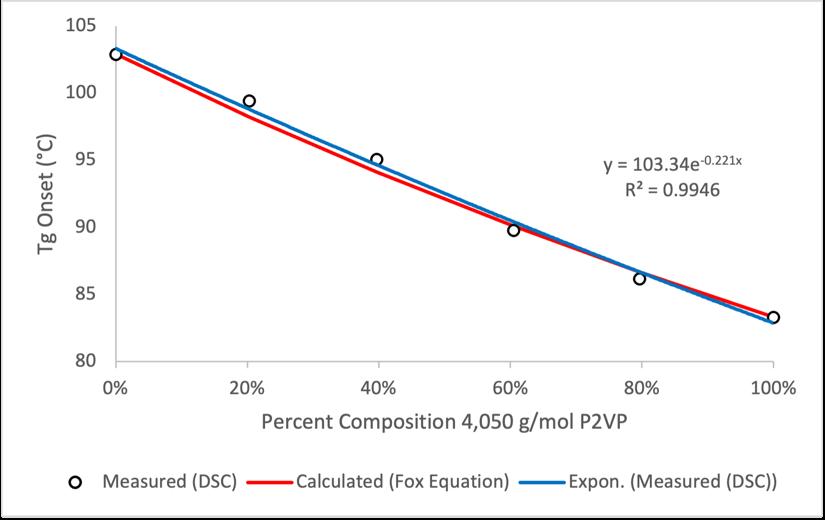
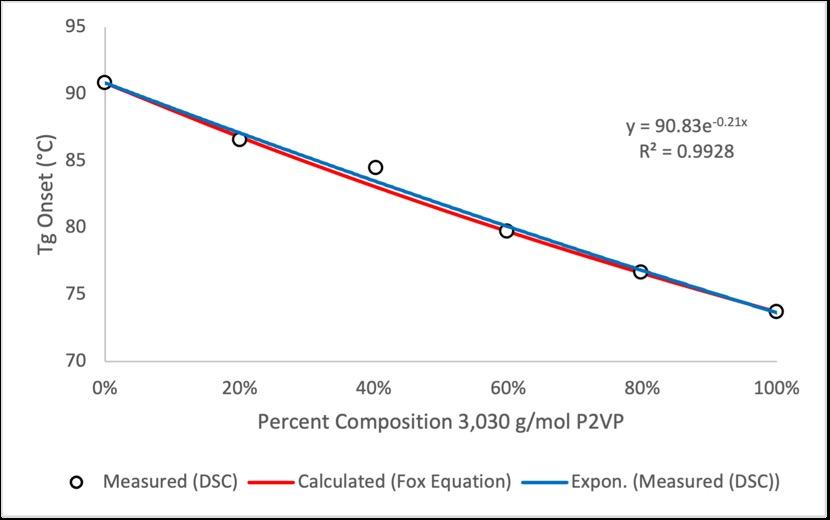
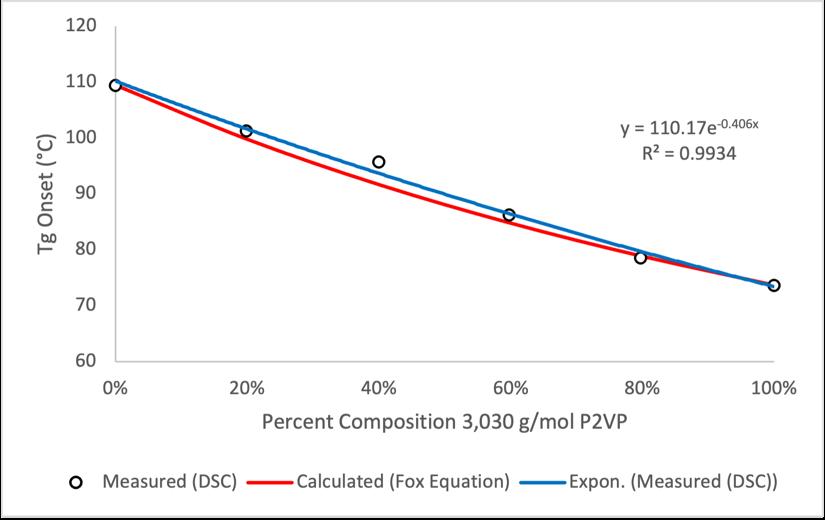
The Tg of a binary mixture of amorphous polymers changes with the weight percent of the components of the binary mixture This relationship is described by the Fox equation shown below, where w indicates the weight percent of each amorphous polymer
1
�! %&' = �( �! ( + �) �! )
1. To establish the Flory-Fox Equation and associated Flory -Fox parameters Tg ∞ and K for the examined amorphous polymer, poly(2 -vinylpyridine) (P2VP).
2. To develop a technique in which homogeneous blends of P2VP could be easily produced.
3. To corroborate the Fox equation for utilizing various binary mixtures (blends) of P2VP of different number-average molecular weights ( Mn ).
E leven P 2VP samples were obtained from Scientific Polymer Products and used without further purification in order to establish the Flory-Fox and linear plots shown in Figure 2 and Figure 3 The molecular weight (Mw ), number average molecular weight (Mn ), and polydispersity index (PDI) data for these samples are displayed in Table 1 Combinations of P 2VP from Table 1 were utilized to prepare the binary mixtures (blends) of Tables 2 and 3
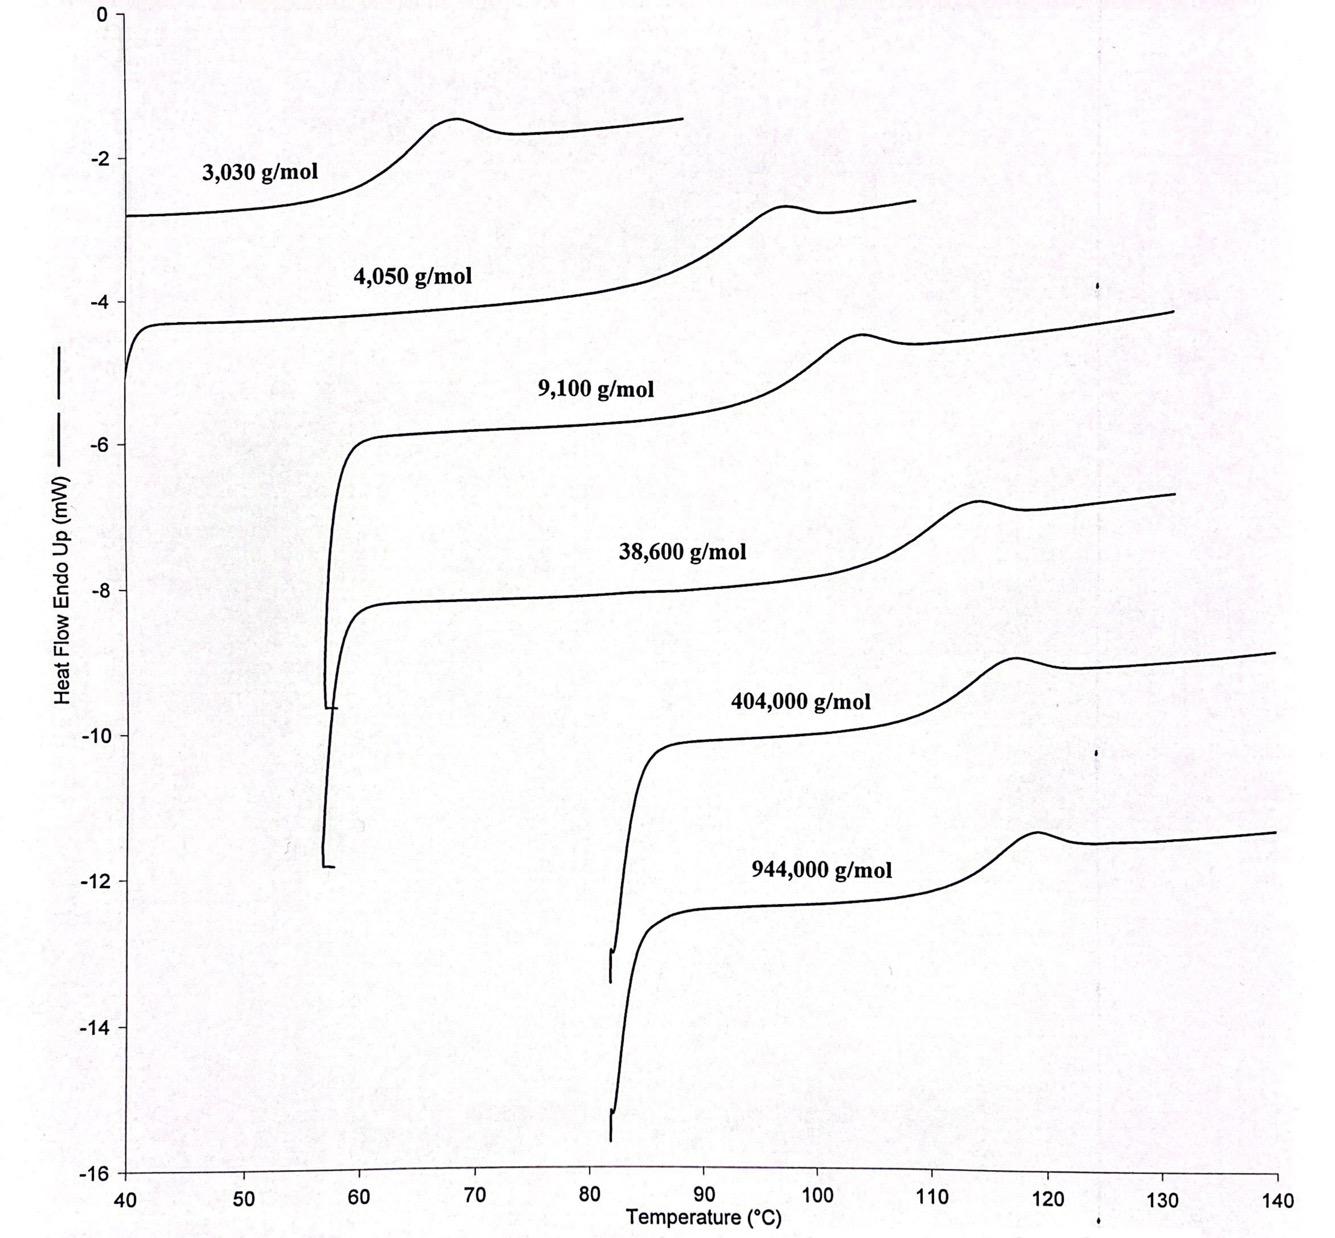
Each P 2VP sample was packed into a standard aluminum pan and the lid was left laying on top of the sample, unpressed These samples were analyzed using a Perkin Elmer Pyris 1 DSC with nitrogen serving as the purge gas flowing at 20 mL min-1 Each thermogram was obtained at a rate of 10°C per minute and Tg data was calculated using the “Tg” option found in the Pyris DSC software package Selected thermograms for various P 2VP samples are shown in Figure 4 An indium metal standard was used to calibrate the temperature and enthalpy measurements of the DSC
Combinations of different molecular weight P 2VP with sufficiently large differences in Tg were first identified Both samples of P 2VP were added to 3 mL glass vials in proportions defined in Table 2 and Table 3, followed by the addition of 200 µ L of methanol A Pasteur pipet was used to aliquot the dissolved P 2VP blends directly into a DSC standard aluminum pan atop a hot plate maintained at 160-180°C The hot plate acted to drive off the methanol which if ignored, would have acted as a plasticizer, producing inaccurate, decreased Tg values This step was repeated until a desirable amount of P 2VP blend (15-20 mg) had accumulated within the DSC standard pan
1. Flory-Fox equation for P2VP was found to be Tg = 112°C – 1.5e+5°C·g·mol-1Mw -1 (r2 > 0.99).
2. Associated Flory-Fox parameters were evaluated to be Tg ∞ = 112 °C and K = 1.5e+5°C·g·mol-1
3. A solvent blend technique was successfully developed to create binary mixtures of P2VP, confirmed by the appearance of a single glass transition in all DSC thermograms.
4. The Fox equation Tg-1 = w 1Tg1-1 + w 2Tg2-1 was corroborated for various blends of P2VP.
[1] D’Amelia, R.P.; Kreth, E. H. Establishment of the Flory-Fox Equation for Polymethyl Methacrylate (PMMA) Using Differential Scanning Calorimetry (DSC) and Determination of Relative Tacticity Using Quantitative Nuclear Magnetic Resonance Spectroscopy (qHNMR). Journal of Polymer and Biopolymer Physics Chemistry 2023, 11 (1), 1-10.
[2] Fox Jr., T. G.; Flory, P. J. Second -Order Transition Temperatures and Related Properties of Polystyrene. I. Influence of Molecular Weight. Journal of Applied Physics 1950, 21 (6), 581-591.
[3] Fox, T. G. and Flory, P. J. The Glass Temperature and Related Properties of Polystyrenes Influence of Molecular Weight. Journal of Polymer Science 1954 14 (75). 315-319.